Embed Size (px)
Citation preview
CHICO HISTORICAL
GEOGRAPHIC INFORMATION SYSTEM
INTERACTIVE WEBSITE
_________________
A Project
Presented
to the Faculty of
California State University, Chico
_________________
In Partial Fulfillment
of the Requirements for the Degree
Master of Arts
In
Geography
__________________
By
Heidi Marie Ogle
Fall 2012
iii
PUBLICATION RIGHTS
No portion of this thesis may be reprinted or reproduced in any manner
unacceptable to the usual copyright restrictions without the written permission of the
author.

iv
DEDICATION
For my mother and father,
Marilyn and Rolla Ogle.
v
ACKNOWLEDGMENTS
This thesis project would have never been attempted nor concluded without
the support of my good friend, mentor, and thesis advisor, Dr. Eugenie Rovai. She
believed in me and saw me through a project that clearly persisted much longer than
anticipated. She never gave up on me and was always willing to spend time making sure
it was all coming together. You are a rock star, Doc! Thanks for being my friend.
I am also grateful for my other two thesis committee members, Dr. Scott
Brady and Pam Figge. Their friendship and guidance could always be counted on and
their trust in my abilities has raised my confidence that this whole effort was truly worth
the time invested.
I raise my glass to a great friend and GIS confidant, Sylvie Cares. The
countless hours spent brainstorming, troubleshooting, and geeking out have meant the
world to me. Love you girl!
I owe a good deal of gratitude to ESRI Product Engineer and all around
Javascript guru, Kelly Hutchins. Having no programming background whatsoever before
biting off significantly more than I could initially chew, Kelly cheered me on and picked
me up when I fell. Thanks Kelly!
An additional debt of gratitude is owed to Candace Grubbs and the good folks
at the Butte County Recorder’s Office. This project is more robust and compelling
thanks to the inclusion of digital images of the deeds. I appreciate your patience and
assistance helping me gather all the images used in this project.
vi
Thanks to Randy Needham at the Geographic Information Center and Cathie
Benjamin at CSU Chico for serving up my geospatial data. I appreciate your patience
and helping me as I waded through this jungle.
The Chico Heritage Associate has given their blessings to include their work
as hyperlinks in this project for which I owe another debt of gratitude. But more
importantly, I’d like to take this opportunity to thank them all for the work they have
done over the past 30 years to preserve the proud heritage and charm of Chico.
Finally, Deb Besnard and George Thompson in Special Collections at CSU
Chico have been incredibly accommodating and helpful throughout this project. Thank
you for opening up your collections and encouraging me through to see this through to its
completion.
vii
TABLE OF CONTENTS
PAGE
Publication Rights ....................................................................................................... iii
Dedication ................................................................................................................... iv
Acknowledgments....................................................................................................... v
List of Tables .............................................................................................................. ix
List of Figures ............................................................................................................. x
Abstract ....................................................................................................................... xi
CHAPTER
I. Introduction to the Study ................................................................................ 1
Project Statement and Objectives ............................................................. 3 Plan of Development ................................................................................. 3 Summary ................................................................................................... 4
II. Review of Literature ....................................................................................... 5
Summary ................................................................................................... 9
III. Definition and Temporal Resolution of the Project Area ............................... 10
History of Chico ........................................................................................ 12 Historic Preservation Movement in Chico ................................................ 13 Summary ................................................................................................... 14
IV. Selected Source Material ................................................................................ 15
Historical Maps ......................................................................................... 16 Ownership Records ................................................................................... 19 Population Data ......................................................................................... 19
viii
CHAPTER PAGE Historical Photographs .............................................................................. 20 Contemporary Historic Resource Documentation .................................... 21 Summary ................................................................................................... 21
V. Creating the Chico Historical GIS .................................................................. 23
Historical Maps ......................................................................................... 25 Ownership Records ................................................................................... 27 Population Data ......................................................................................... 31 Historical Photographs .............................................................................. 34 Contemporary Historic Resource Documentation .................................... 35 Ancillary Vector Data Layers ................................................................... 36 Summary ................................................................................................... 37
VI. Web Mapping and Visualization .................................................................... 38
Preparing the Chico Historical GIS for the web ....................................... 39 Website Design and Construction ............................................................. 43 Web Map Functionality ............................................................................ 46 Limitations ................................................................................................ 48 Summary ................................................................................................... 48
VII. Conclusions ................................................................................................... 49
Historical Research Results ...................................................................... 49 Website Visitor Usage .............................................................................. 51 Future Recommendations ......................................................................... 55 Summary ................................................................................................... 56
References ................................................................................................................... 58 Appendices
A. Definition of Terms .............................................................................. 63 B. Chico Historical GIS website screen captures ..................................... 67
ix
LIST OF TABLES
TABLE PAGE
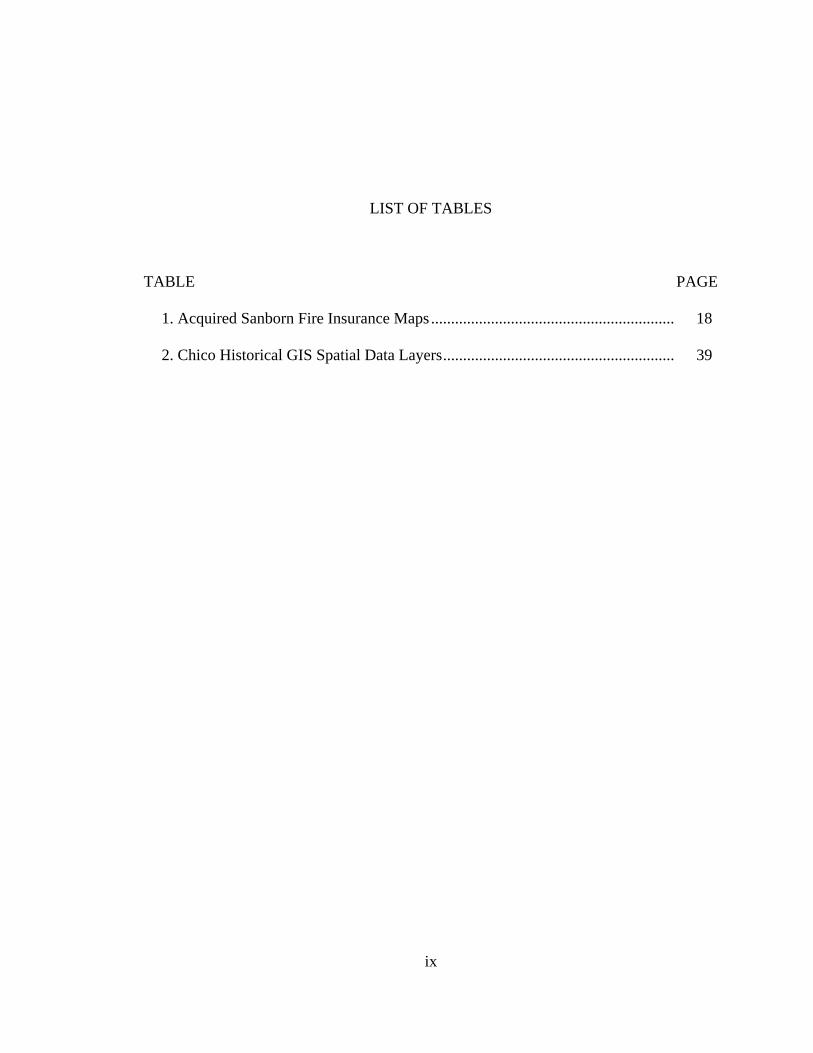
1. Acquired Sanborn Fire Insurance Maps ............................................................. 18
2. Chico Historical GIS Spatial Data Layers .......................................................... 39
x
LIST OF FIGURES
FIGURE PAGE
1. Location of the project area in Chico, California ............................................... 11
2. Sanborn map example ......................................................................................... 17
3. Chico Historical GIS in an ArcGIS map document ............................................ 24
4. Process applied to georeference historical Sanborn maps .................................. 27
5. Ownership records GIS layer derivation ............................................................. 29 6. Reconfiguration of ownership records spreadsheet ............................................ 31 7. Population data GIS layer derivation. ................................................................. 33
8. Time tab .............................................................................................................. 41
9. Web map data publish and retrieval structure. .................................................. 43
10. Developing environment in Notepad++. .......................................................... 45
11. Chico Historical GIS web map page. ................................................................ 47
12. Website visitor flow and usages. ...................................................................... 55
xi
ABSTRACT
CHICO HISTORICAL
GEOGRAPHIC INFORMATION SYSTEM
by
Heidi Marie Ogle
Master of Arts in Geography
California State University, Chico
Fall 2012
Web mapping applications have been emerging throughout the internet in
recent years, crossing disciplinary lines to investigate places from an innovative and
interactive platform. These pioneering endeavors empower the individual to visualize
past places using a dynamic and creative environment. Archival data sources provide a
wealth of information to experienced scholars with proficient historical research skills but
they are rarely used by the general public. This project is an interdisciplinary approach to
research, combining historical scholarship and geospatial technology to examine the past.
The Chico Historical Geographic Information System (GIS) is a time-enabled spatial
analysis research tool that allows public access to historical maps, ownership records,
xii
population data, historical photographs and contemporary historic resource
documentation centralized into one integrated information management system.
Deployed from a cartographic perspective using an interactive and user-friendly website
interface, it is designed and developed for a wide variety of people with varying degrees
of technical skill. The South Campus Historic District, Chico’s original residential
neighborhood and the project area selected for this study, was listed on the National
Register of Historic Places in 1991. The Chico Historical GIS is designed to investigate
the neighborhood history, from its inception when the first lots were sold in 1862 through
to the end of the historic period in 1960. This project discourse describes the techniques
used to cultivate selected source material, create the Chico Historical GIS and visualize
these resources over the internet. This discussion will conclude with a brief analysis of
website visitor use and some future recommendations for further expansion of the
project.
1
CHAPTER I
INTRODUCTION TO THE STUDY
Geographic Information Systems (GIS) are used to manipulate and analyze
spatial data stored in layers that demonstrate both what and where features are located
(Gregory 2003). Adopted by planners and land managers to assess environmental
impacts, model geographical distribution, and investigate landscape pattern, GIS
combines conventional cartography and rich spatial datasets developed from disparate
data sources. The result is an information management system proficient as an effective
research tool for a range of academic disciplines. Recent advances in geographic
information technology are changing the method by which place is examined (Bailey and
Schick 2009).
Social scientists endeavor to encapsulate the essence of place using a myriad
of media. Historians use books, geographers use maps, photographers use images, yet
none of these interpretations entirely explore the story of a place. In much the same way
as a traditional GIS, a historical GIS stores spatially and temporally referenced objects,
integrated to represent landscape change through time. It is ideally suited as a research
tool for historic inquiry because any single event is frequently defined by layers of forces.
A historical GIS employs an interdisciplinary approach to research, combining historical
scholarship and GIS technology to examine the past with an emphasis on the
geographical aspects of research questions (Gregory and Ell 2007). Essentially, a
2
historical GIS adds when to a traditional GIS as landscape change can be examined over
time exposing unknown, unconsidered or unacknowledged processes previously
inconceivable solely within the frameworks of books, maps and images (DeBats and
Gregory 2011). Processes playing out across many scales through complex human
interactions that result in patterns of landscape change can now be visualized and
understood in a historical GIS. The temporal and spatial unification that historical GIS
provides has changed the way we can work with archival data, revealing relationships
that are indistinguishable when textual or graphical resources are analyzed independently
(Audisio, Nigrelli and Lollino 2009, Alhasanat, et al. 2012).
While GIS has enjoyed a central role in planning and land management for
decades, it has largely remained out of reach to the public who are most affected by
decisions made through its use. The development and deployment of a successful GIS is
time and resource intensive and its practitioners are highly skilled specialists who have
invested many years of training (Rodriguez, Sirmans and Parks 1995). While this
continues to be true, GIS data is now being made available to the public through the
internet with no GIS background knowledge required. Web maps are being created by
GIS professionals and employed by popular audiences at astounding rates, enabling them
to understand and make more informed decisions about the world around them (M.
Brovelli, et al. 2012).
The logical transition for any historical GIS is to harness the power of the
internet to make the information available to a wider audience. The development of a
compelling and useful historical GIS is an enormous investment of time that would
largely go unrealized should it remain limited in access to GIS professionals alone.
3
The unparalleled access to information granted by cloud computing coupled with
enhanced efficiency of web maps, public audiences are becoming increasingly adept at
manipulating them.
Project Statement and Objectives
The Chico Historical GIS is an interactive website designed, developed and
deployed in an easily accessible and intuitive mapping platform for a wide variety of
people with varying degrees of technical skills and interests. Its goal is to provide
citizens, researchers, public policy makers and planners with the tools to learn about and
appreciate Chico’s proud heritage. It introduces the audience to a new medium through
which to study the cultural landscape. It brings the historical geography of the study area
to life by exhuming the documents and photographs of its forgotten residents.
Plan of Development
This project discourse covers the creation of the Chico Historical GIS and
discusses how this web mapping technology has empowered the public to explore urban
landscape change. The first chapter introduces the study and provides background
information on historical GIS and web mapping. Chapter II identifies other historical
GIS and web mapping projects and literature relevant to this research. Chapter III
introduces the project area, its history and local preservation achievements. Chapter IV
identifies selected archival source material compiled to develop a comprehensive
collection of historical documentation and Chapter V discusses how those resources are
realized in a historical GIS. Chapter VI discusses how a historical GIS is visualized for
mass consumption on the web and highlights considerations unique to web mapping of a
4
historical GIS. Finally, Chapter VII discusses the conclusions of this study including
some future recommendations. Appendix A contains a list of defined terms and
Appendix B illustrates the final product with website screen captures.
Summary
Advancements in geospatial technology, information management systems,
cartographic visualization and cloud computing can be used to explore landscape change.
Publicly available archival materials are abundant sources of historical information that
can be transformed to create a compelling new model for historical research. This
research project demonstrates how historical GIS and the internet can be combined to
create a new platform from which to investigate an urban landscape throughout its
formative years.
5
CHAPTER II
REVIEW OF LITERATURE
Integration of temporal modeling inside a GIS was slow to develop, so early
adoption of GIS by historical geographers was very rare and web applications developed
through its use were virtually non-existent. Much of the early literature discussed the
concept of studying time and space from a comprehensive framework merely in theory,
concluding with no tangible projects or manuals of instruction for substantive
applications (Cartwright 1997). A secondary influx of literature developed through the
computer science community focused on the physical development of the software (Ott
and Swiaczny 2001). These early compositions brought some awareness to the
development of a new model by which to study landscape change and subsequently
modest projects and research designs began to surface.
Though GIS users were looking to incorporate historical information into their
spatial datasets, often the only available technique was to simply add a time field
whereby a filtering process could be employed to eliminate query results outside the
desired time period. Incremental or transactional dataset archiving was frequently
accomplished using this technique. Analysis was nearly impossible and visualization was
cumbersome and ineffective. Exporting multiple maps presenting an array of time slices
was often the only means by which time could be visualized using a GIS. Christine
Crown (Crown 1995) and Lora Richards (Richards 1999) designed historical GIS
6
projects around the California cities of Chico and Truckee respectively. The former
sought to make the study available to the public through a CD-ROM, an effort inhibited
by proprietary software, while the latter documented her findings in a thesis. Both
pioneering enterprises of their time, visualization of these achievements lacked
illustration and the breadth of the exercise was not fully unrealized.
Attempts to publish historical GIS to the internet was accomplished in tandem
with the advancement of cloud computing. Explicitly titled a historical GIS, the first web
applications to incorporate historical geography and GIS came in the form of large,
national scale historical mapping projects. Secured by funding streams, these projects
were designed to develop large datasets that may be analyzed on the web or downloaded
and manipulated by a GIS specialist. These include the Great Britain Historical GIS
(Gregory and Southall 2002), the China Historical GIS (Bol 2007), and the National
Historical GIS here in the United States (Fitch and Ruggles 2003). Predominantly
focused on serving historical census datasets, the majority of the literature produced
regarding these endeavors concentrated on administrative boundary changes and
aggregated datasets. Largely academic exercises, these early pursuits resulted in little
more than repositories for historical TIGER files, of little practical value to researchers
who lacked training in GIS.
With the innovation of ESRI’s ArcIMS platform in 2000, a few small project-
based historical GIS mapping applications began to surface around the internet. The
Urban Transition Historical GIS Project explored the development of cities at the end of
the 19th century and the early 20th century using census data (Brown University,
Department of Sociology n.d.). The Lewis and Clark Historic Landscape Project was
7
designed to publish all available maps and manuscript information during their journey
across Missouri to the internet using an ArcIMS platform (University of Missouri-
Columbia, Department of Geography n.d.).
Appeals by librarians and archivists who recognized the value of GIS for
scholars with place-based research questions (Abbott and Argentati 1995) remained
largely unanswered by web developers until the Google Maps API was released in 2005
(Presner 2010). New online spatial search engines, gazetteers, and historical atlases have
been developed to publish materials in the collections of libraries and archives around the
world. Harvard’s World Map is a spatial digital collection of tens of thousands of
humanities data layers and maps, served through the internet to scholarly and popular
audiences alike (Guan, et al. 2012). The National Endowment for the Humanities is
currently funding a three year project for the New York Public Library called the New
York City Historical GIS Project (Knutzen 2012). To date, this project has digitized
nearly 8,000 historical maps and enlisted volunteers to assist with georeferencing them.
David Rumsey has also digitized and georeferenced a large portion of his privately
owned historic maps collection and made them available to download and view in
Google Earth (Rumsey and Williams 2002).
The same powerful advancements that made publishing these collections
possible were also harnessed to address specific research questions for large scale
applications. The Historical Society of Pennsylvania’s PhilaPlace is an interactive
javascript web mapping application in which a client can explore Philadelphia’s history
using historical maps, photographs, stories and documents (Historical Society of
Pennsylvania n.d.). Digital Harlem has a remarkable collection of historical maps and
8
data layers enlightening its users about the everyday lives of Harlem residents between
1915 and 1930 (University of Sydney, Australia, Department of History n.d.). Art
departments from both Columbia University and Vassar College teamed up to publish
Mapping Gothic France, an interactive javascript web mapping and timeline application
comprised of images, texts, charts and historical maps (Columbia University Media Art
Center and Vassar College Art History Department n.d.). This graphically stunning
website invites the user to “explore the parallel stories of gothic architecture and the
formation of France in the 12th and 13th centuries.” Powered by ESRI’s ArcGIS for
Javascript API©, Beyond Steel’s map component addresses the rise and fall of LeHigh
Valley’s industrial sector using a historical GIS comprised of historical maps, census
information and other primary resource documentation (LeHigh University, Digital
Library n.d.).
In 2010, time was added to the core functionality in ESRI’s release of ArcGIS
10. This game-changing addition enabled spatio-temporal modeling without Python
scripting. By simply adding a time slider to the interface, analysis is now possible across
both space and time. This innovation was also included in ArcServer, thereby enabling
the publishing of spatio-temporal data models to the internet. New javascript based web
maps can now be served directly from a historical GIS making these new web mapping
applications scalable and truly dynamic.
Two distinctive platforms have emerged: one as a repository for archives,
collections, historic datasets and maps, and the other to serve local and regional research
projects. The former is designed for scholarly research with little or no GIS training and
the latter for a popular audience, less versed with historical research methodologies.

9
Both platforms are now powerful enough to fulfill their objectives and as cloud
computing and historical GIS technologies continue to improve, digital rendition of past
places will be an exciting field with endless possibility.
The Chico Historical GIS is designed to achieve both research and collections
management objectives. It is used by popular audiences to investigate landscape change
in the project area while simultaneously provides a digital repository for historic maps,
documents and images. This project capitalizes on the achievements of historical
geographers, GIS professionals and the web development community by incorporating
historical research methodologies and web mapping technology to explore the project
area.
Summary
Historical GIS web applications are now vigorously populating the internet,
thanks to recent innovations from the geographic information technology and web
programming communities. Historic maps, photographs, and records stowed away in
libraries and archives are now transformed using modern mapping technologies and
explored in new and exciting ways (Grosso 2010). Both popular and scholarly audiences
interested in the study of landscape change are enriched by these ventures, facilitated by
accessible and interactive platforms that serve rich spatial datasets.
10
CHAPTER III
DEFINITION AND TEMPORAL RESOLUTION OF THE PROJECT AREA
The project area was primarily selected based on the availability of source
material sufficient to accomplish research objectives. The South Campus Historic
District in Chico, California, afforded readily available archival source material, with the
exception of one journey to Southern California to acquire historical maps from the
Sanborn Map Library at California State University, Northridge. The concise history and
confined space provided an excellent opportunity to encapsulate the essence and
evolution of place.
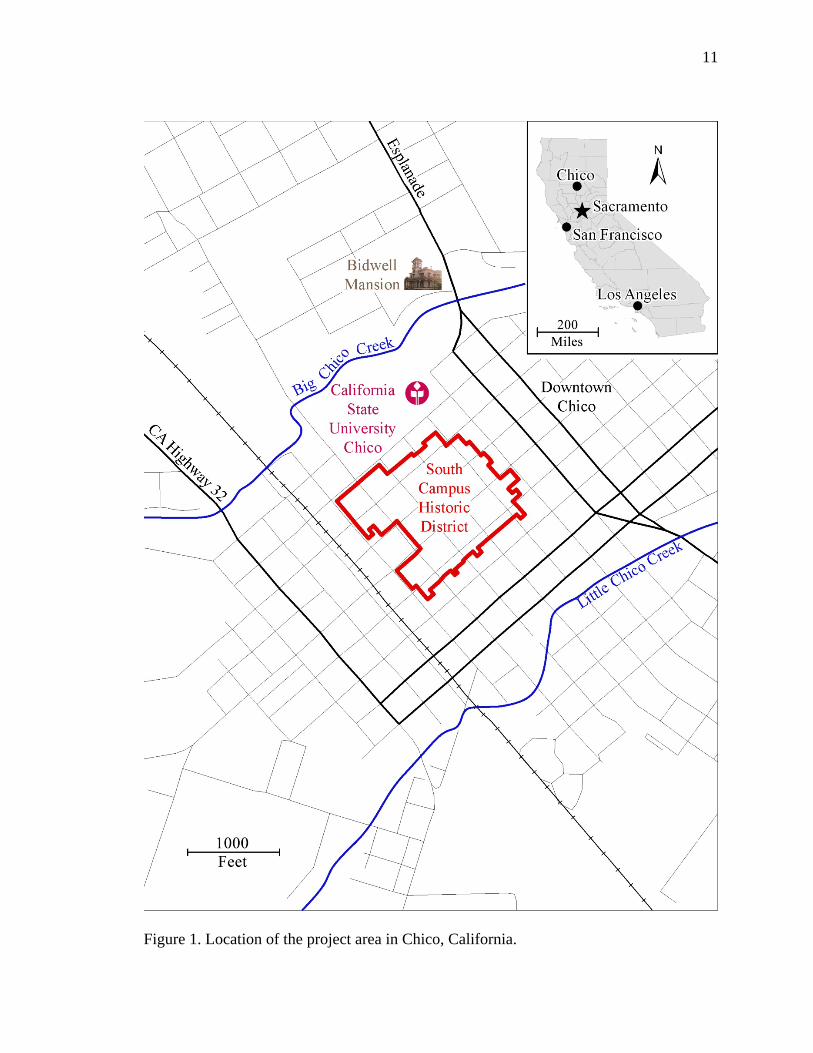
The City of Chico is located in the Central Valley of Northern California. It is
90 miles north of Sacramento situated along the western foothills of the Sierra Nevada
Mountain Range. The project area is Chico’s original residential neighborhood known
today as the South Campus Historic District, listed in the National Register of Historic
Places in 1991. The District is roughly bordered to the northwest by California State
University, Chico, and the railroad tracks and to the southeast by California Highway 32
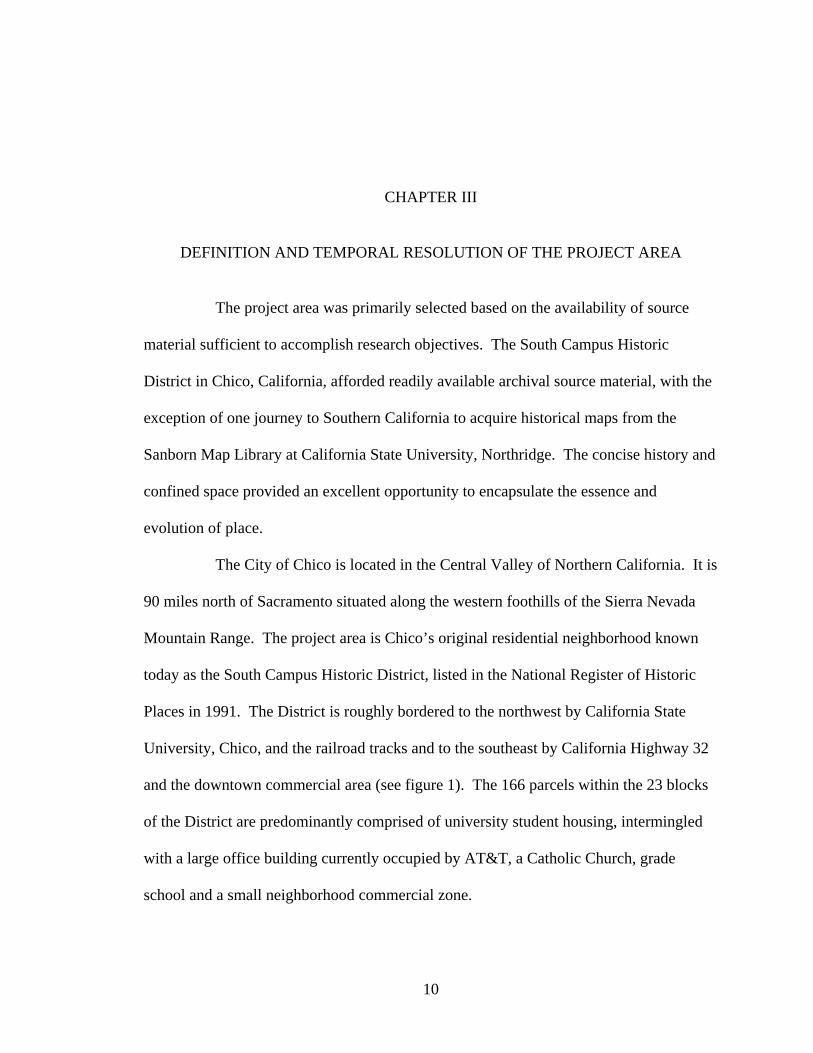
and the downtown commercial area (see figure 1). The 166 parcels within the 23 blocks
of the District are predominantly comprised of university student housing, intermingled
with a large office building currently occupied by AT&T, a Catholic Church, grade
school and a small neighborhood commercial zone.
11
Figure 1. Location of the project area in Chico, California.
12
The District’s historic integrity has been maintained by 114 structures designated as
contributors to the historic significance of the neighborhood. The Chico Historical GIS
was designed to investigate the history of the neighborhood, from its inception when the
first lots were sold in 1862 through to the end of the selected historic period in 1960.
History of Chico
In 1849, General John Bidwell purchased the 22,000 acre Rancho Arroyo
Chico Mexican land grant and planted wheat in the rich soils of the Central Valley
(Brewer 1975). The wheat was milled into flour and sold to miners in the foothills and
shipped southeast to the frontlines during the Civil War era (Moon 2003). Amid
dabbling in the political arena and harvesting his wheat, Bidwell laid out the Town of
Chico and began selling lots to settlers and speculators in 1862 (Gillis and Magliari
2003). Many of the early Chicoans invested in large mining operations to the east or
farms to the west while others built stores for goods and services downtown. Land was
for churches and schools was donated by General Bidwell and within a decade, nearly all
the lots within the project area had been sold.
Today, the City of Chico is primarily known as a college town. In 1887,
General John Bidwell donated eight acres to form the Chico Normal School, a teaching
college later named the California State University, Chico (Hunt 1942). Chico’s tree-
lined streets, favorable weather conditions and small town appeal have made it the
college of choice for San Francisco Bay Area natives for decades (Abbiati 2012).
Chico’s charm is tied to its history, and generations have worked hard to keep that record
13
intact. Taking a stroll through the older neighborhoods in Chico is a refreshing walk
back in time, covered by giant sycamores and flanked by colonial revivals.
The District has its own tempo, often blaring out of windows of the great
corner houses now home to Greek fraternities. It has its own texture, from the bumpy
sidewalks, cracked and upended by the root systems of massive sycamores overhead, to
the smell of pizza and taco shops. Disposable red cups and ping pong tables adorn
malnourished lawns often substituted as parking places by their tenants. On Chico’s hot
summer days, residents take refuge on grand front porches since their homes have yet to
be equipped with air conditioning.
Despite frequent cases of deterioration resulting from inattentive absentee
landlords paired with the damaging and destructive lifestyle exhibited by college
students, the District has managed to maintain its historic integrity. This is in no small
part due to the diligence of the historic preservation community and a few prized
homeowners and builders consigned to revitalize the neighborhood with their restoration
and rehabilitation efforts.
Historic Preservation Movement in Chico
In 1981, a grassroots organization of volunteers and concerned citizens
formed the Chico Heritage Association in direct response to the threatened demolition of
a historic building in downtown Chico (Chico Heritage Association n.d.). For the next
two years, through the help of grants from the State of California Office of Historic
Preservation and the City of Chico, the Chico Heritage Association inventoried over 250
structures and features throughout the city to identify historic properties that may be
14
eligible for the National Register of Historic Places. The survey identified a 23 block
cluster of properties in the South Campus Neighborhood, which was later nominated to
the National Register of Historic Places in 1991 (National Register of Historic Places
1991). Over the counter demolition permits continued to be authorized throughout the
city until 1998 when the Historic Landmark Overlay Zone was established to enforce a
demolitions permit review process for any structures threatened within the zone. Finally
in January of 2009, the Chico City Council authorized the Historic Preservation Program,
which included the adoption of the Cultural Resources and Historic Preservation Element
of the 2030 General Plan, the development of the Historic Preservation Ordinance, and
the creation of a Historic Preservation Board (City of Chico 2010).
Summary
The proximity to archival source material, abbreviated temporal and spatial
distribution and contemporary historic authenticity established the South Campus
Historic District as the ideal study area for this research. It is also the desire of this
author to help nourish the healthy grassroots efforts conducted by a vibrant historic
preservation community and that District residents come to appreciate the proud and
dynamic local history that surrounds them.
15
CHAPTER IV
SELECTED SOURCE MATERIAL
Primary and secondary archival source materials selected for inclusion in this
study were based on their potential to realize project goals and objectives. These sources
were textual, graphical and cartographical and none were previously publicly available in
GIS format. Archival search and recovery methods were exercised to accumulate and
cultivate this substantive collection. This chapter will discuss the selected source
material and their contribution toward the development of the Chico Historical GIS.
The selected source materials will be addressed in the following manner.
First, an introduction to the historic Sanborn maps will provide some background
information regarding their significance to historic research. Second, ownership records
and their contribution to the project will be discussed. Third, the incorporation of
population data using census records will be presented followed by a conversation about
the identification and inclusion of historical photographs. Finally, this chapter will
conclude with a discussion about addition of contemporary historical resource
documentation, including Historic Resource Inventory forms and National Register
nomination descriptions.
16
Historical Maps
Historical map comparisons offer the most common method for tracking
landscape change. By juxtaposing maps based on their publishing dates, patterns can be
revealed that indicate land use or structural change (Rumsey and Williams 2002).
Sanborn Fire Insurance Maps, published intermittently from 1867-1970, were designed
for use by insurance companies to determine risk. The result is an unparalleled and
authoritative collection of accurate and detailed urban development maps. The maps
exhibit building footprints, construction material, fenestration, location of doors and other
pertinent information. Additions and demolitions can easily be identified by comparing
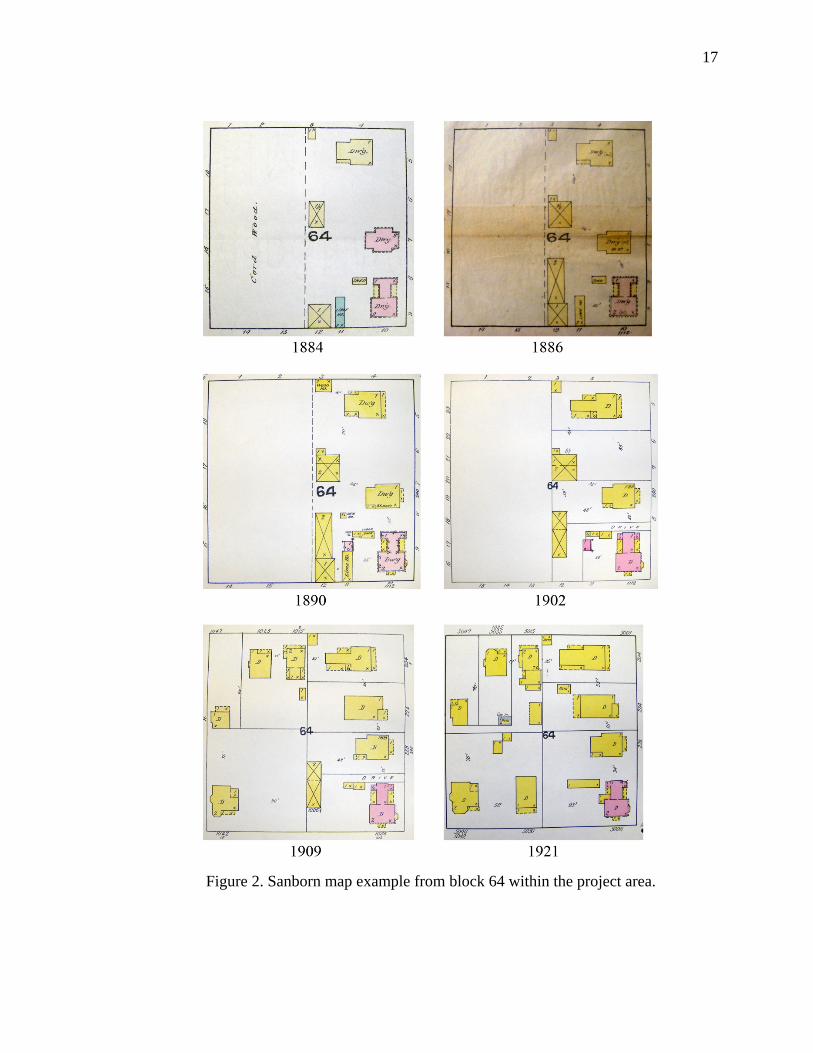
different years. Figure 2 illustrates how block 64 in the study area developed throughout
its formative years with the use of Sanborn Fire Insurance Maps.
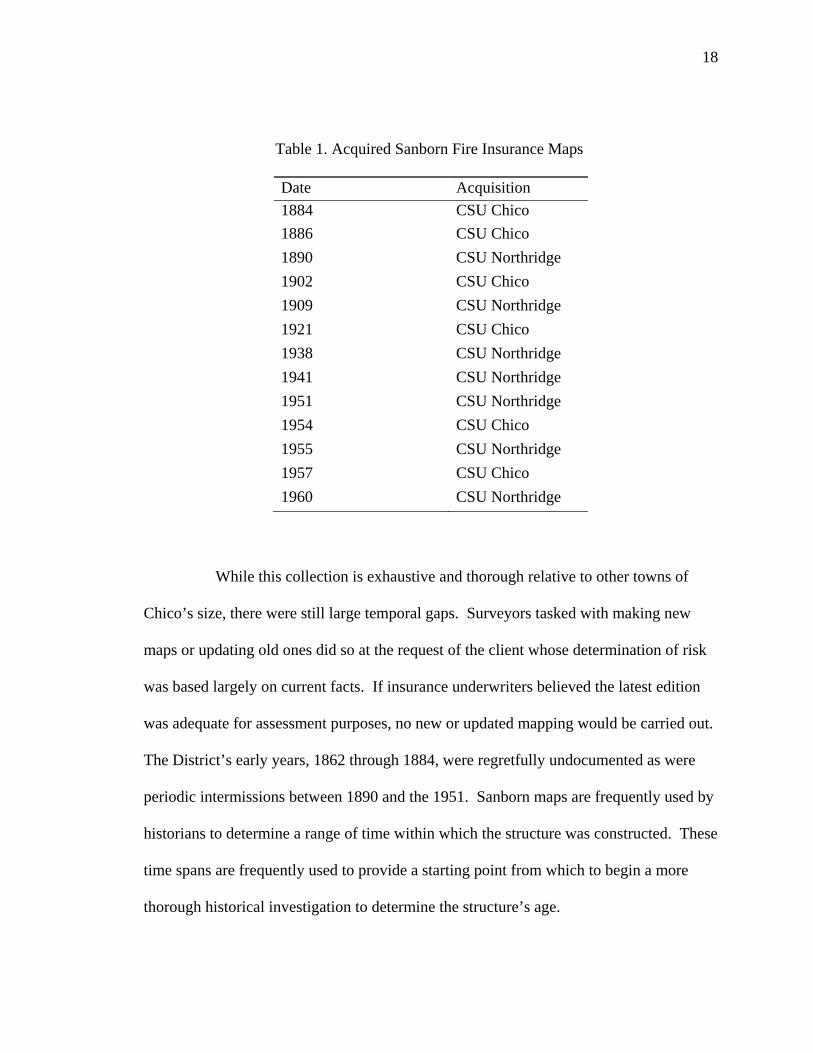
Thirteen editions published from 1884-1960 have been included in this study.
The paper atlases were made available through the California State University, Chico
Special Collections Department in the Meriam Library and the California State
University, Northridge Geography Department Map Library (see table 1).
The Sanborn Fire Insurance Maps were particularly useful to identify
addresses through time. Unfortunately, street address changes were common throughout
the historic period in Chico as homes sometimes changed addresses three times or more.
Cataloguing these address changes was critical to match the correct census record
information, especially in the case of renters, to the corresponding parcel. A discussion
regarding the collection of census record information will be addresses in greater detail in
Chapter V.
17
Figure 2. Sanborn map example from block 64 within the project area.
18
Table 1. Acquired Sanborn Fire Insurance Maps
Date Acquisition
1884 CSU Chico
1886 CSU Chico
1890 CSU Northridge
1902 CSU Chico
1909 CSU Northridge
1921 CSU Chico
1938 CSU Northridge
1941 CSU Northridge
1951 CSU Northridge
1954 CSU Chico
1955 CSU Northridge
1957 CSU Chico
1960 CSU Northridge
While this collection is exhaustive and thorough relative to other towns of
Chico’s size, there were still large temporal gaps. Surveyors tasked with making new
maps or updating old ones did so at the request of the client whose determination of risk
was based largely on current facts. If insurance underwriters believed the latest edition
was adequate for assessment purposes, no new or updated mapping would be carried out.
The District’s early years, 1862 through 1884, were regretfully undocumented as were
periodic intermissions between 1890 and the 1951. Sanborn maps are frequently used by
historians to determine a range of time within which the structure was constructed. These
time spans are frequently used to provide a starting point from which to begin a more
thorough historical investigation to determine the structure’s age.
19
Ownership Records
Ownership data was an integral element in this study, the central component
from which all other relational data was derived. Ownership records for the City of
Chico are located at the Butte County Recorder’s Office in Oroville, California. A chain
of title originating from town founder John Bidwell through to the current owner in 1960
was completed for every parcel in the District. Each deed represents a beginning of
ownership for the grantee and the end of ownership for the grantor. Once a chain was
complete from inception through to 1960, that information was transposed to identify
each owner and corresponding period of ownership. Nearly 1,600 deeds for all parcels
within the project area have been identified, photographed or scanned from microfilm,
and incorporated as hyperlinked resources.
Short-term speculators (proprietors who held title for less than one month)
were excluded and were not inventoried as owners in the historical GIS. This decision
was based on the belief that short-term speculators would have had little to no effect on
construction, addition or demolition of a structure on the property and as such could pose
no significant contributions to the examination of urban growth and landscape change
throughout the District. To preserve the chain of title, transfers of ownership are listed on
the website in the form of hyperlinks to deed records. This will be addressed in greater
detail in the discussion of web mapping in Chapter VI.
Population Data
With the chain of title complete, an inventory of additional occupants of the
District was conducted using census records. These residents could include spouses who
20
were not named in ownership records, children of the owner, extended family members,
lodgers, and renters. Inclusion of these additional occupants was necessary to achieve a
comprehensive collection of neighborhood residents.
Census data available at the individual household level was available for six
of the ten decades under review in this study. The 1890 census for all of California
burned in the 1906 earthquake and subsequent fire in San Francisco. Upon completion of
census research, 1940, 1950 and 1960 had not yet been released at the individual
household level for privacy reasons. Addresses were not provided on the 1870, 1880, or
1900 census enumerations though occasional street names were noted in the margin.
Historical research using individual household level census data was
frequently inhibited by limitations inherent in the records. These limitations include
illegible entries, inaccurate address designation, and absence of occupants at the moment
of enumeration. Given these limitations, a complete account of all the inhabitants in the
District for any census year was impossible. Only enumerations that could reasonably be
presumed to be correctly attributed and geolocated were included. If an account was
inconclusive, it was excluded to preserve data integrity.
Historical Photographs
The Historical Photographs Collection at California State University, Chico,
contains over 18,000 images, and over 2,900 of those have been digitized and made
available online (California State University n.d.). This vast resource was searched for
digital images of District residents identified through chain of title and population data
research as well as photographs of structures within the District boundary, once razed or
21
still standing. Due to address changes across the District throughout the historic period,
variation of data entry and aggregation techniques employed by Special Collections
digitizers, and limited citation information provided by the image’s author, a variety of
search techniques were exercised to ensure a comprehensive compilation was achieved.
These techniques will be discussed in greater detail in Chapter V.
Contemporary Historic Resource Documentation
During the first half of the 1980s and again in the early 1990s, the historic
integrity of the District was evaluated and documented by the Chico Heritage
Association. A Historic Resource Inventory (HRI) was completed across the City,
documenting over 250 properties, including 41 properties within the District. When the
District was nominated to the National Register of Historic Places in 1991, all 166
properties within the District were evaluated and individually documented. During a GIS
digitization project for the City of Chico in the summer of 2005, the author and
colleague, Erec DeVost, digitally photographed these 166 properties and appended the
photographs to the resource description. To limit capturing dense foliage and eliminate
the heavy presence of on-street parking prevalent in the District throughout most of the
year, every structure within the District was photographed again during the winter on
December 25th 2011.
Summary
The primary and secondary sources identified for inclusion in this study
provide users and researchers a vast breadth of material, collectively compiled nowhere
else. Modifications to existing structures and new building construction are represented
22
through the incorporation of historic Sanborn Fire Insurance Maps. Ownership and
census records establish community membership throughout the historic period.
Neighborhood texture and complexion are rendered through historic photographs of both
residents and structures across the District. Contemporary historic resource
documentation presents architectural and historically significant information about the
property. This collection of selected source material constitutes the storyline required for
understanding change across the project area. They are the foundation of this study on
which all visualization, interpretation and analysis are built.
23
CHAPTER V
CREATING THE CHICO HISTORICAL GIS
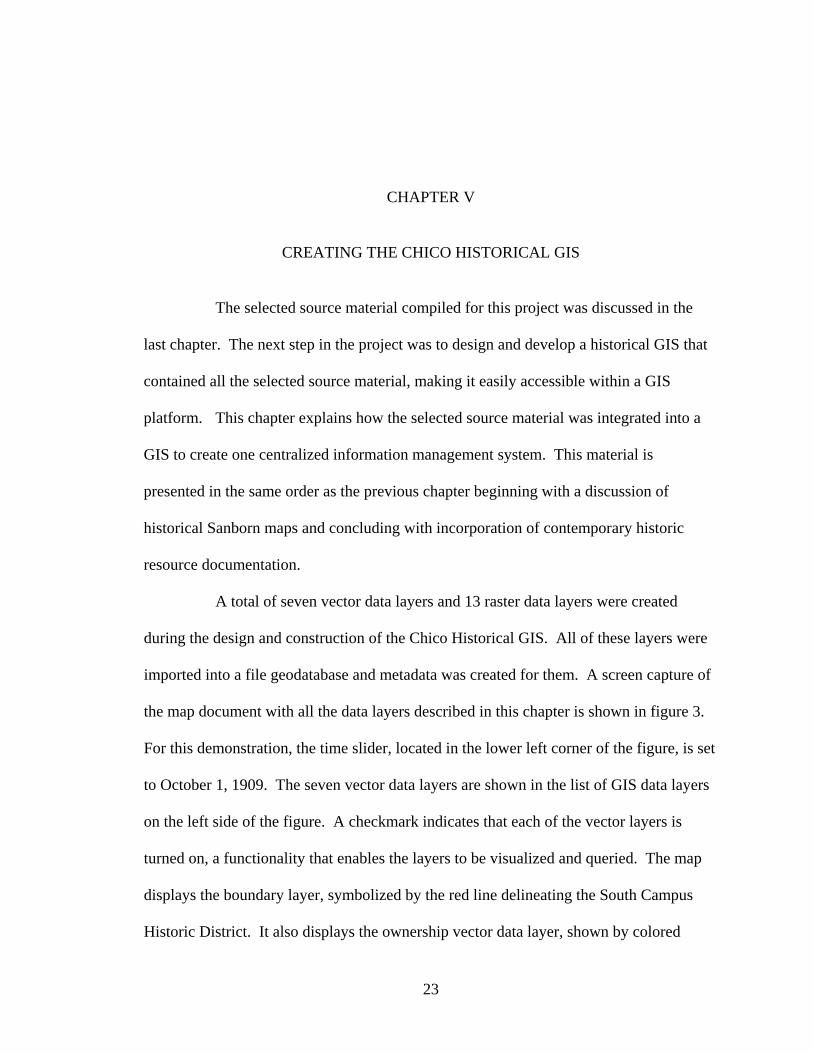
The selected source material compiled for this project was discussed in the
last chapter. The next step in the project was to design and develop a historical GIS that
contained all the selected source material, making it easily accessible within a GIS
platform. This chapter explains how the selected source material was integrated into a
GIS to create one centralized information management system. This material is
presented in the same order as the previous chapter beginning with a discussion of
historical Sanborn maps and concluding with incorporation of contemporary historic
resource documentation.
A total of seven vector data layers and 13 raster data layers were created
during the design and construction of the Chico Historical GIS. All of these layers were
imported into a file geodatabase and metadata was created for them. A screen capture of
the map document with all the data layers described in this chapter is shown in figure 3.
For this demonstration, the time slider, located in the lower left corner of the figure, is set
to October 1, 1909. The seven vector data layers are shown in the list of GIS data layers
on the left side of the figure. A checkmark indicates that each of the vector layers is
turned on, a functionality that enables the layers to be visualized and queried. The map
displays the boundary layer, symbolized by the red line delineating the South Campus
Historic District. It also displays the ownership vector data layer, shown by colored
24
parcels for October 1, 1909 (the time selected by the time slider). The other vector data
layers (Photo_Person, District, Census, Owner_Opaque, and Photo_Structure) are all
turned on but are transparent to show the Sanborn map layer below. The transparent
vector data layers may, however, be queried to return attribute information by clicking on
a parcel. The 13 raster data layers, the historical Sanborn Maps, are listed below the
vector data layers. The 1909 Sanborn map is turned on in this demonstration.
Figure 3. Chico Historical GIS in an ArcGIS map document.
The construction of the Chico Historical GIS will address each selected source
in the same order they were discussed in earlier chapters, rather than the order in which
25
they are listed in figure 3. First, the process applied to capturing and georeferencing the
historic Sanborn maps will be discussed. Second, the methods used to capture, then
convert ownership records into a GIS data layer will be presented. Third, how population
census data was used to identify additional community members beyond just property
owners in the District will be explored. Fourth, the methodology behind the
identification and inclusion of historical photographs into the Chico Historical GIS will
be discussed. Fifth, the addition of contemporary historical resource documentation,
including Historic Resource Inventory forms and National Register nomination
descriptions will be reviewed. Finally, some ancillary and extemporaneous vector layers
will be briefly introduced.
Historical Maps
As discussed in Chapter IV, 13 Sanborn Fire Insurance Map atlases of the
project area were identified and included in this study (see table 1 in the preceding
chapter). To work with the maps inside a GIS, the paper map atlases needed to be
converted to a digital format. Because soft copies are not already available, a digital
image of each block in the project area was captured by the author using a Sony
Cybershot DSC-T100 8.1 megapixel digital camera. Each page in an atlas contained nine
blocks but each block was captured individually. This ensured better resolution and
increased accuracy since the originals were often severely warped. This practice also
provided visual access for the Google Streetview Pegman, which will be discussed in
greater detail in the next chapter.
26
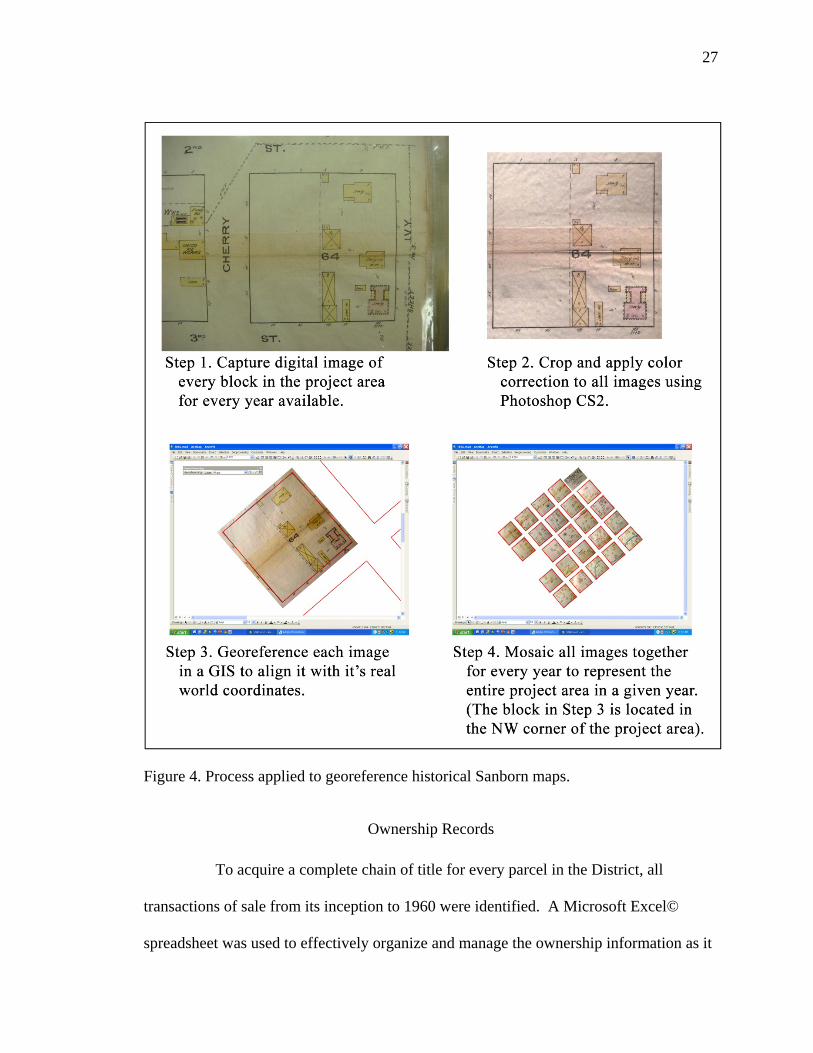
Each image needed to be cropped and color corrected using Adobe Photoshop
CS2© and then imported into ESRI ArcGIS 10©. The Butte County parcel vector data
layer was used as the control layer to georeference each Sanborn map image. Control
points were assigned to the Sanborn map images in a GIS to designate their real-world
coordinates so that they could be aligned and compared over time. The amount of control
points assigned to the image was based on the severity of warping that had occurred to
the original. Once all the images for a year had been georeferenced, they were
mosaicked together into one raster data layer (see figure 4). The result was 13 individual
raster data layers, each one representing the District during the year it was produced.
27
Figure 4. Process applied to georeference historical Sanborn maps.
Ownership Records
To acquire a complete chain of title for every parcel in the District, all
transactions of sale from its inception to 1960 were identified. A Microsoft Excel©
spreadsheet was used to effectively organize and manage the ownership information as it
28
was acquired. Spreadsheets were subdivided into worksheets organized by block because
blocks were the most effective areal unit for managing the data. Assessor’s Parcel
Numbers (APN) were not used because they did not exist in the early years and street
address changes occurred across the District throughout the historic period. Each block
within the District was assigned a worksheet so there were 23 worksheets in all.
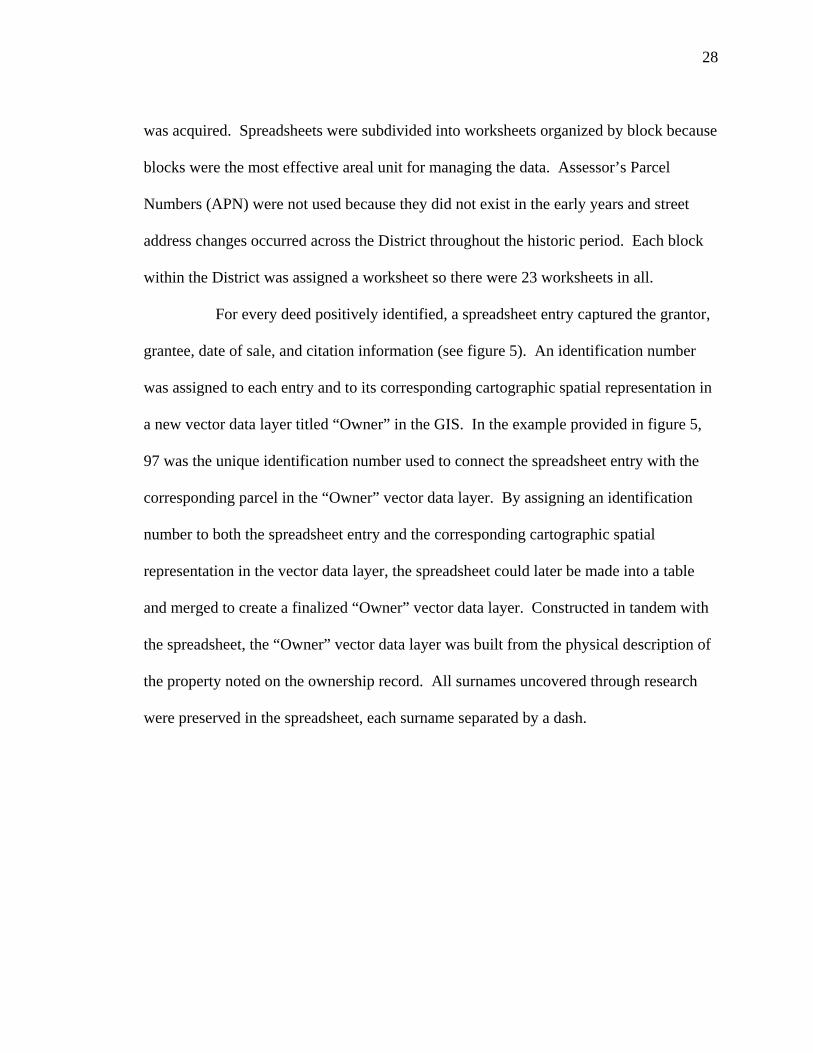
For every deed positively identified, a spreadsheet entry captured the grantor,
grantee, date of sale, and citation information (see figure 5). An identification number
was assigned to each entry and to its corresponding cartographic spatial representation in
a new vector data layer titled “Owner” in the GIS. In the example provided in figure 5,
97 was the unique identification number used to connect the spreadsheet entry with the
corresponding parcel in the “Owner” vector data layer. By assigning an identification
number to both the spreadsheet entry and the corresponding cartographic spatial
representation in the vector data layer, the spreadsheet could later be made into a table
and merged to create a finalized “Owner” vector data layer. Constructed in tandem with
the spreadsheet, the “Owner” vector data layer was built from the physical description of
the property noted on the ownership record. All surnames uncovered through research
were preserved in the spreadsheet, each surname separated by a dash.
29
Figure 5. Illustration of how ownership records were used to create the "Owner" vector data layer.
30
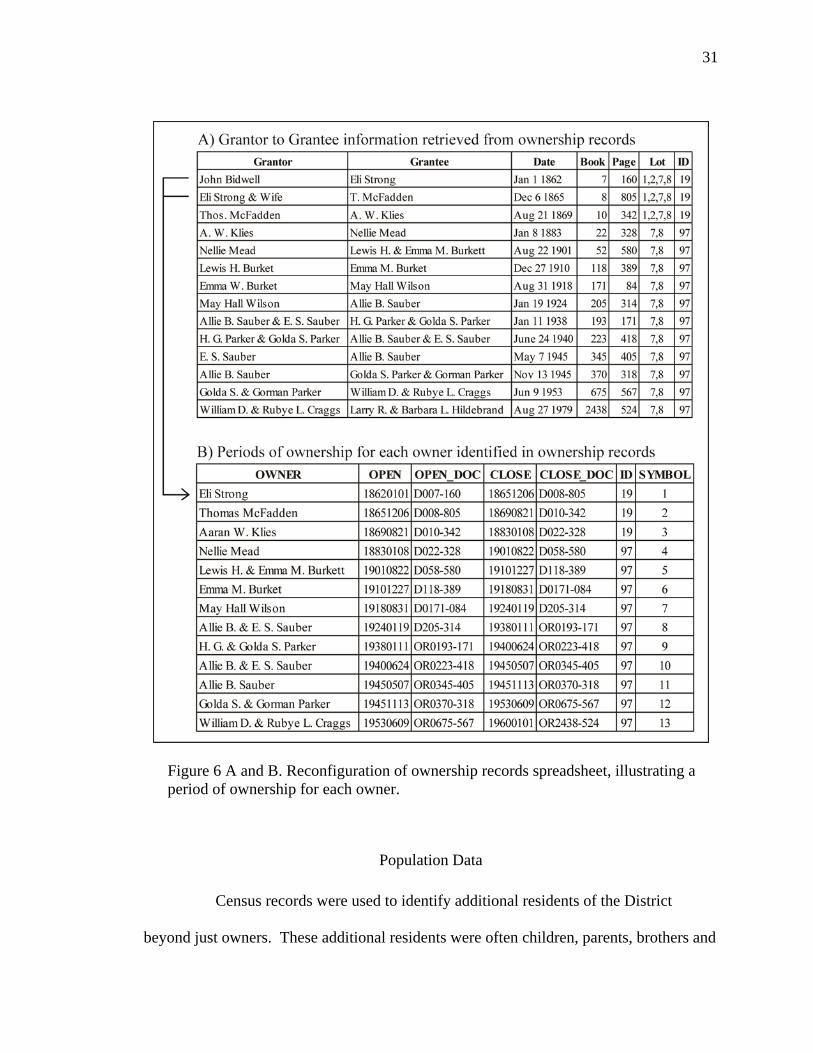
Upon completion of the chain of title research, the spreadsheet recorded over
1,500 transactions, each indicating title had been passed from one person to another. To
express how long each owner retained title of a given property, the spreadsheet was
reconfigured to show periods of ownership rather than a series of transactions (see figure
6). For example, Eli Strong owned the parcel in the northwest corner of block 30 (stored
in the “Owner” vector data layer as parcel 19) from January 1, 1862 to December 6,
1865, as indicated in figure 6A. Figure 6B shows how the transactions of purchase and
sale were used to create a period of ownership, stored in the attribute table as a string of
numbers. Owners were then chronologically listed and assigned a number that would
later be used to symbolize a change in ownership. Using a unique identification number,
the spreadsheet data was then merged to its corresponding spatial representations in the
“Owner” vector data layer. Adjacent parcels owned by the same individual at the same
time were combined into one parcel and associated ownership information for the
blended parcel was updated.
Finally, digital images of all the deeds identified during research were
captured. Permission to check out and scan microfilm reproductions of the ownership
records was granted by Butte County Clerk-Recorder, Candace Grubbs, in the spring of
2011. Most of the microfilms were scanned at California State University, Chico, using
a Konica Minolta MS 6000 MK II microfilm conversion machine. For those ownership
records that were originally handwritten or for which the microfilm was illegible, the
deed was photographed using a Sony Cybershot DSC-T100 8.1 megapixel digital camera.
31
Figure 6 A and B. Reconfiguration of ownership records spreadsheet, illustrating a period of ownership for each owner.
Population Data
Census records were used to identify additional residents of the District
beyond just owners. These additional residents were often children, parents, brothers and
32
sisters of owners identified during chain of title research. Renters, lodgers and workers
who lived in the District could also be identified through census research. Population
data research was undertaken to expand the compilation of District occupants and achieve
the most comprehensive collection of neighborhood residents possible.
Owners of parcels during years of census enumeration were identified and
selected from the “Owner” vector data layer. This information was then used to search
Ancestry.com© to locate corresponding census records. Filtered by location, all unique
surnames were searched and census records documenting habitation within the project
area were identified. Census entries that placed owners on or near the correct street were
appended to the collection whereas entries which located owners elsewhere were
excluded. Prior to 1910, precise street addresses were not included by census
enumerators, therefore, renters were excluded from this collection due to the lack of
sufficient data with which to associate them to a given property. For the 1910, 1920 and
1930 census’ where addresses indicated the property occupied by renters, those
individuals were included as well. For each positive identification, an entry including
year of census enumeration, occupants, address, citation and a unique identification
number matching the spatial representation of the corresponding parcel in the “Owner”
vector layer was made in a Microsoft Excel© spreadsheet. A digital image of each
positively identified census record was captured to be included in the website.
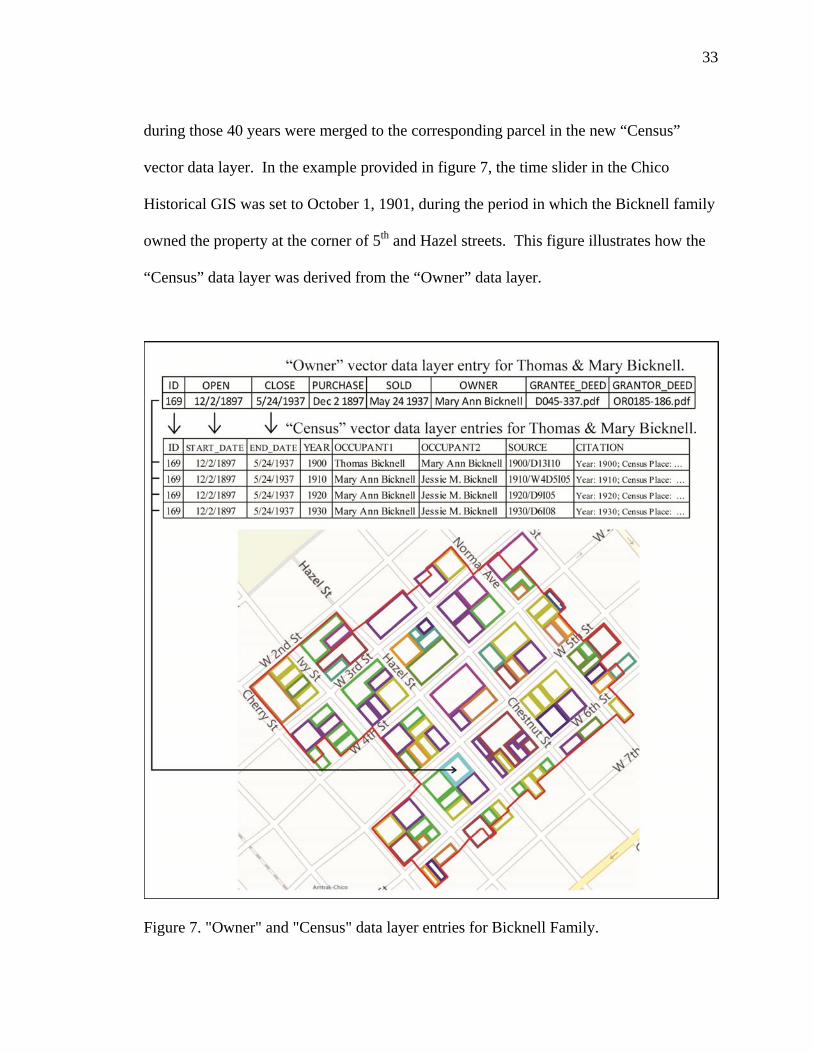
A new vector data layer titled “Census” was derived from the “Owner” layer.
The “Census” layer was composed of parcels that corresponded to the census entries in
spreadsheets described above. For example, Thomas and Mary Bicknell owned their
home for 40 years from 1897 through 1937 (see figure 7). All matching census entries
33
during those 40 years were merged to the corresponding parcel in the new “Census”
vector data layer. In the example provided in figure 7, the time slider in the Chico
Historical GIS was set to October 1, 1901, during the period in which the Bicknell family
owned the property at the corner of 5th and Hazel streets. This figure illustrates how the
“Census” data layer was derived from the “Owner” data layer.
Figure 7. "Owner" and "Census" data layer entries for Bicknell Family.
34
Irrelevant fields from the “Owner” vector data layer were removed, including
links to the deeds and alphanumeric transaction dates. The date fields from the “Owner”
layer, however, were retained to allow the “Census” layer to become time-enabled and
operate with the time slider. A detailed discussion about how the time slider works will
be addressed in greater detail in the next chapter where web mapping and visualization
will be presented. The spreadsheet was converted to a table and merged with the new
“Census” data layer. Finally, any additional surnames acquired through census research
were added to corresponding owners in the “Owner” vector data layer.
Historical Photographs
Historical photographs of residents and the structures within the District create
visual texture of the neighborhood through time. To find digital images of District
residents, the “Owner” and “Census” vector data layers were merged to provide a
cumulative list of District residents. All names from the two layers were used to search
the Digital Historic Photographs Collection at California State University, Chico. Where
maiden and married names were uncovered through research, both surnames were used in
unique searches to identify photographs associated with the individual. When an image
of a resident was positively identified, an entry was made in a new spreadsheet. This new
spreadsheet contained fields for the name of the resident, the internet address of the
image, the internet address of the image citation and a unique identification number to
match to the corresponding parcel in the GIS.
At the conclusion of the search for all photographs of District residents, the
spreadsheet was merged with the “Owner” and “Census” data layers to create a new
35
“Photo_Person” vector data layer. To enable time on this layer, the date fields were
retained and all other data irrelevant to the personal photographs layer were removed.
Finally, new surnames acquired through this research were incorporated in both the
“Owner” and “Census” vector data layers.
To find historic photographs of structures in the District, a variety of search
techniques were used. Since street address changes occurred across the District
throughout the historic period, photos of structures could not be found simply by
searching by street addresses. The variation of data entry methods and categorical
aggregation techniques applied by Special Collections as well as limited citation
information provided by the image’s author presented challenges for locating images.
All digital photographs from the John Nopel Collection, managed by Special Collections,
were reviewed. Different categorical subheadings were applied to images in the Digital
Historical Photographs Collection. All digital photographs linked to the “Chico, Calif. –
Buildings, Structures, etc. – photographs” subheading were examined. All photographs
linked to the “Dwellings – California – Chico – photographs” subheading were also
surveyed. When a structure was positively identified, an entry was made in a new
spreadsheet. This new “Structures” spreadsheet contained fields for the internet address
of the image, the internet address of the image citation and a unique identification
number matching to the corresponding parcel in a GIS. The APN was used as the unique
identification number to merge the spreadsheet to the Butte County parcel vector data
layer and the entry’s corresponding parcel in a GIS. This merge created the new
“Photo_Structure” vector data layer.
36
Contemporary Historic Resource Documentation
Parcels within the District boundary were selected from the Butte County
parcel vector data layer to create the new “District” vector data layer. This new
“District” layer would come to contain the contemporary historic resource documentation
described in Chapter III. Zoning and other irrelevant fields were removed retaining only
the street address and APN fields. A new attribute field was added and populated with
hyperlinks to digital photos taken by the author on December 25th, 2011. New fields
were also created and populated with corresponding hyperlinks to digital copies of the 41
matching Historic Resource Inventory forms and the 166 National Register nomination
property descriptions. A new field, populated with the historic integrity classification
listed on the National Register nomination property descriptions, was also added for each
structure. Finally, all irrelevant fields were removed maintaining only the address, APN,
classification, hyperlinked photos, hyperlinked HRI forms and hyperlinked National
Register descriptions.
Ancillary Vector Data Layers
Two additional vector data layers were created during construction of the
Chico Historical GIS. The “Boundary” and “Owner_Opaque” vector data layers were
constructed for visual purposes only. Their contributions to the project area described
below and complete the discussion about all data layers created for the Chico Historical
GIS.
The “Boundary” vector data layer was created from a paper map included in
the South Campus Historic District National Register nomination documentation. This
37
layer contains no attribute information and is not time-enabled. It was constructed to
delineate the project area. In all figures in this project discourse and in the Chico
Historical GIS web map, this layer is shown as a red line around the project area.
The “Owner_Opaque” vector data layer was created for functionality in the
web mapping component of this project. It contains the exact same information as the
“Owner” vector data layer but is rendered transparent in both the ArcMap document and
the Chico Historical GIS web map. It was created merely to assist with a programming
complication in javascript.
Summary
Historical Sanborn maps were digitized and georeferenced into 13 raster data
layers that became optional base maps. Seven vector data layers were constructed from
primary and secondary source materials during research and development of the Chico
Historical GIS. Information gleaned from these resources was added to spreadsheets that
were eventually merged into new vector data layers. All 20 of these new data layers were
created from research conducted at a variety of repositories and were integrated into a
GIS to create one centralized information management system. The historical data from
which these data layers were derived have also been made available to the user through
digital copies in hyperlinks. This compilation of data is available nowhere else as it was
created specifically for this project.
38
38
CHAPTER VI
WEB MAPPING AND VISUALIZATION
Archival data sources provide a wealth of information to experienced scholars
with proficient historical research skills but they are rarely used by the general public.
This disparity results from a lack of training and an overwhelming response when
presented with stacks of historic documentation. A key objective of this project has been
to design a comprehensive website for the Chico Historical GIS that could be understood
and navigated by anyone, regardless of their background in historical research
methodology or GIS.
This chapter details the procedures undertaken to visualize and effectively
publish historical GIS data over the internet. The discussion begins with the process by
which the historical Sanborn maps are included. It is followed by addressing how the
“Owner” vector data layer is displayed and how time changes are represented on the web
map. Finally, functionality of the transparent vector data layers, including the “Census”
population layer, the “Photo_Person” and “Photo_Structure” historic photos layers, and
“District” contemporary resource documentation layer, will be addressed. The following
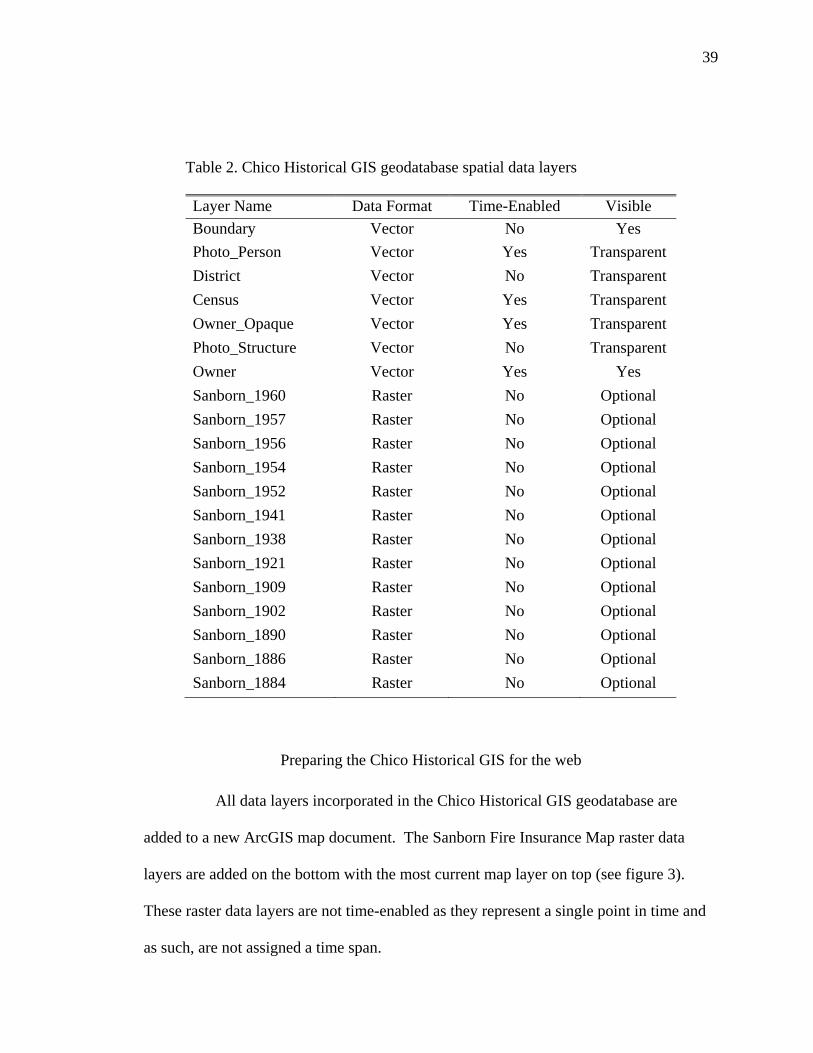
table (table 2) provides an overview of all the data layers created during development.
The table also includes whether or not layers are time-enabled and how they are
displayed in the Chico Historical GIS. This chapter will conclude with a discussion of
website design, construction and functionality.
39
Table 2. Chico Historical GIS geodatabase spatial data layers
Layer Name Data Format Time-Enabled Visible
Boundary Vector No Yes
Photo_Person Vector Yes Transparent
District Vector No Transparent
Census Vector Yes Transparent
Owner_Opaque Vector Yes Transparent
Photo_Structure Vector No Transparent
Owner Vector Yes Yes
Sanborn_1960 Raster No Optional
Sanborn_1957 Raster No Optional
Sanborn_1956 Raster No Optional
Sanborn_1954 Raster No Optional
Sanborn_1952 Raster No Optional
Sanborn_1941 Raster No Optional
Sanborn_1938 Raster No Optional
Sanborn_1921 Raster No Optional
Sanborn_1909 Raster No Optional
Sanborn_1902 Raster No Optional
Sanborn_1890 Raster No Optional
Sanborn_1886 Raster No Optional
Sanborn_1884 Raster No Optional
Preparing the Chico Historical GIS for the web
All data layers incorporated in the Chico Historical GIS geodatabase are
added to a new ArcGIS map document. The Sanborn Fire Insurance Map raster data
layers are added on the bottom with the most current map layer on top (see figure 3).
These raster data layers are not time-enabled as they represent a single point in time and
as such, are not assigned a time span.
40
The “Owner” vector data layer is added just above the 1960 Sanborn map. To
visually delineate the property lines while still allowing for viewing of the Sanborn maps
below, a hollow cartographic representation is applied to all parcels in the “Owner”
vector data layer. This hollow cartographic representation encircles the parcel but does
not obstruct viewing other layers below. Bold primary colors are assigned to parcels
based on sale succession, each one located on the opposite end of the color wheel from
the next. For example, the cartographic representation for the first owner of a parcel is a
hollow purple polygon. The following representation for next owner of the parcel is
brown. The third is blue, and so on. By assigning a stark color variation to parcels
chronologically, the user is visually alerted to a change in ownership.
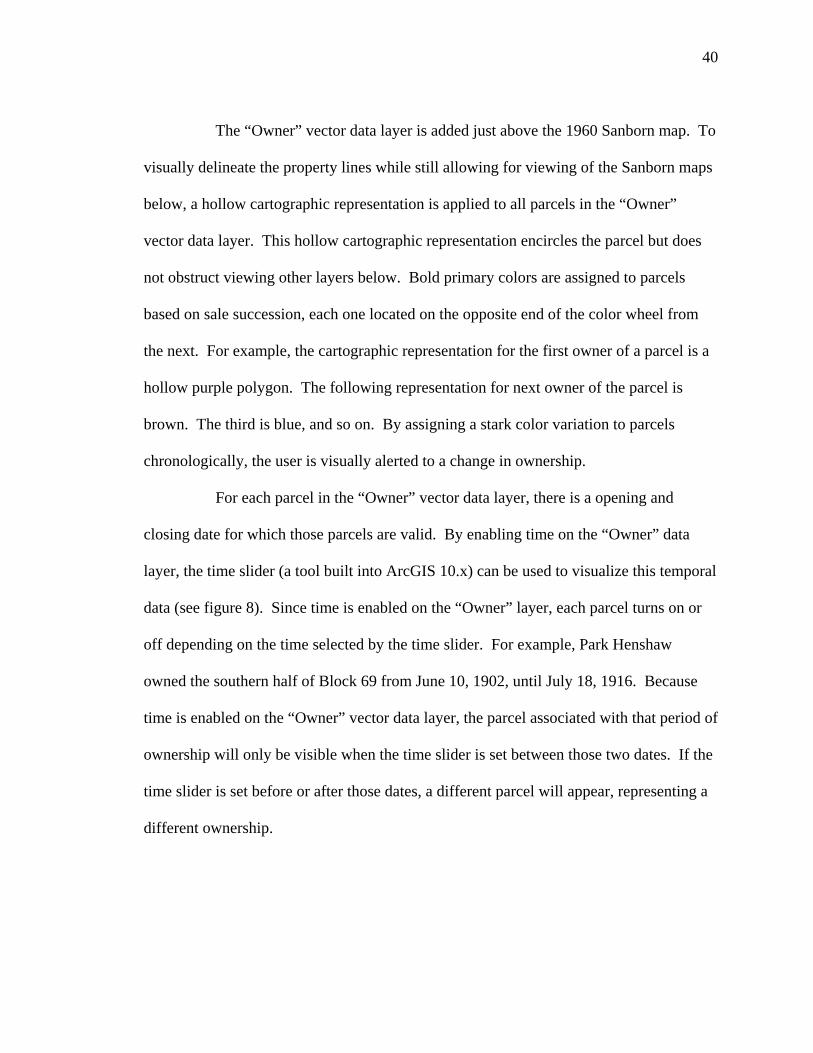
For each parcel in the “Owner” vector data layer, there is a opening and
closing date for which those parcels are valid. By enabling time on the “Owner” data
layer, the time slider (a tool built into ArcGIS 10.x) can be used to visualize this temporal
data (see figure 8). Since time is enabled on the “Owner” layer, each parcel turns on or
off depending on the time selected by the time slider. For example, Park Henshaw
owned the southern half of Block 69 from June 10, 1902, until July 18, 1916. Because
time is enabled on the “Owner” vector data layer, the parcel associated with that period of
ownership will only be visible when the time slider is set between those two dates. If the
time slider is set before or after those dates, a different parcel will appear, representing a
different ownership.
41
Figure 8. Time tab of the properties dialog box for the "Owner" vector data layer Time is also enabled on the “Census” data layer. As discussed in the previous
chapter, census entries were assigned a time span based on the period of ownership that
corresponded to that census record. For example, since Park Henshaw owned the
southern half of block 69 from 1902 to 1916, the corresponding census record for 1910 is
valid during that same period of ownership from 1902 to 1916, not just during 1910. The
spatial representation of the “Census” vector data layer is transparent, however, results
are still returned when the user clicks one of the parcels.
42
Transparency is also applied to both historic photographs layers
(“Photo_Person” and “Photo_Structure”) though geometry is still active and attribute data
is available by clicking on a parcel. Time is enabled on the “Photo_Person” data layer to
connect the person in the photograph with the “Owner” or “Census” data layers with
which they correspond. Time is disabled on the “Photo_Structure” data layer for two
reasons. First, dates documenting when the photographs were taken are not always
known. Second, users seeking these images are most likely interested in seeing all
available images for a particular structure regardless of time selected on the time slider.
The “District” vector data layer is also transparent but available to a user by
clicking on a parcel. Time was not enabled on this data layer because all documentation
in this layer occurred after the end of the historic period in 1960. As is the case of the
“Photo_Strutcure” vector data layer, users are interested in this information regardless of
the time selected on the time slider.
Finally, on top of all other data layers, the “Boundary” layer is added to
delineate the District using a red line. Time was also not enabled on this data layer and
no data is associated with this data layer. Also, as mentioned in the previous chapter, the
“Owner_Opaque” vector data layer is added. This data layer is a copy of the “Owner”
vector data layer, included for programming purposes in the web map. Transparency is
applied to the layer and it is time enabled.
A map service was generated from the map document and the geodatabase.
By publishing the Chico Historical GIS to a map service, each of these data layers is
available to be pulled into a web mapping application and made publicly accessible on
43
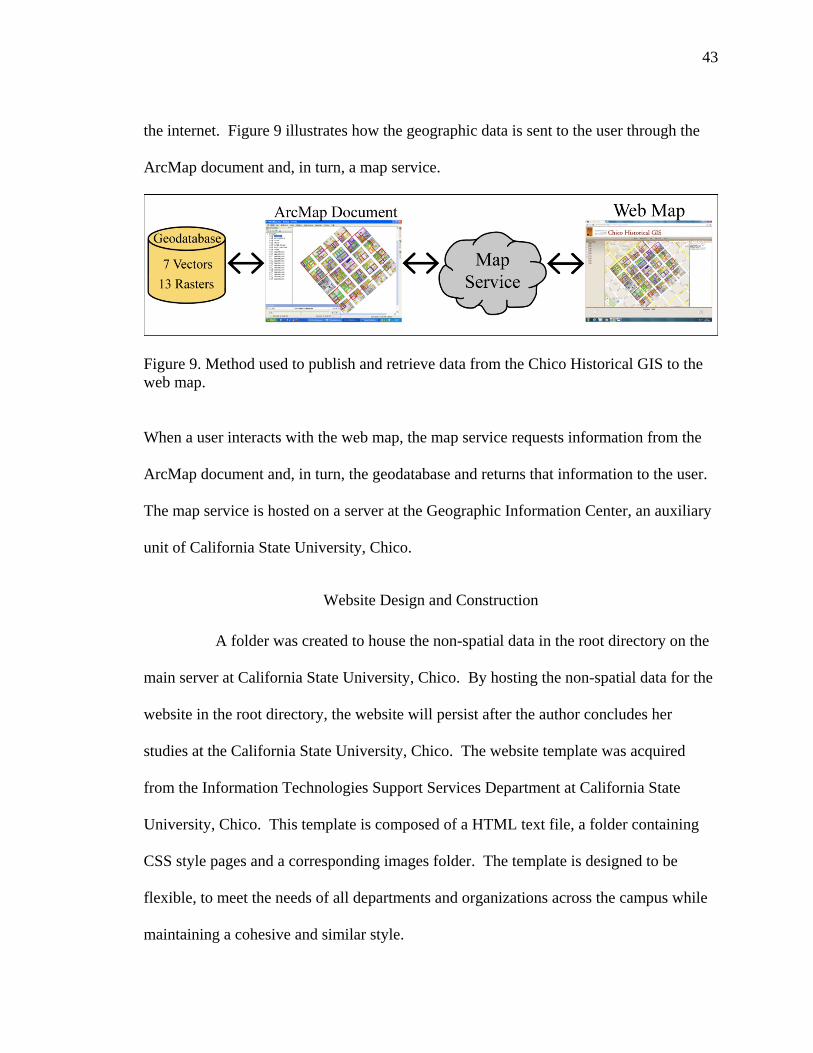
the internet. Figure 9 illustrates how the geographic data is sent to the user through the
ArcMap document and, in turn, a map service.
Figure 9. Method used to publish and retrieve data from the Chico Historical GIS to the web map.
When a user interacts with the web map, the map service requests information from the
ArcMap document and, in turn, the geodatabase and returns that information to the user.
The map service is hosted on a server at the Geographic Information Center, an auxiliary
unit of California State University, Chico.
Website Design and Construction
A folder was created to house the non-spatial data in the root directory on the
main server at California State University, Chico. By hosting the non-spatial data for the
website in the root directory, the website will persist after the author concludes her
studies at the California State University, Chico. The website template was acquired
from the Information Technologies Support Services Department at California State
University, Chico. This template is composed of a HTML text file, a folder containing
CSS style pages and a corresponding images folder. The template is designed to be
flexible, to meet the needs of all departments and organizations across the campus while
maintaining a cohesive and similar style.
44
The template was modified to support supplementary pages of the website.
These supplementary pages include the home page, the background page, the resources
page and the about page (see appendix B). The home page includes text about historical
GIS and general information the website. The background page contains a project area
description, a brief local history and an introduction to the historic preservation
movement in Chico. The resources page provides information about the selected source
material and the about page presents biographical information about the author and those
who assisted in the creation of the project.
A great deal of modification to the template was necessary to create the web
map page. The template was designed to display information using a predetermined pixel
width. Though this design is convenient for developing a template that can be used by a
wide variety of departments, screen availability is wasted on users with large screens. To
maximize users screen availability, the web map page is designed using percentages,
rather than pixels, to instruct the web browser how the information should be presented to
the user. Regardless of the user’s screen size, all the elements on the web map page
appear proportionately by using percentages.
The ArcGIS API for Javascript© was used to construct the web map. The
API uses the Dojo© toolkit to ensure that functionality is maintained properly across all
web browsers. A wide variety of basemaps are available including ESRI’s basemaps and
Open Street Map but Google Maps© was selected due to the Street View functionality.
“Street View lets you explore places around the world through 360-degree street-level
imagery (Google n.d.).” This functionality is especially useful for this particular
45
application as it provides users the ability to virtually walk through the District in modern
times to get a feel for the neighborhood today.
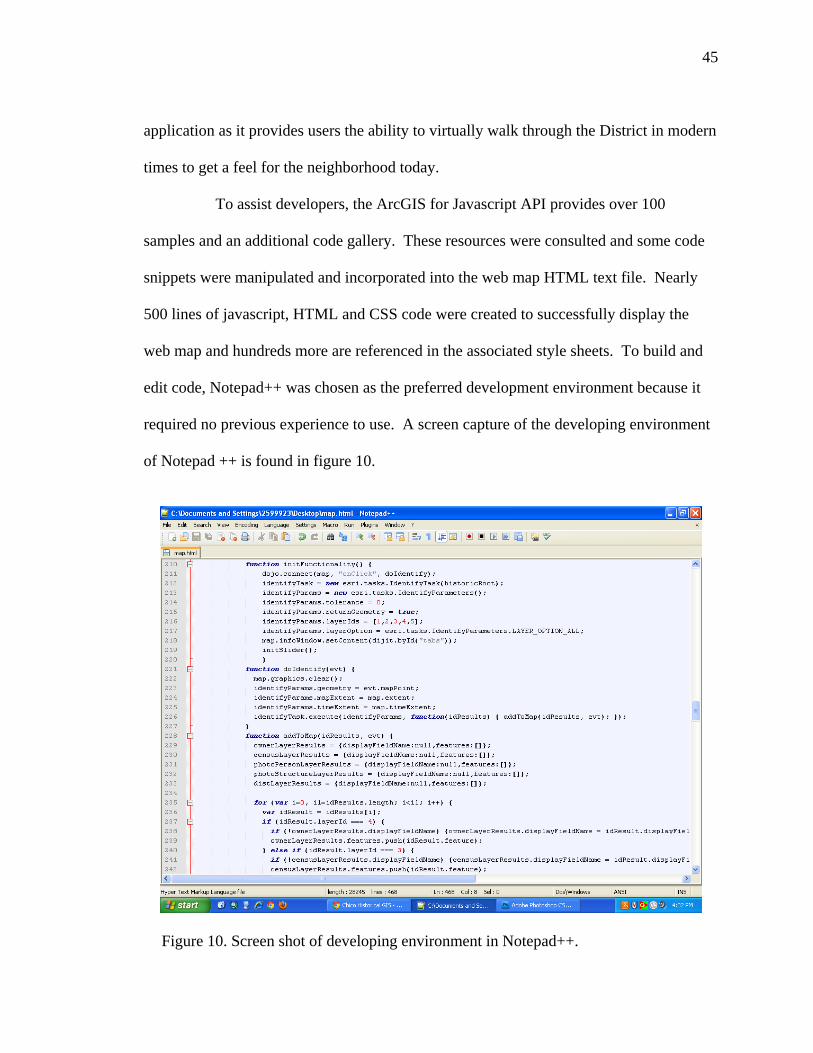
To assist developers, the ArcGIS for Javascript API provides over 100
samples and an additional code gallery. These resources were consulted and some code
snippets were manipulated and incorporated into the web map HTML text file. Nearly
500 lines of javascript, HTML and CSS code were created to successfully display the
web map and hundreds more are referenced in the associated style sheets. To build and
edit code, Notepad++ was chosen as the preferred development environment because it
required no previous experience to use. A screen capture of the developing environment
of Notepad ++ is found in figure 10.
Figure 10. Screen shot of developing environment in Notepad++.
46
To maintain a compact file structure, all layers are served as dynamic map
service layers. Each time a user interacts with the web map page, a request is sent to and
returned from the server. Due to the relatively small size of the project area, latency does
not present a problem for users as the return time is relatively short.
Web Map Functionality
The Chico Historical GIS website is located at
http://www.csuchico.edu/chicohistoricalgis and the map page is located in the
corresponding subdirectory (see figure 11). When a user arrives at the web map, a
welcome dialog box provides the user instructions for navigating and working with the
data. At the center of the page is the map box that houses the Google Maps base maps,
Street View capability in the top left corner, the District “Boundary” layer, and the visible
“Owner” layer.
The box on the left is the Sanborn map panel that houses a checkbox toggle
system to render and remove Sanborn maps at the user’s request. As discussed earlier,
these historic Sanborn maps were not time-enabled so they can be toggled on and off,
regardless of the time selected on the time slider. The Sanborn maps are layered from
oldest to newest so that the most current one, 1960, is on top. When multiple Sanborn
maps are toggled on, the most current map will be presented to the user and the others
will be layered below. By situating the Sanborn maps in this way, the user can turn on
the maps in a linear order through time, from oldest to newest, modeling the
neighborhood’s succession.
47
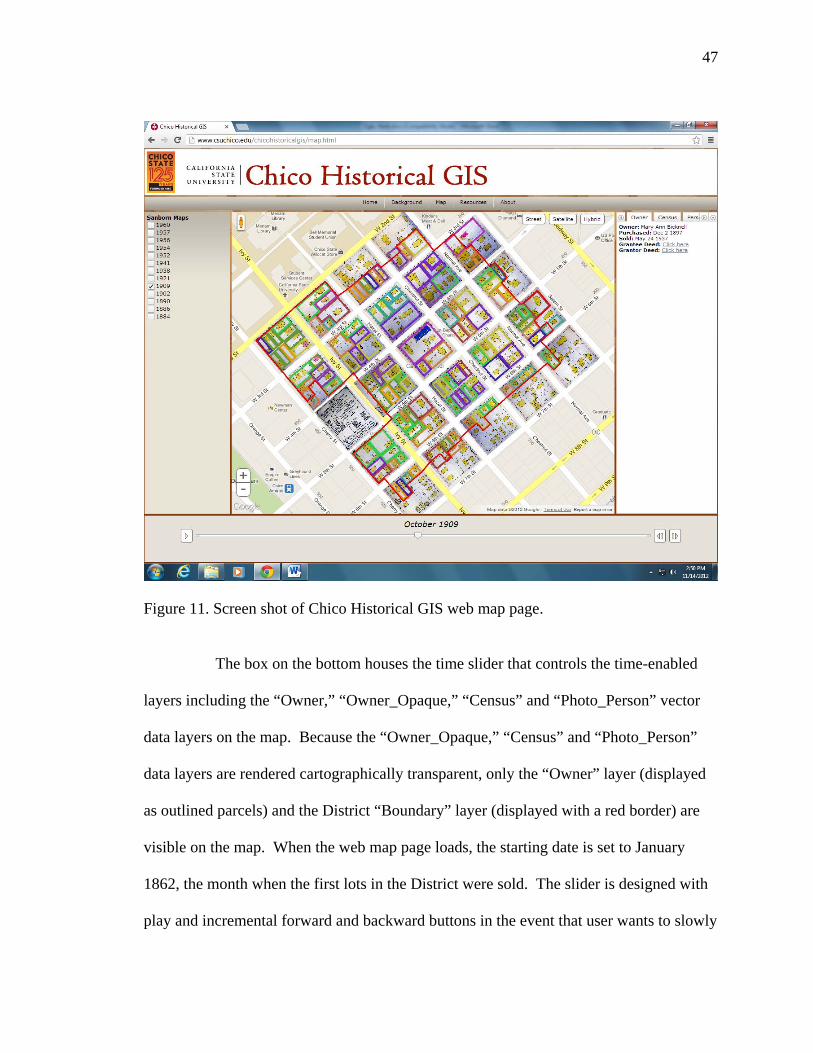
Figure 11. Screen shot of Chico Historical GIS web map page.
The box on the bottom houses the time slider that controls the time-enabled
layers including the “Owner,” “Owner_Opaque,” “Census” and “Photo_Person” vector
data layers on the map. Because the “Owner_Opaque,” “Census” and “Photo_Person”
data layers are rendered cartographically transparent, only the “Owner” layer (displayed
as outlined parcels) and the District “Boundary” layer (displayed with a red border) are
visible on the map. When the web map page loads, the starting date is set to January
1862, the month when the first lots in the District were sold. The slider is designed with
play and incremental forward and backward buttons in the event that user wants to slowly
48
click through time. The time slider thumb can also be pulled to a specific month by the
user.
When the user has the time slider set to a month of interest, a click on one of
the parcels returns results in the panel on the right. This panel with tabs at the top houses
the results of all vector data layer requests. Each tab contains the data for each individual
vector data layer in the Chico Historical GIS map service. When a user clicks on a
parcel, results from the “Owner” data layer are returned to the Owner tab, “Census” data
layer results are returned to the Census tab and so on. From these tabs, the user can click
on a hyperlink and open up the associated record in a new window. In the example from
figure 11, the Owner tab is shown in the panel on the right. The data from the
“Owner_Opaque” layer is shown in this tab corresponding to parcel clicked by the user
and the time set on the time slider. The user can click on the “click here” hyperlinks to
view the associated ownership record of purchase or sale. If the user clicked on the
census tab, results from the “Census” vector data layer would be returned. If the user
clicked on the personal photo tab, results would be returned from the “Photo_Person”
vector data layer, and so on.
Limitations
A key objective of this project was to design a comprehensive and user-
friendly historical GIS website. Web pages optimized for mobile devices are in high
demand today; however, the quantity of data available to the user in this project is not
suited for a mobile device. The website has been designed to provide the user large
amounts of historical data suited for complex historical research questions. Optimizing
49
the website for mobile devices would hinder this objective. As a result any subsequent
attempt to navigate or interact with a mobile device would be unsuccessful. Testing
conducted on an Apple iPad© was successful indicating that navigation and interaction
with the web map page on any tablet is possible. Future development in this area is
possible and will be discussed briefly in the next chapter.
Summary
Thoughtful data selection and preparation, diligent attention to web design,
and rapidly responsive functionality provide a user-friendly and interactive historical
research environment. The Chico Historical GIS website facilitates place-based
historical research by binding historical information to spatial coordinates. A wider
audience can access this material since no GIS training is required to interact with the
data. The website provides public access to archival data stored in repositories, keeping
the originals safe from frequent handling and subsequent deterioration.
50
CHAPTER VII
CONCLUSIONS
During construction and deployment of the Chico Historical GIS, selected
source material was cultivated into new spatial datasets and made available to the public
through an interactive website. Analytical data was gathered by Google Analytics© over
a two week period beginning after the initial launch of the Chico Historical GIS website.
This data was used to evaluate website visitor usage and the subsequent effectiveness of
website design. This accumulated data is useful for evaluating website design; however,
subsequent adaptation to website design was beyond the scope of this project. Some of
the more intriguing results will be addressed in this chapter including some future
recommendations to enhance visitor experience.
Historical research results
A total of 13 Sanborn Fire Insurance Maps acquired from California State
University, Chico, and California State University, Northridge, were digitized and
georeferenced for this project. These raster data layers contain a wealth of urban
landscape change information throughout 76 formative years during the District’s historic
period. All 13 georeferenced Sanborn maps are not available as a collection anywhere
else, digitally or on paper.
51
The chain of title compiled through this research has resulted in the
accumulation and distribution of 1,583 deed records. The Butte County Recorder’s
Office has not digitized any ownership records created before 1988. Only records created
after 1988 have been digitized and are available to be researched using a computer. All
ownership records created before 1988 are only available by searching through indexes,
paper volumes, microfilm and microfiche. For this reason, the ownership information
compiled during research is not freely available anywhere else. Title agencies compile
ownership information geographically and distribute that information at a premium
expense to the researcher, but it is extremely unlikely that they would have these records
going back to the 1860s.
In addition, this research has identified 1,381 individuals who owned property
in the project area for over one month between 1862 and 1960. Research conducted by
the Chico Heritage Association identified homeowners in the District during the selected
historic period. This research, however, was only conducted on some of the 41 parcels
inventoried in the early 1980’s and it is unlikely that chains of title were completed from
their inception through to the end of the historic period. No chain of title was conducted
for the remaining 125 parcels in the District. The collection of owners in the Chico
Historical GIS is the only research of its kind made freely available to popular and
scholarly audiences alike.
Population data research conducted on individual household level census
records resulted in the positive identification of 486 entries, representing 1,494
individuals. District residents were never before identified using the methods described
in Chapters IV and V. The comprehensive collection of District residents is unique to
52
this project and unavailable anywhere else. In total, 2,529 unique owners and residents
were identified through chain of title and population data research. The identification of
such a large number of owners and residents easily towers over any compilations made in
the past.
Research conducted on the Digital Historical Photographs Collection at
California State University, Chico, identified 400 digitized photographs of or associated
with a District resident were identified. These 400 photographs captured images of 167
unique individuals throughout the historic period in the District. In addition to the
images of residents, 68 images of structures were identified corresponding to one of 36
parcels within the District.
The time and resources invested in creating the Chico Historical GIS
interactive website may be prohibitive for duplication outside of an agency or well-
funded organization. This project can be expanded to encompass additional
neighborhoods in Chico or ancillary resources. This project discourse provides a
narrative of the process and a blueprint for parties interested in developing a similar
project in their community.
Website Visitor Usage
Email notifications were sent out to potentially interested parties when the
website was launched on October 30th, 2012. A few lines of javascript code were
included on each page to track visitor usage through Google Analytics©. A wide range
of statistical information was gathered about each website visit, the most significant of
which will be discussed in the following few paragraphs.
53
During its first two weeks, the website hosted 248 visits and 747 page views
across the website. The average visitor, therefore, accessed three pages during their
entire visit to the website. Returning visitors contributed to 43% of the total number of
website visits, indicating that many users came back a second or third time. The majority
of visitors used Internet Explorer (39%) as their browser. Firefox was used 25% of the
time followed by Chrome (15%) and Safari (11%). The remaining 10% of users came to
the website through mobile devices.
Because the website was not optimized for mobile devices, visitor usage
statistics indicated larger than average bounce rates by mobile device users. Thirteen
percent of visitors came through a mobile device and 60% of them left the site after
visiting only one page. Desktops and laptops achieved significantly lower bounce rates
(below 25%), suggesting that optimizing the site for mobile devices might increase the
number of pages viewed and visitation duration rates. Functionality on tablets was
significantly superior to that of smartphones, which may account for the 40%
continuation rate achieved by mobile device users, though there is no statistical evidence
to support this conjecture.
Unfortunately, a statistical analysis indicating time spent on pages is
impossible using Google Analytics©. Page visit duration is tracked by subtracting the
difference between two time stamps generated by a user during site navigation between
pages. Page visit duration statistics, therefore, were not generated for the final page
visited by a user. This analytical information would have been most illuminating for the
map page because visit duration could easily indicate the success to which a user was
able to interact with the page and use it as a research tool. Visitors to the map page
54
exited the website entirely 55% of the time concluding their visit; therefore, duration was
not calculated for time spent on the map page.
Figure 12 illustrates a flow chart that examines how users moved through the
website during the first two weeks after it was launched. Of the 248 visits to the website,
219 visitors first arrived at the home page. Of visitors who landed on the home page,
28% left immediately and did not continue to other pages. These drop offs were often
mobile device users or visitors who had received notification about the website and were
simply not intrigued by the subject matter or could not manipulate site to their
satisfaction. The remaining 157 visitors (72%) continued on to visit other pages in the
website. Of continuing visitors, 92 visitors (59%) went directly to the map page, of
which 64% left the site entirely at the conclusion of their research. Forty-nine visitors
(30%) went on to the background page to learn about the history of Chico and 42 of them
continued to the map page. Of those who traversed the website from the home page to
the background page and then to the map page, 44% left the website entirely following
their visit to the map page.
Visitor usage indicates that the objective of this research was achieved and
evidence to support this claim will continue to build as statistics continue to accumulate.
Returning visitation indicates not only interest in the subject matter but understanding of
how this material is organized and presented to the user. Average page visitation of three
pages per visitor indicates the audience is interested in the subject matter and how the
project was constructed.
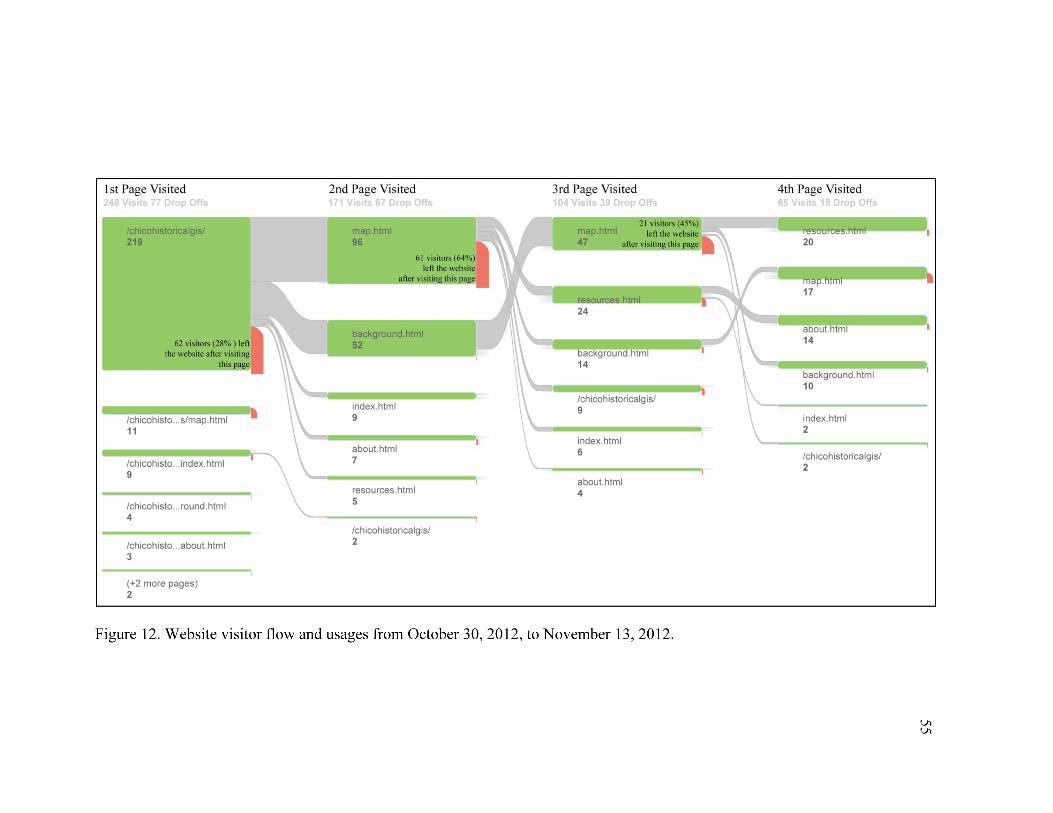
56
Future Recommendations
A wide variety of additional source material could be digitized, georeferenced
and incorporated into the Chico Historical GIS. Additional population data research
using the 1940 census, now available at the individual household level, would identify
more District residents. The Polk Directories would be an excellent extension as they
contain occupational information about residents in the District. Recently, the Library of
Congress and the National Endowment for the Humanities have begun a monumental
effort to digitize historic American newspapers and make them available over the internet
in a project titled “Chronicling America (Library of Congress n.d.).” This resource could
be researched to capture additional qualitative information about District residents.
A handful of historic neighborhoods in Chico have received little or no
recognition that could foster historic appreciation for these areas and perhaps invigorate
rehabilitation of deteriorating structures. The scalable nature of this project allows for
such development and would be an additional benefit.
A mobile application incorporating research accrued through this project
would be a valuable accessory to this study. A virtual tour guide or treasure hunt could
be deployed by instructors for use in the classroom to develop appreciation for Chico’s
oldest and nationally recognized neighborhood in which so many students live. As
mobile applications continue to become more powerful, interaction with handheld
devices will be an exciting and innovative avenue for exploration.

57
Summary
Historical research conducted during the early stages of this project recovered
a wealth of documentation of the study area. These resources were used to develop
unique spatial datasets served to popular and scholarly audiences using modern web
mapping technologies. The user-friendly website design encouraged visitors with
varying degrees of technical skill to interact with the material and investigate resources
associated with the neighborhood and its residents. Visitor usage results revealed
multiple page visitation and recurring traffic indicating interest and comprehension of the
material as visualized on the Chico Historical GIS website.

REFERENCES
58
REFERENCES
Abbiati, J. Lynn, interview by Heidi Ogle. Research Technician of Institutional Research (October 2012).
Abbott, Lisa, and Carolyn Argentati. "GIS: A New Component of Public Services."
Journal of Academic Librarianship 21, no. 4 (1995): 251-256. Alhasanat, Mahmoud Bashir, Shahid Kabir, Wan Muhd Aminuddin Wan Hussin, and
Erin Addison. "Spatial analysis of a historical phenomenon: using GIS to demonstrate the strategic placement of Umayyad desert palaces." GeoJournal 77 (2012): 343–359.
Audisio, Chiara, Guido Nigrelli, and Giorgio Lollino. "A GIS tool for historical
instability processes data entry: An approach to hazard management in two Italian Alpine river basins." Computers and Geosciences 35 (2009): 1735–1747.
Bailey, Timothy, and James B Schick. "Historical GIS: Enabling the Collision of History
and Geography." Social Science Computer Review 27, no. 3 (2009): 291-296. Bol, Peter K. "Creating a GIS for the History of China." In Placing History: How Maps,
Spatial Data, and GIS Are Changing Historical Scholarship, by Anne Kelly Knowles, 25-57. Redlands, CA: ESRI Press, 2007.
Brewer, William H. Up and Down California in 1860-1864: the Journal of William H.
Brewer. Edited by Francis P. Farquhar. Berkeley, CA: University of California Press, 1975.
Brovelli, Maria, Marco Minghini, Gianluca Giori, and Michele Beretta. "Web
Geoservices and Ancient Cadastral Maps: The Web C.A.R.T.E. Project." Transactions in GIS 16, no. 2 (2012): 125-142.
Brovelli, M. A., M. Minghini, and L. Valentini. "Web services and historical cadastral
maps: The first step in the implementation of the Web C.A.R.T.E. system." In Advances in Cartography and GIScience (Volume 2), by Anne Ruas, 147-161. Berlin: Springer, 2011.
Brown University, Department of Sociology. Urban Transition Historical GIS Project.
n.d. http://www.s4.brown.edu/utp (accessed October 20, 2012).
60
California State University, Chico, Meriam Library, Special Collections. Historical Photographs Collection. n.d. http://www.csuchico.edu/lbib/spc/netpages/hisphotos.html (accessed October 20, 2012).
Cartwright, William. "New Media and Their Application to the Production of Map
Products." Computers & Geosciences 23, no. 4 (1997): 447-456. Chico Heritage Association. About Us. n.d. http://chicoheritage.org/about-cha-2
(accessed October 20, 2012). City of Chico. "General Plan Update." Draft Environmental Impact Report, Chico, CA,
2010. Columbia University Media Art Center and Vassar College Art History Department.
Mapping Gothic France. n.d. http://mappinggothic.org (accessed October 20, 2012).
Crown, Christine C. Geo-Chico: a geographic information system for historic resources
in downtown Chico. Master’s thesis, Chico: California State University, Chico, 1995.
DeBats, Donald, and Ian N. Gregory. "Introduction to Historical GIS and the Study of
Urban History." Social Science History 35, no. 4 (2011): 455-463. Fitch, Catherine, and Steven Ruggles. "Building the National Historical Geographic
Information System." Historical Methods 36, no. 1 (2003): 41-51. Gillis, Michael J., and Michael F. Magliari. John Bidwell and California: the life and
writings of a pioneer, 1841-1900. Spokane, WA: A. H. Clark Co., 2003. Google. Google Maps Street View. n.d.
http://maps.google.com/intl/en/help/maps/streetview/ (accessed October 20, 2012).
Gregory, Ian N. A Place in History: a Guide to Using GIS in Historical Research.
Oakville, CT: Oxbow Books Ltd, 2003. Gregory, Ian N., and Humphrey R. Southall. "Mapping British population history." In
Past Time, Past Place: GIS for History, by Anne Kelly Knowles, 117-130. Redlands, CA: ESRI Press, 2002.
61
Gregory, Ian N., and Paul S. Ell. Historical GIS: Technologies, Methodologies and Scholarship. Cambridge: Cambridge University Press, 2007.
Grosso, Eric. "Integration of historical geographic data into current georeferenced
frameworks: A user-centred approach." E-Perimetron 5, no. 3 (2010): 107-117. Guan, Weihe Wendy, Matthew Bertrand, Jeffrey Blossom, Peter Bol, Merrick Lex
Berman, and Benjamin Lewis. "WorldMap - a Geospatial Framework for Collaborative Research." Annals of GIS 18, no. 2 (2012): 121-134.
Historical Society of Pennsylvania. PhilaPlace. n.d. http://www.philaplace.org (accessed
October 20, 2012). Hunt, Rockwell D. John Bidwell: price of California pioneers. Caldwell, ID: Caxton
Printers, 1942. Knutzen, Matt. "The New York City Historical GIS Project." New York Public Library
Blog. June 13, 2012. http://www.nypl.org/blog/2012/06/13/nyc-historical-gis-project (accessed October 20, 2012).
LeHigh University, Digital Library. Beyond Steel. n.d.
http://digital.lib.lehigh.edu/beyondsteel/ (accessed October 20, 2012). Library of Congress. Chronicling America. n.d. http://chroniclingamerica.loc.gov/
(accessed October 20, 2012). Moon, Debra. Chico: life and times of a city of fortune. Charleston, SC: Arcadia
Publishing, 2003. National Register of Historic Places. South of Campus Neighborhood Historic District,
Chico, Butte County, California. National Register #91000636., Washington, D.C.: Department of the Interior, 1991.
Ott, Thomas, and Frank Swiaczny. Time-integrative geographic information systems:
management and analysis of spatio-temporal data. Berlin: Springer-Verlag, 2001. Presner, Todd. "Digital Harlem: Everyday Life, 1915-1930/Henry Hudson 400:
Celebrating the History of Hudson." Journal of American History 97, no. 3 (2010): 916-917.
Richards, Lora R. An historical geographic information system for Truckee, California.
Master’s thesis, Chico: California State University, Chico, 1999.

62
Rodriguez, Mauricio, C. F. Sirmans, and Allen P. Parks. "Using GIS to improve real estate analysis." Journal of Real Estate Research 10 (1995): 163-173.
Rumsey, David, and Meredith Williams. "Historical maps in GIS." In Past time, past
place: GIS for history, by Anne Kelly Knowles, 1-18. Redlands, CA: ESRI Press, 2002.
University of Missouri-Columbia, Department of Geography. Lewis and Clark across
Missouri. n.d. http://lewisclark.geog.missouri.edu (accessed October 20, 2012). University of Sydney, Australia, Department of History. Digital Harlem. n.d.
http://acl.arts.usyd.edu.au/harlem (accessed October 20, 2012).

APPENDIX A
64
DEFINITION OF TERMS
APN (Assessor’s Parcel Number): a number assigned to parcels of real property by the tax assessor of a particular jurisdiction for purposes of identification and record-keeping.
ArcGIS: ESRI’s mapping platform for working with maps and geographic information. It is used for: creating and using maps; compiling geographic data; analyzing mapped information; sharing and discovering geographic information; using maps and geographic information in a range of applications; and managing geographic information in a database.
ArcGIS Server: ESRI’s current web map server used to build web mapping applications and publish maps and geographic data to the internet.
ArcIMS: ESRI’s first web map server to publish maps to the internet. It has been
deprecated and replaced by ArcGIS Server. API (Application Programming Interface): a set of programming instructions and
standards for accessing a Web-based application. A software company releases its API to the public so that other software developers can design products that are powered by its service.
Attribute Table: A database or tabular file containing information about a set of
geographic features, usually arranged so that each row represents a feature and each column represents one feature attribute.
Bounce Rate: represents the percentage of visitors to a website who enter the site then
leave rather than continuing on to view other pages within the same site. Browser: platform used to access the World Wide Web – for example, Internet Explorer,
Firefox, Chrome and Safari. CSS (Cascading Style Sheet): used to style web pages written in HTML. Client: software that accesses a remote service on another computer. Cloud computing: the use of hardware and software that are delivered as a service over
the Internet.
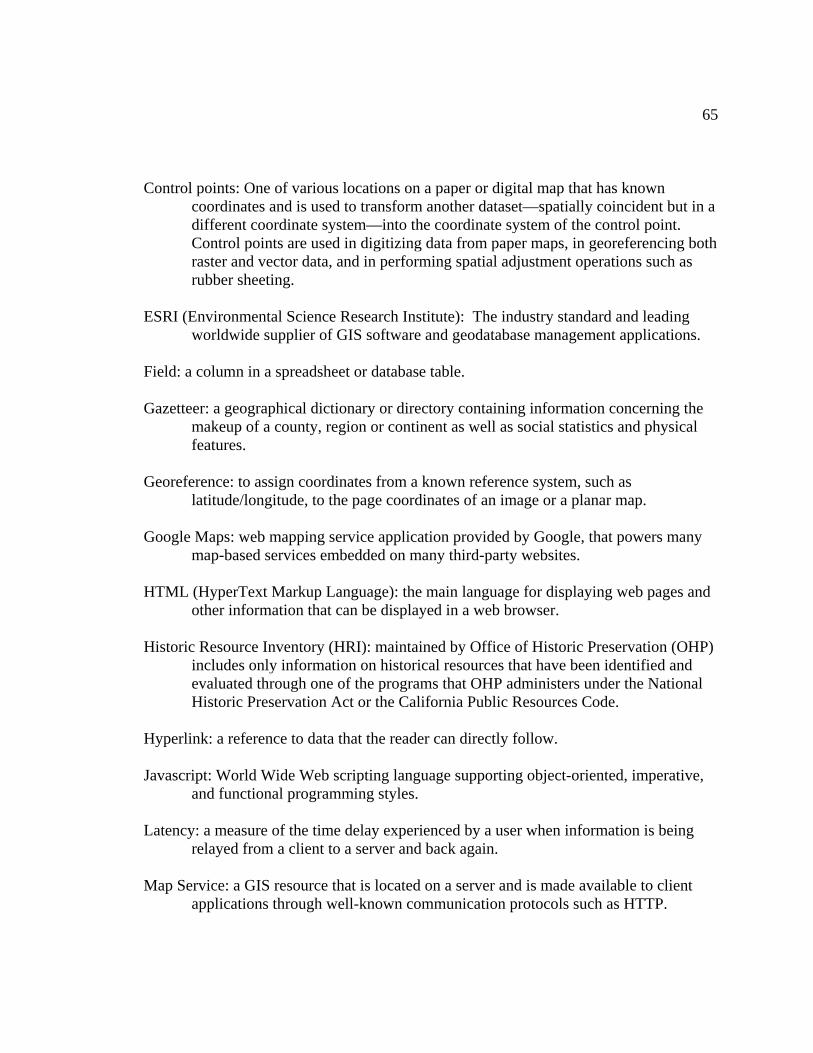
65
Control points: One of various locations on a paper or digital map that has known coordinates and is used to transform another dataset—spatially coincident but in a different coordinate system—into the coordinate system of the control point. Control points are used in digitizing data from paper maps, in georeferencing both raster and vector data, and in performing spatial adjustment operations such as rubber sheeting.
ESRI (Environmental Science Research Institute): The industry standard and leading
worldwide supplier of GIS software and geodatabase management applications. Field: a column in a spreadsheet or database table. Gazetteer: a geographical dictionary or directory containing information concerning the
makeup of a county, region or continent as well as social statistics and physical features.
Georeference: to assign coordinates from a known reference system, such as
latitude/longitude, to the page coordinates of an image or a planar map. Google Maps: web mapping service application provided by Google, that powers many
map-based services embedded on many third-party websites. HTML (HyperText Markup Language): the main language for displaying web pages and
other information that can be displayed in a web browser. Historic Resource Inventory (HRI): maintained by Office of Historic Preservation (OHP)
includes only information on historical resources that have been identified and evaluated through one of the programs that OHP administers under the National Historic Preservation Act or the California Public Resources Code.
Hyperlink: a reference to data that the reader can directly follow. Javascript: World Wide Web scripting language supporting object-oriented, imperative,
and functional programming styles. Latency: a measure of the time delay experienced by a user when information is being
relayed from a client to a server and back again. Map Service: a GIS resource that is located on a server and is made available to client
applications through well-known communication protocols such as HTTP.
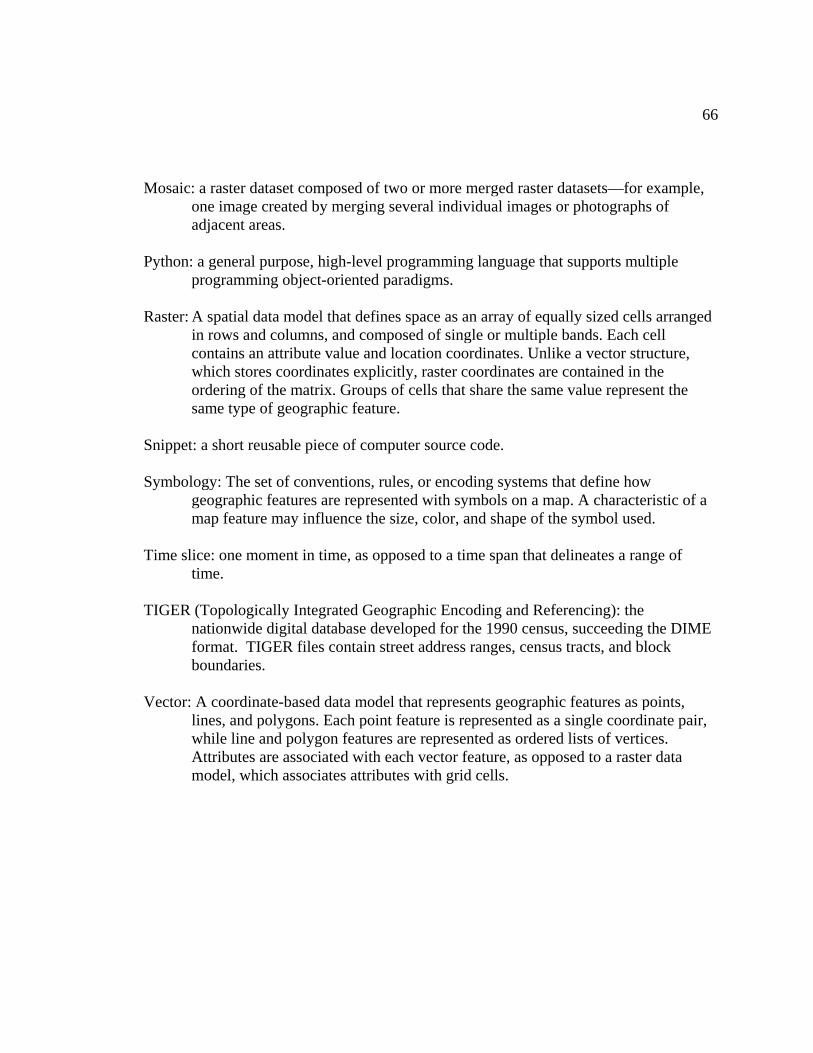
66
Mosaic: a raster dataset composed of two or more merged raster datasets—for example, one image created by merging several individual images or photographs of adjacent areas.
Python: a general purpose, high-level programming language that supports multiple
programming object-oriented paradigms. Raster: A spatial data model that defines space as an array of equally sized cells arranged
in rows and columns, and composed of single or multiple bands. Each cell contains an attribute value and location coordinates. Unlike a vector structure, which stores coordinates explicitly, raster coordinates are contained in the ordering of the matrix. Groups of cells that share the same value represent the same type of geographic feature.
Snippet: a short reusable piece of computer source code. Symbology: The set of conventions, rules, or encoding systems that define how
geographic features are represented with symbols on a map. A characteristic of a map feature may influence the size, color, and shape of the symbol used.
Time slice: one moment in time, as opposed to a time span that delineates a range of
time. TIGER (Topologically Integrated Geographic Encoding and Referencing): the
nationwide digital database developed for the 1990 census, succeeding the DIME format. TIGER files contain street address ranges, census tracts, and block boundaries.
Vector: A coordinate-based data model that represents geographic features as points,
lines, and polygons. Each point feature is represented as a single coordinate pair, while line and polygon features are represented as ordered lists of vertices. Attributes are associated with each vector feature, as opposed to a raster data model, which associates attributes with grid cells.

APPENDIX B
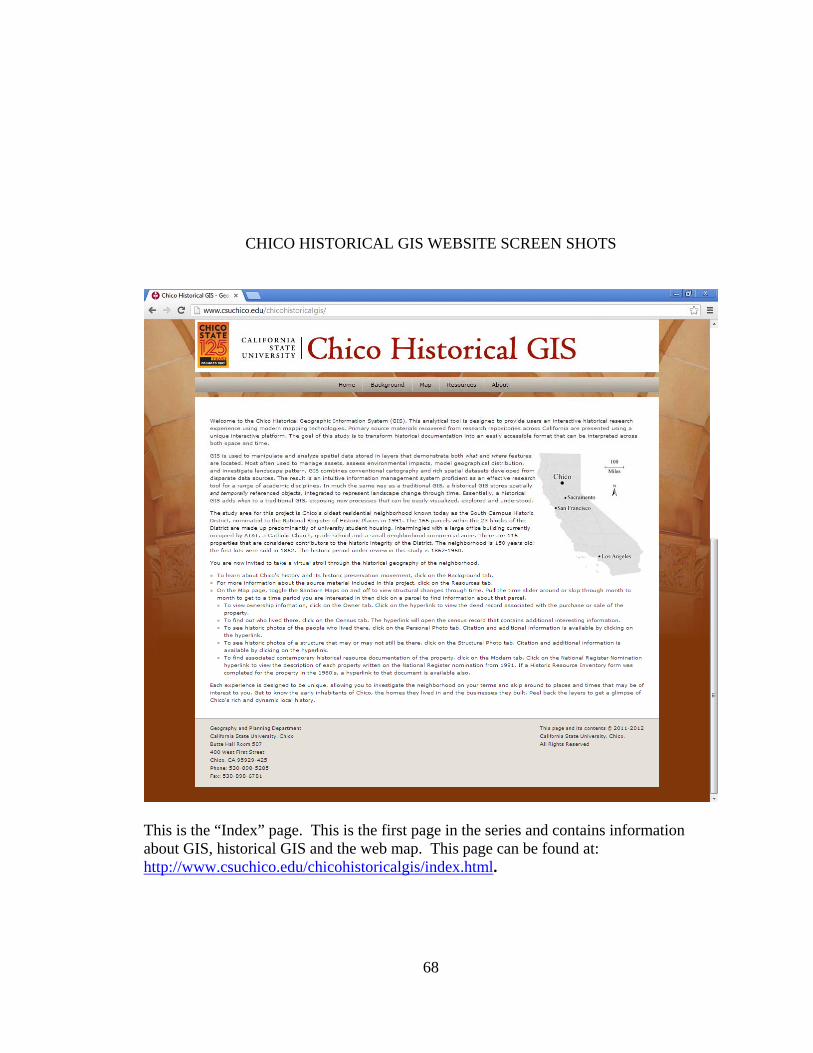
68
CHICO HISTORICAL GIS WEBSITE SCREEN SHOTS
This is the “Index” page. This is the first page in the series and contains information about GIS, historical GIS and the web map. This page can be found at: http://www.csuchico.edu/chicohistoricalgis/index.html.
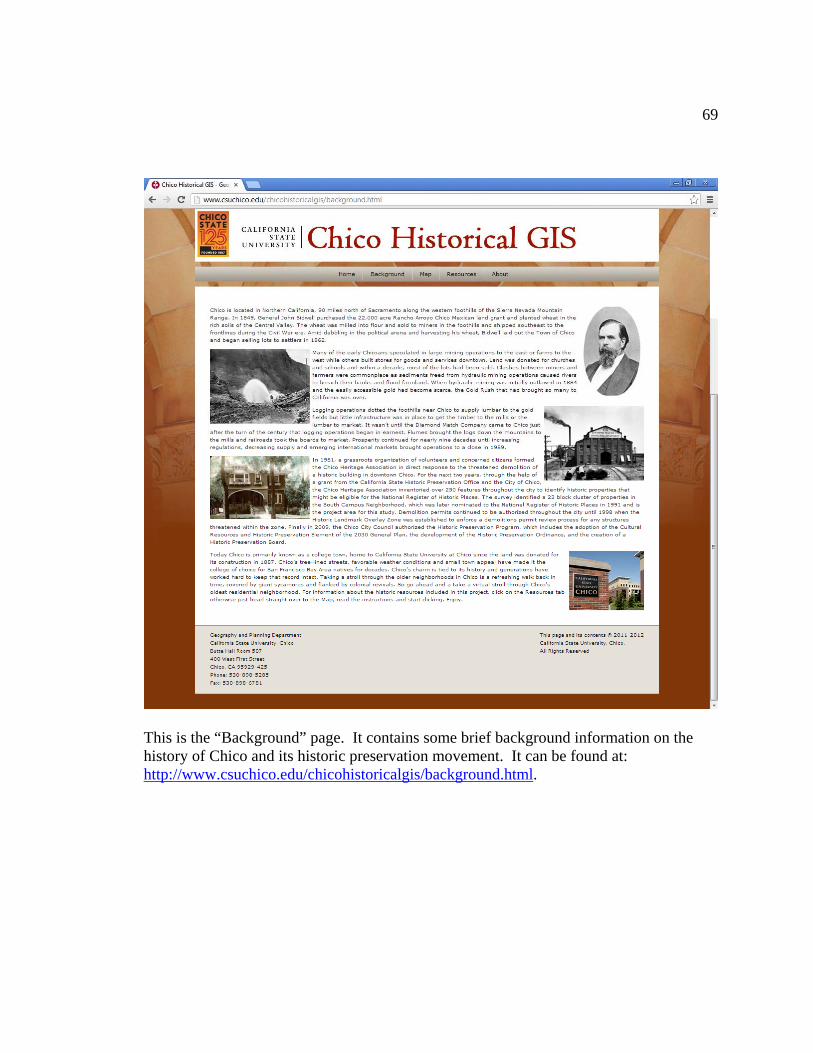
69
This is the “Background” page. It contains some brief background information on the history of Chico and its historic preservation movement. It can be found at: http://www.csuchico.edu/chicohistoricalgis/background.html.
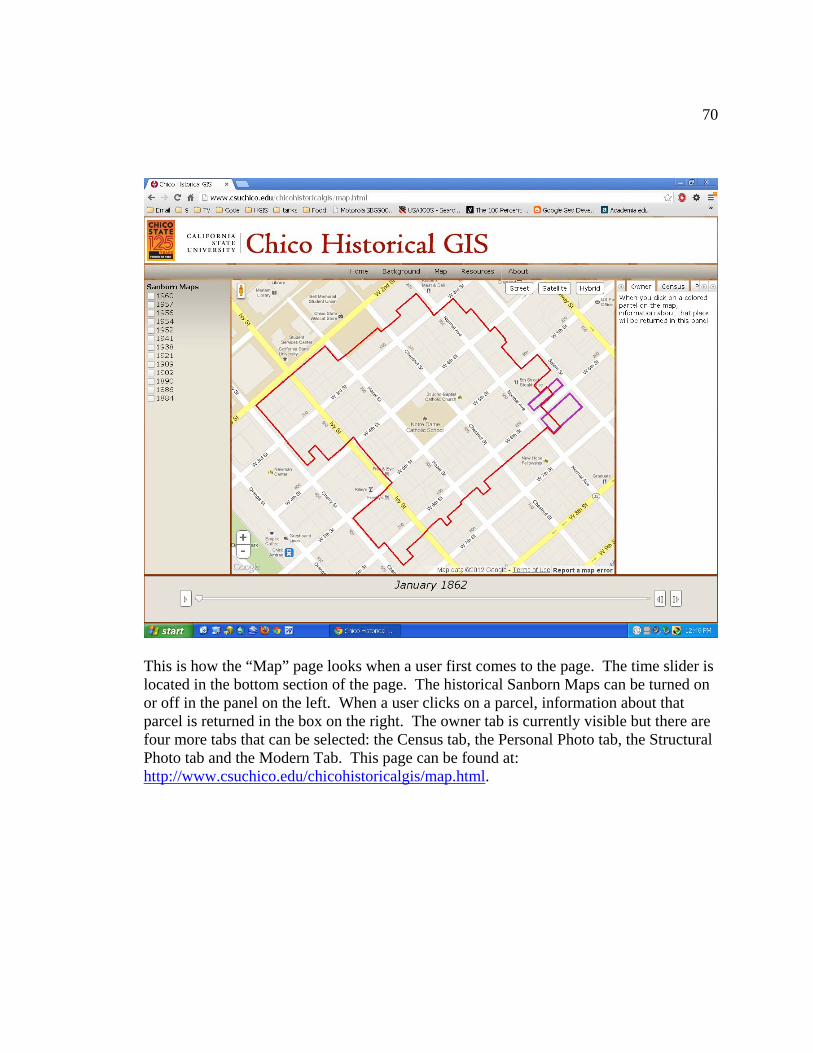
70
This is how the “Map” page looks when a user first comes to the page. The time slider is located in the bottom section of the page. The historical Sanborn Maps can be turned on or off in the panel on the left. When a user clicks on a parcel, information about that parcel is returned in the box on the right. The owner tab is currently visible but there are four more tabs that can be selected: the Census tab, the Personal Photo tab, the Structural Photo tab and the Modern Tab. This page can be found at: http://www.csuchico.edu/chicohistoricalgis/map.html.
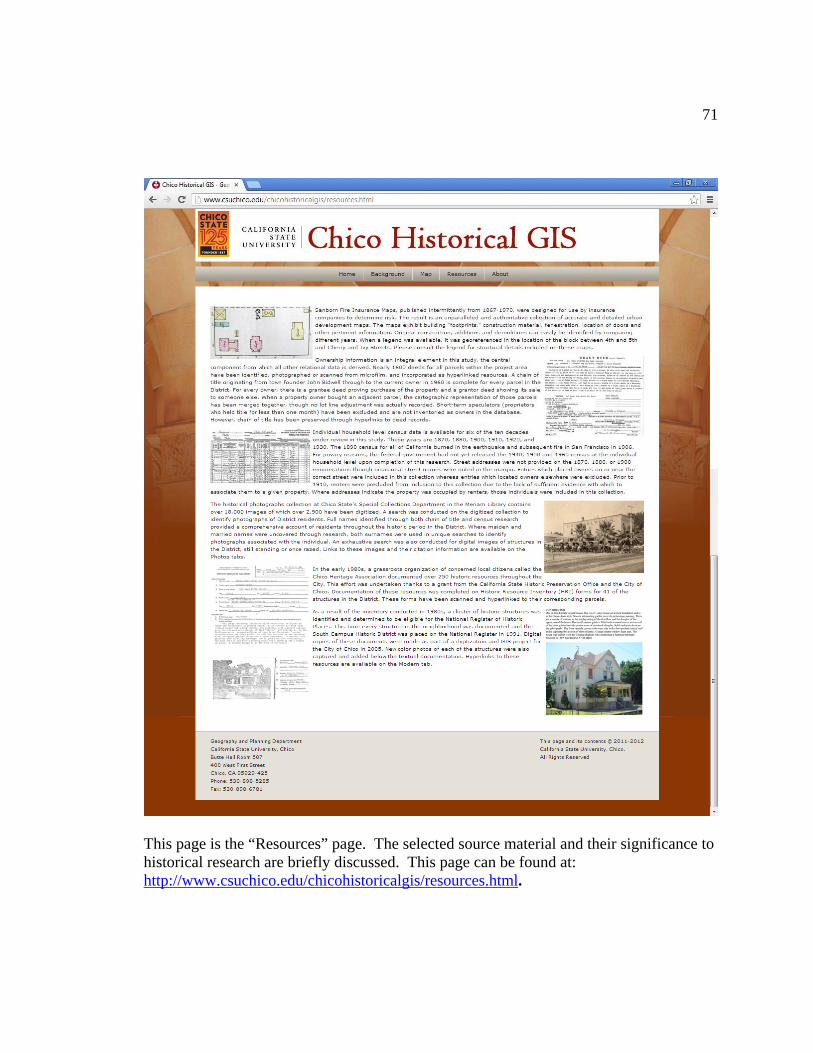
71
This page is the “Resources” page. The selected source material and their significance to historical research are briefly discussed. This page can be found at: http://www.csuchico.edu/chicohistoricalgis/resources.html.
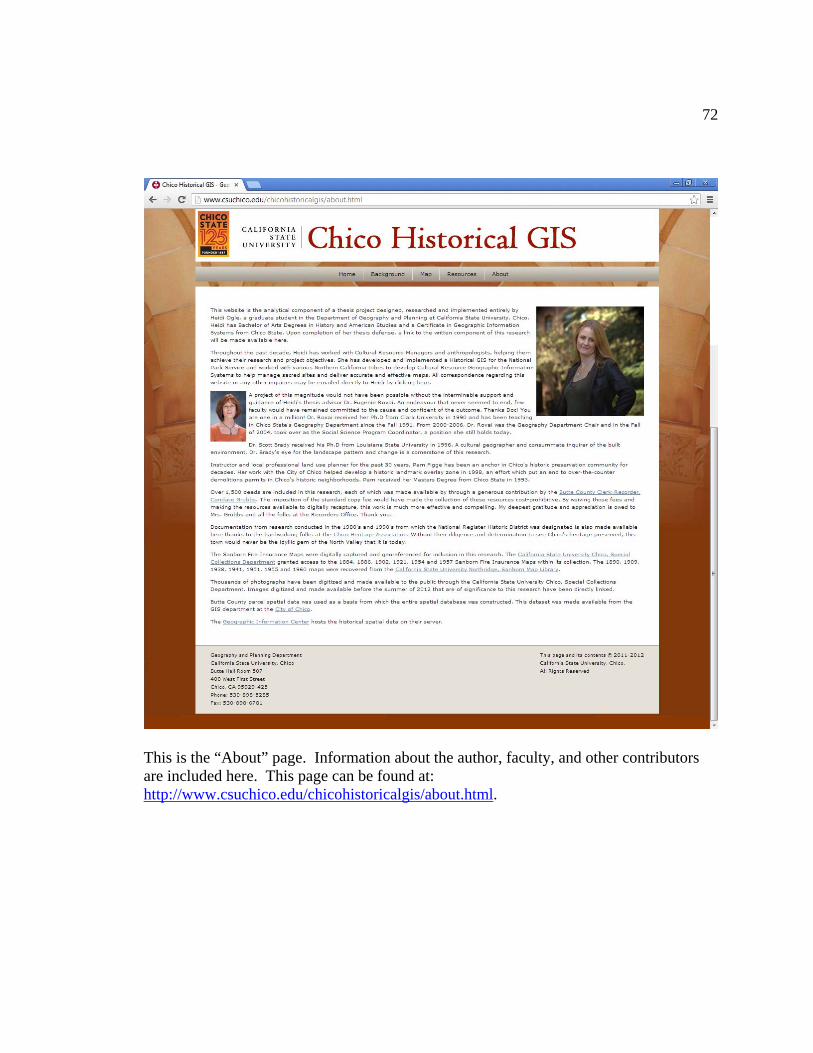
72
This is the “About” page. Information about the author, faculty, and other contributors are included here. This page can be found at: http://www.csuchico.edu/chicohistoricalgis/about.html.


