Embed Size (px)
Citation preview

Campus Box 1196 One Brookings Drive St. Louis, MO 63130-9906 (314) 935.7433 csd.wustl.edu
Child Development Accounts and Saving for Children’s Future
Do Financial Incentives Matter?
Lisa Reyes Mason Center for Social Development
Yunju Nam
George Warren Brown School of Social Work Center for Social Development
Margaret Clancy
Center for Social Development
Youngmi Kim George Warren Brown School of Social Work
Center for Social Development
Vernon Loke Eastern Washington University
2009
CSD Working Papers No. 09-54

C H I L D D E V E L O P M E N T A C C O U N T S A N D S A V I N G F O R C H I L D R E N ’ S F U T U R E
C E N T E R F O R S O C I A L D E V E L O P M E N T W A S H I N G T O N U N I V E R S I T Y I N S T . L O U I S
1
Child Development Accounts and Saving for Children’s Future:
Do Financial Incentives Matter?
This study examines savings outcomes in the first large-scale demonstration of Child Development Accounts (CDAs) in the United States—the Saving for Education, Entrepreneurship, and Downpayment (SEED) initiative. It is also the first empirical study, to our knowledge, to investigate associations between savings outcomes and incentives in an asset-building program for children. This study enhances knowledge about saving in CDAs, incentives in public policy in general, and incentives in savings policy in particular. Results can inform CDA policy design.
Key words: Child Development Accounts, SEED, financial incentives, savings, child savings, college savings
Introduction
Savings in households may improve life chances for children by increasing investment for their long-term development. In addition, the process of saving and building assets may teach money management, foster future orientation, and encourage long-term planning (Nam, Huang, & Sherraden, 2008; Oliver & Shapiro, 1995; Sherraden, 1991). A growing body of evidence suggests that household savings is associated with educational achievement, operating in part through increased aspirations and expectations (Destin & Oyserman, 2009; Elliott, 2009; Zhan, 2006; Zhan & Sherraden, 2003). In short, savings may help young people successfully transition to adulthood.
Many families, however, do not have enough savings to support children’s long-term development. Among parents with teenagers, median financial net worth is an estimated $500 for married parents and $0 for unmarried parents. Amounts tend to be lowest for minority, less educated, and younger parents (Lusardi, Cossa, & Krupka, 2001). In addition, education savings policy for college savings plans (i.e., 529 plans) is highly regressive, with wealthy families benefiting far more than the poor (Clancy et al., 2009). These statistics are alarming in light of escalating higher education costs and the increasing necessity of a college degree for economic success (National Center for Public Policy and Higher Education, 2002).
The authors wish to thank the funders of the Saving for Education, Entrepreneurship, and Downpayment (SEED) initiative: Ford Foundation, Charles and Helen Schwab Foundation, Jim Casey Youth Opportunity Initiative, Citi Foundation, Ewing Marion Kauffman Foundation, Charles Stewart Mott Foundation, Richard and Rhoda Goldman Fund, MetLife Foundation, Evelyn and Walter Haas, Jr. Fund, Lumina Foundation for Education, Edwin Gould Foundation for Children, and W.K. Kellogg Foundation. We also thank CFED for implementing SEED with the host organizations, and express gratitude to the SEED staff and participants. Finally, we thank Michael Sherraden for thoughtful comments on prior drafts, and Julia Stevens and Eunlye Lee for editorial assistance.

C H I L D D E V E L O P M E N T A C C O U N T S A N D S A V I N G F O R C H I L D R E N ’ S F U T U R E
C E N T E R F O R S O C I A L D E V E L O P M E N T W A S H I N G T O N U N I V E R S I T Y I N S T . L O U I S
2
It is thus in the public interest to facilitate savings for children’s future. Child Development Account (CDA) policies provide a structured, incentivized way for children to accumulate assets. Such policies have recently been adopted in the United Kingdom, Canada, South Korea, and Singapore (Loke & Sherraden, 2009). In the United States, there is also growing interest in CDAs. At the federal level, several CDA bills have been introduced, including the America Saving for Personal Investment, Retirement, and Education (ASPIRE) Act, Young Savers Accounts, 401Kids Accounts, and Baby Bonds (Cramer, 2008; Loke & Sherraden, 2009).
Despite growing interest in CDAs, there is little empirical knowledge to guide policy design. Specifically, we know little about (1) whether CDAs facilitate savings for children, especially those from low- and moderate-income families, and (2) whether incentives help build such savings.
This study examines savings outcomes in the first large-scale demonstration of CDAs in the United States—the Saving for Education, Entrepreneurship, and Downpayment (SEED) initiative. It is also the first empirical study, to our knowledge, to investigate associations between savings outcomes and incentives in an asset-building program for children. This study enhances knowledge about saving in CDAs, incentives in public policy in general, and incentives in savings policy in particular. Results can inform CDA policy design.
Background
Knowledge is limited about how to design CDAs to best facilitate savings. Dominant theories and empirical studies of saving focus mainly on individual factors. The life-cycle hypothesis and buffer-stock model, two neoclassical economic theories, explain variation in savings with individual differences in preferences, constraints, and opportunities. These theories highlight the role of income and other economic resources, stage in the life cycle, and individual preferences for risk-taking (Ando & Modigliani, 1963; Beverly et al., 2008; Carroll, 1997). Behavioral economists focus on common individual shortcomings such as cognitive limitations and self-control problems and often suggest ways policies and programs can accommodate these individual characteristics (Beverly et al., 2008).
The emerging institutional theory of saving pays special attention to the role of institutional factors in individual saving and asset accumulation (Beverly et al., 2008; Schreiner & Sherraden, 2007; Sherraden, Schreiner, & Beverly, 2003). This theory argues that institutional barriers (e.g., lack of access to financial institutions and information, restrictive asset eligibility rules in public assistance programs) may contribute to low saving rates, especially among low-income families, and that the poor can save with institutional supports (e.g., incentives and information) that fit their needs. Institutional theory calls for policy interventions that facilitate low-income families’ asset accumulation.
Recent empirical studies have tested the institutional theory of saving and investigated the role of incentives. These studies have mostly been tested with employer-sponsored retirement savings programs (401(k) plans) or matched savings programs for low- and moderate-income adults, and tend to examine a single incentive such as match dollars or a tax benefit. Overall, findings on the relationship between incentives and saving are mixed.
C H I L D D E V E L O P M E N T A C C O U N T S A N D S A V I N G F O R C H I L D R E N ’ S F U T U R E
C E N T E R F O R S O C I A L D E V E L O P M E N T W A S H I N G T O N U N I V E R S I T Y I N S T . L O U I S
3
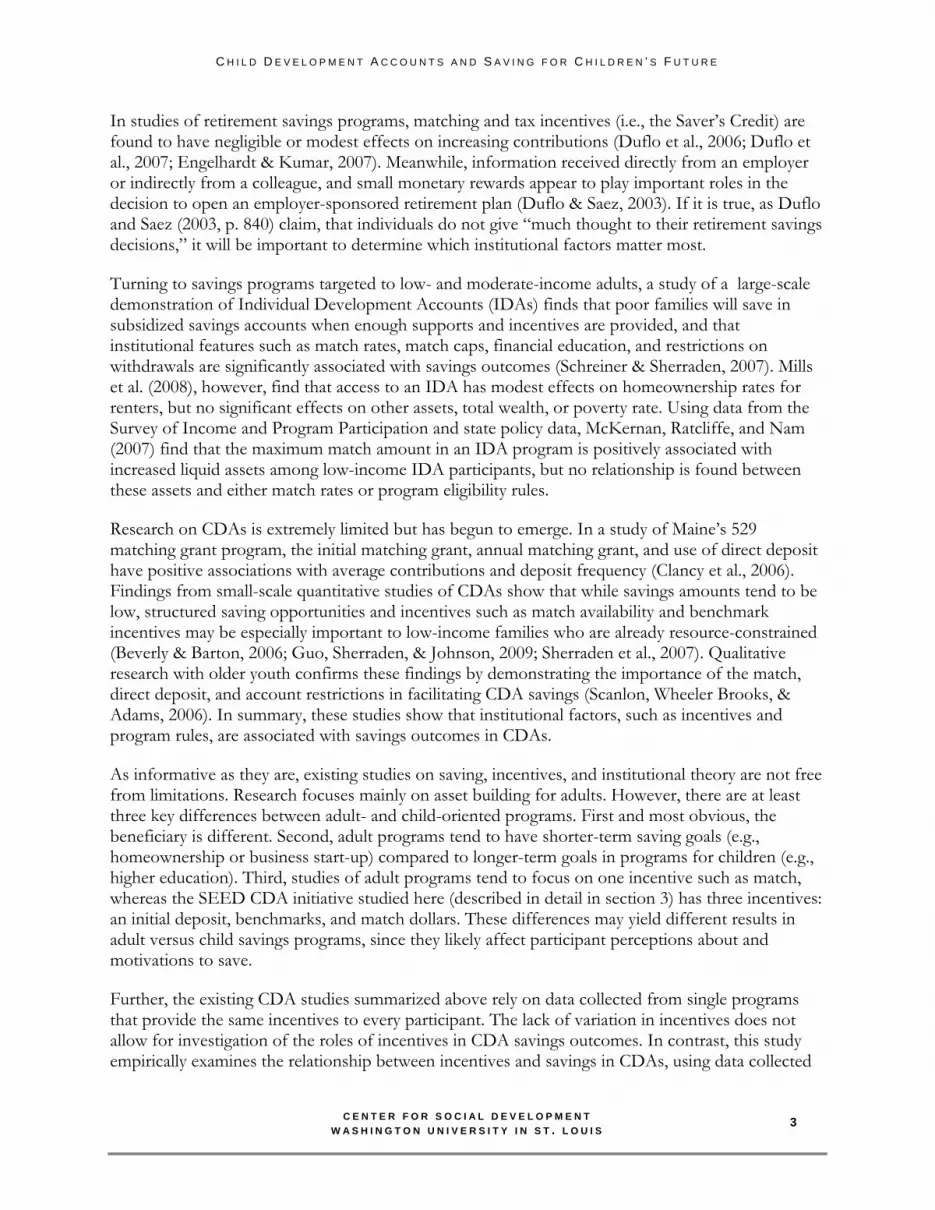
In studies of retirement savings programs, matching and tax incentives (i.e., the Saver’s Credit) are found to have negligible or modest effects on increasing contributions (Duflo et al., 2006; Duflo et al., 2007; Engelhardt & Kumar, 2007). Meanwhile, information received directly from an employer or indirectly from a colleague, and small monetary rewards appear to play important roles in the decision to open an employer-sponsored retirement plan (Duflo & Saez, 2003). If it is true, as Duflo and Saez (2003, p. 840) claim, that individuals do not give “much thought to their retirement savings decisions,” it will be important to determine which institutional factors matter most.
Turning to savings programs targeted to low- and moderate-income adults, a study of a large-scale demonstration of Individual Development Accounts (IDAs) finds that poor families will save in subsidized savings accounts when enough supports and incentives are provided, and that institutional features such as match rates, match caps, financial education, and restrictions on withdrawals are significantly associated with savings outcomes (Schreiner & Sherraden, 2007). Mills et al. (2008), however, find that access to an IDA has modest effects on homeownership rates for renters, but no significant effects on other assets, total wealth, or poverty rate. Using data from the Survey of Income and Program Participation and state policy data, McKernan, Ratcliffe, and Nam (2007) find that the maximum match amount in an IDA program is positively associated with increased liquid assets among low-income IDA participants, but no relationship is found between these assets and either match rates or program eligibility rules.
Research on CDAs is extremely limited but has begun to emerge. In a study of Maine’s 529 matching grant program, the initial matching grant, annual matching grant, and use of direct deposit have positive associations with average contributions and deposit frequency (Clancy et al., 2006). Findings from small-scale quantitative studies of CDAs show that while savings amounts tend to be low, structured saving opportunities and incentives such as match availability and benchmark incentives may be especially important to low-income families who are already resource-constrained (Beverly & Barton, 2006; Guo, Sherraden, & Johnson, 2009; Sherraden et al., 2007). Qualitative research with older youth confirms these findings by demonstrating the importance of the match, direct deposit, and account restrictions in facilitating CDA savings (Scanlon, Wheeler Brooks, & Adams, 2006). In summary, these studies show that institutional factors, such as incentives and program rules, are associated with savings outcomes in CDAs.
As informative as they are, existing studies on saving, incentives, and institutional theory are not free from limitations. Research focuses mainly on asset building for adults. However, there are at least three key differences between adult- and child-oriented programs. First and most obvious, the beneficiary is different. Second, adult programs tend to have shorter-term saving goals (e.g., homeownership or business start-up) compared to longer-term goals in programs for children (e.g., higher education). Third, studies of adult programs tend to focus on one incentive such as match, whereas the SEED CDA initiative studied here (described in detail in section 3) has three incentives: an initial deposit, benchmarks, and match dollars. These differences may yield different results in adult versus child savings programs, since they likely affect participant perceptions about and motivations to save.
Further, the existing CDA studies summarized above rely on data collected from single programs that provide the same incentives to every participant. The lack of variation in incentives does not allow for investigation of the roles of incentives in CDA savings outcomes. In contrast, this study empirically examines the relationship between incentives and savings in CDAs, using data collected

C H I L D D E V E L O P M E N T A C C O U N T S A N D S A V I N G F O R C H I L D R E N ’ S F U T U R E
C E N T E R F O R S O C I A L D E V E L O P M E N T W A S H I N G T O N U N I V E R S I T Y I N S T . L O U I S
4
from multiple community programs with different structures of incentives. In addition, this study examines multiple types of financial incentives (initial deposit, benchmarks, and match dollars) rather than a single type.
This study contributes to the literature by examining associations between incentives and savings outcomes in a CDA initiative using data collected from 10 community programs with distinct incentive structures. In this way, findings from this study can inform future CDA policy design. At the same time, this study expands understanding of incentives in public policy in general and savings policy in particular. Incentives, as well as penalties, are one of the most commonly used policy tools. Policymakers often adopt incentives to induce or encourage certain behaviors among the target population. Policy incentives, however, do not always produce the expected outcomes because the target population may perceive or respond to these incentives differently than how policymakers anticipated (Stone, 2002). It is, therefore, an empirical question as to whether or not incentives in a CDA initiative achieve the expected outcome of facilitating savings for children’s future.
SEED Programs and Incentives
In SEED, nonprofit community organizations established CDAs for low- and moderate-income children and youth in different locations across the United States. Programs launched in 2003 and 2004. Participants typically had three to four years to save and accumulate incentives. Although some youth participants could use their savings to purchase an asset during SEED, savings were generally held for long-term use such as higher education. The number of participants by program was about 75, with the exception of one quasi-experimental program with 495 participants. Target recruitment at the 10 programs ranged from preschool-aged children to college-age youth in their early 20s. Participants were recruited through a variety of means. Most programs either targeted specific schools or recruited from within their existing agency clientele.1
SEED programs received $2,000 in initiative funds per participant, to allocate between an initial deposit, benchmarks, and match dollars. Each program had a unique incentive structure, as presented in Table 1, and some programs raised funds to provide supplemental benchmarks or match dollars to participants.
Table 1. Incentive amounts by SEED program Program Initial Deposit ($) Benchmark Cap ($) Match Limit ($) Beyond Housing 500 250 1,250 Cherokee Nation 1,000 250 750 Foundation Communities 500 500 1,000 Fundación Chana y Samuel Levis 250 500 1,700 Harlem Children’s Zone 500 750 1,250 Juma Ventures 0 500 1,500 Mile High United Way 0 1,000 3,000 Oakland Livingston Human Service Agency 800
0 1,200
People for People 500 320 1,200 Southern Good Faith Fund 1,000 250 1,000
1 For more information about the 10 SEED programs, see Mason et al. (2009).

C H I L D D E V E L O P M E N T A C C O U N T S A N D S A V I N G F O R C H I L D R E N ’ S F U T U R E
C E N T E R F O R S O C I A L D E V E L O P M E N T W A S H I N G T O N U N I V E R S I T Y I N S T . L O U I S
5
The initial deposit is the amount provided by each program to seed the CDA. This incentive was deposited automatically into each participant’s account after enrollment in SEED. The initial deposit ranges from $0 to $1,000 across programs.
Benchmarks are financial incentives for achieving certain goals or milestones. Benchmarks varied widely among programs and included incentives such as $50 for a caregiver attending a financial workshop, $20 for a child making the honor roll, and $5 for a child’s birthday. At some programs, benchmarks were deposited automatically into participant accounts and were eligible to be matched. At others, benchmarks were paid to participants or caregivers, and could be deposited in the account at the family’s discretion. Benchmarks were implemented at different points in time after each program’s launch. The benchmark cap, which represents the maximum amount of benchmarks offered by a program, ranges from $0 to $1,000 across programs.
Match dollars are earned at a 1:1 rate on savings in the account other than the initial deposit. Match limit is the maximum amount of match dollars that a participant can receive and has a range of $750 to $3,000. In general, match dollars could not be used during the SEED initiative, as most participants were young children and savings were intended for long-term purposes such as higher education, homeownership, or business start-up. At three programs, however, some or all youth participants were eligible to make matched withdrawals during SEED for expenses such as college tuition and fees, computers, vehicles, and independent living.
These incentives were built into the SEED initiative to promote saving among participants. Match dollars were provided since research on asset-building programs for low-income adults finds that match limit has a significant association with savings outcomes (Clancy, Johnson, & Schreiner, 2001; McKernan et al., 2007; Schreiner & Sherraden, 2007). The initial deposit and benchmark incentives were included out of recognition that children and youth have few economic resources of their own and may have difficulty saving into their own accounts. In SEED, participants can receive initial deposit and benchmark incentives even when their caregivers do not deposit into accounts (Clancy et al., 2001). To our best knowledge, there is no existing empirical research on whether and how these two types of incentives increase savings in low- or moderate-income households.
Methods
This study uses data collected from 1,171 children and youth participating in 10 SEED programs, as approved by the Washington University Institutional Review Board. The dataset was created by merging four types of data. First, we use demographic data collected by program staff at participant enrollment. Second, we use quarterly account data collected from September 2003 through December 2007. These account data were transferred directly to the SEED researchers by the financial institution at one program. At the other nine programs, program staff entered account data into a management information system with built-in quality control functions (MIS IDA), using account statements provided by the financial institutions holding SEED accounts plus program records of matched withdrawals. Third, we use incentive data comprised of program-reported, participant-level records of distributed incentives. Finally, we use metropolitan statistical area (MSA) unemployment rate data for each of the 10 programs’ geographic location as obtained from the Bureau of Labor Statistics (see http://www.bls.gov).

C H I L D D E V E L O P M E N T A C C O U N T S A N D S A V I N G F O R C H I L D R E N ’ S F U T U R E
C E N T E R F O R S O C I A L D E V E L O P M E N T W A S H I N G T O N U N I V E R S I T Y I N S T . L O U I S
6
The dependent variables in this study are two savings outcomes: average quarterly net savings (AQNS) and total accumulation (accumulation). AQNS is participant’s (and/or caregiver’s) own net savings per quarter, including net earnings. Specifically, AQNS is defined as all deposits plus interest; less any fees, unmatched withdrawals, and incentives paid into accounts by SEED programs; per quarter of participation in SEED. Accumulation is the total amount accumulated in the account at December 31, 2007, including SEED incentives and any matched withdrawals already made. In short, there are two main distinctions between AQNS and accumulation: (1) AQNS is a quarterly measure, while accumulation is a cumulative measure, and (2) AQNS excludes incentives paid into accounts by SEED programs, while accumulation includes these amounts.
The major independent variables are the three distinct incentives: the amounts of the initial deposit, benchmark cap, and match limit for each participant’s SEED program. As described above, the initial deposit is the amount provided by the program to seed the account. The benchmark cap is the maximum amount of benchmarks available to each participant. Match limit is the maximum amount of match dollars that a participant can receive from SEED.
Linear regression analysis is used to examine associations between the two savings outcome measures and each of the three incentives, while controlling for demographic characteristics and program-related variables. In the analysis, we exclude 42 cases with missing values. In addition, we identify outliers with diagnostic statistics (Cook’s distance [Bollen and Jackman, 1990]) and exclude them from analysis (42 cases in the analysis on AQNS and 67 in the analysis on accumulation).
Accordingly, the analysis sample consists of 1,087 participants for AQNS and 1,062 for accumulation. Since some participants (23 percent of the full sample) have siblings also enrolled in the program, they share the same family and other unobserved characteristics and are not independent observations. For this reason, standard errors are adjusted by clustering siblings into the same family unit (Greene, 2003).
Both analyses include a series of control variables: participant, caregiver, and family characteristics; asset ownership indicators; and environmental factors. Participant characteristics are age, age squared, gender, and race and ethnicity. Age squared is included as well as age to consider the nonlinear relationship between age and savings outcomes. Caregiver characteristics are relationship to the participant,2 marital and employment status, and education. Family characteristics consist of the number of adults, the number of children, monthly family income, indicator of missing value for monthly family income, receipt of government assistance, and indicator of having multiple children enrolled in SEED. For monthly family income, we use the log form because the distribution of the original variable is highly skewed. A series of asset ownership indicators are created for home, business, bank account, investment (e.g., stocks), vehicle, and rental property or land. Environmental factors are urban residence and average local unemployment rate during SEED participation.
2 Caregiver and family characteristics for participants who are (1) in the foster care system (including those in group homes and residential treatment centers), (2) cared for by an unrelated guardian, or (3) living independently without another caregiver may not represent these participants’ long-term living situations and are not comparable with the data for other participants. In addition, caregiver and family characteristics are often missing for these participants. For these reasons, we do not use these participants’ data on caregiver and family characteristics collected at enrollment even if they are not missing. Instead, we categorize them into their own group for the relationship to participant variable. Accordingly, the indicator for this group estimates the overall difference between this group and other groups in savings outcomes.

C H I L D D E V E L O P M E N T A C C O U N T S A N D S A V I N G F O R C H I L D R E N ’ S F U T U R E
C E N T E R F O R S O C I A L D E V E L O P M E N T W A S H I N G T O N U N I V E R S I T Y I N S T . L O U I S
7
Additional control variables are program-related measures: eligibility for matched withdrawals during the period of data collection, length of participation in SEED, and length of participation squared (which is included to consider the nonlinear relationship between length of participation and the dependent variables).
We run additional models to check the robustness of our findings: (1) a model based on an alternative outlier diagnosis tool, dfits (Belsley, Kuh, & Welsch, 1980), (2) a model including an indicator of whether a participant lives independently without a caregiver, and (3) a model that uses a categorical instead of continuous measure of age. We also run the basic model with different sample compositions: (1) a sample excluding those who dropped out of the program, and (2) a sample including only participants under 18 years old. Results from these additional analyses are not substantially different from those reported in this study.3
Results
Descriptive statistics
Table 2 presents sample characteristics. We report statistics only for the AQNS analysis sample since characteristics for the full and accumulation samples are very similar to those reported here. About half of the participants are female and the majority are racial or ethnic minorities. Average monthly family income is $1,864.36, with 47.91 percent of participants in families that receive government assistance, 38.57 percent in families that own their home, and 71.27 percent in families that have at least one bank account.
3 Full results are available from the authors upon request.

C H I L D D E V E L O P M E N T A C C O U N T S A N D S A V I N G F O R C H I L D R E N ’ S F U T U R E
C E N T E R F O R S O C I A L D E V E L O P M E N T W A S H I N G T O N U N I V E R S I T Y I N S T . L O U I S
8
Table 2. Demographic and program-related characteristics
Variable AQNS Sample (n = 1,087)
Age of participant (mean, years) 7.49 Female participant 51.98 Race/ethnicity of participant Non-Hispanic white 23.37 Non-Hispanic black 43.33 Latino or Hispanic 17.57 Native American 7.36 Asian 2.85 Mixed/Bi-racial 3.86 Missing 1.66 Caregiver relationship to participant Caregiver is non-parent relative 7.45 Caregiver is mother or father 87.76
Participant in foster care, with unrelated guardian, or is own caregiver
4.78
Marital/employment status of caregiver* Not married and not working 23.36 Not married but working 38.37 Married and not working 12.92 Married and working 25.35 Education of caregiver* Less than high school diploma 16.60 High school diploma or GED 26.74 Some college 41.65 Bachelor’s degree or more 15.01 Number of adults in family (mean)* 1.80 Number of children in family (mean)* 2.42 Monthly family income (mean, dollars)** 1,864.36 Data missing for monthly family income 3.88 Family receives government assistance* 47.91 Family owns home* 38.57 Family owns business* 4.37 Family owns bank account* 71.27 Family owns investments* 20.08 Family owns vehicle* 76.84 Family owns rental property or land* 3.98 Multiple participants from same family* 23.37 Urban residence 84.36 Average unemployment rate (mean) 6.50 Length of participation (mean, quarters) 11.28
Note: All numbers are percentages, unless otherwise noted. *n = 1,006 (excludes participants who are in foster care, whose caregiver is an unrelated guardian, or who serve as their own caregiver) **n = 967 (excludes missing cases in addition to participants who are in foster care, whose caregiver is an unrelated guardian, or who serve as their own caregiver)

C H I L D D E V E L O P M E N T A C C O U N T S A N D S A V I N G F O R C H I L D R E N ’ S F U T U R E
C E N T E R F O R S O C I A L D E V E L O P M E N T W A S H I N G T O N U N I V E R S I T Y I N S T . L O U I S
9
Table 3 summarizes savings outcome results for all three samples. Mean AQNS is $29.58 for the full sample, $22.52 for the AQNS analysis sample, and $20.97 for the accumulation analysis sample. Median AQNS is $7.20 for all three samples. Statistics on accumulation show the same pattern, with means of $1,518.24, $1,408.13, and $1,360.44, and medians of either $1,092.85 or $1,092.13. The discrepancies in mean AQNS and accumulation across the three samples are explained by the identification and deletion of outliers with extremely large values from the two analysis samples.
Table 3. Descriptive statistics for savings outcomes
Savings Outcome Full Sample (n = 1,171)
AQNS Sample (n = 1,087)
Accumulation Sample (n = 1,062)
AQNS Mean ($) 29.58 22.52 20.97 Median ($) 7.20 7.20 7.20 Accumulation Mean ($) 1,518.24 1,408.13 1,360.44 Median ($) 1,092.85 1,092.85 1,092.13
Note: AQNS is average quarterly net savings.
Multivariate analysis results
Incentives and AQNS. Table 4 presents multivariate analysis results. The three incentives have distinct relationships with AQNS. Although the initial deposit and benchmark cap are not significantly associated with AQNS, there is a positive, significant association between match limit and AQNS (p < .05), controlling for other variables in the model. According to model estimates, a $100.00 increase in match limit is associated with a $2.00 increase in AQNS.
Incentives and accumulation. The initial deposit has a large and significant association with accumulation (p < .001). A $100.00 increase in the initial deposit is associated with a $110.00 increase in accumulation. Benchmark cap also has a significant positive association with accumulation (p < .05), with a benchmark cap increase of $100.00 associated with a $38.00 increase in accumulation. Higher match limits, meanwhile, are not significantly associated with accumulation.

C H I L D D E V E L O P M E N T A C C O U N T S A N D S A V I N G F O R C H I L D R E N ’ S F U T U R E
C E N T E R F O R S O C I A L D E V E L O P M E N T W A S H I N G T O N U N I V E R S I T Y I N S T . L O U I S
10
Table 4. Multivariate analysis results
Explanatory Variable Average Quarterly Net Savings Total Accumulation
b Adjusted SE b Adjusted SE
Incentives Initial deposit 0.01 (0.01) 1.10*** (0.24) Benchmark cap 0.00 (0.01) 0.38* (0.18) Match limit 0.02* (0.01) 0.24 (0.17)
Demographics
Age of participant 1.22 (1.72) -74.81 (39.23) Age of participant, squared -0.07 (0.10) 2.60 (2.33) Female participant -1.66 (1.81) 18.07 (39.55) Race/ethnicity of participant (Non-Hispanic white) Non-Hispanic black -10.39** (3.41) -263.22*** (68.82) Latino or Hispanic -8.03* (4.00) -106.11 (83.28) Native American -22.14* (9.13) -397.35* (196.21) Asian 62.22*** (15.00) 1,477.24*** (360.15) Mixed/Bi-racial -4.77 (5.93) -168.62 (118.39) Missing -15.56** (5.11) -286.97* (124.84) Caregiver relationship to participant (Caregiver is non-parent relative) Caregiver is mother or father -12.11* (5.92) -261.56* (120.14)
Participant in foster care, with unrelated guardian, or is own caregiver
-98.00 (66.99) -2,391.55 (1,472.93)
Marital/employment status of caregiver (Not married and not working) Not married but working -5.58* (2.41) -195.33*** (55.21) Married and not working 2.61 (4.90) -42.96 (84.09) Married and working 0.67 (3.43) 16.71 (79.28) Education of caregiver (Less than high school diploma) High school diploma or GED -4.14 (2.77) -46.67 (61.98) Some college -2.09 (3.01) 11.29 (63.92) Bachelor’s degree or more 12.72* (6.32) 398.56*** (110.05) Number of adults in family -1.97 (1.32) -43.12 (28.30) Number of children in family -1.74 (1.00) -50.92** (19.32) Monthly family income, logged 0.77 (0.55) 22.21 (11.98) Data missing for monthly family income 5.03 (5.17) 95.48 (109.27) Family receives government assistance -4.40 (2.39) -85.18 (52.09) Family owns home 8.88** (2.57) 193.24*** (51.71) Family owns business 1.21 (6.77) -57.36 (149.92) Family owns bank account 2.24 (2.08) 47.64 (47.57) Family owns investments 6.64 (3.67) 57.48 (70.26) Family owns vehicle 0.29 (2.22) -9.90 (52.53) Family owns rental property or land -3.13 (5.26) 125.50 (117.89) Multiple participants from same family 4.46 (3.39) 85.30 (64.51) Urban residence 1.65 (3.57) 67.03 (79.93) Average unemployment rate 0.20 (1.07) -42.13 (24.71)
Program-Related Characteristics Length of participation, quarters 18.33*** (3.17) 408.57*** (73.65) Length of participation, quarters squared -0.66*** (0.123) -12.75*** (3.09) Eligible for matched withdrawals 9.28 (10.61) 314.63 (248.10)
Constant -113.43*** (27.75) -1,710.92** (631.34) Observations 1,087 1,062 R-squared .30 .33
*p < .05; **p < .01; ***p < .001

C H I L D D E V E L O P M E N T A C C O U N T S A N D S A V I N G F O R C H I L D R E N ’ S F U T U R E
C E N T E R F O R S O C I A L D E V E L O P M E N T W A S H I N G T O N U N I V E R S I T Y I N S T . L O U I S
11
Control variables. Most demographic characteristics have expected relationships with savings outcomes. Specifically, caregiver education and homeownership have significant, positive associations with AQNS and accumulation. On average, non-Hispanic blacks and Native Americans have less savings and accumulation than non-Hispanic whites, while Asians have more.
Less savings and accumulation among non-married, working caregivers in comparison with non-married, non-working caregivers could possibly be explained by work-related expenses (e.g., child care and transportation) of the former. This finding is consistent with previous qualitative research showing that working single mothers face tougher economic situations than non-working single mothers (Edin & Lein, 1997).
Somewhat surprising are the results for caregiver relationship. Participants under the care of non-parent relatives have better savings outcomes than those cared for by their parents. This finding may be explained by the advantages of caregivers who can take custody of their relatives’ children in the low-income population. In SEED, the homeownership rate is higher among caregivers who are non-parent relatives compared with parents (57.69 percent versus 37.53 percent, p = 0.004). Unobserved characteristics associated with this financial advantage may account for higher savings and accumulation for participants whose caregivers are non-parent relatives.
Turning to program-related characteristics, there is a significant association between length of participation and AQNS. The positive coefficient suggests that the longer a participant is in SEED, the more he or she saves per quarter. However, the relationship between savings and participation length is not linear as shown by the significant, negative coefficient of the length of participation squared. This result indicates that the growth rate declines as length of participation increases.
Discussion
This study provides new information about saving in CDAs by examining data from the first large-scale demonstration of CDAs in the United States. Two savings outcomes—AQNS (quarterly measure, excludes incentives paid to accounts by SEED) and accumulation (cumulative measure, includes incentives paid to accounts by SEED) are examined, along with the associations between these outcomes and incentives. Findings provide preliminary empirical support for policies that facilitate savings for children through institutional mechanisms. While mean AQNS of $29.58 might be considered modest, it indicates that some families can and will save in CDAs with institutional supports such as those studied here. In addition, the $1,518.24 that each participant accumulated on average as an investment for the future is not trivial. It would cover over 60 percent of tuition and fees for one year at a typical community college in 2008-2009 (College Board, 2008).
Findings also provide insight into whether incentives are likely to matter in CDA programs. In SEED, the three financial incentives—initial deposit, benchmark cap, and match limit—appear to have distinct associations with AQNS and accumulation.
The initial deposit is placed into an account as a lump sum soon after a participant enrolls in the program. This incentive does not have an association with AQNS, but is positively and strongly associated with accumulation. Regarding AQNS, we might hope that an initial deposit would spur new saving, but findings from this study do not support this. The positive relationship between initial deposit and accumulation is expected, since initial deposits were placed directly into

C H I L D D E V E L O P M E N T A C C O U N T S A N D S A V I N G F O R C H I L D R E N ’ S F U T U R E
C E N T E R F O R S O C I A L D E V E L O P M E N T W A S H I N G T O N U N I V E R S I T Y I N S T . L O U I S
12
participants’ accounts and are part of accumulation as long as participants do not make unmatched withdrawals.4
Turning to benchmarks, since these incentives were periodically distributed and were often deposited into participants’ own accounts, participants may not distinguish their own savings from benchmark deposits. Considering that benchmarks are relatively easy to receive in SEED, and that their benefit is typically doubled by match dollars, it is not surprising to find a positive association between benchmark cap and accumulation.
While it might be appropriate, in a purely economic sense, to dismiss these effects on accumulation with the argument that if people are given money, then they will have money, there is an additional element in saving in SEED that must be considered. As mentioned earlier, owning savings appears to have positive psychological as well as purely economic effects. In SEED, it may be that participants and caregivers look at their SEED balances as their own savings, even when the funds have come from others. This is comparable to the way that an employee might think of her 401(k) balance as being entirely her savings. Thus, it may be that the subsidized accumulation generates effects beyond the economic value of the assets, and if so, this may warrant additional thinking and research.
Match limit, meanwhile, is positively associated with AQNS, but not with accumulation. This finding is similar to results from the first large-scale study of IDAs with adults in the United States, in which match limit (or match cap) was found to be strongly and positively associated with monthly net savings among savers (Schreiner & Sherraden, 2007). The match is a strong incentive to save. In SEED, the 1:1 match rate provides a 100 percent return on savings. A higher match limit is likely to motivate participants to save more, which may explain the positive, significant association between match limit and AQNS in this study. At the same time, match limit is not significantly associated with accumulation, in contrast to initial deposit and benchmark cap. The result for accumulation suggests difficulties in saving among participants despite the strong incentive of the match. It appears that a higher match limit does not motivate enough additional savings to have a significant association with accumulation in SEED. Considering that depositing one’s own money into a SEED account requires more effort than accumulating the initial deposit and benchmark incentives, these findings are not surprising.
In sum, findings suggest that the initial deposit and benchmarks may increase accumulation, while a higher match limit may increase AQNS. It may be that each incentive has a way of influencing participant motivation to save that results in discrete savings outcomes. Or, perhaps the combination of these incentives—offered in a package—affects outcomes for a specific incentive. Little is known about such potential interactions of incentives at this stage.
It is important to note the limitations of this study. The foremost limitation is that the study sample is not random. Rather, it is a convenience sample of voluntary participants and caregivers in 10 community-based programs and thus is not representative of all children in low- and moderate-income families. In addition, the study is observational, not experimental. Since potential participants were not assigned to treatment and control groups, this study can find associations
4 In practice, almost all programs used joint or custodial account structures, or established program rules that required participants to contact staff before withdrawing funds, in order to minimize unmatched withdrawals.
C H I L D D E V E L O P M E N T A C C O U N T S A N D S A V I N G F O R C H I L D R E N ’ S F U T U R E
C E N T E R F O R S O C I A L D E V E L O P M E N T W A S H I N G T O N U N I V E R S I T Y I N S T . L O U I S
13
between savings outcomes and independent variables, but it cannot establish causality. Furthermore, information is not available about the 10 programs’ management practices. Since effective and supportive operation of a savings program is likely to facilitate participant savings, this lack of information may have resulted in biased estimations.5 In addition, we could not examine the roles of institutional features other than financial incentives, such as restrictions (i.e., account structures in SEED that discouraged unmatched withdrawals) because almost all programs in SEED share the same other features. Finally, demographic data were collected at participant enrollment, but it is possible that some demographic characteristics changed during SEED.
Conclusions
It may be useful to summarize the larger context for this study: First, child savings can have positive effects—especially on increasing educational performance and achievement. Second, these effects may not be entirely economic, but in part psychological. Third, in a practical sense, savings are becoming essential as a part of college financing. Fourth, current education savings policy via 529 college savings plans is highly regressive, and there is a strong policy case for making these benefits more fair. And fifth, above and beyond educational uses, lifetime savings may matter for other aspects of development and security, such as homeownership, business capitalization, investments, and retirement security. In this larger context, CDAs can be understood as a start in saving that could have longer-term benefits. Therefore, it is worthwhile to test aspects of CDAs to inform future policy development.
Findings from this study support an institutional theory of saving, and inform public and savings policy discussions, by showing that incentives can matter in saving and asset accumulation. More specifically, incentives appear to matter in a savings program for children, providing preliminary empirical support for the pursuit of CDA policies in the United States.
Several CDA bills already introduced at the federal level include a variety of incentives, including some or all of those studied here. Results from this study suggest that an initial deposit, benchmarks, and match dollars may have unique contributions to saving and accumulation in CDAs. At the outset of SEED, match dollars were chosen for the initiative based on prior empirical work on match limits, and the initial deposit and benchmarks were added in recognition of the economic constraints of children and youth in low- and moderate-income families. The match limit appears to have had the intended outcome of increasing participant or caregiver’s own savings, while the initial deposit and benchmarks seem to have increased accumulation.
More research on these and other incentives is needed to better understand how they may affect saving and accumulation, individually and in different incentive packages, in order to find the best CDA policy design. Future research could also examine in depth how the institutional theory of saving applies to saving for children compared to adults.
5 We did not have enough statistical power to control for unobserved variation among programs with program dummy variables. Nine of the ten programs have less than 100 participants each.

C H I L D D E V E L O P M E N T A C C O U N T S A N D S A V I N G F O R C H I L D R E N ’ S F U T U R E
C E N T E R F O R S O C I A L D E V E L O P M E N T W A S H I N G T O N U N I V E R S I T Y I N S T . L O U I S
14
References
Ando, A., & Modigliani, F. (1963). The ‘life cycle’ hypothesis of saving: Aggregate implications
and tests. American Economic Review, 53(1), 55-84.
Belsley, D. A., Kuh, E., & Welsch, R. E. (1980). Regression diagnostics: Identifying influential data and sources of collinearity. New York: Wiley.
Beverly, S. G., & Barton, J. (2006). Barriers to asset accumulation for families in the SEED Pre-School Demonstration and Impact Assessment (SEED Research Report). Lawrence, KS: University of Kansas School of Social Welfare.
Beverly, S. G., Sherraden, M., Cramer, R., Williams Shanks, T. R., Nam, Y., & Zhan, M. (2008). Determinants of asset holdings. In S.-M. McKernan & M. Sherraden (Eds.), Asset building and low-income families (pp. 89-151). Washington, DC: The Urban Institute Press.
Bollen, K. A., & Jackman, R. W. (1990). Regression diagnostics: An ex-pository treatment of outliers and influential cases. In J. Fox & J. S. Long (Eds.), Modern methods of data analysis (pp. 257-291). Newbury Park, CA: Sage.
Carroll, C. D. (1997). Buffer-stock saving and the life cycle/permanent income hypothesis. Quarterly Journal of Economics, 12(1), 1–55.
Clancy, M., Han, C.-K., Mason, L. R., & Sherraden, M. (2006). Inclusion in college savings plans: Program features and savings. Proceedings of the 99th Annual Conference on Taxation of the National Tax Association, 385-393.
Clancy, M., Johnson, L., & Schreiner, M. (2001). Savings deposits, incentive structure, and management information systems: Implications for research on a children and youth savings account policy demonstration (Research Background Paper 01-1). St. Louis, MO: Washington University, Center for Social Development.
Clancy, M., Sherraden, M., Huelsman, M., Newville, D., & Boshara, R. (2009). Toward progressive 529 plans: Key points. St. Louis, MO: Washington University, Center for Social Development; Washington, DC: New America Foundation.
College Board. (2008). Trends in college pricing. Washington, DC: The College Board.
Cramer, R. (2008). Promoting the vision: A savings account for every child in America. Growing Knowledge from SEED bulletin, Washington, DC: CFED.
Destin, M., & Oyserman, D. (2009). From assets to school outcomes: How finances shape children’s perceived possibilities and intentions. Psychological Science, 20 (4), 414-418.
Duflo, E., Gale,W., Liebman, J., Orszag, P., & Saez, E. (2006). Saving incentives for low- and middle-income families: Evidence from a field experiment with H&R block. Quarterly Journal of Economics, 121(4), 1311-1346.

C H I L D D E V E L O P M E N T A C C O U N T S A N D S A V I N G F O R C H I L D R E N ’ S F U T U R E
C E N T E R F O R S O C I A L D E V E L O P M E N T W A S H I N G T O N U N I V E R S I T Y I N S T . L O U I S
15
Duflo, E., Gale,W., Liebman, J., Orszag, P., & Saez, E. (2007). Savings incentives for low- and moderate-income families in the United States: Why is the saver's credit not more effective? Journal of the European Economic Association, 5(2-3), 647-661.
Duflo, E., & Emmanuel, S. (2003). The role of information and social interactions in retirement plan decisions: Evidence from a randomized experiment. Quarterly Journal of Economics, 118(3), 815-842.
Edin, K., & Lein, L. (1997). Making ends meet: How single mothers survive welfare and low-wage work. New York: Russell Sage Foundation Publications.
Elliott, W., III. (2009). Children's college aspirations and expectations: The potential role of Children's Development Accounts (CDAs). Children and Youth Services Review, 31(2), 274-283.
Engelhardt, G. V., & Kumar, A. (2007). Employer matching and 401(k) saving: Evidence from the health and retirement study. Journal of Public Economics, 91(10), 1920-1943.
Greene, W. H. (2003). Econometric Analysis (5th ed.). Upper Saddle River, NJ: Prentice Hall.
Guo, B., Sherraden, M. S., & Johnson, L. (2009). Seed deposit, match cap, and net savings patterns: An assessment of institutional incentives in the I Can Save program (CSD Working Paper 09-13). St. Louis, MO: Washington University, Center for Social Development.
Loke, V., & Sherraden, M. (2009). Building assets from birth: A global comparison of child development account policies. International Journal of Social Welfare, 18, 119-129.
Lusardi, A., Cossa, R., & Krupka, E. L. (2001). Savings of young parents. Journal of Human Resources, 36(4), 762-794.
Mason, L. R., Nam, Y., Clancy, M., Loke, V., & Kim, Y. (2009). SEED account monitoring research: Participants, savings, and accumulation (CSD Research Report 09-05). St. Louis, MO: Washington University, Center for Social Development.
McKernan, S.-M., Ratcliffe, C., & Nam, Y. (2007). The effects of welfare and IDA program rules on the asset holdings of low-income families (Urban Institute Poor Finances Series).Washington, DC: Urban Institute.
Mills, G., Gale, W. G., Patterson, R., Engelhardt, G. V., Eriksen, M. D., & Apostolov, A. (2008). Effects of Individual Development Accounts on asset purchases and saving behavior: Evidence from a controlled experiment. Journal of Public Economics, 92(5-6), 1509-1530.
Nam, Y., Huang, J., & Sherraden, M. (2008). Assets, poverty, and public policy: Challenges in definition and measurement (Urban Institute Poor Finances Series).Washington, DC: Urbane Institute.
National Center for Public Policy and Higher Education. (2002). Losing ground: A national status report on the affordability of higher education (Report). San Jose, CA: National Center for Public Policy and Higher Education.
C H I L D D E V E L O P M E N T A C C O U N T S A N D S A V I N G F O R C H I L D R E N ’ S F U T U R E
C E N T E R F O R S O C I A L D E V E L O P M E N T W A S H I N G T O N U N I V E R S I T Y I N S T . L O U I S
16
Oliver, M., & Shapiro, T. M. (1995). Black wealth/white wealth: A new perspective on racial inequality. New York: Routledge.
Scanlon, E., Brooks, J. W., & Adams, D. (2006). How young people save money: Findings from interviews with SEED participants (SEED Research Report). Lawrence, KS: University of Kansas School of Social Welfare.
Schreiner, M., & Sherraden, M. (2007). Can the poor save? Saving and asset building in Individual Development Accounts. New Brunswick, NJ: Transaction.
Sherraden, M. (1991). Assets and the poor: A new American welfare policy. New York: M.E. Sharpe, Inc.
Sherraden, M., Schreiner, M., & Beverly, S. (2003). Income and saving performance in Individual Development Accounts. Economic Development Quarterly, 17(1), 95–112.
Sherraden, M. S., Johnson, L., Elliott, W., III., Porterfield, S., & Rainford, R. (2007). School-based children's saving accounts for college: The I Can Save program. Children and Youth Services Review, 29, 294-312.
Stone, D. (2001). Policy paradox: The art of political decision making. New York: W.W. Norton & Company.
Zhan, M. (2006). Assets, parental expectations and involvement, and children’s educational performance. Children and Youth Services Review, 28(8), 961-975.
Zhan, M., & Sherraden, M. (2003). Assets, expectations, and children’s educational achievement in female-headed households. Social Service Review, 77(2), 191-211.


