Embed Size (px)
Citation preview
China Renewable Energy Outlook 2019
Energy Research Institute of Academy of Macroeconomic Research/NDRC
China National Renewable Energy Centre
“Low-carbon energy development concerns the future of
humanity.”
“China attaches great importance to low-carbon energy
development and actively promotes energy consumption,
supply, technology and institutional transformation.
The country is ready to work with the international
community to strengthen energy cooperation in all aspects,
safeguard energy security, address climate change, protect
the ecology and environment, promote sustainable
development and bring more benefits to people around the
world.”
President Xi Jinping
congratulatory letter to Taiyuan Energy Low Carbon Development Forum
October 18, 2019
Domestic Supporting Institutes
College of Environmental Sciences and Engineering, Peking University
State Grid Hebei Economic Research Institute
North China Electric Power University
Content
1 |
Table of Contents
Foreword .................................................................................................... 1
Key Recommendations .............................................................................. 4
China’s emerging energy transition............................................................ 6
Energy scenarios for China’s energy transition ......................................... 12
Roadmap for Energy Transition ............................................................... 21
Policy emphasis in the 14th Five-Year Plan ............................................... 29
China Renewable Energy Outlook 2019
2 |
Part1: Energy Transition Status ................................................................. 37
1 Global energy transition ........................................................................ 38
2 China energy transition status ............................................................... 49
3. Renewable energy in China – status and obstacles ............................ 62
Content
3 |
Part2: Energy Scenarios for 2035 and 2050 .............................................. 80
4. Energy scenarios to 2050 ................................................................... 81
5. China’s energy system in 2035 and 2050 ............................................ 92
Part3: Energy Sector Development Roadmaps ....................................... 107
6. Industry development roadmap ...................................................... 108
7. Transportation development roadmap ............................................. 131
8. Heat sector roadmap ....................................................................... 152
9. Power system development ............................................................. 172
China Renewable Energy Outlook 2019
4 |
10. Energy Sector Development ......................................................... 206
Part4: Policy Action suggestions ............................................................ 221
11. Suggestions for Policy Actions During the 14th Five-Year Plan .... 222
12. Recommendations for Innovation and R&D ................................. 232
References ............................................................................................. 240
Summary
1 |
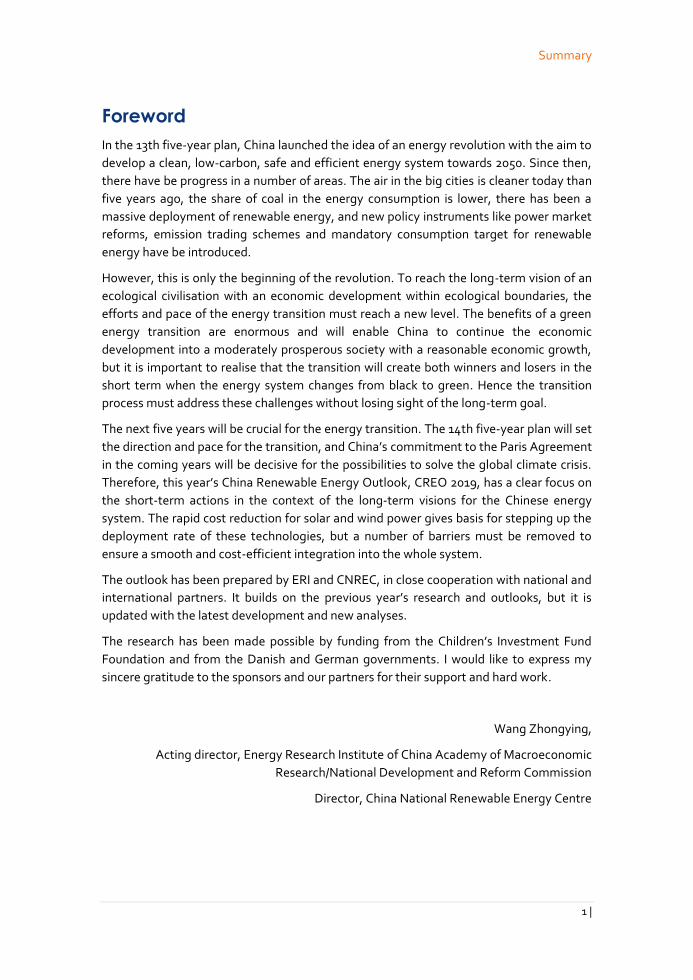
Foreword
In the 13th five-year plan, China launched the idea of an energy revolution with the aim to
develop a clean, low-carbon, safe and efficient energy system towards 2050. Since then,
there have be progress in a number of areas. The air in the big cities is cleaner today than
five years ago, the share of coal in the energy consumption is lower, there has been a
massive deployment of renewable energy, and new policy instruments like power market
reforms, emission trading schemes and mandatory consumption target for renewable
energy have be introduced.
However, this is only the beginning of the revolution. To reach the long-term vision of an
ecological civilisation with an economic development within ecological boundaries, the
efforts and pace of the energy transition must reach a new level. The benefits of a green
energy transition are enormous and will enable China to continue the economic
development into a moderately prosperous society with a reasonable economic growth,
but it is important to realise that the transition will create both winners and losers in the
short term when the energy system changes from black to green. Hence the transition
process must address these challenges without losing sight of the long-term goal.
The next five years will be crucial for the energy transition. The 14th five-year plan will set
the direction and pace for the transition, and China’s commitment to the Paris Agreement
in the coming years will be decisive for the possibilities to solve the global climate crisis.
Therefore, this year’s China Renewable Energy Outlook, CREO 2019, has a clear focus on
the short-term actions in the context of the long-term visions for the Chinese energy
system. The rapid cost reduction for solar and wind power gives basis for stepping up the
deployment rate of these technologies, but a number of barriers must be removed to
ensure a smooth and cost-efficient integration into the whole system.
The outlook has been prepared by ERI and CNREC, in close cooperation with national and
international partners. It builds on the previous year’s research and outlooks, but it is
updated with the latest development and new analyses.
The research has been made possible by funding from the Children’s Investment Fund
Foundation and from the Danish and German governments. I would like to express my
sincere gratitude to the sponsors and our partners for their support and hard work.
Wang Zhongying,
Acting director, Energy Research Institute of China Academy of Macroeconomic
Research/National Development and Reform Commission
Director, China National Renewable Energy Centre

China Renewable Energy Outlook 2019
2 |

Summary
3 |
Summary
China Renewable Energy Outlook 2019
4 |
Key Recommendations
In China Renewable Energy Outlook 2019 (CREO 2019) the possible role for renewable
energy in the Chinese energy system is analysed and the scenarios provide a consistent
vision as a foundation for policy development.
The Stated Policies scenario expresses the impact of a firm implementation of
announced polices.
The Below 2 °C scenario shows a pathway for China for building an ecological
civilisation and the role China could take in the fulfilment of the Paris agreement.
This summary report provides a concise walkthrough of the main insights of CREO 2019.
The energy transition has started, but an energy revolution is needed
China has developed leading capabilities and practical experience with core scientific,
technological, and industrial fields necessary for building the new system to sustain the
Ecological Civilization; and it has the necessary policy blueprint for this next era.
The fossil economy, whose rapid expansion fuelled the revival of China’s economy, must
now be replaced by an efficient low-carbon system, tailormade to the future’s
requirements. As stated in the 13th five-year plan an energy revolution is needed, or more
precisely an Energy Consumption Revolution and an Energy Supply Revolution.
Comprehensive energy transition to build the Ecological Civilisation
The Energy Consumption Revolution is an Energy Efficiency Revolution with the key feature
of deep electrification. Energy efficiency is a key demand-side pillar to ensure the pace and
scale of supply-side deployments are adequate to support the required economic growth.
Electrification is a means to drive fossil fuels from end-use consumption, in conjunction
decarbonised electricity supply.
The Energy Supply Revolution is a Renewable Energy Revolution, with strong emphasis on
renewable electricity. Technological progress and cost reduction make renewable energy
able to provide the clean energy in bulk, particularly through renewable electricity.
The 14th Five-Year Plan should accelerate the energy transition
The 14th five-year plan period 2021-2025 will be a watershed in China’s energy transition
history. A confluence of developments provides risks and opportunities. Many renewable
energy technologies are cost-competitive and removing the subsidy element from these
technologies is a necessary step in the energy transition process to stop uncertainty in the
short term. Fossil fuels’ external costs remain largely untaxed, and the emissions trading
scheme (ETS) needs refinement to promote renewable energy over coal. The delicate
process of macroeconomic adjustment could invoke traditional policy responses, reversing
the energy transition.
Summary
5 |
Mismanagement of the situation risks a reversal of RE development trends and a
resurgence of fossil generation and investments, acerbating technology lock-ins, more
stranded assets and overshooting of China’s GHG emissions vis-à-vis the Paris targets.
Hence, strong and coordinated policy measures are necessary to ensure the process moves
in the right direction in a cost-efficient manner.
Key recommendations for the 14th Five-Year Plan
Set ambitious, but realistic end-targets for the period: Achieve 19% non-fossil
energy by physical energy content, target a reduction of energy intensity of the
real GDP by 21%, and reduce CO2 emissions targeting a reduction of real GDP
CO2 intensity by 27%.
Leverage the cost reductions in wind and solar and scale-up the pace of RE
installations, including averaging annual additions of wind 53 GW and solar 58 GW.
Ensure supporting RE policies, such as strong RE purchasing requirements, after
the transition from subsidy to market prices.
Internalise fossil fuels’ damage and/or abatement costs through the refined ETS
mechanism.
Pursue electrification with focus on industry to reduce coal consumption and
transport to stymie the growing consumption of oil products.
Avoid new coal power plants and conduct orderly prioritised closures of inefficient
plants and coal mines.
Continue the energy revolution in the next five-year plans
To reach the 2050 visions, the energy revolution must continue and further accelerate in
the 15th and 16th five-year plans. CREO 2019 shows a clear roadmap for the energy system
development. It is, however, too early to come up with detailed policy recommendations
for these plan periods. The planning process should be carried out as an iterative process,
where research and analyses give basis for policy actions, while on the other hand the
development process and new opportunities in technologies and institutional settings pave
way for new scenarios and research. The main imperative in the process is to stick to the
long-term visions and requirements given by the Chinese leadership for the Ecological
Civilisation with a clean, low-carbon, safe and efficient energy system.
China Renewable Energy Outlook 2019
6 |
China’s emerging energy transition
China is in the beginning of an energy transition with the aim of building an energy system
for the future. The 13th five-year plan made it clear that China should start an energy
revolution and, with the important milestones for 2020, 2035 and 2050, build a “clean, low
carbon, safe and efficient energy system.” 1 At the 19th National Congress of the
Communist Party of China, President Xi Jinping confirmed that China will promote a
revolution in energy production and consumption. The country’s plans emphasise shifting
economic development from high growth to high-quality growth, a paradigm shift that
also applies to the energy sector.
Energy consumption development
China’s energy trend shows slowing growth and improving efficiency
In 2018, China’s GDP grew by 6.6%, the lowest level since 1990, and primary energy
consumption reached 4,640 Mtce (136 billion GJ), an increase of 3% year-on-year. Gradual
improvement in energy intensity of the economy continued: energy consumption per unit
of GDP decreased 3.1% in 2018, indicating an increase in energy efficiency.2
Coal showed second consecutive year of absolute consumption growth in 2018
Residential consumption of coal has decreased due to policies aimed at controlling emissions. Nevertheless, due to industrial consumption growth, China’s coal consumption reached 3.84 billion tonnes, an increase of 1% year-on-year.3 The proportion of coal used for power generation increased by 8% compared with 2017.4
China’s crude oil consumption increased by 6.5% in 2018
Oil consumption reached 639 million tonnes, 3.4 times more than domestic output. Oil import dependence reached 72%, an increase of 2.4 percentage points from the prior year.
Natural gas consumption is the fastest-growing fossil energy source in China in 2018
Natural gas consumption increased by 18% in 2018, with a total volume of 282 billion cubic
metres (bcm), 10 percentage points higher than natural gas production growth rate. 5
China’s natural gas production reached 160 bcm. Import dependence rose to 45.3%.6
China’s 2020 target for non-fossil energy will be achieved
Non-fossil energy consumption accounted for 14.3% in 2018, implying China’s 2020 target
of 15% non-fossil energy will likely be achieved ahead of schedule. 7
Electricity consumption continued to increase.
China’s total electricity consumption in 2018 reached 6,846 TWh, an 8.5% annual increase,
the highest annual growth since 2012. While accounted for 57% of the total consumption
growth, the growth rate was higher in services (12.7% year-on-year) and households (10.4%
year-on-year) than in industry which showed 7.1% growth year-on-year.
Summary
7 |
Energy sector investment
In 2018, China’s energy structure has become more diversified, and the efficiency of the
whole system improved. Although coal still dominates energy consumption, this is
gradually changing, and natural gas has become a new growth point for fossil fuels.
Overall investment dropped while renewable energy is still attractive
In 2018, China remained the world’s largest energy investment market, although its overall
sector investment dropped by 1.5% compared to 2017.8 The investment of newly added
coal-fired power plants decreased by more than 60% and energy efficiency improved by 6%
in the past three years, which led to the investment decrease. In contrast, about 70% out
of US$ 120 billion invested in the power sector was spent on renewable energy. 9
Natural gas infrastructure build-out continues
Due to shortages of residential gas supplies in winter 2017, China promoted the expansion
of gas pipelines and LNG import terminals in order to increase gas supply capacity.10
China’s EV and grid-side energy storage market has continued to expand rapidly
In 2018, the sales of all passenger vehicles in China declined for the first time since 1990, while new EVs continued rapid sales growth.11 China has ranked as the largest EV market in the world for four years running, and 2018 saw 62% of global EVs sold in China.12 The grid-connected energy storage sector also showed strong growth in 2018. Newly built
battery energy storage facilities exceeded 600 MW, of which 36% was on the grid side.13
Cumulative installed capacity reached 1,020 MW. 14
Carbon and other air pollutant emissions
Carbon and major pollutant emissions intensity of production continued to decline
We estimate that CO2 emissions intensity dropped by ~2% per unit of real GDP in 2018. In
China’s 338 cities at or above prefecture level, ambient PM10 concentrations dropped by
5.3% and ambient PM2.5 dropped by 9.3% in 2018 versus the prior year, and the nationwide
average number of haze days declined from 27.6 days in 2017 to 20.5 days in 2018. Acid rain
measurements showed improvement in most Chinese regions with the lowest average
frequency since 1992 when records began.15
New Blue-Sky Action Plan released.
The State Council issued a new three-year air pollution control plan in 2018.16 The plan
focuses on reducing the total emissions of major air pollutants, and reducing greenhouse
gas emissions, particularly in the Beijing-Tianjin-Hebei region, the Yangtze River Delta
region, and the Fenwei Plain (Shaanxi and Shanxi) region, reducing the concentration of
PM2.5 and the number of days of heavy pollution, and improving the quality of ambient air.
This is the first time to include Shaanxi and Shanxi as targeted regions.
China Renewable Energy Outlook 2019
8 |
China’s national ETS marks first anniversary
China’s national ETS was officially launched at the end of 2017. At the time, the schedule
for establishing the ETS called for a preparation phase, followed by trial operation, and
then official operation. The ETS currently remains in the preparation period.
Eight spot power market pilots have launched
NDRC and NEA jointly announced the first batch of spot power market pilots in August
2017. These pilots covered eight regions and aimed to complete market designs by the end
of 2018.17 Almost all pilots have faced delays.
Renewable energy in China
Current progress
China has made substantial progress on scaling up renewable power as well as reducing
the cost of renewable energy in the past 20 years, and as a result China has fulfilled the
13th Five-Year Plan targets ahead of time. Wind and solar PV have gradually entered the
post-subsidy era, and nationwide subsidy-free and FiT tendering projects will be the new
trend.
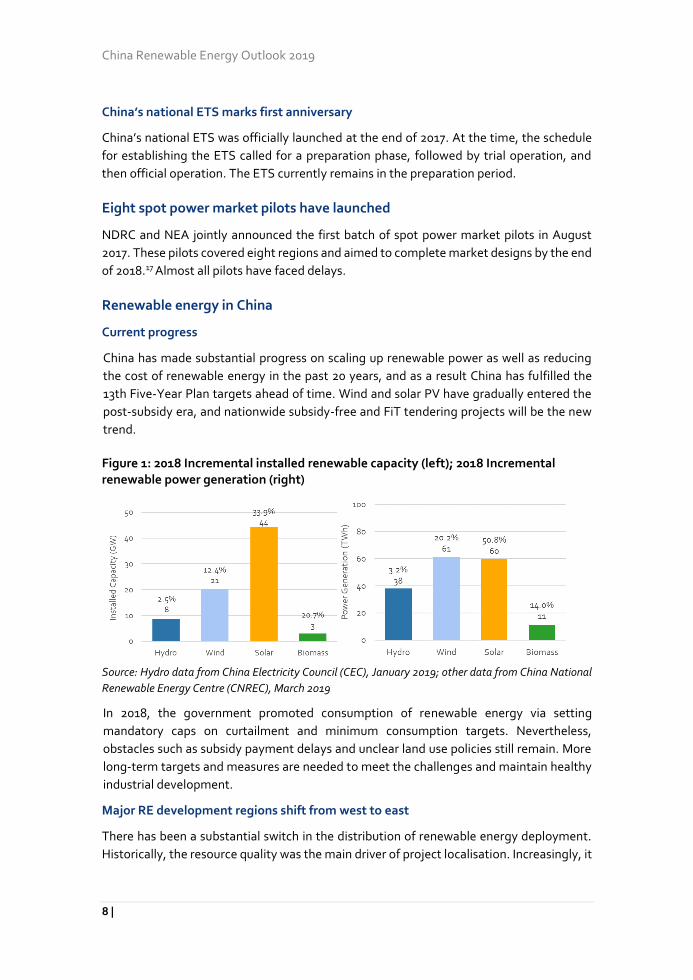
Figure 1: 2018 Incremental installed renewable capacity (left); 2018 Incremental renewable power generation (right)
Source: Hydro data from China Electricity Council (CEC), January 2019; other data from China National
Renewable Energy Centre (CNREC), March 2019
In 2018, the government promoted consumption of renewable energy via setting
mandatory caps on curtailment and minimum consumption targets. Nevertheless,
obstacles such as subsidy payment delays and unclear land use policies still remain. More
long-term targets and measures are needed to meet the challenges and maintain healthy
industrial development.
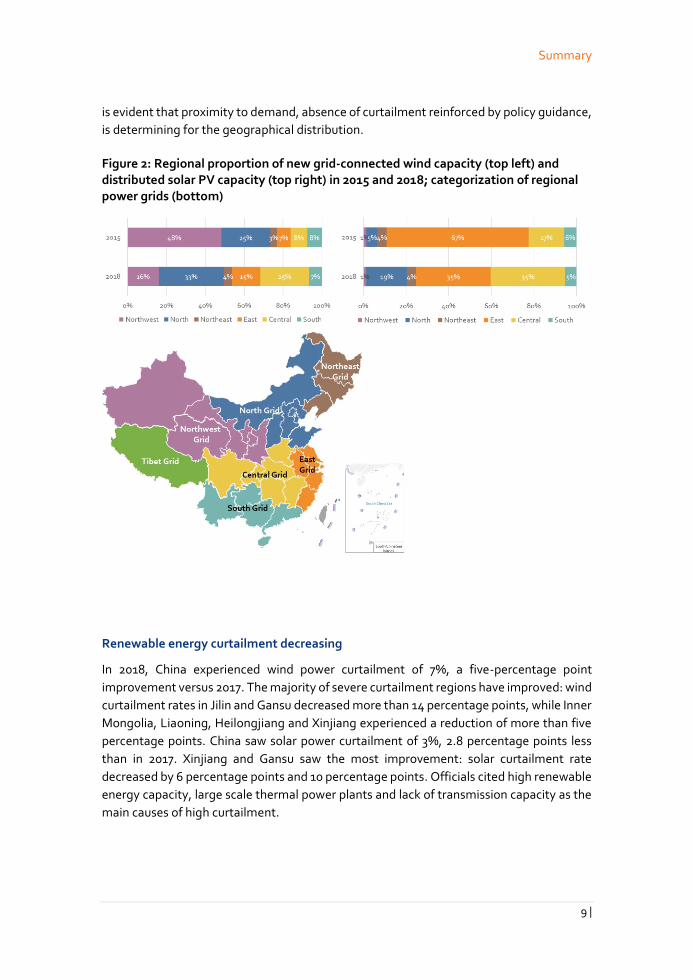
Major RE development regions shift from west to east
There has been a substantial switch in the distribution of renewable energy deployment.
Historically, the resource quality was the main driver of project localisation. Increasingly, it
Summary
9 |
is evident that proximity to demand, absence of curtailment reinforced by policy guidance,
is determining for the geographical distribution.
Figure 2: Regional proportion of new grid-connected wind capacity (top left) and distributed solar PV capacity (top right) in 2015 and 2018; categorization of regional power grids (bottom)
Renewable energy curtailment decreasing
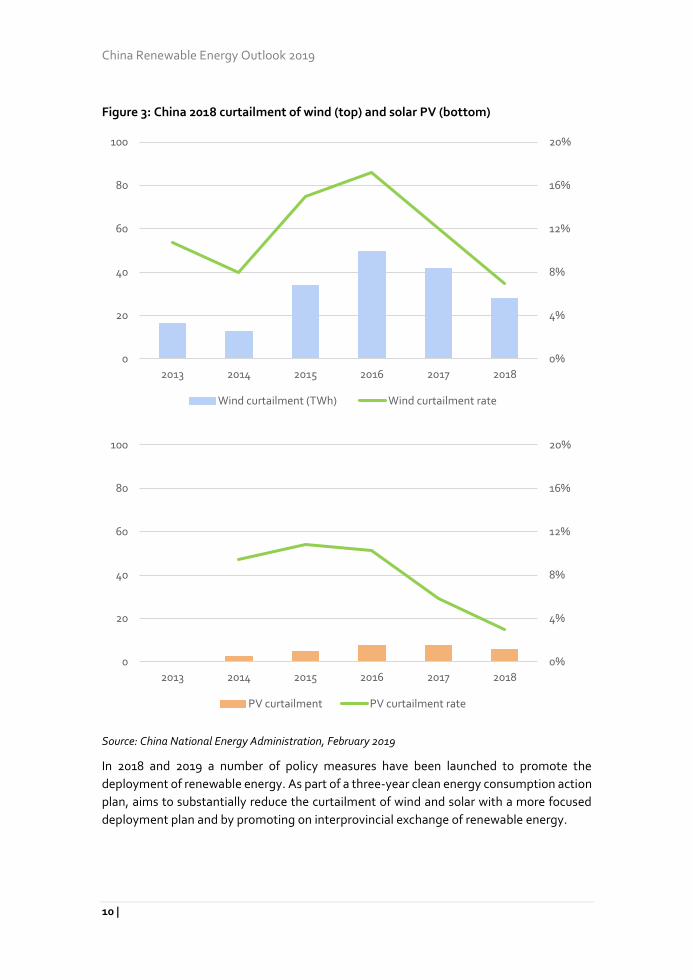
In 2018, China experienced wind power curtailment of 7%, a five-percentage point
improvement versus 2017. The majority of severe curtailment regions have improved: wind
curtailment rates in Jilin and Gansu decreased more than 14 percentage points, while Inner
Mongolia, Liaoning, Heilongjiang and Xinjiang experienced a reduction of more than five
percentage points. China saw solar power curtailment of 3%, 2.8 percentage points less
than in 2017. Xinjiang and Gansu saw the most improvement: solar curtailment rate
decreased by 6 percentage points and 10 percentage points. Officials cited high renewable
energy capacity, large scale thermal power plants and lack of transmission capacity as the
main causes of high curtailment.
China Renewable Energy Outlook 2019
10 |
Figure 3: China 2018 curtailment of wind (top) and solar PV (bottom)
Source: China National Energy Administration, February 2019
In 2018 and 2019 a number of policy measures have been launched to promote the
deployment of renewable energy. As part of a three-year clean energy consumption action
plan, aims to substantially reduce the curtailment of wind and solar with a more focused
deployment plan and by promoting on interprovincial exchange of renewable energy.
0%
4%
8%
12%
16%
20%
0
20
40
60
80
100
2013 2014 2015 2016 2017 2018
Wind curtailment (TWh) Wind curtailment rate
0%
4%
8%
12%
16%
20%
0
20
40
60
80
100
2013 2014 2015 2016 2017 2018
PV curtailment PV curtailment rate
Summary
11 |
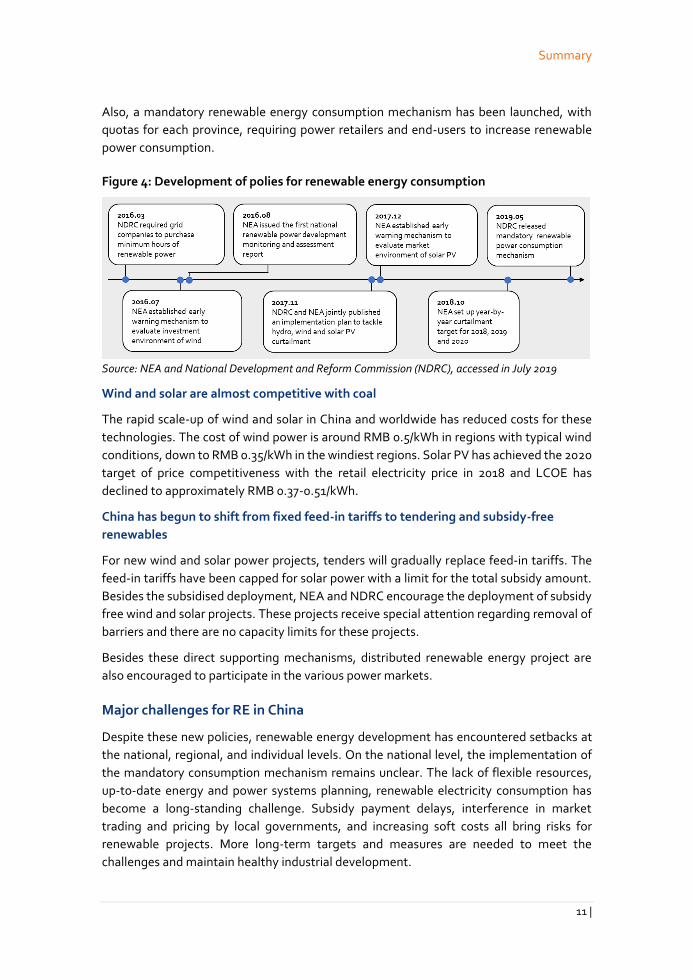
Also, a mandatory renewable energy consumption mechanism has been launched, with
quotas for each province, requiring power retailers and end-users to increase renewable
power consumption.
Figure 4: Development of polies for renewable energy consumption
Source: NEA and National Development and Reform Commission (NDRC), accessed in July 2019
Wind and solar are almost competitive with coal
The rapid scale-up of wind and solar in China and worldwide has reduced costs for these
technologies. The cost of wind power is around RMB 0.5/kWh in regions with typical wind
conditions, down to RMB 0.35/kWh in the windiest regions. Solar PV has achieved the 2020
target of price competitiveness with the retail electricity price in 2018 and LCOE has
declined to approximately RMB 0.37-0.51/kWh.
China has begun to shift from fixed feed-in tariffs to tendering and subsidy-free
renewables
For new wind and solar power projects, tenders will gradually replace feed-in tariffs. The
feed-in tariffs have been capped for solar power with a limit for the total subsidy amount.
Besides the subsidised deployment, NEA and NDRC encourage the deployment of subsidy
free wind and solar projects. These projects receive special attention regarding removal of
barriers and there are no capacity limits for these projects.
Besides these direct supporting mechanisms, distributed renewable energy project are
also encouraged to participate in the various power markets.
Major challenges for RE in China
Despite these new policies, renewable energy development has encountered setbacks at
the national, regional, and individual levels. On the national level, the implementation of
the mandatory consumption mechanism remains unclear. The lack of flexible resources,
up-to-date energy and power systems planning, renewable electricity consumption has
become a long-standing challenge. Subsidy payment delays, interference in market
trading and pricing by local governments, and increasing soft costs all bring risks for
renewable projects. More long-term targets and measures are needed to meet the
challenges and maintain healthy industrial development.
China Renewable Energy Outlook 2019
12 |
Energy scenarios for China’s energy transition
CREO 2019 continues the tradition from previous outlooks by defining two core scenarios
for the energy systems development. The scenarios provide a clear and consistent vision
for the long-term development as basis for short-term decisions
Ecological civilisation fuelled by clean, low-carbon, safe and efficient energy
The Stated Policies scenario expresses the impact of a firm implementation of announced
polices, while the Below 2 °C scenario shows a pathway for China to achieve the ambitious
vision for an ecological civilisation and the role China could take in the fulfilment of the
Paris agreement.
Scenarios’ strategy
Economic growth is a bottom-line precondition of China’s socioeconomic objectives for
2050. It is required that GDP grows 4.2 times from 2018 level in real terms by 2050.
However, the growth shall be sustainable and supported by the transition of the Chinese
energy system – an essential component in the efforts to build China’s Ecological
Civilisation.
The strategy for the energy transition explored in CREO 2019 relies on three pillars:
Energy efficiency is a key demand-side pillar to ensure the pace and scale of
supply-side deployments are adequate to support the required economic growth.
Electrification and market reforms will change the rules of the game and drive
fossil fuels from end-use consumption, in conjunction decarbonised electricity
supply.
Green energy supply – technological progress and cost reduction makes RE able
to provide the clean energy in bulk, particularly through renewable electricity.
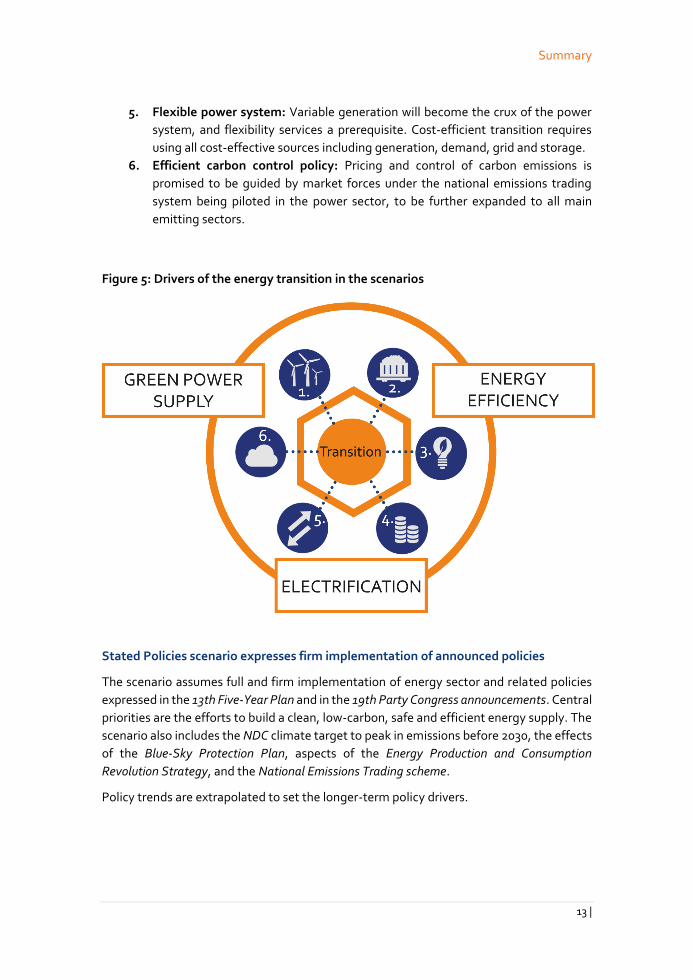
The strategy is supported by key drivers:
1. RE promotion: Supporting frameworks must ensure continued development, as
subsidies are phased out.
2. Coal control: Coal is the main culprit of China’s environmental challenges and
greenhouse gas emissions, requiring firm control of both production and
consumption.
3. Energy efficiency measures: Energy efficiency potentials in China’s energy
system are profound but must be supported by strong policy. This goes hand in
hand with the restructuring of the economy towards less energy intensive sectors.
4. Power markets: Power market reforms shall deliver significant efficiency gains,
enabling electricity to be a cost-competitive energy carrier for more consumption
applications. Increased variable generation makes dynamic short-term power
markets important for motivating comprehensive balancing participation.
Summary
13 |
5. Flexible power system: Variable generation will become the crux of the power
system, and flexibility services a prerequisite. Cost-efficient transition requires
using all cost-effective sources including generation, demand, grid and storage.
6. Efficient carbon control policy: Pricing and control of carbon emissions is
promised to be guided by market forces under the national emissions trading
system being piloted in the power sector, to be further expanded to all main
emitting sectors.
Figure 5: Drivers of the energy transition in the scenarios
Stated Policies scenario expresses firm implementation of announced policies
The scenario assumes full and firm implementation of energy sector and related policies
expressed in the 13th Five-Year Plan and in the 19th Party Congress announcements. Central
priorities are the efforts to build a clean, low-carbon, safe and efficient energy supply. The
scenario also includes the NDC climate target to peak in emissions before 2030, the effects
of the Blue-Sky Protection Plan, aspects of the Energy Production and Consumption
Revolution Strategy, and the National Emissions Trading scheme.
Policy trends are extrapolated to set the longer-term policy drivers.
China Renewable Energy Outlook 2019
14 |
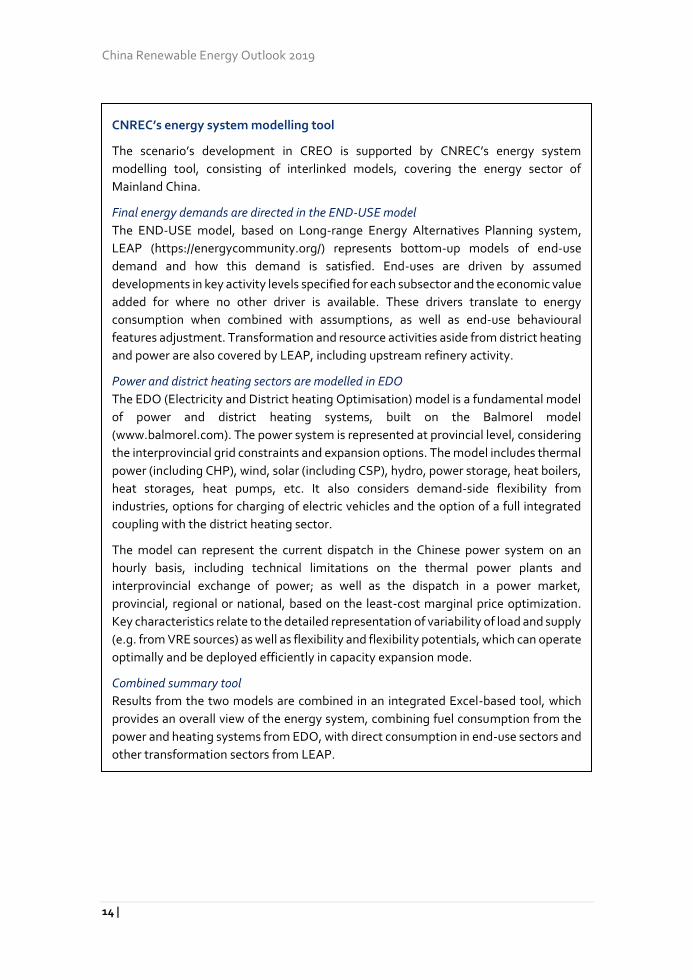
CNREC’s energy system modelling tool
The scenario’s development in CREO is supported by CNREC’s energy system
modelling tool, consisting of interlinked models, covering the energy sector of
Mainland China.
Final energy demands are directed in the END-USE model
The END-USE model, based on Long-range Energy Alternatives Planning system,
LEAP (https://energycommunity.org/) represents bottom-up models of end-use
demand and how this demand is satisfied. End-uses are driven by assumed
developments in key activity levels specified for each subsector and the economic value
added for where no other driver is available. These drivers translate to energy
consumption when combined with assumptions, as well as end-use behavioural
features adjustment. Transformation and resource activities aside from district heating
and power are also covered by LEAP, including upstream refinery activity.
Power and district heating sectors are modelled in EDO
The EDO (Electricity and District heating Optimisation) model is a fundamental model
of power and district heating systems, built on the Balmorel model
(www.balmorel.com). The power system is represented at provincial level, considering
the interprovincial grid constraints and expansion options. The model includes thermal
power (including CHP), wind, solar (including CSP), hydro, power storage, heat boilers,
heat storages, heat pumps, etc. It also considers demand-side flexibility from
industries, options for charging of electric vehicles and the option of a full integrated
coupling with the district heating sector.
The model can represent the current dispatch in the Chinese power system on an
hourly basis, including technical limitations on the thermal power plants and
interprovincial exchange of power; as well as the dispatch in a power market,
provincial, regional or national, based on the least-cost marginal price optimization.
Key characteristics relate to the detailed representation of variability of load and supply
(e.g. from VRE sources) as well as flexibility and flexibility potentials, which can operate
optimally and be deployed efficiently in capacity expansion mode.
Combined summary tool
Results from the two models are combined in an integrated Excel-based tool, which
provides an overall view of the energy system, combining fuel consumption from the
power and heating systems from EDO, with direct consumption in end-use sectors and
other transformation sectors from LEAP.
Summary
15 |
Below 2 °C scenario shows how China can build an energy system for the ecological
civilisation
The main driver is a hard target for energy related CO2 emissions through a strategy with
renewable electricity, electrification and sectoral transformation at the core. The cap is set
at 200 million tons of energy related CO2 emissions in total between 2018-2050.
Main assumptions in the Below 2 °C scenario
Population of 1.38 bn in 2050.
GDP increased 4.2 times in real terms to RMB 380 trillion by 2050.
Urbanisation rate of 78% by 2050
Primary energy consumption stable after 2030 below 6 bn tce.
Coal consumption restricted to 1 billion tons of coal (714 billion tce) by 2050.
Natural gas to peak in 2040 in the range 580-600 bcm
Diversified supply with significantly reduced dependence on imported fuels.
Energy intensity shall be reduced by 85% relative to 2018.
Non-fossil energy to cover 2/3 of primary energy.
CO2 emission 2018-2050 below 200 billion tons cumulative, and 2050 emissions
less than 2500 million tons.
Electrification rate above 60%
The Stated Policies scenario adopts a similar pathway, but with a less ambition
electrification target (50%) and without a strict CO2 boundary.
Overview of the 2050 Energy System – The Below 2 °C scenario
In CREO, the main scenario is the Below 2 °C scenario, since the scenario comply with all
long-term goal to build a clean, low-carbon, safe and efficient energy system. Furthermore,
China’s contribution is essential for global efforts to comply with the temperature
objectives of the Paris agreement. Hence, emphasis for the Chinese energy transition
should be on the Below 2 °C scenario for a Low Carbon Energy system compliant with Paris
objective.
In the following the main results from the Below 2 °C scenario in the medium- and long-
term are presented and explained.
China Renewable Energy Outlook 2019
16 |
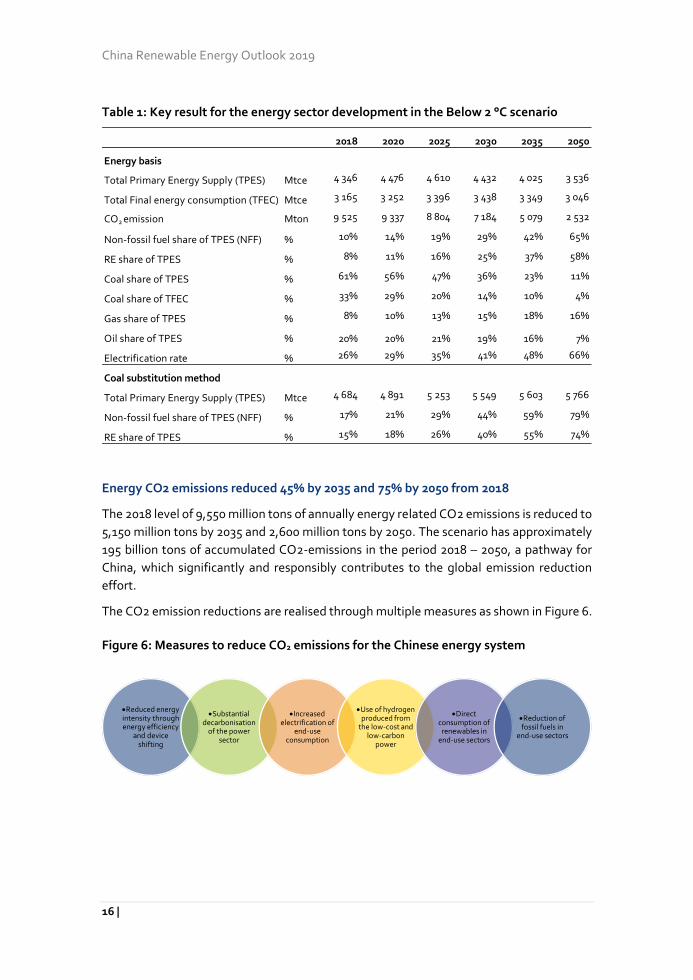
Table 1: Key result for the energy sector development in the Below 2 °C scenario
Energy CO2 emissions reduced 45% by 2035 and 75% by 2050 from 2018
The 2018 level of 9,550 million tons of annually energy related CO2 emissions is reduced to
5,150 million tons by 2035 and 2,600 million tons by 2050. The scenario has approximately
195 billion tons of accumulated CO2-emissions in the period 2018 – 2050, a pathway for
China, which significantly and responsibly contributes to the global emission reduction
effort.
The CO2 emission reductions are realised through multiple measures as shown in Figure 6.
Figure 6: Measures to reduce CO2 emissions for the Chinese energy system
2018 2020 2025 2030 2035 2050
Energy basis
Total Primary Energy Supply (TPES) Mtce 4 346 4 476 4 610 4 432 4 025 3 536
Total Final energy consumption (TFEC) Mtce 3 165 3 252 3 396 3 438 3 349 3 046
CO2 emission Mton 9 525 9 337 8 804 7 184 5 079 2 532
Non-fossil fuel share of TPES (NFF) % 10% 14% 19% 29% 42% 65%
RE share of TPES % 8% 11% 16% 25% 37% 58%
Coal share of TPES % 61% 56% 47% 36% 23% 11%
Coal share of TFEC % 33% 29% 20% 14% 10% 4%
Gas share of TPES % 8% 10% 13% 15% 18% 16%
Oil share of TPES % 20% 20% 21% 19% 16% 7%
Electrification rate % 26% 29% 35% 41% 48% 66%
Coal substitution method
Total Primary Energy Supply (TPES) Mtce 4 684 4 891 5 253 5 549 5 603 5 766
Non-fossil fuel share of TPES (NFF) % 17% 21% 29% 44% 59% 79%
RE share of TPES % 15% 18% 26% 40% 55% 74%
Reduced energy intensity through energy efficiency
and device shifting
Substantial decarbonisation
of the power sector
Increased electrification of
end-use consumption
Use of hydrogen produced from
the low-cost and low-carbon
power
Direct consumption of renewables in
end-use sectors
Reduction of fossil fuels in
end-use sectors
Summary
17 |
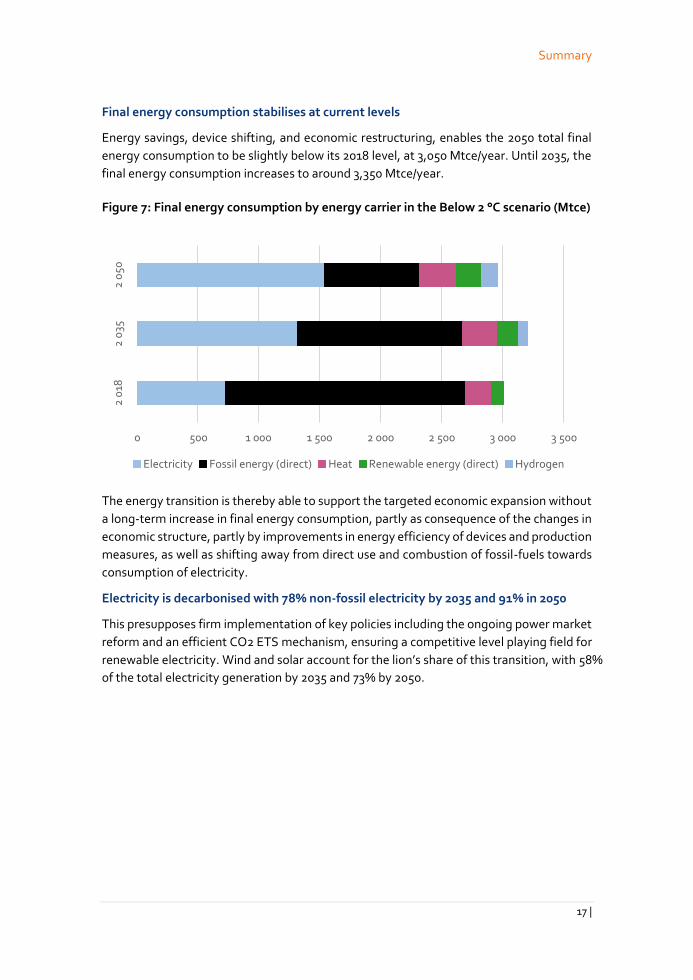
Final energy consumption stabilises at current levels
Energy savings, device shifting, and economic restructuring, enables the 2050 total final
energy consumption to be slightly below its 2018 level, at 3,050 Mtce/year. Until 2035, the
final energy consumption increases to around 3,350 Mtce/year.
Figure 7: Final energy consumption by energy carrier in the Below 2 °C scenario (Mtce)
The energy transition is thereby able to support the targeted economic expansion without
a long-term increase in final energy consumption, partly as consequence of the changes in
economic structure, partly by improvements in energy efficiency of devices and production
measures, as well as shifting away from direct use and combustion of fossil-fuels towards
consumption of electricity.
Electricity is decarbonised with 78% non-fossil electricity by 2035 and 91% in 2050
This presupposes firm implementation of key policies including the ongoing power market
reform and an efficient CO2 ETS mechanism, ensuring a competitive level playing field for
renewable electricity. Wind and solar account for the lion’s share of this transition, with 58%
of the total electricity generation by 2035 and 73% by 2050.
0 500 1 000 1 500 2 000 2 500 3 000 3 500
2 0
182
035
2 0
50
Electricity Fossil energy (direct) Heat Renewable energy (direct) Hydrogen
China Renewable Energy Outlook 2019
18 |
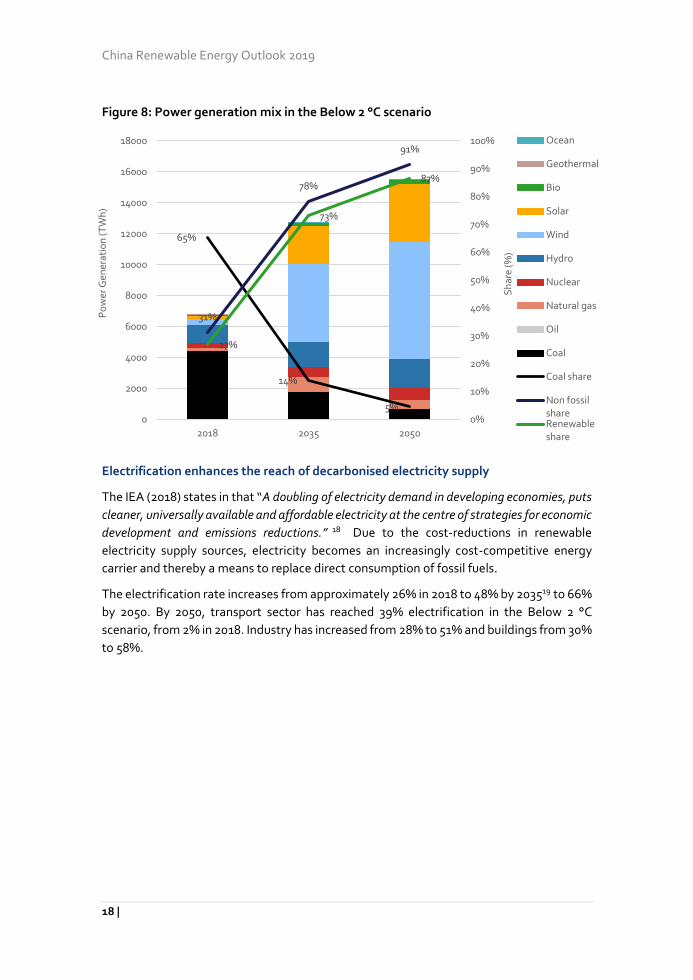
Figure 8: Power generation mix in the Below 2 °C scenario
Electrification enhances the reach of decarbonised electricity supply
The IEA (2018) states in that “A doubling of electricity demand in developing economies, puts
cleaner, universally available and affordable electricity at the centre of strategies for economic
development and emissions reductions.” 18 Due to the cost-reductions in renewable
electricity supply sources, electricity becomes an increasingly cost-competitive energy
carrier and thereby a means to replace direct consumption of fossil fuels.
The electrification rate increases from approximately 26% in 2018 to 48% by 203519 to 66%
by 2050. By 2050, transport sector has reached 39% electrification in the Below 2 °C
scenario, from 2% in 2018. Industry has increased from 28% to 51% and buildings from 30%
to 58%.
65%
14%
5%
31%
78%
91%
27%
73%
87%
0%
10%
20%
30%
40%
50%
60%
70%
80%
90%
100%
0
2000
4000
6000
8000
10000
12000
14000
16000
18000
2018 2035 2050
Sh
are
(%)
Po
wer
Gen
erat
ion
(TW
h)
Ocean
Geothermal
Bio
Solar
Wind
Hydro
Nuclear
Natural gas
Oil
Coal
Coal share
Non fossilshareRenewableshare
Summary
19 |
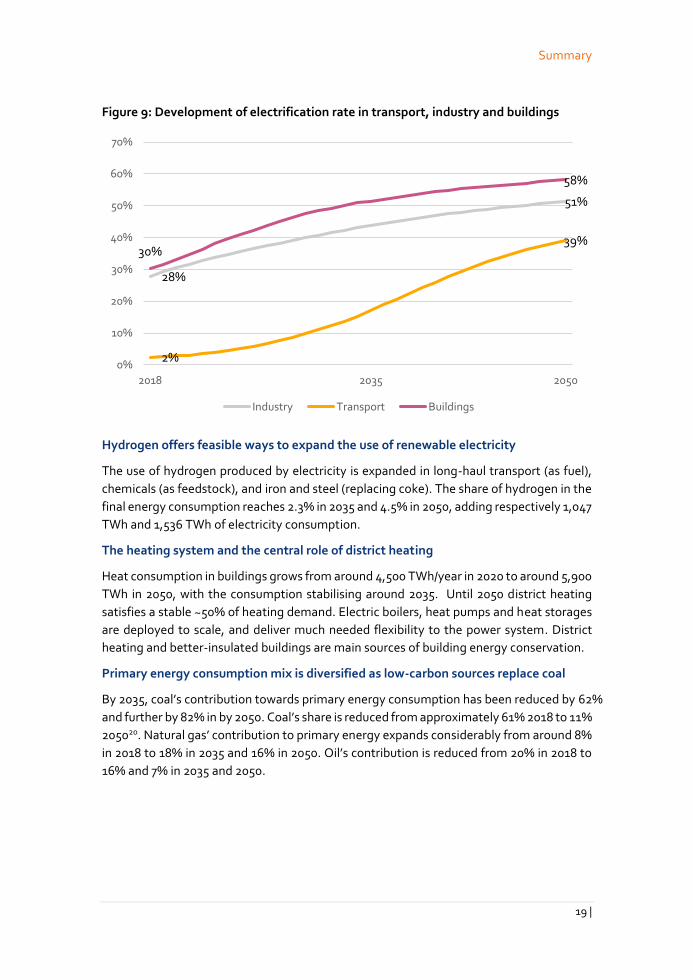
Figure 9: Development of electrification rate in transport, industry and buildings
Hydrogen offers feasible ways to expand the use of renewable electricity
The use of hydrogen produced by electricity is expanded in long-haul transport (as fuel),
chemicals (as feedstock), and iron and steel (replacing coke). The share of hydrogen in the
final energy consumption reaches 2.3% in 2035 and 4.5% in 2050, adding respectively 1,047
TWh and 1,536 TWh of electricity consumption.
The heating system and the central role of district heating
Heat consumption in buildings grows from around 4,500 TWh/year in 2020 to around 5,900
TWh in 2050, with the consumption stabilising around 2035. Until 2050 district heating
satisfies a stable ~50% of heating demand. Electric boilers, heat pumps and heat storages
are deployed to scale, and deliver much needed flexibility to the power system. District
heating and better-insulated buildings are main sources of building energy conservation.
Primary energy consumption mix is diversified as low-carbon sources replace coal
By 2035, coal’s contribution towards primary energy consumption has been reduced by 62%
and further by 82% in by 2050. Coal’s share is reduced from approximately 61% 2018 to 11%
205020. Natural gas’ contribution to primary energy expands considerably from around 8%
in 2018 to 18% in 2035 and 16% in 2050. Oil’s contribution is reduced from 20% in 2018 to
16% and 7% in 2035 and 2050.
28%
51%
2%
39%30%
58%
0%
10%
20%
30%
40%
50%
60%
70%
2018 2035 2050
Industry Transport Buildings
China Renewable Energy Outlook 2019
20 |
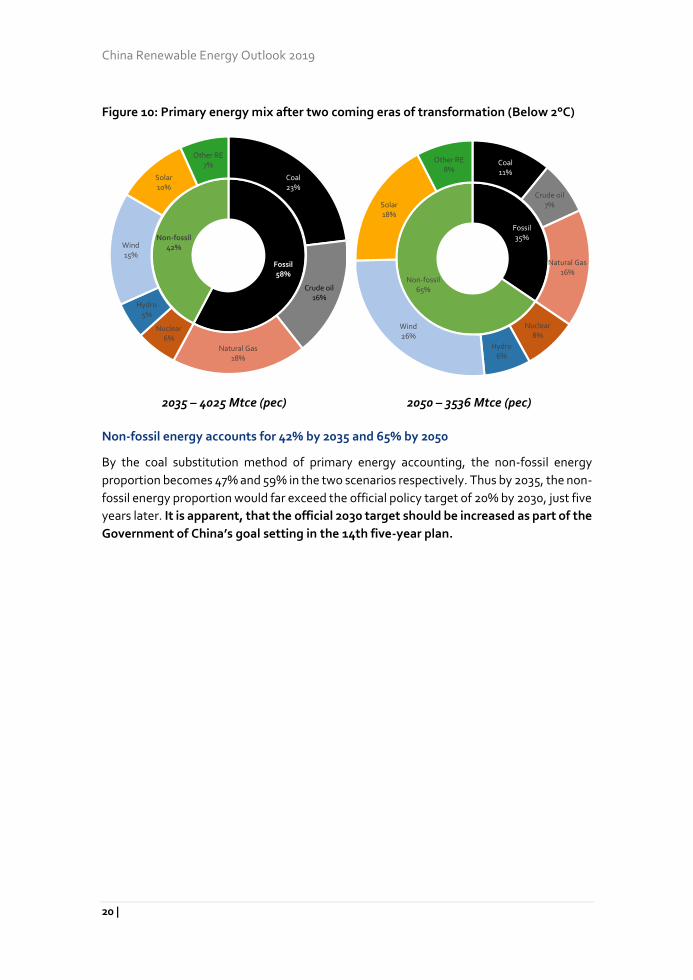
Figure 10: Primary energy mix after two coming eras of transformation (Below 2°C)
2035 – 4025 Mtce (pec) 2050 – 3536 Mtce (pec)
Non-fossil energy accounts for 42% by 2035 and 65% by 2050
By the coal substitution method of primary energy accounting, the non-fossil energy
proportion becomes 47% and 59% in the two scenarios respectively. Thus by 2035, the non-
fossil energy proportion would far exceed the official policy target of 20% by 2030, just five
years later. It is apparent, that the official 2030 target should be increased as part of the
Government of China’s goal setting in the 14th five-year plan.
Fossil58%
Non-fossil42%
Coal23%
Crude oil16%
Natural Gas18%
Nuclear6%
Hydro5%
Wind15%
Solar10%
Other RE7%
Fossil35%
Non-fossil65%
Coal11%
Crude oil7%
Natural Gas16%
Nuclear8%
Hydro6%
Wind26%
Solar18%
Other RE8%
Summary
21 |
Roadmap for Energy Transition
The Energy Consumption Revolution is an Energy Efficiency Revolution with the key feature
of deep electrification. The Energy Supply Revolution is a Renewable Energy Revolution,
with strong emphasis on renewable electricity. Renewable electricity is the most cost-
effective large-scale decarbonisation approach. To ensure that renewable electricity by
2035 is at the core of the energy system steps the 14th, 15th and 16th five-year plans are
crucial.
Sustainable economic growth while building the ecological civilization
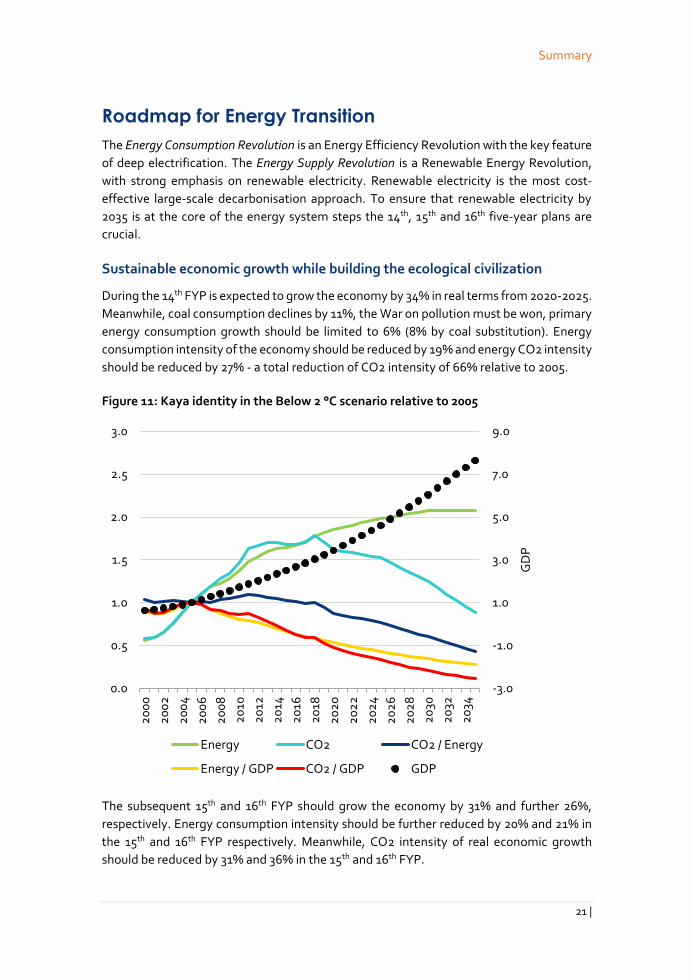
During the 14th FYP is expected to grow the economy by 34% in real terms from 2020-2025.
Meanwhile, coal consumption declines by 11%, the War on pollution must be won, primary
energy consumption growth should be limited to 6% (8% by coal substitution). Energy
consumption intensity of the economy should be reduced by 19% and energy CO2 intensity
should be reduced by 27% - a total reduction of CO2 intensity of 66% relative to 2005.
Figure 11: Kaya identity in the Below 2 °C scenario relative to 2005
The subsequent 15th and 16th FYP should grow the economy by 31% and further 26%,
respectively. Energy consumption intensity should be further reduced by 20% and 21% in
the 15th and 16th FYP respectively. Meanwhile, CO2 intensity of real economic growth
should be reduced by 31% and 36% in the 15th and 16th FYP.
-3.0
-1.0
1.0
3.0
5.0
7.0
9.0
0.0
0.5
1.0
1.5
2.0
2.5
3.0
20
00
20
02
20
04
20
06
20
08
20
10
20
12
20
14
20
16
20
18
20
20
20
22
20
24
20
26
20
28
20
30
20
32
20
34
GD
P
Energy CO2 CO2 / Energy
Energy / GDP CO2 / GDP GDP
China Renewable Energy Outlook 2019
22 |
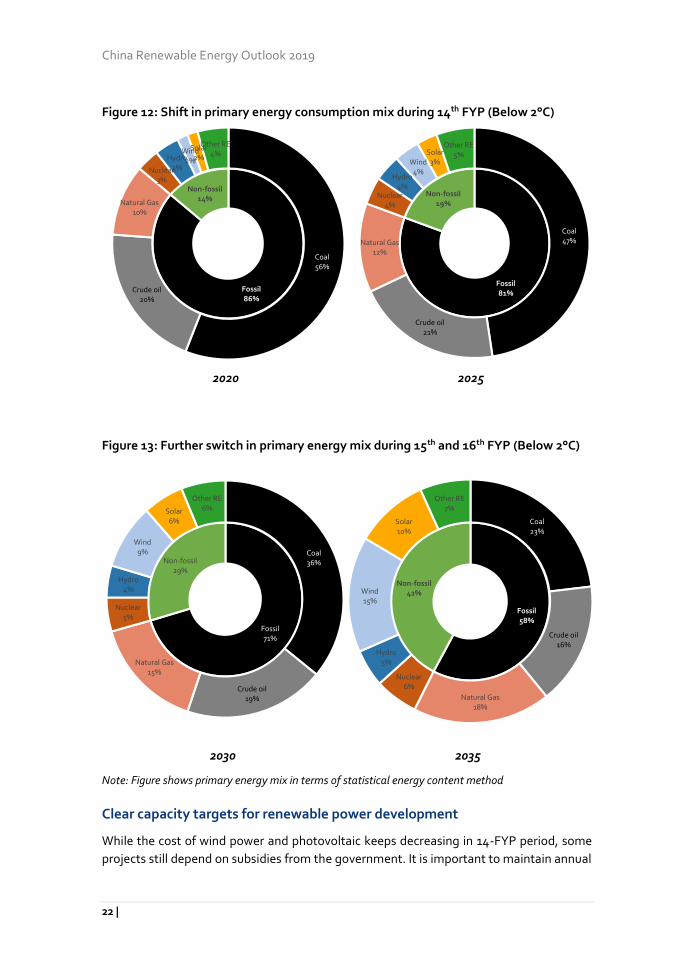
Figure 12: Shift in primary energy consumption mix during 14th FYP (Below 2°C)
2020 2025
Figure 13: Further switch in primary energy mix during 15th and 16th FYP (Below 2°C)
2030 2035
Note: Figure shows primary energy mix in terms of statistical energy content method
Clear capacity targets for renewable power development
While the cost of wind power and photovoltaic keeps decreasing in 14-FYP period, some
projects still depend on subsidies from the government. It is important to maintain annual
Fossil86%
Non-fossil14%
Coal56%
Crude oil20%
Natural Gas10%
Nuclear3%
Hydro3%
Wind2%
Solar2%
Other RE4%
Fossil81%
Non-fossil19%
Coal47%
Crude oil21%
Natural Gas12%
Nuclear4%
Hydro4%
Wind4%
Solar3%
Other RE5%
Fossil71%
Non-fossil29%
Coal36%
Crude oil19%
Natural Gas15%
Nuclear5%
Hydro4%
Wind9%
Solar6%
Other RE6%
Fossil58%
Non-fossil42%
Coal23%
Crude oil16%
Natural Gas18%
Nuclear6%
Hydro5%
Wind15%
Solar10%
Other RE7%
Summary
23 |
additional capacity targets for the projects, so that a level of industrial scale of equipment
suppliers and construction ability can be maintained while the total amount of subsidy can
be limited to an affordable level.
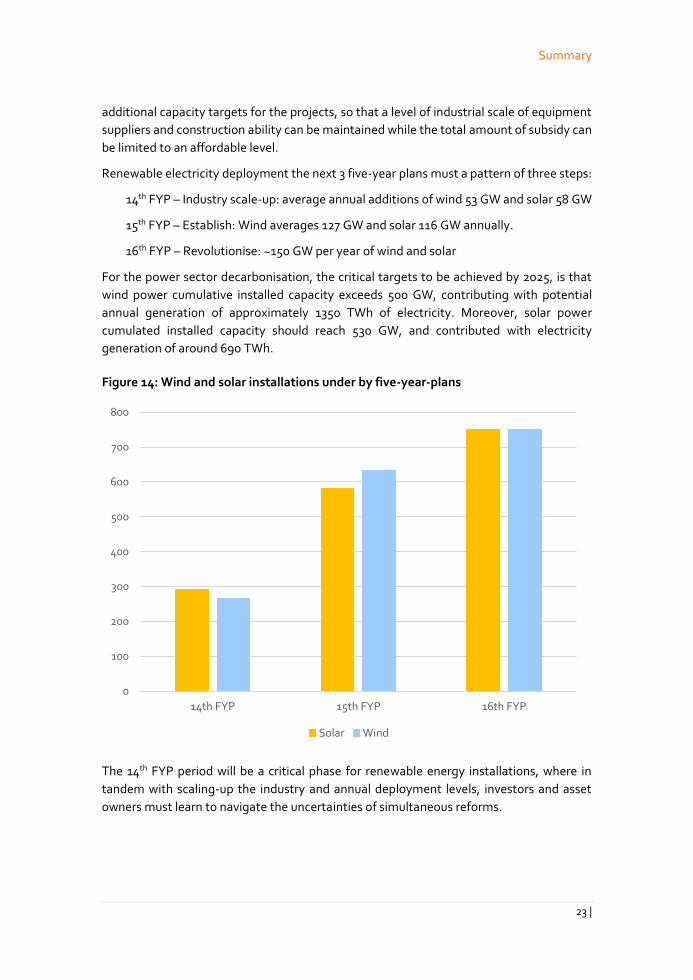
Renewable electricity deployment the next 3 five-year plans must a pattern of three steps:
14th FYP – Industry scale-up: average annual additions of wind 53 GW and solar 58 GW
15th FYP – Establish: Wind averages 127 GW and solar 116 GW annually.
16th FYP – Revolutionise: ~150 GW per year of wind and solar
For the power sector decarbonisation, the critical targets to be achieved by 2025, is that
wind power cumulative installed capacity exceeds 500 GW, contributing with potential
annual generation of approximately 1350 TWh of electricity. Moreover, solar power
cumulated installed capacity should reach 530 GW, and contributed with electricity
generation of around 690 TWh.
Figure 14: Wind and solar installations under by five-year-plans
The 14th FYP period will be a critical phase for renewable energy installations, where in
tandem with scaling-up the industry and annual deployment levels, investors and asset
owners must learn to navigate the uncertainties of simultaneous reforms.
0
100
200
300
400
500
600
700
800
14th FYP 15th FYP 16th FYP
Solar Wind
China Renewable Energy Outlook 2019
24 |
RE investments must wean off the comfortable business model of fixed price
subsidies and navigate the emergence of spot-markets as well as medium- to
long-term contracting markets as these are developed.
Investors and asset owners shall have confidence that they are able to capture
adequate prices for their electricity generation, and that they will not be curtailed,
while being exposed to the market. There must be evidence that system flexibility
develops as needed; alternatively, they must develop more complex business
models bundling VRE sources with own investments in flexibility and storage.
The market must respond timely to the development of the demand for green,
clean or non-fossil electricity – the pull from demand and the requirements from
regulation. Finally, there must be confidence that, despite a slowing energy
consumption growth resulting from energy efficiency and economic restructuring,
there will be increased electrification, and that the authorities will abstain
distorting the markets by supporting competing power offerings from coal and
gas and depress the prices.
The 14th FYP should give priority to developing capacity and balancing capability near
consumption centres, including giving focus on wind offshore developing, opening for
more distributed siting of wind, and improving conditions for DGPV.
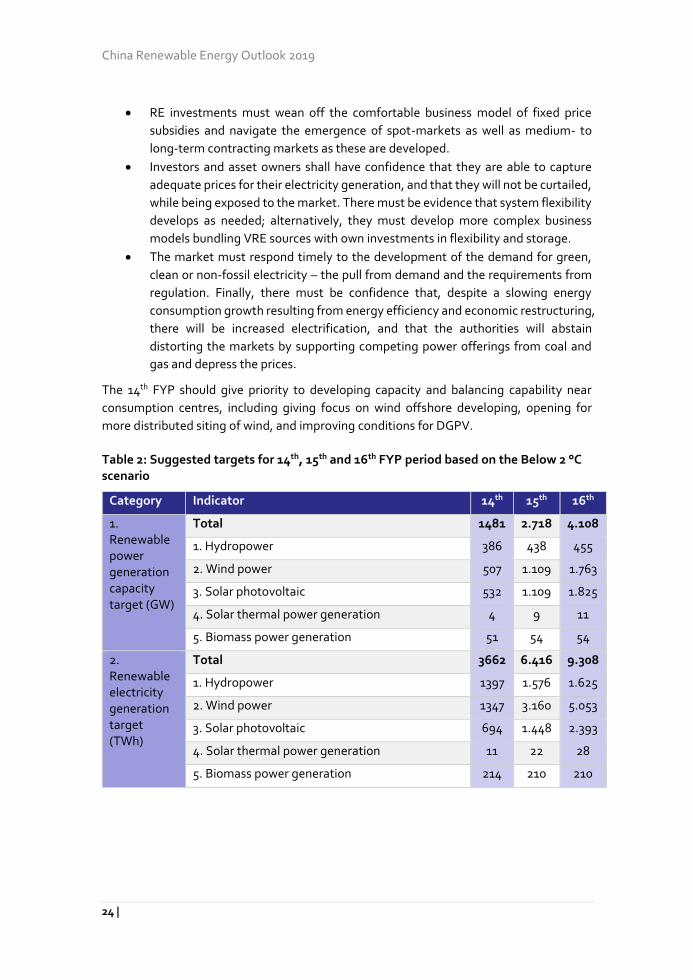
Table 2: Suggested targets for 14th, 15th and 16th FYP period based on the Below 2 °C scenario
Category Indicator 14th 15th 16th
1. Renewable power generation capacity target (GW)
Total 1481 2.718 4.108
1. Hydropower 386 438 455
2. Wind power 507 1.109 1.763
3. Solar photovoltaic 532 1.109 1.825
4. Solar thermal power generation 4 9 11
5. Biomass power generation 51 54 54
2. Renewable electricity generation target (TWh)
Total 3662 6.416 9.308
1. Hydropower 1397 1.576 1.625
2. Wind power 1347 3.160 5.053
3. Solar photovoltaic 694 1.448 2.393
4. Solar thermal power generation 11 22 28
5. Biomass power generation 214 210 210
Summary
25 |
In the 15th FYP, the pace of RE capacity additions moves towards the peak, while growth
rates in power consumption, drops to 3.5% p.a. on average. The 15th FYP must thread the
needle of building the capacity for a long-term sustainable renewable energy industry.
The 16th FYP will be the period of disruptive transformation. We are past the economic
tipping points with significant impact to asset utilisations. Wind and solar annual
installations should reach their peak at around ~150 GW/year and new electricity storage
should be coming online at the pace of 30 GW per year. Utilisation rates of fossil-thermal
plants shall decline significantly, and strategic plant closures should be considered.
Developing a coupled energy system with electrification as the crux
Electrification plus renewables can economically displace fossil fuel consumption in other
sectors. Meanwhile, the consuming sectors shall be developed to further support the
electricity sector in maintaining the system balance cost effectively through provision of
flexibility.
The 14th FYP should include targets and measures to support technologies an incentive to
unleash the benefits of an efficient power and district heating coupling. The stock of
individual heat pumps should be increasing and displace individual coal boilers and stoves.
The number of EVs should increase to almost 33 million by 2025, and around 14% of the
vehicle stock should be new energy vehicles (NEVS) including electric, hydrogen and plugin
hybrids. For EVs, this shall be accompanied by charging infrastructure, with around 1
normal charging stations for every 10 EV’s and around 1 fast charging stations per 100 EVs.
Programmes and/or retail tariffs for EV charging should expose users to changing prices,
such that smart charging is motivated.
Electrification should move to exceed 42% of the final energy consumption in industry, and
industries should be exposed to fluctuating market prices, and motivated towards
providing cost-efficient demand respond. Key energy intensive industries should be at the
forefront. Scrap-based electric arc furnace steel should reach 30-32% by 2025.
By the end of the 16th FYP, the penetration levels of variable renewable energy will be high,
and the availability of traditional thermal assets for maintaining the system balance
including ancillary services shall reduce. Smart energy services, demand response from
industrial and residential loads and electric vehicles must be deployed at scale. The district
heating sector has achieved the tipping point, where large-scale replacements of thermal
heating capacity, including CHPs are being replaced/supplemented by power-to-heat
technologies. The energy internet becomes a reality, with data and digitisation supporting
the timing, scheduling, adjustments and power based on a comprehensive system of data
on loads, prices, assets locations. This becomes possible with the introduction of smart
meters as well as home energy management systems, etc.
China Renewable Energy Outlook 2019
26 |
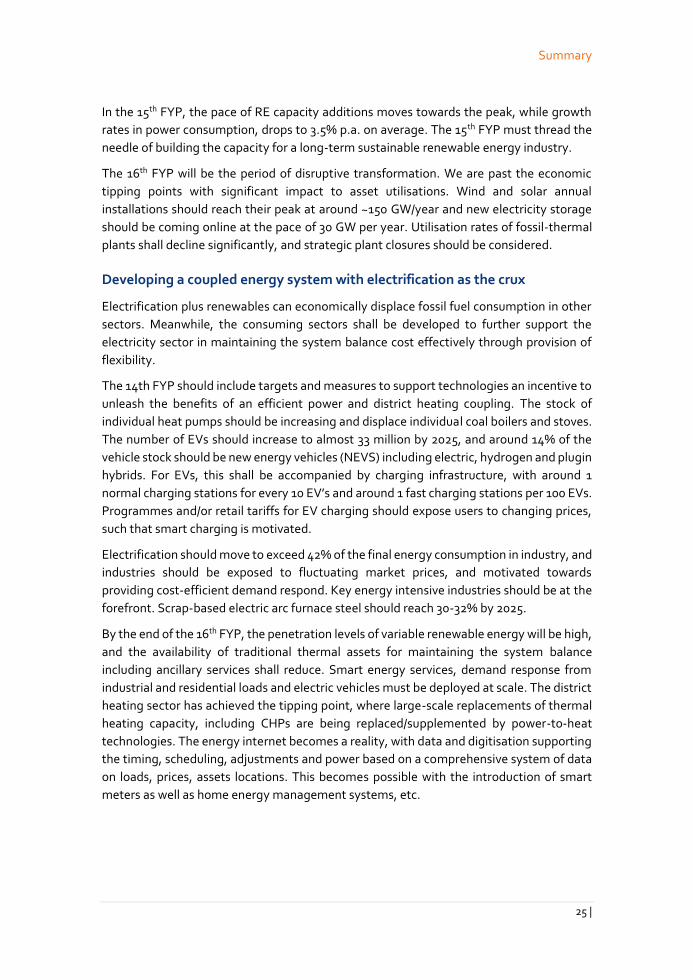
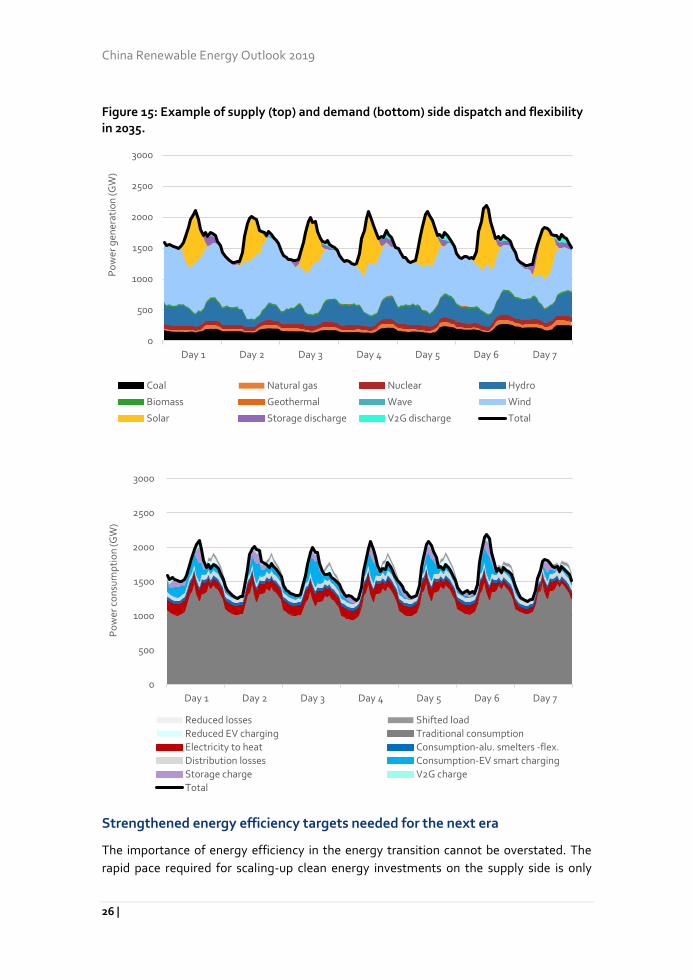
Figure 15: Example of supply (top) and demand (bottom) side dispatch and flexibility in 2035.
Strengthened energy efficiency targets needed for the next era
The importance of energy efficiency in the energy transition cannot be overstated. The
rapid pace required for scaling-up clean energy investments on the supply side is only
0
500
1000
1500
2000
2500
3000
Day 1 Day 2 Day 3 Day 4 Day 5 Day 6 Day 7
Po
wer
gen
erat
ion
(GW
)
Coal Natural gas Nuclear Hydro
Biomass Geothermal Wave Wind
Solar Storage discharge V2G discharge Total
0
500
1000
1500
2000
2500
3000
Day 1 Day 2 Day 3 Day 4 Day 5 Day 6 Day 7
Po
wer
co
nsu
mp
tio
n (G
W)
Reduced losses Shifted load
Reduced EV charging Traditional consumption
Electricity to heat Consumption-alu. smelters -flex.
Distribution losses Consumption-EV smart charging
Storage charge V2G charge
Total
Summary
27 |
sufficient, given that energy consumption is significantly decoupled from the economic
growth targets.
In the 14th FYP energy efficiency measures must be defined such that the primary energy
consumption per unit of GDP should decline by at least 19%. The measures shall support
the transitioning of consumption from their current energy carriers towards electricity.
Final energy consumption should remain below 3400 Mtce/year and primary energy
consumption not grow above 4610 Mtce.
Energy efficiency shall take place both in the point of energy use and in the supply-chain.
It can be achieved through better insulation and technology improvement in buildings (e.g.,
electric heaters will reach an efficiency of 98.1% by 16th FYP) as well as the promotion of
efficient processes in industry (e.g., in steelmaking, EAF process will contribute up to 29%
in steelmaking production by 16th FYP). Furthermore, the energy efficiency benefit of
renewables should be recognized in setting targets for primary energy consumption. Until
2035, the final energy consumption increases to around 3,350 Mtce/year, while primary
energy consumption should be contained below 4025 Mtce/year.
Strict coal controls to halve consumption by 2035
While in the long run, the expanded national ETS system could be the preferred mode of
coal and carbon containment, administrative measures are needed in the short-term.
In the 14th FYP, the coal consumption should be reduced by 10%. The 15th FYP should
implement further 24% reduction, and in the 16th five-year plan period the reduction
should be 37%. Thereby the coal share of primary energy consumption is reduced to 47%,
36% and 23% by the end of the 14th, 15th and 16th five-year plans respectively. Preserving
energy security by the energy transition
The energy transition must ensure that safe and stable energy fuels the economy in the
next era of economic development. The rapid growth of oil consumption is potentially
destabilising, as oil imports have been accounting for increasing percentages of the
country’s supply. While oil and gas imports will increase in absolute terms during the 14th
five-year plan by at least 8%, the import percentage of oil can be stabilised.
The efforts to expand indigenous natural gas supplies are merited and necessary, provided
that environmental safeguards are forcefully upheld. China must avoid the economy is
significantly dependent on imported foreign fuel. Natural gas imports, which grow by
almost 70%, see an estimated increase in the import share by at least 6 %-points during the
14th five-year plan. Hereafter, the by a combination of increased domestic production and
a slowdown in growth of gas consumption in favour of other clean energy sources, implies
that the import share of natural gas can decline in the 15th FYP.
By 2035, the import share of oil and natural gas can be lower than today, as a result of the
energy transition.
China Renewable Energy Outlook 2019
28 |
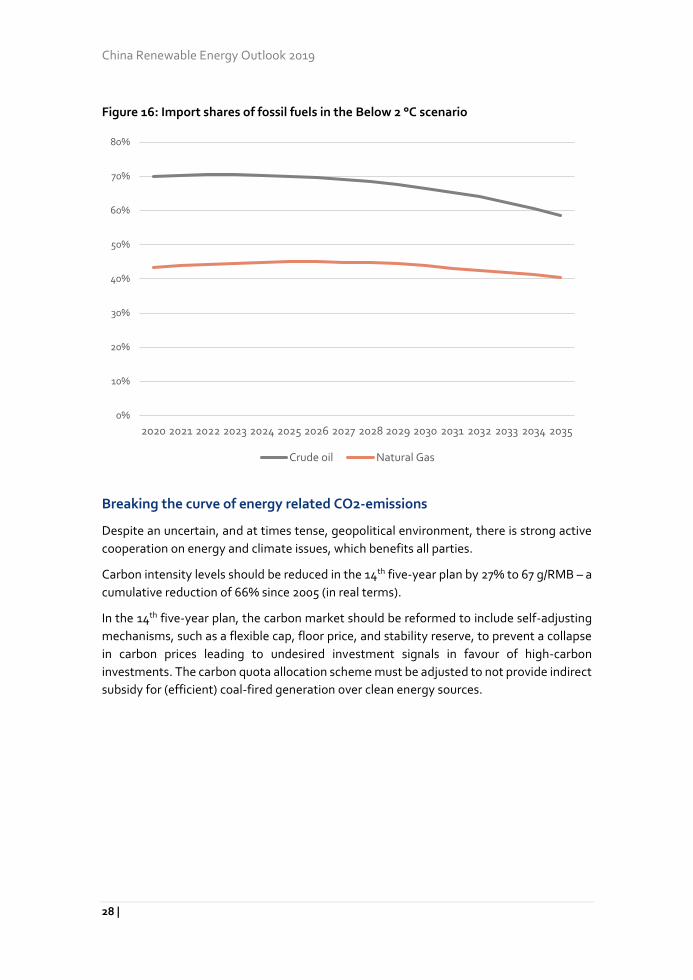
Figure 16: Import shares of fossil fuels in the Below 2 °C scenario
Breaking the curve of energy related CO2-emissions
Despite an uncertain, and at times tense, geopolitical environment, there is strong active
cooperation on energy and climate issues, which benefits all parties.
Carbon intensity levels should be reduced in the 14th five-year plan by 27% to 67 g/RMB – a
cumulative reduction of 66% since 2005 (in real terms).
In the 14th five-year plan, the carbon market should be reformed to include self-adjusting
mechanisms, such as a flexible cap, floor price, and stability reserve, to prevent a collapse
in carbon prices leading to undesired investment signals in favour of high-carbon
investments. The carbon quota allocation scheme must be adjusted to not provide indirect
subsidy for (efficient) coal-fired generation over clean energy sources.
0%
10%
20%
30%
40%
50%
60%
70%
80%
2020 2021 2022 2023 2024 2025 2026 2027 2028 2029 2030 2031 2032 2033 2034 2035
Crude oil Natural Gas
Summary
29 |
Policy emphasis in the 14th Five-Year Plan
The 14th five-year plan period 2021-2025 will be a watershed in China’s energy transition
history. A confluence of developments provides risks and opportunities. It is critical that
policy guidance is consistent and that measures ensure policy continuity during a period of
upheaval and policy driven energy revolution.
Ambitious, but realistic end-targets for the period should be set
Achieve 19% non-fossil energy (by physical energy content), target a reduction of energy
intensity of the real GDP by 21%, reduce CO2 emissions targeting a reduction of real GDP
CO2 intensity by 27%, reduce coal consumption by 11%.
Clear guidance for power sector needed in 14th Five-Year Plan period
Conduct integrated long-term planning
Given the boundary conditions, such as national targets of non-fossil fuel energy and
electricity consumption growth predictions, a proper planning model and a standard
planning procedure should help evaluating and coordinating the development of
infrastructure, power sources, and flexibility investments. With a clear long-term vision,
potential risks and uncertainties can be examined through the model and reduced by
improving the policy framework. By fitting into the long-term strategy, short-term targets
can better facilitate the long-term visions to yearly action plans without adverse impacts
from short-term incidents. An integrated long-term planning process will become
increasingly important when administrative approval procedures are replaced by power
markets driven incentives. Experiences from the European integrated planning processes
could be inspiration for a planning process in a Chinese context.
Give priority focus to power system flexibility
Flexibility is an essential element for the successful integration of renewable electricity in
the power system. It is important that the policy design promotes flexibility. The power
market should facilitate flexibility services for existing flexible sources to be discovered and
better utilized. Compensation through reservation of flexible sources should attract
investments in flexibility and to maintain a stable level of flexible capacity.
As fossil-fuel plants face increasingly face insufficient operating hours they should have
focus on providing flexibility, and inefficient and unclean plants should be phased out in an
orderly manner.
Continue to foster good market environment for renewable integration
It is important to continue to complete and consolidate existing spot markets and focus on
mobilizing flexible sources in current power system to better integrate renewable energy,
including transmission, thermal and hydro power plants, industrial demand response and
storage. Better use of the Mandatory Renewable Electricity Consumption Mechanism21 is
China Renewable Energy Outlook 2019
30 |
key to ensure the renewable share in electricity consumption and to motivate consumption
of renewable energy. The national carbon market must be enhanced and expanded to
better reflect the external cost of emissions. Furthermore, an effective administrative
monitoring system during the power sector reform process should be established to
maintain the market rules.
Development of wind and solar requires improved grid integration and uptake of RE
To enable healthy wind and solar development, grid companies and third-party
organizations should be required to annually publish five-year electricity demand forecasts,
including forecasts for absorption of new wind and solar output, establish a mechanism for
regularly publishing forecast results, and use this as the basis for wind and PV development
and policies. The market should guide the timing and location of new wind and solar
projects via competitive allocation of construction quotas. When China’s wholesale power
markets mature, wind and PV additions will more depend on market forces.
As wind and solar become increasingly competitive with coal, policymakers may
temporary need to limit annual wind and PV additions in specific regions to prevent new
grid bottlenecks. Policymakers must manage the risk of stop-go situations in renewables
investments market and industry. Policies must prevent grid and market constraints on
renewable development, ensuring bottlenecks do not lead to a collapse of the renewable
energy industry. Policy must support China’s transition to clean energy, ensure the sound
development of manufacturing industry, while also ensuring integration of electricity
demand and absorption of renewable output.
Adding new coal power capacity should be avoided
Adding new coal power capacity, with a lifetime of 40 years or more, would be
counterproductive for the energy transition, introducing risks for stranded investments in
a competitive power market. Investments in new coal capacity should be avoided or limited
as much as possible. The institutional mechanisms for accelerating a smooth retirement of
old and inefficient coal plant needs to be put in place. Limiting the share of coal in the
electricity generation mix is critical for the reduction CO2 emission and structural
enhancement of power supply, especially during 14-FYP, when renewable energies’ cost-
competitiveness is just emerging, and the carbon price incentive is weak.
The 14th Five-Year Plan is key to reform of renewable energy policy
Early in the 14th Five-Year Plan period, the feed-in tariffs for onshore wind and PV
generation will be withdrawn since these have become mature industries with rapid market
development and large-scale manufacturing.
Industry expects PV costs on par with coal power early in the 14th Five Year Plan
In 2019, the weighted average difference between the tariffs for coal-fired power
generation and onshore wind is RMB 0.1/kWh and RMB 0.14/kWh for PV, and the feed-in
Summary
31 |
tariff for new onshore wind projects will be completely withdrawn by 2021. In 2019, the
average subsidy level of PV auction projects is only RMB 0.065/kWh.
New policies will support renewable energy and guide the RE industry’s development.
After a decade of feed-in tariff and subsidy compensation to support the renewable energy
deployment, policy supports will shift during the 14th Five-Year Plan period. Even though
the subsidy for onshore wind power and photovoltaic power will phased out in 14-FYP, new
mechanisms and regulations are necessary to continue to drive the cost down, by
improving the investment and utilisation environment as well as enhancing regulations and
monitoring systems.
New support policies will continue to both support prior renewable energy deployment and
operation, as well as guiding the renewable energy industry’s development. These changes
coincide with wholesale power market reform, for which the 14th Five-Year Plan period will
be critical. The challenges of regulatory transformation are, multifaceted and uncertain in
terms of their design and implication from the support of renewable energy.
Removal of subsidies does not imply removal of economic policies
Reducing or eliminating non-technical costs remains critical. International experience
indicates that economic policies related to non-technical costs, such as regulatory
expenses, marketing costs, land use fees, and financing costs, become more important as
renewable energy reaches cost-competitive levels and participates in power markets. For
example, in 2016 a PV generation project in the United Arab Emirates bid a price of USD
0.0242 per kWh in a power auction, and this price was only possible due to the country’s
land tax exemption policy, consumption tax exemption policy, long-term low-interest
loans, and summer tariff policies.
The 12 measures proposed by the National Energy Administration in 2018 to reduce the
regulatory cost burden on renewable energy companies should be sustained and
strengthened in the post-subsidy era to reduce non-technical costs, especially
unreasonable non-technical costs. On land policy, some regions still violate national
regulations or collect unreasonable renewable energy resource fees and urban land use
taxes. The basic principles of land availability and land cost for renewable energy
development should be clarified and national policies should be fully implemented.
Consumption guarantees for renewable energy remain essential over the long-term
China issued its most recent policies guaranteeing the consumption of renewable energy
power in May 2019. The policy establishes mandatory consumption targets and
responsibilities, along with indicators in order to guide the consumption of renewable
energy power. The policy includes aspects that promote both supply and demand of
renewables, both in the near-term and long-term. After wind and PV prices fall below
present grid tariffs for coal and subsidies are withdrawn, renewable uptake will be the most
important factor affecting annual installations of wind and solar. To meet China’s need to
continue wind and solar installations and thereby achieve long-term national clean energy
China Renewable Energy Outlook 2019
32 |
targets, renewable demand responsibility should at least remain stable or grow over time,
to create space for sustainable growth of renewable energy.
Supportive policies are still needed for some renewable energy sources
Considering the renewable energy industry’s development and diversity, it is important to
continue the support of other kinds of renewable energy than wind and PV, such as
biomass, CSP, geothermal, marine, as well as related technologies in battery storage,
hydrogen, etc. For biomass power from agricultural and forestry residues, raw materials
account for at least two-thirds of the generation cost. Prohibition of straw burning via
education, agricultural transfer payments, and subsidies for procurement of biomass
would support development of biomass power. For large-scale solar thermal plants, such
as utility-scale concentrating solar, these remain in the initial stage of industrial
development, but the energy storage and flexibility aspects of the technology suggest they
will have value in the world’s future renewable-based energy system. For CSP technologies,
competitively-set tariffs for new projects combined with annual installation targets would
ensure continued development. Either grid companies should be required to enter PPAs
and the cost premium may be covered by the end-users through the retail electricity price,
or a differential price should still be offered for these technologies through the renewable
energy development fund. If such technologies participate in power markets, they could
do so under a contract-for-difference arrangement.
Renewable energy participation in the power market
A dynamic power system is needed for cost efficient VRE integration
China’s electricity market should be able to mobilize existing flexibility through efficient
price signals and market services; and guide investments to bring flexibility sources
through the market design.
The power system should be structured to efficiently dispatch so fluctuations and
uncertainties can be handled without interfering with system security. This requires
integrated market operation, deep participation in spot, balancing and ancillary service
markets; and a process to connect, provincial, regional and national resources seamlessly.
A clear market design target model is needed, which will enable operating the power
system of the future.
Summary
33 |
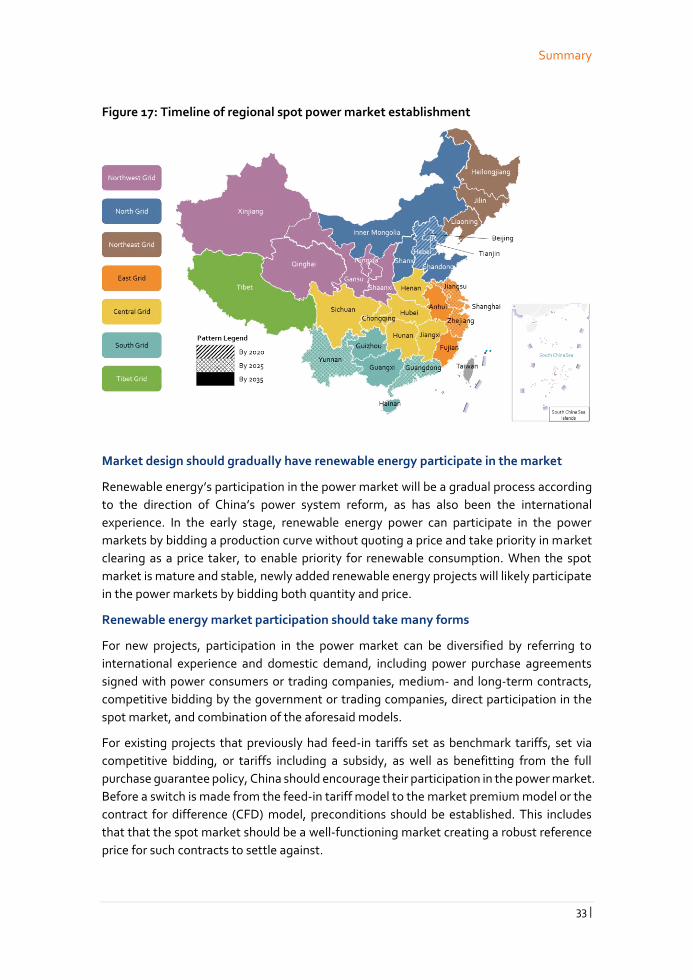
Figure 17: Timeline of regional spot power market establishment
Market design should gradually have renewable energy participate in the market
Renewable energy’s participation in the power market will be a gradual process according
to the direction of China’s power system reform, as has also been the international
experience. In the early stage, renewable energy power can participate in the power
markets by bidding a production curve without quoting a price and take priority in market
clearing as a price taker, to enable priority for renewable consumption. When the spot
market is mature and stable, newly added renewable energy projects will likely participate
in the power markets by bidding both quantity and price.
Renewable energy market participation should take many forms
For new projects, participation in the power market can be diversified by referring to
international experience and domestic demand, including power purchase agreements
signed with power consumers or trading companies, medium- and long-term contracts,
competitive bidding by the government or trading companies, direct participation in the
spot market, and combination of the aforesaid models.
For existing projects that previously had feed-in tariffs set as benchmark tariffs, set via
competitive bidding, or tariffs including a subsidy, as well as benefitting from the full
purchase guarantee policy, China should encourage their participation in the power market.
Before a switch is made from the feed-in tariff model to the market premium model or the
contract for difference (CFD) model, preconditions should be established. This includes
that that the spot market should be a well-functioning market creating a robust reference
price for such contracts to settle against.
China Renewable Energy Outlook 2019
34 |
Renewable energy should not partake in imperfect power market competition
Before the market is well-functioning, and effective competition is achieved, it is unhelpful
for wind and PV to participate. It is recommended to continue the benchmark tariff parity
pricing or auction-based pricing policies for wind and PV for a period. In 2019, China
implemented a new auction system for PV generation. The major elements of this system,
such as competitive allocation, national ranking, amended tariff, and forewarning
management, are also applicable after the complete removal of subsidy for wind and PV.
The feed-in tariff will be lower than the price of coal power through auction or bidding (in
August 2019, the final bid prices for PV in projects auctioned were lower than the respective
local coal benchmark prices).
Clean heating with a central role for district heating
With a supply of around 2,300 TWh, district heating is responsible for around 50% of the all
heating demand in 2020. Heating sector reforms in China deserves attention due to large
energy consumption, low cost options for decarbonization including reducing pollution
and high potential for providing flexibility regarding renewable electricity integration.
Renewable heating development and planning needs priority
Renewable heating should have priority over other sources in urban heating networks for
connection and utilisation. Regional energy transformation demonstration projects should
include renewable heating targets, incorporate renewable heating into unified regional
planning, and include renewable heating as an indicator in the regional ecological
civilization construction evaluation system. Solar energy, biomass and geothermal energy
technologies should be included in the preferred technology catalogue for air pollution,
energy conservation and emission reduction.
Overall RE heating development goals should be put forward for the country and for key
provinces. In the planning and construction process of new urban district construction,
reconstruction of old city and construction of industrial parks (areas), China should
combine the regional energy planning with urban development planning and prioritize the
simultaneous development of renewable power and heating.
Promote the market competitiveness of renewable heating
Restrictions should be lifted on access to heating systems and encourage private
enterprises to enter the clean heating sector. Market-oriented approaches such as
competitive bidding should be incorporated in the sector. For users not covered by district
heating, China should promote the development of decentralized renewable heating
through the combination of user investment and government subsidies.
Support technology development and demonstration
Research and design optimization of new systems should be supported, including a multi-
energy complementary system for renewable energy—which involves the integration of
Summary
35 |
renewable energy and conventional energy systems, and can include combining renewable
heating with other energy sources and storage.
Combined with the reformation of the power system and the construction of the power
market, China should establish an information platform to coordinate energy flow and
other data from the electric power grid and the heat networks.
Strengthen environmental supervision of renewable heating projects
For projects that may affect surface water, underground water, soil, or air quality, China
should improve the overall supervision system before, during, and after the renewable
heating project’s initiation. This entails monitoring geothermal energy development and
utilization, including real-time monitoring and dynamic evaluation of the exploration,
development, utilization and environment condition of geothermal energy resources.
Regulators should fully implement requirements for reinjection of geothermal tail water
and ensure the balance of extraction and injection. Technical standards should be
developed for biomass heating and NOx emissions from large biomass boilers shall be
reduced. China should promote the manufacturing of standardized, serialized and
complete set of equipment, and formulate standards for biomass heating engineering
design, briquette-fuel products, moulding equipment, biomass boilers and emissions.
Improve the standard system for renewable heating
The testing and certification system for the renewable heating products should be
strengthened, third-party testing and certification institutions should be established, and
quality certification system for renewable heating equipment and engineering services
should be developed and improved.
Renewable energy gas
Renewable gases can displace fossil gas while reducing methane emissions
Development of this industry requires coordinated management across departments and
fields, especially the sorting and integration of upstream raw materials and promotion of
consumption of renewable energy gas.
A collaborative management system for the biogas industry must be established
The responsibilities of the leading authorities and departments for the biogas industry shall
be clarified and coordinated across the multiple departments of finance, development and
reform commissions, agriculture, environmental protection, energy, housing and
construction, taxation and quality inspection. Industrial goals, plans, policies, and
standards shall be formulated jointly.
Supervision and management shall be strengthened
Professional third-party evaluation agencies should assess projects upon completion
according to project feasibility report, implementation plan and operational impact of the
project. A project grading evaluation mechanism considering environmental impact,
China Renewable Energy Outlook 2019
36 |
technical advancement, sustainable operating capacity, and innovation shall be
established, and grading linked with subsidy and tax policies to ensure the construction
quality and actual production impact of the projects. The blacklist or credit system should
also apply to such projects, to notify and penalize companies with records of multiple
ineffective projects.
Private capital should participate in establishing collection, storage and
transportation systems for agricultural organic wastes
Policymakers can establish investment subsidies, co-equity investments, long-term off-
take contracts, and public-private partnerships. New ways should be explored to integrate
private investment together with government investment in waste regulation, prohibitions
on straw burning, fees for sewage and waste disposal, and environment taxes for livestock
and poultry farms.
Preferential tax policy should be improved and include agricultural organic waste collection
and treatment services in the scope of VAT refund and marginal relief.
Gas network companies should fully purchase biogas in accordance with the RE Law
The supportive policy for the construction of gas supply networks in rural areas shall be
improved, and it shall be ensured that biogas and marsh gas power generation and central
gas supply are treated equally in the market.
Biofuels
Bioethanol production should match reasonable rates of consumption
The official plans state that China should promote biofuel ethanol nationwide by 202022.
To ensure a stable supply of biofuel ethanol raw materials, policymakers should set
production and consumption policies in accordance to avoid situations where biofuel
ethanol producers cannot meet demand.
Increase research and development of biofuel ethanol from non-grain raw materials
Due to limits on raw material availability, should focus be on the research and development
of biofuel ethanol from non-grain raw materials, realize nationwide use of biofuel ethanol.
Raw material management and regulation of the biodiesel upstream industry system
should be strengthened. It is urgent for China to standardize the collection, transhipment,
disposal and supervision of the upstream raw materials of biodiesel such as gutter oil. A
long-term management mechanism should be established, and the regulation of the
industry management system should be enforced through local legislation, to ensure the
safe flow of raw materials such as gutter oil and provide a raw material guarantee for
biodiesel production.
Chapter 1 | Global Energy Transition
37 |
Part1:
Energy Transition Status
China Renewable Energy Outlook 2019 | Energy Transition Status
38 |
1 Global energy transition
Global energy transition shows uneven progress. The world is at the early phases of a
long-term transition towards cleaner energy sources and more efficient consumption—
changes which are critical to avoiding the worst impacts of climate change and reducing
the other negative consequences of fossil fuel production and consumption. This chapter
reviews the latest global energy sector trends and most recent developments. Overall,
2018 was a year in which renewable energy continued to grow strongly, but so did fossil
fuel use and emissions. While several developments this year have been positive for the
global energy transition, according to the analysis of several major international
institutions the world is far from fully on the path to energy sustainability.
1.1 Fossil fuels
Coal
Coal consumption growth stagnated and several countries have begun to suppress coal
use. World coal consumption slowed in 2018, growing 0.7%, similar to the prior year. Most
2018 coal consumption growth took place in Asia, particularly in China, India, and
Southeast Asian countries; together, Asia accounts for almost three-fourths of world coal
use.23 Coal’s share of power generation remained steady at 38%, and coal contributed 44%
of global energy-related carbon emissions.24 Coal still is the main source of heating and
industrial fuel combustion in large parts of the world.
Perhaps more than any other energy source, trends in coal use have diverged, and many
regions are moving away from the fuel. U.K. experiences long intervals with no coal in its
energy mix at all.25 Germany announced plans to gradually phase out its remaining coal
plants over two decades, with most closures to take place in the 2020s. The U.S. is retiring
coal plants at a rapid rate, and coal consumption has fallen 44% since its peak in 2007.26 In
both the U.S. and Australia, where the central government supports coal and adopts
measures to keep coal plants open beyond their economic life, coal plants are still shutting
due to their poor competitiveness with natural gas and renewable energy. This trend is now
spreading to the developing world. Recently, India has seen a large number of coal plant
cancellations, private companies and banks won’t finance new coal plants, and an
estimated 40 GW of existing coal is already considered stranded due to high operating
cost.27 Nearby Pakistan has also shelved planned coal plants for economic reasons.28
Oil
Oil consumption continues to rise and the oil market sees higher risk. Global oil
consumption grew 1.5% in 2018, and surpassed 100 million barrels of oil per day, more than
double the rate of consumption in 1970, prior to the 1970s energy crisis. 29 Oil price
volatility, which experienced a lull during the past decade, has picked up recently, implying
that countries with greater economic exposure to oil prices face greater uncertainty and
investment risk. Increasingly, developing world countries such as China have the greatest
such exposure: China is now the largest oil importing country.
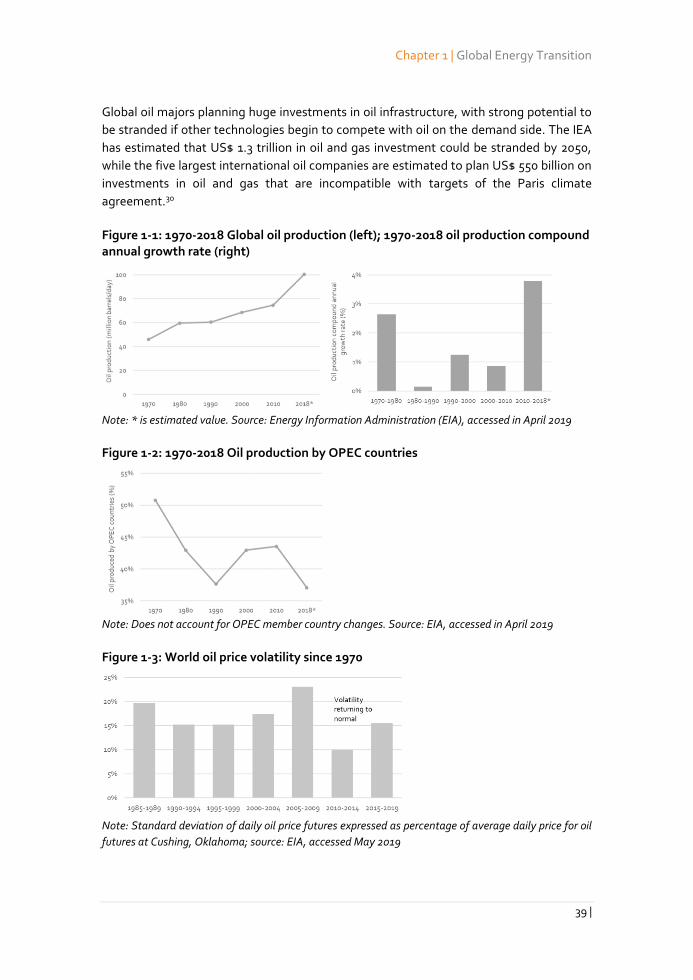
Chapter 1 | Global Energy Transition
39 |
Global oil majors planning huge investments in oil infrastructure, with strong potential to
be stranded if other technologies begin to compete with oil on the demand side. The IEA
has estimated that US$ 1.3 trillion in oil and gas investment could be stranded by 2050,
while the five largest international oil companies are estimated to plan US$ 550 billion on
investments in oil and gas that are incompatible with targets of the Paris climate
agreement.30
Figure 1-1: 1970-2018 Global oil production (left); 1970-2018 oil production compound annual growth rate (right)
Note: * is estimated value. Source: Energy Information Administration (EIA), accessed in April 2019
Figure 1-2: 1970-2018 Oil production by OPEC countries
Note: Does not account for OPEC member country changes. Source: EIA, accessed in April 2019
Figure 1-3: World oil price volatility since 1970
Note: Standard deviation of daily oil price futures expressed as percentage of average daily price for oil
futures at Cushing, Oklahoma; source: EIA, accessed May 2019
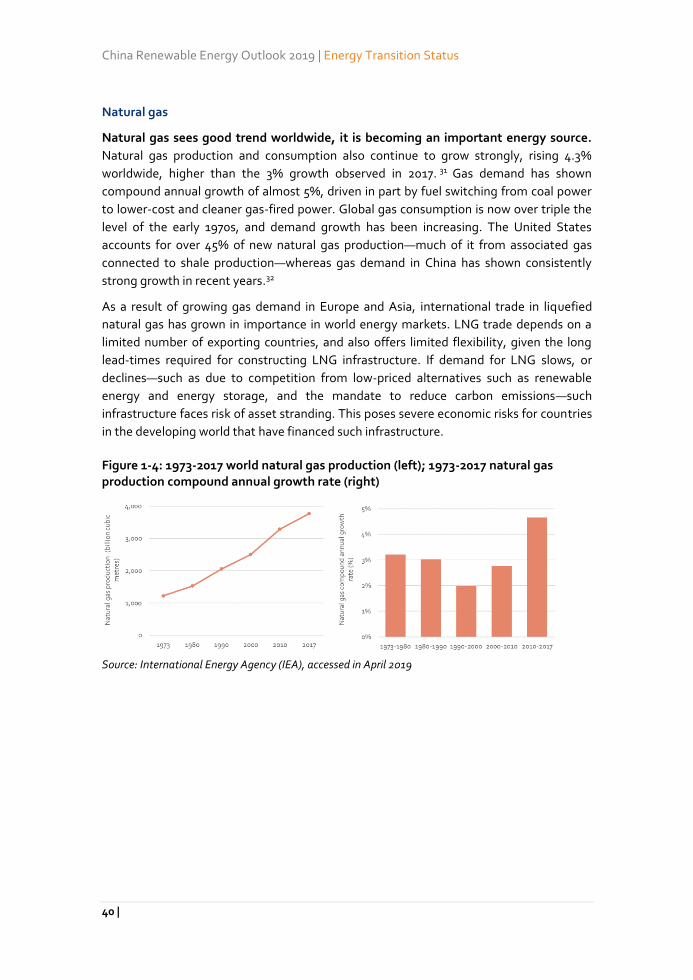
China Renewable Energy Outlook 2019 | Energy Transition Status
40 |
Natural gas
Natural gas sees good trend worldwide, it is becoming an important energy source.
Natural gas production and consumption also continue to grow strongly, rising 4.3%
worldwide, higher than the 3% growth observed in 2017. 31 Gas demand has shown
compound annual growth of almost 5%, driven in part by fuel switching from coal power
to lower-cost and cleaner gas-fired power. Global gas consumption is now over triple the
level of the early 1970s, and demand growth has been increasing. The United States
accounts for over 45% of new natural gas production—much of it from associated gas
connected to shale production—whereas gas demand in China has shown consistently
strong growth in recent years.32
As a result of growing gas demand in Europe and Asia, international trade in liquefied
natural gas has grown in importance in world energy markets. LNG trade depends on a
limited number of exporting countries, and also offers limited flexibility, given the long
lead-times required for constructing LNG infrastructure. If demand for LNG slows, or
declines—such as due to competition from low-priced alternatives such as renewable
energy and energy storage, and the mandate to reduce carbon emissions—such
infrastructure faces risk of asset stranding. This poses severe economic risks for countries
in the developing world that have financed such infrastructure.
Figure 1-4: 1973-2017 world natural gas production (left); 1973-2017 natural gas production compound annual growth rate (right)
Source: International Energy Agency (IEA), accessed in April 2019
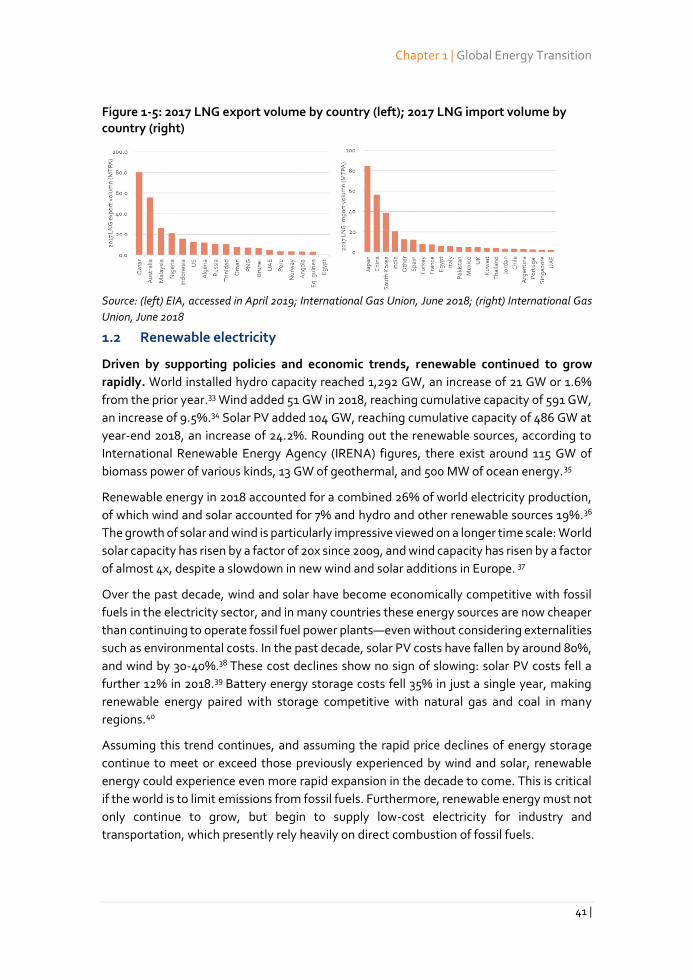
Chapter 1 | Global Energy Transition
41 |
Figure 1-5: 2017 LNG export volume by country (left); 2017 LNG import volume by country (right)
Source: (left) EIA, accessed in April 2019; International Gas Union, June 2018; (right) International Gas
Union, June 2018
1.2 Renewable electricity
Driven by supporting policies and economic trends, renewable continued to grow
rapidly. World installed hydro capacity reached 1,292 GW, an increase of 21 GW or 1.6%
from the prior year.33 Wind added 51 GW in 2018, reaching cumulative capacity of 591 GW,
an increase of 9.5%.34 Solar PV added 104 GW, reaching cumulative capacity of 486 GW at
year-end 2018, an increase of 24.2%. Rounding out the renewable sources, according to
International Renewable Energy Agency (IRENA) figures, there exist around 115 GW of
biomass power of various kinds, 13 GW of geothermal, and 500 MW of ocean energy.35
Renewable energy in 2018 accounted for a combined 26% of world electricity production,
of which wind and solar accounted for 7% and hydro and other renewable sources 19%.36
The growth of solar and wind is particularly impressive viewed on a longer time scale: World
solar capacity has risen by a factor of 20x since 2009, and wind capacity has risen by a factor
of almost 4x, despite a slowdown in new wind and solar additions in Europe. 37
Over the past decade, wind and solar have become economically competitive with fossil
fuels in the electricity sector, and in many countries these energy sources are now cheaper
than continuing to operate fossil fuel power plants—even without considering externalities
such as environmental costs. In the past decade, solar PV costs have fallen by around 80%,
and wind by 30-40%.38 These cost declines show no sign of slowing: solar PV costs fell a
further 12% in 2018.39 Battery energy storage costs fell 35% in just a single year, making
renewable energy paired with storage competitive with natural gas and coal in many
regions.40
Assuming this trend continues, and assuming the rapid price declines of energy storage
continue to meet or exceed those previously experienced by wind and solar, renewable
energy could experience even more rapid expansion in the decade to come. This is critical
if the world is to limit emissions from fossil fuels. Furthermore, renewable energy must not
only continue to grow, but begin to supply low-cost electricity for industry and
transportation, which presently rely heavily on direct combustion of fossil fuels.
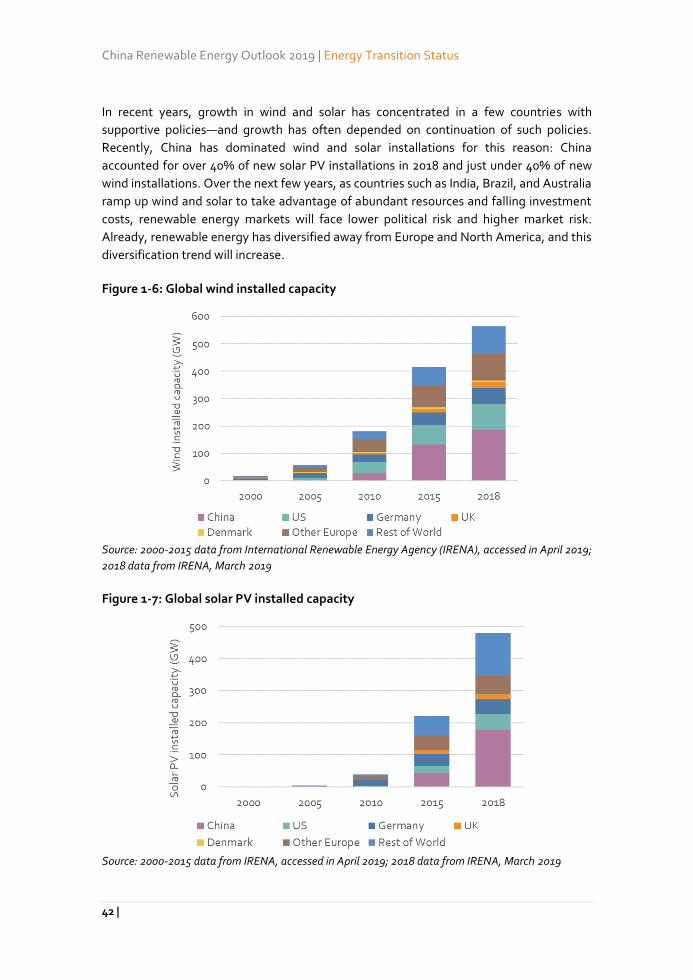
China Renewable Energy Outlook 2019 | Energy Transition Status
42 |
In recent years, growth in wind and solar has concentrated in a few countries with
supportive policies—and growth has often depended on continuation of such policies.
Recently, China has dominated wind and solar installations for this reason: China
accounted for over 40% of new solar PV installations in 2018 and just under 40% of new
wind installations. Over the next few years, as countries such as India, Brazil, and Australia
ramp up wind and solar to take advantage of abundant resources and falling investment
costs, renewable energy markets will face lower political risk and higher market risk.
Already, renewable energy has diversified away from Europe and North America, and this
diversification trend will increase.
Figure 1-6: Global wind installed capacity
Source: 2000-2015 data from International Renewable Energy Agency (IRENA), accessed in April 2019;
2018 data from IRENA, March 2019
Figure 1-7: Global solar PV installed capacity
Source: 2000-2015 data from IRENA, accessed in April 2019; 2018 data from IRENA, March 2019
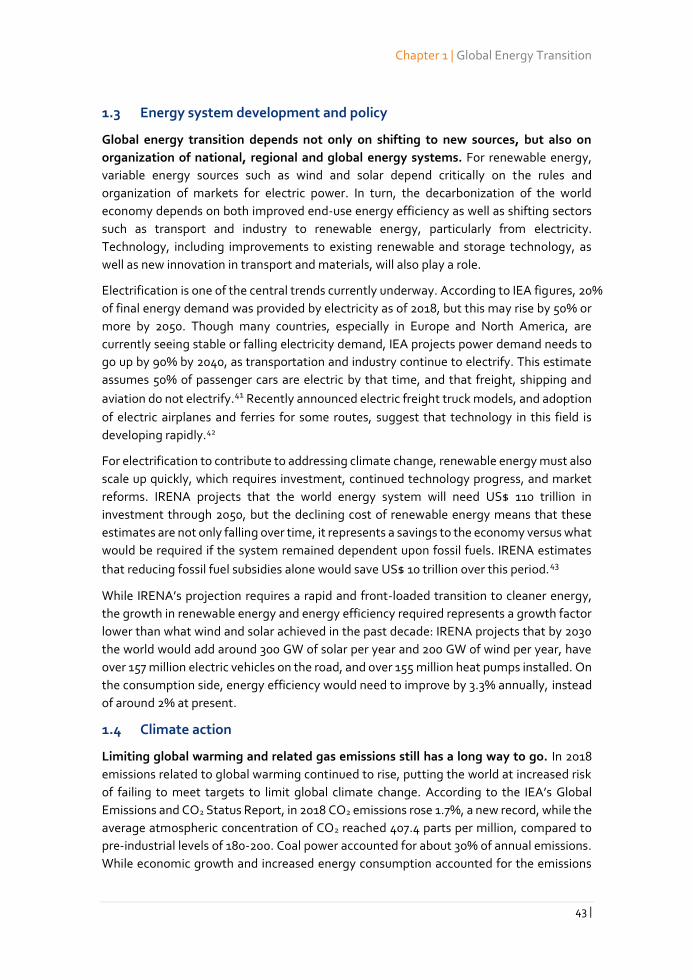
Chapter 1 | Global Energy Transition
43 |
1.3 Energy system development and policy
Global energy transition depends not only on shifting to new sources, but also on
organization of national, regional and global energy systems. For renewable energy,
variable energy sources such as wind and solar depend critically on the rules and
organization of markets for electric power. In turn, the decarbonization of the world
economy depends on both improved end-use energy efficiency as well as shifting sectors
such as transport and industry to renewable energy, particularly from electricity.
Technology, including improvements to existing renewable and storage technology, as
well as new innovation in transport and materials, will also play a role.
Electrification is one of the central trends currently underway. According to IEA figures, 20%
of final energy demand was provided by electricity as of 2018, but this may rise by 50% or
more by 2050. Though many countries, especially in Europe and North America, are
currently seeing stable or falling electricity demand, IEA projects power demand needs to
go up by 90% by 2040, as transportation and industry continue to electrify. This estimate
assumes 50% of passenger cars are electric by that time, and that freight, shipping and
aviation do not electrify.41 Recently announced electric freight truck models, and adoption
of electric airplanes and ferries for some routes, suggest that technology in this field is
developing rapidly.42
For electrification to contribute to addressing climate change, renewable energy must also
scale up quickly, which requires investment, continued technology progress, and market
reforms. IRENA projects that the world energy system will need US$ 110 trillion in
investment through 2050, but the declining cost of renewable energy means that these
estimates are not only falling over time, it represents a savings to the economy versus what
would be required if the system remained dependent upon fossil fuels. IRENA estimates
that reducing fossil fuel subsidies alone would save US$ 10 trillion over this period.43
While IRENA’s projection requires a rapid and front-loaded transition to cleaner energy,
the growth in renewable energy and energy efficiency required represents a growth factor
lower than what wind and solar achieved in the past decade: IRENA projects that by 2030
the world would add around 300 GW of solar per year and 200 GW of wind per year, have
over 157 million electric vehicles on the road, and over 155 million heat pumps installed. On
the consumption side, energy efficiency would need to improve by 3.3% annually, instead
of around 2% at present.
1.4 Climate action
Limiting global warming and related gas emissions still has a long way to go. In 2018
emissions related to global warming continued to rise, putting the world at increased risk
of failing to meet targets to limit global climate change. According to the IEA’s Global
Emissions and CO2 Status Report, in 2018 CO2 emissions rose 1.7%, a new record, while the
average atmospheric concentration of CO2 reached 407.4 parts per million, compared to
pre-industrial levels of 180-200. Coal power accounted for about 30% of annual emissions.
While economic growth and increased energy consumption accounted for the emissions
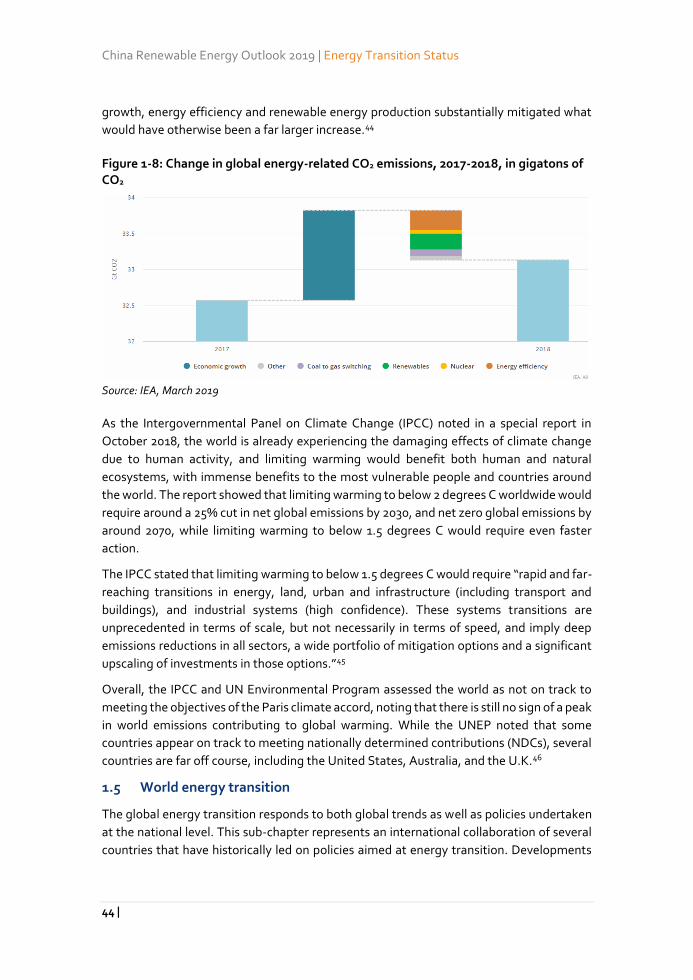
China Renewable Energy Outlook 2019 | Energy Transition Status
44 |
growth, energy efficiency and renewable energy production substantially mitigated what
would have otherwise been a far larger increase.44
Figure 1-8: Change in global energy-related CO2 emissions, 2017-2018, in gigatons of CO2
Source: IEA, March 2019
As the Intergovernmental Panel on Climate Change (IPCC) noted in a special report in
October 2018, the world is already experiencing the damaging effects of climate change
due to human activity, and limiting warming would benefit both human and natural
ecosystems, with immense benefits to the most vulnerable people and countries around
the world. The report showed that limiting warming to below 2 degrees C worldwide would
require around a 25% cut in net global emissions by 2030, and net zero global emissions by
around 2070, while limiting warming to below 1.5 degrees C would require even faster
action.
The IPCC stated that limiting warming to below 1.5 degrees C would require “rapid and far-
reaching transitions in energy, land, urban and infrastructure (including transport and
buildings), and industrial systems (high confidence). These systems transitions are
unprecedented in terms of scale, but not necessarily in terms of speed, and imply deep
emissions reductions in all sectors, a wide portfolio of mitigation options and a significant
upscaling of investments in those options.”45
Overall, the IPCC and UN Environmental Program assessed the world as not on track to
meeting the objectives of the Paris climate accord, noting that there is still no sign of a peak
in world emissions contributing to global warming. While the UNEP noted that some
countries appear on track to meeting nationally determined contributions (NDCs), several
countries are far off course, including the United States, Australia, and the U.K.46
1.5 World energy transition
The global energy transition responds to both global trends as well as policies undertaken
at the national level. This sub-chapter represents an international collaboration of several
countries that have historically led on policies aimed at energy transition. Developments
Chapter 1 | Global Energy Transition
45 |
and challenges faced by these countries illustrate and often prefigure similar changes and
developments elsewhere.
China
China is in the beginning of an energy transition, and aims to cut coal use while
encouraging renewables and introducing related measures. This emphasizes shifting
economic development from high growth to high-quality growth, as it develops a clean,
low carbon, safe, and efficient energy system. Though China raw coal production increased
by 4.5% in 2018, its share in total primary energy consumption declined below 60% for the
first time. China’s oil and natural gas use and import dependence continue to rise,
however.47 China’s wind and solar PV capacity continue to grow, and the country added 21
GW of wind and 44 GW of PV in 2018, while curtailment of wind and solar energy declined.48
In the past year, China has begun to introduce a renewable energy obligation, renewable
tendering policies, and subsidy-free wind and solar pilots. Chinese policy-makers have
faced delays in building out the national Emissions Trading System (ETS) and regional spot
power markets.
Europe
The European Union is in the midst of wide-ranging changes to energy and economic
policies, which comes with new measures and goals. This is linked with long-term efforts
to decarbonise the economy, reduce dependence on energy imports, and develop new
energy technology sectors. Arguably the most far-reaching policy is the Clean Energy for
all Europeans legislative package, also called the Winter Package, of eight legislative acts
aimed at reaching the EU energy targets for 2030 and 2050. In general, the EU is
introducing new governance frameworks, adding new regulatory policies, and reforming
specific laws and policies. In the field of targets, the EU has introduced new reporting
system, obliging member states every ten years to set out national objectives, targets and
contributions for the five dimensions of the Energy Union.49 The EU has also adopted a 32%
binding target for the share of RES in final EU energy consumption by 2030. The EU has
reformed and reinforced the Agency for the Cooperation of Energy Regulators (ACER),
creating a more powerful agency to oversee the integrated energy market and decide on
cross-border regulatory issues. The EU has also adopted several measures to empower
consumers and prosumers to actively take part in the electricity markets.
Germany
Germany’s energy transition continues, with increases in related targets and laws. The
transition sees a trend of gradually increasing renewable electricity share and closures of
coal and nuclear plants, while at the policy level the government is working on issues
related to coal transition and electromobility. In the electricity sector, Germany reached a
new high of renewable share: 38.2% of the power consumed was generated by wind, solar
PV, biomass and hydropower.50 Higher prices for carbon allowances in the EU ETS, along
with lower gas prices, encouraged fuel switching from coal to gas. Nuclear output
remained stable, leading up to the next nuclear plant retirement this year. Looking forward,
China Renewable Energy Outlook 2019 | Energy Transition Status
46 |
Germany’s governing coalition agreed to coalition treaty agreed to increase the target for
the expansion of renewables in power consumption to 65% by 2030.51 The government has
also prioritized grid expansion, introducing a new law that allows accelerated approvals for
power lines. In January 2019, Germany’s coal commission concluded work with a proposal
for phasing out coal by 2038, building strong and sustainable regions, modernizing the
power and energy system as well as absorbing negative effects on vulnerable affected
groups.
Denmark
Denmark continues to add renewable capacity, and has developed clear long-term
energy transformation goals. Renewables contributed a third of final energy
consumption in Denmark in 2017, and in terms of power generation the country sets a new
world record of covering 44% of Danish power demand by wind. Solar now contributes 2.3%
of total power production.52 Denmark is recognized worldwide as a pioneer in offshore
wind as well as for its redesign of the power and heating sectors to accommodate a high
share of variable wind generation.
Denmark will easily surpass its EU obligations of 30% of final energy consumption from
clean energy by 2020. This year, political negotiations on a new Danish energy agreement
resulted in new targets for the period beyond 2020: Denmark will target 55% of gross final
energy consumption by renewable energy sources by 2030, a further expansion of offshore
wind, increased electrification of the Danish energy sector, and an explicit target to
eliminate coal in the power sector by 2030.53
United States
The energy transition in the U.S. is complex due to the implementation of the federal
system. Given the different priorities and policy responsibility division between the federal
and state governments and relatively strong role of market forces in driving the fuel mix
there are big regional differences in energy transitions in the U.S.. The Trump
administration aims to propel the U.S. to lead the world in both oil and natural gas
production, taking advantage of a long-standing trend towards greater domestic
production of these fuels.54 The Trump administration has also modified or reconsidered
Obama-era energy-related policies such as the U.S. commitment to the Paris Climate
Change agreement, the Clean Power Plan, and vehicle fuel efficiency standards. The
Trump administration has also sought to keep coal plants open. 55 Nevertheless, many
federal policies promoting renewable energy technology remain in place. State
governments—such as California and Colorado—are increasingly adopting targets to
transition electricity or energy systems away from fossil fuels.56 In many U.S. regions, wind
and solar are now cheaper than the operating costs of existing conventional power plants.57
Electric vehicle adoption is growing, and the development of battery technology has led to
an increasing focus on hybrid power plants that include energy storage, especially in areas
like Hawaii and California that already feature high renewable energy shares.58
Chapter 1 | Global Energy Transition
47 |
1.6 COP24 and CEM9
World leaders and countries continue to make gradual strides toward implementing the
Paris climate accords through global agreements and technical cooperation activities. In
this section, we highlight developments over the last year at the Poland climate change
conference and the Council of Energy Ministers in Denmark.
COP24
Carbon-cutting agreements were made, but still lacked clear implementation method.
The 2018 United Nations Climate Change Conference was held in Katowice, Poland (COP
24) in December 2018. The major achievement agreed upon by countries on COP 24
Katowice was putting the 2015 Paris Agreement into concrete practices. To maintain the
pre-determined standard of limiting temperature rise to below 1.5C, countries on COP 24
agreed on how government will measure, report on and verify their emission-cutting plans.
59 Fifty countries signed the Solidarity and Just Transition Silesia Declaration, which required
governments to create employment opportunities and infrastructures to incentive
transition to low-carbon economy. 60 However, countries have yet to agree on the methods
to implement such plans.
CEM9
Power system flexibility campion established during CEM9. The Clean Energy
Ministerial (CEM) is a global forum that fosters a transition to clean energy technology
through programs and campaigns. CEM 9 took place in Denmark and Sweden in May 2018,
its theme focusing on innovation and competition in moving towards a low-carbon world.
Members launched four new campaigns, including the Power System Flexibility Campaign,
which would be carried out in partnership amongst industry and governments.61 The IEA’s
Status of Power System Transformation Report was launched at CEM 9. The report
suggested several ways to improve flexibility of the power system. It emphasized that
capital investment is not the prerequisite to operate a more flexible power plant and that
changes in operational practices in existing plants could also be cost-effective. Secondarily,
flexibility could also be improved by retrofit options or power plant technologies. Thirdly,
discrepancies emerge as the power plant system requires cost-efficient operations and
individual power plants require maintaining profitability. Thus, options including policy,
market and regulatory instruments could be useful to coordinate individual power plants
and the whole power system in light of this issue.62
1.7 Conclusion
International energy and carbon trends continue to evolve in ways that are both
constructive towards achieving global climate goals—such as in the case of renewable
energy growth and declining costs—while remaining inadequate to achieving these goals.
Indeed, it is a paradox that much of the world is beginning to adopt policies to advance
clean energy deployment and shift away from coal, but at the same time fossil fuel use and
carbon emissions continue to rise. To prevent the worst effects of global climate change,
the entire world must accelerate energy transition efforts.

China Renewable Energy Outlook 2019 | Energy Transition Status
48 |
As the world’s largest energy consumer, China plays a central role in many aspects of the
global energy transition underway. The next section analyses trends in China’s energy
transition in greater detail, showing that in many respects, China mirrors the trends
described above.
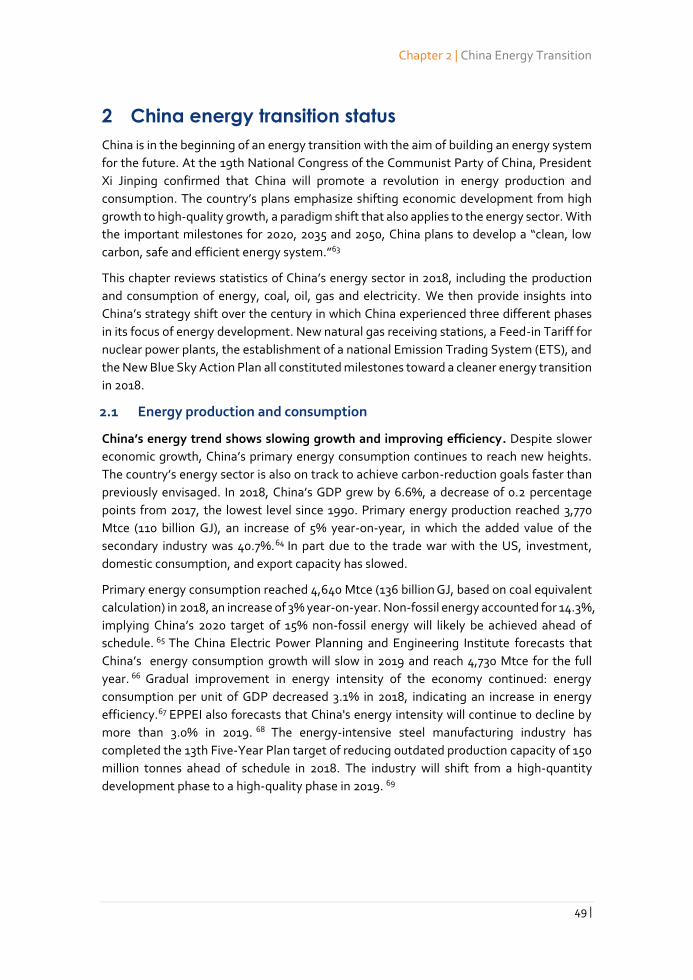
Chapter 2 | China Energy Transition
49 |
2 China energy transition status
China is in the beginning of an energy transition with the aim of building an energy system
for the future. At the 19th National Congress of the Communist Party of China, President
Xi Jinping confirmed that China will promote a revolution in energy production and
consumption. The country’s plans emphasize shifting economic development from high
growth to high-quality growth, a paradigm shift that also applies to the energy sector. With
the important milestones for 2020, 2035 and 2050, China plans to develop a “clean, low
carbon, safe and efficient energy system.”63
This chapter reviews statistics of China’s energy sector in 2018, including the production
and consumption of energy, coal, oil, gas and electricity. We then provide insights into
China’s strategy shift over the century in which China experienced three different phases
in its focus of energy development. New natural gas receiving stations, a Feed-in Tariff for
nuclear power plants, the establishment of a national Emission Trading System (ETS), and
the New Blue Sky Action Plan all constituted milestones toward a cleaner energy transition
in 2018.
2.1 Energy production and consumption
China’s energy trend shows slowing growth and improving efficiency. Despite slower
economic growth, China’s primary energy consumption continues to reach new heights.
The country’s energy sector is also on track to achieve carbon-reduction goals faster than
previously envisaged. In 2018, China’s GDP grew by 6.6%, a decrease of 0.2 percentage
points from 2017, the lowest level since 1990. Primary energy production reached 3,770
Mtce (110 billion GJ), an increase of 5% year-on-year, in which the added value of the
secondary industry was 40.7%.64 In part due to the trade war with the US, investment,
domestic consumption, and export capacity has slowed.
Primary energy consumption reached 4,640 Mtce (136 billion GJ, based on coal equivalent
calculation) in 2018, an increase of 3% year-on-year. Non-fossil energy accounted for 14.3%,
implying China’s 2020 target of 15% non-fossil energy will likely be achieved ahead of
schedule. 65 The China Electric Power Planning and Engineering Institute forecasts that
China’s energy consumption growth will slow in 2019 and reach 4,730 Mtce for the full
year. 66 Gradual improvement in energy intensity of the economy continued: energy
consumption per unit of GDP decreased 3.1% in 2018, indicating an increase in energy
efficiency.67 EPPEI also forecasts that China's energy intensity will continue to decline by
more than 3.0% in 2019. 68 The energy-intensive steel manufacturing industry has
completed the 13th Five-Year Plan target of reducing outdated production capacity of 150
million tonnes ahead of schedule in 2018. The industry will shift from a high-quantity
development phase to a high-quality phase in 2019. 69
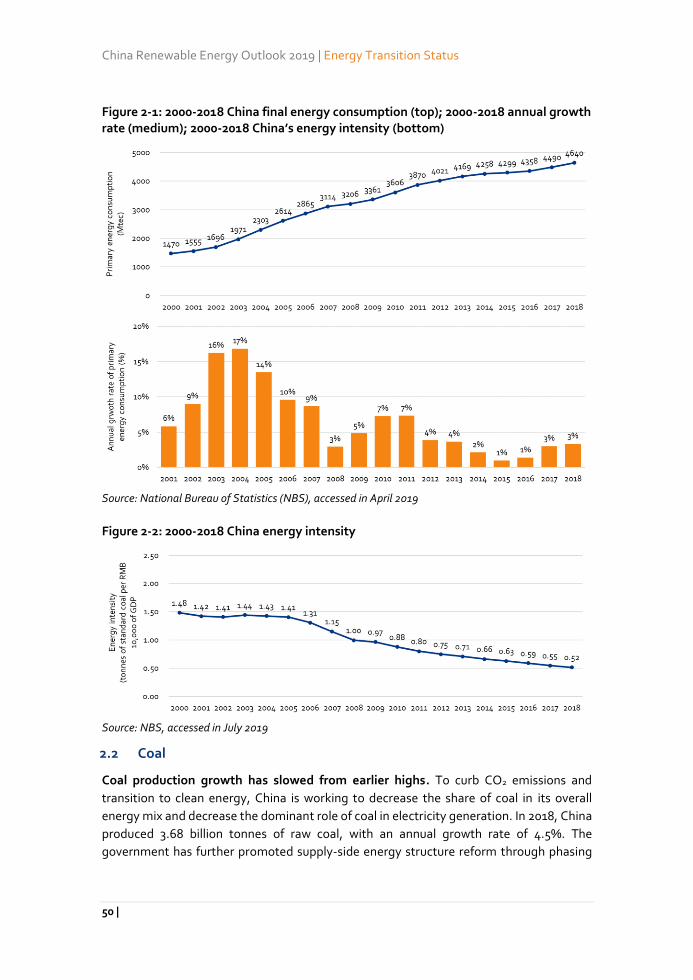
China Renewable Energy Outlook 2019 | Energy Transition Status
50 |
Figure 2-1: 2000-2018 China final energy consumption (top); 2000-2018 annual growth rate (medium); 2000-2018 China’s energy intensity (bottom)
Source: National Bureau of Statistics (NBS), accessed in April 2019
Figure 2-2: 2000-2018 China energy intensity
Source: NBS, accessed in July 2019
2.2 Coal
Coal production growth has slowed from earlier highs. To curb CO2 emissions and
transition to clean energy, China is working to decrease the share of coal in its overall
energy mix and decrease the dominant role of coal in electricity generation. In 2018, China
produced 3.68 billion tonnes of raw coal, with an annual growth rate of 4.5%. The
government has further promoted supply-side energy structure reform through phasing
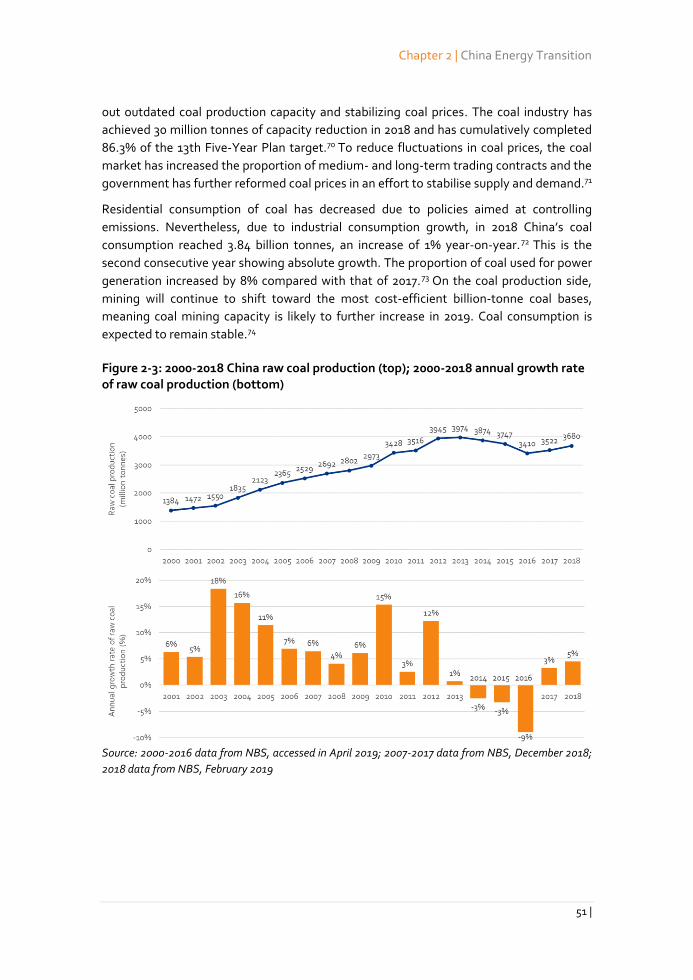
Chapter 2 | China Energy Transition
51 |
out outdated coal production capacity and stabilizing coal prices. The coal industry has
achieved 30 million tonnes of capacity reduction in 2018 and has cumulatively completed
86.3% of the 13th Five-Year Plan target.70 To reduce fluctuations in coal prices, the coal
market has increased the proportion of medium- and long-term trading contracts and the
government has further reformed coal prices in an effort to stabilise supply and demand.71
Residential consumption of coal has decreased due to policies aimed at controlling
emissions. Nevertheless, due to industrial consumption growth, in 2018 China’s coal
consumption reached 3.84 billion tonnes, an increase of 1% year-on-year.72 This is the
second consecutive year showing absolute growth. The proportion of coal used for power
generation increased by 8% compared with that of 2017.73 On the coal production side,
mining will continue to shift toward the most cost-efficient billion-tonne coal bases,
meaning coal mining capacity is likely to further increase in 2019. Coal consumption is
expected to remain stable.74
Figure 2-3: 2000-2018 China raw coal production (top); 2000-2018 annual growth rate of raw coal production (bottom)
Source: 2000-2016 data from NBS, accessed in April 2019; 2007-2017 data from NBS, December 2018;
2018 data from NBS, February 2019
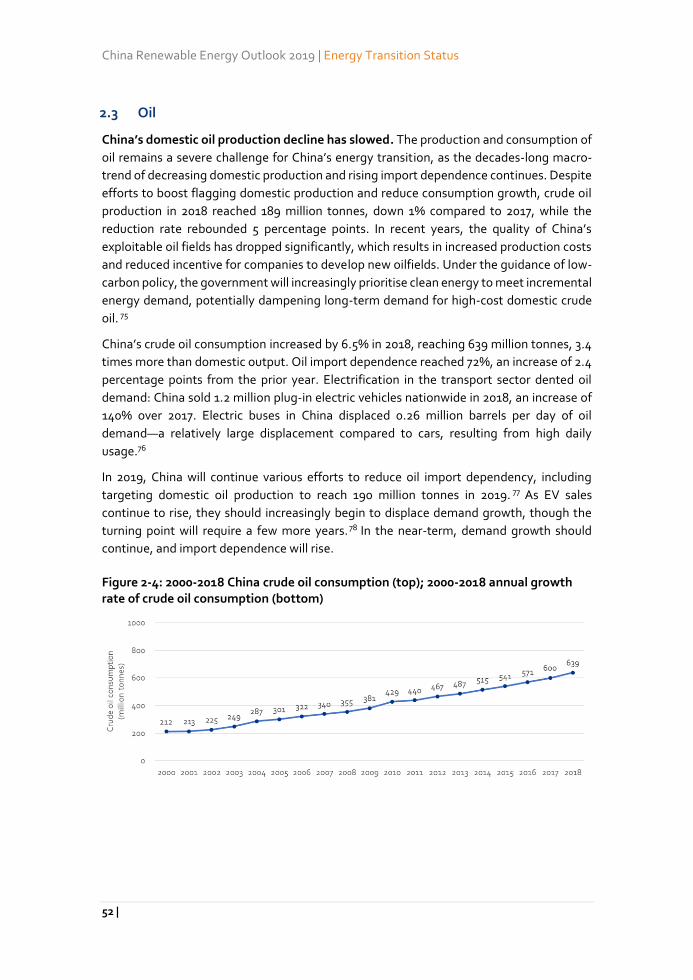
China Renewable Energy Outlook 2019 | Energy Transition Status
52 |
2.3 Oil
China’s domestic oil production decline has slowed. The production and consumption of
oil remains a severe challenge for China’s energy transition, as the decades-long macro-
trend of decreasing domestic production and rising import dependence continues. Despite
efforts to boost flagging domestic production and reduce consumption growth, crude oil
production in 2018 reached 189 million tonnes, down 1% compared to 2017, while the
reduction rate rebounded 5 percentage points. In recent years, the quality of China’s
exploitable oil fields has dropped significantly, which results in increased production costs
and reduced incentive for companies to develop new oilfields. Under the guidance of low-
carbon policy, the government will increasingly prioritise clean energy to meet incremental
energy demand, potentially dampening long-term demand for high-cost domestic crude
oil. 75
China’s crude oil consumption increased by 6.5% in 2018, reaching 639 million tonnes, 3.4
times more than domestic output. Oil import dependence reached 72%, an increase of 2.4
percentage points from the prior year. Electrification in the transport sector dented oil
demand: China sold 1.2 million plug-in electric vehicles nationwide in 2018, an increase of
140% over 2017. Electric buses in China displaced 0.26 million barrels per day of oil
demand—a relatively large displacement compared to cars, resulting from high daily
usage.76
In 2019, China will continue various efforts to reduce oil import dependency, including
targeting domestic oil production to reach 190 million tonnes in 2019. 77 As EV sales
continue to rise, they should increasingly begin to displace demand growth, though the
turning point will require a few more years.78 In the near-term, demand growth should
continue, and import dependence will rise.
Figure 2-4: 2000-2018 China crude oil consumption (top); 2000-2018 annual growth rate of crude oil consumption (bottom)
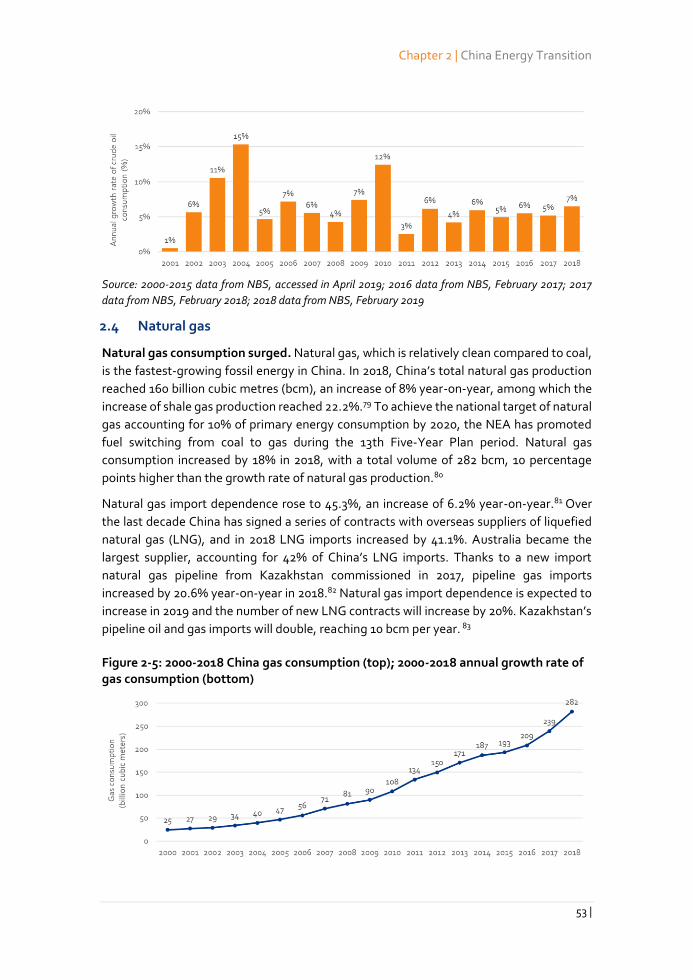
Chapter 2 | China Energy Transition
53 |
Source: 2000-2015 data from NBS, accessed in April 2019; 2016 data from NBS, February 2017; 2017
data from NBS, February 2018; 2018 data from NBS, February 2019
2.4 Natural gas
Natural gas consumption surged. Natural gas, which is relatively clean compared to coal,
is the fastest-growing fossil energy in China. In 2018, China’s total natural gas production
reached 160 billion cubic metres (bcm), an increase of 8% year-on-year, among which the
increase of shale gas production reached 22.2%.79 To achieve the national target of natural
gas accounting for 10% of primary energy consumption by 2020, the NEA has promoted
fuel switching from coal to gas during the 13th Five-Year Plan period. Natural gas
consumption increased by 18% in 2018, with a total volume of 282 bcm, 10 percentage
points higher than the growth rate of natural gas production.80
Natural gas import dependence rose to 45.3%, an increase of 6.2% year-on-year.81 Over
the last decade China has signed a series of contracts with overseas suppliers of liquefied
natural gas (LNG), and in 2018 LNG imports increased by 41.1%. Australia became the
largest supplier, accounting for 42% of China’s LNG imports. Thanks to a new import
natural gas pipeline from Kazakhstan commissioned in 2017, pipeline gas imports
increased by 20.6% year-on-year in 2018.82 Natural gas import dependence is expected to
increase in 2019 and the number of new LNG contracts will increase by 20%. Kazakhstan’s
pipeline oil and gas imports will double, reaching 10 bcm per year. 83
Figure 2-5: 2000-2018 China gas consumption (top); 2000-2018 annual growth rate of gas consumption (bottom)
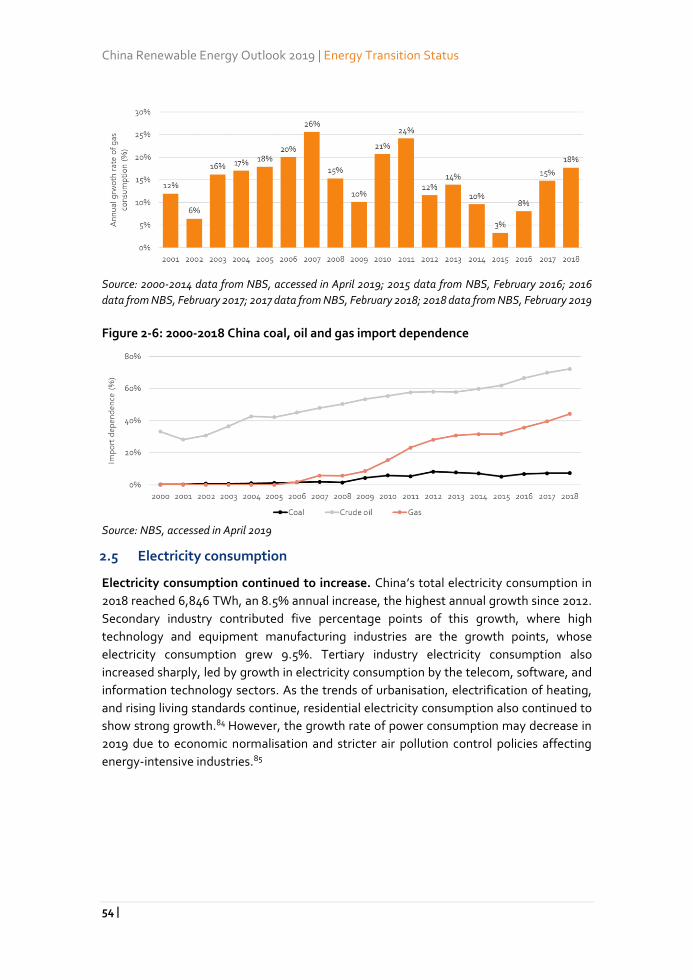
China Renewable Energy Outlook 2019 | Energy Transition Status
54 |
Source: 2000-2014 data from NBS, accessed in April 2019; 2015 data from NBS, February 2016; 2016
data from NBS, February 2017; 2017 data from NBS, February 2018; 2018 data from NBS, February 2019
Figure 2-6: 2000-2018 China coal, oil and gas import dependence
Source: NBS, accessed in April 2019
2.5 Electricity consumption
Electricity consumption continued to increase. China’s total electricity consumption in
2018 reached 6,846 TWh, an 8.5% annual increase, the highest annual growth since 2012.
Secondary industry contributed five percentage points of this growth, where high
technology and equipment manufacturing industries are the growth points, whose
electricity consumption grew 9.5%. Tertiary industry electricity consumption also
increased sharply, led by growth in electricity consumption by the telecom, software, and
information technology sectors. As the trends of urbanisation, electrification of heating,
and rising living standards continue, residential electricity consumption also continued to
show strong growth.84 However, the growth rate of power consumption may decrease in
2019 due to economic normalisation and stricter air pollution control policies affecting
energy-intensive industries.85
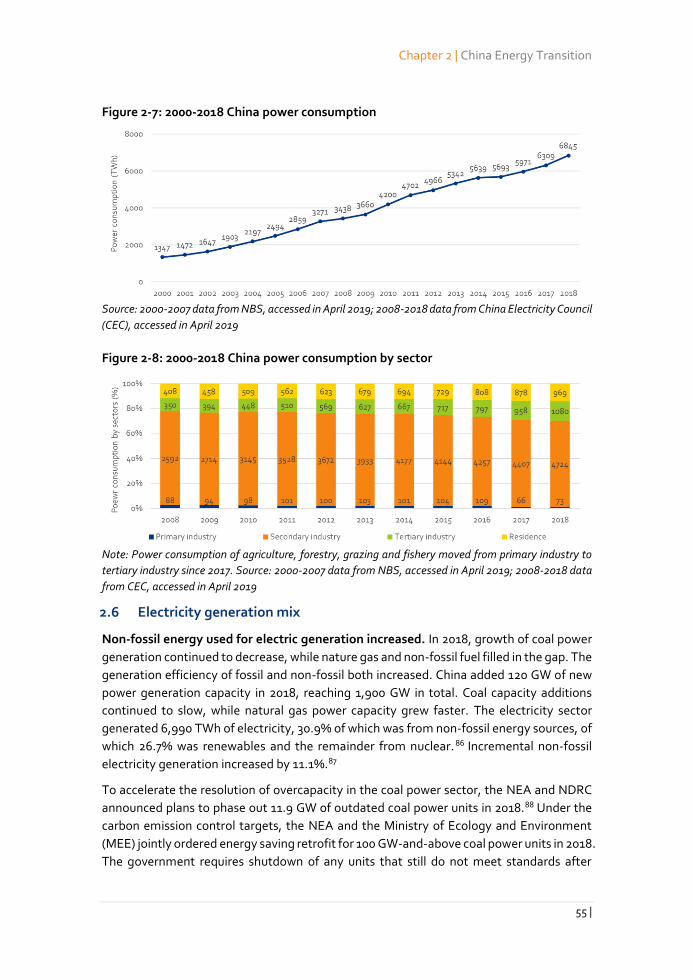
Chapter 2 | China Energy Transition
55 |
Figure 2-7: 2000-2018 China power consumption
Source: 2000-2007 data from NBS, accessed in April 2019; 2008-2018 data from China Electricity Council
(CEC), accessed in April 2019
Figure 2-8: 2000-2018 China power consumption by sector
Note: Power consumption of agriculture, forestry, grazing and fishery moved from primary industry to
tertiary industry since 2017. Source: 2000-2007 data from NBS, accessed in April 2019; 2008-2018 data
from CEC, accessed in April 2019
2.6 Electricity generation mix
Non-fossil energy used for electric generation increased. In 2018, growth of coal power
generation continued to decrease, while nature gas and non-fossil fuel filled in the gap. The
generation efficiency of fossil and non-fossil both increased. China added 120 GW of new
power generation capacity in 2018, reaching 1,900 GW in total. Coal capacity additions
continued to slow, while natural gas power capacity grew faster. The electricity sector
generated 6,990 TWh of electricity, 30.9% of which was from non-fossil energy sources, of
which 26.7% was renewables and the remainder from nuclear. 86 Incremental non-fossil
electricity generation increased by 11.1%.87
To accelerate the resolution of overcapacity in the coal power sector, the NEA and NDRC
announced plans to phase out 11.9 GW of outdated coal power units in 2018.88 Under the
carbon emission control targets, the NEA and the Ministry of Ecology and Environment
(MEE) jointly ordered energy saving retrofit for 100 GW-and-above coal power units in 2018.
The government requires shutdown of any units that still do not meet standards after
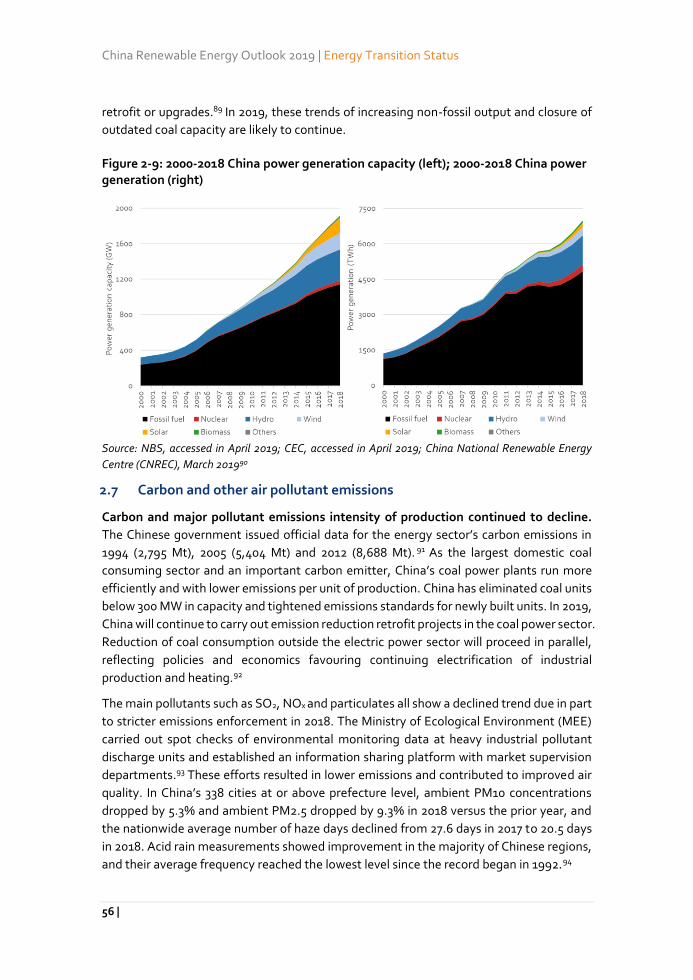
China Renewable Energy Outlook 2019 | Energy Transition Status
56 |
retrofit or upgrades.89 In 2019, these trends of increasing non-fossil output and closure of
outdated coal capacity are likely to continue.
Figure 2-9: 2000-2018 China power generation capacity (left); 2000-2018 China power generation (right)
Source: NBS, accessed in April 2019; CEC, accessed in April 2019; China National Renewable Energy
Centre (CNREC), March 201990
2.7 Carbon and other air pollutant emissions
Carbon and major pollutant emissions intensity of production continued to decline.
The Chinese government issued official data for the energy sector’s carbon emissions in
1994 (2,795 Mt), 2005 (5,404 Mt) and 2012 (8,688 Mt). 91 As the largest domestic coal
consuming sector and an important carbon emitter, China’s coal power plants run more
efficiently and with lower emissions per unit of production. China has eliminated coal units
below 300 MW in capacity and tightened emissions standards for newly built units. In 2019,
China will continue to carry out emission reduction retrofit projects in the coal power sector.
Reduction of coal consumption outside the electric power sector will proceed in parallel,
reflecting policies and economics favouring continuing electrification of industrial
production and heating.92
The main pollutants such as SO2, NOx and particulates all show a declined trend due in part
to stricter emissions enforcement in 2018. The Ministry of Ecological Environment (MEE)
carried out spot checks of environmental monitoring data at heavy industrial pollutant
discharge units and established an information sharing platform with market supervision
departments.93 These efforts resulted in lower emissions and contributed to improved air
quality. In China’s 338 cities at or above prefecture level, ambient PM10 concentrations
dropped by 5.3% and ambient PM2.5 dropped by 9.3% in 2018 versus the prior year, and
the nationwide average number of haze days declined from 27.6 days in 2017 to 20.5 days
in 2018. Acid rain measurements showed improvement in the majority of Chinese regions,
and their average frequency reached the lowest level since the record began in 1992.94
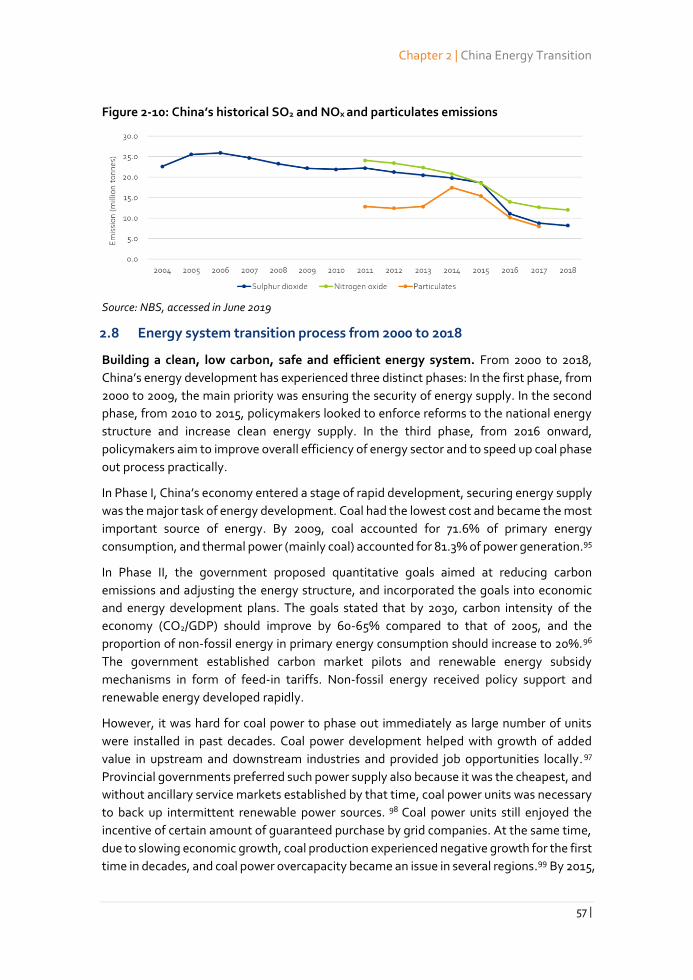
Chapter 2 | China Energy Transition
57 |
Figure 2-10: China’s historical SO2 and NOx and particulates emissions
Source: NBS, accessed in June 2019
2.8 Energy system transition process from 2000 to 2018
Building a clean, low carbon, safe and efficient energy system. From 2000 to 2018,
China’s energy development has experienced three distinct phases: In the first phase, from
2000 to 2009, the main priority was ensuring the security of energy supply. In the second
phase, from 2010 to 2015, policymakers looked to enforce reforms to the national energy
structure and increase clean energy supply. In the third phase, from 2016 onward,
policymakers aim to improve overall efficiency of energy sector and to speed up coal phase
out process practically.
In Phase I, China’s economy entered a stage of rapid development, securing energy supply
was the major task of energy development. Coal had the lowest cost and became the most
important source of energy. By 2009, coal accounted for 71.6% of primary energy
consumption, and thermal power (mainly coal) accounted for 81.3% of power generation.95
In Phase II, the government proposed quantitative goals aimed at reducing carbon
emissions and adjusting the energy structure, and incorporated the goals into economic
and energy development plans. The goals stated that by 2030, carbon intensity of the
economy (CO2/GDP) should improve by 60-65% compared to that of 2005, and the
proportion of non-fossil energy in primary energy consumption should increase to 20%.96
The government established carbon market pilots and renewable energy subsidy
mechanisms in form of feed-in tariffs. Non-fossil energy received policy support and
renewable energy developed rapidly.
However, it was hard for coal power to phase out immediately as large number of units
were installed in past decades. Coal power development helped with growth of added
value in upstream and downstream industries and provided job opportunities locally. 97
Provincial governments preferred such power supply also because it was the cheapest, and
without ancillary service markets established by that time, coal power units was necessary
to back up intermittent renewable power sources. 98 Coal power units still enjoyed the
incentive of certain amount of guaranteed purchase by grid companies. At the same time,
due to slowing economic growth, coal production experienced negative growth for the first
time in decades, and coal power overcapacity became an issue in several regions.99 By 2015,
China Renewable Energy Outlook 2019 | Energy Transition Status
58 |
the country no longer faced energy supply shortages, and the national energy structure
was beginning to grow more diverse, more low-carbon, and increasingly market-oriented.
Air pollution remains a major public concern.
In Phase III, the government deepened supply side structural reform and improved energy
consumption to boost overall operation efficiency of the energy system. This included
incorporating energy into the ecological framework emphasizing the phase-out of coal and
development of clean energy on the supply side, as well as the clean and efficient use of
the demand side. NDRC and NEA set a target of keeping total coal power capacity under
1,100 GW by year 2020. 100 During the 13th Five-Year Plan period, more than 20 GW of
outdated thermal power capacity was targeted for closure, and any remaining coal-fired
units under 300 MW should meet ultra-low emissions standards.101 Outdated enterprises
without development potential, as well as coal power units not in compliance to technical
and emission regulations, shall be suspended. 102 The guaranteed purchase hours of coal
power plants approved by 15 March 2015 should decrease by at least 20% annually.103
The government has also worked to expand the share of clean energy in the power and
heating sectors. In the power sector, driven by the non-fossil targets and incentives made
in Phase II, renewable energy has become the major power source for incremental power
demand and is gradually replacing existing coal power in some regions.104 The share of
renewable power generation increased from 24.2% in 2015 to 26.7% in 2018. 105 In the
heating sector, the government established clean heating pilots and an electricity
substitution program. 106 With subsidies for fuel switching from coal to gas and coal to
electricity projects, the consumption of natural gas increased rapidly, helping replace
inefficient and highly-polluting burning of loose coal (sanmei) and fuel oil. By year 2018, the
power replacement program has replaced 60 million tonnes of loose coal burning.
The economic structure of China has undergone shifts during Phase I to Phase III. The
tertiary industry (namely, the service sector) has been gradually becoming a new leading
economic growth point. In secondary industry, high-tech industries and equipment
manufacturing industry that possess relatively low energy consumption and high added
value also grew more rapidly than traditional industries.107 On the consumption side, new
business models and technologies such as distributed generation, electric vehicles, and
multi-energy complementarity (enabling multiple energy sources to complement one
another flexibly) are also expanding, eventually helping China transit into a low-emission
energy society.
2.9 Major changes in 2018
Energy sector investment
Overall investment dropped while renewable energy is still attractive. In 2018, China
remained the world’s largest energy investment market, although its overall sector
investment dropped by 1.5% compared to 2017.108 The investment of newly added coal-
fired power plants decreased by more than 60% and energy efficiency improved by 6% in
the past three years, which led to the investment decrease. In contrast, about 70% out of
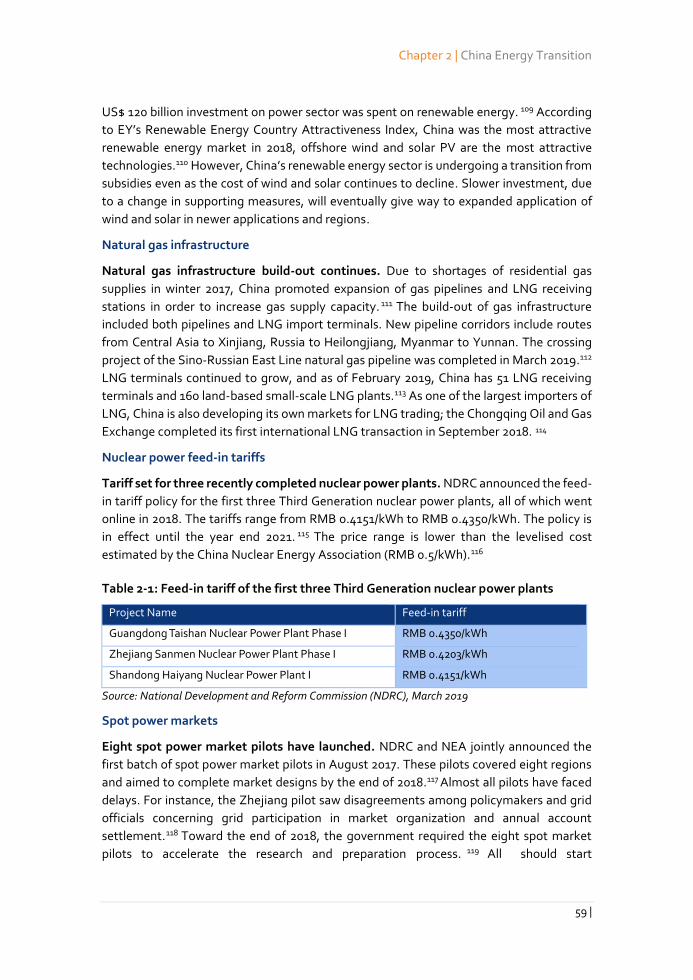
Chapter 2 | China Energy Transition
59 |
US$ 120 billion investment on power sector was spent on renewable energy. 109 According
to EY’s Renewable Energy Country Attractiveness Index, China was the most attractive
renewable energy market in 2018, offshore wind and solar PV are the most attractive
technologies.110 However, China’s renewable energy sector is undergoing a transition from
subsidies even as the cost of wind and solar continues to decline. Slower investment, due
to a change in supporting measures, will eventually give way to expanded application of
wind and solar in newer applications and regions.
Natural gas infrastructure
Natural gas infrastructure build-out continues. Due to shortages of residential gas
supplies in winter 2017, China promoted expansion of gas pipelines and LNG receiving
stations in order to increase gas supply capacity. 111 The build-out of gas infrastructure
included both pipelines and LNG import terminals. New pipeline corridors include routes
from Central Asia to Xinjiang, Russia to Heilongjiang, Myanmar to Yunnan. The crossing
project of the Sino-Russian East Line natural gas pipeline was completed in March 2019.112
LNG terminals continued to grow, and as of February 2019, China has 51 LNG receiving
terminals and 160 land-based small-scale LNG plants.113 As one of the largest importers of
LNG, China is also developing its own markets for LNG trading; the Chongqing Oil and Gas
Exchange completed its first international LNG transaction in September 2018. 114
Nuclear power feed-in tariffs
Tariff set for three recently completed nuclear power plants. NDRC announced the feed-
in tariff policy for the first three Third Generation nuclear power plants, all of which went
online in 2018. The tariffs range from RMB 0.4151/kWh to RMB 0.4350/kWh. The policy is
in effect until the year end 2021. 115 The price range is lower than the levelised cost
estimated by the China Nuclear Energy Association (RMB 0.5/kWh).116
Table 2-1: Feed-in tariff of the first three Third Generation nuclear power plants
Project Name Feed-in tariff
Guangdong Taishan Nuclear Power Plant Phase I RMB 0.4350/kWh
Zhejiang Sanmen Nuclear Power Plant Phase I RMB 0.4203/kWh
Shandong Haiyang Nuclear Power Plant I RMB 0.4151/kWh
Source: National Development and Reform Commission (NDRC), March 2019
Spot power markets
Eight spot power market pilots have launched. NDRC and NEA jointly announced the
first batch of spot power market pilots in August 2017. These pilots covered eight regions
and aimed to complete market designs by the end of 2018.117 Almost all pilots have faced
delays. For instance, the Zhejiang pilot saw disagreements among policymakers and grid
officials concerning grid participation in market organization and annual account
settlement.118 Toward the end of 2018, the government required the eight spot market
pilots to accelerate the research and preparation process. 119 All should start
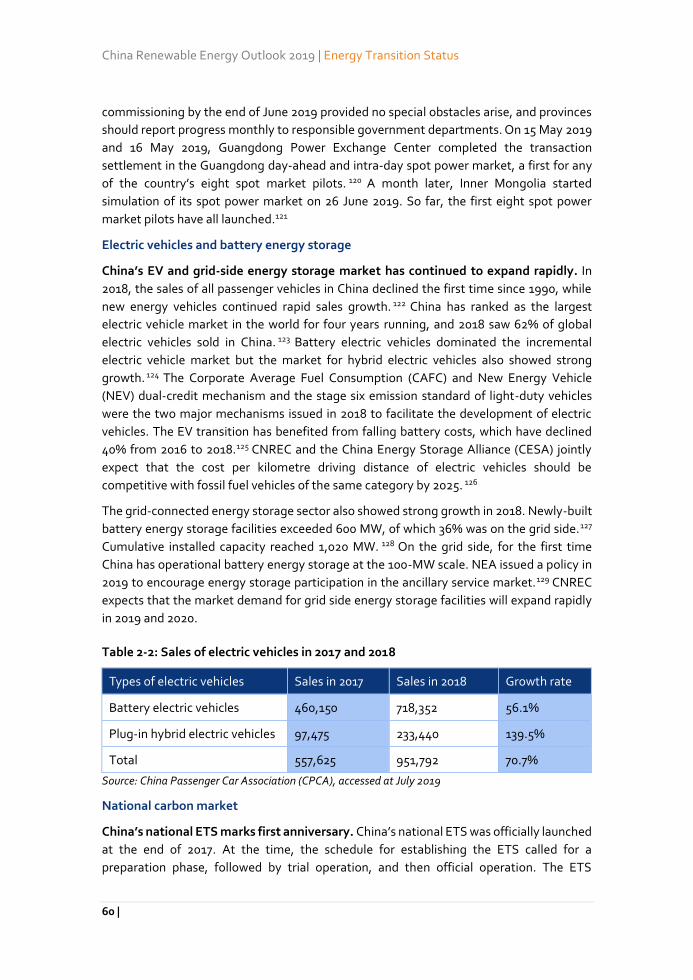
China Renewable Energy Outlook 2019 | Energy Transition Status
60 |
commissioning by the end of June 2019 provided no special obstacles arise, and provinces
should report progress monthly to responsible government departments. On 15 May 2019
and 16 May 2019, Guangdong Power Exchange Center completed the transaction
settlement in the Guangdong day-ahead and intra-day spot power market, a first for any
of the country’s eight spot market pilots. 120 A month later, Inner Mongolia started
simulation of its spot power market on 26 June 2019. So far, the first eight spot power
market pilots have all launched.121
Electric vehicles and battery energy storage
China’s EV and grid-side energy storage market has continued to expand rapidly. In
2018, the sales of all passenger vehicles in China declined the first time since 1990, while
new energy vehicles continued rapid sales growth. 122 China has ranked as the largest
electric vehicle market in the world for four years running, and 2018 saw 62% of global
electric vehicles sold in China. 123 Battery electric vehicles dominated the incremental
electric vehicle market but the market for hybrid electric vehicles also showed strong
growth. 124 The Corporate Average Fuel Consumption (CAFC) and New Energy Vehicle
(NEV) dual-credit mechanism and the stage six emission standard of light-duty vehicles
were the two major mechanisms issued in 2018 to facilitate the development of electric
vehicles. The EV transition has benefited from falling battery costs, which have declined
40% from 2016 to 2018.125 CNREC and the China Energy Storage Alliance (CESA) jointly
expect that the cost per kilometre driving distance of electric vehicles should be
competitive with fossil fuel vehicles of the same category by 2025. 126
The grid-connected energy storage sector also showed strong growth in 2018. Newly-built
battery energy storage facilities exceeded 600 MW, of which 36% was on the grid side.127
Cumulative installed capacity reached 1,020 MW. 128 On the grid side, for the first time
China has operational battery energy storage at the 100-MW scale. NEA issued a policy in
2019 to encourage energy storage participation in the ancillary service market.129 CNREC
expects that the market demand for grid side energy storage facilities will expand rapidly
in 2019 and 2020.
Table 2-2: Sales of electric vehicles in 2017 and 2018
Types of electric vehicles Sales in 2017 Sales in 2018 Growth rate
Battery electric vehicles 460,150 718,352 56.1%
Plug-in hybrid electric vehicles 97,475 233,440 139.5%
Total 557,625 951,792 70.7%
Source: China Passenger Car Association (CPCA), accessed at July 2019
National carbon market
China’s national ETS marks first anniversary. China’s national ETS was officially launched
at the end of 2017. At the time, the schedule for establishing the ETS called for a
preparation phase, followed by trial operation, and then official operation. The ETS
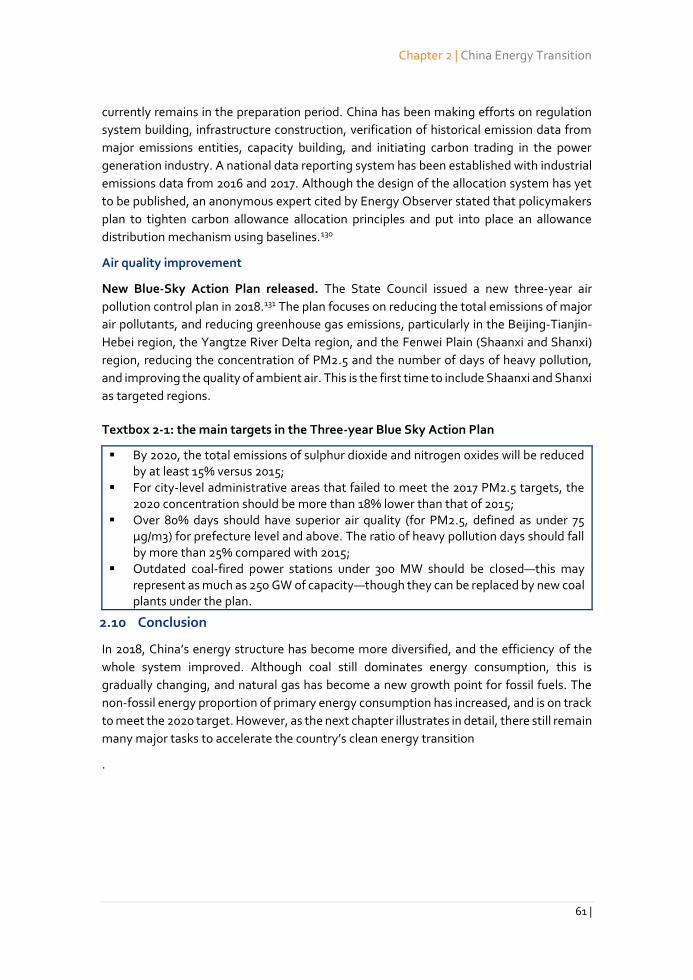
Chapter 2 | China Energy Transition
61 |
currently remains in the preparation period. China has been making efforts on regulation
system building, infrastructure construction, verification of historical emission data from
major emissions entities, capacity building, and initiating carbon trading in the power
generation industry. A national data reporting system has been established with industrial
emissions data from 2016 and 2017. Although the design of the allocation system has yet
to be published, an anonymous expert cited by Energy Observer stated that policymakers
plan to tighten carbon allowance allocation principles and put into place an allowance
distribution mechanism using baselines.130
Air quality improvement
New Blue-Sky Action Plan released. The State Council issued a new three-year air
pollution control plan in 2018.131 The plan focuses on reducing the total emissions of major
air pollutants, and reducing greenhouse gas emissions, particularly in the Beijing-Tianjin-
Hebei region, the Yangtze River Delta region, and the Fenwei Plain (Shaanxi and Shanxi)
region, reducing the concentration of PM2.5 and the number of days of heavy pollution,
and improving the quality of ambient air. This is the first time to include Shaanxi and Shanxi
as targeted regions.
Textbox 2-1: the main targets in the Three-year Blue Sky Action Plan
By 2020, the total emissions of sulphur dioxide and nitrogen oxides will be reduced by at least 15% versus 2015;
For city-level administrative areas that failed to meet the 2017 PM2.5 targets, the 2020 concentration should be more than 18% lower than that of 2015;
Over 80% days should have superior air quality (for PM2.5, defined as under 75 μg/m3) for prefecture level and above. The ratio of heavy pollution days should fall by more than 25% compared with 2015;
Outdated coal-fired power stations under 300 MW should be closed—this may represent as much as 250 GW of capacity—though they can be replaced by new coal plants under the plan.
2.10 Conclusion
In 2018, China’s energy structure has become more diversified, and the efficiency of the
whole system improved. Although coal still dominates energy consumption, this is
gradually changing, and natural gas has become a new growth point for fossil fuels. The
non-fossil energy proportion of primary energy consumption has increased, and is on track
to meet the 2020 target. However, as the next chapter illustrates in detail, there still remain
many major tasks to accelerate the country’s clean energy transition
.
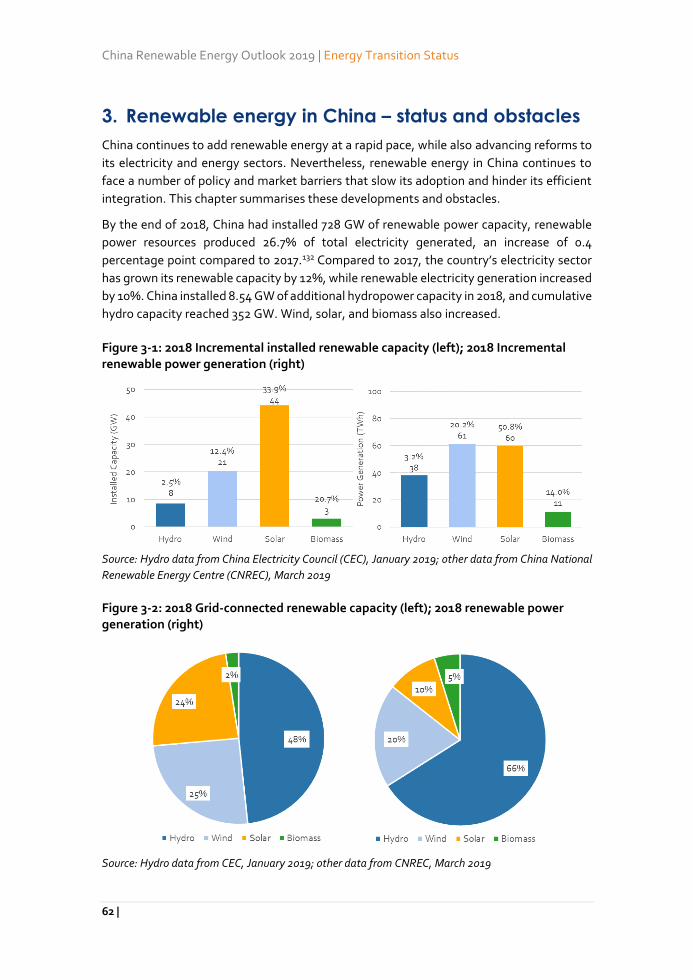
China Renewable Energy Outlook 2019 | Energy Transition Status
62 |
3. Renewable energy in China – status and obstacles
China continues to add renewable energy at a rapid pace, while also advancing reforms to
its electricity and energy sectors. Nevertheless, renewable energy in China continues to
face a number of policy and market barriers that slow its adoption and hinder its efficient
integration. This chapter summarises these developments and obstacles.
By the end of 2018, China had installed 728 GW of renewable power capacity, renewable
power resources produced 26.7% of total electricity generated, an increase of 0.4
percentage point compared to 2017.132 Compared to 2017, the country’s electricity sector
has grown its renewable capacity by 12%, while renewable electricity generation increased
by 10%. China installed 8.54 GW of additional hydropower capacity in 2018, and cumulative
hydro capacity reached 352 GW. Wind, solar, and biomass also increased.
Figure 3-1: 2018 Incremental installed renewable capacity (left); 2018 Incremental renewable power generation (right)
Source: Hydro data from China Electricity Council (CEC), January 2019; other data from China National
Renewable Energy Centre (CNREC), March 2019
Figure 3-2: 2018 Grid-connected renewable capacity (left); 2018 renewable power generation (right)
Source: Hydro data from CEC, January 2019; other data from CNREC, March 2019
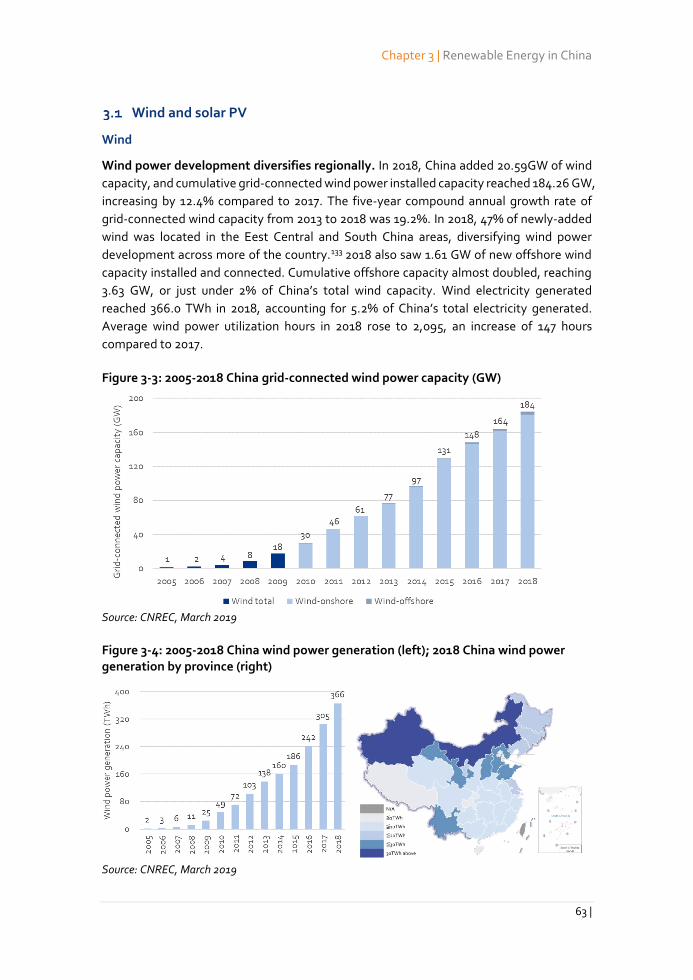
Chapter 3 | Renewable Energy in China
63 |
Wind and solar PV
Wind
Wind power development diversifies regionally. In 2018, China added 20.59GW of wind
capacity, and cumulative grid-connected wind power installed capacity reached 184.26 GW,
increasing by 12.4% compared to 2017. The five-year compound annual growth rate of
grid-connected wind capacity from 2013 to 2018 was 19.2%. In 2018, 47% of newly-added
wind was located in the Eest Central and South China areas, diversifying wind power
development across more of the country.133 2018 also saw 1.61 GW of new offshore wind
capacity installed and connected. Cumulative offshore capacity almost doubled, reaching
3.63 GW, or just under 2% of China’s total wind capacity. Wind electricity generated
reached 366.0 TWh in 2018, accounting for 5.2% of China’s total electricity generated.
Average wind power utilization hours in 2018 rose to 2,095, an increase of 147 hours
compared to 2017.
Figure 3-3: 2005-2018 China grid-connected wind power capacity (GW)
Source: CNREC, March 2019
Figure 3-4: 2005-2018 China wind power generation (left); 2018 China wind power generation by province (right)
Source: CNREC, March 2019
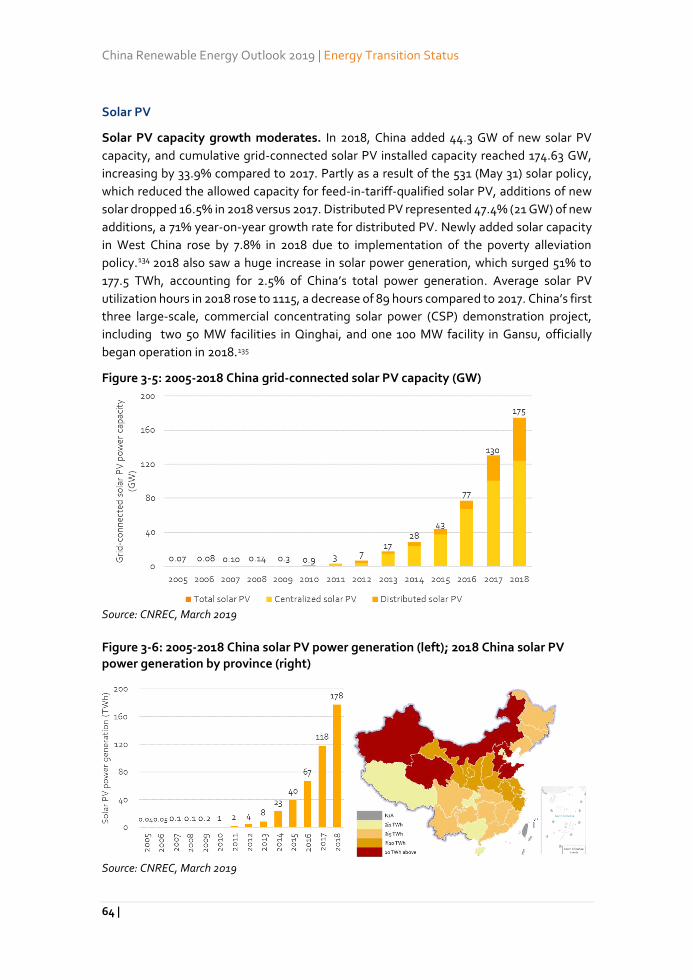
China Renewable Energy Outlook 2019 | Energy Transition Status
64 |
Solar PV
Solar PV capacity growth moderates. In 2018, China added 44.3 GW of new solar PV
capacity, and cumulative grid-connected solar PV installed capacity reached 174.63 GW,
increasing by 33.9% compared to 2017. Partly as a result of the 531 (May 31) solar policy,
which reduced the allowed capacity for feed-in-tariff-qualified solar PV, additions of new
solar dropped 16.5% in 2018 versus 2017. Distributed PV represented 47.4% (21 GW) of new
additions, a 71% year-on-year growth rate for distributed PV. Newly added solar capacity
in West China rose by 7.8% in 2018 due to implementation of the poverty alleviation
policy.134 2018 also saw a huge increase in solar power generation, which surged 51% to
177.5 TWh, accounting for 2.5% of China’s total power generation. Average solar PV
utilization hours in 2018 rose to 1115, a decrease of 89 hours compared to 2017. China’s first
three large-scale, commercial concentrating solar power (CSP) demonstration project,
including two 50 MW facilities in Qinghai, and one 100 MW facility in Gansu, officially
began operation in 2018.135
Figure 3-5: 2005-2018 China grid-connected solar PV capacity (GW)
Source: CNREC, March 2019
Figure 3-6: 2005-2018 China solar PV power generation (left); 2018 China solar PV power generation by province (right)
Source: CNREC, March 2019
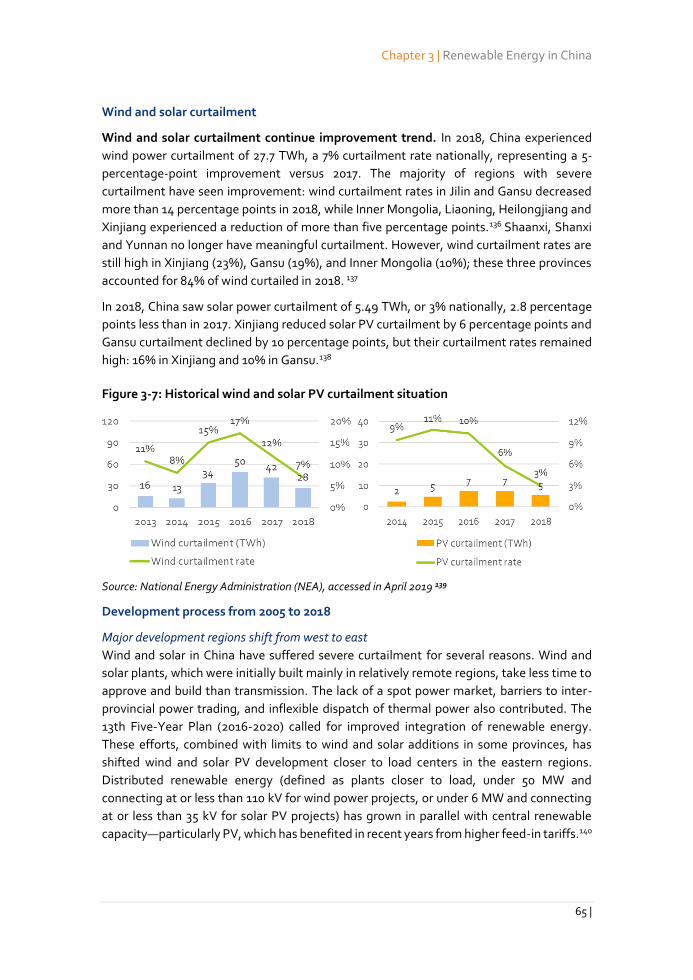
Chapter 3 | Renewable Energy in China
65 |
Wind and solar curtailment
Wind and solar curtailment continue improvement trend. In 2018, China experienced
wind power curtailment of 27.7 TWh, a 7% curtailment rate nationally, representing a 5-
percentage-point improvement versus 2017. The majority of regions with severe
curtailment have seen improvement: wind curtailment rates in Jilin and Gansu decreased
more than 14 percentage points in 2018, while Inner Mongolia, Liaoning, Heilongjiang and
Xinjiang experienced a reduction of more than five percentage points.136 Shaanxi, Shanxi
and Yunnan no longer have meaningful curtailment. However, wind curtailment rates are
still high in Xinjiang (23%), Gansu (19%), and Inner Mongolia (10%); these three provinces
accounted for 84% of wind curtailed in 2018. 137
In 2018, China saw solar power curtailment of 5.49 TWh, or 3% nationally, 2.8 percentage
points less than in 2017. Xinjiang reduced solar PV curtailment by 6 percentage points and
Gansu curtailment declined by 10 percentage points, but their curtailment rates remained
high: 16% in Xinjiang and 10% in Gansu.138
Figure 3-7: Historical wind and solar PV curtailment situation
Source: National Energy Administration (NEA), accessed in April 2019 139
Development process from 2005 to 2018
Major development regions shift from west to east
Wind and solar in China have suffered severe curtailment for several reasons. Wind and
solar plants, which were initially built mainly in relatively remote regions, take less time to
approve and build than transmission. The lack of a spot power market, barriers to inter-
provincial power trading, and inflexible dispatch of thermal power also contributed. The
13th Five-Year Plan (2016-2020) called for improved integration of renewable energy.
These efforts, combined with limits to wind and solar additions in some provinces, has
shifted wind and solar PV development closer to load centers in the eastern regions.
Distributed renewable energy (defined as plants closer to load, under 50 MW and
connecting at or less than 110 kV for wind power projects, or under 6 MW and connecting
at or less than 35 kV for solar PV projects) has grown in parallel with central renewable
capacity—particularly PV, which has benefited in recent years from higher feed-in tariffs.140
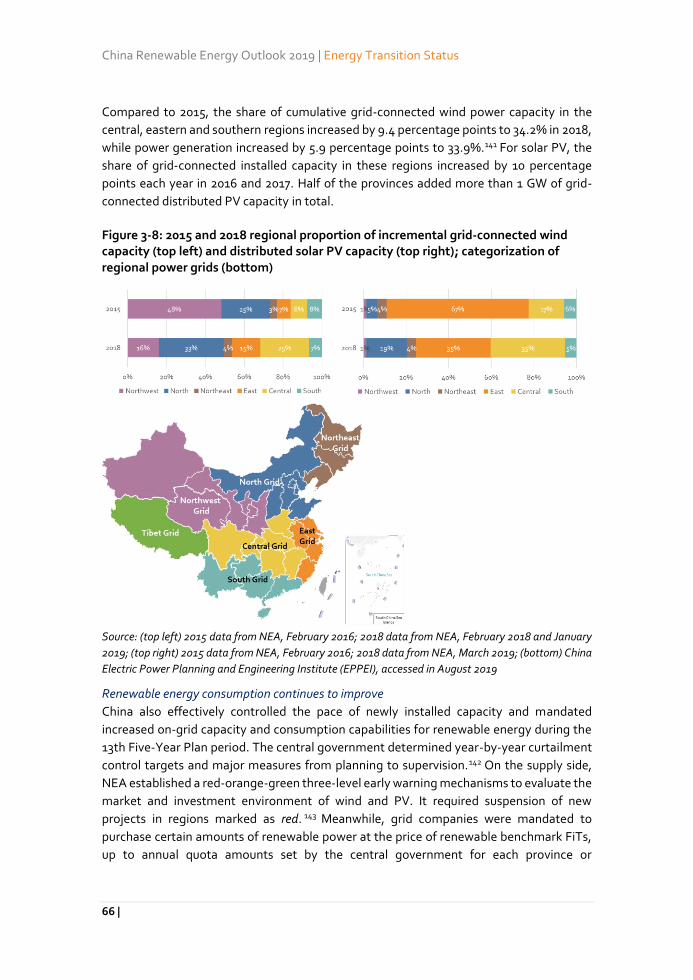
China Renewable Energy Outlook 2019 | Energy Transition Status
66 |
Compared to 2015, the share of cumulative grid-connected wind power capacity in the
central, eastern and southern regions increased by 9.4 percentage points to 34.2% in 2018,
while power generation increased by 5.9 percentage points to 33.9%.141 For solar PV, the
share of grid-connected installed capacity in these regions increased by 10 percentage
points each year in 2016 and 2017. Half of the provinces added more than 1 GW of grid-
connected distributed PV capacity in total.
Figure 3-8: 2015 and 2018 regional proportion of incremental grid-connected wind capacity (top left) and distributed solar PV capacity (top right); categorization of regional power grids (bottom)
Source: (top left) 2015 data from NEA, February 2016; 2018 data from NEA, February 2018 and January
2019; (top right) 2015 data from NEA, February 2016; 2018 data from NEA, March 2019; (bottom) China
Electric Power Planning and Engineering Institute (EPPEI), accessed in August 2019
Renewable energy consumption continues to improve
China also effectively controlled the pace of newly installed capacity and mandated
increased on-grid capacity and consumption capabilities for renewable energy during the
13th Five-Year Plan period. The central government determined year-by-year curtailment
control targets and major measures from planning to supervision.142 On the supply side,
NEA established a red-orange-green three-level early warning mechanisms to evaluate the
market and investment environment of wind and PV. It required suspension of new
projects in regions marked as red. 143 Meanwhile, grid companies were mandated to
purchase certain amounts of renewable power at the price of renewable benchmark FiTs,
up to annual quota amounts set by the central government for each province or
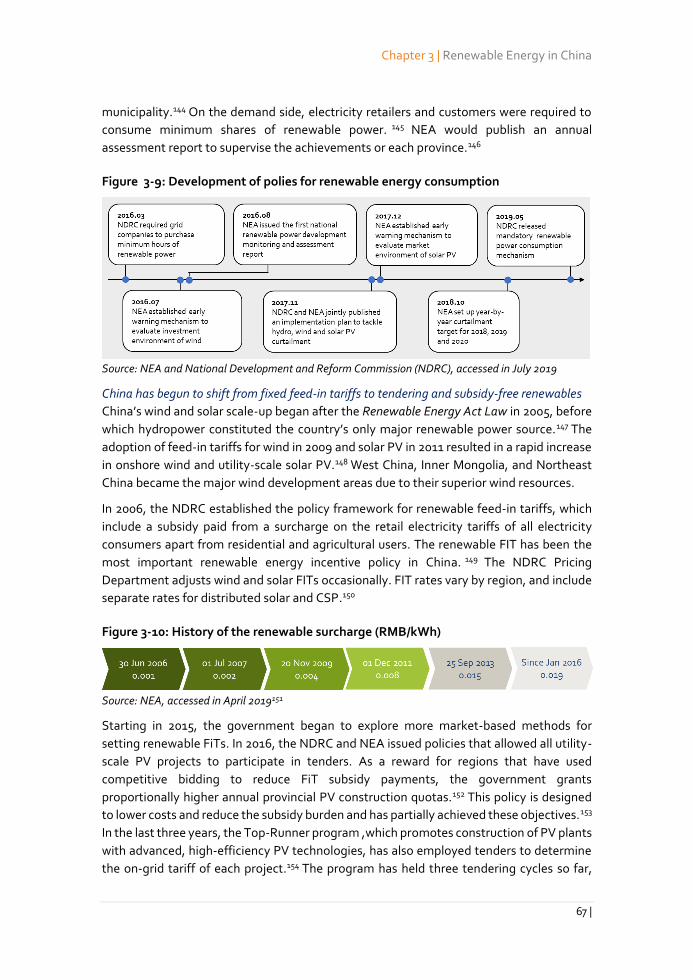
Chapter 3 | Renewable Energy in China
67 |
municipality.144 On the demand side, electricity retailers and customers were required to
consume minimum shares of renewable power. 145 NEA would publish an annual
assessment report to supervise the achievements or each province.146
Figure 3-9: Development of polies for renewable energy consumption
Source: NEA and National Development and Reform Commission (NDRC), accessed in July 2019
China has begun to shift from fixed feed-in tariffs to tendering and subsidy-free renewables
China’s wind and solar scale-up began after the Renewable Energy Act Law in 2005, before
which hydropower constituted the country’s only major renewable power source.147 The
adoption of feed-in tariffs for wind in 2009 and solar PV in 2011 resulted in a rapid increase
in onshore wind and utility-scale solar PV.148 West China, Inner Mongolia, and Northeast
China became the major wind development areas due to their superior wind resources.
In 2006, the NDRC established the policy framework for renewable feed-in tariffs, which
include a subsidy paid from a surcharge on the retail electricity tariffs of all electricity
consumers apart from residential and agricultural users. The renewable FIT has been the
most important renewable energy incentive policy in China. 149 The NDRC Pricing
Department adjusts wind and solar FITs occasionally. FIT rates vary by region, and include
separate rates for distributed solar and CSP.150
Figure 3-10: History of the renewable surcharge (RMB/kWh)
Source: NEA, accessed in April 2019151
Starting in 2015, the government began to explore more market-based methods for
setting renewable FiTs. In 2016, the NDRC and NEA issued policies that allowed all utility-
scale PV projects to participate in tenders. As a reward for regions that have used
competitive bidding to reduce FiT subsidy payments, the government grants
proportionally higher annual provincial PV construction quotas.152 This policy is designed
to lower costs and reduce the subsidy burden and has partially achieved these objectives.153
In the last three years, the Top-Runner program ,which promotes construction of PV plants
with advanced, high-efficiency PV technologies, has also employed tenders to determine
the on-grid tariff of each project.154 The program has held three tendering cycles so far,
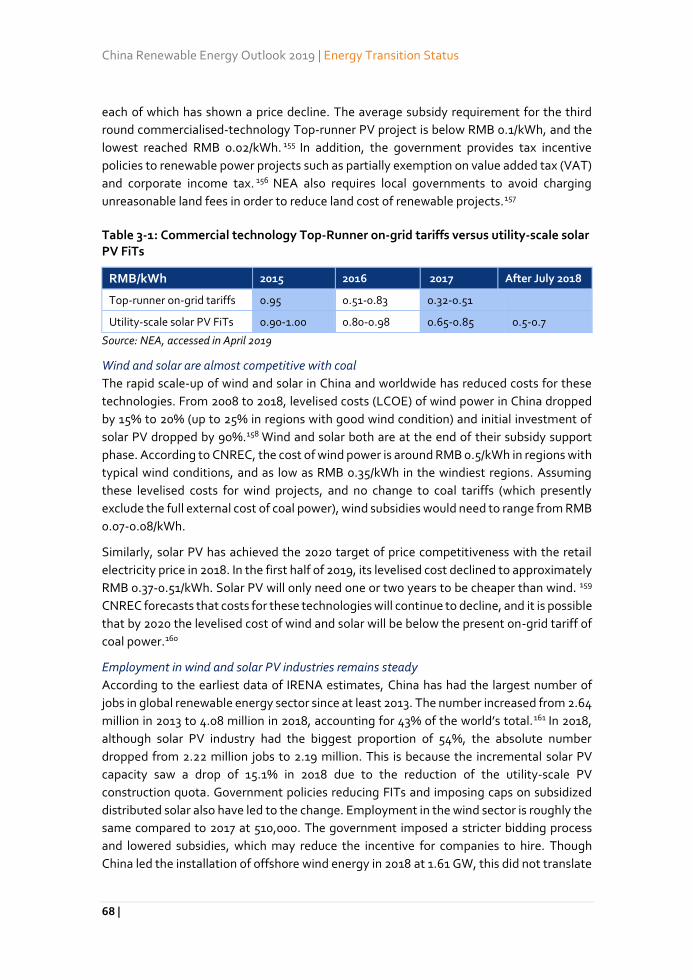
China Renewable Energy Outlook 2019 | Energy Transition Status
68 |
each of which has shown a price decline. The average subsidy requirement for the third
round commercialised-technology Top-runner PV project is below RMB 0.1/kWh, and the
lowest reached RMB 0.02/kWh. 155 In addition, the government provides tax incentive
policies to renewable power projects such as partially exemption on value added tax (VAT)
and corporate income tax. 156 NEA also requires local governments to avoid charging
unreasonable land fees in order to reduce land cost of renewable projects.157
Table 3-1: Commercial technology Top-Runner on-grid tariffs versus utility-scale solar PV FiTs
RMB/kWh 2015 2016 2017 After July 2018
Top-runner on-grid tariffs 0.95 0.51-0.83 0.32-0.51
Utility-scale solar PV FiTs 0.90-1.00 0.80-0.98 0.65-0.85 0.5-0.7
Source: NEA, accessed in April 2019
Wind and solar are almost competitive with coal
The rapid scale-up of wind and solar in China and worldwide has reduced costs for these
technologies. From 2008 to 2018, levelised costs (LCOE) of wind power in China dropped
by 15% to 20% (up to 25% in regions with good wind condition) and initial investment of
solar PV dropped by 90%.158 Wind and solar both are at the end of their subsidy support
phase. According to CNREC, the cost of wind power is around RMB 0.5/kWh in regions with
typical wind conditions, and as low as RMB 0.35/kWh in the windiest regions. Assuming
these levelised costs for wind projects, and no change to coal tariffs (which presently
exclude the full external cost of coal power), wind subsidies would need to range from RMB
0.07-0.08/kWh.
Similarly, solar PV has achieved the 2020 target of price competitiveness with the retail
electricity price in 2018. In the first half of 2019, its levelised cost declined to approximately
RMB 0.37-0.51/kWh. Solar PV will only need one or two years to be cheaper than wind. 159
CNREC forecasts that costs for these technologies will continue to decline, and it is possible
that by 2020 the levelised cost of wind and solar will be below the present on-grid tariff of
coal power.160
Employment in wind and solar PV industries remains steady
According to the earliest data of IRENA estimates, China has had the largest number of
jobs in global renewable energy sector since at least 2013. The number increased from 2.64
million in 2013 to 4.08 million in 2018, accounting for 43% of the world’s total.161 In 2018,
although solar PV industry had the biggest proportion of 54%, the absolute number
dropped from 2.22 million jobs to 2.19 million. This is because the incremental solar PV
capacity saw a drop of 15.1% in 2018 due to the reduction of the utility-scale PV
construction quota. Government policies reducing FITs and imposing caps on subsidized
distributed solar also have led to the change. Employment in the wind sector is roughly the
same compared to 2017 at 510,000. The government imposed a stricter bidding process
and lowered subsidies, which may reduce the incentive for companies to hire. Though
China led the installation of offshore wind energy in 2018 at 1.61 GW, this did not translate
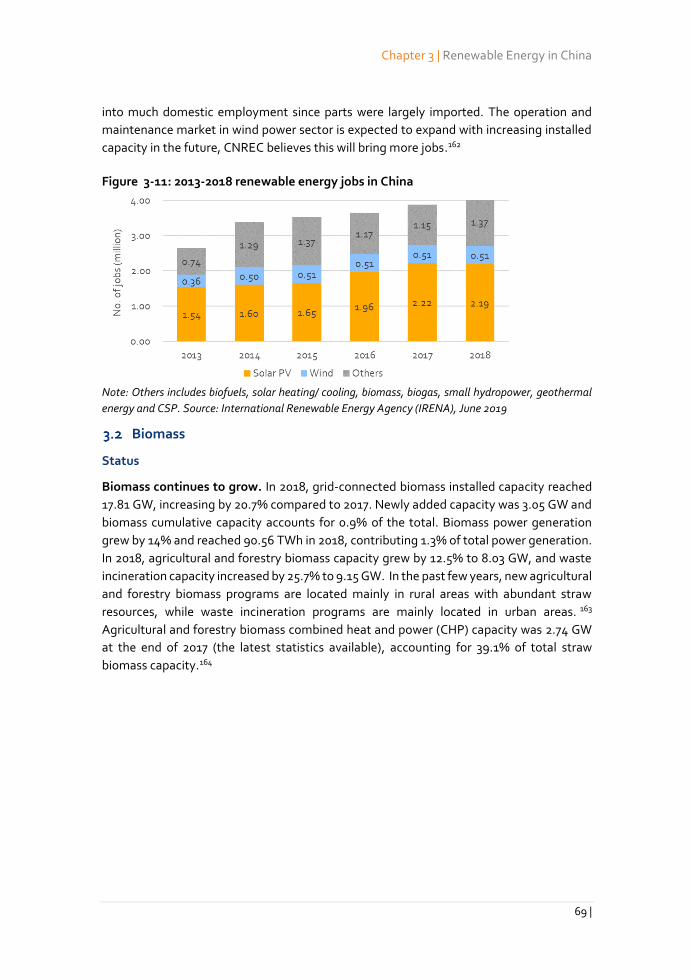
Chapter 3 | Renewable Energy in China
69 |
into much domestic employment since parts were largely imported. The operation and
maintenance market in wind power sector is expected to expand with increasing installed
capacity in the future, CNREC believes this will bring more jobs.162
Figure 3-11: 2013-2018 renewable energy jobs in China
Note: Others includes biofuels, solar heating/ cooling, biomass, biogas, small hydropower, geothermal
energy and CSP. Source: International Renewable Energy Agency (IRENA), June 2019
Biomass
Status
Biomass continues to grow. In 2018, grid-connected biomass installed capacity reached
17.81 GW, increasing by 20.7% compared to 2017. Newly added capacity was 3.05 GW and
biomass cumulative capacity accounts for 0.9% of the total. Biomass power generation
grew by 14% and reached 90.56 TWh in 2018, contributing 1.3% of total power generation.
In 2018, agricultural and forestry biomass capacity grew by 12.5% to 8.03 GW, and waste
incineration capacity increased by 25.7% to 9.15 GW. In the past few years, new agricultural
and forestry biomass programs are located mainly in rural areas with abundant straw
resources, while waste incineration programs are mainly located in urban areas. 163
Agricultural and forestry biomass combined heat and power (CHP) capacity was 2.74 GW
at the end of 2017 (the latest statistics available), accounting for 39.1% of total straw
biomass capacity.164
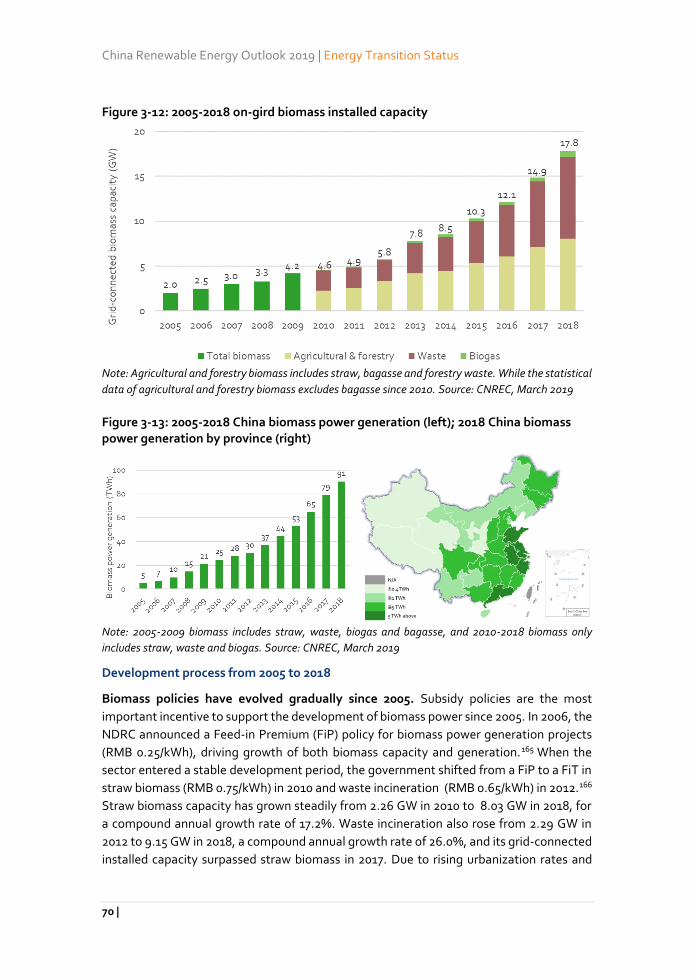
China Renewable Energy Outlook 2019 | Energy Transition Status
70 |
Figure 3-12: 2005-2018 on-gird biomass installed capacity
Note: Agricultural and forestry biomass includes straw, bagasse and forestry waste. While the statistical
data of agricultural and forestry biomass excludes bagasse since 2010. Source: CNREC, March 2019
Figure 3-13: 2005-2018 China biomass power generation (left); 2018 China biomass power generation by province (right)
Note: 2005-2009 biomass includes straw, waste, biogas and bagasse, and 2010-2018 biomass only
includes straw, waste and biogas. Source: CNREC, March 2019
Development process from 2005 to 2018
Biomass policies have evolved gradually since 2005. Subsidy policies are the most
important incentive to support the development of biomass power since 2005. In 2006, the
NDRC announced a Feed-in Premium (FiP) policy for biomass power generation projects
(RMB 0.25/kWh), driving growth of both biomass capacity and generation.165 When the
sector entered a stable development period, the government shifted from a FiP to a FiT in
straw biomass (RMB 0.75/kWh) in 2010 and waste incineration (RMB 0.65/kWh) in 2012.166
Straw biomass capacity has grown steadily from 2.26 GW in 2010 to 8.03 GW in 2018, for
a compound annual growth rate of 17.2%. Waste incineration also rose from 2.29 GW in
2012 to 9.15 GW in 2018, a compound annual growth rate of 26.0%, and its grid-connected
installed capacity surpassed straw biomass in 2017. Due to rising urbanization rates and
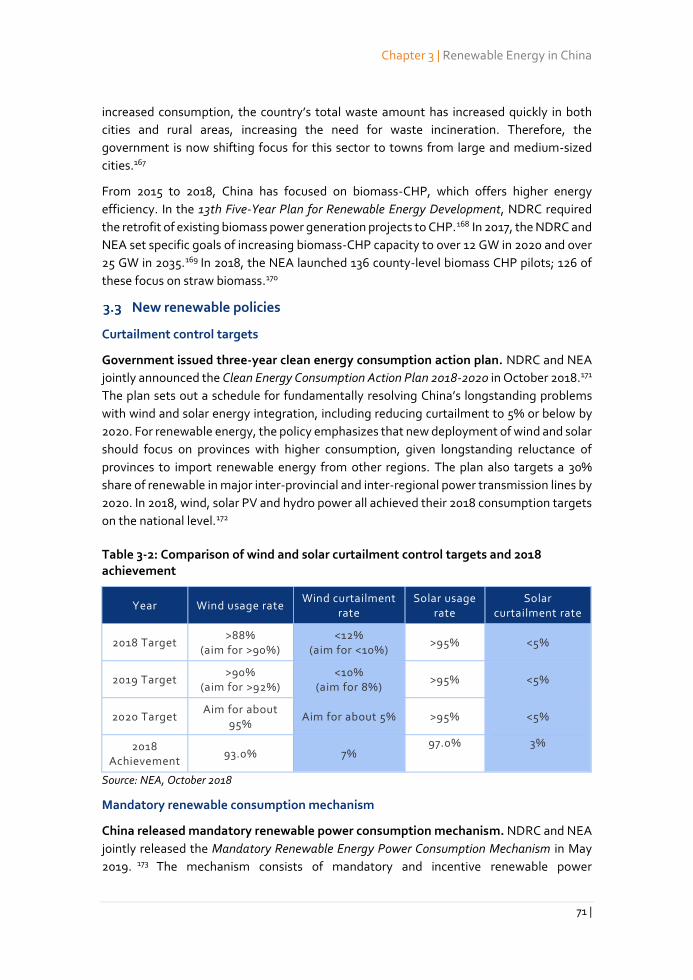
Chapter 3 | Renewable Energy in China
71 |
increased consumption, the country’s total waste amount has increased quickly in both
cities and rural areas, increasing the need for waste incineration. Therefore, the
government is now shifting focus for this sector to towns from large and medium-sized
cities.167
From 2015 to 2018, China has focused on biomass-CHP, which offers higher energy
efficiency. In the 13th Five-Year Plan for Renewable Energy Development, NDRC required
the retrofit of existing biomass power generation projects to CHP.168 In 2017, the NDRC and
NEA set specific goals of increasing biomass-CHP capacity to over 12 GW in 2020 and over
25 GW in 2035.169 In 2018, the NEA launched 136 county-level biomass CHP pilots; 126 of
these focus on straw biomass.170
New renewable policies
Curtailment control targets
Government issued three-year clean energy consumption action plan. NDRC and NEA
jointly announced the Clean Energy Consumption Action Plan 2018-2020 in October 2018.171
The plan sets out a schedule for fundamentally resolving China’s longstanding problems
with wind and solar energy integration, including reducing curtailment to 5% or below by
2020. For renewable energy, the policy emphasizes that new deployment of wind and solar
should focus on provinces with higher consumption, given longstanding reluctance of
provinces to import renewable energy from other regions. The plan also targets a 30%
share of renewable in major inter-provincial and inter-regional power transmission lines by
2020. In 2018, wind, solar PV and hydro power all achieved their 2018 consumption targets
on the national level.172
Table 3-2: Comparison of wind and solar curtailment control targets and 2018 achievement
Year Wind usage rate Wind curtailment
rate Solar usage
rate Solar
curtailment rate
2018 Target >88%
(aim for >90%) <12%
(aim for <10%) >95% <5%
2019 Target >90%
(aim for >92%) <10%
(aim for 8%) >95% <5%
2020 Target Aim for about
95% Aim for about 5% >95% <5%
2018 Achievement
93.0% 7% 97.0% 3%
Source: NEA, October 2018
Mandatory renewable consumption mechanism
China released mandatory renewable power consumption mechanism. NDRC and NEA
jointly released the Mandatory Renewable Energy Power Consumption Mechanism in May
2019. 173 The mechanism consists of mandatory and incentive renewable power
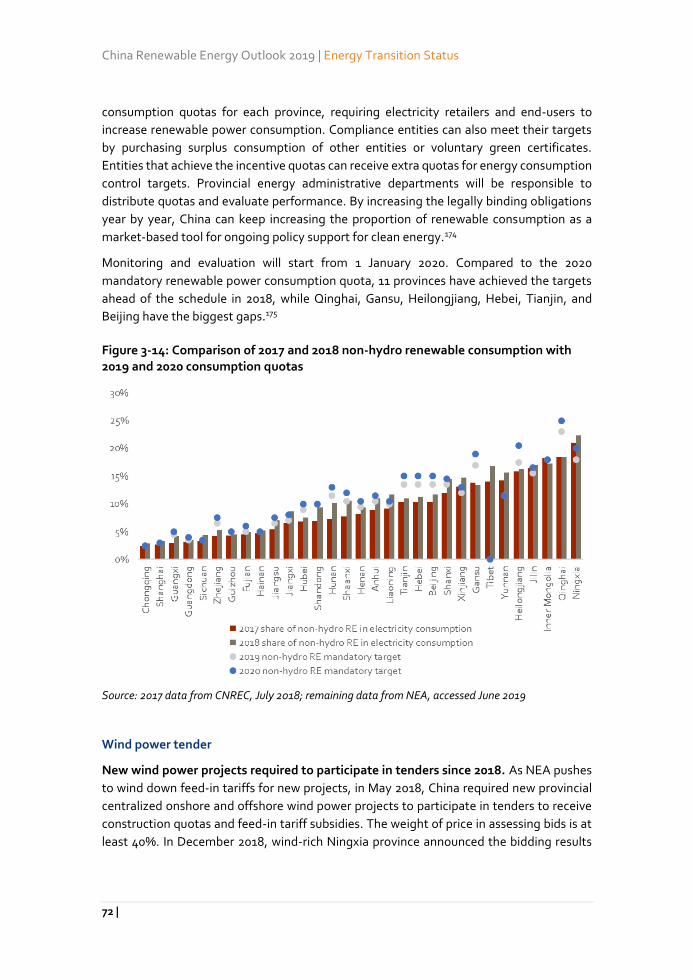
China Renewable Energy Outlook 2019 | Energy Transition Status
72 |
consumption quotas for each province, requiring electricity retailers and end-users to
increase renewable power consumption. Compliance entities can also meet their targets
by purchasing surplus consumption of other entities or voluntary green certificates.
Entities that achieve the incentive quotas can receive extra quotas for energy consumption
control targets. Provincial energy administrative departments will be responsible to
distribute quotas and evaluate performance. By increasing the legally binding obligations
year by year, China can keep increasing the proportion of renewable consumption as a
market-based tool for ongoing policy support for clean energy.174
Monitoring and evaluation will start from 1 January 2020. Compared to the 2020
mandatory renewable power consumption quota, 11 provinces have achieved the targets
ahead of the schedule in 2018, while Qinghai, Gansu, Heilongjiang, Hebei, Tianjin, and
Beijing have the biggest gaps.175
Figure 3-14: Comparison of 2017 and 2018 non-hydro renewable consumption with 2019 and 2020 consumption quotas
Source: 2017 data from CNREC, July 2018; remaining data from NEA, accessed June 2019
Wind power tender
New wind power projects required to participate in tenders since 2018. As NEA pushes
to wind down feed-in tariffs for new projects, in May 2018, China required new provincial
centralized onshore and offshore wind power projects to participate in tenders to receive
construction quotas and feed-in tariff subsidies. The weight of price in assessing bids is at
least 40%. In December 2018, wind-rich Ningxia province announced the bidding results
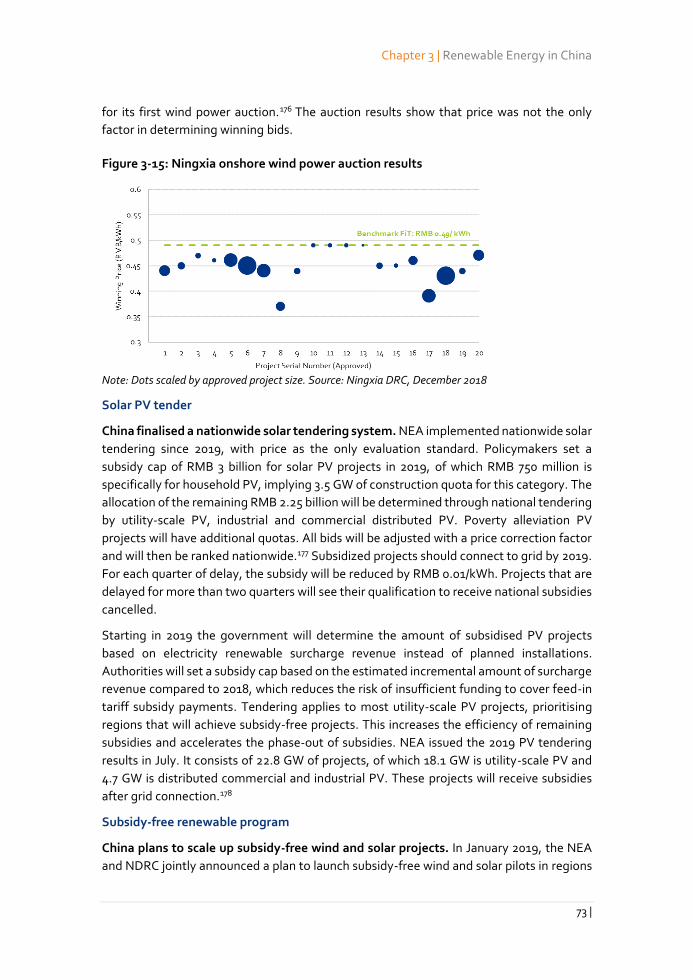
Chapter 3 | Renewable Energy in China
73 |
for its first wind power auction.176 The auction results show that price was not the only
factor in determining winning bids.
Figure 3-15: Ningxia onshore wind power auction results
Note: Dots scaled by approved project size. Source: Ningxia DRC, December 2018
Solar PV tender
China finalised a nationwide solar tendering system. NEA implemented nationwide solar
tendering since 2019, with price as the only evaluation standard. Policymakers set a
subsidy cap of RMB 3 billion for solar PV projects in 2019, of which RMB 750 million is
specifically for household PV, implying 3.5 GW of construction quota for this category. The
allocation of the remaining RMB 2.25 billion will be determined through national tendering
by utility-scale PV, industrial and commercial distributed PV. Poverty alleviation PV
projects will have additional quotas. All bids will be adjusted with a price correction factor
and will then be ranked nationwide.177 Subsidized projects should connect to grid by 2019.
For each quarter of delay, the subsidy will be reduced by RMB 0.01/kWh. Projects that are
delayed for more than two quarters will see their qualification to receive national subsidies
cancelled.
Starting in 2019 the government will determine the amount of subsidised PV projects
based on electricity renewable surcharge revenue instead of planned installations.
Authorities will set a subsidy cap based on the estimated incremental amount of surcharge
revenue compared to 2018, which reduces the risk of insufficient funding to cover feed-in
tariff subsidy payments. Tendering applies to most utility-scale PV projects, prioritising
regions that will achieve subsidy-free projects. This increases the efficiency of remaining
subsidies and accelerates the phase-out of subsidies. NEA issued the 2019 PV tendering
results in July. It consists of 22.8 GW of projects, of which 18.1 GW is utility-scale PV and
4.7 GW is distributed commercial and industrial PV. These projects will receive subsidies
after grid connection.178
Subsidy-free renewable program
China plans to scale up subsidy-free wind and solar projects. In January 2019, the NEA
and NDRC jointly announced a plan to launch subsidy-free wind and solar pilots in regions
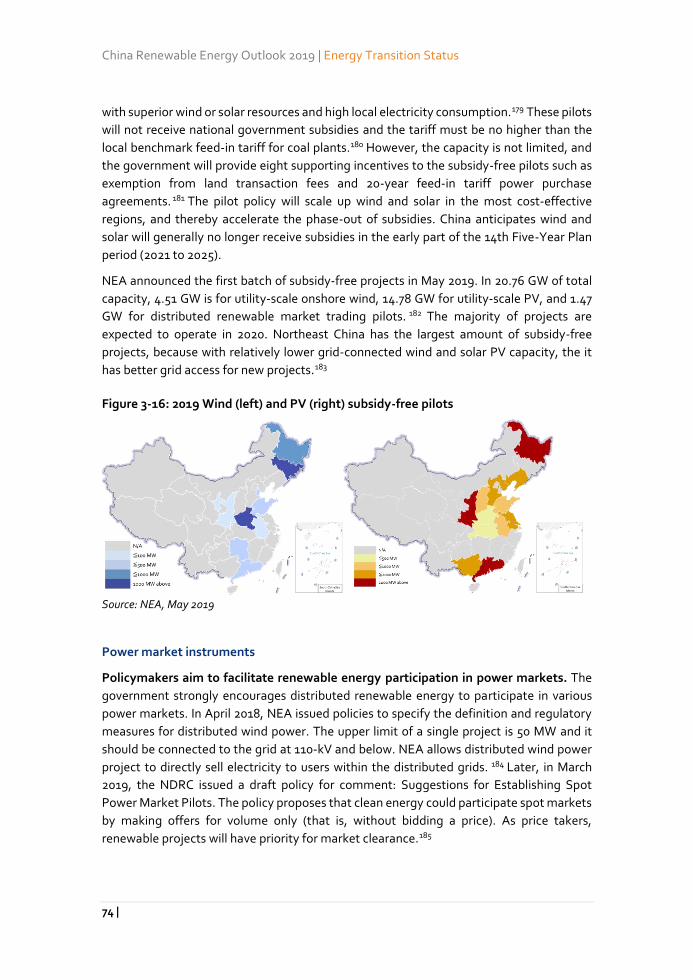
China Renewable Energy Outlook 2019 | Energy Transition Status
74 |
with superior wind or solar resources and high local electricity consumption.179 These pilots
will not receive national government subsidies and the tariff must be no higher than the
local benchmark feed-in tariff for coal plants.180 However, the capacity is not limited, and
the government will provide eight supporting incentives to the subsidy-free pilots such as
exemption from land transaction fees and 20-year feed-in tariff power purchase
agreements. 181 The pilot policy will scale up wind and solar in the most cost-effective
regions, and thereby accelerate the phase-out of subsidies. China anticipates wind and
solar will generally no longer receive subsidies in the early part of the 14th Five-Year Plan
period (2021 to 2025).
NEA announced the first batch of subsidy-free projects in May 2019. In 20.76 GW of total
capacity, 4.51 GW is for utility-scale onshore wind, 14.78 GW for utility-scale PV, and 1.47
GW for distributed renewable market trading pilots. 182 The majority of projects are
expected to operate in 2020. Northeast China has the largest amount of subsidy-free
projects, because with relatively lower grid-connected wind and solar PV capacity, the it
has better grid access for new projects.183
Figure 3-16: 2019 Wind (left) and PV (right) subsidy-free pilots
Source: NEA, May 2019
Power market instruments
Policymakers aim to facilitate renewable energy participation in power markets. The
government strongly encourages distributed renewable energy to participate in various
power markets. In April 2018, NEA issued policies to specify the definition and regulatory
measures for distributed wind power. The upper limit of a single project is 50 MW and it
should be connected to the grid at 110-kV and below. NEA allows distributed wind power
project to directly sell electricity to users within the distributed grids. 184 Later, in March
2019, the NDRC issued a draft policy for comment: Suggestions for Establishing Spot
Power Market Pilots. The policy proposes that clean energy could participate spot markets
by making offers for volume only (that is, without bidding a price). As price takers,
renewable projects will have priority for market clearance.185
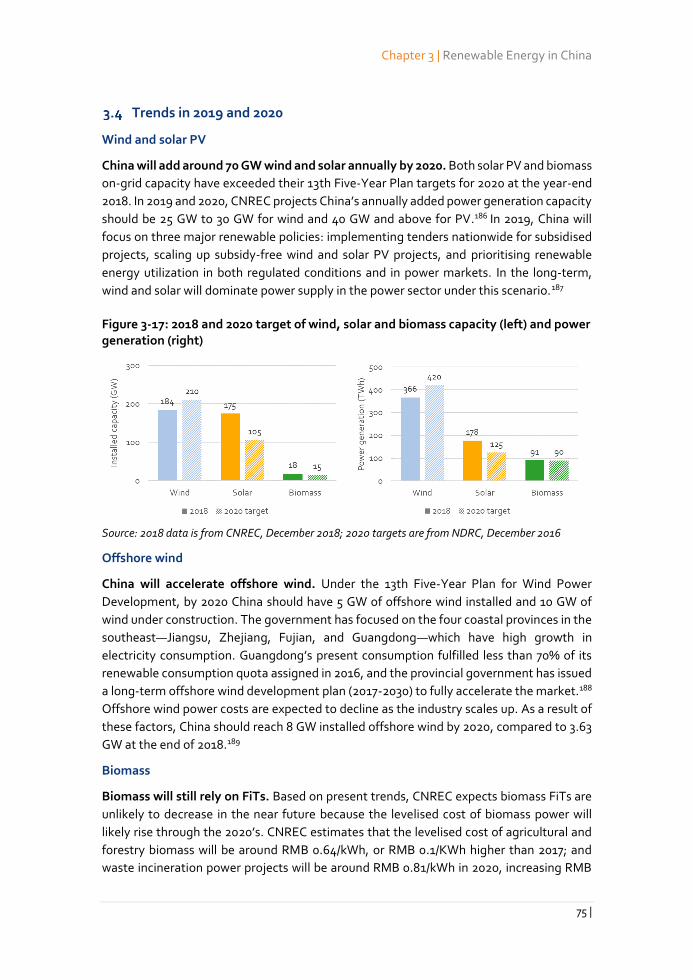
Chapter 3 | Renewable Energy in China
75 |
Trends in 2019 and 2020
Wind and solar PV
China will add around 70 GW wind and solar annually by 2020. Both solar PV and biomass
on-grid capacity have exceeded their 13th Five-Year Plan targets for 2020 at the year-end
2018. In 2019 and 2020, CNREC projects China’s annually added power generation capacity
should be 25 GW to 30 GW for wind and 40 GW and above for PV.186 In 2019, China will
focus on three major renewable policies: implementing tenders nationwide for subsidised
projects, scaling up subsidy-free wind and solar PV projects, and prioritising renewable
energy utilization in both regulated conditions and in power markets. In the long-term,
wind and solar will dominate power supply in the power sector under this scenario.187
Figure 3-17: 2018 and 2020 target of wind, solar and biomass capacity (left) and power generation (right)
Source: 2018 data is from CNREC, December 2018; 2020 targets are from NDRC, December 2016
Offshore wind
China will accelerate offshore wind. Under the 13th Five-Year Plan for Wind Power
Development, by 2020 China should have 5 GW of offshore wind installed and 10 GW of
wind under construction. The government has focused on the four coastal provinces in the
southeast—Jiangsu, Zhejiang, Fujian, and Guangdong—which have high growth in
electricity consumption. Guangdong’s present consumption fulfilled less than 70% of its
renewable consumption quota assigned in 2016, and the provincial government has issued
a long-term offshore wind development plan (2017-2030) to fully accelerate the market.188
Offshore wind power costs are expected to decline as the industry scales up. As a result of
these factors, China should reach 8 GW installed offshore wind by 2020, compared to 3.63
GW at the end of 2018.189
Biomass
Biomass will still rely on FiTs. Based on present trends, CNREC expects biomass FiTs are
unlikely to decrease in the near future because the levelised cost of biomass power will
likely rise through the 2020’s. CNREC estimates that the levelised cost of agricultural and
forestry biomass will be around RMB 0.64/kWh, or RMB 0.1/KWh higher than 2017; and
waste incineration power projects will be around RMB 0.81/kWh in 2020, increasing RMB
China Renewable Energy Outlook 2019 | Energy Transition Status
76 |
0.1/KWh compared to 2017 due to the cost of biomass inputs, and rising investment and
operational cost required to comply with emissions regulations. Biomass CHP is the main
trend underway. With the exception of retrofitting existing biomass power projects, to
contain subsidy costs and maximize energy efficiency, policymakers may restrict the
expansion of biomass projects that only generate power. 190
Major challenges
Overall, renewable energy development has encountered setbacks at the national,
regional, and individual levels. On the national level, the implementation of the mandatory
consumption mechanism remains unclear. The lack of flexible resources, up-to-date
energy and power systems planning, renewable electricity consumption has become a
long-standing challenge. Subsidy payment delays, interference in market trading and
pricing by local governments, and increasing soft costs all bring risks for renewable projects.
Some local governments have banned companies from building new distributed
generation in light of previous ill-considered projects, while some demand unreasonable
taxes and fees from renewable projects to boost local revenue.
Renewable electricity consumption
To reduce coal consumption and increase the proportion of clean energy, China must
continue to increase renewable installed capacity and electricity generation. According to
CNREC projections, in 2019 China will add around 70 GW of new wind and solar PV capacity.
Unless reforms continue to keep pace with these additions, enabling full consumption of
renewable energy, curtailment could increase. 191
China has yet to fully incentivise important institutional players to prioritize renewable
consumption. The western and northern regions have large-scale wind and solar PV, but
these regions historically focused on capacity expansion over planning and construction of
transmission lines or improving provincial consumption. Most of the central and eastern
provinces still rely on local thermal power and do not fully give market space for renewable
energy production.192 Although the government has established a binding consumption
mechanism, the long-term implementation path is still unclear. By 2018, there was still a
gap of 3.5% to 6.5% between the 2020 provincial binding targets of non-hydro renewable
energy consumption and the actual consumption ratios in Qinghai, Gansu, Heilongjiang,
and the Jing-Jin-Ji region.193
The flexible resource and adjustment capability of the power system remains only partially
exploited. In terms of capacity, the current proportion of flexible power supply such as
pumped hydro storage and flexible gas power plants in the Three Norths is less than 2%,
and especially in winter, flexible capacity is limited due to the large share and inflexible
operating protocol for CHP units. 194 Wind and solar PV electricity have also increased
demand for frequency regulation in day-ahead and intra-day power dispatch plans. Power
dispatch centres currently set power dispatch plans based on the yearly, monthly, weekly
and daily periods. This approach needs further optimization for variable renewable
energy.195
Chapter 3 | Renewable Energy in China
77 |
Despite the urgency of enhancing inter-provincial and inter-regional power transmission
of renewables, national long-term inter-regional transmission plans have yet to include this
element, reducing local government motivation to consume renewable energy. 196 In
addition, demand side management is still in the trial phase; so far there is no functional
flexible load utilization mechanisms to promote renewable energy consumption. 197
Planning also affects renewable consumption. Solar PV and wind installation targets set in
the 13th Five-Year Plan for Power Development were completed ahead of schedule in 2017
and 2018. However, the construction and operation of the power grid are still in accordance
with plans set earlier, hampering export renewable electricity to consumption centres.198
System planning and coordination among grid, generation, land use, and environmental
protection represents a long-term obstacle to renewable energy integration.
Profitability of renewable projects
The development of wind and solar PV has gradually entered a post-subsidy era. Yet
although wind and solar PV have reduced capital costs, revenue declines, added external
costs, and increased uncertainty have hampered renewable developers. Some provinces
have established various market mechanisms, yet the actual tariff is mainly based on the
local government's guiding price, and some on-grid tariffs may be as low as a few cents per
kWh. This reduces realized income of projects, in turn making it more difficult to reduce
subsidies. The cost of ancillary services in the Northeast has not been transferred to users
or collected from transmission and distribution tariffs; rather, renewable projects absorb
these costs. 199
Regulatory restrictions on land use, environmental impact assessments, soil and water
conservation have become stricter, and this has increased costs for new renewable projects.
In 2018, non-technical costs accounted for 30% of the total installed cost of utility-scale
solar PV plants in China, versus 16% in Germany, 22% in the United States, and 24% in
India.200 Although VAT regulations are clear, regulations setting the farmland occupation
tax, land use tax, and water resource fees for renewable projects, local implementation
often varies, creating additional hurdles. For instance, in the Provisional Regulations on
Farmland Occupation Tax issued by the State Council in 2007, the scope of urban farmland
occupation tax is given a 20-fold interval tax rate, giving local governments wide discretion
to set taxes at prohibitive levels.201
During the 13th Five-Year Plan period, incremental wind and solar PV capacity began to
shift to the central and coastal regions based on national policy guidance. This has shifted
attention to the problem of high land cost. Solar PV developers should pay the farmland
occupancy tax all at once and pay the land use tax every year. However, the land use tax in
differs greatly by city: in some eastern cities and towns, the annual land use tax exceeds
RMB 1000/mu.202 In addition, some local governments require solar PV developers to pay
20 years of land use tax all up front, severely challenging investment cash flow returns.203
Another issue is that ministries have different classification for land types, leading to a
back-and-forth negotiation among government departments for land use approval,
extending the investment and development cycle and increasing uncertainty. For instance,
China Renewable Energy Outlook 2019 | Energy Transition Status
78 |
part of the unused land and wasteland listed in the planning documents of the former
Ministry of Land and Resources was defined as forest land in the planning documents of
the former State Forestry Administration, preventing the use of this wasteland for solar PV
plants.204
Existing renewable power projects face risks from delayed subsidy payments and price
competition in power markets. Since 2012, the government has paid more than RMB 400
billion in subsidies for renewable electricity via the Renewable Energy Development Fund,
derived from electricity surcharge funds. Because wind and solar have developed rapidly in
the last five years, while the funds collected from the Renewable Surcharge have not kept
pace, the cumulative surcharge deficit in 2018 exceeded RMB 160 billion. 205 Subsidy
payment delays may last through the 2020s, leading to financial risks for renewable project
developers and hindering involvement of private sector players, ultimately leading to
higher costs. In addition, the current coal power price does not fully count external costs.206
Given these circumstances, wind and solar must achieve even lower prices to compete with
conventional fuels without subsidies.
Distributed generation
Development of distributed generation faces both market and regulatory issues. NEA
announced plans to establish liberalized trading markets for distributed generators and
consumers within distributed grids in 2017, but only a small number of pilots had kicked off
by 2018, partly due to issues related to transmission and distribution (T&D) tariffs.207 T&D
prices range from RMB 0.001/kWh to RMB 0.3/kWh, which is either too high or too low to
represent the real costs of power transmission and distribution. The absence of either
effective electricity markets or reasonable grid-utilization pricing prevents many
distributed generators from selling electricity directly to end-users and consequently
reduces or eliminates their competitiveness.208
Second, the management and supervision of land use and environmental impacts of
distributed renewable projects are under control of different local departments, making it
difficult to implement projects. Due to unclear departmental regulatory functions and
changing local land use policies, renewable projects have in some cases been demolished
following construction, while other projects have been denied grid connection after
completing construction. Meanwhile, renewable developers have lacked guidance and
monitoring, and hence illegally built projects on wetlands, farmlands, or on the foundations
of condemned buildings. 209 To avoid these problems, some local governments have
banned all companies from building any new distributed generation.210 Land occupation
larger than expectation and potential adverse impacts on crops and animals are also
concerns raised by local governments.
Conclusion
China has made substantial progress on scaling up renewable power as well as reducing
the cost of renewable energy in the past 20 years, and as a result China has fulfilled the
13th Five-Year Plan targets ahead of time. Wind and solar PV have gradually entered the

Chapter 3 | Renewable Energy in China
79 |
post-subsidy era, and nationwide subsidy-free and FiT tendering projects will be the new
trend. In 2018, the government promoted consumption of renewable energy via setting
mandatory caps on curtailment and minimum consumption targets. Nevertheless,
obstacles such as subsidy payment delays and unclear land use policies still remain. More
long-term targets and measures are needed to meet the challenges and maintain healthy
industrial development.
China Renewable Energy Outlook 2019 | Energy Scenarios for 2035 and 2050
80 |
Part2:
Energy Scenarios for 2035 and
2050
Chapter 4 | Energy Scenarios to 2050
81 |
4. Energy scenarios to 2050
The renewable energy outlook for China uses scenarios to analyse how renewable energy
can be used in the Chinese energy system. The scenarios provide a clear and consistent
vision for the long-term development as basis for short-term decisions. Two scenarios are
defined: The Stated Policies scenario expresses the impact of a firm implementation of
announced polices, while the Below 2 °C scenario shows a pathway for China to achieve the
ambitions vision for an ecological civilisation and the role China could take in the fulfilment
of the Paris agreement. On top of these scenarios, several variants are analysed to illustrate
specific issues which influence the implementation strategies.
The scenarios are modelled in detailed bottom-up models for the end-use sectors and for
the power sector. Specific assumptions for macroeconomic indicators, demographic
indicators and targets or restrictions to the scenarios’ energy systems are used as input to
the models to guide the development trends in the desired direction and to ensure
fulfilment of the goals for the energy system development. Within these boundaries, the
power sector model is driven by an overall cost-optimisation to ensure cost-efficient
energy system transformation.
This chapter explains the scenario methodology, the general ideas behind the two
scenarios and the main assumptions used in the scenarios.
Scenario methodology
The scenarios are designed to achieve the following:
Provide a clear long-term vision. The energy system composition of this vision will
be presented as well as the reasoning behind.
Establish a clear view of the current situation, trends, market and policy direction,
and project this into the future.
The forecasted trends and the long-term visions are forced to converge and form
a connected story as a complete energy system scenario.
During the work with the scenarios, the gaps between the short-term direction and the
long-term vision become apparent. The scenarios and their supporting models are loaded
with constraints and strategic priorities to achieve a consistent connection between the
short-term and long-term.
As a matter of principle, there is no claim of cost-optimality or that the presented scenarios
are perfect. However, where possible, it has been attempted to quantify the costs and
benefits of the scenarios and evaluate the performance of the scenarios against key policy
imperatives.
As a matter of process, least-cost optimisation principles are relied upon to fill in the blanks,
and as a proxy for agent behaviour within the overall policy framework conditions and
constraints defined in the scenarios.
China Renewable Energy Outlook 2019 | Energy Scenarios for 2035 and 2050
82 |
The scenario results provide input for timely policy making
The quantitative and qualitative expressions of the scenarios are inputs for policy making
with three distinct frameworks:
1. Recommendations for policy approaches, policy measures and targeting setting
in the 14th Five-Year Plan period (2021-2025).
2. Recommendations for the medium-term policy developments in the 15th and 16th
Five-Year Plan periods (2026-2035)
3. To assist in crystallising the long-term policy objectives and targets and provide a
measure of confidence, supporting long-term objectives for the realisation of bold
policy visions.
Two main scenarios
CREO 2019 continues the tradition from previous outlooks with two core scenarios for the
energy systems development.
Stated Policies scenario expresses firm implementation of announced policies
The scenario assumes full and firm implementation of energy sector and related policies
expressed in the 13th Five-Year Plan and in the 19th Party Congress announcements. Central
priorities are the efforts to build a clean, low-carbon, safe and efficient energy supply. The
scenario also includes the NDC climate target to peak in emissions before 2030, the effects
of the Blue-Sky Protection Plan, aspects of the Energy Production and Consumption
Revolution Strategy, and the National Emissions Trading scheme.
Policy trends are extrapolated to set the longer-term policy drivers.
Below 2 °C scenario shows how China can build an energy system for the ecological
civilisation
The Below 2 °C scenario shows a road for China to achieve the ambitious vision for an
ecological civilisation and the role China could take in the fulfilment of the Paris agreement.
The main driver is a hard target for energy related CO2 emissions through a strategy with
renewable electricity, electrification and sectoral transformation at the core. The target is
set at 200 million tons of energy related CO2 emissions in total between 2018-2050.
Supplementary scenario variants to illuminate specific issues
Scenario variants are used in the report to highlight or quantify in isolation the
implications of alternative approaches to a specific issue. This year’s CREO includes
variants on the resource recycling in industries, energy saving potential based on useful
energy analysis, available resource potential for distributed resources, demand
response in aluminium smelters, availability of smart charging and V2G, possibility
flexible coal plant investments and retrofits, transmission investments, transmission
flexibility and the use of natural gas.
Chapter 4 | Energy Scenarios to 2050
83 |
The two core scenarios are compound scenarios with an array of differences in terms of
the assumptions. Therefore, it is not always straightforward, or even possible, to
attribute specific outcomes to specific measures included in the scenarios. The core
scenarios provide a reference upon which to base a differential analysis against their
scenario variants. Variants can be thought of as single parameter variations, where one
of the core scenarios is recalculated, with a single alteration on the input side.
Modelling provides quantification, consistency and completeness
The scenario’s development in CREO is supported by CNREC’s energy system modelling
tool, consisting of interlinked models, covering the energy sector of Mainland China.
The China National Renewable Energy Centre has, since it was established in 2011, focused
on developing comprehensive modelling tools to analyse the energy and socioeconomic
impact of development and integration of renewable energy in the Chinese energy system.
Final energy demands are directed in the END-USE model
The END-USE model, based on LEAP (Long-range Energy Alternatives Planning system),
represents bottom-up modelling of end-use demand and how this demand is satisfied.
End-uses are driven by assumed developments in key activity levels in the economy,
including production projection of key energy intensive products (steel, cement, chemicals,
etc), and the economic value added for other industries.
These drivers translate to energy consumption when combined with assumptions such as
industrial output changes, floor area development, energy efficiency improvement, device
and fuel shifting (mainly in industry and transportation sectors), as well as end-use
behavioural features adjustment.
Transformation activities aside from district heating and power are also covered by LEAP,
including upstream refinery activity, such as hydrogen production from the electrolysis
process, biofuel production via different technical routines, oil-refining, etc.
Power and district heating sectors are modelled in EDO
The EDO (Electricity and District heating Optimisation) model is a fundamental model of
power and district heating systems, built on the Balmorel model (www.balmorel.com). The
power system is represented at provincial level, considering the interprovincial grid
constraints and expansion options. The model includes all relevant production units, i.e.
thermal (including CHP), wind, solar (including CSP), hydro, power storage, heat boilers,
heat storages, heat pumps, etc on the supply side. Moreover, it also considers options for
demand-side flexibility, e.g., from industries, smart charging of electric vehicles, as well as
the option of a full integrated coupling with the district heating sector.
The model can represent the current dispatch in the Chinese power system on an hourly
basis, with limitations on the thermal power plants and interprovincial exchange of power;
it can also represent the dispatch in a power market, provincial, regional or national, based
on the least-cost marginal price optimization. Key characteristics relate to the detailed
representation of variability of load and supply (e.g. from VRE sources) as well as flexibility
China Renewable Energy Outlook 2019 | Energy Scenarios for 2035 and 2050
84 |
and flexibility potentials, which can operate optimally and be deployed efficiently in
capacity expansion mode. As the Balmorel model is open-source, it has allowed for flexible
customisation and enhancements including core features and ‘add-ons’ to tailor the model
for application on China, and for interaction with CNRECs suite of models. EDO was
introduced in 2012 and has been continuously used and enhanced hereafter, including in
the production of the previous CREO reports.
Combined summary tool
Quantitative results from the two models are combined in an integrated Excel-based tool,
which provides an overall view of the energy system, e.g. combining the fuel consumption
from the power and heating systems from EDO, with direct consumption in end-use
sectors and consumption in other transformation sectors from LEAP.
Energy transition strategy underpinning the scenarios
Economic growth is bottom line precondition of China’s socioeconomic objectives for 2050.
It is required that GDP grows 4.2 times from 2018 level in real terms by 2050. However, the
growth shall be sustainable and supported by the transition of the Chinese energy system
to build in the properties of clean, low-carbon, safe and efficient – and essential component
in the efforts to build China’s Ecological Civilisation.
The strategy for the energy transition explored in the China Renewable Energy Outlook
relies on three pillars.
Green energy supply – technological progress and cost reduction makes RE
deployment possible to provide the clean energy in bulk, particularly through
renewable electricity.
Energy efficiency improvement is a key pillar on the demand-side to ensure
adequacy of the pace and scale of deployments on the supply-side and support
the required economic growth.
Electrification and market reforms will change rules of the game on the demand-
side and drive fossil fuels from end-use consumption, in conjunction with
decarbonisation of the electricity supply.
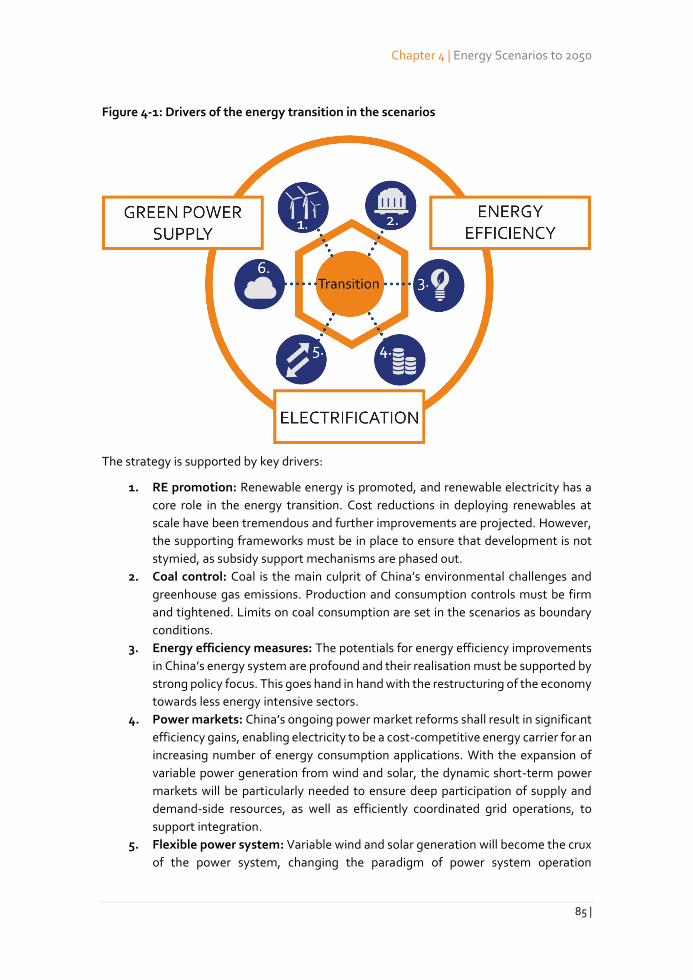
Chapter 4 | Energy Scenarios to 2050
85 |
Figure 4-1: Drivers of the energy transition in the scenarios
The strategy is supported by key drivers:
1. RE promotion: Renewable energy is promoted, and renewable electricity has a
core role in the energy transition. Cost reductions in deploying renewables at
scale have been tremendous and further improvements are projected. However,
the supporting frameworks must be in place to ensure that development is not
stymied, as subsidy support mechanisms are phased out.
2. Coal control: Coal is the main culprit of China’s environmental challenges and
greenhouse gas emissions. Production and consumption controls must be firm
and tightened. Limits on coal consumption are set in the scenarios as boundary
conditions.
3. Energy efficiency measures: The potentials for energy efficiency improvements
in China’s energy system are profound and their realisation must be supported by
strong policy focus. This goes hand in hand with the restructuring of the economy
towards less energy intensive sectors.
4. Power markets: China’s ongoing power market reforms shall result in significant
efficiency gains, enabling electricity to be a cost-competitive energy carrier for an
increasing number of energy consumption applications. With the expansion of
variable power generation from wind and solar, the dynamic short-term power
markets will be particularly needed to ensure deep participation of supply and
demand-side resources, as well as efficiently coordinated grid operations, to
support integration.
5. Flexible power system: Variable wind and solar generation will become the crux
of the power system, changing the paradigm of power system operation
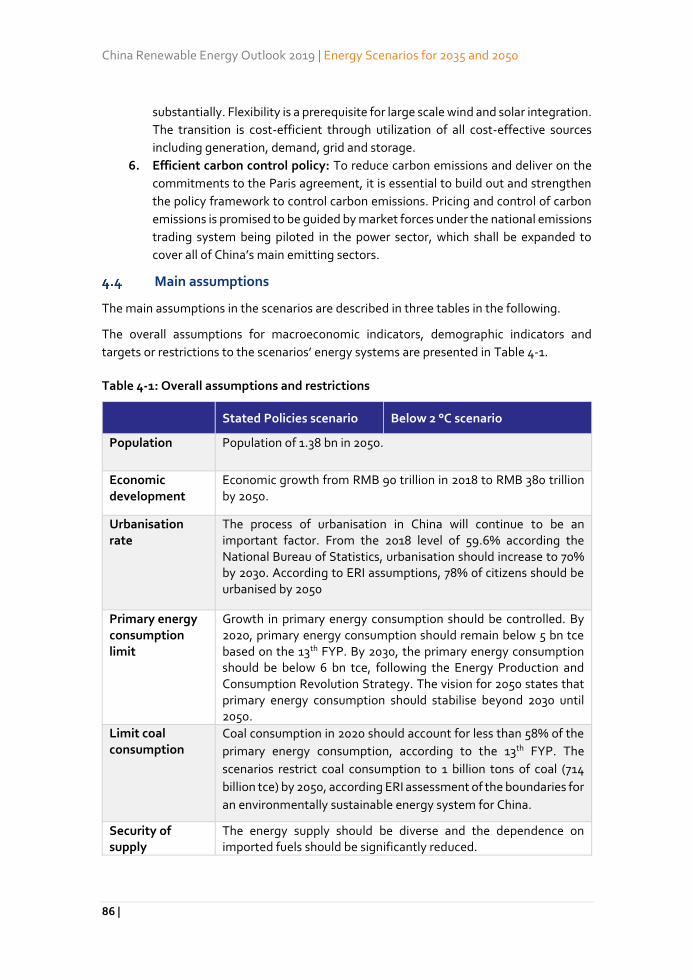
China Renewable Energy Outlook 2019 | Energy Scenarios for 2035 and 2050
86 |
substantially. Flexibility is a prerequisite for large scale wind and solar integration.
The transition is cost-efficient through utilization of all cost-effective sources
including generation, demand, grid and storage.
6. Efficient carbon control policy: To reduce carbon emissions and deliver on the
commitments to the Paris agreement, it is essential to build out and strengthen
the policy framework to control carbon emissions. Pricing and control of carbon
emissions is promised to be guided by market forces under the national emissions
trading system being piloted in the power sector, which shall be expanded to
cover all of China’s main emitting sectors.
Main assumptions
The main assumptions in the scenarios are described in three tables in the following.
The overall assumptions for macroeconomic indicators, demographic indicators and
targets or restrictions to the scenarios’ energy systems are presented in Table 4-1.
Table 4-1: Overall assumptions and restrictions
Stated Policies scenario Below 2 °C scenario
Population Population of 1.38 bn in 2050.
Economic development
Economic growth from RMB 90 trillion in 2018 to RMB 380 trillion by 2050.
Urbanisation rate
The process of urbanisation in China will continue to be an important factor. From the 2018 level of 59.6% according the National Bureau of Statistics, urbanisation should increase to 70% by 2030. According to ERI assumptions, 78% of citizens should be urbanised by 2050
Primary energy consumption limit
Growth in primary energy consumption should be controlled. By 2020, primary energy consumption should remain below 5 bn tce based on the 13th FYP. By 2030, the primary energy consumption should be below 6 bn tce, following the Energy Production and Consumption Revolution Strategy. The vision for 2050 states that primary energy consumption should stabilise beyond 2030 until 2050.
Limit coal consumption
Coal consumption in 2020 should account for less than 58% of the
primary energy consumption, according to the 13th FYP. The
scenarios restrict coal consumption to 1 billion tons of coal (714
billion tce) by 2050, according ERI assessment of the boundaries for
an environmentally sustainable energy system for China.
Security of supply
The energy supply should be diverse and the dependence on imported fuels should be significantly reduced.
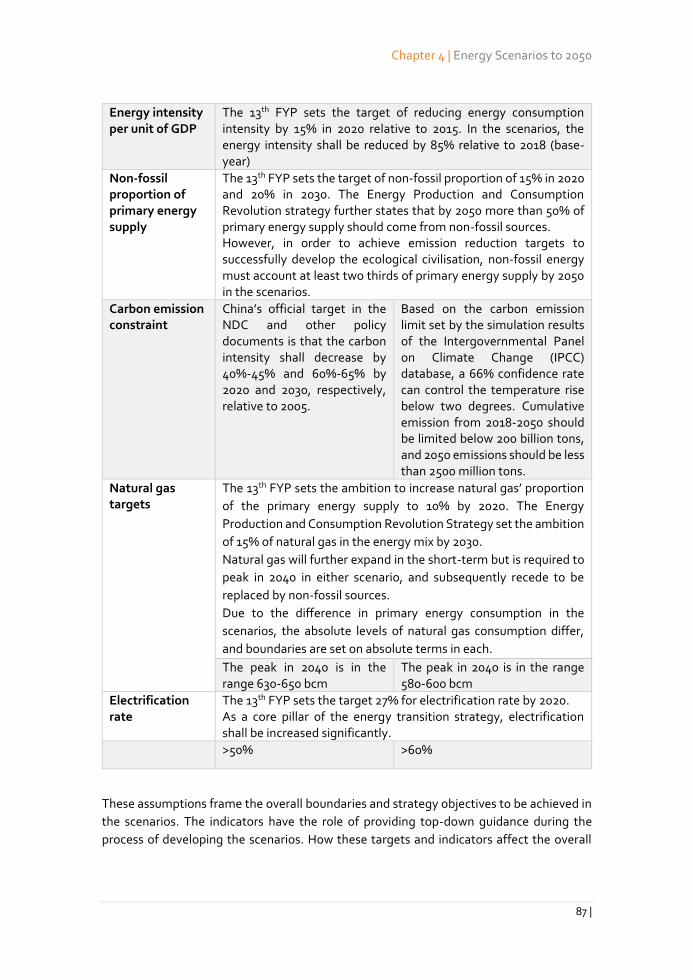
Chapter 4 | Energy Scenarios to 2050
87 |
Energy intensity per unit of GDP
The 13th FYP sets the target of reducing energy consumption intensity by 15% in 2020 relative to 2015. In the scenarios, the energy intensity shall be reduced by 85% relative to 2018 (base-year)
Non-fossil proportion of primary energy supply
The 13th FYP sets the target of non-fossil proportion of 15% in 2020 and 20% in 2030. The Energy Production and Consumption Revolution strategy further states that by 2050 more than 50% of primary energy supply should come from non-fossil sources. However, in order to achieve emission reduction targets to successfully develop the ecological civilisation, non-fossil energy must account at least two thirds of primary energy supply by 2050 in the scenarios.
Carbon emission constraint
China’s official target in the NDC and other policy documents is that the carbon intensity shall decrease by 40%-45% and 60%-65% by 2020 and 2030, respectively, relative to 2005.
Based on the carbon emission limit set by the simulation results of the Intergovernmental Panel on Climate Change (IPCC) database, a 66% confidence rate can control the temperature rise below two degrees. Cumulative emission from 2018-2050 should be limited below 200 billion tons, and 2050 emissions should be less than 2500 million tons.
Natural gas targets
The 13th FYP sets the ambition to increase natural gas’ proportion
of the primary energy supply to 10% by 2020. The Energy
Production and Consumption Revolution Strategy set the ambition
of 15% of natural gas in the energy mix by 2030.
Natural gas will further expand in the short-term but is required to
peak in 2040 in either scenario, and subsequently recede to be
replaced by non-fossil sources.
Due to the difference in primary energy consumption in the
scenarios, the absolute levels of natural gas consumption differ,
and boundaries are set on absolute terms in each.
The peak in 2040 is in the range 630-650 bcm
The peak in 2040 is in the range 580-600 bcm
Electrification rate
The 13th FYP sets the target 27% for electrification rate by 2020. As a core pillar of the energy transition strategy, electrification shall be increased significantly.
>50% >60%
These assumptions frame the overall boundaries and strategy objectives to be achieved in
the scenarios. The indicators have the role of providing top-down guidance during the
process of developing the scenarios. How these targets and indicators affect the overall
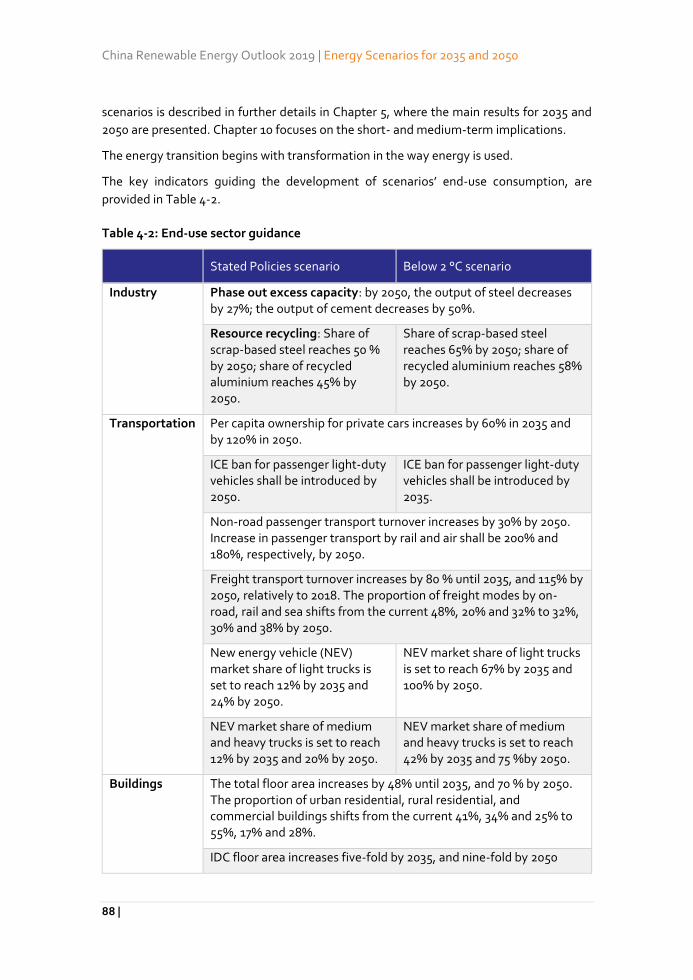
China Renewable Energy Outlook 2019 | Energy Scenarios for 2035 and 2050
88 |
scenarios is described in further details in Chapter 5, where the main results for 2035 and
2050 are presented. Chapter 10 focuses on the short- and medium-term implications.
The energy transition begins with transformation in the way energy is used.
The key indicators guiding the development of scenarios’ end-use consumption, are
provided in Table 4-2.
Table 4-2: End-use sector guidance
Stated Policies scenario Below 2 °C scenario
Industry Phase out excess capacity: by 2050, the output of steel decreases by 27%; the output of cement decreases by 50%.
Resource recycling: Share of scrap-based steel reaches 50 % by 2050; share of recycled aluminium reaches 45% by 2050.
Share of scrap-based steel reaches 65% by 2050; share of recycled aluminium reaches 58% by 2050.
Transportation Per capita ownership for private cars increases by 60% in 2035 and by 120% in 2050.
ICE ban for passenger light-duty vehicles shall be introduced by 2050.
ICE ban for passenger light-duty vehicles shall be introduced by 2035.
Non-road passenger transport turnover increases by 30% by 2050. Increase in passenger transport by rail and air shall be 200% and 180%, respectively, by 2050.
Freight transport turnover increases by 80 % until 2035, and 115% by 2050, relatively to 2018. The proportion of freight modes by on-road, rail and sea shifts from the current 48%, 20% and 32% to 32%, 30% and 38% by 2050.
New energy vehicle (NEV) market share of light trucks is set to reach 12% by 2035 and 24% by 2050.
NEV market share of light trucks is set to reach 67% by 2035 and 100% by 2050.
NEV market share of medium and heavy trucks is set to reach 12% by 2035 and 20% by 2050.
NEV market share of medium and heavy trucks is set to reach 42% by 2035 and 75 %by 2050.
Buildings The total floor area increases by 48% until 2035, and 70 % by 2050. The proportion of urban residential, rural residential, and commercial buildings shifts from the current 41%, 34% and 25% to 55%, 17% and 28%.
IDC floor area increases five-fold by 2035, and nine-fold by 2050
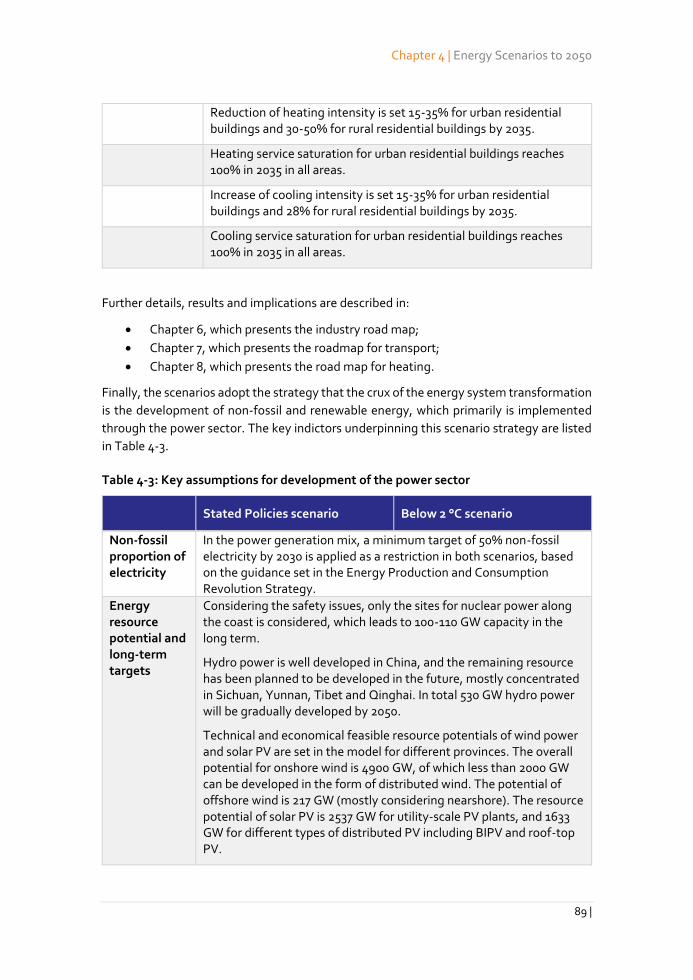
Chapter 4 | Energy Scenarios to 2050
89 |
Reduction of heating intensity is set 15-35% for urban residential buildings and 30-50% for rural residential buildings by 2035.
Heating service saturation for urban residential buildings reaches 100% in 2035 in all areas.
Increase of cooling intensity is set 15-35% for urban residential buildings and 28% for rural residential buildings by 2035.
Cooling service saturation for urban residential buildings reaches 100% in 2035 in all areas.
Further details, results and implications are described in:
Chapter 6, which presents the industry road map;
Chapter 7, which presents the roadmap for transport;
Chapter 8, which presents the road map for heating.
Finally, the scenarios adopt the strategy that the crux of the energy system transformation
is the development of non-fossil and renewable energy, which primarily is implemented
through the power sector. The key indictors underpinning this scenario strategy are listed
in Table 4-3.
Table 4-3: Key assumptions for development of the power sector
Stated Policies scenario Below 2 °C scenario
Non-fossil proportion of electricity
In the power generation mix, a minimum target of 50% non-fossil electricity by 2030 is applied as a restriction in both scenarios, based on the guidance set in the Energy Production and Consumption Revolution Strategy.
Energy resource potential and long-term targets
Considering the safety issues, only the sites for nuclear power along the coast is considered, which leads to 100-110 GW capacity in the long term.
Hydro power is well developed in China, and the remaining resource has been planned to be developed in the future, mostly concentrated in Sichuan, Yunnan, Tibet and Qinghai. In total 530 GW hydro power will be gradually developed by 2050.
Technical and economical feasible resource potentials of wind power and solar PV are set in the model for different provinces. The overall potential for onshore wind is 4900 GW, of which less than 2000 GW can be developed in the form of distributed wind. The potential of offshore wind is 217 GW (mostly considering nearshore). The resource potential of solar PV is 2537 GW for utility-scale PV plants, and 1633 GW for different types of distributed PV including BIPV and roof-top PV.
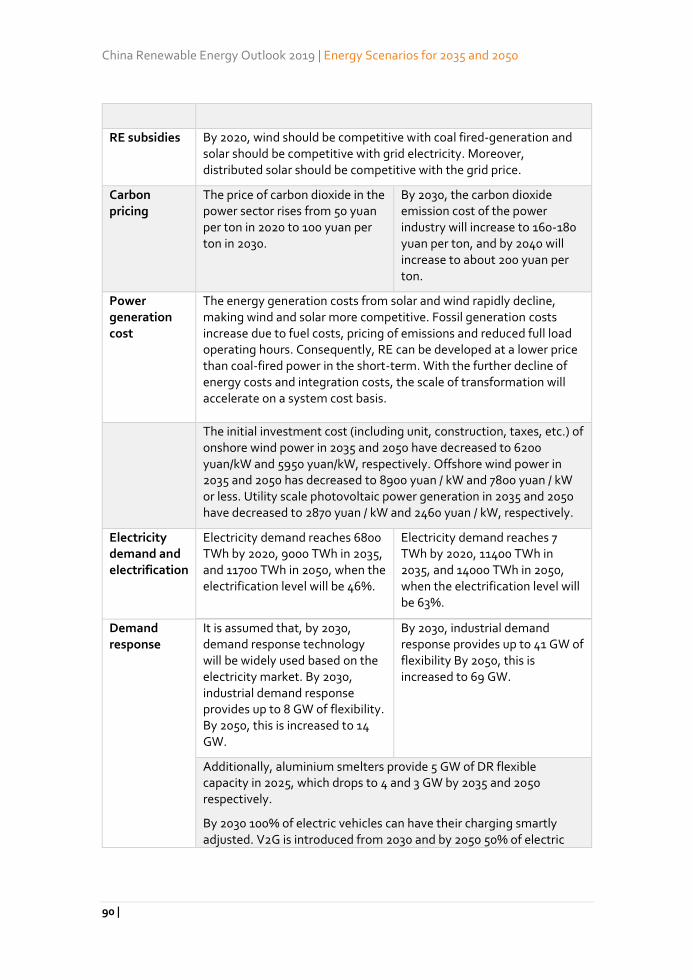
China Renewable Energy Outlook 2019 | Energy Scenarios for 2035 and 2050
90 |
RE subsidies By 2020, wind should be competitive with coal fired-generation and solar should be competitive with grid electricity. Moreover, distributed solar should be competitive with the grid price.
Carbon pricing
The price of carbon dioxide in the power sector rises from 50 yuan per ton in 2020 to 100 yuan per ton in 2030.
By 2030, the carbon dioxide emission cost of the power industry will increase to 160-180 yuan per ton, and by 2040 will increase to about 200 yuan per ton.
Power generation cost
The energy generation costs from solar and wind rapidly decline, making wind and solar more competitive. Fossil generation costs increase due to fuel costs, pricing of emissions and reduced full load operating hours. Consequently, RE can be developed at a lower price than coal-fired power in the short-term. With the further decline of energy costs and integration costs, the scale of transformation will accelerate on a system cost basis.
The initial investment cost (including unit, construction, taxes, etc.) of onshore wind power in 2035 and 2050 have decreased to 6200 yuan/kW and 5950 yuan/kW, respectively. Offshore wind power in 2035 and 2050 has decreased to 8900 yuan / kW and 7800 yuan / kW or less. Utility scale photovoltaic power generation in 2035 and 2050 have decreased to 2870 yuan / kW and 2460 yuan / kW, respectively.
Electricity demand and electrification
Electricity demand reaches 6800 TWh by 2020, 9000 TWh in 2035, and 11700 TWh in 2050, when the electrification level will be 46%.
Electricity demand reaches 7 TWh by 2020, 11400 TWh in 2035, and 14000 TWh in 2050, when the electrification level will be 63%.
Demand response
It is assumed that, by 2030, demand response technology will be widely used based on the electricity market. By 2030, industrial demand response provides up to 8 GW of flexibility. By 2050, this is increased to 14 GW.
By 2030, industrial demand response provides up to 41 GW of flexibility By 2050, this is increased to 69 GW.
Additionally, aluminium smelters provide 5 GW of DR flexible capacity in 2025, which drops to 4 and 3 GW by 2035 and 2050 respectively.
By 2030 100% of electric vehicles can have their charging smartly adjusted. V2G is introduced from 2030 and by 2050 50% of electric
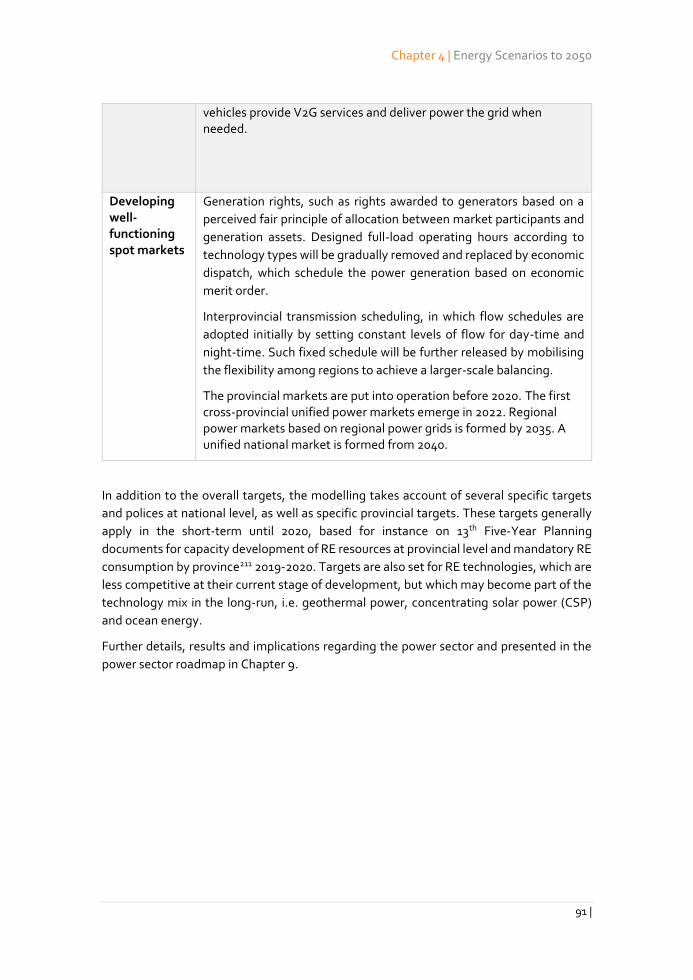
Chapter 4 | Energy Scenarios to 2050
91 |
vehicles provide V2G services and deliver power the grid when needed.
Developing well-functioning spot markets
Generation rights, such as rights awarded to generators based on a
perceived fair principle of allocation between market participants and
generation assets. Designed full-load operating hours according to
technology types will be gradually removed and replaced by economic
dispatch, which schedule the power generation based on economic
merit order.
Interprovincial transmission scheduling, in which flow schedules are
adopted initially by setting constant levels of flow for day-time and
night-time. Such fixed schedule will be further released by mobilising
the flexibility among regions to achieve a larger-scale balancing.
The provincial markets are put into operation before 2020. The first cross-provincial unified power markets emerge in 2022. Regional power markets based on regional power grids is formed by 2035. A unified national market is formed from 2040.
In addition to the overall targets, the modelling takes account of several specific targets
and polices at national level, as well as specific provincial targets. These targets generally
apply in the short-term until 2020, based for instance on 13th Five-Year Planning
documents for capacity development of RE resources at provincial level and mandatory RE
consumption by province211 2019-2020. Targets are also set for RE technologies, which are
less competitive at their current stage of development, but which may become part of the
technology mix in the long-run, i.e. geothermal power, concentrating solar power (CSP)
and ocean energy.
Further details, results and implications regarding the power sector and presented in the
power sector roadmap in Chapter 9.
China Renewable Energy Outlook 2019 | Energy Scenarios for 2035 and 2050
92 |
5. China’s energy system in 2035 and 2050
Renewables are at the core of China’s long-term energy system and ensuring a rapid scale-
up of deployment, investments and integration of renewables, will be central to
maximising the long-term benefits of the energy transition. In this chapter, the main
scenario results are presented, with focus on the medium and long-term milestones of 2035
and 2050.
A quick overview
Both the Stated Policies and the Below 2 °C scenarios emphasize China’s ongoing process
of energy transition. The pace of transition differs as well as the timing and level of
emphasis on the deployment of different technologies.
Energy CO2 emissions reduced by 30-45% by 2035 and by 60-75% by 2050 from 2018
From the 2018 level of 9,550 million tons of annually energy related CO2 emissions, the
Stated Policies scenario’s emissions are reduced to 6,750 million tons by 2035 and 3,700
million tons per year by 2050. The Below 2 °C scenario’s CO2 emissions are reduced to
5,150 million tons and 2,600 million tons by 2035 and 2050, respectively. Cumulative
energy CO2 emission are 230 billion tons between 2018-2050 in the Stated Policies
scenario and 195 billion tons in the Below 2 °C scenario.
The reductions in CO2 emission are realised through:
Reduction of the energy intensity of the economy through stringent focus on
energy efficiency.
Substantial decarbonisation of the power sector.
Increased electrification of end-use consumption.
Increased direct consumption of renewables in end-use sectors.
Reduction of fossil fuels in end-use sectors.
Increasing the use of natural gas in the medium term to replace coal, followed by
a decline in the long-term as non-fossil sources replace natural gas.
The additional reductions in CO2 emissions in the Below 2 °C scenario arise from:
More comprehensive decarbonisation of electricity supply through additional
renewables – particularly wind and solar.
Increased electrification of end-use sectors, and in the long-term scaling-up the
use of alternative secondary energy carriers like hydrogen, further extending the
reach of decarbonised low-cost power supply.
More significant role for device shifting is taken as a means of energy saving
measures.
Final energy consumption stabilises at current levels
Energy savings, together with economic restructuring, enable the 2050 total final energy
consumption to be on par with its 2018 level, around 3,160 mtce/year. Until 2035, the final
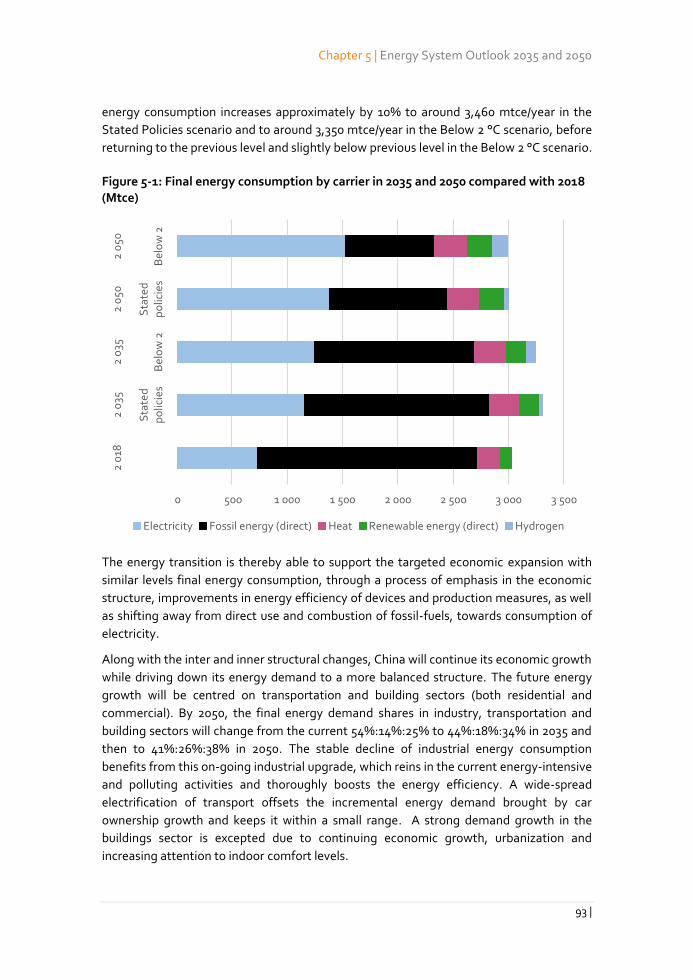
Chapter 5 | Energy System Outlook 2035 and 2050
93 |
energy consumption increases approximately by 10% to around 3,460 mtce/year in the
Stated Policies scenario and to around 3,350 mtce/year in the Below 2 °C scenario, before
returning to the previous level and slightly below previous level in the Below 2 °C scenario.
Figure 5-1: Final energy consumption by carrier in 2035 and 2050 compared with 2018 (Mtce)
The energy transition is thereby able to support the targeted economic expansion with
similar levels final energy consumption, through a process of emphasis in the economic
structure, improvements in energy efficiency of devices and production measures, as well
as shifting away from direct use and combustion of fossil-fuels, towards consumption of
electricity.
Along with the inter and inner structural changes, China will continue its economic growth
while driving down its energy demand to a more balanced structure. The future energy
growth will be centred on transportation and building sectors (both residential and
commercial). By 2050, the final energy demand shares in industry, transportation and
building sectors will change from the current 54%:14%:25% to 44%:18%:34% in 2035 and
then to 41%:26%:38% in 2050. The stable decline of industrial energy consumption
benefits from this on-going industrial upgrade, which reins in the current energy-intensive
and polluting activities and thoroughly boosts the energy efficiency. A wide-spread
electrification of transport offsets the incremental energy demand brought by car
ownership growth and keeps it within a small range. A strong demand growth in the
buildings sector is excepted due to continuing economic growth, urbanization and
increasing attention to indoor comfort levels.
0 500 1 000 1 500 2 000 2 500 3 000 3 500
Sta
ted
po
licie
sB
elo
w 2
Sta
ted
po
licie
sB
elo
w 2
2 0
182
035
2 0
352
050
2 0
50
Electricity Fossil energy (direct) Heat Renewable energy (direct) Hydrogen
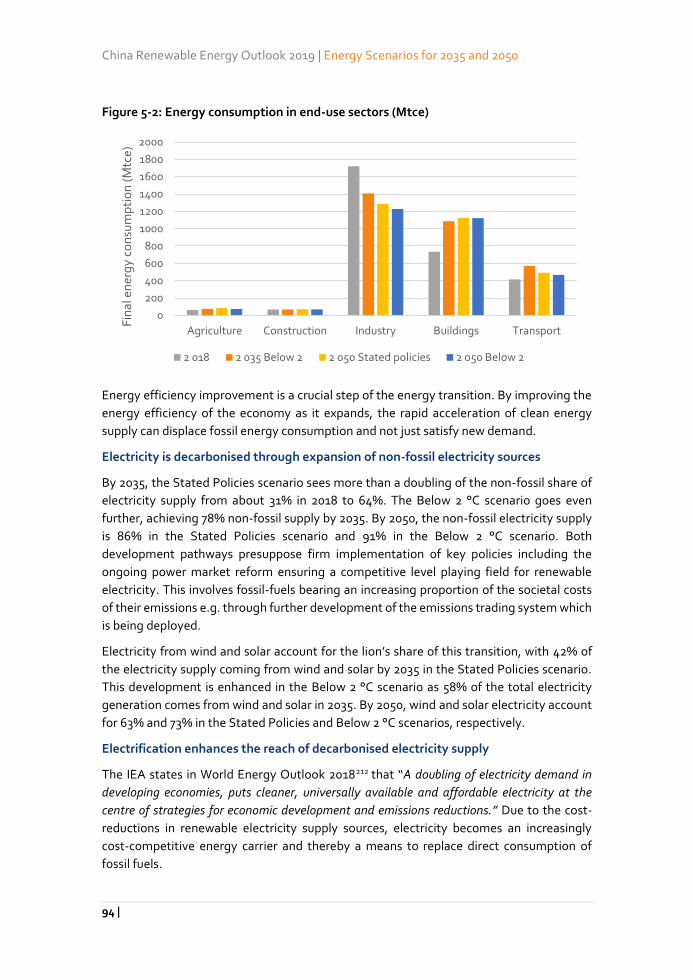
China Renewable Energy Outlook 2019 | Energy Scenarios for 2035 and 2050
94 |
Figure 5-2: Energy consumption in end-use sectors (Mtce)
Energy efficiency improvement is a crucial step of the energy transition. By improving the
energy efficiency of the economy as it expands, the rapid acceleration of clean energy
supply can displace fossil energy consumption and not just satisfy new demand.
Electricity is decarbonised through expansion of non-fossil electricity sources
By 2035, the Stated Policies scenario sees more than a doubling of the non-fossil share of
electricity supply from about 31% in 2018 to 64%. The Below 2 °C scenario goes even
further, achieving 78% non-fossil supply by 2035. By 2050, the non-fossil electricity supply
is 86% in the Stated Policies scenario and 91% in the Below 2 °C scenario. Both
development pathways presuppose firm implementation of key policies including the
ongoing power market reform ensuring a competitive level playing field for renewable
electricity. This involves fossil-fuels bearing an increasing proportion of the societal costs
of their emissions e.g. through further development of the emissions trading system which
is being deployed.
Electricity from wind and solar account for the lion’s share of this transition, with 42% of
the electricity supply coming from wind and solar by 2035 in the Stated Policies scenario.
This development is enhanced in the Below 2 °C scenario as 58% of the total electricity
generation comes from wind and solar in 2035. By 2050, wind and solar electricity account
for 63% and 73% in the Stated Policies and Below 2 °C scenarios, respectively.
Electrification enhances the reach of decarbonised electricity supply
The IEA states in World Energy Outlook 2018212 that “A doubling of electricity demand in
developing economies, puts cleaner, universally available and affordable electricity at the
centre of strategies for economic development and emissions reductions.” Due to the cost-
reductions in renewable electricity supply sources, electricity becomes an increasingly
cost-competitive energy carrier and thereby a means to replace direct consumption of
fossil fuels.
0
200
400
600
800
1000
1200
1400
1600
1800
2000
Agriculture Construction Industry Buildings Transport
Fin
al e
ner
gy
con
sum
pti
on
(M
tce)
2 018 2 035 Below 2 2 050 Stated policies 2 050 Below 2
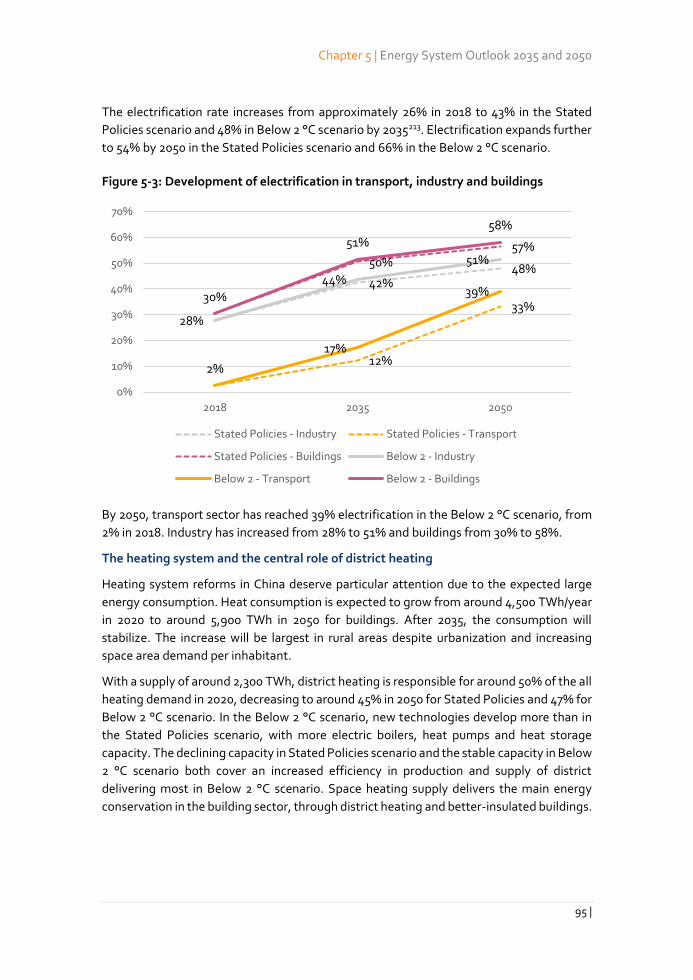
Chapter 5 | Energy System Outlook 2035 and 2050
95 |
The electrification rate increases from approximately 26% in 2018 to 43% in the Stated
Policies scenario and 48% in Below 2 °C scenario by 2035213. Electrification expands further
to 54% by 2050 in the Stated Policies scenario and 66% in the Below 2 °C scenario.
Figure 5-3: Development of electrification in transport, industry and buildings
By 2050, transport sector has reached 39% electrification in the Below 2 °C scenario, from
2% in 2018. Industry has increased from 28% to 51% and buildings from 30% to 58%.
The heating system and the central role of district heating
Heating system reforms in China deserve particular attention due to the expected large
energy consumption. Heat consumption is expected to grow from around 4,500 TWh/year
in 2020 to around 5,900 TWh in 2050 for buildings. After 2035, the consumption will
stabilize. The increase will be largest in rural areas despite urbanization and increasing
space area demand per inhabitant.
With a supply of around 2,300 TWh, district heating is responsible for around 50% of the all
heating demand in 2020, decreasing to around 45% in 2050 for Stated Policies and 47% for
Below 2 °C scenario. In the Below 2 °C scenario, new technologies develop more than in
the Stated Policies scenario, with more electric boilers, heat pumps and heat storage
capacity. The declining capacity in Stated Policies scenario and the stable capacity in Below
2 °C scenario both cover an increased efficiency in production and supply of district
delivering most in Below 2 °C scenario. Space heating supply delivers the main energy
conservation in the building sector, through district heating and better-insulated buildings.
42%48%
2%12%
33%
50%57%
28%
44%
51%
17%
39%30%
51%
58%
0%
10%
20%
30%
40%
50%
60%
70%
2018 2035 2050
Stated Policies - Industry Stated Policies - Transport
Stated Policies - Buildings Below 2 - Industry
Below 2 - Transport Below 2 - Buildings
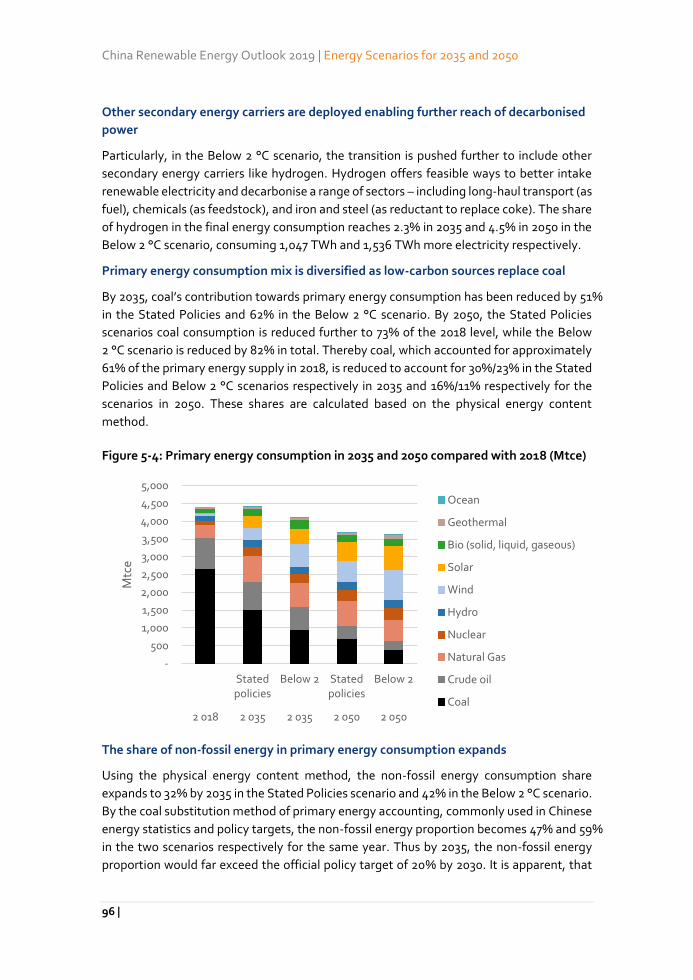
China Renewable Energy Outlook 2019 | Energy Scenarios for 2035 and 2050
96 |
Other secondary energy carriers are deployed enabling further reach of decarbonised
power
Particularly, in the Below 2 °C scenario, the transition is pushed further to include other
secondary energy carriers like hydrogen. Hydrogen offers feasible ways to better intake
renewable electricity and decarbonise a range of sectors – including long-haul transport (as
fuel), chemicals (as feedstock), and iron and steel (as reductant to replace coke). The share
of hydrogen in the final energy consumption reaches 2.3% in 2035 and 4.5% in 2050 in the
Below 2 °C scenario, consuming 1,047 TWh and 1,536 TWh more electricity respectively.
Primary energy consumption mix is diversified as low-carbon sources replace coal
By 2035, coal’s contribution towards primary energy consumption has been reduced by 51%
in the Stated Policies and 62% in the Below 2 °C scenario. By 2050, the Stated Policies
scenarios coal consumption is reduced further to 73% of the 2018 level, while the Below
2 °C scenario is reduced by 82% in total. Thereby coal, which accounted for approximately
61% of the primary energy supply in 2018, is reduced to account for 30%/23% in the Stated
Policies and Below 2 °C scenarios respectively in 2035 and 16%/11% respectively for the
scenarios in 2050. These shares are calculated based on the physical energy content
method.
Figure 5-4: Primary energy consumption in 2035 and 2050 compared with 2018 (Mtce)
The share of non-fossil energy in primary energy consumption expands
Using the physical energy content method, the non-fossil energy consumption share
expands to 32% by 2035 in the Stated Policies scenario and 42% in the Below 2 °C scenario.
By the coal substitution method of primary energy accounting, commonly used in Chinese
energy statistics and policy targets, the non-fossil energy proportion becomes 47% and 59%
in the two scenarios respectively for the same year. Thus by 2035, the non-fossil energy
proportion would far exceed the official policy target of 20% by 2030. It is apparent, that
-
500
1,000
1,500
2,000
2,500
3,000
3,500
4,000
4,500
5,000
Statedpolicies
Below 2 Statedpolicies
Below 2
2 018 2 035 2 035 2 050 2 050
Mtc
e
Ocean
Geothermal
Bio (solid, liquid, gaseous)
Solar
Wind
Hydro
Nuclear
Natural Gas
Crude oil
Coal
Chapter 5 | Energy System Outlook 2035 and 2050
97 |
the 2030 target needs to be increased and there are strong indications that this is
understood by the GoC.
Natural gas’ contribution to primary energy expands considerably
In the Stated Policies scenario, natural gas accounts for 20% of primary energy by 2035 and
21% by 2050. In the Below 2 °C scenario, the natural gas consumption share is 18% in 2035
and 16% in 2050. This marks a temporary increase and then decrease in shares from 2018,
which were 8%. In this context, natural gas can act as a temporary intermediary solution
for coal substitution to serve the purpose of short-term emissions reduction.
Developing a clean, low-carbon, safe and efficient energy system
The energy transitions outlined in the scenarios, shed light on what is needed for the
transition of the Chinese energy system to be successful. Both scenarios take giant strides
towards achieving these objectives, but the analyses show that the Below 2 °C scenario has
superior performance.
Emphasis should be on the Below 2 °C scenario for a Low Carbon Energy system
compliant with Paris objective
Achieving the GoCs ambitions for a low carbon energy system requires fast and firm
implementations policy measures to peak CO2 emissions in time. China’s contribution is
essential for global efforts to comply with the temperature objectives of the Paris
agreement. The Below 2 °C scenario’s approximately 195 billion tons of accumulated CO2-
emissions is a pathway for China, which significantly and responsibly contributes towards
this success of the global effort. The Stated Policies cumulative CO2 emissions must also
be characterised as an impressive and massive transformation of China’s energy system,
and compliance with current targets and policy objectives, but is likely to be insufficient
towards adequately curtailing the global temperature increase.
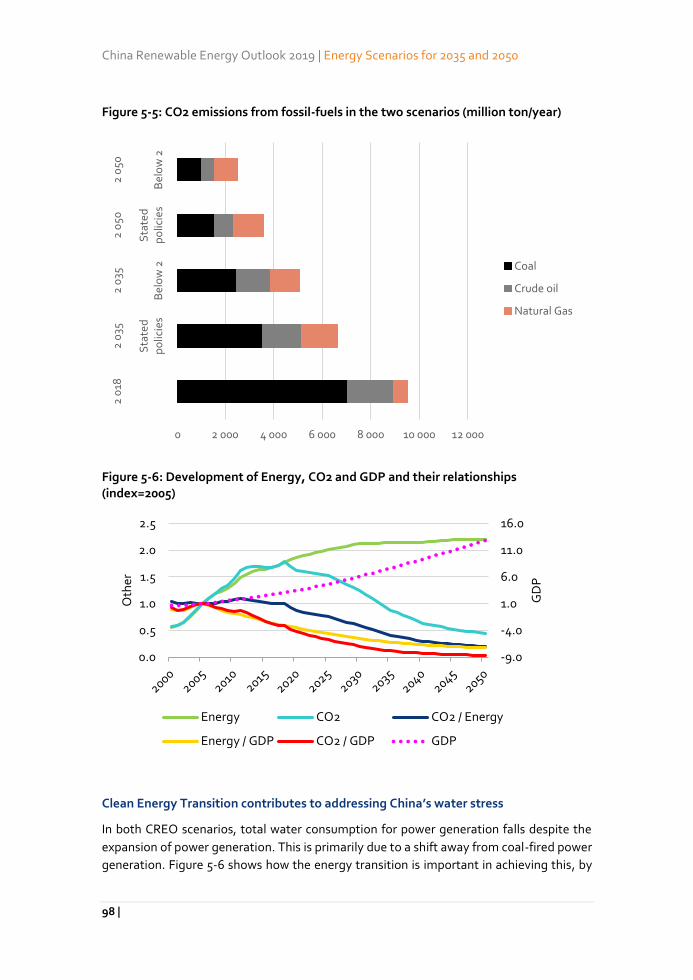
China Renewable Energy Outlook 2019 | Energy Scenarios for 2035 and 2050
98 |
Figure 5-5: CO2 emissions from fossil-fuels in the two scenarios (million ton/year)
Figure 5-6: Development of Energy, CO2 and GDP and their relationships (index=2005)
Clean Energy Transition contributes to addressing China’s water stress
In both CREO scenarios, total water consumption for power generation falls despite the
expansion of power generation. This is primarily due to a shift away from coal-fired power
generation. Figure 5-6 shows how the energy transition is important in achieving this, by
0 2 000 4 000 6 000 8 000 10 000 12 000
Sta
ted
po
licie
sB
elo
w 2
Sta
ted
po
licie
sB
elo
w 2
2 0
182
035
2 0
352
050
2 0
50
Coal
Crude oil
Natural Gas
-9.0
-4.0
1.0
6.0
11.0
16.0
0.0
0.5
1.0
1.5
2.0
2.5G
DP
Oth
er
Energy CO2 CO2 / Energy
Energy / GDP CO2 / GDP GDP
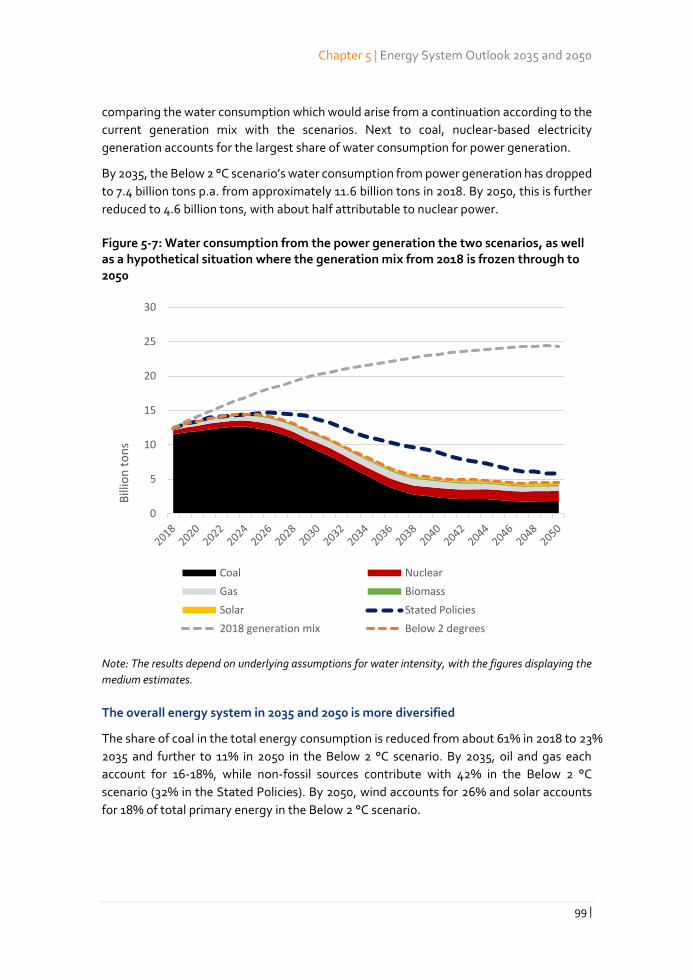
Chapter 5 | Energy System Outlook 2035 and 2050
99 |
comparing the water consumption which would arise from a continuation according to the
current generation mix with the scenarios. Next to coal, nuclear-based electricity
generation accounts for the largest share of water consumption for power generation.
By 2035, the Below 2 °C scenario’s water consumption from power generation has dropped
to 7.4 billion tons p.a. from approximately 11.6 billion tons in 2018. By 2050, this is further
reduced to 4.6 billion tons, with about half attributable to nuclear power.
Figure 5-7: Water consumption from the power generation the two scenarios, as well as a hypothetical situation where the generation mix from 2018 is frozen through to 2050
Note: The results depend on underlying assumptions for water intensity, with the figures displaying the
medium estimates.
The overall energy system in 2035 and 2050 is more diversified
The share of coal in the total energy consumption is reduced from about 61% in 2018 to 23%
2035 and further to 11% in 2050 in the Below 2 °C scenario. By 2035, oil and gas each
account for 16-18%, while non-fossil sources contribute with 42% in the Below 2 °C
scenario (32% in the Stated Policies). By 2050, wind accounts for 26% and solar accounts
for 18% of total primary energy in the Below 2 °C scenario.
0
5
10
15
20
25
30
Bill
ion
to
ns
Coal Nuclear
Gas Biomass
Solar Stated Policies
2018 generation mix Below 2 degrees
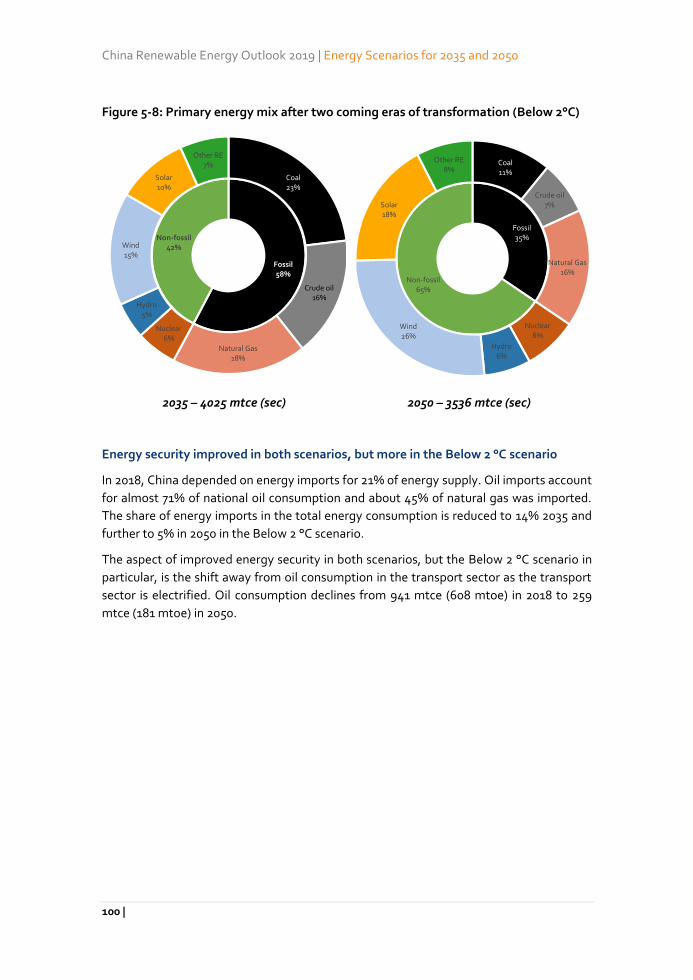
China Renewable Energy Outlook 2019 | Energy Scenarios for 2035 and 2050
100 |
Figure 5-8: Primary energy mix after two coming eras of transformation (Below 2°C)
2035 – 4025 mtce (sec) 2050 – 3536 mtce (sec)
Energy security improved in both scenarios, but more in the Below 2 °C scenario
In 2018, China depended on energy imports for 21% of energy supply. Oil imports account
for almost 71% of national oil consumption and about 45% of natural gas was imported.
The share of energy imports in the total energy consumption is reduced to 14% 2035 and
further to 5% in 2050 in the Below 2 °C scenario.
The aspect of improved energy security in both scenarios, but the Below 2 °C scenario in
particular, is the shift away from oil consumption in the transport sector as the transport
sector is electrified. Oil consumption declines from 941 mtce (608 mtoe) in 2018 to 259
mtce (181 mtoe) in 2050.
Fossil58%
Non-fossil42%
Coal23%
Crude oil16%
Natural Gas18%
Nuclear6%
Hydro5%
Wind15%
Solar10%
Other RE7%
Fossil35%
Non-fossil65%
Coal11%
Crude oil7%
Natural Gas16%
Nuclear8%
Hydro6%
Wind26%
Solar18%
Other RE8%
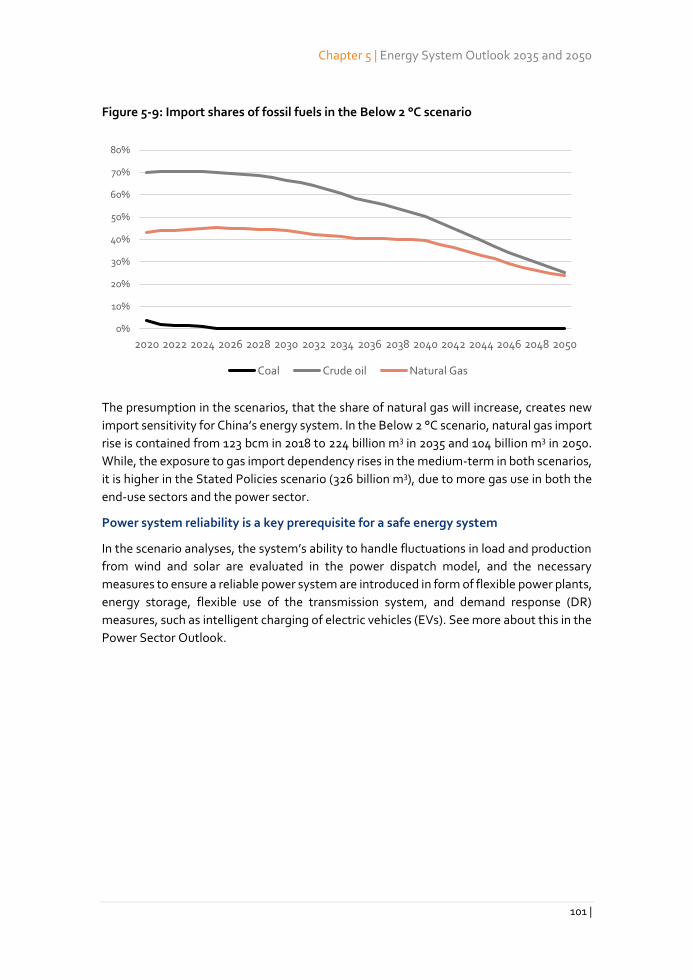
Chapter 5 | Energy System Outlook 2035 and 2050
101 |
Figure 5-9: Import shares of fossil fuels in the Below 2 °C scenario
The presumption in the scenarios, that the share of natural gas will increase, creates new
import sensitivity for China’s energy system. In the Below 2 °C scenario, natural gas import
rise is contained from 123 bcm in 2018 to 224 billion m3 in 2035 and 104 billion m3 in 2050.
While, the exposure to gas import dependency rises in the medium-term in both scenarios,
it is higher in the Stated Policies scenario (326 billion m3), due to more gas use in both the
end-use sectors and the power sector.
Power system reliability is a key prerequisite for a safe energy system
In the scenario analyses, the system’s ability to handle fluctuations in load and production
from wind and solar are evaluated in the power dispatch model, and the necessary
measures to ensure a reliable power system are introduced in form of flexible power plants,
energy storage, flexible use of the transmission system, and demand response (DR)
measures, such as intelligent charging of electric vehicles (EVs). See more about this in the
Power Sector Outlook.
0%
10%
20%
30%
40%
50%
60%
70%
80%
2020 2022 2024 2026 2028 2030 2032 2034 2036 2038 2040 2042 2044 2046 2048 2050
Coal Crude oil Natural Gas
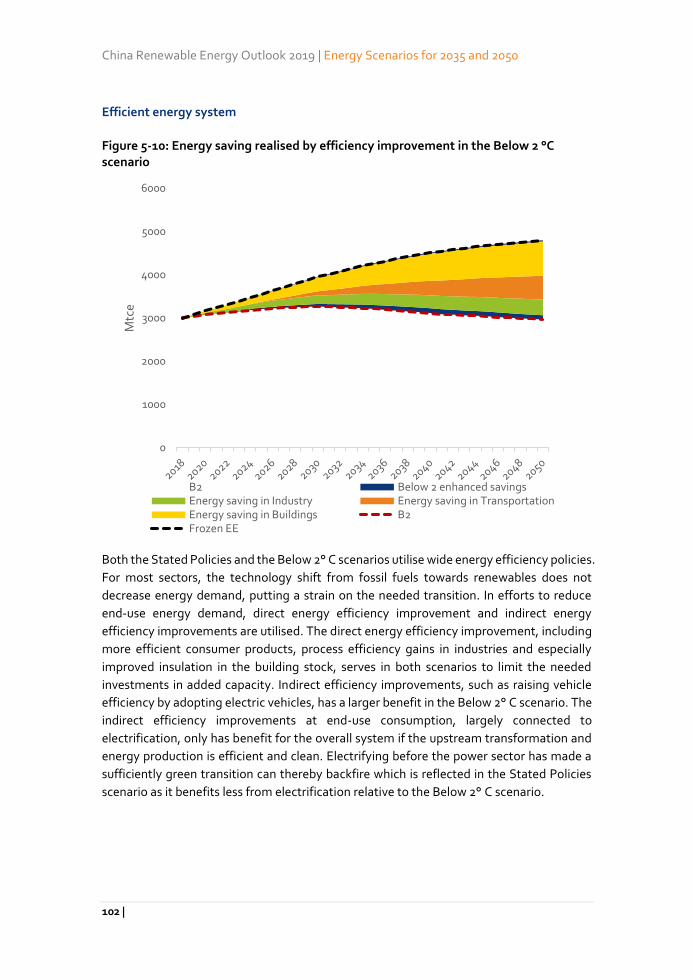
China Renewable Energy Outlook 2019 | Energy Scenarios for 2035 and 2050
102 |
Efficient energy system
Figure 5-10: Energy saving realised by efficiency improvement in the Below 2 °C scenario
Both the Stated Policies and the Below 2° C scenarios utilise wide energy efficiency policies.
For most sectors, the technology shift from fossil fuels towards renewables does not
decrease energy demand, putting a strain on the needed transition. In efforts to reduce
end-use energy demand, direct energy efficiency improvement and indirect energy
efficiency improvements are utilised. The direct energy efficiency improvement, including
more efficient consumer products, process efficiency gains in industries and especially
improved insulation in the building stock, serves in both scenarios to limit the needed
investments in added capacity. Indirect efficiency improvements, such as raising vehicle
efficiency by adopting electric vehicles, has a larger benefit in the Below 2° C scenario. The
indirect efficiency improvements at end-use consumption, largely connected to
electrification, only has benefit for the overall system if the upstream transformation and
energy production is efficient and clean. Electrifying before the power sector has made a
sufficiently green transition can thereby backfire which is reflected in the Stated Policies
scenario as it benefits less from electrification relative to the Below 2° C scenario.
0
1000
2000
3000
4000
5000
6000
Mtc
e
B2 Below 2 enhanced savingsEnergy saving in Industry Energy saving in TransportationEnergy saving in Buildings B2Frozen EE
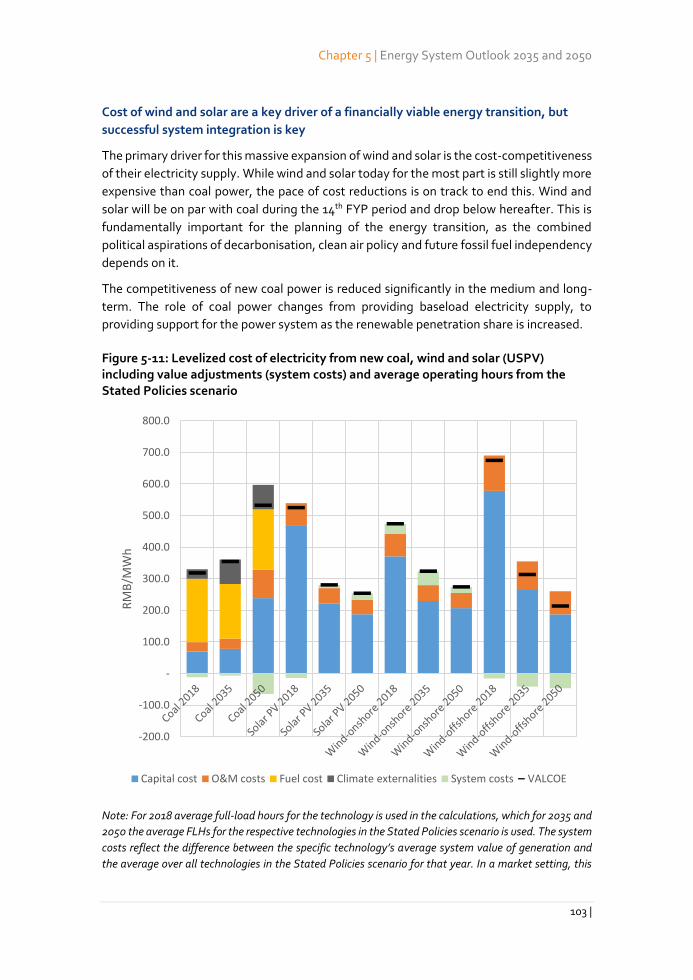
Chapter 5 | Energy System Outlook 2035 and 2050
103 |
Cost of wind and solar are a key driver of a financially viable energy transition, but
successful system integration is key
The primary driver for this massive expansion of wind and solar is the cost-competitiveness
of their electricity supply. While wind and solar today for the most part is still slightly more
expensive than coal power, the pace of cost reductions is on track to end this. Wind and
solar will be on par with coal during the 14th FYP period and drop below hereafter. This is
fundamentally important for the planning of the energy transition, as the combined
political aspirations of decarbonisation, clean air policy and future fossil fuel independency
depends on it.
The competitiveness of new coal power is reduced significantly in the medium and long-
term. The role of coal power changes from providing baseload electricity supply, to
providing support for the power system as the renewable penetration share is increased.
Figure 5-11: Levelized cost of electricity from new coal, wind and solar (USPV) including value adjustments (system costs) and average operating hours from the Stated Policies scenario
Note: For 2018 average full-load hours for the technology is used in the calculations, which for 2035 and
2050 the average FLHs for the respective technologies in the Stated Policies scenario is used. The system
costs reflect the difference between the specific technology’s average system value of generation and
the average over all technologies in the Stated Policies scenario for that year. In a market setting, this
-200.0
-100.0
-
100.0
200.0
300.0
400.0
500.0
600.0
700.0
800.0
RM
B/M
Wh
Capital cost O&M costs Fuel cost Climate externalities System costs VALCOE
China Renewable Energy Outlook 2019 | Energy Scenarios for 2035 and 2050
104 |
reflects the higher (or lower) energy price that can be captured by the technology vis-à-vis the average.
Two key factors determine this for the technologies averaged over all of China, namely the timing and
location of generation vs. the needs in the system.
The LCOE concept makes costs comparable per MWh between technologies, yet in an
energy system context, and the capacity factor (or full-load hours), a key input to the LCOE
calculation, is determined by competitiveness according to short-run marginal costs. While
the LCOE of coal power is not expected to increase significantly on an equal running hour
basis, despite the added cost of CO2 emissions under the ETS, the annual operating hours
increasing the fixed cost contribution on a per MWh basis. The premium value of
dispatchability will only partly compensate this to a lesser degree.
Cost efficient system integration is a central challenge of energy transition
Variable renewable electricity provides the lowest cost of electricity and constitutes one of
the lowest cost options for displacing other fossil energy consumption at utility-scale. The
transition is made cost-efficient in the scenarios by utilising all available cost-effective
sources. This includes a host of technical messages in both power generation-side and
consumption-side. Various flexible sources, including storage, V2G, industrial load shifting,
and smart EV charging are mobilized to accommodate the power system fluctuation
caused by high share of VREs. The system will include new technologies as well as
retrofitting and designing thermal plants for flexible operation, using the flexibility of
hydro reservoirs, expanding and utilising the power transmission grid efficiently.
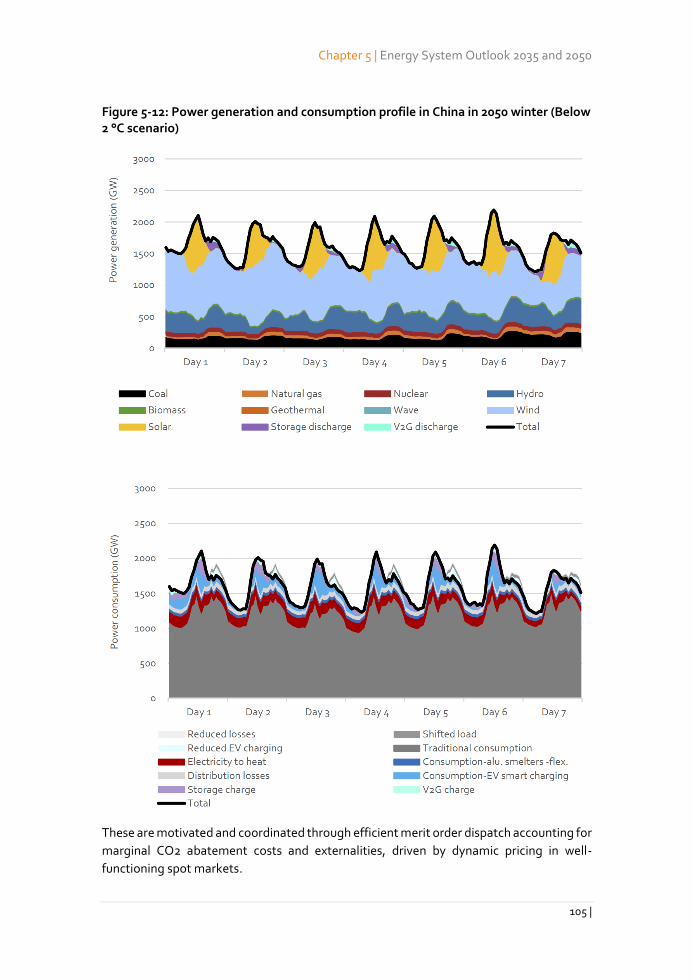
Chapter 5 | Energy System Outlook 2035 and 2050
105 |
Figure 5-12: Power generation and consumption profile in China in 2050 winter (Below 2 °C scenario)
These are motivated and coordinated through efficient merit order dispatch accounting for
marginal CO2 abatement costs and externalities, driven by dynamic pricing in well-
functioning spot markets.

China Renewable Energy Outlook 2019 | Energy Scenarios for 2035 and 2050
106 |
Energy system transition is affordable and cost efficient but requires more upfront
investment and a new approach to institutions, regulations and management.
Chapter 7 | Transportation Sector Development Roadmap
107 |
Part3:
Energy Sector Development
Roadmaps
China Renewable Energy Outlook 2019 | Energy Sector Development Roadmaps
108 |
6. Industry development roadmap
6.1. Main findings
The final energy consumption in industry shall decline due to improvements in energy
efficiency and structural changes in the industrial output. In the Stated Policies scenario,
the final energy consumption decreases by 25%, from 1720 Mtce in 2018 to 1290 Mtce in
2050, further to 1230 Mtce in the Below 2 °C scenario, meaning a 29% reduction.
The fuel mix shall be cleaner. Coal consumption shrinks dramatically, from 53% in 2018 to
14% in 2050 in the Stated policies scenario and to 10% in the Below 2 °C scenario. Electricity
as a share of final consumption increases from 23% to 49% in the Stated Policies scenario
and to 51% in the Below 2 °C scenario. The process of electrification plays a role in
modernising industries and increases long-term competitiveness. Industrial electrification
benefits from the availability of low-cost decarbonised electricity, while modern industrial
processes can supply flexibility for the power system.
Energy savings are a main driver for future energy consumption control. Industrial
energy saving potential is about 364 Mtce in the Stated Policies scenario, and 424 Mtce the
Below 2 °C scenario. Energy savings are a collective effect of innovative technologies
replacement, fuel change caused by appliance shifting, and single technology
improvement. Among them, technology replacement shows the largest potential, about
207 Mtce; from the sectoral perspective. Iron and steel industry has the most significant
potential, about 231 Mtce, but with the condition that 65% of steel shall come from
recycled scrap by 2050.
Useful energy analysis for energy services indicates process heating will be the most
electrified end-use in industry. Under the Below 2 °C scenario, 129 Mtce more electricity
will be put into use of process heating by electric heat pumps, electric boilers, induction
furnaces, microwave sintering etc. Additionally, 132 Mtce of electricity will be used to
produce electro-chemicals like hydrogen.
Industrial CO2 emissions show steady decline. Renewable energy and energy efficiency
provide the optimal pathway to deliver most of the emission reductions needed at the
necessary speed. These two factors reduce the yearly energy related CO2 emission in
industry from the current 2854 million tonnes to 977 million tonnes by 2050, and the
deepened measures in Below 2 °C scenario can provide further reductions in CO2 emissions
by as much as 24% to 736 million tonnes in 2050.
The future work priorities and phased objectives should be centred on energy saving
and decarbonisation. Detailed movement and sectoral targets can be found in the
strategic roadmap in the end of this chapter.
6.2. Current situation, requirements and transformative trends
China has undergone rapid industrialization, achieving one of the world’s highest industrial
growth rates. Total industrial added value was up to 36,000 billion yuan in 2018 from 175.5
Chapter 7 | Transportation Sector Development Roadmap
109 |
billion yuan in 1978, with average annual growth of around 14.2%. Industry has been a
major factor contributing to China's rapid economic rise and a cornerstone of the economy.
From an ecological perspective, China’s industrial growth has created a major source of
pollution, energy consumption, greenhouse gas emissions and waste generation, which
impose significant costs on the economy and have an increasingly adverse impact on
health and the environment. According to the China Energy Statistical Yearbook, in 2016
China’s industrial sector consumed 2.1 billion tce, accounting for 59% of the total final
energy consumption. From 1995 to 2015, the CO2 emissions of China’s manufacturing
industry increased by approximately 221% and accounted for 58.3% of national CO2
emissions214.
With the increasing concern of the environment, economic growth is not the only
driving force for industrial development. New requirements rise to promote the
transformation of industry and balance economic, social and environmental sustainability
factors. The future changes in industry lie in industry restructuring, deep decarbonisation and
fuel switching, and energy efficiency improvements.
Industry restructuring
Since 2000, capacity expansion in several industries in China, such as steel, cement,
aluminium, has become increasingly disconnected from market demand. Actions to curb
this have been constrained because regions with the most acute challenges of overcapacity
lack incentives to address them. However, as China’s industrialization process deepens,
energy-intensive branches will nevertheless reduce their excess production capacity
according to the market trends, tempered profitability and strengthened polices.
Previously, China’s industrial competitiveness relied on abundant cheap labour and the low
pricing on environmental externalities. As labour and other business costs increase, the era
of low-end manufacturing is coming to an end. An industrial upgrading is now required in
China in order to become more environmentally sustainable. Policies, such as Made in
China 2025, have promoted a shift towards higher value-added production through
domestic innovation and industrial upgrading. In the future, urban industries such as food
manufacturing and textiles will continue to increase; service-oriented manufacturing and
producer service industry which featured with low-energy-intensity and high-added-value
will be scaled-up.
Deep decarbonisation and fuel switching
China’s industrial energy consumption relies heavily on fossil fuels, especially coal. In 2016,
coal and coal products assumed approximately 56% in industrial final energy consumption,
while electricity only took up to 23%. In the EU, the share of coal and coal products in
industrial final energy use is about 13%, while the share of electricity is about 32%.
In order to develop an effective strategy for future decarbonisation, a deep understanding
of the end-use of coal in industry is needed. According to our analysis, the use for process
heat and process steam is almost 64% of the total coal and coal products consumption, of
China Renewable Energy Outlook 2019 | Energy Sector Development Roadmaps
110 |
which the coal burned in cement furnace alone takes up to 20 percentage points; coal use
in chemical industries as feedstock accounts for 12 percentage points; coke use as a
reaction agent in steel production is about 24 percentage points. The heavy coal
consumption is not only a result of the current industrial structure, but also a reason for the
low industrial energy efficiency.
China needs to accelerate its coal phase-out process in industry. In the short term, a
realistic choice is to promote natural gas as a main replacement for coal to provide process
heat and steam. In the medium and long term, green electricity will become the main
source for industrial energy supply.
Electric heat pumps are expected to produce low temperature heat.
Electro-magnetic heating technologies, which allow for more rapid and more
controllable processing, will be used extensively in various industries for curing,
gluing, laminating, melting, shrinking, soldering and tempering.
Electric arc and plasma arc furnaces, ovens and kilns can replace their fossil-
fuelled counterparts.
Innovative uses of hydrogen in industry would go along these developments, where direct
electricity use is limited. Steel today is largely produced in blast furnaces and basic oxygen
furnaces. Electrolytic hydrogen could replace coke in a large amount in direct iron
reduction route, prior to smelting in electric arc furnaces together with scrap steel.
Ammonia, methanol and a great variety of hydrocarbons can be produced from hydrogen
and carbon, with benefits for the climate that differ according to the origin or that carbon,
and the decarbonisation of electricity.
Energy efficiency improvement
Over the past decades, the Chinese government has launched a series of energy-efficiency
directives for its energy-intensive industries which have had significant impact. During the
period from 2005 to 2014, the energy efficiency of major energy-intensive products
improved from 15% to 25%. However, compared to the post-industrial economies, China
is still suffering low industrial efficiency. In 2016, China’s overall industrial energy intensity
per added value was almost two times higher than European countries. A higher degree of
the efficiency potential needs to be realised.
The industrial structural adjustments and fuel shifting through appliance and technology
replacement could be considered as a substantial part of energy saving effort. Additionally,
single equipment improvement and production process optimization will also affect the
overall efficiency. Better designed electric motors and other end-use devices will be
promoted in suitable areas; waste-heat recovery and heat integration technologies, as well
as smart energy management and optimization control technologies, will be more and
more put into practice.
Recycling is another measure which can improve industry energy efficiency.
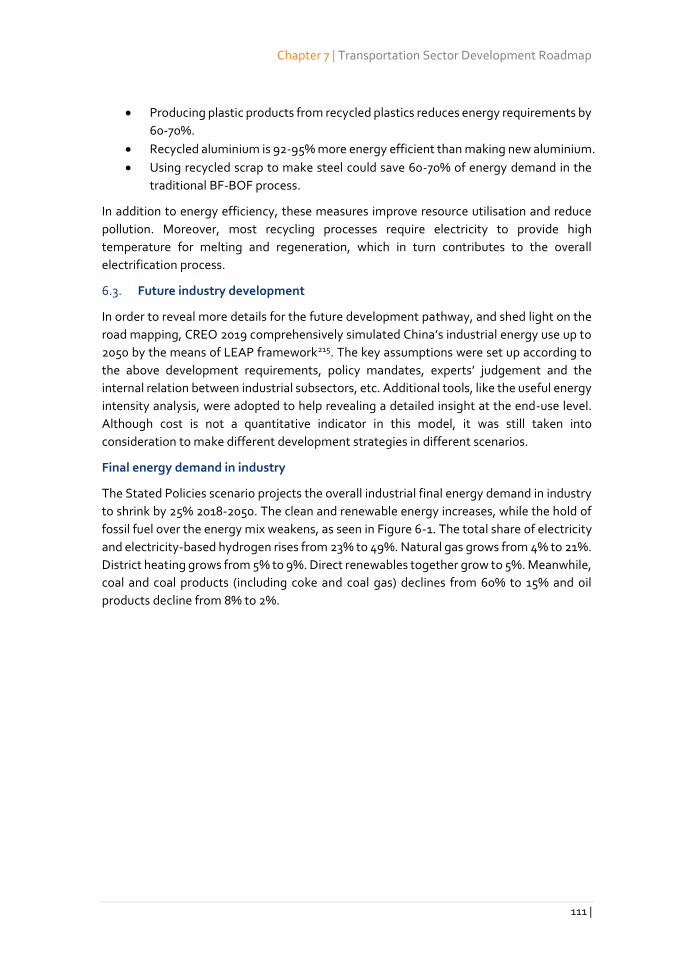
Chapter 7 | Transportation Sector Development Roadmap
111 |
Producing plastic products from recycled plastics reduces energy requirements by
60-70%.
Recycled aluminium is 92-95% more energy efficient than making new aluminium.
Using recycled scrap to make steel could save 60-70% of energy demand in the
traditional BF-BOF process.
In addition to energy efficiency, these measures improve resource utilisation and reduce
pollution. Moreover, most recycling processes require electricity to provide high
temperature for melting and regeneration, which in turn contributes to the overall
electrification process.
6.3. Future industry development
In order to reveal more details for the future development pathway, and shed light on the
road mapping, CREO 2019 comprehensively simulated China’s industrial energy use up to
2050 by the means of LEAP framework215. The key assumptions were set up according to
the above development requirements, policy mandates, experts’ judgement and the
internal relation between industrial subsectors, etc. Additional tools, like the useful energy
intensity analysis, were adopted to help revealing a detailed insight at the end-use level.
Although cost is not a quantitative indicator in this model, it was still taken into
consideration to make different development strategies in different scenarios.
Final energy demand in industry
The Stated Policies scenario projects the overall industrial final energy demand in industry
to shrink by 25% 2018-2050. The clean and renewable energy increases, while the hold of
fossil fuel over the energy mix weakens, as seen in Figure 6-1. The total share of electricity
and electricity-based hydrogen rises from 23% to 49%. Natural gas grows from 4% to 21%.
District heating grows from 5% to 9%. Direct renewables together grow to 5%. Meanwhile,
coal and coal products (including coke and coal gas) declines from 60% to 15% and oil
products decline from 8% to 2%.
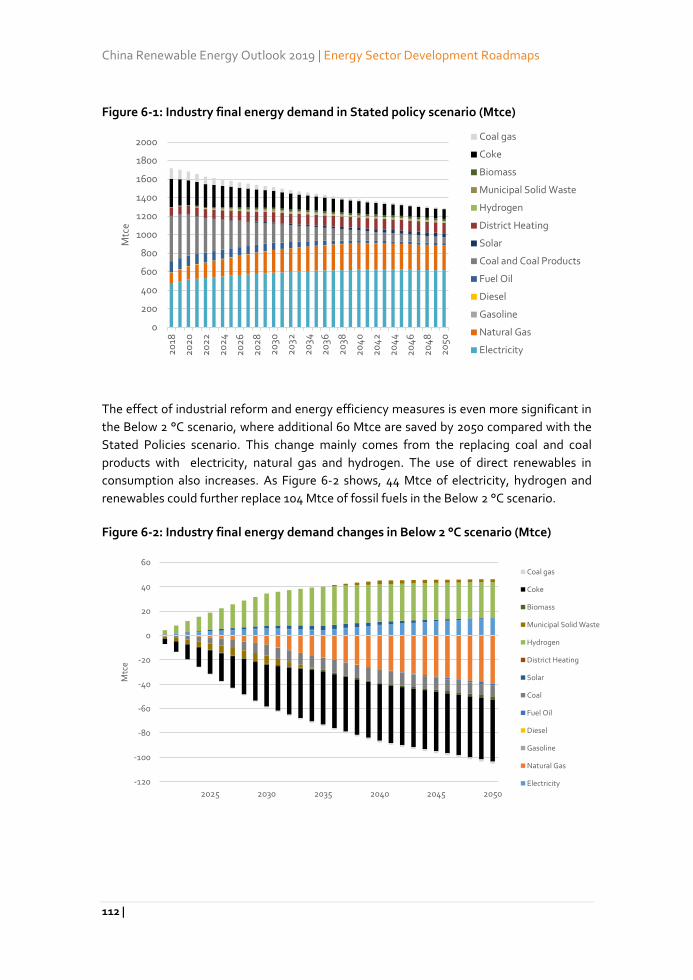
China Renewable Energy Outlook 2019 | Energy Sector Development Roadmaps
112 |
Figure 6-1: Industry final energy demand in Stated policy scenario (Mtce)
The effect of industrial reform and energy efficiency measures is even more significant in
the Below 2 °C scenario, where additional 60 Mtce are saved by 2050 compared with the
Stated Policies scenario. This change mainly comes from the replacing coal and coal
products with electricity, natural gas and hydrogen. The use of direct renewables in
consumption also increases. As Figure 6-2 shows, 44 Mtce of electricity, hydrogen and
renewables could further replace 104 Mtce of fossil fuels in the Below 2 °C scenario.
Figure 6-2: Industry final energy demand changes in Below 2 °C scenario (Mtce)
0
200
400
600
800
1000
1200
1400
1600
1800
2000
20
18
20
20
20
22
20
24
20
26
20
28
20
30
20
32
20
34
20
36
20
38
20
40
20
42
20
44
20
46
20
48
20
50
Mtc
eCoal gas
Coke
Biomass
Municipal Solid Waste
Hydrogen
District Heating
Solar
Coal and Coal Products
Fuel Oil
Diesel
Gasoline
Natural Gas
Electricity
-120
-100
-80
-60
-40
-20
0
20
40
60
2025 2030 2035 2040 2045 2050
Mtc
e
Coal gas
Coke
Biomass
Municipal Solid Waste
Hydrogen
District Heating
Solar
Coal
Fuel Oil
Diesel
Gasoline
Natural Gas
Electricity
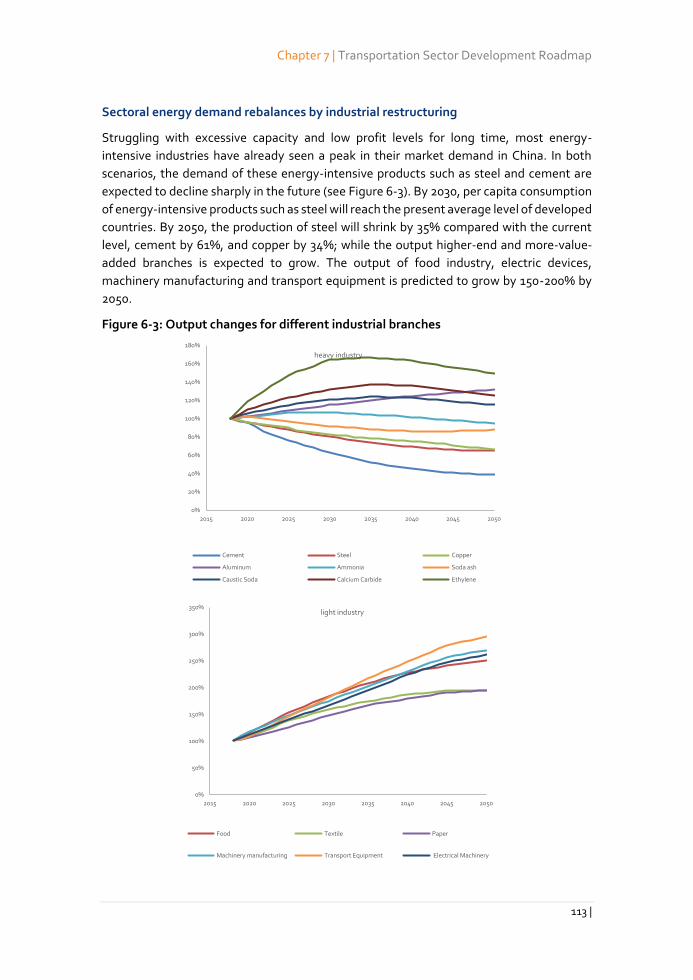
Chapter 7 | Transportation Sector Development Roadmap
113 |
Sectoral energy demand rebalances by industrial restructuring
Struggling with excessive capacity and low profit levels for long time, most energy-
intensive industries have already seen a peak in their market demand in China. In both
scenarios, the demand of these energy-intensive products such as steel and cement are
expected to decline sharply in the future (see Figure 6-3). By 2030, per capita consumption
of energy-intensive products such as steel will reach the present average level of developed
countries. By 2050, the production of steel will shrink by 35% compared with the current
level, cement by 61%, and copper by 34%; while the output higher-end and more-value-
added branches is expected to grow. The output of food industry, electric devices,
machinery manufacturing and transport equipment is predicted to grow by 150-200% by
2050.
Figure 6-3: Output changes for different industrial branches
0%
20%
40%
60%
80%
100%
120%
140%
160%
180%
2015 2020 2025 2030 2035 2040 2045 2050
heavy industry
Cement Steel Copper
Aluminum Ammonia Soda ash
Caustic Soda Calcium Carbide Ethylene
0%
50%
100%
150%
200%
250%
300%
350%
2015 2020 2025 2030 2035 2040 2045 2050
light industry
Food Textile Paper
Machinery manufacturing Transport Equipment Electrical Machinery
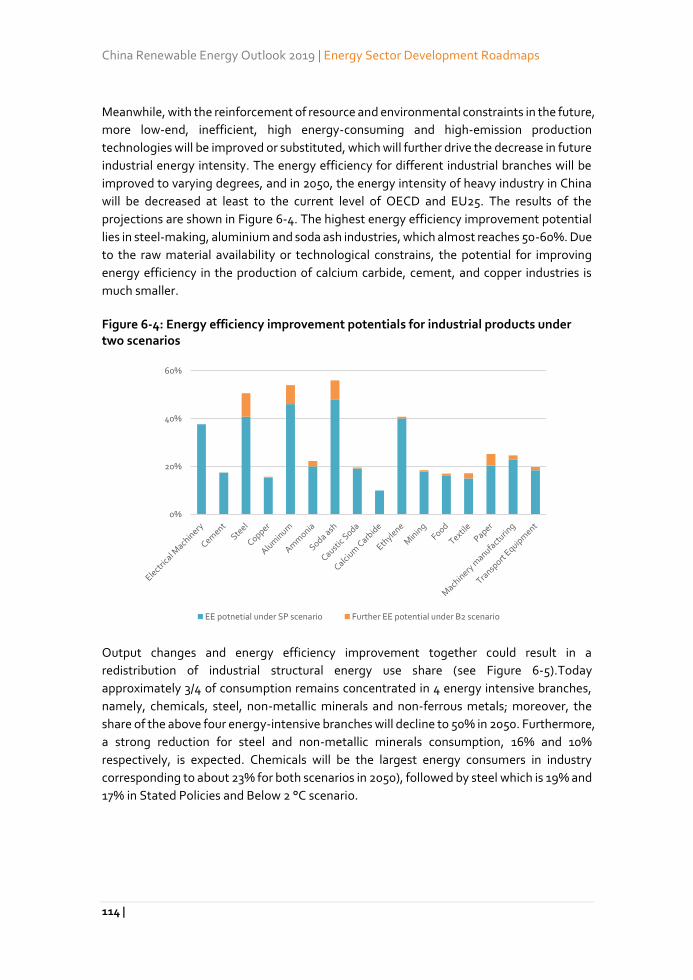
China Renewable Energy Outlook 2019 | Energy Sector Development Roadmaps
114 |
Meanwhile, with the reinforcement of resource and environmental constraints in the future,
more low-end, inefficient, high energy-consuming and high-emission production
technologies will be improved or substituted, which will further drive the decrease in future
industrial energy intensity. The energy efficiency for different industrial branches will be
improved to varying degrees, and in 2050, the energy intensity of heavy industry in China
will be decreased at least to the current level of OECD and EU25. The results of the
projections are shown in Figure 6-4. The highest energy efficiency improvement potential
lies in steel-making, aluminium and soda ash industries, which almost reaches 50-60%. Due
to the raw material availability or technological constrains, the potential for improving
energy efficiency in the production of calcium carbide, cement, and copper industries is
much smaller.
Figure 6-4: Energy efficiency improvement potentials for industrial products under two scenarios
Output changes and energy efficiency improvement together could result in a
redistribution of industrial structural energy use share (see Figure 6-5).Today
approximately 3/4 of consumption remains concentrated in 4 energy intensive branches,
namely, chemicals, steel, non-metallic minerals and non-ferrous metals; moreover, the
share of the above four energy-intensive branches will decline to 50% in 2050. Furthermore,
a strong reduction for steel and non-metallic minerals consumption, 16% and 10%
respectively, is expected. Chemicals will be the largest energy consumers in industry
corresponding to about 23% for both scenarios in 2050), followed by steel which is 19% and
17% in Stated Policies and Below 2 °C scenario.
0%
20%
40%
60%
EE potnetial under SP scenario Further EE potential under B2 scenario
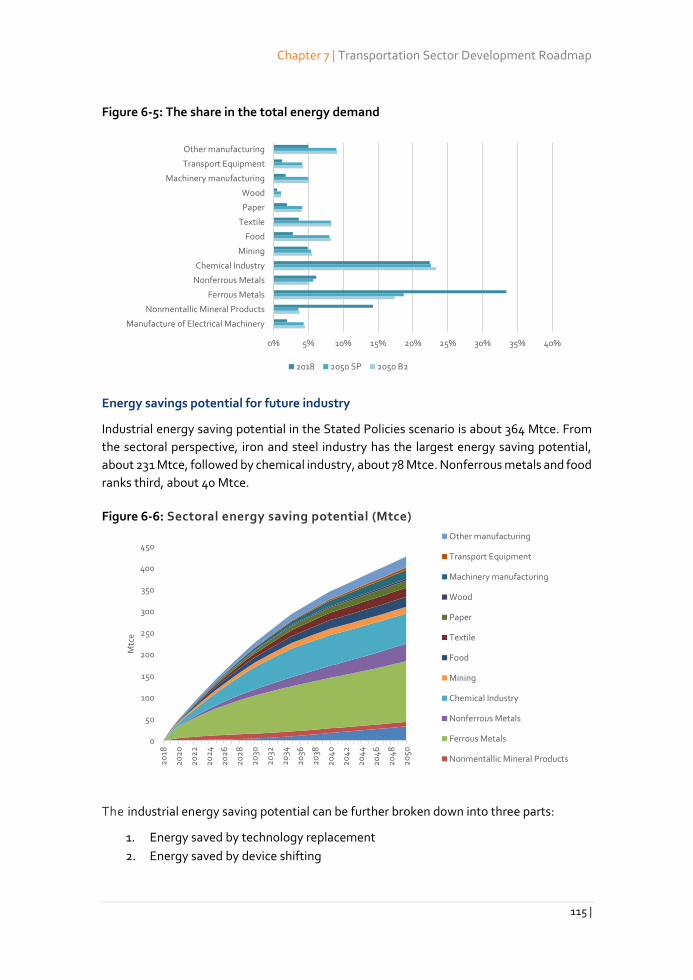
Chapter 7 | Transportation Sector Development Roadmap
115 |
Figure 6-5: The share in the total energy demand
Energy savings potential for future industry
Industrial energy saving potential in the Stated Policies scenario is about 364 Mtce. From
the sectoral perspective, iron and steel industry has the largest energy saving potential,
about 231 Mtce, followed by chemical industry, about 78 Mtce. Nonferrous metals and food
ranks third, about 40 Mtce.
Figure 6-6: Sectoral energy saving potential (Mtce)
The industrial energy saving potential can be further broken down into three parts:
1. Energy saved by technology replacement
2. Energy saved by device shifting
0% 5% 10% 15% 20% 25% 30% 35% 40%
Manufacture of Electrical Machinery
Nonmentallic Mineral Products
Ferrous Metals
Nonferrous Metals
Chemical Industry
Mining
Food
Textile
Paper
Wood
Machinery manufacturing
Transport Equipment
Other manufacturing
2018 2050 SP 2050 B2
0
50
100
150
200
250
300
350
400
450
20
18
20
20
20
22
20
24
20
26
20
28
20
30
20
32
20
34
20
36
20
38
20
40
20
42
20
44
20
46
20
48
20
50
Mtc
e
Other manufacturing
Transport Equipment
Machinery manufacturing
Wood
Paper
Textile
Food
Mining
Chemical Industry
Nonferrous Metals
Ferrous Metals
Nonmentallic Mineral Products
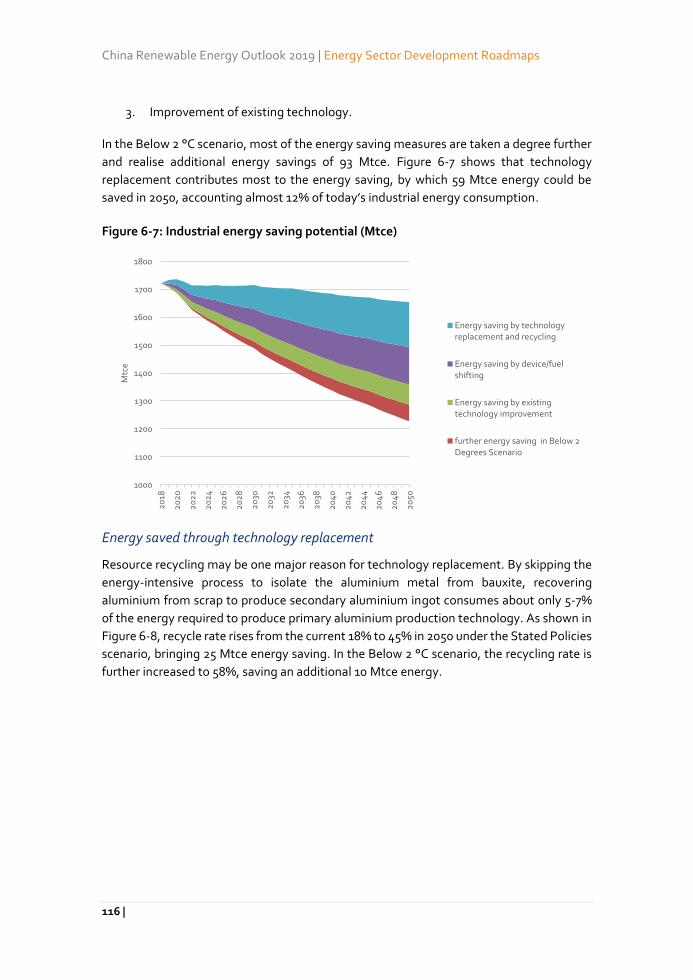
China Renewable Energy Outlook 2019 | Energy Sector Development Roadmaps
116 |
3. Improvement of existing technology.
In the Below 2 °C scenario, most of the energy saving measures are taken a degree further
and realise additional energy savings of 93 Mtce. Figure 6-7 shows that technology
replacement contributes most to the energy saving, by which 59 Mtce energy could be
saved in 2050, accounting almost 12% of today’s industrial energy consumption.
Figure 6-7: Industrial energy saving potential (Mtce)
Energy saved through technology replacement
Resource recycling may be one major reason for technology replacement. By skipping the
energy-intensive process to isolate the aluminium metal from bauxite, recovering
aluminium from scrap to produce secondary aluminium ingot consumes about only 5-7%
of the energy required to produce primary aluminium production technology. As shown in
Figure 6-8, recycle rate rises from the current 18% to 45% in 2050 under the Stated Policies
scenario, bringing 25 Mtce energy saving. In the Below 2 °C scenario, the recycling rate is
further increased to 58%, saving an additional 10 Mtce energy.
1000
1100
1200
1300
1400
1500
1600
1700
1800
20
18
20
20
20
22
20
24
20
26
20
28
20
30
20
32
20
34
20
36
20
38
20
40
20
42
20
44
20
46
20
48
20
50
Mtc
e
Energy saving by technologyreplacement and recycling
Energy saving by device/fuelshifting
Energy saving by existingtechnology improvement
further energy saving in Below 2Degrees Scenario
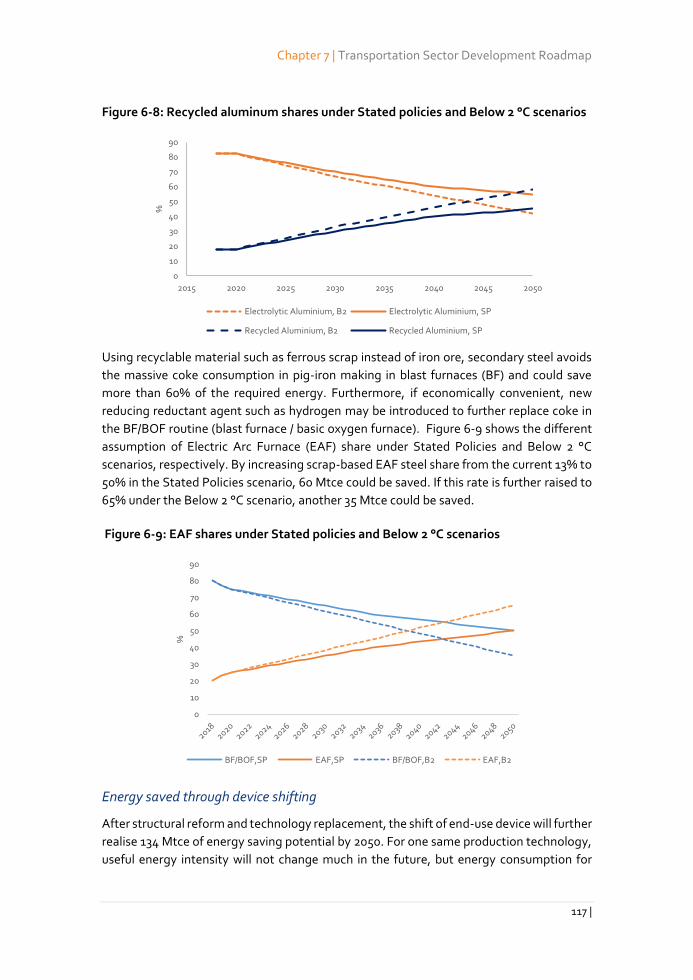
Chapter 7 | Transportation Sector Development Roadmap
117 |
Figure 6-8: Recycled aluminum shares under Stated policies and Below 2 °C scenarios
Using recyclable material such as ferrous scrap instead of iron ore, secondary steel avoids
the massive coke consumption in pig-iron making in blast furnaces (BF) and could save
more than 60% of the required energy. Furthermore, if economically convenient, new
reducing reductant agent such as hydrogen may be introduced to further replace coke in
the BF/BOF routine (blast furnace / basic oxygen furnace). Figure 6-9 shows the different
assumption of Electric Arc Furnace (EAF) share under Stated Policies and Below 2 °C
scenarios, respectively. By increasing scrap-based EAF steel share from the current 13% to
50% in the Stated Policies scenario, 60 Mtce could be saved. If this rate is further raised to
65% under the Below 2 °C scenario, another 35 Mtce could be saved.
Figure 6-9: EAF shares under Stated policies and Below 2 °C scenarios
Energy saved through device shifting
After structural reform and technology replacement, the shift of end-use device will further
realise 134 Mtce of energy saving potential by 2050. For one same production technology,
useful energy intensity will not change much in the future, but energy consumption for
0
10
20
30
40
50
60
70
80
90
2015 2020 2025 2030 2035 2040 2045 2050
%
Electrolytic Aluminium, B2 Electrolytic Aluminium, SP
Recycled Aluminium, B2 Recycled Aluminium, SP
0
10
20
30
40
50
60
70
80
90
%
BF/BOF,SP EAF,SP BF/BOF,B2 EAF,B2
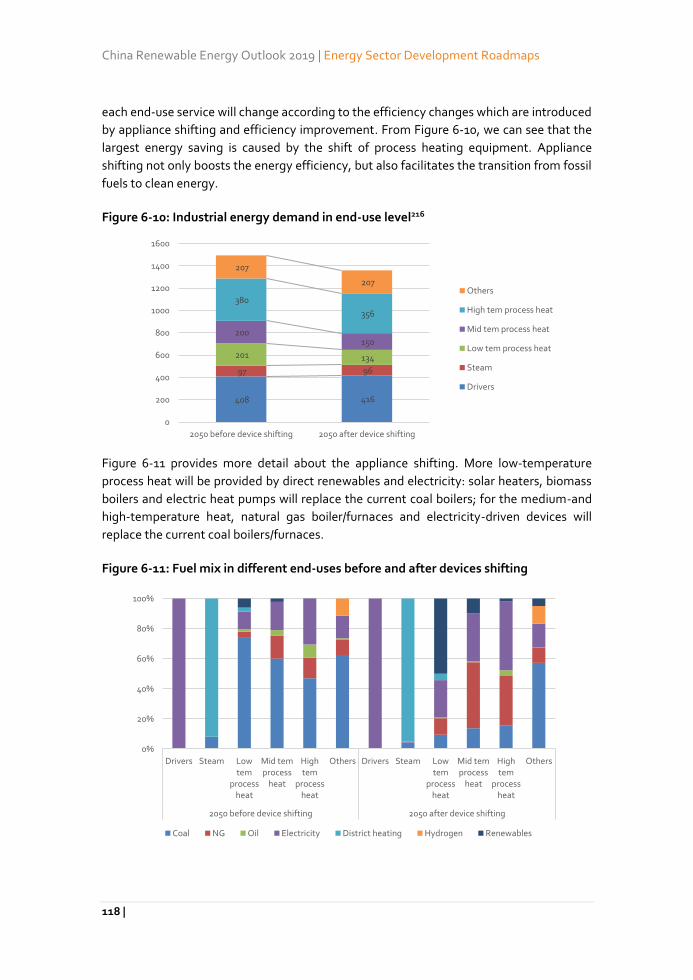
China Renewable Energy Outlook 2019 | Energy Sector Development Roadmaps
118 |
each end-use service will change according to the efficiency changes which are introduced
by appliance shifting and efficiency improvement. From Figure 6-10, we can see that the
largest energy saving is caused by the shift of process heating equipment. Appliance
shifting not only boosts the energy efficiency, but also facilitates the transition from fossil
fuels to clean energy.
Figure 6-10: Industrial energy demand in end-use level216
Figure 6-11 provides more detail about the appliance shifting. More low-temperature
process heat will be provided by direct renewables and electricity: solar heaters, biomass
boilers and electric heat pumps will replace the current coal boilers; for the medium-and
high-temperature heat, natural gas boiler/furnaces and electricity-driven devices will
replace the current coal boilers/furnaces.
Figure 6-11: Fuel mix in different end-uses before and after devices shifting
408 416
97 96
201 134
200 150
380
356
207
207
0
200
400
600
800
1000
1200
1400
1600
2050 before device shifting 2050 after device shifting
Others
High tem process heat
Mid tem process heat
Low tem process heat
Steam
Drivers
0%
20%
40%
60%
80%
100%
Drivers Steam Lowtem
processheat
Mid temprocess
heat
Hightem
processheat
Others Drivers Steam Lowtem
processheat
Mid temprocess
heat
Hightem
processheat
Others
2050 before device shifting 2050 after device shifting
Coal NG Oil Electricity District heating Hydrogen Renewables
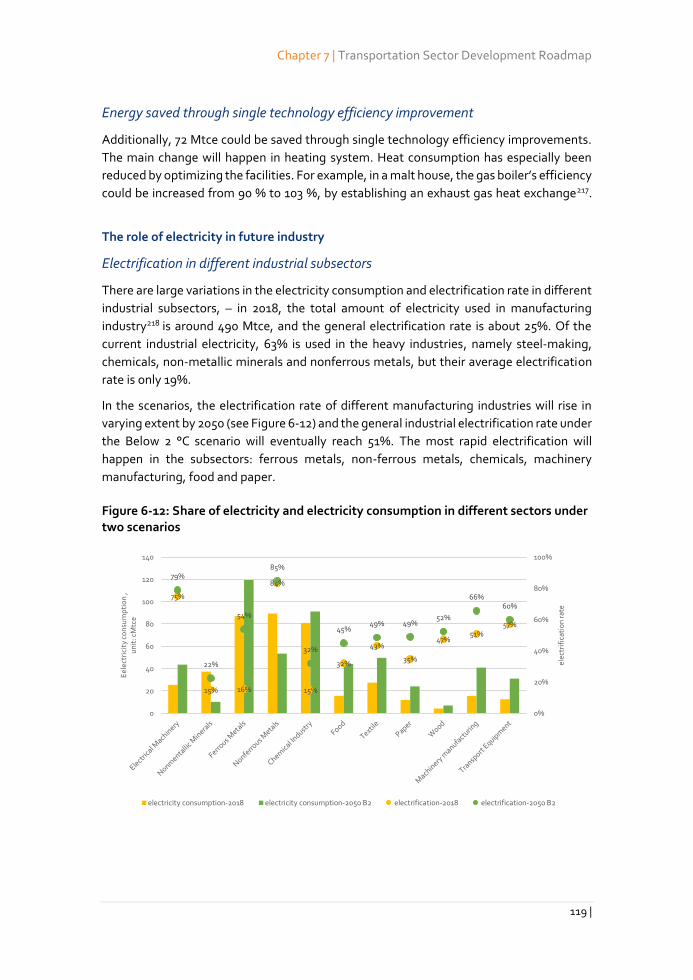
Chapter 7 | Transportation Sector Development Roadmap
119 |
Energy saved through single technology efficiency improvement
Additionally, 72 Mtce could be saved through single technology efficiency improvements.
The main change will happen in heating system. Heat consumption has especially been
reduced by optimizing the facilities. For example, in a malt house, the gas boiler’s efficiency
could be increased from 90 % to 103 %, by establishing an exhaust gas heat exchange217.
The role of electricity in future industry
Electrification in different industrial subsectors
There are large variations in the electricity consumption and electrification rate in different
industrial subsectors, – in 2018, the total amount of electricity used in manufacturing
industry218 is around 490 Mtce, and the general electrification rate is about 25%. Of the
current industrial electricity, 63% is used in the heavy industries, namely steel-making,
chemicals, non-metallic minerals and nonferrous metals, but their average electrification
rate is only 19%.
In the scenarios, the electrification rate of different manufacturing industries will rise in
varying extent by 2050 (see Figure 6-12) and the general industrial electrification rate under
the Below 2 °C scenario will eventually reach 51%. The most rapid electrification will
happen in the subsectors: ferrous metals, non-ferrous metals, chemicals, machinery
manufacturing, food and paper.
Figure 6-12: Share of electricity and electricity consumption in different sectors under two scenarios
75%
15% 16%
84%
15%
32%
43%
35%
47%51%
57%
79%
22%
54%
85%
32%
45%49% 49%
52%
66%60%
0%
20%
40%
60%
80%
100%
0
20
40
60
80
100
120
140el
ectr
ific
atio
n r
ate
Eel
ectr
icit
y co
nsu
mp
tio
n ,
un
it: c
Mtc
e
electricity consumption-2018 electricity consumption-2050 B2 electrification-2018 electrification-2050 B2
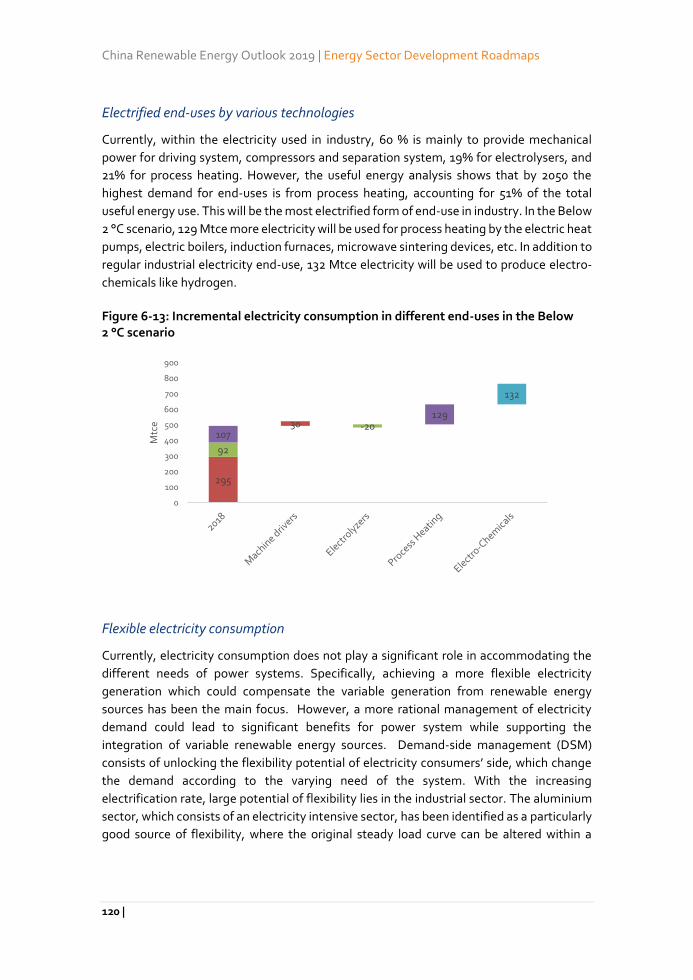
China Renewable Energy Outlook 2019 | Energy Sector Development Roadmaps
120 |
Electrified end-uses by various technologies
Currently, within the electricity used in industry, 60 % is mainly to provide mechanical
power for driving system, compressors and separation system, 19% for electrolysers, and
21% for process heating. However, the useful energy analysis shows that by 2050 the
highest demand for end-uses is from process heating, accounting for 51% of the total
useful energy use. This will be the most electrified form of end-use in industry. In the Below
2 °C scenario, 129 Mtce more electricity will be used for process heating by the electric heat
pumps, electric boilers, induction furnaces, microwave sintering devices, etc. In addition to
regular industrial electricity end-use, 132 Mtce electricity will be used to produce electro-
chemicals like hydrogen.
Figure 6-13: Incremental electricity consumption in different end-uses in the Below 2 °C scenario
Flexible electricity consumption
Currently, electricity consumption does not play a significant role in accommodating the
different needs of power systems. Specifically, achieving a more flexible electricity
generation which could compensate the variable generation from renewable energy
sources has been the main focus. However, a more rational management of electricity
demand could lead to significant benefits for power system while supporting the
integration of variable renewable energy sources. Demand-side management (DSM)
consists of unlocking the flexibility potential of electricity consumers’ side, which change
the demand according to the varying need of the system. With the increasing
electrification rate, large potential of flexibility lies in the industrial sector. The aluminium
sector, which consists of an electricity intensive sector, has been identified as a particularly
good source of flexibility, where the original steady load curve can be altered within a
295
30
92
-20107
129
132
0
100
200
300
400
500
600
700
800
900
Mtc
e
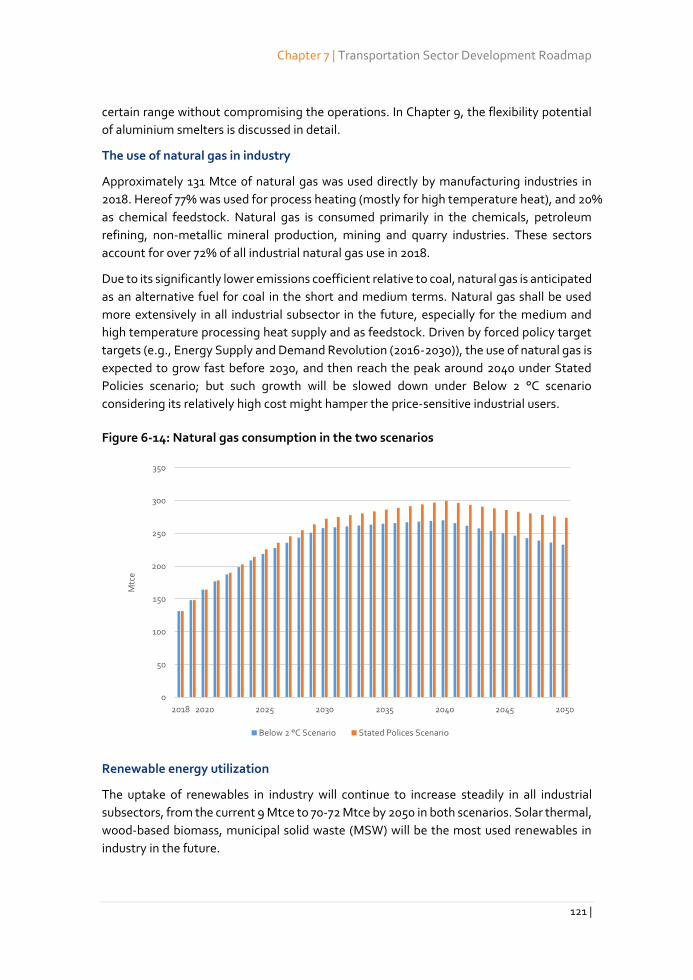
Chapter 7 | Transportation Sector Development Roadmap
121 |
certain range without compromising the operations. In Chapter 9, the flexibility potential
of aluminium smelters is discussed in detail.
The use of natural gas in industry
Approximately 131 Mtce of natural gas was used directly by manufacturing industries in
2018. Hereof 77% was used for process heating (mostly for high temperature heat), and 20%
as chemical feedstock. Natural gas is consumed primarily in the chemicals, petroleum
refining, non-metallic mineral production, mining and quarry industries. These sectors
account for over 72% of all industrial natural gas use in 2018.
Due to its significantly lower emissions coefficient relative to coal, natural gas is anticipated
as an alternative fuel for coal in the short and medium terms. Natural gas shall be used
more extensively in all industrial subsector in the future, especially for the medium and
high temperature processing heat supply and as feedstock. Driven by forced policy target
targets (e.g., Energy Supply and Demand Revolution (2016-2030)), the use of natural gas is
expected to grow fast before 2030, and then reach the peak around 2040 under Stated
Policies scenario; but such growth will be slowed down under Below 2 °C scenario
considering its relatively high cost might hamper the price-sensitive industrial users.
Figure 6-14: Natural gas consumption in the two scenarios
Renewable energy utilization
The uptake of renewables in industry will continue to increase steadily in all industrial
subsectors, from the current 9 Mtce to 70-72 Mtce by 2050 in both scenarios. Solar thermal,
wood-based biomass, municipal solid waste (MSW) will be the most used renewables in
industry in the future.
0
50
100
150
200
250
300
350
2018 2020 2025 2030 2035 2040 2045 2050
Mtc
e
Below 2 °C Scenario Stated Polices Scenario
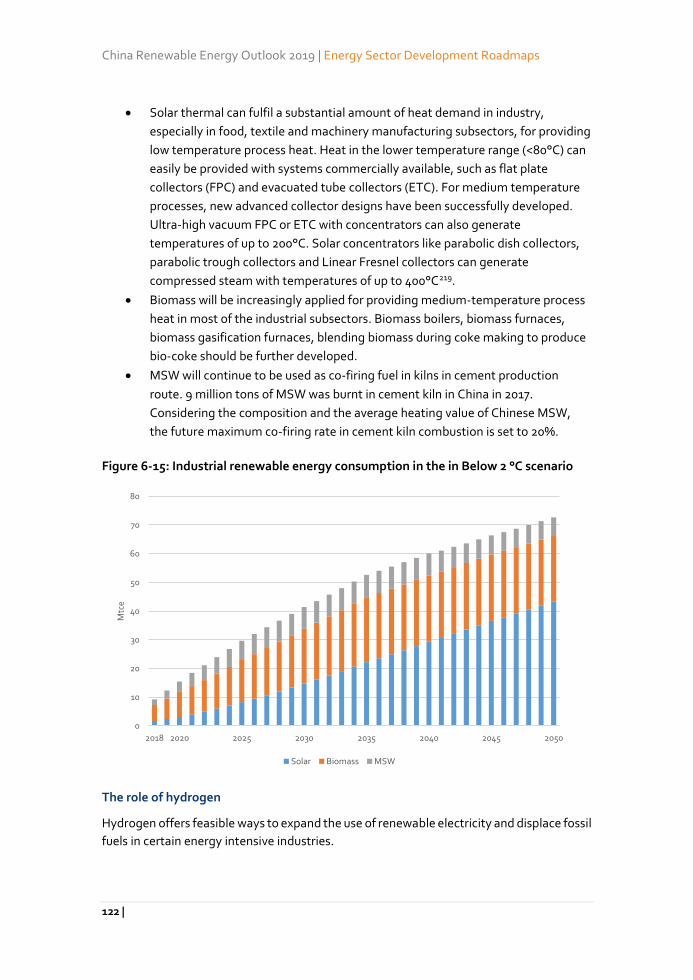
China Renewable Energy Outlook 2019 | Energy Sector Development Roadmaps
122 |
Solar thermal can fulfil a substantial amount of heat demand in industry,
especially in food, textile and machinery manufacturing subsectors, for providing
low temperature process heat. Heat in the lower temperature range (<80°C) can
easily be provided with systems commercially available, such as flat plate
collectors (FPC) and evacuated tube collectors (ETC). For medium temperature
processes, new advanced collector designs have been successfully developed.
Ultra-high vacuum FPC or ETC with concentrators can also generate
temperatures of up to 200°C. Solar concentrators like parabolic dish collectors,
parabolic trough collectors and Linear Fresnel collectors can generate
compressed steam with temperatures of up to 400°C219.
Biomass will be increasingly applied for providing medium-temperature process
heat in most of the industrial subsectors. Biomass boilers, biomass furnaces,
biomass gasification furnaces, blending biomass during coke making to produce
bio-coke should be further developed.
MSW will continue to be used as co-firing fuel in kilns in cement production
route. 9 million tons of MSW was burnt in cement kiln in China in 2017.
Considering the composition and the average heating value of Chinese MSW,
the future maximum co-firing rate in cement kiln combustion is set to 20%.
Figure 6-15: Industrial renewable energy consumption in the in Below 2 °C scenario
The role of hydrogen
Hydrogen offers feasible ways to expand the use of renewable electricity and displace fossil
fuels in certain energy intensive industries.
0
10
20
30
40
50
60
70
80
2018 2020 2025 2030 2035 2040 2045 2050
Mtc
e
Solar Biomass MSW
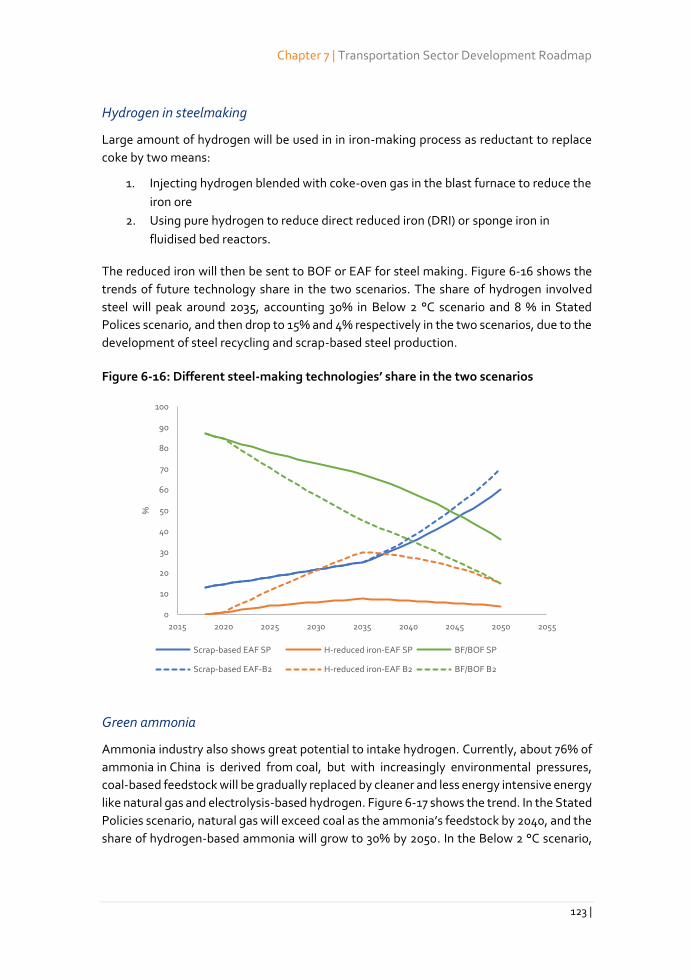
Chapter 7 | Transportation Sector Development Roadmap
123 |
Hydrogen in steelmaking
Large amount of hydrogen will be used in in iron-making process as reductant to replace
coke by two means:
1. Injecting hydrogen blended with coke-oven gas in the blast furnace to reduce the
iron ore
2. Using pure hydrogen to reduce direct reduced iron (DRI) or sponge iron in
fluidised bed reactors.
The reduced iron will then be sent to BOF or EAF for steel making. Figure 6-16 shows the
trends of future technology share in the two scenarios. The share of hydrogen involved
steel will peak around 2035, accounting 30% in Below 2 °C scenario and 8 % in Stated
Polices scenario, and then drop to 15% and 4% respectively in the two scenarios, due to the
development of steel recycling and scrap-based steel production.
Figure 6-16: Different steel-making technologies’ share in the two scenarios
Green ammonia
Ammonia industry also shows great potential to intake hydrogen. Currently, about 76% of
ammonia in China is derived from coal, but with increasingly environmental pressures,
coal-based feedstock will be gradually replaced by cleaner and less energy intensive energy
like natural gas and electrolysis-based hydrogen. Figure 6-17 shows the trend. In the Stated
Policies scenario, natural gas will exceed coal as the ammonia’s feedstock by 2040, and the
share of hydrogen-based ammonia will grow to 30% by 2050. In the Below 2 °C scenario,
0
10
20
30
40
50
60
70
80
90
100
2015 2020 2025 2030 2035 2040 2045 2050 2055
%
Scrap-based EAF SP H-reduced iron-EAF SP BF/BOF SP
Scrap-based EAF-B2 H-reduced iron-EAF B2 BF/BOF B2
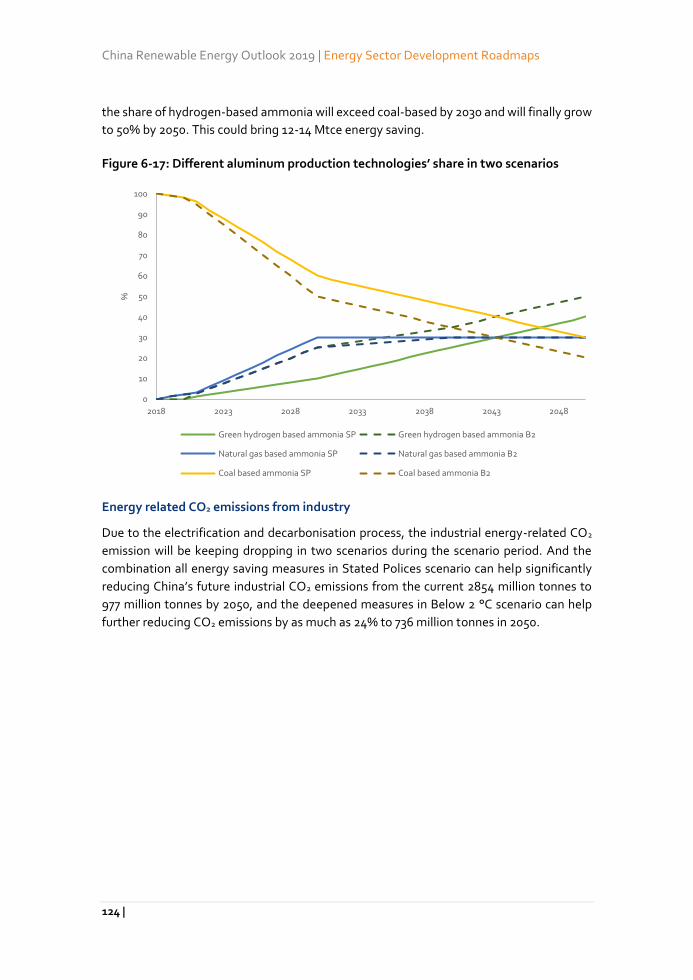
China Renewable Energy Outlook 2019 | Energy Sector Development Roadmaps
124 |
the share of hydrogen-based ammonia will exceed coal-based by 2030 and will finally grow
to 50% by 2050. This could bring 12-14 Mtce energy saving.
Figure 6-17: Different aluminum production technologies’ share in two scenarios
Energy related CO2 emissions from industry
Due to the electrification and decarbonisation process, the industrial energy-related CO2
emission will be keeping dropping in two scenarios during the scenario period. And the
combination all energy saving measures in Stated Polices scenario can help significantly
reducing China’s future industrial CO2 emissions from the current 2854 million tonnes to
977 million tonnes by 2050, and the deepened measures in Below 2 °C scenario can help
further reducing CO2 emissions by as much as 24% to 736 million tonnes in 2050.
0
10
20
30
40
50
60
70
80
90
100
2018 2023 2028 2033 2038 2043 2048
%
Green hydrogen based ammonia SP Green hydrogen based ammonia B2
Natural gas based ammonia SP Natural gas based ammonia B2
Coal based ammonia SP Coal based ammonia B2
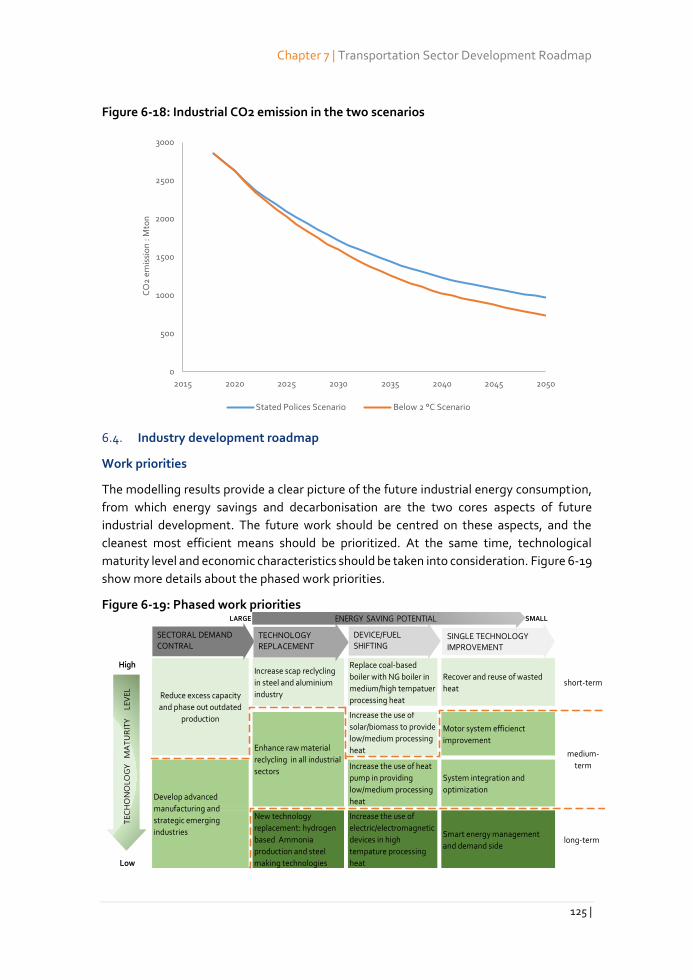
Chapter 7 | Transportation Sector Development Roadmap
125 |
Figure 6-18: Industrial CO2 emission in the two scenarios
6.4. Industry development roadmap
Work priorities
The modelling results provide a clear picture of the future industrial energy consumption,
from which energy savings and decarbonisation are the two cores aspects of future
industrial development. The future work should be centred on these aspects, and the
cleanest most efficient means should be prioritized. At the same time, technological
maturity level and economic characteristics should be taken into consideration. Figure 6-19
show more details about the phased work priorities.
Figure 6-19: Phased work priorities
0
500
1000
1500
2000
2500
3000
2015 2020 2025 2030 2035 2040 2045 2050
CO
2 e
mis
sio
n :
Mto
n
Stated Polices Scenario Below 2 °C Scenario
LARGE SMALL
HighIncrease scap reclycling
in steel and aluminium
industry
Replace coal-based
boiler with NG boiler in
medium/high tempatuer
processing heat
Recover and reuse of wasted
heatshort-term
Increase the use of
solar/biomass to provide
low/medium processing
heat
Motor system efficienct
improvement
Increase the use of heat
pump in providing
low/medium processing
heat
System integration and
optimization
Low
New technology
replacement: hydrogen
based Ammonia
production and steel
making technologies
Increase the use of
electric/electromagnetic
devices in high
tempature processing
heat
Smart energy management
and demand side long-term
Reduce excess capacity
and phase out outdated
production
Develop advanced
manufacturing and
strategic emerging
industries
Enhance raw material
reclycling in all industrial
sectors
medium-
term
SECTORAL DEMAND CONTRAL
TECHNOLOGY REPLACEMENT
DEVICE/FUEL SHIFTING
SINGLE TECHNOLOGY IMPROVEMENT
TECH
ON
OLO
GY M
ATU
RIT
Y L
EVEL
ENERGY SAVING POTENTIAL
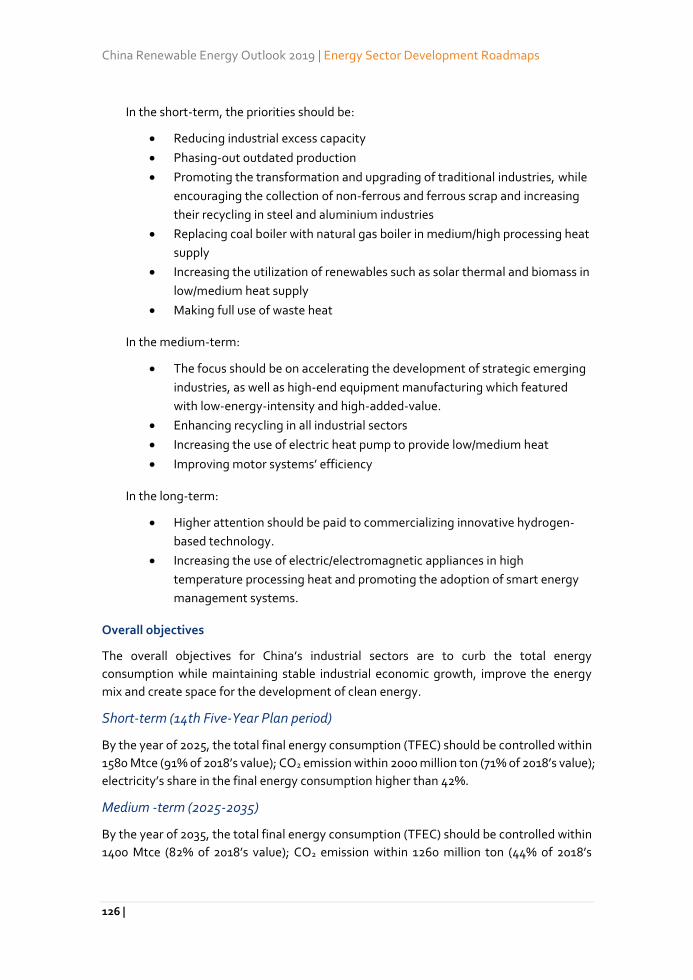
China Renewable Energy Outlook 2019 | Energy Sector Development Roadmaps
126 |
In the short-term, the priorities should be:
Reducing industrial excess capacity
Phasing-out outdated production
Promoting the transformation and upgrading of traditional industries, while
encouraging the collection of non-ferrous and ferrous scrap and increasing
their recycling in steel and aluminium industries
Replacing coal boiler with natural gas boiler in medium/high processing heat
supply
Increasing the utilization of renewables such as solar thermal and biomass in
low/medium heat supply
Making full use of waste heat
In the medium-term:
The focus should be on accelerating the development of strategic emerging
industries, as well as high-end equipment manufacturing which featured
with low-energy-intensity and high-added-value.
Enhancing recycling in all industrial sectors
Increasing the use of electric heat pump to provide low/medium heat
Improving motor systems’ efficiency
In the long-term:
Higher attention should be paid to commercializing innovative hydrogen-
based technology.
Increasing the use of electric/electromagnetic appliances in high
temperature processing heat and promoting the adoption of smart energy
management systems.
Overall objectives
The overall objectives for China’s industrial sectors are to curb the total energy
consumption while maintaining stable industrial economic growth, improve the energy
mix and create space for the development of clean energy.
Short-term (14th Five-Year Plan period)
By the year of 2025, the total final energy consumption (TFEC) should be controlled within
1580 Mtce (91% of 2018’s value); CO2 emission within 2000 million ton (71% of 2018’s value);
electricity’s share in the final energy consumption higher than 42%.
Medium -term (2025-2035)
By the year of 2035, the total final energy consumption (TFEC) should be controlled within
1400 Mtce (82% of 2018’s value); CO2 emission within 1260 million ton (44% of 2018’s
Chapter 7 | Transportation Sector Development Roadmap
127 |
value); electricity’s share in the final energy consumption higher than 51%.
Long -term (2035-2050)
By the year of 2050, the total final energy consumption (TFEC) should be controlled within
1300 Mtce (71% of 2018’s value); CO2 emission within 750 million ton (26% of 2018’s value);
electricity’s share in the final energy consumption higher than 36%.
Sub-sectoral targets
Different targets are made for long-term decarbonisation and energy efficiency with the
key industrial sectors, focusing on those that use the greatest amount of heat and
represent the greatest greenhouse gas emissions.
Steel-making:
Product output control: the annual crude steel production capacity should be
controlled within 82 million tonnes by 2025, 69 million tonnes by 2035, 60 million
tonnes by 2050 (Lightweight technology, Magnesium aluminium alloy will be
used to replace steel in transport vehicle manufacturing)
Energy intensity: general energy intensity for the whole steel-making industry
should decrease 8-10% by 2025, 17-24%by 2030, 41-51% by 2050
Resource recycling: the proportion of scrap-based electric arc furnace steel
should reach 30-32% by 2025, 40-45% by 2035, 50-65% by 2050
Supporting technologies: increase the energy efficiency standard and promote
technologies such as Direct reduced iron production technology; Coal moisture
control (CMC) Coke dry quenching technology; Sintering waste heat recovery
and utilization technology; Low temperature sintering technology Mini-
pelletized sinter process technology; BF top gas dry type TRT technology;
Converter fume dry dusting technology; Converter flue gas waste heat recovery
technology; Thin slab continuous casting technology; Energy management
centre for steel enterprises;
Cement:
Product output control: by infrastructure deceleration, also building quality
improvement, cement production should be reduced to 1.6 billion tons by 2025;
1.1 billion by 2035, 0.84 billion tons by 2050;
Energy intensity: should decrease 28% by 2025, 55%by 2035, 68% by 2050;
Renewable energy utilization: the share of MSW should reach 5% by 2025, 12%
by 2030, 16% by 2050;
Supporting technologies: The cement industry develops new dry kiln
decomposition technology to intake more natural gas and electricity; improves
the proportion of new dry process cement clinker; actively promotes energy-
saving grinding equipment and implement energy-saving retrofit of existing
China Renewable Energy Outlook 2019 | Energy Sector Development Roadmaps
128 |
large and medium-sized rotary kiln, mill and dryer. Gradually phase out the
machine shaft kiln, wet kiln, dry hollow kiln and other backward cement
production processes.
Nonferrous Metals
Aluminium: Energy intensity decreases 6% by 2025, 14%by 2030, 54% by 2050;
Aluminium recycling rate: 29% by 2025, 43% by 2035, 58% by 2050
Supporting technologies: Copper smelting should adopt advanced oxygen-rich
flash and oxygen-rich molten pool smelting process to replace traditional
processes such as reverberator furnace, blast furnace and electric furnace to
improve smelting strength; alumina should gradually eliminate direct heating
and melting technology; The aluminium production should adopt large-scale
pre-bake electrolytic cell, and the self-baked electrolytic cell is eliminated within
a time limit, and the small pre-baked trough is gradually eliminated; the lead
smelting production adopts the new technology of oxygen bottom blowing and
other direct oxygen lead-smelting technology, transforms the sintering blast
furnace process, and eliminates the soil method. Lead smelting; zinc smelting
production develops new wet process and eliminates zinc smelting.
Chemicals
Ammonia: Energy intensity decreases 6-8% by 2025, 14-17%by 2030, 20-23% by
2050
Calcium carbide: Energy intensity decreases 3% by 2025, 7% by 2030, 10 % by
2050
Ethylene: Energy intensity decreases 15% by 2025, 30 %by 2030, 40% by 2050
Soda coda: Energy intensity decreases 5% by 2025, 11%by 2030, 19% by 2050
Supporting technologies: Large-scale ammonia plant adopts advanced energy-
saving technology, new catalyst and high-efficiency energy-saving equipment to
improve conversion efficiency and strengthen waste heat recovery and
utilization; synthetic ammonia with natural gas as raw material to promote one-
stage flue gas waste heat recovery technology and transform steam system;
synthetic ammonia with petroleum as raw material. Accelerate the replacement
of feedstock oil with clean coal or natural gas; small and medium-sized synthetic
ammonia uses energy-saving equipment and pressure swing adsorption
technology to reduce energy consumption. Coal gasification uses coal water
slurry or advanced powder coal gasification technology to replace traditional
fixed bed gasification technology. The caustic soda production gradually phases
out the graphite anode diaphragm caustic soda to increase the specific gravity of
the ion-exchange membrane caustic soda. Soda ash production eliminates high-
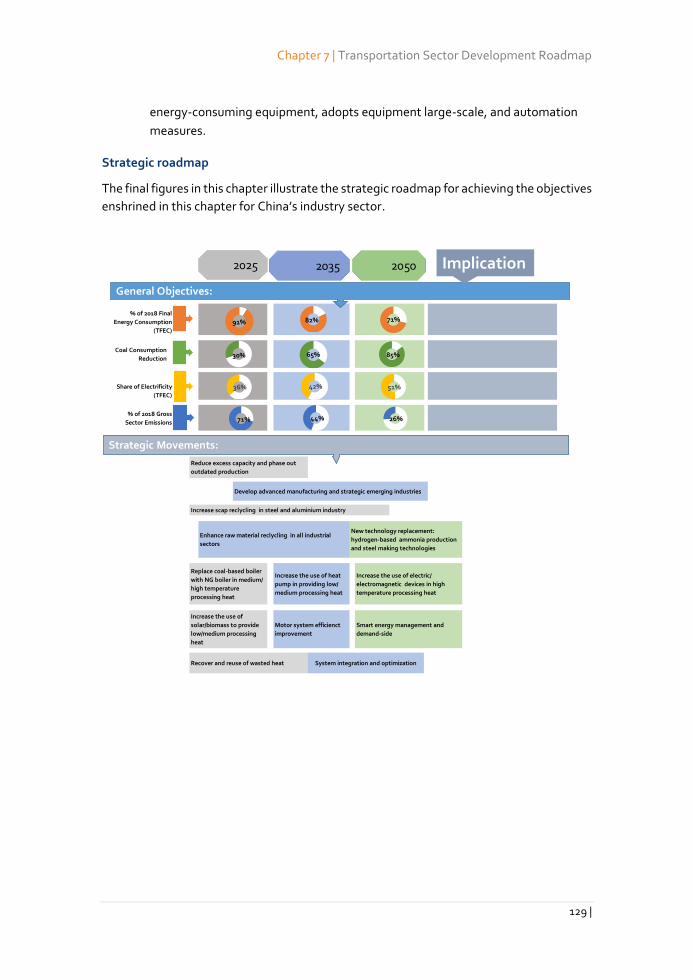
Chapter 7 | Transportation Sector Development Roadmap
129 |
energy-consuming equipment, adopts equipment large-scale, and automation
measures.
Strategic roadmap
The final figures in this chapter illustrate the strategic roadmap for achieving the objectives
enshrined in this chapter for China’s industry sector.
% of 2018 Final
Energy Consumption
(TFEC)
Coal Consumption
Reduction
Share of Electrificity
(TFEC)
% of 2018 Gross
Sector Emissions
Replace coal-based boiler
with NG boiler in medium/
high temperature
processing heat
Increase the use of
solar/biomass to provide
low/medium processing
heat
Recover and reuse of wasted heat
Increase the use of heat
pump in providing low/
medium processing heat
Motor system efficienct
improvement
Reduce excess capacity and phase out
outdated production
Develop advanced manufacturing and strategic emerging industries
Enhance raw material reclycling in all industrial
sectors
New technology replacement:
hydrogen-based ammonia production
and steel making technologies
Increase scap reclycling in steel and aluminium industry
System integration and optimization
Smart energy management and
demand-side
Increase the use of electric/
electromagnetic devices in high
temperature processing heat
2025 2035 2050
General Objectives:
36% 42% 51%
71% 44% 26%
91% 82% 71%
30% 65% 85%
Implication
Strategic Movements:
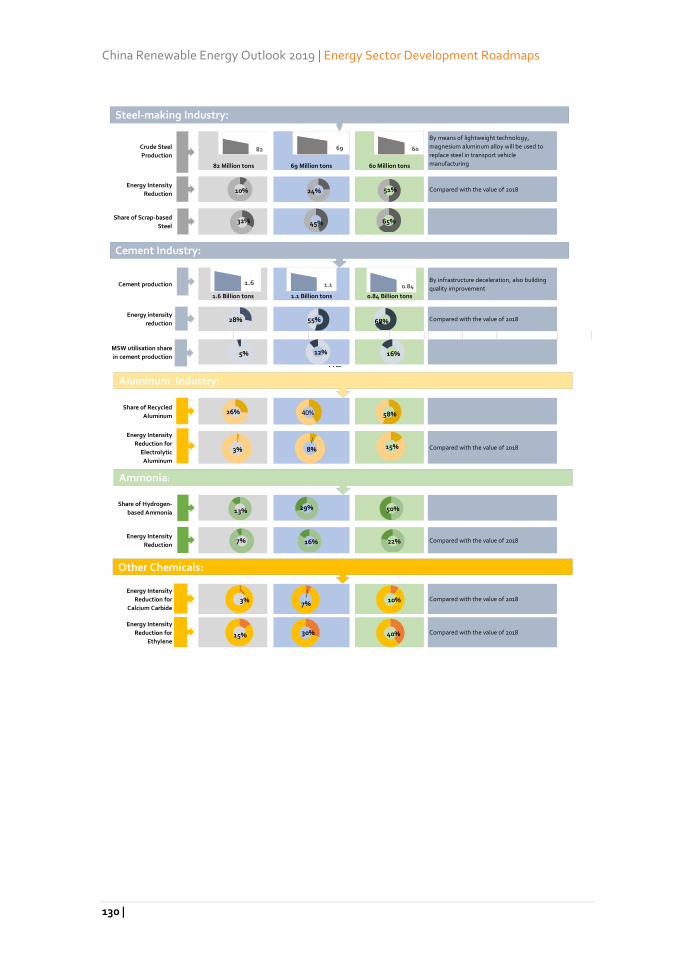
China Renewable Energy Outlook 2019 | Energy Sector Development Roadmaps
130 |
Crude Steel
Production
Energy Intensity
Reduction
Share of Scrap-based
Steel
Cement production
Energy intensity
reduction
MSW utilisation share
in cement production
Share of Recycled
Aluminum
Energy Intensity
Reduction for
Electrolytic
Aluminum
Share of Hydrogen-
based Ammonia
Energy Intensity
Reduction
Energy Intensity
Reduction for
Calcium Carbide
Energy Intensity
Reduction for
Ethylene
69 Million tons 60 Million tons
By means of lightweight technology,
magnesium aluminum alloy will be used to
replace steel in transport vehicle
manufacturing 82 Million tons
1.6 Billion tons 1.1 Billion tons 0.84 Billion tons
By infrastructure deceleration, also building
quality improvement
Compared with the value of 2018
Compared with the value of 2018
Compared with the value of 2018
Compared with the value of 2018
Compared with the value of 2018
Compared with the value of 2018
Steel-making Industry:
Cement Industry:
82 69 60
Aluminum Industry:
44%
1.6 1.1 0.84
10% 24% 51%
32% 45% 65%
28% 55% 68%
5% 12% 16%
3%
Ammonia:
44%
Other Chemicals:
44%
3% 7%10%
26% 40% 58%
8% 15%
13% 29% 50%
7% 16% 22%
15% 30% 40%
Chapter 7 | Transportation Sector Development Roadmap
131 |
7. Transportation development roadmap
As the economy of China develops towards an abundant service-based economy, the
transport sector of the country sees large changes. Despite the fact that the transport
demand will significantly increase, the growth of final energy consumption of transport
sector can be managed at a moderate level in the long term thanks to the high penetration
of electric vehicles. A large electric vehicle stock can also serve as a valuable flexibility
resource for variable renewable energy. The electrification of transport sector, particularly
for heavy duty freight vehicles, could be enhanced through the introduction of fuel cell
vehicles running on electrolyte hydrogen, which has a large cost reduction potential in B2
scenario.
The increased transport need can either cause air pollution in cities or it can help the
balancing of the electricity grid, dependent on the technology track chosen. China is
already well underway with high targets for EV implementation and progressive fuel
standards.
7.1. Main findings
Ownership of vehicles and general passenger transport continues to increase. The
ownership for passenger cars shall continue to grow steadily and reach 450 million by 2050.
There will also be a shift from air passenger transport high-speed rail in non-road passenger
transport, due to of high-speed rail’s environmental effectiveness and economic efficiency.
Freight transport demand will lag due to the ‘new normal’ transition and the reduced
need for cargo transport. Moreover, market pressures will drive the productivity of freight
transport on from the roads to less energy-intensive modes such as railways and ships.
A controlled growth in final energy consumption of transportation sector. Despite the
increasing transportation demand and the rise in ownership of passenger vehicles, the final
energy consumption of the entire transportation sector peaks around 2030 at 643 Mtce,
then decreases to 491 Mtce by 2050 in Stated Polices Scenario. In Below 2 °C Scenario, it
peaks around 2030 at 614 Mtce and falls back to 467 Mtce by 2050.
Vehicles adopts a cleaner fuel mix. China’s fossil fuel demand for transport is projected
to peak around 2026-2027 at 550-570 Mtce. The share of oil product in transportation fuels
continues to decline over the projection period, from 95% in 2018 to 32%- 45% in 2050.
Electricity will become the fast-growing fuel types in future traffic energy consumption. Its
share grows from 2% in 2018, to 33%-39% in 2050. By 2047, electricity shall replace oil
products as the dominant energy in the Below 2 °C scenario.
Strong growth of electric vehicles. Along with policy incentives and technology advances,
the cost of electric vehicles will reduce greatly. Electric vehicles and plug-in hybrid vehicles
will be the main route for China's new energy vehicles’ development long-term. According
to our analysis, 450-490 million electric vehicles (including both passenger and freight) are
expected on road by 2050. To achieve that, China needs to introduce stricter regulation to
control new ICE sales in the 14th-15th FYP.
China Renewable Energy Outlook 2019 | Energy Sector Development Roadmaps
132 |
Improved energy efficiency. The domination of EV will introduce substantial
improvements on average fuel economy due to their efficiency advantages compared to
the current ICE engines power. New propulsion systems including electric motors powered
by batteries or fuel cells, battery performance boost, and various fuel hybrid concepts could
offer significant reductions in energy intensity as well as carbon emissions. Moreover,
automated and connected vehicles could also help to further lower fuel consumption and
GHG emissions.
Added flexibility. A high penetration of EV’s will support the power system transformation
and EV owners can benefit from providing flexibility and system services to the grid. Used
EV batteries are can be repurposed for stationary storage at low cost and play a role in
distributed and aggregated energy storage.
Flexibility from active EV’s have limitations, mostly due to transport service times,
charging power limits and time at charger. Chapter 9 includes analysis of the potentials by
EV smart charging and its limitations. The positive effects of EVs for the power system and
security of supply in the grid is only achieved by using smart charging, as regular charging
causes a large pool of vehicles to charge concurrently to residential peak energy
consumption, putting unnecessary strain on the grid. The total battery capacity available
from active EV batteries (not counting PHEVs) is 32.7-38 TWh by 2050. The electricity grid
will be able to utilise a large part of this capacity for flexibility.
Decoupling of transportation development and carbon emissions. Despite the strong
increase of transport demand, by 2050, the direct CO2 emission are only 340-480 million
tonnes in the two scenarios, which is 40-55% of the 2018 level. This requires government
focus on technical innovation and promoting EVs as much as possible for early carbon
emissions peaking, realizing the decoupling between transportation development and
carbon emissions. Beyond EVs, biofuels and P2X provides alternative decarbonised
transport fuel particularly for heavy-duty transport, where long running hours makes
battery EVs less suitable.
7.2. The current situation
Gasoline and diesel dominate the transportation energy use
Together, these two fuels accounted for 84% of total delivered transportation energy in
2018. Gasoline consumption is primarily for the movement of people, especially by light-
duty vehicles. Diesel fuel consumption is primarily for the movement of goods, especially
by heavy-duty trucks. Jet fuel accounts for 11% of transportation energy consumption,
while Natural gas and electricity together accounting for about 4%. The current oil-
dominant energy consumption of transportation is an energy security issue. It is imperative
to adjust and optimize the energy consumption structure of the entire transport sector.
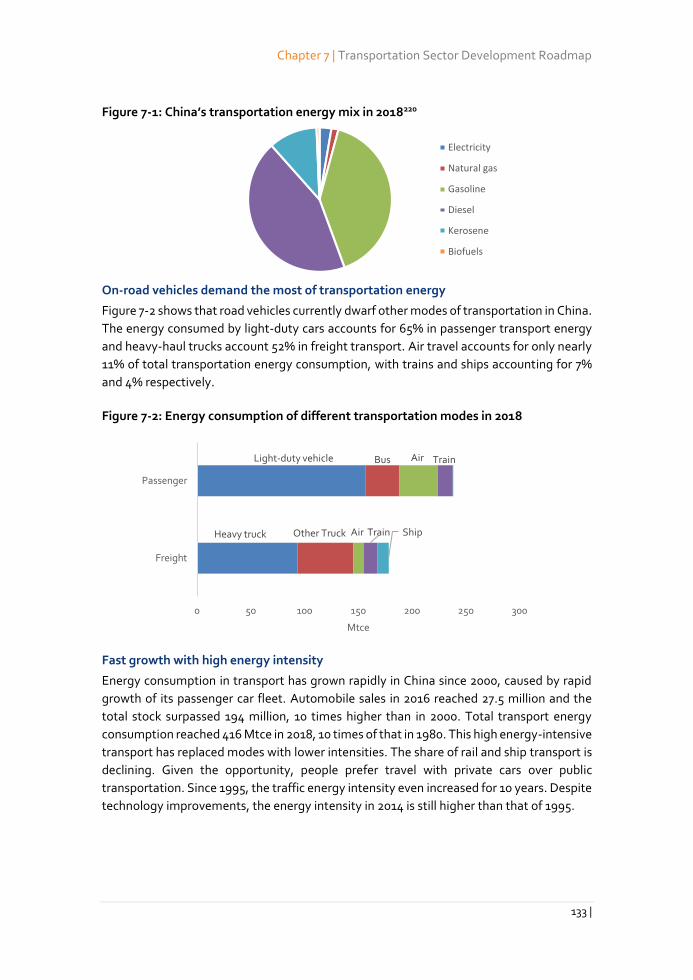
Chapter 7 | Transportation Sector Development Roadmap
133 |
Figure 7-1: China’s transportation energy mix in 2018220
On-road vehicles demand the most of transportation energy
Figure 7-2 shows that road vehicles currently dwarf other modes of transportation in China.
The energy consumed by light-duty cars accounts for 65% in passenger transport energy
and heavy-haul trucks account 52% in freight transport. Air travel accounts for only nearly
11% of total transportation energy consumption, with trains and ships accounting for 7%
and 4% respectively.
Figure 7-2: Energy consumption of different transportation modes in 2018
Fast growth with high energy intensity
Energy consumption in transport has grown rapidly in China since 2000, caused by rapid
growth of its passenger car fleet. Automobile sales in 2016 reached 27.5 million and the
total stock surpassed 194 million, 10 times higher than in 2000. Total transport energy
consumption reached 416 Mtce in 2018, 10 times of that in 1980. This high energy-intensive
transport has replaced modes with lower intensities. The share of rail and ship transport is
declining. Given the opportunity, people prefer travel with private cars over public
transportation. Since 1995, the traffic energy intensity even increased for 10 years. Despite
technology improvements, the energy intensity in 2014 is still higher than that of 1995.
Electricity
Natural gas
Gasoline
Diesel
Kerosene
Biofuels
Heavy truck
Light-duty vehicle
Other Truck
Bus
Air
Air
Train
Train
Ship
0 50 100 150 200 250 300
Freight
Passenger
Mtce
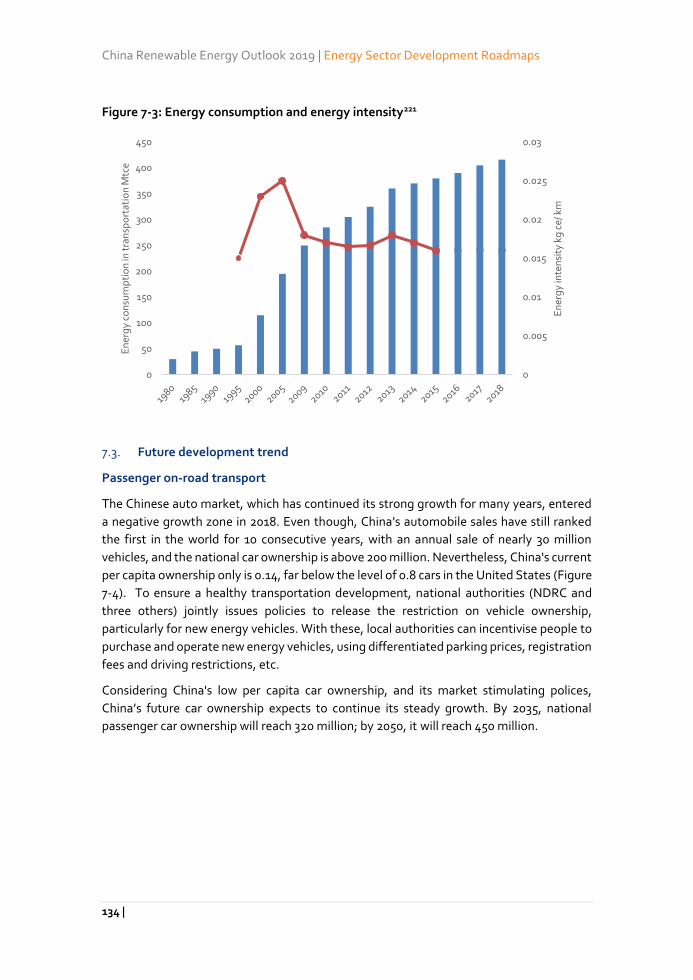
China Renewable Energy Outlook 2019 | Energy Sector Development Roadmaps
134 |
Figure 7-3: Energy consumption and energy intensity221
7.3. Future development trend
Passenger on-road transport
The Chinese auto market, which has continued its strong growth for many years, entered
a negative growth zone in 2018. Even though, China's automobile sales have still ranked
the first in the world for 10 consecutive years, with an annual sale of nearly 30 million
vehicles, and the national car ownership is above 200 million. Nevertheless, China's current
per capita ownership only is 0.14, far below the level of 0.8 cars in the United States (Figure
7-4). To ensure a healthy transportation development, national authorities (NDRC and
three others) jointly issues policies to release the restriction on vehicle ownership,
particularly for new energy vehicles. With these, local authorities can incentivise people to
purchase and operate new energy vehicles, using differentiated parking prices, registration
fees and driving restrictions, etc.
Considering China's low per capita car ownership, and its market stimulating polices,
China’s future car ownership expects to continue its steady growth. By 2035, national
passenger car ownership will reach 320 million; by 2050, it will reach 450 million.
0
0.005
0.01
0.015
0.02
0.025
0.03
0
50
100
150
200
250
300
350
400
450
En
erg
y in
ten
sity
kg
ce/
km
En
erg
y co
nsu
mp
tio
n in
tra
nsp
ort
atio
n M
tce
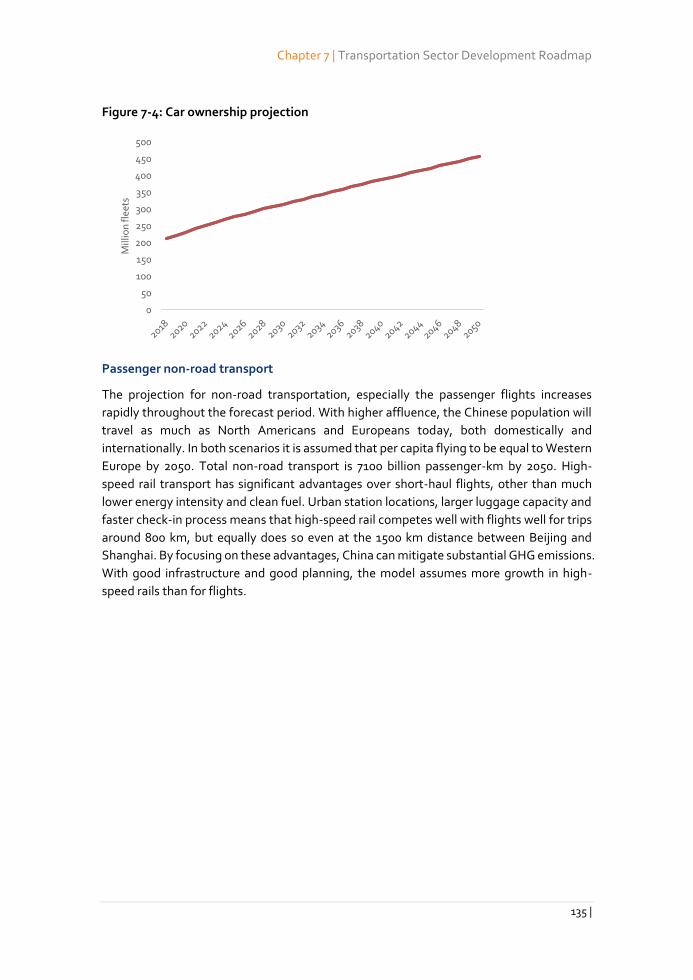
Chapter 7 | Transportation Sector Development Roadmap
135 |
Figure 7-4: Car ownership projection
Passenger non-road transport
The projection for non-road transportation, especially the passenger flights increases
rapidly throughout the forecast period. With higher affluence, the Chinese population will
travel as much as North Americans and Europeans today, both domestically and
internationally. In both scenarios it is assumed that per capita flying to be equal to Western
Europe by 2050. Total non-road transport is 7100 billion passenger-km by 2050. High-
speed rail transport has significant advantages over short-haul flights, other than much
lower energy intensity and clean fuel. Urban station locations, larger luggage capacity and
faster check-in process means that high-speed rail competes well with flights well for trips
around 800 km, but equally does so even at the 1500 km distance between Beijing and
Shanghai. By focusing on these advantages, China can mitigate substantial GHG emissions.
With good infrastructure and good planning, the model assumes more growth in high-
speed rails than for flights.
0
50
100
150
200
250
300
350
400
450
500
Mill
ion
flee
ts
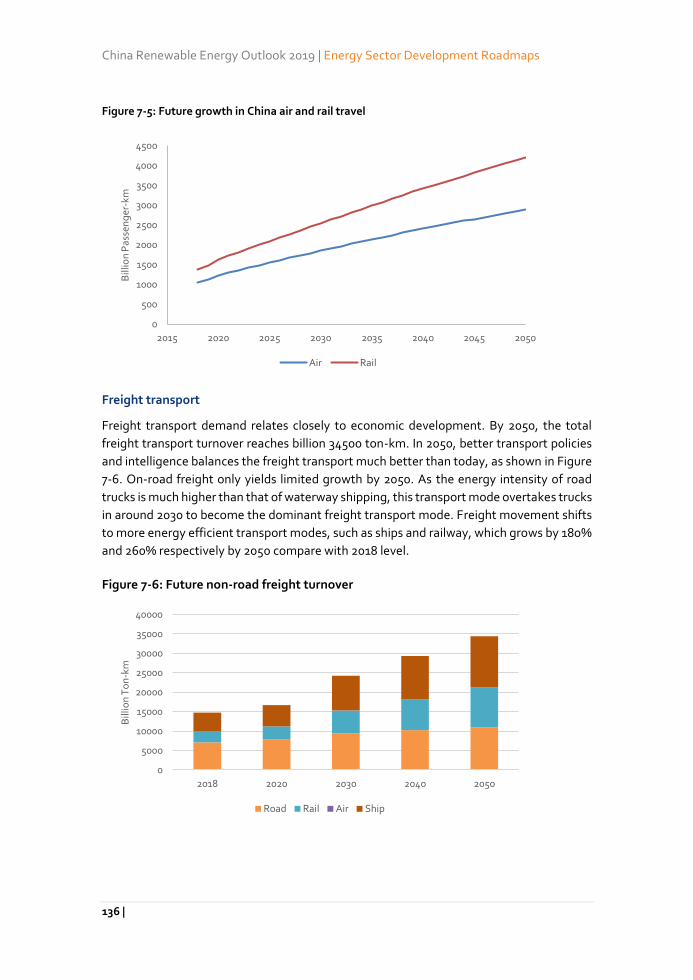
China Renewable Energy Outlook 2019 | Energy Sector Development Roadmaps
136 |
Figure 7-5: Future growth in China air and rail travel
Freight transport
Freight transport demand relates closely to economic development. By 2050, the total
freight transport turnover reaches billion 34500 ton-km. In 2050, better transport policies
and intelligence balances the freight transport much better than today, as shown in Figure
7-6. On-road freight only yields limited growth by 2050. As the energy intensity of road
trucks is much higher than that of waterway shipping, this transport mode overtakes trucks
in around 2030 to become the dominant freight transport mode. Freight movement shifts
to more energy efficient transport modes, such as ships and railway, which grows by 180%
and 260% respectively by 2050 compare with 2018 level.
Figure 7-6: Future non-road freight turnover
0
500
1000
1500
2000
2500
3000
3500
4000
4500
2015 2020 2025 2030 2035 2040 2045 2050
Bill
ion
Pas
sen
ger
-km
Air Rail
0
5000
10000
15000
20000
25000
30000
35000
40000
2018 2020 2030 2040 2050
Bill
ion
To
n-k
m
Road Rail Air Ship
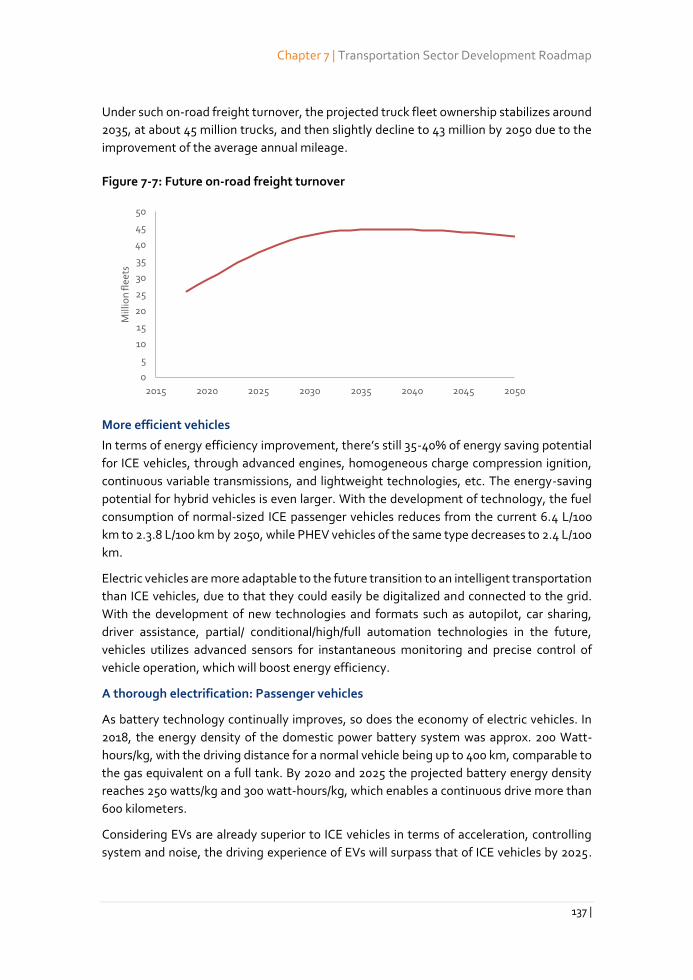
Chapter 7 | Transportation Sector Development Roadmap
137 |
Under such on-road freight turnover, the projected truck fleet ownership stabilizes around
2035, at about 45 million trucks, and then slightly decline to 43 million by 2050 due to the
improvement of the average annual mileage.
Figure 7-7: Future on-road freight turnover
More efficient vehicles
In terms of energy efficiency improvement, there’s still 35-40% of energy saving potential
for ICE vehicles, through advanced engines, homogeneous charge compression ignition,
continuous variable transmissions, and lightweight technologies, etc. The energy-saving
potential for hybrid vehicles is even larger. With the development of technology, the fuel
consumption of normal-sized ICE passenger vehicles reduces from the current 6.4 L/100
km to 2.3.8 L/100 km by 2050, while PHEV vehicles of the same type decreases to 2.4 L/100
km.
Electric vehicles are more adaptable to the future transition to an intelligent transportation
than ICE vehicles, due to that they could easily be digitalized and connected to the grid.
With the development of new technologies and formats such as autopilot, car sharing,
driver assistance, partial/ conditional/high/full automation technologies in the future,
vehicles utilizes advanced sensors for instantaneous monitoring and precise control of
vehicle operation, which will boost energy efficiency.
A thorough electrification: Passenger vehicles
As battery technology continually improves, so does the economy of electric vehicles. In
2018, the energy density of the domestic power battery system was approx. 200 Watt-
hours/kg, with the driving distance for a normal vehicle being up to 400 km, comparable to
the gas equivalent on a full tank. By 2020 and 2025 the projected battery energy density
reaches 250 watts/kg and 300 watt-hours/kg, which enables a continuous drive more than
600 kilometers.
Considering EVs are already superior to ICE vehicles in terms of acceleration, controlling
system and noise, the driving experience of EVs will surpass that of ICE vehicles by 2025.
0
5
10
15
20
25
30
35
40
45
50
2015 2020 2025 2030 2035 2040 2045 2050
Mill
ion
flee
ts
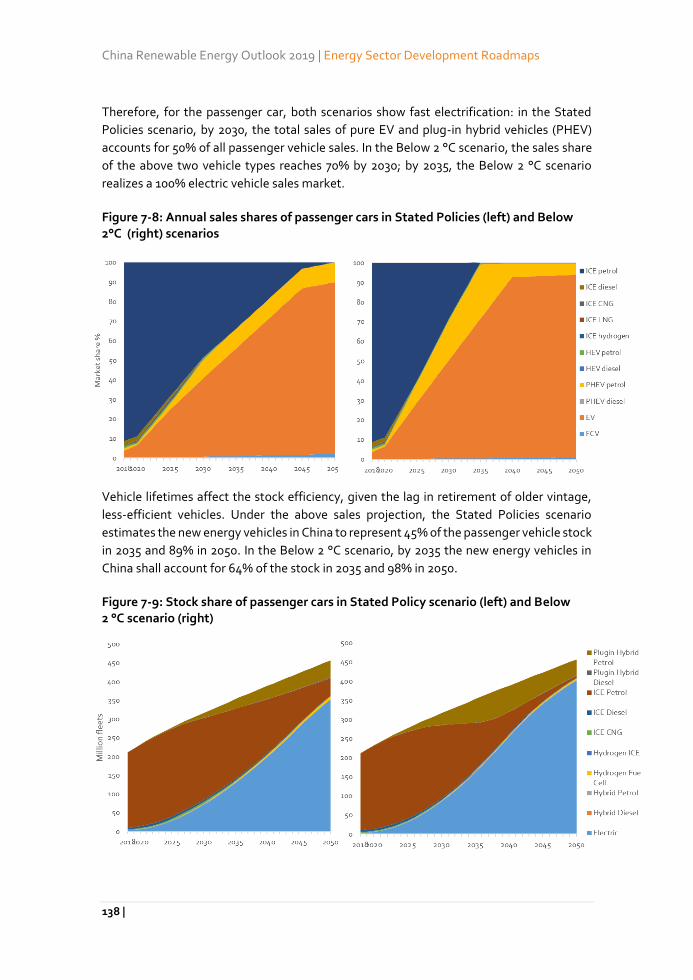
China Renewable Energy Outlook 2019 | Energy Sector Development Roadmaps
138 |
Therefore, for the passenger car, both scenarios show fast electrification: in the Stated
Policies scenario, by 2030, the total sales of pure EV and plug-in hybrid vehicles (PHEV)
accounts for 50% of all passenger vehicle sales. In the Below 2 °C scenario, the sales share
of the above two vehicle types reaches 70% by 2030; by 2035, the Below 2 °C scenario
realizes a 100% electric vehicle sales market.
Figure 7-8: Annual sales shares of passenger cars in Stated Policies (left) and Below 2°C (right) scenarios
Vehicle lifetimes affect the stock efficiency, given the lag in retirement of older vintage,
less-efficient vehicles. Under the above sales projection, the Stated Policies scenario
estimates the new energy vehicles in China to represent 45% of the passenger vehicle stock
in 2035 and 89% in 2050. In the Below 2 °C scenario, by 2035 the new energy vehicles in
China shall account for 64% of the stock in 2035 and 98% in 2050.
Figure 7-9: Stock share of passenger cars in Stated Policy scenario (left) and Below 2 °C scenario (right)
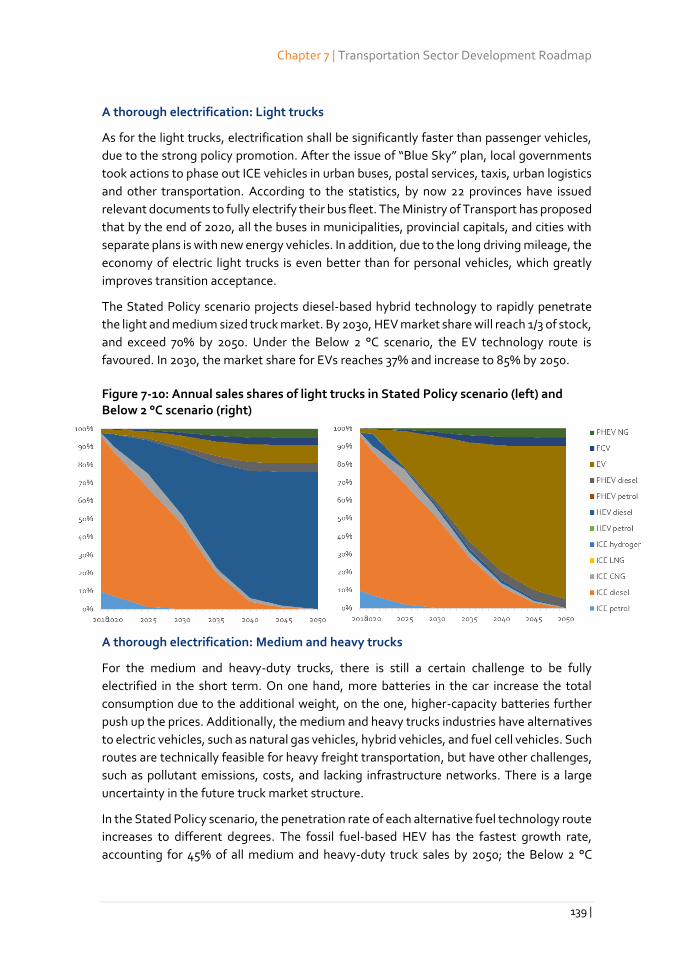
Chapter 7 | Transportation Sector Development Roadmap
139 |
A thorough electrification: Light trucks
As for the light trucks, electrification shall be significantly faster than passenger vehicles,
due to the strong policy promotion. After the issue of “Blue Sky” plan, local governments
took actions to phase out ICE vehicles in urban buses, postal services, taxis, urban logistics
and other transportation. According to the statistics, by now 22 provinces have issued
relevant documents to fully electrify their bus fleet. The Ministry of Transport has proposed
that by the end of 2020, all the buses in municipalities, provincial capitals, and cities with
separate plans is with new energy vehicles. In addition, due to the long driving mileage, the
economy of electric light trucks is even better than for personal vehicles, which greatly
improves transition acceptance.
The Stated Policy scenario projects diesel-based hybrid technology to rapidly penetrate
the light and medium sized truck market. By 2030, HEV market share will reach 1/3 of stock,
and exceed 70% by 2050. Under the Below 2 °C scenario, the EV technology route is
favoured. In 2030, the market share for EVs reaches 37% and increase to 85% by 2050.
Figure 7-10: Annual sales shares of light trucks in Stated Policy scenario (left) and Below 2 °C scenario (right)
A thorough electrification: Medium and heavy trucks
For the medium and heavy-duty trucks, there is still a certain challenge to be fully
electrified in the short term. On one hand, more batteries in the car increase the total
consumption due to the additional weight, on the one, higher-capacity batteries further
push up the prices. Additionally, the medium and heavy trucks industries have alternatives
to electric vehicles, such as natural gas vehicles, hybrid vehicles, and fuel cell vehicles. Such
routes are technically feasible for heavy freight transportation, but have other challenges,
such as pollutant emissions, costs, and lacking infrastructure networks. There is a large
uncertainty in the future truck market structure.
In the Stated Policy scenario, the penetration rate of each alternative fuel technology route
increases to different degrees. The fossil fuel-based HEV has the fastest growth rate,
accounting for 45% of all medium and heavy-duty truck sales by 2050; the Below 2 °C
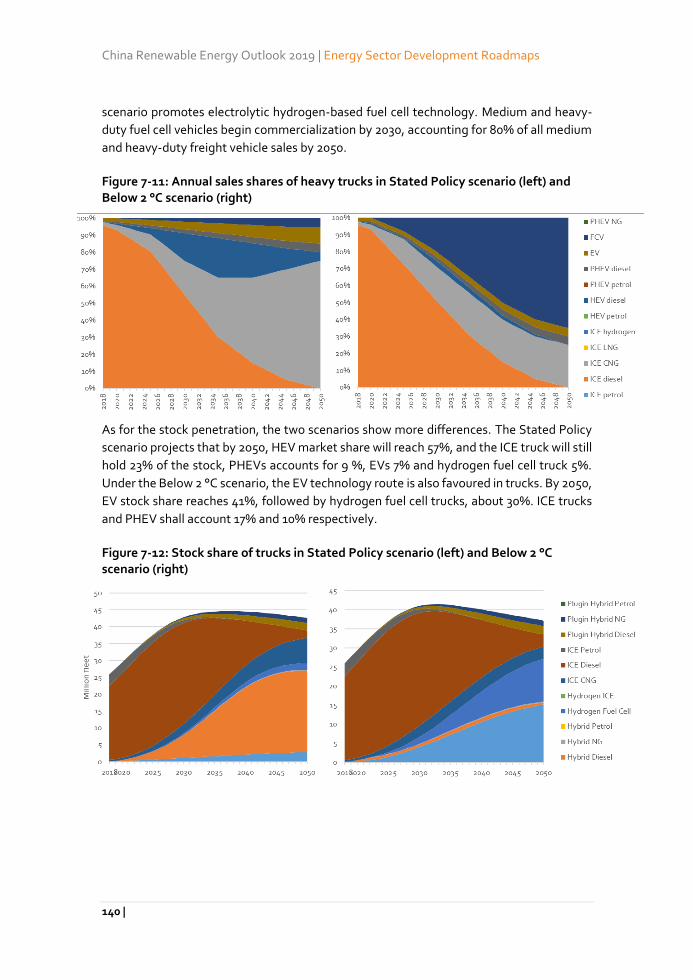
China Renewable Energy Outlook 2019 | Energy Sector Development Roadmaps
140 |
scenario promotes electrolytic hydrogen-based fuel cell technology. Medium and heavy-
duty fuel cell vehicles begin commercialization by 2030, accounting for 80% of all medium
and heavy-duty freight vehicle sales by 2050.
Figure 7-11: Annual sales shares of heavy trucks in Stated Policy scenario (left) and Below 2 °C scenario (right)
As for the stock penetration, the two scenarios show more differences. The Stated Policy
scenario projects that by 2050, HEV market share will reach 57%, and the ICE truck will still
hold 23% of the stock, PHEVs accounts for 9 %, EVs 7% and hydrogen fuel cell truck 5%.
Under the Below 2 °C scenario, the EV technology route is also favoured in trucks. By 2050,
EV stock share reaches 41%, followed by hydrogen fuel cell trucks, about 30%. ICE trucks
and PHEV shall account 17% and 10% respectively.
Figure 7-12: Stock share of trucks in Stated Policy scenario (left) and Below 2 °C scenario (right)
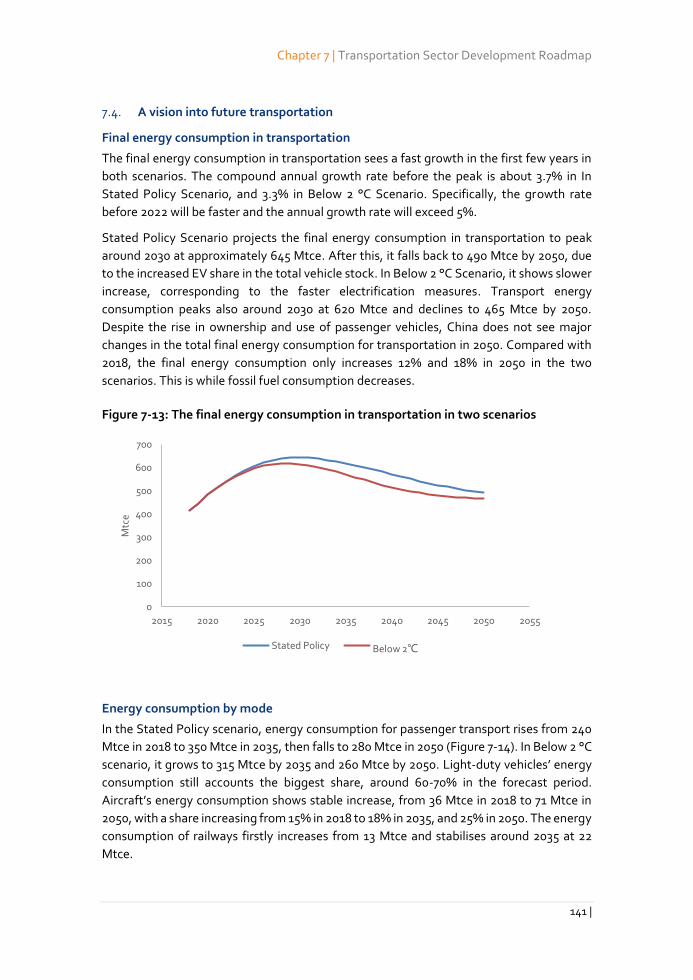
Chapter 7 | Transportation Sector Development Roadmap
141 |
7.4. A vision into future transportation
Final energy consumption in transportation
The final energy consumption in transportation sees a fast growth in the first few years in
both scenarios. The compound annual growth rate before the peak is about 3.7% in In
Stated Policy Scenario, and 3.3% in Below 2 °C Scenario. Specifically, the growth rate
before 2022 will be faster and the annual growth rate will exceed 5%.
Stated Policy Scenario projects the final energy consumption in transportation to peak
around 2030 at approximately 645 Mtce. After this, it falls back to 490 Mtce by 2050, due
to the increased EV share in the total vehicle stock. In Below 2 °C Scenario, it shows slower
increase, corresponding to the faster electrification measures. Transport energy
consumption peaks also around 2030 at 620 Mtce and declines to 465 Mtce by 2050.
Despite the rise in ownership and use of passenger vehicles, China does not see major
changes in the total final energy consumption for transportation in 2050. Compared with
2018, the final energy consumption only increases 12% and 18% in 2050 in the two
scenarios. This is while fossil fuel consumption decreases.
Figure 7-13: The final energy consumption in transportation in two scenarios
Energy consumption by mode
In the Stated Policy scenario, energy consumption for passenger transport rises from 240
Mtce in 2018 to 350 Mtce in 2035, then falls to 280 Mtce in 2050 (Figure 7-14). In Below 2 °C
scenario, it grows to 315 Mtce by 2035 and 260 Mtce by 2050. Light-duty vehicles’ energy
consumption still accounts the biggest share, around 60-70% in the forecast period.
Aircraft’s energy consumption shows stable increase, from 36 Mtce in 2018 to 71 Mtce in
2050, with a share increasing from 15% in 2018 to 18% in 2035, and 25% in 2050. The energy
consumption of railways firstly increases from 13 Mtce and stabilises around 2035 at 22
Mtce.
0
100
200
300
400
500
600
700
2015 2020 2025 2030 2035 2040 2045 2050 2055
Mtc
e
Stated Policy Below 2℃
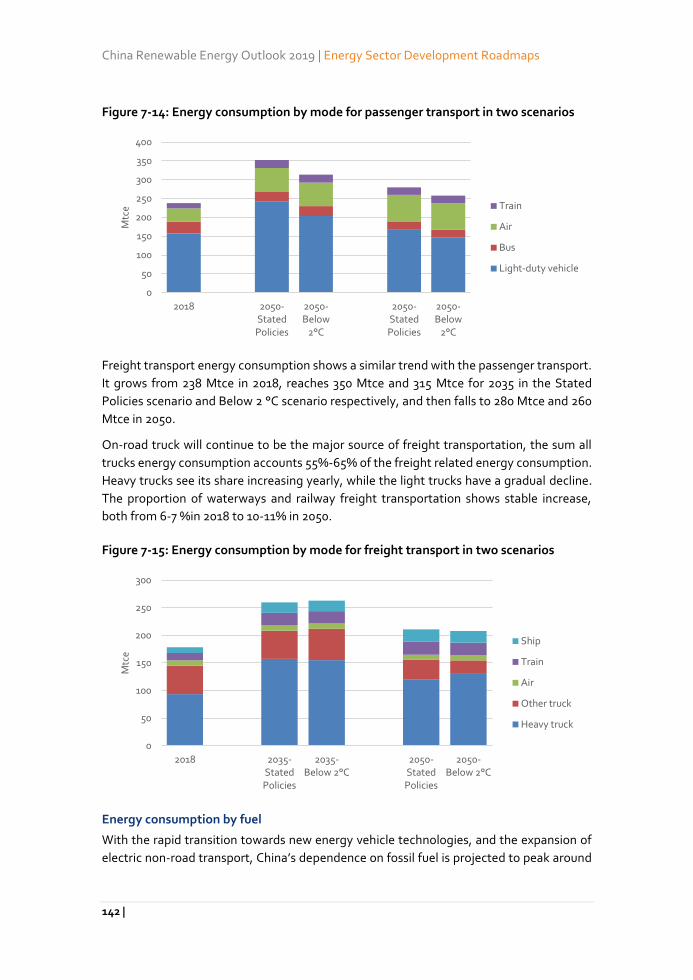
China Renewable Energy Outlook 2019 | Energy Sector Development Roadmaps
142 |
Figure 7-14: Energy consumption by mode for passenger transport in two scenarios
Freight transport energy consumption shows a similar trend with the passenger transport.
It grows from 238 Mtce in 2018, reaches 350 Mtce and 315 Mtce for 2035 in the Stated
Policies scenario and Below 2 °C scenario respectively, and then falls to 280 Mtce and 260
Mtce in 2050.
On-road truck will continue to be the major source of freight transportation, the sum all
trucks energy consumption accounts 55%-65% of the freight related energy consumption.
Heavy trucks see its share increasing yearly, while the light trucks have a gradual decline.
The proportion of waterways and railway freight transportation shows stable increase,
both from 6-7 %in 2018 to 10-11% in 2050.
Figure 7-15: Energy consumption by mode for freight transport in two scenarios
Energy consumption by fuel
With the rapid transition towards new energy vehicle technologies, and the expansion of
electric non-road transport, China’s dependence on fossil fuel is projected to peak around
0
50
100
150
200
250
300
350
400
2018 2050-StatedPolicies
2050-Below
2°C
2050-StatedPolicies
2050-Below
2°C
Mtc
e Train
Air
Bus
Light-duty vehicle
0
50
100
150
200
250
300
2018 2035-StatedPolicies
2035-Below 2°C
2050-StatedPolicies
2050-Below 2°C
Mtc
e
Ship
Train
Air
Other truck
Heavy truck
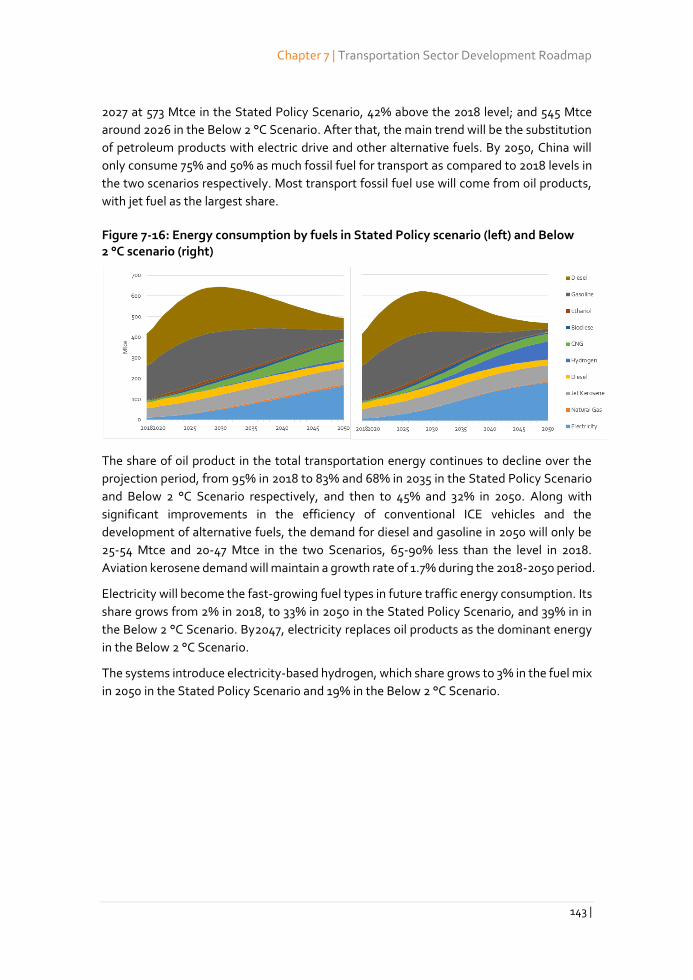
Chapter 7 | Transportation Sector Development Roadmap
143 |
2027 at 573 Mtce in the Stated Policy Scenario, 42% above the 2018 level; and 545 Mtce
around 2026 in the Below 2 °C Scenario. After that, the main trend will be the substitution
of petroleum products with electric drive and other alternative fuels. By 2050, China will
only consume 75% and 50% as much fossil fuel for transport as compared to 2018 levels in
the two scenarios respectively. Most transport fossil fuel use will come from oil products,
with jet fuel as the largest share.
Figure 7-16: Energy consumption by fuels in Stated Policy scenario (left) and Below 2 °C scenario (right)
The share of oil product in the total transportation energy continues to decline over the
projection period, from 95% in 2018 to 83% and 68% in 2035 in the Stated Policy Scenario
and Below 2 °C Scenario respectively, and then to 45% and 32% in 2050. Along with
significant improvements in the efficiency of conventional ICE vehicles and the
development of alternative fuels, the demand for diesel and gasoline in 2050 will only be
25-54 Mtce and 20-47 Mtce in the two Scenarios, 65-90% less than the level in 2018.
Aviation kerosene demand will maintain a growth rate of 1.7% during the 2018-2050 period.
Electricity will become the fast-growing fuel types in future traffic energy consumption. Its
share grows from 2% in 2018, to 33% in 2050 in the Stated Policy Scenario, and 39% in in
the Below 2 °C Scenario. By2047, electricity replaces oil products as the dominant energy
in the Below 2 °C Scenario.
The systems introduce electricity-based hydrogen, which share grows to 3% in the fuel mix
in 2050 in the Stated Policy Scenario and 19% in the Below 2 °C Scenario.
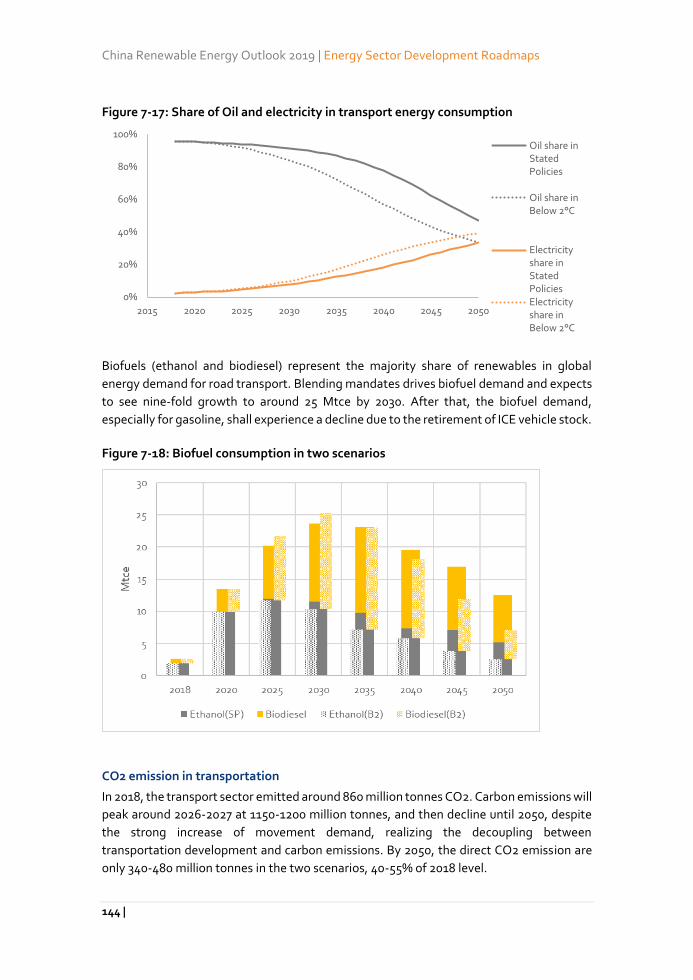
China Renewable Energy Outlook 2019 | Energy Sector Development Roadmaps
144 |
Figure 7-17: Share of Oil and electricity in transport energy consumption
Biofuels (ethanol and biodiesel) represent the majority share of renewables in global
energy demand for road transport. Blending mandates drives biofuel demand and expects
to see nine-fold growth to around 25 Mtce by 2030. After that, the biofuel demand,
especially for gasoline, shall experience a decline due to the retirement of ICE vehicle stock.
Figure 7-18: Biofuel consumption in two scenarios
CO2 emission in transportation
In 2018, the transport sector emitted around 860 million tonnes CO2. Carbon emissions will
peak around 2026-2027 at 1150-1200 million tonnes, and then decline until 2050, despite
the strong increase of movement demand, realizing the decoupling between
transportation development and carbon emissions. By 2050, the direct CO2 emission are
only 340-480 million tonnes in the two scenarios, 40-55% of 2018 level.
0%
20%
40%
60%
80%
100%
2015 2020 2025 2030 2035 2040 2045 2050
Oil share inStatedPolicies
Oil share inBelow 2°C
Electricityshare inStatedPoliciesElectricityshare inBelow 2°C
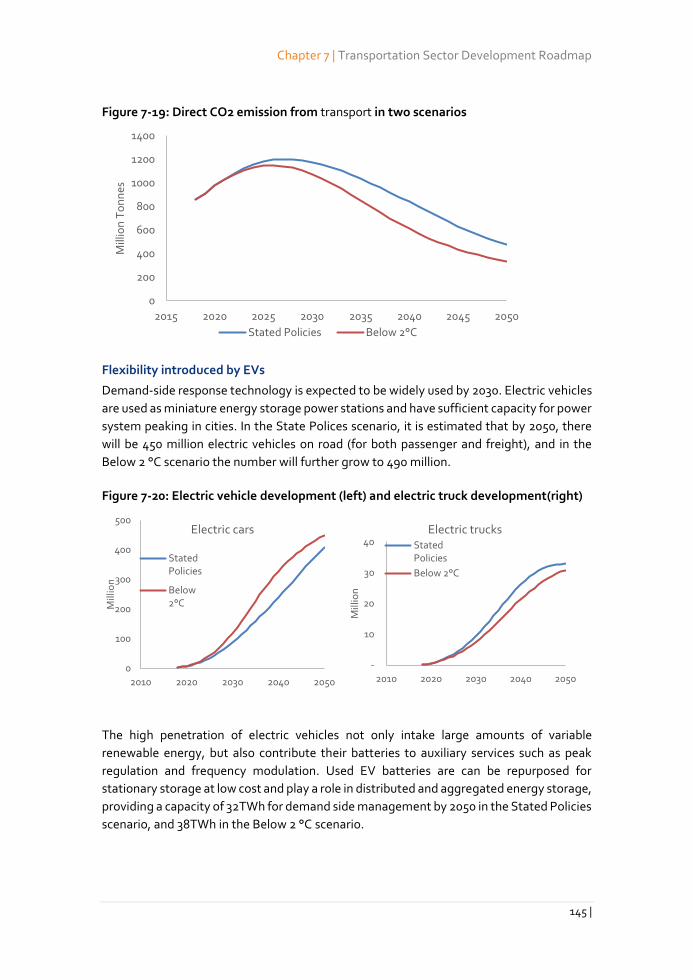
Chapter 7 | Transportation Sector Development Roadmap
145 |
Figure 7-19: Direct CO2 emission from transport in two scenarios
Flexibility introduced by EVs
Demand-side response technology is expected to be widely used by 2030. Electric vehicles
are used as miniature energy storage power stations and have sufficient capacity for power
system peaking in cities. In the State Polices scenario, it is estimated that by 2050, there
will be 450 million electric vehicles on road (for both passenger and freight), and in the
Below 2 °C scenario the number will further grow to 490 million.
Figure 7-20: Electric vehicle development (left) and electric truck development(right)
The high penetration of electric vehicles not only intake large amounts of variable
renewable energy, but also contribute their batteries to auxiliary services such as peak
regulation and frequency modulation. Used EV batteries are can be repurposed for
stationary storage at low cost and play a role in distributed and aggregated energy storage,
providing a capacity of 32TWh for demand side management by 2050 in the Stated Policies
scenario, and 38TWh in the Below 2 °C scenario.
0
200
400
600
800
1000
1200
1400
2015 2020 2025 2030 2035 2040 2045 2050
Mill
ion
To
nn
es
Stated Policies Below 2°C
0
100
200
300
400
500
2010 2020 2030 2040 2050
Mill
ion
Electric cars
StatedPolicies
Below2°C
-
10
20
30
40
2010 2020 2030 2040 2050
Mill
ion
Electric trucksStatedPolicies
Below 2°C
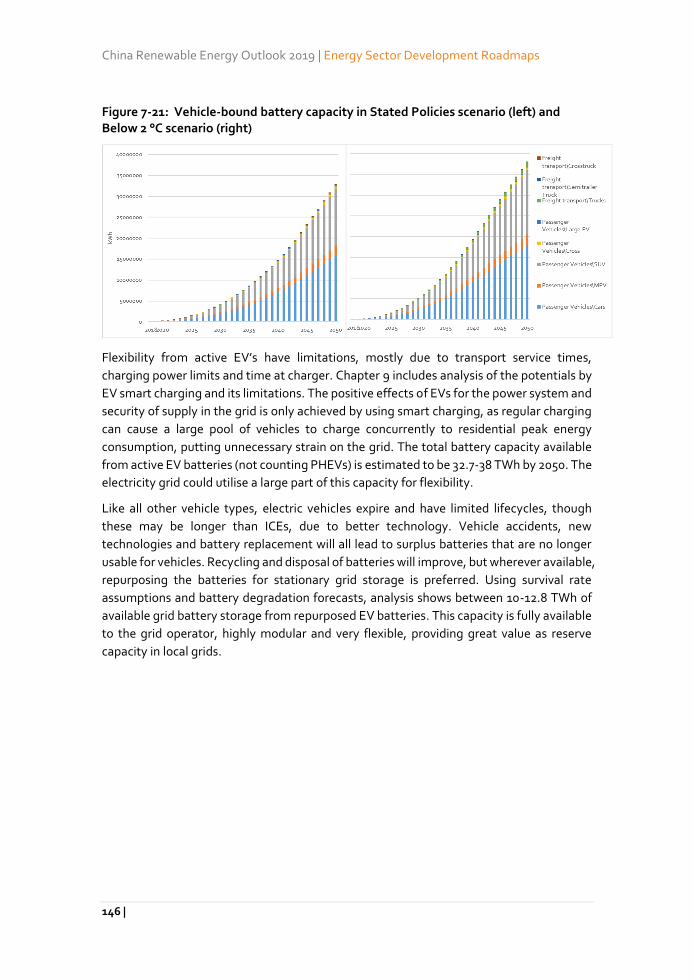
China Renewable Energy Outlook 2019 | Energy Sector Development Roadmaps
146 |
Figure 7-21: Vehicle-bound battery capacity in Stated Policies scenario (left) and Below 2 °C scenario (right)
Flexibility from active EV’s have limitations, mostly due to transport service times,
charging power limits and time at charger. Chapter 9 includes analysis of the potentials by
EV smart charging and its limitations. The positive effects of EVs for the power system and
security of supply in the grid is only achieved by using smart charging, as regular charging
can cause a large pool of vehicles to charge concurrently to residential peak energy
consumption, putting unnecessary strain on the grid. The total battery capacity available
from active EV batteries (not counting PHEVs) is estimated to be 32.7-38 TWh by 2050. The
electricity grid could utilise a large part of this capacity for flexibility.
Like all other vehicle types, electric vehicles expire and have limited lifecycles, though
these may be longer than ICEs, due to better technology. Vehicle accidents, new
technologies and battery replacement will all lead to surplus batteries that are no longer
usable for vehicles. Recycling and disposal of batteries will improve, but wherever available,
repurposing the batteries for stationary grid storage is preferred. Using survival rate
assumptions and battery degradation forecasts, analysis shows between 10-12.8 TWh of
available grid battery storage from repurposed EV batteries. This capacity is fully available
to the grid operator, highly modular and very flexible, providing great value as reserve
capacity in local grids.
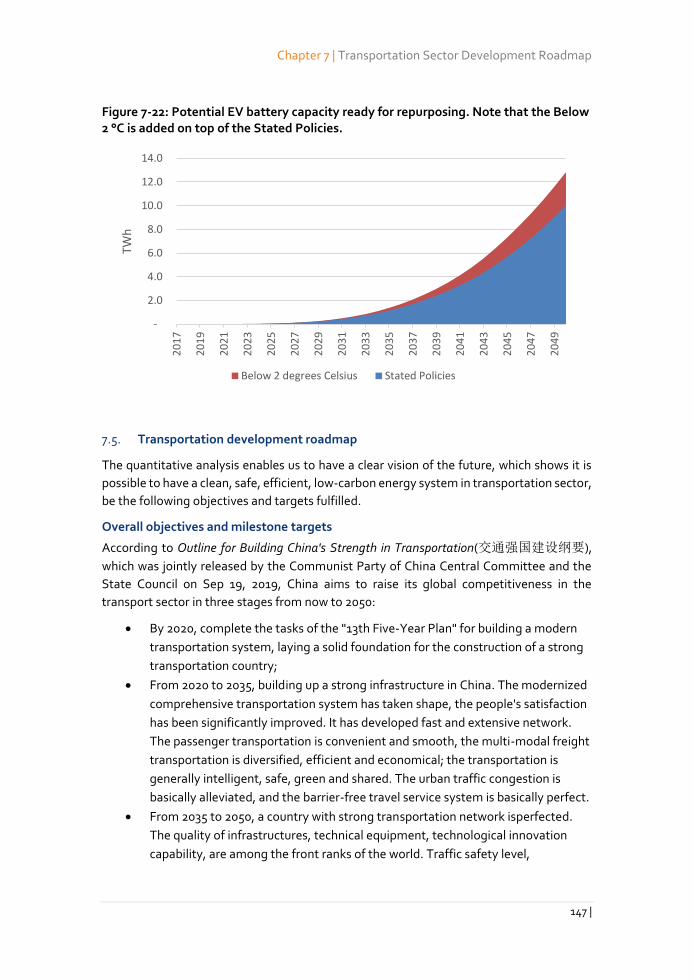
Chapter 7 | Transportation Sector Development Roadmap
147 |
Figure 7-22: Potential EV battery capacity ready for repurposing. Note that the Below 2 °C is added on top of the Stated Policies.
7.5. Transportation development roadmap
The quantitative analysis enables us to have a clear vision of the future, which shows it is
possible to have a clean, safe, efficient, low-carbon energy system in transportation sector,
be the following objectives and targets fulfilled.
Overall objectives and milestone targets
According to Outline for Building China's Strength in Transportation(交通强国建设纲要),
which was jointly released by the Communist Party of China Central Committee and the
State Council on Sep 19, 2019, China aims to raise its global competitiveness in the
transport sector in three stages from now to 2050:
By 2020, complete the tasks of the "13th Five-Year Plan" for building a modern
transportation system, laying a solid foundation for the construction of a strong
transportation country;
From 2020 to 2035, building up a strong infrastructure in China. The modernized
comprehensive transportation system has taken shape, the people's satisfaction
has been significantly improved. It has developed fast and extensive network.
The passenger transportation is convenient and smooth, the multi-modal freight
transportation is diversified, efficient and economical; the transportation is
generally intelligent, safe, green and shared. The urban traffic congestion is
basically alleviated, and the barrier-free travel service system is basically perfect.
From 2035 to 2050, a country with strong transportation network isperfected.
The quality of infrastructures, technical equipment, technological innovation
capability, are among the front ranks of the world. Traffic safety level,
-
2.0
4.0
6.0
8.0
10.0
12.0
14.0
20
17
20
19
20
21
20
23
20
25
20
27
20
29
20
31
20
33
20
35
20
37
20
39
20
41
20
43
20
45
20
47
20
49
TWh
Below 2 degrees Celsius Stated Policies
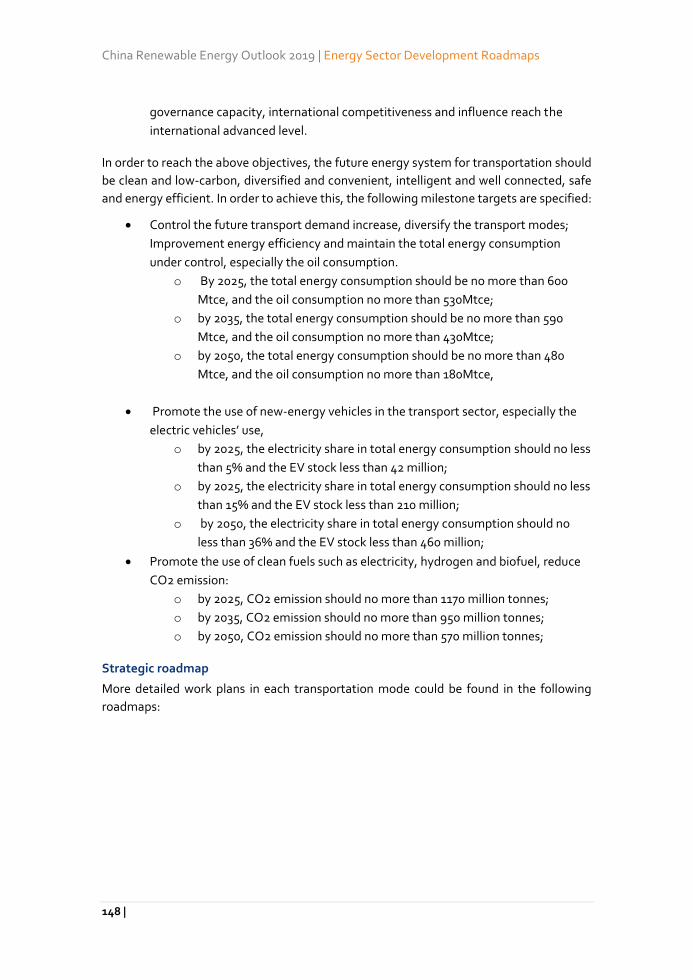
China Renewable Energy Outlook 2019 | Energy Sector Development Roadmaps
148 |
governance capacity, international competitiveness and influence reach the
international advanced level.
In order to reach the above objectives, the future energy system for transportation should
be clean and low-carbon, diversified and convenient, intelligent and well connected, safe
and energy efficient. In order to achieve this, the following milestone targets are specified:
Control the future transport demand increase, diversify the transport modes;
Improvement energy efficiency and maintain the total energy consumption
under control, especially the oil consumption.
o By 2025, the total energy consumption should be no more than 600
Mtce, and the oil consumption no more than 530Mtce;
o by 2035, the total energy consumption should be no more than 590
Mtce, and the oil consumption no more than 430Mtce;
o by 2050, the total energy consumption should be no more than 480
Mtce, and the oil consumption no more than 180Mtce,
Promote the use of new-energy vehicles in the transport sector, especially the
electric vehicles’ use,
o by 2025, the electricity share in total energy consumption should no less
than 5% and the EV stock less than 42 million;
o by 2025, the electricity share in total energy consumption should no less
than 15% and the EV stock less than 210 million;
o by 2050, the electricity share in total energy consumption should no
less than 36% and the EV stock less than 460 million;
Promote the use of clean fuels such as electricity, hydrogen and biofuel, reduce
CO2 emission:
o by 2025, CO2 emission should no more than 1170 million tonnes;
o by 2035, CO2 emission should no more than 950 million tonnes;
o by 2050, CO2 emission should no more than 570 million tonnes;
Strategic roadmap
More detailed work plans in each transportation mode could be found in the following
roadmaps:
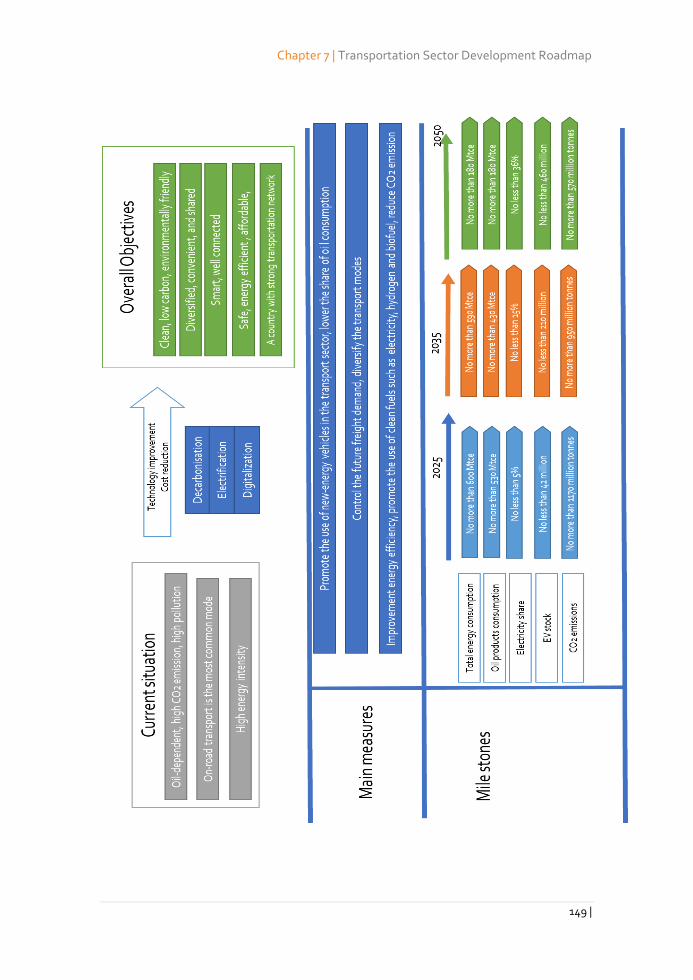
Chapter 7 | Transportation Sector Development Roadmap
149 |
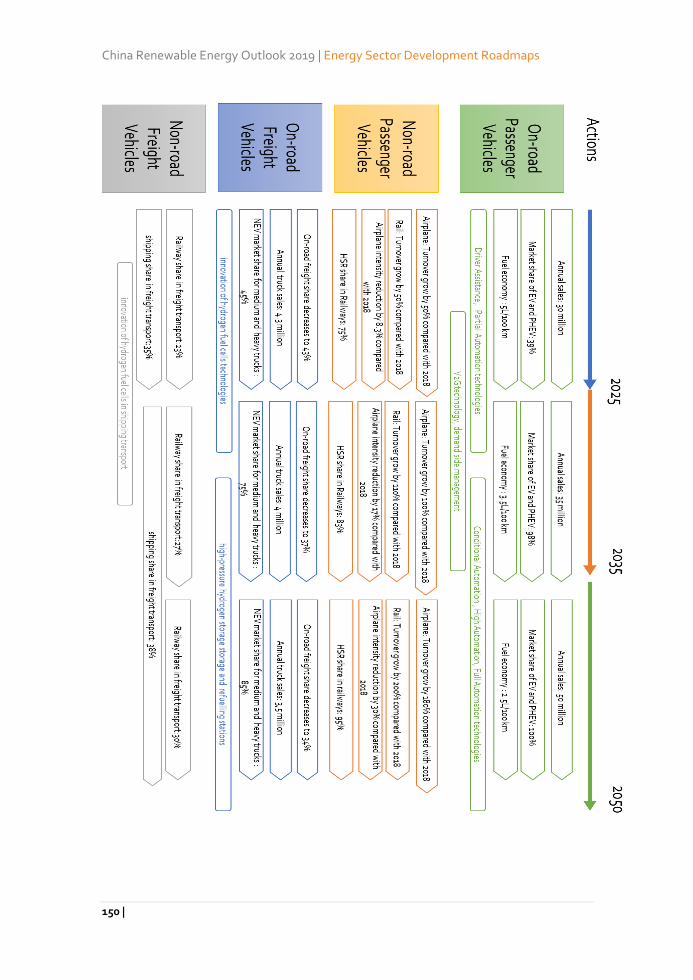
China Renewable Energy Outlook 2019 | Energy Sector Development Roadmaps
150 |
Chapter 7 | Transportation Sector Development Roadmap
151 |
Policies recommended
In general, electric vehicles and plug-in hybrid vehicles will be the main route for the long-
term development of China's new energy vehicles. Driven by the “Blue Sky” policies and
increasing economic competitiveness, electric vehicles already has the potential to fully
replace the light-duty ICE vehicles by 2025 in the fields of taxi/car-hailing services, light
freight vehicles, as well as the short-distance commercial vehicles. For private cars, due to
lack of economic competitiveness, the promotion of pure electric vehicles will face certain
challenges in the next few years, especially after the subsidy is withdrawn. Diversely,
continuous incentives (financial and otherwise), improvement of charging facilities, and
enhancement of vehicle-grid interaction will be the strong support to ensure the steady
growth of the electric vehicle market.
The charging and discharging price are the decisive factors affecting the large-scale
application of electric vehicle in the total energy system. According to the current
regulations, the only collected fees are the catalogue electricity price (which is lower than
the normal electricity price) and a charging service fee. In actual operation, a fixed charging
price is always charged. Electric vehicle users have relatively higher price tolerance, and
due to the separation of drive time and charging time, there is a high potential to adjust
the load for electric vehicle and bring more flexibility to the grid. This is very hard to realize
under a fixed charging electricity price. Therefore, it is highly recommended to increase the
pace of the research and formulation of the special charging price for electric vehicles,
whose design bases itself on local load, which takes into consideration that the charging
facility operators should be also entitled to a certain pricing right. For the vehicle-to-Grid
(V2G) and the battery-based grid energy storage, recommendations are to design a
discharge price to guide the reasonable charging and discharging behaviour of EV owners,
with reference to the peak-valley time-of-use (TOU) price.
The transportation and storage of hydrogen fuel, as well as storage infrastructures are the
most realistic problems faced by China's fuel cell vehicle industry. Recommendations are:
1. First speed up the industrialization of 70MPa high-pressure hydrogen storage
system, reduce O&M costs, and set up clear targets for hydrogen production,
storage and refuelling stations.
2. Make operating differential subsidy (ODS) policies for hydrogen infrastructure.
3. Defining the unclear roles and responsibilities between the relevant departments
such as housing construction and safety supervision involved in the construction
of hydrogen fuel infrastructure;
4. Strengthen the collaborative innovation between hydrogen fuel cells and core
technologies of pure electric vehicles such as lithium batteries, motors and
motor controllers. Accelerate the research on the coordinated development
between hydrogen fuel and pure electric vehicles.
China Renewable Energy Outlook 2019 | Energy Sector Development Roadmaps
152 |
8. Heat sector roadmap
Summary
Heating sector reforms in China deserve attention due to large energy consumption, low
cost options for decarbonization, reducing pollution and high potential for providing
flexibility for renewable electricity integration.
The transition from the present heating system towards a more efficient heating system
cannot be achieved without incentives created by metering and billing the heat supply, as
well as by establishing legislation ensuring that societal objectives are met through
organized and comprehensive heat planning for district heating in suitable areas.
The available solutions, technologies and heat sources differ between provinces and
climate zones. The planning process should take account of these differences and take
advantage of the local opportunities. China should promote either a decentral energy
planning methodology or alternatively, replicate the model for planning large
infrastructure projects. In either case the planning process requires procedures for finding
areas suitable for district heating, procedures for evaluating consumer and socio-economic
feasibility, guidelines for choosing technologies, standards and perhaps incentives to deter
unwanted solutions and support wanted solutions from the perspectives of economics and
flexibility. If no choice is made, such objectives and targets can be difficult to meet.
District heating systems are one of the best energy storage solution for integrating variable
power production. District heating can absorb excess power and convert it into heat with
high efficiency and fast response time, and low cost compared to electricity storage.
Furthermore, power-to-heat and CHP solutions can provide peak load capacity for both
power and heating systems integrating the two sectors, creating storage capacity, gaining
high efficiency and avoiding curtailment.
The future renewable district heating technologies depends on the implementation of
modern district heating network with flow and temperature control, low heat losses, low
forward temperature and storage possibilities. The chosen heat planning scheme needs to
ensure these solutions are put into place.
Biomass is a limited resource in China and has to be used in efficient solutions. Biomass and
municipal waste are then best utilized in CHP plants in connection with industrial parks able
to deliver excess heat for heating and cooling of nearby urban areas.
Individual heating is roughly half of the heating demand in the period 2020 to 2050 slightly
increasing due to better buildings in urban areas supplied by district heating making the
energy share for district heating decreasing. The change in individual area is dominated by
phasing out coal boilers replacing them with solar, electricity and gas solutions.
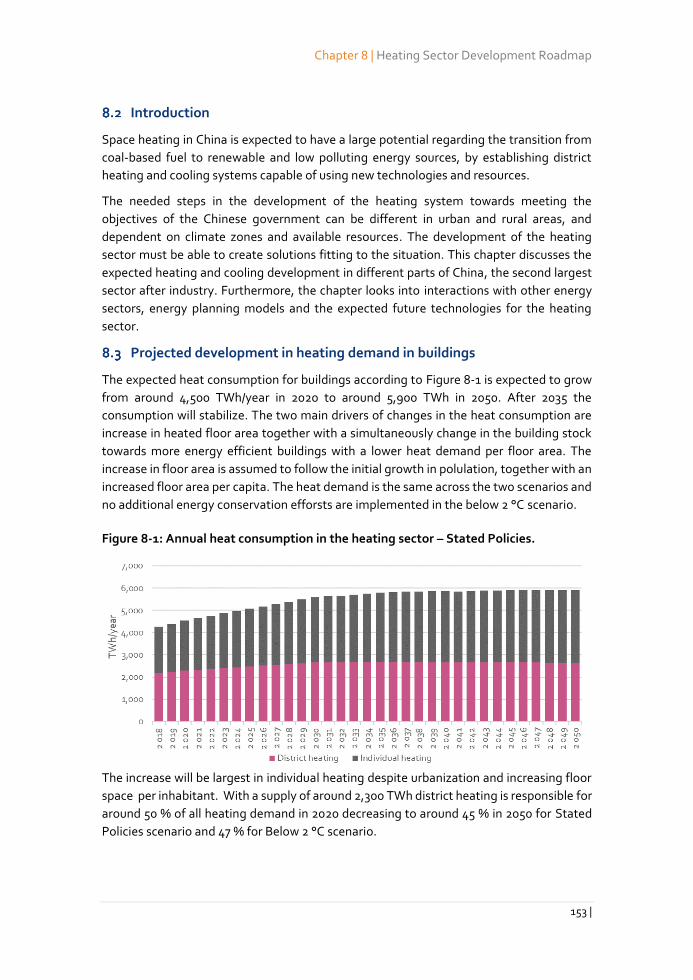
Chapter 8 | Heating Sector Development Roadmap
153 |
Introduction
Space heating in China is expected to have a large potential regarding the transition from
coal-based fuel to renewable and low polluting energy sources, by establishing district
heating and cooling systems capable of using new technologies and resources.
The needed steps in the development of the heating system towards meeting the
objectives of the Chinese government can be different in urban and rural areas, and
dependent on climate zones and available resources. The development of the heating
sector must be able to create solutions fitting to the situation. This chapter discusses the
expected heating and cooling development in different parts of China, the second largest
sector after industry. Furthermore, the chapter looks into interactions with other energy
sectors, energy planning models and the expected future technologies for the heating
sector.
Projected development in heating demand in buildings
The expected heat consumption for buildings according to Figure 8-1 is expected to grow
from around 4,500 TWh/year in 2020 to around 5,900 TWh in 2050. After 2035 the
consumption will stabilize. The two main drivers of changes in the heat consumption are
increase in heated floor area together with a simultaneously change in the building stock
towards more energy efficient buildings with a lower heat demand per floor area. The
increase in floor area is assumed to follow the initial growth in polulation, together with an
increased floor area per capita. The heat demand is the same across the two scenarios and
no additional energy conservation efforsts are implemented in the below 2 °C scenario.
Figure 8-1: Annual heat consumption in the heating sector – Stated Policies.
The increase will be largest in individual heating despite urbanization and increasing floor
space per inhabitant. With a supply of around 2,300 TWh district heating is responsible for
around 50 % of all heating demand in 2020 decreasing to around 45 % in 2050 for Stated
Policies scenario and 47 % for Below 2 °C scenario.
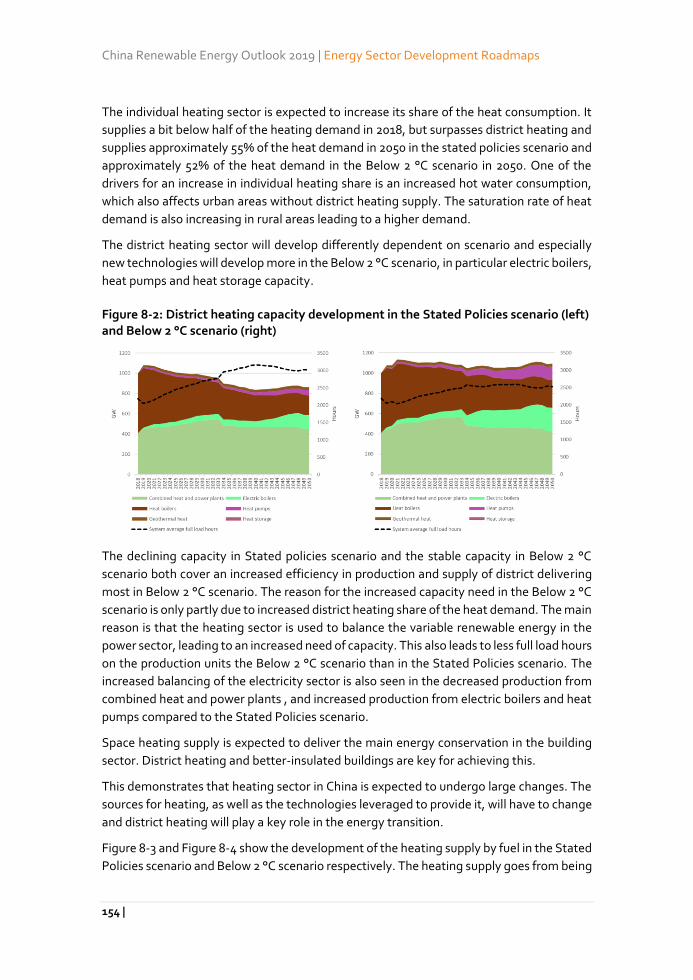
China Renewable Energy Outlook 2019 | Energy Sector Development Roadmaps
154 |
The individual heating sector is expected to increase its share of the heat consumption. It
supplies a bit below half of the heating demand in 2018, but surpasses district heating and
supplies approximately 55% of the heat demand in 2050 in the stated policies scenario and
approximately 52% of the heat demand in the Below 2 °C scenario in 2050. One of the
drivers for an increase in individual heating share is an increased hot water consumption,
which also affects urban areas without district heating supply. The saturation rate of heat
demand is also increasing in rural areas leading to a higher demand.
The district heating sector will develop differently dependent on scenario and especially
new technologies will develop more in the Below 2 °C scenario, in particular electric boilers,
heat pumps and heat storage capacity.
Figure 8-2: District heating capacity development in the Stated Policies scenario (left) and Below 2 °C scenario (right)
The declining capacity in Stated policies scenario and the stable capacity in Below 2 °C
scenario both cover an increased efficiency in production and supply of district delivering
most in Below 2 °C scenario. The reason for the increased capacity need in the Below 2 °C
scenario is only partly due to increased district heating share of the heat demand. The main
reason is that the heating sector is used to balance the variable renewable energy in the
power sector, leading to an increased need of capacity. This also leads to less full load hours
on the production units the Below 2 °C scenario than in the Stated Policies scenario. The
increased balancing of the electricity sector is also seen in the decreased production from
combined heat and power plants , and increased production from electric boilers and heat
pumps compared to the Stated Policies scenario.
Space heating supply is expected to deliver the main energy conservation in the building
sector. District heating and better-insulated buildings are key for achieving this.
This demonstrates that heating sector in China is expected to undergo large changes. The
sources for heating, as well as the technologies leveraged to provide it, will have to change
and district heating will play a key role in the energy transition.
Figure 8-3 and Figure 8-4 show the development of the heating supply by fuel in the Stated
Policies scenario and Below 2 °C scenario respectively. The heating supply goes from being
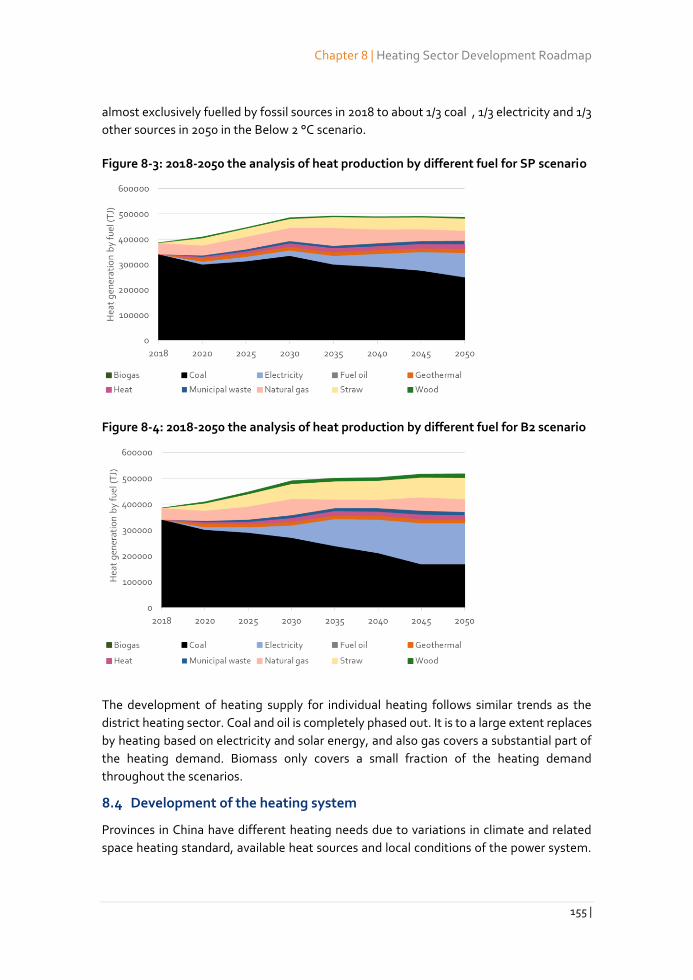
Chapter 8 | Heating Sector Development Roadmap
155 |
almost exclusively fuelled by fossil sources in 2018 to about 1/3 coal , 1/3 electricity and 1/3
other sources in 2050 in the Below 2 °C scenario.
Figure 8-3: 2018-2050 the analysis of heat production by different fuel for SP scenario
Figure 8-4: 2018-2050 the analysis of heat production by different fuel for B2 scenario
The development of heating supply for individual heating follows similar trends as the
district heating sector. Coal and oil is completely phased out. It is to a large extent replaces
by heating based on electricity and solar energy, and also gas covers a substantial part of
the heating demand. Biomass only covers a small fraction of the heating demand
throughout the scenarios.
Development of the heating system
Provinces in China have different heating needs due to variations in climate and related
space heating standard, available heat sources and local conditions of the power system.
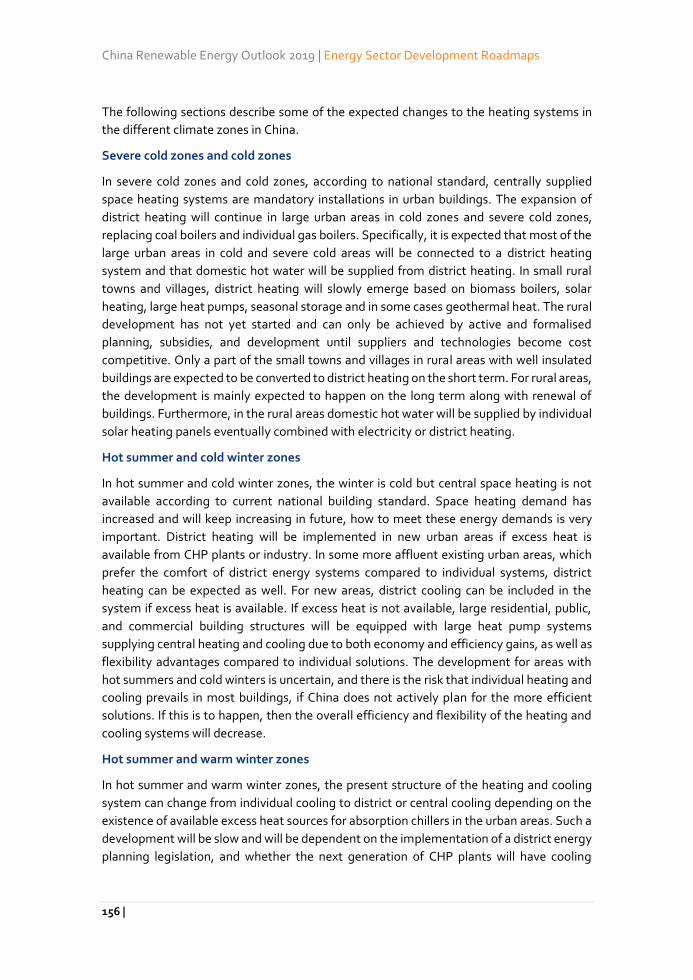
China Renewable Energy Outlook 2019 | Energy Sector Development Roadmaps
156 |
The following sections describe some of the expected changes to the heating systems in
the different climate zones in China.
Severe cold zones and cold zones
In severe cold zones and cold zones, according to national standard, centrally supplied
space heating systems are mandatory installations in urban buildings. The expansion of
district heating will continue in large urban areas in cold zones and severe cold zones,
replacing coal boilers and individual gas boilers. Specifically, it is expected that most of the
large urban areas in cold and severe cold areas will be connected to a district heating
system and that domestic hot water will be supplied from district heating. In small rural
towns and villages, district heating will slowly emerge based on biomass boilers, solar
heating, large heat pumps, seasonal storage and in some cases geothermal heat. The rural
development has not yet started and can only be achieved by active and formalised
planning, subsidies, and development until suppliers and technologies become cost
competitive. Only a part of the small towns and villages in rural areas with well insulated
buildings are expected to be converted to district heating on the short term. For rural areas,
the development is mainly expected to happen on the long term along with renewal of
buildings. Furthermore, in the rural areas domestic hot water will be supplied by individual
solar heating panels eventually combined with electricity or district heating.
Hot summer and cold winter zones
In hot summer and cold winter zones, the winter is cold but central space heating is not
available according to current national building standard. Space heating demand has
increased and will keep increasing in future, how to meet these energy demands is very
important. District heating will be implemented in new urban areas if excess heat is
available from CHP plants or industry. In some more affluent existing urban areas, which
prefer the comfort of district energy systems compared to individual systems, district
heating can be expected as well. For new areas, district cooling can be included in the
system if excess heat is available. If excess heat is not available, large residential, public,
and commercial building structures will be equipped with large heat pump systems
supplying central heating and cooling due to both economy and efficiency gains, as well as
flexibility advantages compared to individual solutions. The development for areas with
hot summers and cold winters is uncertain, and there is the risk that individual heating and
cooling prevails in most buildings, if China does not actively plan for the more efficient
solutions. If this is to happen, then the overall efficiency and flexibility of the heating and
cooling systems will decrease.
Hot summer and warm winter zones
In hot summer and warm winter zones, the present structure of the heating and cooling
system can change from individual cooling to district or central cooling depending on the
existence of available excess heat sources for absorption chillers in the urban areas. Such a
development will be slow and will be dependent on the implementation of a district energy
planning legislation, and whether the next generation of CHP plants will have cooling
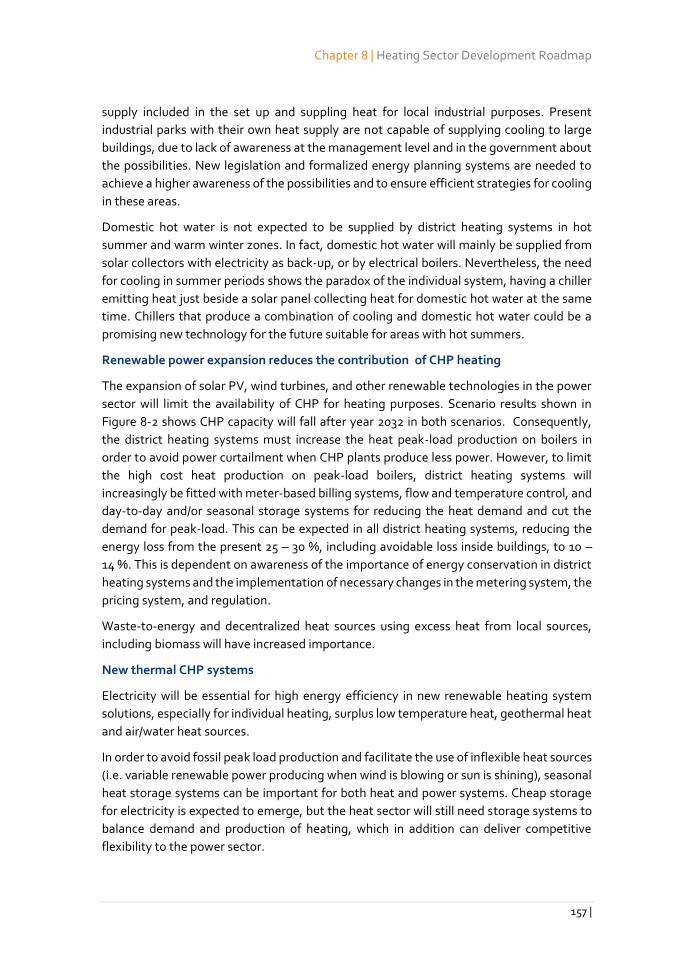
Chapter 8 | Heating Sector Development Roadmap
157 |
supply included in the set up and suppling heat for local industrial purposes. Present
industrial parks with their own heat supply are not capable of supplying cooling to large
buildings, due to lack of awareness at the management level and in the government about
the possibilities. New legislation and formalized energy planning systems are needed to
achieve a higher awareness of the possibilities and to ensure efficient strategies for cooling
in these areas.
Domestic hot water is not expected to be supplied by district heating systems in hot
summer and warm winter zones. In fact, domestic hot water will mainly be supplied from
solar collectors with electricity as back-up, or by electrical boilers. Nevertheless, the need
for cooling in summer periods shows the paradox of the individual system, having a chiller
emitting heat just beside a solar panel collecting heat for domestic hot water at the same
time. Chillers that produce a combination of cooling and domestic hot water could be a
promising new technology for the future suitable for areas with hot summers.
Renewable power expansion reduces the contribution of CHP heating
The expansion of solar PV, wind turbines, and other renewable technologies in the power
sector will limit the availability of CHP for heating purposes. Scenario results shown in
Figure 8-2 shows CHP capacity will fall after year 2032 in both scenarios. Consequently,
the district heating systems must increase the heat peak-load production on boilers in
order to avoid power curtailment when CHP plants produce less power. However, to limit
the high cost heat production on peak-load boilers, district heating systems will
increasingly be fitted with meter-based billing systems, flow and temperature control, and
day-to-day and/or seasonal storage systems for reducing the heat demand and cut the
demand for peak-load. This can be expected in all district heating systems, reducing the
energy loss from the present 25 – 30 %, including avoidable loss inside buildings, to 10 –
14 %. This is dependent on awareness of the importance of energy conservation in district
heating systems and the implementation of necessary changes in the metering system, the
pricing system, and regulation.
Waste-to-energy and decentralized heat sources using excess heat from local sources,
including biomass will have increased importance.
New thermal CHP systems
Electricity will be essential for high energy efficiency in new renewable heating system
solutions, especially for individual heating, surplus low temperature heat, geothermal heat
and air/water heat sources.
In order to avoid fossil peak load production and facilitate the use of inflexible heat sources
(i.e. variable renewable power producing when wind is blowing or sun is shining), seasonal
heat storage systems can be important for both heat and power systems. Cheap storage
for electricity is expected to emerge, but the heat sector will still need storage systems to
balance demand and production of heating, which in addition can deliver competitive
flexibility to the power sector.
China Renewable Energy Outlook 2019 | Energy Sector Development Roadmaps
158 |
To achieve high efficiency, it is important to consider the localization of CHP plants. If
possible, they should be be placed between industrial parks and urban areas with
heat/cooling demand, to be able to provide both heat for industry and excess heat for
district heating and cooling. Waste incineration, waste and biomass residue gasification,
and biomass CHP systems should be preferred over fossil fuel-based CHP production and
should replace coal systems. Standards for collecting and handling renewable fuels are
necessary, as well as a new legislation and a new subsidy system which can make such heat
sources competitive.
New CSP solar technologies producing heat up to 400 ⁰C will probably replace some CHP
base load production for industry and/or for district heating in areas with high solar
radiation. Such technologies can take over the role of delivering flexible base load supply
for heating, cooling and power systems.
The heating system provides flexibility to balance power systems
Combining capacity on CHP, heat pumps, electrical boilers and heat storage in district
energy systems, increases flexibility and efficiency in both the power and the heating
sector. District heating systems can be a central solution for balancing the power systems,
when combined with other technologies and storage capacity. The following four figures
show the scenarios’ hourly heating dispatch and it’s relationship with the VRE power
generation and, more directly, the marginal cost of electricity (the power price). The figures
depicted a winter week in 2035 both nationally (Figure 8-5 and Figure 8-6) and in Shandong
(Figure 8-6and Figure 8-7), as a selected illustrative province.
Figure 8-5: The marginal electricity cost, VRE generation and the heat generation by technology in China for SP scenario in 2035 winter
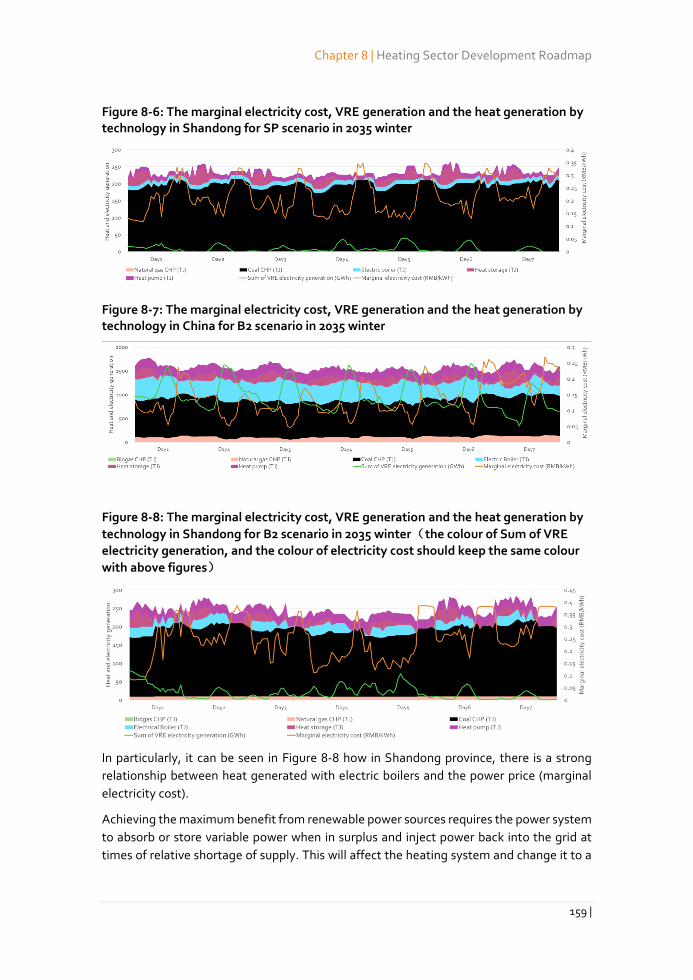
Chapter 8 | Heating Sector Development Roadmap
159 |
Figure 8-6: The marginal electricity cost, VRE generation and the heat generation by technology in Shandong for SP scenario in 2035 winter
Figure 8-7: The marginal electricity cost, VRE generation and the heat generation by technology in China for B2 scenario in 2035 winter
Figure 8-8: The marginal electricity cost, VRE generation and the heat generation by
technology in Shandong for B2 scenario in 2035 winter(the colour of Sum of VRE
electricity generation, and the colour of electricity cost should keep the same colour
with above figures)
In particularly, it can be seen in Figure 8-8 how in Shandong province, there is a strong
relationship between heat generated with electric boilers and the power price (marginal
electricity cost).
Achieving the maximum benefit from renewable power sources requires the power system
to absorb or store variable power when in surplus and inject power back into the grid at
times of relative shortage of supply. This will affect the heating system and change it to a
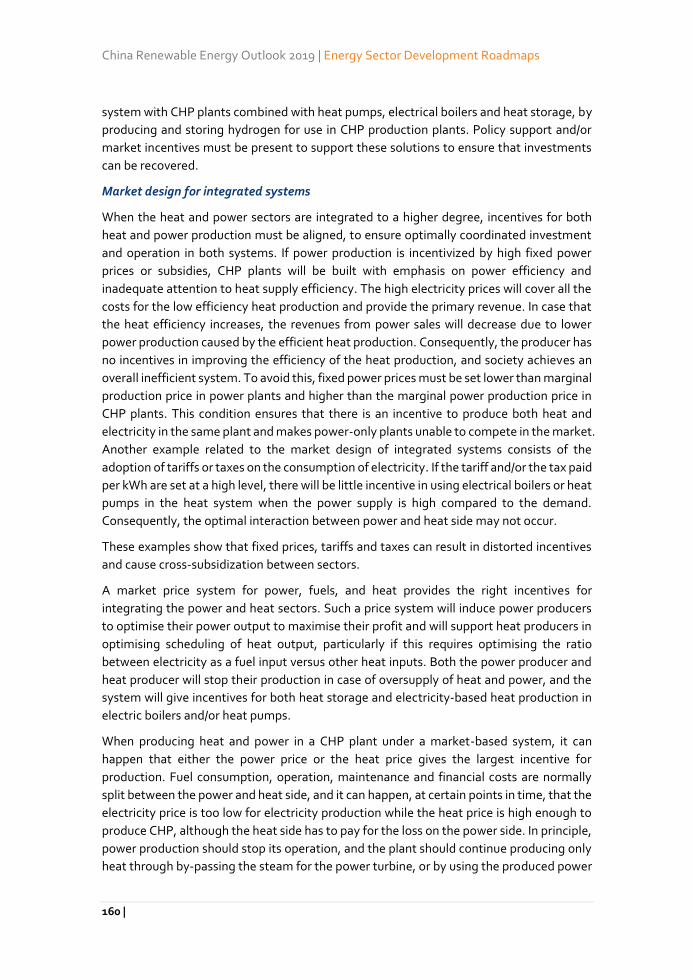
China Renewable Energy Outlook 2019 | Energy Sector Development Roadmaps
160 |
system with CHP plants combined with heat pumps, electrical boilers and heat storage, by
producing and storing hydrogen for use in CHP production plants. Policy support and/or
market incentives must be present to support these solutions to ensure that investments
can be recovered.
Market design for integrated systems
When the heat and power sectors are integrated to a higher degree, incentives for both
heat and power production must be aligned, to ensure optimally coordinated investment
and operation in both systems. If power production is incentivized by high fixed power
prices or subsidies, CHP plants will be built with emphasis on power efficiency and
inadequate attention to heat supply efficiency. The high electricity prices will cover all the
costs for the low efficiency heat production and provide the primary revenue. In case that
the heat efficiency increases, the revenues from power sales will decrease due to lower
power production caused by the efficient heat production. Consequently, the producer has
no incentives in improving the efficiency of the heat production, and society achieves an
overall inefficient system. To avoid this, fixed power prices must be set lower than marginal
production price in power plants and higher than the marginal power production price in
CHP plants. This condition ensures that there is an incentive to produce both heat and
electricity in the same plant and makes power-only plants unable to compete in the market.
Another example related to the market design of integrated systems consists of the
adoption of tariffs or taxes on the consumption of electricity. If the tariff and/or the tax paid
per kWh are set at a high level, there will be little incentive in using electrical boilers or heat
pumps in the heat system when the power supply is high compared to the demand.
Consequently, the optimal interaction between power and heat side may not occur.
These examples show that fixed prices, tariffs and taxes can result in distorted incentives
and cause cross-subsidization between sectors.
A market price system for power, fuels, and heat provides the right incentives for
integrating the power and heat sectors. Such a price system will induce power producers
to optimise their power output to maximise their profit and will support heat producers in
optimising scheduling of heat output, particularly if this requires optimising the ratio
between electricity as a fuel input versus other heat inputs. Both the power producer and
heat producer will stop their production in case of oversupply of heat and power, and the
system will give incentives for both heat storage and electricity-based heat production in
electric boilers and/or heat pumps.
When producing heat and power in a CHP plant under a market-based system, it can
happen that either the power price or the heat price gives the largest incentive for
production. Fuel consumption, operation, maintenance and financial costs are normally
split between the power and heat side, and it can happen, at certain points in time, that the
electricity price is too low for electricity production while the heat price is high enough to
produce CHP, although the heat side has to pay for the loss on the power side. In principle,
power production should stop its operation, and the plant should continue producing only
heat through by-passing the steam for the power turbine, or by using the produced power
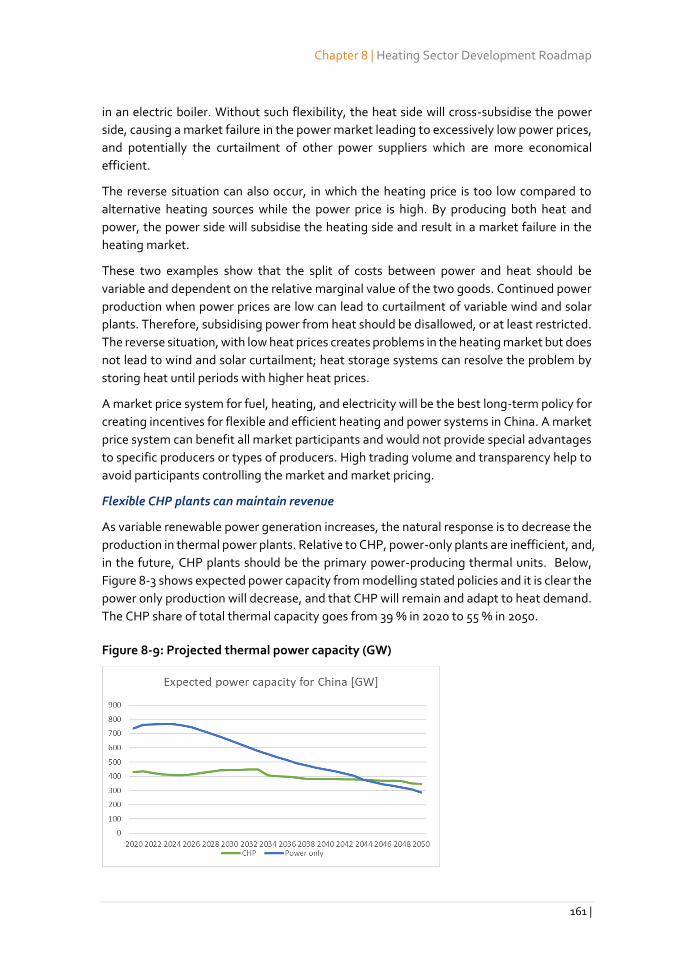
Chapter 8 | Heating Sector Development Roadmap
161 |
in an electric boiler. Without such flexibility, the heat side will cross-subsidise the power
side, causing a market failure in the power market leading to excessively low power prices,
and potentially the curtailment of other power suppliers which are more economical
efficient.
The reverse situation can also occur, in which the heating price is too low compared to
alternative heating sources while the power price is high. By producing both heat and
power, the power side will subsidise the heating side and result in a market failure in the
heating market.
These two examples show that the split of costs between power and heat should be
variable and dependent on the relative marginal value of the two goods. Continued power
production when power prices are low can lead to curtailment of variable wind and solar
plants. Therefore, subsidising power from heat should be disallowed, or at least restricted.
The reverse situation, with low heat prices creates problems in the heating market but does
not lead to wind and solar curtailment; heat storage systems can resolve the problem by
storing heat until periods with higher heat prices.
A market price system for fuel, heating, and electricity will be the best long-term policy for
creating incentives for flexible and efficient heating and power systems in China. A market
price system can benefit all market participants and would not provide special advantages
to specific producers or types of producers. High trading volume and transparency help to
avoid participants controlling the market and market pricing.
Flexible CHP plants can maintain revenue
As variable renewable power generation increases, the natural response is to decrease the
production in thermal power plants. Relative to CHP, power-only plants are inefficient, and,
in the future, CHP plants should be the primary power-producing thermal units. Below,
Figure 8-3 shows expected power capacity from modelling stated policies and it is clear the
power only production will decrease, and that CHP will remain and adapt to heat demand.
The CHP share of total thermal capacity goes from 39 % in 2020 to 55 % in 2050.
Figure 8-9: Projected thermal power capacity (GW)
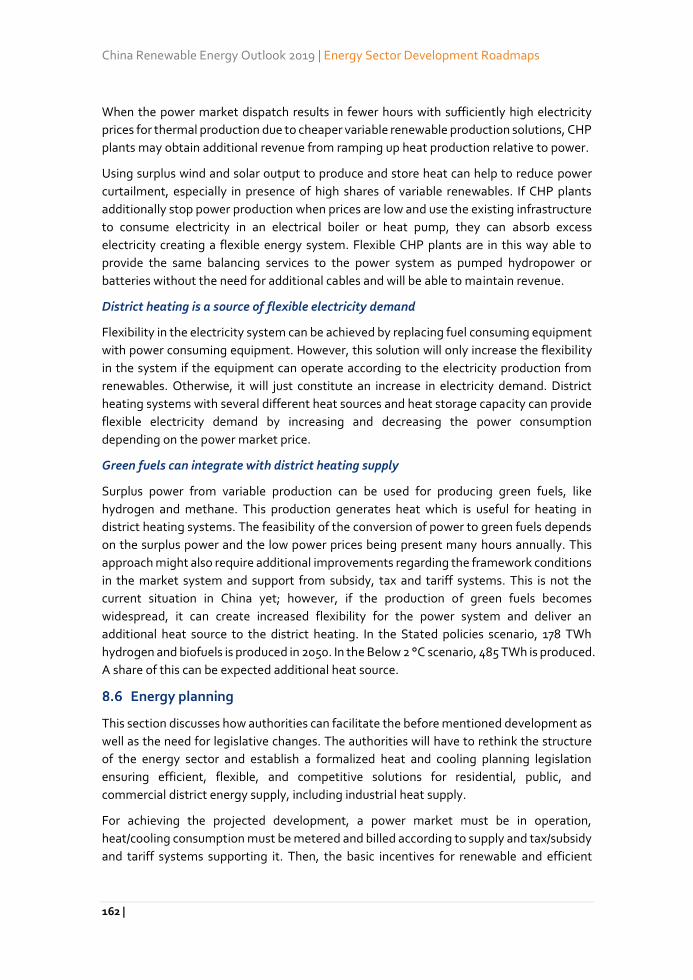
China Renewable Energy Outlook 2019 | Energy Sector Development Roadmaps
162 |
When the power market dispatch results in fewer hours with sufficiently high electricity
prices for thermal production due to cheaper variable renewable production solutions, CHP
plants may obtain additional revenue from ramping up heat production relative to power.
Using surplus wind and solar output to produce and store heat can help to reduce power
curtailment, especially in presence of high shares of variable renewables. If CHP plants
additionally stop power production when prices are low and use the existing infrastructure
to consume electricity in an electrical boiler or heat pump, they can absorb excess
electricity creating a flexible energy system. Flexible CHP plants are in this way able to
provide the same balancing services to the power system as pumped hydropower or
batteries without the need for additional cables and will be able to maintain revenue.
District heating is a source of flexible electricity demand
Flexibility in the electricity system can be achieved by replacing fuel consuming equipment
with power consuming equipment. However, this solution will only increase the flexibility
in the system if the equipment can operate according to the electricity production from
renewables. Otherwise, it will just constitute an increase in electricity demand. District
heating systems with several different heat sources and heat storage capacity can provide
flexible electricity demand by increasing and decreasing the power consumption
depending on the power market price.
Green fuels can integrate with district heating supply
Surplus power from variable production can be used for producing green fuels, like
hydrogen and methane. This production generates heat which is useful for heating in
district heating systems. The feasibility of the conversion of power to green fuels depends
on the surplus power and the low power prices being present many hours annually. This
approach might also require additional improvements regarding the framework conditions
in the market system and support from subsidy, tax and tariff systems. This is not the
current situation in China yet; however, if the production of green fuels becomes
widespread, it can create increased flexibility for the power system and deliver an
additional heat source to the district heating. In the Stated policies scenario, 178 TWh
hydrogen and biofuels is produced in 2050. In the Below 2 °C scenario, 485 TWh is produced.
A share of this can be expected additional heat source.
Energy planning
This section discusses how authorities can facilitate the before mentioned development as
well as the need for legislative changes. The authorities will have to rethink the structure
of the energy sector and establish a formalized heat and cooling planning legislation
ensuring efficient, flexible, and competitive solutions for residential, public, and
commercial district energy supply, including industrial heat supply.
For achieving the projected development, a power market must be in operation,
heat/cooling consumption must be metered and billed according to supply and tax/subsidy
and tariff systems supporting it. Then, the basic incentives for renewable and efficient
Chapter 8 | Heating Sector Development Roadmap
163 |
energy saving solutions will be in place. Today, much of the development and planning
does not integrate power, heat, cooling, industry and gas systems. Solutions often
optimize only parts of systems, creating curtailment and surplus in other parts. Integrated
energy planning is essential for meeting the coming objectives for society and the energy
systems.
There are different ways to plan for the future system with the pros and cons depending on
the chosenmethods. The key priority for the next five year plan is to decide a planning
model .
Pure market-based approaches may not support overall societal objectives
In some western countries, 100% market-based solutions are preferred for the
development of the energy system, with the expectation that the market adapts to
overcome any issues and ensures that production always meets demand. This may be true
regarding short-term prices for building developers, but not for other actors, and especially
not when public objectives need to be met. There is a risk that developers will save on
short-term investments leading to a higher cost in reinvestments in the long-term. This is
likely to result in higher variable energy prices for the consumers. A 100% market-based
system will then not meet public objectives.
Centralised energy planning features consistency but risks not accounting for local
conditions and ownership
The planning system can be centralised if authorities’ direct specific provinces, towns and
district on which actions to execute for meeting the objectives. The authorities require
central specialists, advisors and perhaps universities to carry out the planning of the energy
system. Consequently, most of the knowledge will stay in such central institutions: local
authorities will have little ownership of the projects except for the subsidies and revenue
received as a result of the centralised planning. The authorities will have to ensure
financing by assisting the provinces and towns with grants and subsidies for solutions that
make them competitive. The present 26+2 heat planning project222 in China is an example
of centralised heat system planning. The advantage is that the planning and
implementation of required changes can be done at speed, however, the changes will only
occur in the selected areas without taking advantage of the possible contribution of other
areas of the country towards achieving the public objectives.
Decentral energy planning supports local engagement, but must be supported by centralised
framework
In a decentralised planning model, the development of the energy system will be decided
by local authorities, while the central government will set a legislation framework to ensure
that the local governments follow the national objectives. For example, an air quality
standard can be set by central authorities, however, local authorities need to define their
own way to meet such a standard. The local authorities can propose a planning system that
suits the local context; therefore, different areas can follow different plans accounting for
different local solutions dependent on their possibilities. This way of planning is similar to
China Renewable Energy Outlook 2019 | Energy Sector Development Roadmaps
164 |
the model used in the European Union, making the independent countries responsible for
finding own solutions and planning models to fulfil common targets and standards. The
advantage is that knowledge will be achieved locally and that local authorities will take
ownership to targets and changes. Meanwhile, central authorities must only focus on
targets, the legislative framework, reporting, and control system.
This system requests local legislation, and as a consequence, the planning models used in
the provinces varies from province to province. Such a setting might lead to the risk that
targets are not met if provinces have different priorities or if the needed knowledge,
technologies, and heat sources are not available, expensive or difficult to achieve. Central
authorities may have to establish different targets for specific provinces and might have to
facilitate the financing of projects.
China evidently does not have the same structure as the European Union, and this has an
influence on how the energy planning model is established, by fitting to the structural and
political system. Decentralised planning may be a suitable model; however, China will need
to find its own version of the model in a manner fitting to the present economic and
political structure while making the provinces responsible for meeting individual objectives
dependent on local possibilities and the level of the local economy.
China’s existing infrastructure planning approach could support system planning for heating
and cooling
In recent years, China has shown a strong infrastructure planning model regarding the
construction of highways, railways, airports, telecommunication systems, among others.
Building infrastructure for efficient, flexible and renewable district heating and cooling is
not different from building other types of infrastructure, and China has an excellent class
model for doing so in a fast and efficient manner. If China applies the model used for other
infrastructure to for district heating and cooling, such a planning should include a
formalised model for finding areas suitable for heating and cooling, a model for evaluating
consumer feasibility and socio-economic feasibility and a model for establishing local
network companies and financing.
If the infrastructure planning approach is applied for the heating and cooling system
planning for China, the difficult part will be finding energy sources for the urban areas
suitable for district heating or cooling. Excess heat from CHP plants and industry will be the
most appropriate source, although it should be replaced with renewable sources in a longer
perspective. It is difficult to see how the needed investigations in heat sources and
establishing local heat production can be achieved without including local knowledge in
the planning process. It might still be a job for the local authorities to find, organise and
deliver heat and cooling to established networks. The advantage of such a system is the
possibility to define a low loss network standard including flow and temperature control
and professional network construction and centralised planning combined with local
knowledge on the available heat sources.
Chapter 8 | Heating Sector Development Roadmap
165 |
The heat and cooling production and delivery may or may not be included in the network
company and the planning system. If not, the system will be unbundled with third party
access which demand rules, standards and legislation for making non-discriminating
agreements with suppliers, contracts and payment systems and probably some kind of
public price control in the form of benchmark or price cap.
This way of planning district energy infrastructure can be a good solution, however, if the
planning system and solutions do not integrate industry supply and demand, power system,
waste management, renewables and other local opportunities it can potentially miss some
of the advantages of energy systems integration.
New technologies play a critical role in the future of district heating and
must be demonstrated
The changes in the power sector, the development of heating sectors and the need for
energy planning will lead to changes and new technologies is expected to play a critical role
for promoting an efficient, dynamic and diversified energy system, which relates to the
previous sections on what can be achieved with district heating.
Heat storage, solar heat, geothermal heat, large district heating heat/cooling pumps using
low temperature heat sources, small and big biomass solutions, gasification solutions,
waste incineration, excess heat from industry and a new generation of district heating and
cooling systems will be some of the most important technologies for heating and cooling
in the future. These sources and technologies have different characteristics and may need
further development and support in a future energy system. Coal and natural gas CHP will
decrease their operation in the future. Coal and natural gas technologies are not discussed
in detail in the following section; however, such technologies have a potential for increased
efficiency and will in combination with other technologies still be part of the future heating
systems. Figure 8-3 and 8-4 show that fossil fuels slowly will decrease towards 2050, but
still be around 50 % of the sources in the Stated Policies scenario and around 40 % in the
Below 2 °C scenario. There will be a change from coal to natural gas making natural gas
increasing until 2030 and 2040 dependent on scenario. It then will be important to set
standards for new natural gas equipment for increased efficiency and reduced emissions.
Individual technologies will still be a large part of China’s heating and cooling. Figure 8-1
show how these technologies will have increased efficiency due to technology
development and also by minimum standards set by government.
Future district heating and cooling systems
District heating and cooling systems have comparative advantages to individual solutions
with respect to efficiency, economics and flexibility. These relative benefits fade if the
district heating distribution system is inefficient through heat losses. The district heating
transmission and distribution technologies and supply conditions also needs to be
improved.
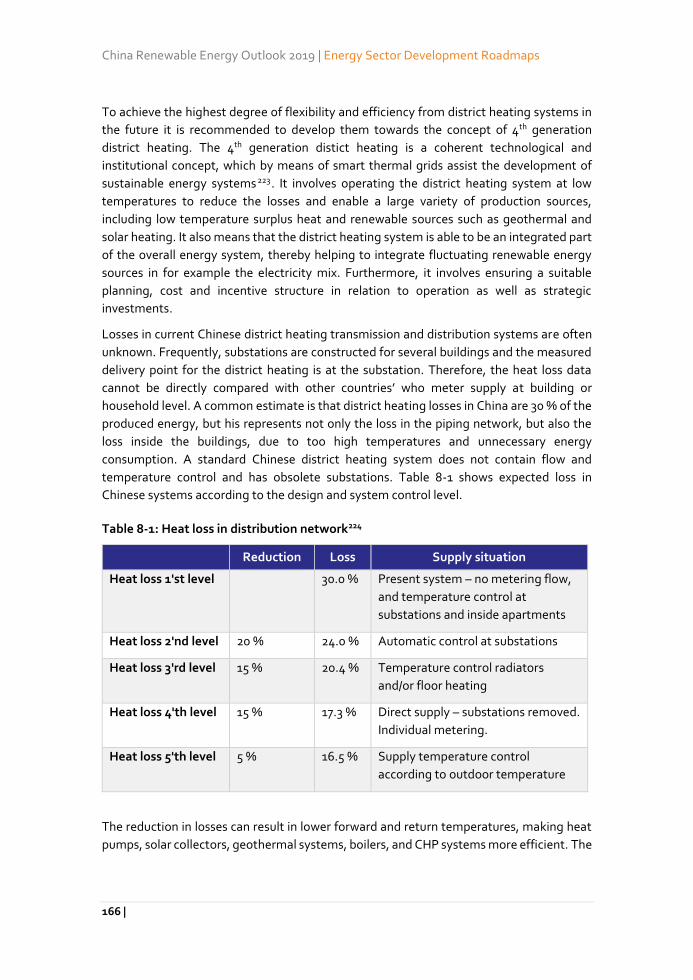
China Renewable Energy Outlook 2019 | Energy Sector Development Roadmaps
166 |
To achieve the highest degree of flexibility and efficiency from district heating systems in
the future it is recommended to develop them towards the concept of 4th generation
district heating. The 4th generation distict heating is a coherent technological and
institutional concept, which by means of smart thermal grids assist the development of
sustainable energy systems 223. It involves operating the district heating system at low
temperatures to reduce the losses and enable a large variety of production sources,
including low temperature surplus heat and renewable sources such as geothermal and
solar heating. It also means that the district heating system is able to be an integrated part
of the overall energy system, thereby helping to integrate fluctuating renewable energy
sources in for example the electricity mix. Furthermore, it involves ensuring a suitable
planning, cost and incentive structure in relation to operation as well as strategic
investments.
Losses in current Chinese district heating transmission and distribution systems are often
unknown. Frequently, substations are constructed for several buildings and the measured
delivery point for the district heating is at the substation. Therefore, the heat loss data
cannot be directly compared with other countries’ who meter supply at building or
household level. A common estimate is that district heating losses in China are 30 % of the
produced energy, but his represents not only the loss in the piping network, but also the
loss inside the buildings, due to too high temperatures and unnecessary energy
consumption. A standard Chinese district heating system does not contain flow and
temperature control and has obsolete substations. Table 8-1 shows expected loss in
Chinese systems according to the design and system control level.
Table 8-1: Heat loss in distribution network224
Reduction Loss Supply situation
Heat loss 1'st level 30.0 % Present system – no metering flow,
and temperature control at
substations and inside apartments
Heat loss 2'nd level 20 % 24.0 % Automatic control at substations
Heat loss 3'rd level 15 % 20.4 % Temperature control radiators
and/or floor heating
Heat loss 4'th level 15 % 17.3 % Direct supply – substations removed.
Individual metering.
Heat loss 5'th level 5 % 16.5 % Supply temperature control
according to outdoor temperature
The reduction in losses can result in lower forward and return temperatures, making heat
pumps, solar collectors, geothermal systems, boilers, and CHP systems more efficient. The
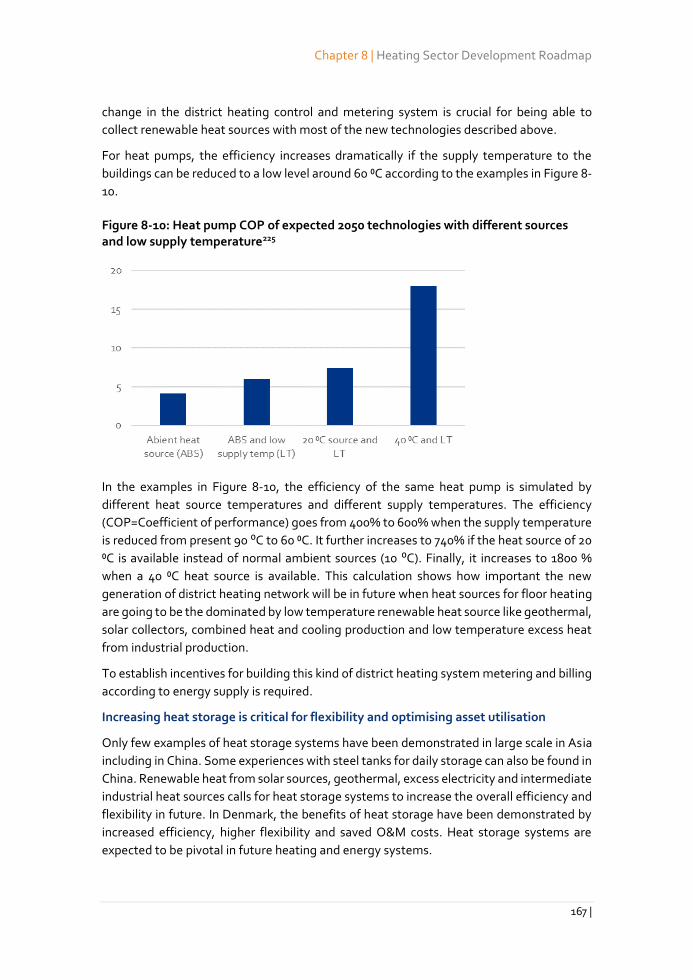
Chapter 8 | Heating Sector Development Roadmap
167 |
change in the district heating control and metering system is crucial for being able to
collect renewable heat sources with most of the new technologies described above.
For heat pumps, the efficiency increases dramatically if the supply temperature to the
buildings can be reduced to a low level around 60 ⁰C according to the examples in Figure 8-
10.
Figure 8-10: Heat pump COP of expected 2050 technologies with different sources and low supply temperature225
In the examples in Figure 8-10, the efficiency of the same heat pump is simulated by
different heat source temperatures and different supply temperatures. The efficiency
(COP=Coefficient of performance) goes from 400% to 600% when the supply temperature
is reduced from present 90 ⁰C to 60 ⁰C. It further increases to 740% if the heat source of 20
⁰C is available instead of normal ambient sources (10 ⁰C). Finally, it increases to 1800 %
when a 40 ⁰C heat source is available. This calculation shows how important the new
generation of district heating network will be in future when heat sources for floor heating
are going to be the dominated by low temperature renewable heat source like geothermal,
solar collectors, combined heat and cooling production and low temperature excess heat
from industrial production.
To establish incentives for building this kind of district heating system metering and billing
according to energy supply is required.
Increasing heat storage is critical for flexibility and optimising asset utilisation
Only few examples of heat storage systems have been demonstrated in large scale in Asia
including in China. Some experiences with steel tanks for daily storage can also be found in
China. Renewable heat from solar sources, geothermal, excess electricity and intermediate
industrial heat sources calls for heat storage systems to increase the overall efficiency and
flexibility in future. In Denmark, the benefits of heat storage have been demonstrated by
increased efficiency, higher flexibility and saved O&M costs. Heat storage systems are
expected to be pivotal in future heating and energy systems.
China Renewable Energy Outlook 2019 | Energy Sector Development Roadmaps
168 |
For China, the investment costs in storage systems are still too high according to a
demonstration project in Tongchuan, Shaanxi province, which can be decreased with the
introduction of more competition between suppliers. More demonstration projects can be
a way to support the implementation of heat storage in China. This calls for more
demonstration projects in next two five-year plans.
Solar heating can be exploited in new ways in China
China has extensive experience in producing solar collectors that cover the hot water
demand of single-family houses and industry users, however, it only has few successful
experiences in solar heating for district heating. Experiences from Denmark show a large
potential in solar district heating systems. When combined with daily and seasonal heat
storage systems, solar district heating systems can produce base load heat and reduce
consumption of fossil fuels. Furthermore, China has high solar irradiance during summer
and winter in large parts of the country and it is expected that solar heating will be an
important heat source, especially for rural towns and villages. The first solar heat plants
have already been developed and it is expected that investment prices will decrease due to
more suppliers, increased experience and improved competition.
Efficient solar heating depends on the development of storage systems, 4th generation
district heating systems with low forward temperatures, and to some extent large heat
pumps able to increase efficiency in collectors and storage systems. Solar collectors can
utilise approximately 40 % of the solar irradiance, which is double the performance of
photovoltaics.
New solar collectors combined with PV can increase the efficiency for both PV and heat
collector systems. New CSP solar heating technologies, able to produce heat in
temperatures up to 400 ⁰C may be a new catalyser for solar systems for producing heating,
cooling and power.
Solar heating in large scale district heating system is not mature in China and more
demonstration projects are needed.
Geothermal heat
Geothermal heat covers several heat sources; hot springs in the surface of the earth, rock
heat, ground water heat, to deep ground heat from dwellings 1-4 km underneath the
surface of the earth. The temperature levels may differ from 10 ⁰C to more than 100 ⁰C and,
dependent on temperatures and setup, heat pumps are often needed to efficiently utilise
the heat source and capture all the energy. Underground geothermal heat normally has
quite expensive initial investment and low operation cost, which depend on the electricity
price., and can be an important heat source for the future in China in areas with available
sources.
It must be developed, and potentially subsidised dependent on the power price for
electricity needed for pumping and heat pumps. The present power price system in China
might not accommodate the needs of geothermal heat solutions and further investigation
Chapter 8 | Heating Sector Development Roadmap
169 |
into the cost of electricity for geothermal heat is needed. More demonstration projects are
needed.
Large heat pumps for heating/cooling
Large heat pumps for heating and cooling are needed to produce efficient cooling and
heating energy from renewable sources like solar heat, geothermal heat, waste water,
excess heat industry, air, lake/sea/rivers, excess electricity from power system or the like.
Heat pumps are extremely important for collecting low temperature renewable heat
sources and reusing the energy in district heating systems. Large heat pumps are one of
the most important key technologies for making the transition from fossil fuels to
renewable energy possible. Heat pumps can be driven both by steam (hot water) in
absorption heat pumps, and by electricity in compressor heat pumps. Both types of heat
pumps can additionally be driven by gas using a burner in absorption heat pumps and an
engine for compressor heat pumps.
The large electric heat pumps is expected to cover 7.4% of the district heating heat demand
by stated policie scenario and 18.3% in the Below 2 °C scenario. This tells that large heat
pumps can be important if high climate targets are set in China.
The heat source temperature and heat supply temperature define the efficiency of the
system, making the heat production cost dependent on high temperature sources and low
supply temperatures. A new generation of district heating systems are essential for the
efficiency of heat pumps, since they operate at low temperatures, and therefore allow for
lower temperature sources for the heat pumps.
Heat pumps will probably be used locally for producing heat where sources are available
and will reverse the district heating system from central heat deliveries to locally produced
sources. This transition will not be limited to small urban areas but can also take place
locally in large urban areas using excess heat from all available heat sources.
The present power price system is not suitable for heat pumps needing a lower price in
general and incentives for producing in periods with low electricity demand and/or high
electricity supply.
Heat pumps will be important for individual heating covering 22.5 % in the Stated Policies
scenario and 27.9 % in the Below 2 °C scenario.
Small- and large-scale biomass solutions
Biomass resources are limited, and only a fraction of China’s fossil energy use can be
replaced by biomass. Biomass should be used where it provides the largest value, for
example as fuels for transportation or for producing raw material for the chemical industry.
Alternatively, biomass should be used where it gives largest reduction in climate effect as
fuel in industrial CHP plants replacing coal or coal boilers.
In China, biomass collecting, handling and transportation is neither standardized nor
automated at present. Moreover, it is challenging to harvest, collect and transport over
China Renewable Energy Outlook 2019 | Energy Sector Development Roadmaps
170 |
long distances for most biomass types. Standardization is important for machine builders,
transportation vehicles, boilers, and handling equipment providers. Without
standardization, costs for equipment will be high and solutions will be inefficient.
China’s biomass resource is predominantly agricultural residues. Wood products are
limited but may increase in the future according to the reforestation plans in many
provinces of China. At some point new forest yields will be used in building materials and
the residues from managing the wood and the residues from building industry will be
possible energy sources for the industry and heating sector.
Currently, agricultural biomass residues do not have significant value for farmers and are
often unused. This leaves farmers with a problem, since it is not allowed to burn the
biomass on the fields. Biomass residues need to have a value for farmers, giving them
incentives for collecting and selling the biomass for revenue.
The present situation calls for a two-stage development. The first stage is about
standardizing the collection, transportation and handling system; and using the residues in
local industrial areas, local towns, and villages in CHP plants and boilers. The second stage
is about gasification and making biofuels for transportation and industry, or letting the
biomass be a part of industrial processes making biological raw materials for products. In
other words, the first stage provides the infrastructure, while the second stage increases
the value of biomass across the entire supply chain.
Without national waste gas emission standard for biomass boilers, there is ambiguity on
whether biomass heating is clean or not. Chinese authorities need to develop and issue
national standards and solutions, in order to clarify its clean energy proposition and
support its sustainable development.
Gasification provides a means to utilise waste water and biological residues as energy
resources
Gasification is a process that is growing worldwide. It is primarily manure from animals and
waste water treatment sludge that are used together with animal and biological residues.
Biogas processes improve the fertilizing value of sludge and provide storable gaseous fuel
important for future transportation and industry. Gasification of biomass residues and
wood are emerging technologies still in demonstration.
Compared to the direct incineration in CHP plants, gasification has additional losses.
Consequently, gasification has primarily been used on wet manure and sludge not suitable
for incineration. However, the environmental benefits from gasification compared to
incineration may soon make gasification more relevant than incineration and change the
technology choice from incineration to gasification.
Gasification of wood and other residues is not without challenges and the technology still
needs to be improved, investment costs are currently high and often needs subsidies. More
demonstration projects are needed.
Chapter 8 | Heating Sector Development Roadmap
171 |
Waste-to-energy plants can supply urban heating, industrial energy demand and
supply electricity
Waste incineration has a significant positive CO2-effect compared to landfilling and should
be implemented in all urban areas of China, and with the energy used for industry, heat and
power. Proper cleaning of the flue gas is vital for a positive environmental impact of waste
incineration. Industry using heat and power all year round is the optimal partner for waste
incineration and waste incineration plants should be placed in industrial areas having
priority to supply heat and power to the industry. District heating and cooling systems may
be connected to industry areas, collecting excess heat from the industry and waste
incineration plants, optimizing the overall efficiency.
Waste should always be sorted for valuable raw materials like metals, plastic, paper, glass
etc. before incinerated. Waste incineration should always be the last solution and only if it
is not possible to sort for reuse.
Gasification may prove a better treatment process in the future compared to waste
incineration. It should be possible to utilize more of the available energy in the waste with
gasification, but the technology is currently less mature. However, this does not change
the fact that waste should be treated in a way where it is possible to harvest the available
energy.
China Renewable Energy Outlook 2019 | Energy Sector Development Roadmaps
172 |
9. Power system development
Main findings
Electrification in the end use sectors boosts the electricity consumption. The energy
transition requires a high penetration of renewable energy in power sector.
Electrification is one of the key elements in the energy transition. It provides not only space
for efficiency improvements on the end use of energy, but also big potential on electricity
supplied by renewable energy that can significantly accelerate energy transition.
According to Below 2 °C Scenario, the electrification rate grows from 26% in 2018 to 47%
in 2035 and 63% in 2050. The electricity consumption in 2050 is more than doubled
compared with the 2018 level. It is mainly driven by the transport and agriculture sectors
and increasing applications of hydrogen produced from electricity.
Renewable power technologies are the most promising and mature technologies that can
efficiently and cost-effectively reduce CO2 emissions in the energy sector. Along with a
growing electricity consumption, it is essential for power sector to provide clean energy by
integrating a high penetration of renewable energy. Our results show that in the Below 2 °C
Scenario, the share of renewable energy generation in power sector increases from 27% in
2018 to 73% in 2035 and to 87% in 2050. Renewable energy in the power sector contributes
to 64% of overall renewable energy consumption in 2018, 77% in 2035 and 81% in 2050
respectively. More than 50% of conversion losses in 2018 is reduced through integrating
renewable energy in power sector during the period of 2018 to 2050.
An energy transition driven by renewables requires a reimagining of China’s power
system.
To adopt renewable power generation in power system, the integration becomes critical,
as renewable generation is fluctuant, distributed and uncertain. The scenarios
demonstrate that while the post-transition power system outperforms the present system
according to all relevant criteria, the system is radically different. Characteristics in terms
of asset mix, dispatchability, operational paradigm, cost structure, operational timescales,
and topology, will transform. The system cannot be planned or operated according to
today’s principles, using today’s sources of flexibility, under today’s regulatory paradigms.
Every aspect of the power industry needs to be ready to be changed itself, from market
designs and regulatory setups, to product and service definitions, to stakeholder roles.
Power system planning, innovation, and reform must be forward-looking. Managing
uncertainty, variability, and complexity will be key.
To accommodate high penetration of renewable sources, China’s electricity market should
be able to mobilize existing flexibility through efficient price signals and market services,
as well as to guide investments in unavailable flexibility sources through long-term market
design. The power system should be structured to efficiently dispatch available flexibility
such that fluctuations and uncertainties can be handled without interfering the system
security.
Chapter 9 | Power System Development Roadmap
173 |
Renewable energy is competitive on cost basis, on value adjusted basis, and in the
long run can reach high penetration levels if cost-effective flexibility is deployed.
Based on recent years’ experiences, it is projected that renewable energy costs will
continue to decline, making wind and solar competitive with investing in new coal power
plants during the 14th Five-Year Plan period. When the external costs of coal power plants
are accounted for, investments in new renewable energy sources will be cheaper than
continuing to operate existing coal plants. The focus on cost reduction of onshore wind and
solar PV will be shifted from reducing equipment and construction cost to improving the
capacity factor.
The power reforms and meaningful carbon price levels will take some time to implement.
The scenario results suggest that until 2040, carbon market is a very efficient tool to make
non-fossil fuel competitive with fossil fuel, which indicate that the additional system
integration cost by renewable energy still needs stimulations through policies. The price of
CO2 should translate to a higher market value for renewables and a disincentive for fossil-
fired generation as a (partial) proxy for the external costs from fossil fuel combustion.
Auctioning of CO2 allowances could finance accelerated investments in the energy
transition.
Role of natural gas and carbon capture and storage in future power system.
Replacement of coal with natural gas will reduce CO2 emission from the power sector.
However, natural gas based power production is expensive relative to cleaner technologies
for providing coal-replaced electricity as well as power system balancing. Its growth in
power system is mainly driven by forced policy targets (e.g., Energy Supply and Demand
Revolution (2016-2030)). We anticipate China’s energy transition will involve a
leapfrogging of gas-based power for economic as well as environmental reasons.
Carbon capture and storage is an alternative solution for CO2 emission reduction. There
are 18 large-scale CCUS facilities operating globally, and only 8.2% of the captured CO2 is
from power sector, due to high cost and other cost-effective CO2 reduction solutions. The
scenario results show that CCS is not competitive with other reduction solutions unless a
very high carbon price or very strict CO2 budget is set for power sector. As the cost of
renewable energy as well as chemical battery drops significantly, “RE + storage” will be
more attractive than “Coal + CCS” from an economic and environmental point of view.
In the 14th Five-Year Plan period (2021-2025), China should set clear guidance for
developing the power sector.
Integrated long-term planning of generation, transmission, as well as flexible sources
(such as storage, flexible load, etc.) is extremely important. Given boundary conditions,
such as national targets of non-fossil fuel energy and electricity consumption growth
predictions, a proper planning model and a standard planning procedure can help to
evaluate and coordinate the development of infrastructure, power sources, and flexibility
investments. With a clear long-term vision, potential risks and uncertainties can be
examined through the model, thus is reduced by improving the policy framework. By
China Renewable Energy Outlook 2019 | Energy Sector Development Roadmaps
174 |
fitting into the long-term strategy, short-term targets can better facilitate the long-term
visions to yearly action plans without impacts from short-term incidents.
Clear capacity targets for renewable power development. While the cost of wind power
and photovoltaic keeps decreasing in 14-FYP period, the development of some
technologies, such as offshore wind power and CSP, still depend on subsidies from the
government. It is important to maintain annual additional capacity targets for the projects,
so that a level of industrial scale of equipment suppliers and construction ability can be
maintained while the total amount of subsidy can be limited to an affordable level.
Flexibility is an essential element for the successful integration of renewable energy in
power system. Therefore, it is important that the policy design is able to promote flexibility
in power system. On one hand, a market should be established to facilitate the flexibility
services so that the existing flexible sources can be discovered and better utilized. On the
other hand, the reservation of flexible sources in the system should be established to
attract investments on flexibility and to maintain a stable level of flexible capacity.
Consistent policy framework is important for a smooth energy transition. Even though
the subsidy for onshore wind power and photovoltaic power will phase out in 14-FYP, new
mechanisms and regulations are necessary to continue to drive the cost reduction, by
improving investment and utilization environment as well as enhancing regulations and
monitoring system. Policies for fossil-fuel plants need to be established, so that insufficient
operating hours can be compensated for providing flexibility and a smooth phase-out of
inefficient and unclean plants. Considering not just from the energy supply’s point of view,
but also from the industry development and diversity, it is also important to continue the
support of other kinds of renewable energy than wind and PV, such as biomass, CSP,
geothermal, marine, as well as related technologies in battery storage, hydrogen, etc.
Continue to foster a good market environment for renewable integration. Continue to
complete and consolidate existing spot markets and focus on mobilizing flexible sources in
current power system to better integrate renewable energy, such as transmission capacity,
thermal and hydro power plants, industrial demand response and storage. Better utilize
the Mandatory Renewable Electricity Consumption Mechanism226 to ensure the renewable
share in electricity consumption and to promote the willingness to consume green energy.
Enhance the national carbon market and expand the quota coverage to reflect the external
cost of emissions. Establish an effective administrative monitoring system during the
power sector reform process to maintain the market rules.
Adding new coal power capacity should be avoided. Adding new coal power capacity
with a lifetime of around 40 years would be contra-productive for the energy transition,
introducing risks for stranded investments in a competitive power market and could turn
out to be less cost-competitive compared with the best renewable energy solutions. Hence,
investments in new coal capacity should be avoided or limited as much as possible. In
addition, the institutional mechanisms for accelerating a smooth retirement of old and
inefficient coal plant needs to be put in place. Limiting the share of coal in the electricity
generation mix is critical for the reduction CO2 emission and structural enhancement of
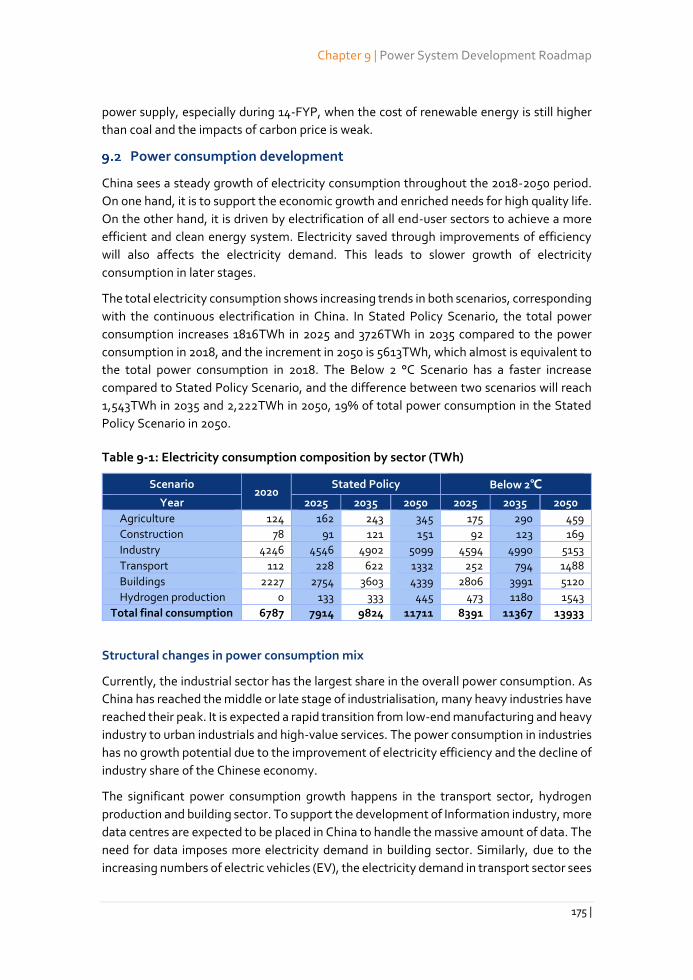
Chapter 9 | Power System Development Roadmap
175 |
power supply, especially during 14-FYP, when the cost of renewable energy is still higher
than coal and the impacts of carbon price is weak.
Power consumption development
China sees a steady growth of electricity consumption throughout the 2018-2050 period.
On one hand, it is to support the economic growth and enriched needs for high quality life.
On the other hand, it is driven by electrification of all end-user sectors to achieve a more
efficient and clean energy system. Electricity saved through improvements of efficiency
will also affects the electricity demand. This leads to slower growth of electricity
consumption in later stages.
The total electricity consumption shows increasing trends in both scenarios, corresponding
with the continuous electrification in China. In Stated Policy Scenario, the total power
consumption increases 1816TWh in 2025 and 3726TWh in 2035 compared to the power
consumption in 2018, and the increment in 2050 is 5613TWh, which almost is equivalent to
the total power consumption in 2018. The Below 2 °C Scenario has a faster increase
compared to Stated Policy Scenario, and the difference between two scenarios will reach
1,543TWh in 2035 and 2,222TWh in 2050, 19% of total power consumption in the Stated
Policy Scenario in 2050.
Table 9-1: Electricity consumption composition by sector (TWh)
Scenario 2020
Stated Policy Below 2℃
Year 2025 2035 2050 2025 2035 2050
Agriculture 124 162 243 345 175 290 459
Construction 78 91 121 151 92 123 169
Industry 4246 4546 4902 5099 4594 4990 5153
Transport 112 228 622 1332 252 794 1488
Buildings 2227 2754 3603 4339 2806 3991 5120
Hydrogen production 0 133 333 445 473 1180 1543
Total final consumption 6787 7914 9824 11711 8391 11367 13933
Structural changes in power consumption mix
Currently, the industrial sector has the largest share in the overall power consumption. As
China has reached the middle or late stage of industrialisation, many heavy industries have
reached their peak. It is expected a rapid transition from low-end manufacturing and heavy
industry to urban industrials and high-value services. The power consumption in industries
has no growth potential due to the improvement of electricity efficiency and the decline of
industry share of the Chinese economy.
The significant power consumption growth happens in the transport sector, hydrogen
production and building sector. To support the development of Information industry, more
data centres are expected to be placed in China to handle the massive amount of data. The
need for data imposes more electricity demand in building sector. Similarly, due to the
increasing numbers of electric vehicles (EV), the electricity demand in transport sector sees
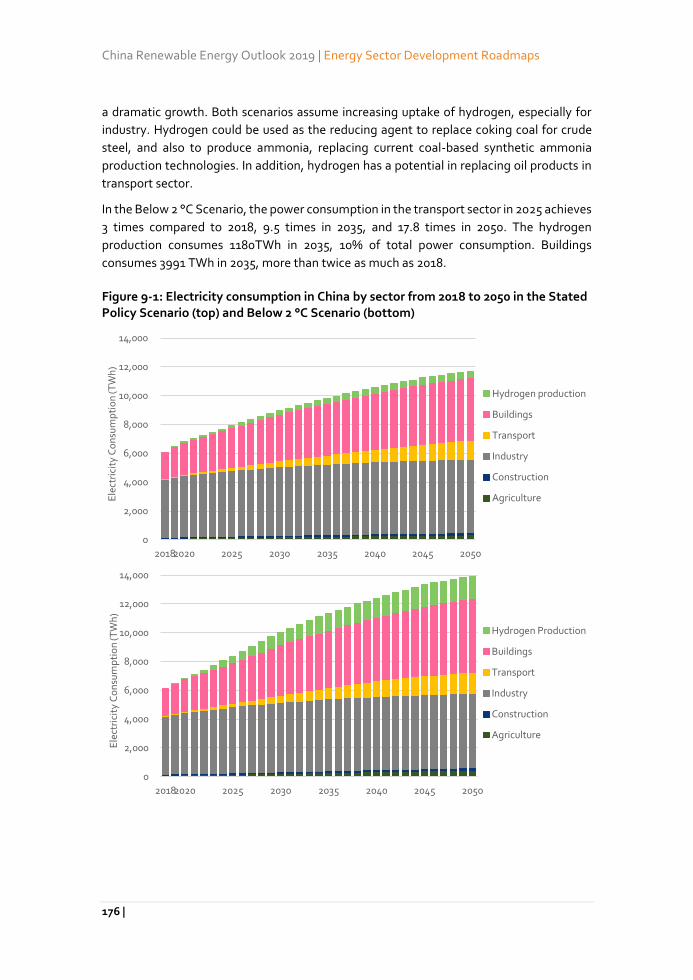
China Renewable Energy Outlook 2019 | Energy Sector Development Roadmaps
176 |
a dramatic growth. Both scenarios assume increasing uptake of hydrogen, especially for
industry. Hydrogen could be used as the reducing agent to replace coking coal for crude
steel, and also to produce ammonia, replacing current coal-based synthetic ammonia
production technologies. In addition, hydrogen has a potential in replacing oil products in
transport sector.
In the Below 2 °C Scenario, the power consumption in the transport sector in 2025 achieves
3 times compared to 2018, 9.5 times in 2035, and 17.8 times in 2050. The hydrogen
production consumes 1180TWh in 2035, 10% of total power consumption. Buildings
consumes 3991 TWh in 2035, more than twice as much as 2018.
Figure 9-1: Electricity consumption in China by sector from 2018 to 2050 in the Stated Policy Scenario (top) and Below 2 °C Scenario (bottom)
0
2,000
4,000
6,000
8,000
10,000
12,000
14,000
20182020 2025 2030 2035 2040 2045 2050
Ele
ctri
city
Co
nsu
mp
tio
n (T
Wh
)
Hydrogen production
Buildings
Transport
Industry
Construction
Agriculture
0
2,000
4,000
6,000
8,000
10,000
12,000
14,000
20182020 2025 2030 2035 2040 2045 2050
Ele
ctri
city
Co
nsu
mp
tio
n (T
Wh
)
Hydrogen Production
Buildings
Transport
Industry
Construction
Agriculture
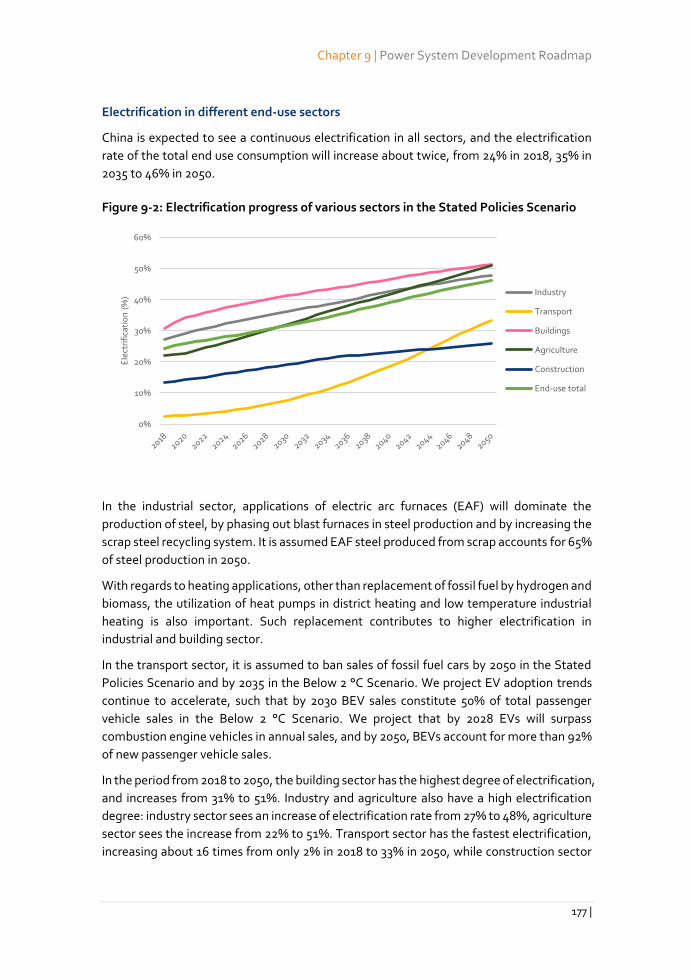
Chapter 9 | Power System Development Roadmap
177 |
Electrification in different end-use sectors
China is expected to see a continuous electrification in all sectors, and the electrification
rate of the total end use consumption will increase about twice, from 24% in 2018, 35% in
2035 to 46% in 2050.
Figure 9-2: Electrification progress of various sectors in the Stated Policies Scenario
In the industrial sector, applications of electric arc furnaces (EAF) will dominate the
production of steel, by phasing out blast furnaces in steel production and by increasing the
scrap steel recycling system. It is assumed EAF steel produced from scrap accounts for 65%
of steel production in 2050.
With regards to heating applications, other than replacement of fossil fuel by hydrogen and
biomass, the utilization of heat pumps in district heating and low temperature industrial
heating is also important. Such replacement contributes to higher electrification in
industrial and building sector.
In the transport sector, it is assumed to ban sales of fossil fuel cars by 2050 in the Stated
Policies Scenario and by 2035 in the Below 2 °C Scenario. We project EV adoption trends
continue to accelerate, such that by 2030 BEV sales constitute 50% of total passenger
vehicle sales in the Below 2 °C Scenario. We project that by 2028 EVs will surpass
combustion engine vehicles in annual sales, and by 2050, BEVs account for more than 92%
of new passenger vehicle sales.
In the period from 2018 to 2050, the building sector has the highest degree of electrification,
and increases from 31% to 51%. Industry and agriculture also have a high electrification
degree: industry sector sees an increase of electrification rate from 27% to 48%, agriculture
sector sees the increase from 22% to 51%. Transport sector has the fastest electrification,
increasing about 16 times from only 2% in 2018 to 33% in 2050, while construction sector
0%
10%
20%
30%
40%
50%
60%
Ele
ctri
fica
tio
n (
%) Industry
Transport
Buildings
Agriculture
Construction
End-use total
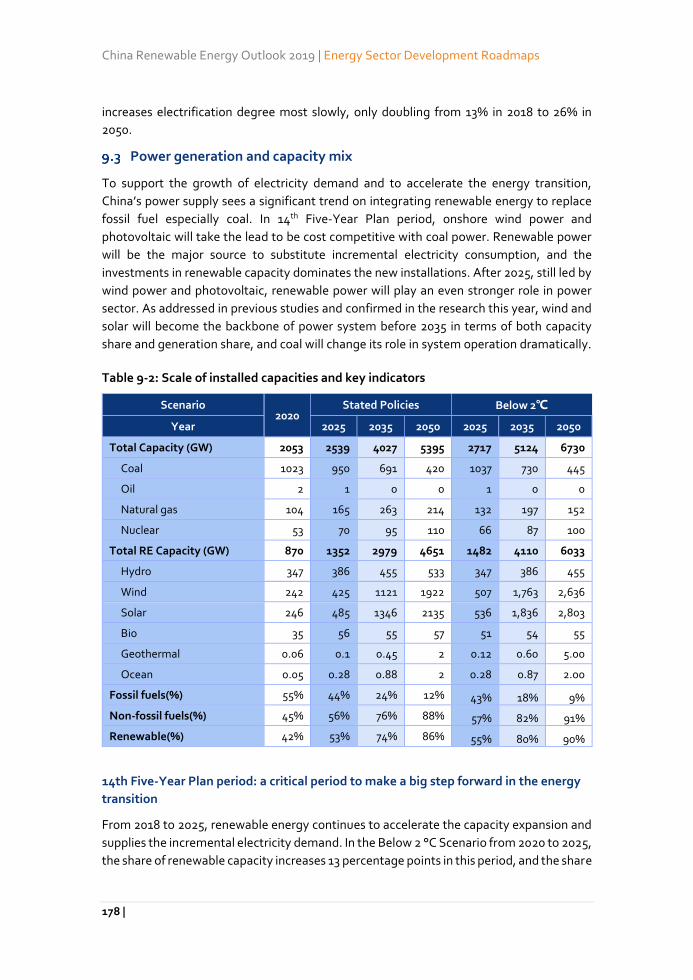
China Renewable Energy Outlook 2019 | Energy Sector Development Roadmaps
178 |
increases electrification degree most slowly, only doubling from 13% in 2018 to 26% in
2050.
Power generation and capacity mix
To support the growth of electricity demand and to accelerate the energy transition,
China’s power supply sees a significant trend on integrating renewable energy to replace
fossil fuel especially coal. In 14th Five-Year Plan period, onshore wind power and
photovoltaic will take the lead to be cost competitive with coal power. Renewable power
will be the major source to substitute incremental electricity consumption, and the
investments in renewable capacity dominates the new installations. After 2025, still led by
wind power and photovoltaic, renewable power will play an even stronger role in power
sector. As addressed in previous studies and confirmed in the research this year, wind and
solar will become the backbone of power system before 2035 in terms of both capacity
share and generation share, and coal will change its role in system operation dramatically.
Table 9-2: Scale of installed capacities and key indicators
Scenario 2020
Stated Policies Below 2℃
Year 2025 2035 2050 2025 2035 2050
Total Capacity (GW) 2053 2539 4027 5395 2717 5124 6730
Coal 1023 950 691 420 1037 730 445
Oil 2 1 0 0 1 0 0
Natural gas 104 165 263 214 132 197 152
Nuclear 53 70 95 110 66 87 100
Total RE Capacity (GW) 870 1352 2979 4651 1482 4110 6033
Hydro 347 386 455 533 347 386 455
Wind 242 425 1121 1922 507 1,763 2,636
Solar 246 485 1346 2135 536 1,836 2,803
Bio 35 56 55 57 51 54 55
Geothermal 0.06 0.1 0.45 2 0.12 0.60 5.00
Ocean 0.05 0.28 0.88 2 0.28 0.87 2.00
Fossil fuels(%) 55% 44% 24% 12% 43% 18% 9%
Non-fossil fuels(%) 45% 56% 76% 88% 57% 82% 91%
Renewable(%) 42% 53% 74% 86% 55% 80% 90%
14th Five-Year Plan period: a critical period to make a big step forward in the energy
transition
From 2018 to 2025, renewable energy continues to accelerate the capacity expansion and
supplies the incremental electricity demand. In the Below 2 °C Scenario from 2020 to 2025,
the share of renewable capacity increases 13 percentage points in this period, and the share
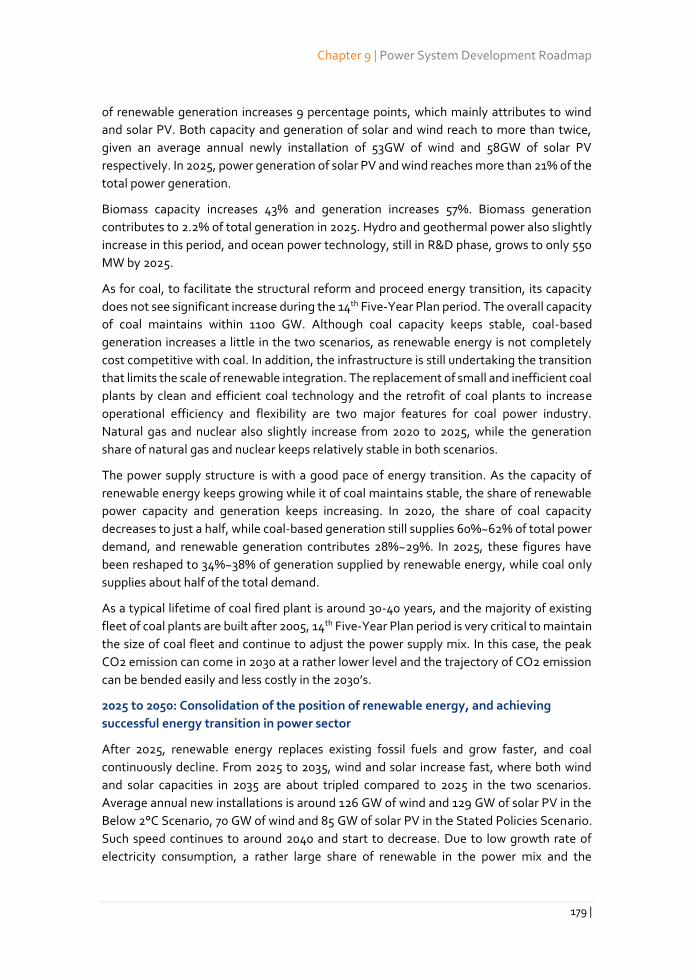
Chapter 9 | Power System Development Roadmap
179 |
of renewable generation increases 9 percentage points, which mainly attributes to wind
and solar PV. Both capacity and generation of solar and wind reach to more than twice,
given an average annual newly installation of 53GW of wind and 58GW of solar PV
respectively. In 2025, power generation of solar PV and wind reaches more than 21% of the
total power generation.
Biomass capacity increases 43% and generation increases 57%. Biomass generation
contributes to 2.2% of total generation in 2025. Hydro and geothermal power also slightly
increase in this period, and ocean power technology, still in R&D phase, grows to only 550
MW by 2025.
As for coal, to facilitate the structural reform and proceed energy transition, its capacity
does not see significant increase during the 14th Five-Year Plan period. The overall capacity
of coal maintains within 1100 GW. Although coal capacity keeps stable, coal-based
generation increases a little in the two scenarios, as renewable energy is not completely
cost competitive with coal. In addition, the infrastructure is still undertaking the transition
that limits the scale of renewable integration. The replacement of small and inefficient coal
plants by clean and efficient coal technology and the retrofit of coal plants to increase
operational efficiency and flexibility are two major features for coal power industry.
Natural gas and nuclear also slightly increase from 2020 to 2025, while the generation
share of natural gas and nuclear keeps relatively stable in both scenarios.
The power supply structure is with a good pace of energy transition. As the capacity of
renewable energy keeps growing while it of coal maintains stable, the share of renewable
power capacity and generation keeps increasing. In 2020, the share of coal capacity
decreases to just a half, while coal-based generation still supplies 60%~62% of total power
demand, and renewable generation contributes 28%~29%. In 2025, these figures have
been reshaped to 34%~38% of generation supplied by renewable energy, while coal only
supplies about half of the total demand.
As a typical lifetime of coal fired plant is around 30-40 years, and the majority of existing
fleet of coal plants are built after 2005, 14th Five-Year Plan period is very critical to maintain
the size of coal fleet and continue to adjust the power supply mix. In this case, the peak
CO2 emission can come in 2030 at a rather lower level and the trajectory of CO2 emission
can be bended easily and less costly in the 2030’s.
2025 to 2050: Consolidation of the position of renewable energy, and achieving
successful energy transition in power sector
After 2025, renewable energy replaces existing fossil fuels and grow faster, and coal
continuously decline. From 2025 to 2035, wind and solar increase fast, where both wind
and solar capacities in 2035 are about tripled compared to 2025 in the two scenarios.
Average annual new installations is around 126 GW of wind and 129 GW of solar PV in the
Below 2°C Scenario, 70 GW of wind and 85 GW of solar PV in the Stated Policies Scenario.
Such speed continues to around 2040 and start to decrease. Due to low growth rate of
electricity consumption, a rather large share of renewable in the power mix and the
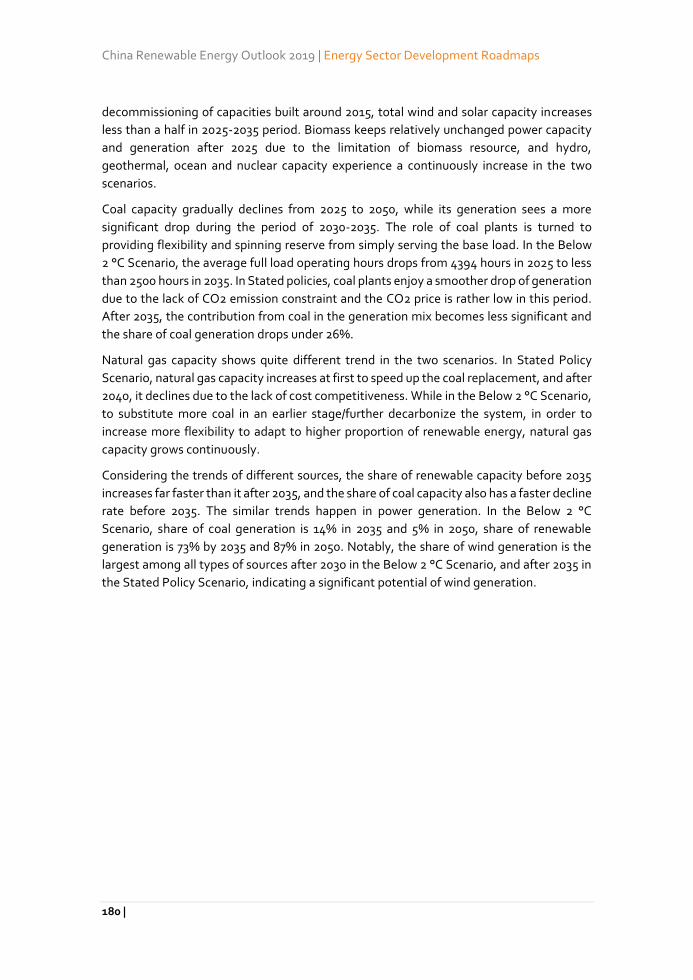
China Renewable Energy Outlook 2019 | Energy Sector Development Roadmaps
180 |
decommissioning of capacities built around 2015, total wind and solar capacity increases
less than a half in 2025-2035 period. Biomass keeps relatively unchanged power capacity
and generation after 2025 due to the limitation of biomass resource, and hydro,
geothermal, ocean and nuclear capacity experience a continuously increase in the two
scenarios.
Coal capacity gradually declines from 2025 to 2050, while its generation sees a more
significant drop during the period of 2030-2035. The role of coal plants is turned to
providing flexibility and spinning reserve from simply serving the base load. In the Below
2 °C Scenario, the average full load operating hours drops from 4394 hours in 2025 to less
than 2500 hours in 2035. In Stated policies, coal plants enjoy a smoother drop of generation
due to the lack of CO2 emission constraint and the CO2 price is rather low in this period.
After 2035, the contribution from coal in the generation mix becomes less significant and
the share of coal generation drops under 26%.
Natural gas capacity shows quite different trend in the two scenarios. In Stated Policy
Scenario, natural gas capacity increases at first to speed up the coal replacement, and after
2040, it declines due to the lack of cost competitiveness. While in the Below 2 °C Scenario,
to substitute more coal in an earlier stage/further decarbonize the system, in order to
increase more flexibility to adapt to higher proportion of renewable energy, natural gas
capacity grows continuously.
Considering the trends of different sources, the share of renewable capacity before 2035
increases far faster than it after 2035, and the share of coal capacity also has a faster decline
rate before 2035. The similar trends happen in power generation. In the Below 2 °C
Scenario, share of coal generation is 14% in 2035 and 5% in 2050, share of renewable
generation is 73% by 2035 and 87% in 2050. Notably, the share of wind generation is the
largest among all types of sources after 2030 in the Below 2 °C Scenario, and after 2035 in
the Stated Policy Scenario, indicating a significant potential of wind generation.
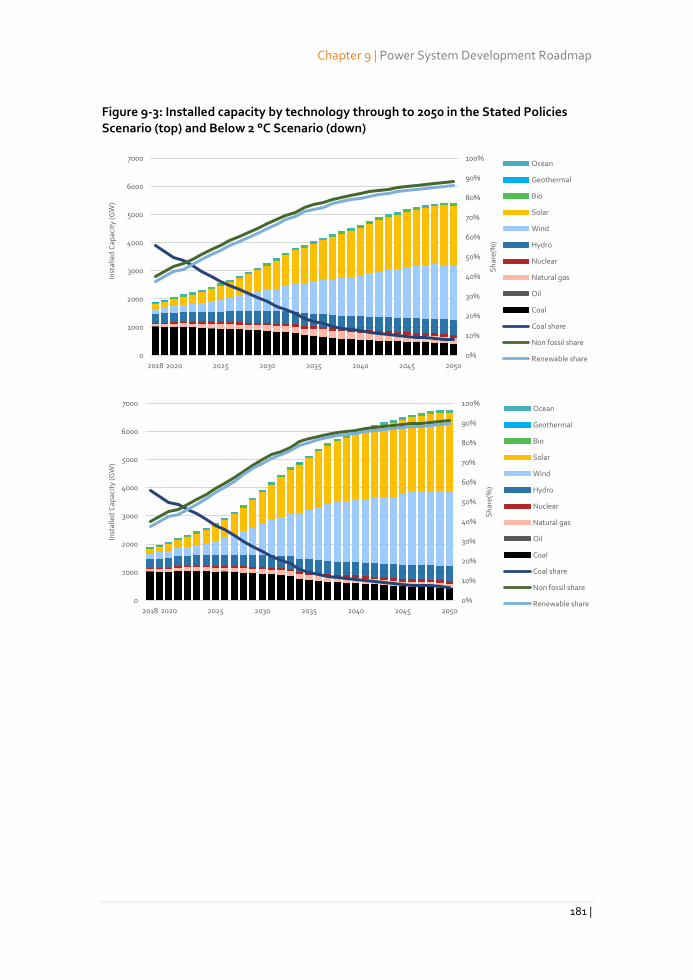
Chapter 9 | Power System Development Roadmap
181 |
Figure 9-3: Installed capacity by technology through to 2050 in the Stated Policies Scenario (top) and Below 2 °C Scenario (down)
0%
10%
20%
30%
40%
50%
60%
70%
80%
90%
100%
0
1000
2000
3000
4000
5000
6000
7000
2018 2020 2025 2030 2035 2040 2045 2050
Sh
are(
%)
Inst
alle
d C
apac
ity
(GW
)
Ocean
Geothermal
Bio
Solar
Wind
Hydro
Nuclear
Natural gas
Oil
Coal
Coal share
Non fossil share
Renewable share
0%
10%
20%
30%
40%
50%
60%
70%
80%
90%
100%
0
1000
2000
3000
4000
5000
6000
7000
2018 2020 2025 2030 2035 2040 2045 2050
Sh
are(
%)
Inst
alle
d C
apac
ity
(GW
)
Ocean
Geothermal
Bio
Solar
Wind
Hydro
Nuclear
Natural gas
Oil
Coal
Coal share
Non fossil share
Renewable share
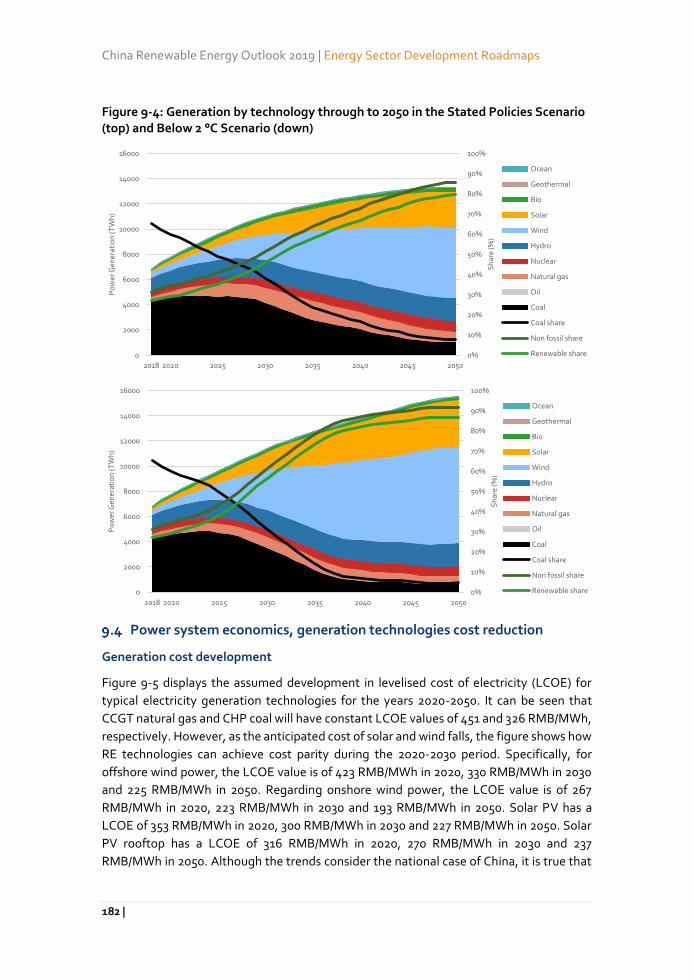
China Renewable Energy Outlook 2019 | Energy Sector Development Roadmaps
182 |
Figure 9-4: Generation by technology through to 2050 in the Stated Policies Scenario (top) and Below 2 °C Scenario (down)
Power system economics, generation technologies cost reduction
Generation cost development
Figure 9-5 displays the assumed development in levelised cost of electricity (LCOE) for
typical electricity generation technologies for the years 2020-2050. It can be seen that
CCGT natural gas and CHP coal will have constant LCOE values of 451 and 326 RMB/MWh,
respectively. However, as the anticipated cost of solar and wind falls, the figure shows how
RE technologies can achieve cost parity during the 2020-2030 period. Specifically, for
offshore wind power, the LCOE value is of 423 RMB/MWh in 2020, 330 RMB/MWh in 2030
and 225 RMB/MWh in 2050. Regarding onshore wind power, the LCOE value is of 267
RMB/MWh in 2020, 223 RMB/MWh in 2030 and 193 RMB/MWh in 2050. Solar PV has a
LCOE of 353 RMB/MWh in 2020, 300 RMB/MWh in 2030 and 227 RMB/MWh in 2050. Solar
PV rooftop has a LCOE of 316 RMB/MWh in 2020, 270 RMB/MWh in 2030 and 237
RMB/MWh in 2050. Although the trends consider the national case of China, it is true that
0%
10%
20%
30%
40%
50%
60%
70%
80%
90%
100%
0
2000
4000
6000
8000
10000
12000
14000
16000
2018 2020 2025 2030 2035 2040 2045 2050
Sh
are
(%)
Po
wer
Gen
erat
ion
(T
Wh
)
Ocean
Geothermal
Bio
Solar
Wind
Hydro
Nuclear
Natural gas
Oil
Coal
Coal share
Non fossil share
Renewable share
0%
10%
20%
30%
40%
50%
60%
70%
80%
90%
100%
0
2000
4000
6000
8000
10000
12000
14000
16000
2018 2020 2025 2030 2035 2040 2045 2050
Sh
are
(%)
Po
wer
Gen
erat
ion
(T
Wh
)
Ocean
Geothermal
Bio
Solar
Wind
Hydro
Nuclear
Natural gas
Oil
Coal
Coal share
Non fossil share
Renewable share
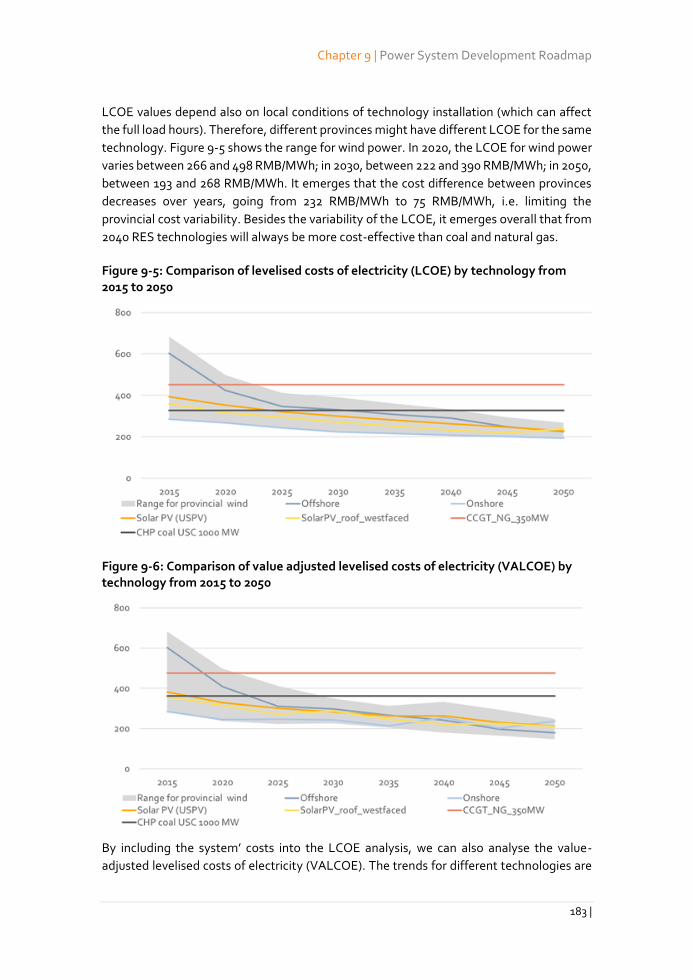
Chapter 9 | Power System Development Roadmap
183 |
LCOE values depend also on local conditions of technology installation (which can affect
the full load hours). Therefore, different provinces might have different LCOE for the same
technology. Figure 9-5 shows the range for wind power. In 2020, the LCOE for wind power
varies between 266 and 498 RMB/MWh; in 2030, between 222 and 390 RMB/MWh; in 2050,
between 193 and 268 RMB/MWh. It emerges that the cost difference between provinces
decreases over years, going from 232 RMB/MWh to 75 RMB/MWh, i.e. limiting the
provincial cost variability. Besides the variability of the LCOE, it emerges overall that from
2040 RES technologies will always be more cost-effective than coal and natural gas.
Figure 9-5: Comparison of levelised costs of electricity (LCOE) by technology from 2015 to 2050
Figure 9-6: Comparison of value adjusted levelised costs of electricity (VALCOE) by technology from 2015 to 2050
By including the system’ costs into the LCOE analysis, we can also analyse the value-
adjusted levelised costs of electricity (VALCOE). The trends for different technologies are
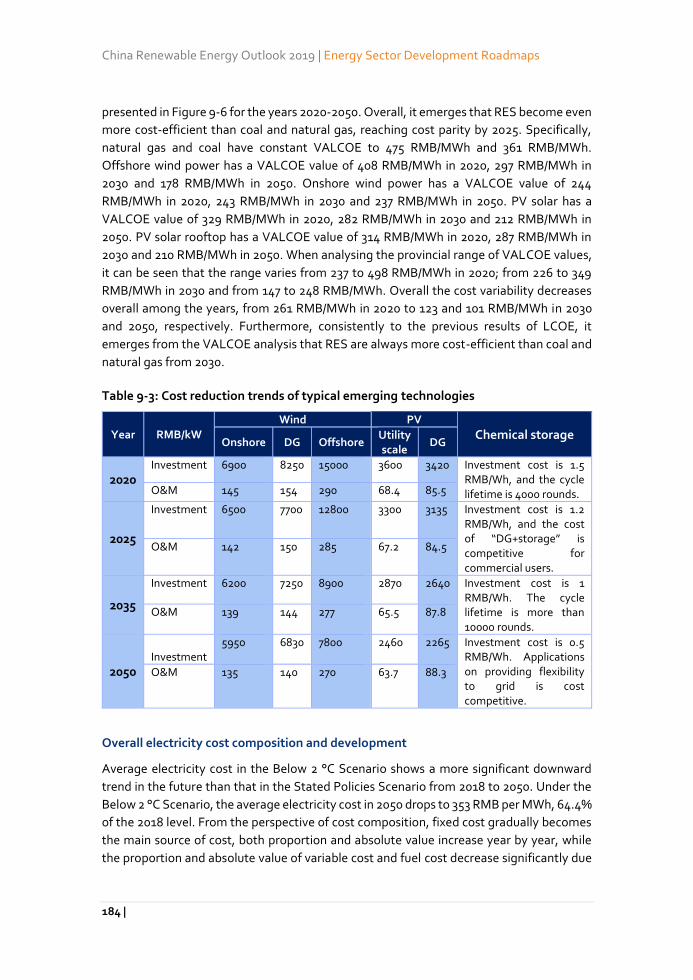
China Renewable Energy Outlook 2019 | Energy Sector Development Roadmaps
184 |
presented in Figure 9-6 for the years 2020-2050. Overall, it emerges that RES become even
more cost-efficient than coal and natural gas, reaching cost parity by 2025. Specifically,
natural gas and coal have constant VALCOE to 475 RMB/MWh and 361 RMB/MWh.
Offshore wind power has a VALCOE value of 408 RMB/MWh in 2020, 297 RMB/MWh in
2030 and 178 RMB/MWh in 2050. Onshore wind power has a VALCOE value of 244
RMB/MWh in 2020, 243 RMB/MWh in 2030 and 237 RMB/MWh in 2050. PV solar has a
VALCOE value of 329 RMB/MWh in 2020, 282 RMB/MWh in 2030 and 212 RMB/MWh in
2050. PV solar rooftop has a VALCOE value of 314 RMB/MWh in 2020, 287 RMB/MWh in
2030 and 210 RMB/MWh in 2050. When analysing the provincial range of VALCOE values,
it can be seen that the range varies from 237 to 498 RMB/MWh in 2020; from 226 to 349
RMB/MWh in 2030 and from 147 to 248 RMB/MWh. Overall the cost variability decreases
overall among the years, from 261 RMB/MWh in 2020 to 123 and 101 RMB/MWh in 2030
and 2050, respectively. Furthermore, consistently to the previous results of LCOE, it
emerges from the VALCOE analysis that RES are always more cost-efficient than coal and
natural gas from 2030.
Table 9-3: Cost reduction trends of typical emerging technologies
Year RMB/kW
Wind PV
Chemical storage Onshore DG Offshore
Utility scale
DG
2020 Investment 6900 8250 15000 3600 3420 Investment cost is 1.5
RMB/Wh, and the cycle lifetime is 4000 rounds. O&M 145 154 290 68.4 85.5
2025
Investment 6500 7700 12800 3300 3135 Investment cost is 1.2 RMB/Wh, and the cost of “DG+storage” is competitive for commercial users.
O&M 142 150 285 67.2 84.5
2035
Investment 6200 7250 8900 2870 2640 Investment cost is 1 RMB/Wh. The cycle lifetime is more than 10000 rounds.
O&M 139 144 277 65.5 87.8
2050
Investment
5950 6830 7800 2460 2265 Investment cost is 0.5 RMB/Wh. Applications on providing flexibility to grid is cost competitive.
O&M 135 140 270 63.7 88.3
Overall electricity cost composition and development
Average electricity cost in the Below 2 °C Scenario shows a more significant downward
trend in the future than that in the Stated Policies Scenario from 2018 to 2050. Under the
Below 2 °C Scenario, the average electricity cost in 2050 drops to 353 RMB per MWh, 64.4%
of the 2018 level. From the perspective of cost composition, fixed cost gradually becomes
the main source of cost, both proportion and absolute value increase year by year, while
the proportion and absolute value of variable cost and fuel cost decrease significantly due
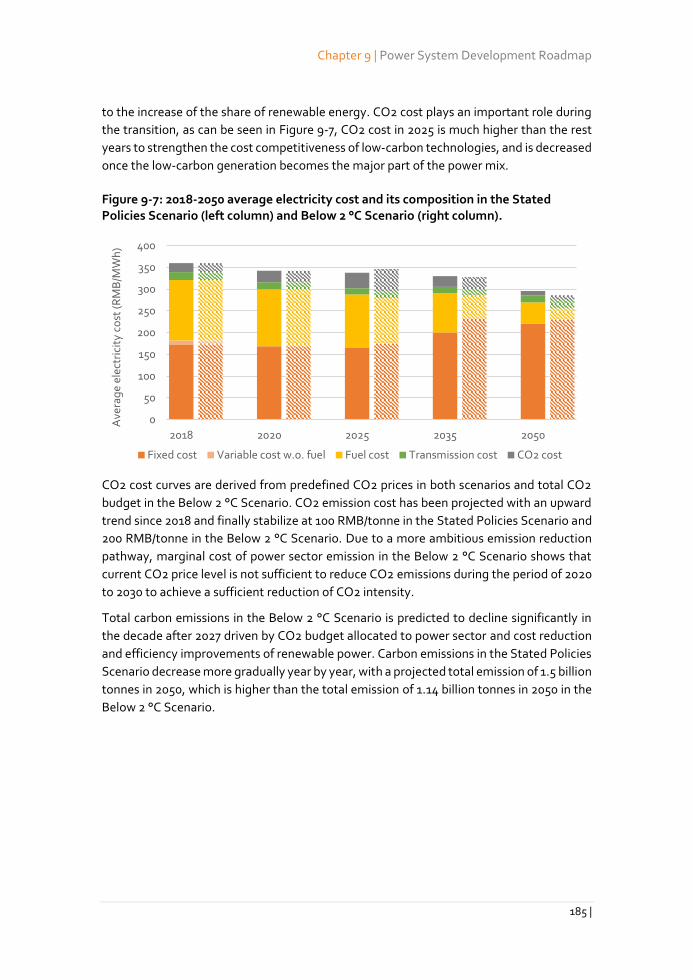
Chapter 9 | Power System Development Roadmap
185 |
to the increase of the share of renewable energy. CO2 cost plays an important role during
the transition, as can be seen in Figure 9-7, CO2 cost in 2025 is much higher than the rest
years to strengthen the cost competitiveness of low-carbon technologies, and is decreased
once the low-carbon generation becomes the major part of the power mix.
Figure 9-7: 2018-2050 average electricity cost and its composition in the Stated Policies Scenario (left column) and Below 2 °C Scenario (right column).
CO2 cost curves are derived from predefined CO2 prices in both scenarios and total CO2
budget in the Below 2 °C Scenario. CO2 emission cost has been projected with an upward
trend since 2018 and finally stabilize at 100 RMB/tonne in the Stated Policies Scenario and
200 RMB/tonne in the Below 2 °C Scenario. Due to a more ambitious emission reduction
pathway, marginal cost of power sector emission in the Below 2 °C Scenario shows that
current CO2 price level is not sufficient to reduce CO2 emissions during the period of 2020
to 2030 to achieve a sufficient reduction of CO2 intensity.
Total carbon emissions in the Below 2 °C Scenario is predicted to decline significantly in
the decade after 2027 driven by CO2 budget allocated to power sector and cost reduction
and efficiency improvements of renewable power. Carbon emissions in the Stated Policies
Scenario decrease more gradually year by year, with a projected total emission of 1.5 billion
tonnes in 2050, which is higher than the total emission of 1.14 billion tonnes in 2050 in the
Below 2 °C Scenario.
0
50
100
150
200
250
300
350
400
2018 2020 2025 2035 2050
Ave
rag
e el
ectr
icit
y co
st (
RM
B/M
Wh
)
Fixed cost Variable cost w.o. fuel Fuel cost Transmission cost CO2 cost
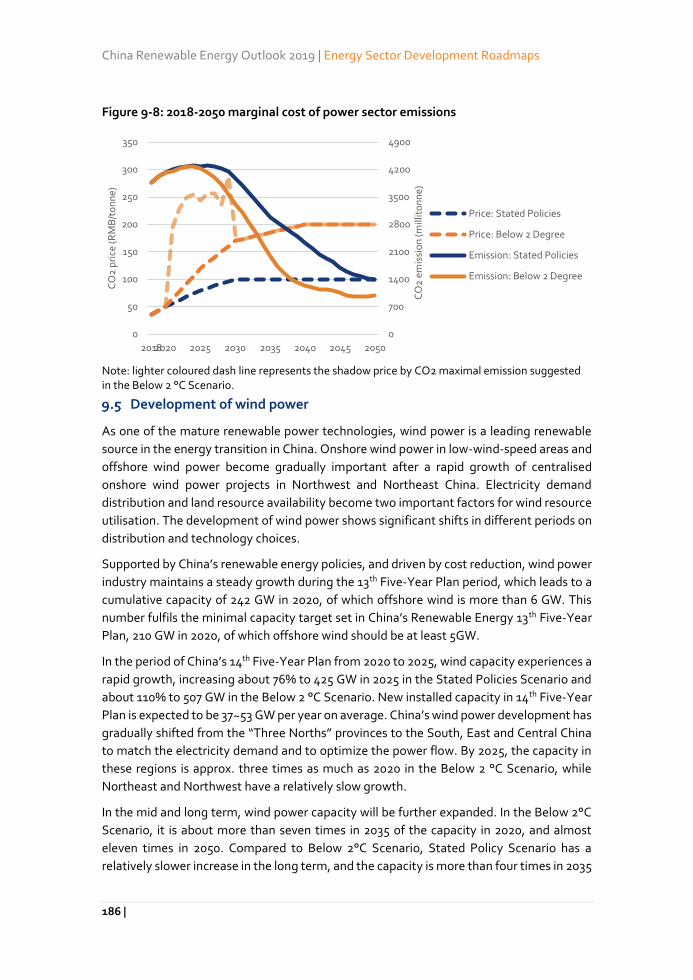
China Renewable Energy Outlook 2019 | Energy Sector Development Roadmaps
186 |
Figure 9-8: 2018-2050 marginal cost of power sector emissions
Note: lighter coloured dash line represents the shadow price by CO2 maximal emission suggested in the Below 2 °C Scenario.
Development of wind power
As one of the mature renewable power technologies, wind power is a leading renewable
source in the energy transition in China. Onshore wind power in low-wind-speed areas and
offshore wind power become gradually important after a rapid growth of centralised
onshore wind power projects in Northwest and Northeast China. Electricity demand
distribution and land resource availability become two important factors for wind resource
utilisation. The development of wind power shows significant shifts in different periods on
distribution and technology choices.
Supported by China’s renewable energy policies, and driven by cost reduction, wind power
industry maintains a steady growth during the 13th Five-Year Plan period, which leads to a
cumulative capacity of 242 GW in 2020, of which offshore wind is more than 6 GW. This
number fulfils the minimal capacity target set in China’s Renewable Energy 13th Five-Year
Plan, 210 GW in 2020, of which offshore wind should be at least 5GW.
In the period of China’s 14th Five-Year Plan from 2020 to 2025, wind capacity experiences a
rapid growth, increasing about 76% to 425 GW in 2025 in the Stated Policies Scenario and
about 110% to 507 GW in the Below 2 °C Scenario. New installed capacity in 14th Five-Year
Plan is expected to be 37~53 GW per year on average. China’s wind power development has
gradually shifted from the “Three Norths” provinces to the South, East and Central China
to match the electricity demand and to optimize the power flow. By 2025, the capacity in
these regions is approx. three times as much as 2020 in the Below 2 °C Scenario, while
Northeast and Northwest have a relatively slow growth.
In the mid and long term, wind power capacity will be further expanded. In the Below 2°C
Scenario, it is about more than seven times in 2035 of the capacity in 2020, and almost
eleven times in 2050. Compared to Below 2°C Scenario, Stated Policy Scenario has a
relatively slower increase in the long term, and the capacity is more than four times in 2035
0
700
1400
2100
2800
3500
4200
4900
0
50
100
150
200
250
300
350
20182020 2025 2030 2035 2040 2045 2050
CO
2 e
mis
sio
n (m
illit
on
ne)
CO
2 p
rice
(RM
B/t
on
ne)
Price: Stated Policies
Price: Below 2 Degree
Emission: Stated Policies
Emission: Below 2 Degree
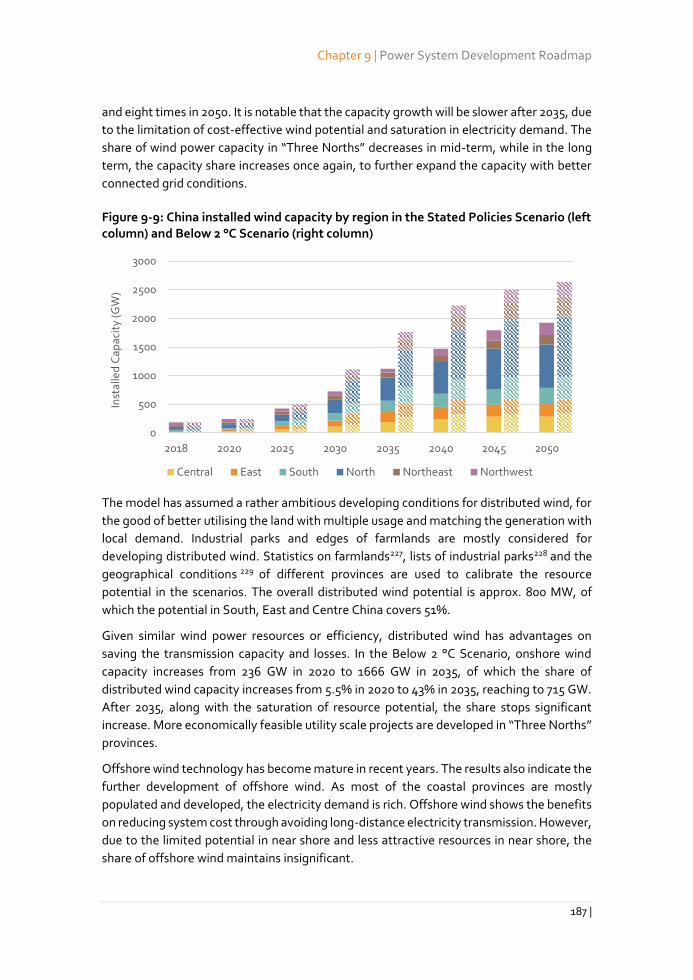
Chapter 9 | Power System Development Roadmap
187 |
and eight times in 2050. It is notable that the capacity growth will be slower after 2035, due
to the limitation of cost-effective wind potential and saturation in electricity demand. The
share of wind power capacity in “Three Norths” decreases in mid-term, while in the long
term, the capacity share increases once again, to further expand the capacity with better
connected grid conditions.
Figure 9-9: China installed wind capacity by region in the Stated Policies Scenario (left column) and Below 2 °C Scenario (right column)
The model has assumed a rather ambitious developing conditions for distributed wind, for
the good of better utilising the land with multiple usage and matching the generation with
local demand. Industrial parks and edges of farmlands are mostly considered for
developing distributed wind. Statistics on farmlands227, lists of industrial parks228 and the
geographical conditions 229 of different provinces are used to calibrate the resource
potential in the scenarios. The overall distributed wind potential is approx. 800 MW, of
which the potential in South, East and Centre China covers 51%.
Given similar wind power resources or efficiency, distributed wind has advantages on
saving the transmission capacity and losses. In the Below 2 °C Scenario, onshore wind
capacity increases from 236 GW in 2020 to 1666 GW in 2035, of which the share of
distributed wind capacity increases from 5.5% in 2020 to 43% in 2035, reaching to 715 GW.
After 2035, along with the saturation of resource potential, the share stops significant
increase. More economically feasible utility scale projects are developed in “Three Norths”
provinces.
Offshore wind technology has become mature in recent years. The results also indicate the
further development of offshore wind. As most of the coastal provinces are mostly
populated and developed, the electricity demand is rich. Offshore wind shows the benefits
on reducing system cost through avoiding long-distance electricity transmission. However,
due to the limited potential in near shore and less attractive resources in near shore, the
share of offshore wind maintains insignificant.
0
500
1000
1500
2000
2500
3000
2018 2020 2025 2030 2035 2040 2045 2050
Inst
alle
d C
apac
ity
(GW
)
Central East South North Northeast Northwest
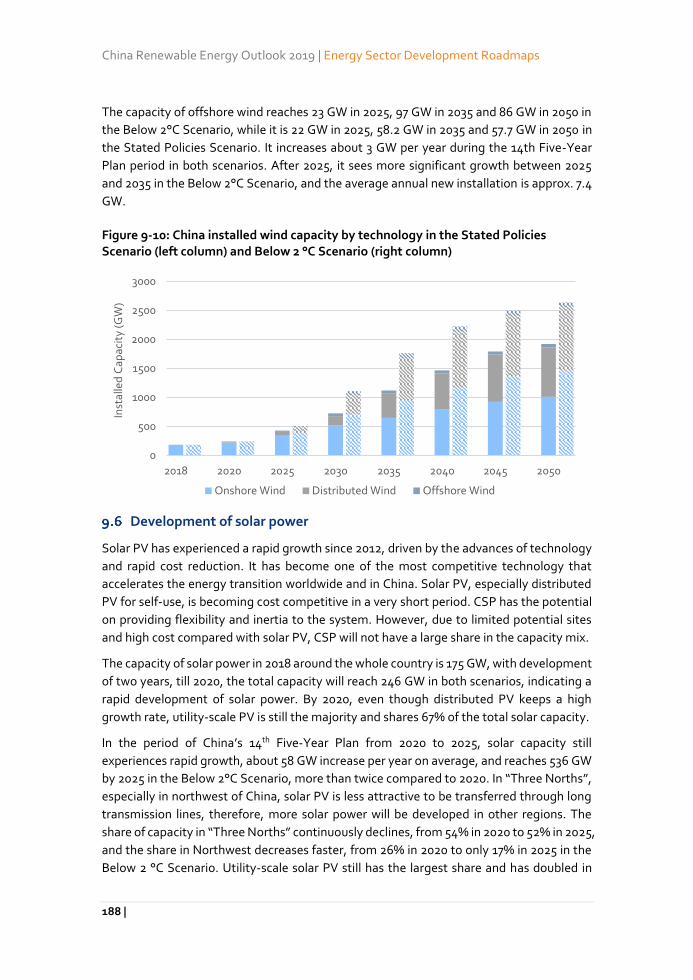
China Renewable Energy Outlook 2019 | Energy Sector Development Roadmaps
188 |
The capacity of offshore wind reaches 23 GW in 2025, 97 GW in 2035 and 86 GW in 2050 in
the Below 2°C Scenario, while it is 22 GW in 2025, 58.2 GW in 2035 and 57.7 GW in 2050 in
the Stated Policies Scenario. It increases about 3 GW per year during the 14th Five-Year
Plan period in both scenarios. After 2025, it sees more significant growth between 2025
and 2035 in the Below 2°C Scenario, and the average annual new installation is approx. 7.4
GW.
Figure 9-10: China installed wind capacity by technology in the Stated Policies Scenario (left column) and Below 2 °C Scenario (right column)
Development of solar power
Solar PV has experienced a rapid growth since 2012, driven by the advances of technology
and rapid cost reduction. It has become one of the most competitive technology that
accelerates the energy transition worldwide and in China. Solar PV, especially distributed
PV for self-use, is becoming cost competitive in a very short period. CSP has the potential
on providing flexibility and inertia to the system. However, due to limited potential sites
and high cost compared with solar PV, CSP will not have a large share in the capacity mix.
The capacity of solar power in 2018 around the whole country is 175 GW, with development
of two years, till 2020, the total capacity will reach 246 GW in both scenarios, indicating a
rapid development of solar power. By 2020, even though distributed PV keeps a high
growth rate, utility-scale PV is still the majority and shares 67% of the total solar capacity.
In the period of China’s 14th Five-Year Plan from 2020 to 2025, solar capacity still
experiences rapid growth, about 58 GW increase per year on average, and reaches 536 GW
by 2025 in the Below 2°C Scenario, more than twice compared to 2020. In “Three Norths”,
especially in northwest of China, solar PV is less attractive to be transferred through long
transmission lines, therefore, more solar power will be developed in other regions. The
share of capacity in “Three Norths” continuously declines, from 54% in 2020 to 52% in 2025,
and the share in Northwest decreases faster, from 26% in 2020 to only 17% in 2025 in the
Below 2 °C Scenario. Utility-scale solar PV still has the largest share and has doubled in
0
500
1000
1500
2000
2500
3000
2018 2020 2025 2030 2035 2040 2045 2050
Inst
alle
d C
apac
ity
(GW
)
Onshore Wind Distributed Wind Offshore Wind
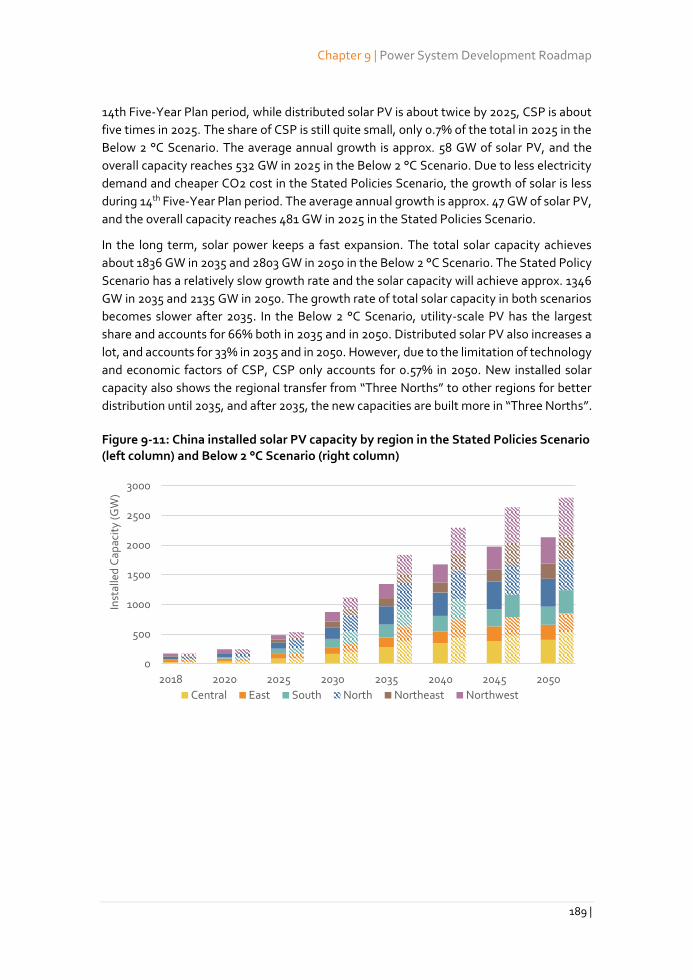
Chapter 9 | Power System Development Roadmap
189 |
14th Five-Year Plan period, while distributed solar PV is about twice by 2025, CSP is about
five times in 2025. The share of CSP is still quite small, only 0.7% of the total in 2025 in the
Below 2 °C Scenario. The average annual growth is approx. 58 GW of solar PV, and the
overall capacity reaches 532 GW in 2025 in the Below 2 °C Scenario. Due to less electricity
demand and cheaper CO2 cost in the Stated Policies Scenario, the growth of solar is less
during 14th Five-Year Plan period. The average annual growth is approx. 47 GW of solar PV,
and the overall capacity reaches 481 GW in 2025 in the Stated Policies Scenario.
In the long term, solar power keeps a fast expansion. The total solar capacity achieves
about 1836 GW in 2035 and 2803 GW in 2050 in the Below 2 °C Scenario. The Stated Policy
Scenario has a relatively slow growth rate and the solar capacity will achieve approx. 1346
GW in 2035 and 2135 GW in 2050. The growth rate of total solar capacity in both scenarios
becomes slower after 2035. In the Below 2 °C Scenario, utility-scale PV has the largest
share and accounts for 66% both in 2035 and in 2050. Distributed solar PV also increases a
lot, and accounts for 33% in 2035 and in 2050. However, due to the limitation of technology
and economic factors of CSP, CSP only accounts for 0.57% in 2050. New installed solar
capacity also shows the regional transfer from “Three Norths” to other regions f0r better
distribution until 2035, and after 2035, the new capacities are built more in “Three Norths”.
Figure 9-11: China installed solar PV capacity by region in the Stated Policies Scenario (left column) and Below 2 °C Scenario (right column)
0
500
1000
1500
2000
2500
3000
2018 2020 2025 2030 2035 2040 2045 2050
Inst
alle
d C
apac
ity
(GW
)
Central East South North Northeast Northwest
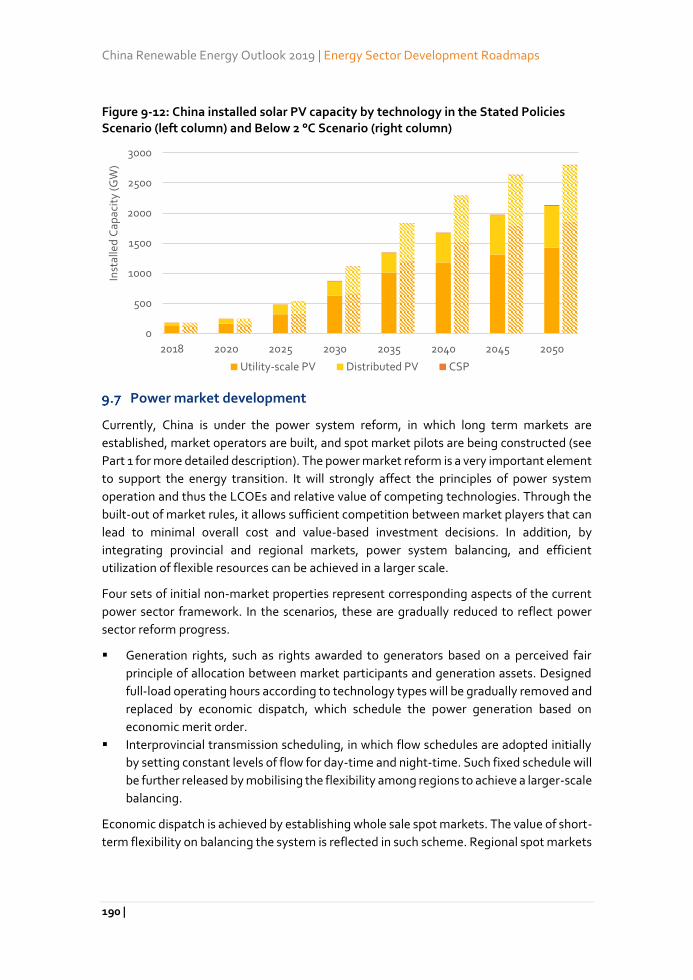
China Renewable Energy Outlook 2019 | Energy Sector Development Roadmaps
190 |
Figure 9-12: China installed solar PV capacity by technology in the Stated Policies Scenario (left column) and Below 2 °C Scenario (right column)
Power market development
Currently, China is under the power system reform, in which long term markets are
established, market operators are built, and spot market pilots are being constructed (see
Part 1 for more detailed description). The power market reform is a very important element
to support the energy transition. It will strongly affect the principles of power system
operation and thus the LCOEs and relative value of competing technologies. Through the
built-out of market rules, it allows sufficient competition between market players that can
lead to minimal overall cost and value-based investment decisions. In addition, by
integrating provincial and regional markets, power system balancing, and efficient
utilization of flexible resources can be achieved in a larger scale.
Four sets of initial non-market properties represent corresponding aspects of the current
power sector framework. In the scenarios, these are gradually reduced to reflect power
sector reform progress.
Generation rights, such as rights awarded to generators based on a perceived fair
principle of allocation between market participants and generation assets. Designed
full-load operating hours according to technology types will be gradually removed and
replaced by economic dispatch, which schedule the power generation based on
economic merit order.
Interprovincial transmission scheduling, in which flow schedules are adopted initially
by setting constant levels of flow for day-time and night-time. Such fixed schedule will
be further released by mobilising the flexibility among regions to achieve a larger-scale
balancing.
Economic dispatch is achieved by establishing whole sale spot markets. The value of short-
term flexibility on balancing the system is reflected in such scheme. Regional spot markets
0
500
1000
1500
2000
2500
3000
2018 2020 2025 2030 2035 2040 2045 2050
Inst
alle
d C
apac
ity
(GW
)
Utility-scale PV Distributed PV CSP
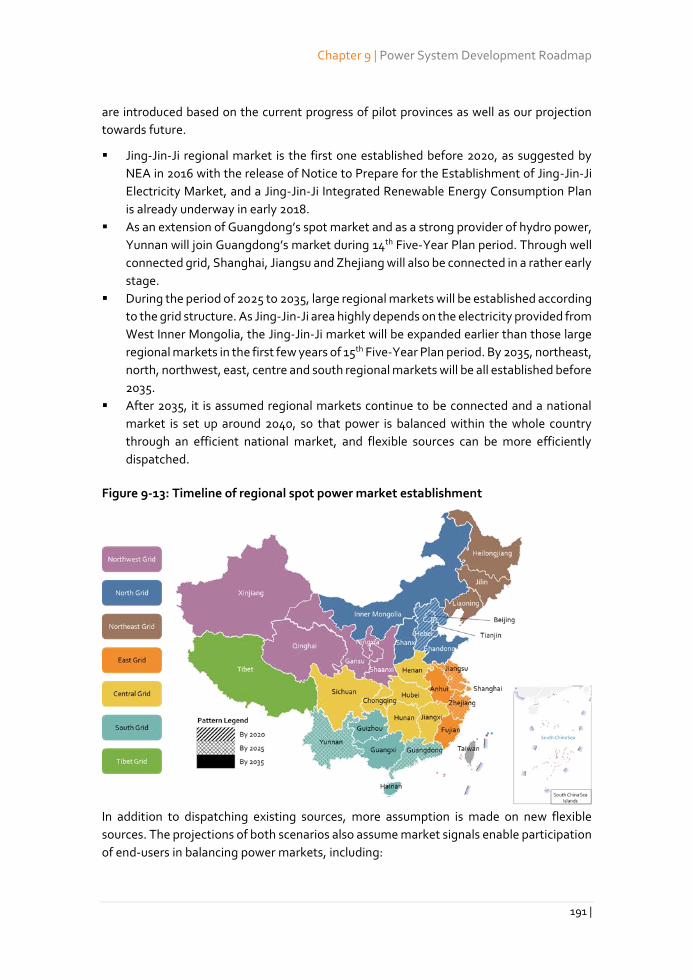
Chapter 9 | Power System Development Roadmap
191 |
are introduced based on the current progress of pilot provinces as well as our projection
towards future.
Jing-Jin-Ji regional market is the first one established before 2020, as suggested by
NEA in 2016 with the release of Notice to Prepare for the Establishment of Jing-Jin-Ji
Electricity Market, and a Jing-Jin-Ji Integrated Renewable Energy Consumption Plan
is already underway in early 2018.
As an extension of Guangdong’s spot market and as a strong provider of hydro power,
Yunnan will join Guangdong’s market during 14th Five-Year Plan period. Through well
connected grid, Shanghai, Jiangsu and Zhejiang will also be connected in a rather early
stage.
During the period of 2025 to 2035, large regional markets will be established according
to the grid structure. As Jing-Jin-Ji area highly depends on the electricity provided from
West Inner Mongolia, the Jing-Jin-Ji market will be expanded earlier than those large
regional markets in the first few years of 15th Five-Year Plan period. By 2035, northeast,
north, northwest, east, centre and south regional markets will be all established before
2035.
After 2035, it is assumed regional markets continue to be connected and a national
market is set up around 2040, so that power is balanced within the whole country
through an efficient national market, and flexible sources can be more efficiently
dispatched.
Figure 9-13: Timeline of regional spot power market establishment
In addition to dispatching existing sources, more assumption is made on new flexible
sources. The projections of both scenarios also assume market signals enable participation
of end-users in balancing power markets, including:
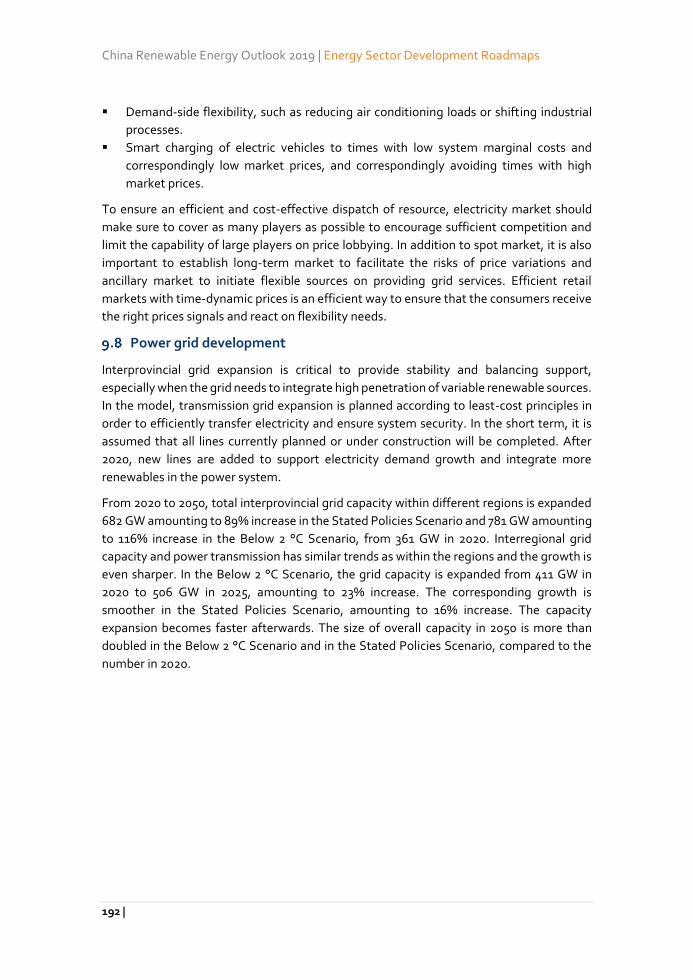
China Renewable Energy Outlook 2019 | Energy Sector Development Roadmaps
192 |
Demand-side flexibility, such as reducing air conditioning loads or shifting industrial
processes.
Smart charging of electric vehicles to times with low system marginal costs and
correspondingly low market prices, and correspondingly avoiding times with high
market prices.
To ensure an efficient and cost-effective dispatch of resource, electricity market should
make sure to cover as many players as possible to encourage sufficient competition and
limit the capability of large players on price lobbying. In addition to spot market, it is also
important to establish long-term market to facilitate the risks of price variations and
ancillary market to initiate flexible sources on providing grid services. Efficient retail
markets with time-dynamic prices is an efficient way to ensure that the consumers receive
the right prices signals and react on flexibility needs.
Power grid development
Interprovincial grid expansion is critical to provide stability and balancing support,
especially when the grid needs to integrate high penetration of variable renewable sources.
In the model, transmission grid expansion is planned according to least-cost principles in
order to efficiently transfer electricity and ensure system security. In the short term, it is
assumed that all lines currently planned or under construction will be completed. After
2020, new lines are added to support electricity demand growth and integrate more
renewables in the power system.
From 2020 to 2050, total interprovincial grid capacity within different regions is expanded
682 GW amounting to 89% increase in the Stated Policies Scenario and 781 GW amounting
to 116% increase in the Below 2 °C Scenario, from 361 GW in 2020. Interregional grid
capacity and power transmission has similar trends as within the regions and the growth is
even sharper. In the Below 2 °C Scenario, the grid capacity is expanded from 411 GW in
2020 to 506 GW in 2025, amounting to 23% increase. The corresponding growth is
smoother in the Stated Policies Scenario, amounting to 16% increase. The capacity
expansion becomes faster afterwards. The size of overall capacity in 2050 is more than
doubled in the Below 2 °C Scenario and in the Stated Policies Scenario, compared to the
number in 2020.
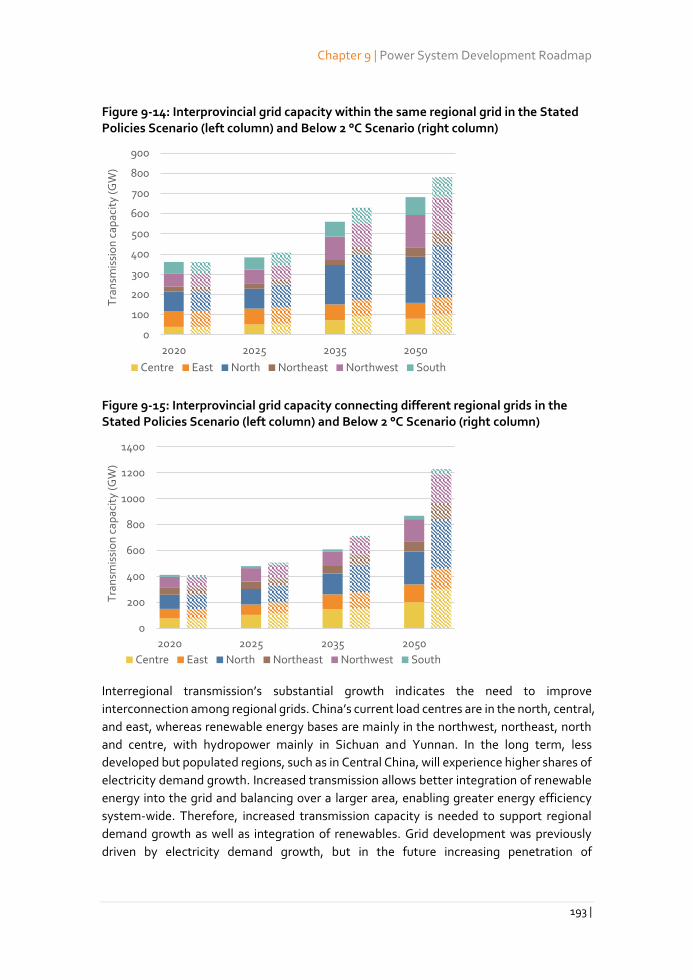
Chapter 9 | Power System Development Roadmap
193 |
Figure 9-14: Interprovincial grid capacity within the same regional grid in the Stated Policies Scenario (left column) and Below 2 °C Scenario (right column)
Figure 9-15: Interprovincial grid capacity connecting different regional grids in the Stated Policies Scenario (left column) and Below 2 °C Scenario (right column)
Interregional transmission’s substantial growth indicates the need to improve
interconnection among regional grids. China’s current load centres are in the north, central,
and east, whereas renewable energy bases are mainly in the northwest, northeast, north
and centre, with hydropower mainly in Sichuan and Yunnan. In the long term, less
developed but populated regions, such as in Central China, will experience higher shares of
electricity demand growth. Increased transmission allows better integration of renewable
energy into the grid and balancing over a larger area, enabling greater energy efficiency
system-wide. Therefore, increased transmission capacity is needed to support regional
demand growth as well as integration of renewables. Grid development was previously
driven by electricity demand growth, but in the future increasing penetration of
0
100
200
300
400
500
600
700
800
900
2020 2025 2035 2050
Tra
nsm
issi
on
cap
acit
y (G
W)
Centre East North Northeast Northwest South
0
200
400
600
800
1000
1200
1400
2020 2025 2035 2050
Tra
nsm
issi
on
cap
acit
y (G
W)
Centre East North Northeast Northwest South
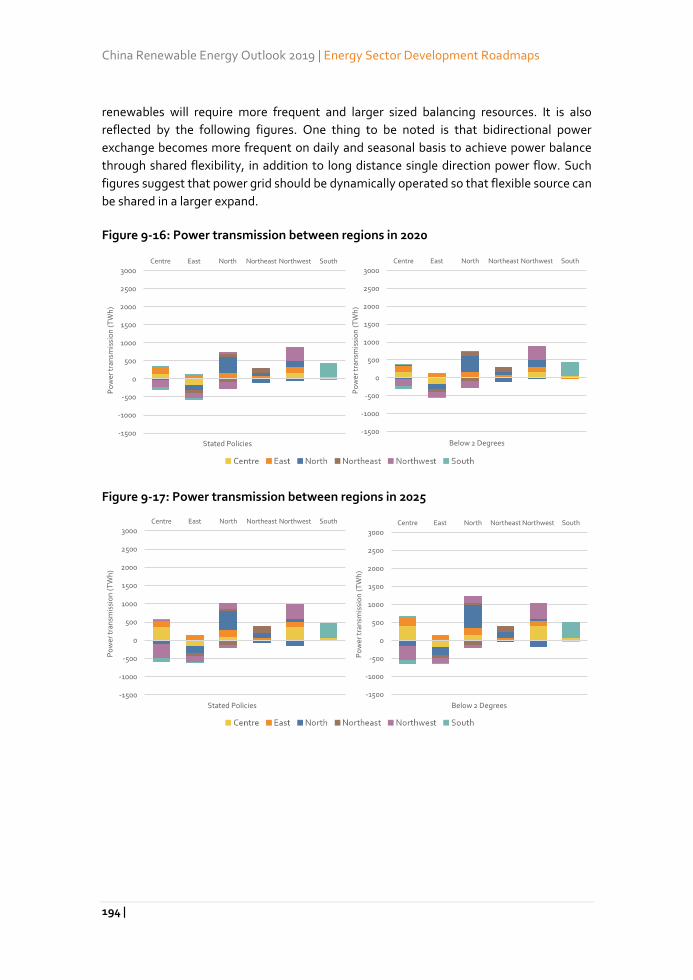
China Renewable Energy Outlook 2019 | Energy Sector Development Roadmaps
194 |
renewables will require more frequent and larger sized balancing resources. It is also
reflected by the following figures. One thing to be noted is that bidirectional power
exchange becomes more frequent on daily and seasonal basis to achieve power balance
through shared flexibility, in addition to long distance single direction power flow. Such
figures suggest that power grid should be dynamically operated so that flexible source can
be shared in a larger expand.
Figure 9-16: Power transmission between regions in 2020
Figure 9-17: Power transmission between regions in 2025
-1500
-1000
-500
0
500
1000
1500
2000
2500
3000Centre East North Northeast Northwest South
Po
wer
tran
smis
sio
n (
TW
h)
Stated Policies
-1500
-1000
-500
0
500
1000
1500
2000
2500
3000Centre East North Northeast Northwest South
Po
wer
tra
nsm
issi
on
(T
Wh
)
Below 2 Degrees
-1500
-1000
-500
0
500
1000
1500
2000
2500
3000Centre East North Northeast Northwest South
Po
wer
tra
nsm
issi
on
(T
Wh
)
Stated Policies
-1500
-1000
-500
0
500
1000
1500
2000
2500
3000Centre East North Northeast Northwest South
Po
wer
tra
nsm
issi
on
(T
Wh
)
Below 2 Degrees
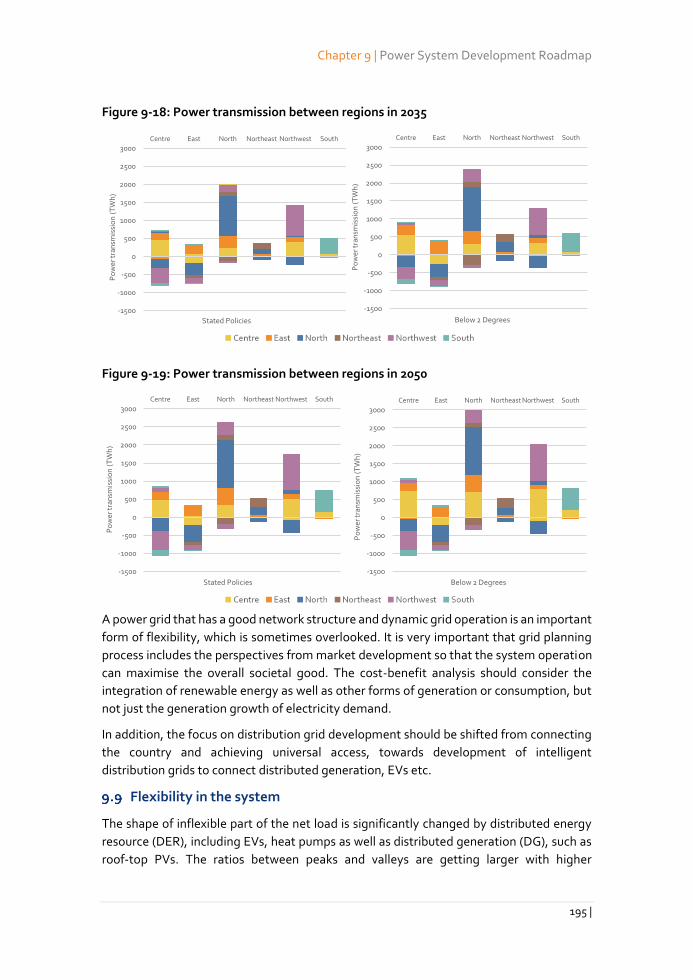
Chapter 9 | Power System Development Roadmap
195 |
Figure 9-18: Power transmission between regions in 2035
Figure 9-19: Power transmission between regions in 2050
A power grid that has a good network structure and dynamic grid operation is an important
form of flexibility, which is sometimes overlooked. It is very important that grid planning
process includes the perspectives from market development so that the system operation
can maximise the overall societal good. The cost-benefit analysis should consider the
integration of renewable energy as well as other forms of generation or consumption, but
not just the generation growth of electricity demand.
In addition, the focus on distribution grid development should be shifted from connecting
the country and achieving universal access, towards development of intelligent
distribution grids to connect distributed generation, EVs etc.
Flexibility in the system
The shape of inflexible part of the net load is significantly changed by distributed energy
resource (DER), including EVs, heat pumps as well as distributed generation (DG), such as
roof-top PVs. The ratios between peaks and valleys are getting larger with higher
-1500
-1000
-500
0
500
1000
1500
2000
2500
3000Centre East North Northeast Northwest South
Po
wer
tran
smis
sio
n (
TW
h)
Stated Policies
-1500
-1000
-500
0
500
1000
1500
2000
2500
3000Centre East North Northeast Northwest South
Po
wer
tran
smis
sio
n (
TW
h)
Below 2 Degrees
-1500
-1000
-500
0
500
1000
1500
2000
2500
3000Centre East North Northeast Northwest South
Po
wer
tra
nsm
issi
on
(T
Wh
)
Stated Policies
-1500
-1000
-500
0
500
1000
1500
2000
2500
3000Centre East North Northeast Northwest South
Po
wer
tran
smis
sio
n (
TW
h)
Below 2 Degrees
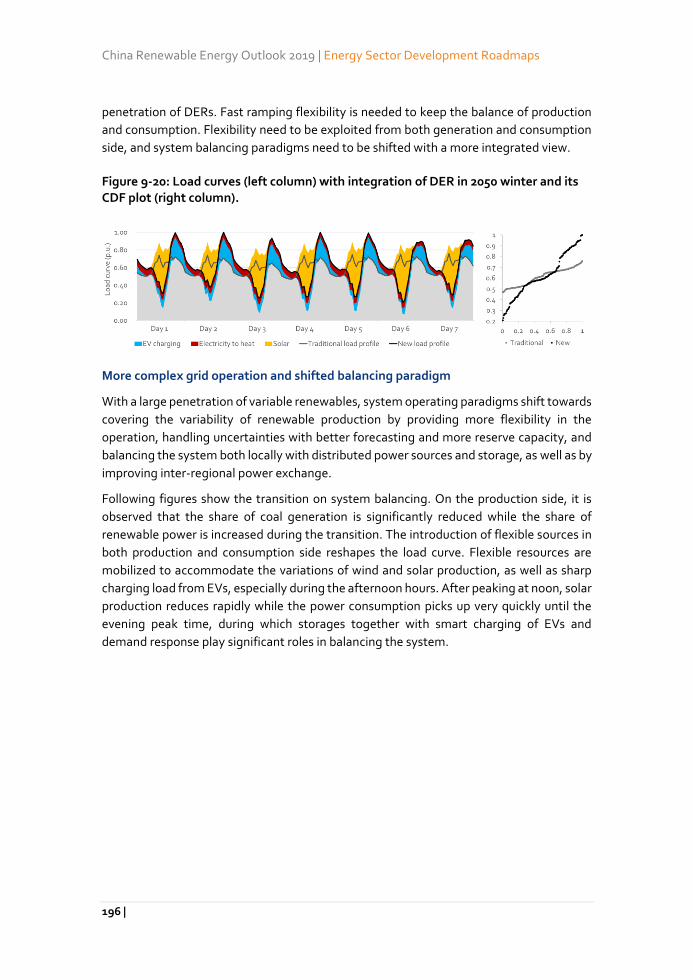
China Renewable Energy Outlook 2019 | Energy Sector Development Roadmaps
196 |
penetration of DERs. Fast ramping flexibility is needed to keep the balance of production
and consumption. Flexibility need to be exploited from both generation and consumption
side, and system balancing paradigms need to be shifted with a more integrated view.
Figure 9-20: Load curves (left column) with integration of DER in 2050 winter and its CDF plot (right column).
More complex grid operation and shifted balancing paradigm
With a large penetration of variable renewables, system operating paradigms shift towards
covering the variability of renewable production by providing more flexibility in the
operation, handling uncertainties with better forecasting and more reserve capacity, and
balancing the system both locally with distributed power sources and storage, as well as by
improving inter-regional power exchange.
Following figures show the transition on system balancing. On the production side, it is
observed that the share of coal generation is significantly reduced while the share of
renewable power is increased during the transition. The introduction of flexible sources in
both production and consumption side reshapes the load curve. Flexible resources are
mobilized to accommodate the variations of wind and solar production, as well as sharp
charging load from EVs, especially during the afternoon hours. After peaking at noon, solar
production reduces rapidly while the power consumption picks up very quickly until the
evening peak time, during which storages together with smart charging of EVs and
demand response play significant roles in balancing the system.
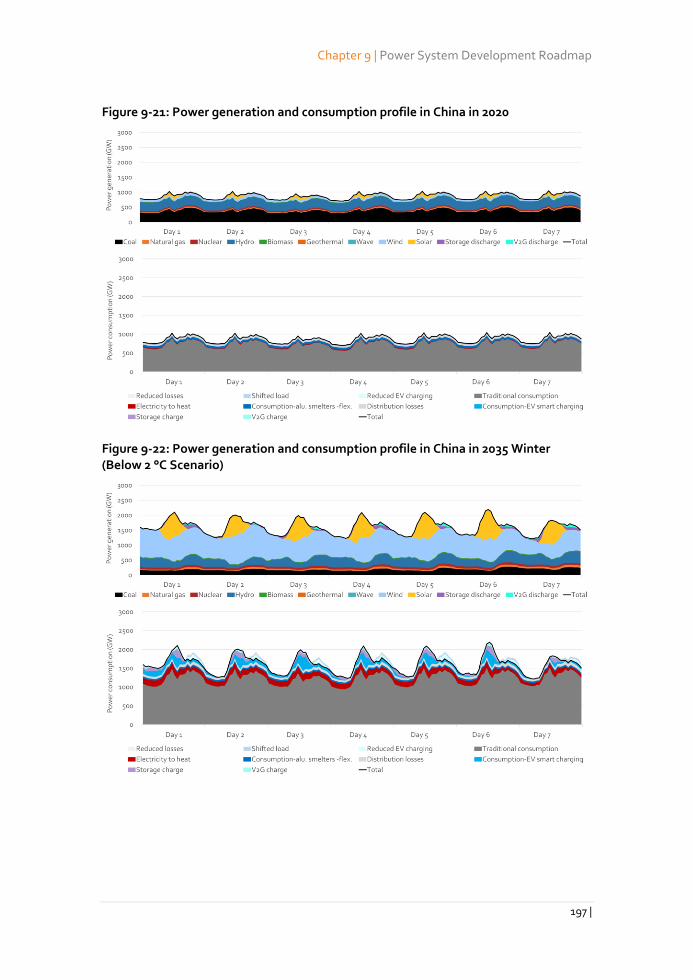
Chapter 9 | Power System Development Roadmap
197 |
Figure 9-21: Power generation and consumption profile in China in 2020
Figure 9-22: Power generation and consumption profile in China in 2035 Winter (Below 2 °C Scenario)
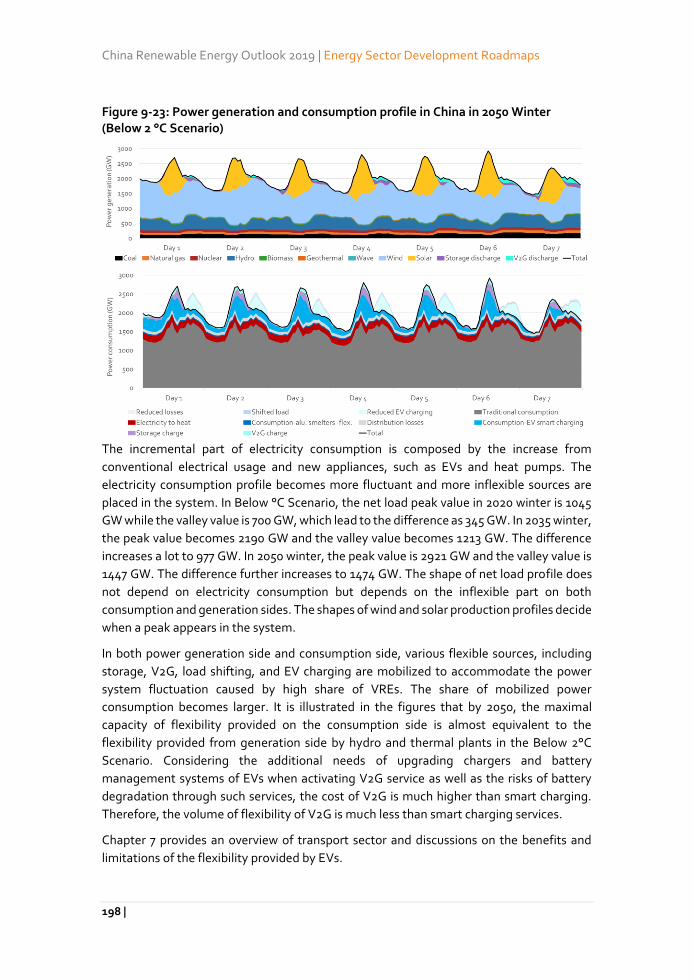
China Renewable Energy Outlook 2019 | Energy Sector Development Roadmaps
198 |
Figure 9-23: Power generation and consumption profile in China in 2050 Winter (Below 2 °C Scenario)
The incremental part of electricity consumption is composed by the increase from
conventional electrical usage and new appliances, such as EVs and heat pumps. The
electricity consumption profile becomes more fluctuant and more inflexible sources are
placed in the system. In Below °C Scenario, the net load peak value in 2020 winter is 1045
GW while the valley value is 700 GW, which lead to the difference as 345 GW. In 2035 winter,
the peak value becomes 2190 GW and the valley value becomes 1213 GW. The difference
increases a lot to 977 GW. In 2050 winter, the peak value is 2921 GW and the valley value is
1447 GW. The difference further increases to 1474 GW. The shape of net load profile does
not depend on electricity consumption but depends on the inflexible part on both
consumption and generation sides. The shapes of wind and solar production profiles decide
when a peak appears in the system.
In both power generation side and consumption side, various flexible sources, including
storage, V2G, load shifting, and EV charging are mobilized to accommodate the power
system fluctuation caused by high share of VREs. The share of mobilized power
consumption becomes larger. It is illustrated in the figures that by 2050, the maximal
capacity of flexibility provided on the consumption side is almost equivalent to the
flexibility provided from generation side by hydro and thermal plants in the Below 2°C
Scenario. Considering the additional needs of upgrading chargers and battery
management systems of EVs when activating V2G service as well as the risks of battery
degradation through such services, the cost of V2G is much higher than smart charging.
Therefore, the volume of flexibility of V2G is much less than smart charging services.
Chapter 7 provides an overview of transport sector and discussions on the benefits and
limitations of the flexibility provided by EVs.
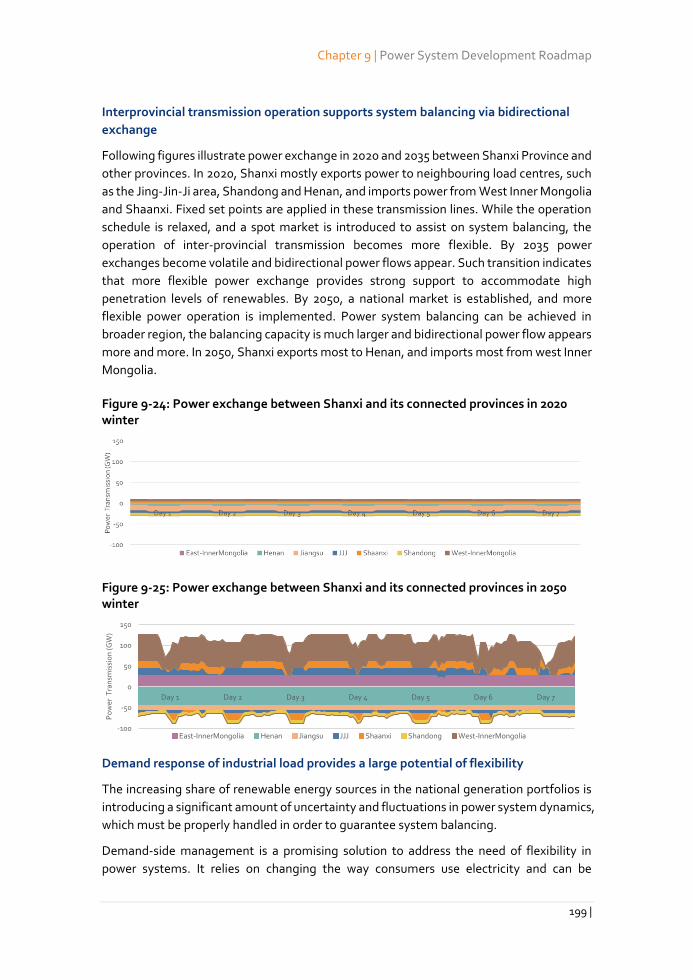
Chapter 9 | Power System Development Roadmap
199 |
Interprovincial transmission operation supports system balancing via bidirectional
exchange
Following figures illustrate power exchange in 2020 and 2035 between Shanxi Province and
other provinces. In 2020, Shanxi mostly exports power to neighbouring load centres, such
as the Jing-Jin-Ji area, Shandong and Henan, and imports power from West Inner Mongolia
and Shaanxi. Fixed set points are applied in these transmission lines. While the operation
schedule is relaxed, and a spot market is introduced to assist on system balancing, the
operation of inter-provincial transmission becomes more flexible. By 2035 power
exchanges become volatile and bidirectional power flows appear. Such transition indicates
that more flexible power exchange provides strong support to accommodate high
penetration levels of renewables. By 2050, a national market is established, and more
flexible power operation is implemented. Power system balancing can be achieved in
broader region, the balancing capacity is much larger and bidirectional power flow appears
more and more. In 2050, Shanxi exports most to Henan, and imports most from west Inner
Mongolia.
Figure 9-24: Power exchange between Shanxi and its connected provinces in 2020 winter
Figure 9-25: Power exchange between Shanxi and its connected provinces in 2050 winter
Demand response of industrial load provides a large potential of flexibility
The increasing share of renewable energy sources in the national generation portfolios is
introducing a significant amount of uncertainty and fluctuations in power system dynamics,
which must be properly handled in order to guarantee system balancing.
Demand-side management is a promising solution to address the need of flexibility in
power systems. It relies on changing the way consumers use electricity and can be
-100
-50
0
50
100
150
Day 1 Day 2 Day 3 Day 4 Day 5 Day 6 Day 7
Po
wer
Tra
nsm
issi
on
(G
W)
East-InnerMongolia Henan Jiangsu JJJ Shaanxi Shandong West-InnerMongolia
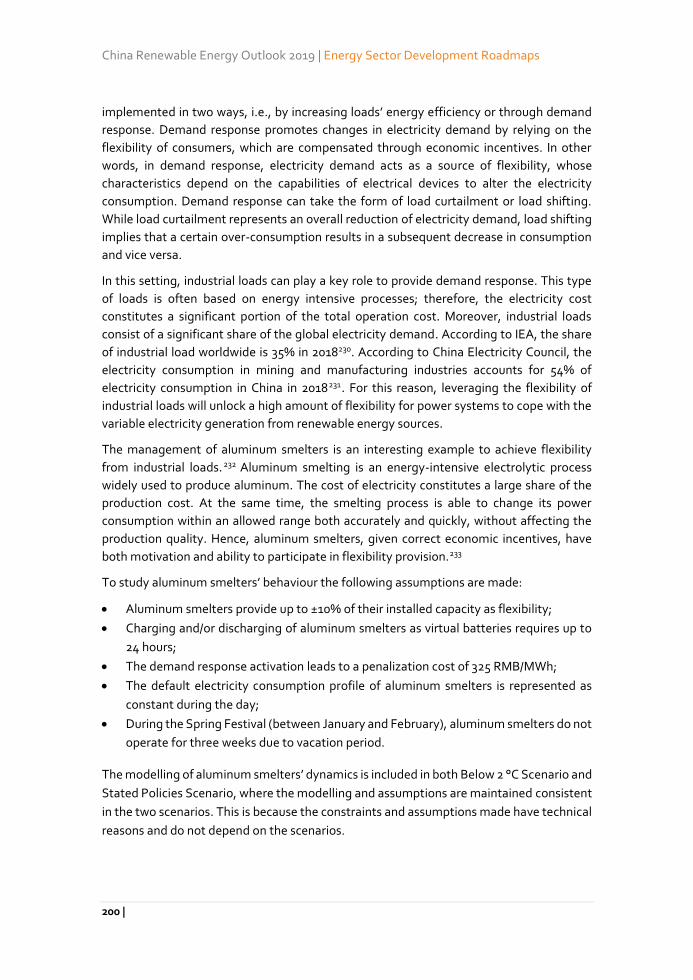
China Renewable Energy Outlook 2019 | Energy Sector Development Roadmaps
200 |
implemented in two ways, i.e., by increasing loads’ energy efficiency or through demand
response. Demand response promotes changes in electricity demand by relying on the
flexibility of consumers, which are compensated through economic incentives. In other
words, in demand response, electricity demand acts as a source of flexibility, whose
characteristics depend on the capabilities of electrical devices to alter the electricity
consumption. Demand response can take the form of load curtailment or load shifting.
While load curtailment represents an overall reduction of electricity demand, load shifting
implies that a certain over-consumption results in a subsequent decrease in consumption
and vice versa.
In this setting, industrial loads can play a key role to provide demand response. This type
of loads is often based on energy intensive processes; therefore, the electricity cost
constitutes a significant portion of the total operation cost. Moreover, industrial loads
consist of a significant share of the global electricity demand. According to IEA, the share
of industrial load worldwide is 35% in 2018230. According to China Electricity Council, the
electricity consumption in mining and manufacturing industries accounts for 54% of
electricity consumption in China in 2018231. For this reason, leveraging the flexibility of
industrial loads will unlock a high amount of flexibility for power systems to cope with the
variable electricity generation from renewable energy sources.
The management of aluminum smelters is an interesting example to achieve flexibility
from industrial loads. 232 Aluminum smelting is an energy-intensive electrolytic process
widely used to produce aluminum. The cost of electricity constitutes a large share of the
production cost. At the same time, the smelting process is able to change its power
consumption within an allowed range both accurately and quickly, without affecting the
production quality. Hence, aluminum smelters, given correct economic incentives, have
both motivation and ability to participate in flexibility provision.233
To study aluminum smelters’ behaviour the following assumptions are made:
Aluminum smelters provide up to ±10% of their installed capacity as flexibility;
Charging and/or discharging of aluminum smelters as virtual batteries requires up to
24 hours;
The demand response activation leads to a penalization cost of 325 RMB/MWh;
The default electricity consumption profile of aluminum smelters is represented as
constant during the day;
During the Spring Festival (between January and February), aluminum smelters do not
operate for three weeks due to vacation period.
The modelling of aluminum smelters’ dynamics is included in both Below 2 °C Scenario and
Stated Policies Scenario, where the modelling and assumptions are maintained consistent
in the two scenarios. This is because the constraints and assumptions made have technical
reasons and do not depend on the scenarios.
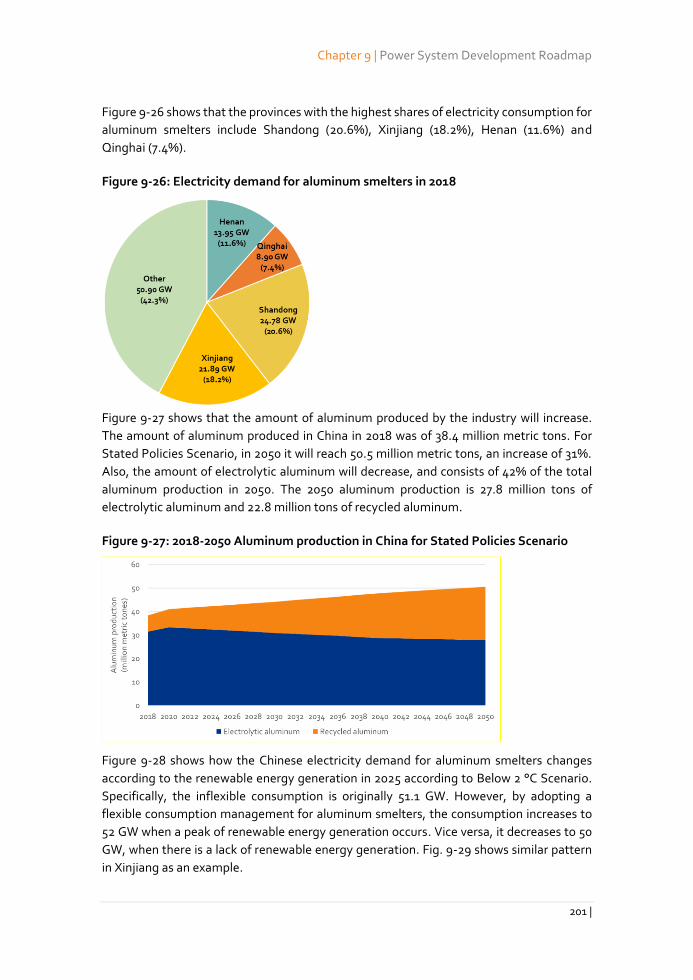
Chapter 9 | Power System Development Roadmap
201 |
Figure 9-26 shows that the provinces with the highest shares of electricity consumption for
aluminum smelters include Shandong (20.6%), Xinjiang (18.2%), Henan (11.6%) and
Qinghai (7.4%).
Figure 9-26: Electricity demand for aluminum smelters in 2018
Figure 9-27 shows that the amount of aluminum produced by the industry will increase.
The amount of aluminum produced in China in 2018 was of 38.4 million metric tons. For
Stated Policies Scenario, in 2050 it will reach 50.5 million metric tons, an increase of 31%.
Also, the amount of electrolytic aluminum will decrease, and consists of 42% of the total
aluminum production in 2050. The 2050 aluminum production is 27.8 million tons of
electrolytic aluminum and 22.8 million tons of recycled aluminum.
Figure 9-27: 2018-2050 Aluminum production in China for Stated Policies Scenario
Figure 9-28 shows how the Chinese electricity demand for aluminum smelters changes
according to the renewable energy generation in 2025 according to Below 2 °C Scenario.
Specifically, the inflexible consumption is originally 51.1 GW. However, by adopting a
flexible consumption management for aluminum smelters, the consumption increases to
52 GW when a peak of renewable energy generation occurs. Vice versa, it decreases to 50
GW, when there is a lack of renewable energy generation. Fig. 9-29 shows similar pattern
in Xinjiang as an example.
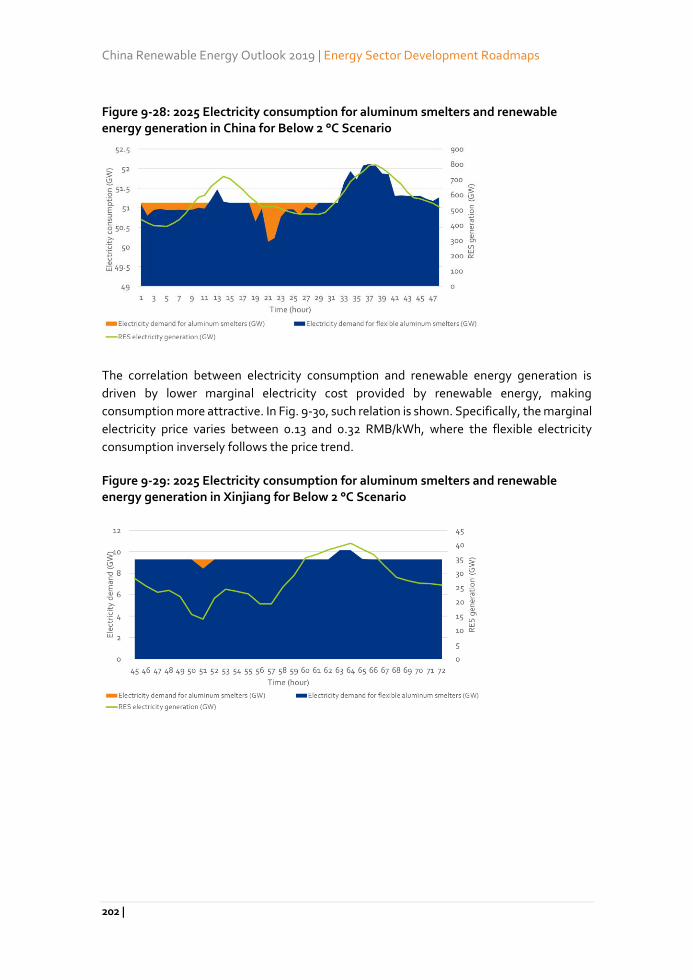
China Renewable Energy Outlook 2019 | Energy Sector Development Roadmaps
202 |
Figure 9-28: 2025 Electricity consumption for aluminum smelters and renewable energy generation in China for Below 2 °C Scenario
The correlation between electricity consumption and renewable energy generation is
driven by lower marginal electricity cost provided by renewable energy, making
consumption more attractive. In Fig. 9-30, such relation is shown. Specifically, the marginal
electricity price varies between 0.13 and 0.32 RMB/kWh, where the flexible electricity
consumption inversely follows the price trend.
Figure 9-29: 2025 Electricity consumption for aluminum smelters and renewable energy generation in Xinjiang for Below 2 °C Scenario
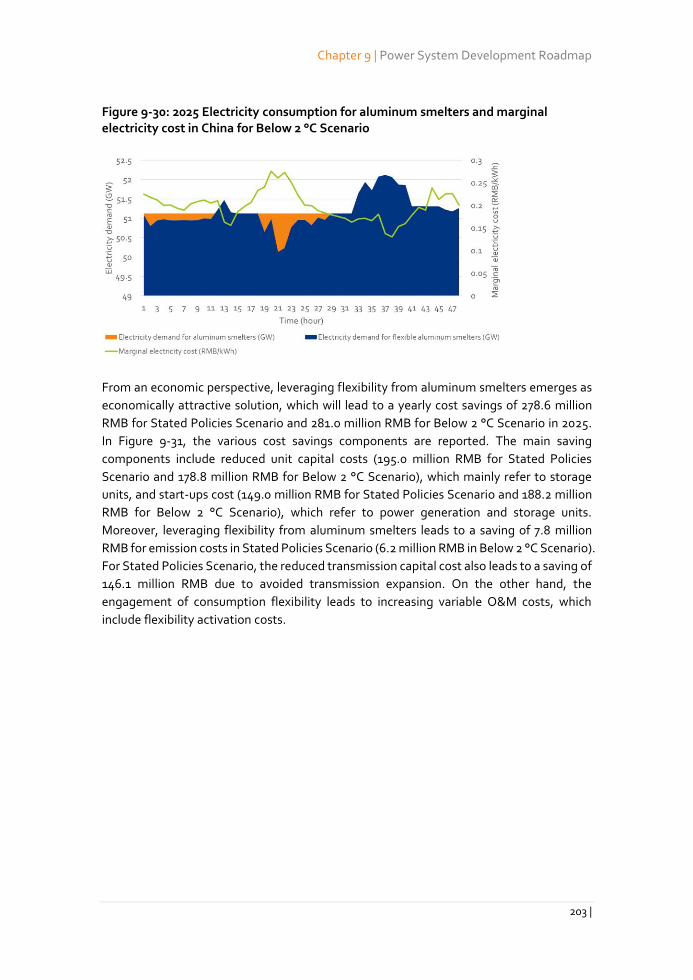
Chapter 9 | Power System Development Roadmap
203 |
Figure 9-30: 2025 Electricity consumption for aluminum smelters and marginal electricity cost in China for Below 2 °C Scenario
From an economic perspective, leveraging flexibility from aluminum smelters emerges as
economically attractive solution, which will lead to a yearly cost savings of 278.6 million
RMB for Stated Policies Scenario and 281.0 million RMB for Below 2 °C Scenario in 2025.
In Figure 9-31, the various cost savings components are reported. The main saving
components include reduced unit capital costs (195.0 million RMB for Stated Policies
Scenario and 178.8 million RMB for Below 2 °C Scenario), which mainly refer to storage
units, and start-ups cost (149.0 million RMB for Stated Policies Scenario and 188.2 million
RMB for Below 2 °C Scenario), which refer to power generation and storage units.
Moreover, leveraging flexibility from aluminum smelters leads to a saving of 7.8 million
RMB for emission costs in Stated Policies Scenario (6.2 million RMB in Below 2 °C Scenario).
For Stated Policies Scenario, the reduced transmission capital cost also leads to a saving of
146.1 million RMB due to avoided transmission expansion. On the other hand, the
engagement of consumption flexibility leads to increasing variable O&M costs, which
include flexibility activation costs.
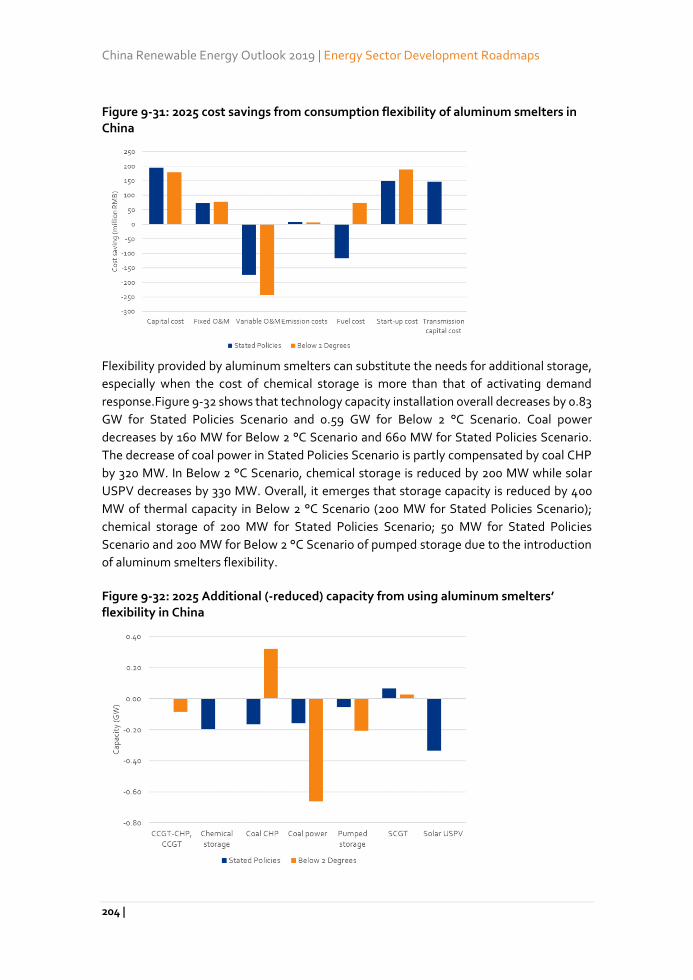
China Renewable Energy Outlook 2019 | Energy Sector Development Roadmaps
204 |
Figure 9-31: 2025 cost savings from consumption flexibility of aluminum smelters in China
Flexibility provided by aluminum smelters can substitute the needs for additional storage,
especially when the cost of chemical storage is more than that of activating demand
response.Figure 9-32 shows that technology capacity installation overall decreases by 0.83
GW for Stated Policies Scenario and 0.59 GW for Below 2 °C Scenario. Coal power
decreases by 160 MW for Below 2 °C Scenario and 660 MW for Stated Policies Scenario.
The decrease of coal power in Stated Policies Scenario is partly compensated by coal CHP
by 320 MW. In Below 2 °C Scenario, chemical storage is reduced by 200 MW while solar
USPV decreases by 330 MW. Overall, it emerges that storage capacity is reduced by 400
MW of thermal capacity in Below 2 °C Scenario (200 MW for Stated Policies Scenario);
chemical storage of 200 MW for Stated Policies Scenario; 50 MW for Stated Policies
Scenario and 200 MW for Below 2 °C Scenario of pumped storage due to the introduction
of aluminum smelters flexibility.
Figure 9-32: 2025 Additional (-reduced) capacity from using aluminum smelters’ flexibility in China

Chapter 9 | Power System Development Roadmap
205 |
To foster the adoption of demand response from industry, it is fundamental that potential
barriers are properly handled. 234 Specifically, it needs to be created adequate
compensation for flexibility provision to reflect its system value. Demand response
requires a transparent wholesale market to provide price signals to short-term flexibility
provision. An entity to aggregate loads (i.e., load aggregator) can be introduced, to simplify
the communication and management of flexible consumers. A solid business model must
be ensured for load aggregators to support the adoption of demand response.
China Renewable Energy Outlook 2019 | Energy Sector Development Roadmaps
206 |
10. Energy Sector Development
The overall energy system development and roadmap are an aggregation of key
devel0pment trends and measures to be taken in key subsectors, including power, heating,
industry, transport etc. The detailed energy needs of consuming sectors and their different
modes of consumption, the state of consuming devices etc, are aggregated to produce key
indicators for the overall energy sector such as final and primary energy consumption,
energy mix and societal emissions.
From a policy planning perspective, in China, policy guidance is set in the form of top-down
targets and objectives. Such objectives can be broken down to sub-targets and finally
implemented through measures for specific energy systems, economic subsectors and
industries.
This chapter presents the scenarios’ overall energy system developments to convey the
metrics achieved in the energy system, as the aggregate effect of the evolutions prescribed
in the roadmaps for the different sectors in the previous chapters. This forms the basis for
establishing an overall roadmap for the energy sector. We emphasise the cross-cutting
trends and developments, their interdependency and the objectives energy sector-related
macro with focus on the 14th five-year plan; and provide guidance for the two following
five-year plan periods leading to the end of China’s next era of economic and social
development, 2035.
Energy sector developments
The high-level indicators of the two scenarios are presented on Table 10-1 and Table 10-2,
aggregating the combined energy system effects of the detailed roadmaps described in
prior chapters.
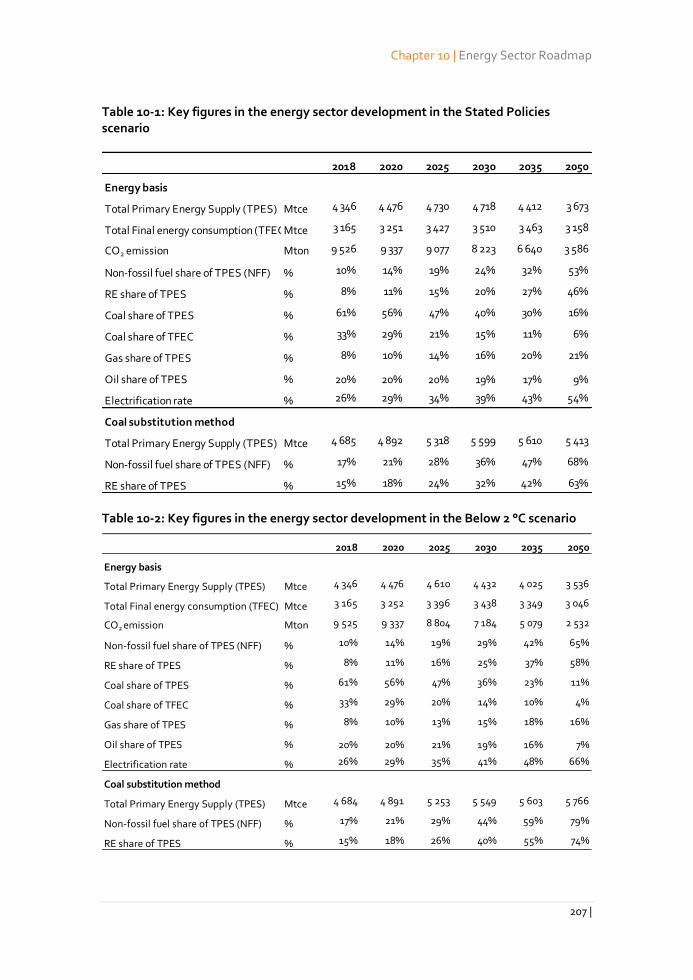
Chapter 10 | Energy Sector Roadmap
207 |
Table 10-1: Key figures in the energy sector development in the Stated Policies scenario
Table 10-2: Key figures in the energy sector development in the Below 2 °C scenario
2018 2020 2025 2030 2035 2050
Energy basis
Total Primary Energy Supply (TPES) Mtce 4 346 4 476 4 730 4 718 4 412 3 673
Total Final energy consumption (TFEC)Mtce 3 165 3 251 3 427 3 510 3 463 3 158
CO2 emission Mton 9 526 9 337 9 077 8 223 6 640 3 586
Non-fossil fuel share of TPES (NFF) % 10% 14% 19% 24% 32% 53%
RE share of TPES % 8% 11% 15% 20% 27% 46%
Coal share of TPES % 61% 56% 47% 40% 30% 16%
Coal share of TFEC % 33% 29% 21% 15% 11% 6%
Gas share of TPES % 8% 10% 14% 16% 20% 21%
Oil share of TPES % 20% 20% 20% 19% 17% 9%
Electrification rate % 26% 29% 34% 39% 43% 54%
Coal substitution method
Total Primary Energy Supply (TPES) Mtce 4 685 4 892 5 318 5 599 5 610 5 413
Non-fossil fuel share of TPES (NFF) % 17% 21% 28% 36% 47% 68%
RE share of TPES % 15% 18% 24% 32% 42% 63%
2018 2020 2025 2030 2035 2050
Energy basis
Total Primary Energy Supply (TPES) Mtce 4 346 4 476 4 610 4 432 4 025 3 536
Total Final energy consumption (TFEC) Mtce 3 165 3 252 3 396 3 438 3 349 3 046
CO2 emission Mton 9 525 9 337 8 804 7 184 5 079 2 532
Non-fossil fuel share of TPES (NFF) % 10% 14% 19% 29% 42% 65%
RE share of TPES % 8% 11% 16% 25% 37% 58%
Coal share of TPES % 61% 56% 47% 36% 23% 11%
Coal share of TFEC % 33% 29% 20% 14% 10% 4%
Gas share of TPES % 8% 10% 13% 15% 18% 16%
Oil share of TPES % 20% 20% 21% 19% 16% 7%
Electrification rate % 26% 29% 35% 41% 48% 66%
Coal substitution method
Total Primary Energy Supply (TPES) Mtce 4 684 4 891 5 253 5 549 5 603 5 766
Non-fossil fuel share of TPES (NFF) % 17% 21% 29% 44% 59% 79%
RE share of TPES % 15% 18% 26% 40% 55% 74%
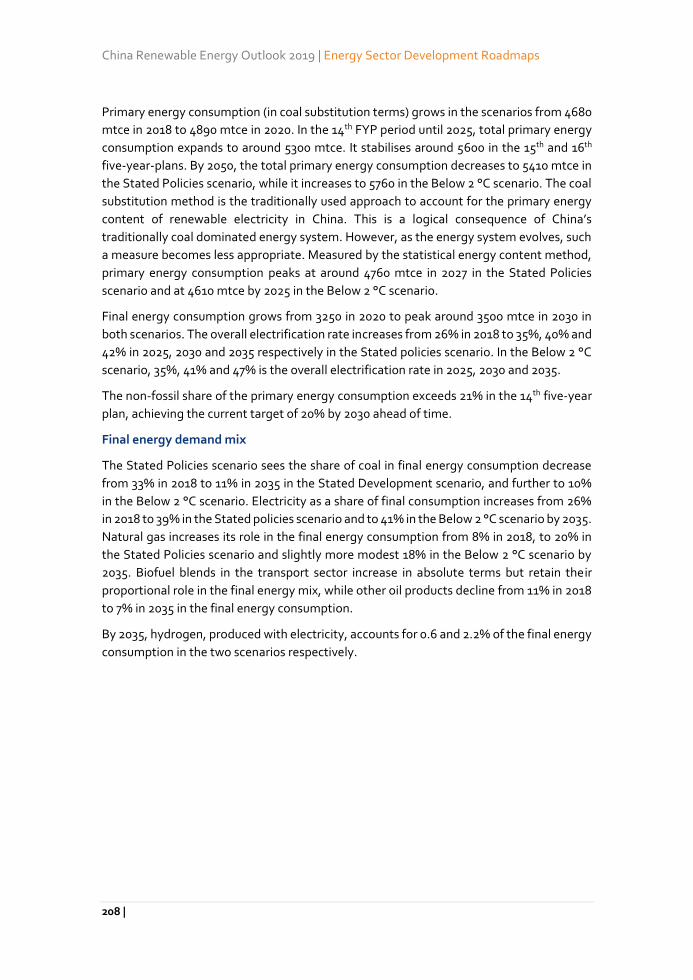
China Renewable Energy Outlook 2019 | Energy Sector Development Roadmaps
208 |
Primary energy consumption (in coal substitution terms) grows in the scenarios from 4680
mtce in 2018 to 4890 mtce in 2020. In the 14th FYP period until 2025, total primary energy
consumption expands to around 5300 mtce. It stabilises around 5600 in the 15th and 16th
five-year-plans. By 2050, the total primary energy consumption decreases to 5410 mtce in
the Stated Policies scenario, while it increases to 5760 in the Below 2 °C scenario. The coal
substitution method is the traditionally used approach to account for the primary energy
content of renewable electricity in China. This is a logical consequence of China’s
traditionally coal dominated energy system. However, as the energy system evolves, such
a measure becomes less appropriate. Measured by the statistical energy content method,
primary energy consumption peaks at around 4760 mtce in 2027 in the Stated Policies
scenario and at 4610 mtce by 2025 in the Below 2 °C scenario.
Final energy consumption grows from 3250 in 2020 to peak around 3500 mtce in 2030 in
both scenarios. The overall electrification rate increases from 26% in 2018 to 35%, 40% and
42% in 2025, 2030 and 2035 respectively in the Stated policies scenario. In the Below 2 °C
scenario, 35%, 41% and 47% is the overall electrification rate in 2025, 2030 and 2035.
The non-fossil share of the primary energy consumption exceeds 21% in the 14th five-year
plan, achieving the current target of 20% by 2030 ahead of time.
Final energy demand mix
The Stated Policies scenario sees the share of coal in final energy consumption decrease
from 33% in 2018 to 11% in 2035 in the Stated Development scenario, and further to 10%
in the Below 2 °C scenario. Electricity as a share of final consumption increases from 26%
in 2018 to 39% in the Stated policies scenario and to 41% in the Below 2 °C scenario by 2035.
Natural gas increases its role in the final energy consumption from 8% in 2018, to 20% in
the Stated Policies scenario and slightly more modest 18% in the Below 2 °C scenario by
2035. Biofuel blends in the transport sector increase in absolute terms but retain their
proportional role in the final energy mix, while other oil products decline from 11% in 2018
to 7% in 2035 in the final energy consumption.
By 2035, hydrogen, produced with electricity, accounts for 0.6 and 2.2% of the final energy
consumption in the two scenarios respectively.
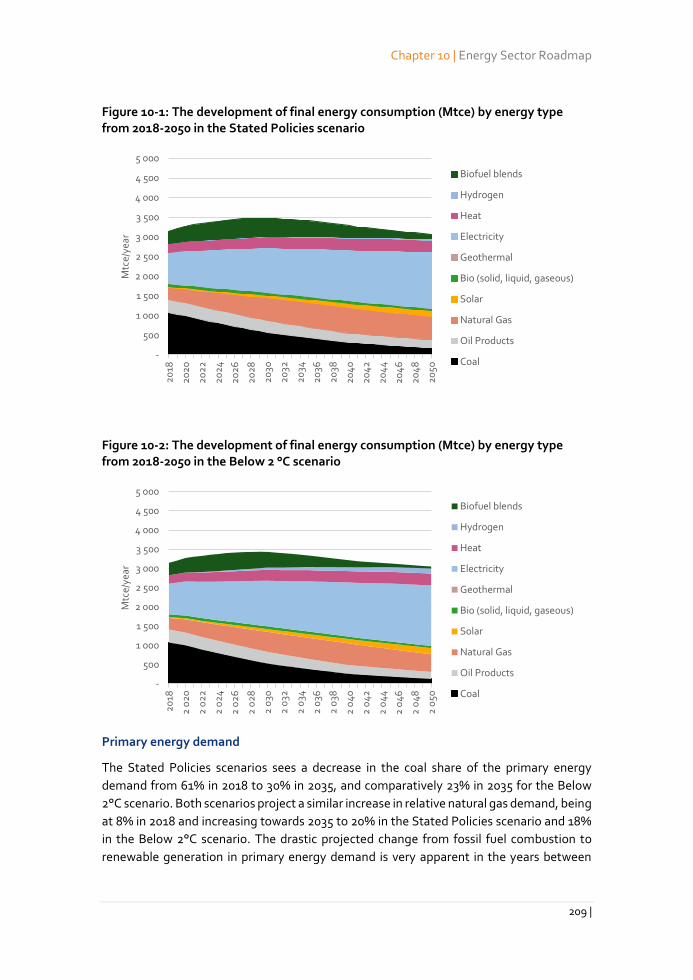
Chapter 10 | Energy Sector Roadmap
209 |
Figure 10-1: The development of final energy consumption (Mtce) by energy type from 2018-2050 in the Stated Policies scenario
Figure 10-2: The development of final energy consumption (Mtce) by energy type from 2018-2050 in the Below 2 °C scenario
Primary energy demand
The Stated Policies scenarios sees a decrease in the coal share of the primary energy
demand from 61% in 2018 to 30% in 2035, and comparatively 23% in 2035 for the Below
2°C scenario. Both scenarios project a similar increase in relative natural gas demand, being
at 8% in 2018 and increasing towards 2035 to 20% in the Stated Policies scenario and 18%
in the Below 2°C scenario. The drastic projected change from fossil fuel combustion to
renewable generation in primary energy demand is very apparent in the years between
-
500
1 000
1 500
2 000
2 500
3 000
3 500
4 000
4 500
5 0002
018
20
20
20
22
20
24
20
26
20
28
20
30
20
32
20
34
20
36
20
38
20
40
20
42
20
44
20
46
20
48
20
50
Mtc
e/ye
ar
Biofuel blends
Hydrogen
Heat
Electricity
Geothermal
Bio (solid, liquid, gaseous)
Solar
Natural Gas
Oil Products
Coal
-
500
1 000
1 500
2 000
2 500
3 000
3 500
4 000
4 500
5 000
20
18
2 0
20
2 0
22
2 0
24
2 0
26
2 0
28
2 0
30
2 0
32
2 0
34
2 0
36
2 0
38
2 0
40
2 0
42
2 0
44
2 0
46
2 0
48
2 0
50
Mtc
e/ye
ar
Biofuel blends
Hydrogen
Heat
Electricity
Geothermal
Bio (solid, liquid, gaseous)
Solar
Natural Gas
Oil Products
Coal
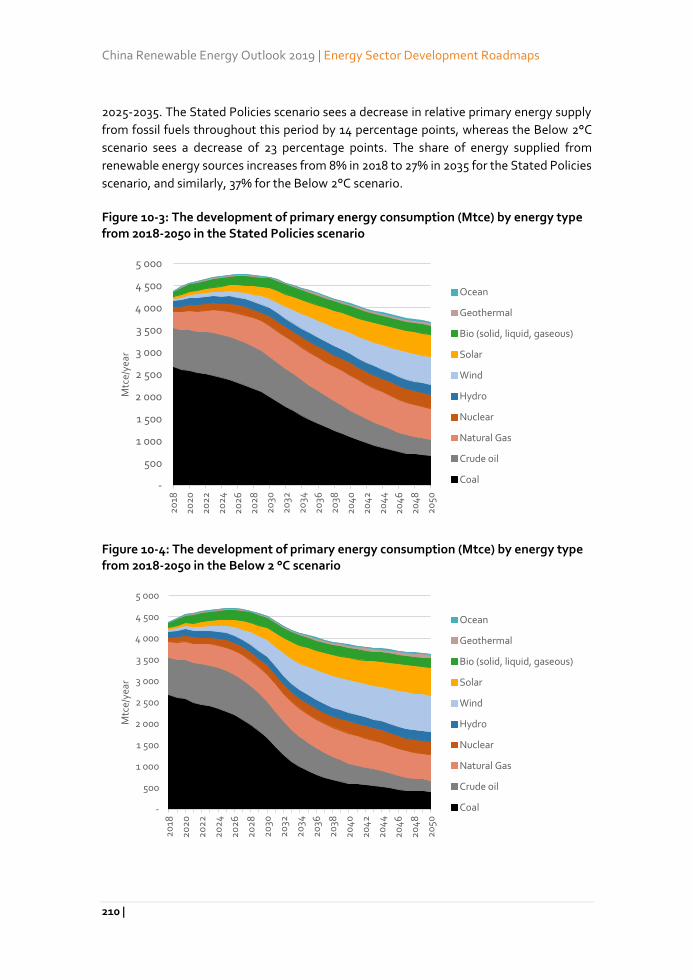
China Renewable Energy Outlook 2019 | Energy Sector Development Roadmaps
210 |
2025-2035. The Stated Policies scenario sees a decrease in relative primary energy supply
from fossil fuels throughout this period by 14 percentage points, whereas the Below 2°C
scenario sees a decrease of 23 percentage points. The share of energy supplied from
renewable energy sources increases from 8% in 2018 to 27% in 2035 for the Stated Policies
scenario, and similarly, 37% for the Below 2°C scenario.
Figure 10-3: The development of primary energy consumption (Mtce) by energy type from 2018-2050 in the Stated Policies scenario
Figure 10-4: The development of primary energy consumption (Mtce) by energy type from 2018-2050 in the Below 2 °C scenario
-
500
1 000
1 500
2 000
2 500
3 000
3 500
4 000
4 500
5 000
20
18
20
20
20
22
20
24
20
26
20
28
20
30
20
32
20
34
20
36
20
38
20
40
20
42
20
44
20
46
20
48
20
50
Mtc
e/ye
ar
Ocean
Geothermal
Bio (solid, liquid, gaseous)
Solar
Wind
Hydro
Nuclear
Natural Gas
Crude oil
Coal
-
500
1 000
1 500
2 000
2 500
3 000
3 500
4 000
4 500
5 000
20
18
20
20
20
22
20
24
20
26
20
28
20
30
20
32
20
34
20
36
20
38
20
40
20
42
20
44
20
46
20
48
20
50
Mtc
e/ye
ar
Ocean
Geothermal
Bio (solid, liquid, gaseous)
Solar
Wind
Hydro
Nuclear
Natural Gas
Crude oil
Coal
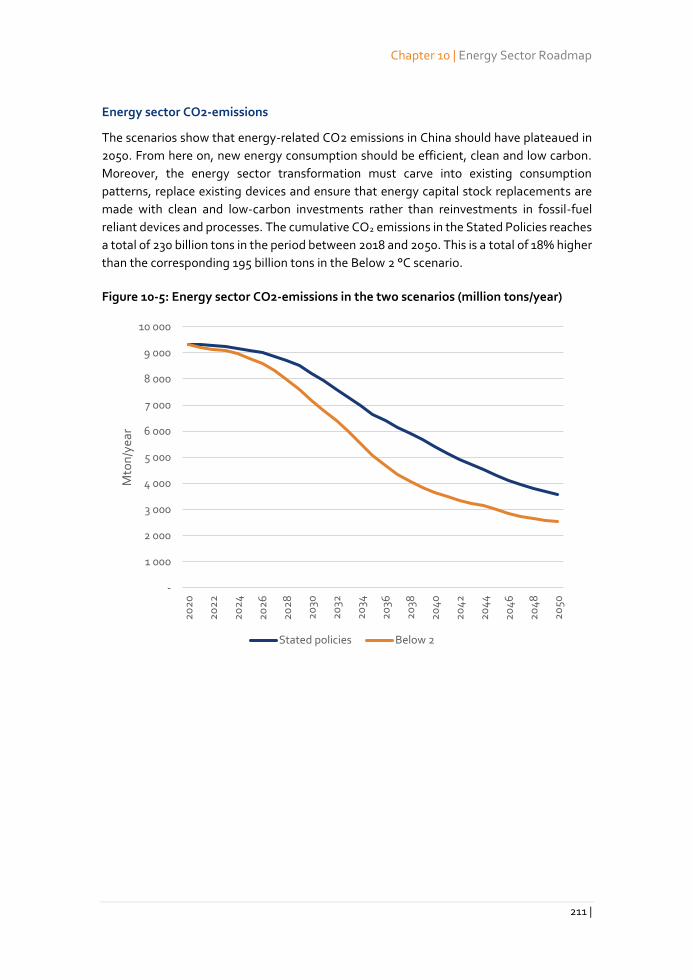
Chapter 10 | Energy Sector Roadmap
211 |
Energy sector CO2-emissions
The scenarios show that energy-related CO2 emissions in China should have plateaued in
2050. From here on, new energy consumption should be efficient, clean and low carbon.
Moreover, the energy sector transformation must carve into existing consumption
patterns, replace existing devices and ensure that energy capital stock replacements are
made with clean and low-carbon investments rather than reinvestments in fossil-fuel
reliant devices and processes. The cumulative CO2 emissions in the Stated Policies reaches
a total of 230 billion tons in the period between 2018 and 2050. This is a total of 18% higher
than the corresponding 195 billion tons in the Below 2 °C scenario.
Figure 10-5: Energy sector CO2-emissions in the two scenarios (million tons/year)
-
1 000
2 000
3 000
4 000
5 000
6 000
7 000
8 000
9 000
10 000
20
20
20
22
20
24
20
26
20
28
20
30
20
32
20
34
20
36
20
38
20
40
20
42
20
44
20
46
20
48
20
50
Mto
n/y
ear
Stated policies Below 2
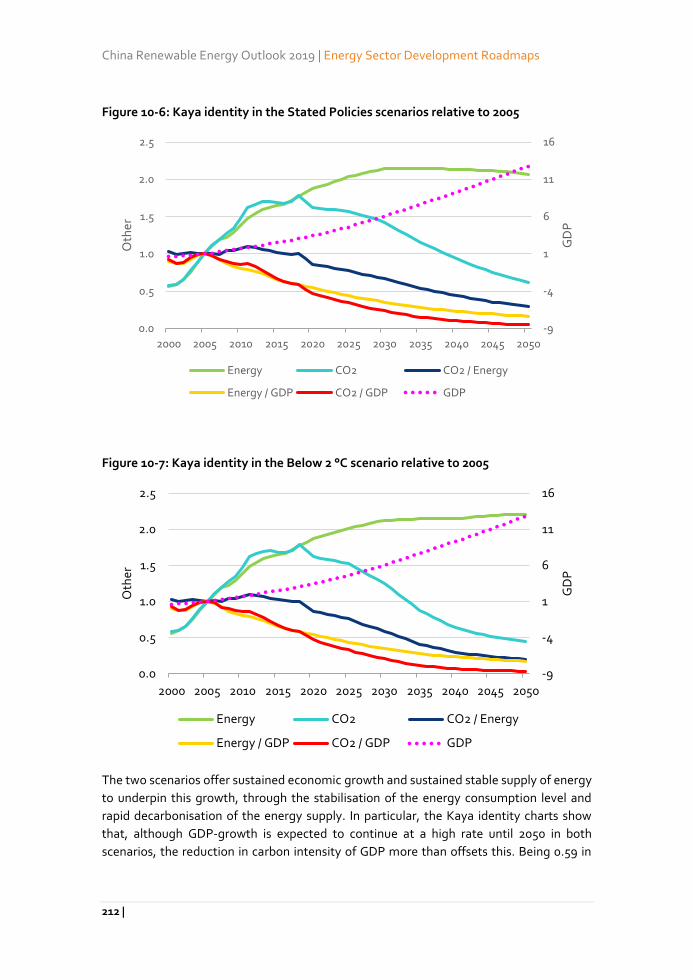
China Renewable Energy Outlook 2019 | Energy Sector Development Roadmaps
212 |
Figure 10-6: Kaya identity in the Stated Policies scenarios relative to 2005
Figure 10-7: Kaya identity in the Below 2 °C scenario relative to 2005
The two scenarios offer sustained economic growth and sustained stable supply of energy
to underpin this growth, through the stabilisation of the energy consumption level and
rapid decarbonisation of the energy supply. In particular, the Kaya identity charts show
that, although GDP-growth is expected to continue at a high rate until 2050 in both
scenarios, the reduction in carbon intensity of GDP more than offsets this. Being 0.59 in
-9
-4
1
6
11
16
0.0
0.5
1.0
1.5
2.0
2.5
2000 2005 2010 2015 2020 2025 2030 2035 2040 2045 2050
GD
P
Oth
er
Energy CO2 CO2 / Energy
Energy / GDP CO2 / GDP GDP
-9
-4
1
6
11
16
0.0
0.5
1.0
1.5
2.0
2.5
2000 2005 2010 2015 2020 2025 2030 2035 2040 2045 2050
GD
P
Oth
er
Energy CO2 CO2 / Energy
Energy / GDP CO2 / GDP GDP
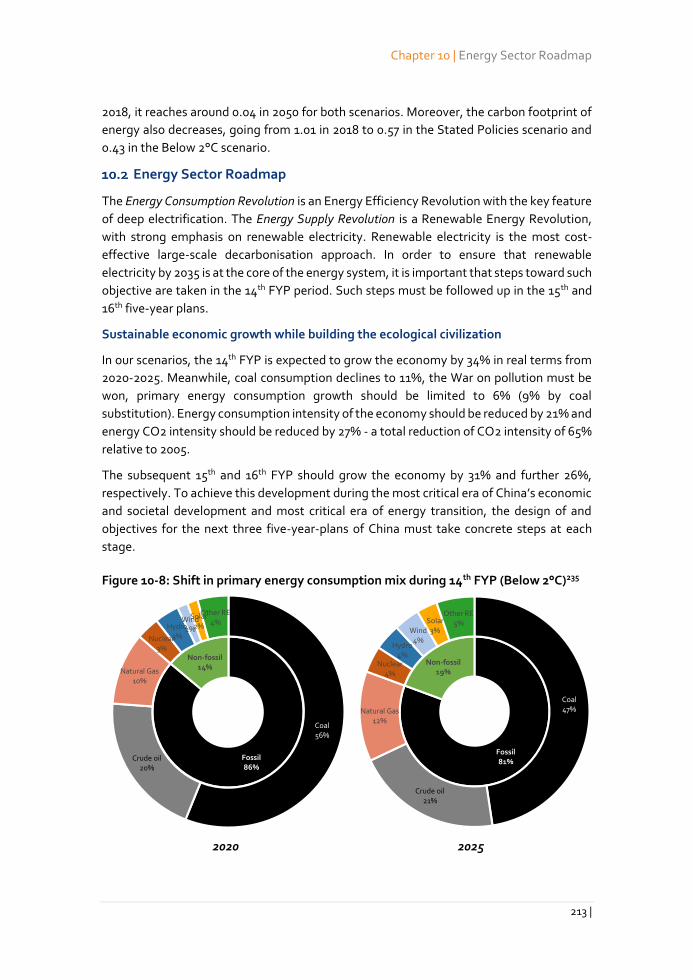
Chapter 10 | Energy Sector Roadmap
213 |
2018, it reaches around 0.04 in 2050 for both scenarios. Moreover, the carbon footprint of
energy also decreases, going from 1.01 in 2018 to 0.57 in the Stated Policies scenario and
0.43 in the Below 2°C scenario.
Energy Sector Roadmap
The Energy Consumption Revolution is an Energy Efficiency Revolution with the key feature
of deep electrification. The Energy Supply Revolution is a Renewable Energy Revolution,
with strong emphasis on renewable electricity. Renewable electricity is the most cost-
effective large-scale decarbonisation approach. In order to ensure that renewable
electricity by 2035 is at the core of the energy system, it is important that steps toward such
objective are taken in the 14th FYP period. Such steps must be followed up in the 15th and
16th five-year plans.
Sustainable economic growth while building the ecological civilization
In our scenarios, the 14th FYP is expected to grow the economy by 34% in real terms from
2020-2025. Meanwhile, coal consumption declines to 11%, the War on pollution must be
won, primary energy consumption growth should be limited to 6% (9% by coal
substitution). Energy consumption intensity of the economy should be reduced by 21% and
energy CO2 intensity should be reduced by 27% - a total reduction of CO2 intensity of 65%
relative to 2005.
The subsequent 15th and 16th FYP should grow the economy by 31% and further 26%,
respectively. To achieve this development during the most critical era of China’s economic
and societal development and most critical era of energy transition, the design of and
objectives for the next three five-year-plans of China must take concrete steps at each
stage.
Figure 10-8: Shift in primary energy consumption mix during 14th FYP (Below 2°C)235
2020 2025
Fossil86%
Non-fossil14%
Coal56%
Crude oil20%
Natural Gas10%
Nuclear3%
Hydro3%
Wind2%
Solar2%
Other RE4%
Fossil81%
Non-fossil19%
Coal47%
Crude oil21%
Natural Gas12%
Nuclear4%
Hydro4%
Wind4%
Solar3%
Other RE5%
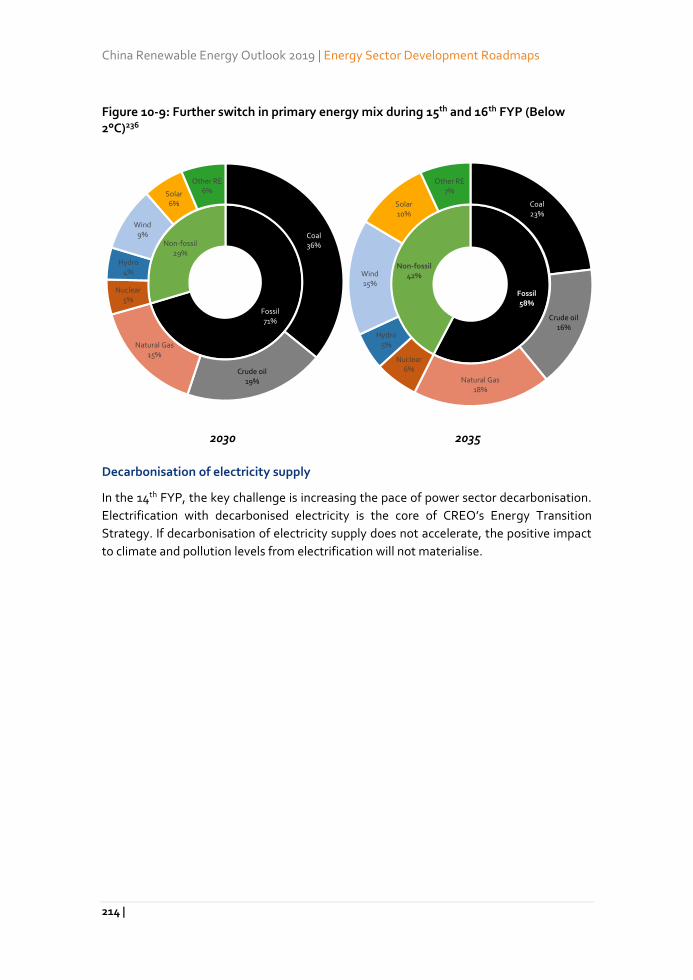
China Renewable Energy Outlook 2019 | Energy Sector Development Roadmaps
214 |
Figure 10-9: Further switch in primary energy mix during 15th and 16th FYP (Below 2°C)236
2030 2035
Decarbonisation of electricity supply
In the 14th FYP, the key challenge is increasing the pace of power sector decarbonisation.
Electrification with decarbonised electricity is the core of CREO’s Energy Transition
Strategy. If decarbonisation of electricity supply does not accelerate, the positive impact
to climate and pollution levels from electrification will not materialise.
Fossil71%
Non-fossil29%
Coal36%
Crude oil19%
Natural Gas15%
Nuclear5%
Hydro4%
Wind9%
Solar6%
Other RE6%
Fossil58%
Non-fossil42%
Coal23%
Crude oil16%
Natural Gas18%
Nuclear6%
Hydro5%
Wind15%
Solar10%
Other RE7%
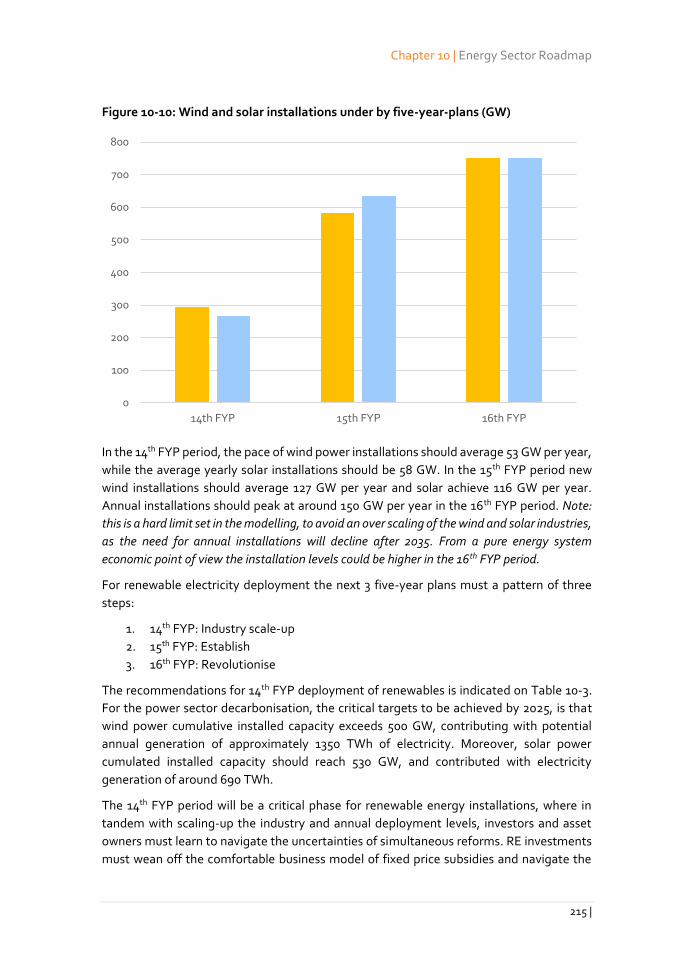
Chapter 10 | Energy Sector Roadmap
215 |
Figure 10-10: Wind and solar installations under by five-year-plans (GW)
In the 14th FYP period, the pace of wind power installations should average 53 GW per year,
while the average yearly solar installations should be 58 GW. In the 15th FYP period new
wind installations should average 127 GW per year and solar achieve 116 GW per year.
Annual installations should peak at around 150 GW per year in the 16th FYP period. Note:
this is a hard limit set in the modelling, to avoid an over scaling of the wind and solar industries,
as the need for annual installations will decline after 2035. From a pure energy system
economic point of view the installation levels could be higher in the 16th FYP period.
For renewable electricity deployment the next 3 five-year plans must a pattern of three
steps:
1. 14th FYP: Industry scale-up
2. 15th FYP: Establish
3. 16th FYP: Revolutionise
The recommendations for 14th FYP deployment of renewables is indicated on Table 10-3.
For the power sector decarbonisation, the critical targets to be achieved by 2025, is that
wind power cumulative installed capacity exceeds 500 GW, contributing with potential
annual generation of approximately 1350 TWh of electricity. Moreover, solar power
cumulated installed capacity should reach 530 GW, and contributed with electricity
generation of around 690 TWh.
The 14th FYP period will be a critical phase for renewable energy installations, where in
tandem with scaling-up the industry and annual deployment levels, investors and asset
owners must learn to navigate the uncertainties of simultaneous reforms. RE investments
must wean off the comfortable business model of fixed price subsidies and navigate the
0
100
200
300
400
500
600
700
800
14th FYP 15th FYP 16th FYP
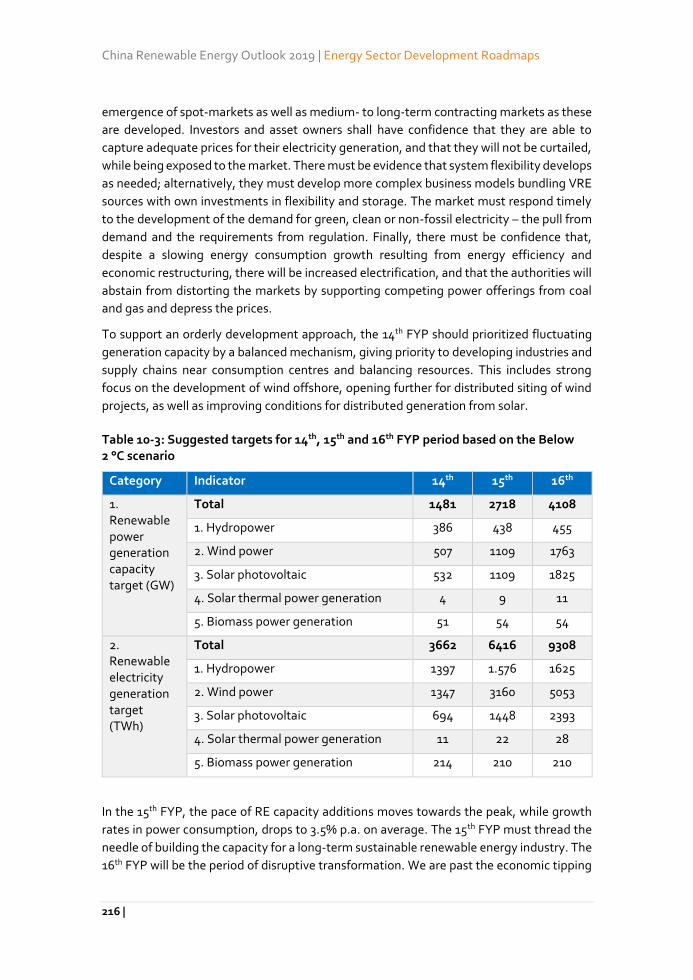
China Renewable Energy Outlook 2019 | Energy Sector Development Roadmaps
216 |
emergence of spot-markets as well as medium- to long-term contracting markets as these
are developed. Investors and asset owners shall have confidence that they are able to
capture adequate prices for their electricity generation, and that they will not be curtailed,
while being exposed to the market. There must be evidence that system flexibility develops
as needed; alternatively, they must develop more complex business models bundling VRE
sources with own investments in flexibility and storage. The market must respond timely
to the development of the demand for green, clean or non-fossil electricity – the pull from
demand and the requirements from regulation. Finally, there must be confidence that,
despite a slowing energy consumption growth resulting from energy efficiency and
economic restructuring, there will be increased electrification, and that the authorities will
abstain from distorting the markets by supporting competing power offerings from coal
and gas and depress the prices.
To support an orderly development approach, the 14th FYP should prioritized fluctuating
generation capacity by a balanced mechanism, giving priority to developing industries and
supply chains near consumption centres and balancing resources. This includes strong
focus on the development of wind offshore, opening further for distributed siting of wind
projects, as well as improving conditions for distributed generation from solar.
Table 10-3: Suggested targets for 14th, 15th and 16th FYP period based on the Below 2 °C scenario
Category Indicator 14th 15th 16th
1. Renewable power generation capacity target (GW)
Total 1481 2718 4108
1. Hydropower 386 438 455
2. Wind power 507 1109 1763
3. Solar photovoltaic 532 1109 1825
4. Solar thermal power generation 4 9 11
5. Biomass power generation 51 54 54
2. Renewable electricity generation target (TWh)
Total 3662 6416 9308
1. Hydropower 1397 1.576 1625
2. Wind power 1347 3160 5053
3. Solar photovoltaic 694 1448 2393
4. Solar thermal power generation 11 22 28
5. Biomass power generation 214 210 210
In the 15th FYP, the pace of RE capacity additions moves towards the peak, while growth
rates in power consumption, drops to 3.5% p.a. on average. The 15th FYP must thread the
needle of building the capacity for a long-term sustainable renewable energy industry. The
16th FYP will be the period of disruptive transformation. We are past the economic tipping
Chapter 10 | Energy Sector Roadmap
217 |
points with significant impact to asset utilisations. Wind and solar annual installations
should reach their peak at around ~150 GW/year and new electricity storage should be
coming online at the pace of 30 GW per year. Utilisation rates of fossil-thermal plants shall
decline significantly – where, in our calculations, remaining coal plants should drop below
2,500 annual FHL and gas plants output should be reduced by approx. 10% over the five-
year period. Though this has not been directly included in the scenarios, a significant focus
on strategic plant closures should be considered.
Developing a coupled energy system with electrification as the crux
The 14th FYP should include targets and measures to support technologies an incentive to
unleash the benefits of an efficient power and district heating coupling. The stock of
individual heat pumps should be increasing and displace individual coal boilers and stoves.
The number of EVs should increase to almost 33 million by 2025, and around 14% of the
vehicle stock should be new energy vehicles (NEVS) including electric, hydrogen and plugin
hybrids. For EVs, this shall be accompanied by charging infrastructure, with around 1
normal charging stations for every 10 EV’s and around 1 fast charging stations per 100 EVs.
Programmes and/or retail tariffs for EV charging should expose users to changing prices,
such that smart charging is motivated.
Electrification should move to exceed 42% of the final energy consumption in industry, and
industries should be exposed to fluctuating market prices, and motivated towards
providing cost-efficient demand respond. Key energy intensive industries should be at the
forefront. Scrap-based electric arc furnace steel should reach 30-32% by 2025.
By the end of the 16th FYP, the penetration levels of variable renewable energy will be high,
and the availability of traditional thermal assets for maintaining the system balance
including ancillary services shall reduce. Smart energy services, demand response from
industrial and residential loads and electric vehicles must be deployed at scale. The district
heating sector has achieved the tipping point, where large-scale replacements of thermal
heating capacity, including CHPs are being replaced/supplemented by power-to-heat
technologies. The energy internet becomes a reality, with data and digitisation supporting
the timing, scheduling, adjustments and power based on a comprehensive system of data
on loads, prices, assets locations. This becomes possible with the introduction of smart
meters as well as home energy management systems, etc.
Strict coal controls to halve consumption by 2035
The 13th five-year plan for energy development set the binding target that coal’s proportion
of the primary energy consumption should be reduced from 65% in 2015 to 58% in 2020 –
a drop of 6 percentages points over the five-year period.
In the 14th FYP, the coal consumption should be reduced by 10%. The 15th FYP should
implement further 24% reduction, and in the 16th five-year plan period the reduction
should be 37%. Thereby the coal share of primary energy consumption is reduced to 47%,
36% and 23% by the end of the 14th, 15th and 16th five-year plans respectively.

China Renewable Energy Outlook 2019 | Energy Sector Development Roadmaps
218 |
While in the long-run, the expanded national ETS system could be the preferred mode of
coal and carbon containment, administrative measures are needed in the short-term. In
the 15th FYP, a de facto ban on new coal should be in place. The direction is critical to avoid
exacerbating the issue of stranded costs in the coal industry.
Addressing economic woes of fossil-dependent industries and local economies
The process of energy system transformation will adversely affect established industries.
Carefully management of the transformation includes promotion of economic and social
policies targeted at areas, where the local economy is currently heavily dependent on coal.
In the 14th FYP it is imperative that industries are not allowed to exacerbate the long-term
challenges. Furthermore, in this period notions of need for coal or fossil-fuel use in the
short-term should not be entertained to justify further investments in industries, which
need to be replaced in the long-term. The power sector, for instance, risks adding stranded
costs of 425-925 billion RMB unless growth in coal power capacity is arrested in this period,
according to sensitivity analyses conducted with the power sector model (assuming coal
capacity expands to 1.25-1.4 TW).
In the 14th FYP, the efforts to promote thermal power plant flexibility should be extended
primarily to support the retrofitting of existing assets with reasonable efficiency and not to
support the development of new plants. This process should not serve to expand the
generation of coal plants; it should ensure that coal plants are able to complement the
expanding renewable sources in the system. Moreover, it should ensure that the value of
these services is compensated at fair market value. In those regions requiring heating, it
should be ensured that CHP plants can be used instead of coal-fired boilers and co-
generate heat with electricity, with generation happening when the power system needs
capacity, and that heat storages, rather than forced CHP generation, can guarantee the
continuity of heating supply.
Preserving energy security by the energy transition
The energy transition must ensure that safe and stable energy fuels the economy in the
next era of economic development. The rapid growth of oil consumption is potentially
destabilising, as oil imports account for increasing percentages of the country’s supply.
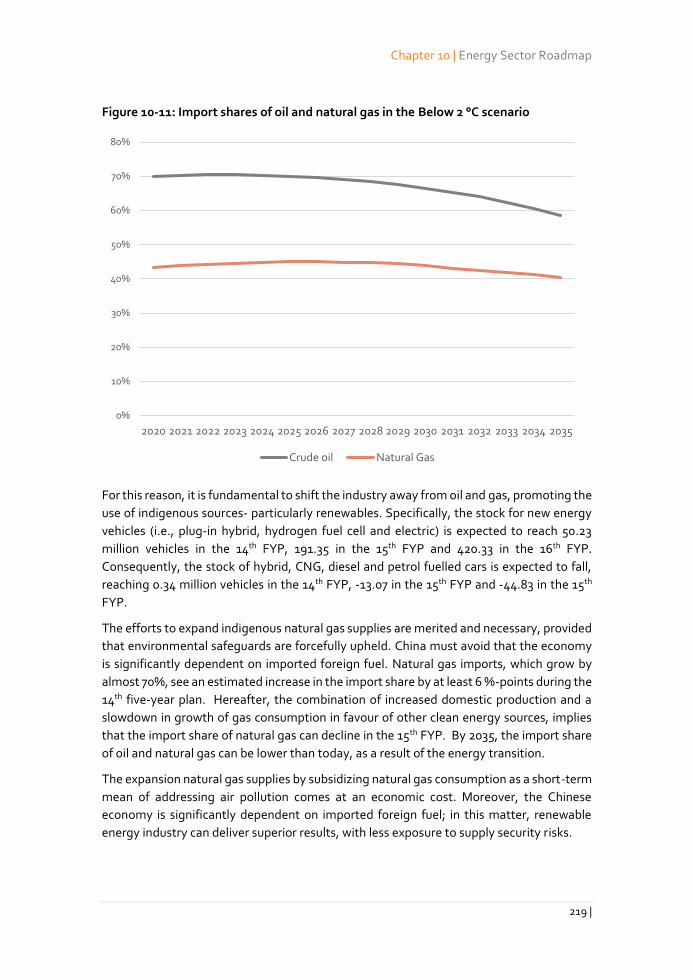
Chapter 10 | Energy Sector Roadmap
219 |
Figure 10-11: Import shares of oil and natural gas in the Below 2 °C scenario
For this reason, it is fundamental to shift the industry away from oil and gas, promoting the
use of indigenous sources- particularly renewables. Specifically, the stock for new energy
vehicles (i.e., plug-in hybrid, hydrogen fuel cell and electric) is expected to reach 50.23
million vehicles in the 14th FYP, 191.35 in the 15th FYP and 420.33 in the 16th FYP.
Consequently, the stock of hybrid, CNG, diesel and petrol fuelled cars is expected to fall,
reaching 0.34 million vehicles in the 14th FYP, -13.07 in the 15th FYP and -44.83 in the 15th
FYP.
The efforts to expand indigenous natural gas supplies are merited and necessary, provided
that environmental safeguards are forcefully upheld. China must avoid that the economy
is significantly dependent on imported foreign fuel. Natural gas imports, which grow by
almost 70%, see an estimated increase in the import share by at least 6 %-points during the
14th five-year plan. Hereafter, the combination of increased domestic production and a
slowdown in growth of gas consumption in favour of other clean energy sources, implies
that the import share of natural gas can decline in the 15th FYP. By 2035, the import share
of oil and natural gas can be lower than today, as a result of the energy transition.
The expansion natural gas supplies by subsidizing natural gas consumption as a short-term
mean of addressing air pollution comes at an economic cost. Moreover, the Chinese
economy is significantly dependent on imported foreign fuel; in this matter, renewable
energy industry can deliver superior results, with less exposure to supply security risks.
0%
10%
20%
30%
40%
50%
60%
70%
80%
2020 2021 2022 2023 2024 2025 2026 2027 2028 2029 2030 2031 2032 2033 2034 2035
Crude oil Natural Gas
China Renewable Energy Outlook 2019 | Energy Sector Development Roadmaps
220 |
In the power sector, for example, an increased role for natural gas of 10% relative to the
CREO scenario, would lead to additional costs of 60 bn RMB.
Strengthened energy efficiency targets for the next phase of energy transition
The importance of energy efficiency in the energy transition cannot be overstated. The
rapid pace required for scaling-up clean energy investments on the supply side is only
sufficient, given that energy consumption is significantly decoupled from the economic
growth targets.
In the 14th FYP energy efficiency measures must be defined such that the primary energy
consumption per unit of GDP should decline by at least 19%. The measures shall support
the transitioning of consumption from their current energy carriers towards electricity.
Final energy consumption should remain below 3400 Mtce/year and primary energy
consumption not grow above 4610 Mtce.
In the 14th FYP, increase in energy efficiency must be achieved:
By promoting efficient processes. For example, in industry, steelmaking from
electric arc furnaces (EAF) is assumed to contribute up to 19% in steelmaking
production.
Through technology improvement. For example, in building, electric heaters are
expected to reach an efficiency of 96.9%.
By leveraging DH, which is expected to cover 69.2% of residential urban heating.
Energy efficiency shall take place both in the point of energy use and in the supply-chain.
It can be achieved through better insulation and technology improvement in buildings (e.g.,
electric heaters will reach an efficiency of 98.1% by 16th FYP) as well as the promotion of
efficient processes in industry (e.g., in steelmaking, EAF process will contribute up to 29%
in steelmaking production by 16th FYP). Furthermore, the energy efficiency benefit of
renewables should be recognized in setting targets for primary energy consumption. Until
2035, the final energy consumption increases to around 3,350 Mtce/year, while primary
energy consumption should be contained below 4025 Mtce/year.
Breaking the curve of energy related CO2-emissions
Despite an uncertain, and at times tense, geopolitical environment, there is strong active
cooperation on energy and climate issues, which benefits all parties.
Carbon intensity levels should be reduced in the 14th five-year plan by 27% to 67 g/RMB – a
cumulative reduction of 66% since 2005 (in real terms).
In the 14th five-year plan, the carbon market should be reformed to include self-adjusting
mechanisms, such as a flexible cap, floor price, and stability reserve, to prevent a collapse
in carbon prices leading to undesired investment signals in favour of high-carbon
investments. The carbon quota allocation scheme must be adjusted to not provide indirect
subsidy for (efficient) coal-fired generation over clean energy sources.

Chapter 11 | Suggestions for Key Policy Actions during the 14th Five-Year Plan
221 |
Part4:
Policy Action suggestions
China Renewable Energy Outlook 2019 | Policy Action suggestions
222 |
11. Suggestions for Policy Actions During the 14th Five-
Year Plan
China’s renewable energy sector, especially wind and solar power, has developed rapidly
in terms of technology, industry, and markets. Large-scale manufacturing, new
technologies, and improved business models have reduced the cost for wind and solar
substantially. In 2018, commercial renewable energy accounted for 12.5% of primary
energy consumption, laying a foundation for China’s energy revolution and transition to
clean energy, and contributing to global development of renewable and low-carbon energy.
China has led new energy development to promote the revolution of energy production
and consumption. This energy revolution means continuously increasing the supply of
clean and green energy and constantly increasing its proportion in energy production and
consumption. China has set the objective that non-fossil energy should account for 15% of
primary energy consumption by 2020 and 20% by 2030. Such targets are not only a guide
for future energy transformation, but also a clear task for the development of renewable
energy in the short and medium term.
Looking ahead, the period between 2019 and 2025 will be critical for China’s energy
transformation, which will be supported by the development of renewable energy. In order
to realize the national objective of non-fossil energy accounting for 20% of the primary
energy consumption and non-fossil energy power accounting for 50% of the total
electricity consumption by 2030, renewable energy industrial development and supporting
policies and markets are strategic. However, the uncertainty over how the renewable
market will develop during the 14th Five-Year Plan period (2021-2025) makes policy and
market design complex and challenging. This chapter mainly analyses the environment
and key policy issues in the development of renewable energy during the 14th Five-Year
Plan period and puts forward policy and institutional recommendations based on a study
of various scenarios.
Renewable energy power
Many RE feed-in tariffs will phase out shortly
Early in the 14th Five-Year Plan period, the feed-in tariffs for onshore wind and PV
generation will be withdrawn since these industries have become mature with rapid
market development and large manufacturing scale. In the 13th Five-Year Plans for
energy, renewable energy, wind energy and solar energy, the Chinese government set
objective that wind power should compete with coal power on the same basis and PV
should reach price parity with government-set coal tariffs by 2020. Since 2016, China has
launched a series of measures and actions to reduce the cost and tariffs for mature
renewable energy sources such as wind and PV. China has demonstration projects for wind
and PV plants that produce energy for at or below local coal tariffs. The government has
introduced auctions for wind power and PV. In addition, the government has launched
market-based trading for distributed generation and put forward 12 measures to reduce
Chapter 11 | Suggestions for Key Policy Actions during the 14th Five-Year Plan
223 |
the financial burden of renewable energy enterprises. Finally, to improve renewable
integration, the government implemented a renewable energy electricity consumption
guarantee as well as a voluntary green certificate system. In 2019, all new wind power
projects were fully determined via competitive allocation to determine project owners and
feed-in tariffs. For PV, in addition to household PV and PV poverty alleviation projects,
China implemented auctions for determining PV construction projects according to the
total amount of subsidies, held competitive allocations locally, established a unified
national project ranking, and formulated eight supporting policies. In 2019, the weighted
average difference between the tariffs for coal-fired power generation and onshore wind
is RMB 0.1/kWh and RMB 0.14/kWh for PV. Considering the implementation of competitive
allocation of onshore wind power, the actual subsidy level will be even lower. According to
the latest wind power tariff policy, the feed-in tariff for newly built onshore wind power
projects will be completely withdrawn by 2021. In 2019, the average subsidy level of PV
auction projects is only RMB 0.065/kWh. According to the industry’s expectations on
technological progress and cost changes, PV generation is expected to enter the stage of
parity with current coal tariffs in the early period of the 14th Five-Year Plan.
The 14th Five-Year Plan period is key to reform of renewable energy policy. For over a
decade, China has implemented a feed-in tariff and subsidy compensation mechanism to
support the renewable energy directly, but policy supports will shift during the 14th Five-
Year Plan period. New support policies will be more innovative, while continuing to both
support prior renewable energy systems, as well as supporting and guiding the renewable
energy industry’s development. These changes coincide with the reform of the electric
power wholesale market, which will both come to greater fulfilment in the 14th Five-Year
Plan period. All involve various, multi-dimensional and uncertain factors in the design and
implementation of renewable energy power policy support.
Renewable energy participates in the power market
Market design should include gradual and conditional participation of renewable
energy in the market. Renewable energy’s participation in the power market is not only a
future trend, but also a gradual process from the perspectives of both international
experience and the direction of China’s power system reform. For example, China has just
started establishing electricity spot markets. At the end of June 2019, the first batch of
eight spot markets entered the stage of trial operation. The Southern Electricity Spot
Market took the lead in implementing electricity spot market settlement in May 2019. As
yet, there is no timetable for other provinces not on the first list, and as a result, the process
and designs of spot markets may vary from region to region. In the future, renewable
energy’s participation in the spot market (among other electricity markets) should
gradually be extended to different regions.
In the early stage, renewable energy power should participate in the power markets by
bidding a production curve without quoting a price, and take priority in market clearing as
a price taker, to enable priority for renewable consumption. When the spot market is
China Renewable Energy Outlook 2019 | Policy Action suggestions
224 |
mature and stable, newly added renewable energy projects will likely participate in the
power markets by bidding both quantity and price.
Renewable energy market participation should take many forms. For new projects,
participation in the power market can be diversified by referring to international
experience and domestic demand, including power purchase agreements signed with
power consumers or purchasing and selling companies, medium- and long-term contracts,
competitive bidding by the government or purchasing and selling companies, direct
participation in the spot market, and combination of the previously mentioned models.
For existing projects that previously had feed-in tariffs set as benchmark tariffs, set via
competitive bidding, or tariffs including a subsidy, as well as benefitting from the full
purchase guarantee policy, China should encourage their participation in the power market.
If China can shift to participatory markets, the issue of policy continuity must be addressed.
For example, China might consider shifting from the feed-in tariff model to the market
premium model or the differential price contract model. Shifting to a new model would
depend on preconditions. The spot market should be a mature market that realizes fully
competitive pricing. Prior to establishing mature spot markets, renewable pricing should
link the level of premium or price difference with the price in the power market.
There is no need for renewable energy to participate in irrational competition in the
imperfect power market. At present, power competition in a few regions or period of time
is irrational, especially in regions and hours with sufficient power supply. Coal power is only
quoted at variable cost or variable cost plus part of fixed cost, resulting in low price. Some
regions have adopted the direct transaction or direct purchase model between power
generation enterprises and power consumption enterprises. The price is brokered by the
government, resulting in a price lower than the actual cost of coal power.
The cost of onshore wind and PV is economically competitive compared with that of coal
power today, which has led to the withdrawal of their feed-in tariffs. If the market is in the
stage of irrational competition, it is unhelpful for wind and PV to participate in irrational
competition. In this case, it is recommended to continue the benchmark tariff parity pricing
or auction-based pricing policies for wind and PV for a period of time. In 2019, China
implemented a new auction system for PV generation. Our analysis shows that the major
elements of this system, such as competitive allocation, national ranking, amended tariff,
and forewarning management, are also applicable after the complete removal of subsidy
for wind and PV. The feed-in tariff will be lower than the price of coal power through
auction or bidding (in August 2019, the final bid prices for PV in projects auctioned were
lower than the respective local coal benchmark prices). The power purchase agreement
(PPA) or contract-for-difference (CfD) model should be implemented.
Renewable energy power planning and management mechanism
Planning and management policies must meet multiple objectives. During the 14th
Five-Year Plan period, wind and PV will play a growing role in power systems in terms of
capacity and output. After the tariff subsidies phase out, and as wind and solar become
Chapter 11 | Suggestions for Key Policy Actions during the 14th Five-Year Plan
225 |
increasingly competitive with coal, policymakers may need to limit annual wind and PV
additions to prevent new grid bottlenecks. Policymakers will also need to avoid the risk of
large swings in the renewable market and industry that unlimited growth might produce.
On the other hand, policies will need to prevent grid and market constraints on renewable
development, ensuring bottlenecks do not lead to a sudden collapse of the renewable
industry. In other words, policy must support China’s transition to clean energy, ensure the
sound development of manufacturing industry, while also ensuring integration of
electricity demand and absorption of renewable output.
Stable development of renewables including wind and solar requires improved grid
integration and uptake of RE. To enable healthy wind and solar development, policies
should ensure that grid companies and third-party organizations annually publish five-year
electricity demand forecasts, including forecasts for absorption of new wind and solar
output, establish a mechanism for regularly publishing forecast results, and use this as the
basis for wind and PV development and policies. The market should guide the timing and
location of new wind and solar projects via competitive allocation of construction quotas.
When China’s wholesale power markets mature, wind and PV additions will more depend
on market forces.
Consumption guarantees for renewable energy remain essential over the long-term.
China issued its most recent policies guaranteeing the consumption of renewable energy
power in May 2019. The policy establishes mandatory consumption targets and
responsibilities, along with indicators in order to guide the consumption of renewable
energy power. The policy includes aspects that promote both supply and demand of
renewables, both in the near-term and long-term. After wind and PV prices fall below
present grid tariffs for coal and subsidies are withdrawn, renewable uptake will be the most
important factor affecting annual installations of wind and solar. To meet China’s need to
continue wind and solar installations and thereby achieve long-term national clean energy
targets, renewable demand responsibility should at least remain stable or grow over time,
to create space for sustainable growth of renewable energy.
Economic policies for renewable energy
Removal of subsidies does not imply removal of economic policies—reducing or
eliminating non-technical costs remains critical. International experience indicates that
economic policies related to non-technical costs—soft costs such as regulatory expenses,
marketing costs, land use fees, and financing costs—become more important as renewable
energy reaches cost-competitive levels and participates in power markets. For example, in
2016, a PV generation project in the United Arab Emirates (UAE) bid a price of US$ 0.0242
cents/kWh in a power auction, and this price was only possible due to the country’s land tax
exemption policy, consumption tax exemption policy, long-term low-interest loans, and
summer tariff policies. The 12 measures proposed by the National Energy Administration
in 2018 to reduce the regulatory cost burden on renewable energy companies should be
sustained and strengthened in the post-subsidy era to reduce non-technical costs,
especially unreasonable non-technical costs. On land policy, some regions still violate
China Renewable Energy Outlook 2019 | Policy Action suggestions
226 |
national regulations or collect unreasonable renewable energy resource fees and urban
land use taxes. The basic principles of land availability and land cost for renewable energy
development should be clarified and national policies should be fully implemented.
Supportive policies are still needed for some renewable energy sources. For not-yet fully
commercial renewable technologies, economic support remains necessary for scale-up.
Examples of these technologies include biomass and solar thermal energy. For biomass
power from agricultural and forestry residues, raw materials account for at least two-thirds
of the generation cost. Prohibition of straw burning via education, agricultural transfer
payments, and subsidies for procurement of biomass would support development of
biomass power. For large-scale solar thermal plants, such as utility-scale concentrating
solar, these remain in the initial stage of industrial development, but the energy storage
and flexibility aspects of the technology suggest they will have value in the world’s future
renewable-based energy system. For CSP technologies, competitively set tariffs for new
projects combined with annual installation targets would ensure continued development.
Grid companies should sign the PPA and the high cost should be covered by the end-users
reflected in the retail price of power. Alternatively, the differential price should be provided
through the renewable energy development fund. If such technologies participate in power
markets, they could do so under a contract-for-difference arrangement.
Renewable heating
Overall renewable heating policy
High-level policies can stimulate the market for renewable heating. The renewable
heating experience of other countries shows the importance of supportive national policies.
These policies include overall national targets for renewable energy and reduction of
greenhouse gas emissions, energy taxes and carbon taxes, and full accounting for social
and environmental external costs. Such policies not only establish a favourable market
environment for renewable heating, but also reduce and thereby clarify the need for
specific supporting policies for individual renewable heating technologies.
At present, without considering external cost factors such as the environment, China’s
renewable heating remains uncompetitive with traditional fossil heating such as coal.
Therefore, from the perspective of policy framework, China should gradually improve the
macro policy environment. For example, China should strengthen efforts to control total
energy consumption, increase incentives to reduce greenhouse gas emissions, study and
improve energy and environment taxes to internalize the external costs of fossil energy,
incorporate renewable energy into the energy saving requirements of buildings, and
explicitly request that the proportion of renewable heating in new buildings and
communities should meet emissions standards. Although some of these policies are
beyond the scope of renewable heating incentive policies, they remain important for
promoting the development of renewable heating.
China will prioritize renewable heating development and planning. Given the
importance of public awareness to this topic, China will continue to improve public
Chapter 11 | Suggestions for Key Policy Actions during the 14th Five-Year Plan
227 |
education of the role of renewable heating in controlling air pollution and emphasize the
importance of renewable energy in solving clean heating in China. The interconnection of
different heat sources in China’s winter heating zones should be strengthened to realize
the optimal scheduling of the heating system. China should prioritize renewable heating
over other heating sources for urban heating pipe networks as well as for heating utilization.
Renewable heating should be included in local infrastructure plans, and policymakers at
various levels should coordinate the utilization of renewable heating. Regional energy
transformation demonstration projects should include renewable heating targets,
incorporate renewable heating into unified regional planning, and include renewable
heating as an indicator in the regional ecological civilization construction evaluation
system.
Various renewable heating technologies, such as solar energy, biomass and geothermal
energy, should be included in the preferred technology catalogue for air pollution, energy
conservation and emission reduction. China should clearly put forward the overall
development goal of renewable heating of the country and the development goals of key
provinces. In the planning and construction process of new urban district construction,
reconstruction of old city and construction of industrial parks (areas), China should
combine the regional energy planning with urban development planning and prioritize the
simultaneous development of renewable power and heating. This should be the focus of
the planning, design and transformation of urban heating systems and heat-supply pipe
networks, optimizing the design of heat-supply pipe networks according to the
characteristics of renewable energy.
Economic policy on renewable heating
Promote the market competitiveness of renewable heating. China should lift
restrictions on access to heating and encourage private enterprises to enter the clean
heating sector. China should promote the selection of heat suppliers by competitive
bidding and other market-oriented ways. Heat supply enterprises that manage heat
sources, pipe networks, and heating fees in an integrated way should be allowed to
determine heating areas and corresponding heating subsidies through franchise and other
business models. In case that a heat supply enterprise sells heat to a heating company
through a contractual heating transaction, a long-term heat supply agreement may be
signed with the heating company with the coordination of the government. For users who
cannot be covered by central heating, China should promote the development of
decentralized renewable heating through the combination of user investment and
government subsidies.
Establish and improve the heating price policy. The pricing and compensation
mechanisms of renewable heating should be explored. China should determine the
national guiding prices of various heating technologies according to the application level
and condition of such technologies, especially for solar energy heating, biomass
cogeneration heating, biomass boiler heating, and middle-deep terrestrial heat. The
environmental externalities should be considered in the determination of heating price.
China Renewable Energy Outlook 2019 | Policy Action suggestions
228 |
The construction and reconstruction cost of heat-supply pipe network of renewable
heating projects should be included in the urban infrastructure costs, which shall charge
according to the different standard of the construction of conventional heat-supply pipe
network. China may adopt different prices for different heating users. For instance, prices
for commercial heat and industrial heat should adopt market means and be determined
through negotiations between enterprises. Prices for space heating and hot water should
be determined through hearings, and the charging model based on heat quantity should
be implemented to encourage heating stations to operate according to the new mode of
energy saving service.
Support technology development and demonstration. China will support research and
design optimization of new systems, including a multi-energy complementary system for
renewable energy—which involves the integration of renewable energy and conventional
energy systems, and can include combining renewable heating with other energy sources
and storage. China will increase fiscal, tax and financial support for demonstrations in these
fields. Renewable heating should enjoy tax incentives and energy-saving subsidy policies,
as well as preferential green finance and green bonds policies set by the national
government. Policies and supports should particularly favour projects that affect
household heating, involve major renovation work, demonstrate significant innovation,
and strictly abide by environmental protection standards.
A new supervisory system for renewable heating
Improve the standard system for renewable heating. China should study and formulate
standards for measuring and accounting for renewable heating, which will require carrying
out heating measurement of individual renewable heating projects as well as establishing
monitoring and statistics systems related for renewable heating. China should strengthen
the testing and certification system for the renewable heating products, establish third-
party testing and certification institutions, as well as develop and improve the quality
certification system for renewable heating equipment and engineering services. Combined
with the reformation of the power system and the construction of the power market, China
should establish an information platform to coordinate energy flow and other data from
the electric power grid and the heat networks.
Strengthen environmental supervision of renewable heating projects. For projects that
may affect surface water, underground water, soil, or air quality, China should improve the
overall supervision system before, during, and after the renewable heating project’s
initiation. This entails monitoring geothermal energy development and utilization,
including real-time monitoring and dynamic evaluation of the exploration, development,
utilization and environment condition of geothermal energy resources. Regulators should
fully implement requirements for reinjection of geothermal tail water and ensure the
balance of extraction and injection. China should develop technical standards for biomass
heating as an alternative to coal heating, and improve technologies for low-nitrogen
combustion of large biomass boilers and equipment manufacturing. China should promote
the manufacturing of standardized, serialized and complete set of equipment, and
Chapter 11 | Suggestions for Key Policy Actions during the 14th Five-Year Plan
229 |
formulate standards for biomass heating engineering design, briquette-fuel products,
molding equipment, biomass boilers and emissions. In areas where mandatory installation
policies such as solar heating are implemented, supervision and management of project
construction and operation should be strengthened.
Renewable energy gas
The gas produced from renewable energy sources has many benefits, such as supplanting
the use of gas from fossil fuels while reducing emissions of methane. The current trend is
toward greater utilization of marsh gas production by fermentation of livestock manure,
straw and other raw materials, and biogas production by purification. Development of this
industry requires coordinated management across departments and fields, especially the
sorting and integration of upstream raw materials and promotion of consumption of
renewable energy gas.
Establish a collaborative management system for the biogas industry. China should
clarify the responsibilities of the leading authorities and departments for the biogas
industry. The field involves multiple departments of finance, development and reform
commissions, agriculture, environmental protection, energy, housing and construction,
taxation and quality inspection. These departments should jointly study and formulate
industrial goals, plans, policies, and standards, and work together to promote the industry.
Strengthen industrial supervision and management. After the completion of biogas
projects, professional third-party evaluation agencies should assess each project according
to project feasibility report, implementation plan and operational impact of the project.
China should study and formulate a project grading evaluation mechanism, including
grading completed projects on environmental impact, technical advancement, sustainable
operating capacity, and innovation. The grading should be linked with subsidy and tax
policies to ensure the construction quality and actual production impact of the projects.
The blacklist or credit system should also apply to such projects, in order to notify and
penalize companies with records of multiple ineffective projects.
Encourage social capital to participate in the construction of the collection, storage and
transportation of agricultural organic wastes. To encourage innovation in the
implementation of biomass-related policies, China should define new ways to integrate
social capital investment with government investment in waste regulation, prohibitions on
straw burning, fees for sewage and waste disposal, and environment taxes for livestock and
poultry farms. To encourage social capital to participate in the collection, storage and
transportation of agricultural organic wastes, policymakers can establish investment
subsidies, co-equity investments, long-term off-take contracts, and PPPs. China should
improve preferential tax policy as well as include agricultural organic waste collection and
treatment services in the scope of VAT refund and marginal relief. The government should
particularly support biogas enterprises with high technical qualifications, strong financial
strength and good records of project implementation to participate in the collection of crop
China Renewable Energy Outlook 2019 | Policy Action suggestions
230 |
straw and manure disposal of livestock and poultry breeding, and allow these enterprises
enjoy preferential VAT and income tax discounts and/or exemptions.
China should study and formulate the biogas blanket guarantee purchasing policy, in
accordance with the Renewable Energy Law. China should promote the blanket
purchasing or quota guarantee purchasing of biogas by pipe network enterprises, improve
the supportive policy for the construction of centralized gas supply pipe network in rural
areas, and ensure that biogas and marsh gas power generation and central gas supply are
treated equally in the market. The law requires that gas pipe network operators and gas
sales must purchase the locally produced biogas products at reasonable prices. In addition,
China may explore ways to ensure full consumption of biogas products, such as granting
franchise rights to biogas stations.
Study a gas quota system for renewable biogas. Given the successful roll-out of China’s
green certificates system for renewable electricity, the ongoing national reforms of the oil
and gas sector and gas pipeline sector, China should research a gas green certificate system.
In such a system, gas pipe network companies and gas sales companies would be required
to guarantee a certain proportion of biogas shares and take a certain volume of biogas
products. China should promote the green gas quota system and remove the restriction of
gas franchise on the market consumption of biogas products.
Biology liquid fuel
Biofuel ethanol
Biofuel ethanol production should match reasonable rates of consumption. The
Implementation Plan on Expanding the Production of Biofuel Ethanol and Promotion of
Ethanol Gasoline for Vehicles (FGNY [2017] No. 1508) and the Overall Layout Plan of the
National Biofuel Ethanol Industry (FGNY [2018] No. 1271) state that China should promote
biofuel ethanol nationwide by 2020. In 2018, China consumed about 3.15 million tons of
biofuel ethanol, far from the market demand of 13 million tons. Thus, nationwide uptake
of biofuel ethanol will likely shift to the 14th Five-Year Plan period. To ensure a stable
supply of biofuel ethanol raw materials, policy-makers should set production and
consumption policies to avoid situations where biofuel ethanol producers cannot meet
demand.
Increasing research and development of biofuel ethanol from non-grain raw materials.
Due to limits on raw material availability, China should supplement domestic production
of biofuel ethanol needs with non-grain biofuels. Non-grain biofuel ethanol has not
achieved large-scale development yet, and raw material cultivation guarantee and
production technology would require technological breakthroughs. China should focus on
the research and development of biofuel ethanol from non-grain raw materials, to solve
the urgent task of realizing nationwide use of biofuel ethanol.
Chapter 11 | Suggestions for Key Policy Actions during the 14th Five-Year Plan
231 |
Biodiesel
Strengthen raw material management, and regulate the upstream industry system.
The raw materials of biodiesel in China mainly come from animal and vegetable fat and oil
waste and waste cooking oil. Such organic wastes must be treated and disposed of, and
there is a major food safety risk caused by the return of gutter oil to the table. It is urgent
for China to standardize the collection, transhipment, disposal and supervision of the
upstream raw materials of biodiesel such as gutter oil. China should establish a long-term
management mechanism and enforce the regulation of the industry management system
through local legislation. This will ensure safe flow of raw materials, such as gutter oil, and
provide a raw material guarantee for biodiesel production.
Carry out pilot projects for biodiesel mixing. In China, the application and promotion of
biodiesel in the field of transportation is very narrow and limited to the production of
plasticizer and other chemical products. The pilot application and promotion of biodiesel
should be carried out according to the promotion experience of biofuel ethanol, to provide
a broad market for biodiesel and form a sustainable circular economic industry chain.
Conclusions
The scenarios and paths of energy development (which is characterized by high proportion
of renewable energy) are proposed and analysed in detail in the third part of this report.
Realizing this vision requires the development of technology and industry as well as
effective policies.
The 14th-five-year will be milestone for China renewable energy development, as the
innovative key policy mechanisms will impact the renewable energy development in the
short and long-term.
China Renewable Energy Outlook 2019 | Policy Action suggestions
232 |
12. Recommendations for Innovation and R&D
Build up a strategic system for energy technological R&D and
innovation
Formulate national innovative development strategy for energy sector and support
technological breakthrough in key fields. The government will focus on key technologies
that currently hinder the development and may lead to revolutionary breakthroughs. It will
lead to formulate the strategies, plans and policies that can support innovative
technological development, as well as breakthrough the bottleneck of core technologies.
China expects to establish a coordination mechanism in field of energy technology that
integrates the resources of governments, industries, universities and research institutes,
based on an innovative management system. Meanwhile, the government will improve the
supporting policies and regulations covering energy transition based on technological
legislation, technology commercialization, intellectual property protection and standard
making. To establish an innovative R&D culture is another goal, which implies the
development of a diversified, innovative, permissive and competitive environment. China
also aims to improve the quality of equipment standards, to establish and improve the
processes on quality testing, certification and inspection. It will build up an evaluation and
incentive mechanism for technical experts, based on the individual capacity and
contribution.
Persist on market orientation and stimulate the motivation and innovation of
enterprises. The government targets to establish an enterprise-led innovative
technological mechanism to felicitate energy transition, specifically on energy innovation,
R&D investment and product commercialization, for which the formulation of a healthy
market environment can play a key role. China will particularly guide enterprises to
increase investments in innovative energy technologies, especially capacity building in
large scale state-owned companies and private companies. The weighting of technological
innovation in evaluation criteria of state-owned energy enterprises could be increased. For
small scale enterprises, the government will promote private companies to carry out
technological innovation tasks assigned by the relevant authorities. China could deepen
the integration of production, study and R&D sections, creating a channel to bind industrial,
technological and economic development. Moreover, the country expects to increase
success rate of product commercialization and encourages innovative technical alliances in
industries that are enterprise-led and production-study integrated.
Increase investment and support in technology innovation and optimize management
mechanism for high-tech projects. The share of high-tech investments can be increased
by raising up the relevant proportion in central government’s annual budget and in
government managed funds. The industry should focus on breakthrough of major
technological projects around generic of technologies, equipment and standards for
energy transition. In the meantime, the government will provide guidance for venture
investment and private equity investment to implement innovative fiscal and tax policies
Chapter 12 | Technology Innovation recommendations
233 |
and facilitate localization of major technological equipment. Besides, the management
standard for high-tech projects should be improved in parallel, simplifying the approval
process of the State Programs of Science and Technology Development, as well as reducing
government intervention and improving transparency. The government shall implement
incentive mechanisms for participants, in a way that the life-long expert system for the
Program will be cancelled. In addition, the industry should avoid blindly following suit on
determination of technological innovation direction.
Support sector coupling to inspire the potential and advantages of collaborative
innovations. The industry should bind hardware and software more tightly. Integration of
energy with physics, chemistry, material and meteorology science, as well as sector
coupling of power, heat and gas networks, is necessary.
Continue to support the innovations that are self-dependent or through international
cooperation. The industry should aim at global cutting-edge technologies. Self-dependent
innovation of technology should always be the core solution in energy transition process;
parallelly, China should be more open to carry out international collaborations with a
broader scope. The industry should take advantage of new technologies, methods and
concepts around the world, to form a united and coordinated innovation system.
Key areas of technological innovation
Large-scale renewable and hydrogen utilization technology
Innovation in efficient utilization of solar energy
The industry should further research on key technologies that are beneficial for the
industrialization of efficient and cost-effective crystalline silicon cells and develop key
materials to support them. The main focus includes the production lines of crystalline
silicon cells with average efficiency exceeding 25% such as HIT cell, TopCON cell
technology and IBC cell. Furthermore, the government can encourage implementing
demonstrations for high-efficiency battery pack production and application.
It is necessary to develop new types of photoelectric converters with higher efficiency and
lower cost, as well as breakthrough the technological bottleneck in industrialization
processes. By doing so, China would master the technology, production process and
equipment for industrialization of thin-film battery such as CdTe, CuInGaSe and Si Film.
The industry should greatly improve cell efficiency and achieve localization of key raw
materials. The targeted technologies include building integrated PV, smart PV plants,
wind-PV-CSP hybrid power plants, DC grid connection of distributed PV and PV micro-grid.
China aims to develop a demonstration project of 50 MW wind-PV-CSP power system with
heat storage equipment assembled.
Innovation of large-scale wind power technology
In order to expand the application of wind power generation at height of 200 to 300 meters,
China would need to deepen the research on the full package of technologies for large scale
wind power system at such height, key technologies for large scale high-altitude wind
China Renewable Energy Outlook 2019 | Policy Action suggestions
234 |
turbines, and design and manufacture of 100 meters and above wind blades. The industry
should study in depth the offshore wind resource characteristics and its utilization methods.
The main goal is to develop local offshore wind resource assessment system, understand
the complexity of wind conditions and make optimal decisions regarding site selection. The
government should require to breakthrough key technologies on design and construction
of high sea offshore wind power plants, including the infrastructures to support wind
turbines, site selection, deployment, building, construction, operation and maintenance of
the project.
China should implement R&D on 10 MW and above offshore wind turbine with
independent intellectual property rights, and key components such as bearing system,
control system, converter and blades. Operation, control and grid connection of offshore
wind power bases based on big data and cloud computing technologies are also a key task.
Additionally, China will focus on mastering key technologies such as cluster control of
large-scale offshore wind power bases based on big data, optimal control and intelligent
maintenance of offshore wind power bases, real-time monitoring and smart diagnosis
system for offshore wind farms.
Research on key technology of large-scale hydropower
The government aims to make breakthroughs in hydropower engineering under complex
construction conditions, such as high earthquake-intensity areas and ultra-deep
overburden layers. It involves engineering technologies for large-scale underground
caverns, high-pressure watercourse lining structure and high-pressure grouting,
temperature control and crack prevention of high-duty mass concrete, dam foundation
treatment in high earthquake-intensity areas and ultra-deep overburden layers, as well as
construction technologies under ultra-high ground stress conditions.
The industry should master the key technologies for the safety, emergency, terrorism and
riot prevention for cascade hydropower stations. The key technologies for multi-objective
coordinated optimal operation of cascade hydropower stations based on hydrological
forecast is also an important focus, as well as the technologies for optimal siting, retrofit
and retirement of cascade hydropower stations. The country would build a basin
environmental monitoring system and database platform, dynamically monitoring the
evolution rule of the ecological environment of the basin hydropower development.
Innovation in utilization technology of biomass, marine and geothermal energy
The government aims to make breakthrough in advanced biomass energy and chemical
technology. The industry should carry out large-scale industrial demonstrations of
biological aviation oil (including military), cellulosic ethanol and green bio-refinery. In the
meantime, it should study new varieties and high-efficiency energy plants, build ecological
energy farms, and form an advanced bio-energy chemical industry chain and a sustainable
supply system of biomass materials.
China should also strengthen the development and utilization of marine energy, develop
efficient wave energy, tidal energy and thermal (salinity) gradient energy generators. The
Chapter 12 | Technology Innovation recommendations
235 |
industry expects to build megawatt demonstration power stations and form a complete
industry chain of marine energy utilization.
The development and utilization of geothermal energy is also necessary. Specifically,
China should focus on the retrofit and productivity increment technologies for
hydrothermal geothermal system, as well as investigate key technical equipment for the
development of dry hot rock and build megawatt demonstration projects for dry hot rock
power generation and cascade utilization of geothermal energy.
Innovation in hydrogen energy and fuel cell technology
The industry should study the large-scale cost-effective hydrogen production technology
based on renewable energy. Distributed electrolytic hydrogen production technology that
can adapt to the rapid variable renewable energy is an important technology to develop,
and establish a standardized on-site hydrogen production mode for hydrogen refuelling
stations and demonstrate its application is a target.
Another goal consists of the development of the key materials and technical equipment for
hydrogen storage and transportation. Such achievement will allow large scale cost-
effective integration of hydrogen production, storage, transportation and application,
achieve standardization and promotion of various hydrogen on-site production and
storage modes for hydrogen refuelling stations.
Meanwhile, in order to realize demonstrative operation and market expansion of PEMFC
automobiles, the industry should formulate technical solutions to manufacture the key
materials and components and realize system integration for high-performance PEMFC.
The industry should also focus on distribution power generation technology based on
PEMFC and SOFC, realizing the demonstration application of high-power distributed
power generation system, and explore the marketing mode.
Key technologies for the new generation of smart energy system adapted to a high
proportion of renewable energy
Innovation in key technologies for modern power grid
China will study intelligent control technologies for modern power grids. The goal is to
master key technologies for large-scale renewable energy and distributed grid-connected
operation and carry out demonstration projects. The government also expects
breakthroughs in the overall coordinated control technology for the power system and
demonstration of new applications.
China aims to master advanced power transmission and transformation equipment
technologies such as flexible DC power transmission and distribution technology, new
high-capacity high-voltage electric and electronic components technology and high-
voltage submarine power cable. The country will also focus on the research, experiment
and demonstration of DC power grid technology as well as future technology for power
transmission. China will support studies on key technologies and processes for energy
equipment components, such as high-temperature superconducting materials, new
insulating medium and sensing materials and devices for power equipment. It is also
China Renewable Energy Outlook 2019 | Policy Action suggestions
236 |
necessary to research the security and stability technology for modern complex large
power grid, in order to achieve a safe and stable operation of modern complex large power
grid.
The country will also focus on simulation technology for modern complex large power grid
leveraging big data. Such an approach will make full use of the mutual coordination
technology between micro grid/LAN and large power grid, as well as the intelligent control
technology for source-network-load coordination.
Innovation in advanced energy storage technology
China will support research on chemical energy storage technologies for grid-connected of
renewable energy, distributed and micro-grid and EV applications. The emphasis is high-
safety, low-cost and long-life battery technologies, including lithium-ion batteries, lead-
carbon batteries, sodium-sulphur batteries and vanadium redox batteries.
The country also aims to study physical energy storage technologies for peak load
regulation and efficiency improvement of power grid and regional energy supply. It targets
at developing its own independent intellectual property of the new compressed air energy
storage technology, flywheel energy storage technology and high-temperature
superconducting energy storage technology.
China will also conduct research on the high-temperature heat accumulation technology
for the efficient utilization of solar thermal and the high-capacity heat (cold) accumulation
technology for distributed energy system. The target is to master the key core
technologies for various links of energy storage technologies and verify the demonstration
projects.
Innovation in energy Internet technology
The government will support research on key energy conversion technologies, such as
high-temperature superconducting materials, high power electronic devices, integrated
power generation/energy storage fuel cells, and heat pumps for regional thermal energy
taste regulation. This research will support the development of standardized energy
routers. Using power grid and pipe network as backbone network, China will coordinate
the interconnection of cold, hot, water and gas networks, and build a multi-energy
collaborative energy network.
The country will also enhance innovation in energy internet integrated technology. It will
focus on technologies such as the efficient integration and intelligent control of
information systems and physical systems, the integration and safe sharing of energy big
data, the application and management of energy storage and EVs, and the demand-side
response. It also aims to form a relatively complete technical standard system.
Innovation in advanced nuclear technology
China intends to realize the demonstration application of self-developed advanced nuclear
fuel element. It will promote the irradiation test and commercial operation of ATF and
Chapter 12 | Technology Innovation recommendations
237 |
annular fuel element. The country intends to possess the international leading R&D
capability of nuclear fuel element.
As China’s third generation PWR technology has been at a leading level in the world, the
country will focus on promoting the construction of fast reactor and advanced modular
small reactor demonstration projects, as well as the construction of an advanced nuclear
fuel circulatory system. The objective is to make major breakthroughs in basic theory and
R&D of key technical equipment and materials for the new generation of advanced
reactors, such as ultra-high temperature gas cooled reactors and molten salt reactors.
Technologies for energy conservation and efficiency improvement
The industry should strengthen innovation in energy-saving technologies. It should focus
on conducting researches and carrying out demonstration projects on efficient industrial
boilers (kilns), innovative energy-saving motors, deep recycling of industrial
complementary energy, and energy conservation of industrial systems, based on advanced
information technology.
The construction industry should innovate in energy-saving technologies, such as building
industrialization, prefabricated housing, and energy efficient smart devices. In the
transportation industry, China will promote innovation in advanced transportation energy-
saving technologies such as energy-efficient vehicles, braking energy feedback system,
and transportation system based on advanced information technology.
China will also enhance innovation in energy-saving technologies for global optimization
systems such as the cascade utilization of energy. It will make research and demonstration
on comprehensive energy utilization technologies, such as the replacement of bulk coal, to
support the country in achieving the goal of energy conservation and emission reduction.
Technologies of the green mining and clean low & zero carbon utilization for fossil
energy
China expects technology innovation in extracting unconventional oil & gas, deep oil & gas
and deep-sea oil & gas. It will develop extraction technologies, aiming at the efficient
extraction of unconventional oil & gas such as shale oil & gas and coalbed methane. The
government also expects to master the technologies for deep-sea oil & gas exploration and
extraction. It will comprehensively improve the technological level of deep-sea oil & gas
drilling and the capability of independent equipment constructing. The target is to realize
the independent and efficient extraction of oil & gas fields at 3,000m and 4,000m ultra-
deep water.
China also aims at making breakthroughs in the basic theory and key technology for NGH
exploration and extraction, as well as carrying out pilot drilling and trial production tests.
Revolutionary technologies associated with energy development
China expects breakthroughs in the high-temperature superconducting technology and its
application in power transmission, energy conversion and storage. The industry should
China Renewable Energy Outlook 2019 | Policy Action suggestions
238 |
explore controllable thermonuclear fusion technology. It should carry out experiments on
fusion reactor core combustion plasma and conduct research on its control technology. It
should also focus on the design of fusion demonstration reactor DEMO. The government
will encourage the integration of AI, big data, 5G and other key technologies with energy
production and consumption.
Innovation in business models
Innovative business models play a vital role in promoting energy transformation and
accelerating new technology introduction. With the increase of distributed energy, China
will gradually introduce more flexible and innovative business models into the energy field
through resource sharing and diversified development of market traders.
Integrated energy service model
The integrated energy service model aims to sell services to customers instead of selling
electricity. By purchasing energy services, customers can reduce the energy consumption
cost and improve their comprehensive energy utilization efficiency. Energy service
providers, relying on the energy efficiency data sharing platform, are able to fully exert
their advantages on energy data resources and provide customers with energy efficiency
improvement services. They can promote integrated energy services such as market-
oriented electricity sales and integrated energy consumption of electricity, water, gas and
heat. They can also expand service models such as electric energy substitution, energy-
saving, multi-energy complement and energy consumption monitoring and diagnosis in
areas.
Australia, China, Finland, Ireland, Italy, Japan, Sweden, the United Kingdom and the
United States have adopted the integrated energy service model. In China, both State Grid
and China Southern Power Grid have taken integrated energy services as their next
business expansion direction and started to establish corresponding institutions. For
example, State Grid has built the Tongli Integrated Energy Service Centre and has put it
into operation.
“Energy aggregator” model
Energy aggregator (also known as “virtual power plants”) can aggregate many distributed
renewable energy sources at the same time, producing a comparable capacity to
conventional power plants. Energy aggregators can sell electricity directly to the wholesale
market and provide ancillary services to grid operators, for a smooth integration of
distributed energy sources into the power system. Therefore, energy aggregators
contribute to power system flexibility. Energy aggregation companies have already been
established in Australia, Belgium, France, Germany, the Netherlands, the United Kingdom
and the United States. In the United Kingdom, there are 19 energy aggregation companies,
with about 10 GW of installed capacity. In order to develop the “energy aggregator” model,
China expects to make breakthroughs in power market and supporting mechanism.
Chapter 12 | Technology Innovation recommendations
239 |
P2P trading model
P2P trading mode creates an online marketplace platform for energy trading, where
consumers trade peer-to-peer with distributed energy suppliers. The main goal of P2P
market is to provide a transparent and credible platform for producers and consumers. The
platform equitably balances the preferences and needs of both power producers and
consumers, to achieve a win-win situation for all the participants. An important mode for
P2P trading consists of building the trading system based on blockchain technology in
micro-grid application scenario. It encourages the development of distributed renewable
energy generators and the consumption of local energy. Germany, the Netherlands, the
United Kingdom and the United States have carried out some demo projects using P2P
models . In China, some energy blockchain labs are actively exploring the P2P trading mode.
However, at the operation level, similarly to power transactions with nearby power users
within a distribution network, it requires the establishment of corresponding rules on the
T&D cost mechanism.
Community ownership model
Community ownership (CO) model aims to manage energy-related assets uniformly in
communities and allow community members to share the benefits of renewable power
plants. The CO model can supply renewable energy to consumers who are unable or
unwilling to install power generation facilities on their buildings. The model encourages
the energy generation and consumption from local renewable energy sources. Currently,
there are more than 4,000 renewable energy communities around the world, mainly in
countries such as the United States, Europe, Australia, with project scale ranging from 50
kW to 10 MW. In China, this model is technically available. However, there are still
ambiguity in implementation, such as the asset management of renewable energy projects,
ownership of the community building roofs, and the role of power grid enterprises.
China Renewable Energy Outlook 2019
240 |
References
1 “习近平:决胜全面建成小康社会 夺取新时代中国特色社会主义伟大胜利——在中国共产党第十九次全国
代表大会上的报告,” The State Council, 27 October 2017, accessed at http://www.gov.cn/zhuanti/2017-10/27/content_5234876.htm. 2 Si Jiming, Qiu Bo, Zhang Xiaofeng, “能源环境政策:2018 全回顾 2019 抢“鲜”看!,” Huaneng Institute of technology and Economics, 12 April 2019, accessed at http://news.bjx.com.cn/html/20190412/974542.shtml. 3 "2018 国民经济和社会发展统计公报," National Bureau of Statistics, 28 February 2019, accessed at http://www.stats.gov.cn/tjsj/zxfb/201902/t20190228_1651265.html. 4 Coal consumption in 2018:“《2018 煤炭行业发展年度报告》发布:电力行业全年耗煤 21 亿吨左右,” China National Coal Association, 15 March 2019, accessed at http://news.bjx.com.cn/html/20190315/969088.shtml;
coal consumption in 2017: “中国能源统计年鉴-2017,” National Bureau of Statistics of China, 13 June 2018, Pg74. 5 "2018 国民经济和社会发展统计公报," National Bureau of Statistics, 28 February 2019, accessed at http://www.stats.gov.cn/tjsj/zxfb/201902/t20190228_1651265.html. 6 "2018 国民经济和社会发展统计公报," National Bureau of Statistics, 28 February 2019, accessed at http://www.stats.gov.cn/tjsj/zxfb/201902/t20190228_1651265.html. 7 “中国能源发展报告 2018,” China Electric Power Planning & Engineering Institute, 23 April 2019, P6. 8 “World Energy Investment 2018,” International Energy Agency, July 2018, accessed at iea.org/wei2018. 9 “World Energy Investment 2019,” International Energy Agency, May 2019, accessed at iea.org/wei2019. 10 “Notice of the National Development and Reform Commission on matters related to speeding up the key projects of interconnection of natural gas infrastructure in 2018,” Wall Street Stories, 19 June 2018, accessed at https://wallstreetcn.com/articles/3340448. 11 “中汽协:2018 全年汽车销量自 1990 年来首次年度下滑,” sina.com, 14 January 2019, accessed at http://finance.sina.com.cn/chanjing/cyxw/2019-01-14/doc-ihqfskcn6997845.shtml. 12 “董扬:去年中国电动车销量占全球 62.5%你还认为电动车不行么?” sohu.com, 1 April 2019, accessed at https://www.sohu.com/a/305260389_680702. 13 “2018 年中国储能行业细分市场现状及发展前景分析 抽水储能仍将是未来发展重点,” Prospective Industry Research Institute, 23 July 2019, accessed at https://www.qianzhan.com/analyst/detail/220/190404-54463c2a.html. 14 Zhang Yousheng, Ga Hu, Liu Jian, “我国新能源技术进步超过预期
推动新能源发展步入新阶段,” Energy Research Institute of National Development and Reform Commission, July 2019. 15 “权威数据证实:去年我国蓝天白云更多了!主要空气污染物下降明显,” China Weather Fan, 12 May 2019, accessed at https://baijiahao.baidu.com/s?id=1632953003474884541&wfr=spider&for=pc. 16 “国务院关于印发打赢蓝天保卫战三年行动计划的通知, 国发〔2018〕22 号,”State Council, 27 June 2018, accessed at http://www.gov.cn/zhengce/content/2018-07/03/content_5303158.htm. 17 “国家发展改革委办公厅国家能源局综合司关于开展电力现货市场建设试点工作的通知, 发改办能源
〔2017〕1453 号,” National Development and Reform Commission and National Energy Administration, 28 August 2017, accessed at http://www.ndrc.gov.cn/gzdt/201709/t20170905_860117.html. 18 International Energy Agency. "World Energy Outlook." Paris (2018). https://webstore.iea.org/world-energy-outlook-2018 19 The electrification rate is defined as the electricity generation / final energy consumption (including power plants own consumption). 20 These shares are calculated based on the physical energy content method (pec). 21 “关于建立健全可再生能源电力消纳保障机制的通知, 发改能源[2019]807 号,” National Development and Reform Commission and National Energy Administration, 10 May 2019, accessed at http://www.ndrc.gov.cn/zcfb/zcfbtz/201905/t20190515_936170.html. 22 Implementation Plan on Expanding the Production of Biofuel Ethanol and Promotion of Ethanol Gasoline for Vehicles (FGNY [2017] No. 1508) and the Overall Layout Plan of the National Biofuel Ethanol Industry (FGNY [2018] No. 1271) 23 “Global Energy & CO2 Status Report,” International Energy Agency, 2019, at https://ww.iea.org/geco/coal/. Nikos Tsafos, “The Center of Coal Demand Keeps Shifting,’ Center for Strategic and International Studies, 15 October 2018, at https://www.csis.org/analysis/center-coal-demand-keeps-shifting. 24 “Global Energy & CO2 Status Report,” International Energy Agency, 2019, at
References
241 |
https://ww.iea.org/geco/emissions/. 44% figure based on the sum of 4.5 Gt of CO2 from other coal use and 10.1 Gt of CO2 from coal power, of 33.2 Gt CO2 from all energy-related sources. 25 Elizabeth Mahy, “Britain breaks coal-free power record over Easter weekend,” BBC News, 22 April 2019, at https://www.bbc.co.uk/news/business-48015613. 26 Scott DiSavino, “President Trump can't stop U.S. coal plants from retiring,” Reuters, 14 January 2019, at https://www.reuters.com/article/us-usa-trump-coal/president-trump-cant-stop-u-s-coal-plants-from-retiring-idUSKCN1P80BY; Stacy MacIntyre and Scott Jell, “U.S. coal consumption in 2018 expected to be the lowest in 39 years,” U.S. Department of Energy, Energy Information Agency, 4 December 2018, at https://www.eia.gov/todayinenergy/detail.php?id=37692. 27 Clyde Russell, “Coal going from winner to loser in India's energy future,” Reuters, 20 February 2019, at https://uk.reuters.com/article/uk-column-russell-coal-india/column-coal-going-from-winner-to-loser-in-indias-energy-future-idUKKCN1Q912N; Simon Mundy, “India’s renewable rush puts coal on the back burner,” Financial Times, 1 January 2019, at https://www.ft.com/content/b8d24c94-fde7-11e8-aebf-99e208d3e521. 28 Haroon Janjua, “Cash-strapped Pakistan asks China to shelve US$2 billion coal plant,” South China Morning Post, 16 January 2019, at https://www.scmp.com/week-asia/geopolitics/article/2182326/cash-strapped-pakistan-asks-china-shelve-us2-billion-coal. 29 “Short-term Energy Outlook, April 2019,” U.S. Department of Energy, Energy Information Administration, April 2019, at https://www.eia.gov/outlooks/steo/report/global_oil.php. 30 “Stranded Assets and Renewables: Working Paper,” International Renewable Energy Agency, July 2017, at https://www.irena.org/DocumentDownloads/Publications/IRENA_REmap_Stranded_assets_and_renewables_2017.pdf; "Entire $4.9 trillion investment in new oil and gas is incompatible with global climate goals,” Global Witness, 23 April 2019, at https://www.businessgreen.com/bg/news-analysis/3074416/alarming-oil-and-gas-investment-plans-blow-a-hole-in-15c-ambition. 31 “Global Energy & CO2 Status Report,” International Energy Agency, 2019, at https://ww.iea.org/geco/gas/ 32 “Gas 2018: Executive Summary,” International Energy Agency, 2018, at https://webstore.iea.org/download/summary/1235?fileName=English-Gas-2018-ES.pdf. 33 “Renewable Capacity Statistics 2019,” International Renewable Energy Agency, March 2019, at https://www.irena.org/publications/2019/Mar/Renewable-Capacity-Statistics-2019. 34 “Global Wind Report 2018,” Global Wind Energy Council, April 2019, at https://gwec.net/wp-content/uploads/2019/04/GWEC-Global-Wind-Report-2018.pdf. 35 “Renewable Capacity Statistics 2019,” International Renewable Energy Agency, March 2019, at https://www.irena.org/publications/2019/Mar/Renewable-Capacity-Statistics-2019. 36 “Global Energy & CO2 Status Report,” International Energy Agency, 2019, at https://ww.iea.org/geco/electricity/. 37 “Renewable Capacity Statistics 2019,” International Renewable Energy Agency, March 2019, at https://www.irena.org/publications/2019/Mar/Renewable-Capacity-Statistics-2019. 38 “Costs,” International Renewable Energy Agency, accessed 4 May 2019, at https://www.irena.org/costs. 39 Mark Osborne, “Global solar PV installations reach 109GW in 2018 – BNEF,” PV Tech, 16 January 2019, at https://www.pv-tech.org/news/global-solar-pv-installations-reach-109gw-in-2018-bnef. 40 Jeff St. John, “BNEF: Battery storage prices falling faster than expected,” Greentech Media, 26 March 2019, at https://www.greentechmedia.com/articles/read/report-levelized-cost-of-energy-for-lithium-ion-batteries-bnef; “How Utilities Can Look Beyond Natural Gas with Cost-Effective Solar Plus Storage Strategies,” Navigant Research, 1Q 2019, at https://www.navigantresearch.com/reports/how-utilities-can-look-beyond-natural-gas-with-cost-effective-solar-plus-storage-strategies. 41 “World Energy Outlook 2018, Executive Summary,” International Energy Agency, 2018, at https://webstore.iea.org/download/summary/190?fileName=English-WEO-2018-ES.pdf. 42 “Fly Electric,” The Atlantic, 2019, at https://www.theatlantic.com/sponsored/thomson-reuters-why-2025-matters/electric-flight/208/; Darrell Etherington, “Zunum Aeros Electric Passenger Plane Hopes to Offer Cheaper Flights by 2020,” Tech Crunch, 5 April 2017, at https://techcrunch.com/2017/04/05/zunum-aeros-electric-passenger-plane-hopes-to-offer-cheaper-flights-by-2020/. 43 “Global energy transformation: A roadmap to 2050 (2019 edition),” International Renewable Energy Agency, 2019, at https://www.irena.org/publications/2019/Apr/Global-energy-transformation-A-roadmap-to-2050-2019Edition. 44 “Global Energy & CO2 Status Report 2018,” International Energy Agency, 26 March 2019, at https://webstore.iea.org/global-energy-co2-status-report-2018. Other estimates suggest the increase in emissions may have been higher: “Strong growth in global CO2 emissions expected for 2018,” Tynall Centre for Climate Change Research, 2018, at https://www.tyndall.ac.uk/news/strong-growth-global-co2-emissions-expected-2018; Jeff Tollefson, “Global industrial carbon emissions to reach all-time high in 2018,” Nature, 7 December 2018, at https://www.nature.com/articles/d41586-018-07666-6.
China Renewable Energy Outlook 2019
242 |
45 “Special Report: Global Warming of 1.5 degrees C, Summary for Policymakers,” Intergovernmental Panel on Climate Change, 18 October 2018, at https://www.ipcc.ch/sr15/chapter/summary-for-policy-makers/. 46 “Emissions Gap Report 2018,” United Nations Environmental Programme, IPCC Side Event, 5 December 2018, at https://www.ipcc.ch/site/assets/uploads/2018/12/UNEP-1.pdf. 47 中国石油新闻中心发布《2018 年国内外油气行业发展报告》, China National Petroleum Corporation (CNPC), 16th January 2019, accessed at http://news.cnpc.com.cn/system/2019/01/18/001717430.shtml. 48 “2018 年可再生能源并网运行情况介绍,” National Energy Administration, 28 January 2019, accessed at http://www.nea.gov.cn/2019-01/28/c_137780519.htm?from=groupmessage&isappinstalled=0. 49 “Regulation (EU) 2018/1999 of the European Parliament and of the Council of 11 December 2018 on the Governance of the Energy Union and Climate Action, amending Regulations (EC) No 663/2009 and (EC) No 715/2009 of the European Parliament and of the Council, Directives 94/22/EC, 98/70/EC, 2009/31/EC, 2009/73/EC, 2010/31/EU, 2012/27/EU and 2013/30/EU of the European Parliament and of the Council, Council Directives 2009/119/EC and (EU) 2015/652 and repealing Regulation (EU) No 525/2013 of the European Parliament and of the Council”, European Union, 21 December 2018, accessed at https://eur-lex.europa.eu/legal-content/EN/TXT/?uri=uriserv:OJ.L_.2018.328.01.0001.01.ENG&toc=OJ:L:2018:328:TOC 50 Agora Energiewende, “Die Energiewende im Stromsektor: Stand der Dinge 2018“, accessed at https://www.agora-energiewende.de/veroeffentlichungen/die-energiewende-im-stromsektor-stand-der-dinge-2018/ . 51 “Shaping Germany’s Future, Coalition treaty between CDU/CSU and SPD, 18th legislative period”, Kanrod-Adenauer-Stiftung, February 2014, accessed at https://www.kas.de/c/document_library/get_file?uuid=d58641a0-02ab-935a-c295-1148b45cc426&groupId=252038 52 “Environmental declaration report”, Energinet.dk, 2018, accessed at https://en.energinet.dk/-/media/54B20C77CE954D7D98696520C23BAD6E.pdf. 53 “Danish Energy Agreement”, Danish Energy Agency, June 2018, accessed at https://efkm.dk/ministeriet/aftaler-og-politiske-udspil/energiaftalen/. 54 “DOE 2018 Notable Achievements”, Department of Energy, January 2019, accessed at https://www.energy.gov/sites/prod/files/2019/01/f58/DOE-YearEndAccomplishments2018.pdf. 55 “Trump Admin’s Push for Coal, Nuke Bailout Reflected in Key Staff Positions at Federal Agencies”, Wood Mackenzie, accessed at https://www.greentechmedia.com/articles/read/political-pressure-ferc-doe-to-push-coal-and-nuclear-bailout#gs.3l83g6. 56 Galen Barbose, “U.S. Renewable Portfolio Standards 2018 Annual Status Report”, Lawrence Berkeley National Laboratory, November 2018, accessed at http://eta-publications.lbl.gov/sites/default/files/2018_annual_rps_summary_report.pdf; “Decision approving, with modifications, non-unanimous comprehensive settlement; and establishing electric energy savings and demand reduction goals for 2019 through 2023, with associated financial incentives”. Public Utilities Commission of the State of Colorado, 6 June 2018, accessed at http://www.m.swenergy.org/Data/Sites/1/media/documents/news/co-xcel-dsm-puc-decision-6-6-18.pdf. 57 “The Coal Cost Crossover”, Energy Innovation and Vibrant Clean Energy (VCE), March 2019, accessed at https://energyinnovation.org/wp-content/uploads/2019/03/Coal-Cost-Crossover_Energy-Innovation_VCE_FINAL.pdf. 58 “The State of Electric Vehicles in Hawaii”, Electric Vehicle Transportation Center (EVTC), March 2015, accessed at http://evtc.fsec.ucf.edu/publications/documents/HNEI-05-15.pdf; “Hawaiian Electric Announces ‘Mind-Blowing’ Solar-Plus-Storage Contracts”, Wood Mackenzie, January 2019, accessed at https://www.greentechmedia.com/articles/read/hawaiian-electric-industries-announces-mind-blowing-solar-plus-storage-cont#gs.3l5kl7. 59 Fiona Harvey, ”What was agreed at COP24 in Poland and why did it take so long?” The Guardian, December 2018, accessed at https://www.theguardian.com/environment/2018/dec/16/what-was-agreed-at-cop24-in-poland-and-why-did-it-take-so-long. 60 “Solidarity and Just Transition Silesia Declaration,” Just Transition Solidarna Transformacja; COP24 Katowice 2018, December 2018, accessed at https://cop24.gov.pl/fileadmin/user_upload/files/Solidarity_and_Just_Transition_Silesia_Declaration.pdf. 61 “Power System Flexibility Campaign,” Clean Energy Ministerial, accessed at http://www.cleanenergyministerial.org/campaign-clean-energy-ministerial/power-system-flexibility 62 “IEA report highlights need for policy action to improve power system flexibility,” International Energy Agency, May 2018, accessed at https://www.iea.org/newsroom/news/2018/may/iea-report-highlights-need-for-policy-action-to-improve-power-system-flexibility.html. 63 “习近平:决胜全面建成小康社会 夺取新时代中国特色社会主义伟大胜利——在中国共产党第十九次全国
代表大会上的报告,” The State Council, 27 October 2017, accessed at http://www.gov.cn/zhuanti/2017-
References
243 |
10/27/content_5234876.htm. 64 “中华人民共和国 2017 年国民经济和社会发展统计公报,”National Bureau of Statistics, 28 February 2019, accessed at http://www.stats.gov.cn/tjsj/zxfb/201802/t20180228_1585631.html. 65 “中国能源发展报告 2018,” China Electric Power Planning & Engineering Institute, 23 April 2019, P6. 66 “中国能源发展报告 2018,” China Electric Power Planning & Engineering Institute, 23 April 2019, P40. 67 Si Jiming, Qiu Bo, Zhang Xiaofeng, “能源环境政策:2018 全回顾 2019 抢“鲜”看!,” Huaneng Institute of technology and Economics, 12 April 2019, accessed at http://news.bjx.com.cn/html/20190412/974542.shtml. 68 “中国能源发展报告 2018,” China Electric Power Planning & Engineering Institute, 23 April 2019, P38. 69 ““十三五”煤钢去产能基本完成未来多方合力谋求转型发展,”Sina News, 31 January 2019, accessed at http://finance.sina.com.cn/roll/2019-01-31/doc-ihrfqzka2498625.shtml. 70 Zhao Bi, ““十三五”煤钢去产能基本完成未来多方合力谋求转型发展,” Xinlang Financial News, 31 January 2019, Accessed at http://finance.sina.com.cn/roll/2019-01-31/doc-ihrfqzka2498625.shtml. 71 “《2018 煤炭行业发展年度报告》发布:电力行业全年耗煤 21 亿吨左右(2),” News BJX, 14 March 2019, accessed at http://news.bjx.com.cn/html/20190315/969088-2.shtml 72 "2018 国民经济和社会发展统计公报," National Bureau of Statistics, 28 February 2019, accessed at http://www.stats.gov.cn/tjsj/zxfb/201902/t20190228_1651265.html. 73 Coal consumption in 2018:“《2018 煤炭行业发展年度报告》发布:电力行业全年耗煤 21 亿吨左右,” China National Coal Association, 15 March 2019, accessed at
http://news.bjx.com.cn/html/20190315/969088.shtml; coal consumption in 2017: “中国能源统计年鉴-2017,” National Bureau of Statistics of China, 13 June 2018, Pg74. 74 Coal consumption in 2018:“《2018 煤炭行业发展年度报告》发布:电力行业全年耗煤 21 亿吨左右,” China National Coal Association, 15 March 2019, accessed at http://news.bjx.com.cn/html/20190315/969088.shtml. 75 Mu Xiaofei, “2018 年中国石油化工行业分析 原油产量下滑、天然气较快增长,” Forward - The Economist, 02 November 2018, accessed at https://www.qianzhan.com/analyst/detail/220/181101-98d9d7f0.html. 76 Katharina Buchholz, “China’s E-Bus fleet dents global oil demand,” Statista, 25 March 2019, accessed at https://www.statista.com/chart/17468/global-oil-demand-displacement-by-electric-vehicles/. 77 “《2018 年国内外油气行业发展报告》发布,我国油气产业扩大开放,” Sohu News, 18 January 2019, accessed at http://www.sohu.com/a/289990960_505855. 78 “目前来看新能源汽车对汽油消费的影响甚微,” Huatai Futures, 28 July 2018, accessed at https://www.htfc.com/wz_upload/png_upload/20180725/1532498596875e609ef.pdf. 79 “2018 年我国页岩气产量超百亿方,” China Energy News, 17 January 2019, accessed at http://gas.in-
en.com/html/gas-3011343.shtml; Wu Li, “我国天然气对外依存度突破 45% 中石油经济技术研究院发布《2018
年国内外油气行业发展报告》,” China Energy News, 23 January 2019, accessed at http://news.bjx.com.cn/html/20190123/958514.shtml. 80 "2018 国民经济和社会发展统计公报," National Bureau of Statistics, 28 February 2019, accessed at http://www.stats.gov.cn/tjsj/zxfb/201902/t20190228_1651265.html. 81 "2018 国民经济和社会发展统计公报," National Bureau of Statistics, 28 February 2019, accessed at http://www.stats.gov.cn/tjsj/zxfb/201902/t20190228_1651265.html. 82 Wu Li, “我国天然气对外依存度突破 45% 中石油经济技术研究院发布《2018 年国内外油气行业发展报
告》,” China Energy News, 23 January 2019, accessed at http://news.bjx.com.cn/html/20190123/958514.shtml. 83 Wu Li, “我国天然气对外依存度突破 45% 中石油经济技术研究院发布《2018 年国内外油气行业发展报
告》,” China Energy News, 23 January 2019, accessed at http://news.bjx.com.cn/html/20190123/958514.shtml. 84 “中电联发布《2018-2019 年度全国电力供需形势分析预测报告》,” China Electricity Council, 29 January 2019, accessed at http://www.cec.org.cn/yaowenkuaidi/2019-01-29/188578.html. 85 “中国电力工业现状与展望(2019),” China Electricity Council, February 2019, pg 30-31; air pollution control
policy: “国务院关于印发打赢蓝天保卫战三年行动计划的通知, 国发〔2018〕22 号,” The State Council – The People’s Republic of China, 27 Jun 2018, accessed at http://www.gov.cn/zhengce/content/2018-07/03/content_5303158.htm. 86 “中电联发布《2018-2019 年度全国电力供需形势分析预测报告》,” China Electricity Council, 29 January 2019, accessed at http://www.cec.org.cn/yaowenkuaidi/2019-01-29/188578.html. 87 “国家发展改革委国家能源局关于有序放开发用电计划的通知, 发改运行〔2017〕294 号,” National Energy Administration and National Development and Reform Commission, 29 March 2017, accessed at http://www.sdpc.gov.cn/zcfb/zcfbtz/201704/t20170410_843769.html. 88 “国家发展改革委 国家能源局关于加快做好淘汰关停不达标的 30 万千瓦以下煤电机组工作暨下达 2018
年煤电行业淘汰落后产能目标任务(第一批)的通知,发改能源[2018]1228 号,” National Energy Administration
China Renewable Energy Outlook 2019
244 |
and National Development and Reform Commission, September 2018, accessed at http://news.bjx.com.cn/html/20180927/930799.shtml. 89 “关于印发 2018 年各省(区、市)煤电超低排放和节能改造目标任务的通知,” National Energy Administration and Ministry of Ecological Environment, 19 August 2018, accessed at http://zfxxgk.nea.gov.cn/auto84/201808/t20180828_3227.htm. 90 2000-2017 fossil, nuclear and hydro power capacity: "中国统计年鉴-发电装机容量," National Bureau of Statistics of China, accessed on 12 April 2019 at http://www.stats.gov.cn/tjsj/ndsj/2018/indexch.htm; 2000-2018
wind, solar and biomass power capacity: "中国可再生能源及非化石能源利用数据一览表," China National
Renewable Energy Centre, 13 March 2019; 2018 fossil, nuclear and hydro power capacity: "2018 年全国电力工
业统计快报一览表," China Electricity Council, 22 January 2019, accessed at http://www.cec.org.cn/d/file/guihuayutongji/tongjxinxi/niandushuju/2019-01-
22/4fedb4c956f6059c5998913b10a6233a.pdf; 2000-2007 fossil, nuclear and hydro power generation: "发电量," National Bureau of Statistics of China, accessed on 12 April 2019 at http://data.stats.gov.cn/easyquery.htm?cn=C01&zb=A070B&sj=2018; 2000-2018 wind, solar and biomass power
generation: "中国可再生能源及非化石能源利用数据一览表," China National Renewable Energy Centre, 13
March 2019; 2008-2018 fossil, nuclear and hydro power generation: "2009-2018 电力统计基本数据一览表," China Electricity Council, accessed on 15 April 2019 at http://www.cec.org.cn/guihuayutongji/tongjxinxi/niandushuju/. 91 1994 data: "中华人民共和国气候变化初始国家信息通报," National Development and Reform Commission,
2004, accessed at http://qhs.mee.gov.cn/kzwsqtpf/201904/P020190419524224387926.pdf; 2005 data: "中华人
民共和国气候变化第二次国家信息通报," National Development and Reform Commission, 15 April 2014,
accessed at http://www.ccchina.org.cn/archiver/ccchinacn/UpFile/Files/Default/20130218142020138656.pdf; "中
华人民共和国气候变化第一次两年更新报告," National Development and Reform Commission, December 2016, accessed at http://en.ccchina.org.cn/archiver/ccchinacn/UpFile/Files/Default/20170124155928346053.pdf. 92 “关于印发《2019 年全国大气污染防治工作要点》的通知, 环办大气[2019]16 号,” Ministry of Ecological Environment, 27 February 2019, accessed at http://www.mee.gov.cn/xxgk2018/xxgk/xxgk05/201903/t20190306_694550.html. 93 “关于印发《生态环境监测质量监督检查三年行动计划(2018-2020 年)》的通知, 环办监测函[2018]793
号,” Ministry of Ecological Environment, 3 August 2018, accessed at http://www.mee.gov.cn/gkml/sthjbgw/stbgth/201808/t20180815_451423.htm. 94 “权威数据证实:去年我国蓝天白云更多了!主要空气污染物下降明显,” China Weather Fan, 12 May 2019, accessed at https://baijiahao.baidu.com/s?id=1632953003474884541&wfr=spider&for=pc. 95 "发电量," National Bureau of Statistics of China, accessed on 12 April 2019 at
http://data.stats.gov.cn/easyquery.htm?cn=C01&zb=A070B&sj=2018; “中国能源统计年鉴 2017,” National Bureau of Statistics, December 2017, pg 59. 96 Wang Zhongying and Zhao Yongqiang, “国际清洁能源产业发展报告 2018-中国壮大清洁能源产业政策研
究,” International Clean Energy Forum (Macao), December 2018, pg 2. 97 Wang Dongrong,“煤电和新能源未来如何相爱相杀,” Global View, 18 August 2015, accessed at http://www.globalview.cn/html/economic/info_5287.html. 98 “煤电在中国仍然具有不可替代性,” China Coal News , 28 March 2016, accessed at http://www.cwestc.com/newshtml/2016-3-28/406211.shtml. 99 "中国能源统计年鉴 2017," National Bureau of Statistics, p111. 100 “到 2020 年 全国煤电装机规模将控制在 11 亿千瓦以内,” National Energy Administration, 8 August 2017, accessed at http://www.nea.gov.cn/2017-08/08/c_136508226.htm. 101 Ultra-low emission is defined as the emission levels of coal power units that do not exceed 5 mg/m³ for particulates, 35 mg/m³ for sulphur dioxide and 50 mg/m³ for NOx. These limits are 75%, 30% and 50% respectively lower than the upper limits in the Thermal Power Air Pollutant Emission Standard (GB13223-2011). “Ultra-low-emission Definition,” Baidu Baike, accessed at https://baike.baidu.com/item/%E8%B6%85%E4%BD%8E%E6%8E%92%E6%94%BE/19125632?fr=aladdin. 102 “电力发展十三五规划(2016-2020),” National Energy Administration and National Development and Reform Commission, 7 November 2016, accessed at http://www.ndrc.gov.cn/fzgggz/fzgh/ghwb/gjjgh/201706/t20170605_849994.html. 103 “国家发展改革委国家能源局关于有序放开发用电计划的通知, 发改运行〔2017〕294 号,” National Development and Reform Commission and National Energy Administration, 29 March 2017, accessed at http://www.sdpc.gov.cn/zcfb/zcfbtz/201704/t20170410_843769.html. 104 “可再生能源进入增量替代阶段,” National Energy Administration, 19 October 2017, accessed at http://www.nea.gov.cn/2017-10/19/c_136690989.htm.
References
245 |
105 2000-2017 fossil, nuclear and hydro power capacity: "中国统计年鉴-发电装机容量," National Bureau of Statistics of China, accessed on 12 April 2019 at http://www.stats.gov.cn/tjsj/ndsj/2018/indexch.htm. 106 “关于开展中央财政支持北方地区冬季清洁取暖试点工作的通知,财建[2018]397 号,” National Energy Administration, Ministry of Finance, etc., 23 July 2018, accessed at http://news.bjx.com.cn/html/20180726/915902. shtml. 107 Li Keqiang, “2019 年政府工作报告,” The State Council of the People's Republic of China, 5 March 2019, accessed at http://www.gov.cn/zhuanti/2019qglh/2019lhzfgzbg/index.htm. 108 “World Energy Investment 2018,” International Energy Agency, July 2018, accessed at iea.org/wei2018. 109 “World Energy Investment 2019,” International Energy Agency, May 2019, accessed at iea.org/wei2019. 110 “Renewable Energy Country Attractiveness Index,” Ernst & Young Global Limited, May 2019, accessed at https://www.ey.com/uk/en/industries/power---utilities/ey-renewable-energy-country-attractiveness-index 111 “Notice of the National Development and Reform Commission on matters related to speeding up the key projects of interconnection of natural gas infrastructure in 2018,” Wall Street Stories, 19 June 2018, accessed at https://wallstreetcn.com/articles/3340448. 112 “中俄东线天然气管道黑龙江穿越工程通过验收,” Xinhua News, 38 March 2019, accessed at http://www.xinhuanet.com/2019-03/28/c_1124294337.htm. 113 “China Gas Map 2019,” SIA energy, February 2019, accessed at http://www.sia-energy.com/maps/china-gas-map/. 114 “境外天然气首次通过交易中心投放国内市场,” Energy Observer, 29 October 2018, accessed at http://www.china-nengyuan.com/news/130721.html. 115 “国家发展改革委关于三代核电首批项目实行上网电价的通知, 发改价格[2019]535 号,” National Development and Reform Commission, 20 March 2019, accessed at http://www.ndrc.gov.cn/fzgggz/jggl/zcfg/201904/t20190401_932486.html. 116 Zhu Xuerui, Zhao Ziyuan, “首批三代项目上网电价定了,核电有竞争力吗?这份报告解读,” China Energy News, 1 April 2019, accessed at http://news.bjx.com.cn/html/20190402/972370.shtml. 117 “国家发展改革委办公厅国家能源局综合司关于开展电力现货市场建设试点工作的通知, 发改办能源
〔2017〕1453 号,” National Development and Reform Commission and National Energy Administration, 28 August 2017, accessed at http://www.ndrc.gov.cn/gzdt/201709/t20170905_860117.html. 118 “电力现货市场试点期限推迟,电力现货市场究竟难在哪里?” Energy Magazine, 27 November 2018, accessed at http://www.chuandong.com/news/news.aspx?id=224710. 119 “国家能源局综合司关于健全完善电力现货市场建设试点工作机制的通知, 国能综通法改〔2018〕164
号, ” National Energy Administration, 8 November 2018, accessed at http://zfxxgk.nea.gov.cn/auto81/201812/t20181217_3499.htm. 120 “南方(以广东起步)电力现货市场 5 月 16 日日前交易概况:总成交电量 9.42 亿千瓦时,” Guangdong Power Exchange Center, 16 May 2019, accessed at http://shoudian.bjx.com.cn/html/20190516/980673.shtml. 121 “第一批 8 个电力现货市场建设试点全部启动试运行,” Caixin.com, 28 June 2019, accessed at http://companies.caixin.com/2019-06-28/101432869.html?NOJP. 122 “中汽协:2018 全年汽车销量自 1990 年来首次年度下滑,” sina.com, 14 January 2019, accessed at http://finance.sina.com.cn/chanjing/cyxw/2019-01-14/doc-ihqfskcn6997845.shtml. 123 “董扬:去年中国电动车销量占全球 62.5%你还认为电动车不行么?” sohu.com, 1 April 2019, accessed at https://www.sohu.com/a/305260389_680702. 124 “2018 年 12 月新能源汽车行业月报,” China Passenger Car Association, 20 February 2019, accessed at http://www.cpcaauto.com/newslist.asp?types=bgzl&id=5973&page=1. 125 2018 data: Zhang Lianyi, “从投资到价格,解密 2018 年动力电池市场,” Autohome.com, 11 January 2019,
accessed at https://www.autohome.com.cn/news/201901/928198.html; 2016 data: “《中国新能源汽车动力电
池产业发展报告(2018)》发布,” China Quality News, 26 July 2018, accessed at https://libattery.ofweek.com/2018-07/ART-36001-8420-30251901.html. 126 Zhang Yousheng, Ga Hu, Liu Jian, “我国新能源技术进步超过预期
推动新能源发展步入新阶段,” Energy Research Institute of National Development and Reform Commission, July 2019. 127 “2018 年中国储能行业细分市场现状及发展前景分析 抽水储能仍将是未来发展重点,” Prospective Industry Research Institute, 23 July 2019, accessed at https://www.qianzhan.com/analyst/detail/220/190404-54463c2a.html. 128 Zhang Yousheng, Ga Hu, Liu Jian, “我国新能源技术进步超过预期
推动新能源发展步入新阶段,” Energy Research Institute of National Development and Reform Commission, July 2019. 129 “2019-2020 Action Plan to Guide the Technological and Industrial Development of Energy Storage Sector,
China Renewable Energy Outlook 2019
246 |
NDRC Energy [2019] No. 725,” NDRC, MIIT, NEA and MoST, 25 June 2019, accessed at http://www.ndrc.gov.cn/zcfb/zcfbtz/201907/t20190701_940747.html. 130 Cai Yixuan, “COP24 速递 | 中国碳市场周岁,碳价预期如何?” Energy Observer, 18 December 2018, accessed at http://wemedia.ifeng.com/93708336/wemedia.shtml. 131 “国务院关于印发打赢蓝天保卫战三年行动计划的通知, 国发〔2018〕22 号,”State Council, 27 June 2018, accessed at http://www.gov.cn/zhengce/content/2018-07/03/content_5303158.htm. 132 “中电联发布《2018-2019 年度全国电力供需形势分析预测报告》,” China Electricity Council, 29 January 2019, accessed at http://www.cec.org.cn/yaowenkuaidi/2019-01-29/188578.html. 133 “2018 年可再生能源并网运行情况介绍,” National Energy Administration, 28 January 2019, accessed at http://www.nea.gov.cn/2019-01/28/c_137780519.htm?from=groupmessage&isappinstalled=0. 134 “中电联发布《2018-2019 年度全国电力供需形势分析预测报告》,” China Electricity Council, 29 January 2019, accessed at http://www.cec.org.cn/yaowenkuaidi/2019-01-29/188578.html. 135 “2018 我国首批光热发电示范项目进展&2019 预期,” CSPFocus 光热发电资讯, 27 December 2018,
accessed at https://new.qq.com/omn/20181227/20181227G0DOWB.html; “青海中控太阳能德令哈 50MW 塔式
光热发电项目一次并网成功,” 中控太阳能, 30 December 2018, accessed at http://www.cspplaza.com/article-14016-1.html. 136 “2018 年风电并网运行情况,” National Energy Administration, 28 January 2019, accessed at http://www.nea.gov.cn/2019-01/28/c_137780779.htm. 137 “2018 年风电并网运行情况,” National Energy Administration, 28 January 2019, accessed at http://www.nea.gov.cn/2019-01/28/c_137780779.htm. 138 “2018 年光伏发电统计信息,” National Energy Administration, 19 March 2019, accessed at http://www.nea.gov.cn/2019-03/19/c_137907428.htm. 139 2013 wind curtailment and curtailment rate: "2013 年风电产业继续保持平稳较快发展势头," National Energy Administration, 6 March 2014, accessed at http://www.nea.gov.cn/2014-03/06/c_133166473.htm; 2014
wind curtailment and curtailment rate: "2014 年风电产业监测情况," National Energy Administration, 12 February 2015, accessed at http://www.nea.gov.cn/2015-02/12/c_133989991.htm; 2015 wind curtailment and
curtailment rate: "2015 年风电产业发展情况," National Energy Administration, 2 February 2016, accessed at
http://www.nea.gov.cn/2016-02/02/c_135066586.htm; 2016 wind curtailment and curtailment rate: "2016 年风
电并网运行情况," National Energy Administration, 26 January 2017, accessed at http://www.nea.gov.cn/2017-
01/26/c_136014615.htm; 2017 wind curtailment and curtailment rate: "2017 年风电并网运行情况," National Energy Administration, 1 February 2018, accessed at http://www.nea.gov.cn/2018-02/01/c_136942234.htm; 2018
wind curtailment and curtailment rate: "2018 年风电并网运行情况," National Energy Administration, 28 January 2019, accessed at http://www.nea.gov.cn/2019-01/28/c_137780779.htm; 2014-2017 solar PV curtailment
and curtailment rate: “中国电力发展报告 2017,” National Energy Administration; 2018 solar PV curtailment and
curtailment rate: "2018 年光伏发电统计信息," National Energy Administration, 19 March 2019, accessed at http://www.nea.gov.cn/2019-03/19/c_137907428.htm. 140 Distributed wind: “国家能源局关于印发《分散式风电项目开发建设暂行管理办法》的通知, 国能发新能
[2018]30 号,” National Energy Administration, 3 April 2018, accessed at
http://zfxxgk.nea.gov.cn/auto87/201804/t20180416_3150.htm; Distributed solar PV: “国家电网公司关于印发分
布式电源并网服务管理规则的通知(国家电网营销[2014]174 号),” State Gird, 31 July 2017, accessed at
http://www.sn.sgcc.com.cn/html/main/col2813/2017-08/01/20170801111619717207271_1.html; “国家能源局关于
印发分布式光伏发电项目管理暂行办法的通知, 国能新能〔2013〕433 号,” National Energy Administration, 18 November 2013, accessed at http://zfxxgk.nea.gov.cn/auto87/201312/t20131211_1735.htm. 141 "2018 年风电并网运行情况," National Energy Administration, 28 January 2019, accessed at
http://www.nea.gov.cn/2019-01/28/c_137780779.htm; "2015 年风电产业发展情况," National Energy Administration, 2 February 2016, accessed at http://www.nea.gov.cn/2016-02/02/c_135066586.htm. 142 “国家发展改革委 国家能源局关于印发《解决弃水弃风弃光问题实施方案》的通知, 发改能源[2017]1942
号,” National Energy Administration and National Development and Reform Commisison, 8 November 2017,
accessed at http://zfxxgk.nea.gov.cn/auto87/201711/t20171113_3056.htm; “国家发改委、能源局关于印发《清
洁能源消纳行动计划(2018-2020 年)》的通知,发改能源规[2018] 1575 号,” National Development and Reform Commission and National Energy Administration, 31 October 2018, accessed at http://183.222.242.204:10086/index.php?do=show&id=1632. 143 “国家能源局关于发布 2018 年度风电投资监测预警结果的通知, 国能发新能 [2018] 23 号,” National Energy Administration, 5 March 2018, accessed at ttp://zfxxgk.nea.gov.cn/auto87/201803/t20180307_3124.htm. 144 “国家发展改革委国家能源局关于做好风电、光伏发电全额保障性收购管理工作的通知, 发改能源
[2016]1150 号,” National Energy Administration and National Development and Reform Commission, 27 May 2016, accessed at http://www.sdpc.gov.cn/zcfb/zcfbtz/201605/t20160531_806101.html.
References
247 |
145 “国家发展改革委 国家能源局关于建立健全可再生能源电力消纳保障机制的通知, 发改能源[2019]807
号,” National Development and Reform Commission, 10 May 2019, accessed at http://www.ndrc.gov.cn/zcfb/zcfbtz/201905/t20190515_936170.html. 146 “国家能源局关于 2018 年度全国可再生能源电力发展监测评价的通报, 国能发新能〔2019〕53
号,”National Energy Administration, 4 June 2019, accessed at http://zfxxgk.nea.gov.cn/auto87/201906/t20190610_3673.htm. 147 Li Junfeng and Shi Jingli, “国内外可再生能源政策综述与进一步促进我国可再生能演发展的建议,” Renewable Energy Magazine No. 125, January 2006. 148 “国家发展改革委关于完善风力发电上网电价政策的通知,发改价格〔2009〕1906 号,” National Development and Reform Commission, 20 July 2009, accessed at http://www.gov.cn/zwgk/2009-07/27/content_1376064.htm. 149 “国家发展改革委关于印发《可再生能源发电价格和费用分摊管理试行办法》的通知, 发改价格[2006]7
号,” State Development & Reform Commission (incl. former State Development Planning Commission), 4
January 2006, access at http://en.pkulaw.cn/display.aspx?cgid=73166&lib=law ; “国家发展改革委关于印发《可
再生能源电价附加收人调配暂行办法》的通知, 发改价格〔2007〕44 号,” State Development & Reform Commission (incl. former State Development Planning Commission), 11 January 2007, access at
http://en.pkulaw.cn/display.aspx?cgid=88287&lib=law; “国家发展改革委关于印发《可再生能源发电价格和费
用分摊管理试行办法》的通知, 发改价格[2006]7 号,” National Development and Reform Commission, 14
January 2006, access at http://www.lawinfochina.com/display.aspx?lib=law&id=8981&CGid= ; “财政部、国家发
展改革委、国家能源局关于印发《可再生能源发展基金征收使用管理暂行办法》的通知, 财综[2011]115
号,” Ministry of Finance, State Development & Reform Commission (incl. former State Development Planning Commission),National Energy Administration, 29 January 2011, access at http://zhs.mof.gov.cn/zhengwuxinxi/zhengcefabu/201112/t20111212_614767.html 150 “国家发展改革委 财政部 国家能源局关于 2018 年光伏发电有关事项的通知, 发改能源〔2018〕823 号,” National Development and Reform Commission, Ministry of Finance of the People’s Republic of China and National Energy Administration, 31 May 2018, accessed at http://www.nea.gov.cn/2018-06/01/c_137223460.htm;
“国家发展改革委关于太阳能热发电标杆上网电价政策的通知, 发改价格〔2016〕1881 号,” National Development and Reform Commission, 29 August 2016, accessed at http://www.ndrc.gov.cn/zcfb/zcfbtz/201609/t20160902_817573.html. 151 Zhihuiguangfu, ”第八批可再生能源目录可能遥遥无期,” www.china-nengyuan.com, 23 July 2018, access at
http://www.china-nengyuan.com/news/126722.html; ”2013–2014 年度全国电力企业价格情况监管通报索引
号:000019705/2015-00078,” 18 August 2015, access at
http://zfxxgk.nea.gov.cn/auto92/201509/t20150902_1959.htm; Lin Boqiang, ”中国能源展望报告 2018,” China Energy Research Society, 17 June 2018, access at https://books.google.co.jp/books?id=3QtUDQAAQBAJ&pg=PT598&lpg=PT598&dq=2006%E5%B9%B4%E9%94%80%E5%94%AE%E7%94%B5%E4%BB%B7&source=bl&ots=A77eOzcyB8&sig=6ioNzn0eYQP47grExWrJjZ9ryoU&hl=zh-CN&sa=X&redir_esc=y#v=onepage&q=2006%E5%B9%B4%E9%94%80%E5%94%AE%E7%94%B5%E4%BB%B7&f=false; “China Electricity Yearbook, ” China Electricity Power Press, December 2012, access at http://navi.cnki.net/KNavi/YearbookDetail?pcode=CYFD&pykm=YZGDL&bh=N2013030107. 152 “Guiding Opinions on Improving Scale Management and Implementing Tendering PV Projects, NRDC Energy
[2016] No.1163, ” (CHN: 关于完善光伏发电规模管理和竞争方式配置项目指导意见,发改能源[2016]1163
号), National Development and Reform Commission and National Energy Administration, 30 May 2016, accessed at http://www.ne21.com/news/show-77051.html. 153 “李创军:我国光伏发电度电成本 10 年下降约 90%,” National Energy Administration, 14 April 2018, accessed at https://www.sohu.com/a/228248326_99919252. 154 “关于推进光伏发电“领跑者”计划实施和 2017 年领跑基地建设有关要求的通知,国能发新能[2017]54 号,” National Energy Administration, 22 September 2017, accessed at http://zfxxgk.nea.gov.cn/auto87/201709/t20170922_2971.htm. 155 “国家发改委时璟丽谈 2019 新能源电价补贴政策方向,” Energy News, 27 March 2019, accessed at http://www.china-nengyuan.com/news/137121.html. 156 中华人民共和国企业所得税法实施条例, 中华人民共和国国务院令[2007]512 号, 28 November 2007,
accessed at http://www.chinatax.gov.cn/n810341/n810765/n812176/n812748/c1193046/content.html; 国家发展
改革委关于电网企业增值税税率调整相应降低一般工商业电价的通知, 发改价格〔2019〕559 号, 27 March
2019, accessed at http://www.ndrc.gov.cn/zcfb/zcfbtz/201903/t20190329_931929.html; 关于风力发电增值税政
策的通知, 财税[2015]74 号, 12 June 2015, accessed at http://szs.mof.gov.cn/zhengwuxinxi/zhengcefabu/201506/t20150616_1256851.html.
China Renewable Energy Outlook 2019
248 |
157 国家能源局关于减轻可再生能源领域企业负担有关事项的通知, 国能发新能[2018]34 号, 02 April 2018. accessed at http://zfxxgk.nea.gov.cn/auto87/201804/t20180426_3156.htm. 158 “发改委研究员时璟丽谈 2019 新能源电价补贴政策方向,” Energy News, 28 March 2019, accessed at http://www.china-nengyuan.com/news/137121.html. 159 “国家发改委时璟丽谈 2019 新能源电价补贴政策方向,” Energy News, 27 March 2019, accessed at http://www.china-nengyuan.com/news/137121.html. 160 “发改委研究员时璟丽谈 2019 新能源电价补贴政策方向,” Energy News, 28 March 2019, accessed at
http://www.china-nengyuan.com/news/137121.html; “时璟丽:煤电承担非水可再生能源配额必要且可行,” China Energy News, 16 May 2016, accessed at http://news.bjx.com.cn/html/20160516/733206.shtml. 161 “Renewable Energy and Jobs – Annual Review 2019,” International Renewable Energy Agency, June 2019, accessed at https://www.irena.org/publications/2019/Jun/Renewable-Energy-and-Jobs-Annual-Review-2019.
162 “中国风电开发商将受出保风机数量增加深感压力 下一个 10 年中国风电运维市场将达到 50 亿美
元,”sina.com, 8 July 2019, accessed at http://www.chinairn.com/news/20190708/141022882.shtml. 163 “生物质电价政策研究报告,” Biomass Energy Industry Promotion Association, November 2018, accessed at http://www.cn-bea.com/fujian/2.pdf. 164 “生物质电价政策研究报告,” Biomass Energy Industry Promotion Association, November 2018, accessed at http://www.cn-bea.com/fujian/2.pdf. 165 “国家发展改革委关于印发《可再生能源发电价格和费用分摊管理试行办法》的通知, 发改价格[2006]7
号,” National Development and Reform Commission, 4 January 2006, accessed at http://www.ndrc.gov.cn/fzgggz/jggl/zcfg/200601/t20060120_57586.html. 166 Straw biomass FiT: “国家发展改革委关于完善农林生物质发电价格政策的通知, 发改价格[2010]1579 号,” National Development and Reform Commission, 18 July 2010, accessed at
http://www.ndrc.gov.cn/zcfb/zcfbtz/201007/t20100728_363362.html; Waste incineration FiT: “国家发展改革委
关于完善垃圾焚烧发电价格政策的通知, 发改价格[2012]801 号, ” National Development and Reform Commission, 28 March 2012, accessed at http://www.ndrc.gov.cn/zcfb/zcfbtz/201204/t20120410_472395.html. 167 “生物质电价政策研究报告,” Biomass Energy Industry Promotion Association, November 2018, accessed at http://www.cn-bea.com/fujian/2.pdf. 168 “可再生能源发展“十三五”规划, 发改能源〔2016〕2619 号,” National Development and Reform Commission, December 2016, accessed at http://www.ndrc.gov.cn/fzgggz/fzgh/ghwb/gjjgh/201706/t20170614_850910.html. 169 “国家发展改革委、国家能源局关于印发促进生物质能供热发展指导意见的通知, 发改能源[2017]2123
号,” National Energy Administration, 6 December 2017, accessed at http://zfxxgk.nea.gov.cn/auto87/201712/t20171228_3085.htm. 170 “国家能源局关于开展“百个城镇”生物质热电联产县域清洁供热示范项目建设的通知, 国能发新能
〔2018〕8 号,” National Energy Administration, 19 January 2019, accessed at http://www.ahpc.gov.cn/zwgk/zwgk_content.jsp?newsId=04A62F8F-786F-43BD-89D1-5CE2725E8EAF. 171 “国家发改委、能源局关于印发《清洁能源消纳行动计划(2018-2020 年)》的通知, 发改能源规 [2018]
1575 号,” National Developlent and Reform Commission and National Energy Administration, 31 November 2018, accessed at http://183.222.242.204:10086/index.php?do=show&id=1632. 172 “国家能源局关于 2018 年度全国可再生能源电力发展监测评价的通报, 国能发新能〔2019〕53 号,” National Energy Administration, 4 June 2019, accessed at http://zfxxgk.nea.gov.cn/auto87/201906/t20190610_3673.htm. 173 “国家发展改革委 国家能源局关于建立健全可再生能源电力消纳保障机制的通知, 发改能源〔2019〕807
号,” National Development and Reform Commission, and National Energy Administration, 10 May 2019, accessed at http://www.gov.cn/xinwen/2019-05/16/content_5392082.htm. 174 “创新性长效消纳保障机制:为可再生能源电力持续健康发展、推进能源转型保驾护航,” China National Renewable Energy Centre, 15 May 2019, accessed at http://solar.in-en.com/html/solar-2340445.shtml. 175 “国家能源局关于 2018 年度全国可再生能源电力发展监测评价的通报, 国能发新能〔2019〕53 号,” National Energy Administration, 4 June 2019, accessed at http://zfxxgk.nea.gov.cn/auto87/201906/t20190610_3673.htm. 176 “关于宁夏风电基地 2018 年度风电项目竞争配置评优结果的公示,” Ningxia Development and Reform Commission, 17 December 2018, accessed at https://www.sohu.com/a/280162662_99951840. 177 For utility-scale solar PV plants and industrial and commercial distributed PV projects that fully feed into the grid: the corrected bidding price for Type II irradiance resources regions = original bidding price - RMB 0.05/kWh, and the corrected bidding price of Type III irradiance resources region = original bidding price – RMB 0.15/kWh. For self-use industrial and commercial distributed PV projects: the corrected bidding price = original bidding
References
249 |
price - coal benchmark FiT of the province + RMB 0.3/kWh. For regions with coal benchmark FiT less than RMB 0.3/kWh, the bidding price will not be corrected. 178 “国家能源局综合司关于公布 2019 年光伏发电
项目国家补贴竞价结果的通知, 国能综通新能〔2019〕59 号,” National Energy Administration, 10 July 2019, accessed at http://zfxxgk.nea.gov.cn/auto87/201907/t20190711_3682.htm. 179 “国家发展改革委 国家能源局关于积极推进风电、光伏发电无补贴平价上网有关工作的通知, 发改能源
〔2019〕19 号,” National Development and Reform Commission and National Energy Administration, 7 January 2019, accessed at http://www.ndrc.gov.cn/zcfb/zcfbtz/201901/t20190109_925398.html. 180 Projects that only receive local subsidies are still considered as subsidy-free pilots. In regions where subsidy free remains impossible, the government will continue to hold wind and solar auctions. 181 “国家发展改革委 国家能源局关于积极推进风电、光伏发电无补贴平价上网有关工作的通知, 发改能源
〔2019〕19 号,” National Development and Reform Commission and National Energy Administration, 7 January 2019, accessed at http://www.ndrc.gov.cn/zcfb/zcfbtz/201901/t20190109_925398.html. 182 “国家发展改革委办公厅 国家能源局综合司关于公布 2019 年第一批风电、光伏发电平价上网项目的通
知, 发改办能源[2019]594 号,” National Energy Administration, 20 May 2019, accessed at http://www.ndrc.gov.cn/zcfb/zcfbtz/201905/t20190522_936543.html. 183 “黑龙江:至少 1.55 GW 平价上网项目完成备案,” Solarbe, 17 April 2019, accessed at https://m.sohu.com/a/308437944_418320. 184 “国家能源局关于印发《分散式风电项目开发建设暂行管理办法》的通知, 国能发新能[2018]30 号,” National Energy Administration, 3 April 2018, accessed at http://zfxxgk.nea.gov.cn/auto87/201804/t20180416_3150.htm. 185 “国家能源局综合司关于征求进一步推进电力现货市场建设试点工作的意见的函,” National Energy Administration, 5 March 2019, accessed at http://www.nea.gov.cn/2019-03/08/c_137878845.htm. 186 Shi Jingli, “Renewable energy policy reform and roadmap of marketing development,” China National Renewable Energy Centre, 3 July 2019, EU-China Energy Cooperation Platform. 187 “China Renewable Energy Outlook 2018,” China National Renewable Energy Centre, December 2018, accessed at http://boostre.cnrec.org.cn/index.php/2018/11/27/creo2018. 188 “Green Electricity Exchange Workshop,” Energy Foundation China, 26 March 2019; “广东省发展改革委关于
印发海上风电发展规划(2017-2030 年)(修编)的通知,粤发改能新[2018]193 号,” Guangdong Energy Administration, 23 April 2018, accessed at http://www.gddrc.gov.cn/zwgk/ywtz/201804/t20180423_470226.shtml. 189 “Bloomberg: tender reduces British offshore power price by 50%,” BJX, 14 June 2018, accessed at http://news.bjx.com.cn/html/20180614/906177.shtml. 190 “生物质电价政策研究报告,” Biomass Energy Industry Promotion Association, November 2018, accessed at http://www.cn-bea.com/training/download/2018/1107/119.html 191 “China Renewable Energy Industry Development Report,” China National Renewable Energy Centre, October 2018, pg 147. 192 “China Renewable Energy Industry Development Report,” China National Renewable Energy Centre, October 2018, pg 150. 193 “国家能源局关于 2018 年度全国可再生能源电力发展监测评价的通报, 国能发新能〔2019〕53 号,” National Energy Administration, 4 June 2019, accessed at http://zfxxgk.nea.gov.cn/auto87/201906/t20190610_3673.htm. 194 “China Renewable Energy Industry Development Report,” China National Renewable Energy Centre, October 2018, pg 152. 195 “China Renewable Energy Industry Development Report,” China National Renewable Energy Centre, October 2018, pg 153. 196 “China Renewable Energy Industry Development Report,” China National Renewable Energy Centre, October 2018, pg 150. 197 “China Renewable Energy Industry Development Report,” China National Renewable Energy Centre, October 2018, pg 153. 198 “China Renewable Energy Industry Development Report,” China National Renewable Energy Centre, October 2018, pg 148. 199 “China Renewable Energy Industry Development Report,” China National Renewable Energy Centre, October 2018, pg 151. 200 “Renewable Power Generation Costs in 2018,” International Renewable Energy Agency, May 2019, accessed at https://www.irena.org/publications/2019/May/Renewable-power-generation-costs-in-2018. 201 “中华人民共共和国耕地占用税暂行条例, 中华人民共和国国务院令第 511 号,” the State Council, 1 December 2007, accessed at http://www.gov.cn/zwgk/2007-12/06/content_826778.htm.
China Renewable Energy Outlook 2019
250 |
202 “光伏电站需要缴纳的土地费用及对项目影响”, OFweek 太阳能光伏网, 05 April 2017, accessed at https://solar.ofweek.com/2017-04/ART-260009-8470-30121321_2.html 203 “光伏电站平价上网非技术成本有哪些,如何控制?” 能源杂志, 15 November 2018, accessed at https://www.xianjichina.com/news/details_91590.html 204 “光伏电站现用地难问题 三大瓶颈亟待解决,” China Power News, 2 November 2016, accessed at http://www.hbzhan.com/news/detail/111957.html. 205 China National Renewable Energy Centre. 206 Environmental taxes: Jorrit Gosens, “Environmental Protection Tax Law of the People’s Republic of China–Policy Summary,” Deutsche Gesellschaft für Internationale Zusammenarbeit (GIZ) GmbH, 1 February 2018; “China Power System Transformation,” International Energy Agency, February 2019, accessed at https://webstore.iea.org/china-power-system-transformation. 207 “国家发展改革委 国家能源局关于开展分布式发电市场化交易试点的通知, 发改能源[2017]1901 号,” National Energy Administration, 31 October 2017, accessed
http://zfxxgk.nea.gov.cn/auto87/201711/t20171113_3055.htm; “国家发展改革委办公厅 国家能源局综合司关于
开展分布式发电市场化交易试点的补充通知, 发改办能源〔2017〕2150 号,” National Development and Reform Commission and National Energy Administration, 28 December 2017, accessed at http://www.gov.cn/xinwen/2018-01/03/content_5252800.htm. 208 Han Xue, “分布式可再生能源发电高质量发展研究 研究报告,” Energy Reform Institute of National Development and Reform Commission, March 2019. 209 Han Xue “分布式可再生能源发电高质量发展研究 研究报告,” Energy Reform Institute of National Development and Reform Commission, March 2019. 210 Han Xue “分布式可再生能源发电高质量发展研究 研究报告,” Energy Reform Institute of National Development and Reform Commission, March 2019. 211 : Notice Establishing a Mandatory Renewable Electricity Consumption Mechanism, NDRC Energy [2019] No.807.
“国家发展改革委 国家能源局关于建立健全可再生能源电力消纳保障机制的通知, 发改能源〔2019〕807
号,” National Development and Reform Commission, and National Energy Administration, May 16 2019, accessed at http://www.gov.cn/xinwen/2019-05/16/content_5392082.htm, accessed June 14 2019. 212 International Energy Agency. "World Energy Outlook." Paris (2018). https://webstore.iea.org/world-energy-outlook-2018
213 The electrification rate is defined as the electricity generation / final energy consumption (including power plants own consumption). 214 Liu, Jian & Yang, Qingshan & Zhang, yu & Sun, Wen & Xu, Yiming. (2019). Analysis of CO2 Emissions in China’s Manufacturing Industry Based on Extended Logarithmic Mean Division Index Decomposition. Sustainability. 11. 226. 10.3390/su11010226. 215 https://energycommunity.org/default.asp?action=citing 216 Driver Device mechanical sub-processes, including motors, Pumps, compressors, electrolysers. Although there are no formal temperature bands for differentiation of thermal processes, they can generally be categorised into low (<100°C), medium (100-400) and high (>400°C). Feedstock, non-energy use, and energy consumed in some non-divisible branches are defined as “others” 217 https://ens.dk/sites/ens.dk/files/Globalcooperation/ee_in_industries_toolkit.pdf 218 According to <China energy statistical yearbook>, manufacturing industry is excluded from mining and Mining and Quarrying, and also the Electric Power, Gas and Water Production and Supply 219 Solar Heat for Industrial Processes, IEA-ETSAP and IRENA© Technology Brief E21 – January 2015 220 The data is split from “Transport, Storage and Post” of “Energy Balance of China” in <China Energy Statistical Yearbook>. 221 Energy Research Institute,Lawrence Berkeley National Laboratory, and Rocky Mountain Institute, 2016, Reinventing Fire: China – A Roadmap for China’s Revolution in Energy Consumption and Production to 2050. 222 “Clean winter heating plan for north China, NDRC [2017] No.2100,” National Development Reform Commission, 2017. 223 H. Lund et al., Energy 164 (2018) 147-159. 224 The data and figures for this chapter is due to Danfoss experiences. Lipeng Zhang el al. Energy 107, 2016, 431-442. 225 Technologies for 2050 can be found in Danish Technology catalogues. Danish Energy Agency and Energinet, accessed at www.ens.dk and www.energinet.dk. 226 “关于建立健全可再生能源电力消纳保障机制的通知, 发改能源[2019]807 号,” National Development and
References
251 |
Reform Commission and National Energy Administration, 10 May 2019, accessed at http://www.ndrc.gov.cn/zcfb/zcfbtz/201905/t20190515_936170.html. 227 Farmland data: National Bureau of Statistics of China, accessed in September 2019. 228 Lists of industrial parks data: “中国开发区审核公告目录,” National Development and Reform Commission, 2
March 2018, accessed at http://www.ndrc.gov.cn/xwzx/xwfb/201803/t20180302_878819.html. 229 Geographical conditions data: First National Survey on Geographic Conditions Statistics and “中国地理国情蓝皮书 2017,” Chinese Academy of Surveying and Mapping, 28 February 2018, accessed at
http://www.sohu.com/a/224600161_466840. 230 “World Energy Outlook,” International Energy Agency, 2019, accessed at https://www.iea.org/data-and-statistics/charts/electricity-demand-by-sector-and-scenario-2018-2040 231 “Annual Power Sector Statistics 2018 (fast access),” China Electricity Council, 2019, accessed at
http://www.cec.org.cn/guihuayutongji/tongjxinxi/niandushuju/2019-01-22/188396.html. 232 Molina A., Gabaldon A., Faura F., Fuentes J.A.,”New approaches to model electric demand in aluminum smelter industry,” Conference Record - IAS Annual Meeting (IEEE Industry Applications Society), 2001, pp. 1426-1431. 233 Xiao Zhang, Gabriela Hug, “Bidding strategy in energy and spinning reserve markets for aluminum smelters'
demand response,”2015 IEEE Power & Energy Society Innovative Smart Grid Technologies Conference (ISGT), 2015. 234 “Industrial Demand Side Flexibility in China – German Experiences – Status Quo and Potential in China – Policy and Market Recommendation,” German Energy Agency, August 2019, accessed at https://www.dena.de/fileadmin/dena/Publikationen/PDFs/2019/190830_Industrial_Demand_Side_Flexibility_report_final_dena.pdf. 235 Figure shows primary energy mix in terms of physical energy content method 236 Figure shows primary energy mix in terms of physical energy content method