Embed Size (px)
Citation preview
R
C
Ma
b
a
ARRAA
KCNIP
1
fstgetbtoa
f
j
.
f
0
ARTICLE IN PRESSG ModelESPOL-2195; No. of Pages 15
Research Policy xxx (2008) xxx–xxx
Contents lists available at ScienceDirect
Research Policy
journa l homepage: www.e lsev ier .com/ locate / respol
hina’s national innovative capacity
ei-Chih Hua,∗, John A. Mathewsb,1
National Chung Hsing University, Graduate Institute of Technology & Innovation Management, Taichung 402, TaiwanMacquarie Graduate School of Management, Macquarie University, Sydney, NSW 2109, Australia
r t i c l e i n f o
rticle history:eceived 3 September 2007eceived in revised form 20 May 2008ccepted 2 July 2008vailable online xxx
eywords:hina
a b s t r a c t
China is transforming itself into the workshop of the world, building an export-orientednational production system linked by global value chains to the world’s leading economies.But to what extent is it laying the foundations for moving from imitation to innovation? Inthis first study of China’s national innovative capacity, we extend earlier work conductedon the East Asian Tiger economies, and bring it up to the year 2005. We demonstrate a surgein patenting activity by Chinese firms and organizations since 2001, and analyze the driversbehind this, as well as the quality characteristics of the patenting – in terms of intensity,
ational innovative capacitynnovation performanceatents
impact and links with the science base. We have some striking findings to report, includingthe strong role played by universities in the building of China’s national innovative capacityover the last 15 years, and the puzzling apparent lack of contribution of the public sectorin reinforcing China’s national innovative capacity. On the latter point we suggest that therole of public sector institutions has been mixed, and only exerts its effects after reforms
stem an
streamlined the sy. Introduction
China has caught the world’s imagination, as it powersorward in an industrial transformation larger in scale andcope than ever before witnessed. The measures of China’sransformation – from exceptional GDP growth rates androwth rates per capita, through investment levels that arenhanced through large flows of foreign direct investment,o levels of exports that now rank China as the world’s num-
Please cite this article in press as: Hu, M.-C., Mathews, J.A., China’s national in
er three trading nation, and soon to be number one – allhese capture at the macro-scale the astonishing progressf this 21st century industrial giant. When combined withmicro perspective, which examines the rise of Chinese
∗ Corresponding author. Tel.: +886 4 22840547x209;ax: +886 4 22859480.
E-mail addresses: [email protected] (M.-C. Hu),[email protected] (J.A. Mathews).
URL: http://www.gsm.mq.edu.au/facultyhome/john.mathews/indexhtml (J.A. Mathews).
1 Tel.: +61 2 9850 6082 (direct); Tel.: +61 2 9850 9016 (switch);ax: +61 2 9850 9942.
048-7333/$ – see front matter © 2008 Elsevier B.V. All rights reserved.doi:10.1016/j.respol.2008.07.003
d brought many of the institutions into the private sector.© 2008 Elsevier B.V. All rights reserved.
firms to become world players – from Haier in householdgoods, or Lenovo in IT and PCs, or Huawei in telecomm, orthe Konka group in consumer electronics, not to mentionSinopec or CNOOC as global energy giants – then it becomesclear that there is a depth and breadth to China’s manufac-turing industry and its infrastructure underpinning that hasmade it the ‘workshop of the world’.
China’s undoubted gains in production and trade havebeen achieved through following a latecomer strategy – byaccessing and putting to use the world’s stock of technolog-ical knowledge with cheaper costs, and at a greater scale,than can be managed by incumbents. The latecomer alwayshas to fashion entry strategies that mesh with, or comple-ment, the prevailing strategies of the incumbents. In China’scase its rise as production powerhouse has coincided withthe trend towards outsourcing, creating opportunities thatfirms in China, and in wider East Asia, have been quick to
novative capacity. Res Policy (2008), doi:10.1016/j.respol.2008.07.003
seize, creating global value chains that are now one of theprincipal drivers of globalization.
As the latecomer approaches the technological frontier,so its strategies have to shift from imitation to innovation(Kim, 1997). This has been the case for all of the successful
INesearch
ARTICLEG ModelRESPOL-2195; No. of Pages 15
2 M.-C. Hu, J.A. Mathews / R
East Asian Tiger economies – for Japan first, then for Taiwan,Korea and Singapore – and now for China. Our question is:to what extent is China laying the foundations for futureinnovative capacity? Is it likely to stay stuck in catch-upmode as a perpetual imitator, or can it build its absorptivecapacity to the point that it can sustain genuine innovation?To what extent is it building the elements of sustainableinnovative capacity?
Our earlier study of innovative capacity in East Asiaattempted to answer this question for the case of the AsianTigers. Building on earlier work in innovative capacity andin particular on the framework for innovative capacitydeveloped by Furman et al. (2002) for the OECD countries,Hu and Mathews (2005) replicated and extended this workto five East Asian economies – Korea, Taiwan, Singapore,Hong Kong and China – to assess to what extent they hadbeen able to build the elements of innovative capacity, mea-sured in terms of patenting rates at the USPTO.2 Takingthe study up to the year 2000, Hu and Mathews (2005)found that the East Asian Tigers (largely Korea and Tai-wan) were more focused in their innovative capacity thanthe advanced OECD countries, in keeping with their late-comer strategies of concentrating their meagre resourceson certain targeted activities and industries. We also foundthat the East Asian Tigers had made strong use of Pub-lic Research Institutes (PRIs) in guiding and focusing theirefforts at technological catch-up – a feature not broughtout in studies of the OECD countries. This made abundantsense, since micro-level studies of the role played by insti-tutions such as ITRI for Taiwan or KIET for Korea made itclear that these PRIs had indeed been the architects of thetechnological catch-up strategies and had been responsi-ble for acquiring the technologies that were then diffusedrapidly across to the private sector (Lee, 2005).
What about China? In our earlier study, that took thestory up to the year 2000, China hardly figured as a patent-ing player at all, and the drivers of national innovativecapacity scarcely registered as having significant effects.Hence our interest in seeing to what extent the country’sinnovative capacity has been enhanced since then, and inanalyzing the patenting activities as a guide to the overallarchitecture of an innovation system and its depth in termsof technological knowledge.
This present study is concerned with China itself, and isformulated as an extension of earlier work on East Asia that
Please cite this article in press as: Hu, M.-C., Mathews, J.A., China’s national in
took the story up to the year 2000 (Hu and Mathews, 2005).This present study takes the story for China forward to theyear 2005, and thus captures a half decade of patentingactivity at the USPTO that – as we shall demonstrate – has
2 The concept of innovative capacity has been formulated by numer-ous scholars, including Suarez-Villa (1990) and Suarez-Villa and Hasnath(1993). Porter and his collaborators adopted this notion and implementedit in a fashion that links innovative capacity to a country’s knowledge pro-duction function, and applied it to the patenting record of OECD countries(Furman et al., 2002). Hu and Mathews (2005) took this methodology andapplied and extended it to the case of the five East Asian Tiger economies,looking for points of consistency with innovative capacity as demonstratedin advanced OECD countries and points of difference in order to demon-strate the distinctiveness of latecomer strategies being pursued by the EastAsian Tigers.
PRESSPolicy xxx (2008) xxx–xxx
already begun to create an intellectual production systemthat stands comparison with the physical production sys-tem that holds the world in awe. We extend our study of theEast Asian Tigers also in the sense that we analyze patent-ing activity utilizing several tools that add a dimension ofquality to the purely quantitative measures used in earlierstudies – measures such as patenting intensity, patentingimpact (in terms of forward citations), the depth of absorp-tive capacity (in terms of backward citations), cycle time,R&D cost per patent, and links with the science base (mea-sured by patent citation to the scientific literature). Thisis the first study, we believe, that has examined China’snational innovative capacity utilizing such a range of tools.
We are surprised at our findings, to be elaborated inwhat follows. We find that China shares many of the char-acteristics of the latecomer East Asian Tigers which it soclearly views as models for its own development. But it alsohas some defining characteristics of its own. One principaldifference is that China exhibits a much larger reliance onuniversities as sources of innovative activity and of enter-prises spun-off from universities and Academies which arethemselves sources of further innovative activity. Anothermajor difference is that the sprawling public sector in Chinahas so far played less of a role in building China’s inno-vative activity than would be expected, based on earlierEast Asian experience. We attempt an explanation for boththese interesting findings that have been thrown up by ouranalysis.
We begin by recalling the features of our earlier inves-tigation of national innovative capacity (NIC) in East Asia,bringing the story of patenting rates up to the year 2005.We then outline the concept of NIC that we shall use in ouranalysis of China, and the details of the methodology to beemployed. We then proceed to our analysis, conducted intwo stages – the first as an extension of our East Asian NICanalysis to the case of China, taken up to the year 2005,then followed in a second stage by a closer examinationof China’s patenting activities at the USPTO, in terms ofthe quality and impact of the patents granted. We use thisanalysis to shed light on the somewhat surprising findingsgenerated by our analysis of the drivers of China’s NIC, par-ticularly in relation to the role of universities and the roleof PRIs.
2. National innovative capacity in East Asian and inChina
National innovative capacity (NIC) may be broadlydefined as the institutional potential of a country to sus-tain innovation, which has been investigated by numerousscholars, at least since Suarez-Villa (1990) formulated aclear definition of the concept and a measure of it in termsof patenting rates. One of the clearest indications of inno-vation performance is the rate of take-up of patents issuedby the US Patent and Trademarks Office (USPTO). Patentsare widely recognized as providing a reliable and unbiased
novative capacity. Res Policy (2008), doi:10.1016/j.respol.2008.07.003
indication of the innovation effort being expended by acountry (Griliches, 1990; Trajtenberg, 1990).
We therefore adopt the patenting activities by Chinesefirms and organizations at the USPTO as a measure ofChina’s national innovative capacity. We extend work pre-
ARTICLE IN PRESSG ModelRESPOL-2195; No. of Pages 15
M.-C. Hu, J.A. Mathews / Research Policy xxx (2008) xxx–xxx 3
Fcp
vcfOewctofcltsaRibc
(ospcifv
bbptsfi
atWif
China taking out patents at the USPTO. The prominent roleplayed by PRIs from the chemical and petrochemical sectoris striking, while Tsinghua University emerges as dominantwithin the university sector, and a handful of private sector
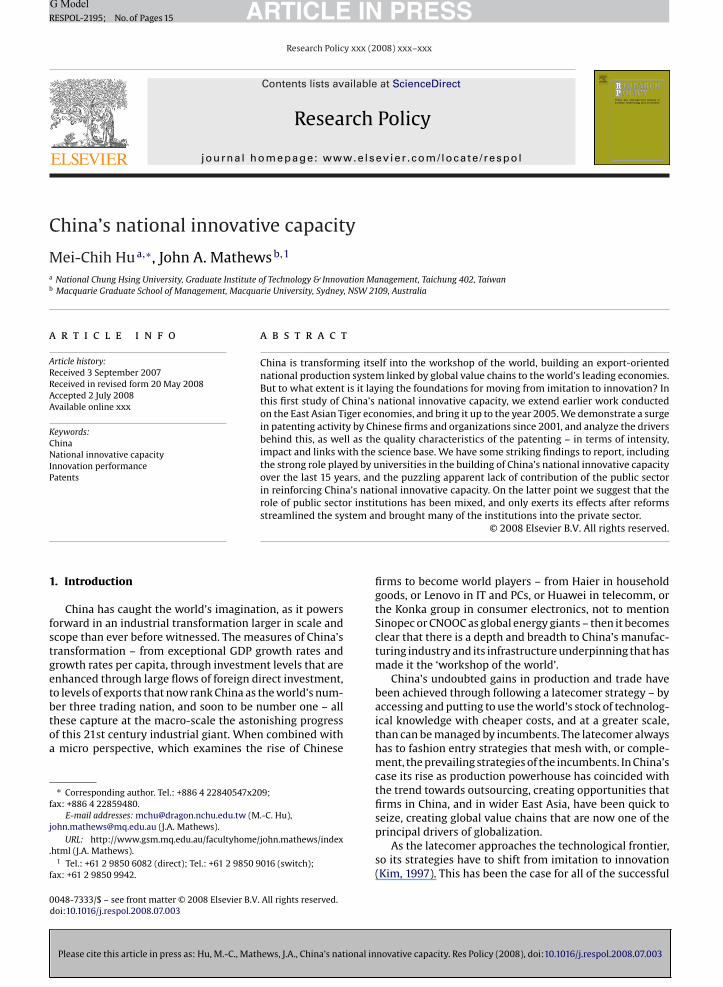
ig. 1. Source: USPTO and compiled by the authors. Note: China’s perapita patenting rate is too small to see on this Chart, given its very largeopulation.
iously performed by Furman et al. (2002) for the 17 OECDountries, and by Hu and Mathews (2005) in applying theirramework to the five East Asian Tiger economies. In theECD countries studied by Furman et al. (2002) and oth-rs, more broadly-based variables are closely associatedith variations in the rate of patenting, namely GDP per
apita, total R&D expenditure, intellectual property protec-ion, public expenditure on higher education and fundingn academic R&D. In comparison, Hu and Mathews (2005)ound that the process of building national innovationapacity in latecomer countries is comparable to that fol-owed in more advanced countries, yet distinctive in wayshat focus on four variables in particular, namely patenttocks, levels of R&D manpower, private R&D expenditurend specialization in high-tech industry along with Public&D funding. The results are consistent with many works
n East Asia and present the necessity of a strategic focus inuilding national innovative capacity in catching-up late-omer countries.
In this present study we update the Hu and Mathews2005) study to encompass the years 2000–2005, and focusn a single country, namely China.3 We engage in a two-tep study, firstly employing the same framework androcedure for identifying the drivers of national innovativeapacity, applied to China, and then analyzing the patent-ng record of firms and organizations at the USPTO to seekurther insight into the way in which the elements of inno-ative capacity are being put in place in China.
In Fig. 1, we show how East Asian Tiger economies haveeen ramping up their patenting activities at the USPTO,oth in terms of average growth rates and particularly in
Please cite this article in press as: Hu, M.-C., Mathews, J.A., China’s national in
er capita terms. Taiwan has now achieved the status ofhird highest per capita patenting economy in the worldince the mid-1990s, while Korea is just behind Germany infth place. China, starting from a low base, is growing faster
3 It is certainly the case that China is a very much larger country thanny of the East Asian Tiger economies, and therefore it might be suggestedhat a regional approach in analyzing China’s NIC might be appropriate.
hatever the merits of this argument for future studies, at this early stagen the development of China’s NIC, we hold that a national examinationor China makes sense.
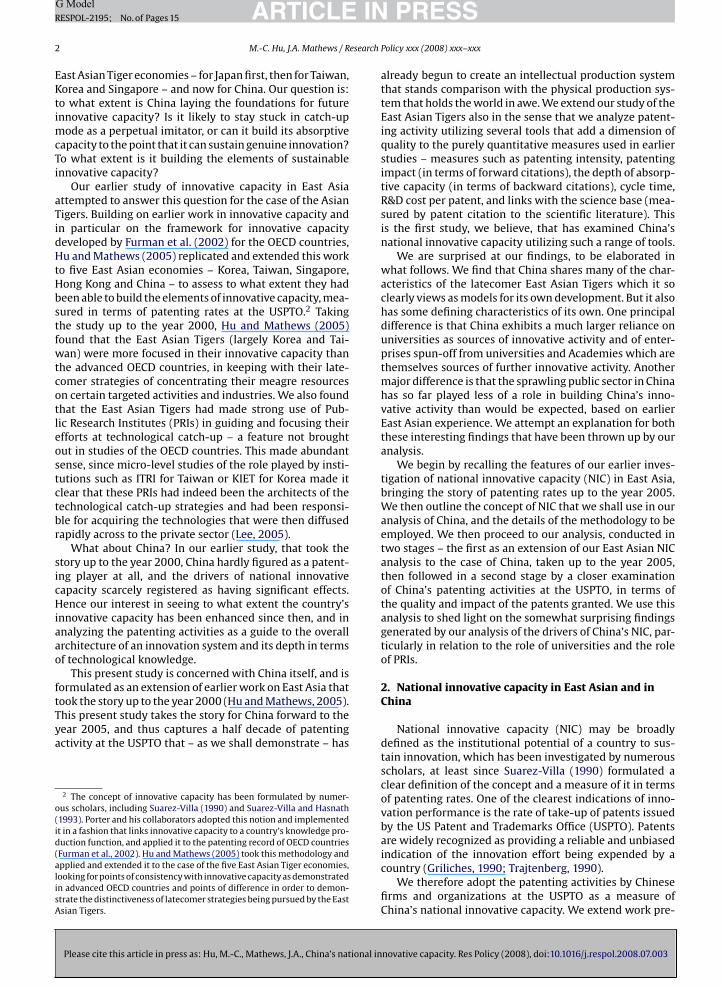
Fig. 2. Source: USPTO.
than others and holds the highest growth rate over the mostrecent period 2001–2005. As argued in Hu and Mathews(2005), we believe that the record of the East Asian Tigereconomies throws up a mirror in which China can view itsown likely future development, since it is following broadlysimilar latecomer strategies and building broadly similarcatch-up institutions to those deployed in the East Asiantiger economies in the 1980s and 1990s.
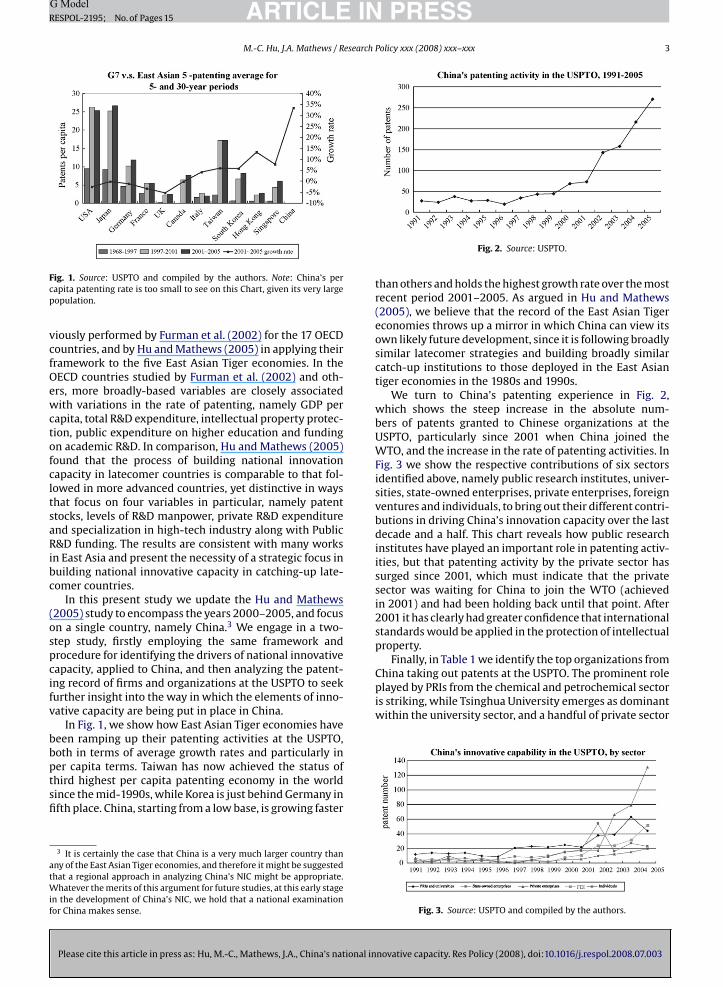
We turn to China’s patenting experience in Fig. 2,which shows the steep increase in the absolute num-bers of patents granted to Chinese organizations at theUSPTO, particularly since 2001 when China joined theWTO, and the increase in the rate of patenting activities. InFig. 3 we show the respective contributions of six sectorsidentified above, namely public research institutes, univer-sities, state-owned enterprises, private enterprises, foreignventures and individuals, to bring out their different contri-butions in driving China’s innovation capacity over the lastdecade and a half. This chart reveals how public researchinstitutes have played an important role in patenting activ-ities, but that patenting activity by the private sector hassurged since 2001, which must indicate that the privatesector was waiting for China to join the WTO (achievedin 2001) and had been holding back until that point. After2001 it has clearly had greater confidence that internationalstandards would be applied in the protection of intellectualproperty.
Finally, in Table 1 we identify the top organizations from
novative capacity. Res Policy (2008), doi:10.1016/j.respol.2008.07.003
Fig. 3. Source: USPTO and compiled by the authors.
ARTICLE IN PRESSG ModelRESPOL-2195; No. of Pages 15
4 M.-C. Hu, J.A. Mathews / Research Policy xxx (2008) xxx–xxx
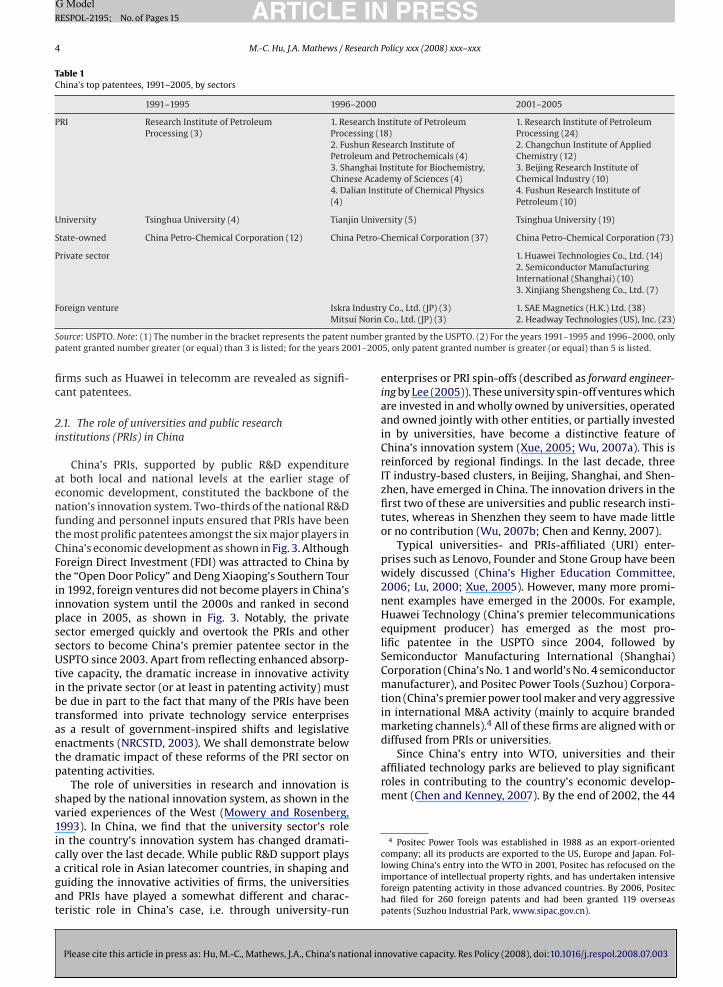
Table 1China’s top patentees, 1991–2005, by sectors
1991–1995 1996–2000 2001–2005
PRI Research Institute of PetroleumProcessing (3)
1. Research Institute of PetroleumProcessing (18)
1. Research Institute of PetroleumProcessing (24)
2. Fushun Research Institute ofPetroleum and Petrochemicals (4)
2. Changchun Institute of AppliedChemistry (12)
3. Shanghai Institute for Biochemistry,Chinese Academy of Sciences (4)
3. Beijing Research Institute ofChemical Industry (10)
4. Dalian Institute of Chemical Physics(4)
4. Fushun Research Institute ofPetroleum (10)
University Tsinghua University (4) Tianjin University (5) Tsinghua University (19)
State-owned China Petro-Chemical Corporation (12) China Petro-Chemical Corporation (37) China Petro-Chemical Corporation (73)
Private sector 1. Huawei Technologies Co., Ltd. (14)2. Semiconductor ManufacturingInternational (Shanghai) (10)3. Xinjiang Shengsheng Co., Ltd. (7)
Industrui Norin
number01–200
Since China’s entry into WTO, universities and theiraffiliated technology parks are believed to play significantroles in contributing to the country’s economic develop-ment (Chen and Kenney, 2007). By the end of 2002, the 44
4 Positec Power Tools was established in 1988 as an export-oriented
Foreign venture IskraMits
Source: USPTO. Note: (1) The number in the bracket represents the patentpatent granted number greater (or equal) than 3 is listed; for the years 20
firms such as Huawei in telecomm are revealed as signifi-cant patentees.
2.1. The role of universities and public researchinstitutions (PRIs) in China
China’s PRIs, supported by public R&D expenditureat both local and national levels at the earlier stage ofeconomic development, constituted the backbone of thenation’s innovation system. Two-thirds of the national R&Dfunding and personnel inputs ensured that PRIs have beenthe most prolific patentees amongst the six major players inChina’s economic development as shown in Fig. 3. AlthoughForeign Direct Investment (FDI) was attracted to China bythe “Open Door Policy” and Deng Xiaoping’s Southern Tourin 1992, foreign ventures did not become players in China’sinnovation system until the 2000s and ranked in secondplace in 2005, as shown in Fig. 3. Notably, the privatesector emerged quickly and overtook the PRIs and othersectors to become China’s premier patentee sector in theUSPTO since 2003. Apart from reflecting enhanced absorp-tive capacity, the dramatic increase in innovative activityin the private sector (or at least in patenting activity) mustbe due in part to the fact that many of the PRIs have beentransformed into private technology service enterprisesas a result of government-inspired shifts and legislativeenactments (NRCSTD, 2003). We shall demonstrate belowthe dramatic impact of these reforms of the PRI sector onpatenting activities.
The role of universities in research and innovation isshaped by the national innovation system, as shown in thevaried experiences of the West (Mowery and Rosenberg,1993). In China, we find that the university sector’s rolein the country’s innovation system has changed dramati-
Please cite this article in press as: Hu, M.-C., Mathews, J.A., China’s national in
cally over the last decade. While public R&D support playsa critical role in Asian latecomer countries, in shaping andguiding the innovative activities of firms, the universitiesand PRIs have played a somewhat different and charac-teristic role in China’s case, i.e. through university-run
y Co., Ltd. (JP) (3) 1. SAE Magnetics (H.K.) Ltd. (38)Co., Ltd. (JP) (3) 2. Headway Technologies (US), Inc. (23)
granted by the USPTO. (2) For the years 1991–1995 and 1996–2000, only5, only patent granted number is greater (or equal) than 5 is listed.
enterprises or PRI spin-offs (described as forward engineer-ing by Lee (2005)). These university spin-off ventures whichare invested in and wholly owned by universities, operatedand owned jointly with other entities, or partially investedin by universities, have become a distinctive feature ofChina’s innovation system (Xue, 2005; Wu, 2007a). This isreinforced by regional findings. In the last decade, threeIT industry-based clusters, in Beijing, Shanghai, and Shen-zhen, have emerged in China. The innovation drivers in thefirst two of these are universities and public research insti-tutes, whereas in Shenzhen they seem to have made littleor no contribution (Wu, 2007b; Chen and Kenny, 2007).
Typical universities- and PRIs-affiliated (URI) enter-prises such as Lenovo, Founder and Stone Group have beenwidely discussed (China’s Higher Education Committee,2006; Lu, 2000; Xue, 2005). However, many more promi-nent examples have emerged in the 2000s. For example,Huawei Technology (China’s premier telecommunicationsequipment producer) has emerged as the most pro-lific patentee in the USPTO since 2004, followed bySemiconductor Manufacturing International (Shanghai)Corporation (China’s No. 1 and world’s No. 4 semiconductormanufacturer), and Positec Power Tools (Suzhou) Corpora-tion (China’s premier power tool maker and very aggressivein international M&A activity (mainly to acquire brandedmarketing channels).4 All of these firms are aligned with ordiffused from PRIs or universities.
novative capacity. Res Policy (2008), doi:10.1016/j.respol.2008.07.003
company; all its products are exported to the US, Europe and Japan. Fol-lowing China’s entry into the WTO in 2001, Positec has refocused on theimportance of intellectual property rights, and has undertaken intensiveforeign patenting activity in those advanced countries. By 2006, Positechad filed for 260 foreign patents and had been granted 119 overseaspatents (Suzhou Industrial Park, www.sipac.gov.cn).
INR
esearch
um1i22i8
aacaaWcasefttiltataip
3
ocotcriaaddR
3
ocod
sicw
H for human capital and financial resources as R&D inputs,A for cumulative technological sophistication, XINF for com-mon innovation infrastructure, YCLUS for cluster- specificenvironment for innovation, ZLINK for the quality of linkagesbetween innovation infrastructure and the environment of
ARTICLEG ModelESPOL-2195; No. of Pages 15
M.-C. Hu, J.A. Mathews / R
niversity-established science parks had attracted invest-ent of RMB 29.7 billion, employed 100,000 persons in
200 R&D centers, supported 5500 high-tech companies,ncubated 2300 start-ups of which 920 have graduated and9 been listed on the stock exchange (Zhou, 2003). As of004, no fewer than 52% of all URI-affiliated enterprises are
n advanced technology fields which produced more than0% of the total revenue (Ministry of Education, 2005).
Patents and patenting activities remain a central part ofnation’s innovation system, and an extremely important
spect and signal of the health of the innovation pro-ess. Patenting by Chinese firms at the USPTO indicatesserious innovative intent, and hence provides us withreliable foundation for measuring innovative capacity.hile patenting systems have complex economic and legal
haracteristics, and the US system certainly exhibits somelarming characteristics today – e.g. a tendency amongstome firms to patent as a substitute for real innovation, andven as a block to innovation (Pisano, 2006) – neverthelessor latecomer countries that are looking to catch-up withhe industrial leaders today a capacity to register innova-ive capacity in terms of patenting activity appears to benescapable as a strategy for advance. The East Asian Tigersearnt this the hard way (by having to pay very high royal-ies for their high-tech successes) and as a result they aremongst the highest patentees on a per capita basis now inhe world. It is a lesson that China seems to have absorbed,nd it is now embarked on a growth and transformation ofts innovation system that looks set to emulate its stellarerformance in its production and trade system.
. Methodology
This study utilizes two interactive statistical methods inrder to clarify the drivers of China’s evolving innovativeapacity and patterns of development that have emergedver the past 15 years. The first stage of our analysis applieshe East Asian NIC concept to China, in order to specifi-ally examine the drivers of China’s innovative capacity. Theesults are then elaborated in the second stage by examin-ng China’s innovation performance (i.e. patenting activityt the USPTO) through the lens of measures of the qualitynd intensity of patenting activities, utilizing three stan-ard patenting indicators and five citation indicators asefined by the consulting organization ipIQ (formerly CHIesearch).5
.1. The concept of national innovative capacity
Please cite this article in press as: Hu, M.-C., Mathews, J.A., China’s national in
Given that changes in China’s innovative capacity cannly be discerned since the “Open Door Policy” was furtheronfirmed in Deng Xiaoping’s Southern Tour in the springf 1992, the first stage of our analysis thus begins withata collection from the period 1991–2005, and focuses
5 ipIQ (formerly CHI Research) is a leading Intellectual Property con-ulting firm, providing technology-oriented services, including IP-relatedndustry surveys and reports to firms contemplating acquisitions. Theompany has formulated various measures of patenting quality, whiche deploy through our own calculations in this study.
PRESSPolicy xxx (2008) xxx–xxx 5
on the drivers of national innovative capacity as revealedin the East Asian work by Hu and Mathews (2005). Inthis work, public R&D expenditure emerges as a distinctivedriver of innovation in latecomer countries.6 The concep-tual framework of this present study is mainly derivedfrom the endogenous growth theory, and specifically theidea of the “knowledge production function” (Romer, 1990;Jones, 1995, 2002), in which the growth of new knowledgedepends positively on the cumulative stock of knowledgeand the amount of human capital engaged in R&D.
Three main sets of ideas underpin the notion of NIC.These are (1) common innovation infrastructure, where thevariables are population (POP), each country’s number offull-time-equivalent scientists and engineers (FTE S&E),total R&D expenditures (TOTAL R&D), GDP per capita, thecountry’s openness to international trade and investment(OPENNESS), its regime for the protection of Intellec-tual Property Rights (IP), the strength of its antitrust law(ANTITRST), and the critical public variable R&D expen-diture (PUBLIC R&D) which is found to play a prominentrole in East Asian latecomer development; (2) environ-ment for innovation in industrial clusters, where the variablesare R&D expenditure in the private sector (PRIVATE R&D),and China’s relative specialization in three importanttechnological sectors (namely SPECIALISATION in chem-icals, electrical and mechanical) in the USPTO; and (3)the linkages between innovative infrastructure and cluster-specific innovation, where the variables are universities R&Dexpenditure (UNIV R&D) and venture capital availability(VENTURE CAPITAL).7 Except for the patenting data (fromthe USPTO), country’s openness (OPENNESS), IP protection,ANTITRUST and VENTURE CAPITAL (from the IMD’s Com-petitiveness Reports), all datasets are collected from China’sScience and Technology Statistics and National Bureau ofStatistics of China.
The equation to be estimated and analyzed in this studyadopted a log–log formulation of the following kind:
LÀj,t = ıYEARYEARt + ıcountryCj + ıINFLXINFj,t + ıCLUSLYCLUS
j,t
+ ıLINKLZLINKj,t + �LHA
j,t + ϕLA j,t + εj,t
In the equation, L stands for the logarithm, À stands forthe production of innovation, YEARt stands for year-specifictechnology shock, Cj for country-specific technology shock,
A
novative capacity. Res Policy (2008), doi:10.1016/j.respol.2008.07.003
6 The measure of national innovative capacity in the OECD countriesdid not include the public R&D expenditure in the work of Furman et al.(2002).
7 The majority of China’s manufacturing goods are exported to NorthAmerica and the EU (either directly shipment or through East Asian trans-shipment effected in order to avoid the anti-dumping restrictions imposedby the advanced countries. This is one of the factors behind our choice touse patent data from the USPTO instead of from the EPO or JPO. In addition,important inventions, regardless of origin, are likely to be patented in theUSPTO, especially for the East Asian latecomer countries which have closehistorical and economic ties with the US.
INesearch
GDP per capita and accumulated patent stock respectivelyas proxies for knowledge stock. Given the size of the pop-ulation in China, it is not surprising to find a negativecontribution made by population (POP), while FTE S&Tmanpower makes a positive contribution to the knowl-
ARTICLEG ModelRESPOL-2195; No. of Pages 15
6 M.-C. Hu, J.A. Mathews / R
cluster- specific innovation, and finally � for the sources oferror.
A nation’s ability to develop absorptive capacity reliesheavily on previous investment experience. Investment inthe early years allows them to make better technologi-cal choices and to exploit new opportunities (Cohen andLevinthal, 1990). Therefore, we employ GDP PER CAPITAand PATENT STOCK as dependent variables respectivelybecause they reflect the potential and direct capacity tosupport knowledge accumulation.
3.2. Innovation performance indicators
One of the clearest indicators of innovation performanceis the rate of take-up of patents issued by the USPTO,although the precise rate of technological innovation isinaccessible (Mansfield, 1986; Arundel and Kabla, 1998).To capture and reflect faithfully the evolving pattern ofdevelopment for China’s innovative capacity over the past15 years, the empirical results derived from the first stagewill be cross verified by careful analysis of citations ofpatents in the USPTO in the second stage. The dataset isthus divided into six sectors across three 5-year periods:1991–1995; 1996–2000; and 2001–2005. The six sectorschosen are (1) universities; (2) public research institutes;(3) state-owned enterprises; (4) private enterprises; (5) for-eign direct investment ventures; and (6) individuals. Ourresearch methodology makes use of a computerized USpatent database from the firm World Intellectual Prop-erty Search (WIPS). Patents are the most valuable formof information available for competitive analysis. Differentindicators are being used to predict the value of a patentor any organization’s strength. This study uses three stan-dard patent indicators and five advanced citation indicatorsinvented by ipIQ to analyze China’s innovative capacity overthe past 15 years. All indicators are calculated for the sixparticular sectors mentioned above, namely universities,public research institutes, state-owned enterprises, privateenterprises, foreign affiliations and individuals.
The standard patent indicators utilized in this studyare the number of patents, patent compound growth rateand patent intensity in each of the sectors. Since patentscan vary enormously in their importance or value, sim-ple patent counts are unlikely to capture the full forceof the innovative output of the sectors (see, for exampleTrajtenberg, 1990; Jaffe et al., 1993; Jaffe and Trajtenberg,2002). Thus the alternative is patent citations rate, whichis recognized as a proxy reflecting the impact and depthof innovation activity. While research has established thathighly cited patents represent economically and technicallyimportant inventions (e.g. Griliches, 1990; Narin, 1993), weuse five patent citation indicators to evaluate innovativecapability in the six sectors, as follows.
(1) Forward citation rate: A count of the citations receivedby a sector’s patents from subsequent patents. This
Please cite this article in press as: Hu, M.-C., Mathews, J.A., China’s national in
helps to evaluate the technological impact of patents.High citation counts are often associated with impor-tant inventions, ones that are fundamental to futureinventions and may have more competitive advantagesin that technological field.
PRESSPolicy xxx (2008) xxx–xxx
(2) Backward citation rate: A count of the citations madereference by a sector’s patents to prior patents. Thishelps to trace the source of innovation/knowledge aswell as the developmental trajectory of innovationcapability in the sectors.
(3) Average citation frequency: Since China is an emerg-ing latecomer country with an unique economic andindustrial development, this study also utilize averagecitation frequency in order to evaluate China’s endoge-nous innovative capability in the past 25 years. Averagecitation frequency, comparable to Current Impact Index(CII), represents the average number of times in whicha sector’s previous 5 years of patents are cited in thecurrent year in the USPTO; this shows how frequentlythey were used as the foundation for other inventions.
(4) Technology Cycle Time (TCT): Indicates speed of inno-vation or how fast the technology is turning over,defined as the median age of the patent cited on thefront page of a patent document. The TCT is mea-sured in years. This indicator can measure the paceof technological progress. Shorter cycle times reflectfaster substitutions, indicating faster progress; whilelonger cycle times reflect slower substitutions, indicat-ing slower progress (Narin, 1993).
(5) Science Linkage Indicators: The counts of patent ref-erences citing papers from the scientific literature.Increasingly, patents are citing non-patent documentsas prior art, and many of these are papers in scientificjournals. A high level of science linkage thus indicatesthat a patent is building on a technology base groundedin advances in science.8
4. China’s national innovative capacity: analysis ofthe drivers
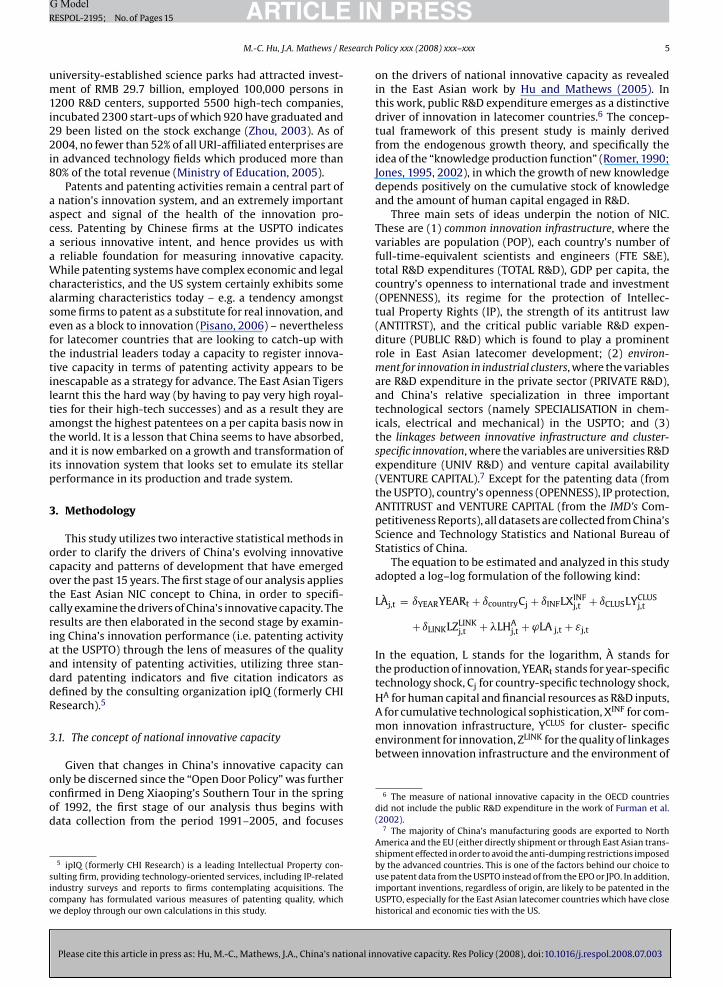
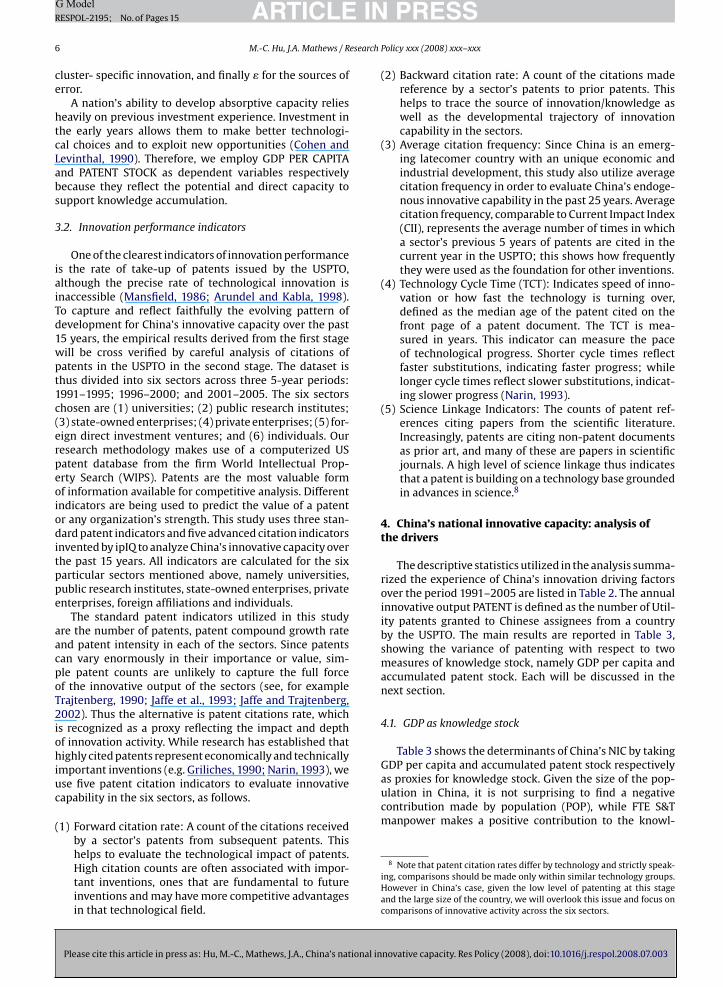
The descriptive statistics utilized in the analysis summa-rized the experience of China’s innovation driving factorsover the period 1991–2005 are listed in Table 2. The annualinnovative output PATENT is defined as the number of Util-ity patents granted to Chinese assignees from a countryby the USPTO. The main results are reported in Table 3,showing the variance of patenting with respect to twomeasures of knowledge stock, namely GDP per capita andaccumulated patent stock. Each will be discussed in thenext section.
4.1. GDP as knowledge stock
Table 3 shows the determinants of China’s NIC by taking
novative capacity. Res Policy (2008), doi:10.1016/j.respol.2008.07.003
8 Note that patent citation rates differ by technology and strictly speak-ing, comparisons should be made only within similar technology groups.However in China’s case, given the low level of patenting at this stageand the large size of the country, we will overlook this issue and focus oncomparisons of innovative activity across the six sectors.
ARTICLE IN PRESSG ModelRESPOL-2195; No. of Pages 15
M.-C. Hu, J.A. Mathews / Research Policy xxx (2008) xxx–xxx 7
Table 2Descriptive statistics
N Minimum Maximum Mean S.D.
PATENT 16 19 270 77.31 77.12GDP 16 1492 5332 3260.13 1235.04GDPPER 16 1.5 4.5 2.744 .932PATSTOCK 16 194 1406 540.50 350.56POP 16 1135185.0 1307555.0 1231082.8 55111.8FTE S&T 16 565400 1211350 855006.25 191021.82TOTALRD 16 10810 245000 79305.00 69582.91PUBLICRD 16 3837 53470 24471.06 14453.19OPENNESS 16 4.6 6.1 5.474 .407IP 16 2.70 5.32 4.1675 .9420ANTITRUS 16 4.04 6.33 4.8850 .7094PRIVATRD 16 3993 167300 46182.75 49305.42CHEMICAL 16 .22 .58 .3781 .1059MECHANIC 16 .19 .50 .3762 9.337E-02ELECTRIC 16 .13 .38 .2469 7.726E-02UNIVRD 16 2980 24230 8651.25 6481.10CAPITAL 16 1.95 5.34 4.2588 .8809Valid N (listwise) 16
Note: Total R&D = public R&D + private R&D + university R&D.
Table 3GDP per capita/patent stock as knowledge stock
Knowledge productionfunction
Innovationinfrastructure
National innovative capacity:including all variables
GDP per capita Patent stock GDP per capita Patent stock GDP per capita Patent stock
Innovation infrastructureA L Patent stock 1.256*** 1.474 −3.610**A L GDP 0.872** 0.322** 0.071HA L POP −1.456*** 0.564** 1.054HA L FTE S&T 1.461*** 0.085 −0.016 −0.024 −0.403 −0.677***HA L Total R&D 0.535** −0.315 0.746 0.452XINF Public R&D −0.339 0.033 −0.606 −2.551**XINF Openness 0.036 −0.002 0.138 0.671**XINF IP −0.035 −0.167 −0.500* −1.038***XINF Antitrust −0.038 0.018 0.196* 0.284***
Cluster-specific innovation environmentYCLUS Private R&D −0.236 2.974**YCLUS Specializationchemical 0.144 0.486**YCLUS Specializationmechanicall −0.746 0.024YCLUS Specializationelectrical −0.417 −0.210***
Quality of linkagesZLINK University R&D 1.711** 2.766***ZLINK Venture capital −0.321 −0.843***
ControlsYear fixed effects Significant Significant Insignificant Insignificant Insignificant SignificantR2 0.913 0.984 0.997 0.99 0.998 0.999
0.9916
N
eofyttCuwaCt
separation between R&D and production activities underthe Soviet model). The critical effect of the antitrust pol-icy may be deduced from a series of reforms in the last
Adjusted R2 0.891 0.98Number of observations 16 16
ote: *P < 0.1, **P < 0.05, ***P < 0.01.
dge production function. Moreover, China’s lower basef industrial development and the fact that it has beenocused on labour-intensive industries over the past 20ears allow GDP, population and total R&D expenditureo act as the most important drivers of innovation infras-ructure and contribute to overall economic growth. Whenhina’s innovative system includes all interactive variables,
Please cite this article in press as: Hu, M.-C., Mathews, J.A., China’s national in
niversity R&D leaps out as the most significant driverhile the antitrust policy also exerts its influence on over-
ll innovative capacity. Indeed, significant GDP growth inhina is observed particularly from the mid-1990s whenhe universities began to focus on research for indus-
4 0.978 0.991 0.99816 16 16
trial needs (due to the large number of universities-runenterprises or spin-offs).9 This forward engineering modelgenerated by university R&D is attributed to China’s weakinnovation capability in the private sector (due to the
novative capacity. Res Policy (2008), doi:10.1016/j.respol.2008.07.003
decade encouraging mergers and restructuring of state-
9 The accumulated number of university spin-offs reached 42,945within 7 years between 1997 and 2004 (Xue, 2005).
INesearch
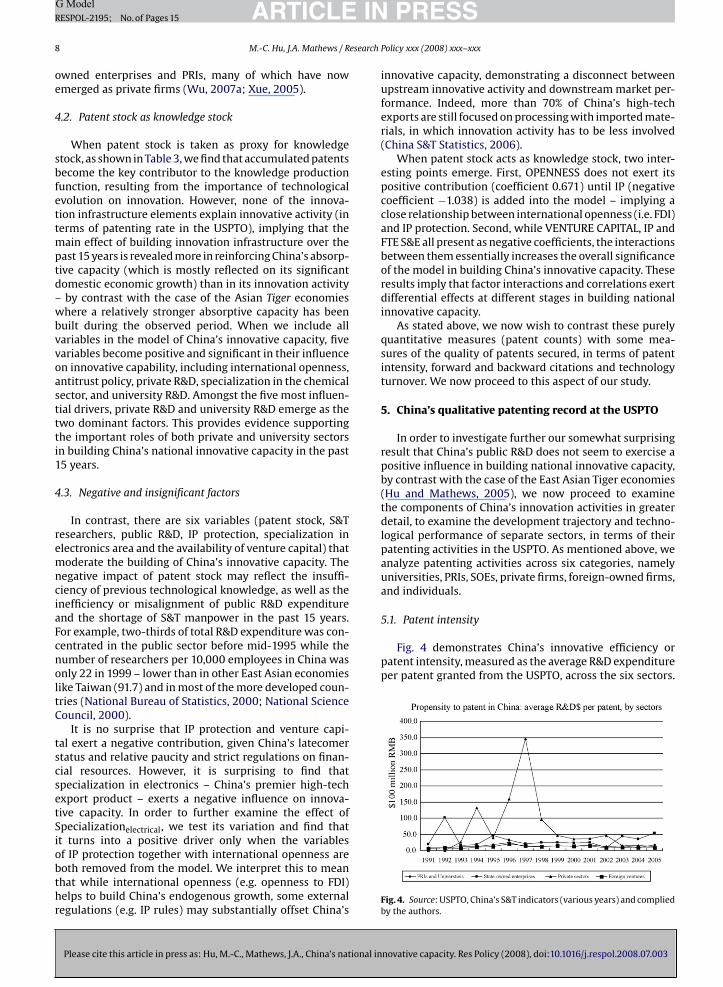
5.1. Patent intensity
Fig. 4 demonstrates China’s innovative efficiency orpatent intensity, measured as the average R&D expenditureper patent granted from the USPTO, across the six sectors.
ARTICLEG ModelRESPOL-2195; No. of Pages 15
8 M.-C. Hu, J.A. Mathews / R
owned enterprises and PRIs, many of which have nowemerged as private firms (Wu, 2007a; Xue, 2005).
4.2. Patent stock as knowledge stock
When patent stock is taken as proxy for knowledgestock, as shown in Table 3, we find that accumulated patentsbecome the key contributor to the knowledge productionfunction, resulting from the importance of technologicalevolution on innovation. However, none of the innova-tion infrastructure elements explain innovative activity (interms of patenting rate in the USPTO), implying that themain effect of building innovation infrastructure over thepast 15 years is revealed more in reinforcing China’s absorp-tive capacity (which is mostly reflected on its significantdomestic economic growth) than in its innovation activity– by contrast with the case of the Asian Tiger economieswhere a relatively stronger absorptive capacity has beenbuilt during the observed period. When we include allvariables in the model of China’s innovative capacity, fivevariables become positive and significant in their influenceon innovative capability, including international openness,antitrust policy, private R&D, specialization in the chemicalsector, and university R&D. Amongst the five most influen-tial drivers, private R&D and university R&D emerge as thetwo dominant factors. This provides evidence supportingthe important roles of both private and university sectorsin building China’s national innovative capacity in the past15 years.
4.3. Negative and insignificant factors
In contrast, there are six variables (patent stock, S&Tresearchers, public R&D, IP protection, specialization inelectronics area and the availability of venture capital) thatmoderate the building of China’s innovative capacity. Thenegative impact of patent stock may reflect the insuffi-ciency of previous technological knowledge, as well as theinefficiency or misalignment of public R&D expenditureand the shortage of S&T manpower in the past 15 years.For example, two-thirds of total R&D expenditure was con-centrated in the public sector before mid-1995 while thenumber of researchers per 10,000 employees in China wasonly 22 in 1999 – lower than in other East Asian economieslike Taiwan (91.7) and in most of the more developed coun-tries (National Bureau of Statistics, 2000; National ScienceCouncil, 2000).
It is no surprise that IP protection and venture capi-tal exert a negative contribution, given China’s latecomerstatus and relative paucity and strict regulations on finan-cial resources. However, it is surprising to find thatspecialization in electronics – China’s premier high-techexport product – exerts a negative influence on innova-tive capacity. In order to further examine the effect ofSpecializationelectrical, we test its variation and find thatit turns into a positive driver only when the variables
Please cite this article in press as: Hu, M.-C., Mathews, J.A., China’s national in
of IP protection together with international openness areboth removed from the model. We interpret this to meanthat while international openness (e.g. openness to FDI)helps to build China’s endogenous growth, some externalregulations (e.g. IP rules) may substantially offset China’s
PRESSPolicy xxx (2008) xxx–xxx
innovative capacity, demonstrating a disconnect betweenupstream innovative activity and downstream market per-formance. Indeed, more than 70% of China’s high-techexports are still focused on processing with imported mate-rials, in which innovation activity has to be less involved(China S&T Statistics, 2006).
When patent stock acts as knowledge stock, two inter-esting points emerge. First, OPENNESS does not exert itspositive contribution (coefficient 0.671) until IP (negativecoefficient −1.038) is added into the model – implying aclose relationship between international openness (i.e. FDI)and IP protection. Second, while VENTURE CAPITAL, IP andFTE S&E all present as negative coefficients, the interactionsbetween them essentially increases the overall significanceof the model in building China’s innovative capacity. Theseresults imply that factor interactions and correlations exertdifferential effects at different stages in building nationalinnovative capacity.
As stated above, we now wish to contrast these purelyquantitative measures (patent counts) with some mea-sures of the quality of patents secured, in terms of patentintensity, forward and backward citations and technologyturnover. We now proceed to this aspect of our study.
5. China’s qualitative patenting record at the USPTO
In order to investigate further our somewhat surprisingresult that China’s public R&D does not seem to exercise apositive influence in building national innovative capacity,by contrast with the case of the East Asian Tiger economies(Hu and Mathews, 2005), we now proceed to examinethe components of China’s innovation activities in greaterdetail, to examine the development trajectory and techno-logical performance of separate sectors, in terms of theirpatenting activities in the USPTO. As mentioned above, weanalyze patenting activities across six categories, namelyuniversities, PRIs, SOEs, private firms, foreign-owned firms,and individuals.
novative capacity. Res Policy (2008), doi:10.1016/j.respol.2008.07.003
Fig. 4. Source: USPTO, China’s S&T indicators (various years) and compliedby the authors.
ARTICLE IN PRESSG ModelRESPOL-2195; No. of Pages 15
M.-C. Hu, J.A. Mathews / Research Policy xxx (2008) xxx–xxx 9
Notwitiidorw1
5
(tiueofiepaaotvctpia
oett
developmental trajectory of innovation capability. Thehigher backward citation rate may represent the higherdependency and stronger absorptive capacity from previ-ous innovations (Rothaermel and Hill, 2005; Cohen andLevinthal, 1989). In Fig. 7, the evolution of China’s innova-
Fig. 5. Source: USPTO search and complied by the authors.
ot surprisingly, foreign ventures exhibit the highest levelsf innovative efficiency, followed by the PRIs and universi-ies; this reflects the essential role of foreign technology asell as the suggestion of top-down technological diffusion
n China (Chen and Kenney, 2007). It is also worth notinghat while the private sector exerts a critical influence onnnovative capacity and efficiency in the recent period, thennovative efficiency in the state-owned enterprises hasiminished; this could correspond to the fact that betweenne-third and two-thirds of state-owned enterprises areunning at a loss, even though efficiency has been some-hat improved in recent years (Sun and Tong, 2003; Xue,
997).10
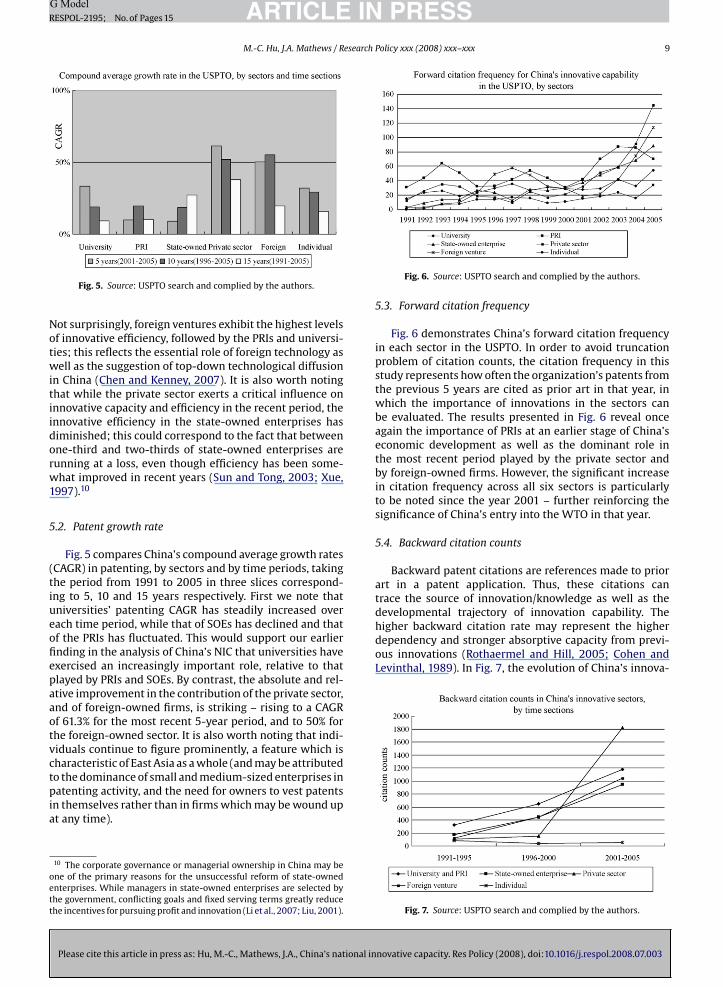
.2. Patent growth rate
Fig. 5 compares China’s compound average growth ratesCAGR) in patenting, by sectors and by time periods, takinghe period from 1991 to 2005 in three slices correspond-ng to 5, 10 and 15 years respectively. First we note thatniversities’ patenting CAGR has steadily increased overach time period, while that of SOEs has declined and thatf the PRIs has fluctuated. This would support our earliernding in the analysis of China’s NIC that universities havexercised an increasingly important role, relative to thatlayed by PRIs and SOEs. By contrast, the absolute and rel-tive improvement in the contribution of the private sector,nd of foreign-owned firms, is striking – rising to a CAGRf 61.3% for the most recent 5-year period, and to 50% forhe foreign-owned sector. It is also worth noting that indi-iduals continue to figure prominently, a feature which isharacteristic of East Asia as a whole (and may be attributed
Please cite this article in press as: Hu, M.-C., Mathews, J.A., China’s national in
o the dominance of small and medium-sized enterprises inatenting activity, and the need for owners to vest patents
n themselves rather than in firms which may be wound upt any time).
10 The corporate governance or managerial ownership in China may bene of the primary reasons for the unsuccessful reform of state-ownednterprises. While managers in state-owned enterprises are selected byhe government, conflicting goals and fixed serving terms greatly reducehe incentives for pursuing profit and innovation (Li et al., 2007; Liu, 2001).
Fig. 6. Source: USPTO search and complied by the authors.
5.3. Forward citation frequency
Fig. 6 demonstrates China’s forward citation frequencyin each sector in the USPTO. In order to avoid truncationproblem of citation counts, the citation frequency in thisstudy represents how often the organization’s patents fromthe previous 5 years are cited as prior art in that year, inwhich the importance of innovations in the sectors canbe evaluated. The results presented in Fig. 6 reveal onceagain the importance of PRIs at an earlier stage of China’seconomic development as well as the dominant role inthe most recent period played by the private sector andby foreign-owned firms. However, the significant increasein citation frequency across all six sectors is particularlyto be noted since the year 2001 – further reinforcing thesignificance of China’s entry into the WTO in that year.
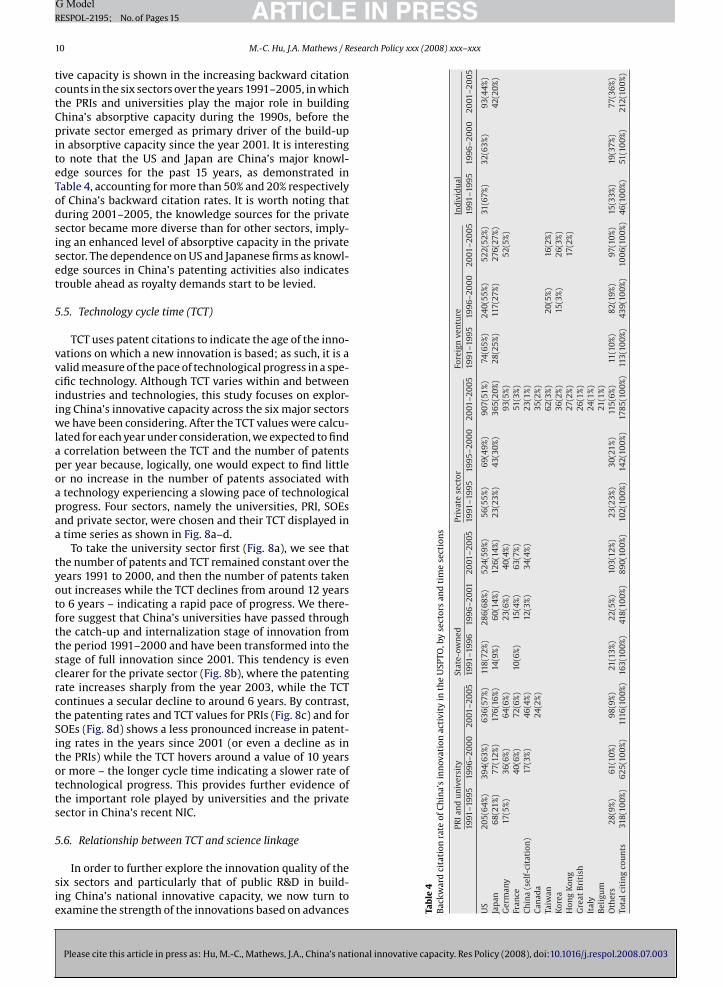
5.4. Backward citation counts
Backward patent citations are references made to priorart in a patent application. Thus, these citations cantrace the source of innovation/knowledge as well as the
novative capacity. Res Policy (2008), doi:10.1016/j.respol.2008.07.003
Fig. 7. Source: USPTO search and complied by the authors.
IN PRESSesearch Policy xxx (2008) xxx–xxx
onra
teof
Ch
ina’
sin
nov
atio
nac
tivi
tyin
the
USP
TO,b
yse
ctor
san
dti
me
sect
ion
s
PRIa
nd
un
iver
sity
Stat
e-ow
ned
Priv
ate
sect
orFo
reig
nve
ntu
reIn
div
idu
al19
91–1
995
1996
–20
00
2001
–20
0519
91–1
996
1996
–20
0120
01–2
005
1991
–199
519
95–2
00
020
01–2
005
1991
–199
519
96–2
00
020
01–2
005
1991
–199
519
96–2
00
020
01–2
005
205(
64%
)39
4(63
%)
636(
57%
)11
8(72
%)
286(
68%
)52
4(59
%)
56(5
5%)
69(4
9%)
907(
51%
)74
(65%
)24
0(55
%)
522(
52%
)31
(67%
)32
(63%
)93
(44%
)6
8(21
%)
77(1
2%)
176(
16%
)14
(9%
)60
(14%
)12
6(14
%)
23(2
3%)
43(3
0%)
365(
20%
)28
(25%
)11
7(27
%)
276(
27%
)42
(20%
)17
(5%
)36
(6%
)6
4(6%
)23
(6%
)40
(4%
)93
(5%
)52
(5%
)40
(6%
)72
(6%
)10
(6%
)15
(4%
)63
(7%
)51
(3%
)on
)17
(3%
)46
(4%
)12
(3%
)34
(4%
)23
(1%
)24
(2%
)35
(2%
)62
(3%
)20
(5%
)16
(2%
)36
(2%
)15
(3%
)26
(3%
)27
(2%
)17
(2%
)26
(1%
)24
(1%
)21
(1%
)28
(9%
)61
(10%
)98
(9%
)21
(13%
)22
(5%
)10
3(12
%)
23(2
3%)
30(2
1%)
115(
6%)
11(1
0%)
82(1
9%)
97(1
0%)
15(3
3%)
19(3
7%)
77(3
6%)
ts31
8(10
0%)
625(
100%
)11
16(1
00%
)16
3(10
0%)
418(
100%
)89
0(10
0%)
102(
100%
)14
2(10
0%)
1785
(10
0%)
113(
100%
)43
9(10
0%)
1006
(10
0%)
46(1
00%
)51
(10
0%)
212(
100%
)
ARTICLEG ModelRESPOL-2195; No. of Pages 15
10 M.-C. Hu, J.A. Mathews / R
tive capacity is shown in the increasing backward citationcounts in the six sectors over the years 1991–2005, in whichthe PRIs and universities play the major role in buildingChina’s absorptive capacity during the 1990s, before theprivate sector emerged as primary driver of the build-upin absorptive capacity since the year 2001. It is interestingto note that the US and Japan are China’s major knowl-edge sources for the past 15 years, as demonstrated inTable 4, accounting for more than 50% and 20% respectivelyof China’s backward citation rates. It is worth noting thatduring 2001–2005, the knowledge sources for the privatesector became more diverse than for other sectors, imply-ing an enhanced level of absorptive capacity in the privatesector. The dependence on US and Japanese firms as knowl-edge sources in China’s patenting activities also indicatestrouble ahead as royalty demands start to be levied.
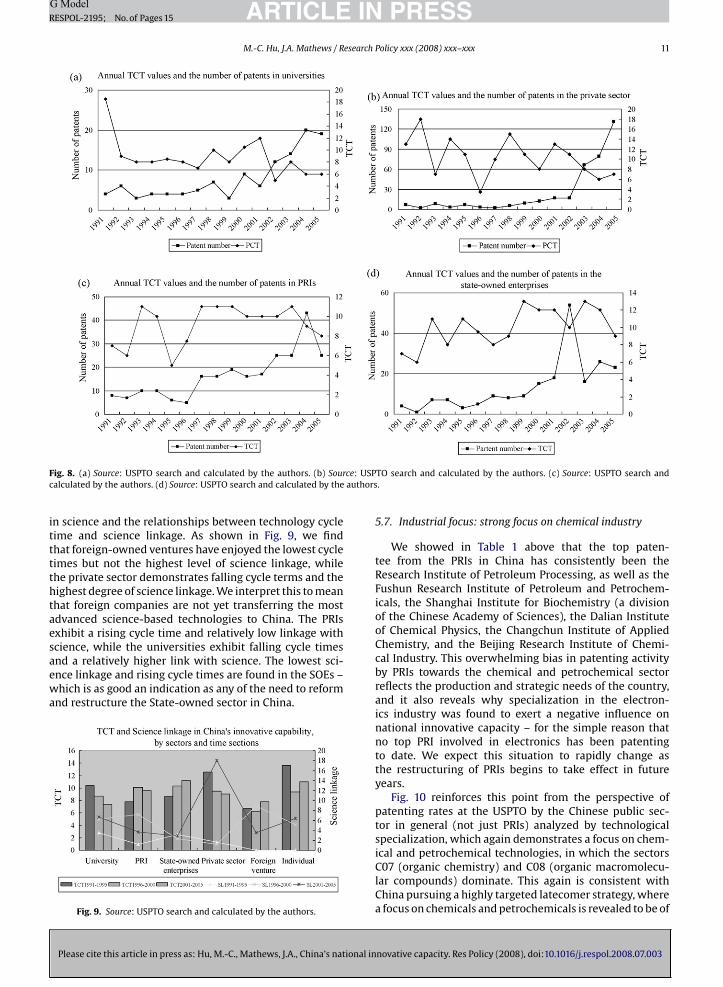
5.5. Technology cycle time (TCT)
TCT uses patent citations to indicate the age of the inno-vations on which a new innovation is based; as such, it is avalid measure of the pace of technological progress in a spe-cific technology. Although TCT varies within and betweenindustries and technologies, this study focuses on explor-ing China’s innovative capacity across the six major sectorswe have been considering. After the TCT values were calcu-lated for each year under consideration, we expected to finda correlation between the TCT and the number of patentsper year because, logically, one would expect to find littleor no increase in the number of patents associated witha technology experiencing a slowing pace of technologicalprogress. Four sectors, namely the universities, PRI, SOEsand private sector, were chosen and their TCT displayed ina time series as shown in Fig. 8a–d.
To take the university sector first (Fig. 8a), we see thatthe number of patents and TCT remained constant over theyears 1991 to 2000, and then the number of patents takenout increases while the TCT declines from around 12 yearsto 6 years – indicating a rapid pace of progress. We there-fore suggest that China’s universities have passed throughthe catch-up and internalization stage of innovation fromthe period 1991–2000 and have been transformed into thestage of full innovation since 2001. This tendency is evenclearer for the private sector (Fig. 8b), where the patentingrate increases sharply from the year 2003, while the TCTcontinues a secular decline to around 6 years. By contrast,the patenting rates and TCT values for PRIs (Fig. 8c) and forSOEs (Fig. 8d) shows a less pronounced increase in patent-ing rates in the years since 2001 (or even a decline as inthe PRIs) while the TCT hovers around a value of 10 yearsor more – the longer cycle time indicating a slower rate oftechnological progress. This provides further evidence ofthe important role played by universities and the privatesector in China’s recent NIC.
5.6. Relationship between TCT and science linkage
Please cite this article in press as: Hu, M.-C., Mathews, J.A., China’s national innovative capacity. Res Policy (2008), doi:10.1016/j.respol.2008.07.003
In order to further explore the innovation quality of thesix sectors and particularly that of public R&D in build-ing China’s national innovative capacity, we now turn toexamine the strength of the innovations based on advances Ta
ble
4B
ackw
ard
cita
ti
US
Jap
anG
erm
any
Fran
ceC
hin
a(s
elf-
cita
tiC
anad
aTa
iwan
Kor
eaH
ong
Kon
gG
reat
Bri
tish
Ital
yB
elig
um
Oth
ers
Tota
lcit
ing
cou
n
ARTICLE IN PRESSG ModelRESPOL-2195; No. of Pages 15
M.-C. Hu, J.A. Mathews / Research Policy xxx (2008) xxx–xxx 11
F ce: USPc authors
itttthtaesaewa
ig. 8. (a) Source: USPTO search and calculated by the authors. (b) Souralculated by the authors. (d) Source: USPTO search and calculated by the
n science and the relationships between technology cycleime and science linkage. As shown in Fig. 9, we findhat foreign-owned ventures have enjoyed the lowest cycleimes but not the highest level of science linkage, whilehe private sector demonstrates falling cycle terms and theighest degree of science linkage. We interpret this to meanhat foreign companies are not yet transferring the mostdvanced science-based technologies to China. The PRIsxhibit a rising cycle time and relatively low linkage withcience, while the universities exhibit falling cycle times
Please cite this article in press as: Hu, M.-C., Mathews, J.A., China’s national in
nd a relatively higher link with science. The lowest sci-nce linkage and rising cycle times are found in the SOEs –hich is as good an indication as any of the need to reform
nd restructure the State-owned sector in China.
Fig. 9. Source: USPTO search and calculated by the authors.
TO search and calculated by the authors. (c) Source: USPTO search and.
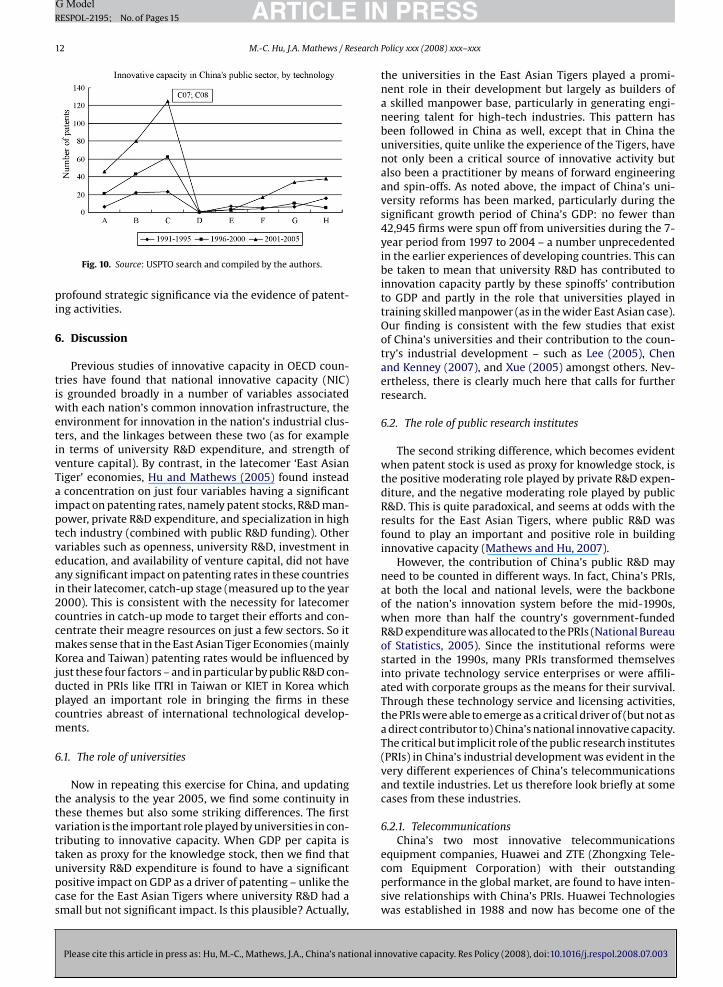
5.7. Industrial focus: strong focus on chemical industry
We showed in Table 1 above that the top paten-tee from the PRIs in China has consistently been theResearch Institute of Petroleum Processing, as well as theFushun Research Institute of Petroleum and Petrochem-icals, the Shanghai Institute for Biochemistry (a divisionof the Chinese Academy of Sciences), the Dalian Instituteof Chemical Physics, the Changchun Institute of AppliedChemistry, and the Beijing Research Institute of Chemi-cal Industry. This overwhelming bias in patenting activityby PRIs towards the chemical and petrochemical sectorreflects the production and strategic needs of the country,and it also reveals why specialization in the electron-ics industry was found to exert a negative influence onnational innovative capacity – for the simple reason thatno top PRI involved in electronics has been patentingto date. We expect this situation to rapidly change asthe restructuring of PRIs begins to take effect in futureyears.
Fig. 10 reinforces this point from the perspective ofpatenting rates at the USPTO by the Chinese public sec-tor in general (not just PRIs) analyzed by technologicalspecialization, which again demonstrates a focus on chem-
novative capacity. Res Policy (2008), doi:10.1016/j.respol.2008.07.003
ical and petrochemical technologies, in which the sectorsC07 (organic chemistry) and C08 (organic macromolecu-lar compounds) dominate. This again is consistent withChina pursuing a highly targeted latecomer strategy, wherea focus on chemicals and petrochemicals is revealed to be of
ARTICLE ING ModelRESPOL-2195; No. of Pages 15
12 M.-C. Hu, J.A. Mathews / Research
Fig. 10. Source: USPTO search and compiled by the authors.
profound strategic significance via the evidence of patent-ing activities.
6. Discussion
Previous studies of innovative capacity in OECD coun-tries have found that national innovative capacity (NIC)is grounded broadly in a number of variables associatedwith each nation’s common innovation infrastructure, theenvironment for innovation in the nation’s industrial clus-ters, and the linkages between these two (as for examplein terms of university R&D expenditure, and strength ofventure capital). By contrast, in the latecomer ‘East AsianTiger’ economies, Hu and Mathews (2005) found insteada concentration on just four variables having a significantimpact on patenting rates, namely patent stocks, R&D man-power, private R&D expenditure, and specialization in hightech industry (combined with public R&D funding). Othervariables such as openness, university R&D, investment ineducation, and availability of venture capital, did not haveany significant impact on patenting rates in these countriesin their latecomer, catch-up stage (measured up to the year2000). This is consistent with the necessity for latecomercountries in catch-up mode to target their efforts and con-centrate their meagre resources on just a few sectors. So itmakes sense that in the East Asian Tiger Economies (mainlyKorea and Taiwan) patenting rates would be influenced byjust these four factors – and in particular by public R&D con-ducted in PRIs like ITRI in Taiwan or KIET in Korea whichplayed an important role in bringing the firms in thesecountries abreast of international technological develop-ments.
6.1. The role of universities
Now in repeating this exercise for China, and updatingthe analysis to the year 2005, we find some continuity inthese themes but also some striking differences. The firstvariation is the important role played by universities in con-tributing to innovative capacity. When GDP per capita is
Please cite this article in press as: Hu, M.-C., Mathews, J.A., China’s national in
taken as proxy for the knowledge stock, then we find thatuniversity R&D expenditure is found to have a significantpositive impact on GDP as a driver of patenting – unlike thecase for the East Asian Tigers where university R&D had asmall but not significant impact. Is this plausible? Actually,
PRESSPolicy xxx (2008) xxx–xxx
the universities in the East Asian Tigers played a promi-nent role in their development but largely as builders ofa skilled manpower base, particularly in generating engi-neering talent for high-tech industries. This pattern hasbeen followed in China as well, except that in China theuniversities, quite unlike the experience of the Tigers, havenot only been a critical source of innovative activity butalso been a practitioner by means of forward engineeringand spin-offs. As noted above, the impact of China’s uni-versity reforms has been marked, particularly during thesignificant growth period of China’s GDP: no fewer than42,945 firms were spun off from universities during the 7-year period from 1997 to 2004 – a number unprecedentedin the earlier experiences of developing countries. This canbe taken to mean that university R&D has contributed toinnovation capacity partly by these spinoffs’ contributionto GDP and partly in the role that universities played intraining skilled manpower (as in the wider East Asian case).Our finding is consistent with the few studies that existof China’s universities and their contribution to the coun-try’s industrial development – such as Lee (2005), Chenand Kenney (2007), and Xue (2005) amongst others. Nev-ertheless, there is clearly much here that calls for furtherresearch.
6.2. The role of public research institutes
The second striking difference, which becomes evidentwhen patent stock is used as proxy for knowledge stock, isthe positive moderating role played by private R&D expen-diture, and the negative moderating role played by publicR&D. This is quite paradoxical, and seems at odds with theresults for the East Asian Tigers, where public R&D wasfound to play an important and positive role in buildinginnovative capacity (Mathews and Hu, 2007).
However, the contribution of China’s public R&D mayneed to be counted in different ways. In fact, China’s PRIs,at both the local and national levels, were the backboneof the nation’s innovation system before the mid-1990s,when more than half the country’s government-fundedR&D expenditure was allocated to the PRIs (National Bureauof Statistics, 2005). Since the institutional reforms werestarted in the 1990s, many PRIs transformed themselvesinto private technology service enterprises or were affili-ated with corporate groups as the means for their survival.Through these technology service and licensing activities,the PRIs were able to emerge as a critical driver of (but not asa direct contributor to) China’s national innovative capacity.The critical but implicit role of the public research institutes(PRIs) in China’s industrial development was evident in thevery different experiences of China’s telecommunicationsand textile industries. Let us therefore look briefly at somecases from these industries.
6.2.1. TelecommunicationsChina’s two most innovative telecommunications
novative capacity. Res Policy (2008), doi:10.1016/j.respol.2008.07.003
equipment companies, Huawei and ZTE (Zhongxing Tele-com Equipment Corporation) with their outstandingperformance in the global market, are found to have inten-sive relationships with China’s PRIs. Huawei Technologieswas established in 1988 and now has become one of the
INR
esearch
lmfWiWeHjtPTRDoSZwwp
6
midaSPmbiccemfrrImsp
ioyPwittaod2pvici
patenting rate in China up to the year 2000 (albeit still smallby international standards), their innovation performancewas mostly confined to a few PRIs and concentrated in thechemicals and petrochemicals area. After the year 2000,
ARTICLEG ModelESPOL-2195; No. of Pages 15
M.-C. Hu, J.A. Mathews / R
eading vendors of switching systems in the global telecom-unications market. In 2007, Huawei rose to become the
ourth largest patent applicant in the world under theIPO Patent Cooperation Treaty (PCT); in the same year
t was recognized by Forbes magazine as one of the 200orld’s Most Respected Companies. Apart from leveraging
xternal technology through its six overseas R&D centers,uawei operates another six domestic R&D centers in Bei-
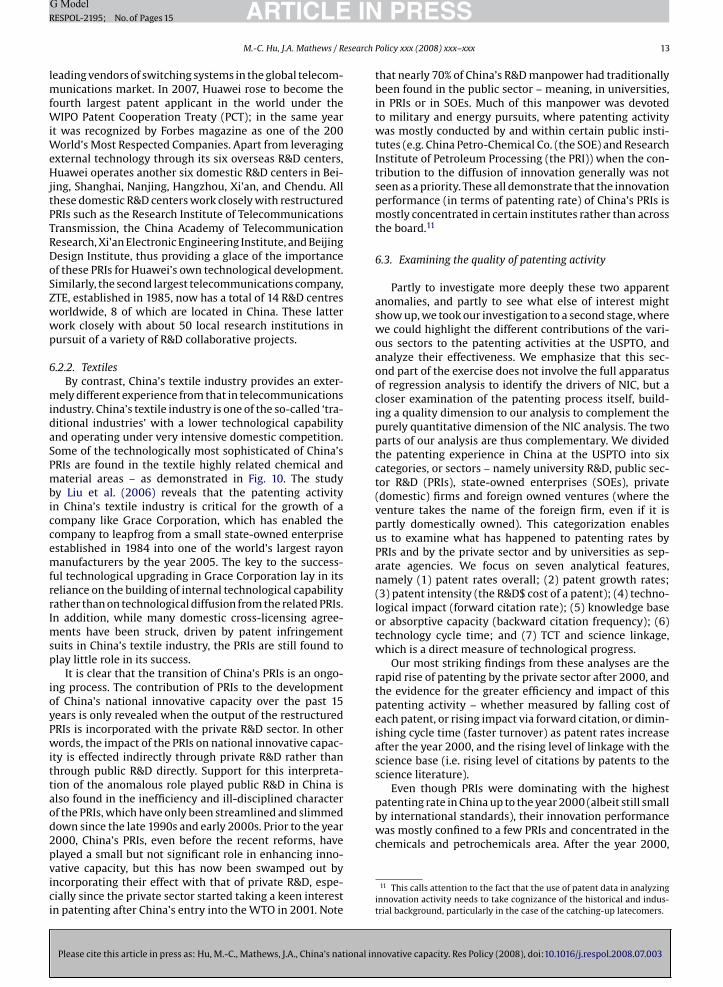
ing, Shanghai, Nanjing, Hangzhou, Xi’an, and Chendu. Allhese domestic R&D centers work closely with restructuredRIs such as the Research Institute of Telecommunicationsransmission, the China Academy of Telecommunicationesearch, Xi’an Electronic Engineering Institute, and Beijingesign Institute, thus providing a glace of the importancef these PRIs for Huawei’s own technological development.imilarly, the second largest telecommunications company,TE, established in 1985, now has a total of 14 R&D centresorldwide, 8 of which are located in China. These latterork closely with about 50 local research institutions inursuit of a variety of R&D collaborative projects.
.2.2. TextilesBy contrast, China’s textile industry provides an exter-
ely different experience from that in telecommunicationsndustry. China’s textile industry is one of the so-called ‘tra-itional industries’ with a lower technological capabilitynd operating under very intensive domestic competition.ome of the technologically most sophisticated of China’sRIs are found in the textile highly related chemical andaterial areas – as demonstrated in Fig. 10. The study
y Liu et al. (2006) reveals that the patenting activityn China’s textile industry is critical for the growth of aompany like Grace Corporation, which has enabled theompany to leapfrog from a small state-owned enterprisestablished in 1984 into one of the world’s largest rayonanufacturers by the year 2005. The key to the success-
ul technological upgrading in Grace Corporation lay in itseliance on the building of internal technological capabilityather than on technological diffusion from the related PRIs.n addition, while many domestic cross-licensing agree-
ents have been struck, driven by patent infringementuits in China’s textile industry, the PRIs are still found tolay little role in its success.
It is clear that the transition of China’s PRIs is an ongo-ng process. The contribution of PRIs to the developmentf China’s national innovative capacity over the past 15ears is only revealed when the output of the restructuredRIs is incorporated with the private R&D sector. In otherords, the impact of the PRIs on national innovative capac-
ty is effected indirectly through private R&D rather thanhrough public R&D directly. Support for this interpreta-ion of the anomalous role played public R&D in China islso found in the inefficiency and ill-disciplined characterf the PRIs, which have only been streamlined and slimmedown since the late 1990s and early 2000s. Prior to the year000, China’s PRIs, even before the recent reforms, have
Please cite this article in press as: Hu, M.-C., Mathews, J.A., China’s national in
layed a small but not significant role in enhancing inno-ative capacity, but this has now been swamped out byncorporating their effect with that of private R&D, espe-ially since the private sector started taking a keen interestn patenting after China’s entry into the WTO in 2001. Note
PRESSPolicy xxx (2008) xxx–xxx 13
that nearly 70% of China’s R&D manpower had traditionallybeen found in the public sector – meaning, in universities,in PRIs or in SOEs. Much of this manpower was devotedto military and energy pursuits, where patenting activitywas mostly conducted by and within certain public insti-tutes (e.g. China Petro-Chemical Co. (the SOE) and ResearchInstitute of Petroleum Processing (the PRI)) when the con-tribution to the diffusion of innovation generally was notseen as a priority. These all demonstrate that the innovationperformance (in terms of patenting rate) of China’s PRIs ismostly concentrated in certain institutes rather than acrossthe board.11
6.3. Examining the quality of patenting activity
Partly to investigate more deeply these two apparentanomalies, and partly to see what else of interest mightshow up, we took our investigation to a second stage, wherewe could highlight the different contributions of the vari-ous sectors to the patenting activities at the USPTO, andanalyze their effectiveness. We emphasize that this sec-ond part of the exercise does not involve the full apparatusof regression analysis to identify the drivers of NIC, but acloser examination of the patenting process itself, build-ing a quality dimension to our analysis to complement thepurely quantitative dimension of the NIC analysis. The twoparts of our analysis are thus complementary. We dividedthe patenting experience in China at the USPTO into sixcategories, or sectors – namely university R&D, public sec-tor R&D (PRIs), state-owned enterprises (SOEs), private(domestic) firms and foreign owned ventures (where theventure takes the name of the foreign firm, even if it ispartly domestically owned). This categorization enablesus to examine what has happened to patenting rates byPRIs and by the private sector and by universities as sep-arate agencies. We focus on seven analytical features,namely (1) patent rates overall; (2) patent growth rates;(3) patent intensity (the R&D$ cost of a patent); (4) techno-logical impact (forward citation rate); (5) knowledge baseor absorptive capacity (backward citation frequency); (6)technology cycle time; and (7) TCT and science linkage,which is a direct measure of technological progress.
Our most striking findings from these analyses are therapid rise of patenting by the private sector after 2000, andthe evidence for the greater efficiency and impact of thispatenting activity – whether measured by falling cost ofeach patent, or rising impact via forward citation, or dimin-ishing cycle time (faster turnover) as patent rates increaseafter the year 2000, and the rising level of linkage with thescience base (i.e. rising level of citations by patents to thescience literature).
Even though PRIs were dominating with the highest
novative capacity. Res Policy (2008), doi:10.1016/j.respol.2008.07.003
11 This calls attention to the fact that the use of patent data in analyzinginnovation activity needs to take cognizance of the historical and indus-trial background, particularly in the case of the catching-up latecomers.
INesearch
ARTICLEG ModelRESPOL-2195; No. of Pages 15
14 M.-C. Hu, J.A. Mathews / R
the PRIs’ innovation activity was overtaken and blendedinto that of the universities and particularly incorporatedwithin the private sector and foreign owned enterprises.The rate of patenting by PRIs themselves fell after the year2002 (indicating a decline in applications for patents dat-ing from 2000) and the forward citation frequency alsodipped after 2002, indicating that the PRI patents were hav-ing less impact than previously. Meanwhile the cycle timeof patents taken out by the PRIs shows no discernible trendin terms of technological progress.
We see these contrasting experiences as providing afurther explanation for our argument: the contributionof China’s PRIs in reinforcing China’s national innovativecapacity can only be identified when the restructured PRIsexert an indirect effect through being incorporated with theprivate R&D rather than exerting a direct effect as publicR&D. Unlike the case of the East Asian Tigers, China inher-ited a large and unwieldy public sector from the closedcommunist era, and it has taken a long time to dismantleit and make it efficient. Meanwhile new sources of inno-vation have been unleashed, with the university sector asa whole playing a role equivalent in entrepreneurial driveand efficiency to the private sector in other systems, and theprivate sector itself, together with the foreign-owned sec-tor, rapidly moving to the lead in patenting after the turningpoint in the year 2001 when China joined the WTO.
China is still at a relatively early stage in the evolutionof its national innovation capacity, and we would expectto see the streamlined public sector, after its restructuringand transition, now coming to play a role similar to therole played in the East Asian Tigers, as steering and lever-aging institutions for technological capacity, once the lessefficient organizations had been eliminated.
7. Concluding remarks
China has achieved a remarkable transformation overthe past two and a half decades, with superlative rates ofgrowth driven largely by high levels of investment, bothdomestic and foreign-sourced. Its openness to investmentand trade, combined with its latecomer advantages in lowcosts, has made it the world’s export platform for manufac-tured goods. But the real question for its future concernsits capacity to move from imitation to innovation, sinceit is through an economy’s capacity to sustain innovationthat its future prosperity is secured. In China’s case, ourstudy demonstrates that the foundations of national inno-vative capacity are already being laid. National innovativecapacity depends, in China’s case as in the case of the EastAsian Tigers (Korea, Taiwan, Singapore), on a few key sec-tors, with universities playing a much more important rolein China’s case than in the Tigers while the contribution ofthe PRIs in reinforcing China’s national innovative capac-ity is exerted indirectly through private R&D rather thanthrough public R&D directly. It is a fact that the private sec-tor activity has really taken off since the early years of the
Please cite this article in press as: Hu, M.-C., Mathews, J.A., China’s national in
21st century, and this is demonstrated clearly in our deeperanalysis of China’s patenting activity at the USPTO, touch-ing on propensity to patent (costs in R&D per patent), theimpact of patents in terms of frequency of subsequent cita-tion, the extent to which patents draw on earlier bodies
PRESSPolicy xxx (2008) xxx–xxx
of knowledge (absorptive capacity), the diminishing cycletimes, and the strong linkage with the science base. All thispromises much for the Chinese national system of innova-tion.
The outstanding puzzling feature of China’s innovativecapacity to date is the less than stellar performance of itspublic sector in providing a means to steer the overall tech-nological development of the country through its catch-upstage. We have offered an original solution to this paradox,based on our findings in this study, that the streamlining ofthe public research sector from the late 1990s, and havingan effect from the early 2000s, will enable the PRIs to playthe steering role that one would expect them to play in alatecomer country based on the earlier experience of theEast Asian Tigers.
Acknowledgements
The first author would like to acknowledge the financialsupport of the National Science Council (96-2416-H-005-027-MY3). Valuable comments from two anonymousreviewers are also acknowledged.
References
Arundel, A., Kabla, J., 1998. What percentage of innovations are patented?Experimental estimates in European firms. Research Policy 27,127–142.
Chen, K., Kenney, M., 2007. Universities/Research institutes and regionalinnovation system systems: the cases of Beijing and Shenzhen. WorldDevelopment 35 (6), 1056–1074.
China’s Higher Education Committee., 2006. Cases Study on the Collab-oration between University and Large Companies in China. TsinghuaUniversity Publisher, China (in Chinese).
China Science and Technology (S&T), 2006. Statistics Data Book.http://www.sts.org.cn.
Cohen, W.M., Levinthal, D.A., 1990. Absorptive capacity: a new perspec-tive on learning and innovation. Administrative Science Quarterly 35,128–152.
Cohen, W.M., Levinthal, D.A., 1989. Innovation and learning: the two facesof R&D. Economic Journal 99, 569–596.
Furman, J.L., Porter, M.E., Stern, S., 2002. The determinants of nationalinnovative capacity. Research Policy 31, 899–933.
Griliches, Z., 1990. Patent statistics as economic indicators: a survey. Jour-nal of Economic Literature 25, 1661–1707.
Hu, M.C., Mathews, J.A., 2005. Innovative capacity in East Asia. ResearchPolicy 34, 1322–1349.
Jaffe, A., Trajtenberg, M., 2002. Patents, Citations & Innovations: A Windowon the Knowledge Economy. The MIT Press. Massachusetts Institute ofTechnology.
Jaffe, A., Trajtenberg, M., Henderson, R., 1993. Geographic localization ofknowledge spillovers as evidenced by patent citations. The QuarterlyJournal of Economics 434, 577–598.
Jones, C., 1995. R&D based models of economic growth. Journal of PoliticalEconomy 103, 739–784.
Jones, C., 2002. Sources of U.S. economic growth in a world of ideas. Amer-ican Economic Review 92 (1), 220–239.
Kim, L., 1997. Imitation to Innovation: The Dynamics of Korea’s Techno-logical Learning. Harvard Business School Press, Cambridge, MA.
Lee, K., 2005. Making a technological catch-up: barriers and opportunities.Asian Journal of Technological Innovation 13 (2), 97–131.
Li, D., Moshirian, F., Nguyen, P., Tan, L.W., 2007. Managerial ownership andfirm performance: evidence from China’s privatization. Research inInternational Business and Finance 21 (3), 396–413.
Liu, J., Xiao, Y., Liu, J., 2006. Benefiting from technological innovationthrough patent strategy: a case study of a textile company in China.
novative capacity. Res Policy (2008), doi:10.1016/j.respol.2008.07.003
Paper delivered to Globelics 2006 conference, 4–6 October, Trivan-drum, India.
Liu, X., 2001. Chinese Technology Innovation System in 21st Century (inChinese). Peking University Press, Beijing, China.
Lu, Q., 2000. China’s Leap into the Information Age: Innovation and Orga-nization in the Computer Industry. Oxford University Press, Oxford.
INR
esearch
M
M
M
M
N
N
N
N
P
R
R
67–81.Xue, L., 2005. University-Market linkages in China: the case of university-
ARTICLEG ModelESPOL-2195; No. of Pages 15
M.-C. Hu, J.A. Mathews / R
ansfield, E., 1986. Patents and innovation: an empirical study. Manage-ment Science 32, 173–181.
athews, J.A., Hu, M.C., 2007. Enhancing the role of universities in buildingnational innovative capacity in East Asia: the case of Taiwan. WorldDevelopment 35 (6), 1005–1020.
inistry of Education, 2005. Year 2004 statistical report of university-runindustry in China. Chengdu, China.
owery, D.C., Rosenberg, N., 1993. The U.S. national innovation system.In: Nelson, R.R. (Ed.), National Innovation Systems: A ComparativeAnalysis. Oxford University Press, New York.
arin, F., 1993. Technology indicators and corporate strategy. Review ofBusiness 14 (3), 19–23.
ational Bureau of Statistics, 2000–2005. Science and Technology Statis-tics Yearly Report 2004. http://www.stats.gov.cn/english/.
ational Science Council, 2000. Indicators of Science and Technology. Tai-wan. http://www.nsc.gov.tw/tech/index.asp.
RCSTD (National Research Center for Science and Technology Develop-ment), 2003. Report on China’s S&T Development Research. NationalResearch Center for Science and Technology Development, Beijing,China (in Chinese).
isano, G., 2006. Profiting from innovation and the intellectual property
Please cite this article in press as: Hu, M.-C., Mathews, J.A., China’s national in
revolution. Research Policy 35, 1122–1130.omer, P.M., 1990. Endogenous technological change. Journal of Political
Economy 98 (5), S71–S102.othaermel, F.T., Hill, C.W.L., 2005. Technological discontinuities and
complementary assets: a longitudinal study of industry and firm per-formance. Organization Science 16, 52–70.
PRESSPolicy xxx (2008) xxx–xxx 15
Suarez-Villa, L., 1990. Invention, inventive learning, and innovative capac-ity. Behavioral Science 35 (4), 290–310.
Suarez-Villa, L., Hasnath, S.A., 1993. The effect of infrastructure on inno-vation: Innovative capacity and the dynamics of public constructioninvestment. Technological Forecasting and Social Change 44 (4),333–358.
Sun, Q., Tong, W., 2003. China share issue privatization: the extent of itssuccess. Journal of Finance and Economics 70, 183–222.
Trajtenberg, M., 1990. Patents as indicators of innovation, Economic Anal-ysis of Product Innovation. Harvard University Press, Cambridge,MA.
Wu, W., 2007a. Building research universities for knowledge transfer: thecase of China. In: Yusuf, S., Nabeshima, K. (Eds.), How University Pro-motes Economic Growth. World Bank Publications, Washington, DC,US.
Wu, G., 2007b. On Regional Science and Technology. Tsinghua UniversityPublications, China (in Chinese).
Xue, L., 1997. A historical perspective of Chin’s innovation system reform:a case study. Journal of Engineering and Technology Management 14,
novative capacity. Res Policy (2008), doi:10.1016/j.respol.2008.07.003
affiliated enterprises. http://iis-db.stanford.edu/evnts/4097/LXueUniversity-Market Linkages in China.pdf.
Zhou, J., 2003. Opening Speech at the 2nd University Science Park AnnualConference. China University Science Park Newsletter, vol. 8.


