Embed Size (px)
Citation preview
1
Interest Rate Pass-Through in the Polish Banking Sector
and Bank-Specific Financial Disturbances
Tomasz Chmielewski1
First draft: November 14, 2003 This version: January 31, 2004
Abstract
The purpose of this study is to assess the impact of disturbances in operation of the Polish banking sector on the effectiveness of monetary policy implementation. The pass-through of changes in market interest rates to retail interest rates, offered by banks to their customers, is analysed in the context of a deterioration in quality of bank credit portfolios, a decrease in bank profitability (both related to a slowdown of the economy) and capital adequacy ratios. Main empirical findings are that the more profitable banks tend to adjust lending rates and rates for the longest deposits faster and stronger than the less profitable ones and that the banks with loans of lower quality tend to adjust corporate loan interest rates faster and stronger than banks with less risky credit portfolios, but the opposite is true for the most popular term deposit. These have some implications for interest rates spread dynamics that are analysed in the paper.
Introduction
The purpose of this study is to assess the impact of disturbances in operation of the Polish
banking sector on the effectiveness of implementation monetary policy implementation. This
paper concentrates on financial disturbances stemming from a deterioration in asset quality
and differences in profitability levels and capital adequacy ratios. They are considered as the
factors that may influence strength of the mechanism of passing-through changes in market
interest rates to bank retail interest rates.
Recent literature, both theoretical and empirical, analyses the stickiness of bank retail rates
and the sluggishness of their response to changes in market conditions. The literature
attempted to explain these phenomena referring to:
- structural characteristics of financial sectors, such as: development of financial
markets, ownership structure, barriers to entry the market, e.g. Cottarelli and Kourelis
(1994), Cottarelli et al. (1995)
1 National Bank of Poland, Financial System Department and Warsaw School of Economic, Chair of Monetary Policy, e-mail: [email protected] The views presented are those of the author and not necessarily those of the National Bank of Poland. I would like to thank especially István Hamecz and other participants of the ECB Workshop “Asset Prices and Monetary Policy”, held on December 11-12, 2003 in Frankfurt for very valuable comments and suggestions. All errors and omissions remain mine.
2
- factors related to the structure of the industry, proposed by literature related to applied
industrial organisation (like market structure, concentration and degree of competition
within the sector), e.g. Hannan and Berger (1991), Angbazo (1997), Wong (1997),
Mojon (2000))
- individual bank characteristics (bank size, liquidity, long-term customer relation, type
of customers, riskiness of the loan portfolio), e.g. Weth (2002), Berstein and Fuentes
(2003).
Some main methodological points, relevant to the analysis carried out in this paper, are briefly
reviewed in the next section.
There are some references to aforementioned factors in the previous literature related to the
Polish banking sector. The conclusion of Gołajewska and Zaremba (2002) and MPC (2002)
(pp. 104-107) is that in a situation when the quality of credit portfolios in the sector
deteriorates, banks try to offset the losses resulting from an increase in the volume of non-
performing loans by widening interest rate margins. This is assumed as a reason for only
partial adjustment of retail lending interest rates to changes in market interest rates. Wróbel
and Pawłowska (2002), using interest rate aggregates for the Polish banking sector, found
complete long-term pass-through (however with lags of several months) for all deposit rates,
except 1-month deposits, and for corporate loans with maturities up to 3 years. They found,
however, an incomplete pass-through for consumer credit interest rate and corporate loans
with maturities exceeding 5 years. Assuming that the increase in the interest rate margins is
properly attributed to higher specific provisions, an asymmetry between the adjustment of the
credit and the deposit interest rates to changes in the market interest rate on the individual-
bank level may be a function (among other factors) of the credit portfolio quality of a given
bank.
The main point of the paper is that banks’ individual characteristics are reflected in the
dynamics of banks’ responses to changing market conditions. The question this study tries to
answer is how strong asymmetries in the interest rate pass-through, resulting from the
deterioration in asset quality and adverse macro developments, are and how they are
distributed across the banking sector. Wróbel and Pawłowska (2002) point out that in the case
of the Polish banking sector individual bank characteristics are helpful in explaining the
dynamics of the volume of credit granted to non-financial entities. This paper aims to broaden
the knowledge about the functioning of the credit channel in the Polish banking sector on the
3
individual-bank level by looking at the determinants of the interest rates pass-through that
might be attributed to the financial condition of a bank, especially the quality of the credit
portfolio, profitability and capital adequacy.
The retail bank interest rates strongly influence, among other factors, investment and
consumption decisions of firms and households; this is due to the dominant position of banks
in the Polish financial system. For most of the post-transformation period, there were no
important alternatives to bank deposits for allocation of household savings. Only very
recently other financial institutions have gained on importance with respect to allocation of
household savings. Therefore banks have operated in an environment of almost no or very
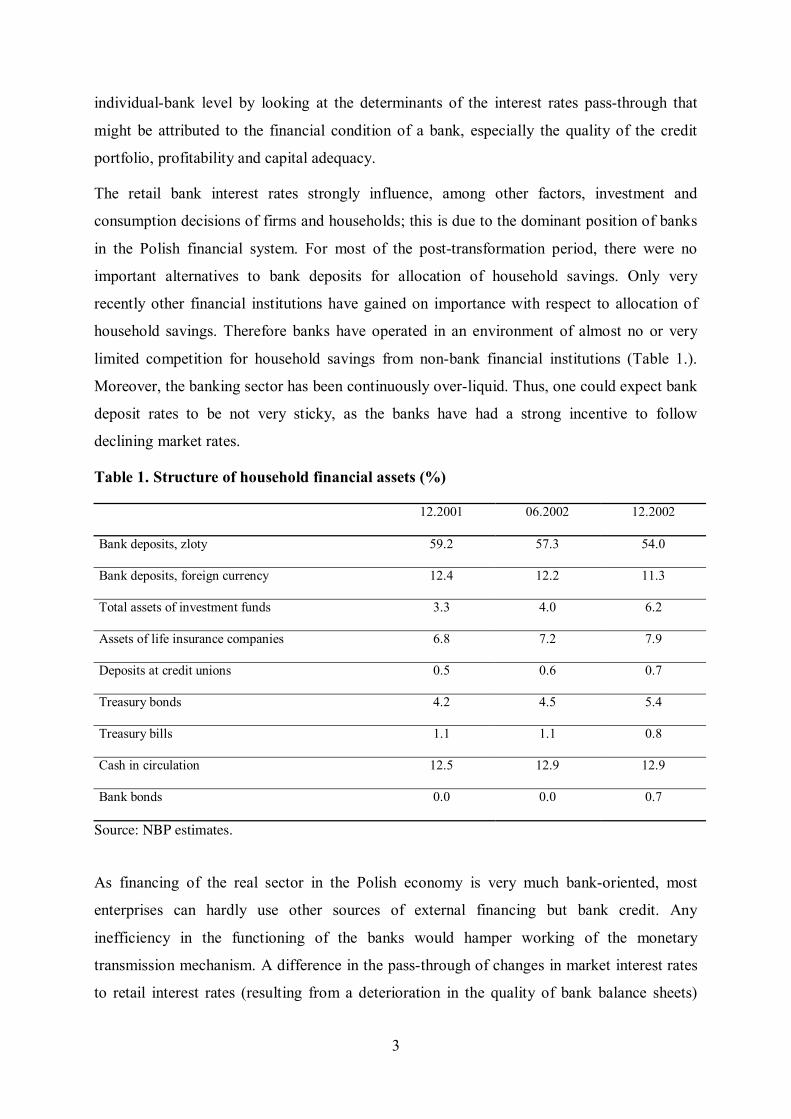
limited competition for household savings from non-bank financial institutions (Table 1.).
Moreover, the banking sector has been continuously over-liquid. Thus, one could expect bank
deposit rates to be not very sticky, as the banks have had a strong incentive to follow
declining market rates.
Table 1. Structure of household financial assets (%)
12.2001 06.2002 12.2002
Bank deposits, zloty 59.2 57.3 54.0
Bank deposits, foreign currency 12.4 12.2 11.3
Total assets of investment funds 3.3 4.0 6.2
Assets of life insurance companies 6.8 7.2 7.9
Deposits at credit unions 0.5 0.6 0.7
Treasury bonds 4.2 4.5 5.4
Treasury bills 1.1 1.1 0.8
Cash in circulation 12.5 12.9 12.9
Bank bonds 0.0 0.0 0.7
Source: NBP estimates.
As financing of the real sector in the Polish economy is very much bank-oriented, most
enterprises can hardly use other sources of external financing but bank credit. Any
inefficiency in the functioning of the banks would hamper working of the monetary
transmission mechanism. A difference in the pass-through of changes in market interest rates
to retail interest rates (resulting from a deterioration in the quality of bank balance sheets)
4
might be one of the symptoms of credit rationing during an economic slowdown. Therefore,
this is of crucial relevance for the conduct of monetary policy to understand how the banking
sector “filters” monetary policy shocks.
An imperfect adjustment of bank lending interest rates to market interest rates should be taken
into account in monetary policy-making, especially during periods of an economic downturn
or when other disturbances in functioning of the banking sector arise, resulting in worsening
bank balance sheets quality. It is therefore important to be able to assess to what extent
financial disturbances in banks may result in instability of the monetary transmission
mechanism.
The approach presented in the paper allows analysing a possible scale of differences in the
interest rate pass-through over a business cycle. During a downturn a greater number of banks
are affected by the worsening financial stance of their customers. This results in a
deterioration in quality of loan portfolios and subsequently in profit and capital. Therefore,
reactions that can be attributed to banks of relatively worse financial standing become more
widespread in the banking sector. The opposite process occurs during an economic revival. In
the case of an economy with the bank-oriented financial system, such asymmetries may
significantly alter the monetary transmission mechanism.
The outline of the paper is as follows. The following section selectively reviews the literature
related to the interest rate pass-trough. Next, developments in the Polish banking sector that
might be relevant for the interest rate pass-through are briefly presented. This is followed by
the presentation of data and methodology used in the study. Subsequently, empirical results
are presented. The final section concludes.
Determinants of retail interest rates stickiness and pass-through
It seems that the most important question to be answered is whether the imperfect and delayed
interest rate pass-through is a phenomenon that can be reasonably attributed to some
economic developments or whether this is merely a purely empirical accident. If the former is
true, the next question is to what extent it could be attributed to sector-specific and to
individual bank-specific variables. Then, it comes to the problems of modelling and
measurement. Therefore, the selective literature review, which follows, first presents
theoretical explanations relevant for the analysis of the interest rate pass-through and next
deals with different empirical approaches.
5
There is a vast theoretical and empirical literature dealing with financial sector characteristics
that explain observed retail interest rate stickiness and sluggishness of the adjustment to
changing market conditions (e.g. Cottarelli and Kourelis (1994), Cottarelli et al. (1995),
Mojon (2000), Sander and Kleimeier (2000), de Bondt et al. (2003)). The empirical literature
has concentrated so far mostly on explaining sources of differences in the interest rate pass-
through between financial systems of different countries or on looking for the evidence of
progressive convergence of the interest rate transmission in analysed countries2. The studies
using bank level data are much less frequent; Weth (2002), Berstein and Fuentes (2003) and
Angbazo (1997) offer here noticeable contribution. In this paper the emphasis is put on
factors that may explain differences in the pass-through on the individual-bank level.
However, some studies employing the aggregated (sector-specific estimation) approach are
also mentioned, as bank-specific estimates might be controlled for sector-wide changes.
Lowe and Rohling (1992) consider four factors that may explain loan interest rate stickiness:
credit rationing, switching costs for consumers, implicit risk sharing arrangement and
consumer irrationality. They explain changes in various types of loan interest rates by changes
(also lagged) in marginal costs of funds measures for banks. They test whether there is a
complete pass-through and whether the response of retail interest rates is symmetric for costs
of funds increases and decreases. They are not able to distinguish between the importance of
the theories due to which the stickiness of loan interest rates is present. However, they
advocate for switching costs as possibly the most significant factor for loan interest rate
stickiness.
Wong (1997) considers a firm-theoretical model explaining optimal bank interest margins
under multiple sources of uncertainty and risk aversion. In his framework, an increase in
credit risk is reflected by a higher optimal loan-deposit interest rate spread. Higher equity
capital results in decline of this spread. Moreover, the spread is larger for a risk-averse bank
compared to risk-neutral one. Information asymmetry (adverse selection and moral hazard)
implies additional costs stemming from a change in borrowers’ risk profile when loan interest
rate increases. Therefore introduction of information asymmetry results in lowering the
optimal spread.
Winker (1999) combines a model with credit rationing due to asymmetric information with a
marginal cost pricing approach. He assumes that banks price loans and deposits with a mark-
2 The latter group consists to a large extent of studies concentrating on Euro-area countries.

6
up over their marginal cost of liquidity (using overnight money market rate in the empirical
part of the paper). Winker (1999) assumes also that there is no credit rationing in the long run,
hence then a lending rate depends only on a money market rate. In the short run, however, the
lending rate is influenced by the marginal cost for a bank (i.e. money market rate) and the
adjustment cost due to information asymmetry. For non-stationary variables, the presence of
long-run relationships implies the existence of a cointegrating vector. Finally, Winker(1999)
derives an error-correction specification for the relationship between money market and bank
interest rates.
The novelty, compared to previous studies, in de Bondt et al. (2003) is that they analyse
simultaneously impact of both short- and long-term market rates on bank lending and deposit
rates. According to them, the responsiveness of bank retail rates to long-term market rates
reflects prudent bank approach to interest rate risk management and explains large part of
sluggishness found in previous studies. In their theoretical framework, risk-aversion of a bank
may influence composition of its portfolio with respect to long-term and short-term market
instruments. De Bondt et al. (2003) consider also state dependent versions of the baseline
model: an asymmetric ECM and a model when the parameter by the error correction term is a
linear function of variables being proxies for credit risk (industrial production, output growth,
unemployment rate). The latter variant of state-dependency appears as not supported by the
data.
Weth (2002) analyses the pass-through for lending rates using bank level data for Germany.
He assumes that in the long run bank retail rates adjust to an equilibrium mark-up over money
market or capital market interest rates of comparable maturities. He assumes further that
determinants of the mark-up are bank-specific and do not change over time. Within his
framework, the mark-ups might be influenced in particular by creditworthiness of bank
customers and therefore riskiness of the bank portfolio.
Bernstein and Fuentes (2003) assume in their theoretical model imperfect competition in the
banking sector. Following the Monte-Klein model, they model a bank facing downward
sloping demand for loans and upward sloping supply of deposits in the long run, being
functions of relevant bank interest rates. Thus in their setting, loan interest rates in the long
run are functions of demand elasticity and debtors’ default probability. Bernstein and Fuentes
(2003) attribute short-term sluggishness of bank interest rates adjustment to adverse selection
and moral hazard. Basing on their model, they conclude that differences in interest rates pass-
through for different banks are related to some product characteristics, such as type of

7
customers or risk level. According to their results, banks with smaller share of past due loans
and higher percentage of household adjust faster to policy rate movements.
The studies reviewed so far point out that stickiness and sluggishness of adjustment of retail
interest rates may be explained by factors that are imminent in banking: uncertainty,
asymmetric information and degree of risk aversion. The literature differs on which market
interest rate measures the marginal or alternative cost for a bank and, therefore, which is the
rate to which a retail rate responds. Usually, this is either a short-term rate (assumed to
represent the monetary policy stance) or a market rate of the maturity comparable to that of
the analysed retail rate. It seems that the answer should be left to empirical consideration,
depending on the dominant mode of bank operation in a given system.
If banks can exert market power over their customers, it is possible that the financial
institutions adjust their pricing asymmetrically. For example, deposit interest rates might be
adjusted relatively fast when market interest rates decrease but the adjustment might become
sluggish during period of monetary policy tightening. Therefore, it is interesting to investigate
also this aspect of the interest rate pass-through.
Scholnick (1996) tests asymmetry for bank retail interest rates for Malaysia and Singapore
and finds its evidence in case of the deposit rate. The adjustment of the deposit rate is quicker
when above the equilibrium level than when it was below the equilibrium level.
Similar approach is used by Sander and Kleimeier (2000), who find evidence of asymmetry in
adjustment of lending rates for some countries, also with adjustment being faster when rates
are above the equilibrium level. Another study dealing extensively with asymmetry and non-
linearity of retail rates adjustment is Mizen and Hofmann (2002).
The remaining part of the section is devoted to some empirical aspect of interest rate pass-
through analysis. The recent empirical literature extensively uses the ECM framework for
analysing the relationship between money (or bond) market condition and bank retail interest
rates. Appealing features of the error correction modelling in this context are the possibility of
analysing both short- and long-run dynamics and the fact that estimated parameters have
intuitive interpretation in terms of the economic theory. Possible and interesting extensions of
the baseline ECM are e.g. specification with asymmetric error correction term (e.g. de Bondt
et al. (2003), Hofmann (2002), Scholnick (1996), Mizen and Hofmann (2002)) or interacting
the error term with other variables (see de Bondt et al. (2003)). Berstein and Fuentes (2003)

8
interact interest rate levels (due to stationarity of the Chilean data) with individual bank
characteristics within panel data framework.
De Bondt (2002) uses for international comparison of pass-through the following
specification:
(1) ttttt riri εβααα +−+∆+=∆ −− )( 11310
where it denotes a bank retail rate and rt denotes short-term money market rate.
De Bondt et al. (2003) assume that both a short-term money market rate (mrt) as well as a
long-term bond rate (brt) influence both short- and long-term retail bank rates. Therefore both
market rates are present in their quite general baseline specification of estimated equation
explaining dynamics of a retail rate (it):
(2) ∑ ∑∑= =
−−−−−=
− +−−−+∆+∆+∆=∆2
03
2
112111
2
0)(
jt
jtttjtjjtj
jjtjt brmriibrmri εϕϕϕδγβα
They also propose to specify the model with δ being a linear function of a proxy for credit
risk. This is equivalent to the assumption that the speed of adjustment to equilibrium is state
dependent.
Cottarelli et al. (1995) augment ECM specification for the average lending rate with changes
in share of bad loans in the loan portfolio.
Weth (2002) uses the ECM framework for panel data analysis. He runs panel regressions for
groups of banks, to which the banks are assigned on the basis of their individual
characteristics (size, volume of savings deposits and long-term business with non-banks). In
this way he obtains group-specific estimates. This is the basis for calculating one-month pass-
through elasticities and long-run relationships between market rates and bank retail lending
rates. He specifies the estimated equation for each group as follows:
(3) tntnj
ttnjtnjj
jtjntn iriiri .1,
3
111,,
3
0, )( εδγβαη ++−+∆+∆+=∆ −
=−−−
=− ∑∑
In this framework, insignificant δ is interpreted as argument supporting the complete pass-
through for the given group of banks.
Bernstein and Fuentes (2003) estimate a dynamic panel data model, where bank
characteristics are interacted with the interbank market interest rate (the model is in levels due
to stationarity of the Chilean interest rates time series). In their specification (4) the

9
adjustment cost coefficient is a function of the quality of loan portfolio, demand elasticity is a
function of the type of customers and the size of the bank.
(4) ∑ ∑∑∑= =
−−−−=
−−=
− ++++=n
k
n
kktkthkktkthk
n
kktkthk
m
jjthjhth mcmsmlii
0 0,,
0,
0,, γδαβη
where:
i –a lending rate, m –an interbank rate, l – loan portfolio risk (share of past-due loans), c –
type of customers (share of loans to households), s – bank size (percentage of total loans), ηh –
bank-specific effect.
The empirical studies dealing with asymmetry of the adjustment concentrate on sector
aggregates. Scholnick (1996) estimates the model with parsimonious lag structure:
(5) ttttt ectectri εαααα +++∆+=∆ −−
+− 141310 .
The error correction term series is divided into two, depending whether for given t it is
negative (ect-) or positive (ect+). Similar approach is used by Sander and Kleimeier (2000)
who, however, allow for lagged ∆it and up to two additional lags of ∆rt as explanatory
variables.
Possible sources of retail rates stickiness in the Polish banking sector
Commercial banks in Poland have been able to exert significant market power over their
customers, with respect to both loans and deposits. High demand for loans can be expected in
the long-term. This view is supported by still relatively low level of financial intermediation,
measured e.g. as the ratio of total credit to GDP, as well as by high dynamics (in real terms)
of credit during years 1997-2000, especially with respect to loans granted to households (see
Figure 1). The recent slowdown of the economy has contributed to even slightly negative real
growth rate of some credit categories, but an economic revival should result in re-establishing
significantly positive dynamics of loans granted.
10
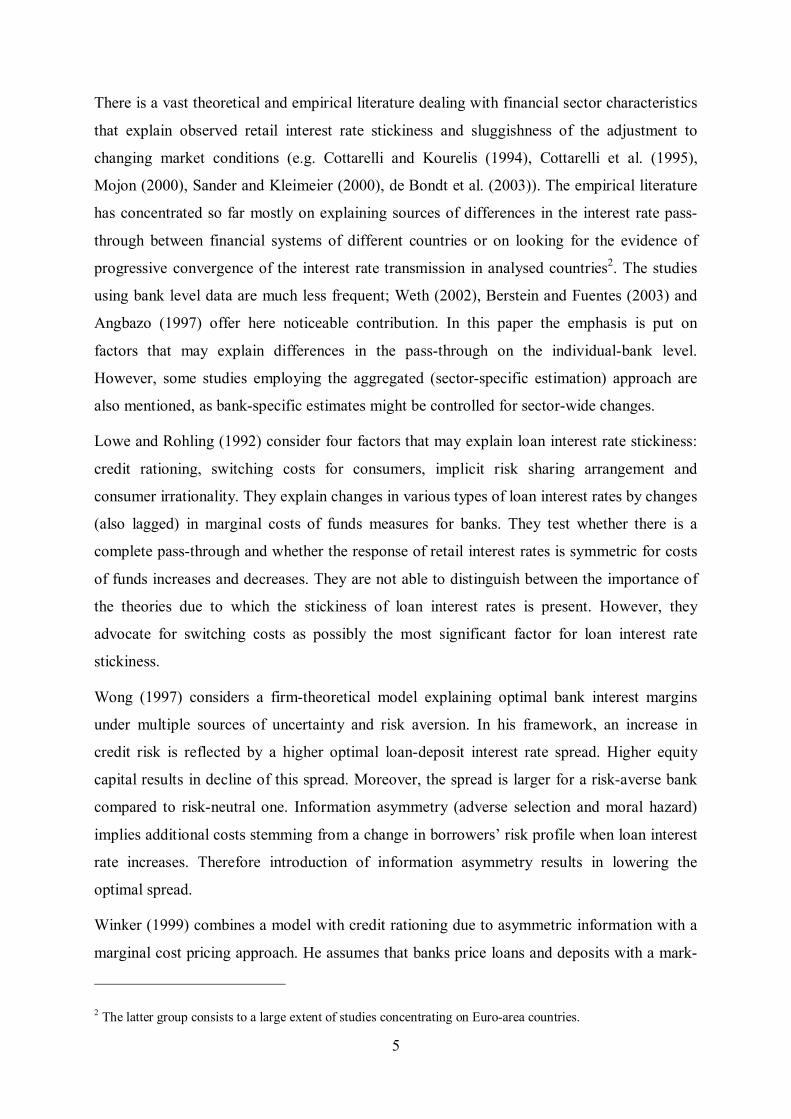
Figure 1. Real growth (YoY) in the banks’ zloty claims on non-financial customers (gross) vs. growth in GDP
Claims on households are deflated by the CPI, while those on non-financial customers excluding households are deflated by the PPI.
Source: GUS, NBP.
With the financial system being still dominated by banks, the banking sector is the most
important source of capital (except self-financing) for firms3. With no serious competitors
from outside the sector and possibly monopolistic competition within the sector (as suggested
by Pawłowska (2003)), banks have dominant positions in relationships with borrowers.
Moreover, lack of a credit register of companies, or other means of customers’ credit records
exchange among the banks, might have strengthened the importance of established
relationship between a bank and its customers. This could result in sizeable switching costs
for borrowers. These circumstances prove strong market power of the banks over most of
borrowers. Additionally, high volatility (and therefore implicitly higher risk) of the most
important macroeconomic variables (both real and nominal) has given an opportunity for
implicit risk sharing (compare Lowe and Rohling (1992)). These factors, in the environment
of generally decreasing interest rates, created favourable conditions for lending rates
stickiness.
Relatively rapid growth in loans during the late 90-ties and 2000 resulted in the accumulation
of credit risk in bank loan portfolios. This risk materialised during the recent economic
3 Capitalisation of the Warsaw Stock Exchange amounts to only about 15% of GDP.
-5%
10%
25%
40%19
97-4
1998
-1
1998
-2
1998
-3
1998
-4
1999
-1
1999
-2
1999
-3
1999
-4
2000
-1
2000
-2
2000
-3
2000
-4
2001
-1
2001
-2
2001
-3
2001
-4
2002
-1
2002
-2
2002
-3
2002
-4
2003
-1
2003
-2
quarter
Households Non-financial customers, excluding households
Total non-financial customers GDP
11
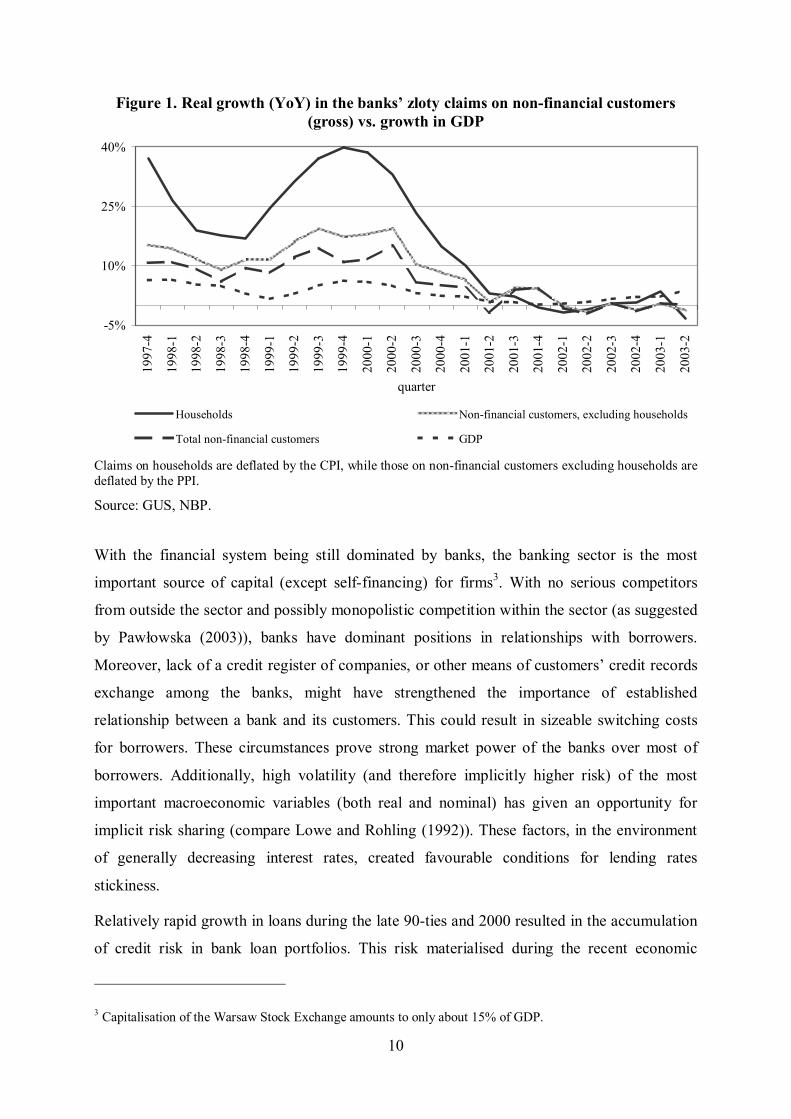
downturn, resulting in the increasing volume of classified loans and specific provisions.
Increasing net provision charges added to the deterioration in profits caused by lowering net
interest income due to the lower volume of performing loans and generally decreasing
nominal interest rates (see Figures 2. and 3.).
Generally high share of irregular loans in bank portfolio is to some extent caused by strict
regulatory requirements concerning loan classification. Loans classified as irregular may
belong to one of three categories: substandard, doubtful or loss. A loan is classified as
substandard if either principal or interest is past due between 30 and 90 days or financial
standing of the borrower suggests that there exists a threat for timely repayment. The doubtful
loan category covers loans with either principal or interest payment past due between three
months and six months or if financial condition of the borrower is subject to substantial
deterioration. Finally, a loan is classified as loss if either principal or interest payment is past
due over six months or financial stance of the borrower precludes the repayment. All
classifications are carried out with no regard to collateral taken4 (see also NBP (2003), pp. 38-
44).
Figure 2. Distribution of irregular loan ratios in the Polish banking sector
The lower bound of the shaded area represents the first quartile of the distribution, while the upper bound represents the third quartile.
Source: NBP.
4 As a result of such a prudent approach, Polish data should not be directly used in the international comparisons. Unlike other regulatory systems that usually consider a loan as a classified one after at least 90 days of delay in repayment, the Polish regulation, as can be seen, sets the limit of 30 days in this respect.
0%
5%
10%
15%
20%
25%
30%
35%
1996
-4
1997
-2
1997
-4
1998
-2
1998
-4
1999
-2
1999
-4
2000
-2
2000
-4
2001
-2
2001
-4
2002
-2
2002
-4
quarterInterquartile range Median Mean
12
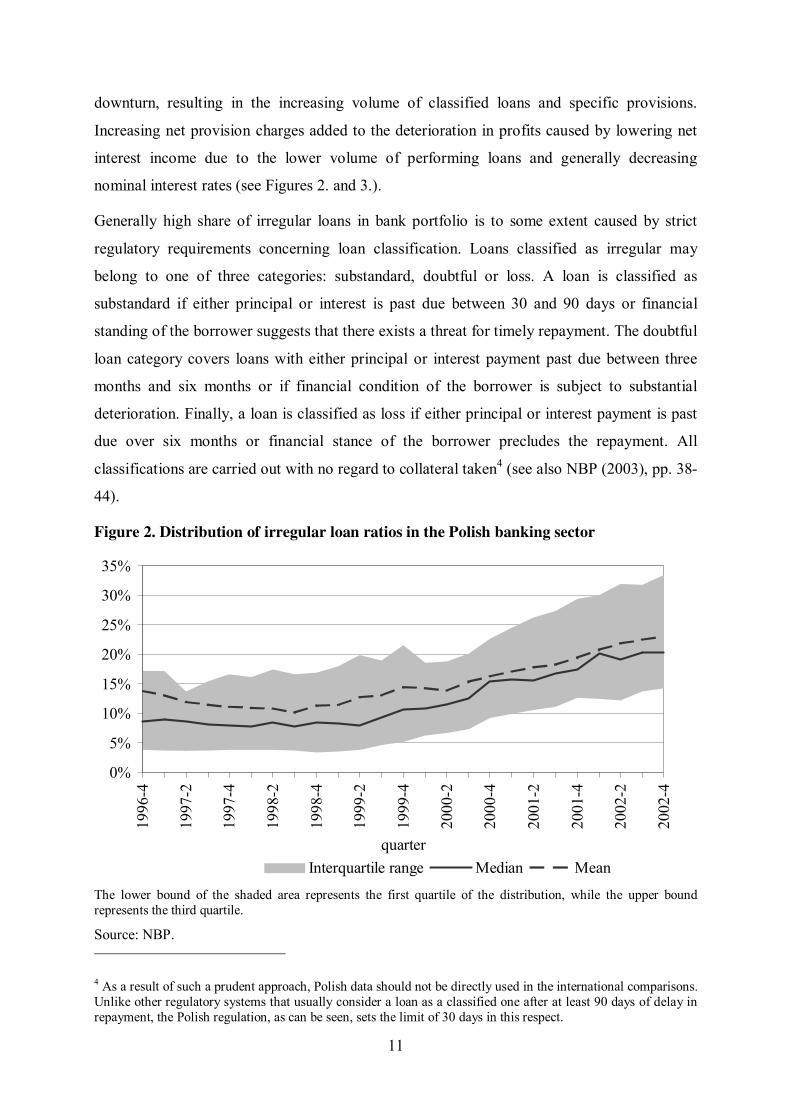
Figure 3. Distribution of bank profitability (ROA)
The lower bound of the shaded area represents the first quartile of the distribution, while the upper bound represents the third quartile.
Source: NBP.
Analysing the interest rate pass-through in banks with different profitability levels allows for
assessing effectiveness of different bank strategies. First, banks might have tried to offset
decreasing, due to smaller volume of performing assets, interest income by keeping interest
spreads as large as possible, as suggested by Gołajewska and Zaremba (2002) and MPC
(2002), pp. 104-107. This strategy assumes that deposit supply and credit demand are
relatively inelastic, due to e.g. switching costs for bank customers. Assuming that the increase
in the interest rate margins is properly attributed to higher specific provisions, an asymmetry
between the adjustment of lending and deposit interest rates to changes in market interest
rates on the individual banks level may be a function (among other factors) of the credit
portfolio quality of a given bank. Second, another strategy might include narrowing of
spreads in order to attract new customers and to widen the base for generating the interest
income. Banks with low quality loan portfolios might be willing to decrease lending rates
aiming at attracting safer borrowers and improving asset quality.
The paper analyses also developments in bank that differ with respect to capital adequacy
ratios. The rationale for this approach is the fact that capital adequacy ratios are influenced by
-2%-1%-1%0%1%1%2%2%3%3%
1997
-4
1998
-2
1998
-4
1999
-2
1999
-4
2000
-2
2000
-4
2001
-2
2001
-4
2002
-2
2002
-4
2003
-2
quarterInterquartile range Median Mean
13
both increased riskiness of bank assets and a lower increase in capital (due to lower
profitability).
Data and methodology
This study is based on bank-level data set collected by the National Bank of Poland for
supervision and analytical purposes. As a part of the project, the largest banks are obliged to
report their offered retail interest rates for dominating products within specified maturity
brackets of loans and deposits6. The interest rates reporting group of banks has covered about
80% of the banking sector assets. At the beginning of the sample period the analysed group
consisted of 14 banks. The number of banks diminished to 11 at the end of the sample period,
due to acquisitions and mergers.
The data-set used in the study covers monthly data on term-deposits of households for 1, 3, 6,
12 and 24 months, loans to firms for maturities of 1, 2, 3, 5 years and more than 5 years. Data
on consumer credit (without specified maturity) are also used, however a substantial change
in the data-collection framework resulting in discontinuation of time series prevented the
author from extending the analysis beyond February 2002 in this case7. The rest of interest
rate time series used are available from January 1998 until August 2003. The starting date of
the sample coincides with the creation of the Monetary Policy Council. Therefore the analysis
covers the period characterised by the relatively stable institutional environment.
It is not clear whether short- or long-term market rates are more relevant for explaining price
setting behaviour of the Polish banks. Unfortunately, data on assets and liabilities composition
with respect to floating and fixed rates is very scarce. Anecdotal evidences suggest that
floating-rate assets and liabilities constituted important part of the banking sector balance
sheet, especially before the period when inflation has reached the current low level8. It has
been a common practice to index corporate loans to a short-term money market rate. In such
an environment a short-term rate should be considered as the “cost of funds” for a bank, even
in the case of long-term loans. Moreover, expectations for continuation of downward trend in
5 The latter group consists to a large extent of studies concentrating on Euro-area countries. 6 The framework for data collection changed several times during recent years, which affects data comparability. These considerations prevented the author from using the individual interest rate data from the period before 1998. Therefore, this paper uses only a subset of the dataset when comparability of data can be approximately assumed. 7 This is the only case, however, where data availability allows for analysis both fixed and floating interest rate contracts. 8 In this way banks were able to hedge against inflation (and implicitly also to some extent interest rate) risk.

14
interest rates were consistent with disinflation process. This made borrowers also less willing
to look for fixed-rate loan contracts.
As far as deposit rates are concerned, the perspective of decreasing interest rates made banks
rather unwilling to offer fixed rate deposits. Due to excessive liquidity in the sector and
significant market power of banks (due to lack of competition from other financial
intermediaries until very recently) banks were interested in as flexible repricing conditions for
deposits as possible.
Another factor that might support stressing the importance of short-term money market rates
is the structurally excessive liquidity in the banking sector. Therefore one should look for a
market rate that could be considered as an alternative cost for a bank and not necessarily the
refinancing cost. Transactions on the interbank market concentrate on short-term instruments,
so the long-term Treasury bond market is of less importance. This fact also suggests the
importance of considering short-term money market rate changes as an significant
determinant of bank loan and deposit rates.
As the short-term end of the yield curve is highly correlated with the policy stance of the
central bank, an approach that takes a money market rate as a starting point allows for
analysing a part of the monetary transmission mechanism, namely pass-through of monetary
policy impulses to bank retail rates. As this framework seems to be especially relevant from
the monetary policy point of view, the short term (1-month) interbank market interest rate
(monthly average of WIBOR 1M) is used to draw main conclusions. Additionally, results
where 5-year Treasury bond yield was used as the reference market rate are also presented9.
The main purpose of this paper is to study whether bank-specific financial disturbances
influence the mechanism of interest rates pass-through. To meet this objective several
empirical approaches were considered. In order to assess differences in the speed and size of
the interest rate pass-through caused by bank-specific financial disturbances, three sets of
regressions were run. In each case the interest rate reporting banks were divided into two
groups (“better” and “worse” banks) according to one of the following criteria:
- share of classified loans in total loans
- capital adequacy ratio
9 The interbank market for long-term instruments was underdeveloped and thus relatively illiquid until mid 1998. Therefore interbank market data for Treasury bond yields are available from July 1998.

15
- profitability, measured by return on assets (ROA).
The average value of above mentioned variables over the whole analysis period were
calculated for each bank. Basing on each separate criterion the banks were ordered from the
best to the worst one. After each rating, the first half of banks constituted the “better” group
and the rest constituted the “worse” group. Therefore each bank belongs to three groups.
Comparing the results for the “better” banks with those for “worse” ones, according to each
criterion, allows analysing whether banks with different characteristics with this respects
shows differences in passing-through interbank market interest rate changes to their retail
interest rates.
First, the baseline error correction specification (6) was estimated. Then specification similar
to the one of Weth (2002) was used. Finally, the paper reports the results for a non-linear
version of ECM (basing on Scholnick (1996), but using individual bank data), where the
speed of adjustment depends on the fact whether a bank retail rate is above or below the
equilibrium.
The starting point for empirical investigation was the marginal price approach (presented e.g.
by de Bondt (2002)). Long-run relationship between a market interest rate (r) and a retail rate
(in) for the n-th bank is assumed as in (6):
(6) tntn ri γµ +=,
The bank-specific mark-up µn is assumed to be constant over time and to reflect the bank risk
profile, market position, customer base, riskiness of borrowers etc. Demand elasticity for
loans and supply elasticity for deposits with respect to bank retail rates influence γ. The value
of γ depends on the market structure, bank customers behaviour and the bank individual
characteristics. Following Winker (1999), an ECM specification can be further derived, what
allows for analysing both short- and long-run dynamics of retail rates adjustment.
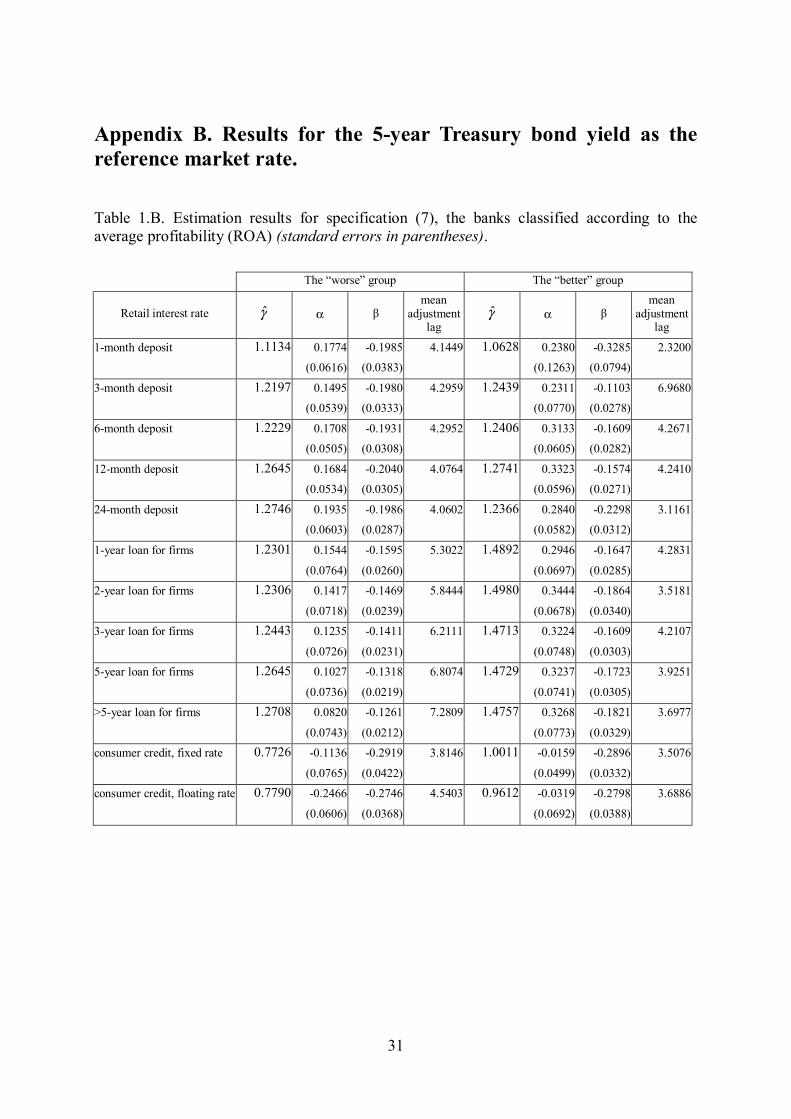
A two-step approach was utilised in the estimation. First, the long-run parameter γ from
specification (6) was estimated using a fixed effects (LSDV) estimator. In the second step,
residuals from the first step were used as the explanatory variable in the following equation:
(7) tnnttntntn riri ,11,, )ˆˆ( εµγβ∆αη∆ +−−++= −−
The bank-specific long-run mark-up is here subtracted from the long-run relationship
between a bank retail rate and a market rate. The rationale for such an approach is the
assumption that in the equilibrium a bank prices its products taking into account the bank-

16
specific mark-up. Finally, in the error correction term in (7) the deviation from the bank-
specific equilibrium drives the retail interest rate adjustment. The immediate one-period pass-
through and the speed of the adjustment to equilibrium (parameters α and β, respectively) are
equal over all cross-sections within a subgroup. To give an idea of the speed of retail interest
rate adjustment, mean adjustment lags, defined as (1-α)/(-β) (Hendry (1995), p.287), are
reported.
The next specification used the error correction term reparametrisation of Weth (2002),
resulting in the following final specification :
(8) tntnttntntn iriri .1,11,, )( εδβαη ++−+∆+=∆ −−−
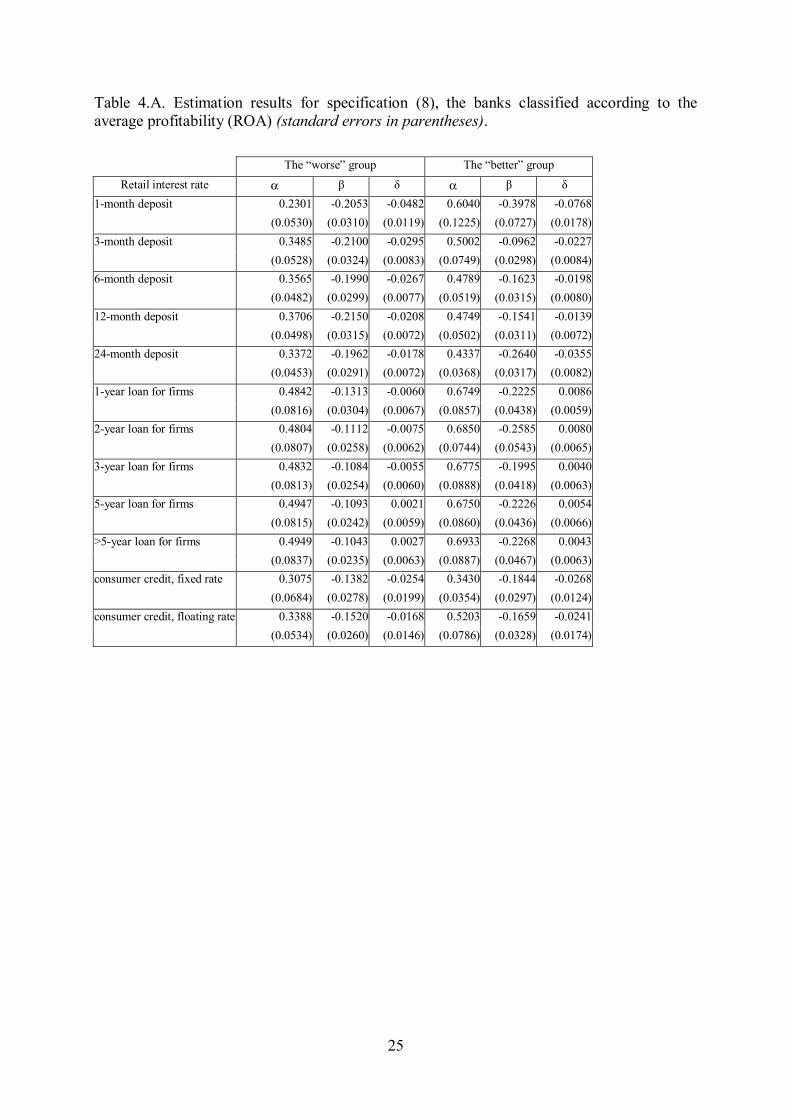
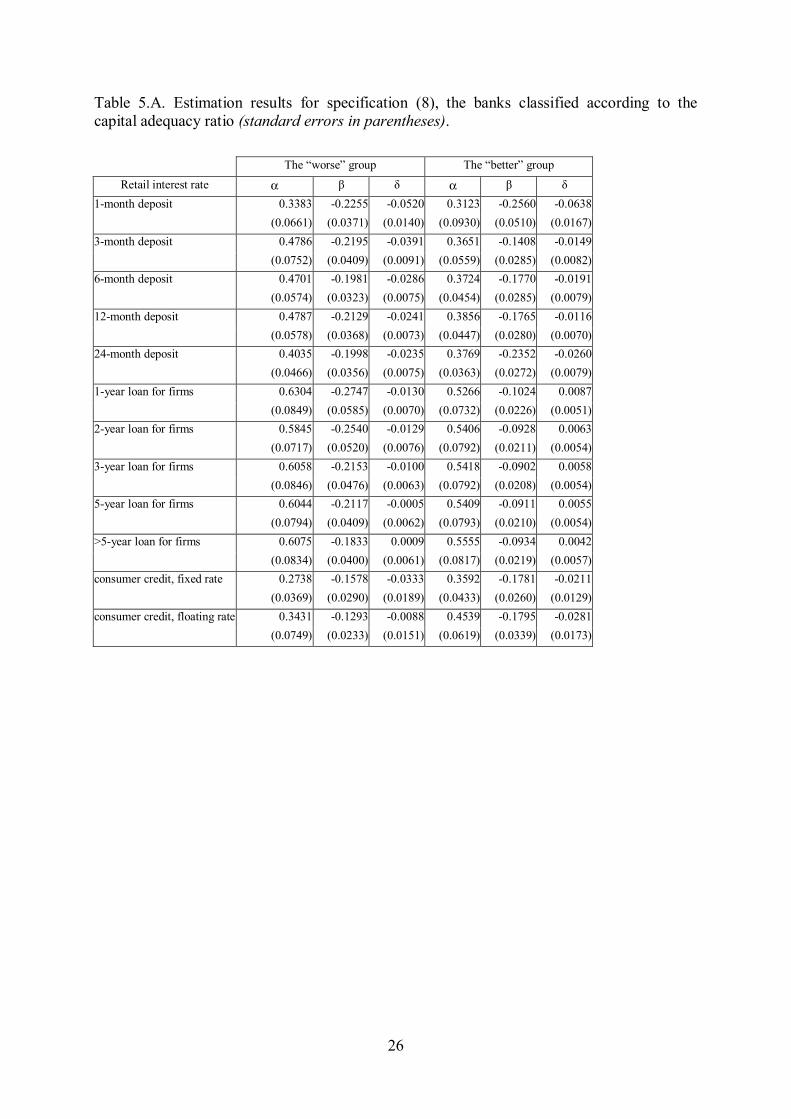
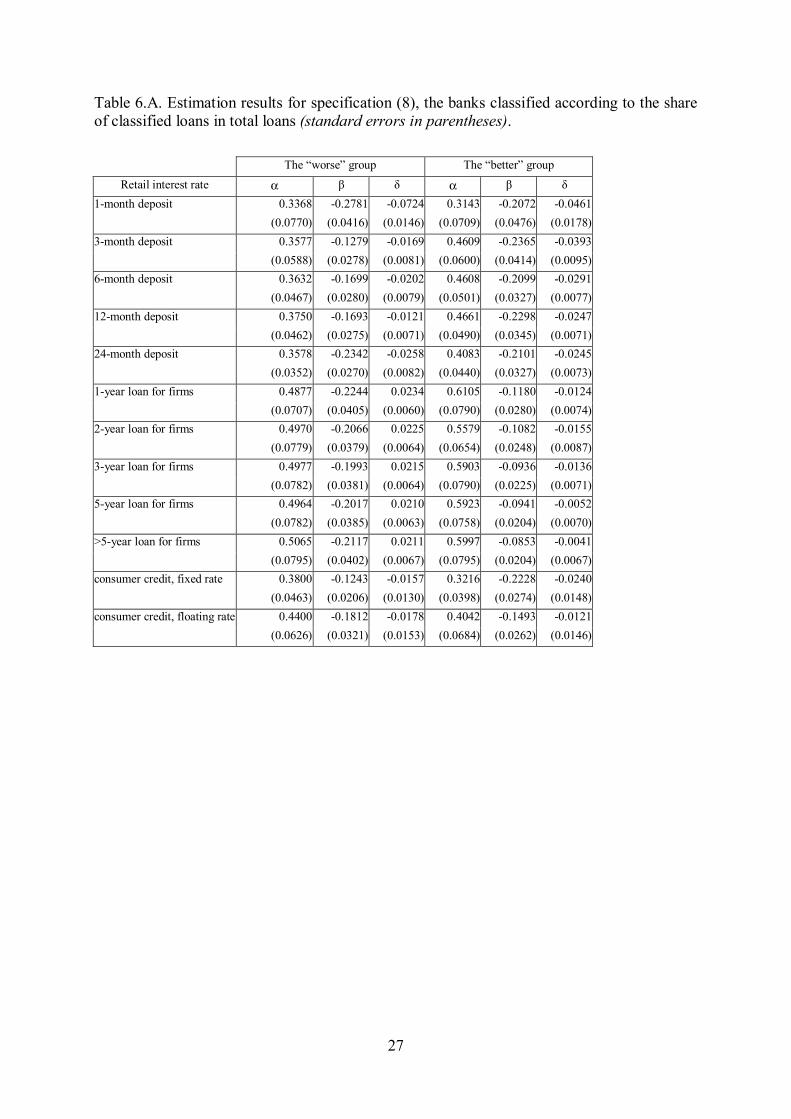
According to Weth (2002), the estimation results of (8) support an incomplete pass-through if
estimated value of δ is significantly different from 0. In order to estimate (8), one-step
estimation procedure is used, and therefore no bank-specific mark-ups similar to nµ̂ from (7)
are available. The parameter ηn is the only bank-specific effect present in (8).
Finally, an asymmetric error correction model was estimated. The framework of Scholnick
(1996) was adapted to the panel-data setting. First, the residuals from (6) were recoded
according to (9):
(9) )0),ˆˆmax(( ,, nttntn riect µγ −−=+ )0),ˆˆmin(( ,, nttntn riect µγ −−=−
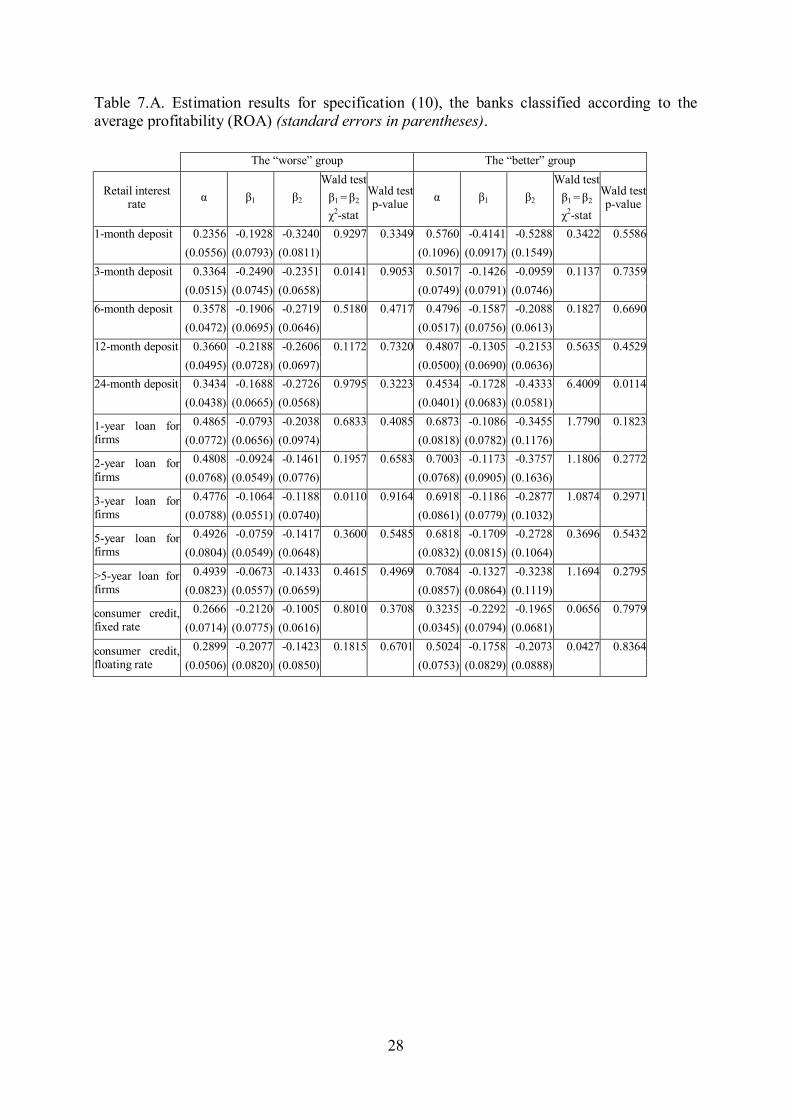
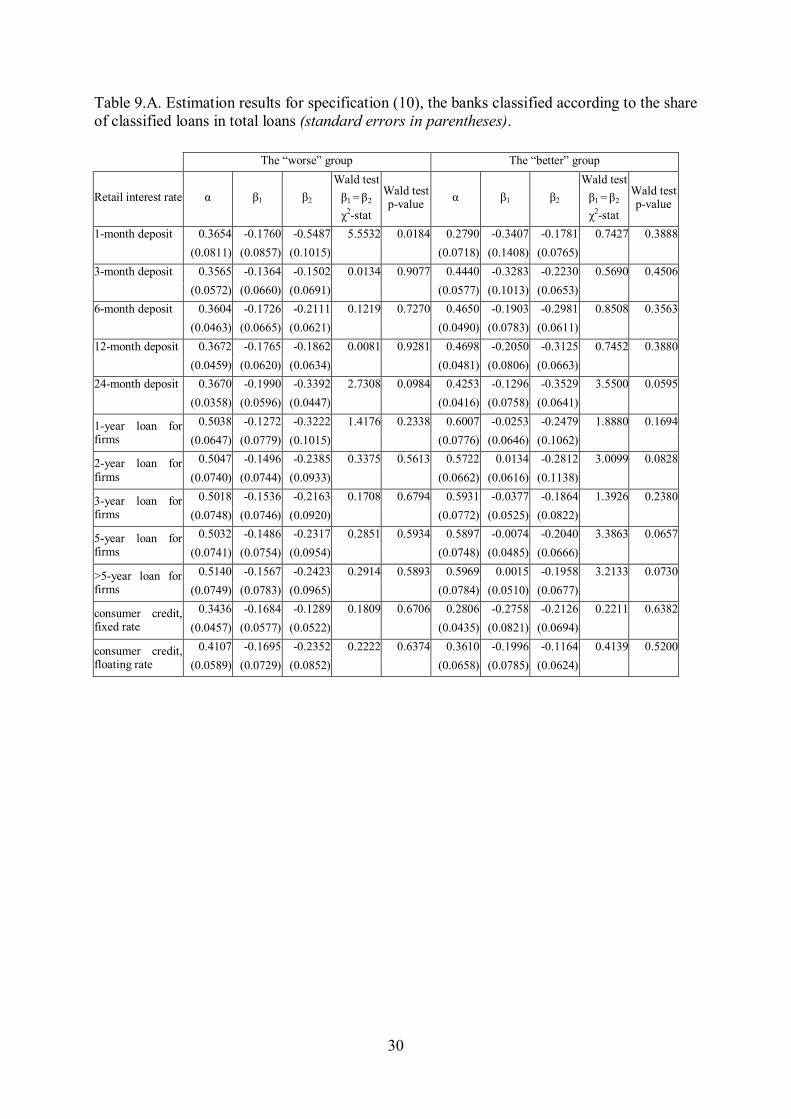
Then, panel regression equation (10) was estimated:
(10) tntntntntn ectectri .1,21,1, εββαη +++∆+=∆ −−
+−
If the asymmetric specification is the true one, the parameters β1 and β2 in (10) should be
significantly different (otherwise the symmetric ECM specification should be used to obtain
more efficient estimators). Therefore, the results of the Wald test for hypothesis β1=β2 are
reported for this specification.
All the final specifications (7), (8) and (10) were estimated using fixed effects estimator with
heteroscedasticity consistent White standard errors10. In cases of mergers and acquisitions, the
banks before the event were treated as separate entities and afterwards the merged bank was
supposed to be a successor of the dominant bank.
10 Specifications with extended short-term dynamics were also conducted (estimated by GMM). The results did not occur to be considerably superior, therefore the results of more parsimonious representations are presented.
17
Although a number of other (listed below) specifications proposed in the literature were also
tested, the outcomes are not reported in the paper due to unsatisfactory results. Both short-
and long-term interest rates were used simultaneously, as advocated by de Bondt et al. (2003),
but the parameter for Treasury bond yield appeared not significant in the error correction
term. After reparametrising the specification of Berstein and Fuentes (2003) to the ECM
form, interest rate changes interacted with bank-specific measures of loan portfolio quality,
profitability and capital adequacy also turned out to be insignificant. Adding proxies of bank-
specific financial disturbances as separate variables, similar to the approach of Cottarelli et al.
(1995), also did not result in significant estimates. The last finding might be explained as
resulting from using panel-data set-up with fixed individual effects, where individual effects
could account for omitted bank-specific variables that were rather time-invariant.
Estimation results
Detailed estimation outcomes are presented in the Appendices A and B. Due to their
relevance for the monetary policy, the results from specifications taking the 1-month money
market rate (WIBOR 1M) as the reference market rate are the most important ones. In the
Appendix C graphs of responses of selected retail interest rates to a 1 percentage point
decrease in WIBOR 1M are presented. Responses to a decrease in the market rate were
chosen because of predominantly downward trend in interest rates during the analysed period.
The results seem to support the hypothesis of sluggishness of the retail interest rates in the
Polish banking sector. There are, however, some interesting differences between the groups of
banks. The more profitable banks tend to adjust lending rates and rates for the longest
deposits faster than the less profitable ones. The more profitable ones pass-through
immediately a larger part of market interest rate changes and tend to return faster to the
equilibrium, but simultaneously decrease their spreads between lending and deposit rates, as
lending rates are generally adjusted faster in the environment of declining market interest
rates. Moreover, long-run adjustment of retail rates by more profitable banks is larger than in
the other group. The less profitable banks, after a decrease in the short-term market rate widen
the lending-deposit rate spread, although this widening diminishes over time. These results
can be interpreted as suggesting that the more profitable banks, as being in a better
competitive position, are able to narrow they spreads, whereas the less profitable banks try to
defend their interest margins. There may be, however, another explanation: the more
18
profitable banks are more profitable because their pricing strategy (narrowing the spreads) is
more competitive.
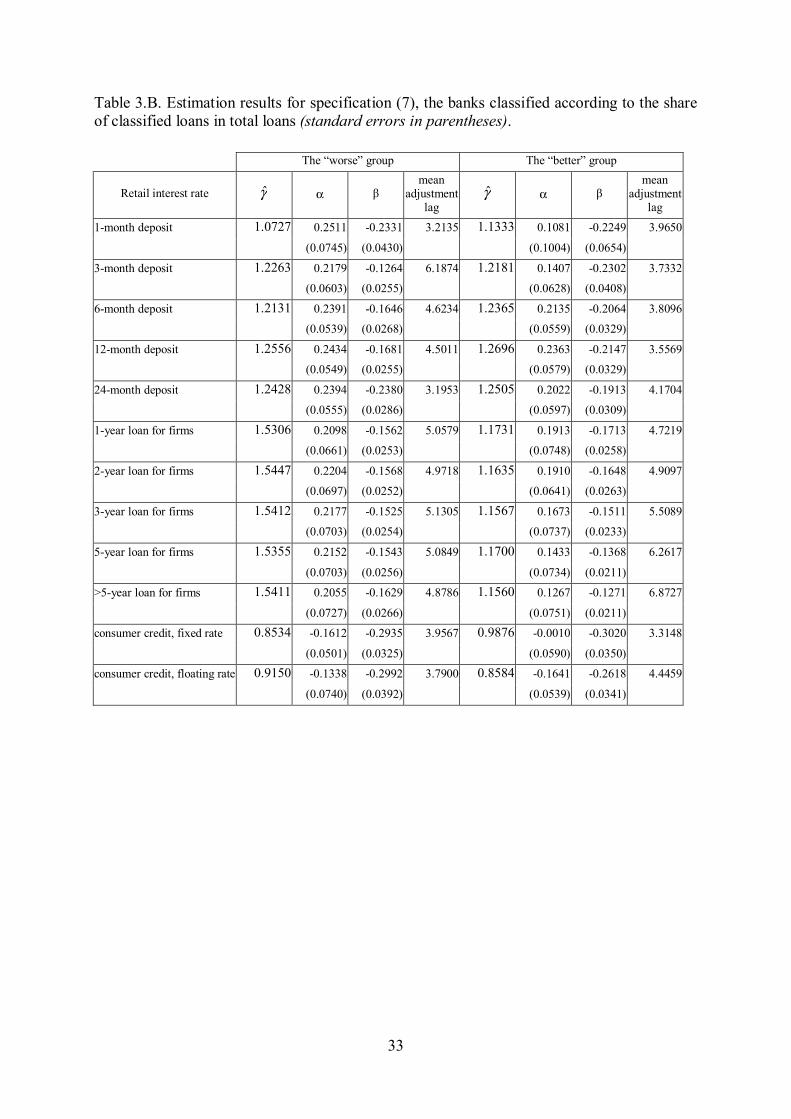
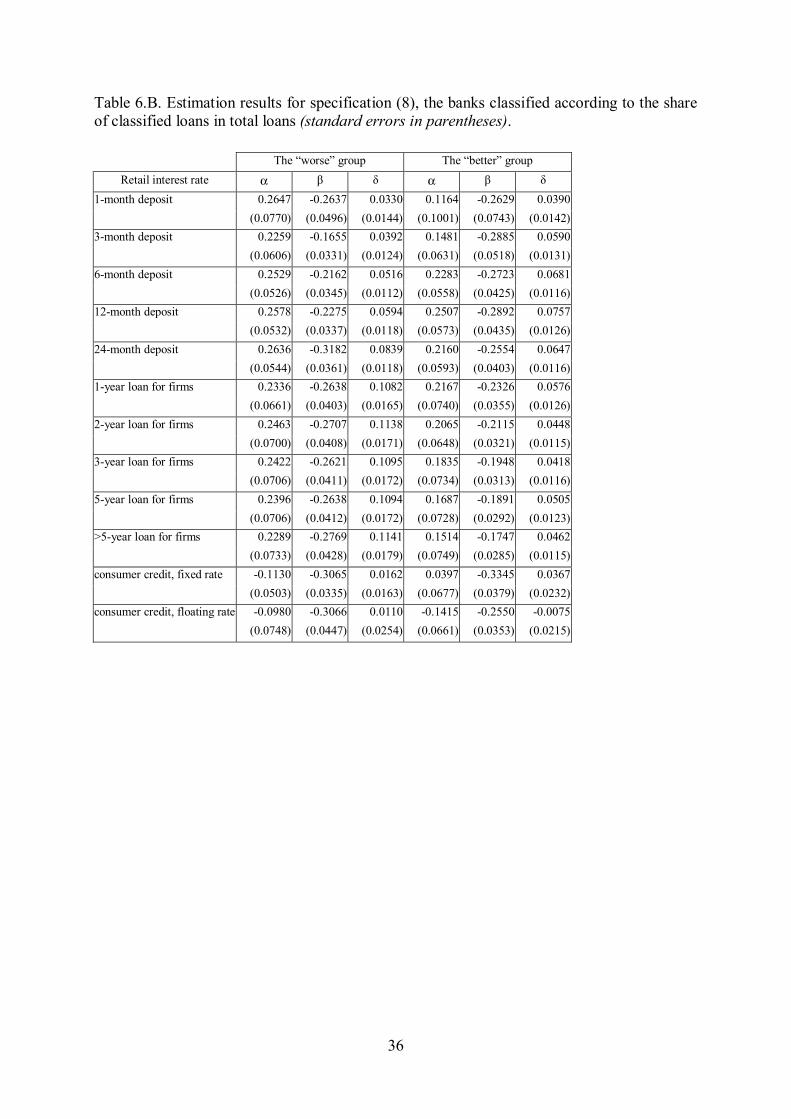
The estimation results also suggest that the banks with loan portfolios of lower quality tend to
adjust corporate loan interest rates faster and stronger than the banks with less risky credit
portfolios, but lag behind as far as the most popular term deposit (3-12 months) rates are
concerned. This implies narrowing lending-deposit rate spreads (after a negative market
interest rate shock) by the banks with riskier assets and widening of the spreads by the banks
with better quality loan portfolios. This result might be quite surprising given the hypothesis
of substituting lost income due to the increase in non-performing loans with higher net
interest income due to wider interest rate spreads. However, it may be another adjustment
process that is present in the Polish banking sector. The banks with lower-quality loan
portfolios have to adjust pricing of deposits to their increased risk level (what results in
stickier deposit rates) and simultaneously they try to improve their assets quality by attracting
safer borrowers by decreasing lending rates faster than other banks.
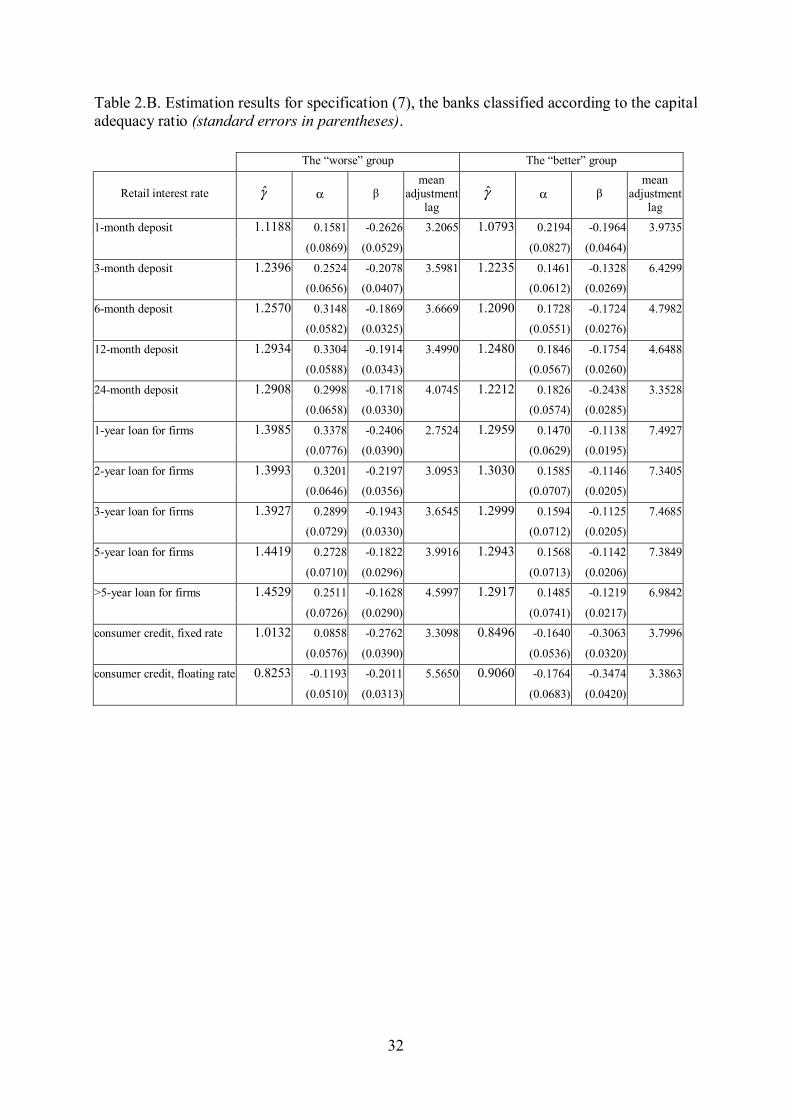
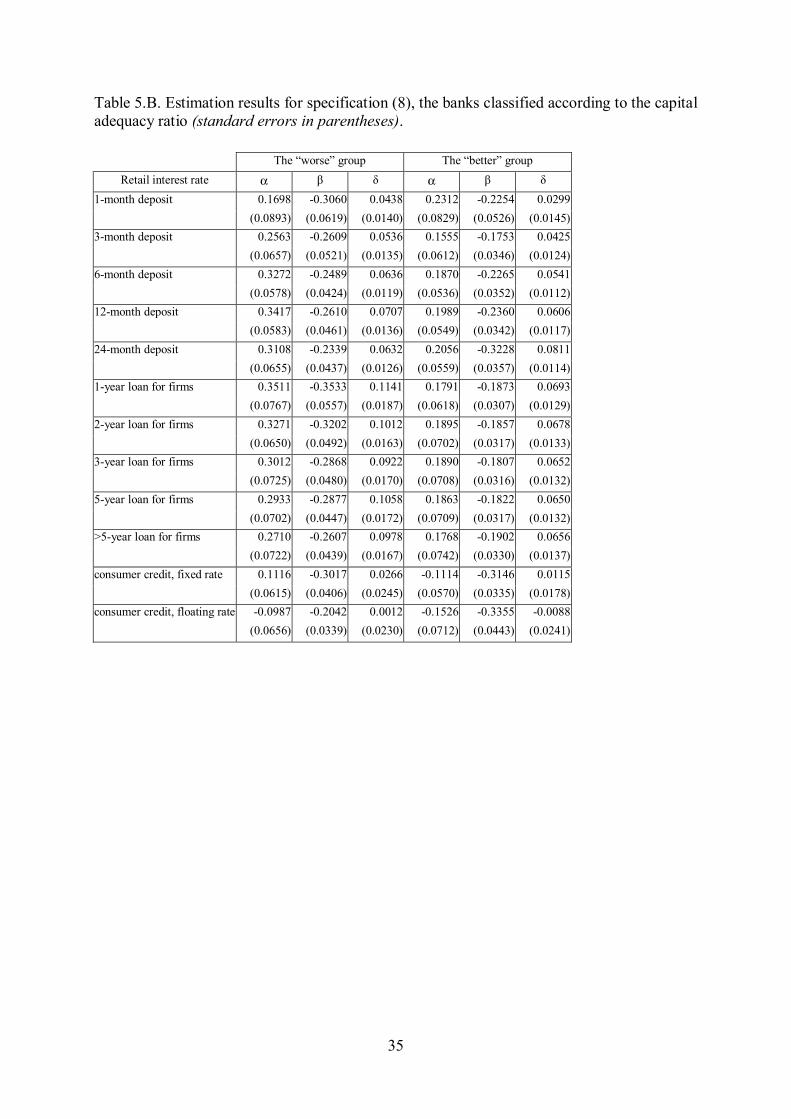
The results for the two groups when the banks were classified according to their capital
adequacy ratios support the credit channel view. The banks with lower capital adequacy ratios
happen to transmit monetary impulses much more effectively. This is in line with the credit
channel theory that suggests inverse relationship between capital strength of a bank and the
bank’s responsiveness to monetary policy changes. This is true both in short- and long run,
however, only for lending rates. Although the banks with lower capital adequacy ratios adjust
their deposit rates faster in first few months after a shock, in the long run their reaction
becomes to be similar to that of the better capitalised banks. Narrowing of the spreads by the
less capitalised banks after a negative market interest rate shock is in line with the results for
the groups divided according to the portfolio quality criterion, as more risky assets imply
usually a lower capital adequacy ratio.
Tests for asymmetry of adjustment to changes in the short-term money market rate give no
support for rejecting the symmetric adjustment hypothesis.
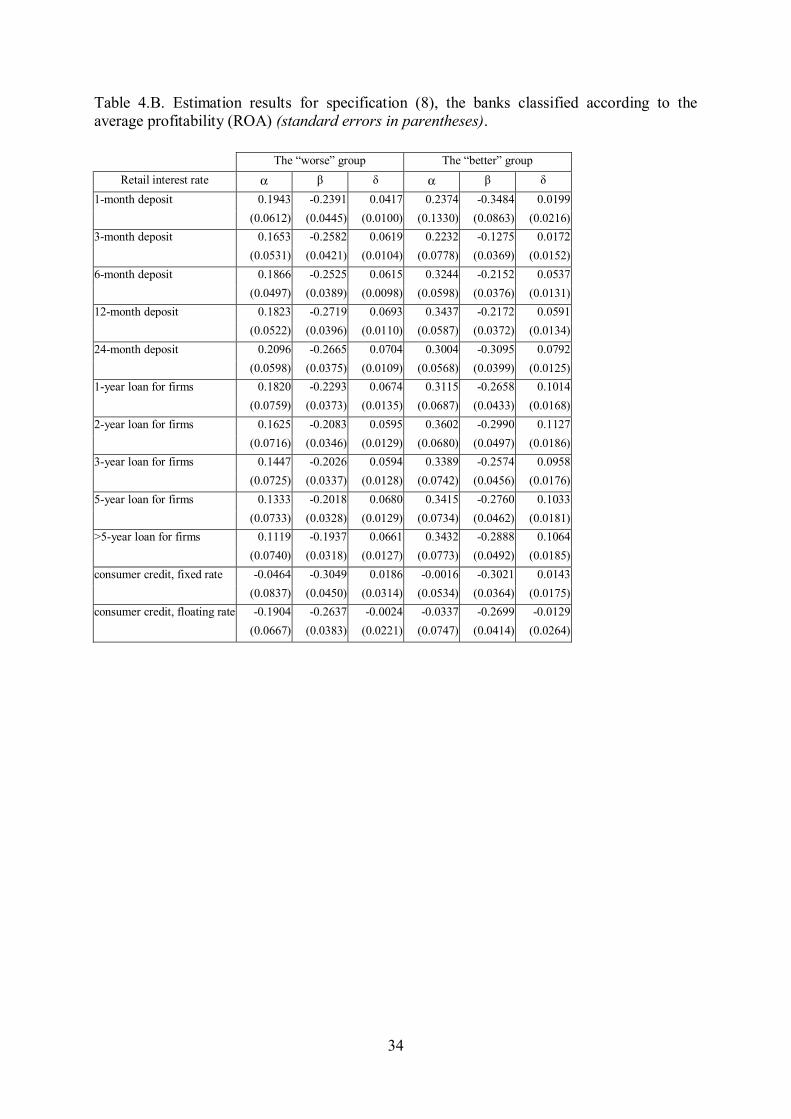
The results for the 5-year Treasury bond yield as the reference market rate are qualitatively
similar to those for the money market rate. The adjustment process is longer comparing with
the case of the money market rate. The noticeable difference is rejecting the symmetry of the
adjustment. This might be explained by the flattening yield curve tendency during estimation

19
period. Therefore long-term interest rates have been changing faster when compared with
money market rates.
Conclusions
Knowledge about differences in bank reactions might be relevant for the conduct of monetary
policy. Those differences stem from heterogeneity in responses of different economic agents
to monetary policy impulses. In the Polish financial system, banks are the most important
agents whose reactions may significantly influence the monetary transmission mechanism. As
suggested in the credit channel theory literature, in an economy with bank-oriented financing,
the monetary impulses that reach the real sector might be seriously modified by financial
intermediaries’ response to it. If there is a relationship between different bank characteristics
(especially those correlated with business cycle), the speed and lags in interest rate pass-
through developments within the banking sector should be observed by monetary policy
makers.
The empirical results for the Polish banking sector, on the basis of the bank-level data,
suggest that there are differences in bank reactions, depending on their individual
characteristics. These characteristics include also those that can be related to financial
disturbances correlated with business cycle, such as a deterioration in asset quality and
profitability, that are finally reflected in the capital adequacy ratios.
One can expect that possibilities for diversification of financing sources for Polish firms will
expand in the future. Therefore the Polish monetary policy would become more concerned
about asset prices. The results of this research might be the starting point for further analyses
of the effects of more generally defined financial disturbances on the monetary transmission
mechanism, including the asset price channel.
20
References
Angbazo L. (1997), “Commercial bank net interest margins, default risk, interest-rate risk,
and off-balance sheet banking”, Journal of Banking and Finance, vol. 21, pp. 55-87.
Berstein S., R. Fuentes (2003), ”Is there Lending Rate Stickiness in the Chilean Banking
Industry?”, Central Bank of Chile Working Papers No. 218, August 2003.
Bondt G. de (2002), “Retail bank interest rate pass-through: new evidence at the euro area
level”, ECB Working Paper No. 136.
Bondt G. de, B. Mojon, N. Valla (2003), “Term Structure and the Sluggishness of Retail Bank
Rates in Euro Area Countries”, paper presented at the conference “The Economics of
Consumer Credit: European Experience and Lessons from the US”, EUI Florence, available
at: http://www.iue.it/FinConsEU/may2003papers/natacha3.pdf.
Cottarelli C., G. Ferri, A. Generale (1995), “Bank Lending Rates and Financial Structure in
Italy”, IMF Staff Papers, vol. 42, pp. 670-700.
Cottarelli C., A. Kourelis (1994), “Financial Structure, Bank Lending Rates, and the
Transmission Mechanism of Monetary Policy”, IMF Staff Papers, vol. 41, pp. 587-623.
Gołajewska M., M. Zaremba (2002), “Problems with the interpretation of interest rate policy
of commercial banks” (in Polish), National Bank of Poland (mimeo).
Hannan T., A. Berger (1991), “The rigidity of prices: evidence from the banking industry”,
American Economic Review, vol. 81, pp. 938-945.
Hendry D. F. (1995), “Dynamic Econometrics”, Oxford University Press.
Hofmann B. (2002), “Non-linear Base Rate Pass-Through in Banks’ and Building Societies’
Retail Rates”, mimeo, available at: http://www.hkimr.org/download/hofmann_paper251002.pdf.
Lowe P., T. Rohling (1992), “Loan rate stickiness: theory and evidence, Research Discussion
Paper No. 9206, Reserve Bank of Australia.
Mizen P., B. Hofmann (2002), “Base rate pass-through: evidence from banks’ and building
societies’ retail rates”, Working Paper No. 170, Bank of England.
Mojon B. (2000), “Financial structure and the interest rate channel of ECB monetary policy”,
ECB Working Paper No. 40.
Monetary Policy Council (2002), “Inflation Report 2001”, National Bank of Poland.
21
National Bank of Poland (2003), “Financial Stability Report”, NBP, Warsaw.
Pawłowska M. (2003), “Efficiency, competitiveness and the level of acceptable concentration
on the bank market”, NBP, mimeo (in Polish).
Sander H., S. Kleimeier (2000), „Asymmetric adjustment of commercial bank interest rates in
the Euro area: implications for monetary policy“, paper prepared for the 3rd Conference of the
Swiss Society for Financial Market Research, available at:
http://www.eco.rug.nl/ccso/download/sander.pdf.
Scholnick B. (1996), “Asymmetric adjustment of commercial bank interest rates: evidence
from Malaysia and Singapore”, Journal of International Money and Finance, vol. 15, no. 3,
pp. 485-496.
Weth M. A. (2002), ”The pass-through from market interest rates to bank lending rates in
Germany”, Discussion Paper 11/02, Deutsche Bundesbank.
Winker P. (1999), “Sluggish adjustment of interest rates and credit rationing: an application
of unit root testing and error correction modelling”, Applied Economics, vol. 31, pp. 267-277.
Wong K. P. (1997), “On the determinants of bank interest margins under credit and interest
rate risks”, Journal of Banking and Finance, vol. 21, pp. 251-271.
Wróbel E., M. Pawłowska (2002), „Monetary transmission in Poland: some evidence on
interest rate and credit channels”, Materiały i Studia No. 24, National Bank of Poland.
22
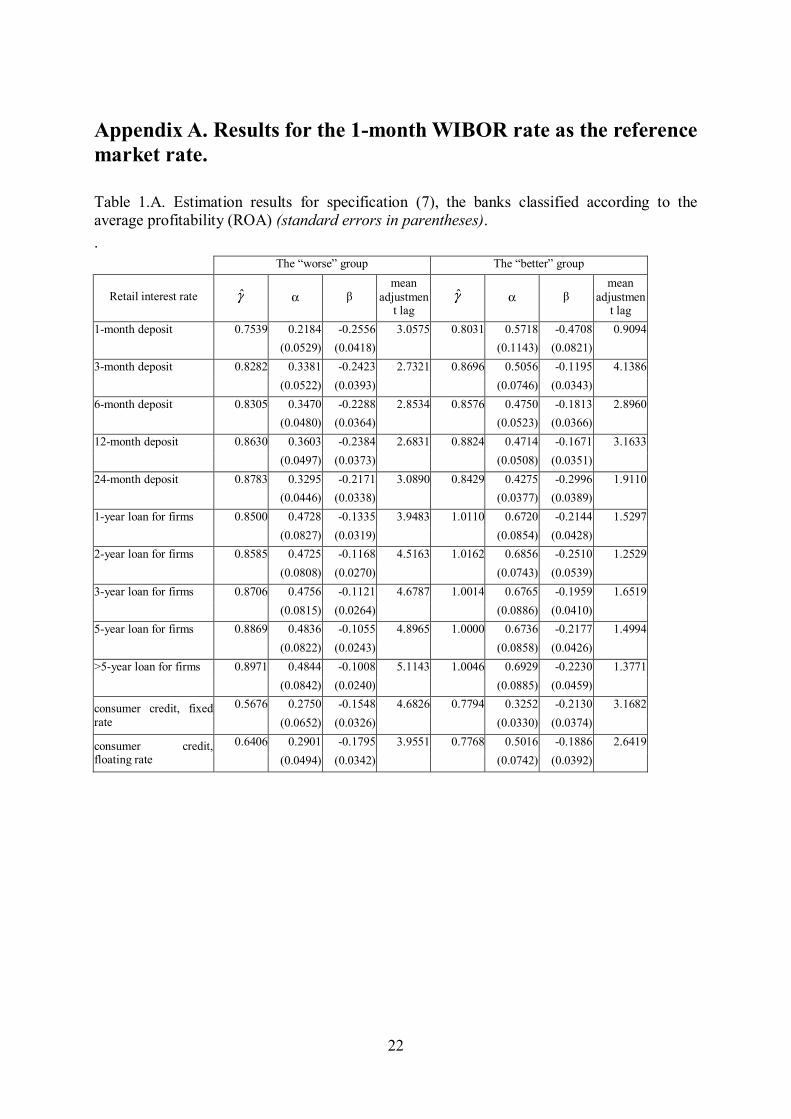
Appendix A. Results for the 1-month WIBOR rate as the reference market rate. Table 1.A. Estimation results for specification (7), the banks classified according to the average profitability (ROA) (standard errors in parentheses). .
The “worse” group The “better” group
Retail interest rate γ̂ α β mean
adjustment lag
γ̂ α β mean
adjustment lag
1-month deposit 0.7539 0.2184 -0.2556 3.0575 0.8031 0.5718 -0.4708 0.9094 (0.0529) (0.0418) (0.1143) (0.0821) 3-month deposit 0.8282 0.3381 -0.2423 2.7321 0.8696 0.5056 -0.1195 4.1386 (0.0522) (0.0393) (0.0746) (0.0343) 6-month deposit 0.8305 0.3470 -0.2288 2.8534 0.8576 0.4750 -0.1813 2.8960 (0.0480) (0.0364) (0.0523) (0.0366) 12-month deposit 0.8630 0.3603 -0.2384 2.6831 0.8824 0.4714 -0.1671 3.1633 (0.0497) (0.0373) (0.0508) (0.0351) 24-month deposit 0.8783 0.3295 -0.2171 3.0890 0.8429 0.4275 -0.2996 1.9110 (0.0446) (0.0338) (0.0377) (0.0389) 1-year loan for firms 0.8500 0.4728 -0.1335 3.9483 1.0110 0.6720 -0.2144 1.5297 (0.0827) (0.0319) (0.0854) (0.0428) 2-year loan for firms 0.8585 0.4725 -0.1168 4.5163 1.0162 0.6856 -0.2510 1.2529 (0.0808) (0.0270) (0.0743) (0.0539) 3-year loan for firms 0.8706 0.4756 -0.1121 4.6787 1.0014 0.6765 -0.1959 1.6519 (0.0815) (0.0264) (0.0886) (0.0410) 5-year loan for firms 0.8869 0.4836 -0.1055 4.8965 1.0000 0.6736 -0.2177 1.4994 (0.0822) (0.0243) (0.0858) (0.0426) >5-year loan for firms 0.8971 0.4844 -0.1008 5.1143 1.0046 0.6929 -0.2230 1.3771 (0.0842) (0.0240) (0.0885) (0.0459)
0.5676 0.2750 -0.1548 4.6826 0.7794 0.3252 -0.2130 3.1682 consumer credit, fixed rate (0.0652) (0.0326) (0.0330) (0.0374)
0.6406 0.2901 -0.1795 3.9551 0.7768 0.5016 -0.1886 2.6419 consumer credit, floating rate (0.0494) (0.0342) (0.0742) (0.0392)
23
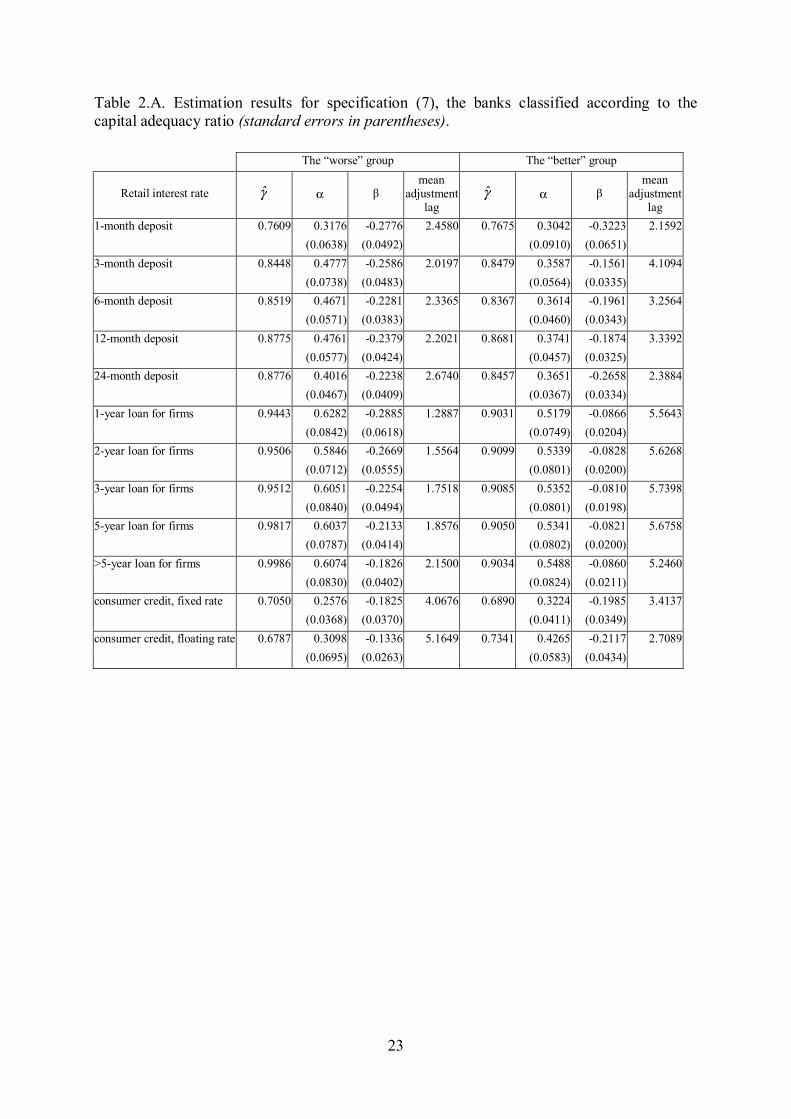
Table 2.A. Estimation results for specification (7), the banks classified according to the capital adequacy ratio (standard errors in parentheses).
The “worse” group The “better” group
Retail interest rate γ̂ α β mean
adjustment lag
γ̂ α β mean
adjustment lag
1-month deposit 0.7609 0.3176 -0.2776 2.4580 0.7675 0.3042 -0.3223 2.1592 (0.0638) (0.0492) (0.0910) (0.0651) 3-month deposit 0.8448 0.4777 -0.2586 2.0197 0.8479 0.3587 -0.1561 4.1094 (0.0738) (0.0483) (0.0564) (0.0335) 6-month deposit 0.8519 0.4671 -0.2281 2.3365 0.8367 0.3614 -0.1961 3.2564 (0.0571) (0.0383) (0.0460) (0.0343) 12-month deposit 0.8775 0.4761 -0.2379 2.2021 0.8681 0.3741 -0.1874 3.3392 (0.0577) (0.0424) (0.0457) (0.0325) 24-month deposit 0.8776 0.4016 -0.2238 2.6740 0.8457 0.3651 -0.2658 2.3884 (0.0467) (0.0409) (0.0367) (0.0334) 1-year loan for firms 0.9443 0.6282 -0.2885 1.2887 0.9031 0.5179 -0.0866 5.5643 (0.0842) (0.0618) (0.0749) (0.0204) 2-year loan for firms 0.9506 0.5846 -0.2669 1.5564 0.9099 0.5339 -0.0828 5.6268 (0.0712) (0.0555) (0.0801) (0.0200) 3-year loan for firms 0.9512 0.6051 -0.2254 1.7518 0.9085 0.5352 -0.0810 5.7398 (0.0840) (0.0494) (0.0801) (0.0198) 5-year loan for firms 0.9817 0.6037 -0.2133 1.8576 0.9050 0.5341 -0.0821 5.6758 (0.0787) (0.0414) (0.0802) (0.0200) >5-year loan for firms 0.9986 0.6074 -0.1826 2.1500 0.9034 0.5488 -0.0860 5.2460 (0.0830) (0.0402) (0.0824) (0.0211) consumer credit, fixed rate 0.7050 0.2576 -0.1825 4.0676 0.6890 0.3224 -0.1985 3.4137 (0.0368) (0.0370) (0.0411) (0.0349) consumer credit, floating rate 0.6787 0.3098 -0.1336 5.1649 0.7341 0.4265 -0.2117 2.7089 (0.0695) (0.0263) (0.0583) (0.0434)
24
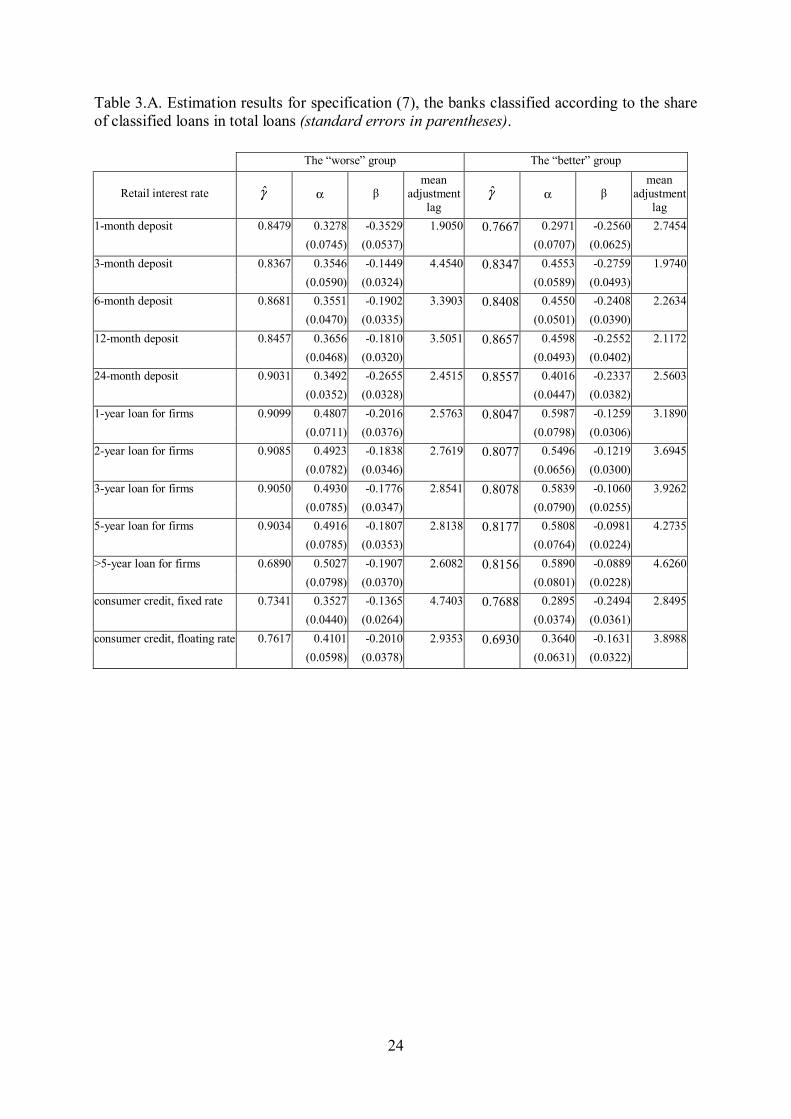
Table 3.A. Estimation results for specification (7), the banks classified according to the share of classified loans in total loans (standard errors in parentheses).
The “worse” group The “better” group
Retail interest rate γ̂ α β mean
adjustment lag
γ̂ α β mean
adjustment lag
1-month deposit 0.8479 0.3278 -0.3529 1.9050 0.7667 0.2971 -0.2560 2.7454 (0.0745) (0.0537) (0.0707) (0.0625) 3-month deposit 0.8367 0.3546 -0.1449 4.4540 0.8347 0.4553 -0.2759 1.9740 (0.0590) (0.0324) (0.0589) (0.0493) 6-month deposit 0.8681 0.3551 -0.1902 3.3903 0.8408 0.4550 -0.2408 2.2634 (0.0470) (0.0335) (0.0501) (0.0390) 12-month deposit 0.8457 0.3656 -0.1810 3.5051 0.8657 0.4598 -0.2552 2.1172 (0.0468) (0.0320) (0.0493) (0.0402) 24-month deposit 0.9031 0.3492 -0.2655 2.4515 0.8557 0.4016 -0.2337 2.5603 (0.0352) (0.0328) (0.0447) (0.0382) 1-year loan for firms 0.9099 0.4807 -0.2016 2.5763 0.8047 0.5987 -0.1259 3.1890 (0.0711) (0.0376) (0.0798) (0.0306) 2-year loan for firms 0.9085 0.4923 -0.1838 2.7619 0.8077 0.5496 -0.1219 3.6945 (0.0782) (0.0346) (0.0656) (0.0300) 3-year loan for firms 0.9050 0.4930 -0.1776 2.8541 0.8078 0.5839 -0.1060 3.9262 (0.0785) (0.0347) (0.0790) (0.0255) 5-year loan for firms 0.9034 0.4916 -0.1807 2.8138 0.8177 0.5808 -0.0981 4.2735 (0.0785) (0.0353) (0.0764) (0.0224) >5-year loan for firms 0.6890 0.5027 -0.1907 2.6082 0.8156 0.5890 -0.0889 4.6260 (0.0798) (0.0370) (0.0801) (0.0228) consumer credit, fixed rate 0.7341 0.3527 -0.1365 4.7403 0.7688 0.2895 -0.2494 2.8495 (0.0440) (0.0264) (0.0374) (0.0361) consumer credit, floating rate 0.7617 0.4101 -0.2010 2.9353 0.6930 0.3640 -0.1631 3.8988 (0.0598) (0.0378) (0.0631) (0.0322)
25
Table 4.A. Estimation results for specification (8), the banks classified according to the average profitability (ROA) (standard errors in parentheses).
The “worse” group The “better” group Retail interest rate α β δ α β δ
1-month deposit 0.2301 -0.2053 -0.0482 0.6040 -0.3978 -0.0768 (0.0530) (0.0310) (0.0119) (0.1225) (0.0727) (0.0178) 3-month deposit 0.3485 -0.2100 -0.0295 0.5002 -0.0962 -0.0227 (0.0528) (0.0324) (0.0083) (0.0749) (0.0298) (0.0084) 6-month deposit 0.3565 -0.1990 -0.0267 0.4789 -0.1623 -0.0198 (0.0482) (0.0299) (0.0077) (0.0519) (0.0315) (0.0080) 12-month deposit 0.3706 -0.2150 -0.0208 0.4749 -0.1541 -0.0139 (0.0498) (0.0315) (0.0072) (0.0502) (0.0311) (0.0072) 24-month deposit 0.3372 -0.1962 -0.0178 0.4337 -0.2640 -0.0355 (0.0453) (0.0291) (0.0072) (0.0368) (0.0317) (0.0082) 1-year loan for firms 0.4842 -0.1313 -0.0060 0.6749 -0.2225 0.0086 (0.0816) (0.0304) (0.0067) (0.0857) (0.0438) (0.0059) 2-year loan for firms 0.4804 -0.1112 -0.0075 0.6850 -0.2585 0.0080 (0.0807) (0.0258) (0.0062) (0.0744) (0.0543) (0.0065) 3-year loan for firms 0.4832 -0.1084 -0.0055 0.6775 -0.1995 0.0040 (0.0813) (0.0254) (0.0060) (0.0888) (0.0418) (0.0063) 5-year loan for firms 0.4947 -0.1093 0.0021 0.6750 -0.2226 0.0054 (0.0815) (0.0242) (0.0059) (0.0860) (0.0436) (0.0066) >5-year loan for firms 0.4949 -0.1043 0.0027 0.6933 -0.2268 0.0043 (0.0837) (0.0235) (0.0063) (0.0887) (0.0467) (0.0063) consumer credit, fixed rate 0.3075 -0.1382 -0.0254 0.3430 -0.1844 -0.0268 (0.0684) (0.0278) (0.0199) (0.0354) (0.0297) (0.0124) consumer credit, floating rate 0.3388 -0.1520 -0.0168 0.5203 -0.1659 -0.0241 (0.0534) (0.0260) (0.0146) (0.0786) (0.0328) (0.0174)
26
Table 5.A. Estimation results for specification (8), the banks classified according to the capital adequacy ratio (standard errors in parentheses).
The “worse” group The “better” group Retail interest rate α β δ α β δ
1-month deposit 0.3383 -0.2255 -0.0520 0.3123 -0.2560 -0.0638 (0.0661) (0.0371) (0.0140) (0.0930) (0.0510) (0.0167) 3-month deposit 0.4786 -0.2195 -0.0391 0.3651 -0.1408 -0.0149 (0.0752) (0.0409) (0.0091) (0.0559) (0.0285) (0.0082) 6-month deposit 0.4701 -0.1981 -0.0286 0.3724 -0.1770 -0.0191 (0.0574) (0.0323) (0.0075) (0.0454) (0.0285) (0.0079) 12-month deposit 0.4787 -0.2129 -0.0241 0.3856 -0.1765 -0.0116 (0.0578) (0.0368) (0.0073) (0.0447) (0.0280) (0.0070) 24-month deposit 0.4035 -0.1998 -0.0235 0.3769 -0.2352 -0.0260 (0.0466) (0.0356) (0.0075) (0.0363) (0.0272) (0.0079) 1-year loan for firms 0.6304 -0.2747 -0.0130 0.5266 -0.1024 0.0087 (0.0849) (0.0585) (0.0070) (0.0732) (0.0226) (0.0051) 2-year loan for firms 0.5845 -0.2540 -0.0129 0.5406 -0.0928 0.0063 (0.0717) (0.0520) (0.0076) (0.0792) (0.0211) (0.0054) 3-year loan for firms 0.6058 -0.2153 -0.0100 0.5418 -0.0902 0.0058 (0.0846) (0.0476) (0.0063) (0.0792) (0.0208) (0.0054) 5-year loan for firms 0.6044 -0.2117 -0.0005 0.5409 -0.0911 0.0055 (0.0794) (0.0409) (0.0062) (0.0793) (0.0210) (0.0054) >5-year loan for firms 0.6075 -0.1833 0.0009 0.5555 -0.0934 0.0042 (0.0834) (0.0400) (0.0061) (0.0817) (0.0219) (0.0057) consumer credit, fixed rate 0.2738 -0.1578 -0.0333 0.3592 -0.1781 -0.0211 (0.0369) (0.0290) (0.0189) (0.0433) (0.0260) (0.0129) consumer credit, floating rate 0.3431 -0.1293 -0.0088 0.4539 -0.1795 -0.0281 (0.0749) (0.0233) (0.0151) (0.0619) (0.0339) (0.0173)
27
Table 6.A. Estimation results for specification (8), the banks classified according to the share of classified loans in total loans (standard errors in parentheses).
The “worse” group The “better” group Retail interest rate α β δ α β δ
1-month deposit 0.3368 -0.2781 -0.0724 0.3143 -0.2072 -0.0461 (0.0770) (0.0416) (0.0146) (0.0709) (0.0476) (0.0178) 3-month deposit 0.3577 -0.1279 -0.0169 0.4609 -0.2365 -0.0393 (0.0588) (0.0278) (0.0081) (0.0600) (0.0414) (0.0095) 6-month deposit 0.3632 -0.1699 -0.0202 0.4608 -0.2099 -0.0291 (0.0467) (0.0280) (0.0079) (0.0501) (0.0327) (0.0077) 12-month deposit 0.3750 -0.1693 -0.0121 0.4661 -0.2298 -0.0247 (0.0462) (0.0275) (0.0071) (0.0490) (0.0345) (0.0071) 24-month deposit 0.3578 -0.2342 -0.0258 0.4083 -0.2101 -0.0245 (0.0352) (0.0270) (0.0082) (0.0440) (0.0327) (0.0073) 1-year loan for firms 0.4877 -0.2244 0.0234 0.6105 -0.1180 -0.0124 (0.0707) (0.0405) (0.0060) (0.0790) (0.0280) (0.0074) 2-year loan for firms 0.4970 -0.2066 0.0225 0.5579 -0.1082 -0.0155 (0.0779) (0.0379) (0.0064) (0.0654) (0.0248) (0.0087) 3-year loan for firms 0.4977 -0.1993 0.0215 0.5903 -0.0936 -0.0136 (0.0782) (0.0381) (0.0064) (0.0790) (0.0225) (0.0071) 5-year loan for firms 0.4964 -0.2017 0.0210 0.5923 -0.0941 -0.0052 (0.0782) (0.0385) (0.0063) (0.0758) (0.0204) (0.0070) >5-year loan for firms 0.5065 -0.2117 0.0211 0.5997 -0.0853 -0.0041 (0.0795) (0.0402) (0.0067) (0.0795) (0.0204) (0.0067) consumer credit, fixed rate 0.3800 -0.1243 -0.0157 0.3216 -0.2228 -0.0240 (0.0463) (0.0206) (0.0130) (0.0398) (0.0274) (0.0148) consumer credit, floating rate 0.4400 -0.1812 -0.0178 0.4042 -0.1493 -0.0121 (0.0626) (0.0321) (0.0153) (0.0684) (0.0262) (0.0146)
28
Table 7.A. Estimation results for specification (10), the banks classified according to the average profitability (ROA) (standard errors in parentheses).
The “worse” group The “better” group
Retail interest rate α β1 β2
Wald test β1 = β2
χ2-stat
Wald test p-value α β1 β2
Wald test β1 = β2
χ2-stat
Wald test p-value
1-month deposit 0.2356 -0.1928 -0.3240 0.9297 0.3349 0.5760 -0.4141 -0.5288 0.3422 0.5586 (0.0556) (0.0793) (0.0811) (0.1096) (0.0917) (0.1549) 3-month deposit 0.3364 -0.2490 -0.2351 0.0141 0.9053 0.5017 -0.1426 -0.0959 0.1137 0.7359 (0.0515) (0.0745) (0.0658) (0.0749) (0.0791) (0.0746) 6-month deposit 0.3578 -0.1906 -0.2719 0.5180 0.4717 0.4796 -0.1587 -0.2088 0.1827 0.6690 (0.0472) (0.0695) (0.0646) (0.0517) (0.0756) (0.0613) 12-month deposit 0.3660 -0.2188 -0.2606 0.1172 0.7320 0.4807 -0.1305 -0.2153 0.5635 0.4529 (0.0495) (0.0728) (0.0697) (0.0500) (0.0690) (0.0636) 24-month deposit 0.3434 -0.1688 -0.2726 0.9795 0.3223 0.4534 -0.1728 -0.4333 6.4009 0.0114 (0.0438) (0.0665) (0.0568) (0.0401) (0.0683) (0.0581)
0.4865 -0.0793 -0.2038 0.6833 0.4085 0.6873 -0.1086 -0.3455 1.7790 0.18231-year loan for firms (0.0772) (0.0656) (0.0974) (0.0818) (0.0782) (0.1176)
0.4808 -0.0924 -0.1461 0.1957 0.6583 0.7003 -0.1173 -0.3757 1.1806 0.27722-year loan for firms (0.0768) (0.0549) (0.0776) (0.0768) (0.0905) (0.1636)
0.4776 -0.1064 -0.1188 0.0110 0.9164 0.6918 -0.1186 -0.2877 1.0874 0.29713-year loan for firms (0.0788) (0.0551) (0.0740) (0.0861) (0.0779) (0.1032)
0.4926 -0.0759 -0.1417 0.3600 0.5485 0.6818 -0.1709 -0.2728 0.3696 0.54325-year loan for firms (0.0804) (0.0549) (0.0648) (0.0832) (0.0815) (0.1064)
0.4939 -0.0673 -0.1433 0.4615 0.4969 0.7084 -0.1327 -0.3238 1.1694 0.2795>5-year loan for firms (0.0823) (0.0557) (0.0659) (0.0857) (0.0864) (0.1119)
0.2666 -0.2120 -0.1005 0.8010 0.3708 0.3235 -0.2292 -0.1965 0.0656 0.7979consumer credit, fixed rate (0.0714) (0.0775) (0.0616) (0.0345) (0.0794) (0.0681)
0.2899 -0.2077 -0.1423 0.1815 0.6701 0.5024 -0.1758 -0.2073 0.0427 0.8364consumer credit, floating rate (0.0506) (0.0820) (0.0850) (0.0753) (0.0829) (0.0888)

29
Table 8.A. Estimation results for specification (10), the banks classified according to the capital adequacy ratio (standard errors in parentheses).
The “worse” group The “better” group
Retail interest rate α β1 Β2 Wald test β1 = β2
χ2-stat
Wald test p-value α β1 β2
Wald test β1 = β2
χ2-stat
Wald test p-value
1-month deposit 0.3191 -0.2958 -0.2626 0.0404 0.8406 0.3337 -0.1748 -0.4927 2.8946 0.0889 (0.0673) (0.1038) (0.0895) (0.0933) (0.1047) (0.1185) 3-month deposit 0.4566 -0.3673 -0.1571 2.0353 0.1537 0.3601 -0.1510 -0.1581 0.0036 0.9523 (0.0723) (0.1014) (0.0718) (0.0545) (0.0676) (0.0681) 6-month deposit 0.4740 -0.1882 -0.2710 0.4978 0.4805 0.3670 -0.1779 -0.2180 0.1290 0.7195 (0.0570) (0.0761) (0.0637) (0.0450) (0.0676) (0.0629) 12-month deposit 0.4877 -0.1762 -0.3110 0.9824 0.3216 0.3773 -0.1781 -0.1987 0.0358 0.8499 (0.0571) (0.0854) (0.0736) (0.0448) (0.0627) (0.0637) 24-month deposit 0.4358 -0.0796 -0.3986 6.4568 0.0111 0.3771 -0.2183 -0.3171 1.2295 0.2675 (0.0422) (0.0815) (0.0669) (0.0373) (0.0611) (0.0483)
0.6471 -0.2118 -0.3770 0.5888 0.4429 0.5231 -0.0595 -0.1249 0.4449 0.50481-year loan for firms (0.0877) (0.1022) (0.1434) (0.0724) (0.0473) (0.0585)
0.6161 -0.1654 -0.3863 1.1468 0.2842 0.5376 -0.0642 -0.1084 0.2019 0.65322-year loan for firms (0.0797) (0.0799) (0.1460) (0.0785) (0.0498) (0.0557)
0.6100 -0.2105 -0.2428 0.0332 0.8554 0.5383 -0.0662 -0.1013 0.1308 0.71763-year loan for firms (0.0860) (0.0848) (0.1169) (0.0786) (0.0492) (0.0552)
0.6142 -0.1738 -0.2589 0.2797 0.5969 0.5378 -0.0641 -0.1066 0.1849 0.66725-year loan for firms (0.0799) (0.0856) (0.0954) (0.0785) (0.0495) (0.0566)
0.6272 -0.1170 -0.2596 0.7034 0.4016 0.5535 -0.0600 -0.1202 0.3343 0.5632>5-year loan for firms (0.0844) (0.0916) (0.0968) (0.0805) (0.0523) (0.0596)
0.2241 -0.3746 0.0258 14.4377 0.0001 0.3242 -0.1327 -0.2753 1.4710 0.2252consumer credit, fixed rate (0.0424) (0.0826) (0.0272) (0.0394) (0.0604) (0.0768)
0.3010 -0.2043 -0.0595 1.1495 0.2836 0.4262 -0.1858 -0.2444 0.1679 0.6820consumer credit, floating rate (0.0731) (0.0784) (0.0651) (0.0577) (0.0756) (0.0919)
30
Table 9.A. Estimation results for specification (10), the banks classified according to the share of classified loans in total loans (standard errors in parentheses).
The “worse” group The “better” group
Retail interest rate α β1 β2 Wald test β1 = β2
χ2-stat
Wald test p-value α β1 β2
Wald test β1 = β2
χ2-stat
Wald test p-value
1-month deposit 0.3654 -0.1760 -0.5487 5.5532 0.0184 0.2790 -0.3407 -0.1781 0.7427 0.3888 (0.0811) (0.0857) (0.1015) (0.0718) (0.1408) (0.0765) 3-month deposit 0.3565 -0.1364 -0.1502 0.0134 0.9077 0.4440 -0.3283 -0.2230 0.5690 0.4506 (0.0572) (0.0660) (0.0691) (0.0577) (0.1013) (0.0653) 6-month deposit 0.3604 -0.1726 -0.2111 0.1219 0.7270 0.4650 -0.1903 -0.2981 0.8508 0.3563 (0.0463) (0.0665) (0.0621) (0.0490) (0.0783) (0.0611) 12-month deposit 0.3672 -0.1765 -0.1862 0.0081 0.9281 0.4698 -0.2050 -0.3125 0.7452 0.3880 (0.0459) (0.0620) (0.0634) (0.0481) (0.0806) (0.0663) 24-month deposit 0.3670 -0.1990 -0.3392 2.7308 0.0984 0.4253 -0.1296 -0.3529 3.5500 0.0595 (0.0358) (0.0596) (0.0447) (0.0416) (0.0758) (0.0641)
0.5038 -0.1272 -0.3222 1.4176 0.2338 0.6007 -0.0253 -0.2479 1.8880 0.16941-year loan for firms (0.0647) (0.0779) (0.1015) (0.0776) (0.0646) (0.1062)
0.5047 -0.1496 -0.2385 0.3375 0.5613 0.5722 0.0134 -0.2812 3.0099 0.08282-year loan for firms (0.0740) (0.0744) (0.0933) (0.0662) (0.0616) (0.1138)
0.5018 -0.1536 -0.2163 0.1708 0.6794 0.5931 -0.0377 -0.1864 1.3926 0.23803-year loan for firms (0.0748) (0.0746) (0.0920) (0.0772) (0.0525) (0.0822)
0.5032 -0.1486 -0.2317 0.2851 0.5934 0.5897 -0.0074 -0.2040 3.3863 0.06575-year loan for firms (0.0741) (0.0754) (0.0954) (0.0748) (0.0485) (0.0666)
0.5140 -0.1567 -0.2423 0.2914 0.5893 0.5969 0.0015 -0.1958 3.2133 0.0730>5-year loan for firms (0.0749) (0.0783) (0.0965) (0.0784) (0.0510) (0.0677)
0.3436 -0.1684 -0.1289 0.1809 0.6706 0.2806 -0.2758 -0.2126 0.2211 0.6382consumer credit, fixed rate (0.0457) (0.0577) (0.0522) (0.0435) (0.0821) (0.0694)
0.4107 -0.1695 -0.2352 0.2222 0.6374 0.3610 -0.1996 -0.1164 0.4139 0.5200consumer credit, floating rate (0.0589) (0.0729) (0.0852) (0.0658) (0.0785) (0.0624)
31
Appendix B. Results for the 5-year Treasury bond yield as the reference market rate. Table 1.B. Estimation results for specification (7), the banks classified according to the average profitability (ROA) (standard errors in parentheses).
The “worse” group The “better” group
Retail interest rate γ̂ α β mean
adjustment lag
γ̂ α β mean
adjustment lag
1-month deposit 1.1134 0.1774 -0.1985 4.1449 1.0628 0.2380 -0.3285 2.3200
(0.0616) (0.0383) (0.1263) (0.0794)
3-month deposit 1.2197 0.1495 -0.1980 4.2959 1.2439 0.2311 -0.1103 6.9680
(0.0539) (0.0333) (0.0770) (0.0278)
6-month deposit 1.2229 0.1708 -0.1931 4.2952 1.2406 0.3133 -0.1609 4.2671
(0.0505) (0.0308) (0.0605) (0.0282)
12-month deposit 1.2645 0.1684 -0.2040 4.0764 1.2741 0.3323 -0.1574 4.2410
(0.0534) (0.0305) (0.0596) (0.0271)
24-month deposit 1.2746 0.1935 -0.1986 4.0602 1.2366 0.2840 -0.2298 3.1161
(0.0603) (0.0287) (0.0582) (0.0312)
1-year loan for firms 1.2301 0.1544 -0.1595 5.3022 1.4892 0.2946 -0.1647 4.2831
(0.0764) (0.0260) (0.0697) (0.0285)
2-year loan for firms 1.2306 0.1417 -0.1469 5.8444 1.4980 0.3444 -0.1864 3.5181
(0.0718) (0.0239) (0.0678) (0.0340)
3-year loan for firms 1.2443 0.1235 -0.1411 6.2111 1.4713 0.3224 -0.1609 4.2107
(0.0726) (0.0231) (0.0748) (0.0303)
5-year loan for firms 1.2645 0.1027 -0.1318 6.8074 1.4729 0.3237 -0.1723 3.9251
(0.0736) (0.0219) (0.0741) (0.0305)
>5-year loan for firms 1.2708 0.0820 -0.1261 7.2809 1.4757 0.3268 -0.1821 3.6977
(0.0743) (0.0212) (0.0773) (0.0329)
consumer credit, fixed rate 0.7726 -0.1136 -0.2919 3.8146 1.0011 -0.0159 -0.2896 3.5076
(0.0765) (0.0422) (0.0499) (0.0332)
consumer credit, floating rate 0.7790 -0.2466 -0.2746 4.5403 0.9612 -0.0319 -0.2798 3.6886
(0.0606) (0.0368) (0.0692) (0.0388)
32
Table 2.B. Estimation results for specification (7), the banks classified according to the capital adequacy ratio (standard errors in parentheses).
The “worse” group The “better” group
Retail interest rate γ̂ α β mean
adjustment lag
γ̂ α β mean
adjustment lag
1-month deposit 1.1188 0.1581 -0.2626 3.2065 1.0793 0.2194 -0.1964 3.9735
(0.0869) (0.0529) (0.0827) (0.0464)
3-month deposit 1.2396 0.2524 -0.2078 3.5981 1.2235 0.1461 -0.1328 6.4299
(0.0656) (0.0407) (0.0612) (0.0269)
6-month deposit 1.2570 0.3148 -0.1869 3.6669 1.2090 0.1728 -0.1724 4.7982
(0.0582) (0.0325) (0.0551) (0.0276)
12-month deposit 1.2934 0.3304 -0.1914 3.4990 1.2480 0.1846 -0.1754 4.6488
(0.0588) (0.0343) (0.0567) (0.0260)
24-month deposit 1.2908 0.2998 -0.1718 4.0745 1.2212 0.1826 -0.2438 3.3528
(0.0658) (0.0330) (0.0574) (0.0285)
1-year loan for firms 1.3985 0.3378 -0.2406 2.7524 1.2959 0.1470 -0.1138 7.4927
(0.0776) (0.0390) (0.0629) (0.0195)
2-year loan for firms 1.3993 0.3201 -0.2197 3.0953 1.3030 0.1585 -0.1146 7.3405
(0.0646) (0.0356) (0.0707) (0.0205)
3-year loan for firms 1.3927 0.2899 -0.1943 3.6545 1.2999 0.1594 -0.1125 7.4685
(0.0729) (0.0330) (0.0712) (0.0205)
5-year loan for firms 1.4419 0.2728 -0.1822 3.9916 1.2943 0.1568 -0.1142 7.3849
(0.0710) (0.0296) (0.0713) (0.0206)
>5-year loan for firms 1.4529 0.2511 -0.1628 4.5997 1.2917 0.1485 -0.1219 6.9842
(0.0726) (0.0290) (0.0741) (0.0217)
consumer credit, fixed rate 1.0132 0.0858 -0.2762 3.3098 0.8496 -0.1640 -0.3063 3.7996
(0.0576) (0.0390) (0.0536) (0.0320)
consumer credit, floating rate 0.8253 -0.1193 -0.2011 5.5650 0.9060 -0.1764 -0.3474 3.3863
(0.0510) (0.0313) (0.0683) (0.0420)
33
Table 3.B. Estimation results for specification (7), the banks classified according to the share of classified loans in total loans (standard errors in parentheses).
The “worse” group The “better” group
Retail interest rate γ̂ α β mean
adjustment lag
γ̂ α β mean
adjustment lag
1-month deposit 1.0727 0.2511 -0.2331 3.2135 1.1333 0.1081 -0.2249 3.9650
(0.0745) (0.0430) (0.1004) (0.0654)
3-month deposit 1.2263 0.2179 -0.1264 6.1874 1.2181 0.1407 -0.2302 3.7332
(0.0603) (0.0255) (0.0628) (0.0408)
6-month deposit 1.2131 0.2391 -0.1646 4.6234 1.2365 0.2135 -0.2064 3.8096
(0.0539) (0.0268) (0.0559) (0.0329)
12-month deposit 1.2556 0.2434 -0.1681 4.5011 1.2696 0.2363 -0.2147 3.5569
(0.0549) (0.0255) (0.0579) (0.0329)
24-month deposit 1.2428 0.2394 -0.2380 3.1953 1.2505 0.2022 -0.1913 4.1704
(0.0555) (0.0286) (0.0597) (0.0309)
1-year loan for firms 1.5306 0.2098 -0.1562 5.0579 1.1731 0.1913 -0.1713 4.7219
(0.0661) (0.0253) (0.0748) (0.0258)
2-year loan for firms 1.5447 0.2204 -0.1568 4.9718 1.1635 0.1910 -0.1648 4.9097
(0.0697) (0.0252) (0.0641) (0.0263)
3-year loan for firms 1.5412 0.2177 -0.1525 5.1305 1.1567 0.1673 -0.1511 5.5089
(0.0703) (0.0254) (0.0737) (0.0233)
5-year loan for firms 1.5355 0.2152 -0.1543 5.0849 1.1700 0.1433 -0.1368 6.2617
(0.0703) (0.0256) (0.0734) (0.0211)
>5-year loan for firms 1.5411 0.2055 -0.1629 4.8786 1.1560 0.1267 -0.1271 6.8727
(0.0727) (0.0266) (0.0751) (0.0211)
consumer credit, fixed rate 0.8534 -0.1612 -0.2935 3.9567 0.9876 -0.0010 -0.3020 3.3148
(0.0501) (0.0325) (0.0590) (0.0350)
consumer credit, floating rate 0.9150 -0.1338 -0.2992 3.7900 0.8584 -0.1641 -0.2618 4.4459
(0.0740) (0.0392) (0.0539) (0.0341)
34
Table 4.B. Estimation results for specification (8), the banks classified according to the average profitability (ROA) (standard errors in parentheses).
The “worse” group The “better” group Retail interest rate α β δ α β δ
1-month deposit 0.1943 -0.2391 0.0417 0.2374 -0.3484 0.0199 (0.0612) (0.0445) (0.0100) (0.1330) (0.0863) (0.0216) 3-month deposit 0.1653 -0.2582 0.0619 0.2232 -0.1275 0.0172 (0.0531) (0.0421) (0.0104) (0.0778) (0.0369) (0.0152) 6-month deposit 0.1866 -0.2525 0.0615 0.3244 -0.2152 0.0537 (0.0497) (0.0389) (0.0098) (0.0598) (0.0376) (0.0131) 12-month deposit 0.1823 -0.2719 0.0693 0.3437 -0.2172 0.0591 (0.0522) (0.0396) (0.0110) (0.0587) (0.0372) (0.0134) 24-month deposit 0.2096 -0.2665 0.0704 0.3004 -0.3095 0.0792 (0.0598) (0.0375) (0.0109) (0.0568) (0.0399) (0.0125) 1-year loan for firms 0.1820 -0.2293 0.0674 0.3115 -0.2658 0.1014 (0.0759) (0.0373) (0.0135) (0.0687) (0.0433) (0.0168) 2-year loan for firms 0.1625 -0.2083 0.0595 0.3602 -0.2990 0.1127 (0.0716) (0.0346) (0.0129) (0.0680) (0.0497) (0.0186) 3-year loan for firms 0.1447 -0.2026 0.0594 0.3389 -0.2574 0.0958 (0.0725) (0.0337) (0.0128) (0.0742) (0.0456) (0.0176) 5-year loan for firms 0.1333 -0.2018 0.0680 0.3415 -0.2760 0.1033 (0.0733) (0.0328) (0.0129) (0.0734) (0.0462) (0.0181) >5-year loan for firms 0.1119 -0.1937 0.0661 0.3432 -0.2888 0.1064 (0.0740) (0.0318) (0.0127) (0.0773) (0.0492) (0.0185) consumer credit, fixed rate -0.0464 -0.3049 0.0186 -0.0016 -0.3021 0.0143 (0.0837) (0.0450) (0.0314) (0.0534) (0.0364) (0.0175) consumer credit, floating rate -0.1904 -0.2637 -0.0024 -0.0337 -0.2699 -0.0129 (0.0667) (0.0383) (0.0221) (0.0747) (0.0414) (0.0264)
35
Table 5.B. Estimation results for specification (8), the banks classified according to the capital adequacy ratio (standard errors in parentheses).
The “worse” group The “better” group Retail interest rate α β δ α β δ
1-month deposit 0.1698 -0.3060 0.0438 0.2312 -0.2254 0.0299 (0.0893) (0.0619) (0.0140) (0.0829) (0.0526) (0.0145) 3-month deposit 0.2563 -0.2609 0.0536 0.1555 -0.1753 0.0425 (0.0657) (0.0521) (0.0135) (0.0612) (0.0346) (0.0124) 6-month deposit 0.3272 -0.2489 0.0636 0.1870 -0.2265 0.0541 (0.0578) (0.0424) (0.0119) (0.0536) (0.0352) (0.0112) 12-month deposit 0.3417 -0.2610 0.0707 0.1989 -0.2360 0.0606 (0.0583) (0.0461) (0.0136) (0.0549) (0.0342) (0.0117) 24-month deposit 0.3108 -0.2339 0.0632 0.2056 -0.3228 0.0811 (0.0655) (0.0437) (0.0126) (0.0559) (0.0357) (0.0114) 1-year loan for firms 0.3511 -0.3533 0.1141 0.1791 -0.1873 0.0693 (0.0767) (0.0557) (0.0187) (0.0618) (0.0307) (0.0129) 2-year loan for firms 0.3271 -0.3202 0.1012 0.1895 -0.1857 0.0678 (0.0650) (0.0492) (0.0163) (0.0702) (0.0317) (0.0133) 3-year loan for firms 0.3012 -0.2868 0.0922 0.1890 -0.1807 0.0652 (0.0725) (0.0480) (0.0170) (0.0708) (0.0316) (0.0132) 5-year loan for firms 0.2933 -0.2877 0.1058 0.1863 -0.1822 0.0650 (0.0702) (0.0447) (0.0172) (0.0709) (0.0317) (0.0132) >5-year loan for firms 0.2710 -0.2607 0.0978 0.1768 -0.1902 0.0656 (0.0722) (0.0439) (0.0167) (0.0742) (0.0330) (0.0137) consumer credit, fixed rate 0.1116 -0.3017 0.0266 -0.1114 -0.3146 0.0115 (0.0615) (0.0406) (0.0245) (0.0570) (0.0335) (0.0178) consumer credit, floating rate -0.0987 -0.2042 0.0012 -0.1526 -0.3355 -0.0088 (0.0656) (0.0339) (0.0230) (0.0712) (0.0443) (0.0241)
36
Table 6.B. Estimation results for specification (8), the banks classified according to the share of classified loans in total loans (standard errors in parentheses).
The “worse” group The “better” group Retail interest rate α β δ α β δ
1-month deposit 0.2647 -0.2637 0.0330 0.1164 -0.2629 0.0390 (0.0770) (0.0496) (0.0144) (0.1001) (0.0743) (0.0142) 3-month deposit 0.2259 -0.1655 0.0392 0.1481 -0.2885 0.0590 (0.0606) (0.0331) (0.0124) (0.0631) (0.0518) (0.0131) 6-month deposit 0.2529 -0.2162 0.0516 0.2283 -0.2723 0.0681 (0.0526) (0.0345) (0.0112) (0.0558) (0.0425) (0.0116) 12-month deposit 0.2578 -0.2275 0.0594 0.2507 -0.2892 0.0757 (0.0532) (0.0337) (0.0118) (0.0573) (0.0435) (0.0126) 24-month deposit 0.2636 -0.3182 0.0839 0.2160 -0.2554 0.0647 (0.0544) (0.0361) (0.0118) (0.0593) (0.0403) (0.0116) 1-year loan for firms 0.2336 -0.2638 0.1082 0.2167 -0.2326 0.0576 (0.0661) (0.0403) (0.0165) (0.0740) (0.0355) (0.0126) 2-year loan for firms 0.2463 -0.2707 0.1138 0.2065 -0.2115 0.0448 (0.0700) (0.0408) (0.0171) (0.0648) (0.0321) (0.0115) 3-year loan for firms 0.2422 -0.2621 0.1095 0.1835 -0.1948 0.0418 (0.0706) (0.0411) (0.0172) (0.0734) (0.0313) (0.0116) 5-year loan for firms 0.2396 -0.2638 0.1094 0.1687 -0.1891 0.0505 (0.0706) (0.0412) (0.0172) (0.0728) (0.0292) (0.0123) >5-year loan for firms 0.2289 -0.2769 0.1141 0.1514 -0.1747 0.0462 (0.0733) (0.0428) (0.0179) (0.0749) (0.0285) (0.0115) consumer credit, fixed rate -0.1130 -0.3065 0.0162 0.0397 -0.3345 0.0367 (0.0503) (0.0335) (0.0163) (0.0677) (0.0379) (0.0232) consumer credit, floating rate -0.0980 -0.3066 0.0110 -0.1415 -0.2550 -0.0075 (0.0748) (0.0447) (0.0254) (0.0661) (0.0353) (0.0215)
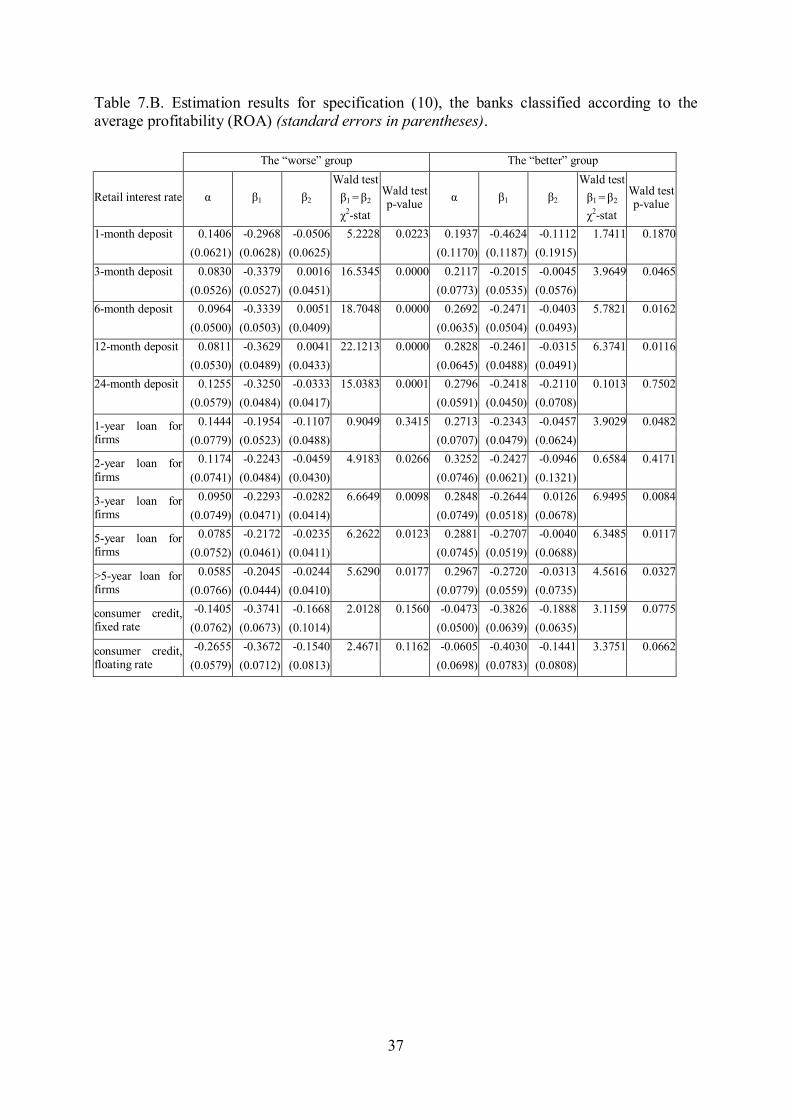
37
Table 7.B. Estimation results for specification (10), the banks classified according to the average profitability (ROA) (standard errors in parentheses).
The “worse” group The “better” group
Retail interest rate α β1 β2 Wald test β1 = β2
χ2-stat
Wald test p-value α β1 β2
Wald test β1 = β2
χ2-stat
Wald test p-value
1-month deposit 0.1406 -0.2968 -0.0506 5.2228 0.0223 0.1937 -0.4624 -0.1112 1.7411 0.1870 (0.0621) (0.0628) (0.0625) (0.1170) (0.1187) (0.1915) 3-month deposit 0.0830 -0.3379 0.0016 16.5345 0.0000 0.2117 -0.2015 -0.0045 3.9649 0.0465 (0.0526) (0.0527) (0.0451) (0.0773) (0.0535) (0.0576) 6-month deposit 0.0964 -0.3339 0.0051 18.7048 0.0000 0.2692 -0.2471 -0.0403 5.7821 0.0162 (0.0500) (0.0503) (0.0409) (0.0635) (0.0504) (0.0493) 12-month deposit 0.0811 -0.3629 0.0041 22.1213 0.0000 0.2828 -0.2461 -0.0315 6.3741 0.0116 (0.0530) (0.0489) (0.0433) (0.0645) (0.0488) (0.0491) 24-month deposit 0.1255 -0.3250 -0.0333 15.0383 0.0001 0.2796 -0.2418 -0.2110 0.1013 0.7502 (0.0579) (0.0484) (0.0417) (0.0591) (0.0450) (0.0708)
0.1444 -0.1954 -0.1107 0.9049 0.3415 0.2713 -0.2343 -0.0457 3.9029 0.04821-year loan for firms (0.0779) (0.0523) (0.0488) (0.0707) (0.0479) (0.0624)
0.1174 -0.2243 -0.0459 4.9183 0.0266 0.3252 -0.2427 -0.0946 0.6584 0.41712-year loan for firms (0.0741) (0.0484) (0.0430) (0.0746) (0.0621) (0.1321)
0.0950 -0.2293 -0.0282 6.6649 0.0098 0.2848 -0.2644 0.0126 6.9495 0.00843-year loan for firms (0.0749) (0.0471) (0.0414) (0.0749) (0.0518) (0.0678)
0.0785 -0.2172 -0.0235 6.2622 0.0123 0.2881 -0.2707 -0.0040 6.3485 0.01175-year loan for firms (0.0752) (0.0461) (0.0411) (0.0745) (0.0519) (0.0688)
0.0585 -0.2045 -0.0244 5.6290 0.0177 0.2967 -0.2720 -0.0313 4.5616 0.0327>5-year loan for firms (0.0766) (0.0444) (0.0410) (0.0779) (0.0559) (0.0735)
-0.1405 -0.3741 -0.1668 2.0128 0.1560 -0.0473 -0.3826 -0.1888 3.1159 0.0775consumer credit, fixed rate (0.0762) (0.0673) (0.1014) (0.0500) (0.0639) (0.0635)
-0.2655 -0.3672 -0.1540 2.4671 0.1162 -0.0605 -0.4030 -0.1441 3.3751 0.0662consumer credit, floating rate (0.0579) (0.0712) (0.0813) (0.0698) (0.0783) (0.0808)
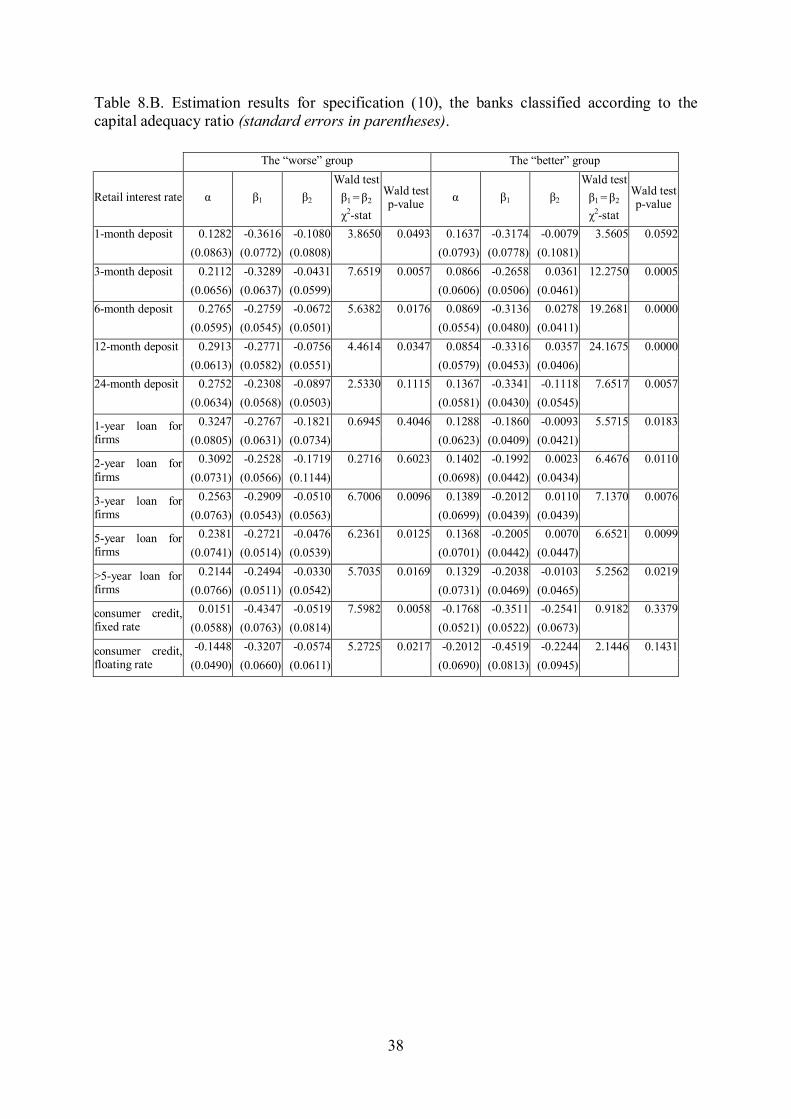
38
Table 8.B. Estimation results for specification (10), the banks classified according to the capital adequacy ratio (standard errors in parentheses).
The “worse” group The “better” group
Retail interest rate α β1 β2 Wald test β1 = β2
χ2-stat
Wald test p-value α β1 β2
Wald test β1 = β2
χ2-stat
Wald test p-value
1-month deposit 0.1282 -0.3616 -0.1080 3.8650 0.0493 0.1637 -0.3174 -0.0079 3.5605 0.0592 (0.0863) (0.0772) (0.0808) (0.0793) (0.0778) (0.1081) 3-month deposit 0.2112 -0.3289 -0.0431 7.6519 0.0057 0.0866 -0.2658 0.0361 12.2750 0.0005 (0.0656) (0.0637) (0.0599) (0.0606) (0.0506) (0.0461) 6-month deposit 0.2765 -0.2759 -0.0672 5.6382 0.0176 0.0869 -0.3136 0.0278 19.2681 0.0000 (0.0595) (0.0545) (0.0501) (0.0554) (0.0480) (0.0411) 12-month deposit 0.2913 -0.2771 -0.0756 4.4614 0.0347 0.0854 -0.3316 0.0357 24.1675 0.0000 (0.0613) (0.0582) (0.0551) (0.0579) (0.0453) (0.0406) 24-month deposit 0.2752 -0.2308 -0.0897 2.5330 0.1115 0.1367 -0.3341 -0.1118 7.6517 0.0057 (0.0634) (0.0568) (0.0503) (0.0581) (0.0430) (0.0545)
0.3247 -0.2767 -0.1821 0.6945 0.4046 0.1288 -0.1860 -0.0093 5.5715 0.01831-year loan for firms (0.0805) (0.0631) (0.0734) (0.0623) (0.0409) (0.0421)
0.3092 -0.2528 -0.1719 0.2716 0.6023 0.1402 -0.1992 0.0023 6.4676 0.01102-year loan for firms (0.0731) (0.0566) (0.1144) (0.0698) (0.0442) (0.0434)
0.2563 -0.2909 -0.0510 6.7006 0.0096 0.1389 -0.2012 0.0110 7.1370 0.00763-year loan for firms (0.0763) (0.0543) (0.0563) (0.0699) (0.0439) (0.0439)
0.2381 -0.2721 -0.0476 6.2361 0.0125 0.1368 -0.2005 0.0070 6.6521 0.00995-year loan for firms (0.0741) (0.0514) (0.0539) (0.0701) (0.0442) (0.0447)
0.2144 -0.2494 -0.0330 5.7035 0.0169 0.1329 -0.2038 -0.0103 5.2562 0.0219>5-year loan for firms (0.0766) (0.0511) (0.0542) (0.0731) (0.0469) (0.0465)
0.0151 -0.4347 -0.0519 7.5982 0.0058 -0.1768 -0.3511 -0.2541 0.9182 0.3379consumer credit, fixed rate (0.0588) (0.0763) (0.0814) (0.0521) (0.0522) (0.0673)
-0.1448 -0.3207 -0.0574 5.2725 0.0217 -0.2012 -0.4519 -0.2244 2.1446 0.1431consumer credit, floating rate (0.0490) (0.0660) (0.0611) (0.0690) (0.0813) (0.0945)
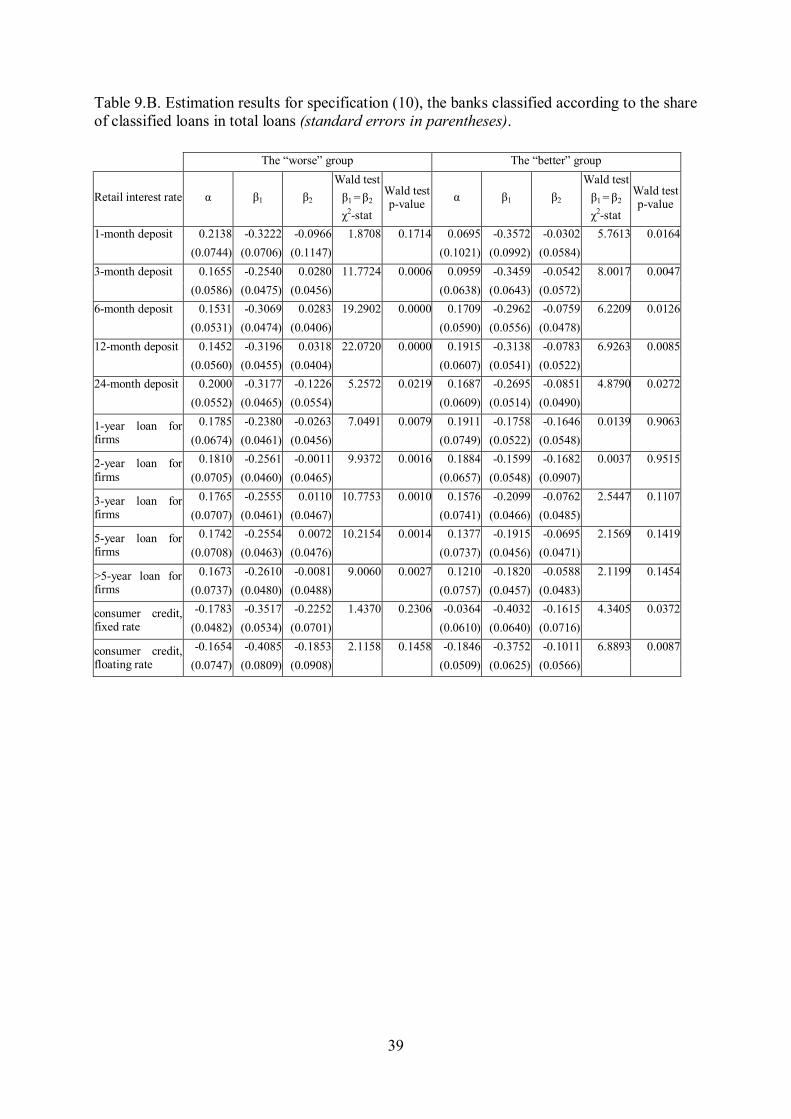
39
Table 9.B. Estimation results for specification (10), the banks classified according to the share of classified loans in total loans (standard errors in parentheses).
The “worse” group The “better” group
Retail interest rate α β1 β2 Wald test β1 = β2
χ2-stat
Wald test p-value α β1 β2
Wald test β1 = β2
χ2-stat
Wald test p-value
1-month deposit 0.2138 -0.3222 -0.0966 1.8708 0.1714 0.0695 -0.3572 -0.0302 5.7613 0.0164 (0.0744) (0.0706) (0.1147) (0.1021) (0.0992) (0.0584) 3-month deposit 0.1655 -0.2540 0.0280 11.7724 0.0006 0.0959 -0.3459 -0.0542 8.0017 0.0047 (0.0586) (0.0475) (0.0456) (0.0638) (0.0643) (0.0572) 6-month deposit 0.1531 -0.3069 0.0283 19.2902 0.0000 0.1709 -0.2962 -0.0759 6.2209 0.0126 (0.0531) (0.0474) (0.0406) (0.0590) (0.0556) (0.0478) 12-month deposit 0.1452 -0.3196 0.0318 22.0720 0.0000 0.1915 -0.3138 -0.0783 6.9263 0.0085 (0.0560) (0.0455) (0.0404) (0.0607) (0.0541) (0.0522) 24-month deposit 0.2000 -0.3177 -0.1226 5.2572 0.0219 0.1687 -0.2695 -0.0851 4.8790 0.0272 (0.0552) (0.0465) (0.0554) (0.0609) (0.0514) (0.0490)
0.1785 -0.2380 -0.0263 7.0491 0.0079 0.1911 -0.1758 -0.1646 0.0139 0.90631-year loan for firms (0.0674) (0.0461) (0.0456) (0.0749) (0.0522) (0.0548)
0.1810 -0.2561 -0.0011 9.9372 0.0016 0.1884 -0.1599 -0.1682 0.0037 0.95152-year loan for firms (0.0705) (0.0460) (0.0465) (0.0657) (0.0548) (0.0907)
0.1765 -0.2555 0.0110 10.7753 0.0010 0.1576 -0.2099 -0.0762 2.5447 0.11073-year loan for firms (0.0707) (0.0461) (0.0467) (0.0741) (0.0466) (0.0485)
0.1742 -0.2554 0.0072 10.2154 0.0014 0.1377 -0.1915 -0.0695 2.1569 0.14195-year loan for firms (0.0708) (0.0463) (0.0476) (0.0737) (0.0456) (0.0471)
0.1673 -0.2610 -0.0081 9.0060 0.0027 0.1210 -0.1820 -0.0588 2.1199 0.1454>5-year loan for firms (0.0737) (0.0480) (0.0488) (0.0757) (0.0457) (0.0483)
-0.1783 -0.3517 -0.2252 1.4370 0.2306 -0.0364 -0.4032 -0.1615 4.3405 0.0372consumer credit, fixed rate (0.0482) (0.0534) (0.0701) (0.0610) (0.0640) (0.0716)
-0.1654 -0.4085 -0.1853 2.1158 0.1458 -0.1846 -0.3752 -0.1011 6.8893 0.0087consumer credit, floating rate (0.0747) (0.0809) (0.0908) (0.0509) (0.0625) (0.0566)
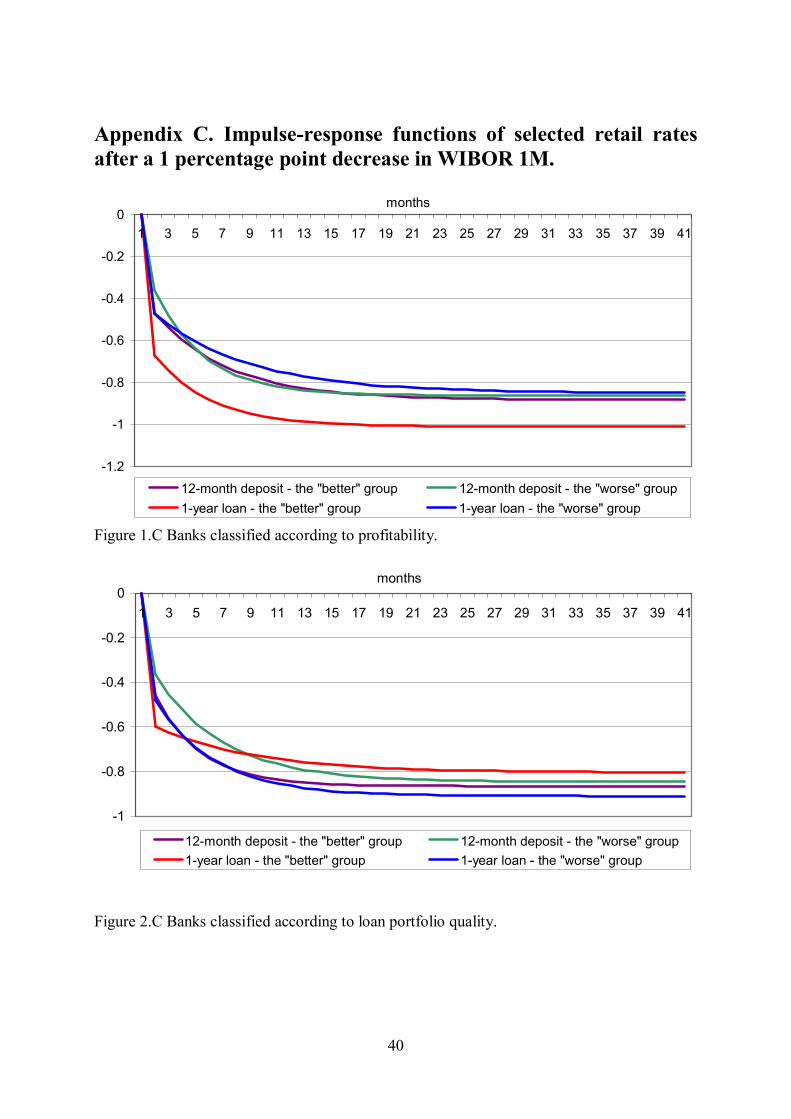
40
Appendix C. Impulse-response functions of selected retail rates after a 1 percentage point decrease in WIBOR 1M.
Figure 1.C Banks classified according to profitability.
Figure 2.C Banks classified according to loan portfolio quality.
-1.2
-1
-0.8
-0.6
-0.4
-0.2
01 3 5 7 9 11 13 15 17 19 21 23 25 27 29 31 33 35 37 39 41
months
12-month deposit - the "better" group 12-month deposit - the "worse" group1-year loan - the "better" group 1-year loan - the "worse" group
-1
-0.8
-0.6
-0.4
-0.2
01 3 5 7 9 11 13 15 17 19 21 23 25 27 29 31 33 35 37 39 41
months
12-month deposit - the "better" group 12-month deposit - the "worse" group1-year loan - the "better" group 1-year loan - the "worse" group
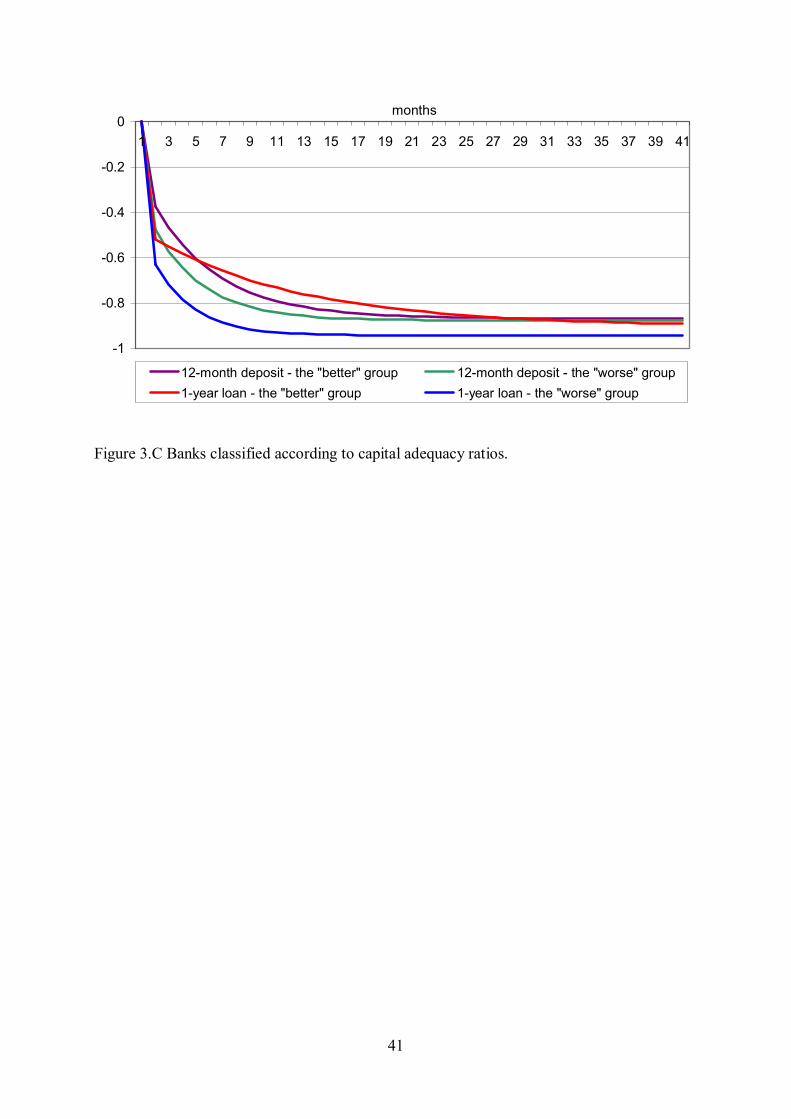
41
Figure 3.C Banks classified according to capital adequacy ratios.
-1
-0.8
-0.6
-0.4
-0.2
01 3 5 7 9 11 13 15 17 19 21 23 25 27 29 31 33 35 37 39 41
months
12-month deposit - the "better" group 12-month deposit - the "worse" group1-year loan - the "better" group 1-year loan - the "worse" group