Embed Size (px)
Citation preview
- 1 -
Chromosomal inversion polymorphism leads to extensive genetic structure: a
multilocus survey in Drosophila subobscura
Authors: Agustí Munté1, Julio Rozas, Montserrat Aguadé and Carmen Segarra.
Departament de Genètica, Facultat de Biologia, Universitat de Barcelona, 08028
Barcelona, Spain.
1 Present address: Parc Científic de Barcelona. Josep Samitier 1-5, 08028
Barcelona, Spain.
Sequence data from this article have been deposited with the EMBL/GenBank
Data Libraries under accession numbers AJ849711-AJ849884.
Genetics: Published Articles Ahead of Print, published on January 31, 2005 as 10.1534/genetics.104.032748

- 2 -
Running Head:
Nucleotide polymorphism in the O chromosome of D. subobscura.
Key words:
Drosophila subobscura, inversion polymorphism, nucleotide variation,
genetic differentiation, linkage disequilibrium, natural selection.
Corresponding Author:
Author: Carmen Segarra
Departament de Genètica, Facultat de Biologia, Universitat de Barcelona,
Diagonal 645, 08028 Barcelona, Spain.
Telephone Number: 34-93-4021493
Fax Number: 34-93-4110969
E-mail address: [email protected]

- 3 -
ABSTRACT
The adaptive character of inversion polymorphism in Drosophila subobscura is
well established. The OST and O3+4 chromosomal arrangements of this species
differ by two overlapping inversions that arose independently on O3
chromosomes. Nucleotide variation in eight gene regions distributed along
inversion O3 was analyzed in 14 OST and 14 O3+4 lines. Levels of variation within
arrangement were quite similar along the inversion. In addition, we detected i)
extensive genetic differentiation between arrangements in all regions, regardless
of their distance to the inversion breakpoints; ii) strong association between
nucleotide variants and chromosomal arrangements; and iii) high levels of linkage
disequilibrium in intralocus and also in interlocus comparisons, extending over
distances as high as ~ 4 Mb. These results are not consistent with the higher
genetic exchange between chromosomal arrangements expected in the central part
of an inversion from double crossover events. Hence, double crossovers were not
produced or, alternatively, recombinant chromosomes were eliminated by natural
selection to maintain coadapted gene complexes. If the strong genetic
differentiation detected along O3 extends to other inversions, nucleotide variation

- 4 -
would be highly structured not only in D. subobscura, but also in the genome of
other species with a rich chromosomal polymorphism.

- 5 -
INTRODUCTION
Chromosomal inversion polymorphism is a common feature of the genome
in the Drosophila genus. About 60% of Drosophila species are polymorphic for
paracentric inversions in natural populations (POWELL 1997). The geographic
distribution of inversions in many species and the seasonal change in frequency
detected in some species strongly support that chromosomal polymorphism is
adaptive (DOBZHANSKY 1970; KRIMBAS 1992; LEVITAN 1992; and others).
Moreover, the reduced recombination in inversion heterokaryotypes
(STURTEVANT 1926) led to propose that inversions could maintain complexes of
coadapted linked genes favored by natural selection under particular conditions.
Overdominance, frequency dependent selection or variable selection in time or
space can contribute to the adaptive character of chromosomal polymorphism (see
KRIMBAS and POWELL 1992; POWELL 1997).
For an advantageous inversion, the action of directional selection would
rapidly drive the new arrangement to its equilibrium frequency. As a result of this
rapid increase, all regions included in the new arrangement would be completely
depleted of variation even when the inversion had reached a relatively high
frequency. Indeed, inverted chromosomes would initially be monomorphic for the
particular haplotype captured by the inversion, which would include not only
members of the coadapted gene complex but also neutral variants. The
establishment of an inversion can thus be envisaged as a partial hitchhiking or
selective sweep (MAYNARD SMITH and HAIGH 1974) that would lead to an initial
- 6 -
genetic differentiation of inverted and noninverted chromosomes. Moreover, new
mutations arising independently in the different arrangements would contribute to
their further differentiation. Genetic exchange between chromosomal
arrangements, either by gene conversion or double crossover, could however
erode any genetic differentiation. Most importantly, it could breakdown the
coadapted gene complexes putatively underlying the selective advantage of
inversions.
In the absence of selection, genetic differentiation would decay according
to the rate of genetic exchange between arrangements. The gene conversion rate
would be uniformly distributed along the inversion loop, whereas the contribution
of double crossovers to genetic exchange would be considerably higher in the
central part of the inversion loop (NAVARRO et al. 1997). Under this scenario (i.e.,
in which genetic exchange increases with physical distance to inversion
breakpoints), genetic differentiation between arrangements would be weaker in
the central part of the loop than near the breakpoints (NAVARRO et al. 2000). In
contrast, if selection were maintaining coadapted gene complexes, it would
counteract the homogenizing effect of genetic exchange on members of the
complex. The differential action of selection would cause different levels of
genetic differentiation along the inversion, but no relationship would be expected
between level of differentiation and physical distance to breakpoints. Analysis of
nucleotide variation along an inversion can thus inform us about the role played
by natural selection in the establishment and maintenance of chromosomal
polymorphism.

- 7 -
The O3+4/OST system of D. subobscura presents several distinctive features
that make it especially suitable to detect the action of selection on chromosomal
polymorphism through the study of nucleotide variation. First, the O3+4 and OST
chromosomal arrangements differ by two overlapping inversions (inversions 3
and 4) that arose independently on the ancestral O3 arrangement (RAMOS-ONSINS
et al. 1998), which is now extinct in D. subobscura (Figure 1). This independent
origin (which could be regarded as sampling a single O3 chromosome twice)
would result in an initial lack of nucleotide variation within arrangement, and in
the initial presence of fixed differences between arrangements. Second, the
existence of parallel latitudinal clines for these arrangements, both in Europe
(KRIMBAS 1992) and in the recently colonized areas of North and South America,
would support their adaptive character (PREVOSTI et al. 1988). Third, the O3+4-O3-
OST complex would conform to the Wallace rule of triads for partially overlapping
inversions (WALLACE 1953, KRIMBAS 1992). According to this rule, elimination
of the central member of a chromosomal triad would contribute to more
efficiently maintain longer coadapted gene complexes, since genetic exchange
would be greatly reduced between the two external arrangements. Fourth, there is
evidence of strong genetic differentiation between OST and O3+4 at loci near the
distal breakpoint of inversion O3 (ROZAS and AGUADÉ 1993, 1994; NAVARRO-
SABATÉ et al. 1999). And fifth, the rather old age of OST and O3+4 (ROZAS and
AGUADÉ 1994) suggests that recombination may have eroded the initial
association between nucleotide variants and chromosomal arrangements. These
features, and particularly the derived character of both arrangements and their age,

- 8 -
differentiate the OST/O3+4 inversion system from others where variation at multiple
regions has been surveyed (HASSON and EANES 1996; LAAYOUNI et al. 2003;
MOUSSET et al. 2003; SCHAEFFER et al. 2003).
Here, we have analyzed the level and pattern of nucleotide variation in
eight gene regions in a sample of O3+4 and OST chromosomes collected from a
single natural population. These regions differ in their physical distance to the O3
inversion breakpoints, and completely cover this inversion. Our results show that
genetic differentiation between OST and O3+4 chromosomes is strong and extends
homogeneously all over the inversion. Therefore, genetic exchange between
arrangements has been strongly suppressed even in the central part of the
inversion loop. The strong differentiation detected might be explained either by
the absence of double crossovers in the O3 inversion loop or by the elimination of
double crossover products by natural selection. The maintenance of the O3+4 and
OST arrangements in natural populations of D. subobscura would have caused
genetic variation at loci associated with these arrangements to be strongly
structured.

- 9 -
MATERIALS AND METHODS
Isolation of genomic regions: Recombinant phages were isolated from the
IPP246 genomic library of D. subobscura and amplified following standard
procedures (SAMBROOK et al. 1989). Phage DNA was purified with the QIAGEN
Lambda Mini Kit following manufacturer’s instructions. DNA was labeled with 16-
bio-dUTP and in situ hybridized on polytene chromosomes of D. subobscura
according to SEGARRA and AGUADÉ (1992). A homokaryotypic O3+4 strain (ch cu)
and an isochromosomal OST line were used for this purpose. Probes were mapped on
the D. subobscura cytological map (KUNZE-MÜHL and MÜLLER 1958).
Phage DNA was digested with suitable restriction enzymes to release the arms,
cloned into pBluescript SK+ and subsequently used to transform XL1-Blue
Escherichia coli competent cells (Stratagene). Insert sizes of recombinant plasmids
were screened by PCR (KILGER and SCHMID 1994). DNA from plasmids with
differing insert sizes was purified and both ends of each insert were sequenced.
Inserts were completely sequenced by primer walking only in those cases where
partial sequences showed high similarity to known or predicted genes of the 3R
chromosomal arm of D. melanogaster (which is homologous to the D. subobscura O
chromosome).
Fly samples: Twenty-eight isochromosomal lines for the O chromosome
established from a natural population of D. subobscura (ROZAS and AGUADÉ 1994;

- 10 -
NAVARRO-SABATÉ et al. 1999) were used in this study: 14 OST and 14 O3+4 lines. A
highly inbred Drosophila madeirensis line was also used for interspecific
comparisons.
DNA sequencing: Genomic DNA from frozen flies was extracted using the
DNA tissue kit (QIAGEN) following manufacturer’s instructions, and the selected
regions were subsequently PCR-amplified using 21-mer primers. PCR conditions and
amplification primers for the six newly reported regions are available in Figure S1,
which is published as Supplementary Material on the Genetics web site. Sequencing
reactions were carried out with the ABI Prism® BigDyeTM Terminators 3.0 Cycle
Sequencing Kit (Applied Biosystems). Partial sequences were assembled with the
SeqEd 1.03 program (HAGEMANN and KWAN 1997). Complete sequences were
multiply aligned with the Clustal W program (THOMSON et al. 1994) and further
edited with the BioEdit 5.0.2 program (HALL 1999).
Data Analysis: Analyses were based on the DNA sequences from the six
newly reported regions and on the sequences from the Acph-1 (NAVARRO-SABATÉ et
al. 1999; EMBL accession nos. AJ389424-AJ389476 and Y18840) and rp49 (ROZAS
and AGUADÉ 1994; RAMOS-ONSINS et al. 1998; accession nos. X80076-X80109 and
Y09708) gene regions of D. subobscura and D. madeirensis. Analyses were
performed for each region separately, and for a single concatenated data set
- 11 -
comprising those gene regions sequenced in the same 28 lines (i.e., the six newly
studied regions and Acph-1).
Standard parameters of nucleotide polymorphism were estimated: the number
of segregating sites in the sample (S), the minimum number of mutations (η),
nucleotide diversity (π; NEI 1987) and θ (heterozygosity per site; WATTERSON 1975).
The nucleotide divergence per silent site (Ksil) was estimated according to NEI and
GOJOBORI (1986). The level of genetic differentiation between arrangements was
estimated as DXY (NEI 1987) and FST (HUDSON et al. 1992a) and its significance
established using the Ks* test statistic (HUDSON et al. 1992b). Gene conversion tracts
were detected following BETRÁN et al. (1997). The probability that the observed
number of polymorphisms shared between arrangements were due to recurrent
mutation was estimated from the hypergeometric distribution as described in ROZAS
and AGUADÉ (1994). The recombination length of the O3 inversion was obtained
considering a total length of 228.3 cM for the O chromosome of D. subobscura
(LOUKAS et al. 1979). The physical distance between regions (or between a region
and the nearest breakpoint) was estimated assuming that the euchromatic portion of
the D. subobscura genome has 120 Mb (ADAMS et al. 2000) that are homogeneously
distributed.
Linkage disequilibrium (LD) between pairs of parsimony informative sites (and
association between informative sites and chromosomal arrangement) was estimated
by the r2 statistic (HILL and ROBERTSON 1968), and its statistical significance

- 12 -
assessed by the χ2 test with Bonferroni’s correction for multiple comparisons (WEIR
1996). The overall level of LD was measured as ZnS (KELLY 1997) for parsimony
informative sites (ZnSi).
Neutrality tests (TAJIMA 1989, FU and LI 1993, HUDSON et al. 1987) were
performed separately for the OST and O3+4 samples. Multilocus tests could also be
performed within chromosomal arrangement given that recombination between
regions was high and, therefore, these regions have independent evolutionary
histories. Statistical significance for all tests was assessed by coalescent simulations
(10,000 independent replicates) conditioned on S under the conservative assumption
of no intragenic recombination. D. madeirensis was used as the outgroup in those
tests that required interspecific data. The DnaSP program 4.0 (ROZAS et al. 2003) was
used to perform most of the analyses, and the HKA program (HEY 2004) for the
multilocus tests.
Gene genealogies were reconstructed by the neighbor-joining method (SAITOU
and NEI 1987) as implemented in the MEGA 2.1 program (KUMAR et al. 2001).
Genetic distances were obtained according to JUKES and CANTOR (1969). Bootstrap
values were obtained after 1,000 replicates.

- 13 -
RESULTS
Isolation of gene regions: A total of 200 recombinant phages randomly
isolated from a D. subobscura genomic library were used for in situ hybridization on
polytene chromosomes of this species. Thirty-four of the approximately 100 phages
that gave a unique signal mapped on the O chromosome. Six of the 11 recombinant
phages that hybridized in or around the O3 inversion (S25, P22, P154, P2, S1 and
P21) exhibited sequence similarity to genes on the 3R chromosomal arm of D.
melanogaster (see Table S1, which is published as Supplementary Material on the
Genetics web site, for some relevant information about these regions). The location of
the six isolated regions, plus that of rp49 and Acph-1, along the O chromosome of D.
subobscura is shown in Figure 1.
Nucleotide polymorphism and genetic differentiation between
arrangements: The multiple alignment of the 6 newly reported gene regions in the
28 lines of D. subobscura consisted in 11,542 sites after excluding sites with
alignment gaps. A total of 600 nucleotide polymorphic sites (293 singletons), which
correspond to at least 612 mutations, were detected: 173 in coding regions (52
nonsynonymous and 121 synonymous) and 439 in noncoding regions (see Figure S2,
which is published as Supplementary Material on the Genetics web site). A summary
of nucleotide variation in each region is shown in Table S2, which is published as

- 14 -
Supplementary Material on the Genetics web site. Some indel polymorphisms were
also detected, mainly in noncoding regions.
Estimates of genetic differentiation between the OST and O3+4 arrangements
were quite similar for the different regions (Table 1). Genetic differentiation was
strong in each region as well as in the concatenated data set. Despite the significant
genetic differentiation, all regions presented shared polymorphisms that only in three
cases (P154, P2 and P21) could be explained by recurrent mutation. Genetic
exchange between arrangements would therefore be necessary to explain the
observed number of shared polymorphisms detected in Acph-1, rp49, S25, P22 and
S1. Indeed, genetic exchange could have contributed to the shared polymorphisms in
all regions, since gene conversion tracts were identified in all but two regions (S1 and
P21). No relationship (Figure 2a) was detected between the level of genetic
differentiation and the distance to the nearest breakpoint (Kendall’s τ = 0.143, P =
0.310; Spearman’s ρ = 0.167, P = 0.347).
Nucleotide variation estimates (Table 2) were obtained separately for each
chromosomal arrangement given the strong genetic differentiation detected.
Estimates of nucleotide diversity (πtotal and πsil) were higher in O3+4 than in OST for all
regions but P154, where they were similar in both arrangements. No relationship was
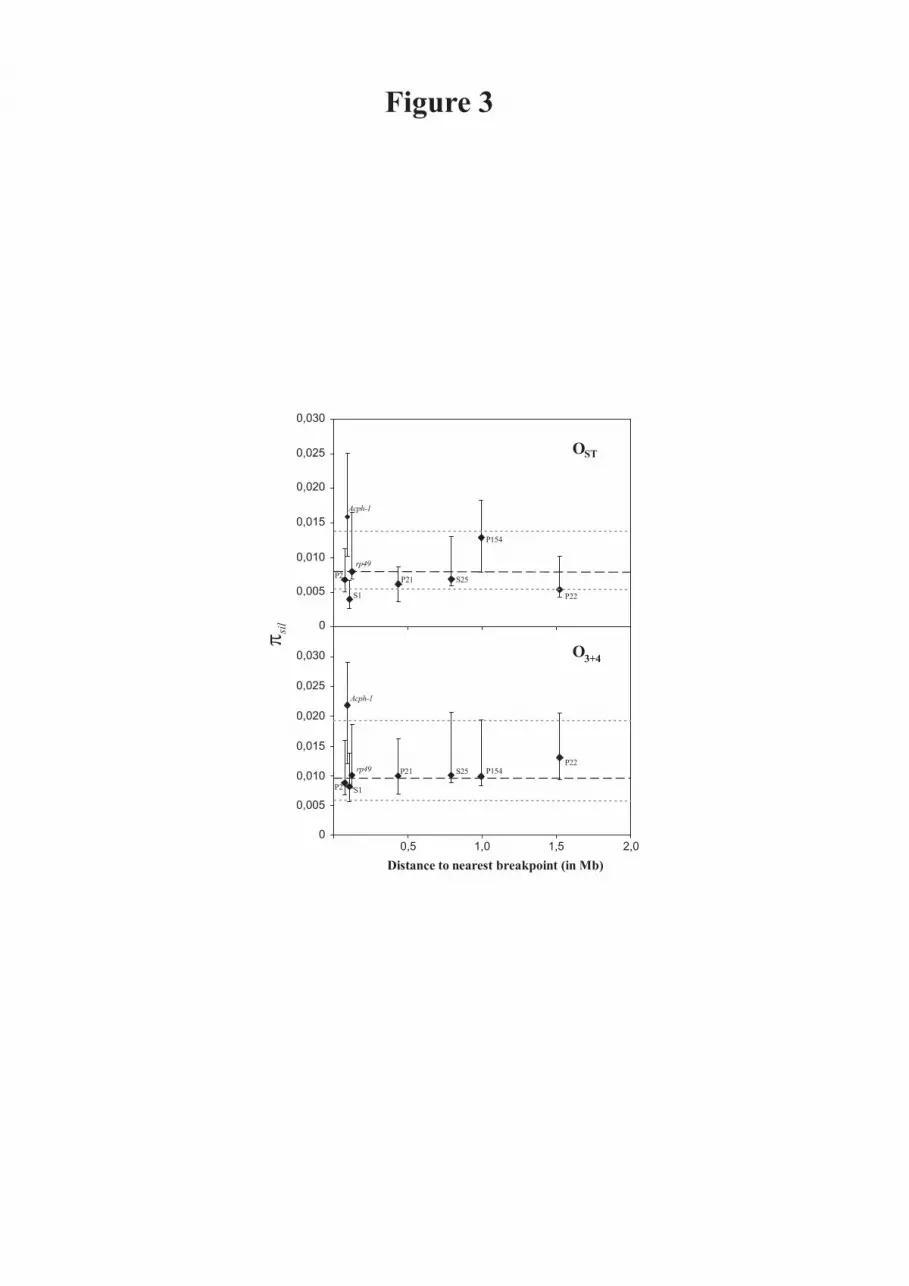
detected, either in O3+4 or OST, between levels of silent nucleotide diversity within
chromosomal arrangement and physical distance to the nearest inversion breakpoint
(Figure 3). Regions close to breakpoints did not show any reduction in nucleotide

- 15 -
diversity. In fact, Acph-1 shows the highest πsil value, both in OST and O3+4, despite
its tight linkage to the proximal breakpoint of the O3 inversion. However, Acph-1 also
showed the highest Ksil estimates suggesting that this gene has a high neutral mutation
rate. The direct relationship expected under the neutral model between levels of silent
polymorphism and divergence (Table 2) was contrasted by the HKA test (HUDSON et
al. 1987) using D. madeirensis as the outgroup. None of the tests performed between
pairs of gene regions yielded a significant result either in OST or O3+4. A similar result
was obtained in the multilocus test performed within arrangement (for OST, X2 = 1.87,
7 d.f., P = 0.96; for O3+4, X2 = 0.84, 7 d.f., P = 0.99). Therefore, there is no
significant heterogeneity in the ratio of polymorphism to divergence among the
different regions.
Linkage disequilibrium analysis: Association between chromosomal
arrangements (OST and O3+4) and the variants present at informative polymorphic
sites was analyzed (see Figure S3, which is published as Supplementary Material on
the Genetics web site). Two hundred twenty-eight of the 385 informative sites in the
concatenated data set (59.15 %) showed a significant association (P < 0.05) with
chromosomal arrangements. The association remained significant after Bonferroni
correction in 34 sites (8.8 %), which correspond to fixed differences between
arrangements. A similar result was obtained for 48 informative sites in the rp49 data
set (43.7 % and 20.8% of significant associations prior and after Bonferroni
correction, respectively). No relationship was detected between the level of the

- 16 -
association in each region (measured as the average r2 value) and distance to the
nearest breakpoint (Figure 2b).
The detected associations between variants at nucleotide sites and chromosomal
arrangement should result in linkage disequilibrium between polymorphic nucleotide
sites themselves. LD in the concatenated data set was analyzed first including all
sequences (total sample) and then separately for O3+4 and OST. In the concatenated
total data set with 385 informative sites, 28.8 % of the pairwise comparisons showed
significant LD (P < 0.05) (Table 3). This percentage dropped to approximately 5%
when each chromosomal arrangement was analyzed separately. Global estimates of
LD, measured as ZnSi, were also higher in the total sample than within chromosomal
arrangement: 0.1330 in the total sample, 0.0839 in OST and 0.0845 in O3+4.
Recombination in homokaryotypes would explain the lower percentage of significant
LD within arrangement.
Pairwise comparisons were further classified as intralocus and interlocus. The
percentage of significant pairwise associations in the total sample was similar for
intralocus (29.5 %) than for interlocus (28.7 %) comparisons, indicating that LD in
the O3 inversion extends over a long range. The presence of both arrangements
contributes, therefore, to increase the level of intralocus LD and the extent of
interlocus disequilibrium. On the other hand, the level of LD was relatively reduced
in both the intralocus and the interlocus analyses within arrangement (Table 3). This
result can be explained again by recombination in homokaryotypes.

- 17 -
Global estimates of interlocus LD were also obtained for all pairwise
comparisons between regions and compared with those for intralocus LD. As shown
in Figure 4, ZnSi estimates in OST and in O3+4 were higher for intralocus than for
interlocus comparisons. In contrast, in the total sample, the intralocus and interlocus
ZnSi estimates were much more similar. Indeed, all interlocus estimates were within
the range established by the intralocus estimates. Moreover, no relationship between
interlocus ZnSi estimates and distance between pairs of regions was detected.
Pattern of polymorphism: Several statistical tests (TAJIMA 1989; FU and LI
1993) were performed to assess whether the pattern of variation within arrangement
conforms to expectations of the neutral equilibrium model of molecular evolution
(see Table S3, which is published as Supplementary Material on the Genetics web
site). For individual regions, all test statistics were negative in OST, and also in 7 of
the 8 regions in O3+4. This trend toward negative values was further analyzed using
the multilocus test based on the mean value of Tajima’s D statistic ( D ). Both for OST
and O3+4, the empirical D value averaged across the 8 regions studied was
significantly lower (two-tailed test) than the average D-value obtained from the
simulations: D (O3+4) = -0.8666, P = 0.004; D (OST) = -0.8349, P = 0.018. A similar
result was obtained for the multilocus test based on Fu and Li’s D statistic (not
shown). Therefore, an overall significant excess of low frequency variants, mainly
singletons, was detected in both arrangements.

- 18 -
Gene genealogy: Figure 5 shows the gene genealogy reconstructed from total
variation in the concatenated total data set. Sequenced lines clearly cluster according
to chromosomal arrangement, which is consistent with the strong genetic
differentiation detected between arrangements. This clustering was supported by very
high bootstrap percentages (100 % for the OST and the O3+4 clusters), and was also
detected when each region was analyzed separately, except S25 (in this region, an
O3+4 line with a rather long gene conversion tract clustered with the OST lines). For
each cluster, the genealogy is characterized by relatively short internal and long
external branches, i.e., a star-like genealogy.

- 19 -
DISCUSSION
The establishment and maintenance of inversion polymorphism in natural
populations of Drosophila has been explained by a superior fitness of
heterokaryotypes (DOBZHANSKY 1970). The pattern of variation detected in the
present multilocus study is consistent with the action of natural selection in the
establishment of OST and O3+4. The general trend towards an excess of low
frequency variants in the derived arrangements OST and O3+4, the significant
multilocus neutrality tests, and the star-like genealogy within arrangement would
reflect the partial hitchhiking or selective sweep that drove these arrangements to
their equilibrium frequencies.
After the partial selective sweep associated with the establishment of a
new inversion, a strong depletion of variation is expected around the breakpoints
and also in very close-by regions (ANDOLFATTO et al. 2001). Indeed, new
variation in these regions can be introduced only by mutation, as gene conversion
would be suppressed due to mechanical problems in synapses. Although some of
the regions studied here are rather close to the breakpoints, none of them exhibits
a reduction in variation. Indeed, estimates of πsil in these regions are similar to,
although slightly lower than the value estimated for the Acp70A region of D.
subobscura (πsil = 0.016; CIRERA and AGUADÉ 1998), which is located in a
chromosomal region not affected by inversions. Moreover, the polymorphism to
divergence ratio is quite homogeneous among regions. These results, and the
detection of gene conversion tracts in most of the regions studied, indicate that
- 20 -
their distance to the nearest breakpoint is high enough for gene conversion having
contributed to the recovery of variation.
The multilocus analysis reported here clearly indicates that genetic
differentiation is strong, and extends all over the inversion. Indeed, LD is as
pervasive in interlocus as in intralocus comparisons, despite a 0.5–4 Mb range of
interlocus distances (Figure 4). There is no evidence for the higher genetic
exchange between arrangements expected in the central part of the inversion loop
in the presence of gene conversion and double crossover (NAVARRO et al. 1997).
The rather homogeneous distribution of genetic exchange detected across the
inversion would indicate, therefore, that no double crossovers were produced in
the inversion loop or, alternatively, that selection has acted against the
recombinant chromosomes.
The occurrence over evolutionary time of double crossovers inside an
inversion loop may be contingent on its length and age. Considering the empirical
values of interference in Drosophila, NAVARRO et al. (1977) suggested that double
crossover is unlikely only in short inversions (< 20 cM). The estimated length of
the O3 inversion (27.4 cM) would thus a priori support that double crossovers
could have contributed, at least partly, to the genetic exchange in this inversion. In
addition, the time elapsed since its origin (0.25-0.3 Mya; ROZAS and AGUADÉ
1994) is long enough for double crossovers to have broken the initial associations,
at least in the central part of the inversion loop. Double crossovers have not been
effective either in eroding the genetic differentiation in the central part of the ~65

- 21 -
cM long inversion that differentiates the O3+4 and O3+4+8 arrangements (ROZAS et
al. 1999; NAVARRO-SABATÉ et al. 2003).
Accepting the occurrence of double crossovers, selection acting against the
products of genetic exchange between chromosomal arrangements, and more
specifically against double crossover products, would be the most plausible
explanation for the strong genetic differentiation detected in the eight regions
studied. Indeed, epistatic fitness interactions between genes within the inversion
would result in the lower fitness of those between-arrangement recombinants that
affected the coadapted complex. Sets of coadapted linked genes would be more
likely broken by double crossover than by gene conversion, as the length of the
segments affected by gene conversion are much shorter (HILLIKER et al. 1994,
BETRAN et al. 1997). Consequently, selection would have acted mostly against
double crossover products.
The eight regions studied, which were chosen at random with the solely
restriction to cover the O3 inversion, exhibited a strong genetic differentiation. For
epistatic selection to explain this result, the regions need not be the targets of
selection themselves, but they should be tightly linked to genes of the coadapted
complex. Our observation would imply a rather high number of target genes, or
alternatively fewer genes with stronger effects. Indeed, the high level of interlocus
LD detected in the total sample of OST and O3+4 chromosomes (Figure 4) indicates
that the regions linked to each arrangement have followed independent
evolutionary histories. Therefore, the effects of coadapted complexes on
nucleotide variation and genetic differentiation would be large and, at least for the

- 22 -
O3 inversion, might affect the complete inverted fragment. In D. pseudoobscura,
the pattern of nucleotide variation detected in gene regions associated with the
third-chromosome arrangements also supports that epistatic selection is
maintaining chromosomal polymorphism (SCHAEFFER et al. 2003). However in
this species, unlike in D. subobscura, there was a general trend towards a
reduction of linkage disequilibrium with distance.
The strong genetic differentiation detected all along the O3 inversion is
remarkable regardless of whether it is a consequence of the lack of double
crossovers inside the inversion loop, or of the action of epistatic selection. The
presence of OST and O3+4 in natural populations would cause a strong structuring
of nucleotide variation that extends along more than the approximately 3.5 Mb of
the O3 inversion, since regions outside but close to breakpoints exhibit the same
pattern. D. subobscura harbors a very rich chromosomal polymorphism in all
chromosomes of the complement (except the dot-like element), and all individuals
in natural populations are likely heterozygous for chromosomal inversions. If the
results found in O3 held for other inversions, nucleotide variation in a major part
of the D. subobscura genome might indeed be highly structured. A similar
although less general pattern might be expected in other species where
chromosomal polymorphism is more restricted. Chromosomal polymorphism
would thus result in the presence of different gene pools with independent
evolutionary fates, which might have major evolutionary consequences.

- 23 -
ACKNOWLEDGMENTS
We thank Gema Blasco for technical support. We also thank Serveis
Científico-Tècnics, Universitat de Barcelona, for automated DNA sequencing
facilities. This work was supported by grants PB97-0918 and BMC2001-2906
from Comisión Interdepartamental de Ciencia y Tecnología, Spain, and grants
1999SGR-25 and 2001SGR-00101 from Comissió Interdepartamental de Recerca
i Innovació Tecnològica, Generalitat de Catalunya, Spain to M.A.
- 24 -
LITERATURE CITED
ADAMS, M. D., S. E. CELNIKER, R. A. HOLT, C. A. EVANS, J. D. GOCAYNE, et al., 2000
The genome sequence of Drosophila melanogaster. Science 287: 2185-2195.
ANDOLFATTO, P., F. DEPAULIS and A. NAVARRO, 2001 Inversion polymorphisms and
nucleotide variability in Drosophila. Genet. Res. 77: 1-8.
BETRÁN, E., J. ROZAS, A. NAVARRO and A. BARBADILLA, 1997 The estimation of the
number and the length distribution of gene conversion tracts from population DNA
sequence data. Genetics 146: 89-99.
CIRERA, S., and M. AGUADÉ, 1998 Molecular evolution of a duplication: the sex-
peptide (Acp70A) gene region of Drosophila subobscura and Drosophila madeirensis.
Mol. Biol. Evol. 15: 988-996.
DOBZHANSKY, TH., 1970 Genetics of the Evolutionary Process. Columbia University
Press, New York.
FU, Y.-X., and W.-H. LI, 1993 Statistical tests of neutrality of mutations. Genetics 133:
693-709.
HAGEMANN, T. L., and S. P. KWAN, 1997 SeqEd. Manipulation of sequence data and
chromatograms from the ABI DNA sequencer analysis files. Methods Mol. Biol. 70:
55-63.

- 25 -
HALL, T. A., 1999 BioEdit: a user-friendly biological sequence alignment editor and
analysis program for Windows 95/98/NT. Nucl. Acids. Symp. Ser. 41: 95-98.
HASSON, E., and W. F. EANES, 1996 Contrasting histories of three gene regions
associated with In(3L)Payne of Drosophila melanogaster. Genetics 144: 1565-1575.
HEY, J., 2004 http://lifesci.rutgers.edu/~heylab/HeylabSoftware.htm.
HILL, W. G., and A. ROBERTSON, 1968 Linkage disequilibrium in finite populations.
Theor. Appl. Genet. 38: 226-231.
HILLIKER, A. J., G. HARAUZ, A. G. REAUME, M. GRAY, S. H. CLARK et al., 1994 Meiotic
gene conversion tract length distribution within the rosy locus of Drosophila
melanogaster. Genetics 137: 1019-1026.
HUDSON, R. R., M. KREITMAN and M. AGUADÉ, 1987 A test of neutral molecular
evolution based on nucleotide data. Genetics 116: 153-159.
HUDSON, R. R., M. SLATKIN and W. P. MADDISON, 1992a Estimation of levels of gene
flow from DNA sequence data. Genetics 132: 583-589.
HUDSON, R. R., D. D. BOOS and N. L. KAPLAN, 1992b A statistical test for detecting
geographic subdivision. Mol. Biol. Evol. 9: 138-151.
JUKES, T.H. and C.R. CANTOR. 1969 Evolution of protein molecules, p. 21-120. In
Mammalian Protein Metabolism, edited by H.M. Munro (ed.). Academic Press, New
York.

- 26 -
KELLY, J. K., 1997 A test of neutrality based on interlocus associations. Genetics 146:
1197-1206.
KILGER, C., and K. SCHMID, 1994 Rapid characterization of bacterial clones by
microwave treatment and PCR. Trends Genet. 10: 149.
KRIMBAS, C. B. 1992 The inversion polymorphism of Drosophila subobscura, p. 127-
220. In Drosophila inversion polymorphism, edited by C. B. Krimbas and J. R. Powell
(ed.). CRC Press, Boca Raton.
KRIMBAS, C. B. and J. R. POWELL. 1992 The inversion polymorphism of Drosophila
subobscura, p. 1-52. In Drosophila inversion polymorphism, edited by C. B. Krimbas
and J. R. Powell (ed.). CRC Press, Boca Raton.
KUMAR, S., K. TAMURA, I. B. JAKOBSEN and M. NEI, 2001 MEGA2: molecular
evolutionary genetics analysis software. Bioinformatics. 17: 1244-1245.
KUNZE-MÜHL, E. and E. MÜLLER, 1958. Weitere Untersuchungen über die
chromosomale Struktur und natürlichen Strukturtypen von D. subobscura.
Chromosoma 9: 559-570.
LAAYOUNI, H., E. HASSON, M. SANTOS and A. FONTDEVILA, 2003 The evolutionary
history of Drosophila buzzatii. XXXV. Inversion polymorphism and nucleotide
variability in different regions of the second chromosome. Mol. Biol. Evol. 20: 931-
944.

- 27 -
LEVITAN, M., 1992 Chromosomal Variation in Drosophila robusta Sturtevant, p. 221-
338. In Drosophila inversion polymorphism, edited by C. B. Krimbas and J. R. Powell
(ed.). CRC Press, Boca Raton.
LOUKAS, M., C. B. KRIMBAS and Y. VERGINI, 1979 The genetics of Drosophila
subobscura populations. IX. Studies on linkage disequilibrium in four natural
populations. Genetics 93: 497-523.
MAYNARD SMITH, J., and J. HAIGH, 1974 The hitch-hiking effect of a favourable gene.
Genet. Res. 23: 23-35.
MOUSSET, S., L. BRAZIER, M. L. CARIOU, F. CHARTOIS, F. DEPAULIS et al., 2003
Evidence of a high rate of selective sweeps in African Drosophila melanogaster.
Genetics 163: 599-609.
NAVARRO-SABATÉ, A., M. AGUADÉ and C. SEGARRA, 1999 The Relationship Between
Allozyme and Chromosomal Polymorphism Inferred From Nucleotide Variation at the
Acph-1 Gene Region of Drosophila subobscura. Genetics 153: 871-889.
NAVARRO-SABATÉ, A., M. AGUADÉ and C. SEGARRA, 2003 Excess of Nonsynonymous
Polymorphism at Acph-1 in Different Gene Arrangements of Drosophila subobscura.
Mol. Biol. Evol. 20: 1833-1843.
NAVARRO, A., E. BETRÁN, A. BARBADILLA and A. RUIZ, 1997 Recombination and gene
flux caused by gene conversion and crossing over in inversion heterokaryotypes.
Genetics 146: 695-709.

- 28 -
NAVARRO, A., A. BARBADILLA and A. RUIZ, 2000 Effect of inversion polymorphism on
the neutral nucleotide variability of linked chromosomal regions in Drosophila.
Genetics 155: 685-698.
NEI, M., and T. GOJOBORI, 1986 Simple methods for estimating the numbers of
synonymous and nonsynonymous nucleotide substitutions. Mol. Biol. Evol. 3: 418-426.
NEI, M., 1987 Molecular Evolutionary Genetics. Columbia University Press, New
York.
POWELL, J. R., 1997 Progress and prospects in evolutionary biology: the Drosophila
model. Oxford University Press, Inc., New York.
PREVOSTI, A., G. RIBÓ, LL. SERRA, M. AGUADÉ, J. BALAÑÀ et al., 1988 Colonization of
America by Drosophila subobscura: experiment in natural populations suporting the
adaptative role of chromosomal-inversion polymorphism. Proc. Natl. Acad. Sci. USA
85: 5597-5600.
RAMOS-ONSINS, S., C. SEGARRA, J. ROZAS and M. AGUADÉ, 1998 Molecular and
chromosomal phylogeny in the obscura group of Drosophila inferred from sequences of
the rp49 gene region. Mol. Phylogenet. Evol. 9: 33-41.
ROZAS, J., and M. AGUADÉ, 1993 Transfer of genetic information in the rp49 region of
Drosophila subobscura between different chromosomal gene arrangements. Proc. Natl.
Acad. Sci. USA 90: 8083-8087.

- 29 -
ROZAS, J., and M. AGUADÉ, 1994 Gene conversion is involved in the transfer of genetic
information between naturally occurring inversions of Drosophila. Proc. Natl. Acad.
Sci. USA 91: 11517-11521.
ROZAS, J., J. C. SANCHEZ-DELBARRIO, X. MESSEGUER and R. ROZAS, 2003 DnaSP,
DNA polymorphism analyses by the coalescent and other methods. Bioinformatics. 19:
2496-2497.
ROZAS, J., C. SEGARRA, G. RIBÓ and M. AGUADÉ, 1999 Molecular population genetics
of the rp49 gene region in different chromosomal inversions of Drosophila subobscura.
Genetics 151: 189-202.
SAITOU, N., and M. NEI, 1987 The neighbor-joining method: a new method for
reconstructiong phylogenetic trees. Mol. Biol. Evol. 4: 406-425.
SAMBROOK, J., E. F. FRITSCH, and T. MANIATIS, 1989 Molecular cloning: A laboratory
manual. Cold Spring Harbor Laboratory, Cold Spring Harbor, N.Y.
SCHAEFFER, S. W., M. P. GOETTING-MINESKY, M. KOVACEVIC, J. R. PEOPLES, J. L.
GRAYBILL, et al., 2003 Evolutionary genomics of inversions in Drosophila
pseudoobscura: evidence for epistasis. Proc. Natl. Acad. Sci. USA 100: 8319-8324.
SEGARRA, C., and M. AGUADÉ, 1992 Molecular organization of the X chromosome in
different species of the obscura group of Drosophila. Genetics 130: 513-521.

- 30 -
STURTEVANT, A. H., 1926 A crossover reducer in Drosophila melanogaster due to
inversion of a section of the third chromosome. Biol. Zentralbl. 46: 697-702.
TAJIMA, F., 1989 Statistical method for testing the neutral mutation hypothesis by DNA
polymorphism. Genetics 123: 585-595.
THOMPSON, J. D., D. G. HIGGINS and T. J. GIBSON, 1994 CLUSTAL W: improving the
sensitivity of progressive multiple sequence alignment through sequence weighting,
position-specific gap penalties and weight matrix choice. Nucleic. Acids. Res. 22:
4673-4680.
WALLACE, B., 1953 On coadaptation in Drosophila. Am. Nat. 87: 343-358.
WATTERSON, G. A., 1975 On the number of segregating sites in genetical models
without recombination. Theor. Popul. Biol. 7 : 256-276.
WEIR, B. S., 1996 Genetic Data Analysis II . Sinauer Associates, Inc. Sunderland,
- 31 -
FIGURE LEGENDS
Figure 1
Location of the eight gene regions in different chromosomal arrangements of the D.
subobscura O chromosome. Their distribution along the ancestral O3 arrangement is
shown above. The effect of the O3 (in light grey) and O4 (in dark grey) inversions on the
location of the regions studied is also shown.
Figure 2
a) Genetic differentiation between chromosomal arrangements in gene regions
distributed along the O3 inversion. The distance between each region and the nearest O3
inversion breakpoint was estimated assuming a homogeneous DNA distribution along
the O3 inversion (3.5 Mb).
b) Association between chromosomal arrangement and variants at informative
polymorphic sites in each gene region plotted vs. distance to the nearest breakpoint. In
all regions, except rp49, association was estimated for the same 28 lines (concatenated
data set).
Figure 3
Silent nucleotide diversity (πsil) in the OST (top) and O3+4 (bottom) arrangements in each
of the eight gene regions analyzed plotted vs. distance to the nearest breakpoint of the
O3 inversion. πsil estimates (diamonds) for each region and their 95% confidence
intervals (vertical lines) are presented. Dashed and dotted horizontal lines show πsil
estimates within arrangement in the concatenated data set, and the 95 % confidence
interval. Distance to the nearest breakpoint was inferred as in Figure 2.

- 32 -
Figure 4
Interlocus LD (open circles) in each chromosomal arrangement and in the total sample
plotted vs. interlocus distance. Intralocus LD (black circles) is also shown. Pairwise
distances between regions are different in OST and O3+4 since these arrangements differ
by two inversions (Figure 1); in the total sample, distances between regions were
estimated as the average of the distances in OST and O3+4.
Figure 5
Neighbor-joining gene genealogy based on total nucleotide variation in the
concatenated data set (see Material & Methods). Bootstrap values higher than 95 % are
shown. Open and black diamonds refer to OST and O3+4 D. subobscura lines,
respectively. D. mad refers to the D. madeirensis line used as outgroup.

TA
BL
E 1
Acph-1
rp49
S25
P22
P154
P2S1
P21
Con
cate
nate
d da
taa
Shar
ed19
1222
64
26
362
Fixe
d3
20
910
35
434
SX1
7334
3632
3950
1227
269
SX2
7244
7364
5269
2856
414
DXY
0.01
910.
0145
0.01
430.
0170
0.01
570.
0157
0.01
380.
0106
0.01
53FST
0.43
0.50
0.44
0.52
0.66
0.54
0.59
0.51
0.52
KS*
3.15
***
2.39
***
2.78
***
2.59
***
2.51
***
2.7*
**1.
92**
*2.
49**
*4.
60**
*
Gen
etic
diff
eren
tiatio
n an
d ge
ne fl
ow b
etw
een
the
OST
and
O3+
4 chr
omos
omal
arr
ange
men
ts
Shar
ed,p
olym
orph
icsi
tes
segr
egat
ing
for
the
sam
etw
ova
riant
sin
both
arra
ngem
ents
;Fix
ed,f
ixed
diff
eren
ces
betw
een
arra
ngem
ents
;SX1
,site
spo
lym
orph
icin
OST
and
mon
omor
phic
inO
3+4;SX2
,site
spo
lym
orph
icin
O3+
4an
dm
onom
orph
icin
OST
;DXY
,ave
rage
num
bero
fnuc
leot
ide
diff
eren
ces
pers
itebe
twee
nar
rang
emen
ts;K
S*
,gen
etic
diff
eren
tiatio
nte
stst
atis
tic(s
eeM
ater
ials
and
Met
hods
);FST
,pro
porti
onof
nucl
eotid
edi
vers
ityat
tribu
tabl
eto
varia
tion
betw
een
arra
ngem
ents
.***
,P<
0.00
1.a
Ana
lysi
spe
rfor
med
in th
e co
ncat
enat
ed d
ata
set t
hat i
nclu
des a
ll si
x ne
wly
repo
rted
regi
ons a
nd o
nly
28 o
ut o
f the
41 Acph-1
sequ
ence
s (se
e M
ater
ials
and
Met
hods
).
TABLE 2
OST O3+4 OST O3+4 OST O3+4 OST O3+4 OST O3+4 OST O3+4 OST O3+4 OST O3+4
n 21 20 16 18 14 14 14 14 14 14 14 14 14 14 14 14
S 92 91 45 54 58 93 38 70 43 56 50 70 17 34 30 58
π total 0.010 0.012 0.006 0.008 0.006 0.010 0.005 0.011 0.005 0.005 0.006 0.008 0.004 0.007 0.004 0.006
π sil 0.016 0.022 0.008 0.010 0.007 0.010 0.005 0.013 0.013 0.010 0.007 0.009 0.004 0.008 0.006 0.010
θsil 0.018 0.021 0.012 0.014 0.009 0.015 0.007 0.015 0.013 0.014 0.009 0.012 0.005 0.010 0.006 0.012
K sil 0.043 0.046 0.013 0.018 0.016 0.018 0.020 0.027 0.034 0.035 0.023 0.028 0.018 0.022 0.023 0.026
n, sample size or number of sequences; S , number of polymorphic sites; πtotal , nucleotide diversity in all sites; πsil , nucleotide diversity in silent sites; θsil , heterozygosity per silent site based on segregating
sites; K sil , divergence per silent site between D. subobscura and D. madeirensis .
Estimates of nucleotide polymorphism and divergence within chromosomal arrangement
Acph-1 rp49 S25 P22 P154 P2 S1 P21
TABLE 3
Total Intralocus Interlocus
Both arrangements (n=28) 28.8 % 29.5 % 28.7 %
OST 5 % 10.8 % 3.9 %
O3+4 5.3 % 11.1 % 3.6 %
Linkage disequilibrium in the concatenated data seta
a Linkage disequilibrium measured as the percentage of significant (P < 0.05)
pairwise comparisons by the χ2 test.

O3O3O3 inversionO3 inversion
O4 inversionO4 inversion
TelomereCentromere
O3+4O3+4
P2 S1P21
rp49S25
P22P154Acph-1
OSTOST
S1P21rp49
S25P22
P154P2
Acph-1
S1P21
rp49S25
P22P154
P2Acph-1
Figure 1

Figure 2
Distance to nearest breakpoint (in Mb)
Aver
age
r2
FST
0.5 1.0 1.5 2.0
0,0
0,1
0,2
0,3
0,4
0,5
0,6
Acph-1
rp49
P2
S1
P21
S25
P154
P22
a)
Acph-1
rp49
P21
S25
P154
P22
S1
P2
0.0
0.2
0.4
0.6
b)
O3+4
Distance to nearest breakpoint (in Mb)
�si
l
OST
Acph-1
S1
P2P21 S25
P154
P22
Acph-1
S1P2
P21 S25 P154
P22
0
0,005
0,5 1,0 1,5 2,0
0,010
0,015
0,020
0,025
0,030
0
0,005
0,010
0,015
0,020
0,025
0,030
rp49
rp49
Figure 3

OST
O3+4
Zn
Si
Total sample
Distance (in Mb)
0
0.05
0.10
0.15
0.20
0.25
0
0.05
0.10
0.15
0.20
1.0 2.0 3.0 4.0 5.0 6.0 7.0
0
0.05
0.10
0.15
0.20
Figure 4

D. mad
98
100
100
0.002
Figure 5


