Embed Size (px)
Citation preview

MATE Design Archive User and Administration GuideRelease 6.1 February 2015
Cisco Systems, Inc. www.cisco.com
Cisco has more than 200 offices worldwide. Addresses, phone numbers, and fax numbers are listed on the Cisco website at www.cisco.com/go/offices.
Text Part Number:

THE SPECIFICATIONS AND INFORMATION REGARDING THE PRODUCTS IN THIS MANUAL ARE SUBJECT TO CHANGE WITHOUT NOTICE. ALL STATEMENTS, INFORMATION, AND RECOMMENDATIONS IN THIS MANUAL ARE BELIEVED TO BE ACCURATE BUT ARE PRESENTED WITHOUT WARRANTY OF ANY KIND, EXPRESS OR IMPLIED. USERS MUST TAKE FULL RESPONSIBILITY FOR THEIR APPLICATION OF ANY PRODUCTS.
THE SOFTWARE LICENSE AND LIMITED WARRANTY FOR THE ACCOMPANYING PRODUCT ARE SET FORTH IN THE INFORMATION PACKET THAT SHIPPED WITH THE PRODUCT AND ARE INCORPORATED HEREIN BY THIS REFERENCE. IF YOU ARE UNABLE TO LOCATE THE SOFTWARE LICENSE OR LIMITED WARRANTY, CONTACT YOUR CISCO REPRESENTATIVE FOR A COPY.
The Cisco implementation of TCP header compression is an adaptation of a program developed by the University of California, Berkeley (UCB) as part of UCB’s public domain version of the UNIX operating system. All rights reserved. Copyright © 1981, Regents of the University of California.
NOTWITHSTANDING ANY OTHER WARRANTY HEREIN, ALL DOCUMENT FILES AND SOFTWARE OF THESE SUPPLIERS ARE PROVIDED “AS IS” WITH ALL FAULTS. CISCO AND THE ABOVE-NAMED SUPPLIERS DISCLAIM ALL WARRANTIES, EXPRESSED OR IMPLIED, INCLUDING, WITHOUT LIMITATION, THOSE OF MERCHANTABILITY, FITNESS FOR A PARTICULAR PURPOSE AND NONINFRINGEMENT OR ARISING FROM A COURSE OF DEALING, USAGE, OR TRADE PRACTICE.
IN NO EVENT SHALL CISCO OR ITS SUPPLIERS BE LIABLE FOR ANY INDIRECT, SPECIAL, CONSEQUENTIAL, OR INCIDENTAL DAMAGES, INCLUDING, WITHOUT LIMITATION, LOST PROFITS OR LOSS OR DAMAGE TO DATA ARISING OUT OF THE USE OR INABILITY TO USE THIS MANUAL, EVEN IF CISCO OR ITS SUPPLIERS HAVE BEEN ADVISED OF THE POSSIBILITY OF SUCH DAMAGES.
Cisco and the Cisco logo are trademarks or registered trademarks of Cisco and/or its affiliates in the U.S. and other countries. To view a list of Cisco trademarks, go to this URL: www.cisco.com/go/trademarks. Third-party trademarks mentioned are the property of their respective owners. The use of the word partner does not imply a partnership relationship between Cisco and any other company. (1110R)
Any Internet Protocol (IP) addresses and phone numbers used in this document are not intended to be actual addresses and phone numbers. Any examples, command display output, network topology diagrams, and other figures included in the document are shown for illustrative purposes only. Any use of actual IP addresses or phone numbers in illustrative content is unintentional and coincidental.
© 2015 Cisco Systems, Inc. All rights reserved.
C O N T E N T S
Overview 1-1
Related Topics 1-1
Using MATE Design Archive 2-1
Reading the Home Page 2-1
View Weathermaps 2-2
Weathermap Objects 2-2
Change Weathermap Parameters 2-3
Set Plot Options 2-5
View Time-Sequence Plots 2-5
Navigation 2-6
Navigate Time Scales 2-7
Navigate to Specific Dates and Times 2-7
Manage Settings 2-8
Managing the MATE Design Archive Application 3-1
Customize the Home Page 3-1
Visually Group Archives 3-1
Add Custom Content 3-2
Customize Weathermaps 3-3
Set Plot Options for All Users 3-3
Add Popup Windows 3-3
Customize Visual Format Files 3-5
Panels 3-5
Plot Data 3-6
Customize Summary Files 3-7
Customize the Summary Format 3-8
Related Topics 3-9
MATE GUI and Remote MATE Design Archive 4-1
Upload Templates from MATE Design Archive UI 4-2
Related Topics 4-2
iMATE Design Archive User and Administration Guide

Contents
iiMATE Design Archive User and Administration Guide
C H A P T E R 1
OverviewThe MATE Design Archive application is a collection of tools that enable you to capture, store, and display network changes over time in a standard web browser. The application works on information gathered in multiple network snapshots and stored in a repository called an archive, and is often used for the following common tasks.
• Visualize changes in topology and traffic patterns over time, from a remote location using a web browser. For instance, you might want to view the maximum interface utilization over an interval, such as a day or week. Another frequent use is to view the total network traffic for many traffic levels for every hour for the last 24 hours. Based on your requests, MATE retrieves summary information from an archive in real-time and formats it for viewing in a browser.
• Status or events displayed in the web browser might require more detailed investigation. Because the application saves the original plan with the summary, you can drill down to a time of interest to view the full network plan.
Related Topics • WAE Platform Configuration Guide
• System Administration Guide
• MATE GUI Visualization Guide
• Table Schema and CLI Reference
1-1MATE Design Archive User and Administration Guide

Chapter 1 Overview Related Topics
1-2MATE Design Archive User and Administration Guide
C H A P T E R 2
Using MATE Design ArchiveThis chapter, which is organized as follows, assumes that the MATE Design Archive application has been set up and is already running and available via a web browser.
• View Weathermaps
• View Time-Sequence Plots
• Navigation
• Manage Settings
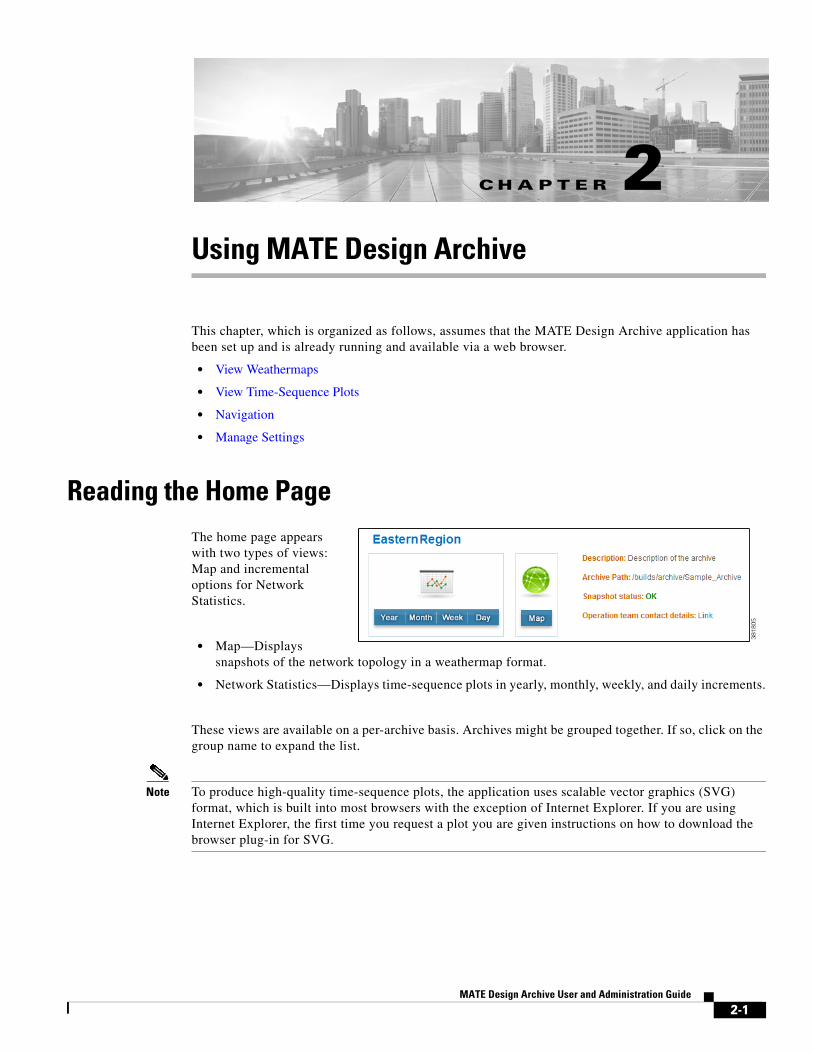
Reading the Home PageThe home page appears with two types of views: Map and incremental options for Network Statistics.
• Map—Displays snapshots of the network topology in a weathermap format.
• Network Statistics—Displays time-sequence plots in yearly, monthly, weekly, and daily increments.
These views are available on a per-archive basis. Archives might be grouped together. If so, click on the group name to expand the list.
Note To produce high-quality time-sequence plots, the application uses scalable vector graphics (SVG) format, which is built into most browsers with the exception of Internet Explorer. If you are using Internet Explorer, the first time you request a plot you are given instructions on how to download the browser plug-in for SVG.
2-1MATE Design Archive User and Administration Guide
Chapter 2 Using MATE Design Archive View Weathermaps
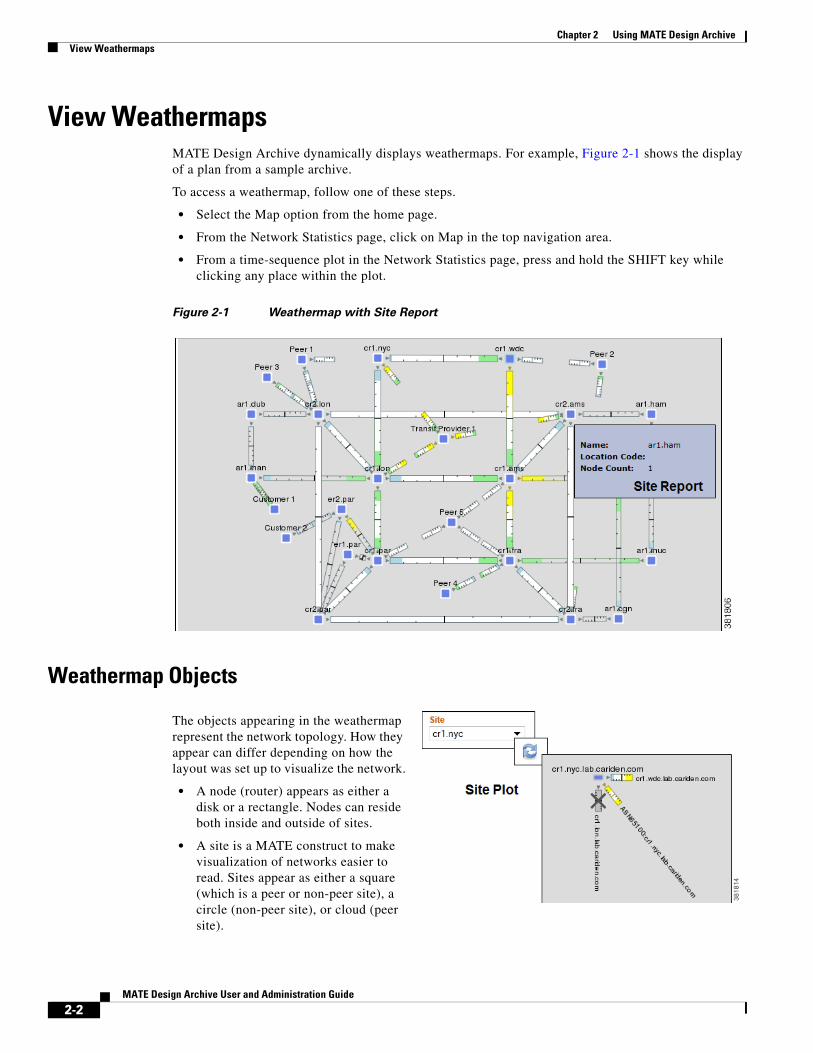
View WeathermapsMATE Design Archive dynamically displays weathermaps. For example, Figure 2-1 shows the display of a plan from a sample archive.
To access a weathermap, follow one of these steps.
• Select the Map option from the home page.
• From the Network Statistics page, click on Map in the top navigation area.
• From a time-sequence plot in the Network Statistics page, press and hold the SHIFT key while clicking any place within the plot.
Figure 2-1 Weathermap with Site Report
Weathermap Objects
The objects appearing in the weathermap represent the network topology. How they appear can differ depending on how the layout was set up to visualize the network.
• A node (router) appears as either a disk or a rectangle. Nodes can reside both inside and outside of sites.
• A site is a MATE construct to make visualization of networks easier to read. Sites appear as either a square (which is a peer or non-peer site), a circle (non-peer site), or cloud (peer site).
2-2MATE Design Archive User and Administration Guide
Chapter 2 Using MATE Design ArchiveView Weathermaps
Unless a site is empty, there is a hierarchy of the sites and nodes that a site contains. A site can be both a parent and a child site. A site that contains another site is called a parent site. The contained nodes and sites are called children. Often the child nodes and sites are geographically co-located. For instance, a site might be a PoP where the routers reside.
– In the weathermap, the parent site shows all egress inter-site interfaces of all nodes contained within it, no matter how deeply the nodes are nested. Similarly, this is true for each child site view within it.
– To view a site report (Figure 2-1) listing the name, location code, and node count, double-click a site. A node count in a site report (tooltip) identifies the nodes directly within that site. That is, it does not count nodes for nested sites.
– To view a site plot, select the desired site from the Site drop-down list in the control panel below the weathermap. Then click the Refresh icon. To return to the network plot, select Full Plot from the Site list and click Refresh.
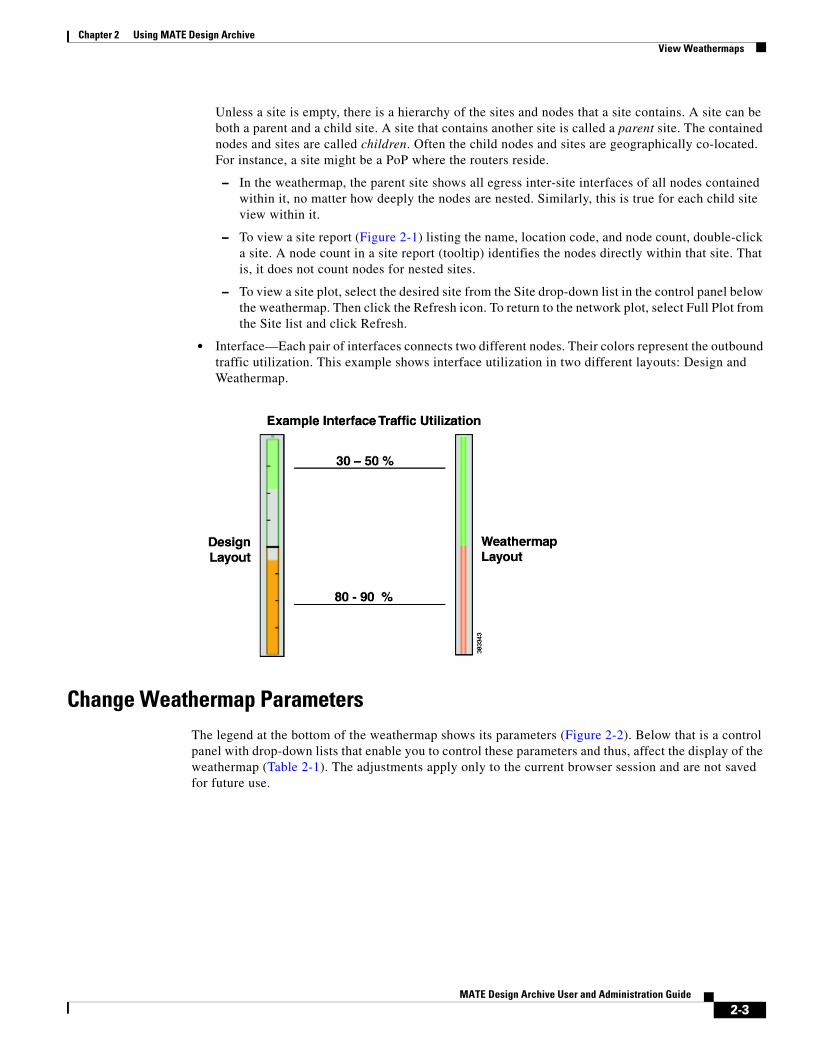
• Interface—Each pair of interfaces connects two different nodes. Their colors represent the outbound traffic utilization. This example shows interface utilization in two different layouts: Design and Weathermap.
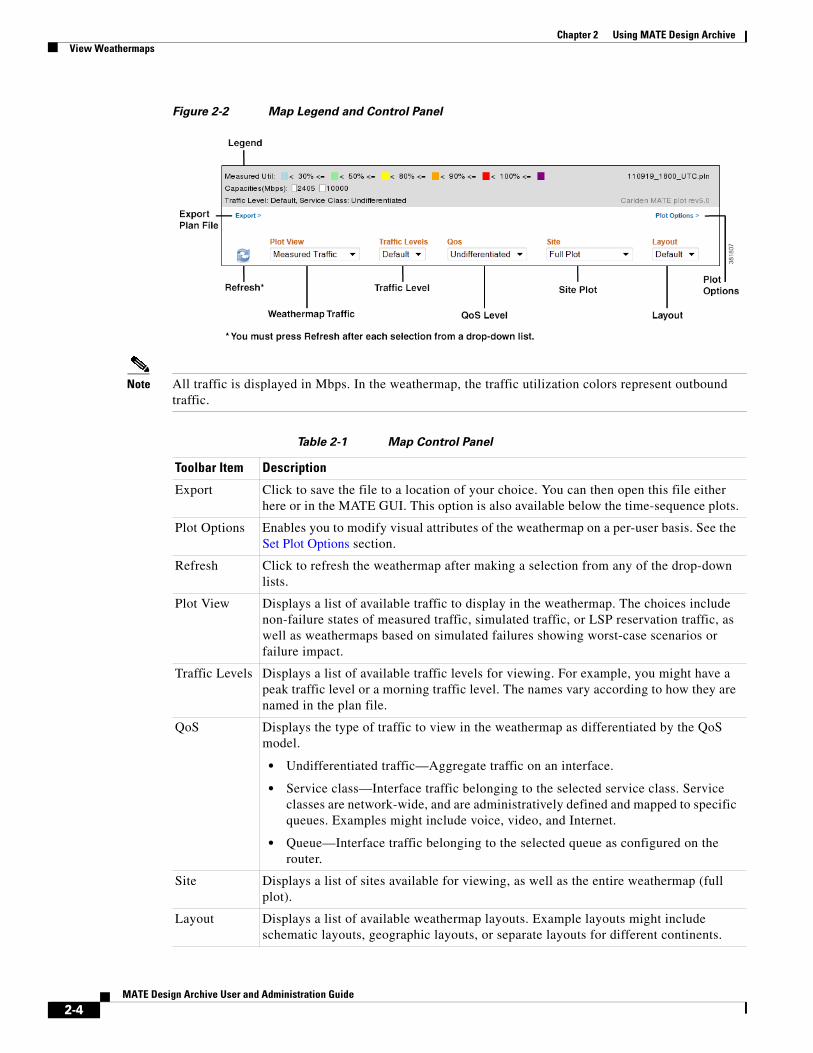
Change Weathermap ParametersThe legend at the bottom of the weathermap shows its parameters (Figure 2-2). Below that is a control panel with drop-down lists that enable you to control these parameters and thus, affect the display of the weathermap (Table 2-1). The adjustments apply only to the current browser session and are not saved for future use.
2-3MATE Design Archive User and Administration Guide
Chapter 2 Using MATE Design Archive View Weathermaps
Figure 2-2 Map Legend and Control Panel
Note All traffic is displayed in Mbps. In the weathermap, the traffic utilization colors represent outbound traffic.
Table 2-1 Map Control Panel
Toolbar Item Description
Export Click to save the file to a location of your choice. You can then open this file either here or in the MATE GUI. This option is also available below the time-sequence plots.
Plot Options Enables you to modify visual attributes of the weathermap on a per-user basis. See the Set Plot Options section.
Refresh Click to refresh the weathermap after making a selection from any of the drop-down lists.
Plot View Displays a list of available traffic to display in the weathermap. The choices include non-failure states of measured traffic, simulated traffic, or LSP reservation traffic, as well as weathermaps based on simulated failures showing worst-case scenarios or failure impact.
Traffic Levels Displays a list of available traffic levels for viewing. For example, you might have a peak traffic level or a morning traffic level. The names vary according to how they are named in the plan file.
QoS Displays the type of traffic to view in the weathermap as differentiated by the QoS model.
• Undifferentiated traffic—Aggregate traffic on an interface.
• Service class—Interface traffic belonging to the selected service class. Service classes are network-wide, and are administratively defined and mapped to specific queues. Examples might include voice, video, and Internet.
• Queue—Interface traffic belonging to the selected queue as configured on the router.
Site Displays a list of sites available for viewing, as well as the entire weathermap (full plot).
Layout Displays a list of available weathermap layouts. Example layouts might include schematic layouts, geographic layouts, or separate layouts for different continents.
2-4MATE Design Archive User and Administration Guide
Chapter 2 Using MATE Design ArchiveView Time-Sequence Plots
Set Plot OptionsYou can modify the visual attributes of the circuits and plot via the Plot Options dialog box. Options are retained for future sessions. Note that although an administrator can set these options on a per-archive basis, you can override those settings using the Plot Options link that is located just below the weathermap. For detailed information about the effects of plot options, see the MATE GUI Visualization Guide.
• Circuit Width—The circuit width is based on its capacity (the higher the capacity, the wider the circuit). Using these options, you can set the minimum width and the capacity it represents, as well as how fast the width grows as the capacity grows.
• Interface Text—By default, there is no text on the interfaces. Using this option, you can display the percentage of interface filled with traffic, or the interface name, IP address, or IGP metric.
• Parallel Grouping—This option enables you to simplify the visual display by grouping circuits that are parallel in nature using any of the following methods. The worst or highest utilization displays for the grouping, thus enabling you to see congestion.
– None—Each parallel circuit is displayed as a separate circuit (default).
– Node—Groups parallel circuits between two nodes.
– Metric—Groups parallel circuits between two nodes whose interfaces have the same IGP metric.
– Site—Groups parallel circuits between two sites.
– SRLG—Groups parallel circuits that belong to the same SRLG.
– Group Name—Groups circuits belonging to a user-specified group.
There is also an option to set the maximum display width for parallel circuits.
• Show QoS Bounds—This option enables you to toggle on/off the display of QoS bounds, which is the maximum interface capacity available without violating the QoS requirements. The default is On.
View Time-Sequence Plots
Step 1 Enter the URL path to the archive in the browser URL, which takes you to the home page.
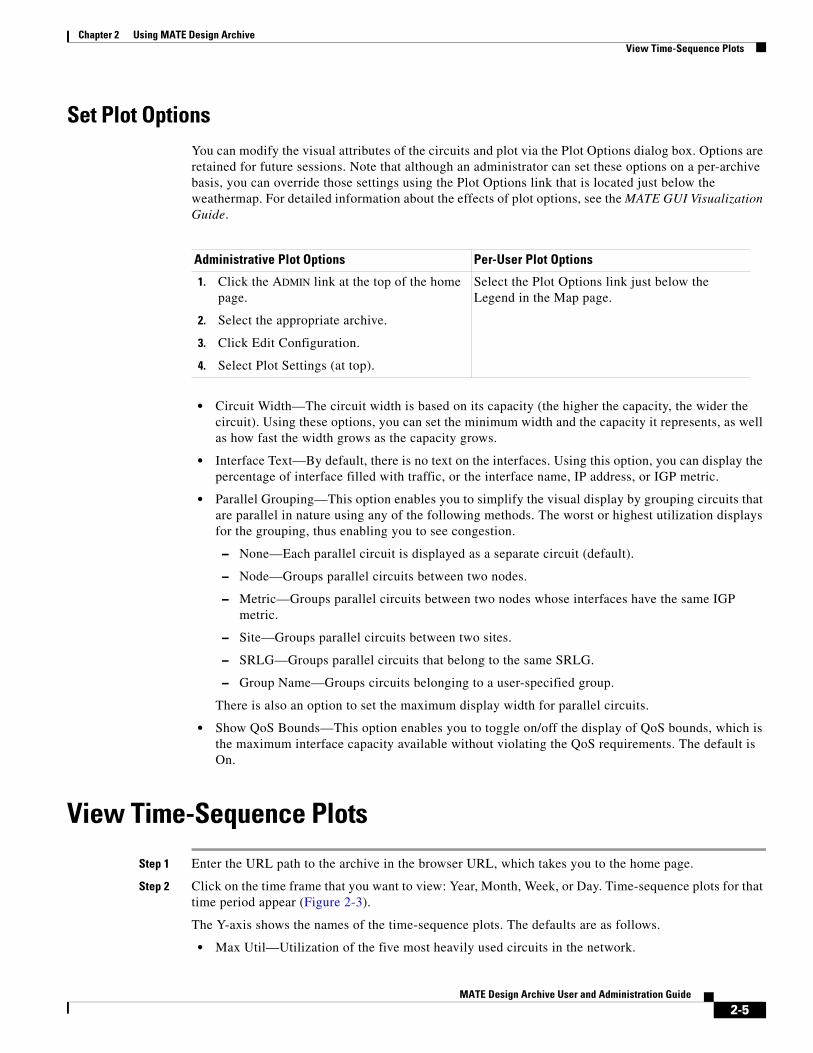
Step 2 Click on the time frame that you want to view: Year, Month, Week, or Day. Time-sequence plots for that time period appear (Figure 2-3).
The Y-axis shows the names of the time-sequence plots. The defaults are as follows.
• Max Util—Utilization of the five most heavily used circuits in the network.
Administrative Plot Options Per-User Plot Options
1. Click the ADMIN link at the top of the home page.
2. Select the appropriate archive.
3. Click Edit Configuration.
4. Select Plot Settings (at top).
Select the Plot Options link just below the Legend in the Map page.
2-5MATE Design Archive User and Administration Guide
Chapter 2 Using MATE Design Archive Navigation
• Total Traffic—Sum of traffic on all interfaces.
• Metric Event for Interfaces—Interfaces going up, down, and their capacity changes.
• Metric Event for Metric Changes—Nodes going up and down.
The X-axis shows the time and is located at the bottom of the time-sequence plot. The default time is UTC.
Historic activity is shown on the left of the display, and predicted traffic (optional) is shown on the right with a gray background. MATE generates the predicted data points based on the previous day's network activity and the current network topology and configuration. For example, if there was a network failure, this portion of the plot might show how the network would respond against a repeat of the previous day's traffic loads. This tool is very useful for predicting and anticipating congestion problems that might occur in the event of a network failure or during planned equipment downtime for maintenance.
This is an interactive plot where you can mouse over to obtain additional information.
• To view an actual value (for instance, the Max Util), move the mouse over a specific data point. As you do, the Panel Legend displays the value associated with that data point.
• To view descriptive information, move the mouse over a specific data point. A tooltip (popup window) appears displaying information about that data point. For example, moving the cursor over a spike utilization point gives you the network interface associated with that spike. If you do not see a tooltip, then the application has not been configured to show one.
Figure 2-3 Network Statistics Page Showing Time-Sequence Plots
NavigationYou can easily navigate between different time scales from increments in minutes to years, as well as navigate between weathermaps and time-sequence plots.
2-6MATE Design Archive User and Administration Guide
Chapter 2 Using MATE Design ArchiveNavigation
Navigate Time Scales
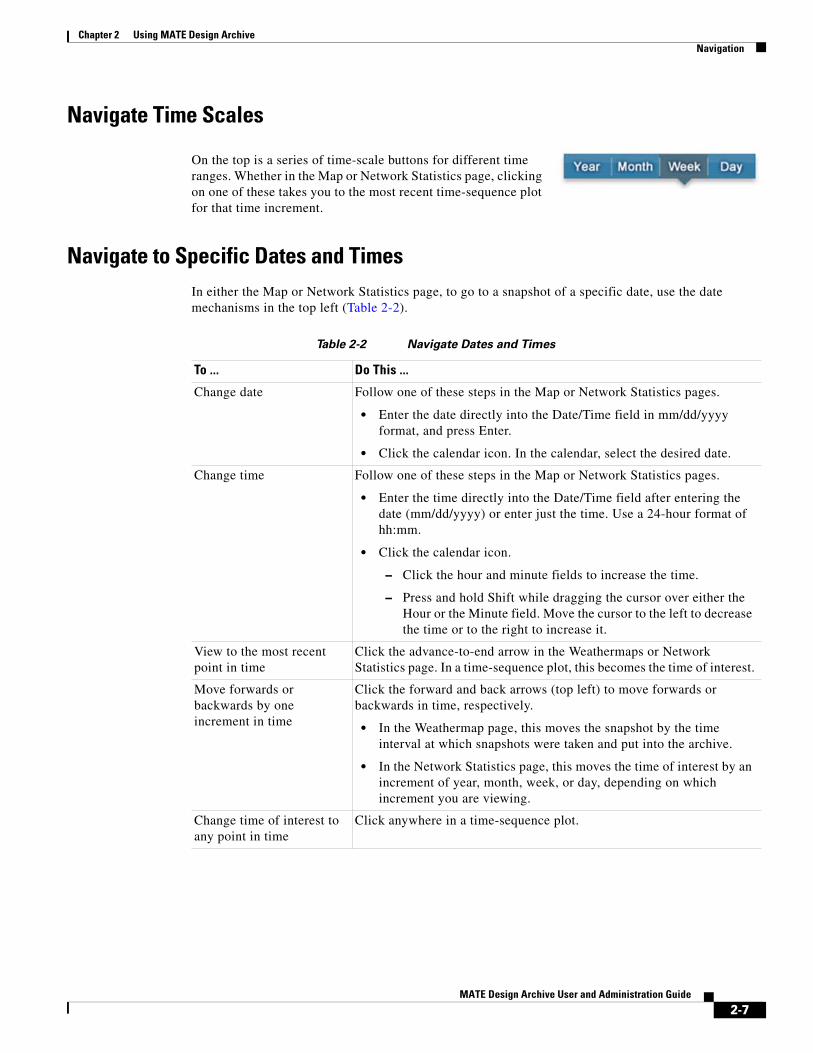
On the top is a series of time-scale buttons for different time ranges. Whether in the Map or Network Statistics page, clicking on one of these takes you to the most recent time-sequence plot for that time increment.
Navigate to Specific Dates and TimesIn either the Map or Network Statistics page, to go to a snapshot of a specific date, use the date mechanisms in the top left (Table 2-2).
Table 2-2 Navigate Dates and Times
To ... Do This ...
Change date Follow one of these steps in the Map or Network Statistics pages.
• Enter the date directly into the Date/Time field in mm/dd/yyyy format, and press Enter.
• Click the calendar icon. In the calendar, select the desired date.
Change time Follow one of these steps in the Map or Network Statistics pages.
• Enter the time directly into the Date/Time field after entering the date (mm/dd/yyyy) or enter just the time. Use a 24-hour format of hh:mm.
• Click the calendar icon.
– Click the hour and minute fields to increase the time.
– Press and hold Shift while dragging the cursor over either the Hour or the Minute field. Move the cursor to the left to decrease the time or to the right to increase it.
View to the most recent point in time
Click the advance-to-end arrow in the Weathermaps or Network Statistics page. In a time-sequence plot, this becomes the time of interest.
Move forwards or backwards by one increment in time
Click the forward and back arrows (top left) to move forwards or backwards in time, respectively.
• In the Weathermap page, this moves the snapshot by the time interval at which snapshots were taken and put into the archive.
• In the Network Statistics page, this moves the time of interest by an increment of year, month, week, or day, depending on which increment you are viewing.
Change time of interest to any point in time
Click anywhere in a time-sequence plot.
2-7MATE Design Archive User and Administration Guide
Chapter 2 Using MATE Design Archive Manage Settings
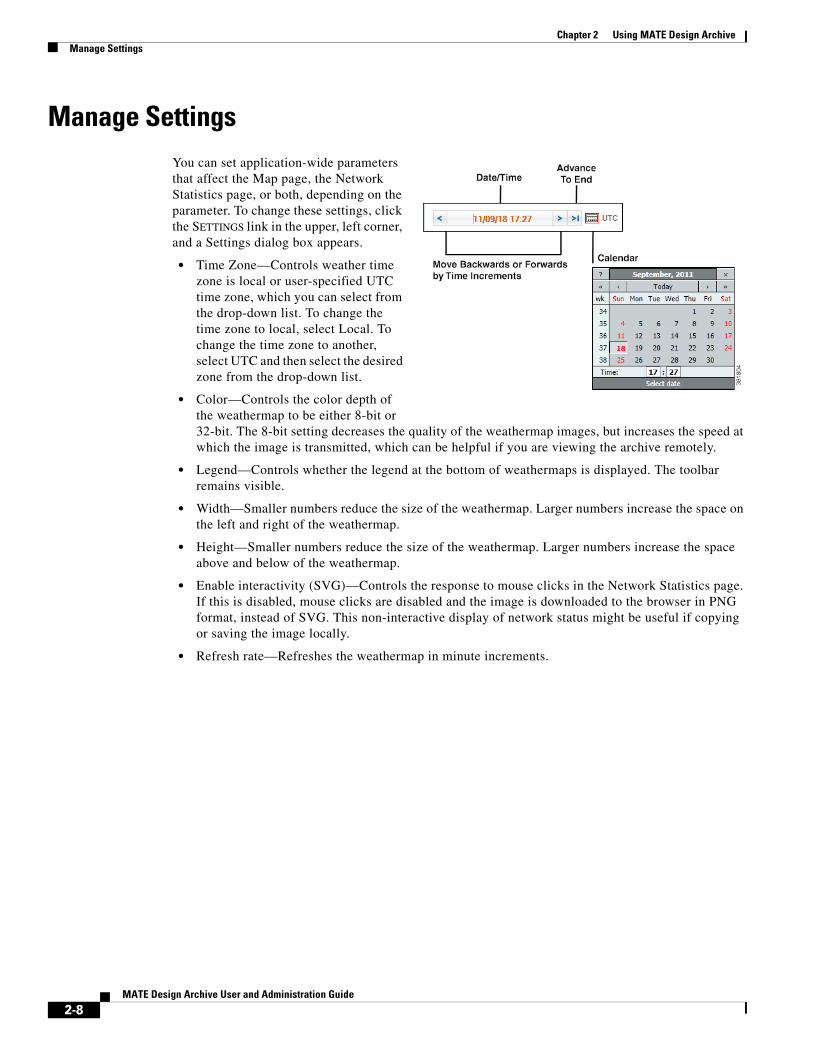
Manage SettingsYou can set application-wide parameters that affect the Map page, the Network Statistics page, or both, depending on the parameter. To change these settings, click the SETTINGS link in the upper, left corner, and a Settings dialog box appears.
• Time Zone—Controls weather time zone is local or user-specified UTC time zone, which you can select from the drop-down list. To change the time zone to local, select Local. To change the time zone to another, select UTC and then select the desired zone from the drop-down list.
• Color—Controls the color depth of the weathermap to be either 8-bit or 32-bit. The 8-bit setting decreases the quality of the weathermap images, but increases the speed at which the image is transmitted, which can be helpful if you are viewing the archive remotely.
• Legend—Controls whether the legend at the bottom of weathermaps is displayed. The toolbar remains visible.
• Width—Smaller numbers reduce the size of the weathermap. Larger numbers increase the space on the left and right of the weathermap.
• Height—Smaller numbers reduce the size of the weathermap. Larger numbers increase the space above and below of the weathermap.
• Enable interactivity (SVG)—Controls the response to mouse clicks in the Network Statistics page. If this is disabled, mouse clicks are disabled and the image is downloaded to the browser in PNG format, instead of SVG. This non-interactive display of network status might be useful if copying or saving the image locally.
• Refresh rate—Refreshes the weathermap in minute increments.
2-8MATE Design Archive User and Administration Guide
C H A P T E R 3
Managing the MATE Design Archive ApplicationMATE Design Archive is a web application that enables you to store, preview, and retrieve plan files gathered from numerous network snapshots. It shows both a weathermap and time-sequence plots of the network data.
This chapter is divided into these topics, which are specific to managing the MATE Design Archive application.
• Customize the Home Page
• Customize Weathermaps
• Customize Visual Format Files
Note Use the System UI page to manage users.
Customize the Home PageYou can customize the MATE Design Archive application home page in several ways.
• Group archives together for easy access.
• Add custom content that appears next to each archive and points to either an HTML file or URL.
Visually Group Archives You can group archives together so that they can be easily identified on the MATE Design Archive home page. Doing so creates a group icon and name with an associated list from which users can select.
To add archives to an existing group, use the archive_config tool with these options.
• -action edit—Edit the archive to place it in a group for display on the MATE Design Archive home page.
• -name <value>—Name of the archive.
• -group-name <value>—Name of the group. If this group does not exist, it is created.
Example: This groups an archive named “Backbone” within a group named “Chicago.”
archive_config -action edit -name Backbone -group-name Chicago
3-1MATE Design Archive User and Administration Guide
Chapter 3 Managing the MATE Design Archive Application Customize the Home Page
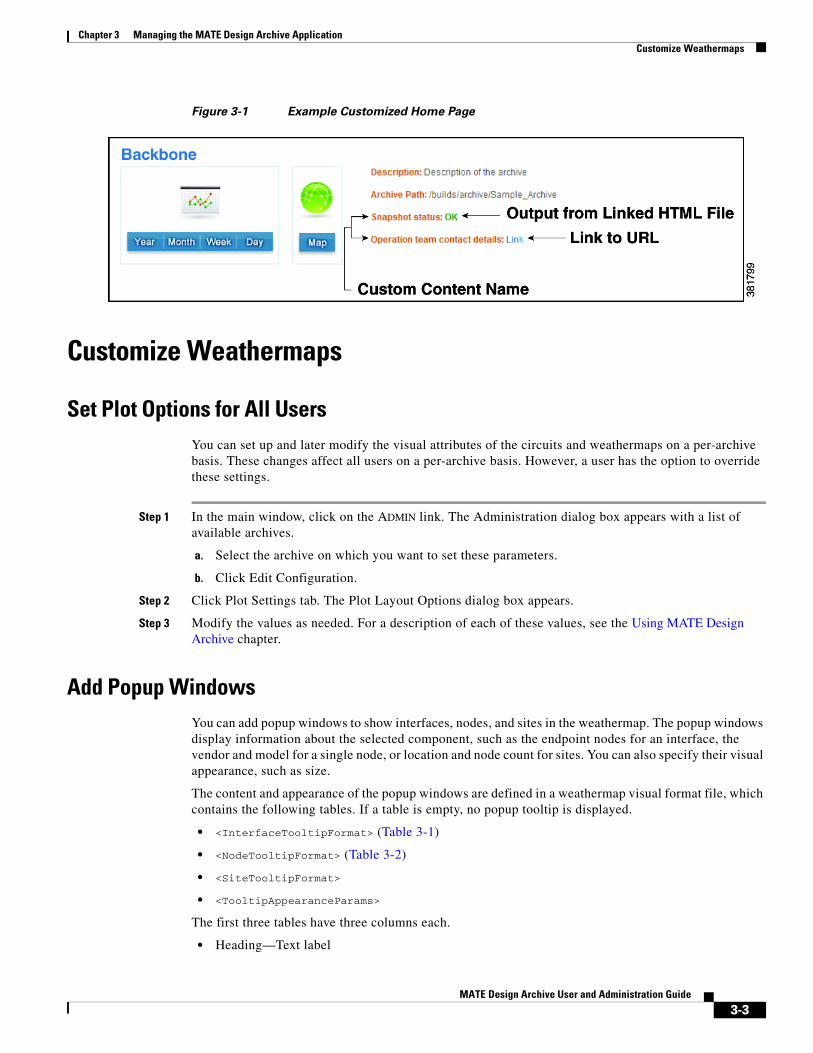
Add Custom ContentYou can add custom information that is displayed next to the archive name on the MATE Design Archive home page. This custom content includes a name (text that appears next to the archive) and a link to either an HTML file or a URL. The HTML content is then interpreted and output to the MATE Design Archive home page.
Example: The content name is "Status." The link is to an HTML file with the following contents.
<span style="font-weight:bold">OK</span>
The home page would have the following custom content for the specified archive.
Status: OK
To add this custom content, use the archive_config tool with the following options.
• -action edit—Edit the archive to add custom information next to its displayed name on the MATE Design Archive home page.
• -name—Name of the archive.
• -custom-archive-content-name—Custom content name, which is text that appears next to the archive.
• Use one of these two options.
– -custom-archive-content-html—Points to an HTML file location.
– -custom-archive-content-url—Points to a URL.
Additionally, two system variables are available.
• $archive_name—Name of the archive.
• $latest_snapshot_datetime—Snapshot file that was most recently inserted into the archive repository.
Examples: Refer to Figure 3-1 for the output of the following two customization examples.
• Create custom content with “Snapshot Status” as the name. It outputs HTML file information about the latest snapshot status. The archive name is “Backbone.”
archive_config -action edit -name Backbone -custom-archive-content-name "Snapshot
status" -custom-archive-content-html
/noc/$archive_name-$latest_snapshot_datetime-status.html
• For the same archive, create another custom content named “Operation team contact details” that links to a URL of associated information.
archive_config -action -edit -name Backbone -custom-content-name "Operation team
contact details" -custom-archive-content-url
"http://acme_company/noc.html?archive_name=$archive_name"
3-2MATE Design Archive User and Administration Guide
Chapter 3 Managing the MATE Design Archive ApplicationCustomize Weathermaps
Figure 3-1 Example Customized Home Page
Customize Weathermaps
Set Plot Options for All UsersYou can set up and later modify the visual attributes of the circuits and weathermaps on a per-archive basis. These changes affect all users on a per-archive basis. However, a user has the option to override these settings.
Step 1 In the main window, click on the ADMIN link. The Administration dialog box appears with a list of available archives.
a. Select the archive on which you want to set these parameters.
b. Click Edit Configuration.
Step 2 Click Plot Settings tab. The Plot Layout Options dialog box appears.
Step 3 Modify the values as needed. For a description of each of these values, see the Using MATE Design Archive chapter.
Add Popup WindowsYou can add popup windows to show interfaces, nodes, and sites in the weathermap. The popup windows display information about the selected component, such as the endpoint nodes for an interface, the vendor and model for a single node, or location and node count for sites. You can also specify their visual appearance, such as size.
The content and appearance of the popup windows are defined in a weathermap visual format file, which contains the following tables. If a table is empty, no popup tooltip is displayed.
• <InterfaceTooltipFormat> (Table 3-1)
• <NodeTooltipFormat> (Table 3-2)
• <SiteTooltipFormat>
• <TooltipAppearanceParams>
The first three tables have three columns each.
• Heading—Text label
3-3MATE Design Archive User and Administration Guide
Chapter 3 Managing the MATE Design Archive Application Customize Weathermaps
• SQL Expression—Queries columns in the table_extract file
• Type—Defines the data type; can have the following values.
– string—Text string to display
– img—URL reference to an image; implemented as <img src=’url’/>
– url—URL reference; implemented as: <a href=’url’>Header-value</a>
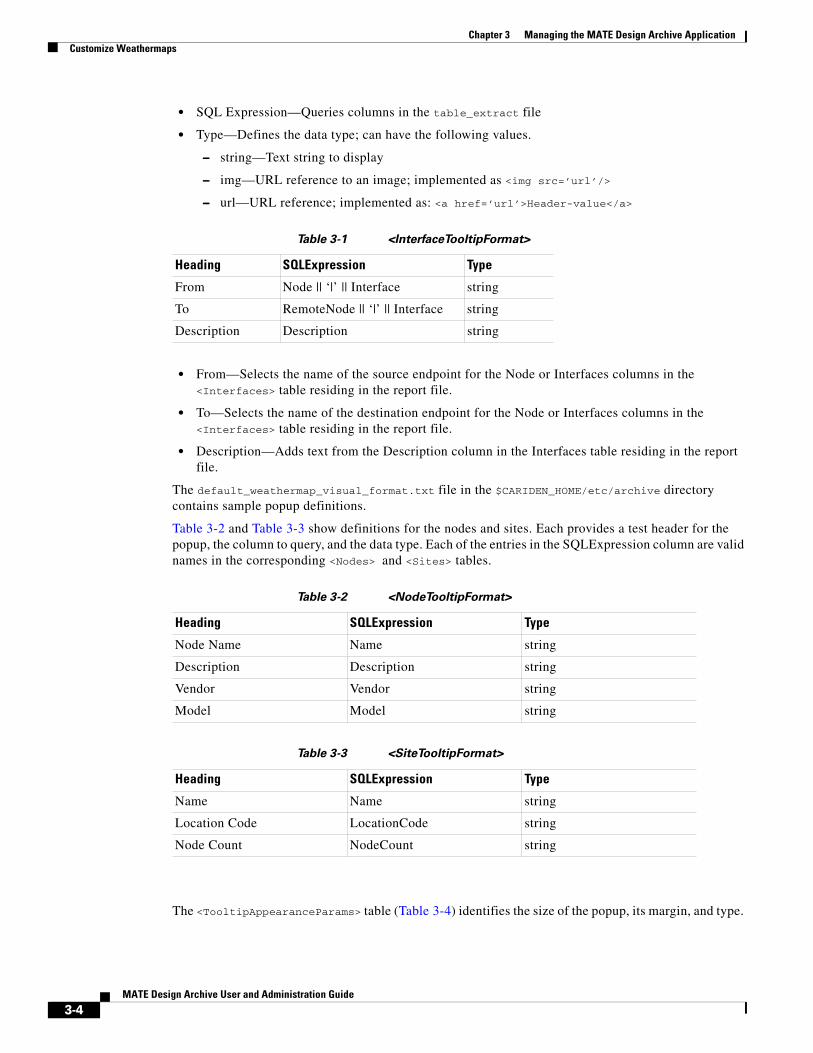
Table 3-1 <InterfaceTooltipFormat>
• From—Selects the name of the source endpoint for the Node or Interfaces columns in the <Interfaces> table residing in the report file.
• To—Selects the name of the destination endpoint for the Node or Interfaces columns in the <Interfaces> table residing in the report file.
• Description—Adds text from the Description column in the Interfaces table residing in the report file.
The default_weathermap_visual_format.txt file in the $CARIDEN_HOME/etc/archive directory contains sample popup definitions.
Table 3-2 and Table 3-3 show definitions for the nodes and sites. Each provides a test header for the popup, the column to query, and the data type. Each of the entries in the SQLExpression column are valid names in the corresponding <Nodes> and <Sites> tables.
Table 3-2 <NodeTooltipFormat>
Table 3-3 <SiteTooltipFormat>
The <TooltipAppearanceParams> table (Table 3-4) identifies the size of the popup, its margin, and type.
Heading SQLExpression Type
From Node || ‘|’ || Interface string
To RemoteNode || ‘|’ || Interface string
Description Description string
Heading SQLExpression Type
Node Name Name string
Description Description string
Vendor Vendor string
Model Model string
Heading SQLExpression Type
Name Name string
Location Code LocationCode string
Node Count NodeCount string
3-4MATE Design Archive User and Administration Guide
Chapter 3 Managing the MATE Design Archive ApplicationCustomize Visual Format Files
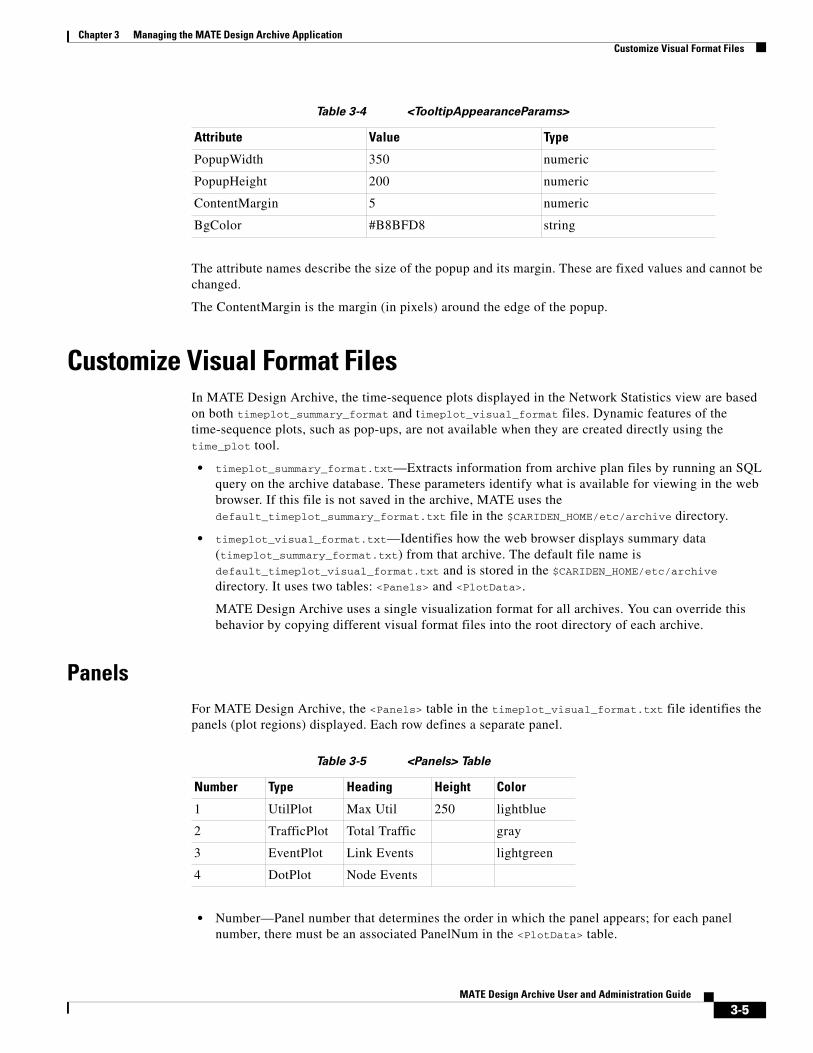
Table 3-4 <TooltipAppearanceParams>
The attribute names describe the size of the popup and its margin. These are fixed values and cannot be changed.
The ContentMargin is the margin (in pixels) around the edge of the popup.
Customize Visual Format FilesIn MATE Design Archive, the time-sequence plots displayed in the Network Statistics view are based on both timeplot_summary_format and timeplot_visual_format files. Dynamic features of the time-sequence plots, such as pop-ups, are not available when they are created directly using the time_plot tool.
• timeplot_summary_format.txt—Extracts information from archive plan files by running an SQL query on the archive database. These parameters identify what is available for viewing in the web browser. If this file is not saved in the archive, MATE uses the default_timeplot_summary_format.txt file in the $CARIDEN_HOME/etc/archive directory.
• timeplot_visual_format.txt—Identifies how the web browser displays summary data (timeplot_summary_format.txt) from that archive. The default file name is default_timeplot_visual_format.txt and is stored in the $CARIDEN_HOME/etc/archive directory. It uses two tables: <Panels> and <PlotData>.
MATE Design Archive uses a single visualization format for all archives. You can override this behavior by copying different visual format files into the root directory of each archive.
PanelsFor MATE Design Archive, the <Panels> table in the timeplot_visual_format.txt file identifies the panels (plot regions) displayed. Each row defines a separate panel.
Table 3-5 <Panels> Table
• Number—Panel number that determines the order in which the panel appears; for each panel number, there must be an associated PanelNum in the <PlotData> table.
Attribute Value Type
PopupWidth 350 numeric
PopupHeight 200 numeric
ContentMargin 5 numeric
BgColor #B8BFD8 string
Number Type Heading Height Color
1 UtilPlot Max Util 250 lightblue
2 TrafficPlot Total Traffic gray
3 EventPlot Link Events lightgreen
4 DotPlot Node Events
3-5MATE Design Archive User and Administration Guide
Chapter 3 Managing the MATE Design Archive Application Customize Visual Format Files
• Type—Type of plots in the panel. Each plot type interprets the summary data and the <PlotData> columns. See Panel Types.
• Heading—Name of the panel.
• Height—Height of the panel in pixels.
• Color—Color of the panel background using standard HTML color definitions or RGB values. For example, red = #FF0000. For a reference to HTML colors, see See http://www.w3schools.com/html/html_colornames.asp.
• MinValue—Minimum value of the Y-axis. If omitted, this value scales to the data; only valid for UtilPlot, ProportionPlot, and BarGraphPlot.
• URL—This column is not used.
Panel Types
The panel types determine how the summary data assigned to each panel is plotted.
• TrafficPlot—Displays traffic values; similar to UtilPlot, but the Y-axis is in bits per second (bps).
• CumTrafficPlot—Displays traffic values with plots stacked on top of each other to show cumulative traffic totals.
• ProportionPlot—Displays cumulative traffic with an overall total that is scaled to 100%. An example application is to show proportions of traffic entering or leaving the data from particular peers.
• BarGraphPlot—Shows utilizations or values represented as percentages; utilizations are shown as bars. Otherwise, this plot is similar to UtilPlot.
• EventPlot—If there are one or more entries in the referenced group in the summary table, a tick mark is displayed in the plot. The only relevant column in the summary table is the Details column. If the mouse is held over the data point, a pop-up displays the first few entries in this column.
The above example <Panels> tables uses EventPlot to mark changes in the plot topology: nodes and interfaces added or removed, capacities and metrics changed. In this case, the Details column defined in the query section of timeplot_summary_format file provides details of all the changes. Refer to the Interfaces Up query in the default_timeplot_summary_format.txt file provided with MATE as an example of how the Details column is defined.
• DotPlot—Similar to the EventPlot, except that instead of a data point, a column of dots equal to the number of rows assigned to the displayed group is shown. If small numbers of events are expected, the dot plot can provide more immediate detail. Refer to the MaxUtilMeas group in the default_timeplot_summary_format.txt provided with MATE. This query returns the top five utilized interfaces. The results are going to be five plot lines with the same grouping that is MaxUtilMeas. As a result, the label will be Label_1 through Label_5.
• EventBarPlot—Similar to the EventPlot and DotPlot, except instead of a dot, a filled colored bar graph with a height that represents the number of rows in the displayed group. The color is defined in the <PlotData> table.
• Spacer—Creates space between panels, with height equal to the Height setting.
Plot DataThe <PlotData> table in the timeplot_visual_format.txt file specifies which parameters the timeplot_summary_format file should query for and display in the web browser. Each row defines a separate plot and a distinct query.
3-6MATE Design Archive User and Administration Guide
Chapter 3 Managing the MATE Design Archive ApplicationCustomize Summary Files
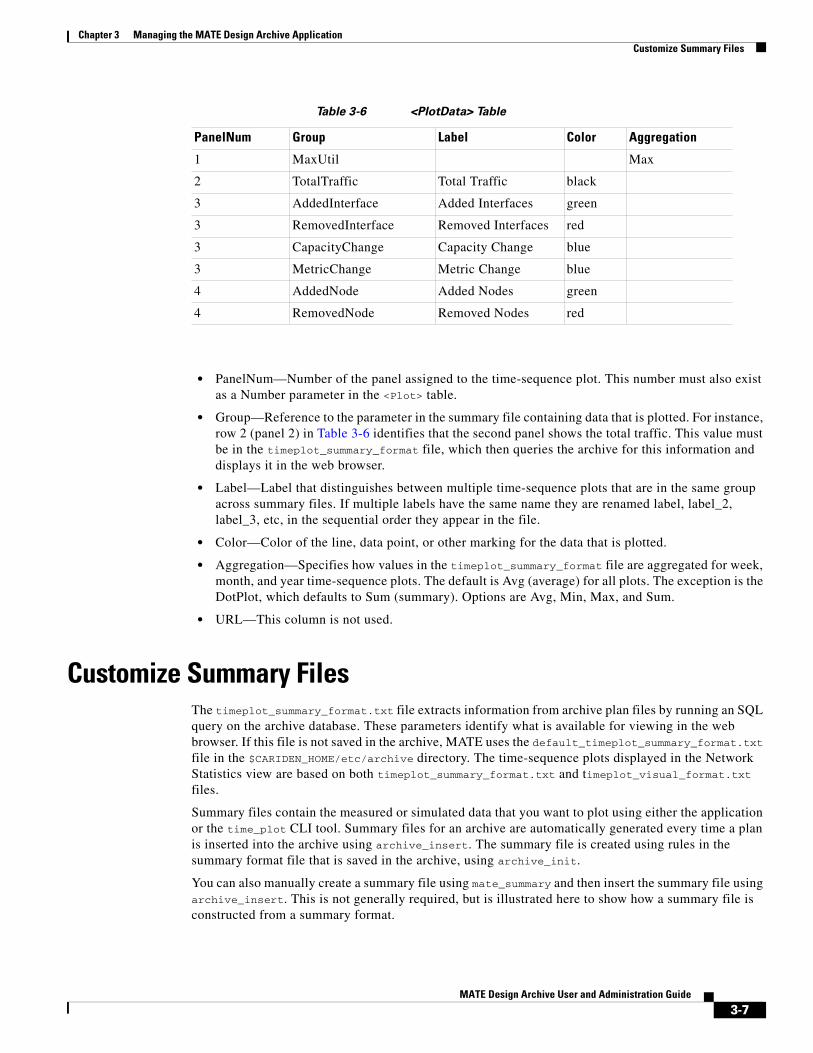
Table 3-6 <PlotData> Table
• PanelNum—Number of the panel assigned to the time-sequence plot. This number must also exist as a Number parameter in the <Plot> table.
• Group—Reference to the parameter in the summary file containing data that is plotted. For instance, row 2 (panel 2) in Table 3-6 identifies that the second panel shows the total traffic. This value must be in the timeplot_summary_format file, which then queries the archive for this information and displays it in the web browser.
• Label—Label that distinguishes between multiple time-sequence plots that are in the same group across summary files. If multiple labels have the same name they are renamed label, label_2, label_3, etc, in the sequential order they appear in the file.
• Color—Color of the line, data point, or other marking for the data that is plotted.
• Aggregation—Specifies how values in the timeplot_summary_format file are aggregated for week, month, and year time-sequence plots. The default is Avg (average) for all plots. The exception is the DotPlot, which defaults to Sum (summary). Options are Avg, Min, Max, and Sum.
• URL—This column is not used.
Customize Summary FilesThe timeplot_summary_format.txt file extracts information from archive plan files by running an SQL query on the archive database. These parameters identify what is available for viewing in the web browser. If this file is not saved in the archive, MATE uses the default_timeplot_summary_format.txt file in the $CARIDEN_HOME/etc/archive directory. The time-sequence plots displayed in the Network Statistics view are based on both timeplot_summary_format.txt and timeplot_visual_format.txt files.
Summary files contain the measured or simulated data that you want to plot using either the application or the time_plot CLI tool. Summary files for an archive are automatically generated every time a plan is inserted into the archive using archive_insert. The summary file is created using rules in the summary format file that is saved in the archive, using archive_init.
You can also manually create a summary file using mate_summary and then insert the summary file using archive_insert. This is not generally required, but is illustrated here to show how a summary file is constructed from a summary format.
PanelNum Group Label Color Aggregation
1 MaxUtil Max
2 TotalTraffic Total Traffic black
3 AddedInterface Added Interfaces green
3 RemovedInterface Removed Interfaces red
3 CapacityChange Capacity Change blue
3 MetricChange Metric Change blue
4 AddedNode Added Nodes green
4 RemovedNode Removed Nodes red
3-7MATE Design Archive User and Administration Guide
Chapter 3 Managing the MATE Design Archive Application Customize Summary Files
To manually create a summary file, first create a report that contains the relevant tables from the plan, and then extract the summary information from the report file. The table_extract tool creates a report file from a plan file, and the mate_summary tool queries the report to produce the summary file.
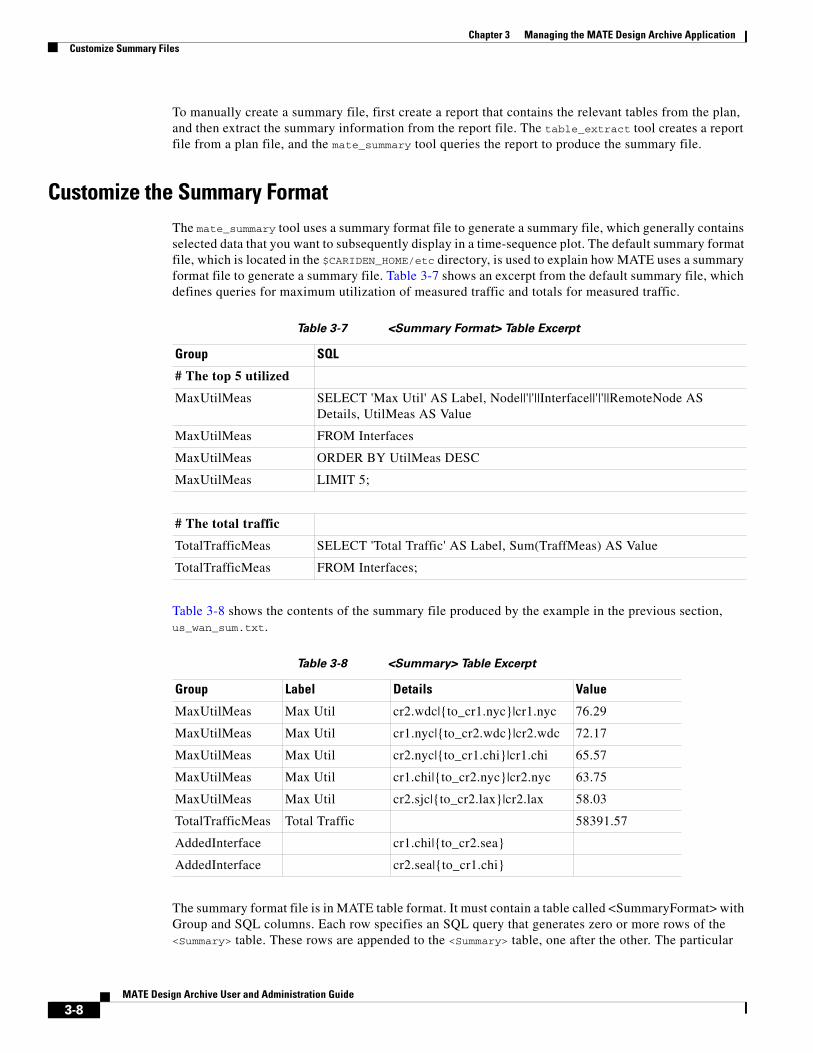
Customize the Summary FormatThe mate_summary tool uses a summary format file to generate a summary file, which generally contains selected data that you want to subsequently display in a time-sequence plot. The default summary format file, which is located in the $CARIDEN_HOME/etc directory, is used to explain how MATE uses a summary format file to generate a summary file. Table 3-7 shows an excerpt from the default summary file, which defines queries for maximum utilization of measured traffic and totals for measured traffic.
Table 3-7 <Summary Format> Table Excerpt
Table 3-8 shows the contents of the summary file produced by the example in the previous section, us_wan_sum.txt.
Table 3-8 <Summary> Table Excerpt
The summary format file is in MATE table format. It must contain a table called <SummaryFormat> with Group and SQL columns. Each row specifies an SQL query that generates zero or more rows of the <Summary> table. These rows are appended to the <Summary> table, one after the other. The particular
Group SQL
# The top 5 utilized
MaxUtilMeas SELECT 'Max Util' AS Label, Node||'|'||Interface||'|'||RemoteNode AS Details, UtilMeas AS Value
MaxUtilMeas FROM Interfaces
MaxUtilMeas ORDER BY UtilMeas DESC
MaxUtilMeas LIMIT 5;
# The total traffic
TotalTrafficMeas SELECT 'Total Traffic' AS Label, Sum(TraffMeas) AS Value
TotalTrafficMeas FROM Interfaces;
Group Label Details Value
MaxUtilMeas Max Util cr2.wdc|{to_cr1.nyc}|cr1.nyc 76.29
MaxUtilMeas Max Util cr1.nyc|{to_cr2.wdc}|cr2.wdc 72.17
MaxUtilMeas Max Util cr2.nyc|{to_cr1.chi}|cr1.chi 65.57
MaxUtilMeas Max Util cr1.chi|{to_cr2.nyc}|cr2.nyc 63.75
MaxUtilMeas Max Util cr2.sjc|{to_cr2.lax}|cr2.lax 58.03
TotalTrafficMeas Total Traffic 58391.57
AddedInterface cr1.chi|{to_cr2.sea}
AddedInterface cr2.sea|{to_cr1.chi}
3-8MATE Design Archive User and Administration Guide
Chapter 3 Managing the MATE Design Archive ApplicationRelated Topics
implementation of SQL used by MATE is described in the in the MATE Integration and Development Guide. The query is performed by mate_summary on tables passed to it, the table-file and, and optionally, the old-table-file. Typically, as in the example above, these tables are generated from a plan file using table_extract. This is the method that archive_insert uses to generate summary files.
The summary file also uses the MATE table format, containing the <Summary> table with columns defined by the queries in the summary format. Particular columns (Group, Label, Value, Details) are used by Archive to display time-sequence plots of this information in a web browser.
The tables available to the SQL queries in the summary format file are the following.
• <TableName>, for each table in the table-file.
These tables contain exactly the columns of the corresponding tables in the table-file. Examples used in the summary format above are the <Interfaces> and <Nodes> tables. The <Interfaces> table, for example, contains the columns Node, Interface, RemoteNode, and UtilMeas.
• Old_<TableName>, for each table in the old-table-file.
These tables contain exactly the columns of the corresponding tables in the old-table-file, if it is specified.
• Joined_<TableName>, for each object table in the table-file. These tables are listed in the MATE Integration and Development Guide, and they contain following columns. For key column information, refer to the $CARIDEN_HOME/docs/table_schema.html file.
– <ColumnName>, for each column name in <TableName> in the table-file,
– Old_<ColumnName>, for each column name <TableName> in the old-table-file.
That is, Joined_<TableName> is the result of a an outer join between the two tables, matching rows by the key columns. This means that the table contains the union of the rows in the two tables. The join fills in NULL entries for TableName rows that are not in Old_TableName, and for Old_TableName rows that are not in TableName. This is used by the example summary format shown above to list the names of the added and removed nodes and interfaces in the plan, compared to the old plan.
An example is the Joined_Interfaces table.
A special case is the Joined_Interfaces_IP table, which is defined in the same way as Joined_Interfaces, except that
– The tables are joined on Node and IP Address, rather than Node and Interface.
– Entries with blank IP Address in the <Interfaces> table are removed.
Joined_Interfaces_IP is used in the default summary format to signal changes in interface settings. It has been found generally more reliable to match interfaces across time using the IP Address tables than using the Interface name. Note that copy_from_template also, by default, matches interfaces between plans using the IP Address.
Related Topics • MATE GUI Visualization Guide
• System Administration Guide
• MATE Integration and Development Guide
3-9MATE Design Archive User and Administration Guide

Chapter 3 Managing the MATE Design Archive Application Related Topics
3-10MATE Design Archive User and Administration Guide
C H A P T E R 4
MATE GUI and Remote MATE Design ArchivePlan files and templates are stored in archive repositories, which can be installed on a different device than the one on which the MATE GUI is used. From the MATE GUI, you can extract .pln plan files from remote archive directories, make whatever modifications are necessary, and re-insert them as .pln files into an archive used by the MATE Design Archive application. You can also open, modify, and then save a remote archive template.
Prerequisite
You must have an admin role assigned to you through the web System UI, and you must know that username and password.
Note The recommendation is to open the remote plan file, modify it to create the visual template, and save it to the remote archive as a template. When uploading a template to a remote archive, you are overwriting the template that is in the archive.
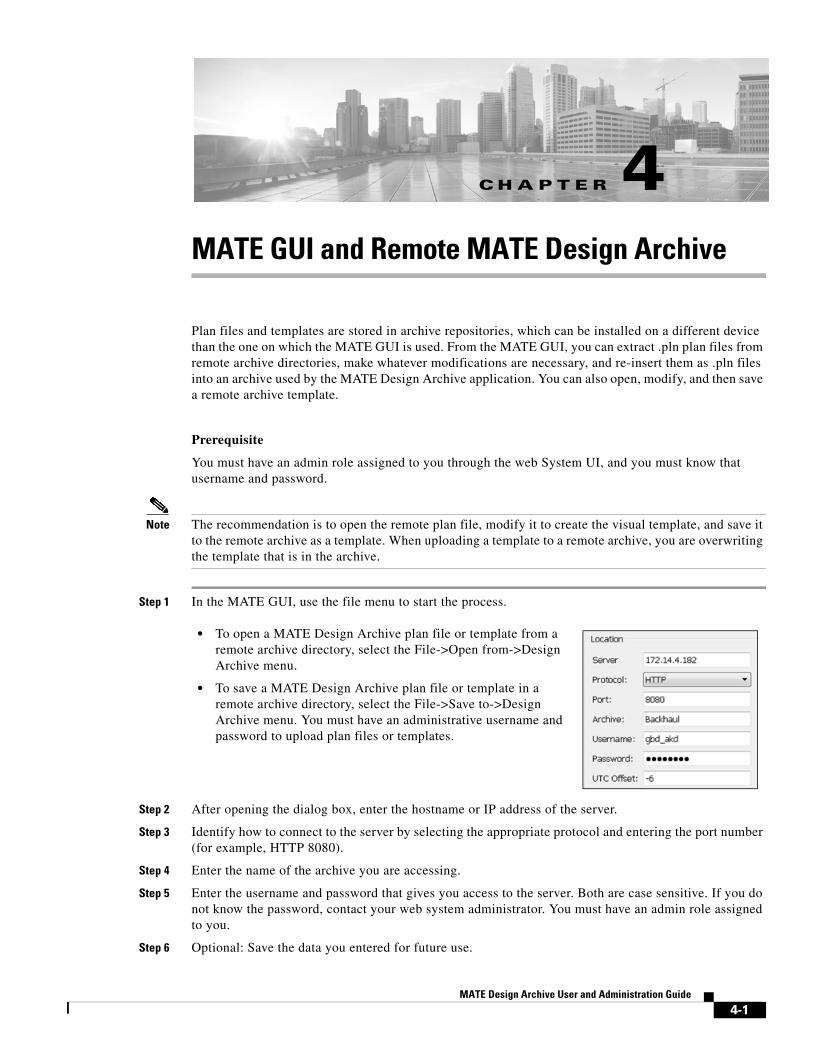
Step 1 In the MATE GUI, use the file menu to start the process.
• To open a MATE Design Archive plan file or template from a remote archive directory, select the File->Open from->Design Archive menu.
• To save a MATE Design Archive plan file or template in a remote archive directory, select the File->Save to->Design Archive menu. You must have an administrative username and password to upload plan files or templates.
Step 2 After opening the dialog box, enter the hostname or IP address of the server.
Step 3 Identify how to connect to the server by selecting the appropriate protocol and entering the port number (for example, HTTP 8080).
Step 4 Enter the name of the archive you are accessing.
Step 5 Enter the username and password that gives you access to the server. Both are case sensitive. If you do not know the password, contact your web system administrator. You must have an admin role assigned to you.
Step 6 Optional: Save the data you entered for future use.
4-1MATE Design Archive User and Administration Guide
Chapter 4 MATE GUI and Remote MATE Design Archive Upload Templates from MATE Design Archive UI
• To save all settings except the password, select Save Settings.
• To save the password for future use, select Save Password.
Step 7 Enter the UTC offset to apply to the date specified in the "Plan at Time" field. If you do not enter a date, the file is opened or saved according the server’s UTC time.
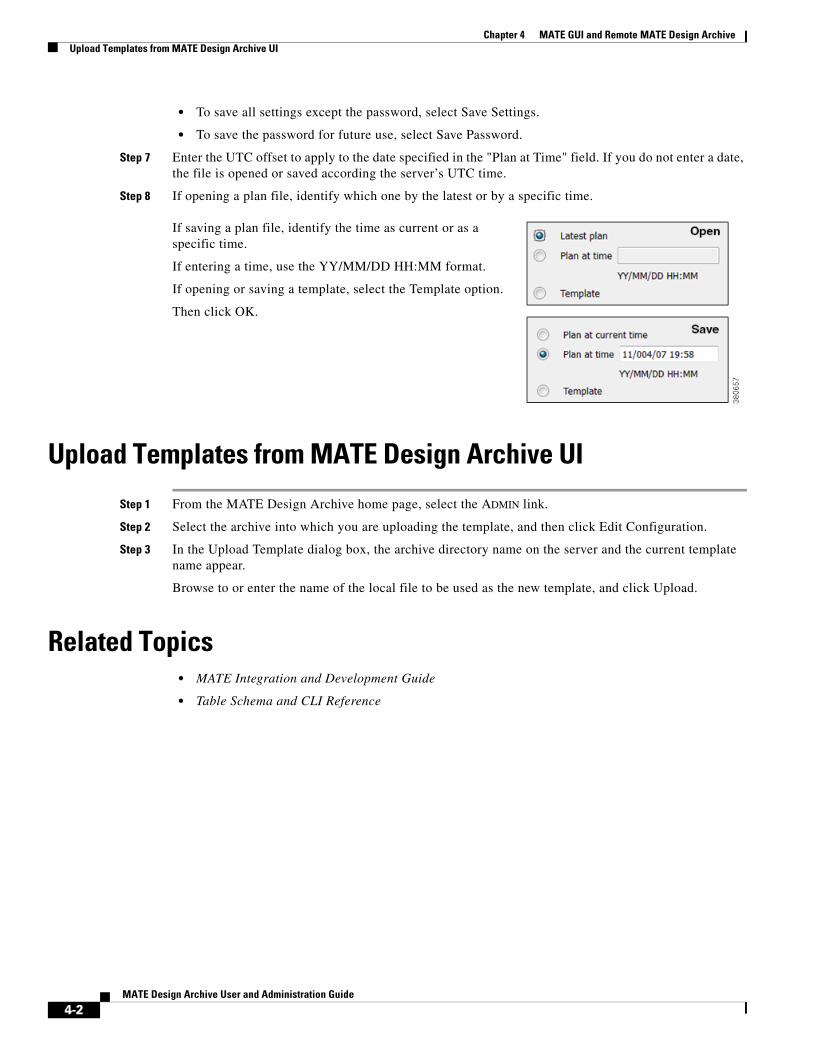
Step 8 If opening a plan file, identify which one by the latest or by a specific time.
If saving a plan file, identify the time as current or as a specific time.
If entering a time, use the YY/MM/DD HH:MM format.
If opening or saving a template, select the Template option.
Then click OK.
Upload Templates from MATE Design Archive UI
Step 1 From the MATE Design Archive home page, select the ADMIN link.
Step 2 Select the archive into which you are uploading the template, and then click Edit Configuration.
Step 3 In the Upload Template dialog box, the archive directory name on the server and the current template name appear.
Browse to or enter the name of the local file to be used as the new template, and click Upload.
Related Topics • MATE Integration and Development Guide
• Table Schema and CLI Reference
4-2MATE Design Archive User and Administration Guide


