Embed Size (px)
Citation preview
THE ASTRONOMICAL JOURNAL, 119 :2645È2663, 2000 June2000. The American Astronomical Society. All rights reserved. Printed in U.S.A.(
STRUCTURAL AND PHOTOMETRIC CLASSIFICATION OF GALAXIES. I. CALIBRATION BASED ON ANEARBY GALAXY SAMPLE
MATTHEW A. BERSHADY
Department of Astronomy, University of Wisconsin, 475 North Charter Street, Madison, WI 53706 ; mab=astro.wisc.edu
ANNA JANGREN
Department of Astronomy and Astrophysics, Pennsylvania State University, 525 Davey Laboratory, University Park, PA 16802 ;jangren=astro.psu.edu
AND
CHRISTOPHER J. CONSELICE
Department of Astronomy, University of Wisconsin, 475 North Charter Street, Madison, WI 53706 ; chris=astro.wisc.eduReceived 1999 August 30 ; accepted 2000 February 11
ABSTRACTIn this paper we deÐne an observationally robust, multiparameter space for the classiÐcation of nearby
and distant galaxies. The parameters include luminosity, color, and the image-structure parameters : size,image concentration, asymmetry, and surface brightness. Based on an initial calibration of this parameterspace using the ““ normal ÏÏ Hubble types surveyed in 1996 by Frei et al., we Ðnd that only a subset of theparameters provide useful classiÐcation boundaries for this sample. Interestingly, this subset does notinclude distance-dependent scale parameters such as size or luminosity. The essential ingredient is thecombination of a spectral index (e.g., color) with parameters of image structure and scale : concentration,asymmetry, and surface brightness. We refer to the image structure parameters (concentration andasymmetry) as indices of ““ form.ÏÏ We deÐne a preliminary classiÐcation based on spectral index, form,and surface brightness (a scale) that successfully separates normal galaxies into three classes. We inten-tionally identify these classes with the familiar labels of early, intermediate, and late. This classiÐcation,or others based on the above four parameters, can be used reliably to deÐne comparable samples over abroad range in redshift. The size and luminosity distribution of such samples will not be biased by thisselection process except through astrophysical correlations between spectral index, form, and surfacebrightness.Key words : galaxies : compact È galaxies : fundamental parameters È galaxies : starburst
1. INTRODUCTION
It is now well established that a large fraction of galaxiesdiscovered at intermediate and high redshift have unusualmorphologies and thus cannot be classiÐed in terms of thenominal Hubble-Sandage system (Driver, Windhorst, &Griffiths 1995 ; Driver et al. 1998 ; Abraham et al. 1996a,1996b). The Hubble classiÐcation scheme is also difficult toapply to many local galaxies, dubbed ““ peculiar,ÏÏ or anygalaxies imaged at low signal-to-noise (S/N) or apparentlysmall size (relative to the point-spread function). TheHubble-Sandage classiÐcation system was predicated onthe study of nearby ““ normal ÏÏ galaxiesÈluminous and rela-tively quiescent objects (Sandage 1961, Sandage & Tamman1987, Sandage & Bedke 1993). While the classiÐcationsystem developed by de Vaucouleurs et al. (1976) makes anattempt to push the framework to ““ later ÏÏ types, it stillsu†ers from the above shortcomings. Fundamentally, thesetraditional classiÐcation schemes are based on the conceptof pigeon-holing galaxies based on a reference set, or arche-types. These archetypes are selected from samples in thelocal universe and are preferentially axisymmetric systems.Since our local census is undoubtedly incomplete and sincegalaxies evolve, such reference sets by their very deÐnitionare incomplete. Thus it is not surprising that these systemsare of marginal utility in the study of dwarf galaxies, inter-acting galaxies, or galaxies at high redshift.
An alternative classiÐcation scheme could be based onquantitative indices, the interrelation of which is not prede-termined by a Ðnite reference set. This would permit gal-axies to be classiÐed, for example, in di†erent stages of their
evolution ; albeit the classiÐcation would be di†erent but thebasis set of indices would be the same. The goal of thispaper is to deÐne such a set of indices that can be used asquantitative, objective classiÐers of galaxies (1) over a widerange in redshift and (2) for wide range of galaxy types. Inparticular, we desire classiÐers that are well suited to typingboth ““ normal ÏÏ galaxies and the compact galaxies that arethe focus of a companion study (Jangren et al. 2000, here-after Paper II). We anticipate that such a classiÐcationscheme is both necessary and enabling for the explorationof the physical mechanisms driving galaxy evolution(Bershady 1999).
What are the desired characteristics of classiÐcationparameters? They should be physically interesting (closelyrelated to underlying physical properties of galaxies), modelindependent, and measurable for all galaxy types. It alsoshould be possible to accurately determine the parameterschosen for a wide range of image resolution and signal-to-noise ratios.
From HubbleÏs classiÐcation a posteriori we have learnedthat a strong correlation exists between galaxy spectral typeand apparent morphological featuresÈat least for thegalaxy types that Ðt well within his scheme. ThiscorrelationÈnoted by Hubble as early as 1936 (Hubble1936)Ècan loosely be termed a color-morphology relation,although the correlation is not necessarily limited to broad-band color. This is a triumph of HubbleÏs classiÐcationexplicitly because it is not part of the classiÐcation. Further-more, the correlation yields clues about the physical con-nection of the present matter distribution and the star
2645
2646 BERSHADY, JANGREN, & CONSELICE Vol. 119
formation histories in galaxies. But while morphology (orform) and spectral type are correlated, there is also signiÐ-cant dispersion in this correlation. Some of the morenotable deviations from the nominal color-morphologyrelation are found in the plethora of forms for spectrally““ late ÏÏ-type galaxies, the presence of E]A galaxies(Dressler & Gunn 1993), and the compact luminous blueemission-line galaxies studied in Paper II (as we shall show).This points to the importance of form and spectral type askey, yet independent, axes of a revised classiÐcation system.
However, the only example of such a revised classi-Ðcation system is that of Morgan (1958, 1959), where centrallight concentration is used as the primary classiÐcationparameter. Morgan was motivated by the facts that (1) asalient criterion used in classifying galaxies in the Hubble-Sandage system is the degree of central concentration oflight, (2) there was a signiÐcant dispersion in spectral typeand Hubble type (Humason, Mayall, & Sandage 1956), and(3) spectral type appeared to correlate more strongly withlight concentration. In this way, Morgan hoped to wed theclassiÐcation of stellar populations to the classiÐcation ofgalaxies. Nonetheless, he was compelled to introduce a sec-ondary parameter, i.e., the ““ form family,ÏÏ because there wasstill a dispersion of morphological forms within each of hisspectral types. Today, one should be able to improve uponMorganÏs scheme by introducing quantitative measures ofimage concentration and other indices of form and by inde-pendently assessing the spectral type via colors or spectra.
A number of subsequent attempts have been made toconstruct quantitative classiÐcation system that couldreplace or modify the current Hubble scheme. Yet theseschemes are generally based purely either on photometricform (e.g., Elmegreen & Elmegreen 1982 ; Okamura et al.1984 ; Watanabe, Kodaira, & Okamura. 1985 ; Doi, Fuku-gita, & Okamura 1993 ; Abraham et al. 1994 ; Odewahn1995 ; Han 1995) or spectral type (e.g., Bershady 1995 ; Con-nolly et al. 1995 ; Zaritsky, Zabludo†, & Willick 1995 ;Folkes, Lahav, & Maddox 1996 ; Bromley et al. 1998 ;Ronen, & Lahav 1999). In essence, theyArago� n-Salamanca,have relied implicitly on an assumed correlation betweengalaxy spectral type and apparent morphology. Relatedattempts have been made to use artiÐcial neural networksto reproduce the Hubble scheme in an objective way (e.g.,Burda & Feitzinger 1992 ; Storrie-Lombardi et al. 1992 ;Spiekermann 1992 ; Serra-Ricart et al. 1993 ; Naim et al.1995 ; Odewahn 1995 ; Odewahn et al. 1996). Yet these gono further in di†erentiating between spectral type and form.Only in WhitmoreÏs (1984) scheme are spectral and struc-tural parameters combined ; i.e., B[H color, size, andbulge-to-total ratio are used to deÐne two principal classi-Ðcation axes of scale and form. But again, the correlation(s)between galaxy spectral type, scale, and form are notexplicit.
Here we attempt to expand on MorganÏs program byfully quantifying the classiÐcation of form via image con-centration and several other structural parameters, andexplicitly using color as an indicator of spectral type. In thisstudy we choose to use only a single color (B[V ), but weanticipate that a more desirable future development wouldbe to include broadwavelength coverage, multicolor data,and spectroscopic line indices. Spectroscopic line indiceswould be required, for example, to identify E]A galaxies.While such galaxies are not the focus of the present work, acomprehensive classiÐcation scheme should be able to
isolate these systems and determine the range of their mor-phology (see Dressler & Gunn 1992, Couch et al. 1994, andWirth, Koo, & Kron 1994). Nonetheless, broadband colorsare a cost-e†ective way to characterize the spectral contin-uum (see Bershady 1995 and Connolly et al. 1995). Of moredirect relevance to the study at hand, a future elaborationincluding U[V and V [K would enhance the ability todistinguish between spectral types, particularly for galaxieswith extremely blue optical colors (e.g., Aaronson 1978 ;Bershady 1995).
We have also chosen to quantify form and scale via non-parametric measures, such as luminosity, half-light size andsurface brightness, asymmetry, and image concentration.An alternative, model-dependent approach is to decomposea galaxyÏs light proÐle into a disk and bulge. The traditionalone-dimensional decompositions are fraught with technicalproblems, such that decompositions can only be achievedreliably for about half of all disk galaxies (Kent 1985). Thenewer two-dimensional decomposition techniques aresuperior (e.g., de Jong 1996b) and have been shown to suc-cessfully reproduce observed light proÐles for faint galaxies(e.g., Simard et al. 1999). Indeed, one can argue that two-dimensional model Ðtting to imaging data is optimum interms of using the available information and for minimizingrandom error. At high S/N and high angular resolution,however, even the most ““ normal ÏÏ galaxies exhibit pecu-liarities (as discussed in more detail in ° 3.3.2), such thatsimple bulge-plus-disk models cannot reproduce these fre-quently observed peculiarities in light distributions withhigh Ðdelity. The situation worsens for ““ peculiar ÏÏ galaxies.For this reason we have some concerns about the unique-ness of the observationally derived model parameters andhence about their interpretation. We anticipate futuredevelopments that use the models and nonparametric mea-surements in a hybrid scheme optimal for characterizinggalaxy light distributions both in terms of random and sys-tematic errors.
It is worth noting again that bright galaxy samples arenotorious for missing or underrepresenting certain galaxytypesÈparticularly dwarfs and low surface brightness gal-axies. The samples used here are no exception. While thiswas one of our complaints about the classical Hubblescheme, there are two key di†erences with our approach : (1)the classiÐcation parameters we develop are objective, and(2) these parameters do not assume the presence of basicaxisymmetry, disk-plus-bulge structure, or spiral patterns,which underly the Hubble scheme. As we will show, thegalaxies examined here are sufficiently diverse to establishthe parameter space for a comprehensive classiÐcationscheme, although not the comprehensive classiÐcation itself.By developing an initial classiÐcation of these galaxies,however, we intend to use it as a foil against which we canbegin to compare the classiÐcation of more distant samples :How are the classiÐcations di†erent? Do the nearby anddistant samples occupy the same regions of parameterspace? If not, do the di†erences represent continuous exten-sions of these parameters, or are they physically disjoint?These are the types of questions one can address given thelimitations of current local samples. Note that we must stopshort of identifying di†erences as ““ new ÏÏ epoch-speciÐcclasses of galaxies. Without a complete census of both thenearby and distant universe, it is not possible to establishwhether there are di†erent classes of galaxies at di†erentredshifts ; apparent di†erences could simply be artifacts of
No. 6, 2000 CLASSIFICATION OF GALAXIES. I. 2647
the presently limited samples. With such a complete census,in the future we may hope to address the deeper issue ofhow the comoving space densities of di†erent classes evolve.
Toward the goal of establishing a comprehensive classi-Ðcation scheme of utility to distant galaxy studies, in thispaper we assemble a robust set of nonparametric, photo-metric and structural properties for a range of nearby lumi-nous galaxies. We deÐne a multivariate photometricparameter space that forms an initial classiÐcation schemefor these galaxies. This classiÐcation can be used reliably toidentify comparable samples in other surveys and at higherredshift. In the accompanying paper (Paper II) we measurethese properties for compact, luminous emission-line gal-axies at intermediate redshift, compare them with the““ normal ÏÏ nearby galaxies studied here, and demonstratethat our classiÐcation parameter space distinguishesbetween these two samples. We discuss the implications forthe evolution of this intermediate-redshift sample therein.In future papers in this series we intend to extend ouranalysis (1) to more representative samples of the localvolume that include dwarf and emission-line galaxies (e.g.,the University of Michigan Objective Prism Survey ; Salzeret al. 1989), (2) to more comprehensive samples of distantgalaxies (e.g., magnitude-limited samples from the HubbleDeep Field), and (3) to studies of the morphological evolu-tion of these distant samples. The classiÐcation scheme thatwe propose here is intended as a framework for these futurestudies.
The data sets are presented in ° 2 ; the analysis isdescribed in ° 3. The results are presented in ° 4 and sum-marized in ° 5. Throughout this paper we adopt H0\ 50km s~1 Mpc~1, "\ 0.q0\ 0.1,
2. NEARBY GALAXY SAMPLES
As a primary reference sample, 101 of the 113 localHubble-type galaxies from the catalog of Frei et al. (1996)were analyzed. This sample will deÐne what we mean by““ normal ÏÏ galaxies in this paper. This catalog is the onlydigital multiband sample publicly available that is reason-ably comprehensive ; it consists of ground-based CCDimages of bright galaxies, all apparently large (most havediameters of 4@È6@) and well resolved. As a result the samplecontains mostly luminous and physically large galaxies : outof the 101 objects we used in our analysis, only seven haveL \ 0.1 L *. We excluded 12 objects whose apparent sizeswere larger than the CCD Ðeld of view (thus their imagestructure parameters could not be well estimated). Two ofthe excluded objects are early-type galaxies (EÈS0), sevenare intermediate (SaÈSb), and three are late-type (ScÈIrr).1
ÈÈÈÈÈÈÈÈÈÈÈÈÈÈÈ1 The excluded objects are : NGC 2403, 2683, 3031, 3079, 3351, 3623,
4406, 4472, 4594, 4826, 5746, and 6503.
The majority of the remaining sample are spirals and S0galaxies. Frei et al. have removed foreground stars from theimages of the nearby galaxies, in a few cases leaving visiblescars ; except in the case of NGC 5792, these residuals didnot cause noticeable problems when determining the struc-tural parameters (° 3.3).
In several instances in the present analysis we referencethe sample of Kent (1984, 1985), which is composed of 53nearby, luminous, and physically large galaxies similar tothe Frei et al. sample. We Ðnd KentÏs sample useful forcomparison of both photometric and structural parameters.We also reference the sample of 196 normal (nonactive)Markarian galaxies studied by Huchra (1977a). Relevantcharacteristics of the above three samples are summarizedin Table 1, including an enumeration of the e†ective Ðltersystems used in each study. Further details on these photo-metric systems are found in the studies listed in the tableand references therein.
2.1. Comparison of Reference Samples with Emission-L ineGalaxy Samples
Both the Frei et al. and Kent samples are under-representative of dwarf galaxies and contain neither H II
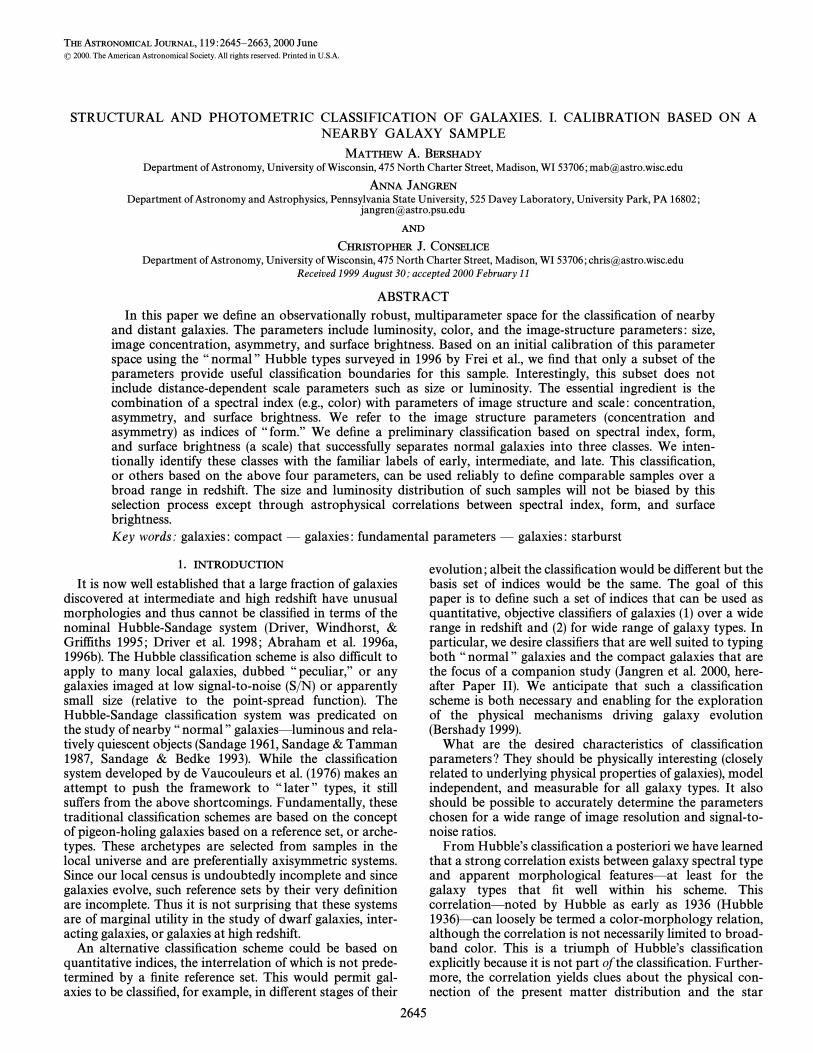
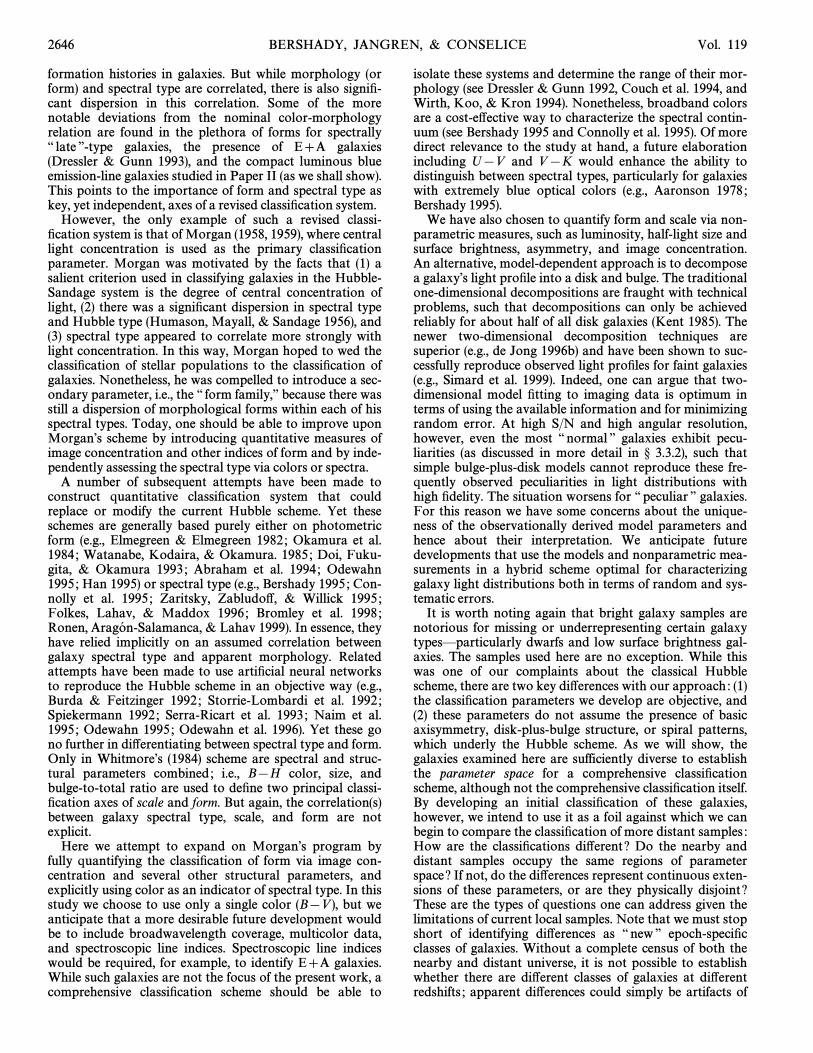
galaxies nor low surface brightness galaxies. The latterobjects have been shown to make up a signiÐcant fraction ofthe local galaxy population (de Jong 1995, 1996a). Clearlyour reference samples do not constitute a representativetemplate of the local population. Here we estimate wherethese samples may be particularly unrepresentative with aneye toward the study of faint galaxy samples in futurepapers. In Figures 1 and 2 we compare the Frei et al.samples photometric properties of color and luminositywith (1) the normal Markarian galaxies (Huchra 1977a), (2)dwarf spheroidals (as described in the following section),and (3) the intermediate-redshift samples presented in PaperII.
Since the Markarian galaxies were selected from objec-tive prism plates based on their strong UV continua, thesample is biased toward bluer colors than the Frei et al.galaxies and is thus likely more representative of star-forming galaxies. HuchraÏs sample contains fainter galaxiesthat extend the magnitude range down to andM
BD[14
the color-color locus blueward of B[V \ 0.4.The intermediate-redshift galaxies, also selected in part
because of their blue color (see Paper II), have blue lumi-nosities comparable to the brighter half of the Frei et al.sample, but with bluer colors. This places most of them in adistinct region of the color-luminosity plot from the Frei etal. sample. In contrast, the distribution of the Markariangalaxies extends into the region occupied by theintermediate-redshift objects. In the color-color diagram,again the intermediate-redshift galaxies largely overlap with
TABLE 1
NEARBY GALAXY DATA SETS
Survey N Distance Telescope Filters
Frei et al. (1996) . . . . . . 72 ¹41 Mpc Lowell 1.1 m BJ,R
29 ¹19 Mpc Palomar 1.3 m griKent (1984) . . . . . . . . . . . 53 ¹65 Mpc Whipple 0.6 m rHuchra (1977a) . . . . . . . 196 ¹286 Mpc Mount Wilson 2.5 m, UBV
Palomar 1.5 m
2648 BERSHADY, JANGREN, & CONSELICE
FIG. 1.ÈRest-frame B[V vs. for the nearby galaxy samples of FreiMBet al. and Kent (EÈS0, SaÈSb, and ScÈIrr) and HuchraÏs (1977a) samples of
normal Markarian galaxies (plus signs). The dotted outline indicates theapproximate locus of dE/dSph galaxies. The intermediate-redshift samplesfrom Paper II are also plotted for comparison : blue nucleated galaxies(BNGs), compact, narrow emission-line galaxies (CNELGs), and small,blue galaxies (SBGs). (The two SBGs and the BNG that we ultimatelydetermine not to be ““ luminous blue compact galaxies ÏÏ in Paper II areshown as hatched symbols.) Only a few Markarian galaxies and late-typegalaxies from the Frei et al. and Kent catalog share the extreme colorÈmagnitude properties of the intermediate-redshift objects. In this plot, andin Figs. 2È6, the vigorously star-forming galaxy NGC 4449 is labeled.Characteristic random errors are indicated separately for the Frei et al.sample and the intermediate-z objects.
the Markarian sample in the region corresponding toextreme blue colors not occupied by the Frei et al. or Kentsamples.
In short, the Frei et al. sample is spectro-photometricallydisjoint from extreme samples of blue star-forming galaxiesat intermediate redshift (e.g., Paper II), even though bothcontain intrinsically luminous and moderate to high surfacebrightness systems. Yet clearly there are local examples (e.g.,from Markarian) which are as blue and luminous as these
FIG. 2.ÈRest-frame U[B vs. B[V for the samples as in Fig. 1. Theintermediate-redshift samples of Paper II largely overlap with the bluestMarkarian galaxies, which extend blueward the color-color relation seenfor the ““ normal ÏÏ galaxies from Frei et al. and Kent.
intermediate-redshift, star-forming galaxies. These sourcesare simply missing from the Frei et al. sample. The compari-son of the global properties of the intermediate-redshift,compact, star-forming galaxies in Paper II to those of localgalaxies from Frei et al. (here) is then an initial step inmapping the range of galaxy types at any redshift. Furtherinvestigation of the nature and evolution of these types ofextreme, star-forming systems will be greatly facilitated byfuture work quantifying the image structure of localcounterparts B[V \ 0.4 and M
B\ [19.
2.2. Comparison of Reference Samples with DwarfSpheroidals
We have made some attempt where possible to access thephotometric and structural properties of other key dwarfpopulations. We schematically indicate the locus of dwarfellipticals/spheroidals in Figures 1 and 2, using data fromCaldwell (1983), Bingelli & Cameron (1991), and Bingelli &Jerjen (1998). The dwarf spheroidals occupy a virtuallyunpopulated region of the color-luminosity diagram at rela-tively red colors and low luminosity. The absence of suchobjects from most surveys is attributed typically to a selec-tion bias since these sources are at low surface brightness. Itis interesting to note that in the color-color diagram thedwarf spheroidals occupy a region overlapping with theearly- to intermediate-type spirals. Hence the integratedbroadband light of these systems is unusual compared withour reference samples only with respect to their luminosity.We refer to the dwarf spheroidal properties extensively infuture papers, where we also explore their image structuralproperties.
3. ANALYSIS
As noted in the introduction, many galaxies are sufficient-ly unusual that they cannot be classiÐed in terms of thenormal Hubble scheme. This becomes increasingly true atintermediate redshifts. The compact luminous emission-linegalaxies in Paper II are such an example. This is not due topoor spatial resolution, but to truly unusual morphologicalproperties, e.g., o†-centered nuclei, tails, asymmetricenvelopes, etc. To compare such objects morphologically to““ normal ÏÏ galaxies, we deÐne here six fundamental param-eters of galaxy type that are quantitative, can be reliablydetermined over a range in redshift, and are physicallymeaningful.
Two of these parameters are photometric, derivedfrom existing ground-based imaging and estimatedk-corrections : rest-frame color (B[V ) and absolute blueluminosity Two are image structure parameters,(M
B).
derived from multiaperture photometric analysis presentedbelow: physical half-light radius and image concentra-(R
e)
tion (C). One is a combined photometric-structural param-eter : average rest-frame surface brightness within(SB
e) R
e.
Of the three parameters luminosity, half-light radius, andsurface brightness, any one can obviously be derived fromthe other two. (We consider all three since in any givenrange of, e.g., luminosity, there is signiÐcant dispersion inboth and The sixth parameter, a 180¡ rotationalSB
eR
e.)
asymmetry index (A), utilizes the multiaperture photometryindirectly through deÐnition of the extraction radius forrotation ; we refer to A as a structural parameter. Table 2contains all individual measurements for the Frei et al.sources. Luminosities and all image-structure parametersare measured in the rest-frame B band.
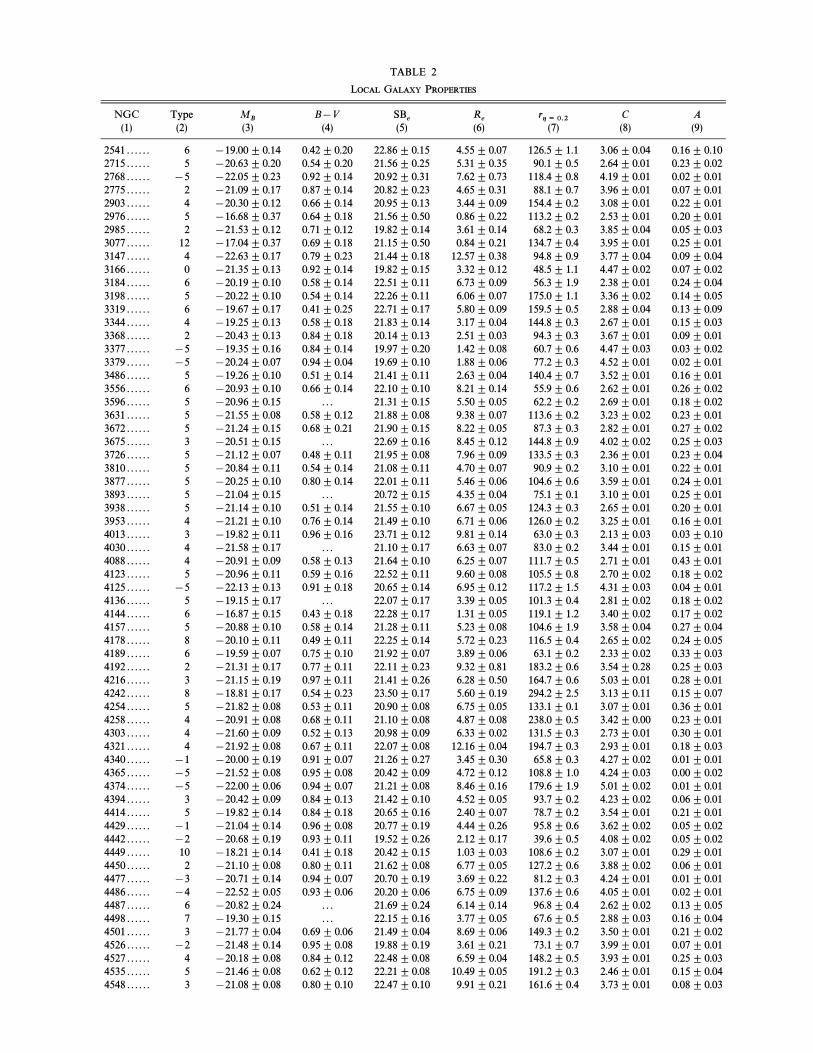
TABLE 2
LOCAL GALAXY PROPERTIES
NGC Type MB
B[V SBe
Re
rg / 0.2 C A(1) (2) (3) (4) (5) (6) (7) (8) (9)
2541 . . . . . . 6 [19.00^ 0.14 0.42 ^ 0.20 22.86 ^ 0.15 4.55 ^ 0.07 126.5^ 1.1 3.06 ^ 0.04 0.16 ^ 0.102715 . . . . . . 5 [20.63^ 0.20 0.54 ^ 0.20 21.56 ^ 0.25 5.31 ^ 0.35 90.1^ 0.5 2.64 ^ 0.01 0.23 ^ 0.022768 . . . . . . [5 [22.05^ 0.23 0.92 ^ 0.14 20.92 ^ 0.31 7.62 ^ 0.73 118.4^ 0.8 4.19 ^ 0.01 0.02 ^ 0.012775 . . . . . . 2 [21.09^ 0.17 0.87 ^ 0.14 20.82 ^ 0.23 4.65 ^ 0.31 88.1^ 0.7 3.96 ^ 0.01 0.07 ^ 0.012903 . . . . . . 4 [20.30^ 0.12 0.66 ^ 0.14 20.95 ^ 0.13 3.44 ^ 0.09 154.4^ 0.2 3.08 ^ 0.01 0.22 ^ 0.012976 . . . . . . 5 [16.68^ 0.37 0.64 ^ 0.18 21.56 ^ 0.50 0.86 ^ 0.22 113.2^ 0.2 2.53 ^ 0.01 0.20 ^ 0.012985 . . . . . . 2 [21.53^ 0.12 0.71 ^ 0.12 19.82 ^ 0.14 3.61 ^ 0.14 68.2^ 0.3 3.85 ^ 0.04 0.05 ^ 0.033077 . . . . . . 12 [17.04^ 0.37 0.69 ^ 0.18 21.15 ^ 0.50 0.84 ^ 0.21 134.7^ 0.4 3.95 ^ 0.01 0.25 ^ 0.013147 . . . . . . 4 [22.63^ 0.17 0.79 ^ 0.23 21.44 ^ 0.18 12.57 ^ 0.38 94.8^ 0.9 3.77 ^ 0.04 0.09 ^ 0.043166 . . . . . . 0 [21.35^ 0.13 0.92 ^ 0.14 19.82 ^ 0.15 3.32 ^ 0.12 48.5^ 1.1 4.47 ^ 0.02 0.07 ^ 0.023184 . . . . . . 6 [20.19^ 0.10 0.58 ^ 0.14 22.51 ^ 0.11 6.73 ^ 0.09 56.3^ 1.9 2.38 ^ 0.01 0.24 ^ 0.043198 . . . . . . 5 [20.22^ 0.10 0.54 ^ 0.14 22.26 ^ 0.11 6.06 ^ 0.07 175.0^ 1.1 3.36 ^ 0.02 0.14 ^ 0.053319 . . . . . . 6 [19.67^ 0.17 0.41 ^ 0.25 22.71 ^ 0.17 5.80 ^ 0.09 159.5^ 0.5 2.88 ^ 0.04 0.13 ^ 0.093344 . . . . . . 4 [19.25^ 0.13 0.58 ^ 0.18 21.83 ^ 0.14 3.17 ^ 0.04 144.8^ 0.3 2.67 ^ 0.01 0.15 ^ 0.033368 . . . . . . 2 [20.43^ 0.13 0.84 ^ 0.18 20.14 ^ 0.13 2.51 ^ 0.03 94.3^ 0.3 3.67 ^ 0.01 0.09 ^ 0.013377 . . . . . . [5 [19.35^ 0.16 0.84 ^ 0.14 19.97 ^ 0.20 1.42 ^ 0.08 60.7^ 0.6 4.47 ^ 0.03 0.03 ^ 0.023379 . . . . . . [5 [20.24^ 0.07 0.94 ^ 0.04 19.69 ^ 0.10 1.88 ^ 0.06 77.2^ 0.3 4.52 ^ 0.01 0.02 ^ 0.013486 . . . . . . 5 [19.26^ 0.10 0.51 ^ 0.14 21.41 ^ 0.11 2.63 ^ 0.04 140.4^ 0.7 3.52 ^ 0.01 0.16 ^ 0.013556 . . . . . . 6 [20.93^ 0.10 0.66 ^ 0.14 22.10 ^ 0.10 8.21 ^ 0.14 55.9^ 0.6 2.62 ^ 0.01 0.26 ^ 0.023596 . . . . . . 5 [20.96^ 0.15 . . . 21.31 ^ 0.15 5.50 ^ 0.05 62.2^ 0.2 2.69 ^ 0.01 0.18 ^ 0.023631 . . . . . . 5 [21.55^ 0.08 0.58 ^ 0.12 21.88 ^ 0.08 9.38 ^ 0.07 113.6^ 0.2 3.23 ^ 0.02 0.23 ^ 0.013672 . . . . . . 5 [21.24^ 0.15 0.68 ^ 0.21 21.90 ^ 0.15 8.22 ^ 0.05 87.3^ 0.3 2.82 ^ 0.01 0.27 ^ 0.023675 . . . . . . 3 [20.51^ 0.15 . . . 22.69 ^ 0.16 8.45 ^ 0.12 144.8^ 0.9 4.02 ^ 0.02 0.25 ^ 0.033726 . . . . . . 5 [21.12^ 0.07 0.48 ^ 0.11 21.95 ^ 0.08 7.96 ^ 0.09 133.5^ 0.3 2.36 ^ 0.01 0.23 ^ 0.043810 . . . . . . 5 [20.84^ 0.11 0.54 ^ 0.14 21.08 ^ 0.11 4.70 ^ 0.07 90.9^ 0.2 3.10 ^ 0.01 0.22 ^ 0.013877 . . . . . . 5 [20.25^ 0.10 0.80 ^ 0.14 22.01 ^ 0.11 5.46 ^ 0.06 104.6^ 0.6 3.59 ^ 0.01 0.24 ^ 0.013893 . . . . . . 5 [21.04^ 0.15 . . . 20.72 ^ 0.15 4.35 ^ 0.04 75.1^ 0.1 3.10 ^ 0.01 0.25 ^ 0.013938 . . . . . . 5 [21.14^ 0.10 0.51 ^ 0.14 21.55 ^ 0.10 6.67 ^ 0.05 124.3^ 0.3 2.65 ^ 0.01 0.20 ^ 0.013953 . . . . . . 4 [21.21^ 0.10 0.76 ^ 0.14 21.49 ^ 0.10 6.71 ^ 0.06 126.0^ 0.2 3.25 ^ 0.01 0.16 ^ 0.014013 . . . . . . 3 [19.82^ 0.11 0.96 ^ 0.16 23.71 ^ 0.12 9.81 ^ 0.14 63.0^ 0.3 2.13 ^ 0.03 0.03 ^ 0.104030 . . . . . . 4 [21.58^ 0.17 . . . 21.10 ^ 0.17 6.63 ^ 0.07 83.0^ 0.2 3.44 ^ 0.01 0.15 ^ 0.014088 . . . . . . 4 [20.91^ 0.09 0.58 ^ 0.13 21.64 ^ 0.10 6.25 ^ 0.07 111.7^ 0.5 2.71 ^ 0.01 0.43 ^ 0.014123 . . . . . . 5 [20.96^ 0.11 0.59 ^ 0.16 22.52 ^ 0.11 9.60 ^ 0.08 105.5^ 0.8 2.70 ^ 0.02 0.18 ^ 0.024125 . . . . . . [5 [22.13^ 0.13 0.91 ^ 0.18 20.65 ^ 0.14 6.95 ^ 0.12 117.2^ 1.5 4.31 ^ 0.03 0.04 ^ 0.014136 . . . . . . 5 [19.15^ 0.17 . . . 22.07 ^ 0.17 3.39 ^ 0.05 101.3^ 0.4 2.81 ^ 0.02 0.18 ^ 0.024144 . . . . . . 6 [16.87^ 0.15 0.43 ^ 0.18 22.28 ^ 0.17 1.31 ^ 0.05 119.1^ 1.2 3.40 ^ 0.02 0.17 ^ 0.024157 . . . . . . 5 [20.88^ 0.10 0.58 ^ 0.14 21.28 ^ 0.11 5.23 ^ 0.08 104.6^ 1.9 3.58 ^ 0.04 0.27 ^ 0.044178 . . . . . . 8 [20.10^ 0.11 0.49 ^ 0.11 22.25 ^ 0.14 5.72 ^ 0.23 116.5^ 0.4 2.65 ^ 0.02 0.24 ^ 0.054189 . . . . . . 6 [19.59^ 0.07 0.75 ^ 0.10 21.92 ^ 0.07 3.89 ^ 0.06 63.1^ 0.2 2.33 ^ 0.02 0.33 ^ 0.034192 . . . . . . 2 [21.31^ 0.17 0.77 ^ 0.11 22.11 ^ 0.23 9.32 ^ 0.81 183.2^ 0.6 3.54 ^ 0.28 0.25 ^ 0.034216 . . . . . . 3 [21.15^ 0.19 0.97 ^ 0.11 21.41 ^ 0.26 6.28 ^ 0.50 164.7^ 0.6 5.03 ^ 0.01 0.28 ^ 0.014242 . . . . . . 8 [18.81^ 0.17 0.54 ^ 0.23 23.50 ^ 0.17 5.60 ^ 0.19 294.2^ 2.5 3.13 ^ 0.11 0.15 ^ 0.074254 . . . . . . 5 [21.82^ 0.08 0.53 ^ 0.11 20.90 ^ 0.08 6.75 ^ 0.05 133.1^ 0.1 3.07 ^ 0.01 0.36 ^ 0.014258 . . . . . . 4 [20.91^ 0.08 0.68 ^ 0.11 21.10 ^ 0.08 4.87 ^ 0.08 238.0^ 0.5 3.42 ^ 0.00 0.23 ^ 0.014303 . . . . . . 4 [21.60^ 0.09 0.52 ^ 0.13 20.98 ^ 0.09 6.33 ^ 0.02 131.5^ 0.3 2.73 ^ 0.01 0.30 ^ 0.014321 . . . . . . 4 [21.92^ 0.08 0.67 ^ 0.11 22.07 ^ 0.08 12.16 ^ 0.04 194.7^ 0.3 2.93 ^ 0.01 0.18 ^ 0.034340 . . . . . . [1 [20.00^ 0.19 0.91 ^ 0.07 21.26 ^ 0.27 3.45 ^ 0.30 65.8^ 0.3 4.27 ^ 0.02 0.01 ^ 0.014365 . . . . . . [5 [21.52^ 0.08 0.95 ^ 0.08 20.42 ^ 0.09 4.72 ^ 0.12 108.8^ 1.0 4.24 ^ 0.03 0.00 ^ 0.024374 . . . . . . [5 [22.00^ 0.06 0.94 ^ 0.07 21.21 ^ 0.08 8.46 ^ 0.16 179.6^ 1.9 5.01 ^ 0.02 0.01 ^ 0.014394 . . . . . . 3 [20.42^ 0.09 0.84 ^ 0.13 21.42 ^ 0.10 4.52 ^ 0.05 93.7^ 0.2 4.23 ^ 0.02 0.06 ^ 0.014414 . . . . . . 5 [19.82^ 0.14 0.84 ^ 0.18 20.65 ^ 0.16 2.40 ^ 0.07 78.7^ 0.2 3.54 ^ 0.01 0.21 ^ 0.014429 . . . . . . [1 [21.04^ 0.14 0.96 ^ 0.08 20.77 ^ 0.19 4.44 ^ 0.26 95.8^ 0.6 3.62 ^ 0.02 0.05 ^ 0.024442 . . . . . . [2 [20.68^ 0.19 0.93 ^ 0.11 19.52 ^ 0.26 2.12 ^ 0.17 39.6^ 0.5 4.08 ^ 0.02 0.05 ^ 0.024449 . . . . . . 10 [18.21^ 0.14 0.41 ^ 0.18 20.42 ^ 0.15 1.03 ^ 0.03 108.6^ 0.2 3.07 ^ 0.01 0.29 ^ 0.014450 . . . . . . 2 [21.10^ 0.08 0.80 ^ 0.11 21.62 ^ 0.08 6.77 ^ 0.05 127.2^ 0.6 3.88 ^ 0.02 0.06 ^ 0.014477 . . . . . . [3 [20.71^ 0.14 0.94 ^ 0.07 20.70 ^ 0.19 3.69 ^ 0.22 81.2^ 0.3 4.24 ^ 0.01 0.01 ^ 0.014486 . . . . . . [4 [22.52^ 0.05 0.93 ^ 0.06 20.20 ^ 0.06 6.75 ^ 0.09 137.6^ 0.6 4.05 ^ 0.01 0.02 ^ 0.014487 . . . . . . 6 [20.82^ 0.24 . . . 21.69 ^ 0.24 6.14 ^ 0.14 96.8^ 0.4 2.62 ^ 0.02 0.13 ^ 0.054498 . . . . . . 7 [19.30^ 0.15 . . . 22.15 ^ 0.16 3.77 ^ 0.05 67.6^ 0.5 2.88 ^ 0.03 0.16 ^ 0.044501 . . . . . . 3 [21.77^ 0.04 0.69 ^ 0.06 21.49 ^ 0.04 8.69 ^ 0.06 149.3^ 0.2 3.50 ^ 0.01 0.21 ^ 0.024526 . . . . . . [2 [21.48^ 0.14 0.95 ^ 0.08 19.88 ^ 0.19 3.61 ^ 0.21 73.1^ 0.7 3.99 ^ 0.01 0.07 ^ 0.014527 . . . . . . 4 [20.18^ 0.08 0.84 ^ 0.12 22.48 ^ 0.08 6.59 ^ 0.04 148.2^ 0.5 3.93 ^ 0.01 0.25 ^ 0.034535 . . . . . . 5 [21.46^ 0.08 0.62 ^ 0.12 22.21 ^ 0.08 10.49 ^ 0.05 191.2^ 0.3 2.46 ^ 0.01 0.15 ^ 0.044548 . . . . . . 3 [21.08^ 0.08 0.80 ^ 0.10 22.47 ^ 0.10 9.91 ^ 0.21 161.6^ 0.4 3.73 ^ 0.01 0.08 ^ 0.03
2650 BERSHADY, JANGREN, & CONSELICE Vol. 119
TABLE 2ÈContinued
NGC Type MB
B[V SBe
Re
rg / 0.2 C A(1) (2) (3) (4) (5) (6) (7) (8) (9)
4559 . . . . . . 6 [20.48^ 0.11 0.43 ^ 0.16 21.12 ^ 0.12 4.05 ^ 0.05 135.4^ 0.2 2.71 ^ 0.01 0.22 ^ 0.034564 . . . . . . [5 [20.05^ 0.09 0.90 ^ 0.07 20.31 ^ 0.11 2.28 ^ 0.08 46.0^ 0.7 4.38 ^ 0.04 0.02 ^ 0.034569 . . . . . . 2 [21.80^ 0.18 0.70 ^ 0.11 21.82 ^ 0.24 10.23 ^ 0.75 179.4^ 0.8 3.39 ^ 0.01 0.15 ^ 0.034571 . . . . . . 7 [20.21^ 0.17 0.49 ^ 0.10 22.59 ^ 0.23 7.02 ^ 0.51 111.0^ 0.4 2.73 ^ 0.02 0.08 ^ 0.074579 . . . . . . 3 [21.58^ 0.10 0.78 ^ 0.11 21.25 ^ 0.11 7.13 ^ 0.18 135.5^ 0.4 3.97 ^ 0.01 0.06 ^ 0.024593 . . . . . . 3 [22.25^ 0.25 . . . 21.38 ^ 0.30 10.32 ^ 0.73 96.7^ 0.5 3.98 ^ 0.02 0.09 ^ 0.014621 . . . . . . [5 [21.48^ 0.22 0.92 ^ 0.08 19.46 ^ 0.30 2.98 ^ 0.28 60.0^ 0.3 4.17 ^ 0.02 0.01 ^ 0.014636 . . . . . . [5 [21.60^ 0.12 0.92 ^ 0.14 20.84 ^ 0.13 5.95 ^ 0.16 133.5^ 0.4 3.89 ^ 0.01 0.01 ^ 0.014651 . . . . . . 5 [20.7^ 0.10 0.56 ^ 0.12 21.78 ^ 0.12 6.04 ^ 0.19 103.6^ 1.1 4.34 ^ 0.02 0.11 ^ 0.034654 . . . . . . 6 [20.90^ 0.10 0.58 ^ 0.14 21.76 ^ 0.10 6.58 ^ 0.07 106.8^ 0.3 2.75 ^ 0.02 0.20 ^ 0.044689 . . . . . . 4 [20.48^ 0.14 0.63 ^ 0.11 22.87 ^ 0.17 9.06 ^ 0.46 149.3^ 1.7 3.66 ^ 0.03 0.07 ^ 0.084710 . . . . . . [1 [20.21^ 0.14 0.88 ^ 0.18 21.50 ^ 0.15 4.25 ^ 0.09 77.2^ 0.3 3.33 ^ 0.01 0.05 ^ 0.014725 . . . . . . 2 [21.38^ 0.13 0.70 ^ 0.19 21.95 ^ 0.13 8.96 ^ 0.07 212.1^ 5.4 3.75 ^ 0.00 0.08 ^ 0.054731 . . . . . . 6 [21.19^ 0.15 0.41 ^ 0.21 22.40 ^ 0.15 10.08 ^ 0.11 145.2^ 0.8 3.18 ^ 0.03 0.27 ^ 0.044754 . . . . . . [3 [20.68^ 0.14 0.90 ^ 0.11 19.58 ^ 0.18 2.17 ^ 0.11 42.148^ 1.8 4.22 ^ 0.02 0.00 ^ 0.024861 . . . . . . 9 [19.52^ 0.23 . . . 23.66 ^ 0.23 8.37 ^ 0.08 110.7^ 1.2 3.58 ^ 0.04 0.14 ^ 0.074866 . . . . . . [1 [20.17^ 0.10 0.90 ^ 0.14 20.35 ^ 0.10 2.46 ^ 0.03 62.7^ 0.6 3.91 ^ 0.03 0.04 ^ 0.035005 . . . . . . 4 [21.86^ 0.10 0.80 ^ 0.11 20.57 ^ 0.11 5.92 ^ 0.15 96.7^ 0.4 3.91 ^ 0.01 0.20 ^ 0.015033 . . . . . . 5 [21.54^ 0.10 0.55 ^ 0.15 22.04 ^ 0.11 10.05 ^ 0.12 166.2^ 1.4 4.69 ^ 0.02 0.18 ^ 0.055055 . . . . . . 4 [20.78^ 0.10 0.72 ^ 0.14 21.14 ^ 0.10 4.69 ^ 0.05 216.5^ 0.6 3.45 ^ 0.00 0.19 ^ 0.025204 . . . . . . 9 [17.58^ 0.14 0.41 ^ 0.18 21.79 ^ 0.15 1.45 ^ 0.04 90.5^ 1.0 2.88 ^ 0.07 0.25 ^ 0.065248 . . . . . . 4 [21.82^ 0.13 0.65 ^ 0.18 21.34 ^ 0.13 8.32 ^ 0.08 103.6^ 0.3 3.19 ^ 0.02 0.20 ^ 0.025322 . . . . . . [5 [22.34^ 0.16 0.89 ^ 0.18 20.99 ^ 0.18 8.97 ^ 0.36 105.3^ 3.2 4.87 ^ 0.02 0.02 ^ 0.015334 . . . . . . 5 [21.01^ 0.22 . . . 23.41 ^ 0.22 14.84 ^ 0.23 126.3^ 1.4 3.36 ^ 0.04 0.09 ^ 0.125364 . . . . . . 4 [21.84^ 0.22 0.61 ^ 0.18 22.29 ^ 0.29 12.97 ^ 1.09 161.5^ 0.7 2.97 ^ 0.01 0.15 ^ 0.025371 . . . . . . 4 [22.45^ 0.14 0.68 ^ 0.20 21.64 ^ 0.14 12.73 ^ 0.06 105.7^ 0.2 2.61 ^ 0.02 0.14 ^ 0.025377 . . . . . . 1 [21.14^ 0.18 0.89 ^ 0.18 21.38 ^ 0.21 6.18 ^ 0.34 76.2^ 0.9 4.32 ^ 0.03 0.07 ^ 0.025585 . . . . . . 7 [18.79^ 0.14 0.46 ^ 0.20 21.97 ^ 0.15 2.74 ^ 0.05 135.8^ 0.5 2.80 ^ 0.02 0.16 ^ 0.035669 . . . . . . 6 [20.85^ 0.21 . . . 21.61 ^ 0.21 6.00 ^ 0.06 84.8^ 0.5 2.74 ^ 0.04 0.19 ^ 0.065701 . . . . . . 0 [21.30^ 0.14 0.84 ^ 0.20 20.73 ^ 0.14 4.91 ^ 0.04 52.1^ 0.3 4.28 ^ 0.01 0.05 ^ 0.025792 . . . . . . 3 [21.35^ 0.13 0.78 ^ 0.18 22.19 ^ 0.13 9.85 ^ 0.11 90.1^ 0.7 3.32 ^ 0.02 0.36 ^ 0.035813 . . . . . . [5 [21.74^ 0.15 0.94 ^ 0.18 21.02 ^ 0.17 6.89 ^ 0.24 83.4^ 0.9 4.07 ^ 0.03 0.03 ^ 0.025850 . . . . . . 3 [21.68^ 0.13 0.74 ^ 0.18 21.54 ^ 0.13 8.51 ^ 0.09 109.2^ 1.5 3.99 ^ 0.04 0.08 ^ 0.035985 . . . . . . 3 [22.09^ 0.13 0.74 ^ 0.18 22.20 ^ 0.13 13.99 ^ 0.06 107.1^ 0.5 2.71 ^ 0.01 0.11 ^ 0.026015 . . . . . . 6 [20.45^ 0.10 0.56 ^ 0.14 21.76 ^ 0.11 5.34 ^ 0.07 91.4^ 0.4 2.70 ^ 0.01 0.19 ^ 0.026118 . . . . . . 6 [21.10^ 0.13 0.64 ^ 0.18 22.38 ^ 0.13 9.62 ^ 0.10 112.8^ 0.7 2.78 ^ 0.03 0.14 ^ 0.046384 . . . . . . 4 [22.14^ 0.14 0.61 ^ 0.20 21.42 ^ 0.14 9.95 ^ 0.06 138.5^ 0.5 3.27 ^ 0.02 0.13 ^ 0.02
NOTE.ÈCol. (1) : galaxy identiÐcation. Col. (2) : morphological type of the galaxy. Col. (3) : absolute B-band magnitude. Col. (4) : rest-frameB[V color. Col. (5) : average surface brightness within the half-light radius. Col. (6) : half-light radius (in kpc). Col. (7) : radius corresponding tog \ 0.2 (in arcseconds). Col. (8) : image concentration. Col. (9) : image asymmetry. Quantities in columns (5)È(9) are for the observed or gB
Jbands.
3.1. Photometric Parameters : Rest-Frame Color andL uminosity
While the Frei et al. (1996) data set contains images forBJ75% of the sample and g-band images for the remaining
objects, there is no blue bandpass in which observations areavailable for all galaxies (see Table 1). We have made acomparison of the apparent (uncorrected) B magnitudeslisted in the Third Reference Catalogue of Bright Galaxies(de Vaucouleurs et al. 1991, hereafter RC3) with thosederived from our photometry of the Frei et al. images,appropriately transformed to the B band using the tabulat-ed corrections of Frei & Gunn (1994). This comparisonshows that, while the two magnitude estimates do not di†erin the mean, there is a 0.25 mag (rms) scatter. To avoid theuncertainty associated with SED-dependent color trans-formations (see also ° A.3) we use the RC3 uncorrected Bmagnitudes and B[V colors, instead of the values from ourown photometry.
We apply k-corrections and corrections for Galacticextinction to the B[V colors and apparent B-band magni-tudes of the nearby galaxy sample in the manner described
in RC3. The heliocentric velocities of the galaxies arevhcsmall (no greater than 3000 km s~1 for any object) ; theaverage velocity is km s~1. Hence the associ-SvhcT D 1000ated k-corrections are \0.05 mag. We use the distancesgiven in the Nearby Galaxies Catalogue (Tully 1988), recal-culated to km s~1 Mpc~1, to derive absolute mag-H0\ 50nitudes from the corrected apparent magnitudes. NoteM
Bwe do not correct for internal extinction since the suitabilityand procedure for applying such corrections may be illdeÐned for higher redshift galaxies.
3.2. Multiaperture PhotometryTo characterize the light distributions of the galaxies, we
performed multiaperture photometry on all images. Theapertures are centered at the intensity-weighted centroid ofeach object. Since much of the proÐle shape information iscontained in the central parts of the image, logarithmicallyspaced apertures are used. For the photometry of theHubble Space Telescope (HST ) images in Paper II, the smal-lest aperture corresponds to the largest to 15A ; for the0A.05,nearby galaxy photometry here, the aperture radii are
No. 6, 2000 CLASSIFICATION OF GALAXIES. I. 2651
scaled to correspond to similar linear sizes. The aperturesare circular to accommodate the irregular morphology ofthe intermediate redshift galaxies in Paper II that would bedifficult to Ðt with another geometrical Ðgure. The efficacyof this approach is addressed in more detail below and inthe Appendix (° A.3).
3.3. Structural ParametersImage structure is most commonly quantiÐed via bulgeÈ
disk decomposition, yielding a bulge-to-total ratio B/T . Werefrain from this approach here, for reasons we alluded to inthe introduction. For example, B/T parameter may bepoorly deÐned for asymmetric and compact galaxies.Irregularities in the surface brightness proÐles, which can becaused by asymmetric structure, rings, or lenses, also causeproblems for bulgeÈdisk decompositions. While Kentshowed that the concentration parameter correlates wellwith the bulge-to-total ratio, this holds only for objects withB/T \ 0.63. At larger values of B/T , bulge-disk decomposi-tion fails for several objects in KentÏs sample, resulting ingalaxies of type S0ÈSa being given extremely high values ofB/T . BulgeÈdisk decomposition also becomes unreliablewhen galaxy disks are fainter than the bulges.
It is worth noting again that these problems mainly arisefrom older, one-dimensional methods of decomposition.The newer two-dimensional decomposition techniques areclearly successful at reproducing the observed light proÐleswith remarkably small residuals (Schade et al. 1995, 1996 ;Simard 1998 ; Marleau & Simard 1998). Still, there arephysical situations where bulgeÈdisk decomposition tech-niques in general become problematic, namely, where theastrophysical reality is more complex than simple bulgeÈdisk models. Some galaxies have central condensationsbetter described by an exponential proÐle rather than anr1@4 law (Wyse et al. 1997) ; many galaxies have strongbisymmetries, such as bars ; virtually all galaxies havevarying degrees of asymmetry due to star formation, dust,or large-scale gravitational perturbations and lopsidedness.All of these features represent details that decompositioninto bulge and disk components do not address correctly.Simple disk and bulge decomposition is also inadequate fordisk galaxies where the luminosity proÐle deviates from apure exponential (Freeman 1970) ; e.g., type I and type IIdisks. (Type I disk proÐles have an added component whichcontributes to the light just outside the bulge region ; thesurface brightness of a type II proÐle shows the oppositebehavior [an inner truncation], and drops below the level ofan exponential proÐle in the region near the center.)
Given the astrophysical complexity of real galaxies, thephysical interpretation of the derived model parameters ofdisk-bulge Ðts remains uncertain. Nonetheless, such proÐle-Ðtting methods should be useful for estimating nonpara-metric structural and photometric parameters (e.g.,characteristic sizes, surface brightness, image concentration,and ellipticity) in a way that uses the data in an optimalmanner. In the current e†ort, however, we have taken acompletely nonparametric approach of measuring sizes,surface brightness, image concentration, and asymmetryusing multiaperture photometry, rather than deriving amodel-dependent B/T parameter.
3.3.1. Half-L ight Radii and Surface Brightness
We deÐne Ðrst our working deÐnition of a total magni-tude, since it represents the critical zero point for measure-
ment of the half-light radius and surface brightness. We usethe dimensionless parameter g to deÐne the total aperture ofthe galaxiesÈa limiting radius which is not based on iso-photes.2 The concept of deÐning the size of a galaxy basedon the rate of change in the enclosed light as a function ofradius was Ðrst introduced by Petrosian (1976). In terms ofintensity, g can be deÐned as the ratio of the average surfacebrightness within radius r to the local surface brightness at r(Djorgovski & Spinrad 1981 ; Sandage & Perelmuter 1990).Like Wirth et al. (1994), we follow KronÏs (1995) suggestionto use the inverted form g(r) 4 I(r)/SI(r)T, which equals oneat the center of the galaxy and approaches zero at largegalactic radii. The radius r(g \ 0.5) corresponds roughly tothe half-light radius r
e.
Since g is deÐned as an intensity ratio, it is not a†ected bythe surface brightness dimming e†ect that makes the use ofisophotes problematic. Moreover, g is only dependent onthe surface brightness within a given radius and not on anyprior knowledge of total luminosity or the shape of the lightproÐle. These properties make it advantageous for faintobject photometry. We deÐned the ““ total ÏÏ aperture of theintermediate-redshift objects as twice the radius r(g \ 0.2).The apparent total magnitudes are then deÐned within thisaperture. For ideal Gaussian or exponential proÐles, themagnitude within the radius 2r(g \ 0.2) is approx-m0.2imately equal to the true total magnitude more thanmtot ;99% of the light is included within the radius r(g \ 0.2). Foran r1@4 law proÐle, there is a di†erence m0.2[ mtotD 0.13mag ; this is due to the slow decline in luminosity at largeradii that characterizes this proÐle. The radius r(g \ 0.2)was chosen based on visual inspection of the curves ofgrowth derived from the aperture photometry out to largeradii.
For reference, the theoretical value for the ratio ofr(g \ 0.2) to half-light radius is 2.16, 1.95, and 1.82 for threestandard proÐles : exponential, Gaussian, and r1@4 law,respectively. The observed ratio is 2.3^ 0.3 forB[V \ 0.85 (with little trend with color), but it rises slight-ly (2.6^ 0.25) for the reddest galaxies with B[V [ 0.85. Acontributing cause to this rise is that for about half of thereddest objects, has been underestimated by D20%r1@2because of their higher ellipticity. As we show in the Appen-dix (° A.3.2), the half-light radii of early-type galaxies withaxis ratio a/b [ 2 are systematically underestimated by upto 30%. This e†ect will also cause small changes to themeasured image concentration (° 3.3.2) of these galaxies.
Finally, the angular half-light radii were determinedrefrom the normalized curves of growth. Based on andM
B(corrected) we calculated the photometric-structuralReparameter the average blue surface brightness withinSBe,
the half-light radius, for all objects. For the nearby galaxysample, the Tully catalog distances (as described in ° 3.1)were used to determine (kpc).R
e3.3.2. Image Concentration
We use the image concentration parameter C as deÐnedby Kent (1985), which is based on the curve of growth. Thisparameter was shown to be closely correlated with Hubble
ÈÈÈÈÈÈÈÈÈÈÈÈÈÈÈ2 Isophotal radii introduce redshift-dependent biases unless careful con-
sideration and corrections are made for dimming due to the expansion[P(1] z)~3 in broadband photon counts] and k-corrections. While suchredshift-dependent biases are not an issue for the samples studied in thispaper, in future papers in the series this would be an issue were we not toavoid isophotes.
2652 BERSHADY, JANGREN, & CONSELICE Vol. 119
type for ““ normal ÏÏ galaxies
C4 5 log (ro/r
i) .
In the above equation, and are the outer and innerro
riradii, enclosing some fraction of the total Ñux. In contrast,
the concentration parameter deÐned by Abraham et al.(1994) is not based on curve of growth radii, but on a Ñuxratio within two isophotal radii.
However, in practice Kent also uses isophotes : Hereplaces the outer radius which encloses 80% of the totalro,light, by the radius of the 24th mag arcsec~2 isophote. Hehas demonstrated that this radius encloses D79% of thetotal light for all galaxy types in the restrictive conÐnes ofhis sample (Kent 1984). Because of the surface brightnessdimming e†ect that becomes important for nonlocal gal-axies, we instead use a method that is independent of iso-photes. The total aperture of the galaxy, which determinesthe curve of growth, is deÐned based on the g-radius asdescribed in ° 3.3.1.
We have also explored the possibility of using g-radii todeÐne a concentration parameter. However, a concentra-tion parameter based on the curve of growth was ultimatelyfound to be the more robust measure : the curve of growthincreases monotonically with galactic radius for all objects,while the g(r) function will be nonmonotonic for a““ bumpy ÏÏ light proÐle (like that of a well-resolved spiralgalaxy). As a consequence, image concentration deÐned bythe curve of growth rather than g exhibits less scatter whenplotted against other correlated observables (e.g., color,surface brightness) than an image concentration parameterbased on the g-function.
Anticipating our need to measure image concentrationfor small galaxies in Paper II and future papers in thisseries, we have studied the e†ects of spatial resolution andS/N on C. Here we focus primarily on resolution, as thiswas the dominant e†ect. The importance of resolution isdemonstrated by the comparison of Schade et al. (1996) ofdecompositions of compact objects in ground-based andHST images : the cores of the blue nucleated galaxies arenot resolved in ground-based imaging, and hence they arefrequently misclassiÐed as having much lower B/T ratiosthan what is revealed by HST imaging. In Paper II weanalyze this sample of galaxies, and hence this illustration isof particular relevance.
Resolution e†ects on image concentration were estimatedby block-averaging the images of nearby galaxy sampleover a range of values until the spatial sampling (as mea-sured in pixels per half-light radius) was comparable to thatof the compact galaxies at intermediate redshift observedwith the HST Wide Field Planetary Camera 2 (WFPC2).The details of these simulations are presented in the Appen-dix (° A.1). In short, as the objectsÏ half-light radii getsmaller, the scatter in the measured concentration indicesincreases. While larger inner radii or a smaller outer radiidecrease this scatter (because of improved resolution andS/N, respectively), such choices decrease the dynamic rangeof the concentration index.
Based on these simulations, we chose a deÐnition of Cthat is, to Ðrst order, sufficiently robust to allow a directcomparison of the image concentration of the local and thehigher redshift samples studied here and in Paper IIand, furthermore, gives a large dynamic range :C\ 5 log [r(80%)/r(20%)]. This concentration index isremarkably stable : the mean concentration does not
deviate from that measured in the original image by morethan 0.2, or D8% of the dynamic range in C, down toresolution of 5 pixels per half-light radius.
Our deÐnition is sufficiently close to that of Kent (1985)so that it is meaningful to compare our values directly withthose he determined from photometric analysis of a sampleof nearby galaxies. With this choice of radii, a theoreticalr1@4-law proÐle has C\ 5.2, an exponential proÐle hasC\ 2.7, and a Gaussian has C\ 2.1. These values agreewell with the results of KentÏs analysis : he Ðnds that ellip-tical galaxies have CD 5.2, and late-type spirals haveCD 3.3.
Lastly, since we use circular apertures, the measuredimage concentration may be a†ected by the ellipticity of thegalaxy. Based on the comparison between our results forthe Frei et al. sample and those of KentÏs elliptical aperturephotometry, we believe this to be a negligible e†ect in allcases but the earliest, must elliptic galaxies. Wirth et al.(1994) found that for an r1@4 law proÐle with axis ratiob/a \ 0.2, the change in C is less than 5%. The e†ectappears to be larger in our study. A more detailed descrip-tion of this possible systematic is given in the Appendix.
3.3.3. Image Asymmetry
The last image structure parameter is rotational asym-metry A, as deÐned by Conselice et a. (2000). This deÐnitiondi†ers from earlier methods in that the asymmetry is deter-mined within a constant g-radius of g \ 0.2, a noise correc-tion is applied, and an iterative procedure which minimizesA is used to deÐne the center of rotation. This algorithmwas tested to be robust to changes in spatial resolution andsignal-to-noise by Conselice et al. (2000) using simulationssimilar to those described here for the concentration param-eter C ; the systematics with resolution are below 10% of theoriginal value for galaxies in this paper and in Paper II.
3.3.4. Morphological K-Corrections
To obviate the issue of ““ morphological ÏÏ k-corrections,image structural parameters should ideally be measured atthe same rest-frame wavelength for all objects. Anticipatingour needs to derive the structural parameters forintermediate-redshift objects in Paper II (and future papersin this series), we have adopted the following protocol : (1)For the nearby galaxy sample we use the images in the B
Jand g bands to derive the primary local image structureparameters. (The rest-frame wavelengths sampled by theR, rÈband images correspond to bands redshifted into thenear-infrared for the intermediate-redshift galaxies.) (2) Weuse the multiband images of the Frei et al. sample to deter-mine corrections to compensate for the wavelength depen-dence of asymmetry, concentration, and half-lightradiusÈas described in the Appendix (° A.2). For example,WFPC2 images in the band of objects betweenI8140.3\ z\ 0.8 correspond to Ðrst order to the rest-wavelength range of the and g bands. Nonetheless, theB
Je†ective rest-wavelength for such intermediate-redshift gal-axies is typically slightly redward of rest frame and gB
Jbands. The corrections in ° A.2 are suitable for suchsamples, as well as higher redshift samples imaged in redderbands.
4. RESULTS
4.1. Mean Properties, Distributions, and CorrelationsThe mean properties for our six parameters B[V ,(M
B,
C, and A) are listed in Table 3 as a function ofRe, SB
e,
No. 6, 2000 CLASSIFICATION OF GALAXIES. I. 2653
TABLE 3
AVERAGE GALAXY PROPERTIES
Type Sample MB
B[V Re
SBe
C A(1) (2) (3) (4) (5) (6) (7) (8)
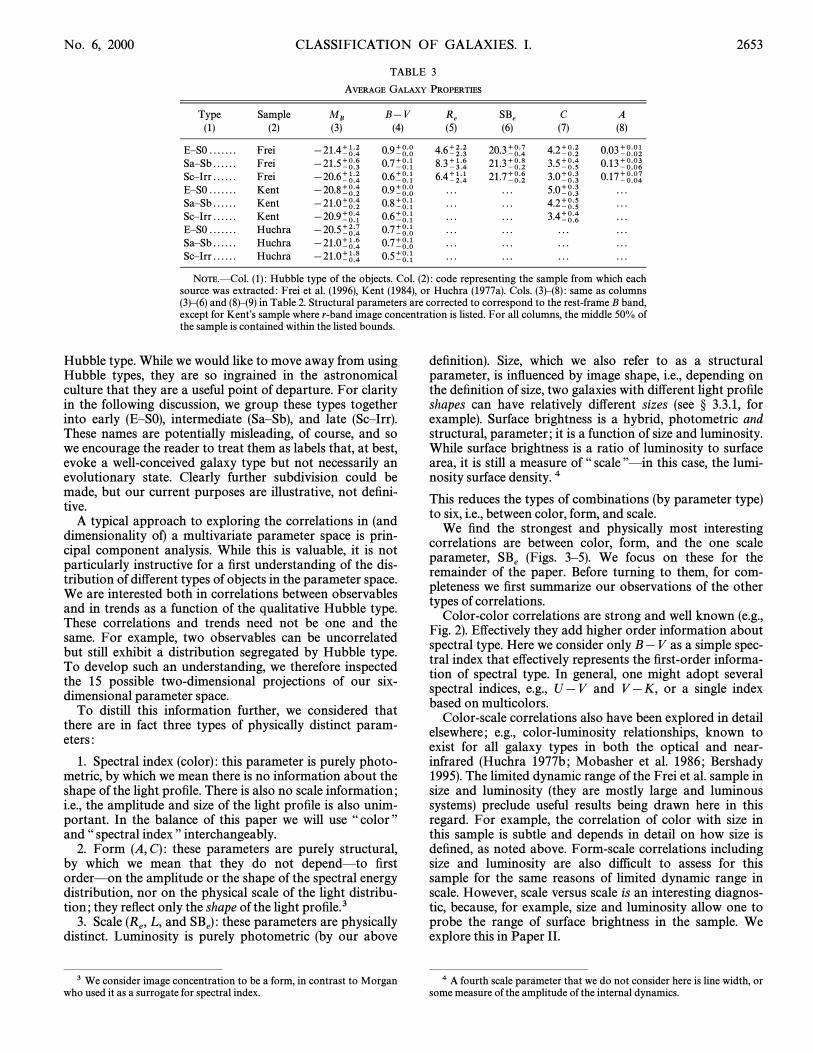
EÈS0 . . . . . . . Frei [21.4~0.4`1.2 0.9~0.0`0.0 4.6~2.3`2.2 20.3~0.4`0.7 4.2~0.2`0.2 0.03~0.02`0.01SaÈSb . . . . . . Frei [21.5~0.3`0.6 0.7~0.1`0.1 8.3~3.4`1.6 21.3~0.2`0.8 3.5~0.5`0.4 0.13~0.06`0.03ScÈIrr . . . . . . Frei [20.6~0.4`1.2 0.6~0.1`0.1 6.4~2.4`1.1 21.7~0.2`0.6 3.0~0.3`0.3 0.17~0.04`0.07EÈS0 . . . . . . . Kent [20.8~0.2`0.4 0.9~0.0`0.0 . . . . . . 5.0~0.3`0.3 . . .SaÈSb . . . . . . Kent [21.0~0.2`0.4 0.8~0.1`0.1 . . . . . . 4.2~0.5`0.5 . . .ScÈIrr . . . . . . Kent [20.9~0.1`0.4 0.6~0.1`0.1 . . . . . . 3.4~0.6`0.4 . . .EÈS0 . . . . . . . Huchra [20.5~0.4`2.7 0.7~0.0`0.1 . . . . . . . . . . . .SaÈSb . . . . . . Huchra [21.0~0.4`1.6 0.7~0.0`0.1 . . . . . . . . . . . .ScÈIrr . . . . . . Huchra [21.0~0.4`1.8 0.5~0.1`0.1 . . . . . . . . . . . .
NOTE.ÈCol. (1) : Hubble type of the objects. Col. (2) : code representing the sample from which eachsource was extracted : Frei et al. (1996), Kent (1984), or Huchra (1977a). Cols. (3)È(8) : same as columns(3)È(6) and (8)È(9) in Table 2. Structural parameters are corrected to correspond to the rest-frame B band,except for KentÏs sample where r-band image concentration is listed. For all columns, the middle 50% ofthe sample is contained within the listed bounds.
Hubble type. While we would like to move away from usingHubble types, they are so ingrained in the astronomicalculture that they are a useful point of departure. For clarityin the following discussion, we group these types togetherinto early (EÈS0), intermediate (SaÈSb), and late (ScÈIrr).These names are potentially misleading, of course, and sowe encourage the reader to treat them as labels that, at best,evoke a well-conceived galaxy type but not necessarily anevolutionary state. Clearly further subdivision could bemade, but our current purposes are illustrative, not deÐni-tive.
A typical approach to exploring the correlations in (anddimensionality of) a multivariate parameter space is prin-cipal component analysis. While this is valuable, it is notparticularly instructive for a Ðrst understanding of the dis-tribution of di†erent types of objects in the parameter space.We are interested both in correlations between observablesand in trends as a function of the qualitative Hubble type.These correlations and trends need not be one and thesame. For example, two observables can be uncorrelatedbut still exhibit a distribution segregated by Hubble type.To develop such an understanding, we therefore inspectedthe 15 possible two-dimensional projections of our six-dimensional parameter space.
To distill this information further, we considered thatthere are in fact three types of physically distinct param-eters :
1. Spectral index (color) : this parameter is purely photo-metric, by which we mean there is no information about theshape of the light proÐle. There is also no scale information ;i.e., the amplitude and size of the light proÐle is also unim-portant. In the balance of this paper we will use ““ color ÏÏand ““ spectral index ÏÏ interchangeably.
2. Form (A,C) : these parameters are purely structural,by which we mean that they do not dependÈto ÐrstorderÈon the amplitude or the shape of the spectral energydistribution, nor on the physical scale of the light distribu-tion ; they reÑect only the shape of the light proÐle.3
3. Scale L , and these parameters are physically(Re, SB
e) :
distinct. Luminosity is purely photometric (by our above
ÈÈÈÈÈÈÈÈÈÈÈÈÈÈÈ3 We consider image concentration to be a form, in contrast to Morgan
who used it as a surrogate for spectral index.
deÐnition). Size, which we also refer to as a structuralparameter, is inÑuenced by image shape, i.e., depending onthe deÐnition of size, two galaxies with di†erent light proÐleshapes can have relatively di†erent sizes (see ° 3.3.1, forexample). Surface brightness is a hybrid, photometric andstructural, parameter ; it is a function of size and luminosity.While surface brightness is a ratio of luminosity to surfacearea, it is still a measure of ““ scale ÏÏÈin this case, the lumi-nosity surface density. 4This reduces the types of combinations (by parameter type)to six, i.e., between color, form, and scale.
We Ðnd the strongest and physically most interestingcorrelations are between color, form, and the one scaleparameter, (Figs. 3È5). We focus on these for theSB
eremainder of the paper. Before turning to them, for com-pleteness we Ðrst summarize our observations of the othertypes of correlations.
Color-color correlations are strong and well known (e.g.,Fig. 2). E†ectively they add higher order information aboutspectral type. Here we consider only B[V as a simple spec-tral index that e†ectively represents the Ðrst-order informa-tion of spectral type. In general, one might adopt severalspectral indices, e.g., U[V and V [K, or a single indexbased on multicolors.
Color-scale correlations also have been explored in detailelsewhere ; e.g., color-luminosity relationships, known toexist for all galaxy types in both the optical and near-infrared (Huchra 1977b ; Mobasher et al. 1986 ; Bershady1995). The limited dynamic range of the Frei et al. sample insize and luminosity (they are mostly large and luminoussystems) preclude useful results being drawn here in thisregard. For example, the correlation of color with size inthis sample is subtle and depends in detail on how size isdeÐned, as noted above. Form-scale correlations includingsize and luminosity are also difficult to assess for thissample for the same reasons of limited dynamic range inscale. However, scale versus scale is an interesting diagnos-tic, because, for example, size and luminosity allow one toprobe the range of surface brightness in the sample. Weexplore this in Paper II.
ÈÈÈÈÈÈÈÈÈÈÈÈÈÈÈ4 A fourth scale parameter that we do not consider here is line width, or
some measure of the amplitude of the internal dynamics.
2654 BERSHADY, JANGREN, & CONSELICE Vol. 119
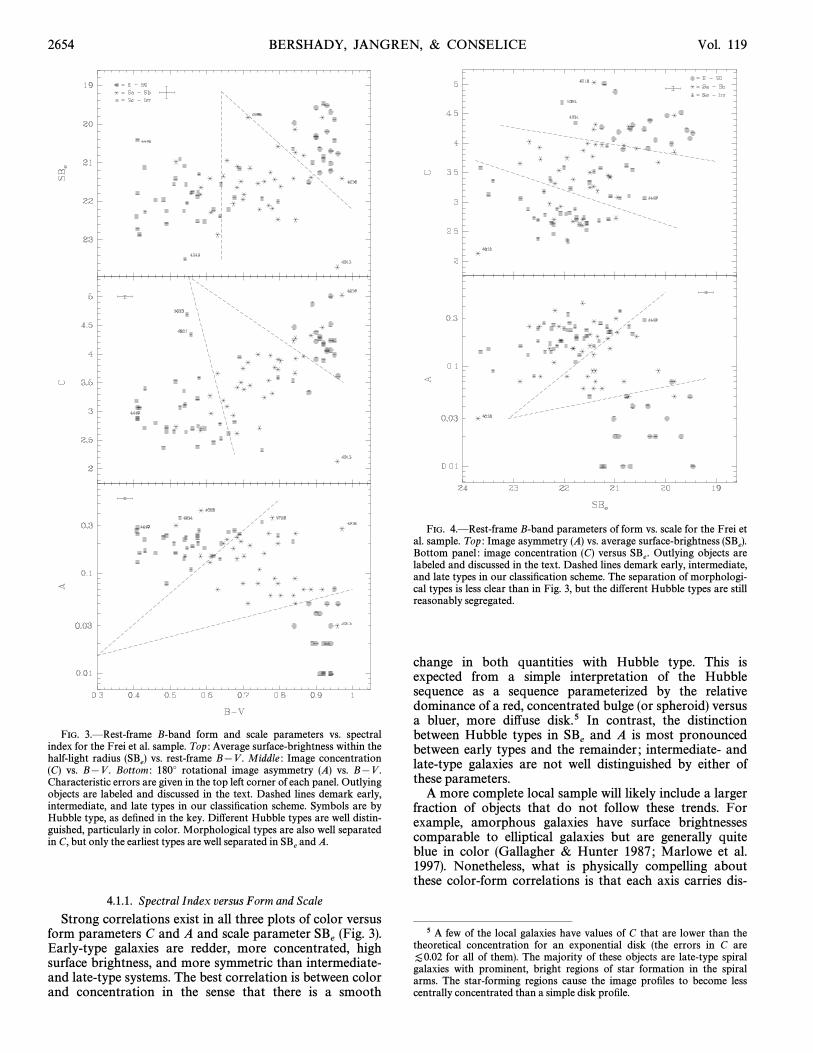
FIG. 3.ÈRest-frame B-band form and scale parameters vs. spectralindex for the Frei et al. sample. Top : Average surface-brightness within thehalf-light radius vs. rest-frame B[V . Middle : Image concentration(SB
e)
(C) vs. B[V . Bottom : 180¡ rotational image asymmetry (A) vs. B[V .Characteristic errors are given in the top left corner of each panel. Outlyingobjects are labeled and discussed in the text. Dashed lines demark early,intermediate, and late types in our classiÐcation scheme. Symbols are byHubble type, as deÐned in the key. Di†erent Hubble types are well distin-guished, particularly in color. Morphological types are also well separatedin C, but only the earliest types are well separated in and A.SB
e
4.1.1. Spectral Index versus Form and Scale
Strong correlations exist in all three plots of color versusform parameters C and A and scale parameter (Fig. 3).SB
eEarly-type galaxies are redder, more concentrated, highsurface brightness, and more symmetric than intermediate-and late-type systems. The best correlation is between colorand concentration in the sense that there is a smooth
FIG. 4.ÈRest-frame B-band parameters of form vs. scale for the Frei etal. sample. Top : Image asymmetry (A) vs. average surface-brightness (SB
e).
Bottom panel : image concentration (C) versus Outlying objects areSBe.
labeled and discussed in the text. Dashed lines demark early, intermediate,and late types in our classiÐcation scheme. The separation of morphologi-cal types is less clear than in Fig. 3, but the di†erent Hubble types are stillreasonably segregated.
change in both quantities with Hubble type. This isexpected from a simple interpretation of the Hubblesequence as a sequence parameterized by the relativedominance of a red, concentrated bulge (or spheroid) versusa bluer, more di†use disk.5 In contrast, the distinctionbetween Hubble types in and A is most pronouncedSB
ebetween early types and the remainder ; intermediate- andlate-type galaxies are not well distinguished by either ofthese parameters.
A more complete local sample will likely include a largerfraction of objects that do not follow these trends. Forexample, amorphous galaxies have surface brightnessescomparable to elliptical galaxies but are generally quiteblue in color (Gallagher & Hunter 1987 ; Marlowe et al.1997). Nonetheless, what is physically compelling aboutthese color-form correlations is that each axis carries dis-
ÈÈÈÈÈÈÈÈÈÈÈÈÈÈÈ5 A few of the local galaxies have values of C that are lower than the
theoretical concentration for an exponential disk (the errors in C arefor all of them). The majority of these objects are late-type spiral[0.02
galaxies with prominent, bright regions of star formation in the spiralarms. The star-forming regions cause the image proÐles to become lesscentrally concentrated than a simple disk proÐle.
No. 6, 2000 CLASSIFICATION OF GALAXIES. I. 2655
tinct information, respectively, on the integrated stellarpopulation and its spatial distribution.
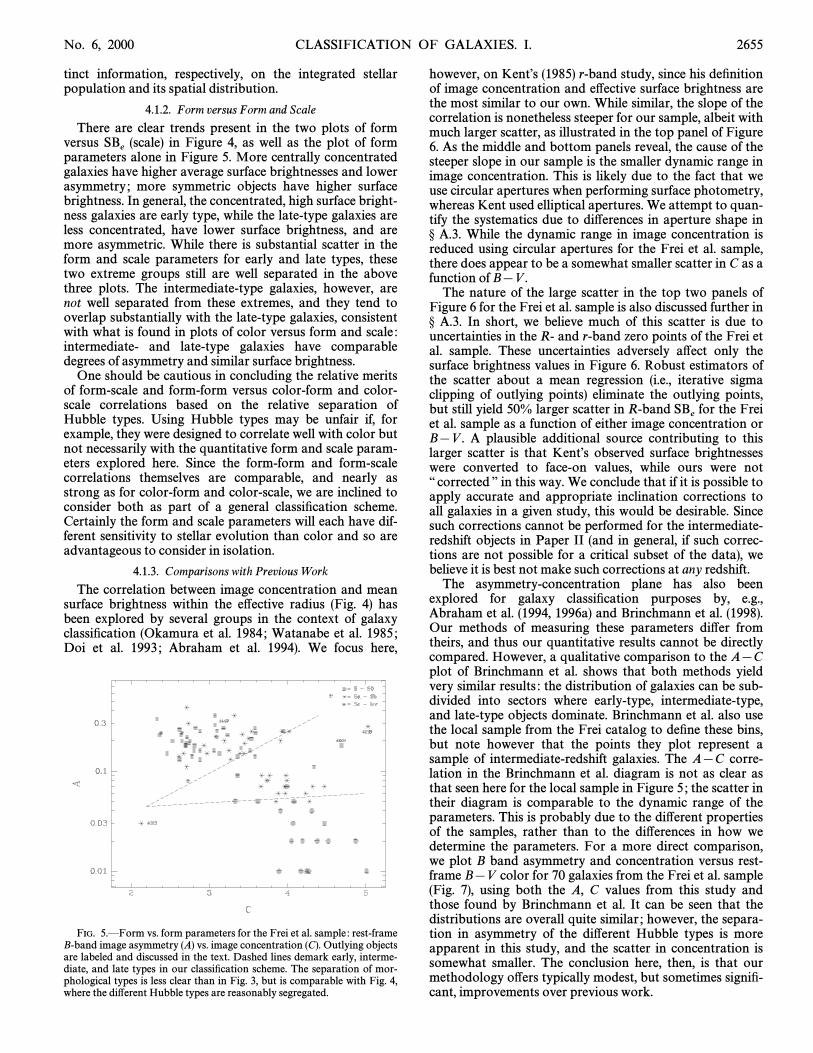
4.1.2. Form versus Form and Scale
There are clear trends present in the two plots of formversus (scale) in Figure 4, as well as the plot of formSB
eparameters alone in Figure 5. More centrally concentratedgalaxies have higher average surface brightnesses and lowerasymmetry ; more symmetric objects have higher surfacebrightness. In general, the concentrated, high surface bright-ness galaxies are early type, while the late-type galaxies areless concentrated, have lower surface brightness, and aremore asymmetric. While there is substantial scatter in theform and scale parameters for early and late types, thesetwo extreme groups still are well separated in the abovethree plots. The intermediate-type galaxies, however, arenot well separated from these extremes, and they tend tooverlap substantially with the late-type galaxies, consistentwith what is found in plots of color versus form and scale :intermediate- and late-type galaxies have comparabledegrees of asymmetry and similar surface brightness.
One should be cautious in concluding the relative meritsof form-scale and form-form versus color-form and color-scale correlations based on the relative separation ofHubble types. Using Hubble types may be unfair if, forexample, they were designed to correlate well with color butnot necessarily with the quantitative form and scale param-eters explored here. Since the form-form and form-scalecorrelations themselves are comparable, and nearly asstrong as for color-form and color-scale, we are inclined toconsider both as part of a general classiÐcation scheme.Certainly the form and scale parameters will each have dif-ferent sensitivity to stellar evolution than color and so areadvantageous to consider in isolation.
4.1.3. Comparisons with Previous Work
The correlation between image concentration and meansurface brightness within the e†ective radius (Fig. 4) hasbeen explored by several groups in the context of galaxyclassiÐcation (Okamura et al. 1984 ; Watanabe et al. 1985 ;Doi et al. 1993 ; Abraham et al. 1994). We focus here,
FIG. 5.ÈForm vs. form parameters for the Frei et al. sample : rest-frameB-band image asymmetry (A) vs. image concentration (C). Outlying objectsare labeled and discussed in the text. Dashed lines demark early, interme-diate, and late types in our classiÐcation scheme. The separation of mor-phological types is less clear than in Fig. 3, but is comparable with Fig. 4,where the di†erent Hubble types are reasonably segregated.
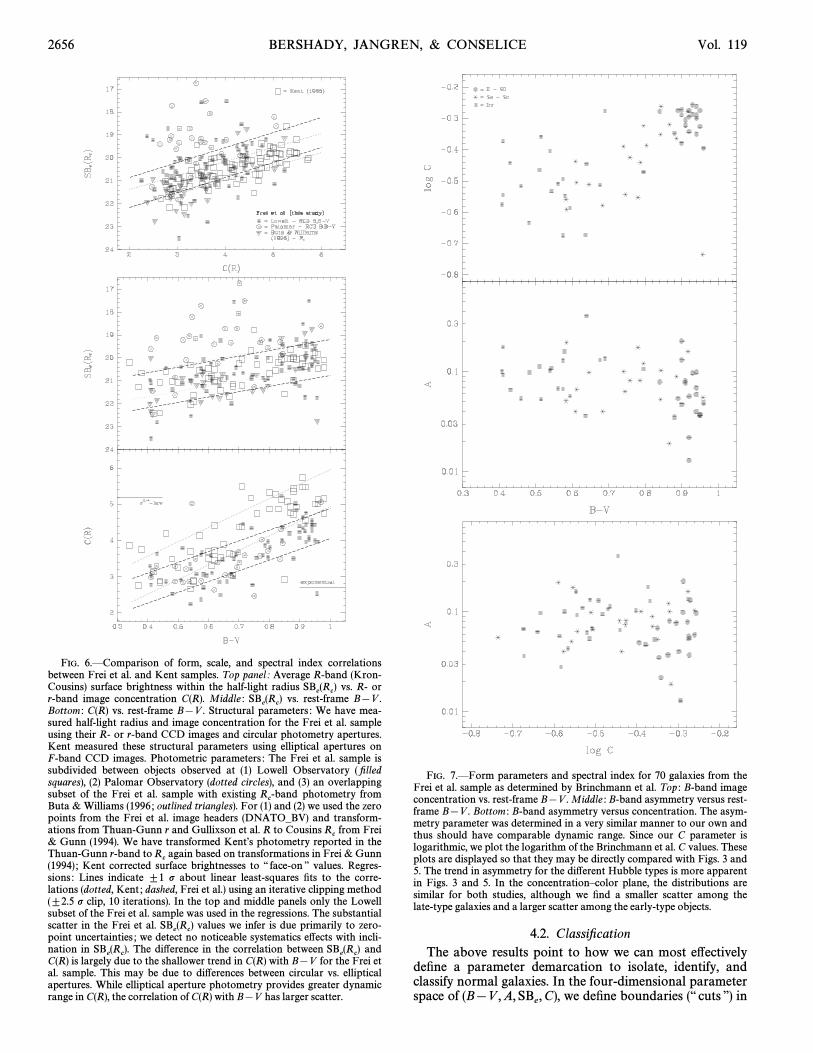
however, on KentÏs (1985) r-band study, since his deÐnitionof image concentration and e†ective surface brightness arethe most similar to our own. While similar, the slope of thecorrelation is nonetheless steeper for our sample, albeit withmuch larger scatter, as illustrated in the top panel of Figure6. As the middle and bottom panels reveal, the cause of thesteeper slope in our sample is the smaller dynamic range inimage concentration. This is likely due to the fact that weuse circular apertures when performing surface photometry,whereas Kent used elliptical apertures. We attempt to quan-tify the systematics due to di†erences in aperture shape in° A.3. While the dynamic range in image concentration isreduced using circular apertures for the Frei et al. sample,there does appear to be a somewhat smaller scatter in C as afunction of B[V .
The nature of the large scatter in the top two panels ofFigure 6 for the Frei et al. sample is also discussed further in° A.3. In short, we believe much of this scatter is due touncertainties in the R- and r-band zero points of the Frei etal. sample. These uncertainties adversely a†ect only thesurface brightness values in Figure 6. Robust estimators ofthe scatter about a mean regression (i.e., iterative sigmaclipping of outlying points) eliminate the outlying points,but still yield 50% larger scatter in R-band for the FreiSB
eet al. sample as a function of either image concentration orB[V . A plausible additional source contributing to thislarger scatter is that KentÏs observed surface brightnesseswere converted to face-on values, while ours were not““ corrected ÏÏ in this way. We conclude that if it is possible toapply accurate and appropriate inclination corrections toall galaxies in a given study, this would be desirable. Sincesuch corrections cannot be performed for the intermediate-redshift objects in Paper II (and in general, if such correc-tions are not possible for a critical subset of the data), webelieve it is best not make such corrections at any redshift.
The asymmetry-concentration plane has also beenexplored for galaxy classiÐcation purposes by, e.g.,Abraham et al. (1994, 1996a) and Brinchmann et al. (1998).Our methods of measuring these parameters di†er fromtheirs, and thus our quantitative results cannot be directlycompared. However, a qualitative comparison to the A[Cplot of Brinchmann et al. shows that both methods yieldvery similar results : the distribution of galaxies can be sub-divided into sectors where early-type, intermediate-type,and late-type objects dominate. Brinchmann et al. also usethe local sample from the Frei catalog to deÐne these bins,but note however that the points they plot represent asample of intermediate-redshift galaxies. The A[C corre-lation in the Brinchmann et al. diagram is not as clear asthat seen here for the local sample in Figure 5 ; the scatter intheir diagram is comparable to the dynamic range of theparameters. This is probably due to the di†erent propertiesof the samples, rather than to the di†erences in how wedetermine the parameters. For a more direct comparison,we plot B band asymmetry and concentration versus rest-frame B[V color for 70 galaxies from the Frei et al. sample(Fig. 7), using both the A, C values from this study andthose found by Brinchmann et al. It can be seen that thedistributions are overall quite similar ; however, the separa-tion in asymmetry of the di†erent Hubble types is moreapparent in this study, and the scatter in concentration issomewhat smaller. The conclusion here, then, is that ourmethodology o†ers typically modest, but sometimes signiÐ-cant, improvements over previous work.
2656 BERSHADY, JANGREN, & CONSELICE Vol. 119
FIG. 6.ÈComparison of form, scale, and spectral index correlationsbetween Frei et al. and Kent samples. Top panel : Average R-band (Kron-Cousins) surface brightness within the half-light radius vs. R- orSB
e(R
c)
r-band image concentration C(R). Middle : vs. rest-frame B[V .SBe(R
c)
Bottom : C(R) vs. rest-frame B[V . Structural parameters : We have mea-sured half-light radius and image concentration for the Frei et al. sampleusing their R- or r-band CCD images and circular photometry apertures.Kent measured these structural parameters using elliptical apertures onF-band CCD images. Photometric parameters : The Frei et al. sample issubdivided between objects observed at (1) Lowell Observatory ( Ðlledsquares), (2) Palomar Observatory (dotted circles), and (3) an overlappingsubset of the Frei et al. sample with existing photometry fromR
c-band
Buta & Williams (1996 ; outlined triangles). For (1) and (2) we used the zeropoints from the Frei et al. image headers (DNATO–BV) and transform-ations from Thuan-Gunn r and Gullixson et al. R to Cousins from FreiR
c& Gunn (1994). We have transformed KentÏs photometry reported in theThuan-Gunn r-band to again based on transformations in Frei & GunnR
c(1994) ; Kent corrected surface brightnesses to ““ face-on ÏÏ values. Regres-sions : Lines indicate ^1 p about linear least-squares Ðts to the corre-lations (dotted, Kent ; dashed, Frei et al.) using an iterative clipping method(^2.5 p clip, 10 iterations). In the top and middle panels only the Lowellsubset of the Frei et al. sample was used in the regressions. The substantialscatter in the Frei et al. values we infer is due primarily to zero-SB
e(R
c)
point uncertainties ; we detect no noticeable systematics e†ects with incli-nation in The di†erence in the correlation between andSB
e(R
c). SB
e(R
c)
C(R) is largely due to the shallower trend in C(R) with B[V for the Frei etal. sample. This may be due to di†erences between circular vs. ellipticalapertures. While elliptical aperture photometry provides greater dynamicrange in C(R), the correlation of C(R) with B[V has larger scatter.
FIG. 7.ÈForm parameters and spectral index for 70 galaxies from theFrei et al. sample as determined by Brinchmann et al. Top : B-band imageconcentration vs. rest-frame B[V . Middle : B-band asymmetry versus rest-frame B[V . Bottom : B-band asymmetry versus concentration. The asym-metry parameter was determined in a very similar manner to our own andthus should have comparable dynamic range. Since our C parameter islogarithmic, we plot the logarithm of the Brinchmann et al. C values. Theseplots are displayed so that they may be directly compared with Figs. 3 and5. The trend in asymmetry for the di†erent Hubble types is more apparentin Figs. 3 and 5. In the concentrationÈcolor plane, the distributions aresimilar for both studies, although we Ðnd a smaller scatter among thelate-type galaxies and a larger scatter among the early-type objects.
4.2. ClassiÐcationThe above results point to how we can most e†ectively
deÐne a parameter demarcation to isolate, identify, andclassify normal galaxies. In the four-dimensional parameterspace of (B[V ,A, we deÐne boundaries (““ cuts ÏÏ) inSB
e,C),
No. 6, 2000 CLASSIFICATION OF GALAXIES. I. 2657
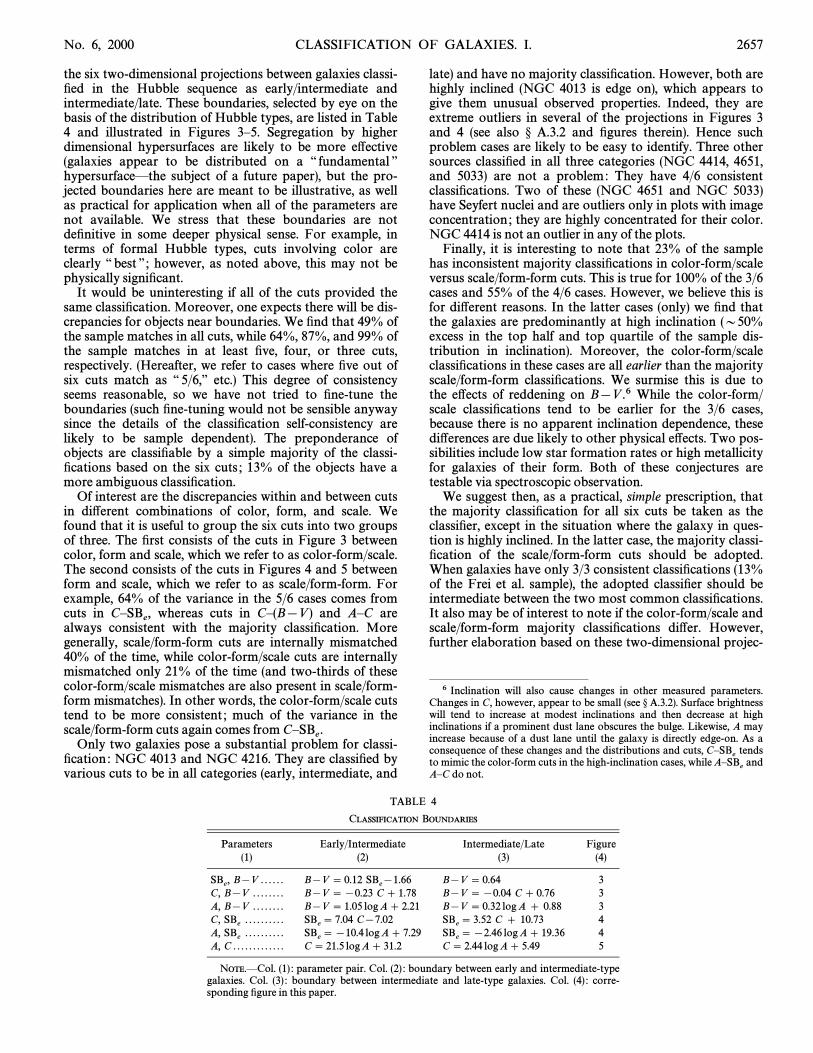
the six two-dimensional projections between galaxies classi-Ðed in the Hubble sequence as early/intermediate andintermediate/late. These boundaries, selected by eye on thebasis of the distribution of Hubble types, are listed in Table4 and illustrated in Figures 3È5. Segregation by higherdimensional hypersurfaces are likely to be more e†ective(galaxies appear to be distributed on a ““ fundamental ÏÏhypersurfaceÈthe subject of a future paper), but the pro-jected boundaries here are meant to be illustrative, as wellas practical for application when all of the parameters arenot available. We stress that these boundaries are notdeÐnitive in some deeper physical sense. For example, interms of formal Hubble types, cuts involving color areclearly ““ best ÏÏ ; however, as noted above, this may not bephysically signiÐcant.
It would be uninteresting if all of the cuts provided thesame classiÐcation. Moreover, one expects there will be dis-crepancies for objects near boundaries. We Ðnd that 49% ofthe sample matches in all cuts, while 64%, 87%, and 99% ofthe sample matches in at least Ðve, four, or three cuts,respectively. (Hereafter, we refer to cases where Ðve out ofsix cuts match as ““ 5/6,ÏÏ etc.) This degree of consistencyseems reasonable, so we have not tried to Ðne-tune theboundaries (such Ðne-tuning would not be sensible anywaysince the details of the classiÐcation self-consistency arelikely to be sample dependent). The preponderance ofobjects are classiÐable by a simple majority of the classi-Ðcations based on the six cuts ; 13% of the objects have amore ambiguous classiÐcation.
Of interest are the discrepancies within and between cutsin di†erent combinations of color, form, and scale. Wefound that it is useful to group the six cuts into two groupsof three. The Ðrst consists of the cuts in Figure 3 betweencolor, form and scale, which we refer to as color-form/scale.The second consists of the cuts in Figures 4 and 5 betweenform and scale, which we refer to as scale/form-form. Forexample, 64% of the variance in the 5/6 cases comes fromcuts in whereas cuts in CÈ(B[V ) and AÈC areCÈSB
e,
always consistent with the majority classiÐcation. Moregenerally, scale/form-form cuts are internally mismatched40% of the time, while color-form/scale cuts are internallymismatched only 21% of the time (and two-thirds of thesecolor-form/scale mismatches are also present in scale/form-form mismatches). In other words, the color-form/scale cutstend to be more consistent ; much of the variance in thescale/form-form cuts again comes from CÈSB
e.
Only two galaxies pose a substantial problem for classi-Ðcation : NGC 4013 and NGC 4216. They are classiÐed byvarious cuts to be in all categories (early, intermediate, and
late) and have no majority classiÐcation. However, both arehighly inclined (NGC 4013 is edge on), which appears togive them unusual observed properties. Indeed, they areextreme outliers in several of the projections in Figures 3and 4 (see also ° A.3.2 and Ðgures therein). Hence suchproblem cases are likely to be easy to identify. Three othersources classiÐed in all three categories (NGC 4414, 4651,and 5033) are not a problem: They have 4/6 consistentclassiÐcations. Two of these (NGC 4651 and NGC 5033)have Seyfert nuclei and are outliers only in plots with imageconcentration ; they are highly concentrated for their color.NGC 4414 is not an outlier in any of the plots.
Finally, it is interesting to note that 23% of the samplehas inconsistent majority classiÐcations in color-form/scaleversus scale/form-form cuts. This is true for 100% of the 3/6cases and 55% of the 4/6 cases. However, we believe this isfor di†erent reasons. In the latter cases (only) we Ðnd thatthe galaxies are predominantly at high inclination (D50%excess in the top half and top quartile of the sample dis-tribution in inclination). Moreover, the color-form/scaleclassiÐcations in these cases are all earlier than the majorityscale/form-form classiÐcations. We surmise this is due tothe e†ects of reddening on B[V .6 While the color-form/scale classiÐcations tend to be earlier for the 3/6 cases,because there is no apparent inclination dependence, thesedi†erences are due likely to other physical e†ects. Two pos-sibilities include low star formation rates or high metallicityfor galaxies of their form. Both of these conjectures aretestable via spectroscopic observation.
We suggest then, as a practical, simple prescription, thatthe majority classiÐcation for all six cuts be taken as theclassiÐer, except in the situation where the galaxy in ques-tion is highly inclined. In the latter case, the majority classi-Ðcation of the scale/form-form cuts should be adopted.When galaxies have only 3/3 consistent classiÐcations (13%of the Frei et al. sample), the adopted classiÐer should beintermediate between the two most common classiÐcations.It also may be of interest to note if the color-form/scale andscale/form-form majority classiÐcations di†er. However,further elaboration based on these two-dimensional projec-
ÈÈÈÈÈÈÈÈÈÈÈÈÈÈÈ6 Inclination will also cause changes in other measured parameters.
Changes in C, however, appear to be small (see ° A.3.2). Surface brightnesswill tend to increase at modest inclinations and then decrease at highinclinations if a prominent dust lane obscures the bulge. Likewise, A mayincrease because of a dust lane until the galaxy is directly edge-on. As aconsequence of these changes and the distributions and cuts, tendsCÈSB
eto mimic the color-form cuts in the high-inclination cases, while andAÈSBeAÈC do not.
TABLE 4
CLASSIFICATION BOUNDARIES
Parameters Early/Intermediate Intermediate/Late Figure(1) (2) (3) (4)
SBe, B[V . . . . . . B[V \ 0.12 SB
e[1.66 B[V \ 0.64 3
C, B[V . . . . . . . . B[V \ [0.23 C] 1.78 B[V \ [0.04 C] 0.76 3A, B[V . . . . . . . . B[V \ 1.05 logA] 2.21 B[V \ 0.32 logA ] 0.88 3C, SB
e. . . . . . . . . . SB
e\ 7.04 C[7.02 SB
e\ 3.52 C ] 10.73 4
A, SBe
. . . . . . . . . . SBe\ [10.4 logA] 7.29 SB
e\ [2.46 logA] 19.36 4
A, C . . . . . . . . . . . . . C\ 21.5 logA] 31.2 C\ 2.44 logA] 5.49 5
NOTE.ÈCol. (1) : parameter pair. Col. (2) : boundary between early and intermediate-typegalaxies. Col. (3) : boundary between intermediate and late-type galaxies. Col. (4) : corre-sponding Ðgure in this paper.
2658 BERSHADY, JANGREN, & CONSELICE Vol. 119
tions of a higher dimensional distribution is not likely to bewarranted.
4.2.1. Discussion
We note that there are no distance-dependent scaleparameters in our classiÐcation. By this we mean speciÐ-cally that the classiÐcation parameters do not depend onknowledge of the distance modulus. Hence this classi-Ðcation is both quantitative and independent of the cosmo-logical distance scale and its change with cosmologicalepoch (i.e., no a priori knowledge is needed about orH0 q0).The e†ects of the expansion do change the observed classi-Ðcation parameters. However, with knowledge of galaxyredshifts and judicious choice of ““ redshifted ÏÏ photometricbands, surface brightness dimming can be corrected andband-shifting either eliminated or corrected via the protocoldescribed in the Appendix. Galaxy evolution, of course, willalso modify the values of the parameters, but this is preci-sely the utility of the classiÐcation systems as applied tosuch a study : In what way do the parameters and theircorrelations evolve? How do the scale parameters changefor a Ðxed range in classiÐcation parameters? These areissues that we intend to explore in subsequent papers in thisseries.
We also comment on the efficacy of using the four-dimensional parameter space of color, concentration,surface-brightness, and asymmetry for the classiÐcation ofdistant galaxies. As noted earlier, Abraham et al. (1996a)and Brinchmann et al. (1998) have explored the use of theasymmetryÈconcentration plane as a tool for distant galaxyclassiÐcation. The use of the additional parameters of colorand surface-brightness are clearly advantageous ; they o†ersubstantially more information, particularly as a diagnosticof the stellar population age and surface density. Thereasoning behind using A and C alone has been that to Ðrstorder, they can be estimated without redshift information.Yet the wavelength dependence of both parameters (i.e.,what is referred to as ““ morphological k-corrections ÏÏ) canlead to measurement systematics. These systematics, if notcorrected, in turn result in objects over a range in redshiftbeing systematically misclassiÐed. For example, Brinch-mann estimates that at z\ 0.9, 25% of spiral galaxies aremisclassiÐed as peculiar objects in the A[C plane. Thisfraction is expected to increase at larger redshifts. Hence, forhigh-z studies of galaxy morphology, redshift information iscrucial even when using asymmetry and concentration.Therefore, since redshift information is crucial no matterwhat, there is no reason not to use the four-dimensionalclassiÐcation we have outlined in future studies. The recentreÐnements and calibration of the technique of estimatingredshifts photometrically make this all the more tractable.
Finally, we note that while the classiÐcation we have pro-posed here is practical and useful, there are Ðve areas wherewe anticipate it can be improved or elaborated. (1) As wehave mentioned before, the spectral-index parameter couldhave much greater leverage in distinguishing between di†er-ent stellar populations by adding passbands that expandthe wavelength baseline (e.g., the U and K bands in thenear-UV and near-IR, respectively) or by increasing thespectral resolution (e.g., line strengths and ratios). A furtherstep of elaboration would be to explore spatially resolvedspectral indices (gradients) and determine their correlationwith form parameters. (2) Internal kinematics should beconsidered. Ideally, the kinematic information would
include estimates of both the random and ordered motion(rotation) so that the dynamical temperature could beassessed, in addition to the overall scale. Kinematics arerelatively expensive to obtain (compared with images), butwith modern spectrographs on large telescopes, the abso-lute cost is minimal at least for nearby galaxies. (3) Higherdimensional correlations are worthy of exploration todetermine, for example, whether ““ fundamental ÏÏ hyper-planes can adequately describe the entirety of the galaxydistribution. (4) It is worth considering whether there areadditional form parameters of value for classiÐcation thathave not been included here. (5) The classiÐcation schemeneeds to be tested against much larger and more volume-representative samples of galaxies.
5. SUMMARY AND CONCLUSIONS
We have presented results from a study of the photo-metric and image-structural characteristics and correlationsof a sample of local, bright galaxies (Frei et al. 1996). WeÐnd it illuminating to distinguish between parameters thatcharacterize spectral index (color), form (image concentra-tion and asymmetry), and scale (size, luminosity, andsurface brightness). In this context, we arrive at the follow-ing main results and conclusions.
1. We Ðnd that a combination of spectral index, form,and scale parameters has the greatest discriminatory powerin separating normal Hubble types. The strongest corre-lation is found between color and image concentration.However, there are equally strong correlations betweenform parameters (e.g., A and C), but here the Hubble typesare not as well distinguished. As an indicator of classi-Ðcation utility, we suggest that the strength of the corre-lation between parameters is likely more important than theseparation of Hubble types within the correlation.
2. It is possible to deÐne a quantitative classiÐcationsystem for normal galaxies based on a four-parametersubset of spectral index, form, and scale : rest-frame B[Vcolor, image concentration, asymmetry, and average surfacebrightness within the half-light radius. We propose a spe-ciÐc classiÐcation that distinguishes between ““ normal ÏÏ gal-axies as early, intermediate, and late based on cuts in thesefour parameters. The classiÐcation is successful for 99% ofthe Frei et al. sample. Nonetheless, we designate this aspreliminary until larger, more comprehensive samples ofgalaxies are analyzed than in the present study.
3. Distance-dependent scale parameters are not part ofthis preliminary classiÐcation.
4. These classiÐcation parameters can be measured reli-ably over a broad range in S/N and image resolution, andhence they should be suitable for reliably distinguishingbetween a wide variety of galaxies over a large range inredshift.
5. Redshift information is needed to reliably estimateboth the photometric properties (rest-frame color andsurface brightness) as well as the structural parametersasymmetry and concentration at a Ðxed (B-band) rest-framewavelength. In terms of redshift independence, asymmetryand concentration alone thus o†er no advantages over theadditional classiÐerss proposed here. Indeed, incorporatingthe full suite of parameters deÐned here is advantageous forthe purposes of classiÐcation.
The authors wish to thank Greg Wirth for his highlyreÐned algorithm for calculating g-radii used here and in
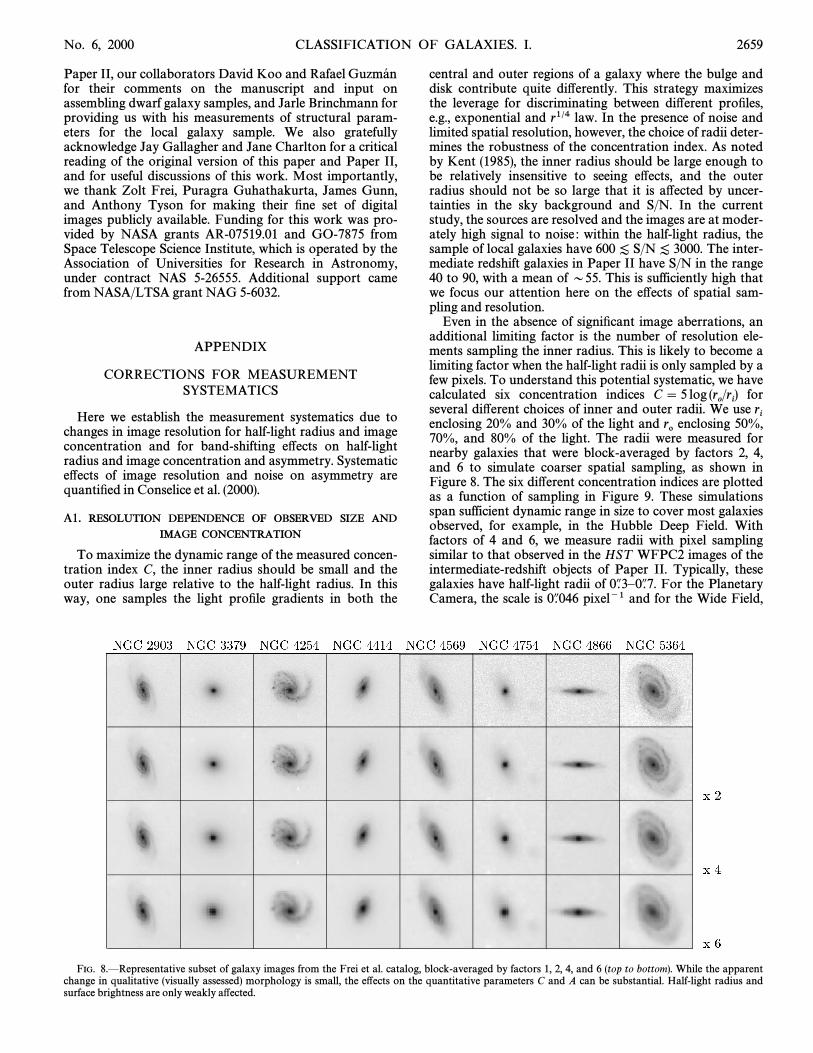
No. 6, 2000 CLASSIFICATION OF GALAXIES. I. 2659
Paper II, our collaborators David Koo and Rafael Guzma� nfor their comments on the manuscript and input onassembling dwarf galaxy samples, and Jarle Brinchmann forproviding us with his measurements of structural param-eters for the local galaxy sample. We also gratefullyacknowledge Jay Gallagher and Jane Charlton for a criticalreading of the original version of this paper and Paper II,and for useful discussions of this work. Most importantly,we thank Zolt Frei, Puragra Guhathakurta, James Gunn,and Anthony Tyson for making their Ðne set of digitalimages publicly available. Funding for this work was pro-vided by NASA grants AR-07519.01 and GO-7875 fromSpace Telescope Science Institute, which is operated by theAssociation of Universities for Research in Astronomy,under contract NAS 5-26555. Additional support camefrom NASA/LTSA grant NAG 5-6032.
APPENDIX
CORRECTIONS FOR MEASUREMENTSYSTEMATICS
Here we establish the measurement systematics due tochanges in image resolution for half-light radius and imageconcentration and for band-shifting e†ects on half-lightradius and image concentration and asymmetry. Systematice†ects of image resolution and noise on asymmetry arequantiÐed in Conselice et al. (2000).
A1. RESOLUTION DEPENDENCE OF OBSERVED SIZE AND
IMAGE CONCENTRATION
To maximize the dynamic range of the measured concen-tration index C, the inner radius should be small and theouter radius large relative to the half-light radius. In thisway, one samples the light proÐle gradients in both the
central and outer regions of a galaxy where the bulge anddisk contribute quite di†erently. This strategy maximizesthe leverage for discriminating between di†erent proÐles,e.g., exponential and r1@4 law. In the presence of noise andlimited spatial resolution, however, the choice of radii deter-mines the robustness of the concentration index. As notedby Kent (1985), the inner radius should be large enough tobe relatively insensitive to seeing e†ects, and the outerradius should not be so large that it is a†ected by uncer-tainties in the sky background and S/N. In the currentstudy, the sources are resolved and the images are at moder-ately high signal to noise : within the half-light radius, thesample of local galaxies have The inter-600 [ S/N [ 3000.mediate redshift galaxies in Paper II have S/N in the range40 to 90, with a mean of D55. This is sufficiently high thatwe focus our attention here on the e†ects of spatial sam-pling and resolution.
Even in the absence of signiÐcant image aberrations, anadditional limiting factor is the number of resolution ele-ments sampling the inner radius. This is likely to become alimiting factor when the half-light radii is only sampled by afew pixels. To understand this potential systematic, we havecalculated six concentration indices forC\ 5 log (r
o/r
i)
several di†erent choices of inner and outer radii. We use rienclosing 20% and 30% of the light and enclosing 50%,ro70%, and 80% of the light. The radii were measured for
nearby galaxies that were block-averaged by factors 2, 4,and 6 to simulate coarser spatial sampling, as shown inFigure 8. The six di†erent concentration indices are plottedas a function of sampling in Figure 9. These simulationsspan sufficient dynamic range in size to cover most galaxiesobserved, for example, in the Hubble Deep Field. Withfactors of 4 and 6, we measure radii with pixel samplingsimilar to that observed in the HST WFPC2 images of theintermediate-redshift objects of Paper II. Typically, thesegalaxies have half-light radii of For the Planetary0A.3È0A.7.Camera, the scale is pixel~1 and for the Wide Field,0A.046
FIG. 8.ÈRepresentative subset of galaxy images from the Frei et al. catalog, block-averaged by factors 1, 2, 4, and 6 (top to bottom). While the apparentchange in qualitative (visually assessed) morphology is small, the e†ects on the quantitative parameters C and A can be substantial. Half-light radius andsurface brightness are only weakly a†ected.
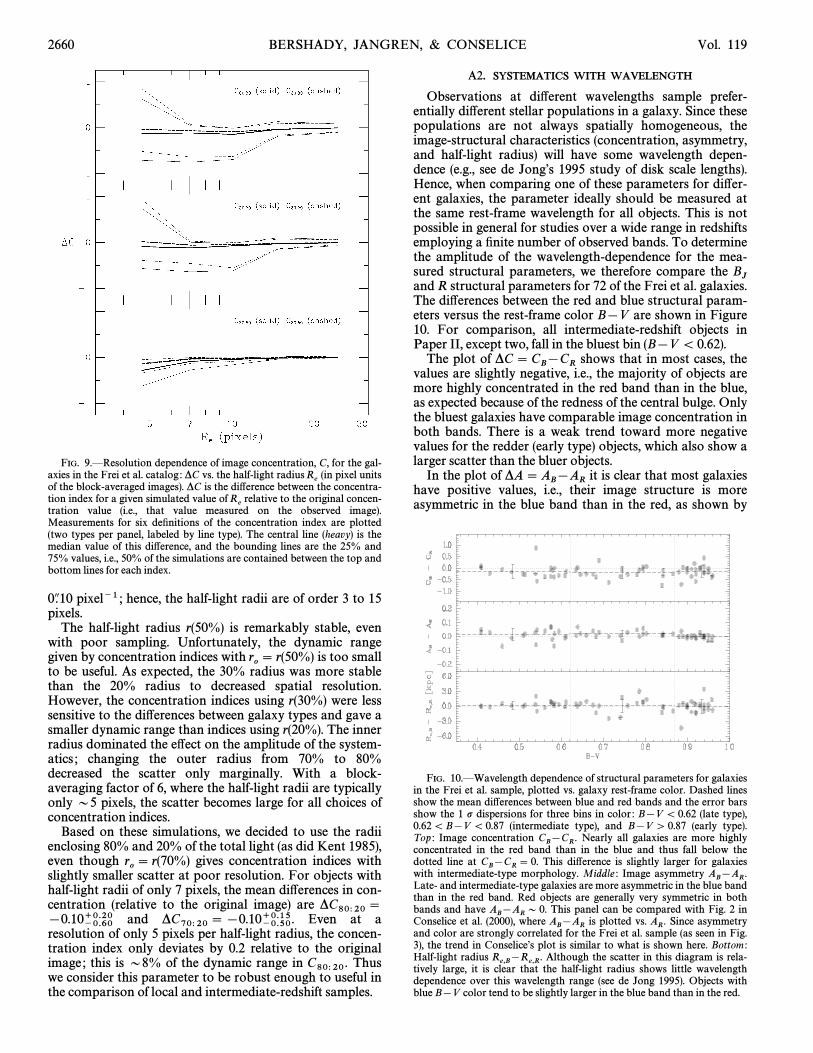
2660 BERSHADY, JANGREN, & CONSELICE Vol. 119
FIG. 9.ÈResolution dependence of image concentration, C, for the gal-axies in the Frei et al. catalog : *C vs. the half-light radius (in pixel unitsR
eof the block-averaged images). *C is the di†erence between the concentra-tion index for a given simulated value of relative to the original concen-R
etration value (i.e., that value measured on the observed image).Measurements for six deÐnitions of the concentration index are plotted(two types per panel, labeled by line type). The central line (heavy) is themedian value of this di†erence, and the bounding lines are the 25% and75% values, i.e., 50% of the simulations are contained between the top andbottom lines for each index.
pixel~1 ; hence, the half-light radii are of order 3 to 150A.10pixels.
The half-light radius r(50%) is remarkably stable, evenwith poor sampling. Unfortunately, the dynamic rangegiven by concentration indices with is too smallr
o\ r(50%)
to be useful. As expected, the 30% radius was more stablethan the 20% radius to decreased spatial resolution.However, the concentration indices using r(30%) were lesssensitive to the di†erences between galaxy types and gave asmaller dynamic range than indices using r(20%). The innerradius dominated the e†ect on the amplitude of the system-atics ; changing the outer radius from 70% to 80%decreased the scatter only marginally. With a block-averaging factor of 6, where the half-light radii are typicallyonly D5 pixels, the scatter becomes large for all choices ofconcentration indices.
Based on these simulations, we decided to use the radiienclosing 80% and 20% of the total light (as did Kent 1985),even though gives concentration indices withr
o\ r(70%)
slightly smaller scatter at poor resolution. For objects withhalf-light radii of only 7 pixels, the mean di†erences in con-centration (relative to the original image) are *C80>20 \
and Even at a[0.10~0.60`0.20 *C70>20 \[0.10~0.50`0.15.resolution of only 5 pixels per half-light radius, the concen-tration index only deviates by 0.2 relative to the originalimage ; this is D8% of the dynamic range in ThusC80>20.we consider this parameter to be robust enough to useful inthe comparison of local and intermediate-redshift samples.
A2. SYSTEMATICS WITH WAVELENGTH
Observations at di†erent wavelengths sample prefer-entially di†erent stellar populations in a galaxy. Since thesepopulations are not always spatially homogeneous, theimage-structural characteristics (concentration, asymmetry,and half-light radius) will have some wavelength depen-dence (e.g., see de JongÏs 1995 study of disk scale lengths).Hence, when comparing one of these parameters for di†er-ent galaxies, the parameter ideally should be measured atthe same rest-frame wavelength for all objects. This is notpossible in general for studies over a wide range in redshiftsemploying a Ðnite number of observed bands. To determinethe amplitude of the wavelength-dependence for the mea-sured structural parameters, we therefore compare the B
Jand R structural parameters for 72 of the Frei et al. galaxies.The di†erences between the red and blue structural param-eters versus the rest-frame color B[V are shown in Figure10. For comparison, all intermediate-redshift objects inPaper II, except two, fall in the bluest bin (B[V \ 0.62).
The plot of shows that in most cases, the*C\CB[C
Rvalues are slightly negative, i.e., the majority of objects aremore highly concentrated in the red band than in the blue,as expected because of the redness of the central bulge. Onlythe bluest galaxies have comparable image concentration inboth bands. There is a weak trend toward more negativevalues for the redder (early type) objects, which also show alarger scatter than the bluer objects.
In the plot of it is clear that most galaxies*A\AB[A
Rhave positive values, i.e., their image structure is moreasymmetric in the blue band than in the red, as shown by
FIG. 10.ÈWavelength dependence of structural parameters for galaxiesin the Frei et al. sample, plotted vs. galaxy rest-frame color. Dashed linesshow the mean di†erences between blue and red bands and the error barsshow the 1 p dispersions for three bins in color : B[V \ 0.62 (late type),0.62\ B[V \ 0.87 (intermediate type), and B[V [ 0.87 (early type).Top : Image concentration Nearly all galaxies are more highlyC
B[C
R.
concentrated in the red band than in the blue and thus fall below thedotted line at This di†erence is slightly larger for galaxiesC
B[C
R\ 0.
with intermediate-type morphology. Middle : Image asymmetry AB[A
R.
Late- and intermediate-type galaxies are more asymmetric in the blue bandthan in the red band. Red objects are generally very symmetric in bothbands and have This panel can be compared with Fig. 2 inA
B[A
RD 0.
Conselice et al. (2000), where is plotted vs. Since asymmetryAB[A
RA
R.
and color are strongly correlated for the Frei et al. sample (as seen in Fig.3), the trend in ConseliceÏs plot is similar to what is shown here. Bottom :Half-light radius Although the scatter in this diagram is rela-R
e,B[Re,R.
tively large, it is clear that the half-light radius shows little wavelengthdependence over this wavelength range (see de Jong 1995). Objects withblue B[V color tend to be slightly larger in the blue band than in the red.
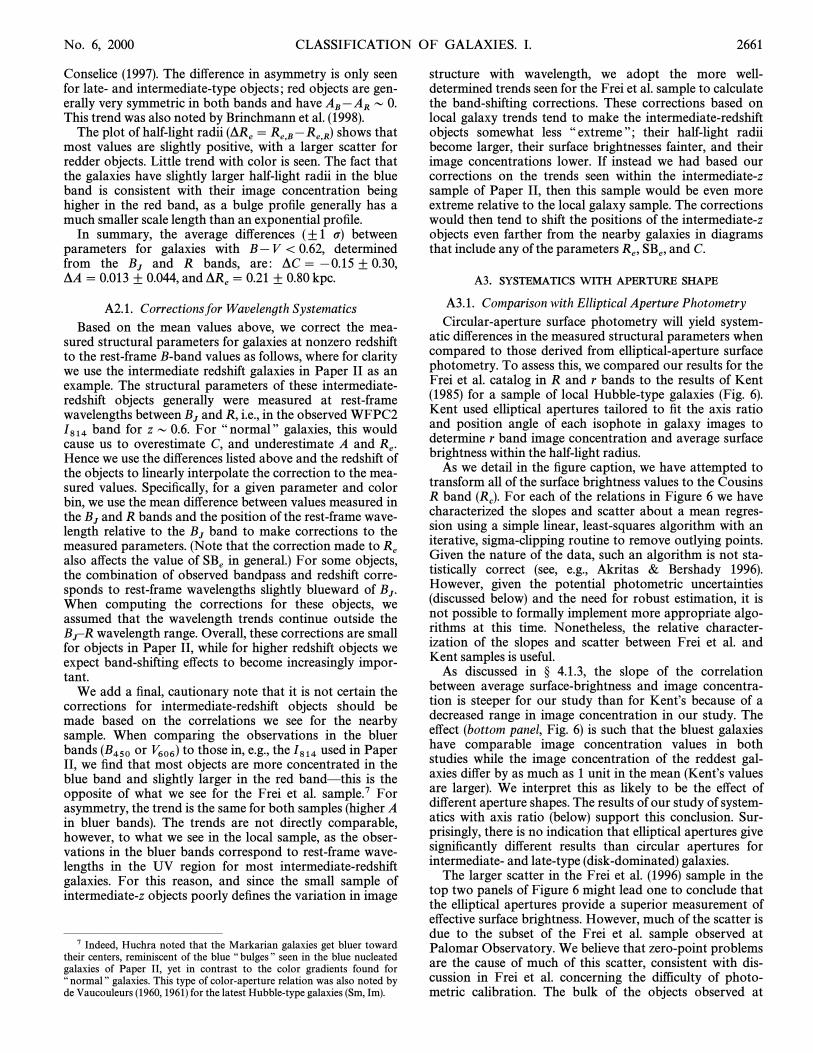
No. 6, 2000 CLASSIFICATION OF GALAXIES. I. 2661
Conselice (1997). The di†erence in asymmetry is only seenfor late- and intermediate-type objects ; red objects are gen-erally very symmetric in both bands and have A
B[A
RD 0.
This trend was also noted by Brinchmann et al. (1998).The plot of half-light radii shows that(*R
e\ R
e,B[Re,R)most values are slightly positive, with a larger scatter for
redder objects. Little trend with color is seen. The fact thatthe galaxies have slightly larger half-light radii in the blueband is consistent with their image concentration beinghigher in the red band, as a bulge proÐle generally has amuch smaller scale length than an exponential proÐle.
In summary, the average di†erences (^1 p) betweenparameters for galaxies with B[V \ 0.62, determinedfrom the and R bands, are : *C\ [0.15^ 0.30,B
J*A\ 0.013^ 0.044, and kpc.*Re\ 0.21^ 0.80
A2.1. Corrections for Wavelength SystematicsBased on the mean values above, we correct the mea-
sured structural parameters for galaxies at nonzero redshiftto the rest-frame B-band values as follows, where for claritywe use the intermediate redshift galaxies in Paper II as anexample. The structural parameters of these intermediate-redshift objects generally were measured at rest-framewavelengths between and R, i.e., in the observed WFPC2B
Jband for zD 0.6. For ““ normal ÏÏ galaxies, this wouldI814cause us to overestimate C, and underestimate A and Re.
Hence we use the di†erences listed above and the redshift ofthe objects to linearly interpolate the correction to the mea-sured values. SpeciÐcally, for a given parameter and colorbin, we use the mean di†erence between values measured inthe and R bands and the position of the rest-frame wave-B
Jlength relative to the band to make corrections to theBJmeasured parameters. (Note that the correction made to R
ealso a†ects the value of in general.) For some objects,SBethe combination of observed bandpass and redshift corre-
sponds to rest-frame wavelengths slightly blueward of BJ.
When computing the corrections for these objects, weassumed that the wavelength trends continue outside the
wavelength range. Overall, these corrections are smallBJÈR
for objects in Paper II, while for higher redshift objects weexpect band-shifting e†ects to become increasingly impor-tant.
We add a Ðnal, cautionary note that it is not certain thecorrections for intermediate-redshift objects should bemade based on the correlations we see for the nearbysample. When comparing the observations in the bluerbands or to those in, e.g., the used in Paper(B450 V606) I814II, we Ðnd that most objects are more concentrated in theblue band and slightly larger in the red bandÈthis is theopposite of what we see for the Frei et al. sample.7 Forasymmetry, the trend is the same for both samples (higher Ain bluer bands). The trends are not directly comparable,however, to what we see in the local sample, as the obser-vations in the bluer bands correspond to rest-frame wave-lengths in the UV region for most intermediate-redshiftgalaxies. For this reason, and since the small sample ofintermediate-z objects poorly deÐnes the variation in image
ÈÈÈÈÈÈÈÈÈÈÈÈÈÈÈ7 Indeed, Huchra noted that the Markarian galaxies get bluer toward
their centers, reminiscent of the blue ““ bulges ÏÏ seen in the blue nucleatedgalaxies of Paper II, yet in contrast to the color gradients found for““ normal ÏÏ galaxies. This type of color-aperture relation was also noted byde Vaucouleurs (1960, 1961) for the latest Hubble-type galaxies (Sm, Im).
structure with wavelength, we adopt the more well-determined trends seen for the Frei et al. sample to calculatethe band-shifting corrections. These corrections based onlocal galaxy trends tend to make the intermediate-redshiftobjects somewhat less ““ extreme ÏÏ ; their half-light radiibecome larger, their surface brightnesses fainter, and theirimage concentrations lower. If instead we had based ourcorrections on the trends seen within the intermediate-zsample of Paper II, then this sample would be even moreextreme relative to the local galaxy sample. The correctionswould then tend to shift the positions of the intermediate-zobjects even farther from the nearby galaxies in diagramsthat include any of the parameters and C.R
e, SB
e,
A3. SYSTEMATICS WITH APERTURE SHAPE
A3.1. Comparison with Elliptical Aperture PhotometryCircular-aperture surface photometry will yield system-
atic di†erences in the measured structural parameters whencompared to those derived from elliptical-aperture surfacephotometry. To assess this, we compared our results for theFrei et al. catalog in R and r bands to the results of Kent(1985) for a sample of local Hubble-type galaxies (Fig. 6).Kent used elliptical apertures tailored to Ðt the axis ratioand position angle of each isophote in galaxy images todetermine r band image concentration and average surfacebrightness within the half-light radius.
As we detail in the Ðgure caption, we have attempted totransform all of the surface brightness values to the CousinsR band For each of the relations in Figure 6 we have(R
c).
characterized the slopes and scatter about a mean regres-sion using a simple linear, least-squares algorithm with aniterative, sigma-clipping routine to remove outlying points.Given the nature of the data, such an algorithm is not sta-tistically correct (see, e.g., Akritas & Bershady 1996).However, given the potential photometric uncertainties(discussed below) and the need for robust estimation, it isnot possible to formally implement more appropriate algo-rithms at this time. Nonetheless, the relative character-ization of the slopes and scatter between Frei et al. andKent samples is useful.
As discussed in ° 4.1.3, the slope of the correlationbetween average surface-brightness and image concentra-tion is steeper for our study than for KentÏs because of adecreased range in image concentration in our study. Thee†ect (bottom panel, Fig. 6) is such that the bluest galaxieshave comparable image concentration values in bothstudies while the image concentration of the reddest gal-axies di†er by as much as 1 unit in the mean (KentÏs valuesare larger). We interpret this as likely to be the e†ect ofdi†erent aperture shapes. The results of our study of system-atics with axis ratio (below) support this conclusion. Sur-prisingly, there is no indication that elliptical apertures givesigniÐcantly di†erent results than circular apertures forintermediate- and late-type (disk-dominated) galaxies.
The larger scatter in the Frei et al. (1996) sample in thetop two panels of Figure 6 might lead one to conclude thatthe elliptical apertures provide a superior measurement ofe†ective surface brightness. However, much of the scatter isdue to the subset of the Frei et al. sample observed atPalomar Observatory. We believe that zero-point problemsare the cause of much of this scatter, consistent with dis-cussion in Frei et al. concerning the difficulty of photo-metric calibration. The bulk of the objects observed at
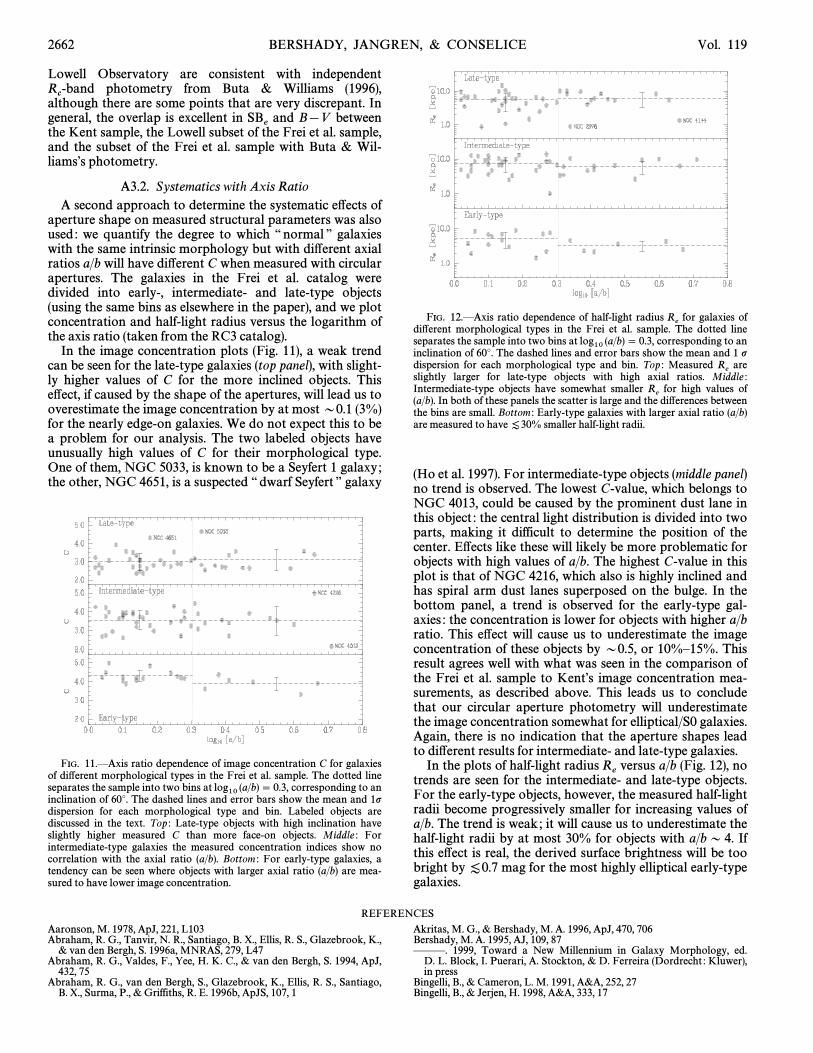
2662 BERSHADY, JANGREN, & CONSELICE Vol. 119
Lowell Observatory are consistent with independentphotometry from Buta & Williams (1996),R
c-band
although there are some points that are very discrepant. Ingeneral, the overlap is excellent in and B[V betweenSB
ethe Kent sample, the Lowell subset of the Frei et al. sample,and the subset of the Frei et al. sample with Buta & Wil-liamsÏs photometry.
A3.2. Systematics with Axis RatioA second approach to determine the systematic e†ects of
aperture shape on measured structural parameters was alsoused : we quantify the degree to which ““ normal ÏÏ galaxieswith the same intrinsic morphology but with di†erent axialratios a/b will have di†erent C when measured with circularapertures. The galaxies in the Frei et al. catalog weredivided into early-, intermediate- and late-type objects(using the same bins as elsewhere in the paper), and we plotconcentration and half-light radius versus the logarithm ofthe axis ratio (taken from the RC3 catalog).
In the image concentration plots (Fig. 11), a weak trendcan be seen for the late-type galaxies (top panel), with slight-ly higher values of C for the more inclined objects. Thise†ect, if caused by the shape of the apertures, will lead us tooverestimate the image concentration by at most D0.1 (3%)for the nearly edge-on galaxies. We do not expect this to bea problem for our analysis. The two labeled objects haveunusually high values of C for their morphological type.One of them, NGC 5033, is known to be a Seyfert 1 galaxy ;the other, NGC 4651, is a suspected ““ dwarf Seyfert ÏÏ galaxy
FIG. 11.ÈAxis ratio dependence of image concentration C for galaxiesof di†erent morphological types in the Frei et al. sample. The dotted lineseparates the sample into two bins at corresponding to anlog10 (a/b)\ 0.3,inclination of 60¡. The dashed lines and error bars show the mean and 1pdispersion for each morphological type and bin. Labeled objects arediscussed in the text. Top : Late-type objects with high inclination haveslightly higher measured C than more face-on objects. Middle : Forintermediate-type galaxies the measured concentration indices show nocorrelation with the axial ratio (a/b). Bottom : For early-type galaxies, atendency can be seen where objects with larger axial ratio (a/b) are mea-sured to have lower image concentration.
FIG. 12.ÈAxis ratio dependence of half-light radius for galaxies ofRedi†erent morphological types in the Frei et al. sample. The dotted line
separates the sample into two bins at corresponding to anlog10 (a/b)\ 0.3,inclination of 60¡. The dashed lines and error bars show the mean and 1 pdispersion for each morphological type and bin. Top : Measured areR
eslightly larger for late-type objects with high axial ratios. Middle :Intermediate-type objects have somewhat smaller for high values ofR
e(a/b). In both of these panels the scatter is large and the di†erences betweenthe bins are small. Bottom : Early-type galaxies with larger axial ratio (a/b)are measured to have smaller half-light radii.[30%
(Ho et al. 1997). For intermediate-type objects (middle panel)no trend is observed. The lowest C-value, which belongs toNGC 4013, could be caused by the prominent dust lane inthis object : the central light distribution is divided into twoparts, making it difficult to determine the position of thecenter. E†ects like these will likely be more problematic forobjects with high values of a/b. The highest C-value in thisplot is that of NGC 4216, which also is highly inclined andhas spiral arm dust lanes superposed on the bulge. In thebottom panel, a trend is observed for the early-type gal-axies : the concentration is lower for objects with higher a/bratio. This e†ect will cause us to underestimate the imageconcentration of these objects by D0.5, or 10%È15%. Thisresult agrees well with what was seen in the comparison ofthe Frei et al. sample to KentÏs image concentration mea-surements, as described above. This leads us to concludethat our circular aperture photometry will underestimatethe image concentration somewhat for elliptical/S0 galaxies.Again, there is no indication that the aperture shapes leadto di†erent results for intermediate- and late-type galaxies.
In the plots of half-light radius versus a/b (Fig. 12), noRetrends are seen for the intermediate- and late-type objects.
For the early-type objects, however, the measured half-lightradii become progressively smaller for increasing values ofa/b. The trend is weak ; it will cause us to underestimate thehalf-light radii by at most 30% for objects with a/b D 4. Ifthis e†ect is real, the derived surface brightness will be toobright by mag for the most highly elliptical early-type[0.7galaxies.
REFERENCES
Aaronson, M. 1978, ApJ, 221, L103Abraham, R. G., Tanvir, N. R., Santiago, B. X., Ellis, R. S., Glazebrook, K.,
& van den Bergh, S. 1996a, MNRAS, 279, L47Abraham, R. G., Valdes, F., Yee, H. K. C., & van den Bergh, S. 1994, ApJ,
432, 75Abraham, R. G., van den Bergh, S., Glazebrook, K., Ellis, R. S., Santiago,
B. X., Surma, P., & Griffiths, R. E. 1996b, ApJS, 107, 1
Akritas, M. G., & Bershady, M. A. 1996, ApJ, 470, 706Bershady, M. A. 1995, AJ, 109, 87ÈÈÈ. 1999, Toward a New Millennium in Galaxy Morphology, ed.
D. L. Block, I. Puerari, A. Stockton, & D. Ferreira (Dordrecht : Kluwer),in press
Bingelli, B., & Cameron, L. M. 1991, A&A, 252, 27Bingelli, B., & Jerjen, H. 1998, A&A, 333, 17
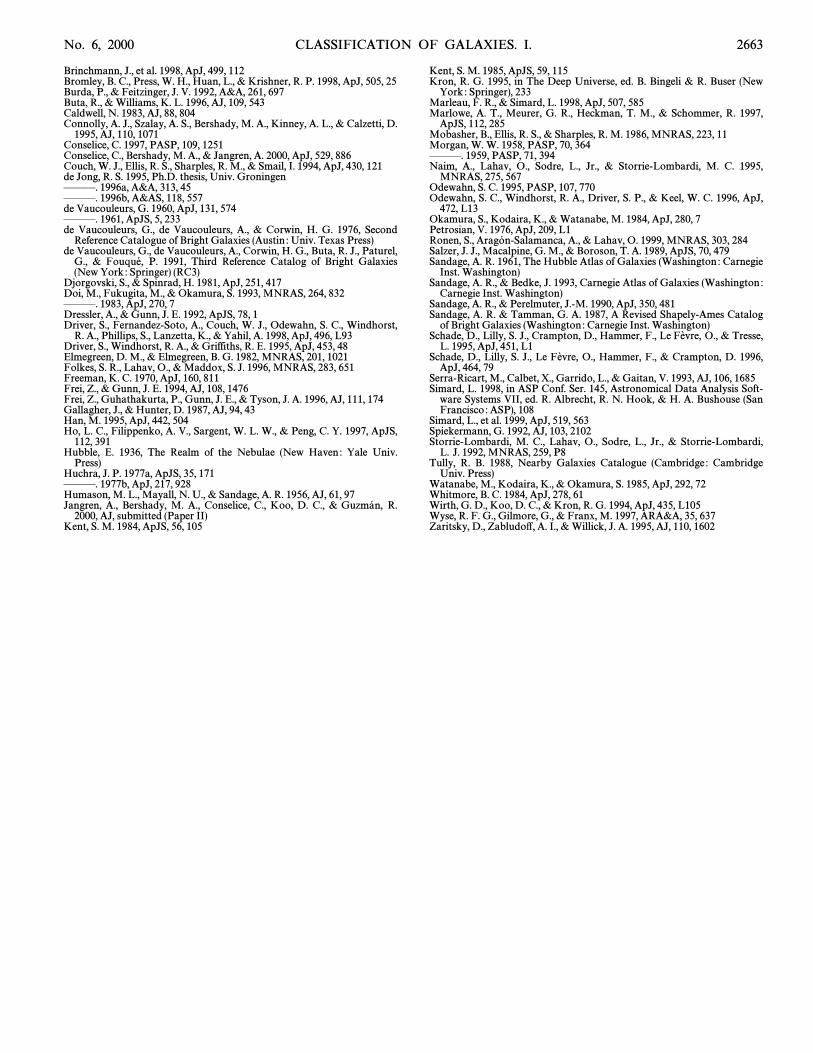
No. 6, 2000 CLASSIFICATION OF GALAXIES. I. 2663
Brinchmann, J., et al. 1998, ApJ, 499, 112Bromley, B. C., Press, W. H., Huan, L., & Krishner, R. P. 1998, ApJ, 505, 25Burda, P., & Feitzinger, J. V. 1992, A&A, 261, 697Buta, R., & Williams, K. L. 1996, AJ, 109, 543Caldwell, N. 1983, AJ, 88, 804Connolly, A. J., Szalay, A. S., Bershady, M. A., Kinney, A. L., & Calzetti, D.
1995, AJ, 110, 1071Conselice, C. 1997, PASP, 109, 1251Conselice, C., Bershady, M. A., & Jangren, A. 2000, ApJ, 529, 886Couch, W. J., Ellis, R. S., Sharples, R. M., & Smail, I. 1994, ApJ, 430, 121de Jong, R. S. 1995, Ph.D. thesis, Univ. GroningenÈÈÈ. 1996a, A&A, 313, 45ÈÈÈ. 1996b, A&AS, 118, 557de Vaucouleurs, G. 1960, ApJ, 131, 574ÈÈÈ. 1961, ApJS, 5, 233de Vaucouleurs, G., de Vaucouleurs, A., & Corwin, H. G. 1976, Second
Reference Catalogue of Bright Galaxies (Austin : Univ. Texas Press)de Vaucouleurs, G., de Vaucouleurs, A., Corwin, H. G., Buta, R. J., Paturel,
G., & P. 1991, Third Reference Catalog of Bright GalaxiesFouque� ,(New York : Springer) (RC3)
Djorgovski, S., & Spinrad, H. 1981, ApJ, 251, 417Doi, M., Fukugita, M., & Okamura, S. 1993, MNRAS, 264, 832ÈÈÈ. 1983, ApJ, 270, 7Dressler, A., & Gunn, J. E. 1992, ApJS, 78, 1Driver, S., Fernandez-Soto, A., Couch, W. J., Odewahn, S. C., Windhorst,
R. A., Phillips, S., Lanzetta, K., & Yahil, A. 1998, ApJ, 496, L93Driver, S., Windhorst, R. A., & Griffiths, R. E. 1995, ApJ, 453, 48Elmegreen, D. M., & Elmegreen, B. G. 1982, MNRAS, 201, 1021Folkes, S. R., Lahav, O., & Maddox, S. J. 1996, MNRAS, 283, 651Freeman, K. C. 1970, ApJ, 160, 811Frei, Z., & Gunn, J. E. 1994, AJ, 108, 1476Frei, Z., Guhathakurta, P., Gunn, J. E., & Tyson, J. A. 1996, AJ, 111, 174Gallagher, J., & Hunter, D. 1987, AJ, 94, 43Han, M. 1995, ApJ, 442, 504Ho, L. C., Filippenko, A. V., Sargent, W. L. W., & Peng, C. Y. 1997, ApJS,
112, 391Hubble, E. 1936, The Realm of the Nebulae (New Haven : Yale Univ.
Press)Huchra, J. P. 1977a, ApJS, 35, 171ÈÈÈ. 1977b, ApJ, 217, 928Humason, M. L., Mayall, N. U., & Sandage, A. R. 1956, AJ, 61, 97Jangren, A., Bershady, M. A., Conselice, C., Koo, D. C., & R.Guzma� n,
2000, AJ, submitted (Paper II)Kent, S. M. 1984, ApJS, 56, 105
Kent, S. M. 1985, ApJS, 59, 115Kron, R. G. 1995, in The Deep Universe, ed. B. Bingeli & R. Buser (New
York : Springer), 233Marleau, F. R., & Simard, L. 1998, ApJ, 507, 585Marlowe, A. T., Meurer, G. R., Heckman, T. M., & Schommer, R. 1997,
ApJS, 112, 285Mobasher, B., Ellis, R. S., & Sharples, R. M. 1986, MNRAS, 223, 11Morgan, W. W. 1958, PASP, 70, 364ÈÈÈ. 1959, PASP, 71, 394Naim, A., Lahav, O., Sodre, L., Jr., & Storrie-Lombardi, M. C. 1995,
MNRAS, 275, 567Odewahn, S. C. 1995, PASP, 107, 770Odewahn, S. C., Windhorst, R. A., Driver, S. P., & Keel, W. C. 1996, ApJ,
472, L13Okamura, S., Kodaira, K., & Watanabe, M. 1984, ApJ, 280, 7Petrosian, V. 1976, ApJ, 209, L1Ronen, S., A., & Lahav, O. 1999, MNRAS, 303, 284Arago� n-Salamanca,Salzer, J. J., Macalpine, G. M., & Boroson, T. A. 1989, ApJS, 70, 479Sandage, A. R. 1961, The Hubble Atlas of Galaxies (Washington : Carnegie
Inst. Washington)Sandage, A. R., & Bedke, J. 1993, Carnegie Atlas of Galaxies (Washington :
Carnegie Inst. Washington)Sandage, A. R., & Perelmuter, J.-M. 1990, ApJ, 350, 481Sandage, A. R. & Tamman, G. A. 1987, A Revised Shapely-Ames Catalog
of Bright Galaxies (Washington : Carnegie Inst. Washington)Schade, D., Lilly, S. J., Crampton, D., Hammer, F., Le O., & Tresse,Fevre,
L. 1995, ApJ, 451, L1Schade, D., Lilly, S. J., Le O., Hammer, F., & Crampton, D. 1996,Fevre,
ApJ, 464, 79Serra-Ricart, M., Calbet, X., Garrido, L., & Gaitan, V. 1993, AJ, 106, 1685Simard, L. 1998, in ASP Conf. Ser. 145, Astronomical Data Analysis Soft-
ware Systems VII, ed. R. Albrecht, R. N. Hook, & H. A. Bushouse (SanFrancisco : ASP), 108
Simard, L., et al. 1999, ApJ, 519, 563Spiekermann, G. 1992, AJ, 103, 2102Storrie-Lombardi, M. C., Lahav, O., Sodre, L., Jr., & Storrie-Lombardi,
L. J. 1992, MNRAS, 259, P8Tully, R. B. 1988, Nearby Galaxies Catalogue (Cambridge : Cambridge
Univ. Press)Watanabe, M., Kodaira, K., & Okamura, S. 1985, ApJ, 292, 72Whitmore, B. C. 1984, ApJ, 278, 61Wirth, G. D., Koo, D. C., & Kron, R. G. 1994, ApJ, 435, L105Wyse, R. F. G., Gilmore, G., & Franx, M. 1997, ARA&A, 35, 637Zaritsky, D., Zabludo†, A. I., & Willick, J. A. 1995, AJ, 110, 1602


