Embed Size (px)
Citation preview
5.4
IBM OMEGAMON for Db2 PerformanceExpert on z/OSClassic Interface User's Guide
IBM
SH12-7068

2021-03-23 edition
This edition applies to Version 5 Release 4 of IBM® OMEGAMON for DB2® Performance Expert on z/OS (product number5655-W37) and to all subsequent releases and modifications until otherwise indicated in new editions.© Copyright International Business Machines Corporation 2005, 2021.US Government Users Restricted Rights – Use, duplication or disclosure restricted by GSA ADP Schedule Contract withIBM Corp.© Rocket Software Inc. 2016, 2021.
Contents
About this information.......................................................................................... xi
Chapter 1. Overview.............................................................................................. 1Where to find information............................................................................................................................ 1Service updates and support information...................................................................................................2Accessibility features...................................................................................................................................2How to send your comments....................................................................................................................... 3
Chapter 2. Using the Classic Interface....................................................................5
Chapter 3. Main menus.......................................................................................... 7Creating and executing reporting commands............................................................................................. 7View online DB2 activity.............................................................................................................................. 8
Logging on to the Classic Interface........................................................................................................8Directly logging on to the Classic Interface from native VTAM............................................................. 8The Classic Interface main menu.......................................................................................................... 9Switching among DB2 subsystems and data sharing group members.............................................. 11
View online DB2 activity - PE ISPF OLM....................................................................................................12Maintain parameter data sets....................................................................................................................12Customize report and trace layouts.......................................................................................................... 14Exception Profiling..................................................................................................................................... 14
Chapter 4. Summary............................................................................................17Summary of DB2 Activity...........................................................................................................................17MVS System Console and Message Traffic................................................................................................20Redirect Monitoring to Another DB2......................................................................................................... 20
Chapter 5. Exceptions..........................................................................................23Exception Messages.................................................................................................................................. 23Current Status for Exceptions....................................................................................................................35Status for Tripped Exceptions................................................................................................................... 36Reset Last and Worst Values..................................................................................................................... 38
Chapter 6. Thread Activity................................................................................... 39Threads Summary Excluding Idle Threads............................................................................................... 39
Thread Detail........................................................................................................................................ 41Thread Lock/Claim/Drain Activity........................................................................................................ 52Lock/Claims Causing a Thread to Wait................................................................................................ 53Locks/Claims Owned By a Thread....................................................................................................... 60Thread Global Lock Activity................................................................................................................. 60SQL Call Being Executed...................................................................................................................... 63Current SQL Counts.............................................................................................................................. 66Distributed Thread Detail..................................................................................................................... 76Threads with DB2 Connect gateway connections...............................................................................84Thread Buffer Pool Activity................................................................................................................ 101Thread Group Buffer Pool Activity..................................................................................................... 105Thread Package Summary................................................................................................................. 109Thread Resource Limit Statistics....................................................................................................... 118Current Parallel Task Summary......................................................................................................... 122
iii
Utility Detail Information................................................................................................................... 124Stopped Utility Detail Information.....................................................................................................127Objects Used By Thread.....................................................................................................................128Cancel Thread.................................................................................................................................... 130DB2 System Console and Message Traffic........................................................................................ 133Data Sets Used by Thread..................................................................................................................134Specify Application Trace.................................................................................................................. 137Enclave Detail Information................................................................................................................ 138Long Names........................................................................................................................................145Thread Accelerator Detail.................................................................................................................. 147
TSO Thread Summary..............................................................................................................................150CICS Thread Summary............................................................................................................................ 152
CICS RCT Summary............................................................................................................................156IMS Thread Summary..............................................................................................................................162
IMS Connection Detail Information...................................................................................................165Background Thread Summary.................................................................................................................166Distributed Allied Thread Summary........................................................................................................169Distributed Database Access Thread Summary..................................................................................... 170Utility Summary....................................................................................................................................... 172Inactive Threads...................................................................................................................................... 173Filter Options For Thread Activity Displays.............................................................................................176Functions Thread Summary.................................................................................................................... 180Stored Procedures Thread Summary......................................................................................................181Triggers Thread Summary....................................................................................................................... 183Sysplex Parallel Thread Summary.......................................................................................................... 184Enclave Thread Summary........................................................................................................................186Threads Having Remote ID Information.................................................................................................188Threads Summary Including Idle Threads............................................................................................. 190
Chapter 7. Locking Conflicts...............................................................................191Locking Conflicts panel............................................................................................................................191Locks/Claims Owned by a Thread........................................................................................................... 195Thread Lock/Claim/Drain Activity........................................................................................................... 201Thread activity: Locks/Claims causing a thread to wait......................................................................... 204Thread Global Lock Activity.....................................................................................................................211
Chapter 8. Resource Managers and Other DB2 Subsystem Information menu...... 215Buffer Manager Information....................................................................................................................216Buffer Pool Detail.....................................................................................................................................218Buffer Pool Snapshot Open Pagesets..................................................................................................... 225Buffer Pool Snapshot Datasets............................................................................................................... 226Group Buffer Pool Information................................................................................................................228Group Buffer Pool Detail..........................................................................................................................229DB2 Log Manager Information................................................................................................................ 231DB2 Log Dataset Information..................................................................................................................235EDM Pool Information............................................................................................................................. 237EDM Pool Snapshot Summary.................................................................................................................243EDM Snapshot Database Descriptors..................................................................................................... 244EDM Snapshot Cursor Tables.................................................................................................................. 245EDM Snapshot Package Table Summary................................................................................................ 246EDM Snapshot Package Table Detail.......................................................................................................247EDM Snapshot Skeleton Cursor Tables...................................................................................................247EDM Snapshot Authorization Cache Storage.......................................................................................... 248EDM Snapshot Skeleton Package Table Summary................................................................................. 249EDM Snapshot Skeleton Package Table Detail....................................................................................... 250Dynamic SQL Cache by Authid................................................................................................................ 251Dynamic SQL Cache by Transaction ID................................................................................................... 253
iv
Dynamic SQL Cache Statistics by Workstation Name............................................................................ 254Dynamic SQL Cache Statistics by End User ID....................................................................................... 255Dynamic SQL Cache Statement Summary by Key Field......................................................................... 257Dynamic SQL Cache Statistics.................................................................................................................258Static SQL Cache Statistics......................................................................................................................259Static SQL Cache Statistics with Package Information.......................................................................... 262EDM Snapshot Static SQL Cache Statement Detail................................................................................ 264EDM Snapshot Dynamic SQL Cache Statement Statistics Detail........................................................... 268EDM Snapshot Free Storage....................................................................................................................275Bind Statistics.......................................................................................................................................... 275DB2 Subsystem Support Manager Statistics.......................................................................................... 278Active Trace Summary.............................................................................................................................280Active Trace Detail................................................................................................................................... 281IRLM Startup Options and CSA Usage.................................................................................................... 284DSNZPARM Thread Parameters.............................................................................................................. 285DSNZPARM Trace Parameters.................................................................................................................288DSNZPARM Logging Parameters............................................................................................................. 291DSNZPARM Archiving Parameters.......................................................................................................... 295DSNZPARM Authorization, RLF and DDF Parameters............................................................................ 300DSNZPARM IRLM Parameters................................................................................................................. 308DSNZPARM Storage Parameters............................................................................................................. 311DSNZPARM Data set and Database Parameters.....................................................................................313DSNZPARM Data Definition Control Support Parameters...................................................................... 320DSNZPARM Data Sharing Parameters.....................................................................................................322DSNZPARM Stored Procedures Parameters........................................................................................... 323DSNZPARM Application Parameters....................................................................................................... 325DSNZPARM Data Parameters.................................................................................................................. 332DSNZPARM Performance and Optimization Parameters....................................................................... 336DSNZPARM Buffer Pool Parameters....................................................................................................... 346DSNZPARM Utility Parameters................................................................................................................ 348DSNZPARM Other System Parameters................................................................................................... 358Lock Manager Information...................................................................................................................... 370Global Lock Statistics.............................................................................................................................. 377SQL/RID Pool/Parallelism/Stored Procedure Information.....................................................................380Open/Close Statistics.............................................................................................................................. 396DB2 Command Statistics.........................................................................................................................398DB2 Storage............................................................................................................................................. 402Address Space Summary........................................................................................................................ 403Thread Information................................................................................................................................. 407Shared and Common Storage..................................................................................................................408Statement Cache and XProc Detail......................................................................................................... 412Pool Detail................................................................................................................................................413IRLM Storage Usage................................................................................................................................ 414GBP Coupling Facility Cache Structure Statistics Summary.................................................................. 416GBP Coupling Facility Cache Structure Statistics................................................................................... 418Accelerator Statistics Overview.............................................................................................................. 420Accelerator Statistics Detail.................................................................................................................... 421
Chapter 9. Application Trace Facility (ATF)......................................................... 435Application Trace Facility Menu.............................................................................................................. 435
Specify Application Trace.................................................................................................................. 437View the Active In-Memory Non-Dataset Trace................................................................................441Stop In-Memory Non-Dataset Trace Requests................................................................................. 442Select Data Set and Trace Parameters.............................................................................................. 443Application Trace Thread Summary - View Dataset......................................................................... 445Stop Viewing Trace Dataset............................................................................................................... 446Create Application Trace Data Set Name.......................................................................................... 446
v
Processing Traces Written to VSAM Datasets................................................................................... 447Application Trace Unit of Work Activity Summary.................................................................................. 452
Application Trace Program Summary................................................................................................453Application Trace Program Detail...................................................................................................... 454Application Trace SQL Index..............................................................................................................459Application Trace SQL Detail............................................................................................................. 461Application Trace Lock Detail............................................................................................................ 467Application Trace Event Detail...........................................................................................................470
Chapter 10. Distributed Data Facility..................................................................481Distributed Data Facility Statistics.......................................................................................................... 481Distributed Data Facility VTAM Summary............................................................................................... 483Distributed Data Facility VTAM Detail..................................................................................................... 484
Chapter 11. Object Analysis............................................................................... 487Object Allocation Summary.....................................................................................................................487
Database Allocations......................................................................................................................... 488Spacename Allocations......................................................................................................................490Dataset Allocations............................................................................................................................ 492Display Options For Object Activity Summary...................................................................................494
Object Activity Summary......................................................................................................................... 495Database Activity............................................................................................................................... 496Thread Activity by Database.............................................................................................................. 497Spacename Activity............................................................................................................................499Thread Activity by Spacename.......................................................................................................... 500Display Options For Database Allocations........................................................................................ 501
Volume Activity Summary....................................................................................................................... 503Volume Database Activity.................................................................................................................. 504Volume Service...................................................................................................................................506Thread Activity by Volume................................................................................................................. 507Volume Spacename Activity.............................................................................................................. 508Volume Thread Activity by Database.................................................................................................510Volume Dataset Activity.....................................................................................................................511Volume Thread Activity by Spacename.............................................................................................512Volume Dataset/Extent Activity.........................................................................................................514Volume Thread Activity by Dataset....................................................................................................515Display Options For Volume Activity Summary Display....................................................................517
Dataset Extend Activity........................................................................................................................... 518Start Object Analysis Collection..............................................................................................................519Stop Object Analysis Collection.............................................................................................................. 519
Chapter 12. DB2 Connect Server........................................................................ 521DB2 Connect/Gateway Statistics............................................................................................................ 522DB2 Connect/Gateway Tasks List........................................................................................................... 524DB2 Connect/Gateway Performance...................................................................................................... 526DB2 Connect/Gateway Package Statistics..............................................................................................527
Chapter 13. Address Space Information............................................................. 529Address Space Information and OMEGAMON Commands menu.......................................................... 529Virtual Storage Map................................................................................................................................. 529DB2 Address Space Allocated DDnames and Datasets......................................................................... 531Job Information and Start Time.............................................................................................................. 532Jobpack Area Modules............................................................................................................................ 533Region and Program Information............................................................................................................535DB2 Storage Allocated by Subpool......................................................................................................... 537Task Control Block Structure...................................................................................................................538Local System Queue Area........................................................................................................................540
vi
Chapter 14. OMEGAMON Commands.................................................................. 543
Chapter 15. Profile Maintenance Facility............................................................ 579Customizing session characteristics in profiles......................................................................................579
The default IBM profile...................................................................................................................... 579The installation profile....................................................................................................................... 579User profiles....................................................................................................................................... 579Panels for profile management..........................................................................................................579
Profile Maintenance menu.......................................................................................................................580Set Display Options................................................................................................................................. 581Set Control Function Options.................................................................................................................. 584Set Printer and Routing Options..............................................................................................................586Set Exception Analysis Message Option................................................................................................. 587Set Performance Options........................................................................................................................ 588Set Background Exception Processing....................................................................................................589Exception Analysis Options menu...........................................................................................................590Set Exception Analysis Options...............................................................................................................590List Profiles.............................................................................................................................................. 597Describe a Profile.....................................................................................................................................598Save New/Altered User Profile................................................................................................................ 599Delete User Profile...................................................................................................................................599Save New/Altered Installation Profile.....................................................................................................600Delete Installation Profile........................................................................................................................601Change Profile..........................................................................................................................................601Exception Logging menu..........................................................................................................................602Set XLF Printer and Routing Options.......................................................................................................603Set DB2/IRLM Messages that MSGE Exception Monitors...................................................................... 604Filter Options For Thread Activity Displays.............................................................................................605
Chapter 16. Near-term history information......................................................... 611Near-Term History Information menu.....................................................................................................611Subsystem Support Manager Statistics Summary by Report Interval...................................................613
Subsystem Support Manager Statistics Detail.................................................................................. 614Bind Statistics Summary by Report Interval...........................................................................................616
Bind Statistics Detail.......................................................................................................................... 618Buffer Pool Statistics Summary by Report Interval................................................................................621
Buffer Pool Statistics Detail............................................................................................................... 623Group Buffer Pool Statistics Summary by Report Interval.....................................................................630
Group Buffer Pool Statistics Detail.................................................................................................... 631Distributed Data Facility Statistics Summary by Report Interval...........................................................634
Distributed Data Facility Statistics Detail.......................................................................................... 636EDM Pool Statistics Summary by Report Interval.................................................................................. 638
EDM Pool Statistics Detail..................................................................................................................640Log Manager Statistics Summary by Report Interval............................................................................. 647
Log Manager Statistics Detail.............................................................................................................648Open/Close Statistics Summary by Report Interval...............................................................................652
Open/Close Statistics Detail.............................................................................................................. 653SQL Statistics Summary by Report Interval............................................................................................655
SQL/RID Pool/I/O Parallelism Statistics Detail.................................................................................656Lock Manager Statistics Summary by Report Interval........................................................................... 673
Lock Manager Statistics Detail...........................................................................................................675Global Lock Statistics Summary by Report Interval............................................................................... 681
Global Lock Statistics Detail.............................................................................................................. 682DB2 Command Statistics By Report Interval..........................................................................................686
DB2 Command Statistics Detail.........................................................................................................687Near-Term History Report Option........................................................................................................... 692
vii
Near-Term Thread History Filter Options................................................................................................693Near-Term Thread History Filter Options - Confirmation....................................................................... 696Thread History By Report Interval.......................................................................................................... 698Thread History By Plan............................................................................................................................ 700Thread History By Authid........................................................................................................................ 702Thread History By Plan, Authid............................................................................................................... 703Thread History By Authid, Plan............................................................................................................... 705Thread History Display Options...............................................................................................................706Thread History Summary.........................................................................................................................708Thread History By Subinterval.................................................................................................................710Thread History By Correlation ID............................................................................................................ 713Thread History Buffer Pool Summary..................................................................................................... 714Thread History DB2 Time Summary........................................................................................................716Thread History DB2 Lock/Scan/Sort Summary.......................................................................................718Thread History Times Summary..............................................................................................................719Thread History Detail...............................................................................................................................721Thread History Lock Waits.......................................................................................................................727Thread History Lock/Claim/Drain Activity...............................................................................................737Thread History Global Lock Activity........................................................................................................ 740Thread History Dynamic SQL Calls..........................................................................................................742Thread History SQL Counts..................................................................................................................... 746Thread History Buffer Pool Activity.........................................................................................................757Thread History Resource Limit Statistics................................................................................................760Thread History Distributed Activity.........................................................................................................762Thread History Package Summary..........................................................................................................766Thread History Package Detail................................................................................................................ 769Thread History Sort and Scan Activity.................................................................................................... 773Thread History Group Buffer Pool Activity..............................................................................................776Thread History Parallel Task Summary...................................................................................................780Near-Term History Data Collection Options............................................................................................782Near-Term History Data Record Information..........................................................................................785Near-Term History Data Collector Dataset Status.................................................................................. 786
Chapter 17. SQL Performance Analyzer Reports................................................. 789SQL Performance Analysis: Available Reports........................................................................................789SQL Performance Analysis: Enhanced Explain....................................................................................... 791SQL Performance Analysis: Query Limits................................................................................................792SQL Performance Analysis: Trace........................................................................................................... 792SQL Performance Analysis: SYSPRINT................................................................................................... 793SQL Performance Analysis: ANLSQL....................................................................................................... 794SQL Performance Analysis: JOBERR.......................................................................................................795
Chapter 18. Analyzing DB2 CPU Usage............................................................... 797DB2 CPU Usage........................................................................................................................................797CICS Attachments................................................................................................................................... 797Non-CICS Attachments........................................................................................................................... 797
Thread Status..................................................................................................................................... 797Attachment Environment...................................................................................................................798
Chapter 19. Trace requirements for OMEGAMON XE for DB2 PE...........................799Trace activation........................................................................................................................................799Realtime data fields for which data is unavailable................................................................................. 799Realtime data fields for which data is cumulative..................................................................................802
Chapter 20. Lock types and lock levels............................................................... 805Lock types................................................................................................................................................ 805Page lock levels....................................................................................................................................... 810
viii
Tablespace lock levels.............................................................................................................................811Internal lock types...................................................................................................................................811
Chapter 21. DB2 Thread Status Values............................................................... 813
Product legal notices......................................................................................... 817
Index................................................................................................................ 821
ix

x
About this information
IBM OMEGAMON for Db2 Performance Expert on z/OS (also referred to asOMEGAMON for Db2Performance Expert) is a performance analysis, monitoring, and tuning tool for Db2 on z/OS®
environments.
The document is part of the OMEGAMON for Db2 Performance Expert documentation library whichprovides instructions for installing, configuring, and using OMEGAMON for Db2 Performance Expert and isdesigned to help database administrators, system programmers, application programmers, and systemoperators perform these tasks:
• Plan for the installation of OMEGAMON for Db2 Performance Expert• Install and operate OMEGAMON for Db2 Performance Expert• Customize your OMEGAMON for Db2 Performance Expert environment• Diagnose and recover from OMEGAMON for Db2 Performance Expert problems• Design and write applications for OMEGAMON for Db2 Performance Expert• Use OMEGAMON for Db2 Performance Expert with other DB2 products
Tip: To find the most current version of this information, always use IBM Knowledge Center, which isupdated more frequently than PDF books.
© Copyright IBM Corp. 2005, 2021 xi

xii Classic Interface User's Guide
Chapter 1. OverviewOMEGAMON for Db2 Performance Expert is a performance analysis, monitoring, and tuning tool for Db2on z/OS environments that enables you to perform a variety of tasks such as reporting, trend analysis, andbuffer pool analysis.
Where to find informationThe OMEGAMON for Db2 Performance Expert documentation set includes the following documents.Full documentation library (Knowledge Center)
SC27-9821-00The OMEGAMON for Db2 Performance Expert Knowledge Center library includes all OMEGAMON forDb2 Performance Expert content.https://www.ibm.com/support/knowledgecenter/SSUSPS_5.4.0/kdp54/kdp54_welcome.html
Program DirectoryGI19-5019http://publibfp.dhe.ibm.com/epubs/pdf/i1950190.pdf
Full documentation library (PDF)SC27-9821-00The IBM OMEGAMON for Db2 Performance Expert User's Guide PDF includes all of the OMEGAMONfor Db2 Performance Expert content. It is the PDF version of the Knowledge Center library.https://www.ibm.com/support/knowledgecenter/SSUSPS_5.4.0/kdp54/kdpuge4.pdf
The OMEGAMON for Db2 Performance Expert documentation is also divided into smaller individualdocuments for ease-of-use. These documents contain a subset of the topics in the full documentationlibrary.
Planning, Customization, and Migration GuideGH12-7072https://www.ibm.com/support/knowledgecenter/SSUSPS_5.4.0/kdp54/ko2cc540.pdf
Buffer Pool Analyzer User's GuideSH12-7075https://www.ibm.com/support/knowledgecenter/SSUSPS_5.4.0/kdp54/bpobp540.pdf
Reporting User's GuideSH12-7071https://www.ibm.com/support/knowledgecenter/SSUSPS_5.4.0/kdp54/ko2ru540.pdf
Classic Interface User's GuideSH12-7068https://www.ibm.com/support/knowledgecenter/SSUSPS_5.4.0/kdp54/ko2ci540.pdf
ISPF Client User's GuideSH12-7070https://www.ibm.com/support/knowledgecenter/SSUSPS_5.4.0/kdp54/ko2mi540.pdf
Enhanced 3270 User Interface User's GuideSH12-7074https://www.ibm.com/support/knowledgecenter/SSUSPS_5.4.0/kdp54/ko2ui540.pdf
Performance Expert Client User's GuideSH12-7069https://www.ibm.com/support/knowledgecenter/SSUSPS_5.4.0/kdp54/ko2mp540.pdf
© Copyright IBM Corp. 2005, 2021 1
Report ReferenceSH12-7065https://www.ibm.com/support/knowledgecenter/SSUSPS_5.4.0/kdp54/ko2rr540.pdf
Report Command ReferenceSH12-7066https://www.ibm.com/support/knowledgecenter/SSUSPS_5.4.0/kdp54/ko2rc540.pdf
Parameter ReferenceSH12-7073https://www.ibm.com/support/knowledgecenter/SSUSPS_5.4.0/kdp54/ko2pr540.pdf
Messages and Troubleshooting GuideGH12-7067https://www.ibm.com/support/knowledgecenter/SSUSPS_5.4.0/kdp54/ko2me540.pdf
Other documentsThese OMEGAMON for Db2 Performance Expert documents are available for users who need informationabout special topics.
Quick Start Guide - GI19-5019Quick start information for the SQL Dashboard and the end-to-end SQL monitoring functions.http://publibfp.dhe.ibm.com/epubs/pdf/h1270640.pdf
DB2 Performance Expert for MultiplatformsSG24-6867A guide to installing, configuring, and using OMEGAMON for Db2 Performance Expert.http://www.redbooks.ibm.com/redbooks/pdfs/sg246470.pdf
Service updates and support informationYou can access support information for IBM Tivoli®OMEGAMON® for Db2 Performance Expert on z/OS andIBM OMEGAMON for Db2 Performance Monitor on z/OS on the Support home website, or you can use theIBM Support Assistant.
Support home
On the Support home website, you can find service updates and support information including software fixpacks, PTFs, Frequently Asked Questions (FAQs), technical notes, troubleshooting information, anddownloads.
Accessibility featuresAccessibility features help people with a physical disability, such as restricted mobility or limited vision, orwith other special needs, to use software products successfully. This Knowledge Center is developed tocomply with the accessibility requirements of software products according to Section 508 of theRehabilitation Act of the United States.
The accessibility features in this Knowledge Center enable users to do the following tasks:
• Use assistive technologies, such as screen-reader software and digital speech synthesizer, to hear whatis displayed on the screen. In this Knowledge Center, all information is provided in HTML format.Consult the product documentation of the assistive technology for details on using assistivetechnologies with HTML-based information.
• Operate specific or equivalent features using only the keyboard.• Magnify what is displayed on the screen.
2 Classic Interface User's Guide
In addition, all images are provided with alternative text so that users with vision impairments canunderstand the contents of the images.
Navigating the interface by using the keyboardStandard shortcut and accelerator keys are used by the product and are documented by the operatingsystem. Refer to the documentation provided by your operating system for more information.
Magnifying what is displayed on the screenYou can enlarge information in the product windows using facilities provided by the operating systems onwhich the product is run. For example, in a Microsoft Windows environment, you can lower the resolutionof the screen to enlarge the font sizes of the text on the screen. Refer to the documentation provided byyour operating system for more information.
How to send your commentsYour feedback is important in helping to provide the most accurate and high-quality information.
If you have any comments about this information or any other documentation, you can complete andsubmit the Reader Comment Form.
Chapter 1. Overview 3

4 Classic Interface User's Guide
Chapter 2. Using the Classic InterfaceOMEGAMON for Db2 Performance Expert monitors your Db2 subsystems in realtime and near-termhistory.
The sections that follow describe the online monitoring functions that are accessible through the ClassicInterface (also called the VTAM® interface).
Realtime componentThe realtime component consists of a realtime monitor that you can use to monitor Db2. It provides aclassic user interface, with conventional menus and panels to facilitate navigation through the product.Through these menus and panels you can access the most current Db2 performance data, like thread use,locking conflicts, SQL calls, and so on. They also enable you to start and view an application trace toobtain realtime information about application flow and resource consumption.
Near-Term History Data CollectorThe Near-Term History Data Collector gathers statistical and accounting information (including distributeddatabase information), and limited performance information from a Db2 subsystem and stores it in VSAMdata sets or sequential files, as the activities occur. Use the near-term history panels to view statistics andthread information that was gathered a few minutes or a few hours ago and to view the current Near-TermHistory Data Collector specifications.
© Copyright IBM Corp. 2005, 2021 5

6 Classic Interface User's Guide
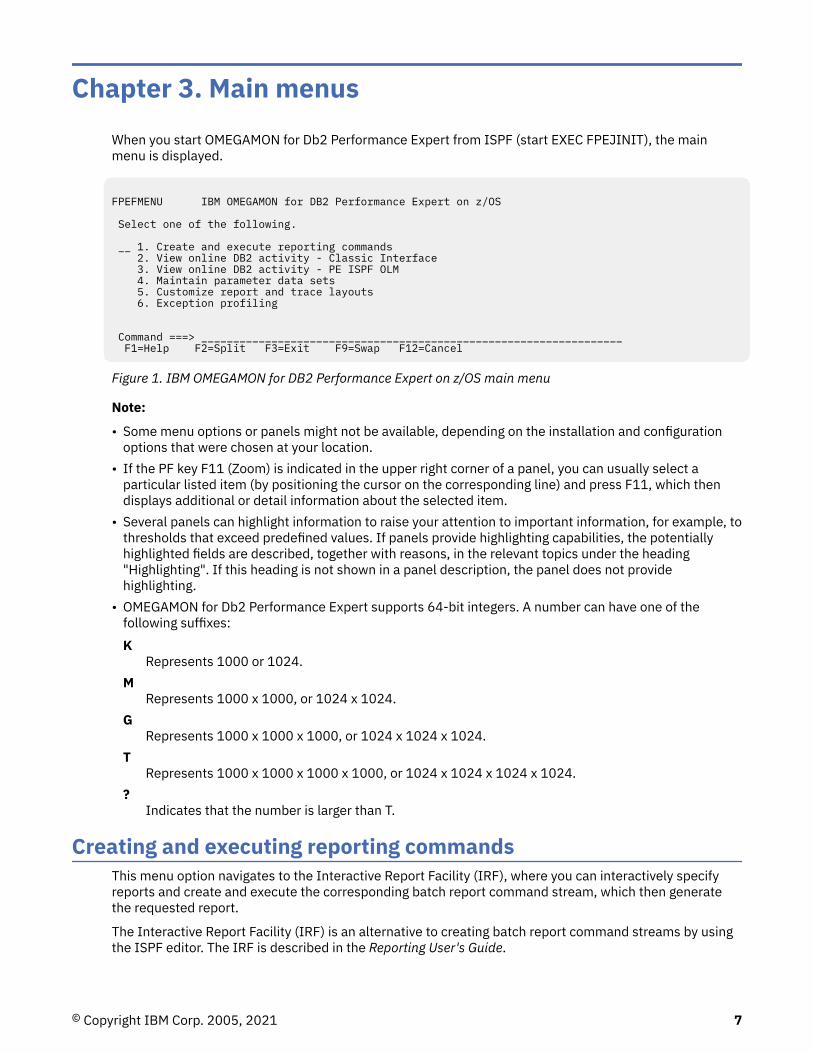
Chapter 3. Main menusWhen you start OMEGAMON for Db2 Performance Expert from ISPF (start EXEC FPEJINIT), the mainmenu is displayed.
FPEFMENU IBM OMEGAMON for DB2 Performance Expert on z/OS Select one of the following. __ 1. Create and execute reporting commands 2. View online DB2 activity - Classic Interface 3. View online DB2 activity - PE ISPF OLM 4. Maintain parameter data sets 5. Customize report and trace layouts 6. Exception profiling Command ===> __________________________________________________________________ F1=Help F2=Split F3=Exit F9=Swap F12=Cancel
Figure 1. IBM OMEGAMON for DB2 Performance Expert on z/OS main menu
Note:
• Some menu options or panels might not be available, depending on the installation and configurationoptions that were chosen at your location.
• If the PF key F11 (Zoom) is indicated in the upper right corner of a panel, you can usually select aparticular listed item (by positioning the cursor on the corresponding line) and press F11, which thendisplays additional or detail information about the selected item.
• Several panels can highlight information to raise your attention to important information, for example, tothresholds that exceed predefined values. If panels provide highlighting capabilities, the potentiallyhighlighted fields are described, together with reasons, in the relevant topics under the heading"Highlighting". If this heading is not shown in a panel description, the panel does not providehighlighting.
• OMEGAMON for Db2 Performance Expert supports 64-bit integers. A number can have one of thefollowing suffixes:K
Represents 1000 or 1024.M
Represents 1000 x 1000, or 1024 x 1024.G
Represents 1000 x 1000 x 1000, or 1024 x 1024 x 1024. T
Represents 1000 x 1000 x 1000 x 1000, or 1024 x 1024 x 1024 x 1024.?
Indicates that the number is larger than T.
Creating and executing reporting commandsThis menu option navigates to the Interactive Report Facility (IRF), where you can interactively specifyreports and create and execute the corresponding batch report command stream, which then generatethe requested report.
The Interactive Report Facility (IRF) is an alternative to creating batch report command streams by usingthe ISPF editor. The IRF is described in the Reporting User's Guide.
© Copyright IBM Corp. 2005, 2021 7
View online DB2 activitySelect this menu option to navigate to the OMEGAMON for Db2 Performance Expert Classic Interfacepanel, where you can specify certain parameters and log on to the Classic Interface Realtime Monitor.
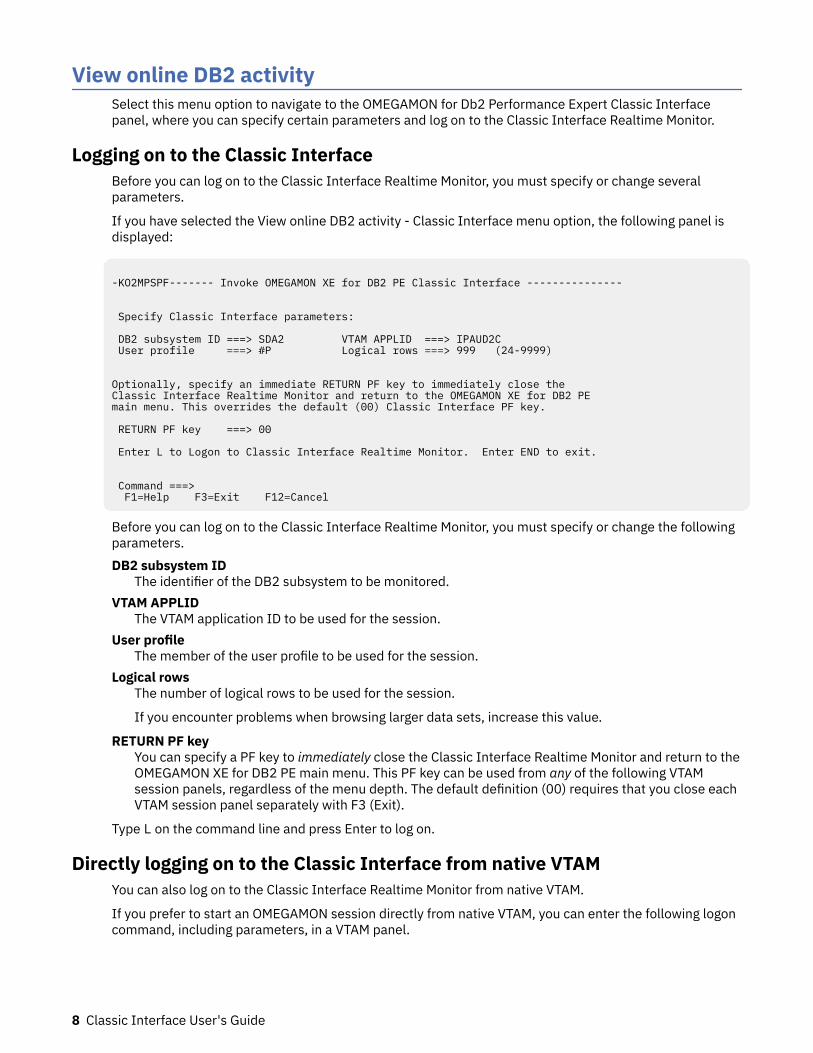
Logging on to the Classic InterfaceBefore you can log on to the Classic Interface Realtime Monitor, you must specify or change severalparameters.
If you have selected the View online DB2 activity - Classic Interface menu option, the following panel isdisplayed:
-KO2MPSPF------- Invoke OMEGAMON XE for DB2 PE Classic Interface --------------- Specify Classic Interface parameters: DB2 subsystem ID ===> SDA2 VTAM APPLID ===> IPAUD2C User profile ===> #P Logical rows ===> 999 (24-9999) Optionally, specify an immediate RETURN PF key to immediately close the Classic Interface Realtime Monitor and return to the OMEGAMON XE for DB2 PE main menu. This overrides the default (00) Classic Interface PF key. RETURN PF key ===> 00 Enter L to Logon to Classic Interface Realtime Monitor. Enter END to exit. Command ===> F1=Help F3=Exit F12=Cancel
Before you can log on to the Classic Interface Realtime Monitor, you must specify or change the followingparameters.DB2 subsystem ID
The identifier of the DB2 subsystem to be monitored.VTAM APPLID
The VTAM application ID to be used for the session.User profile
The member of the user profile to be used for the session.Logical rows
The number of logical rows to be used for the session.
If you encounter problems when browsing larger data sets, increase this value.
RETURN PF keyYou can specify a PF key to immediately close the Classic Interface Realtime Monitor and return to theOMEGAMON XE for DB2 PE main menu. This PF key can be used from any of the following VTAMsession panels, regardless of the menu depth. The default definition (00) requires that you close eachVTAM session panel separately with F3 (Exit).
Type L on the command line and press Enter to log on.
Directly logging on to the Classic Interface from native VTAMYou can also log on to the Classic Interface Realtime Monitor from native VTAM.
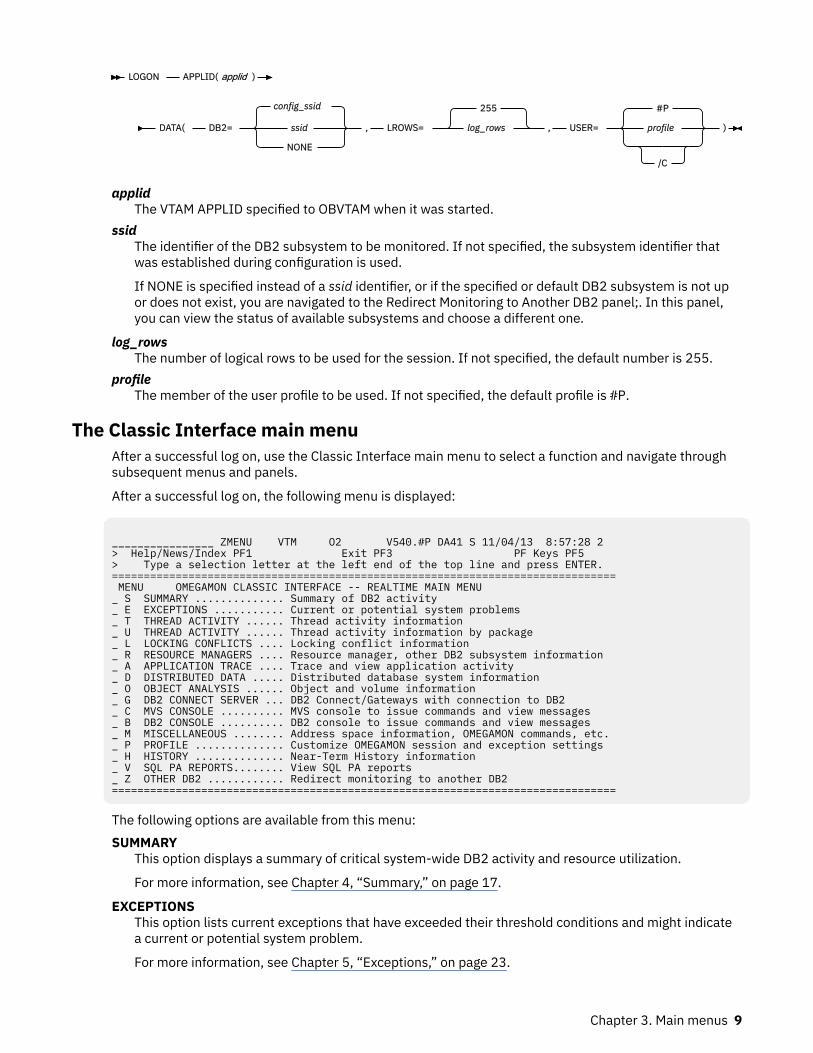
If you prefer to start an OMEGAMON session directly from native VTAM, you can enter the following logoncommand, including parameters, in a VTAM panel.
8 Classic Interface User's Guide
LOGON APPLID( applid )
DATA( DB2=
config_ssid
ssid
NONE
, LROWS=
255
log_rows , USER=
#P
profile
/C
)
applidThe VTAM APPLID specified to OBVTAM when it was started.
ssidThe identifier of the DB2 subsystem to be monitored. If not specified, the subsystem identifier thatwas established during configuration is used.
If NONE is specified instead of a ssid identifier, or if the specified or default DB2 subsystem is not upor does not exist, you are navigated to the Redirect Monitoring to Another DB2 panel;. In this panel,you can view the status of available subsystems and choose a different one.
log_rowsThe number of logical rows to be used for the session. If not specified, the default number is 255.
profileThe member of the user profile to be used. If not specified, the default profile is #P.
The Classic Interface main menuAfter a successful log on, use the Classic Interface main menu to select a function and navigate throughsubsequent menus and panels.
After a successful log on, the following menu is displayed:
________________ ZMENU VTM O2 V540.#P DA41 S 11/04/13 8:57:28 2 > Help/News/Index PF1 Exit PF3 PF Keys PF5 > Type a selection letter at the left end of the top line and press ENTER. =============================================================================== MENU OMEGAMON CLASSIC INTERFACE -- REALTIME MAIN MENU _ S SUMMARY .............. Summary of DB2 activity _ E EXCEPTIONS ........... Current or potential system problems _ T THREAD ACTIVITY ...... Thread activity information _ U THREAD ACTIVITY ...... Thread activity information by package _ L LOCKING CONFLICTS .... Locking conflict information _ R RESOURCE MANAGERS .... Resource manager, other DB2 subsystem information _ A APPLICATION TRACE .... Trace and view application activity _ D DISTRIBUTED DATA ..... Distributed database system information _ O OBJECT ANALYSIS ...... Object and volume information _ G DB2 CONNECT SERVER ... DB2 Connect/Gateways with connection to DB2 _ C MVS CONSOLE .......... MVS console to issue commands and view messages _ B DB2 CONSOLE .......... DB2 console to issue commands and view messages _ M MISCELLANEOUS ........ Address space information, OMEGAMON commands, etc. _ P PROFILE .............. Customize OMEGAMON session and exception settings _ H HISTORY .............. Near-Term History information _ V SQL PA REPORTS........ View SQL PA reports _ Z OTHER DB2 ............ Redirect monitoring to another DB2 ===============================================================================
The following options are available from this menu:SUMMARY
This option displays a summary of critical system-wide DB2 activity and resource utilization.
For more information, see Chapter 4, “Summary,” on page 17.
EXCEPTIONSThis option lists current exceptions that have exceeded their threshold conditions and might indicatea current or potential system problem.
For more information, see Chapter 5, “Exceptions,” on page 23.
Chapter 3. Main menus 9
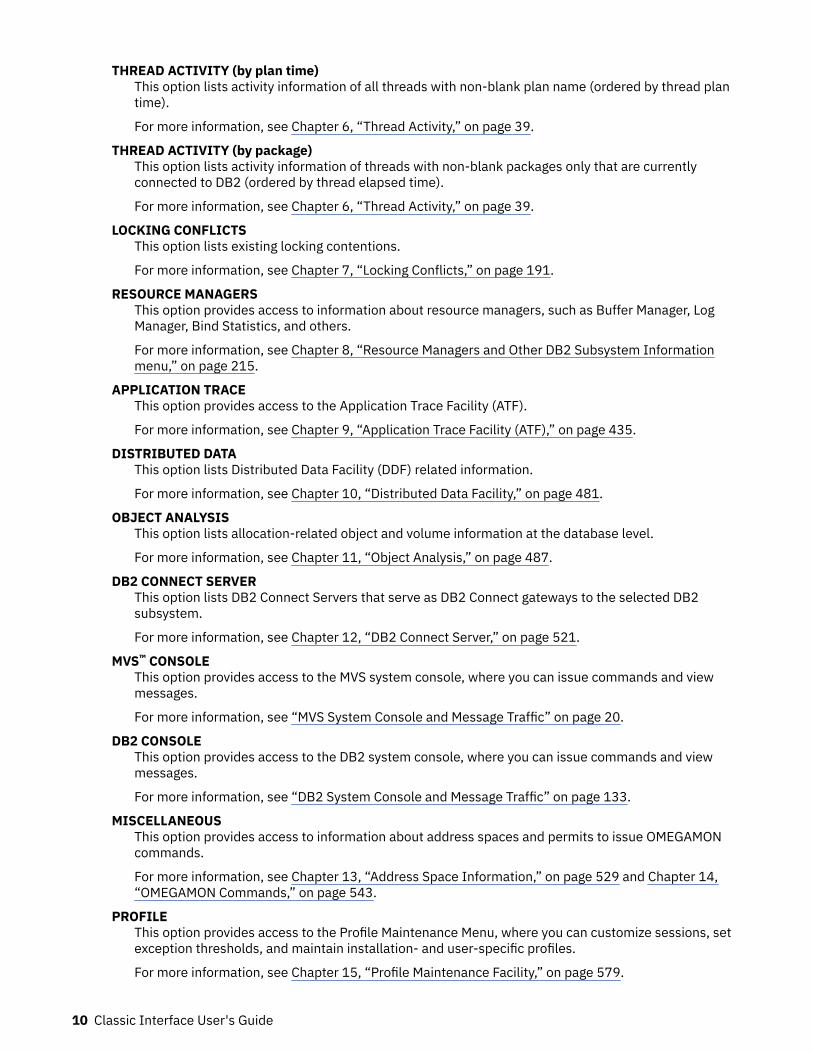
THREAD ACTIVITY (by plan time)This option lists activity information of all threads with non-blank plan name (ordered by thread plantime).
For more information, see Chapter 6, “Thread Activity,” on page 39.
THREAD ACTIVITY (by package)This option lists activity information of threads with non-blank packages only that are currentlyconnected to DB2 (ordered by thread elapsed time).
For more information, see Chapter 6, “Thread Activity,” on page 39.
LOCKING CONFLICTSThis option lists existing locking contentions.
For more information, see Chapter 7, “Locking Conflicts,” on page 191.
RESOURCE MANAGERSThis option provides access to information about resource managers, such as Buffer Manager, LogManager, Bind Statistics, and others.
For more information, see Chapter 8, “Resource Managers and Other DB2 Subsystem Informationmenu,” on page 215.
APPLICATION TRACEThis option provides access to the Application Trace Facility (ATF).
For more information, see Chapter 9, “Application Trace Facility (ATF),” on page 435.
DISTRIBUTED DATAThis option lists Distributed Data Facility (DDF) related information.
For more information, see Chapter 10, “Distributed Data Facility,” on page 481.
OBJECT ANALYSISThis option lists allocation-related object and volume information at the database level.
For more information, see Chapter 11, “Object Analysis,” on page 487.
DB2 CONNECT SERVERThis option lists DB2 Connect Servers that serve as DB2 Connect gateways to the selected DB2subsystem.
For more information, see Chapter 12, “DB2 Connect Server,” on page 521.
MVS™ CONSOLEThis option provides access to the MVS system console, where you can issue commands and viewmessages.
For more information, see “MVS System Console and Message Traffic” on page 20.
DB2 CONSOLEThis option provides access to the DB2 system console, where you can issue commands and viewmessages.
For more information, see “DB2 System Console and Message Traffic” on page 133.
MISCELLANEOUSThis option provides access to information about address spaces and permits to issue OMEGAMONcommands.
For more information, see Chapter 13, “Address Space Information,” on page 529 and Chapter 14,“OMEGAMON Commands,” on page 543.
PROFILEThis option provides access to the Profile Maintenance Menu, where you can customize sessions, setexception thresholds, and maintain installation- and user-specific profiles.
For more information, see Chapter 15, “Profile Maintenance Facility,” on page 579.
10 Classic Interface User's Guide
HISTORYThis option navigates to the Near-Term History Information menu, where you can work with near-termhistory statistics information and near-term thread information. You can also view the currentspecifications about the Near-Term History Data Collector.
For more information, see Chapter 16, “Near-term history information,” on page 611.
SQL PA REPORTSThis option provides access to various SQL Performance Analyzer (SQL PA) reports about current SQLperformance.
For more information, see Chapter 17, “SQL Performance Analyzer Reports,” on page 789.
OTHER DB2This option permits to redirect monitoring to another DB2 subsystem.
For more information, see “Redirect Monitoring to Another DB2” on page 20.
For detailed information about this panel and on subsequent panels, press F1 (Help). If applicable, placethe cursor in an entry field for specific field help.
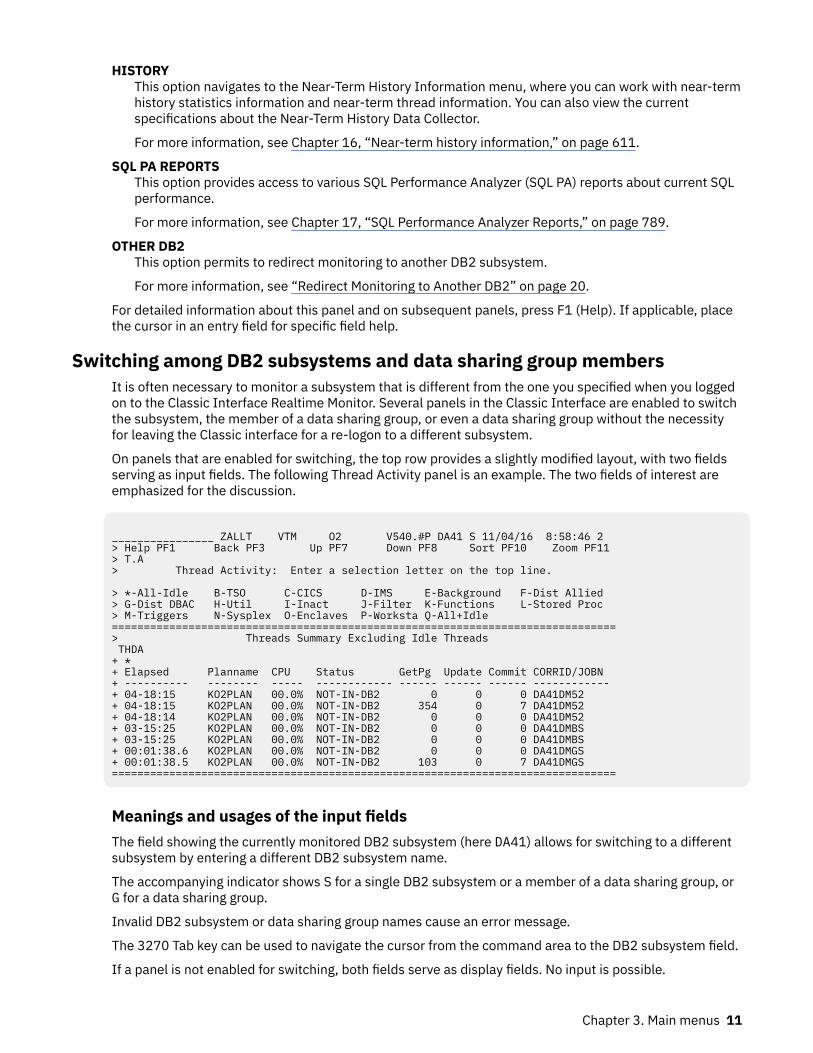
Switching among DB2 subsystems and data sharing group membersIt is often necessary to monitor a subsystem that is different from the one you specified when you loggedon to the Classic Interface Realtime Monitor. Several panels in the Classic Interface are enabled to switchthe subsystem, the member of a data sharing group, or even a data sharing group without the necessityfor leaving the Classic interface for a re-logon to a different subsystem.
On panels that are enabled for switching, the top row provides a slightly modified layout, with two fieldsserving as input fields. The following Thread Activity panel is an example. The two fields of interest areemphasized for the discussion.
________________ ZALLT VTM O2 V540.#P DA41 S 11/04/16 8:58:46 2 > Help PF1 Back PF3 Up PF7 Down PF8 Sort PF10 Zoom PF11 > T.A > Thread Activity: Enter a selection letter on the top line. > *-All-Idle B-TSO C-CICS D-IMS E-Background F-Dist Allied > G-Dist DBAC H-Util I-Inact J-Filter K-Functions L-Stored Proc > M-Triggers N-Sysplex O-Enclaves P-Worksta Q-All+Idle =============================================================================== > Threads Summary Excluding Idle Threads THDA + * + Elapsed Planname CPU Status GetPg Update Commit CORRID/JOBN + ---------- -------- ----- ------------ ------ ------ ------ ------------ + 04-18:15 KO2PLAN 00.0% NOT-IN-DB2 0 0 0 DA41DM52 + 04-18:15 KO2PLAN 00.0% NOT-IN-DB2 354 0 7 DA41DM52 + 04-18:14 KO2PLAN 00.0% NOT-IN-DB2 0 0 0 DA41DM52 + 03-15:25 KO2PLAN 00.0% NOT-IN-DB2 0 0 0 DA41DMBS + 03-15:25 KO2PLAN 00.0% NOT-IN-DB2 0 0 0 DA41DMBS + 00:01:38.6 KO2PLAN 00.0% NOT-IN-DB2 0 0 0 DA41DMGS + 00:01:38.5 KO2PLAN 00.0% NOT-IN-DB2 103 0 7 DA41DMGS ===============================================================================
Meanings and usages of the input fieldsThe field showing the currently monitored DB2 subsystem (here DA41) allows for switching to a differentsubsystem by entering a different DB2 subsystem name.
The accompanying indicator shows S for a single DB2 subsystem or a member of a data sharing group, orG for a data sharing group.
Invalid DB2 subsystem or data sharing group names cause an error message.
The 3270 Tab key can be used to navigate the cursor from the command area to the DB2 subsystem field.
If a panel is not enabled for switching, both fields serve as display fields. No input is possible.
Chapter 3. Main menus 11
View online DB2 activity - PE ISPF OLMThis menu option navigates to the Online Monitor Main Menu, where you can access the IBM DB2Performance Expert ISPF Online Monitor.
Note: The IBM DB2 Performance Expert ISPF Online Monitor is described in Monitoring Performance fromISPF. It is kept available until an equivalent function is provided by the OMEGAMON XE for DB2 PE ClassicInterface.
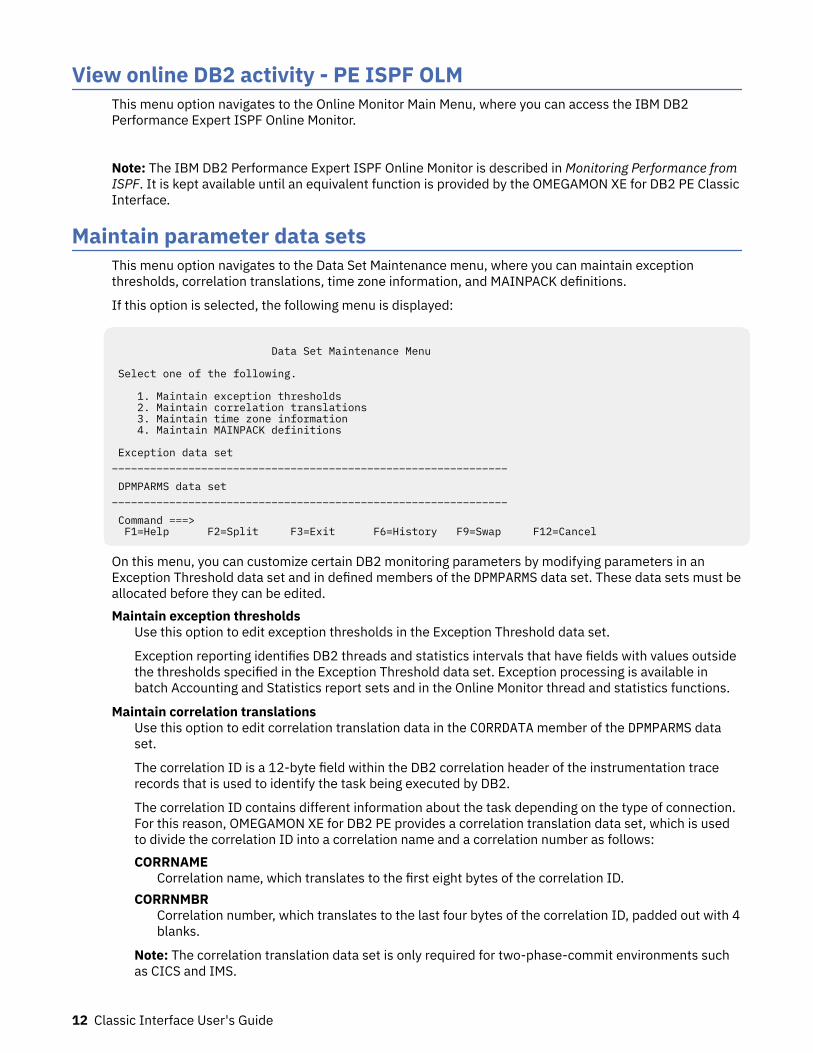
Maintain parameter data setsThis menu option navigates to the Data Set Maintenance menu, where you can maintain exceptionthresholds, correlation translations, time zone information, and MAINPACK definitions.
If this option is selected, the following menu is displayed:
Data Set Maintenance Menu Select one of the following. 1. Maintain exception thresholds 2. Maintain correlation translations 3. Maintain time zone information 4. Maintain MAINPACK definitions Exception data set ______________________________________________________________ DPMPARMS data set ______________________________________________________________ Command ===> F1=Help F2=Split F3=Exit F6=History F9=Swap F12=Cancel
On this menu, you can customize certain DB2 monitoring parameters by modifying parameters in anException Threshold data set and in defined members of the DPMPARMS data set. These data sets must beallocated before they can be edited.Maintain exception thresholds
Use this option to edit exception thresholds in the Exception Threshold data set.
Exception reporting identifies DB2 threads and statistics intervals that have fields with values outsidethe thresholds specified in the Exception Threshold data set. Exception processing is available inbatch Accounting and Statistics report sets and in the Online Monitor thread and statistics functions.
Maintain correlation translationsUse this option to edit correlation translation data in the CORRDATA member of the DPMPARMS dataset.
The correlation ID is a 12-byte field within the DB2 correlation header of the instrumentation tracerecords that is used to identify the task being executed by DB2.
The correlation ID contains different information about the task depending on the type of connection.For this reason, OMEGAMON XE for DB2 PE provides a correlation translation data set, which is usedto divide the correlation ID into a correlation name and a correlation number as follows:CORRNAME
Correlation name, which translates to the first eight bytes of the correlation ID.CORRNMBR
Correlation number, which translates to the last four bytes of the correlation ID, padded out with 4blanks.
Note: The correlation translation data set is only required for two-phase-commit environments suchas CICS and IMS.
12 Classic Interface User's Guide
Maintain time zone informationUse this option to edit the time zone information in the LOCDATA member of the DPMPARMS data setmember.
The time zone information is used to adjust differences in the times of the data to be reported. Adjustthe times if:
• The CPU clock of your MVS system is not set to the local time, but you want to use the local time inyour reports.
• You want to generate reports or traces that show activity at more than one location and the CPUclock settings of the locations are different. This is often the case when the locations are in differenttime zones.
When you have entered the time zone information to the DPMPARMS data set member, you can usethe TIMEZONE option of the GLOBAL command to adjust the times used in reporting.
Maintain MAINPACK definitionsUse this option to edit MAINPACK definitions in the MAINPACK member of the DPMPARMS data setmember.
In the Accounting report set you can use the MAINPACK identifier to distinguish plans according tothe packages they contain. You can define certain aspects of the MAINPACK identifier:
• Whether the first or the last package executed within a plan is used as the MAINPACK.• Whether you want to use the package ID, the collection ID, or the location name of the package as
the value of the identifier. In the case of a DBRM, the program name is always used.
You can specify different MAINPACK definitions for data from different environments and fromdifferent plans.
Exception data setUse this field to specify the name of your Exception Threshold data set. The data set must bepreallocated and cataloged before you can edit it.
To specify the data set, enter any fully qualified name by enclosing it in apostrophes. If you omit theapostrophes, your TSO prefix is appended to the data set name.
If you want to use a new Exception Threshold data set, it must be allocated using the followingattributes:DSORG
A data set organization of PS (sequential).RECFM
A record format of VB or V.LRECL
A record size of at least 255.BLKSIZE
The block size must be at least 4 bytes more than LRECL.
DPMPARMS data setUse this field to specify the name of your DPMPARMS data set. Any modifications you make to timezone specifications, correlation translation, or to the MAINPACK identifier definition are recorded inthe individual members of the DPMPARMS data set.
The data set must be preallocated and cataloged before you can edit it.
To specify the data set, enter any fully qualified name by enclosing it in apostrophes. If you omit theapostrophes, your TSO prefix is appended to the data set name.
If you want to use a new DPMPARMS data set, it should be allocated using the following attributes:DSORG
A data set organization of PO (partitioned).
Chapter 3. Main menus 13
RECFMA record format of FB or F.
LRECLA record size of 80.
BLKSIZEA block size that can be any multiple of LRECL.
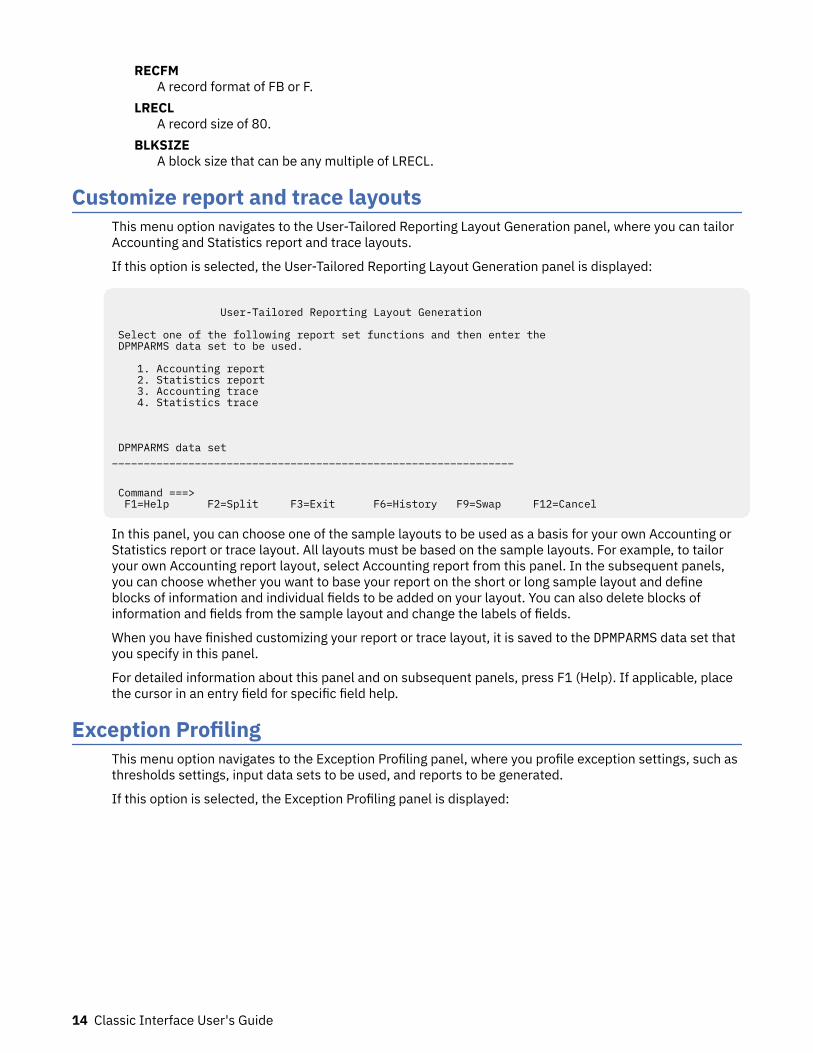
Customize report and trace layoutsThis menu option navigates to the User-Tailored Reporting Layout Generation panel, where you can tailorAccounting and Statistics report and trace layouts.
If this option is selected, the User-Tailored Reporting Layout Generation panel is displayed:
User-Tailored Reporting Layout Generation Select one of the following report set functions and then enter the DPMPARMS data set to be used. 1. Accounting report 2. Statistics report 3. Accounting trace 4. Statistics trace DPMPARMS data set _______________________________________________________________ Command ===> F1=Help F2=Split F3=Exit F6=History F9=Swap F12=Cancel
In this panel, you can choose one of the sample layouts to be used as a basis for your own Accounting orStatistics report or trace layout. All layouts must be based on the sample layouts. For example, to tailoryour own Accounting report layout, select Accounting report from this panel. In the subsequent panels,you can choose whether you want to base your report on the short or long sample layout and defineblocks of information and individual fields to be added on your layout. You can also delete blocks ofinformation and fields from the sample layout and change the labels of fields.
When you have finished customizing your report or trace layout, it is saved to the DPMPARMS data set thatyou specify in this panel.
For detailed information about this panel and on subsequent panels, press F1 (Help). If applicable, placethe cursor in an entry field for specific field help.
Exception ProfilingThis menu option navigates to the Exception Profiling panel, where you profile exception settings, such asthresholds settings, input data sets to be used, and reports to be generated.
If this option is selected, the Exception Profiling panel is displayed:
14 Classic Interface User's Guide
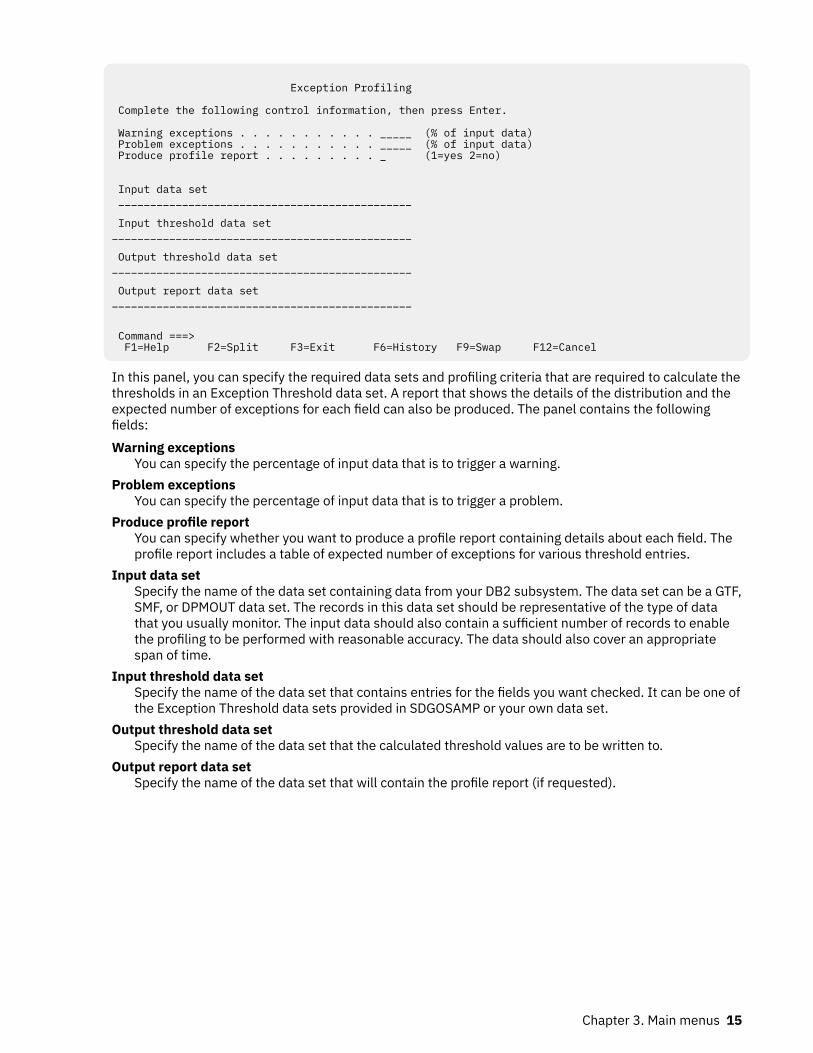
Exception Profiling Complete the following control information, then press Enter. Warning exceptions . . . . . . . . . . . _____ (% of input data) Problem exceptions . . . . . . . . . . . _____ (% of input data) Produce profile report . . . . . . . . . _ (1=yes 2=no) Input data set ______________________________________________ Input threshold data set _______________________________________________ Output threshold data set _______________________________________________ Output report data set _______________________________________________ Command ===> F1=Help F2=Split F3=Exit F6=History F9=Swap F12=Cancel
In this panel, you can specify the required data sets and profiling criteria that are required to calculate thethresholds in an Exception Threshold data set. A report that shows the details of the distribution and theexpected number of exceptions for each field can also be produced. The panel contains the followingfields:Warning exceptions
You can specify the percentage of input data that is to trigger a warning.Problem exceptions
You can specify the percentage of input data that is to trigger a problem.Produce profile report
You can specify whether you want to produce a profile report containing details about each field. Theprofile report includes a table of expected number of exceptions for various threshold entries.
Input data setSpecify the name of the data set containing data from your DB2 subsystem. The data set can be a GTF,SMF, or DPMOUT data set. The records in this data set should be representative of the type of datathat you usually monitor. The input data should also contain a sufficient number of records to enablethe profiling to be performed with reasonable accuracy. The data should also cover an appropriatespan of time.
Input threshold data setSpecify the name of the data set that contains entries for the fields you want checked. It can be one ofthe Exception Threshold data sets provided in SDGOSAMP or your own data set.
Output threshold data setSpecify the name of the data set that the calculated threshold values are to be written to.
Output report data setSpecify the name of the data set that will contain the profile report (if requested).
Chapter 3. Main menus 15

16 Classic Interface User's Guide
Chapter 4. SummarySelect this main menu option for summary and overview information of current DB2 activity and DB2connections.
For more system-related information, see Chapter 8, “Resource Managers and Other DB2 SubsystemInformation menu,” on page 215.
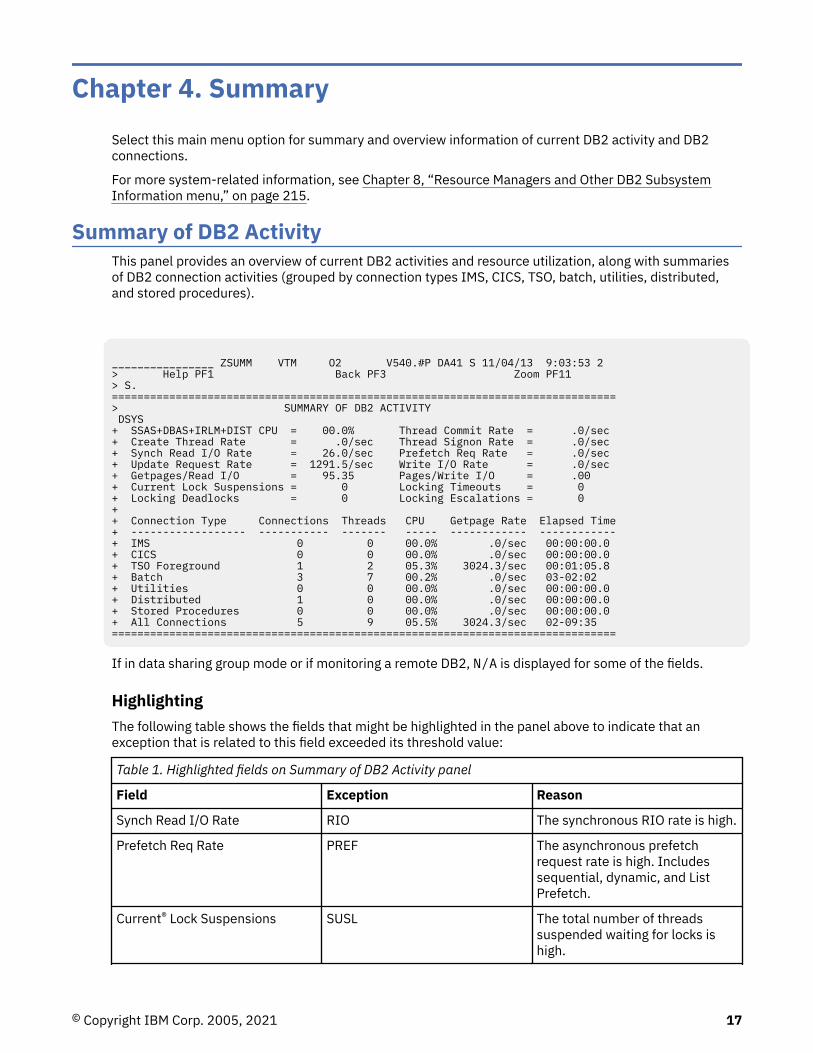
Summary of DB2 ActivityThis panel provides an overview of current DB2 activities and resource utilization, along with summariesof DB2 connection activities (grouped by connection types IMS, CICS, TSO, batch, utilities, distributed,and stored procedures).
________________ ZSUMM VTM O2 V540.#P DA41 S 11/04/13 9:03:53 2 > Help PF1 Back PF3 Zoom PF11 > S. =============================================================================== > SUMMARY OF DB2 ACTIVITY DSYS + SSAS+DBAS+IRLM+DIST CPU = 00.0% Thread Commit Rate = .0/sec + Create Thread Rate = .0/sec Thread Signon Rate = .0/sec + Synch Read I/O Rate = 26.0/sec Prefetch Req Rate = .0/sec + Update Request Rate = 1291.5/sec Write I/O Rate = .0/sec + Getpages/Read I/O = 95.35 Pages/Write I/O = .00 + Current Lock Suspensions = 0 Locking Timeouts = 0 + Locking Deadlocks = 0 Locking Escalations = 0 + + Connection Type Connections Threads CPU Getpage Rate Elapsed Time + ------------------ ----------- ------- ----- ------------ ------------ + IMS 0 0 00.0% .0/sec 00:00:00.0 + CICS 0 0 00.0% .0/sec 00:00:00.0 + TSO Foreground 1 2 05.3% 3024.3/sec 00:01:05.8 + Batch 3 7 00.2% .0/sec 03-02:02 + Utilities 0 0 00.0% .0/sec 00:00:00.0 + Distributed 1 0 00.0% .0/sec 00:00:00.0 + Stored Procedures 0 0 00.0% .0/sec 00:00:00.0 + All Connections 5 9 05.5% 3024.3/sec 02-09:35 ===============================================================================
If in data sharing group mode or if monitoring a remote DB2, N/A is displayed for some of the fields.
HighlightingThe following table shows the fields that might be highlighted in the panel above to indicate that anexception that is related to this field exceeded its threshold value:
Table 1. Highlighted fields on Summary of DB2 Activity panel
Field Exception Reason
Synch Read I/O Rate RIO The synchronous RIO rate is high.
Prefetch Req Rate PREF The asynchronous prefetchrequest rate is high. Includessequential, dynamic, and ListPrefetch.
Current® Lock Suspensions SUSL The total number of threadssuspended waiting for locks ishigh.
© Copyright IBM Corp. 2005, 2021 17
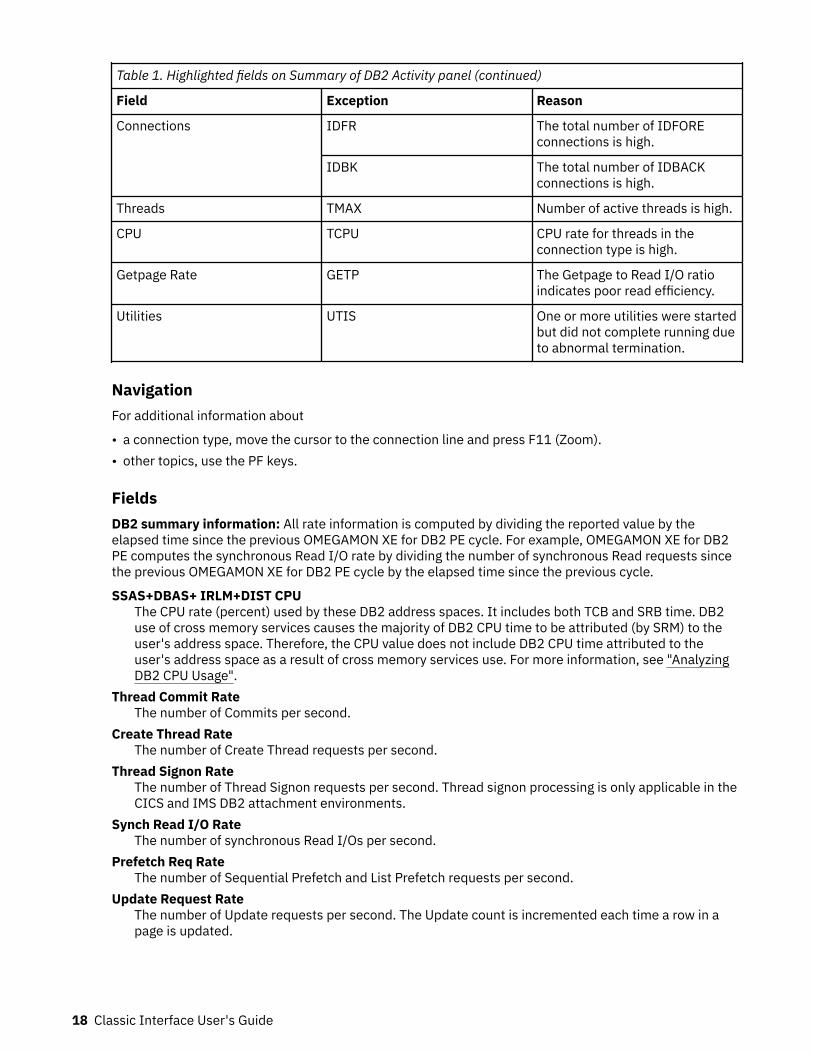
Table 1. Highlighted fields on Summary of DB2 Activity panel (continued)
Field Exception Reason
Connections IDFR The total number of IDFOREconnections is high.
IDBK The total number of IDBACKconnections is high.
Threads TMAX Number of active threads is high.
CPU TCPU CPU rate for threads in theconnection type is high.
Getpage Rate GETP The Getpage to Read I/O ratioindicates poor read efficiency.
Utilities UTIS One or more utilities were startedbut did not complete running dueto abnormal termination.
NavigationFor additional information about
• a connection type, move the cursor to the connection line and press F11 (Zoom).• other topics, use the PF keys.
FieldsDB2 summary information: All rate information is computed by dividing the reported value by theelapsed time since the previous OMEGAMON XE for DB2 PE cycle. For example, OMEGAMON XE for DB2PE computes the synchronous Read I/O rate by dividing the number of synchronous Read requests sincethe previous OMEGAMON XE for DB2 PE cycle by the elapsed time since the previous cycle.
SSAS+DBAS+ IRLM+DIST CPUThe CPU rate (percent) used by these DB2 address spaces. It includes both TCB and SRB time. DB2use of cross memory services causes the majority of DB2 CPU time to be attributed (by SRM) to theuser's address space. Therefore, the CPU value does not include DB2 CPU time attributed to theuser's address space as a result of cross memory services use. For more information, see "AnalyzingDB2 CPU Usage".
Thread Commit RateThe number of Commits per second.
Create Thread RateThe number of Create Thread requests per second.
Thread Signon RateThe number of Thread Signon requests per second. Thread signon processing is only applicable in theCICS and IMS DB2 attachment environments.
Synch Read I/O RateThe number of synchronous Read I/Os per second.
Prefetch Req RateThe number of Sequential Prefetch and List Prefetch requests per second.
Update Request RateThe number of Update requests per second. The Update count is incremented each time a row in apage is updated.
18 Classic Interface User's Guide
Write I/O RateThe number of Write I/Os per second. Write I/O is normally performed asynchronously. Updatedpages are queued by the data set until written. Updated pages are physically written using the DB2Deferred Write algorithm.
Getpages/Read I/OThe Getpage to Read I/O ratio. This value helps in measuring read and buffer pool efficiency The valueis computed by dividing the total number of Getpage requests by the total number of synchronousread I/O requests since the last OMEGAMON XE for DB2 PE cycle.
Pages/Write I/OThe average number of pages written per Write I/O. This value is computed by dividing the number ofpages written by the number of Write I/Os since the last OMEGAMON XE for DB2 PE cycle.
Current Lock SuspensionsThe current number of threads that are waiting because of a lock request issued for a resource that isunavailable.
Locking TimeoutsThe number of locking timeouts since DB2 was started. Timeouts occur because lock requests weresuspended for a time in excess of the locking timeout value.
Locking DeadlocksThe number of locking deadlocks that occurred since DB2 was started. Deadlocks are a result oflocking contention.
Locking EscalationsThe number of lock escalations that occurred since DB2 was started. This count includes the numberof escalations to both shared and exclusive modes.
DB2 connection information: A summary of connection information by DB2 connection type.Connection Type
A single line is displayed for each DB2 connection type.Connections
The number of active connections originating from the connection type. For Distributed, it is the countof remote DB2 connections in which the DB2 subsystem being monitored has active DB2-to-DB2system conversations.For remote DB2 subsystems and in Data Sharing Group mode, this field is marked as not available(N/A).
ThreadsThe number of active threads that are originating from the connection type. This number includesactive parallel task threads that are initiated by threads that are originating from the connection type.For Distributed, it is the number of active database access threads that are active on the DB2subsystem being monitored.
CPUThe total CPU rate (percent) attributable to the connection type. For non-CICS connection types, thisvalue is the total CPU rate of all address spaces within the connection type with active threads. ForCICS connections, this value is the total CPU rate attributable to all active threads originating fromCICS connections. For more information about CPU use, see "Analyzing DB2 CPU Usage".For remote DB2 subsystems and in Data Sharing Group mode, this field is marked as not available(N/A).
Getpage RateThe total Getpage rate per second for active threads originating from the connection type.
Elapsed TimeThe average elapsed time for an active thread within the connection type. This value is computed byadding the elapsed time of all active threads within the connection type and dividing it by the totalnumber of active threads.
Chapter 4. Summary 19
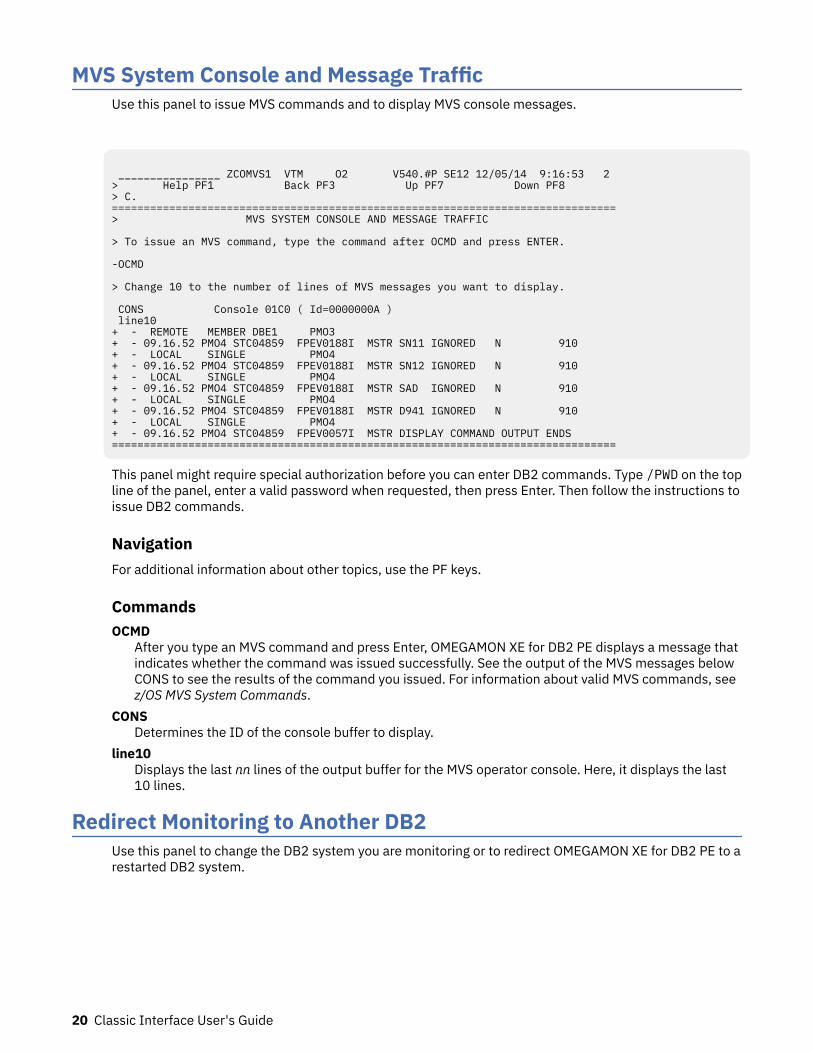
MVS System Console and Message TrafficUse this panel to issue MVS commands and to display MVS console messages.
________________ ZCOMVS1 VTM O2 V540.#P SE12 12/05/14 9:16:53 2 > Help PF1 Back PF3 Up PF7 Down PF8 > C. ===============================================================================> MVS SYSTEM CONSOLE AND MESSAGE TRAFFIC > To issue an MVS command, type the command after OCMD and press ENTER. -OCMD > Change 10 to the number of lines of MVS messages you want to display. CONS Console 01C0 ( Id=0000000A ) line10 + - REMOTE MEMBER DBE1 PMO3 + - 09.16.52 PMO4 STC04859 FPEV0188I MSTR SN11 IGNORED N 910 + - LOCAL SINGLE PMO4 + - 09.16.52 PMO4 STC04859 FPEV0188I MSTR SN12 IGNORED N 910 + - LOCAL SINGLE PMO4 + - 09.16.52 PMO4 STC04859 FPEV0188I MSTR SAD IGNORED N 910 + - LOCAL SINGLE PMO4 + - 09.16.52 PMO4 STC04859 FPEV0188I MSTR D941 IGNORED N 910 + - LOCAL SINGLE PMO4 + - 09.16.52 PMO4 STC04859 FPEV0057I MSTR DISPLAY COMMAND OUTPUT ENDS ===============================================================================
This panel might require special authorization before you can enter DB2 commands. Type /PWD on the topline of the panel, enter a valid password when requested, then press Enter. Then follow the instructions toissue DB2 commands.
NavigationFor additional information about other topics, use the PF keys.
CommandsOCMD
After you type an MVS command and press Enter, OMEGAMON XE for DB2 PE displays a message thatindicates whether the command was issued successfully. See the output of the MVS messages belowCONS to see the results of the command you issued. For information about valid MVS commands, seez/OS MVS System Commands.
CONSDetermines the ID of the console buffer to display.
line10Displays the last nn lines of the output buffer for the MVS operator console. Here, it displays the last10 lines.
Redirect Monitoring to Another DB2Use this panel to change the DB2 system you are monitoring or to redirect OMEGAMON XE for DB2 PE to arestarted DB2 system.
20 Classic Interface User's Guide
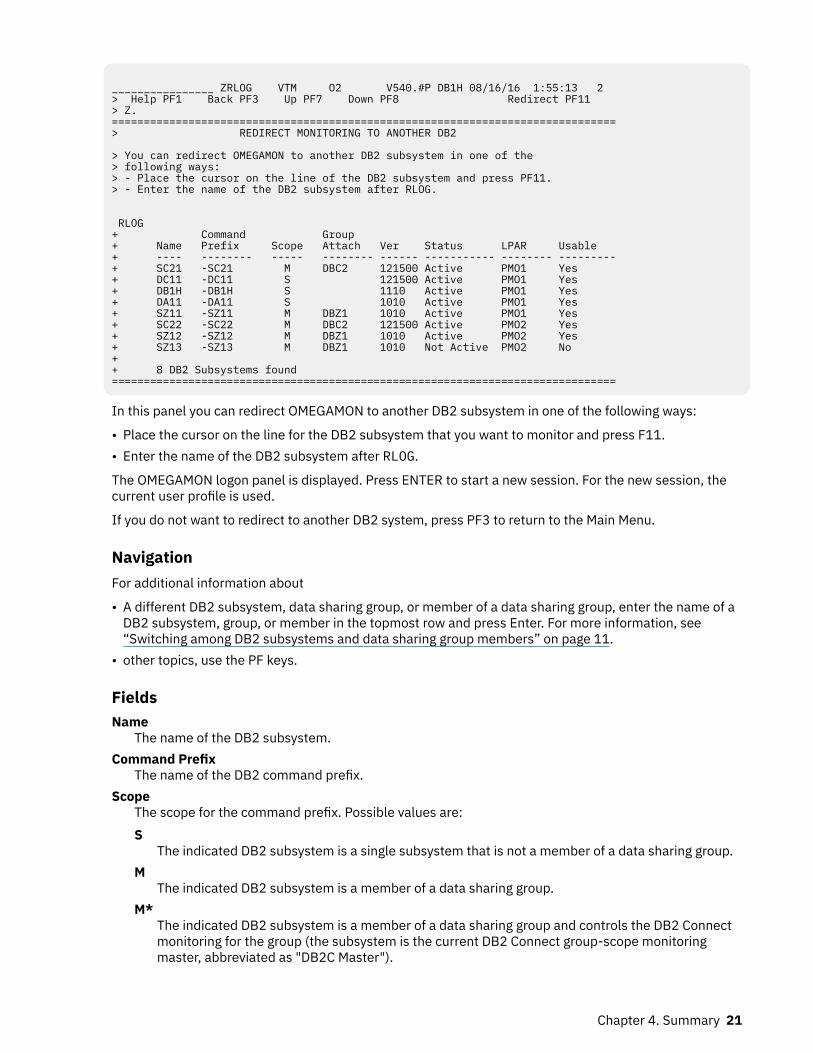
________________ ZRLOG VTM O2 V540.#P DB1H 08/16/16 1:55:13 2 > Help PF1 Back PF3 Up PF7 Down PF8 Redirect PF11 > Z. =============================================================================== > REDIRECT MONITORING TO ANOTHER DB2 > You can redirect OMEGAMON to another DB2 subsystem in one of the > following ways: > - Place the cursor on the line of the DB2 subsystem and press PF11. > - Enter the name of the DB2 subsystem after RLOG. RLOG + Command Group + Name Prefix Scope Attach Ver Status LPAR Usable + ---- -------- ----- -------- ------ ----------- -------- --------- + SC21 -SC21 M DBC2 121500 Active PMO1 Yes + DC11 -DC11 S 121500 Active PMO1 Yes + DB1H -DB1H S 1110 Active PMO1 Yes + DA11 -DA11 S 1010 Active PMO1 Yes + SZ11 -SZ11 M DBZ1 1010 Active PMO1 Yes + SC22 -SC22 M DBC2 121500 Active PMO2 Yes + SZ12 -SZ12 M DBZ1 1010 Active PMO2 Yes + SZ13 -SZ13 M DBZ1 1010 Not Active PMO2 No + + 8 DB2 Subsystems found ===============================================================================
In this panel you can redirect OMEGAMON to another DB2 subsystem in one of the following ways:
• Place the cursor on the line for the DB2 subsystem that you want to monitor and press F11.• Enter the name of the DB2 subsystem after RLOG.
The OMEGAMON logon panel is displayed. Press ENTER to start a new session. For the new session, thecurrent user profile is used.
If you do not want to redirect to another DB2 system, press PF3 to return to the Main Menu.
NavigationFor additional information about
• A different DB2 subsystem, data sharing group, or member of a data sharing group, enter the name of aDB2 subsystem, group, or member in the topmost row and press Enter. For more information, see“Switching among DB2 subsystems and data sharing group members” on page 11.
• other topics, use the PF keys.
FieldsName
The name of the DB2 subsystem.Command Prefix
The name of the DB2 command prefix.Scope
The scope for the command prefix. Possible values are:S
The indicated DB2 subsystem is a single subsystem that is not a member of a data sharing group.M
The indicated DB2 subsystem is a member of a data sharing group.M*
The indicated DB2 subsystem is a member of a data sharing group and controls the DB2 Connectmonitoring for the group (the subsystem is the current DB2 Connect group-scope monitoringmaster, abbreviated as "DB2C Master").
Chapter 4. Summary 21
When the PE Server subtask acting as DB2C Master terminates, the value changes from M* to Mand DB2 Connect data is no longer monitored.
If another PE Server subtask in the data sharing group takes over DB2 Connect monitoring andbecomes the new DB2C Master:
• The value changes from M to M*.• The name of the DB2 subsystem now acting as the new DB2C Master is shown on the
corresponding DB2 Connect panels.
Note: During the transition of the DB2C Master role (which might take several minutes) DB2Connect data cannot be monitored, no DB2 subsystem is marked as DB2C Master, and oncorresponding DB2 Connect panels the name of the DB2C Master is shown as N/A.
Group AttachThe group attachment name, used for data sharing. This field is blank if the DB2 subsystem is notdefined as a member of a data sharing group.
VerThe version of the DB2 subsystem is displayed if the DB2 subsystem is active.
StatusThe following values are possibleActive
DB2 subsystem is active.Not Active
DB2 subsystem is not active.Unreachable
Unable to connect to the DB2 subsystem.Unsupported
DB2 lower than version 10 or higher than version 12 is not supported.Restricted
DB2 is in restricted access mode.Wait RRS
DB2 is waiting for RRS connection.LPAR
The logical partition (LPAR) defined for your system.Usable
An indication whether the resources defined for your system can be used.
If a DB2 subsystem has not been fully configured for monitoring or is not active, it will be indicated asNo.
22 Classic Interface User's Guide
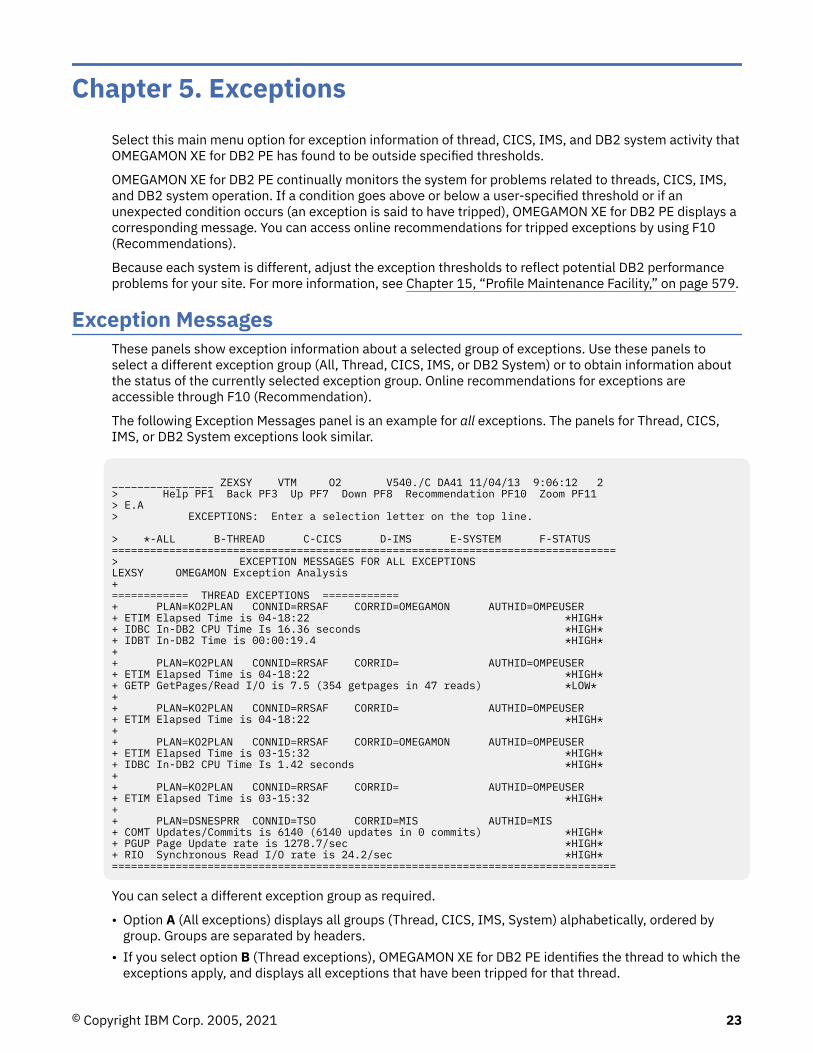
Chapter 5. ExceptionsSelect this main menu option for exception information of thread, CICS, IMS, and DB2 system activity thatOMEGAMON XE for DB2 PE has found to be outside specified thresholds.
OMEGAMON XE for DB2 PE continually monitors the system for problems related to threads, CICS, IMS,and DB2 system operation. If a condition goes above or below a user-specified threshold or if anunexpected condition occurs (an exception is said to have tripped), OMEGAMON XE for DB2 PE displays acorresponding message. You can access online recommendations for tripped exceptions by using F10(Recommendations).
Because each system is different, adjust the exception thresholds to reflect potential DB2 performanceproblems for your site. For more information, see Chapter 15, “Profile Maintenance Facility,” on page 579.
Exception MessagesThese panels show exception information about a selected group of exceptions. Use these panels toselect a different exception group (All, Thread, CICS, IMS, or DB2 System) or to obtain information aboutthe status of the currently selected exception group. Online recommendations for exceptions areaccessible through F10 (Recommendation).
The following Exception Messages panel is an example for all exceptions. The panels for Thread, CICS,IMS, or DB2 System exceptions look similar.
________________ ZEXSY VTM O2 V540./C DA41 11/04/13 9:06:12 2 > Help PF1 Back PF3 Up PF7 Down PF8 Recommendation PF10 Zoom PF11 > E.A > EXCEPTIONS: Enter a selection letter on the top line. > *-ALL B-THREAD C-CICS D-IMS E-SYSTEM F-STATUS ===============================================================================> EXCEPTION MESSAGES FOR ALL EXCEPTIONS LEXSY OMEGAMON Exception Analysis + ============ THREAD EXCEPTIONS ============ + PLAN=KO2PLAN CONNID=RRSAF CORRID=OMEGAMON AUTHID=OMPEUSER + ETIM Elapsed Time is 04-18:22 *HIGH* + IDBC In-DB2 CPU Time Is 16.36 seconds *HIGH* + IDBT In-DB2 Time is 00:00:19.4 *HIGH* + + PLAN=KO2PLAN CONNID=RRSAF CORRID= AUTHID=OMPEUSER + ETIM Elapsed Time is 04-18:22 *HIGH* + GETP GetPages/Read I/O is 7.5 (354 getpages in 47 reads) *LOW* + + PLAN=KO2PLAN CONNID=RRSAF CORRID= AUTHID=OMPEUSER + ETIM Elapsed Time is 04-18:22 *HIGH* + + PLAN=KO2PLAN CONNID=RRSAF CORRID=OMEGAMON AUTHID=OMPEUSER + ETIM Elapsed Time is 03-15:32 *HIGH* + IDBC In-DB2 CPU Time Is 1.42 seconds *HIGH* + + PLAN=KO2PLAN CONNID=RRSAF CORRID= AUTHID=OMPEUSER + ETIM Elapsed Time is 03-15:32 *HIGH* + + PLAN=DSNESPRR CONNID=TSO CORRID=MIS AUTHID=MIS + COMT Updates/Commits is 6140 (6140 updates in 0 commits) *HIGH* + PGUP Page Update rate is 1278.7/sec *HIGH* + RIO Synchronous Read I/O rate is 24.2/sec *HIGH* ===============================================================================
You can select a different exception group as required.
• Option A (All exceptions) displays all groups (Thread, CICS, IMS, System) alphabetically, ordered bygroup. Groups are separated by headers.
• If you select option B (Thread exceptions), OMEGAMON XE for DB2 PE identifies the thread to which theexceptions apply, and displays all exceptions that have been tripped for that thread.
© Copyright IBM Corp. 2005, 2021 23
• If option C (CICS exceptions) is selected, OMEGAMON XE for DB2 PE provides information aboutexceptional conditions occurring within the CICS/DB2 attachment of CICS regions connected to DB2.
• If you select option D (IMS exceptions), OMEGAMON XE for DB2 PE provides information aboutexceptional conditions occurring within the IMS/DB2 attachment of IMS dependent and control regionsconnected to DB2.
• If you select option E (DB2 System), OMEGAMON XE for DB2 PE provides information about the currentcondition of DB2 system resources and functions, including DB2 connections and threads, buffermanagement, log management, and locking.
If you select F (Status), OMEGAMON XE for DB2 PE displays the Current Status for Exceptions panel forthe currently selected exception group (the group displayed in Exception Messages panel). For moreinformation, see the description of panel "Current Status for Exceptions".
NavigationFor additional information about
• an exception, move the cursor to the exception line and press F11 (Zoom).• exception recommendations, move the cursor to the exception line and press F10 (Recommendation).• related topics, select one of the options on the top of the panel.• other topics, use the PF keys.
FieldsEach of the exceptions on the Exception Messages panel has the following default characteristics:
• Bell=OFF• Boxchar=NO BOX• Boxclr=NONE• Boxattr=NONE• Display=CLR3• Attribute=NONE• ExNcyc=0• Stop=0• Cumulative=0• Auto=OFF• Log=OFF• Limit=200• Repeat=YES• Persist=1
To change a characteristic of any exception, see "Profile Maintenance Facility".
A description of possible exceptions (arranged in alphabetical order) follows:ARCM
Thread backout processing is waiting for an archive tape mount.
OMEGAMON XE for DB2 PE displays the ARCM exception when a thread is waiting for a tape mount.DB2 requires the archive tape mount during abort processing to backout changes made in the currentunit of recovery. The thread does not do any processing until the tape is mounted, and holds DB2resources until the abort request is complete.
ARCM is a member of the thread (TH) exception group. This exception monitors an action, not a value;its threshold is always N/A. The default state for ARCM is ON. If State is ON and a DB2 thread iswaiting for a tape mount of an archive log, OMEGAMON XE for DB2 PE displays the exception.
24 Classic Interface User's Guide
ARCVA DB2 recovery log archive is currently waiting for a tape mount.
A tape mount is necessary if DB2 recovery log archiving is to tape. Log data set archiving is anautomatic feature of the DB2 log manager. Log archiving is initiated internally by DB2 when an activelog is full. It runs as a subtask within the DB2 subsystem, and as a result, no job or started task isinitiated.
ARCV is a member of the DB2 system (SY) exception group. This exception monitors an action, not avalue; its threshold is always N/A. The default state for ARCV is ON. If State is ON and an archive iswaiting for a tape mount, OMEGAMON XE for DB2 PE displays the exception.
BMTHWarns that a particular buffer pool has exceeded a user-specified percentage of its capacity. Thisexception can also warn that use of the buffer pool has reached one of three DB2 buffer managerthresholds: SPTH, DMTH, or IWTH.
When the percentage is below 90%, you get the basic exception message, assuming that you have setthe threshold at 90% or lower. This message simply reports the percentage of use for any buffer poolthat has reached the threshold value.
When the buffer pool used percentage is between 90% and 94.9%, inclusive, the exception messagewill include the information that the buffer pool has reached the Sequential Prefetch threshold(SPTH).
When the buffer pool used percentage is between 95% and 97.5%, inclusive, the exception messagewill include the information that the buffer pool has reached the Data Manager threshold (DMTH).
When the buffer pool used percentage exceeds 97.5%, the exception message will include theinformation that the buffer pool has reached the Immediate Write threshold (IWTH).
BMTH is a member of the system (SY) exception group. The default threshold is 90%.
Note: To be notified when each of the buffer manager thresholds is reached, set the BMTH thresholdto 90% or less.
CICTProvides thread use information for an individual CICS region.
CICT is a member of the CICS (CI) exception group. The default threshold for CICT is 80% of theTHRDMAX value in the Resource Control Table (RCT). The threshold can be any value from 1%through 100%. If the ratio of active CICS threads to the THRDMAX value exceeds the threshold,OMEGAMON XE for DB2 PE displays the exception.
COMTRatio of updates to commits is greater than nnn:n.
OMEGAMON XE for DB2 PE displays the COMT exception when the number of system page updatesper Commit exceeds the installation-defined threshold.
The update count used in the rate calculation is incremented each time a row in a page is updated.
COMT is a member of the thread (TH) exception group. Default threshold for COMT is 100 pageupdates to 1 commit. The threshold can be any value from 1 through 10,000. If the ratio of updates tocommits exceeds the threshold, OMEGAMON XE for DB2 PE displays the exception.
CTHDApplication is waiting for thread creation.
This is caused when the system maximum thread limit is reached (CTHREAD parameter). CTHD is amember of the thread (TH) exception group. This exception monitors an action, not a value; itsthreshold is always N/A. If State is ON and a user is waiting for thread creation, OMEGAMON XE forDB2 PE displays the exception.
DDFSReports when DDF is not active.
Chapter 5. Exceptions 25
OMEGAMON XE for DB2 PE displays the DDFS exception when it detects that the DistributedDatabase Facility (DDF) is not active in the DB2 subsystem being monitored. This might be becauseDSNZPARM specifies that DDF must be started manually; it might also reflect an abnormaltermination of the distributed database facility.
DDFS is a member of the system (SY) exception group. This exception monitors an action, not a value;its threshold is always N/A.
DRCVMonitors the VTAM APPC receive rate.
OMEGAMON XE for DB2 PE displays the DRCV exception when the DDF VTAM receive data rateexceeds the exception threshold.
DRCV is a member of the system (SY) exception group. The exception threshold rate is expressed asKB per second. The default threshold for DRCV is 1000 KB per second.
DSNDMonitors the VTAM APPC send rate.
OMEGAMON XE for DB2 PE displays the DSND exception when the DDF VTAM APPC send data rateexceeds the exception threshold.
DSND is a member of the system (SY) exception group. The exception threshold rate is expressed asKB per second. The default threshold for DSND is 1000 KB per second.
DWATMonitors the time a distributed allied thread has been waiting for a response to a remote SQL request.
OMEGAMON XE for DB2 PE displays the DWAT exception when it detects that a distributed alliedthread has been waiting for a response to a remote SQL request for a period of time greater than theexception threshold
DWAT is a member of the thread (TH) exception group. The exception threshold is expressed as aninteger, that is, the number of seconds that can elapse before the exception will trip. The defaultthreshold for DWAT is 120 seconds.
EDMUEDMU is a member of the DB2 system (SY) exception group. The default threshold for EDMU is 90% ofthe pool size. The threshold can be any value between 1% to 100%. If the ratio of the pool in use tototal pool size exceeds this threshold, OMEGAMON XE for DB2 PE displays an exception message.EDMU provides information about EDM pool utilization.DB2 uses the environmental descriptor management (EDM) pool to manage and contain the followingfeatures:
• Database descriptors (DBDs)• Cursor tables (CTs)• Skeleton cursor tables (SKCTs)• Package tables (PTs)• Skeleton package tables (SKPTs)• Dynamic SQL caches (DSCs)
The size of each pool is defined by its individual installation parameter.To compute the EDM-in-use-ratio for DB2 10.1 and higher, OMEGAMON XE for DB2 PE totals the EDMpages in use by database descriptors (DBDs) and divides this number by the total DBD pool size.
ENTOProvides information about POOL thread use originating from CICS transactions that were diverted tothe pool because all ENTRY threads for the requested DB2 plan are in use.
ENTO does not analyze ENTRY definitions with a THRDA value of zero because these threadsautomatically use the buffer pool and are considered legitimate POOL thread users.
26 Classic Interface User's Guide
ENTO analyzes all ENTRY thread definitions with TWAIT=POOL and THRDA>0 specified. As a result, itcan trip and display multiple times on one OMEGAMON XE for DB2 PE cycle for the same CICS region.The Plan=cccccccc displays the DB2 plan name assigned to the entry threads. If the DB2 plan name is********, the entry definition is using the CICS dynamic plan exit. The variable aaaa is the first CICStransaction defined to the plan. The CICS transaction ID is needed because the same DB2 plan can bedefined to multiple ENTRY definitions. A CICS transaction can only be defined to a single DB2 plan.Therefore, the transaction ID in the exception output provides a unique identifier of which ENTRYdefinition is overflowing if the DB2 plan is defined to multiple ENTRY definitions.
ENTO is a member of the CICS (CI) exception group. The default threshold for ENTO is threetransactions. The threshold can be any value from 1 through 100 transactions. If the number oftransactions using a POOL thread due to an overflow exceeds the threshold, OMEGAMON XE for DB2PE displays the exception.
ENTUProvides information about CICS ENTRY thread use.
The definition of ENTRY threads (in the RCT) is optional. The definition and use of ENTRY threadsenables the DB2 user to assign one or more DB2 threads to a single DB2 plan. You can also define oneor more transactions that might use the plan.
ENTU analyzes all ENTRY thread definitions. As a result, it can trip and display multiple times on oneOMEGAMON XE for DB2 PE cycle for the same CICS region. The Plan=cccccccc is the DB2 plan nameassigned to the entry threads. If the DB2 plan name is ********, the entry definition is using the CICSdynamic plan exit. The variable aaaa is the first CICS transaction defined to the plan. The CICStransaction ID is needed because the same DB2 plan can be defined to multiple ENTRY definitions. ACICS transaction can only be defined to a single DB2 plan. The transaction ID in the exception outputprovides a unique identifier of which ENTRY definition is incurring the thread use reported by theexception.
ENTU ignores all ENTRY definitions with a THRDA value of zero and TWAIT=POOL. It also ignores anyENTRY definitions in which THRDA is set to one, regardless of the TWAIT operand in use.
ENTU is a member of the CICS (CI) exception group. The default threshold for ENTU is 95% of theTHRDA value. The threshold can be any value from 1% through 100%. If the ratio of active threadsoriginating from an ENTRY definition to the ENTRY definition's THRDA value exceeds the threshold,OMEGAMON XE for DB2 PE displays the exception.
ENTWProvides information about CICS transactions waiting for ENTRY threads.
The definition of ENTRY threads (in the RCT) is optional. By using ENTRY threads, you can assign oneor more DB2 threads to a single DB2 plan. You can also define one or more transactions which mightuse the plan. Other options are available when defining ENTRY threads, one of it is TWAIT. TWAIT isused to govern the required processing when all DB2 threads associated with an ENTRY definition(plan) are in use. If TWAIT is YES is specified and no ENTRY thread is available, the request is queuedand waits for a thread assigned to the ENTRY definition to become available. This exception is trippedand displayed when the number of transactions waiting for an ENTRY thread exceeds the exceptionthreshold.
The exception routine analyzes all ENTRY thread definitions with TWAIT is YES specified. As a result,the exception can trip and display multiple times on one OMEGAMON XE for DB2 PE cycle for thesame CICS region. The Plan=cccccccc is the DB2 plan name assigned to the ENTRY threads. Thevariable aaaa is the first CICS transaction defined to the plan. The CICS transaction ID is neededbecause the same DB2 plan can be defined to multiple ENTRY definitions. A CICS transaction can onlybe defined to a single DB2 plan. The transaction ID in the exception output provides a uniqueidentifier of which ENTRY definition is incurring the waits if the DB2 plan is defined to multiple ENTRYdefinitions.
ENTW is a member of the CICS (CI) exception group. The default threshold for ENTW is twotransactions. The threshold can be any value between 1 and 100 transactions. If the number oftransactions waiting for an ENTRY thread exceeds the threshold, OMEGAMON XE for DB2 PE displaysthe exception.
Chapter 5. Exceptions 27
ETIMMonitors the elapsed time for a DB2 thread (from Signon or Create Thread).
ETIM displays the wall clock time that the plan has been actively holding thread resources. This mightindicate that service level commitments have been exceeded.
ETIM is a member of the thread (TH) exception group. The default threshold for ETIM is 600 seconds.The threshold can be any value between 1 and 999999.99 seconds. If the thread elapsed timeexceeds the threshold, OMEGAMON XE for DB2 PE displays the exception.
GETPProvides information about Getpage requests per Read I/O.
The counters which DB2 maintains for this activity are updated throughout the life of the thread, andare reset when DB2 signon occurs.
GETP is a member of the thread (TH) exception group. The default threshold for GETP is 15 (1.5Getpages to Read I/Os). The threshold can be any value between 0 and 100. Specify the threshold asan integer, where 1 equals 0.1 Getpages to Read I/Os. For example, OMEGAMON XE for DB2 PE sets athreshold specified as 20 equal to a ratio of 2.0 Getpages to Read I/Os. If the ratio of the Getpage rateto Read I/Os falls below the threshold, OMEGAMON XE for DB2 PE displays the exception.
GTRCIndicates that the DB2 global trace is currently active.
GTRC is a member of the DB2 system (SY) exception group. This exception monitors an action, not avalue; its threshold is always N/A. If State is ON and the global trace is active, OMEGAMON XE for DB2PE displays the exception.
IDBCProvides information about the CPU time used by DB2 to process this thread.
IDBC is a member of the thread (TH) exception group. The default threshold for IDBC is.7 seconds.The threshold can be any value between 0.00 and 999999.99 seconds. The threshold is specified in100ths of seconds. For example, to set a threshold of.7, specify a value of 70. If the total In-DB2 CPUtime exceeds the threshold value, OMEGAMON XE for DB2 PE displays the exception.
IDBKProvides information about how close DB2 is to the maximum number of allowed backgroundconnections.
IDBK is a member of the DB2 system (SY) exception group. The default threshold for IDBK is 90% ofthe IDBACK installation parameter. The threshold can be any value between 1% and 100%. If theratio of active background connections to the IDBACK value in use exceeds the threshold value,OMEGAMON XE for DB2 PE displays the exception.
IDBTProvides information about how long DB2 has been processing this thread.
IDBT is a member of the thread (TH) exception group. The default threshold for IDBT is 5 seconds.The threshold can be any value between 1 and 999999.99 seconds. If the total In-DB2 time exceedsthe threshold value, OMEGAMON XE for DB2 PE displays the exception.
IDFRProvides information about how close DB2 is to the maximum number of allowed foregroundconnections.
IDFR is a member of the DB2 system (SY) exception group. The default threshold for IDFR is 85% ofthe IDFORE installation parameter. The threshold can be any value between 1% and 100%. If theratio of active foreground connections to the IDFORE value in use exceeds the threshold value,OMEGAMON XE for DB2 PE displays the exception.
IMCNWarns when an IMS region is defined to DB2, but the connection failed.
28 Classic Interface User's Guide
IMCN is a member of the IMS (IM) exception group. This exception monitors an action, not a value; itsthreshold is always N/A. If State is ON and a region is defined but not connected to DB2, OMEGAMONXE for DB2 PE displays the exception.
IMNDWarns when no IMS dependent region is defined to DB2.
IMND is a member of the IMS (IM) exception group. This exception monitors an action, not a value; itsthreshold is always N/A. If State=ON and no dependent region is defined to DB2, OMEGAMON XE forDB2 PE displays the exception.
INDBProvides information about individual threads that are in indoubt status.
These threads might cause DB2 resources to be unavailable to other active threads until either restartor RECOVER INDOUBT processing occurs.
INDB is a member of the thread (TH) exception group. This exception monitors an action, not a value;its threshold is always N/A. If State=ON and a thread is in doubt, OMEGAMON XE for DB2 PE displaysthe exception.
INDTProvides information about the number of indoubt threads in the DB2 system.
INDT is a member of the DB2 system (SY) exception group. The default threshold for INDT is oneindoubt thread. The threshold is a value between 1 and 100 threads. If the number of indoubt threadsexceeds the threshold value, OMEGAMON XE for DB2 PE displays the exception.
LKUSProvides information about the number of locks owned by an individual thread. If the thread reaches100% of NUMLKUS, DB2 terminates the thread.
LKUS is a member of the thread (TH) exception group. The default threshold for LKUS is 80% of theNUMLKUS parameter defined by the installation. The threshold can be any value between 1% and100%. If an active thread exceeds the threshold, OMEGAMON XE for DB2 PE displays the exception.
LOGNProvides information about the availability of primary active logs.
Active log data sets are allocated to DB2 during startup processing. When an active log data set is full,it is automatically archived by DB2 to an archive log. When an active log is successfully archived, it isavailable for reuse. The availability of active logs is critical to the functioning of DB2. If no active log isavailable, the DB2 subsystem will hang until one becomes available. The lack of an active log could becaused by an insufficient number of logs defined when DB2 was installed, too small log data set size,or possibly due to problems encountered during the archive process.
LOGN is a member of the DB2 system (SY) exception group. The default threshold for LOGN is twoavailable logs. The threshold is a value between 1 and 100 logs. If the number of available primaryactive logs is less than or equal to the threshold value, OMEGAMON XE for DB2 PE displays theexception.
MCNVMonitors the percentage of the maximum number of allowed conversations for each logmode and thenumber of threads that are waiting (if any).
OMEGAMON XE for DB2 PE displays the MCNV exception when the number of conversations in useconstitutes a specified percentage of the preset maximum for a given logmode. In addition, when thepercentage reaches 100%, the exception displays the number of threads waiting because the presetmaximum was exceeded.
MCNV is a member of the system (SY) exception group. The exception threshold is expressed as apercentage (0-100). For example, if you want OMEGAMON XE for DB2 PE to notify you when anylogmode has started 80% of its allotment of conversations, set the threshold to 80. The defaultthreshold for MCNV is 80%.
Chapter 5. Exceptions 29
MDBTMonitors the percentage of maximum number of allowed database access threads that are in use.
OMEGAMON XE for DB2 PE displays the MDBT exception when the number of distributed databaseaccess threads in use constitutes a specified percentage of the preset maximum. The maximum is setin DSNZPARM by the MAXDBAT parameter.
MDBT is a member of the system (SY) exception group. The exception threshold is expressed as apercentage (0-100). For example, if you want OMEGAMON XE for DB2 PE to notify you when anapplication has used 80% of its allotment of database access threads, set the threshold to 80. Thedefault threshold for MDBT is 85%.
MDBWMonitors the number of database access threads that are waiting because MAXDBAT was reached.
OMEGAMON XE for DB2 PE displays the MDBW exception when the number of distributed databaseaccess threads waiting because the maximum has been reached exceeds the exception threshold.The maximum is set in DSNZPARM by the MAXDBAT parameter.
MDBW is a member of the system (SY) exception group. The exception threshold is expressed as aninteger, that is, the number of threads waiting because MAXDBAT was reached. The default thresholdfor MDBW is 2.
MSGEDisplays DB2 and Internal Resource Lock Manager (IRLM) messages that were generated since thelast OMEGAMON XE for DB2 PE cycle.
OMEGAMON XE for DB2 PE displays the DB2 and IRLM messages that have been written to thesystem log since the last OMEGAMON XE for DB2 PE cycle, or as many of the messages as the LROWSparameter for the terminal allows, whichever is less. To control which DB2 and IRLM messages theMSGE exception displays, see "Set DB2/IRLM Messages that MSGE Exception Monitors".
MSGE is a member of the DB2 system (SY) exception group. The default threshold for MSGE is N/A. IfState is ON and new messages exist, OMEGAMON XE for DB2 PE displays the messages.
PGUPMonitors the number of Page Update requests per second made by a thread.
The update count reflected in this exception is incremented each time a row in a page is updated.Updated pages are not necessarily written at commit, but rather later, asynchronously as determinedby the DB2 Deferred Write algorithm. There is no direct immediate relationship between page updatesand page writes.
The counters which DB2 maintains for this activity are updated throughout the life of the thread, andare reset at DB2 signon if the thread is reused.
PGUP is a member of the thread (TH) exception group. The default threshold for PGUP is 10 updatesper second. The threshold can be any value between 1 and 1000 updates per second. If the activethread exceeds the threshold, OMEGAMON XE for DB2 PE displays the exception.
POLUProvides information about POOL threads in use.
POLU is a member of the CICS (CI) exception group. The default threshold for POLU is 90% of the totalnumber of POOL threads allowed. The threshold can be any value between 1% and 100%. If thepercentage of POOL threads exceeds the threshold, OMEGAMON XE for DB2 PE displays theexception.
POLWProvides information about CICS transactions waiting for a POOL thread.
POLW is a member of the CICS (CI) exception group. The default threshold for POLW is twotransactions. The threshold can be any value between 1 and 99 transactions. If the number oftransactions waiting for a POOL thread exceeds the threshold, OMEGAMON XE for DB2 PE displays theexception.
30 Classic Interface User's Guide
PREFProvides information about Sequential Prefetch read activity.
Unlike normal Read I/O, Sequential Prefetch Read I/O is performed asynchronously with the user'srequest. It provides a read-ahead capability. A single Sequential Prefetch I/O results in multiple pagesbeing read. Threads with excessive sequential prefetch rates might cause reduced overall DB2performance.
The counters which DB2 maintains for this activity are updated throughout the life of the thread, andare reset during DB2 signon if the thread is reused.
PREF is a member of the thread (TH) exception group. The default threshold for PREF is 10 Prefetchrequests per second. The threshold can be any value between 1 and 100 Sequential Prefetchrequests per second. If the prefetch rate exceeds the threshold, OMEGAMON XE for DB2 PE displaysthe exception.
RELMProvides information about the resource limit facility.
This exception analyzes the ratio of the resource limit high-water mark (CPU seconds) to the currentresource limit.
RELM is a member of the thread (TH) exception group. The default threshold for RELM is 85 percent ofthe resource high-water mark (CPU seconds). The threshold can be any value between 1 and 100percent of the resource limit. If the resource limit exceeds the threshold, OMEGAMON XE for DB2 PEdisplays the exception.
RIOProvides information about the thread synchronous Read I/O rate.
Generally, this exception indicates excessive physical Read I/O on behalf of a thread. Although asingle SELECT might return a limited number of rows, the pages searched might be enormous. I/Omight be caused by access path selection changes which occurred due to object changes (indexesdropped or no longer clustered), or by inadvertent use of stage 2 (non-sargable) predicates. It mightsimply result from the fact that the SQL is a set-oriented language, which operates on sets of data,rather than on individual rows (records).
The counters which DB2 maintains for this activity are updated throughout the life of the thread, andare reset during DB2 signon if the thread is reused.
RIO is a member of the thread (TH) exception group. The default threshold for RIO is 10 Readrequests per second. The threshold can be any value between 1 and 1000 synchronous Readrequests per second. If the Read I/O rate per second exceeds the threshold, OMEGAMON XE for DB2PE displays the exception.
SPACIndicates that the number of ASIDs executing stored procedures exceeds the threshold. Thethreshold is expressed as a count of address spaces capable of executing stored procedures. It can bean integer from 0 to 99. Stored procedures can be executed in any WLM-managed stored procedureaddress space. SPAC is a member of the DB2 system (SY) group. The default threshold is 3 and thedefault state is ON.
STPEIndicates that the number of stored procedures executing exceeds the threshold. The threshold isexpressed as a count of stored procedures currently executing. It can be an integer from 0 to 99. STPEis a member of the DB2 system (SY) group. The default threshold is 10 and the default state is ON.
SUSLDetects the number of threads that could not continue execution and are suspended due to a lockingconflict.
SUSL is a member of the DB2 system (SY) exception group. The default threshold for SUSL is fivesuspended threads. The threshold can be any value between 1 and 100 suspended threads. If thenumber of lock suspensions exceeds the threshold value, OMEGAMON XE for DB2 PE displays theexception.
Chapter 5. Exceptions 31
TCPUMonitors the CPU rate (percent) of active threads.
For non-CICS threads, this is the CPU rate of the address space from which the thread originates. Itincludes both TCB and SRB time. For CICS threads, this is the CPU rate attributable to the threadoriginating from the CICS connection. It includes only TCB time incurred by the thread.
This exception limits its analysis of CPU use to DB2 connections that contain active threads. Thisexception does not report CPU use for connections with no active threads.
TCPU is a member of the thread (TH) exception group. The default threshold for TCPU is 20% of totalprocessor utilization. The threshold can be any value between 1% and 100%. If CPU utilizationexceeds the threshold value, OMEGAMON XE for DB2 PE displays the exception.
THDQDetects users waiting for thread creation to occur.
OMEGAMON XE for DB2 PE displays this exception when the number of users queued and waiting forcreate-thread processing exceeds the exception threshold.
This exception might indicate that DB2 reached the CTHREAD value that controls the number of activethreads.
THDQ is a member of the DB2 system (SY) exception group. The default threshold for THDQ is 2. Thethreshold is a value between 1 and 100 requests. If the number of requests queued and waiting forCreate Thread processing exceeds the threshold, OMEGAMON XE for DB2 PE displays the exception.
TMAXIndicates when the number of active threads is approaching the maximum number allowed.
DB2 thread concurrency can be controlled by the CTHREAD value. CTHREAD defines the maximumnumber of concurrent threads allowed.
TMAX is a member of the DB2 system (SY) exception group. The default threshold for TMAX is 85% ofthe CTHREAD installation parameter. The threshold can be any value between 1 and 100%. If theratio of active threads to the CTHREAD parameter exceeds the threshold, OMEGAMON XE for DB2 PEdisplays the exception.
TRCVMonitors the amount of data received by distributed threads from a remote DB2 subsystem.
OMEGAMON XE for DB2 PE displays the TRCV exception when it detects that a distributed thread hasreceived an amount of data greater than the exception threshold.
TRCV is a member of the thread (TH) exception group. The exception threshold is expressed in KB.The default threshold for TRCV is 1000 KB.
TRGDIndicates that the depth of the largest trigger stack exceeds the threshold. The threshold is expressedas the number of triggers in the largest trigger stack. It can be an integer from 0 to 99. TRGD is amember of the DB2 system (SY) group. The default is 1 and the default state is ON.
TRGEIndicates that the number of triggers executing exceeds the threshold. The threshold is expressed asa count of triggers currently executing. It can be an integer from 0 to 99. TRGE is a member of the DB2system (SY) group. The default threshold is 10 and the default state is ON.
TSNDMonitors the amount of data sent by distributed threads to a remote DB2 subsystem.
OMEGAMON XE for DB2 PE displays the TSND exception when it detects that a distributed thread hassent an amount of data greater than the exception threshold.
TSND is a member of the thread (TH) exception group. The exception threshold is expressed in KB.The default threshold for TSND is 1000 KB.
32 Classic Interface User's Guide
UDFEIndicates that the number of user-defined functions executing exceeds the threshold. The threshold isexpressed as a count of user functions currently executing. It can be an integer from 0 to 99. UDFE isa member of the DB2 system (SY) group. The default threshold is 10 and the default state is ON.
UFACIndicates that the number of ASIDs executing user functions exceeds the threshold. The threshold isexpressed as a count of address spaces capable of executing user-defined functions. It can be aninteger from 0 to 99. User-defined functions can be executed only from WLM-managed storedprocedure address spaces. UFAC is a member of the DB2 system (SY) group. The default threshold is3 and the default state is ON.
UTISWarns when a DB2 utility was started but did not finish running due to abnormal termination. Usershould restart the utility with the corresponding phase.
UTIS is a member of the system (SY) exception group. The default state for UTIS is OFF. If State is ONand a DB2 utility has been started but has not yet completed running due to abnormal termination,OMEGAMON XE for DB2 PE displays the exception.
The next group of exceptions (VDIO, VEDR, VSRV, VTIO, and VUTL) share the following characteristics:
• They are in effect only when the object analysis collector is active.• The collector will collect data from volumes that contain DB2 data sets that are currently MVS-allocated
to the monitored DB2 subsystem.• All rates and ratios used in setting the exception thresholds are calculated using the object analysis
collection interval elapsed time. For example, the total volume I/O rate is calculated by dividing thenumber of volume I/Os that occurred during the current collection interval by the elapsed time duringthe collection interval.
• They are tripped only if there is I/O within the current collection interval from the DB2 being monitored.
VDIOMonitors volume DB2 I/O rate activity.
This exception warns you when a volume's DB2 I/O rate per second has reached a user-specifiedthreshold. The threshold is expressed as the number of DB2 I/Os per second. It must be an integerbetween 0 and 9999.
VDIO is a member of the DB2 system (SY) exception group. The default threshold is 50, and thedefault state is ON.
VEDRMonitors volume data set extend activity.
This exception warns you when the data set-to-data set extent ratio of a volume reaches the user-specified threshold. The threshold is expressed as a ratio that represents the number of DB2 extentson the volume divided by the number of DB2 data sets. It must be an integer between 0 and 123.
VEDR is a member of the DB2 system (SY) exception group. The default threshold is 5, and the defaultstate is ON.
VSRVMonitors volume service time.
This exception warns you when a volume's service time has reached a user-specified threshold. Thethreshold is expressed in milliseconds, and it must be an integer between 0 and 9999.
VSRV is a member of the DB2 system (SY) exception group. The default threshold is 30, and thedefault state is ON.
VTIOMonitors volume total I/O rate activity.
Chapter 5. Exceptions 33
This exception warns you when a volume's total I/O rate per second has reached a user-specifiedthreshold. The threshold is expressed as the total number of I/Os per second. It must be an integerbetween 0 and 9999.
VTIO is a member of the DB2 system (SY) exception group. The default threshold is 50, and thedefault state is ON.
VUTLMonitors volume utilization.
This exception warns you when a volume's utilization percentage has reached a user-specifiedthreshold. The threshold is expressed as a percentage, and it must be an integer between 0 and 100.
VUTL is a member of the DB2 system (SY) exception group. The default threshold is 30, and thedefault state is ON.
WCLMIndicates when a thread has been waiting for more than the specified time for a resource to bedrained of claimers.
WCLM is a member of the thread (TH) exception group. The default threshold for WCLM is 60 seconds.The threshold can be any value between 0 and 999999.99 seconds. If the time the thread is waitingexceeds the threshold, OMEGAMON XE for DB2 PE displays the exception.
WDLKIndicates when a thread has been waiting for more than the specified time to acquire a drain lock.
WDLK is a member of the thread (TH) exception group. The default threshold for WDLK is 60 seconds.The threshold can be any value between 0 and 999999.99 seconds. If the time the thread is waitingexceeds the threshold, OMEGAMON XE for DB2 PE displays the exception.
WGLKWait for global lock time.
Indicates when a thread has been waiting for more than the specified time to acquire a global lock in adata sharing environment.
WGLK is a member of the thread (TH) exception group. The default threshold for WGLK is 60 seconds.The threshold can be any value between 0 and 999999.99 seconds. If the length of time the thread iswaiting exceeds the threshold, OMEGAMON XE for DB2 PE displays the exception.
WLGQIndicates when a thread has been waiting for more than the specified time for an ARCHIVE LOGMODE(QUIESCE) command to complete.
WLGQ is a member of the thread (TH) exception group. The default threshold for WLGQ is 60 seconds.The threshold can be any value between 0 and 999999.99 seconds. If the time the thread is waitingexceeds the threshold, OMEGAMON XE for DB2 PE displays the exception.
WSPSStored procedure wait time.
Indicates when a thread has been waiting for more than the specified time for the stored proceduresaddress space to become available in order for a stored procedure to be scheduled.
WSPS is a member of the thread (TH) exception group. The default threshold for WSPS is 100seconds. The threshold can be any value between 0 and 999999.99 seconds. If the time the thread iswaiting exceeds the threshold, OMEGAMON XE for DB2 PE displays the exception.
Note: Stored procedure wait time is reported under class 1 time.
WSRVIndicates when a thread has been waiting for more than the specified time for a DB2 service. DB2service waits include
• Open/close data set• SYSLGRNG update
34 Classic Interface User's Guide
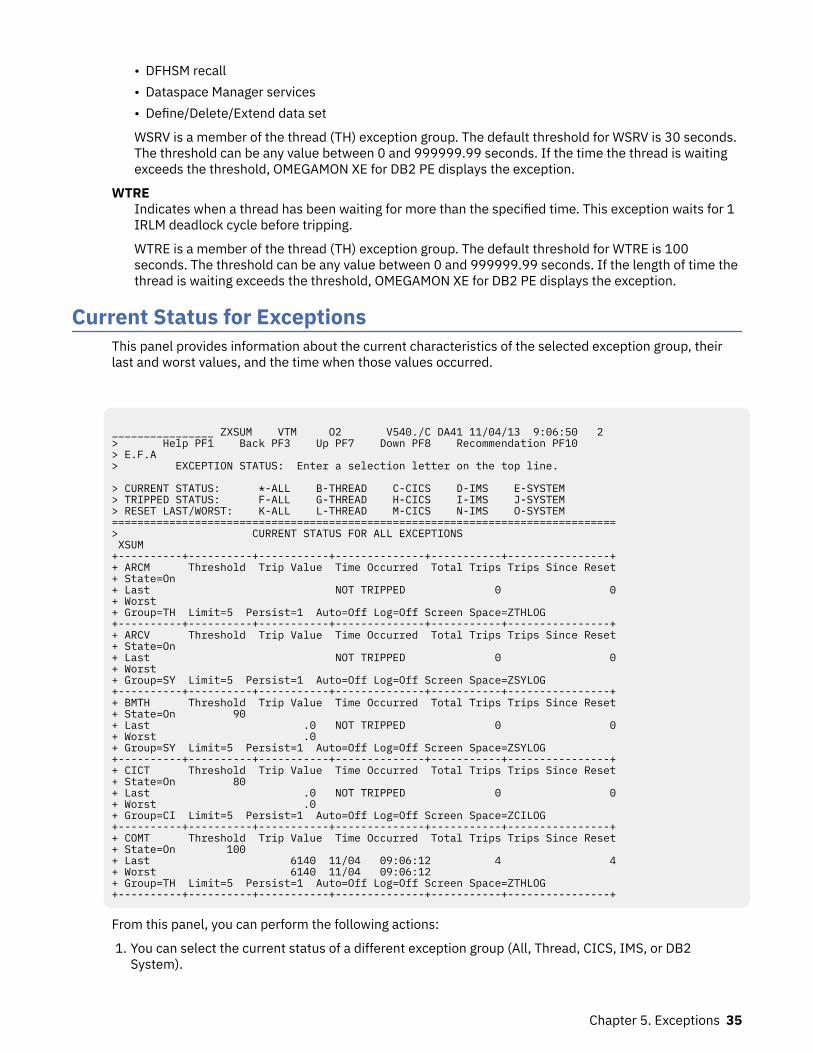
• DFHSM recall• Dataspace Manager services• Define/Delete/Extend data set
WSRV is a member of the thread (TH) exception group. The default threshold for WSRV is 30 seconds.The threshold can be any value between 0 and 999999.99 seconds. If the time the thread is waitingexceeds the threshold, OMEGAMON XE for DB2 PE displays the exception.
WTREIndicates when a thread has been waiting for more than the specified time. This exception waits for 1IRLM deadlock cycle before tripping.
WTRE is a member of the thread (TH) exception group. The default threshold for WTRE is 100seconds. The threshold can be any value between 0 and 999999.99 seconds. If the length of time thethread is waiting exceeds the threshold, OMEGAMON XE for DB2 PE displays the exception.
Current Status for ExceptionsThis panel provides information about the current characteristics of the selected exception group, theirlast and worst values, and the time when those values occurred.
________________ ZXSUM VTM O2 V540./C DA41 11/04/13 9:06:50 2 > Help PF1 Back PF3 Up PF7 Down PF8 Recommendation PF10 > E.F.A > EXCEPTION STATUS: Enter a selection letter on the top line. > CURRENT STATUS: *-ALL B-THREAD C-CICS D-IMS E-SYSTEM > TRIPPED STATUS: F-ALL G-THREAD H-CICS I-IMS J-SYSTEM > RESET LAST/WORST: K-ALL L-THREAD M-CICS N-IMS O-SYSTEM =============================================================================== > CURRENT STATUS FOR ALL EXCEPTIONS XSUM +----------+----------+-----------+--------------+-----------+----------------+ + ARCM Threshold Trip Value Time Occurred Total Trips Trips Since Reset + State=On + Last NOT TRIPPED 0 0 + Worst + Group=TH Limit=5 Persist=1 Auto=Off Log=Off Screen Space=ZTHLOG +----------+----------+-----------+--------------+-----------+----------------+ + ARCV Threshold Trip Value Time Occurred Total Trips Trips Since Reset + State=On + Last NOT TRIPPED 0 0 + Worst + Group=SY Limit=5 Persist=1 Auto=Off Log=Off Screen Space=ZSYLOG +----------+----------+-----------+--------------+-----------+----------------+ + BMTH Threshold Trip Value Time Occurred Total Trips Trips Since Reset + State=On 90 + Last .0 NOT TRIPPED 0 0 + Worst .0 + Group=SY Limit=5 Persist=1 Auto=Off Log=Off Screen Space=ZSYLOG +----------+----------+-----------+--------------+-----------+----------------+ + CICT Threshold Trip Value Time Occurred Total Trips Trips Since Reset + State=On 80 + Last .0 NOT TRIPPED 0 0 + Worst .0 + Group=CI Limit=5 Persist=1 Auto=Off Log=Off Screen Space=ZCILOG +----------+----------+-----------+--------------+-----------+----------------+ + COMT Threshold Trip Value Time Occurred Total Trips Trips Since Reset + State=On 100 + Last 6140 11/04 09:06:12 4 4 + Worst 6140 11/04 09:06:12 + Group=TH Limit=5 Persist=1 Auto=Off Log=Off Screen Space=ZTHLOG +----------+----------+-----------+--------------+-----------+----------------+
From this panel, you can perform the following actions:
1. You can select the current status of a different exception group (All, Thread, CICS, IMS, or DB2System).
Chapter 5. Exceptions 35
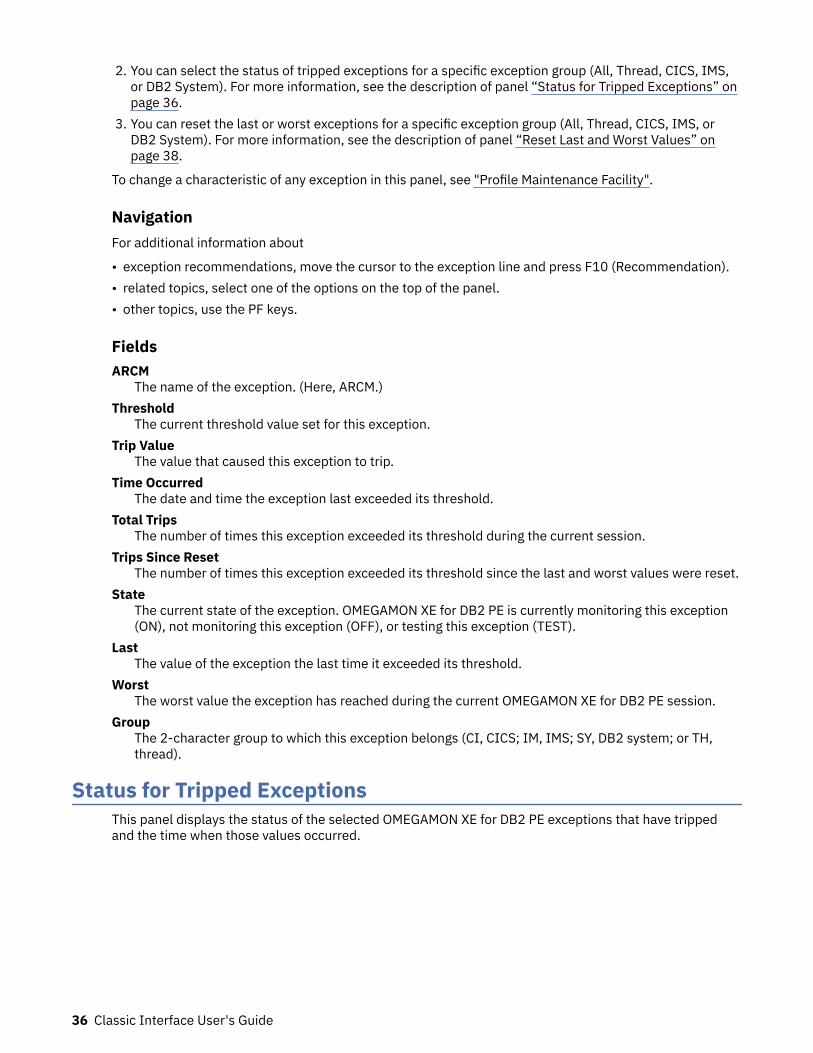
2. You can select the status of tripped exceptions for a specific exception group (All, Thread, CICS, IMS,or DB2 System). For more information, see the description of panel “Status for Tripped Exceptions” onpage 36.
3. You can reset the last or worst exceptions for a specific exception group (All, Thread, CICS, IMS, orDB2 System). For more information, see the description of panel “Reset Last and Worst Values” onpage 38.
To change a characteristic of any exception in this panel, see "Profile Maintenance Facility".
NavigationFor additional information about
• exception recommendations, move the cursor to the exception line and press F10 (Recommendation).• related topics, select one of the options on the top of the panel.• other topics, use the PF keys.
FieldsARCM
The name of the exception. (Here, ARCM.)Threshold
The current threshold value set for this exception.Trip Value
The value that caused this exception to trip.Time Occurred
The date and time the exception last exceeded its threshold.Total Trips
The number of times this exception exceeded its threshold during the current session.Trips Since Reset
The number of times this exception exceeded its threshold since the last and worst values were reset.State
The current state of the exception. OMEGAMON XE for DB2 PE is currently monitoring this exception(ON), not monitoring this exception (OFF), or testing this exception (TEST).
LastThe value of the exception the last time it exceeded its threshold.
WorstThe worst value the exception has reached during the current OMEGAMON XE for DB2 PE session.
GroupThe 2-character group to which this exception belongs (CI, CICS; IM, IMS; SY, DB2 system; or TH,thread).
Status for Tripped ExceptionsThis panel displays the status of the selected OMEGAMON XE for DB2 PE exceptions that have trippedand the time when those values occurred.
36 Classic Interface User's Guide
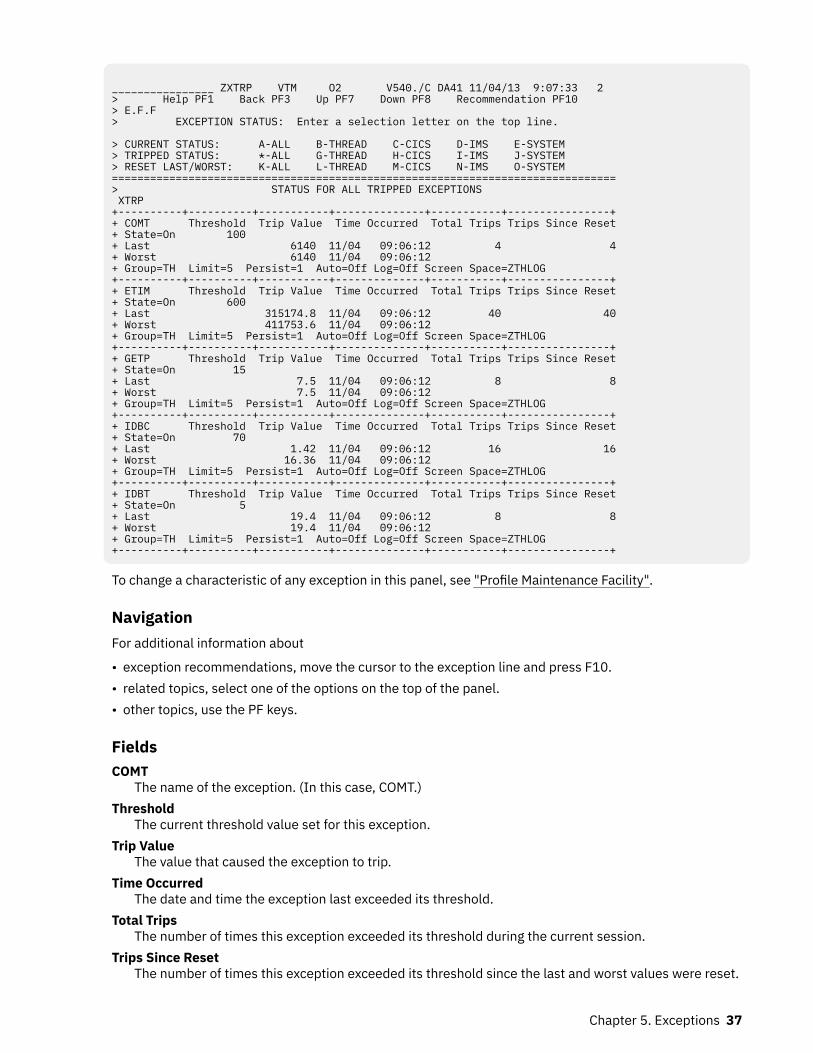
________________ ZXTRP VTM O2 V540./C DA41 11/04/13 9:07:33 2 > Help PF1 Back PF3 Up PF7 Down PF8 Recommendation PF10 > E.F.F > EXCEPTION STATUS: Enter a selection letter on the top line. > CURRENT STATUS: A-ALL B-THREAD C-CICS D-IMS E-SYSTEM > TRIPPED STATUS: *-ALL G-THREAD H-CICS I-IMS J-SYSTEM > RESET LAST/WORST: K-ALL L-THREAD M-CICS N-IMS O-SYSTEM =============================================================================== > STATUS FOR ALL TRIPPED EXCEPTIONS XTRP +----------+----------+-----------+--------------+-----------+----------------+ + COMT Threshold Trip Value Time Occurred Total Trips Trips Since Reset + State=On 100 + Last 6140 11/04 09:06:12 4 4 + Worst 6140 11/04 09:06:12 + Group=TH Limit=5 Persist=1 Auto=Off Log=Off Screen Space=ZTHLOG +----------+----------+-----------+--------------+-----------+----------------+ + ETIM Threshold Trip Value Time Occurred Total Trips Trips Since Reset + State=On 600 + Last 315174.8 11/04 09:06:12 40 40 + Worst 411753.6 11/04 09:06:12 + Group=TH Limit=5 Persist=1 Auto=Off Log=Off Screen Space=ZTHLOG +----------+----------+-----------+--------------+-----------+----------------+ + GETP Threshold Trip Value Time Occurred Total Trips Trips Since Reset + State=On 15 + Last 7.5 11/04 09:06:12 8 8 + Worst 7.5 11/04 09:06:12 + Group=TH Limit=5 Persist=1 Auto=Off Log=Off Screen Space=ZTHLOG +----------+----------+-----------+--------------+-----------+----------------+ + IDBC Threshold Trip Value Time Occurred Total Trips Trips Since Reset + State=On 70 + Last 1.42 11/04 09:06:12 16 16 + Worst 16.36 11/04 09:06:12 + Group=TH Limit=5 Persist=1 Auto=Off Log=Off Screen Space=ZTHLOG +----------+----------+-----------+--------------+-----------+----------------+ + IDBT Threshold Trip Value Time Occurred Total Trips Trips Since Reset + State=On 5 + Last 19.4 11/04 09:06:12 8 8 + Worst 19.4 11/04 09:06:12 + Group=TH Limit=5 Persist=1 Auto=Off Log=Off Screen Space=ZTHLOG +----------+----------+-----------+--------------+-----------+----------------+
To change a characteristic of any exception in this panel, see "Profile Maintenance Facility".
NavigationFor additional information about
• exception recommendations, move the cursor to the exception line and press F10.• related topics, select one of the options on the top of the panel.• other topics, use the PF keys.
FieldsCOMT
The name of the exception. (In this case, COMT.)Threshold
The current threshold value set for this exception.Trip Value
The value that caused the exception to trip.Time Occurred
The date and time the exception last exceeded its threshold.Total Trips
The number of times this exception exceeded its threshold during the current session.Trips Since Reset
The number of times this exception exceeded its threshold since the last and worst values were reset.
Chapter 5. Exceptions 37
StateThe current state of the exception. OMEGAMON XE for DB2 PE is currently monitoring this exception(ON), not monitoring this exception (OFF), or testing this exception (TEST).
LastThe value of the exception the last time it exceeded its threshold.
WorstThe worst value the exception has reached during the current OMEGAMON XE for DB2 PE session.
GroupThe 2-character group to which this exception belongs (CI, CICS; IM, IMS; SY, DB2 system; or TH,thread).
Reset Last and Worst ValuesUse this panel to reset the values displayed on the Current Tripped Exceptions panel for the exceptiongroup specified below the title line (all, thread, CICS, IMS, or system). In particular, the last and worstvalues and the time that they occurred are reset for each tripped exception.
________________ ZXTRPX VTM O2 V540./C DA41 11/04/13 9:07:48 2 > Help PF1 Back PF3 > E.F.K > EXCEPTION STATUS: Enter a selection letter on the top line. > CURRENT STATUS: A-ALL B-THREAD C-CICS D-IMS E-SYSTEM > TRIPPED STATUS: F-ALL G-THREAD H-CICS I-IMS J-SYSTEM > RESET LAST/WORST: *-ALL L-THREAD M-CICS N-IMS O-SYSTEM =============================================================================== > RESET LAST AND WORST VALUES FOR ALL EXCEPTIONS > To reset the last and worst values, space over the > character to the left of > XTRP and then press ENTER. > To return to the previous screen without resetting these values, press PF3. >XTRP RESET ===============================================================================
NavigationFor additional information about other topics, use the PF keys.
FieldsAfter you remove the comment character, the Reset Last and Worst Values panel displays the message:
Last, Worst, and Trip Counter Values Are Reset
This message confirms that OMEGAMON XE for DB2 PE has reset the last and worst values for all trippedexceptions.
38 Classic Interface User's Guide
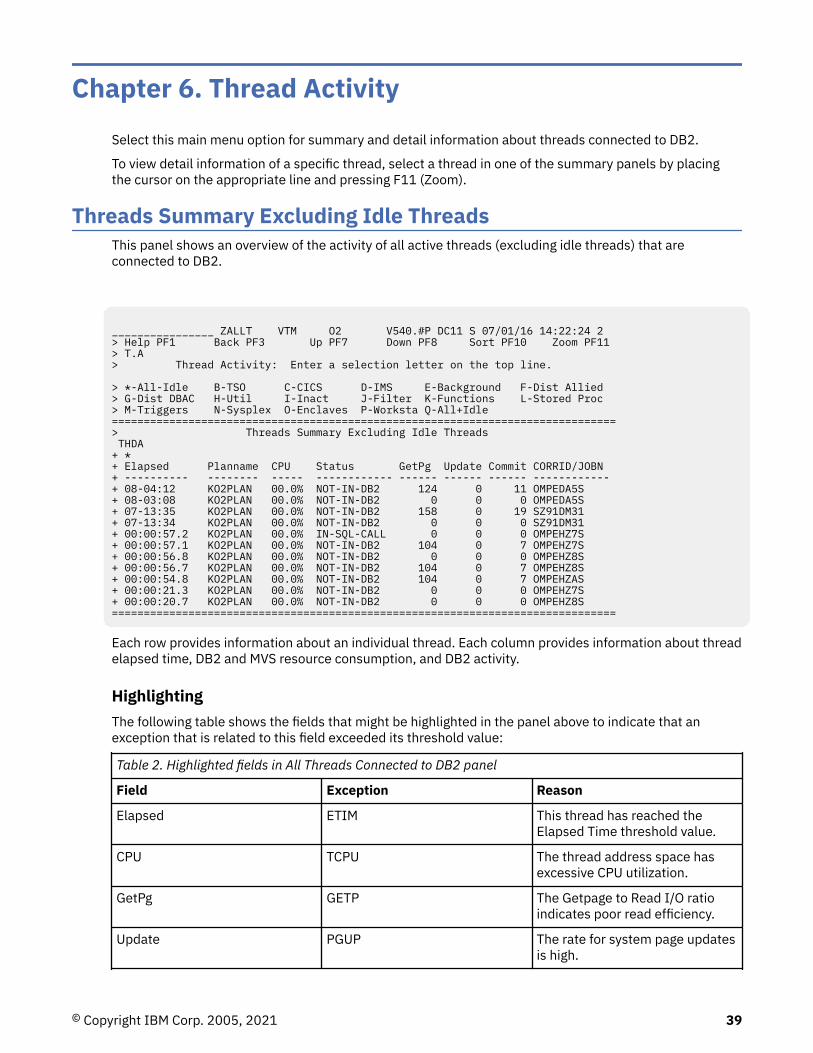
Chapter 6. Thread ActivitySelect this main menu option for summary and detail information about threads connected to DB2.
To view detail information of a specific thread, select a thread in one of the summary panels by placingthe cursor on the appropriate line and pressing F11 (Zoom).
Threads Summary Excluding Idle ThreadsThis panel shows an overview of the activity of all active threads (excluding idle threads) that areconnected to DB2.
________________ ZALLT VTM O2 V540.#P DC11 S 07/01/16 14:22:24 2 > Help PF1 Back PF3 Up PF7 Down PF8 Sort PF10 Zoom PF11 > T.A > Thread Activity: Enter a selection letter on the top line. > *-All-Idle B-TSO C-CICS D-IMS E-Background F-Dist Allied > G-Dist DBAC H-Util I-Inact J-Filter K-Functions L-Stored Proc > M-Triggers N-Sysplex O-Enclaves P-Worksta Q-All+Idle =============================================================================== > Threads Summary Excluding Idle Threads THDA + * + Elapsed Planname CPU Status GetPg Update Commit CORRID/JOBN + ---------- -------- ----- ------------ ------ ------ ------ ------------ + 08-04:12 KO2PLAN 00.0% NOT-IN-DB2 124 0 11 OMPEDA5S + 08-03:08 KO2PLAN 00.0% NOT-IN-DB2 0 0 0 OMPEDA5S + 07-13:35 KO2PLAN 00.0% NOT-IN-DB2 158 0 19 SZ91DM31 + 07-13:34 KO2PLAN 00.0% NOT-IN-DB2 0 0 0 SZ91DM31 + 00:00:57.2 KO2PLAN 00.0% IN-SQL-CALL 0 0 0 OMPEHZ7S + 00:00:57.1 KO2PLAN 00.0% NOT-IN-DB2 104 0 7 OMPEHZ7S + 00:00:56.8 KO2PLAN 00.0% NOT-IN-DB2 0 0 0 OMPEHZ8S + 00:00:56.7 KO2PLAN 00.0% NOT-IN-DB2 104 0 7 OMPEHZ8S + 00:00:54.8 KO2PLAN 00.0% NOT-IN-DB2 104 0 7 OMPEHZAS + 00:00:21.3 KO2PLAN 00.0% NOT-IN-DB2 0 0 0 OMPEHZ7S + 00:00:20.7 KO2PLAN 00.0% NOT-IN-DB2 0 0 0 OMPEHZ8S ===============================================================================
Each row provides information about an individual thread. Each column provides information about threadelapsed time, DB2 and MVS resource consumption, and DB2 activity.
HighlightingThe following table shows the fields that might be highlighted in the panel above to indicate that anexception that is related to this field exceeded its threshold value:
Table 2. Highlighted fields in All Threads Connected to DB2 panel
Field Exception Reason
Elapsed ETIM This thread has reached theElapsed Time threshold value.
CPU TCPU The thread address space hasexcessive CPU utilization.
GetPg GETP The Getpage to Read I/O ratioindicates poor read efficiency.
Update PGUP The rate for system page updatesis high.
© Copyright IBM Corp. 2005, 2021 39
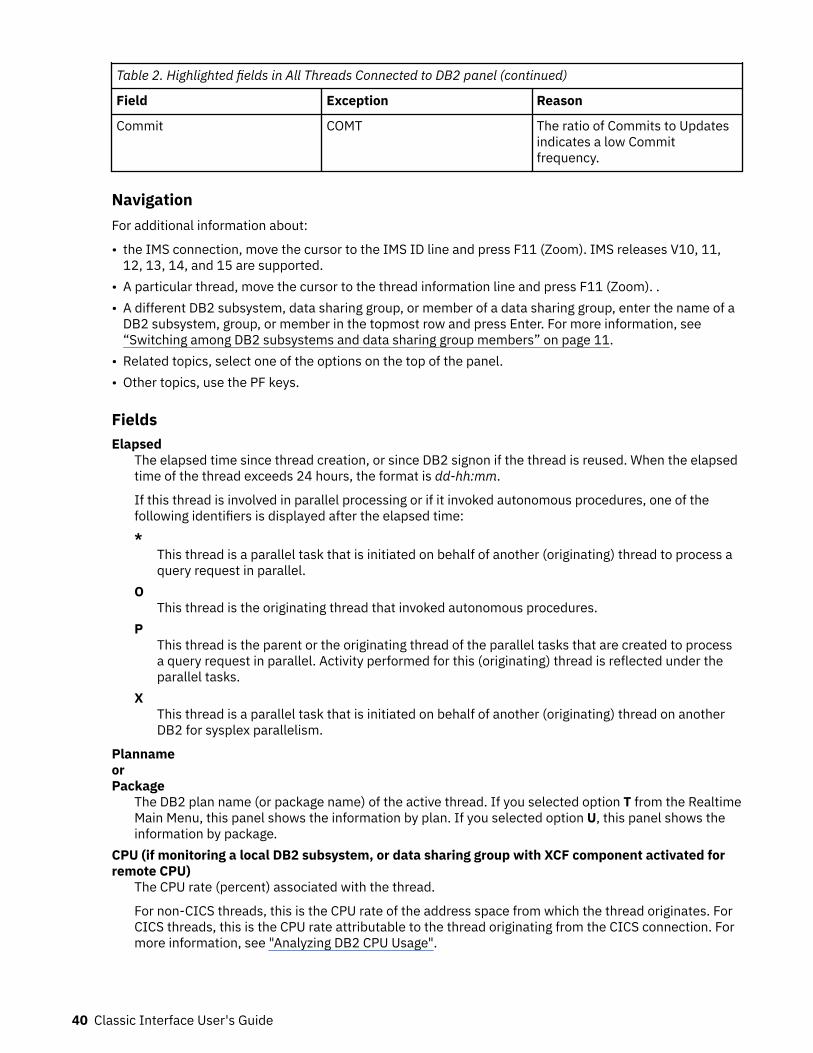
Table 2. Highlighted fields in All Threads Connected to DB2 panel (continued)
Field Exception Reason
Commit COMT The ratio of Commits to Updatesindicates a low Commitfrequency.
NavigationFor additional information about:
• the IMS connection, move the cursor to the IMS ID line and press F11 (Zoom). IMS releases V10, 11,12, 13, 14, and 15 are supported.
• A particular thread, move the cursor to the thread information line and press F11 (Zoom). .• A different DB2 subsystem, data sharing group, or member of a data sharing group, enter the name of a
DB2 subsystem, group, or member in the topmost row and press Enter. For more information, see“Switching among DB2 subsystems and data sharing group members” on page 11.
• Related topics, select one of the options on the top of the panel.• Other topics, use the PF keys.
FieldsElapsed
The elapsed time since thread creation, or since DB2 signon if the thread is reused. When the elapsedtime of the thread exceeds 24 hours, the format is dd-hh:mm.
If this thread is involved in parallel processing or if it invoked autonomous procedures, one of thefollowing identifiers is displayed after the elapsed time:*
This thread is a parallel task that is initiated on behalf of another (originating) thread to process aquery request in parallel.
OThis thread is the originating thread that invoked autonomous procedures.
PThis thread is the parent or the originating thread of the parallel tasks that are created to processa query request in parallel. Activity performed for this (originating) thread is reflected under theparallel tasks.
XThis thread is a parallel task that is initiated on behalf of another (originating) thread on anotherDB2 for sysplex parallelism.
PlannameorPackage
The DB2 plan name (or package name) of the active thread. If you selected option T from the RealtimeMain Menu, this panel shows the information by plan. If you selected option U, this panel shows theinformation by package.
CPU (if monitoring a local DB2 subsystem, or data sharing group with XCF component activated forremote CPU)
The CPU rate (percent) associated with the thread.
For non-CICS threads, this is the CPU rate of the address space from which the thread originates. ForCICS threads, this is the CPU rate attributable to the thread originating from the CICS connection. Formore information, see "Analyzing DB2 CPU Usage".
40 Classic Interface User's Guide
DB2 (if monitoring a data sharing group or remote DB2 subsystem while XCF component is notactivated for remote CPU)
The DB2 subsystem name of the data sharing group member that is currently monitored.You can use the Tab key to move to a detail line and to select this detail line for drill down.
StatusThe current DB2 status of the thread. For definitions of all possible status values, see "DB2 ThreadStatus".
GetPgThe number of thread Getpage requests. Getpage requests are logical Read requests that might notactually result in physical I/O if the requested page is currently in the buffer pool.
DB2 resets the Getpage count at Create Thread and Signon. If Signon is not driven, the Getpage countis cumulative.
UpdateThe number of DB2 page updates made by the thread since thread creation. This value is incrementedeach time a row in a page is updated, not just once for each page updated. DB2 might update pageswhen it creates intermediate result tables because of a qualified SELECT statement, even thoughSELECT statements are generally thought of as read only operations. Pages that have been updatedare written asynchronously by DB2, according to DB2's internal Deferred Write algorithm, notimmediately after update or commit. DB2 resets the page update count at Create Thread and Signon.If Signon is not driven, the page update count is cumulative.
CommitThe number of times the thread successfully completed Commit processing.
DB2 resets the Commit count at Create Thread and Signon. If Signon is not driven, the count iscumulative.
CORRID/JOBNThis field is customizable by means of user mod TKANSAM(KO2MOD02) and shows either:CORRID
The correlation ID of the thread.JOBN
The jobname of the thread.For remote DB2 subsystems, the correlation ID is displayed instead of the job name.
Thread DetailThis panel provides detailed information about the activity of a selected thread or parallel task.
A parallel task is created from an originating thread to process a part of a query. Thread activity is brokendown into general status and resource consumption information, and buffer manager activity.
Chapter 6. Thread Activity 41
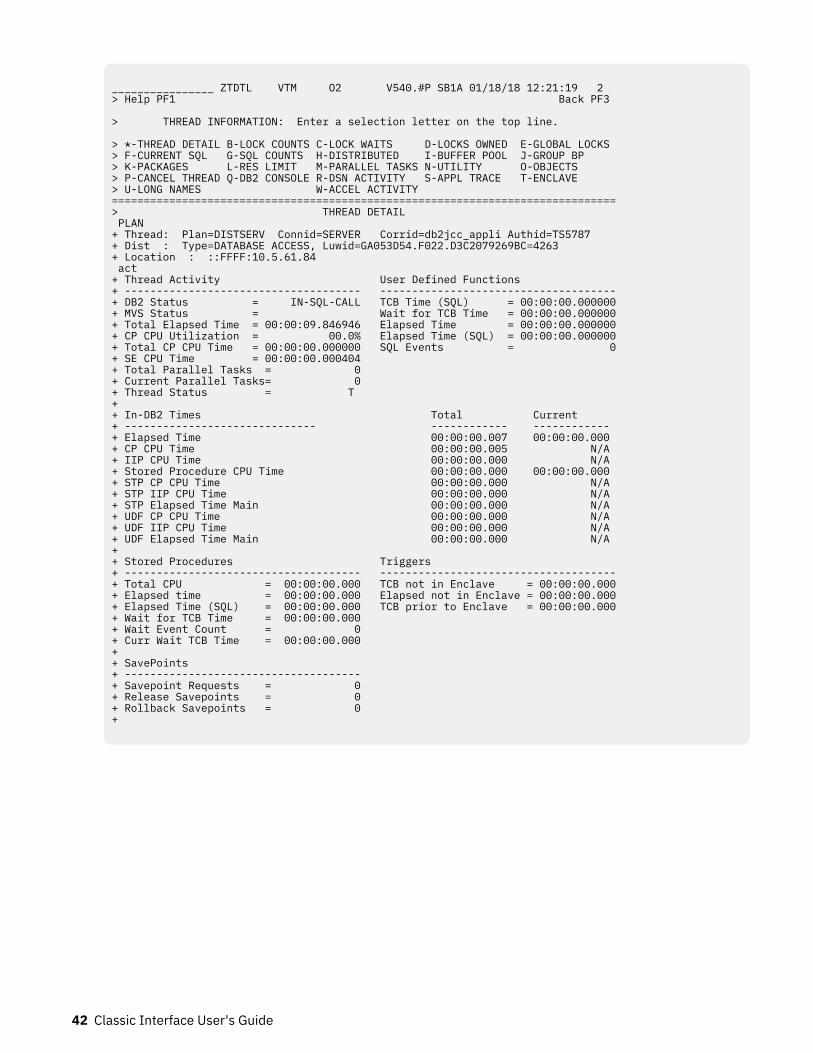
________________ ZTDTL VTM O2 V540.#P SB1A 01/18/18 12:21:19 2 > Help PF1 Back PF3 > THREAD INFORMATION: Enter a selection letter on the top line. > *-THREAD DETAIL B-LOCK COUNTS C-LOCK WAITS D-LOCKS OWNED E-GLOBAL LOCKS > F-CURRENT SQL G-SQL COUNTS H-DISTRIBUTED I-BUFFER POOL J-GROUP BP > K-PACKAGES L-RES LIMIT M-PARALLEL TASKS N-UTILITY O-OBJECTS > P-CANCEL THREAD Q-DB2 CONSOLE R-DSN ACTIVITY S-APPL TRACE T-ENCLAVE > U-LONG NAMES W-ACCEL ACTIVITY ===============================================================================> THREAD DETAIL PLAN + Thread: Plan=DISTSERV Connid=SERVER Corrid=db2jcc_appli Authid=TS5787 + Dist : Type=DATABASE ACCESS, Luwid=GA053D54.F022.D3C2079269BC=4263 + Location : ::FFFF:10.5.61.84 act + Thread Activity User Defined Functions + ------------------------------------- -------------------------------------+ DB2 Status = IN-SQL-CALL TCB Time (SQL) = 00:00:00.000000+ MVS Status = Wait for TCB Time = 00:00:00.000000+ Total Elapsed Time = 00:00:09.846946 Elapsed Time = 00:00:00.000000+ CP CPU Utilization = 00.0% Elapsed Time (SQL) = 00:00:00.000000+ Total CP CPU Time = 00:00:00.000000 SQL Events = 0+ SE CPU Time = 00:00:00.000404 + Total Parallel Tasks = 0 + Current Parallel Tasks= 0 + Thread Status = T + + In-DB2 Times Total Current + ------------------------------ ------------ ------------ + Elapsed Time 00:00:00.007 00:00:00.000 + CP CPU Time 00:00:00.005 N/A + IIP CPU Time 00:00:00.000 N/A + Stored Procedure CPU Time 00:00:00.000 00:00:00.000 + STP CP CPU Time 00:00:00.000 N/A + STP IIP CPU Time 00:00:00.000 N/A + STP Elapsed Time Main 00:00:00.000 N/A + UDF CP CPU Time 00:00:00.000 N/A + UDF IIP CPU Time 00:00:00.000 N/A + UDF Elapsed Time Main 00:00:00.000 N/A + + Stored Procedures Triggers + ------------------------------------- ------------------------------------- + Total CPU = 00:00:00.000 TCB not in Enclave = 00:00:00.000 + Elapsed time = 00:00:00.000 Elapsed not in Enclave = 00:00:00.000 + Elapsed Time (SQL) = 00:00:00.000 TCB prior to Enclave = 00:00:00.000 + Wait for TCB Time = 00:00:00.000 + Wait Event Count = 0 + Curr Wait TCB Time = 00:00:00.000 + + SavePoints + ------------------------------------- + Savepoint Requests = 0 + Release Savepoints = 0 + Rollback Savepoints = 0 +
42 Classic Interface User's Guide
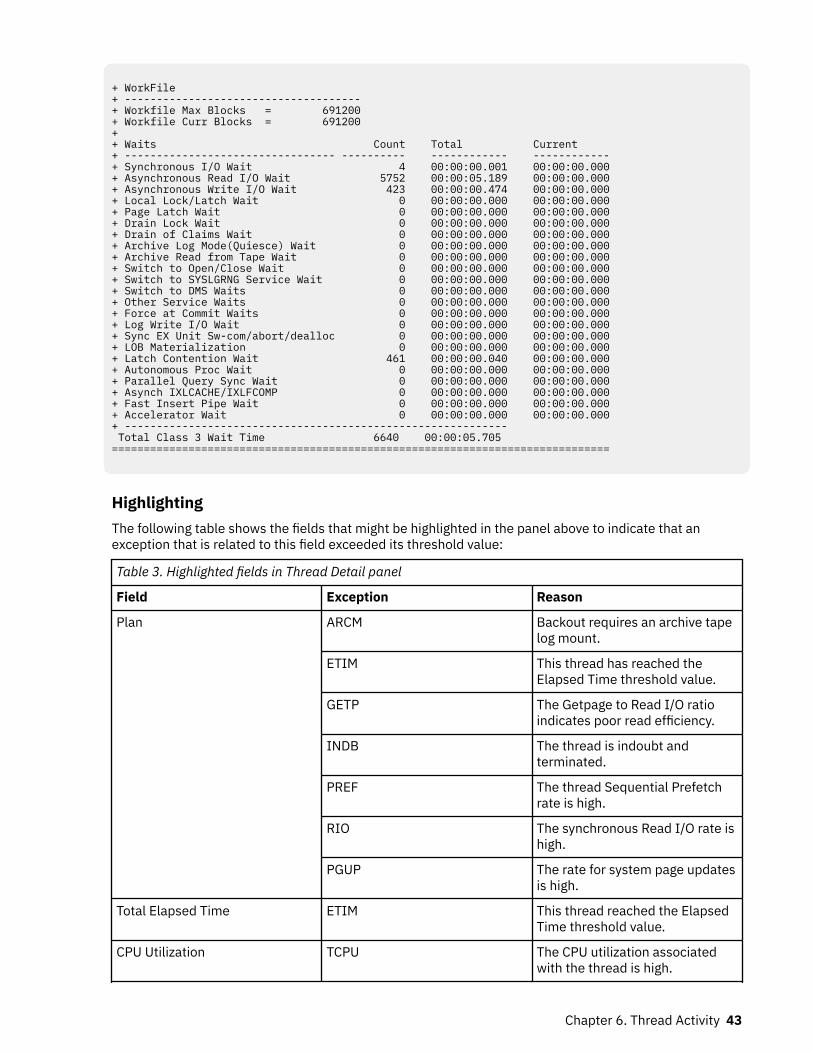
+ WorkFile + ------------------------------------- + Workfile Max Blocks = 691200 + Workfile Curr Blocks = 691200 + + Waits Count Total Current + --------------------------------- ---------- ------------ ------------ + Synchronous I/O Wait 4 00:00:00.001 00:00:00.000 + Asynchronous Read I/O Wait 5752 00:00:05.189 00:00:00.000 + Asynchronous Write I/O Wait 423 00:00:00.474 00:00:00.000 + Local Lock/Latch Wait 0 00:00:00.000 00:00:00.000 + Page Latch Wait 0 00:00:00.000 00:00:00.000 + Drain Lock Wait 0 00:00:00.000 00:00:00.000 + Drain of Claims Wait 0 00:00:00.000 00:00:00.000 + Archive Log Mode(Quiesce) Wait 0 00:00:00.000 00:00:00.000 + Archive Read from Tape Wait 0 00:00:00.000 00:00:00.000 + Switch to Open/Close Wait 0 00:00:00.000 00:00:00.000 + Switch to SYSLGRNG Service Wait 0 00:00:00.000 00:00:00.000 + Switch to DMS Waits 0 00:00:00.000 00:00:00.000 + Other Service Waits 0 00:00:00.000 00:00:00.000 + Force at Commit Waits 0 00:00:00.000 00:00:00.000 + Log Write I/O Wait 0 00:00:00.000 00:00:00.000 + Sync EX Unit Sw-com/abort/dealloc 0 00:00:00.000 00:00:00.000 + LOB Materialization 0 00:00:00.000 00:00:00.000 + Latch Contention Wait 461 00:00:00.040 00:00:00.000 + Autonomous Proc Wait 0 00:00:00.000 00:00:00.000 + Parallel Query Sync Wait 0 00:00:00.000 00:00:00.000 + Asynch IXLCACHE/IXLFCOMP 0 00:00:00.000 00:00:00.000 + Fast Insert Pipe Wait 0 00:00:00.000 00:00:00.000 + Accelerator Wait 0 00:00:00.000 00:00:00.000 + ------------------------------------------------------------ Total Class 3 Wait Time 6640 00:00:05.705 ==============================================================================
HighlightingThe following table shows the fields that might be highlighted in the panel above to indicate that anexception that is related to this field exceeded its threshold value:
Table 3. Highlighted fields in Thread Detail panel
Field Exception Reason
Plan ARCM Backout requires an archive tapelog mount.
ETIM This thread has reached theElapsed Time threshold value.
GETP The Getpage to Read I/O ratioindicates poor read efficiency.
INDB The thread is indoubt andterminated.
PREF The thread Sequential Prefetchrate is high.
RIO The synchronous Read I/O rate ishigh.
PGUP The rate for system page updatesis high.
Total Elapsed Time ETIM This thread reached the ElapsedTime threshold value.
CPU Utilization TCPU The CPU utilization associatedwith the thread is high.
Chapter 6. Thread Activity 43
Table 3. Highlighted fields in Thread Detail panel (continued)
Field Exception Reason
Current Drain Lock Wait WDLK The thread reached drain lockwait threshold.
Current Drain of Claims Wait WCLM The thread reached wait for drainof claims threshold.
Current Service Task Wait WSRV The thread reached Db2 servicewait threshold.
Current Archive Log Mode(Quiesce) Wait
WLGQ The thread reached Archive LogMode (Quiesce) wait threshold.
Current Stored ProcedureSchedule Wait
WSPS The thread reached storedprocedure schedule waitthreshold.
Total elapsed time IDBT In-Db2 Times - Total elapsedtime.
Total CP CPU wait IDBC In Db2-Times - Total CP CPUwait.
Current global parent L-lock wait WGLK The thread reached the globallock wait threshold.
NavigationYou can scroll through the information using F7 and F8.
For additional information about
• related topics, select one of the options on the top of the panel.• other topics, use the PF keys.
FieldsIf the accounting trace classes are not active, the fields show N/A (not applicable) instead of a value.
Thread identifier: This information identifies the thread to which the information in this panel applies.Plan
The Db2 plan name of the active thread.Connid
The Db2 connection identifier of the active thread.Corrid
The Db2 correlation identifier of the active thread. If the correlation is not set, N/A is displayed.Authid
The Db2 authorization identifier of the active thread.Attach
Depending on the type of connection, the appropriate information is displayed.Attach information is displayed only if the thread is a distributed allied thread (not for distributeddatabase access threads).
Connection TypeBatch
The MVS jobname and ASID.
44 Classic Interface User's Guide

Note: For threads from remote Db2, the MVS job name is N/A.
CICSThe CICS jobname, task name, task number, terminal ID, and thread type. The thread type is:Pool
The thread in use is a pool thread.Entry
The thread in use is a nonprotected entry thread.Prot
The thread in use is a protected thread. Protected threads are defined in an RCT entrydefinition using the THRDS operand.
IMSThe IMS region number, transaction name, region name, and terminal ID (LTERM).
RRSAFThe MVS job name and ASID.
Note: For threads from remote Db2, the MVS job name is N/A.
SystemThe originating Db2 job name and the resource manager that is the source of the thread. Anadditional line below the Attach line identifies the user thread, if any, being served by the systemthread.
TSOThe TSO user ID and region ASID.
UtilityNo additional information.
Db2The Db2 subsystem identifier.
MVSThe MVS system identifier.
ORIGAUTHThe original (primary) Db2 authorization identifier of the thread. This field displays only when theoriginal identifier is different from the Authid.
Package identifier: This information identifies the package to which the information in this panel applies.Package
The Db2 package name of the active thread. Up to 18 characters of the package name are returned.Collection
The package collection identifier. This field is displayed only if a package is being used.
Distributed thread identifier: The following fields are displayed if the thread has a distributedrelationship with a remote Db2 subsystem.Type
The distributed thread type.Distributed Allied
A requesting thread; one that has issued an SQL call to a remote Db2 location.Database Access
A responding thread; one that is serving a remote Db2 location by responding to an SQL call.Db2=
The Db2 subsystem ID, indicating the member of the data sharing group of this thread.
Chapter 6. Thread Activity 45
LuwidThis value consists of two parts: the logical unit of work ID (luw-id) and a token. The token can beused in place of the luw-id in any Db2 command that accepts luw-id as input. Format:
luw-id=token
The luw-id consists of the network name, the originating VTAM LUNAME, and a unique identifier(separated by periods). Thus, the Luwid field displays data like in the following example:
USCACO01.O2D22A.A1FE8E04B9D4=8
SystemThe originating Db2 job name and the resource manager that is the source of the thread. An additionalline below the Attach line identifies the user thread, if any, being served by the system thread.
Thread Activity:Db2 Status
For definitions of all possible status values, see "DB2 Thread Status".MVS Status
The current MVS status of the thread:Asid Notdisp
The address space in which the active task is not available for dispatch.Db2 I/O Wait
The thread is waiting for the completion of Db2 database I/O.Logical Swap
The address space is currently logically swapped out.Swapped Out
The memory is physically swapped out.Using CPU
The thread is currently using CPU cycles.Wait-Dispatch
The task is waiting on the active CPU dispatching queue. It is available for use, but is not yetrunning on a processor.
WAIT-MISCThe thread is waiting for some other reason and is not on the available dispatch queue.
Note: If the panel displays a distributed database access thread, this field is blank.
Total Elapsed TimeThe total elapsed time for the thread, in the format hh:mm:ss.tht. Elapsed time is the time which haselapsed since thread creation or Db2 signon.
CP CPU UtilizationThe central processor CPU rate (percent) associated with the thread.
For non-CICS threads, this is the central processor CPU rate of the address space from which thethread originates. For CICS threads, this is the central processor CPU rate attributable to the threadoriginating from the CICS connection. For more information about central processor CPU use, see"Analyzing Db2 CPU Usage".
Total CP CPU TimeThe total central processor CPU time accumulated for the thread. This value includes only MVS TCBtime. SRB time is not included.
SE CPU TimeThe accumulated class 2 CPU time consumed while executing on an IBM specialty engine..
Total Parallel TasksThe total number of parallel tasks that were created on behalf of this thread.
46 Classic Interface User's Guide
Current Parallel TasksThe number of parallel tasks currently executing. To see information about these tasks, select optionM-PARALLEL TASKS.
Thread StatusValid values:AC
Execute in accelaratorAT
Process autonomous procedureD
Termination due to allied task's terminationDA
DBaccess thread slot is available for new connectionDI
Disconnected, no TCB associated with the Db2 thread. (Available for reuse.)N
In IDENTIFY or SIGNON statusND
IN IDENTIFY or SIGNON status with no TCB associatedPT
Parallel task threadQD
Queued for termination due to allied task's terminationQT
CREATE THREAD request is queuedR2
Type2 inactive thread waiting for agent to become availableRA
Active distributed thread performing remote accessRK
Distributed thread invokes Kerberos servicesRN
Distributed thread waits for system conversation service taskRQ
Distributed thread waits for dbaccess agent, due to MAXDBAT orDSN_PROFILE_ATTRIBUTES_TABLE
RXDistributed thread executes XA transaction
SPIn stored procedure
SWWait for a stored procedure to be scheduled
TNon-distributed allied thread
TDAn allied thread is not associated with TCB
TNAn allied thread is waiting for system conversation service task
TRAn allied thread is active
Chapter 6. Thread Activity 47
N/AQW0148ST is not populated
User-Defined Functions:TCB Time (SQL)
The accumulated CPU time consumed executing user-defined functions. This time does not includeCPU time consumed on an IBM specialty engine. It consists of following parts:
• The accumulated CPU time consumed in Db2 when processing SQL statements that were issued byUDFs in a Db2 stored procedure or WLM address space. This time also includes the Db2 timerequired to connect or disconnect the UDF task. It is only calculated if accounting class 2 is active.
• The accumulated CPU time consumed executing user-defined functions on the main applicationexecution unit. This time represents class 1 and class 2 time, because these UDFs run entirelywithin Db2.
Wait for TCB TimeTotal elapsed time spent waiting for an available TCB before the user-defined function could bescheduled.
Elapsed TimeTotal elapsed time spent in user-defined functions, including time executing SQL statements.
Elapsed Time (SQL)Total elapsed time spent in user-defined functions executing SQL statements.
SQL EventsNumber of SQL entry/exit events performed by user-defined functions.
In-Db2 Times
Elapsed Time (Total)
The accumulated CPU time consumed executing user-defined functions. This time does not includeCPU consumed on an IBM specialty engine. It consists of following parts:
The accumulated CPU time used to satisfy UDF requests processed in a Db2 stored procedure or WLMaddress space. This time is only calculated if accounting class 1 is active.
The accumulated CPU time consumed executing user-defined functions on the main applicationexecution unit. This time represents class 1 and class 2 time, because these UDFs run entirely withinDb2.
Elapsed Time (Current)
The total amount of time spent executing the currently active SQL statement. It is only calculated ifmonitor class 9 is activated.
CP CPU Time (Total)
The class 2 CPU time (in Db2). It indicates:
• The class 2 CPU time for the allied agent. This includes the accumulated class 2 TCB time forprocessing any stored procedures, user-defined functions, and triggers.
• The accumulated CPU time for processing parallel tasks. This is valid for query CP parallelism,sysplex query parallelism, and parallel tasks generated by utilities. Only CPU times of parallel tasks,running on the same member of the sysplex group as the originating task, are included. This CPUtime does not include time that is consumed on an IBM specialty engine.
CP CPU Time (Current)
CPU time consumed for execution of the SQL statement. This value is not available for SQL statementsthat run under an SRB. Therefore, this value does not include time that is consumed on an IBMspecialty engine. It is only calculated if monitor class 9 is activated.
48 Classic Interface User's Guide
SE CPU Time (Total)
The accumulated and consumed class 2 time on an IBM specialty engine (SE) that consists of timesfor non-nested, stored procedures, user-defined functions, triggers, and parallel tasks.
SE CPU Time (Current)
The total SE CPU time used by the currently active SQL statement. The value is always zero fordatabase access threads.
Stored Procedure CPU Time (Total)
The accumulated CPU time that is used for executing stored procedure requests on the mainapplication execution unit. This time does not include the time that is consumed on an IBM specialtyengine. As these stored procedures run entirely in Db2, this time represents class 1 and class 2 time.
UDF CP CPU Time (Total)
Accumulated CPU time consumed executing user defined functions on the main application executionunit. This time does not include CPU consumed on an IBM specialty engine. Because these UDFs runentirely within Db2, this time represents class 1 and class 2 time. No current value will be provided.
UDF IIP CPU Time (Total)
Accumulated CPU time consumed executing user defined functions on the main application executionunit on an IBM specialty engine. Because these UDFs run entirely within Db2, this time representsclass 1 and class 2 time. No current value will be provided.
UDF Elapsed Time Main (Total)
The accumulated CPU time consumed executing user-defined functions. This time does not includeCPU consumed on an IBM specialty engine. It consists of following parts:
• The accumulated CPU time used to satisfy UDF requests processed in a Db2 stored procedure orWLM address space. This time is only calculated if accounting class 1 is active.
• The accumulated CPU time consumed executing user-defined functions on the main applicationexecution unit. This time represents class 1 and class 2 time, because these UDFs run entirelywithin Db2.
Stored Procedures:Total CPU
The CPU time (TCB time) spent in Db2 processing SQL statements issued by stored procedures forthis thread. This is an accumulated and consumed time for stored procedures that consists of thefollowing information:
• The CPU time accumulated in Db2 for processing SQL statements issued by stored proceduresprocessed in a Db2 stored procedure or WLM address space. This time is only calculated ifaccounting class 2 is active
• In-Db2 time needed to connect and disconnect the SP task for non-SQL procedure storedprocedures
• SQL procedure times are included in this time if the SQL procedure was called on a nested task andwas not invoked by the main application execution unit
• CPU time that is consumed when running stored procedure requests on the main applicationexecution unit. This time does not include the CPU time consumed on an IBM specialty engine.
Elapsed TimeTotal elapsed time spent in stored procedures including time executing SQL statements. This is anaccumulated and consumed time for stored procedures that consists of the following parts:
• The CPU time accumulated in Db2 for processing SQL CALL statements in the stored procedures orWLM address space. This time is only calculated if accounting class 1 is active.
• The accumulated CPU time consumed when running stored procedure requests on the mainapplication execution unit. This time does not include CPU time consumed on an IBM specialty
Chapter 6. Thread Activity 49
engine. As these stored procedures run entirely within Db2, this time represents class 1 and class 2time.
Elapsed Time (SQL)Total elapsed time spent for stored procedures executing SQL statements.
Wait for TCB TimeThe total time waiting for an available TCB to schedule a stored procedure.
Wait Event CountThe number of wait trace events processed for an available TCB that are needed in order to schedule astored procedure.
Curr Wait TCB TimeThe current time waiting for an available TCB to schedule a stored procedure.
Triggers:Trigger CPU Time
The accumulated CPU time consumed while executing under the control of triggers. For triggers thereis no distinction between class 1 and class 2 CPU time. All processing controlled by a trigger is withinDb2.
Elapsed not in EnclaveThe accumulated elapsed time used when executing under the control of a trigger. This does notinclude the time used while in user-defined function or stored procedures that are called from thetrigger not under an enclave.
TCB prior to EnclaveThe accumulated TCB time consumed before enclave creation time.
SavePoints:Savepoint Requests
The number of savepoints set.Release Savepoints
The number of savepoints deleted.Rollback Savepoints
The number of rollback-to-savepoint requests issued.
WorkFile:Workfile Max Blocks
Maximum number of workfile blocks being used by this agent at any given point in time (traditionalworkfile use, DGTT and DGTT indexes). DB2 12 and later.
Workfile Curr BlocksCurrent number of workfile blocks being used by this agent (traditional workfile use, DGTT and DGTTindexes). DB2 12 and later.
In-Db2 Times: In-Db2 times require an Accounting trace class 2. If this trace was not active, N/A isdisplayed.Elapsed Time (Total)
The total In-Db2 elapsed time for the thread, in the format hh:mm:ss.tht.Elapsed Time (Current)
The total time spent executing the currently active SQL statement.CP CPU Time (Total)
The total In-Db2 central processor CPU time for the thread. This includes MVS TCB time only. SRBtime is not included.
CP CPU Time (Current)The total central processor CPU time used by the currently active SQL statement, in the formathh:mm:ss.tht. The value is always zero for database access threads.
50 Classic Interface User's Guide
IIP CPU Time (Total)The total In-Db2 SE (Specialty Engine) CPU time for the thread.
IIP CPU Time (Current)The total SE (Specialty Engine) CPU time used by the currently active SQL statement in seconds. Thevalue is always zero for database access threads.
Stored Procedure CPU Time (Total)The CPU time (TCB time) spent in Db2 processing SQL statements issued by Db2 stored proceduresfor this thread.
Stored Procedure CPU Time (Current)The CPU time (TCB time) spent in Db2 processing SQL statements issued by Db2 stored procedurethat is currently active.
UDF CP CPU Time (Total)The CPU time spent in Db2 processing SQL statements issued by user defined functions for thisthread. This time represents central processor time only and does not include SE (Specialty Engine)time.
UDF IIP CPU Time (Total)The amount of SE (Specialty Engine) CPU time spent in Db2 processing SQL statements issued fromuser defined functions for this thread.
UDF Elapsed Time Main (Total)The elapsed time by the user defined functions for this thread in the format hh:mm:ss.tht.
Waits (Class 3): Wait times require an Accounting trace class 3. If this trace is not active, N/A isdisplayed. For each field described below the following statistics are provided:
• Count is the total number of waits.• Total is the total wait time that has elapsed.• Current is the elapsed time waiting for the current event to complete.
Synchronous I/O WaitWaits for synchronous I/O reads or writes.
Asynchronous Read I/O WaitWaits for Read I/O performed under another thread (for example, list or Sequential Prefetch).
Asynchronous Write I/O WaitWaits for Write I/O performed under another thread (for example, deferred writes).
Local Lock/Latch WaitWaits for locks or latches.
Page Latch WaitWaits for page latch.
Drain Lock WaitWaits to acquire drain lock.
Drain of Claims WaitWaits for claims to be released after acquiring drain lock.
Archive Log Mode (Quiesce) WaitWait for ARCHIVE LOG MODE(QUIESCE) command to complete.
Archive Read from Tape WaitWaits for read of archive log from tape.
Switch to Open/Close WaitWait for switches to the OPEN/CLOSE service.
Switch to SYSLGRNG Service WaitWait for switches to the SYSLGRNG recording service.
Switch to DMS WaitsWait for switches to the database-managed space (DMS).
Chapter 6. Thread Activity 51
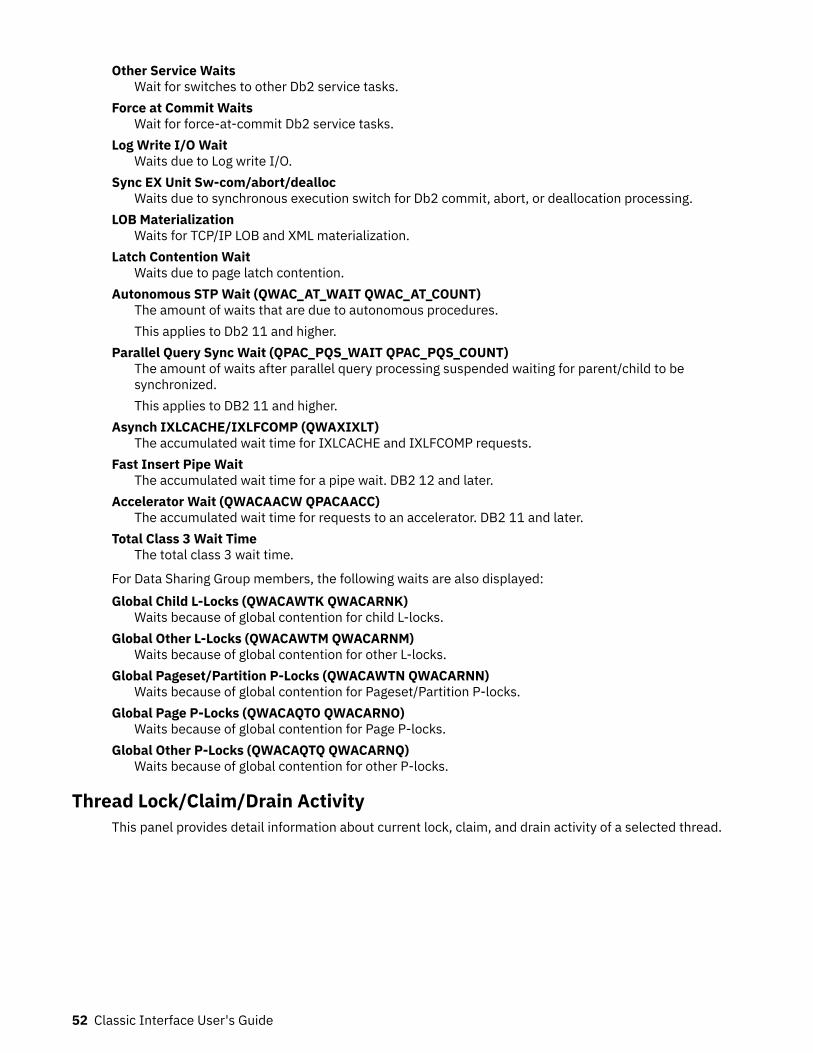
Other Service WaitsWait for switches to other Db2 service tasks.
Force at Commit WaitsWait for force-at-commit Db2 service tasks.
Log Write I/O WaitWaits due to Log write I/O.
Sync EX Unit Sw-com/abort/deallocWaits due to synchronous execution switch for Db2 commit, abort, or deallocation processing.
LOB MaterializationWaits for TCP/IP LOB and XML materialization.
Latch Contention WaitWaits due to page latch contention.
Autonomous STP Wait (QWAC_AT_WAIT QWAC_AT_COUNT)The amount of waits that are due to autonomous procedures.This applies to Db2 11 and higher.
Parallel Query Sync Wait (QPAC_PQS_WAIT QPAC_PQS_COUNT)The amount of waits after parallel query processing suspended waiting for parent/child to besynchronized.This applies to DB2 11 and higher.
Asynch IXLCACHE/IXLFCOMP (QWAXIXLT)The accumulated wait time for IXLCACHE and IXLFCOMP requests.
Fast Insert Pipe WaitThe accumulated wait time for a pipe wait. DB2 12 and later.
Accelerator Wait (QWACAACW QPACAACC)The accumulated wait time for requests to an accelerator. DB2 11 and later.
Total Class 3 Wait TimeThe total class 3 wait time.
For Data Sharing Group members, the following waits are also displayed:Global Child L-Locks (QWACAWTK QWACARNK)
Waits because of global contention for child L-locks.Global Other L-Locks (QWACAWTM QWACARNM)
Waits because of global contention for other L-locks.Global Pageset/Partition P-Locks (QWACAWTN QWACARNN)
Waits because of global contention for Pageset/Partition P-locks.Global Page P-Locks (QWACAQTO QWACARNO)
Waits because of global contention for Page P-locks.Global Other P-Locks (QWACAQTQ QWACARNQ)
Waits because of global contention for other P-locks.
Thread Lock/Claim/Drain ActivityThis panel provides detail information about current lock, claim, and drain activity of a selected thread.
52 Classic Interface User's Guide
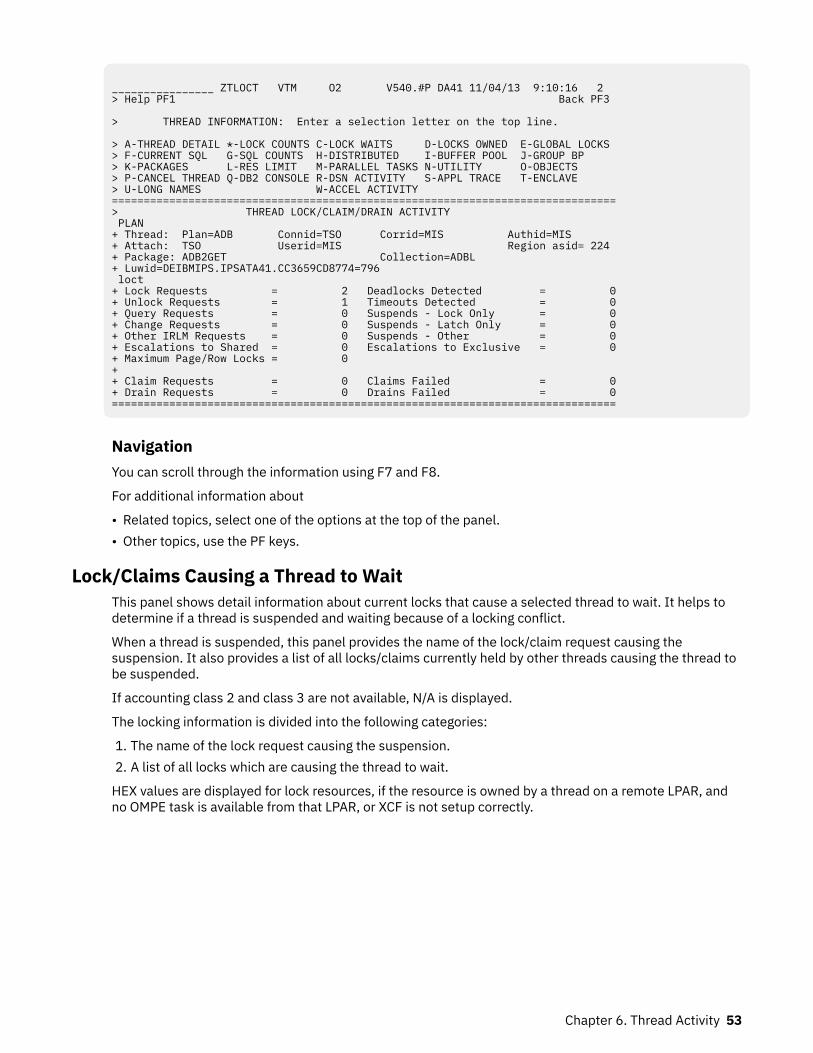
________________ ZTLOCT VTM O2 V540.#P DA41 11/04/13 9:10:16 2 > Help PF1 Back PF3 > THREAD INFORMATION: Enter a selection letter on the top line. > A-THREAD DETAIL *-LOCK COUNTS C-LOCK WAITS D-LOCKS OWNED E-GLOBAL LOCKS > F-CURRENT SQL G-SQL COUNTS H-DISTRIBUTED I-BUFFER POOL J-GROUP BP > K-PACKAGES L-RES LIMIT M-PARALLEL TASKS N-UTILITY O-OBJECTS > P-CANCEL THREAD Q-DB2 CONSOLE R-DSN ACTIVITY S-APPL TRACE T-ENCLAVE > U-LONG NAMES W-ACCEL ACTIVITY ===============================================================================> THREAD LOCK/CLAIM/DRAIN ACTIVITY PLAN + Thread: Plan=ADB Connid=TSO Corrid=MIS Authid=MIS + Attach: TSO Userid=MIS Region asid= 224 + Package: ADB2GET Collection=ADBL + Luwid=DEIBMIPS.IPSATA41.CC3659CD8774=796 loct + Lock Requests = 2 Deadlocks Detected = 0+ Unlock Requests = 1 Timeouts Detected = 0+ Query Requests = 0 Suspends - Lock Only = 0+ Change Requests = 0 Suspends - Latch Only = 0+ Other IRLM Requests = 0 Suspends - Other = 0+ Escalations to Shared = 0 Escalations to Exclusive = 0+ Maximum Page/Row Locks = 0 + + Claim Requests = 0 Claims Failed = 0+ Drain Requests = 0 Drains Failed = 0===============================================================================
NavigationYou can scroll through the information using F7 and F8.
For additional information about
• Related topics, select one of the options at the top of the panel.• Other topics, use the PF keys.
Lock/Claims Causing a Thread to WaitThis panel shows detail information about current locks that cause a selected thread to wait. It helps todetermine if a thread is suspended and waiting because of a locking conflict.
When a thread is suspended, this panel provides the name of the lock/claim request causing thesuspension. It also provides a list of all locks/claims currently held by other threads causing the thread tobe suspended.
If accounting class 2 and class 3 are not available, N/A is displayed.
The locking information is divided into the following categories:
1. The name of the lock request causing the suspension.2. A list of all locks which are causing the thread to wait.
HEX values are displayed for lock resources, if the resource is owned by a thread on a remote LPAR, andno OMPE task is available from that LPAR, or XCF is not setup correctly.
Chapter 6. Thread Activity 53
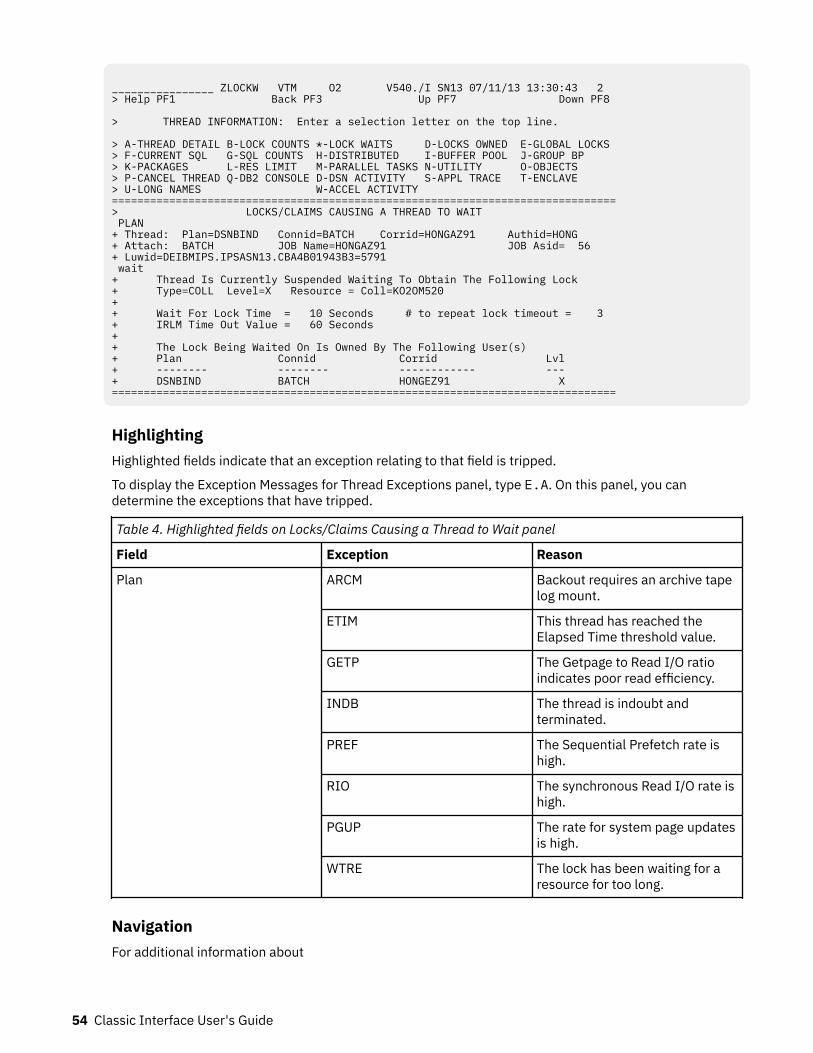
________________ ZLOCKW VTM O2 V540./I SN13 07/11/13 13:30:43 2 > Help PF1 Back PF3 Up PF7 Down PF8 > THREAD INFORMATION: Enter a selection letter on the top line. > A-THREAD DETAIL B-LOCK COUNTS *-LOCK WAITS D-LOCKS OWNED E-GLOBAL LOCKS > F-CURRENT SQL G-SQL COUNTS H-DISTRIBUTED I-BUFFER POOL J-GROUP BP > K-PACKAGES L-RES LIMIT M-PARALLEL TASKS N-UTILITY O-OBJECTS > P-CANCEL THREAD Q-DB2 CONSOLE D-DSN ACTIVITY S-APPL TRACE T-ENCLAVE > U-LONG NAMES W-ACCEL ACTIVITY ===============================================================================> LOCKS/CLAIMS CAUSING A THREAD TO WAIT PLAN + Thread: Plan=DSNBIND Connid=BATCH Corrid=HONGAZ91 Authid=HONG + Attach: BATCH JOB Name=HONGAZ91 JOB Asid= 56 + Luwid=DEIBMIPS.IPSASN13.CBA4B01943B3=5791 wait + Thread Is Currently Suspended Waiting To Obtain The Following Lock + Type=COLL Level=X Resource = Coll=KO2OM520 + + Wait For Lock Time = 10 Seconds # to repeat lock timeout = 3 + IRLM Time Out Value = 60 Seconds + + The Lock Being Waited On Is Owned By The Following User(s) + Plan Connid Corrid Lvl + -------- -------- ------------ --- + DSNBIND BATCH HONGEZ91 X ===============================================================================
HighlightingHighlighted fields indicate that an exception relating to that field is tripped.
To display the Exception Messages for Thread Exceptions panel, type E.A. On this panel, you candetermine the exceptions that have tripped.
Table 4. Highlighted fields on Locks/Claims Causing a Thread to Wait panel
Field Exception Reason
Plan ARCM Backout requires an archive tapelog mount.
ETIM This thread has reached theElapsed Time threshold value.
GETP The Getpage to Read I/O ratioindicates poor read efficiency.
INDB The thread is indoubt andterminated.
PREF The Sequential Prefetch rate ishigh.
RIO The synchronous Read I/O rate ishigh.
PGUP The rate for system page updatesis high.
WTRE The lock has been waiting for aresource for too long.
NavigationFor additional information about
54 Classic Interface User's Guide
• about the locks that are owned by a thread, an SQL activity, a general thread activity, or a resource limitactivity, or to go to the Db2 system console, type the appropriate option letter on the top line and pressENTER.
• related topics, select one of the options on the top of the panel.• other topics, use the PF keys.
NavigationYou can scroll through the information using F7 and F8.
For additional information about
• related topics, select one of the options at the top of the panel.• other topics, use the PF keys.
FieldsThread identifier: This information identifies the thread to which the information in this panel applies.Plan
The Db2 plan name of the active thread.Connid
The Db2 connection identifier of the active thread.Corrid
The Db2 correlation identifier of the active thread. If the correlation is not set, N/A is displayed.Authid
The Db2 authorization identifier of the active thread.Attach
Depending on the type of connection, the appropriate information is displayed.Attach information is displayed only if the thread is a distributed allied thread (not for distributeddatabase access threads).
Connection TypeBatch
The MVS jobname and ASID.
Note: For threads from remote Db2, the MVS job name is N/A.
CICSThe CICS jobname, task name, task number, terminal ID, and thread type. The thread type is:Pool
The thread in use is a pool thread.Entry
The thread in use is a nonprotected entry thread.Prot
The thread in use is a protected thread. Protected threads are defined in an RCT entrydefinition using the THRDS operand.
IMSThe IMS region number, transaction name, region name, and terminal ID (LTERM).
RRSAFThe MVS job name and ASID.
Note: For threads from remote Db2, the MVS job name is N/A.
Chapter 6. Thread Activity 55
SystemThe originating Db2 job name and the resource manager that is the source of the thread. Anadditional line below the Attach line identifies the user thread, if any, being served by the systemthread.
TSOThe TSO user ID and region ASID.
UtilityNo additional information.
Db2The Db2 subsystem identifier.
MVSThe MVS system identifier.
ORIGAUTHThe original (primary) Db2 authorization identifier of the thread. This field displays only when theoriginal identifier is different from the Authid.
Package identifier: This information identifies the package to which the information in this panel applies.Package
The Db2 package name of the active thread. Up to 18 characters of the package name are returned.Collection
The package collection identifier. This field is displayed only if a package is being used.
Distributed thread identifier: The following fields are displayed when the thread has a distributedrelationship with a remote DB2 subsystem.Type
The distributed thread type.Distributed Allied
A requesting thread; one that has issued an SQL call to a remote DB2 location.Database Access
A responding thread; one that is serving a remote DB2 location by responding to an SQL call.Luwid
This value consists of two parts: the logical unit-of-work ID (luw-id) and a token. The token can beused in place of the luw-id in any DB2 command that accepts luw-id as input. Format:
luw-id=token
The luw-id consists of the network name, the originating VTAM LUNAME, and a unique identifier(separated by periods). Thus, the Luwid field displays data such as the following:
USCACO01.O2D22A.A1FE8E04B9D4=8
Drain information:Type
The type of object being drained. Possible object types are:TS
TablespaceTS PART
Data PartitionIX
IndexspaceIX PART
Index Partition
56 Classic Interface User's Guide
ClassThe drain class. Possible classes are:CS
Drain all CS read access to object.RR
Drain all RR access to object.Write
Drain all write access to object.Resource
The name of the resource being drained. This includes the database name, pageset name, and thepartition number (if any).
Claim information:Plan
The planname of the thread claiming the resource.Connid
The connection identifier of the thread claiming the resource.Corrid
The correlation identifier of the thread claiming the resource.Class
The claim class. Possible classes are:CS
Cursor StabilityRR
Repeatable ReadWrite
Write access
Lock wait information:Type
The lock type on which the thread is waiting. For more information about lock types, see "Lock Typesand Lock Levels".
LevelThe level or state (mode) of the lock request. This information describes the level of resource accessdemanded by the lock request. For more information about lock levels, see "Lock Types and LockLevels".
ResourceThe resource for which the user is waiting. The content of the Resource field is dependent on locktype.
The resource varies depending upon the type of lock held. This field displays the following resources:Lock Type
ResourceALBP
BP=buffer pool IDBIND
COLL=collection ID PKG=package nameBMBA
BMC_MBAO or BMC_MBARBPPS
BP=buffer pool ID, DB=database name, PS=pageset name
Chapter 6. Thread Activity 57
CDRNDB=database name PS=pageset name PT=partition
COLLCOLL=collection ID
DBEXDB=database name PS=pageset name PT=partition
DBXUHASH CLASS=class number
DGTTURID=unit of recovery ID
DPAGDB=database name PS=pageset name PG=page
DSETDB=database name PS=pageset name PT=partition
DTBSDB=database name
GRBPBP=buffer pool ID
HASHDB=database name PS=pageset name PG=page
IEOFDB=database name PS=pageset name PT=partition
IPAGDB=database name PS=pageset name PG=page
LBLKDB=database name PS=pageset name
MDELDB=database name PS=pageset name
PALKDB=database name PS=pageset name PT=partition
PBPCBP=buffer pool ID
PCDBDB=database name
PDBDDB=database name
PDSODB=database name PS=pageset name
PITRDB=database name PS=pageset name PT=partition
PPAGDB=database name PS=pageset name PG=page
PPSCDB=database name PS=pageset name PT=partition
PPSPDB=database name PS=pageset name PT=partition
PRLFDB=database name PS=pageset name PT=partition
PSETDB=database name PS=pageset name
58 Classic Interface User's Guide
PSPIDB=dataset name PS=pageset name
RDRNDB=dataset name PS=pageset name PT=partition
RGDADB=database name PS=pageset name PG=page
ROWDB=database name PS=pageset name PG=page
RSTRBMC-RSTP
SDBADB=dataset name PS=pageset name
SKCTPLAN=plan name
SKPT
TOKEN is the consistency token (CONTOKEN) column from SYSIBM.SYSPACKAGE. Token=token
SPRCSYS_PITR
SRECDB=database name TS=tablespace name
TABLDB=database name PS=pageset name
UNDTResource ID (in hexadecimal)
UTEXUTEXEC
UTIDUID=utility identifier
UTOBDB=database name PS=pageset name PT=partition
UTSEUTSERIAL
WDRNDB=database name PS=pageset name PT=partition
Note: DB=database name can be represented as a DBID=identifier, which is the decimal identifier ofthe database. PSID=identifier can be represented as PSID=identifier, which is the decimal identifier ofthe table space or index space.
For more information about lock resources, see "Lock Types and Lock Levels".
Wait For Lock TimeThe time that DB2 has been waiting for the locked resource.
# To Repeat Lock TimeoutThe number of times DB2 repeats the lock timeout.
IRLM Time Out ValueThe maximum time that DB2 waits for a locked resource. When DB2 reaches the maximum value, itrolls back the unit of work.
LevelThe level or state (mode) of the lock request. This information describes the level of resource accessdemanded by the lock request. For more information about lock levels, see “Tablespace lock levels”on page 811.
Chapter 6. Thread Activity 59
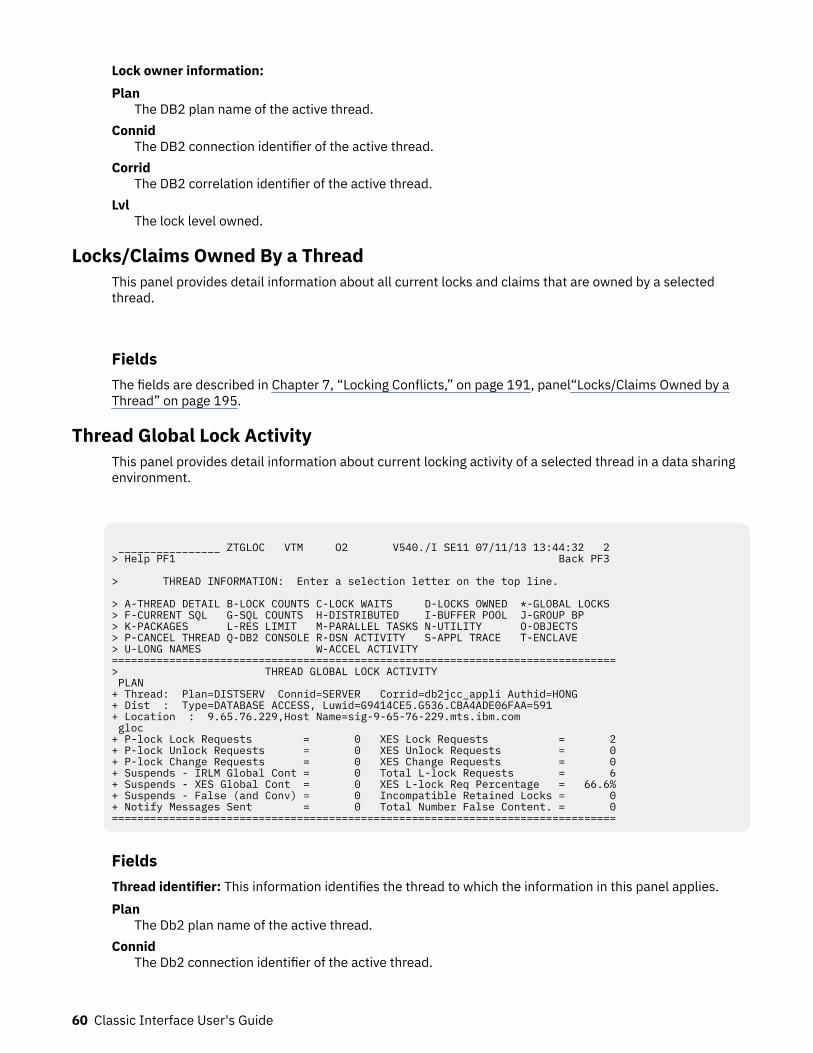
Lock owner information:Plan
The DB2 plan name of the active thread.Connid
The DB2 connection identifier of the active thread.Corrid
The DB2 correlation identifier of the active thread.Lvl
The lock level owned.
Locks/Claims Owned By a ThreadThis panel provides detail information about all current locks and claims that are owned by a selectedthread.
FieldsThe fields are described in Chapter 7, “Locking Conflicts,” on page 191, panel“Locks/Claims Owned by aThread” on page 195.
Thread Global Lock ActivityThis panel provides detail information about current locking activity of a selected thread in a data sharingenvironment.
________________ ZTGLOC VTM O2 V540./I SE11 07/11/13 13:44:32 2 > Help PF1 Back PF3 > THREAD INFORMATION: Enter a selection letter on the top line. > A-THREAD DETAIL B-LOCK COUNTS C-LOCK WAITS D-LOCKS OWNED *-GLOBAL LOCKS > F-CURRENT SQL G-SQL COUNTS H-DISTRIBUTED I-BUFFER POOL J-GROUP BP > K-PACKAGES L-RES LIMIT M-PARALLEL TASKS N-UTILITY O-OBJECTS > P-CANCEL THREAD Q-DB2 CONSOLE R-DSN ACTIVITY S-APPL TRACE T-ENCLAVE > U-LONG NAMES W-ACCEL ACTIVITY =============================================================================== > THREAD GLOBAL LOCK ACTIVITY PLAN + Thread: Plan=DISTSERV Connid=SERVER Corrid=db2jcc_appli Authid=HONG + Dist : Type=DATABASE ACCESS, Luwid=G9414CE5.G536.CBA4ADE06FAA=591 + Location : 9.65.76.229,Host Name=sig-9-65-76-229.mts.ibm.com gloc + P-lock Lock Requests = 0 XES Lock Requests = 2 + P-lock Unlock Requests = 0 XES Unlock Requests = 0 + P-lock Change Requests = 0 XES Change Requests = 0 + Suspends - IRLM Global Cont = 0 Total L-lock Requests = 6 + Suspends - XES Global Cont = 0 XES L-lock Req Percentage = 66.6% + Suspends - False (and Conv) = 0 Incompatible Retained Locks = 0 + Notify Messages Sent = 0 Total Number False Content. = 0 ===============================================================================
FieldsThread identifier: This information identifies the thread to which the information in this panel applies.Plan
The Db2 plan name of the active thread.Connid
The Db2 connection identifier of the active thread.
60 Classic Interface User's Guide
CorridThe Db2 correlation identifier of the active thread. If the correlation is not set, N/A is displayed.
AuthidThe Db2 authorization identifier of the active thread.
AttachDepending on the type of connection, the appropriate information is displayed.Attach information is displayed only if the thread is a distributed allied thread (not for distributeddatabase access threads).
Connection TypeBatch
The MVS jobname and ASID.
Note: For threads from remote Db2, the MVS job name is N/A.
CICSThe CICS jobname, task name, task number, terminal ID, and thread type. The thread type is:Pool
The thread in use is a pool thread.Entry
The thread in use is a nonprotected entry thread.Prot
The thread in use is a protected thread. Protected threads are defined in an RCT entrydefinition using the THRDS operand.
IMSThe IMS region number, transaction name, region name, and terminal ID (LTERM).
RRSAFThe MVS job name and ASID.
Note: For threads from remote Db2, the MVS job name is N/A.
SystemThe originating Db2 job name and the resource manager that is the source of the thread. Anadditional line below the Attach line identifies the user thread, if any, being served by the systemthread.
TSOThe TSO user ID and region ASID.
UtilityNo additional information.
Db2The Db2 subsystem identifier.
MVSThe MVS system identifier.
ORIGAUTHThe original (primary) Db2 authorization identifier of the thread. This field displays only when theoriginal identifier is different from the Authid.
Package identifier: This information identifies the package to which the information in this panel applies.Package
The Db2 package name of the active thread. Up to 18 characters of the package name are returned.Collection
The package collection identifier. This field is displayed only if a package is being used.
Distributed thread identifier: The following fields are displayed if the thread has a distributedrelationship with a remote Db2 subsystem.
Chapter 6. Thread Activity 61
TypeThe distributed thread type.Distributed Allied
A requesting thread; one that has issued an SQL call to a remote Db2 location.Database Access
A responding thread; one that is serving a remote Db2 location by responding to an SQL call.Db2=
The Db2 subsystem ID, indicating the member of the data sharing group of this thread.Luwid
This value consists of two parts: the logical unit of work ID (luw-id) and a token. The token can beused in place of the luw-id in any Db2 command that accepts luw-id as input. Format:
luw-id=token
The luw-id consists of the network name, the originating VTAM LUNAME, and a unique identifier(separated by periods). Thus, the Luwid field displays data like in the following example:
USCACO01.O2D22A.A1FE8E04B9D4=8
SystemThe originating Db2 job name and the resource manager that is the source of the thread. An additionalline below the Attach line identifies the user thread, if any, being served by the system thread.
Global lock information:
P-lock Lock RequestsNumber of lock requests for P-locks. A P-lock is a physical lock used only in a data sharingenvironment to provide consistency of data cached in different DB2 subsystems.
P-lock Unlock RequestsNumber of unlock requests for P-locks.
P-lock Change RequestsNumber of change requests for P-locks.
XES Lock RequestsThe number of lock requests (both logical and physical) that were propagated to MVS XESsynchronously under the caller's execution unit. This count does not include suspended requests.Only the most restrictive lock for a particular resource is propagated to XES and the coupling facility.
XES Unlock RequestsThe number of unlock requests (both logical and physical) that are propagated to MVS XESsynchronously under the caller's execution unit. This count does not include suspended requests.
XES Change RequestsThe number of change requests (both logical and physical) that were propagated to MVS XESsynchronously under the caller's execution unit. This count does not include suspended requests.
Suspends - IRLM Global ContThe number of suspends due to Internal Resource Lock Manager (IRLM) global resource contentions.IRLM lock states were in conflict and inter-system communication is required to resolve the conflict.
Suspends - XES Global ContThe number of suspends due to MVS XES global resource contentions that were not IRLM-levelcontentions. The XES lock states were in conflict, but the IRLM lock states were not.
Suspends - False (and Conv)Summation of false contentions and sync-to-async heuristic conversions.
XES detects hash class contention when two different locks on different resources hash to the sameentry in the coupling facility lock table. The requester is suspended until it is determined that no reallock contention exists.
62 Classic Interface User's Guide
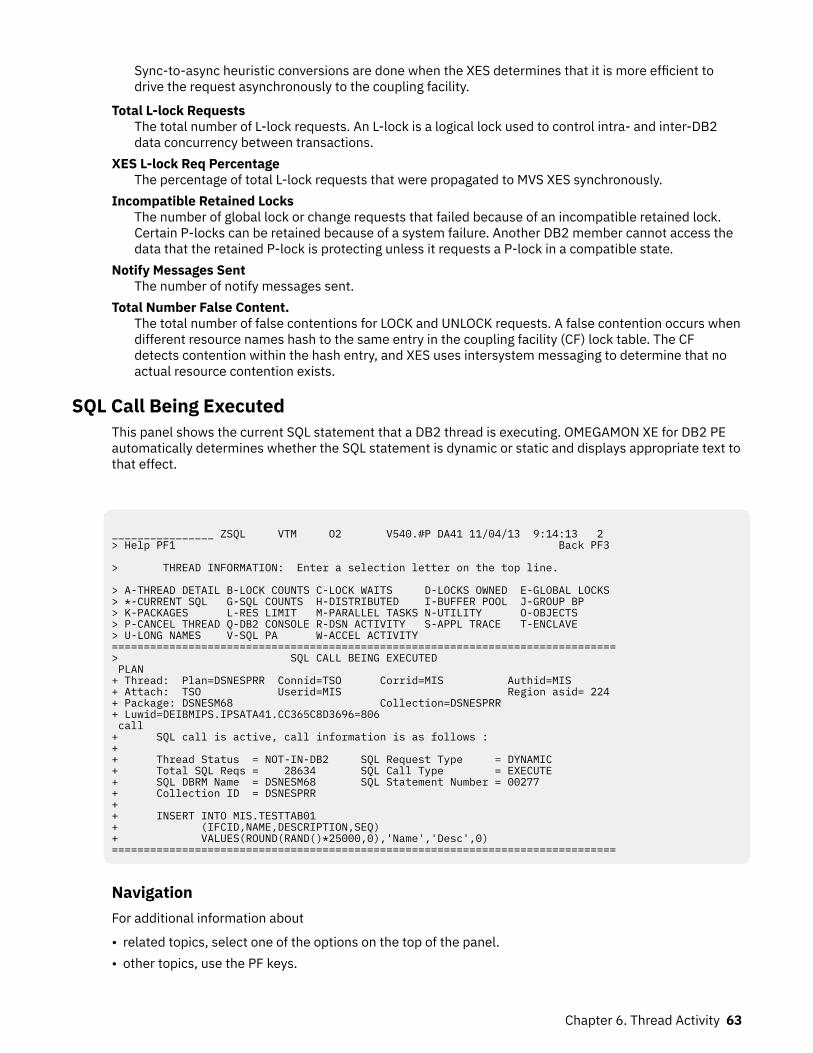
Sync-to-async heuristic conversions are done when the XES determines that it is more efficient todrive the request asynchronously to the coupling facility.
Total L-lock RequestsThe total number of L-lock requests. An L-lock is a logical lock used to control intra- and inter-DB2data concurrency between transactions.
XES L-lock Req PercentageThe percentage of total L-lock requests that were propagated to MVS XES synchronously.
Incompatible Retained LocksThe number of global lock or change requests that failed because of an incompatible retained lock.Certain P-locks can be retained because of a system failure. Another DB2 member cannot access thedata that the retained P-lock is protecting unless it requests a P-lock in a compatible state.
Notify Messages SentThe number of notify messages sent.
Total Number False Content.The total number of false contentions for LOCK and UNLOCK requests. A false contention occurs whendifferent resource names hash to the same entry in the coupling facility (CF) lock table. The CFdetects contention within the hash entry, and XES uses intersystem messaging to determine that noactual resource contention exists.
SQL Call Being ExecutedThis panel shows the current SQL statement that a DB2 thread is executing. OMEGAMON XE for DB2 PEautomatically determines whether the SQL statement is dynamic or static and displays appropriate text tothat effect.
________________ ZSQL VTM O2 V540.#P DA41 11/04/13 9:14:13 2 > Help PF1 Back PF3 > THREAD INFORMATION: Enter a selection letter on the top line. > A-THREAD DETAIL B-LOCK COUNTS C-LOCK WAITS D-LOCKS OWNED E-GLOBAL LOCKS > *-CURRENT SQL G-SQL COUNTS H-DISTRIBUTED I-BUFFER POOL J-GROUP BP > K-PACKAGES L-RES LIMIT M-PARALLEL TASKS N-UTILITY O-OBJECTS > P-CANCEL THREAD Q-DB2 CONSOLE R-DSN ACTIVITY S-APPL TRACE T-ENCLAVE > U-LONG NAMES V-SQL PA W-ACCEL ACTIVITY =============================================================================== > SQL CALL BEING EXECUTED PLAN + Thread: Plan=DSNESPRR Connid=TSO Corrid=MIS Authid=MIS + Attach: TSO Userid=MIS Region asid= 224 + Package: DSNESM68 Collection=DSNESPRR + Luwid=DEIBMIPS.IPSATA41.CC365C8D3696=806 call + SQL call is active, call information is as follows : + + Thread Status = NOT-IN-DB2 SQL Request Type = DYNAMIC + Total SQL Reqs = 28634 SQL Call Type = EXECUTE + SQL DBRM Name = DSNESM68 SQL Statement Number = 00277 + Collection ID = DSNESPRR + + INSERT INTO MIS.TESTTAB01 + (IFCID,NAME,DESCRIPTION,SEQ) + VALUES(ROUND(RAND()*25000,0),'Name','Desc',0) ===============================================================================
NavigationFor additional information about
• related topics, select one of the options on the top of the panel.• other topics, use the PF keys.
Chapter 6. Thread Activity 63
FieldsThread identifier: OMEGAMON XE for DB2 PE identifies the thread to which the information in this panelapplies.Plan
The DB2 plan name of the active thread.Connid
The DB2 connection identifier of the active thread.Corrid
The DB2 correlation identifier of the active thread.Authid
The DB2 authorization identifier of the active thread.
Package identifier: This information identifies the package to which the information in this panel applies.Package
The Db2 package name of the active thread. Up to 18 characters of the package name are returned.Collection
The package collection identifier. This field is displayed only if a package is being used.
Connection TypeBatch
The MVS jobname and ASID.
Note: For threads from remote Db2, the MVS job name is N/A.
CICSThe CICS jobname, task name, task number, terminal ID, and thread type. The thread type is:Pool
The thread in use is a pool thread.Entry
The thread in use is a nonprotected entry thread.Prot
The thread in use is a protected thread. Protected threads are defined in an RCT entrydefinition using the THRDS operand.
IMSThe IMS region number, transaction name, region name, and terminal ID (LTERM).
RRSAFThe MVS job name and ASID.
Note: For threads from remote Db2, the MVS job name is N/A.
SystemThe originating Db2 job name and the resource manager that is the source of the thread. Anadditional line below the Attach line identifies the user thread, if any, being served by the systemthread.
TSOThe TSO user ID and region ASID.
UtilityNo additional information.
Db2The Db2 subsystem identifier.
MVSThe MVS system identifier.
64 Classic Interface User's Guide
ORIGAUTHThe original (primary) Db2 authorization identifier of the thread. This field displays only when theoriginal identifier is different from the Authid.
Distributed thread identifier: The following fields are displayed when the thread has a distributedrelationship with a remote DB2 subsystem.Type
The distributed thread type.Distributed Allied
A requesting thread; one that has issued an SQL call to a remote DB2 location.Database Access
A responding thread; one that is serving a remote DB2 location by responding to an SQL call.Luwid
This value consists of two parts: the logical unit-of-work ID (luw-id) and a token. The token can beused in place of the luw-id in any DB2 command that accepts luw-id as input. Format:
luw-id=token
The luw-id consists of the network name, the originating VTAM LUNAME, and a unique identifier(separated by periods). Thus, the Luwid field displays data such as the following:
USCACO01.O2D22A.A1FE8E04B9D4=8
SQL call information: The information that OMEGAMON XE for DB2 PE displays in this area varies slightly,depending on whether the SQL call is active or not. If the call is active, OMEGAMON XE for DB2 PEdisplays the information described below with the actual text of the SQL call. If the call is not active,OMEGAMON XE for DB2 PE displays only the information described below.Thread Status
The current DB2 status of the thread. For definitions of all possible status values, see "DB2 ThreadStatus".
SQL Request TypeThe type of the SQL request: dynamic SQL or static SQL.
Total SQL ReqsThe total number of SQL requests issued by the thread.
SQL Call TypeThe SQL call type of the currently or previously active SQL call. This is the specific activity that DB2 isperforming. For example, a dynamic SQL call can indicate PREPARE, EXECUTE, or OPEN CURSOR eventhough the original SQL statement might have been an SQL SELECT. A static SQL call can indicateOPEN CURSOR, CLOSE CURSOR, or FETCH even though the originating SQL statement was an SQLDECLARE CURSOR.
SQL DBRM NameThe database request module name containing the active call. The DBRM name is usually set to theapplication program name. It helps you to locate the program that is issuing the call if diagnosis isnecessary.
SQL Statement NumberThe DB2 precompiler statement number of the active SQL statement. The statement number, whenused together with the DBRM name, helps you easily locate the specific SQL call for diagnosticpurposes.
Collection IDThe Collection ID of the currently executing statement. This field is displayed only if the currentlyexecuting statement is contained in a package.
Chapter 6. Thread Activity 65
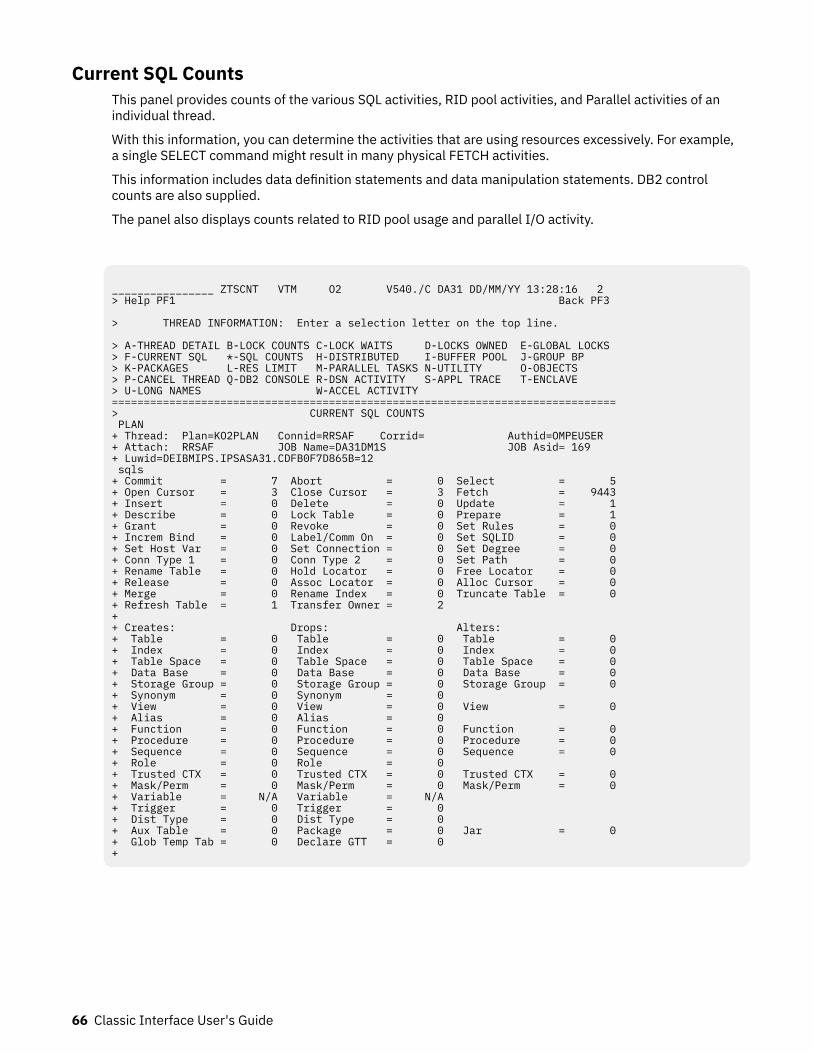
Current SQL CountsThis panel provides counts of the various SQL activities, RID pool activities, and Parallel activities of anindividual thread.
With this information, you can determine the activities that are using resources excessively. For example,a single SELECT command might result in many physical FETCH activities.
This information includes data definition statements and data manipulation statements. DB2 controlcounts are also supplied.
The panel also displays counts related to RID pool usage and parallel I/O activity.
________________ ZTSCNT VTM O2 V540./C DA31 DD/MM/YY 13:28:16 2 > Help PF1 Back PF3 > THREAD INFORMATION: Enter a selection letter on the top line. > A-THREAD DETAIL B-LOCK COUNTS C-LOCK WAITS D-LOCKS OWNED E-GLOBAL LOCKS > F-CURRENT SQL *-SQL COUNTS H-DISTRIBUTED I-BUFFER POOL J-GROUP BP > K-PACKAGES L-RES LIMIT M-PARALLEL TASKS N-UTILITY O-OBJECTS > P-CANCEL THREAD Q-DB2 CONSOLE R-DSN ACTIVITY S-APPL TRACE T-ENCLAVE > U-LONG NAMES W-ACCEL ACTIVITY =============================================================================== > CURRENT SQL COUNTS PLAN + Thread: Plan=KO2PLAN Connid=RRSAF Corrid= Authid=OMPEUSER + Attach: RRSAF JOB Name=DA31DM1S JOB Asid= 169 + Luwid=DEIBMIPS.IPSASA31.CDFB0F7D865B=12 sqls + Commit = 7 Abort = 0 Select = 5 + Open Cursor = 3 Close Cursor = 3 Fetch = 9443 + Insert = 0 Delete = 0 Update = 1 + Describe = 0 Lock Table = 0 Prepare = 1 + Grant = 0 Revoke = 0 Set Rules = 0 + Increm Bind = 0 Label/Comm On = 0 Set SQLID = 0 + Set Host Var = 0 Set Connection = 0 Set Degree = 0 + Conn Type 1 = 0 Conn Type 2 = 0 Set Path = 0 + Rename Table = 0 Hold Locator = 0 Free Locator = 0 + Release = 0 Assoc Locator = 0 Alloc Cursor = 0 + Merge = 0 Rename Index = 0 Truncate Table = 0 + Refresh Table = 1 Transfer Owner = 2+ + Creates: Drops: Alters: + Table = 0 Table = 0 Table = 0 + Index = 0 Index = 0 Index = 0 + Table Space = 0 Table Space = 0 Table Space = 0 + Data Base = 0 Data Base = 0 Data Base = 0 + Storage Group = 0 Storage Group = 0 Storage Group = 0 + Synonym = 0 Synonym = 0 + View = 0 View = 0 View = 0 + Alias = 0 Alias = 0 + Function = 0 Function = 0 Function = 0 + Procedure = 0 Procedure = 0 Procedure = 0 + Sequence = 0 Sequence = 0 Sequence = 0 + Role = 0 Role = 0 + Trusted CTX = 0 Trusted CTX = 0 Trusted CTX = 0 + Mask/Perm = 0 Mask/Perm = 0 Mask/Perm = 0 + Variable = N/A Variable = N/A + Trigger = 0 Trigger = 0 + Dist Type = 0 Dist Type = 0 + Aux Table = 0 Package = 0 Jar = 0 + Glob Temp Tab = 0 Declare GTT = 0 +
66 Classic Interface User's Guide
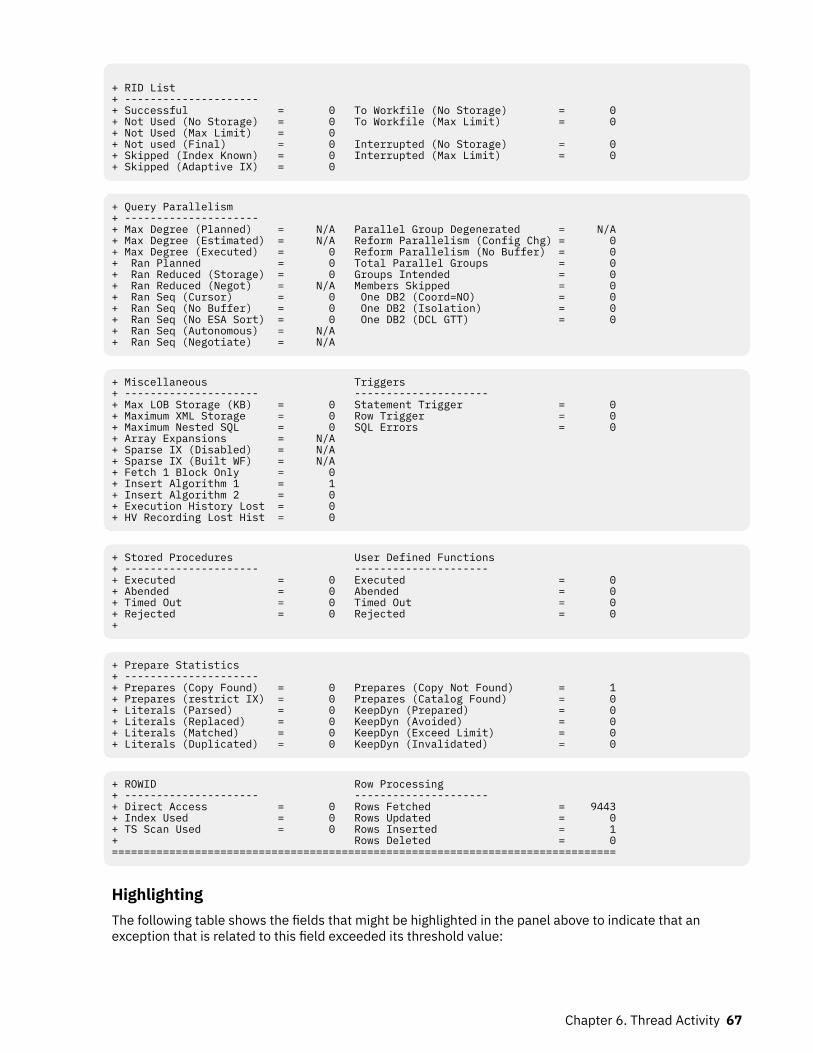
+ RID List + --------------------- + Successful = 0 To Workfile (No Storage) = 0 + Not Used (No Storage) = 0 To Workfile (Max Limit) = 0 + Not Used (Max Limit) = 0 + Not used (Final) = 0 Interrupted (No Storage) = 0+ Skipped (Index Known) = 0 Interrupted (Max Limit) = 0 + Skipped (Adaptive IX) = 0
+ Query Parallelism + --------------------- + Max Degree (Planned) = N/A Parallel Group Degenerated = N/A + Max Degree (Estimated) = N/A Reform Parallelism (Config Chg) = 0 + Max Degree (Executed) = 0 Reform Parallelism (No Buffer) = 0 + Ran Planned = 0 Total Parallel Groups = 0 + Ran Reduced (Storage) = 0 Groups Intended = 0 + Ran Reduced (Negot) = N/A Members Skipped = 0 + Ran Seq (Cursor) = 0 One DB2 (Coord=NO) = 0 + Ran Seq (No Buffer) = 0 One DB2 (Isolation) = 0 + Ran Seq (No ESA Sort) = 0 One DB2 (DCL GTT) = 0 + Ran Seq (Autonomous) = N/A + Ran Seq (Negotiate) = N/A
+ Miscellaneous Triggers + --------------------- --------------------- + Max LOB Storage (KB) = 0 Statement Trigger = 0 + Maximum XML Storage = 0 Row Trigger = 0 + Maximum Nested SQL = 0 SQL Errors = 0 + Array Expansions = N/A + Sparse IX (Disabled) = N/A + Sparse IX (Built WF) = N/A + Fetch 1 Block Only = 0+ Insert Algorithm 1 = 1+ Insert Algorithm 2 = 0+ Execution History Lost = 0+ HV Recording Lost Hist = 0
+ Stored Procedures User Defined Functions + --------------------- --------------------- + Executed = 0 Executed = 0 + Abended = 0 Abended = 0 + Timed Out = 0 Timed Out = 0 + Rejected = 0 Rejected = 0 +
+ Prepare Statistics + --------------------- + Prepares (Copy Found) = 0 Prepares (Copy Not Found) = 1 + Prepares (restrict IX) = 0 Prepares (Catalog Found) = 0 + Literals (Parsed) = 0 KeepDyn (Prepared) = 0 + Literals (Replaced) = 0 KeepDyn (Avoided) = 0 + Literals (Matched) = 0 KeepDyn (Exceed Limit) = 0 + Literals (Duplicated) = 0 KeepDyn (Invalidated) = 0
+ ROWID Row Processing + --------------------- --------------------- + Direct Access = 0 Rows Fetched = 9443 + Index Used = 0 Rows Updated = 0 + TS Scan Used = 0 Rows Inserted = 1 + Rows Deleted = 0 ===============================================================================
HighlightingThe following table shows the fields that might be highlighted in the panel above to indicate that anexception that is related to this field exceeded its threshold value:
Chapter 6. Thread Activity 67
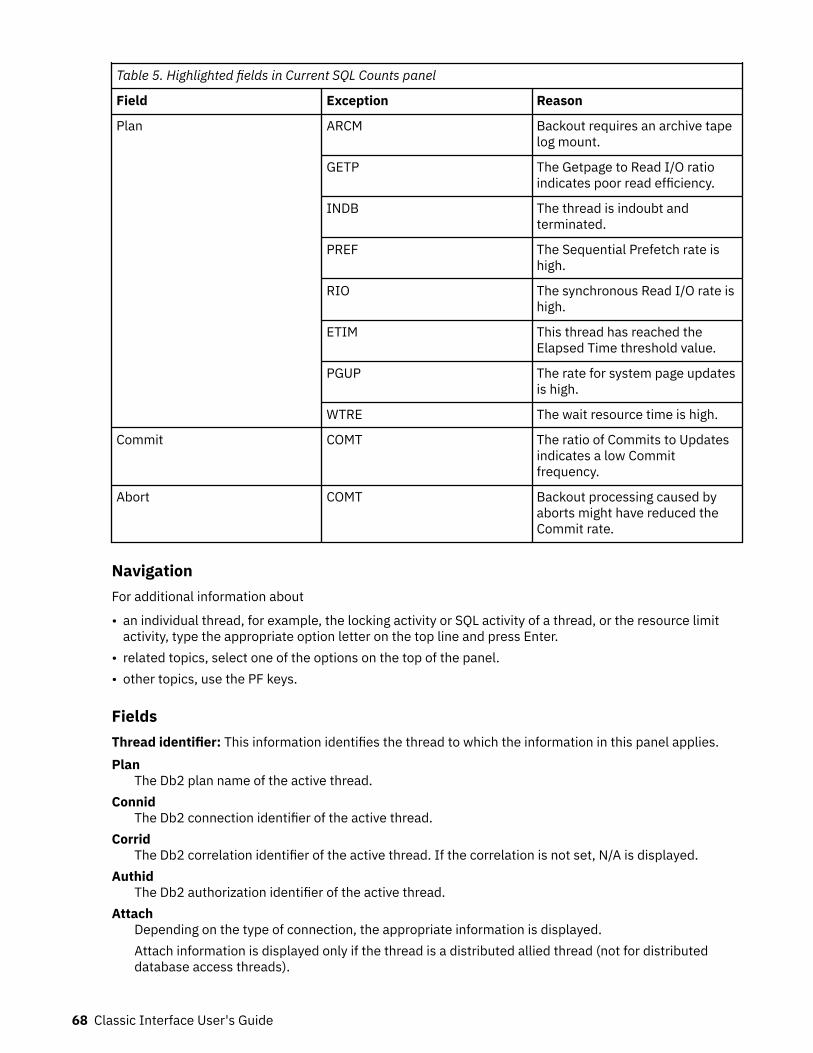
Table 5. Highlighted fields in Current SQL Counts panel
Field Exception Reason
Plan ARCM Backout requires an archive tapelog mount.
GETP The Getpage to Read I/O ratioindicates poor read efficiency.
INDB The thread is indoubt andterminated.
PREF The Sequential Prefetch rate ishigh.
RIO The synchronous Read I/O rate ishigh.
ETIM This thread has reached theElapsed Time threshold value.
PGUP The rate for system page updatesis high.
WTRE The wait resource time is high.
Commit COMT The ratio of Commits to Updatesindicates a low Commitfrequency.
Abort COMT Backout processing caused byaborts might have reduced theCommit rate.
NavigationFor additional information about
• an individual thread, for example, the locking activity or SQL activity of a thread, or the resource limitactivity, type the appropriate option letter on the top line and press Enter.
• related topics, select one of the options on the top of the panel.• other topics, use the PF keys.
FieldsThread identifier: This information identifies the thread to which the information in this panel applies.Plan
The Db2 plan name of the active thread.Connid
The Db2 connection identifier of the active thread.Corrid
The Db2 correlation identifier of the active thread. If the correlation is not set, N/A is displayed.Authid
The Db2 authorization identifier of the active thread.Attach
Depending on the type of connection, the appropriate information is displayed.Attach information is displayed only if the thread is a distributed allied thread (not for distributeddatabase access threads).
68 Classic Interface User's Guide
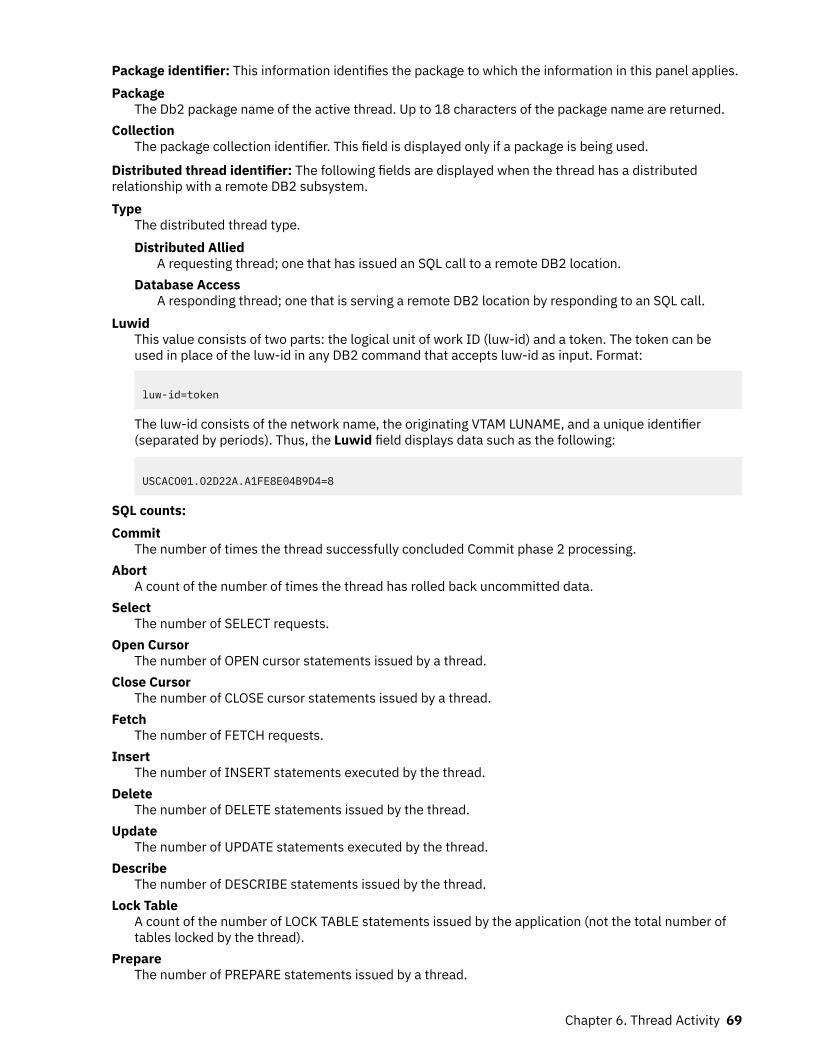
Package identifier: This information identifies the package to which the information in this panel applies.Package
The Db2 package name of the active thread. Up to 18 characters of the package name are returned.Collection
The package collection identifier. This field is displayed only if a package is being used.
Distributed thread identifier: The following fields are displayed when the thread has a distributedrelationship with a remote DB2 subsystem.Type
The distributed thread type.Distributed Allied
A requesting thread; one that has issued an SQL call to a remote DB2 location.Database Access
A responding thread; one that is serving a remote DB2 location by responding to an SQL call.Luwid
This value consists of two parts: the logical unit of work ID (luw-id) and a token. The token can beused in place of the luw-id in any DB2 command that accepts luw-id as input. Format:
luw-id=token
The luw-id consists of the network name, the originating VTAM LUNAME, and a unique identifier(separated by periods). Thus, the Luwid field displays data such as the following:
USCACO01.O2D22A.A1FE8E04B9D4=8
SQL counts:Commit
The number of times the thread successfully concluded Commit phase 2 processing.Abort
A count of the number of times the thread has rolled back uncommitted data.Select
The number of SELECT requests.Open Cursor
The number of OPEN cursor statements issued by a thread.Close Cursor
The number of CLOSE cursor statements issued by a thread.Fetch
The number of FETCH requests.Insert
The number of INSERT statements executed by the thread.Delete
The number of DELETE statements issued by the thread.Update
The number of UPDATE statements executed by the thread.Describe
The number of DESCRIBE statements issued by the thread.Lock Table
A count of the number of LOCK TABLE statements issued by the application (not the total number oftables locked by the thread).
PrepareThe number of PREPARE statements issued by a thread.
Chapter 6. Thread Activity 69
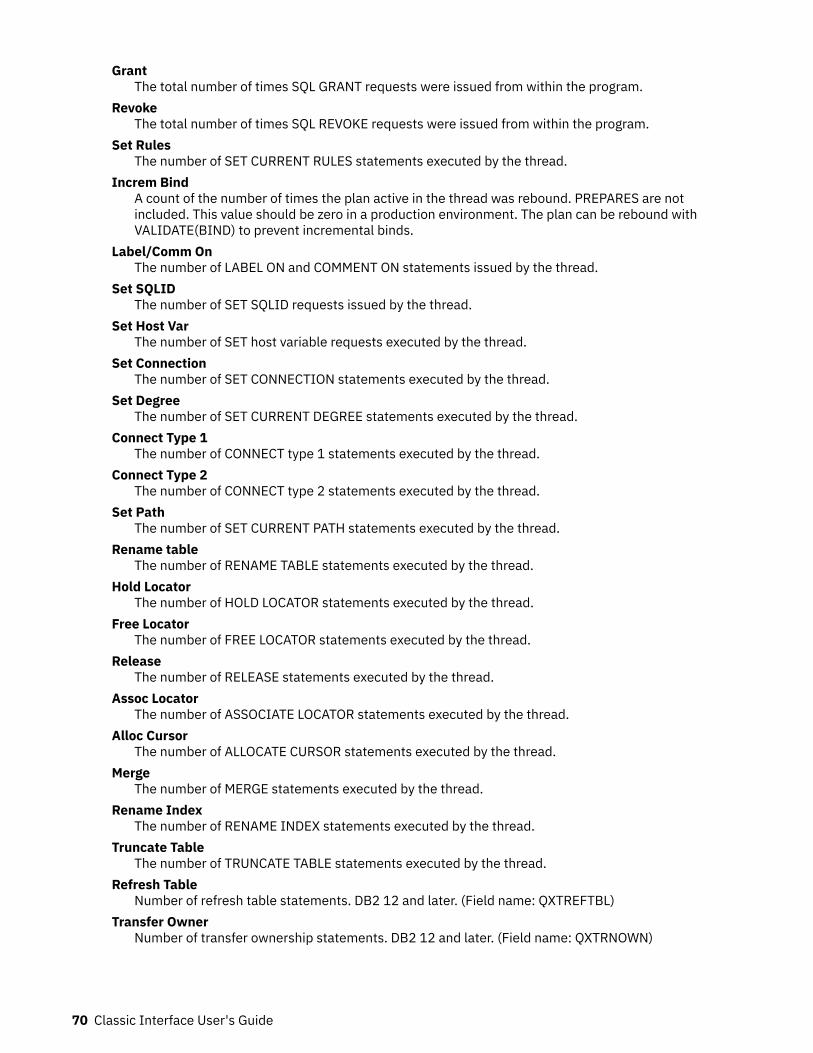
GrantThe total number of times SQL GRANT requests were issued from within the program.
RevokeThe total number of times SQL REVOKE requests were issued from within the program.
Set RulesThe number of SET CURRENT RULES statements executed by the thread.
Increm BindA count of the number of times the plan active in the thread was rebound. PREPARES are notincluded. This value should be zero in a production environment. The plan can be rebound withVALIDATE(BIND) to prevent incremental binds.
Label/Comm OnThe number of LABEL ON and COMMENT ON statements issued by the thread.
Set SQLIDThe number of SET SQLID requests issued by the thread.
Set Host VarThe number of SET host variable requests executed by the thread.
Set ConnectionThe number of SET CONNECTION statements executed by the thread.
Set DegreeThe number of SET CURRENT DEGREE statements executed by the thread.
Connect Type 1The number of CONNECT type 1 statements executed by the thread.
Connect Type 2The number of CONNECT type 2 statements executed by the thread.
Set PathThe number of SET CURRENT PATH statements executed by the thread.
Rename tableThe number of RENAME TABLE statements executed by the thread.
Hold LocatorThe number of HOLD LOCATOR statements executed by the thread.
Free LocatorThe number of FREE LOCATOR statements executed by the thread.
ReleaseThe number of RELEASE statements executed by the thread.
Assoc LocatorThe number of ASSOCIATE LOCATOR statements executed by the thread.
Alloc CursorThe number of ALLOCATE CURSOR statements executed by the thread.
MergeThe number of MERGE statements executed by the thread.
Rename IndexThe number of RENAME INDEX statements executed by the thread.
Truncate TableThe number of TRUNCATE TABLE statements executed by the thread.
Refresh TableNumber of refresh table statements. DB2 12 and later. (Field name: QXTREFTBL)
Transfer OwnerNumber of transfer ownership statements. DB2 12 and later. (Field name: QXTRNOWN)
70 Classic Interface User's Guide
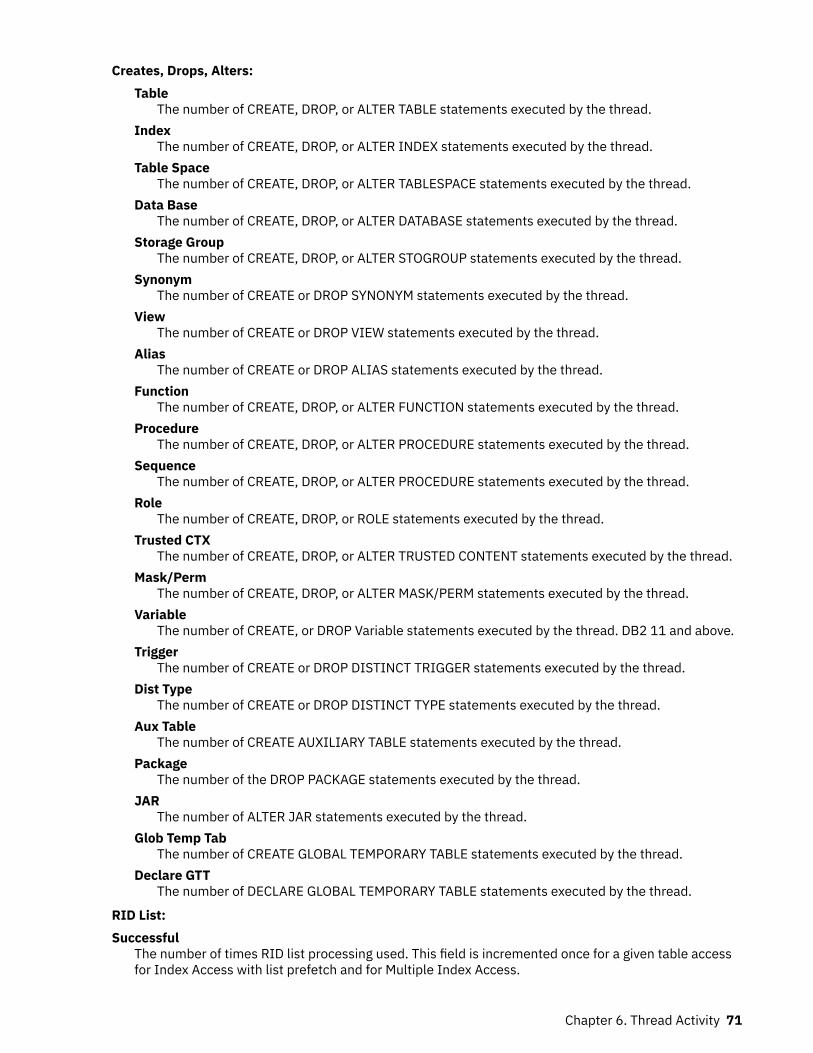
Creates, Drops, Alters:Table
The number of CREATE, DROP, or ALTER TABLE statements executed by the thread.Index
The number of CREATE, DROP, or ALTER INDEX statements executed by the thread.Table Space
The number of CREATE, DROP, or ALTER TABLESPACE statements executed by the thread.Data Base
The number of CREATE, DROP, or ALTER DATABASE statements executed by the thread.Storage Group
The number of CREATE, DROP, or ALTER STOGROUP statements executed by the thread.Synonym
The number of CREATE or DROP SYNONYM statements executed by the thread.View
The number of CREATE or DROP VIEW statements executed by the thread.Alias
The number of CREATE or DROP ALIAS statements executed by the thread.Function
The number of CREATE, DROP, or ALTER FUNCTION statements executed by the thread.Procedure
The number of CREATE, DROP, or ALTER PROCEDURE statements executed by the thread.Sequence
The number of CREATE, DROP, or ALTER PROCEDURE statements executed by the thread.Role
The number of CREATE, DROP, or ROLE statements executed by the thread.Trusted CTX
The number of CREATE, DROP, or ALTER TRUSTED CONTENT statements executed by the thread.Mask/Perm
The number of CREATE, DROP, or ALTER MASK/PERM statements executed by the thread.Variable
The number of CREATE, or DROP Variable statements executed by the thread. DB2 11 and above.Trigger
The number of CREATE or DROP DISTINCT TRIGGER statements executed by the thread.Dist Type
The number of CREATE or DROP DISTINCT TYPE statements executed by the thread.Aux Table
The number of CREATE AUXILIARY TABLE statements executed by the thread.Package
The number of the DROP PACKAGE statements executed by the thread.JAR
The number of ALTER JAR statements executed by the thread.Glob Temp Tab
The number of CREATE GLOBAL TEMPORARY TABLE statements executed by the thread.Declare GTT
The number of DECLARE GLOBAL TEMPORARY TABLE statements executed by the thread.
RID List:Successful
The number of times RID list processing used. This field is incremented once for a given table accessfor Index Access with list prefetch and for Multiple Index Access.
Chapter 6. Thread Activity 71
To Workfile (No Storage)The number of times a RID list was overflown to a work file because no RIDPOOL storage wasavailable to hold the list of RIDs. DB2 10 and above.
Not Used (No Storage)The number of times a RID list was not used for a given RID list process involving one index (IndexAccess with list prefetch) or involving multiple indexes (Multiple Index Access) because no storagewas available to hold the list of RIDs.
To Workfile (Max Limit)The number of times a RID list was overflown to a work file because the number of RIDs exceededone or more internal limits. DB2 10 and above.
Not Used (Max Limit)The number of times one or more RID lists were not used for a given RID list process involving oneindex (Index Access with list prefetch) or involving multiple indexes (Multiple Index Access) becausethe number of RIDs exceeded one or more internal limits.
Not Used (Final)Number of times RID list processing was not used. This field is incremented once when RID listprocessing could not be used for a given table access for Index Access with list prefetch and/or forMultiple Index Access. DB2 12 and later.
Interrupted (No Storage)The number of times a RID list append for a Hybrid Join was interrupted because no RIDPOOL storagewas available to hold the list of RIDs (that is, number of times DB2 interrupted the RID phase andswitched to the Data phase). DB2 10 and above.
Skipped (Index Known)The number of times a RID list retrieval for multiple index access was skipped because it was notnecessary due to DB2 being able to predetermine the outcome of index ANDing or ORing. DB2 10 andabove.
Interrupted (Max Limit)The number of times a RID list append for a Hybrid Join was interrupted because the number of RIDsexceeded one or more internal limits (that is, number of times DB2 interrupted the RID phase andswitched to the Data phase). DB2 10 and above.
Skipped (Adaptive IX)The number of times a DM is not called for RID list retrieval for multiple index access or LPF because itwas not necessary due to Runtime Adaptive Index processing being able to predetermine theoutcome. DB2 12 and later. (Field name: QXRSDMAD)
Query Parallelism:Max Degree (Planned)
The planned maximum degree of parallelism for a parall group. This value is the optimal degree ofparallelis that can be obtained at execution time, after host variables or parameter markers areresolved, and before buffer pool negotiation and system negotiation are performed. DB2 11 andabove.
Parallel Group DegeneratedTotal number of parallel groups that changed to sequential mode during optimization, for reasonssuch as, the result of evaluation of a parallel group is that zero rows are returned, or a parallel group ispartitioned on a single record. DB2 11 and above.
Max Degree (Estimated)The estimated maximum degree of parallelism for a parallel group. This value is estimated at bindtime, based on the cost formula. If a parallel group contains a host variable or parameter marker, theestimate is based on assumed values. DB2 11 and above.
Reform Parallelism (Config Chg)The total number of parallel groups for which DB2 reformulated the parallel portion of the access pathbecause the sysplex configuration was different from the sysplex configuration at bind time. Thiscounter is only incremented by the parallelism coordinator at run time.
72 Classic Interface User's Guide
Max Degree (Executed)Maximum degree of parallelism among the parallel groups to indicate the extent to which queryparallelism applies.
Reform Parallelism (No Buf)The total number of parallel groups for which DB2 reformulated the parallel portion of the access pathbecause there was not enough buffer pool resource. This counter is only incremented by theparallelism coordinator at run time.
Ran PlannedThe total number of parallel groups that have a planned degree greater than one at run time, and wereexecuted to the same degree because of sufficient storage on the buffer pool.
Total Parallel GroupsThe total number of parallel groups executed.
Ran Reduced (Storage)The total number of parallel groups that have a planned degree greater than one at run time, but wereprocessed to a parallel degree less than planned because of a storage shortage or contention on thebuffer pool.
Groups IntendedThe total number of parallel groups that were intended to run across the data sharing group. Thiscount is only incremented on the parallelism coordinator at run time.
Ran Reduced (Negot)The total number of parallel groups for which the degree of parallelism was reduced as a result ofparallel system negotiation because system resources were constrained. DB2 11 and above.
Members SkippedThe number of times that the parallelism coordinator had to bypass a DB2 when distributing tasksbecause there was not enough buffer pool storage on one or more DB2 members. This field isincremented only on the parallelism coordinator, and it is only incremented once per parallel group,even though it is possible that more than one DB2 had a buffer pool shortage for that parallel group.The purpose of this count is to indicate when there are not enough buffers on a member. Therefore,this count is incremented only when the buffer pool is defined to allow parallelism. For example, ifVPXPSEQT = 0 on an assistant, DB2 does not send parallel work there, but this count is notincremented.
Ran Seq (Cursor)The total number of parallel groups which fell back to sequential mode because the cursor may beused in UPDATE/DELETE.
One DB2 (Coord=NO)The total number of parallel groups executed on a single DB2 due to the COORDINATOR subsystemparameter being set to NO. When the statement was bound, the COORDINATOR subsystem parameterwas set to YES. This situation can also occur when a plan or package is bound on one DB2 whereCOORDINATOR=YES but is run on a DB2 where COORDINATOR=NO.
Ran Seq (No Buffer)The total number of parallel groups that have a planned degree greater than one at run time, but fellback to sequential mode because of storage shortage or contention on the buffer pool.
One DB2 (Isolation)The total number of parallel groups executed on a single DB2 due to repeatable-read or read-stabilityisolation.
Ran Seq (No ESA Sort)The total number of parallel groups that fell back to sequential operation because of a lack of ESA sortsupport.
One DB2 (DCL GTT)The total number of parallel groups that are part of a query block using a UDF and executed on asingle DB2 due to the existence of a Declared Temporary Table in the application process. Neither thequery block nor the parallel group references a Declared Temporary Table, and a parallel group may ormay not use a UDF.
Chapter 6. Thread Activity 73
Ran Seq (Autonomous)The total number of parallel groups that changed to sequential mode because they were executingunder an autonomous procedure. DB2 11 and above.
Ran Seq (Negotiate)The total number of parallel groups that changed to sequential mode as a result of parallel systemnegotiation because system resources were constrained. DB2 11 and above.
Ran Seq (No ESA Enc)The total number of parallel groups executed in sequential because Z/OS enclave services wereunavailable. DB2 9 only.
Miscellaneous:Maximum LOB Storage
The maximum storage used for LOB values, in Megabytes.Maximum XML Storage
The maximum storage used for XML values.Maximum Nested SQL
Maximum level of nested SQL cascading because of Triggers, User-Defined Functions, or StoredProcedures.
Array ExpansionsThe number of times an array variable was expanded to be larger than 32KB. DB2 11 and above.
Sparse IX (Disabled)The number of times that sparse index was disabled because of insufficient storage. DB2 11 andabove.
Sparse IX (Built WF)The number of times that sparse index built a physical work file for probing. DB2 11 and above.
Fetched 1 Block Only (QXR1BOAD)The number of times 1 block is fetched and there were no further fetches. DB2 12 and later.
Insert Algorithm 1INSERT algorithm type 1. DB2 12 and later.
Insert Algorithm 2INSERT algorithm type 2. DB2 12 and later.
Execution History LostNumber of execution histories lost. DB2 12 and later.
HV Recording Lost HistNumber of HV recordings lost in execution history. DB2 12 and later.
Triggers:Statement Trigger
Number of times a Statement Trigger is activated.Row Trigger
Number of times a Row Trigger is activated.SQL Errors
Number of times an SQL error occurred during execution of a triggered action.
Stored procedures: For each field described below the following statistics are provided:
• Total quantity, which reflects the amount of activities since DB2 was started.• Interval quantity, which reflects activity during the last cycle.• Rate per minute during the last cycle.• Rate per thread during the last cycle.• Rate per Commit during the last cycle.
74 Classic Interface User's Guide
AbendedCALL statements executed to invoke a stored procedure that terminated abnormally.
Timed OutCALL statements executed to invoke a stored procedure that timed out while waiting to be scheduled.
RejectedCALL statements executed to invoke a stored procedure that was in the STOP ACTION(REJECT) state.
User Defined Functions:Executed
The number of user-defined functions (UDFs) executed.Abended
The number of times a UDF abended.Timed Out
The number of times a UDF timed out when waiting to be scheduled.Rejected
The number of times a UDF was rejected.
Prepare Statistics:Prepares (Copy Found)
The number of times that DB2 satisfied a prepare request by making a copy of a statement in thePrepared Statement Cache.
Prepare (Copy Not Found)The number of times that DB2 searched the Prepared Statement Cache but could not find a suitableprepared statement.
Prepares (Catalog Found)The number of times a PREPARE request is satisfied by making a copy from the stabilized statement inSYSIBM.SYSDYNQRY catalog table. The stabilized statement search is done only when no matchingstatement is found in the prepared statement cache. DB2 12 and later. (Field name: QXSTSFND)
Prepare (Restrict IX)The number of prepare statements for which the use of indexes was restricted because the indexeswere in a pending state.
Literals (Parsed)Number of times DB2 parsed dynamic statements because of CONCENTRATE STATEMENTS WITHLITERALS behaviour.
Literals (Replaced)Number of times DB2 replaced at least one literal in a dynamic statement because of CONCENTRATESTATEMENTS WITH LITERALS behaviour.
Literals (Matched)Number of times DB2 found a matching reusable copy of a dynamic statement in cache because ofCONCENTRATE STATEMENTS WITH LITERALS behaviour.
Literals (Duplicated)Number of times DB2 created a duplicate stmt instance in the statement cache because ofCONCENTRATE STATEMENTS WITH LITERALS behaviour.
KeepDyn (Prepared)The number of times that DB2 did an implicit prepare for a statement bound withKEEPDYNAMIC(YES), because the Prepared Statement Cache did not contain a valid copy of theprepared statement.
KeepDyn (Avoided)The number of times that DB2 did not prepare a statement bound with KEEPDYNAMIC(YES), becausethe Prepared Statement Cache contained a valid copy of the prepared statement.
Chapter 6. Thread Activity 75
KeepDyn (Exceed Limit)The number of times that DB2 discarded a prepared statement from the Prepared Statement Cache,because the number of prepared statements in the cache exceeded the value of subsystem parameterMAXKEEPD.
KeepDyn (Invalidated)The number of times that DB2 discarded a prepared statement from the Prepared Statement Cache,because a program executed a DROP, ALTER, or REVOKE statement against a dependent object.
Row IDSuccessful
The number of times that direct row access was successful.Revert to Index
The number of times an attempt to use direct row access reverted to using an index to locate a record.Revert to TS Scan
The number of times an attempt to use direct row access reverted to using a table space scan tolocate a record.
Row ProcessingRows Fetched
The number of fetched rows.Rows Inserted
The number of inserted rows.Rows Updated
The number of updated rows.Rows Deleted
The number of deleted rows.
Distributed Thread Detail (VTAM and TCP/IP Connections)This panel provides information about VTAM APPC threads, TCP/IP threads, or RRSAF threads of anindividual distributed thread. For VTAM APPC and TCP/IP conversations, it additionally includes statisticsabout the distributed activity of the thread.
VTAM APPC threadsThe thread subtype determines the data that is displayed with the RSUM minor command.
This panel provides information about VTAM APPC conversations.
76 Classic Interface User's Guide
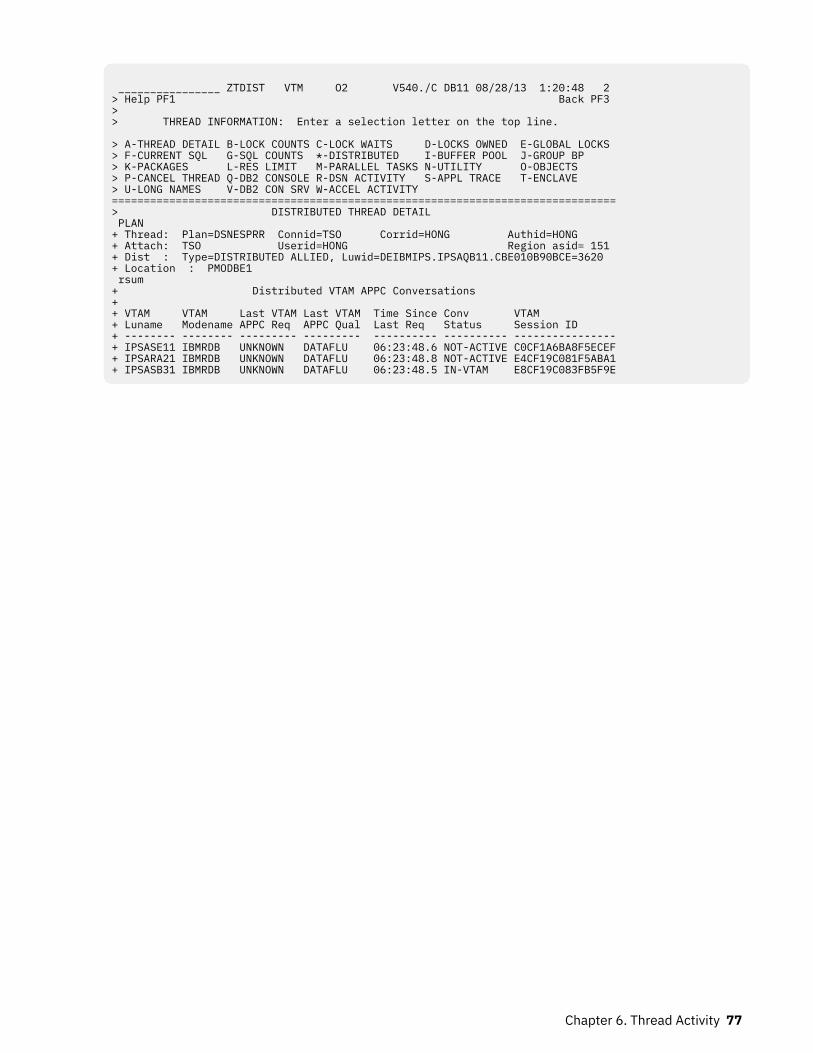
________________ ZTDIST VTM O2 V540./C DB11 08/28/13 1:20:48 2 > Help PF1 Back PF3 > > THREAD INFORMATION: Enter a selection letter on the top line. > A-THREAD DETAIL B-LOCK COUNTS C-LOCK WAITS D-LOCKS OWNED E-GLOBAL LOCKS > F-CURRENT SQL G-SQL COUNTS *-DISTRIBUTED I-BUFFER POOL J-GROUP BP > K-PACKAGES L-RES LIMIT M-PARALLEL TASKS N-UTILITY O-OBJECTS > P-CANCEL THREAD Q-DB2 CONSOLE R-DSN ACTIVITY S-APPL TRACE T-ENCLAVE > U-LONG NAMES V-DB2 CON SRV W-ACCEL ACTIVITY =============================================================================== > DISTRIBUTED THREAD DETAIL PLAN + Thread: Plan=DSNESPRR Connid=TSO Corrid=HONG Authid=HONG + Attach: TSO Userid=HONG Region asid= 151 + Dist : Type=DISTRIBUTED ALLIED, Luwid=DEIBMIPS.IPSAQB11.CBE010B90BCE=3620 + Location : PMODBE1 rsum + Distributed VTAM APPC Conversations + + VTAM VTAM Last VTAM Last VTAM Time Since Conv VTAM + Luname Modename APPC Req APPC Qual Last Req Status Session ID + -------- -------- --------- --------- ---------- ---------- ---------------- + IPSASE11 IBMRDB UNKNOWN DATAFLU 06:23:48.6 NOT-ACTIVE C0CF1A6BA8F5ECEF + IPSARA21 IBMRDB UNKNOWN DATAFLU 06:23:48.8 NOT-ACTIVE E4CF19C081F5ABA1 + IPSASB31 IBMRDB UNKNOWN DATAFLU 06:23:48.5 IN-VTAM E8CF19C083FB5F9E
Chapter 6. Thread Activity 77
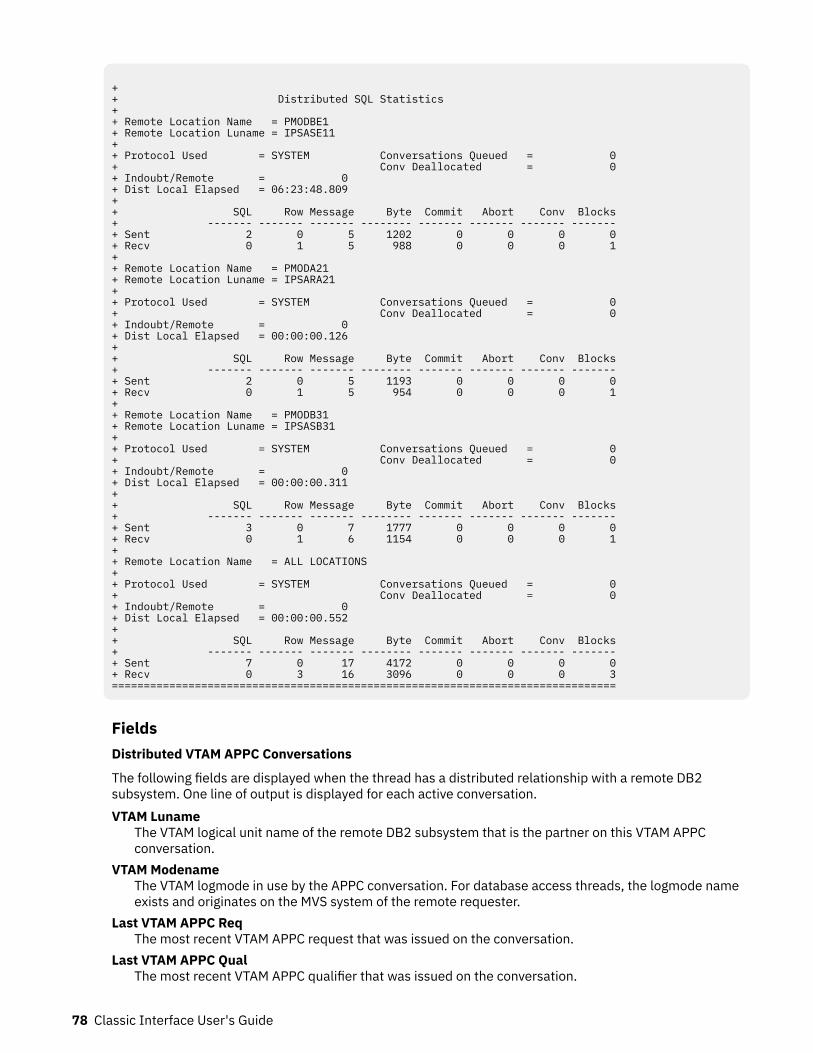
+ + Distributed SQL Statistics + + Remote Location Name = PMODBE1 + Remote Location Luname = IPSASE11 + + Protocol Used = SYSTEM Conversations Queued = 0 + Conv Deallocated = 0 + Indoubt/Remote = 0 + Dist Local Elapsed = 06:23:48.809 + + SQL Row Message Byte Commit Abort Conv Blocks + ------- ------- ------- -------- ------- ------- ------- ------- + Sent 2 0 5 1202 0 0 0 0 + Recv 0 1 5 988 0 0 0 1 + + Remote Location Name = PMODA21 + Remote Location Luname = IPSARA21 + + Protocol Used = SYSTEM Conversations Queued = 0 + Conv Deallocated = 0 + Indoubt/Remote = 0 + Dist Local Elapsed = 00:00:00.126 + + SQL Row Message Byte Commit Abort Conv Blocks + ------- ------- ------- -------- ------- ------- ------- ------- + Sent 2 0 5 1193 0 0 0 0 + Recv 0 1 5 954 0 0 0 1 + + Remote Location Name = PMODB31 + Remote Location Luname = IPSASB31 + + Protocol Used = SYSTEM Conversations Queued = 0 + Conv Deallocated = 0 + Indoubt/Remote = 0 + Dist Local Elapsed = 00:00:00.311 + + SQL Row Message Byte Commit Abort Conv Blocks + ------- ------- ------- -------- ------- ------- ------- ------- + Sent 3 0 7 1777 0 0 0 0 + Recv 0 1 6 1154 0 0 0 1 + + Remote Location Name = ALL LOCATIONS + + Protocol Used = SYSTEM Conversations Queued = 0 + Conv Deallocated = 0 + Indoubt/Remote = 0 + Dist Local Elapsed = 00:00:00.552 + + SQL Row Message Byte Commit Abort Conv Blocks + ------- ------- ------- -------- ------- ------- ------- ------- + Sent 7 0 17 4172 0 0 0 0 + Recv 0 3 16 3096 0 0 0 3 ===============================================================================
FieldsDistributed VTAM APPC Conversations
The following fields are displayed when the thread has a distributed relationship with a remote DB2subsystem. One line of output is displayed for each active conversation.VTAM Luname
The VTAM logical unit name of the remote DB2 subsystem that is the partner on this VTAM APPCconversation.
VTAM ModenameThe VTAM logmode in use by the APPC conversation. For database access threads, the logmode nameexists and originates on the MVS system of the remote requester.
Last VTAM APPC ReqThe most recent VTAM APPC request that was issued on the conversation.
Last VTAM APPC QualThe most recent VTAM APPC qualifier that was issued on the conversation.
78 Classic Interface User's Guide
Time Since Last ReqThe elapsed time since the last APPC command was issued on the conversation.
Conv StatusThe status of the conversation.WAIT-VTAM
The conversation is suspended and waiting for a VTAM response.IN-VTAM
The conversation is active within VTAM.NOT-ACTIVE
The conversation is inactive-neither waiting for a VTAM response nor active in VTAM.VTAM Session ID
The VTAM session identifier in use by the conversation.
Distributed SQL statistics
The following group of fields occurs for each remote DB2 location with which the thread hascommunicated, either as a requester or a server. Each sent/received field generates two rows of output;the top row is the sent value, and the bottom row is the received value.Remote Location Name
The name of a remote location with which the local DB2 has communicated.Remote Location Luname
The logical unit name of the location specified in the "Remote Location Name" field. This field is notdisplayed for distributed TCP/IP threads.
Protocol UsedThe type of distributed protocol being used. The values are SYSTEM, APPLICATION, or BOTH,depending on whether system directed access, application directed access, or both are being used.
Conversations QueuedThe number of conversation requests queued by DDF waiting for allocation.
Conv DeallocatedThe number of conversations deallocated.
Indoubt/RemoteThe number of threads that went indoubt with the remote location as coordinator.
Dist Local ElapsedThe time the thread has spent waiting for a response to a remote SQL request (includes remote DB2processing time, VTAM processing time, and network time). The time is calculated from the point ofthread creation (or DB2 signon if the thread is reused). This field is displayed only for distributed alliedthreads.
SQL Sent/RecvThe number of SQL calls sent to and from the remote location since thread creation or DB2 signon.
Row Sent/RecvThe number of rows sent to and from the remote location since thread creation or DB2 signon.
Message Sent/RecvThe number of VTAM messages sent to and from the remote location since thread creation or DB2signon.
Byte Sent/RecvThe number of bytes sent to and from the remote location since thread creation or DB2 signon.
Commit Sent/RecvThe number of Commits sent to and from the remote location since thread creation or DB2 signon.
Abort Sent/RecvThe number of aborts sent to and from the remote location since thread creation or DB2 signon.
Chapter 6. Thread Activity 79
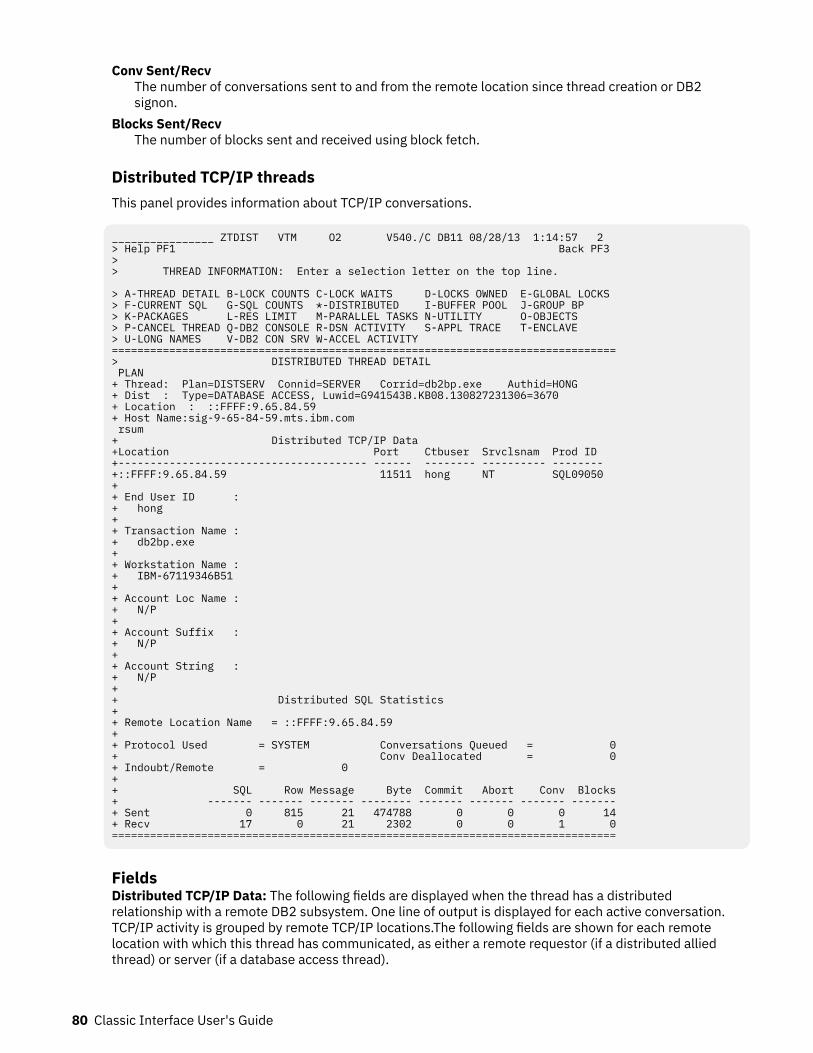
Conv Sent/RecvThe number of conversations sent to and from the remote location since thread creation or DB2signon.
Blocks Sent/RecvThe number of blocks sent and received using block fetch.
Distributed TCP/IP threadsThis panel provides information about TCP/IP conversations.
________________ ZTDIST VTM O2 V540./C DB11 08/28/13 1:14:57 2 > Help PF1 Back PF3 > > THREAD INFORMATION: Enter a selection letter on the top line. > A-THREAD DETAIL B-LOCK COUNTS C-LOCK WAITS D-LOCKS OWNED E-GLOBAL LOCKS > F-CURRENT SQL G-SQL COUNTS *-DISTRIBUTED I-BUFFER POOL J-GROUP BP > K-PACKAGES L-RES LIMIT M-PARALLEL TASKS N-UTILITY O-OBJECTS > P-CANCEL THREAD Q-DB2 CONSOLE R-DSN ACTIVITY S-APPL TRACE T-ENCLAVE > U-LONG NAMES V-DB2 CON SRV W-ACCEL ACTIVITY =============================================================================== > DISTRIBUTED THREAD DETAIL PLAN + Thread: Plan=DISTSERV Connid=SERVER Corrid=db2bp.exe Authid=HONG + Dist : Type=DATABASE ACCESS, Luwid=G941543B.KB08.130827231306=3670 + Location : ::FFFF:9.65.84.59 + Host Name:sig-9-65-84-59.mts.ibm.com rsum + Distributed TCP/IP Data +Location Port Ctbuser Srvclsnam Prod ID +--------------------------------------- ------ -------- ---------- -------- +::FFFF:9.65.84.59 11511 hong NT SQL09050 + + End User ID : + hong + + Transaction Name : + db2bp.exe + + Workstation Name : + IBM-67119346B51 + + Account Loc Name : + N/P + + Account Suffix : + N/P + + Account String : + N/P + + Distributed SQL Statistics + + Remote Location Name = ::FFFF:9.65.84.59 + + Protocol Used = SYSTEM Conversations Queued = 0 + Conv Deallocated = 0 + Indoubt/Remote = 0 + + SQL Row Message Byte Commit Abort Conv Blocks + ------- ------- ------- -------- ------- ------- ------- ------- + Sent 0 815 21 474788 0 0 0 14 + Recv 17 0 21 2302 0 0 1 0 ===============================================================================
FieldsDistributed TCP/IP Data: The following fields are displayed when the thread has a distributedrelationship with a remote DB2 subsystem. One line of output is displayed for each active conversation.TCP/IP activity is grouped by remote TCP/IP locations.The following fields are shown for each remotelocation with which this thread has communicated, as either a remote requestor (if a distributed alliedthread) or server (if a database access thread).
80 Classic Interface User's Guide
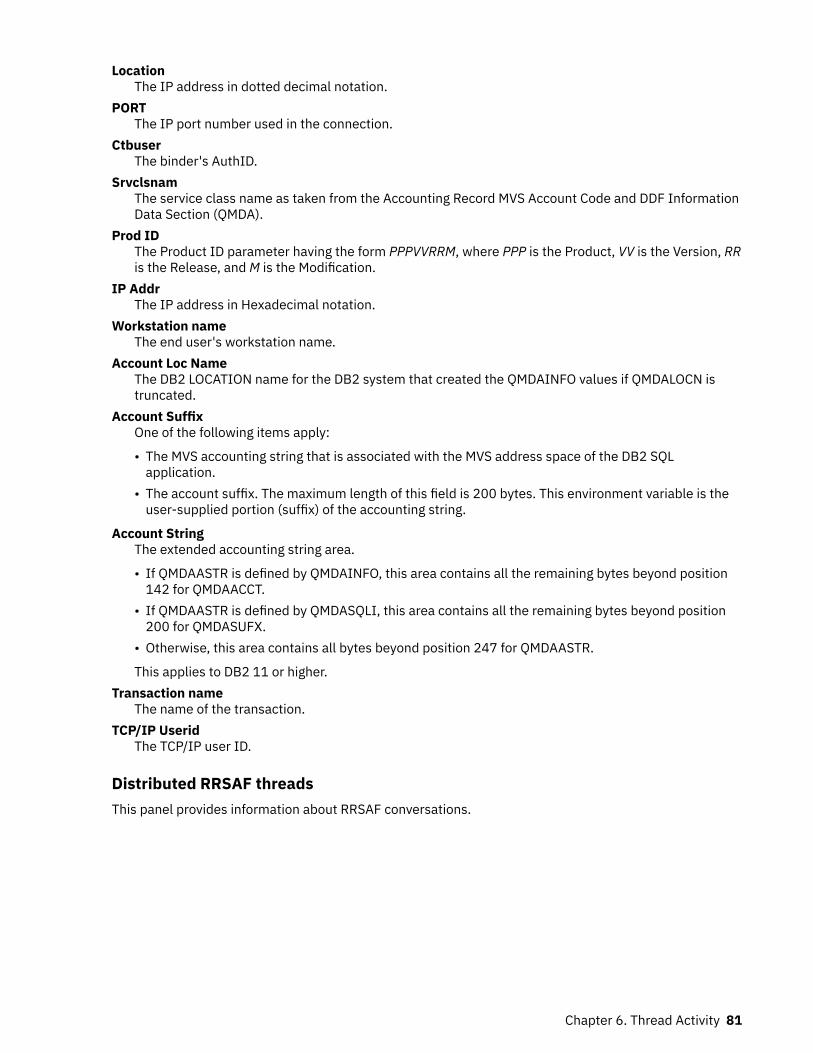
LocationThe IP address in dotted decimal notation.
PORTThe IP port number used in the connection.
CtbuserThe binder's AuthID.
SrvclsnamThe service class name as taken from the Accounting Record MVS Account Code and DDF InformationData Section (QMDA).
Prod IDThe Product ID parameter having the form PPPVVRRM, where PPP is the Product, VV is the Version, RRis the Release, and M is the Modification.
IP AddrThe IP address in Hexadecimal notation.
Workstation nameThe end user's workstation name.
Account Loc NameThe DB2 LOCATION name for the DB2 system that created the QMDAINFO values if QMDALOCN istruncated.
Account SuffixOne of the following items apply:
• The MVS accounting string that is associated with the MVS address space of the DB2 SQLapplication.
• The account suffix. The maximum length of this field is 200 bytes. This environment variable is theuser-supplied portion (suffix) of the accounting string.
Account StringThe extended accounting string area.
• If QMDAASTR is defined by QMDAINFO, this area contains all the remaining bytes beyond position142 for QMDAACCT.
• If QMDAASTR is defined by QMDASQLI, this area contains all the remaining bytes beyond position200 for QMDASUFX.
• Otherwise, this area contains all bytes beyond position 247 for QMDAASTR.
This applies to DB2 11 or higher.Transaction name
The name of the transaction.TCP/IP Userid
The TCP/IP user ID.
Distributed RRSAF threadsThis panel provides information about RRSAF conversations.
Chapter 6. Thread Activity 81
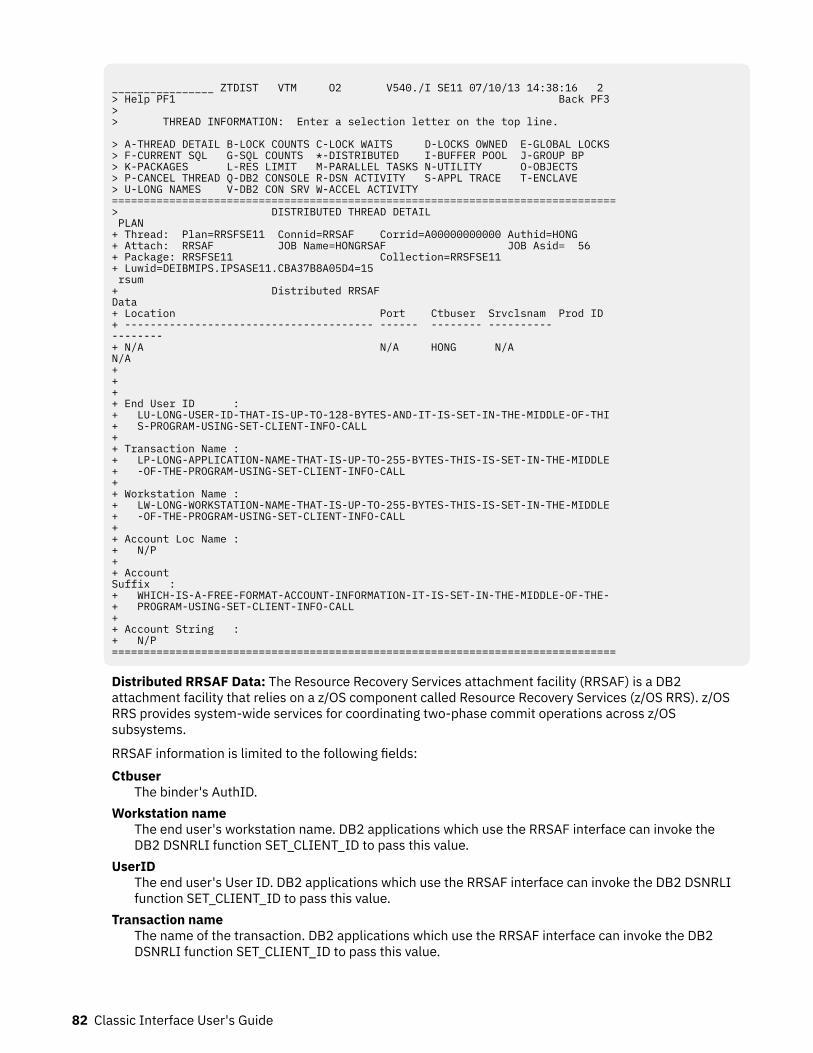
________________ ZTDIST VTM O2 V540./I SE11 07/10/13 14:38:16 2 > Help PF1 Back PF3 > > THREAD INFORMATION: Enter a selection letter on the top line. > A-THREAD DETAIL B-LOCK COUNTS C-LOCK WAITS D-LOCKS OWNED E-GLOBAL LOCKS > F-CURRENT SQL G-SQL COUNTS *-DISTRIBUTED I-BUFFER POOL J-GROUP BP > K-PACKAGES L-RES LIMIT M-PARALLEL TASKS N-UTILITY O-OBJECTS > P-CANCEL THREAD Q-DB2 CONSOLE R-DSN ACTIVITY S-APPL TRACE T-ENCLAVE > U-LONG NAMES V-DB2 CON SRV W-ACCEL ACTIVITY =============================================================================== > DISTRIBUTED THREAD DETAIL PLAN + Thread: Plan=RRSFSE11 Connid=RRSAF Corrid=A00000000000 Authid=HONG + Attach: RRSAF JOB Name=HONGRSAF JOB Asid= 56 + Package: RRSFSE11 Collection=RRSFSE11 + Luwid=DEIBMIPS.IPSASE11.CBA37B8A05D4=15 rsum + Distributed RRSAF Data + Location Port Ctbuser Srvclsnam Prod ID + --------------------------------------- ------ -------- ---------- -------- + N/A N/A HONG N/A N/A + + + + End User ID : + LU-LONG-USER-ID-THAT-IS-UP-TO-128-BYTES-AND-IT-IS-SET-IN-THE-MIDDLE-OF-THI + S-PROGRAM-USING-SET-CLIENT-INFO-CALL + + Transaction Name : + LP-LONG-APPLICATION-NAME-THAT-IS-UP-TO-255-BYTES-THIS-IS-SET-IN-THE-MIDDLE + -OF-THE-PROGRAM-USING-SET-CLIENT-INFO-CALL + + Workstation Name : + LW-LONG-WORKSTATION-NAME-THAT-IS-UP-TO-255-BYTES-THIS-IS-SET-IN-THE-MIDDLE + -OF-THE-PROGRAM-USING-SET-CLIENT-INFO-CALL + + Account Loc Name : + N/P + + Account Suffix : + WHICH-IS-A-FREE-FORMAT-ACCOUNT-INFORMATION-IT-IS-SET-IN-THE-MIDDLE-OF-THE- + PROGRAM-USING-SET-CLIENT-INFO-CALL + + Account String : + N/P ===============================================================================
Distributed RRSAF Data: The Resource Recovery Services attachment facility (RRSAF) is a DB2attachment facility that relies on a z/OS component called Resource Recovery Services (z/OS RRS). z/OSRRS provides system-wide services for coordinating two-phase commit operations across z/OSsubsystems.
RRSAF information is limited to the following fields:Ctbuser
The binder's AuthID.Workstation name
The end user's workstation name. DB2 applications which use the RRSAF interface can invoke theDB2 DSNRLI function SET_CLIENT_ID to pass this value.
UserIDThe end user's User ID. DB2 applications which use the RRSAF interface can invoke the DB2 DSNRLIfunction SET_CLIENT_ID to pass this value.
Transaction nameThe name of the transaction. DB2 applications which use the RRSAF interface can invoke the DB2DSNRLI function SET_CLIENT_ID to pass this value.
82 Classic Interface User's Guide
NavigationFor additional information about
• related topics, select one of the options at the top of the panel.• other topics, use the PF keys.
FieldsThread identifier: This information identifies the thread to which the information in this panel applies.Plan
The Db2 plan name of the active thread.Connid
The Db2 connection identifier of the active thread.Corrid
The Db2 correlation identifier of the active thread. If the correlation is not set, N/A is displayed.Authid
The Db2 authorization identifier of the active thread.Attach
Depending on the type of connection, the appropriate information is displayed.Attach information is displayed only if the thread is a distributed allied thread (not for distributeddatabase access threads).
Package identifier: This information identifies the package to which the information in this panel applies.Package
The Db2 package name of the active thread. Up to 18 characters of the package name are returned.Collection
The package collection identifier. This field is displayed only if a package is being used.
Distributed thread identifier: The following fields are displayed when the thread has a distributedrelationship with a remote DB2 subsystem.Type
The distributed thread type:Distributed Allied
A requesting thread that has issued an SQL call to a remote DB2 location.Database Access
A responding thread that is serving a remote DB2 location by responding to an SQL call.Location
The remote location name.Luwid
Logical unit of work indicator for the distributed thread. It has the following format (separated byperiods):
network-name.originating-VTAM-luname.unique-identifier=tokennetwork-name
The network nameoriginating-VTAM-luname
The originating VTAM LUNAMEunique-identifier
The unique identifiertoken
You can use the token instead of luwid in any DB2 command that accepts luwid as input.
Chapter 6. Thread Activity 83
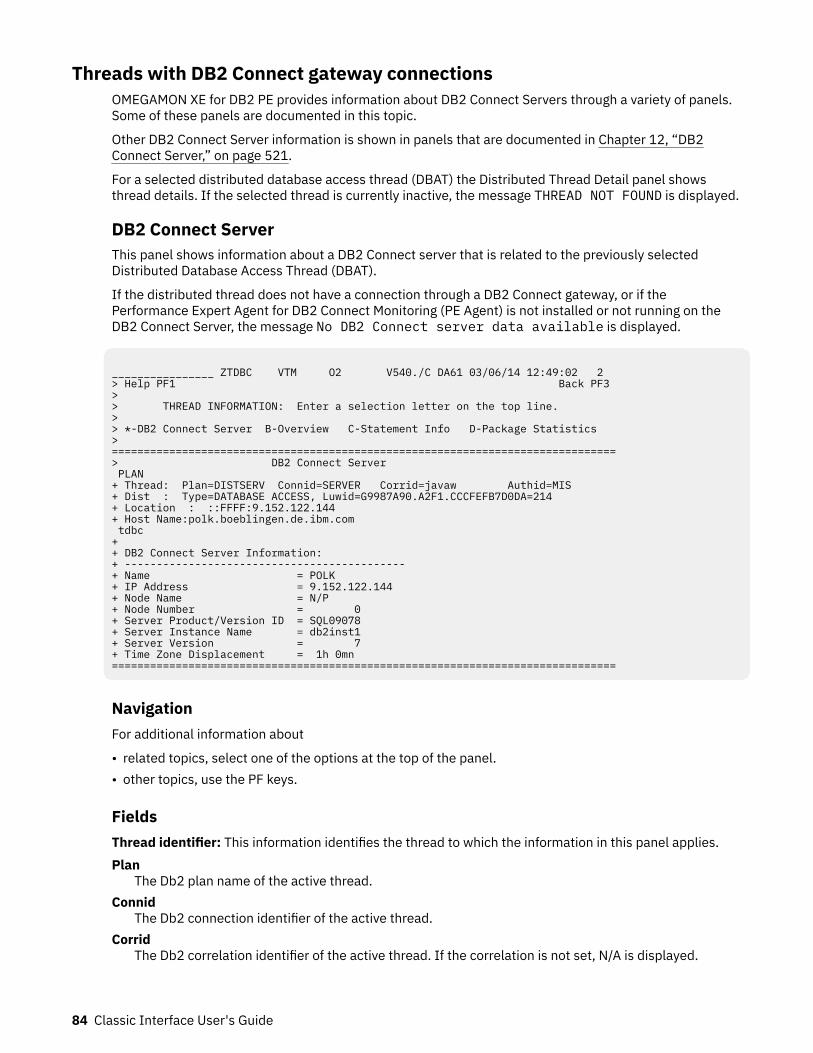
Threads with DB2 Connect gateway connectionsOMEGAMON XE for DB2 PE provides information about DB2 Connect Servers through a variety of panels.Some of these panels are documented in this topic.
Other DB2 Connect Server information is shown in panels that are documented in Chapter 12, “DB2Connect Server,” on page 521.
For a selected distributed database access thread (DBAT) the Distributed Thread Detail panel showsthread details. If the selected thread is currently inactive, the message THREAD NOT FOUND is displayed.
DB2 Connect ServerThis panel shows information about a DB2 Connect server that is related to the previously selectedDistributed Database Access Thread (DBAT).
If the distributed thread does not have a connection through a DB2 Connect gateway, or if thePerformance Expert Agent for DB2 Connect Monitoring (PE Agent) is not installed or not running on theDB2 Connect Server, the message No DB2 Connect server data available is displayed.
________________ ZTDBC VTM O2 V540./C DA61 03/06/14 12:49:02 2 > Help PF1 Back PF3 > > THREAD INFORMATION: Enter a selection letter on the top line. > > *-DB2 Connect Server B-Overview C-Statement Info D-Package Statistics > =============================================================================== > DB2 Connect Server PLAN + Thread: Plan=DISTSERV Connid=SERVER Corrid=javaw Authid=MIS + Dist : Type=DATABASE ACCESS, Luwid=G9987A90.A2F1.CCCFEFB7D0DA=214 + Location : ::FFFF:9.152.122.144 + Host Name:polk.boeblingen.de.ibm.com tdbc + + DB2 Connect Server Information: + -------------------------------------------- + Name = POLK + IP Address = 9.152.122.144 + Node Name = N/P + Node Number = 0 + Server Product/Version ID = SQL09078 + Server Instance Name = db2inst1 + Server Version = 7 + Time Zone Displacement = 1h 0mn ===============================================================================
NavigationFor additional information about
• related topics, select one of the options at the top of the panel.• other topics, use the PF keys.
FieldsThread identifier: This information identifies the thread to which the information in this panel applies.Plan
The Db2 plan name of the active thread.Connid
The Db2 connection identifier of the active thread.Corrid
The Db2 correlation identifier of the active thread. If the correlation is not set, N/A is displayed.
84 Classic Interface User's Guide
AuthidThe Db2 authorization identifier of the active thread.
AttachDepending on the type of connection, the appropriate information is displayed.Attach information is displayed only if the thread is a distributed allied thread (not for distributeddatabase access threads).
Connection TypeBatch
The MVS jobname and ASID.
Note: For threads from remote Db2, the MVS job name is N/A.
CICSThe CICS jobname, task name, task number, terminal ID, and thread type. The thread type is:Pool
The thread in use is a pool thread.Entry
The thread in use is a nonprotected entry thread.Prot
The thread in use is a protected thread. Protected threads are defined in an RCT entrydefinition using the THRDS operand.
IMSThe IMS region number, transaction name, region name, and terminal ID (LTERM).
RRSAFThe MVS job name and ASID.
Note: For threads from remote Db2, the MVS job name is N/A.
SystemThe originating Db2 job name and the resource manager that is the source of the thread. Anadditional line below the Attach line identifies the user thread, if any, being served by the systemthread.
TSOThe TSO user ID and region ASID.
UtilityNo additional information.
Db2The Db2 subsystem identifier.
MVSThe MVS system identifier.
ORIGAUTHThe original (primary) Db2 authorization identifier of the thread. This field displays only when theoriginal identifier is different from the Authid.
Package identifier: This information identifies the package to which the information in this panel applies.Package
The Db2 package name of the active thread. Up to 18 characters of the package name are returned.Collection
The package collection identifier. This field is displayed only if a package is being used.
Distributed thread identifier: The following fields are displayed if the thread has a distributedrelationship with a remote Db2 subsystem.Type
The distributed thread type.
Chapter 6. Thread Activity 85
Distributed AlliedA requesting thread; one that has issued an SQL call to a remote Db2 location.
Database AccessA responding thread; one that is serving a remote Db2 location by responding to an SQL call.
Db2=The Db2 subsystem ID, indicating the member of the data sharing group of this thread.
LuwidThis value consists of two parts: the logical unit of work ID (luw-id) and a token. The token can beused in place of the luw-id in any Db2 command that accepts luw-id as input. Format:
luw-id=token
The luw-id consists of the network name, the originating VTAM LUNAME, and a unique identifier(separated by periods). Thus, the Luwid field displays data like in the following example:
USCACO01.O2D22A.A1FE8E04B9D4=8
SystemThe originating Db2 job name and the resource manager that is the source of the thread. An additionalline below the Attach line identifies the user thread, if any, being served by the system thread.
DB2C MasterShows the name of the member of the data sharing group that controls DB2 Connect monitoring forthe group. If N/A is shown, the DB2C Master is currently being changed. For more information, see thedescription of panel “Redirect Monitoring to Another DB2” on page 20.
DB2 Connect Server Information:Name
Shows the name in the database manager configuration file at the client node. It identifies the clientnode that is running the application.
IP AddressShows the current IP address.
Node NameShows the name of the node being monitored by the database system monitor. It identifies thedatabase server node being monitored.
Node NumberShows the number assigned to the node in the db2nodes.cfg file.
Server Product/Version IDShows the product and version that is running on the DB2 data server in the form pppvvrrm, where:
• ppp stands for SQL• vv identifies a 2-digit version number (with high-order 0 in the case of a 1-digit version)• rr identifies a 2-digit release number (with high-order 0 in the case of a 1-digit release)• m identifies a 1-digit modification level
Server Instance NameShows the name of the database manager instance for which the snapshot was taken.
Server VersionShows the version of the DB2 data server returning the information.
Time Zone DisplacementShows the number of hours and minutes that the local time zone is displaced from Greenwich MeanTime (GMT).
86 Classic Interface User's Guide
DB2 Connect Server - OverviewThis panel shows application-, client-, and DB2 host-related information for the previously selectedDistributed Database Access Thread (DBAT).
If the distributed thread does not have a connection through a DB2 Connect gateway, or if thePerformance Expert Agent for DB2 Connect Monitoring (PE Agent) is not installed or not running on theDB2 Connect Server, the message No DB2 Connect server data available is displayed.
Chapter 6. Thread Activity 87
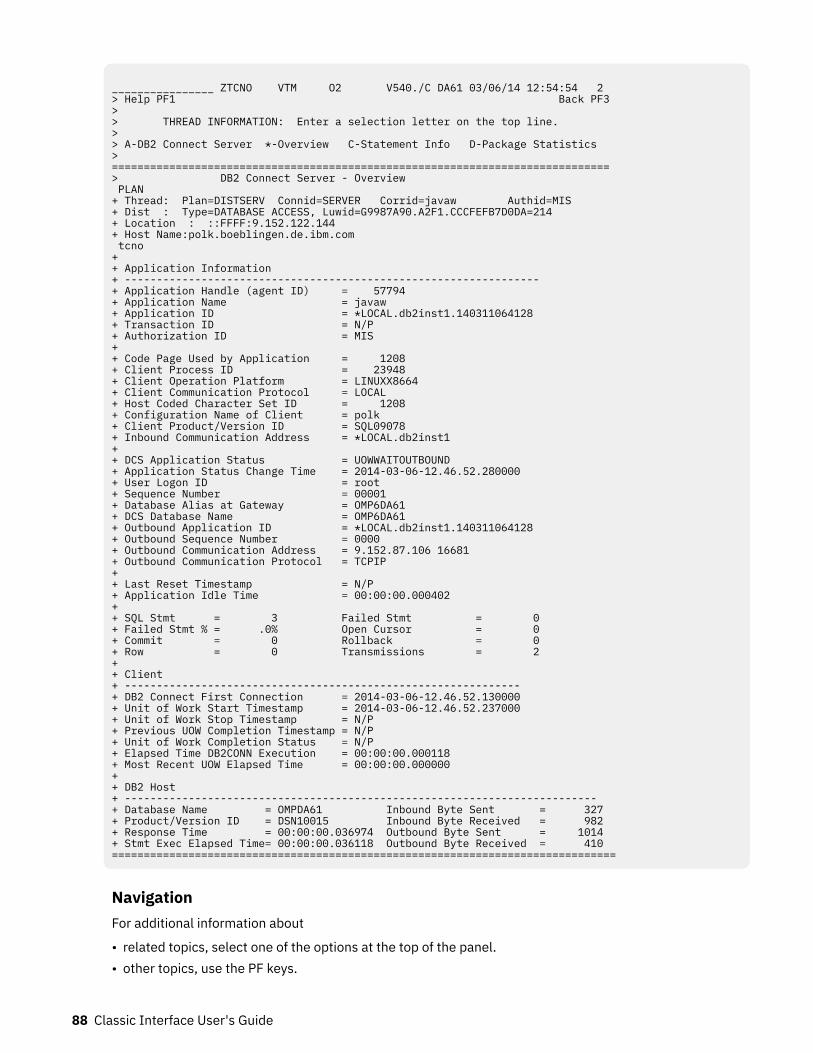
________________ ZTCNO VTM O2 V540./C DA61 03/06/14 12:54:54 2> Help PF1 Back PF3> > THREAD INFORMATION: Enter a selection letter on the top line. > > A-DB2 Connect Server *-Overview C-Statement Info D-Package Statistics > ==============================================================================> DB2 Connect Server - Overview PLAN + Thread: Plan=DISTSERV Connid=SERVER Corrid=javaw Authid=MIS + Dist : Type=DATABASE ACCESS, Luwid=G9987A90.A2F1.CCCFEFB7D0DA=214 + Location : ::FFFF:9.152.122.144 + Host Name:polk.boeblingen.de.ibm.com tcno + + Application Information + ----------------------------------------------------------------- + Application Handle (agent ID) = 57794 + Application Name = javaw + Application ID = *LOCAL.db2inst1.140311064128 + Transaction ID = N/P + Authorization ID = MIS + + Code Page Used by Application = 1208 + Client Process ID = 23948 + Client Operation Platform = LINUXX8664 + Client Communication Protocol = LOCAL + Host Coded Character Set ID = 1208 + Configuration Name of Client = polk + Client Product/Version ID = SQL09078 + Inbound Communication Address = *LOCAL.db2inst1 + + DCS Application Status = UOWWAITOUTBOUND + Application Status Change Time = 2014-03-06-12.46.52.280000 + User Logon ID = root + Sequence Number = 00001 + Database Alias at Gateway = OMP6DA61 + DCS Database Name = OMP6DA61 + Outbound Application ID = *LOCAL.db2inst1.140311064128 + Outbound Sequence Number = 0000 + Outbound Communication Address = 9.152.87.106 16681 + Outbound Communication Protocol = TCPIP + + Last Reset Timestamp = N/P + Application Idle Time = 00:00:00.000402 + + SQL Stmt = 3 Failed Stmt = 0 + Failed Stmt % = .0% Open Cursor = 0 + Commit = 0 Rollback = 0 + Row = 0 Transmissions = 2 + + Client + -------------------------------------------------------------- + DB2 Connect First Connection = 2014-03-06-12.46.52.130000 + Unit of Work Start Timestamp = 2014-03-06-12.46.52.237000 + Unit of Work Stop Timestamp = N/P + Previous UOW Completion Timestamp = N/P + Unit of Work Completion Status = N/P + Elapsed Time DB2CONN Execution = 00:00:00.000118 + Most Recent UOW Elapsed Time = 00:00:00.000000 + + DB2 Host + -------------------------------------------------------------------------- + Database Name = OMPDA61 Inbound Byte Sent = 327 + Product/Version ID = DSN10015 Inbound Byte Received = 982 + Response Time = 00:00:00.036974 Outbound Byte Sent = 1014 + Stmt Exec Elapsed Time= 00:00:00.036118 Outbound Byte Received = 410 ===============================================================================
NavigationFor additional information about
• related topics, select one of the options at the top of the panel.• other topics, use the PF keys.
88 Classic Interface User's Guide
FieldsThread identifier: This information identifies the thread to which the information in this panel applies.Plan
The Db2 plan name of the active thread.Connid
The Db2 connection identifier of the active thread.Corrid
The Db2 correlation identifier of the active thread. If the correlation is not set, N/A is displayed.Authid
The Db2 authorization identifier of the active thread.Attach
Depending on the type of connection, the appropriate information is displayed.Attach information is displayed only if the thread is a distributed allied thread (not for distributeddatabase access threads).
Connection TypeBatch
The MVS jobname and ASID.
Note: For threads from remote Db2, the MVS job name is N/A.
CICSThe CICS jobname, task name, task number, terminal ID, and thread type. The thread type is:Pool
The thread in use is a pool thread.Entry
The thread in use is a nonprotected entry thread.Prot
The thread in use is a protected thread. Protected threads are defined in an RCT entrydefinition using the THRDS operand.
IMSThe IMS region number, transaction name, region name, and terminal ID (LTERM).
RRSAFThe MVS job name and ASID.
Note: For threads from remote Db2, the MVS job name is N/A.
SystemThe originating Db2 job name and the resource manager that is the source of the thread. Anadditional line below the Attach line identifies the user thread, if any, being served by the systemthread.
TSOThe TSO user ID and region ASID.
UtilityNo additional information.
Db2The Db2 subsystem identifier.
MVSThe MVS system identifier.
ORIGAUTHThe original (primary) Db2 authorization identifier of the thread. This field displays only when theoriginal identifier is different from the Authid.
Package identifier: This information identifies the package to which the information in this panel applies.
Chapter 6. Thread Activity 89
PackageThe Db2 package name of the active thread. Up to 18 characters of the package name are returned.
CollectionThe package collection identifier. This field is displayed only if a package is being used.
Distributed thread identifier: The following fields are displayed if the thread has a distributedrelationship with a remote Db2 subsystem.Type
The distributed thread type.Distributed Allied
A requesting thread; one that has issued an SQL call to a remote Db2 location.Database Access
A responding thread; one that is serving a remote Db2 location by responding to an SQL call.Db2=
The Db2 subsystem ID, indicating the member of the data sharing group of this thread.Luwid
This value consists of two parts: the logical unit of work ID (luw-id) and a token. The token can beused in place of the luw-id in any Db2 command that accepts luw-id as input. Format:
luw-id=token
The luw-id consists of the network name, the originating VTAM LUNAME, and a unique identifier(separated by periods). Thus, the Luwid field displays data like in the following example:
USCACO01.O2D22A.A1FE8E04B9D4=8
SystemThe originating Db2 job name and the resource manager that is the source of the thread. An additionalline below the Attach line identifies the user thread, if any, being served by the system thread.
DB2C MasterShows the name of the member of the data sharing group that controls DB2 Connect monitoring forthe group. If N/A is shown, the DB2C Master is currently being changed. For more information, see thedescription of panel “Redirect Monitoring to Another DB2” on page 20.
Application information:Application Handle (agent ID)
Shows the system-wide unique ID for the application.Application Name
Shows the name of the application running at the client as known to the DB2 Connect.Application ID
Shows the identifier that is generated when the application connects to the database manager orwhen Distributed Database Connection Server (DDCS) receives a request to connect to a DRDAdatabase.
Transaction IDShows the unique transaction identifier across all databases generated by a transaction manager in atwo-phase-commit transaction.
Authorization IDShows the authorization ID of the user who invoked the application.
Code Page Used by ApplicationShows the code page identifier.
Client Process IDShows the process ID of the client application that made the connection to the database.
Client Operation PlatformShows the operating system on which the client application is running.
90 Classic Interface User's Guide
Client Communication ProtocolShows the communication protocol that the client application is using to communicate with theserver.
Host Coded Character Set IDShows the coded character set identifier (CCSID) of the host database.
Configuration Name of ClientShows the NNAME in the database manager configuration file at the client node.
Client Product/Version IDShows the communication address of the client. It could be an SNA net ID and LU partner name, or anIP address and port number for TCP/IP.
Inbound Communication AddressShows the product and version that is running on the client.
DCS Application StatusShows the current status of the application.
Application Status Change TimeShows the date and time the application entered its current status.
User Login IDShows the ID that the user specified when logging in to the operating system.
Sequence NumberIncrements whenever a unit of work ends, that is, when a COMMIT or ROLLBACK terminates a unit ofwork.
Database Alias at GatewayShows the alias used at the DB2 Connect gateway to connect to the host database.
DCS Database NameShows the name of the remote database as cataloged in the DCS directory.
Outbound Application IDIs generated when the application connects the DRDA host database.
Outbound Sequence NumberIs generated when the application connects the DRDA host database.
Outbound Communication AddressShows the communication address of the target database.
Outbound Communication ProtocolShows the communication protocol used between the DB2 Connect gateway and host.
Last Reset TimestampShows the date and time that the monitor counters were reset for the application issuing the GETSNAPSHOT.
Application Idle TimeShows the number of seconds since an application issued any requests to the server.
SQL StmtShows the number of SQL statements that have been attempted since the latter of: applicationstartup, database activation, or last reset.
Failed StmtShows the number of SQL statements that were attempted, but failed.
Failed Stmt %Shows the percentage of failed statements versus all SQL statements.
Open CursorShows the number of cursors currently open for an application.
CommitShows the total number of SQL COMMIT statements that have been attempted.
Chapter 6. Thread Activity 91
RollbackShows the total number of SQL ROLLBACK statements that have been attempted.
RowShows the number of rows that have been selected and returned to the application.
TransmissionsShows the number of data transmissions between DB2 Connect gateway and host that was used toprocess this DCS statement. (One data transmission consists of one send or one receive).
Client fields:DB2 Connect First Connection
Shows the date and time at which the first connection to the host database was initiated from the DB2Connect gateway.
Unit of Work Start TimestampShows the date and time at which the unit of work first required database resources.
Unit of Work Stop TimestampShows the date and time at which the most recent unit of work completed which occurs whendatabase changes are committed or rolled back.
Previous UOW Completion TimestampShows the time the unit of work completed.
Unit of Work Completion StatusShows the status of the unit of work and how it stopped. It can have:
• Committed because of a COMMIT statement• Rolled back because of a ROLLBACK statement• Rolled back because of a deadlock• Rolled back due to an abnormal termination• Committed at normal application termination• Unknown as a result of a FLUSH EVENT MONITOR command for which units of work were in
progress.
Elapsed Time DB2CONN ExecutionShows the time, in seconds and microseconds, at the DB2 Connect gateway to process an applicationrequest (since the connection was established), or to process a single statement.
Most Recent UOW Elapsed TimeShows the elapsed execution time of the most recently completed unit of work.
DB2 Host fields:Database Name
Shows the real name of the host database for which information is being collected or to which theapplication is connected. This is the name that was given to the database when it is created.
Product/Version IDShows the product and version that is running on the DB2 data server in the form pppvvrrm, where:
• ppp stands for SQL• vv identifies a 2-digit version number (with high-order 0 in the case of a 1-digit version)• rr identifies a 2-digit release number (with high-order 0 in the case of a 1-digit release)• m identifies a 1-digit modification level
Response TimeFor a DCS statement, this is the elapsed time between the time that the statement was sent from theDB2 Connect gateway to the host for processing and the time when the result was received from thehost.
92 Classic Interface User's Guide
Stmt Execution Elapsed TimeFor a DCS statement, this is the elapsed time spent processing an SQL request on a host databaseserver.
Inbound Byte SentShows the number of bytes sent by the DB2 Connect gateway to the client, excluding communicationprotocol overhead (for example, TCP/IP or SNA headers).
Inbound Byte ReceivedShows the number of bytes received by the DB2 Connect gateway from the client, excludingcommunication protocol overhead (for example, TCP/IP or SNA headers).
Outbound Byte SentShows the number of bytes sent by the DB2 Connect gateway to the host excluding communicationprotocol overhead (for example, TCP/IP or SNA headers).
Outbound Byte ReceivedShows the number of bytes received by the DB2 Connect gateway from the host, excludingcommunication protocol overhead (for example, TCP/IP or SNA headers).
DB2 Connect Server - Statement InformationThis panel shows SQL statement-, time-, and network traffic-related information for the previouslyselected Distributed Database Access Thread (DBAT).
If the distributed thread does not have a connection through a DB2 Connect gateway, or if thePerformance Expert Agent for DB2 Connect Monitoring (PE Agent) is not installed or not running on theDB2 Connect Server, the message No DB2 Connect server data available is displayed.
Chapter 6. Thread Activity 93
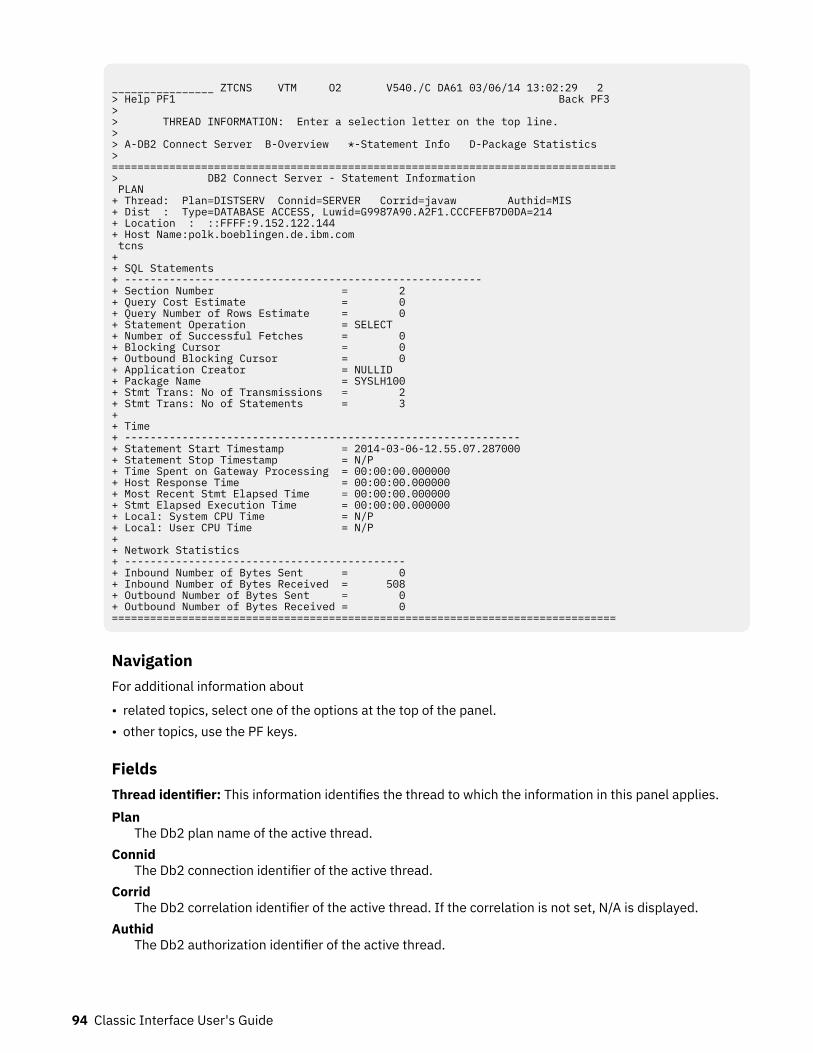
________________ ZTCNS VTM O2 V540./C DA61 03/06/14 13:02:29 2 > Help PF1 Back PF3 > > THREAD INFORMATION: Enter a selection letter on the top line. > > A-DB2 Connect Server B-Overview *-Statement Info D-Package Statistics > =============================================================================== > DB2 Connect Server - Statement Information PLAN + Thread: Plan=DISTSERV Connid=SERVER Corrid=javaw Authid=MIS + Dist : Type=DATABASE ACCESS, Luwid=G9987A90.A2F1.CCCFEFB7D0DA=214 + Location : ::FFFF:9.152.122.144 + Host Name:polk.boeblingen.de.ibm.com tcns + + SQL Statements + -------------------------------------------------------- + Section Number = 2 + Query Cost Estimate = 0 + Query Number of Rows Estimate = 0 + Statement Operation = SELECT + Number of Successful Fetches = 0 + Blocking Cursor = 0 + Outbound Blocking Cursor = 0 + Application Creator = NULLID + Package Name = SYSLH100 + Stmt Trans: No of Transmissions = 2 + Stmt Trans: No of Statements = 3 + + Time + -------------------------------------------------------------- + Statement Start Timestamp = 2014-03-06-12.55.07.287000 + Statement Stop Timestamp = N/P + Time Spent on Gateway Processing = 00:00:00.000000 + Host Response Time = 00:00:00.000000 + Most Recent Stmt Elapsed Time = 00:00:00.000000 + Stmt Elapsed Execution Time = 00:00:00.000000 + Local: System CPU Time = N/P + Local: User CPU Time = N/P + + Network Statistics + -------------------------------------------- + Inbound Number of Bytes Sent = 0 + Inbound Number of Bytes Received = 508 + Outbound Number of Bytes Sent = 0 + Outbound Number of Bytes Received = 0 ===============================================================================
NavigationFor additional information about
• related topics, select one of the options at the top of the panel.• other topics, use the PF keys.
FieldsThread identifier: This information identifies the thread to which the information in this panel applies.Plan
The Db2 plan name of the active thread.Connid
The Db2 connection identifier of the active thread.Corrid
The Db2 correlation identifier of the active thread. If the correlation is not set, N/A is displayed.Authid
The Db2 authorization identifier of the active thread.
94 Classic Interface User's Guide
AttachDepending on the type of connection, the appropriate information is displayed.Attach information is displayed only if the thread is a distributed allied thread (not for distributeddatabase access threads).
Connection TypeBatch
The MVS jobname and ASID.
Note: For threads from remote Db2, the MVS job name is N/A.
CICSThe CICS jobname, task name, task number, terminal ID, and thread type. The thread type is:Pool
The thread in use is a pool thread.Entry
The thread in use is a nonprotected entry thread.Prot
The thread in use is a protected thread. Protected threads are defined in an RCT entrydefinition using the THRDS operand.
IMSThe IMS region number, transaction name, region name, and terminal ID (LTERM).
RRSAFThe MVS job name and ASID.
Note: For threads from remote Db2, the MVS job name is N/A.
SystemThe originating Db2 job name and the resource manager that is the source of the thread. Anadditional line below the Attach line identifies the user thread, if any, being served by the systemthread.
TSOThe TSO user ID and region ASID.
UtilityNo additional information.
Db2The Db2 subsystem identifier.
MVSThe MVS system identifier.
ORIGAUTHThe original (primary) Db2 authorization identifier of the thread. This field displays only when theoriginal identifier is different from the Authid.
Package identifier: This information identifies the package to which the information in this panel applies.Package
The Db2 package name of the active thread. Up to 18 characters of the package name are returned.Collection
The package collection identifier. This field is displayed only if a package is being used.
Distributed thread identifier: The following fields are displayed if the thread has a distributedrelationship with a remote Db2 subsystem.Type
The distributed thread type.Distributed Allied
A requesting thread; one that has issued an SQL call to a remote Db2 location.
Chapter 6. Thread Activity 95
Database AccessA responding thread; one that is serving a remote Db2 location by responding to an SQL call.
Db2=The Db2 subsystem ID, indicating the member of the data sharing group of this thread.
LuwidThis value consists of two parts: the logical unit of work ID (luw-id) and a token. The token can beused in place of the luw-id in any Db2 command that accepts luw-id as input. Format:
luw-id=token
The luw-id consists of the network name, the originating VTAM LUNAME, and a unique identifier(separated by periods). Thus, the Luwid field displays data like in the following example:
USCACO01.O2D22A.A1FE8E04B9D4=8
SystemThe originating Db2 job name and the resource manager that is the source of the thread. An additionalline below the Attach line identifies the user thread, if any, being served by the system thread.
DB2C MasterShows the name of the member of the data sharing group that controls DB2 Connect monitoring forthe group. If N/A is shown, the DB2C Master is currently being changed. For more information, see thedescription of panel “Redirect Monitoring to Another DB2” on page 20.
SQL statements:
Section NumberShows the internal section number in the package for the SQL statement that is currently processingor has processed most recently.
Query Cost EstimateShows the estimated cost, in "timerons", for a query, as determined by the SQL compiler.
Query Number of Rows EstimateShows the estimated number of rows that is returned by a query.
Statement OperationShows the statement operation that is currently being processed or has processed most recently (ifnone is currently running).
Number of Successful FetchesFor statement snapshot monitoring and statement event type, this is the number of successful fetchesperformed on a specific cursor.
Blocking CursorIndicates whether the statement being executed is using a blocking cursor.
Outbound Blocking CursorIndicates whether blocking is used for data transfer from DRDA server to the DB2 Connect gatewayfor a particular query.
Application CreatorShows the authorization ID of the user who precompiled the application.
Package NameShows the name of the package that contains the SQL statement that is currently executing.
Stmt Trans: No of TransmissionsShows the number of data transmissions between the DB2 Connect gateway and the host that wasused to process this DCS statement.
Stmt Trans: No of StatementsShows the number of SQL statements that have been attempted since the latter of: applicationstartup, database activation, or last reset.
Time fields:
96 Classic Interface User's Guide
Statement Start TimestampShows the date and time at which the statement operation started execution.
Statement Stop TimestampShows the date and time at which the statement operation stopped execution.
Time Spent on Gateway ProcessingShows the time, in seconds and microseconds, at the DB2 Connect gateway to process an applicationrequest (since the connection was established), or to process a single statement.
Host Response TimeFor a DCS statement, this is the elapsed time between the time that the statement was sent from theDB2 Connect gateway to the host for processing and the time when the result was received from thehost.
Most Recent Stmt Elapsed TimeShows the elapsed execution time of the most recently completed statement.
Stmt Elapsed Execution TimeFor a DCS statement, this is the elapsed time spent processing an SQL request on a host databaseserver.
Local: System CPU TimeShows the total system CPU time, in seconds and microseconds, used by the statement that iscurrently executing.
Local: User CPU TimeShows the total user CPU time, in seconds and microseconds, used by the statement that is currentlyexecuting.
Network Statistics fields:
Inbound Number of Bytes SentShows the number of bytes sent by the DB2 Connect gateway to the client, excluding communicationprotocol overhead, for example, TCP/IP or SNA headers.
Inbound Number of Bytes ReceivedShows the number of bytes received by the DB2 Connect gateway from the client, excludingcommunication protocol overhead, such as TCP/IP or SNA headers.
Outbound Number of Bytes SentShows the number of bytes sent by the DB2 Connect gateway to the host, excluding communicationprotocol overhead, for example, TCP/IP or SNA headers.
Outbound Number of Bytes ReceivedShows the number of bytes received by the DB2 Connect gateway from the host, excludingcommunication protocol overhead, such as TCP/IP or SNA headers.
DB2 Connect Server - Package StatisticsThis panel shows package statistics for the previously selected Distributed Database Access Thread(DBAT).
If the distributed thread does not have a connection through a DB2 Connect gateway, or if thePerformance Expert Agent for DB2 Connect Monitoring (PE Agent) is not installed or not running on theDB2 Connect Server, the message No DB2 Connect server data available is displayed.
Chapter 6. Thread Activity 97
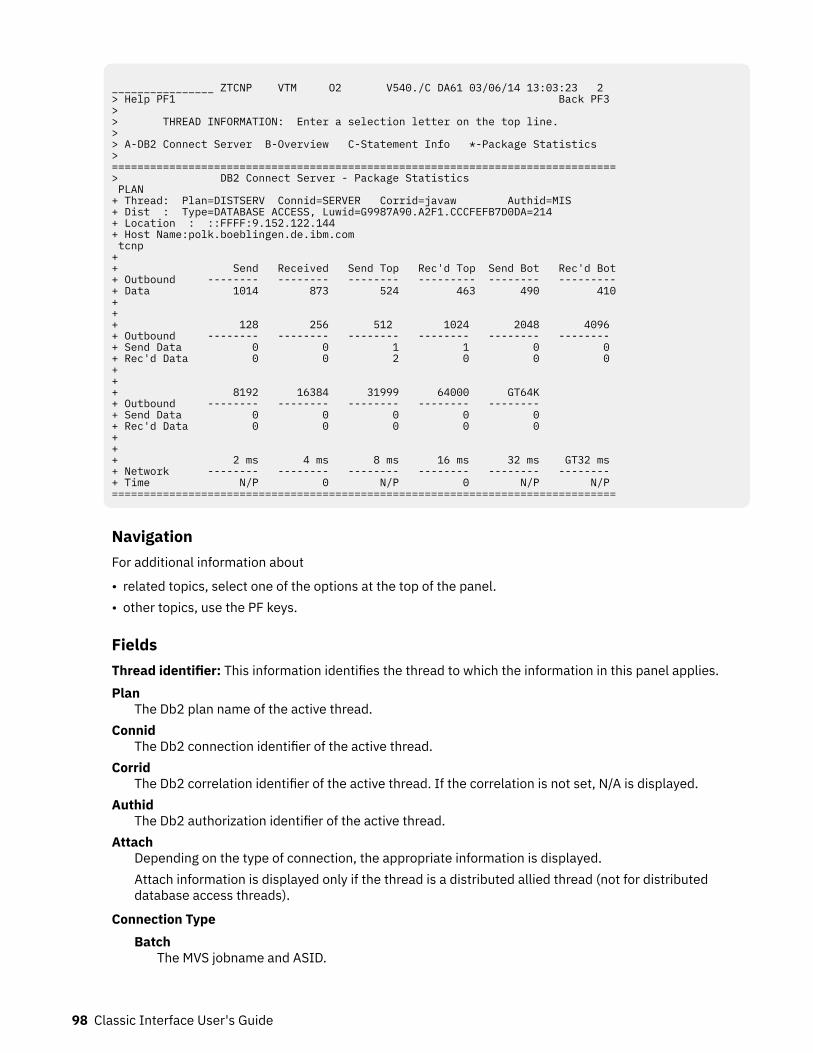
________________ ZTCNP VTM O2 V540./C DA61 03/06/14 13:03:23 2 > Help PF1 Back PF3 > > THREAD INFORMATION: Enter a selection letter on the top line. > > A-DB2 Connect Server B-Overview C-Statement Info *-Package Statistics > =============================================================================== > DB2 Connect Server - Package Statistics PLAN + Thread: Plan=DISTSERV Connid=SERVER Corrid=javaw Authid=MIS + Dist : Type=DATABASE ACCESS, Luwid=G9987A90.A2F1.CCCFEFB7D0DA=214 + Location : ::FFFF:9.152.122.144 + Host Name:polk.boeblingen.de.ibm.com tcnp + + Send Received Send Top Rec'd Top Send Bot Rec'd Bot + Outbound -------- -------- -------- --------- -------- --------- + Data 1014 873 524 463 490 410 + + + 128 256 512 1024 2048 4096 + Outbound -------- -------- -------- -------- -------- -------- + Send Data 0 0 1 1 0 0 + Rec'd Data 0 0 2 0 0 0 + + + 8192 16384 31999 64000 GT64K + Outbound -------- -------- -------- -------- -------- + Send Data 0 0 0 0 0 + Rec'd Data 0 0 0 0 0 + + + 2 ms 4 ms 8 ms 16 ms 32 ms GT32 ms + Network -------- -------- -------- -------- -------- -------- + Time N/P 0 N/P 0 N/P N/P ===============================================================================
NavigationFor additional information about
• related topics, select one of the options at the top of the panel.• other topics, use the PF keys.
FieldsThread identifier: This information identifies the thread to which the information in this panel applies.Plan
The Db2 plan name of the active thread.Connid
The Db2 connection identifier of the active thread.Corrid
The Db2 correlation identifier of the active thread. If the correlation is not set, N/A is displayed.Authid
The Db2 authorization identifier of the active thread.Attach
Depending on the type of connection, the appropriate information is displayed.Attach information is displayed only if the thread is a distributed allied thread (not for distributeddatabase access threads).
Connection TypeBatch
The MVS jobname and ASID.
98 Classic Interface User's Guide
Note: For threads from remote Db2, the MVS job name is N/A.
CICSThe CICS jobname, task name, task number, terminal ID, and thread type. The thread type is:Pool
The thread in use is a pool thread.Entry
The thread in use is a nonprotected entry thread.Prot
The thread in use is a protected thread. Protected threads are defined in an RCT entrydefinition using the THRDS operand.
IMSThe IMS region number, transaction name, region name, and terminal ID (LTERM).
RRSAFThe MVS job name and ASID.
Note: For threads from remote Db2, the MVS job name is N/A.
SystemThe originating Db2 job name and the resource manager that is the source of the thread. Anadditional line below the Attach line identifies the user thread, if any, being served by the systemthread.
TSOThe TSO user ID and region ASID.
UtilityNo additional information.
Db2The Db2 subsystem identifier.
MVSThe MVS system identifier.
ORIGAUTHThe original (primary) Db2 authorization identifier of the thread. This field displays only when theoriginal identifier is different from the Authid.
Package identifier: This information identifies the package to which the information in this panel applies.Package
The Db2 package name of the active thread. Up to 18 characters of the package name are returned.Collection
The package collection identifier. This field is displayed only if a package is being used.
Distributed thread identifier: The following fields are displayed if the thread has a distributedrelationship with a remote Db2 subsystem.Type
The distributed thread type.Distributed Allied
A requesting thread; one that has issued an SQL call to a remote Db2 location.Database Access
A responding thread; one that is serving a remote Db2 location by responding to an SQL call.Db2=
The Db2 subsystem ID, indicating the member of the data sharing group of this thread.
Chapter 6. Thread Activity 99
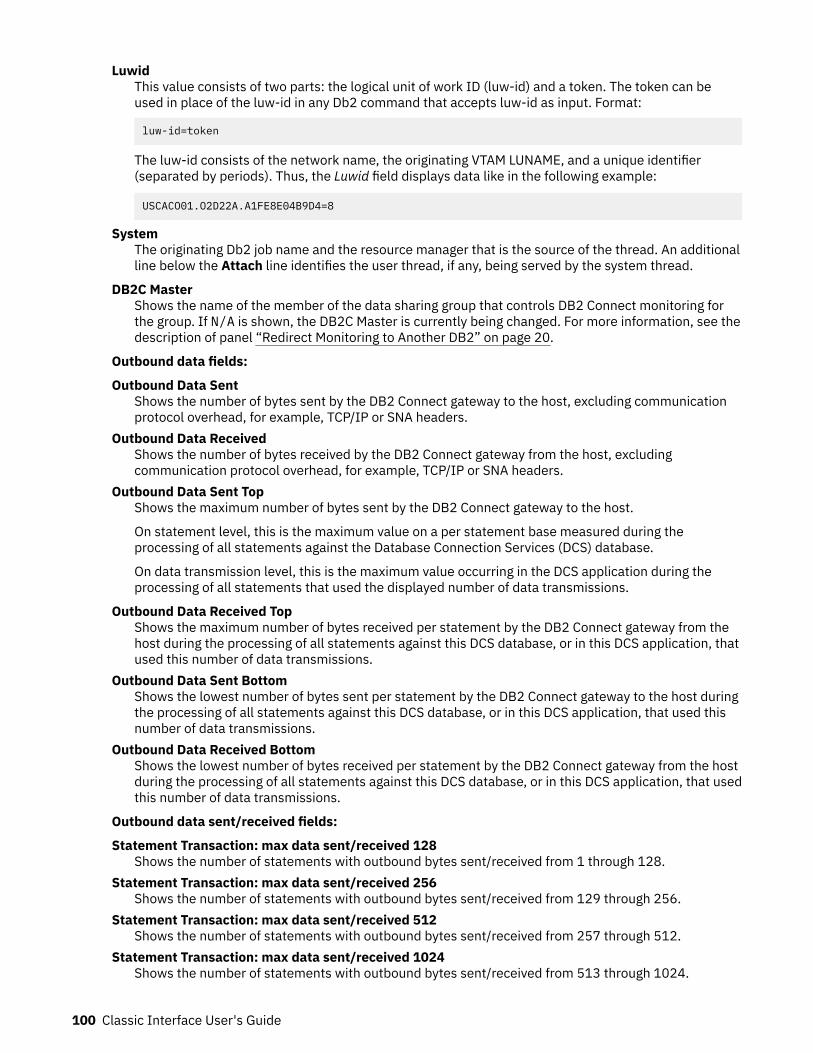
LuwidThis value consists of two parts: the logical unit of work ID (luw-id) and a token. The token can beused in place of the luw-id in any Db2 command that accepts luw-id as input. Format:
luw-id=token
The luw-id consists of the network name, the originating VTAM LUNAME, and a unique identifier(separated by periods). Thus, the Luwid field displays data like in the following example:
USCACO01.O2D22A.A1FE8E04B9D4=8
SystemThe originating Db2 job name and the resource manager that is the source of the thread. An additionalline below the Attach line identifies the user thread, if any, being served by the system thread.
DB2C MasterShows the name of the member of the data sharing group that controls DB2 Connect monitoring forthe group. If N/A is shown, the DB2C Master is currently being changed. For more information, see thedescription of panel “Redirect Monitoring to Another DB2” on page 20.
Outbound data fields:
Outbound Data SentShows the number of bytes sent by the DB2 Connect gateway to the host, excluding communicationprotocol overhead, for example, TCP/IP or SNA headers.
Outbound Data ReceivedShows the number of bytes received by the DB2 Connect gateway from the host, excludingcommunication protocol overhead, for example, TCP/IP or SNA headers.
Outbound Data Sent TopShows the maximum number of bytes sent by the DB2 Connect gateway to the host.
On statement level, this is the maximum value on a per statement base measured during theprocessing of all statements against the Database Connection Services (DCS) database.
On data transmission level, this is the maximum value occurring in the DCS application during theprocessing of all statements that used the displayed number of data transmissions.
Outbound Data Received TopShows the maximum number of bytes received per statement by the DB2 Connect gateway from thehost during the processing of all statements against this DCS database, or in this DCS application, thatused this number of data transmissions.
Outbound Data Sent BottomShows the lowest number of bytes sent per statement by the DB2 Connect gateway to the host duringthe processing of all statements against this DCS database, or in this DCS application, that used thisnumber of data transmissions.
Outbound Data Received BottomShows the lowest number of bytes received per statement by the DB2 Connect gateway from the hostduring the processing of all statements against this DCS database, or in this DCS application, that usedthis number of data transmissions.
Outbound data sent/received fields:
Statement Transaction: max data sent/received 128Shows the number of statements with outbound bytes sent/received from 1 through 128.
Statement Transaction: max data sent/received 256Shows the number of statements with outbound bytes sent/received from 129 through 256.
Statement Transaction: max data sent/received 512Shows the number of statements with outbound bytes sent/received from 257 through 512.
Statement Transaction: max data sent/received 1024Shows the number of statements with outbound bytes sent/received from 513 through 1024.
100 Classic Interface User's Guide
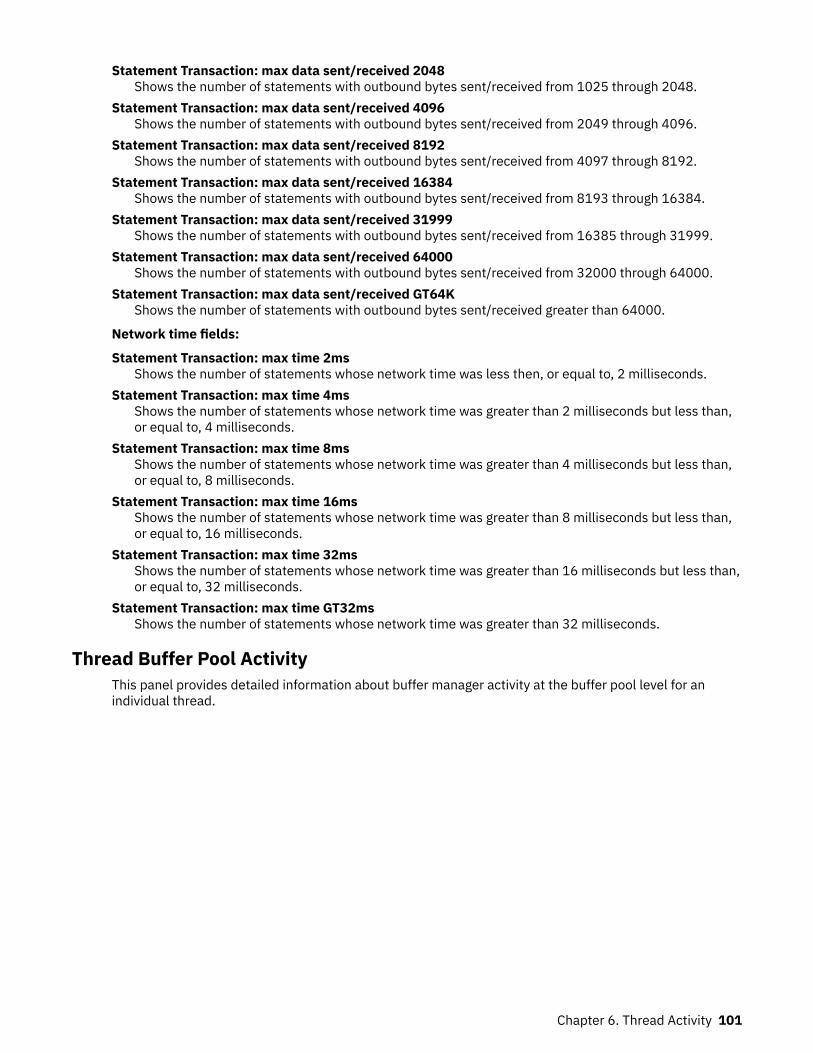
Statement Transaction: max data sent/received 2048Shows the number of statements with outbound bytes sent/received from 1025 through 2048.
Statement Transaction: max data sent/received 4096Shows the number of statements with outbound bytes sent/received from 2049 through 4096.
Statement Transaction: max data sent/received 8192Shows the number of statements with outbound bytes sent/received from 4097 through 8192.
Statement Transaction: max data sent/received 16384Shows the number of statements with outbound bytes sent/received from 8193 through 16384.
Statement Transaction: max data sent/received 31999Shows the number of statements with outbound bytes sent/received from 16385 through 31999.
Statement Transaction: max data sent/received 64000Shows the number of statements with outbound bytes sent/received from 32000 through 64000.
Statement Transaction: max data sent/received GT64KShows the number of statements with outbound bytes sent/received greater than 64000.
Network time fields:
Statement Transaction: max time 2msShows the number of statements whose network time was less then, or equal to, 2 milliseconds.
Statement Transaction: max time 4msShows the number of statements whose network time was greater than 2 milliseconds but less than,or equal to, 4 milliseconds.
Statement Transaction: max time 8msShows the number of statements whose network time was greater than 4 milliseconds but less than,or equal to, 8 milliseconds.
Statement Transaction: max time 16msShows the number of statements whose network time was greater than 8 milliseconds but less than,or equal to, 16 milliseconds.
Statement Transaction: max time 32msShows the number of statements whose network time was greater than 16 milliseconds but less than,or equal to, 32 milliseconds.
Statement Transaction: max time GT32msShows the number of statements whose network time was greater than 32 milliseconds.
Thread Buffer Pool ActivityThis panel provides detailed information about buffer manager activity at the buffer pool level for anindividual thread.
Chapter 6. Thread Activity 101
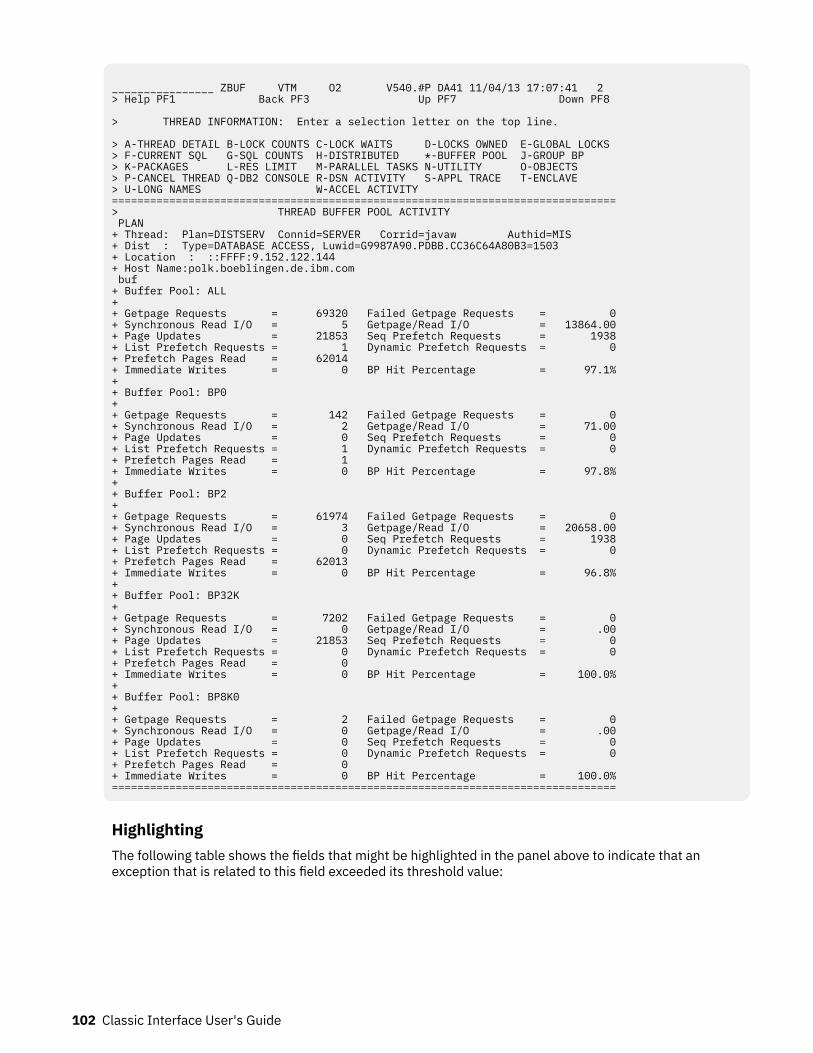
________________ ZBUF VTM O2 V540.#P DA41 11/04/13 17:07:41 2 > Help PF1 Back PF3 Up PF7 Down PF8 > THREAD INFORMATION: Enter a selection letter on the top line. > A-THREAD DETAIL B-LOCK COUNTS C-LOCK WAITS D-LOCKS OWNED E-GLOBAL LOCKS > F-CURRENT SQL G-SQL COUNTS H-DISTRIBUTED *-BUFFER POOL J-GROUP BP > K-PACKAGES L-RES LIMIT M-PARALLEL TASKS N-UTILITY O-OBJECTS > P-CANCEL THREAD Q-DB2 CONSOLE R-DSN ACTIVITY S-APPL TRACE T-ENCLAVE > U-LONG NAMES W-ACCEL ACTIVITY =============================================================================== > THREAD BUFFER POOL ACTIVITY PLAN + Thread: Plan=DISTSERV Connid=SERVER Corrid=javaw Authid=MIS + Dist : Type=DATABASE ACCESS, Luwid=G9987A90.PDBB.CC36C64A80B3=1503 + Location : ::FFFF:9.152.122.144 + Host Name:polk.boeblingen.de.ibm.com buf + Buffer Pool: ALL + + Getpage Requests = 69320 Failed Getpage Requests = 0 + Synchronous Read I/O = 5 Getpage/Read I/O = 13864.00 + Page Updates = 21853 Seq Prefetch Requests = 1938 + List Prefetch Requests = 1 Dynamic Prefetch Requests = 0 + Prefetch Pages Read = 62014 + Immediate Writes = 0 BP Hit Percentage = 97.1% + + Buffer Pool: BP0 + + Getpage Requests = 142 Failed Getpage Requests = 0 + Synchronous Read I/O = 2 Getpage/Read I/O = 71.00 + Page Updates = 0 Seq Prefetch Requests = 0 + List Prefetch Requests = 1 Dynamic Prefetch Requests = 0 + Prefetch Pages Read = 1 + Immediate Writes = 0 BP Hit Percentage = 97.8% + + Buffer Pool: BP2 + + Getpage Requests = 61974 Failed Getpage Requests = 0 + Synchronous Read I/O = 3 Getpage/Read I/O = 20658.00 + Page Updates = 0 Seq Prefetch Requests = 1938 + List Prefetch Requests = 0 Dynamic Prefetch Requests = 0 + Prefetch Pages Read = 62013 + Immediate Writes = 0 BP Hit Percentage = 96.8%+ + Buffer Pool: BP32K + + Getpage Requests = 7202 Failed Getpage Requests = 0+ Synchronous Read I/O = 0 Getpage/Read I/O = .00+ Page Updates = 21853 Seq Prefetch Requests = 0+ List Prefetch Requests = 0 Dynamic Prefetch Requests = 0+ Prefetch Pages Read = 0 + Immediate Writes = 0 BP Hit Percentage = 100.0%+ + Buffer Pool: BP8K0 + + Getpage Requests = 2 Failed Getpage Requests = 0+ Synchronous Read I/O = 0 Getpage/Read I/O = .00+ Page Updates = 0 Seq Prefetch Requests = 0+ List Prefetch Requests = 0 Dynamic Prefetch Requests = 0+ Prefetch Pages Read = 0 + Immediate Writes = 0 BP Hit Percentage = 100.0%===============================================================================
HighlightingThe following table shows the fields that might be highlighted in the panel above to indicate that anexception that is related to this field exceeded its threshold value:
102 Classic Interface User's Guide
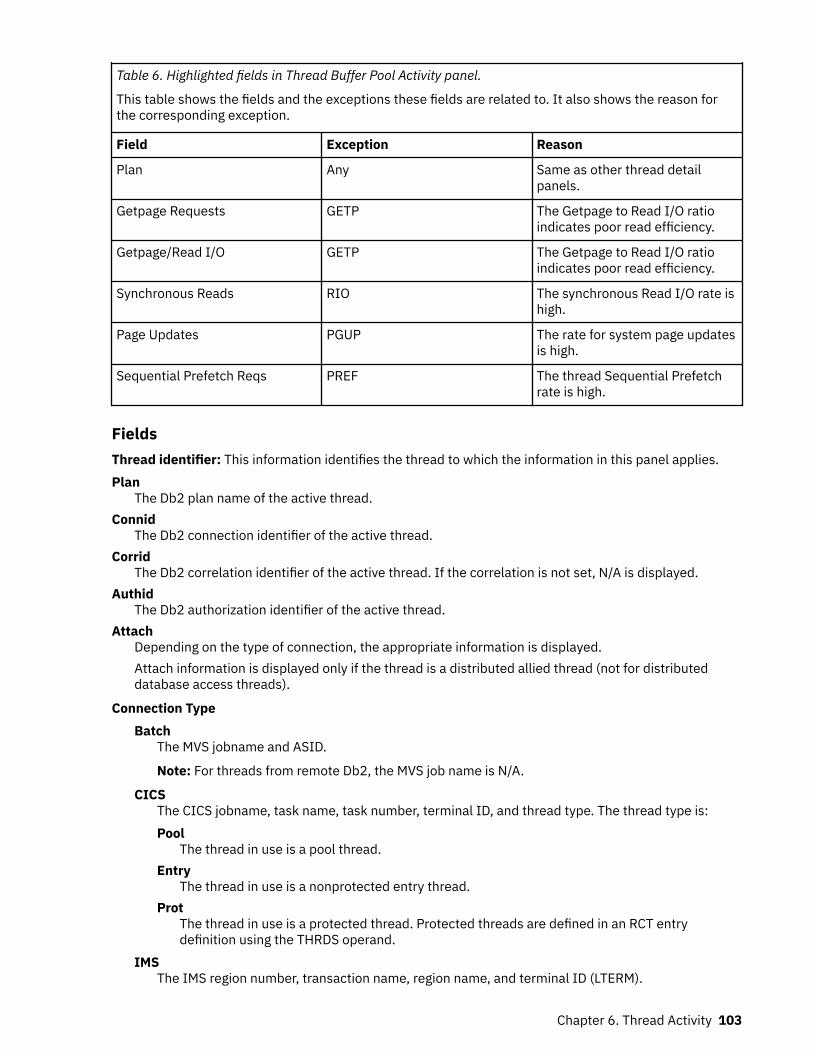
Table 6. Highlighted fields in Thread Buffer Pool Activity panel.
This table shows the fields and the exceptions these fields are related to. It also shows the reason forthe corresponding exception.
Field Exception Reason
Plan Any Same as other thread detailpanels.
Getpage Requests GETP The Getpage to Read I/O ratioindicates poor read efficiency.
Getpage/Read I/O GETP The Getpage to Read I/O ratioindicates poor read efficiency.
Synchronous Reads RIO The synchronous Read I/O rate ishigh.
Page Updates PGUP The rate for system page updatesis high.
Sequential Prefetch Reqs PREF The thread Sequential Prefetchrate is high.
FieldsThread identifier: This information identifies the thread to which the information in this panel applies.Plan
The Db2 plan name of the active thread.Connid
The Db2 connection identifier of the active thread.Corrid
The Db2 correlation identifier of the active thread. If the correlation is not set, N/A is displayed.Authid
The Db2 authorization identifier of the active thread.Attach
Depending on the type of connection, the appropriate information is displayed.Attach information is displayed only if the thread is a distributed allied thread (not for distributeddatabase access threads).
Connection TypeBatch
The MVS jobname and ASID.
Note: For threads from remote Db2, the MVS job name is N/A.
CICSThe CICS jobname, task name, task number, terminal ID, and thread type. The thread type is:Pool
The thread in use is a pool thread.Entry
The thread in use is a nonprotected entry thread.Prot
The thread in use is a protected thread. Protected threads are defined in an RCT entrydefinition using the THRDS operand.
IMSThe IMS region number, transaction name, region name, and terminal ID (LTERM).
Chapter 6. Thread Activity 103
RRSAFThe MVS job name and ASID.
Note: For threads from remote Db2, the MVS job name is N/A.
SystemThe originating Db2 job name and the resource manager that is the source of the thread. Anadditional line below the Attach line identifies the user thread, if any, being served by the systemthread.
TSOThe TSO user ID and region ASID.
UtilityNo additional information.
Db2The Db2 subsystem identifier.
MVSThe MVS system identifier.
ORIGAUTHThe original (primary) Db2 authorization identifier of the thread. This field displays only when theoriginal identifier is different from the Authid.
Package identifier: This information identifies the package to which the information in this panel applies.Package
The Db2 package name of the active thread. Up to 18 characters of the package name are returned.Collection
The package collection identifier. This field is displayed only if a package is being used.
Distributed thread identifier: The following fields are displayed when the thread has a distributedrelationship with a remote DB2 subsystem.Type
The distributed thread type.Distributed Allied
A requesting thread; one that has issued an SQL call to a remote DB2 location.Database Access
A responding thread; one that is serving a remote DB2 location by responding to an SQL call.Luwid
This value consists of two parts: the logical unit-of-work ID (luw-id) and a token. The token can beused in place of the luw-id in any DB2 command that accepts luw-id as input. Format:
luw-id=token
The luw-id consists of the network name, the originating VTAM LUNAME, and a unique identifier(separated by periods). Thus, the Luwid field displays data such as the following:
USCACO01.O2D22A.A1FE8E04B9D4=8
SystemThe originating DB2 job name and the resource manager that is the source of the thread.
An additional line below the attachment identifier displays the user thread, if any, that is served by thesystem thread.
Thread status: The totals for all of the buffer pools in use by the thread are displayed, followed by thevalues for each individual buffer pool in use.
104 Classic Interface User's Guide
Getpage RequestsThe number of thread Getpage requests. The value includes conditional, unconditional, successful,and unsuccessful requests. This logical read request might not actually result in physical I/O of thepage request currently in the buffer pool.
Failed Getpage RequestsThe number of times a conditional Getpage request could not be satisfied. Conditional Getpage, usedonly with queries being processed in parallel, will not wait for a page that is not currently in the bufferpool.
Synchronous Read I/OThe number of synchronous Read I/O requests issued by the thread.
Getpage/Read I/OThe number of Getpage requests divided by the number of synchronous Read I/Os. This value doesnot include Prefetch requests, because each prefetch request can return a variable number of pages(from one to 16).
Page UpdatesThe number of DB2 page updates made by the thread since thread creation. This value is incrementedeach time a row in a page is updated, not just once for each page updated. DB2 might update pageswhen it creates intermediate result tables because of a qualified SELECT statement, even thoughSELECT statements are generally thought of as read only operations. Pages that have been updatedare written asynchronously by DB2, according to DB2's internal Deferred Write algorithm, notimmediately after update or commit. DB2 resets the page update count at Create Thread and Signon.If Signon is not driven, the page update count is cumulative.
Seq Prefetch RequestsThe number of Prefetch requests issued by the thread.
Unlike normal Read I/O, Sequential Prefetch Read I/O is performed asynchronously with the user'srequest. It provides a read-ahead capability. A single sequential prefetch I/O results in multiple pagesbeing read. Threads with excessive Sequential Prefetch rates can cause reduced overall DB2performance.
List Prefetch RequestsThe number of List Prefetch requests issued by the thread.
Dynamic Prefetch RequestsThe number of Dynamic Prefetch requests made.
Prefetch Pages ReadThe number of pages read asynchronously for prefetch.
Immediate WritesThe number of immediate (synchronous) writes to DASD.
BP Hit PercentageThe percentage of Getpage requests issued by the thread for which the data was already in the bufferpool.
Thread Group Buffer Pool ActivityThis panel provides a summary of group buffer pool usage for an individual thread.
This panel is only available in a data sharing environment.
Chapter 6. Thread Activity 105
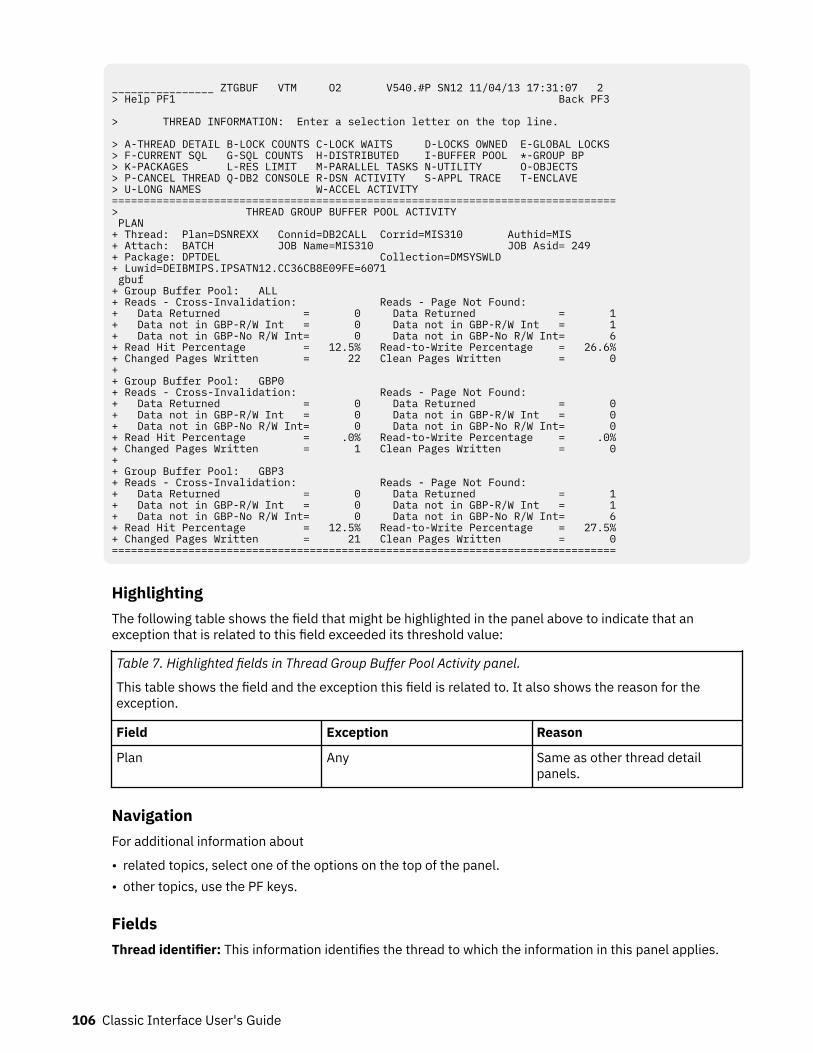
________________ ZTGBUF VTM O2 V540.#P SN12 11/04/13 17:31:07 2 > Help PF1 Back PF3 > THREAD INFORMATION: Enter a selection letter on the top line. > A-THREAD DETAIL B-LOCK COUNTS C-LOCK WAITS D-LOCKS OWNED E-GLOBAL LOCKS > F-CURRENT SQL G-SQL COUNTS H-DISTRIBUTED I-BUFFER POOL *-GROUP BP > K-PACKAGES L-RES LIMIT M-PARALLEL TASKS N-UTILITY O-OBJECTS > P-CANCEL THREAD Q-DB2 CONSOLE R-DSN ACTIVITY S-APPL TRACE T-ENCLAVE > U-LONG NAMES W-ACCEL ACTIVITY =============================================================================== > THREAD GROUP BUFFER POOL ACTIVITY PLAN + Thread: Plan=DSNREXX Connid=DB2CALL Corrid=MIS310 Authid=MIS + Attach: BATCH JOB Name=MIS310 JOB Asid= 249 + Package: DPTDEL Collection=DMSYSWLD + Luwid=DEIBMIPS.IPSATN12.CC36CB8E09FE=6071 gbuf + Group Buffer Pool: ALL + Reads - Cross-Invalidation: Reads - Page Not Found: + Data Returned = 0 Data Returned = 1 + Data not in GBP-R/W Int = 0 Data not in GBP-R/W Int = 1 + Data not in GBP-No R/W Int= 0 Data not in GBP-No R/W Int= 6 + Read Hit Percentage = 12.5% Read-to-Write Percentage = 26.6% + Changed Pages Written = 22 Clean Pages Written = 0 + + Group Buffer Pool: GBP0 + Reads - Cross-Invalidation: Reads - Page Not Found: + Data Returned = 0 Data Returned = 0 + Data not in GBP-R/W Int = 0 Data not in GBP-R/W Int = 0 + Data not in GBP-No R/W Int= 0 Data not in GBP-No R/W Int= 0 + Read Hit Percentage = .0% Read-to-Write Percentage = .0% + Changed Pages Written = 1 Clean Pages Written = 0 + + Group Buffer Pool: GBP3 + Reads - Cross-Invalidation: Reads - Page Not Found: + Data Returned = 0 Data Returned = 1 + Data not in GBP-R/W Int = 0 Data not in GBP-R/W Int = 1 + Data not in GBP-No R/W Int= 0 Data not in GBP-No R/W Int= 6 + Read Hit Percentage = 12.5% Read-to-Write Percentage = 27.5% + Changed Pages Written = 21 Clean Pages Written = 0 ===============================================================================
HighlightingThe following table shows the field that might be highlighted in the panel above to indicate that anexception that is related to this field exceeded its threshold value:
Table 7. Highlighted fields in Thread Group Buffer Pool Activity panel.
This table shows the field and the exception this field is related to. It also shows the reason for theexception.
Field Exception Reason
Plan Any Same as other thread detailpanels.
NavigationFor additional information about
• related topics, select one of the options on the top of the panel.• other topics, use the PF keys.
FieldsThread identifier: This information identifies the thread to which the information in this panel applies.
106 Classic Interface User's Guide
PlanThe Db2 plan name of the active thread.
ConnidThe Db2 connection identifier of the active thread.
CorridThe Db2 correlation identifier of the active thread. If the correlation is not set, N/A is displayed.
AuthidThe Db2 authorization identifier of the active thread.
AttachDepending on the type of connection, the appropriate information is displayed.Attach information is displayed only if the thread is a distributed allied thread (not for distributeddatabase access threads).
Connection TypeBatch
The MVS jobname and ASID.
Note: For threads from remote Db2, the MVS job name is N/A.
CICSThe CICS jobname, task name, task number, terminal ID, and thread type. The thread type is:Pool
The thread in use is a pool thread.Entry
The thread in use is a nonprotected entry thread.Prot
The thread in use is a protected thread. Protected threads are defined in an RCT entrydefinition using the THRDS operand.
IMSThe IMS region number, transaction name, region name, and terminal ID (LTERM).
RRSAFThe MVS job name and ASID.
Note: For threads from remote Db2, the MVS job name is N/A.
SystemThe originating Db2 job name and the resource manager that is the source of the thread. Anadditional line below the Attach line identifies the user thread, if any, being served by the systemthread.
TSOThe TSO user ID and region ASID.
UtilityNo additional information.
Db2The Db2 subsystem identifier.
MVSThe MVS system identifier.
ORIGAUTHThe original (primary) Db2 authorization identifier of the thread. This field displays only when theoriginal identifier is different from the Authid.
Package identifier: This information identifies the package to which the information in this panel applies.Package
The Db2 package name of the active thread. Up to 18 characters of the package name are returned.
Chapter 6. Thread Activity 107
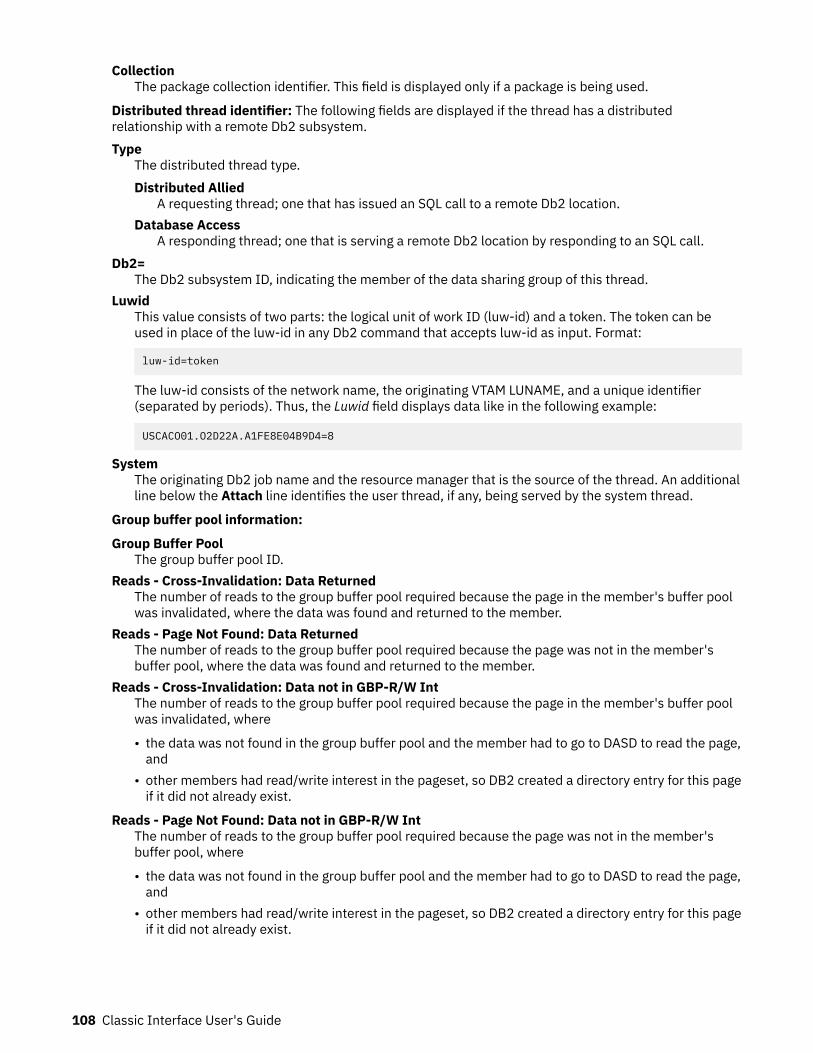
CollectionThe package collection identifier. This field is displayed only if a package is being used.
Distributed thread identifier: The following fields are displayed if the thread has a distributedrelationship with a remote Db2 subsystem.Type
The distributed thread type.Distributed Allied
A requesting thread; one that has issued an SQL call to a remote Db2 location.Database Access
A responding thread; one that is serving a remote Db2 location by responding to an SQL call.Db2=
The Db2 subsystem ID, indicating the member of the data sharing group of this thread.Luwid
This value consists of two parts: the logical unit of work ID (luw-id) and a token. The token can beused in place of the luw-id in any Db2 command that accepts luw-id as input. Format:
luw-id=token
The luw-id consists of the network name, the originating VTAM LUNAME, and a unique identifier(separated by periods). Thus, the Luwid field displays data like in the following example:
USCACO01.O2D22A.A1FE8E04B9D4=8
SystemThe originating Db2 job name and the resource manager that is the source of the thread. An additionalline below the Attach line identifies the user thread, if any, being served by the system thread.
Group buffer pool information:
Group Buffer PoolThe group buffer pool ID.
Reads - Cross-Invalidation: Data ReturnedThe number of reads to the group buffer pool required because the page in the member's buffer poolwas invalidated, where the data was found and returned to the member.
Reads - Page Not Found: Data ReturnedThe number of reads to the group buffer pool required because the page was not in the member'sbuffer pool, where the data was found and returned to the member.
Reads - Cross-Invalidation: Data not in GBP-R/W IntThe number of reads to the group buffer pool required because the page in the member's buffer poolwas invalidated, where
• the data was not found in the group buffer pool and the member had to go to DASD to read the page,and
• other members had read/write interest in the pageset, so DB2 created a directory entry for this pageif it did not already exist.
Reads - Page Not Found: Data not in GBP-R/W IntThe number of reads to the group buffer pool required because the page was not in the member'sbuffer pool, where
• the data was not found in the group buffer pool and the member had to go to DASD to read the page,and
• other members had read/write interest in the pageset, so DB2 created a directory entry for this pageif it did not already exist.
108 Classic Interface User's Guide
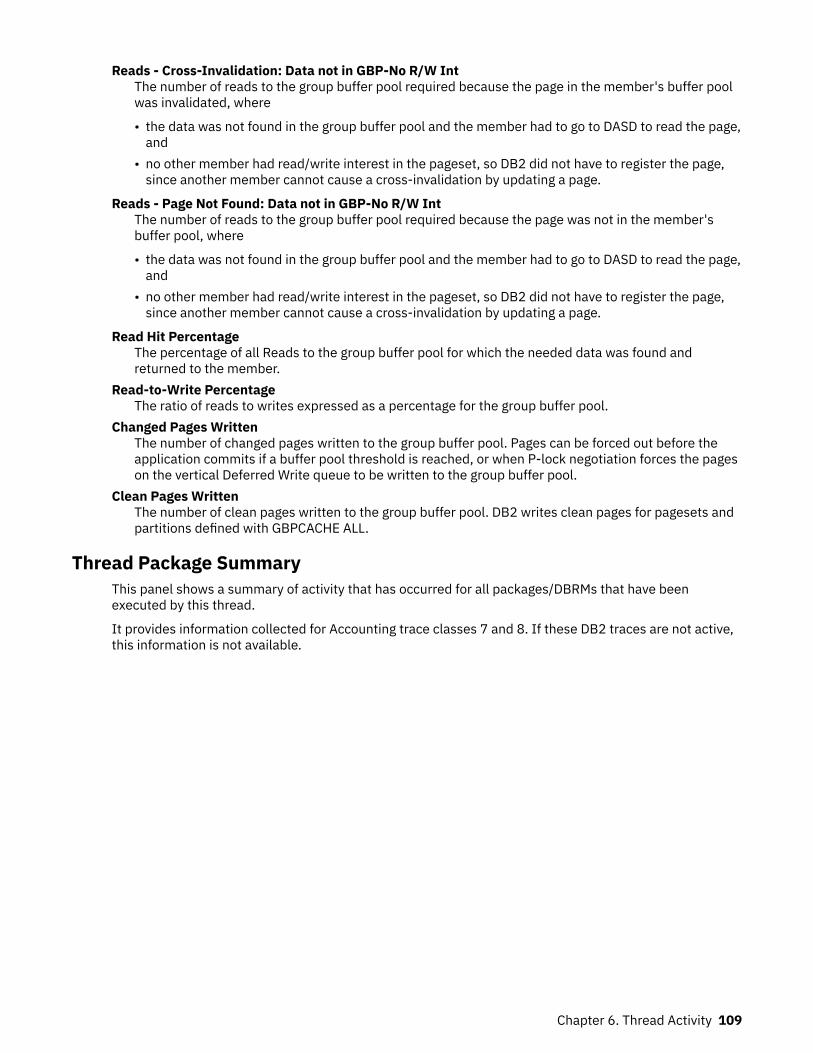
Reads - Cross-Invalidation: Data not in GBP-No R/W IntThe number of reads to the group buffer pool required because the page in the member's buffer poolwas invalidated, where
• the data was not found in the group buffer pool and the member had to go to DASD to read the page,and
• no other member had read/write interest in the pageset, so DB2 did not have to register the page,since another member cannot cause a cross-invalidation by updating a page.
Reads - Page Not Found: Data not in GBP-No R/W IntThe number of reads to the group buffer pool required because the page was not in the member'sbuffer pool, where
• the data was not found in the group buffer pool and the member had to go to DASD to read the page,and
• no other member had read/write interest in the pageset, so DB2 did not have to register the page,since another member cannot cause a cross-invalidation by updating a page.
Read Hit PercentageThe percentage of all Reads to the group buffer pool for which the needed data was found andreturned to the member.
Read-to-Write PercentageThe ratio of reads to writes expressed as a percentage for the group buffer pool.
Changed Pages WrittenThe number of changed pages written to the group buffer pool. Pages can be forced out before theapplication commits if a buffer pool threshold is reached, or when P-lock negotiation forces the pageson the vertical Deferred Write queue to be written to the group buffer pool.
Clean Pages WrittenThe number of clean pages written to the group buffer pool. DB2 writes clean pages for pagesets andpartitions defined with GBPCACHE ALL.
Thread Package SummaryThis panel shows a summary of activity that has occurred for all packages/DBRMs that have beenexecuted by this thread.
It provides information collected for Accounting trace classes 7 and 8. If these DB2 traces are not active,this information is not available.
Chapter 6. Thread Activity 109
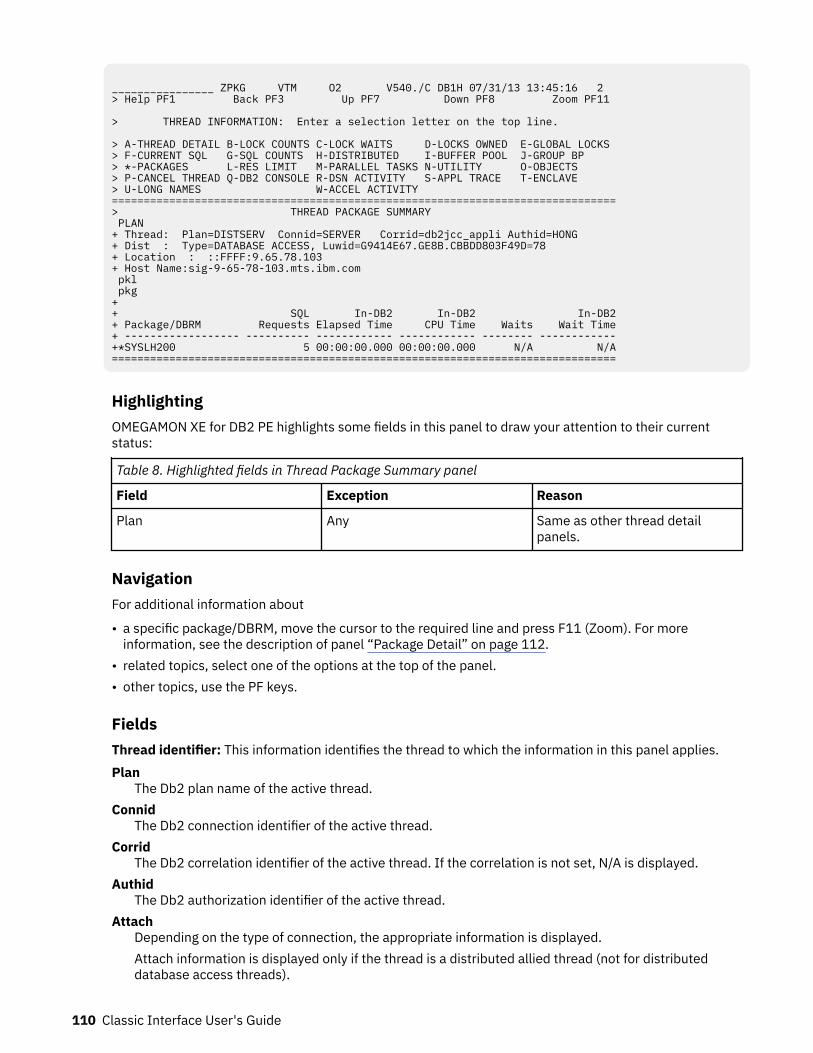
________________ ZPKG VTM O2 V540./C DB1H 07/31/13 13:45:16 2 > Help PF1 Back PF3 Up PF7 Down PF8 Zoom PF11 > THREAD INFORMATION: Enter a selection letter on the top line. > A-THREAD DETAIL B-LOCK COUNTS C-LOCK WAITS D-LOCKS OWNED E-GLOBAL LOCKS > F-CURRENT SQL G-SQL COUNTS H-DISTRIBUTED I-BUFFER POOL J-GROUP BP > *-PACKAGES L-RES LIMIT M-PARALLEL TASKS N-UTILITY O-OBJECTS > P-CANCEL THREAD Q-DB2 CONSOLE R-DSN ACTIVITY S-APPL TRACE T-ENCLAVE > U-LONG NAMES W-ACCEL ACTIVITY =============================================================================== > THREAD PACKAGE SUMMARY PLAN + Thread: Plan=DISTSERV Connid=SERVER Corrid=db2jcc_appli Authid=HONG + Dist : Type=DATABASE ACCESS, Luwid=G9414E67.GE8B.CBBDD803F49D=78 + Location : ::FFFF:9.65.78.103 + Host Name:sig-9-65-78-103.mts.ibm.com pkl pkg + + SQL In-DB2 In-DB2 In-DB2 + Package/DBRM Requests Elapsed Time CPU Time Waits Wait Time + ------------------ ---------- ------------ ------------ -------- ------------ +*SYSLH200 5 00:00:00.000 00:00:00.000 N/A N/A ===============================================================================
HighlightingOMEGAMON XE for DB2 PE highlights some fields in this panel to draw your attention to their currentstatus:
Table 8. Highlighted fields in Thread Package Summary panel
Field Exception Reason
Plan Any Same as other thread detailpanels.
NavigationFor additional information about
• a specific package/DBRM, move the cursor to the required line and press F11 (Zoom). For moreinformation, see the description of panel “Package Detail” on page 112.
• related topics, select one of the options at the top of the panel.• other topics, use the PF keys.
FieldsThread identifier: This information identifies the thread to which the information in this panel applies.Plan
The Db2 plan name of the active thread.Connid
The Db2 connection identifier of the active thread.Corrid
The Db2 correlation identifier of the active thread. If the correlation is not set, N/A is displayed.Authid
The Db2 authorization identifier of the active thread.Attach
Depending on the type of connection, the appropriate information is displayed.Attach information is displayed only if the thread is a distributed allied thread (not for distributeddatabase access threads).
110 Classic Interface User's Guide
Connection TypeBatch
The MVS jobname and ASID.
Note: For threads from remote Db2, the MVS job name is N/A.
CICSThe CICS jobname, task name, task number, terminal ID, and thread type. The thread type is:Pool
The thread in use is a pool thread.Entry
The thread in use is a nonprotected entry thread.Prot
The thread in use is a protected thread. Protected threads are defined in an RCT entrydefinition using the THRDS operand.
IMSThe IMS region number, transaction name, region name, and terminal ID (LTERM).
RRSAFThe MVS job name and ASID.
Note: For threads from remote Db2, the MVS job name is N/A.
SystemThe originating Db2 job name and the resource manager that is the source of the thread. Anadditional line below the Attach line identifies the user thread, if any, being served by the systemthread.
TSOThe TSO user ID and region ASID.
UtilityNo additional information.
Db2The Db2 subsystem identifier.
MVSThe MVS system identifier.
ORIGAUTHThe original (primary) Db2 authorization identifier of the thread. This field displays only when theoriginal identifier is different from the Authid.
Package identifier: This information identifies the package to which the information in this panel applies.Package
The Db2 package name of the active thread. Up to 18 characters of the package name are returned.Collection
The package collection identifier. This field is displayed only if a package is being used.
Distributed thread identifier: The following fields are displayed when the thread has a distributedrelationship with a remote DB2 subsystem.
TypeThe distributed thread type.Distributed Allied
A requesting thread; one that has issued an SQL call to a remote DB2 location.Database Access
A responding thread; one that is serving a remote DB2 location by responding to an SQL call.
Chapter 6. Thread Activity 111
LuwidThis value consists of two parts: the logical unit-of-work ID (luw-id) and a token. The token can beused in place of the luw-id in any DB2 command that accepts luw-id as input. Format:
luw-id=token
The luw-id consists of the network name, the originating VTAM LUNAME, and a unique identifier(separated by periods). Thus, the Luwid field displays data such as the following:
USCACO01.O2D22A.A1FE8E04B9D4=8
Package list: For each entry in the package list, the display indicates the location, collection, and packagethat were bound into the plan.
LocationThe name of the location where the package was bound. For remote packages, times displayedrepresent the time spent locally to execute the remote package.
CollectionThe package collection identifier. This field is displayed only if a package is being used.
PackageThe Db2 package name of the active thread. Up to 18 characters of the package name are returned.
Package/DBRM information:Program
Program filtering input field. You can enter a specific package or DBRM that you want to display in thepanel. You can use wildcard characters in this field. For example, enter DSNESM* to display allpackages or DBRMs that begin with DSNESM.
Package/DBRMThe name of the program for which data is reported. Up to 18 characters of the package name arereturned. An asterisk (*) is displayed after the program name of the last executed program.
SQL RequestsThe number of SQL statements issued in this package or DBRM.
Total Elapsed TimeThe total elapsed time while executing in this package or DBRM. This field requires an Accountingtrace class 7. If this trace is not active, N/A is displayed.
Total CPU TimeThe total CPU time used while executing in this package or DBRM. This field requires an Accountingtrace class 7. If this trace is not active, N/A is displayed.
WaitsThe total number of times that the thread had to wait for a class 8 event to complete while executingin this package or DBRM. This field requires an Accounting trace class 8. If this trace is not active, N/Ais displayed.
Total Wait TimeThe total time spent waiting for a class 8 event to complete while executing in this package or DBRM.This field requires an Accounting trace class 8. If this trace is not active, N/A is displayed.
Package DetailThis panel provides detailed information about the activity that has occurred for specific packages/DBRMsthat have been executed by a particular thread.
It provides information collected for accounting classes 7 and 8. If these DB2 traces are not active, thisinformation is not available.
112 Classic Interface User's Guide
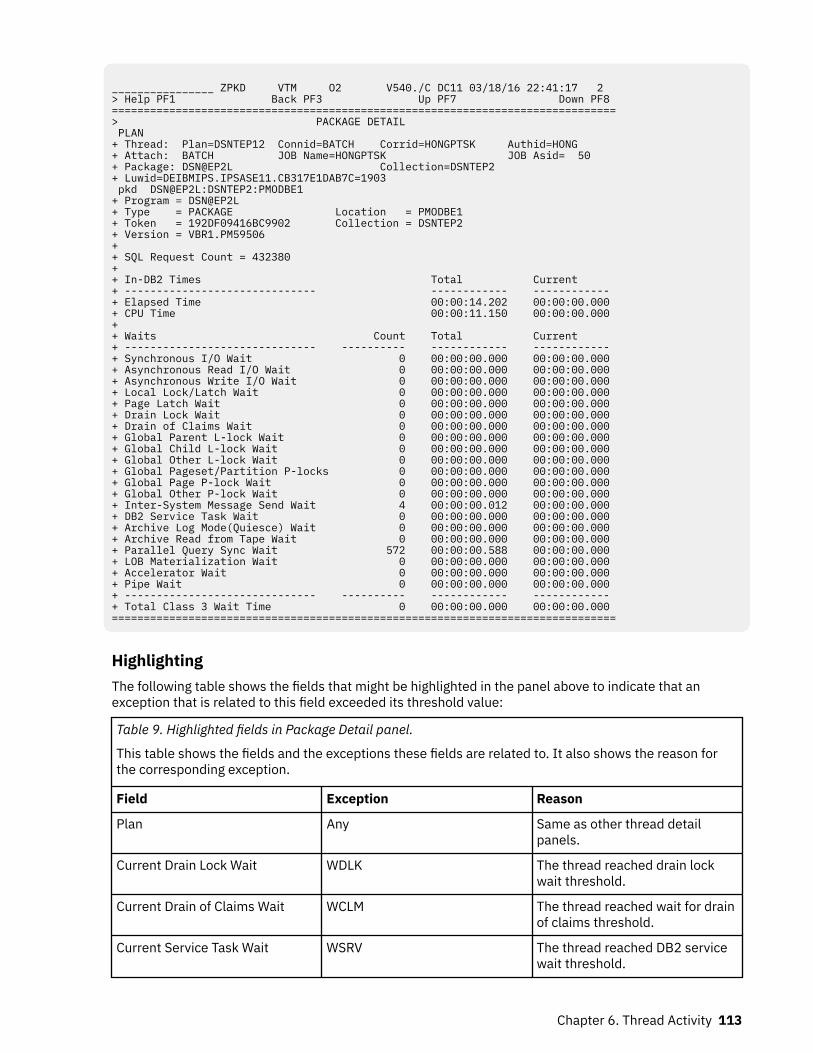
________________ ZPKD VTM O2 V540./C DC11 03/18/16 22:41:17 2 > Help PF1 Back PF3 Up PF7 Down PF8 ===============================================================================> PACKAGE DETAIL PLAN + Thread: Plan=DSNTEP12 Connid=BATCH Corrid=HONGPTSK Authid=HONG + Attach: BATCH JOB Name=HONGPTSK JOB Asid= 50 + Package: DSN@EP2L Collection=DSNTEP2 + Luwid=DEIBMIPS.IPSASE11.CB317E1DAB7C=1903 pkd DSN@EP2L:DSNTEP2:PMODBE1 + Program = DSN@EP2L + Type = PACKAGE Location = PMODBE1 + Token = 192DF09416BC9902 Collection = DSNTEP2 + Version = VBR1.PM59506 + + SQL Request Count = 432380 + + In-DB2 Times Total Current + ------------------------------ ------------ ------------ + Elapsed Time 00:00:14.202 00:00:00.000 + CPU Time 00:00:11.150 00:00:00.000 + + Waits Count Total Current + ------------------------------ ---------- ------------ ------------ + Synchronous I/O Wait 0 00:00:00.000 00:00:00.000 + Asynchronous Read I/O Wait 0 00:00:00.000 00:00:00.000 + Asynchronous Write I/O Wait 0 00:00:00.000 00:00:00.000 + Local Lock/Latch Wait 0 00:00:00.000 00:00:00.000 + Page Latch Wait 0 00:00:00.000 00:00:00.000 + Drain Lock Wait 0 00:00:00.000 00:00:00.000 + Drain of Claims Wait 0 00:00:00.000 00:00:00.000 + Global Parent L-lock Wait 0 00:00:00.000 00:00:00.000+ Global Child L-lock Wait 0 00:00:00.000 00:00:00.000+ Global Other L-lock Wait 0 00:00:00.000 00:00:00.000+ Global Pageset/Partition P-locks 0 00:00:00.000 00:00:00.000+ Global Page P-lock Wait 0 00:00:00.000 00:00:00.000+ Global Other P-lock Wait 0 00:00:00.000 00:00:00.000+ Inter-System Message Send Wait 4 00:00:00.012 00:00:00.000 + DB2 Service Task Wait 0 00:00:00.000 00:00:00.000 + Archive Log Mode(Quiesce) Wait 0 00:00:00.000 00:00:00.000 + Archive Read from Tape Wait 0 00:00:00.000 00:00:00.000+ Parallel Query Sync Wait 572 00:00:00.588 00:00:00.000 + LOB Materialization Wait 0 00:00:00.000 00:00:00.000+ Accelerator Wait 0 00:00:00.000 00:00:00.000+ Pipe Wait 0 00:00:00.000 00:00:00.000 + ------------------------------ ---------- ------------ ------------ + Total Class 3 Wait Time 0 00:00:00.000 00:00:00.000===============================================================================
HighlightingThe following table shows the fields that might be highlighted in the panel above to indicate that anexception that is related to this field exceeded its threshold value:
Table 9. Highlighted fields in Package Detail panel.
This table shows the fields and the exceptions these fields are related to. It also shows the reason forthe corresponding exception.
Field Exception Reason
Plan Any Same as other thread detailpanels.
Current Drain Lock Wait WDLK The thread reached drain lockwait threshold.
Current Drain of Claims Wait WCLM The thread reached wait for drainof claims threshold.
Current Service Task Wait WSRV The thread reached DB2 servicewait threshold.
Chapter 6. Thread Activity 113
Table 9. Highlighted fields in Package Detail panel.
This table shows the fields and the exceptions these fields are related to. It also shows the reason forthe corresponding exception.
(continued)
Field Exception Reason
Current Archive Log Mode(Quiesce) Wait
WLGQ The thread reached ARCHIVELOG MODE(QUIESCE) waitthreshold.
Current Stored ProcedureSchedule Wait
WSPS The thread reached the wait forstored procedure schedulethreshold.
Current Global Lock Wait WGLK The thread reached the globallock wait threshold.
NavigationTo return to the Thread Package Summary panel, press F3.
FieldsThread identifier: This information identifies the thread to which the information in this panel applies.Plan
The Db2 plan name of the active thread.Connid
The Db2 connection identifier of the active thread.Corrid
The Db2 correlation identifier of the active thread. If the correlation is not set, N/A is displayed.Authid
The Db2 authorization identifier of the active thread.Attach
Depending on the type of connection, the appropriate information is displayed.Attach information is displayed only if the thread is a distributed allied thread (not for distributeddatabase access threads).
Connection TypeBatch
The MVS jobname and ASID.
Note: For threads from remote Db2, the MVS job name is N/A.
CICSThe CICS jobname, task name, task number, terminal ID, and thread type. The thread type is:Pool
The thread in use is a pool thread.Entry
The thread in use is a nonprotected entry thread.Prot
The thread in use is a protected thread. Protected threads are defined in an RCT entrydefinition using the THRDS operand.
IMSThe IMS region number, transaction name, region name, and terminal ID (LTERM).
114 Classic Interface User's Guide
RRSAFThe MVS job name and ASID.
Note: For threads from remote Db2, the MVS job name is N/A.
SystemThe originating Db2 job name and the resource manager that is the source of the thread. Anadditional line below the Attach line identifies the user thread, if any, being served by the systemthread.
TSOThe TSO user ID and region ASID.
UtilityNo additional information.
Db2The Db2 subsystem identifier.
MVSThe MVS system identifier.
ORIGAUTHThe original (primary) Db2 authorization identifier of the thread. This field displays only when theoriginal identifier is different from the Authid.
Package identifier: This information identifies the package to which the information in this panel applies.Package
The Db2 package name of the active thread. Up to 18 characters of the package name are returned.Collection
The package collection identifier. This field is displayed only if a package is being used.
Distributed thread identifier: The following fields are displayed if the thread has a distributedrelationship with a remote Db2 subsystem.Type
The distributed thread type.Distributed Allied
A requesting thread; one that has issued an SQL call to a remote Db2 location.Database Access
A responding thread; one that is serving a remote Db2 location by responding to an SQL call.Db2=
The Db2 subsystem ID, indicating the member of the data sharing group of this thread.Luwid
This value consists of two parts: the logical unit of work ID (luw-id) and a token. The token can beused in place of the luw-id in any Db2 command that accepts luw-id as input. Format:
luw-id=token
The luw-id consists of the network name, the originating VTAM LUNAME, and a unique identifier(separated by periods). Thus, the Luwid field displays data like in the following example:
USCACO01.O2D22A.A1FE8E04B9D4=8
SystemThe originating Db2 job name and the resource manager that is the source of the thread. An additionalline below the Attach line identifies the user thread, if any, being served by the system thread.
Package information:Program
The program name for which data is reported. Up to 18 characters of the package name are returned.
Chapter 6. Thread Activity 115
TypeThe program type can be:
• PACKAGE• DBRM• PACKAGE-STORPROC, which means that the program is a package that was loaded by a stored
procedure.
LocationThe name of the location where the package is executed. For remote packages, times displayedrepresent the time spent locally to execute the remote package.
TokenThe consistency token.
CollectionThe package collection ID. This field is displayed only if the program type is PACKAGE.
SQL Request CountThe number of SQL statements issued. All DCL, DDL, and DML SQL statements as well as someStatistic Counters from DSNDQXST are included. COMMIT and ROLLBACK/ABORT are not included.
In-DB2 Times: In-DB2 times require an Accounting trace class 7. If this trace is not active, N/A isdisplayed.In-DB2 elapsed time
The elapsed time while processing this package or DBRM:Total
The total time the thread spends processing this package or DBRM.Current
The total time spent processing the currently active SQL statement.In-DB2 CPU time
The CPU time spent processing this package or DBRM.Total
The total time the thread spends processing this package or DBRM.Current
The total time spent processing the currently active SQL statement.
Waits: Wait times require an Accounting trace class 8. If this trace is not active, N/A is displayed. Thefollowing Statistics information is provided for each field described below:Count
The total number of waits.Total
The total wait time.Current
The elapsed time waiting for the current event to complete.
Synchronous I/O WaitWaits for synchronous I/O reads or writes.
Asynchronous Read I/O WaitWaits for Read I/O performed under another thread (for example, list or Sequential Prefetch).
Asynchronous Write I/O WaitWaits for Write I/O performed under another thread (for example, deferred writes).
Local Lock/Latch WaitWaits for locks or latches.
Page Latch WaitWaits for page latch.
116 Classic Interface User's Guide
Drain Lock WaitWaits to acquire drain lock.
Drain of Claims WaitWaits for claims to be released after acquiring drain lock.
Global Lock WaitWaits for global locks in a data sharing environment.
Global Parent L-Lock WaitWaits for global parent L-locks in a data sharing environment.
Global Child L-Locks (QWACAWTK QWACARNK)Waits because of global contention for child L-locks.
Global Other L-Locks (QWACAWTM QWACARNM)Waits because of global contention for other L-locks.
Global Pageset/Partition P-Locks (QWACAWTN QWACARNN)Waits because of global contention for Pageset/Partition P-locks.
Global Page P-Locks (QWACAQTO QWACARNO)Waits because of global contention for Page P-locks.
Global Other P-Locks (QWACAQTQ QWACARNQ)Waits because of global contention for other P-locks.
Inter-System Message Send WaitWaits for sending messages to other members in the data sharing group.
DB2 Service Task WaitWaits for DB2 services. The following types of DB2 services are included:
• Open/close of data set• DFHSM recall of a data set• SYSLGRNG update• Define/extend/delete of data set• Commit phase 2 for read only threads.
Starting from DB2 11, waits that are associated with autonomous procedures are also included.Archive Log Mode(Quiesce) Wait
Wait for ARCHIVE LOG MODE(QUIESCE) command to complete.Archive Read from Tape Wait
Waits for read of archive log from tape.Current I/O Wait Resource
If the thread is currently waiting for an I/O to complete, the resource will be identified here.Parallel Query Sync Wait (QPAC_PQS_WAIT QPAC_PQS_COUNT)
The amount of waits after parallel query processing suspended waiting for parent/child to besynchronized.This applies to DB2 11 and higher.
LOB Materialization Wait (QPACALBW QPACALBC)Waits for TCP/IP LOB and XML materialization.
Accelerator Wait (QWACAACW QPACAACC)The accumulated wait time for requests to an accelerator. DB2 11 and later.
Pipe Wait (QOAC_PIPE_WAIT QPAC_PIPEWAIT_COUNT)The accumulated wait time for a pipe while this package is being executed. DB2 12 and later.
Total Class 3 Wait TimeThe total class 3 wait time.
Chapter 6. Thread Activity 117
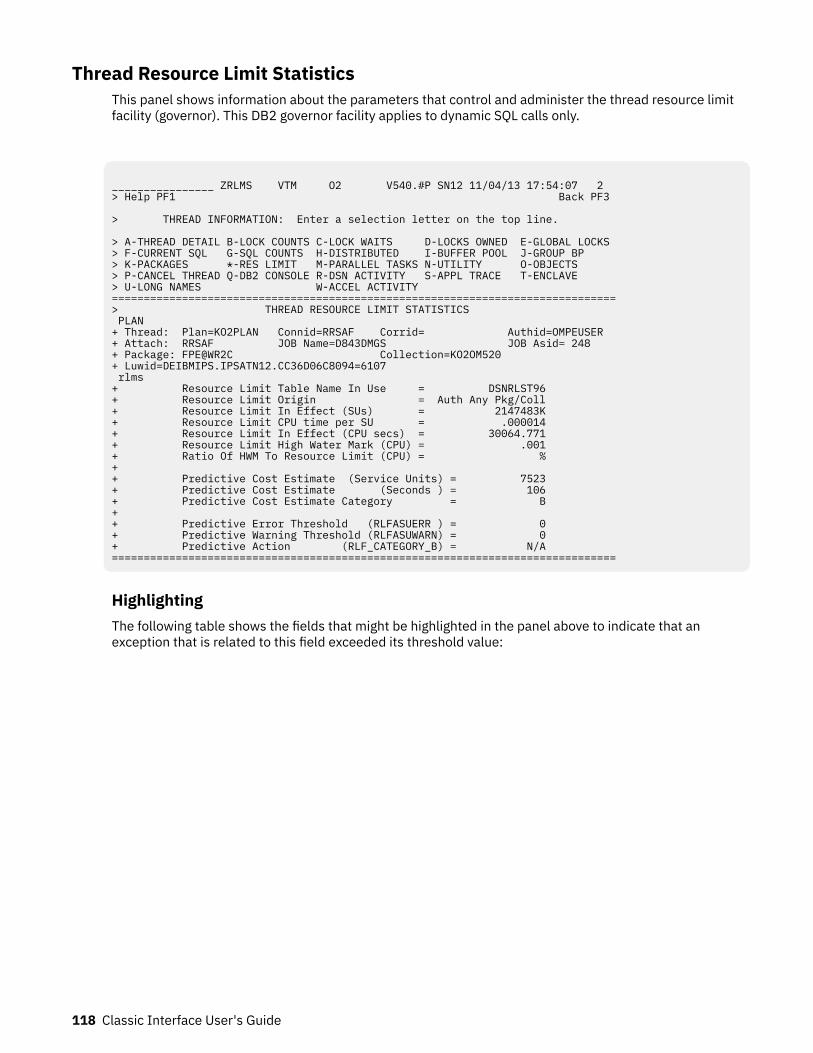
Thread Resource Limit StatisticsThis panel shows information about the parameters that control and administer the thread resource limitfacility (governor). This DB2 governor facility applies to dynamic SQL calls only.
________________ ZRLMS VTM O2 V540.#P SN12 11/04/13 17:54:07 2 > Help PF1 Back PF3 > THREAD INFORMATION: Enter a selection letter on the top line. > A-THREAD DETAIL B-LOCK COUNTS C-LOCK WAITS D-LOCKS OWNED E-GLOBAL LOCKS > F-CURRENT SQL G-SQL COUNTS H-DISTRIBUTED I-BUFFER POOL J-GROUP BP > K-PACKAGES *-RES LIMIT M-PARALLEL TASKS N-UTILITY O-OBJECTS > P-CANCEL THREAD Q-DB2 CONSOLE R-DSN ACTIVITY S-APPL TRACE T-ENCLAVE > U-LONG NAMES W-ACCEL ACTIVITY ===============================================================================> THREAD RESOURCE LIMIT STATISTICS PLAN + Thread: Plan=KO2PLAN Connid=RRSAF Corrid= Authid=OMPEUSER + Attach: RRSAF JOB Name=D843DMGS JOB Asid= 248 + Package: FPE@WR2C Collection=KO2OM520 + Luwid=DEIBMIPS.IPSATN12.CC36D06C8094=6107 rlms + Resource Limit Table Name In Use = DSNRLST96 + Resource Limit Origin = Auth Any Pkg/Coll + Resource Limit In Effect (SUs) = 2147483K + Resource Limit CPU time per SU = .000014 + Resource Limit In Effect (CPU secs) = 30064.771 + Resource Limit High Water Mark (CPU) = .001 + Ratio Of HWM To Resource Limit (CPU) = % + + Predictive Cost Estimate (Service Units) = 7523 + Predictive Cost Estimate (Seconds ) = 106 + Predictive Cost Estimate Category = B + + Predictive Error Threshold (RLFASUERR ) = 0 + Predictive Warning Threshold (RLFASUWARN) = 0 + Predictive Action (RLF_CATEGORY_B) = N/A ===============================================================================
HighlightingThe following table shows the fields that might be highlighted in the panel above to indicate that anexception that is related to this field exceeded its threshold value:
118 Classic Interface User's Guide
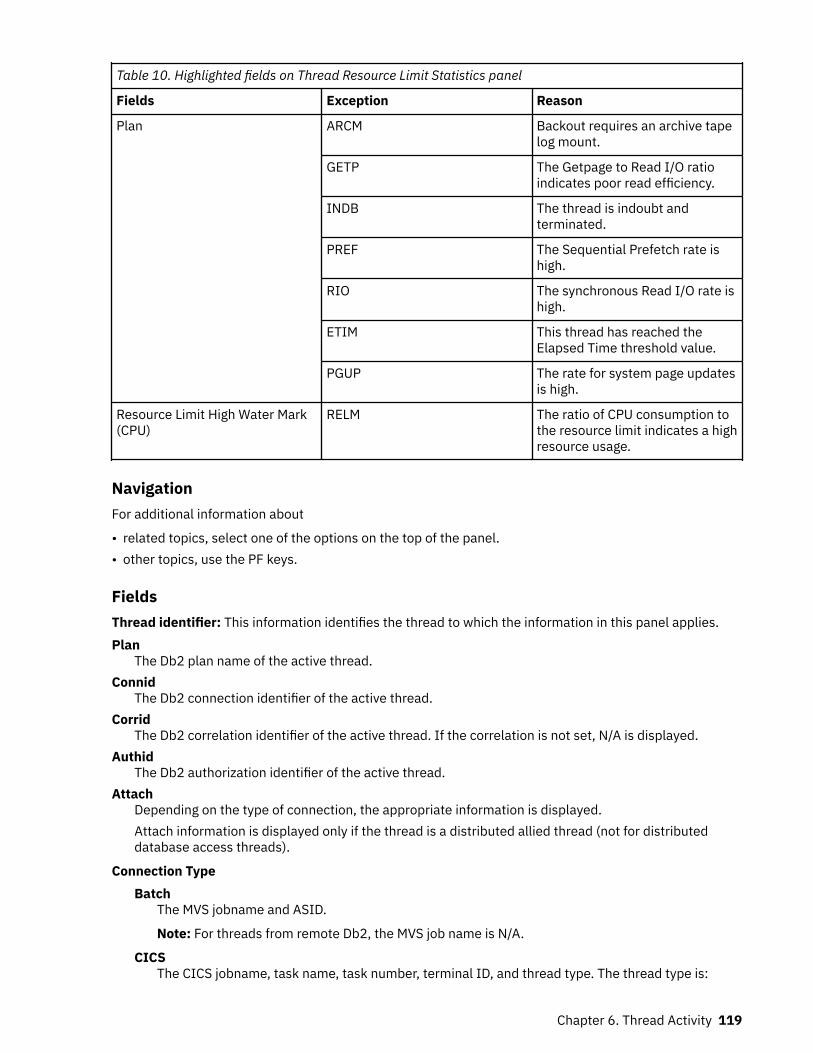
Table 10. Highlighted fields on Thread Resource Limit Statistics panel
Fields Exception Reason
Plan ARCM Backout requires an archive tapelog mount.
GETP The Getpage to Read I/O ratioindicates poor read efficiency.
INDB The thread is indoubt andterminated.
PREF The Sequential Prefetch rate ishigh.
RIO The synchronous Read I/O rate ishigh.
ETIM This thread has reached theElapsed Time threshold value.
PGUP The rate for system page updatesis high.
Resource Limit High Water Mark(CPU)
RELM The ratio of CPU consumption tothe resource limit indicates a highresource usage.
NavigationFor additional information about
• related topics, select one of the options on the top of the panel.• other topics, use the PF keys.
FieldsThread identifier: This information identifies the thread to which the information in this panel applies.Plan
The Db2 plan name of the active thread.Connid
The Db2 connection identifier of the active thread.Corrid
The Db2 correlation identifier of the active thread. If the correlation is not set, N/A is displayed.Authid
The Db2 authorization identifier of the active thread.Attach
Depending on the type of connection, the appropriate information is displayed.Attach information is displayed only if the thread is a distributed allied thread (not for distributeddatabase access threads).
Connection TypeBatch
The MVS jobname and ASID.
Note: For threads from remote Db2, the MVS job name is N/A.
CICSThe CICS jobname, task name, task number, terminal ID, and thread type. The thread type is:
Chapter 6. Thread Activity 119
PoolThe thread in use is a pool thread.
EntryThe thread in use is a nonprotected entry thread.
ProtThe thread in use is a protected thread. Protected threads are defined in an RCT entrydefinition using the THRDS operand.
IMSThe IMS region number, transaction name, region name, and terminal ID (LTERM).
RRSAFThe MVS job name and ASID.
Note: For threads from remote Db2, the MVS job name is N/A.
SystemThe originating Db2 job name and the resource manager that is the source of the thread. Anadditional line below the Attach line identifies the user thread, if any, being served by the systemthread.
TSOThe TSO user ID and region ASID.
UtilityNo additional information.
Db2The Db2 subsystem identifier.
MVSThe MVS system identifier.
ORIGAUTHThe original (primary) Db2 authorization identifier of the thread. This field displays only when theoriginal identifier is different from the Authid.
Package identifier: This information identifies the package to which the information in this panel applies.Package
The Db2 package name of the active thread. Up to 18 characters of the package name are returned.Collection
The package collection identifier. This field is displayed only if a package is being used.
Distributed thread identifier: The following fields are displayed when the thread has a distributedrelationship with a remote DB2 subsystem.Type
The distributed thread type.Distributed Allied
A requesting thread; one that has issued an SQL call to a remote DB2 location.Database Access
A responding thread; one that is serving a remote DB2 location by responding to an SQL call.Luwid
This value consists of two parts: the logical unit of work ID (luw-id) and a token. The token can beused in place of the luw-id in any DB2 command that accepts luw-id as input. Format:
luw-id=token
120 Classic Interface User's Guide
The luw-id consists of the network name, the originating VTAM LUNAME, and a unique identifier(separated by periods). Thus, the Luwid field displays data such as the following:
USCACO01.O2D22A.A1FE8E04B9D4=8
Resource limit information:Resource Limit Table Name in Use
The name of the DB2 resource limit specification table (RLST) currently in use by the DB2 subsystem.Resource Limit Origin
The origin of the resource limit in effect for this thread, if resource limiting is active. The origin isdetermined by the hierarchical precedence order within the resource limit specification table (RLST).The possible origins are:Auth/Plan
Table entry containing matching authid and plan name.Authid
Table entry containing matching authid, and plan name was blank.Planname
Table entry containing matching plan name, and authid was blank.Blank Entry
Table entry containing blank plan name and authid.Install
No table entry exists; the value in effect was determined from the RLFERR/RLFERRD parameter ofthe DSNZPARM module.
I/O ErrorResource limit table I/O error; the value in effect was determined from the RLFERR/RLFERRDparameter of the DSNZPARM module.
Sysadm/SysoprTable entry is install SYSADM or SYSOPR. No limits apply to these authorization groups.
Auth/Coll/PkgTable entry containing matching authid, collection and package.
Auth Any PkgTable entry containing matching authid and collection, and blank package.
Auth any CollTable entry containing matching authid and package, and blank collection.
Auth Any Pkg/CollTable entry containing matching authid and blank collection and package.
Pkg/Coll Any AuthTable entry containing matching package and collection.
Any Auth/PkgTable entry containing matching collection and blank authid and package.
Any Auth/CollTable entry containing matching package and blank authid and collection.
Any Auth/Coll/PkgTable entry containing blank authid, collection and package.
Resource Limit in Effect (SUs)The resource limit in MVS service units for the thread. Express® DB2 limits in service units. If the originis Sysadm/Sysopr or the ASUTIME parameter is NULL, no limits apply.
Chapter 6. Thread Activity 121
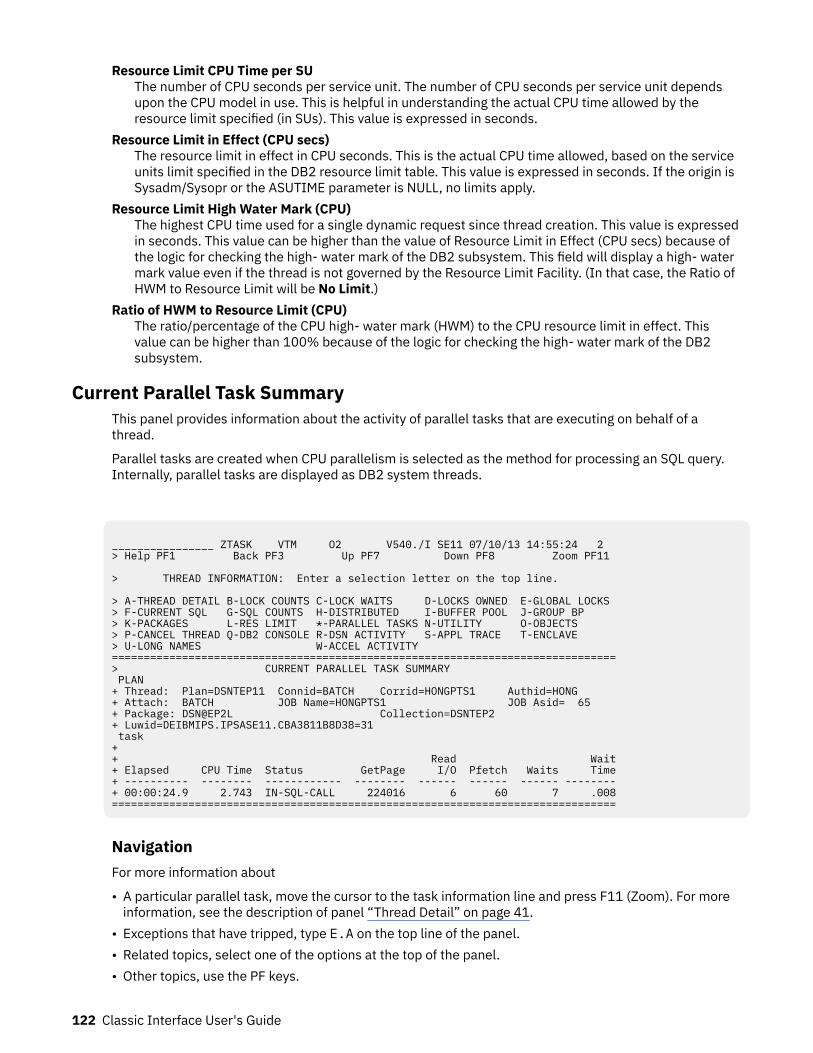
Resource Limit CPU Time per SUThe number of CPU seconds per service unit. The number of CPU seconds per service unit dependsupon the CPU model in use. This is helpful in understanding the actual CPU time allowed by theresource limit specified (in SUs). This value is expressed in seconds.
Resource Limit in Effect (CPU secs)The resource limit in effect in CPU seconds. This is the actual CPU time allowed, based on the serviceunits limit specified in the DB2 resource limit table. This value is expressed in seconds. If the origin isSysadm/Sysopr or the ASUTIME parameter is NULL, no limits apply.
Resource Limit High Water Mark (CPU)The highest CPU time used for a single dynamic request since thread creation. This value is expressedin seconds. This value can be higher than the value of Resource Limit in Effect (CPU secs) because ofthe logic for checking the high- water mark of the DB2 subsystem. This field will display a high- watermark value even if the thread is not governed by the Resource Limit Facility. (In that case, the Ratio ofHWM to Resource Limit will be No Limit.)
Ratio of HWM to Resource Limit (CPU)The ratio/percentage of the CPU high- water mark (HWM) to the CPU resource limit in effect. Thisvalue can be higher than 100% because of the logic for checking the high- water mark of the DB2subsystem.
Current Parallel Task SummaryThis panel provides information about the activity of parallel tasks that are executing on behalf of athread.
Parallel tasks are created when CPU parallelism is selected as the method for processing an SQL query.Internally, parallel tasks are displayed as DB2 system threads.
________________ ZTASK VTM O2 V540./I SE11 07/10/13 14:55:24 2 > Help PF1 Back PF3 Up PF7 Down PF8 Zoom PF11 > THREAD INFORMATION: Enter a selection letter on the top line. > A-THREAD DETAIL B-LOCK COUNTS C-LOCK WAITS D-LOCKS OWNED E-GLOBAL LOCKS > F-CURRENT SQL G-SQL COUNTS H-DISTRIBUTED I-BUFFER POOL J-GROUP BP > K-PACKAGES L-RES LIMIT *-PARALLEL TASKS N-UTILITY O-OBJECTS > P-CANCEL THREAD Q-DB2 CONSOLE R-DSN ACTIVITY S-APPL TRACE T-ENCLAVE > U-LONG NAMES W-ACCEL ACTIVITY =============================================================================== > CURRENT PARALLEL TASK SUMMARY PLAN + Thread: Plan=DSNTEP11 Connid=BATCH Corrid=HONGPTS1 Authid=HONG + Attach: BATCH JOB Name=HONGPTS1 JOB Asid= 65 + Package: DSN@EP2L Collection=DSNTEP2 + Luwid=DEIBMIPS.IPSASE11.CBA3811B8D38=31 task + + Read Wait + Elapsed CPU Time Status GetPage I/O Pfetch Waits Time + ---------- -------- ------------ -------- ------ ------ ------ -------- + 00:00:24.9 2.743 IN-SQL-CALL 224016 6 60 7 .008 ===============================================================================
NavigationFor more information about
• A particular parallel task, move the cursor to the task information line and press F11 (Zoom). For moreinformation, see the description of panel “Thread Detail” on page 41.
• Exceptions that have tripped, type E.A on the top line of the panel.• Related topics, select one of the options at the top of the panel.• Other topics, use the PF keys.
122 Classic Interface User's Guide

FieldsThread identifier: This information identifies the thread to which the information in this panel applies.Plan
The Db2 plan name of the active thread.Connid
The Db2 connection identifier of the active thread.Corrid
The Db2 correlation identifier of the active thread. If the correlation is not set, N/A is displayed.Authid
The Db2 authorization identifier of the active thread.Attach
Depending on the type of connection, the appropriate information is displayed.Attach information is displayed only if the thread is a distributed allied thread (not for distributeddatabase access threads).
Connection TypeBatch
The MVS jobname and ASID.
Note: For threads from remote Db2, the MVS job name is N/A.
CICSThe CICS jobname, task name, task number, terminal ID, and thread type. The thread type is:Pool
The thread in use is a pool thread.Entry
The thread in use is a nonprotected entry thread.Prot
The thread in use is a protected thread. Protected threads are defined in an RCT entrydefinition using the THRDS operand.
IMSThe IMS region number, transaction name, region name, and terminal ID (LTERM).
RRSAFThe MVS job name and ASID.
Note: For threads from remote Db2, the MVS job name is N/A.
SystemThe originating Db2 job name and the resource manager that is the source of the thread. Anadditional line below the Attach line identifies the user thread, if any, being served by the systemthread.
TSOThe TSO user ID and region ASID.
UtilityNo additional information.
Db2The Db2 subsystem identifier.
MVSThe MVS system identifier.
ORIGAUTHThe original (primary) Db2 authorization identifier of the thread. This field displays only when theoriginal identifier is different from the Authid.
Package identifier: This information identifies the package to which the information in this panel applies.
Chapter 6. Thread Activity 123
PackageThe Db2 package name of the active thread. Up to 18 characters of the package name are returned.
CollectionThe package collection identifier. This field is displayed only if a package is being used.
ElapsedThe time elapsed since the parallel task was created. When the task's elapsed time exceeds 24 hours,the format is dd-hh:mm.
CPU TimeThe total central processor CPU time accumulated for the thread. This value includes only MVS TCBtime. SRB time is not included.
StatusThe current DB2 status of the parallel task. For definitions of all possible status values, see "DB2Thread Status".
GetPgThe number of Getpage requests for the parallel task.
Getpage requests are logical Read requests that might not actually result in physical I/O if therequested page is currently in the buffer pool. DB2 resets this count at Create Thread and Signon.
Read I/OThe number of synchronous Read I/O requests.
PfetchThe number of Sequential, List, and Dynamic Prefetch requests.
WaitsThe total number of times that the parallel task had to wait for a class 3 event to complete. IfAccounting trace class 3 is not active, N/A is displayed.
Wait TimeThe total elapsed time that the parallel task had to wait for a class 3 event to complete.
Utility Detail InformationThis panel provides detailed information about the activity of an individual utility. The informationincludes the relative utility statement position, the contents of the currently executing utility statement,and data specific to a particular utility.
For detailed information about a utility that has been started but not completed because of an abnormaltermination (status UTIL-STOP on the Utility Summary panel), the “Stopped Utility Detail Information” onpage 127 panel is displayed.
124 Classic Interface User's Guide
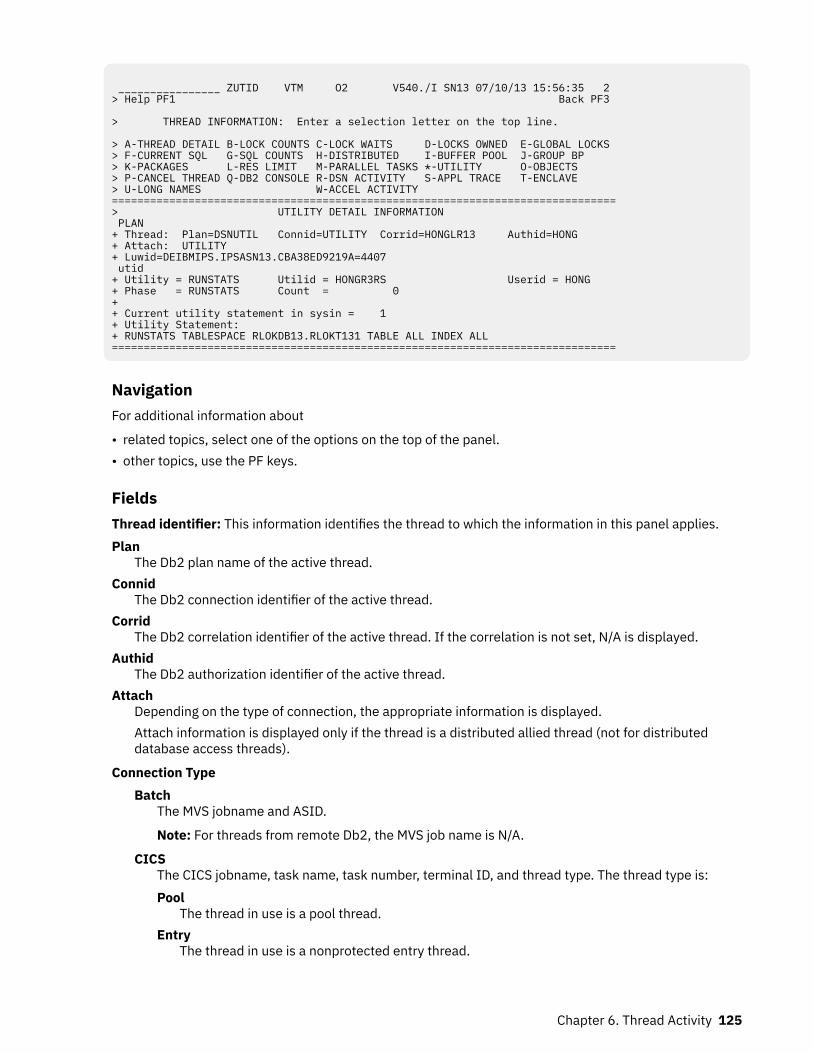
________________ ZUTID VTM O2 V540./I SN13 07/10/13 15:56:35 2 > Help PF1 Back PF3 > THREAD INFORMATION: Enter a selection letter on the top line. > A-THREAD DETAIL B-LOCK COUNTS C-LOCK WAITS D-LOCKS OWNED E-GLOBAL LOCKS > F-CURRENT SQL G-SQL COUNTS H-DISTRIBUTED I-BUFFER POOL J-GROUP BP > K-PACKAGES L-RES LIMIT M-PARALLEL TASKS *-UTILITY O-OBJECTS > P-CANCEL THREAD Q-DB2 CONSOLE R-DSN ACTIVITY S-APPL TRACE T-ENCLAVE > U-LONG NAMES W-ACCEL ACTIVITY =============================================================================== > UTILITY DETAIL INFORMATION PLAN + Thread: Plan=DSNUTIL Connid=UTILITY Corrid=HONGLR13 Authid=HONG + Attach: UTILITY + Luwid=DEIBMIPS.IPSASN13.CBA38ED9219A=4407 utid + Utility = RUNSTATS Utilid = HONGR3RS Userid = HONG + Phase = RUNSTATS Count = 0 + + Current utility statement in sysin = 1 + Utility Statement: + RUNSTATS TABLESPACE RLOKDB13.RLOKT131 TABLE ALL INDEX ALL ===============================================================================
NavigationFor additional information about
• related topics, select one of the options on the top of the panel.• other topics, use the PF keys.
FieldsThread identifier: This information identifies the thread to which the information in this panel applies.Plan
The Db2 plan name of the active thread.Connid
The Db2 connection identifier of the active thread.Corrid
The Db2 correlation identifier of the active thread. If the correlation is not set, N/A is displayed.Authid
The Db2 authorization identifier of the active thread.Attach
Depending on the type of connection, the appropriate information is displayed.Attach information is displayed only if the thread is a distributed allied thread (not for distributeddatabase access threads).
Connection TypeBatch
The MVS jobname and ASID.
Note: For threads from remote Db2, the MVS job name is N/A.
CICSThe CICS jobname, task name, task number, terminal ID, and thread type. The thread type is:Pool
The thread in use is a pool thread.Entry
The thread in use is a nonprotected entry thread.
Chapter 6. Thread Activity 125
ProtThe thread in use is a protected thread. Protected threads are defined in an RCT entrydefinition using the THRDS operand.
IMSThe IMS region number, transaction name, region name, and terminal ID (LTERM).
RRSAFThe MVS job name and ASID.
Note: For threads from remote Db2, the MVS job name is N/A.
SystemThe originating Db2 job name and the resource manager that is the source of the thread. Anadditional line below the Attach line identifies the user thread, if any, being served by the systemthread.
TSOThe TSO user ID and region ASID.
UtilityNo additional information.
Db2The Db2 subsystem identifier.
MVSThe MVS system identifier.
ORIGAUTHThe original (primary) Db2 authorization identifier of the thread. This field displays only when theoriginal identifier is different from the Authid.
Package identifier: This information identifies the package to which the information in this panel applies.Package
The Db2 package name of the active thread. Up to 18 characters of the package name are returned.Collection
The package collection identifier. This field is displayed only if a package is being used.
Utility information:Utility
The name of the DB2 utility.UtilID
The identifier that defines the utility to DB2. Each utility that has been started and is not yetterminated must have a unique utility ID.
UserIDThe authorization ID of the invoker of the DB2 utility.
PhaseThe executing phase of the DB2 utility.
CountThe total number of items (such as records or pages) that have been processed. The type of itemdepends on the utility and its phase.
Share LevelThe share level of the tablespace accessed by utilities. The share level can be exclusive control, shareread access, or share write access.
Output data setThe name of the output data set currently in use. If the utility is not MERGECOPY or COPY, this field isnot displayed.
Input data setThe name of the input data set currently referenced by the utility. If the utility is not LOAD, this field isnot displayed.
126 Classic Interface User's Guide
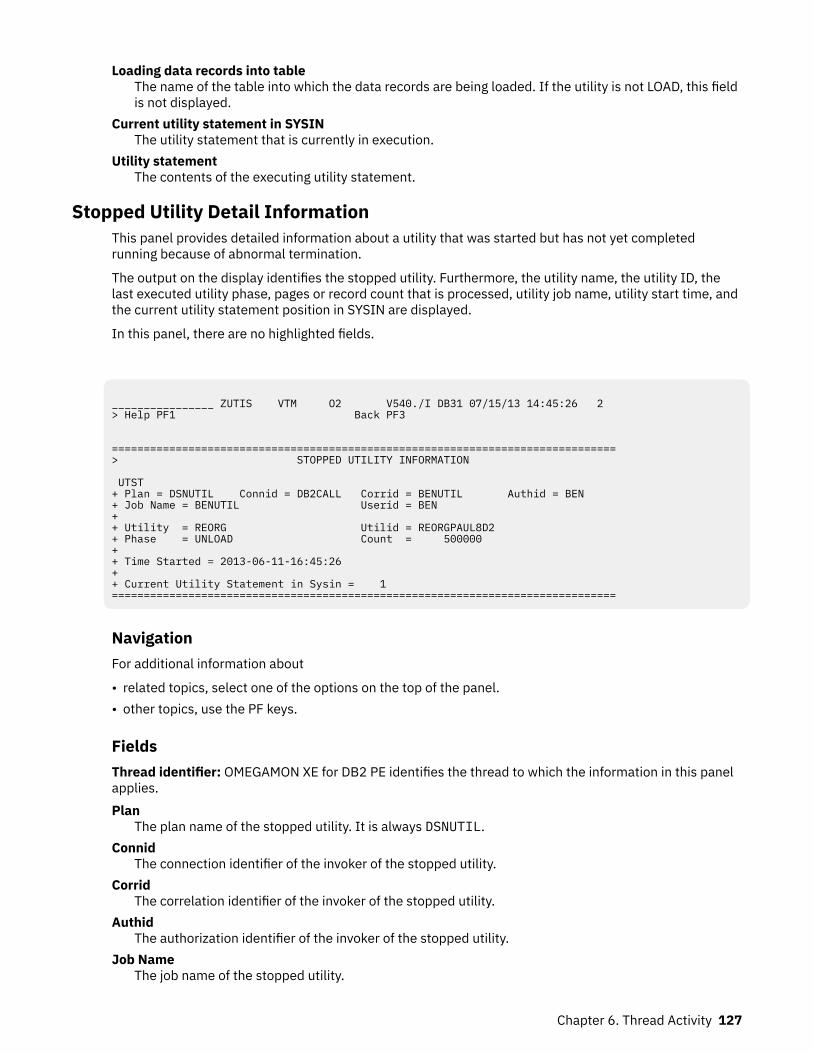
Loading data records into tableThe name of the table into which the data records are being loaded. If the utility is not LOAD, this fieldis not displayed.
Current utility statement in SYSINThe utility statement that is currently in execution.
Utility statementThe contents of the executing utility statement.
Stopped Utility Detail InformationThis panel provides detailed information about a utility that was started but has not yet completedrunning because of abnormal termination.
The output on the display identifies the stopped utility. Furthermore, the utility name, the utility ID, thelast executed utility phase, pages or record count that is processed, utility job name, utility start time, andthe current utility statement position in SYSIN are displayed.
In this panel, there are no highlighted fields.
________________ ZUTIS VTM O2 V540./I DB31 07/15/13 14:45:26 2 > Help PF1 Back PF3 =============================================================================== > STOPPED UTILITY INFORMATION UTST + Plan = DSNUTIL Connid = DB2CALL Corrid = BENUTIL Authid = BEN + Job Name = BENUTIL Userid = BEN + + Utility = REORG Utilid = REORGPAUL8D2 + Phase = UNLOAD Count = 500000 + + Time Started = 2013-06-11-16:45:26 + + Current Utility Statement in Sysin = 1 ===============================================================================
NavigationFor additional information about
• related topics, select one of the options on the top of the panel.• other topics, use the PF keys.
FieldsThread identifier: OMEGAMON XE for DB2 PE identifies the thread to which the information in this panelapplies.Plan
The plan name of the stopped utility. It is always DSNUTIL.Connid
The connection identifier of the invoker of the stopped utility.Corrid
The correlation identifier of the invoker of the stopped utility.Authid
The authorization identifier of the invoker of the stopped utility.Job Name
The job name of the stopped utility.
Chapter 6. Thread Activity 127
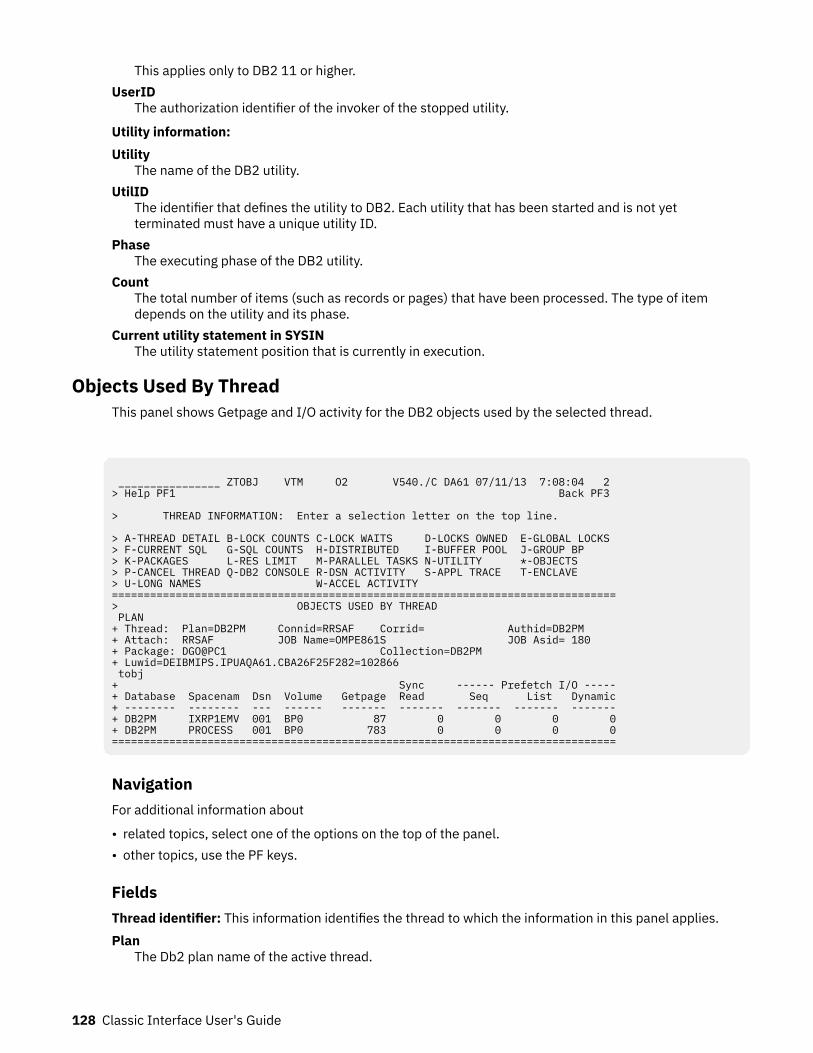
This applies only to DB2 11 or higher.UserID
The authorization identifier of the invoker of the stopped utility.
Utility information:Utility
The name of the DB2 utility.UtilID
The identifier that defines the utility to DB2. Each utility that has been started and is not yetterminated must have a unique utility ID.
PhaseThe executing phase of the DB2 utility.
CountThe total number of items (such as records or pages) that have been processed. The type of itemdepends on the utility and its phase.
Current utility statement in SYSINThe utility statement position that is currently in execution.
Objects Used By ThreadThis panel shows Getpage and I/O activity for the DB2 objects used by the selected thread.
________________ ZTOBJ VTM O2 V540./C DA61 07/11/13 7:08:04 2 > Help PF1 Back PF3 > THREAD INFORMATION: Enter a selection letter on the top line. > A-THREAD DETAIL B-LOCK COUNTS C-LOCK WAITS D-LOCKS OWNED E-GLOBAL LOCKS > F-CURRENT SQL G-SQL COUNTS H-DISTRIBUTED I-BUFFER POOL J-GROUP BP > K-PACKAGES L-RES LIMIT M-PARALLEL TASKS N-UTILITY *-OBJECTS > P-CANCEL THREAD Q-DB2 CONSOLE R-DSN ACTIVITY S-APPL TRACE T-ENCLAVE > U-LONG NAMES W-ACCEL ACTIVITY =============================================================================== > OBJECTS USED BY THREAD PLAN + Thread: Plan=DB2PM Connid=RRSAF Corrid= Authid=DB2PM + Attach: RRSAF JOB Name=OMPE861S JOB Asid= 180 + Package: DGO@PC1 Collection=DB2PM + Luwid=DEIBMIPS.IPUAQA61.CBA26F25F282=102866 tobj + Sync ------ Prefetch I/O ----- + Database Spacenam Dsn Volume Getpage Read Seq List Dynamic + -------- -------- --- ------ ------- ------- ------- ------- ------- + DB2PM IXRP1EMV 001 BP0 87 0 0 0 0 + DB2PM PROCESS 001 BP0 783 0 0 0 0 ===============================================================================
NavigationFor additional information about
• related topics, select one of the options on the top of the panel.• other topics, use the PF keys.
FieldsThread identifier: This information identifies the thread to which the information in this panel applies.Plan
The Db2 plan name of the active thread.
128 Classic Interface User's Guide
ConnidThe Db2 connection identifier of the active thread.
CorridThe Db2 correlation identifier of the active thread. If the correlation is not set, N/A is displayed.
AuthidThe Db2 authorization identifier of the active thread.
AttachDepending on the type of connection, the appropriate information is displayed.Attach information is displayed only if the thread is a distributed allied thread (not for distributeddatabase access threads).
Connection TypeBatch
The MVS jobname and ASID.
Note: For threads from remote Db2, the MVS job name is N/A.
CICSThe CICS jobname, task name, task number, terminal ID, and thread type. The thread type is:Pool
The thread in use is a pool thread.Entry
The thread in use is a nonprotected entry thread.Prot
The thread in use is a protected thread. Protected threads are defined in an RCT entrydefinition using the THRDS operand.
IMSThe IMS region number, transaction name, region name, and terminal ID (LTERM).
RRSAFThe MVS job name and ASID.
Note: For threads from remote Db2, the MVS job name is N/A.
SystemThe originating Db2 job name and the resource manager that is the source of the thread. Anadditional line below the Attach line identifies the user thread, if any, being served by the systemthread.
TSOThe TSO user ID and region ASID.
UtilityNo additional information.
Db2The Db2 subsystem identifier.
MVSThe MVS system identifier.
ORIGAUTHThe original (primary) Db2 authorization identifier of the thread. This field displays only when theoriginal identifier is different from the Authid.
Package identifier: This information identifies the package to which the information in this panel applies.Package
The Db2 package name of the active thread. Up to 18 characters of the package name are returned.Collection
The package collection identifier. This field is displayed only if a package is being used.
Chapter 6. Thread Activity 129
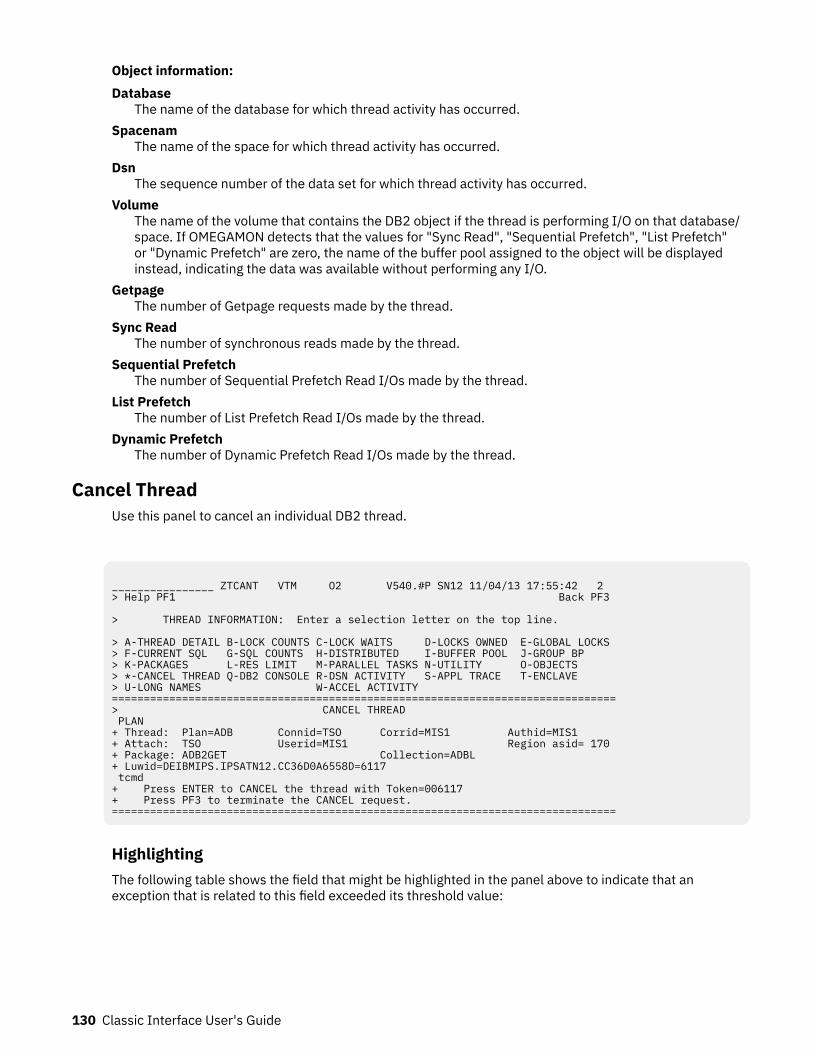
Object information:Database
The name of the database for which thread activity has occurred.Spacenam
The name of the space for which thread activity has occurred.Dsn
The sequence number of the data set for which thread activity has occurred.Volume
The name of the volume that contains the DB2 object if the thread is performing I/O on that database/space. If OMEGAMON detects that the values for "Sync Read", "Sequential Prefetch", "List Prefetch"or "Dynamic Prefetch" are zero, the name of the buffer pool assigned to the object will be displayedinstead, indicating the data was available without performing any I/O.
GetpageThe number of Getpage requests made by the thread.
Sync ReadThe number of synchronous reads made by the thread.
Sequential PrefetchThe number of Sequential Prefetch Read I/Os made by the thread.
List PrefetchThe number of List Prefetch Read I/Os made by the thread.
Dynamic PrefetchThe number of Dynamic Prefetch Read I/Os made by the thread.
Cancel ThreadUse this panel to cancel an individual DB2 thread.
________________ ZTCANT VTM O2 V540.#P SN12 11/04/13 17:55:42 2 > Help PF1 Back PF3 > THREAD INFORMATION: Enter a selection letter on the top line. > A-THREAD DETAIL B-LOCK COUNTS C-LOCK WAITS D-LOCKS OWNED E-GLOBAL LOCKS > F-CURRENT SQL G-SQL COUNTS H-DISTRIBUTED I-BUFFER POOL J-GROUP BP > K-PACKAGES L-RES LIMIT M-PARALLEL TASKS N-UTILITY O-OBJECTS > *-CANCEL THREAD Q-DB2 CONSOLE R-DSN ACTIVITY S-APPL TRACE T-ENCLAVE > U-LONG NAMES W-ACCEL ACTIVITY ===============================================================================> CANCEL THREAD PLAN + Thread: Plan=ADB Connid=TSO Corrid=MIS1 Authid=MIS1 + Attach: TSO Userid=MIS1 Region asid= 170 + Package: ADB2GET Collection=ADBL + Luwid=DEIBMIPS.IPSATN12.CC36D0A6558D=6117 tcmd + Press ENTER to CANCEL the thread with Token=006117 + Press PF3 to terminate the CANCEL request. ===============================================================================
HighlightingThe following table shows the field that might be highlighted in the panel above to indicate that anexception that is related to this field exceeded its threshold value:
130 Classic Interface User's Guide
Table 11. Highlighted fields in Cancel Thread panel.
This table shows the field and the exception this field is related to. It also shows the reason for theexception.
Field Exception Reason
Plan Any Same as other thread detailpanels.
NavigationFor additional information about
• related topics, select one of the options on the top of the panel.• other topics, use the PF keys.
FieldsThread identifier: This information identifies the thread to which the information in this panel applies.Plan
The Db2 plan name of the active thread.Connid
The Db2 connection identifier of the active thread.Corrid
The Db2 correlation identifier of the active thread. If the correlation is not set, N/A is displayed.Authid
The Db2 authorization identifier of the active thread.Attach
Depending on the type of connection, the appropriate information is displayed.Attach information is displayed only if the thread is a distributed allied thread (not for distributeddatabase access threads).
Connection TypeBatch
The MVS jobname and ASID.
Note: For threads from remote Db2, the MVS job name is N/A.
CICSThe CICS jobname, task name, task number, terminal ID, and thread type. The thread type is:Pool
The thread in use is a pool thread.Entry
The thread in use is a nonprotected entry thread.Prot
The thread in use is a protected thread. Protected threads are defined in an RCT entrydefinition using the THRDS operand.
IMSThe IMS region number, transaction name, region name, and terminal ID (LTERM).
RRSAFThe MVS job name and ASID.
Note: For threads from remote Db2, the MVS job name is N/A.
Chapter 6. Thread Activity 131
SystemThe originating Db2 job name and the resource manager that is the source of the thread. Anadditional line below the Attach line identifies the user thread, if any, being served by the systemthread.
TSOThe TSO user ID and region ASID.
UtilityNo additional information.
Db2The Db2 subsystem identifier.
MVSThe MVS system identifier.
ORIGAUTHThe original (primary) Db2 authorization identifier of the thread. This field displays only when theoriginal identifier is different from the Authid.
Package identifier: This information identifies the package to which the information in this panel applies.Package
The Db2 package name of the active thread. Up to 18 characters of the package name are returned.Collection
The package collection identifier. This field is displayed only if a package is being used.
Distributed thread identifier: The following fields are displayed if the thread has a distributedrelationship with a remote Db2 subsystem.Type
The distributed thread type.Distributed Allied
A requesting thread; one that has issued an SQL call to a remote Db2 location.Database Access
A responding thread; one that is serving a remote Db2 location by responding to an SQL call.Db2=
The Db2 subsystem ID, indicating the member of the data sharing group of this thread.Luwid
This value consists of two parts: the logical unit of work ID (luw-id) and a token. The token can beused in place of the luw-id in any Db2 command that accepts luw-id as input. Format:
luw-id=token
The luw-id consists of the network name, the originating VTAM LUNAME, and a unique identifier(separated by periods). Thus, the Luwid field displays data like in the following example:
USCACO01.O2D22A.A1FE8E04B9D4=8
SystemThe originating Db2 job name and the resource manager that is the source of the thread. An additionalline below the Attach line identifies the user thread, if any, being served by the system thread.
Cancel fields:
CANCELThe type of cancel command to be performed. You can specify the following values:TOKEN
The token shown will be used to issue the cancel command:
CANCEL THREAD(token).
132 Classic Interface User's Guide
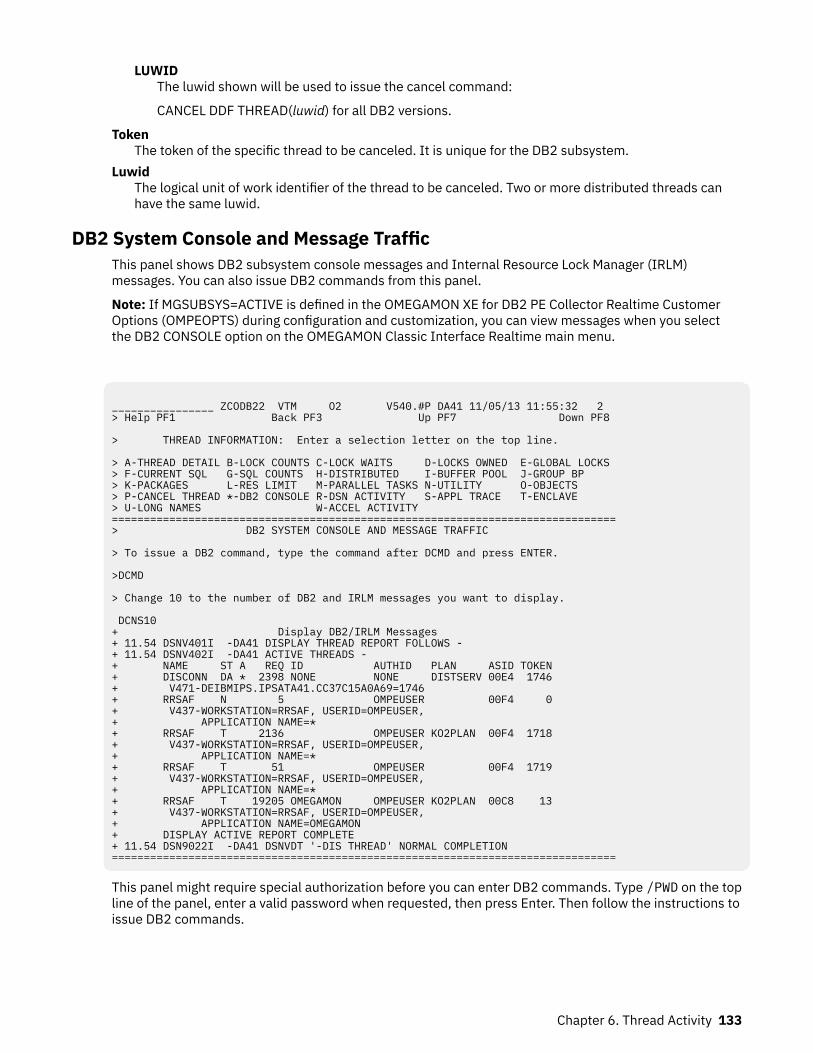
LUWIDThe luwid shown will be used to issue the cancel command:
CANCEL DDF THREAD(luwid) for all DB2 versions.
TokenThe token of the specific thread to be canceled. It is unique for the DB2 subsystem.
LuwidThe logical unit of work identifier of the thread to be canceled. Two or more distributed threads canhave the same luwid.
DB2 System Console and Message TrafficThis panel shows DB2 subsystem console messages and Internal Resource Lock Manager (IRLM)messages. You can also issue DB2 commands from this panel.
Note: If MGSUBSYS=ACTIVE is defined in the OMEGAMON XE for DB2 PE Collector Realtime CustomerOptions (OMPEOPTS) during configuration and customization, you can view messages when you selectthe DB2 CONSOLE option on the OMEGAMON Classic Interface Realtime main menu.
________________ ZCODB22 VTM O2 V540.#P DA41 11/05/13 11:55:32 2 > Help PF1 Back PF3 Up PF7 Down PF8 > THREAD INFORMATION: Enter a selection letter on the top line. > A-THREAD DETAIL B-LOCK COUNTS C-LOCK WAITS D-LOCKS OWNED E-GLOBAL LOCKS > F-CURRENT SQL G-SQL COUNTS H-DISTRIBUTED I-BUFFER POOL J-GROUP BP > K-PACKAGES L-RES LIMIT M-PARALLEL TASKS N-UTILITY O-OBJECTS > P-CANCEL THREAD *-DB2 CONSOLE R-DSN ACTIVITY S-APPL TRACE T-ENCLAVE > U-LONG NAMES W-ACCEL ACTIVITY =============================================================================== > DB2 SYSTEM CONSOLE AND MESSAGE TRAFFIC > To issue a DB2 command, type the command after DCMD and press ENTER. >DCMD > Change 10 to the number of DB2 and IRLM messages you want to display. DCNS10 + Display DB2/IRLM Messages + 11.54 DSNV401I -DA41 DISPLAY THREAD REPORT FOLLOWS - + 11.54 DSNV402I -DA41 ACTIVE THREADS - + NAME ST A REQ ID AUTHID PLAN ASID TOKEN + DISCONN DA * 2398 NONE NONE DISTSERV 00E4 1746 + V471-DEIBMIPS.IPSATA41.CC37C15A0A69=1746 + RRSAF N 5 OMPEUSER 00F4 0 + V437-WORKSTATION=RRSAF, USERID=OMPEUSER, + APPLICATION NAME=* + RRSAF T 2136 OMPEUSER KO2PLAN 00F4 1718 + V437-WORKSTATION=RRSAF, USERID=OMPEUSER, + APPLICATION NAME=* + RRSAF T 51 OMPEUSER 00F4 1719 + V437-WORKSTATION=RRSAF, USERID=OMPEUSER, + APPLICATION NAME=* + RRSAF T 19205 OMEGAMON OMPEUSER KO2PLAN 00C8 13 + V437-WORKSTATION=RRSAF, USERID=OMPEUSER, + APPLICATION NAME=OMEGAMON + DISPLAY ACTIVE REPORT COMPLETE + 11.54 DSN9022I -DA41 DSNVDT '-DIS THREAD' NORMAL COMPLETION ===============================================================================
This panel might require special authorization before you can enter DB2 commands. Type /PWD on the topline of the panel, enter a valid password when requested, then press Enter. Then follow the instructions toissue DB2 commands.
Chapter 6. Thread Activity 133
NavigationFor additional information about
• related topics, select one of the options at the top of the panel.• other topics, use the PF keys.
CommandsDCMD
When you type a DB2 command and press Enter, OMEGAMON XE for DB2 PE displays a message thatindicates whether the command was issued successfully. (Do not include the subsystem recognitioncharacter in the DB2 command. OMEGAMON XE for DB2 PE does this for you automatically.) WhenOMEGAMON XE for DB2 PE executes DCMD, it comments out the DCMD command to preventaccidental re-execution. To issue another DB2 command, replace the comment character (>) with ahyphen (-) and enter the command as described before.
DCNS10Displays the last nn DB2 and IRLM messages. In this case, it displays the last 10 messages.
Data Sets Used by ThreadThis panel shows data set I/O activity for the DB2 objects used by the selected thread.
134 Classic Interface User's Guide
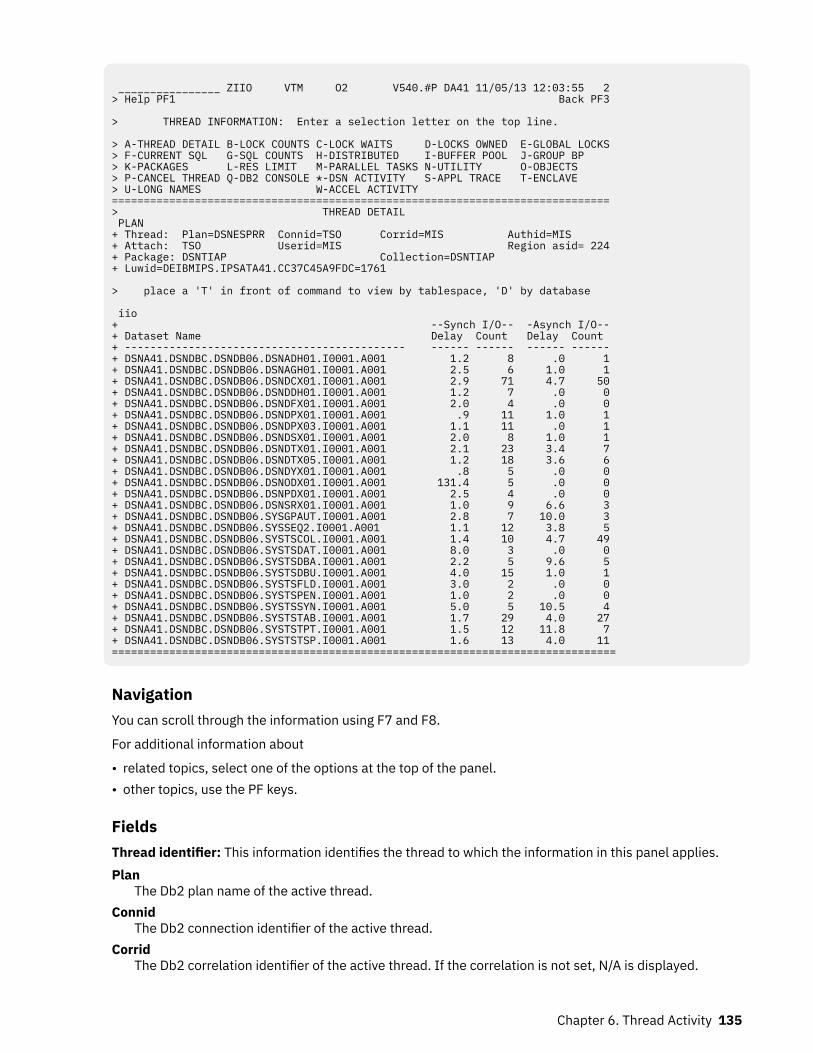
________________ ZIIO VTM O2 V540.#P DA41 11/05/13 12:03:55 2> Help PF1 Back PF3 > THREAD INFORMATION: Enter a selection letter on the top line. > A-THREAD DETAIL B-LOCK COUNTS C-LOCK WAITS D-LOCKS OWNED E-GLOBAL LOCKS> F-CURRENT SQL G-SQL COUNTS H-DISTRIBUTED I-BUFFER POOL J-GROUP BP > K-PACKAGES L-RES LIMIT M-PARALLEL TASKS N-UTILITY O-OBJECTS > P-CANCEL THREAD Q-DB2 CONSOLE *-DSN ACTIVITY S-APPL TRACE T-ENCLAVE > U-LONG NAMES W-ACCEL ACTIVITY ==============================================================================> THREAD DETAIL PLAN + Thread: Plan=DSNESPRR Connid=TSO Corrid=MIS Authid=MIS + Attach: TSO Userid=MIS Region asid= 224+ Package: DSNTIAP Collection=DSNTIAP + Luwid=DEIBMIPS.IPSATA41.CC37C45A9FDC=1761 > place a 'T' in front of command to view by tablespace, 'D' by database iio + --Synch I/O-- -Asynch I/O--+ Dataset Name Delay Count Delay Count + -------------------------------------------- ------ ------ ------ ------+ DSNA41.DSNDBC.DSNDB06.DSNADH01.I0001.A001 1.2 8 .0 1+ DSNA41.DSNDBC.DSNDB06.DSNAGH01.I0001.A001 2.5 6 1.0 1+ DSNA41.DSNDBC.DSNDB06.DSNDCX01.I0001.A001 2.9 71 4.7 50+ DSNA41.DSNDBC.DSNDB06.DSNDDH01.I0001.A001 1.2 7 .0 0+ DSNA41.DSNDBC.DSNDB06.DSNDFX01.I0001.A001 2.0 4 .0 0+ DSNA41.DSNDBC.DSNDB06.DSNDPX01.I0001.A001 .9 11 1.0 1+ DSNA41.DSNDBC.DSNDB06.DSNDPX03.I0001.A001 1.1 11 .0 1+ DSNA41.DSNDBC.DSNDB06.DSNDSX01.I0001.A001 2.0 8 1.0 1+ DSNA41.DSNDBC.DSNDB06.DSNDTX01.I0001.A001 2.1 23 3.4 7+ DSNA41.DSNDBC.DSNDB06.DSNDTX05.I0001.A001 1.2 18 3.6 6+ DSNA41.DSNDBC.DSNDB06.DSNDYX01.I0001.A001 .8 5 .0 0+ DSNA41.DSNDBC.DSNDB06.DSNODX01.I0001.A001 131.4 5 .0 0+ DSNA41.DSNDBC.DSNDB06.DSNPDX01.I0001.A001 2.5 4 .0 0+ DSNA41.DSNDBC.DSNDB06.DSNSRX01.I0001.A001 1.0 9 6.6 3+ DSNA41.DSNDBC.DSNDB06.SYSGPAUT.I0001.A001 2.8 7 10.0 3+ DSNA41.DSNDBC.DSNDB06.SYSSEQ2.I0001.A001 1.1 12 3.8 5+ DSNA41.DSNDBC.DSNDB06.SYSTSCOL.I0001.A001 1.4 10 4.7 49+ DSNA41.DSNDBC.DSNDB06.SYSTSDAT.I0001.A001 8.0 3 .0 0+ DSNA41.DSNDBC.DSNDB06.SYSTSDBA.I0001.A001 2.2 5 9.6 5+ DSNA41.DSNDBC.DSNDB06.SYSTSDBU.I0001.A001 4.0 15 1.0 1 + DSNA41.DSNDBC.DSNDB06.SYSTSFLD.I0001.A001 3.0 2 .0 0 + DSNA41.DSNDBC.DSNDB06.SYSTSPEN.I0001.A001 1.0 2 .0 0 + DSNA41.DSNDBC.DSNDB06.SYSTSSYN.I0001.A001 5.0 5 10.5 4 + DSNA41.DSNDBC.DSNDB06.SYSTSTAB.I0001.A001 1.7 29 4.0 27 + DSNA41.DSNDBC.DSNDB06.SYSTSTPT.I0001.A001 1.5 12 11.8 7 + DSNA41.DSNDBC.DSNDB06.SYSTSTSP.I0001.A001 1.6 13 4.0 11 ===============================================================================
NavigationYou can scroll through the information using F7 and F8.
For additional information about
• related topics, select one of the options at the top of the panel.• other topics, use the PF keys.
FieldsThread identifier: This information identifies the thread to which the information in this panel applies.Plan
The Db2 plan name of the active thread.Connid
The Db2 connection identifier of the active thread.Corrid
The Db2 correlation identifier of the active thread. If the correlation is not set, N/A is displayed.
Chapter 6. Thread Activity 135
AuthidThe Db2 authorization identifier of the active thread.
AttachDepending on the type of connection, the appropriate information is displayed.Attach information is displayed only if the thread is a distributed allied thread (not for distributeddatabase access threads).
Connection TypeBatch
The MVS jobname and ASID.
Note: For threads from remote Db2, the MVS job name is N/A.
CICSThe CICS jobname, task name, task number, terminal ID, and thread type. The thread type is:Pool
The thread in use is a pool thread.Entry
The thread in use is a nonprotected entry thread.Prot
The thread in use is a protected thread. Protected threads are defined in an RCT entrydefinition using the THRDS operand.
IMSThe IMS region number, transaction name, region name, and terminal ID (LTERM).
RRSAFThe MVS job name and ASID.
Note: For threads from remote Db2, the MVS job name is N/A.
SystemThe originating Db2 job name and the resource manager that is the source of the thread. Anadditional line below the Attach line identifies the user thread, if any, being served by the systemthread.
TSOThe TSO user ID and region ASID.
UtilityNo additional information.
Db2The Db2 subsystem identifier.
MVSThe MVS system identifier.
ORIGAUTHThe original (primary) Db2 authorization identifier of the thread. This field displays only when theoriginal identifier is different from the Authid.
Package identifier: This information identifies the package to which the information in this panel applies.Package
The Db2 package name of the active thread. Up to 18 characters of the package name are returned.Collection
The package collection identifier. This field is displayed only if a package is being used.
DatabaseThe name of the database for which thread activity has occurred.
SpacenamThe name of the table space for which thread activity has occurred.
136 Classic Interface User's Guide
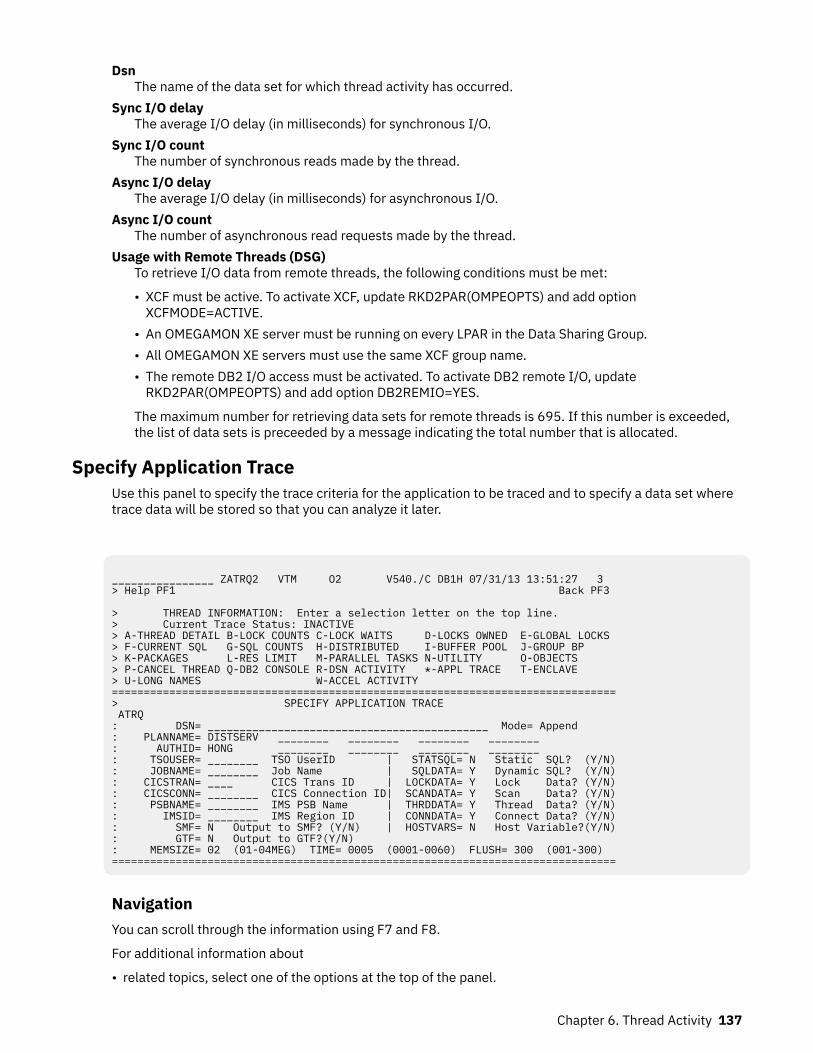
DsnThe name of the data set for which thread activity has occurred.
Sync I/O delayThe average I/O delay (in milliseconds) for synchronous I/O.
Sync I/O countThe number of synchronous reads made by the thread.
Async I/O delayThe average I/O delay (in milliseconds) for asynchronous I/O.
Async I/O countThe number of asynchronous read requests made by the thread.
Usage with Remote Threads (DSG)To retrieve I/O data from remote threads, the following conditions must be met:
• XCF must be active. To activate XCF, update RKD2PAR(OMPEOPTS) and add optionXCFMODE=ACTIVE.
• An OMEGAMON XE server must be running on every LPAR in the Data Sharing Group.• All OMEGAMON XE servers must use the same XCF group name.• The remote DB2 I/O access must be activated. To activate DB2 remote I/O, update
RKD2PAR(OMPEOPTS) and add option DB2REMIO=YES.
The maximum number for retrieving data sets for remote threads is 695. If this number is exceeded,the list of data sets is preceeded by a message indicating the total number that is allocated.
Specify Application TraceUse this panel to specify the trace criteria for the application to be traced and to specify a data set wheretrace data will be stored so that you can analyze it later.
________________ ZATRQ2 VTM O2 V540./C DB1H 07/31/13 13:51:27 3 > Help PF1 Back PF3 > THREAD INFORMATION: Enter a selection letter on the top line. > Current Trace Status: INACTIVE > A-THREAD DETAIL B-LOCK COUNTS C-LOCK WAITS D-LOCKS OWNED E-GLOBAL LOCKS > F-CURRENT SQL G-SQL COUNTS H-DISTRIBUTED I-BUFFER POOL J-GROUP BP > K-PACKAGES L-RES LIMIT M-PARALLEL TASKS N-UTILITY O-OBJECTS > P-CANCEL THREAD Q-DB2 CONSOLE R-DSN ACTIVITY *-APPL TRACE T-ENCLAVE > U-LONG NAMES W-ACCEL ACTIVITY =============================================================================== > SPECIFY APPLICATION TRACE ATRQ : DSN= ____________________________________________ Mode= Append : PLANNAME= DISTSERV ________ ________ ________ ________ : AUTHID= HONG ________ ________ ________ ________ : TSOUSER= ________ TSO UserID | STATSQL= N Static SQL? (Y/N) : JOBNAME= ________ Job Name | SQLDATA= Y Dynamic SQL? (Y/N) : CICSTRAN= ____ CICS Trans ID | LOCKDATA= Y Lock Data? (Y/N) : CICSCONN= ________ CICS Connection ID| SCANDATA= Y Scan Data? (Y/N) : PSBNAME= ________ IMS PSB Name | THRDDATA= Y Thread Data? (Y/N) : IMSID= ________ IMS Region ID | CONNDATA= Y Connect Data? (Y/N) : SMF= N Output to SMF? (Y/N) | HOSTVARS= N Host Variable?(Y/N) : GTF= N Output to GTF?(Y/N) : MEMSIZE= 02 (01-04MEG) TIME= 0005 (0001-0060) FLUSH= 300 (001-300) ===============================================================================
NavigationYou can scroll through the information using F7 and F8.
For additional information about
• related topics, select one of the options at the top of the panel.
Chapter 6. Thread Activity 137
• other topics, use the PF keys.
FieldsThe fields are described in Chapter 9, “Application Trace Facility (ATF),” on page 435, panel “SpecifyApplication Trace” on page 437.
Enclave Detail InformationThis panel provides detailed information about the attributes of a thread running under an individualenclave. This information includes the information provided by the PLAN major command. It also providesinformation provided by the "enc" minor command.
138 Classic Interface User's Guide
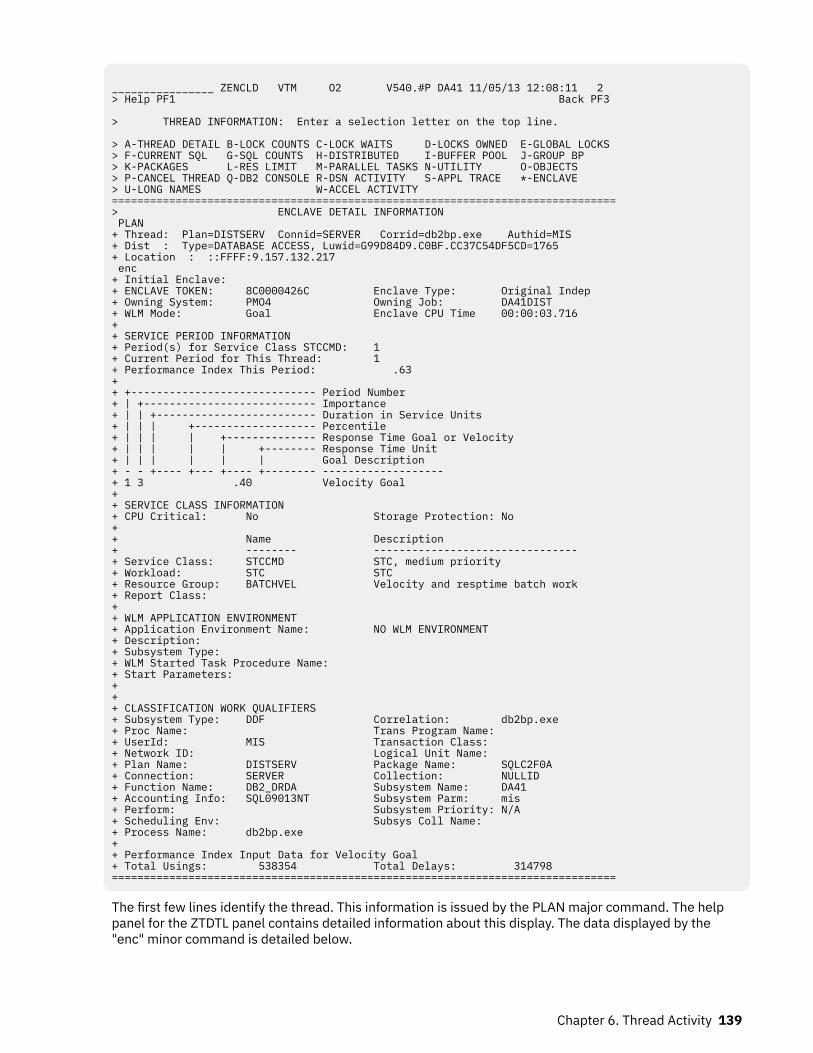
________________ ZENCLD VTM O2 V540.#P DA41 11/05/13 12:08:11 2 > Help PF1 Back PF3 > THREAD INFORMATION: Enter a selection letter on the top line. > A-THREAD DETAIL B-LOCK COUNTS C-LOCK WAITS D-LOCKS OWNED E-GLOBAL LOCKS > F-CURRENT SQL G-SQL COUNTS H-DISTRIBUTED I-BUFFER POOL J-GROUP BP > K-PACKAGES L-RES LIMIT M-PARALLEL TASKS N-UTILITY O-OBJECTS > P-CANCEL THREAD Q-DB2 CONSOLE R-DSN ACTIVITY S-APPL TRACE *-ENCLAVE > U-LONG NAMES W-ACCEL ACTIVITY ===============================================================================> ENCLAVE DETAIL INFORMATION PLAN + Thread: Plan=DISTSERV Connid=SERVER Corrid=db2bp.exe Authid=MIS + Dist : Type=DATABASE ACCESS, Luwid=G99D84D9.C0BF.CC37C54DF5CD=1765 + Location : ::FFFF:9.157.132.217 enc + Initial Enclave: + ENCLAVE TOKEN: 8C0000426C Enclave Type: Original Indep + Owning System: PMO4 Owning Job: DA41DIST + WLM Mode: Goal Enclave CPU Time 00:00:03.716 + + SERVICE PERIOD INFORMATION + Period(s) for Service Class STCCMD: 1 + Current Period for This Thread: 1 + Performance Index This Period: .63 + + +----------------------------- Period Number + | +--------------------------- Importance + | | +------------------------- Duration in Service Units + | | | +------------------- Percentile + | | | | +-------------- Response Time Goal or Velocity + | | | | | +-------- Response Time Unit + | | | | | | Goal Description + - - +---- +--- +---- +-------- ------------------- + 1 3 .40 Velocity Goal + + SERVICE CLASS INFORMATION + CPU Critical: No Storage Protection: No + + Name Description + -------- -------------------------------- + Service Class: STCCMD STC, medium priority + Workload: STC STC + Resource Group: BATCHVEL Velocity and resptime batch work + Report Class: + + WLM APPLICATION ENVIRONMENT + Application Environment Name: NO WLM ENVIRONMENT + Description: + Subsystem Type: + WLM Started Task Procedure Name: + Start Parameters: + + + CLASSIFICATION WORK QUALIFIERS + Subsystem Type: DDF Correlation: db2bp.exe + Proc Name: Trans Program Name: + UserId: MIS Transaction Class: + Network ID: Logical Unit Name: + Plan Name: DISTSERV Package Name: SQLC2F0A + Connection: SERVER Collection: NULLID + Function Name: DB2_DRDA Subsystem Name: DA41 + Accounting Info: SQL09013NT Subsystem Parm: mis + Perform: Subsystem Priority: N/A + Scheduling Env: Subsys Coll Name: + Process Name: db2bp.exe + + Performance Index Input Data for Velocity Goal + Total Usings: 538354 Total Delays: 314798 ===============================================================================
The first few lines identify the thread. This information is issued by the PLAN major command. The helppanel for the ZTDTL panel contains detailed information about this display. The data displayed by the"enc" minor command is detailed below.
Chapter 6. Thread Activity 139
If a remote DB2 is being monitored, enclave information is not available. Message Enclaveinformation not available from remote DB2 is displayed instead of the information followingthe "enc" minor command.
NavigationYou can scroll through the information using F7 and F8.
For additional information about
• related topics, select one of the options at the top of the panel.• other topics, use the PF keys.
FieldsThread identifier: This information identifies the thread to which the information in this panel applies.Plan
The Db2 plan name of the active thread.Connid
The Db2 connection identifier of the active thread.Corrid
The Db2 correlation identifier of the active thread. If the correlation is not set, N/A is displayed.Authid
The Db2 authorization identifier of the active thread.Attach
Depending on the type of connection, the appropriate information is displayed.Attach information is displayed only if the thread is a distributed allied thread (not for distributeddatabase access threads).
Connection TypeBatch
The MVS jobname and ASID.
Note: For threads from remote Db2, the MVS job name is N/A.
CICSThe CICS jobname, task name, task number, terminal ID, and thread type. The thread type is:Pool
The thread in use is a pool thread.Entry
The thread in use is a nonprotected entry thread.Prot
The thread in use is a protected thread. Protected threads are defined in an RCT entrydefinition using the THRDS operand.
IMSThe IMS region number, transaction name, region name, and terminal ID (LTERM).
RRSAFThe MVS job name and ASID.
Note: For threads from remote Db2, the MVS job name is N/A.
SystemThe originating Db2 job name and the resource manager that is the source of the thread. Anadditional line below the Attach line identifies the user thread, if any, being served by the systemthread.
140 Classic Interface User's Guide
TSOThe TSO user ID and region ASID.
UtilityNo additional information.
Db2The Db2 subsystem identifier.
MVSThe MVS system identifier.
ORIGAUTHThe original (primary) Db2 authorization identifier of the thread. This field displays only when theoriginal identifier is different from the Authid.
Package identifier: This information identifies the package to which the information in this panel applies.Package
The Db2 package name of the active thread. Up to 18 characters of the package name are returned.Collection
The package collection identifier. This field is displayed only if a package is being used.
Initial EnclaveAfter applying the DB2 APARs PM12256 and PM28626 and the z/OS APAR OA35146, more than oneenclave can be used by DB2 for the same Distributed Thread. The initial enclave is shown.
Enclave TokenThis is the hexadecimal representation of an 8-byte field. An enclave is an anchor for a transactionthat can be spread across multiple dispatchable units in multiple address spaces.
Enclave TypeThe enclave type describes the condition of an enclave. An enclave can be of one of the followingtypes:Dependent
This enclave is created by IWMECREA. It is a continuation of the transaction for the owningaddress space.
Original IndependentThis enclave is created by IWMECREA. It is an independent transaction.
Foreign IndependentThis enclave is created by IWMIMPT. It is a continuation of an independent enclave on anothersystem.
Foreign DependentThis enclave is created by IWMIMPT. It is a continuation of a dependent enclave on anothersystem.
Inactive EnclaveThis enclave is currently in an inactive enclave queue because SRM did not find any work unit thatis associated with the enclave. When a work unit joins the enclave, it is moved back to the activequeue.
Currently PromotedThis enclave is currently promoted due to a chronic resource contention.
Continuation IndependentThis enclave is a continuation of an independent enclave.
Owning SystemThe originating system for the enclave.
Owning JobThe originating jobname for the enclave
Chapter 6. Thread Activity 141
WLM ModeGoal - Workload manager is monitoring and classifying work. It is periodically adjusting dispatchingpriorities to meet the service policies (Goals) associated with that work.
Compatibility - Workload manager is monitoring and classifying work. However the dispatchingpriorities are set according to values in IEAIPSxx member of SYS1.PARMLIB.
Enclave CPU TimeTotal CPU time associated with the Enclave.
Service period information: For more information, see "Defining Service Classes and Performance Goals"in z/OS MVS Planning: Workload Management.Service Period(s) This Class
A 1-character number ranging from 1 to 8. This is the number of service periods which have beendefined for this service class.
Current Period for This ThreadA 1-character number ranging from 1 to 8. This is the current service period definition that iscontrolling the work.
Performance Index This PeriodA number computed to two decimal places.
A Performance Index less than one is an indication that the goal for this service class period is beingexceeded. The service class period might be considered as a "donor", giving up CPU or pageablestorage for other more important service class periods on the system.
A Performance Index greater than one is an indication that the goal for this service class period is notbeing met. Depending on the importance, this Service class period might be considered for additionalservices to meet the defined goal.
Period NumberA 1-character column ranging from 1 to 8.
ImportanceA 1-character column ranging from 1 to 5. The importance level 1 is most important. This indicates toWLM how important it is to meet this performance period goal.
Duration in Service UnitsA numeric column. All defined periods except the last period have a duration. The duration isexpressed in service units so as to be portable among different processor speeds. After the work hasused the service units defined for that period, WLM switches to the goals defined in the next period.
PercentileA numeric percentage column. This column is only valid for a percentile response time goal.
Response Time Goal or Velocity %A numeric column. This column is only valid for percentile response time goals, average responsetime goals or velocity goals. For response time goals, this is the time value. For Velocity goals, this isthe acceptable amount of delay for work when work is ready to run.
Response Time UnitA character column. This column contains the time unit that the response time goals are expressed in.Possible values are blank, Millisecs, Seconds, Minutes and Hours.
Goal DescriptionA character column. This column describes the type of goal set for this service period. Possible valuesare:
• Percentile response time goal• Average response time goal• Velocity goal• Discretionary goal• System goal
142 Classic Interface User's Guide
Service class information: For more information, see "Defining Service Classes and Performance Goals"in z/OS MVS Planning: Workload Management.CPU Critical
A Yes or No value indicates whether long term CPU protection is assigned to this class.Storage Protection
A Yes or No value indicates whether long term storage protection is assigned to this class.Service Class Name
An eight character name for a group of work within a workload having similar performancecharacteristics.
Service Class DescriptionA 32-character field that describes the service class.
Workload NameAn 8-character field that contains the name of the workload associated with this service class.
Workload DescriptionA 32-character field that describes the workload associated with this service class.
Resource Group NameAn 8-character field that contains the name of the resource group associated with this service class.
Resource Group DescriptionA 32-character field that describes the resource group associated with this service class.
Report Class NameAn 8-character field that contains the name of the report class associated with this service class.
Report Class DescriptionA 32-character field that describes the report class associated with this Service Class.
WLM application environment:Application Environment Name
A 32-character field that contains the name assigned to the environment. This name can be the WLMENVIRONMENT specified as part of the SQL CREATE PROCEDURE syntax.
DescriptionA 32-character field that describes the WLM ENVIRONMENT
Subsystem TypeFor DB2 threads, this value is always DB2.
WLM Started Task Procedure NameAn 8-character field that contains the name of the server address space in which this enclave isexecuting.
Start ParametersA 115-character field that contains any parameters to be passed to the stored procedure.
Classification work qualifiers:Subsystem Type
The primary qualifier used to classify work on the system. Examples are JES, ASCH, OMVS, STC, TSO,and DDF.
CorrelationA name associated with the user/program creating the work request.
Proc NameAn 18-character field that contains the DB2 stored SQL procedure name associated with the workrequest.
Trans Program NameAn 8-character field that contains the transaction name for the work request, as known by the workmanager.
UserIdAn 8-character field that contains the User ID associated with the work request.
Chapter 6. Thread Activity 143
Transaction ClassAn 8-character field that contains a class name within a subsystem. This can be any meaningful valuethat the installation can recognize and specify to match the value presented by the work manager.
Network IDAn 8-character field that contains the network identifier associated with the requestor.
Logical Unit NameAn 8-character field that contains the local LU name associated with the requestor.
Plan NameAn 8-character field that contains the DB2 plan name associated with the requestor.
Package NameAn 8-character field that contains the DB2 package name associated with the requestor.
ConnectionAn 8-character field that contains the connection type associated with the requestor.
CollectionAn 18-character field that contains the collection name associated with the requestor.
Function NameAn 8-character field that contains the function name associated with the requestor.
Subsystem NameAn 8-character field that contains the subsystem name associated with the requestor.
Accounting InfoThe first sixteen characters passed as accounting information on the batch jobcard.
Subsystem ParmThe first sixteen characters passed as a subsystem parameter. This is site defined information.
PerformAn eight-character field that contains the performance group number (PGN) associated with therequest. The number can be 1 - 999.
Subsystem PriorityAn numeric field that contains the priority associated with the request.
Scheduling EnvA 16-character field that contains the scheduling environment associated with the work request.
Subsys Coll NameAn 8-character field that contains the subsystem collection name associated with the request. Asubsystem collection is a named group of related subsystem address spaces.
Process NameA 32-character field that contains the process name associated with the work request.
Performance index input data: Depending on the type of performance goal for the current period,Certain input numbers are used to compute the performance index.Velocity Goal
Total Usings (U) - This is a sum of the number of times the work for the service class period is allowedto use WLM managed resources.
Total Delays (D) - This is a sum of the number of times the work for the service class period is delayedfor lack of WLM managed resources.
The formula for Actual Velocity (V) is:
V = U / U + D
Compute Performance Index (PI) using the goal velocity (G)
PI = G / V
Average Response Time GoalCompleted Trans (C) - This is a count of all completed transactions that have run for this Service ClassPeriod.
144 Classic Interface User's Guide
Total Elapsed Seconds (T) - This is a sum of the time used to complete the transactions which haverun for this Service Class Period.
Average Response Time (A) - A = T / C
Compute Performance Index (PI) using the Goal Response Time (G) - PI = A / G
Percentile Response Time GoalPercentile Performance Index is found by examining the distribution of response times in thepercentage array (PA).
Total Transactions (TT) - TT = Sum(PA)
Compute Goal (G) Using the Goal Percentile (GP) - G = TT * GP
Sum the array again, until you reach or surpass the Goal (G). The corresponding percentage is thePerformance Index (PI) to two decimal places.
Long NamesThis panel shows the long names for the connection ID and the package name of a selected thread.
With this information, you can uniquely identify the individual owners of the various threads.
On the display, the first few lines of output identify the thread. This information is issued by using thePLAN major command.
By using the lnam minor command, the information on the following panel is displayed.
Chapter 6. Thread Activity 145
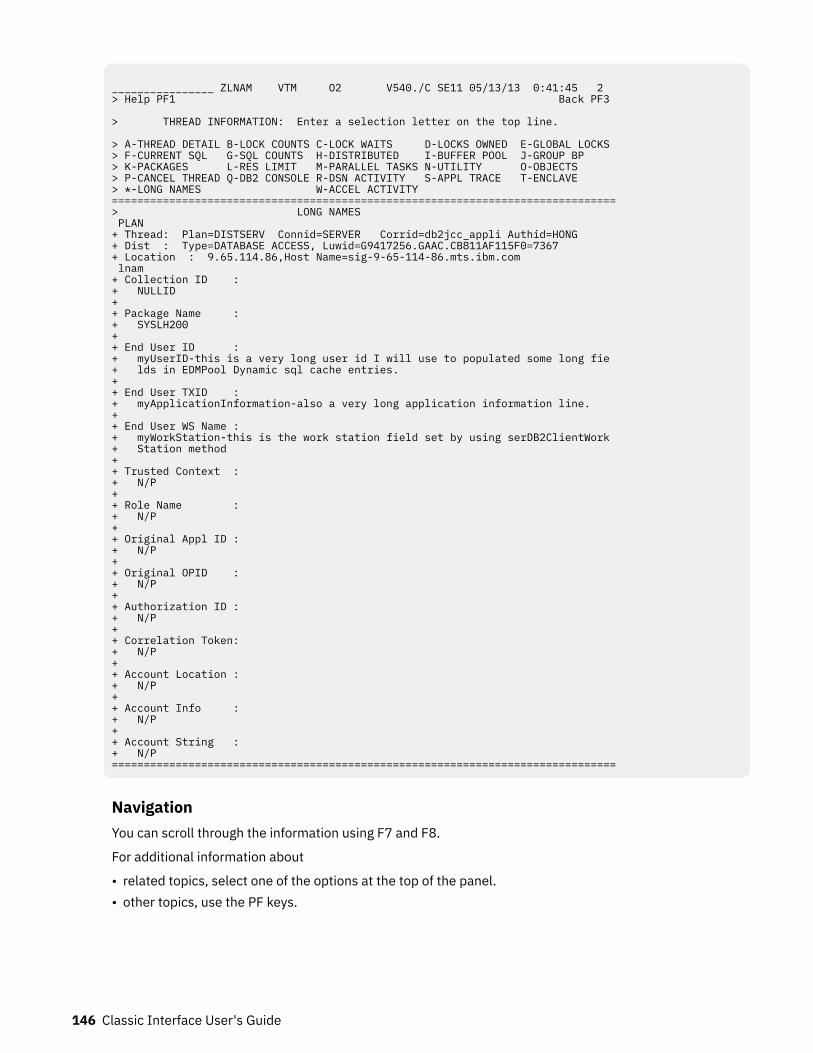
________________ ZLNAM VTM O2 V540./C SE11 05/13/13 0:41:45 2 > Help PF1 Back PF3 > THREAD INFORMATION: Enter a selection letter on the top line. > A-THREAD DETAIL B-LOCK COUNTS C-LOCK WAITS D-LOCKS OWNED E-GLOBAL LOCKS > F-CURRENT SQL G-SQL COUNTS H-DISTRIBUTED I-BUFFER POOL J-GROUP BP > K-PACKAGES L-RES LIMIT M-PARALLEL TASKS N-UTILITY O-OBJECTS > P-CANCEL THREAD Q-DB2 CONSOLE R-DSN ACTIVITY S-APPL TRACE T-ENCLAVE > *-LONG NAMES W-ACCEL ACTIVITY ===============================================================================> LONG NAMES PLAN + Thread: Plan=DISTSERV Connid=SERVER Corrid=db2jcc_appli Authid=HONG + Dist : Type=DATABASE ACCESS, Luwid=G9417256.GAAC.CB811AF115F0=7367 + Location : 9.65.114.86,Host Name=sig-9-65-114-86.mts.ibm.com lnam + Collection ID : + NULLID + + Package Name : + SYSLH200 + + End User ID : + myUserID-this is a very long user id I will use to populated some long fie + lds in EDMPool Dynamic sql cache entries. + + End User TXID : + myApplicationInformation-also a very long application information line. + + End User WS Name : + myWorkStation-this is the work station field set by using serDB2ClientWork + Station method + + Trusted Context : + N/P + + Role Name : + N/P + + Original Appl ID : + N/P + + Original OPID : + N/P + + Authorization ID : + N/P + + Correlation Token: + N/P + + Account Location : + N/P + + Account Info : + N/P + + Account String : + N/P ===============================================================================
NavigationYou can scroll through the information using F7 and F8.
For additional information about
• related topics, select one of the options at the top of the panel.• other topics, use the PF keys.
146 Classic Interface User's Guide
FieldsCollection ID
The name of the collection ID.Package name
The name of the package.End User ID
The name of the end user.End User TXID
The transaction name of the end user.End User WS Name
The workstation name of the end user.Trusted Context
The name of the trusted context.Role Name
The name of the role that is associated to the author ID.Original Appl ID
The authorization ID.Original OPID
The original operator ID.Authorization ID
Original application user ID.Correlation Token
The correlation token.Account Location
The DB2 LOCATION name of the DB2 system that creats the QMDAINFO values if QMDALOCN istruncated.
Account InformationThe maximum length of this field is 200 bytes. You can specify this suffix for the accounting string.
Account StringThe extended accounting string area.
• If QMDAASTR is defined by QMDAINFO, this area contains all the remaining bytes beyond position142 for QMDAACCT.
• If QMDAASTR is defined by QMDASQLI, this area contains all the remaining bytes beyond position200 for QMDASUFX.
• Otherwise, this area contains all bytes beyond position 247.
Thread Accelerator DetailThis panel formats Accelerator activity for the selected thread.
Chapter 6. Thread Activity 147
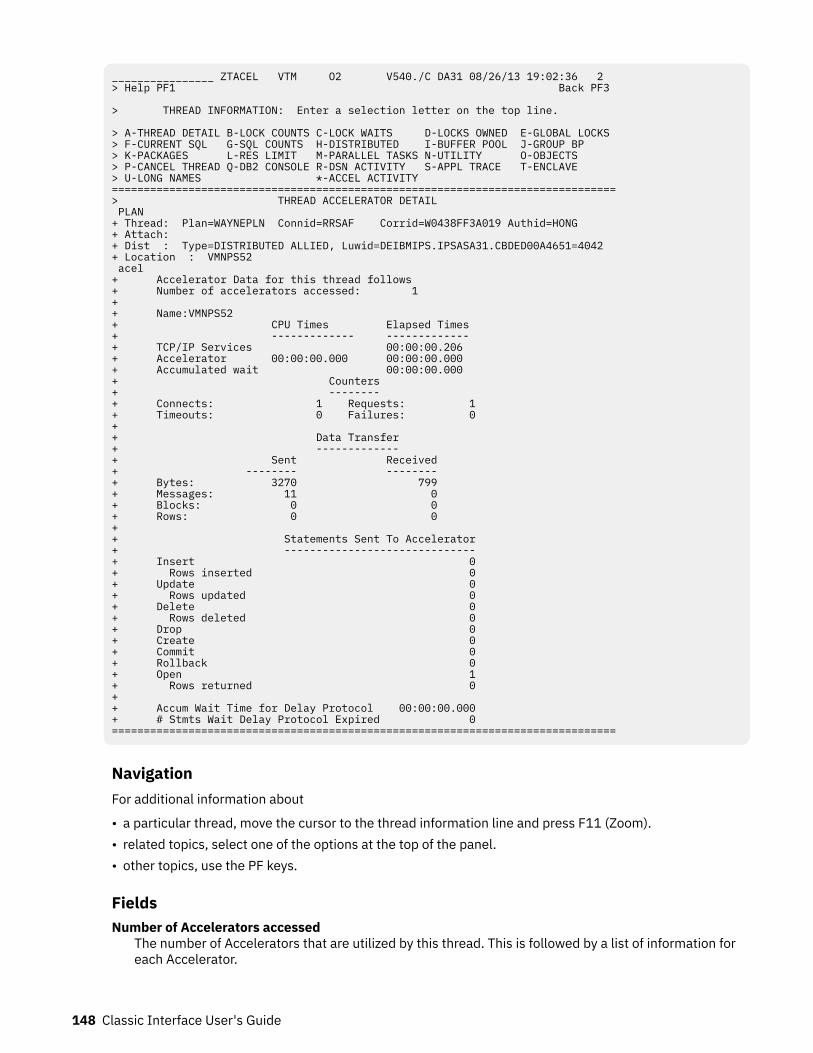
________________ ZTACEL VTM O2 V540./C DA31 08/26/13 19:02:36 2 > Help PF1 Back PF3 > THREAD INFORMATION: Enter a selection letter on the top line. > A-THREAD DETAIL B-LOCK COUNTS C-LOCK WAITS D-LOCKS OWNED E-GLOBAL LOCKS > F-CURRENT SQL G-SQL COUNTS H-DISTRIBUTED I-BUFFER POOL J-GROUP BP > K-PACKAGES L-RES LIMIT M-PARALLEL TASKS N-UTILITY O-OBJECTS > P-CANCEL THREAD Q-DB2 CONSOLE R-DSN ACTIVITY S-APPL TRACE T-ENCLAVE > U-LONG NAMES *-ACCEL ACTIVITY ===============================================================================> THREAD ACCELERATOR DETAIL PLAN + Thread: Plan=WAYNEPLN Connid=RRSAF Corrid=W0438FF3A019 Authid=HONG + Attach: + Dist : Type=DISTRIBUTED ALLIED, Luwid=DEIBMIPS.IPSASA31.CBDED00A4651=4042 + Location : VMNPS52 acel + Accelerator Data for this thread follows + Number of accelerators accessed: 1 + + Name:VMNPS52 + CPU Times Elapsed Times + ------------- ------------- + TCP/IP Services 00:00:00.206 + Accelerator 00:00:00.000 00:00:00.000 + Accumulated wait 00:00:00.000 + Counters + -------- + Connects: 1 Requests: 1 + Timeouts: 0 Failures: 0 + + Data Transfer + ------------- + Sent Received + -------- -------- + Bytes: 3270 799 + Messages: 11 0 + Blocks: 0 0 + Rows: 0 0 ++ Statements Sent To Accelerator+ ------------------------------+ Insert 0+ Rows inserted 0+ Update 0+ Rows updated 0+ Delete 0+ Rows deleted 0+ Drop 0+ Create 0+ Commit 0+ Rollback 0+ Open 1+ Rows returned 0++ Accum Wait Time for Delay Protocol 00:00:00.000+ # Stmts Wait Delay Protocol Expired 0 ===============================================================================
NavigationFor additional information about
• a particular thread, move the cursor to the thread information line and press F11 (Zoom).• related topics, select one of the options at the top of the panel.• other topics, use the PF keys.
FieldsNumber of Accelerators accessed
The number of Accelerators that are utilized by this thread. This is followed by a list of information foreach Accelerator.
148 Classic Interface User's Guide
NameThe name of the Accelerator.
CPU TimesThe CPU time that is consumed within the Accelerator device.
Elapsed TimesTCP/IP Services
The total elapsed time from the time Db2 started processing requests until the requests arecomplete.
AcceleratorThe total elapsed time that the thread is processed on the Accelerator. The Accelerator time is asubset of the TCP/IP time.
Accumulated WaitThe total wait time within the Accelerator.
ConnectsThe number of times the Db2 thread connected to the Accelerator.
RequestsThe number of requests this thread made to the Accelerator.
TimeoutsThe number of requests that failed due to a timeout while waiting for the Accelerator.
FailuresThe total number of failed Accelerator requests. This number includes any timeout errors.
The following fields are related to data transfer between Db2 and the Accelerator.Bytes Sent
The count of bytes of data that is sent to the Accelerator.Bytes Received
The count of bytes of data that is received from the Accelerator.Messages Sent
The count of messages that are sent to the Accelerator.Messages Received
The count of messages that are received from the Accelerator.Blocks Sent
The count of blocks that are sent to the Accelerator.Blocks Received
The count of blocks that are received from the Accelerator.Rows Sent
The count of data rows that are sent to the Accelerator.Rows Received
The count of data rows that are received from the Accelerator.Insert
The count of insert statements sent to the Accelerator.Rows inserted
The count of rows inserted.Update
The count of update statements sent to the Accelerator.Rows updated
The count of rows updated.Delete
The count of delete statements sent to the Accelerator.
Chapter 6. Thread Activity 149
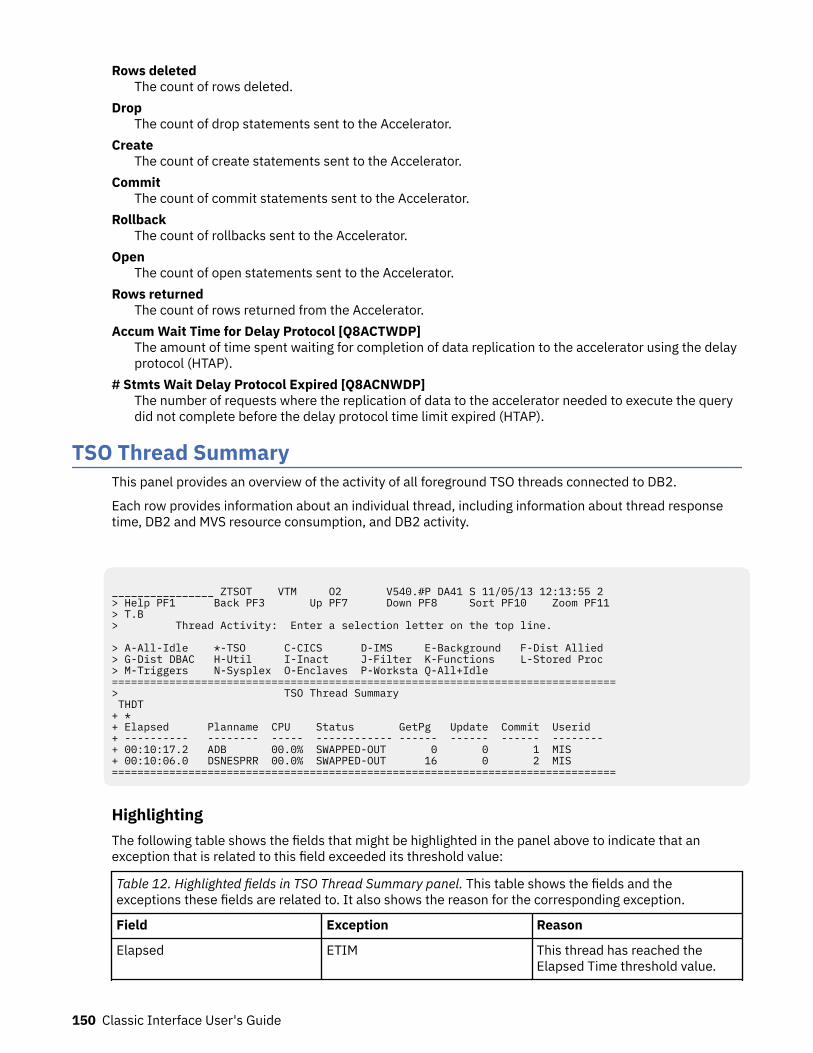
Rows deletedThe count of rows deleted.
DropThe count of drop statements sent to the Accelerator.
CreateThe count of create statements sent to the Accelerator.
CommitThe count of commit statements sent to the Accelerator.
RollbackThe count of rollbacks sent to the Accelerator.
OpenThe count of open statements sent to the Accelerator.
Rows returnedThe count of rows returned from the Accelerator.
Accum Wait Time for Delay Protocol [Q8ACTWDP]The amount of time spent waiting for completion of data replication to the accelerator using the delayprotocol (HTAP).
# Stmts Wait Delay Protocol Expired [Q8ACNWDP]The number of requests where the replication of data to the accelerator needed to execute the querydid not complete before the delay protocol time limit expired (HTAP).
TSO Thread SummaryThis panel provides an overview of the activity of all foreground TSO threads connected to DB2.
Each row provides information about an individual thread, including information about thread responsetime, DB2 and MVS resource consumption, and DB2 activity.
________________ ZTSOT VTM O2 V540.#P DA41 S 11/05/13 12:13:55 2 > Help PF1 Back PF3 Up PF7 Down PF8 Sort PF10 Zoom PF11 > T.B > Thread Activity: Enter a selection letter on the top line. > A-All-Idle *-TSO C-CICS D-IMS E-Background F-Dist Allied > G-Dist DBAC H-Util I-Inact J-Filter K-Functions L-Stored Proc > M-Triggers N-Sysplex O-Enclaves P-Worksta Q-All+Idle ===============================================================================> TSO Thread Summary THDT + * + Elapsed Planname CPU Status GetPg Update Commit Userid + ---------- -------- ----- ------------ ------ ------ ------ -------- + 00:10:17.2 ADB 00.0% SWAPPED-OUT 0 0 1 MIS + 00:10:06.0 DSNESPRR 00.0% SWAPPED-OUT 16 0 2 MIS ===============================================================================
HighlightingThe following table shows the fields that might be highlighted in the panel above to indicate that anexception that is related to this field exceeded its threshold value:
Table 12. Highlighted fields in TSO Thread Summary panel. This table shows the fields and theexceptions these fields are related to. It also shows the reason for the corresponding exception.
Field Exception Reason
Elapsed ETIM This thread has reached theElapsed Time threshold value.
150 Classic Interface User's Guide
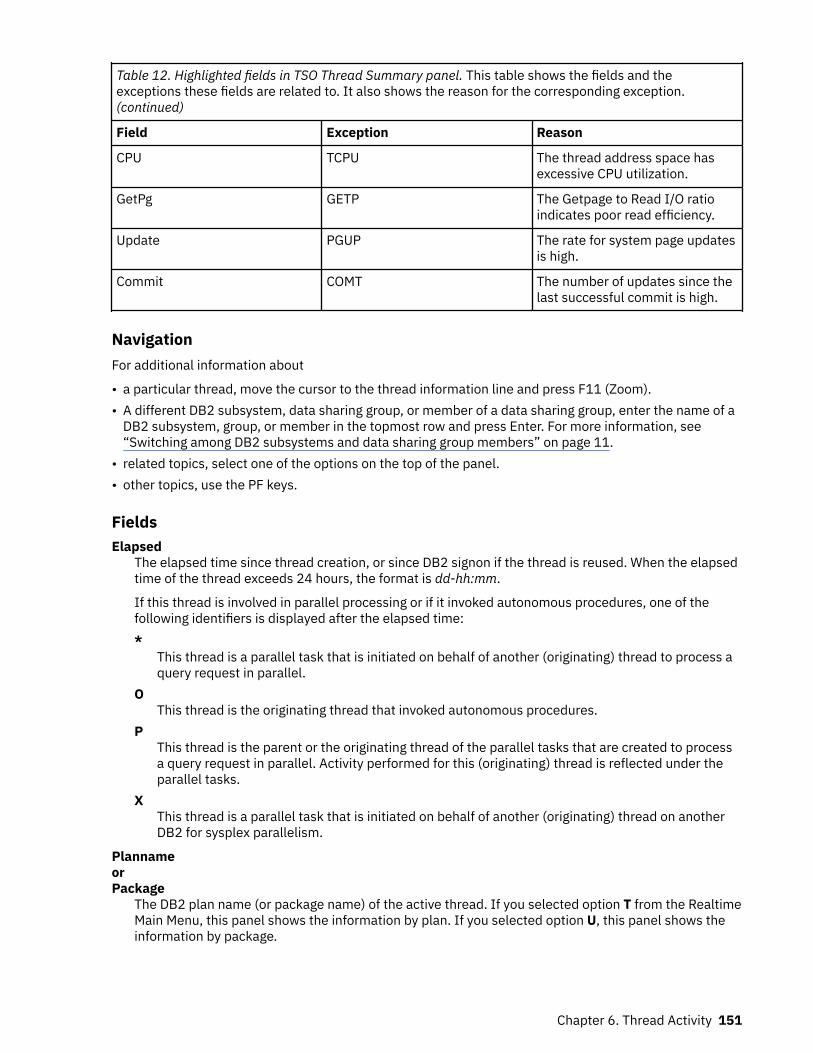
Table 12. Highlighted fields in TSO Thread Summary panel. This table shows the fields and theexceptions these fields are related to. It also shows the reason for the corresponding exception.(continued)
Field Exception Reason
CPU TCPU The thread address space hasexcessive CPU utilization.
GetPg GETP The Getpage to Read I/O ratioindicates poor read efficiency.
Update PGUP The rate for system page updatesis high.
Commit COMT The number of updates since thelast successful commit is high.
NavigationFor additional information about
• a particular thread, move the cursor to the thread information line and press F11 (Zoom).• A different DB2 subsystem, data sharing group, or member of a data sharing group, enter the name of a
DB2 subsystem, group, or member in the topmost row and press Enter. For more information, see“Switching among DB2 subsystems and data sharing group members” on page 11.
• related topics, select one of the options on the top of the panel.• other topics, use the PF keys.
FieldsElapsed
The elapsed time since thread creation, or since DB2 signon if the thread is reused. When the elapsedtime of the thread exceeds 24 hours, the format is dd-hh:mm.
If this thread is involved in parallel processing or if it invoked autonomous procedures, one of thefollowing identifiers is displayed after the elapsed time:*
This thread is a parallel task that is initiated on behalf of another (originating) thread to process aquery request in parallel.
OThis thread is the originating thread that invoked autonomous procedures.
PThis thread is the parent or the originating thread of the parallel tasks that are created to processa query request in parallel. Activity performed for this (originating) thread is reflected under theparallel tasks.
XThis thread is a parallel task that is initiated on behalf of another (originating) thread on anotherDB2 for sysplex parallelism.
PlannameorPackage
The DB2 plan name (or package name) of the active thread. If you selected option T from the RealtimeMain Menu, this panel shows the information by plan. If you selected option U, this panel shows theinformation by package.
Chapter 6. Thread Activity 151
CPU (if monitoring a local DB2 subsystem or a data sharing group with XCF component activated forremote CPU)
The CPU rate (percent) that is associated with the thread. Database access threads run in MVS SRBmode. The displayed rate is SRB time (no TCB time).
DB2 (if monitoring a data sharing group or remote DB2 subsystem while XCF component is notactivated for remote CPU)
The DB2 subsystem name of the data sharing group member that is currently monitored.You can use the Tab key to move to a detail line and to select this detail line for drill down.
StatusThe current DB2 status of the thread. For definitions of all possible status values, see "DB2 ThreadStatus".
GetPgThe number of thread Getpage requests.
This logical read request might not actually result in physical I/O if the requested page is currently inthe buffer pool.
UpdateThe number of DB2 page updates made by the thread since thread creation. This value is incrementedeach time a row in a page is updated, not just once for each page updated. DB2 might update pageswhen it creates intermediate result tables because of a qualified SELECT statement, even thoughSELECT statements are generally thought of as read only operations. Pages that have been updatedare written asynchronously by DB2, according to DB2's internal Deferred Write algorithm, notimmediately after update or commit. DB2 resets the page update count at Create Thread and Signon.If Signon is not driven, the page update count is cumulative.
CommitThe number of times the thread successfully completed commit processing.
If a QMF thread user exits from a query panel to other than the home panel, tablespace locks definedwith DEALLOCATE(COMMIT) will be retained until Commit is effected. This is also true of SPUFI userswho do not specify AUTOCOMMIT, or who specify DEFER on completion of a transaction.
UseridThe TSO user ID of the active thread user.
CICS Thread SummaryThis panel provides an overview of DB2 thread activity that is originating from connected CICS regions.
It provides information about the activity of each CICS region attached to DB2. It also presentsinformation about individual CICS threads that are active in DB2. The display lines are ordered by threadelapsed time (total time since thread creation or reuse) and include information about the DB2 activity.
If monitoring a single remote DB2, the CICA command cannot display the information in this panel. Themessage Remote DB2 is not supported for this command is displayed.
152 Classic Interface User's Guide
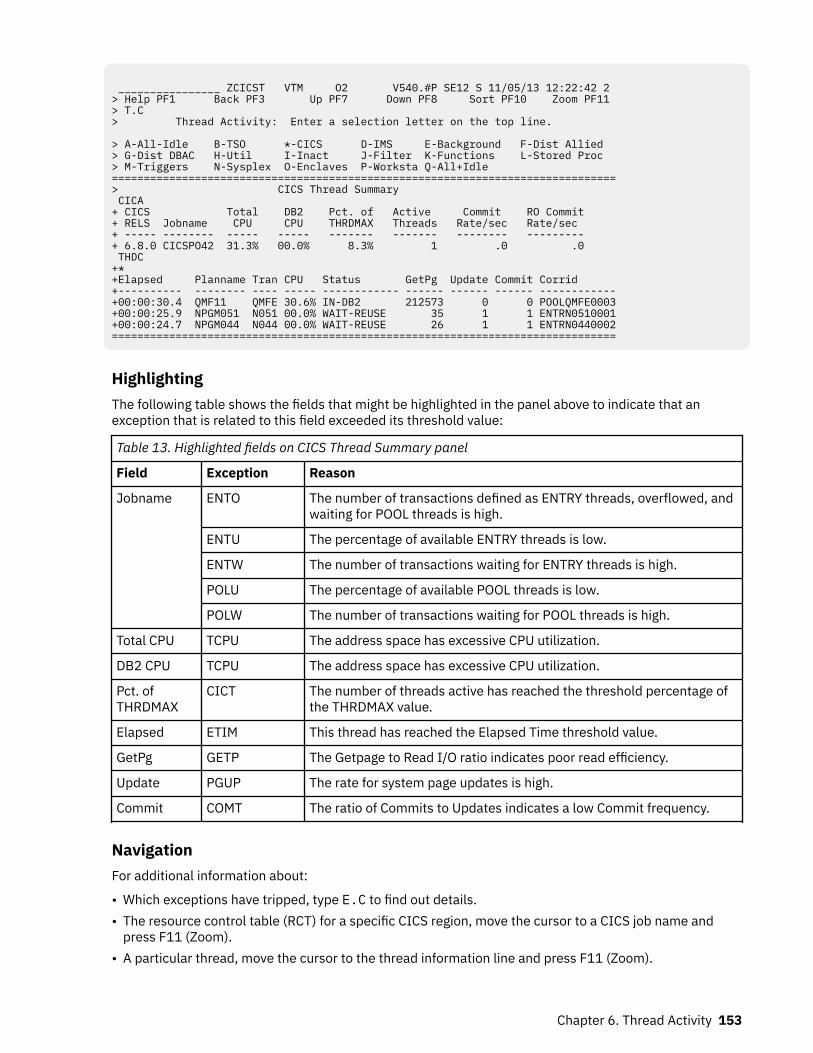
________________ ZCICST VTM O2 V540.#P SE12 S 11/05/13 12:22:42 2 > Help PF1 Back PF3 Up PF7 Down PF8 Sort PF10 Zoom PF11 > T.C > Thread Activity: Enter a selection letter on the top line. > A-All-Idle B-TSO *-CICS D-IMS E-Background F-Dist Allied > G-Dist DBAC H-Util I-Inact J-Filter K-Functions L-Stored Proc > M-Triggers N-Sysplex O-Enclaves P-Worksta Q-All+Idle ===============================================================================> CICS Thread Summary CICA + CICS Total DB2 Pct. of Active Commit RO Commit + RELS Jobname CPU CPU THRDMAX Threads Rate/sec Rate/sec + ----- -------- ----- ----- ------- ------- -------- --------- + 6.8.0 CICSPO42 31.3% 00.0% 8.3% 1 .0 .0 THDC +* +Elapsed Planname Tran CPU Status GetPg Update Commit Corrid +---------- -------- ---- ----- ------------ ------ ------ ------ ------------+00:00:30.4 QMF11 QMFE 30.6% IN-DB2 212573 0 0 POOLQMFE0003+00:00:25.9 NPGM051 N051 00.0% WAIT-REUSE 35 1 1 ENTRN0510001+00:00:24.7 NPGM044 N044 00.0% WAIT-REUSE 26 1 1 ENTRN0440002===============================================================================
HighlightingThe following table shows the fields that might be highlighted in the panel above to indicate that anexception that is related to this field exceeded its threshold value:
Table 13. Highlighted fields on CICS Thread Summary panel
Field Exception Reason
Jobname ENTO The number of transactions defined as ENTRY threads, overflowed, andwaiting for POOL threads is high.
ENTU The percentage of available ENTRY threads is low.
ENTW The number of transactions waiting for ENTRY threads is high.
POLU The percentage of available POOL threads is low.
POLW The number of transactions waiting for POOL threads is high.
Total CPU TCPU The address space has excessive CPU utilization.
DB2 CPU TCPU The address space has excessive CPU utilization.
Pct. ofTHRDMAX
CICT The number of threads active has reached the threshold percentage ofthe THRDMAX value.
Elapsed ETIM This thread has reached the Elapsed Time threshold value.
GetPg GETP The Getpage to Read I/O ratio indicates poor read efficiency.
Update PGUP The rate for system page updates is high.
Commit COMT The ratio of Commits to Updates indicates a low Commit frequency.
NavigationFor additional information about:
• Which exceptions have tripped, type E.C to find out details.• The resource control table (RCT) for a specific CICS region, move the cursor to a CICS job name and
press F11 (Zoom).• A particular thread, move the cursor to the thread information line and press F11 (Zoom).
Chapter 6. Thread Activity 153
• A different DB2 subsystem, data sharing group, or member of a data sharing group, enter the name of aDB2 subsystem, group, or member in the topmost row and press Enter. For more information, see“Switching among DB2 subsystems and data sharing group members” on page 11.
• Related topics, select one of the options on the top of the panel.• Other topics, use the PF keys.
FieldsCICS connection information:
CICS RELSThe CICS release of the connected CICS region:6.6.0 for CICS Transaction Server 4.1
For CICS Transaction Server 4.16.7.0 for CICS Transaction Server 4.2
For CICS Transaction Server 4.26.8.0 for CICS Transaction Server 5.1
For CICS Transaction Server 5.16.9.0 for CICS Transaction Server 5.2
For CICS Transaction Server 5.27.0.0 for CICS Transaction Server 5.3
For CICS Transaction Server 5.37.1.0 for CICS Transaction Server 5.4
For CICS Transaction Server 5.47.2.0 for CICS Transaction Server 5.5
For CICS Transaction Server 5.57.3.0 for CICS Transaction Server 5.6
For CICS Transaction Server 5.6Jobname
The job name of the connected CICS region.For remote threads, this fields displays the correlation ID up to 8 characters.
Total CPUThe total CPU rate (percent) of the CICS region connected to DB2. This includes both TCB and SRBtime. For more information about CPU use, see "Analyzing DB2 CPU Usage".
Note: The following fields do not include data of parallel task threads that is initiated by anotherthread that is originating from the CICS connection:
Total CPUDB2 CPUPct. of THRDMAXActive Threads
DB2 CPUThe total CPU rate (percent) that is attributable to active threads originating from the CICSconnection. This value is a subset of the total CICS region CPU utilization. For more information aboutCPU use, see "Analyzing DB2 CPU Usage".
Pct. of THRDMAXThe percentage of THRDMAX (CICS maximum threads) that the current threads have reached.
Active ThreadsThe number of active threads originating from the CICS connection. This value includes outstandingCreate Thread requests not yet satisfied by DB2. This value excludes threads originating from theCICS connection that are waiting for reuse.
154 Classic Interface User's Guide
Commit Rate/SecThe number of DB2 Commits per second originating from the CICS connection.
The Commit rate is computed by determining the number of commits that occurred since the previousOMEGAMON cycle divided by the elapsed time since the previous cycle.
RO Commit Rate/SecThe number of DB2 read-only Commits per second originating from the CICS connection.
This rate is computed by determining the number of read-only Commits that occurred since theprevious OMEGAMON cycle divided by the elapsed time since the previous cycle.
Note: The following fields do not include data of parallel task threads that is initiated by anotherthread that is originating from the CICS connection:
Total CPUDB2 CPUPct. of THRDMAXActive Threads
CICS thread information:
ElapsedThe elapsed time since thread creation, or since DB2 signon if the thread is reused. When the elapsedtime of the thread exceeds 24 hours, the format is dd-hh:mm.
If this thread is involved in parallel processing or if it invoked autonomous procedures, one of thefollowing identifiers is displayed after the elapsed time:*
This thread is a parallel task that is initiated on behalf of another (originating) thread to process aquery request in parallel.
OThis thread is the originating thread that invoked autonomous procedures.
PThis thread is the parent or the originating thread of the parallel tasks that are created to processa query request in parallel. Activity performed for this (originating) thread is reflected under theparallel tasks.
XThis thread is a parallel task that is initiated on behalf of another (originating) thread on anotherDB2 for sysplex parallelism.
PlannameThe DB2 plan name of the active thread.
TranThe CICS transaction identifier active in the thread.
CPU (if monitoring a DB2 subsystem or a data sharing group member)The CPU rate (percent) attributable to the thread.
For more information about CPU use, see "Analyzing DB2 CPU Usage".
DB2 (if monitoring a data sharing group or remote DB2 subsystem while XCF component is notactivated for remote CPU)
The DB2 subsystem name of the data sharing group member that is currently monitored.You can use the Tab key to move to a detail line and to select this detail line for drill down.
StatusThe current DB2 status of the thread. For definitions of all possible status values, see "DB2 ThreadStatus".
GetPgThe number of thread Getpage requests. This logical read request might not actually result in physicalI/O if the requested page is currently in the buffer pool.
Chapter 6. Thread Activity 155
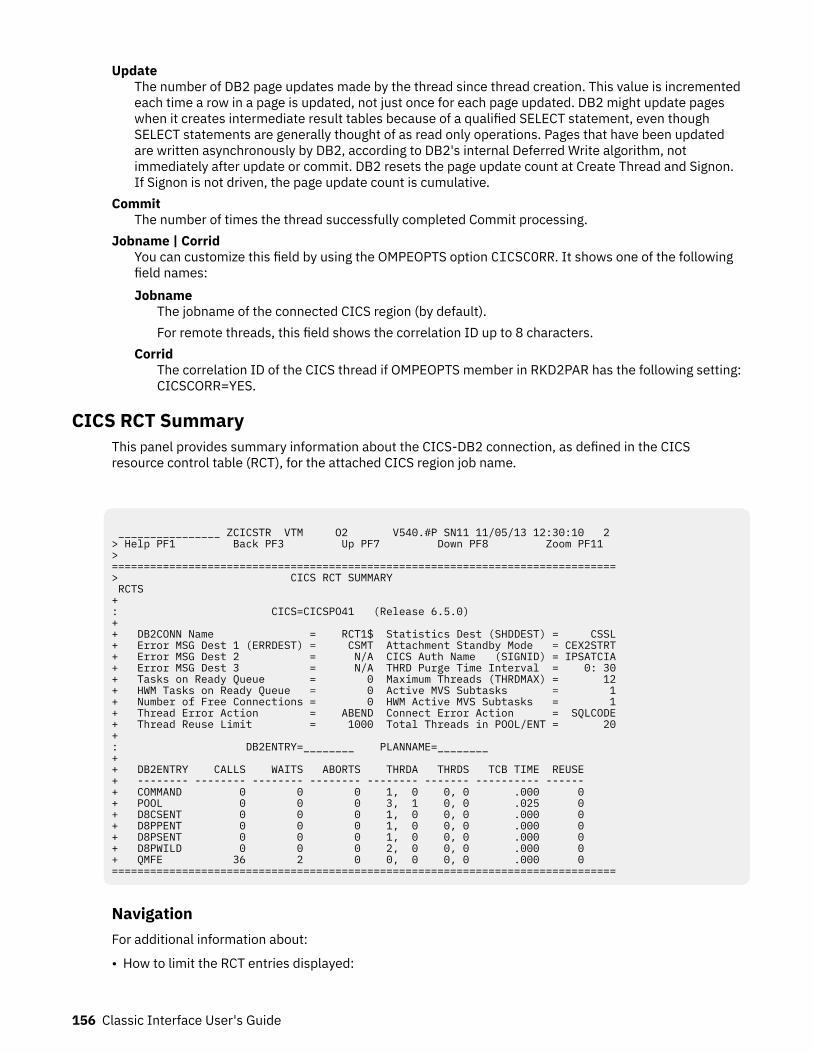
UpdateThe number of DB2 page updates made by the thread since thread creation. This value is incrementedeach time a row in a page is updated, not just once for each page updated. DB2 might update pageswhen it creates intermediate result tables because of a qualified SELECT statement, even thoughSELECT statements are generally thought of as read only operations. Pages that have been updatedare written asynchronously by DB2, according to DB2's internal Deferred Write algorithm, notimmediately after update or commit. DB2 resets the page update count at Create Thread and Signon.If Signon is not driven, the page update count is cumulative.
CommitThe number of times the thread successfully completed Commit processing.
Jobname | CorridYou can customize this field by using the OMPEOPTS option CICSCORR. It shows one of the followingfield names:Jobname
The jobname of the connected CICS region (by default).For remote threads, this field shows the correlation ID up to 8 characters.
CorridThe correlation ID of the CICS thread if OMPEOPTS member in RKD2PAR has the following setting:CICSCORR=YES.
CICS RCT SummaryThis panel provides summary information about the CICS-DB2 connection, as defined in the CICSresource control table (RCT), for the attached CICS region job name.
________________ ZCICSTR VTM O2 V540.#P SN11 11/05/13 12:30:10 2 > Help PF1 Back PF3 Up PF7 Down PF8 Zoom PF11 > ===============================================================================> CICS RCT SUMMARY RCTS + : CICS=CICSPO41 (Release 6.5.0) + + DB2CONN Name = RCT1$ Statistics Dest (SHDDEST) = CSSL+ Error MSG Dest 1 (ERRDEST) = CSMT Attachment Standby Mode = CEX2STRT+ Error MSG Dest 2 = N/A CICS Auth Name (SIGNID) = IPSATCIA+ Error MSG Dest 3 = N/A THRD Purge Time Interval = 0: 30+ Tasks on Ready Queue = 0 Maximum Threads (THRDMAX) = 12+ HWM Tasks on Ready Queue = 0 Active MVS Subtasks = 1+ Number of Free Connections = 0 HWM Active MVS Subtasks = 1+ Thread Error Action = ABEND Connect Error Action = SQLCODE+ Thread Reuse Limit = 1000 Total Threads in POOL/ENT = 20+ : DB2ENTRY=________ PLANNAME=________ + + DB2ENTRY CALLS WAITS ABORTS THRDA THRDS TCB TIME REUSE + -------- -------- -------- -------- -------- ------- ---------- ------ + COMMAND 0 0 0 1, 0 0, 0 .000 0 + POOL 0 0 0 3, 1 0, 0 .025 0 + D8CSENT 0 0 0 1, 0 0, 0 .000 0 + D8PPENT 0 0 0 1, 0 0, 0 .000 0 + D8PSENT 0 0 0 1, 0 0, 0 .000 0 + D8PWILD 0 0 0 2, 0 0, 0 .000 0 + QMFE 36 2 0 0, 0 0, 0 .000 0 ===============================================================================
NavigationFor additional information about:
• How to limit the RCT entries displayed:
156 Classic Interface User's Guide
– To display all CICS DB2ENTRYs starting with VX, enter DB2ENTRY=VX* which shows VX01, VX05,VXAA, VXYZ, and so on.
– To display all plan names with any character in the third position, enter PLANNAME=YZ?PLAN whichshows YZAPLAN, YZ2PLAN, YZQPLAN, and so on.
• An RCT entry definition, move the cursor to one of the lines under DB2ENTRY and press F11 (Zoom). Bydefault, all RCT entries for the region are displayed. For more information, see the description of panel“CICS RCT Detail” on page 159.
• Other topics, use the PF keys.
FieldsCICS
The CICS job name. If you enter a different job name, the corresponding RCT summary information isdisplayed.
RELEASEIdentifies the internal release number of the CICS system:6.6.0 for CICS Transaction Server 4.1
For CICS Transaction Server 4.16.7.0 for CICS Transaction Server 4.2
For CICS Transaction Server 4.26.8.0 for CICS Transaction Server 5.1
For CICS Transaction Server 5.16.9.0 for CICS Transaction Server 5.2
For CICS Transaction Server 5.27.0.0 for CICS Transaction Server 5.3
For CICS Transaction Server 5.37.1.0 for CICS Transaction Server 5.4
For CICS Transaction Server 5.47.2.0 for CICS Transaction Server 5.5
For CICS Transaction Server 5.57.3.0 for CICS Transaction Server 5.6
For CICS Transaction Server 5.6DB2CONN Name
The RCT name in use by the CICS jobname.Statistics Dest (SHDDEST)
The transient data destination used for the shutdown statistics when the attachment facility isstopped.
Error MSG Dest 1, 2, or 3 (ERRDEST)The identifier of the DFHDCT destination for unsolicited error messages. As many as three destinationIDs can be assigned.
Attachment Standby ModeThe attachment standby mode for this CICS region. Possible values are: STANDBY, CEX2STRT,CEX2TERM, DB2MAINT, MSBACTIV, RESYNC, or N/A.
CICS Auth Name (SIGNID)The authorization ID used when the attachment connects to DB2.
THRD Purge Time IntervalSpecifies the length of the protected thread purge cycle in the format: MINUTES : SECONDS.
Tasks on Ready QueueThe number of tasks that are on ready queue (waiting to be scheduled).
Maximum Threads (THRDMAX)The maximum number of threads that can be created between CICS and DB2 within this RCT.
Chapter 6. Thread Activity 157
HWM Tasks on Ready QueueThe high-water mark (HWM) of tasks on ready queue.
Active MVS SubtasksThe number of MVS subtasks that are active.
Number of Free ConnectionsThe number of free connections available.
HWM Active MVS SubtasksThe high-water mark (HWM) of MVS subtasks that are active.
Thread Error ActionThe action that will be taken when thread is in error condition. Possible values: ABEND, N906D, N906,or N/A.
Connect Error ActionThe action that will be taken when connection is failed. Possible values ABEND, SQLCODE, or N/A.
Thread Reuse LimitThe REUSELIMIT parameter specifies the maximum number of times a thread can be reused before itis terminated. This limit applies to all DB2 threads whether they are protected or unprotected. CICS42and above.
Total Threads in POOL/ENTTotal threads in POOL and DB2ENTRYs. CICS52 and above.
DB2ENTRYThe identifier of a classification of transactions within this CICS job. When there are multipletransactions with the same RCT definition, this field will display the ID of the first transaction.
PLANNAMEThe name of the specific plan for which you want to display statistical information. Use this field toreduce the number of lines displayed at the bottom of the panel.
The following fields are displayed for each command, entry, and pool RCT definition that exists within theresource control table.DB2ENTRY
The identifier of a classification of transactions within this CICS job. When there are multipletransactions with the same RCT definition, this field displays the ID of the first transaction.
CallsThe number of DB2 calls generated by transactions that share an RCT definition since the attachfacility was started.
WaitsThe number of DB2 waits experienced by transactions that share an RCT definition since the attachfacility was started.
AbortsThe number of aborts experienced by transactions that share an RCT definition since the attachfacility was started.
THRDAThe maximum number of active threads for this RCT entry.
THRDSThe number of MVS TCBs that will be attached (for use by the RCT definition) to the transactions whenthe attach facility is started.
TCB TimeThe CPU time (in seconds) used by transactions originating from this RCT definition. This timerepresents CP time only and does not include zIIP time.
REUSEThe number of times CICS transactions using DB2ENTRY were able to reuse an already created DB2thread.
158 Classic Interface User's Guide

CICS RCT DetailThis panel provides information about the CICS resource control table (RCT) entry definition selectedfrom the CICS RCT Summary panel.
The output includes RCT entry parameters in use, thread information, and miscellaneous statistics.
________________ ZCICTRD VTM O2 V540.#P SE12 11/05/13 12:31:34 2 > Help PF1 Back PF3 Up PF7 Down PF8 > ===============================================================================> CICS RCT DETAIL RCTD + CICS=CICSPO42 (Release 6.8.0 ) + + Transaction ID (TXID) = N044 + DB2ENTRY Name = N044ENT Plan Name (PLAN) = NPGM044+ Thread TCB Prty (DPMODE) = High Plan Alloc Exit (PLNEXIT) = N/A+ Rollbck on Deadlok (ROLBE) = Yes Thread Wait (TWAIT) = Yes+ DB2 Accounting Reason = TXID AUTHID = + Thread Limit (THRDA) = 5 Prot Thread Limit (THRDS) = 5+ Authorization Opt. (AUTH) = UserID + + Statistics Information + Count of Calls = 97 Current Free TCBs = 0+ Count of Commits = 0 Current Active TCBs = 0+ Count of Authorizations = 1 Current Total TCB Time = .000+ Count of Aborts = 0 Current Active Thread = 0+ Count of RO Commits = 6 HighWater Active Thread = 1+ Count of Waits/Ovflw Pool = 0 Current Waits/Ovflw Pool = 0+ Count of Tasks = 6 Current Protected Thread = 1+ Count of Partial SignOns = 0 HighWater Protected Thread= 1+ Count of Thread Terminates = 4 Current ReadyQue Thread = 0+ Count of Thread Creates = 5 HighWater ReadyQue Thread = 0+ Count of Thread Reuse = 1 Current User Request = 0+ Count of Thread Limit Hits = 0 HighWater User Request = 1===============================================================================
NavigationFor additional information about other topics, use the PF keys.
FieldsCICS
The CICS job name and the release number of the CICS system.6.6.0 for CICS Transaction Server 4.1
For CICS Transaction Server 4.16.7.0 for CICS Transaction Server 4.2
For CICS Transaction Server 4.26.8.0 for CICS Transaction Server 5.1
For CICS Transaction Server 5.16.9.0 for CICS Transaction Server 5.2
For CICS Transaction Server 5.27.0.0 for CICS Transaction Server 5.3
For CICS Transaction Server 5.37.1.0 for CICS Transaction Server 5.4
For CICS Transaction Server 5.47.2.0 for CICS Transaction Server 5.5
For CICS Transaction Server 5.57.3.0 for CICS Transaction Server 5.6
For CICS Transaction Server 5.6
Chapter 6. Thread Activity 159
Transaction ID (TXID)The transaction IDs of all CICS transactions that are defined in the RCT entry definition being viewed.
DB2ENTRY NameThe identifier of the transaction or transaction group being viewed.
Plan Name (PLAN)The name of the plan assigned to the transactions.
Thread TCB Prty (DPMODE)The MVS dispatching priority of thread TCBs relative to the CICS main TCB. Possible values: High orLow.
Plan Alloc Exit (PLNEXIT)The name of the exit program that can dynamically allocate the planname for the transaction ID whenthe first SQL call is issued.
Rollbck on Deadlok (ROLBE)Determines whether CICS issues a syncpoint rollback when the transaction experiences an InternalResource Lock Manager (IRLM)-detected deadlock or timeout.Yes
CICS will roll back all DB2 work and all CICS-protected resources to the last syncpoint.No
CICS will roll back only the incomplete SQL call that was involved in the deadlock/timeout.Thread Wait (TWAIT)
The action to take if no thread is available to execute a DB2-CICS transaction.Pool
If all threads are in use, DB2 places this transaction in the pool; if all pool threads are in use, DB2places this transaction in a queue.
YesIf all threads are in use, the transaction waits until a thread is available.
NoIf all threads are in use, the transaction abends.
DB2 Accounting ReasonThe reason for DB2 Accounting. DB2 accounting is done by one of the following:UOW
Account for each unit of work (UOW)TASK
Account for each taskTXID
Account for each Transaction ID changeNONE
No accountingAUTHID
The authorization identifier if used by transaction(s).Thread Limit (THRDA)
The maximum number of active threads for this RCT entry.Prot Thread Limit (THRDS)
The number of MVS TCBs that will be attached (for use by the RCT definition) to the transactions whenthe attach facility is started.
Authorization Opt. (AUTH)The type of authorization ID required to execute the DB2 plan for transactions that are originatingfrom the RCT definition.Group
The group
160 Classic Interface User's Guide
OPIDA sign-on operator ID
SignIDA sign-on ID
TermThe terminal ID
TxIDThe transaction ID
UseridThe user's sign-on ID
xxxxxxA character string
*Indicates a null value
Statistics information:
Count of CallsThe number of DB2 calls generated by the transactions since the CICS-DB2 attach was started.
Current Free TCBsThe number of currently free task control blocks (TCBs) to be reconnected with threads.
Count of CommitsThe number of Commits completed since the attach facility was started.
Current Active TCBsThe number of currently active threads.
Count of AuthorizationsThe number of times authorization has been invoked for the threads defined to the transactions.
Current Total TCB TimeThe CP time (in seconds) used by currently active threads. This time represents CP time only and doesnot include zIIP time.
Count of AbortsThe number of aborts experienced by the transactions since the attach facility was started.
Current Active ThreadsThe number of transactions that are currently active in DB2 or are waiting for a thread (TWAIT=YES).
Count of RO CommitsThe number of read-only Commits since the attach facility was started.
Highwater Active ThreadThe high-water mark of active threads.
Count of Waits/Ovflw PoolThe number of transactions that are waiting for a thread, or that have overflowed into the pool.
Current Waits/Ovflw PoolThe number of times that all available threads for the entry were busy, and the transaction had to waitor be diverted to the pool. This condition depends on the setting of the Thread Wait (TWAIT) field.
Count of TasksThe total number of tasks using this DB2ENTRY.
Current Protected ThreadThe currently protected thread count.
Count of Partial SignOnsThe total count of signons.
Highwater Protected ThreadThe high-water mark of protected threads.
Chapter 6. Thread Activity 161
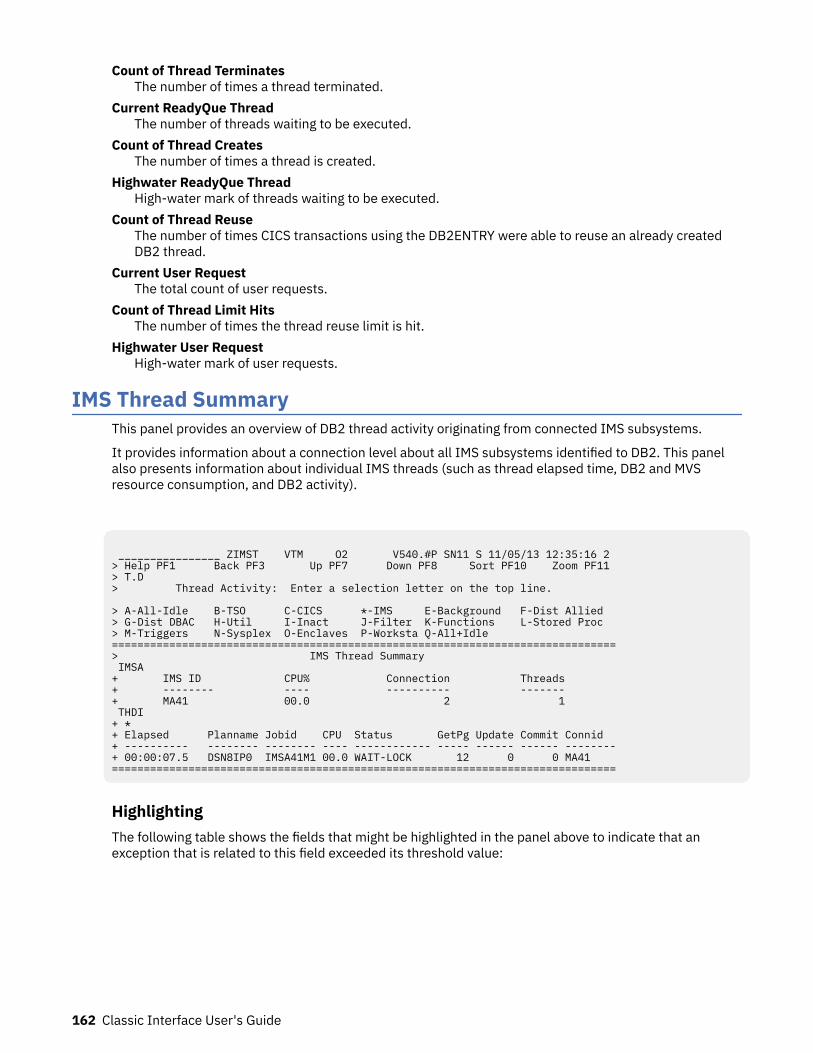
Count of Thread TerminatesThe number of times a thread terminated.
Current ReadyQue ThreadThe number of threads waiting to be executed.
Count of Thread CreatesThe number of times a thread is created.
Highwater ReadyQue ThreadHigh-water mark of threads waiting to be executed.
Count of Thread ReuseThe number of times CICS transactions using the DB2ENTRY were able to reuse an already createdDB2 thread.
Current User RequestThe total count of user requests.
Count of Thread Limit HitsThe number of times the thread reuse limit is hit.
Highwater User RequestHigh-water mark of user requests.
IMS Thread SummaryThis panel provides an overview of DB2 thread activity originating from connected IMS subsystems.
It provides information about a connection level about all IMS subsystems identified to DB2. This panelalso presents information about individual IMS threads (such as thread elapsed time, DB2 and MVSresource consumption, and DB2 activity).
________________ ZIMST VTM O2 V540.#P SN11 S 11/05/13 12:35:16 2 > Help PF1 Back PF3 Up PF7 Down PF8 Sort PF10 Zoom PF11 > T.D > Thread Activity: Enter a selection letter on the top line. > A-All-Idle B-TSO C-CICS *-IMS E-Background F-Dist Allied > G-Dist DBAC H-Util I-Inact J-Filter K-Functions L-Stored Proc > M-Triggers N-Sysplex O-Enclaves P-Worksta Q-All+Idle ===============================================================================> IMS Thread Summary IMSA + IMS ID CPU% Connection Threads + -------- ---- ---------- ------- + MA41 00.0 2 1 THDI + * + Elapsed Planname Jobid CPU Status GetPg Update Commit Connid + ---------- -------- -------- ---- ------------ ----- ------ ------ --------+ 00:00:07.5 DSN8IP0 IMSA41M1 00.0 WAIT-LOCK 12 0 0 MA41 ===============================================================================
HighlightingThe following table shows the fields that might be highlighted in the panel above to indicate that anexception that is related to this field exceeded its threshold value:
162 Classic Interface User's Guide
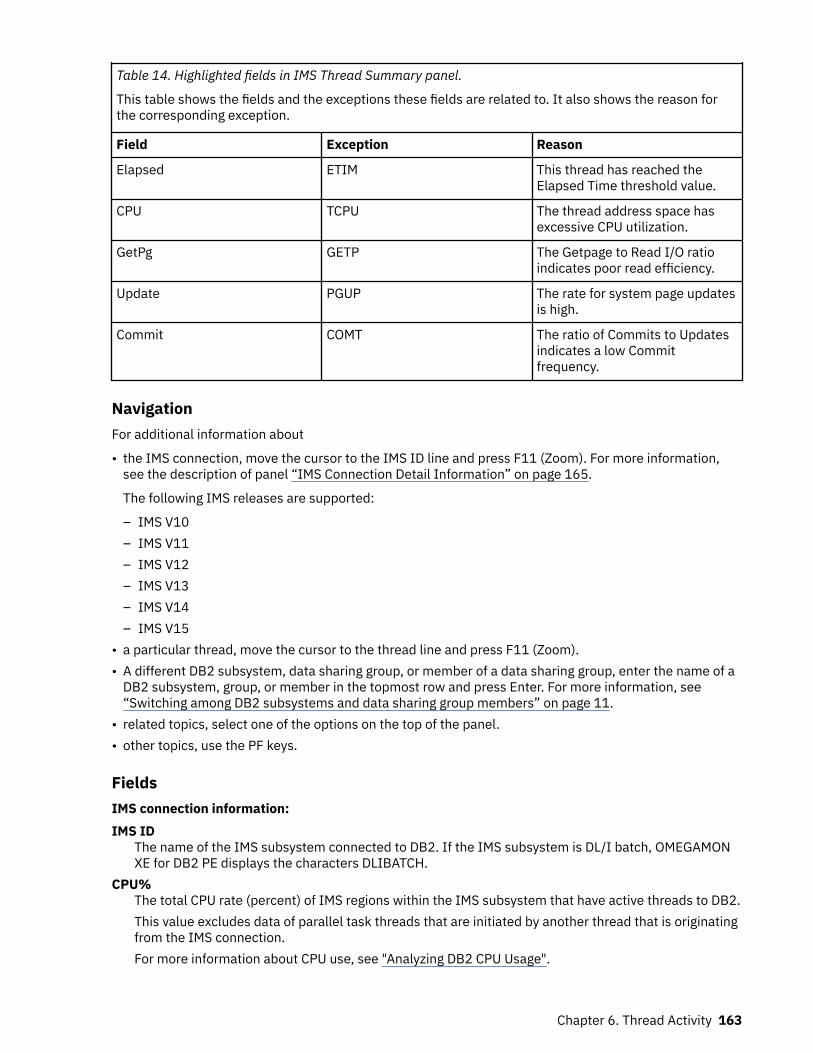
Table 14. Highlighted fields in IMS Thread Summary panel.
This table shows the fields and the exceptions these fields are related to. It also shows the reason forthe corresponding exception.
Field Exception Reason
Elapsed ETIM This thread has reached theElapsed Time threshold value.
CPU TCPU The thread address space hasexcessive CPU utilization.
GetPg GETP The Getpage to Read I/O ratioindicates poor read efficiency.
Update PGUP The rate for system page updatesis high.
Commit COMT The ratio of Commits to Updatesindicates a low Commitfrequency.
NavigationFor additional information about
• the IMS connection, move the cursor to the IMS ID line and press F11 (Zoom). For more information,see the description of panel “IMS Connection Detail Information” on page 165.
The following IMS releases are supported:
– IMS V10– IMS V11– IMS V12– IMS V13– IMS V14– IMS V15
• a particular thread, move the cursor to the thread line and press F11 (Zoom).• A different DB2 subsystem, data sharing group, or member of a data sharing group, enter the name of a
DB2 subsystem, group, or member in the topmost row and press Enter. For more information, see“Switching among DB2 subsystems and data sharing group members” on page 11.
• related topics, select one of the options on the top of the panel.• other topics, use the PF keys.
FieldsIMS connection information:IMS ID
The name of the IMS subsystem connected to DB2. If the IMS subsystem is DL/I batch, OMEGAMONXE for DB2 PE displays the characters DLIBATCH.
CPU%The total CPU rate (percent) of IMS regions within the IMS subsystem that have active threads to DB2.This value excludes data of parallel task threads that are initiated by another thread that is originatingfrom the IMS connection.For more information about CPU use, see "Analyzing DB2 CPU Usage".
Chapter 6. Thread Activity 163
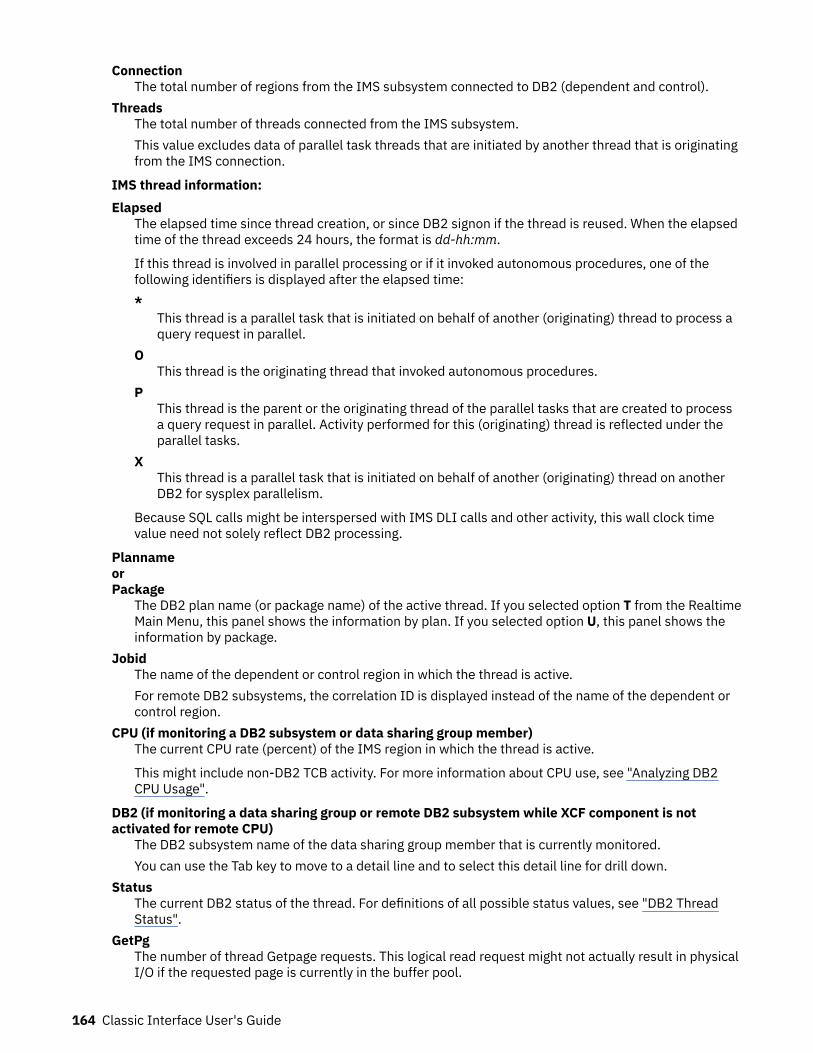
ConnectionThe total number of regions from the IMS subsystem connected to DB2 (dependent and control).
ThreadsThe total number of threads connected from the IMS subsystem.This value excludes data of parallel task threads that are initiated by another thread that is originatingfrom the IMS connection.
IMS thread information:Elapsed
The elapsed time since thread creation, or since DB2 signon if the thread is reused. When the elapsedtime of the thread exceeds 24 hours, the format is dd-hh:mm.
If this thread is involved in parallel processing or if it invoked autonomous procedures, one of thefollowing identifiers is displayed after the elapsed time:*
This thread is a parallel task that is initiated on behalf of another (originating) thread to process aquery request in parallel.
OThis thread is the originating thread that invoked autonomous procedures.
PThis thread is the parent or the originating thread of the parallel tasks that are created to processa query request in parallel. Activity performed for this (originating) thread is reflected under theparallel tasks.
XThis thread is a parallel task that is initiated on behalf of another (originating) thread on anotherDB2 for sysplex parallelism.
Because SQL calls might be interspersed with IMS DLI calls and other activity, this wall clock timevalue need not solely reflect DB2 processing.
PlannameorPackage
The DB2 plan name (or package name) of the active thread. If you selected option T from the RealtimeMain Menu, this panel shows the information by plan. If you selected option U, this panel shows theinformation by package.
JobidThe name of the dependent or control region in which the thread is active.For remote DB2 subsystems, the correlation ID is displayed instead of the name of the dependent orcontrol region.
CPU (if monitoring a DB2 subsystem or data sharing group member)The current CPU rate (percent) of the IMS region in which the thread is active.
This might include non-DB2 TCB activity. For more information about CPU use, see "Analyzing DB2CPU Usage".
DB2 (if monitoring a data sharing group or remote DB2 subsystem while XCF component is notactivated for remote CPU)
The DB2 subsystem name of the data sharing group member that is currently monitored.You can use the Tab key to move to a detail line and to select this detail line for drill down.
StatusThe current DB2 status of the thread. For definitions of all possible status values, see "DB2 ThreadStatus".
GetPgThe number of thread Getpage requests. This logical read request might not actually result in physicalI/O if the requested page is currently in the buffer pool.
164 Classic Interface User's Guide
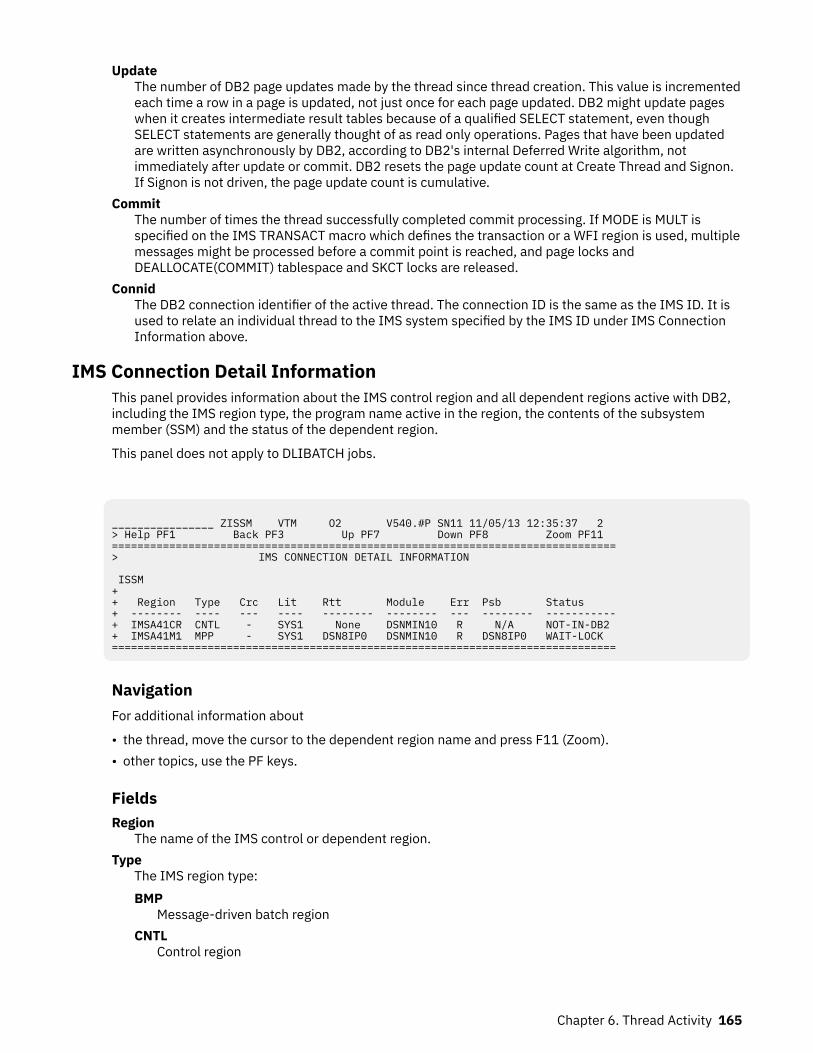
UpdateThe number of DB2 page updates made by the thread since thread creation. This value is incrementedeach time a row in a page is updated, not just once for each page updated. DB2 might update pageswhen it creates intermediate result tables because of a qualified SELECT statement, even thoughSELECT statements are generally thought of as read only operations. Pages that have been updatedare written asynchronously by DB2, according to DB2's internal Deferred Write algorithm, notimmediately after update or commit. DB2 resets the page update count at Create Thread and Signon.If Signon is not driven, the page update count is cumulative.
CommitThe number of times the thread successfully completed commit processing. If MODE is MULT isspecified on the IMS TRANSACT macro which defines the transaction or a WFI region is used, multiplemessages might be processed before a commit point is reached, and page locks andDEALLOCATE(COMMIT) tablespace and SKCT locks are released.
ConnidThe DB2 connection identifier of the active thread. The connection ID is the same as the IMS ID. It isused to relate an individual thread to the IMS system specified by the IMS ID under IMS ConnectionInformation above.
IMS Connection Detail InformationThis panel provides information about the IMS control region and all dependent regions active with DB2,including the IMS region type, the program name active in the region, the contents of the subsystemmember (SSM) and the status of the dependent region.
This panel does not apply to DLIBATCH jobs.
________________ ZISSM VTM O2 V540.#P SN11 11/05/13 12:35:37 2 > Help PF1 Back PF3 Up PF7 Down PF8 Zoom PF11 ===============================================================================> IMS CONNECTION DETAIL INFORMATION ISSM + + Region Type Crc Lit Rtt Module Err Psb Status + -------- ---- --- ---- -------- -------- --- -------- -----------+ IMSA41CR CNTL - SYS1 None DSNMIN10 R N/A NOT-IN-DB2 + IMSA41M1 MPP - SYS1 DSN8IP0 DSNMIN10 R DSN8IP0 WAIT-LOCK ===============================================================================
NavigationFor additional information about
• the thread, move the cursor to the dependent region name and press F11 (Zoom).• other topics, use the PF keys.
FieldsRegion
The name of the IMS control or dependent region.Type
The IMS region type:BMP
Message-driven batch regionCNTL
Control region
Chapter 6. Thread Activity 165
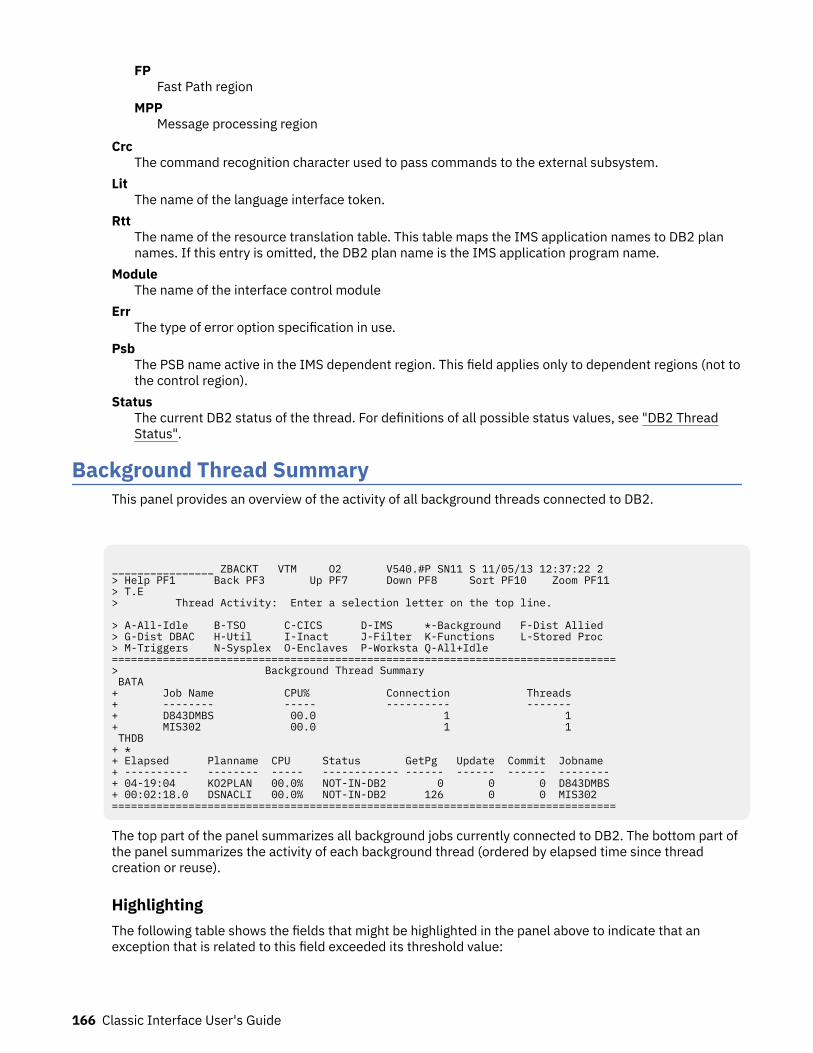
FPFast Path region
MPPMessage processing region
CrcThe command recognition character used to pass commands to the external subsystem.
LitThe name of the language interface token.
RttThe name of the resource translation table. This table maps the IMS application names to DB2 plannames. If this entry is omitted, the DB2 plan name is the IMS application program name.
ModuleThe name of the interface control module
ErrThe type of error option specification in use.
PsbThe PSB name active in the IMS dependent region. This field applies only to dependent regions (not tothe control region).
StatusThe current DB2 status of the thread. For definitions of all possible status values, see "DB2 ThreadStatus".
Background Thread SummaryThis panel provides an overview of the activity of all background threads connected to DB2.
________________ ZBACKT VTM O2 V540.#P SN11 S 11/05/13 12:37:22 2 > Help PF1 Back PF3 Up PF7 Down PF8 Sort PF10 Zoom PF11 > T.E > Thread Activity: Enter a selection letter on the top line. > A-All-Idle B-TSO C-CICS D-IMS *-Background F-Dist Allied > G-Dist DBAC H-Util I-Inact J-Filter K-Functions L-Stored Proc > M-Triggers N-Sysplex O-Enclaves P-Worksta Q-All+Idle ===============================================================================> Background Thread Summary BATA + Job Name CPU% Connection Threads + -------- ----- ---------- ------- + D843DMBS 00.0 1 1 + MIS302 00.0 1 1 THDB + * + Elapsed Planname CPU Status GetPg Update Commit Jobname + ---------- -------- ----- ------------ ------ ------ ------ -------- + 04-19:04 KO2PLAN 00.0% NOT-IN-DB2 0 0 0 D843DMBS + 00:02:18.0 DSNACLI 00.0% NOT-IN-DB2 126 0 0 MIS302 ===============================================================================
The top part of the panel summarizes all background jobs currently connected to DB2. The bottom part ofthe panel summarizes the activity of each background thread (ordered by elapsed time since threadcreation or reuse).
HighlightingThe following table shows the fields that might be highlighted in the panel above to indicate that anexception that is related to this field exceeded its threshold value:
166 Classic Interface User's Guide
Table 15. Highlighted fields in Background Thread Summary panel.
This table shows the fields and the exceptions these fields are related to. It also shows the reason forthe corresponding exception.
Field Exception Reason
Elapsed ETIM This thread has reached theElapsed Time threshold value.
CPU TCPU The thread address space hasexcessive CPU utilization.
GetPg GETP The Getpage to Read I/O ratioindicates poor read efficiency.
Update PGUP The rate for system page updatesis high.
Commit COMT The ratio of Commits to Updatesindicates a low Commitfrequency.
NavigationFor additional information about
• summary information about individual threads that originated from a particular background job, placethe cursor to the line that contains that job and press F11 (Zoom).
The information might not be displayed if individual threads do not work the address space of thebackground job, for example, if threads work inside of a DB2 address space.
• detail information about a particular thread, place the cursor to the line that contains that thread andpress F11 (Zoom).
• A different DB2 subsystem, data sharing group, or member of a data sharing group, enter the name of aDB2 subsystem, group, or member in the topmost row and press Enter. For more information, see“Switching among DB2 subsystems and data sharing group members” on page 11.
• related topics, select one of the options on the top of the panel.• other topics, use the PF keys.
FieldsBackground connection information:Job Name
The name of the background job connected to DB2.CPU %
The total CPU usage rate (percent) of background jobs that have active threads to DB2. For moreinformation, see "Analyzing DB2 CPU Usage".
ConnectionThe number of connections to DB2 that originated from this background thread.
Active ThreadsThe number of active threads that originated from the background connection.This value excludes parallel task threads that are initiated by another thread that is originating fromthe background connection.
Background thread information:
Chapter 6. Thread Activity 167
ElapsedThe elapsed time since thread creation, or since DB2 signon if the thread is reused. When the elapsedtime of the thread exceeds 24 hours, the format is dd-hh:mm.
If this thread is involved in parallel processing or if it invoked autonomous procedures, one of thefollowing identifiers is displayed after the elapsed time:*
This thread is a parallel task that is initiated on behalf of another (originating) thread to process aquery request in parallel.
OThis thread is the originating thread that invoked autonomous procedures.
PThis thread is the parent or the originating thread of the parallel tasks that are created to processa query request in parallel. Activity performed for this (originating) thread is reflected under theparallel tasks.
XThis thread is a parallel task that is initiated on behalf of another (originating) thread on anotherDB2 for sysplex parallelism.
PlannameorPackage
The DB2 plan name (or package name) of the active thread. If you selected option T from the RealtimeMain Menu, this panel shows the information by plan. If you selected option U, this panel shows theinformation by package.
CPU (if monitoring a DB2 subsystem or a data sharing group member)The current CPU rate (percent) of the batch or utility region from which the active thread originates.This includes both TCB and SRB time.
DB2 (if monitoring a data sharing group or remote DB2 subsystem while XCF component is notactivated for remote CPU)
The DB2 subsystem name of the data sharing group member that is currently monitored.You can use the Tab key to move to a detail line and to select this detail line for drill down.
StatusThe current DB2 status of the thread. For definitions of all possible status values, see "DB2 ThreadStatus".
GetPgThe number of thread Getpage requests.
Getpage requests are logical Read requests that might not actually result in physical I/O if therequested page is currently in the buffer pool. DB2 resets this count at thread creation and signon.
UpdateThe number of DB2 page updates made by the thread since thread creation. This value is incrementedeach time a row in a page is updated, not just once for each page updated. DB2 might update pageswhen it creates intermediate result tables because of a qualified SELECT statement, even thoughSELECT statements are generally thought of as read only operations. Pages that have been updatedare written asynchronously by DB2, according to DB2's internal Deferred Write algorithm, notimmediately after update or commit. DB2 resets the page update count at Create Thread and Signon.If Signon is not driven, the page update count is cumulative.
CommitThe number of times the thread successfully completed Commit processing.
DB2 resets the Commit count at thread creation and signon. If Signon is not driven, the count iscumulative.
JobnameThe name of the connected batch job or utility.
168 Classic Interface User's Guide
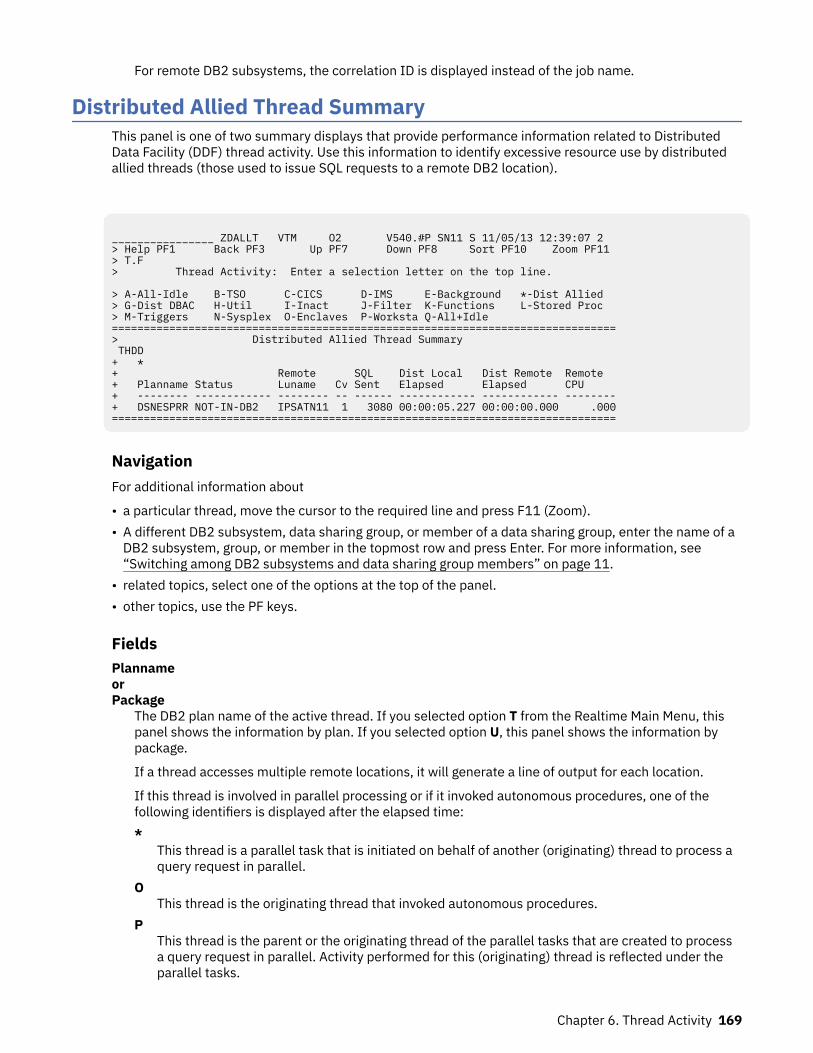
For remote DB2 subsystems, the correlation ID is displayed instead of the job name.
Distributed Allied Thread SummaryThis panel is one of two summary displays that provide performance information related to DistributedData Facility (DDF) thread activity. Use this information to identify excessive resource use by distributedallied threads (those used to issue SQL requests to a remote DB2 location).
________________ ZDALLT VTM O2 V540.#P SN11 S 11/05/13 12:39:07 2 > Help PF1 Back PF3 Up PF7 Down PF8 Sort PF10 Zoom PF11 > T.F > Thread Activity: Enter a selection letter on the top line. > A-All-Idle B-TSO C-CICS D-IMS E-Background *-Dist Allied > G-Dist DBAC H-Util I-Inact J-Filter K-Functions L-Stored Proc > M-Triggers N-Sysplex O-Enclaves P-Worksta Q-All+Idle ===============================================================================> Distributed Allied Thread Summary THDD + * + Remote SQL Dist Local Dist Remote Remote + Planname Status Luname Cv Sent Elapsed Elapsed CPU + -------- ------------ -------- -- ------ ------------ ------------ --------+ DSNESPRR NOT-IN-DB2 IPSATN11 1 3080 00:00:05.227 00:00:00.000 .000===============================================================================
NavigationFor additional information about
• a particular thread, move the cursor to the required line and press F11 (Zoom).• A different DB2 subsystem, data sharing group, or member of a data sharing group, enter the name of a
DB2 subsystem, group, or member in the topmost row and press Enter. For more information, see“Switching among DB2 subsystems and data sharing group members” on page 11.
• related topics, select one of the options at the top of the panel.• other topics, use the PF keys.
FieldsPlannameorPackage
The DB2 plan name of the active thread. If you selected option T from the Realtime Main Menu, thispanel shows the information by plan. If you selected option U, this panel shows the information bypackage.
If a thread accesses multiple remote locations, it will generate a line of output for each location.
If this thread is involved in parallel processing or if it invoked autonomous procedures, one of thefollowing identifiers is displayed after the elapsed time:*
This thread is a parallel task that is initiated on behalf of another (originating) thread to process aquery request in parallel.
OThis thread is the originating thread that invoked autonomous procedures.
PThis thread is the parent or the originating thread of the parallel tasks that are created to processa query request in parallel. Activity performed for this (originating) thread is reflected under theparallel tasks.
Chapter 6. Thread Activity 169
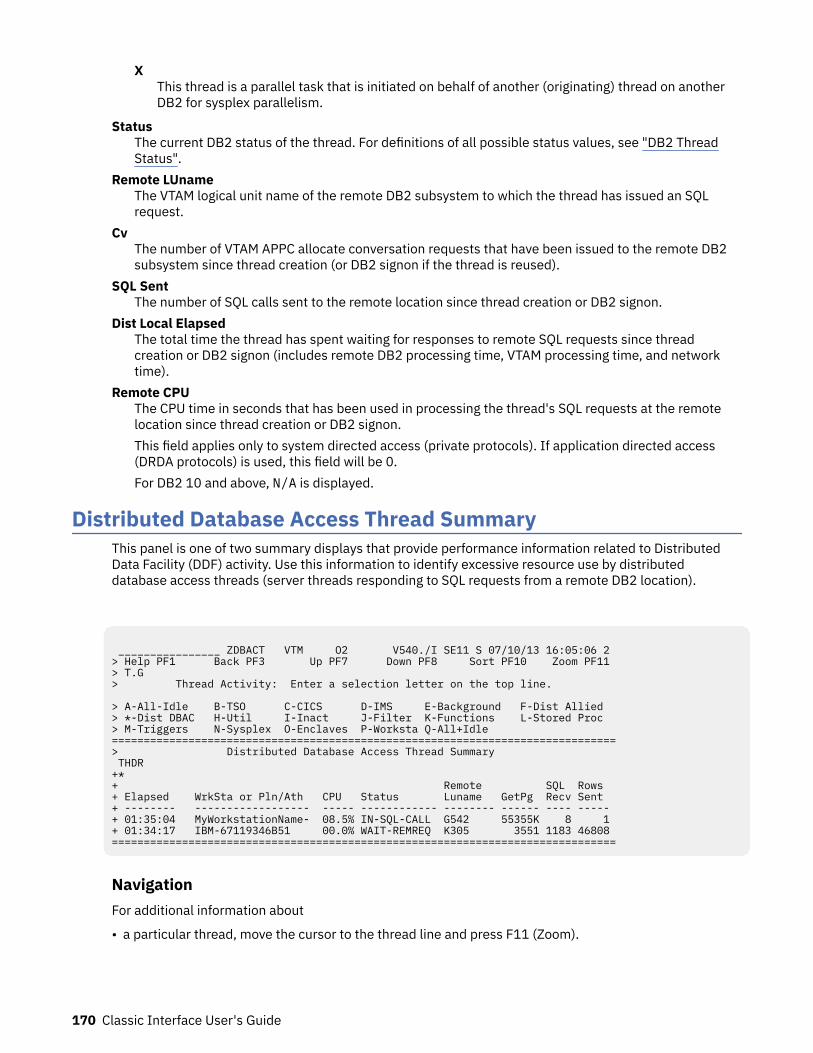
XThis thread is a parallel task that is initiated on behalf of another (originating) thread on anotherDB2 for sysplex parallelism.
StatusThe current DB2 status of the thread. For definitions of all possible status values, see "DB2 ThreadStatus".
Remote LUnameThe VTAM logical unit name of the remote DB2 subsystem to which the thread has issued an SQLrequest.
CvThe number of VTAM APPC allocate conversation requests that have been issued to the remote DB2subsystem since thread creation (or DB2 signon if the thread is reused).
SQL SentThe number of SQL calls sent to the remote location since thread creation or DB2 signon.
Dist Local ElapsedThe total time the thread has spent waiting for responses to remote SQL requests since threadcreation or DB2 signon (includes remote DB2 processing time, VTAM processing time, and networktime).
Remote CPUThe CPU time in seconds that has been used in processing the thread's SQL requests at the remotelocation since thread creation or DB2 signon.This field applies only to system directed access (private protocols). If application directed access(DRDA protocols) is used, this field will be 0.For DB2 10 and above, N/A is displayed.
Distributed Database Access Thread SummaryThis panel is one of two summary displays that provide performance information related to DistributedData Facility (DDF) activity. Use this information to identify excessive resource use by distributeddatabase access threads (server threads responding to SQL requests from a remote DB2 location).
________________ ZDBACT VTM O2 V540./I SE11 S 07/10/13 16:05:06 2 > Help PF1 Back PF3 Up PF7 Down PF8 Sort PF10 Zoom PF11 > T.G > Thread Activity: Enter a selection letter on the top line. > A-All-Idle B-TSO C-CICS D-IMS E-Background F-Dist Allied > *-Dist DBAC H-Util I-Inact J-Filter K-Functions L-Stored Proc > M-Triggers N-Sysplex O-Enclaves P-Worksta Q-All+Idle =============================================================================== > Distributed Database Access Thread Summary THDR +* + Remote SQL Rows + Elapsed WrkSta or Pln/Ath CPU Status Luname GetPg Recv Sent + -------- ------------------ ----- ------------ -------- ------ ---- ----- + 01:35:04 MyWorkstationName- 08.5% IN-SQL-CALL G542 55355K 8 1 + 01:34:17 IBM-67119346B51 00.0% WAIT-REMREQ K305 3551 1183 46808 ===============================================================================
NavigationFor additional information about
• a particular thread, move the cursor to the thread line and press F11 (Zoom).
170 Classic Interface User's Guide
• A different DB2 subsystem, data sharing group, or member of a data sharing group, enter the name of aDB2 subsystem, group, or member in the topmost row and press Enter. For more information, see“Switching among DB2 subsystems and data sharing group members” on page 11.
• related topics, select one of the options at the top of the panel.• other topics, use the PF keys.
FieldsElapsed
The elapsed time since thread creation, or since DB2 signon if the thread is reused. When the elapsedtime of the thread exceeds 24 hours, the format is dd-hh:mm.
If this thread is involved in parallel processing or if it invoked autonomous procedures, one of thefollowing identifiers is displayed after the elapsed time:*
This thread is a parallel task that is initiated on behalf of another (originating) thread to process aquery request in parallel.
OThis thread is the originating thread that invoked autonomous procedures.
PThis thread is the parent or the originating thread of the parallel tasks that are created to processa query request in parallel. Activity performed for this (originating) thread is reflected under theparallel tasks.
XThis thread is a parallel task that is initiated on behalf of another (originating) thread on anotherDB2 for sysplex parallelism.
WrkSta or Pln/Ath or Pkg/AthOne of following information is displayed:WrkSta
The name of the workstation, if it is set by the application.Pln/Ath or Pkg/Ath
The DB2 plan (Pln) or package (Pkg) name of the active thread, if an optional USERMOD is appliedto your system. (see member rhilev.TKANSAM(KO2MOD02) . This USERMOD can controlwhether the workstation name is displayed on the summary screen. The plan or package name isfollowed by a slash (/) and the DB2 thread authorization identifier (Ath) of the active thread.
-CPU (if monitoring a local DB2 subsystem or a data sharing group with XCF component activated forremote CPU)
The CPU rate (percent) that is associated with the thread. Database access threads run in MVS SRBmode. The displayed rate is SRB time (no TCB time).
DB2 (if monitoring a data sharing group or remote DB2 subsystem while XCF component is notactivated for remote CPU)
The DB2 subsystem name of the data sharing group member that is currently monitored.You can use the Tab key to move to a detail line and to select this detail line for drill down.
StatusThe current DB2 status of the thread. For definitions of all possible status values, see "DB2 ThreadStatus".
Remote LunameThe VTAM logical unit name of the requesting DB2 subsystem whose SQL request is being serviced bythe thread.
GetPgThe number of Getpage requests issued by the thread since thread creation.
Chapter 6. Thread Activity 171
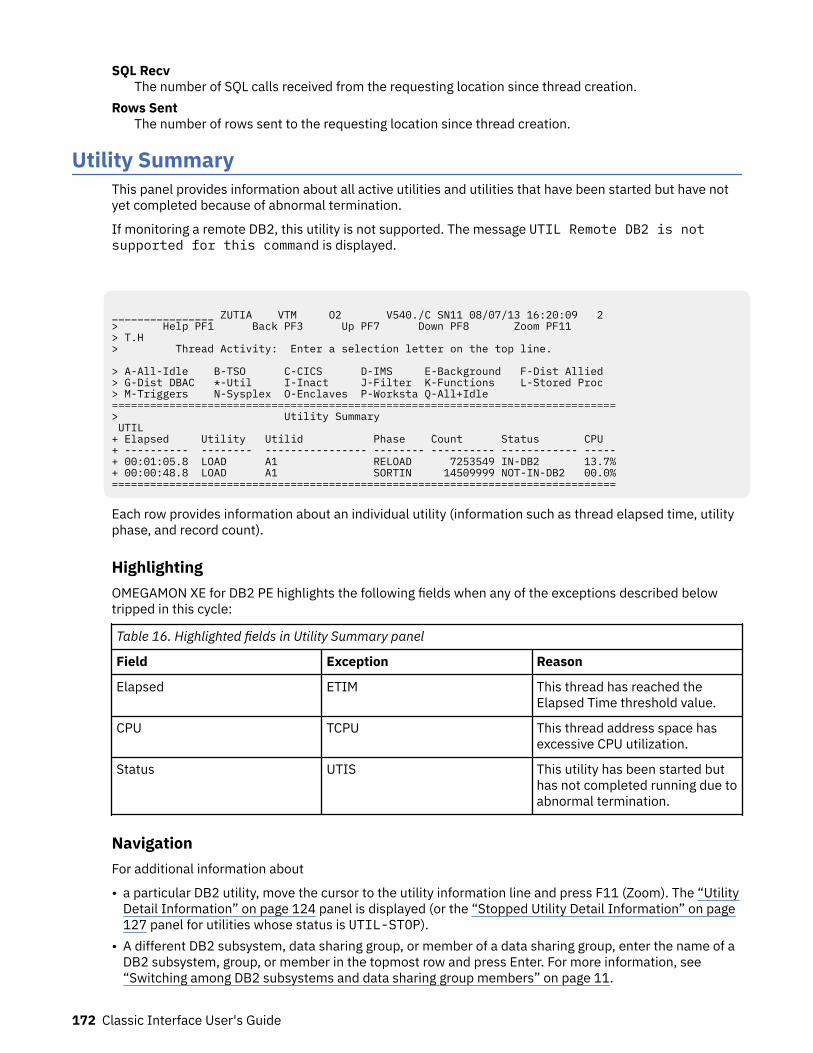
SQL RecvThe number of SQL calls received from the requesting location since thread creation.
Rows SentThe number of rows sent to the requesting location since thread creation.
Utility SummaryThis panel provides information about all active utilities and utilities that have been started but have notyet completed because of abnormal termination.
If monitoring a remote DB2, this utility is not supported. The message UTIL Remote DB2 is notsupported for this command is displayed.
________________ ZUTIA VTM O2 V540./C SN11 08/07/13 16:20:09 2 > Help PF1 Back PF3 Up PF7 Down PF8 Zoom PF11 > T.H > Thread Activity: Enter a selection letter on the top line. > A-All-Idle B-TSO C-CICS D-IMS E-Background F-Dist Allied > G-Dist DBAC *-Util I-Inact J-Filter K-Functions L-Stored Proc > M-Triggers N-Sysplex O-Enclaves P-Worksta Q-All+Idle =============================================================================== > Utility Summary UTIL + Elapsed Utility Utilid Phase Count Status CPU + ---------- -------- ---------------- -------- ---------- ------------ ----- + 00:01:05.8 LOAD A1 RELOAD 7253549 IN-DB2 13.7% + 00:00:48.8 LOAD A1 SORTIN 14509999 NOT-IN-DB2 00.0% ===============================================================================
Each row provides information about an individual utility (information such as thread elapsed time, utilityphase, and record count).
HighlightingOMEGAMON XE for DB2 PE highlights the following fields when any of the exceptions described belowtripped in this cycle:
Table 16. Highlighted fields in Utility Summary panel
Field Exception Reason
Elapsed ETIM This thread has reached theElapsed Time threshold value.
CPU TCPU This thread address space hasexcessive CPU utilization.
Status UTIS This utility has been started buthas not completed running due toabnormal termination.
NavigationFor additional information about
• a particular DB2 utility, move the cursor to the utility information line and press F11 (Zoom). The “UtilityDetail Information” on page 124 panel is displayed (or the “Stopped Utility Detail Information” on page127 panel for utilities whose status is UTIL-STOP).
• A different DB2 subsystem, data sharing group, or member of a data sharing group, enter the name of aDB2 subsystem, group, or member in the topmost row and press Enter. For more information, see“Switching among DB2 subsystems and data sharing group members” on page 11.
172 Classic Interface User's Guide
• related topics, select one of the options on the top of the panel.
FieldsElapsed
The elapsed time since thread creation, or since DB2 signon if the thread is reused. When the elapsedtime of the thread exceeds 24 hours, the format is dd-hh:mm.
If this thread is involved in parallel processing or if it invoked autonomous procedures, one of thefollowing identifiers is displayed after the elapsed time:*
This thread is a parallel task that is initiated on behalf of another (originating) thread to process aquery request in parallel.
OThis thread is the originating thread that invoked autonomous procedures.
PThis thread is the parent or the originating thread of the parallel tasks that are created to processa query request in parallel. Activity performed for this (originating) thread is reflected under theparallel tasks.
XThis thread is a parallel task that is initiated on behalf of another (originating) thread on anotherDB2 for sysplex parallelism.
When status field displays UTIL-STOP, this field is N/A (not applicable).
UtilityThe name of the DB2 utility.
UtilidThe identifier that defines the utility to DB2. Each utility that has been started and is not yetterminated must have a unique utility ID.
PhaseThe executing phase of the DB2 utility. If the utility is stopped, you must specify this phase when yourestart it.
CountThe total number of items (such as records or pages) that have been processed. The type of itemdepends on the utility and its phase.
StatusThe status of the DB2 utility. The status is UTIL-STOP if the DB2 utility has been started but has notyet completed running because of abnormal termination. For more information, refer to "DB2 ThreadStatus".
CPUThe current CPU rate of the DB2 utility job. When status field displays UTIL-STOP, this field is notapplicable.
Inactive ThreadsThis panel shows information about inactive threads. The information is collected from a DB2 displaythread command.
A distributed thread is accessing a remote site on behalf of a request from another location. The thread iscurrently an inactive connection (type 2 inactive thread). It is waiting for an agent to become available.
Each row displays information about an individual inactive thread. The columns are ordered by locationname initially.
Chapter 6. Thread Activity 173
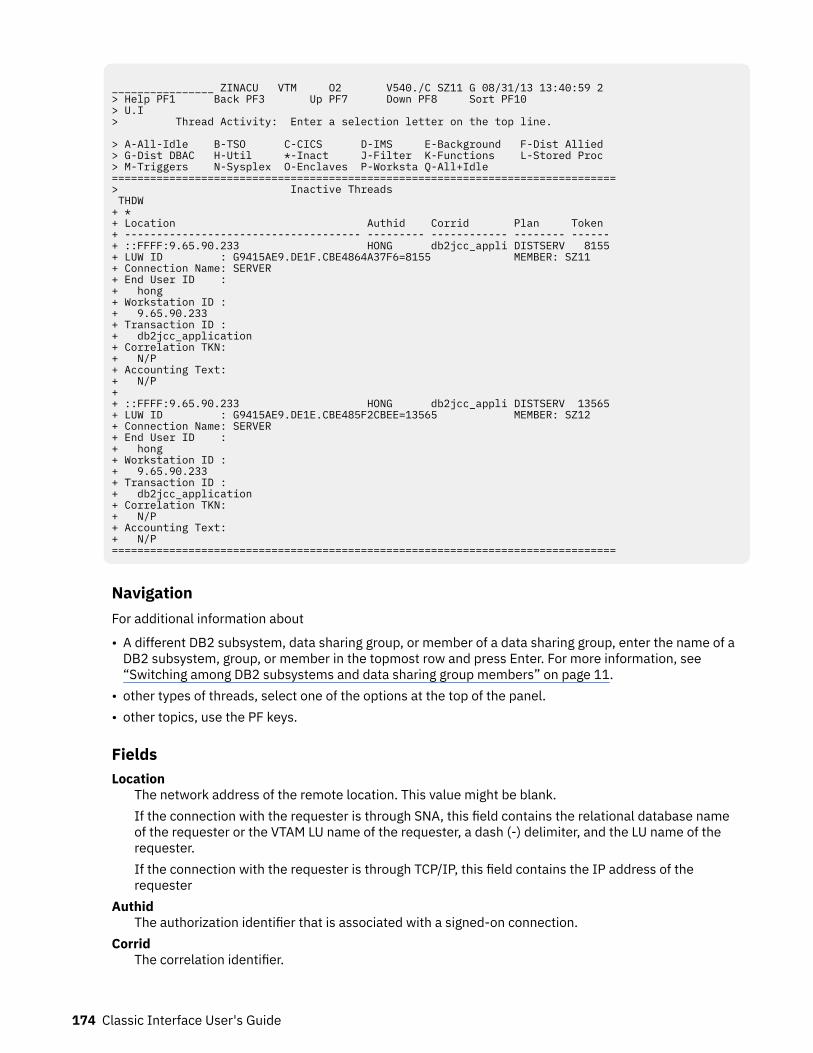
________________ ZINACU VTM O2 V540./C SZ11 G 08/31/13 13:40:59 2 > Help PF1 Back PF3 Up PF7 Down PF8 Sort PF10 > U.I > Thread Activity: Enter a selection letter on the top line. > A-All-Idle B-TSO C-CICS D-IMS E-Background F-Dist Allied > G-Dist DBAC H-Util *-Inact J-Filter K-Functions L-Stored Proc > M-Triggers N-Sysplex O-Enclaves P-Worksta Q-All+Idle =============================================================================== > Inactive Threads THDW + * + Location Authid Corrid Plan Token + ------------------------------------- --------- ------------ -------- ------ + ::FFFF:9.65.90.233 HONG db2jcc_appli DISTSERV 8155 + LUW ID : G9415AE9.DE1F.CBE4864A37F6=8155 MEMBER: SZ11 + Connection Name: SERVER + End User ID : + hong + Workstation ID : + 9.65.90.233 + Transaction ID : + db2jcc_application + Correlation TKN: + N/P + Accounting Text: + N/P + + ::FFFF:9.65.90.233 HONG db2jcc_appli DISTSERV 13565 + LUW ID : G9415AE9.DE1E.CBE485F2CBEE=13565 MEMBER: SZ12 + Connection Name: SERVER + End User ID : + hong + Workstation ID : + 9.65.90.233 + Transaction ID : + db2jcc_application + Correlation TKN: + N/P + Accounting Text: + N/P ===============================================================================
NavigationFor additional information about
• A different DB2 subsystem, data sharing group, or member of a data sharing group, enter the name of aDB2 subsystem, group, or member in the topmost row and press Enter. For more information, see“Switching among DB2 subsystems and data sharing group members” on page 11.
• other types of threads, select one of the options at the top of the panel.• other topics, use the PF keys.
FieldsLocation
The network address of the remote location. This value might be blank.If the connection with the requester is through SNA, this field contains the relational database nameof the requester or the VTAM LU name of the requester, a dash (-) delimiter, and the LU name of therequester.If the connection with the requester is through TCP/IP, this field contains the IP address of therequester
AuthidThe authorization identifier that is associated with a signed-on connection.
CorridThe correlation identifier.
174 Classic Interface User's Guide
If the application requestor is a DB2 system, this is the same correlation ID assigned at the requestor.If the application requestor is not DB2, this is the name of the job, task, or process that is beingserviced.
PlanThe plan name that is associated with the thread. For distributed database access threads, this fieldcontains one of the following values:DISTSERV
For threads that use application-directed access from a non-DB2 requester, a plan name is notidentified.
requester-valueFor threads that use system-directed access or application-directed access from a DB2 requester,this value is the plan name that is being executed at the requesting location.
TokenThe thread token that is assigned to the thread.
LUW IDThe output is in the format of text=numtext
The global logical unit of work ID (LUWID).num
The local token that identifies the thread. This token can be used in place of the LUWID in any DB2command that accepts LUWID as input.
MemberThe data sharing group member name for this DB2 subsystem. For DB2 subsystems that do notbelong to a data sharing group, N/P is displayed.
Connection NameThe connection name that is used to establish the thread. For distributed database access threads,this field contains the following information:requester-value
For threads that access the server from a DB2 for z/OS requester, this value is the connectionname of the thread at the requesting location.
SERVERFor threads that access the server from a non-DB2 for z/OS requester, a connection name is notidentified.
blankFor threads where the originating task is running on the same DB2 subsystem, this value is blank.
End User IDThe user ID of the end user.
Workstation IDThe name of the workstation.
Transaction IDThe name of the client application.
Correlation TKNThe correlation token consists of the following components:ip-address
The length of the IP address can be from 3 to 39 characters.port-address
The length of the port address can be from 1 to 8 characters.unique-id
The length of the unique ID is 12 characters.
Chapter 6. Thread Activity 175
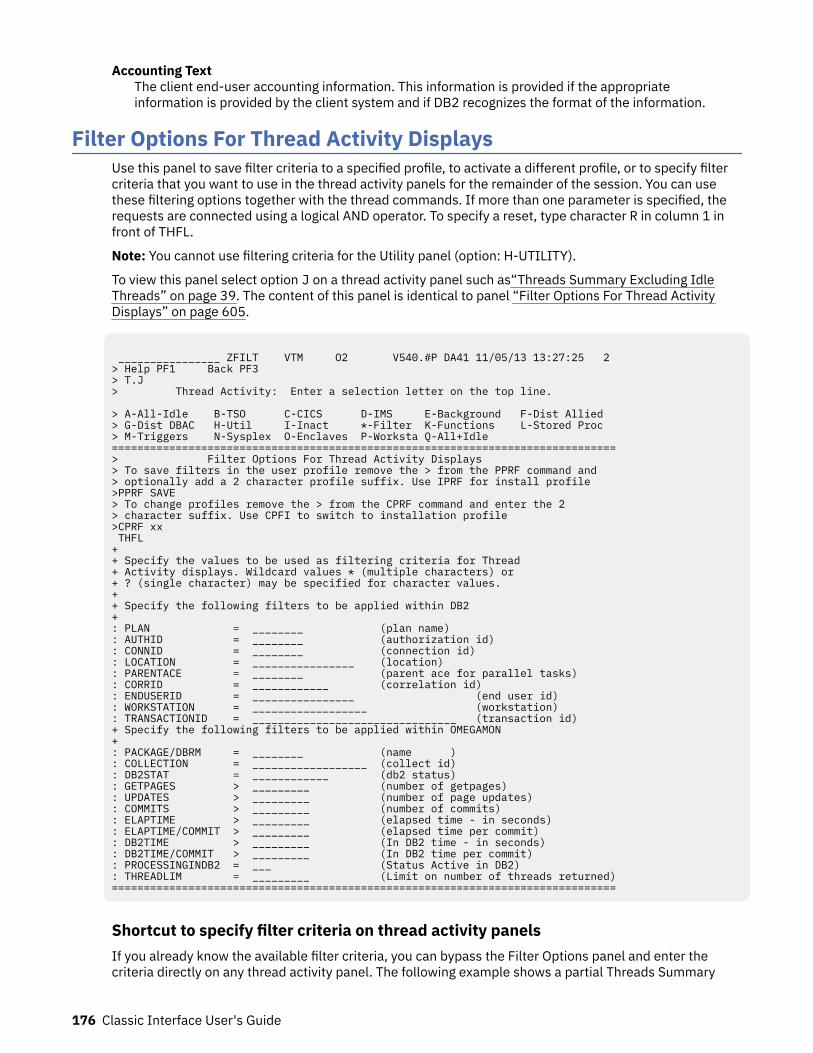
Accounting TextThe client end-user accounting information. This information is provided if the appropriateinformation is provided by the client system and if DB2 recognizes the format of the information.
Filter Options For Thread Activity DisplaysUse this panel to save filter criteria to a specified profile, to activate a different profile, or to specify filtercriteria that you want to use in the thread activity panels for the remainder of the session. You can usethese filtering options together with the thread commands. If more than one parameter is specified, therequests are connected using a logical AND operator. To specify a reset, type character R in column 1 infront of THFL.
Note: You cannot use filtering criteria for the Utility panel (option: H-UTILITY).
To view this panel select option J on a thread activity panel such as“Threads Summary Excluding IdleThreads” on page 39. The content of this panel is identical to panel “Filter Options For Thread ActivityDisplays” on page 605.
________________ ZFILT VTM O2 V540.#P DA41 11/05/13 13:27:25 2 > Help PF1 Back PF3 > T.J > Thread Activity: Enter a selection letter on the top line. > A-All-Idle B-TSO C-CICS D-IMS E-Background F-Dist Allied > G-Dist DBAC H-Util I-Inact *-Filter K-Functions L-Stored Proc > M-Triggers N-Sysplex O-Enclaves P-Worksta Q-All+Idle =============================================================================== > Filter Options For Thread Activity Displays > To save filters in the user profile remove the > from the PPRF command and > optionally add a 2 character profile suffix. Use IPRF for install profile >PPRF SAVE > To change profiles remove the > from the CPRF command and enter the 2 > character suffix. Use CPFI to switch to installation profile >CPRF xx THFL + + Specify the values to be used as filtering criteria for Thread + Activity displays. Wildcard values * (multiple characters) or + ? (single character) may be specified for character values. + + Specify the following filters to be applied within DB2 + : PLAN = ________ (plan name) : AUTHID = ________ (authorization id) : CONNID = ________ (connection id) : LOCATION = ________________ (location) : PARENTACE = ________ (parent ace for parallel tasks) : CORRID = ____________ (correlation id) : ENDUSERID = ________________ (end user id) : WORKSTATION = __________________ (workstation) : TRANSACTIONID = ________________________________ (transaction id) + Specify the following filters to be applied within OMEGAMON + : PACKAGE/DBRM = ________ (name ) : COLLECTION = __________________ (collect id) : DB2STAT = ____________ (db2 status) : GETPAGES > _________ (number of getpages) : UPDATES > _________ (number of page updates) : COMMITS > _________ (number of commits) : ELAPTIME > _________ (elapsed time - in seconds) : ELAPTIME/COMMIT > _________ (elapsed time per commit) : DB2TIME > _________ (In DB2 time - in seconds) : DB2TIME/COMMIT > _________ (In DB2 time per commit) : PROCESSINGINDB2 = ___ (Status Active in DB2) : THREADLIM = _________ (Limit on number of threads returned) ===============================================================================
Shortcut to specify filter criteria on thread activity panelsIf you already know the available filter criteria, you can bypass the Filter Options panel and enter thecriteria directly on any thread activity panel. The following example shows a partial Threads Summary
176 Classic Interface User's Guide
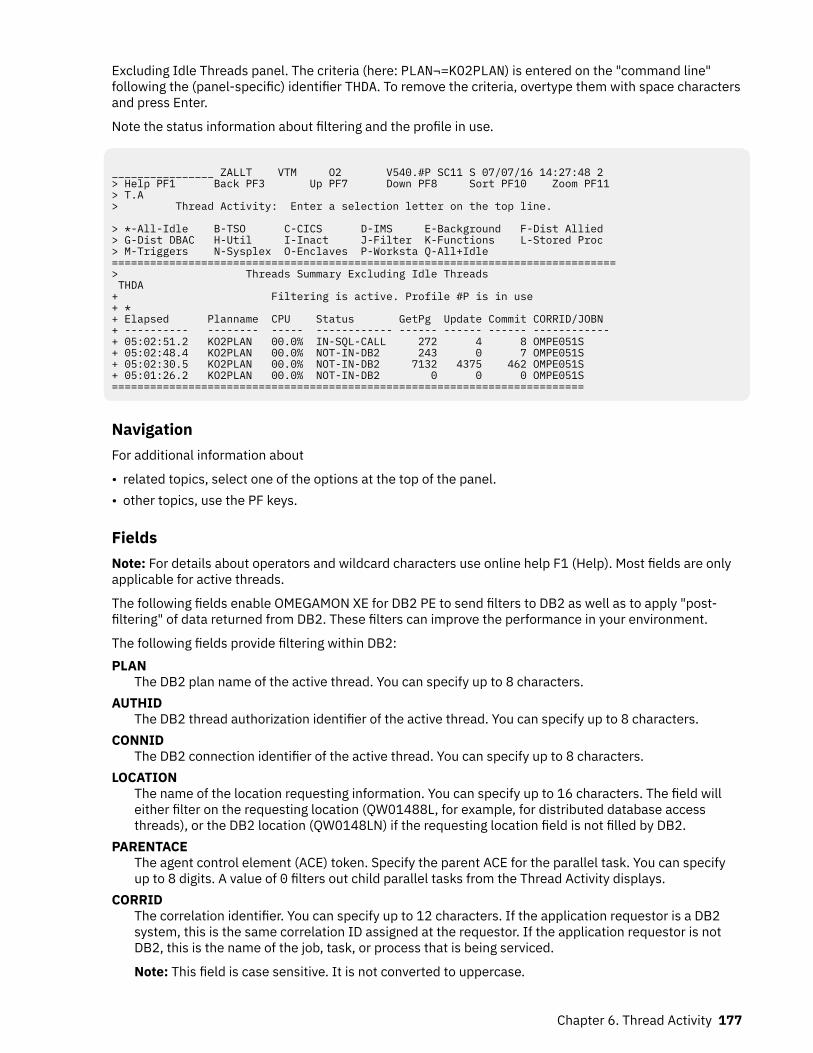
Excluding Idle Threads panel. The criteria (here: PLAN¬=KO2PLAN) is entered on the "command line"following the (panel-specific) identifier THDA. To remove the criteria, overtype them with space charactersand press Enter.
Note the status information about filtering and the profile in use.
________________ ZALLT VTM O2 V540.#P SC11 S 07/07/16 14:27:48 2 > Help PF1 Back PF3 Up PF7 Down PF8 Sort PF10 Zoom PF11 > T.A > Thread Activity: Enter a selection letter on the top line.
> *-All-Idle B-TSO C-CICS D-IMS E-Background F-Dist Allied > G-Dist DBAC H-Util I-Inact J-Filter K-Functions L-Stored Proc > M-Triggers N-Sysplex O-Enclaves P-Worksta Q-All+Idle =============================================================================== > Threads Summary Excluding Idle Threads THDA + Filtering is active. Profile #P is in use + * + Elapsed Planname CPU Status GetPg Update Commit CORRID/JOBN + ---------- -------- ----- ------------ ------ ------ ------ ------------ + 05:02:51.2 KO2PLAN 00.0% IN-SQL-CALL 272 4 8 OMPE051S + 05:02:48.4 KO2PLAN 00.0% NOT-IN-DB2 243 0 7 OMPE051S + 05:02:30.5 KO2PLAN 00.0% NOT-IN-DB2 7132 4375 462 OMPE051S + 05:01:26.2 KO2PLAN 00.0% NOT-IN-DB2 0 0 0 OMPE051S ==========================================================================
NavigationFor additional information about
• related topics, select one of the options at the top of the panel.• other topics, use the PF keys.
FieldsNote: For details about operators and wildcard characters use online help F1 (Help). Most fields are onlyapplicable for active threads.
The following fields enable OMEGAMON XE for DB2 PE to send filters to DB2 as well as to apply "post-filtering" of data returned from DB2. These filters can improve the performance in your environment.
The following fields provide filtering within DB2:PLAN
The DB2 plan name of the active thread. You can specify up to 8 characters.AUTHID
The DB2 thread authorization identifier of the active thread. You can specify up to 8 characters.CONNID
The DB2 connection identifier of the active thread. You can specify up to 8 characters.LOCATION
The name of the location requesting information. You can specify up to 16 characters. The field willeither filter on the requesting location (QW01488L, for example, for distributed database accessthreads), or the DB2 location (QW0148LN) if the requesting location field is not filled by DB2.
PARENTACEThe agent control element (ACE) token. Specify the parent ACE for the parallel task. You can specifyup to 8 digits. A value of 0 filters out child parallel tasks from the Thread Activity displays.
CORRIDThe correlation identifier. You can specify up to 12 characters. If the application requestor is a DB2system, this is the same correlation ID assigned at the requestor. If the application requestor is notDB2, this is the name of the job, task, or process that is being serviced.
Note: This field is case sensitive. It is not converted to uppercase.
Chapter 6. Thread Activity 177
ENDUSERIDThe end user's work station user ID. You can specify up to 16 characters. This can be different fromthe authorization ID used to connect to DB2. It contains blanks if the client does not supply thisinformation.
Note: This field is case sensitive. It is not converted to uppercase.
WORKSTATIONThe workstation identifier. You can specify up to 18 characters. It contains blanks if the client does notsupply this information.
Note: This field is case sensitive. It is not converted to uppercase.
TRANSACTIONIDThe name of the transaction or application that the end user is running. It identifies the applicationthat is currently running, not the product that is used to run the application. You can specify up to 32characters. This field contains blanks if the client does not supply this information.
Note: This field is case sensitive. It is not converted to uppercase.
The following fields enable filtering of the data returned from DB2 and are applied by OMEGAMON XE forDB2 PE:PACKAGE/DBRM
The DB2 package name or DBRM name of the active thread. You can specify up to 8 characters.COLLECTION
The package collection identifier of the active thread. You can specify up to 18 characters.DB2STAT
The DB2 status. You can specify up to 12 characters. For definitions of all possible status values, see"DB2 Thread Status".
GETPAGESThe number of Getpage requests issued by the active thread since thread creation. You can specify upto 9 digits.
UPDATESThe number of DB2 page updates made by the thread since thread creation. This value is incrementedeach time a row in a page is updated, not just once for each page updated. DB2 might update pageswhen it creates intermediate result tables because of a qualified SELECT statement, even thoughSELECT statements are generally thought of as read only operations. Pages that have been updatedare written asynchronously by DB2, according to DB2's internal Deferred Write algorithm, notimmediately after update or commit. DB2 resets the page update count at Create Thread and Signon.If Signon is not driven, the page update count is cumulative. This file is applicable for active threadsonly. You can specify up to 9 digits.
COMMITSThe number of times the thread successfully completed commit processing. DB2 resets the commitcount at thread create and signon. If signon is not driven, the count is cumulative. You can specify upto 9 digits.
ELAPTIMEThe elapsed time since thread creation. You can specify up to 9 digits.
ELAPTIME/COMMITAverage elapsed time between commits. If the number of commits is zero this field is the same asELAPTIME. You can specify up to 9 digits.
DB2TIMEThe total In-DB2 elapsed time in seconds for an active thread. You can specify up to 9 digits.
DB2TIME/COMMITAverage In-DB2 elapsed time between commits. If the number of commits is zero this field is thesame as DB2TIME. You can specify up to 9 digits.
PROCESSING-IN-DB2Values YES, NO or blank.
178 Classic Interface User's Guide
YESOnly threads that are in a status that is active in DB2 are shown. If a thread is executing in theapplication it is not shown. The following thread statuses are processing in DB2:
• IN-DB2• IN-TRIGGER• IN-COMMAND• IN-STOR-PROC• IN-USER-FUNC• IN-TERM-THRD• WAIT-LOCK• WAIT-GLBLOCK• WAIT-MSGSEND• WAIT-ARCHIVE• WAIT-REMSQL• WAIT-CONVLIM• WAIT-TERM-TH• WAIT-SP-STOP• WAIT-SP-SCHD• SP/UDF-INACT• WAIT-SYNC-IO• WAIT-SERVICE• WAIT-ASYNCRD• WAIT-ASYNCWR• WAIT-LOGQSCE• WAIT-PGLATCH• WAIT-DRNLOCK• WAIT-CLAIMER• WAIT-ARCREAD• WAIT-LOCKPIP• WAIT-LOCKPQS• WAIT-SWITCH• WAIT-ACCEL• WAIT-LOB• WAIT-COMMIT• WAIT-CL3LOCK• IN-SQL-SORT• IN-SQL-CALL• WAIT-REMREQ• IN-BIND-DYNM• IN-ACCEL• IN-AUTO-PROC
NOOnly threads that are not in an active status in DB2 are shown.
Chapter 6. Thread Activity 179
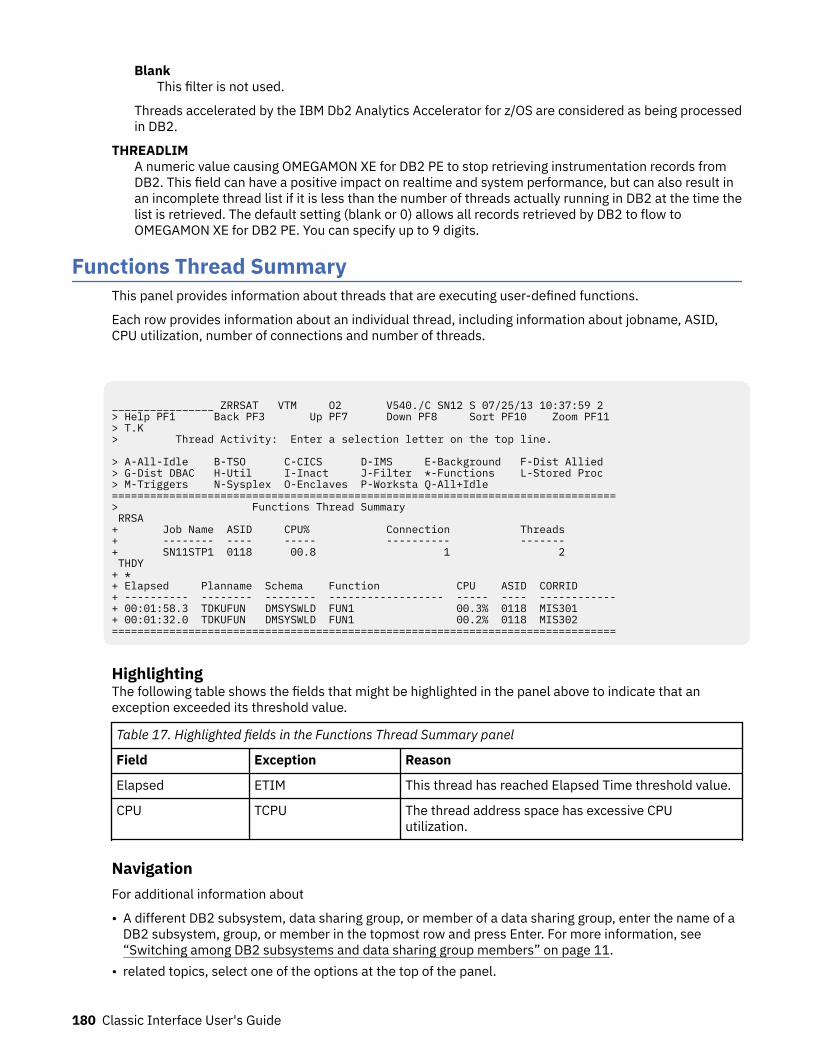
BlankThis filter is not used.
Threads accelerated by the IBM Db2 Analytics Accelerator for z/OS are considered as being processedin DB2.
THREADLIMA numeric value causing OMEGAMON XE for DB2 PE to stop retrieving instrumentation records fromDB2. This field can have a positive impact on realtime and system performance, but can also result inan incomplete thread list if it is less than the number of threads actually running in DB2 at the time thelist is retrieved. The default setting (blank or 0) allows all records retrieved by DB2 to flow toOMEGAMON XE for DB2 PE. You can specify up to 9 digits.
Functions Thread SummaryThis panel provides information about threads that are executing user-defined functions.
Each row provides information about an individual thread, including information about jobname, ASID,CPU utilization, number of connections and number of threads.
________________ ZRRSAT VTM O2 V540./C SN12 S 07/25/13 10:37:59 2 > Help PF1 Back PF3 Up PF7 Down PF8 Sort PF10 Zoom PF11 > T.K > Thread Activity: Enter a selection letter on the top line. > A-All-Idle B-TSO C-CICS D-IMS E-Background F-Dist Allied > G-Dist DBAC H-Util I-Inact J-Filter *-Functions L-Stored Proc > M-Triggers N-Sysplex O-Enclaves P-Worksta Q-All+Idle ===============================================================================> Functions Thread Summary RRSA + Job Name ASID CPU% Connection Threads + -------- ---- ----- ---------- ------- + SN11STP1 0118 00.8 1 2 THDY + * + Elapsed Planname Schema Function CPU ASID CORRID + ---------- -------- -------- ------------------ ----- ---- ------------+ 00:01:58.3 TDKUFUN DMSYSWLD FUN1 00.3% 0118 MIS301 + 00:01:32.0 TDKUFUN DMSYSWLD FUN1 00.2% 0118 MIS302 ===============================================================================
HighlightingThe following table shows the fields that might be highlighted in the panel above to indicate that anexception exceeded its threshold value.
Table 17. Highlighted fields in the Functions Thread Summary panel
Field Exception Reason
Elapsed ETIM This thread has reached Elapsed Time threshold value.
CPU TCPU The thread address space has excessive CPUutilization.
NavigationFor additional information about
• A different DB2 subsystem, data sharing group, or member of a data sharing group, enter the name of aDB2 subsystem, group, or member in the topmost row and press Enter. For more information, see“Switching among DB2 subsystems and data sharing group members” on page 11.
• related topics, select one of the options at the top of the panel.
180 Classic Interface User's Guide
• other topics, use the PF keys.
FieldsJob Name
The name of the WLM stored procedure address space.ASID
The address space identifier of the WLM stored procedure address space.CPU%
The percentage of CPU time utilized.Connection
The number of connections.Threads
The number of threads.Elapsed
The elapsed time since the function thread was created or reused.PlannameorPackage
The DB2 plan name (or package name) of the active thread. If you selected option T from the RealtimeMain Menu, this panel shows the information by plan. If you selected option U, this panel shows theinformation by package.
SchemaThe schema name of the user-defined function.
FunctionThe name of the user-defined function.
CPUThis field is displayed if you are monitoring a DB2 subsystem or a data sharing member.The CPU rate in percent that is attributable to the user-defined function thread.For more information about CPU use, see "Analyzing DB2 CPU Usage".
DB2This field is displayed if you are monitoring a data sharing group.The name of the DB2 subsystem that is currently monitored.
ASIDThe ASID of the WLM stored procedure address space in which the user-defined function is executing.
CORRIDThe correlation ID of the user-defined function.
Stored Procedures Thread SummaryThis panel provides information about threads that are executing stored procedures.
Each row provides information about an individual thread, including information about jobname, ASID,CPU utilization, number of connections and number of threads.
Note: To display WLM address spaces, the OMEGAMON XE for DB2 PE started task must have been givenRead access authority in the RACF® profile MVSADMIN.WLM.POLICY for the general resource classFACILITY. If the OMEGAMON XE for DB2 PE started task has a user ID associated with it, use that user IDinstead of the started task name. The following RACF commands show an example:
PERMIT MVSADMIN.WLM.POLICY CLASS(FACILITY) ID(user_id) ACCESS(READ)SETROPTS RACLIST(FACILITY) REFRESHALTUSER user_id OMVS(UID(0))
Chapter 6. Thread Activity 181
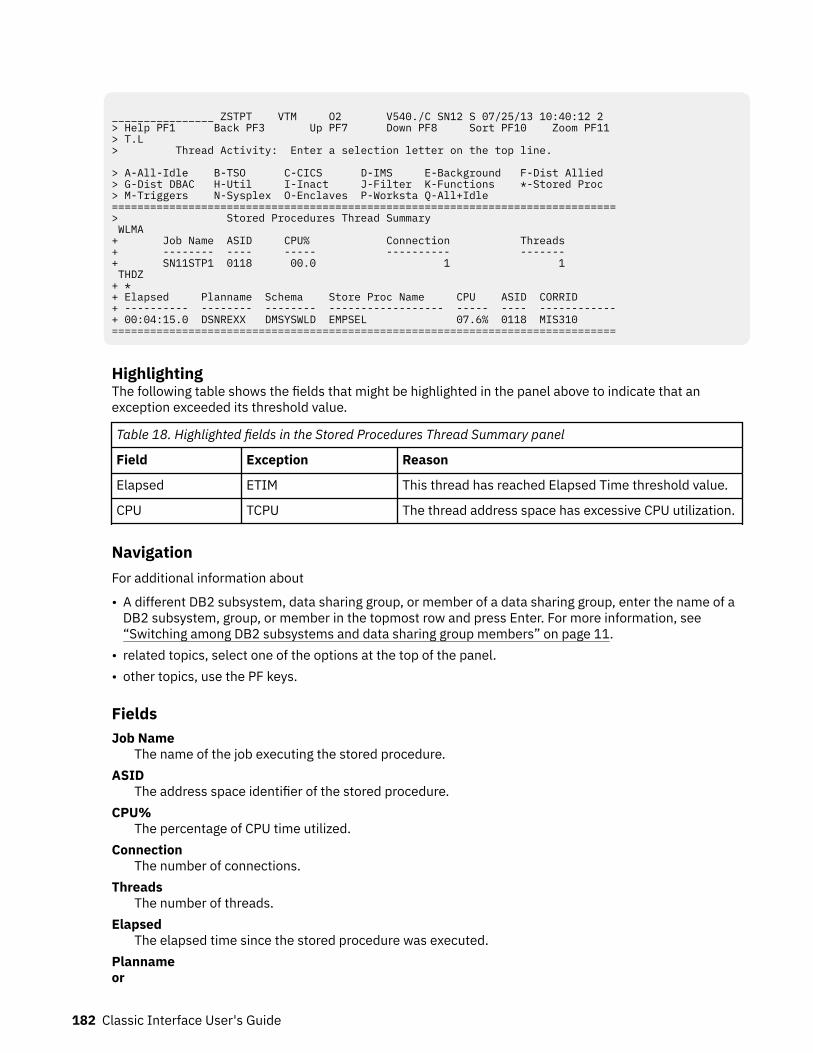
________________ ZSTPT VTM O2 V540./C SN12 S 07/25/13 10:40:12 2 > Help PF1 Back PF3 Up PF7 Down PF8 Sort PF10 Zoom PF11 > T.L > Thread Activity: Enter a selection letter on the top line. > A-All-Idle B-TSO C-CICS D-IMS E-Background F-Dist Allied > G-Dist DBAC H-Util I-Inact J-Filter K-Functions *-Stored Proc > M-Triggers N-Sysplex O-Enclaves P-Worksta Q-All+Idle ===============================================================================> Stored Procedures Thread Summary WLMA + Job Name ASID CPU% Connection Threads + -------- ---- ----- ---------- ------- + SN11STP1 0118 00.0 1 1 THDZ + * + Elapsed Planname Schema Store Proc Name CPU ASID CORRID + ---------- -------- -------- ------------------ ----- ---- ------------+ 00:04:15.0 DSNREXX DMSYSWLD EMPSEL 07.6% 0118 MIS310 ===============================================================================
HighlightingThe following table shows the fields that might be highlighted in the panel above to indicate that anexception exceeded its threshold value.
Table 18. Highlighted fields in the Stored Procedures Thread Summary panel
Field Exception Reason
Elapsed ETIM This thread has reached Elapsed Time threshold value.
CPU TCPU The thread address space has excessive CPU utilization.
NavigationFor additional information about
• A different DB2 subsystem, data sharing group, or member of a data sharing group, enter the name of aDB2 subsystem, group, or member in the topmost row and press Enter. For more information, see“Switching among DB2 subsystems and data sharing group members” on page 11.
• related topics, select one of the options at the top of the panel.• other topics, use the PF keys.
FieldsJob Name
The name of the job executing the stored procedure.ASID
The address space identifier of the stored procedure.CPU%
The percentage of CPU time utilized.Connection
The number of connections.Threads
The number of threads.Elapsed
The elapsed time since the stored procedure was executed.Plannameor
182 Classic Interface User's Guide
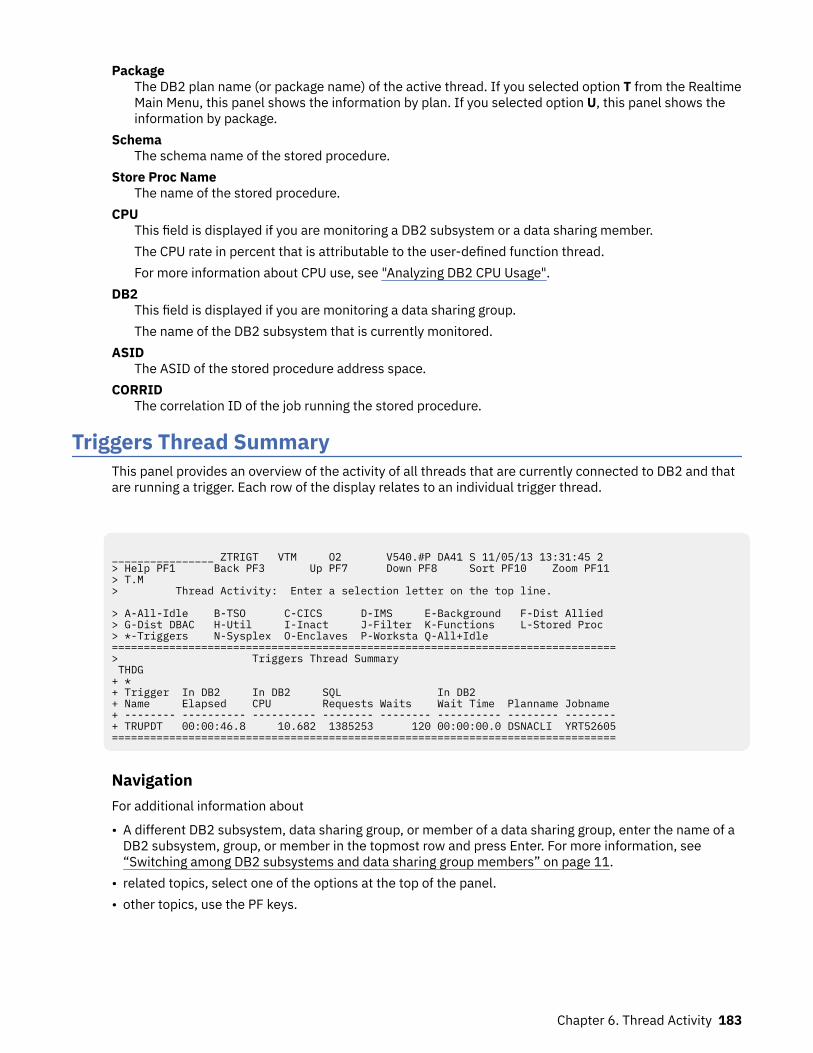
PackageThe DB2 plan name (or package name) of the active thread. If you selected option T from the RealtimeMain Menu, this panel shows the information by plan. If you selected option U, this panel shows theinformation by package.
SchemaThe schema name of the stored procedure.
Store Proc NameThe name of the stored procedure.
CPUThis field is displayed if you are monitoring a DB2 subsystem or a data sharing member.The CPU rate in percent that is attributable to the user-defined function thread.For more information about CPU use, see "Analyzing DB2 CPU Usage".
DB2This field is displayed if you are monitoring a data sharing group.The name of the DB2 subsystem that is currently monitored.
ASIDThe ASID of the stored procedure address space.
CORRIDThe correlation ID of the job running the stored procedure.
Triggers Thread SummaryThis panel provides an overview of the activity of all threads that are currently connected to DB2 and thatare running a trigger. Each row of the display relates to an individual trigger thread.
________________ ZTRIGT VTM O2 V540.#P DA41 S 11/05/13 13:31:45 2 > Help PF1 Back PF3 Up PF7 Down PF8 Sort PF10 Zoom PF11 > T.M > Thread Activity: Enter a selection letter on the top line. > A-All-Idle B-TSO C-CICS D-IMS E-Background F-Dist Allied > G-Dist DBAC H-Util I-Inact J-Filter K-Functions L-Stored Proc > *-Triggers N-Sysplex O-Enclaves P-Worksta Q-All+Idle ===============================================================================> Triggers Thread Summary THDG + * + Trigger In DB2 In DB2 SQL In DB2 + Name Elapsed CPU Requests Waits Wait Time Planname Jobname + -------- ---------- ---------- -------- -------- ---------- -------- --------+ TRUPDT 00:00:46.8 10.682 1385253 120 00:00:00.0 DSNACLI YRT52605===============================================================================
NavigationFor additional information about
• A different DB2 subsystem, data sharing group, or member of a data sharing group, enter the name of aDB2 subsystem, group, or member in the topmost row and press Enter. For more information, see“Switching among DB2 subsystems and data sharing group members” on page 11.
• related topics, select one of the options at the top of the panel.• other topics, use the PF keys.
Chapter 6. Thread Activity 183
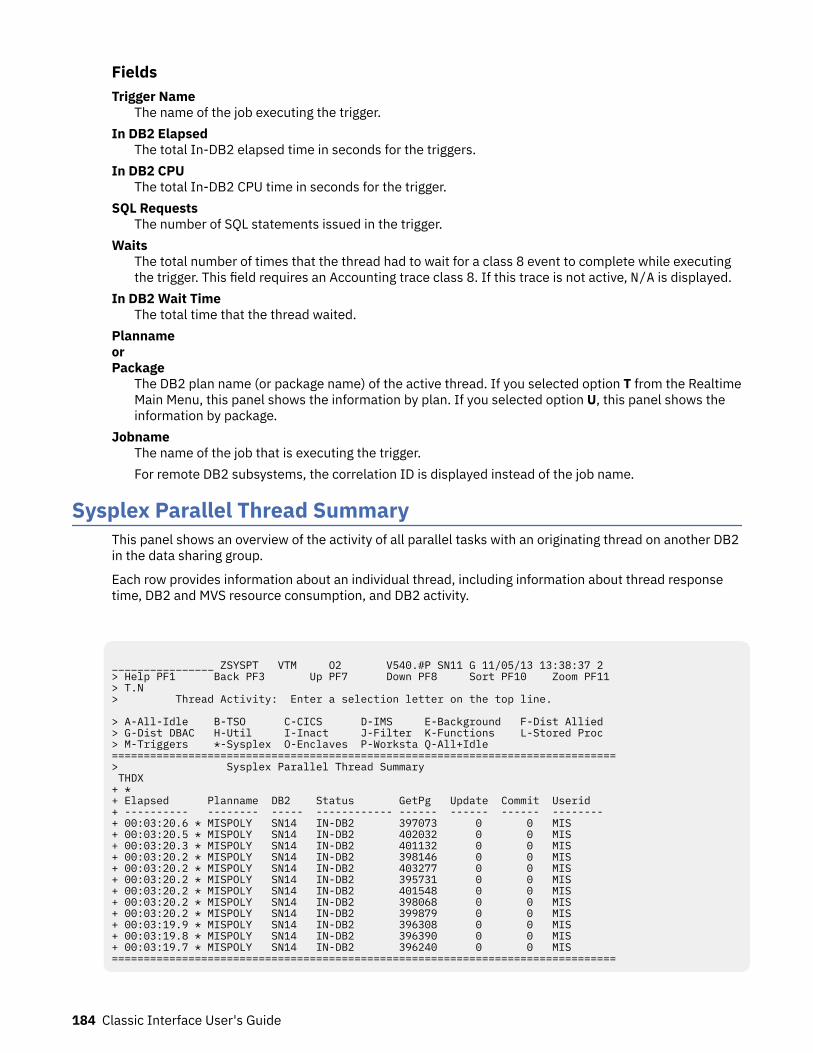
FieldsTrigger Name
The name of the job executing the trigger.In DB2 Elapsed
The total In-DB2 elapsed time in seconds for the triggers.In DB2 CPU
The total In-DB2 CPU time in seconds for the trigger.SQL Requests
The number of SQL statements issued in the trigger.Waits
The total number of times that the thread had to wait for a class 8 event to complete while executingthe trigger. This field requires an Accounting trace class 8. If this trace is not active, N/A is displayed.
In DB2 Wait TimeThe total time that the thread waited.
PlannameorPackage
The DB2 plan name (or package name) of the active thread. If you selected option T from the RealtimeMain Menu, this panel shows the information by plan. If you selected option U, this panel shows theinformation by package.
JobnameThe name of the job that is executing the trigger.For remote DB2 subsystems, the correlation ID is displayed instead of the job name.
Sysplex Parallel Thread SummaryThis panel shows an overview of the activity of all parallel tasks with an originating thread on another DB2in the data sharing group.
Each row provides information about an individual thread, including information about thread responsetime, DB2 and MVS resource consumption, and DB2 activity.
________________ ZSYSPT VTM O2 V540.#P SN11 G 11/05/13 13:38:37 2 > Help PF1 Back PF3 Up PF7 Down PF8 Sort PF10 Zoom PF11 > T.N > Thread Activity: Enter a selection letter on the top line. > A-All-Idle B-TSO C-CICS D-IMS E-Background F-Dist Allied > G-Dist DBAC H-Util I-Inact J-Filter K-Functions L-Stored Proc > M-Triggers *-Sysplex O-Enclaves P-Worksta Q-All+Idle =============================================================================== > Sysplex Parallel Thread Summary THDX + * + Elapsed Planname DB2 Status GetPg Update Commit Userid + ---------- -------- ----- ------------ ------ ------ ------ -------- + 00:03:20.6 * MISPOLY SN14 IN-DB2 397073 0 0 MIS + 00:03:20.5 * MISPOLY SN14 IN-DB2 402032 0 0 MIS + 00:03:20.3 * MISPOLY SN14 IN-DB2 401132 0 0 MIS + 00:03:20.2 * MISPOLY SN14 IN-DB2 398146 0 0 MIS + 00:03:20.2 * MISPOLY SN14 IN-DB2 403277 0 0 MIS + 00:03:20.2 * MISPOLY SN14 IN-DB2 395731 0 0 MIS + 00:03:20.2 * MISPOLY SN14 IN-DB2 401548 0 0 MIS + 00:03:20.2 * MISPOLY SN14 IN-DB2 398068 0 0 MIS + 00:03:20.2 * MISPOLY SN14 IN-DB2 399879 0 0 MIS + 00:03:19.9 * MISPOLY SN14 IN-DB2 396308 0 0 MIS + 00:03:19.8 * MISPOLY SN14 IN-DB2 396390 0 0 MIS + 00:03:19.7 * MISPOLY SN14 IN-DB2 396240 0 0 MIS ===============================================================================
184 Classic Interface User's Guide
HighlightingThe following table shows the fields that might be highlighted in the panel above to indicate that anexception that is related to this field exceeded its threshold value:
Table 19. Highlighted fields in Sysplex Parallel Thread Summary panel.
This table shows the fields and the exceptions these fields are related to. It also shows the reason forthe corresponding exception.
Field Exception Reason
Elapsed ETIM This thread has reached theElapsed Time threshold value.
CPU TCPU The thread address space hasexcessive CPU utilization.
GetPg GETP The Getpage to Read I/O ratioindicates poor read efficiency.
Update PGUP The rate for system page updatesis high.
Commit COMT The number of updates since thelast successful commit is high.
NavigationFor additional information about
• a particular thread, move the cursor to the thread information line and press F11 (Zoom).• A different DB2 subsystem, data sharing group, or member of a data sharing group, enter the name of a
DB2 subsystem, group, or member in the topmost row and press Enter. For more information, see“Switching among DB2 subsystems and data sharing group members” on page 11.
• related topics, select one of the options on the top of the panel.• other topics, use the PF keys.
FieldsElapsed
The elapsed time since thread creation, or since DB2 signon if the thread is reused. When the elapsedtime of the thread exceeds 24 hours, the format is dd-hh:mm.
If this thread is involved in parallel processing or if it invoked autonomous procedures, one of thefollowing identifiers is displayed after the elapsed time:*
This thread is a parallel task that is initiated on behalf of another (originating) thread to process aquery request in parallel.
OThis thread is the originating thread that invoked autonomous procedures.
PThis thread is the parent or the originating thread of the parallel tasks that are created to processa query request in parallel. Activity performed for this (originating) thread is reflected under theparallel tasks.
XThis thread is a parallel task that is initiated on behalf of another (originating) thread on anotherDB2 for sysplex parallelism.
Planname
Chapter 6. Thread Activity 185
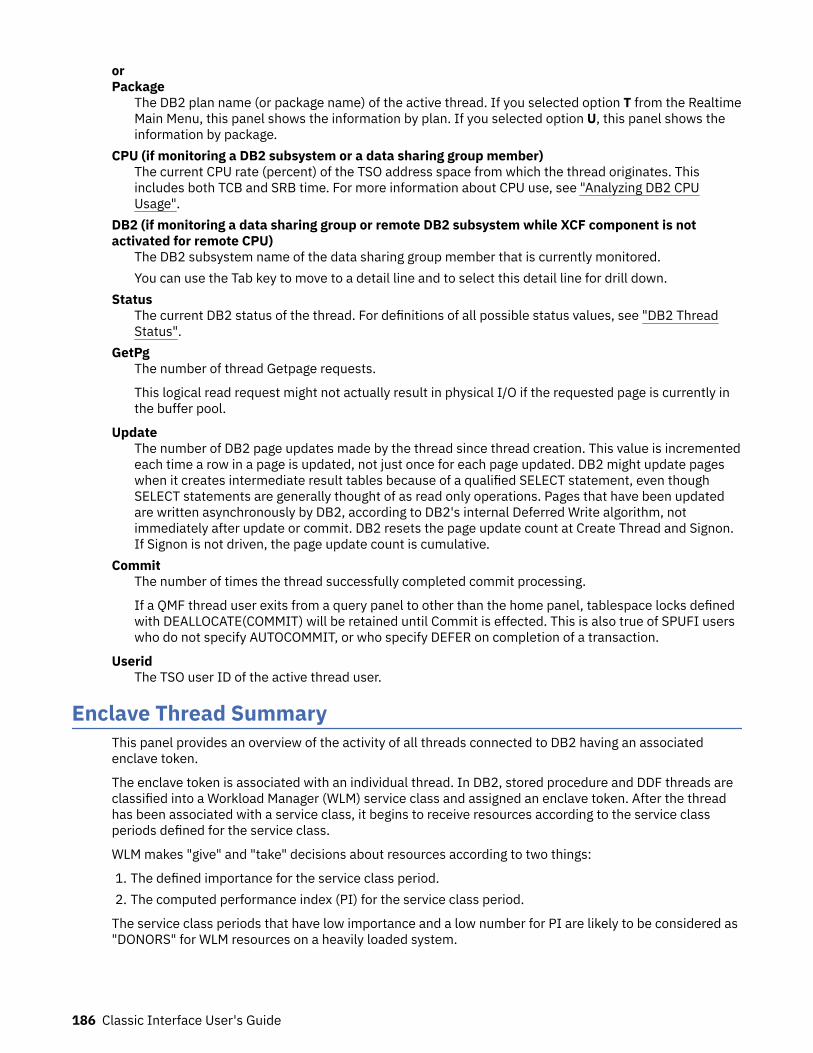
orPackage
The DB2 plan name (or package name) of the active thread. If you selected option T from the RealtimeMain Menu, this panel shows the information by plan. If you selected option U, this panel shows theinformation by package.
CPU (if monitoring a DB2 subsystem or a data sharing group member)The current CPU rate (percent) of the TSO address space from which the thread originates. Thisincludes both TCB and SRB time. For more information about CPU use, see "Analyzing DB2 CPUUsage".
DB2 (if monitoring a data sharing group or remote DB2 subsystem while XCF component is notactivated for remote CPU)
The DB2 subsystem name of the data sharing group member that is currently monitored.You can use the Tab key to move to a detail line and to select this detail line for drill down.
StatusThe current DB2 status of the thread. For definitions of all possible status values, see "DB2 ThreadStatus".
GetPgThe number of thread Getpage requests.
This logical read request might not actually result in physical I/O if the requested page is currently inthe buffer pool.
UpdateThe number of DB2 page updates made by the thread since thread creation. This value is incrementedeach time a row in a page is updated, not just once for each page updated. DB2 might update pageswhen it creates intermediate result tables because of a qualified SELECT statement, even thoughSELECT statements are generally thought of as read only operations. Pages that have been updatedare written asynchronously by DB2, according to DB2's internal Deferred Write algorithm, notimmediately after update or commit. DB2 resets the page update count at Create Thread and Signon.If Signon is not driven, the page update count is cumulative.
CommitThe number of times the thread successfully completed commit processing.
If a QMF thread user exits from a query panel to other than the home panel, tablespace locks definedwith DEALLOCATE(COMMIT) will be retained until Commit is effected. This is also true of SPUFI userswho do not specify AUTOCOMMIT, or who specify DEFER on completion of a transaction.
UseridThe TSO user ID of the active thread user.
Enclave Thread SummaryThis panel provides an overview of the activity of all threads connected to DB2 having an associatedenclave token.
The enclave token is associated with an individual thread. In DB2, stored procedure and DDF threads areclassified into a Workload Manager (WLM) service class and assigned an enclave token. After the threadhas been associated with a service class, it begins to receive resources according to the service classperiods defined for the service class.
WLM makes "give" and "take" decisions about resources according to two things:
1. The defined importance for the service class period.2. The computed performance index (PI) for the service class period.
The service class periods that have low importance and a low number for PI are likely to be considered as"DONORS" for WLM resources on a heavily loaded system.
186 Classic Interface User's Guide
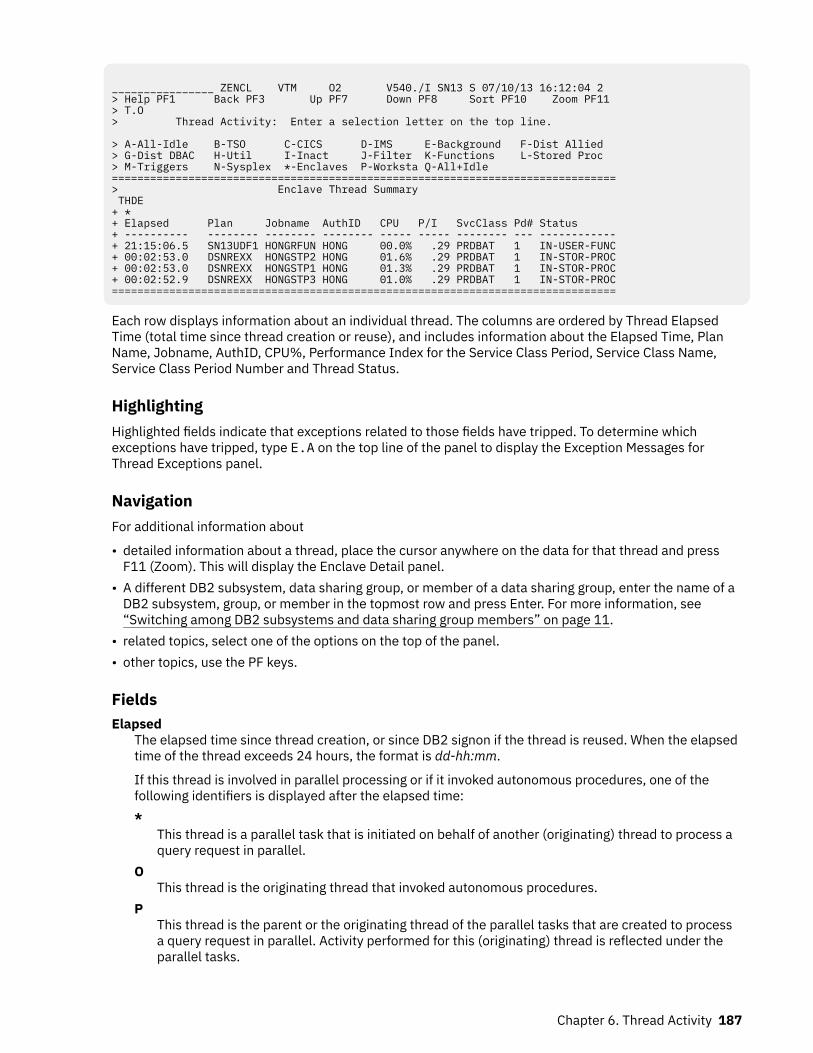
________________ ZENCL VTM O2 V540./I SN13 S 07/10/13 16:12:04 2 > Help PF1 Back PF3 Up PF7 Down PF8 Sort PF10 Zoom PF11 > T.O > Thread Activity: Enter a selection letter on the top line. > A-All-Idle B-TSO C-CICS D-IMS E-Background F-Dist Allied > G-Dist DBAC H-Util I-Inact J-Filter K-Functions L-Stored Proc > M-Triggers N-Sysplex *-Enclaves P-Worksta Q-All+Idle =============================================================================== > Enclave Thread Summary THDE + * + Elapsed Plan Jobname AuthID CPU P/I SvcClass Pd# Status + ---------- -------- -------- -------- ----- ----- -------- --- ------------ + 21:15:06.5 SN13UDF1 HONGRFUN HONG 00.0% .29 PRDBAT 1 IN-USER-FUNC + 00:02:53.0 DSNREXX HONGSTP2 HONG 01.6% .29 PRDBAT 1 IN-STOR-PROC + 00:02:53.0 DSNREXX HONGSTP1 HONG 01.3% .29 PRDBAT 1 IN-STOR-PROC + 00:02:52.9 DSNREXX HONGSTP3 HONG 01.0% .29 PRDBAT 1 IN-STOR-PROC ===============================================================================
Each row displays information about an individual thread. The columns are ordered by Thread ElapsedTime (total time since thread creation or reuse), and includes information about the Elapsed Time, PlanName, Jobname, AuthID, CPU%, Performance Index for the Service Class Period, Service Class Name,Service Class Period Number and Thread Status.
HighlightingHighlighted fields indicate that exceptions related to those fields have tripped. To determine whichexceptions have tripped, type E.A on the top line of the panel to display the Exception Messages forThread Exceptions panel.
NavigationFor additional information about
• detailed information about a thread, place the cursor anywhere on the data for that thread and pressF11 (Zoom). This will display the Enclave Detail panel.
• A different DB2 subsystem, data sharing group, or member of a data sharing group, enter the name of aDB2 subsystem, group, or member in the topmost row and press Enter. For more information, see“Switching among DB2 subsystems and data sharing group members” on page 11.
• related topics, select one of the options on the top of the panel.• other topics, use the PF keys.
FieldsElapsed
The elapsed time since thread creation, or since DB2 signon if the thread is reused. When the elapsedtime of the thread exceeds 24 hours, the format is dd-hh:mm.
If this thread is involved in parallel processing or if it invoked autonomous procedures, one of thefollowing identifiers is displayed after the elapsed time:*
This thread is a parallel task that is initiated on behalf of another (originating) thread to process aquery request in parallel.
OThis thread is the originating thread that invoked autonomous procedures.
PThis thread is the parent or the originating thread of the parallel tasks that are created to processa query request in parallel. Activity performed for this (originating) thread is reflected under theparallel tasks.
Chapter 6. Thread Activity 187
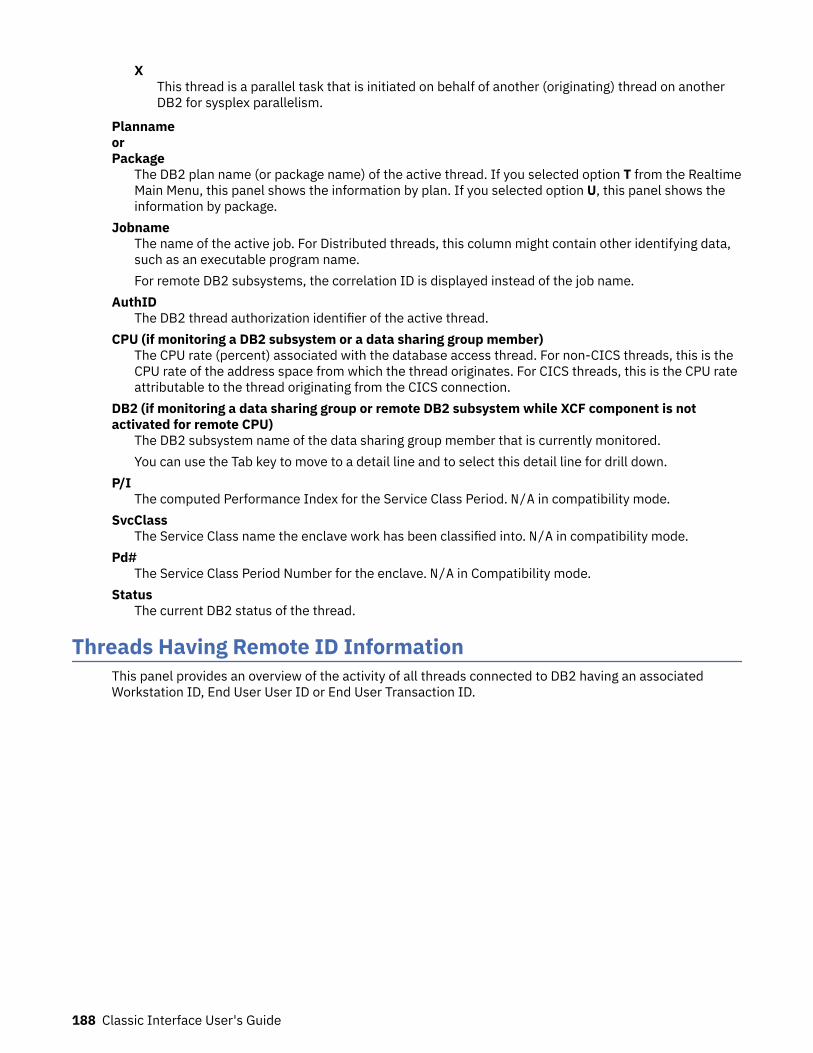
XThis thread is a parallel task that is initiated on behalf of another (originating) thread on anotherDB2 for sysplex parallelism.
PlannameorPackage
The DB2 plan name (or package name) of the active thread. If you selected option T from the RealtimeMain Menu, this panel shows the information by plan. If you selected option U, this panel shows theinformation by package.
JobnameThe name of the active job. For Distributed threads, this column might contain other identifying data,such as an executable program name.For remote DB2 subsystems, the correlation ID is displayed instead of the job name.
AuthIDThe DB2 thread authorization identifier of the active thread.
CPU (if monitoring a DB2 subsystem or a data sharing group member)The CPU rate (percent) associated with the database access thread. For non-CICS threads, this is theCPU rate of the address space from which the thread originates. For CICS threads, this is the CPU rateattributable to the thread originating from the CICS connection.
DB2 (if monitoring a data sharing group or remote DB2 subsystem while XCF component is notactivated for remote CPU)
The DB2 subsystem name of the data sharing group member that is currently monitored.You can use the Tab key to move to a detail line and to select this detail line for drill down.
P/IThe computed Performance Index for the Service Class Period. N/A in compatibility mode.
SvcClassThe Service Class name the enclave work has been classified into. N/A in compatibility mode.
Pd#The Service Class Period Number for the enclave. N/A in Compatibility mode.
StatusThe current DB2 status of the thread.
Threads Having Remote ID InformationThis panel provides an overview of the activity of all threads connected to DB2 having an associatedWorkstation ID, End User User ID or End User Transaction ID.
188 Classic Interface User's Guide
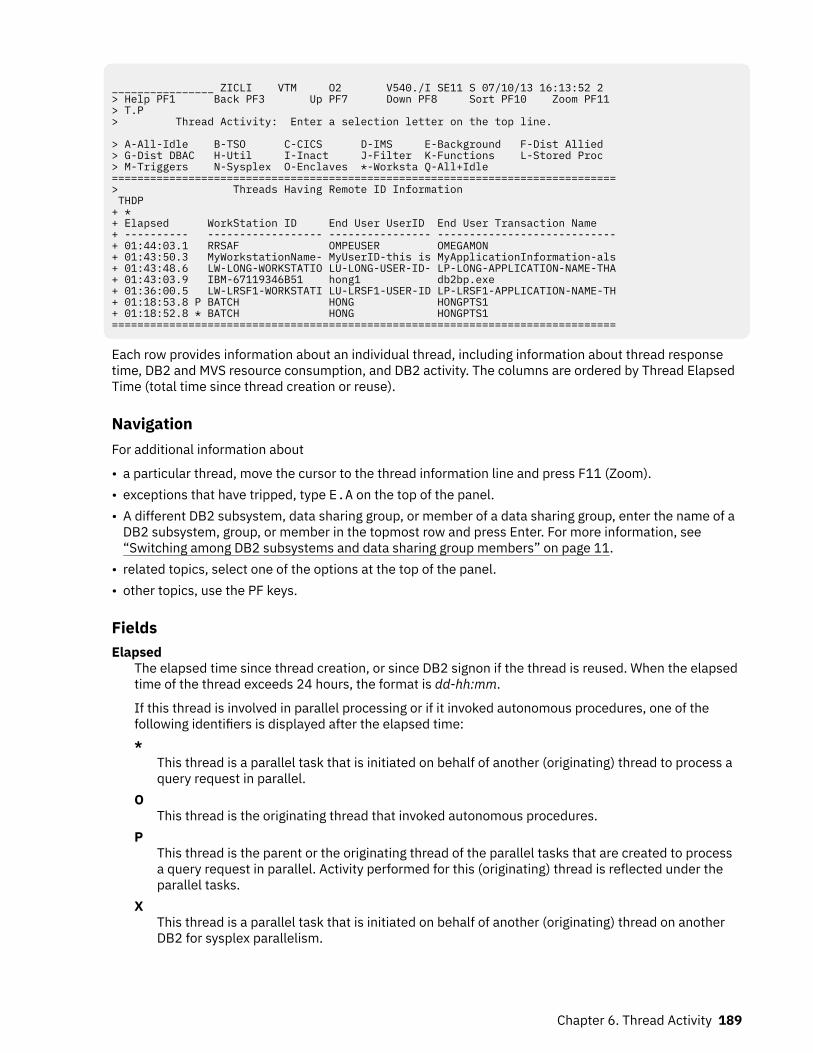
________________ ZICLI VTM O2 V540./I SE11 S 07/10/13 16:13:52 2 > Help PF1 Back PF3 Up PF7 Down PF8 Sort PF10 Zoom PF11 > T.P > Thread Activity: Enter a selection letter on the top line. > A-All-Idle B-TSO C-CICS D-IMS E-Background F-Dist Allied > G-Dist DBAC H-Util I-Inact J-Filter K-Functions L-Stored Proc > M-Triggers N-Sysplex O-Enclaves *-Worksta Q-All+Idle ===============================================================================> Threads Having Remote ID Information THDP + * + Elapsed WorkStation ID End User UserID End User Transaction Name + ---------- ------------------ ---------------- ----------------------------+ 01:44:03.1 RRSAF OMPEUSER OMEGAMON + 01:43:50.3 MyWorkstationName- MyUserID-this is MyApplicationInformation-als+ 01:43:48.6 LW-LONG-WORKSTATIO LU-LONG-USER-ID- LP-LONG-APPLICATION-NAME-THA+ 01:43:03.9 IBM-67119346B51 hong1 db2bp.exe + 01:36:00.5 LW-LRSF1-WORKSTATI LU-LRSF1-USER-ID LP-LRSF1-APPLICATION-NAME-TH+ 01:18:53.8 P BATCH HONG HONGPTS1 + 01:18:52.8 * BATCH HONG HONGPTS1 ===============================================================================
Each row provides information about an individual thread, including information about thread responsetime, DB2 and MVS resource consumption, and DB2 activity. The columns are ordered by Thread ElapsedTime (total time since thread creation or reuse).
NavigationFor additional information about
• a particular thread, move the cursor to the thread information line and press F11 (Zoom).• exceptions that have tripped, type E.A on the top of the panel.• A different DB2 subsystem, data sharing group, or member of a data sharing group, enter the name of a
DB2 subsystem, group, or member in the topmost row and press Enter. For more information, see“Switching among DB2 subsystems and data sharing group members” on page 11.
• related topics, select one of the options at the top of the panel.• other topics, use the PF keys.
FieldsElapsed
The elapsed time since thread creation, or since DB2 signon if the thread is reused. When the elapsedtime of the thread exceeds 24 hours, the format is dd-hh:mm.
If this thread is involved in parallel processing or if it invoked autonomous procedures, one of thefollowing identifiers is displayed after the elapsed time:*
This thread is a parallel task that is initiated on behalf of another (originating) thread to process aquery request in parallel.
OThis thread is the originating thread that invoked autonomous procedures.
PThis thread is the parent or the originating thread of the parallel tasks that are created to processa query request in parallel. Activity performed for this (originating) thread is reflected under theparallel tasks.
XThis thread is a parallel task that is initiated on behalf of another (originating) thread on anotherDB2 for sysplex parallelism.
Chapter 6. Thread Activity 189
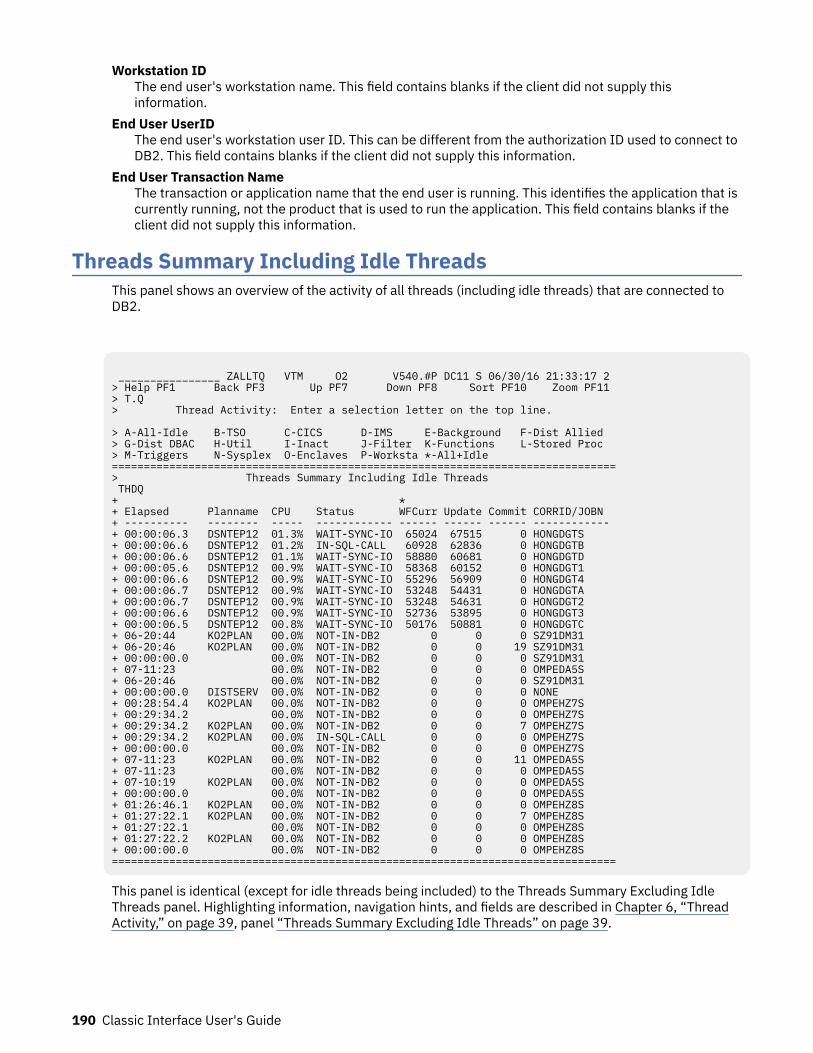
Workstation IDThe end user's workstation name. This field contains blanks if the client did not supply thisinformation.
End User UserIDThe end user's workstation user ID. This can be different from the authorization ID used to connect toDB2. This field contains blanks if the client did not supply this information.
End User Transaction NameThe transaction or application name that the end user is running. This identifies the application that iscurrently running, not the product that is used to run the application. This field contains blanks if theclient did not supply this information.
Threads Summary Including Idle ThreadsThis panel shows an overview of the activity of all threads (including idle threads) that are connected toDB2.
________________ ZALLTQ VTM O2 V540.#P DC11 S 06/30/16 21:33:17 2 > Help PF1 Back PF3 Up PF7 Down PF8 Sort PF10 Zoom PF11 > T.Q > Thread Activity: Enter a selection letter on the top line. > A-All-Idle B-TSO C-CICS D-IMS E-Background F-Dist Allied > G-Dist DBAC H-Util I-Inact J-Filter K-Functions L-Stored Proc > M-Triggers N-Sysplex O-Enclaves P-Worksta *-All+Idle =============================================================================== > Threads Summary Including Idle Threads THDQ + * + Elapsed Planname CPU Status WFCurr Update Commit CORRID/JOBN + ---------- -------- ----- ------------ ------ ------ ------ ------------ + 00:00:06.3 DSNTEP12 01.3% WAIT-SYNC-IO 65024 67515 0 HONGDGTS + 00:00:06.6 DSNTEP12 01.2% IN-SQL-CALL 60928 62836 0 HONGDGTB + 00:00:06.6 DSNTEP12 01.1% WAIT-SYNC-IO 58880 60681 0 HONGDGTD + 00:00:05.6 DSNTEP12 00.9% WAIT-SYNC-IO 58368 60152 0 HONGDGT1 + 00:00:06.6 DSNTEP12 00.9% WAIT-SYNC-IO 55296 56909 0 HONGDGT4 + 00:00:06.7 DSNTEP12 00.9% WAIT-SYNC-IO 53248 54431 0 HONGDGTA + 00:00:06.7 DSNTEP12 00.9% WAIT-SYNC-IO 53248 54631 0 HONGDGT2 + 00:00:06.6 DSNTEP12 00.9% WAIT-SYNC-IO 52736 53895 0 HONGDGT3 + 00:00:06.5 DSNTEP12 00.8% WAIT-SYNC-IO 50176 50881 0 HONGDGTC + 06-20:44 KO2PLAN 00.0% NOT-IN-DB2 0 0 0 SZ91DM31 + 06-20:46 KO2PLAN 00.0% NOT-IN-DB2 0 0 19 SZ91DM31 + 00:00:00.0 00.0% NOT-IN-DB2 0 0 0 SZ91DM31 + 07-11:23 00.0% NOT-IN-DB2 0 0 0 OMPEDA5S + 06-20:46 00.0% NOT-IN-DB2 0 0 0 SZ91DM31 + 00:00:00.0 DISTSERV 00.0% NOT-IN-DB2 0 0 0 NONE + 00:28:54.4 KO2PLAN 00.0% NOT-IN-DB2 0 0 0 OMPEHZ7S + 00:29:34.2 00.0% NOT-IN-DB2 0 0 0 OMPEHZ7S + 00:29:34.2 KO2PLAN 00.0% NOT-IN-DB2 0 0 7 OMPEHZ7S + 00:29:34.2 KO2PLAN 00.0% IN-SQL-CALL 0 0 0 OMPEHZ7S + 00:00:00.0 00.0% NOT-IN-DB2 0 0 0 OMPEHZ7S + 07-11:23 KO2PLAN 00.0% NOT-IN-DB2 0 0 11 OMPEDA5S + 07-11:23 00.0% NOT-IN-DB2 0 0 0 OMPEDA5S + 07-10:19 KO2PLAN 00.0% NOT-IN-DB2 0 0 0 OMPEDA5S + 00:00:00.0 00.0% NOT-IN-DB2 0 0 0 OMPEDA5S + 01:26:46.1 KO2PLAN 00.0% NOT-IN-DB2 0 0 0 OMPEHZ8S + 01:27:22.1 KO2PLAN 00.0% NOT-IN-DB2 0 0 7 OMPEHZ8S + 01:27:22.1 00.0% NOT-IN-DB2 0 0 0 OMPEHZ8S + 01:27:22.2 KO2PLAN 00.0% NOT-IN-DB2 0 0 0 OMPEHZ8S + 00:00:00.0 00.0% NOT-IN-DB2 0 0 0 OMPEHZ8S ===============================================================================
This panel is identical (except for idle threads being included) to the Threads Summary Excluding IdleThreads panel. Highlighting information, navigation hints, and fields are described in Chapter 6, “ThreadActivity,” on page 39, panel “Threads Summary Excluding Idle Threads” on page 39.
190 Classic Interface User's Guide
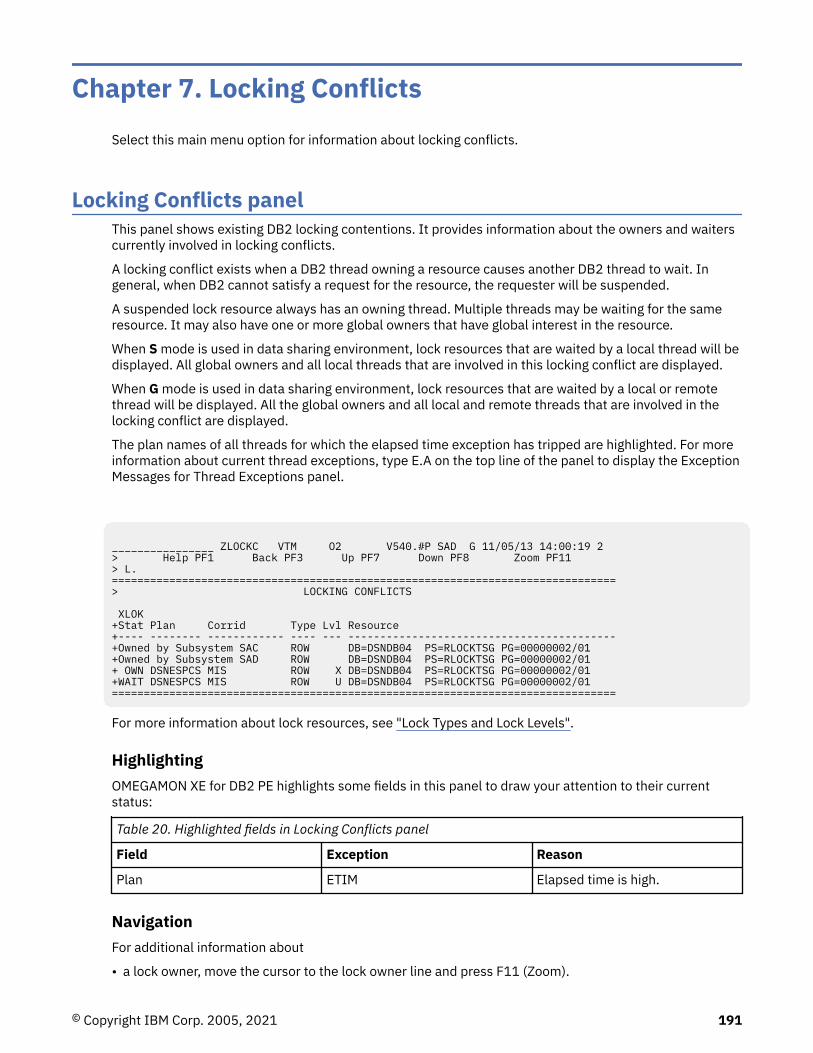
Chapter 7. Locking ConflictsSelect this main menu option for information about locking conflicts.
Locking Conflicts panelThis panel shows existing DB2 locking contentions. It provides information about the owners and waiterscurrently involved in locking conflicts.
A locking conflict exists when a DB2 thread owning a resource causes another DB2 thread to wait. Ingeneral, when DB2 cannot satisfy a request for the resource, the requester will be suspended.
A suspended lock resource always has an owning thread. Multiple threads may be waiting for the sameresource. It may also have one or more global owners that have global interest in the resource.
When S mode is used in data sharing environment, lock resources that are waited by a local thread will bedisplayed. All global owners and all local threads that are involved in this locking conflict are displayed.
When G mode is used in data sharing environment, lock resources that are waited by a local or remotethread will be displayed. All the global owners and all local and remote threads that are involved in thelocking conflict are displayed.
The plan names of all threads for which the elapsed time exception has tripped are highlighted. For moreinformation about current thread exceptions, type E.A on the top line of the panel to display the ExceptionMessages for Thread Exceptions panel.
________________ ZLOCKC VTM O2 V540.#P SAD G 11/05/13 14:00:19 2 > Help PF1 Back PF3 Up PF7 Down PF8 Zoom PF11 > L. ===============================================================================> LOCKING CONFLICTS XLOK +Stat Plan Corrid Type Lvl Resource +---- -------- ------------ ---- --- ------------------------------------------+Owned by Subsystem SAC ROW DB=DSNDB04 PS=RLOCKTSG PG=00000002/01 +Owned by Subsystem SAD ROW DB=DSNDB04 PS=RLOCKTSG PG=00000002/01 + OWN DSNESPCS MIS ROW X DB=DSNDB04 PS=RLOCKTSG PG=00000002/01 +WAIT DSNESPCS MIS ROW U DB=DSNDB04 PS=RLOCKTSG PG=00000002/01 ===============================================================================
For more information about lock resources, see "Lock Types and Lock Levels".
HighlightingOMEGAMON XE for DB2 PE highlights some fields in this panel to draw your attention to their currentstatus:
Table 20. Highlighted fields in Locking Conflicts panel
Field Exception Reason
Plan ETIM Elapsed time is high.
NavigationFor additional information about
• a lock owner, move the cursor to the lock owner line and press F11 (Zoom).
© Copyright IBM Corp. 2005, 2021 191
• a lock waiter, move the cursor to the lock waiter line and press F11 (Zoom).• other topics, use the PF keys.
Note: Thread information is not available if the thread is owned by the other member of the data sharinggroup.
FieldsThe output lines are displayed in descending order, with those reflecting the greatest degree of conflictdisplayed first.
StatThe status of the thread can be one of the following:
• OWN indicates that the thread is a lock owner.• WAIT indicates that the thread is suspended because the lock it requested is owned by another
thread.
PlanThe name of the DB2 plan that is currently active in this thread.
CorridThe DB2 correlation identifier for the thread involved in the locking conflict.
TypeThe type of lock that is owned or requested and is unavailable. For more information about lock types,see "Lock Types and Lock Levels".
LvlThe level at which the lock is owned or was requested. The level of a lock requested is frequently thereason for lock suspensions. For more information about lock levels, see "Lock Types and LockLevels".
ResourceIdentifies the resource that is currently locked by the lock owner, or the lock resource causing the lockto be suspended. The resource varies depending upon the type of lock held.
Note: DB=database name can be represented as a DBID=identifier, which is the decimal identifier ofthe database. PSID=identifier can be represented as PSID=identifier, which is the decimal identifier ofthe table space. HEX values are displayed for lock resources if the resource is owned by a thread on aremote LPAR, and no OMPE task is available from that LPAR, or XCF is not set up correctly. If theowner is a thread running on some other member of the data sharing group, the DB2 subsystem nameis displayed.
This field displays the following resources:Lock Type
ResourceACSC
Accelerator Services commands lockALBP
Alter buffer pool lockBIND
Autobind/remote bind lockBMBA
Buffer manager SCA MBA L-lockBPPS
Buffer manager pageset RP P-lockCCAT
CATMAINT convert catalog lock
192 Classic Interface User's Guide
CDBLCompress dictionary build lock
CDIRCATMAINT convert directory lock
CDRNCursor Stability drain lock
CMDSDB2 Command Serialization lock
CMIGCATMAINT migration lock
COLLCollection lock
DBEXDatabase exception LPL/GRECP lock
DBXUDatabase exception update lock
DGTTDGTT URID lock
DPAGDB2 pageset page lock
DPLK32 K Desperation Pool lock
DSETPartitioned lock
DTBSDatabase lock
GRBPGroup buffer pool start/stop lock
HASHHash anchor lock
IEOFIndex end of file lock
IPAGIndex page lock
LBLKLOB lock
LPLRLPL Recovery lock
MDELMass delete lock
PALKPartition lock
PBPCGroup buffer pool castout P-lock
PCDBDDF CDB P-lock
PDBDDBD P-lock
PDSOPageset or partition pageset open lock
Chapter 7. Locking Conflicts 193
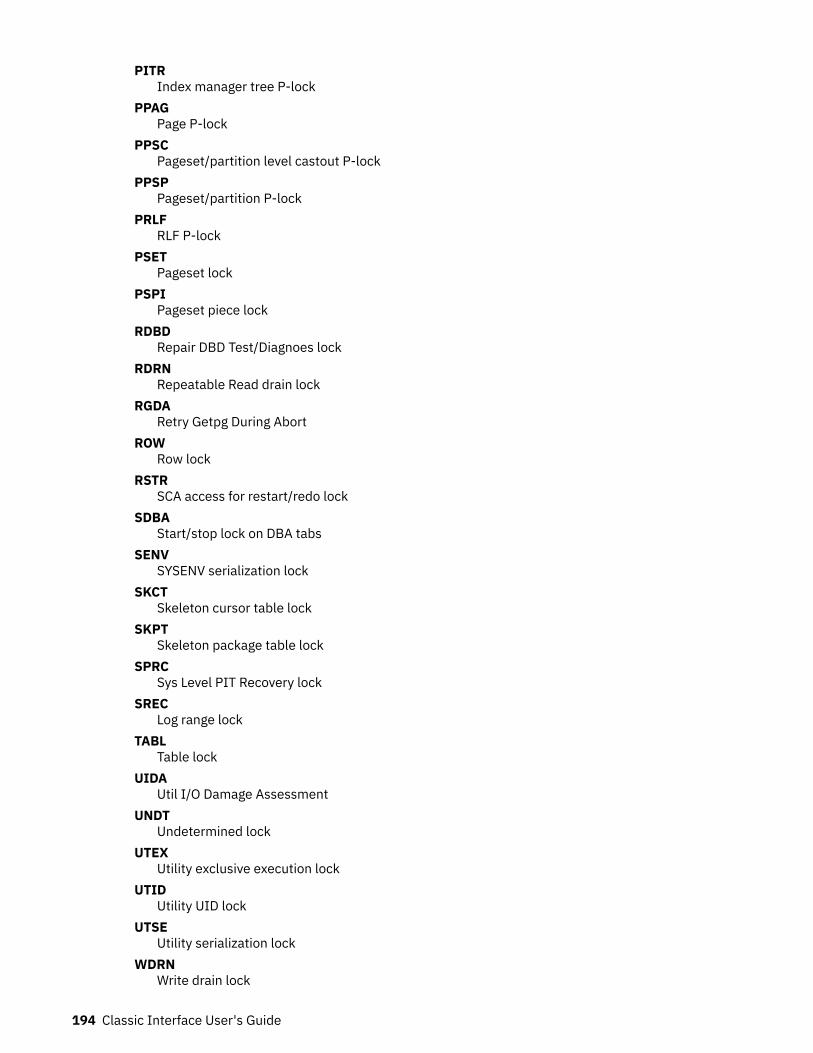
PITRIndex manager tree P-lock
PPAGPage P-lock
PPSCPageset/partition level castout P-lock
PPSPPageset/partition P-lock
PRLFRLF P-lock
PSETPageset lock
PSPIPageset piece lock
RDBDRepair DBD Test/Diagnoes lock
RDRNRepeatable Read drain lock
RGDARetry Getpg During Abort
ROWRow lock
RSTRSCA access for restart/redo lock
SDBAStart/stop lock on DBA tabs
SENVSYSENV serialization lock
SKCTSkeleton cursor table lock
SKPTSkeleton package table lock
SPRCSys Level PIT Recovery lock
SRECLog range lock
TABLTable lock
UIDAUtil I/O Damage Assessment
UNDTUndetermined lock
UTEXUtility exclusive execution lock
UTIDUtility UID lock
UTSEUtility serialization lock
WDRNWrite drain lock
194 Classic Interface User's Guide
XMLKXML lock
UTOBUtility object lock
DBDLDBD load lock
IXKYIndex key lock
HPSPHeader page bucket or Stored Proc Cmd lock
Locks/Claims Owned by a ThreadThis panel shows lock and claim information of a specific thread. Use this information to analyze locks andclaims, for example, the number of locks owned, the type and level of the locks, and the object of thelocks.
The locking information is divided into the following categories:
1. The totals of all the types of locks owned by the thread, as well as the percentage of total locksallowed that are currently held (the percent of the DB2 parameter NUMLKUS).
2. The type, level and object of each lock. HEX values are displayed for lock resources, if the resource isowned by a thread on a remote LPAR, and no OMPE task is available from that LPAR, or XCF is notsetup correctly.
The claim information displays all of the claims currently owned by the thread. Claims are used to informDB2 that an object is being accessed.
Chapter 7. Locking Conflicts 195
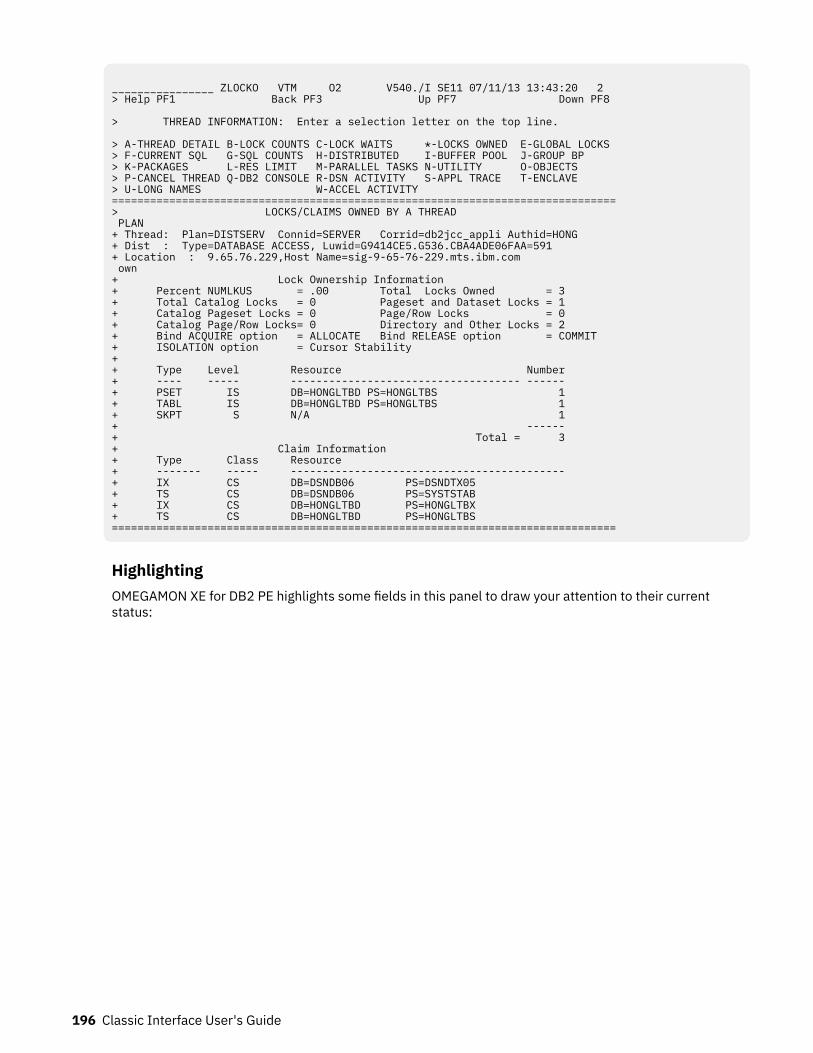
________________ ZLOCKO VTM O2 V540./I SE11 07/11/13 13:43:20 2 > Help PF1 Back PF3 Up PF7 Down PF8 > THREAD INFORMATION: Enter a selection letter on the top line. > A-THREAD DETAIL B-LOCK COUNTS C-LOCK WAITS *-LOCKS OWNED E-GLOBAL LOCKS > F-CURRENT SQL G-SQL COUNTS H-DISTRIBUTED I-BUFFER POOL J-GROUP BP > K-PACKAGES L-RES LIMIT M-PARALLEL TASKS N-UTILITY O-OBJECTS > P-CANCEL THREAD Q-DB2 CONSOLE R-DSN ACTIVITY S-APPL TRACE T-ENCLAVE > U-LONG NAMES W-ACCEL ACTIVITY =============================================================================== > LOCKS/CLAIMS OWNED BY A THREAD PLAN + Thread: Plan=DISTSERV Connid=SERVER Corrid=db2jcc_appli Authid=HONG + Dist : Type=DATABASE ACCESS, Luwid=G9414CE5.G536.CBA4ADE06FAA=591 + Location : 9.65.76.229,Host Name=sig-9-65-76-229.mts.ibm.com own + Lock Ownership Information + Percent NUMLKUS = .00 Total Locks Owned = 3 + Total Catalog Locks = 0 Pageset and Dataset Locks = 1 + Catalog Pageset Locks = 0 Page/Row Locks = 0 + Catalog Page/Row Locks= 0 Directory and Other Locks = 2 + Bind ACQUIRE option = ALLOCATE Bind RELEASE option = COMMIT + ISOLATION option = Cursor Stability + + Type Level Resource Number + ---- ----- ------------------------------------ ------ + PSET IS DB=HONGLTBD PS=HONGLTBS 1 + TABL IS DB=HONGLTBD PS=HONGLTBS 1 + SKPT S N/A 1 + ------ + Total = 3 + Claim Information + Type Class Resource + ------- ----- ------------------------------------------- + IX CS DB=DSNDB06 PS=DSNDTX05 + TS CS DB=DSNDB06 PS=SYSTSTAB + IX CS DB=HONGLTBD PS=HONGLTBX + TS CS DB=HONGLTBD PS=HONGLTBS ===============================================================================
HighlightingOMEGAMON XE for DB2 PE highlights some fields in this panel to draw your attention to their currentstatus:
196 Classic Interface User's Guide
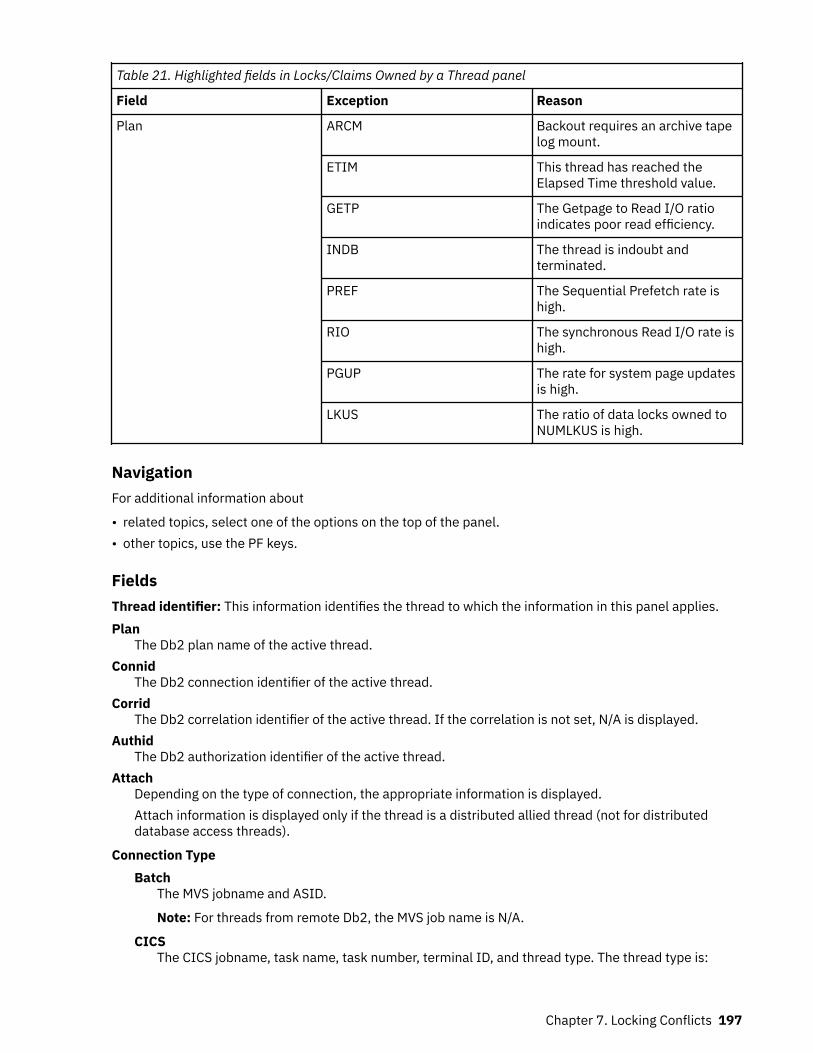
Table 21. Highlighted fields in Locks/Claims Owned by a Thread panel
Field Exception Reason
Plan ARCM Backout requires an archive tapelog mount.
ETIM This thread has reached theElapsed Time threshold value.
GETP The Getpage to Read I/O ratioindicates poor read efficiency.
INDB The thread is indoubt andterminated.
PREF The Sequential Prefetch rate ishigh.
RIO The synchronous Read I/O rate ishigh.
PGUP The rate for system page updatesis high.
LKUS The ratio of data locks owned toNUMLKUS is high.
NavigationFor additional information about
• related topics, select one of the options on the top of the panel.• other topics, use the PF keys.
FieldsThread identifier: This information identifies the thread to which the information in this panel applies.Plan
The Db2 plan name of the active thread.Connid
The Db2 connection identifier of the active thread.Corrid
The Db2 correlation identifier of the active thread. If the correlation is not set, N/A is displayed.Authid
The Db2 authorization identifier of the active thread.Attach
Depending on the type of connection, the appropriate information is displayed.Attach information is displayed only if the thread is a distributed allied thread (not for distributeddatabase access threads).
Connection TypeBatch
The MVS jobname and ASID.
Note: For threads from remote Db2, the MVS job name is N/A.
CICSThe CICS jobname, task name, task number, terminal ID, and thread type. The thread type is:
Chapter 7. Locking Conflicts 197

PoolThe thread in use is a pool thread.
EntryThe thread in use is a nonprotected entry thread.
ProtThe thread in use is a protected thread. Protected threads are defined in an RCT entrydefinition using the THRDS operand.
IMSThe IMS region number, transaction name, region name, and terminal ID (LTERM).
RRSAFThe MVS job name and ASID.
Note: For threads from remote Db2, the MVS job name is N/A.
SystemThe originating Db2 job name and the resource manager that is the source of the thread. Anadditional line below the Attach line identifies the user thread, if any, being served by the systemthread.
TSOThe TSO user ID and region ASID.
UtilityNo additional information.
Db2The Db2 subsystem identifier.
MVSThe MVS system identifier.
ORIGAUTHThe original (primary) Db2 authorization identifier of the thread. This field displays only when theoriginal identifier is different from the Authid.
Package identifier: This information identifies the package to which the information in this panel applies.Package
The Db2 package name of the active thread. Up to 18 characters of the package name are returned.Collection
The package collection identifier. This field is displayed only if a package is being used.
Distributed thread identifier: The following fields are displayed when the thread has a distributedrelationship with a remote DB2 subsystem.Type
The distributed thread type.Distributed Allied
A requesting thread; one that has issued an SQL call to a remote DB2 location.Database Access
A responding thread; one that is serving a remote DB2 location by responding to an SQL call.Luwid
This value consists of two parts: the logical unit of work ID (luw-id) and a token. The token can beused in place of the luw-id in any DB2 command that accepts luw-id as input. Format:
luw-id=token
198 Classic Interface User's Guide
The luw-id consists of the network name, the originating VTAM LUNAME, and a unique identifier(separated by periods). Thus, the Luwid field displays data such as the following:
USCACO01.O2D22A.A1FE8E04B9D4=8
SystemThe originating DB2 job name and the resource manager that is the source of the thread.
An additional line below the attachment identifier displays the user thread, if any, that is served by thesystem thread.
Lock ownership information: The following fields are displayed when the thread has a distributedrelationship with a remote DB2 subsystem.Percent NUMLKUS
The current percentage of NUMLKUS reached by the thread. NUMLKUS is an installation parameter inDSNZPARM that specifies the maximum number of page, row, LOB, or XML locks that can be held by asingle process at any one time. It includes locks for both, the DB2 catalog and directory and for userdata.
Total Locks OwnedThe total number of all locks owned by the thread. This includes all lock types.
Total Catalog LocksTotal of all catalog locks owned. This number includes any locks owned on a page or tablespace indatabase DSNDB06. This is the total of the catalog pageset and page locks.
Pageset and Dataset LocksThe total number of pageset locks held. This excludes pageset locks in which the lock object is apageset owned by the catalog database or the directory database. Lock types included are PSET andDSET.
Catalog Pageset LocksThe total number of pageset locks in which the object of the lock is a pageset owned by the catalog(DSNDB06) database (PSET).
Page/Row LocksTotal number of page, row, LOB, and XML locks owned by the thread. It includes DPAG, IPAG, ROW,LOB, and XML locks. It includes any of the listed locks in which the lock object is owned by the catalogdatabase or the directory database.
Catalog Page/Row LocksThe total number of page and row locks on the catalog (DSNDB06) database. This includes data page(DPAG), index page (IPAG), and row (ROW) locks.
Directory and Other LocksThe total number of directory and other locks owned by the thread. Directory locks are issued againstresources contained in the DSNDB01 directory database.
Bind ACQUIRE OptionThe ACQUIRE option specified at BIND time: ALLOCATE or USE. This allows you to control when theallocation of tablespace locks is to occur. If ACQUIRE(USE) is specified, tablespace locks will beacquired when the resource is used by the application. When ACQUIRE(ALLOCATE) is specified, alltablespace locks will be obtained at plan allocation time. Dynamic SQL users (QMF, SPUFI) alwaysexecute with the ACQUIRE(USE) option.
Bind RELEASE Option (Static) (QW01243F)The RELEASE option specified at BIND time: COMMIT or DEALLOCATE.
The RELEASE option controls when tablespace and SKCT locks are freed. RELEASE(COMMIT) causesthese locks to be released at each commit point. RELEASE(DEALLOCATE) causes these locks to befreed at application termination. Page locks are always released at commit time, regardless of therelease option.
ISOLATION OptionThe ISOLATION option specifies when the plan is bound.
Chapter 7. Locking Conflicts 199
The isolation parameter allows you to control the data consistency in the pages that the planaccesses. It has an effect on the number of page or row locks held concurrently by an application. Theavailable options are:
Cursor Stability (CS)Causes a page lock acquired for read processing to be released when the applicationsubsequently accesses data contained on another data page. (Page locks acquired as a result ofupdate activity are always retained until commit.)
Read Stability (RS)Is similar to Repeatable Read but this isolation option allows to insert new rows or update rowsthat did not satisfy the original search condition of the application.
Repeatable Read (RR)Causes all application locks obtained for read processing to be retained until application committime.
RR with X-lockMeans Repeatable Read with X-lock.
RS with X-lockMeans Read Stability with X-lock.
Uncommitted Read (UR)Causes data to be read without acquiring locks. This can result in accessing data that has beenupdated but not yet committed. It applies only to read-only operations: SELECT, SELECT INTO, orFETCH from a read-only result table. Use this isolation level only when:
• Data consistency is not necessary or inconsistencies already exist• Errors cannot occur with its use, such as with a reference table that is rarely updated
TypeThe lock type owned. Every lock type owned by the thread will be displayed. For more informationabout lock types, lock levels, and lock resources, see "Lock Types and Lock Levels".
LevelThe lock levels of the various lock types owned. All lock levels owned within a lock type will be listed.Lock levels can occur repetitively for a single lock type due to the different resources owned by thelocks.
ResourceThe resource that is the object of the lock. The content of this field is dependent on lock type. For datapage (DPAG) and index page (IPAG) locks, the resource does not contain the actual data page numberthat is locked; it lists the database and pageset owning the data or index page lock. The Number fieldthen displays how many data or index page locks exist within the resource (pageset) listed.
NumberThe number of locks meeting the type, level, and resource description of the lock.
Claim information:Type
The type of object being claimed. Possible object types are:TS
TablespaceTS LPRT
Tablespace logical partitionTS PART
Data PartitionIX
IndexspaceIX LPRT
Indexspace logical partition
200 Classic Interface User's Guide
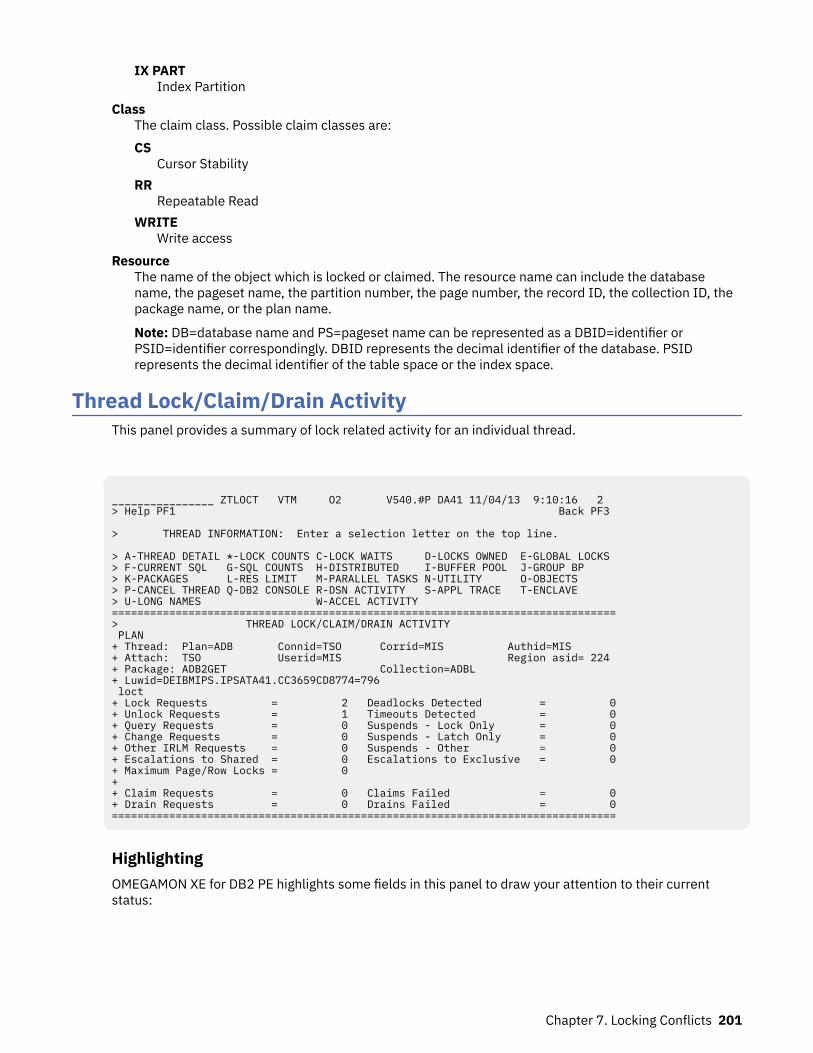
IX PARTIndex Partition
ClassThe claim class. Possible claim classes are:CS
Cursor StabilityRR
Repeatable ReadWRITE
Write accessResource
The name of the object which is locked or claimed. The resource name can include the databasename, the pageset name, the partition number, the page number, the record ID, the collection ID, thepackage name, or the plan name.
Note: DB=database name and PS=pageset name can be represented as a DBID=identifier orPSID=identifier correspondingly. DBID represents the decimal identifier of the database. PSIDrepresents the decimal identifier of the table space or the index space.
Thread Lock/Claim/Drain ActivityThis panel provides a summary of lock related activity for an individual thread.
________________ ZTLOCT VTM O2 V540.#P DA41 11/04/13 9:10:16 2 > Help PF1 Back PF3 > THREAD INFORMATION: Enter a selection letter on the top line. > A-THREAD DETAIL *-LOCK COUNTS C-LOCK WAITS D-LOCKS OWNED E-GLOBAL LOCKS > F-CURRENT SQL G-SQL COUNTS H-DISTRIBUTED I-BUFFER POOL J-GROUP BP > K-PACKAGES L-RES LIMIT M-PARALLEL TASKS N-UTILITY O-OBJECTS > P-CANCEL THREAD Q-DB2 CONSOLE R-DSN ACTIVITY S-APPL TRACE T-ENCLAVE > U-LONG NAMES W-ACCEL ACTIVITY ===============================================================================> THREAD LOCK/CLAIM/DRAIN ACTIVITY PLAN + Thread: Plan=ADB Connid=TSO Corrid=MIS Authid=MIS + Attach: TSO Userid=MIS Region asid= 224 + Package: ADB2GET Collection=ADBL + Luwid=DEIBMIPS.IPSATA41.CC3659CD8774=796 loct + Lock Requests = 2 Deadlocks Detected = 0+ Unlock Requests = 1 Timeouts Detected = 0+ Query Requests = 0 Suspends - Lock Only = 0+ Change Requests = 0 Suspends - Latch Only = 0+ Other IRLM Requests = 0 Suspends - Other = 0+ Escalations to Shared = 0 Escalations to Exclusive = 0+ Maximum Page/Row Locks = 0 + + Claim Requests = 0 Claims Failed = 0+ Drain Requests = 0 Drains Failed = 0===============================================================================
HighlightingOMEGAMON XE for DB2 PE highlights some fields in this panel to draw your attention to their currentstatus:
Chapter 7. Locking Conflicts 201
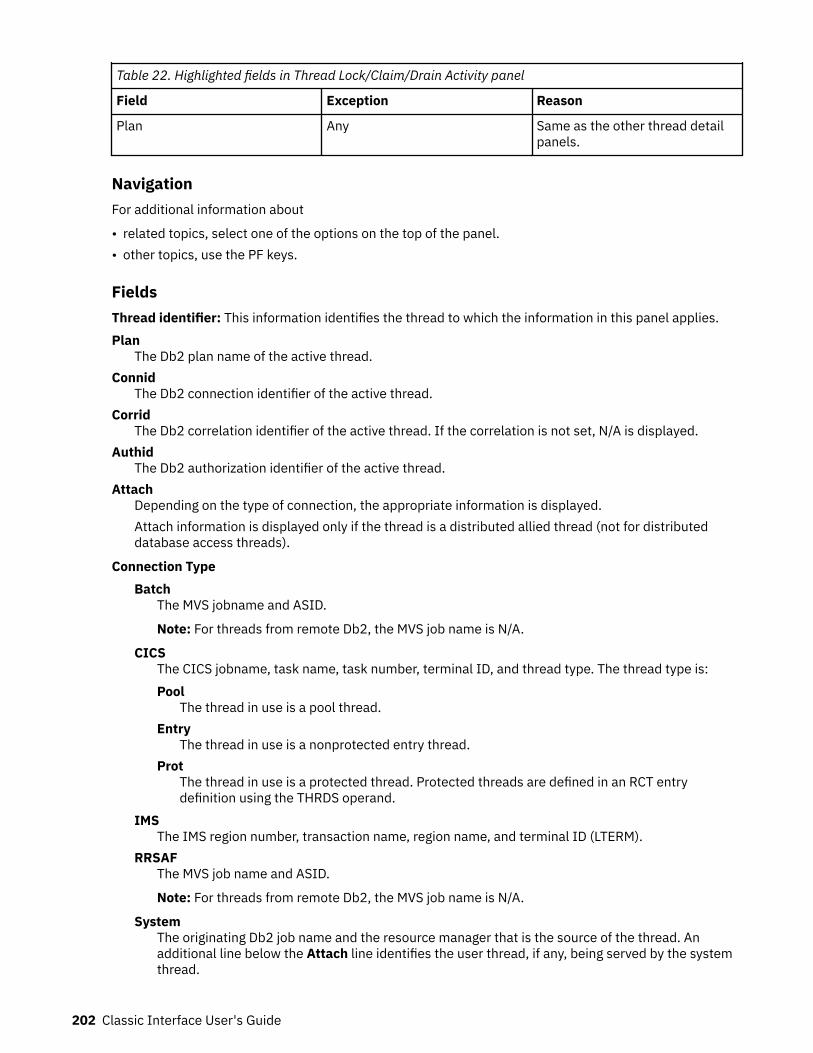
Table 22. Highlighted fields in Thread Lock/Claim/Drain Activity panel
Field Exception Reason
Plan Any Same as the other thread detailpanels.
NavigationFor additional information about
• related topics, select one of the options on the top of the panel.• other topics, use the PF keys.
FieldsThread identifier: This information identifies the thread to which the information in this panel applies.Plan
The Db2 plan name of the active thread.Connid
The Db2 connection identifier of the active thread.Corrid
The Db2 correlation identifier of the active thread. If the correlation is not set, N/A is displayed.Authid
The Db2 authorization identifier of the active thread.Attach
Depending on the type of connection, the appropriate information is displayed.Attach information is displayed only if the thread is a distributed allied thread (not for distributeddatabase access threads).
Connection TypeBatch
The MVS jobname and ASID.
Note: For threads from remote Db2, the MVS job name is N/A.
CICSThe CICS jobname, task name, task number, terminal ID, and thread type. The thread type is:Pool
The thread in use is a pool thread.Entry
The thread in use is a nonprotected entry thread.Prot
The thread in use is a protected thread. Protected threads are defined in an RCT entrydefinition using the THRDS operand.
IMSThe IMS region number, transaction name, region name, and terminal ID (LTERM).
RRSAFThe MVS job name and ASID.
Note: For threads from remote Db2, the MVS job name is N/A.
SystemThe originating Db2 job name and the resource manager that is the source of the thread. Anadditional line below the Attach line identifies the user thread, if any, being served by the systemthread.
202 Classic Interface User's Guide
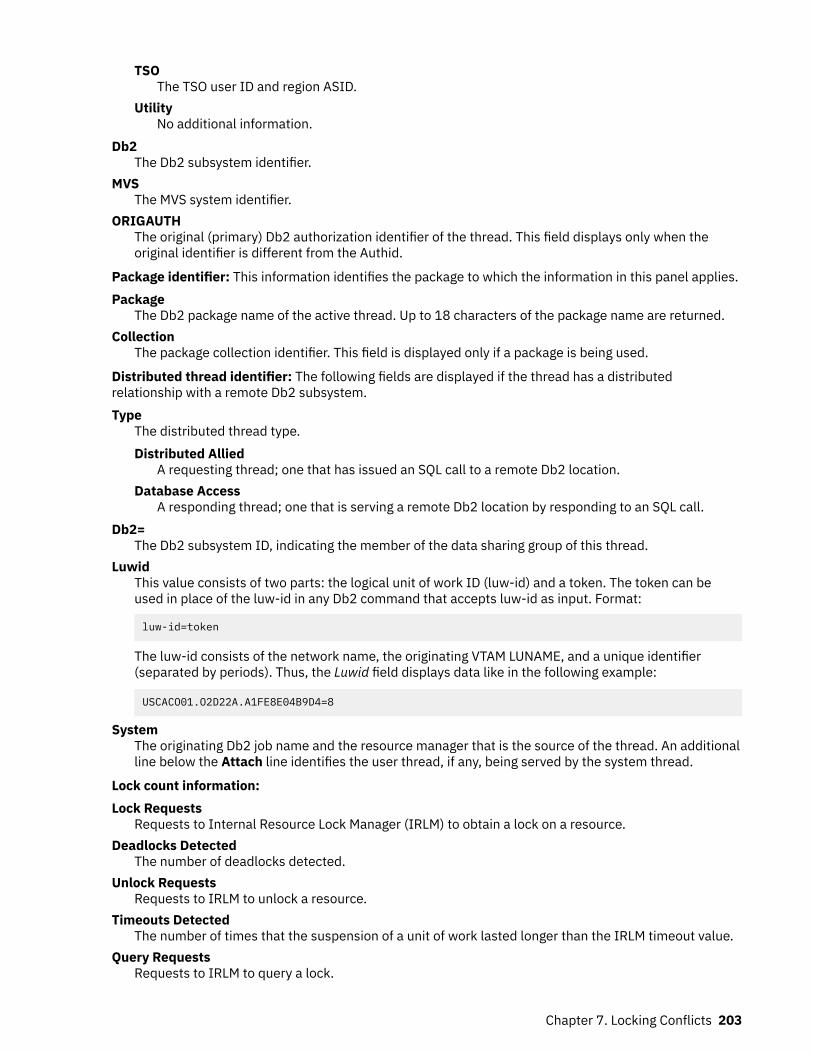
TSOThe TSO user ID and region ASID.
UtilityNo additional information.
Db2The Db2 subsystem identifier.
MVSThe MVS system identifier.
ORIGAUTHThe original (primary) Db2 authorization identifier of the thread. This field displays only when theoriginal identifier is different from the Authid.
Package identifier: This information identifies the package to which the information in this panel applies.Package
The Db2 package name of the active thread. Up to 18 characters of the package name are returned.Collection
The package collection identifier. This field is displayed only if a package is being used.
Distributed thread identifier: The following fields are displayed if the thread has a distributedrelationship with a remote Db2 subsystem.Type
The distributed thread type.Distributed Allied
A requesting thread; one that has issued an SQL call to a remote Db2 location.Database Access
A responding thread; one that is serving a remote Db2 location by responding to an SQL call.Db2=
The Db2 subsystem ID, indicating the member of the data sharing group of this thread.Luwid
This value consists of two parts: the logical unit of work ID (luw-id) and a token. The token can beused in place of the luw-id in any Db2 command that accepts luw-id as input. Format:
luw-id=token
The luw-id consists of the network name, the originating VTAM LUNAME, and a unique identifier(separated by periods). Thus, the Luwid field displays data like in the following example:
USCACO01.O2D22A.A1FE8E04B9D4=8
SystemThe originating Db2 job name and the resource manager that is the source of the thread. An additionalline below the Attach line identifies the user thread, if any, being served by the system thread.
Lock count information:Lock Requests
Requests to Internal Resource Lock Manager (IRLM) to obtain a lock on a resource.Deadlocks Detected
The number of deadlocks detected.Unlock Requests
Requests to IRLM to unlock a resource.Timeouts Detected
The number of times that the suspension of a unit of work lasted longer than the IRLM timeout value.Query Requests
Requests to IRLM to query a lock.
Chapter 7. Locking Conflicts 203
Suspends - Lock OnlySuspensions of a unit of work because a lock could not be obtained.
Change RequestsRequests to IRLM to change a lock.
Suspends - Latch OnlyDB2 internal latch suspensions.
Other IRLM RequestsRequests to IRLM to perform a function other than those listed before.
Suspends - OtherSuspensions caused by something other than locks and latches.
Escalations to SharedOccasions when the allowable number of locks per tablespace was exceeded, causing a page (IS) lockto escalate to a shared (S) lock.
Escalations to ExclusiveOccasions when the allowable number of locks per tablespace was exceeded, causing a page (IX) lockto escalate to an exclusive (X) lock.
Maximum Page/Row LocksThe maximum number of page or row locks held concurrently. This count cannot exceed the value ofthe NUMLKUS (locks per user) installation parameter.
Claim RequestsThe number of claim requests.
Claims FailedThe number of unsuccessful claim requests.
Drain RequestsThe number of drain requests.
Drains FailedThe number of unsuccessful drain requests.
Thread activity: Locks/Claims causing a thread to waitThis panel shows information about the locks that cause a thread to wait. You can use this information todetermine whether a selected thread is suspended and waiting because of a locking conflict.
When a thread is suspended, this panel provides the name of the lock/claim request causing thesuspension. It also provides a list of all locks/claims currently held by other threads causing the thread tobe suspended.
If accounting class 2 and class 3 are not available, N/A is displayed.
The locking information is divided into the following categories:
1. The name of the lock request causing the suspension.2. A list of all locks which are causing the thread to wait.
HEX values are displayed for lock resources, if the resource is owned by a thread on a remote LPAR, andno OMPE task is available from that LPAR, or XCF is not setup correctly.
204 Classic Interface User's Guide
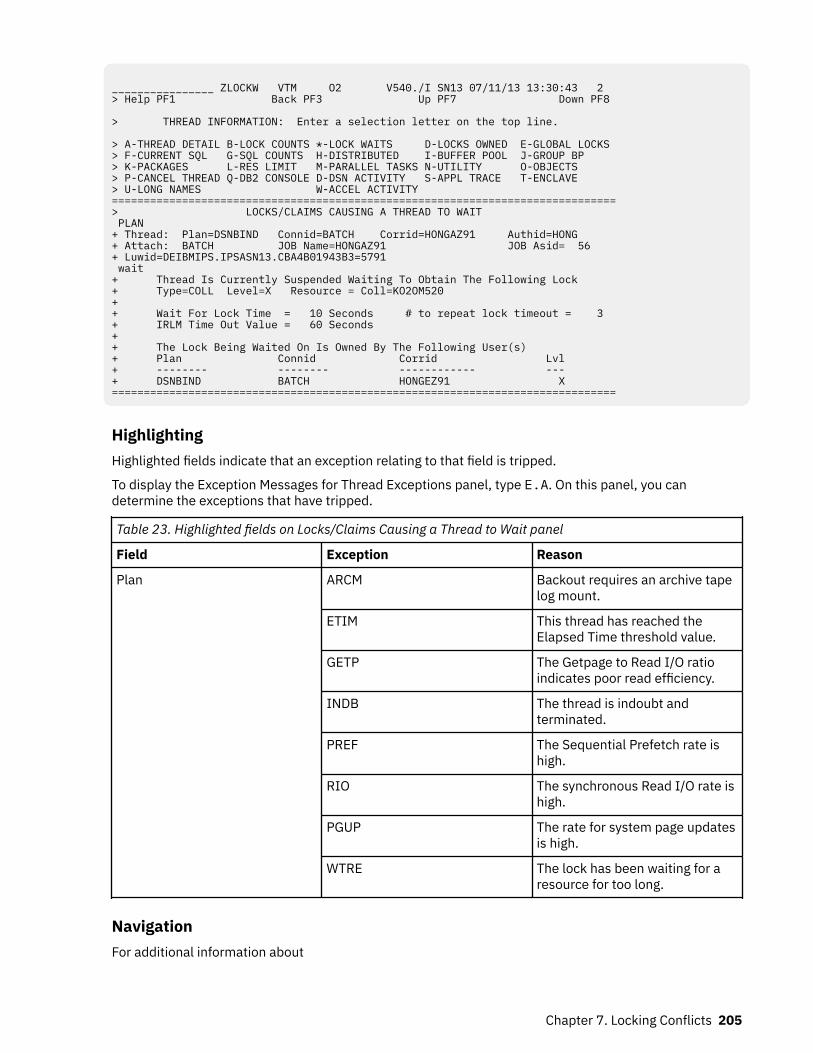
________________ ZLOCKW VTM O2 V540./I SN13 07/11/13 13:30:43 2 > Help PF1 Back PF3 Up PF7 Down PF8 > THREAD INFORMATION: Enter a selection letter on the top line. > A-THREAD DETAIL B-LOCK COUNTS *-LOCK WAITS D-LOCKS OWNED E-GLOBAL LOCKS > F-CURRENT SQL G-SQL COUNTS H-DISTRIBUTED I-BUFFER POOL J-GROUP BP > K-PACKAGES L-RES LIMIT M-PARALLEL TASKS N-UTILITY O-OBJECTS > P-CANCEL THREAD Q-DB2 CONSOLE D-DSN ACTIVITY S-APPL TRACE T-ENCLAVE > U-LONG NAMES W-ACCEL ACTIVITY ===============================================================================> LOCKS/CLAIMS CAUSING A THREAD TO WAIT PLAN + Thread: Plan=DSNBIND Connid=BATCH Corrid=HONGAZ91 Authid=HONG + Attach: BATCH JOB Name=HONGAZ91 JOB Asid= 56 + Luwid=DEIBMIPS.IPSASN13.CBA4B01943B3=5791 wait + Thread Is Currently Suspended Waiting To Obtain The Following Lock + Type=COLL Level=X Resource = Coll=KO2OM520 + + Wait For Lock Time = 10 Seconds # to repeat lock timeout = 3 + IRLM Time Out Value = 60 Seconds + + The Lock Being Waited On Is Owned By The Following User(s) + Plan Connid Corrid Lvl + -------- -------- ------------ --- + DSNBIND BATCH HONGEZ91 X ===============================================================================
HighlightingHighlighted fields indicate that an exception relating to that field is tripped.
To display the Exception Messages for Thread Exceptions panel, type E.A. On this panel, you candetermine the exceptions that have tripped.
Table 23. Highlighted fields on Locks/Claims Causing a Thread to Wait panel
Field Exception Reason
Plan ARCM Backout requires an archive tapelog mount.
ETIM This thread has reached theElapsed Time threshold value.
GETP The Getpage to Read I/O ratioindicates poor read efficiency.
INDB The thread is indoubt andterminated.
PREF The Sequential Prefetch rate ishigh.
RIO The synchronous Read I/O rate ishigh.
PGUP The rate for system page updatesis high.
WTRE The lock has been waiting for aresource for too long.
NavigationFor additional information about
Chapter 7. Locking Conflicts 205
• about the locks that are owned by a thread, an SQL activity, a general thread activity, or a resource limitactivity, or to go to the Db2 system console, type the appropriate option letter on the top line and pressENTER.
• related topics, select one of the options on the top of the panel.• other topics, use the PF keys.
FieldsThread identifier: This information identifies the thread to which the information in this panel applies.Plan
The Db2 plan name of the active thread.Connid
The Db2 connection identifier of the active thread.Corrid
The Db2 correlation identifier of the active thread. If the correlation is not set, N/A is displayed.Authid
The Db2 authorization identifier of the active thread.Attach
Depending on the type of connection, the appropriate information is displayed.Attach information is displayed only if the thread is a distributed allied thread (not for distributeddatabase access threads).
Connection TypeBatch
The MVS jobname and ASID.
Note: For threads from remote Db2, the MVS job name is N/A.
CICSThe CICS jobname, task name, task number, terminal ID, and thread type. The thread type is:Pool
The thread in use is a pool thread.Entry
The thread in use is a nonprotected entry thread.Prot
The thread in use is a protected thread. Protected threads are defined in an RCT entrydefinition using the THRDS operand.
IMSThe IMS region number, transaction name, region name, and terminal ID (LTERM).
RRSAFThe MVS job name and ASID.
Note: For threads from remote Db2, the MVS job name is N/A.
SystemThe originating Db2 job name and the resource manager that is the source of the thread. Anadditional line below the Attach line identifies the user thread, if any, being served by the systemthread.
TSOThe TSO user ID and region ASID.
UtilityNo additional information.
Db2The Db2 subsystem identifier.
206 Classic Interface User's Guide
MVSThe MVS system identifier.
ORIGAUTHThe original (primary) Db2 authorization identifier of the thread. This field displays only when theoriginal identifier is different from the Authid.
Package identifier: This information identifies the package to which the information in this panel applies.Package
The Db2 package name of the active thread. Up to 18 characters of the package name are returned.Collection
The package collection identifier. This field is displayed only if a package is being used.
Distributed thread identifier: The following fields are displayed when the thread has a distributedrelationship with a remote DB2 subsystem.Type
The distributed thread type.Distributed Allied
A requesting thread; one that has issued an SQL call to a remote DB2 location.Database Access
A responding thread; one that is serving a remote DB2 location by responding to an SQL call.Luwid
This value consists of two parts: the logical unit-of-work ID (luw-id) and a token. The token can beused in place of the luw-id in any DB2 command that accepts luw-id as input. Format:
luw-id=token
The luw-id consists of the network name, the originating VTAM LUNAME, and a unique identifier(separated by periods). Thus, the Luwid field displays data such as the following:
USCACO01.O2D22A.A1FE8E04B9D4=8
Drain information:Type
The type of object being drained. Possible object types are:TS
TablespaceTS PART
Data PartitionIX
IndexspaceIX PART
Index PartitionClass
The drain class. Possible classes are:CS
Drain all CS read access to object.RR
Drain all RR access to object.Write
Drain all write access to object.
Chapter 7. Locking Conflicts 207
ResourceThe name of the resource being drained. This includes the database name, pageset name, and thepartition number (if any).
Claim information:Plan
The planname of the thread claiming the resource.Connid
The connection identifier of the thread claiming the resource.Corrid
The correlation identifier of the thread claiming the resource.Class
The claim class. Possible classes are:CS
Cursor StabilityRR
Repeatable ReadWrite
Write access
Lock wait information:Type
The lock type on which the thread is waiting. For more information about lock types, see "Lock Typesand Lock Levels".
LevelThe level or state (mode) of the lock request. This information describes the level of resource accessdemanded by the lock request. For more information about lock levels, see "Lock Types and LockLevels".
ResourceThe resource for which the user is waiting. The content of the Resource field is dependent on locktype.
The resource varies depending upon the type of lock held. This field displays the following resources:Lock Type
ResourceALBP
BP=buffer pool IDBIND
COLL=collection ID PKG=package nameBMBA
BMC_MBAO or BMC_MBARBPPS
BP=buffer pool ID, DB=database name, PS=pageset nameCDRN
DB=database name PS=pageset name PT=partitionCOLL
COLL=collection IDDBEX
DB=database name PS=pageset name PT=partitionDBXU
HASH CLASS=class number
208 Classic Interface User's Guide
DGTTURID=unit of recovery ID
DPAGDB=database name PS=pageset name PG=page
DSETDB=database name PS=pageset name PT=partition
DTBSDB=database name
GRBPBP=buffer pool ID
HASHDB=database name PS=pageset name PG=page
IEOFDB=database name PS=pageset name PT=partition
IPAGDB=database name PS=pageset name PG=page
LBLKDB=database name PS=pageset name
MDELDB=database name PS=pageset name
PALKDB=database name PS=pageset name PT=partition
PBPCBP=buffer pool ID
PCDBDB=database name
PDBDDB=database name
PDSODB=database name PS=pageset name
PITRDB=database name PS=pageset name PT=partition
PPAGDB=database name PS=pageset name PG=page
PPSCDB=database name PS=pageset name PT=partition
PPSPDB=database name PS=pageset name PT=partition
PRLFDB=database name PS=pageset name PT=partition
PSETDB=database name PS=pageset name
PSPIDB=dataset name PS=pageset name
RDRNDB=dataset name PS=pageset name PT=partition
RGDADB=database name PS=pageset name PG=page
ROWDB=database name PS=pageset name PG=page
Chapter 7. Locking Conflicts 209
RSTRBMC-RSTP
SDBADB=dataset name PS=pageset name
SKCTPLAN=plan name
SKPT
TOKEN is the consistency token (CONTOKEN) column from SYSIBM.SYSPACKAGE. Token=token
SPRCSYS_PITR
SRECDB=database name TS=tablespace name
TABLDB=database name PS=pageset name
UNDTResource ID (in hexadecimal)
UTEXUTEXEC
UTIDUID=utility identifier
UTOBDB=database name PS=pageset name PT=partition
UTSEUTSERIAL
WDRNDB=database name PS=pageset name PT=partition
Note: DB=database name can be represented as a DBID=identifier, which is the decimal identifier ofthe database. PSID=identifier can be represented as PSID=identifier, which is the decimal identifier ofthe table space or index space.
For more information about lock resources, see "Lock Types and Lock Levels".
Wait For Lock TimeThe time that DB2 has been waiting for the locked resource.
# To Repeat Lock TimeoutThe number of times DB2 repeats the lock timeout.
IRLM Time Out ValueThe maximum time that DB2 waits for a locked resource. When DB2 reaches the maximum value, itrolls back the unit of work.
LevelThe level or state (mode) of the lock request. This information describes the level of resource accessdemanded by the lock request. For more information about lock levels, see “Tablespace lock levels”on page 811.
Lock owner information:Plan
The DB2 plan name of the active thread.Connid
The DB2 connection identifier of the active thread.Corrid
The DB2 correlation identifier of the active thread.
210 Classic Interface User's Guide
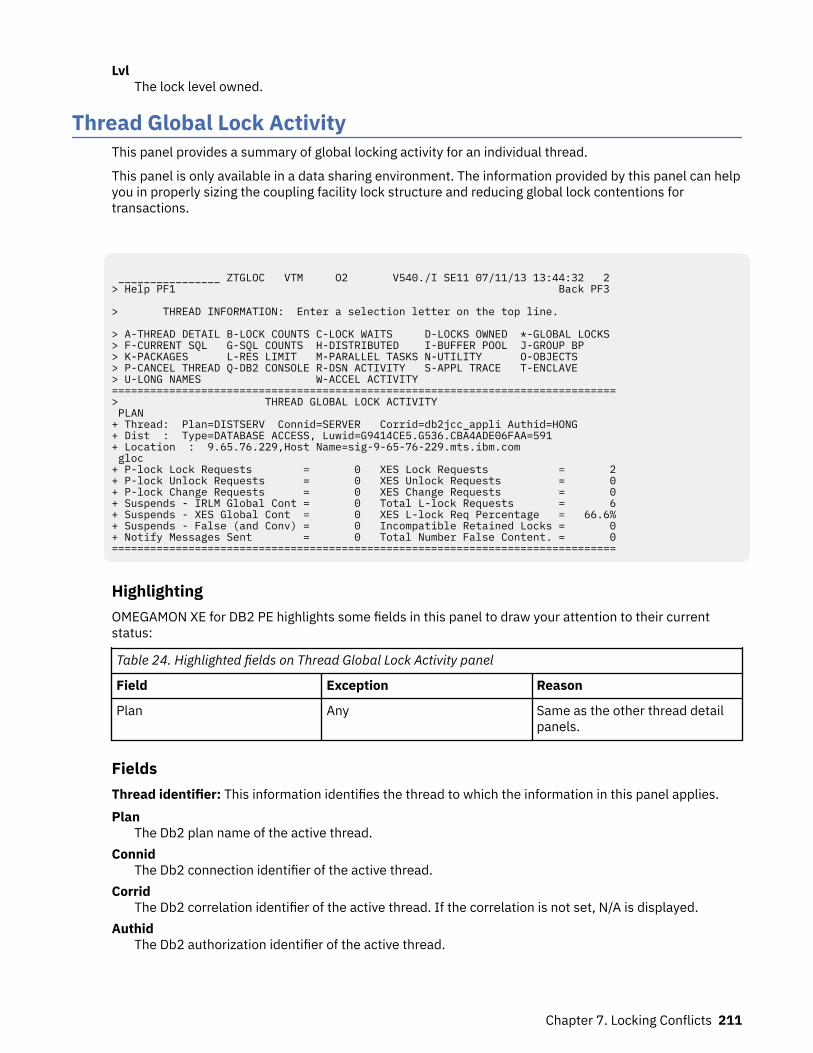
LvlThe lock level owned.
Thread Global Lock ActivityThis panel provides a summary of global locking activity for an individual thread.
This panel is only available in a data sharing environment. The information provided by this panel can helpyou in properly sizing the coupling facility lock structure and reducing global lock contentions fortransactions.
________________ ZTGLOC VTM O2 V540./I SE11 07/11/13 13:44:32 2 > Help PF1 Back PF3 > THREAD INFORMATION: Enter a selection letter on the top line. > A-THREAD DETAIL B-LOCK COUNTS C-LOCK WAITS D-LOCKS OWNED *-GLOBAL LOCKS > F-CURRENT SQL G-SQL COUNTS H-DISTRIBUTED I-BUFFER POOL J-GROUP BP > K-PACKAGES L-RES LIMIT M-PARALLEL TASKS N-UTILITY O-OBJECTS > P-CANCEL THREAD Q-DB2 CONSOLE R-DSN ACTIVITY S-APPL TRACE T-ENCLAVE > U-LONG NAMES W-ACCEL ACTIVITY =============================================================================== > THREAD GLOBAL LOCK ACTIVITY PLAN + Thread: Plan=DISTSERV Connid=SERVER Corrid=db2jcc_appli Authid=HONG + Dist : Type=DATABASE ACCESS, Luwid=G9414CE5.G536.CBA4ADE06FAA=591 + Location : 9.65.76.229,Host Name=sig-9-65-76-229.mts.ibm.com gloc + P-lock Lock Requests = 0 XES Lock Requests = 2 + P-lock Unlock Requests = 0 XES Unlock Requests = 0 + P-lock Change Requests = 0 XES Change Requests = 0 + Suspends - IRLM Global Cont = 0 Total L-lock Requests = 6 + Suspends - XES Global Cont = 0 XES L-lock Req Percentage = 66.6% + Suspends - False (and Conv) = 0 Incompatible Retained Locks = 0 + Notify Messages Sent = 0 Total Number False Content. = 0 ===============================================================================
HighlightingOMEGAMON XE for DB2 PE highlights some fields in this panel to draw your attention to their currentstatus:
Table 24. Highlighted fields on Thread Global Lock Activity panel
Field Exception Reason
Plan Any Same as the other thread detailpanels.
FieldsThread identifier: This information identifies the thread to which the information in this panel applies.Plan
The Db2 plan name of the active thread.Connid
The Db2 connection identifier of the active thread.Corrid
The Db2 correlation identifier of the active thread. If the correlation is not set, N/A is displayed.Authid
The Db2 authorization identifier of the active thread.
Chapter 7. Locking Conflicts 211
AttachDepending on the type of connection, the appropriate information is displayed.Attach information is displayed only if the thread is a distributed allied thread (not for distributeddatabase access threads).
Connection TypeBatch
The MVS jobname and ASID.
Note: For threads from remote Db2, the MVS job name is N/A.
CICSThe CICS jobname, task name, task number, terminal ID, and thread type. The thread type is:Pool
The thread in use is a pool thread.Entry
The thread in use is a nonprotected entry thread.Prot
The thread in use is a protected thread. Protected threads are defined in an RCT entrydefinition using the THRDS operand.
IMSThe IMS region number, transaction name, region name, and terminal ID (LTERM).
RRSAFThe MVS job name and ASID.
Note: For threads from remote Db2, the MVS job name is N/A.
SystemThe originating Db2 job name and the resource manager that is the source of the thread. Anadditional line below the Attach line identifies the user thread, if any, being served by the systemthread.
TSOThe TSO user ID and region ASID.
UtilityNo additional information.
Db2The Db2 subsystem identifier.
MVSThe MVS system identifier.
ORIGAUTHThe original (primary) Db2 authorization identifier of the thread. This field displays only when theoriginal identifier is different from the Authid.
Package identifier: This information identifies the package to which the information in this panel applies.Package
The Db2 package name of the active thread. Up to 18 characters of the package name are returned.Collection
The package collection identifier. This field is displayed only if a package is being used.
Distributed thread identifier: The following fields are displayed if the thread has a distributedrelationship with a remote Db2 subsystem.Type
The distributed thread type.Distributed Allied
A requesting thread; one that has issued an SQL call to a remote Db2 location.
212 Classic Interface User's Guide
Database AccessA responding thread; one that is serving a remote Db2 location by responding to an SQL call.
Db2=The Db2 subsystem ID, indicating the member of the data sharing group of this thread.
LuwidThis value consists of two parts: the logical unit of work ID (luw-id) and a token. The token can beused in place of the luw-id in any Db2 command that accepts luw-id as input. Format:
luw-id=token
The luw-id consists of the network name, the originating VTAM LUNAME, and a unique identifier(separated by periods). Thus, the Luwid field displays data like in the following example:
USCACO01.O2D22A.A1FE8E04B9D4=8
SystemThe originating Db2 job name and the resource manager that is the source of the thread. An additionalline below the Attach line identifies the user thread, if any, being served by the system thread.
Global lock information:
P-lock Lock RequestsNumber of lock requests for P-locks. A P-lock is a physical lock used only in a data sharingenvironment to provide consistency of data cached in different DB2 subsystems.
P-lock Unlock RequestsNumber of unlock requests for P-locks.
P-lock Change RequestsNumber of change requests for P-locks.
XES Lock RequestsThe number of lock requests (both logical and physical) that were propagated to MVS XESsynchronously under the caller's execution unit. This count does not include suspended requests.Only the most restrictive lock for a particular resource is propagated to XES and the coupling facility.
XES Unlock RequestsThe number of unlock requests (both logical and physical) that are propagated to MVS XESsynchronously under the caller's execution unit. This count does not include suspended requests.
XES Change RequestsThe number of change requests (both logical and physical) that were propagated to MVS XESsynchronously under the caller's execution unit. This count does not include suspended requests.
Suspends - IRLM Global ContThe number of suspends due to Internal Resource Lock Manager (IRLM) global resource contentions.IRLM lock states were in conflict and inter-system communication is required to resolve the conflict.
Suspends - XES Global ContThe number of suspends due to MVS XES global resource contentions that were not IRLM-levelcontentions. The XES lock states were in conflict, but the IRLM lock states were not.
Suspends - False (and Conv)Summation of false contentions and sync-to-async heuristic conversions.
XES detects hash class contention when two different locks on different resources hash to the sameentry in the coupling facility lock table. The requester is suspended until it is determined that no reallock contention exists.
Sync-to-async heuristic conversions are done when the XES determines that it is more efficient todrive the request asynchronously to the coupling facility.
Total L-lock RequestsThe total number of L-lock requests. An L-lock is a logical lock used to control intra- and inter-DB2data concurrency between transactions.
Chapter 7. Locking Conflicts 213
XES L-lock Req PercentageThe percentage of total L-lock requests that were propagated to MVS XES synchronously.
Incompatible Retained LocksThe number of global lock or change requests that failed because of an incompatible retained lock.Certain P-locks can be retained because of a system failure. Another DB2 member cannot access thedata that the retained P-lock is protecting unless it requests a P-lock in a compatible state.
Notify Messages SentThe number of notify messages sent.
Total Number False Content.The total number of false contentions for LOCK and UNLOCK requests. A false contention occurs whendifferent resource names hash to the same entry in the coupling facility (CF) lock table. The CFdetects contention within the hash entry, and XES uses intersystem messaging to determine that noactual resource contention exists.
214 Classic Interface User's Guide
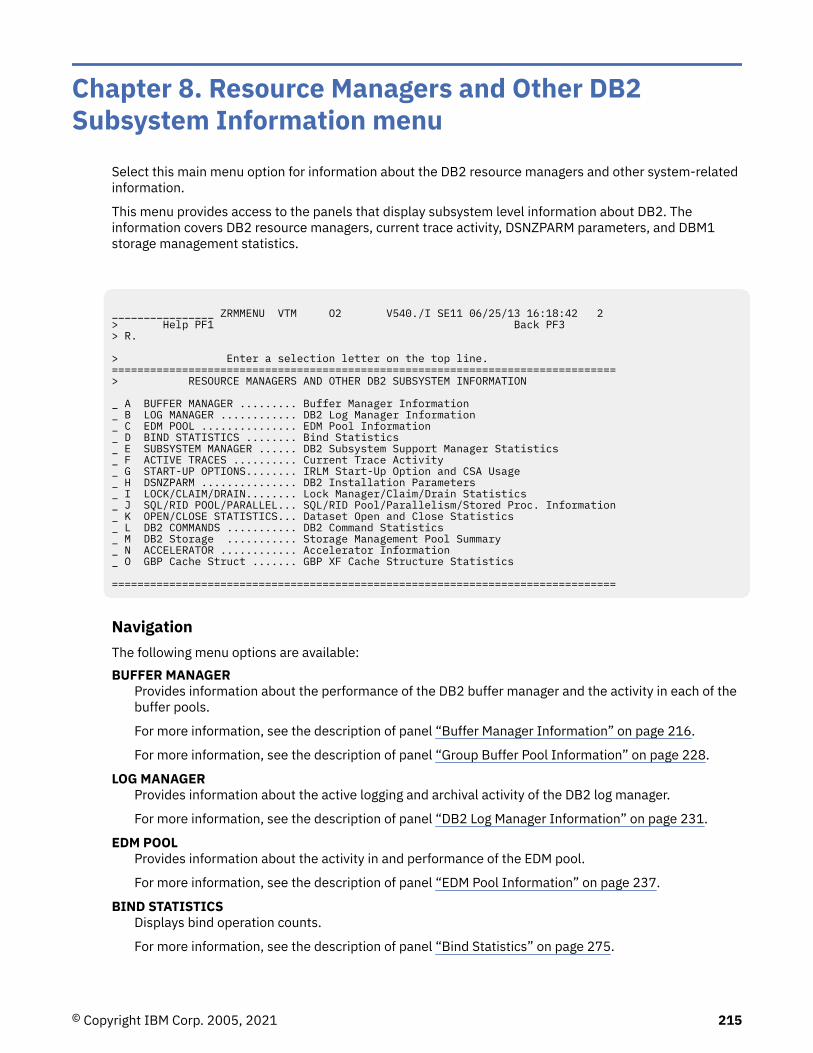
Chapter 8. Resource Managers and Other DB2Subsystem Information menu
Select this main menu option for information about the DB2 resource managers and other system-relatedinformation.
This menu provides access to the panels that display subsystem level information about DB2. Theinformation covers DB2 resource managers, current trace activity, DSNZPARM parameters, and DBM1storage management statistics.
________________ ZRMMENU VTM O2 V540./I SE11 06/25/13 16:18:42 2 > Help PF1 Back PF3 > R. > Enter a selection letter on the top line. ===============================================================================> RESOURCE MANAGERS AND OTHER DB2 SUBSYSTEM INFORMATION _ A BUFFER MANAGER ......... Buffer Manager Information _ B LOG MANAGER ............ DB2 Log Manager Information _ C EDM POOL ............... EDM Pool Information _ D BIND STATISTICS ........ Bind Statistics _ E SUBSYSTEM MANAGER ...... DB2 Subsystem Support Manager Statistics _ F ACTIVE TRACES .......... Current Trace Activity _ G START-UP OPTIONS........ IRLM Start-Up Option and CSA Usage _ H DSNZPARM ............... DB2 Installation Parameters _ I LOCK/CLAIM/DRAIN........ Lock Manager/Claim/Drain Statistics _ J SQL/RID POOL/PARALLEL... SQL/RID Pool/Parallelism/Stored Proc. Information_ K OPEN/CLOSE STATISTICS... Dataset Open and Close Statistics _ L DB2 COMMANDS ........... DB2 Command Statistics _ M DB2 Storage ........... Storage Management Pool Summary _ N ACCELERATOR ............ Accelerator Information _ O GBP Cache Struct ....... GBP XF Cache Structure Statistics ===============================================================================
NavigationThe following menu options are available:BUFFER MANAGER
Provides information about the performance of the DB2 buffer manager and the activity in each of thebuffer pools.
For more information, see the description of panel “Buffer Manager Information” on page 216.
For more information, see the description of panel “Group Buffer Pool Information” on page 228.
LOG MANAGERProvides information about the active logging and archival activity of the DB2 log manager.
For more information, see the description of panel “DB2 Log Manager Information” on page 231.
EDM POOLProvides information about the activity in and performance of the EDM pool.
For more information, see the description of panel “EDM Pool Information” on page 237.
BIND STATISTICSDisplays bind operation counts.
For more information, see the description of panel “Bind Statistics” on page 275.
© Copyright IBM Corp. 2005, 2021 215
SUBSYSTEM MANAGERDisplays workload-related information about the monitored DB2 subsystem.
For more information, see the description of panel “DB2 Subsystem Support Manager Statistics” onpage 278.
ACTIVE TRACESDisplays summary and detail information about the DB2 traces that are currently active.
For more information, see the description of panel “Active Trace Summary” on page 280.
DSNZPARMDisplays the settings of the installation options in the DSNZPARM module.
For more information, see the description of panel “DSNZPARM Thread Parameters” on page 285 andsubsequent DSNZPARM-related panels.
LOCK/CLAIM/DRAINDisplays information about current locking activity and claim and drain statistics.
For more information, see the description of panel “Lock Manager Information” on page 370.
For more information, see the description of panel “Global Lock Statistics” on page 377.
SQL/RID POOL/PARALLELDisplays information about current SQL activity, RID pool accesses, parallelism, and stored procedureinformation.
For more information, see the description of panel “SQL/RID Pool/Parallelism/Stored ProcedureInformation” on page 380.
OPEN/CLOSE STATISTICSProvides information about open and close data set activity occurring within the DB2 subsystem.
For more information, see the description of panel “Open/Close Statistics” on page 396.
DB2 COMMANDSProvides information about DB2 command activity.
For more information, see the description of panel “DB2 Command Statistics” on page 398.
DB2 StorageProvides statistics information about DBM1 (DB2 database services address space) virtual and realstorage and MVS storage performance.
For more information, see the description of panel “DB2 Storage” on page 402.
AcceleratorDisplays a list of the available accelerators. You can sort this list.For more information, see the description of panel “Accelerator Statistics Overview” on page 420
GBP Cache StructProvides information about a group buffer pool across all DB2 members in the data sharing group.For more information, see the description of panel “GBP Coupling Facility Cache Structure StatisticsSummary” on page 416 and “GBP Coupling Facility Cache Structure Statistics” on page 418.
Buffer Manager InformationThis panel provides information about the performance of the DB2 buffer manager and the activity in eachof the buffer pools.
This information helps you analyze buffer pool utilization.
216 Classic Interface User's Guide
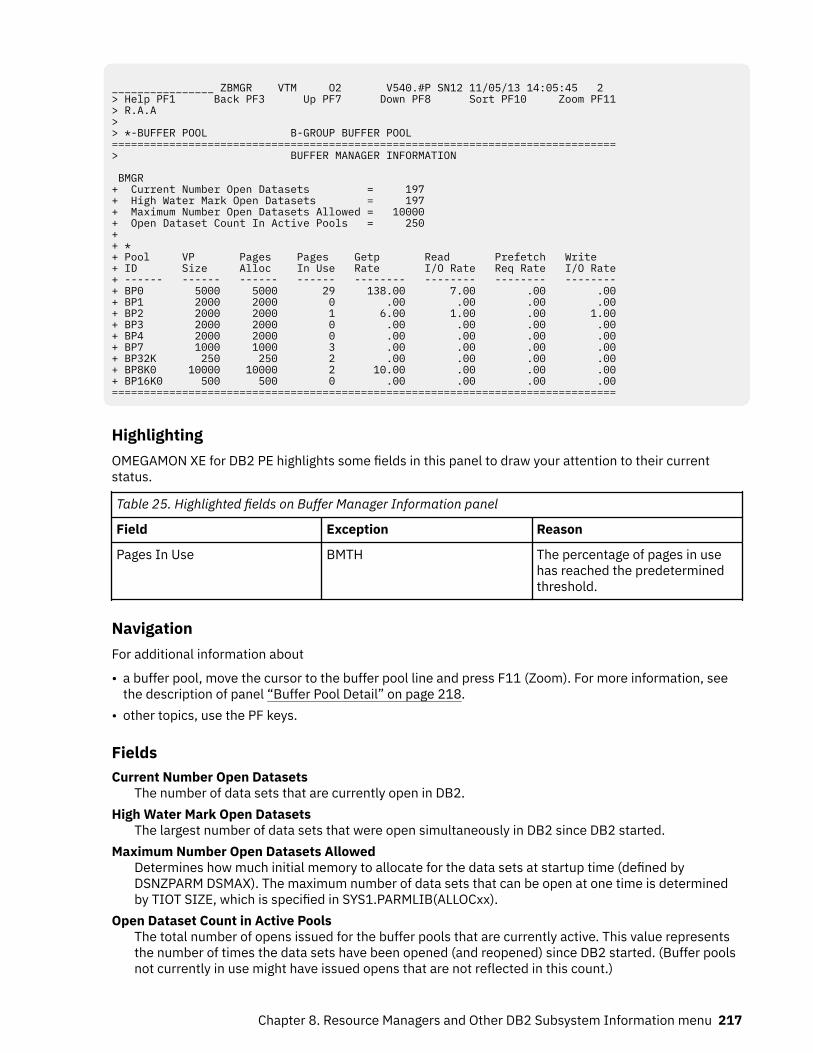
________________ ZBMGR VTM O2 V540.#P SN12 11/05/13 14:05:45 2 > Help PF1 Back PF3 Up PF7 Down PF8 Sort PF10 Zoom PF11> R.A.A > > *-BUFFER POOL B-GROUP BUFFER POOL ===============================================================================> BUFFER MANAGER INFORMATION BMGR + Current Number Open Datasets = 197 + High Water Mark Open Datasets = 197 + Maximum Number Open Datasets Allowed = 10000 + Open Dataset Count In Active Pools = 250 + + * + Pool VP Pages Pages Getp Read Prefetch Write + ID Size Alloc In Use Rate I/O Rate Req Rate I/O Rate+ ------ ------ ------ ------ -------- -------- -------- --------+ BP0 5000 5000 29 138.00 7.00 .00 .00+ BP1 2000 2000 0 .00 .00 .00 .00+ BP2 2000 2000 1 6.00 1.00 .00 1.00+ BP3 2000 2000 0 .00 .00 .00 .00+ BP4 2000 2000 0 .00 .00 .00 .00+ BP7 1000 1000 3 .00 .00 .00 .00+ BP32K 250 250 2 .00 .00 .00 .00+ BP8K0 10000 10000 2 10.00 .00 .00 .00+ BP16K0 500 500 0 .00 .00 .00 .00===============================================================================
HighlightingOMEGAMON XE for DB2 PE highlights some fields in this panel to draw your attention to their currentstatus.
Table 25. Highlighted fields on Buffer Manager Information panel
Field Exception Reason
Pages In Use BMTH The percentage of pages in usehas reached the predeterminedthreshold.
NavigationFor additional information about
• a buffer pool, move the cursor to the buffer pool line and press F11 (Zoom). For more information, seethe description of panel “Buffer Pool Detail” on page 218.
• other topics, use the PF keys.
FieldsCurrent Number Open Datasets
The number of data sets that are currently open in DB2.High Water Mark Open Datasets
The largest number of data sets that were open simultaneously in DB2 since DB2 started.Maximum Number Open Datasets Allowed
Determines how much initial memory to allocate for the data sets at startup time (defined byDSNZPARM DSMAX). The maximum number of data sets that can be open at one time is determinedby TIOT SIZE, which is specified in SYS1.PARMLIB(ALLOCxx).
Open Dataset Count in Active PoolsThe total number of opens issued for the buffer pools that are currently active. This value representsthe number of times the data sets have been opened (and reopened) since DB2 started. (Buffer poolsnot currently in use might have issued opens that are not reflected in this count.)
Chapter 8. Resource Managers and Other DB2 Subsystem Information menu 217
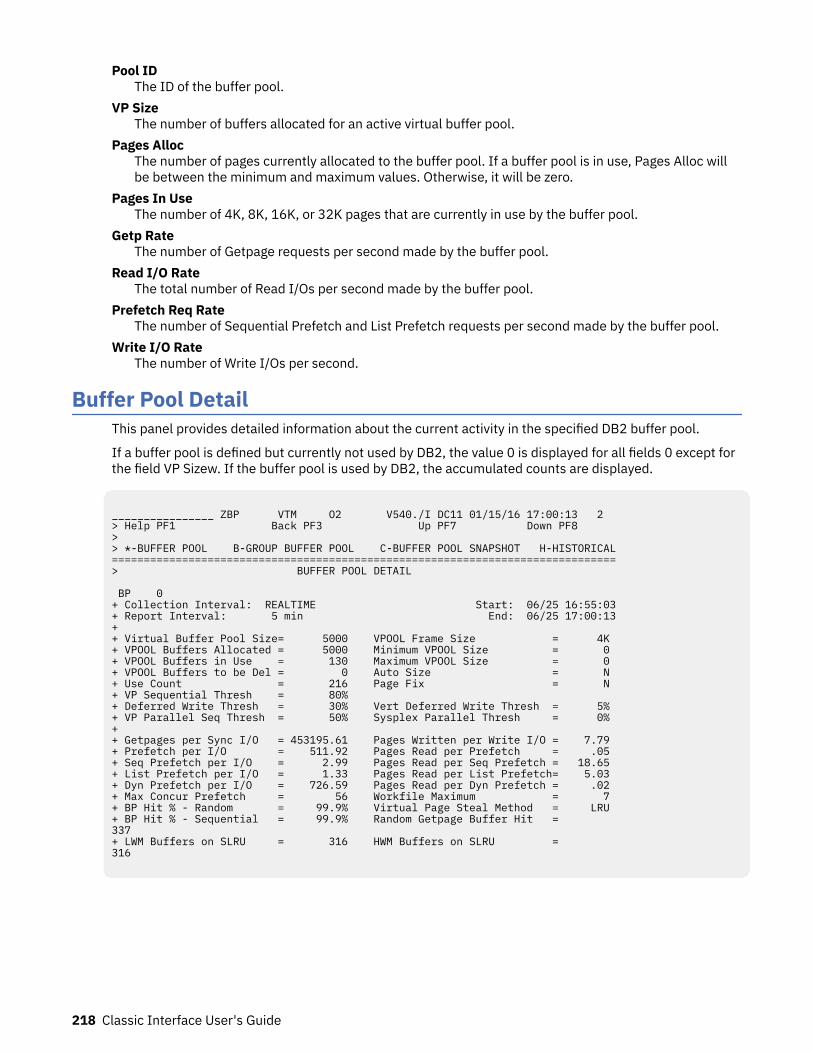
Pool IDThe ID of the buffer pool.
VP SizeThe number of buffers allocated for an active virtual buffer pool.
Pages AllocThe number of pages currently allocated to the buffer pool. If a buffer pool is in use, Pages Alloc willbe between the minimum and maximum values. Otherwise, it will be zero.
Pages In UseThe number of 4K, 8K, 16K, or 32K pages that are currently in use by the buffer pool.
Getp RateThe number of Getpage requests per second made by the buffer pool.
Read I/O RateThe total number of Read I/Os per second made by the buffer pool.
Prefetch Req RateThe number of Sequential Prefetch and List Prefetch requests per second made by the buffer pool.
Write I/O RateThe number of Write I/Os per second.
Buffer Pool DetailThis panel provides detailed information about the current activity in the specified DB2 buffer pool.
If a buffer pool is defined but currently not used by DB2, the value 0 is displayed for all fields 0 except forthe field VP Sizew. If the buffer pool is used by DB2, the accumulated counts are displayed.
________________ ZBP VTM O2 V540./I DC11 01/15/16 17:00:13 2 > Help PF1 Back PF3 Up PF7 Down PF8 > > *-BUFFER POOL B-GROUP BUFFER POOL C-BUFFER POOL SNAPSHOT H-HISTORICAL =============================================================================== > BUFFER POOL DETAIL BP 0 + Collection Interval: REALTIME Start: 06/25 16:55:03 + Report Interval: 5 min End: 06/25 17:00:13 + + Virtual Buffer Pool Size= 5000 VPOOL Frame Size = 4K + VPOOL Buffers Allocated = 5000 Minimum VPOOL Size = 0 + VPOOL Buffers in Use = 130 Maximum VPOOL Size = 0 + VPOOL Buffers to be Del = 0 Auto Size = N + Use Count = 216 Page Fix = N + VP Sequential Thresh = 80% + Deferred Write Thresh = 30% Vert Deferred Write Thresh = 5% + VP Parallel Seq Thresh = 50% Sysplex Parallel Thresh = 0% + + Getpages per Sync I/O = 453195.61 Pages Written per Write I/O = 7.79 + Prefetch per I/O = 511.92 Pages Read per Prefetch = .05 + Seq Prefetch per I/O = 2.99 Pages Read per Seq Prefetch = 18.65 + List Prefetch per I/O = 1.33 Pages Read per List Prefetch= 5.03 + Dyn Prefetch per I/O = 726.59 Pages Read per Dyn Prefetch = .02 + Max Concur Prefetch = 56 Workfile Maximum = 7 + BP Hit % - Random = 99.9% Virtual Page Steal Method = LRU + BP Hit % - Sequential = 99.9% Random Getpage Buffer Hit = 337 + LWM Buffers on SLRU = 316 HWM Buffers on SLRU = 316
218 Classic Interface User's Guide
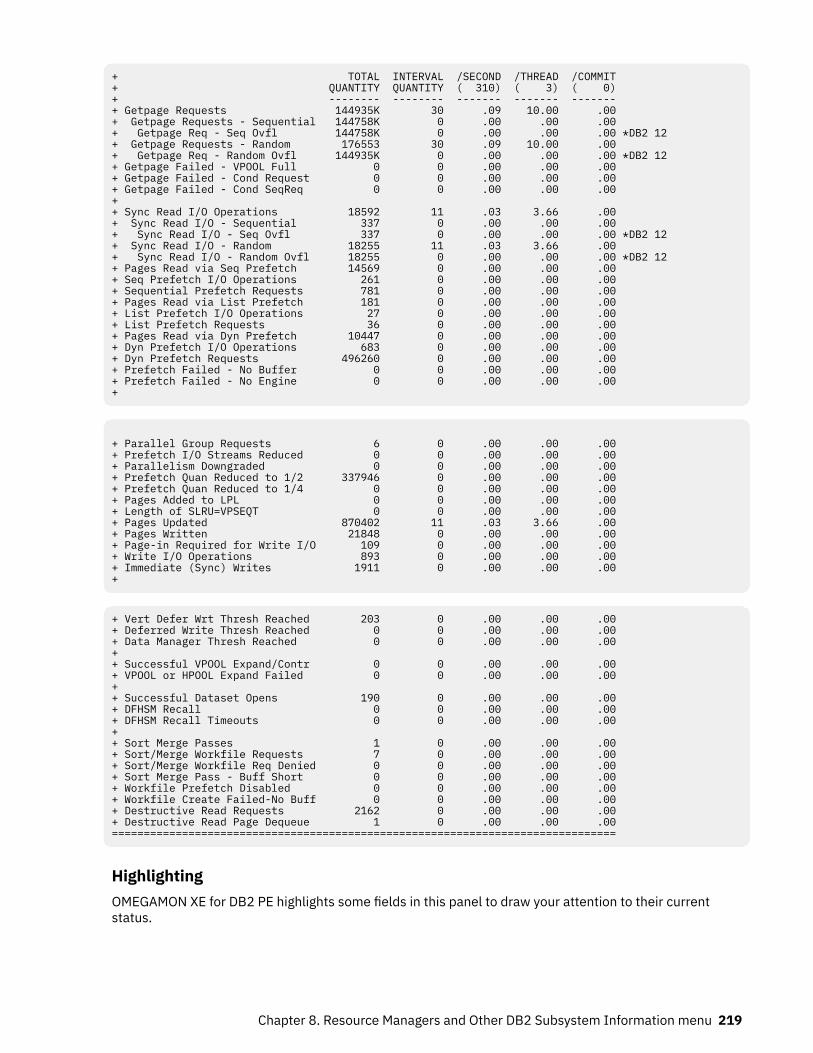
+ TOTAL INTERVAL /SECOND /THREAD /COMMIT + QUANTITY QUANTITY ( 310) ( 3) ( 0) + -------- -------- ------- ------- ------- + Getpage Requests 144935K 30 .09 10.00 .00 + Getpage Requests - Sequential 144758K 0 .00 .00 .00 + Getpage Req - Seq Ovfl 144758K 0 .00 .00 .00 *DB2 12+ Getpage Requests - Random 176553 30 .09 10.00 .00 + Getpage Req - Random Ovfl 144935K 0 .00 .00 .00 *DB2 12+ Getpage Failed - VPOOL Full 0 0 .00 .00 .00 + Getpage Failed - Cond Request 0 0 .00 .00 .00 + Getpage Failed - Cond SeqReq 0 0 .00 .00 .00 + + Sync Read I/O Operations 18592 11 .03 3.66 .00 + Sync Read I/O - Sequential 337 0 .00 .00 .00 + Sync Read I/O - Seq Ovfl 337 0 .00 .00 .00 *DB2 12+ Sync Read I/O - Random 18255 11 .03 3.66 .00 + Sync Read I/O - Random Ovfl 18255 0 .00 .00 .00 *DB2 12+ Pages Read via Seq Prefetch 14569 0 .00 .00 .00 + Seq Prefetch I/O Operations 261 0 .00 .00 .00 + Sequential Prefetch Requests 781 0 .00 .00 .00 + Pages Read via List Prefetch 181 0 .00 .00 .00 + List Prefetch I/O Operations 27 0 .00 .00 .00 + List Prefetch Requests 36 0 .00 .00 .00 + Pages Read via Dyn Prefetch 10447 0 .00 .00 .00 + Dyn Prefetch I/O Operations 683 0 .00 .00 .00 + Dyn Prefetch Requests 496260 0 .00 .00 .00 + Prefetch Failed - No Buffer 0 0 .00 .00 .00 + Prefetch Failed - No Engine 0 0 .00 .00 .00 +
+ Parallel Group Requests 6 0 .00 .00 .00 + Prefetch I/O Streams Reduced 0 0 .00 .00 .00 + Parallelism Downgraded 0 0 .00 .00 .00 + Prefetch Quan Reduced to 1/2 337946 0 .00 .00 .00 + Prefetch Quan Reduced to 1/4 0 0 .00 .00 .00 + Pages Added to LPL 0 0 .00 .00 .00 + Length of SLRU=VPSEQT 0 0 .00 .00 .00 + Pages Updated 870402 11 .03 3.66 .00 + Pages Written 21848 0 .00 .00 .00 + Page-in Required for Write I/O 109 0 .00 .00 .00 + Write I/O Operations 893 0 .00 .00 .00 + Immediate (Sync) Writes 1911 0 .00 .00 .00 +
+ Vert Defer Wrt Thresh Reached 203 0 .00 .00 .00 + Deferred Write Thresh Reached 0 0 .00 .00 .00 + Data Manager Thresh Reached 0 0 .00 .00 .00 + + Successful VPOOL Expand/Contr 0 0 .00 .00 .00 + VPOOL or HPOOL Expand Failed 0 0 .00 .00 .00 + + Successful Dataset Opens 190 0 .00 .00 .00 + DFHSM Recall 0 0 .00 .00 .00 + DFHSM Recall Timeouts 0 0 .00 .00 .00 + + Sort Merge Passes 1 0 .00 .00 .00 + Sort/Merge Workfile Requests 7 0 .00 .00 .00 + Sort/Merge Workfile Req Denied 0 0 .00 .00 .00 + Sort Merge Pass - Buff Short 0 0 .00 .00 .00 + Workfile Prefetch Disabled 0 0 .00 .00 .00 + Workfile Create Failed-No Buff 0 0 .00 .00 .00+ Destructive Read Requests 2162 0 .00 .00 .00+ Destructive Read Page Dequeue 1 0 .00 .00 .00===============================================================================
HighlightingOMEGAMON XE for DB2 PE highlights some fields in this panel to draw your attention to their currentstatus.
Chapter 8. Resource Managers and Other DB2 Subsystem Information menu 219
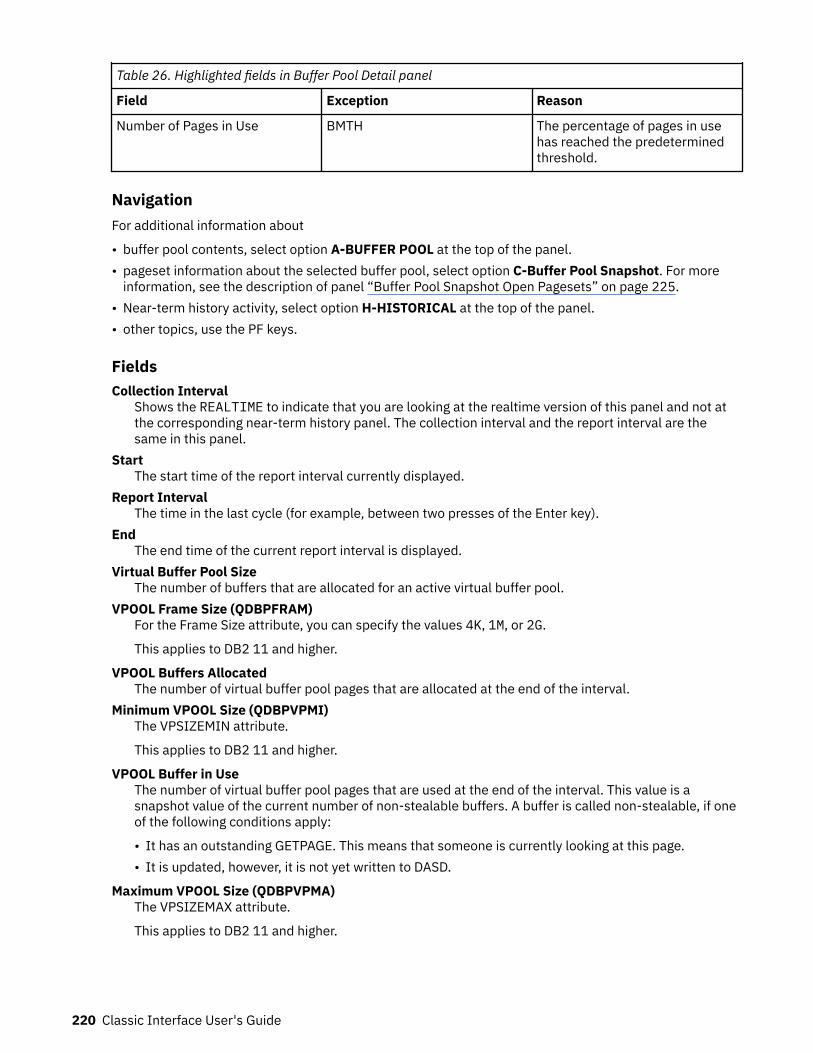
Table 26. Highlighted fields in Buffer Pool Detail panel
Field Exception Reason
Number of Pages in Use BMTH The percentage of pages in usehas reached the predeterminedthreshold.
NavigationFor additional information about
• buffer pool contents, select option A-BUFFER POOL at the top of the panel.• pageset information about the selected buffer pool, select option C-Buffer Pool Snapshot. For more
information, see the description of panel “Buffer Pool Snapshot Open Pagesets” on page 225.• Near-term history activity, select option H-HISTORICAL at the top of the panel.• other topics, use the PF keys.
FieldsCollection Interval
Shows the REALTIME to indicate that you are looking at the realtime version of this panel and not atthe corresponding near-term history panel. The collection interval and the report interval are thesame in this panel.
StartThe start time of the report interval currently displayed.
Report IntervalThe time in the last cycle (for example, between two presses of the Enter key).
EndThe end time of the current report interval is displayed.
Virtual Buffer Pool SizeThe number of buffers that are allocated for an active virtual buffer pool.
VPOOL Frame Size (QDBPFRAM)For the Frame Size attribute, you can specify the values 4K, 1M, or 2G.
This applies to DB2 11 and higher.
VPOOL Buffers AllocatedThe number of virtual buffer pool pages that are allocated at the end of the interval.
Minimum VPOOL Size (QDBPVPMI)The VPSIZEMIN attribute.
This applies to DB2 11 and higher.
VPOOL Buffer in UseThe number of virtual buffer pool pages that are used at the end of the interval. This value is asnapshot value of the current number of non-stealable buffers. A buffer is called non-stealable, if oneof the following conditions apply:
• It has an outstanding GETPAGE. This means that someone is currently looking at this page.• It is updated, however, it is not yet written to DASD.
Maximum VPOOL Size (QDBPVPMA)The VPSIZEMAX attribute.
This applies to DB2 11 and higher.
220 Classic Interface User's Guide
VPOOL Buffers to be DelThe number of pages that can be deleted from an active virtual buffer pool as a result of poolcontraction.
Auto SizeDetermines whether Auto Size is used. You can specify Y (YES) or N (NO).
Use CountThe number of open tablespaces or indexspaces in this buffer pool.
Page FixDetermines whether a page is fixed in real storage when it is first used. You can specify Y (YES) or N(NO).
VP Sequential ThreshSequential Steal threshold for the virtual buffer pool VPSEQT. The percentage of the virtual buffer poolthat can be occupied by sequentially accessed pages. If set to zero, prefetch is disabled.
Deferred Write ThreshDeferred Write threshold for the virtual buffer pool DWQT. Write operations are scheduled when thepercentage of unavailable pages in the virtual buffer pool exceeds this threshold to decrease theunavailable pages to 10% below the threshold.
Vert Deferred Write ThreshVertical Deferred Write threshold for the virtual buffer pool VDWQT. The percentage of the buffer poolthat might be occupied by updated pages from a single data set.
VP Parallel Seq ThreshParallel I/O sequential threshold VPPSEQT. This threshold determines how much of the virtual bufferpool might be used for parallel I/O operations. It is expressed as a percentage of VPSEQT. If set tozero, I/O parallelism is disabled.
Sysplex Parallel ThreshVirtual buffer pool assisting parallel sequential threshold. This threshold determines how much of thevirtual buffer pool might support parallel I/O operations from another DB2 in a data sharing group.
Getpages per Sync I/OThe ratio of Getpage requests to Read I/Os.
Pages Written per Write I/OThe ratio of pages written to physical I/Os.
Prefetch per I/OThe ratio of Prefetch requests to physical I/Os.
Pages Read per PrefetchThe ratio of pages read by Prefetch processing to total Prefetch requests.
Seq Prefetch per I/OThe ratio of pages read by Sequential Prefetch to Sequential Prefetch I/O.
Pages Read per Seq PrefetchThe ratio of pages read by Sequential Prefetch to Sequential Prefetch requests.
List Prefetch per I/OThe ratio of List Prefetch requests to List Prefetch I/Os.
Pages Read per List PrefetchThe ratio of pages read by List Prefetch to List Prefetch requests.
Dyn Prefetch per I/OThe ratio of Dynamic Prefetch request to Dynamic Prefetch I/Os.
Pages Read per Dyn PrefetchThe ratio of pages read by Dynamic Prefetch to Dynamic Prefetch request.
Max Concur Prefetch I/OThe highest number of concurrent prefetch I/O streams that were allocated to support I/Oparallelism.
Chapter 8. Resource Managers and Other DB2 Subsystem Information menu 221
Workfile MaximumThe maximum number of work files that are allocated during sort/merge processing during the currentstatistics period.
BP Hit % - RandomThe percentage of times that DB2 performed a Getpage operation with a random request and thepage was already in the buffer pool. A DASD read was not required.
BP Hit % - SequentialThe percentage of times that DB2 performed a Getpage operation with a sequential request and thepage was already in the buffer pool. A DASD read was not required.
Virtual Page Steal MethodDetermines when and whether performance-critical objects in buffer pools are removed from bufferpools when the space is needed by other objects. Valid values:LRU
"Least Recently Used" objects are removed first.FIFO
Oldest objects are removed first (First-In-First-Out).NONE
Objects are not removed from buffer pool (no page stealing). This setting provides the highestavailability for business-critical objects.
Random Getpage Buffer HitThe number of times that the random Getpage request has a buffer hit and the buffer is on the least-recently-used (SLRU) chain. DB2 11 and later. (Field name: QBSTRHS)
LWM Buffers on SLRUThe minimum number of buffers on the sequential least-recently-used (SLRU) chain in the laststatistical period. This is the low-water mark (LWM) within an interval. DB2 11 and later. (Field name:QBSTSMIN)
HWM Buffers on SLRUThe maximum number of buffers on the sequential least-recently-used (SLRU) chain in the laststatistical period,. This is the low water mark (LWM) within an interval. DB2 11 and later. (Field name:QBSTSMAX)
For each of the following fields, the following statistics values are provided:TOTAL QUANTITY
Total quantity, which reflects the amount of activities since DB2 was started.INTERVAL QUANTITY
Interval quantity, which reflects the amount of activities during the last cycle./SECOND
Rate per second during the last cycle. The number under /SECOND (in parentheses) is the number ofseconds in the interval.
/THREADRate per thread during the last cycle. The number under /THREAD (in parentheses) is the number ofCreate Threads during the interval.
/COMMITRate per Commit during the last cycle. The number under /COMMIT (in parentheses) is the number ofcommit requests (including abort requests) during the interval.
Getpage RequestsThe number of Getpage requests for the buffer pool.
Getpage Requests - SequentialThe number of Getpage requests issued by sequential access requestors.
Getpage Requests - RandomThe number of Getpage requests issued by random access requestors.
222 Classic Interface User's Guide
Getpage Requests - Seq OvflThe number of sequential GETPAGE requests using overflowed buffers. DB2 12 and later.
Getpage Requests - Random OvflThe number of non-sequential GETPAGE requests using overflowed buffers. DB2 12 and later.
Getpage Failed - VPOOL FullThe number of Getpage failures due to unavailable buffers because the virtual buffer pool is full.
Getpage Failed - Cond RequestThe number of conditional getpage requests that cannot be satisfied for this buffer pool. A conditionalgetpage is used with parallel I/O processing only.
Getpage Failed - Cond SeqReqThe number of conditional sequential getpage requests that failed because the page is not in thebuffer pool.This applies to DB2 9 or higher.
Sync Read I/O OperationsSynchronous read operations done by DB2.
Sync Read I/Os - SequentialThe number of synchronous Read I/O operations performed by sequential requests.
Sync Read I/Os - RandomThe number of synchronous Read I/O operations performed by random requests.
Sync Read I/Os - Seq OvflThe number of synchronous Read I/O operations performed for sequential GETPAGE requests usingoverflowed buffers. DB2 12 and later.
Sync Read I/Os - Random OvflThe number of synchronous Read I/O operations performed for non-sequential GETPAGE requestsusing overflowed buffers. DB2 12 and later.
Pages Read via Seq PrefetchThe pages that are read as a result of sequential prefetch requests.
Seq Prefetch I/O OperationsThe number of asynchronous read I/Os that are caused by sequential prefetch.
Sequential Prefetch RequestsSequential prefetch requests for the buffer pool.
Pages Read via List PrefetchThe pages read as a result of list prefetch requests.
List Prefetch I/O OperationsThe number of asynchronous read I/Os caused by list prefetch.
List Prefetch RequestsThe List prefetch requests for the buffer pool.
Pages Read via Dyn PrefetchThe pages read as a result of dynamic prefetch requests. Dynamic prefetch is triggered because ofsequential detection.
Dyn Prefetch I/O OperationsThe number of asynchronous read I/Os caused by dynamic prefetch.
Dyn Prefetch RequestsThe number of dynamic prefetch requests for the buffer pool.
Prefetch Failed - No BufferFailures of prefetch because the sequential prefetch threshold (SPTH) is reached.
Prefetch Failed - No EngineFailures of prefetch because the maximum number of concurrent prefetches is reached. You cannotchange this maximum value.
Chapter 8. Resource Managers and Other DB2 Subsystem Information menu 223
Parallel Group RequestsThe number of requests made for processing queries in parallel.
Prefetch I/O Streams ReducedThe number of requested prefetch I/O streams that are denied because of a buffer pool shortage. Thisapplies only for non-work file pagesets for queries that are processed in parallel.
Parallelism DowngradedThe number of times the requested number of buffers to allow a parallel group to run to the planneddegree cannot be allocated because of a buffer pool shortage.
Prefetch Quan Reduced to 1/2The number of times the sequential prefetch quantity is reduced from normal to one-half of normal.This is done to continue to allow execution concurrently with parallel I/O.
Prefetch Quan Reduced to 1/4The number of times the sequential prefetch quantity is reduced from one-half to one-quarter ofnormal.
Pages Added to LPLThe number of times one or more pages are added to logical page lists (LPL). (Field name: QBSTLPL)
Length of SLRU=VPSEQTThe number of times when the length of the sequential least-recently-used (SLRU) chain equals thesequential steal threshold VPSEQT. DB11 and later. (Field name: QBSTHST)
Pages UpdatedThe number of updates to pages in the buffer pool.
Pages WrittenThe number of buffer pool pages written to DASD.
Page-in Required for Write I/OThe number of page-ins that are required for write I/O operations.
Write I/O OperationsThe number of Write operations performed by media manager for both synchronous andasynchronous I/O.
Immediate (Sync) WritesImmediate writes to DASD. This value is incremented when 97.5% of the buffer pool pages are used.In addition, DB2 might flag buffer pool pages for immediate write during checkpoint processing andwhen a database is stopped.Consider the value of Data Manager Threshold Reached (DMTH) when interpreting this value. If DMTHis zero, this value is probably insignificant.
Vert Defer Wrt Threshold ReachedThe number of times the vertical write threshold is hit.
Deferred Write Threshold ReachedThe Deferred Write Threshold (DWTH) is reached. This occurs in the following situations:
• If DB2 uses 50% of the buffer pool.• If a data set has updated 10% of the buffer pool pages or 64 pages. At this threshold, DB2 forces
writes to free pool space.
Data Manager Threshold ReachedData manager threshold (DMTH) is reached. This occurs when DB2 uses 95% of the buffer poolminimum value and begins to operate at the row level instead of the page level. When this occurs,CPU usage increases considerably.
Successful VPOOL Expand/ContractThe number of successful virtual pool expansions or contractions because of the ALTER BUFFERPOOLcommand.
VPOOL Expand FailedThe number of virtual buffer pool expansion failures.
224 Classic Interface User's Guide
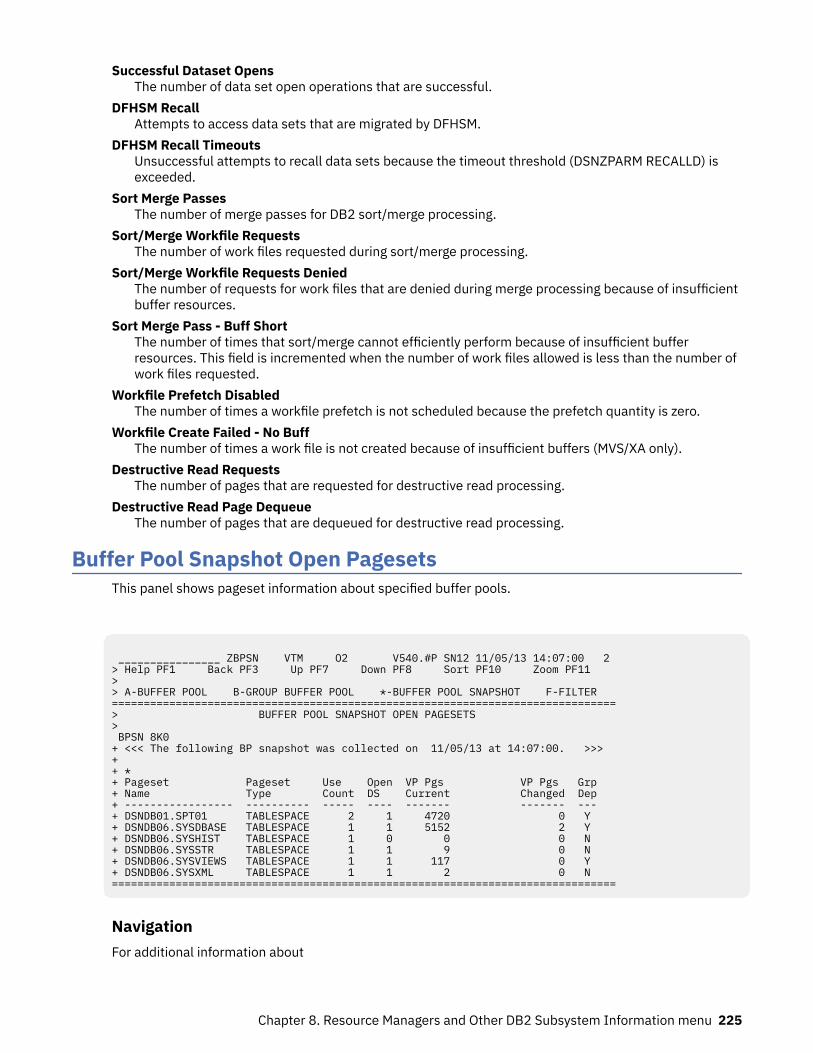
Successful Dataset OpensThe number of data set open operations that are successful.
DFHSM RecallAttempts to access data sets that are migrated by DFHSM.
DFHSM Recall TimeoutsUnsuccessful attempts to recall data sets because the timeout threshold (DSNZPARM RECALLD) isexceeded.
Sort Merge PassesThe number of merge passes for DB2 sort/merge processing.
Sort/Merge Workfile RequestsThe number of work files requested during sort/merge processing.
Sort/Merge Workfile Requests DeniedThe number of requests for work files that are denied during merge processing because of insufficientbuffer resources.
Sort Merge Pass - Buff ShortThe number of times that sort/merge cannot efficiently perform because of insufficient bufferresources. This field is incremented when the number of work files allowed is less than the number ofwork files requested.
Workfile Prefetch DisabledThe number of times a workfile prefetch is not scheduled because the prefetch quantity is zero.
Workfile Create Failed - No BuffThe number of times a work file is not created because of insufficient buffers (MVS/XA only).
Destructive Read RequestsThe number of pages that are requested for destructive read processing.
Destructive Read Page DequeueThe number of pages that are dequeued for destructive read processing.
Buffer Pool Snapshot Open PagesetsThis panel shows pageset information about specified buffer pools.
________________ ZBPSN VTM O2 V540.#P SN12 11/05/13 14:07:00 2 > Help PF1 Back PF3 Up PF7 Down PF8 Sort PF10 Zoom PF11 > > A-BUFFER POOL B-GROUP BUFFER POOL *-BUFFER POOL SNAPSHOT F-FILTER ===============================================================================> BUFFER POOL SNAPSHOT OPEN PAGESETS > BPSN 8K0 + <<< The following BP snapshot was collected on 11/05/13 at 14:07:00. >>> + + * + Pageset Pageset Use Open VP Pgs VP Pgs Grp + Name Type Count DS Current Changed Dep + ----------------- ---------- ----- ---- ------- ------- --- + DSNDB01.SPT01 TABLESPACE 2 1 4720 0 Y + DSNDB06.SYSDBASE TABLESPACE 1 1 5152 2 Y + DSNDB06.SYSHIST TABLESPACE 1 0 0 0 N + DSNDB06.SYSSTR TABLESPACE 1 1 9 0 N + DSNDB06.SYSVIEWS TABLESPACE 1 1 117 0 Y + DSNDB06.SYSXML TABLESPACE 1 1 2 0 N ===============================================================================
NavigationFor additional information about
Chapter 8. Resource Managers and Other DB2 Subsystem Information menu 225
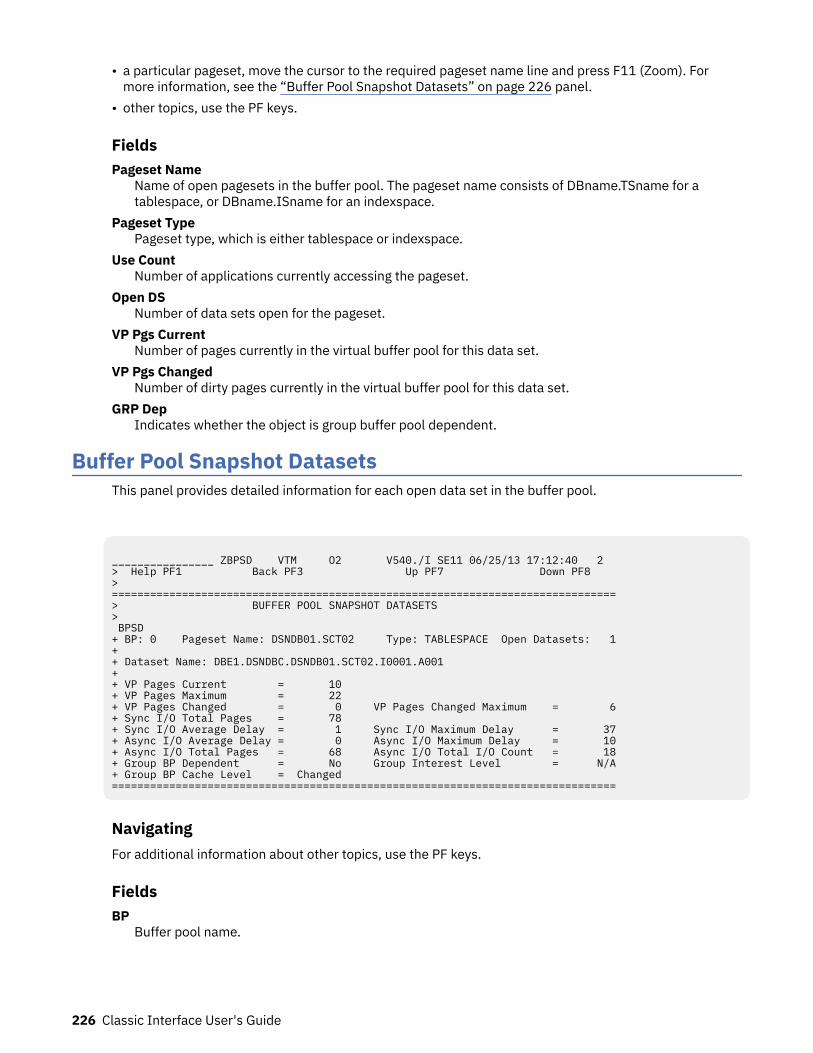
• a particular pageset, move the cursor to the required pageset name line and press F11 (Zoom). Formore information, see the “Buffer Pool Snapshot Datasets” on page 226 panel.
• other topics, use the PF keys.
FieldsPageset Name
Name of open pagesets in the buffer pool. The pageset name consists of DBname.TSname for atablespace, or DBname.ISname for an indexspace.
Pageset TypePageset type, which is either tablespace or indexspace.
Use CountNumber of applications currently accessing the pageset.
Open DSNumber of data sets open for the pageset.
VP Pgs CurrentNumber of pages currently in the virtual buffer pool for this data set.
VP Pgs ChangedNumber of dirty pages currently in the virtual buffer pool for this data set.
GRP DepIndicates whether the object is group buffer pool dependent.
Buffer Pool Snapshot DatasetsThis panel provides detailed information for each open data set in the buffer pool.
________________ ZBPSD VTM O2 V540./I SE11 06/25/13 17:12:40 2 > Help PF1 Back PF3 Up PF7 Down PF8 > =============================================================================== > BUFFER POOL SNAPSHOT DATASETS > BPSD + BP: 0 Pageset Name: DSNDB01.SCT02 Type: TABLESPACE Open Datasets: 1 + + Dataset Name: DBE1.DSNDBC.DSNDB01.SCT02.I0001.A001 + + VP Pages Current = 10 + VP Pages Maximum = 22 + VP Pages Changed = 0 VP Pages Changed Maximum = 6 + Sync I/O Total Pages = 78 + Sync I/O Average Delay = 1 Sync I/O Maximum Delay = 37 + Async I/O Average Delay = 0 Async I/O Maximum Delay = 10 + Async I/O Total Pages = 68 Async I/O Total I/O Count = 18 + Group BP Dependent = No Group Interest Level = N/A + Group BP Cache Level = Changed ===============================================================================
NavigatingFor additional information about other topics, use the PF keys.
FieldsBP
Buffer pool name.
226 Classic Interface User's Guide
Pageset NameName of the pageset. The pageset name comprises DBname.TSname for a tablespace, orDBname.ISname for an indexspace.
TypePageset type, either tablespace or indexspace.
Open DatasetsNumber of data sets open for the pageset.
The following fields below are displayed for each open data set:Dataset Name
The name of the data set associated with this pageset piece.VP Pages Current
Number of pages currently in the virtual buffer pool for this data set.VP Pages Maximum
Maximum number of pages concurrently in the virtual buffer pool for this data set - high-water marksince the last DISPLAY BUFFERPOOL command with the LSTATS option was issued.
VP Pages ChangedNumber of dirty pages currently in the virtual buffer pool for this data set.
VP Pages Changed MaximumMaximum number of dirty pages concurrently in the virtual buffer pool for this data set - high-watermark since the last DISPLAY BUFFERPOOL command with the LSTATS option was issued.
The following data set statistics are available only if there was activity for the data set since it was lastdisplayed using the DISPLAY BUFFERPOOL command. These values match the data set statistics kept byDB2, which are incremented since the data set was last displayed using the DISPLAY BUFFERPOOLcommand. If all values are zero, N/A is displayed for these fields.
Sync I/O Total PagesTotal number of pages read or written synchronously for the data set.
Sync I/O Average DelayAverage synchronous I/O delay in milliseconds for pages in the data set.
Sync I/O Maximum DelayMaximum synchronous I/O delay in milliseconds for pages in the data set.
Async I/O Average DelayAverage asynchronous I/O delay in milliseconds for pages in the data set.
Async I/O Maximum DelayMaximum asynchronous I/O delay in milliseconds for pages in the data set.
Async I/O Total PagesTotal number of pages read or written asynchronously for the data set.
Async I/O Total I/O CountTotal number of asynchronous I/Os issued for the data set.
Group BP DependentIndicates whether the pageset or partition is dependent upon the group buffer pool from either
• active inter-DB2 read/write interest• changed pages in the group buffer pool that have not yet been castout to DASD
This field applies only in a data sharing environment.
Group Interest LevelThe highest interest level of all data sharing group members interested in a pageset or partition that isin the group buffer pool. This field applies only in a data sharing environment. Possible values:R/O
Read-only interest
Chapter 8. Resource Managers and Other DB2 Subsystem Information menu 227
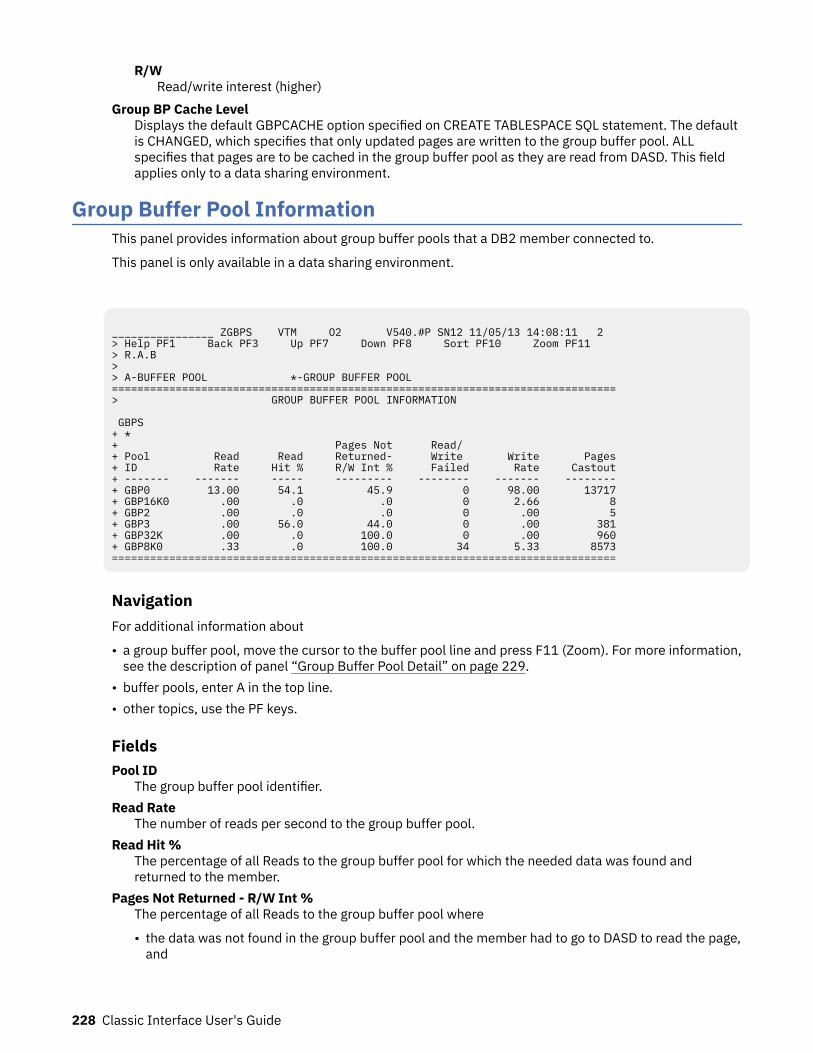
R/WRead/write interest (higher)
Group BP Cache LevelDisplays the default GBPCACHE option specified on CREATE TABLESPACE SQL statement. The defaultis CHANGED, which specifies that only updated pages are written to the group buffer pool. ALLspecifies that pages are to be cached in the group buffer pool as they are read from DASD. This fieldapplies only to a data sharing environment.
Group Buffer Pool InformationThis panel provides information about group buffer pools that a DB2 member connected to.
This panel is only available in a data sharing environment.
________________ ZGBPS VTM O2 V540.#P SN12 11/05/13 14:08:11 2 > Help PF1 Back PF3 Up PF7 Down PF8 Sort PF10 Zoom PF11 > R.A.B > > A-BUFFER POOL *-GROUP BUFFER POOL ===============================================================================> GROUP BUFFER POOL INFORMATION GBPS + * + Pages Not Read/ + Pool Read Read Returned- Write Write Pages+ ID Rate Hit % R/W Int % Failed Rate Castout+ ------- ------- ----- --------- -------- ------- --------+ GBP0 13.00 54.1 45.9 0 98.00 13717+ GBP16K0 .00 .0 .0 0 2.66 8+ GBP2 .00 .0 .0 0 .00 5+ GBP3 .00 56.0 44.0 0 .00 381+ GBP32K .00 .0 100.0 0 .00 960+ GBP8K0 .33 .0 100.0 34 5.33 8573===============================================================================
NavigationFor additional information about
• a group buffer pool, move the cursor to the buffer pool line and press F11 (Zoom). For more information,see the description of panel “Group Buffer Pool Detail” on page 229.
• buffer pools, enter A in the top line.• other topics, use the PF keys.
FieldsPool ID
The group buffer pool identifier.Read Rate
The number of reads per second to the group buffer pool.Read Hit %
The percentage of all Reads to the group buffer pool for which the needed data was found andreturned to the member.
Pages Not Returned - R/W Int %The percentage of all Reads to the group buffer pool where
• the data was not found in the group buffer pool and the member had to go to DASD to read the page,and
228 Classic Interface User's Guide
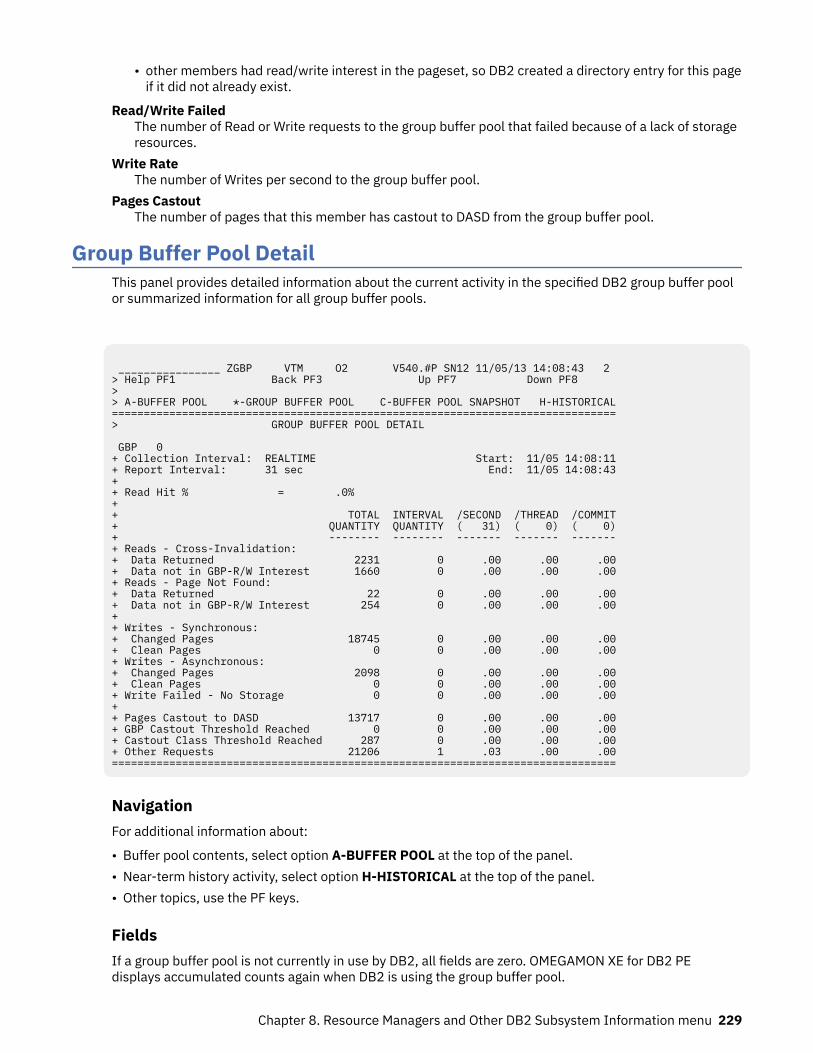
• other members had read/write interest in the pageset, so DB2 created a directory entry for this pageif it did not already exist.
Read/Write FailedThe number of Read or Write requests to the group buffer pool that failed because of a lack of storageresources.
Write RateThe number of Writes per second to the group buffer pool.
Pages CastoutThe number of pages that this member has castout to DASD from the group buffer pool.
Group Buffer Pool DetailThis panel provides detailed information about the current activity in the specified DB2 group buffer poolor summarized information for all group buffer pools.
________________ ZGBP VTM O2 V540.#P SN12 11/05/13 14:08:43 2 > Help PF1 Back PF3 Up PF7 Down PF8 > > A-BUFFER POOL *-GROUP BUFFER POOL C-BUFFER POOL SNAPSHOT H-HISTORICAL===============================================================================> GROUP BUFFER POOL DETAIL GBP 0 + Collection Interval: REALTIME Start: 11/05 14:08:11+ Report Interval: 31 sec End: 11/05 14:08:43+ + Read Hit % = .0% + + TOTAL INTERVAL /SECOND /THREAD /COMMIT+ QUANTITY QUANTITY ( 31) ( 0) ( 0)+ -------- -------- ------- ------- -------+ Reads - Cross-Invalidation: + Data Returned 2231 0 .00 .00 .00+ Data not in GBP-R/W Interest 1660 0 .00 .00 .00+ Reads - Page Not Found: + Data Returned 22 0 .00 .00 .00+ Data not in GBP-R/W Interest 254 0 .00 .00 .00+ + Writes - Synchronous: + Changed Pages 18745 0 .00 .00 .00+ Clean Pages 0 0 .00 .00 .00+ Writes - Asynchronous: + Changed Pages 2098 0 .00 .00 .00+ Clean Pages 0 0 .00 .00 .00+ Write Failed - No Storage 0 0 .00 .00 .00+ + Pages Castout to DASD 13717 0 .00 .00 .00+ GBP Castout Threshold Reached 0 0 .00 .00 .00+ Castout Class Threshold Reached 287 0 .00 .00 .00+ Other Requests 21206 1 .03 .00 .00===============================================================================
NavigationFor additional information about:
• Buffer pool contents, select option A-BUFFER POOL at the top of the panel.• Near-term history activity, select option H-HISTORICAL at the top of the panel.• Other topics, use the PF keys.
FieldsIf a group buffer pool is not currently in use by DB2, all fields are zero. OMEGAMON XE for DB2 PEdisplays accumulated counts again when DB2 is using the group buffer pool.
Chapter 8. Resource Managers and Other DB2 Subsystem Information menu 229
Collection IntervalShows the REALTIME to indicate that you are looking at the realtime version of this panel and not atthe corresponding near-term history panel. The collection interval and the report interval are thesame in this panel.
StartThe start time of the report interval currently displayed.
Report IntervalThe time in the last cycle (for example, between two presses of the Enter key).
EndThe end time of the report interval currently displayed.
Read Hit %The percentage of all Reads to the group buffer pool for which the needed data was found andreturned to the member.
For each of the following fields, the following statistics values are provided:TOTAL QUANTITY
Total quantity, which reflects the amount of activities since DB2 was started.INTERVAL QUANTITY
Interval quantity, which reflects the amount of activities during the last cycle./SECOND
Rate per second during the last cycle. The number under /SECOND (in parentheses) is the number ofseconds in the interval.
/THREADRate per thread during the last cycle. The number under /THREAD (in parentheses) is the number ofCreate Threads during the interval.
/COMMITRate per Commit during the last cycle. The number under /COMMIT (in parentheses) is the number ofcommit requests (including abort requests) during the interval.
Reads - Cross Invalidation: Data ReturnedThe number of reads to the group buffer pool required because the page in the member's buffer poolwas invalidated, where the data was found and returned to the member.
Reads - Cross Invalidation: Data not in GBP-R/W InterestThe number of reads to the group buffer pool required because the page in the member's buffer poolwas invalidated, where:
• The data was not found in the group buffer pool and the member had to go to DASD to read the page• Other members had read/write interest in the pageset, so DB2 created a directory entry for this
page if it did not already exist.
Reads - Page Not Found: Data ReturnedThe number of reads to the group buffer pool required because the page was not in the member'sbuffer pool where the data was found and returned to the member.
Reads - Page Not Found: Data not in GBP-R/W InterestThe number of reads to the group buffer pool required because the page was not in the member'sbuffer pool, where:
• The data was not found in the group buffer pool and the member had to go to DASD to read the page• Other members had read/write interest in the pageset, so DB2 created a directory entry for this
page if it did not already exist.
Writes - Synchronous: Changed PagesThe number of changed pages that are synchronously written to the group buffer pool. Pages can beforced out before the application commits if a buffer pool threshold is reached, or when P-locknegotiation forces the pages on the Vertical Deferred Write queue to be written to the group bufferpool.
230 Classic Interface User's Guide
Writes - Synchronous: Clean PagesThe number of clean pages that are synchronously written to the group buffer pool. DB2 writes cleanpages for pagesets and partitions defined with GBPCACHE ALL.
Writes - Asynchronous: Changed PagesThe number of changed pages asynchronously written to the group buffer pool. Pages can be forcedout before the application commits if a buffer pool threshold is reached, or when P-lock negotiationforces the pages on the Vertical Deferred Write queue to be written to the group buffer pool.
Writes - Asynchronous: Clean PagesThe number of clean pages asynchronously written to the group buffer pool. DB2 writes clean pagesfor pagesets and partitions defined with GBPCACHE ALL.
Write Failed - No StorageThe number of group buffer pool write requests that failed because of a shortage of coupling facilityresources.
Pages Castout to DASDThe number of pages that this member has castout to DASD from the group buffer pool.
GBP Castout Threshold ReachedThe number of times that castout was initiated because the group buffer pool castout threshold wasreached.
Castout Class Threshold ReachedThe number of times that castout was initiated because the castout class threshold was reached.
Other RequestsThe number of other requests.
DB2 Log Manager InformationThis panel shows information about the active logging and archiving activity of the DB2 log manager.
The panel shows current statistics about log read and write activity and read and write log allocations.The panel also provides information regarding where DB2 is in the checkpoint cycle.
Chapter 8. Resource Managers and Other DB2 Subsystem Information menu 231

________________ ZLOGM VTM O2 V540./C DB11 08/14/13 13:45:07 2 > Help PF1 Back PF3 Up PF7 Down PF8 Zoom PF11 > R.B > > H-HISTORICAL ================================================================================> DB2 LOG MANAGER INFORMATION LOGM + Collection Interval: REALTIME Start: 08/14 13:45:02 + Report Interval: 4 sec End: 08/14 13:45:07 + + Logging Mode = SINGLE Archiving Mode = DUAL + Number of Logs Defined = 3 Number of Logs Available = 2 + Checkpoint Frequency = 500000 Records Until Checkpoint = 499592 + Input Buffer Size = 60K Output Buffer Size = 4000K + Write Threshold = 20 + Current Log Record RBA = 00000000000C0254D4A2 + + Primary Active Log = DSNB11.LOGCOPY1.DS01 + Secondary Active Log = + + TOTAL INTERVAL /SECOND /THREAD /COMMIT + QUANTITY QUANTITY ( 4) ( 0) ( 0) + -------- -------- ------- ------- ------- + Reads from Output Buffers 0 0 .00 .00 .00 + Reads from Active Log 357 0 .00 .00 .00 + Reads from Archive Log 0 0 .00 .00 .00 + Reads Delayed - Tape Contention 0 0 .00 .00 .00 + Reads Delayed - No Tape Unit 0 0 .00 .00 .00 + Look-Ahead TapeMounts Attempted 0 0 .00 .00 .00 + Look-Ahead TapeMounts Performed 0 0 .00 .00 .00 + + Write NOWAIT Requests 496 0 .00 .00 .00 + Write FORCE Requests 54 0 .00 .00 .00 + Write Delayed - No Buffer 0 0 .00 .00 .00 + + Write Active Log Buffers 87 0 .00 .00 .00 + Active Log CIs Created 23 0 .00 .00 .00 + Archive Log Read Allocations 0 0 .00 .00 .00 + Archive Log Write Allocations 0 0 .00 .00 .00 + Archive Log CIs Offloaded 0 0 .00 .00 .00 + BSDS Access Requests 106 0 .00 .00 .00 + Checkpoints 0 0 .00 .00 .00 + IFI Abends 0 0 .00 .00 .00 + IFI Unrecog Func 0 0 .00 .00 .00 + IFI Command Reqs 15 0 .00 .00 .00 + IFI READA Reqs 325 0 .00 .00 .00 + IFI READS Reqs 33 3 .75 .00 .00 + IFI WRITE Reqs 0 0 .00 .00 .00 + Data Capture Invoked 0 0 .00 .00 .00 + Data Capture READS 0 0 .00 .00 .00 + Data Capture Rec Returned 0 0 .00 .00 .00 + Data Capture Row Returned 0 0 .00 .00 .00 + Data Capture Desc Returned 0 0 .00 .00 .00 + Data Capture Desc Performed 0 0 .00 .00 .00 + Data Capture Table Returned 0 0 .00 .00 .00 + Rollup (Threshold) 0 0 .00 .00 .00 + Rollup (Storage) 0 0 .00 .00 .00 + Rollup (Stallness) 0 0 .00 .00 .00 + Rollup (Non Qual) 0 0 .00 .00 .00 =================================================================================
HighlightingOMEGAMON XE for DB2 PE highlights some fields in this panel to draw your attention to their currentstatus:
Table 27. Highlighted fields in Log Manager Information panel
Field Exception Reason
Logs Available LOGN The number of log data setsavailable.
232 Classic Interface User's Guide
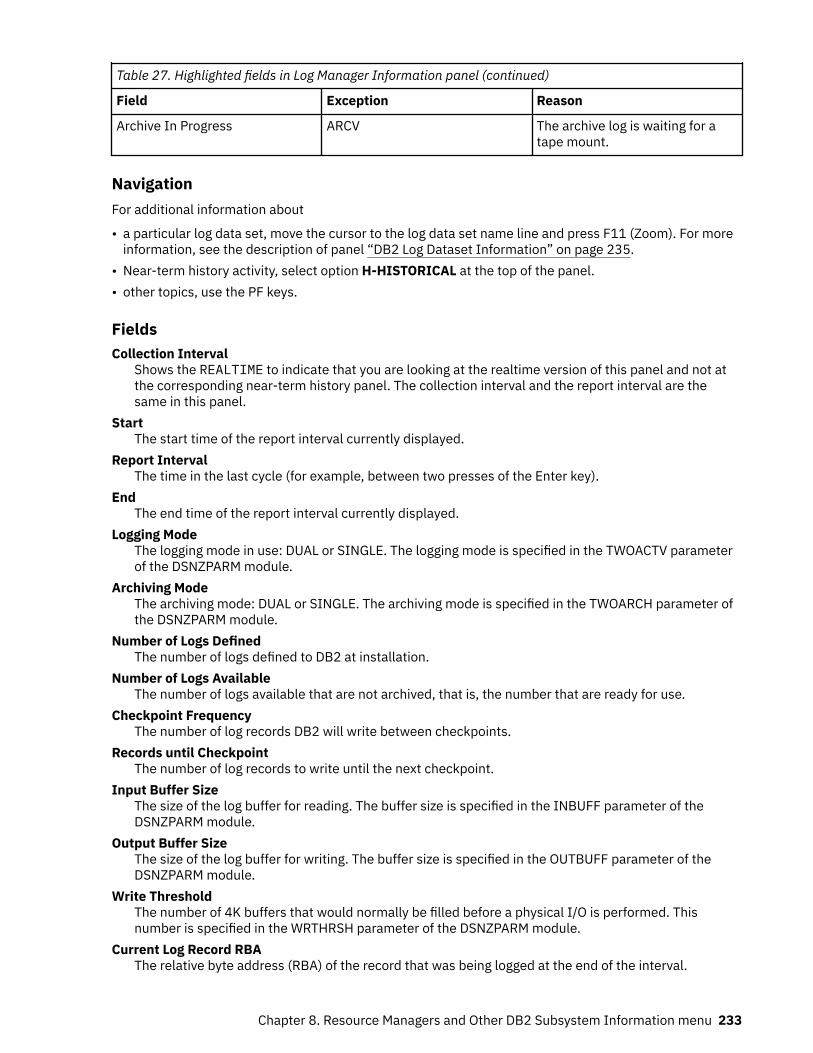
Table 27. Highlighted fields in Log Manager Information panel (continued)
Field Exception Reason
Archive In Progress ARCV The archive log is waiting for atape mount.
NavigationFor additional information about
• a particular log data set, move the cursor to the log data set name line and press F11 (Zoom). For moreinformation, see the description of panel “DB2 Log Dataset Information” on page 235.
• Near-term history activity, select option H-HISTORICAL at the top of the panel.• other topics, use the PF keys.
FieldsCollection Interval
Shows the REALTIME to indicate that you are looking at the realtime version of this panel and not atthe corresponding near-term history panel. The collection interval and the report interval are thesame in this panel.
StartThe start time of the report interval currently displayed.
Report IntervalThe time in the last cycle (for example, between two presses of the Enter key).
EndThe end time of the report interval currently displayed.
Logging ModeThe logging mode in use: DUAL or SINGLE. The logging mode is specified in the TWOACTV parameterof the DSNZPARM module.
Archiving ModeThe archiving mode: DUAL or SINGLE. The archiving mode is specified in the TWOARCH parameter ofthe DSNZPARM module.
Number of Logs DefinedThe number of logs defined to DB2 at installation.
Number of Logs AvailableThe number of logs available that are not archived, that is, the number that are ready for use.
Checkpoint FrequencyThe number of log records DB2 will write between checkpoints.
Records until CheckpointThe number of log records to write until the next checkpoint.
Input Buffer SizeThe size of the log buffer for reading. The buffer size is specified in the INBUFF parameter of theDSNZPARM module.
Output Buffer SizeThe size of the log buffer for writing. The buffer size is specified in the OUTBUFF parameter of theDSNZPARM module.
Write ThresholdThe number of 4K buffers that would normally be filled before a physical I/O is performed. Thisnumber is specified in the WRTHRSH parameter of the DSNZPARM module.
Current Log Record RBAThe relative byte address (RBA) of the record that was being logged at the end of the interval.
Chapter 8. Resource Managers and Other DB2 Subsystem Information menu 233
Primary Active LogThe data set name of the primary log.
Secondary Active LogThe data set name of the second copy of a dual logged log.
Archive in ProgressThe data set name of the active archive log, if an archive is in progress.
For each of the following fields, the following statistics values are provided:TOTAL QUANTITY
Total quantity, which reflects the amount of activities since DB2 was started.INTERVAL QUANTITY
Interval quantity, which reflects the amount of activities during the last cycle./SECOND
Rate per second during the last cycle. The number under /SECOND (in parentheses) is the number ofseconds in the interval.
/THREADRate per thread during the last cycle. The number under /THREAD (in parentheses) is the number ofCreate Threads during the interval.
/COMMITRate per Commit during the last cycle. The number under /COMMIT (in parentheses) is the number ofcommit requests (including abort requests) during the interval.
Reads from Output BuffersThe Reads that were satisfied from the output buffers.
Reads from Active LogThe Reads that were satisfied from the active log.
Reads from Archive LogThe Reads that were satisfied from the archive log.
Reads Delayed - Tape ContentionThe number of reads delayed because a tape volume was already in use.
Reads Delayed - No Tape UnitNumber of archive log reads that were delayed because of unavailable tape units, or because themaximum amount of read parallelism is being used (not likely).
Look-Ahead Tape Mounts AttemptedNumber of look-ahead tape mounts attempted.
Look-Ahead Tape Mounts PerformedNumber of successful look-ahead tape mounts.
Write NOWAIT RequestsThe times DB2 externalized log records asynchronously.
Write FORCE RequestsThe times DB2 externalized log records synchronously.
Write Delayed - No BufferDB2 attempts to place log records in the output buffer when no log buffer could be found.
Write Active Log BuffersCalls to the log write routine.
Active Log CIs CreatedActive log control intervals created.
Archive Log Read AllocationsArchive read allocations, which reflect archive log open/close activity.
Archive Log Write AllocationsArchive write allocations, which reflect archive log open/close activity.
234 Classic Interface User's Guide
Archive Log CIs OffloadedNumber of active log control intervals offloaded to archive data sets.
BSDS Access RequestsCalls to the bootstrap data set access routine.
CheckpointsThe number of checkpoints DB2 takes since startup.
IFI AbendsThe count of IFI abends.
IFI Unrecog FuncThe count of IFI unrecognized functions.
IFI Command ReqsThe count of IFI command requests.
IFI READA ReqsThe count of IFI READA requests.
IFI READS ReqsThe count of IFI READS requests.
IFI WRITE ReqsThe count of IFI WRITE requests.
Data Capture InvokedThe number of log records retrieved for which data capture processing is invoked.
Data Capture READSThe number of data capture log reads for processing IFI requests for IFCID 0185.
Data Capture Rec ReturnedThe number of data capture log records returned.
Data Capture Row ReturnedThe number of data capture data rows returned.
Data Capture Desc ReturnedThe number of data capture data descriptions returned.
Data Capture Desc PerformedThe number of data capture describes performed.
Data Capture Table ReturnedThe number of data capture tables returned.
Rollup (Threshold)The number of rollup accounting records that are written because the rollup threshold is exceeded.
Rollup (Storage)The number of rollup accounting records that are written because the rollup accounting storagethreshold is exceeded.
Rollup (Stallness)The number of rollup accounting records that are written because the staleness threshold isexceeded.
Rollup (Non Qual)The number of records that failed to qualify for accounting rollup because all rollup key fields areNULL, or NULL values are not permitted.
DB2 Log Dataset InformationThis panel shows information about the activity of the DB2 log manager in the area of active logging andarchival.
The current statistics about log read and write activity and read and write log allocations are shown. Inaddition, information where DB2 is in the checkpoint cycle is shown.
Chapter 8. Resource Managers and Other DB2 Subsystem Information menu 235
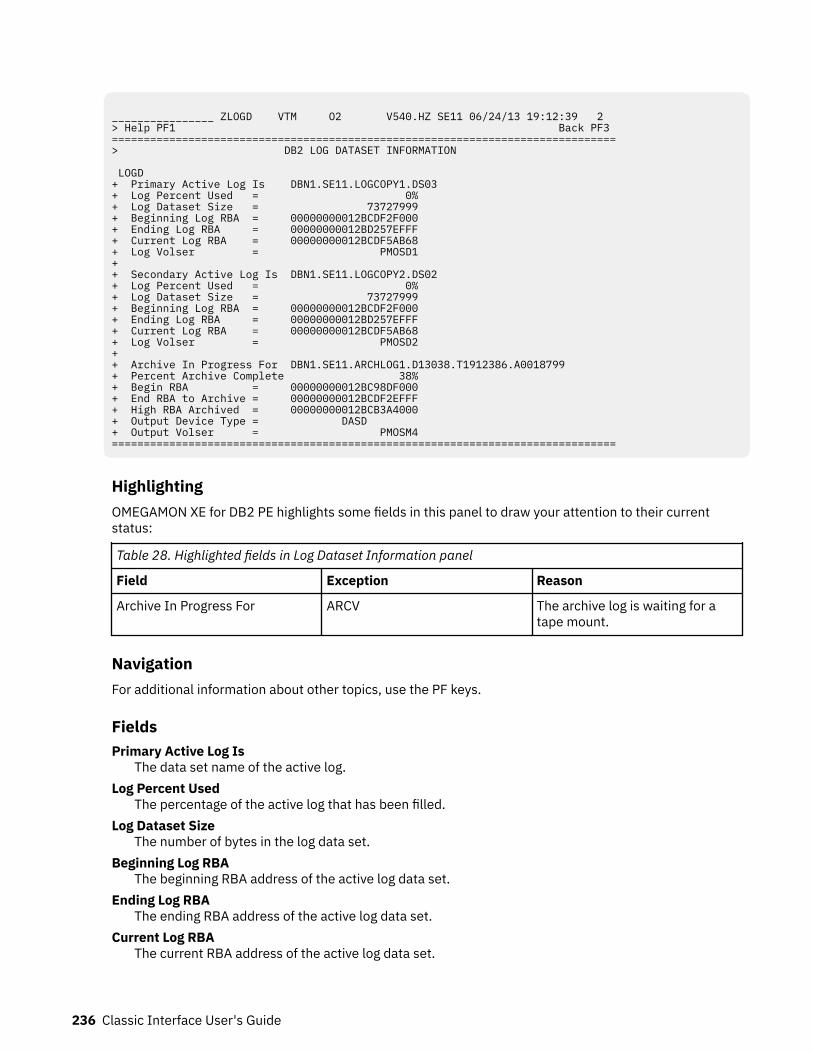
________________ ZLOGD VTM O2 V540.HZ SE11 06/24/13 19:12:39 2> Help PF1 Back PF3 =============================================================================== > DB2 LOG DATASET INFORMATION LOGD + Primary Active Log Is DBN1.SE11.LOGCOPY1.DS03 + Log Percent Used = 0% + Log Dataset Size = 73727999 + Beginning Log RBA = 00000000012BCDF2F000 + Ending Log RBA = 00000000012BD257EFFF + Current Log RBA = 00000000012BCDF5AB68 + Log Volser = PMOSD1 + + Secondary Active Log Is DBN1.SE11.LOGCOPY2.DS02 + Log Percent Used = 0% + Log Dataset Size = 73727999 + Beginning Log RBA = 00000000012BCDF2F000 + Ending Log RBA = 00000000012BD257EFFF + Current Log RBA = 00000000012BCDF5AB68 + Log Volser = PMOSD2 + + Archive In Progress For DBN1.SE11.ARCHLOG1.D13038.T1912386.A0018799 + Percent Archive Complete 38% + Begin RBA = 00000000012BC98DF000 + End RBA to Archive = 00000000012BCDF2EFFF + High RBA Archived = 00000000012BCB3A4000 + Output Device Type = DASD + Output Volser = PMOSM4 ===============================================================================
HighlightingOMEGAMON XE for DB2 PE highlights some fields in this panel to draw your attention to their currentstatus:
Table 28. Highlighted fields in Log Dataset Information panel
Field Exception Reason
Archive In Progress For ARCV The archive log is waiting for atape mount.
NavigationFor additional information about other topics, use the PF keys.
FieldsPrimary Active Log Is
The data set name of the active log.Log Percent Used
The percentage of the active log that has been filled.Log Dataset Size
The number of bytes in the log data set.Beginning Log RBA
The beginning RBA address of the active log data set.Ending Log RBA
The ending RBA address of the active log data set.Current Log RBA
The current RBA address of the active log data set.
236 Classic Interface User's Guide
Log VolserThe volume serial(s) of the active log data set.
Secondary Active Log IsThe data set name of the secondary log.
Log Percent UsedThe percentage of the secondary log that has been filled.
Log Dataset SizeThe number of bytes in the secondary log data set.
Beginning Log RBAThe beginning RBA address of the secondary log data set.
Ending Log RBAThe ending RBA address of the secondary log data set.
Current Log RBAThe current RBA address of the secondary log data set.
Log VolserThe volume serial(s) of the secondary log data set.
Archive In Progress ForThe data set name of the active archive log.
Begin RBAThe beginning RBA of the archive log.
End RBA to ArchiveThe last RBA to be archived.
High RBA ArchivedThe last RBA written to the archive log.
Percent Archive CompleteThe amount of the archival that has completed.
Output Device TypeThe device type of the archive log.
Output VolserThe volser(s) of the archive log.
EDM Pool InformationThis panel provides information about the activity in the EDM pool and its performance.
Depending on the DB2 version that is used, the content of this panel is different.
The following panel shows the display of DB2 10:
Chapter 8. Resource Managers and Other DB2 Subsystem Information menu 237
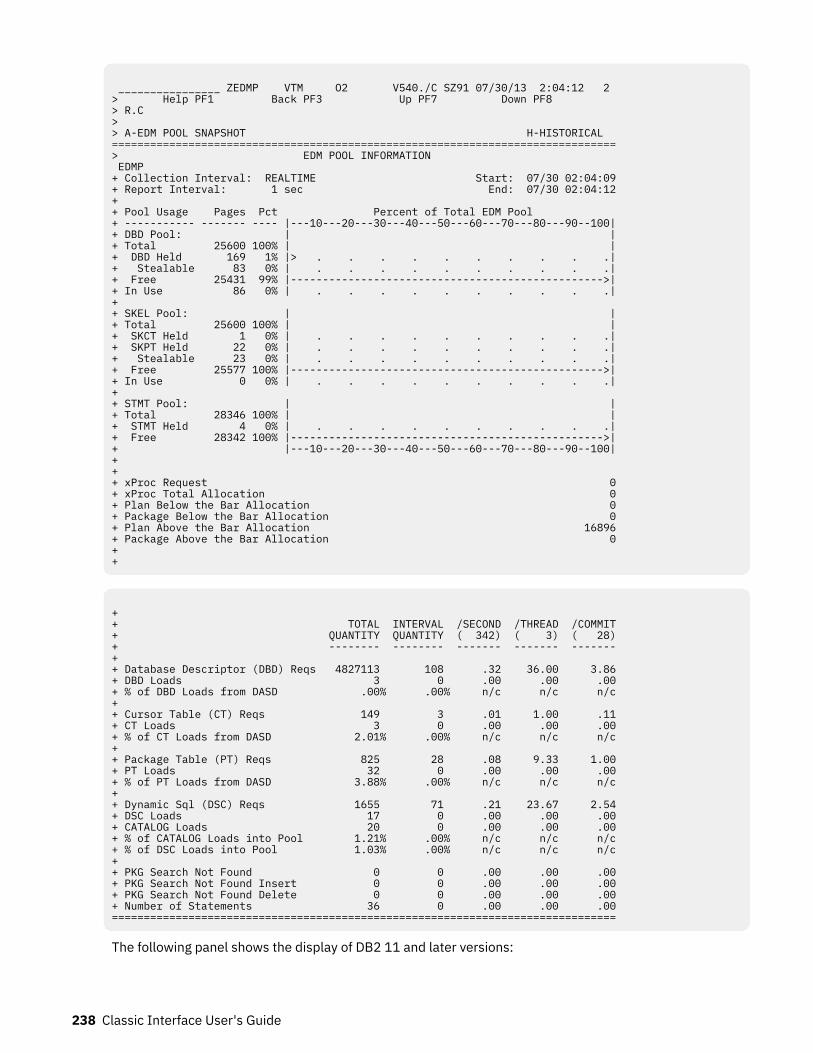
________________ ZEDMP VTM O2 V540./C SZ91 07/30/13 2:04:12 2 > Help PF1 Back PF3 Up PF7 Down PF8 > R.C > > A-EDM POOL SNAPSHOT H-HISTORICAL =============================================================================== > EDM POOL INFORMATION EDMP + Collection Interval: REALTIME Start: 07/30 02:04:09 + Report Interval: 1 sec End: 07/30 02:04:12 + + Pool Usage Pages Pct Percent of Total EDM Pool + ----------- ------- ---- |---10---20---30---40---50---60---70---80---90--100| + DBD Pool: | | + Total 25600 100% | | + DBD Held 169 1% |> . . . . . . . . . .| + Stealable 83 0% | . . . . . . . . . .| + Free 25431 99% |------------------------------------------------->| + In Use 86 0% | . . . . . . . . . .| + + SKEL Pool: | | + Total 25600 100% | | + SKCT Held 1 0% | . . . . . . . . . .| + SKPT Held 22 0% | . . . . . . . . . .| + Stealable 23 0% | . . . . . . . . . .| + Free 25577 100% |------------------------------------------------->| + In Use 0 0% | . . . . . . . . . .| + + STMT Pool: | | + Total 28346 100% | | + STMT Held 4 0% | . . . . . . . . . .| + Free 28342 100% |------------------------------------------------->| + |---10---20---30---40---50---60---70---80---90--100| + + + xProc Request 0 + xProc Total Allocation 0 + Plan Below the Bar Allocation 0 + Package Below the Bar Allocation 0 + Plan Above the Bar Allocation 16896 + Package Above the Bar Allocation 0 + +
+ + TOTAL INTERVAL /SECOND /THREAD /COMMIT + QUANTITY QUANTITY ( 342) ( 3) ( 28) + -------- -------- ------- ------- ------- + + Database Descriptor (DBD) Reqs 4827113 108 .32 36.00 3.86 + DBD Loads 3 0 .00 .00 .00 + % of DBD Loads from DASD .00% .00% n/c n/c n/c + + Cursor Table (CT) Reqs 149 3 .01 1.00 .11 + CT Loads 3 0 .00 .00 .00 + % of CT Loads from DASD 2.01% .00% n/c n/c n/c + + Package Table (PT) Reqs 825 28 .08 9.33 1.00 + PT Loads 32 0 .00 .00 .00 + % of PT Loads from DASD 3.88% .00% n/c n/c n/c + + Dynamic Sql (DSC) Reqs 1655 71 .21 23.67 2.54 + DSC Loads 17 0 .00 .00 .00 + CATALOG Loads 20 0 .00 .00 .00 + % of CATALOG Loads into Pool 1.21% .00% n/c n/c n/c + % of DSC Loads into Pool 1.03% .00% n/c n/c n/c + + PKG Search Not Found 0 0 .00 .00 .00 + PKG Search Not Found Insert 0 0 .00 .00 .00 + PKG Search Not Found Delete 0 0 .00 .00 .00 + Number of Statements 36 0 .00 .00 .00 ===============================================================================
The following panel shows the display of DB2 11 and later versions:
238 Classic Interface User's Guide
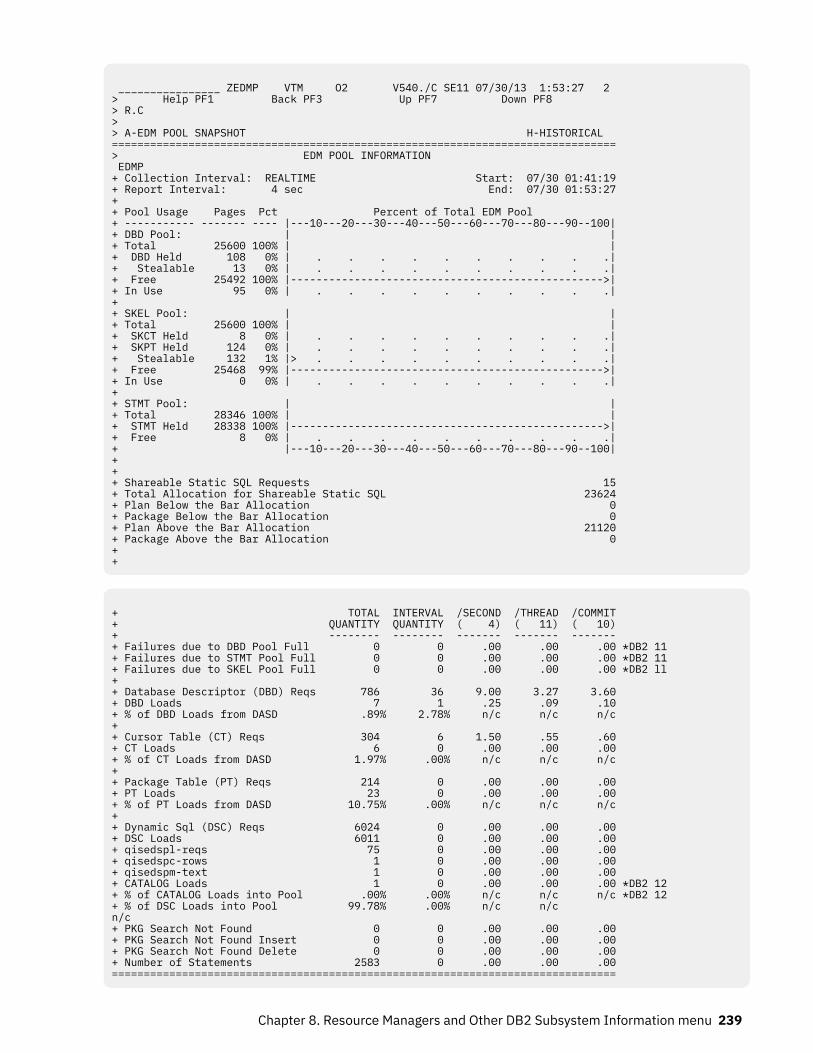
________________ ZEDMP VTM O2 V540./C SE11 07/30/13 1:53:27 2 > Help PF1 Back PF3 Up PF7 Down PF8 > R.C > > A-EDM POOL SNAPSHOT H-HISTORICAL =============================================================================== > EDM POOL INFORMATION EDMP + Collection Interval: REALTIME Start: 07/30 01:41:19 + Report Interval: 4 sec End: 07/30 01:53:27 + + Pool Usage Pages Pct Percent of Total EDM Pool + ----------- ------- ---- |---10---20---30---40---50---60---70---80---90--100| + DBD Pool: | | + Total 25600 100% | | + DBD Held 108 0% | . . . . . . . . . .| + Stealable 13 0% | . . . . . . . . . .| + Free 25492 100% |------------------------------------------------->| + In Use 95 0% | . . . . . . . . . .| + + SKEL Pool: | | + Total 25600 100% | | + SKCT Held 8 0% | . . . . . . . . . .| + SKPT Held 124 0% | . . . . . . . . . .| + Stealable 132 1% |> . . . . . . . . . .| + Free 25468 99% |------------------------------------------------->| + In Use 0 0% | . . . . . . . . . .| + + STMT Pool: | | + Total 28346 100% | | + STMT Held 28338 100% |------------------------------------------------->| + Free 8 0% | . . . . . . . . . .| + |---10---20---30---40---50---60---70---80---90--100| + + + Shareable Static SQL Requests 15 + Total Allocation for Shareable Static SQL 23624 + Plan Below the Bar Allocation 0 + Package Below the Bar Allocation 0 + Plan Above the Bar Allocation 21120 + Package Above the Bar Allocation 0+ +
+ TOTAL INTERVAL /SECOND /THREAD /COMMIT + QUANTITY QUANTITY ( 4) ( 11) ( 10) + -------- -------- ------- ------- ------- + Failures due to DBD Pool Full 0 0 .00 .00 .00 *DB2 11+ Failures due to STMT Pool Full 0 0 .00 .00 .00 *DB2 11+ Failures due to SKEL Pool Full 0 0 .00 .00 .00 *DB2 ll+ + Database Descriptor (DBD) Reqs 786 36 9.00 3.27 3.60 + DBD Loads 7 1 .25 .09 .10 + % of DBD Loads from DASD .89% 2.78% n/c n/c n/c + + Cursor Table (CT) Reqs 304 6 1.50 .55 .60 + CT Loads 6 0 .00 .00 .00 + % of CT Loads from DASD 1.97% .00% n/c n/c n/c + + Package Table (PT) Reqs 214 0 .00 .00 .00 + PT Loads 23 0 .00 .00 .00 + % of PT Loads from DASD 10.75% .00% n/c n/c n/c + + Dynamic Sql (DSC) Reqs 6024 0 .00 .00 .00 + DSC Loads 6011 0 .00 .00 .00 + qisedspl-reqs 75 0 .00 .00 .00 + qisedspc-rows 1 0 .00 .00 .00 + qisedspm-text 1 0 .00 .00 .00 + CATALOG Loads 1 0 .00 .00 .00 *DB2 12+ % of CATALOG Loads into Pool .00% .00% n/c n/c n/c *DB2 12+ % of DSC Loads into Pool 99.78% .00% n/c n/c n/c + PKG Search Not Found 0 0 .00 .00 .00 + PKG Search Not Found Insert 0 0 .00 .00 .00 + PKG Search Not Found Delete 0 0 .00 .00 .00 + Number of Statements 2583 0 .00 .00 .00 ===============================================================================
Chapter 8. Resource Managers and Other DB2 Subsystem Information menu 239
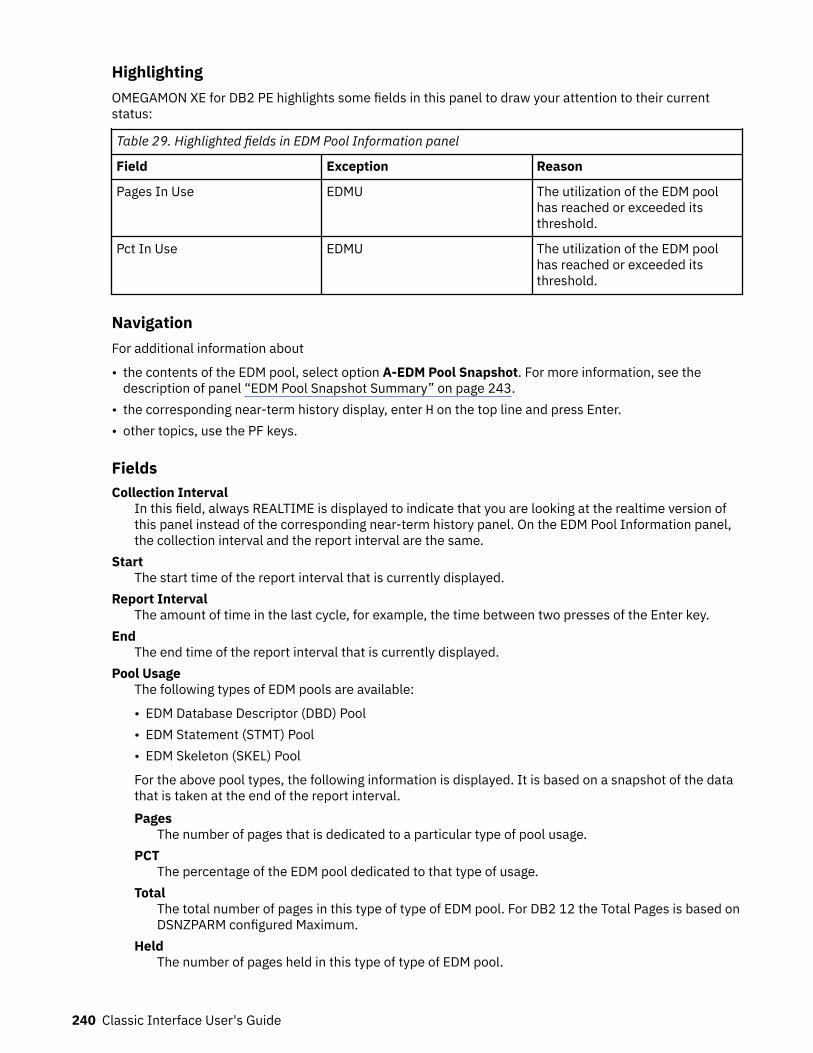
HighlightingOMEGAMON XE for DB2 PE highlights some fields in this panel to draw your attention to their currentstatus:
Table 29. Highlighted fields in EDM Pool Information panel
Field Exception Reason
Pages In Use EDMU The utilization of the EDM poolhas reached or exceeded itsthreshold.
Pct In Use EDMU The utilization of the EDM poolhas reached or exceeded itsthreshold.
NavigationFor additional information about
• the contents of the EDM pool, select option A-EDM Pool Snapshot. For more information, see thedescription of panel “EDM Pool Snapshot Summary” on page 243.
• the corresponding near-term history display, enter H on the top line and press Enter.• other topics, use the PF keys.
FieldsCollection Interval
In this field, always REALTIME is displayed to indicate that you are looking at the realtime version ofthis panel instead of the corresponding near-term history panel. On the EDM Pool Information panel,the collection interval and the report interval are the same.
StartThe start time of the report interval that is currently displayed.
Report IntervalThe amount of time in the last cycle, for example, the time between two presses of the Enter key.
EndThe end time of the report interval that is currently displayed.
Pool UsageThe following types of EDM pools are available:
• EDM Database Descriptor (DBD) Pool• EDM Statement (STMT) Pool• EDM Skeleton (SKEL) Pool
For the above pool types, the following information is displayed. It is based on a snapshot of the datathat is taken at the end of the report interval.Pages
The number of pages that is dedicated to a particular type of pool usage.PCT
The percentage of the EDM pool dedicated to that type of usage.Total
The total number of pages in this type of type of EDM pool. For DB2 12 the Total Pages is based onDSNZPARM configured Maximum.
HeldThe number of pages held in this type of type of EDM pool.
240 Classic Interface User's Guide
CT HeldPages held in RDS pool for the cursor tables.This applies only to DB2 9, below and above the bar usage.
PT HeldPages held in RDS pool for the package tables.This applies only to DB2 9, below and above the bar usage.
SKCT HeldPages held in SKEL pool for skeleton cursor tables.
DBD HeldPages held in DBD pool.
STMT HeldPages held in STMT pool.
StealableThe total number of pages that can be reused.
FreeThe number of pages currently not used by any object in this type of EDM pool.
In UseThe number of pages that are used in this type of EDM pool.This applies only to DBD and SKEL pools.The percentage of DBD In Use is calculated like this:
((In Use - Stealable/Reusable)/Total)*100
The percentage of SKEL in Use is calculated like this:
((SKCTs + SKPTs) - Stealable/Reusable)/Total)*100
xProc Request (QISEKSPG)The total number of requests for PROCS.This applies to DB2 10.
xProc Total Allocation (QISEKSPA)The total number of pages that are allocated for xPROCS.This applies to DB2 10.
Shareable Static SQL Requests (QISEKSPG)The number of shareable static SQL statement requests.This applies to DB2 11 or higher.
Total Allocation Shareable Static SQL (QISEKSPA8)The total storage that is allocated to shareable static SQL statements.This applies to DB2 11 or higher.
SKEL Reusable (QISEKLRU)The total number of SKPT and SKCT pages that can be reused.This applies to DB2 10 or higher.
DBD Reusable (QISEDLRU)The total number of DBD pages that can be reused.This applies to DB2 10 or higher.
Plan Below the Bar Allocation (QISESQCB)The amount of storage below the bar that is allocated for plans.This applies to DB2 10 or higher.
Package Below the Bar Allocation (QISESQKB)The amount of storage below the bar that is allocated for packages.
Chapter 8. Resource Managers and Other DB2 Subsystem Information menu 241
This applies to DB2 10 or higher.Plan Above the Bar Allocation (QISESQCA)
The amount of storage above the bar that is allocated for plans.This applies to DB2 10 or higher.
Package Above the Bar Allocation (QISESQKA)The amount of storage above the bar that is allocated for packages.This applies to DB2 10 or higher.
For each of the following fields, the following statistics are provided:TOTAL QUANTITY
The amount of activities that occurred since DB2 is started.INTERVAL QUANTITY
The amount of activities that occur during the interval./SECOND
Rate per second. The number under /SECOND (in parentheses) is the number of seconds in theinterval.
/THREADRate per thread. The number under /THREAD (in parentheses) is the number of Create Threads duringthe interval.
/COMMITRate per Commit. The number under /COMMIT (in parentheses) is the number of Commit requests(including abort requests) during the interval.
Failures due to DBD Pool FullFailures that occurred because the DBD pool is full. DB2 10 and DB2 11 only.
Failures due to STMT Pool FullFailures that occurred because the STMT pool is full. DB2 10 and DB2 11 only.
Failures due to SKEL Pool FullFailures that occurred because the SKELpool is full. DB2 10 and DB2 11 only.
Database Descriptor (DBD) ReqsRequests for database descriptors.
DBD LoadsDatabase descriptors that have to be loaded from DASD.
% of DBD Loads from DASDThe percentage of DBD requests that result in DT loads from DASD.This value should be kept low. 20% or lower is considered acceptable.
Cursor Table (CT) ReqsRequests for cursor tables.
CT LoadsCursor tables that have to be loaded from DASD.
% of CT Loads from DASDThe percentage of CT requests that resulted in CT loads from DASD.This value should be kept low. 20% or lower is considered acceptable.
Package Table (PT) ReqsRequests for package tables.
PT LoadsPackage tables that had to be loaded from DASD.
% of PT Loads from DASDThe percentage of PT requests that result in PT loads from DASD.This value should be kept low. 20% or lower is considered acceptable.
242 Classic Interface User's Guide
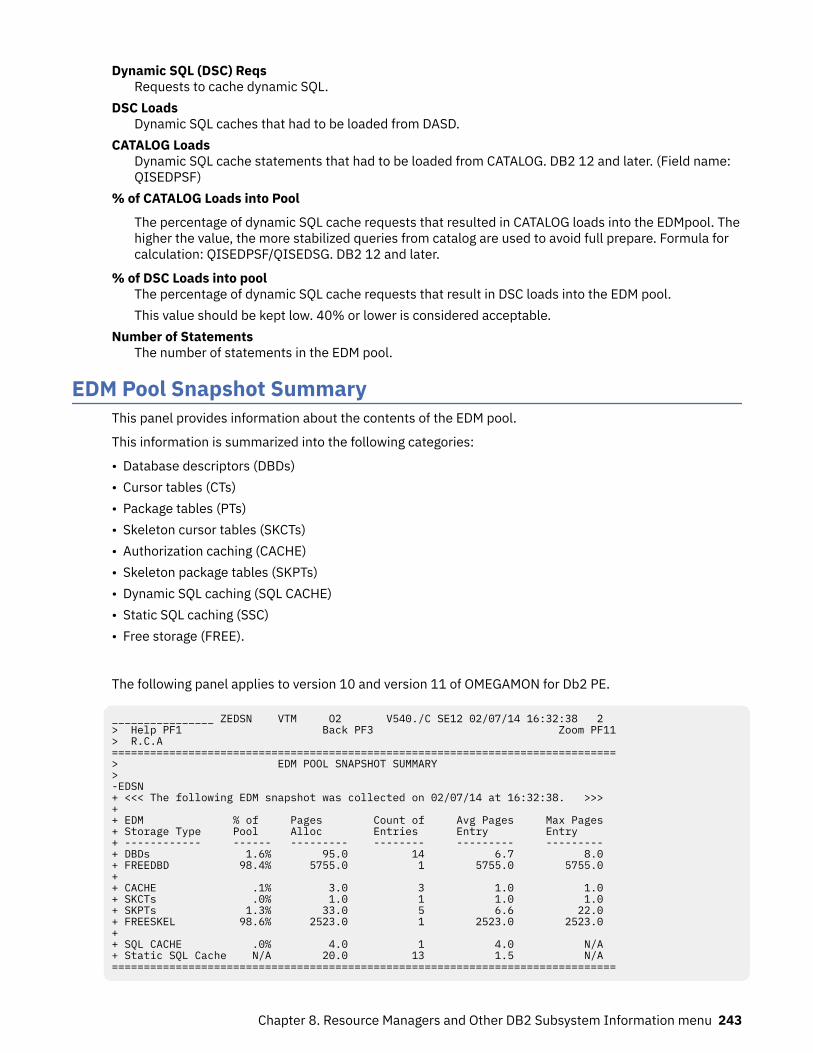
Dynamic SQL (DSC) ReqsRequests to cache dynamic SQL.
DSC LoadsDynamic SQL caches that had to be loaded from DASD.
CATALOG LoadsDynamic SQL cache statements that had to be loaded from CATALOG. DB2 12 and later. (Field name:QISEDPSF)
% of CATALOG Loads into Pool
The percentage of dynamic SQL cache requests that resulted in CATALOG loads into the EDMpool. Thehigher the value, the more stabilized queries from catalog are used to avoid full prepare. Formula forcalculation: QISEDPSF/QISEDSG. DB2 12 and later.
% of DSC Loads into poolThe percentage of dynamic SQL cache requests that result in DSC loads into the EDM pool.This value should be kept low. 40% or lower is considered acceptable.
Number of StatementsThe number of statements in the EDM pool.
EDM Pool Snapshot SummaryThis panel provides information about the contents of the EDM pool.
This information is summarized into the following categories:
• Database descriptors (DBDs)• Cursor tables (CTs)• Package tables (PTs)• Skeleton cursor tables (SKCTs)• Authorization caching (CACHE)• Skeleton package tables (SKPTs)• Dynamic SQL caching (SQL CACHE)• Static SQL caching (SSC)• Free storage (FREE).
The following panel applies to version 10 and version 11 of OMEGAMON for Db2 PE.
________________ ZEDSN VTM O2 V540./C SE12 02/07/14 16:32:38 2 > Help PF1 Back PF3 Zoom PF11> R.C.A ===============================================================================> EDM POOL SNAPSHOT SUMMARY > -EDSN + <<< The following EDM snapshot was collected on 02/07/14 at 16:32:38. >>> + + EDM % of Pages Count of Avg Pages Max Pages + Storage Type Pool Alloc Entries Entry Entry + ------------ ------ --------- -------- --------- --------- + DBDs 1.6% 95.0 14 6.7 8.0 + FREEDBD 98.4% 5755.0 1 5755.0 5755.0 + + CACHE .1% 3.0 3 1.0 1.0 + SKCTs .0% 1.0 1 1.0 1.0 + SKPTs 1.3% 33.0 5 6.6 22.0 + FREESKEL 98.6% 2523.0 1 2523.0 2523.0 + + SQL CACHE .0% 4.0 1 4.0 N/A + Static SQL Cache N/A 20.0 13 1.5 N/A ===============================================================================
Chapter 8. Resource Managers and Other DB2 Subsystem Information menu 243
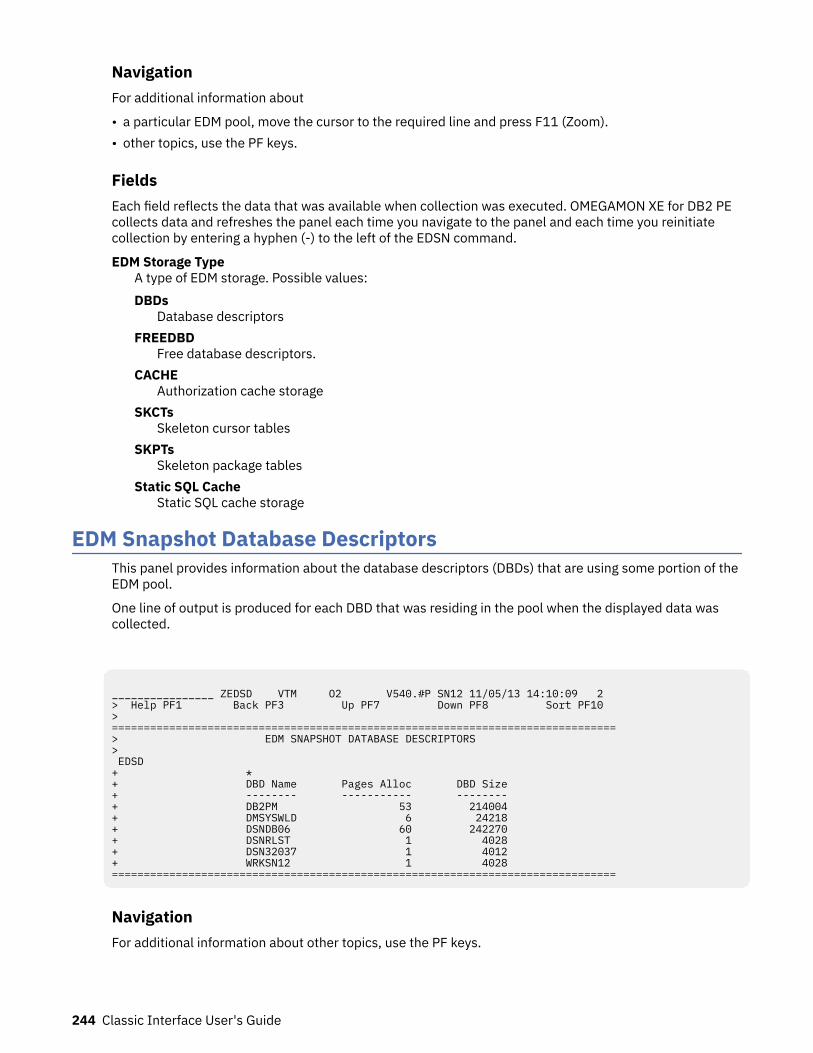
NavigationFor additional information about
• a particular EDM pool, move the cursor to the required line and press F11 (Zoom).• other topics, use the PF keys.
FieldsEach field reflects the data that was available when collection was executed. OMEGAMON XE for DB2 PEcollects data and refreshes the panel each time you navigate to the panel and each time you reinitiatecollection by entering a hyphen (-) to the left of the EDSN command.
EDM Storage TypeA type of EDM storage. Possible values:DBDs
Database descriptorsFREEDBD
Free database descriptors.CACHE
Authorization cache storageSKCTs
Skeleton cursor tablesSKPTs
Skeleton package tablesStatic SQL Cache
Static SQL cache storage
EDM Snapshot Database DescriptorsThis panel provides information about the database descriptors (DBDs) that are using some portion of theEDM pool.
One line of output is produced for each DBD that was residing in the pool when the displayed data wascollected.
________________ ZEDSD VTM O2 V540.#P SN12 11/05/13 14:10:09 2 > Help PF1 Back PF3 Up PF7 Down PF8 Sort PF10 > =============================================================================== > EDM SNAPSHOT DATABASE DESCRIPTORS > EDSD + * + DBD Name Pages Alloc DBD Size + -------- ----------- -------- + DB2PM 53 214004 + DMSYSWLD 6 24218 + DSNDB06 60 242270 + DSNRLST 1 4028 + DSN32037 1 4012 + WRKSN12 1 4028 ===============================================================================
NavigationFor additional information about other topics, use the PF keys.
244 Classic Interface User's Guide
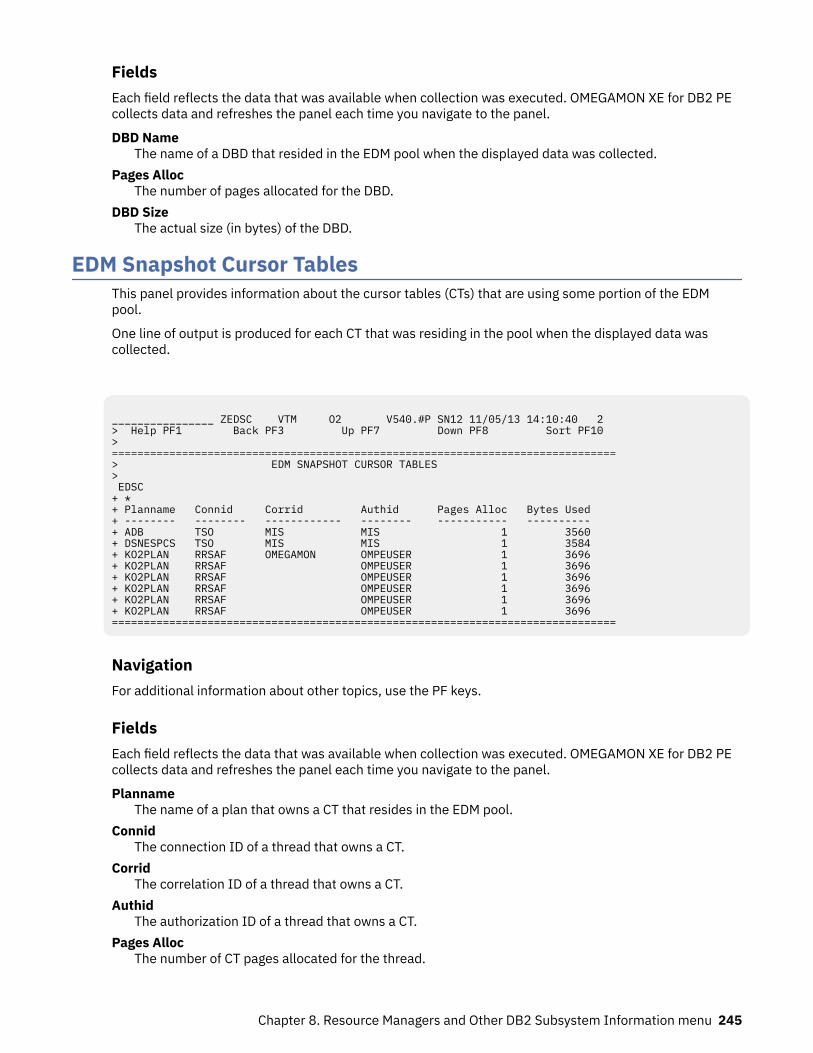
FieldsEach field reflects the data that was available when collection was executed. OMEGAMON XE for DB2 PEcollects data and refreshes the panel each time you navigate to the panel.
DBD NameThe name of a DBD that resided in the EDM pool when the displayed data was collected.
Pages AllocThe number of pages allocated for the DBD.
DBD SizeThe actual size (in bytes) of the DBD.
EDM Snapshot Cursor TablesThis panel provides information about the cursor tables (CTs) that are using some portion of the EDMpool.
One line of output is produced for each CT that was residing in the pool when the displayed data wascollected.
________________ ZEDSC VTM O2 V540.#P SN12 11/05/13 14:10:40 2 > Help PF1 Back PF3 Up PF7 Down PF8 Sort PF10 > ===============================================================================> EDM SNAPSHOT CURSOR TABLES > EDSC + * + Planname Connid Corrid Authid Pages Alloc Bytes Used + -------- -------- ------------ -------- ----------- ---------- + ADB TSO MIS MIS 1 3560 + DSNESPCS TSO MIS MIS 1 3584 + KO2PLAN RRSAF OMEGAMON OMPEUSER 1 3696 + KO2PLAN RRSAF OMPEUSER 1 3696 + KO2PLAN RRSAF OMPEUSER 1 3696 + KO2PLAN RRSAF OMPEUSER 1 3696 + KO2PLAN RRSAF OMPEUSER 1 3696 + KO2PLAN RRSAF OMPEUSER 1 3696 ===============================================================================
NavigationFor additional information about other topics, use the PF keys.
FieldsEach field reflects the data that was available when collection was executed. OMEGAMON XE for DB2 PEcollects data and refreshes the panel each time you navigate to the panel.
PlannameThe name of a plan that owns a CT that resides in the EDM pool.
ConnidThe connection ID of a thread that owns a CT.
CorridThe correlation ID of a thread that owns a CT.
AuthidThe authorization ID of a thread that owns a CT.
Pages AllocThe number of CT pages allocated for the thread.
Chapter 8. Resource Managers and Other DB2 Subsystem Information menu 245
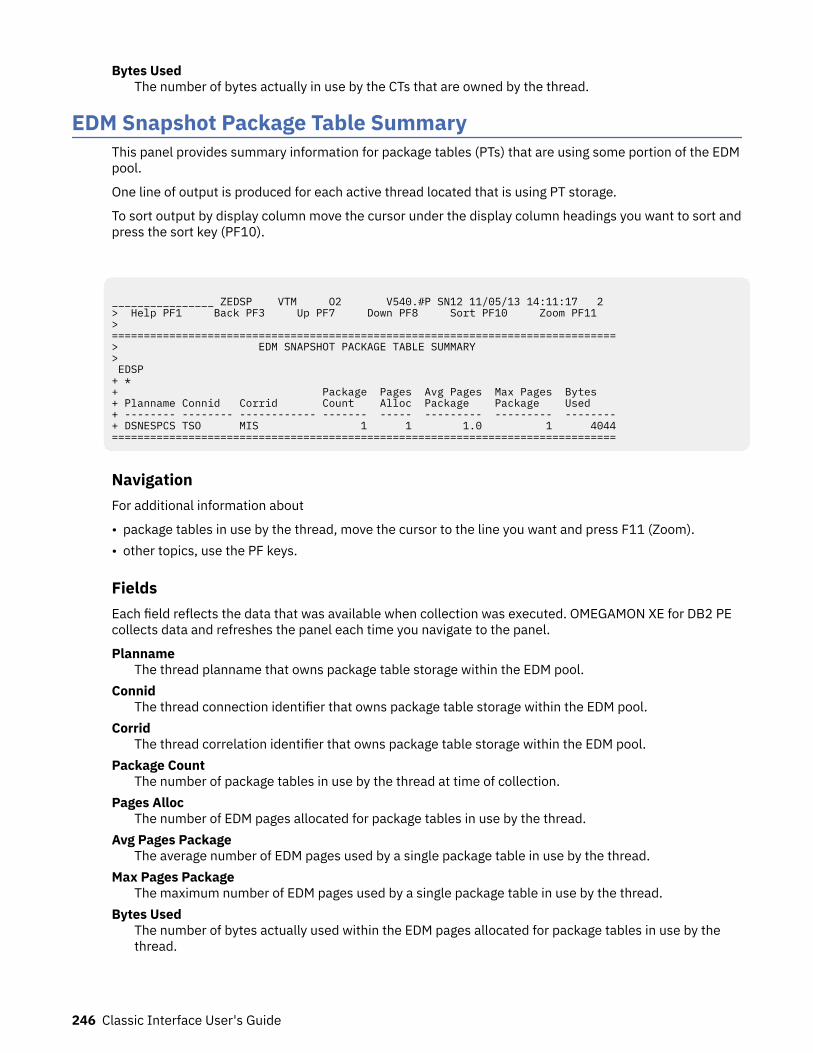
Bytes UsedThe number of bytes actually in use by the CTs that are owned by the thread.
EDM Snapshot Package Table SummaryThis panel provides summary information for package tables (PTs) that are using some portion of the EDMpool.
One line of output is produced for each active thread located that is using PT storage.
To sort output by display column move the cursor under the display column headings you want to sort andpress the sort key (PF10).
________________ ZEDSP VTM O2 V540.#P SN12 11/05/13 14:11:17 2 > Help PF1 Back PF3 Up PF7 Down PF8 Sort PF10 Zoom PF11 > ===============================================================================> EDM SNAPSHOT PACKAGE TABLE SUMMARY > EDSP + * + Package Pages Avg Pages Max Pages Bytes + Planname Connid Corrid Count Alloc Package Package Used + -------- -------- ------------ ------- ----- --------- --------- --------+ DSNESPCS TSO MIS 1 1 1.0 1 4044===============================================================================
NavigationFor additional information about
• package tables in use by the thread, move the cursor to the line you want and press F11 (Zoom).• other topics, use the PF keys.
FieldsEach field reflects the data that was available when collection was executed. OMEGAMON XE for DB2 PEcollects data and refreshes the panel each time you navigate to the panel.
PlannameThe thread planname that owns package table storage within the EDM pool.
ConnidThe thread connection identifier that owns package table storage within the EDM pool.
CorridThe thread correlation identifier that owns package table storage within the EDM pool.
Package CountThe number of package tables in use by the thread at time of collection.
Pages AllocThe number of EDM pages allocated for package tables in use by the thread.
Avg Pages PackageThe average number of EDM pages used by a single package table in use by the thread.
Max Pages PackageThe maximum number of EDM pages used by a single package table in use by the thread.
Bytes UsedThe number of bytes actually used within the EDM pages allocated for package tables in use by thethread.
246 Classic Interface User's Guide
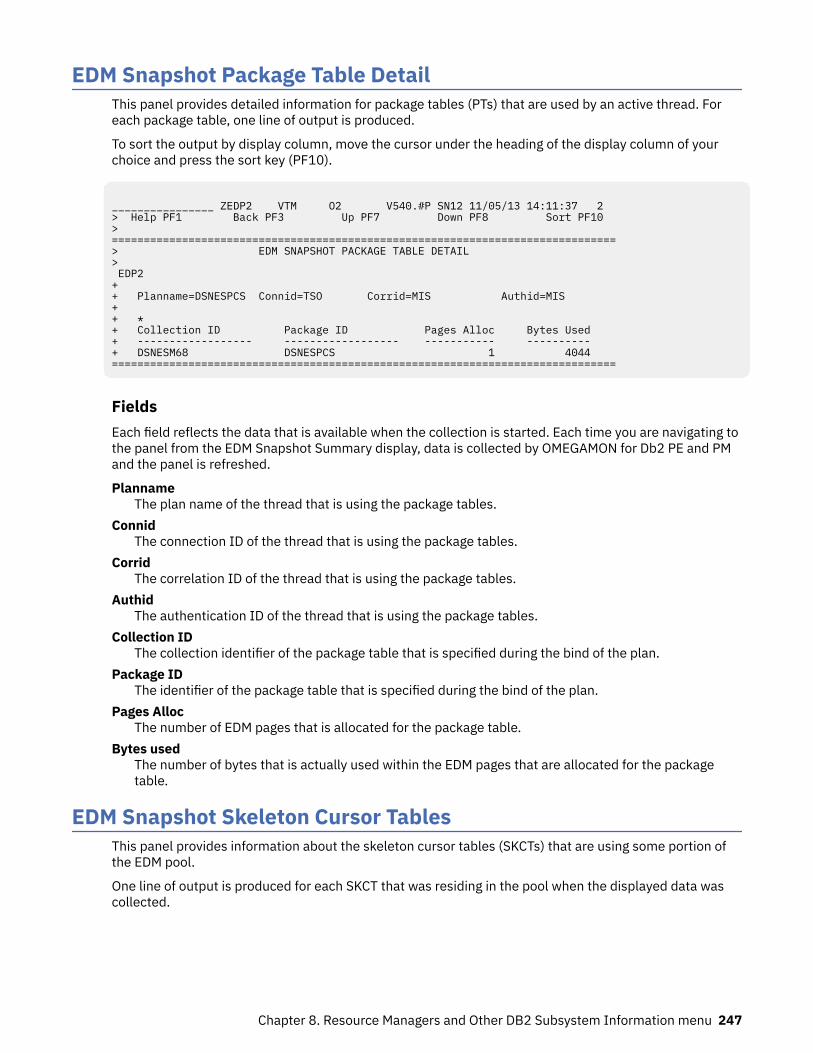
EDM Snapshot Package Table DetailThis panel provides detailed information for package tables (PTs) that are used by an active thread. Foreach package table, one line of output is produced.
To sort the output by display column, move the cursor under the heading of the display column of yourchoice and press the sort key (PF10).
________________ ZEDP2 VTM O2 V540.#P SN12 11/05/13 14:11:37 2 > Help PF1 Back PF3 Up PF7 Down PF8 Sort PF10 > =============================================================================== > EDM SNAPSHOT PACKAGE TABLE DETAIL > EDP2 + + Planname=DSNESPCS Connid=TSO Corrid=MIS Authid=MIS + + * + Collection ID Package ID Pages Alloc Bytes Used + ------------------ ------------------ ----------- ---------- + DSNESM68 DSNESPCS 1 4044 ===============================================================================
FieldsEach field reflects the data that is available when the collection is started. Each time you are navigating tothe panel from the EDM Snapshot Summary display, data is collected by OMEGAMON for Db2 PE and PMand the panel is refreshed.
PlannameThe plan name of the thread that is using the package tables.
ConnidThe connection ID of the thread that is using the package tables.
CorridThe correlation ID of the thread that is using the package tables.
AuthidThe authentication ID of the thread that is using the package tables.
Collection IDThe collection identifier of the package table that is specified during the bind of the plan.
Package IDThe identifier of the package table that is specified during the bind of the plan.
Pages AllocThe number of EDM pages that is allocated for the package table.
Bytes usedThe number of bytes that is actually used within the EDM pages that are allocated for the packagetable.
EDM Snapshot Skeleton Cursor TablesThis panel provides information about the skeleton cursor tables (SKCTs) that are using some portion ofthe EDM pool.
One line of output is produced for each SKCT that was residing in the pool when the displayed data wascollected.
Chapter 8. Resource Managers and Other DB2 Subsystem Information menu 247
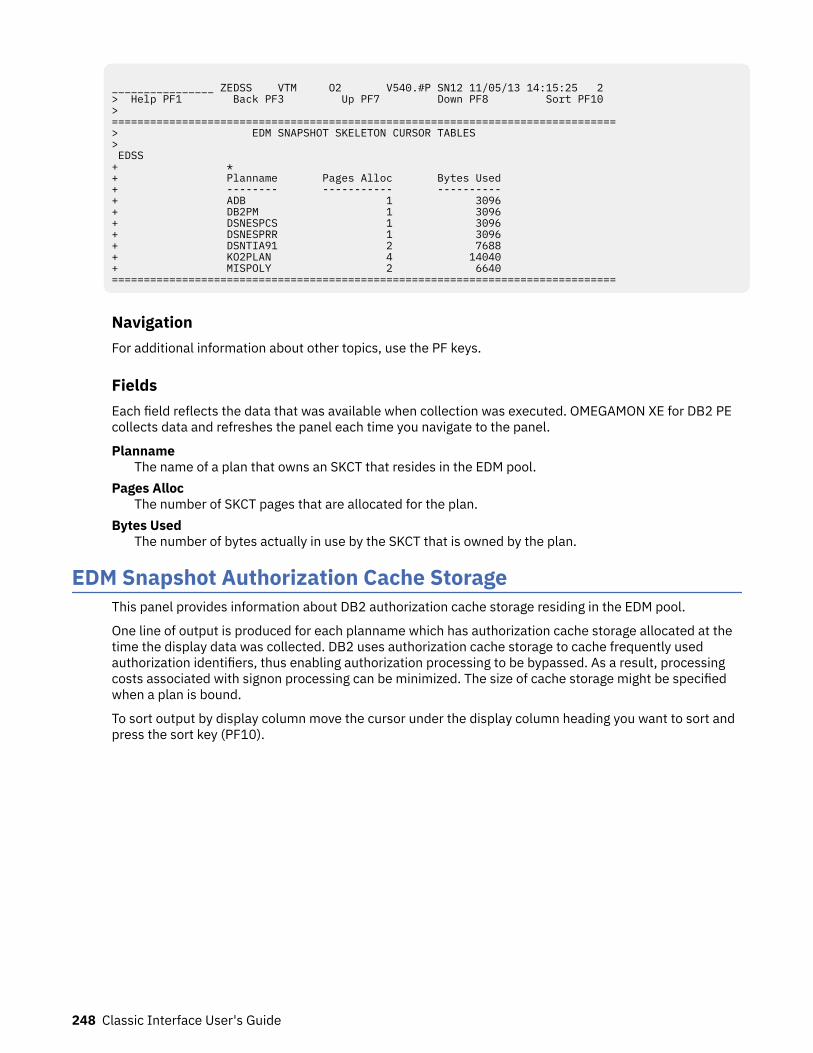
________________ ZEDSS VTM O2 V540.#P SN12 11/05/13 14:15:25 2 > Help PF1 Back PF3 Up PF7 Down PF8 Sort PF10 > ===============================================================================> EDM SNAPSHOT SKELETON CURSOR TABLES > EDSS + * + Planname Pages Alloc Bytes Used + -------- ----------- ---------- + ADB 1 3096 + DB2PM 1 3096 + DSNESPCS 1 3096 + DSNESPRR 1 3096 + DSNTIA91 2 7688 + KO2PLAN 4 14040 + MISPOLY 2 6640 ===============================================================================
NavigationFor additional information about other topics, use the PF keys.
FieldsEach field reflects the data that was available when collection was executed. OMEGAMON XE for DB2 PEcollects data and refreshes the panel each time you navigate to the panel.
PlannameThe name of a plan that owns an SKCT that resides in the EDM pool.
Pages AllocThe number of SKCT pages that are allocated for the plan.
Bytes UsedThe number of bytes actually in use by the SKCT that is owned by the plan.
EDM Snapshot Authorization Cache StorageThis panel provides information about DB2 authorization cache storage residing in the EDM pool.
One line of output is produced for each planname which has authorization cache storage allocated at thetime the display data was collected. DB2 uses authorization cache storage to cache frequently usedauthorization identifiers, thus enabling authorization processing to be bypassed. As a result, processingcosts associated with signon processing can be minimized. The size of cache storage might be specifiedwhen a plan is bound.
To sort output by display column move the cursor under the display column heading you want to sort andpress the sort key (PF10).
248 Classic Interface User's Guide
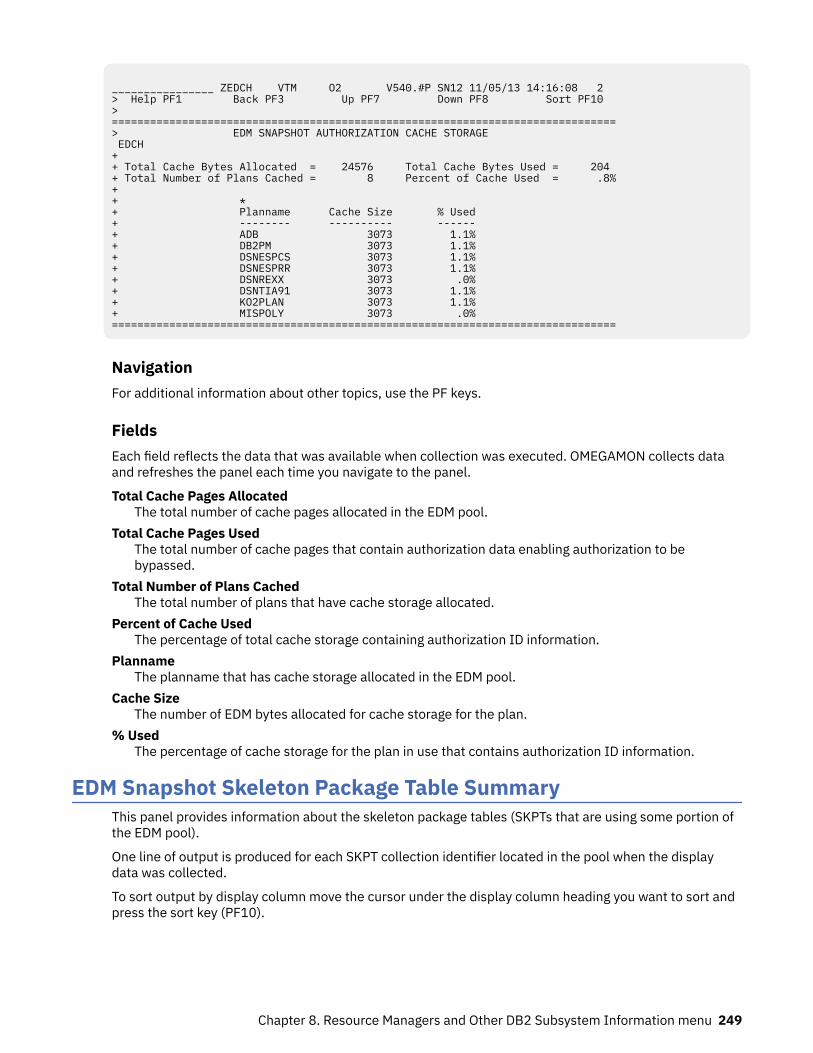
________________ ZEDCH VTM O2 V540.#P SN12 11/05/13 14:16:08 2 > Help PF1 Back PF3 Up PF7 Down PF8 Sort PF10 > =============================================================================== > EDM SNAPSHOT AUTHORIZATION CACHE STORAGE EDCH + + Total Cache Bytes Allocated = 24576 Total Cache Bytes Used = 204 + Total Number of Plans Cached = 8 Percent of Cache Used = .8% + + * + Planname Cache Size % Used + -------- ---------- ------ + ADB 3073 1.1% + DB2PM 3073 1.1% + DSNESPCS 3073 1.1% + DSNESPRR 3073 1.1% + DSNREXX 3073 .0% + DSNTIA91 3073 1.1% + KO2PLAN 3073 1.1% + MISPOLY 3073 .0% ===============================================================================
NavigationFor additional information about other topics, use the PF keys.
FieldsEach field reflects the data that was available when collection was executed. OMEGAMON collects dataand refreshes the panel each time you navigate to the panel.
Total Cache Pages AllocatedThe total number of cache pages allocated in the EDM pool.
Total Cache Pages UsedThe total number of cache pages that contain authorization data enabling authorization to bebypassed.
Total Number of Plans CachedThe total number of plans that have cache storage allocated.
Percent of Cache UsedThe percentage of total cache storage containing authorization ID information.
PlannameThe planname that has cache storage allocated in the EDM pool.
Cache SizeThe number of EDM bytes allocated for cache storage for the plan.
% UsedThe percentage of cache storage for the plan in use that contains authorization ID information.
EDM Snapshot Skeleton Package Table SummaryThis panel provides information about the skeleton package tables (SKPTs that are using some portion ofthe EDM pool).
One line of output is produced for each SKPT collection identifier located in the pool when the displaydata was collected.
To sort output by display column move the cursor under the display column heading you want to sort andpress the sort key (PF10).
Chapter 8. Resource Managers and Other DB2 Subsystem Information menu 249
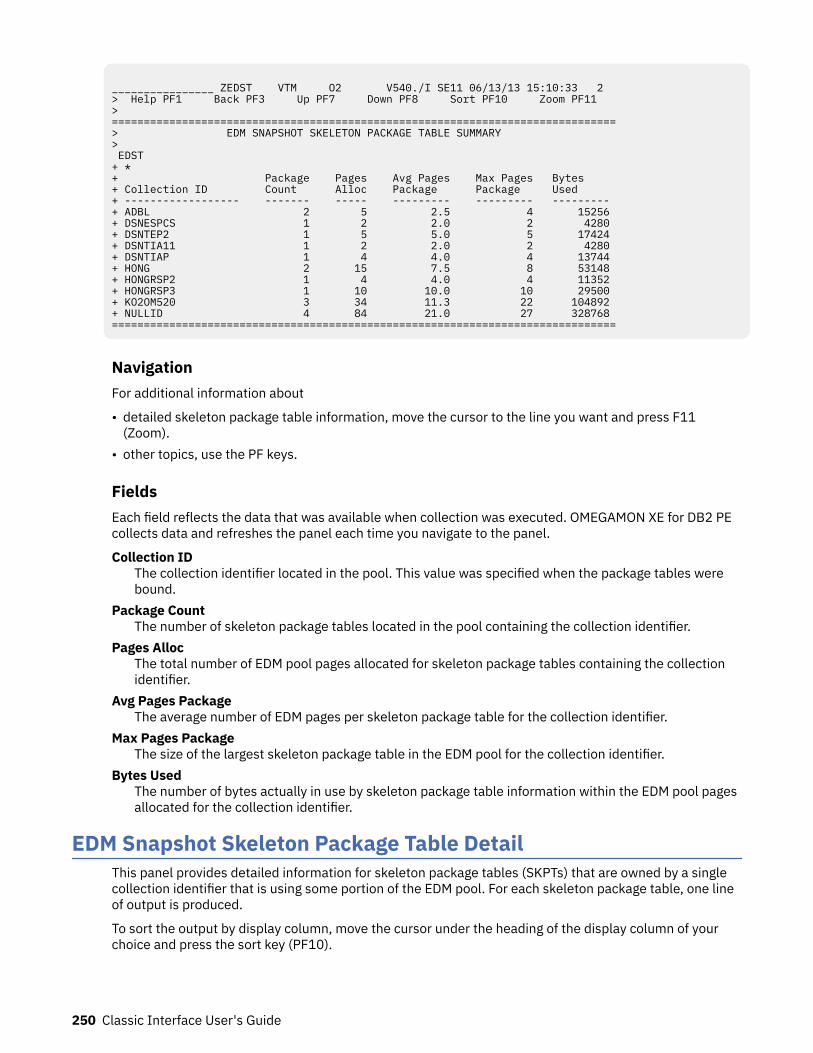
________________ ZEDST VTM O2 V540./I SE11 06/13/13 15:10:33 2 > Help PF1 Back PF3 Up PF7 Down PF8 Sort PF10 Zoom PF11 > ===============================================================================> EDM SNAPSHOT SKELETON PACKAGE TABLE SUMMARY > EDST + * + Package Pages Avg Pages Max Pages Bytes + Collection ID Count Alloc Package Package Used + ------------------ ------- ----- --------- --------- --------- + ADBL 2 5 2.5 4 15256 + DSNESPCS 1 2 2.0 2 4280 + DSNTEP2 1 5 5.0 5 17424 + DSNTIA11 1 2 2.0 2 4280 + DSNTIAP 1 4 4.0 4 13744 + HONG 2 15 7.5 8 53148 + HONGRSP2 1 4 4.0 4 11352 + HONGRSP3 1 10 10.0 10 29500 + KO2OM520 3 34 11.3 22 104892 + NULLID 4 84 21.0 27 328768 ===============================================================================
NavigationFor additional information about
• detailed skeleton package table information, move the cursor to the line you want and press F11(Zoom).
• other topics, use the PF keys.
FieldsEach field reflects the data that was available when collection was executed. OMEGAMON XE for DB2 PEcollects data and refreshes the panel each time you navigate to the panel.
Collection IDThe collection identifier located in the pool. This value was specified when the package tables werebound.
Package CountThe number of skeleton package tables located in the pool containing the collection identifier.
Pages AllocThe total number of EDM pool pages allocated for skeleton package tables containing the collectionidentifier.
Avg Pages PackageThe average number of EDM pages per skeleton package table for the collection identifier.
Max Pages PackageThe size of the largest skeleton package table in the EDM pool for the collection identifier.
Bytes UsedThe number of bytes actually in use by skeleton package table information within the EDM pool pagesallocated for the collection identifier.
EDM Snapshot Skeleton Package Table DetailThis panel provides detailed information for skeleton package tables (SKPTs) that are owned by a singlecollection identifier that is using some portion of the EDM pool. For each skeleton package table, one lineof output is produced.
To sort the output by display column, move the cursor under the heading of the display column of yourchoice and press the sort key (PF10).
250 Classic Interface User's Guide
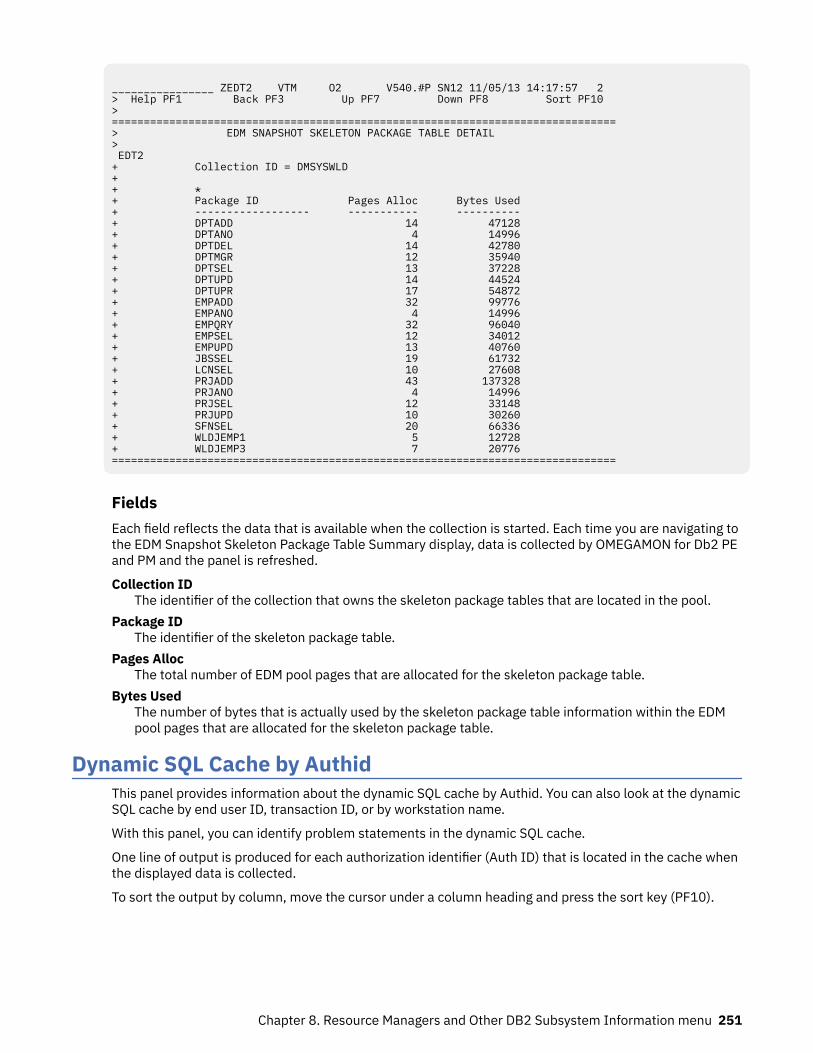
________________ ZEDT2 VTM O2 V540.#P SN12 11/05/13 14:17:57 2 > Help PF1 Back PF3 Up PF7 Down PF8 Sort PF10 > =============================================================================== > EDM SNAPSHOT SKELETON PACKAGE TABLE DETAIL > EDT2 + Collection ID = DMSYSWLD + + * + Package ID Pages Alloc Bytes Used + ------------------ ----------- ---------- + DPTADD 14 47128 + DPTANO 4 14996 + DPTDEL 14 42780 + DPTMGR 12 35940 + DPTSEL 13 37228 + DPTUPD 14 44524 + DPTUPR 17 54872 + EMPADD 32 99776 + EMPANO 4 14996 + EMPQRY 32 96040 + EMPSEL 12 34012 + EMPUPD 13 40760 + JBSSEL 19 61732 + LCNSEL 10 27608 + PRJADD 43 137328 + PRJANO 4 14996 + PRJSEL 12 33148 + PRJUPD 10 30260 + SFNSEL 20 66336 + WLDJEMP1 5 12728 + WLDJEMP3 7 20776 ===============================================================================
FieldsEach field reflects the data that is available when the collection is started. Each time you are navigating tothe EDM Snapshot Skeleton Package Table Summary display, data is collected by OMEGAMON for Db2 PEand PM and the panel is refreshed.
Collection IDThe identifier of the collection that owns the skeleton package tables that are located in the pool.
Package IDThe identifier of the skeleton package table.
Pages AllocThe total number of EDM pool pages that are allocated for the skeleton package table.
Bytes UsedThe number of bytes that is actually used by the skeleton package table information within the EDMpool pages that are allocated for the skeleton package table.
Dynamic SQL Cache by AuthidThis panel provides information about the dynamic SQL cache by Authid. You can also look at the dynamicSQL cache by end user ID, transaction ID, or by workstation name.
With this panel, you can identify problem statements in the dynamic SQL cache.
One line of output is produced for each authorization identifier (Auth ID) that is located in the cache whenthe displayed data is collected.
To sort the output by column, move the cursor under a column heading and press the sort key (PF10).
Chapter 8. Resource Managers and Other DB2 Subsystem Information menu 251
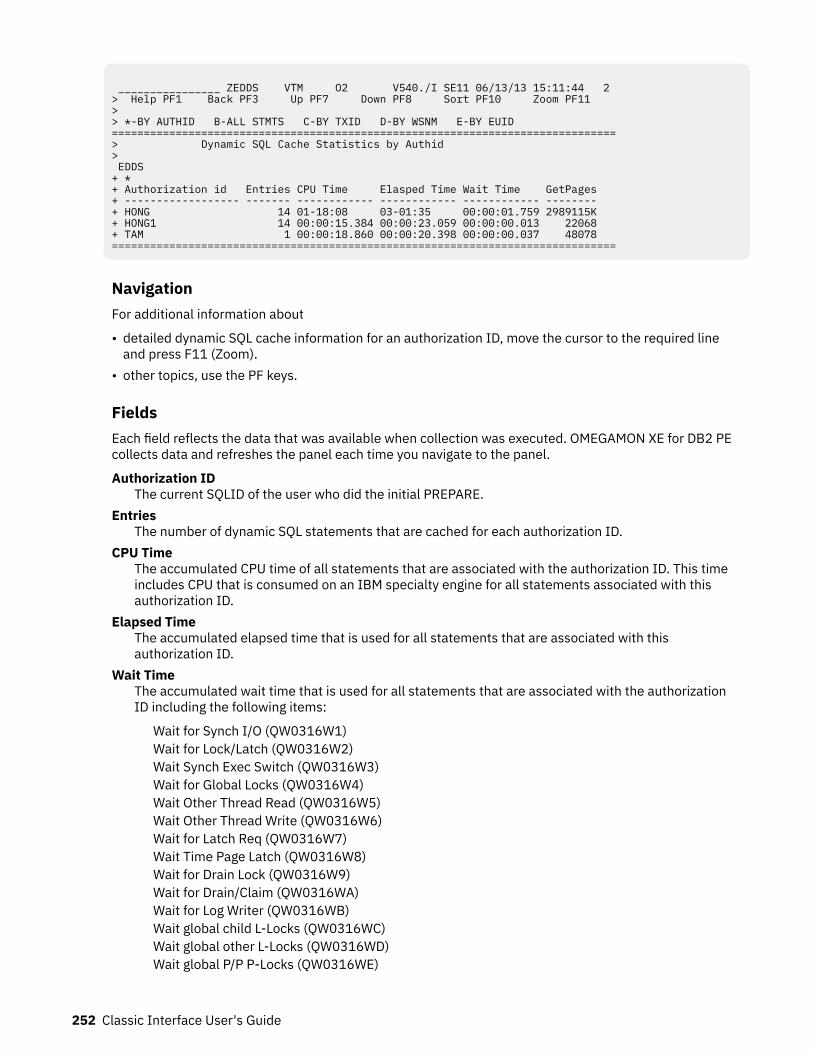
________________ ZEDDS VTM O2 V540./I SE11 06/13/13 15:11:44 2 > Help PF1 Back PF3 Up PF7 Down PF8 Sort PF10 Zoom PF11 > > *-BY AUTHID B-ALL STMTS C-BY TXID D-BY WSNM E-BY EUID ===============================================================================> Dynamic SQL Cache Statistics by Authid > EDDS + * + Authorization id Entries CPU Time Elasped Time Wait Time GetPages + ------------------ ------- ------------ ------------ ------------ -------- + HONG 14 01-18:08 03-01:35 00:00:01.759 2989115K + HONG1 14 00:00:15.384 00:00:23.059 00:00:00.013 22068 + TAM 1 00:00:18.860 00:00:20.398 00:00:00.037 48078 ===============================================================================
NavigationFor additional information about
• detailed dynamic SQL cache information for an authorization ID, move the cursor to the required lineand press F11 (Zoom).
• other topics, use the PF keys.
FieldsEach field reflects the data that was available when collection was executed. OMEGAMON XE for DB2 PEcollects data and refreshes the panel each time you navigate to the panel.
Authorization IDThe current SQLID of the user who did the initial PREPARE.
EntriesThe number of dynamic SQL statements that are cached for each authorization ID.
CPU TimeThe accumulated CPU time of all statements that are associated with the authorization ID. This timeincludes CPU that is consumed on an IBM specialty engine for all statements associated with thisauthorization ID.
Elapsed TimeThe accumulated elapsed time that is used for all statements that are associated with thisauthorization ID.
Wait TimeThe accumulated wait time that is used for all statements that are associated with the authorizationID including the following items:
Wait for Synch I/O (QW0316W1)Wait for Lock/Latch (QW0316W2)Wait Synch Exec Switch (QW0316W3)Wait for Global Locks (QW0316W4)Wait Other Thread Read (QW0316W5)Wait Other Thread Write (QW0316W6)Wait for Latch Req (QW0316W7)Wait Time Page Latch (QW0316W8)Wait for Drain Lock (QW0316W9)Wait for Drain/Claim (QW0316WA)Wait for Log Writer (QW0316WB)Wait global child L-Locks (QW0316WC)Wait global other L-Locks (QW0316WD)Wait global P/P P-Locks (QW0316WE)
252 Classic Interface User's Guide
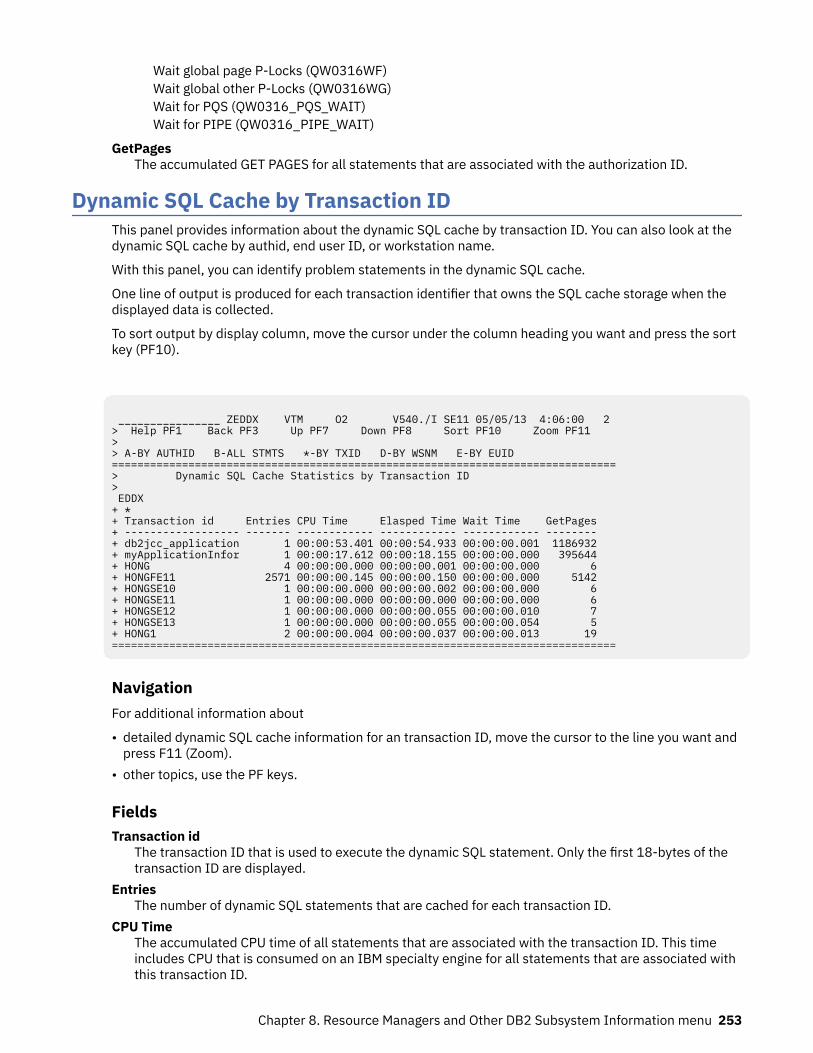
Wait global page P-Locks (QW0316WF)Wait global other P-Locks (QW0316WG)Wait for PQS (QW0316_PQS_WAIT)Wait for PIPE (QW0316_PIPE_WAIT)
GetPagesThe accumulated GET PAGES for all statements that are associated with the authorization ID.
Dynamic SQL Cache by Transaction IDThis panel provides information about the dynamic SQL cache by transaction ID. You can also look at thedynamic SQL cache by authid, end user ID, or workstation name.
With this panel, you can identify problem statements in the dynamic SQL cache.
One line of output is produced for each transaction identifier that owns the SQL cache storage when thedisplayed data is collected.
To sort output by display column, move the cursor under the column heading you want and press the sortkey (PF10).
________________ ZEDDX VTM O2 V540./I SE11 05/05/13 4:06:00 2 > Help PF1 Back PF3 Up PF7 Down PF8 Sort PF10 Zoom PF11 > > A-BY AUTHID B-ALL STMTS *-BY TXID D-BY WSNM E-BY EUID =============================================================================== > Dynamic SQL Cache Statistics by Transaction ID > EDDX + * + Transaction id Entries CPU Time Elasped Time Wait Time GetPages + ------------------ ------- ------------ ------------ ------------ -------- + db2jcc_application 1 00:00:53.401 00:00:54.933 00:00:00.001 1186932 + myApplicationInfor 1 00:00:17.612 00:00:18.155 00:00:00.000 395644 + HONG 4 00:00:00.000 00:00:00.001 00:00:00.000 6 + HONGFE11 2571 00:00:00.145 00:00:00.150 00:00:00.000 5142 + HONGSE10 1 00:00:00.000 00:00:00.002 00:00:00.000 6 + HONGSE11 1 00:00:00.000 00:00:00.000 00:00:00.000 6 + HONGSE12 1 00:00:00.000 00:00:00.055 00:00:00.010 7 + HONGSE13 1 00:00:00.000 00:00:00.055 00:00:00.054 5 + HONG1 2 00:00:00.004 00:00:00.037 00:00:00.013 19 ===============================================================================
NavigationFor additional information about
• detailed dynamic SQL cache information for an transaction ID, move the cursor to the line you want andpress F11 (Zoom).
• other topics, use the PF keys.
FieldsTransaction id
The transaction ID that is used to execute the dynamic SQL statement. Only the first 18-bytes of thetransaction ID are displayed.
EntriesThe number of dynamic SQL statements that are cached for each transaction ID.
CPU TimeThe accumulated CPU time of all statements that are associated with the transaction ID. This timeincludes CPU that is consumed on an IBM specialty engine for all statements that are associated withthis transaction ID.
Chapter 8. Resource Managers and Other DB2 Subsystem Information menu 253
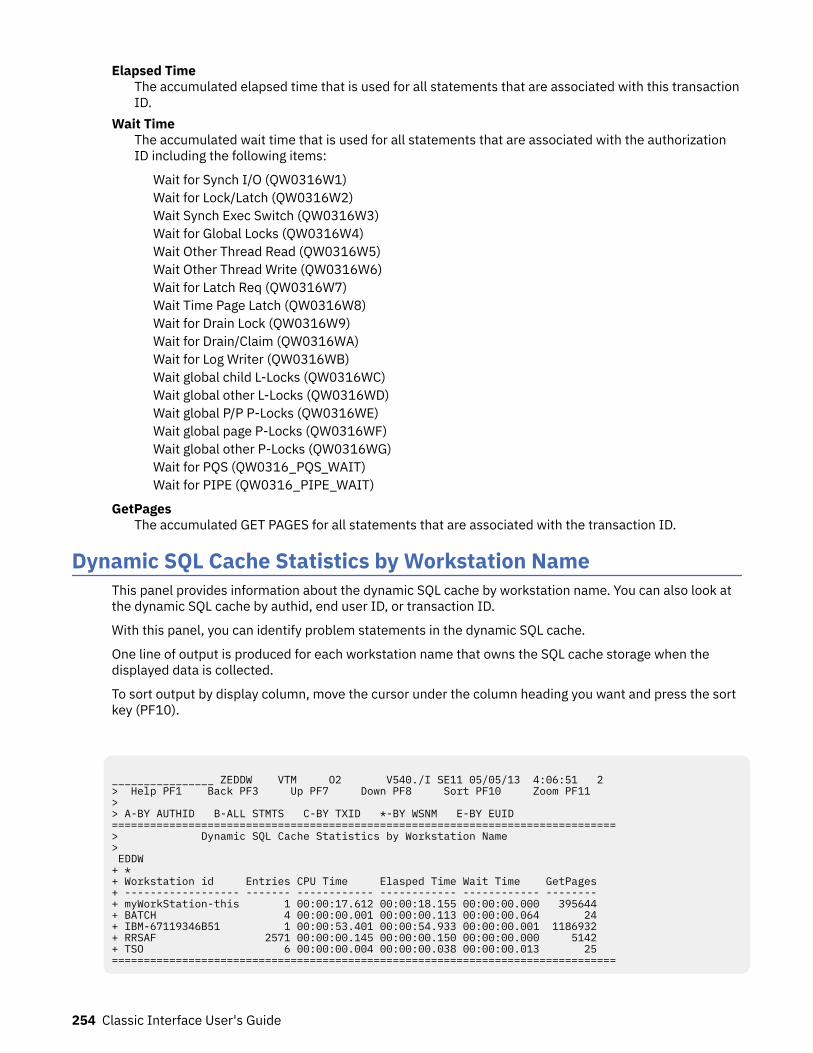
Elapsed TimeThe accumulated elapsed time that is used for all statements that are associated with this transactionID.
Wait TimeThe accumulated wait time that is used for all statements that are associated with the authorizationID including the following items:
Wait for Synch I/O (QW0316W1)Wait for Lock/Latch (QW0316W2)Wait Synch Exec Switch (QW0316W3)Wait for Global Locks (QW0316W4)Wait Other Thread Read (QW0316W5)Wait Other Thread Write (QW0316W6)Wait for Latch Req (QW0316W7)Wait Time Page Latch (QW0316W8)Wait for Drain Lock (QW0316W9)Wait for Drain/Claim (QW0316WA)Wait for Log Writer (QW0316WB)Wait global child L-Locks (QW0316WC)Wait global other L-Locks (QW0316WD)Wait global P/P P-Locks (QW0316WE)Wait global page P-Locks (QW0316WF)Wait global other P-Locks (QW0316WG)Wait for PQS (QW0316_PQS_WAIT)Wait for PIPE (QW0316_PIPE_WAIT)
GetPagesThe accumulated GET PAGES for all statements that are associated with the transaction ID.
Dynamic SQL Cache Statistics by Workstation NameThis panel provides information about the dynamic SQL cache by workstation name. You can also look atthe dynamic SQL cache by authid, end user ID, or transaction ID.
With this panel, you can identify problem statements in the dynamic SQL cache.
One line of output is produced for each workstation name that owns the SQL cache storage when thedisplayed data is collected.
To sort output by display column, move the cursor under the column heading you want and press the sortkey (PF10).
________________ ZEDDW VTM O2 V540./I SE11 05/05/13 4:06:51 2 > Help PF1 Back PF3 Up PF7 Down PF8 Sort PF10 Zoom PF11 > > A-BY AUTHID B-ALL STMTS C-BY TXID *-BY WSNM E-BY EUID ===============================================================================> Dynamic SQL Cache Statistics by Workstation Name > EDDW + * + Workstation id Entries CPU Time Elasped Time Wait Time GetPages + ------------------ ------- ------------ ------------ ------------ -------- + myWorkStation-this 1 00:00:17.612 00:00:18.155 00:00:00.000 395644 + BATCH 4 00:00:00.001 00:00:00.113 00:00:00.064 24 + IBM-67119346B51 1 00:00:53.401 00:00:54.933 00:00:00.001 1186932 + RRSAF 2571 00:00:00.145 00:00:00.150 00:00:00.000 5142 + TSO 6 00:00:00.004 00:00:00.038 00:00:00.013 25 ===============================================================================
254 Classic Interface User's Guide
NavigationFor additional information about
• detailed dynamic SQL cache information for a workstation name, move the cursor to the line you wantand press F11 (Zoom).
• other topics, use the PF keys.
FieldsWorkstation ID
The workstation name that is used to execute the dynamic SQL statement.Entries
The number of dynamic SQL statements that are cached for each workstation name.CPU Time
The accumulated CPU time of all statements that are associated with the workstation name. This timeincludes CPU that is consumed on an IBM specialty engine for all statements that are associated withthis workstation name.
Elapsed TimeThe accumulated elapsed time that is used for all statements that are associated with thisworkstation name.
Wait TimeThe accumulated wait time that is used for all statements that are associated with the authorizationID including the following items:
Wait for Synch I/O (QW0316W1)Wait for Lock/Latch (QW0316W2)Wait Synch Exec Switch (QW0316W3)Wait for Global Locks (QW0316W4)Wait Other Thread Read (QW0316W5)Wait Other Thread Write (QW0316W6)Wait for Latch Req (QW0316W7)Wait Time Page Latch (QW0316W8)Wait for Drain Lock (QW0316W9)Wait for Drain/Claim (QW0316WA)Wait for Log Writer (QW0316WB)Wait global child L-Locks (QW0316WC)Wait global other L-Locks (QW0316WD)Wait global P/P P-Locks (QW0316WE)Wait global page P-Locks (QW0316WF)Wait global other P-Locks (QW0316WG)Wait for PQS (QW0316_PQS_WAIT)Wait for PIPE (QW0316_PIPE_WAIT)
GetPagesThe accumulated GET PAGES for all statements that are associated with the workstation name.
Dynamic SQL Cache Statistics by End User IDThis panel provides information about the dynamic SQL cache by end user ID. You can also look at thedynamic SQL cache by authid, end user ID, or transaction ID.
With this panel, you can identify problem statements in the dynamic SQL cache.
One line of output is produced for each end user ID that owns the SQL cache storage when the displayeddata is collected.
Chapter 8. Resource Managers and Other DB2 Subsystem Information menu 255
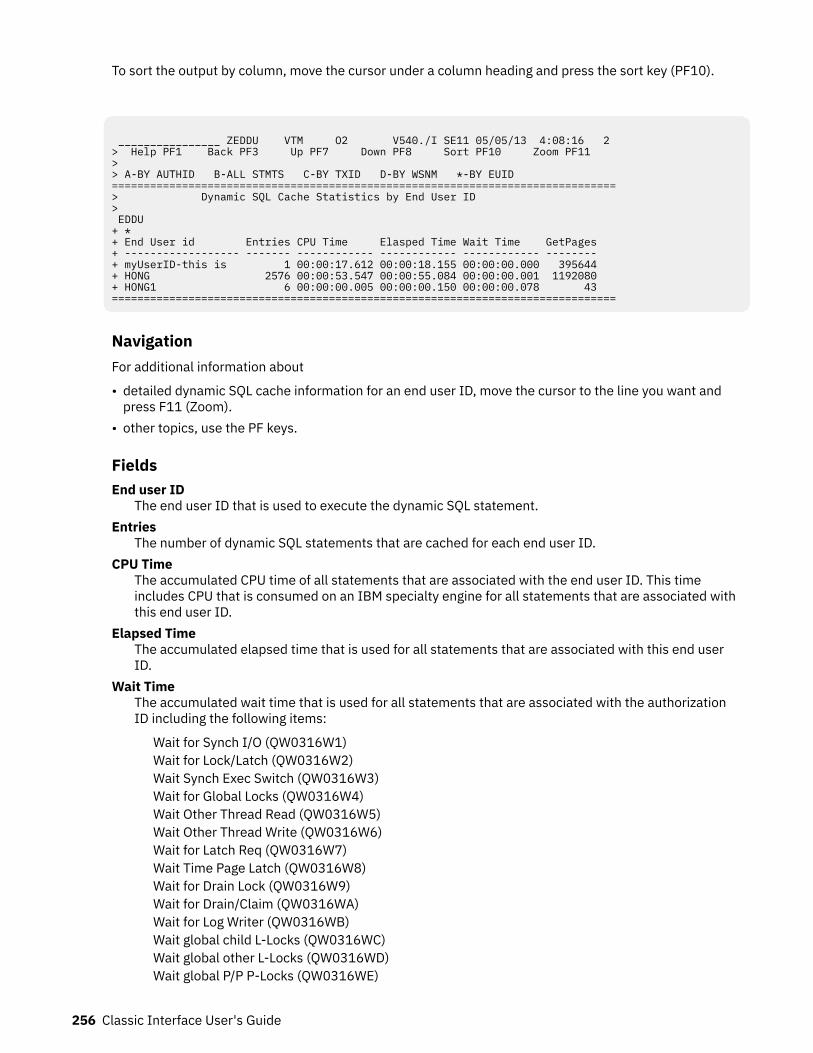
To sort the output by column, move the cursor under a column heading and press the sort key (PF10).
________________ ZEDDU VTM O2 V540./I SE11 05/05/13 4:08:16 2 > Help PF1 Back PF3 Up PF7 Down PF8 Sort PF10 Zoom PF11 > > A-BY AUTHID B-ALL STMTS C-BY TXID D-BY WSNM *-BY EUID =============================================================================== > Dynamic SQL Cache Statistics by End User ID > EDDU + * + End User id Entries CPU Time Elasped Time Wait Time GetPages + ------------------ ------- ------------ ------------ ------------ -------- + myUserID-this is 1 00:00:17.612 00:00:18.155 00:00:00.000 395644 + HONG 2576 00:00:53.547 00:00:55.084 00:00:00.001 1192080 + HONG1 6 00:00:00.005 00:00:00.150 00:00:00.078 43 ===============================================================================
NavigationFor additional information about
• detailed dynamic SQL cache information for an end user ID, move the cursor to the line you want andpress F11 (Zoom).
• other topics, use the PF keys.
FieldsEnd user ID
The end user ID that is used to execute the dynamic SQL statement.Entries
The number of dynamic SQL statements that are cached for each end user ID.CPU Time
The accumulated CPU time of all statements that are associated with the end user ID. This timeincludes CPU that is consumed on an IBM specialty engine for all statements that are associated withthis end user ID.
Elapsed TimeThe accumulated elapsed time that is used for all statements that are associated with this end userID.
Wait TimeThe accumulated wait time that is used for all statements that are associated with the authorizationID including the following items:
Wait for Synch I/O (QW0316W1)Wait for Lock/Latch (QW0316W2)Wait Synch Exec Switch (QW0316W3)Wait for Global Locks (QW0316W4)Wait Other Thread Read (QW0316W5)Wait Other Thread Write (QW0316W6)Wait for Latch Req (QW0316W7)Wait Time Page Latch (QW0316W8)Wait for Drain Lock (QW0316W9)Wait for Drain/Claim (QW0316WA)Wait for Log Writer (QW0316WB)Wait global child L-Locks (QW0316WC)Wait global other L-Locks (QW0316WD)Wait global P/P P-Locks (QW0316WE)
256 Classic Interface User's Guide
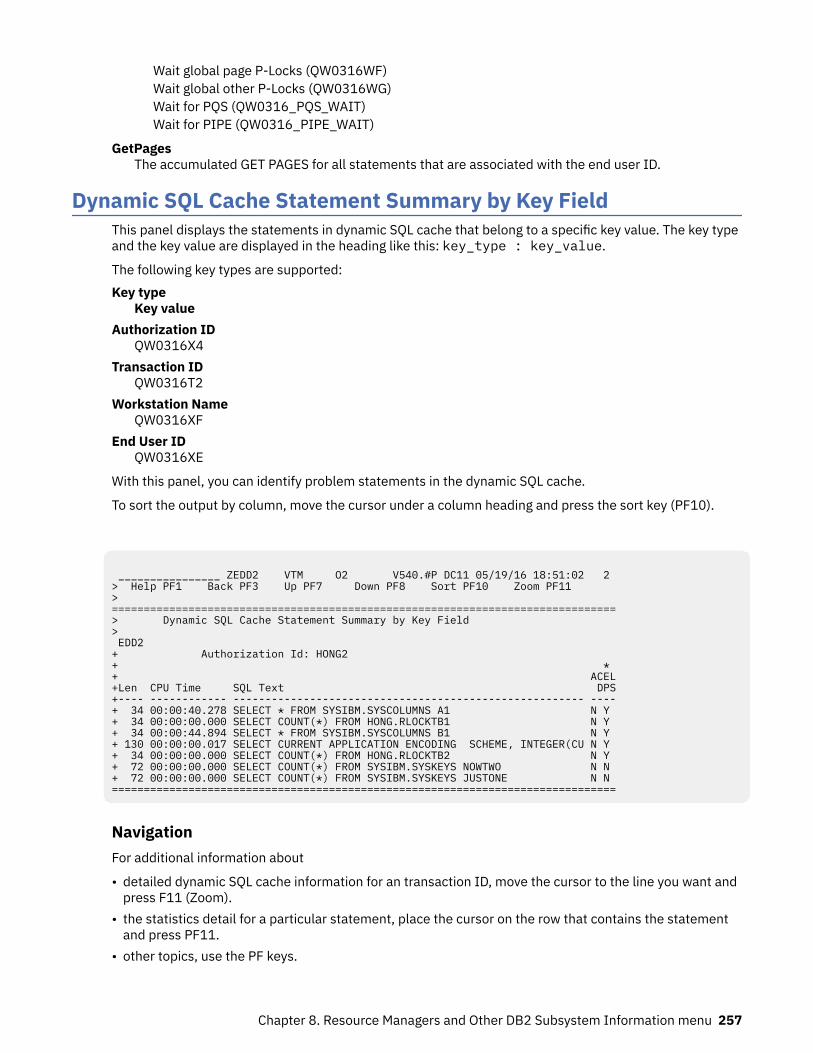
Wait global page P-Locks (QW0316WF)Wait global other P-Locks (QW0316WG)Wait for PQS (QW0316_PQS_WAIT)Wait for PIPE (QW0316_PIPE_WAIT)
GetPagesThe accumulated GET PAGES for all statements that are associated with the end user ID.
Dynamic SQL Cache Statement Summary by Key FieldThis panel displays the statements in dynamic SQL cache that belong to a specific key value. The key typeand the key value are displayed in the heading like this: key_type : key_value.
The following key types are supported:Key type
Key valueAuthorization ID
QW0316X4Transaction ID
QW0316T2Workstation Name
QW0316XFEnd User ID
QW0316XE
With this panel, you can identify problem statements in the dynamic SQL cache.
To sort the output by column, move the cursor under a column heading and press the sort key (PF10).
________________ ZEDD2 VTM O2 V540.#P DC11 05/19/16 18:51:02 2 > Help PF1 Back PF3 Up PF7 Down PF8 Sort PF10 Zoom PF11 > =============================================================================== > Dynamic SQL Cache Statement Summary by Key Field > EDD2 + Authorization Id: HONG2 + * + ACEL +Len CPU Time SQL Text DPS +---- ------------ ------------------------------------------------------- ---- + 34 00:00:40.278 SELECT * FROM SYSIBM.SYSCOLUMNS A1 N Y + 34 00:00:00.000 SELECT COUNT(*) FROM HONG.RLOCKTB1 N Y + 34 00:00:44.894 SELECT * FROM SYSIBM.SYSCOLUMNS B1 N Y + 130 00:00:00.017 SELECT CURRENT APPLICATION ENCODING SCHEME, INTEGER(CU N Y + 34 00:00:00.000 SELECT COUNT(*) FROM HONG.RLOCKTB2 N Y + 72 00:00:00.000 SELECT COUNT(*) FROM SYSIBM.SYSKEYS NOWTWO N N + 72 00:00:00.000 SELECT COUNT(*) FROM SYSIBM.SYSKEYS JUSTONE N N ===============================================================================
NavigationFor additional information about
• detailed dynamic SQL cache information for an transaction ID, move the cursor to the line you want andpress F11 (Zoom).
• the statistics detail for a particular statement, place the cursor on the row that contains the statementand press PF11.
• other topics, use the PF keys.
Chapter 8. Resource Managers and Other DB2 Subsystem Information menu 257
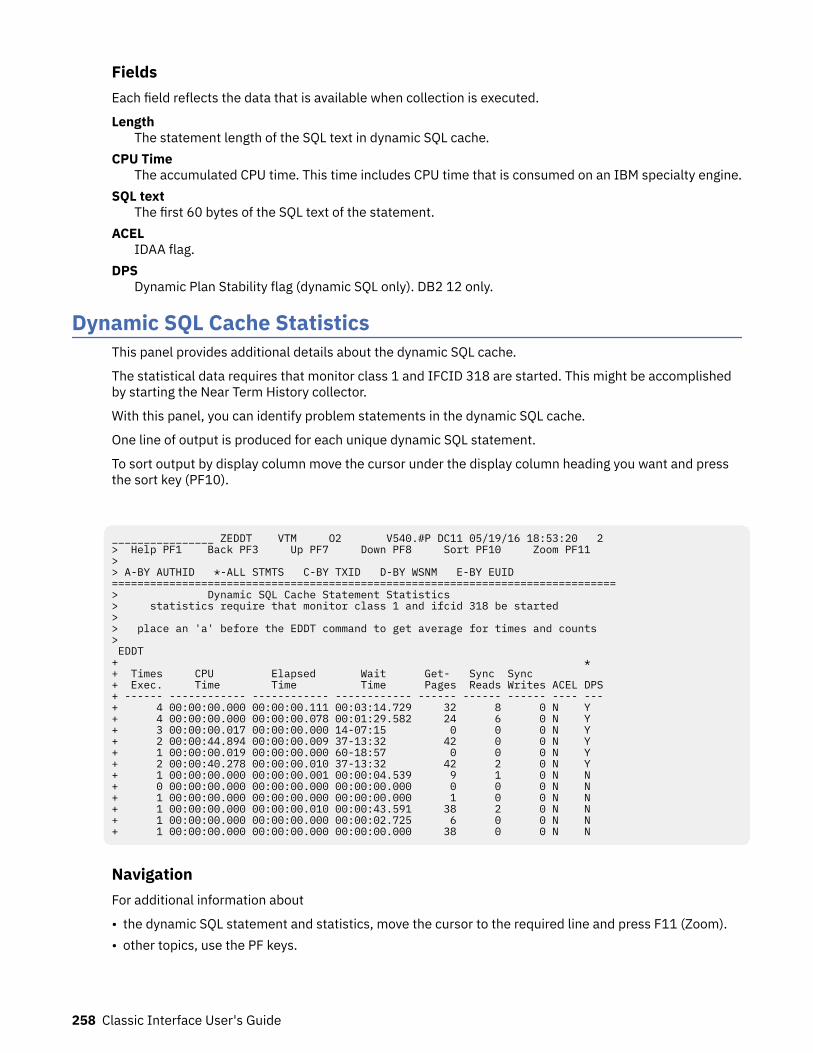
FieldsEach field reflects the data that is available when collection is executed.
LengthThe statement length of the SQL text in dynamic SQL cache.
CPU TimeThe accumulated CPU time. This time includes CPU time that is consumed on an IBM specialty engine.
SQL textThe first 60 bytes of the SQL text of the statement.
ACELIDAA flag.
DPSDynamic Plan Stability flag (dynamic SQL only). DB2 12 only.
Dynamic SQL Cache StatisticsThis panel provides additional details about the dynamic SQL cache.
The statistical data requires that monitor class 1 and IFCID 318 are started. This might be accomplishedby starting the Near Term History collector.
With this panel, you can identify problem statements in the dynamic SQL cache.
One line of output is produced for each unique dynamic SQL statement.
To sort output by display column move the cursor under the display column heading you want and pressthe sort key (PF10).
________________ ZEDDT VTM O2 V540.#P DC11 05/19/16 18:53:20 2 > Help PF1 Back PF3 Up PF7 Down PF8 Sort PF10 Zoom PF11 > > A-BY AUTHID *-ALL STMTS C-BY TXID D-BY WSNM E-BY EUID =============================================================================== > Dynamic SQL Cache Statement Statistics > statistics require that monitor class 1 and ifcid 318 be started > > place an 'a' before the EDDT command to get average for times and counts > EDDT + * + Times CPU Elapsed Wait Get- Sync Sync + Exec. Time Time Time Pages Reads Writes ACEL DPS + ------ ------------ ------------ ------------ ------ ------ ------ ---- --- + 4 00:00:00.000 00:00:00.111 00:03:14.729 32 8 0 N Y + 4 00:00:00.000 00:00:00.078 00:01:29.582 24 6 0 N Y + 3 00:00:00.017 00:00:00.000 14-07:15 0 0 0 N Y + 2 00:00:44.894 00:00:00.009 37-13:32 42 0 0 N Y + 1 00:00:00.019 00:00:00.000 60-18:57 0 0 0 N Y + 2 00:00:40.278 00:00:00.010 37-13:32 42 2 0 N Y + 1 00:00:00.000 00:00:00.001 00:00:04.539 9 1 0 N N + 0 00:00:00.000 00:00:00.000 00:00:00.000 0 0 0 N N + 1 00:00:00.000 00:00:00.000 00:00:00.000 1 0 0 N N + 1 00:00:00.000 00:00:00.010 00:00:43.591 38 2 0 N N + 1 00:00:00.000 00:00:00.000 00:00:02.725 6 0 0 N N + 1 00:00:00.000 00:00:00.000 00:00:00.000 38 0 0 N N
NavigationFor additional information about
• the dynamic SQL statement and statistics, move the cursor to the required line and press F11 (Zoom).• other topics, use the PF keys.
258 Classic Interface User's Guide
FieldsEach field reflects the data that was available when collection was executed. OMEGAMON XE for DB2 PEcollects data and refreshes the panel each time you navigate to the panel.
Times Exec.The number of times that an SQL statement in cache was executed. For a cursor statement, thisnumber represents the number of OPENs.
CPU TimeThe accumulated CPU time used while executing in DB2.
Elapsed TimeThe accumulated elapsed time for the SQL statement.
Wait TimeThe accumulated time spent waiting in DB2 for all causes.
Get - PagesThe number of Getpage requests performed for the SQL statement.
Sync ReadsThe number of synchronous Buffer Read operations performed for the SQL statement.
Sync WritesThe number of synchronous Buffer Write operations performed for the SQL statement.
ACELIDAA flag.
DPSDynamic Plan Stability flag (dynamic SQL only). DB2 12 only.
Static SQL Cache StatisticsThis panel provides additional details about the static SQL cache.
The statistical data requires that monitor class 1 and ifcid 400 are started.
One line of output is produced for each unique static SQL statement.
The following panel shows the display of DB2 11 and DB2 12:
Chapter 8. Resource Managers and Other DB2 Subsystem Information menu 259
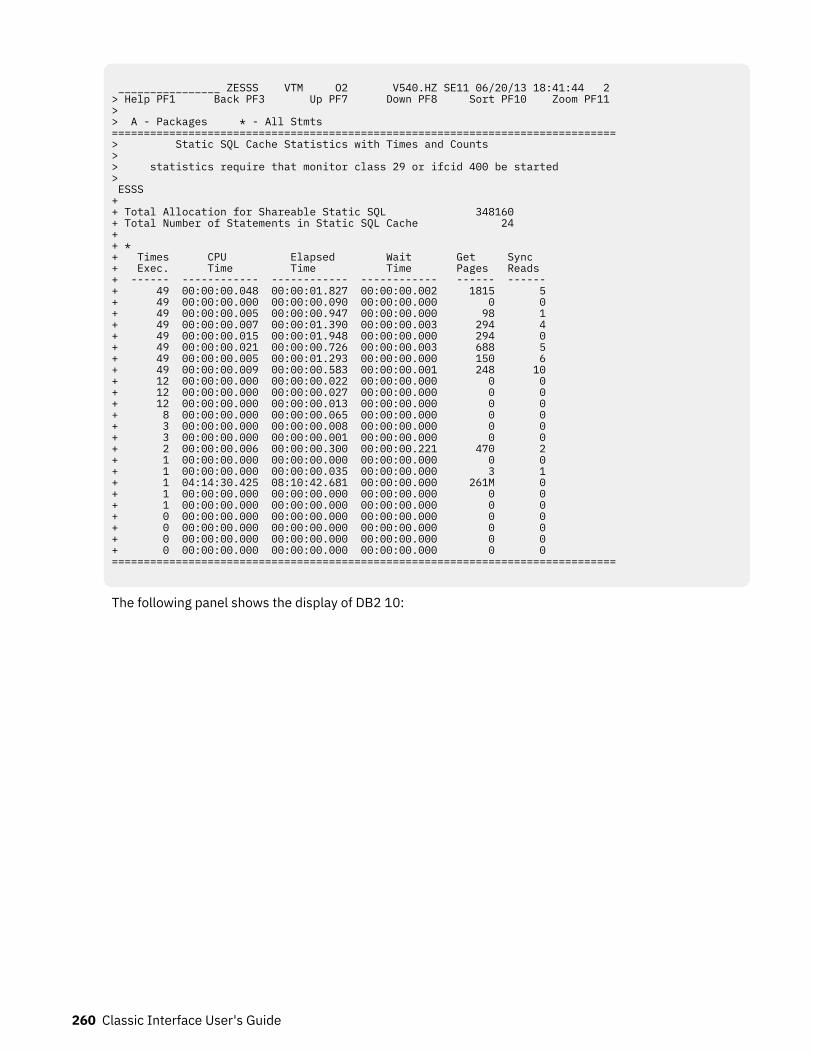
________________ ZESSS VTM O2 V540.HZ SE11 06/20/13 18:41:44 2 > Help PF1 Back PF3 Up PF7 Down PF8 Sort PF10 Zoom PF11 > > A - Packages * - All Stmts =============================================================================== > Static SQL Cache Statistics with Times and Counts > > statistics require that monitor class 29 or ifcid 400 be started > ESSS + + Total Allocation for Shareable Static SQL 348160 + Total Number of Statements in Static SQL Cache 24 + + * + Times CPU Elapsed Wait Get Sync + Exec. Time Time Time Pages Reads + ------ ------------ ------------ ------------ ------ ------ + 49 00:00:00.048 00:00:01.827 00:00:00.002 1815 5 + 49 00:00:00.000 00:00:00.090 00:00:00.000 0 0 + 49 00:00:00.005 00:00:00.947 00:00:00.000 98 1 + 49 00:00:00.007 00:00:01.390 00:00:00.003 294 4 + 49 00:00:00.015 00:00:01.948 00:00:00.000 294 0 + 49 00:00:00.021 00:00:00.726 00:00:00.003 688 5 + 49 00:00:00.005 00:00:01.293 00:00:00.000 150 6 + 49 00:00:00.009 00:00:00.583 00:00:00.001 248 10 + 12 00:00:00.000 00:00:00.022 00:00:00.000 0 0 + 12 00:00:00.000 00:00:00.027 00:00:00.000 0 0 + 12 00:00:00.000 00:00:00.013 00:00:00.000 0 0 + 8 00:00:00.000 00:00:00.065 00:00:00.000 0 0 + 3 00:00:00.000 00:00:00.008 00:00:00.000 0 0 + 3 00:00:00.000 00:00:00.001 00:00:00.000 0 0 + 2 00:00:00.006 00:00:00.300 00:00:00.221 470 2 + 1 00:00:00.000 00:00:00.000 00:00:00.000 0 0 + 1 00:00:00.000 00:00:00.035 00:00:00.000 3 1 + 1 04:14:30.425 08:10:42.681 00:00:00.000 261M 0 + 1 00:00:00.000 00:00:00.000 00:00:00.000 0 0 + 1 00:00:00.000 00:00:00.000 00:00:00.000 0 0 + 0 00:00:00.000 00:00:00.000 00:00:00.000 0 0 + 0 00:00:00.000 00:00:00.000 00:00:00.000 0 0 + 0 00:00:00.000 00:00:00.000 00:00:00.000 0 0 + 0 00:00:00.000 00:00:00.000 00:00:00.000 0 0 ===============================================================================
The following panel shows the display of DB2 10:
260 Classic Interface User's Guide
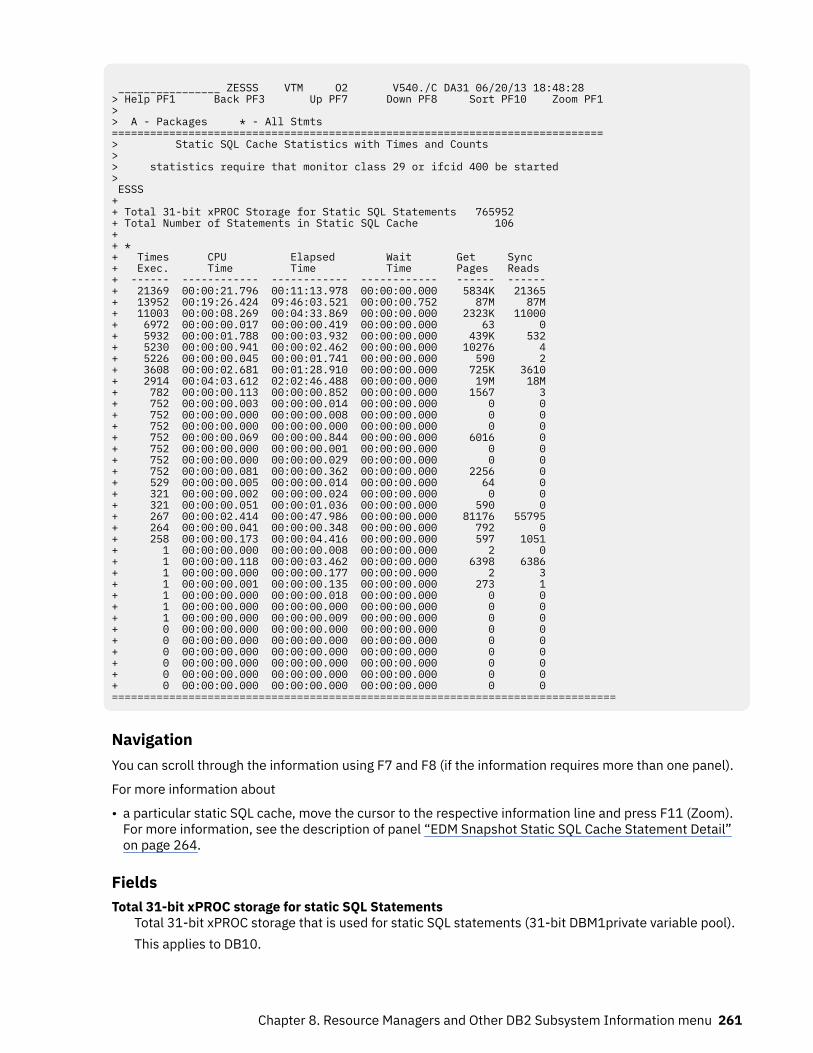
________________ ZESSS VTM O2 V540./C DA31 06/20/13 18:48:28 > Help PF1 Back PF3 Up PF7 Down PF8 Sort PF10 Zoom PF1> > A - Packages * - All Stmts =============================================================================> Static SQL Cache Statistics with Times and Counts > > statistics require that monitor class 29 or ifcid 400 be started > ESSS + + Total 31-bit xPROC Storage for Static SQL Statements 765952 + Total Number of Statements in Static SQL Cache 106 + + * + Times CPU Elapsed Wait Get Sync + Exec. Time Time Time Pages Reads + ------ ------------ ------------ ------------ ------ ------ + 21369 00:00:21.796 00:11:13.978 00:00:00.000 5834K 21365 + 13952 00:19:26.424 09:46:03.521 00:00:00.752 87M 87M + 11003 00:00:08.269 00:04:33.869 00:00:00.000 2323K 11000 + 6972 00:00:00.017 00:00:00.419 00:00:00.000 63 0 + 5932 00:00:01.788 00:00:03.932 00:00:00.000 439K 532 + 5230 00:00:00.941 00:00:02.462 00:00:00.000 10276 4 + 5226 00:00:00.045 00:00:01.741 00:00:00.000 590 2 + 3608 00:00:02.681 00:01:28.910 00:00:00.000 725K 3610 + 2914 00:04:03.612 02:02:46.488 00:00:00.000 19M 18M + 782 00:00:00.113 00:00:00.852 00:00:00.000 1567 3 + 752 00:00:00.003 00:00:00.014 00:00:00.000 0 0 + 752 00:00:00.000 00:00:00.008 00:00:00.000 0 0 + 752 00:00:00.000 00:00:00.000 00:00:00.000 0 0 + 752 00:00:00.069 00:00:00.844 00:00:00.000 6016 0 + 752 00:00:00.000 00:00:00.001 00:00:00.000 0 0 + 752 00:00:00.000 00:00:00.029 00:00:00.000 0 0 + 752 00:00:00.081 00:00:00.362 00:00:00.000 2256 0 + 529 00:00:00.005 00:00:00.014 00:00:00.000 64 0 + 321 00:00:00.002 00:00:00.024 00:00:00.000 0 0 + 321 00:00:00.051 00:00:01.036 00:00:00.000 590 0 + 267 00:00:02.414 00:00:47.986 00:00:00.000 81176 55795 + 264 00:00:00.041 00:00:00.348 00:00:00.000 792 0 + 258 00:00:00.173 00:00:04.416 00:00:00.000 597 1051 + 1 00:00:00.000 00:00:00.008 00:00:00.000 2 0 + 1 00:00:00.118 00:00:03.462 00:00:00.000 6398 6386 + 1 00:00:00.000 00:00:00.177 00:00:00.000 2 3 + 1 00:00:00.001 00:00:00.135 00:00:00.000 273 1 + 1 00:00:00.000 00:00:00.018 00:00:00.000 0 0 + 1 00:00:00.000 00:00:00.000 00:00:00.000 0 0 + 1 00:00:00.000 00:00:00.009 00:00:00.000 0 0 + 0 00:00:00.000 00:00:00.000 00:00:00.000 0 0 + 0 00:00:00.000 00:00:00.000 00:00:00.000 0 0 + 0 00:00:00.000 00:00:00.000 00:00:00.000 0 0 + 0 00:00:00.000 00:00:00.000 00:00:00.000 0 0 + 0 00:00:00.000 00:00:00.000 00:00:00.000 0 0 + 0 00:00:00.000 00:00:00.000 00:00:00.000 0 0 ===============================================================================
NavigationYou can scroll through the information using F7 and F8 (if the information requires more than one panel).
For more information about
• a particular static SQL cache, move the cursor to the respective information line and press F11 (Zoom).For more information, see the description of panel “EDM Snapshot Static SQL Cache Statement Detail”on page 264.
FieldsTotal 31-bit xPROC storage for static SQL Statements
Total 31-bit xPROC storage that is used for static SQL statements (31-bit DBM1private variable pool).This applies to DB10.
Chapter 8. Resource Managers and Other DB2 Subsystem Information menu 261
Total Allocation for Shareable Static SQLThe total allocated shareable storage for static SQL statements.This applies to DB2 11 or higher.
Total number of statements in static SQL CacheThe count of SQL statements in the static SQL cache.
Times Exec.The number of times that an SQL statement in cache was executed.
CPU TimeThe accumulated CPU time used while executing in DB2. This time includes CPU that is consumed onan IBM specialty engine.
Elapsed TimeThe accumulated elapsed time for the SQL statement.
Wait Time (Derived)The accumulated time spent waiting in DB2 for all causes.
QW0401SI Accumulated wait for synchronous I/OQW0401LK Accumulated wait for lockQW0401EU Accumulated wait for synchronous execution unit switchQW0401GL Accumulated wait time for global locksQW0401OR Accumulated wait time for read activity done by another threadQW0401OW Accumulated wait time for write activity done by another threadQW0401LH Accumulated wait time for latch reqQW0401PL Accumulated wait for page latchQW0401DL Accumulated wait for drain lockQW0401CM Accumulated wait for drain lock waiting for for claims to be releasedQW0401LW Accumulated wait for log writerQW0401WC Accumulated wait for global child L-Locks. Db2 12 and later..QW0401WD Accumulated wait for global other L-Locks. Db2 12 and later.QW0401WE Accumulated wait for global P/P P-Locks. Db2 12 and later.QW0401WF Accumulated wait for global page P-Locks. Db2 12 and later.QW0401WG Accumulated wait for global other P-Locks. Db2 12 and later.QW0401WH Accumulated wait for PIPE locks. Db2 12 and later.QW0401WPQS Accumulated wait for PQS locks. Db2 12 and later.
GetPagesThe number of Getpage requests performed for the SQL statement.
Sync ReadsThe number of synchronous Buffer Read operations performed for the SQL statement.
Static SQL Cache Statistics with Package InformationThe statistical data requires that monitor class 1 and ifcid 400 are started.
This panel organizes static SQL cache data by key fields. You can sort the fields to group similar SQLrecords together.
For the package and collection IDs, only the first 17-bytes are displayed. If the data is longer than 17bytes, a plus (+) sign is shown to indicate that the actual data is longer than the data that is displayed inthe panel. For an example, see the following panel.
With the information on this panel, database administrators can locate particular ZPARMS according toDB2 installation panels, so they can view related ZPARMs of the DB2 subsystem.
The following panel shows the display of DB2 10:
262 Classic Interface User's Guide
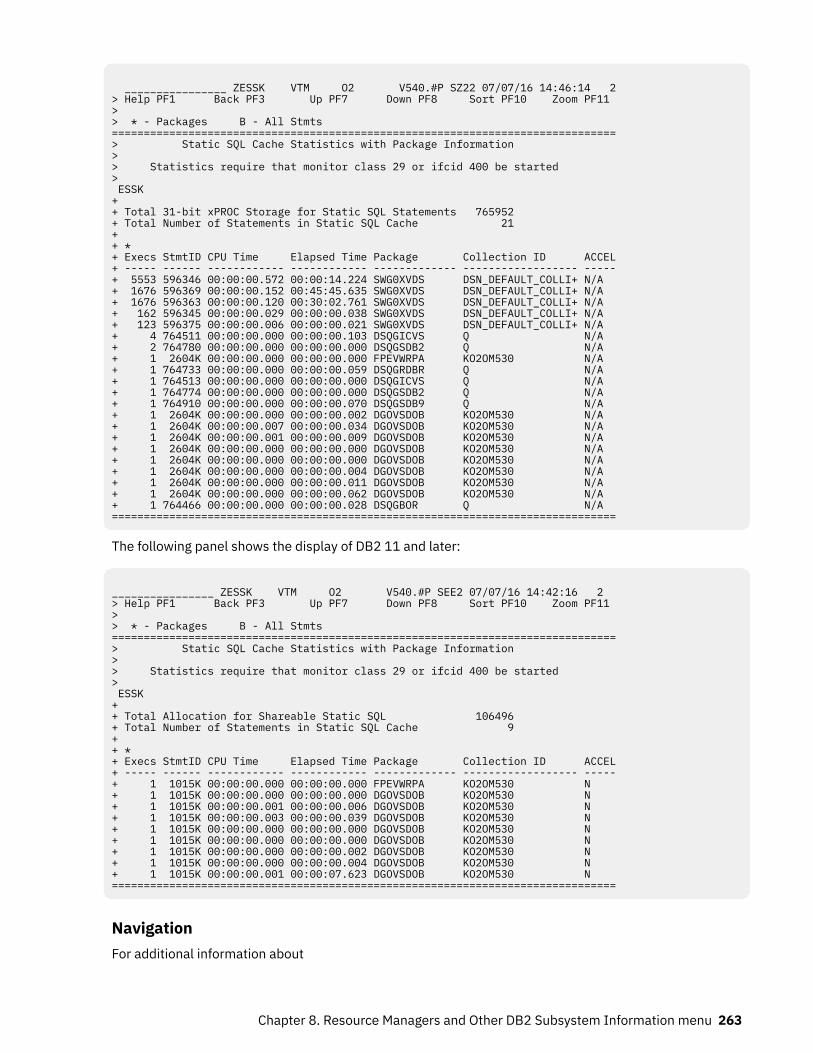
________________ ZESSK VTM O2 V540.#P SZ22 07/07/16 14:46:14 2 > Help PF1 Back PF3 Up PF7 Down PF8 Sort PF10 Zoom PF11 > > * - Packages B - All Stmts ===============================================================================> Static SQL Cache Statistics with Package Information > > Statistics require that monitor class 29 or ifcid 400 be started > ESSK + + Total 31-bit xPROC Storage for Static SQL Statements 765952 + Total Number of Statements in Static SQL Cache 21 + + * + Execs StmtID CPU Time Elapsed Time Package Collection ID ACCEL+ ----- ------ ------------ ------------ ------------- ------------------ -----+ 5553 596346 00:00:00.572 00:00:14.224 SWG0XVDS DSN_DEFAULT_COLLI+ N/A + 1676 596369 00:00:00.152 00:45:45.635 SWG0XVDS DSN_DEFAULT_COLLI+ N/A + 1676 596363 00:00:00.120 00:30:02.761 SWG0XVDS DSN_DEFAULT_COLLI+ N/A + 162 596345 00:00:00.029 00:00:00.038 SWG0XVDS DSN_DEFAULT_COLLI+ N/A + 123 596375 00:00:00.006 00:00:00.021 SWG0XVDS DSN_DEFAULT_COLLI+ N/A + 4 764511 00:00:00.000 00:00:00.103 DSQGICVS Q N/A + 2 764780 00:00:00.000 00:00:00.000 DSQGSDB2 Q N/A + 1 2604K 00:00:00.000 00:00:00.000 FPEVWRPA KO2OM530 N/A + 1 764733 00:00:00.000 00:00:00.059 DSQGRDBR Q N/A + 1 764513 00:00:00.000 00:00:00.000 DSQGICVS Q N/A + 1 764774 00:00:00.000 00:00:00.000 DSQGSDB2 Q N/A + 1 764910 00:00:00.000 00:00:00.070 DSQGSDB9 Q N/A + 1 2604K 00:00:00.000 00:00:00.002 DGOVSDOB KO2OM530 N/A + 1 2604K 00:00:00.007 00:00:00.034 DGOVSDOB KO2OM530 N/A + 1 2604K 00:00:00.001 00:00:00.009 DGOVSDOB KO2OM530 N/A + 1 2604K 00:00:00.000 00:00:00.000 DGOVSDOB KO2OM530 N/A + 1 2604K 00:00:00.000 00:00:00.000 DGOVSDOB KO2OM530 N/A + 1 2604K 00:00:00.000 00:00:00.004 DGOVSDOB KO2OM530 N/A + 1 2604K 00:00:00.000 00:00:00.011 DGOVSDOB KO2OM530 N/A + 1 2604K 00:00:00.000 00:00:00.062 DGOVSDOB KO2OM530 N/A + 1 764466 00:00:00.000 00:00:00.028 DSQGBOR Q N/A ===============================================================================
The following panel shows the display of DB2 11 and later:
________________ ZESSK VTM O2 V540.#P SEE2 07/07/16 14:42:16 2 > Help PF1 Back PF3 Up PF7 Down PF8 Sort PF10 Zoom PF11 > > * - Packages B - All Stmts =============================================================================== > Static SQL Cache Statistics with Package Information > > Statistics require that monitor class 29 or ifcid 400 be started > ESSK + + Total Allocation for Shareable Static SQL 106496 + Total Number of Statements in Static SQL Cache 9 + + * + Execs StmtID CPU Time Elapsed Time Package Collection ID ACCEL + ----- ------ ------------ ------------ ------------- ------------------ ----- + 1 1015K 00:00:00.000 00:00:00.000 FPEVWRPA KO2OM530 N + 1 1015K 00:00:00.000 00:00:00.000 DGOVSDOB KO2OM530 N + 1 1015K 00:00:00.001 00:00:00.006 DGOVSDOB KO2OM530 N + 1 1015K 00:00:00.003 00:00:00.039 DGOVSDOB KO2OM530 N + 1 1015K 00:00:00.000 00:00:00.000 DGOVSDOB KO2OM530 N + 1 1015K 00:00:00.000 00:00:00.000 DGOVSDOB KO2OM530 N + 1 1015K 00:00:00.000 00:00:00.002 DGOVSDOB KO2OM530 N + 1 1015K 00:00:00.000 00:00:00.004 DGOVSDOB KO2OM530 N + 1 1015K 00:00:00.001 00:00:07.623 DGOVSDOB KO2OM530 N ===============================================================================
NavigationFor additional information about
Chapter 8. Resource Managers and Other DB2 Subsystem Information menu 263
• the statistics detail for a particular statement, place the cursor on the row that contains the statementand press PF11.
• other topics, use the PF keys.
FieldsThe following fields are displayed for Static SQL cache:Total 31-bit xPROC Storage for Static SQL Statements
The total 31-bit xPROC storage for static SQL statements (31-bit DBM1 private variable pool).This applies to DB2 10.
Total Allocation for Shareable Static SQLThe total allocated shareable storage for static SQL statements.This applies to DB2 11 and higher.
Total Number of Statements in Static SQL CacheThe count of static SQL statements in cache.
The following fields are displayed for each static SQL statement:Execs
The number of executions.StmtlD
The statement identifier.CPU Time
The accumulated in-DB2 CPU time. This time includes CPU that is consumed on an IBM specialtyengine.
Elapsed TimeThe accumulated in-DB2 elapsed time.
PackageThe first 17 bytes of the package ID.
Collection IDThe first 17 bytes of the collection ID.
ACELIDAA flag.
EDM Snapshot Static SQL Cache Statement DetailThis panel provides static SQL cache statement detail.
The statistical data requires that monitor class 1 and ifcid 400 are started.
264 Classic Interface User's Guide
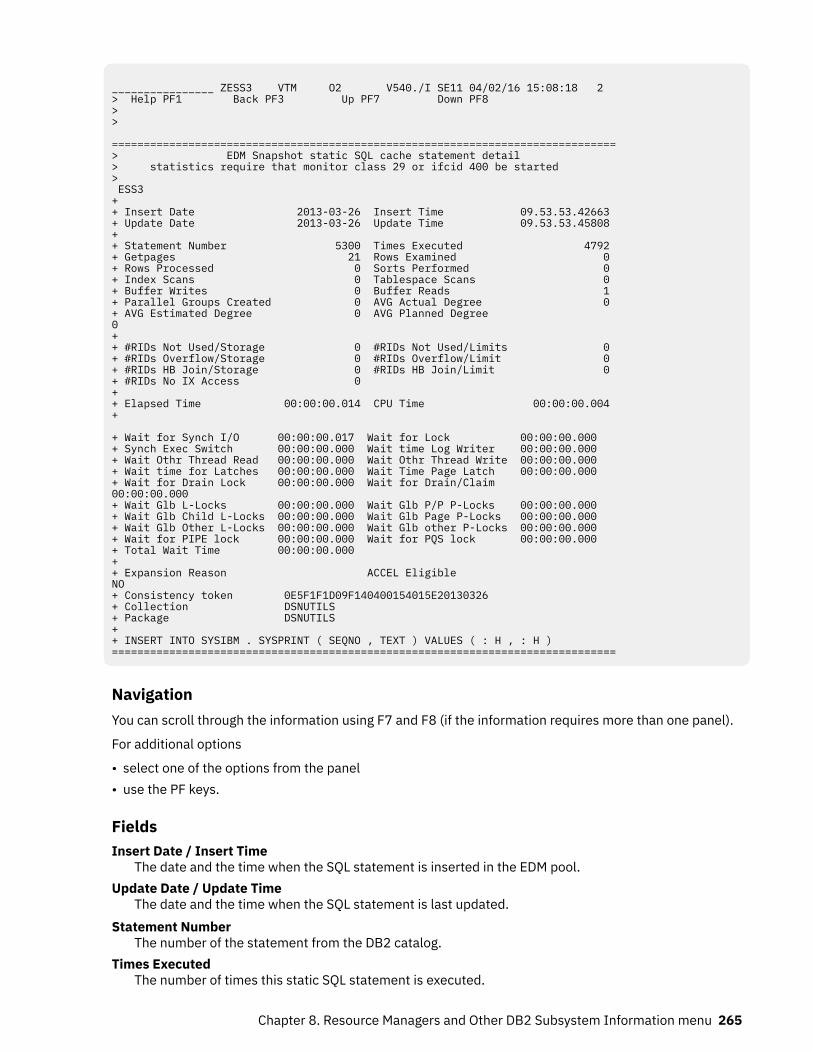
________________ ZESS3 VTM O2 V540./I SE11 04/02/16 15:08:18 2 > Help PF1 Back PF3 Up PF7 Down PF8 > > ===============================================================================> EDM Snapshot static SQL cache statement detail > statistics require that monitor class 29 or ifcid 400 be started > ESS3 + + Insert Date 2013-03-26 Insert Time 09.53.53.42663 + Update Date 2013-03-26 Update Time 09.53.53.45808 + + Statement Number 5300 Times Executed 4792 + Getpages 21 Rows Examined 0 + Rows Processed 0 Sorts Performed 0 + Index Scans 0 Tablespace Scans 0 + Buffer Writes 0 Buffer Reads 1 + Parallel Groups Created 0 AVG Actual Degree 0 + AVG Estimated Degree 0 AVG Planned Degree 0 + + #RIDs Not Used/Storage 0 #RIDs Not Used/Limits 0 + #RIDs Overflow/Storage 0 #RIDs Overflow/Limit 0 + #RIDs HB Join/Storage 0 #RIDs HB Join/Limit 0 + #RIDs No IX Access 0 + + Elapsed Time 00:00:00.014 CPU Time 00:00:00.004 +
+ Wait for Synch I/O 00:00:00.017 Wait for Lock 00:00:00.000 + Synch Exec Switch 00:00:00.000 Wait time Log Writer 00:00:00.000 + Wait Othr Thread Read 00:00:00.000 Wait Othr Thread Write 00:00:00.000 + Wait time for Latches 00:00:00.000 Wait Time Page Latch 00:00:00.000 + Wait for Drain Lock 00:00:00.000 Wait for Drain/Claim 00:00:00.000 + Wait Glb L-Locks 00:00:00.000 Wait Glb P/P P-Locks 00:00:00.000+ Wait Glb Child L-Locks 00:00:00.000 Wait Glb Page P-Locks 00:00:00.000 + Wait Glb Other L-Locks 00:00:00.000 Wait Glb other P-Locks 00:00:00.000+ Wait for PIPE lock 00:00:00.000 Wait for PQS lock 00:00:00.000 + Total Wait Time 00:00:00.000++ Expansion Reason ACCEL Eligible NO + Consistency token 0E5F1F1D09F140400154015E20130326 + Collection DSNUTILS + Package DSNUTILS + + INSERT INTO SYSIBM . SYSPRINT ( SEQNO , TEXT ) VALUES ( : H , : H ) ===============================================================================
NavigationYou can scroll through the information using F7 and F8 (if the information requires more than one panel).
For additional options
• select one of the options from the panel• use the PF keys.
FieldsInsert Date / Insert Time
The date and the time when the SQL statement is inserted in the EDM pool.Update Date / Update Time
The date and the time when the SQL statement is last updated.Statement Number
The number of the statement from the DB2 catalog.Times Executed
The number of times this static SQL statement is executed.
Chapter 8. Resource Managers and Other DB2 Subsystem Information menu 265
GetpagesThe number of pages that are returned.
Rows ExaminedThe number of rows that are examined.
Rows ProcessedThe number of rows that are processed.
Sorts PerformedThe number of rows that are sorted.
Index ScansThe number of index scans that are performed.
Tablespace ScansThe number of tablespace scans that are performed.
Buffer WritesThe number of Buffer Write operations that are performed.
Parallel Groups CreatedThe number of parallel groups that are created.
AVG Actual DegreeThe average actual degree of parallelism for all parallel groups. This value is calculated at executiontime after buffer pool negotiation and system negotiation are taken into account.This applies to DB2 11 and higher.
AVG Estimated DegreeThe average estimated degree of parallelism for all parallel groups. The values for the estimateddegree are calculated at bind time. They are based on the cost formula. The value for the averageestimated degree is calculated at execution time.This applies to DB2 11 and higher.
AVG Planned DegreeThe average planned maximum degree of parallelism for all parallel groups. This value is calculated atexecution time. It is the optimal degree of parallelism that can be obtained at execution time afterhost variables or parameter markers are resolved and before buffer pool negotiation and systemnegotiation are performed.This applies to DB2 11 and higher.
# RIDs Not Used/StorageThe number of times a RID list is not used because there is not enough storage available to hold thelist of RIDs.
# RIDs Not Used/LimitThe number of times a RID list is not used because the number of RIDs exceeds the DB2 limits.
# RIDs Overflow/StorageThe number of times that a RID list overflows to a work file because a RID pool storage is not availableto hold the list of RIDs.This applies to DB2 11 and higher.
# RIDs Overflow/LimitThe number of times that a RID list overflows to a work file because the number of RIDs exceedsinternal limits.This applies to DB2 11 and higher.
# RIDs HB Join/StorageThe number of times that appending to a RID list for a hybrid join is interrupted because a RID poolstorage is not available to hold the list of RIDs.This applies to DB2 11 and higher.
266 Classic Interface User's Guide
# RIDs HB Join/LimitThe number of times that appending to a RID list for a hybrid join is interrupted because the numberof RIDs exceeds internal limits.This applies to DB2 11 and higher.
# RIDs No IX AccessThe number of times that RID list retrieval for multiple index access is not done because DB2 cannotdetermine the outcome of index ANDing or ORing.This applies to DB2 11 and higher.
Elapsed TimeThe accumulated In-DB2 elapsed time.
CPU TimeThe accumulated In-DB2 CPU time. This time includes CPU consumed on a Specialty Engine (SE).
Wait for Sync I/OThe accumulated waiting time for synchronous I/O.
Wait for LockThe accumulated waiting time for lock.
Sync Exec SwitchThe accumulated waiting time for a synchronous execution unit switch.
Wait time Log writerThe accumulated waiting time for log writers.
Wait Othr Thread ReadThe accumulated wait time for read activity done by another thread.
Wait Othr Thread WriteThe accumulated waiting time for writing activity that is done by another thread.
Wait time for LatchesThe accumulated waiting time for latch requests.
Wait time Page LatchThe accumulated waiting time for page latches.
Wait time Drain LockThe accumulated waiting time for drain locks.
Wait time drain/claimThe accumulated waiting time for drain locks that are waiting for claims to be released.
Wait Glb L-LocksThe accumulated waiting time for global locks.
Wait Glb P/P P-LocksAccumulated wait for global P/P P-Locks for the statement. DB2 12 or later.
Wait Glb Child L-LocksAccumulated wait for global child L-Locks for the statement. DB2 12 or later.
Wait Glb Page P-LocksAccumulated wait for global page P-Locks for the statement. DB2 12 or later.
Wait Glb Other L-LocksAccumulated wait for global other L-Locks for the statement. DB2 12 or later.
Wait Glb Other P-LocksAccumulated wait for global other P-Locks for the statement. DB2 12 or later.
Wait for PIPE lockAccumulated wait for pipe wait. DB2 12 or later.
Wait for PQS lockAccumulated time waiting for parallel queries to synchronize between parent and child tasks. DB2 12or later.
Chapter 8. Resource Managers and Other DB2 Subsystem Information menu 267
Total Wait TimeA summary of all waiting times.
Expansion ReasonThe reason that caused the expansion. The query contains an implicit query transformation that iscaused by one of the following items:A
The SYSIBMADM.GET_ARCHIVE built-in global variable.B
The current temporal BUSINESS_TIME special register.S
The current temporal SYSTEM_TIME special register.SB
The current temporal BUSINESS_TIME special register and the current temporal SYSTEM_TIMEspecial register.
' 'The query does not contain an implicit query transformation that is caused by the currenttemporal BUSINESS_TIME special register, the current temporal SYSTEM_TIME special register, orthe SYSIBMADM.GET_ARCHIVE built-in global variable.
N/ANo data available.
ACCEL EligibleStatement is eligible to run on an accelerator. DB2 11 or later.
Consistency tokenThe consistency token of the package for this static SQL statement.
CollectionThe collection ID of the package for this static SQL statement.
PackageThe package ID for this static SQL statement.
SQL TextIf it can be found in the DB2 catalog tables for this statement, the SQL text is displayed.
EDM Snapshot Dynamic SQL Cache Statement Statistics DetailThis panel provides additional details about a particular SQL statement.
268 Classic Interface User's Guide

________________ ZEDD3 VTM O2 V540./C SE11 07/30/13 1:59:11 2 > Help PF1 Back PF3 Up PF7 Down PF8 > A-SQL PA =============================================================================== > Dynamic SQL Cache Statement Statistics Detail > statistics require that monitor class 1 and ifcid 318 be started EDD3 + Authorization Id: HONG + + Insert Date 07/29/2013 Insert Time 23:16:52.6634 + Update Date 07/29/2013 Update Time 23:16:52.8470 + Collection Began Date 07/29/2013 Collection Began Time 16:22:43.7640 + + Statement Token 0000177A Times Executed 1 + Getpages 5 Rows Examined 0 + Rows Processed 1 Sorts Performed 0 + Index Scans 1 Tablespace Scans 0 + Synchronous Buffer Reads 4 Synchronous Writes 0 + Number of Current Users 1 Copies of Statement 1 + Parallel Groups Created 0 AVG Actual Degree 0 + AVG Estimated Degree 0 AVG Planned Degree 0 + + #RIDs Not Used/Storage 0 #RIDs Not Used/Limit 0 + #RIDs Overflow/Storage 0 #RIDs Overflow/Limit 0 + #RIDs HB Join/Storage 0 #RIDs HB Join/Limit 0 + #RIDs No IX Access 0 + + Elapsed Time 00:00:00.140 CPU Time 00:00:00.000 + + Wait for Synch I/O 00:00:00.017 Wait for Lock/Latch 00:00:00.000 + Synch Exec Switch 00:00:00.000 Wait for Log Writer 00:00:00.000 + Wait Othr Thread Read 00:00:00.000 Wait Othr Thread Write 00:00:00.000 + Wait for Latch Req 00:00:00.000 Wait Time Page Latch 00:00:00.000 + Wait for Drain Lock 00:00:00.000 Wait for Drain/Claim 00:00:00.000 + Wait Glb L-Locks 00:00:00.000 Wait Glb P/P P-Locks 00:00:00.000+ Wait Glb Child L-Locks 00:00:00.000 Wait Glb Page P-Locks 00:00:00.000 + Wait Glb Other L-Locks 00:00:00.000 Wait Glb other P-Locks 00:00:00.000+ Wait for PIPE lock 00:00:00.000 Wait for PQS lock 00:00:00.000 + + Isolation Bind RR Currentdata Bind N + Dynamic rules Bind R Current Degree 1 + Current Rules D Current Precision N + Cursor Hold N Concentrate Statement N + Status of Statement UNKNOWN Expansion Reason+ ACCEL Eligible NO + Stabilized Stmt ID 4 Hash ID Version 1 + Query Hash ID 5B263645202428130208737318120876 + + DSG Member SC21 + + Stabilization Grp + HONGTST2_BUT_WITH_LONGNM + + Transaction Name + HONG2 + + Workstation Name + TSO + + End User ID + + Program Name + SYSLH200 + + Prepare ID + HONG
Chapter 8. Resource Managers and Other DB2 Subsystem Information menu 269
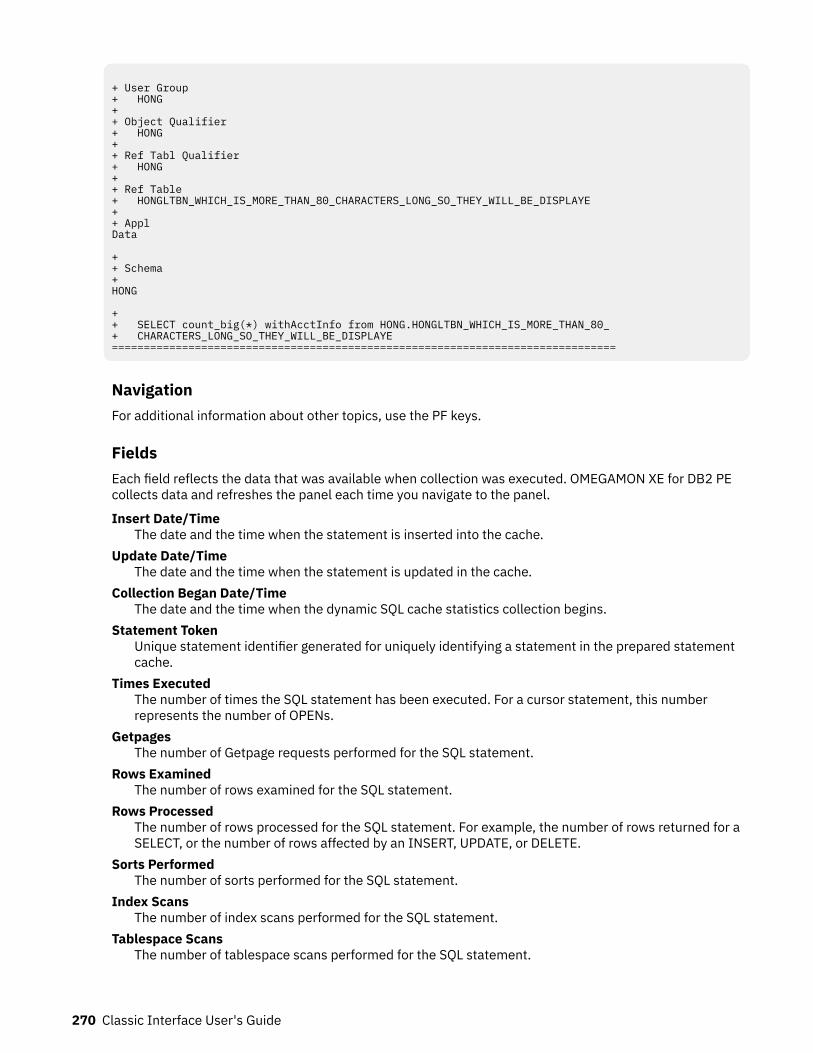
+ User Group + HONG + + Object Qualifier + HONG + + Ref Tabl Qualifier + HONG + + Ref Table + HONGLTBN_WHICH_IS_MORE_THAN_80_CHARACTERS_LONG_SO_THEY_WILL_BE_DISPLAYE + + Appl Data + + Schema + HONG + + SELECT count_big(*) withAcctInfo from HONG.HONGLTBN_WHICH_IS_MORE_THAN_80_ + CHARACTERS_LONG_SO_THEY_WILL_BE_DISPLAYE ===============================================================================
NavigationFor additional information about other topics, use the PF keys.
FieldsEach field reflects the data that was available when collection was executed. OMEGAMON XE for DB2 PEcollects data and refreshes the panel each time you navigate to the panel.
Insert Date/TimeThe date and the time when the statement is inserted into the cache.
Update Date/TimeThe date and the time when the statement is updated in the cache.
Collection Began Date/TimeThe date and the time when the dynamic SQL cache statistics collection begins.
Statement TokenUnique statement identifier generated for uniquely identifying a statement in the prepared statementcache.
Times ExecutedThe number of times the SQL statement has been executed. For a cursor statement, this numberrepresents the number of OPENs.
GetpagesThe number of Getpage requests performed for the SQL statement.
Rows ExaminedThe number of rows examined for the SQL statement.
Rows ProcessedThe number of rows processed for the SQL statement. For example, the number of rows returned for aSELECT, or the number of rows affected by an INSERT, UPDATE, or DELETE.
Sorts PerformedThe number of sorts performed for the SQL statement.
Index ScansThe number of index scans performed for the SQL statement.
Tablespace ScansThe number of tablespace scans performed for the SQL statement.
270 Classic Interface User's Guide
Synchronous Buffer ReadsThe number of synchronous Buffer Read operations performed for the SQL statement.
Synchronous WritesThe number of synchronous Buffer Write operations performed for the SQL statement.
Number of Current UsersThe number of current users of the statement. Current users have prepared or executed thestatement during their current unit of work.
Copies of StatementThe number of copies of the statement that is owned by all threads in the system.
Parallel Groups CreatedThe number of parallel groups created for the SQL statement.
AVG Actual DegreeThe average parallel group actual degree. It is obtained at execution time after considering the bufferpool negotiation and the system negotiation.
AVG Estimated DegreeThe average parallel group estimated degree. This is the bind time estimated parallel group degreethat is based on the cost formula. If the parallel group contains a host variable or a parameter marker,the bind time estimates the parallel group degree based on a valid assumption value.
AVG Planned DegreeThe average parallel group plan degree. This is the ideal parallel group degree that is obtained atexecution time after the host variable or the parameter marker value is plug-in and before buffer poolnegotiation and system negotiation are performed.
# RIDs Not Used/StorageThe number of times that a RID list is not used because enough storage is not available to hold the listof RIDs.
# RIDs not Used/LimitThe number of times that a RID list is not used because the number of RIDs exceeded one or moreinternal DB2 limits.
# RIDs Overflow/StorageThe number of times a RID list is overflowed to a work file because a RIDPOOL storage is not availableto hold the list of the RIDs.
# RIDs Overflow/LimitThe number of times a RID list is overflowed to a work file because the number of RIDs exceeded oneor more internal limits.This applies to DB2 11 and higher.
# RIDs HB Join/StorageThe number of times a RID list append for a Hybrid Join is interrupted because a RIDPOOL storage isnot available to hold the list of RIDs, for example, the number of times DB2 interrupts the RID phaseand switches to the Data phase.This applies to DB2 11 and higher.
# RIDs HB Join/LimitThe number of times a RID list append for a Hybrid Join is interrupted because the number of RIDsexceeded one or more internal limits, for example, the number of times DB2 interrups the RID phaseand switches to the Data phase.This applies to DB2 11 and higher.
RIDs No IX AccessThe number of times a RID list retrieval for multiple index access is skipped because DB2 canpredetermine the outcome of index ANDing or ORing.
Elapsed TimeThe accumulated elapsed time used for the SQL statement.
Chapter 8. Resource Managers and Other DB2 Subsystem Information menu 271
CPU TimeThe accumulated CPU time for the SQL statement. This includes CPU that is consumed on an IBMspecialty engine.
The following wait time fields are only collected when Accounting trace class 3 is active.Wait for Synch I/O
The accumulated wait time for synchronous I/O operations.Wait for Lock/Latch
The accumulated wait time for lock and latch requests.Synch Exec Switch
The accumulated wait time for synchronous execution unit switch.Wait for Log Writer
The accumulated wait time for log writers.Wait Othr Thread Read
The accumulated wait time for read activity performed by another thread.Wait Othr Thread Write
The accumulated wait time for write activity performed by another thread.Wait for Latch Req
The accumulated wait time for Latch requests.Wait Time Page Latch
The accumulated wait time for Page latches.Wait for Drain Lock
The accumulated wait time for Drain locks.Wait for Drain/Claim
The accumulated wait time for Drain locks that are waiting for claims to be released.Wait for Glb L-Locks
The accumulated wait time for global locks.Wait Glb P/P P-Locks
Accumulated wait for global P/P P-Locks for the statement. DB2 12 or later.Wait Glb Child L-Locks
Accumulated wait for global child L-Locks for the statement. DB2 12 or later.Wait Glb Page P-Locks
Accumulated wait for global page P-Locks for the statement. DB2 12 or later.Wait Glb Other L-Locks
Accumulated wait for global other L-Locks for the statement. DB2 12 or later.Wait Glb Other P-Locks
Accumulated wait for global other P-Locks for the statement. DB2 12 or later.Wait for PIPE lock
Accumulated wait for pipe wait. DB2 12 or later.Wait for PQS lock
Accumulated time waiting for parallel queries to synchronize between parent and child tasks. DB2 12or later.
Isolation BindISOLATION BIND is in effect on initial PREPARE; it does not reflect ISOLATION specified in the WITHclauseUR: ISOLATION(UR)
Uncommitted ReadCS: ISOLATION(CS)
Cursor stabilityRS: ISOLATION(RS)
Read stability
272 Classic Interface User's Guide
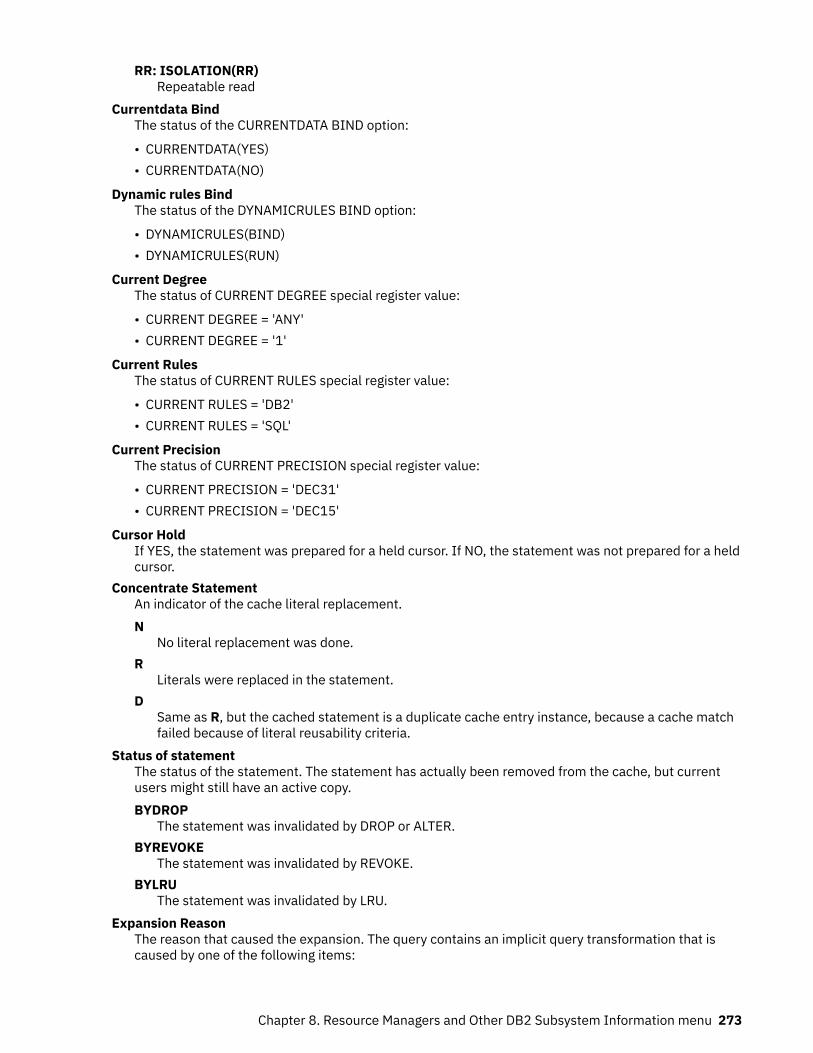
RR: ISOLATION(RR)Repeatable read
Currentdata BindThe status of the CURRENTDATA BIND option:
• CURRENTDATA(YES)• CURRENTDATA(NO)
Dynamic rules BindThe status of the DYNAMICRULES BIND option:
• DYNAMICRULES(BIND)• DYNAMICRULES(RUN)
Current DegreeThe status of CURRENT DEGREE special register value:
• CURRENT DEGREE = 'ANY'• CURRENT DEGREE = '1'
Current RulesThe status of CURRENT RULES special register value:
• CURRENT RULES = 'DB2'• CURRENT RULES = 'SQL'
Current PrecisionThe status of CURRENT PRECISION special register value:
• CURRENT PRECISION = 'DEC31'• CURRENT PRECISION = 'DEC15'
Cursor HoldIf YES, the statement was prepared for a held cursor. If NO, the statement was not prepared for a heldcursor.
Concentrate StatementAn indicator of the cache literal replacement.N
No literal replacement was done.R
Literals were replaced in the statement.D
Same as R, but the cached statement is a duplicate cache entry instance, because a cache matchfailed because of literal reusability criteria.
Status of statementThe status of the statement. The statement has actually been removed from the cache, but currentusers might still have an active copy.BYDROP
The statement was invalidated by DROP or ALTER.BYREVOKE
The statement was invalidated by REVOKE.BYLRU
The statement was invalidated by LRU.Expansion Reason
The reason that caused the expansion. The query contains an implicit query transformation that iscaused by one of the following items:
Chapter 8. Resource Managers and Other DB2 Subsystem Information menu 273
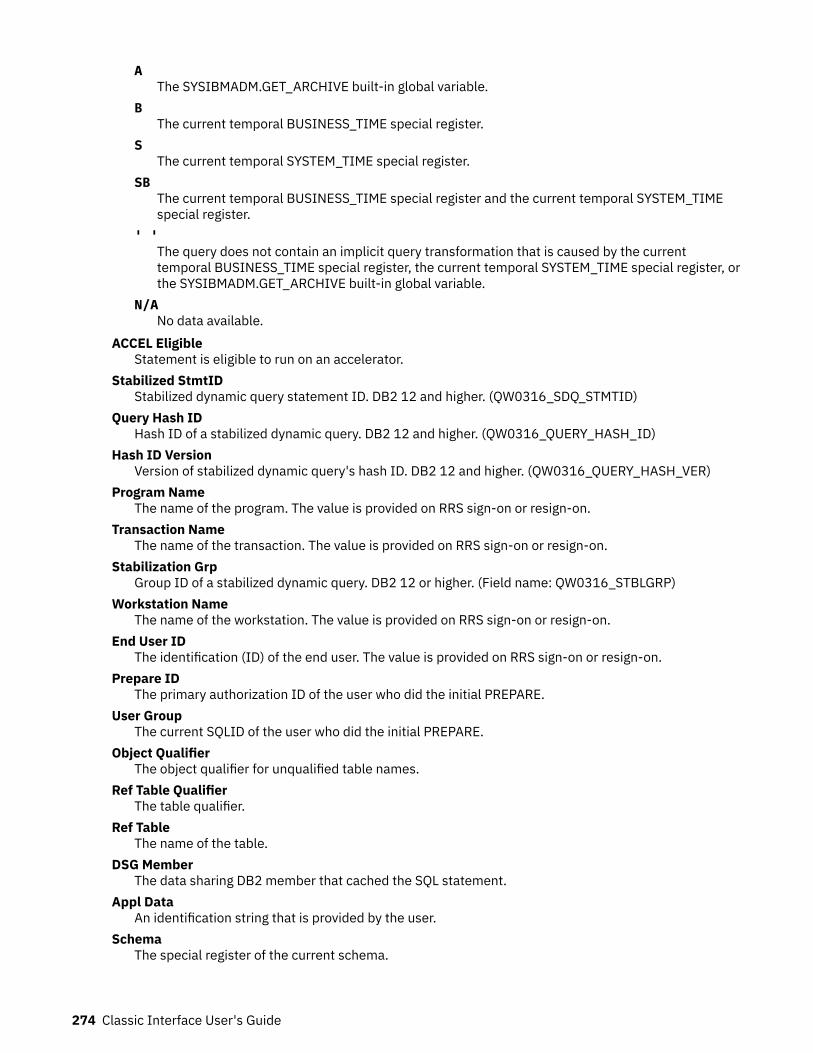
AThe SYSIBMADM.GET_ARCHIVE built-in global variable.
BThe current temporal BUSINESS_TIME special register.
SThe current temporal SYSTEM_TIME special register.
SBThe current temporal BUSINESS_TIME special register and the current temporal SYSTEM_TIMEspecial register.
' 'The query does not contain an implicit query transformation that is caused by the currenttemporal BUSINESS_TIME special register, the current temporal SYSTEM_TIME special register, orthe SYSIBMADM.GET_ARCHIVE built-in global variable.
N/ANo data available.
ACCEL EligibleStatement is eligible to run on an accelerator.
Stabilized StmtIDStabilized dynamic query statement ID. DB2 12 and higher. (QW0316_SDQ_STMTID)
Query Hash IDHash ID of a stabilized dynamic query. DB2 12 and higher. (QW0316_QUERY_HASH_ID)
Hash ID VersionVersion of stabilized dynamic query's hash ID. DB2 12 and higher. (QW0316_QUERY_HASH_VER)
Program NameThe name of the program. The value is provided on RRS sign-on or resign-on.
Transaction NameThe name of the transaction. The value is provided on RRS sign-on or resign-on.
Stabilization GrpGroup ID of a stabilized dynamic query. DB2 12 or higher. (Field name: QW0316_STBLGRP)
Workstation NameThe name of the workstation. The value is provided on RRS sign-on or resign-on.
End User IDThe identification (ID) of the end user. The value is provided on RRS sign-on or resign-on.
Prepare IDThe primary authorization ID of the user who did the initial PREPARE.
User GroupThe current SQLID of the user who did the initial PREPARE.
Object QualifierThe object qualifier for unqualified table names.
Ref Table QualifierThe table qualifier.
Ref TableThe name of the table.
DSG MemberThe data sharing DB2 member that cached the SQL statement.
Appl DataAn identification string that is provided by the user.
SchemaThe special register of the current schema.
274 Classic Interface User's Guide
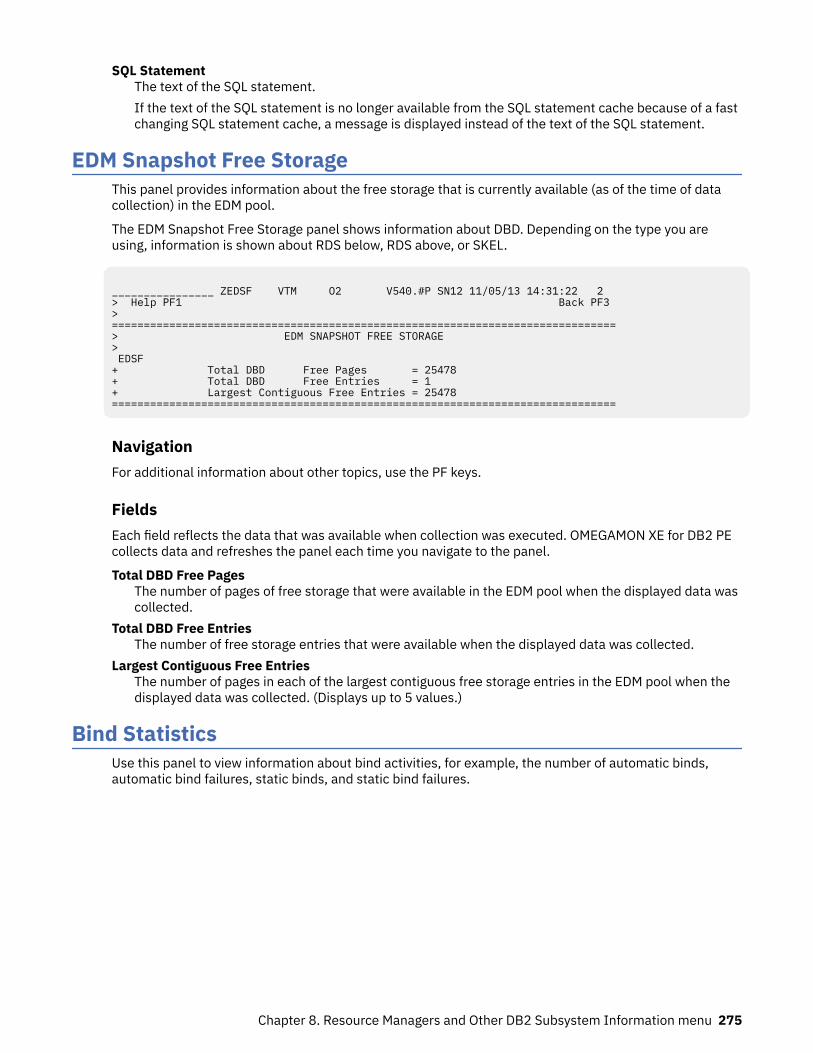
SQL StatementThe text of the SQL statement.If the text of the SQL statement is no longer available from the SQL statement cache because of a fastchanging SQL statement cache, a message is displayed instead of the text of the SQL statement.
EDM Snapshot Free StorageThis panel provides information about the free storage that is currently available (as of the time of datacollection) in the EDM pool.
The EDM Snapshot Free Storage panel shows information about DBD. Depending on the type you areusing, information is shown about RDS below, RDS above, or SKEL.
________________ ZEDSF VTM O2 V540.#P SN12 11/05/13 14:31:22 2 > Help PF1 Back PF3 > =============================================================================== > EDM SNAPSHOT FREE STORAGE > EDSF + Total DBD Free Pages = 25478 + Total DBD Free Entries = 1 + Largest Contiguous Free Entries = 25478 ===============================================================================
NavigationFor additional information about other topics, use the PF keys.
FieldsEach field reflects the data that was available when collection was executed. OMEGAMON XE for DB2 PEcollects data and refreshes the panel each time you navigate to the panel.
Total DBD Free PagesThe number of pages of free storage that were available in the EDM pool when the displayed data wascollected.
Total DBD Free EntriesThe number of free storage entries that were available when the displayed data was collected.
Largest Contiguous Free EntriesThe number of pages in each of the largest contiguous free storage entries in the EDM pool when thedisplayed data was collected. (Displays up to 5 values.)
Bind StatisticsUse this panel to view information about bind activities, for example, the number of automatic binds,automatic bind failures, static binds, and static bind failures.
Chapter 8. Resource Managers and Other DB2 Subsystem Information menu 275
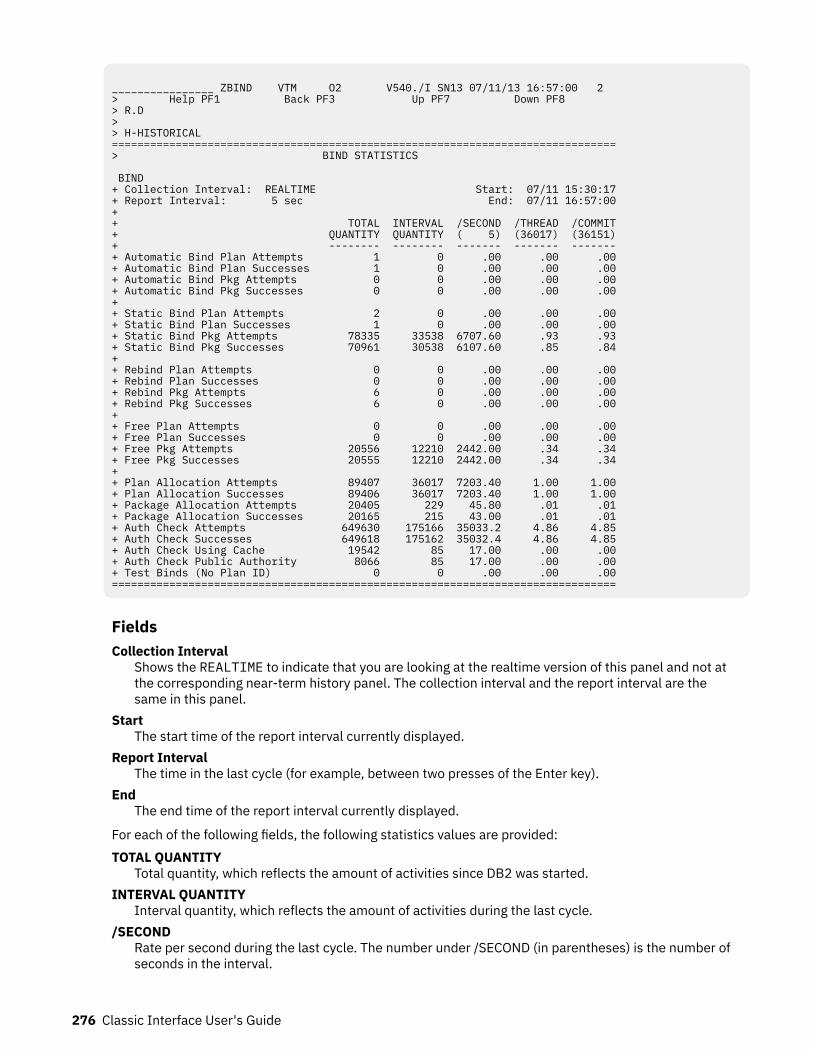
________________ ZBIND VTM O2 V540./I SN13 07/11/13 16:57:00 2 > Help PF1 Back PF3 Up PF7 Down PF8 > R.D > > H-HISTORICAL ===============================================================================> BIND STATISTICS BIND + Collection Interval: REALTIME Start: 07/11 15:30:17+ Report Interval: 5 sec End: 07/11 16:57:00+ + TOTAL INTERVAL /SECOND /THREAD /COMMIT+ QUANTITY QUANTITY ( 5) (36017) (36151)+ -------- -------- ------- ------- -------+ Automatic Bind Plan Attempts 1 0 .00 .00 .00+ Automatic Bind Plan Successes 1 0 .00 .00 .00+ Automatic Bind Pkg Attempts 0 0 .00 .00 .00+ Automatic Bind Pkg Successes 0 0 .00 .00 .00+ + Static Bind Plan Attempts 2 0 .00 .00 .00+ Static Bind Plan Successes 1 0 .00 .00 .00+ Static Bind Pkg Attempts 78335 33538 6707.60 .93 .93+ Static Bind Pkg Successes 70961 30538 6107.60 .85 .84+ + Rebind Plan Attempts 0 0 .00 .00 .00+ Rebind Plan Successes 0 0 .00 .00 .00+ Rebind Pkg Attempts 6 0 .00 .00 .00+ Rebind Pkg Successes 6 0 .00 .00 .00+ + Free Plan Attempts 0 0 .00 .00 .00+ Free Plan Successes 0 0 .00 .00 .00+ Free Pkg Attempts 20556 12210 2442.00 .34 .34+ Free Pkg Successes 20555 12210 2442.00 .34 .34+ + Plan Allocation Attempts 89407 36017 7203.40 1.00 1.00+ Plan Allocation Successes 89406 36017 7203.40 1.00 1.00+ Package Allocation Attempts 20405 229 45.80 .01 .01+ Package Allocation Successes 20165 215 43.00 .01 .01+ Auth Check Attempts 649630 175166 35033.2 4.86 4.85+ Auth Check Successes 649618 175162 35032.4 4.86 4.85+ Auth Check Using Cache 19542 85 17.00 .00 .00+ Auth Check Public Authority 8066 85 17.00 .00 .00 + Test Binds (No Plan ID) 0 0 .00 .00 .00 ===============================================================================
FieldsCollection Interval
Shows the REALTIME to indicate that you are looking at the realtime version of this panel and not atthe corresponding near-term history panel. The collection interval and the report interval are thesame in this panel.
StartThe start time of the report interval currently displayed.
Report IntervalThe time in the last cycle (for example, between two presses of the Enter key).
EndThe end time of the report interval currently displayed.
For each of the following fields, the following statistics values are provided:TOTAL QUANTITY
Total quantity, which reflects the amount of activities since DB2 was started.INTERVAL QUANTITY
Interval quantity, which reflects the amount of activities during the last cycle./SECOND
Rate per second during the last cycle. The number under /SECOND (in parentheses) is the number ofseconds in the interval.
276 Classic Interface User's Guide
/THREADRate per thread during the last cycle. The number under /THREAD (in parentheses) is the number ofCreate Threads during the interval.
/COMMITRate per Commit during the last cycle. The number under /COMMIT (in parentheses) is the number ofcommit requests (including abort requests) during the interval.
Automatic Bind Plan AttemptsThe attempts of DB2 to perform an automatic bind of a plan.
Automatic Bind Plan SuccessesThe successful attempts of DB2 to perform an automatic bind of a plan.
Automatic Bind Pkg AttemptsThe attempts of DB2 to perform an automatic bind of a package.
Automatic Bind Pkg SuccessesThe successful attempts of DB2 to perform an automatic bind of a package.
Static Bind Plan AttemptsRepresents the Bind subcommands issued, including the Bind Plan Add and Bind Plan Replacesubcommands.
Static Bind Plan SuccessesRepresents the Bind subcommands that succeeded.
Static Bind Pkg AttemptsRepresents the bind package subcommands issued, including the Bind Package Add and BindPackage Replace subcommands.
Static Bind Pkg SuccessesRepresents the bind package subcommands that succeeded.
Rebind Plan AttemptsAttempts to rebind a plan.
Rebind Plan SuccessesSuccessful attempts to rebind a plan.
Rebind Pkg AttemptsAttempts to rebind a package.
Rebind Pkg SuccessesSuccessful attempts to rebind a package.
Free Plan AttemptsAttempts to free a plan.
Free Plan SuccessesSuccessful attempts to free a plan.
Free Pkg AttemptsAttempts to free a package.
Free Pkg SuccessesSuccessful attempts to free a package.
Plan Allocation AttemptsThe requests from the attachment facility to DB2 to allocate a bound plan for a user.
Plan Allocation SuccessesSuccessful plan allocation attempts.
Package Allocation AttemptsThe requests from the attachment facility to DB2 to allocate a bound package for a user.
Package Allocation SuccessesSuccessful package allocation attempts.
Auth Check AttemptsAuthorization checks for all plans
Chapter 8. Resource Managers and Other DB2 Subsystem Information menu 277
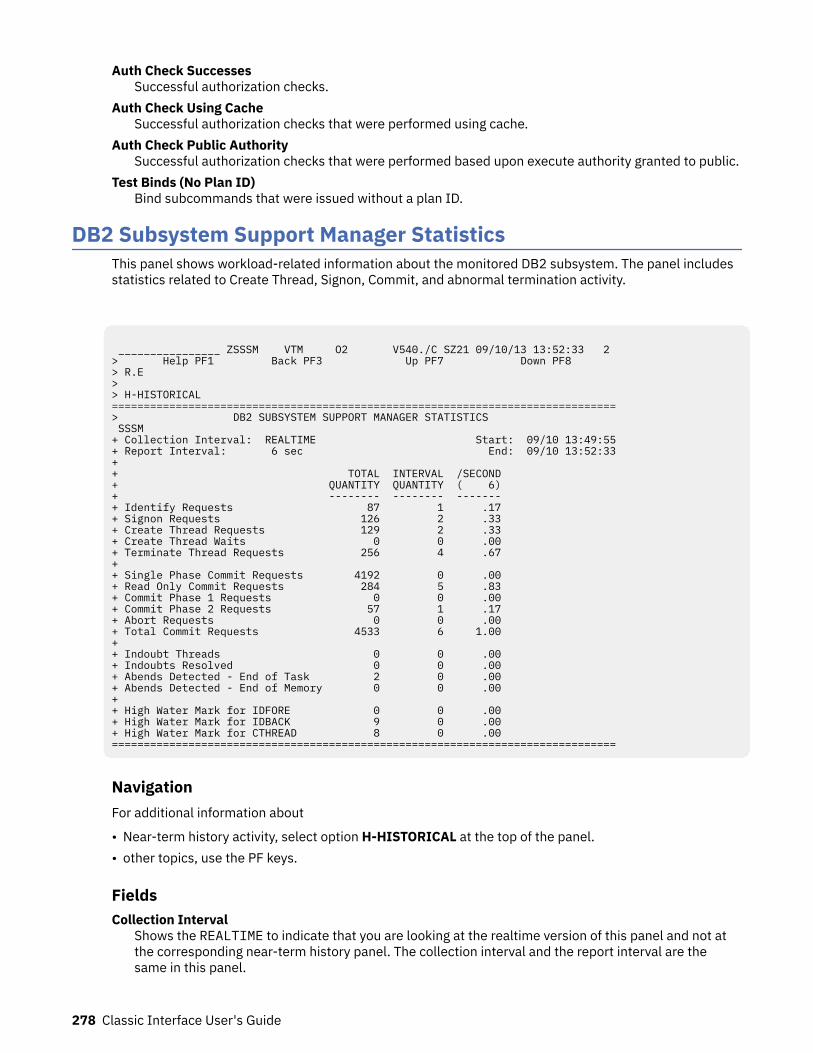
Auth Check SuccessesSuccessful authorization checks.
Auth Check Using CacheSuccessful authorization checks that were performed using cache.
Auth Check Public AuthoritySuccessful authorization checks that were performed based upon execute authority granted to public.
Test Binds (No Plan ID)Bind subcommands that were issued without a plan ID.
DB2 Subsystem Support Manager StatisticsThis panel shows workload-related information about the monitored DB2 subsystem. The panel includesstatistics related to Create Thread, Signon, Commit, and abnormal termination activity.
________________ ZSSSM VTM O2 V540./C SZ21 09/10/13 13:52:33 2 > Help PF1 Back PF3 Up PF7 Down PF8 > R.E > > H-HISTORICAL ===============================================================================> DB2 SUBSYSTEM SUPPORT MANAGER STATISTICS SSSM + Collection Interval: REALTIME Start: 09/10 13:49:55+ Report Interval: 6 sec End: 09/10 13:52:33+ + TOTAL INTERVAL /SECOND + QUANTITY QUANTITY ( 6) + -------- -------- ------- + Identify Requests 87 1 .17 + Signon Requests 126 2 .33 + Create Thread Requests 129 2 .33 + Create Thread Waits 0 0 .00 + Terminate Thread Requests 256 4 .67 + + Single Phase Commit Requests 4192 0 .00 + Read Only Commit Requests 284 5 .83 + Commit Phase 1 Requests 0 0 .00 + Commit Phase 2 Requests 57 1 .17 + Abort Requests 0 0 .00 + Total Commit Requests 4533 6 1.00 + + Indoubt Threads 0 0 .00 + Indoubts Resolved 0 0 .00 + Abends Detected - End of Task 2 0 .00 + Abends Detected - End of Memory 0 0 .00 + + High Water Mark for IDFORE 0 0 .00 + High Water Mark for IDBACK 9 0 .00 + High Water Mark for CTHREAD 8 0 .00 ===============================================================================
NavigationFor additional information about
• Near-term history activity, select option H-HISTORICAL at the top of the panel.• other topics, use the PF keys.
FieldsCollection Interval
Shows the REALTIME to indicate that you are looking at the realtime version of this panel and not atthe corresponding near-term history panel. The collection interval and the report interval are thesame in this panel.
278 Classic Interface User's Guide
StartThe start time of the report interval currently displayed.
Report IntervalThe time in the last cycle (for example, between two presses of the Enter key).
EndThe end time of the report interval currently displayed.
For each of the following fields, three statistics values are provided:
• Total quantity, which reflects the amount of activities since DB2 was started.• Interval quantity, which reflects the amount of activities during the last cycle.• Rate per second, which is the rate at which activities occurred during the last cycle. The number under /
SECOND (in parentheses) is the number of seconds that made up the interval/cycle.
Identify RequestsSuccessful connections to DB2 from an allied address space.
Signon RequestsSuccessful requests to identify a new user for IMS or CICS. Thread Signon processing is applicableonly in CICS-DB2 and IMS-DB2 attachment environments.
Create Thread RequestsSuccessful Create Thread requests.
Create Thread WaitsCreate Thread requests that had to wait because no thread was available.
Terminate Thread RequestsSuccessful thread terminations.
Single Phase Commit RequestsSuccessful Commit requests that took place in a single-phase commit environment, for example, TSO.
Read Only Commit RequestsCommit requests that were read-only. Each of these requests increments the statistics field for phase1 commits and the statistics field for read-only commits.
Commit Phase 1 RequestsCommit phase 1 requests in a two-phase-commit environment, for example, CICS and IMS.
Commit Phase 2 RequestsCommit phase 2 requests in a two-phase-commit environment, for example, CICS and IMS.
Abort RequestsEvents that resulted in successfully backing out a unit of recovery.
Total Commit RequestsIncludes single-phase, read-only, and phase 2 Commit requests.
Indoubt ThreadsA thread goes indoubt in the CICS/IMS attachment to DB2 when one of the two subsystems goesdown between Commit phase 1 and Commit phase 2.
Indoubts ResolvedSuccessful resolutions, either automatic or manual, of indoubt threads.
Abends Detected - End of TaskTasks that abended while connected to DB2.
Abends Detected - End of MemoryThe number of times a non-DB2 address space was deleted by MVS while connected to DB2.
High Water Mark for IDFOREThe maximum number of users that are identified to DB2 from TSO foreground at the same time.
High Water Mark for IDBACKThe maximum number of concurrent connections identified to DB2 from batch.
Chapter 8. Resource Managers and Other DB2 Subsystem Information menu 279
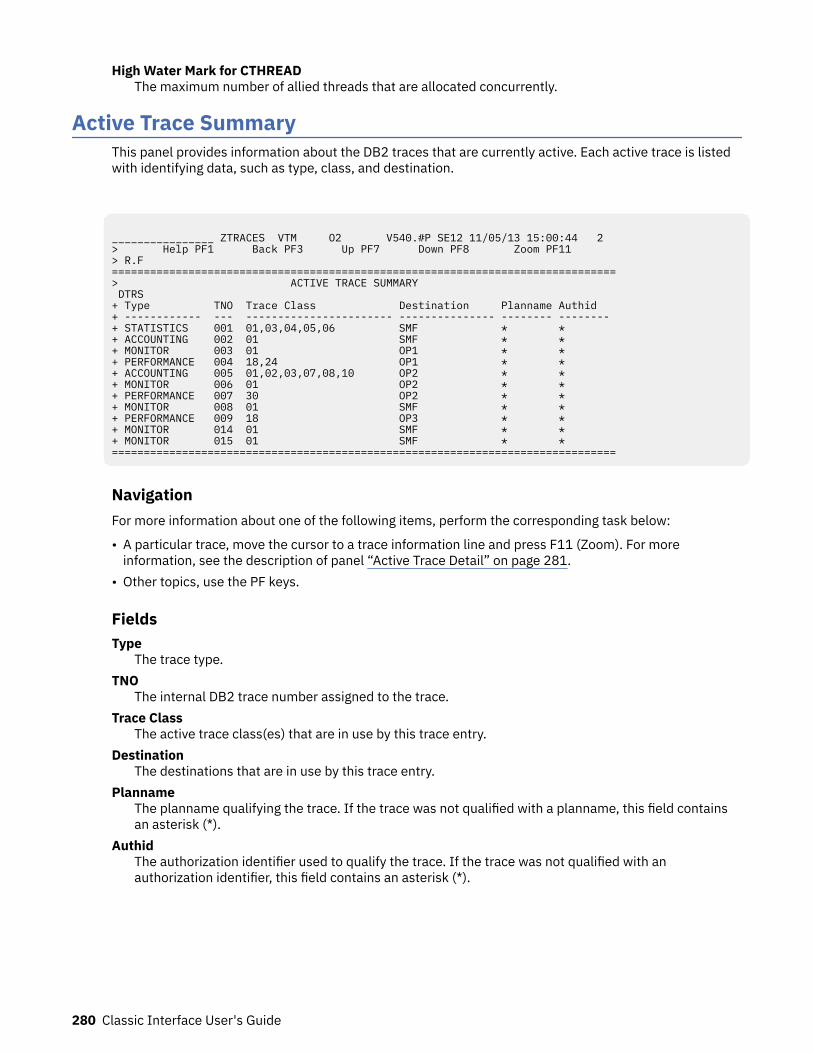
High Water Mark for CTHREADThe maximum number of allied threads that are allocated concurrently.
Active Trace SummaryThis panel provides information about the DB2 traces that are currently active. Each active trace is listedwith identifying data, such as type, class, and destination.
________________ ZTRACES VTM O2 V540.#P SE12 11/05/13 15:00:44 2 > Help PF1 Back PF3 Up PF7 Down PF8 Zoom PF11 > R.F ===============================================================================> ACTIVE TRACE SUMMARY DTRS + Type TNO Trace Class Destination Planname Authid + ------------ --- ----------------------- --------------- -------- -------- + STATISTICS 001 01,03,04,05,06 SMF * * + ACCOUNTING 002 01 SMF * * + MONITOR 003 01 OP1 * * + PERFORMANCE 004 18,24 OP1 * * + ACCOUNTING 005 01,02,03,07,08,10 OP2 * * + MONITOR 006 01 OP2 * * + PERFORMANCE 007 30 OP2 * * + MONITOR 008 01 SMF * * + PERFORMANCE 009 18 OP3 * * + MONITOR 014 01 SMF * * + MONITOR 015 01 SMF * * ===============================================================================
NavigationFor more information about one of the following items, perform the corresponding task below:
• A particular trace, move the cursor to a trace information line and press F11 (Zoom). For moreinformation, see the description of panel “Active Trace Detail” on page 281.
• Other topics, use the PF keys.
FieldsType
The trace type.TNO
The internal DB2 trace number assigned to the trace.Trace Class
The active trace class(es) that are in use by this trace entry.Destination
The destinations that are in use by this trace entry.Planname
The planname qualifying the trace. If the trace was not qualified with a planname, this field containsan asterisk (*).
AuthidThe authorization identifier used to qualify the trace. If the trace was not qualified with anauthorization identifier, this field contains an asterisk (*).
280 Classic Interface User's Guide
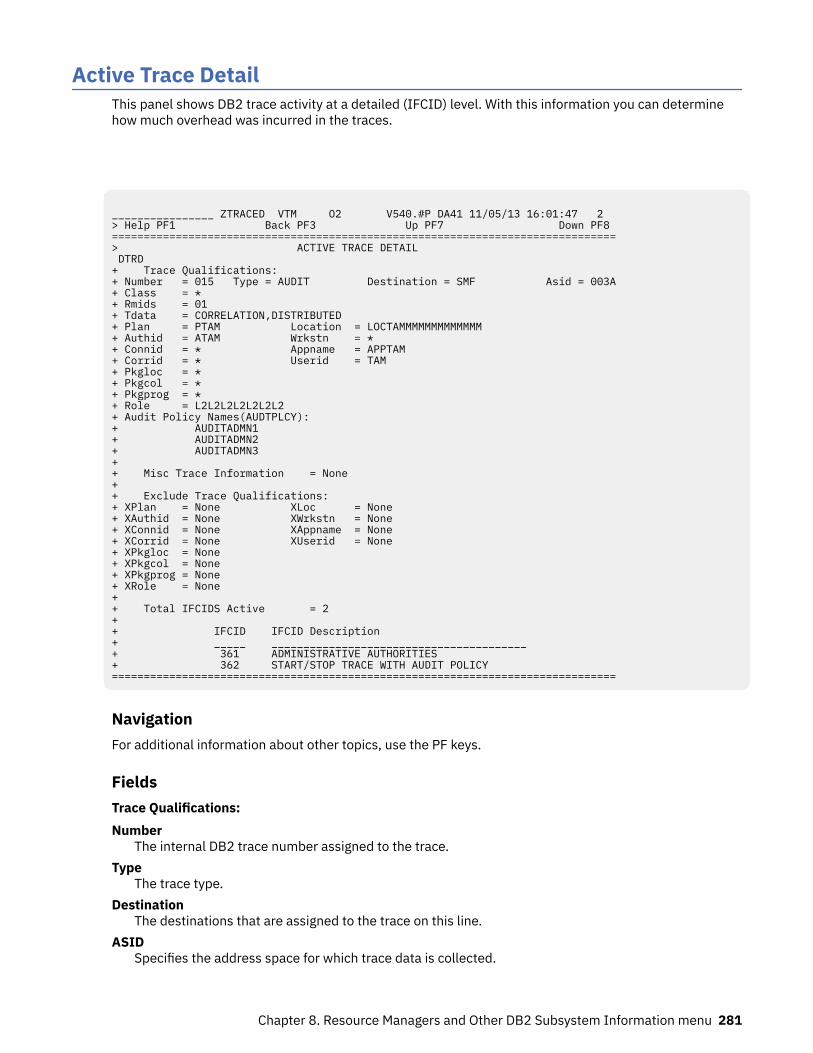
Active Trace DetailThis panel shows DB2 trace activity at a detailed (IFCID) level. With this information you can determinehow much overhead was incurred in the traces.
________________ ZTRACED VTM O2 V540.#P DA41 11/05/13 16:01:47 2 > Help PF1 Back PF3 Up PF7 Down PF8 =============================================================================== > ACTIVE TRACE DETAIL DTRD + Trace Qualifications: + Number = 015 Type = AUDIT Destination = SMF Asid = 003A + Class = * + Rmids = 01 + Tdata = CORRELATION,DISTRIBUTED + Plan = PTAM Location = LOCTAMMMMMMMMMMMMM + Authid = ATAM Wrkstn = * + Connid = * Appname = APPTAM + Corrid = * Userid = TAM + Pkgloc = * + Pkgcol = * + Pkgprog = * + Role = L2L2L2L2L2L2L2 + Audit Policy Names(AUDTPLCY): + AUDITADMN1 + AUDITADMN2 + AUDITADMN3 + + Misc Trace Information = None + + Exclude Trace Qualifications: + XPlan = None XLoc = None + XAuthid = None XWrkstn = None + XConnid = None XAppname = None + XCorrid = None XUserid = None + XPkgloc = None + XPkgcol = None + XPkgprog = None + XRole = None + + Total IFCIDS Active = 2 + + IFCID IFCID Description + _____ ________________________________________ + 361 ADMINISTRATIVE AUTHORITIES + 362 START/STOP TRACE WITH AUDIT POLICY ===============================================================================
NavigationFor additional information about other topics, use the PF keys.
FieldsTrace Qualifications:Number
The internal DB2 trace number assigned to the trace.Type
The trace type.Destination
The destinations that are assigned to the trace on this line.ASID
Specifies the address space for which trace data is collected.
Chapter 8. Resource Managers and Other DB2 Subsystem Information menu 281
ClassThe active trace class(es) on this trace.
RmidsThe resource manager IDs (Rmids) specified when the trace was started. If the trace was qualifiedwith no Rmids, this field contains an asterisk (*).
TdataThe trace headers that are in use by this trace entry.
PlanThe plan name qualifying the trace. If the trace was not qualified with a Plan, this field contains anasterisk (*).
LocationThe location name qualifying the remote trace. If the trace was not qualified with a location, this fieldcontains an asterisk (*).
AuthidThe authorization identifier (Authid) qualifying the trace. If the trace was not qualified with anauthorization identifier, this field contains an asterisk (*).
WrkstnThe workstation name (Wrkstn) qualifying the trace. If the trace was not qualified with a workstationname, this field contains an asterisk (*).
ConnidThe connection name (Connid) qualifying the trace. If the trace was not qualified with a connectionname, this field contains an asterisk (*).
AppnameThe application name (Appname) qualifying the trace. If the trace was not qualified with anapplication name, this field contains an asterisk (*).
CorridThe correlation name (Corrid) qualifying the trace. If the trace was not qualified with a correlationname, this field contains an asterisk (*).
UseridThe user name (Userid) qualifying the trace. If the trace was not qualified with a user name, this fieldcontains an asterisk (*).
PkglocThe location name of the package (Pkgloc) qualifying the trace. If the trace was not qualified with thelocation name of the package, this field contains an asterisk (*).
PkgcolThe collection name of the package (Pkgcol) qualifying the trace. If the trace was not qualified withthe collection name of the package, this field contains an asterisk (*).
PkgprogThe DBRM or program name (Pkgprog) qualifying the trace. If the trace was not qualified with a DBRMor program name, this field contains an asterisk (*).
RoleThe connection role name qualifying the trace. If the trace was not qualified with a connection rolename, this field contains an asterisk (*).
Audit Policy Names(AUDTPLCY)Specifies a list of up to eight audit policy names (AUDTPLCY) for which trace information is gathered.
Miscellaneous trace information: The following fields are displayed if the Trace Destination fieldcontains an OPx destination.JOBNAME
The jobname that started the trace.ASID
The address space ID of the job that started the trace.
282 Classic Interface User's Guide
PLANNAMEThe plan name of the thread that is using the OPx destination.
AUTHIDThe authorization identifier of the thread that started the trace. For active trace requests in use byOMEGAMON XE for DB2 PE, the authorization ID is that of the O2CI address space, not theauthorization ID of the user issuing the start trace request.
CONNIDThe connection ID of the thread that is using the OPx destination.
CORRIDThe correlation ID of the thread that is using the OPx destination.
BUFSIZEThe buffer size value that was used when the trace was started.
Exclude Trace Qualifications:XPlan
The exclude filtering for the plan name (XPlan). If the trace was not qualified with an XPlan , this fieldcontains NONE.
XLocThe exclude filtering for the location name (XLoc) qualifying the remote trace. If the trace was notqualified with an XLoc, this field contains NONE.
XAuthidThe exclude filtering for authorization identifier (Xauthid). If the trace was not qualified with anXAuthid, this field contains NONE.
XWrkstnThe exclude filtering for workstation name (XWrkstn). If the trace was not qualified with an XWrkstn,this field contains NONE.
XConnidThe exclude filtering for connection name (XConnid). If the trace was not qualified with an XConnid,this field contains NONE.
XAppnameThe exclude filtering for application name (XAppname). If the trace was not qualified with anXAppname, this field contains NONE.
XCorridThe exclude filtering for correlation name (XCorrid). If the trace was not qualified with an XCorrid, thisfield contains NONE.
XUseridThe exclude filtering for user name (XUserid). If the trace was not qualified with an XUserid, this fieldcontains NONE.
XPkglocThe exclude filtering for the location name of the package (XPkgloc). If the trace was not qualifiedwith an XPkgloc, this field contains NONE.
XPkgcolThe exclude filtering for the collection name of the package (XPkgcol). If the trace was not qualifiedwith an XPkgcol, this field contains NONE.
XPkgprogThe exclude filtering for DBRM or program name (XPkgprog). If the trace was not qualified with aXPkgprog, this field contains NONE.
XRoleThe exclude filtering for connection role name (XRole). If the trace was not qualified with a XRole, thisfield contains NONE.
IFCID information:
Chapter 8. Resource Managers and Other DB2 Subsystem Information menu 283
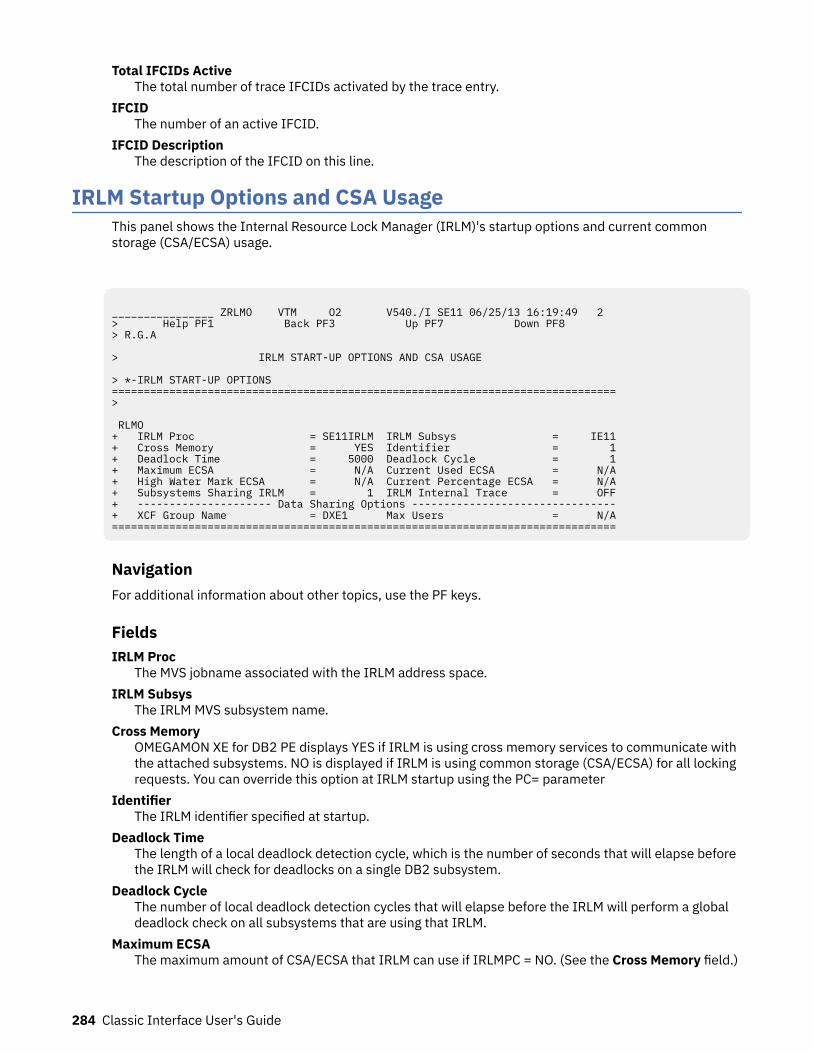
Total IFCIDs ActiveThe total number of trace IFCIDs activated by the trace entry.
IFCIDThe number of an active IFCID.
IFCID DescriptionThe description of the IFCID on this line.
IRLM Startup Options and CSA UsageThis panel shows the Internal Resource Lock Manager (IRLM)'s startup options and current commonstorage (CSA/ECSA) usage.
________________ ZRLMO VTM O2 V540./I SE11 06/25/13 16:19:49 2 > Help PF1 Back PF3 Up PF7 Down PF8 > R.G.A > IRLM START-UP OPTIONS AND CSA USAGE > *-IRLM START-UP OPTIONS ===============================================================================> RLMO + IRLM Proc = SE11IRLM IRLM Subsys = IE11+ Cross Memory = YES Identifier = 1+ Deadlock Time = 5000 Deadlock Cycle = 1+ Maximum ECSA = N/A Current Used ECSA = N/A+ High Water Mark ECSA = N/A Current Percentage ECSA = N/A+ Subsystems Sharing IRLM = 1 IRLM Internal Trace = OFF+ --------------------- Data Sharing Options --------------------------------+ XCF Group Name = DXE1 Max Users = N/A===============================================================================
NavigationFor additional information about other topics, use the PF keys.
FieldsIRLM Proc
The MVS jobname associated with the IRLM address space.IRLM Subsys
The IRLM MVS subsystem name.Cross Memory
OMEGAMON XE for DB2 PE displays YES if IRLM is using cross memory services to communicate withthe attached subsystems. NO is displayed if IRLM is using common storage (CSA/ECSA) for all lockingrequests. You can override this option at IRLM startup using the PC= parameter
IdentifierThe IRLM identifier specified at startup.
Deadlock TimeThe length of a local deadlock detection cycle, which is the number of seconds that will elapse beforethe IRLM will check for deadlocks on a single DB2 subsystem.
Deadlock CycleThe number of local deadlock detection cycles that will elapse before the IRLM will perform a globaldeadlock check on all subsystems that are using that IRLM.
Maximum ECSAThe maximum amount of CSA/ECSA that IRLM can use if IRLMPC = NO. (See the Cross Memory field.)
284 Classic Interface User's Guide
Current Used ECSAThe amount of CSA/ECSA that IRLM is currently using.
High Water Mark ECSAThe largest amount of CSA/ECSA that IRLM has used since startup.
Current Percentage ECSAThe percentage of Maximum ECSA that IRLM is currently using.
Subsystems Sharing IRLMThe number of subsystems using the IRLM.
IRLM Internal TraceThe status of the internal trace (extremely high overhead). ON if the trace is turned on. OFF if the traceis turned off. This option is specified at IRLM startup using the ITRACE parameter.
Data sharing options:
XCF Group NameThe name of the cross-system coupling facility (XCF) group in which this IRLM belongs. This option isspecified at IRLM startup using the GROUP= parameter.
Max UsersThe maximum number of systems in the data sharing group. This option is specified at IRLM startupusing the MAXUSRS= parameter. It is used to determine the size of each hash entry in the global lockstructure.
DSNZPARM Thread ParametersThis panel displays the values that are specified in the DSNZPARM module for thread rmanagementparameters. It shows the name of the DSNZPARM module that is specified for DB2 startup and the dateon which the module is assembled. It also shows a list of the default values of the DB2 application.
If a field is not available for the current Db2 release, the string N/A is displayed. For other conditions, forexample, if specific Db2 traces are not started or control block data is not available, the string N/P isdisplayed.
Chapter 8. Resource Managers and Other DB2 Subsystem Information menu 285
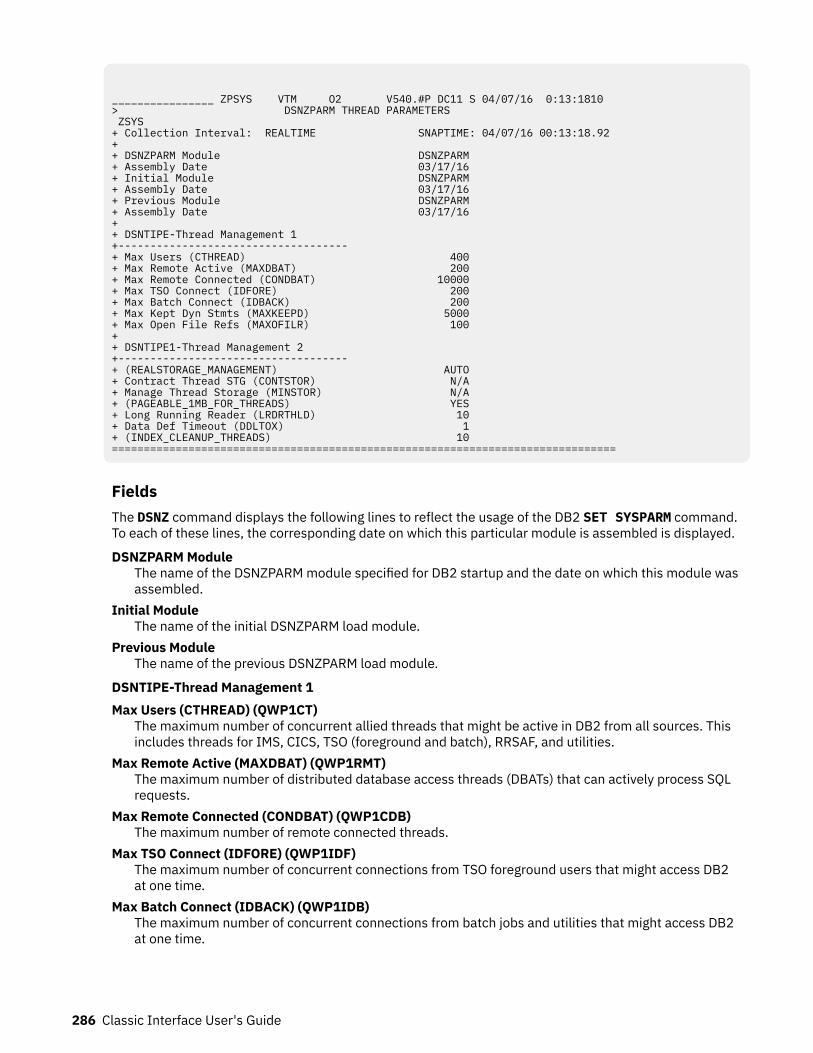
________________ ZPSYS VTM O2 V540.#P DC11 S 04/07/16 0:13:1810 > DSNZPARM THREAD PARAMETERS ZSYS + Collection Interval: REALTIME SNAPTIME: 04/07/16 00:13:18.92 + + DSNZPARM Module DSNZPARM + Assembly Date 03/17/16 + Initial Module DSNZPARM + Assembly Date 03/17/16 + Previous Module DSNZPARM + Assembly Date 03/17/16 + + DSNTIPE-Thread Management 1 +------------------------------------ + Max Users (CTHREAD) 400 + Max Remote Active (MAXDBAT) 200 + Max Remote Connected (CONDBAT) 10000 + Max TSO Connect (IDFORE) 200 + Max Batch Connect (IDBACK) 200 + Max Kept Dyn Stmts (MAXKEEPD) 5000 + Max Open File Refs (MAXOFILR) 100 + + DSNTIPE1-Thread Management 2 +------------------------------------ + (REALSTORAGE_MANAGEMENT) AUTO + Contract Thread STG (CONTSTOR) N/A + Manage Thread Storage (MINSTOR) N/A + (PAGEABLE_1MB_FOR_THREADS) YES + Long Running Reader (LRDRTHLD) 10 + Data Def Timeout (DDLTOX) 1 + (INDEX_CLEANUP_THREADS) 10 ===============================================================================
FieldsThe DSNZ command displays the following lines to reflect the usage of the DB2 SET SYSPARM command.To each of these lines, the corresponding date on which this particular module is assembled is displayed.
DSNZPARM ModuleThe name of the DSNZPARM module specified for DB2 startup and the date on which this module wasassembled.
Initial ModuleThe name of the initial DSNZPARM load module.
Previous ModuleThe name of the previous DSNZPARM load module.
DSNTIPE-Thread Management 1Max Users (CTHREAD) (QWP1CT)
The maximum number of concurrent allied threads that might be active in DB2 from all sources. Thisincludes threads for IMS, CICS, TSO (foreground and batch), RRSAF, and utilities.
Max Remote Active (MAXDBAT) (QWP1RMT)The maximum number of distributed database access threads (DBATs) that can actively process SQLrequests.
Max Remote Connected (CONDBAT) (QWP1CDB)The maximum number of remote connected threads.
Max TSO Connect (IDFORE) (QWP1IDF)The maximum number of concurrent connections from TSO foreground users that might access DB2at one time.
Max Batch Connect (IDBACK) (QWP1IDB)The maximum number of concurrent connections from batch jobs and utilities that might access DB2at one time.
286 Classic Interface User's Guide
Max Kept Dyn Stmts (MAXKEEPD) (QWP4MXKD)The maximum number of prepared dynamic statements saved past commit when dynamic statementcaching is enabled.
Max Open File Refs (MAXOFILR) (QWP1MOFR)The maximum number of concurrently open data sets for processing.
DSNTIPE-Thread Management 2(REALSTORAGE_MANAGEMENT) (QWP4STMN)
This parameter determines whether DB2 storage is monitored.Valid values:
A (AUTO) N (ON) O (OFF)
Contract Thread STG (CONTSTOR) (QWP4CONT)This parameter determines whether thread CT Long Storage Pool is contracted.Valid values:
NOYES
Manage Thread Storage (MINSTOR) (QWP4MSTG)This parameter determines whether DB2 is using storage management algorithms that minimize theamount of working storage that is consumed by individual threads. DB2 10 and DB2 11 only.
(PAGEABLE_1MB_FOR_THREADS) (QWP4P1MT)Specifies whether DB2 may use 1 MB pageable storage when allocating hvshared above-the-barobject storage for thread pools and thread stack. Valid options are:NO
DB2 cannot not use 1 MB pageable storage for these objects.YES
DB2 may use 1 MB pageable storage for these objects. YES requires a level of z/OS that supports1 MB pageable objects for hvshared. Sufficient real storage should be available to avoidperformance issues related to paging. YES is the default for PAGEABLE_1MB_FOR_THREADS, butis enabled only if realstorage_management=off.
Z PARM NAMEPAGEABLE_1MB_FOR_THREADS.
DB2 12 and later.Long Running Reader (LRDRTHLD) (QWP4LRTH)
This parameter determines the number of minutes that a READ claim is held by an agent before anIFCID 0313 record is written to report it as a long-running reader.
Data Def Timeout (DDLTOX) (QWP4DDLTO)This parameter determines the SQL data definition time out factor.
(INDEX CLEANUP THREADS) (QWP4IXCU)This parameter determines the maximum number of threads that can be created to process thecleanup of pseudo-deleted index entires on this subsystem on a data sharing member. Pseudo-deleted entries in an index are those that are logically deleted but still physically present in the index.Valid values:
Integers between 0 - 128
Default: 10
DB2 11 and later.
Chapter 8. Resource Managers and Other DB2 Subsystem Information menu 287
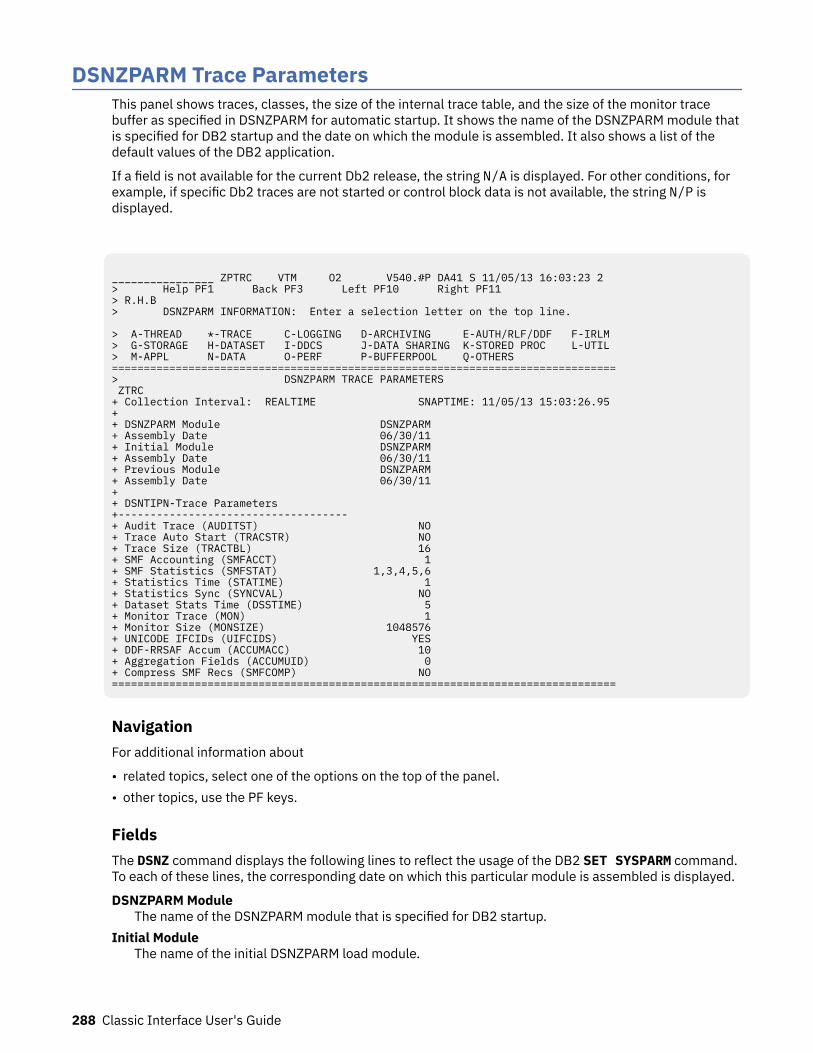
DSNZPARM Trace ParametersThis panel shows traces, classes, the size of the internal trace table, and the size of the monitor tracebuffer as specified in DSNZPARM for automatic startup. It shows the name of the DSNZPARM module thatis specified for DB2 startup and the date on which the module is assembled. It also shows a list of thedefault values of the DB2 application.
If a field is not available for the current Db2 release, the string N/A is displayed. For other conditions, forexample, if specific Db2 traces are not started or control block data is not available, the string N/P isdisplayed.
________________ ZPTRC VTM O2 V540.#P DA41 S 11/05/13 16:03:23 2 > Help PF1 Back PF3 Left PF10 Right PF11 > R.H.B > DSNZPARM INFORMATION: Enter a selection letter on the top line. > A-THREAD *-TRACE C-LOGGING D-ARCHIVING E-AUTH/RLF/DDF F-IRLM > G-STORAGE H-DATASET I-DDCS J-DATA SHARING K-STORED PROC L-UTIL > M-APPL N-DATA O-PERF P-BUFFERPOOL Q-OTHERS ===============================================================================> DSNZPARM TRACE PARAMETERS ZTRC + Collection Interval: REALTIME SNAPTIME: 11/05/13 15:03:26.95 + + DSNZPARM Module DSNZPARM + Assembly Date 06/30/11 + Initial Module DSNZPARM + Assembly Date 06/30/11 + Previous Module DSNZPARM + Assembly Date 06/30/11 + + DSNTIPN-Trace Parameters +------------------------------------ + Audit Trace (AUDITST) NO + Trace Auto Start (TRACSTR) NO + Trace Size (TRACTBL) 16 + SMF Accounting (SMFACCT) 1 + SMF Statistics (SMFSTAT) 1,3,4,5,6 + Statistics Time (STATIME) 1 + Statistics Sync (SYNCVAL) NO + Dataset Stats Time (DSSTIME) 5 + Monitor Trace (MON) 1 + Monitor Size (MONSIZE) 1048576 + UNICODE IFCIDs (UIFCIDS) YES + DDF-RRSAF Accum (ACCUMACC) 10 + Aggregation Fields (ACCUMUID) 0 + Compress SMF Recs (SMFCOMP) NO ===============================================================================
NavigationFor additional information about
• related topics, select one of the options on the top of the panel.• other topics, use the PF keys.
FieldsThe DSNZ command displays the following lines to reflect the usage of the DB2 SET SYSPARM command.To each of these lines, the corresponding date on which this particular module is assembled is displayed.
DSNZPARM ModuleThe name of the DSNZPARM module that is specified for DB2 startup.
Initial ModuleThe name of the initial DSNZPARM load module.
288 Classic Interface User's Guide
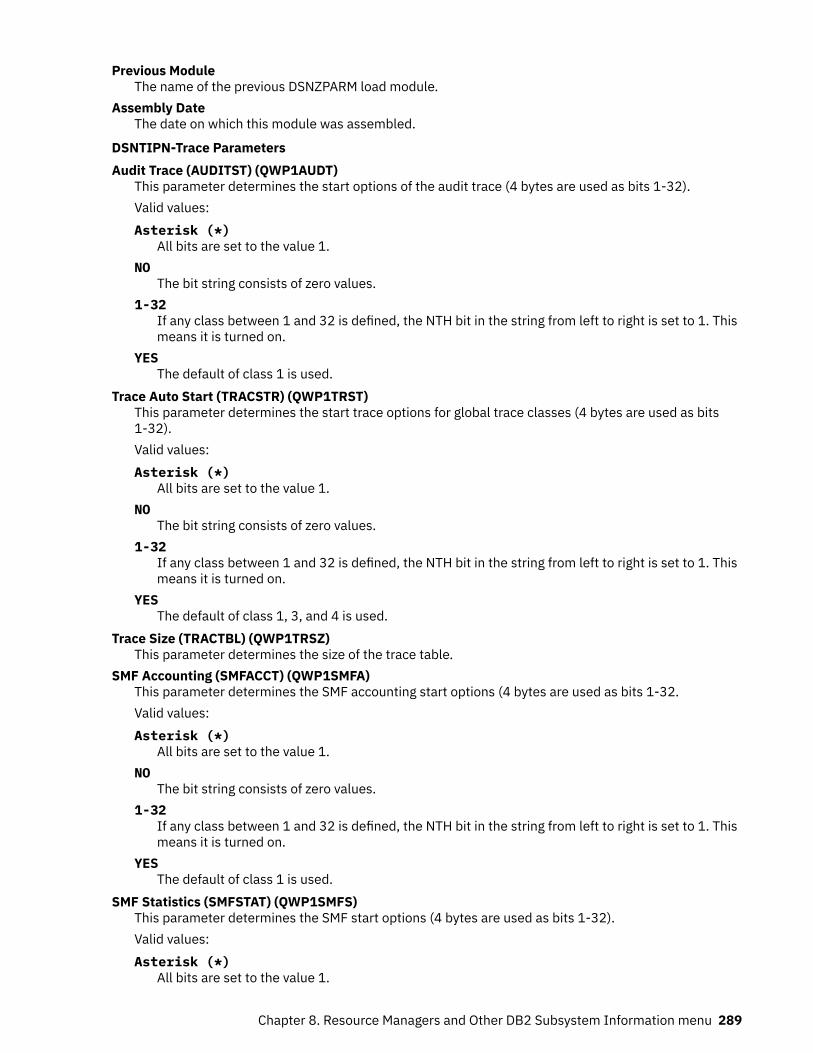
Previous ModuleThe name of the previous DSNZPARM load module.
Assembly DateThe date on which this module was assembled.
DSNTIPN-Trace ParametersAudit Trace (AUDITST) (QWP1AUDT)
This parameter determines the start options of the audit trace (4 bytes are used as bits 1-32).Valid values:Asterisk (*)
All bits are set to the value 1.NO
The bit string consists of zero values.1-32
If any class between 1 and 32 is defined, the NTH bit in the string from left to right is set to 1. Thismeans it is turned on.
YESThe default of class 1 is used.
Trace Auto Start (TRACSTR) (QWP1TRST)This parameter determines the start trace options for global trace classes (4 bytes are used as bits1-32).Valid values:Asterisk (*)
All bits are set to the value 1.NO
The bit string consists of zero values.1-32
If any class between 1 and 32 is defined, the NTH bit in the string from left to right is set to 1. Thismeans it is turned on.
YESThe default of class 1, 3, and 4 is used.
Trace Size (TRACTBL) (QWP1TRSZ)This parameter determines the size of the trace table.
SMF Accounting (SMFACCT) (QWP1SMFA)This parameter determines the SMF accounting start options (4 bytes are used as bits 1-32.Valid values:Asterisk (*)
All bits are set to the value 1.NO
The bit string consists of zero values.1-32
If any class between 1 and 32 is defined, the NTH bit in the string from left to right is set to 1. Thismeans it is turned on.
YESThe default of class 1 is used.
SMF Statistics (SMFSTAT) (QWP1SMFS)This parameter determines the SMF start options (4 bytes are used as bits 1-32).Valid values:Asterisk (*)
All bits are set to the value 1.
Chapter 8. Resource Managers and Other DB2 Subsystem Information menu 289
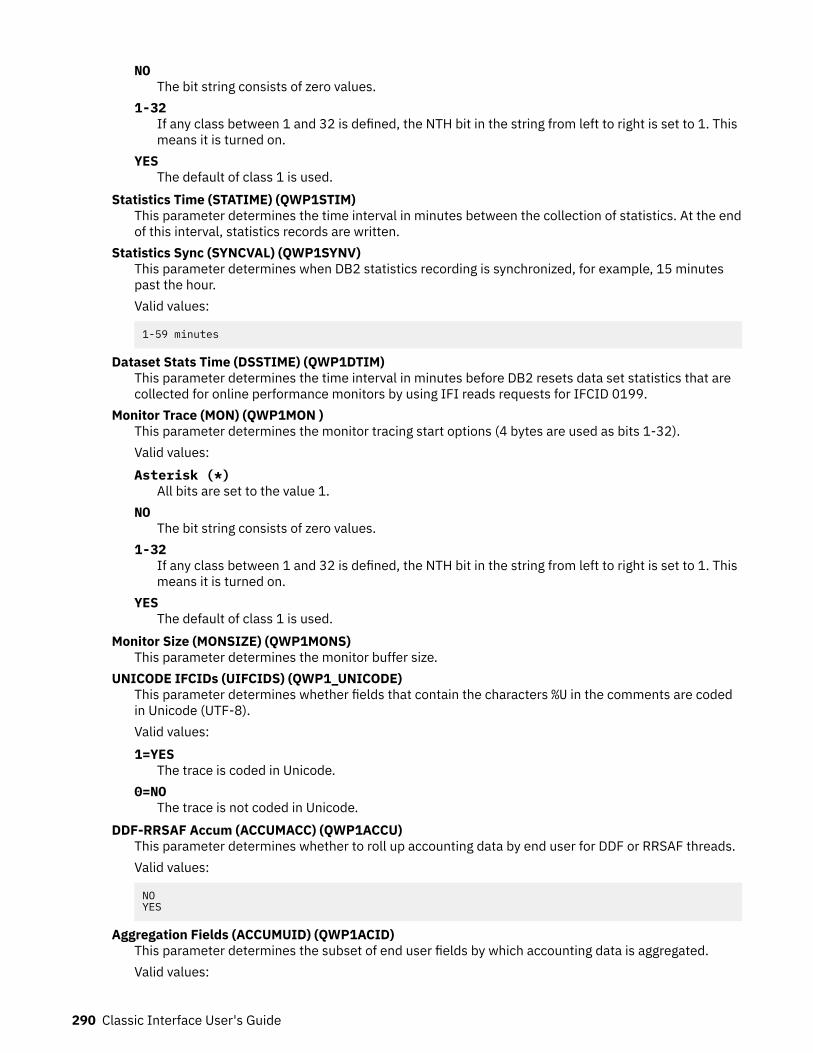
NOThe bit string consists of zero values.
1-32If any class between 1 and 32 is defined, the NTH bit in the string from left to right is set to 1. Thismeans it is turned on.
YESThe default of class 1 is used.
Statistics Time (STATIME) (QWP1STIM)This parameter determines the time interval in minutes between the collection of statistics. At the endof this interval, statistics records are written.
Statistics Sync (SYNCVAL) (QWP1SYNV)This parameter determines when DB2 statistics recording is synchronized, for example, 15 minutespast the hour.Valid values:
1-59 minutes
Dataset Stats Time (DSSTIME) (QWP1DTIM)This parameter determines the time interval in minutes before DB2 resets data set statistics that arecollected for online performance monitors by using IFI reads requests for IFCID 0199.
Monitor Trace (MON) (QWP1MON )This parameter determines the monitor tracing start options (4 bytes are used as bits 1-32).Valid values:Asterisk (*)
All bits are set to the value 1.NO
The bit string consists of zero values.1-32
If any class between 1 and 32 is defined, the NTH bit in the string from left to right is set to 1. Thismeans it is turned on.
YESThe default of class 1 is used.
Monitor Size (MONSIZE) (QWP1MONS)This parameter determines the monitor buffer size.
UNICODE IFCIDs (UIFCIDS) (QWP1_UNICODE)This parameter determines whether fields that contain the characters %U in the comments are codedin Unicode (UTF-8).Valid values:1=YES
The trace is coded in Unicode.0=NO
The trace is not coded in Unicode.DDF-RRSAF Accum (ACCUMACC) (QWP1ACCU)
This parameter determines whether to roll up accounting data by end user for DDF or RRSAF threads.Valid values:
NOYES
Aggregation Fields (ACCUMUID) (QWP1ACID)This parameter determines the subset of end user fields by which accounting data is aggregated.Valid values:
290 Classic Interface User's Guide
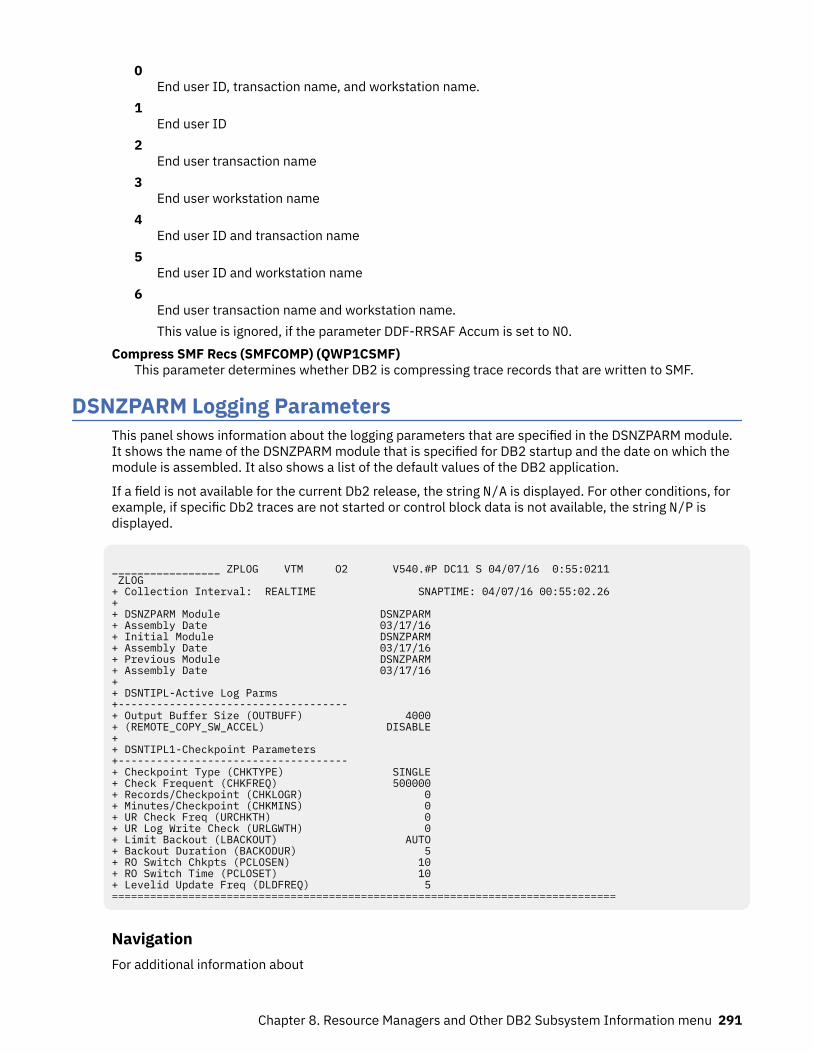
0End user ID, transaction name, and workstation name.
1End user ID
2End user transaction name
3End user workstation name
4End user ID and transaction name
5End user ID and workstation name
6End user transaction name and workstation name.This value is ignored, if the parameter DDF-RRSAF Accum is set to NO.
Compress SMF Recs (SMFCOMP) (QWP1CSMF)This parameter determines whether DB2 is compressing trace records that are written to SMF.
DSNZPARM Logging ParametersThis panel shows information about the logging parameters that are specified in the DSNZPARM module.It shows the name of the DSNZPARM module that is specified for DB2 startup and the date on which themodule is assembled. It also shows a list of the default values of the DB2 application.
If a field is not available for the current Db2 release, the string N/A is displayed. For other conditions, forexample, if specific Db2 traces are not started or control block data is not available, the string N/P isdisplayed.
_________________ ZPLOG VTM O2 V540.#P DC11 S 04/07/16 0:55:0211 ZLOG + Collection Interval: REALTIME SNAPTIME: 04/07/16 00:55:02.26 + + DSNZPARM Module DSNZPARM + Assembly Date 03/17/16 + Initial Module DSNZPARM + Assembly Date 03/17/16 + Previous Module DSNZPARM + Assembly Date 03/17/16 + + DSNTIPL-Active Log Parms +------------------------------------ + Output Buffer Size (OUTBUFF) 4000+ (REMOTE_COPY_SW_ACCEL) DISABLE+ + DSNTIPL1-Checkpoint Parameters +------------------------------------ + Checkpoint Type (CHKTYPE) SINGLE + Check Frequent (CHKFREQ) 500000 + Records/Checkpoint (CHKLOGR) 0 + Minutes/Checkpoint (CHKMINS) 0 + UR Check Freq (URCHKTH) 0 + UR Log Write Check (URLGWTH) 0 + Limit Backout (LBACKOUT) AUTO + Backout Duration (BACKODUR) 5 + RO Switch Chkpts (PCLOSEN) 10 + RO Switch Time (PCLOSET) 10 + Levelid Update Freq (DLDFREQ) 5 ===============================================================================
NavigationFor additional information about
Chapter 8. Resource Managers and Other DB2 Subsystem Information menu 291
• related topics, select one of the options on the top of the panel.• other topics, use the PF keys.
FieldsThe DSNZ command displays the following lines to reflect the usage of the DB2 SET SYSPARM command.To each of these lines, the corresponding date on which this particular module is assembled is displayed.DSNZPARM Module
The name of the DSNZPARM module that is specified for DB2 startup.Initial Module
The name of the initial DSNZPARM load module.Previous Module
The name of the previous DSNZPARM load module.Assembly Date
The date on which this module was assembled.
DSNTIPL-Active Log ParmsOutput Buffer Size (QWP2OBPS)
The OUTBUFF subsystem parameter determines the size of the output buffer that is used for writingactive log data sets.Valid values:
400K to 400000K
Default:
4000K
(REMOTE_COPY_SW_ACCEL) (QWP2RCSA)
Specifies whether DB2 uses software (SW) to control the remote copy process for active log output inpeer-to-peer remote copy (PPRC) environments.
Valid values:
DISABLE (default)ENABLE
DB2 12 and later.
DSNTIPL1-Checkpoint ParametersCheckpoint Type (QWP1LOGT)
The CHKTYPE subsystem parameter indicates whether the interval between log checkpoints is basedon the number of written log records, the time between checkpoints, or both.Valid values:
SINGLE(LOGRECS or MINUTES)BOTH
Check Frequent (QWP1LOGL)The CHKFREQ subsystem parameter determines how many log records are created before logcheckpoints occur.Valid values:
1,000 - 16,000,000 (if CHKTYPE is SINGLE/LOGRECS)1 - 60 (if CHKTYPE is SINGLE/MINUTES)NOTUSED (if CHKTYPE is BOTH).NOTUSED is displayed as 0.
Default:
292 Classic Interface User's Guide

500000
Records/Checkpoint (QWP1LOGR)The RECORDS/CHECKPOINT parameter determines how many log records are created between logcheckpoints.Valid values:
1,000 - 99,999,999 (if CHKTYPE is BOTH)NOTUSED (if CHKTYPE is SINGLE)NOTUSED is displayed as 0.
Default:
NOTUSED(0)
Minutes/Checkpoint (QWP1LOGM)The MINUTES/CHECKPOINT parameter determines how many minutes are passing between logcheckpoints.Valid values:
1- 1439 (if CHKTYPE is BOTH)NOTUSED (if CHKTYPE is SINGLE)NOTUSED is displayed as 0.
Default:
NOTUSED(0)
UR Check Freq (QWP1URCK)The URCHKTH subsystem parameter determines the number of checkpoint cycles to be completedbefore a warning message is issued to the console by DB2 for an uncommitted unit of recovery (UR).If you do not want these warning messages to be issued, you can disable this option.Valid values:
0 to 255
Default:
5
Log Apply Storage V9 (QWP1FLBZ)This parameter determines the maximum amount of dsn1dbm1 storage that can be used for fast logapplication.This value is used by DB2 during the log application phase of the recover utility. This field correspondsto field the field log apply storage on the installation panel DSNTIPL.
UR Log Write Check (QWP1LWCK)The URLGWTH subsystem parameter determines the number of log records that are written before awarning message is issued to the console by an uncommitted unit of recovery (UR).If you do not want these warning messages to be issued, you can disable this option.Valid values:
0 to 1000K
Default:
10K
Limit Backout (QWP1LMBO)The LBACKOUT subsystem parameter determines whether DB2 postpones backward-log processingfor some units of work.
Chapter 8. Resource Managers and Other DB2 Subsystem Information menu 293
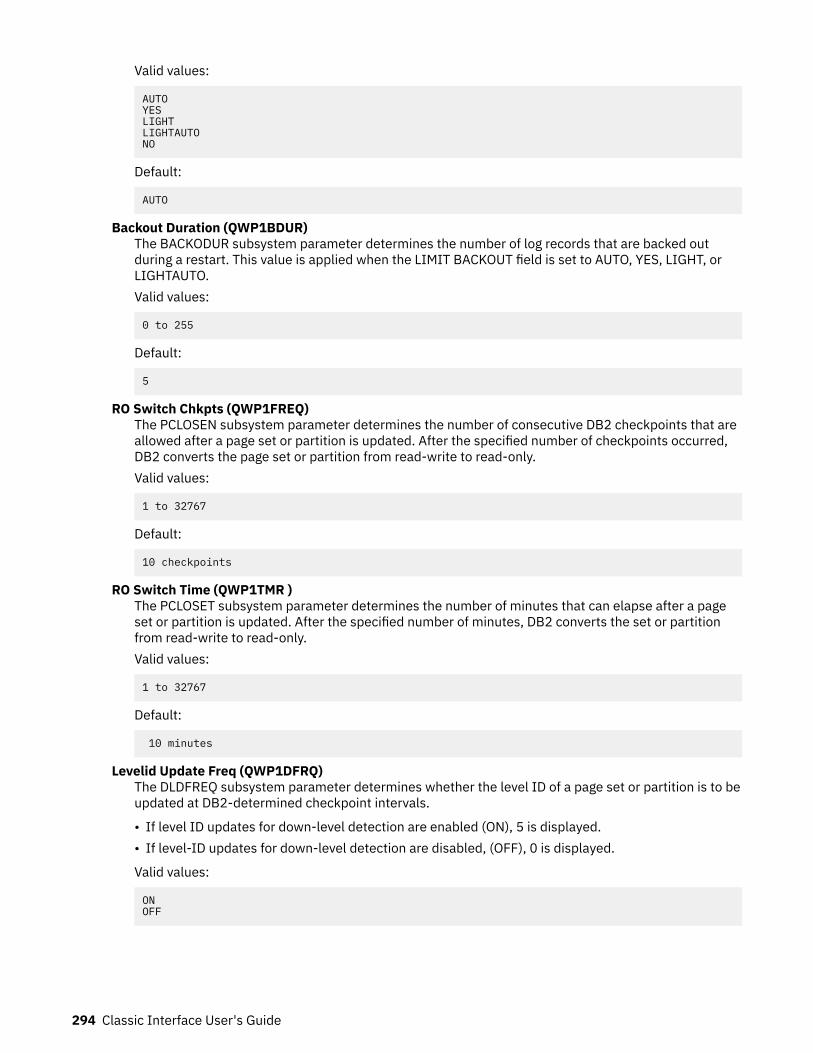
Valid values:
AUTOYESLIGHTLIGHTAUTONO
Default:
AUTO
Backout Duration (QWP1BDUR)The BACKODUR subsystem parameter determines the number of log records that are backed outduring a restart. This value is applied when the LIMIT BACKOUT field is set to AUTO, YES, LIGHT, orLIGHTAUTO.Valid values:
0 to 255
Default:
5
RO Switch Chkpts (QWP1FREQ)The PCLOSEN subsystem parameter determines the number of consecutive DB2 checkpoints that areallowed after a page set or partition is updated. After the specified number of checkpoints occurred,DB2 converts the page set or partition from read-write to read-only.Valid values:
1 to 32767
Default:
10 checkpoints
RO Switch Time (QWP1TMR )The PCLOSET subsystem parameter determines the number of minutes that can elapse after a pageset or partition is updated. After the specified number of minutes, DB2 converts the set or partitionfrom read-write to read-only.Valid values:
1 to 32767
Default:
10 minutes
Levelid Update Freq (QWP1DFRQ)The DLDFREQ subsystem parameter determines whether the level ID of a page set or partition is to beupdated at DB2-determined checkpoint intervals.
• If level ID updates for down-level detection are enabled (ON), 5 is displayed.• If level-ID updates for down-level detection are disabled, (OFF), 0 is displayed.
Valid values:
ONOFF
294 Classic Interface User's Guide
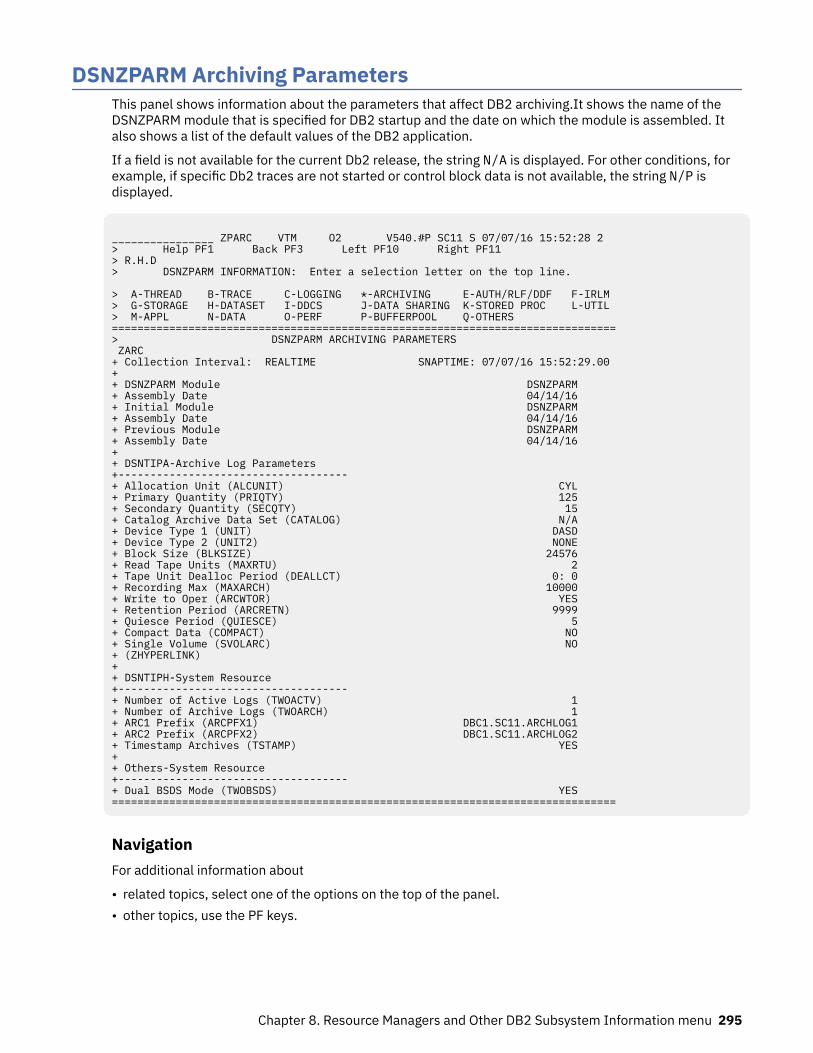
DSNZPARM Archiving ParametersThis panel shows information about the parameters that affect DB2 archiving.It shows the name of theDSNZPARM module that is specified for DB2 startup and the date on which the module is assembled. Italso shows a list of the default values of the DB2 application.
If a field is not available for the current Db2 release, the string N/A is displayed. For other conditions, forexample, if specific Db2 traces are not started or control block data is not available, the string N/P isdisplayed.
________________ ZPARC VTM O2 V540.#P SC11 S 07/07/16 15:52:28 2 > Help PF1 Back PF3 Left PF10 Right PF11 > R.H.D > DSNZPARM INFORMATION: Enter a selection letter on the top line.
> A-THREAD B-TRACE C-LOGGING *-ARCHIVING E-AUTH/RLF/DDF F-IRLM > G-STORAGE H-DATASET I-DDCS J-DATA SHARING K-STORED PROC L-UTIL > M-APPL N-DATA O-PERF P-BUFFERPOOL Q-OTHERS ===============================================================================> DSNZPARM ARCHIVING PARAMETERS ZARC + Collection Interval: REALTIME SNAPTIME: 07/07/16 15:52:29.00 + + DSNZPARM Module DSNZPARM + Assembly Date 04/14/16 + Initial Module DSNZPARM + Assembly Date 04/14/16 + Previous Module DSNZPARM + Assembly Date 04/14/16 + + DSNTIPA-Archive Log Parameters +------------------------------------ + Allocation Unit (ALCUNIT) CYL + Primary Quantity (PRIQTY) 125 + Secondary Quantity (SECQTY) 15 + Catalog Archive Data Set (CATALOG) N/A + Device Type 1 (UNIT) DASD + Device Type 2 (UNIT2) NONE + Block Size (BLKSIZE) 24576 + Read Tape Units (MAXRTU) 2 + Tape Unit Dealloc Period (DEALLCT) 0: 0 + Recording Max (MAXARCH) 10000 + Write to Oper (ARCWTOR) YES + Retention Period (ARCRETN) 9999 + Quiesce Period (QUIESCE) 5 + Compact Data (COMPACT) NO + Single Volume (SVOLARC) NO + (ZHYPERLINK)+ + DSNTIPH-System Resource +------------------------------------ + Number of Active Logs (TWOACTV) 1 + Number of Archive Logs (TWOARCH) 1 + ARC1 Prefix (ARCPFX1) DBC1.SC11.ARCHLOG1 + ARC2 Prefix (ARCPFX2) DBC1.SC11.ARCHLOG2 + Timestamp Archives (TSTAMP) YES + + Others-System Resource +------------------------------------ + Dual BSDS Mode (TWOBSDS) YES ===============================================================================
NavigationFor additional information about
• related topics, select one of the options on the top of the panel.• other topics, use the PF keys.
Chapter 8. Resource Managers and Other DB2 Subsystem Information menu 295
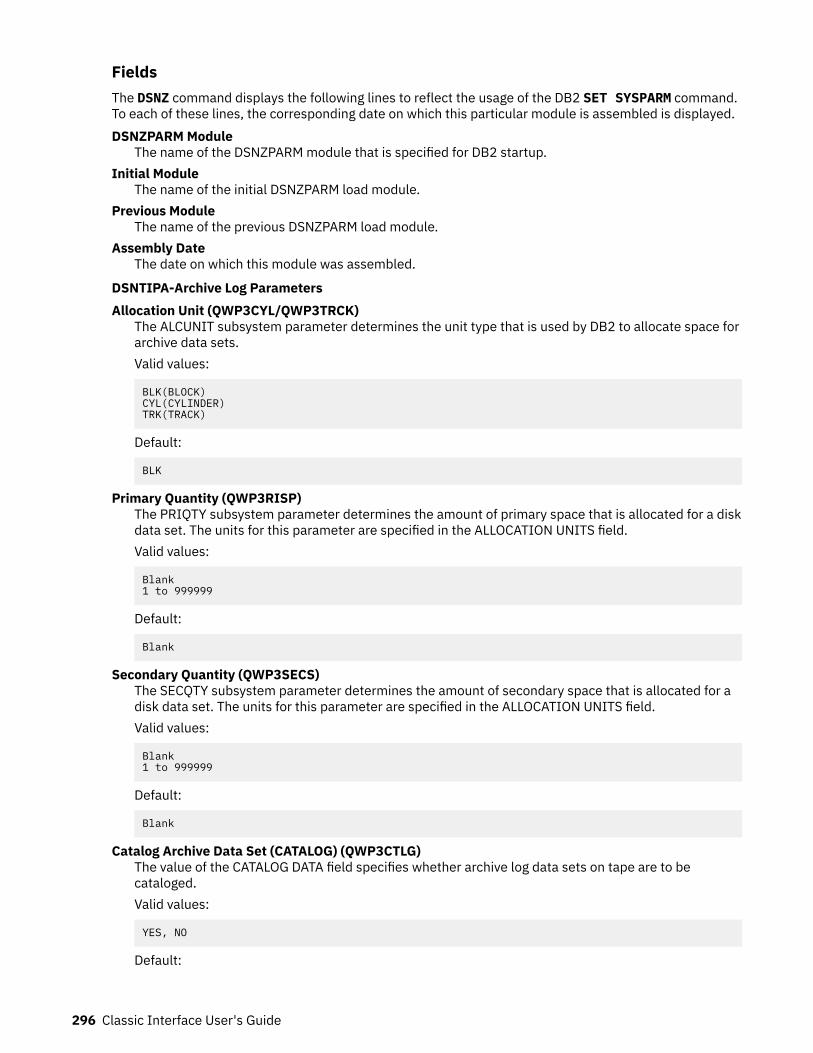
FieldsThe DSNZ command displays the following lines to reflect the usage of the DB2 SET SYSPARM command.To each of these lines, the corresponding date on which this particular module is assembled is displayed.DSNZPARM Module
The name of the DSNZPARM module that is specified for DB2 startup.Initial Module
The name of the initial DSNZPARM load module.Previous Module
The name of the previous DSNZPARM load module.Assembly Date
The date on which this module was assembled.
DSNTIPA-Archive Log ParametersAllocation Unit (QWP3CYL/QWP3TRCK)
The ALCUNIT subsystem parameter determines the unit type that is used by DB2 to allocate space forarchive data sets.Valid values:
BLK(BLOCK)CYL(CYLINDER)TRK(TRACK)
Default:
BLK
Primary Quantity (QWP3RISP)The PRIQTY subsystem parameter determines the amount of primary space that is allocated for a diskdata set. The units for this parameter are specified in the ALLOCATION UNITS field.Valid values:
Blank1 to 999999
Default:
Blank
Secondary Quantity (QWP3SECS)The SECQTY subsystem parameter determines the amount of secondary space that is allocated for adisk data set. The units for this parameter are specified in the ALLOCATION UNITS field.Valid values:
Blank1 to 999999
Default:
Blank
Catalog Archive Data Set (CATALOG) (QWP3CTLG)The value of the CATALOG DATA field specifies whether archive log data sets on tape are to becataloged.Valid values:
YES, NO
Default:
296 Classic Interface User's Guide
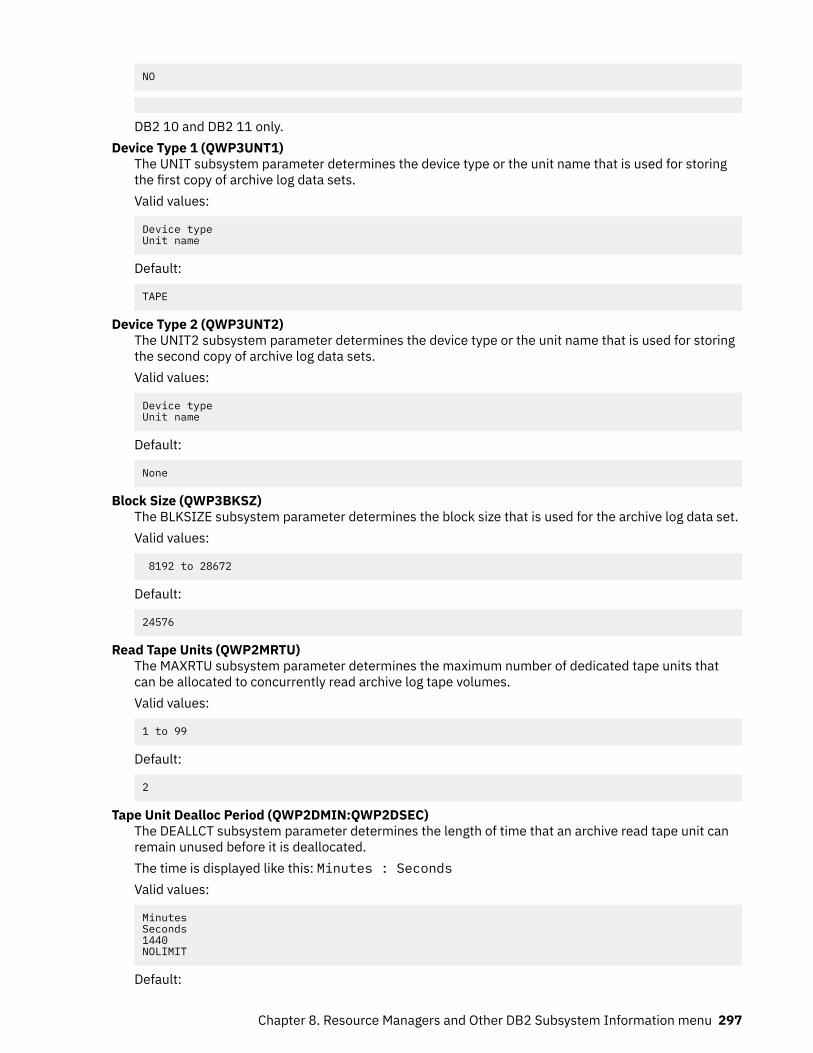
NO
DB2 10 and DB2 11 only.Device Type 1 (QWP3UNT1)
The UNIT subsystem parameter determines the device type or the unit name that is used for storingthe first copy of archive log data sets.Valid values:
Device typeUnit name
Default:
TAPE
Device Type 2 (QWP3UNT2)The UNIT2 subsystem parameter determines the device type or the unit name that is used for storingthe second copy of archive log data sets.Valid values:
Device typeUnit name
Default:
None
Block Size (QWP3BKSZ)The BLKSIZE subsystem parameter determines the block size that is used for the archive log data set.Valid values:
8192 to 28672
Default:
24576
Read Tape Units (QWP2MRTU)The MAXRTU subsystem parameter determines the maximum number of dedicated tape units thatcan be allocated to concurrently read archive log tape volumes.Valid values:
1 to 99
Default:
2
Tape Unit Dealloc Period (QWP2DMIN:QWP2DSEC)The DEALLCT subsystem parameter determines the length of time that an archive read tape unit canremain unused before it is deallocated.The time is displayed like this: Minutes : SecondsValid values:
MinutesSeconds1440NOLIMIT
Default:
Chapter 8. Resource Managers and Other DB2 Subsystem Information menu 297
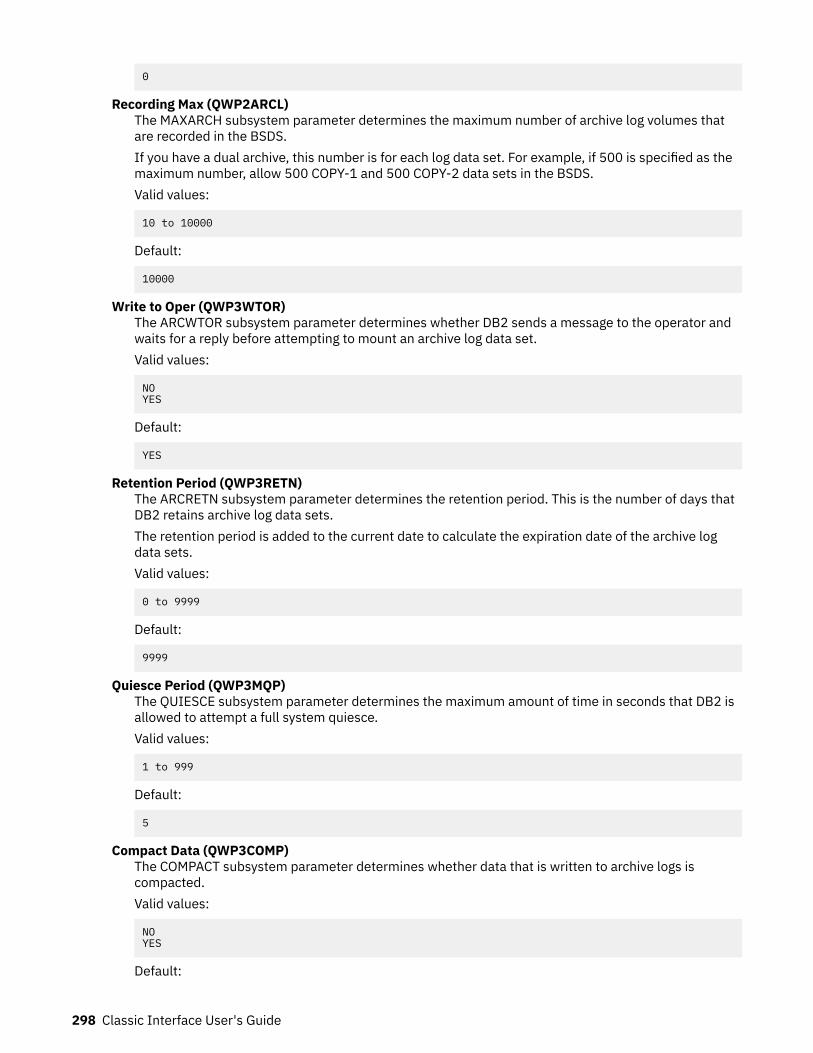
0
Recording Max (QWP2ARCL)The MAXARCH subsystem parameter determines the maximum number of archive log volumes thatare recorded in the BSDS.If you have a dual archive, this number is for each log data set. For example, if 500 is specified as themaximum number, allow 500 COPY-1 and 500 COPY-2 data sets in the BSDS.Valid values:
10 to 10000
Default:
10000
Write to Oper (QWP3WTOR)The ARCWTOR subsystem parameter determines whether DB2 sends a message to the operator andwaits for a reply before attempting to mount an archive log data set.Valid values:
NOYES
Default:
YES
Retention Period (QWP3RETN)The ARCRETN subsystem parameter determines the retention period. This is the number of days thatDB2 retains archive log data sets.The retention period is added to the current date to calculate the expiration date of the archive logdata sets.Valid values:
0 to 9999
Default:
9999
Quiesce Period (QWP3MQP)The QUIESCE subsystem parameter determines the maximum amount of time in seconds that DB2 isallowed to attempt a full system quiesce.Valid values:
1 to 999
Default:
5
Compact Data (QWP3COMP)The COMPACT subsystem parameter determines whether data that is written to archive logs iscompacted.Valid values:
NOYES
Default:
298 Classic Interface User's Guide
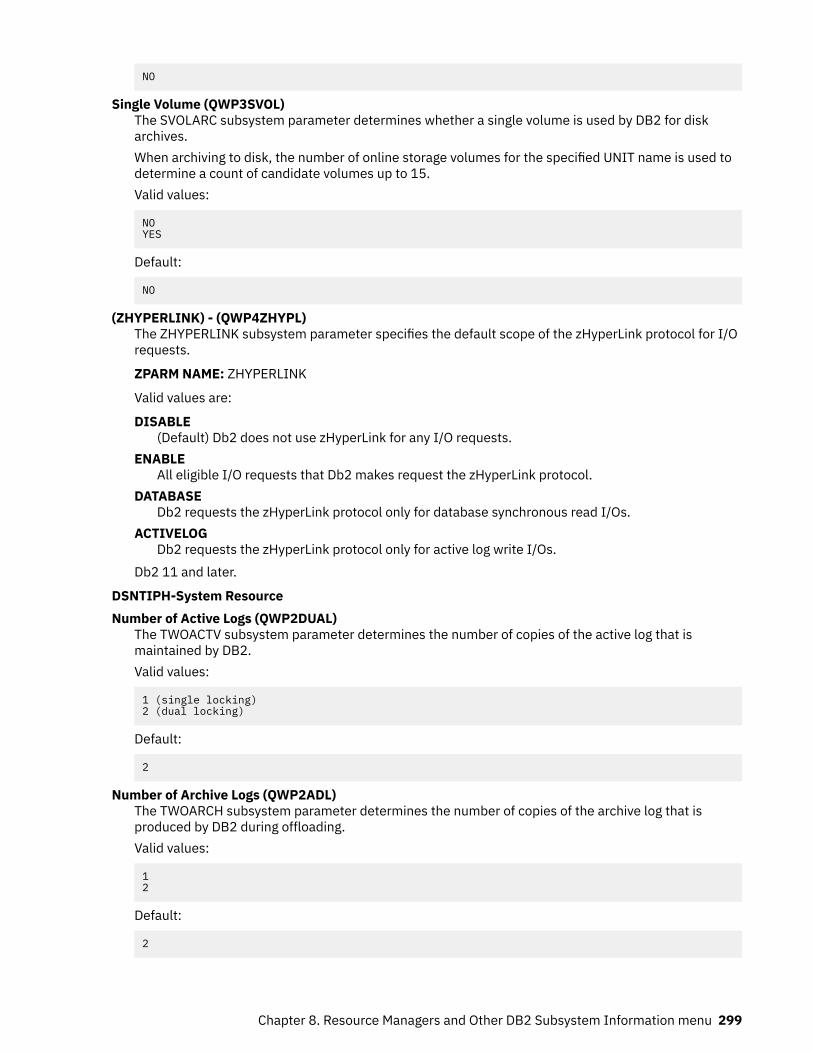
NO
Single Volume (QWP3SVOL)The SVOLARC subsystem parameter determines whether a single volume is used by DB2 for diskarchives.When archiving to disk, the number of online storage volumes for the specified UNIT name is used todetermine a count of candidate volumes up to 15.Valid values:
NOYES
Default:
NO
(ZHYPERLINK) - (QWP4ZHYPL)The ZHYPERLINK subsystem parameter specifies the default scope of the zHyperLink protocol for I/Orequests.
ZPARM NAME: ZHYPERLINK
Valid values are:
DISABLE(Default) Db2 does not use zHyperLink for any I/O requests.
ENABLEAll eligible I/O requests that Db2 makes request the zHyperLink protocol.
DATABASEDb2 requests the zHyperLink protocol only for database synchronous read I/Os.
ACTIVELOGDb2 requests the zHyperLink protocol only for active log write I/Os.
Db2 11 and later.
DSNTIPH-System ResourceNumber of Active Logs (QWP2DUAL)
The TWOACTV subsystem parameter determines the number of copies of the active log that ismaintained by DB2.Valid values:
1 (single locking)2 (dual locking)
Default:
2
Number of Archive Logs (QWP2ADL)The TWOARCH subsystem parameter determines the number of copies of the archive log that isproduced by DB2 during offloading.Valid values:
12
Default:
2
Chapter 8. Resource Managers and Other DB2 Subsystem Information menu 299
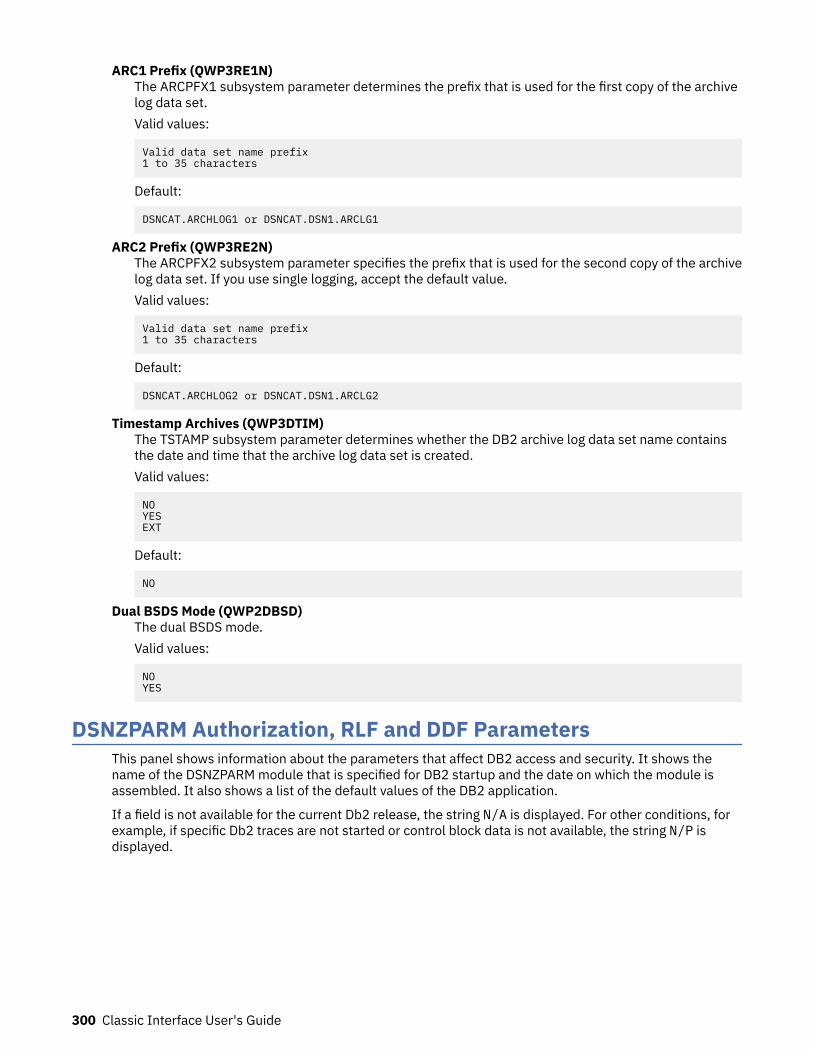
ARC1 Prefix (QWP3RE1N)The ARCPFX1 subsystem parameter determines the prefix that is used for the first copy of the archivelog data set.Valid values:
Valid data set name prefix1 to 35 characters
Default:
DSNCAT.ARCHLOG1 or DSNCAT.DSN1.ARCLG1
ARC2 Prefix (QWP3RE2N)The ARCPFX2 subsystem parameter specifies the prefix that is used for the second copy of the archivelog data set. If you use single logging, accept the default value.Valid values:
Valid data set name prefix1 to 35 characters
Default:
DSNCAT.ARCHLOG2 or DSNCAT.DSN1.ARCLG2
Timestamp Archives (QWP3DTIM)The TSTAMP subsystem parameter determines whether the DB2 archive log data set name containsthe date and time that the archive log data set is created.Valid values:
NOYESEXT
Default:
NO
Dual BSDS Mode (QWP2DBSD)The dual BSDS mode.Valid values:
NOYES
DSNZPARM Authorization, RLF and DDF ParametersThis panel shows information about the parameters that affect DB2 access and security. It shows thename of the DSNZPARM module that is specified for DB2 startup and the date on which the module isassembled. It also shows a list of the default values of the DB2 application.
If a field is not available for the current Db2 release, the string N/A is displayed. For other conditions, forexample, if specific Db2 traces are not started or control block data is not available, the string N/P isdisplayed.
300 Classic Interface User's Guide
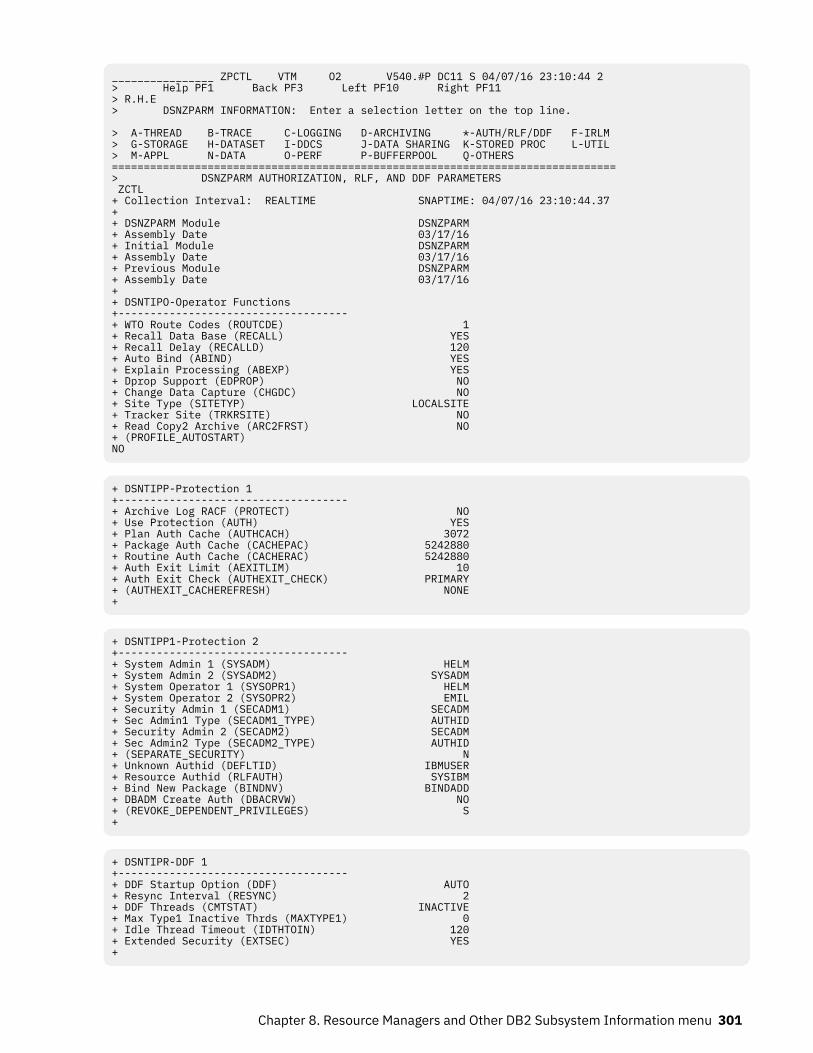
________________ ZPCTL VTM O2 V540.#P DC11 S 04/07/16 23:10:44 2 > Help PF1 Back PF3 Left PF10 Right PF11 > R.H.E > DSNZPARM INFORMATION: Enter a selection letter on the top line. > A-THREAD B-TRACE C-LOGGING D-ARCHIVING *-AUTH/RLF/DDF F-IRLM > G-STORAGE H-DATASET I-DDCS J-DATA SHARING K-STORED PROC L-UTIL > M-APPL N-DATA O-PERF P-BUFFERPOOL Q-OTHERS ===============================================================================> DSNZPARM AUTHORIZATION, RLF, AND DDF PARAMETERS ZCTL + Collection Interval: REALTIME SNAPTIME: 04/07/16 23:10:44.37 + + DSNZPARM Module DSNZPARM + Assembly Date 03/17/16 + Initial Module DSNZPARM + Assembly Date 03/17/16 + Previous Module DSNZPARM + Assembly Date 03/17/16 + + DSNTIPO-Operator Functions +------------------------------------ + WTO Route Codes (ROUTCDE) 1 + Recall Data Base (RECALL) YES + Recall Delay (RECALLD) 120 + Auto Bind (ABIND) YES + Explain Processing (ABEXP) YES + Dprop Support (EDPROP) NO + Change Data Capture (CHGDC) NO + Site Type (SITETYP) LOCALSITE + Tracker Site (TRKRSITE) NO + Read Copy2 Archive (ARC2FRST) NO + (PROFILE_AUTOSTART) NO
+ DSNTIPP-Protection 1 +------------------------------------ + Archive Log RACF (PROTECT) NO + Use Protection (AUTH) YES + Plan Auth Cache (AUTHCACH) 3072 + Package Auth Cache (CACHEPAC) 5242880 + Routine Auth Cache (CACHERAC) 5242880 + Auth Exit Limit (AEXITLIM) 10 + Auth Exit Check (AUTHEXIT_CHECK) PRIMARY + (AUTHEXIT_CACHEREFRESH) NONE +
+ DSNTIPP1-Protection 2 +------------------------------------ + System Admin 1 (SYSADM) HELM + System Admin 2 (SYSADM2) SYSADM + System Operator 1 (SYSOPR1) HELM + System Operator 2 (SYSOPR2) EMIL + Security Admin 1 (SECADM1) SECADM + Sec Admin1 Type (SECADM1_TYPE) AUTHID + Security Admin 2 (SECADM2) SECADM + Sec Admin2 Type (SECADM2_TYPE) AUTHID + (SEPARATE_SECURITY) N + Unknown Authid (DEFLTID) IBMUSER + Resource Authid (RLFAUTH) SYSIBM + Bind New Package (BINDNV) BINDADD + DBADM Create Auth (DBACRVW) NO + (REVOKE_DEPENDENT_PRIVILEGES) S +
+ DSNTIPR-DDF 1 +------------------------------------ + DDF Startup Option (DDF) AUTO + Resync Interval (RESYNC) 2 + DDF Threads (CMTSTAT) INACTIVE + Max Type1 Inactive Thrds (MAXTYPE1) 0 + Idle Thread Timeout (IDTHTOIN) 120 + Extended Security (EXTSEC) YES +
Chapter 8. Resource Managers and Other DB2 Subsystem Information menu 301
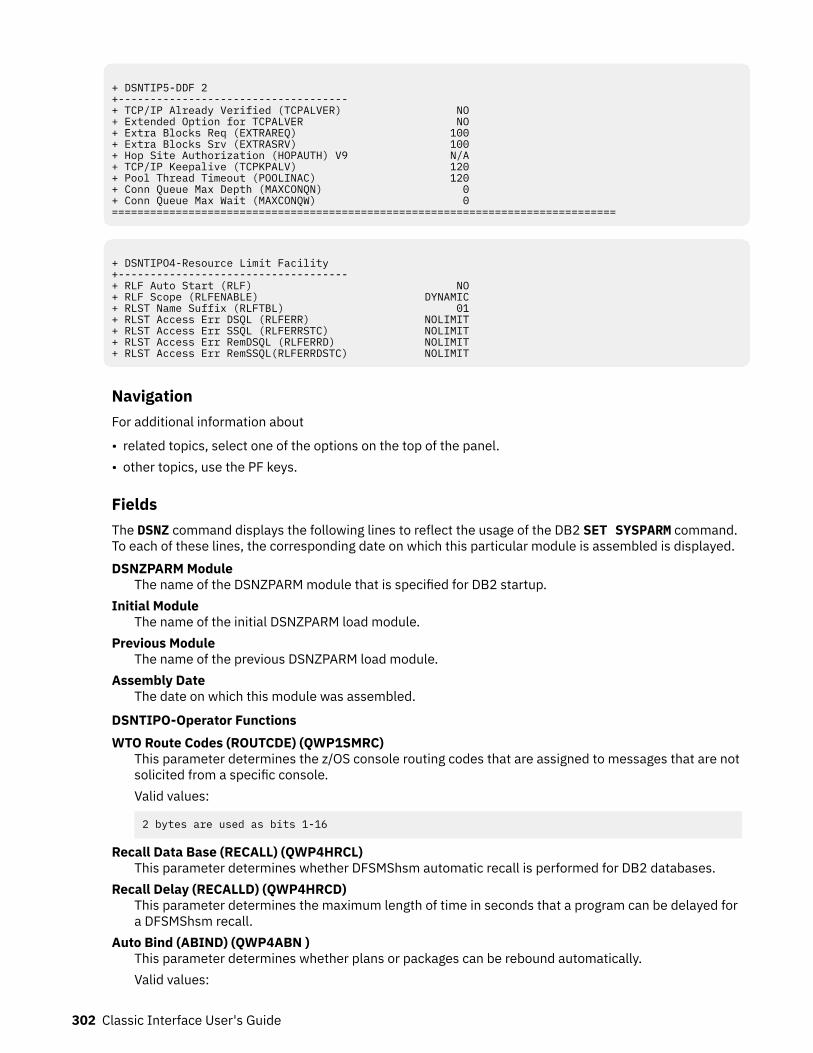
+ DSNTIP5-DDF 2 +------------------------------------ + TCP/IP Already Verified (TCPALVER) NO + Extended Option for TCPALVER NO + Extra Blocks Req (EXTRAREQ) 100 + Extra Blocks Srv (EXTRASRV) 100 + Hop Site Authorization (HOPAUTH) V9 N/A + TCP/IP Keepalive (TCPKPALV) 120 + Pool Thread Timeout (POOLINAC) 120 + Conn Queue Max Depth (MAXCONQN) 0 + Conn Queue Max Wait (MAXCONQW) 0 ===============================================================================
+ DSNTIPO4-Resource Limit Facility +------------------------------------ + RLF Auto Start (RLF) NO+ RLF Scope (RLFENABLE) DYNAMIC + RLST Name Suffix (RLFTBL) 01+ RLST Access Err DSQL (RLFERR) NOLIMIT + RLST Access Err SSQL (RLFERRSTC) NOLIMIT + RLST Access Err RemDSQL (RLFERRD) NOLIMIT + RLST Access Err RemSSQL(RLFERRDSTC) NOLIMIT
NavigationFor additional information about
• related topics, select one of the options on the top of the panel.• other topics, use the PF keys.
FieldsThe DSNZ command displays the following lines to reflect the usage of the DB2 SET SYSPARM command.To each of these lines, the corresponding date on which this particular module is assembled is displayed.DSNZPARM Module
The name of the DSNZPARM module that is specified for DB2 startup.Initial Module
The name of the initial DSNZPARM load module.Previous Module
The name of the previous DSNZPARM load module.Assembly Date
The date on which this module was assembled.
DSNTIPO-Operator FunctionsWTO Route Codes (ROUTCDE) (QWP1SMRC)
This parameter determines the z/OS console routing codes that are assigned to messages that are notsolicited from a specific console.Valid values:
2 bytes are used as bits 1-16
Recall Data Base (RECALL) (QWP4HRCL)This parameter determines whether DFSMShsm automatic recall is performed for DB2 databases.
Recall Delay (RECALLD) (QWP4HRCD)This parameter determines the maximum length of time in seconds that a program can be delayed fora DFSMShsm recall.
Auto Bind (ABIND) (QWP4ABN )This parameter determines whether plans or packages can be rebound automatically.Valid values:
302 Classic Interface User's Guide
COEXISTAutomatic rebind is performed in a data sharing coexistence environment if one of the followingconditions are met:
• The plan or package is marked as invalid.• The plan or package was last bound at the current release level. It is now running on a
subsystem at the previous release level.
DISABLEYou must explicitly rebind any invalid plan or package before it can be used.
ENABLEAutomatic rebind is performed on plans or packages.
Explain Processing (ABEXP) (QWP4ABX )This parameter determines whether EXPLAIN is allowed during AUTOBIND.
Dprop Support (EDPROP) (QWP4ENF)DPROPNR support only.
Change Data Capture (CHGDC) (QWP4CDC )This parameter determines the enablement of change data capture.
Site Type (SITETYP) (QWP4MSTY)This parameter determines whether this system runs at the local site.
Tracker Site (TRKRSITE) (QWP4TRKR)This parameter determines whether this subsystem is a remote tracker site for another DB2 system.
Read Copy2 Archive (ARC2FRST) (QWP2ARC2)This parameter determines whether the COPY2 archives are read first when the DB2 subsystem isstarted.
(PROFILE_AUTOSTART) (QWP1PFSY)Specifies whether start profile command processing is automatically initiated as part of DB2 startup.
• 0=NO• 1=YES
DB2 12 and later.
DSNTIP-Protection 1Archive Log RACF (PROTECT) (QWP3RTCT)
This parameter determines the RACF protection.Use Protection (AUTH) (QWP4AUTH)
This parameter determines whether the DB2 authorization is enabled or disabled.Valid values:
E=ENABLE(YES)D=disable(NO)
Default:
E
Plan Auth Cache (AUTHCACH) (QWP4AUCA)This parameter determines the authorization cache size.
Package Auth Cache (CACHEPAC) (QWP4PAC )This parameter determines the size of package authorization cache.
Routine Auth Cache (CACHERAC) (QWP4RAC )This parameter determines the amount of storage that is allocated to the caching of authorizationinformation for all routines on this subsystem.Default:
Chapter 8. Resource Managers and Other DB2 Subsystem Information menu 303
32K
Auth Exit Limit (AEXITLIM) (QWP4ACAN)This parameter determines the abend count for the access control authorization exit.
Auth Exit Check (AUTHEXIT_CHECK) (QWP4RACK)This parameter determines the authorization exit check.Valid values:
P=PRIMARYD=DB2
DB2 11 and later.(AUTHEXIT_CACHEREFRESH) (QWP4AECR)
This parameter determines the authorization exit cache refresh.Valid values:
A=ALLN=NONE
DB2 11 and later.
DSNTIP1-Protection 2System Admin 1 (SYSADM) (QWP4SADM)
The system administrator user ID 1.If QWP4SADM_OFF is not set to 0, ths value is truncated. If QWP4SADM is truncated, this is the offsetfrom the beginning of QWP4 TO QWP4SADM_LEN.If QWP4SADM_OFF is not set to 0, use the following fields:
• Length of QWP4SADM_VAR• System Administrator user ID 1
System Admin 2 (SYSADM2) (QWP4ADM2)The system administrator user ID 1.If QWP4ADM2_OFF is not set to 0, this value is truncated. If QWP4ADM2 is truncated, this is theoffset from the beginning of QWP4 TO QWP4ADM2_LEN.If QWP4ADM2_OFF is not set to 0, use the following fields:
• Length of QWP4ADM2_VAR• System Administrator user ID 2
System Operator 1 (SYSOPR1) (QWP4OPR1)The system operator user ID 1.If QWP4OPR1_OFF is not set to 0, this value is truncated. If QWP4OPR1 is truncated, this is the offsetfrom the beginning of QWP4 TO QWP4OPR1_LEN.If QWP4OPR1_OFF is not set to 0, use the following fields:
• Length of QWP4OPR1_VAR• System Operator user ID 1.
System Operator 2 (SYSOPR2) (QWP4OPR2)The system operator user ID 1.If QWP4OPR2_OFF is not set to 0, this value is truncated. If QWP4OPR2 is truncated, this is the offsetfrom the beginning of QWP4 TO QWP4OPR2_LEN.If QWP4OPR2_OFF is not set to 0, use the following fields:
• Length of QWP4OPR2_VAR• System Operator user ID 2.
304 Classic Interface User's Guide
Security Admin 1 (SECADM1) (QWP4SECA1_E)The security administrator 1 authorization ID.If QWP4SECA1_OFF is not set to 0, this value is truncated. If the authorization is held by a role, thisvalue is blank.
Sec Admin1 Type (SECADM1_TYPE) (QWP4SECA1_TYPE)The security administrator type 1 authorization ID.' '
Authorization IDL
Role
Security Admin 2 (SECADM2) (QWP4SECA2_E)The security administrator type 2 authorization ID.If QWP4SECA1_OFF is not set to 0, this value is truncated. If the authorization is held by a role, thisvalue is blank.
Sec Admin2 Type (SECADM2_TYPE) (QWP4SECA2_TYPE)The security administrator type 2 authorization ID.' '
Authorization IDL
Role(SEPARATE_SECURITY) (QWP4SEPS)
Specifies whether to separate DB2 security administrator duties from the DB2 system administratorduties.Revoke:Y
SYSADM cannot manage security objects such as roles and trusted contexts. SYSCTRL cannotmanage roles.
NSECADM or ACCESSCTRL AUTHORITY is required for security administration.
Unknown Authid (DEFLTID) (QWP4DFID)The system administrator default user ID.If QWP4DFID_OFF is not set to 0, this value is truncated. If QWP4DFID is truncated, this is the offsetfrom the beginning of QWP4 TO QWP4DFID_LEN.If QWP4DFID_OFF is not set to 0, use the following fields:
• LENGTH OF QWP4DFID_VAR• SYSTEM DEFAULT USER ID.
Resource Authid (RLFAUTH) (QWP1RLFA)The resource limit specification table authorization ID.If QWP1RLFA_OFF is not set to 0, this value is truncated. If QWP1RLFA is truncated, this value is theoffset from the beginning of QWP1 TO QWP1RLFA_LEN.Use the following fields if QWP1RLFA_OFF is not set to 0:
• Length of QWP1RLFA_VAR• Resource limit specification table authorization ID
Bind New Package (BINDNV) (QWP4BNVA)When adding a new package or a new version of an existing package to a collection, one of thefollowing authorities is required:
• BINDADD AUTHORITY
Chapter 8. Resource Managers and Other DB2 Subsystem Information menu 305
• BIND AUTHORITY
DBADM Create Auth (DBACRVW) (QWP4CRVW)Specifies whether an authorization ID with DBADM authority can create a view or an alias for anotherauthorization ID. Valid values are YES or NO. The default value is NO.
(REVOKE_DEPENDENT_PRIVILEGES) (QWP4RVDP)Specifies whether to include dependent privileges on REVOKE:Y
Dependent privileges are included.N
Dependent privileges are not included.S
The REVOKE statement specification is used.
DSNTIPR-DDF 1DDF Startup Option (DDF) QWP9STRT)
The facility start parameter.Resync Interval (RESYNC) (QWP9RYC )
The minutes between resynchronization periods.DDF Threads (CMTSTAT) (QWP9CMST)
The status of the DDF thread.Max Type1 Inactive Thrds (MAXTYPE1) (QWP9MAX1)
Specifies the maximum type 1 inactive threads that are allowed by DB2. 0 indicates that type 1inactive connections are not allowed.
Idle Thread Timeout (IDTHTOIN) (QWP9TTO )The approximate time in seconds that an active server thread can remain dormant before it iscancelled.
Extended Security (EXTSEC) (QWP1SCER)This parameter determines the contents of the error message that is returned to a network clientwhen a DDF connection request fails due to a security error. It also determines whether you canupdate an RACF password by using the DRDA change password function.Y
Detailed error information is returned. You can update the password by using the DRDA function.N
A generic error message is returned. You cannot update the RACF password by using the DRDAfunction.
DSNTIP5-DDF2TCP/IP Already Verified (TCPALVER) (QWP9TCPA)
Specifies whether already verified connections are accepted from TCP/IP clients.Valid values: YES or NO. If connections are not accepted, additional criteria might apply.
Extended Option for TCPALVER (QWP9TCPVE)If YES is specified, user ID and password are required. These values must be AES-encrypted includingRACF passtickets, or a KERBEROS ticket is required, or the connection is protected by one of thefollowing options:
• AT-TLS policy (ensured via a DB2 SECPORT)• IPSEC tunnel
Extra Blocks Req (EXTRAREQ) (QWP1EXBR)The maximum number of extra query blocks that DB2 can request from a remote DRDA server.
Extra Blocks Srv (EXTRASRV) (QWP1EXBS)The maximum number of extra query blocks that DB2 can return to a remote DRDA requester.
306 Classic Interface User's Guide
Hop Site Authorization (HOPAUTH) V9 (QWP4HOP )For a non-DB2 requester that executes a package at a DB2 server that sends an SQL statement toanother DB2 server, you can specify one of the following options:ON
The authorization ID of the package owner is used for static SQL, and the ID of the process runneris used for dynamic SQL.
OFFThe authorization ID of the process runner is used for all statements.
TCP/IP Keepalive (TCPKPALV) (QWP9TCKA)Determines whether to override the TCP/IP stack Keepalive value. The default value is 120.You can specify the following values:ENABLE
The TCP/IP value is not overwritten.DISABLE
Keep alive probing is disabled.1-65534 (SECONDS)
The TCP/IP stack Keepalive value should be replaced with the value that is displayed in this field.Pool Thread Timeout (POOLINAC) (QWP9INAC)
Specifies the time in seconds that a DBAT can remain idle in the pool before it is terminated. If thisparameter is set to 0, a DBAT is terminated instead of going into the pool if there is a sufficientnumber of threads in the pool to process the number of type 2 inactive threads that is currentlyexisting.Valid values: 0-9999.Default: 120.
Conn Queue Max Depth (MAXCONQN) (QWP9MCONQN)The maximum depth for the connection request queue of connections that are waiting for a DBAT toprocess a request. The minimum value is 1.OFF
The queue is limited only by CONDBAT.ON
The depth of the queue corresponds to the maximum value that is specified for MAXDBAT.Conn Queue Max Wait (MAXCONQW) (QWP9MCONQW)
The maximum time in seconds for a connection to wait for a DBAT to process its request.OFF
The connection waits indefinitely.ON
The time value that is specified for IDTHTOIN is used. However, if IDTHTOIN is set to 0, w warningMNOTE is issued. It states that MAXONT is set to OFF because IDTHTOIN is set to 0. Theminimum numeric value is 5. The maximum value is 3600 seconds.This is the default value.
DSNTIP04 - Resource Limit FacilityRLF Auto Start (RLF) (QWP1RLF)
This parameter determines whether the resource limit facility (governor) starts automatically eachtime DB2 is started.
RLF Scope (RFLENABLE)
The level of RLF governing:DYNAMIC
Dynamic SQL only
Chapter 8. Resource Managers and Other DB2 Subsystem Information menu 307
STATICStatic SQL only
ALLBoth, dynamic and static SQL
DB2 12 and later.RLST Name Suffix (RLFTBL) (QWP1RLFT)
This parameter determines the suffix that is used for the default resource limit specification table(RLST). The default RLST is used when the resource limit facility (governor) is started automatically orwhen the governor is started without a specified suffix.
RLST Access Error (RLFERR) (QWP1RLFR)This parameter determines what DB2 is doing if the governor encounters a condition that prevents itfrom accessing the resource limit specification table. This setting applies also if DB2 cannot find anapplicable row in the resource limit specification table. An applicable row applies to the authorizationID, plan or package name, and the name of the logical unit of work of the query user.
RLST Access Err SSQL (RLFERRSTC)
The action taken by DB2 when the governor cannot use the resource limit:NOLIMIT
The static SQL statements run without limit.NORUN
The static SQL statements terminated with an SQL error code. A number from 1 to 5000000represents the number of CPU service units allowed for a query.
DB2 12 and later.RLST Access Err RemDSQL (RLFERRD) (QWP9RLER)
Shows what DB2 does when the governor cannot access the resource limit specification table or whenno row in the table matches the currently running statement. :NOLIMIT
This is the default. It allows all dynamic SQL statements to run without limit.NORUN
Terminates all dynamic SQL statements immediately with an SQL error code. A number from 1 to5000000 is the default limit. If the limit is exceeded, the SQL statement is terminated.
RLST Access Err RemSSQL (RLFERRDSTC)
Shows what DB2 does when the governor cannot access the resource limit specification table or whenno row in the table matches the currently running statement:NOLIMIT
This is the default. It allows all static SQL statements to run without limit.NORUN
Terminates all static SQL statements immediately with an SQL error code. A number from 1 to5000000 is the default limit; if the limit is exceeded, the SQL statement is terminated.
DB2 12 and later.
DSNZPARM IRLM ParametersThis panel shows information about the Internal Resource Lock Manager (IRLM) with which DB2communicates. It shows the name of the DSNZPARM module that is specified for DB2 startup and thedate on which the module is assembled. It also shows a list of the default values of the DB2 application.
If a field is not available for the current Db2 release, the string N/A is displayed. For other conditions, forexample, if specific Db2 traces are not started or control block data is not available, the string N/P isdisplayed.
308 Classic Interface User's Guide
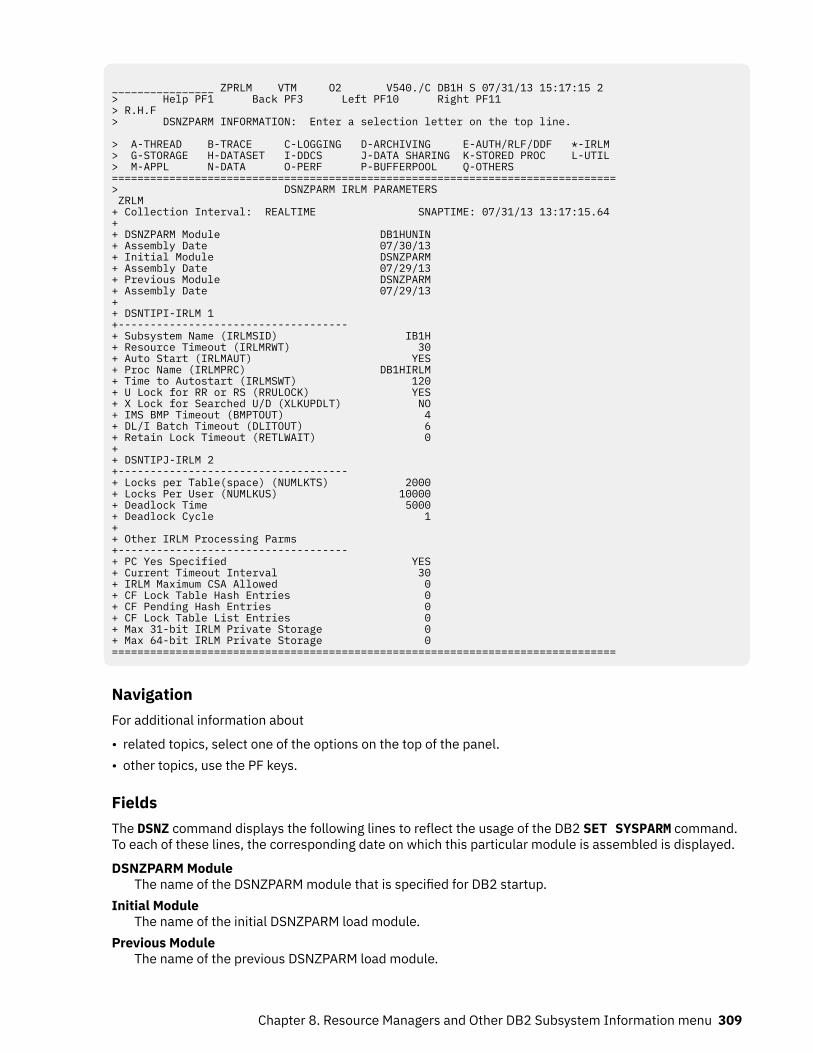
________________ ZPRLM VTM O2 V540./C DB1H S 07/31/13 15:17:15 2 > Help PF1 Back PF3 Left PF10 Right PF11 > R.H.F > DSNZPARM INFORMATION: Enter a selection letter on the top line. > A-THREAD B-TRACE C-LOGGING D-ARCHIVING E-AUTH/RLF/DDF *-IRLM > G-STORAGE H-DATASET I-DDCS J-DATA SHARING K-STORED PROC L-UTIL > M-APPL N-DATA O-PERF P-BUFFERPOOL Q-OTHERS =============================================================================== > DSNZPARM IRLM PARAMETERS ZRLM + Collection Interval: REALTIME SNAPTIME: 07/31/13 13:17:15.64 + + DSNZPARM Module DB1HUNIN + Assembly Date 07/30/13 + Initial Module DSNZPARM + Assembly Date 07/29/13 + Previous Module DSNZPARM + Assembly Date 07/29/13 + + DSNTIPI-IRLM 1 +------------------------------------ + Subsystem Name (IRLMSID) IB1H + Resource Timeout (IRLMRWT) 30 + Auto Start (IRLMAUT) YES + Proc Name (IRLMPRC) DB1HIRLM + Time to Autostart (IRLMSWT) 120 + U Lock for RR or RS (RRULOCK) YES + X Lock for Searched U/D (XLKUPDLT) NO + IMS BMP Timeout (BMPTOUT) 4 + DL/I Batch Timeout (DLITOUT) 6 + Retain Lock Timeout (RETLWAIT) 0 + + DSNTIPJ-IRLM 2 +------------------------------------ + Locks per Table(space) (NUMLKTS) 2000 + Locks Per User (NUMLKUS) 10000 + Deadlock Time 5000 + Deadlock Cycle 1 + + Other IRLM Processing Parms +------------------------------------ + PC Yes Specified YES + Current Timeout Interval 30 + IRLM Maximum CSA Allowed 0 + CF Lock Table Hash Entries 0 + CF Pending Hash Entries 0 + CF Lock Table List Entries 0 + Max 31-bit IRLM Private Storage 0 + Max 64-bit IRLM Private Storage 0 ===============================================================================
NavigationFor additional information about
• related topics, select one of the options on the top of the panel.• other topics, use the PF keys.
FieldsThe DSNZ command displays the following lines to reflect the usage of the DB2 SET SYSPARM command.To each of these lines, the corresponding date on which this particular module is assembled is displayed.
DSNZPARM ModuleThe name of the DSNZPARM module that is specified for DB2 startup.
Initial ModuleThe name of the initial DSNZPARM load module.
Previous ModuleThe name of the previous DSNZPARM load module.
Chapter 8. Resource Managers and Other DB2 Subsystem Information menu 309
Assembly DateThe date on which this module was assembled.
DSNTIPI-IRLM 1
Subsystem Name (IRLMSID) (QWP4ISID)The name of the IRLM subsystem that is known to z/OS.
Resource Timeout (IRLMRWT) (QWP4TOUT)The maximum amount of time in seconds that DB2 is waiting for the release of a locked resource.
Auto Start (IRLMAUT) (QWP4IAUT)The IRLM start mode. OMEGAMON XE for DB2 PE displays YES if DB2 starts IRLM automatically or NOif it does not.
Proc Name (IRLMPRC) (QWP4IPRC)The name of the IRLM procedure that is used by DB2 to start IRLM automatically.
Time to Autostart (IRLMSWT) (QWP4ISWT)The time in seconds that DB2 waits for IRLM to start.If this time expires and IRLM did not yet start, DB2 stops. This applies regardless whether IRLM isstarted automatically or not.
U Lock for RR or RS (RRULOCK) (QWP4RRU )Determines whether the update (U) lock is used when using repeatable read (RR) or read stability (RS)isolation to access a table.Valid values:
NOYES
X Lock for Searched U/D (XLKUPDLT) (QWP4XLUD)Use X lock for searched update or delete. If subsystem parameter XLKUPDT is set to NO, this bit is off.If subsystem parameter XLKUPDT is set to YES or TARGET, see QWP4XLUS.
IMS BMP Timeout (BMPTOUT) (QWP4WBMP)Timeout multiplier for BMP a connection.
DL/I Batch Timeout (DLITOUT) (QWP4WDLI)Timeout multiplier for DL/I batch connection.
Retain Lock Timeout (RETLWAIT) (QWP4WAIT)Multiplier for determining how long a transaction waits for incompatible retained locks. This value ismultiplied by the normal timeout multiplier of the connection.If agents do not wait for incompatible retained locks, the value of this parameter is 0. The default is 0.
Utility Timeout (UTIMOUT)Number of IRLM resource timeout intervals that a utility waits for a lock or claims to be released.
DSNTIPJ-IRLM 2Locks per Table(space) (NUMLKTS) (QWP4LKTS)
The maximum number of page or row locks that can be held concurrently by a thread against a singletable space for which LOCKSIZE ANY is specified before DB2 escalates the locking level to a tablespace lock.The value 0 deactivates this feature.
Locks Per User (NUMLKUS) (QWP4LKUS)The maximum number of page or row locks that can be held concurrently by a thread against all tablespaces in the system including locks against data and index pages. Each lock averages 540 bytes. Ifthis limit is reached, DB2 issues a return code RESOURCE UNAVAILABLE.
Deadlock Time (QWP5DLOK)The time (in seconds or milliseconds) of the local deadlock detection cycle. Values between 1 and 5are seconds. Values between 100 and 5000 are milliseconds. The initial value is retrieved from the
310 Classic Interface User's Guide
IRLMPROC DEADLOK parameter. This value can be changed dynamically with the MODIFYirlmproc,SET,DEADLOCK=nnnn command.
Deadlock Cycle (QWP5DCYC)The number of local deadlock cycles that must expire before the IRLM performs global deadlockdetection processing. This value is retrieved from the IRLMPROC DEADLOK parameter. In a datasharing environment, IRLM synchronizes all DEADLOK values in the group to the values specified onthe most recent IRLM to join the group. The DEADLOK values can be changed by starting a memberwith the required values.
Other IRLM Processing parametersPC Yes Specified (QWP5PCY)
Indicates whether the IRLM is to use the cross-address-space program call. This value is retrievedfrom the IRLMPROC PC parameter.
Current Timeout Interval (QWP5TVAL)The initial value is retrieved from the Timeout Interval (IRLMRWT). The current value can be changeddynamically with the MODIFY irlmproc,SET,TIMEOUT=nnnn,subsystem-name command.
IRLM Maximum CSA Allowed (QWP5MCSA)The maximum amount of common service area (CSA) and extended CSA (ECSA) that the IRLM for thisDB2 uses for its lock control block structure. This value is retrieved from the IRLMPROC MAXCSAparameter.
CF Lock Table Hash Entries (QWP5HASH)The number of lock table entries (LTE) that IRLM has allocated in the XCF LOCK structure. The initialvalue is calculated by the IRLM based on IRLMPROC parameters and the XCF LOCK structure size.This value can be changed dynamically with the MODIFY irlmproc,SET,LTE=nnnn command.
CF Pending Hash Entries (QWP5PHSH)The number of LOCK HASH entries (LTE) that this IRLM can use on the next connect to the XCF LOCKstructure. This value is set by MODIFY irlmproc,SET,LTE=nnnn command and exists until the next timethe IRLM connects to the XCF LOCK structure or a subsequent MODIFY irlmproc,SET,LTE=nnnncommand is issued.
CF Lock Table List Entries (QWP5RLE)The number of entries (RLE) in the list of update locks that are currently held in the XCF LOCKstructure. This list is sometimes called the "modify lock list" or "record list table". The initial value iscalculated by the IRLM based on IRLMPROC parameters and the XCF LOCK structure size. This valuecan be changed dynamically with the MODIFY irlmproc,SET,LTE=nnnn command or a XCF LOCKstructure resizing.
Max 31-bit IRLM Private Storage (QWP5BPM)From a total of 2G virtual storage, a maximum amount of 31-bit IRLM private storage is available fornormal operations in IRLM. IRLM reserves an additional 10% of the total 2G virtual storage for use byrequests in IRLM. DB2 11 and later.
Max 64-bit IRLM Private Storage (QWP5APM)From the total storage that is set as the MEMLIMIT, a maximum amount of 64-bit IRLM private storageis available for normal operations in IRLM. IRLM reserves an additional 10% of the total MEMLIMITstorage for use by requests that must be completed in IRLM. DB2 11 and later.
DSNZPARM Storage ParametersThis panel shows virtual storage allocations for the DB2 buffer pools and the Environmental DescriptorManager (EDM) pool. It shows the name of the DSNZPARM module that is specified for DB2 startup andthe date on which the module is assembled. It also shows a list of the default values of the DB2application.
If a field is not available for the current Db2 release, the string N/A is displayed. For other conditions, forexample, if specific Db2 traces are not started or control block data is not available, the string N/P isdisplayed.
Chapter 8. Resource Managers and Other DB2 Subsystem Information menu 311
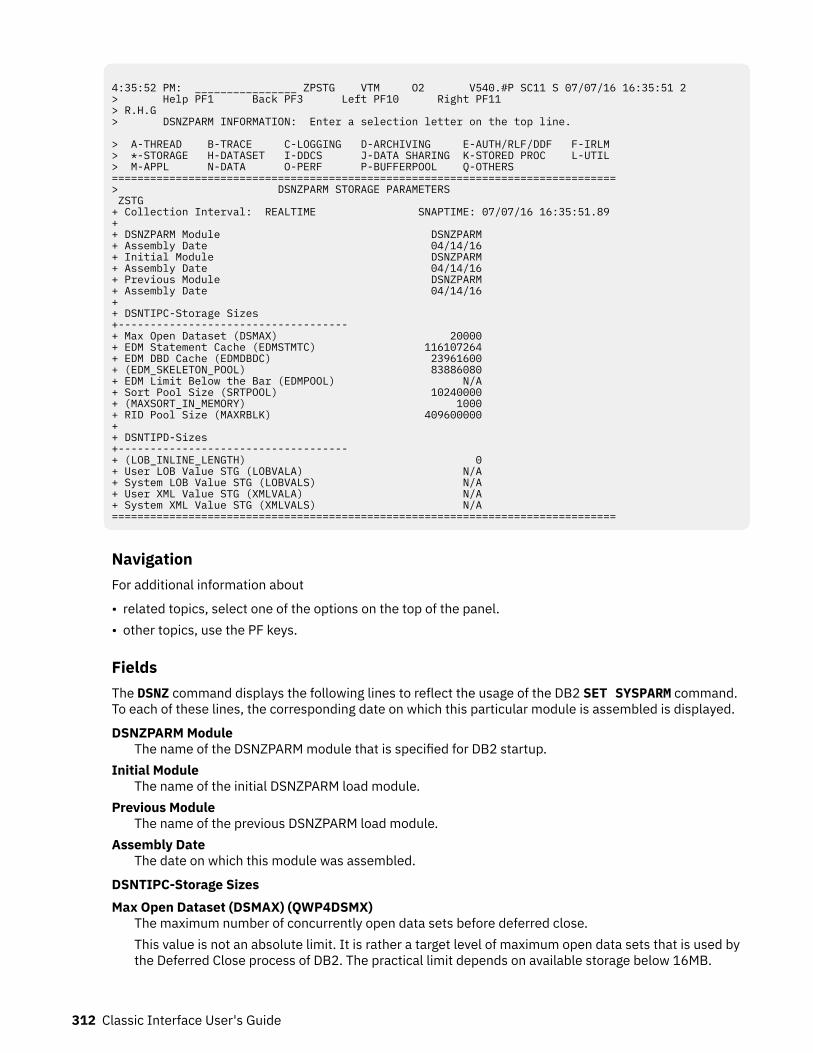
4:35:52 PM: ________________ ZPSTG VTM O2 V540.#P SC11 S 07/07/16 16:35:51 2 > Help PF1 Back PF3 Left PF10 Right PF11 > R.H.G > DSNZPARM INFORMATION: Enter a selection letter on the top line.
> A-THREAD B-TRACE C-LOGGING D-ARCHIVING E-AUTH/RLF/DDF F-IRLM > *-STORAGE H-DATASET I-DDCS J-DATA SHARING K-STORED PROC L-UTIL > M-APPL N-DATA O-PERF P-BUFFERPOOL Q-OTHERS =============================================================================== > DSNZPARM STORAGE PARAMETERS ZSTG + Collection Interval: REALTIME SNAPTIME: 07/07/16 16:35:51.89 + + DSNZPARM Module DSNZPARM + Assembly Date 04/14/16 + Initial Module DSNZPARM + Assembly Date 04/14/16 + Previous Module DSNZPARM + Assembly Date 04/14/16 + + DSNTIPC-Storage Sizes +------------------------------------ + Max Open Dataset (DSMAX) 20000 + EDM Statement Cache (EDMSTMTC) 116107264 + EDM DBD Cache (EDMDBDC) 23961600 + (EDM_SKELETON_POOL) 83886080 + EDM Limit Below the Bar (EDMPOOL) N/A + Sort Pool Size (SRTPOOL) 10240000 + (MAXSORT_IN_MEMORY) 1000 + RID Pool Size (MAXRBLK) 409600000 + + DSNTIPD-Sizes +------------------------------------ + (LOB_INLINE_LENGTH) 0 + User LOB Value STG (LOBVALA) N/A + System LOB Value STG (LOBVALS) N/A + User XML Value STG (XMLVALA) N/A + System XML Value STG (XMLVALS) N/A ===============================================================================
NavigationFor additional information about
• related topics, select one of the options on the top of the panel.• other topics, use the PF keys.
FieldsThe DSNZ command displays the following lines to reflect the usage of the DB2 SET SYSPARM command.To each of these lines, the corresponding date on which this particular module is assembled is displayed.
DSNZPARM ModuleThe name of the DSNZPARM module that is specified for DB2 startup.
Initial ModuleThe name of the initial DSNZPARM load module.
Previous ModuleThe name of the previous DSNZPARM load module.
Assembly DateThe date on which this module was assembled.
DSNTIPC-Storage SizesMax Open Dataset (DSMAX) (QWP4DSMX)
The maximum number of concurrently open data sets before deferred close.This value is not an absolute limit. It is rather a target level of maximum open data sets that is used bythe Deferred Close process of DB2. The practical limit depends on available storage below 16MB.
312 Classic Interface User's Guide
Valid values:
0-100000
EDM Statement Cache (EDMSTMTC) (QWP4ESTC)The maximum size (in KB) of the statement cache that can be used by EDM. This value is either theDB2 startup value or a value (above the DB2 startup value) that you can specify with the SETSYSPARM command.
EDM DBD Cache (EDMDBDC) (QWP4EDBC)The minimum size (in KB) of the DBD cache that can be used by EDM. This value is either the DB2startup value or a value (above the DB2 startup value) that you can specify with the SET SYSPARMcommand.
EDM Limit Below the Bar (EDMPOOL) (QWP4EDPL)Maximum size of the EDM Pool that is in below-the-bar storage. DB2 10 and DB2 11 only.
(EDM_SKELETON_POOL) (QWP4SKLC)The EDM skeleton pool size in bytes (K=1024 bytes, M=1024 x 1024 bytes).
Sort Pool Size (SRTPOOL) (QWP4SPOL)The size of the sort pool, KB.
(MAXSORT_IN_MEMORY) (QWP4MIMTS)The maximum in-memory sort size. DB2 11 and later.
RID Pool Size (MAXRBLK) (QWP4RMAX)The maximum number of RID blocks in bytes. If this value is zero, access path selections that requirethe RID pool (including List Prefetch and hybrid joins) will not be used.
DSNTIPD-Sizes(LOB_INLINE_LENGTH) (QWP1LBIL)
The default number of bytes of a LOB that are stored in the base table.User LOB Value STG (LOBVALA) (QWP1LVA)
The maximum number of kilobytes that a user can use to store LOB values. This field corresponds tofield "User LOB Value Storage" on installation panel DSNTIP7. DB2 10 and DB2 11 only
System LOB Value STG (LOBVALS) (QWP1LVS)The maximum number of megabytes that a subsystem can use to store LOB values. This fieldcorresponds to field "System Value Storage" in DSN6SYSP. DB2 10 and DB2 11 only.
User XML Value STG (XMLVALA) (QWP1XVA)Maximum amount of memory in KB for each user for storing XML values. DB2 10 and DB2 11 only.
System XML Value STG (XMLVALS) (QWP1XVS)Maximum amount of memory in MB for the system for storing XML values. DB2 10 and DB2 11 only.
DSNZPARM Data set and Database ParametersThis panel shows information about the data set and database-related installation parameters in theDSNZPARM module. It shows the name of the DSNZPARM module that is specified for DB2 startup andthe date on which the module is assembled. It also shows a list of the default values of the DB2application.
If a field is not available for the current Db2 release, the string N/A is displayed. For other conditions, forexample, if specific Db2 traces are not started or control block data is not available, the string N/P isdisplayed.
Chapter 8. Resource Managers and Other DB2 Subsystem Information menu 313
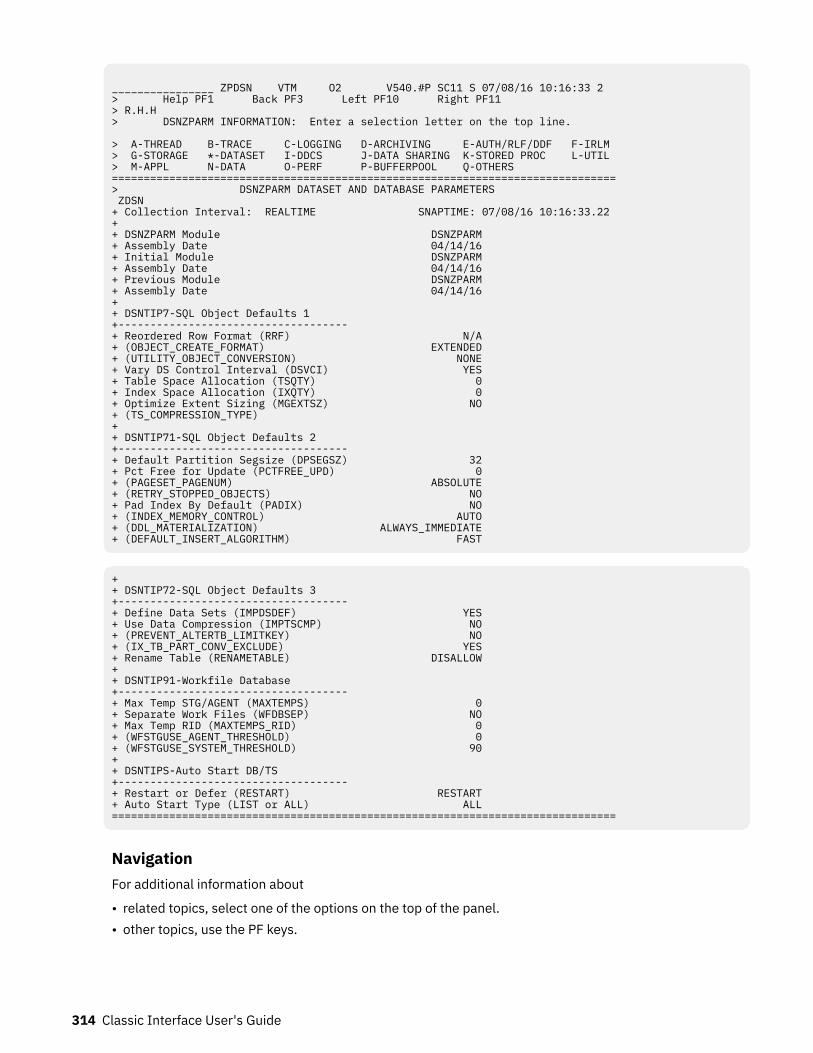
________________ ZPDSN VTM O2 V540.#P SC11 S 07/08/16 10:16:33 2 > Help PF1 Back PF3 Left PF10 Right PF11 > R.H.H > DSNZPARM INFORMATION: Enter a selection letter on the top line. > A-THREAD B-TRACE C-LOGGING D-ARCHIVING E-AUTH/RLF/DDF F-IRLM > G-STORAGE *-DATASET I-DDCS J-DATA SHARING K-STORED PROC L-UTIL > M-APPL N-DATA O-PERF P-BUFFERPOOL Q-OTHERS ===============================================================================> DSNZPARM DATASET AND DATABASE PARAMETERS ZDSN + Collection Interval: REALTIME SNAPTIME: 07/08/16 10:16:33.22 + + DSNZPARM Module DSNZPARM + Assembly Date 04/14/16 + Initial Module DSNZPARM + Assembly Date 04/14/16 + Previous Module DSNZPARM + Assembly Date 04/14/16 + + DSNTIP7-SQL Object Defaults 1 +------------------------------------ + Reordered Row Format (RRF) N/A + (OBJECT_CREATE_FORMAT) EXTENDED + (UTILITY_OBJECT_CONVERSION) NONE + Vary DS Control Interval (DSVCI) YES + Table Space Allocation (TSQTY) 0 + Index Space Allocation (IXQTY) 0 + Optimize Extent Sizing (MGEXTSZ) NO + (TS_COMPRESSION_TYPE)+ + DSNTIP71-SQL Object Defaults 2 +------------------------------------ + Default Partition Segsize (DPSEGSZ) 32 + Pct Free for Update (PCTFREE_UPD) 0 + (PAGESET_PAGENUM) ABSOLUTE + (RETRY_STOPPED_OBJECTS) NO + Pad Index By Default (PADIX) NO + (INDEX_MEMORY_CONTROL) AUTO + (DDL_MATERIALIZATION) ALWAYS_IMMEDIATE + (DEFAULT_INSERT_ALGORITHM) FAST
+ + DSNTIP72-SQL Object Defaults 3 +------------------------------------ + Define Data Sets (IMPDSDEF) YES + Use Data Compression (IMPTSCMP) NO + (PREVENT_ALTERTB_LIMITKEY) NO + (IX_TB_PART_CONV_EXCLUDE) YES + Rename Table (RENAMETABLE) DISALLOW + + DSNTIP91-Workfile Database +------------------------------------ + Max Temp STG/AGENT (MAXTEMPS) 0 + Separate Work Files (WFDBSEP) NO + Max Temp RID (MAXTEMPS_RID) 0 + (WFSTGUSE_AGENT_THRESHOLD) 0 + (WFSTGUSE_SYSTEM_THRESHOLD) 90 + + DSNTIPS-Auto Start DB/TS +------------------------------------ + Restart or Defer (RESTART) RESTART + Auto Start Type (LIST or ALL) ALL ===============================================================================
NavigationFor additional information about
• related topics, select one of the options on the top of the panel.• other topics, use the PF keys.
314 Classic Interface User's Guide
FieldsThe DSNZ command displays the following lines to reflect the usage of the DB2 SET SYSPARM command.To each of these lines, the corresponding date on which this particular module is assembled is displayed.DSNZPARM Module
The name of the DSNZPARM module that is specified for DB2 startup.Initial Module
The name of the initial DSNZPARM load module.Previous Module
The name of the previous DSNZPARM load module.Assembly Date
The date on which this module was assembled.
DSNTIP7-SQL Object Default 1Reordered Row Format (RRF) (QWP4RRF)
This parameter determines whether reordered row format is enabled.YES
Enables reordered row format.Db2 10 and Db2 11 only..
(OBJECT_CREATE_FORMAT) (QWP4OBCF)This parameter determines whether new table spaces and indexes are created in one of the followingformats:1
Extended log record format0
Basic log record formatDb2 11 and later..
(UTILITY_OBJECT_CONVERSION) (QWP4UTOC)If RBALRSW format is not specified, this parameter converts existing table spaces and indexes thatuse extended log record addressing to basic log record addressing and vice versa. Db2 11 and later.
Vary DS Control Interval (DSVCI) (QWP1VVCI)This parameter determines whether CI SIZE=PAGE is used when DB2-managed data sets are defined.
Table Space Allocation (TSQTY) (QWP1TSQT)This parameter determines the default values in KB for PRIQTY and SEQCTY for table spaces.
Index Space Allocation (IXQTY) (QWP1IXQT)This parameter determines the default values in KB for PRIQTY and SEQCTY for index spaces.
Optimize Extent Sizing (MGEXTSZ) (QWP1MESZ)This parameter determines whether a sliding scale for secondary space allocations for DB2-manageddata sets is enabled.
(TS_COMPRESSION_TYPE) - (QWP4TSCT)The TS_COMPRESSION_TYPE subsystem parameter specifies the type of compression algorithm touse when Db2 creates new compressed table spaces, loads into, and reorganizes existing compressedtable spaces.
ZPARM NAME: DSN6SPRM.TS_COMPRESSION_TYPE
Valid values are:
FIXED_LENGTH(Default) Db2 uses its existing compression algorithm to perform compression and decompressionof data stored in the table space. This is the default setting.
Chapter 8. Resource Managers and Other DB2 Subsystem Information menu 315
HUFFMANDb2 uses Huffman compression provided by IBM z14 or later hardware to perform compressionand decompression of data stored in the table space. Huffman compression only applies touniversal table spaces. All other table space types will use fixed-length compression regardless ofthe TS_COMPRESSION_TYPE setting.
Db2 12 and later.
DSNTIP71-SQL Object Default 2Default Partition Segsize (DPSEGSZ) (QWP1DPSS)
This parameter determines the default segment size that is used for a partitioned table space whenthe CREATE TABLESPACE statement does not include the SEGSIZE parameter.
Pct Free for Update (PCTFREE_UPD) (QWP4PFUP)This parameter determines the default percentage of each page that DB2 leaves as free space forupdates when you create a table space without specifying the FOR UPDATE CLAUSE of the PCTFREEoption and a table within that table space is populated. DB2 11 and later. Db2 11 and later.
(PAGESET_PAGENUM) (QWP4PSPN)
Specifies whether range-partitioned table spaces and associated indexes will be created to useabsolute page numbers across partitions or relative page numbers.A
Absolute page numbersR
Relative page numbersDb2 12 and later.
(RETRY_STOPPED_OBJECTS) (QWP4RSO)
Specifies whether DB2 should immediately reject requests for a stopped object or retry them, up tothe IRLM timeout limit, to see if the object has been started.NO
This is the default. It indicates that DB2 immediately rejects requests for a stopped object.YES
DB2 retries such requests, up to the IRLM timeout setting, if the stopped object is restarted.Db2 12 and later.
Pad Index By Default (PADIX) (QWP4PDIX)This parameter determines whether new indexes are paddedValid values:NO
New indexes are not padded unless the PADDED option is included in the CREATE INDEXstatement.
YESNew indexes are padded unless the NOT PADDED option is included in the CREATE INDEXstatement.
Default:
NO
(INDEX_MEMORY_CONTROL) (QWP4IXMC)Shows the amount of memory that DB2 should allocate for fast traversing of DB2 indexes:1 = AUTO (default)
DB2 sets the upper limit of the storage to 20% of the currently allocated buffer pools.
316 Classic Interface User's Guide
0 = DISABLEDB2 returns any existing storage allocated for fast index traversal and does not allocate anyfurther storage for this purpose.
10 - 200000Indicates the storage limit for fast index traversal in megabytes.
Db2 12 and later.(DDL_MATERIALIZATION) (QWP4DDLM)
Specifies when DB2 materializes changes to the definition of an object. Valid values are:ALWAYS IMMEDIATE (default)
Changes are materialized at the time the request is executed, and the containing table space isplaced in the AREO* or REORP status.
ALWAYS PENDINGChanges are not materialized at the time that the request is executed, and the affected objects areavailable until it is convenient to implement changes. The containing table space is placed in theAREO* status.
Db2 12 and later.(DEFAULT_INSERT_ALGORITHM) (QWP4DINA)
Specifies the default algorithm for inserting data into table spaces. Valid values:BASIC(1) (default)
The basic insert algorithm is used.FAST(2)
The fast insert algorithm is used.Db2 12 and later.
Define Data Sets (IMPDSDEF) (QWP1DIDS)This parameter determines the underlying data sets when a table space that is in an implicitly createddatabase is created.
Use Data Compression (IMPTSCMP) (QWP1CITS)This parameter determines whether data compression in table spaces in implicitly defined databasesis used.
DSNTIP72-SQL Object Default 3Define Data Sets (IMPDSDEF) (QWP1DIDS)
This parameter determines the underlying data sets when a table space that is in an implicitly createddatabase is created.
Use Data Compression (IMPTSCMP) (QWP1CITS)This parameter determines whether data compression in table spaces in implicitly defined databasesis used.
(PREVENT_ALTERTB_LIMITKEY) (QWP4XPKE)
Determines whether DB2 disallows altering the limit key by using an ALTER TABLE statement forindex-controlled partitioned table spaces. This alter operation places the table space in REORG-pending (REORP) restrictive status, and the data is not available until the affected partitions arereorganized. Use PREVENT_ALTERTB_LIMITKEY to avoid this data unavailability.NO
Specifies that you can alter a limit key by using an ALTER TABLE statement for index-controlledpartitioned table spaces. NO is the default.
YESSpecifies that it is not permitted to alter a limit key by using an ALTER TABLE statement for index-controlled partitioned table spaces. An ALTER TABLE statement must not attempt to alter the limitkey for an index-controlled partitioned table.
Db2 11 and later.
Chapter 8. Resource Managers and Other DB2 Subsystem Information menu 317
(IX_TB_PART_CONV_EXCLUDE) (QWP4XPKE)This parameter determines whether to include all columns in the partitioning key during theconversion from index-controlled partitioning to table-controlled partitioning.
Rename Table (RENAMETABLE) (QWP4ERTS)
Specifies whether the RENAME TABLE statement should extend to tables that are referenced in a viewdefinition or the definition of an SQL table function:ALLOW_DEP_VIEW_SQLTUDF
YESDISALLOW_DEP_VIEW_SQLTUDF
NO
Db2 12 and later.
DSNTIP91-Workfile DatabaseMax Temp STG/AGENT (MAXTEMPS) (QWP4WFAL)
Specifies the maximum number of megabytes of temporary storage in the work file database that canbe used by a single agend at any given time for all temporary tables. If 0 is specified, a limit is notenforced.Valid values:
0 - 2147483647
Default: 0
Separate Work Files (WFDBSEP) (QWP4WFDBSEP)This parameter determines whether DB2 provides an unconditional separation of table spaces in thework file database based on the allocation attributes of the table spaces.Valid values:YES
DB2 directs declared global temporary table (DGTT) work only to DB2-managed (STOGROUP)work file table spaces that are defined with a non-zero SECQTY and work file work only to otherwork file table spaces (DB2-managed table spaces that are defined with zero SECQTY or user-managed table spaces).If a table space with the preferred allocation type is not available, an error messages is issued byDB2.
NODB2 attempts to direct (DGTT) work to DB2-managed (STOGROUP) work file table spaces that aredefined with a non-zero SECQTY and work file work to any other work file table space (DB2-managed table spaces that are defined with zero SECQTY or user-managed table spaces.If a table space with the preferred allocation type is available, DB2 selects a table space with anon-preferred allocation type.
Default: NOMax Temp RID (MAXTEMPS_RID) (QWP4WFRD)
The maximum number of RID blocks of temporary storage in the work file database that a single RIDlist can use at any point in time.
(WFSTGUSE_AGENT_THRESHOLD) (QWP4WFAT)Determines the percentage of the space that is available in the work file database on this DB2subsystem or in this data sharing member that can be consumed by a single agent before a warningmessage is issued.Space in the work file database can be configured for temporary (DGTT-ORIENTED) work and for sortwork including CGTTS and trigger transition tables.Valid values:
318 Classic Interface User's Guide

0Agent-level space-usage alerts for the work file database are not issued by DB2.This is the default setting.
1 - 100If DSN6SPRM.WFDBSEP is set to YES, a warning message is issued by DB2 if the percentage of thetotal temporary work file space or the percentage of the total sort work file space that isconsumed by an agent exceeds the specified threshold.If DSN6SPRM.WFDBSEP is set to NO, a warning message is issued by DB2 if the percentage of theentire work file space (temporary and sort) that is consumed by an agent exceeds the specifiedthreshold.If DSN6SPRM.MAXTEMPS is greater than 0 and if the threshold that is specified forDSN6SPRM.MAXTEMPS is exceeded before the threshold that is specified for theWFSTGUSE_AGENT is reached, the warning message is not issued because MAXTEMPS is reachedfirst by the agent. This results in a error message "Resource unavailable" with the SQL code -904.
Db2 11 and later.(WFSTGUSE_SYSTEM_THRESHOLD) (QWP4WFST)
Determines the percentage of the space that is available in the work file database on this DB2subsystem or in this data sharing member that can be consumed by all agents before a warningmessage is issued.Valid values:0
System-level space-usage alerts for the work file database are not issued by DB2.1 - 100
If DSN6SPRM.WFDBSEP is set to YES, a warning message is issued by DB2 if the percentage oftotal temporary work file space or the percentage of total sort work file space that is consumed byall agents exceeds the specified threshold.If DSN6SPRM.WFDBSEP is set to NO, a warning message is issued by DB2 if the percentage of theentire work file space (temporary and sort) that is consumed by all agents exceeds the specifiedthreshold.
The default setting is 90. Db2 11 and later.
DSNTIPS-Auto Start DB/TSRestart or Defer (RESTART) (QWP7STR )
This parameter determines whether DB2 databases are started automatically or are deferred.Valid values:NO
The specified databases and page sets are deferred.YES
The specified databases are started automatically.Auto Start Type (LIST or ALL) (SWP7STR )
This parameter determines the DB2 databases that are started or deferred.Valid values:ALL
When DB2 starts, all databases are started automatically.LIST
When DB2 starts, a list of databases and table spaces and indexes is displayed. The databasesand table spaces and indexes of this list are started automatically or they are deferred.
Chapter 8. Resource Managers and Other DB2 Subsystem Information menu 319
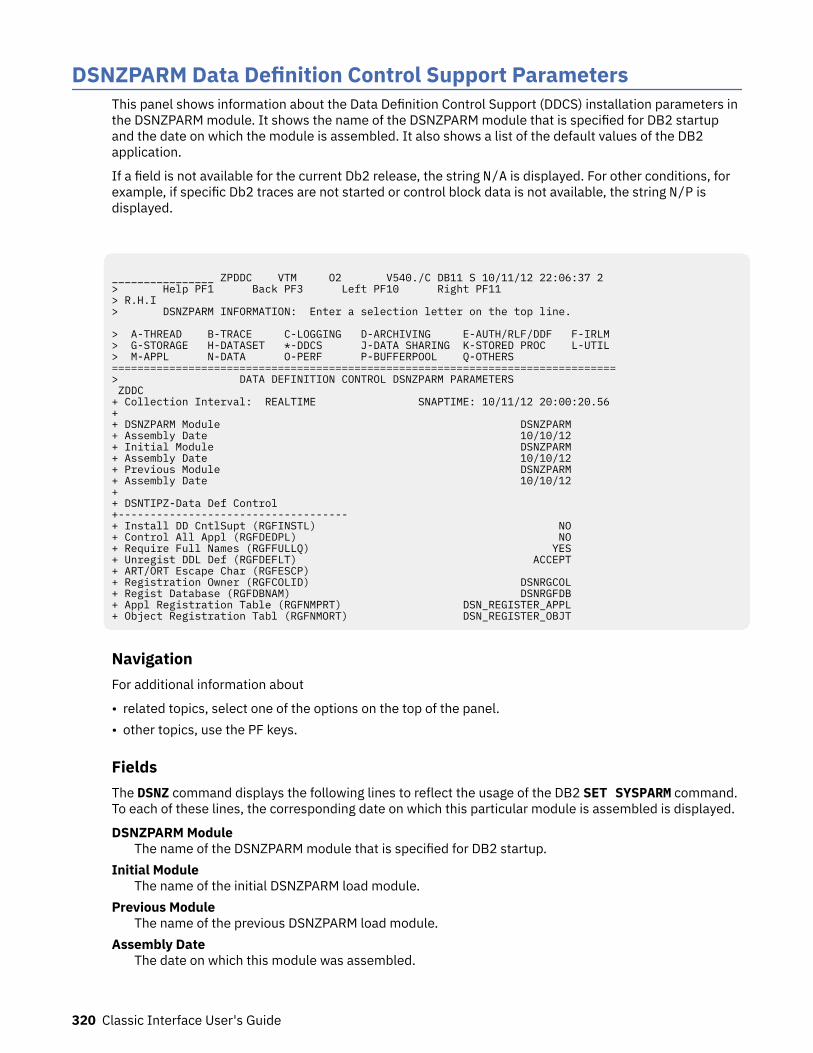
DSNZPARM Data Definition Control Support ParametersThis panel shows information about the Data Definition Control Support (DDCS) installation parameters inthe DSNZPARM module. It shows the name of the DSNZPARM module that is specified for DB2 startupand the date on which the module is assembled. It also shows a list of the default values of the DB2application.
If a field is not available for the current Db2 release, the string N/A is displayed. For other conditions, forexample, if specific Db2 traces are not started or control block data is not available, the string N/P isdisplayed.
________________ ZPDDC VTM O2 V540./C DB11 S 10/11/12 22:06:37 2 > Help PF1 Back PF3 Left PF10 Right PF11 > R.H.I > DSNZPARM INFORMATION: Enter a selection letter on the top line. > A-THREAD B-TRACE C-LOGGING D-ARCHIVING E-AUTH/RLF/DDF F-IRLM > G-STORAGE H-DATASET *-DDCS J-DATA SHARING K-STORED PROC L-UTIL > M-APPL N-DATA O-PERF P-BUFFERPOOL Q-OTHERS =============================================================================== > DATA DEFINITION CONTROL DSNZPARM PARAMETERS ZDDC + Collection Interval: REALTIME SNAPTIME: 10/11/12 20:00:20.56+ + DSNZPARM Module DSNZPARM + Assembly Date 10/10/12 + Initial Module DSNZPARM + Assembly Date 10/10/12 + Previous Module DSNZPARM + Assembly Date 10/10/12 + + DSNTIPZ-Data Def Control +------------------------------------ + Install DD CntlSupt (RGFINSTL) NO + Control All Appl (RGFDEDPL) NO + Require Full Names (RGFFULLQ) YES + Unregist DDL Def (RGFDEFLT) ACCEPT + ART/ORT Escape Char (RGFESCP) + Registration Owner (RGFCOLID) DSNRGCOL + Regist Database (RGFDBNAM) DSNRGFDB + Appl Registration Table (RGFNMPRT) DSN_REGISTER_APPL + Object Registration Tabl (RGFNMORT) DSN_REGISTER_OBJT
NavigationFor additional information about
• related topics, select one of the options on the top of the panel.• other topics, use the PF keys.
FieldsThe DSNZ command displays the following lines to reflect the usage of the DB2 SET SYSPARM command.To each of these lines, the corresponding date on which this particular module is assembled is displayed.
DSNZPARM ModuleThe name of the DSNZPARM module that is specified for DB2 startup.
Initial ModuleThe name of the initial DSNZPARM load module.
Previous ModuleThe name of the previous DSNZPARM load module.
Assembly DateThe date on which this module was assembled.
320 Classic Interface User's Guide
DSNTIPZ-Data Def ControlInstall DDCNTL Support (RGFINSTL) (QWP4REGI)
Determines whether data definition control support is used.Control All Applications (RGFDEDPL) (QWP4REGD)
Determines whether only registered packages or plans can use DDL.Require Full Names (RGFFULLQ) (QWP4REGQ)
Determines whether two-part names are required for every object that is registered in ORT.Unregistered DDL Default (RGFDEFLT) (QWP4REGU)
This is a flag for unregistered DDL default.00
Unregistered DDL are prohibited.1X
Unregistered DDL can be used.X1
Consult the art for unregistered DDL.ART/ORT Escape Char (RGFESCP) (QWP4ESC)
The DDCS escape character for a search of the application registration table (ART) or the objectregistration table (ORT). This character is shown in both display and hexadecimal formats.
Registration Owner (RGFCOLID) (QWP4REGC)Displays the owner of the application registration table and the object registration table.If QWP4REGC_OFF is not set to 0, this value is truncated. If QWP4REGC is truncated, this is the offsetfrom the beginning of QWP4 TO QWP4REGC_LEN.If QWP4REGC_OFF is not set to 0, use the following fields:
• LENGTH OF QWP4REGC_VAR• DDL REGISTRATION TABLE OWNER
Registration Database (RGFDBNAM) (QWP4REGN)Specifies the name of the database that contains the registration tables.
Appl Registration Table (RGFNMPRT) (QWP4REGA)Specifies the name of the application registration table.If QWP4REGA_OFF is not set to 0, this value is truncated. If QWP4REGA is truncated, this is the offsetfrom the beginning of QWP4 TO QWP4REGA_LEN.If QWP4REGA_OFF is not set to 0, use the following fields:
• LENGTH OF QWP4REGA_VAR• DDL REGISTRATION APPLICATION REGISTRATION TABLE NAME
Object Registration Table (RGFNMORT) (QWP4REGO)Specifies the name of the object registration table.If QWP4REGO_OFF is not set to 0, this value is truncated. If QWP4REGO is truncated, this is the offsetfrom the beginning of QWP4 TO QWP4REGO_LEN.If QWP4REGO_OFF is not set to 0, use the following fields:
• LENGTH OF QWP4REGO_VAR• DDL REGISTRATION OBJECT REGISTRATION TABLE NAME
Chapter 8. Resource Managers and Other DB2 Subsystem Information menu 321
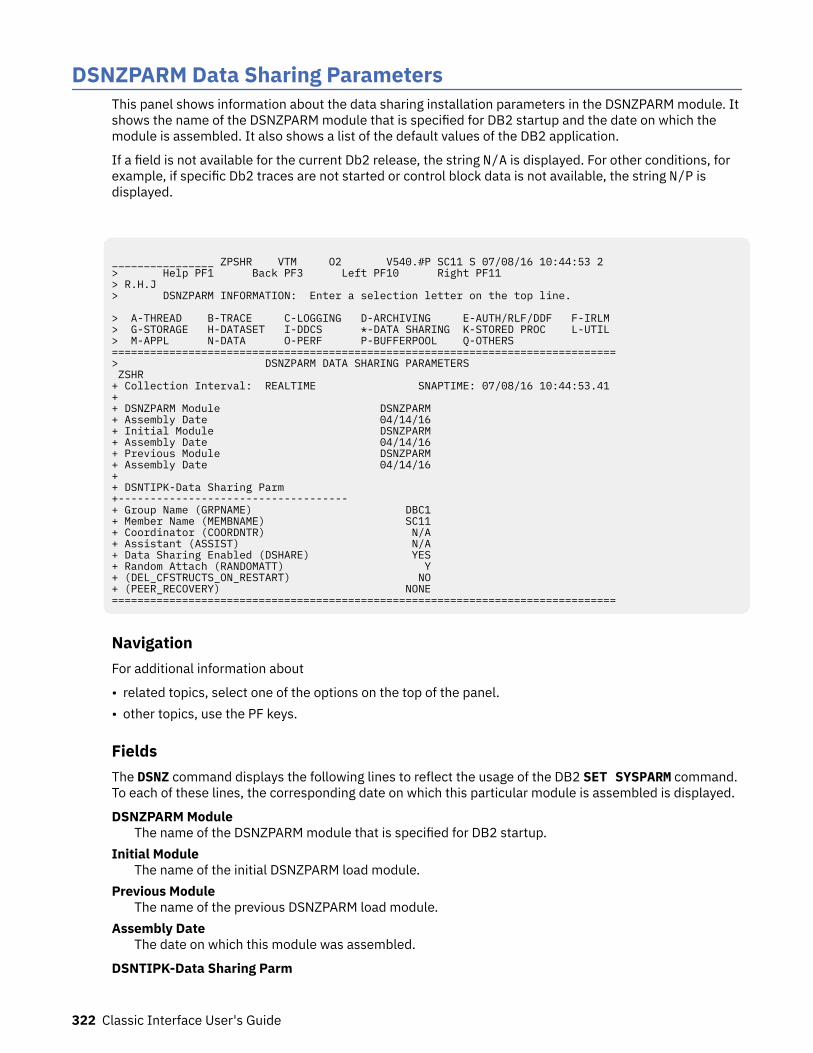
DSNZPARM Data Sharing ParametersThis panel shows information about the data sharing installation parameters in the DSNZPARM module. Itshows the name of the DSNZPARM module that is specified for DB2 startup and the date on which themodule is assembled. It also shows a list of the default values of the DB2 application.
If a field is not available for the current Db2 release, the string N/A is displayed. For other conditions, forexample, if specific Db2 traces are not started or control block data is not available, the string N/P isdisplayed.
________________ ZPSHR VTM O2 V540.#P SC11 S 07/08/16 10:44:53 2 > Help PF1 Back PF3 Left PF10 Right PF11 > R.H.J > DSNZPARM INFORMATION: Enter a selection letter on the top line. > A-THREAD B-TRACE C-LOGGING D-ARCHIVING E-AUTH/RLF/DDF F-IRLM > G-STORAGE H-DATASET I-DDCS *-DATA SHARING K-STORED PROC L-UTIL > M-APPL N-DATA O-PERF P-BUFFERPOOL Q-OTHERS =============================================================================== > DSNZPARM DATA SHARING PARAMETERS ZSHR + Collection Interval: REALTIME SNAPTIME: 07/08/16 10:44:53.41 + + DSNZPARM Module DSNZPARM + Assembly Date 04/14/16 + Initial Module DSNZPARM + Assembly Date 04/14/16 + Previous Module DSNZPARM + Assembly Date 04/14/16 + + DSNTIPK-Data Sharing Parm +------------------------------------ + Group Name (GRPNAME) DBC1 + Member Name (MEMBNAME) SC11 + Coordinator (COORDNTR) N/A + Assistant (ASSIST) N/A + Data Sharing Enabled (DSHARE) YES + Random Attach (RANDOMATT) Y + (DEL_CFSTRUCTS_ON_RESTART) NO + (PEER_RECOVERY) NONE ===============================================================================
NavigationFor additional information about
• related topics, select one of the options on the top of the panel.• other topics, use the PF keys.
FieldsThe DSNZ command displays the following lines to reflect the usage of the DB2 SET SYSPARM command.To each of these lines, the corresponding date on which this particular module is assembled is displayed.
DSNZPARM ModuleThe name of the DSNZPARM module that is specified for DB2 startup.
Initial ModuleThe name of the initial DSNZPARM load module.
Previous ModuleThe name of the previous DSNZPARM load module.
Assembly DateThe date on which this module was assembled.
DSNTIPK-Data Sharing Parm
322 Classic Interface User's Guide
Group Name (GRPNAME) (QWPAGRPN)The name of a new or of an existing DB2 data sharing group.
Member name (MEMBNAME) (QWPAMBRN)The name of a new or of an existing DB2 data sharing member. This field displays N/A if data sharing isnot enabled.
Coordinator (COORDNTR) (QWPACOOR)Determines whether this DB2 can send parallel tasks to eligible DB2 members.Valid values: Y (Yes) or N (No).Default: YesDB2 10 only.
Assistant (ASSIST) (QWPAASST)Determines whether this DB2 can assist parallel processing at BIND time and at RUN time.To be used as an assistant at RUN time, the threshold of the VPPSEQT and the VPXPSEQT buffer poolmust be greater than 0.Valid values: Y (Yes) or N (No)If YES, this member can assist in parallel processing.DB2 10 only.
Data Sharing (DSHARE) (QWPADSHR)Determines whether DB2 data sharing is enabled.Valid values: YES or NO.
Random Attach (RANDOMATT) (QWPARAND)The flag whether this DB2 is eligible for the random group attach.Valid values: Y (Yes) or N (No).
(DEL_CFSTRUCTS_ON_RESTART) (QWP1DCFS)During restart, it is attempted to delete CF structures including the SCA, IRLM LOCK structures andallocated group buffer pools.
PEER_RECOVERY (QWPAPEERREC)Specifies whether the data sharing member participates in data sharing peer recovery. Valid valuesNONE (default)
Does not participate in peer recovery. Use this option if you have configured the z/OS AutomaticRestart Manager (ARM) to restart failed DB2 members.
RECOVERMember is recovered by a peer member if it fails.
ASSISTMember attempts to initiate peer recovery for other failed members. When this member detects afailure it attempts to initiate a LIGHT(YES) restart for the failed member. if it has not already beeninitiated to recover the retained locks.
BOTHBoth RECOVER and ASSIST options are activated for this member
Db2 12 and later.
DSNZPARM Stored Procedures ParametersThis panel shows information about the use of stored procedures in the DB2 system.. It shows the nameof the DSNZPARM module that is specified for DB2 startup and the date on which the module isassembled. It also shows a list of the default values of the DB2 application.
If a field is not available for the current Db2 release, the string N/A is displayed. For other conditions, forexample, if specific Db2 traces are not started or control block data is not available, the string N/P isdisplayed.
Chapter 8. Resource Managers and Other DB2 Subsystem Information menu 323
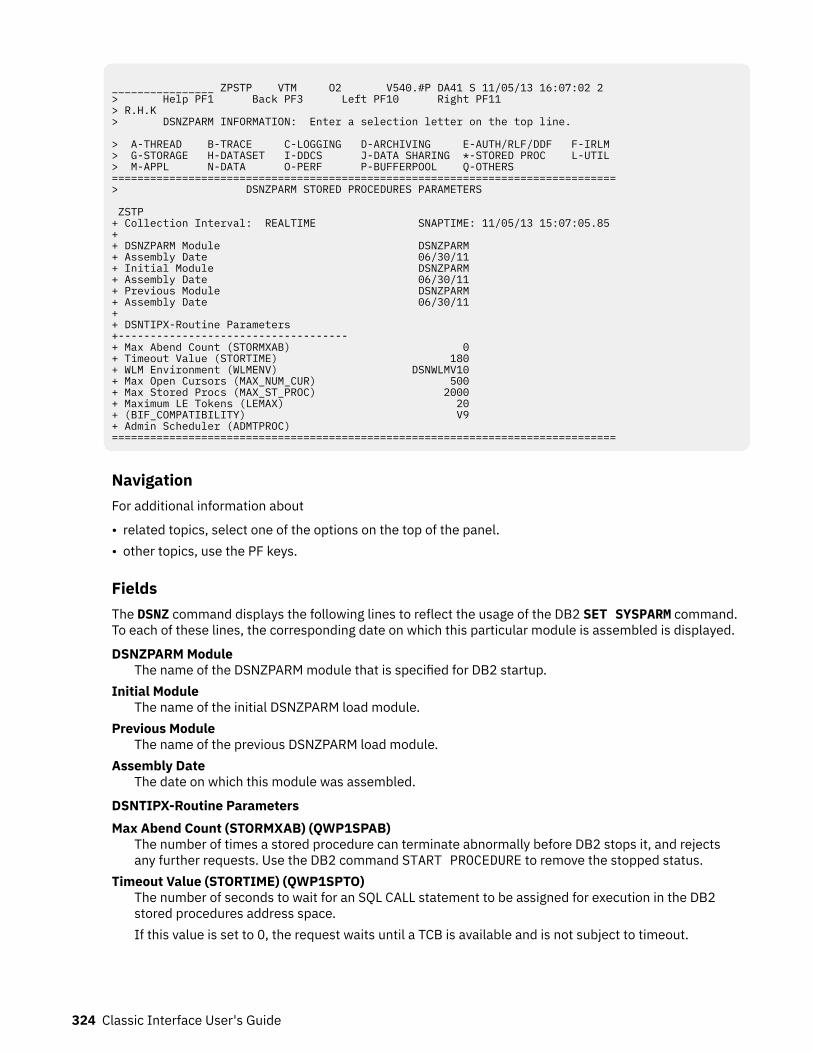
________________ ZPSTP VTM O2 V540.#P DA41 S 11/05/13 16:07:02 2 > Help PF1 Back PF3 Left PF10 Right PF11 > R.H.K > DSNZPARM INFORMATION: Enter a selection letter on the top line. > A-THREAD B-TRACE C-LOGGING D-ARCHIVING E-AUTH/RLF/DDF F-IRLM > G-STORAGE H-DATASET I-DDCS J-DATA SHARING *-STORED PROC L-UTIL > M-APPL N-DATA O-PERF P-BUFFERPOOL Q-OTHERS ===============================================================================> DSNZPARM STORED PROCEDURES PARAMETERS ZSTP + Collection Interval: REALTIME SNAPTIME: 11/05/13 15:07:05.85 + + DSNZPARM Module DSNZPARM + Assembly Date 06/30/11 + Initial Module DSNZPARM + Assembly Date 06/30/11 + Previous Module DSNZPARM + Assembly Date 06/30/11 + + DSNTIPX-Routine Parameters +------------------------------------ + Max Abend Count (STORMXAB) 0 + Timeout Value (STORTIME) 180 + WLM Environment (WLMENV) DSNWLMV10 + Max Open Cursors (MAX_NUM_CUR) 500 + Max Stored Procs (MAX_ST_PROC) 2000 + Maximum LE Tokens (LEMAX) 20 + (BIF_COMPATIBILITY) V9 + Admin Scheduler (ADMTPROC) ===============================================================================
NavigationFor additional information about
• related topics, select one of the options on the top of the panel.• other topics, use the PF keys.
FieldsThe DSNZ command displays the following lines to reflect the usage of the DB2 SET SYSPARM command.To each of these lines, the corresponding date on which this particular module is assembled is displayed.
DSNZPARM ModuleThe name of the DSNZPARM module that is specified for DB2 startup.
Initial ModuleThe name of the initial DSNZPARM load module.
Previous ModuleThe name of the previous DSNZPARM load module.
Assembly DateThe date on which this module was assembled.
DSNTIPX-Routine ParametersMax Abend Count (STORMXAB) (QWP1SPAB)
The number of times a stored procedure can terminate abnormally before DB2 stops it, and rejectsany further requests. Use the DB2 command START PROCEDURE to remove the stopped status.
Timeout Value (STORTIME) (QWP1SPTO)The number of seconds to wait for an SQL CALL statement to be assigned for execution in the DB2stored procedures address space.If this value is set to 0, the request waits until a TCB is available and is not subject to timeout.
324 Classic Interface User's Guide
WLM Environment (WLMENV) (QWP1WLME)This is the default WLM environment for user-defined functions and stored procedures. This value isused by DB2 if the WLM environment is not specified in a CREATE function or a CREATE PROCEDUREstatement.
Max Open Cursors (MAX_NUM_CUR) (QWP4MXNC)The maximum number of open cursors per thread.
Max Stored Procs (MAX_ST_PROC) (QWP4MXSP)The maximum number of active stored procedures per thread.
Maximum LE Tokens (LEMAX) (QWP4LEM )The maximum number of language environment tokens that are active at any time.Valid values: 0 - 50.Default: 20Db2 10 and Db2 11 only.
(BIF_COMPATIBILITY) (QWP4BIF_COMPAT)The BIF compatibility subsystem parameter specifies whether the built-in functions andspecifications are to return results in the DB2 10 format or revert to the pre-version 10 format.BIF_COMPATIBILITY can have the following values:
CURRENTV9V9_TRIMV9_DECIMAL_VARCHARN/P
Admin Scheduler (ADMTPROC) (QWP4ADMT)The name of the JCL procedure that is used to start the DB2 administrative scheduler task addressspace.
DSNZPARM Application ParametersThis panel shows information about the parameters that affect the default settings of the DB2application.It shows the name of the DSNZPARM module that is specified for DB2 startup and the date onwhich the module is assembled. It also shows a list of the default values of the DB2 application.
If a field is not available for the current Db2 release, the string N/A is displayed. For other conditions, forexample, if specific Db2 traces are not started or control block data is not available, the string N/P isdisplayed.
Chapter 8. Resource Managers and Other DB2 Subsystem Information menu 325
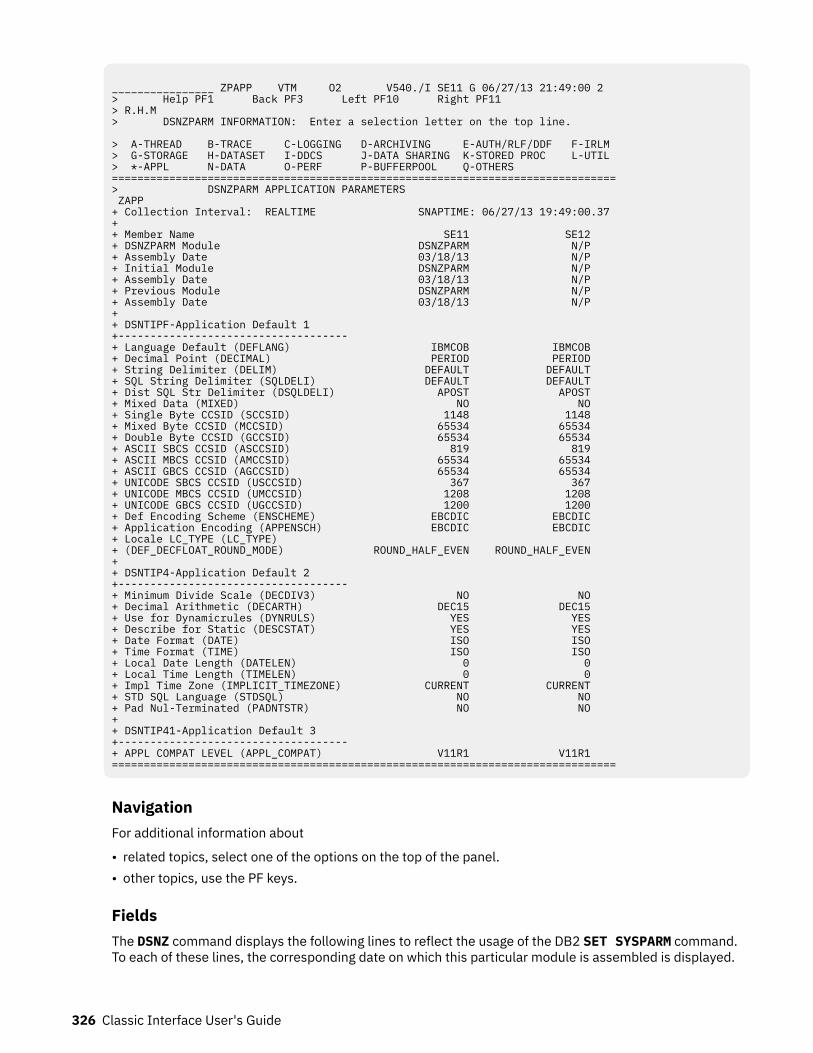
________________ ZPAPP VTM O2 V540./I SE11 G 06/27/13 21:49:00 2 > Help PF1 Back PF3 Left PF10 Right PF11 > R.H.M > DSNZPARM INFORMATION: Enter a selection letter on the top line. > A-THREAD B-TRACE C-LOGGING D-ARCHIVING E-AUTH/RLF/DDF F-IRLM > G-STORAGE H-DATASET I-DDCS J-DATA SHARING K-STORED PROC L-UTIL > *-APPL N-DATA O-PERF P-BUFFERPOOL Q-OTHERS ===============================================================================> DSNZPARM APPLICATION PARAMETERS ZAPP + Collection Interval: REALTIME SNAPTIME: 06/27/13 19:49:00.37 + + Member Name SE11 SE12 + DSNZPARM Module DSNZPARM N/P + Assembly Date 03/18/13 N/P + Initial Module DSNZPARM N/P + Assembly Date 03/18/13 N/P + Previous Module DSNZPARM N/P + Assembly Date 03/18/13 N/P + + DSNTIPF-Application Default 1 +------------------------------------ + Language Default (DEFLANG) IBMCOB IBMCOB + Decimal Point (DECIMAL) PERIOD PERIOD + String Delimiter (DELIM) DEFAULT DEFAULT + SQL String Delimiter (SQLDELI) DEFAULT DEFAULT + Dist SQL Str Delimiter (DSQLDELI) APOST APOST + Mixed Data (MIXED) NO NO + Single Byte CCSID (SCCSID) 1148 1148 + Mixed Byte CCSID (MCCSID) 65534 65534 + Double Byte CCSID (GCCSID) 65534 65534 + ASCII SBCS CCSID (ASCCSID) 819 819 + ASCII MBCS CCSID (AMCCSID) 65534 65534 + ASCII GBCS CCSID (AGCCSID) 65534 65534 + UNICODE SBCS CCSID (USCCSID) 367 367 + UNICODE MBCS CCSID (UMCCSID) 1208 1208 + UNICODE GBCS CCSID (UGCCSID) 1200 1200 + Def Encoding Scheme (ENSCHEME) EBCDIC EBCDIC + Application Encoding (APPENSCH) EBCDIC EBCDIC + Locale LC_TYPE (LC_TYPE) + (DEF_DECFLOAT_ROUND_MODE) ROUND_HALF_EVEN ROUND_HALF_EVEN + + DSNTIP4-Application Default 2 +------------------------------------ + Minimum Divide Scale (DECDIV3) NO NO + Decimal Arithmetic (DECARTH) DEC15 DEC15 + Use for Dynamicrules (DYNRULS) YES YES + Describe for Static (DESCSTAT) YES YES + Date Format (DATE) ISO ISO + Time Format (TIME) ISO ISO + Local Date Length (DATELEN) 0 0 + Local Time Length (TIMELEN) 0 0 + Impl Time Zone (IMPLICIT_TIMEZONE) CURRENT CURRENT + STD SQL Language (STDSQL) NO NO + Pad Nul-Terminated (PADNTSTR) NO NO + + DSNTIP41-Application Default 3 +------------------------------------ + APPL COMPAT LEVEL (APPL_COMPAT) V11R1 V11R1 ===============================================================================
NavigationFor additional information about
• related topics, select one of the options on the top of the panel.• other topics, use the PF keys.
FieldsThe DSNZ command displays the following lines to reflect the usage of the DB2 SET SYSPARM command.To each of these lines, the corresponding date on which this particular module is assembled is displayed.
326 Classic Interface User's Guide
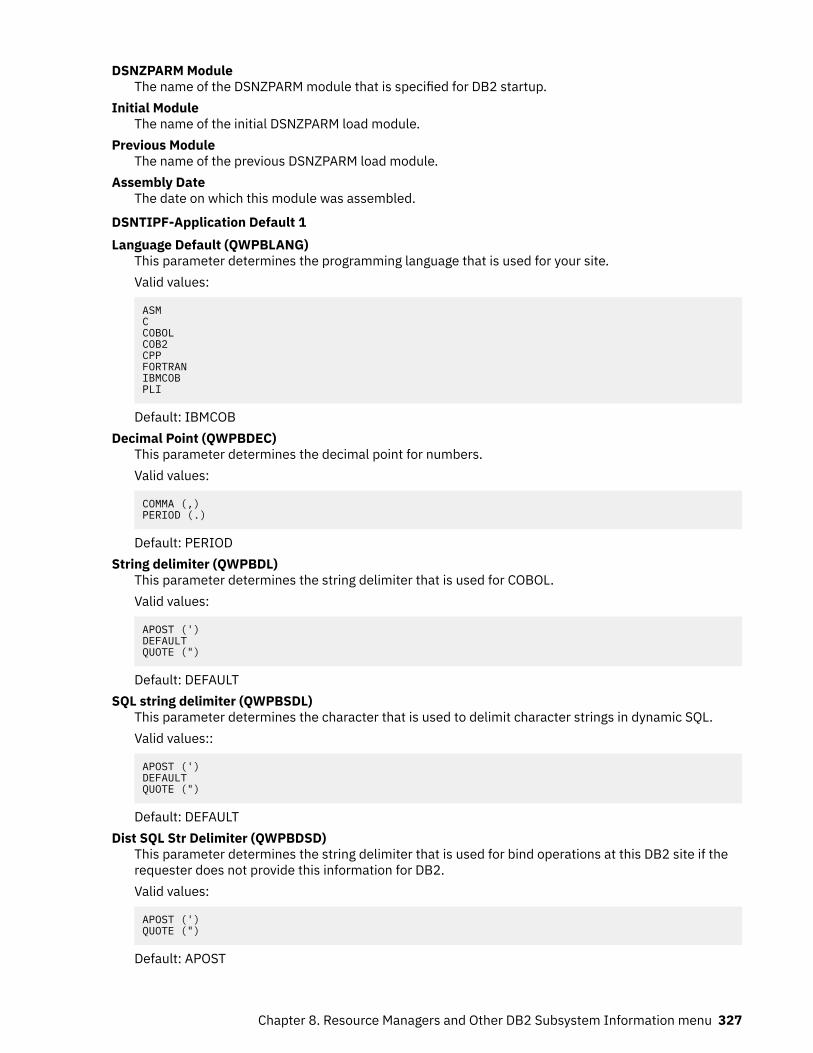
DSNZPARM ModuleThe name of the DSNZPARM module that is specified for DB2 startup.
Initial ModuleThe name of the initial DSNZPARM load module.
Previous ModuleThe name of the previous DSNZPARM load module.
Assembly DateThe date on which this module was assembled.
DSNTIPF-Application Default 1Language Default (QWPBLANG)
This parameter determines the programming language that is used for your site.Valid values:
ASMCCOBOLCOB2CPPFORTRANIBMCOBPLI
Default: IBMCOBDecimal Point (QWPBDEC)
This parameter determines the decimal point for numbers.Valid values:
COMMA (,) PERIOD (.)
Default: PERIODString delimiter (QWPBDL)
This parameter determines the string delimiter that is used for COBOL.Valid values:
APOST (')DEFAULTQUOTE (")
Default: DEFAULTSQL string delimiter (QWPBSDL)
This parameter determines the character that is used to delimit character strings in dynamic SQL.Valid values::
APOST (')DEFAULTQUOTE (")
Default: DEFAULTDist SQL Str Delimiter (QWPBDSD)
This parameter determines the string delimiter that is used for bind operations at this DB2 site if therequester does not provide this information for DB2.Valid values:
APOST (')QUOTE (")
Default: APOST
Chapter 8. Resource Managers and Other DB2 Subsystem Information menu 327
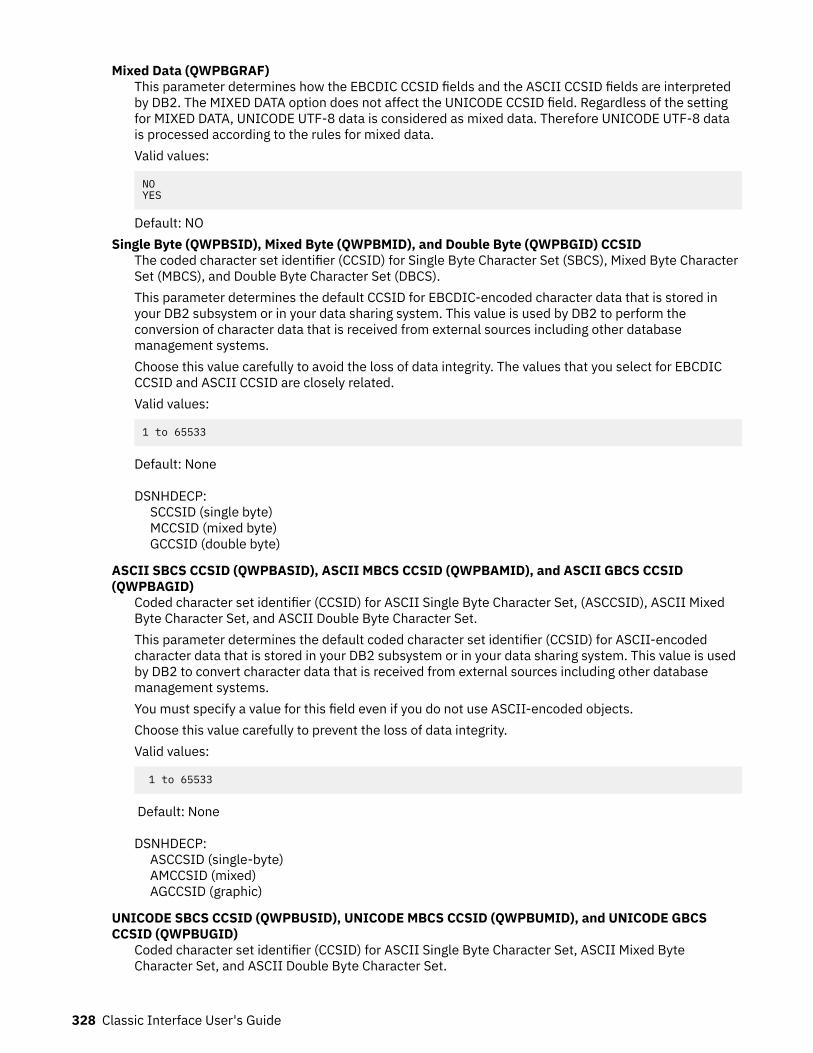
Mixed Data (QWPBGRAF)This parameter determines how the EBCDIC CCSID fields and the ASCII CCSID fields are interpretedby DB2. The MIXED DATA option does not affect the UNICODE CCSID field. Regardless of the settingfor MIXED DATA, UNICODE UTF-8 data is considered as mixed data. Therefore UNICODE UTF-8 datais processed according to the rules for mixed data.Valid values:
NOYES
Default: NOSingle Byte (QWPBSID), Mixed Byte (QWPBMID), and Double Byte (QWPBGID) CCSID
The coded character set identifier (CCSID) for Single Byte Character Set (SBCS), Mixed Byte CharacterSet (MBCS), and Double Byte Character Set (DBCS).This parameter determines the default CCSID for EBCDIC-encoded character data that is stored inyour DB2 subsystem or in your data sharing system. This value is used by DB2 to perform theconversion of character data that is received from external sources including other databasemanagement systems.Choose this value carefully to avoid the loss of data integrity. The values that you select for EBCDICCCSID and ASCII CCSID are closely related.Valid values:
1 to 65533
Default: None
DSNHDECP: SCCSID (single byte) MCCSID (mixed byte) GCCSID (double byte)
ASCII SBCS CCSID (QWPBASID), ASCII MBCS CCSID (QWPBAMID), and ASCII GBCS CCSID(QWPBAGID)
Coded character set identifier (CCSID) for ASCII Single Byte Character Set, (ASCCSID), ASCII MixedByte Character Set, and ASCII Double Byte Character Set.This parameter determines the default coded character set identifier (CCSID) for ASCII-encodedcharacter data that is stored in your DB2 subsystem or in your data sharing system. This value is usedby DB2 to convert character data that is received from external sources including other databasemanagement systems.You must specify a value for this field even if you do not use ASCII-encoded objects.Choose this value carefully to prevent the loss of data integrity.Valid values:
1 to 65533
Default: None
DSNHDECP: ASCCSID (single-byte) AMCCSID (mixed) AGCCSID (graphic)
UNICODE SBCS CCSID (QWPBUSID), UNICODE MBCS CCSID (QWPBUMID), and UNICODE GBCSCCSID (QWPBUGID)
Coded character set identifier (CCSID) for ASCII Single Byte Character Set, ASCII Mixed ByteCharacter Set, and ASCII Double Byte Character Set.
328 Classic Interface User's Guide
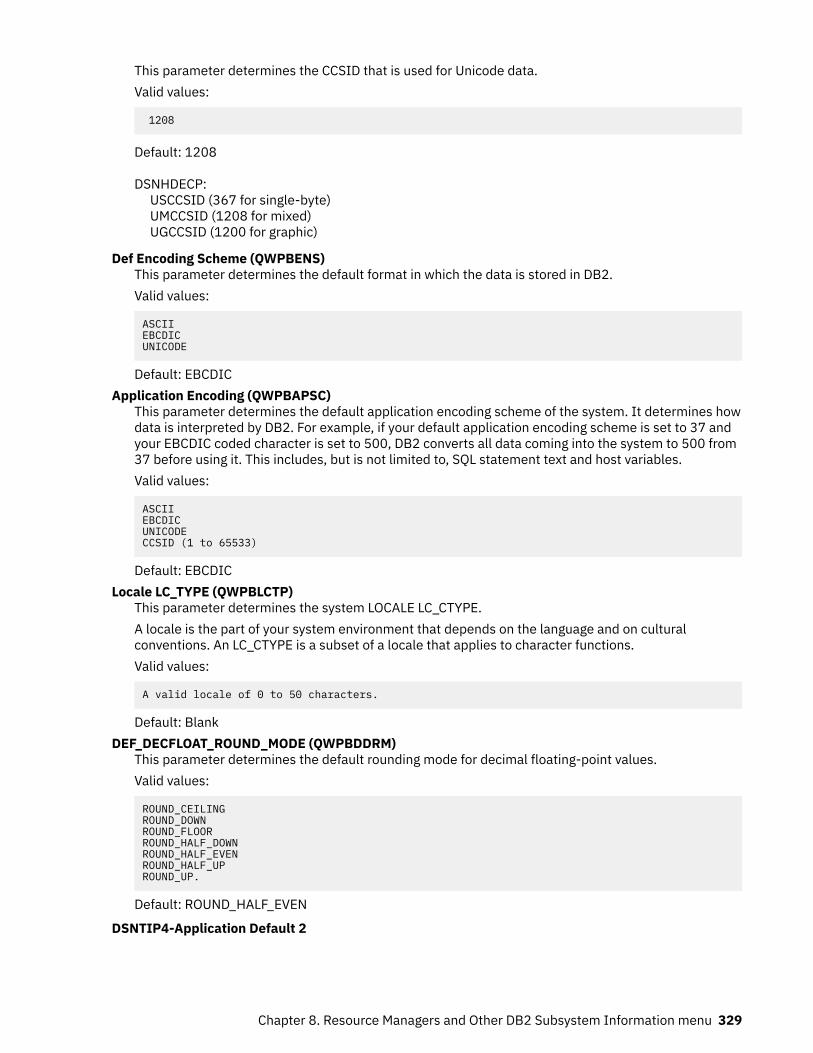
This parameter determines the CCSID that is used for Unicode data.Valid values:
1208
Default: 1208
DSNHDECP: USCCSID (367 for single-byte) UMCCSID (1208 for mixed) UGCCSID (1200 for graphic)
Def Encoding Scheme (QWPBENS)This parameter determines the default format in which the data is stored in DB2.Valid values:
ASCIIEBCDICUNICODE
Default: EBCDICApplication Encoding (QWPBAPSC)
This parameter determines the default application encoding scheme of the system. It determines howdata is interpreted by DB2. For example, if your default application encoding scheme is set to 37 andyour EBCDIC coded character is set to 500, DB2 converts all data coming into the system to 500 from37 before using it. This includes, but is not limited to, SQL statement text and host variables.Valid values:
ASCIIEBCDICUNICODECCSID (1 to 65533)
Default: EBCDICLocale LC_TYPE (QWPBLCTP)
This parameter determines the system LOCALE LC_CTYPE.A locale is the part of your system environment that depends on the language and on culturalconventions. An LC_CTYPE is a subset of a locale that applies to character functions.Valid values:
A valid locale of 0 to 50 characters.
Default: BlankDEF_DECFLOAT_ROUND_MODE (QWPBDDRM)
This parameter determines the default rounding mode for decimal floating-point values.Valid values:
ROUND_CEILINGROUND_DOWNROUND_FLOORROUND_HALF_DOWNROUND_HALF_EVENROUND_HALF_UPROUND_UP.
Default: ROUND_HALF_EVEN
DSNTIP4-Application Default 2
Chapter 8. Resource Managers and Other DB2 Subsystem Information menu 329
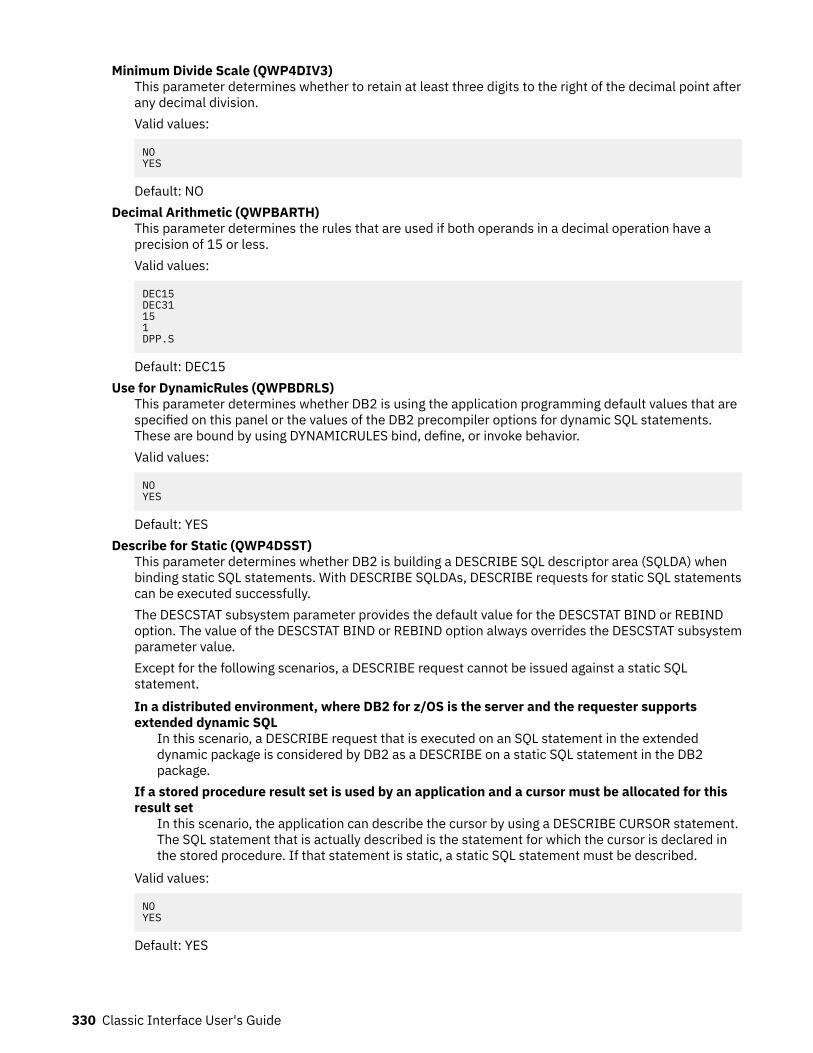
Minimum Divide Scale (QWP4DIV3)This parameter determines whether to retain at least three digits to the right of the decimal point afterany decimal division.Valid values:
NOYES
Default: NODecimal Arithmetic (QWPBARTH)
This parameter determines the rules that are used if both operands in a decimal operation have aprecision of 15 or less.Valid values:
DEC15DEC31151DPP.S
Default: DEC15Use for DynamicRules (QWPBDRLS)
This parameter determines whether DB2 is using the application programming default values that arespecified on this panel or the values of the DB2 precompiler options for dynamic SQL statements.These are bound by using DYNAMICRULES bind, define, or invoke behavior.Valid values:
NOYES
Default: YESDescribe for Static (QWP4DSST)
This parameter determines whether DB2 is building a DESCRIBE SQL descriptor area (SQLDA) whenbinding static SQL statements. With DESCRIBE SQLDAs, DESCRIBE requests for static SQL statementscan be executed successfully.The DESCSTAT subsystem parameter provides the default value for the DESCSTAT BIND or REBINDoption. The value of the DESCSTAT BIND or REBIND option always overrides the DESCSTAT subsystemparameter value.Except for the following scenarios, a DESCRIBE request cannot be issued against a static SQLstatement.In a distributed environment, where DB2 for z/OS is the server and the requester supportsextended dynamic SQL
In this scenario, a DESCRIBE request that is executed on an SQL statement in the extendeddynamic package is considered by DB2 as a DESCRIBE on a static SQL statement in the DB2package.
If a stored procedure result set is used by an application and a cursor must be allocated for thisresult set
In this scenario, the application can describe the cursor by using a DESCRIBE CURSOR statement.The SQL statement that is actually described is the statement for which the cursor is declared inthe stored procedure. If that statement is static, a static SQL statement must be described.
Valid values:
NOYES
Default: YES
330 Classic Interface User's Guide
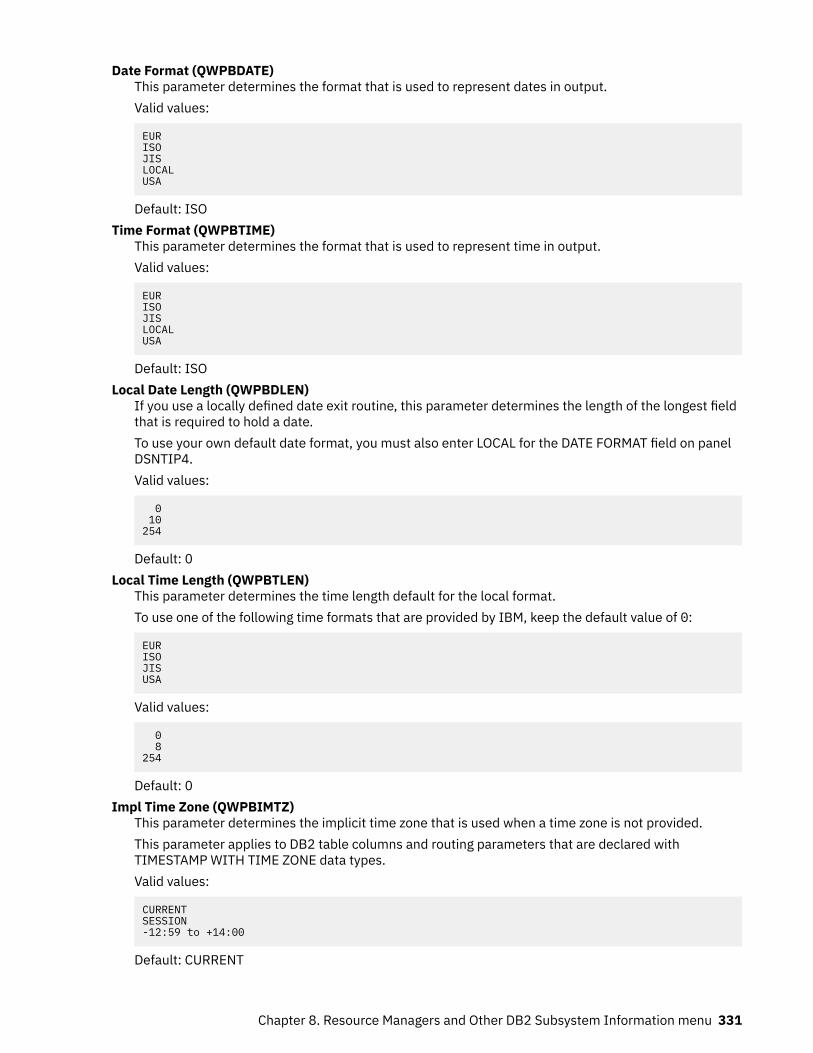
Date Format (QWPBDATE)This parameter determines the format that is used to represent dates in output.Valid values:
EURISOJISLOCALUSA
Default: ISOTime Format (QWPBTIME)
This parameter determines the format that is used to represent time in output.Valid values:
EURISOJISLOCALUSA
Default: ISOLocal Date Length (QWPBDLEN)
If you use a locally defined date exit routine, this parameter determines the length of the longest fieldthat is required to hold a date.To use your own default date format, you must also enter LOCAL for the DATE FORMAT field on panelDSNTIP4.Valid values:
0 10254
Default: 0Local Time Length (QWPBTLEN)
This parameter determines the time length default for the local format.To use one of the following time formats that are provided by IBM, keep the default value of 0:
EURISOJISUSA
Valid values:
0 8254
Default: 0Impl Time Zone (QWPBIMTZ)
This parameter determines the implicit time zone that is used when a time zone is not provided.This parameter applies to DB2 table columns and routing parameters that are declared withTIMESTAMP WITH TIME ZONE data types.Valid values:
CURRENTSESSION-12:59 to +14:00
Default: CURRENT
Chapter 8. Resource Managers and Other DB2 Subsystem Information menu 331
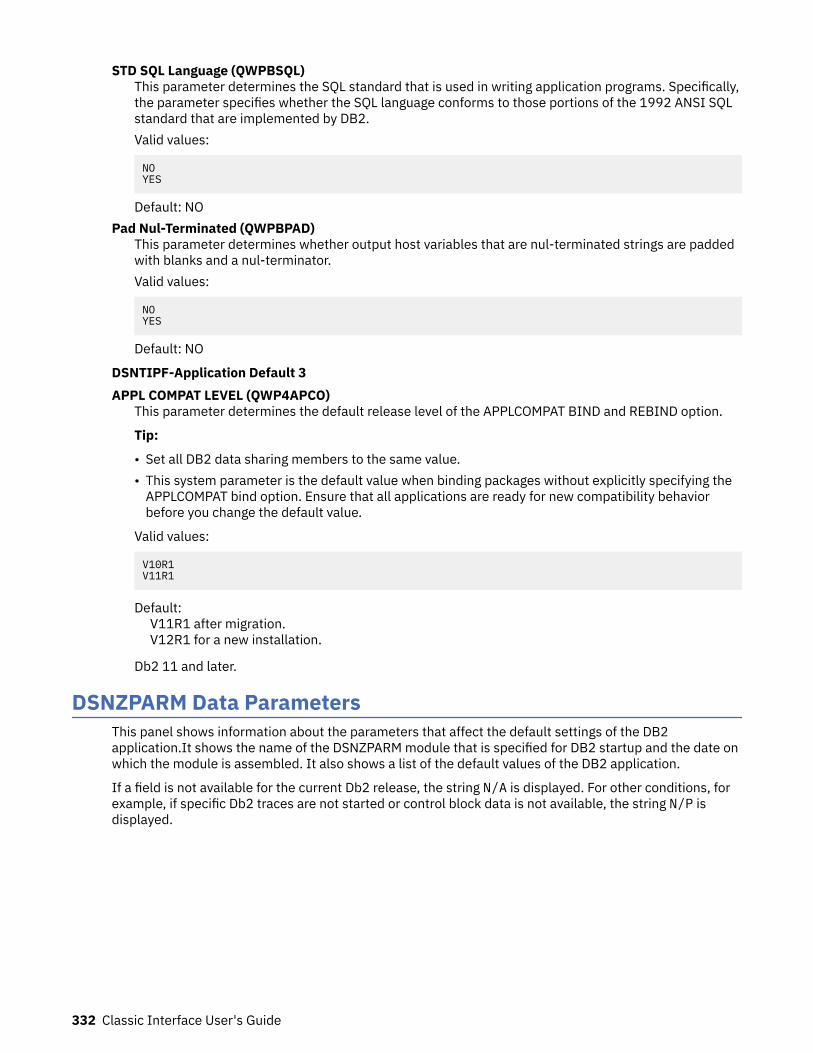
STD SQL Language (QWPBSQL)This parameter determines the SQL standard that is used in writing application programs. Specifically,the parameter specifies whether the SQL language conforms to those portions of the 1992 ANSI SQLstandard that are implemented by DB2.Valid values:
NOYES
Default: NOPad Nul-Terminated (QWPBPAD)
This parameter determines whether output host variables that are nul-terminated strings are paddedwith blanks and a nul-terminator.Valid values:
NOYES
Default: NO
DSNTIPF-Application Default 3APPL COMPAT LEVEL (QWP4APCO)
This parameter determines the default release level of the APPLCOMPAT BIND and REBIND option.
Tip:
• Set all DB2 data sharing members to the same value.• This system parameter is the default value when binding packages without explicitly specifying the
APPLCOMPAT bind option. Ensure that all applications are ready for new compatibility behaviorbefore you change the default value.
Valid values:
V10R1V11R1
Default: V11R1 after migration. V12R1 for a new installation.
Db2 11 and later.
DSNZPARM Data ParametersThis panel shows information about the parameters that affect the default settings of the DB2application.It shows the name of the DSNZPARM module that is specified for DB2 startup and the date onwhich the module is assembled. It also shows a list of the default values of the DB2 application.
If a field is not available for the current Db2 release, the string N/A is displayed. For other conditions, forexample, if specific Db2 traces are not started or control block data is not available, the string N/P isdisplayed.
332 Classic Interface User's Guide
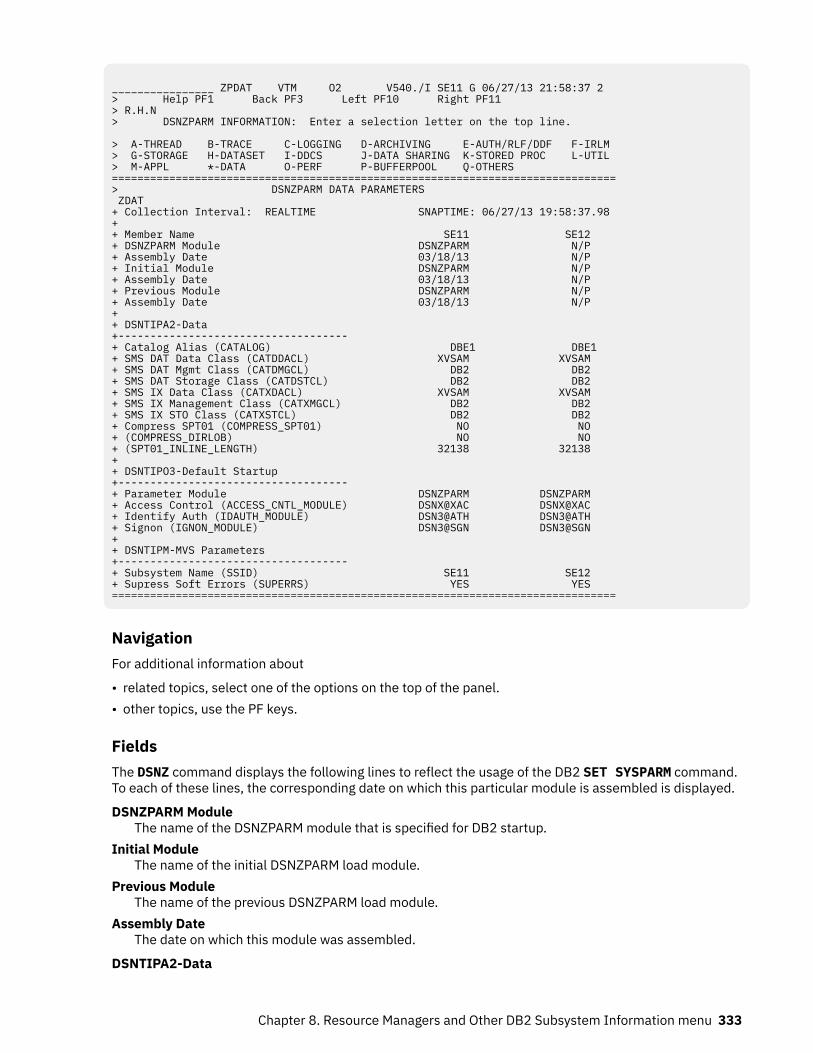
________________ ZPDAT VTM O2 V540./I SE11 G 06/27/13 21:58:37 2 > Help PF1 Back PF3 Left PF10 Right PF11 > R.H.N > DSNZPARM INFORMATION: Enter a selection letter on the top line. > A-THREAD B-TRACE C-LOGGING D-ARCHIVING E-AUTH/RLF/DDF F-IRLM > G-STORAGE H-DATASET I-DDCS J-DATA SHARING K-STORED PROC L-UTIL > M-APPL *-DATA O-PERF P-BUFFERPOOL Q-OTHERS ===============================================================================> DSNZPARM DATA PARAMETERS ZDAT + Collection Interval: REALTIME SNAPTIME: 06/27/13 19:58:37.98 + + Member Name SE11 SE12 + DSNZPARM Module DSNZPARM N/P + Assembly Date 03/18/13 N/P + Initial Module DSNZPARM N/P + Assembly Date 03/18/13 N/P + Previous Module DSNZPARM N/P + Assembly Date 03/18/13 N/P + + DSNTIPA2-Data +------------------------------------ + Catalog Alias (CATALOG) DBE1 DBE1 + SMS DAT Data Class (CATDDACL) XVSAM XVSAM + SMS DAT Mgmt Class (CATDMGCL) DB2 DB2 + SMS DAT Storage Class (CATDSTCL) DB2 DB2 + SMS IX Data Class (CATXDACL) XVSAM XVSAM + SMS IX Management Class (CATXMGCL) DB2 DB2 + SMS IX STO Class (CATXSTCL) DB2 DB2 + Compress SPT01 (COMPRESS_SPT01) NO NO + (COMPRESS_DIRLOB) NO NO + (SPT01_INLINE_LENGTH) 32138 32138 + + DSNTIPO3-Default Startup +------------------------------------ + Parameter Module DSNZPARM DSNZPARM + Access Control (ACCESS_CNTL_MODULE) DSNX@XAC DSNX@XAC + Identify Auth (IDAUTH_MODULE) DSN3@ATH DSN3@ATH + Signon (IGNON_MODULE) DSN3@SGN DSN3@SGN + + DSNTIPM-MVS Parameters +------------------------------------ + Subsystem Name (SSID) SE11 SE12 + Supress Soft Errors (SUPERRS) YES YES ===============================================================================
NavigationFor additional information about
• related topics, select one of the options on the top of the panel.• other topics, use the PF keys.
FieldsThe DSNZ command displays the following lines to reflect the usage of the DB2 SET SYSPARM command.To each of these lines, the corresponding date on which this particular module is assembled is displayed.
DSNZPARM ModuleThe name of the DSNZPARM module that is specified for DB2 startup.
Initial ModuleThe name of the initial DSNZPARM load module.
Previous ModuleThe name of the previous DSNZPARM load module.
Assembly DateThe date on which this module was assembled.
DSNTIPA2-Data
Chapter 8. Resource Managers and Other DB2 Subsystem Information menu 333
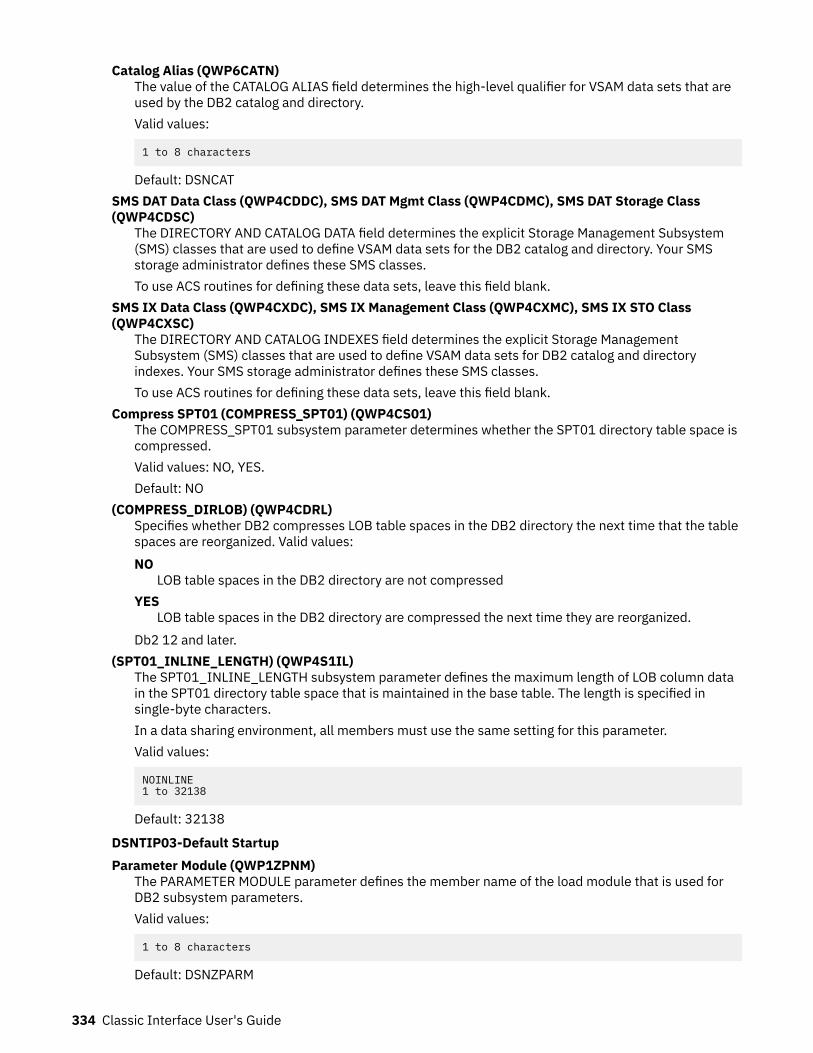
Catalog Alias (QWP6CATN)The value of the CATALOG ALIAS field determines the high-level qualifier for VSAM data sets that areused by the DB2 catalog and directory.Valid values:
1 to 8 characters
Default: DSNCATSMS DAT Data Class (QWP4CDDC), SMS DAT Mgmt Class (QWP4CDMC), SMS DAT Storage Class(QWP4CDSC)
The DIRECTORY AND CATALOG DATA field determines the explicit Storage Management Subsystem(SMS) classes that are used to define VSAM data sets for the DB2 catalog and directory. Your SMSstorage administrator defines these SMS classes.To use ACS routines for defining these data sets, leave this field blank.
SMS IX Data Class (QWP4CXDC), SMS IX Management Class (QWP4CXMC), SMS IX STO Class(QWP4CXSC)
The DIRECTORY AND CATALOG INDEXES field determines the explicit Storage ManagementSubsystem (SMS) classes that are used to define VSAM data sets for DB2 catalog and directoryindexes. Your SMS storage administrator defines these SMS classes.To use ACS routines for defining these data sets, leave this field blank.
Compress SPT01 (COMPRESS_SPT01) (QWP4CS01)The COMPRESS_SPT01 subsystem parameter determines whether the SPT01 directory table space iscompressed.Valid values: NO, YES.Default: NO
(COMPRESS_DIRLOB) (QWP4CDRL)Specifies whether DB2 compresses LOB table spaces in the DB2 directory the next time that the tablespaces are reorganized. Valid values:NO
LOB table spaces in the DB2 directory are not compressedYES
LOB table spaces in the DB2 directory are compressed the next time they are reorganized.Db2 12 and later.
(SPT01_INLINE_LENGTH) (QWP4S1IL)The SPT01_INLINE_LENGTH subsystem parameter defines the maximum length of LOB column datain the SPT01 directory table space that is maintained in the base table. The length is specified insingle-byte characters.In a data sharing environment, all members must use the same setting for this parameter.Valid values:
NOINLINE1 to 32138
Default: 32138
DSNTIP03-Default StartupParameter Module (QWP1ZPNM)
The PARAMETER MODULE parameter defines the member name of the load module that is used forDB2 subsystem parameters.Valid values:
1 to 8 characters
Default: DSNZPARM
334 Classic Interface User's Guide
Access Control (ACCESS_CNTL_MODULE) (QWP1DXAC)This parameter defines the member name of the load module that is used for the DB2 access controlexit routine.Valid values:
For installation: 1 - 8 charactersFor migration: DSNX@XAC
Default: DSNX@XACIdentify Auth (IDAUTH_MODULE) (QWP1DATH)
This parameter determines the member name of the load module that is used for the DB2 connectionauthorization exit routine.Valid values:
For installation: 1 - 8 charactersFor migration: DSN3@ATH
Default: DSN3@ATHSignon (SIGNON_MODULE) (QWP1DSGN)
This parameter determines the member name of the load module that is used for the DB2 sign-on exitroutine.Valid values:
For installation: 1 - 8 charactersFor migration: DSN3@SGN
Default: DSN3@SGN
DSNTIPM-MVS ParametersSubsystem Name (SSID) (QWPBSSID) >
This parameter determines the z/OS subsystem name for DB2.Valid values:
1 to 4 characters
The first character must be a letter (A - Z)or one of the following symbols: #, $, or @. The other characters must be any letter from A to Z,integers from 0 - 9,or any of the following symbols: #, $, or @.
Default: DSN1Supress Soft Errors (SUPERRS) (QWP4SAE )
This parameter determines whether DB2 is recording errors such as invalid decimal data or arithmeticexceptions, and whether SQLCODEs are issued for these errors. These errors are recorded in theoperating system data set SYS1.LOGREC.Valid values:
NOYES
Default: YES
Chapter 8. Resource Managers and Other DB2 Subsystem Information menu 335
DSNZPARM Performance and Optimization ParametersThis panel shows information about the parameters that affect DB2 performance and optimization. Itshows the name of the DSNZPARM module that is specified for DB2 startup and the date on which themodule is assembled. It also shows a list of the default values of the DB2 application.
If a field is not available for the current Db2 release, the string N/A is displayed. For other conditions, forexample, if specific Db2 traces are not started or control block data is not available, the string N/P isdisplayed.
336 Classic Interface User's Guide
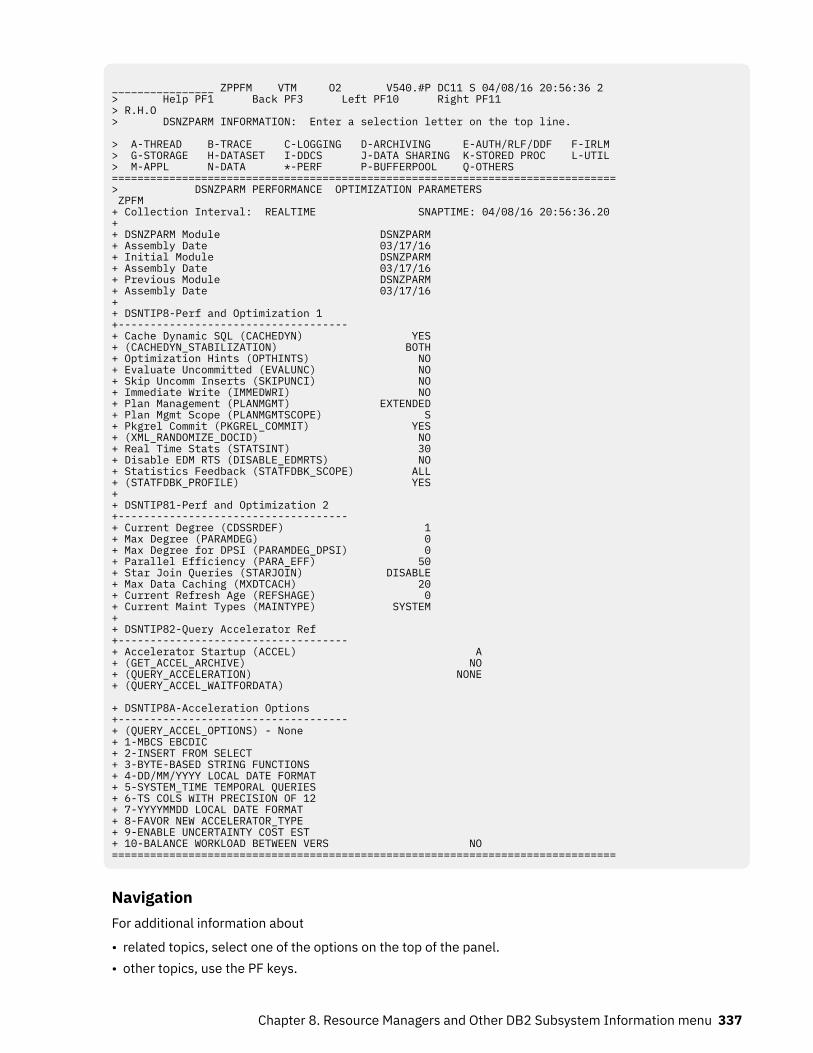
________________ ZPPFM VTM O2 V540.#P DC11 S 04/08/16 20:56:36 2 > Help PF1 Back PF3 Left PF10 Right PF11 > R.H.O > DSNZPARM INFORMATION: Enter a selection letter on the top line. > A-THREAD B-TRACE C-LOGGING D-ARCHIVING E-AUTH/RLF/DDF F-IRLM > G-STORAGE H-DATASET I-DDCS J-DATA SHARING K-STORED PROC L-UTIL > M-APPL N-DATA *-PERF P-BUFFERPOOL Q-OTHERS =============================================================================== > DSNZPARM PERFORMANCE OPTIMIZATION PARAMETERS ZPFM + Collection Interval: REALTIME SNAPTIME: 04/08/16 20:56:36.20 + + DSNZPARM Module DSNZPARM + Assembly Date 03/17/16 + Initial Module DSNZPARM + Assembly Date 03/17/16 + Previous Module DSNZPARM + Assembly Date 03/17/16 + + DSNTIP8-Perf and Optimization 1 +------------------------------------ + Cache Dynamic SQL (CACHEDYN) YES + (CACHEDYN_STABILIZATION) BOTH + Optimization Hints (OPTHINTS) NO + Evaluate Uncommitted (EVALUNC) NO + Skip Uncomm Inserts (SKIPUNCI) NO + Immediate Write (IMMEDWRI) NO + Plan Management (PLANMGMT) EXTENDED + Plan Mgmt Scope (PLANMGMTSCOPE) S + Pkgrel Commit (PKGREL_COMMIT) YES + (XML_RANDOMIZE_DOCID) NO + Real Time Stats (STATSINT) 30 + Disable EDM RTS (DISABLE_EDMRTS) NO + Statistics Feedback (STATFDBK_SCOPE) ALL+ (STATFDBK_PROFILE) YES + + DSNTIP81-Perf and Optimization 2 +------------------------------------ + Current Degree (CDSSRDEF) 1 + Max Degree (PARAMDEG) 0 + Max Degree for DPSI (PARAMDEG_DPSI) 0 + Parallel Efficiency (PARA_EFF) 50 + Star Join Queries (STARJOIN) DISABLE + Max Data Caching (MXDTCACH) 20 + Current Refresh Age (REFSHAGE) 0 + Current Maint Types (MAINTYPE) SYSTEM + + DSNTIP82-Query Accelerator Ref +------------------------------------ + Accelerator Startup (ACCEL) A + (GET_ACCEL_ARCHIVE) NO + (QUERY_ACCELERATION) NONE + (QUERY_ACCEL_WAITFORDATA)
+ DSNTIP8A-Acceleration Options+------------------------------------+ (QUERY_ACCEL_OPTIONS) - None+ 1-MBCS EBCDIC+ 2-INSERT FROM SELECT+ 3-BYTE-BASED STRING FUNCTIONS+ 4-DD/MM/YYYY LOCAL DATE FORMAT+ 5-SYSTEM_TIME TEMPORAL QUERIES+ 6-TS COLS WITH PRECISION OF 12+ 7-YYYYMMDD LOCAL DATE FORMAT+ 8-FAVOR NEW ACCELERATOR_TYPE+ 9-ENABLE UNCERTAINTY COST EST+ 10-BALANCE WORKLOAD BETWEEN VERS NO ===============================================================================
NavigationFor additional information about
• related topics, select one of the options on the top of the panel.• other topics, use the PF keys.
Chapter 8. Resource Managers and Other DB2 Subsystem Information menu 337
FieldsThe DSNZ command displays the following lines to reflect the usage of the DB2 SET SYSPARM command.To each of these lines, the corresponding date on which this particular module is assembled is displayed.
DSNZPARM ModuleThe name of the DSNZPARM module that is specified for DB2 startup.
Initial ModuleThe name of the initial DSNZPARM load module.
Previous ModuleThe name of the previous DSNZPARM load module.
Assembly DateThe date on which this module was assembled.
DSNTIP8-Perf and Optimization 1
Cache Dynamic SQL (QWP4CDYN)The CACHEDYN subsystem parameter determines whether prepared static SQL statements ordynamic SQL statements are cached for later use by eligible application processes.Valid Values:
NOYES
Default: YES
(CACHEDYN_STABILIZATION)
This ZPARM specifies how DB2 is to stabilize cached dynamic SQL statement. When a statement isstabilized, the current SQLID, statement text, and runtime structures are written to catalog tables. If adynamic SQL statement is not present in the dynamic SQL statement cache, DB2 will load the runtimestructures from catalog table rather than performing a full prepare. This extends the stability andreliability of performance of a dynamic SQL. It can have the following values:
CAPTUREStatements may be stabilized through the -START DYNQUERY command using bothMONITOR(NO) and MONITOR(YES). DB2 will not load stabilized statements from SYSDYNQRY.
LOADStatements may not be stabilized via any means. The -START DYNQUERY command will fail, andany MONITOR(YES) commands in progress will not stabilize statements, even if stabilizationcriteria are matched. During long prepare, DB2 will attempt to load stabilized statements fromSYSDYNQRY with which to run.
BOTHStatements may be stabilized through the -START DYNQUERY command via both MONITOR(NO)and MONITOR(YES). During long prepare, DB2 will attempt to load stabilized statements fromSYSDYNQRY with which to run. BOTH is the default setting.
NONEStatements may not be stabilized via any means. The -START DYNQUERY command will fail, andany MONITOR(YES) commands in progress will not stabilize statements, even if stabilizationcriteria are matched. DB2 will not load stabilized statements from SYSDYNQRY.
Db2 12 and later.Optimization Hints (QWP4HINT)
The OPTHINTS subsystem parameter determines whether DB2 applies optimization hints when staticSQL statements are bound or dynamic SQL statements are prepared.Valid Values:
NOYES
338 Classic Interface User's Guide
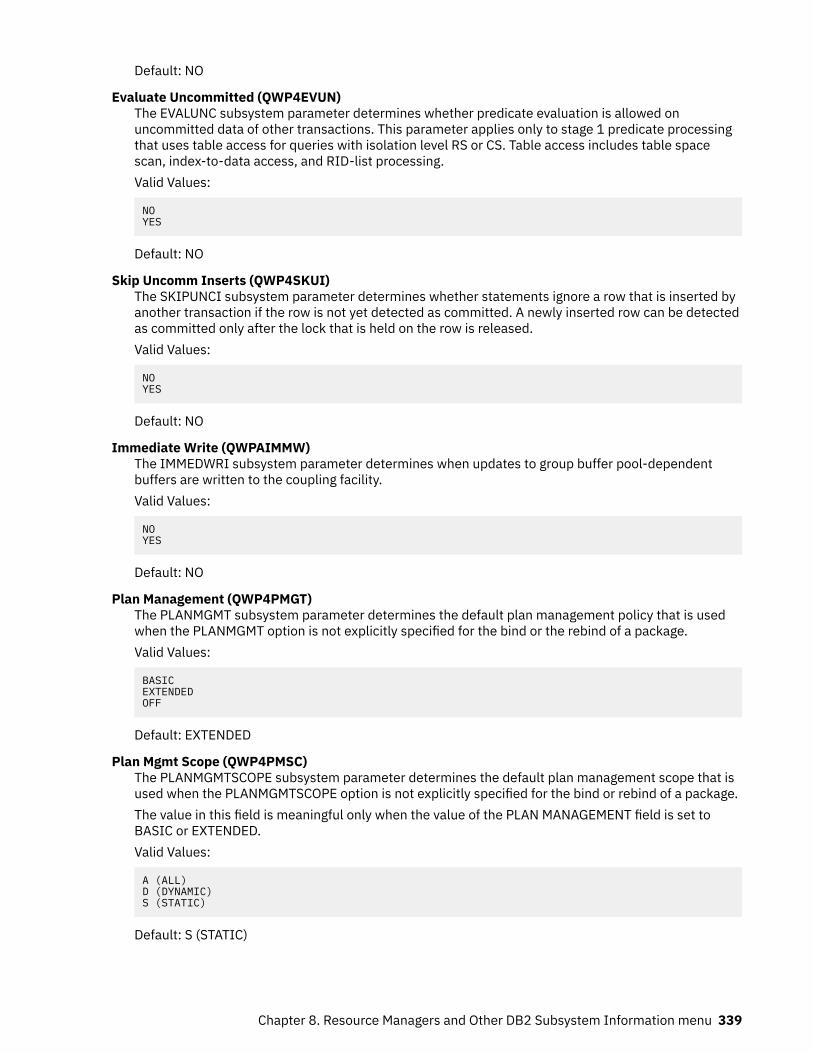
Default: NO
Evaluate Uncommitted (QWP4EVUN)The EVALUNC subsystem parameter determines whether predicate evaluation is allowed onuncommitted data of other transactions. This parameter applies only to stage 1 predicate processingthat uses table access for queries with isolation level RS or CS. Table access includes table spacescan, index-to-data access, and RID-list processing.Valid Values:
NOYES
Default: NO
Skip Uncomm Inserts (QWP4SKUI)The SKIPUNCI subsystem parameter determines whether statements ignore a row that is inserted byanother transaction if the row is not yet detected as committed. A newly inserted row can be detectedas committed only after the lock that is held on the row is released.Valid Values:
NOYES
Default: NO
Immediate Write (QWPAIMMW)The IMMEDWRI subsystem parameter determines when updates to group buffer pool-dependentbuffers are written to the coupling facility.Valid Values:
NOYES
Default: NO
Plan Management (QWP4PMGT)The PLANMGMT subsystem parameter determines the default plan management policy that is usedwhen the PLANMGMT option is not explicitly specified for the bind or the rebind of a package.Valid Values:
BASICEXTENDEDOFF
Default: EXTENDED
Plan Mgmt Scope (QWP4PMSC)The PLANMGMTSCOPE subsystem parameter determines the default plan management scope that isused when the PLANMGMTSCOPE option is not explicitly specified for the bind or rebind of a package.The value in this field is meaningful only when the value of the PLAN MANAGEMENT field is set toBASIC or EXTENDED.Valid Values:
A (ALL)D (DYNAMIC)S (STATIC)
Default: S (STATIC)
Chapter 8. Resource Managers and Other DB2 Subsystem Information menu 339
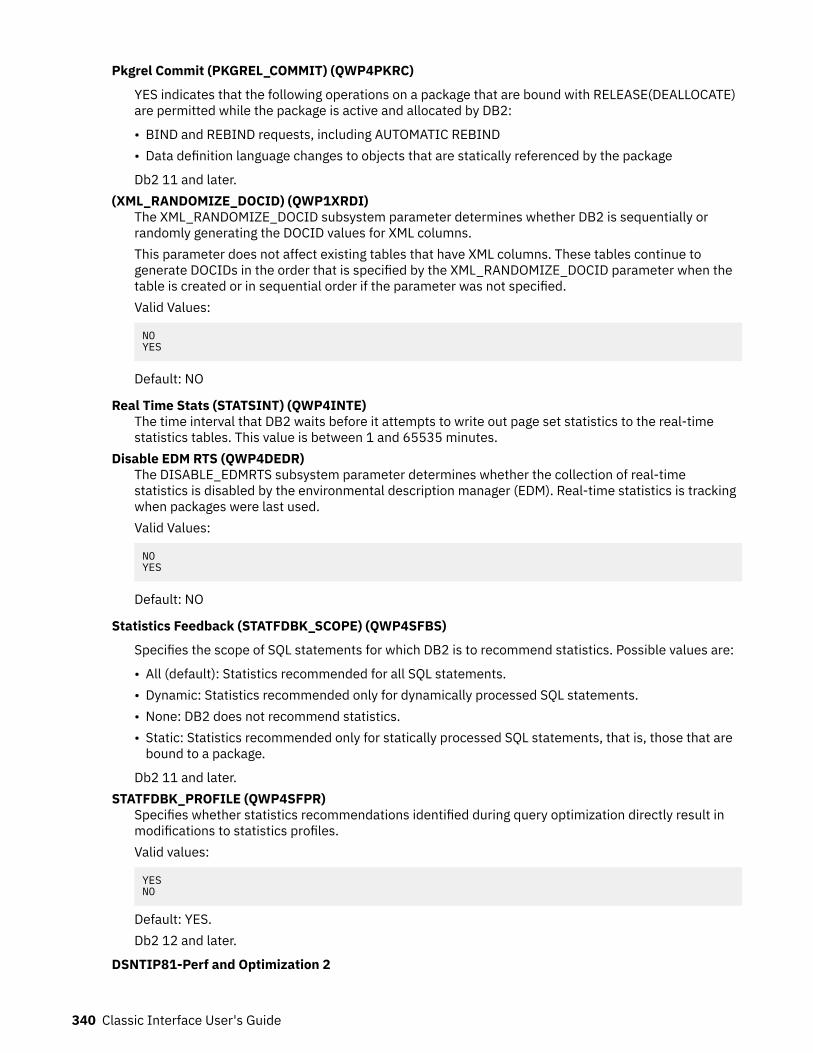
Pkgrel Commit (PKGREL_COMMIT) (QWP4PKRC)
YES indicates that the following operations on a package that are bound with RELEASE(DEALLOCATE)are permitted while the package is active and allocated by DB2:
• BIND and REBIND requests, including AUTOMATIC REBIND• Data definition language changes to objects that are statically referenced by the package
Db2 11 and later.(XML_RANDOMIZE_DOCID) (QWP1XRDI)
The XML_RANDOMIZE_DOCID subsystem parameter determines whether DB2 is sequentially orrandomly generating the DOCID values for XML columns.This parameter does not affect existing tables that have XML columns. These tables continue togenerate DOCIDs in the order that is specified by the XML_RANDOMIZE_DOCID parameter when thetable is created or in sequential order if the parameter was not specified.Valid Values:
NOYES
Default: NO
Real Time Stats (STATSINT) (QWP4INTE)The time interval that DB2 waits before it attempts to write out page set statistics to the real-timestatistics tables. This value is between 1 and 65535 minutes.
Disable EDM RTS (QWP4DEDR)The DISABLE_EDMRTS subsystem parameter determines whether the collection of real-timestatistics is disabled by the environmental description manager (EDM). Real-time statistics is trackingwhen packages were last used.Valid Values:
NOYES
Default: NO
Statistics Feedback (STATFDBK_SCOPE) (QWP4SFBS)
Specifies the scope of SQL statements for which DB2 is to recommend statistics. Possible values are:
• All (default): Statistics recommended for all SQL statements.• Dynamic: Statistics recommended only for dynamically processed SQL statements.• None: DB2 does not recommend statistics.• Static: Statistics recommended only for statically processed SQL statements, that is, those that are
bound to a package.
Db2 11 and later.STATFDBK_PROFILE (QWP4SFPR)
Specifies whether statistics recommendations identified during query optimization directly result inmodifications to statistics profiles.Valid values:
YESNO
Default: YES.Db2 12 and later.
DSNTIP81-Perf and Optimization 2
340 Classic Interface User's Guide
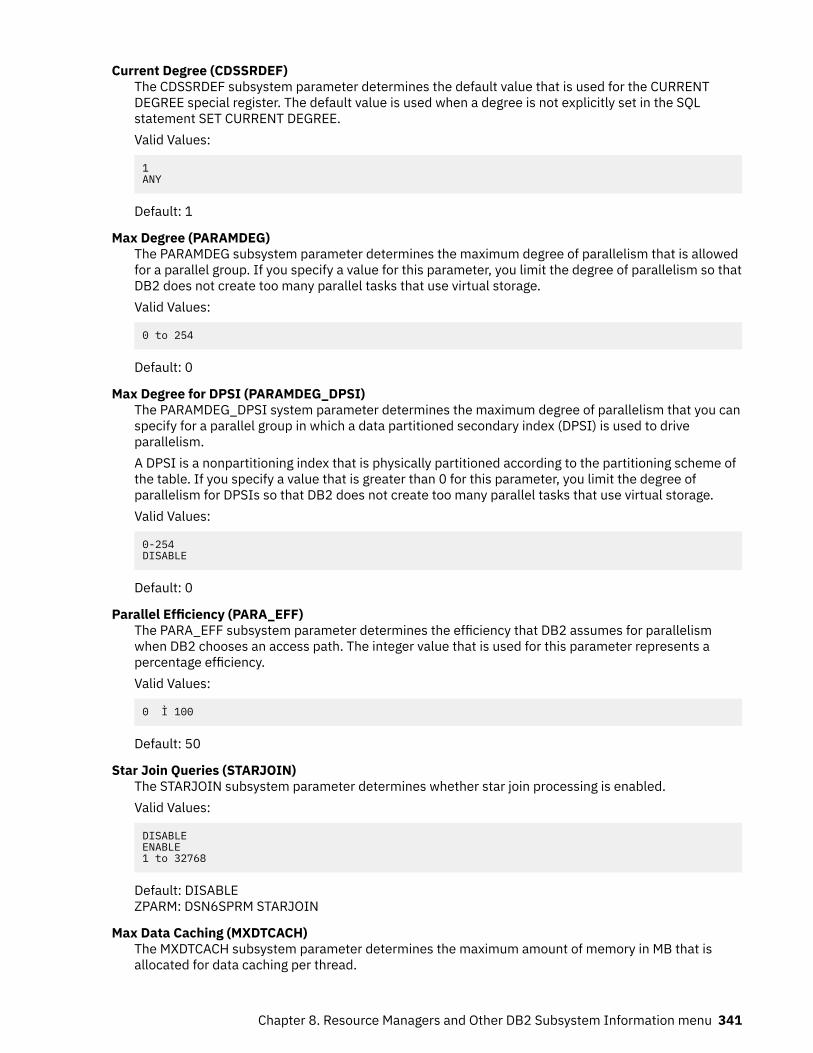
Current Degree (CDSSRDEF)The CDSSRDEF subsystem parameter determines the default value that is used for the CURRENTDEGREE special register. The default value is used when a degree is not explicitly set in the SQLstatement SET CURRENT DEGREE.Valid Values:
1ANY
Default: 1
Max Degree (PARAMDEG)The PARAMDEG subsystem parameter determines the maximum degree of parallelism that is allowedfor a parallel group. If you specify a value for this parameter, you limit the degree of parallelism so thatDB2 does not create too many parallel tasks that use virtual storage.Valid Values:
0 to 254
Default: 0
Max Degree for DPSI (PARAMDEG_DPSI)The PARAMDEG_DPSI system parameter determines the maximum degree of parallelism that you canspecify for a parallel group in which a data partitioned secondary index (DPSI) is used to driveparallelism.A DPSI is a nonpartitioning index that is physically partitioned according to the partitioning scheme ofthe table. If you specify a value that is greater than 0 for this parameter, you limit the degree ofparallelism for DPSIs so that DB2 does not create too many parallel tasks that use virtual storage.Valid Values:
0-254DISABLE
Default: 0
Parallel Efficiency (PARA_EFF)The PARA_EFF subsystem parameter determines the efficiency that DB2 assumes for parallelismwhen DB2 chooses an access path. The integer value that is used for this parameter represents apercentage efficiency.Valid Values:
0 Ì 100
Default: 50
Star Join Queries (STARJOIN)The STARJOIN subsystem parameter determines whether star join processing is enabled.Valid Values:
DISABLEENABLE1 to 32768
Default: DISABLEZPARM: DSN6SPRM STARJOIN
Max Data Caching (MXDTCACH)The MXDTCACH subsystem parameter determines the maximum amount of memory in MB that isallocated for data caching per thread.
Chapter 8. Resource Managers and Other DB2 Subsystem Information menu 341
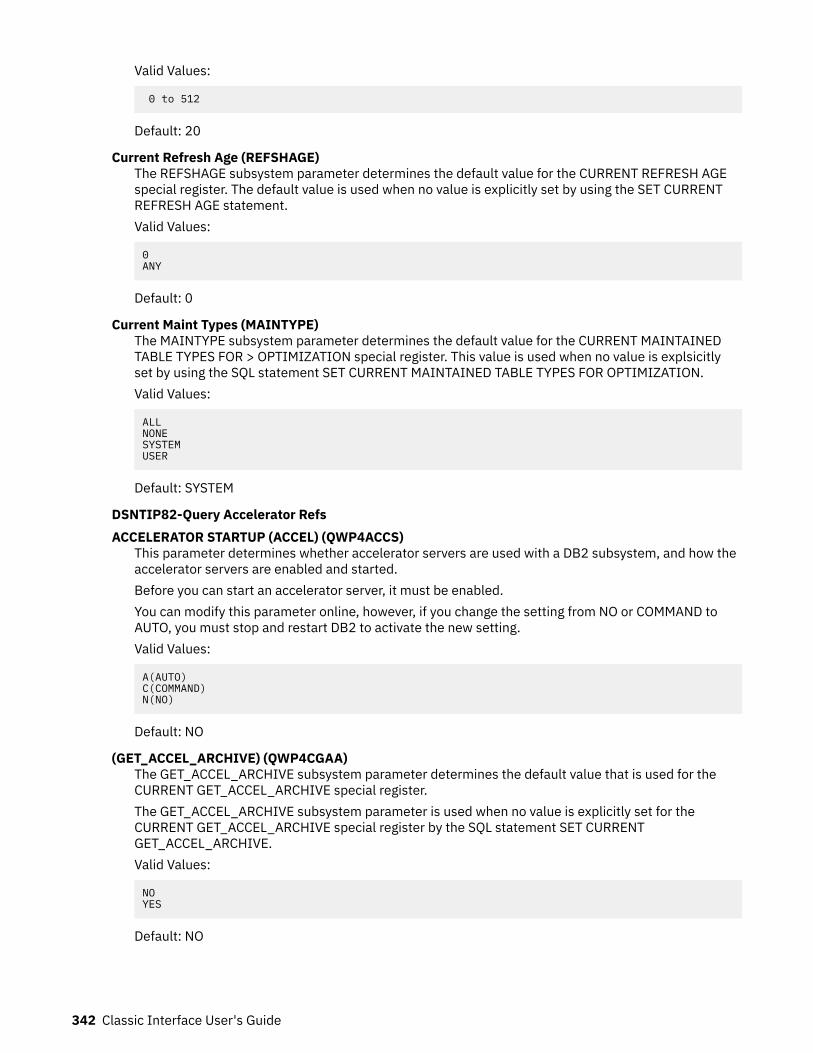
Valid Values:
0 to 512
Default: 20
Current Refresh Age (REFSHAGE)The REFSHAGE subsystem parameter determines the default value for the CURRENT REFRESH AGEspecial register. The default value is used when no value is explicitly set by using the SET CURRENTREFRESH AGE statement.Valid Values:
0ANY
Default: 0
Current Maint Types (MAINTYPE)The MAINTYPE subsystem parameter determines the default value for the CURRENT MAINTAINEDTABLE TYPES FOR > OPTIMIZATION special register. This value is used when no value is explsicitlyset by using the SQL statement SET CURRENT MAINTAINED TABLE TYPES FOR OPTIMIZATION.Valid Values:
ALLNONESYSTEMUSER
Default: SYSTEM
DSNTIP82-Query Accelerator RefsACCELERATOR STARTUP (ACCEL) (QWP4ACCS)
This parameter determines whether accelerator servers are used with a DB2 subsystem, and how theaccelerator servers are enabled and started.Before you can start an accelerator server, it must be enabled.You can modify this parameter online, however, if you change the setting from NO or COMMAND toAUTO, you must stop and restart DB2 to activate the new setting.Valid Values:
A(AUTO)C(COMMAND)N(NO)
Default: NO
(GET_ACCEL_ARCHIVE) (QWP4CGAA)The GET_ACCEL_ARCHIVE subsystem parameter determines the default value that is used for theCURRENT GET_ACCEL_ARCHIVE special register.The GET_ACCEL_ARCHIVE subsystem parameter is used when no value is explicitly set for theCURRENT GET_ACCEL_ARCHIVE special register by the SQL statement SET CURRENTGET_ACCEL_ARCHIVE.Valid Values:
NOYES
Default: NO
342 Classic Interface User's Guide
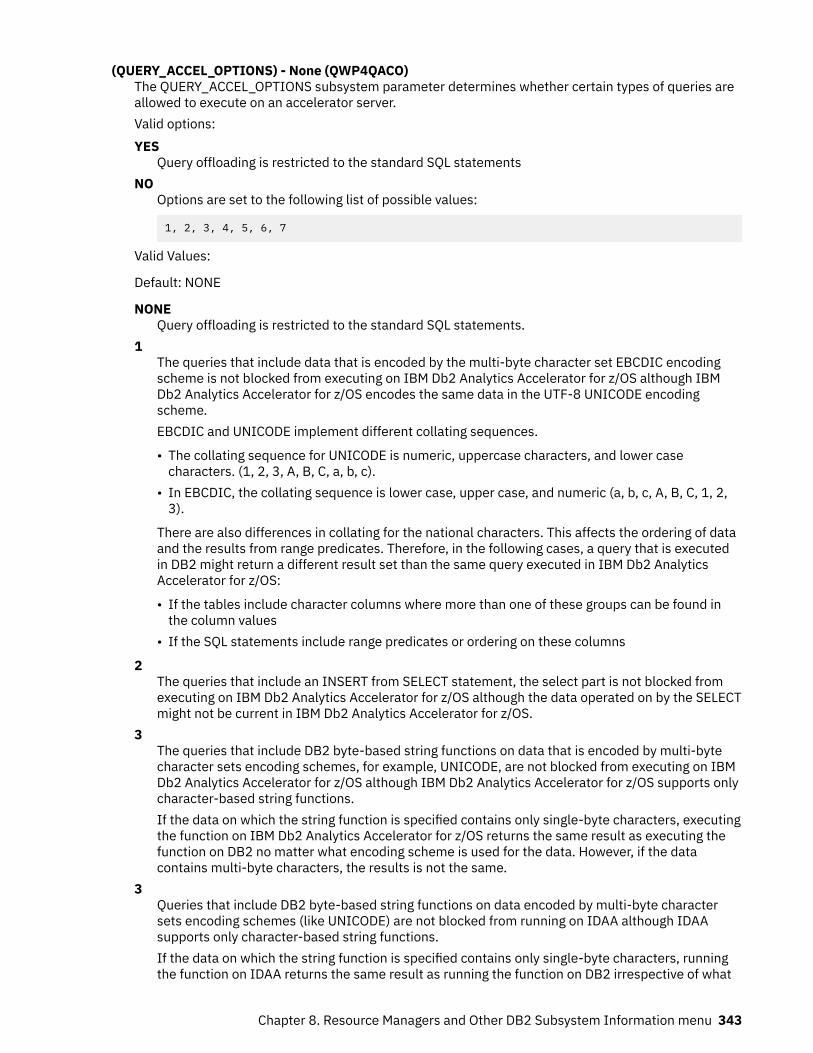
(QUERY_ACCEL_OPTIONS) - None (QWP4QACO)The QUERY_ACCEL_OPTIONS subsystem parameter determines whether certain types of queries areallowed to execute on an accelerator server.Valid options:YES
Query offloading is restricted to the standard SQL statementsNO
Options are set to the following list of possible values:
1, 2, 3, 4, 5, 6, 7
Valid Values:
Default: NONE
NONEQuery offloading is restricted to the standard SQL statements.
1The queries that include data that is encoded by the multi-byte character set EBCDIC encodingscheme is not blocked from executing on IBM Db2 Analytics Accelerator for z/OS although IBMDb2 Analytics Accelerator for z/OS encodes the same data in the UTF-8 UNICODE encodingscheme.EBCDIC and UNICODE implement different collating sequences.
• The collating sequence for UNICODE is numeric, uppercase characters, and lower casecharacters. (1, 2, 3, A, B, C, a, b, c).
• In EBCDIC, the collating sequence is lower case, upper case, and numeric (a, b, c, A, B, C, 1, 2,3).
There are also differences in collating for the national characters. This affects the ordering of dataand the results from range predicates. Therefore, in the following cases, a query that is executedin DB2 might return a different result set than the same query executed in IBM Db2 AnalyticsAccelerator for z/OS:
• If the tables include character columns where more than one of these groups can be found inthe column values
• If the SQL statements include range predicates or ordering on these columns
2The queries that include an INSERT from SELECT statement, the select part is not blocked fromexecuting on IBM Db2 Analytics Accelerator for z/OS although the data operated on by the SELECTmight not be current in IBM Db2 Analytics Accelerator for z/OS.
3The queries that include DB2 byte-based string functions on data that is encoded by multi-bytecharacter sets encoding schemes, for example, UNICODE, are not blocked from executing on IBMDb2 Analytics Accelerator for z/OS although IBM Db2 Analytics Accelerator for z/OS supports onlycharacter-based string functions.If the data on which the string function is specified contains only single-byte characters, executingthe function on IBM Db2 Analytics Accelerator for z/OS returns the same result as executing thefunction on DB2 no matter what encoding scheme is used for the data. However, if the datacontains multi-byte characters, the results is not the same.
3Queries that include DB2 byte-based string functions on data encoded by multi-byte charactersets encoding schemes (like UNICODE) are not blocked from running on IDAA although IDAAsupports only character-based string functions.If the data on which the string function is specified contains only single-byte characters, runningthe function on IDAA returns the same result as running the function on DB2 irrespective of what
Chapter 8. Resource Managers and Other DB2 Subsystem Information menu 343
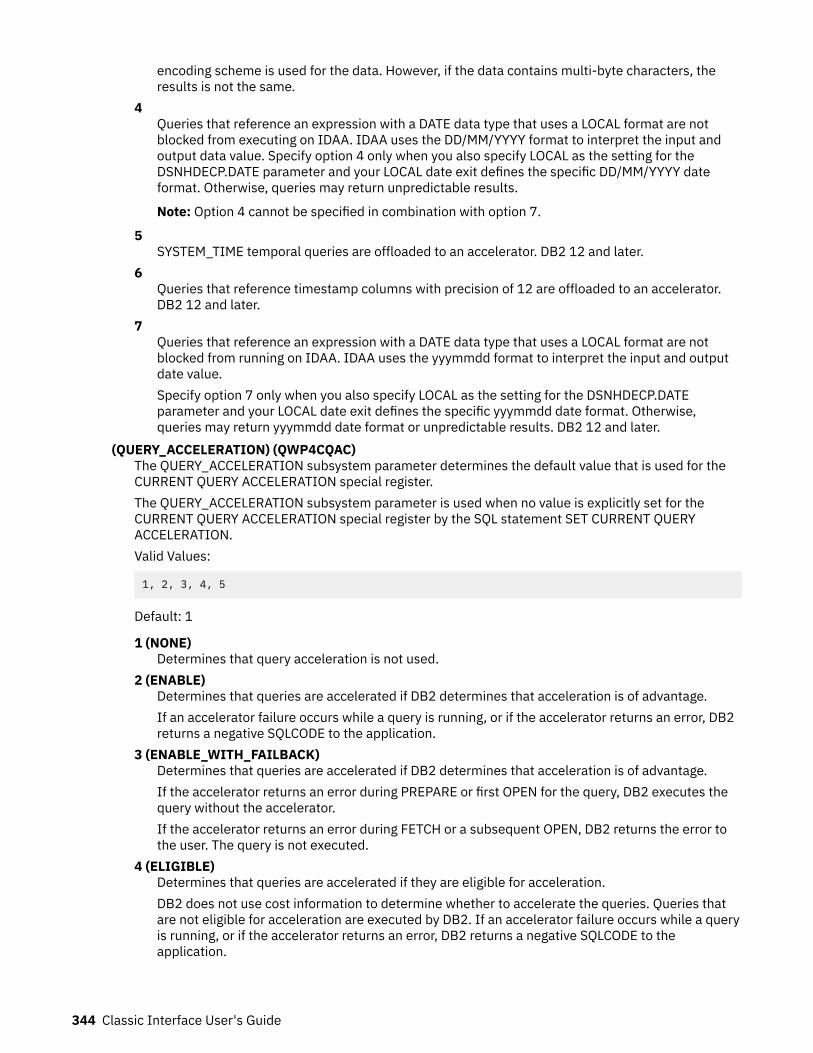
encoding scheme is used for the data. However, if the data contains multi-byte characters, theresults is not the same.
4Queries that reference an expression with a DATE data type that uses a LOCAL format are notblocked from executing on IDAA. IDAA uses the DD/MM/YYYY format to interpret the input andoutput data value. Specify option 4 only when you also specify LOCAL as the setting for theDSNHDECP.DATE parameter and your LOCAL date exit defines the specific DD/MM/YYYY dateformat. Otherwise, queries may return unpredictable results.
Note: Option 4 cannot be specified in combination with option 7.
5SYSTEM_TIME temporal queries are offloaded to an accelerator. DB2 12 and later.
6Queries that reference timestamp columns with precision of 12 are offloaded to an accelerator.DB2 12 and later.
7Queries that reference an expression with a DATE data type that uses a LOCAL format are notblocked from running on IDAA. IDAA uses the yyymmdd format to interpret the input and outputdate value.Specify option 7 only when you also specify LOCAL as the setting for the DSNHDECP.DATEparameter and your LOCAL date exit defines the specific yyymmdd date format. Otherwise,queries may return yyymmdd date format or unpredictable results. DB2 12 and later.
(QUERY_ACCELERATION) (QWP4CQAC)The QUERY_ACCELERATION subsystem parameter determines the default value that is used for theCURRENT QUERY ACCELERATION special register.The QUERY_ACCELERATION subsystem parameter is used when no value is explicitly set for theCURRENT QUERY ACCELERATION special register by the SQL statement SET CURRENT QUERYACCELERATION.Valid Values:
1, 2, 3, 4, 5
Default: 1
1 (NONE)Determines that query acceleration is not used.
2 (ENABLE)Determines that queries are accelerated if DB2 determines that acceleration is of advantage.If an accelerator failure occurs while a query is running, or if the accelerator returns an error, DB2returns a negative SQLCODE to the application.
3 (ENABLE_WITH_FAILBACK)Determines that queries are accelerated if DB2 determines that acceleration is of advantage.If the accelerator returns an error during PREPARE or first OPEN for the query, DB2 executes thequery without the accelerator.If the accelerator returns an error during FETCH or a subsequent OPEN, DB2 returns the error tothe user. The query is not executed.
4 (ELIGIBLE)Determines that queries are accelerated if they are eligible for acceleration.DB2 does not use cost information to determine whether to accelerate the queries. Queries thatare not eligible for acceleration are executed by DB2. If an accelerator failure occurs while a queryis running, or if the accelerator returns an error, DB2 returns a negative SQLCODE to theapplication.
344 Classic Interface User's Guide
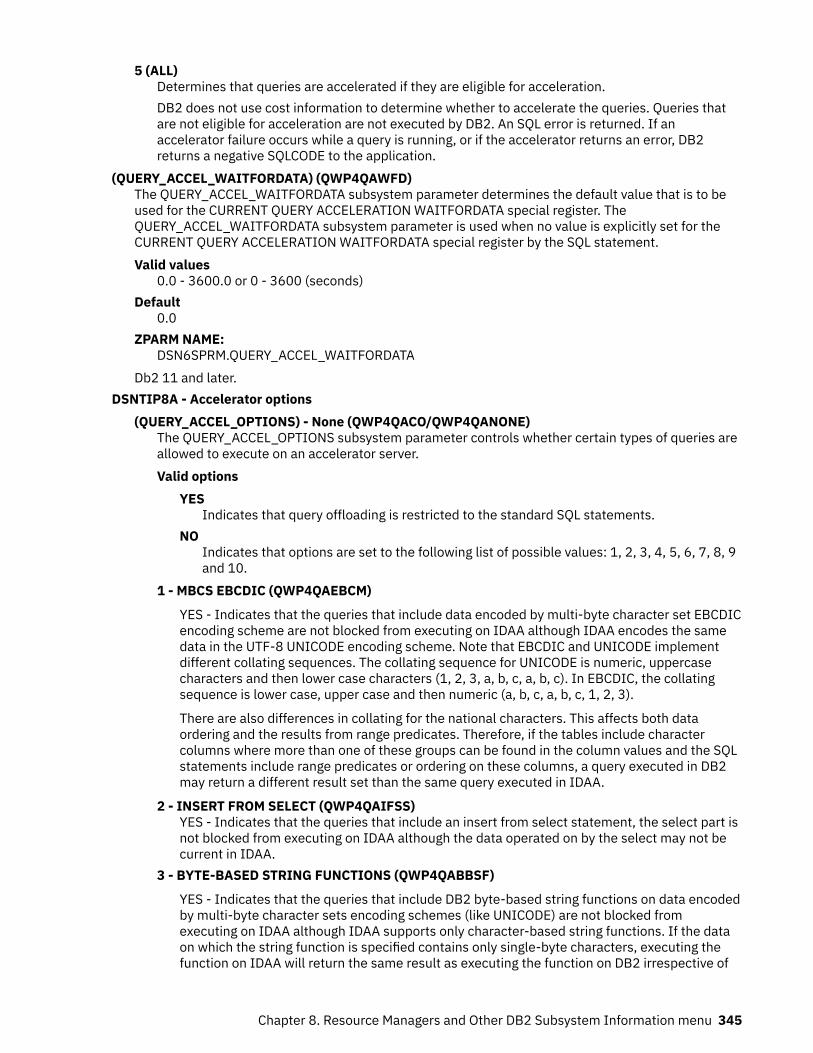
5 (ALL)Determines that queries are accelerated if they are eligible for acceleration.DB2 does not use cost information to determine whether to accelerate the queries. Queries thatare not eligible for acceleration are not executed by DB2. An SQL error is returned. If anaccelerator failure occurs while a query is running, or if the accelerator returns an error, DB2returns a negative SQLCODE to the application.
(QUERY_ACCEL_WAITFORDATA) (QWP4QAWFD)The QUERY_ACCEL_WAITFORDATA subsystem parameter determines the default value that is to beused for the CURRENT QUERY ACCELERATION WAITFORDATA special register. TheQUERY_ACCEL_WAITFORDATA subsystem parameter is used when no value is explicitly set for theCURRENT QUERY ACCELERATION WAITFORDATA special register by the SQL statement.Valid values
0.0 - 3600.0 or 0 - 3600 (seconds)Default
0.0ZPARM NAME:
DSN6SPRM.QUERY_ACCEL_WAITFORDATADb2 11 and later.
DSNTIP8A - Accelerator options(QUERY_ACCEL_OPTIONS) - None (QWP4QACO/QWP4QANONE)
The QUERY_ACCEL_OPTIONS subsystem parameter controls whether certain types of queries areallowed to execute on an accelerator server.Valid options
YESIndicates that query offloading is restricted to the standard SQL statements.
NOIndicates that options are set to the following list of possible values: 1, 2, 3, 4, 5, 6, 7, 8, 9and 10.
1 - MBCS EBCDIC (QWP4QAEBCM)
YES - Indicates that the queries that include data encoded by multi-byte character set EBCDICencoding scheme are not blocked from executing on IDAA although IDAA encodes the samedata in the UTF-8 UNICODE encoding scheme. Note that EBCDIC and UNICODE implementdifferent collating sequences. The collating sequence for UNICODE is numeric, uppercasecharacters and then lower case characters (1, 2, 3, a, b, c, a, b, c). In EBCDIC, the collatingsequence is lower case, upper case and then numeric (a, b, c, a, b, c, 1, 2, 3).
There are also differences in collating for the national characters. This affects both dataordering and the results from range predicates. Therefore, if the tables include charactercolumns where more than one of these groups can be found in the column values and the SQLstatements include range predicates or ordering on these columns, a query executed in DB2may return a different result set than the same query executed in IDAA.
2 - INSERT FROM SELECT (QWP4QAIFSS)YES - Indicates that the queries that include an insert from select statement, the select part isnot blocked from executing on IDAA although the data operated on by the select may not becurrent in IDAA.
3 - BYTE-BASED STRING FUNCTIONS (QWP4QABBSF)
YES - Indicates that the queries that include DB2 byte-based string functions on data encodedby multi-byte character sets encoding schemes (like UNICODE) are not blocked fromexecuting on IDAA although IDAA supports only character-based string functions. If the dataon which the string function is specified contains only single-byte characters, executing thefunction on IDAA will return the same result as executing the function on DB2 irrespective of
Chapter 8. Resource Managers and Other DB2 Subsystem Information menu 345
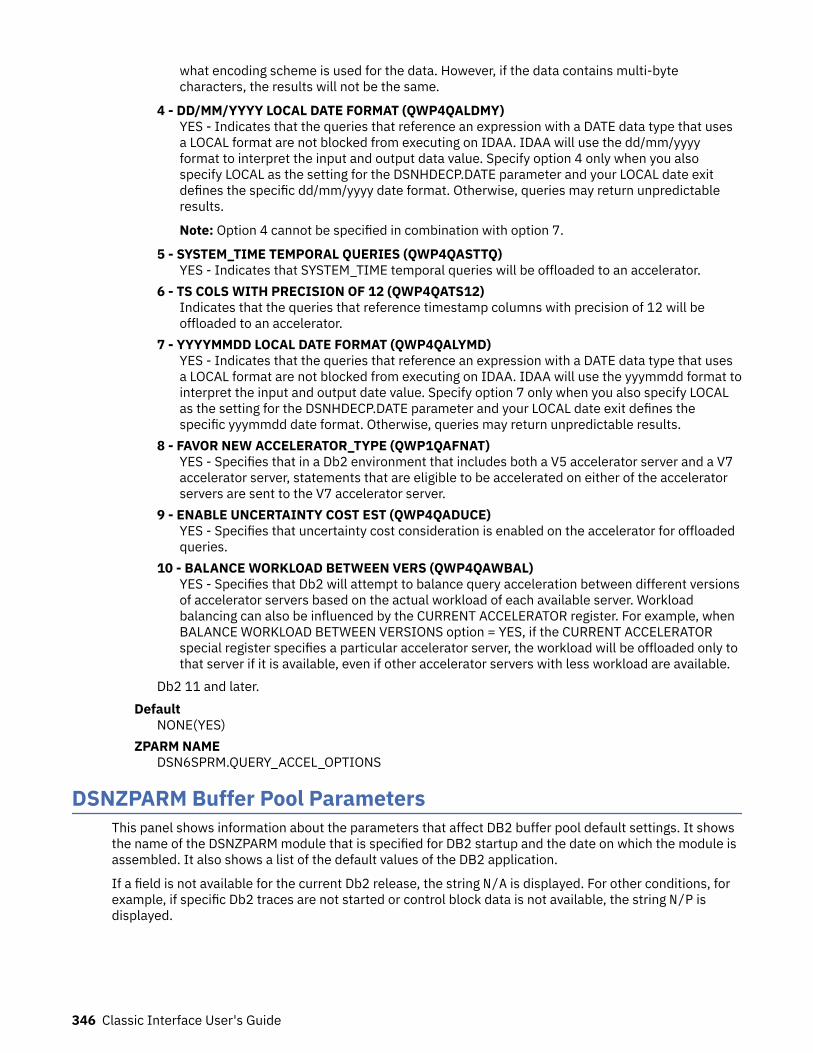
what encoding scheme is used for the data. However, if the data contains multi-bytecharacters, the results will not be the same.
4 - DD/MM/YYYY LOCAL DATE FORMAT (QWP4QALDMY)YES - Indicates that the queries that reference an expression with a DATE data type that usesa LOCAL format are not blocked from executing on IDAA. IDAA will use the dd/mm/yyyyformat to interpret the input and output data value. Specify option 4 only when you alsospecify LOCAL as the setting for the DSNHDECP.DATE parameter and your LOCAL date exitdefines the specific dd/mm/yyyy date format. Otherwise, queries may return unpredictableresults.
Note: Option 4 cannot be specified in combination with option 7.
5 - SYSTEM_TIME TEMPORAL QUERIES (QWP4QASTTQ)YES - Indicates that SYSTEM_TIME temporal queries will be offloaded to an accelerator.
6 - TS COLS WITH PRECISION OF 12 (QWP4QATS12)Indicates that the queries that reference timestamp columns with precision of 12 will beoffloaded to an accelerator.
7 - YYYYMMDD LOCAL DATE FORMAT (QWP4QALYMD)YES - Indicates that the queries that reference an expression with a DATE data type that usesa LOCAL format are not blocked from executing on IDAA. IDAA will use the yyymmdd format tointerpret the input and output date value. Specify option 7 only when you also specify LOCALas the setting for the DSNHDECP.DATE parameter and your LOCAL date exit defines thespecific yyymmdd date format. Otherwise, queries may return unpredictable results.
8 - FAVOR NEW ACCELERATOR_TYPE (QWP1QAFNAT)YES - Specifies that in a Db2 environment that includes both a V5 accelerator server and a V7accelerator server, statements that are eligible to be accelerated on either of the acceleratorservers are sent to the V7 accelerator server.
9 - ENABLE UNCERTAINTY COST EST (QWP4QADUCE)YES - Specifies that uncertainty cost consideration is enabled on the accelerator for offloadedqueries.
10 - BALANCE WORKLOAD BETWEEN VERS (QWP4QAWBAL)YES - Specifies that Db2 will attempt to balance query acceleration between different versionsof accelerator servers based on the actual workload of each available server. Workloadbalancing can also be influenced by the CURRENT ACCELERATOR register. For example, whenBALANCE WORKLOAD BETWEEN VERSIONS option = YES, if the CURRENT ACCELERATORspecial register specifies a particular accelerator server, the workload will be offloaded only tothat server if it is available, even if other accelerator servers with less workload are available.
Db2 11 and later.Default
NONE(YES)ZPARM NAME
DSN6SPRM.QUERY_ACCEL_OPTIONS
DSNZPARM Buffer Pool ParametersThis panel shows information about the parameters that affect DB2 buffer pool default settings. It showsthe name of the DSNZPARM module that is specified for DB2 startup and the date on which the module isassembled. It also shows a list of the default values of the DB2 application.
If a field is not available for the current Db2 release, the string N/A is displayed. For other conditions, forexample, if specific Db2 traces are not started or control block data is not available, the string N/P isdisplayed.
346 Classic Interface User's Guide
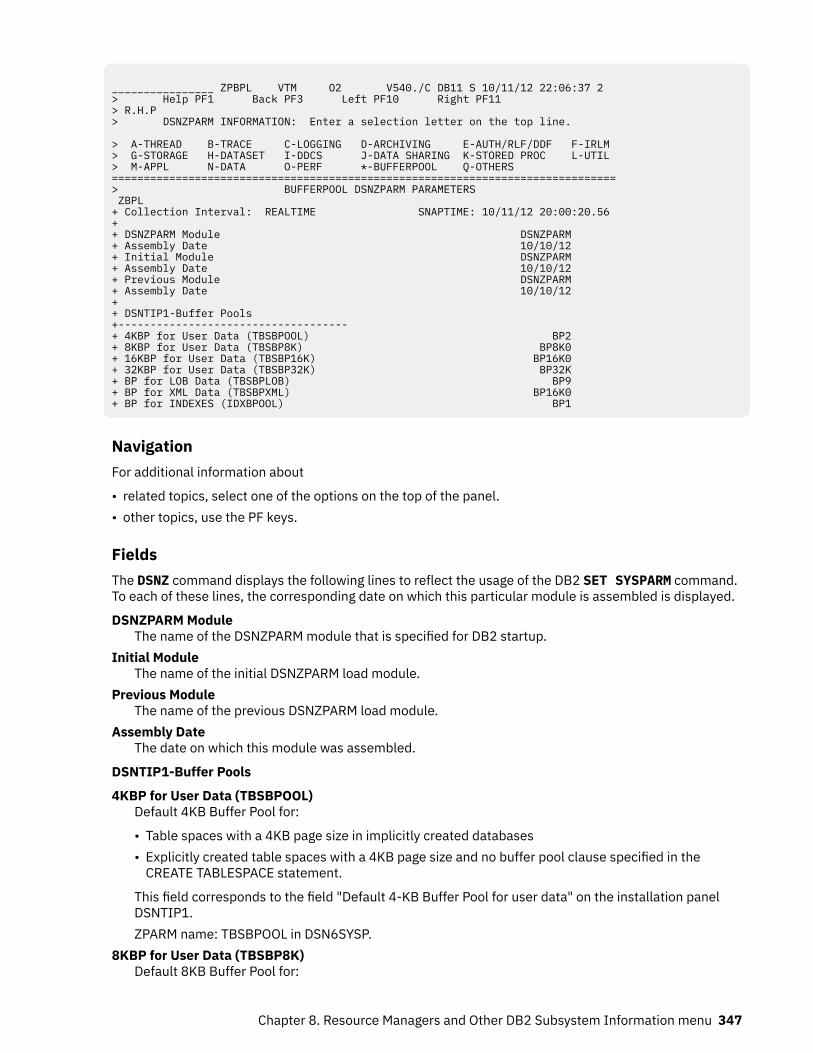
________________ ZPBPL VTM O2 V540./C DB11 S 10/11/12 22:06:37 2 > Help PF1 Back PF3 Left PF10 Right PF11 > R.H.P > DSNZPARM INFORMATION: Enter a selection letter on the top line. > A-THREAD B-TRACE C-LOGGING D-ARCHIVING E-AUTH/RLF/DDF F-IRLM > G-STORAGE H-DATASET I-DDCS J-DATA SHARING K-STORED PROC L-UTIL > M-APPL N-DATA O-PERF *-BUFFERPOOL Q-OTHERS =============================================================================== > BUFFERPOOL DSNZPARM PARAMETERS ZBPL + Collection Interval: REALTIME SNAPTIME: 10/11/12 20:00:20.56+ + DSNZPARM Module DSNZPARM + Assembly Date 10/10/12 + Initial Module DSNZPARM + Assembly Date 10/10/12 + Previous Module DSNZPARM + Assembly Date 10/10/12 + + DSNTIP1-Buffer Pools +------------------------------------ + 4KBP for User Data (TBSBPOOL) BP2 + 8KBP for User Data (TBSBP8K) BP8K0 + 16KBP for User Data (TBSBP16K) BP16K0 + 32KBP for User Data (TBSBP32K) BP32K + BP for LOB Data (TBSBPLOB) BP9 + BP for XML Data (TBSBPXML) BP16K0 + BP for INDEXES (IDXBPOOL) BP1
NavigationFor additional information about
• related topics, select one of the options on the top of the panel.• other topics, use the PF keys.
FieldsThe DSNZ command displays the following lines to reflect the usage of the DB2 SET SYSPARM command.To each of these lines, the corresponding date on which this particular module is assembled is displayed.
DSNZPARM ModuleThe name of the DSNZPARM module that is specified for DB2 startup.
Initial ModuleThe name of the initial DSNZPARM load module.
Previous ModuleThe name of the previous DSNZPARM load module.
Assembly DateThe date on which this module was assembled.
DSNTIP1-Buffer Pools
4KBP for User Data (TBSBPOOL)Default 4KB Buffer Pool for:
• Table spaces with a 4KB page size in implicitly created databases• Explicitly created table spaces with a 4KB page size and no buffer pool clause specified in the
CREATE TABLESPACE statement.
This field corresponds to the field "Default 4-KB Buffer Pool for user data" on the installation panelDSNTIP1.ZPARM name: TBSBPOOL in DSN6SYSP.
8KBP for User Data (TBSBP8K)Default 8KB Buffer Pool for:
Chapter 8. Resource Managers and Other DB2 Subsystem Information menu 347
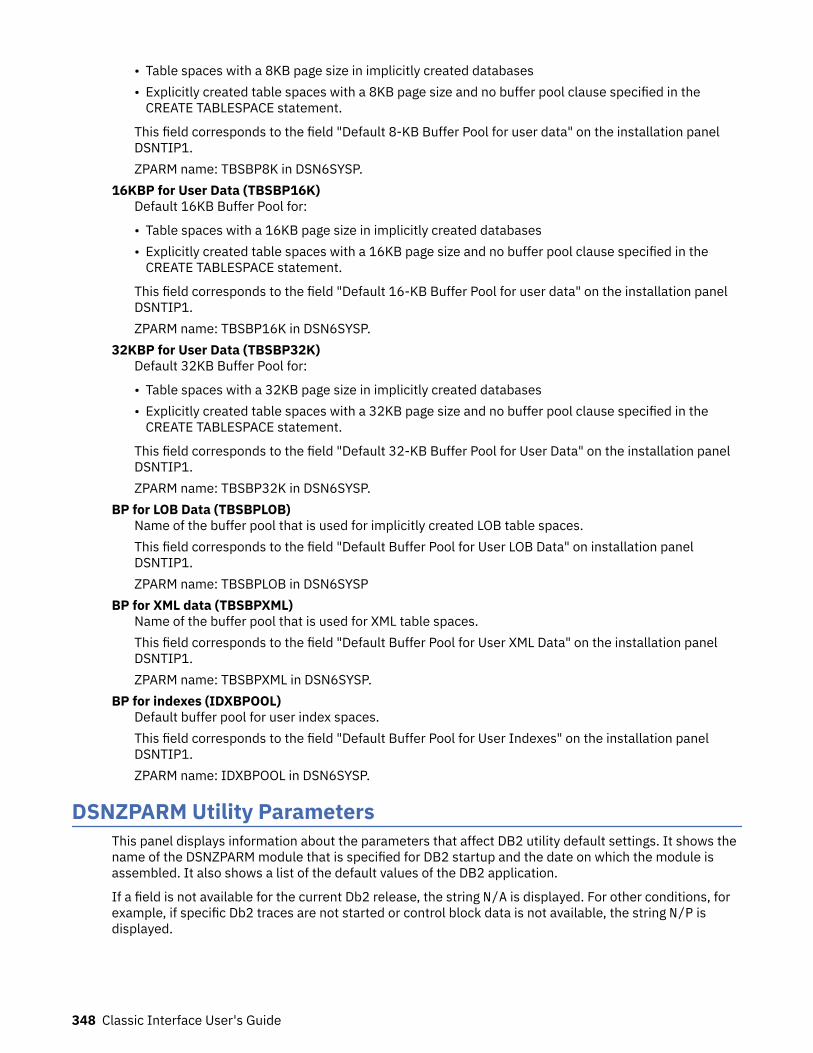
• Table spaces with a 8KB page size in implicitly created databases• Explicitly created table spaces with a 8KB page size and no buffer pool clause specified in the
CREATE TABLESPACE statement.
This field corresponds to the field "Default 8-KB Buffer Pool for user data" on the installation panelDSNTIP1.ZPARM name: TBSBP8K in DSN6SYSP.
16KBP for User Data (TBSBP16K)Default 16KB Buffer Pool for:
• Table spaces with a 16KB page size in implicitly created databases• Explicitly created table spaces with a 16KB page size and no buffer pool clause specified in the
CREATE TABLESPACE statement.
This field corresponds to the field "Default 16-KB Buffer Pool for user data" on the installation panelDSNTIP1.ZPARM name: TBSBP16K in DSN6SYSP.
32KBP for User Data (TBSBP32K)Default 32KB Buffer Pool for:
• Table spaces with a 32KB page size in implicitly created databases• Explicitly created table spaces with a 32KB page size and no buffer pool clause specified in the
CREATE TABLESPACE statement.
This field corresponds to the field "Default 32-KB Buffer Pool for User Data" on the installation panelDSNTIP1.ZPARM name: TBSBP32K in DSN6SYSP.
BP for LOB Data (TBSBPLOB)Name of the buffer pool that is used for implicitly created LOB table spaces.This field corresponds to the field "Default Buffer Pool for User LOB Data" on installation panelDSNTIP1.ZPARM name: TBSBPLOB in DSN6SYSP
BP for XML data (TBSBPXML)Name of the buffer pool that is used for XML table spaces.This field corresponds to the field "Default Buffer Pool for User XML Data" on the installation panelDSNTIP1.ZPARM name: TBSBPXML in DSN6SYSP.
BP for indexes (IDXBPOOL)Default buffer pool for user index spaces.This field corresponds to the field "Default Buffer Pool for User Indexes" on the installation panelDSNTIP1.ZPARM name: IDXBPOOL in DSN6SYSP.
DSNZPARM Utility ParametersThis panel displays information about the parameters that affect DB2 utility default settings. It shows thename of the DSNZPARM module that is specified for DB2 startup and the date on which the module isassembled. It also shows a list of the default values of the DB2 application.
If a field is not available for the current Db2 release, the string N/A is displayed. For other conditions, forexample, if specific Db2 traces are not started or control block data is not available, the string N/P isdisplayed.
348 Classic Interface User's Guide
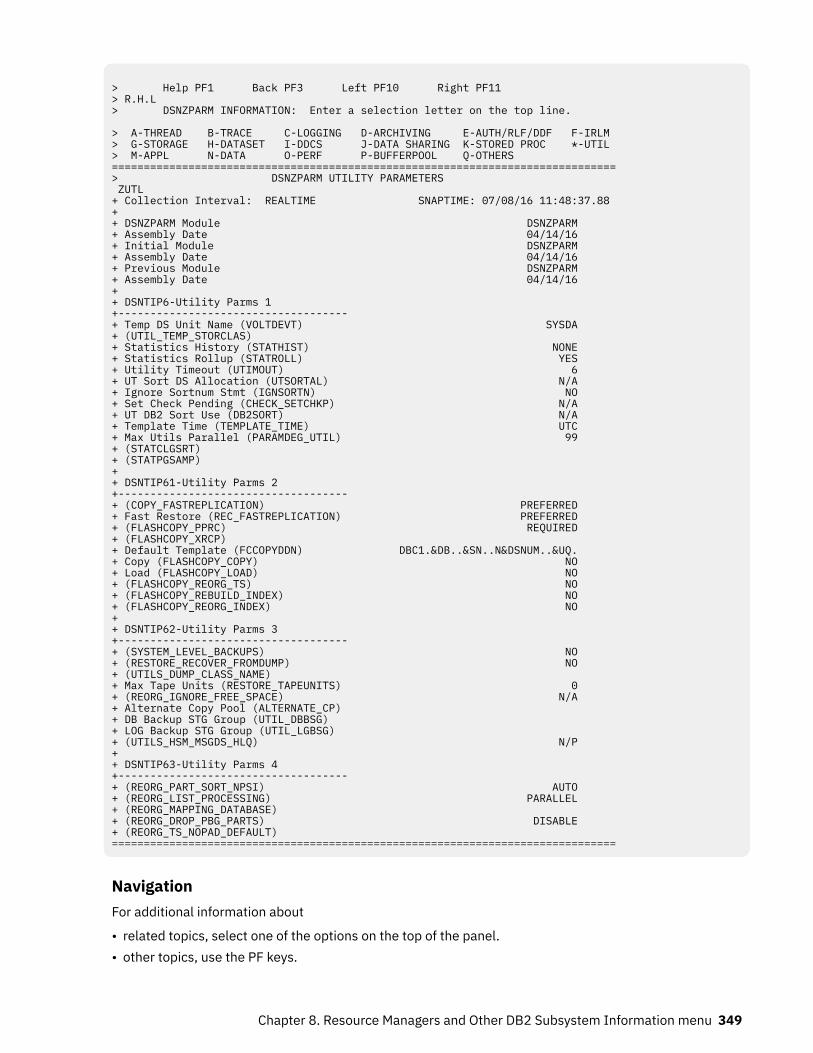
> Help PF1 Back PF3 Left PF10 Right PF11 > R.H.L > DSNZPARM INFORMATION: Enter a selection letter on the top line. > A-THREAD B-TRACE C-LOGGING D-ARCHIVING E-AUTH/RLF/DDF F-IRLM > G-STORAGE H-DATASET I-DDCS J-DATA SHARING K-STORED PROC *-UTIL > M-APPL N-DATA O-PERF P-BUFFERPOOL Q-OTHERS ===============================================================================> DSNZPARM UTILITY PARAMETERS ZUTL + Collection Interval: REALTIME SNAPTIME: 07/08/16 11:48:37.88 + + DSNZPARM Module DSNZPARM + Assembly Date 04/14/16 + Initial Module DSNZPARM + Assembly Date 04/14/16 + Previous Module DSNZPARM + Assembly Date 04/14/16 + + DSNTIP6-Utility Parms 1 +------------------------------------ + Temp DS Unit Name (VOLTDEVT) SYSDA + (UTIL_TEMP_STORCLAS) + Statistics History (STATHIST) NONE + Statistics Rollup (STATROLL) YES + Utility Timeout (UTIMOUT) 6 + UT Sort DS Allocation (UTSORTAL) N/A + Ignore Sortnum Stmt (IGNSORTN) NO + Set Check Pending (CHECK_SETCHKP) N/A + UT DB2 Sort Use (DB2SORT) N/A + Template Time (TEMPLATE_TIME) UTC + Max Utils Parallel (PARAMDEG_UTIL) 99 + (STATCLGSRT)+ (STATPGSAMP) + + DSNTIP61-Utility Parms 2 +------------------------------------ + (COPY_FASTREPLICATION) PREFERRED + Fast Restore (REC_FASTREPLICATION) PREFERRED + (FLASHCOPY_PPRC) REQUIRED + (FLASHCOPY_XRCP) + Default Template (FCCOPYDDN) DBC1.&DB..&SN..N&DSNUM..&UQ. + Copy (FLASHCOPY_COPY) NO + Load (FLASHCOPY_LOAD) NO + (FLASHCOPY_REORG_TS) NO + (FLASHCOPY_REBUILD_INDEX) NO + (FLASHCOPY_REORG_INDEX) NO + + DSNTIP62-Utility Parms 3 +------------------------------------ + (SYSTEM_LEVEL_BACKUPS) NO + (RESTORE_RECOVER_FROMDUMP) NO + (UTILS_DUMP_CLASS_NAME) + Max Tape Units (RESTORE_TAPEUNITS) 0 + (REORG_IGNORE_FREE_SPACE) N/A + Alternate Copy Pool (ALTERNATE_CP) + DB Backup STG Group (UTIL_DBBSG) + LOG Backup STG Group (UTIL_LGBSG) + (UTILS_HSM_MSGDS_HLQ) N/P + + DSNTIP63-Utility Parms 4 +------------------------------------ + (REORG_PART_SORT_NPSI) AUTO + (REORG_LIST_PROCESSING) PARALLEL + (REORG_MAPPING_DATABASE) + (REORG_DROP_PBG_PARTS) DISABLE + (REORG_TS_NOPAD_DEFAULT)===============================================================================
NavigationFor additional information about
• related topics, select one of the options on the top of the panel.• other topics, use the PF keys.
Chapter 8. Resource Managers and Other DB2 Subsystem Information menu 349
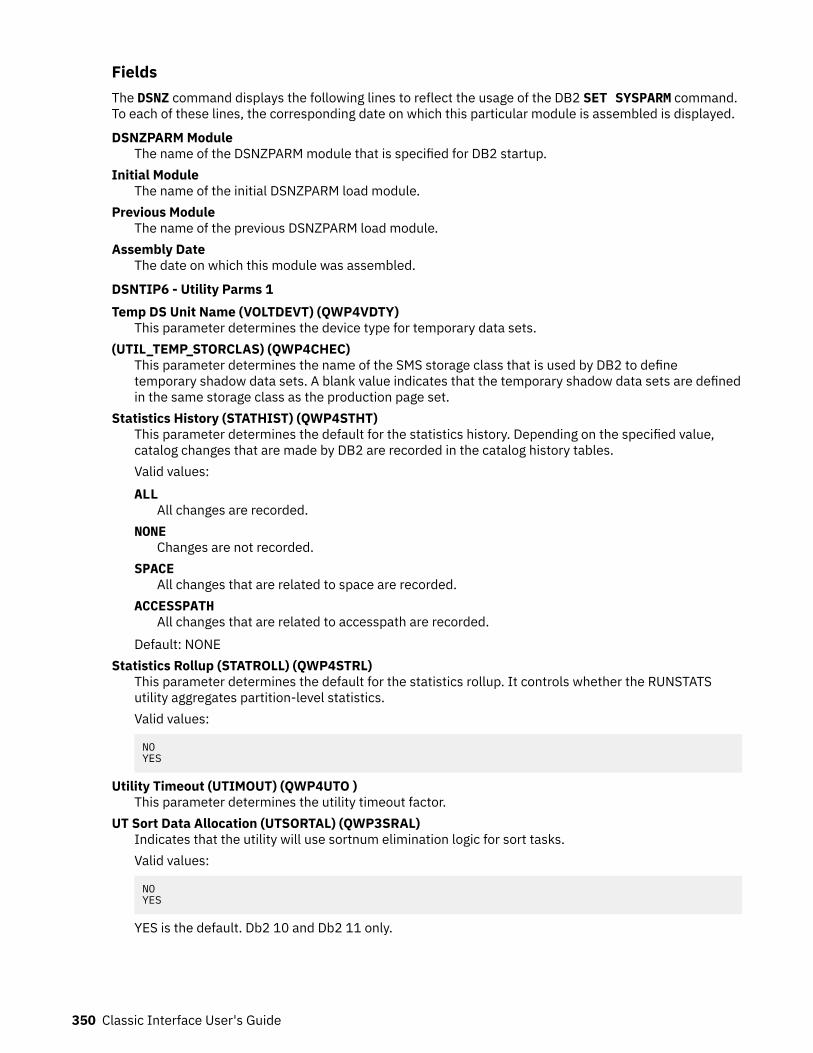
FieldsThe DSNZ command displays the following lines to reflect the usage of the DB2 SET SYSPARM command.To each of these lines, the corresponding date on which this particular module is assembled is displayed.
DSNZPARM ModuleThe name of the DSNZPARM module that is specified for DB2 startup.
Initial ModuleThe name of the initial DSNZPARM load module.
Previous ModuleThe name of the previous DSNZPARM load module.
Assembly DateThe date on which this module was assembled.
DSNTIP6 - Utility Parms 1Temp DS Unit Name (VOLTDEVT) (QWP4VDTY)
This parameter determines the device type for temporary data sets.(UTIL_TEMP_STORCLAS) (QWP4CHEC)
This parameter determines the name of the SMS storage class that is used by DB2 to definetemporary shadow data sets. A blank value indicates that the temporary shadow data sets are definedin the same storage class as the production page set.
Statistics History (STATHIST) (QWP4STHT)This parameter determines the default for the statistics history. Depending on the specified value,catalog changes that are made by DB2 are recorded in the catalog history tables.Valid values:ALL
All changes are recorded.NONE
Changes are not recorded.SPACE
All changes that are related to space are recorded.ACCESSPATH
All changes that are related to accesspath are recorded.Default: NONE
Statistics Rollup (STATROLL) (QWP4STRL)This parameter determines the default for the statistics rollup. It controls whether the RUNSTATSutility aggregates partition-level statistics.Valid values:
NOYES
Utility Timeout (UTIMOUT) (QWP4UTO )This parameter determines the utility timeout factor.
UT Sort Data Allocation (UTSORTAL) (QWP3SRAL)Indicates that the utility will use sortnum elimination logic for sort tasks.Valid values:
NOYES
YES is the default. Db2 10 and Db2 11 only.
350 Classic Interface User's Guide
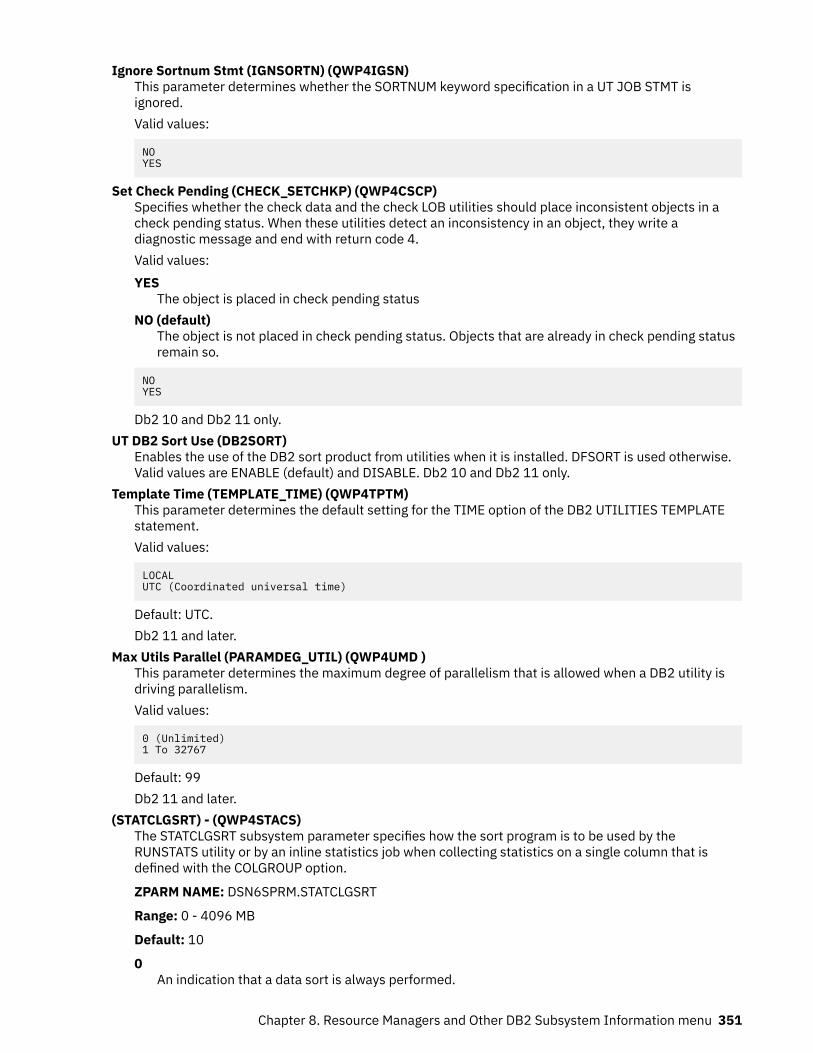
Ignore Sortnum Stmt (IGNSORTN) (QWP4IGSN)This parameter determines whether the SORTNUM keyword specification in a UT JOB STMT isignored.Valid values:
NOYES
Set Check Pending (CHECK_SETCHKP) (QWP4CSCP)Specifies whether the check data and the check LOB utilities should place inconsistent objects in acheck pending status. When these utilities detect an inconsistency in an object, they write adiagnostic message and end with return code 4.Valid values:YES
The object is placed in check pending statusNO (default)
The object is not placed in check pending status. Objects that are already in check pending statusremain so.
NOYES
Db2 10 and Db2 11 only.UT DB2 Sort Use (DB2SORT)
Enables the use of the DB2 sort product from utilities when it is installed. DFSORT is used otherwise.Valid values are ENABLE (default) and DISABLE. Db2 10 and Db2 11 only.
Template Time (TEMPLATE_TIME) (QWP4TPTM)This parameter determines the default setting for the TIME option of the DB2 UTILITIES TEMPLATEstatement.Valid values:
LOCALUTC (Coordinated universal time)
Default: UTC.Db2 11 and later.
Max Utils Parallel (PARAMDEG_UTIL) (QWP4UMD )This parameter determines the maximum degree of parallelism that is allowed when a DB2 utility isdriving parallelism.Valid values:
0 (Unlimited)1 To 32767
Default: 99Db2 11 and later.
(STATCLGSRT) - (QWP4STACS)The STATCLGSRT subsystem parameter specifies how the sort program is to be used by theRUNSTATS utility or by an inline statistics job when collecting statistics on a single column that isdefined with the COLGROUP option.
ZPARM NAME: DSN6SPRM.STATCLGSRT
Range: 0 - 4096 MB
Default: 10
0An indication that a data sort is always performed.
Chapter 8. Resource Managers and Other DB2 Subsystem Information menu 351
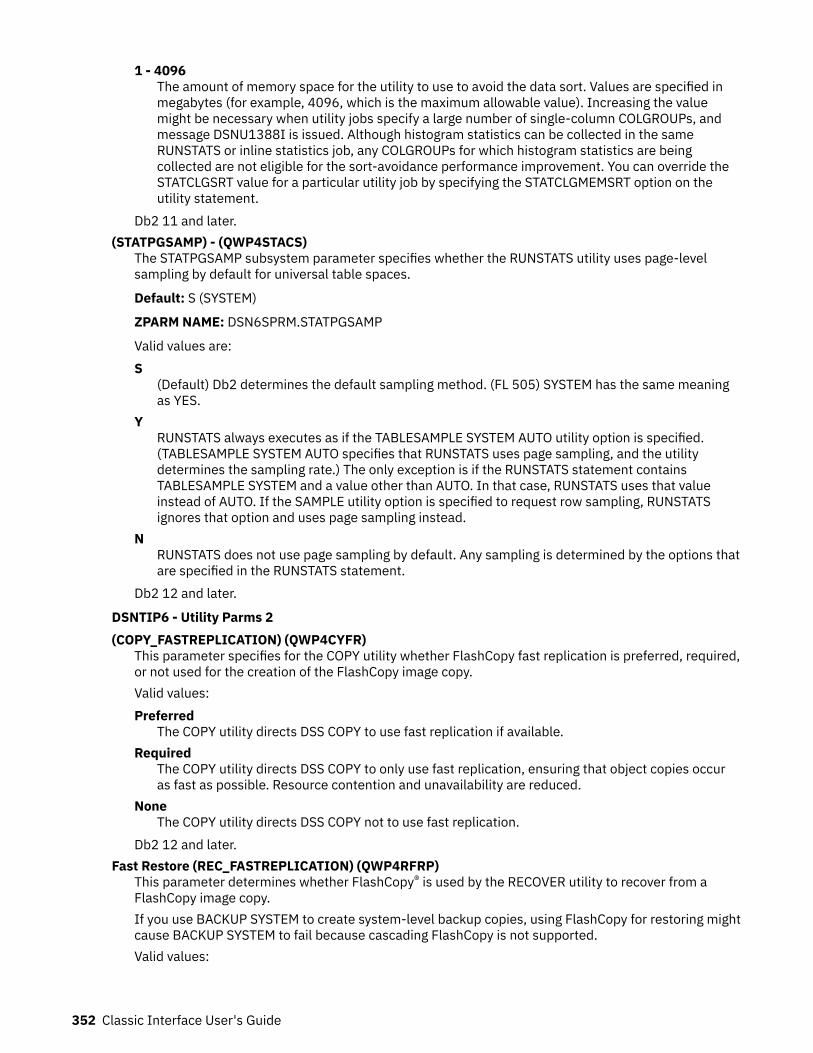
1 - 4096The amount of memory space for the utility to use to avoid the data sort. Values are specified inmegabytes (for example, 4096, which is the maximum allowable value). Increasing the valuemight be necessary when utility jobs specify a large number of single-column COLGROUPs, andmessage DSNU1388I is issued. Although histogram statistics can be collected in the sameRUNSTATS or inline statistics job, any COLGROUPs for which histogram statistics are beingcollected are not eligible for the sort-avoidance performance improvement. You can override theSTATCLGSRT value for a particular utility job by specifying the STATCLGMEMSRT option on theutility statement.
Db2 11 and later.(STATPGSAMP) - (QWP4STACS)
The STATPGSAMP subsystem parameter specifies whether the RUNSTATS utility uses page-levelsampling by default for universal table spaces.
Default: S (SYSTEM)
ZPARM NAME: DSN6SPRM.STATPGSAMP
Valid values are:S
(Default) Db2 determines the default sampling method. (FL 505) SYSTEM has the same meaningas YES.
YRUNSTATS always executes as if the TABLESAMPLE SYSTEM AUTO utility option is specified.(TABLESAMPLE SYSTEM AUTO specifies that RUNSTATS uses page sampling, and the utilitydetermines the sampling rate.) The only exception is if the RUNSTATS statement containsTABLESAMPLE SYSTEM and a value other than AUTO. In that case, RUNSTATS uses that valueinstead of AUTO. If the SAMPLE utility option is specified to request row sampling, RUNSTATSignores that option and uses page sampling instead.
NRUNSTATS does not use page sampling by default. Any sampling is determined by the options thatare specified in the RUNSTATS statement.
Db2 12 and later.
DSNTIP6 - Utility Parms 2(COPY_FASTREPLICATION) (QWP4CYFR)
This parameter specifies for the COPY utility whether FlashCopy fast replication is preferred, required,or not used for the creation of the FlashCopy image copy.Valid values:Preferred
The COPY utility directs DSS COPY to use fast replication if available.Required
The COPY utility directs DSS COPY to only use fast replication, ensuring that object copies occuras fast as possible. Resource contention and unavailability are reduced.
NoneThe COPY utility directs DSS COPY not to use fast replication.
Db2 12 and later.Fast Restore (REC_FASTREPLICATION) (QWP4RFRP)
This parameter determines whether FlashCopy® is used by the RECOVER utility to recover from aFlashCopy image copy.If you use BACKUP SYSTEM to create system-level backup copies, using FlashCopy for restoring mightcause BACKUP SYSTEM to fail because cascading FlashCopy is not supported.Valid values:
352 Classic Interface User's Guide
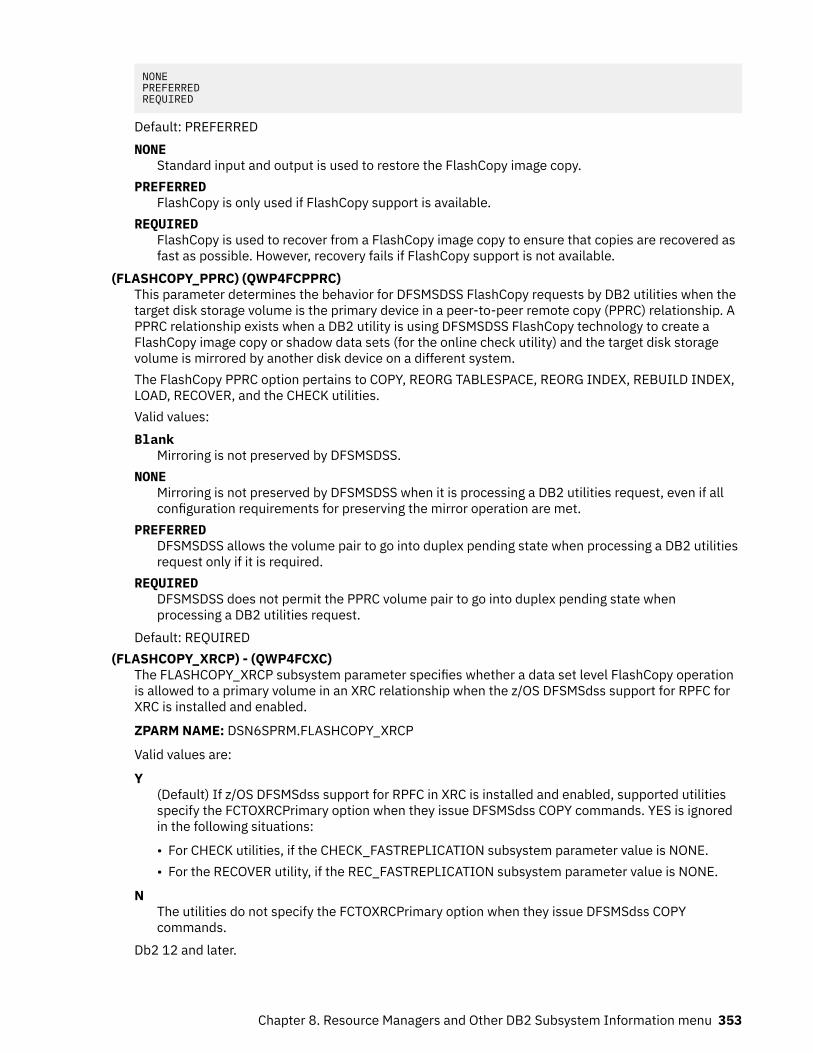
NONEPREFERREDREQUIRED
Default: PREFERREDNONE
Standard input and output is used to restore the FlashCopy image copy.PREFERRED
FlashCopy is only used if FlashCopy support is available.REQUIRED
FlashCopy is used to recover from a FlashCopy image copy to ensure that copies are recovered asfast as possible. However, recovery fails if FlashCopy support is not available.
(FLASHCOPY_PPRC) (QWP4FCPPRC)This parameter determines the behavior for DFSMSDSS FlashCopy requests by DB2 utilities when thetarget disk storage volume is the primary device in a peer-to-peer remote copy (PPRC) relationship. APPRC relationship exists when a DB2 utility is using DFSMSDSS FlashCopy technology to create aFlashCopy image copy or shadow data sets (for the online check utility) and the target disk storagevolume is mirrored by another disk device on a different system.The FlashCopy PPRC option pertains to COPY, REORG TABLESPACE, REORG INDEX, REBUILD INDEX,LOAD, RECOVER, and the CHECK utilities.Valid values:Blank
Mirroring is not preserved by DFSMSDSS.NONE
Mirroring is not preserved by DFSMSDSS when it is processing a DB2 utilities request, even if allconfiguration requirements for preserving the mirror operation are met.
PREFERREDDFSMSDSS allows the volume pair to go into duplex pending state when processing a DB2 utilitiesrequest only if it is required.
REQUIREDDFSMSDSS does not permit the PPRC volume pair to go into duplex pending state whenprocessing a DB2 utilities request.
Default: REQUIRED(FLASHCOPY_XRCP) - (QWP4FCXC)
The FLASHCOPY_XRCP subsystem parameter specifies whether a data set level FlashCopy operationis allowed to a primary volume in an XRC relationship when the z/OS DFSMSdss support for RPFC forXRC is installed and enabled.
ZPARM NAME: DSN6SPRM.FLASHCOPY_XRCP
Valid values are:
Y(Default) If z/OS DFSMSdss support for RPFC in XRC is installed and enabled, supported utilitiesspecify the FCTOXRCPrimary option when they issue DFSMSdss COPY commands. YES is ignoredin the following situations:
• For CHECK utilities, if the CHECK_FASTREPLICATION subsystem parameter value is NONE.• For the RECOVER utility, if the REC_FASTREPLICATION subsystem parameter value is NONE.
NThe utilities do not specify the FCTOXRCPrimary option when they issue DFSMSdss COPYcommands.
Db2 12 and later.
Chapter 8. Resource Managers and Other DB2 Subsystem Information menu 353
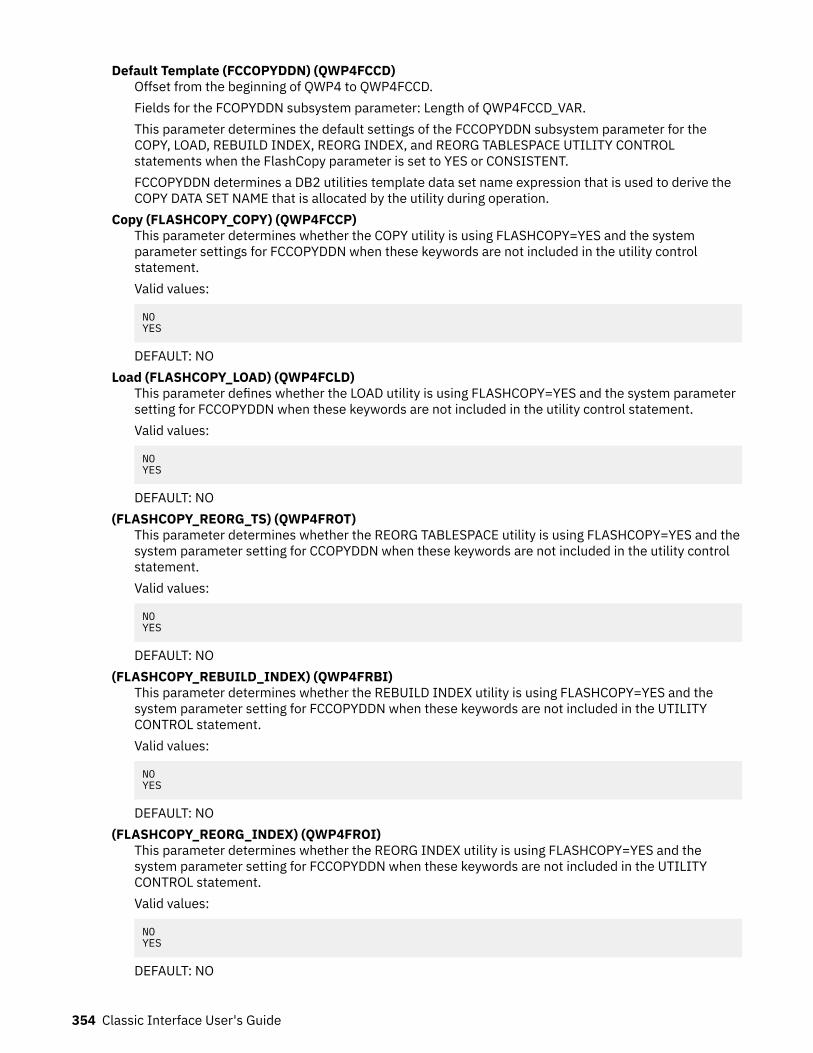
Default Template (FCCOPYDDN) (QWP4FCCD)Offset from the beginning of QWP4 to QWP4FCCD.Fields for the FCOPYDDN subsystem parameter: Length of QWP4FCCD_VAR.This parameter determines the default settings of the FCCOPYDDN subsystem parameter for theCOPY, LOAD, REBUILD INDEX, REORG INDEX, and REORG TABLESPACE UTILITY CONTROLstatements when the FlashCopy parameter is set to YES or CONSISTENT.FCCOPYDDN determines a DB2 utilities template data set name expression that is used to derive theCOPY DATA SET NAME that is allocated by the utility during operation.
Copy (FLASHCOPY_COPY) (QWP4FCCP)This parameter determines whether the COPY utility is using FLASHCOPY=YES and the systemparameter settings for FCCOPYDDN when these keywords are not included in the utility controlstatement.Valid values:
NOYES
DEFAULT: NOLoad (FLASHCOPY_LOAD) (QWP4FCLD)
This parameter defines whether the LOAD utility is using FLASHCOPY=YES and the system parametersetting for FCCOPYDDN when these keywords are not included in the utility control statement.Valid values:
NOYES
DEFAULT: NO(FLASHCOPY_REORG_TS) (QWP4FROT)
This parameter determines whether the REORG TABLESPACE utility is using FLASHCOPY=YES and thesystem parameter setting for CCOPYDDN when these keywords are not included in the utility controlstatement.Valid values:
NOYES
DEFAULT: NO(FLASHCOPY_REBUILD_INDEX) (QWP4FRBI)
This parameter determines whether the REBUILD INDEX utility is using FLASHCOPY=YES and thesystem parameter setting for FCCOPYDDN when these keywords are not included in the UTILITYCONTROL statement.Valid values:
NOYES
DEFAULT: NO(FLASHCOPY_REORG_INDEX) (QWP4FROI)
This parameter determines whether the REORG INDEX utility is using FLASHCOPY=YES and thesystem parameter setting for FCCOPYDDN when these keywords are not included in the UTILITYCONTROL statement.Valid values:
NOYES
DEFAULT: NO
354 Classic Interface User's Guide
DSNTIP6 - Utility Parms 3(SYSTEM_LEVEL_BACKUPS) (QWP4SLBU)
This parameter determines whether the RECOVER utility is using system-level backup copies as arecovery base additional to image copies and concurrent copies for object-level recoveries. If you donot want system-level backup copies with the BACKUP SYSTEM utility, specify NO.For more information, see the chapter Recover in the DB2 10 for z/OS, Utility Guide and Reference,SC19-2984-08.Valid values:
NOYES
Default: NO(RESTORE_RECOVER_FROMDUMP) (QWP4RRFD)
This parameter determines for the restore system and the RECOVER utilities whether the system-levelbackup that is selected as the recovery base is used from the disk copy of the system-level backup(NO) or from the dump on tape (YES).Valid values:
NOYES
Default:
NO
(UTILS_DUMP_CLASS_NAME) (QWP4RSDC)This parameter determines the name of the DFSMSHSM dump clas that is used by the Restore SystemUtility to restore from a system-level backup that is dumped to tape.
Max Tape Units (RESTORE_TAPEUNITS) (QWP4RSMT)This parameter determines the maximum number of tape units or tape drives that the Restore SystemUtility can use to restore from a system-level backup that is dumped to tape.Valid values:
0 (No limit)1-255
(REORG_IGNORE_FREE_SPACE) (QWP4RIFS)This parameter specifies whether the Reorg Tablespace Utility should ignore the PCTFREE andFREEPAGE values while reloading data rows into a a PBG table space in the following circumstances:
• When a subset of the PBG partitions are reorganized• When the table in the PBG table space as LOB columns
The default is NO (PCTFREE and FREEPAGE values are honored).Db2 10 and Db2 11 only.
Alternate Copy Pool (ALTERNATE_CP) (QWP4BSACP)Specifies an optional alternate SMS copy pool for the DB2 BACKUP SYSTEM utility.Valid values:blank (default)
DB2 BACKUP SYSTEM uses the standard copy pool only.1- 16 alphanumeric characters
DB2 BACKUP SYSTEM uses the specified copy pool as the alternate copy pool for the system-levelbackups. DB2 BACKUP SYSTEM alternates between using the standard copy pool and thealternate copy pool for system-level backups.
Db2 12 and later.
Chapter 8. Resource Managers and Other DB2 Subsystem Information menu 355
DB Backup STG Group (UTIL_DBBSG) (QWP4UDBSG)
Specifies an optional backup SMS storage group to be used by the DB2 BACKUP SYSTEM utility for theDB copy pool.
Valid values:blank (default)
DB2 BACKUP SYSTEM requests that DFSMShsm uses the copy pool backup storage group that isassociated with each storage group in the copy pool.
Valid SMS storage group nameDB2 BACKUP SYSTEM requests that DFSMShsm uses the specified copy pool backup storagegroup. The specified storage group must defined with the COPY POOL BACKUP attribute.
Db2 12 and later.LOG Backup STG Group (UTIL_LGBSG) (QWP4ULBSG)
Specifies an optional backup SMS storage group to be used by the DB2 BACKUP SYSTEM utility for theLOG copy pool.
Valid values:blank (default)
DB2 BACKUP SYSTEM requests that DFSMShsm uses the copy pool backup storage group that isassociated with each storage group in the copy pool.
Valid SMS storage group nameDB2 BACKUP SYSTEM requests that DFSMShsm uses the specified copy pool backup storagegroup. The specified storage group must defined with the COPY POOL BACKUP attribute.
Db2 12 and later.(UTILS_HSM_MSGDS_HLQ) (QWP4UHMD)
Shows the high level qualifier (HLQ) for data sets (DS) to be allocated by the DB2 BACKUP SYSTEMand RESTORE SYSTEM utilities to receive messages from the Data Facility Hierarchical StorageManager (DFHSM) and the IBM Data Facility Data Set Services (DFDSS).Valid values:
• blank (default)• Valid data set qualifier of 1 to 6 characters
Db2 12 and later.
DSNTIP63 - Utility Parms 4(REORG_PART_SORT_NPSI) (QWP4RPSN)
This parameter determines the default method of building a non-partitioned secondary index (NPSI)during REORG TABLESPACE PART. This setting is used when the SORTNPSI keyword is not provided inthe utility control statement.The SORTNPSI keyword determines whether REORG TABLESPACE PART is sorting all keys of a NPSI.This setting is ignored for a REORG that is not part-level or a REORG with no NPSIS.Valid values:AUTO
If sorting all keys of the NPSI(s) improves the elapsed time and the CPU performance, all keys aresorted.
NOIf sorting all keys of the NPSI(s) improves the elapsed time and the CPU performance, all keys aresorted.
YESOnly the keys of the NPSI(s) that are in the scope of the REORG are sorted.
Default:
356 Classic Interface User's Guide
AUTO
(REORG_LIST_PROCESSING) (QWP4RLPR)This parameter determines the default setting for the parallel option of the DB2 REORG TABLESPACEutility if the REORG TABLESPACE control statement does not include the parallel keyword. Dependingon the value, the type of processing for partitioned table spaces is selected.The DB2 REORG TABLESPACE utility can process partitions that are specified in the INPUT LISTDEFSTATEMENT like this:Valid values:PARALLEL YES
All partitions are processed in a single utility executionPARALLEL NO
Each partition is processed in a separate utility executionDefault:
PARALLEL YES
Db2 11 and later.(REORG_MAPPING_DATABASE) (QWP4RMDB)
This parameter determines the default database that is used by REORG TABLESPACE SHRLEVELCHANGE to create the mapping table. When a REORG TABLESPACE SHRLEVEL CHANGE REQUEST isprocessed, the REORG UTILITY can create its own mapping table and mapping index or it can processuser input.If this parameter is set to a valid database, REORG allocates the mapping table in the specifieddatabase.If this parameter is set to NULL, REORG allocates the mapping table in an implicitely defineddatabase.
(REORG_DROP_PBG_PARTS) (QWP4RPBG)This parameter determines whether REORG removes trailing empty partitions when operating on anentire partitioned by growth (PBG) table space. An empty trailing partition occurs when REORG movesall data records from a partition into lower numbered partitions.This parameter is only used if REORG runs against an entire PBG table space. It is ignored by REORGSof non-PBG table spaces and for partition-level REORGS of PBG table spaces.Valid values:ENABLE
If there is any trailing empty partition after REORG is completed, it is removed.DISABLE
The number of PBG partitions that is present after REORG is completed is equal or greater thanthe number of partitions that was present before REORG was run. Even if REORG can relocate alldata records into the lowest numbered partitions, trailing empty PBG partitions are retained.
Default:
DISABLE
Db2 11 and later.(REORG_TS_NOPAD_DEFAULT) - (QWP4RTNP)
When the REORG TABLESPACE utility is run with DISCARD or UNLOAD EXTERNAL, the NOPAD optionspecifies whether variable-length columns in unloaded or discarded records occupy the actual datalength without additional padding. The unloaded records can have varying lengths. TheREORG_TS_NOPAD_DEFAULT subsystem parameter indicates whether the NOPAD option is NO or YESby default when it is omitted from the utility control statement.
ZPARM NAME: DSN6SPRM.REORG_TS_NOPAD_DEFAULT
Chapter 8. Resource Managers and Other DB2 Subsystem Information menu 357
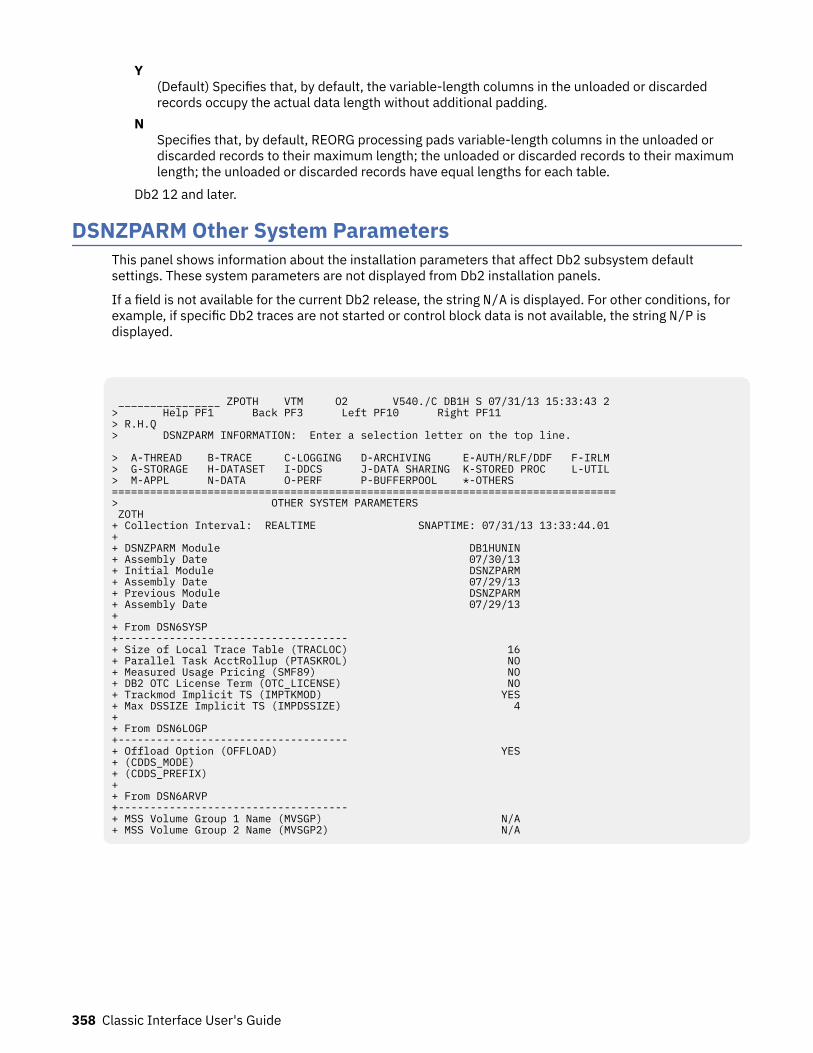
Y(Default) Specifies that, by default, the variable-length columns in the unloaded or discardedrecords occupy the actual data length without additional padding.
NSpecifies that, by default, REORG processing pads variable-length columns in the unloaded ordiscarded records to their maximum length; the unloaded or discarded records to their maximumlength; the unloaded or discarded records have equal lengths for each table.
Db2 12 and later.
DSNZPARM Other System ParametersThis panel shows information about the installation parameters that affect Db2 subsystem defaultsettings. These system parameters are not displayed from Db2 installation panels.
If a field is not available for the current Db2 release, the string N/A is displayed. For other conditions, forexample, if specific Db2 traces are not started or control block data is not available, the string N/P isdisplayed.
________________ ZPOTH VTM O2 V540./C DB1H S 07/31/13 15:33:43 2 > Help PF1 Back PF3 Left PF10 Right PF11 > R.H.Q > DSNZPARM INFORMATION: Enter a selection letter on the top line. > A-THREAD B-TRACE C-LOGGING D-ARCHIVING E-AUTH/RLF/DDF F-IRLM > G-STORAGE H-DATASET I-DDCS J-DATA SHARING K-STORED PROC L-UTIL > M-APPL N-DATA O-PERF P-BUFFERPOOL *-OTHERS ===============================================================================> OTHER SYSTEM PARAMETERS ZOTH + Collection Interval: REALTIME SNAPTIME: 07/31/13 13:33:44.01 + + DSNZPARM Module DB1HUNIN + Assembly Date 07/30/13 + Initial Module DSNZPARM + Assembly Date 07/29/13 + Previous Module DSNZPARM + Assembly Date 07/29/13 + + From DSN6SYSP +------------------------------------ + Size of Local Trace Table (TRACLOC) 16 + Parallel Task AcctRollup (PTASKROL) NO + Measured Usage Pricing (SMF89) NO + DB2 OTC License Term (OTC_LICENSE) NO + Trackmod Implicit TS (IMPTKMOD) YES + Max DSSIZE Implicit TS (IMPDSSIZE) 4 + + From DSN6LOGP +------------------------------------ + Offload Option (OFFLOAD) YES + (CDDS_MODE)+ (CDDS_PREFIX)+ + From DSN6ARVP +------------------------------------ + MSS Volume Group 1 Name (MVSGP) N/A + MSS Volume Group 2 Name (MVSGP2) N/A
358 Classic Interface User's Guide
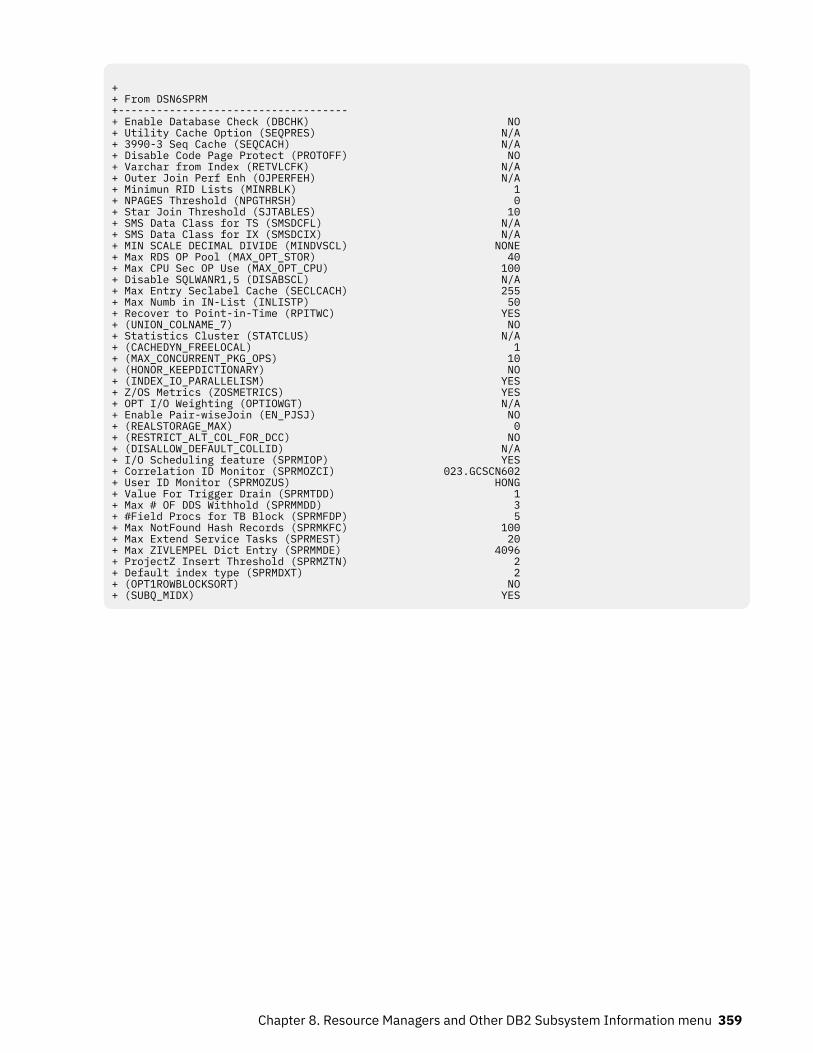
+ + From DSN6SPRM +------------------------------------ + Enable Database Check (DBCHK) NO + Utility Cache Option (SEQPRES) N/A + 3990-3 Seq Cache (SEQCACH) N/A + Disable Code Page Protect (PROTOFF) NO + Varchar from Index (RETVLCFK) N/A + Outer Join Perf Enh (OJPERFEH) N/A + Minimun RID Lists (MINRBLK) 1 + NPAGES Threshold (NPGTHRSH) 0 + Star Join Threshold (SJTABLES) 10 + SMS Data Class for TS (SMSDCFL) N/A + SMS Data Class for IX (SMSDCIX) N/A + MIN SCALE DECIMAL DIVIDE (MINDVSCL) NONE + Max RDS OP Pool (MAX_OPT_STOR) 40 + Max CPU Sec OP Use (MAX_OPT_CPU) 100 + Disable SQLWANR1,5 (DISABSCL) N/A + Max Entry Seclabel Cache (SECLCACH) 255 + Max Numb in IN-List (INLISTP) 50 + Recover to Point-in-Time (RPITWC) YES + (UNION_COLNAME_7) NO + Statistics Cluster (STATCLUS) N/A + (CACHEDYN_FREELOCAL) 1 + (MAX_CONCURRENT_PKG_OPS) 10 + (HONOR_KEEPDICTIONARY) NO + (INDEX_IO_PARALLELISM) YES + Z/OS Metrics (ZOSMETRICS) YES + OPT I/O Weighting (OPTIOWGT) N/A + Enable Pair-wiseJoin (EN_PJSJ) NO + (REALSTORAGE_MAX) 0 + (RESTRICT_ALT_COL_FOR_DCC) NO + (DISALLOW_DEFAULT_COLLID) N/A + I/O Scheduling feature (SPRMIOP) YES + Correlation ID Monitor (SPRMOZCI) 023.GCSCN602 + User ID Monitor (SPRMOZUS) HONG + Value For Trigger Drain (SPRMTDD) 1 + Max # OF DDS Withhold (SPRMMDD) 3 + #Field Procs for TB Block (SPRMFDP) 5 + Max NotFound Hash Records (SPRMKFC) 100 + Max Extend Service Tasks (SPRMEST) 20 + Max ZIVLEMPEL Dict Entry (SPRMMDE) 4096 + ProjectZ Insert Threshold (SPRMZTN) 2 + Default index type (SPRMDXT) 2 + (OPT1ROWBLOCKSORT) NO + (SUBQ_MIDX) YES
Chapter 8. Resource Managers and Other DB2 Subsystem Information menu 359
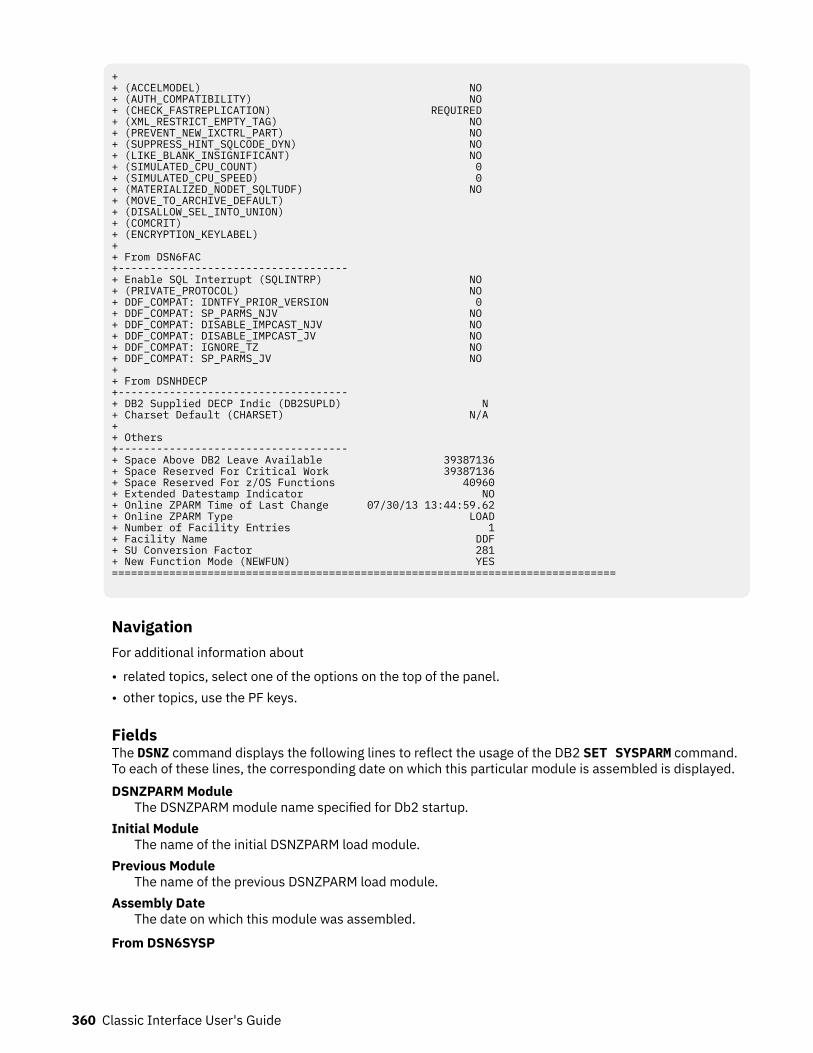
+ + (ACCELMODEL) NO + (AUTH_COMPATIBILITY) NO + (CHECK_FASTREPLICATION) REQUIRED + (XML_RESTRICT_EMPTY_TAG) NO + (PREVENT_NEW_IXCTRL_PART) NO + (SUPPRESS_HINT_SQLCODE_DYN) NO + (LIKE_BLANK_INSIGNIFICANT) NO + (SIMULATED_CPU_COUNT) 0 + (SIMULATED_CPU_SPEED) 0 + (MATERIALIZED_NODET_SQLTUDF) NO + (MOVE_TO_ARCHIVE_DEFAULT)+ (DISALLOW_SEL_INTO_UNION)+ (COMCRIT)+ (ENCRYPTION_KEYLABEL)++ From DSN6FAC +------------------------------------ + Enable SQL Interrupt (SQLINTRP) NO+ (PRIVATE_PROTOCOL) NO+ DDF_COMPAT: IDNTFY_PRIOR_VERSION 0+ DDF_COMPAT: SP_PARMS_NJV NO+ DDF_COMPAT: DISABLE_IMPCAST_NJV NO+ DDF_COMPAT: DISABLE_IMPCAST_JV NO+ DDF_COMPAT: IGNORE_TZ NO+ DDF_COMPAT: SP_PARMS_JV NO + + From DSNHDECP +------------------------------------ + DB2 Supplied DECP Indic (DB2SUPLD) N + Charset Default (CHARSET) N/A + + Others +------------------------------------ + Space Above DB2 Leave Available 39387136 + Space Reserved For Critical Work 39387136 + Space Reserved For z/OS Functions 40960 + Extended Datestamp Indicator NO + Online ZPARM Time of Last Change 07/30/13 13:44:59.62 + Online ZPARM Type LOAD + Number of Facility Entries 1 + Facility Name DDF + SU Conversion Factor 281 + New Function Mode (NEWFUN) YES ===============================================================================
NavigationFor additional information about
• related topics, select one of the options on the top of the panel.• other topics, use the PF keys.
FieldsThe DSNZ command displays the following lines to reflect the usage of the DB2 SET SYSPARM command.To each of these lines, the corresponding date on which this particular module is assembled is displayed.DSNZPARM Module
The DSNZPARM module name specified for Db2 startup.Initial Module
The name of the initial DSNZPARM load module.Previous Module
The name of the previous DSNZPARM load module.Assembly Date
The date on which this module was assembled.
From DSN6SYSP
360 Classic Interface User's Guide
Size of Local Trace Table (TRACLOC)Determines a multiple of 4K that determines the size of the local trace tables.
Parallel Task AcctRollupIndicates whether to roll up the accounting trace of the query parallel tasks into the accounting traceof the originating task. Valid values:Yes
The originating task cuts an additional accounting trace record with all the roll-up values fromparallel tasks.This is the default value.
NoEach parallel task produces its own accounting trace.
Measured Usage PricingIndicates whether Db2 is tracking for measured usage pricing.Default value: NO
Db2 OTC License Term (OTC_LICENSE)Determines whether this Db2 subsystem or data sharing member operates under an OTC license. Theterms of the OTC license are accepted. Valid values:Not used
Indicates that an OTC license is not in effect on this Db2.This is the default value.
Terms acceptedIndicates that an OTC license is in effect on the Db2 and that the owner accepts the terms of thatlicense. To view the terms, see the member DSNTIPO1 of the SDSNSPFP target library for thisversion of Db2.
Trackmod Implicit TSDetermines whether Db2 tracks modifications to the pages of implicitly created table spaces.This setting pertains only to the base table spaces. It is not used for implicitly created LOB or XMLtable spaces. Valid values:Yes
Implicit table spaces are created. Db2 tracks changed pages in the space map pages to improvethe performance of incremental image copy.
NoDb2 does not track changed pages in the space map pages. To determine whether a page ischanged, the LRSN value is used.
Max DSSIZE Implicit TSDetermines the maximum DSSIZE in gigabytes that can be used by Db2 for creating each partition ofan implicitly created base table space.
From DSN6LOGPOffload Option
Determines whether online initiation of the offload process is used. Valid values: YES or NO.Default: YES
(CDDS_MODE) - (QWP2CPSY, QWP2CSRC)
The CDDS_MODE subsystem parameter specifies how a member of a Db2 data sharing groupparticipates in a GDPS Continuous Availability with zero data loss (GDPS Continuous Availability withzero data loss) environment.
ZPARM NAME: DSN6LOGP.CDDS_MODE
Valid values are:
Chapter 8. Resource Managers and Other DB2 Subsystem Information menu 361
NONE(Default) The Db2 subsystem or data sharing group does not participate in a GDPS ContinuousAvailability with zero data loss environment. The subsystem or data sharing group membersupports only the replication of its own log. The data set that the CDDS_PREFIX parameterspecifies can be defined locally but is not used.
SOURCEThe data sharing group that contains the member that is being installed is the source group in animplementation of the GDPS Continuous Availability with zero data loss solution. The source datasharing group supports replication of the logs and log data sets of its members by another datasharing group, which is the proxy group in the implementation of the GDPS Continuous Availabilitywith zero data loss solution. The proxy group performs replication of tables in the source datasharing group that are enabled for changed data capture. The source group must contain a key-sequenced data set with the name that is specified by the CDDS_PREFIX subsystem parameter.That data set is the compression dictionary data set (CDDS). When IFI READS calls are made tothe proxy group to retrieve compressed log records, Db2 uses the CDDS to decompress the logrecords. The location of the source group must be defined in the communications database of theproxy group.
PROXYThe data sharing group that contains the member that is being installed supports only replicationof log data sets for the source data sharing group in an implementation of the GDPS ContinuousAvailability with zero data loss solution. The location of the proxy group must be defined in thecommunications database of the source group.
Db2 11 and later.(CDDS_PREFIX) - (QWP2CDDS)
The CDDS_PREFIX subsystem parameter specifies the prefix for the name of the data set thatcontains dictionaries that Db2 uses to decompress compressed log records when a proxy data sharinggroup in an implementation of the GDPS Continuous Availability with zero data loss (GDPS ContinuousAvailability with zero data loss) solution captures the log records on behalf of a source data sharinggroup. The data set is known as the compression dictionary data set (CDDS).
The data set name is formed by appending the string '.CDDS' to the value of CDDS_PREFIX.
Valid values: 1 - 39 bytes
Default: DSNCAT
ZPARM NAME: DSN6LOGP.CDDS_PREFIX
Db2 11 and later.
From DSN6ARVPMSS Volume Group 1 Name
The name of the mass storage system volume group 1. Db2 10 only.MSS Volume Group 2 Name
The name of the mass storage system volume group 2. Db2 10 only.
From DSN6PRMEnable Database Check
Determines whether additional internal checking is performed to determine whether the databasemanager is producing defective data or index records. Internal checking increases the cost of adatabase request, however, it provides early detection of system errors that might produce incorrectdata. Valid values: YES or NO.Default: NO.
Utility Cache OptionDetermines whether the sequential prestage function of 3990 sequential caching for utilities is used.Db2 10 only.
362 Classic Interface User's Guide
3990-3 Seq CacheDetermines whether sequential mode to read cached data from a 3990 controller is used.Db2 10 only.
Disable Code Page ProtectDetermines whether Code Page Protect is used.
Varchar from IndexDetermines whether Db2 can return data from an index key for a varying length column. Db2 10 only.
Outer Join Perf EnhDetermines whether outer join performance enhancements are used. Db2 10 only.
Minimum RID ListsThe minimum number of RID blocks in the Db2 subsystem.
NPAGES ThresholdThe NPAGES threshold for optimizer.
Star Join ThresholdDetermines the minimum number of tables in a query block before Db2 considers the query block forstar join. Star join must be enabled before Db2 can use this system parameter. Valid values:0
Star join is enabled for a query block with 10 or more tables.This is the default setting.
1,2,3Star joins is enabled.
4-225Star join is enabled if the query block contains a minimum of this number of tables.
226-32767Star join is not enabled.
SMS Data Class for TSThe SMS data class name that is used by Db2 when a cluster for a table space is defined. If this valueis blank, a data class name is not used. Db2 10 only.
SMS Data Class for IXThe SMS data class name that is used by Db2 when a cluster for an index is defined. If this value isblank, a data class name is not used. Db2 10 only.
MIN SCALE DECIMAL DIVIDEThe minimum scale for the result of a decimal division.Valid values: None (default), 3, or 6. If 3 or 6 is specified, this parameter overrides the DECDIV3parameter.
Max RDS OP Pool (QWP4MXOS)The maximum amount of RDS op pool storage in MB to be used by the Db2 Optimizer. Valid values: 0to 100. If 0 is specified, Db2 uses the maximum of 100. Default: 20.
Max CPU Sec OP Use (QWP4MXOC)The maximum amount of CPU time in seconds to be used by the Db2 Optimizer. Valid values: 0 to 500.If 0 is specified, Db2 uses the maximum of 500. Default: 100.
Disable SQLWANR1,5 (QWP4DSCM)Do not set SQLWARN1, SQLWARN4 and SQLWARN5 after the scrollable cursor has been successfullyopened. Db2 10 only.
Max Entry Seclabel Cache (QWP4SCLC)Maximum number of entries in the SECLABEL cache. Used to avoid RACROUTE REQUEST=DIRAUTHREQUESTS.
Max Numb in IN-List (QWP4INLP)The maximum number of elements in an IN-List for an in-list predicate to be optimized. If the IN-Listcontains this number or fewer elements, it is optimized in the following ways:
Chapter 8. Resource Managers and Other DB2 Subsystem Information menu 363
• The IN-List predicated is pushed down into a materialized view or table expression• A correlated IN-List predicate in a subquery that is generated by transitive closure can be moved up
to the parent query block.
Valid values: 0 to 5000. 0 means that no optimization occurs. The default is 50.Recover to Point-in-Time (QWP4RPTC)
Recover to Point-In-Time with consistency.(UNION_COLNAME_7) (QWP4UNM7)
The SQLNAME field in the SQLDA after a query describe in which the result table is the result of aunion, is the name of the column from the first subquery of the union.
Statistics ClusterDefines whether enhanced clustering is used. Db2 10 only.
(CACHEDYN_FREELOCAL)Determines whether statements from the dynamic statement cache can be freed by Db2 to relievestorage constraints below the 2GB bar.This parameter applies only for packages or plans that are bound with KEEPDYNAMIC(YES).Valid values:0
Statements cannot be freed from the cache.1
Statements can be freed from the cache.Db2 10 and Db2 11 only.
MAX_CONCURRENT_PKG_OPSThe maximum number of package requests that can be processed simultaneously.
(HONOR_KEEPDICTIONARY) (QWP4HKPD)Valid values: YES, NO.
(INDEX_IO_PARALLELISM)Determines whether index I/O parallelism is enabled. Db2 10 and Db2 11 only.
Z/OS MetricsDetermines whether the gathering of Z/OS metrix through the RMF interface is enabled.
OPT I/O WeightingDetermines whether the optimizer I/O weighting is enabled. Db2 10 only.
Enable Pair-wise JoinDetermines whether pair-wise join is enabled.
(REALSTORAGE_MAX) (QWP4RSMX)Maximum amount of real plus auxiliary storage that can be used.
(RESTRICT_ALT_COL_FOR_DCC) (QWP4RACD)RESTRICT_ALT_COL_FOR_DCC.
(DISALLOW_DEFAULT_COLLID) (QWP4DDCI)Disallow default collection ID. Db2 10 only.
I/O Scheduling featureDetermines whether the I/O scheduling feature is activated.
Correlation ID Monitor (QWP4OZCI)Online system parameter correlation ID monitor.
User ID MonitorOnline system parameter user ID monitor.If QWP4OZUS_OFF is not 0, this value is truncated. If QWP4OZUS is truncated, this is the offset fromthe beginning of QWP4 TO QWP4OZUS_LEN.
Value for Trigger Drain (QWP4TDDN)Value for trigger drain.
364 Classic Interface User's Guide
Max # of DDS withhold (QWP4MDDN)Maximum number of DDS with HOLD.
Field Procs for TB BlockThe number of field procs for Describe Table Block.
Max NotFound Hash Records (QWP4KNFC)Maximum number of "Not Found" hash records.
Max Extend Service Tasks (QWPEST)Maximum extend service tasks.
Max ZIVLEMPEL Dict Entry (QWP4MDE)Maximum number of ZIVLEMPEL dictionary entries.
ProjectZ Insert Threshold (QWP4ZTN)Project Z insertion threshold.
Default index type (S) (QWP4DXTP)Default index type (type 1 or type 2).
(OPT1ROWBLOCKSORT)Determines for queries that use the option Optimize For 1 Row whether all access paths that requiresorting are blocked if there is at least one access path that avoids sorting.Valid values:Enable
If the option Optimize For 1 Row is used with a query, the option Sort Access Paths is disabled if aNo-Sort choice is available.
DisableIt is unlikely that Sort Access Paths is chosen by Db2. However, a Sort Access Path might win.
(SUBQ_MIDX)Determines whether Multiple Index Access for queries that have subquery predicates is enabled.
(ACCELMODEL) (QWP4ACMO)Specifies whether to enable the modeling of query workloads for evaluating the potential savings forboth accumulated elapsed time and processor time if the plan is run on an accelerator server.Only queries that Db2 deems eligible to run on an accelerator server are included in the accelerator-related fields of accounting trace IFCID 3. Valid values are:NO (default)
Modeling is not done.YES
Modeling is done. This value applies only when the following requirements are also met:
• The value of the QUERY ACCELRATION subsystem parameter value is NONE, ENABLE, ENABLEWITH FAILBACK or ELIGIBLE
• The CURRENT GET_ACCEL_ARCHIVE special register value is NO.• The GET_ACCEL_ARCHIVE subsystem parameter value is NO If other values are specified, Db2
tries to accelerate queries instead of doing accelerator modeling.
(AUTH_COMPATIBILITY) (QWP4AUTCSU)The AUTH_COMPATIBILITY parameter specifies whether the default authorization check is overriddenwhen users request to use the UNLOAD utility. Valid values:NO for blank (default)
Indicates that AUTH_COMPATIBILITY has no effect and that there is no authorization checkoverride.
YES for SELECT_FOR_UNLOADWhen this value is specified, the UNLOAD utility checks if the user has the SELECT privilege on thetarget table. When this value is not specified, the UNLOAD utility checks if the user has theUNLOAD privilege on the target table.
Chapter 8. Resource Managers and Other DB2 Subsystem Information menu 365
Db2 12 and later.(CHECK_FASTREPLICATION) (QWP4CFRP)
Specify the type of replication to be used by DSSCOPY when invoked by the Db2 check utilities to copyobjects to shadow data sets. The check utilities use DSSCOPY to copy Db2 objects to shadow datasets for processing and can stipulate fast replication as either preferred or required. Valid values are:REQUIRED (default)
The check utilities force DSSCOPY to use fast replication ensuring that object copies occur asquickly as possible. This reduces the opportunity for resource contention and unavailability. Thisoption causes the check to fail if flash copy cannot be used.
PREFERREDThe check utilities direct DSSCOPY to use fast replication only if flash copy support is available.
NONEXML_RESTRICT_EMPTY_TAG (QWP4NOET)
Specifies whether Db2 always serializes an empty XML element using a start-element tag followed byan end-element tag.Valid values are NO and YES. NO is the default.A value of NO means that Db2 serializes an empty XML element in either of the following ways:
• As a start-element tag followed by an end-element tag. For example
<emptyElement></emptyElement>
• As an empty-element tag. For example:
<emptyElement/>
A value of YES means that Db2 always serializes an empty XML element as a start-element tagfollowed by an end-element tag. For example:
<emptyElement></emptyElement>
Db2 12 and later.(PREVENT_NEW_IXCTRL_PART) (QWP4PCIP)
The PREVENT_NEW_IXCTRL_PART subsystem parameter determines whether Db2 disallows thecreation of new index-controlled partitioned tables. This subsystem parameter ensures that newpartitioned tables use table-controlled partitioning, which is the preferred partitioning method fornon-universal tablespaces. Valid values:NO
Specifies that new index-controlled partitioned tables can be created.YES
Specifies that new partitioned table spaces must use table-controlled partitioning. A CREATEINDEX statement must not attempt to create an index-controlled partitioned table.
(SUPPRESS_HINT_SQLCODE_DYN) (QWP4SHDE)Specifies whether Db2 suppresses SQLCODE +394 and SQLCODE +395 when specified access pathsare applied for dynamic SQL statements.NO (default)
Specifies that Db2 issues SQLCODEs +394 and +395 for statement-level access paths andPLAN_TABLE access paths.
STMTSpecifies that Db2 suppresses SQLCODEs +394 and +395 for statement-level access paths fordynamic SQL statement.
366 Classic Interface User's Guide
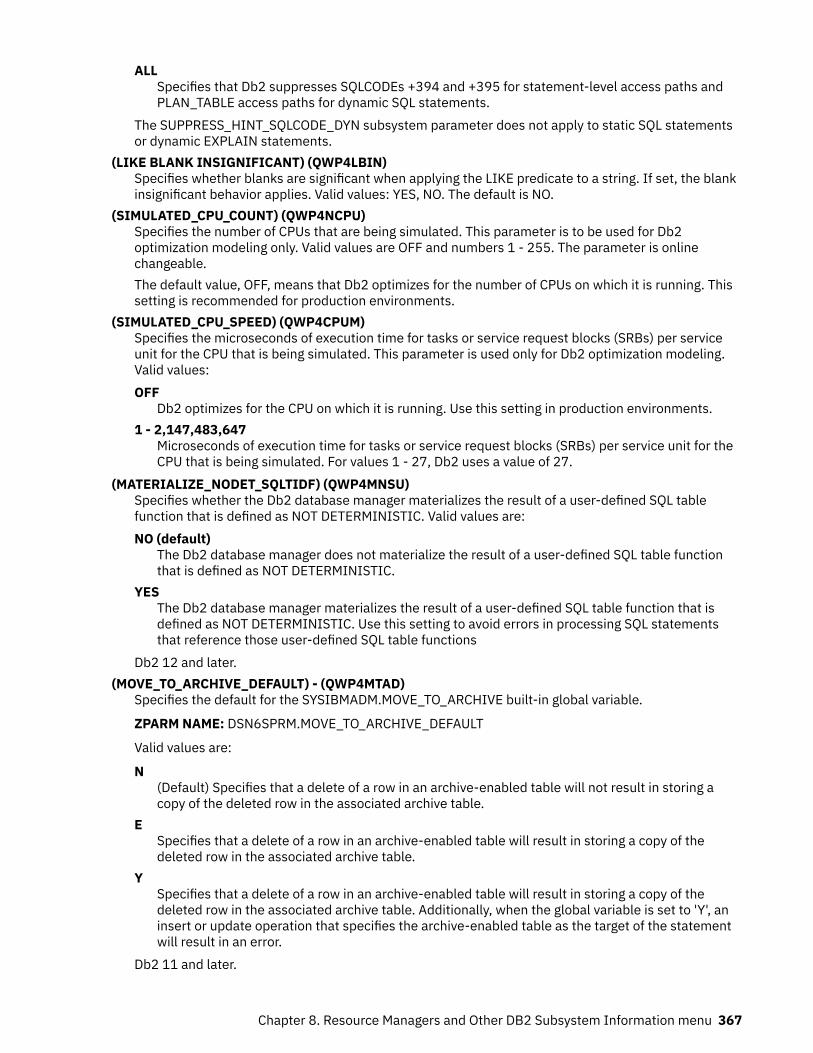
ALLSpecifies that Db2 suppresses SQLCODEs +394 and +395 for statement-level access paths andPLAN_TABLE access paths for dynamic SQL statements.
The SUPPRESS_HINT_SQLCODE_DYN subsystem parameter does not apply to static SQL statementsor dynamic EXPLAIN statements.
(LIKE BLANK INSIGNIFICANT) (QWP4LBIN)Specifies whether blanks are significant when applying the LIKE predicate to a string. If set, the blankinsignificant behavior applies. Valid values: YES, NO. The default is NO.
(SIMULATED_CPU_COUNT) (QWP4NCPU)Specifies the number of CPUs that are being simulated. This parameter is to be used for Db2optimization modeling only. Valid values are OFF and numbers 1 - 255. The parameter is onlinechangeable.The default value, OFF, means that Db2 optimizes for the number of CPUs on which it is running. Thissetting is recommended for production environments.
(SIMULATED_CPU_SPEED) (QWP4CPUM)Specifies the microseconds of execution time for tasks or service request blocks (SRBs) per serviceunit for the CPU that is being simulated. This parameter is used only for Db2 optimization modeling.Valid values:OFF
Db2 optimizes for the CPU on which it is running. Use this setting in production environments.1 - 2,147,483,647
Microseconds of execution time for tasks or service request blocks (SRBs) per service unit for theCPU that is being simulated. For values 1 - 27, Db2 uses a value of 27.
(MATERIALIZE_NODET_SQLTIDF) (QWP4MNSU)Specifies whether the Db2 database manager materializes the result of a user-defined SQL tablefunction that is defined as NOT DETERMINISTIC. Valid values are:NO (default)
The Db2 database manager does not materialize the result of a user-defined SQL table functionthat is defined as NOT DETERMINISTIC.
YESThe Db2 database manager materializes the result of a user-defined SQL table function that isdefined as NOT DETERMINISTIC. Use this setting to avoid errors in processing SQL statementsthat reference those user-defined SQL table functions
Db2 12 and later.(MOVE_TO_ARCHIVE_DEFAULT) - (QWP4MTAD)
Specifies the default for the SYSIBMADM.MOVE_TO_ARCHIVE built-in global variable.
ZPARM NAME: DSN6SPRM.MOVE_TO_ARCHIVE_DEFAULT
Valid values are:
N(Default) Specifies that a delete of a row in an archive-enabled table will not result in storing acopy of the deleted row in the associated archive table.
ESpecifies that a delete of a row in an archive-enabled table will result in storing a copy of thedeleted row in the associated archive table.
YSpecifies that a delete of a row in an archive-enabled table will result in storing a copy of thedeleted row in the associated archive table. Additionally, when the global variable is set to 'Y', aninsert or update operation that specifies the archive-enabled table as the target of the statementwill result in an error.
Db2 11 and later.
Chapter 8. Resource Managers and Other DB2 Subsystem Information menu 367
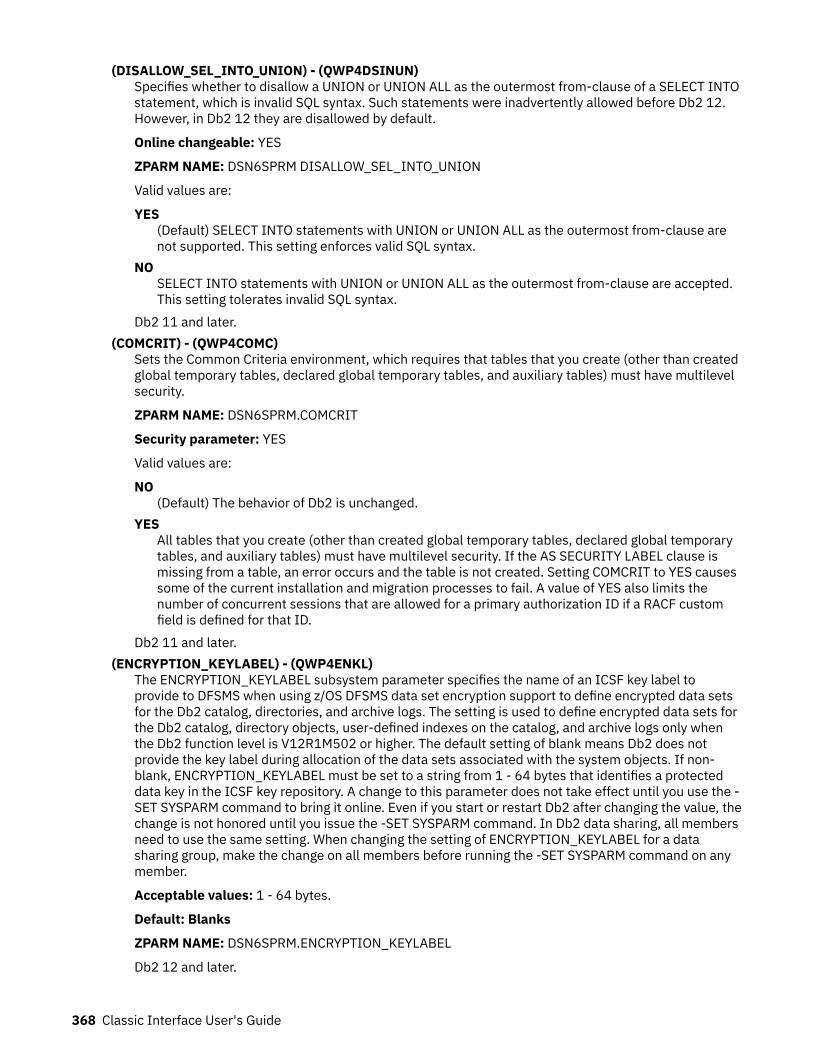
(DISALLOW_SEL_INTO_UNION) - (QWP4DSINUN)Specifies whether to disallow a UNION or UNION ALL as the outermost from-clause of a SELECT INTOstatement, which is invalid SQL syntax. Such statements were inadvertently allowed before Db2 12.However, in Db2 12 they are disallowed by default.
Online changeable: YES
ZPARM NAME: DSN6SPRM DISALLOW_SEL_INTO_UNION
Valid values are:
YES(Default) SELECT INTO statements with UNION or UNION ALL as the outermost from-clause arenot supported. This setting enforces valid SQL syntax.
NOSELECT INTO statements with UNION or UNION ALL as the outermost from-clause are accepted.This setting tolerates invalid SQL syntax.
Db2 11 and later.(COMCRIT) - (QWP4COMC)
Sets the Common Criteria environment, which requires that tables that you create (other than createdglobal temporary tables, declared global temporary tables, and auxiliary tables) must have multilevelsecurity.
ZPARM NAME: DSN6SPRM.COMCRIT
Security parameter: YES
Valid values are:
NO(Default) The behavior of Db2 is unchanged.
YESAll tables that you create (other than created global temporary tables, declared global temporarytables, and auxiliary tables) must have multilevel security. If the AS SECURITY LABEL clause ismissing from a table, an error occurs and the table is not created. Setting COMCRIT to YES causessome of the current installation and migration processes to fail. A value of YES also limits thenumber of concurrent sessions that are allowed for a primary authorization ID if a RACF customfield is defined for that ID.
Db2 11 and later.(ENCRYPTION_KEYLABEL) - (QWP4ENKL)
The ENCRYPTION_KEYLABEL subsystem parameter specifies the name of an ICSF key label toprovide to DFSMS when using z/OS DFSMS data set encryption support to define encrypted data setsfor the Db2 catalog, directories, and archive logs. The setting is used to define encrypted data sets forthe Db2 catalog, directory objects, user-defined indexes on the catalog, and archive logs only whenthe Db2 function level is V12R1M502 or higher. The default setting of blank means Db2 does notprovide the key label during allocation of the data sets associated with the system objects. If non-blank, ENCRYPTION_KEYLABEL must be set to a string from 1 - 64 bytes that identifies a protecteddata key in the ICSF key repository. A change to this parameter does not take effect until you use the -SET SYSPARM command to bring it online. Even if you start or restart Db2 after changing the value, thechange is not honored until you issue the -SET SYSPARM command. In Db2 data sharing, all membersneed to use the same setting. When changing the setting of ENCRYPTION_KEYLABEL for a datasharing group, make the change on all members before running the -SET SYSPARM command on anymember.
Acceptable values: 1 - 64 bytes.
Default: Blanks
ZPARM NAME: DSN6SPRM.ENCRYPTION_KEYLABEL
Db2 12 and later.
368 Classic Interface User's Guide
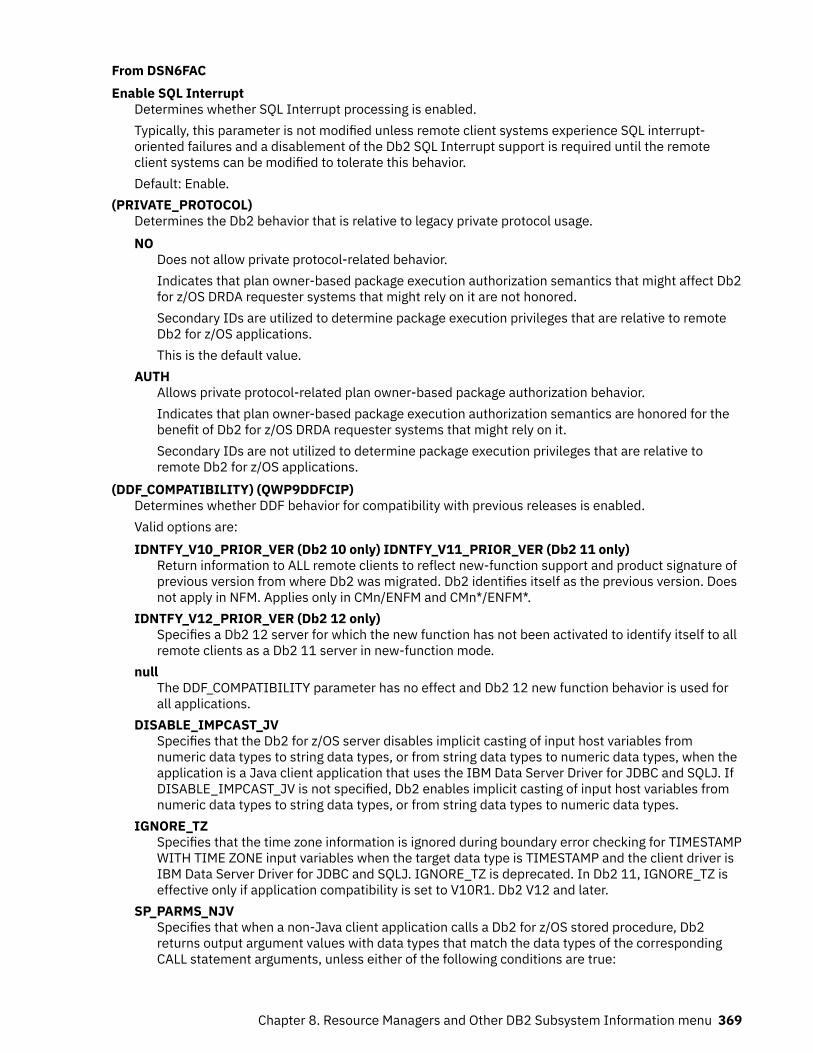
From DSN6FACEnable SQL Interrupt
Determines whether SQL Interrupt processing is enabled.Typically, this parameter is not modified unless remote client systems experience SQL interrupt-oriented failures and a disablement of the Db2 SQL Interrupt support is required until the remoteclient systems can be modified to tolerate this behavior.Default: Enable.
(PRIVATE_PROTOCOL)Determines the Db2 behavior that is relative to legacy private protocol usage.NO
Does not allow private protocol-related behavior.Indicates that plan owner-based package execution authorization semantics that might affect Db2for z/OS DRDA requester systems that might rely on it are not honored.Secondary IDs are utilized to determine package execution privileges that are relative to remoteDb2 for z/OS applications.This is the default value.
AUTHAllows private protocol-related plan owner-based package authorization behavior.Indicates that plan owner-based package execution authorization semantics are honored for thebenefit of Db2 for z/OS DRDA requester systems that might rely on it.Secondary IDs are not utilized to determine package execution privileges that are relative toremote Db2 for z/OS applications.
(DDF_COMPATIBILITY) (QWP9DDFCIP)Determines whether DDF behavior for compatibility with previous releases is enabled.Valid options are:IDNTFY_V10_PRIOR_VER (Db2 10 only) IDNTFY_V11_PRIOR_VER (Db2 11 only)
Return information to ALL remote clients to reflect new-function support and product signature ofprevious version from where Db2 was migrated. Db2 identifies itself as the previous version. Doesnot apply in NFM. Applies only in CMn/ENFM and CMn*/ENFM*.
IDNTFY_V12_PRIOR_VER (Db2 12 only)Specifies a Db2 12 server for which the new function has not been activated to identify itself to allremote clients as a Db2 11 server in new-function mode.
nullThe DDF_COMPATIBILITY parameter has no effect and Db2 12 new function behavior is used forall applications.
DISABLE_IMPCAST_JVSpecifies that the Db2 for z/OS server disables implicit casting of input host variables fromnumeric data types to string data types, or from string data types to numeric data types, when theapplication is a Java client application that uses the IBM Data Server Driver for JDBC and SQLJ. IfDISABLE_IMPCAST_JV is not specified, Db2 enables implicit casting of input host variables fromnumeric data types to string data types, or from string data types to numeric data types.
IGNORE_TZSpecifies that the time zone information is ignored during boundary error checking for TIMESTAMPWITH TIME ZONE input variables when the target data type is TIMESTAMP and the client driver isIBM Data Server Driver for JDBC and SQLJ. IGNORE_TZ is deprecated. In Db2 11, IGNORE_TZ iseffective only if application compatibility is set to V10R1. Db2 V12 and later.
SP_PARMS_NJVSpecifies that when a non-Java client application calls a Db2 for z/OS stored procedure, Db2returns output argument values with data types that match the data types of the correspondingCALL statement arguments, unless either of the following conditions are true:
Chapter 8. Resource Managers and Other DB2 Subsystem Information menu 369
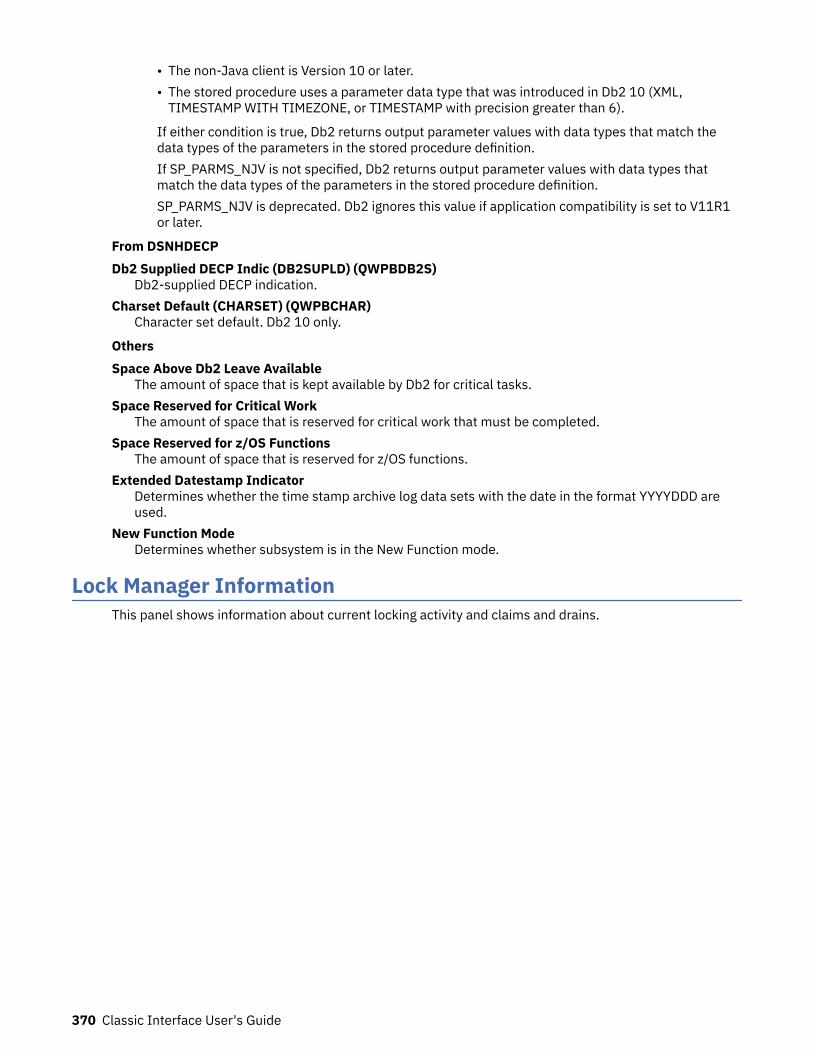
• The non-Java client is Version 10 or later.• The stored procedure uses a parameter data type that was introduced in Db2 10 (XML,
TIMESTAMP WITH TIMEZONE, or TIMESTAMP with precision greater than 6).
If either condition is true, Db2 returns output parameter values with data types that match thedata types of the parameters in the stored procedure definition.If SP_PARMS_NJV is not specified, Db2 returns output parameter values with data types thatmatch the data types of the parameters in the stored procedure definition.SP_PARMS_NJV is deprecated. Db2 ignores this value if application compatibility is set to V11R1or later.
From DSNHDECPDb2 Supplied DECP Indic (DB2SUPLD) (QWPBDB2S)
Db2-supplied DECP indication.Charset Default (CHARSET) (QWPBCHAR)
Character set default. Db2 10 only.
OthersSpace Above Db2 Leave Available
The amount of space that is kept available by Db2 for critical tasks.Space Reserved for Critical Work
The amount of space that is reserved for critical work that must be completed.Space Reserved for z/OS Functions
The amount of space that is reserved for z/OS functions.Extended Datestamp Indicator
Determines whether the time stamp archive log data sets with the date in the format YYYYDDD areused.
New Function ModeDetermines whether subsystem is in the New Function mode.
Lock Manager InformationThis panel shows information about current locking activity and claims and drains.
370 Classic Interface User's Guide
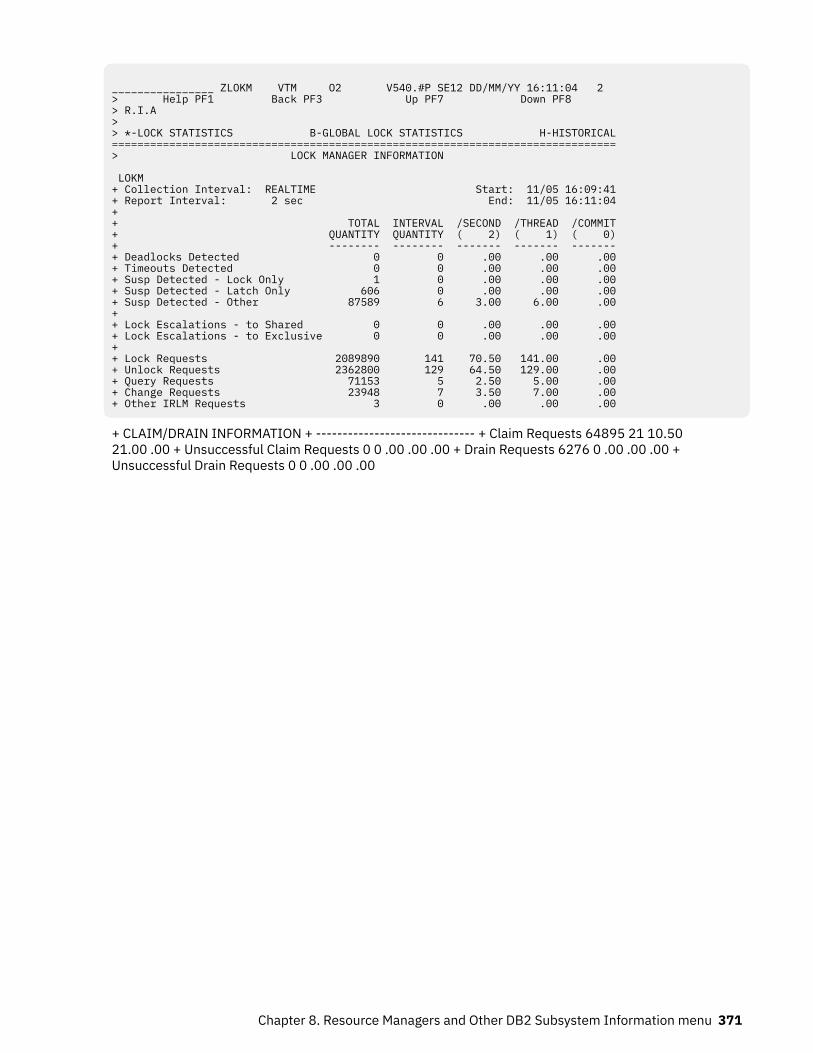
________________ ZLOKM VTM O2 V540.#P SE12 DD/MM/YY 16:11:04 2 > Help PF1 Back PF3 Up PF7 Down PF8 > R.I.A > > *-LOCK STATISTICS B-GLOBAL LOCK STATISTICS H-HISTORICAL===============================================================================> LOCK MANAGER INFORMATION LOKM + Collection Interval: REALTIME Start: 11/05 16:09:41+ Report Interval: 2 sec End: 11/05 16:11:04+ + TOTAL INTERVAL /SECOND /THREAD /COMMIT+ QUANTITY QUANTITY ( 2) ( 1) ( 0)+ -------- -------- ------- ------- -------+ Deadlocks Detected 0 0 .00 .00 .00+ Timeouts Detected 0 0 .00 .00 .00+ Susp Detected - Lock Only 1 0 .00 .00 .00+ Susp Detected - Latch Only 606 0 .00 .00 .00+ Susp Detected - Other 87589 6 3.00 6.00 .00+ + Lock Escalations - to Shared 0 0 .00 .00 .00+ Lock Escalations - to Exclusive 0 0 .00 .00 .00+ + Lock Requests 2089890 141 70.50 141.00 .00+ Unlock Requests 2362800 129 64.50 129.00 .00+ Query Requests 71153 5 2.50 5.00 .00+ Change Requests 23948 7 3.50 7.00 .00+ Other IRLM Requests 3 0 .00 .00 .00
+ CLAIM/DRAIN INFORMATION + ------------------------------ + Claim Requests 64895 21 10.5021.00 .00 + Unsuccessful Claim Requests 0 0 .00 .00 .00 + Drain Requests 6276 0 .00 .00 .00 +Unsuccessful Drain Requests 0 0 .00 .00 .00
Chapter 8. Resource Managers and Other DB2 Subsystem Information menu 371
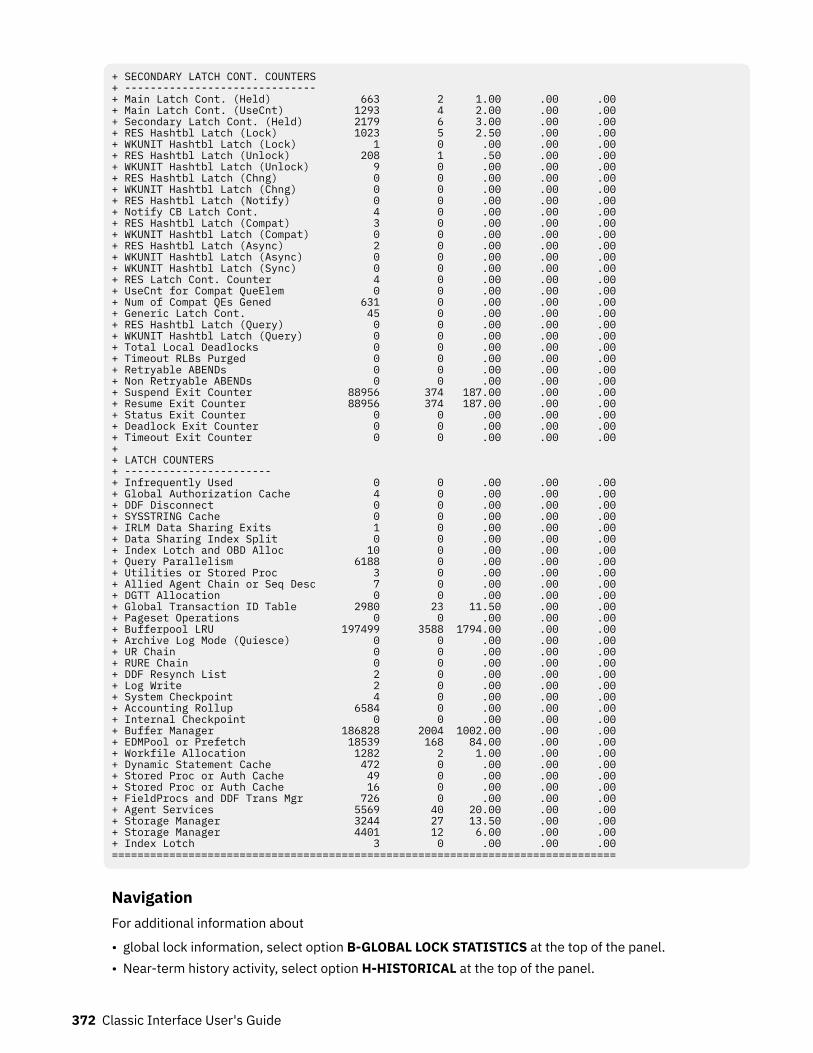
+ SECONDARY LATCH CONT. COUNTERS+ ------------------------------+ Main Latch Cont. (Held) 663 2 1.00 .00 .00 + Main Latch Cont. (UseCnt) 1293 4 2.00 .00 .00 + Secondary Latch Cont. (Held) 2179 6 3.00 .00 .00 + RES Hashtbl Latch (Lock) 1023 5 2.50 .00 .00 + WKUNIT Hashtbl Latch (Lock) 1 0 .00 .00 .00 + RES Hashtbl Latch (Unlock) 208 1 .50 .00 .00 + WKUNIT Hashtbl Latch (Unlock) 9 0 .00 .00 .00 + RES Hashtbl Latch (Chng) 0 0 .00 .00 .00 + WKUNIT Hashtbl Latch (Chng) 0 0 .00 .00 .00 + RES Hashtbl Latch (Notify) 0 0 .00 .00 .00 + Notify CB Latch Cont. 4 0 .00 .00 .00 + RES Hashtbl Latch (Compat) 3 0 .00 .00 .00 + WKUNIT Hashtbl Latch (Compat) 0 0 .00 .00 .00 + RES Hashtbl Latch (Async) 2 0 .00 .00 .00 + WKUNIT Hashtbl Latch (Async) 0 0 .00 .00 .00 + WKUNIT Hashtbl Latch (Sync) 0 0 .00 .00 .00 + RES Latch Cont. Counter 4 0 .00 .00 .00 + UseCnt for Compat QueElem 0 0 .00 .00 .00+ Num of Compat QEs Gened 631 0 .00 .00 .00+ Generic Latch Cont. 45 0 .00 .00 .00+ RES Hashtbl Latch (Query) 0 0 .00 .00 .00+ WKUNIT Hashtbl Latch (Query) 0 0 .00 .00 .00+ Total Local Deadlocks 0 0 .00 .00 .00+ Timeout RLBs Purged 0 0 .00 .00 .00+ Retryable ABENDs 0 0 .00 .00 .00+ Non Retryable ABENDs 0 0 .00 .00 .00+ Suspend Exit Counter 88956 374 187.00 .00 .00+ Resume Exit Counter 88956 374 187.00 .00 .00+ Status Exit Counter 0 0 .00 .00 .00+ Deadlock Exit Counter 0 0 .00 .00 .00+ Timeout Exit Counter 0 0 .00 .00 .00++ LATCH COUNTERS+ -----------------------+ Infrequently Used 0 0 .00 .00 .00 + Global Authorization Cache 4 0 .00 .00 .00 + DDF Disconnect 0 0 .00 .00 .00 + SYSSTRING Cache 0 0 .00 .00 .00 + IRLM Data Sharing Exits 1 0 .00 .00 .00 + Data Sharing Index Split 0 0 .00 .00 .00 + Index Lotch and OBD Alloc 10 0 .00 .00 .00 + Query Parallelism 6188 0 .00 .00 .00 + Utilities or Stored Proc 3 0 .00 .00 .00 + Allied Agent Chain or Seq Desc 7 0 .00 .00 .00 + DGTT Allocation 0 0 .00 .00 .00 + Global Transaction ID Table 2980 23 11.50 .00 .00 + Pageset Operations 0 0 .00 .00 .00 + Bufferpool LRU 197499 3588 1794.00 .00 .00 + Archive Log Mode (Quiesce) 0 0 .00 .00 .00 + UR Chain 0 0 .00 .00 .00 + RURE Chain 0 0 .00 .00 .00 + DDF Resynch List 2 0 .00 .00 .00 + Log Write 2 0 .00 .00 .00 + System Checkpoint 4 0 .00 .00 .00+ Accounting Rollup 6584 0 .00 .00 .00+ Internal Checkpoint 0 0 .00 .00 .00+ Buffer Manager 186828 2004 1002.00 .00 .00+ EDMPool or Prefetch 18539 168 84.00 .00 .00+ Workfile Allocation 1282 2 1.00 .00 .00+ Dynamic Statement Cache 472 0 .00 .00 .00+ Stored Proc or Auth Cache 49 0 .00 .00 .00+ Stored Proc or Auth Cache 16 0 .00 .00 .00+ FieldProcs and DDF Trans Mgr 726 0 .00 .00 .00+ Agent Services 5569 40 20.00 .00 .00+ Storage Manager 3244 27 13.50 .00 .00+ Storage Manager 4401 12 6.00 .00 .00+ Index Lotch 3 0 .00 .00 .00===============================================================================
NavigationFor additional information about
• global lock information, select option B-GLOBAL LOCK STATISTICS at the top of the panel.• Near-term history activity, select option H-HISTORICAL at the top of the panel.
372 Classic Interface User's Guide
• other topics, use the PF keys.
FieldsCollection Interval
Shows the REALTIME to indicate that you are looking at the realtime version of this panel and not atthe corresponding near-term history panel. The collection interval and the report interval are thesame in this panel.
StartThe start time of the report interval currently displayed.
Report IntervalThe time in the last cycle (for example, between two presses of the Enter key).
EndThe end time of the report interval currently displayed.
For each of the following fields, the following statistics values are provided:TOTAL QUANTITY
Total quantity, which reflects the amount of activities since DB2 was started.INTERVAL QUANTITY
Interval quantity, which reflects the amount of activities during the last cycle./SECOND
Rate per second during the last cycle. The number under /SECOND (in parentheses) is the number ofseconds in the interval.
/THREADRate per thread during the last cycle. The number under /THREAD (in parentheses) is the number ofCreate Threads during the interval.
/COMMITRate per Commit during the last cycle. The number under /COMMIT (in parentheses) is the number ofcommit requests (including abort requests) during the interval.
Lock manager information:Deadlocks detected
The number of deadlocks detected.Timeouts detected
Occasions when suspension of a unit of work lasted longer than the Internal Resource Lock Manager(IRLM) timeout value.
Susp detected - lock onlySuspensions of a unit of work because a lock could not be obtained.
Susp detected - latch onlyDb2 internal latch suspensions.
Susp detected - otherSuspensions caused by something other than locks and latches.
Lock escalations - to sharedOccasions when the allowable number of locks per tablespace was exceeded, causing a page (IS) lockto escalate to a shared (S) lock.
Lock escalations - to exclusiveOccasions when the allowable number of locks per tablespace was exceeded, causing a page (ix) lockto escalate to an exclusive (x) lock.
Lock requestsRequests to IRLM to obtain a lock on a resource.
Unlock requestsRequests to IRLM to unlock a resource.
Chapter 8. Resource Managers and Other DB2 Subsystem Information menu 373
Query requestsRequests to IRLM to query a lock.
Change requestsRequests to IRLM to change a lock.
Other irlm requestsRequests to IRLM to perform a function other than those listed before.
Claim/drain information:Claim requests
Number of claim requests.Unsuccessful claim requests
Number of unsuccessful claim requests.Drain requests
Number of drain requests.Unsuccessful drain requests
Number of unsuccessful drain requests.
Secondary Latch Cont. Counters:Main Latch Cont. (Held)
Main latch contention due to Main latch held.Main Latch Cont. (UseCnt)
Main latch contention due to Use Count not being 0.Secondary Latch Cont. (Held)
Secondary latch contention due to Main latch held.RES Hashtbl Latch (Lock)
Resource Hash Table latch contention for LOCK.WKUNIT Hashtbl Latch (Lock)
Workunit Hash Table latch contention for LOCK.RES Hashtbl Latch (Unlock)
Resource Hash Table latch contention for UNLOCK.RES Hashtbl Latch (Chng)
Resource Hash Table latch contention for CHANGE.WKUNIT Hashtbl Latch (Chng)
Workunit Hash Table latch contention for CHANGE.RES Hashtbl Latch (Notify)
Resource Hash Table latch contention for NOTIFY.Notify CB Latch Cont.
Notify Control Block latch contention for NOTIFY.RES Hashtbl Latch (Compat)
Resource Hash Table latch contention for COMPAT.WKUNIT Hashtbl Latch (Compat)
Workunit Hash Table latch contention for COMPAT.RES Hashtbl Latch (Async)
Resource Hash Table latch contention for ASYNC LOCK.WKUNIT Hashtbl Latch (Async)
Workunit Hash Table latch contention for ASYNC LOCK.WKUNIT Hashtbl Latch (Sync)
Workunit Hash Table latch contention for SYNC.RES Latch Cont. Counter
Resource latch contention counter.
374 Classic Interface User's Guide
UseCnt for Compat QueElemUse Count counter for Compat QEs (Queue Elemecreated to perform compatibility check of awrequest following a lock grant/deny) in IRLM.
Num of Compat QEs GenedThe number of Compat QEs generated.
Generic Latch Cont.Generic latch contentions.
RES Hashtbl Latch (Query)Resource Hash Table latch contention for QUERY FAST (Fastpath QUERY request types).
WKUNIT Hashtbl Latch (Query)Workunit Hash Table latch contention for QUERY FAST.
Total Local DeadlocksTotal number of local deadlocks.
Timeout RLBs PurgedTimeout RLBs purged by IRLM.
Retryable ABENDsRe-tryable ABENDs in IRLM.
Non Retryable ABENDsNon re-tryable ABENDs in IRLM.
Suspend Exit CounterSuspend Exit counter (The number of times a DBMS exit code was called).
Resume Exit CounterResume Exit counter.
Status Exit CounterStatus Exit counter.
Deadlock Exit CounterDeadlock Exit counter.
Timeout Exit CounterTimeout Exit counter.
Latch Counters:Infrequently Used
This field is infrequently used.Global Authorization Cache
The predominant latch usage is: Global authorization cache.DDF Disconnect
The predominant latch usage is: DDF disconnect.SYSSTRING Cache
The predominant latch usage is: SYSSTRING cache.IRLM Data Sharing Exits
The predominant latch usage is: IRLM data sharing exits or RLF.Data Sharing Index Split
The predominant latch usage is: Data sharing index split.Index Lotch and OBD Alloc
The predominant latch usage is: Index lotch and OBD allocation.Query Parallelism
The predominant latch usage is: Query parallelism.Utilities or Stored Proc
The predominant latch usage is: Utilities or stored procedure URIDs.
Chapter 8. Resource Managers and Other DB2 Subsystem Information menu 375
Allied Agent Chain or Seq DescThe predominant latch usage is: Allied agent chain or sequence descriptors.
DGTT AllocationThe predominant latch usage is: DGTT allocation.
Global Transaction ID TableThe predominant latch usage is: Global transaction ID table.
Pageset OperationsThe predominant latch usage is: Pageset operations.
Bufferpool LRUThe predominant latch usage is: Bufferpool LRU.
Archive Log Mode (Quiesce)The predominant latch usage is: ARCHIVE LOG MODE(QUIESCE).
UR ChainThe predominant latch usage is: UR chain.
RURE ChainThe predominant latch usage is: RURE chain.
DDF Resynch ListThe predominant latch usage is: DDF resynch list.
Log WriteThe predominant latch usage is: Log write.
System CheckpointThe predominant latch usage is: System checkpoint.
Accounting RollupThe predominant latch usage is: Accounting rollup.
Internal CheckpointThe predominant latch usage is: Internal checkpoint.
Buffer ManagerThe predominant latch usage is: Buffer manager.
EDMPool or PrefetchThe predominant latch usage is: EDM pool or prefetch.
Workfile AllocationThe predominant latch usage is: Workfile allocation.
Dynamic Statement CacheThe predominant latch usage is: Dynamic statement cache.
Stored Proc or Auth CacheThe predominant latch usage is: Stored procedures or authorization cache.
Stored Proc or Auth Cache (QVLSLC27)The predominant latch usage is: Stored procedures or authorization cache.
Stored Proc or Auth Cache (QVLSLC28)The predominant latch usage is: Stored procedures or authorization cache.
FieldProcs and DDF Trans MgrThe predominant latch usage is: Field procs and DDF transaction manager.
Agent ServicesThe predominant latch usage is: Agent services.
Storage Manager (QVLSLC31)The predominant latch usage is: Storage manager.
Storage Manager (QVLSLC32)The predominant latch usage is: Storage manager.
Index LotchThe predominant latch usage is: Index lotch.
376 Classic Interface User's Guide
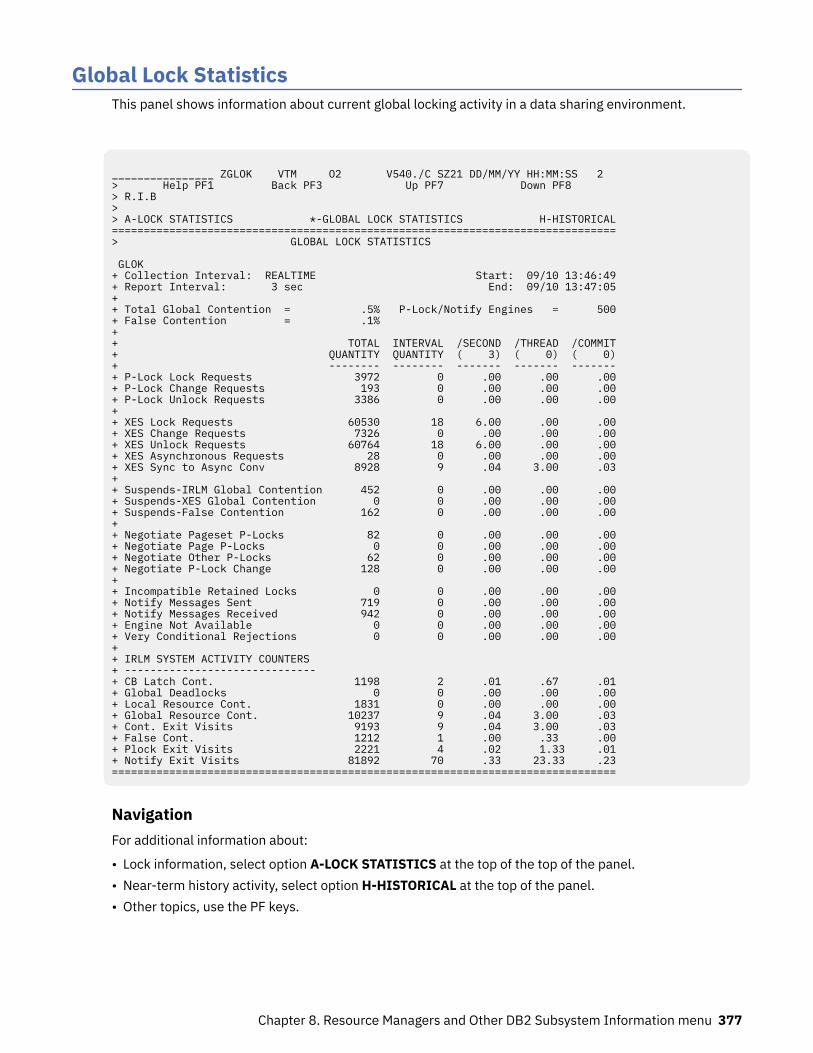
Global Lock StatisticsThis panel shows information about current global locking activity in a data sharing environment.
________________ ZGLOK VTM O2 V540./C SZ21 DD/MM/YY HH:MM:SS 2 > Help PF1 Back PF3 Up PF7 Down PF8 > R.I.B > > A-LOCK STATISTICS *-GLOBAL LOCK STATISTICS H-HISTORICAL =============================================================================== > GLOBAL LOCK STATISTICS GLOK + Collection Interval: REALTIME Start: 09/10 13:46:49 + Report Interval: 3 sec End: 09/10 13:47:05 + + Total Global Contention = .5% P-Lock/Notify Engines = 500 + False Contention = .1% + + TOTAL INTERVAL /SECOND /THREAD /COMMIT + QUANTITY QUANTITY ( 3) ( 0) ( 0) + -------- -------- ------- ------- ------- + P-Lock Lock Requests 3972 0 .00 .00 .00 + P-Lock Change Requests 193 0 .00 .00 .00 + P-Lock Unlock Requests 3386 0 .00 .00 .00 + + XES Lock Requests 60530 18 6.00 .00 .00 + XES Change Requests 7326 0 .00 .00 .00 + XES Unlock Requests 60764 18 6.00 .00 .00 + XES Asynchronous Requests 28 0 .00 .00 .00+ XES Sync to Async Conv 8928 9 .04 3.00 .03+ + Suspends-IRLM Global Contention 452 0 .00 .00 .00 + Suspends-XES Global Contention 0 0 .00 .00 .00 + Suspends-False Contention 162 0 .00 .00 .00 + + Negotiate Pageset P-Locks 82 0 .00 .00 .00 + Negotiate Page P-Locks 0 0 .00 .00 .00 + Negotiate Other P-Locks 62 0 .00 .00 .00 + Negotiate P-Lock Change 128 0 .00 .00 .00 + + Incompatible Retained Locks 0 0 .00 .00 .00 + Notify Messages Sent 719 0 .00 .00 .00 + Notify Messages Received 942 0 .00 .00 .00 + Engine Not Available 0 0 .00 .00 .00 + Very Conditional Rejections 0 0 .00 .00 .00 + + IRLM SYSTEM ACTIVITY COUNTERS+ ------------------------------+ CB Latch Cont. 1198 2 .01 .67 .01+ Global Deadlocks 0 0 .00 .00 .00+ Local Resource Cont. 1831 0 .00 .00 .00 + Global Resource Cont. 10237 9 .04 3.00 .03+ Cont. Exit Visits 9193 9 .04 3.00 .03+ False Cont. 1212 1 .00 .33 .00+ Plock Exit Visits 2221 4 .02 1.33 .01+ Notify Exit Visits 81892 70 .33 23.33 .23===============================================================================
NavigationFor additional information about:
• Lock information, select option A-LOCK STATISTICS at the top of the top of the panel.• Near-term history activity, select option H-HISTORICAL at the top of the panel.• Other topics, use the PF keys.
Chapter 8. Resource Managers and Other DB2 Subsystem Information menu 377
FieldsCollection Interval
Shows the REALTIME to indicate that you are looking at the realtime version of this panel and not atthe corresponding near-term history panel. The collection interval and the report interval are thesame in this panel.
StartThe start time of the interval currently displayed.
Report IntervalThis field determines the report interval. It is set on the Near-Term History Report Option panel.
EndThe end time of the interval currently displayed.
Total Global ContentionThe percent of synchronous XES lock, change, or unlock requests that resulted in global contention.
False Contention PercentageThe rate of false contentions to real contentions. This number should be no more than 50%.
P-Lock/Notify EnginesThe number of engines available for P-lock exit or notify exit requests.
For each of the following fields, the following statistics values are provided:TOTAL QUANTITY
Total quantity, which reflects the amount of activities since DB2 was started.INTERVAL QUANTITY
Interval quantity, which reflects the amount of activities during the last cycle./SECOND
Rate per second during the last cycle. The number under /SECOND (in parentheses) is the number ofseconds in the interval.
/THREADRate per thread during the last cycle. The number under /THREAD (in parentheses) is the number ofCreate Threads during the interval.
/COMMITRate per Commit during the last cycle. The number under /COMMIT (in parentheses) is the number ofcommit requests (including abort requests) during the interval.
P-lock Lock RequestsNumber of lock requests for P-locks.
P-lock Change RequestsNumber of change requests for P-locks.
P-lock Unlock RequestsNumber of unlock requests for P-locks.
XES Lock RequestsThe number of lock requests (both logical and physical) that are propagated to MVS XESsynchronously under the caller's execution unit. This count does not include suspended requests.Only the most restrictive lock for a particular resource is propagated to XES and the coupling facility.
XES Change RequestsThe number of change requests (both logical and physical) that are propagated to MVS XESsynchronously under the caller's execution unit. This count does not include suspended requests.
XES Unlock RequestsThe number of unlock requests (both logical and physical) that are propagated to MVS XESsynchronously under the caller's execution unit. This count does not include suspended requests.
378 Classic Interface User's Guide
XES Asynchronous RequestsThe number of L-locks and P-locks propagated to XES asynchronously. This occurs when a new inter-DB2 interest occurs on a parent resource or when a request completes after the requestor's executionunit has been suspended.
XES Sync to Async ConvThe number of sync to async heuristic conversions for LOCK requests in XES. This conversion is donewhen XES determines that it is more efficient to drive the request asynchronously to the CF.
Suspends-IRLM Global ContentionThe number of suspends due to Internal Resource Lock Manager (IRLM) global resource contentions.IRLM lock states were in conflict and inter-system communication is required to resolve the conflict.
Suspends-XES Global ContentionThe number of suspends due to MVS XES global resource contentions that were not IRLM-levelcontentions. The XES lock states were in conflict, but the IRLM lock states were not.
Suspends-False ContentionThe number of suspends caused by MVS XES false contentions. XES detects hash class contentionwhen two different locks on different resources hash to the same entry in the coupling facility locktable. The requester is suspended until it is determined that no real lock contention exists.
Negotiate Pageset P-LocksThe number of times this DB2 member was driven to negotiate a pageset/partition P-lock because ofchanging inter-DB2 interest levels on the pageset/partition.
Negotiate Page P-LocksThe number of times this DB2 member was driven to negotiate a page P-lock because of inter-DB2 P-lock contention.
Negotiate Other P-LocksThe number of times this DB2 member was driven to negotiate a P-lock type other than pageset/partition or page.
Negotiate P-Lock ChangeThe number of times a P-lock change request was issued during P-lock negotiation.
Incompatible Retained LocksThe number of global lock or change requests that failed because of an incompatible retained lock.Certain P-locks can be retained because of a system failure. Another DB2 member cannot access thedata that the retained P-lock is protecting unless it requests a P-lock in a compatible state.
Notify Messages SentThe number of notify messages sent.
Notify Messages ReceivedThe number of notify messages received.
Engine Not AvailableThe number of times an engine was not available for a P-lock exit or a notify exit request.
Very Conditional RejectionsThe number of rejections of very conditional requests which could not get processed because of theheuristic algorithm used by XES.
IRLM System Activity Counters:CB Latch Cont.
Active IRLM Control Block latch contention counter.Global Deadlocks
Total number of global deadlocks.Local Resource Cont.
Local resource contentions.Global Resource Cont.
Global resource contentions.
Chapter 8. Resource Managers and Other DB2 Subsystem Information menu 379
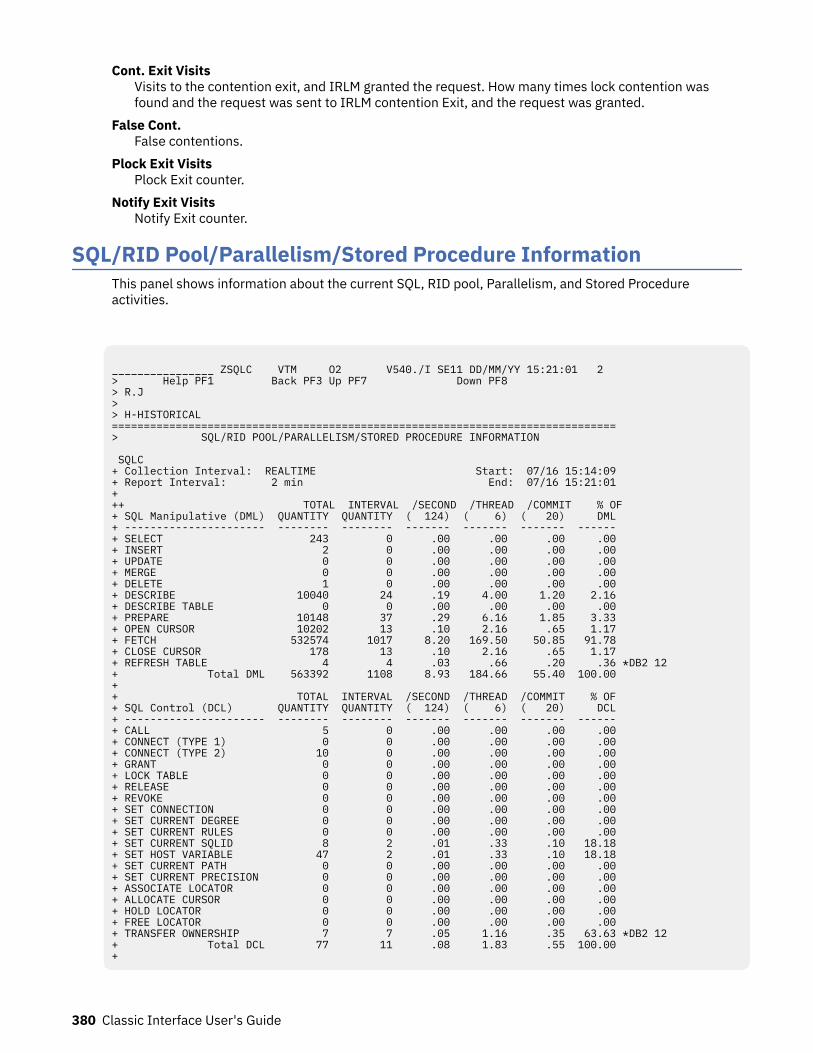
Cont. Exit VisitsVisits to the contention exit, and IRLM granted the request. How many times lock contention wasfound and the request was sent to IRLM contention Exit, and the request was granted.
False Cont.False contentions.
Plock Exit VisitsPlock Exit counter.
Notify Exit VisitsNotify Exit counter.
SQL/RID Pool/Parallelism/Stored Procedure InformationThis panel shows information about the current SQL, RID pool, Parallelism, and Stored Procedureactivities.
________________ ZSQLC VTM O2 V540./I SE11 DD/MM/YY 15:21:01 2 > Help PF1 Back PF3 Up PF7 Down PF8 > R.J > > H-HISTORICAL =============================================================================== > SQL/RID POOL/PARALLELISM/STORED PROCEDURE INFORMATION SQLC + Collection Interval: REALTIME Start: 07/16 15:14:09 + Report Interval: 2 min End: 07/16 15:21:01 + ++ TOTAL INTERVAL /SECOND /THREAD /COMMIT % OF + SQL Manipulative (DML) QUANTITY QUANTITY ( 124) ( 6) ( 20) DML + ---------------------- -------- -------- ------- ------- ------- ------ + SELECT 243 0 .00 .00 .00 .00 + INSERT 2 0 .00 .00 .00 .00 + UPDATE 0 0 .00 .00 .00 .00 + MERGE 0 0 .00 .00 .00 .00 + DELETE 1 0 .00 .00 .00 .00 + DESCRIBE 10040 24 .19 4.00 1.20 2.16 + DESCRIBE TABLE 0 0 .00 .00 .00 .00 + PREPARE 10148 37 .29 6.16 1.85 3.33 + OPEN CURSOR 10202 13 .10 2.16 .65 1.17 + FETCH 532574 1017 8.20 169.50 50.85 91.78 + CLOSE CURSOR 178 13 .10 2.16 .65 1.17 + REFRESH TABLE 4 4 .03 .66 .20 .36 *DB2 12+ Total DML 563392 1108 8.93 184.66 55.40 100.00+ + TOTAL INTERVAL /SECOND /THREAD /COMMIT % OF + SQL Control (DCL) QUANTITY QUANTITY ( 124) ( 6) ( 20) DCL + ---------------------- -------- -------- ------- ------- ------- ------ + CALL 5 0 .00 .00 .00 .00 + CONNECT (TYPE 1) 0 0 .00 .00 .00 .00 + CONNECT (TYPE 2) 10 0 .00 .00 .00 .00 + GRANT 0 0 .00 .00 .00 .00 + LOCK TABLE 0 0 .00 .00 .00 .00 + RELEASE 0 0 .00 .00 .00 .00 + REVOKE 0 0 .00 .00 .00 .00 + SET CONNECTION 0 0 .00 .00 .00 .00 + SET CURRENT DEGREE 0 0 .00 .00 .00 .00 + SET CURRENT RULES 0 0 .00 .00 .00 .00 + SET CURRENT SQLID 8 2 .01 .33 .10 18.18 + SET HOST VARIABLE 47 2 .01 .33 .10 18.18 + SET CURRENT PATH 0 0 .00 .00 .00 .00 + SET CURRENT PRECISION 0 0 .00 .00 .00 .00 + ASSOCIATE LOCATOR 0 0 .00 .00 .00 .00 + ALLOCATE CURSOR 0 0 .00 .00 .00 .00 + HOLD LOCATOR 0 0 .00 .00 .00 .00 + FREE LOCATOR 0 0 .00 .00 .00 .00 + TRANSFER OWNERSHIP 7 7 .05 1.16 .35 63.63 *DB2 12+ Total DCL 77 11 .08 1.83 .55 100.00+
380 Classic Interface User's Guide
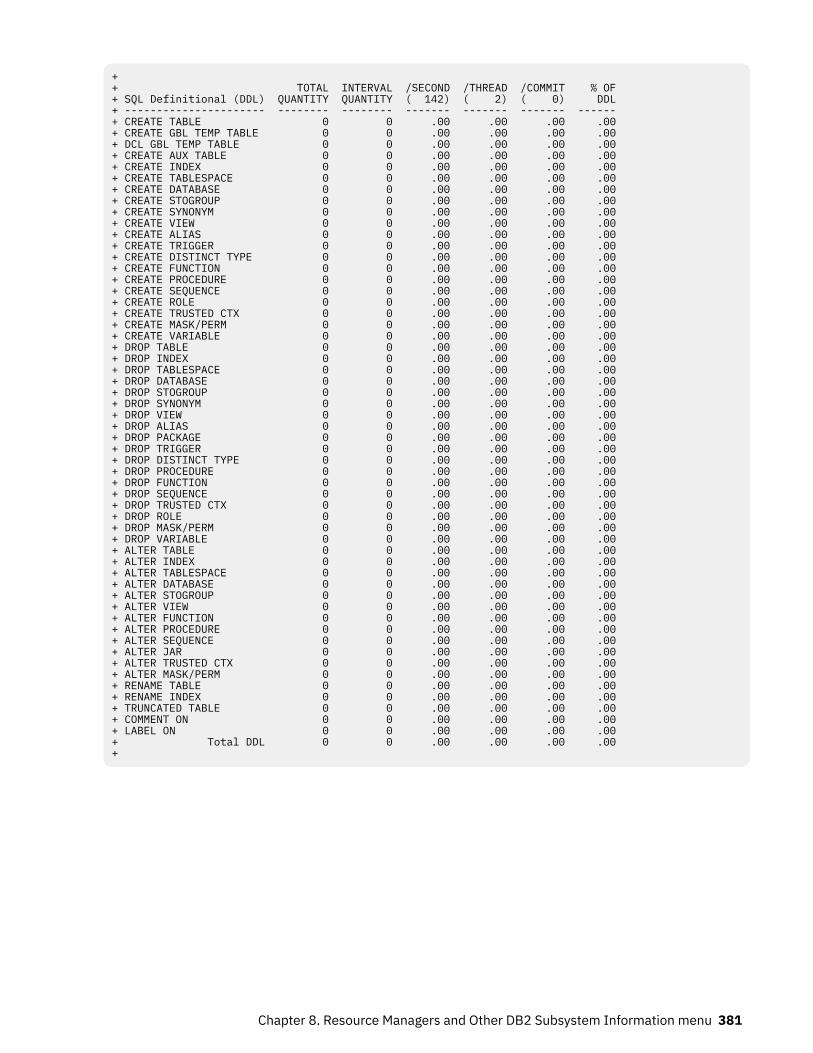
+ + TOTAL INTERVAL /SECOND /THREAD /COMMIT % OF + SQL Definitional (DDL) QUANTITY QUANTITY ( 142) ( 2) ( 0) DDL + ---------------------- -------- -------- ------- ------- ------- ------ + CREATE TABLE 0 0 .00 .00 .00 .00 + CREATE GBL TEMP TABLE 0 0 .00 .00 .00 .00 + DCL GBL TEMP TABLE 0 0 .00 .00 .00 .00 + CREATE AUX TABLE 0 0 .00 .00 .00 .00 + CREATE INDEX 0 0 .00 .00 .00 .00 + CREATE TABLESPACE 0 0 .00 .00 .00 .00 + CREATE DATABASE 0 0 .00 .00 .00 .00 + CREATE STOGROUP 0 0 .00 .00 .00 .00 + CREATE SYNONYM 0 0 .00 .00 .00 .00 + CREATE VIEW 0 0 .00 .00 .00 .00 + CREATE ALIAS 0 0 .00 .00 .00 .00 + CREATE TRIGGER 0 0 .00 .00 .00 .00 + CREATE DISTINCT TYPE 0 0 .00 .00 .00 .00 + CREATE FUNCTION 0 0 .00 .00 .00 .00 + CREATE PROCEDURE 0 0 .00 .00 .00 .00 + CREATE SEQUENCE 0 0 .00 .00 .00 .00 + CREATE ROLE 0 0 .00 .00 .00 .00 + CREATE TRUSTED CTX 0 0 .00 .00 .00 .00 + CREATE MASK/PERM 0 0 .00 .00 .00 .00 + CREATE VARIABLE 0 0 .00 .00 .00 .00 + DROP TABLE 0 0 .00 .00 .00 .00 + DROP INDEX 0 0 .00 .00 .00 .00 + DROP TABLESPACE 0 0 .00 .00 .00 .00 + DROP DATABASE 0 0 .00 .00 .00 .00 + DROP STOGROUP 0 0 .00 .00 .00 .00 + DROP SYNONYM 0 0 .00 .00 .00 .00 + DROP VIEW 0 0 .00 .00 .00 .00 + DROP ALIAS 0 0 .00 .00 .00 .00 + DROP PACKAGE 0 0 .00 .00 .00 .00 + DROP TRIGGER 0 0 .00 .00 .00 .00 + DROP DISTINCT TYPE 0 0 .00 .00 .00 .00 + DROP PROCEDURE 0 0 .00 .00 .00 .00 + DROP FUNCTION 0 0 .00 .00 .00 .00 + DROP SEQUENCE 0 0 .00 .00 .00 .00 + DROP TRUSTED CTX 0 0 .00 .00 .00 .00 + DROP ROLE 0 0 .00 .00 .00 .00 + DROP MASK/PERM 0 0 .00 .00 .00 .00 + DROP VARIABLE 0 0 .00 .00 .00 .00 + ALTER TABLE 0 0 .00 .00 .00 .00 + ALTER INDEX 0 0 .00 .00 .00 .00 + ALTER TABLESPACE 0 0 .00 .00 .00 .00 + ALTER DATABASE 0 0 .00 .00 .00 .00 + ALTER STOGROUP 0 0 .00 .00 .00 .00 + ALTER VIEW 0 0 .00 .00 .00 .00 + ALTER FUNCTION 0 0 .00 .00 .00 .00 + ALTER PROCEDURE 0 0 .00 .00 .00 .00 + ALTER SEQUENCE 0 0 .00 .00 .00 .00 + ALTER JAR 0 0 .00 .00 .00 .00 + ALTER TRUSTED CTX 0 0 .00 .00 .00 .00 + ALTER MASK/PERM 0 0 .00 .00 .00 .00 + RENAME TABLE 0 0 .00 .00 .00 .00 + RENAME INDEX 0 0 .00 .00 .00 .00 + TRUNCATED TABLE 0 0 .00 .00 .00 .00 + COMMENT ON 0 0 .00 .00 .00 .00 + LABEL ON 0 0 .00 .00 .00 .00 + Total DDL 0 0 .00 .00 .00 .00 +
Chapter 8. Resource Managers and Other DB2 Subsystem Information menu 381
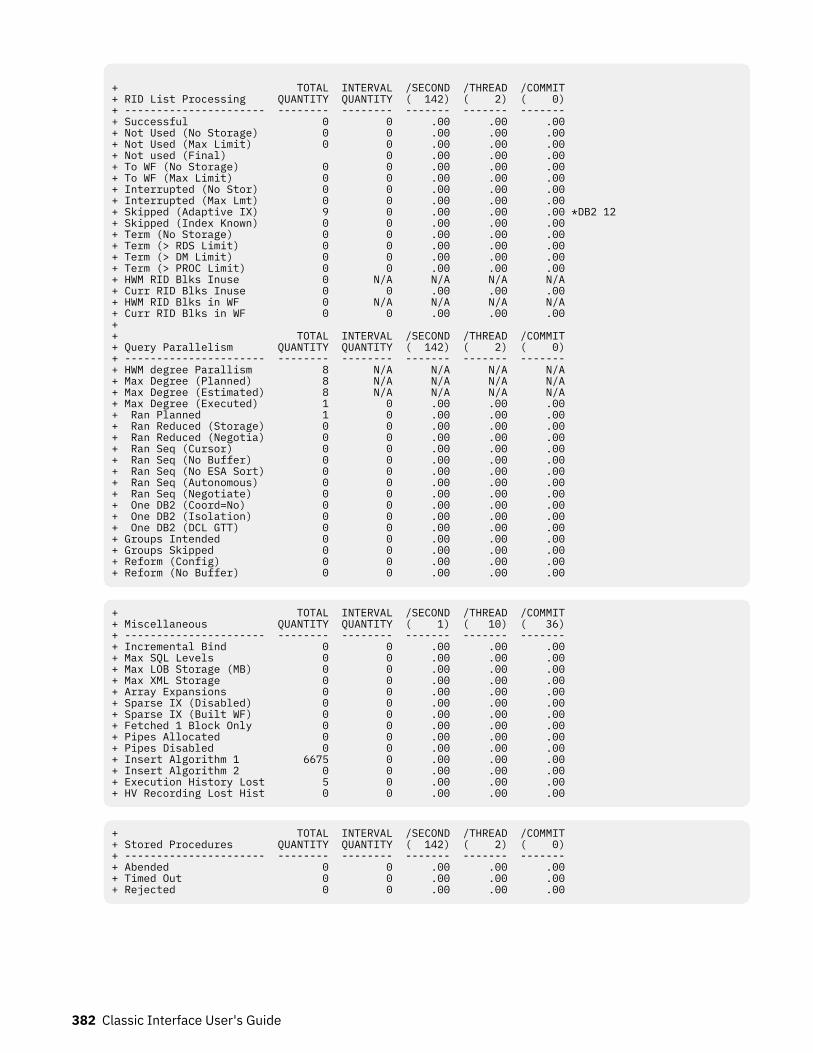
+ TOTAL INTERVAL /SECOND /THREAD /COMMIT + RID List Processing QUANTITY QUANTITY ( 142) ( 2) ( 0) + ---------------------- -------- -------- ------- ------- ------- + Successful 0 0 .00 .00 .00 + Not Used (No Storage) 0 0 .00 .00 .00 + Not Used (Max Limit) 0 0 .00 .00 .00+ Not used (Final) 0 .00 .00 .00 + To WF (No Storage) 0 0 .00 .00 .00 + To WF (Max Limit) 0 0 .00 .00 .00+ Interrupted (No Stor) 0 0 .00 .00 .00 + Interrupted (Max Lmt) 0 0 .00 .00 .00+ Skipped (Adaptive IX) 9 0 .00 .00 .00 *DB2 12 + Skipped (Index Known) 0 0 .00 .00 .00 + Term (No Storage) 0 0 .00 .00 .00 + Term (> RDS Limit) 0 0 .00 .00 .00 + Term (> DM Limit) 0 0 .00 .00 .00 + Term (> PROC Limit) 0 0 .00 .00 .00 + HWM RID Blks Inuse 0 N/A N/A N/A N/A + Curr RID Blks Inuse 0 0 .00 .00 .00 + HWM RID Blks in WF 0 N/A N/A N/A N/A + Curr RID Blks in WF 0 0 .00 .00 .00++ TOTAL INTERVAL /SECOND /THREAD /COMMIT + Query Parallelism QUANTITY QUANTITY ( 142) ( 2) ( 0) + ---------------------- -------- -------- ------- ------- ------- + HWM degree Parallism 8 N/A N/A N/A N/A + Max Degree (Planned) 8 N/A N/A N/A N/A + Max Degree (Estimated) 8 N/A N/A N/A N/A + Max Degree (Executed) 1 0 .00 .00 .00 + Ran Planned 1 0 .00 .00 .00 + Ran Reduced (Storage) 0 0 .00 .00 .00 + Ran Reduced (Negotia) 0 0 .00 .00 .00 + Ran Seq (Cursor) 0 0 .00 .00 .00 + Ran Seq (No Buffer) 0 0 .00 .00 .00 + Ran Seq (No ESA Sort) 0 0 .00 .00 .00 + Ran Seq (Autonomous) 0 0 .00 .00 .00 + Ran Seq (Negotiate) 0 0 .00 .00 .00 + One DB2 (Coord=No) 0 0 .00 .00 .00 + One DB2 (Isolation) 0 0 .00 .00 .00 + One DB2 (DCL GTT) 0 0 .00 .00 .00 + Groups Intended 0 0 .00 .00 .00 + Groups Skipped 0 0 .00 .00 .00 + Reform (Config) 0 0 .00 .00 .00 + Reform (No Buffer) 0 0 .00 .00 .00
+ TOTAL INTERVAL /SECOND /THREAD /COMMIT + Miscellaneous QUANTITY QUANTITY ( 1) ( 10) ( 36) + ---------------------- -------- -------- ------- ------- ------- + Incremental Bind 0 0 .00 .00 .00 + Max SQL Levels 0 0 .00 .00 .00 + Max LOB Storage (MB) 0 0 .00 .00 .00 + Max XML Storage 0 0 .00 .00 .00 + Array Expansions 0 0 .00 .00 .00 + Sparse IX (Disabled) 0 0 .00 .00 .00 + Sparse IX (Built WF) 0 0 .00 .00 .00 + Fetched 1 Block Only 0 0 .00 .00 .00 + Pipes Allocated 0 0 .00 .00 .00 + Pipes Disabled 0 0 .00 .00 .00 + Insert Algorithm 1 6675 0 .00 .00 .00+ Insert Algorithm 2 0 0 .00 .00 .00+ Execution History Lost 5 0 .00 .00 .00+ HV Recording Lost Hist 0 0 .00 .00 .00
+ TOTAL INTERVAL /SECOND /THREAD /COMMIT + Stored Procedures QUANTITY QUANTITY ( 142) ( 2) ( 0) + ---------------------- -------- -------- ------- ------- ------- + Abended 0 0 .00 .00 .00 + Timed Out 0 0 .00 .00 .00 + Rejected 0 0 .00 .00 .00
382 Classic Interface User's Guide
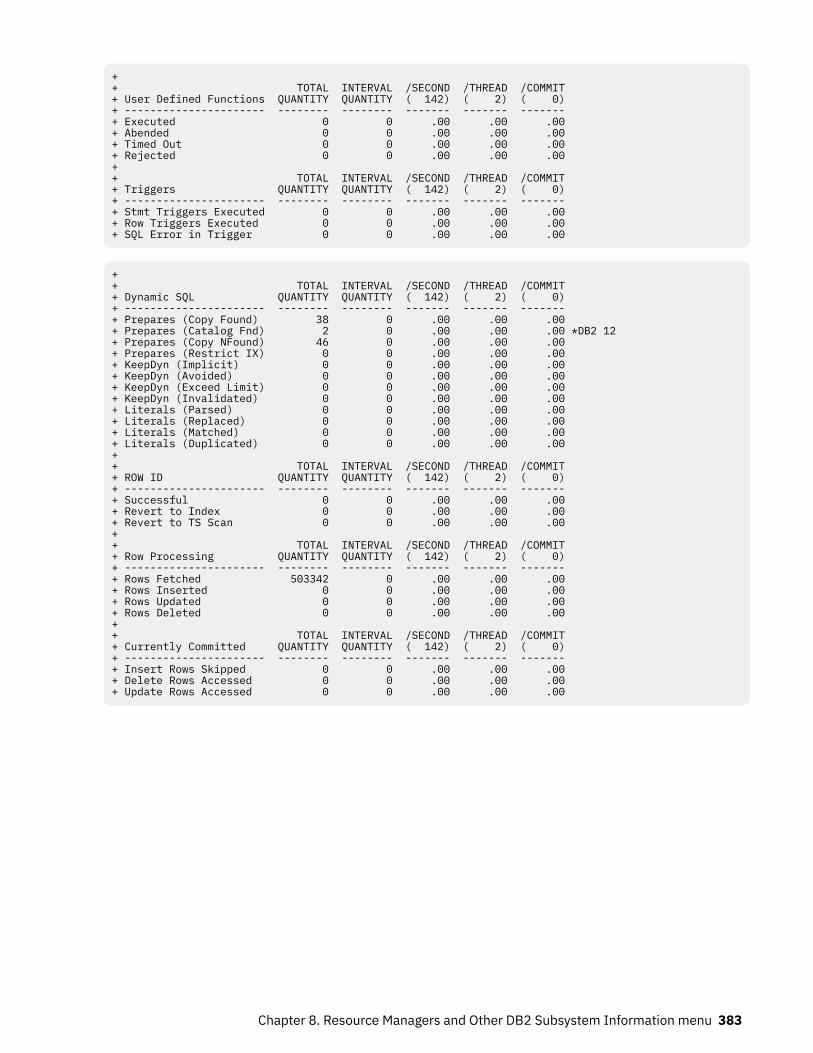
+ + TOTAL INTERVAL /SECOND /THREAD /COMMIT + User Defined Functions QUANTITY QUANTITY ( 142) ( 2) ( 0) + ---------------------- -------- -------- ------- ------- ------- + Executed 0 0 .00 .00 .00 + Abended 0 0 .00 .00 .00 + Timed Out 0 0 .00 .00 .00 + Rejected 0 0 .00 .00 .00 + + TOTAL INTERVAL /SECOND /THREAD /COMMIT + Triggers QUANTITY QUANTITY ( 142) ( 2) ( 0) + ---------------------- -------- -------- ------- ------- ------- + Stmt Triggers Executed 0 0 .00 .00 .00 + Row Triggers Executed 0 0 .00 .00 .00 + SQL Error in Trigger 0 0 .00 .00 .00
+ + TOTAL INTERVAL /SECOND /THREAD /COMMIT + Dynamic SQL QUANTITY QUANTITY ( 142) ( 2) ( 0) + ---------------------- -------- -------- ------- ------- ------- + Prepares (Copy Found) 38 0 .00 .00 .00+ Prepares (Catalog Fnd) 2 0 .00 .00 .00 *DB2 12 + Prepares (Copy NFound) 46 0 .00 .00 .00 + Prepares (Restrict IX) 0 0 .00 .00 .00 + KeepDyn (Implicit) 0 0 .00 .00 .00 + KeepDyn (Avoided) 0 0 .00 .00 .00 + KeepDyn (Exceed Limit) 0 0 .00 .00 .00 + KeepDyn (Invalidated) 0 0 .00 .00 .00 + Literals (Parsed) 0 0 .00 .00 .00 + Literals (Replaced) 0 0 .00 .00 .00 + Literals (Matched) 0 0 .00 .00 .00 + Literals (Duplicated) 0 0 .00 .00 .00 + + TOTAL INTERVAL /SECOND /THREAD /COMMIT + ROW ID QUANTITY QUANTITY ( 142) ( 2) ( 0) + ---------------------- -------- -------- ------- ------- ------- + Successful 0 0 .00 .00 .00 + Revert to Index 0 0 .00 .00 .00 + Revert to TS Scan 0 0 .00 .00 .00 + + TOTAL INTERVAL /SECOND /THREAD /COMMIT + Row Processing QUANTITY QUANTITY ( 142) ( 2) ( 0) + ---------------------- -------- -------- ------- ------- ------- + Rows Fetched 503342 0 .00 .00 .00 + Rows Inserted 0 0 .00 .00 .00 + Rows Updated 0 0 .00 .00 .00 + Rows Deleted 0 0 .00 .00 .00 + + TOTAL INTERVAL /SECOND /THREAD /COMMIT + Currently Committed QUANTITY QUANTITY ( 142) ( 2) ( 0) + ---------------------- -------- -------- ------- ------- ------- + Insert Rows Skipped 0 0 .00 .00 .00 + Delete Rows Accessed 0 0 .00 .00 .00 + Update Rows Accessed 0 0 .00 .00 .00
Chapter 8. Resource Managers and Other DB2 Subsystem Information menu 383
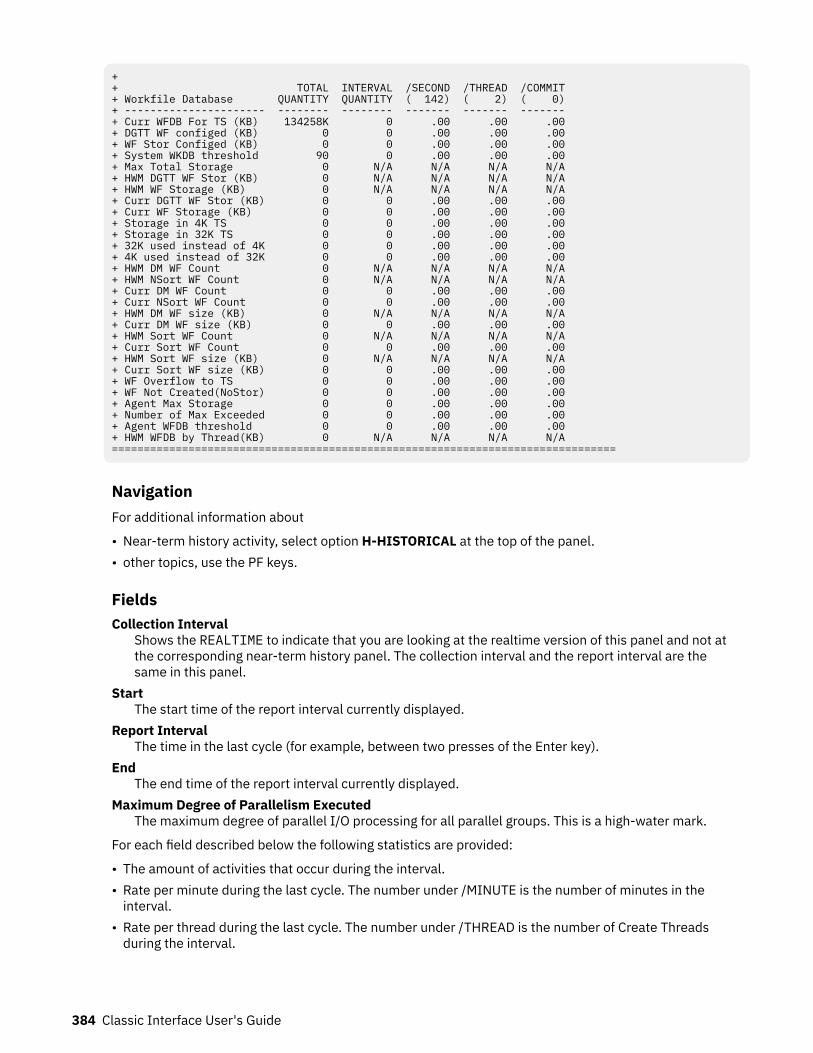
+ + TOTAL INTERVAL /SECOND /THREAD /COMMIT + Workfile Database QUANTITY QUANTITY ( 142) ( 2) ( 0) + ---------------------- -------- -------- ------- ------- ------- + Curr WFDB For TS (KB) 134258K 0 .00 .00 .00 + DGTT WF configed (KB) 0 0 .00 .00 .00 + WF Stor Configed (KB) 0 0 .00 .00 .00 + System WKDB threshold 90 0 .00 .00 .00 + Max Total Storage 0 N/A N/A N/A N/A + HWM DGTT WF Stor (KB) 0 N/A N/A N/A N/A + HWM WF Storage (KB) 0 N/A N/A N/A N/A + Curr DGTT WF Stor (KB) 0 0 .00 .00 .00 + Curr WF Storage (KB) 0 0 .00 .00 .00 + Storage in 4K TS 0 0 .00 .00 .00 + Storage in 32K TS 0 0 .00 .00 .00 + 32K used instead of 4K 0 0 .00 .00 .00 + 4K used instead of 32K 0 0 .00 .00 .00 + HWM DM WF Count 0 N/A N/A N/A N/A + HWM NSort WF Count 0 N/A N/A N/A N/A + Curr DM WF Count 0 0 .00 .00 .00 + Curr NSort WF Count 0 0 .00 .00 .00 + HWM DM WF size (KB) 0 N/A N/A N/A N/A + Curr DM WF size (KB) 0 0 .00 .00 .00 + HWM Sort WF Count 0 N/A N/A N/A N/A + Curr Sort WF Count 0 0 .00 .00 .00 + HWM Sort WF size (KB) 0 N/A N/A N/A N/A + Curr Sort WF size (KB) 0 0 .00 .00 .00 + WF Overflow to TS 0 0 .00 .00 .00 + WF Not Created(NoStor) 0 0 .00 .00 .00 + Agent Max Storage 0 0 .00 .00 .00 + Number of Max Exceeded 0 0 .00 .00 .00 + Agent WFDB threshold 0 0 .00 .00 .00 + HWM WFDB by Thread(KB) 0 N/A N/A N/A N/A ===============================================================================
NavigationFor additional information about
• Near-term history activity, select option H-HISTORICAL at the top of the panel.• other topics, use the PF keys.
FieldsCollection Interval
Shows the REALTIME to indicate that you are looking at the realtime version of this panel and not atthe corresponding near-term history panel. The collection interval and the report interval are thesame in this panel.
StartThe start time of the report interval currently displayed.
Report IntervalThe time in the last cycle (for example, between two presses of the Enter key).
EndThe end time of the report interval currently displayed.
Maximum Degree of Parallelism ExecutedThe maximum degree of parallel I/O processing for all parallel groups. This is a high-water mark.
For each field described below the following statistics are provided:
• The amount of activities that occur during the interval.• Rate per minute during the last cycle. The number under /MINUTE is the number of minutes in the
interval.• Rate per thread during the last cycle. The number under /THREAD is the number of Create Threads
during the interval.
384 Classic Interface User's Guide
• Rate per Commit during the last cycle. The number under /COMMIT is the number of commit requests(including abort requests) during the interval.
• Percentage of DML, DCL, or DDL during the last cycle.
SQL Manipulative (DML):SELECT
SELECT statements executed to retrieve rows from a DB2 table.INSERT
INSERT statements executed to add rows to a DB2 table.UPDATE
UPDATE statements executed to alter existing rows in a DB2 table.MERGE
The number of times a MERGE statement is executed.DELETE
DELETE statements executed to remove rows from a DB2 table.DESCRIBE
DESCRIBE statements executed to obtain information about prepared SQL statements.DESCRIBE TABLE
DESCRIBE TABLE statements executed to obtain information about a table or view.PREPARE
Occasions when SQL statements were dynamically prepared for execution.OPEN CURSOR
OPEN statements executed to prepare cursors for subsequent Fetch operations.FETCH
FETCH statements executed to retrieve rows from DB2 tables.CLOSE CURSOR
CLOSE statements executed to close previously opened cursors.REFRESH TABLE
Number of refresh table statements. DB2 12 and later. (Field name: QXTREFTBL)Total DML
All data manipulative language statements.
SQL Control (DCL):CALL
CALL statements executed to invoke a stored procedure.CONNECT (Type 1)
CONNECT (Type 1) statements executed to connect an application process to a designated server.CONNECT (Type 2)
CONNECT (Type 2) statements executed to connect an application process to a designated server.GRANT
GRANT statements issued to extend DB2 privileges to users.LOCK TABLE
LOCK TABLE statements issued to lock a tablespace or table in a segmented tablespace.RELEASE
RELEASE statements executed to place one or more connections in the released state.REVOKE
REVOKE statements issued to revoke users' DB2 privileges.SET CONNECTION
SET CONNECTION statements executed to establish the application server of the process.
Chapter 8. Resource Managers and Other DB2 Subsystem Information menu 385
SET CURRENT DEGREESET CURRENT DEGREE statements executed to assign a value to the CURRENT DEGREE specialregister.
SET CURRENT RULESSET CURRENT RULE statements executed to assign a value to the current rules special register.
SET CURRENT SQLIDSET CURRENT SQLID statements issued to change your current authorization ID.
SET HOST VARIABLESET host-variable statements issued.
SET CURRENT PATHSET CURRENT PATH statements issued to assign a value to the CURRENT PATH special register.
SET CURRENT PRECISIONThe number of Set Current Precision statements.
ASSOCIATE LOCATORThe number of ASSOCIATE LOCATOR statements issued.
ALLOCATE CURSORThe number of ALLOCATE CURSOR statements issued.
HOLD LOCATORThe number of Hold Locator statements.
FREE LOCATORThe number of Free Locator statements.
TRANSFER OWNERSHIPNumber of transfer ownership statements. DB2 12 and later. (Field name: QXTRNOWN)
Total DCLAll data control language statements.
SQL Definitional (DDL):CREATE TABLE
CREATE TABLE statements issued to define a DB2 table.CREATE GBL TEMP TABLE
The number of Create Global Temporary Table statements issued to create a description of atemporary table at the current server.
DCL GBL TEMP TABLE THThe number of SQL Declare Global Temporary Table statements.
CREATE AUX TABLEThe number of Create Auxiliary Table statements.
CREATE INDEXCREATE INDEX statements issued to establish indexes on DB2 tables.
CREATE TABLESPACECREATE TABLESPACE statements issued to establish DB2 tablespaces.
CREATE DATABASECREATE DATABASE statements issued to establish DB2 databases.
CREATE STOGROUPCREATE STOGROUP statements issued to establish DB2 storage groups.
CREATE SYNONYMCREATE SYNONYM statements issued to create alternate names for DB2 tables and views.
CREATE VIEWCREATE VIEW statements issued to establish views of DB2 tables.
CREATE ALIASCREATE ALIAS statements issued to achieve "location transparency" of DB2 tables. This field is usedprimarily to refer to tables and views from remote DB2 subsystems in a distributed environment.
386 Classic Interface User's Guide
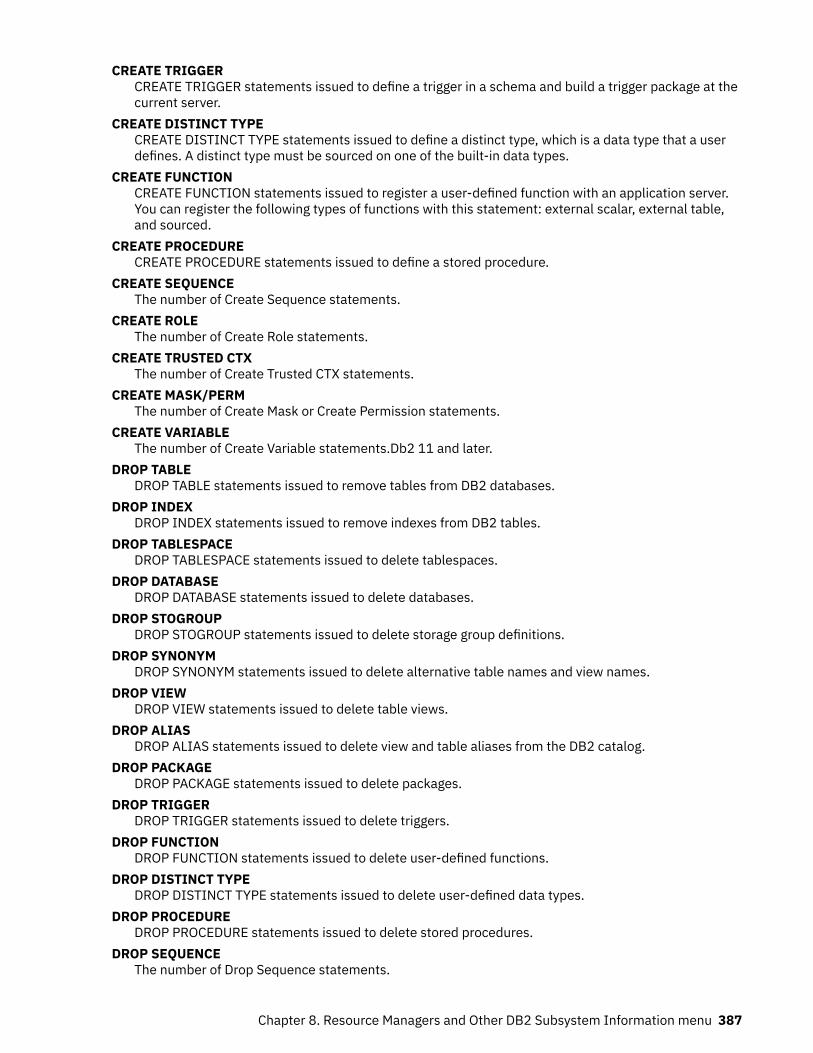
CREATE TRIGGERCREATE TRIGGER statements issued to define a trigger in a schema and build a trigger package at thecurrent server.
CREATE DISTINCT TYPECREATE DISTINCT TYPE statements issued to define a distinct type, which is a data type that a userdefines. A distinct type must be sourced on one of the built-in data types.
CREATE FUNCTIONCREATE FUNCTION statements issued to register a user-defined function with an application server.You can register the following types of functions with this statement: external scalar, external table,and sourced.
CREATE PROCEDURECREATE PROCEDURE statements issued to define a stored procedure.
CREATE SEQUENCEThe number of Create Sequence statements.
CREATE ROLEThe number of Create Role statements.
CREATE TRUSTED CTXThe number of Create Trusted CTX statements.
CREATE MASK/PERMThe number of Create Mask or Create Permission statements.
CREATE VARIABLEThe number of Create Variable statements.Db2 11 and later.
DROP TABLEDROP TABLE statements issued to remove tables from DB2 databases.
DROP INDEXDROP INDEX statements issued to remove indexes from DB2 tables.
DROP TABLESPACEDROP TABLESPACE statements issued to delete tablespaces.
DROP DATABASEDROP DATABASE statements issued to delete databases.
DROP STOGROUPDROP STOGROUP statements issued to delete storage group definitions.
DROP SYNONYMDROP SYNONYM statements issued to delete alternative table names and view names.
DROP VIEWDROP VIEW statements issued to delete table views.
DROP ALIASDROP ALIAS statements issued to delete view and table aliases from the DB2 catalog.
DROP PACKAGEDROP PACKAGE statements issued to delete packages.
DROP TRIGGERDROP TRIGGER statements issued to delete triggers.
DROP FUNCTIONDROP FUNCTION statements issued to delete user-defined functions.
DROP DISTINCT TYPEDROP DISTINCT TYPE statements issued to delete user-defined data types.
DROP PROCEDUREDROP PROCEDURE statements issued to delete stored procedures.
DROP SEQUENCEThe number of Drop Sequence statements.
Chapter 8. Resource Managers and Other DB2 Subsystem Information menu 387
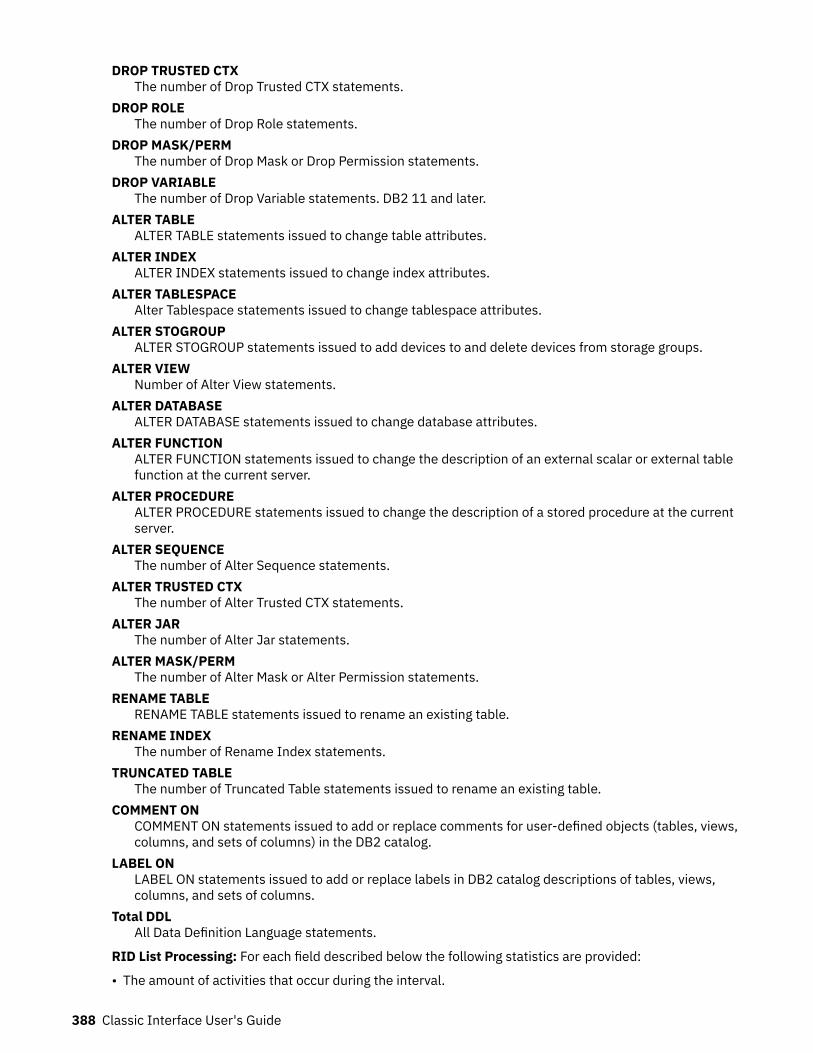
DROP TRUSTED CTXThe number of Drop Trusted CTX statements.
DROP ROLEThe number of Drop Role statements.
DROP MASK/PERMThe number of Drop Mask or Drop Permission statements.
DROP VARIABLEThe number of Drop Variable statements. DB2 11 and later.
ALTER TABLEALTER TABLE statements issued to change table attributes.
ALTER INDEXALTER INDEX statements issued to change index attributes.
ALTER TABLESPACEAlter Tablespace statements issued to change tablespace attributes.
ALTER STOGROUPALTER STOGROUP statements issued to add devices to and delete devices from storage groups.
ALTER VIEWNumber of Alter View statements.
ALTER DATABASEALTER DATABASE statements issued to change database attributes.
ALTER FUNCTIONALTER FUNCTION statements issued to change the description of an external scalar or external tablefunction at the current server.
ALTER PROCEDUREALTER PROCEDURE statements issued to change the description of a stored procedure at the currentserver.
ALTER SEQUENCEThe number of Alter Sequence statements.
ALTER TRUSTED CTXThe number of Alter Trusted CTX statements.
ALTER JARThe number of Alter Jar statements.
ALTER MASK/PERMThe number of Alter Mask or Alter Permission statements.
RENAME TABLERENAME TABLE statements issued to rename an existing table.
RENAME INDEXThe number of Rename Index statements.
TRUNCATED TABLEThe number of Truncated Table statements issued to rename an existing table.
COMMENT ONCOMMENT ON statements issued to add or replace comments for user-defined objects (tables, views,columns, and sets of columns) in the DB2 catalog.
LABEL ONLABEL ON statements issued to add or replace labels in DB2 catalog descriptions of tables, views,columns, and sets of columns.
Total DDLAll Data Definition Language statements.
RID List Processing: For each field described below the following statistics are provided:
• The amount of activities that occur during the interval.
388 Classic Interface User's Guide
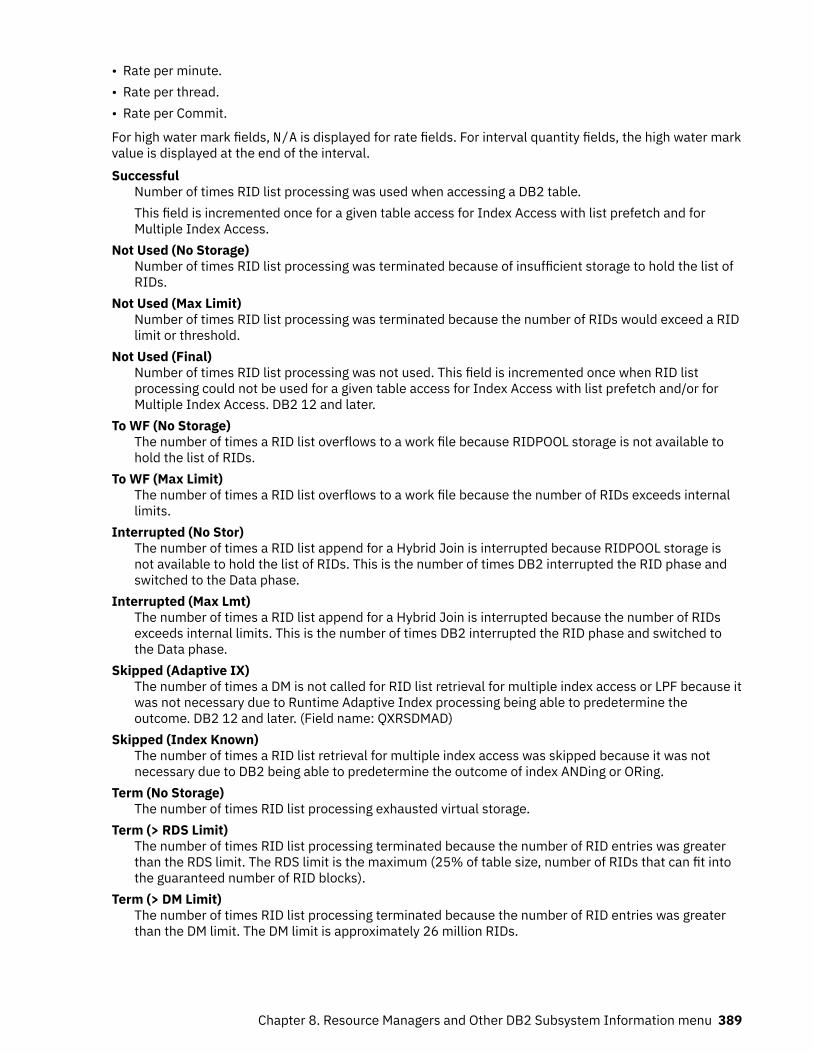
• Rate per minute.• Rate per thread.• Rate per Commit.
For high water mark fields, N/A is displayed for rate fields. For interval quantity fields, the high water markvalue is displayed at the end of the interval.Successful
Number of times RID list processing was used when accessing a DB2 table.This field is incremented once for a given table access for Index Access with list prefetch and forMultiple Index Access.
Not Used (No Storage)Number of times RID list processing was terminated because of insufficient storage to hold the list ofRIDs.
Not Used (Max Limit)Number of times RID list processing was terminated because the number of RIDs would exceed a RIDlimit or threshold.
Not Used (Final)Number of times RID list processing was not used. This field is incremented once when RID listprocessing could not be used for a given table access for Index Access with list prefetch and/or forMultiple Index Access. DB2 12 and later.
To WF (No Storage)The number of times a RID list overflows to a work file because RIDPOOL storage is not available tohold the list of RIDs.
To WF (Max Limit)The number of times a RID list overflows to a work file because the number of RIDs exceeds internallimits.
Interrupted (No Stor)The number of times a RID list append for a Hybrid Join is interrupted because RIDPOOL storage isnot available to hold the list of RIDs. This is the number of times DB2 interrupted the RID phase andswitched to the Data phase.
Interrupted (Max Lmt)The number of times a RID list append for a Hybrid Join is interrupted because the number of RIDsexceeds internal limits. This is the number of times DB2 interrupted the RID phase and switched tothe Data phase.
Skipped (Adaptive IX)The number of times a DM is not called for RID list retrieval for multiple index access or LPF because itwas not necessary due to Runtime Adaptive Index processing being able to predetermine theoutcome. DB2 12 and later. (Field name: QXRSDMAD)
Skipped (Index Known)The number of times a RID list retrieval for multiple index access was skipped because it was notnecessary due to DB2 being able to predetermine the outcome of index ANDing or ORing.
Term (No Storage)The number of times RID list processing exhausted virtual storage.
Term (> RDS Limit)The number of times RID list processing terminated because the number of RID entries was greaterthan the RDS limit. The RDS limit is the maximum (25% of table size, number of RIDs that can fit intothe guaranteed number of RID blocks).
Term (> DM Limit)The number of times RID list processing terminated because the number of RID entries was greaterthan the DM limit. The DM limit is approximately 26 million RIDs.
Chapter 8. Resource Managers and Other DB2 Subsystem Information menu 389
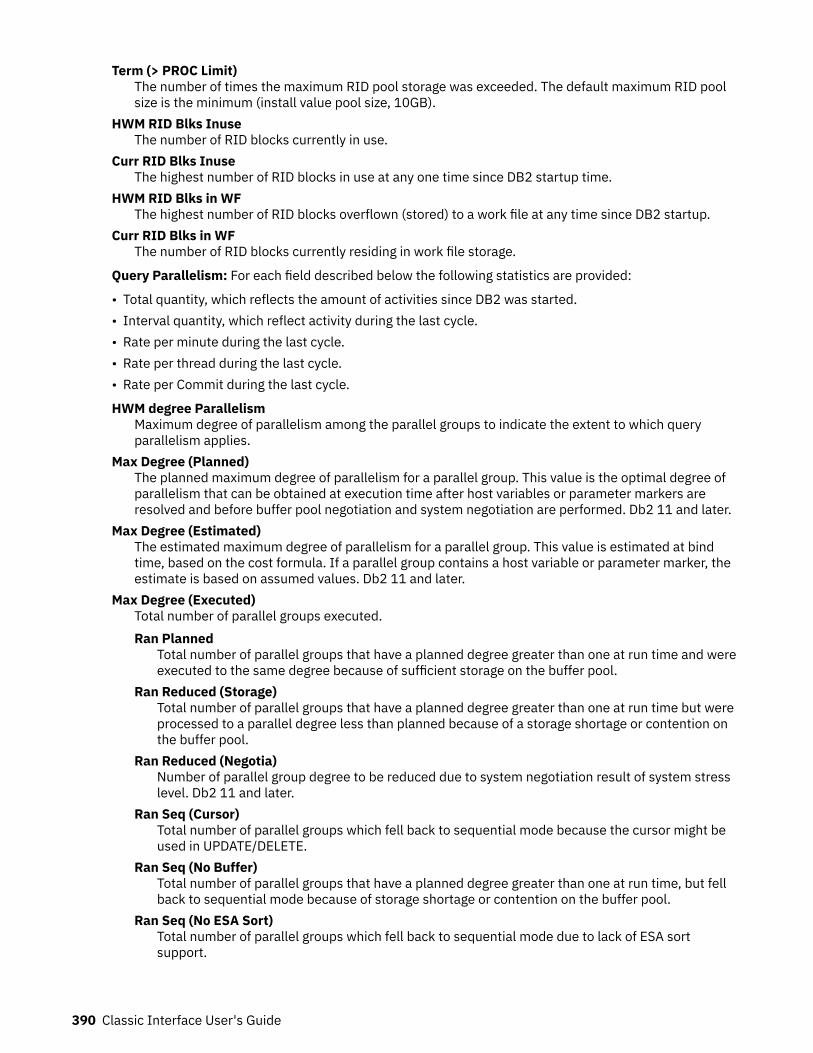
Term (> PROC Limit)The number of times the maximum RID pool storage was exceeded. The default maximum RID poolsize is the minimum (install value pool size, 10GB).
HWM RID Blks InuseThe number of RID blocks currently in use.
Curr RID Blks InuseThe highest number of RID blocks in use at any one time since DB2 startup time.
HWM RID Blks in WFThe highest number of RID blocks overflown (stored) to a work file at any time since DB2 startup.
Curr RID Blks in WFThe number of RID blocks currently residing in work file storage.
Query Parallelism: For each field described below the following statistics are provided:
• Total quantity, which reflects the amount of activities since DB2 was started.• Interval quantity, which reflect activity during the last cycle.• Rate per minute during the last cycle.• Rate per thread during the last cycle.• Rate per Commit during the last cycle.
HWM degree ParallelismMaximum degree of parallelism among the parallel groups to indicate the extent to which queryparallelism applies.
Max Degree (Planned)The planned maximum degree of parallelism for a parallel group. This value is the optimal degree ofparallelism that can be obtained at execution time after host variables or parameter markers areresolved and before buffer pool negotiation and system negotiation are performed. Db2 11 and later.
Max Degree (Estimated)The estimated maximum degree of parallelism for a parallel group. This value is estimated at bindtime, based on the cost formula. If a parallel group contains a host variable or parameter marker, theestimate is based on assumed values. Db2 11 and later.
Max Degree (Executed)Total number of parallel groups executed.Ran Planned
Total number of parallel groups that have a planned degree greater than one at run time and wereexecuted to the same degree because of sufficient storage on the buffer pool.
Ran Reduced (Storage)Total number of parallel groups that have a planned degree greater than one at run time but wereprocessed to a parallel degree less than planned because of a storage shortage or contention onthe buffer pool.
Ran Reduced (Negotia)Number of parallel group degree to be reduced due to system negotiation result of system stresslevel. Db2 11 and later.
Ran Seq (Cursor)Total number of parallel groups which fell back to sequential mode because the cursor might beused in UPDATE/DELETE.
Ran Seq (No Buffer)Total number of parallel groups that have a planned degree greater than one at run time, but fellback to sequential mode because of storage shortage or contention on the buffer pool.
Ran Seq (No ESA Sort)Total number of parallel groups which fell back to sequential mode due to lack of ESA sortsupport.
390 Classic Interface User's Guide
Ran Seq (No ESA Enc)Total number of parallel groups executed in sequential mode due to the unavailable enclave. Thisapplies only to DB2 9.
Ran Seq (Autonomous)Total number of parallel groups which fell back to sequential mode due to executing under anautonomous procedure. This applies only to DB2 11 or higher.
Ran Seq (Negotiate)Number of parallel groups that is degenerated to sequential mode due to system negotiationresult of system stress level.This applies only to DB2 11 or higher.
One DB2 (Coord=No)Total number of parallel groups that are executed on a single DB2 because the COORDINATORsubsystem parameter is set to NO. When the statement is bound, the COORDINATOR subsystemparameter is set to YES. This situation might also occur when a plan or package is bound on a DB2where the COORDINATOR subsystem parameter is set to YES, but is run on a DB2 where thesubsystem parameter COORDINATOR is set to NO.
One DB2 (Isolation)Total number of parallel groups that are executed on a single DB2 because of repeatable-read orread-stability isolation.
One DB2 (DCL GTT)Total number of parallel groups that are part of a query block. The query block is using an UDF. Itis executed on a single DB2 because a Declared Temporary Table exists in the application process.Neither the query block nor the parallel group is referencing a Declared Temporary Table. Aparallel group might use or might not use an UDF.
Groups IntendedTotal number of parallel groups that are intended to run across the data sharing group. This count isonly incremented on the parallelism coordinator at run time.
Groups SkippedThe number of times that the parallelism coordinator must bypass a DB2 when distributing tasksbecause there is not enough buffer pool storage on one or more DB2 members.This field is incremented only on the parallelism coordinator. It is only incremented once per parallelgroup even though it is possible that more than one DB2 systems have a buffer pool shortage for thatparallel group. The purpose of this count is to indicate when there are not enough buffers on amember. Therefore, this count is incremented only when the buffer pool is defined to allowparallelism. For example, if VPXPSEQT is set to 0 on an assistant, DB2 does not send parallel work tothe assistant, but this count is not incremented.
Reform (Config)Total number of parallel groups for which DB2 reformulated the parallel portion of the access pathbecause the sysplex configuration is different from the sysplex configuration at bind time. Thiscounter is only incremented by the parallelism coordinator at run time.
Reform (No Buffer)Total number of parallel groups for which DB2 reformulated the paralllel portion of the access pathbecause there was not enough buffer pool resource. This counter is only incremented by theparallelism coordinator at run time.
MiscellaneousIncremental Bind
Occurrences of incremental bind, which take place upon execution of a DB2 plan that is bound asVALIDATE(RUN).
Max SQL LevelsThe maximum level of nested SQL cascading. This includes cascading because of triggers, UDFs, andstored procedures.
Chapter 8. Resource Managers and Other DB2 Subsystem Information menu 391
Max LOB Storage (MB)Maximum storage that is used for LOB values.
Max XML StorageMaximum storage that is used for XML values.
Array ExpansionsThe number of times an array variable is expanded beyond 32K.This applies to DB2 11 or higher.
Sparse IX (Disabled)The number of times that sparse index is disabled because of insufficient storage.This applies to DB2 11 or higher.
Sparse IX (Built WF)The number of times that sparse index built a physical work file for probing.This applies to DB2 11 or higher.
Fetched 1 Block Only (QXR1BOAD)The number of times 1 block is fetched and there were no further fetches. DB2 12 and later.
Pipes Allocated (QISTINPA)The number of data manager fast insert pipes that were allocated since DB2 restart. Db2 12 and later.
Pipes Disabled (QISTINPD)The number of data manager fast insert pipes that were disabled since DB2 restart. Db2 12 and later.
Insert Algorithm 1INSERT algorithm type 1.Db2 12 and later.
Insert Algorithm 2INSERT algorithm type 2. Db2 12 and later.
Execution History LostThe number of execution histories lost. Db2 12 and later.
HV Recording Lost HistThe number of HV recordings lost in execution history. Db2 12 and later.
Stored procedures: For each field described below the following statistics are provided:
• Total quantity, which reflects the amount of activities since DB2 was started.• Interval quantity, which reflects activity during the last cycle.• Rate per minute during the last cycle.• Rate per thread during the last cycle.• Rate per Commit during the last cycle.
AbendedCALL statements executed to invoke a stored procedure that terminated abnormally.
Timed OutCALL statements executed to invoke a stored procedure that timed out while waiting to be scheduled.
RejectedCALL statements executed to invoke a stored procedure that was in the STOP ACTION(REJECT) state.
User Defined Functions: For each field described below the following statistics are provided:
• Total quantity, which reflects the amount of activities since DB2 was started.• Interval quantity, which reflects activity during the last cycle.• Rate per minute during the last cycle.• Rate per thread during the last cycle.• Rate per Commit during the last cycle.
ExecutedThe number of user-defined functions (UDFs) executed.
392 Classic Interface User's Guide
AbendedThe number of times a UDF abended.
Timed OutThe number of times a UDF timed out when waiting to be scheduled.
RejectedThe number of times a UDF was rejected.
Triggers: For each field described below the following statistics are provided:
• Total quantity, which reflects the amount of activities since DB2 was started.• Interval quantity, which reflects activity during the last cycle.• Rate per minute during the last cycle.• Rate per thread during the last cycle.• Rate per Commit during the last cycle.
Stmt Triggers ExecutedThe number of times a statement trigger was activated.
Row Triggers ActivatedThe number of times a row trigger was activated.
SQL Error in TriggerThe number of times an SQL error occurred during execution of a triggered action.
Dynamic SQLPrepares (Copy Found)
The number of times a PREPARE request is satisfied by making a copy from the prepared statementcache.
Prepares (Catalog Found)The number of times a PREPARE request is satisfied by making a copy from the stabilized statement inSYSIBM.SYSDYNQRY catalog table. The stabilized statement search is done only when no matchingstatement is found in the prepared statement cache. DB2 12 and later. (Field name: QXSTSFND)
Prepares (Copy NFound)The number of times a PREPARE request is received but a matching statement is not found in theprepared statement cache. Cache search is only done for DML SQL and only if cache option is active.
Prepares (Restrict IX)The number of PREPARE requests for which the use of index/indexes are restricted because the indexis in a pending state.
KeepDyn (Implicit)The number of times the following actions occurred:
• An implicit PREPARE is performed because the KEEPDYNAMIC(YES) option is used• An OPEN, EXECUTE, or DESCRIBE of a dynamic statement occurred after a COMMIT, however, DB2
no longer had a valid copy of the executable version of the prepared statement.
KeepDyn (Avoided)The number of times that a PREPARE is avoided because KEEPDYNAMIC(YES) is used together withprepared statement caching, and DB2 still had the copy of the executable version of the preparedstatement.
KeepDyn (Exceed Limit)The number of times that an executable copy of a prepared statement is discarded because theMAXKEEPD system limit is exceeded.
KeepDyn (Invalidated)The number of times that a prepared statement is purged from the cache because a DROP, ALTER, orREVOKE statement is issued on a dependent object.
Chapter 8. Resource Managers and Other DB2 Subsystem Information menu 393
Literals (Parsed)The number of times DB2 parsed dynamic statements because CONCENTRATE STATEMENTS WITHLITERALS behavior is in effect for the prepare of the statement for the dynamic statement cache.
Literals (Replaced)The number of times DB2 replaced at least one literal in a dynamic statement becauseCONCENTRATE STATEMENTS WITH LITERALS is in effect for the prepare of the statement for dynamicstatement cache.
Literals (Matched)The number of times DB2 found a matching reusable copy of a dynamic statement in statement cacheduring preparation of a statement that had literals replaced because of CONCENTRATE.
Literals (Duplicated)The number of times DB2 created a duplicate statement instance in the statement cache for adynamic statement that had literals replaced by CONCENTRATE STATEMENTS WITH LITERALSbehavior and the duplicate statement instance was needed because a cache match failed because ofliteral reusability criteria.
Row IDSuccessful
The number of times that direct row access was successful.Revert to Index
The number of times an attempt to use direct row access reverted to using an index to locate a record.Revert to TS Scan
The number of times an attempt to use direct row access reverted to using a table space scan tolocate a record.
Rows ProcessingRows Fetched
The number of fetched rows.Rows Inserted
The number of inserted rows.Rows Updated
The number of updated rows.Rows Deleted
The number of deleted rows.
Currently CommittedInsert Rows Skipped
The number of rows that are skipped by read transactions because uncommitted inserts areperformed when current committed read is in effect for fetch operations.
Delete Rows AccessedThe number of rows that are skipped by read transactions because uncommitted deletes areperformed when current committed read is in effect for fetch operations.
Update Rows AccessedThe number of rows that are accessed by read transactions while uncommitted updates existedbecause currently committed read behavior is in effect for fetch operation.
Workfile Database (WFDB)Curr WFDB For TS (KB)
Current total storage (KB) that is configured for all table spaces in the WFDB.This applies to DB2 11 or higher.
DGTT WF configed (KB)Total preferred STORAGE (KB) that is configured for DGTTs in the WFDB.This applies to DB2 11 or higher.
394 Classic Interface User's Guide
WF Stor Configed (KB)Total preferred STORAGE (KB) that is configured for work files in the WFDB.This applies to DB2 11 or higher.
System WKDB thresholdThe value in percent (%) for the threshold of the system-level WFDB space usage alert.Valid values: 0 - 100This applies to DB2 11 or higher.
Max Total StorageThe maximum total storage (KBs) that is used in the WFDB at system level for DGTTs and work filessince DB2 is started. After restart, this value starts again with 0.
HWM DGTT WF Stor (KB)The highest total storage (KB) that is used for DGTTs by all agents on the system since DB2 is started.This applies to DB2 11 or higher.
HWM WF Storage (KB)The highest total storage (KB) that is used for work files by all agents on the system since DB2 isstarted.This applies to DB2 11 or higher.
Curr DGTT WF Stor (KB)Current total storage (KB) that is used for DGTTs by all agents on the system since DB2 is started.This applies to DB2 11 or higher.
Curr WF Storage (KB)The current total storage (KB) that is used for work files by all agents on the system since DB2 started.This applies to DB2 11 or higher.
Storage in 4K TSCurrent 4KB table space storage that is used (KB).
Storage in 32K TSCurrent 32KB table space storage that is used (KB).
32K used instead of 4KThe number of times a 32KB page TS is used when a 4KB page TS is to be preferred but not available.
4K used instead of 32KThe number of times a 4KB page TS is used when a 32KB page TS is to be preferred but not available.
HWM DM WF CountHigh watermark count (maximum number) of SORT-related DM in-memory work files that are active atany point in time since DB2 is started.
HWM NSort WF CountHigh watermark count (maximum number) of non-SORT-related DM in-memory work files that areactive at any point in time since DB2 is started.This applies to DB2 11 or higher.
Curr DM WF CountThe number of times SORT-related DM in-memory work files are currently active.
Curr NSort WF CountThe number of times non-SORT related DM in-memory work files are currently active.This applies to DB2 11 or higher.
HWM DM WF size (KB)High watermark count of maximum space in KB that is used for the active DM In-Memory work files atany point in time since DB2 is started.
Curr DM WF size (KB)Total space in KB that is used for the currently active DM In-Memory work files.
Chapter 8. Resource Managers and Other DB2 Subsystem Information menu 395
HWM Sort WF CountHigh watermark count (maximum number) of Sort-Inmem work files that are active at any point intime since DB2 is started.
Curr Sort WF CountThe number of times Sort-Inmem work files are currently active.
HWM Sort WF size (KB)High watermark count of maximum space that is used for the active Sort-Inmem work files at anypoint in time since DB2 is started.
Curr Sort WF size (KB)Total Space that is used for the currently active Sort-Inmem work files.
WF Overflow to TSThe number of times the type-2 in-memory work files overflow into a physical tablespace since DB2 isstarted.This applies to DB2 11 or higher.
WF Not Created(NoStor)The number of times a work file is not created as any type of DM in-memory work file because ofcritical storage conditions since DB2 is started.This applies to DB2 11 or higher.
Agent Max StorageThe limit of the maximum storage per agent (KB).
Number of Max ExceededThe number of times the maximum storage limit is exceeded.
Agent WFDB thresholdThe value for the threshold of the agent-level WFDB space usage alert.Valid values: 0 - 100.This applies to DB2 11 or higher.
HWM WFDB by Thread(KB)The highest amount of WFDB storage (KB) that is used by any thread on the system since DB2 isstarted.This applies to DB2 11 or higher.
Open/Close StatisticsThis panel shows information about open and close data set activity and information about DeferredClose activity.
396 Classic Interface User's Guide
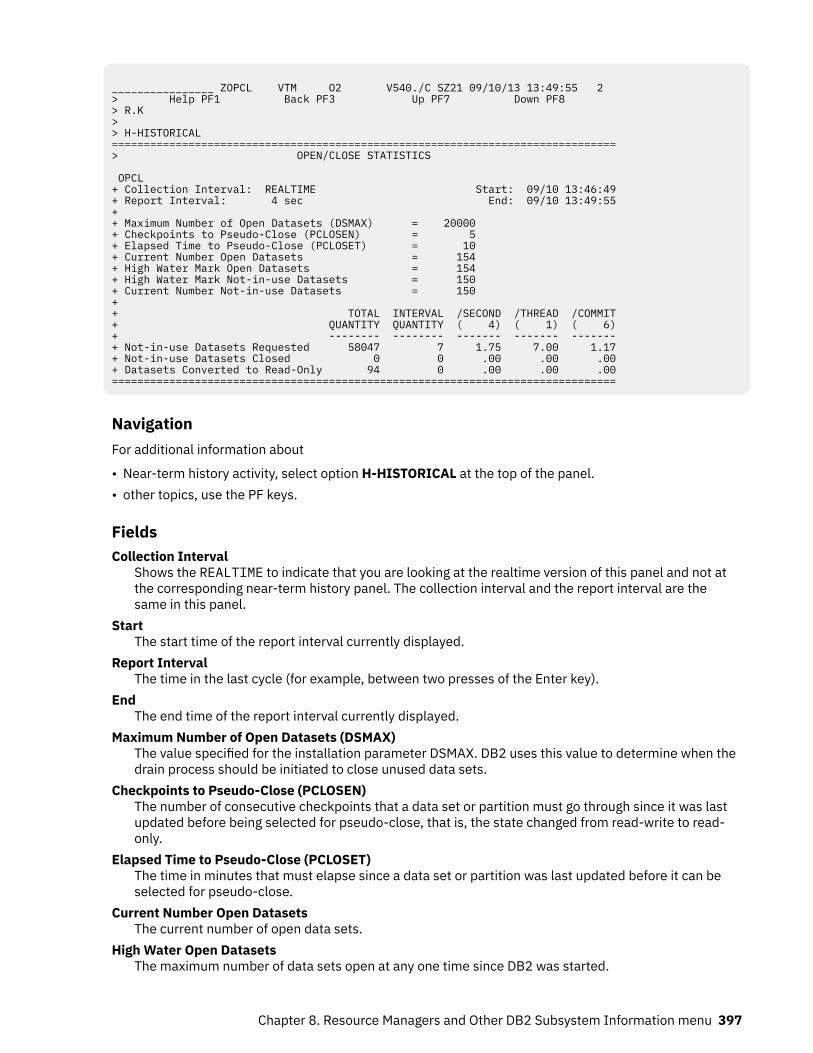
________________ ZOPCL VTM O2 V540./C SZ21 09/10/13 13:49:55 2 > Help PF1 Back PF3 Up PF7 Down PF8 > R.K > > H-HISTORICAL =============================================================================== > OPEN/CLOSE STATISTICS OPCL + Collection Interval: REALTIME Start: 09/10 13:46:49 + Report Interval: 4 sec End: 09/10 13:49:55 + + Maximum Number of Open Datasets (DSMAX) = 20000 + Checkpoints to Pseudo-Close (PCLOSEN) = 5 + Elapsed Time to Pseudo-Close (PCLOSET) = 10 + Current Number Open Datasets = 154 + High Water Mark Open Datasets = 154 + High Water Mark Not-in-use Datasets = 150 + Current Number Not-in-use Datasets = 150 + + TOTAL INTERVAL /SECOND /THREAD /COMMIT + QUANTITY QUANTITY ( 4) ( 1) ( 6) + -------- -------- ------- ------- ------- + Not-in-use Datasets Requested 58047 7 1.75 7.00 1.17 + Not-in-use Datasets Closed 0 0 .00 .00 .00 + Datasets Converted to Read-Only 94 0 .00 .00 .00 ===============================================================================
NavigationFor additional information about
• Near-term history activity, select option H-HISTORICAL at the top of the panel.• other topics, use the PF keys.
FieldsCollection Interval
Shows the REALTIME to indicate that you are looking at the realtime version of this panel and not atthe corresponding near-term history panel. The collection interval and the report interval are thesame in this panel.
StartThe start time of the report interval currently displayed.
Report IntervalThe time in the last cycle (for example, between two presses of the Enter key).
EndThe end time of the report interval currently displayed.
Maximum Number of Open Datasets (DSMAX)The value specified for the installation parameter DSMAX. DB2 uses this value to determine when thedrain process should be initiated to close unused data sets.
Checkpoints to Pseudo-Close (PCLOSEN)The number of consecutive checkpoints that a data set or partition must go through since it was lastupdated before being selected for pseudo-close, that is, the state changed from read-write to read-only.
Elapsed Time to Pseudo-Close (PCLOSET)The time in minutes that must elapse since a data set or partition was last updated before it can beselected for pseudo-close.
Current Number Open DatasetsThe current number of open data sets.
High Water Open DatasetsThe maximum number of data sets open at any one time since DB2 was started.
Chapter 8. Resource Managers and Other DB2 Subsystem Information menu 397
High Water Mark Not-in-use DatasetsThe maximum number of pagesets specified with CLOSE(YES) that are not in use but are notphysically closed.
Current Number Not-in-use DatasetsThe current number of open pagesets specified with CLOSE(YES) that are not in use but are notphysically closed.
For each of the following fields, the following statistics values are provided:TOTAL QUANTITY
Total quantity, which reflects the amount of activities since DB2 was started.INTERVAL QUANTITY
Interval quantity, which reflects the amount of activities during the last cycle./SECOND
Rate per second during the last cycle. The number under /SECOND (in parentheses) is the number ofseconds in the interval.
/THREADRate per thread during the last cycle. The number under /THREAD (in parentheses) is the number ofCreate Threads during the interval.
/COMMITRate per Commit during the last cycle. The number under /COMMIT (in parentheses) is the number ofcommit requests (including abort requests) during the interval.
Not-in-use Datasets RequestedNumber of requests to open a data set that was on the deferred close queue. When this occurs, aphysical data set Open is not necessary.
Not-in-use Datasets ClosedNumber of not-in-use data sets that were closed because the total number of open data sets reachedthe Deferred Close threshold. The Deferred Close threshold is based on the smaller of the values ofDSMAX or the MVS DD limit.
Datasets Converted to Read-OnlyThe number of infrequently updated data sets converted from read-write to read-only (pseudo-close).The SYSLGRNG entry is closed at this time.
DB2 Command StatisticsThis panel shows information about current DB2 command activity.
398 Classic Interface User's Guide
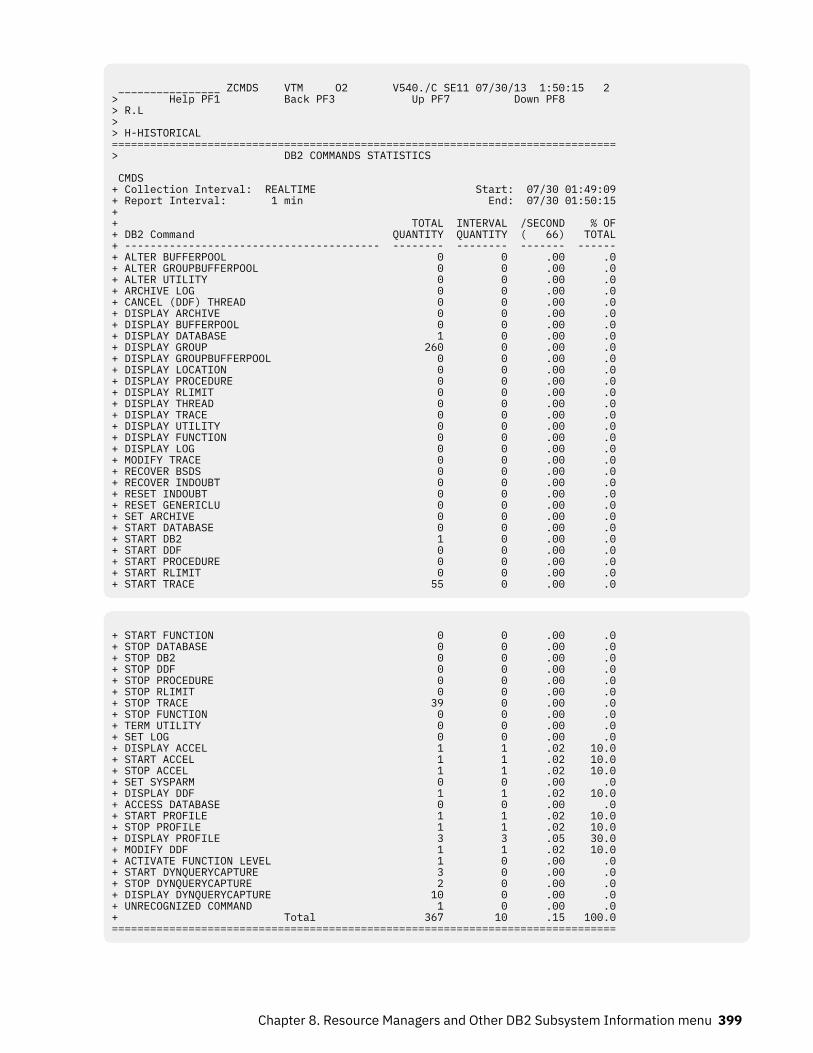
________________ ZCMDS VTM O2 V540./C SE11 07/30/13 1:50:15 2 > Help PF1 Back PF3 Up PF7 Down PF8 > R.L > > H-HISTORICAL =============================================================================== > DB2 COMMANDS STATISTICS CMDS + Collection Interval: REALTIME Start: 07/30 01:49:09 + Report Interval: 1 min End: 07/30 01:50:15 + + TOTAL INTERVAL /SECOND % OF + DB2 Command QUANTITY QUANTITY ( 66) TOTAL + ---------------------------------------- -------- -------- ------- ------ + ALTER BUFFERPOOL 0 0 .00 .0 + ALTER GROUPBUFFERPOOL 0 0 .00 .0 + ALTER UTILITY 0 0 .00 .0 + ARCHIVE LOG 0 0 .00 .0 + CANCEL (DDF) THREAD 0 0 .00 .0 + DISPLAY ARCHIVE 0 0 .00 .0 + DISPLAY BUFFERPOOL 0 0 .00 .0 + DISPLAY DATABASE 1 0 .00 .0 + DISPLAY GROUP 260 0 .00 .0 + DISPLAY GROUPBUFFERPOOL 0 0 .00 .0 + DISPLAY LOCATION 0 0 .00 .0 + DISPLAY PROCEDURE 0 0 .00 .0 + DISPLAY RLIMIT 0 0 .00 .0 + DISPLAY THREAD 0 0 .00 .0 + DISPLAY TRACE 0 0 .00 .0 + DISPLAY UTILITY 0 0 .00 .0 + DISPLAY FUNCTION 0 0 .00 .0 + DISPLAY LOG 0 0 .00 .0 + MODIFY TRACE 0 0 .00 .0 + RECOVER BSDS 0 0 .00 .0 + RECOVER INDOUBT 0 0 .00 .0 + RESET INDOUBT 0 0 .00 .0 + RESET GENERICLU 0 0 .00 .0 + SET ARCHIVE 0 0 .00 .0 + START DATABASE 0 0 .00 .0 + START DB2 1 0 .00 .0 + START DDF 0 0 .00 .0 + START PROCEDURE 0 0 .00 .0+ START RLIMIT 0 0 .00 .0+ START TRACE 55 0 .00 .0
+ START FUNCTION 0 0 .00 .0+ STOP DATABASE 0 0 .00 .0+ STOP DB2 0 0 .00 .0+ STOP DDF 0 0 .00 .0+ STOP PROCEDURE 0 0 .00 .0+ STOP RLIMIT 0 0 .00 .0+ STOP TRACE 39 0 .00 .0+ STOP FUNCTION 0 0 .00 .0+ TERM UTILITY 0 0 .00 .0+ SET LOG 0 0 .00 .0+ DISPLAY ACCEL 1 1 .02 10.0+ START ACCEL 1 1 .02 10.0+ STOP ACCEL 1 1 .02 10.0+ SET SYSPARM 0 0 .00 .0+ DISPLAY DDF 1 1 .02 10.0+ ACCESS DATABASE 0 0 .00 .0+ START PROFILE 1 1 .02 10.0+ STOP PROFILE 1 1 .02 10.0+ DISPLAY PROFILE 3 3 .05 30.0+ MODIFY DDF 1 1 .02 10.0+ ACTIVATE FUNCTION LEVEL 1 0 .00 .0 + START DYNQUERYCAPTURE 3 0 .00 .0 + STOP DYNQUERYCAPTURE 2 0 .00 .0 + DISPLAY DYNQUERYCAPTURE 10 0 .00 .0 + UNRECOGNIZED COMMAND 1 0 .00 .0+ Total 367 10 .15 100.0===============================================================================
Chapter 8. Resource Managers and Other DB2 Subsystem Information menu 399
NavigationFor additional information about
• Near-term history activity, select option H-HISTORICAL at the top of the panel.• other topics, use the PF keys.
Fields• Total Quantity - activity since DB2 was started.• Interval Quantity - activity during the last cycle.• Rate per second during the last cycle.• Percentage of total commands since DB2 was started.
ALTER BUFFERPOOLALTER BUFFERPOOL commands executed to alter attributes for active or inactive buffer pools.
ALTER GROUP BUFFERPOOLALTER GROUPBUFFERPOOL commands executed to alter attributes of group buffer pools.
ARCHIVE LOGARCHIVE LOG commands executed to initiate a DB2 active log switch.
CANCEL DDF THREADCANCEL DDF THREAD commands executed to cancel a thread.
DISPLAY ARCHIVEDISPLAY ARCHIVE commands executed to display input archive log information.
DISPLAY BUFFERPOOLDISPLAY BUFFERPOOL commands executed to display statistics for active or inactive buffer pools.
DISPLAY DATABASEDISPLAY DATABASE commands executed to display status information about tablespaces andindexspaces within a database.
DISPLAY GROUPDISPLAY GROUP commands executed to display statistics about the data sharing group to which theDB2 subsystem belongs.
DISPLAY GROUP BUFFERPOOLDISPLAY GROUPBUFFERPOOL commands executed to display attributes of group buffer pools.
DISPLAY LOCATIONDISPLAY LOCATION commands executed to display statistics about threads with distributedrelationships.
DISPLAY PROCEDUREDISPLAY PROCEDURE commands executed to display statistics about stored procedures.
DISPLAY RLIMITDISPLAY RLIMIT commands executed to display the current status of the resource limit facility.
DISPLAY THREADDISPLAY THREAD commands executed to display status information about DB2 threads.
DISPLAY TRACEDISPLAY TRACE commands executed to display a list of active traces.
DISPLAY UTILITYDISPLAY UTILITY commands executed to display status information about DB2 utility jobs.
MODIFY TRACEMODIFY TRACE commands executed to change the IFCIDs being traced for an active trace.
RECOVER BSDSRECOVER BSDS commands executed to recover a boot strap data set that has been disabled by anerror.
400 Classic Interface User's Guide
RECOVER INDOUBTRECOVER INDOUBT commands executed to recover threads left in the indoubt status.
RESET GENERICLURESET GENERICLU commands executed to purge information stored by VTAM in the coupling facilityfor one or more partners of a particular DB2 subsystem.
RESET INDOUBTRESET INDOUBT commands executed to purge indoubt thread information.
SET ARCHIVESET ARCHIVE commands executed to change the maximum tape units and the de-allocation timeparameters originally set in the installation parameters.
START DATABASESTART DATABASE commands executed to make stopped databases available for use.
START DB2START DB2 commands executed.
START DDFSTART DDF commands executed to start the distributed data facility.
START PROCEDURESTART PROCEDURE commands executed to activate the definition of a stored procedure which wasstopped, or refreshes a stored procedure that is cached.
START RLIMITSTART RLIMIT commands executed to start the resource limit facility.
START TRACESTART TRACE commands executed to begin collection of DB2 trace records.
STOP DATABASESTOP DATABASE commands executed to make specified databases unavailable for use.
STOP DB2STOP DB2 commands executed.
STOP DDFSTOP DDF commands executed to stop the distributed data facility.
STOP PROCEDURESTOP PROCEDURE commands executed to prevent DB2 from accepting SQL CALL statements for oneor more stored procedure.
STOP RLIMITSTOP RLIMIT commands executed to stop the resource limit facility.
STOP TRACESTOP TRACE commands executed to stop collection of DB2 trace records.
TERM UTILITYTERM UTILITY commands executed to terminate execution of a utility job.
SET LOGSet Log commands that are executed to modify the checkpoint frequency that are specified duringinstallation.
DISPLAY ACCELDisplay Accelerator commands that are executed to display details about accelerators that areconnected to the current subsystem.
START ACCELStart Accelerator commands that are executed to activate an accelerator.
STOP ACCELStop Accelerator commands that are executed to deactivate an accelerator.
Chapter 8. Resource Managers and Other DB2 Subsystem Information menu 401
SET SYSPARMThe number of DB2 SET SYSPARM commands that are issued. This includes normal and abnormalcompletion of the command.
DISPLAY DDFThe number of DB2 DISPLAY DDF commands that are issued. This includes normal and abnormalcompletion of the command.
ACCESS DATABASEThe number of DB2 ACCESS DATABASE commands that are issued. This includes normal andabnormal completion of the command.
START PROFILEThe number of DB2 START PROFILE commands that are issued. This includes normal and abnormalcompletion of the command.
STOP PROFILEThe number of DB2 STOP PROFILE commands that are issued. This includes normal and abnormalcompletion of the command.
DISPLAY PROFILEThe number of DB2 DISPLAY PROFILE commands that are issued. This includes normal andabnormal completion of the command.
MODIFY DDFThe number of DB2 MODIFY DDF commands that are issued. This includes normal and abnormalcompletion of the command.This field is only displayed for DB2 10 or above.
ACTIVATE FUNCTION LEVEL (Q9STCTEN)The number of DB2 ACTIVATE FUNCTION LEVEL commands issued. This includes normal andabnormal completion of the command. DB2 12 and later.
START DYNQUERYCAPTURE (Q9STCTSQ)The number of DB2 START DYNQUERYCAPTURE commands issued. This includes normal andabnormal completion of the command. DB2 12 and later.
STOP DYNQUERYCAPTURE (QSTCTXQ)The number of DB2 STOP DYNQUERYCAPTURE commands issued. This includes normal and abnormalcompletion of the command. DB2 12 and later.
DISPLAY DYNQUERYCAPTURE (Q9STCTDQ)The number of DB2 DISPLAY DYNQUERYCAPTURE commands issued. This includes normal andabnormal completion of the command. This field only shown for DB2 12 and later.
UNRECOGNIZED COMMANDNumber of unrecognized commands.
TotalAll DB2 commands.
DB2 StorageThis menu option provides access to realtime DB2 storage management performance and statisticsinformation.
The statistics data shown in the following panels is based on and derived from IFCID 225 performancedata. When the menu option is invoked, data is requested from DB2 through READS, derived fields arecalculated, and the requested data is displayed. To ensure consistency among data on subsequentpanels, this data is kept in memory and is used as long as option M (DB2 Storage) is invoked again. Ifthe Enter key is pressed on any of the panels, the data is refreshed and consistently used on allsubsequent panels.
If data for certain fields on subsequent panels is not available or cannot be calculated because ofdifferences of the installed DB2 version, the contents are marked as N/A.
402 Classic Interface User's Guide
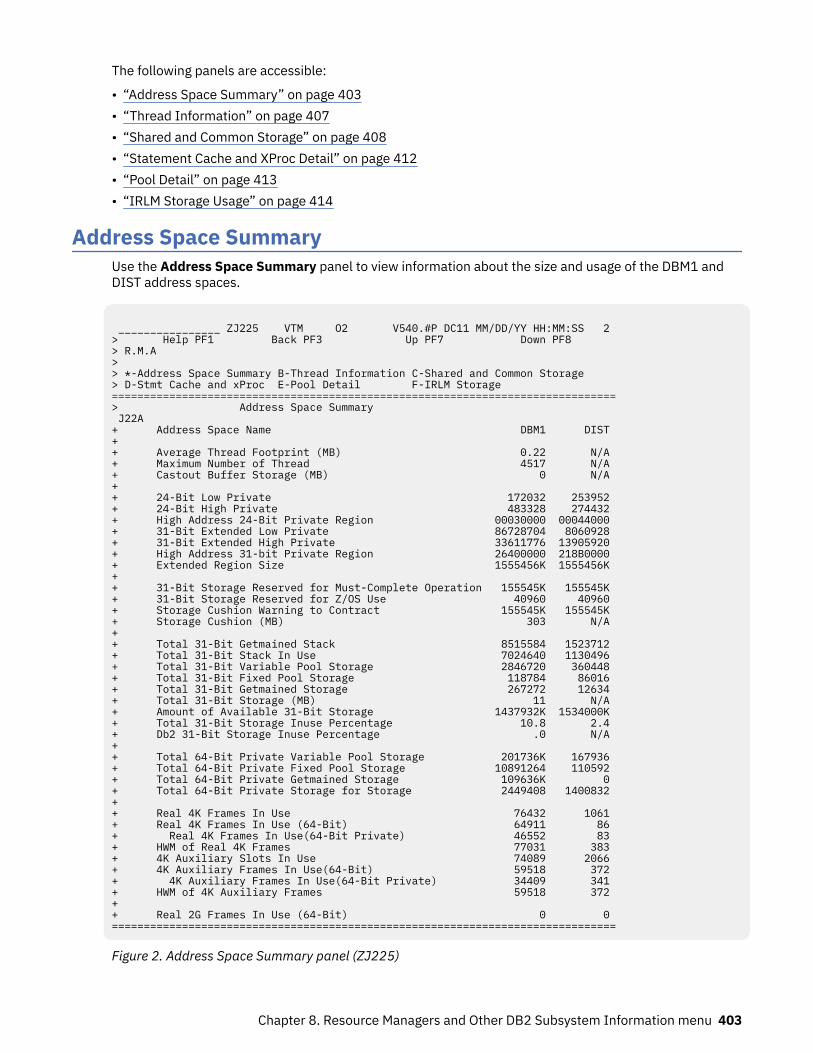
The following panels are accessible:
• “Address Space Summary” on page 403• “Thread Information” on page 407• “Shared and Common Storage” on page 408• “Statement Cache and XProc Detail” on page 412• “Pool Detail” on page 413• “IRLM Storage Usage” on page 414
Address Space SummaryUse the Address Space Summary panel to view information about the size and usage of the DBM1 andDIST address spaces.
________________ ZJ225 VTM O2 V540.#P DC11 MM/DD/YY HH:MM:SS 2 > Help PF1 Back PF3 Up PF7 Down PF8 > R.M.A > > *-Address Space Summary B-Thread Information C-Shared and Common Storage > D-Stmt Cache and xProc E-Pool Detail F-IRLM Storage ===============================================================================> Address Space Summary J22A + Address Space Name DBM1 DIST + + Average Thread Footprint (MB) 0.22 N/A + Maximum Number of Thread 4517 N/A + Castout Buffer Storage (MB) 0 N/A + + 24-Bit Low Private 172032 253952 + 24-Bit High Private 483328 274432 + High Address 24-Bit Private Region 00030000 00044000 + 31-Bit Extended Low Private 86728704 8060928 + 31-Bit Extended High Private 33611776 13905920 + High Address 31-bit Private Region 26400000 218B0000 + Extended Region Size 1555456K 1555456K + + 31-Bit Storage Reserved for Must-Complete Operation 155545K 155545K + 31-Bit Storage Reserved for Z/OS Use 40960 40960 + Storage Cushion Warning to Contract 155545K 155545K + Storage Cushion (MB) 303 N/A + + Total 31-Bit Getmained Stack 8515584 1523712 + Total 31-Bit Stack In Use 7024640 1130496 + Total 31-Bit Variable Pool Storage 2846720 360448 + Total 31-Bit Fixed Pool Storage 118784 86016 + Total 31-Bit Getmained Storage 267272 12634 + Total 31-Bit Storage (MB) 11 N/A + Amount of Available 31-Bit Storage 1437932K 1534000K + Total 31-Bit Storage Inuse Percentage 10.8 2.4+ Db2 31-Bit Storage Inuse Percentage .0 N/A + + Total 64-Bit Private Variable Pool Storage 201736K 167936 + Total 64-Bit Private Fixed Pool Storage 10891264 110592 + Total 64-Bit Private Getmained Storage 109636K 0 + Total 64-Bit Private Storage for Storage 2449408 1400832 + + Real 4K Frames In Use 76432 1061 + Real 4K Frames In Use (64-Bit) 64911 86 + Real 4K Frames In Use(64-Bit Private) 46552 83 + HWM of Real 4K Frames 77031 383 + 4K Auxiliary Slots In Use 74089 2066 + 4K Auxiliary Frames In Use(64-Bit) 59518 372 + 4K Auxiliary Frames In Use(64-Bit Private) 34409 341 + HWM of 4K Auxiliary Frames 59518 372 + + Real 2G Frames In Use (64-Bit) 0 0 ===============================================================================
Figure 2. Address Space Summary panel (ZJ225)
Chapter 8. Resource Managers and Other DB2 Subsystem Information menu 403
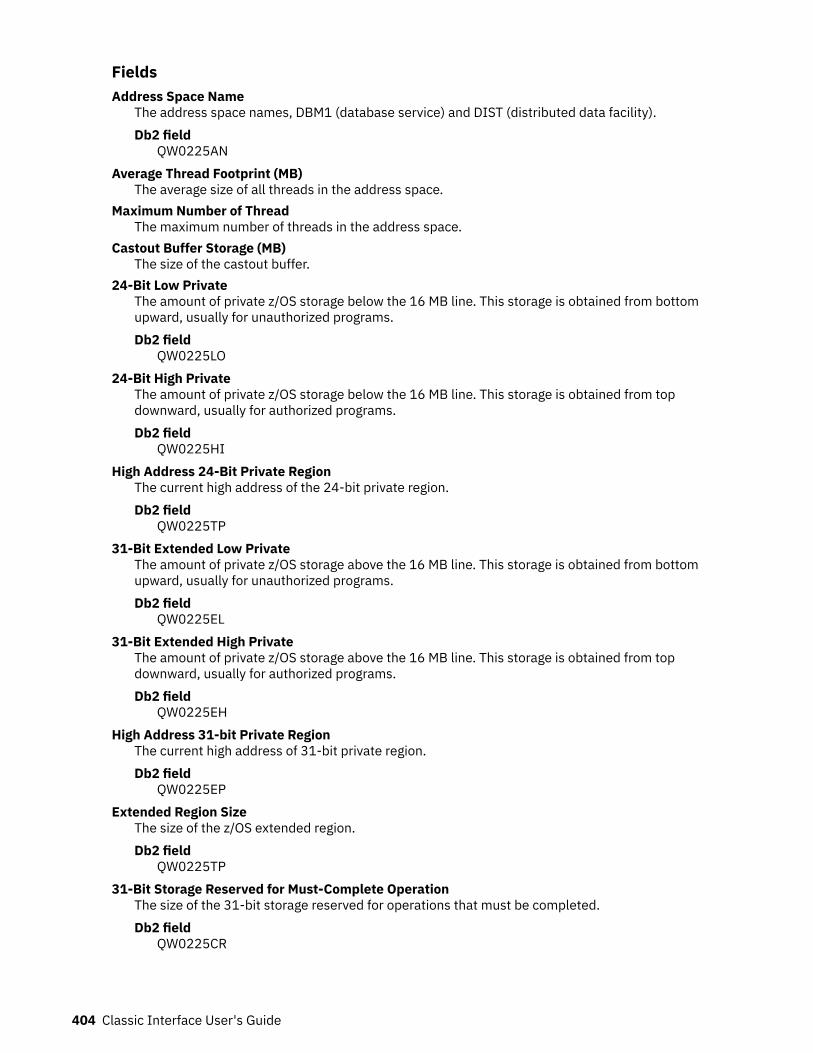
FieldsAddress Space Name
The address space names, DBM1 (database service) and DIST (distributed data facility).Db2 field
QW0225ANAverage Thread Footprint (MB)
The average size of all threads in the address space.Maximum Number of Thread
The maximum number of threads in the address space.Castout Buffer Storage (MB)
The size of the castout buffer.24-Bit Low Private
The amount of private z/OS storage below the 16 MB line. This storage is obtained from bottomupward, usually for unauthorized programs.Db2 field
QW0225LO24-Bit High Private
The amount of private z/OS storage below the 16 MB line. This storage is obtained from topdownward, usually for authorized programs.Db2 field
QW0225HIHigh Address 24-Bit Private Region
The current high address of the 24-bit private region.Db2 field
QW0225TP31-Bit Extended Low Private
The amount of private z/OS storage above the 16 MB line. This storage is obtained from bottomupward, usually for unauthorized programs.Db2 field
QW0225EL31-Bit Extended High Private
The amount of private z/OS storage above the 16 MB line. This storage is obtained from topdownward, usually for authorized programs.Db2 field
QW0225EHHigh Address 31-bit Private Region
The current high address of 31-bit private region.Db2 field
QW0225EPExtended Region Size
The size of the z/OS extended region.Db2 field
QW0225TP31-Bit Storage Reserved for Must-Complete Operation
The size of the 31-bit storage reserved for operations that must be completed.Db2 field
QW0225CR
404 Classic Interface User's Guide
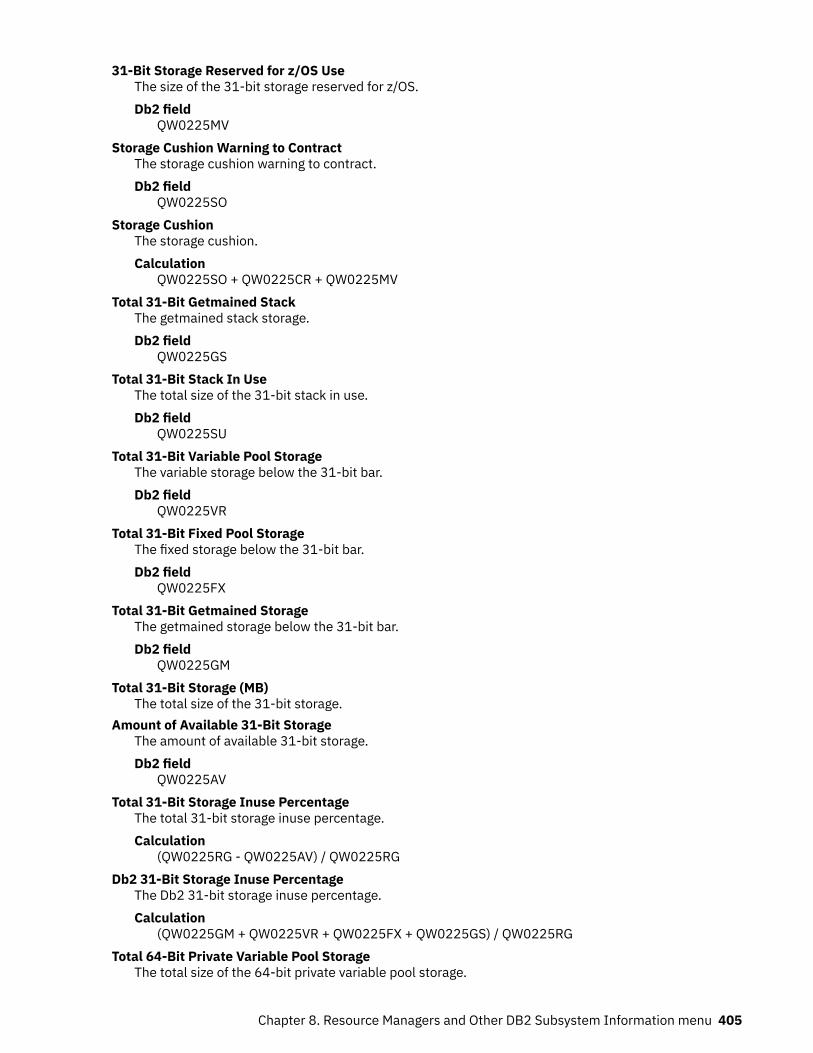
31-Bit Storage Reserved for z/OS UseThe size of the 31-bit storage reserved for z/OS.Db2 field
QW0225MVStorage Cushion Warning to Contract
The storage cushion warning to contract.Db2 field
QW0225SOStorage Cushion
The storage cushion.Calculation
QW0225SO + QW0225CR + QW0225MVTotal 31-Bit Getmained Stack
The getmained stack storage.Db2 field
QW0225GSTotal 31-Bit Stack In Use
The total size of the 31-bit stack in use.Db2 field
QW0225SUTotal 31-Bit Variable Pool Storage
The variable storage below the 31-bit bar.Db2 field
QW0225VRTotal 31-Bit Fixed Pool Storage
The fixed storage below the 31-bit bar.Db2 field
QW0225FXTotal 31-Bit Getmained Storage
The getmained storage below the 31-bit bar.Db2 field
QW0225GMTotal 31-Bit Storage (MB)
The total size of the 31-bit storage.Amount of Available 31-Bit Storage
The amount of available 31-bit storage.Db2 field
QW0225AVTotal 31-Bit Storage Inuse Percentage
The total 31-bit storage inuse percentage.Calculation
(QW0225RG - QW0225AV) / QW0225RGDb2 31-Bit Storage Inuse Percentage
The Db2 31-bit storage inuse percentage.Calculation
(QW0225GM + QW0225VR + QW0225FX + QW0225GS) / QW0225RGTotal 64-Bit Private Variable Pool Storage
The total size of the 64-bit private variable pool storage.
Chapter 8. Resource Managers and Other DB2 Subsystem Information menu 405
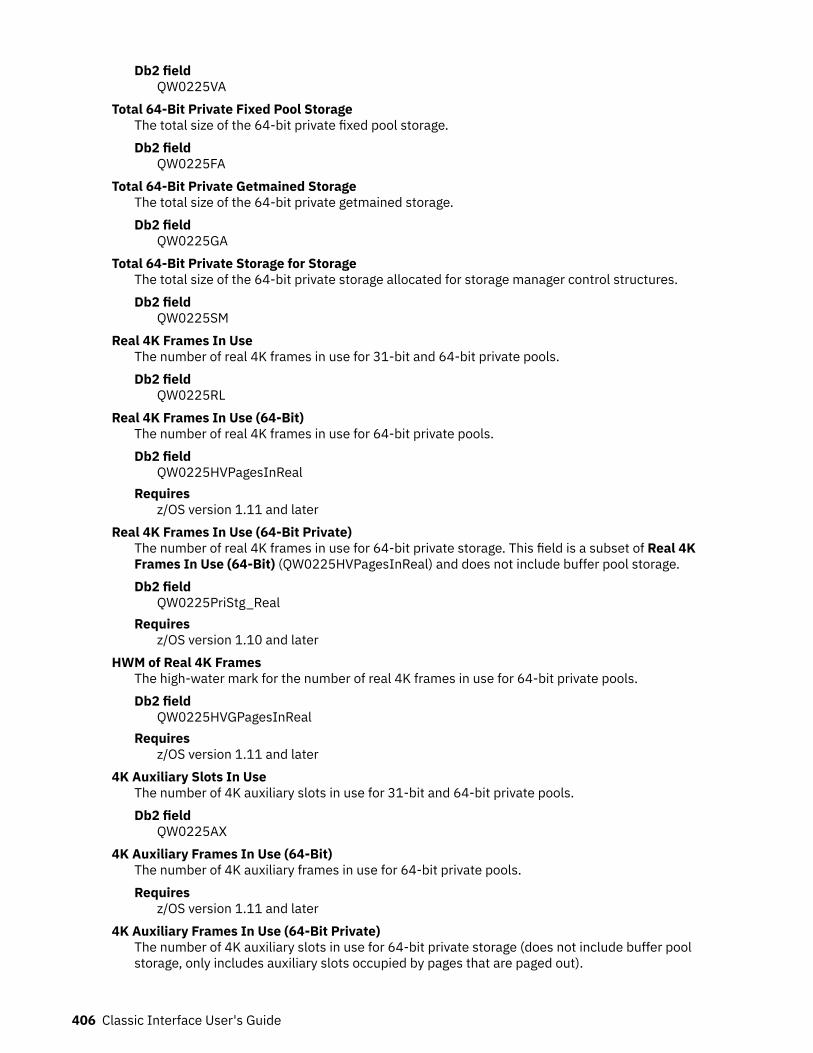
Db2 fieldQW0225VA
Total 64-Bit Private Fixed Pool StorageThe total size of the 64-bit private fixed pool storage.Db2 field
QW0225FATotal 64-Bit Private Getmained Storage
The total size of the 64-bit private getmained storage.Db2 field
QW0225GATotal 64-Bit Private Storage for Storage
The total size of the 64-bit private storage allocated for storage manager control structures.Db2 field
QW0225SMReal 4K Frames In Use
The number of real 4K frames in use for 31-bit and 64-bit private pools.Db2 field
QW0225RLReal 4K Frames In Use (64-Bit)
The number of real 4K frames in use for 64-bit private pools.Db2 field
QW0225HVPagesInRealRequires
z/OS version 1.11 and laterReal 4K Frames In Use (64-Bit Private)
The number of real 4K frames in use for 64-bit private storage. This field is a subset of Real 4KFrames In Use (64-Bit) (QW0225HVPagesInReal) and does not include buffer pool storage.Db2 field
QW0225PriStg_RealRequires
z/OS version 1.10 and laterHWM of Real 4K Frames
The high-water mark for the number of real 4K frames in use for 64-bit private pools.Db2 field
QW0225HVGPagesInRealRequires
z/OS version 1.11 and later4K Auxiliary Slots In Use
The number of 4K auxiliary slots in use for 31-bit and 64-bit private pools.Db2 field
QW0225AX4K Auxiliary Frames In Use (64-Bit)
The number of 4K auxiliary frames in use for 64-bit private pools.Requires
z/OS version 1.11 and later4K Auxiliary Frames In Use (64-Bit Private)
The number of 4K auxiliary slots in use for 64-bit private storage (does not include buffer poolstorage, only includes auxiliary slots occupied by pages that are paged out).
406 Classic Interface User's Guide
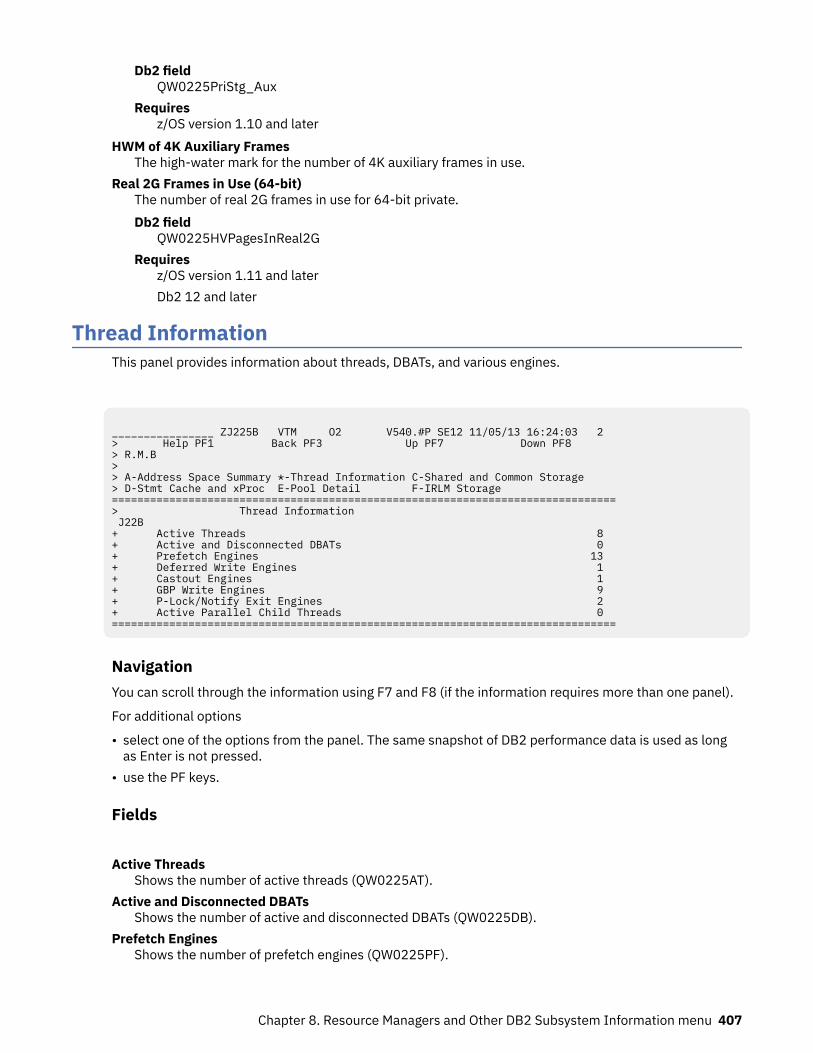
Db2 fieldQW0225PriStg_Aux
Requiresz/OS version 1.10 and later
HWM of 4K Auxiliary FramesThe high-water mark for the number of 4K auxiliary frames in use.
Real 2G Frames in Use (64-bit)The number of real 2G frames in use for 64-bit private.Db2 field
QW0225HVPagesInReal2GRequires
z/OS version 1.11 and laterDb2 12 and later
Thread InformationThis panel provides information about threads, DBATs, and various engines.
________________ ZJ225B VTM O2 V540.#P SE12 11/05/13 16:24:03 2 > Help PF1 Back PF3 Up PF7 Down PF8 > R.M.B > > A-Address Space Summary *-Thread Information C-Shared and Common Storage > D-Stmt Cache and xProc E-Pool Detail F-IRLM Storage ===============================================================================> Thread Information J22B + Active Threads 8 + Active and Disconnected DBATs 0 + Prefetch Engines 13 + Deferred Write Engines 1 + Castout Engines 1 + GBP Write Engines 9 + P-Lock/Notify Exit Engines 2 + Active Parallel Child Threads 0 ===============================================================================
NavigationYou can scroll through the information using F7 and F8 (if the information requires more than one panel).
For additional options
• select one of the options from the panel. The same snapshot of DB2 performance data is used as longas Enter is not pressed.
• use the PF keys.
Fields
Active ThreadsShows the number of active threads (QW0225AT).
Active and Disconnected DBATsShows the number of active and disconnected DBATs (QW0225DB).
Prefetch EnginesShows the number of prefetch engines (QW0225PF).
Chapter 8. Resource Managers and Other DB2 Subsystem Information menu 407
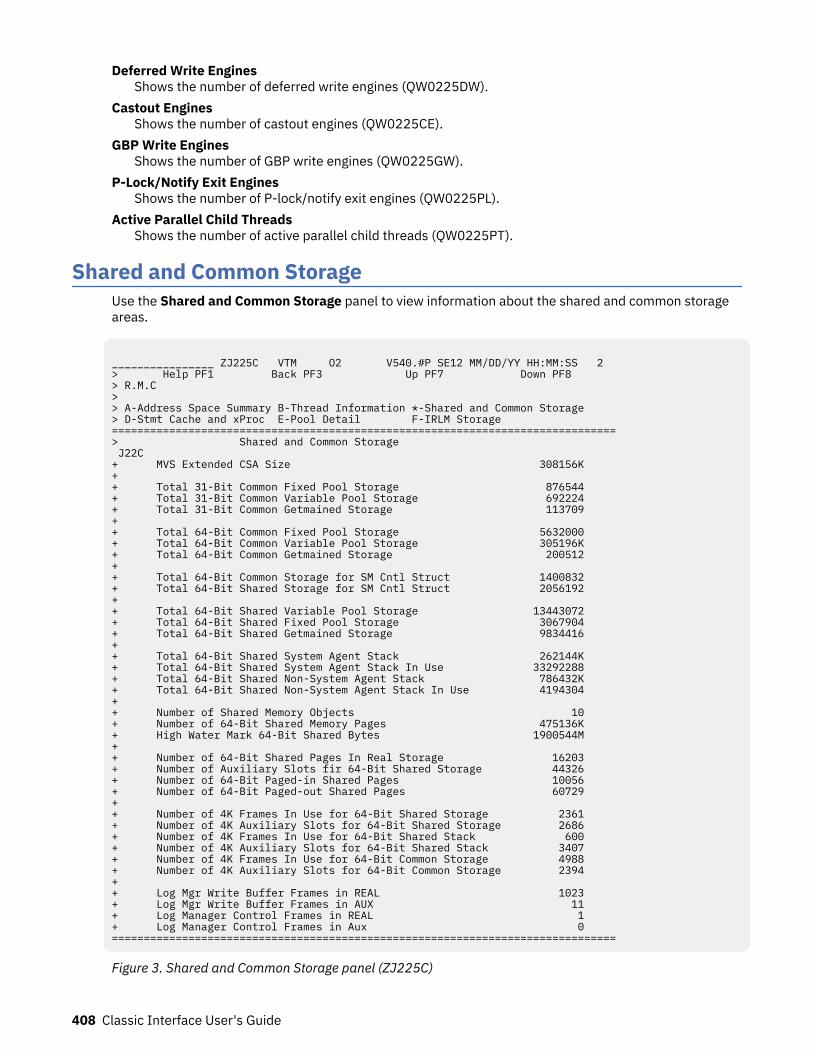
Deferred Write EnginesShows the number of deferred write engines (QW0225DW).
Castout EnginesShows the number of castout engines (QW0225CE).
GBP Write EnginesShows the number of GBP write engines (QW0225GW).
P-Lock/Notify Exit EnginesShows the number of P-lock/notify exit engines (QW0225PL).
Active Parallel Child ThreadsShows the number of active parallel child threads (QW0225PT).
Shared and Common StorageUse the Shared and Common Storage panel to view information about the shared and common storageareas.
________________ ZJ225C VTM O2 V540.#P SE12 MM/DD/YY HH:MM:SS 2 > Help PF1 Back PF3 Up PF7 Down PF8 > R.M.C > > A-Address Space Summary B-Thread Information *-Shared and Common Storage > D-Stmt Cache and xProc E-Pool Detail F-IRLM Storage ===============================================================================> Shared and Common Storage J22C + MVS Extended CSA Size 308156K + + Total 31-Bit Common Fixed Pool Storage 876544 + Total 31-Bit Common Variable Pool Storage 692224 + Total 31-Bit Common Getmained Storage 113709 + + Total 64-Bit Common Fixed Pool Storage 5632000 + Total 64-Bit Common Variable Pool Storage 305196K + Total 64-Bit Common Getmained Storage 200512 + + Total 64-Bit Common Storage for SM Cntl Struct 1400832 + Total 64-Bit Shared Storage for SM Cntl Struct 2056192 + + Total 64-Bit Shared Variable Pool Storage 13443072 + Total 64-Bit Shared Fixed Pool Storage 3067904 + Total 64-Bit Shared Getmained Storage 9834416 + + Total 64-Bit Shared System Agent Stack 262144K + Total 64-Bit Shared System Agent Stack In Use 33292288 + Total 64-Bit Shared Non-System Agent Stack 786432K + Total 64-Bit Shared Non-System Agent Stack In Use 4194304 + + Number of Shared Memory Objects 10 + Number of 64-Bit Shared Memory Pages 475136K + High Water Mark 64-Bit Shared Bytes 1900544M + + Number of 64-Bit Shared Pages In Real Storage 16203 + Number of Auxiliary Slots fir 64-Bit Shared Storage 44326 + Number of 64-Bit Paged-in Shared Pages 10056 + Number of 64-Bit Paged-out Shared Pages 60729 + + Number of 4K Frames In Use for 64-Bit Shared Storage 2361 + Number of 4K Auxiliary Slots for 64-Bit Shared Storage 2686 + Number of 4K Frames In Use for 64-Bit Shared Stack 600 + Number of 4K Auxiliary Slots for 64-Bit Shared Stack 3407 + Number of 4K Frames In Use for 64-Bit Common Storage 4988 + Number of 4K Auxiliary Slots for 64-Bit Common Storage 2394 + + Log Mgr Write Buffer Frames in REAL 1023 + Log Mgr Write Buffer Frames in AUX 11 + Log Manager Control Frames in REAL 1 + Log Manager Control Frames in Aux 0 ===============================================================================
Figure 3. Shared and Common Storage panel (ZJ225C)
408 Classic Interface User's Guide
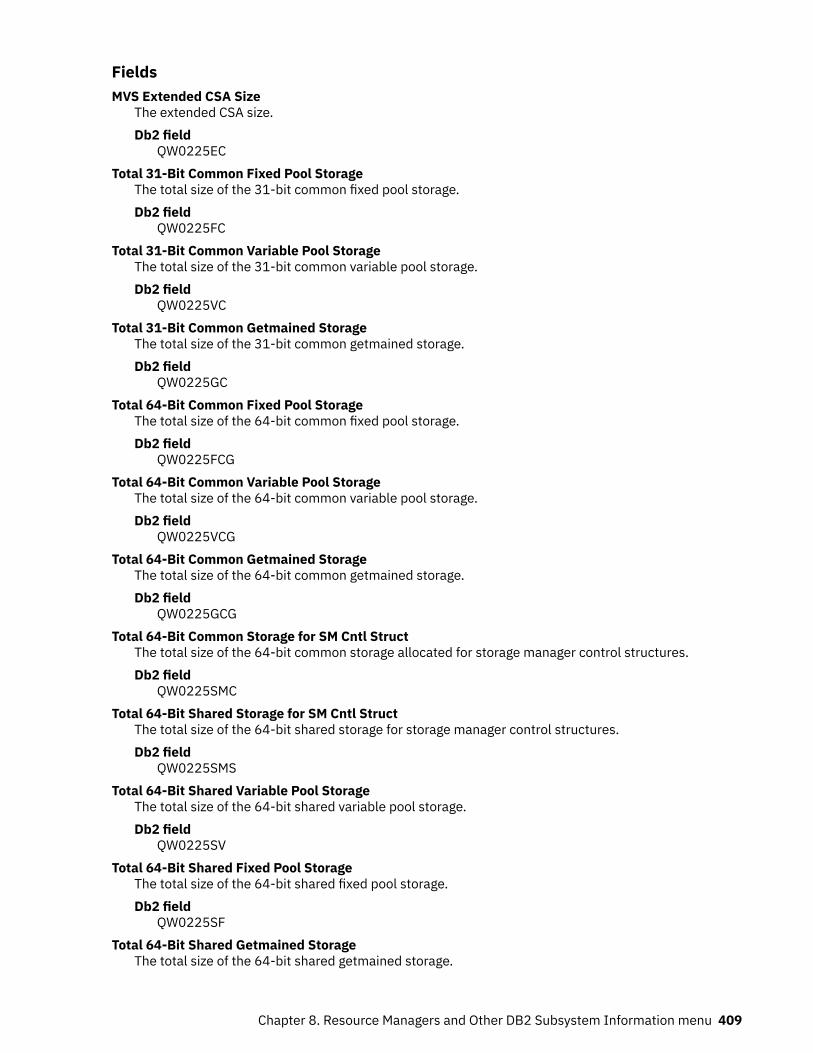
FieldsMVS Extended CSA Size
The extended CSA size.Db2 field
QW0225ECTotal 31-Bit Common Fixed Pool Storage
The total size of the 31-bit common fixed pool storage.Db2 field
QW0225FCTotal 31-Bit Common Variable Pool Storage
The total size of the 31-bit common variable pool storage.Db2 field
QW0225VCTotal 31-Bit Common Getmained Storage
The total size of the 31-bit common getmained storage.Db2 field
QW0225GCTotal 64-Bit Common Fixed Pool Storage
The total size of the 64-bit common fixed pool storage.Db2 field
QW0225FCGTotal 64-Bit Common Variable Pool Storage
The total size of the 64-bit common variable pool storage.Db2 field
QW0225VCGTotal 64-Bit Common Getmained Storage
The total size of the 64-bit common getmained storage.Db2 field
QW0225GCGTotal 64-Bit Common Storage for SM Cntl Struct
The total size of the 64-bit common storage allocated for storage manager control structures.Db2 field
QW0225SMCTotal 64-Bit Shared Storage for SM Cntl Struct
The total size of the 64-bit shared storage for storage manager control structures.Db2 field
QW0225SMSTotal 64-Bit Shared Variable Pool Storage
The total size of the 64-bit shared variable pool storage.Db2 field
QW0225SVTotal 64-Bit Shared Fixed Pool Storage
The total size of the 64-bit shared fixed pool storage.Db2 field
QW0225SFTotal 64-Bit Shared Getmained Storage
The total size of the 64-bit shared getmained storage.
Chapter 8. Resource Managers and Other DB2 Subsystem Information menu 409
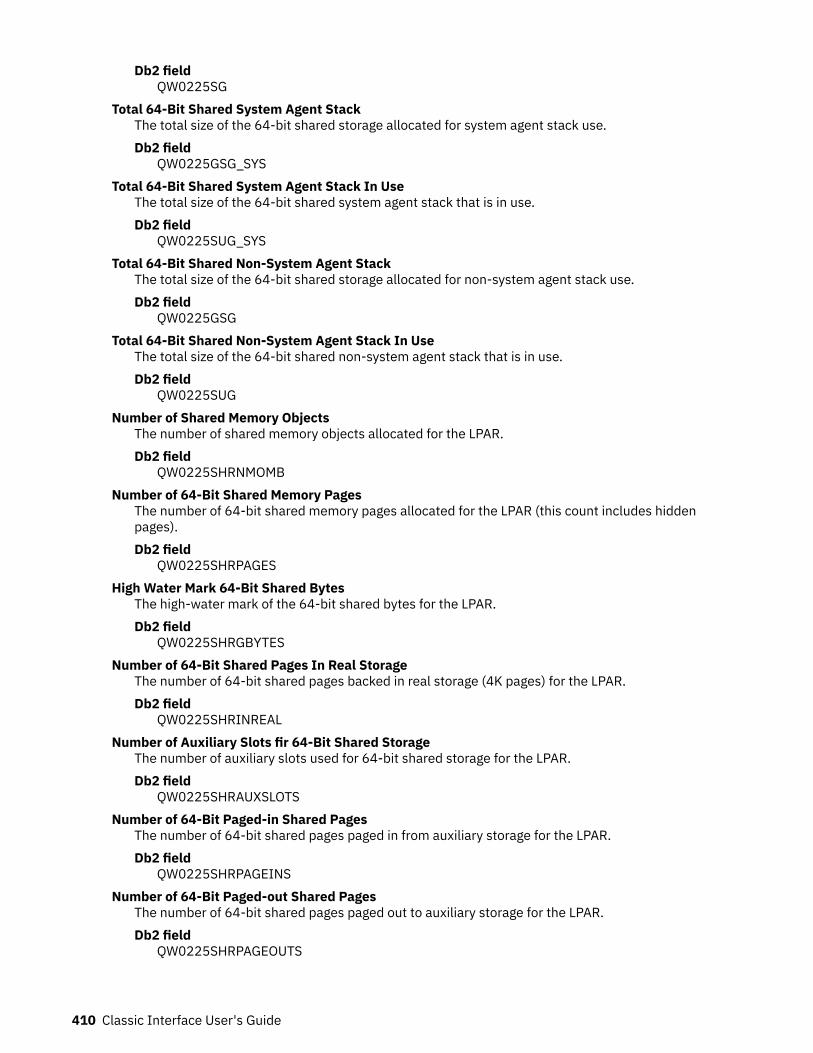
Db2 fieldQW0225SG
Total 64-Bit Shared System Agent StackThe total size of the 64-bit shared storage allocated for system agent stack use.Db2 field
QW0225GSG_SYSTotal 64-Bit Shared System Agent Stack In Use
The total size of the 64-bit shared system agent stack that is in use.Db2 field
QW0225SUG_SYSTotal 64-Bit Shared Non-System Agent Stack
The total size of the 64-bit shared storage allocated for non-system agent stack use.Db2 field
QW0225GSGTotal 64-Bit Shared Non-System Agent Stack In Use
The total size of the 64-bit shared non-system agent stack that is in use.Db2 field
QW0225SUGNumber of Shared Memory Objects
The number of shared memory objects allocated for the LPAR.Db2 field
QW0225SHRNMOMBNumber of 64-Bit Shared Memory Pages
The number of 64-bit shared memory pages allocated for the LPAR (this count includes hiddenpages).Db2 field
QW0225SHRPAGESHigh Water Mark 64-Bit Shared Bytes
The high-water mark of the 64-bit shared bytes for the LPAR.Db2 field
QW0225SHRGBYTESNumber of 64-Bit Shared Pages In Real Storage
The number of 64-bit shared pages backed in real storage (4K pages) for the LPAR.Db2 field
QW0225SHRINREALNumber of Auxiliary Slots fir 64-Bit Shared Storage
The number of auxiliary slots used for 64-bit shared storage for the LPAR.Db2 field
QW0225SHRAUXSLOTSNumber of 64-Bit Paged-in Shared Pages
The number of 64-bit shared pages paged in from auxiliary storage for the LPAR.Db2 field
QW0225SHRPAGEINSNumber of 64-Bit Paged-out Shared Pages
The number of 64-bit shared pages paged out to auxiliary storage for the LPAR.Db2 field
QW0225SHRPAGEOUTS
410 Classic Interface User's Guide
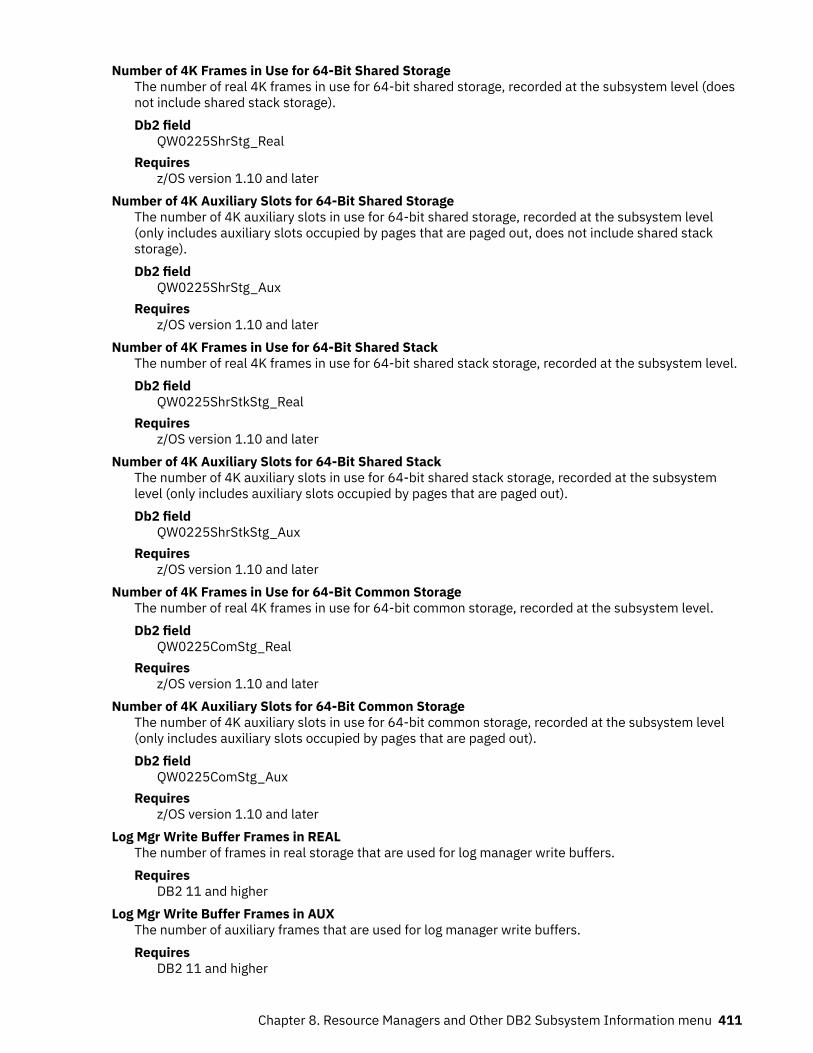
Number of 4K Frames in Use for 64-Bit Shared StorageThe number of real 4K frames in use for 64-bit shared storage, recorded at the subsystem level (doesnot include shared stack storage).Db2 field
QW0225ShrStg_RealRequires
z/OS version 1.10 and laterNumber of 4K Auxiliary Slots for 64-Bit Shared Storage
The number of 4K auxiliary slots in use for 64-bit shared storage, recorded at the subsystem level(only includes auxiliary slots occupied by pages that are paged out, does not include shared stackstorage).Db2 field
QW0225ShrStg_AuxRequires
z/OS version 1.10 and laterNumber of 4K Frames in Use for 64-Bit Shared Stack
The number of real 4K frames in use for 64-bit shared stack storage, recorded at the subsystem level.Db2 field
QW0225ShrStkStg_RealRequires
z/OS version 1.10 and laterNumber of 4K Auxiliary Slots for 64-Bit Shared Stack
The number of 4K auxiliary slots in use for 64-bit shared stack storage, recorded at the subsystemlevel (only includes auxiliary slots occupied by pages that are paged out).Db2 field
QW0225ShrStkStg_AuxRequires
z/OS version 1.10 and laterNumber of 4K Frames in Use for 64-Bit Common Storage
The number of real 4K frames in use for 64-bit common storage, recorded at the subsystem level.Db2 field
QW0225ComStg_RealRequires
z/OS version 1.10 and laterNumber of 4K Auxiliary Slots for 64-Bit Common Storage
The number of 4K auxiliary slots in use for 64-bit common storage, recorded at the subsystem level(only includes auxiliary slots occupied by pages that are paged out).Db2 field
QW0225ComStg_AuxRequires
z/OS version 1.10 and laterLog Mgr Write Buffer Frames in REAL
The number of frames in real storage that are used for log manager write buffers.Requires
DB2 11 and higherLog Mgr Write Buffer Frames in AUX
The number of auxiliary frames that are used for log manager write buffers.Requires
DB2 11 and higher
Chapter 8. Resource Managers and Other DB2 Subsystem Information menu 411
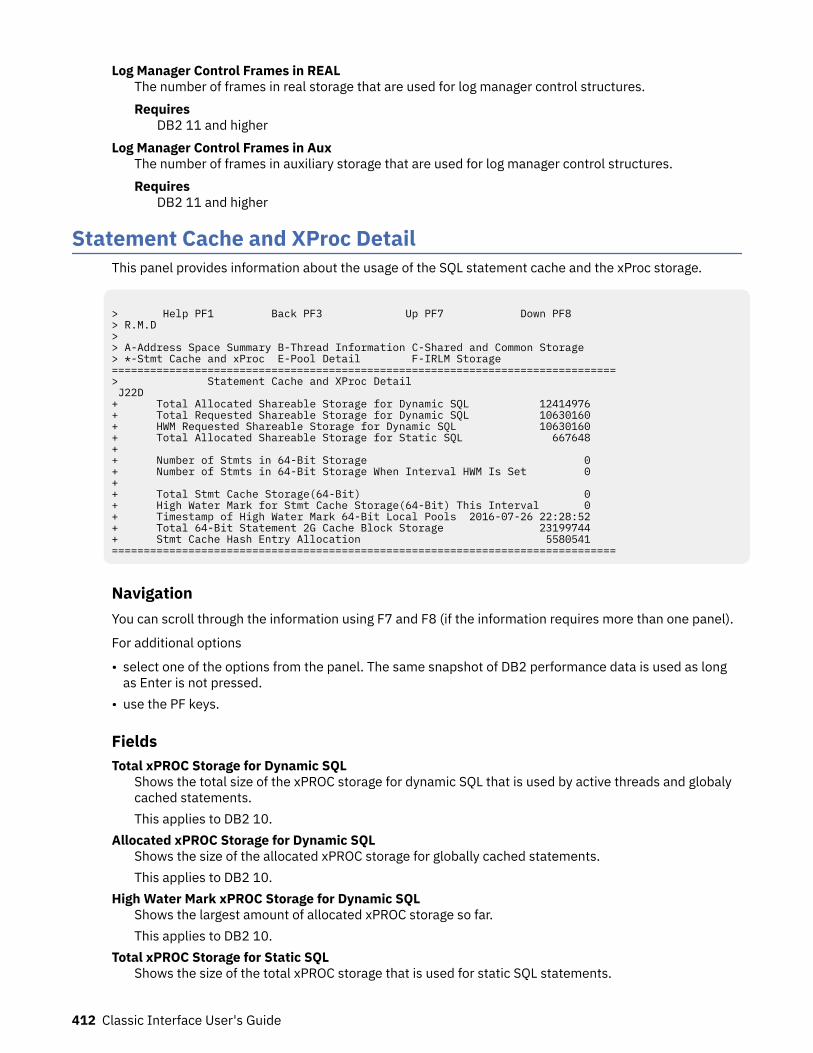
Log Manager Control Frames in REALThe number of frames in real storage that are used for log manager control structures.Requires
DB2 11 and higherLog Manager Control Frames in Aux
The number of frames in auxiliary storage that are used for log manager control structures.Requires
DB2 11 and higher
Statement Cache and XProc DetailThis panel provides information about the usage of the SQL statement cache and the xProc storage.
> Help PF1 Back PF3 Up PF7 Down PF8 > R.M.D > > A-Address Space Summary B-Thread Information C-Shared and Common Storage > *-Stmt Cache and xProc E-Pool Detail F-IRLM Storage =============================================================================== > Statement Cache and XProc Detail J22D + Total Allocated Shareable Storage for Dynamic SQL 12414976 + Total Requested Shareable Storage for Dynamic SQL 10630160 + HWM Requested Shareable Storage for Dynamic SQL 10630160 + Total Allocated Shareable Storage for Static SQL 667648 + + Number of Stmts in 64-Bit Storage 0 + Number of Stmts in 64-Bit Storage When Interval HWM Is Set 0 + + Total Stmt Cache Storage(64-Bit) 0 + High Water Mark for Stmt Cache Storage(64-Bit) This Interval 0 + Timestamp of High Water Mark 64-Bit Local Pools 2016-07-26 22:28:52 + Total 64-Bit Statement 2G Cache Block Storage 23199744 + Stmt Cache Hash Entry Allocation 5580541 ===============================================================================
NavigationYou can scroll through the information using F7 and F8 (if the information requires more than one panel).
For additional options
• select one of the options from the panel. The same snapshot of DB2 performance data is used as longas Enter is not pressed.
• use the PF keys.
FieldsTotal xPROC Storage for Dynamic SQL
Shows the total size of the xPROC storage for dynamic SQL that is used by active threads and globalycached statements.This applies to DB2 10.
Allocated xPROC Storage for Dynamic SQLShows the size of the allocated xPROC storage for globally cached statements.This applies to DB2 10.
High Water Mark xPROC Storage for Dynamic SQLShows the largest amount of allocated xPROC storage so far.This applies to DB2 10.
Total xPROC Storage for Static SQLShows the size of the total xPROC storage that is used for static SQL statements.
412 Classic Interface User's Guide
This applies to DB2 10.Total Allocated Shareable Storage for Dynamic SQL
Shows the total allocated sharable storage for dynamic SQL used by active threads (64-bit sharedsystem variable pools)This applies to DB2 11 or higher.
Total Requested Shareable Storage for Dynamic SQLShows the total requested sharable storage for dynamic SQL used by active threads (64-bit sharedsystem variable pools).This applies to DB2 11 or higher.
HWM Requested Shareable Storage for Dynamic SQLShows the total allocated sharable storage for static SQL statements (64-bit shared system variablepools).This applies to DB2 11 or higher.
Total Allocated Shareable Storage for Static SQLShows the high water mark of total requested sharable storage for dynamic SQL used by activethreads (64-bit shared system variable pools).This applies to DB2 11 or higher.
Number of Stmts in 64-Bit StorageShows the number of statements in the 64-bit agent local pool (64-bit shared agent local variablepools).
Number of Stmts in 64-bit storage when interval HWM Is SetShows the number of statements at the time a new interval High Water Mark is set for 64-bit sharedagent local variable pools (default statistics interval: 1 minute).
Total Stmt Cache Storage(64-Bit)Shows the allocated statement cache storage that is in 64-bit agent local pools (64-bit shared agentlocal variable pools).
High Water Mark for Stmt Cache Storage(64-Bit) This IntervalShows the largest amount of allocated statement cache storage in 64-bit shared agent local pools inthis interval (default statistics interval: 1 minute).
Timestamp of High Water Mark 64-Bit Local PoolsShows the timestamp when the largest amount of storage in 64-bit agent local pools was allocatedafter the last IFCID 0225 record was written (64-bit shared agent local variable pools).
Total 64-Bit Statement 2G Cache Block StorageShows the total statement cache storage blocks above the bar (64-bit shared variable pool).
Stmt Cache Hash Entry Allocation (QW0225DMH)The amount of storage that is allocated for hashing entries in the dynamic statement cache. Db2 12and later.
Pool DetailThis panel displays data for DB2 10 and higher.
Chapter 8. Resource Managers and Other DB2 Subsystem Information menu 413
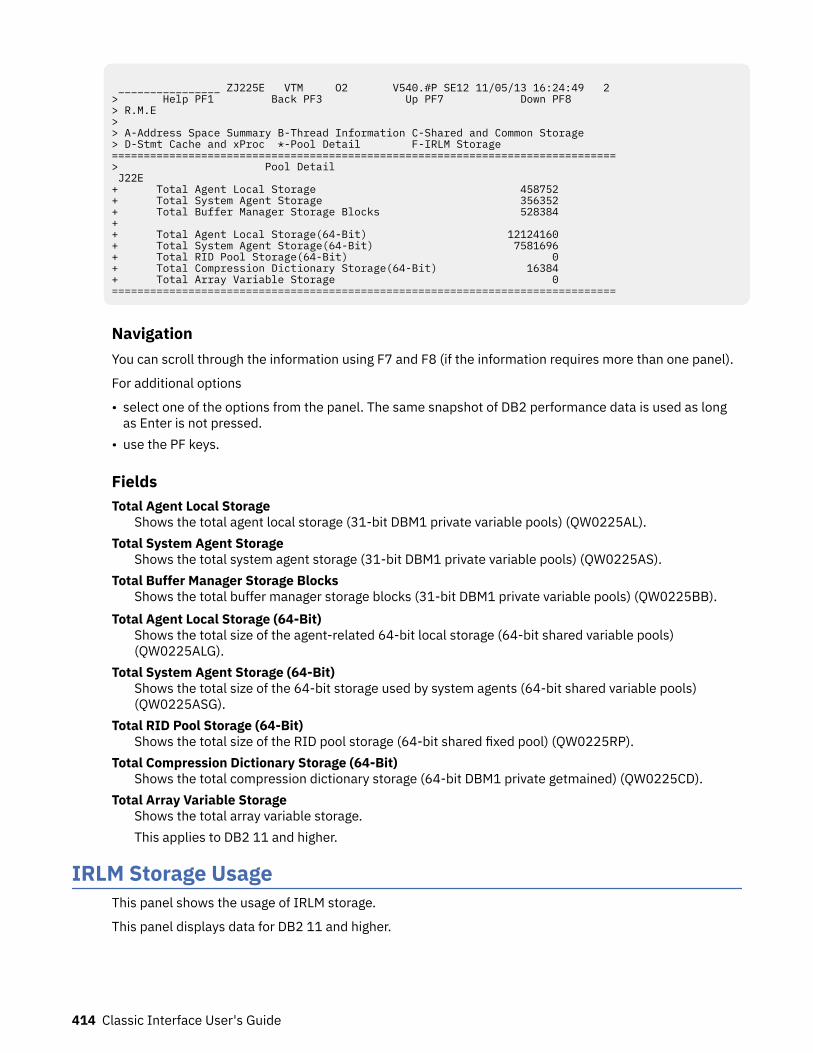
________________ ZJ225E VTM O2 V540.#P SE12 11/05/13 16:24:49 2 > Help PF1 Back PF3 Up PF7 Down PF8 > R.M.E > > A-Address Space Summary B-Thread Information C-Shared and Common Storage > D-Stmt Cache and xProc *-Pool Detail F-IRLM Storage ===============================================================================> Pool Detail J22E + Total Agent Local Storage 458752 + Total System Agent Storage 356352 + Total Buffer Manager Storage Blocks 528384 + + Total Agent Local Storage(64-Bit) 12124160 + Total System Agent Storage(64-Bit) 7581696 + Total RID Pool Storage(64-Bit) 0 + Total Compression Dictionary Storage(64-Bit) 16384 + Total Array Variable Storage 0 ===============================================================================
NavigationYou can scroll through the information using F7 and F8 (if the information requires more than one panel).
For additional options
• select one of the options from the panel. The same snapshot of DB2 performance data is used as longas Enter is not pressed.
• use the PF keys.
FieldsTotal Agent Local Storage
Shows the total agent local storage (31-bit DBM1 private variable pools) (QW0225AL).Total System Agent Storage
Shows the total system agent storage (31-bit DBM1 private variable pools) (QW0225AS).Total Buffer Manager Storage Blocks
Shows the total buffer manager storage blocks (31-bit DBM1 private variable pools) (QW0225BB).Total Agent Local Storage (64-Bit)
Shows the total size of the agent-related 64-bit local storage (64-bit shared variable pools)(QW0225ALG).
Total System Agent Storage (64-Bit)Shows the total size of the 64-bit storage used by system agents (64-bit shared variable pools)(QW0225ASG).
Total RID Pool Storage (64-Bit)Shows the total size of the RID pool storage (64-bit shared fixed pool) (QW0225RP).
Total Compression Dictionary Storage (64-Bit)Shows the total compression dictionary storage (64-bit DBM1 private getmained) (QW0225CD).
Total Array Variable StorageShows the total array variable storage.This applies to DB2 11 and higher.
IRLM Storage UsageThis panel shows the usage of IRLM storage.
This panel displays data for DB2 11 and higher.
414 Classic Interface User's Guide
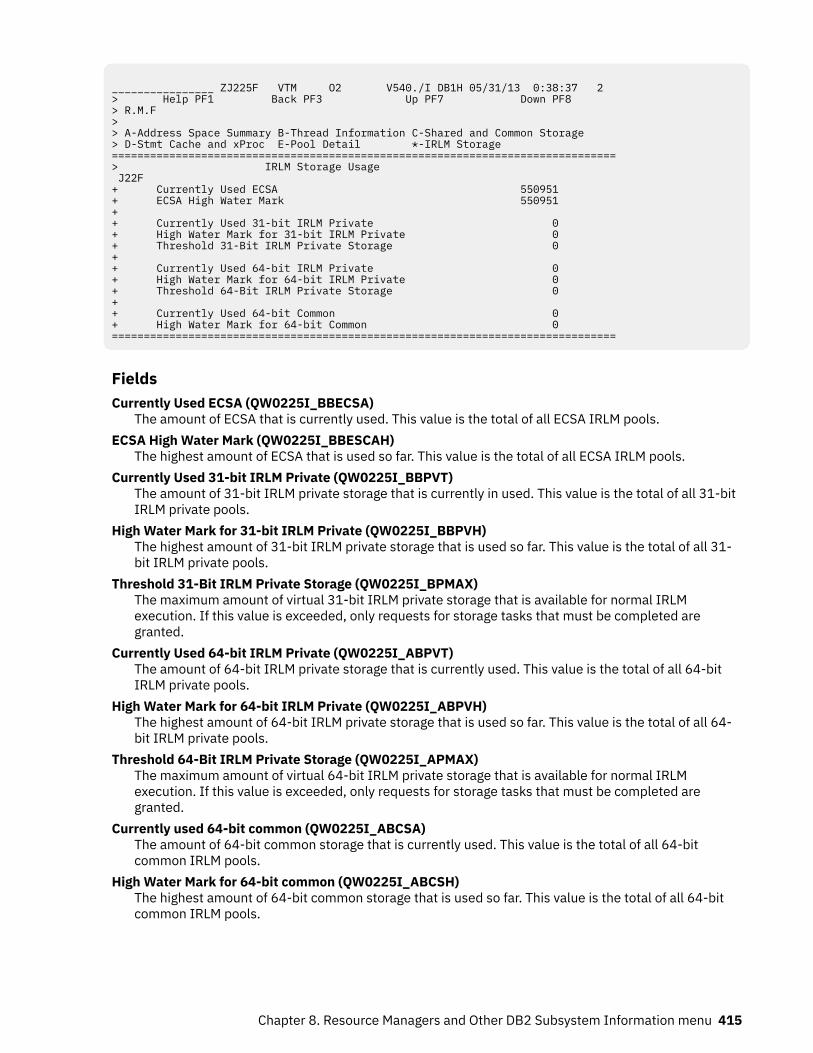
________________ ZJ225F VTM O2 V540./I DB1H 05/31/13 0:38:37 2 > Help PF1 Back PF3 Up PF7 Down PF8 > R.M.F > > A-Address Space Summary B-Thread Information C-Shared and Common Storage > D-Stmt Cache and xProc E-Pool Detail *-IRLM Storage ===============================================================================> IRLM Storage Usage J22F + Currently Used ECSA 550951 + ECSA High Water Mark 550951 + + Currently Used 31-bit IRLM Private 0 + High Water Mark for 31-bit IRLM Private 0 + Threshold 31-Bit IRLM Private Storage 0 + + Currently Used 64-bit IRLM Private 0 + High Water Mark for 64-bit IRLM Private 0 + Threshold 64-Bit IRLM Private Storage 0 + + Currently Used 64-bit Common 0 + High Water Mark for 64-bit Common 0 ===============================================================================
FieldsCurrently Used ECSA (QW0225I_BBECSA)
The amount of ECSA that is currently used. This value is the total of all ECSA IRLM pools.ECSA High Water Mark (QW0225I_BBESCAH)
The highest amount of ECSA that is used so far. This value is the total of all ECSA IRLM pools.Currently Used 31-bit IRLM Private (QW0225I_BBPVT)
The amount of 31-bit IRLM private storage that is currently in used. This value is the total of all 31-bitIRLM private pools.
High Water Mark for 31-bit IRLM Private (QW0225I_BBPVH)The highest amount of 31-bit IRLM private storage that is used so far. This value is the total of all 31-bit IRLM private pools.
Threshold 31-Bit IRLM Private Storage (QW0225I_BPMAX)The maximum amount of virtual 31-bit IRLM private storage that is available for normal IRLMexecution. If this value is exceeded, only requests for storage tasks that must be completed aregranted.
Currently Used 64-bit IRLM Private (QW0225I_ABPVT)The amount of 64-bit IRLM private storage that is currently used. This value is the total of all 64-bitIRLM private pools.
High Water Mark for 64-bit IRLM Private (QW0225I_ABPVH)The highest amount of 64-bit IRLM private storage that is used so far. This value is the total of all 64-bit IRLM private pools.
Threshold 64-Bit IRLM Private Storage (QW0225I_APMAX)The maximum amount of virtual 64-bit IRLM private storage that is available for normal IRLMexecution. If this value is exceeded, only requests for storage tasks that must be completed aregranted.
Currently used 64-bit common (QW0225I_ABCSA)The amount of 64-bit common storage that is currently used. This value is the total of all 64-bitcommon IRLM pools.
High Water Mark for 64-bit common (QW0225I_ABCSH)The highest amount of 64-bit common storage that is used so far. This value is the total of all 64-bitcommon IRLM pools.
Chapter 8. Resource Managers and Other DB2 Subsystem Information menu 415
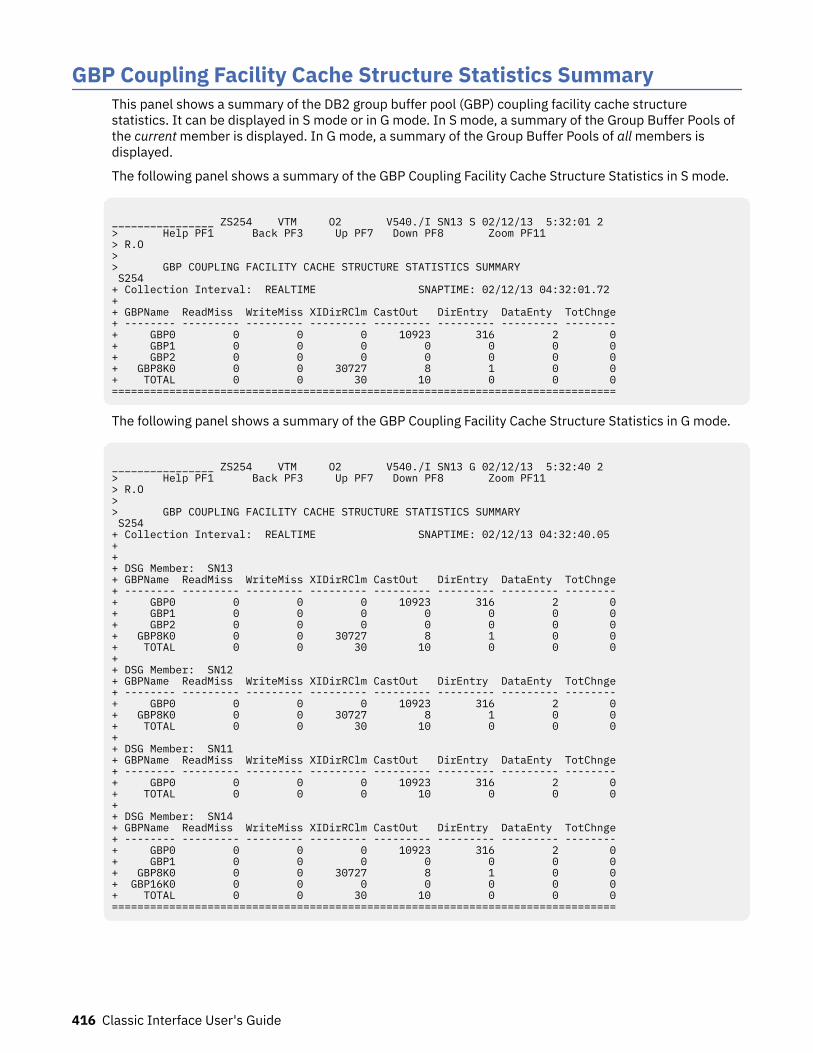
GBP Coupling Facility Cache Structure Statistics SummaryThis panel shows a summary of the DB2 group buffer pool (GBP) coupling facility cache structurestatistics. It can be displayed in S mode or in G mode. In S mode, a summary of the Group Buffer Pools ofthe current member is displayed. In G mode, a summary of the Group Buffer Pools of all members isdisplayed.
The following panel shows a summary of the GBP Coupling Facility Cache Structure Statistics in S mode.
________________ ZS254 VTM O2 V540./I SN13 S 02/12/13 5:32:01 2 > Help PF1 Back PF3 Up PF7 Down PF8 Zoom PF11 > R.O > > GBP COUPLING FACILITY CACHE STRUCTURE STATISTICS SUMMARY S254 + Collection Interval: REALTIME SNAPTIME: 02/12/13 04:32:01.72 + + GBPName ReadMiss WriteMiss XIDirRClm CastOut DirEntry DataEnty TotChnge+ -------- --------- --------- --------- --------- --------- --------- --------+ GBP0 0 0 0 10923 316 2 0+ GBP1 0 0 0 0 0 0 0+ GBP2 0 0 0 0 0 0 0+ GBP8K0 0 0 30727 8 1 0 0+ TOTAL 0 0 30 10 0 0 0===============================================================================
The following panel shows a summary of the GBP Coupling Facility Cache Structure Statistics in G mode.
________________ ZS254 VTM O2 V540./I SN13 G 02/12/13 5:32:40 2 > Help PF1 Back PF3 Up PF7 Down PF8 Zoom PF11 > R.O > > GBP COUPLING FACILITY CACHE STRUCTURE STATISTICS SUMMARY S254 + Collection Interval: REALTIME SNAPTIME: 02/12/13 04:32:40.05 + + + DSG Member: SN13 + GBPName ReadMiss WriteMiss XIDirRClm CastOut DirEntry DataEnty TotChnge + -------- --------- --------- --------- --------- --------- --------- -------- + GBP0 0 0 0 10923 316 2 0 + GBP1 0 0 0 0 0 0 0 + GBP2 0 0 0 0 0 0 0 + GBP8K0 0 0 30727 8 1 0 0 + TOTAL 0 0 30 10 0 0 0 + + DSG Member: SN12 + GBPName ReadMiss WriteMiss XIDirRClm CastOut DirEntry DataEnty TotChnge + -------- --------- --------- --------- --------- --------- --------- -------- + GBP0 0 0 0 10923 316 2 0 + GBP8K0 0 0 30727 8 1 0 0 + TOTAL 0 0 30 10 0 0 0 + + DSG Member: SN11 + GBPName ReadMiss WriteMiss XIDirRClm CastOut DirEntry DataEnty TotChnge + -------- --------- --------- --------- --------- --------- --------- -------- + GBP0 0 0 0 10923 316 2 0 + TOTAL 0 0 0 10 0 0 0 + + DSG Member: SN14 + GBPName ReadMiss WriteMiss XIDirRClm CastOut DirEntry DataEnty TotChnge + -------- --------- --------- --------- --------- --------- --------- -------- + GBP0 0 0 0 10923 316 2 0 + GBP1 0 0 0 0 0 0 0 + GBP8K0 0 0 30727 8 1 0 0 + GBP16K0 0 0 0 0 0 0 0 + TOTAL 0 0 30 10 0 0 0 ===============================================================================
416 Classic Interface User's Guide
NavigationYou can browse details of a group buffer pool or the TOTAL values by moving the cursor to the appropriateline in the panel and pressing PF11 (Zoom).
For additional information about
• G mode in S mode or vice versa, replace the letter S with G or vice versa.• other members of the data sharing group or other DB2 subsystems that are monitored by the current
server, type over the DB2 SSID.• the details of a particular GBP cache structure statistics, move the curser to the GBP of your choice and
click F11 (Zoom).• other topics, use the PF keys.
FieldsGBPName
The name of the group buffer pool.ReadMiss
The Read Miss Cache Full Counter shows the number of times that a coupling facility read requestspecifies a page for which a directory entry does not exist or is not created because the storage in thegroup buffer pool is insufficient.
A nonzero value in this field indicates that the size of the backing coupling facility cache structuremight be too small to support the current workload.
WriteMissThe Write Miss Cache Full Counter shows the number of times a coupling facility write request is notcompleted because the storage in the group buffer pool is insufficient.
The value in this field indicates that the data page resources of the coupling facility are fasterconsumed than the DB2 castout process can free them. For information about alleviating thiscondition, see DB2 Data Sharing: Planning and Administration.
XIDirRClmThe XI Directory Entry Reclaim Counter shows the number of times a directory is reclaimed (stolen)and cross-invalidation (XI) signals are sent because the named page is cached in one or more DB2buffer pools. This means that the stolen directory entry has registered DB2 interest.
A high number might indicate a problem. Check the hit ratio of the group buffer pool to determinewhether the lack of directory entries might be causing excessive reads from the group buffer pool.
CastOutThe Castout Counter shows the number of castout operations that are performed. Castout is theprocess of writing pages from the group buffer pool to DASD.
DirEntryThe Directory Entry Counter shows the number of directory entries that are allocated for the couplingfacility cache structure (DB2 group buffer pool). A directory entry contains control information for onedatabase page. The directory entry is used by the coupling facility to determine where to send cross-validation signals when a page of data is changed or when the directory entry must be reused.
This value is a snapshot value. It is not affected by an incremental display or a cumulative display.
DataEntryThe Data Entry Counter shows the number of data entries that are allocated for the coupling facilitycache structure (DB2 group buffer pool). The data entries are the actual places where the data pageresides.
This value is a snapshot value. It is not affected by an incremental display or a cumulative display.
Chapter 8. Resource Managers and Other DB2 Subsystem Information menu 417
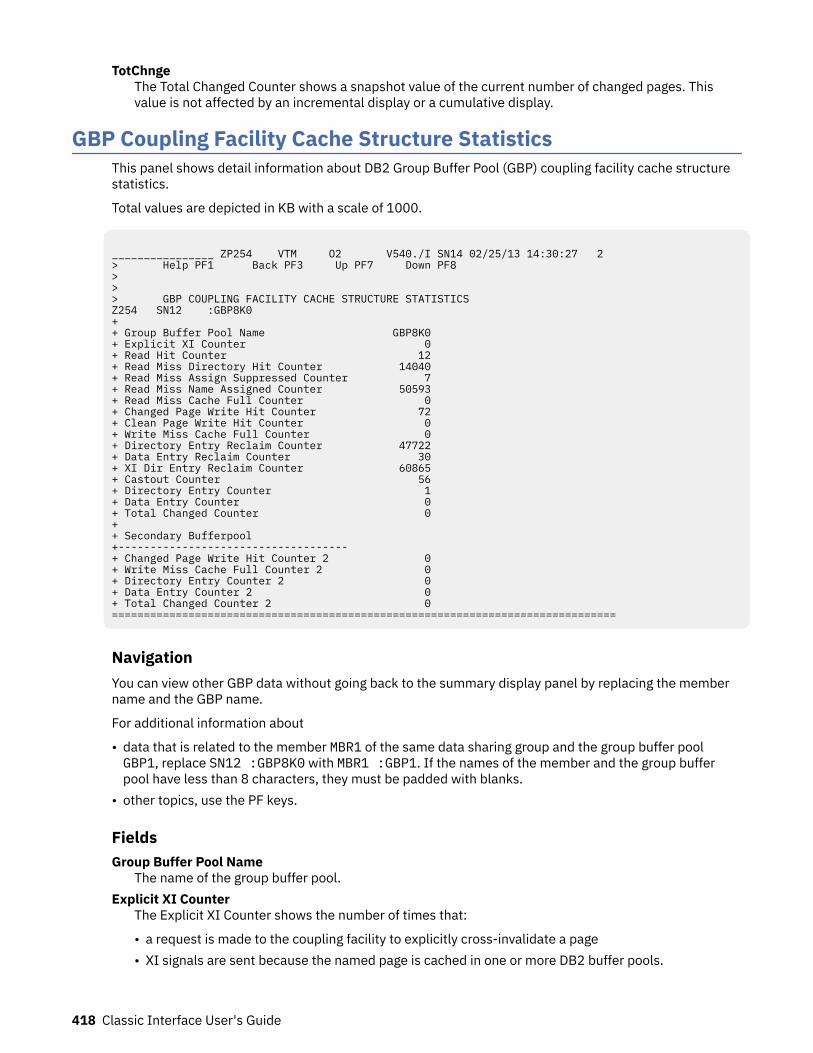
TotChngeThe Total Changed Counter shows a snapshot value of the current number of changed pages. Thisvalue is not affected by an incremental display or a cumulative display.
GBP Coupling Facility Cache Structure StatisticsThis panel shows detail information about DB2 Group Buffer Pool (GBP) coupling facility cache structurestatistics.
Total values are depicted in KB with a scale of 1000.
________________ ZP254 VTM O2 V540./I SN14 02/25/13 14:30:27 2 > Help PF1 Back PF3 Up PF7 Down PF8 > > > GBP COUPLING FACILITY CACHE STRUCTURE STATISTICS Z254 SN12 :GBP8K0 + + Group Buffer Pool Name GBP8K0 + Explicit XI Counter 0 + Read Hit Counter 12 + Read Miss Directory Hit Counter 14040 + Read Miss Assign Suppressed Counter 7 + Read Miss Name Assigned Counter 50593 + Read Miss Cache Full Counter 0 + Changed Page Write Hit Counter 72 + Clean Page Write Hit Counter 0 + Write Miss Cache Full Counter 0 + Directory Entry Reclaim Counter 47722 + Data Entry Reclaim Counter 30 + XI Dir Entry Reclaim Counter 60865 + Castout Counter 56 + Directory Entry Counter 1 + Data Entry Counter 0 + Total Changed Counter 0 + + Secondary Bufferpool +------------------------------------ + Changed Page Write Hit Counter 2 0 + Write Miss Cache Full Counter 2 0 + Directory Entry Counter 2 0 + Data Entry Counter 2 0 + Total Changed Counter 2 0 ===============================================================================
NavigationYou can view other GBP data without going back to the summary display panel by replacing the membername and the GBP name.
For additional information about
• data that is related to the member MBR1 of the same data sharing group and the group buffer poolGBP1, replace SN12 :GBP8K0 with MBR1 :GBP1. If the names of the member and the group bufferpool have less than 8 characters, they must be padded with blanks.
• other topics, use the PF keys.
FieldsGroup Buffer Pool Name
The name of the group buffer pool.Explicit XI Counter
The Explicit XI Counter shows the number of times that:
• a request is made to the coupling facility to explicitly cross-invalidate a page• XI signals are sent because the named page is cached in one or more DB2 buffer pools.
418 Classic Interface User's Guide
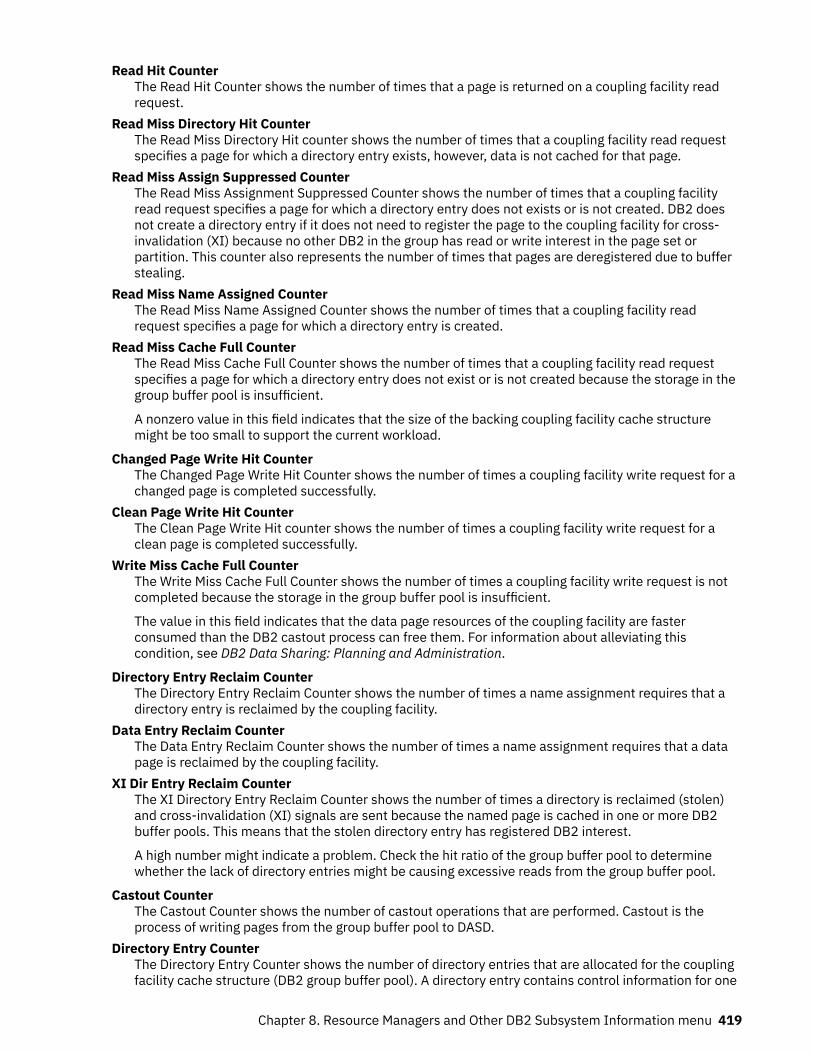
Read Hit CounterThe Read Hit Counter shows the number of times that a page is returned on a coupling facility readrequest.
Read Miss Directory Hit CounterThe Read Miss Directory Hit counter shows the number of times that a coupling facility read requestspecifies a page for which a directory entry exists, however, data is not cached for that page.
Read Miss Assign Suppressed CounterThe Read Miss Assignment Suppressed Counter shows the number of times that a coupling facilityread request specifies a page for which a directory entry does not exists or is not created. DB2 doesnot create a directory entry if it does not need to register the page to the coupling facility for cross-invalidation (XI) because no other DB2 in the group has read or write interest in the page set orpartition. This counter also represents the number of times that pages are deregistered due to bufferstealing.
Read Miss Name Assigned CounterThe Read Miss Name Assigned Counter shows the number of times that a coupling facility readrequest specifies a page for which a directory entry is created.
Read Miss Cache Full CounterThe Read Miss Cache Full Counter shows the number of times that a coupling facility read requestspecifies a page for which a directory entry does not exist or is not created because the storage in thegroup buffer pool is insufficient.
A nonzero value in this field indicates that the size of the backing coupling facility cache structuremight be too small to support the current workload.
Changed Page Write Hit CounterThe Changed Page Write Hit Counter shows the number of times a coupling facility write request for achanged page is completed successfully.
Clean Page Write Hit CounterThe Clean Page Write Hit counter shows the number of times a coupling facility write request for aclean page is completed successfully.
Write Miss Cache Full CounterThe Write Miss Cache Full Counter shows the number of times a coupling facility write request is notcompleted because the storage in the group buffer pool is insufficient.
The value in this field indicates that the data page resources of the coupling facility are fasterconsumed than the DB2 castout process can free them. For information about alleviating thiscondition, see DB2 Data Sharing: Planning and Administration.
Directory Entry Reclaim CounterThe Directory Entry Reclaim Counter shows the number of times a name assignment requires that adirectory entry is reclaimed by the coupling facility.
Data Entry Reclaim CounterThe Data Entry Reclaim Counter shows the number of times a name assignment requires that a datapage is reclaimed by the coupling facility.
XI Dir Entry Reclaim CounterThe XI Directory Entry Reclaim Counter shows the number of times a directory is reclaimed (stolen)and cross-invalidation (XI) signals are sent because the named page is cached in one or more DB2buffer pools. This means that the stolen directory entry has registered DB2 interest.
A high number might indicate a problem. Check the hit ratio of the group buffer pool to determinewhether the lack of directory entries might be causing excessive reads from the group buffer pool.
Castout CounterThe Castout Counter shows the number of castout operations that are performed. Castout is theprocess of writing pages from the group buffer pool to DASD.
Directory Entry CounterThe Directory Entry Counter shows the number of directory entries that are allocated for the couplingfacility cache structure (DB2 group buffer pool). A directory entry contains control information for one
Chapter 8. Resource Managers and Other DB2 Subsystem Information menu 419
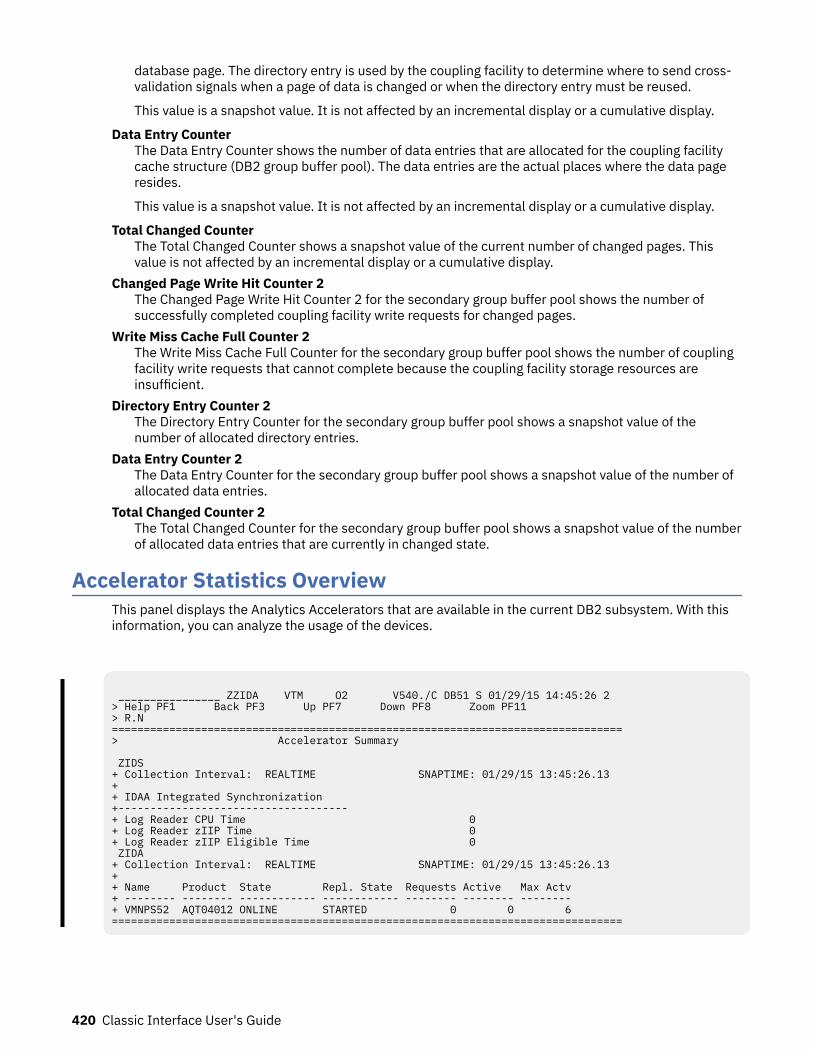
database page. The directory entry is used by the coupling facility to determine where to send cross-validation signals when a page of data is changed or when the directory entry must be reused.
This value is a snapshot value. It is not affected by an incremental display or a cumulative display.
Data Entry CounterThe Data Entry Counter shows the number of data entries that are allocated for the coupling facilitycache structure (DB2 group buffer pool). The data entries are the actual places where the data pageresides.
This value is a snapshot value. It is not affected by an incremental display or a cumulative display.
Total Changed CounterThe Total Changed Counter shows a snapshot value of the current number of changed pages. Thisvalue is not affected by an incremental display or a cumulative display.
Changed Page Write Hit Counter 2The Changed Page Write Hit Counter 2 for the secondary group buffer pool shows the number ofsuccessfully completed coupling facility write requests for changed pages.
Write Miss Cache Full Counter 2The Write Miss Cache Full Counter for the secondary group buffer pool shows the number of couplingfacility write requests that cannot complete because the coupling facility storage resources areinsufficient.
Directory Entry Counter 2The Directory Entry Counter for the secondary group buffer pool shows a snapshot value of thenumber of allocated directory entries.
Data Entry Counter 2The Data Entry Counter for the secondary group buffer pool shows a snapshot value of the number ofallocated data entries.
Total Changed Counter 2The Total Changed Counter for the secondary group buffer pool shows a snapshot value of the numberof allocated data entries that are currently in changed state.
Accelerator Statistics OverviewThis panel displays the Analytics Accelerators that are available in the current DB2 subsystem. With thisinformation, you can analyze the usage of the devices.
________________ ZZIDA VTM O2 V540./C DB51 S 01/29/15 14:45:26 2 > Help PF1 Back PF3 Up PF7 Down PF8 Zoom PF11 > R.N ================================================================================> Accelerator Summary ZIDS+ Collection Interval: REALTIME SNAPTIME: 01/29/15 13:45:26.13 ++ IDAA Integrated Synchronization+------------------------------------+ Log Reader CPU Time 0+ Log Reader zIIP Time 0+ Log Reader zIIP Eligible Time 0 ZIDA + Collection Interval: REALTIME SNAPTIME: 01/29/15 13:45:26.13 + + Name Product State Repl. State Requests Active Max Actv + -------- -------- ------------ ------------ -------- -------- -------- + VMNPS52 AQT04012 ONLINE STARTED 0 0 6 ================================================================================
420 Classic Interface User's Guide
NavigationFor additional information about
• a particular Analytics Accelerator, move the cursor to the Analytics Accelerator line and press F11(Zoom).
• related topics, select one of the options at the top of the panel.• other topics, use the PF keys.
FieldsFor each of the available accelerators, the following information is displayed on the Accelerator Summarypanel:IDAA Integrated Synchronization
The asynchronous log reader task statistics accumulated over all log reader tasks since Db2 start.Log Reader CPU Time
The log reader CPU time.Log Reader zIIP Time
The log reader zIIP time.Log Reader zIIP Eligible Time
The log reader zIIP eligible time.Number of accelerators defined
The number of accelerators that are defined on the system.Name
The name of the Accelerator.Product
The product ID.State
The state of the Accelerator.Repl. State
The state of Replication processing on this Accelerator.Requests
The number of Accelerator requests that are processed since the Accelerator was started.Active
The number of active requests that are processed on the Accelerator.Max Actv
The high water mark of concurrent requests on the Accelerator.
Accelerator Statistics DetailDepending on the version of the Analytics Accelerator that you are using, the information about theactivity of a specified Analytics Accelerator is different. The version number of the Analytics Accelerator isdisplayed in the Product ID field.
Accelerator DetailIf the product ID is lower than AQT04010, the Accelerator Detail panel is displayed. It might look like this:
Chapter 8. Resource Managers and Other DB2 Subsystem Information menu 421
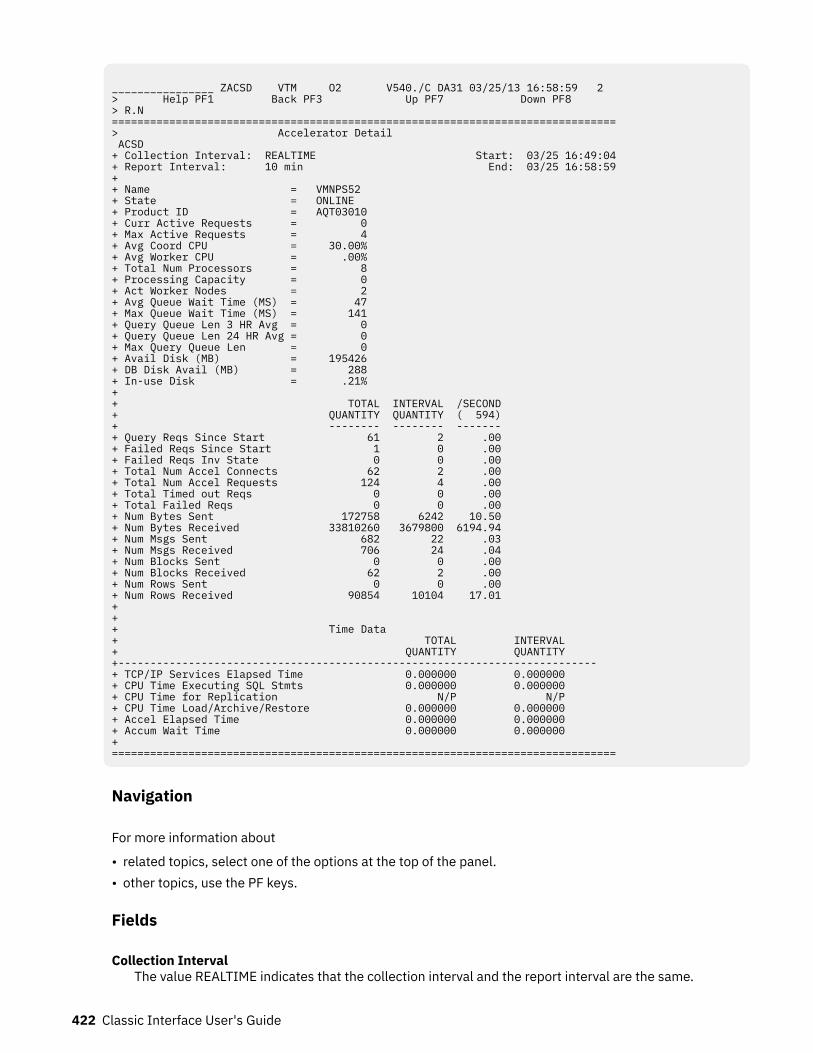
________________ ZACSD VTM O2 V540./C DA31 03/25/13 16:58:59 2 > Help PF1 Back PF3 Up PF7 Down PF8 > R.N ===============================================================================> Accelerator Detail ACSD + Collection Interval: REALTIME Start: 03/25 16:49:04+ Report Interval: 10 min End: 03/25 16:58:59+ + Name = VMNPS52 + State = ONLINE + Product ID = AQT03010 + Curr Active Requests = 0 + Max Active Requests = 4 + Avg Coord CPU = 30.00% + Avg Worker CPU = .00% + Total Num Processors = 8 + Processing Capacity = 0 + Act Worker Nodes = 2 + Avg Queue Wait Time (MS) = 47 + Max Queue Wait Time (MS) = 141 + Query Queue Len 3 HR Avg = 0 + Query Queue Len 24 HR Avg = 0 + Max Query Queue Len = 0 + Avail Disk (MB) = 195426 + DB Disk Avail (MB) = 288 + In-use Disk = .21% + + TOTAL INTERVAL /SECOND + QUANTITY QUANTITY ( 594) + -------- -------- ------- + Query Reqs Since Start 61 2 .00 + Failed Reqs Since Start 1 0 .00 + Failed Reqs Inv State 0 0 .00 + Total Num Accel Connects 62 2 .00 + Total Num Accel Requests 124 4 .00 + Total Timed out Reqs 0 0 .00 + Total Failed Reqs 0 0 .00 + Num Bytes Sent 172758 6242 10.50 + Num Bytes Received 33810260 3679800 6194.94 + Num Msgs Sent 682 22 .03 + Num Msgs Received 706 24 .04 + Num Blocks Sent 0 0 .00 + Num Blocks Received 62 2 .00 + Num Rows Sent 0 0 .00 + Num Rows Received 90854 10104 17.01 + + + Time Data + TOTAL INTERVAL + QUANTITY QUANTITY +--------------------------------------------------------------------------- + TCP/IP Services Elapsed Time 0.000000 0.000000 + CPU Time Executing SQL Stmts 0.000000 0.000000 + CPU Time for Replication N/P N/P + CPU Time Load/Archive/Restore 0.000000 0.000000 + Accel Elapsed Time 0.000000 0.000000 + Accum Wait Time 0.000000 0.000000 + ===============================================================================
Navigation
For more information about
• related topics, select one of the options at the top of the panel.• other topics, use the PF keys.
Fields
Collection IntervalThe value REALTIME indicates that the collection interval and the report interval are the same.
422 Classic Interface User's Guide
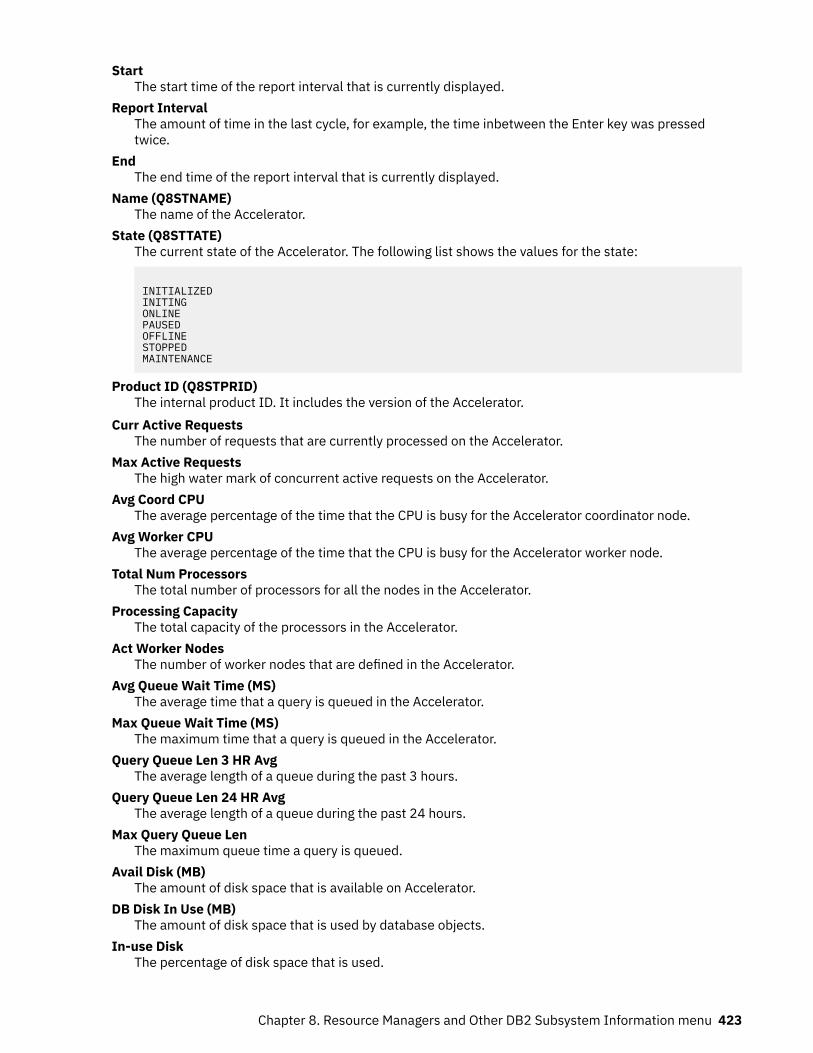
StartThe start time of the report interval that is currently displayed.
Report IntervalThe amount of time in the last cycle, for example, the time inbetween the Enter key was pressedtwice.
EndThe end time of the report interval that is currently displayed.
Name (Q8STNAME)The name of the Accelerator.
State (Q8STTATE)The current state of the Accelerator. The following list shows the values for the state:
INITIALIZEDINITINGONLINEPAUSEDOFFLINESTOPPEDMAINTENANCE
Product ID (Q8STPRID)The internal product ID. It includes the version of the Accelerator.
Curr Active RequestsThe number of requests that are currently processed on the Accelerator.
Max Active RequestsThe high water mark of concurrent active requests on the Accelerator.
Avg Coord CPUThe average percentage of the time that the CPU is busy for the Accelerator coordinator node.
Avg Worker CPUThe average percentage of the time that the CPU is busy for the Accelerator worker node.
Total Num ProcessorsThe total number of processors for all the nodes in the Accelerator.
Processing CapacityThe total capacity of the processors in the Accelerator.
Act Worker NodesThe number of worker nodes that are defined in the Accelerator.
Avg Queue Wait Time (MS)The average time that a query is queued in the Accelerator.
Max Queue Wait Time (MS)The maximum time that a query is queued in the Accelerator.
Query Queue Len 3 HR AvgThe average length of a queue during the past 3 hours.
Query Queue Len 24 HR AvgThe average length of a queue during the past 24 hours.
Max Query Queue LenThe maximum queue time a query is queued.
Avail Disk (MB)The amount of disk space that is available on Accelerator.
DB Disk In Use (MB)The amount of disk space that is used by database objects.
In-use DiskThe percentage of disk space that is used.
Chapter 8. Resource Managers and Other DB2 Subsystem Information menu 423
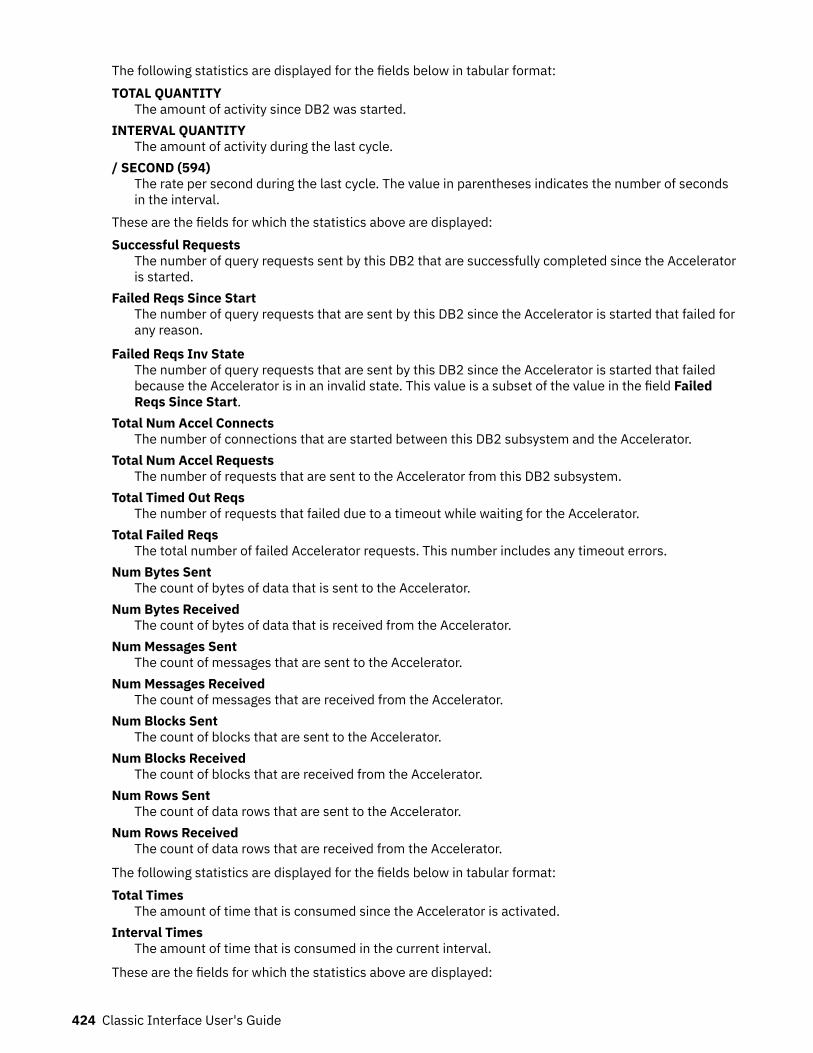
The following statistics are displayed for the fields below in tabular format:TOTAL QUANTITY
The amount of activity since DB2 was started.INTERVAL QUANTITY
The amount of activity during the last cycle./ SECOND (594)
The rate per second during the last cycle. The value in parentheses indicates the number of secondsin the interval.
These are the fields for which the statistics above are displayed:Successful Requests
The number of query requests sent by this DB2 that are successfully completed since the Acceleratoris started.
Failed Reqs Since StartThe number of query requests that are sent by this DB2 since the Accelerator is started that failed forany reason.
Failed Reqs Inv StateThe number of query requests that are sent by this DB2 since the Accelerator is started that failedbecause the Accelerator is in an invalid state. This value is a subset of the value in the field FailedReqs Since Start.
Total Num Accel ConnectsThe number of connections that are started between this DB2 subsystem and the Accelerator.
Total Num Accel RequestsThe number of requests that are sent to the Accelerator from this DB2 subsystem.
Total Timed Out ReqsThe number of requests that failed due to a timeout while waiting for the Accelerator.
Total Failed ReqsThe total number of failed Accelerator requests. This number includes any timeout errors.
Num Bytes SentThe count of bytes of data that is sent to the Accelerator.
Num Bytes ReceivedThe count of bytes of data that is received from the Accelerator.
Num Messages SentThe count of messages that are sent to the Accelerator.
Num Messages ReceivedThe count of messages that are received from the Accelerator.
Num Blocks SentThe count of blocks that are sent to the Accelerator.
Num Blocks ReceivedThe count of blocks that are received from the Accelerator.
Num Rows SentThe count of data rows that are sent to the Accelerator.
Num Rows ReceivedThe count of data rows that are received from the Accelerator.
The following statistics are displayed for the fields below in tabular format:Total Times
The amount of time that is consumed since the Accelerator is activated.Interval Times
The amount of time that is consumed in the current interval.
These are the fields for which the statistics above are displayed:
424 Classic Interface User's Guide
In DB2 CPU TimeThe CPU time that is consumed within the Analytics Accelerator.
TCP/IP Services Elapsed Time (Q8STTELA)The total elapsed time from the time DB2 started to process requests until the requests are complete
Accel CPU Time (Q8STACPU)This is the CPU time consumed within the Accelerator device.
Accel Elapsed Time (Q8STAELA)The total elapsed time that the thread is processed on the Accelerator. The Accelerator time is asubset of the In-DB2 time.
Accum Wait Time (Q8STAWAT)The total wait time within the Accelerator.
Accelerator Detail Subsystem Perspective
If the product ID is greater than or equal to AQT04010, the Accelerator Detail Subsystem Perspectivepanel is displayed. It shows information from the perspective of the individual DB2 subsystem. It mightlook like this:
Chapter 8. Resource Managers and Other DB2 Subsystem Information menu 425
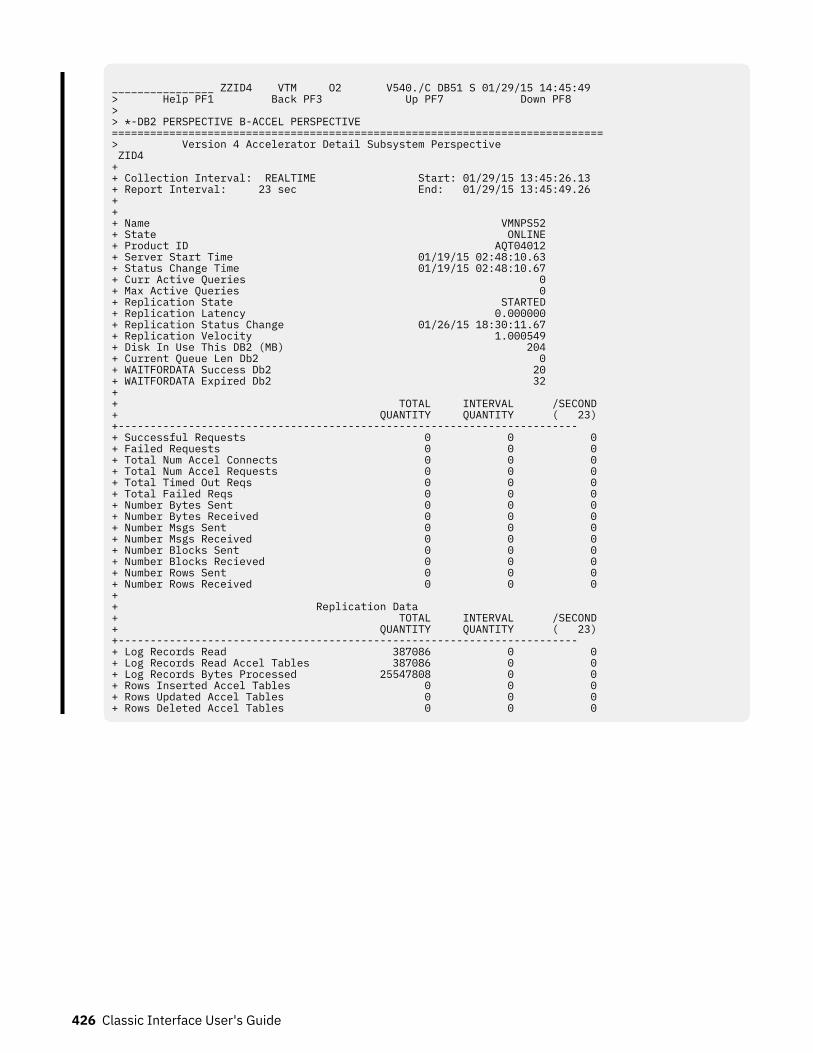
________________ ZZID4 VTM O2 V540./C DB51 S 01/29/15 14:45:49 > Help PF1 Back PF3 Up PF7 Down PF8 > > *-DB2 PERSPECTIVE B-ACCEL PERSPECTIVE =============================================================================> Version 4 Accelerator Detail Subsystem Perspective ZID4 + + Collection Interval: REALTIME Start: 01/29/15 13:45:26.13 + Report Interval: 23 sec End: 01/29/15 13:45:49.26 + + + Name VMNPS52 + State ONLINE + Product ID AQT04012 + Server Start Time 01/19/15 02:48:10.63 + Status Change Time 01/19/15 02:48:10.67 + Curr Active Queries 0 + Max Active Queries 0 + Replication State STARTED + Replication Latency 0.000000 + Replication Status Change 01/26/15 18:30:11.67 + Replication Velocity 1.000549 + Disk In Use This DB2 (MB) 204 + Current Queue Len Db2 0 + WAITFORDATA Success Db2 20 + WAITFORDATA Expired Db2 32 + + TOTAL INTERVAL /SECOND + QUANTITY QUANTITY ( 23) +------------------------------------------------------------------------ + Successful Requests 0 0 0 + Failed Requests 0 0 0 + Total Num Accel Connects 0 0 0 + Total Num Accel Requests 0 0 0 + Total Timed Out Reqs 0 0 0 + Total Failed Reqs 0 0 0 + Number Bytes Sent 0 0 0 + Number Bytes Received 0 0 0 + Number Msgs Sent 0 0 0 + Number Msgs Received 0 0 0 + Number Blocks Sent 0 0 0 + Number Blocks Recieved 0 0 0 + Number Rows Sent 0 0 0 + Number Rows Received 0 0 0 + + Replication Data + TOTAL INTERVAL /SECOND + QUANTITY QUANTITY ( 23) +------------------------------------------------------------------------ + Log Records Read 387086 0 0 + Log Records Read Accel Tables 387086 0 0 + Log Records Bytes Processed 25547808 0 0 + Rows Inserted Accel Tables 0 0 0 + Rows Updated Accel Tables 0 0 0 + Rows Deleted Accel Tables 0 0 0
426 Classic Interface User's Guide
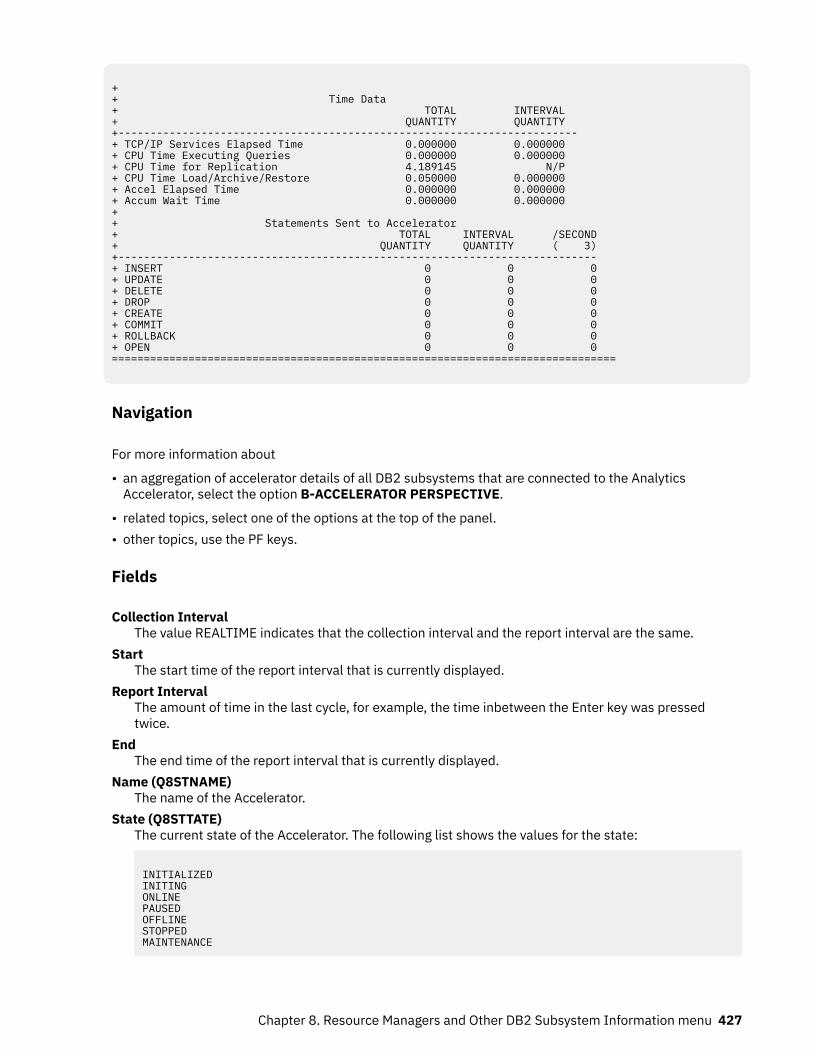
+ + Time Data + TOTAL INTERVAL + QUANTITY QUANTITY +------------------------------------------------------------------------ + TCP/IP Services Elapsed Time 0.000000 0.000000 + CPU Time Executing Queries 0.000000 0.000000 + CPU Time for Replication 4.189145 N/P + CPU Time Load/Archive/Restore 0.050000 0.000000 + Accel Elapsed Time 0.000000 0.000000 + Accum Wait Time 0.000000 0.000000 ++ Statements Sent to Accelerator + TOTAL INTERVAL /SECOND + QUANTITY QUANTITY ( 3) +--------------------------------------------------------------------------- + INSERT 0 0 0 + UPDATE 0 0 0 + DELETE 0 0 0 + DROP 0 0 0 + CREATE 0 0 0 + COMMIT 0 0 0 + ROLLBACK 0 0 0 + OPEN 0 0 0 ===============================================================================
Navigation
For more information about
• an aggregation of accelerator details of all DB2 subsystems that are connected to the AnalyticsAccelerator, select the option B-ACCELERATOR PERSPECTIVE.
• related topics, select one of the options at the top of the panel.• other topics, use the PF keys.
Fields
Collection IntervalThe value REALTIME indicates that the collection interval and the report interval are the same.
StartThe start time of the report interval that is currently displayed.
Report IntervalThe amount of time in the last cycle, for example, the time inbetween the Enter key was pressedtwice.
EndThe end time of the report interval that is currently displayed.
Name (Q8STNAME)The name of the Accelerator.
State (Q8STTATE)The current state of the Accelerator. The following list shows the values for the state:
INITIALIZEDINITINGONLINEPAUSEDOFFLINESTOPPEDMAINTENANCE
Chapter 8. Resource Managers and Other DB2 Subsystem Information menu 427
Product ID (Q8STPRID)The internal product ID. It includes the version of the Accelerator.
Server Start Time (Q8STTART)The time the Accelerator server process is started.
Status Change Time (Q8STTATC)The time the last status change is recorded.
Curr Active Queries (Q8STNCQS)The number of queries that are processed currently on behalf of this DB2.
Max Active Queries (Q8STMNQS)The maximum number of concurrent queries that are processed on behalf of this DB2.
Replication State (Q8STCSS)The state of replication processing for this DB2.
Replication Latency (Q8STCRL)The replication latency for this DB2.
Replication Status Change (Q8STTLSC)The time the last replication status change is recorded.
Replication Velocity (Q8STVLCS)Replication velocity of this Db2 subsystem. Replication velocity is measured in Db2 log secondsreplicated per second to the Accelerator. The value in this field is in microseconds. For external use,convert the value to seconds. This value might be negative if replication for the Accelerator is stopped,or if replication information for the Accelerator is not yet available.
Disk in Use This DB2 (Q8STDSKB)The amount of disk space that is used by database objects.
Current Queue Len Db2 (Q8STCQLS)The current queue length at the accelerator back-end for this Db2 subsystem.
WAITFORDATA Success Db2 (Q8STTDPS)Total number of successful query requests that were sent by this Db2 subsystem to the accelerator,and were run with the WAITFORDATA delay protocol.
WAITFORDATA Expired Db2 (Q8STEDPS)Total number of query requests that were sent by this Db2 subsystem to the accelerator, were runwith the WAITFORDATA delay protocol, and expired because the total wait time was greater than thespecified WAITFORDATA value.
The following statistics are displayed for the fields below in tabular format:TOTAL QUANTITY
The amount of activity since the Accelerator is activated.INTERVAL QUANTITY
The amount of activity during the last cycle./SECOND (1)
The rate per second during the last cycle. The value in parentheses indicates the number of secondsin the interval.
These are the fields for which the statistics above are displayed:Successful Requests (Q8STSREQ)
The number of query requests sent by this DB2 since the Accelerator is started that completedsuccessfully.
Failed Requests (Q8STFREQ)The number of query requests sent by this DB2 since the Accelerator is started that failed for anyreason.
Total Num Accel Connects (Q8STCONN)The number of connections that are started between this DB2 subsystem and the Accelerator.
428 Classic Interface User's Guide
Total Num Accel Requests (Q8STREQ )The number of requests that are sent to the Accelerator from this DB2 subsystem.
Total Timed Out Reqs (Q8STTOUT)The number of requests that failed due to a timeout waiting for the Accelerator.
Total Failed Reqs (Q8STFAIL)The total number of failed Accelerator requests. This number includes any timeout errors.
Number Bytes SentThe number of bytes of data that is sent to the Accelerator.
Number Bytes Received (Q8STBYTR)The number of bytes that are received.
Number Messages Sent (Q8STMSGS)The number of messages that are sent to the Accelerator.
Number Messages Received (Q8STMSGR)The number of messages that are received from the Accelerator.
Number Blocks Sent (Q8STBLKS)The number of blocks that are sent to the Accelerator.
Number Blocks Received (Q8STBLKR)The number of blocks that are received by the Accelerator.
Number Rows Sent (Q8STROWS)The number of data rows that are sent to the Accelerator.
Number Rows Received (Q8STROWR)The number of data rows that are received by the Accelerator.
The following set of statistic fields is related to replication processing. If replication is not configured forthis Accelerator, these fields are not displayed.Log Records Read (Q8STNLRS)
The total number of log records that is read by capture agents on this DB2.Log Records Read Accel Tables (Q8STNLTS)
The number of log records that are read by capture agents on this DB2 for tables that reside in thisAccelerator.
Log Record Bytes Processed (Q8STNBS)The number of bytes that are processed by capture agents for this DB2.
Rows Inserted Accel Tables (Q8STNIS)The number of inserted rows that are processed by capture agents on this DB2 for tables that residein this Accelerator.
Rows Updated Accel Tables (Q8STNUS)The number of updated rows that are processed by capture agents on this DB2 for tables that residein this Accelerator.
Rows Deleted Accel Tables (Q8STNDS)The number of inserted rows that are processed by capture agents on this DB2 for tables that residein this Accelerator.
The following statistics are displayed for the fields below in tabular format:TOTAL QUANTITY
The amount of time that is consumed since the Accelerator is activated.INTERVAL QUANTITY
The amount of time that is consumed in the current interval.These are the fields for which the statistics above are displayed.TCP/IP Services Elapsed Time (Q8STTELA)
The total elapsed time from the time DB2 started to process a request until the time the request iscompleted.
Chapter 8. Resource Managers and Other DB2 Subsystem Information menu 429
CPU Time Executing Queries (Q8STTCQS)The CPU time that is consumed by the Analytics Accelerator for processing queries.
CPU Time for Replication (Q8STTCCS)The CPU time that is consumed by the Analytics Accelerator for replication.
CPU Time for Load/Archive/Restore (Q8STTCMS)The CPU time that is consumed by the Analytics Accelerator for maintenance.
Accel Elapsed Time (Q8STAELA)The total elapsed time that the thread is processed on the Analytics Accelerator. The Accelerator timeis a subset of the In DB2 time.
Accum Wait Time (Q8STAWAT)The total wait time within the Analytics Accelerator.
Statements sent to AcceleratorInsert
The number of Insert statements issued for IDT (Q8STINSC) objects from DB2 to the accelerator.Update
The number of Update statements issued for IDT (Q8STUPDC) objects from DB2 to the accelerator.Delete
This is the number of Delete statements issued for IDT (Q8STDELC) objects from DB2 to theaccelerator.
DropThe number of Drop statements issued for IDT (Q8STDRPC) objects from DB2 to the accelerator.
CreateThe number of Create statements issued for IDT (Q8STCRTC) objects from DB2 to the accelerator.
CommitThe number of Commit statements issued for IDT (Q8STCMTC) objects from DB2 to the accelerator.
RollbackThis is the number of Rollback statements issued for (Q8STRBKC) IDT objects from DB2 to theaccelerator.
OpenThe number of Open statements issued for IDT (Q8STOPNC) objects from DB2 to the accelerator.
Accelerator Detail Accelerator Perspective
This panel displays detailed information that is aggregated across all DB2 subsystems that are connectedto the Analytics Accelerator.
430 Classic Interface User's Guide
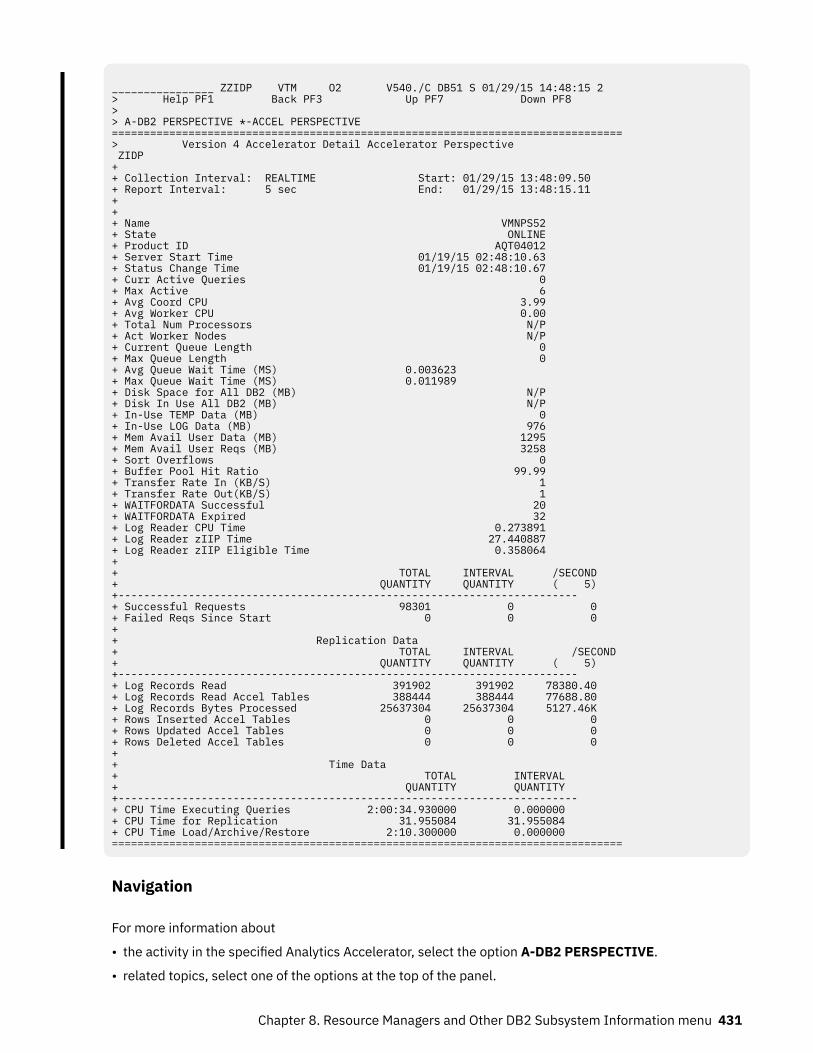
________________ ZZIDP VTM O2 V540./C DB51 S 01/29/15 14:48:15 2 > Help PF1 Back PF3 Up PF7 Down PF8 > > A-DB2 PERSPECTIVE *-ACCEL PERSPECTIVE ================================================================================> Version 4 Accelerator Detail Accelerator Perspective ZIDP + + Collection Interval: REALTIME Start: 01/29/15 13:48:09.50 + Report Interval: 5 sec End: 01/29/15 13:48:15.11 + + + Name VMNPS52 + State ONLINE + Product ID AQT04012 + Server Start Time 01/19/15 02:48:10.63 + Status Change Time 01/19/15 02:48:10.67 + Curr Active Queries 0 + Max Active 6 + Avg Coord CPU 3.99 + Avg Worker CPU 0.00 + Total Num Processors N/P + Act Worker Nodes N/P + Current Queue Length 0 + Max Queue Length 0 + Avg Queue Wait Time (MS) 0.003623 + Max Queue Wait Time (MS) 0.011989 + Disk Space for All DB2 (MB) N/P + Disk In Use All DB2 (MB) N/P + In-Use TEMP Data (MB) 0 + In-Use LOG Data (MB) 976 + Mem Avail User Data (MB) 1295 + Mem Avail User Reqs (MB) 3258 + Sort Overflows 0 + Buffer Pool Hit Ratio 99.99 + Transfer Rate In (KB/S) 1 + Transfer Rate Out(KB/S) 1 + WAITFORDATA Successful 20 + WAITFORDATA Expired 32 + Log Reader CPU Time 0.273891 + Log Reader zIIP Time 27.440887 + Log Reader zIIP Eligible Time 0.358064 + + TOTAL INTERVAL /SECOND + QUANTITY QUANTITY ( 5) +------------------------------------------------------------------------ + Successful Requests 98301 0 0 + Failed Reqs Since Start 0 0 0 + + Replication Data + TOTAL INTERVAL /SECOND + QUANTITY QUANTITY ( 5) +------------------------------------------------------------------------ + Log Records Read 391902 391902 78380.40 + Log Records Read Accel Tables 388444 388444 77688.80 + Log Records Bytes Processed 25637304 25637304 5127.46K + Rows Inserted Accel Tables 0 0 0 + Rows Updated Accel Tables 0 0 0 + Rows Deleted Accel Tables 0 0 0 + + Time Data + TOTAL INTERVAL + QUANTITY QUANTITY +------------------------------------------------------------------------ + CPU Time Executing Queries 2:00:34.930000 0.000000 + CPU Time for Replication 31.955084 31.955084 + CPU Time Load/Archive/Restore 2:10.300000 0.000000 ================================================================================
Navigation
For more information about
• the activity in the specified Analytics Accelerator, select the option A-DB2 PERSPECTIVE.
• related topics, select one of the options at the top of the panel.
Chapter 8. Resource Managers and Other DB2 Subsystem Information menu 431
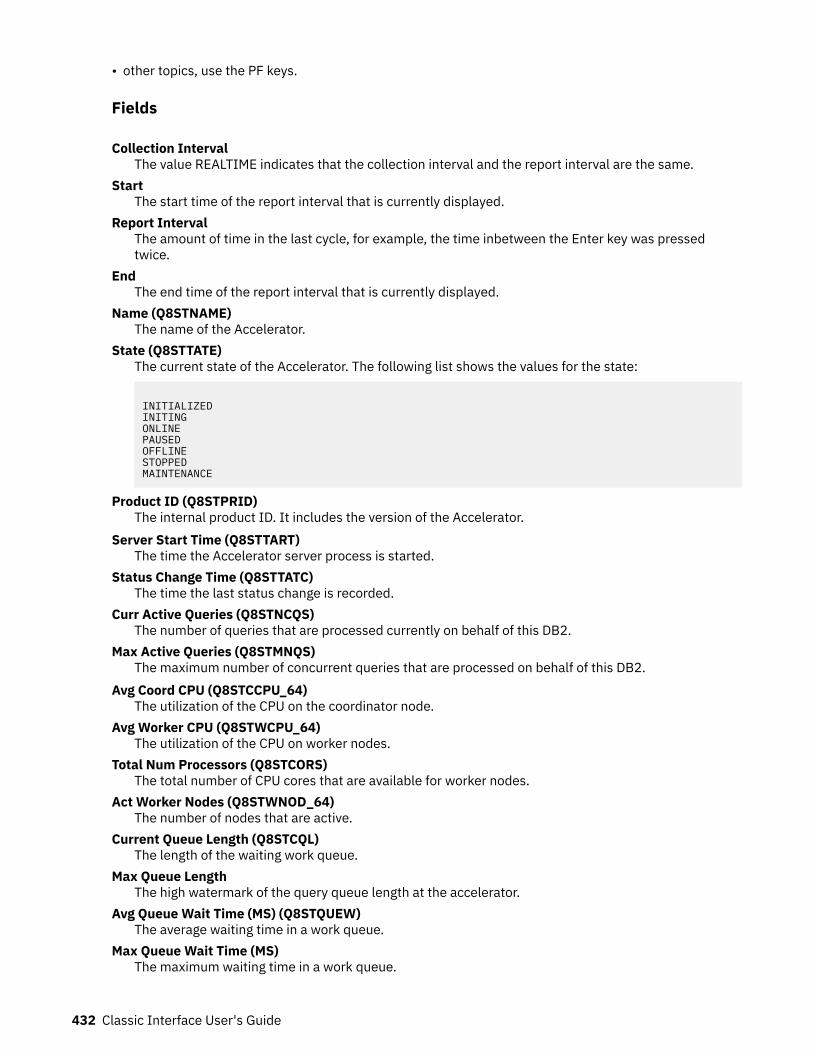
• other topics, use the PF keys.
Fields
Collection IntervalThe value REALTIME indicates that the collection interval and the report interval are the same.
StartThe start time of the report interval that is currently displayed.
Report IntervalThe amount of time in the last cycle, for example, the time inbetween the Enter key was pressedtwice.
EndThe end time of the report interval that is currently displayed.
Name (Q8STNAME)The name of the Accelerator.
State (Q8STTATE)The current state of the Accelerator. The following list shows the values for the state:
INITIALIZEDINITINGONLINEPAUSEDOFFLINESTOPPEDMAINTENANCE
Product ID (Q8STPRID)The internal product ID. It includes the version of the Accelerator.
Server Start Time (Q8STTART)The time the Accelerator server process is started.
Status Change Time (Q8STTATC)The time the last status change is recorded.
Curr Active Queries (Q8STNCQS)The number of queries that are processed currently on behalf of this DB2.
Max Active Queries (Q8STMNQS)The maximum number of concurrent queries that are processed on behalf of this DB2.
Avg Coord CPU (Q8STCCPU_64)The utilization of the CPU on the coordinator node.
Avg Worker CPU (Q8STWCPU_64)The utilization of the CPU on worker nodes.
Total Num Processors (Q8STCORS)The total number of CPU cores that are available for worker nodes.
Act Worker Nodes (Q8STWNOD_64)The number of nodes that are active.
Current Queue Length (Q8STCQL)The length of the waiting work queue.
Max Queue LengthThe high watermark of the query queue length at the accelerator.
Avg Queue Wait Time (MS) (Q8STQUEW)The average waiting time in a work queue.
Max Queue Wait Time (MS)The maximum waiting time in a work queue.
432 Classic Interface User's Guide
Disk Space for All DB2 (MB) (Q8STDSKA)The storage that is available on the disk.
Disk In Use All DB2 (MB) (Q8STDSA)The total disk space that is used in all databases.
In-Use TEMP Data (MB) (Q8STTSA)Amount of disk space, in megabytes, across all Db2 subsystems, for temporary data.
In-Use LOG Data (MB) (Q8STLSA)Amount of disk space, in megabytes, across all Db2 subsystems, for log data.
Mem Avail User Data (MB) (Q8STTMUD)Total amount of memory that is configured for buffer pools, across all worker nodes, in megabytes.This value is the amount of memory that is available for user data.
Mem Avail User Reqs (MB) (Q8STTMPS)Total amount of memory that is available for processing SQL queries or data manipulation languagestatements in the Accelerator, in megabytes.
Sort Overflows (Q8STOFLW)The number of sort overflows at the Accelerator back-end. A sort overflow occurs when an SQLstatement can not be processed entirely in memory.
Buffer Pool Hit Ratio (Q8STABHR)The accelerator buffer pool hit ratio. This value is the buffer pool hit ratio for all work that theAccelerator performs on behalf of currently paired Db2 subsystems.
Transfer Rate In (KB/S) (Q8STANUI)Current inbound transfer rate for data transmitted through a network interface between theAccelerator and Db2, in kilobytes per second.
Transfer Rate Out (KB/S) (Q8STANUO)Current outbound transfer rate for data transmitted through a network interface between theAccelerator and Db2, in kilobytes per second.
WAITFORDATA Successful (Q8STTDPA)Total number of successful query requests that were sent by all Db2 subsystems to the Accelerator,and were run with the WAITFORDATA delay protocol.
WAITFORDATA Expired (Q8STEDPA)Total number of query requests that were sent by all Db2 subsystems to the accelerator, were runwith the WAITFORDATA delay protocol, and expired because the total wait time was greater than thespecified WAITFORDATA value.
Log Reader CPU Time (Q8STLRCP)CPU time used by Integrated Synchronization asynchronous log reader task on behalf of thisaccelerator. (Db2 V12 and later)
Log Reader zIIP Time (Q8STLRZI)zIIP time used by Integrated Synchronization asynchronous log reader task on behalf of thisaccelerator. (Db2 V12 and later)
Log Reader zIIP Eligible Time (Q8STLRZE)zIIP eligible time for Integrated Synchronization asynchronous log reader task on behalf of thisaccelerator. (Db2 V12 and later)
The following statistics are displayed for the fields below in tabular format:TOTAL QUANTITY
The amount of activity since DB2 was started.INTERVAL QUANTITY
The amount of activity during the last cycle./ SECOND (594)
The rate per second during the last cycle. The value in parentheses indicates the number of secondsin the interval.
These are the fields for which the statistics above are displayed:
Chapter 8. Resource Managers and Other DB2 Subsystem Information menu 433
Successful RequestsThe number of query requests sent by this DB2 that are successfully completed since the Acceleratoris started.
Failed Reqs Since StartThe number of query requests that are sent by this DB2 since the Accelerator is started that failed forany reason.
The following set of statistic fields is related to replication processing. If replication is not configured forthis Accelerator, these fields are not displayed.Log Records Read (Q8STNLRS)
The total number of log records that is read by capture agents on this DB2.Log Records Read Accel Tables (Q8STNLTS)
The number of log records that are read by capture agents on this DB2 for tables that reside in thisAccelerator.
Log Record Bytes Processed (Q8STNBS)The number of bytes that are processed by capture agents for this DB2.
Rows Inserted Accel Tables (Q8STNIS)The number of inserted rows that are processed by capture agents on this DB2 for tables that residein this Accelerator.
Rows Updated Accel Tables (Q8STNUS)The number of updated rows that are processed by capture agents on this DB2 for tables that residein this Accelerator.
Rows Deleted Accel Tables (Q8STNDS)The number of inserted rows that are processed by capture agents on this DB2 for tables that residein this Accelerator.
The following statistics are displayed for the fields below in tabular format:TOTAL QUANTITY
The amount of time that is consumed since the Accelerator is activated.INTERVAL QUANTITY
The amount of time that is consumed in the current interval.These are the fields for which the statistics above are displayed.CPU Time Executing Queries (Q8STTCQS)
The CPU time that is consumed by the Analytics Accelerator for processing queries.CPU Time for Replication (Q8STTCCS)
The CPU time that is consumed by the Analytics Accelerator for replication.CPU Time for Load/Archive/Restore (Q8STTCMS)
The CPU time that is consumed by the Analytics Accelerator for maintenance.
434 Classic Interface User's Guide
Chapter 9. Application Trace Facility (ATF)Select this main menu option to access the Application Trace Facility (ATF) to trace the execution of a DB2application.
The information gathered in these traces helps in the analysis of application flow and resourceconsumption. The Application Trace Facility provides the following types of performance information:
• SQL trace information including static host variables and dynamic parameter markers• Sort activity information• Pageset access and scan information• Locking information• Application In-DB2 time and In-DB2 CPU time
The data that is collected by the Application Trace Facility is stored in a VSAM file or resident in memory.If the data is not stored in a VSAM file, it is only available for the current OMEGAMON for Db2 PE session.
All Application Trace Facility (ATF) panels show the current state of an application trace, including apossible trace data set full condition, as ABENDED, ACTIVE, INACTIVE, or DSN FULL. A state of INIT-XXX might be shown briefly during early stages of initialization. For more information, see the descriptionof panel “View the Active In-Memory Non-Dataset Trace” on page 441.
Application Trace Facility MenuThis menu provides access to panels from which you can start an application trace, store trace data,review the data collected by an application trace, stop an application trace, and release the storage dataset.
You can use this panel to specify the criteria for the application to be traced and to store the trace output.Trace output can have the following formats:In memory trace
Trace data is stored in the virtual storage of the OMEGAMON for Db2 PE address space. It is limited tothe total amount of storage that is available. The storage is owned by the VTAM session that startedthe trace. The trace starts as soon as you are completing the start request. If the VTAM sessionterminates while the trace is running, the trace is terminated and the trace output is lost. When thetrace is completed, the data is only available to the VTAM session that started the trace. If the VTAMsession terminates, or if you request another in memory application trace, the trace is discarded.To control the TRACE request, select option B -VIEW TRACE. To terminate the trace or to view thetrace contents, select option C - Stop Trace.
VSAM Dataset TraceThe trace is written to a VSAM dataset. It is limited by the size of the dataset. You can define whetherthe trace is to run immediately or to be deferred (scheduled) for execution at a later time. If the traceis started or scheduled, the VTAM session that requests the trace does not need to stay active for thetrace to complete successfully. Information about the trace is maintained for the duration of theOMEGAMON for Db2 PE address space, unless it is manually deleted. You can view the trace datafrom any VTAM session.To control the trace, select option H - QUEUED Traces and select the appropriate element.
© Copyright IBM Corp. 2005, 2021 435
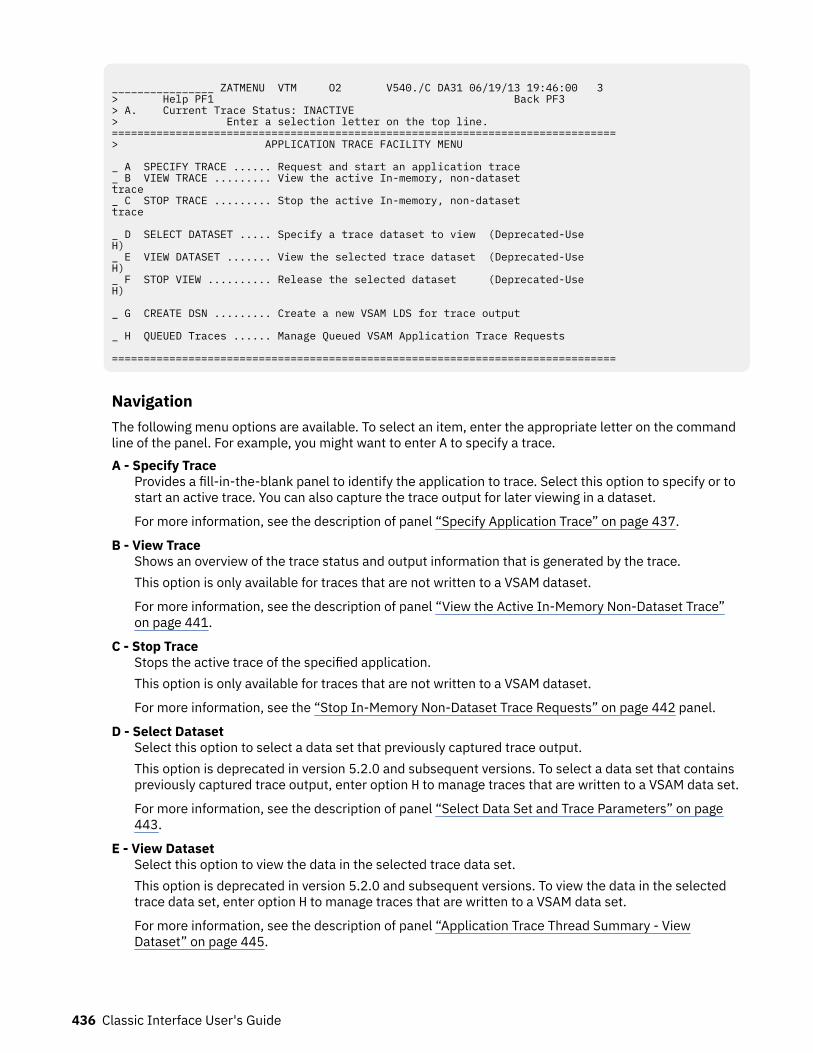
________________ ZATMENU VTM O2 V540./C DA31 06/19/13 19:46:00 3 > Help PF1 Back PF3 > A. Current Trace Status: INACTIVE > Enter a selection letter on the top line. ===============================================================================> APPLICATION TRACE FACILITY MENU _ A SPECIFY TRACE ...... Request and start an application trace _ B VIEW TRACE ......... View the active In-memory, non-dataset trace _ C STOP TRACE ......... Stop the active In-memory, non-dataset trace _ D SELECT DATASET ..... Specify a trace dataset to view (Deprecated-Use H) _ E VIEW DATASET ....... View the selected trace dataset (Deprecated-Use H) _ F STOP VIEW .......... Release the selected dataset (Deprecated-Use H) _ G CREATE DSN ......... Create a new VSAM LDS for trace output _ H QUEUED Traces ...... Manage Queued VSAM Application Trace Requests ===============================================================================
NavigationThe following menu options are available. To select an item, enter the appropriate letter on the commandline of the panel. For example, you might want to enter A to specify a trace.A - Specify Trace
Provides a fill-in-the-blank panel to identify the application to trace. Select this option to specify or tostart an active trace. You can also capture the trace output for later viewing in a dataset.
For more information, see the description of panel “Specify Application Trace” on page 437.
B - View TraceShows an overview of the trace status and output information that is generated by the trace.This option is only available for traces that are not written to a VSAM dataset.
For more information, see the description of panel “View the Active In-Memory Non-Dataset Trace”on page 441.
C - Stop TraceStops the active trace of the specified application.This option is only available for traces that are not written to a VSAM dataset.
For more information, see the “Stop In-Memory Non-Dataset Trace Requests” on page 442 panel.
D - Select DatasetSelect this option to select a data set that previously captured trace output.This option is deprecated in version 5.2.0 and subsequent versions. To select a data set that containspreviously captured trace output, enter option H to manage traces that are written to a VSAM data set.
For more information, see the description of panel “Select Data Set and Trace Parameters” on page443.
E - View DatasetSelect this option to view the data in the selected trace data set.This option is deprecated in version 5.2.0 and subsequent versions. To view the data in the selectedtrace data set, enter option H to manage traces that are written to a VSAM data set.
For more information, see the description of panel “Application Trace Thread Summary - ViewDataset” on page 445.
436 Classic Interface User's Guide
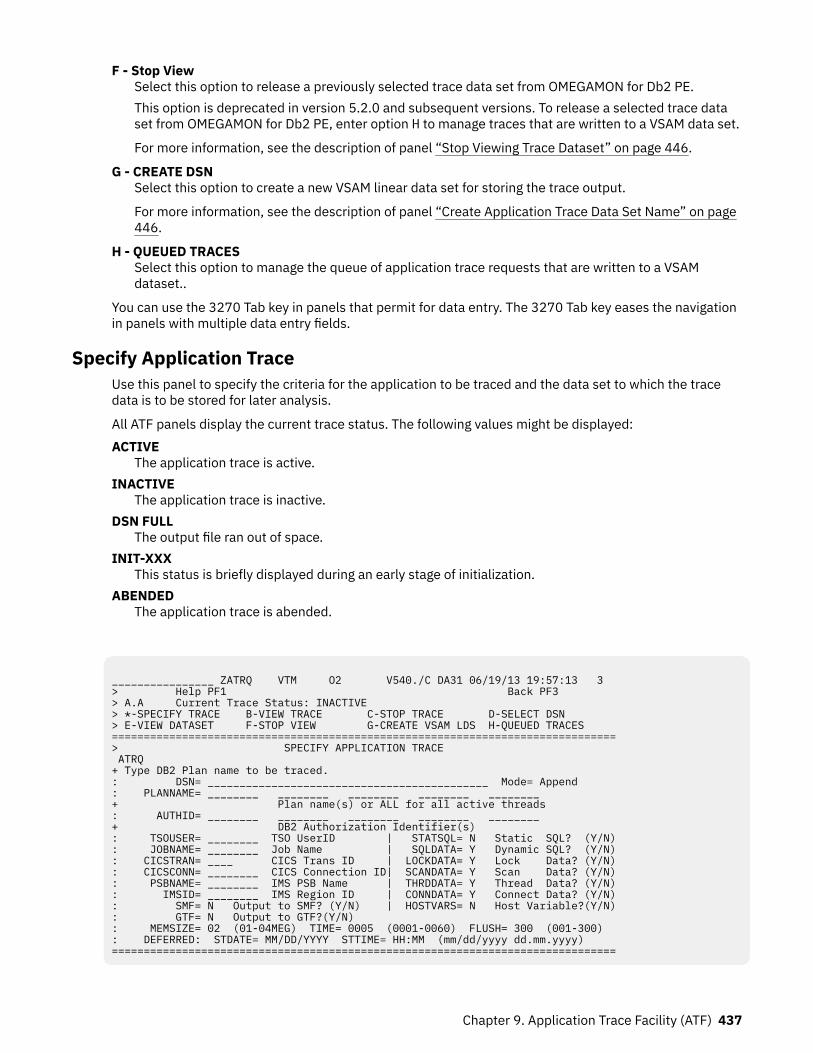
F - Stop ViewSelect this option to release a previously selected trace data set from OMEGAMON for Db2 PE.This option is deprecated in version 5.2.0 and subsequent versions. To release a selected trace dataset from OMEGAMON for Db2 PE, enter option H to manage traces that are written to a VSAM data set.
For more information, see the description of panel “Stop Viewing Trace Dataset” on page 446.
G - CREATE DSNSelect this option to create a new VSAM linear data set for storing the trace output.
For more information, see the description of panel “Create Application Trace Data Set Name” on page446.
H - QUEUED TRACESSelect this option to manage the queue of application trace requests that are written to a VSAMdataset..
You can use the 3270 Tab key in panels that permit for data entry. The 3270 Tab key eases the navigationin panels with multiple data entry fields.
Specify Application TraceUse this panel to specify the criteria for the application to be traced and the data set to which the tracedata is to be stored for later analysis.
All ATF panels display the current trace status. The following values might be displayed:ACTIVE
The application trace is active.INACTIVE
The application trace is inactive.DSN FULL
The output file ran out of space.INIT-XXX
This status is briefly displayed during an early stage of initialization.ABENDED
The application trace is abended.
________________ ZATRQ VTM O2 V540./C DA31 06/19/13 19:57:13 3 > Help PF1 Back PF3 > A.A Current Trace Status: INACTIVE > *-SPECIFY TRACE B-VIEW TRACE C-STOP TRACE D-SELECT DSN > E-VIEW DATASET F-STOP VIEW G-CREATE VSAM LDS H-QUEUED TRACES ===============================================================================> SPECIFY APPLICATION TRACE ATRQ + Type DB2 Plan name to be traced. : DSN= ____________________________________________ Mode= Append : PLANNAME= ________ ________ ________ ________ ________ + Plan name(s) or ALL for all active threads : AUTHID= ________ ________ ________ ________ ________ + DB2 Authorization Identifier(s) : TSOUSER= ________ TSO UserID | STATSQL= N Static SQL? (Y/N): JOBNAME= ________ Job Name | SQLDATA= Y Dynamic SQL? (Y/N): CICSTRAN= ____ CICS Trans ID | LOCKDATA= Y Lock Data? (Y/N): CICSCONN= ________ CICS Connection ID| SCANDATA= Y Scan Data? (Y/N): PSBNAME= ________ IMS PSB Name | THRDDATA= Y Thread Data? (Y/N): IMSID= ________ IMS Region ID | CONNDATA= Y Connect Data? (Y/N): SMF= N Output to SMF? (Y/N) | HOSTVARS= N Host Variable?(Y/N): GTF= N Output to GTF?(Y/N) : MEMSIZE= 02 (01-04MEG) TIME= 0005 (0001-0060) FLUSH= 300 (001-300) : DEFERRED: STDATE= MM/DD/YYYY STTIME= HH:MM (mm/dd/yyyy dd.mm.yyyy) ===============================================================================
Chapter 9. Application Trace Facility (ATF) 437
You can trace up to five individual plans or all plans (threads) executing in the DB2 system. To limit traceoverhead incurred by the DB2 subsystem and OMEGAMON XE for DB2 PE, qualify your trace request asmuch as possible. To qualify a trace request, enter the required information for only one of the connectiontypes (TSO, batch, CICS, or IMS).
Note: Use SMP/E USERMOD if you want to change default options and limits listed below. SeeTKANSAM(KO2MOD01) for more information.
NavigationFor additional options, use the PF keys.
FieldsDSN
The name of a VSAM data set. If you want trace data to be saved for later viewing, enter the name of apreallocated, preformatted data set; otherwise, leave this field blank.
For considerations about sizing VSAM data sets for various record types and output devices, seeConfiguration and Customization.
For procedures about customizing the Application Trace Facility, see Configuration and Customization.The ATF uses only the primary extent of a data set; it does not use secondary extents. Keep this inmind when considering space requirements for the trace data.
MODEDefines whether trace data is appended to existing data in the VSAM data set that is specified in theDSN field. You can use the following values:APPEND
Any previously collected trace data is retained and new data is appended to the end of existingdata.This is the default value.
REUSEDeletes existing trace data from a data set before new trace data is added.
You can change the default value by adding the keyword ATFMODE to the member OMPEOPTS in therhilev.RKD2PAR(OMPEOPTS) data set. Valid values for the keyword ATFMODE are APPEND orREUSE.
PLANNAMEThe DB2 plan names of the application threads to be traced. To trace all thread activity, set the planname to ALL. This field is required.
The specification of individual plan names and individual authorization IDs is restricted such that youcan specify either up to five plan names and one authorization ID or one plan name and up to fiveauthorization IDs.
AUTHIDThe DB2 authorization IDs of the application (threads) to be traced. This field is optional, however, youshould supply one or more authorization IDs to limit trace overhead and the amount of data collected.
See also PLANNAME for possible restrictions.
TSOUSERThe TSO user ID of the application (thread) to be traced if the application originates from a DB2 TSOconnection. This limits the amount of trace data collected and overhead incurred.
JOBNAMEThe jobname of the application (thread) to be traced if the application originates from a DB2 batch(TSO background) connection. This limits the amount of trace data collected and overhead incurred.
438 Classic Interface User's Guide
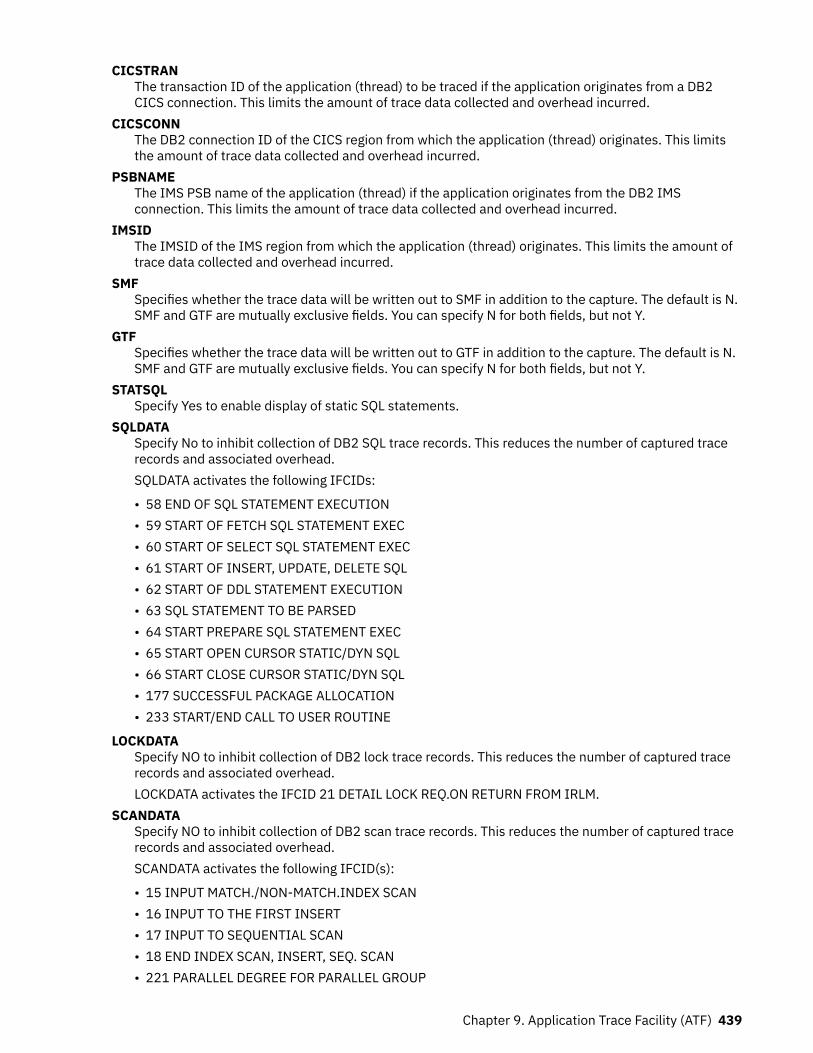
CICSTRANThe transaction ID of the application (thread) to be traced if the application originates from a DB2CICS connection. This limits the amount of trace data collected and overhead incurred.
CICSCONNThe DB2 connection ID of the CICS region from which the application (thread) originates. This limitsthe amount of trace data collected and overhead incurred.
PSBNAMEThe IMS PSB name of the application (thread) if the application originates from the DB2 IMSconnection. This limits the amount of trace data collected and overhead incurred.
IMSIDThe IMSID of the IMS region from which the application (thread) originates. This limits the amount oftrace data collected and overhead incurred.
SMFSpecifies whether the trace data will be written out to SMF in addition to the capture. The default is N.SMF and GTF are mutually exclusive fields. You can specify N for both fields, but not Y.
GTFSpecifies whether the trace data will be written out to GTF in addition to the capture. The default is N.SMF and GTF are mutually exclusive fields. You can specify N for both fields, but not Y.
STATSQLSpecify Yes to enable display of static SQL statements.
SQLDATASpecify No to inhibit collection of DB2 SQL trace records. This reduces the number of captured tracerecords and associated overhead.SQLDATA activates the following IFCIDs:
• 58 END OF SQL STATEMENT EXECUTION• 59 START OF FETCH SQL STATEMENT EXEC• 60 START OF SELECT SQL STATEMENT EXEC• 61 START OF INSERT, UPDATE, DELETE SQL• 62 START OF DDL STATEMENT EXECUTION• 63 SQL STATEMENT TO BE PARSED• 64 START PREPARE SQL STATEMENT EXEC• 65 START OPEN CURSOR STATIC/DYN SQL• 66 START CLOSE CURSOR STATIC/DYN SQL• 177 SUCCESSFUL PACKAGE ALLOCATION• 233 START/END CALL TO USER ROUTINE
LOCKDATASpecify NO to inhibit collection of DB2 lock trace records. This reduces the number of captured tracerecords and associated overhead.LOCKDATA activates the IFCID 21 DETAIL LOCK REQ.ON RETURN FROM IRLM.
SCANDATASpecify NO to inhibit collection of DB2 scan trace records. This reduces the number of captured tracerecords and associated overhead.SCANDATA activates the following IFCID(s):
• 15 INPUT MATCH./NON-MATCH.INDEX SCAN• 16 INPUT TO THE FIRST INSERT• 17 INPUT TO SEQUENTIAL SCAN• 18 END INDEX SCAN, INSERT, SEQ. SCAN• 221 PARALLEL DEGREE FOR PARALLEL GROUP
Chapter 9. Application Trace Facility (ATF) 439
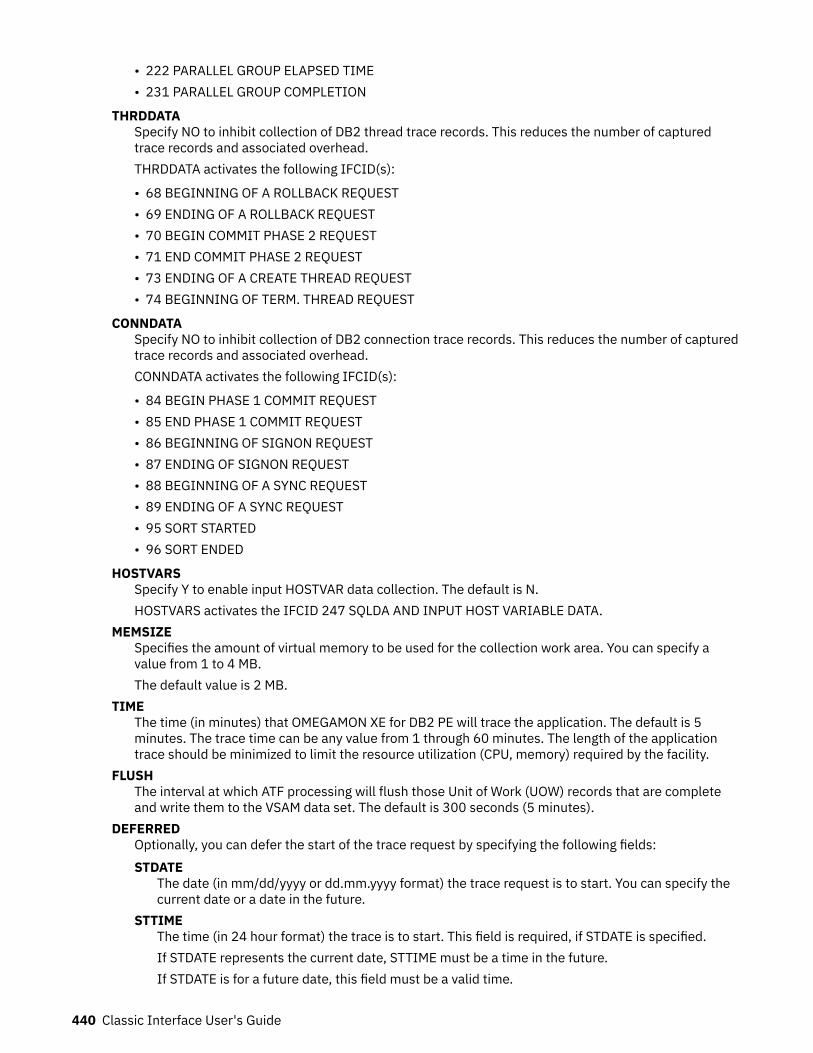
• 222 PARALLEL GROUP ELAPSED TIME• 231 PARALLEL GROUP COMPLETION
THRDDATASpecify NO to inhibit collection of DB2 thread trace records. This reduces the number of capturedtrace records and associated overhead.THRDDATA activates the following IFCID(s):
• 68 BEGINNING OF A ROLLBACK REQUEST• 69 ENDING OF A ROLLBACK REQUEST• 70 BEGIN COMMIT PHASE 2 REQUEST• 71 END COMMIT PHASE 2 REQUEST• 73 ENDING OF A CREATE THREAD REQUEST• 74 BEGINNING OF TERM. THREAD REQUEST
CONNDATASpecify NO to inhibit collection of DB2 connection trace records. This reduces the number of capturedtrace records and associated overhead.CONNDATA activates the following IFCID(s):
• 84 BEGIN PHASE 1 COMMIT REQUEST• 85 END PHASE 1 COMMIT REQUEST• 86 BEGINNING OF SIGNON REQUEST• 87 ENDING OF SIGNON REQUEST• 88 BEGINNING OF A SYNC REQUEST• 89 ENDING OF A SYNC REQUEST• 95 SORT STARTED• 96 SORT ENDED
HOSTVARSSpecify Y to enable input HOSTVAR data collection. The default is N.HOSTVARS activates the IFCID 247 SQLDA AND INPUT HOST VARIABLE DATA.
MEMSIZESpecifies the amount of virtual memory to be used for the collection work area. You can specify avalue from 1 to 4 MB.The default value is 2 MB.
TIMEThe time (in minutes) that OMEGAMON XE for DB2 PE will trace the application. The default is 5minutes. The trace time can be any value from 1 through 60 minutes. The length of the applicationtrace should be minimized to limit the resource utilization (CPU, memory) required by the facility.
FLUSHThe interval at which ATF processing will flush those Unit of Work (UOW) records that are completeand write them to the VSAM data set. The default is 300 seconds (5 minutes).
DEFERREDOptionally, you can defer the start of the trace request by specifying the following fields:STDATE
The date (in mm/dd/yyyy or dd.mm.yyyy format) the trace request is to start. You can specify thecurrent date or a date in the future.
STTIMEThe time (in 24 hour format) the trace is to start. This field is required, if STDATE is specified.If STDATE represents the current date, STTIME must be a time in the future.If STDATE is for a future date, this field must be a valid time.
440 Classic Interface User's Guide
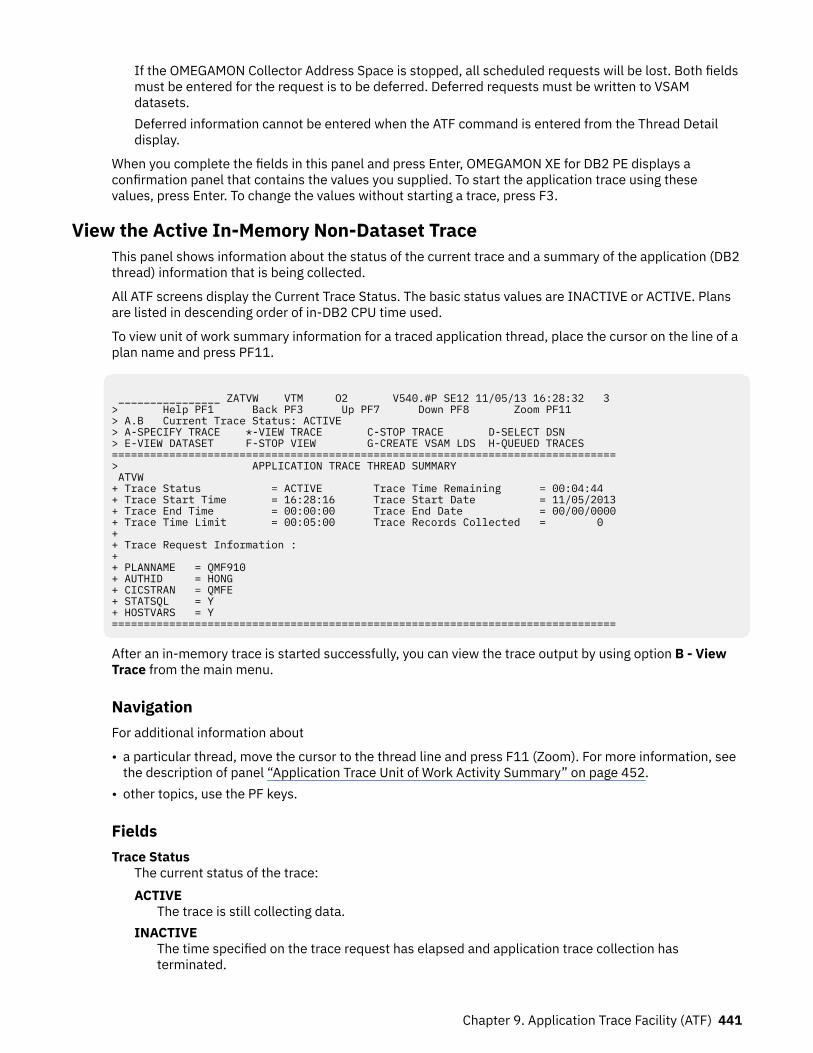
If the OMEGAMON Collector Address Space is stopped, all scheduled requests will be lost. Both fieldsmust be entered for the request is to be deferred. Deferred requests must be written to VSAMdatasets.Deferred information cannot be entered when the ATF command is entered from the Thread Detaildisplay.
When you complete the fields in this panel and press Enter, OMEGAMON XE for DB2 PE displays aconfirmation panel that contains the values you supplied. To start the application trace using thesevalues, press Enter. To change the values without starting a trace, press F3.
View the Active In-Memory Non-Dataset TraceThis panel shows information about the status of the current trace and a summary of the application (DB2thread) information that is being collected.
All ATF screens display the Current Trace Status. The basic status values are INACTIVE or ACTIVE. Plansare listed in descending order of in-DB2 CPU time used.
To view unit of work summary information for a traced application thread, place the cursor on the line of aplan name and press PF11.
________________ ZATVW VTM O2 V540.#P SE12 11/05/13 16:28:32 3 > Help PF1 Back PF3 Up PF7 Down PF8 Zoom PF11 > A.B Current Trace Status: ACTIVE > A-SPECIFY TRACE *-VIEW TRACE C-STOP TRACE D-SELECT DSN > E-VIEW DATASET F-STOP VIEW G-CREATE VSAM LDS H-QUEUED TRACES ===============================================================================> APPLICATION TRACE THREAD SUMMARY ATVW + Trace Status = ACTIVE Trace Time Remaining = 00:04:44 + Trace Start Time = 16:28:16 Trace Start Date = 11/05/2013+ Trace End Time = 00:00:00 Trace End Date = 00/00/0000+ Trace Time Limit = 00:05:00 Trace Records Collected = 0 + + Trace Request Information : + + PLANNAME = QMF910 + AUTHID = HONG + CICSTRAN = QMFE + STATSQL = Y + HOSTVARS = Y ===============================================================================
After an in-memory trace is started successfully, you can view the trace output by using option B - ViewTrace from the main menu.
NavigationFor additional information about
• a particular thread, move the cursor to the thread line and press F11 (Zoom). For more information, seethe description of panel “Application Trace Unit of Work Activity Summary” on page 452.
• other topics, use the PF keys.
FieldsTrace Status
The current status of the trace:ACTIVE
The trace is still collecting data.INACTIVE
The time specified on the trace request has elapsed and application trace collection hasterminated.
Chapter 9. Application Trace Facility (ATF) 441
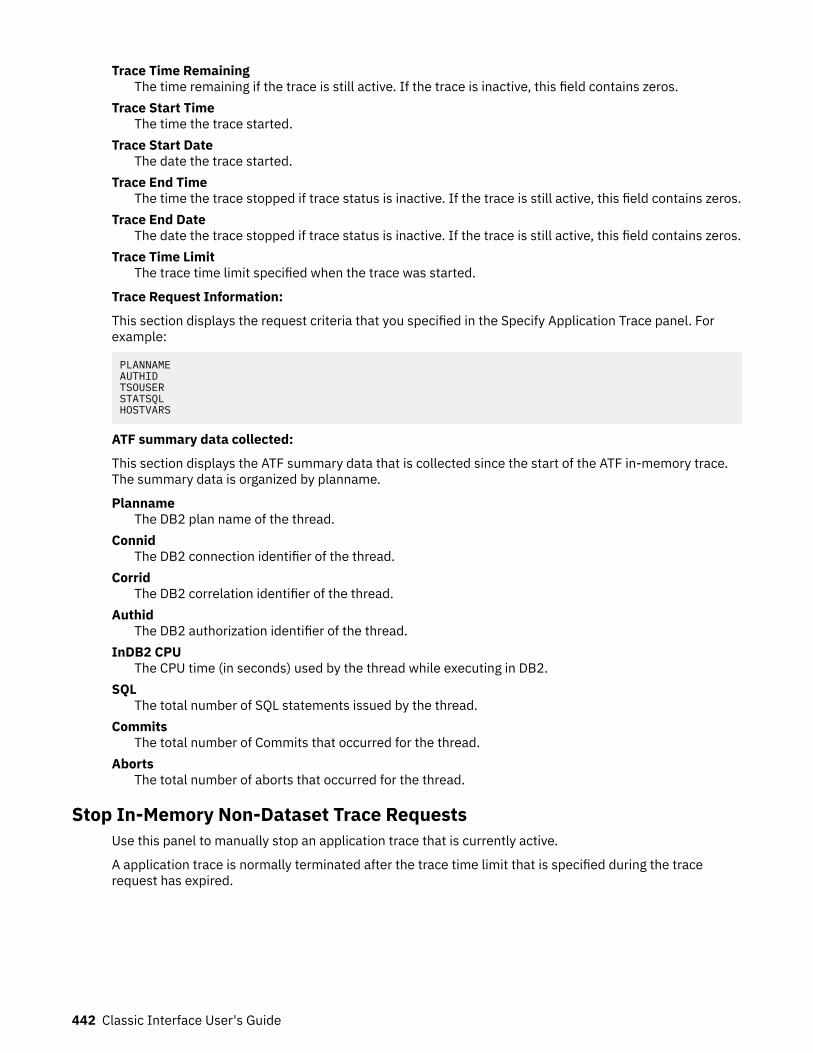
Trace Time RemainingThe time remaining if the trace is still active. If the trace is inactive, this field contains zeros.
Trace Start TimeThe time the trace started.
Trace Start DateThe date the trace started.
Trace End TimeThe time the trace stopped if trace status is inactive. If the trace is still active, this field contains zeros.
Trace End DateThe date the trace stopped if trace status is inactive. If the trace is still active, this field contains zeros.
Trace Time LimitThe trace time limit specified when the trace was started.
Trace Request Information:
This section displays the request criteria that you specified in the Specify Application Trace panel. Forexample:
PLANNAMEAUTHIDTSOUSERSTATSQLHOSTVARS
ATF summary data collected:
This section displays the ATF summary data that is collected since the start of the ATF in-memory trace.The summary data is organized by planname.
PlannameThe DB2 plan name of the thread.
ConnidThe DB2 connection identifier of the thread.
CorridThe DB2 correlation identifier of the thread.
AuthidThe DB2 authorization identifier of the thread.
InDB2 CPUThe CPU time (in seconds) used by the thread while executing in DB2.
SQLThe total number of SQL statements issued by the thread.
CommitsThe total number of Commits that occurred for the thread.
AbortsThe total number of aborts that occurred for the thread.
Stop In-Memory Non-Dataset Trace RequestsUse this panel to manually stop an application trace that is currently active.
A application trace is normally terminated after the trace time limit that is specified during the tracerequest has expired.
442 Classic Interface User's Guide
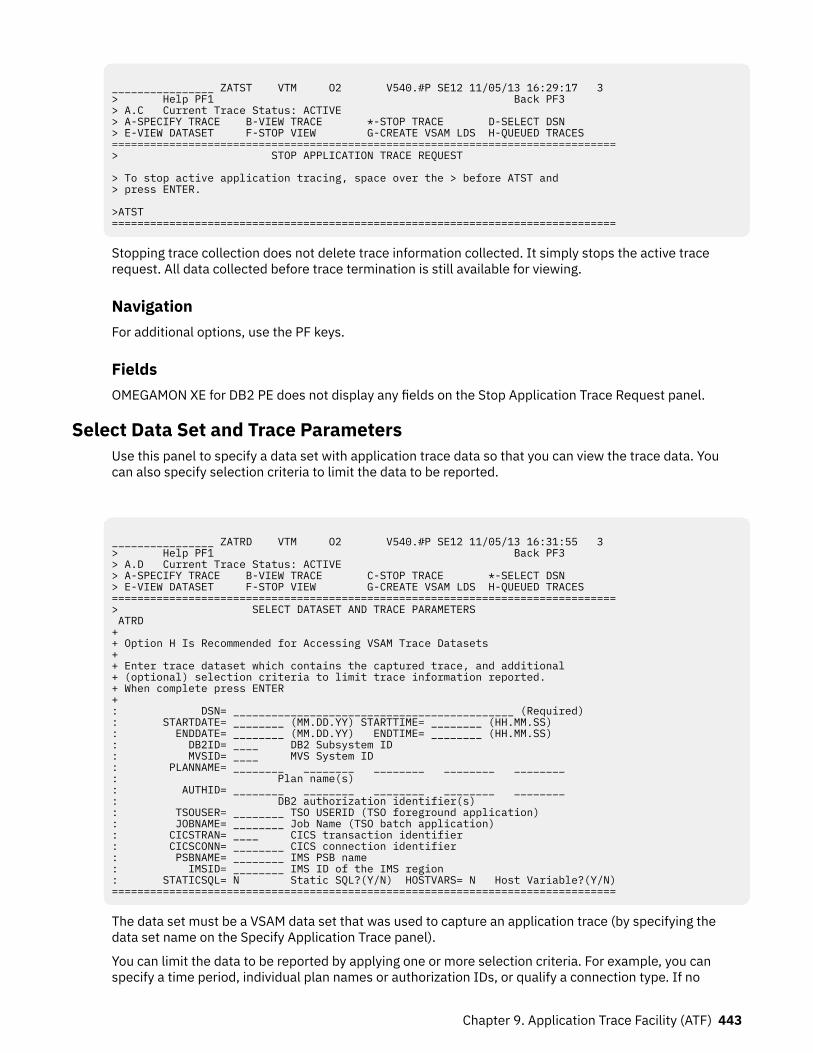
________________ ZATST VTM O2 V540.#P SE12 11/05/13 16:29:17 3 > Help PF1 Back PF3 > A.C Current Trace Status: ACTIVE > A-SPECIFY TRACE B-VIEW TRACE *-STOP TRACE D-SELECT DSN > E-VIEW DATASET F-STOP VIEW G-CREATE VSAM LDS H-QUEUED TRACES ===============================================================================> STOP APPLICATION TRACE REQUEST > To stop active application tracing, space over the > before ATST and > press ENTER. >ATST ===============================================================================
Stopping trace collection does not delete trace information collected. It simply stops the active tracerequest. All data collected before trace termination is still available for viewing.
NavigationFor additional options, use the PF keys.
FieldsOMEGAMON XE for DB2 PE does not display any fields on the Stop Application Trace Request panel.
Select Data Set and Trace ParametersUse this panel to specify a data set with application trace data so that you can view the trace data. Youcan also specify selection criteria to limit the data to be reported.
________________ ZATRD VTM O2 V540.#P SE12 11/05/13 16:31:55 3 > Help PF1 Back PF3 > A.D Current Trace Status: ACTIVE > A-SPECIFY TRACE B-VIEW TRACE C-STOP TRACE *-SELECT DSN > E-VIEW DATASET F-STOP VIEW G-CREATE VSAM LDS H-QUEUED TRACES =============================================================================== > SELECT DATASET AND TRACE PARAMETERS ATRD + + Option H Is Recommended for Accessing VSAM Trace Datasets + + Enter trace dataset which contains the captured trace, and additional + (optional) selection criteria to limit trace information reported. + When complete press ENTER + : DSN= ____________________________________________ (Required) : STARTDATE= ________ (MM.DD.YY) STARTTIME= ________ (HH.MM.SS) : ENDDATE= ________ (MM.DD.YY) ENDTIME= ________ (HH.MM.SS) : DB2ID= ____ DB2 Subsystem ID : MVSID= ____ MVS System ID : PLANNAME= ________ ________ ________ ________ ________ : Plan name(s) : AUTHID= ________ ________ ________ ________ ________ : DB2 authorization identifier(s) : TSOUSER= ________ TSO USERID (TSO foreground application) : JOBNAME= ________ Job Name (TSO batch application) : CICSTRAN= ____ CICS transaction identifier : CICSCONN= ________ CICS connection identifier : PSBNAME= ________ IMS PSB name : IMSID= ________ IMS ID of the IMS region : STATICSQL= N Static SQL?(Y/N) HOSTVARS= N Host Variable?(Y/N) ===============================================================================
The data set must be a VSAM data set that was used to capture an application trace (by specifying thedata set name on the Specify Application Trace panel).
You can limit the data to be reported by applying one or more selection criteria. For example, you canspecify a time period, individual plan names or authorization IDs, or qualify a connection type. If no
Chapter 9. Application Trace Facility (ATF) 443
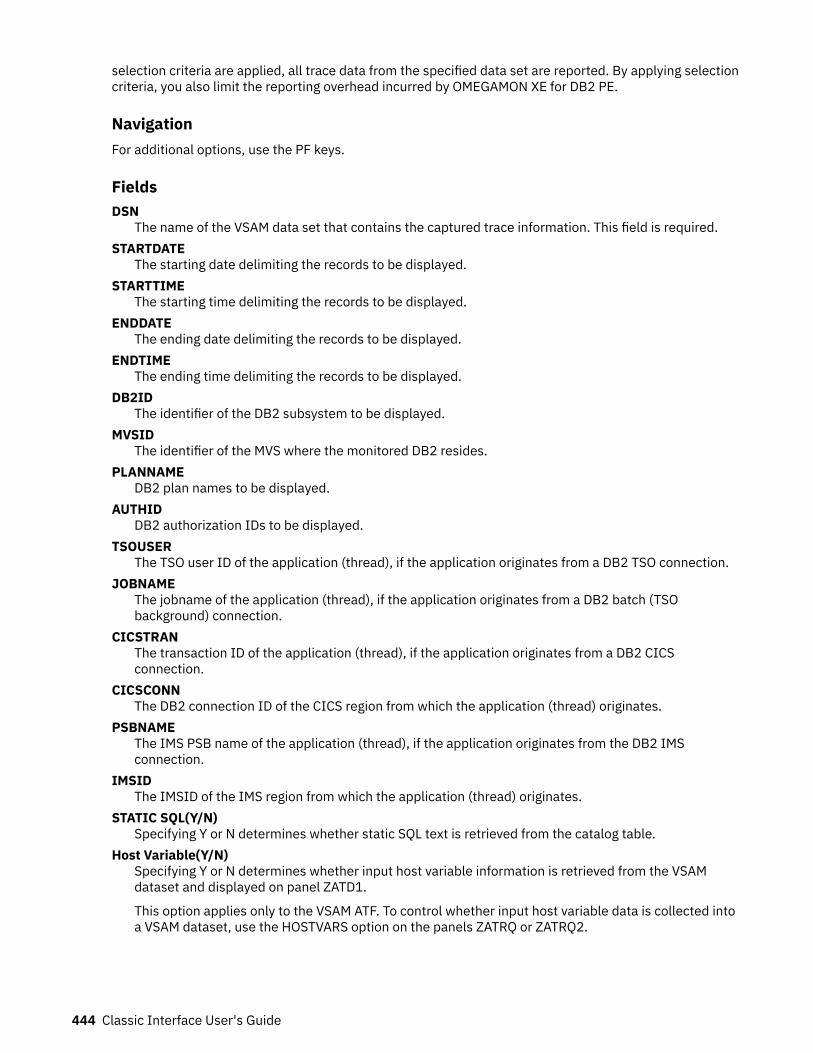
selection criteria are applied, all trace data from the specified data set are reported. By applying selectioncriteria, you also limit the reporting overhead incurred by OMEGAMON XE for DB2 PE.
NavigationFor additional options, use the PF keys.
FieldsDSN
The name of the VSAM data set that contains the captured trace information. This field is required.STARTDATE
The starting date delimiting the records to be displayed.STARTTIME
The starting time delimiting the records to be displayed.ENDDATE
The ending date delimiting the records to be displayed.ENDTIME
The ending time delimiting the records to be displayed.DB2ID
The identifier of the DB2 subsystem to be displayed.MVSID
The identifier of the MVS where the monitored DB2 resides.PLANNAME
DB2 plan names to be displayed.AUTHID
DB2 authorization IDs to be displayed.TSOUSER
The TSO user ID of the application (thread), if the application originates from a DB2 TSO connection.JOBNAME
The jobname of the application (thread), if the application originates from a DB2 batch (TSObackground) connection.
CICSTRANThe transaction ID of the application (thread), if the application originates from a DB2 CICSconnection.
CICSCONNThe DB2 connection ID of the CICS region from which the application (thread) originates.
PSBNAMEThe IMS PSB name of the application (thread), if the application originates from the DB2 IMSconnection.
IMSIDThe IMSID of the IMS region from which the application (thread) originates.
STATIC SQL(Y/N)Specifying Y or N determines whether static SQL text is retrieved from the catalog table.
Host Variable(Y/N)Specifying Y or N determines whether input host variable information is retrieved from the VSAMdataset and displayed on panel ZATD1.
This option applies only to the VSAM ATF. To control whether input host variable data is collected intoa VSAM dataset, use the HOSTVARS option on the panels ZATRQ or ZATRQ2.
444 Classic Interface User's Guide
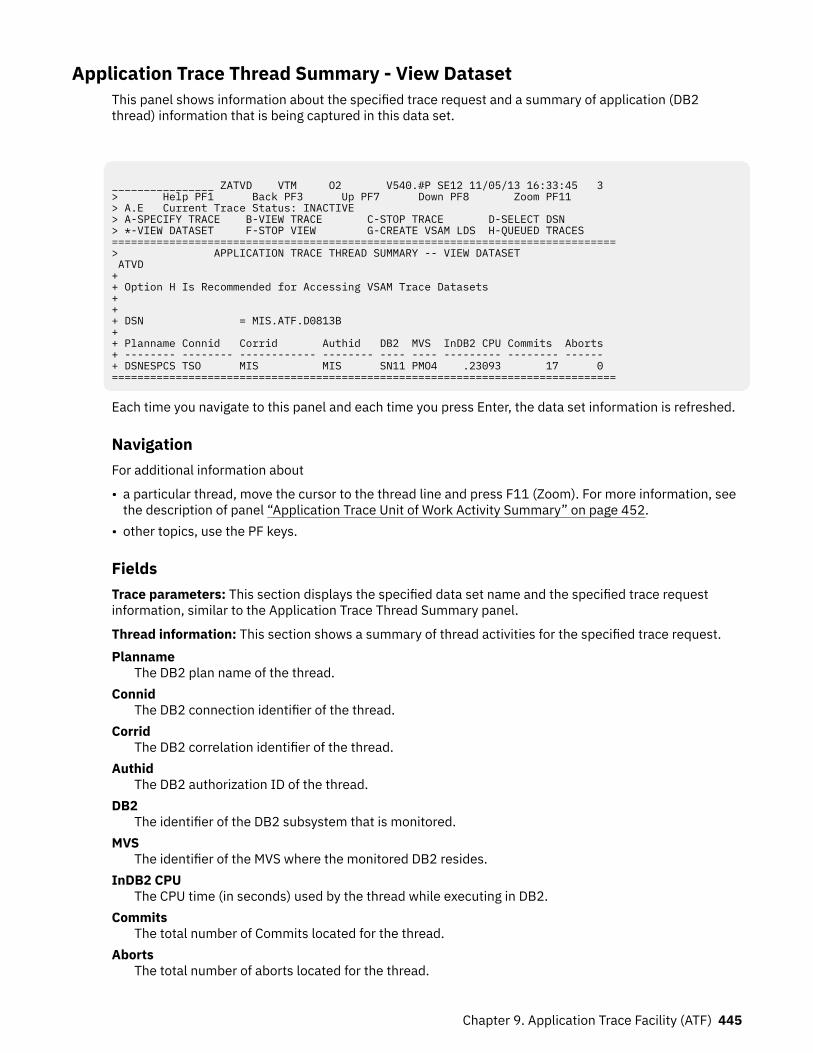
Application Trace Thread Summary - View DatasetThis panel shows information about the specified trace request and a summary of application (DB2thread) information that is being captured in this data set.
________________ ZATVD VTM O2 V540.#P SE12 11/05/13 16:33:45 3 > Help PF1 Back PF3 Up PF7 Down PF8 Zoom PF11 > A.E Current Trace Status: INACTIVE > A-SPECIFY TRACE B-VIEW TRACE C-STOP TRACE D-SELECT DSN > *-VIEW DATASET F-STOP VIEW G-CREATE VSAM LDS H-QUEUED TRACES ===============================================================================> APPLICATION TRACE THREAD SUMMARY -- VIEW DATASET ATVD + + Option H Is Recommended for Accessing VSAM Trace Datasets + + + DSN = MIS.ATF.D0813B + + Planname Connid Corrid Authid DB2 MVS InDB2 CPU Commits Aborts + -------- -------- ------------ -------- ---- ---- --------- -------- ------ + DSNESPCS TSO MIS MIS SN11 PMO4 .23093 17 0 ===============================================================================
Each time you navigate to this panel and each time you press Enter, the data set information is refreshed.
NavigationFor additional information about
• a particular thread, move the cursor to the thread line and press F11 (Zoom). For more information, seethe description of panel “Application Trace Unit of Work Activity Summary” on page 452.
• other topics, use the PF keys.
FieldsTrace parameters: This section displays the specified data set name and the specified trace requestinformation, similar to the Application Trace Thread Summary panel.
Thread information: This section shows a summary of thread activities for the specified trace request.Planname
The DB2 plan name of the thread.Connid
The DB2 connection identifier of the thread.Corrid
The DB2 correlation identifier of the thread.Authid
The DB2 authorization ID of the thread.DB2
The identifier of the DB2 subsystem that is monitored.MVS
The identifier of the MVS where the monitored DB2 resides.InDB2 CPU
The CPU time (in seconds) used by the thread while executing in DB2.Commits
The total number of Commits located for the thread.Aborts
The total number of aborts located for the thread.
Chapter 9. Application Trace Facility (ATF) 445
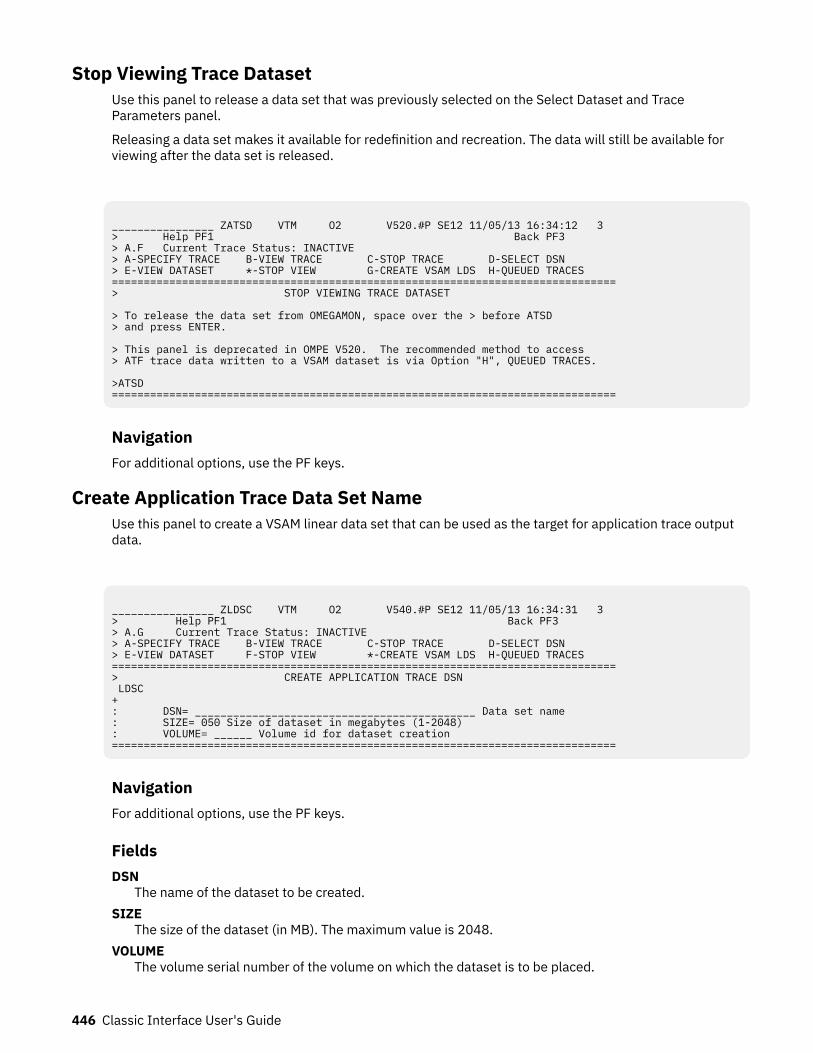
Stop Viewing Trace DatasetUse this panel to release a data set that was previously selected on the Select Dataset and TraceParameters panel.
Releasing a data set makes it available for redefinition and recreation. The data will still be available forviewing after the data set is released.
________________ ZATSD VTM O2 V520.#P SE12 11/05/13 16:34:12 3 > Help PF1 Back PF3 > A.F Current Trace Status: INACTIVE > A-SPECIFY TRACE B-VIEW TRACE C-STOP TRACE D-SELECT DSN > E-VIEW DATASET *-STOP VIEW G-CREATE VSAM LDS H-QUEUED TRACES ===============================================================================> STOP VIEWING TRACE DATASET > To release the data set from OMEGAMON, space over the > before ATSD > and press ENTER. > This panel is deprecated in OMPE V520. The recommended method to access > ATF trace data written to a VSAM dataset is via Option "H", QUEUED TRACES. >ATSD ===============================================================================
NavigationFor additional options, use the PF keys.
Create Application Trace Data Set NameUse this panel to create a VSAM linear data set that can be used as the target for application trace outputdata.
________________ ZLDSC VTM O2 V540.#P SE12 11/05/13 16:34:31 3 > Help PF1 Back PF3 > A.G Current Trace Status: INACTIVE > A-SPECIFY TRACE B-VIEW TRACE C-STOP TRACE D-SELECT DSN > E-VIEW DATASET F-STOP VIEW *-CREATE VSAM LDS H-QUEUED TRACES ===============================================================================> CREATE APPLICATION TRACE DSN LDSC + : DSN= ____________________________________________ Data set name : SIZE= 050 Size of dataset in megabytes (1-2048) : VOLUME= ______ Volume id for dataset creation ===============================================================================
NavigationFor additional options, use the PF keys.
FieldsDSN
The name of the dataset to be created.SIZE
The size of the dataset (in MB). The maximum value is 2048.VOLUME
The volume serial number of the volume on which the dataset is to be placed.
446 Classic Interface User's Guide
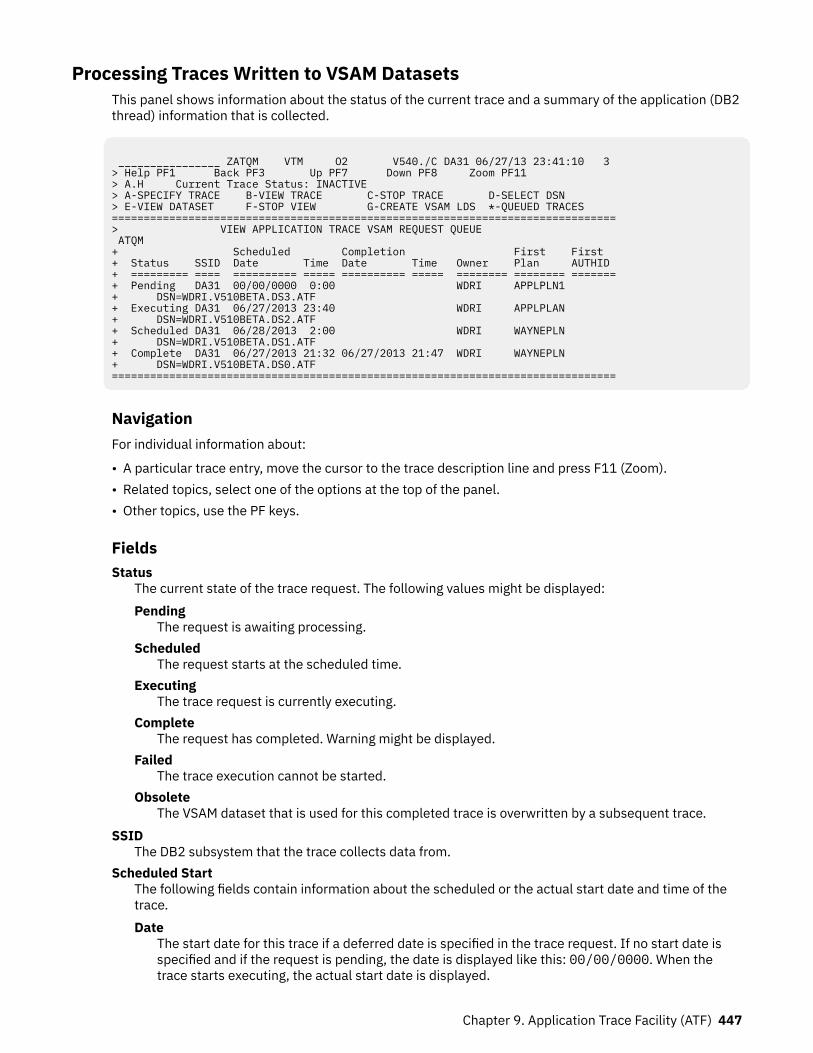
Processing Traces Written to VSAM DatasetsThis panel shows information about the status of the current trace and a summary of the application (DB2thread) information that is collected.
________________ ZATQM VTM O2 V540./C DA31 06/27/13 23:41:10 3 > Help PF1 Back PF3 Up PF7 Down PF8 Zoom PF11 > A.H Current Trace Status: INACTIVE > A-SPECIFY TRACE B-VIEW TRACE C-STOP TRACE D-SELECT DSN > E-VIEW DATASET F-STOP VIEW G-CREATE VSAM LDS *-QUEUED TRACES =============================================================================== > VIEW APPLICATION TRACE VSAM REQUEST QUEUE ATQM + Scheduled Completion First First + Status SSID Date Time Date Time Owner Plan AUTHID + ========= ==== ========== ===== ========== ===== ======== ======== ======= + Pending DA31 00/00/0000 0:00 WDRI APPLPLN1 + DSN=WDRI.V510BETA.DS3.ATF + Executing DA31 06/27/2013 23:40 WDRI APPLPLAN + DSN=WDRI.V510BETA.DS2.ATF + Scheduled DA31 06/28/2013 2:00 WDRI WAYNEPLN + DSN=WDRI.V510BETA.DS1.ATF + Complete DA31 06/27/2013 21:32 06/27/2013 21:47 WDRI WAYNEPLN + DSN=WDRI.V510BETA.DS0.ATF ===============================================================================
NavigationFor individual information about:
• A particular trace entry, move the cursor to the trace description line and press F11 (Zoom).• Related topics, select one of the options at the top of the panel.• Other topics, use the PF keys.
FieldsStatus
The current state of the trace request. The following values might be displayed:Pending
The request is awaiting processing.Scheduled
The request starts at the scheduled time.Executing
The trace request is currently executing.Complete
The request has completed. Warning might be displayed.Failed
The trace execution cannot be started.Obsolete
The VSAM dataset that is used for this completed trace is overwritten by a subsequent trace.SSID
The DB2 subsystem that the trace collects data from.Scheduled Start
The following fields contain information about the scheduled or the actual start date and time of thetrace.Date
The start date for this trace if a deferred date is specified in the trace request. If no start date isspecified and if the request is pending, the date is displayed like this: 00/00/0000. When thetrace starts executing, the actual start date is displayed.
Chapter 9. Application Trace Facility (ATF) 447
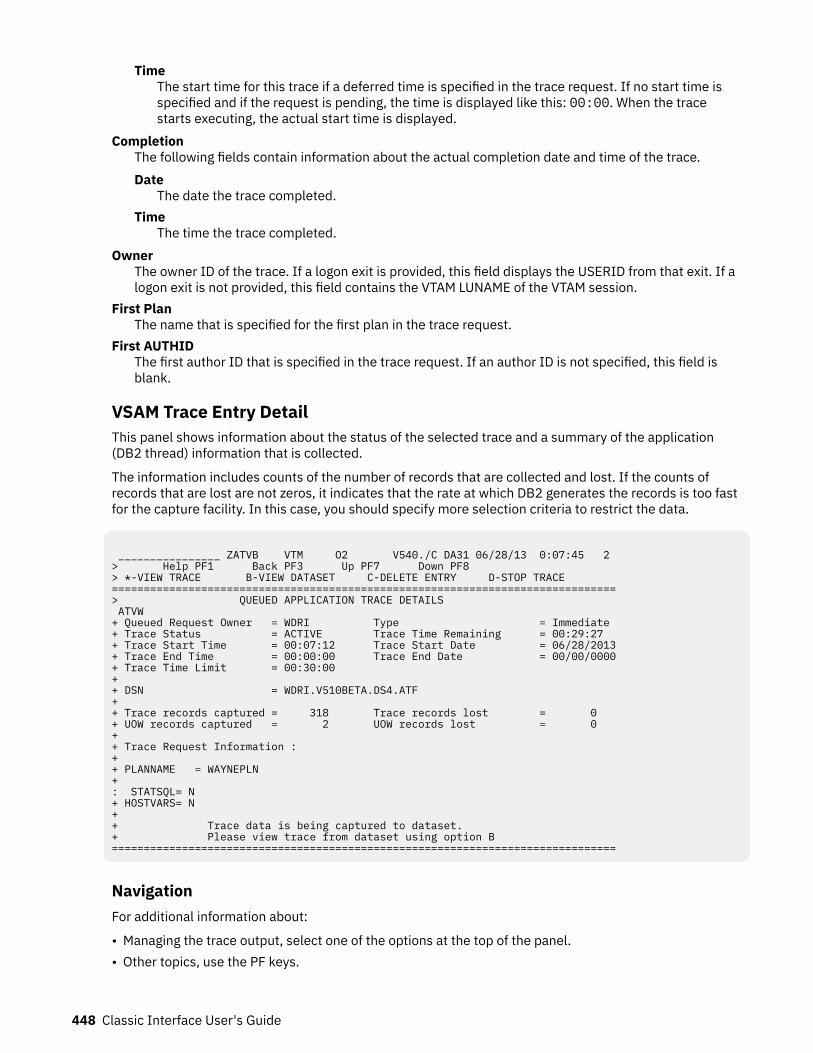
TimeThe start time for this trace if a deferred time is specified in the trace request. If no start time isspecified and if the request is pending, the time is displayed like this: 00:00. When the tracestarts executing, the actual start time is displayed.
CompletionThe following fields contain information about the actual completion date and time of the trace.Date
The date the trace completed.Time
The time the trace completed.Owner
The owner ID of the trace. If a logon exit is provided, this field displays the USERID from that exit. If alogon exit is not provided, this field contains the VTAM LUNAME of the VTAM session.
First PlanThe name that is specified for the first plan in the trace request.
First AUTHIDThe first author ID that is specified in the trace request. If an author ID is not specified, this field isblank.
VSAM Trace Entry DetailThis panel shows information about the status of the selected trace and a summary of the application(DB2 thread) information that is collected.
The information includes counts of the number of records that are collected and lost. If the counts ofrecords that are lost are not zeros, it indicates that the rate at which DB2 generates the records is too fastfor the capture facility. In this case, you should specify more selection criteria to restrict the data.
________________ ZATVB VTM O2 V540./C DA31 06/28/13 0:07:45 2 > Help PF1 Back PF3 Up PF7 Down PF8 > *-VIEW TRACE B-VIEW DATASET C-DELETE ENTRY D-STOP TRACE =============================================================================== > QUEUED APPLICATION TRACE DETAILS ATVW + Queued Request Owner = WDRI Type = Immediate + Trace Status = ACTIVE Trace Time Remaining = 00:29:27 + Trace Start Time = 00:07:12 Trace Start Date = 06/28/2013 + Trace End Time = 00:00:00 Trace End Date = 00/00/0000 + Trace Time Limit = 00:30:00 + + DSN = WDRI.V510BETA.DS4.ATF + + Trace records captured = 318 Trace records lost = 0 + UOW records captured = 2 UOW records lost = 0 + + Trace Request Information : + + PLANNAME = WAYNEPLN + : STATSQL= N + HOSTVARS= N + + Trace data is being captured to dataset. + Please view trace from dataset using option B ===============================================================================
NavigationFor additional information about:
• Managing the trace output, select one of the options at the top of the panel.• Other topics, use the PF keys.
448 Classic Interface User's Guide
FieldsQueued Request Owner
This field displays the USERID that is used to log on to OMEGAMON for Db2 PE or the VTAM TerminalID that the request is issued from if external security is disabled for the OMEGAMON for Db2 PEserver.
TypeThis field identifies the type of queued request. Valid values:Immediate
This request is queued for execution. The queue is processedScheduled
This request is scheduled to be executed at a particular time.Trace Status
The following trace information is available:OBSOLETE
The VSAM dataset used for this trace has been overwritten by > a subsequent trace, so the tracedata cannot be confirmed.
ABENDEDThe trace is terminated due to ABEND.
ACTIVEThe trace is still collecting data.
INACTIVEThe time that is specified in the trace request elapsed and the application trace collectionterminated.
DSN FULLThe VSAM data set that is used for storing the trace data is full.Trace Time Remaining
The time remaining if the trace is still active. If the trace is inactive, this field contains zero.Trace Start Time
The time the trace started.Trace Start Date
The date the trace started.Trace End Time
The time the trace ended.Trace End Date
The date the trace ended.Trace Time Limit
The trace time limit that is specified when the trace is started.DSN
The specified name of the data set that holds data to be captured.Trace records captured
The number of records that are captured.Trace records lost
The number of trace records that are lost.If a nonzero value is displayed in this field, DB2 generated trace records too fast for the capturefacility. You can use trace criteria to limit the amount of data to be captured.
UOW records capturedThe number of Unit of Work (UOW) records that are captured.
UOW records lostThe number of UOW records that are lost.
Chapter 9. Application Trace Facility (ATF) 449
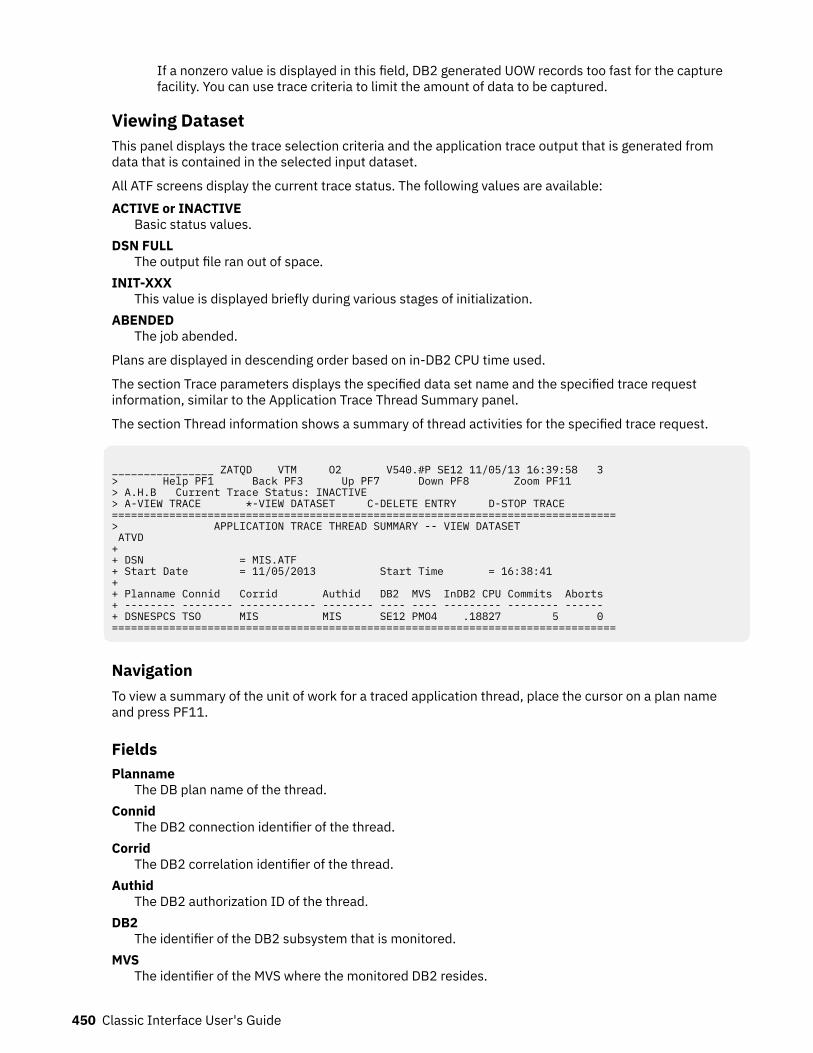
If a nonzero value is displayed in this field, DB2 generated UOW records too fast for the capturefacility. You can use trace criteria to limit the amount of data to be captured.
Viewing DatasetThis panel displays the trace selection criteria and the application trace output that is generated fromdata that is contained in the selected input dataset.
All ATF screens display the current trace status. The following values are available:ACTIVE or INACTIVE
Basic status values.DSN FULL
The output file ran out of space.INIT-XXX
This value is displayed briefly during various stages of initialization.ABENDED
The job abended.
Plans are displayed in descending order based on in-DB2 CPU time used.
The section Trace parameters displays the specified data set name and the specified trace requestinformation, similar to the Application Trace Thread Summary panel.
The section Thread information shows a summary of thread activities for the specified trace request.
________________ ZATQD VTM O2 V540.#P SE12 11/05/13 16:39:58 3 > Help PF1 Back PF3 Up PF7 Down PF8 Zoom PF11 > A.H.B Current Trace Status: INACTIVE > A-VIEW TRACE *-VIEW DATASET C-DELETE ENTRY D-STOP TRACE =============================================================================== > APPLICATION TRACE THREAD SUMMARY -- VIEW DATASET ATVD + + DSN = MIS.ATF + Start Date = 11/05/2013 Start Time = 16:38:41 + + Planname Connid Corrid Authid DB2 MVS InDB2 CPU Commits Aborts + -------- -------- ------------ -------- ---- ---- --------- -------- ------ + DSNESPCS TSO MIS MIS SE12 PMO4 .18827 5 0 ===============================================================================
NavigationTo view a summary of the unit of work for a traced application thread, place the cursor on a plan nameand press PF11.
FieldsPlanname
The DB plan name of the thread.Connid
The DB2 connection identifier of the thread.Corrid
The DB2 correlation identifier of the thread.Authid
The DB2 authorization ID of the thread.DB2
The identifier of the DB2 subsystem that is monitored.MVS
The identifier of the MVS where the monitored DB2 resides.
450 Classic Interface User's Guide
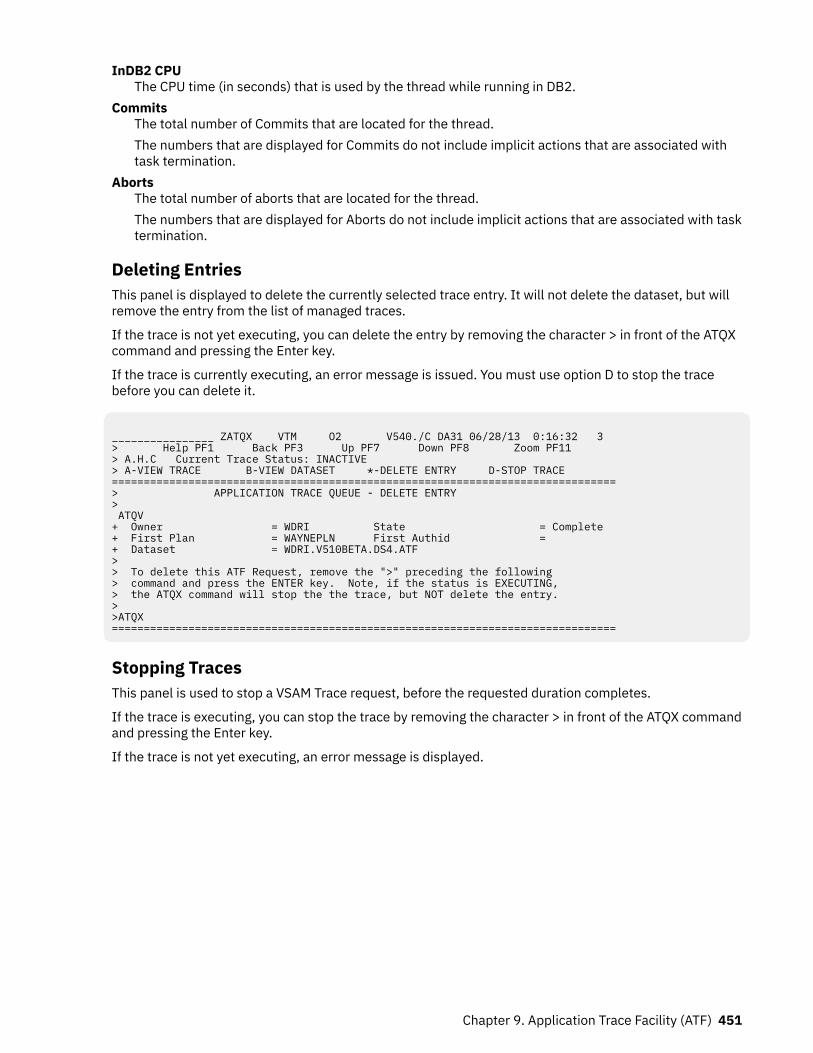
InDB2 CPUThe CPU time (in seconds) that is used by the thread while running in DB2.
CommitsThe total number of Commits that are located for the thread.The numbers that are displayed for Commits do not include implicit actions that are associated withtask termination.
AbortsThe total number of aborts that are located for the thread.The numbers that are displayed for Aborts do not include implicit actions that are associated with tasktermination.
Deleting EntriesThis panel is displayed to delete the currently selected trace entry. It will not delete the dataset, but willremove the entry from the list of managed traces.
If the trace is not yet executing, you can delete the entry by removing the character > in front of the ATQXcommand and pressing the Enter key.
If the trace is currently executing, an error message is issued. You must use option D to stop the tracebefore you can delete it.
________________ ZATQX VTM O2 V540./C DA31 06/28/13 0:16:32 3 > Help PF1 Back PF3 Up PF7 Down PF8 Zoom PF11 > A.H.C Current Trace Status: INACTIVE > A-VIEW TRACE B-VIEW DATASET *-DELETE ENTRY D-STOP TRACE =============================================================================== > APPLICATION TRACE QUEUE - DELETE ENTRY > ATQV + Owner = WDRI State = Complete+ First Plan = WAYNEPLN First Authid = + Dataset = WDRI.V510BETA.DS4.ATF > > To delete this ATF Request, remove the ">" preceding the following > command and press the ENTER key. Note, if the status is EXECUTING, > the ATQX command will stop the the trace, but NOT delete the entry. > >ATQX ===============================================================================
Stopping TracesThis panel is used to stop a VSAM Trace request, before the requested duration completes.
If the trace is executing, you can stop the trace by removing the character > in front of the ATQX commandand pressing the Enter key.
If the trace is not yet executing, an error message is displayed.
Chapter 9. Application Trace Facility (ATF) 451
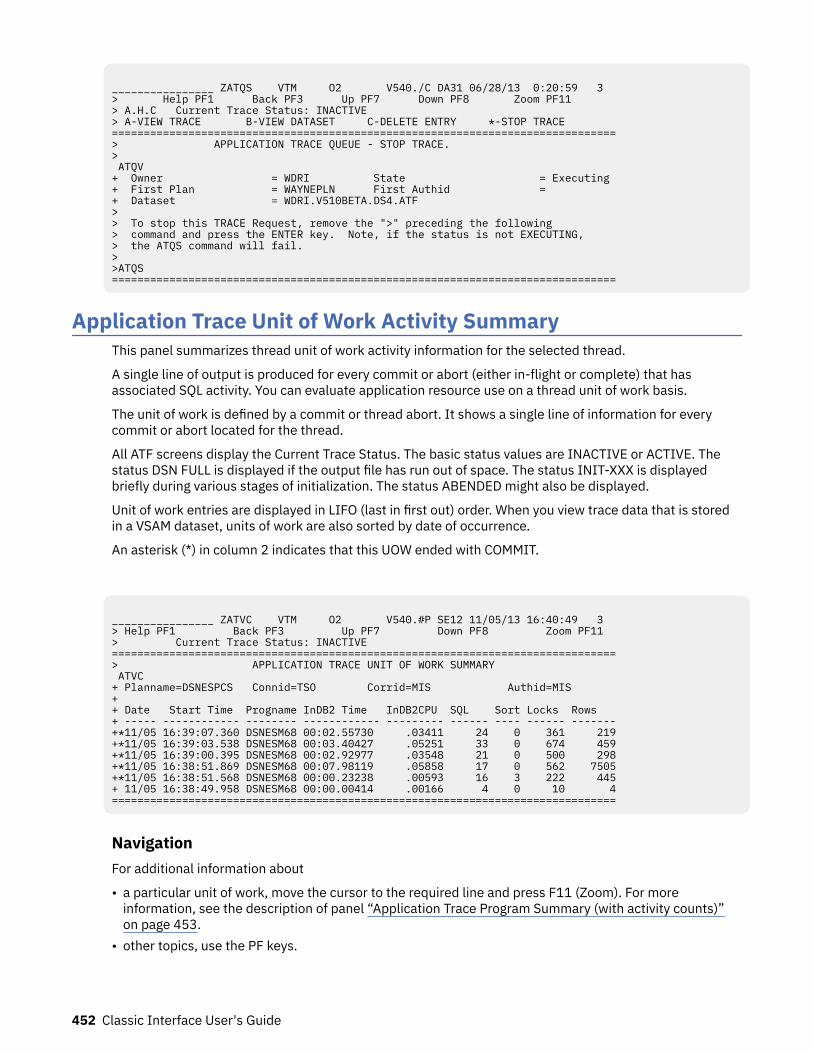
________________ ZATQS VTM O2 V540./C DA31 06/28/13 0:20:59 3 > Help PF1 Back PF3 Up PF7 Down PF8 Zoom PF11 > A.H.C Current Trace Status: INACTIVE > A-VIEW TRACE B-VIEW DATASET C-DELETE ENTRY *-STOP TRACE ===============================================================================> APPLICATION TRACE QUEUE - STOP TRACE. > ATQV + Owner = WDRI State = Executing + First Plan = WAYNEPLN First Authid = + Dataset = WDRI.V510BETA.DS4.ATF > > To stop this TRACE Request, remove the ">" preceding the following > command and press the ENTER key. Note, if the status is not EXECUTING, > the ATQS command will fail. > >ATQS ===============================================================================
Application Trace Unit of Work Activity SummaryThis panel summarizes thread unit of work activity information for the selected thread.
A single line of output is produced for every commit or abort (either in-flight or complete) that hasassociated SQL activity. You can evaluate application resource use on a thread unit of work basis.
The unit of work is defined by a commit or thread abort. It shows a single line of information for everycommit or abort located for the thread.
All ATF screens display the Current Trace Status. The basic status values are INACTIVE or ACTIVE. Thestatus DSN FULL is displayed if the output file has run out of space. The status INIT-XXX is displayedbriefly during various stages of initialization. The status ABENDED might also be displayed.
Unit of work entries are displayed in LIFO (last in first out) order. When you view trace data that is storedin a VSAM dataset, units of work are also sorted by date of occurrence.
An asterisk (*) in column 2 indicates that this UOW ended with COMMIT.
________________ ZATVC VTM O2 V540.#P SE12 11/05/13 16:40:49 3 > Help PF1 Back PF3 Up PF7 Down PF8 Zoom PF11 > Current Trace Status: INACTIVE =============================================================================== > APPLICATION TRACE UNIT OF WORK SUMMARY ATVC + Planname=DSNESPCS Connid=TSO Corrid=MIS Authid=MIS + + Date Start Time Progname InDB2 Time InDB2CPU SQL Sort Locks Rows + ----- ------------ -------- ------------ --------- ------ ---- ------ ------- +*11/05 16:39:07.360 DSNESM68 00:02.55730 .03411 24 0 361 219 +*11/05 16:39:03.538 DSNESM68 00:03.40427 .05251 33 0 674 459 +*11/05 16:39:00.395 DSNESM68 00:02.92977 .03548 21 0 500 298 +*11/05 16:38:51.869 DSNESM68 00:07.98119 .05858 17 0 562 7505 +*11/05 16:38:51.568 DSNESM68 00:00.23238 .00593 16 3 222 445 + 11/05 16:38:49.958 DSNESM68 00:00.00414 .00166 4 0 10 4 ===============================================================================
NavigationFor additional information about
• a particular unit of work, move the cursor to the required line and press F11 (Zoom). For moreinformation, see the description of panel “Application Trace Program Summary (with activity counts)”on page 453.
• other topics, use the PF keys.
452 Classic Interface User's Guide
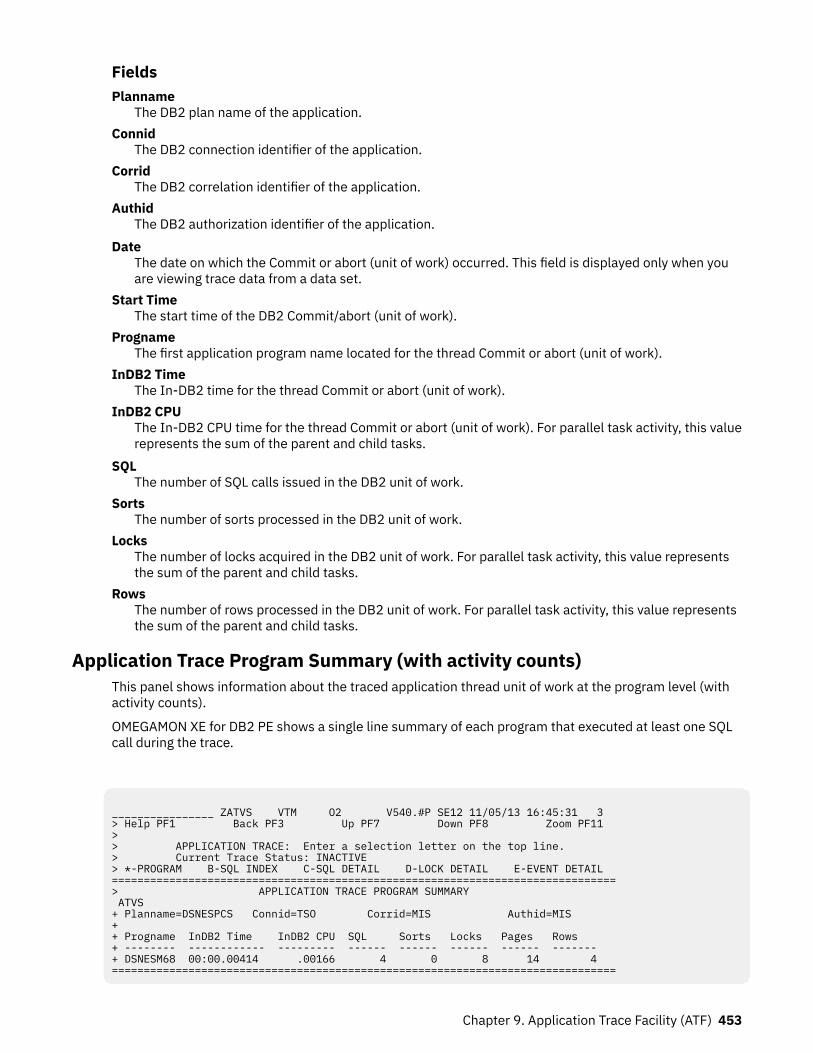
FieldsPlanname
The DB2 plan name of the application.Connid
The DB2 connection identifier of the application.Corrid
The DB2 correlation identifier of the application.Authid
The DB2 authorization identifier of the application.Date
The date on which the Commit or abort (unit of work) occurred. This field is displayed only when youare viewing trace data from a data set.
Start TimeThe start time of the DB2 Commit/abort (unit of work).
PrognameThe first application program name located for the thread Commit or abort (unit of work).
InDB2 TimeThe In-DB2 time for the thread Commit or abort (unit of work).
InDB2 CPUThe In-DB2 CPU time for the thread Commit or abort (unit of work). For parallel task activity, this valuerepresents the sum of the parent and child tasks.
SQLThe number of SQL calls issued in the DB2 unit of work.
SortsThe number of sorts processed in the DB2 unit of work.
LocksThe number of locks acquired in the DB2 unit of work. For parallel task activity, this value representsthe sum of the parent and child tasks.
RowsThe number of rows processed in the DB2 unit of work. For parallel task activity, this value representsthe sum of the parent and child tasks.
Application Trace Program Summary (with activity counts)This panel shows information about the traced application thread unit of work at the program level (withactivity counts).
OMEGAMON XE for DB2 PE shows a single line summary of each program that executed at least one SQLcall during the trace.
________________ ZATVS VTM O2 V540.#P SE12 11/05/13 16:45:31 3 > Help PF1 Back PF3 Up PF7 Down PF8 Zoom PF11 > > APPLICATION TRACE: Enter a selection letter on the top line. > Current Trace Status: INACTIVE > *-PROGRAM B-SQL INDEX C-SQL DETAIL D-LOCK DETAIL E-EVENT DETAIL =============================================================================== > APPLICATION TRACE PROGRAM SUMMARY ATVS + Planname=DSNESPCS Connid=TSO Corrid=MIS Authid=MIS + + Progname InDB2 Time InDB2 CPU SQL Sorts Locks Pages Rows + -------- ------------ --------- ------ ------ ------ ------ ------- + DSNESM68 00:00.00414 .00166 4 0 8 14 4 ===============================================================================
Chapter 9. Application Trace Facility (ATF) 453
NavigationFor additional information about
• a particular program, move the cursor to the program line and press F11 (Zoom). For more information,see the description of panel “Application Trace Program Detail” on page 454.
• related topics, select one of the options on the top of the panel.• other topics, use the PF keys.
FieldsPlanname
The DB2 plan name of the application.Connid
The DB2 connection identifier of the application.Corrid
The DB2 correlation identifier of the application.Authid
The DB2 authorization identifier of the application.Progname
The application program name invoked by application.InDB2 Time
The elapsed time incurred while executing in DB2.InDB2 CPU
The CPU time incurred while executing in DB2. The value is expressed in 1000ths of seconds. Forparallel task activity, this value represents the sum of the parent and child tasks.
SQLThe total number of SQL requests issued by the program.
SortsThe total number of sorts because of SQL activity issued by the program.
LocksThe total number of locks that were acquired by SQL statements issued by the program. For paralleltask activity, this value represents the sum of the parent and child tasks.
PagesThe total number of pages that were referenced (scanned) by the program. For parallel task activity,this value represents the sum of the parent and child tasks.
RowsThe total number of rows that were examined (scanned) by the program. For parallel task activity, thisvalue represents the sum of the parent and child tasks.
Application Trace Program DetailThis panel shows application trace detail information at the program level for a traced application threadunit of work.
Following the thread information, the display is logically broken down into four areas for easy evaluationof program efficiency and DB2 resource usage: SQL, sort, lock, and scan.
454 Classic Interface User's Guide
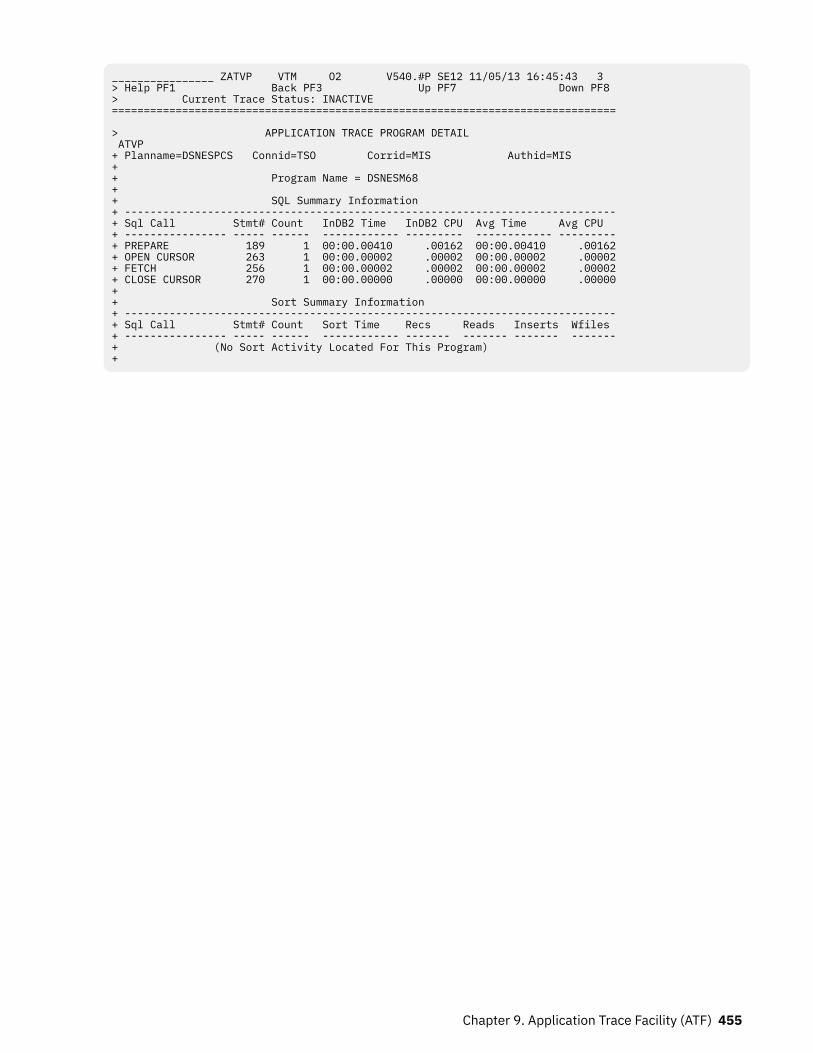
________________ ZATVP VTM O2 V540.#P SE12 11/05/13 16:45:43 3 > Help PF1 Back PF3 Up PF7 Down PF8 > Current Trace Status: INACTIVE =============================================================================== > APPLICATION TRACE PROGRAM DETAIL ATVP + Planname=DSNESPCS Connid=TSO Corrid=MIS Authid=MIS + + Program Name = DSNESM68 + + SQL Summary Information + ----------------------------------------------------------------------------- + Sql Call Stmt# Count InDB2 Time InDB2 CPU Avg Time Avg CPU + ---------------- ----- ------ ------------ --------- ------------ --------- + PREPARE 189 1 00:00.00410 .00162 00:00.00410 .00162 + OPEN CURSOR 263 1 00:00.00002 .00002 00:00.00002 .00002 + FETCH 256 1 00:00.00002 .00002 00:00.00002 .00002 + CLOSE CURSOR 270 1 00:00.00000 .00000 00:00.00000 .00000 + + Sort Summary Information + ----------------------------------------------------------------------------- + Sql Call Stmt# Count Sort Time Recs Reads Inserts Wfiles + ---------------- ----- ------ ------------ ------- ------- ------- ------- + (No Sort Activity Located For This Program) +
Chapter 9. Application Trace Facility (ATF) 455
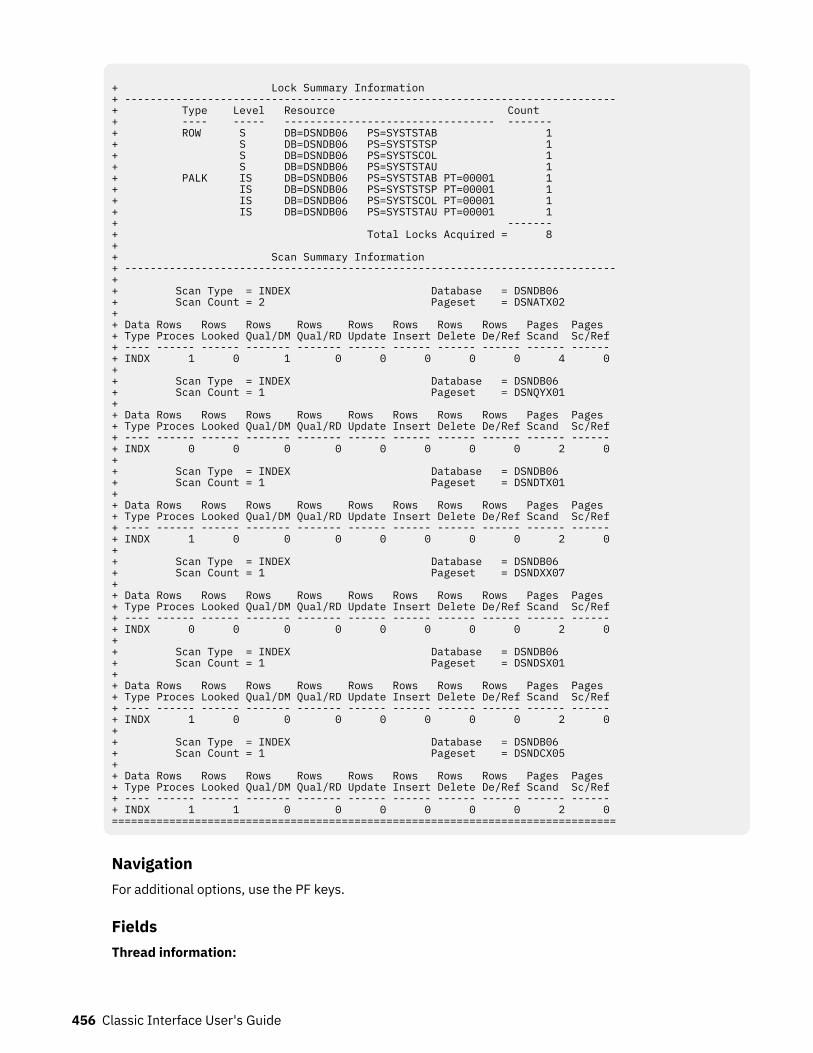
+ Lock Summary Information + ----------------------------------------------------------------------------- + Type Level Resource Count + ---- ----- --------------------------------- ------- + ROW S DB=DSNDB06 PS=SYSTSTAB 1 + S DB=DSNDB06 PS=SYSTSTSP 1 + S DB=DSNDB06 PS=SYSTSCOL 1 + S DB=DSNDB06 PS=SYSTSTAU 1 + PALK IS DB=DSNDB06 PS=SYSTSTAB PT=00001 1 + IS DB=DSNDB06 PS=SYSTSTSP PT=00001 1 + IS DB=DSNDB06 PS=SYSTSCOL PT=00001 1 + IS DB=DSNDB06 PS=SYSTSTAU PT=00001 1 + ------- + Total Locks Acquired = 8 + + Scan Summary Information + ----------------------------------------------------------------------------- + + Scan Type = INDEX Database = DSNDB06 + Scan Count = 2 Pageset = DSNATX02 + + Data Rows Rows Rows Rows Rows Rows Rows Rows Pages Pages + Type Proces Looked Qual/DM Qual/RD Update Insert Delete De/Ref Scand Sc/Ref + ---- ------ ------ ------- ------- ------ ------ ------ ------ ------ ------ + INDX 1 0 1 0 0 0 0 0 4 0 + + Scan Type = INDEX Database = DSNDB06 + Scan Count = 1 Pageset = DSNQYX01 + + Data Rows Rows Rows Rows Rows Rows Rows Rows Pages Pages + Type Proces Looked Qual/DM Qual/RD Update Insert Delete De/Ref Scand Sc/Ref + ---- ------ ------ ------- ------- ------ ------ ------ ------ ------ ------ + INDX 0 0 0 0 0 0 0 0 2 0 + + Scan Type = INDEX Database = DSNDB06 + Scan Count = 1 Pageset = DSNDTX01 + + Data Rows Rows Rows Rows Rows Rows Rows Rows Pages Pages + Type Proces Looked Qual/DM Qual/RD Update Insert Delete De/Ref Scand Sc/Ref + ---- ------ ------ ------- ------- ------ ------ ------ ------ ------ ------ + INDX 1 0 0 0 0 0 0 0 2 0 + + Scan Type = INDEX Database = DSNDB06 + Scan Count = 1 Pageset = DSNDXX07 + + Data Rows Rows Rows Rows Rows Rows Rows Rows Pages Pages + Type Proces Looked Qual/DM Qual/RD Update Insert Delete De/Ref Scand Sc/Ref + ---- ------ ------ ------- ------- ------ ------ ------ ------ ------ ------ + INDX 0 0 0 0 0 0 0 0 2 0 + + Scan Type = INDEX Database = DSNDB06 + Scan Count = 1 Pageset = DSNDSX01 + + Data Rows Rows Rows Rows Rows Rows Rows Rows Pages Pages + Type Proces Looked Qual/DM Qual/RD Update Insert Delete De/Ref Scand Sc/Ref + ---- ------ ------ ------- ------- ------ ------ ------ ------ ------ ------ + INDX 1 0 0 0 0 0 0 0 2 0 + + Scan Type = INDEX Database = DSNDB06 + Scan Count = 1 Pageset = DSNDCX05 + + Data Rows Rows Rows Rows Rows Rows Rows Rows Pages Pages + Type Proces Looked Qual/DM Qual/RD Update Insert Delete De/Ref Scand Sc/Ref + ---- ------ ------ ------- ------- ------ ------ ------ ------ ------ ------ + INDX 1 1 0 0 0 0 0 0 2 0 ===============================================================================
NavigationFor additional options, use the PF keys.
FieldsThread information:
456 Classic Interface User's Guide
PlannameThe DB2 plan name of the application.
ConnidThe DB2 connection identifier of the application.
CorridThe DB2 correlation identifier of the application.
AuthidThe DB2 authorization identifier of the application.
Program NameThe application program name for which information is being displayed.
SQL summary information:
SQL CallThe SQL statement type.
Stmt#The statement number of the SQL statement. This is the actual SQL statement number generated bythe DB2 precompiler and is contained in the precompiler program output listing.
CountThe total number of executions of the SQL statement.
InDB2 TimeThe elapsed time spent executing in DB2 to process the SQL statements.
InDB2 CPUThe elapsed CPU time used executing in DB2 to process the SQL statements. For parallel task activity,this value represents the sum of the parent and child tasks.
Avg TimeThe average elapsed time spent executing in DB2 per SQL statement.
Avg CPUThe average CPU time used while executing in DB2 to process the SQL statement.
Sort summary information:
SQL CallThe SQL statement causing sort processing to be invoked.
Stmt#The SQL statement number causing sort processing to be invoked.
CountThe number of times that the SQL statement invoked a sort.
Sort TimeThe elapsed time spent in sort processing that is required to satisfy the call.
RecsThe total number of records sorted.
ReadsThe number of records retrieved from a work file during sort processing.
InsertsThe number of records inserted into a work file during sort processing.
WfilesThe number of logical workfiles used during sort processing.
Lock summary information: No data is displayed in this area if you set LOCKDATA equals NO in theSpecify Application Trace panel. For parallel task activity, these values include locks held by both parentand child tasks. For more information about lock types, lock levels, and lock resources, see "Lock Typesand Lock Levels".
Chapter 9. Application Trace Facility (ATF) 457
TypeThe lock type owned. Every lock type owned by the thread is displayed.
LevelThe lock levels of the various lock types owned. All lock levels owned within a lock type are listed.Lock levels can occur repetitively for a single lock type because of the different resources owned bythe locks.
ResourceThe resource that is the object of the lock. The content of the Resource field is dependent on locktype. For data page (DPAG) and index page (IPAG) locks, the resource does not contain the actual datapage number that is locked; it lists the database and pageset that own the data or index page lock.The Count field displays how many data or index page locks exist within the resource (pageset) listed.
CountThe number of locks meeting the type, level, and resource description of the lock.
Scan summary information: No data is displayed in this area if you set SCANDATA equals NO in theSpecify Application Trace panel. For parallel task activity, these values represent the sum of the parentand child tasks.
Scan TypeThe type of scan to which the following statistics are related.Index
Idex scanSequential
Sequential data tablespace scanInsert
San for a space to insert a new rowHash
San used for directory DSNDB01 database accessDBID
The identifier of the database that was the object of the scan.Scan Count
The number of scans of the corresponding scan type generated by program SQL activity.PSID
The identifier of the pageset that was the object of the scan.Data Type
The type of statistics displayed:INDX
Index pagesetDATA
Data pagesetWORK
Data workfile (DSNDB07) pagesetRows Proces
The number of rows processed by the Data Manager. This count can include some rows that belong toa table other than the referenced table (such rows are rejected before the Data Manager applies thequalifying stage 1 predicates).
Rows LookedThe number of rows examined by the Data Manager. This count includes only rows that belong to thereferenced table, and to which the Data Manager applied the stage 1 predicates.
Rows Qual/DMThe number of rows qualified by the Data Manager (stage 1).
458 Classic Interface User's Guide
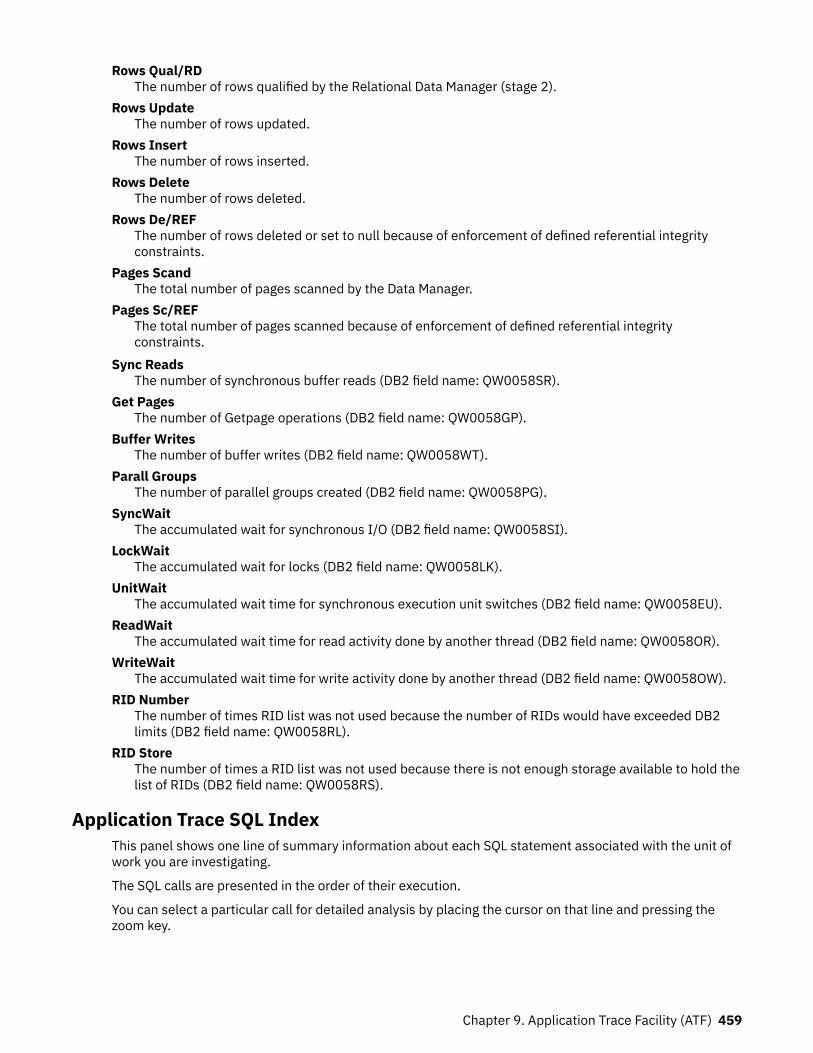
Rows Qual/RDThe number of rows qualified by the Relational Data Manager (stage 2).
Rows UpdateThe number of rows updated.
Rows InsertThe number of rows inserted.
Rows DeleteThe number of rows deleted.
Rows De/REFThe number of rows deleted or set to null because of enforcement of defined referential integrityconstraints.
Pages ScandThe total number of pages scanned by the Data Manager.
Pages Sc/REFThe total number of pages scanned because of enforcement of defined referential integrityconstraints.
Sync ReadsThe number of synchronous buffer reads (DB2 field name: QW0058SR).
Get PagesThe number of Getpage operations (DB2 field name: QW0058GP).
Buffer WritesThe number of buffer writes (DB2 field name: QW0058WT).
Parall GroupsThe number of parallel groups created (DB2 field name: QW0058PG).
SyncWaitThe accumulated wait for synchronous I/O (DB2 field name: QW0058SI).
LockWaitThe accumulated wait for locks (DB2 field name: QW0058LK).
UnitWaitThe accumulated wait time for synchronous execution unit switches (DB2 field name: QW0058EU).
ReadWaitThe accumulated wait time for read activity done by another thread (DB2 field name: QW0058OR).
WriteWaitThe accumulated wait time for write activity done by another thread (DB2 field name: QW0058OW).
RID NumberThe number of times RID list was not used because the number of RIDs would have exceeded DB2limits (DB2 field name: QW0058RL).
RID StoreThe number of times a RID list was not used because there is not enough storage available to hold thelist of RIDs (DB2 field name: QW0058RS).
Application Trace SQL IndexThis panel shows one line of summary information about each SQL statement associated with the unit ofwork you are investigating.
The SQL calls are presented in the order of their execution.
You can select a particular call for detailed analysis by placing the cursor on that line and pressing thezoom key.
Chapter 9. Application Trace Facility (ATF) 459
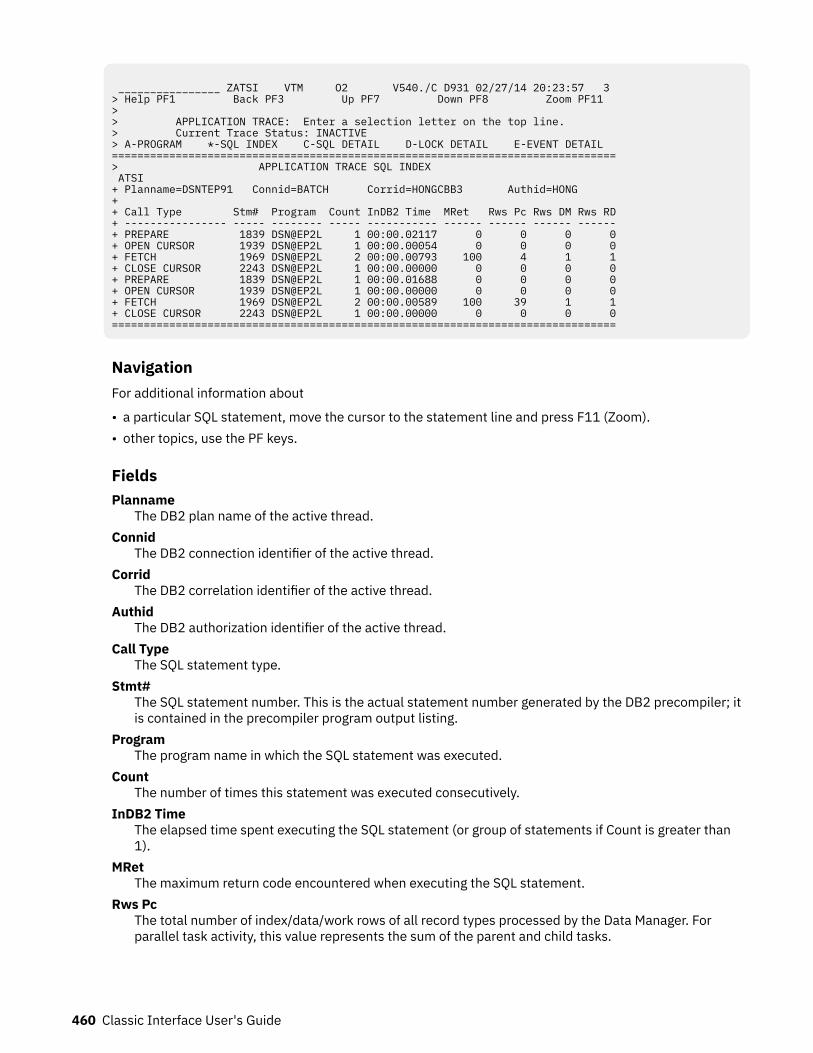
________________ ZATSI VTM O2 V540./C D931 02/27/14 20:23:57 3 > Help PF1 Back PF3 Up PF7 Down PF8 Zoom PF11 > > APPLICATION TRACE: Enter a selection letter on the top line. > Current Trace Status: INACTIVE > A-PROGRAM *-SQL INDEX C-SQL DETAIL D-LOCK DETAIL E-EVENT DETAIL =============================================================================== > APPLICATION TRACE SQL INDEX ATSI + Planname=DSNTEP91 Connid=BATCH Corrid=HONGCBB3 Authid=HONG + + Call Type Stm# Program Count InDB2 Time MRet Rws Pc Rws DM Rws RD + ---------------- ----- -------- ----- ----------- ------ ------ ------ ------ + PREPARE 1839 DSN@EP2L 1 00:00.02117 0 0 0 0 + OPEN CURSOR 1939 DSN@EP2L 1 00:00.00054 0 0 0 0 + FETCH 1969 DSN@EP2L 2 00:00.00793 100 4 1 1 + CLOSE CURSOR 2243 DSN@EP2L 1 00:00.00000 0 0 0 0 + PREPARE 1839 DSN@EP2L 1 00:00.01688 0 0 0 0 + OPEN CURSOR 1939 DSN@EP2L 1 00:00.00000 0 0 0 0 + FETCH 1969 DSN@EP2L 2 00:00.00589 100 39 1 1 + CLOSE CURSOR 2243 DSN@EP2L 1 00:00.00000 0 0 0 0 ===============================================================================
NavigationFor additional information about
• a particular SQL statement, move the cursor to the statement line and press F11 (Zoom).• other topics, use the PF keys.
FieldsPlanname
The DB2 plan name of the active thread.Connid
The DB2 connection identifier of the active thread.Corrid
The DB2 correlation identifier of the active thread.Authid
The DB2 authorization identifier of the active thread.Call Type
The SQL statement type.Stmt#
The SQL statement number. This is the actual statement number generated by the DB2 precompiler; itis contained in the precompiler program output listing.
ProgramThe program name in which the SQL statement was executed.
CountThe number of times this statement was executed consecutively.
InDB2 TimeThe elapsed time spent executing the SQL statement (or group of statements if Count is greater than1).
MRetThe maximum return code encountered when executing the SQL statement.
Rws PcThe total number of index/data/work rows of all record types processed by the Data Manager. Forparallel task activity, this value represents the sum of the parent and child tasks.
460 Classic Interface User's Guide
Rws DMThe total number of index/data/work rows qualified by the Data Manager. For parallel task activity, thisvalue represents the sum of the parent and child tasks.
Rws RDThe total number of index/data/work rows qualified by the Relational Data Manager. For parallel taskactivity, this value represents the sum of the parent and child tasks.
Application Trace SQL DetailThis panel shows information about the traced application at the SQL statement level. It also shows thetext of all dynamic SQL calls.
Depending on the SQL data, the information that is displayed in this panel varies.
Chapter 9. Application Trace Facility (ATF) 461
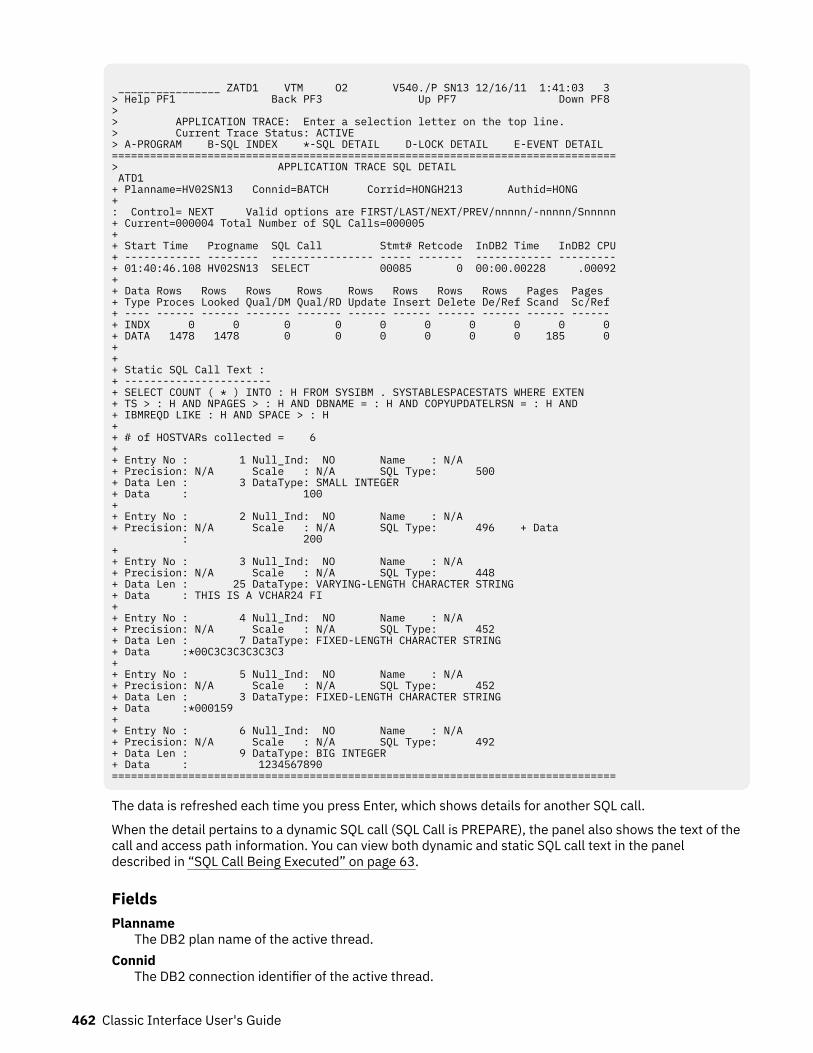
________________ ZATD1 VTM O2 V540./P SN13 12/16/11 1:41:03 3 > Help PF1 Back PF3 Up PF7 Down PF8 > > APPLICATION TRACE: Enter a selection letter on the top line. > Current Trace Status: ACTIVE > A-PROGRAM B-SQL INDEX *-SQL DETAIL D-LOCK DETAIL E-EVENT DETAIL ===============================================================================> APPLICATION TRACE SQL DETAIL ATD1 + Planname=HV02SN13 Connid=BATCH Corrid=HONGH213 Authid=HONG + : Control= NEXT Valid options are FIRST/LAST/NEXT/PREV/nnnnn/-nnnnn/Snnnnn+ Current=000004 Total Number of SQL Calls=000005 + + Start Time Progname SQL Call Stmt# Retcode InDB2 Time InDB2 CPU+ ------------ -------- ---------------- ----- ------- ------------ ---------+ 01:40:46.108 HV02SN13 SELECT 00085 0 00:00.00228 .00092+ + Data Rows Rows Rows Rows Rows Rows Rows Rows Pages Pages + Type Proces Looked Qual/DM Qual/RD Update Insert Delete De/Ref Scand Sc/Ref + ---- ------ ------ ------- ------- ------ ------ ------ ------ ------ ------ + INDX 0 0 0 0 0 0 0 0 0 0 + DATA 1478 1478 0 0 0 0 0 0 185 0 + + + Static SQL Call Text : + ----------------------- + SELECT COUNT ( * ) INTO : H FROM SYSIBM . SYSTABLESPACESTATS WHERE EXTEN + TS > : H AND NPAGES > : H AND DBNAME = : H AND COPYUPDATELRSN = : H AND + IBMREQD LIKE : H AND SPACE > : H + + # of HOSTVARs collected = 6 + + Entry No : 1 Null_Ind: NO Name : N/A + Precision: N/A Scale : N/A SQL Type: 500 + Data Len : 3 DataType: SMALL INTEGER + Data : 100 + + Entry No : 2 Null_Ind: NO Name : N/A + Precision: N/A Scale : N/A SQL Type: 496 + Data : 200 + + Entry No : 3 Null_Ind: NO Name : N/A + Precision: N/A Scale : N/A SQL Type: 448 + Data Len : 25 DataType: VARYING-LENGTH CHARACTER STRING + Data : THIS IS A VCHAR24 FI + + Entry No : 4 Null_Ind: NO Name : N/A + Precision: N/A Scale : N/A SQL Type: 452 + Data Len : 7 DataType: FIXED-LENGTH CHARACTER STRING + Data :*00C3C3C3C3C3C3 + + Entry No : 5 Null_Ind: NO Name : N/A + Precision: N/A Scale : N/A SQL Type: 452 + Data Len : 3 DataType: FIXED-LENGTH CHARACTER STRING + Data :*000159 + + Entry No : 6 Null_Ind: NO Name : N/A + Precision: N/A Scale : N/A SQL Type: 492 + Data Len : 9 DataType: BIG INTEGER + Data : 1234567890 ===============================================================================
The data is refreshed each time you press Enter, which shows details for another SQL call.
When the detail pertains to a dynamic SQL call (SQL Call is PREPARE), the panel also shows the text of thecall and access path information. You can view both dynamic and static SQL call text in the paneldescribed in “SQL Call Being Executed” on page 63.
FieldsPlanname
The DB2 plan name of the active thread.Connid
The DB2 connection identifier of the active thread.
462 Classic Interface User's Guide
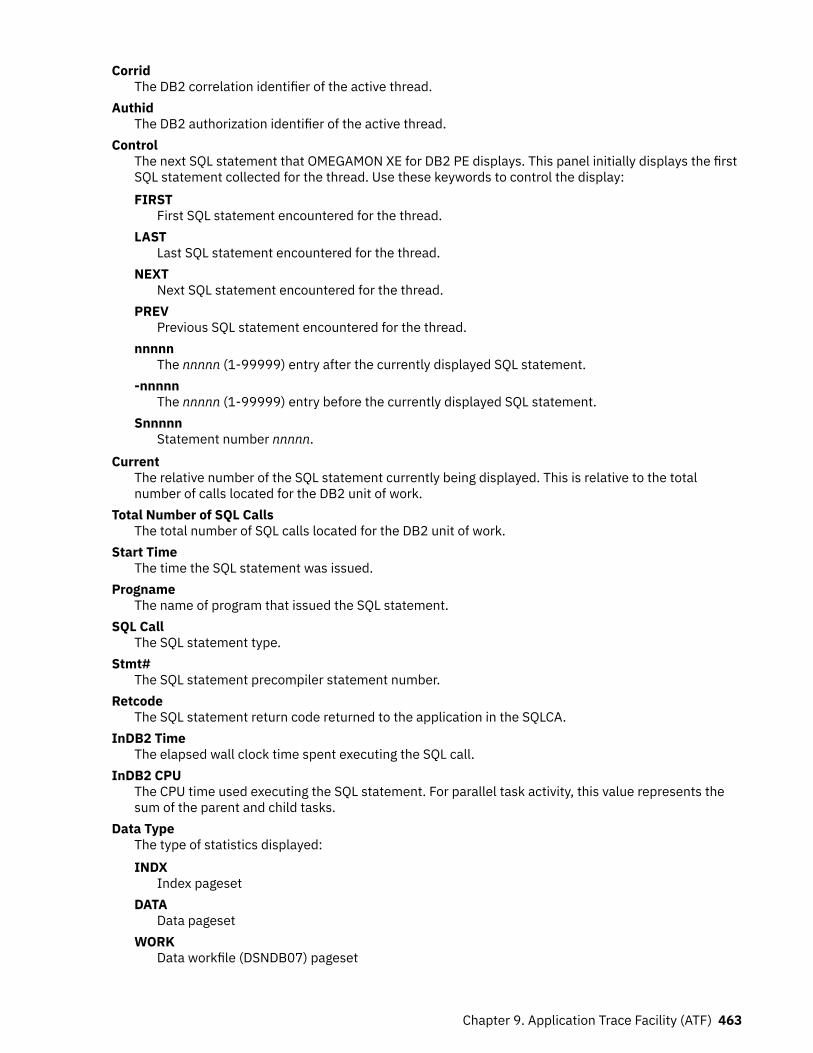
CorridThe DB2 correlation identifier of the active thread.
AuthidThe DB2 authorization identifier of the active thread.
ControlThe next SQL statement that OMEGAMON XE for DB2 PE displays. This panel initially displays the firstSQL statement collected for the thread. Use these keywords to control the display:FIRST
First SQL statement encountered for the thread.LAST
Last SQL statement encountered for the thread.NEXT
Next SQL statement encountered for the thread.PREV
Previous SQL statement encountered for the thread.nnnnn
The nnnnn (1-99999) entry after the currently displayed SQL statement.-nnnnn
The nnnnn (1-99999) entry before the currently displayed SQL statement.Snnnnn
Statement number nnnnn.Current
The relative number of the SQL statement currently being displayed. This is relative to the totalnumber of calls located for the DB2 unit of work.
Total Number of SQL CallsThe total number of SQL calls located for the DB2 unit of work.
Start TimeThe time the SQL statement was issued.
PrognameThe name of program that issued the SQL statement.
SQL CallThe SQL statement type.
Stmt#The SQL statement precompiler statement number.
RetcodeThe SQL statement return code returned to the application in the SQLCA.
InDB2 TimeThe elapsed wall clock time spent executing the SQL call.
InDB2 CPUThe CPU time used executing the SQL statement. For parallel task activity, this value represents thesum of the parent and child tasks.
Data TypeThe type of statistics displayed:INDX
Index pagesetDATA
Data pagesetWORK
Data workfile (DSNDB07) pageset
Chapter 9. Application Trace Facility (ATF) 463
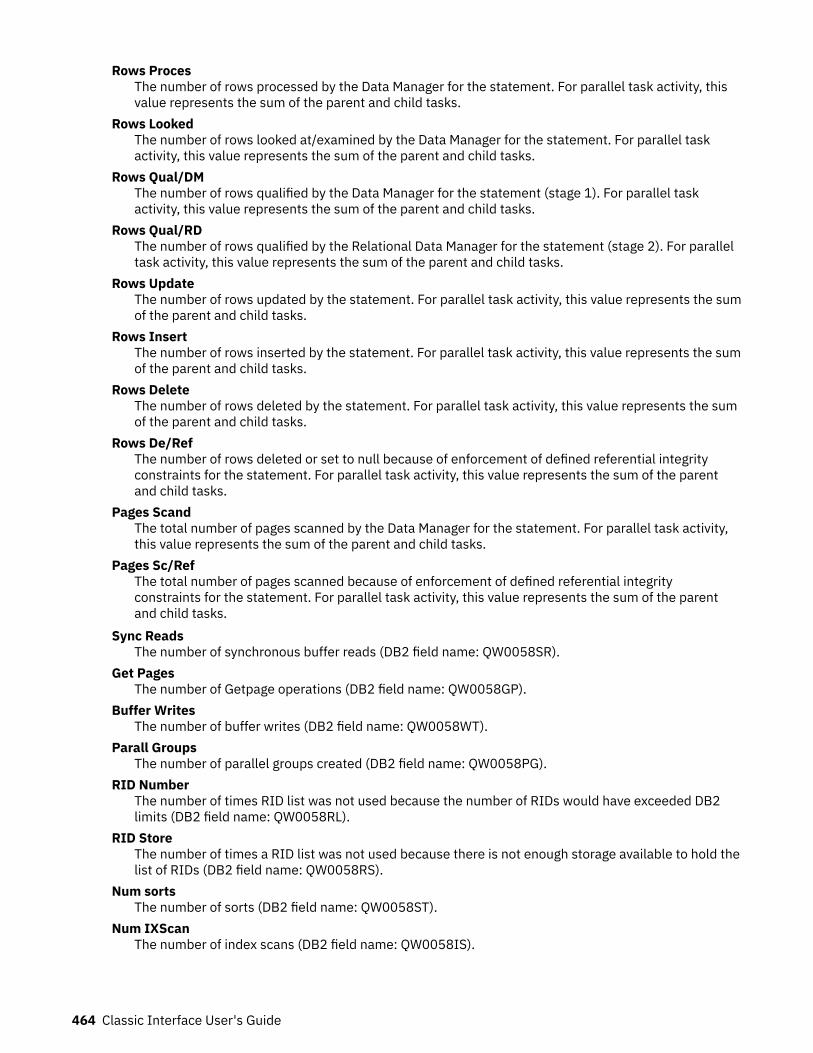
Rows ProcesThe number of rows processed by the Data Manager for the statement. For parallel task activity, thisvalue represents the sum of the parent and child tasks.
Rows LookedThe number of rows looked at/examined by the Data Manager for the statement. For parallel taskactivity, this value represents the sum of the parent and child tasks.
Rows Qual/DMThe number of rows qualified by the Data Manager for the statement (stage 1). For parallel taskactivity, this value represents the sum of the parent and child tasks.
Rows Qual/RDThe number of rows qualified by the Relational Data Manager for the statement (stage 2). For paralleltask activity, this value represents the sum of the parent and child tasks.
Rows UpdateThe number of rows updated by the statement. For parallel task activity, this value represents the sumof the parent and child tasks.
Rows InsertThe number of rows inserted by the statement. For parallel task activity, this value represents the sumof the parent and child tasks.
Rows DeleteThe number of rows deleted by the statement. For parallel task activity, this value represents the sumof the parent and child tasks.
Rows De/RefThe number of rows deleted or set to null because of enforcement of defined referential integrityconstraints for the statement. For parallel task activity, this value represents the sum of the parentand child tasks.
Pages ScandThe total number of pages scanned by the Data Manager for the statement. For parallel task activity,this value represents the sum of the parent and child tasks.
Pages Sc/RefThe total number of pages scanned because of enforcement of defined referential integrityconstraints for the statement. For parallel task activity, this value represents the sum of the parentand child tasks.
Sync ReadsThe number of synchronous buffer reads (DB2 field name: QW0058SR).
Get PagesThe number of Getpage operations (DB2 field name: QW0058GP).
Buffer WritesThe number of buffer writes (DB2 field name: QW0058WT).
Parall GroupsThe number of parallel groups created (DB2 field name: QW0058PG).
RID NumberThe number of times RID list was not used because the number of RIDs would have exceeded DB2limits (DB2 field name: QW0058RL).
RID StoreThe number of times a RID list was not used because there is not enough storage available to hold thelist of RIDs (DB2 field name: QW0058RS).
Num sortsThe number of sorts (DB2 field name: QW0058ST).
Num IXScanThe number of index scans (DB2 field name: QW0058IS).
464 Classic Interface User's Guide
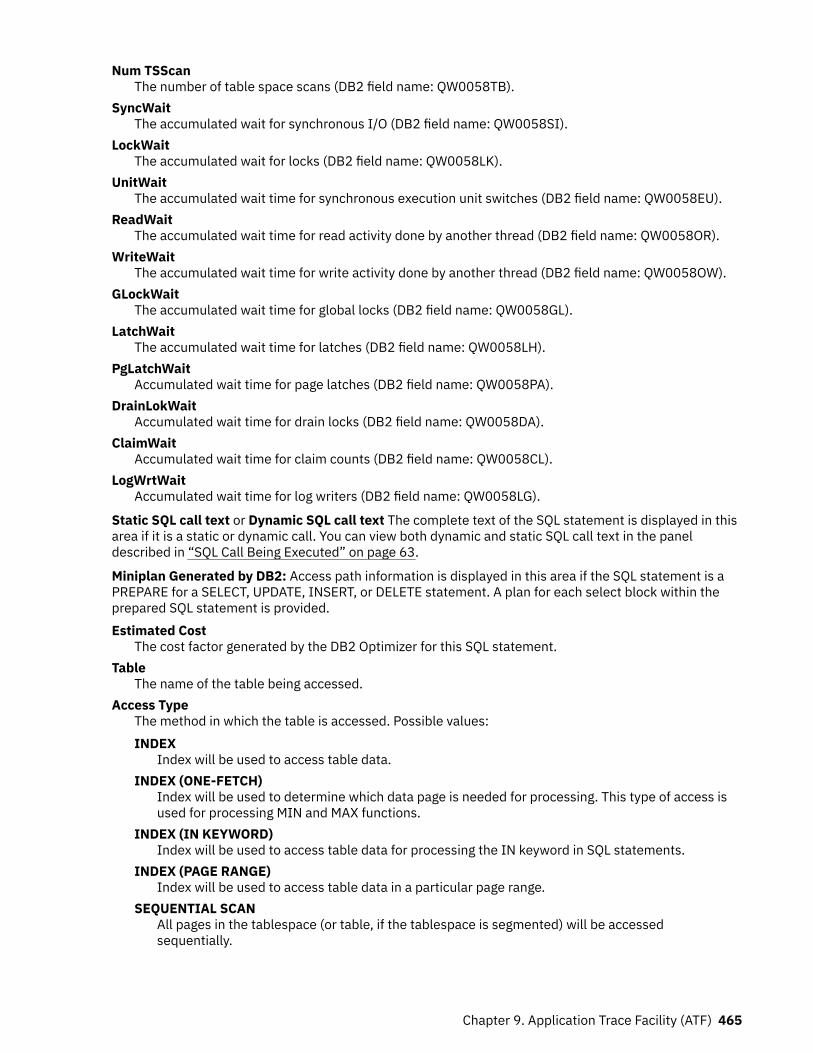
Num TSScanThe number of table space scans (DB2 field name: QW0058TB).
SyncWaitThe accumulated wait for synchronous I/O (DB2 field name: QW0058SI).
LockWaitThe accumulated wait for locks (DB2 field name: QW0058LK).
UnitWaitThe accumulated wait time for synchronous execution unit switches (DB2 field name: QW0058EU).
ReadWaitThe accumulated wait time for read activity done by another thread (DB2 field name: QW0058OR).
WriteWaitThe accumulated wait time for write activity done by another thread (DB2 field name: QW0058OW).
GLockWaitThe accumulated wait time for global locks (DB2 field name: QW0058GL).
LatchWaitThe accumulated wait time for latches (DB2 field name: QW0058LH).
PgLatchWaitAccumulated wait time for page latches (DB2 field name: QW0058PA).
DrainLokWaitAccumulated wait time for drain locks (DB2 field name: QW0058DA).
ClaimWaitAccumulated wait time for claim counts (DB2 field name: QW0058CL).
LogWrtWaitAccumulated wait time for log writers (DB2 field name: QW0058LG).
Static SQL call text or Dynamic SQL call text The complete text of the SQL statement is displayed in thisarea if it is a static or dynamic call. You can view both dynamic and static SQL call text in the paneldescribed in “SQL Call Being Executed” on page 63.
Miniplan Generated by DB2: Access path information is displayed in this area if the SQL statement is aPREPARE for a SELECT, UPDATE, INSERT, or DELETE statement. A plan for each select block within theprepared SQL statement is provided.Estimated Cost
The cost factor generated by the DB2 Optimizer for this SQL statement.Table
The name of the table being accessed.Access Type
The method in which the table is accessed. Possible values:INDEX
Index will be used to access table data.INDEX (ONE-FETCH)
Index will be used to determine which data page is needed for processing. This type of access isused for processing MIN and MAX functions.
INDEX (IN KEYWORD)Index will be used to access table data for processing the IN keyword in SQL statements.
INDEX (PAGE RANGE)Index will be used to access table data in a particular page range.
SEQUENTIAL SCANAll pages in the tablespace (or table, if the tablespace is segmented) will be accessedsequentially.
Chapter 9. Application Trace Facility (ATF) 465
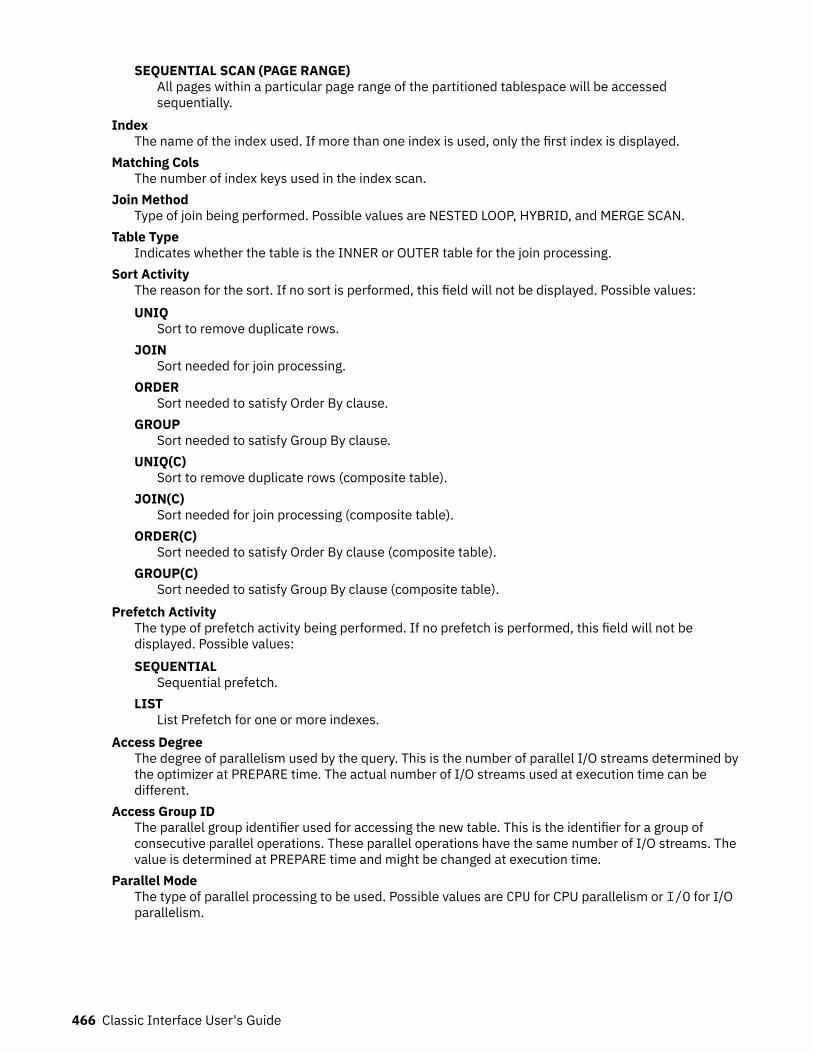
SEQUENTIAL SCAN (PAGE RANGE)All pages within a particular page range of the partitioned tablespace will be accessedsequentially.
IndexThe name of the index used. If more than one index is used, only the first index is displayed.
Matching ColsThe number of index keys used in the index scan.
Join MethodType of join being performed. Possible values are NESTED LOOP, HYBRID, and MERGE SCAN.
Table TypeIndicates whether the table is the INNER or OUTER table for the join processing.
Sort ActivityThe reason for the sort. If no sort is performed, this field will not be displayed. Possible values:UNIQ
Sort to remove duplicate rows.JOIN
Sort needed for join processing.ORDER
Sort needed to satisfy Order By clause.GROUP
Sort needed to satisfy Group By clause.UNIQ(C)
Sort to remove duplicate rows (composite table).JOIN(C)
Sort needed for join processing (composite table).ORDER(C)
Sort needed to satisfy Order By clause (composite table).GROUP(C)
Sort needed to satisfy Group By clause (composite table).Prefetch Activity
The type of prefetch activity being performed. If no prefetch is performed, this field will not bedisplayed. Possible values:SEQUENTIAL
Sequential prefetch.LIST
List Prefetch for one or more indexes.Access Degree
The degree of parallelism used by the query. This is the number of parallel I/O streams determined bythe optimizer at PREPARE time. The actual number of I/O streams used at execution time can bedifferent.
Access Group IDThe parallel group identifier used for accessing the new table. This is the identifier for a group ofconsecutive parallel operations. These parallel operations have the same number of I/O streams. Thevalue is determined at PREPARE time and might be changed at execution time.
Parallel ModeThe type of parallel processing to be used. Possible values are CPU for CPU parallelism or I/O for I/Oparallelism.
466 Classic Interface User's Guide
Join DegreeThe degree of parallelism used in joining the composite table with the new table. This is the number ofparallel I/O streams used for the join. The value is set at PREPARE time and might change at executiontime.
Join Group IDThe value used to identify the parallel group when DB2 joins the composite table with the new table.This is determined at PREPARE time and could be different at execution time.
Data type conversion is done internally. For certain uncommon data types, internal SQLTYPE(integer) isdisplayed.
The following SQL data types of the host variable are supported:
DATETIMETIMESTAMPDATALINKNUL-TERMINATED GRAPHIC STRINGBLOBCLOBDBCLOBVARYING-LENGTH CHARACTER STRINGFIXED-LENGTH CHARACTER STRINGLONG VARYING-LENGTH CHARACTER STRINGNUL-TERMINATED CHARACTER STRINGVARYING-LENGTH GRAPHIC STRINGFIXED-LENGTH GRAPHIC STRINGLONG VARYING-LENGTH GRAPHIC STRINGFLOATING POINTPACKED DECIMALBIG INTEGERLARGE INTEGERSMALL INTEGERVARYING-LENGTH BINARY STRINGFIXED-LENGTH BINARY STRINGBLOB_FILECLOB_FILEDBCLOB_FILEBLOB LOCATORCLOB LOCATORDBCLOB LOCATORXMLDECFLOATUNKNOWN
Application Trace Lock DetailThis panel shows a summary of all locks that are acquired as a result of the SQL statement.
Chapter 9. Application Trace Facility (ATF) 467
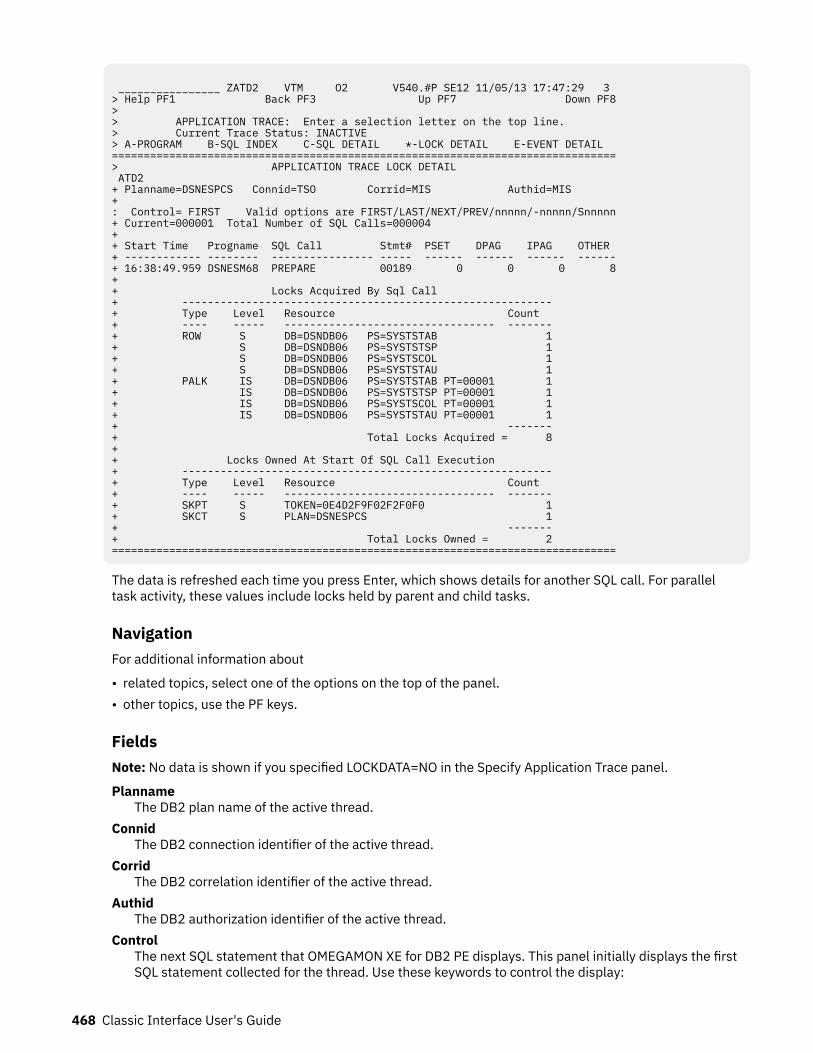
________________ ZATD2 VTM O2 V540.#P SE12 11/05/13 17:47:29 3 > Help PF1 Back PF3 Up PF7 Down PF8 > > APPLICATION TRACE: Enter a selection letter on the top line. > Current Trace Status: INACTIVE > A-PROGRAM B-SQL INDEX C-SQL DETAIL *-LOCK DETAIL E-EVENT DETAIL =============================================================================== > APPLICATION TRACE LOCK DETAIL ATD2 + Planname=DSNESPCS Connid=TSO Corrid=MIS Authid=MIS + : Control= FIRST Valid options are FIRST/LAST/NEXT/PREV/nnnnn/-nnnnn/Snnnnn + Current=000001 Total Number of SQL Calls=000004 + + Start Time Progname SQL Call Stmt# PSET DPAG IPAG OTHER + ------------ -------- ---------------- ----- ------ ------ ------ ------ + 16:38:49.959 DSNESM68 PREPARE 00189 0 0 0 8 + + Locks Acquired By Sql Call + ---------------------------------------------------------- + Type Level Resource Count + ---- ----- --------------------------------- ------- + ROW S DB=DSNDB06 PS=SYSTSTAB 1 + S DB=DSNDB06 PS=SYSTSTSP 1 + S DB=DSNDB06 PS=SYSTSCOL 1 + S DB=DSNDB06 PS=SYSTSTAU 1 + PALK IS DB=DSNDB06 PS=SYSTSTAB PT=00001 1 + IS DB=DSNDB06 PS=SYSTSTSP PT=00001 1 + IS DB=DSNDB06 PS=SYSTSCOL PT=00001 1 + IS DB=DSNDB06 PS=SYSTSTAU PT=00001 1 + ------- + Total Locks Acquired = 8 + + Locks Owned At Start Of SQL Call Execution + ---------------------------------------------------------- + Type Level Resource Count + ---- ----- --------------------------------- ------- + SKPT S TOKEN=0E4D2F9F02F2F0F0 1 + SKCT S PLAN=DSNESPCS 1 + ------- + Total Locks Owned = 2 ===============================================================================
The data is refreshed each time you press Enter, which shows details for another SQL call. For paralleltask activity, these values include locks held by parent and child tasks.
NavigationFor additional information about
• related topics, select one of the options on the top of the panel.• other topics, use the PF keys.
FieldsNote: No data is shown if you specified LOCKDATA=NO in the Specify Application Trace panel.
PlannameThe DB2 plan name of the active thread.
ConnidThe DB2 connection identifier of the active thread.
CorridThe DB2 correlation identifier of the active thread.
AuthidThe DB2 authorization identifier of the active thread.
ControlThe next SQL statement that OMEGAMON XE for DB2 PE displays. This panel initially displays the firstSQL statement collected for the thread. Use these keywords to control the display:
468 Classic Interface User's Guide
FIRSTFirst SQL statement encountered for the thread.
LASTLast SQL statement encountered for the thread.
NEXTNext SQL statement encountered for the thread.
PREVPrevious SQL statement encountered for the thread.
nnnnnThe nnnnn (1-99999) entry after the currently displayed SQL statement.
-nnnnnThe nnnnn (1-99999) entry before the currently displayed SQL statement.
SnnnnnStatement number nnnnn.
CurrentThe relative number of the SQL statement currently being displayed. This is relative to the totalnumber of calls located for the DB2 unit of work.
Total Number of SQL CallsThe total number of SQL calls located for the DB2 unit of work.
Start TimeThe time the SQL statement was issued.
PrognameThe name of program that issued the SQL statement.
SQL CallThe SQL statement type.
Stmt#The SQL statement precompiler statement number.
PSETThe total number of pageset locks acquired by the SQL statement.
DPAGThe total number of datapage locks acquired by the SQL statement.
IPAGThe total number of index page locks acquired by the SQL statement.
OTHERThe total number of other types of locks acquired by the SQL statement.
Locks Acquired and Locks Owned information: For more information about lock types, lock levels, andlock resources, see "Lock Types and Lock Levels".
TYPEThe lock type owned. Every lock type owned by the thread will be displayed.
LEVELThe lock levels of the various lock types owned. All lock levels owned within a lock type will be listed.Lock levels can be displayed repetitively for a single lock type because of the different resourcesowned by the locks.
RESOURCEThe resource that is the object of the lock. The content of the Resource field is dependent on locktype. For data page (DPAG) and index page (IPAG) locks, the resource does not contain the actual datapage number that is locked; it lists the database and pageset that own the data or index page lock.The Count field will then display how many data or index page locks exist within the resource(pageset) listed.
Chapter 9. Application Trace Facility (ATF) 469
Note: When you are using an ATF trace from VSAM, and the resource is a table or a datapage in asegmented tablespace, OMEGAMON XE for DB2 PE will not translate the PSID number (page set ID)to the table name. Instead, OMEGAMON XE for DB2 PE displays the OBID of the DB2 table. (This isbecause OMEGAMON XE for DB2 PE uses IFCIDs 105 and 107 to translate the object identifiers fromlock records, and those IFCIDs do not contain OBID-TABLENAME pairs.)
You can execute the following SQL statement to determine the DB2 table name from the displayedPSID.
SELECT NAME, CREATOR FROM SYSIBM.SYSTABLES WHERE DBNAME= 'dbname' AND OBID= nn
COUNTThe number of locks meeting the type, level, and resource description of the lock.
Application Trace Event DetailThis panel shows detailed information about the flow of an application. The information is shown as aseries of DB2 events. Each line describes a single event or action. You can control the order by usingkeywords.
470 Classic Interface User's Guide
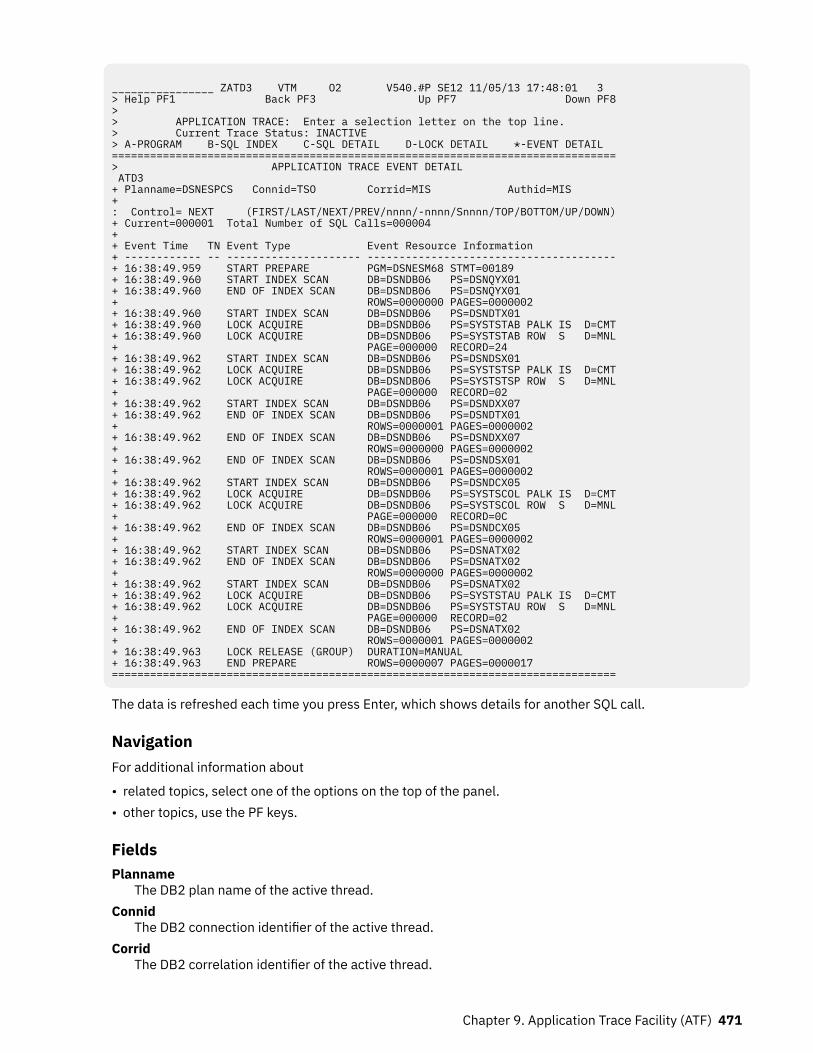
________________ ZATD3 VTM O2 V540.#P SE12 11/05/13 17:48:01 3 > Help PF1 Back PF3 Up PF7 Down PF8> > APPLICATION TRACE: Enter a selection letter on the top line. > Current Trace Status: INACTIVE > A-PROGRAM B-SQL INDEX C-SQL DETAIL D-LOCK DETAIL *-EVENT DETAIL ===============================================================================> APPLICATION TRACE EVENT DETAIL ATD3 + Planname=DSNESPCS Connid=TSO Corrid=MIS Authid=MIS + : Control= NEXT (FIRST/LAST/NEXT/PREV/nnnn/-nnnn/Snnnn/TOP/BOTTOM/UP/DOWN)+ Current=000001 Total Number of SQL Calls=000004 + + Event Time TN Event Type Event Resource Information + ------------ -- --------------------- ---------------------------------------+ 16:38:49.959 START PREPARE PGM=DSNESM68 STMT=00189 + 16:38:49.960 START INDEX SCAN DB=DSNDB06 PS=DSNQYX01 + 16:38:49.960 END OF INDEX SCAN DB=DSNDB06 PS=DSNQYX01 + ROWS=0000000 PAGES=0000002 + 16:38:49.960 START INDEX SCAN DB=DSNDB06 PS=DSNDTX01 + 16:38:49.960 LOCK ACQUIRE DB=DSNDB06 PS=SYSTSTAB PALK IS D=CMT+ 16:38:49.960 LOCK ACQUIRE DB=DSNDB06 PS=SYSTSTAB ROW S D=MNL+ PAGE=000000 RECORD=24 + 16:38:49.962 START INDEX SCAN DB=DSNDB06 PS=DSNDSX01 + 16:38:49.962 LOCK ACQUIRE DB=DSNDB06 PS=SYSTSTSP PALK IS D=CMT+ 16:38:49.962 LOCK ACQUIRE DB=DSNDB06 PS=SYSTSTSP ROW S D=MNL+ PAGE=000000 RECORD=02 + 16:38:49.962 START INDEX SCAN DB=DSNDB06 PS=DSNDXX07 + 16:38:49.962 END OF INDEX SCAN DB=DSNDB06 PS=DSNDTX01 + ROWS=0000001 PAGES=0000002 + 16:38:49.962 END OF INDEX SCAN DB=DSNDB06 PS=DSNDXX07 + ROWS=0000000 PAGES=0000002 + 16:38:49.962 END OF INDEX SCAN DB=DSNDB06 PS=DSNDSX01 + ROWS=0000001 PAGES=0000002 + 16:38:49.962 START INDEX SCAN DB=DSNDB06 PS=DSNDCX05 + 16:38:49.962 LOCK ACQUIRE DB=DSNDB06 PS=SYSTSCOL PALK IS D=CMT+ 16:38:49.962 LOCK ACQUIRE DB=DSNDB06 PS=SYSTSCOL ROW S D=MNL+ PAGE=000000 RECORD=0C + 16:38:49.962 END OF INDEX SCAN DB=DSNDB06 PS=DSNDCX05 + ROWS=0000001 PAGES=0000002 + 16:38:49.962 START INDEX SCAN DB=DSNDB06 PS=DSNATX02 + 16:38:49.962 END OF INDEX SCAN DB=DSNDB06 PS=DSNATX02 + ROWS=0000000 PAGES=0000002 + 16:38:49.962 START INDEX SCAN DB=DSNDB06 PS=DSNATX02 + 16:38:49.962 LOCK ACQUIRE DB=DSNDB06 PS=SYSTSTAU PALK IS D=CMT+ 16:38:49.962 LOCK ACQUIRE DB=DSNDB06 PS=SYSTSTAU ROW S D=MNL+ PAGE=000000 RECORD=02 + 16:38:49.962 END OF INDEX SCAN DB=DSNDB06 PS=DSNATX02 + ROWS=0000001 PAGES=0000002 + 16:38:49.963 LOCK RELEASE (GROUP) DURATION=MANUAL + 16:38:49.963 END PREPARE ROWS=0000007 PAGES=0000017 ===============================================================================
The data is refreshed each time you press Enter, which shows details for another SQL call.
NavigationFor additional information about
• related topics, select one of the options on the top of the panel.• other topics, use the PF keys.
FieldsPlanname
The DB2 plan name of the active thread.Connid
The DB2 connection identifier of the active thread.Corrid
The DB2 correlation identifier of the active thread.
Chapter 9. Application Trace Facility (ATF) 471
AuthidThe DB2 authorization identifier of the active thread.
ControlThe next SQL statement that OMEGAMON XE for DB2 PE displays. This panel initially displays the firstSQL statement collected for the thread. Use these keywords to control the display:FIRST
First SQL statement encountered for the thread.LAST
Last SQL statement encountered for the thread.NEXT
Next SQL statement encountered for the thread.PREV
Previous SQL statement encountered for the thread.+nnnnn
The nnnnn (1-99999) entry after the currently displayed SQL statement.-nnnnn
The nnnnn (1-99999) entry before the currently displayed SQL statement.Snnnnn
Statement number nnnnn.TOP
Display the first LROWS (number of logical rows) records for the current SQL statement.BOTTOM
Display the last LROWS records for the current SQL statement.UP
Scroll up about LROWS records from the current display for the current SQL statement.DOWN
Scroll down about LROWS records from the current display for the current SQL statement.Current
The relative number of the SQL statement currently being displayed. This is relative to the totalnumber of calls located for the DB2 unit of work.
Total Number of SQL CallsThe total number of SQL calls located for the DB2 unit of work.
Event TimeThe time the event described started.
TNFor parallel processing, this field contains the task number of the child task to which this eventapplies. For a parent task, or where there is no parallel task activity, this field is blank. The tasknumbers are assigned arbitrarily at display time to help you distinguish the activity of particular childtasks. Task numbers are not provided by DB2. Events relating to each child task are grouped togetherfollowing those of the parent task.
Event TypeThe DB2 event description. The events displayed are as follows:
• Create Thread• End Abort Request• End Alter Database• End Alter Function• End Alter Index• End Alter JAR• End Alter Mask
472 Classic Interface User's Guide
• End Alter Permission• End Alter Procedure• End Alter Sequence• End Alter Stogroup• End Alter Table• End Alter Tablespace• End Alter Trust Ctx• End Close Cursor• End Comment ON• End Commit• End Commit PhaseI• End Commit PhaseII• End Create Alias• End Create AUX Table• End Create Database• End Create Function• End Create Global Tb• End Create Index• End Create JAR• End Create Mask• End Create Permission• End Create Role• End Create Sequence• End Create Stogroup• End Create Synonyn• End Create Table• End Create Tablespace• End Create Trigger• End Create Trust Ctx• End Create Type• End Create Variable• End Create View• End Dcl Glob Temp Tb• End Delete• End Drop Alias• End Drop Database• End Drop Function• End Drop Index• End Drop JAR• End Drop Mask• End Drop Package• End Drop Permission• End Drop Procedure
Chapter 9. Application Trace Facility (ATF) 473
• End Drop Role• End Drop Sequence• End Drop Stogroup• End Drop Synonym• End Drop Table• End Drop Tablespace• End Drop Trigger• End Drop Trust Ctx• End Drop Type• End Drop Variable• End Drop View• End Fetch• End Free Locator• End Grant• End Hold Locator• End Insert• End Label ON• End Lock Table• End of Index Scan• End of Insert Scan• End of Scan• End Open Cursor• End Prepare• End Rename Index• End Rename Table• End Revoke• End Select• End Sequential Scan• End Signon• End Sort• End Stored Procedures• End Terminate Create Thread• End Update• Input Hostvar• Lock Acquire• Lock Change• Lock Release (Group)• Lock Release (Single)• Parallel Degree• Parallel Group End• Start Abort Request• Start Alter Database• Start Alter Function
474 Classic Interface User's Guide
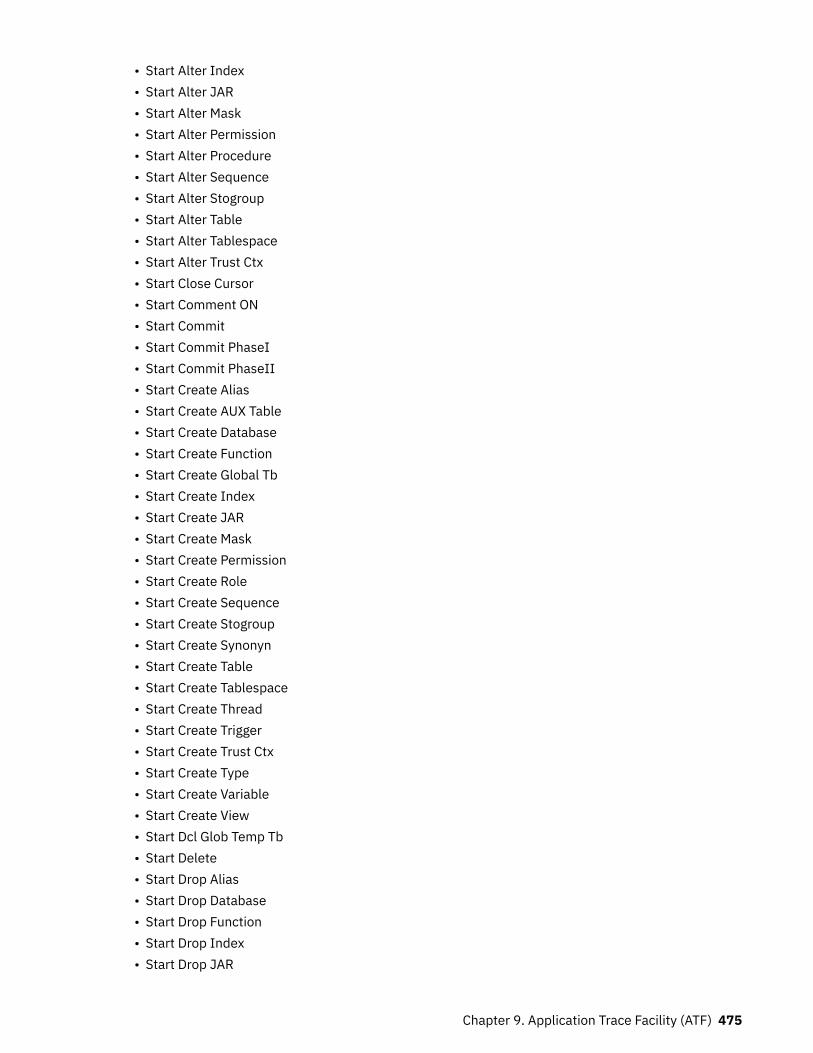
• Start Alter Index• Start Alter JAR• Start Alter Mask• Start Alter Permission• Start Alter Procedure• Start Alter Sequence• Start Alter Stogroup• Start Alter Table• Start Alter Tablespace• Start Alter Trust Ctx• Start Close Cursor• Start Comment ON• Start Commit• Start Commit PhaseI• Start Commit PhaseII• Start Create Alias• Start Create AUX Table• Start Create Database• Start Create Function• Start Create Global Tb• Start Create Index• Start Create JAR• Start Create Mask• Start Create Permission• Start Create Role• Start Create Sequence• Start Create Stogroup• Start Create Synonyn• Start Create Table• Start Create Tablespace• Start Create Thread• Start Create Trigger• Start Create Trust Ctx• Start Create Type• Start Create Variable• Start Create View• Start Dcl Glob Temp Tb• Start Delete• Start Drop Alias• Start Drop Database• Start Drop Function• Start Drop Index• Start Drop JAR
Chapter 9. Application Trace Facility (ATF) 475
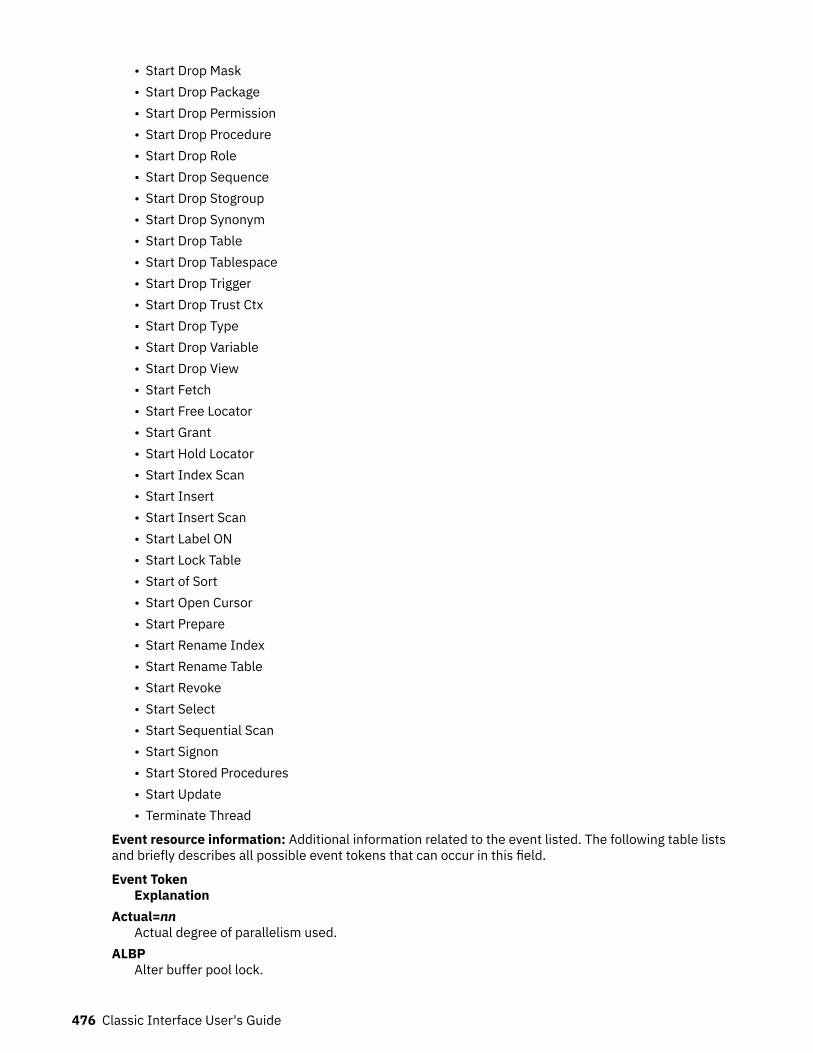
• Start Drop Mask• Start Drop Package• Start Drop Permission• Start Drop Procedure• Start Drop Role• Start Drop Sequence• Start Drop Stogroup• Start Drop Synonym• Start Drop Table• Start Drop Tablespace• Start Drop Trigger• Start Drop Trust Ctx• Start Drop Type• Start Drop Variable• Start Drop View• Start Fetch• Start Free Locator• Start Grant• Start Hold Locator• Start Index Scan• Start Insert• Start Insert Scan• Start Label ON• Start Lock Table• Start of Sort• Start Open Cursor• Start Prepare• Start Rename Index• Start Rename Table• Start Revoke• Start Select• Start Sequential Scan• Start Signon• Start Stored Procedures• Start Update• Terminate Thread
Event resource information: Additional information related to the event listed. The following table listsand briefly describes all possible event tokens that can occur in this field.
Event TokenExplanation
Actual=nnActual degree of parallelism used.
ALBPAlter buffer pool lock.
476 Classic Interface User's Guide
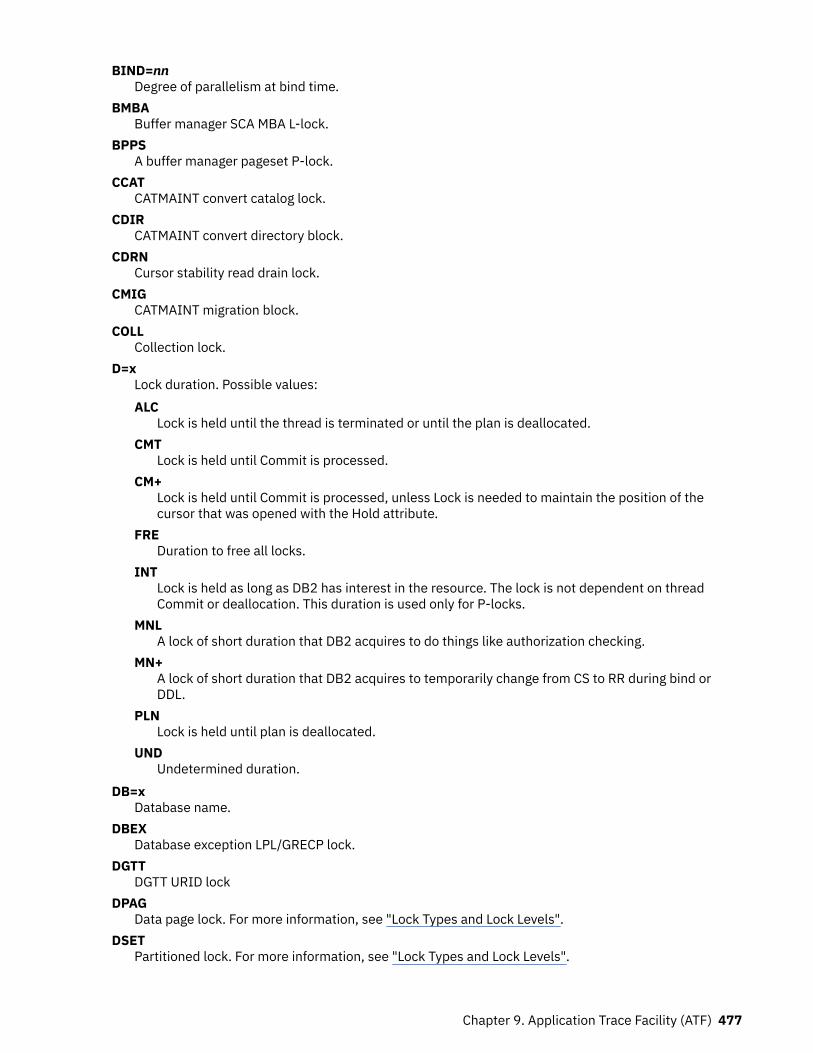
BIND=nnDegree of parallelism at bind time.
BMBABuffer manager SCA MBA L-lock.
BPPSA buffer manager pageset P-lock.
CCATCATMAINT convert catalog lock.
CDIRCATMAINT convert directory block.
CDRNCursor stability read drain lock.
CMIGCATMAINT migration block.
COLLCollection lock.
D=xLock duration. Possible values:ALC
Lock is held until the thread is terminated or until the plan is deallocated.CMT
Lock is held until Commit is processed.CM+
Lock is held until Commit is processed, unless Lock is needed to maintain the position of thecursor that was opened with the Hold attribute.
FREDuration to free all locks.
INTLock is held as long as DB2 has interest in the resource. The lock is not dependent on threadCommit or deallocation. This duration is used only for P-locks.
MNLA lock of short duration that DB2 acquires to do things like authorization checking.
MN+A lock of short duration that DB2 acquires to temporarily change from CS to RR during bind orDDL.
PLNLock is held until plan is deallocated.
UNDUndetermined duration.
DB=xDatabase name.
DBEXDatabase exception LPL/GRECP lock.
DGTTDGTT URID lock
DPAGData page lock. For more information, see "Lock Types and Lock Levels".
DSETPartitioned lock. For more information, see "Lock Types and Lock Levels".
Chapter 9. Application Trace Facility (ATF) 477
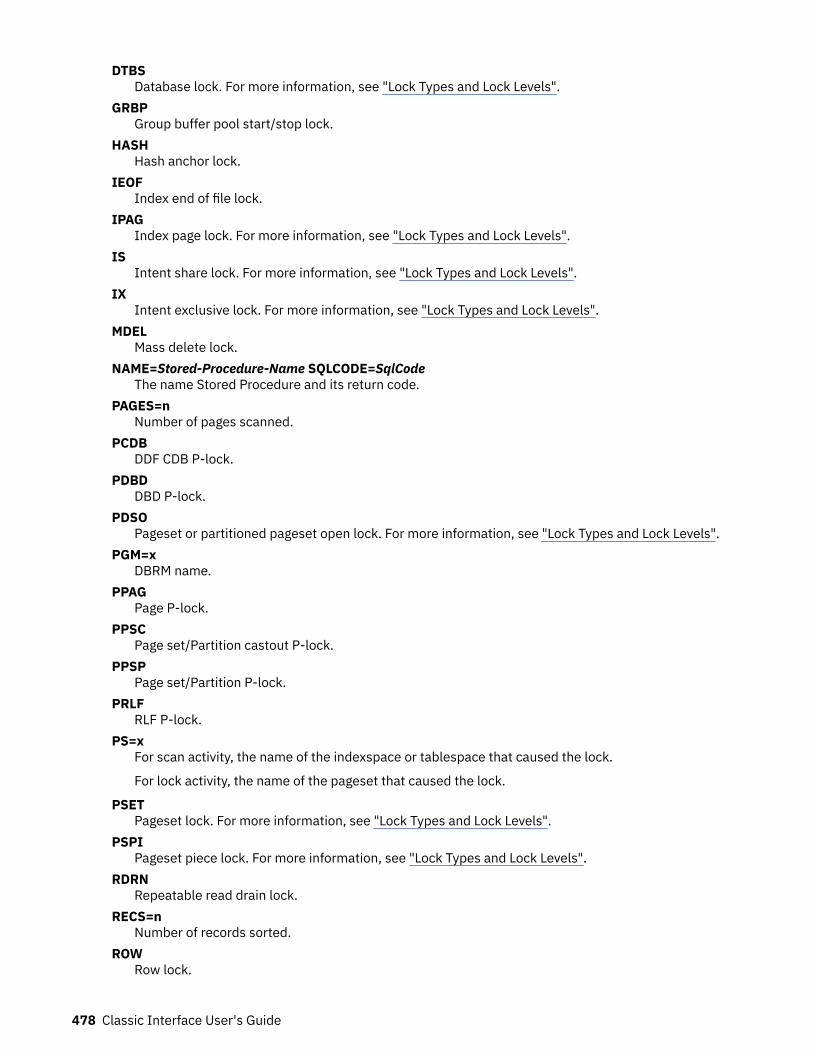
DTBSDatabase lock. For more information, see "Lock Types and Lock Levels".
GRBPGroup buffer pool start/stop lock.
HASHHash anchor lock.
IEOFIndex end of file lock.
IPAGIndex page lock. For more information, see "Lock Types and Lock Levels".
ISIntent share lock. For more information, see "Lock Types and Lock Levels".
IXIntent exclusive lock. For more information, see "Lock Types and Lock Levels".
MDELMass delete lock.
NAME=Stored-Procedure-Name SQLCODE=SqlCodeThe name Stored Procedure and its return code.
PAGES=nNumber of pages scanned.
PCDBDDF CDB P-lock.
PDBDDBD P-lock.
PDSOPageset or partitioned pageset open lock. For more information, see "Lock Types and Lock Levels".
PGM=xDBRM name.
PPAGPage P-lock.
PPSCPage set/Partition castout P-lock.
PPSPPage set/Partition P-lock.
PRLFRLF P-lock.
PS=xFor scan activity, the name of the indexspace or tablespace that caused the lock.
For lock activity, the name of the pageset that caused the lock.
PSETPageset lock. For more information, see "Lock Types and Lock Levels".
PSPIPageset piece lock. For more information, see "Lock Types and Lock Levels".
RDRNRepeatable read drain lock.
RECS=nNumber of records sorted.
ROWRow lock.
478 Classic Interface User's Guide
ROWS=nNumber of rows processed.
RSIZE=nSort record size (in bytes).
Run=nnDegree of parallelism at runtime.
RSIZE=nSort record size (in bytes).
RSTRSCA access for restart/redo lock.
SShared lock. For more information, see "Lock Types and Lock Levels".
SDBAStart/stop lock. For more information, see "Lock Types and Lock Levels".
SIXShare with intent exclusive lock. For more information, see "Lock Types and Lock Levels".
SKCTSkeleton cursor table lock. For more information, see "Lock Types and Lock Levels".
SKPTSkeleton package table lock. For more information, see "Lock Types and Lock Levels".
SPRCSystem Level PIT Recovery lock
SQLCode |SQL code from the CALL to the stored procedure.
SRECLog range lock. For more information, see "Lock Types and Lock Levels".
STMT=nDBRM statement number.
TABLTable lock. For more information, see "Lock Types and Lock Levels".
UUpdate. For more information, see "Lock Types and Lock Levels".
UNDTUndetermined lock. For more information, see "Lock Types and Lock Levels".
UTSEUtility serialization lock. For more information, see "Lock Types and Lock Levels".
WDRNWrite drain lock.
XExclusive lock. For more information, see "Lock Types and Lock Levels".
Chapter 9. Application Trace Facility (ATF) 479

480 Classic Interface User's Guide
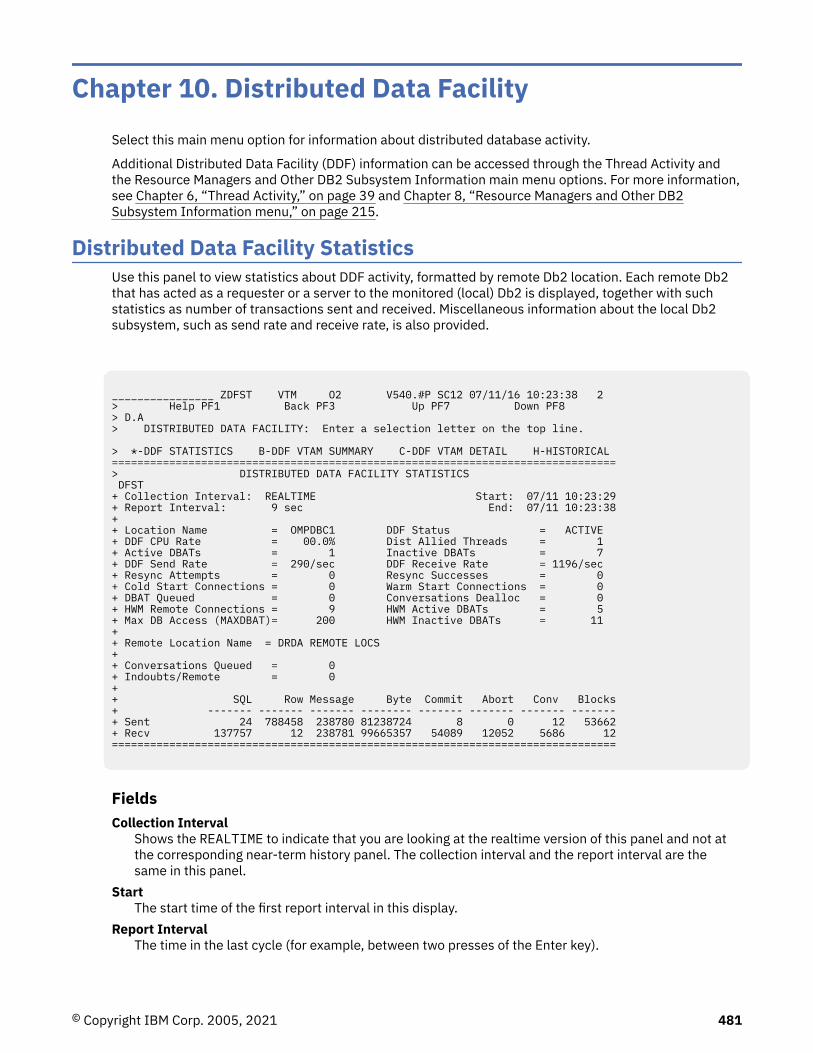
Chapter 10. Distributed Data FacilitySelect this main menu option for information about distributed database activity.
Additional Distributed Data Facility (DDF) information can be accessed through the Thread Activity andthe Resource Managers and Other DB2 Subsystem Information main menu options. For more information,see Chapter 6, “Thread Activity,” on page 39 and Chapter 8, “Resource Managers and Other DB2Subsystem Information menu,” on page 215.
Distributed Data Facility StatisticsUse this panel to view statistics about DDF activity, formatted by remote Db2 location. Each remote Db2that has acted as a requester or a server to the monitored (local) Db2 is displayed, together with suchstatistics as number of transactions sent and received. Miscellaneous information about the local Db2subsystem, such as send rate and receive rate, is also provided.
________________ ZDFST VTM O2 V540.#P SC12 07/11/16 10:23:38 2 > Help PF1 Back PF3 Up PF7 Down PF8 > D.A > DISTRIBUTED DATA FACILITY: Enter a selection letter on the top line. > *-DDF STATISTICS B-DDF VTAM SUMMARY C-DDF VTAM DETAIL H-HISTORICAL =============================================================================== > DISTRIBUTED DATA FACILITY STATISTICS DFST + Collection Interval: REALTIME Start: 07/11 10:23:29 + Report Interval: 9 sec End: 07/11 10:23:38 + + Location Name = OMPDBC1 DDF Status = ACTIVE + DDF CPU Rate = 00.0% Dist Allied Threads = 1 + Active DBATs = 1 Inactive DBATs = 7 + DDF Send Rate = 290/sec DDF Receive Rate = 1196/sec + Resync Attempts = 0 Resync Successes = 0 + Cold Start Connections = 0 Warm Start Connections = 0 + DBAT Queued = 0 Conversations Dealloc = 0 + HWM Remote Connections = 9 HWM Active DBATs = 5 + Max DB Access (MAXDBAT)= 200 HWM Inactive DBATs = 11 + + Remote Location Name = DRDA REMOTE LOCS + + Conversations Queued = 0 + Indoubts/Remote = 0 + + SQL Row Message Byte Commit Abort Conv Blocks + ------- ------- ------- -------- ------- ------- ------- ------- + Sent 24 788458 238780 81238724 8 0 12 53662 + Recv 137757 12 238781 99665357 54089 12052 5686 12 ===============================================================================
FieldsCollection Interval
Shows the REALTIME to indicate that you are looking at the realtime version of this panel and not atthe corresponding near-term history panel. The collection interval and the report interval are thesame in this panel.
StartThe start time of the first report interval in this display.
Report IntervalThe time in the last cycle (for example, between two presses of the Enter key).
© Copyright IBM Corp. 2005, 2021 481
EndThe end time of the last report interval in this display.
Location NameThe DDF location name of the Db2 subsystem being monitored.
DDF StatusThe status of the Distributed Database Facility: ACTIVE or NOT ACTIVE.
DDF CPU RateThe CPU rate of the DDF address space. Includes both MVS TCB and SRB time.
Dist Allied ThreadsThe number of distributed allied threads that are currently active.
Active DBATsThe number of currently active database access threads.
Inactive DBATsThe number of currently inactive database access threads.
DDF Send RateThe rate at which data is being sent by DDF, in bytes, KB, MB, GB per second.
DDF Receive RateThe rate at which data is being received by DDF, in bytes, KB, MB, GB per second.
Resync AttemptsThe number of resynchronization connects attempted with all remote locations. Used only for two-phase commit.
Resync SuccessesThe number of resynchronization connects that succeeded with all remote locations. Used only fortwo-phase commit.
Cold Start ConnectionsThe number of Cold Start connections with all remote locations. Used only for two-phase commit.
Warm Start ConnectionsThe number of Warm Start connections with all remote locations. Used only for two-phase commit.
DBATs QueuedNumber of times a database access thread (DBAT) had to wait because the maximum number ofconcurrent DBATs (MAXDBAT) was reached.
Conversation DeallocThe number of conversations deallocated because the ZPARM limit for maximum connected remotethreads (both active and inactive) was reached.
HWM Remote ConnectionsThe high-water mark (HWM) of inactive and active remote threads.
HWM Active DBATsThe high-water mark (HWM) of active database access threads (DBATs). If the INACTIVE option isspecified, it is possible for this value and the current number of active DBATs to exceed MAXDBAT.This occurs because Db2 allows CONNECTs to be processed even if MAXDBAT has been exceeded.After connect processing is complete, if MAXDBAT is still exceeded, then the DBAT is made inactive.
Max DB Access (MAXDBAT)The maximum number of database access threads allowed for the Db2 being monitored (determinedby the setting of MAXDBAT in DSNZPARM).
HWM Inactive DBATsThe high-water mark (HWM) of inactive database access threads (DBATs).
Remote statistics: The following group of fields occurs for each remote Db2 location with which the localDb2 subsystem has communicated, either as a requester or a responder, since the local Db2 was started.Remote Location Name
The name of a remote location with which the local Db2 has communicated. The statisticsimmediately below this field pertain to this location.
482 Classic Interface User's Guide
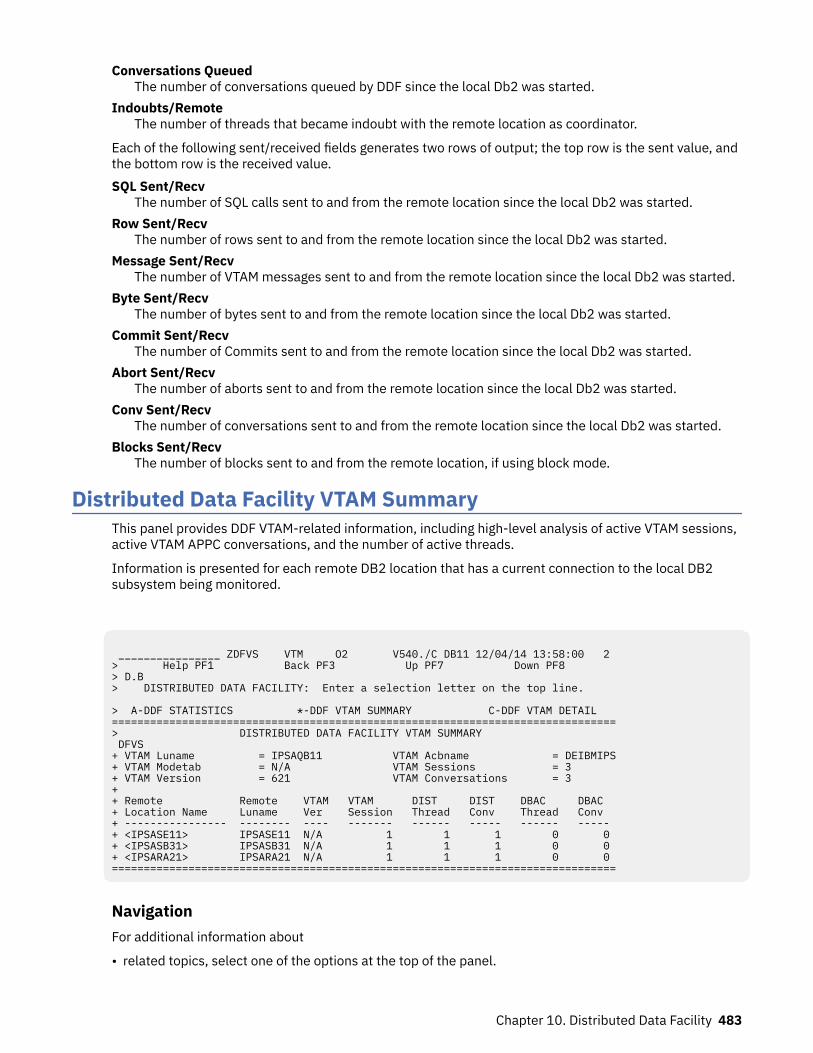
Conversations QueuedThe number of conversations queued by DDF since the local Db2 was started.
Indoubts/RemoteThe number of threads that became indoubt with the remote location as coordinator.
Each of the following sent/received fields generates two rows of output; the top row is the sent value, andthe bottom row is the received value.SQL Sent/Recv
The number of SQL calls sent to and from the remote location since the local Db2 was started.Row Sent/Recv
The number of rows sent to and from the remote location since the local Db2 was started.Message Sent/Recv
The number of VTAM messages sent to and from the remote location since the local Db2 was started.Byte Sent/Recv
The number of bytes sent to and from the remote location since the local Db2 was started.Commit Sent/Recv
The number of Commits sent to and from the remote location since the local Db2 was started.Abort Sent/Recv
The number of aborts sent to and from the remote location since the local Db2 was started.Conv Sent/Recv
The number of conversations sent to and from the remote location since the local Db2 was started.Blocks Sent/Recv
The number of blocks sent to and from the remote location, if using block mode.
Distributed Data Facility VTAM SummaryThis panel provides DDF VTAM-related information, including high-level analysis of active VTAM sessions,active VTAM APPC conversations, and the number of active threads.
Information is presented for each remote DB2 location that has a current connection to the local DB2subsystem being monitored.
________________ ZDFVS VTM O2 V540./C DB11 12/04/14 13:58:00 2 > Help PF1 Back PF3 Up PF7 Down PF8 > D.B > DISTRIBUTED DATA FACILITY: Enter a selection letter on the top line. > A-DDF STATISTICS *-DDF VTAM SUMMARY C-DDF VTAM DETAIL ===============================================================================> DISTRIBUTED DATA FACILITY VTAM SUMMARY DFVS + VTAM Luname = IPSAQB11 VTAM Acbname = DEIBMIPS+ VTAM Modetab = N/A VTAM Sessions = 3 + VTAM Version = 621 VTAM Conversations = 3 + + Remote Remote VTAM VTAM DIST DIST DBAC DBAC + Location Name Luname Ver Session Thread Conv Thread Conv + ---------------- -------- ---- ------- ------ ----- ------ ----- + <IPSASE11> IPSASE11 N/A 1 1 1 0 0 + <IPSASB31> IPSASB31 N/A 1 1 1 0 0 + <IPSARA21> IPSARA21 N/A 1 1 1 0 0 ===============================================================================
NavigationFor additional information about
• related topics, select one of the options at the top of the panel.
Chapter 10. Distributed Data Facility 483
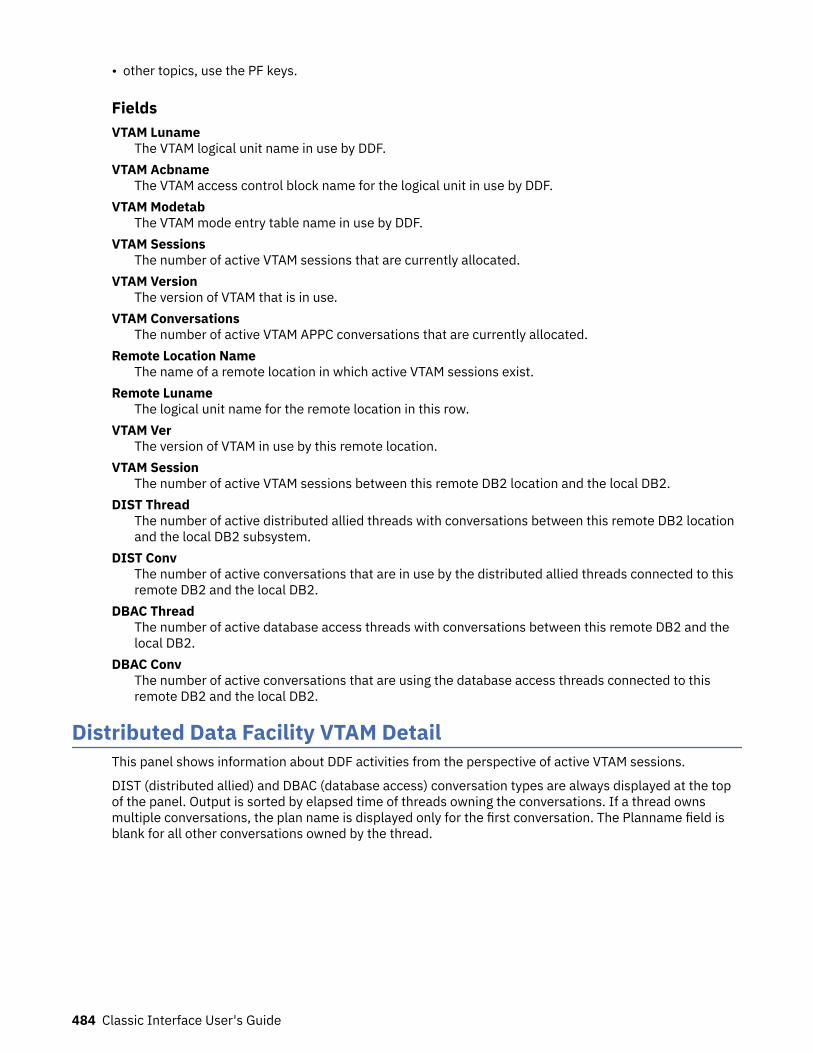
• other topics, use the PF keys.
FieldsVTAM Luname
The VTAM logical unit name in use by DDF.VTAM Acbname
The VTAM access control block name for the logical unit in use by DDF.VTAM Modetab
The VTAM mode entry table name in use by DDF.VTAM Sessions
The number of active VTAM sessions that are currently allocated.VTAM Version
The version of VTAM that is in use.VTAM Conversations
The number of active VTAM APPC conversations that are currently allocated.Remote Location Name
The name of a remote location in which active VTAM sessions exist.Remote Luname
The logical unit name for the remote location in this row.VTAM Ver
The version of VTAM in use by this remote location.VTAM Session
The number of active VTAM sessions between this remote DB2 location and the local DB2.DIST Thread
The number of active distributed allied threads with conversations between this remote DB2 locationand the local DB2 subsystem.
DIST ConvThe number of active conversations that are in use by the distributed allied threads connected to thisremote DB2 and the local DB2.
DBAC ThreadThe number of active database access threads with conversations between this remote DB2 and thelocal DB2.
DBAC ConvThe number of active conversations that are using the database access threads connected to thisremote DB2 and the local DB2.
Distributed Data Facility VTAM DetailThis panel shows information about DDF activities from the perspective of active VTAM sessions.
DIST (distributed allied) and DBAC (database access) conversation types are always displayed at the topof the panel. Output is sorted by elapsed time of threads owning the conversations. If a thread ownsmultiple conversations, the plan name is displayed only for the first conversation. The Planname field isblank for all other conversations owned by the thread.
484 Classic Interface User's Guide
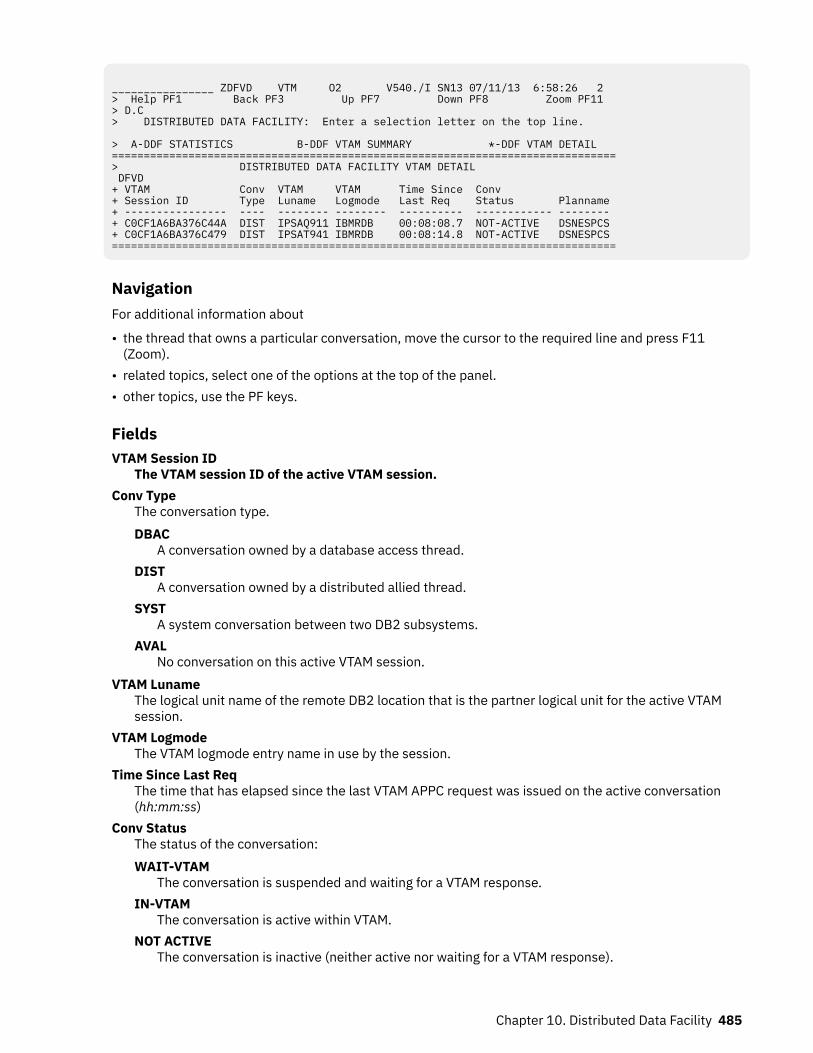
________________ ZDFVD VTM O2 V540./I SN13 07/11/13 6:58:26 2 > Help PF1 Back PF3 Up PF7 Down PF8 Zoom PF11 > D.C > DISTRIBUTED DATA FACILITY: Enter a selection letter on the top line. > A-DDF STATISTICS B-DDF VTAM SUMMARY *-DDF VTAM DETAIL ===============================================================================> DISTRIBUTED DATA FACILITY VTAM DETAIL DFVD + VTAM Conv VTAM VTAM Time Since Conv + Session ID Type Luname Logmode Last Req Status Planname + ---------------- ---- -------- -------- ---------- ------------ -------- + C0CF1A6BA376C44A DIST IPSAQ911 IBMRDB 00:08:08.7 NOT-ACTIVE DSNESPCS + C0CF1A6BA376C479 DIST IPSAT941 IBMRDB 00:08:14.8 NOT-ACTIVE DSNESPCS ===============================================================================
NavigationFor additional information about
• the thread that owns a particular conversation, move the cursor to the required line and press F11(Zoom).
• related topics, select one of the options at the top of the panel.• other topics, use the PF keys.
FieldsVTAM Session ID
The VTAM session ID of the active VTAM session.Conv Type
The conversation type.DBAC
A conversation owned by a database access thread.DIST
A conversation owned by a distributed allied thread.SYST
A system conversation between two DB2 subsystems.AVAL
No conversation on this active VTAM session.VTAM Luname
The logical unit name of the remote DB2 location that is the partner logical unit for the active VTAMsession.
VTAM LogmodeThe VTAM logmode entry name in use by the session.
Time Since Last ReqThe time that has elapsed since the last VTAM APPC request was issued on the active conversation(hh:mm:ss)
Conv StatusThe status of the conversation:WAIT-VTAM
The conversation is suspended and waiting for a VTAM response.IN-VTAM
The conversation is active within VTAM.NOT ACTIVE
The conversation is inactive (neither active nor waiting for a VTAM response).
Chapter 10. Distributed Data Facility 485
PlannameThe plan name of the thread that owns the conversation using this VTAM session. If this field is blankfor a DIST or DBAC conversation type, the plan name is the same as the one immediately before.
If Conv Type is SYST, this field is blank because no plan is involved.
486 Classic Interface User's Guide
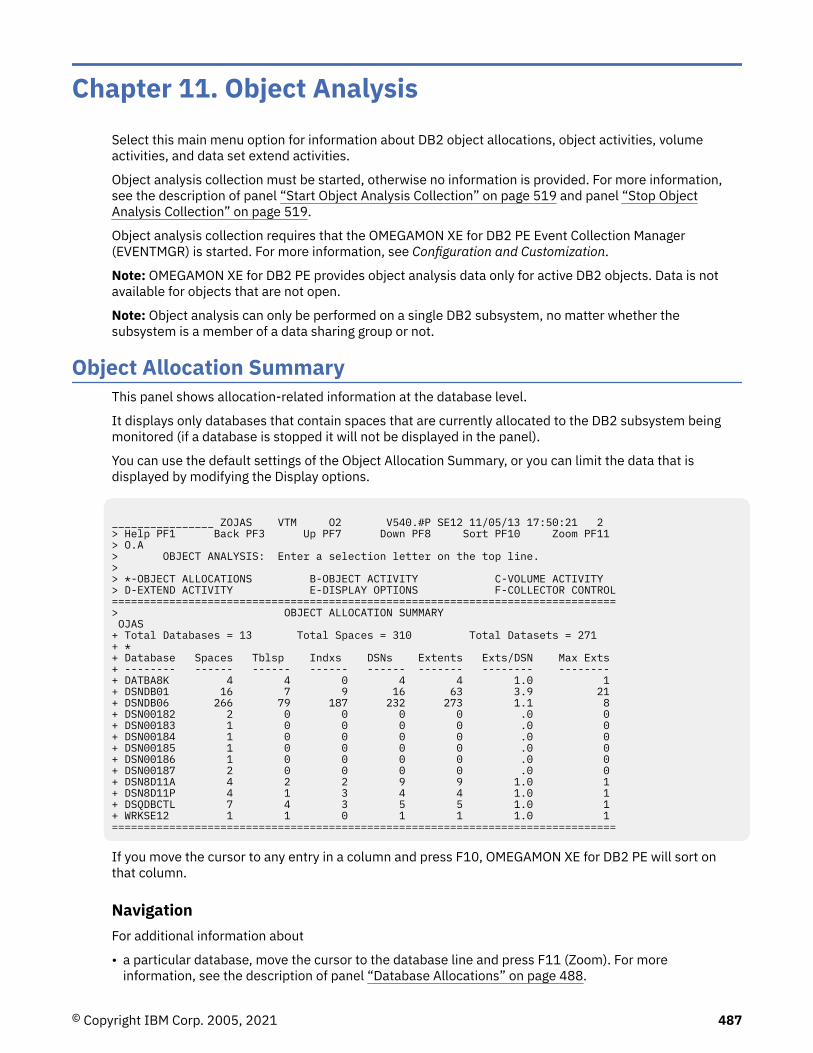
Chapter 11. Object AnalysisSelect this main menu option for information about DB2 object allocations, object activities, volumeactivities, and data set extend activities.
Object analysis collection must be started, otherwise no information is provided. For more information,see the description of panel “Start Object Analysis Collection” on page 519 and panel “Stop ObjectAnalysis Collection” on page 519.
Object analysis collection requires that the OMEGAMON XE for DB2 PE Event Collection Manager(EVENTMGR) is started. For more information, see Configuration and Customization.
Note: OMEGAMON XE for DB2 PE provides object analysis data only for active DB2 objects. Data is notavailable for objects that are not open.
Note: Object analysis can only be performed on a single DB2 subsystem, no matter whether thesubsystem is a member of a data sharing group or not.
Object Allocation SummaryThis panel shows allocation-related information at the database level.
It displays only databases that contain spaces that are currently allocated to the DB2 subsystem beingmonitored (if a database is stopped it will not be displayed in the panel).
You can use the default settings of the Object Allocation Summary, or you can limit the data that isdisplayed by modifying the Display options.
________________ ZOJAS VTM O2 V540.#P SE12 11/05/13 17:50:21 2 > Help PF1 Back PF3 Up PF7 Down PF8 Sort PF10 Zoom PF11 > O.A > OBJECT ANALYSIS: Enter a selection letter on the top line. > > *-OBJECT ALLOCATIONS B-OBJECT ACTIVITY C-VOLUME ACTIVITY > D-EXTEND ACTIVITY E-DISPLAY OPTIONS F-COLLECTOR CONTROL===============================================================================> OBJECT ALLOCATION SUMMARY OJAS + Total Databases = 13 Total Spaces = 310 Total Datasets = 271 + * + Database Spaces Tblsp Indxs DSNs Extents Exts/DSN Max Exts + -------- ------ ------ ------ ------ ------- -------- -------- + DATBA8K 4 4 0 4 4 1.0 1 + DSNDB01 16 7 9 16 63 3.9 21 + DSNDB06 266 79 187 232 273 1.1 8 + DSN00182 2 0 0 0 0 .0 0 + DSN00183 1 0 0 0 0 .0 0 + DSN00184 1 0 0 0 0 .0 0 + DSN00185 1 0 0 0 0 .0 0 + DSN00186 1 0 0 0 0 .0 0 + DSN00187 2 0 0 0 0 .0 0 + DSN8D11A 4 2 2 9 9 1.0 1 + DSN8D11P 4 1 3 4 4 1.0 1 + DSQDBCTL 7 4 3 5 5 1.0 1 + WRKSE12 1 1 0 1 1 1.0 1 ===============================================================================
If you move the cursor to any entry in a column and press F10, OMEGAMON XE for DB2 PE will sort onthat column.
NavigationFor additional information about
• a particular database, move the cursor to the database line and press F11 (Zoom). For moreinformation, see the description of panel “Database Allocations” on page 488.
© Copyright IBM Corp. 2005, 2021 487
• related topics, select one of the options on the top of the panel.• other topics, use the PF keys.
FieldsTotal Databases
The number of databases that are allocated to the monitored DB2.Total Spaces
The number of spaces that are allocated to the monitored DB2.Total Datasets
The number of data sets that are allocated to the monitored DB2.Database
The name of a database.Spaces
The number of spaces owned by the database and currently allocated to DB2.Tblsp
The number of spaces that are tablespaces currently allocated to DB2.Indxs
The number of spaces that are indexspaces currently allocated to DB2.DSNs
The number of data sets that are allocated for the spaces owned by the database.Extents
The number of data set extents allocated by the data sets.Exts/DSN
The average number of extents per data set for the database.Max Exts
The largest number of extents per data set for the database.
Database AllocationsThis panel provides allocation information for all spacenames owned by a particular database.
OMEGAMON XE for DB2 PE will sort on that column.
488 Classic Interface User's Guide
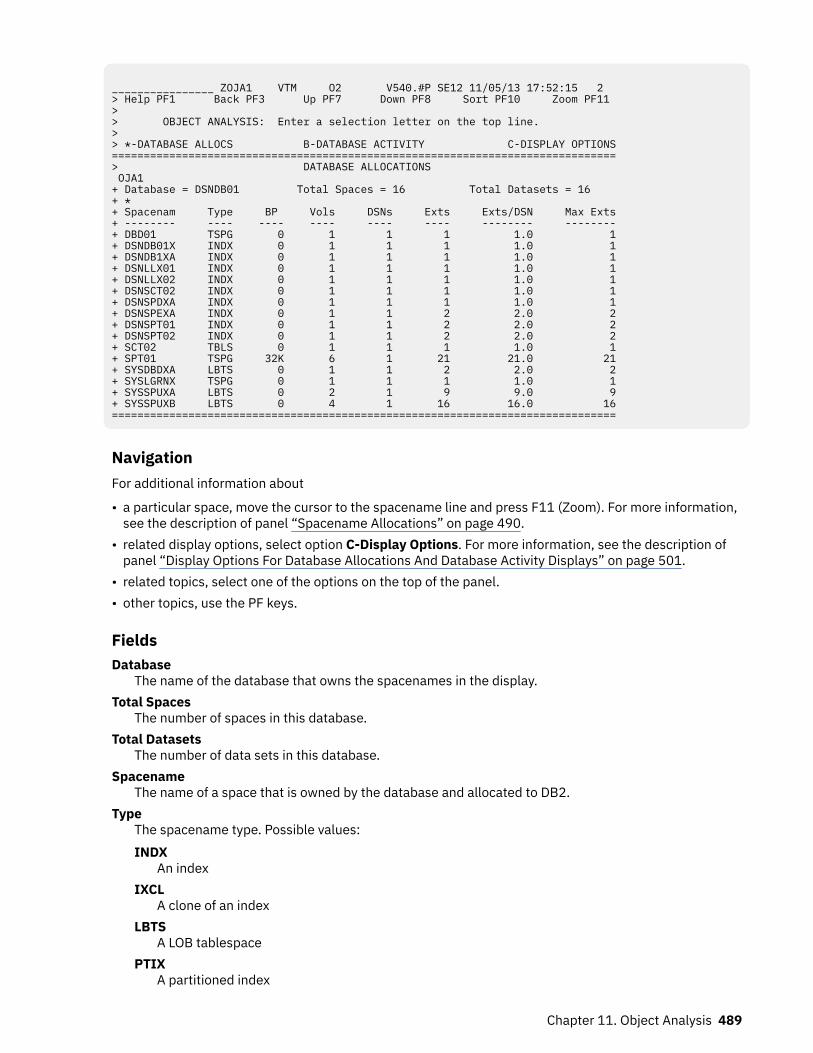
________________ ZOJA1 VTM O2 V540.#P SE12 11/05/13 17:52:15 2 > Help PF1 Back PF3 Up PF7 Down PF8 Sort PF10 Zoom PF11 > > OBJECT ANALYSIS: Enter a selection letter on the top line. > > *-DATABASE ALLOCS B-DATABASE ACTIVITY C-DISPLAY OPTIONS =============================================================================== > DATABASE ALLOCATIONS OJA1 + Database = DSNDB01 Total Spaces = 16 Total Datasets = 16 + * + Spacenam Type BP Vols DSNs Exts Exts/DSN Max Exts + -------- ---- ---- ---- ---- ---- -------- -------- + DBD01 TSPG 0 1 1 1 1.0 1 + DSNDB01X INDX 0 1 1 1 1.0 1 + DSNDB1XA INDX 0 1 1 1 1.0 1 + DSNLLX01 INDX 0 1 1 1 1.0 1 + DSNLLX02 INDX 0 1 1 1 1.0 1 + DSNSCT02 INDX 0 1 1 1 1.0 1 + DSNSPDXA INDX 0 1 1 1 1.0 1 + DSNSPEXA INDX 0 1 1 2 2.0 2 + DSNSPT01 INDX 0 1 1 2 2.0 2 + DSNSPT02 INDX 0 1 1 2 2.0 2 + SCT02 TBLS 0 1 1 1 1.0 1 + SPT01 TSPG 32K 6 1 21 21.0 21 + SYSDBDXA LBTS 0 1 1 2 2.0 2 + SYSLGRNX TSPG 0 1 1 1 1.0 1 + SYSSPUXA LBTS 0 2 1 9 9.0 9 + SYSSPUXB LBTS 0 4 1 16 16.0 16 ===============================================================================
NavigationFor additional information about
• a particular space, move the cursor to the spacename line and press F11 (Zoom). For more information,see the description of panel “Spacename Allocations” on page 490.
• related display options, select option C-Display Options. For more information, see the description ofpanel “Display Options For Database Allocations And Database Activity Displays” on page 501.
• related topics, select one of the options on the top of the panel.• other topics, use the PF keys.
FieldsDatabase
The name of the database that owns the spacenames in the display.Total Spaces
The number of spaces in this database.Total Datasets
The number of data sets in this database.Spacename
The name of a space that is owned by the database and allocated to DB2.Type
The spacename type. Possible values:INDX
An indexIXCL
A clone of an indexLBTS
A LOB tablespacePTIX
A partitioned index
Chapter 11. Object Analysis 489
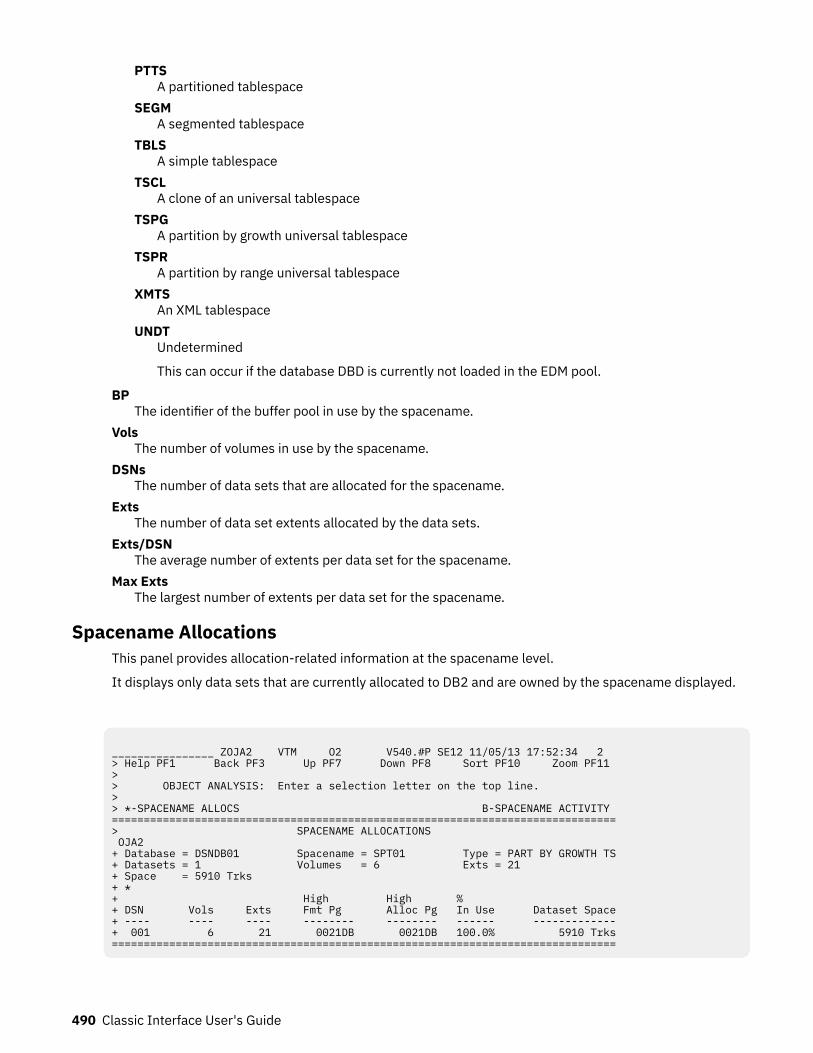
PTTSA partitioned tablespace
SEGMA segmented tablespace
TBLSA simple tablespace
TSCLA clone of an universal tablespace
TSPGA partition by growth universal tablespace
TSPRA partition by range universal tablespace
XMTSAn XML tablespace
UNDTUndetermined
This can occur if the database DBD is currently not loaded in the EDM pool.
BPThe identifier of the buffer pool in use by the spacename.
VolsThe number of volumes in use by the spacename.
DSNsThe number of data sets that are allocated for the spacename.
ExtsThe number of data set extents allocated by the data sets.
Exts/DSNThe average number of extents per data set for the spacename.
Max ExtsThe largest number of extents per data set for the spacename.
Spacename AllocationsThis panel provides allocation-related information at the spacename level.
It displays only data sets that are currently allocated to DB2 and are owned by the spacename displayed.
________________ ZOJA2 VTM O2 V540.#P SE12 11/05/13 17:52:34 2 > Help PF1 Back PF3 Up PF7 Down PF8 Sort PF10 Zoom PF11 > > OBJECT ANALYSIS: Enter a selection letter on the top line. > > *-SPACENAME ALLOCS B-SPACENAME ACTIVITY ===============================================================================> SPACENAME ALLOCATIONS OJA2 + Database = DSNDB01 Spacename = SPT01 Type = PART BY GROWTH TS+ Datasets = 1 Volumes = 6 Exts = 21 + Space = 5910 Trks + * + High High % + DSN Vols Exts Fmt Pg Alloc Pg In Use Dataset Space+ ---- ---- ---- -------- -------- ------ -------------+ 001 6 21 0021DB 0021DB 100.0% 5910 Trks===============================================================================
490 Classic Interface User's Guide
If you move the cursor to any entry in a column and press F10, OMEGAMON XE for DB2 PE will sort onthat column.
NavigationFor additional information about
• a particular data set, move the cursor to the DSN line and press F11 (Zoom). For more information, seethe description of panel “Dataset Allocations” on page 492.
• related topics, select one of the options on the top of the panel.• other topics, use the PF keys.
FieldsDatabase
The name of the database that owns the spacename.Spacename
The name of the space about which information is displayed.Type
The spacename type. Possible values:INDX
An indexIXCL
A clone of an indexLBTS
A LOB tablespacePTIX
A partitioned indexPTTS
A partitioned tablespaceSEGM
A segmented tablespaceTBLS
A simple tablespaceTSCL
A clone of an universal tablespaceTSPG
A partition by growth universal tablespaceTSPR
A partition by range universal tablespaceXMTS
An XML tablespaceUNDT
Undetermined
This can occur if the database DBD is currently not loaded in the EDM pool.
DatasetsThe number of data sets in use by the spacename.
VolumesThe number of volumes in use by the data set.
ExtsThe number of data set extents allocated by all data sets in use by the spacename.
Chapter 11. Object Analysis 491
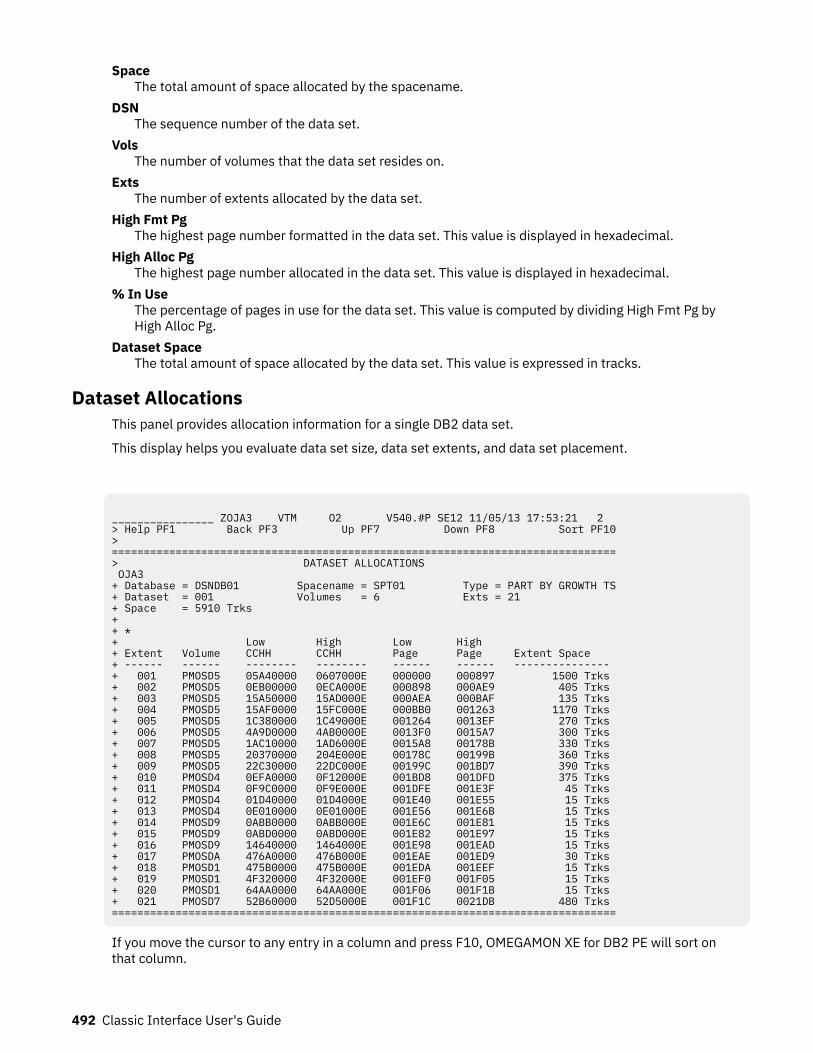
SpaceThe total amount of space allocated by the spacename.
DSNThe sequence number of the data set.
VolsThe number of volumes that the data set resides on.
ExtsThe number of extents allocated by the data set.
High Fmt PgThe highest page number formatted in the data set. This value is displayed in hexadecimal.
High Alloc PgThe highest page number allocated in the data set. This value is displayed in hexadecimal.
% In UseThe percentage of pages in use for the data set. This value is computed by dividing High Fmt Pg byHigh Alloc Pg.
Dataset SpaceThe total amount of space allocated by the data set. This value is expressed in tracks.
Dataset AllocationsThis panel provides allocation information for a single DB2 data set.
This display helps you evaluate data set size, data set extents, and data set placement.
________________ ZOJA3 VTM O2 V540.#P SE12 11/05/13 17:53:21 2 > Help PF1 Back PF3 Up PF7 Down PF8 Sort PF10 > =============================================================================== > DATASET ALLOCATIONS OJA3 + Database = DSNDB01 Spacename = SPT01 Type = PART BY GROWTH TS + Dataset = 001 Volumes = 6 Exts = 21 + Space = 5910 Trks + + * + Low High Low High + Extent Volume CCHH CCHH Page Page Extent Space + ------ ------ -------- -------- ------ ------ --------------- + 001 PMOSD5 05A40000 0607000E 000000 000897 1500 Trks + 002 PMOSD5 0EB00000 0ECA000E 000898 000AE9 405 Trks + 003 PMOSD5 15A50000 15AD000E 000AEA 000BAF 135 Trks + 004 PMOSD5 15AF0000 15FC000E 000BB0 001263 1170 Trks + 005 PMOSD5 1C380000 1C49000E 001264 0013EF 270 Trks + 006 PMOSD5 4A9D0000 4AB0000E 0013F0 0015A7 300 Trks + 007 PMOSD5 1AC10000 1AD6000E 0015A8 00178B 330 Trks + 008 PMOSD5 20370000 204E000E 00178C 00199B 360 Trks + 009 PMOSD5 22C30000 22DC000E 00199C 001BD7 390 Trks + 010 PMOSD4 0EFA0000 0F12000E 001BD8 001DFD 375 Trks + 011 PMOSD4 0F9C0000 0F9E000E 001DFE 001E3F 45 Trks + 012 PMOSD4 01D40000 01D4000E 001E40 001E55 15 Trks + 013 PMOSD4 0E010000 0E01000E 001E56 001E6B 15 Trks + 014 PMOSD9 0ABB0000 0ABB000E 001E6C 001E81 15 Trks + 015 PMOSD9 0ABD0000 0ABD000E 001E82 001E97 15 Trks + 016 PMOSD9 14640000 1464000E 001E98 001EAD 15 Trks + 017 PMOSDA 476A0000 476B000E 001EAE 001ED9 30 Trks + 018 PMOSD1 475B0000 475B000E 001EDA 001EEF 15 Trks + 019 PMOSD1 4F320000 4F32000E 001EF0 001F05 15 Trks + 020 PMOSD1 64AA0000 64AA000E 001F06 001F1B 15 Trks + 021 PMOSD7 52B60000 52D5000E 001F1C 0021DB 480 Trks ===============================================================================
If you move the cursor to any entry in a column and press F10, OMEGAMON XE for DB2 PE will sort onthat column.
492 Classic Interface User's Guide
NavigationFor additional information about
• related topics, select one of the options on the top of the panel.• other topics, use the PF keys.
FieldsDatabase
The name of the database that owns the space.Spacename
The name of the space that owns the data set.Type
The spacename type. Possible values:INDX
An indexIXCL
A clone of an indexLBTS
A LOB tablespacePTIX
A partitioned indexPTTS
A partitioned tablespaceSEGM
A segmented tablespaceTBLS
A simple tablespaceTSCL
A clone of an universal tablespaceTSPG
A partition by growth universal tablespaceTSPR
A partition by range universal tablespaceXMTS
An XML tablespaceUNDT
Undetermined
This can occur if the database DBD is currently not loaded in the EDM pool.
DatasetThe sequence number of the selected data set.
VolumesThe number of volumes in use by the data set.
ExtsThe number of data set extents allocated by the data set.
SpaceThe total amount of space currently allocated by the data set.
ExtentThe sequence number of the extent.
Chapter 11. Object Analysis 493
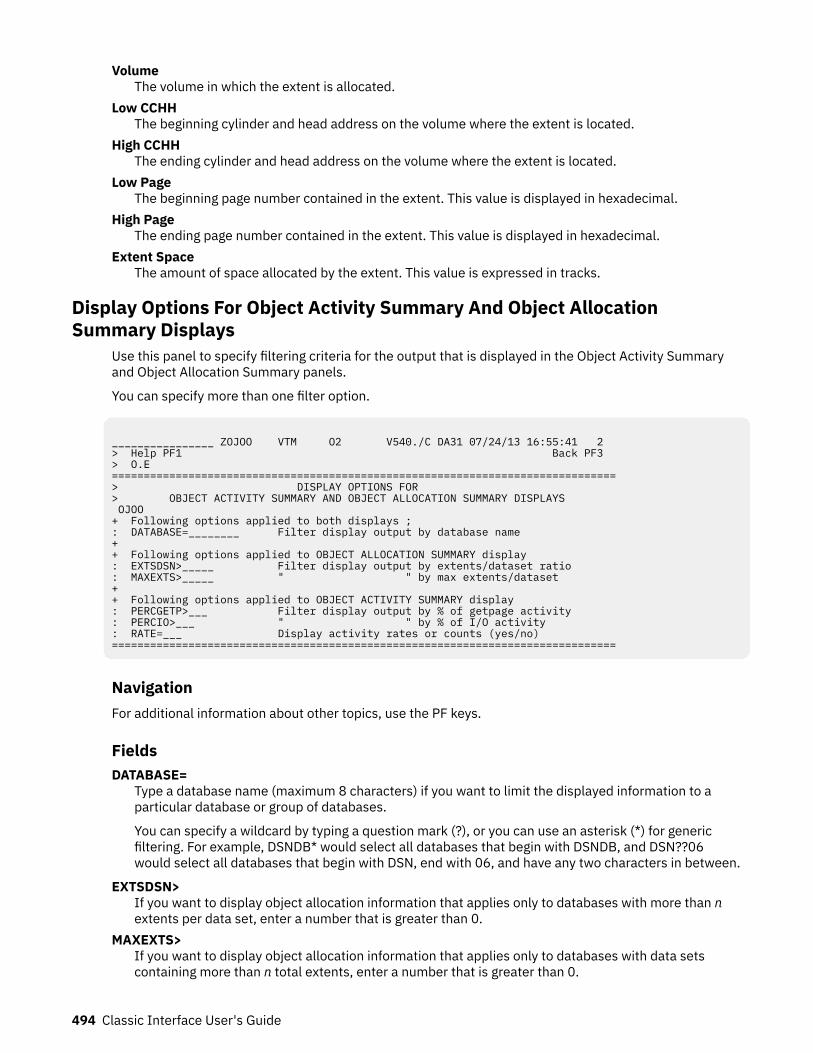
VolumeThe volume in which the extent is allocated.
Low CCHHThe beginning cylinder and head address on the volume where the extent is located.
High CCHHThe ending cylinder and head address on the volume where the extent is located.
Low PageThe beginning page number contained in the extent. This value is displayed in hexadecimal.
High PageThe ending page number contained in the extent. This value is displayed in hexadecimal.
Extent SpaceThe amount of space allocated by the extent. This value is expressed in tracks.
Display Options For Object Activity Summary And Object AllocationSummary Displays
Use this panel to specify filtering criteria for the output that is displayed in the Object Activity Summaryand Object Allocation Summary panels.
You can specify more than one filter option.
________________ ZOJOO VTM O2 V540./C DA31 07/24/13 16:55:41 2 > Help PF1 Back PF3 > O.E ===============================================================================> DISPLAY OPTIONS FOR > OBJECT ACTIVITY SUMMARY AND OBJECT ALLOCATION SUMMARY DISPLAYS OJOO + Following options applied to both displays ; : DATABASE=________ Filter display output by database name + + Following options applied to OBJECT ALLOCATION SUMMARY display : EXTSDSN>_____ Filter display output by extents/dataset ratio : MAXEXTS>_____ " " by max extents/dataset + + Following options applied to OBJECT ACTIVITY SUMMARY display : PERCGETP>___ Filter display output by % of getpage activity : PERCIO>___ " " by % of I/O activity : RATE=___ Display activity rates or counts (yes/no) ===============================================================================
NavigationFor additional information about other topics, use the PF keys.
FieldsDATABASE=
Type a database name (maximum 8 characters) if you want to limit the displayed information to aparticular database or group of databases.
You can specify a wildcard by typing a question mark (?), or you can use an asterisk (*) for genericfiltering. For example, DSNDB* would select all databases that begin with DSNDB, and DSN??06would select all databases that begin with DSN, end with 06, and have any two characters in between.
EXTSDSN>If you want to display object allocation information that applies only to databases with more than nextents per data set, enter a number that is greater than 0.
MAXEXTS>If you want to display object allocation information that applies only to databases with data setscontaining more than n total extents, enter a number that is greater than 0.
494 Classic Interface User's Guide
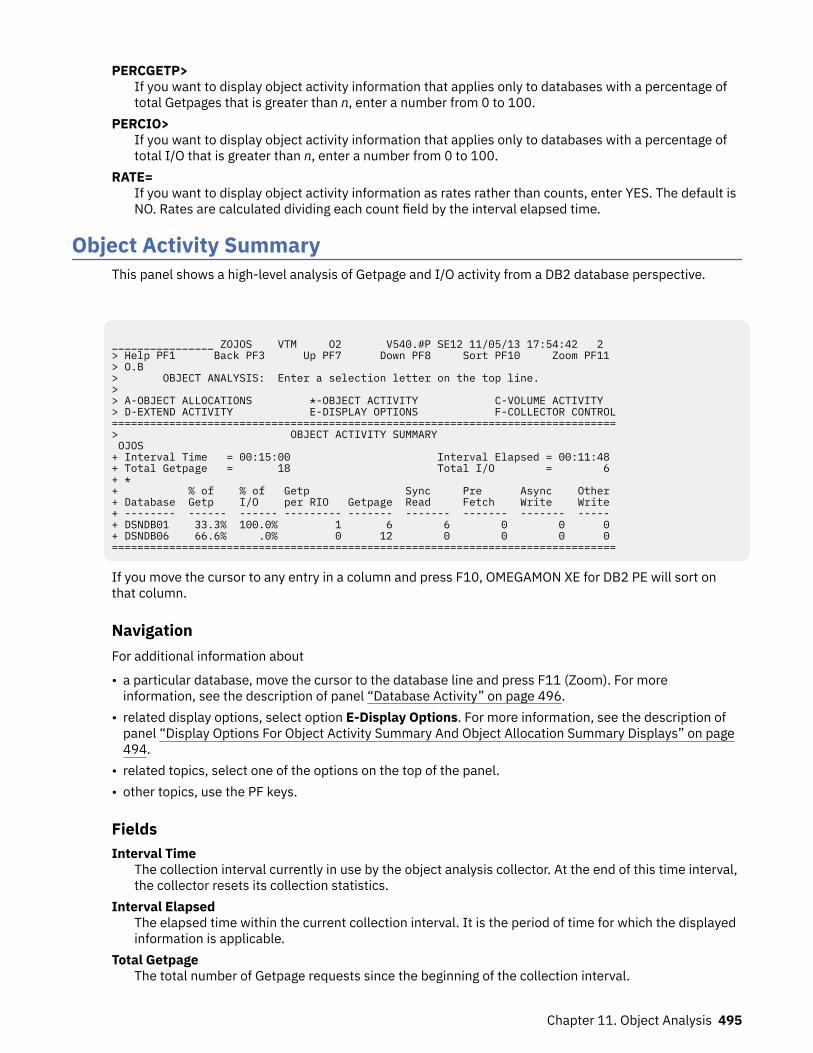
PERCGETP>If you want to display object activity information that applies only to databases with a percentage oftotal Getpages that is greater than n, enter a number from 0 to 100.
PERCIO>If you want to display object activity information that applies only to databases with a percentage oftotal I/O that is greater than n, enter a number from 0 to 100.
RATE=If you want to display object activity information as rates rather than counts, enter YES. The default isNO. Rates are calculated dividing each count field by the interval elapsed time.
Object Activity SummaryThis panel shows a high-level analysis of Getpage and I/O activity from a DB2 database perspective.
________________ ZOJOS VTM O2 V540.#P SE12 11/05/13 17:54:42 2 > Help PF1 Back PF3 Up PF7 Down PF8 Sort PF10 Zoom PF11 > O.B > OBJECT ANALYSIS: Enter a selection letter on the top line. > > A-OBJECT ALLOCATIONS *-OBJECT ACTIVITY C-VOLUME ACTIVITY > D-EXTEND ACTIVITY E-DISPLAY OPTIONS F-COLLECTOR CONTROL===============================================================================> OBJECT ACTIVITY SUMMARY OJOS + Interval Time = 00:15:00 Interval Elapsed = 00:11:48 + Total Getpage = 18 Total I/O = 6 + * + % of % of Getp Sync Pre Async Other + Database Getp I/O per RIO Getpage Read Fetch Write Write + -------- ------ ------ --------- ------- ------- ------- ------- ----- + DSNDB01 33.3% 100.0% 1 6 6 0 0 0 + DSNDB06 66.6% .0% 0 12 0 0 0 0 ===============================================================================
If you move the cursor to any entry in a column and press F10, OMEGAMON XE for DB2 PE will sort onthat column.
NavigationFor additional information about
• a particular database, move the cursor to the database line and press F11 (Zoom). For moreinformation, see the description of panel “Database Activity” on page 496.
• related display options, select option E-Display Options. For more information, see the description ofpanel “Display Options For Object Activity Summary And Object Allocation Summary Displays” on page494.
• related topics, select one of the options on the top of the panel.• other topics, use the PF keys.
FieldsInterval Time
The collection interval currently in use by the object analysis collector. At the end of this time interval,the collector resets its collection statistics.
Interval ElapsedThe elapsed time within the current collection interval. It is the period of time for which the displayedinformation is applicable.
Total GetpageThe total number of Getpage requests since the beginning of the collection interval.
Chapter 11. Object Analysis 495
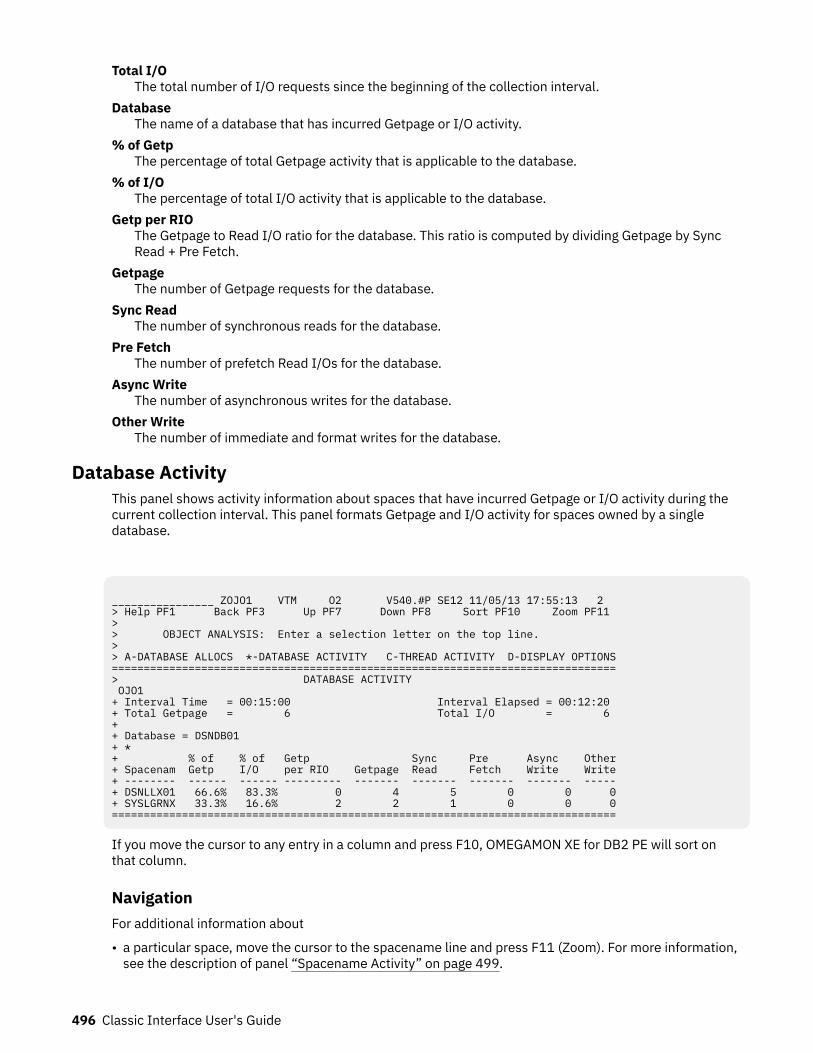
Total I/OThe total number of I/O requests since the beginning of the collection interval.
DatabaseThe name of a database that has incurred Getpage or I/O activity.
% of GetpThe percentage of total Getpage activity that is applicable to the database.
% of I/OThe percentage of total I/O activity that is applicable to the database.
Getp per RIOThe Getpage to Read I/O ratio for the database. This ratio is computed by dividing Getpage by SyncRead + Pre Fetch.
GetpageThe number of Getpage requests for the database.
Sync ReadThe number of synchronous reads for the database.
Pre FetchThe number of prefetch Read I/Os for the database.
Async WriteThe number of asynchronous writes for the database.
Other WriteThe number of immediate and format writes for the database.
Database ActivityThis panel shows activity information about spaces that have incurred Getpage or I/O activity during thecurrent collection interval. This panel formats Getpage and I/O activity for spaces owned by a singledatabase.
________________ ZOJO1 VTM O2 V540.#P SE12 11/05/13 17:55:13 2 > Help PF1 Back PF3 Up PF7 Down PF8 Sort PF10 Zoom PF11 > > OBJECT ANALYSIS: Enter a selection letter on the top line. > > A-DATABASE ALLOCS *-DATABASE ACTIVITY C-THREAD ACTIVITY D-DISPLAY OPTIONS===============================================================================> DATABASE ACTIVITY OJO1 + Interval Time = 00:15:00 Interval Elapsed = 00:12:20 + Total Getpage = 6 Total I/O = 6 + + Database = DSNDB01 + * + % of % of Getp Sync Pre Async Other+ Spacenam Getp I/O per RIO Getpage Read Fetch Write Write+ -------- ------ ------ --------- ------- ------- ------- ------- -----+ DSNLLX01 66.6% 83.3% 0 4 5 0 0 0+ SYSLGRNX 33.3% 16.6% 2 2 1 0 0 0===============================================================================
If you move the cursor to any entry in a column and press F10, OMEGAMON XE for DB2 PE will sort onthat column.
NavigationFor additional information about
• a particular space, move the cursor to the spacename line and press F11 (Zoom). For more information,see the description of panel “Spacename Activity” on page 499.
496 Classic Interface User's Guide
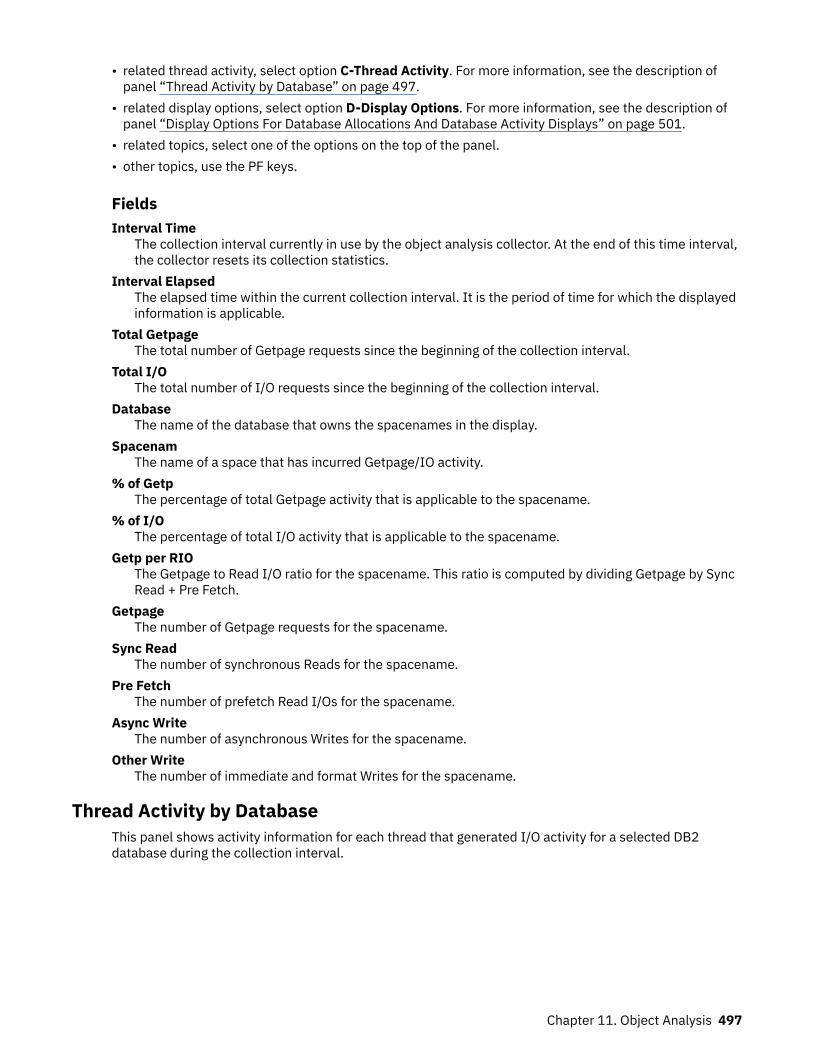
• related thread activity, select option C-Thread Activity. For more information, see the description ofpanel “Thread Activity by Database” on page 497.
• related display options, select option D-Display Options. For more information, see the description ofpanel “Display Options For Database Allocations And Database Activity Displays” on page 501.
• related topics, select one of the options on the top of the panel.• other topics, use the PF keys.
FieldsInterval Time
The collection interval currently in use by the object analysis collector. At the end of this time interval,the collector resets its collection statistics.
Interval ElapsedThe elapsed time within the current collection interval. It is the period of time for which the displayedinformation is applicable.
Total GetpageThe total number of Getpage requests since the beginning of the collection interval.
Total I/OThe total number of I/O requests since the beginning of the collection interval.
DatabaseThe name of the database that owns the spacenames in the display.
SpacenamThe name of a space that has incurred Getpage/IO activity.
% of GetpThe percentage of total Getpage activity that is applicable to the spacename.
% of I/OThe percentage of total I/O activity that is applicable to the spacename.
Getp per RIOThe Getpage to Read I/O ratio for the spacename. This ratio is computed by dividing Getpage by SyncRead + Pre Fetch.
GetpageThe number of Getpage requests for the spacename.
Sync ReadThe number of synchronous Reads for the spacename.
Pre FetchThe number of prefetch Read I/Os for the spacename.
Async WriteThe number of asynchronous Writes for the spacename.
Other WriteThe number of immediate and format Writes for the spacename.
Thread Activity by DatabaseThis panel shows activity information for each thread that generated I/O activity for a selected DB2database during the collection interval.
Chapter 11. Object Analysis 497
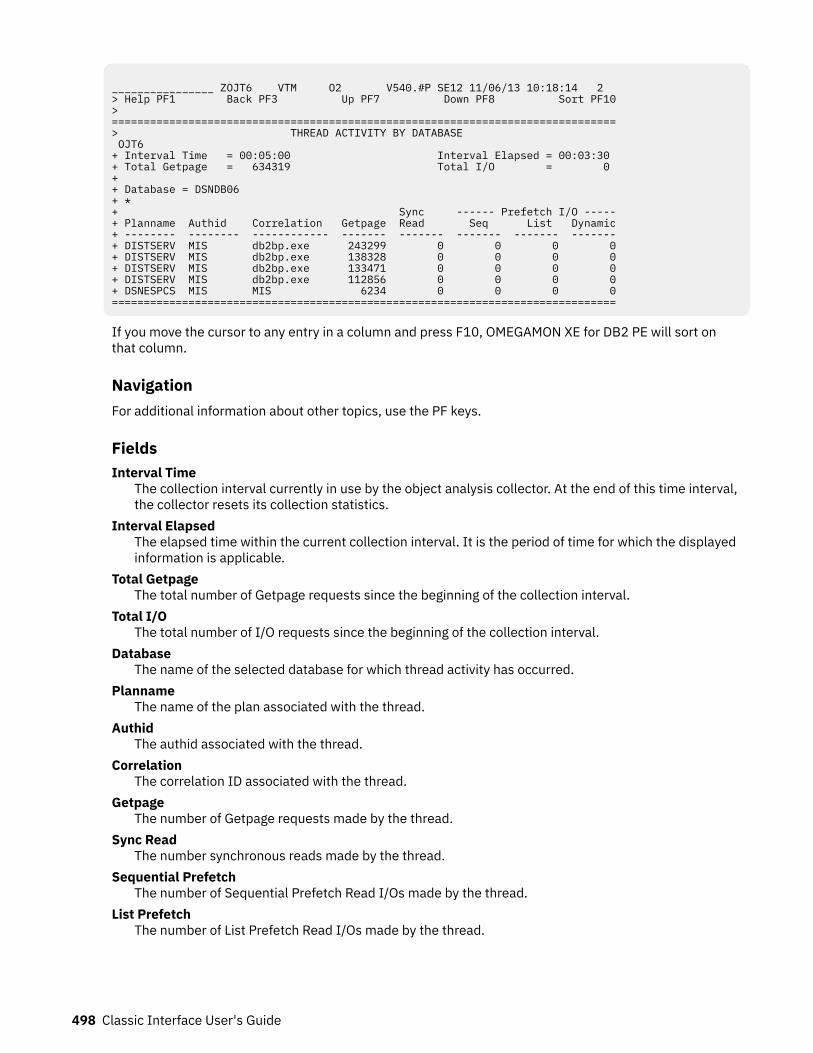
________________ ZOJT6 VTM O2 V540.#P SE12 11/06/13 10:18:14 2 > Help PF1 Back PF3 Up PF7 Down PF8 Sort PF10 > =============================================================================== > THREAD ACTIVITY BY DATABASE OJT6 + Interval Time = 00:05:00 Interval Elapsed = 00:03:30 + Total Getpage = 634319 Total I/O = 0 + + Database = DSNDB06 + * + Sync ------ Prefetch I/O ----- + Planname Authid Correlation Getpage Read Seq List Dynamic + -------- -------- ------------ ------- ------- ------- ------- ------- + DISTSERV MIS db2bp.exe 243299 0 0 0 0 + DISTSERV MIS db2bp.exe 138328 0 0 0 0 + DISTSERV MIS db2bp.exe 133471 0 0 0 0 + DISTSERV MIS db2bp.exe 112856 0 0 0 0 + DSNESPCS MIS MIS 6234 0 0 0 0 ===============================================================================
If you move the cursor to any entry in a column and press F10, OMEGAMON XE for DB2 PE will sort onthat column.
NavigationFor additional information about other topics, use the PF keys.
FieldsInterval Time
The collection interval currently in use by the object analysis collector. At the end of this time interval,the collector resets its collection statistics.
Interval ElapsedThe elapsed time within the current collection interval. It is the period of time for which the displayedinformation is applicable.
Total GetpageThe total number of Getpage requests since the beginning of the collection interval.
Total I/OThe total number of I/O requests since the beginning of the collection interval.
DatabaseThe name of the selected database for which thread activity has occurred.
PlannameThe name of the plan associated with the thread.
AuthidThe authid associated with the thread.
CorrelationThe correlation ID associated with the thread.
GetpageThe number of Getpage requests made by the thread.
Sync ReadThe number synchronous reads made by the thread.
Sequential PrefetchThe number of Sequential Prefetch Read I/Os made by the thread.
List PrefetchThe number of List Prefetch Read I/Os made by the thread.
498 Classic Interface User's Guide
Spacename ActivityThis panel shows activity information about data sets that have incurred Getpage and I/O activity duringthe current collection interval. This panel formats Getpage and I/O activity for a single spacename.
________________ ZOJO2 VTM O2 V540.#P SE12 11/06/13 10:21:29 2 > Help PF1 Back PF3 Up PF7 Down PF8 Sort PF10 > > OBJECT ANALYSIS: Enter a selection letter on the top line. > > A-SPACENAME ALLOCS *-SPACENAME ACTIVITY C-THREAD ACTIVITY =============================================================================== > SPACENAME ACTIVITY OJO2 + Interval Time = 00:05:00 Interval Elapsed = 00:01:45 + Total Getpage = 66 Total I/O = 3 + + Database = DSNDB01 Spacename = DSNLLX01 + * + % of % of Getp Sync Pre Async Other + DSN Getp I/O per RIO Getpage Read Fetch Write Write + --- ------ ------ --------- ------- ------- ------- ------- ----- + 001 100.0% 100.0% 22 66 3 0 0 0 ===============================================================================
If you move the cursor to any entry in a column and press F10, OMEGAMON XE for DB2 PE will sort onthat column.
NavigationFor additional information about
• related topics, select one of the options on the top of the panel.• other topics, use the PF keys.
FieldsInterval Time
The collection interval currently in use by the object analysis collector. At the end of this time interval,the collector resets its collection statistics.
Interval ElapsedThe elapsed time within the current collection interval. It is the period of time for which the displayedinformation is applicable.
Total GetpageThe total number of Getpage requests since the beginning of the collection interval.
Total I/OThe total number of I/O requests since the beginning of the collection interval.
DatabaseThe name of the database that owns the spacename (and data sets) in the display.
SpacenameThe name of the space that contains the data sets in the display.
DSNThe sequence number of a data set that incurred I/O activity.
% of GetpThe percentage of total Getpage activity that is applicable to the spacename.
% of I/OThe percentage of total I/O activity that is applicable to the spacename.
Chapter 11. Object Analysis 499
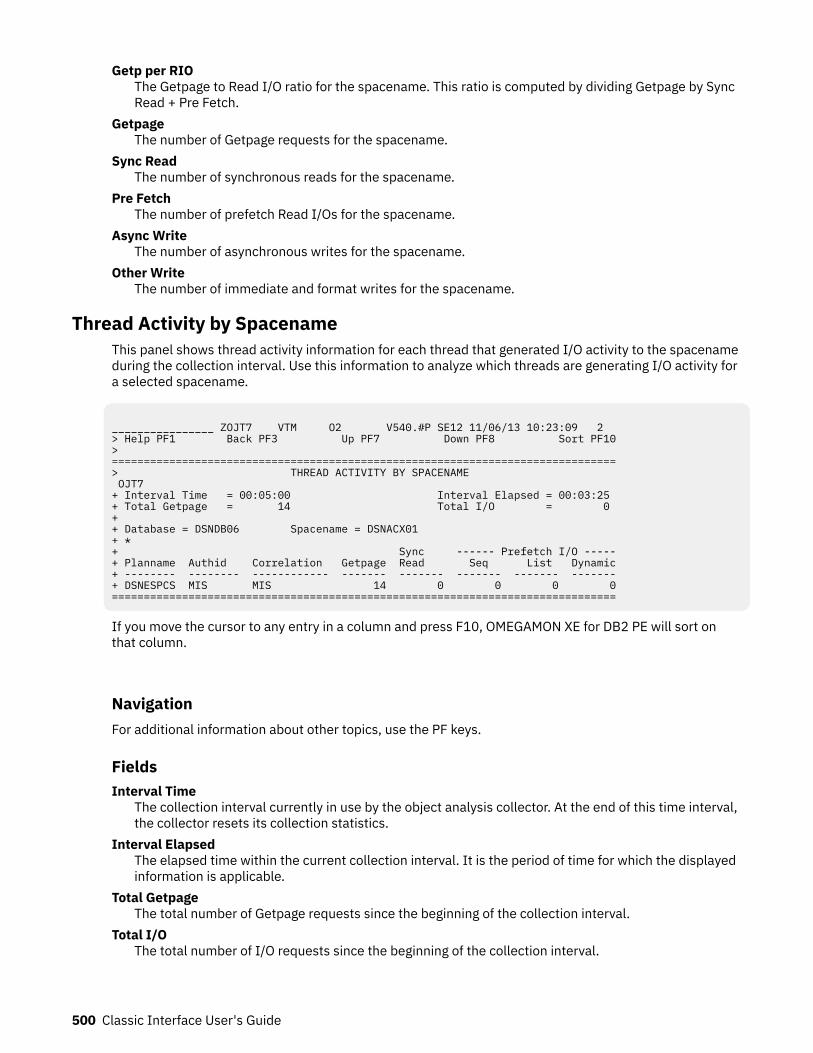
Getp per RIOThe Getpage to Read I/O ratio for the spacename. This ratio is computed by dividing Getpage by SyncRead + Pre Fetch.
GetpageThe number of Getpage requests for the spacename.
Sync ReadThe number of synchronous reads for the spacename.
Pre FetchThe number of prefetch Read I/Os for the spacename.
Async WriteThe number of asynchronous writes for the spacename.
Other WriteThe number of immediate and format writes for the spacename.
Thread Activity by SpacenameThis panel shows thread activity information for each thread that generated I/O activity to the spacenameduring the collection interval. Use this information to analyze which threads are generating I/O activity fora selected spacename.
________________ ZOJT7 VTM O2 V540.#P SE12 11/06/13 10:23:09 2 > Help PF1 Back PF3 Up PF7 Down PF8 Sort PF10> ===============================================================================> THREAD ACTIVITY BY SPACENAME OJT7 + Interval Time = 00:05:00 Interval Elapsed = 00:03:25 + Total Getpage = 14 Total I/O = 0 + + Database = DSNDB06 Spacename = DSNACX01 + * + Sync ------ Prefetch I/O -----+ Planname Authid Correlation Getpage Read Seq List Dynamic+ -------- -------- ------------ ------- ------- ------- ------- -------+ DSNESPCS MIS MIS 14 0 0 0 0===============================================================================
If you move the cursor to any entry in a column and press F10, OMEGAMON XE for DB2 PE will sort onthat column.
NavigationFor additional information about other topics, use the PF keys.
FieldsInterval Time
The collection interval currently in use by the object analysis collector. At the end of this time interval,the collector resets its collection statistics.
Interval ElapsedThe elapsed time within the current collection interval. It is the period of time for which the displayedinformation is applicable.
Total GetpageThe total number of Getpage requests since the beginning of the collection interval.
Total I/OThe total number of I/O requests since the beginning of the collection interval.
500 Classic Interface User's Guide
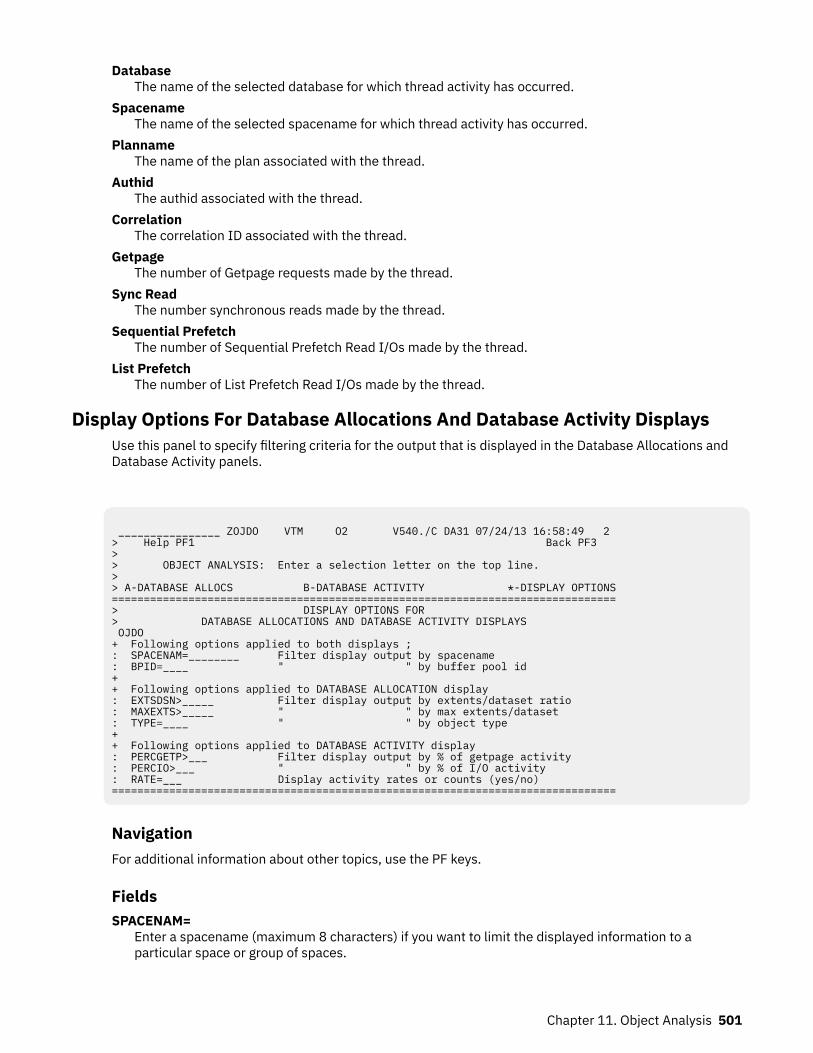
DatabaseThe name of the selected database for which thread activity has occurred.
SpacenameThe name of the selected spacename for which thread activity has occurred.
PlannameThe name of the plan associated with the thread.
AuthidThe authid associated with the thread.
CorrelationThe correlation ID associated with the thread.
GetpageThe number of Getpage requests made by the thread.
Sync ReadThe number synchronous reads made by the thread.
Sequential PrefetchThe number of Sequential Prefetch Read I/Os made by the thread.
List PrefetchThe number of List Prefetch Read I/Os made by the thread.
Display Options For Database Allocations And Database Activity DisplaysUse this panel to specify filtering criteria for the output that is displayed in the Database Allocations andDatabase Activity panels.
________________ ZOJDO VTM O2 V540./C DA31 07/24/13 16:58:49 2 > Help PF1 Back PF3 > > OBJECT ANALYSIS: Enter a selection letter on the top line. > > A-DATABASE ALLOCS B-DATABASE ACTIVITY *-DISPLAY OPTIONS =============================================================================== > DISPLAY OPTIONS FOR > DATABASE ALLOCATIONS AND DATABASE ACTIVITY DISPLAYS OJDO + Following options applied to both displays ; : SPACENAM=________ Filter display output by spacename : BPID=____ " " by buffer pool id + + Following options applied to DATABASE ALLOCATION display : EXTSDSN>_____ Filter display output by extents/dataset ratio : MAXEXTS>_____ " " by max extents/dataset : TYPE=____ " " by object type + + Following options applied to DATABASE ACTIVITY display : PERCGETP>___ Filter display output by % of getpage activity : PERCIO>___ " " by % of I/O activity : RATE=___ Display activity rates or counts (yes/no) ===============================================================================
NavigationFor additional information about other topics, use the PF keys.
FieldsSPACENAM=
Enter a spacename (maximum 8 characters) if you want to limit the displayed information to aparticular space or group of spaces.
Chapter 11. Object Analysis 501
You can specify a wildcard by entering a question mark (?), or you can use an asterisk (*) for genericfiltering. For example, DSN* would select all databases that begin with DSN, and DSN??010 wouldselect all databases that begin with DSN, end with 010, and have any two characters in between.
BPID=If you want to display database allocation and activity information that applies only to a particularbuffer pool, enter the buffer pool ID.
Note: Omit the 'BP' prefix when you specify the buffer pool ID.
4KB 0, 1, 2, ..., 498KB 8K0, 8K1, 8K2, ..., 8K916KB 16K0, 16K1, 16K2, ..., 16K932KB 32K, 32K1, 32K2, ..., 32K9
EXTSDSN>If you want to display database allocation information that applies only to spaces with more than nextents per data set, enter a number that is greater than 0.
MAXEXTS>If you want to display object allocation information that applies only to spaces with more than n totalextents per data set, enter a number that is greater than 0.
TYPE=If you want to limit the displayed information to a particular object type, enter one of the followingvalues:INDX
An indexIXCL
A clone of an indexLBTS
A LOB tablespacePTIX
A partitioned indexPTTS
A partitioned tablespaceSEGM
A segmented tablespaceTBLS
A simple tablespaceTSCL
A clone of an universal tablespaceTSPG
A partition by growth universal tablespaceTSPR
A partition by range universal tablespaceXMTS
An XML tablespaceUNDT
Undetermined
This can occur if the database DBD is currently not loaded in the EDM pool.
PERCGETP>If you want to display database activity information that applies only to spaces with a percentage oftotal Getpage that is greater than n, enter a number from 0 - 100.
502 Classic Interface User's Guide
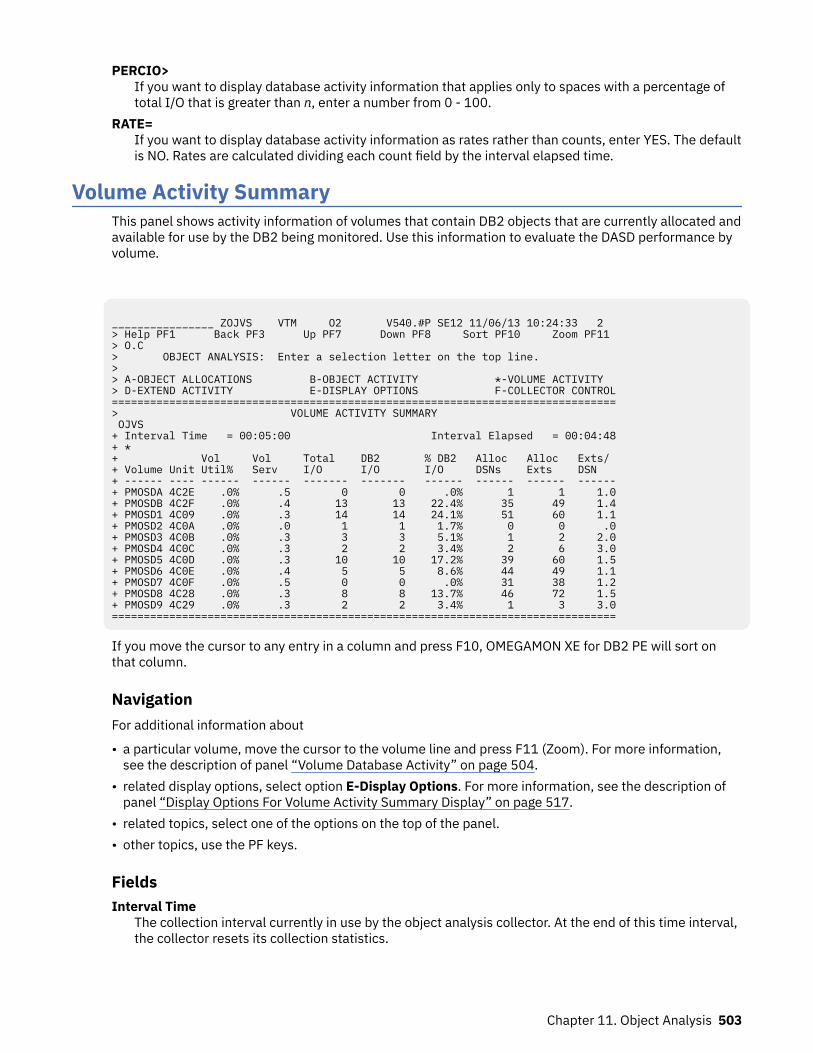
PERCIO>If you want to display database activity information that applies only to spaces with a percentage oftotal I/O that is greater than n, enter a number from 0 - 100.
RATE=If you want to display database activity information as rates rather than counts, enter YES. The defaultis NO. Rates are calculated dividing each count field by the interval elapsed time.
Volume Activity SummaryThis panel shows activity information of volumes that contain DB2 objects that are currently allocated andavailable for use by the DB2 being monitored. Use this information to evaluate the DASD performance byvolume.
________________ ZOJVS VTM O2 V540.#P SE12 11/06/13 10:24:33 2 > Help PF1 Back PF3 Up PF7 Down PF8 Sort PF10 Zoom PF11 > O.C > OBJECT ANALYSIS: Enter a selection letter on the top line. > > A-OBJECT ALLOCATIONS B-OBJECT ACTIVITY *-VOLUME ACTIVITY > D-EXTEND ACTIVITY E-DISPLAY OPTIONS F-COLLECTOR CONTROL===============================================================================> VOLUME ACTIVITY SUMMARY OJVS + Interval Time = 00:05:00 Interval Elapsed = 00:04:48+ * + Vol Vol Total DB2 % DB2 Alloc Alloc Exts/ + Volume Unit Util% Serv I/O I/O I/O DSNs Exts DSN + ------ ---- ------ ------ ------- ------- ------ ------ ------ ------+ PMOSDA 4C2E .0% .5 0 0 .0% 1 1 1.0+ PMOSDB 4C2F .0% .4 13 13 22.4% 35 49 1.4+ PMOSD1 4C09 .0% .3 14 14 24.1% 51 60 1.1+ PMOSD2 4C0A .0% .0 1 1 1.7% 0 0 .0+ PMOSD3 4C0B .0% .3 3 3 5.1% 1 2 2.0+ PMOSD4 4C0C .0% .3 2 2 3.4% 2 6 3.0+ PMOSD5 4C0D .0% .3 10 10 17.2% 39 60 1.5+ PMOSD6 4C0E .0% .4 5 5 8.6% 44 49 1.1+ PMOSD7 4C0F .0% .5 0 0 .0% 31 38 1.2+ PMOSD8 4C28 .0% .3 8 8 13.7% 46 72 1.5+ PMOSD9 4C29 .0% .3 2 2 3.4% 1 3 3.0===============================================================================
If you move the cursor to any entry in a column and press F10, OMEGAMON XE for DB2 PE will sort onthat column.
NavigationFor additional information about
• a particular volume, move the cursor to the volume line and press F11 (Zoom). For more information,see the description of panel “Volume Database Activity” on page 504.
• related display options, select option E-Display Options. For more information, see the description ofpanel “Display Options For Volume Activity Summary Display” on page 517.
• related topics, select one of the options on the top of the panel.• other topics, use the PF keys.
FieldsInterval Time
The collection interval currently in use by the object analysis collector. At the end of this time interval,the collector resets its collection statistics.
Chapter 11. Object Analysis 503
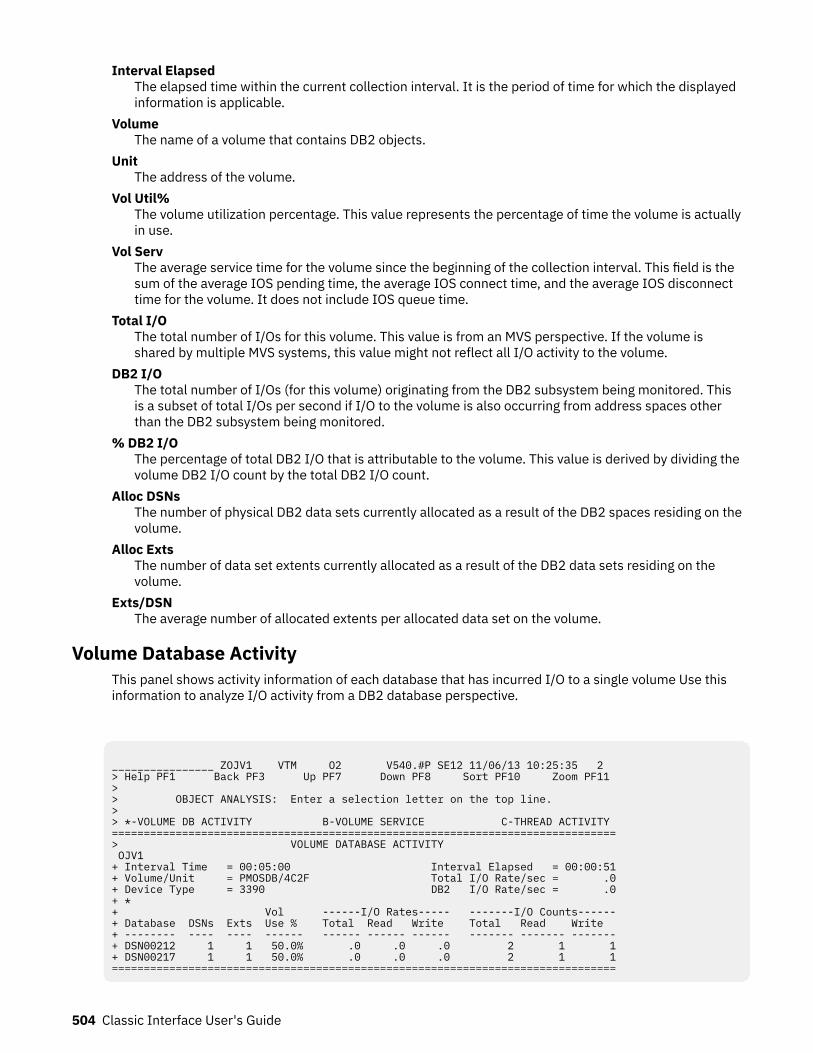
Interval ElapsedThe elapsed time within the current collection interval. It is the period of time for which the displayedinformation is applicable.
VolumeThe name of a volume that contains DB2 objects.
UnitThe address of the volume.
Vol Util%The volume utilization percentage. This value represents the percentage of time the volume is actuallyin use.
Vol ServThe average service time for the volume since the beginning of the collection interval. This field is thesum of the average IOS pending time, the average IOS connect time, and the average IOS disconnecttime for the volume. It does not include IOS queue time.
Total I/OThe total number of I/Os for this volume. This value is from an MVS perspective. If the volume isshared by multiple MVS systems, this value might not reflect all I/O activity to the volume.
DB2 I/OThe total number of I/Os (for this volume) originating from the DB2 subsystem being monitored. Thisis a subset of total I/Os per second if I/O to the volume is also occurring from address spaces otherthan the DB2 subsystem being monitored.
% DB2 I/OThe percentage of total DB2 I/O that is attributable to the volume. This value is derived by dividing thevolume DB2 I/O count by the total DB2 I/O count.
Alloc DSNsThe number of physical DB2 data sets currently allocated as a result of the DB2 spaces residing on thevolume.
Alloc ExtsThe number of data set extents currently allocated as a result of the DB2 data sets residing on thevolume.
Exts/DSNThe average number of allocated extents per allocated data set on the volume.
Volume Database ActivityThis panel shows activity information of each database that has incurred I/O to a single volume Use thisinformation to analyze I/O activity from a DB2 database perspective.
________________ ZOJV1 VTM O2 V540.#P SE12 11/06/13 10:25:35 2 > Help PF1 Back PF3 Up PF7 Down PF8 Sort PF10 Zoom PF11 > > OBJECT ANALYSIS: Enter a selection letter on the top line. > > *-VOLUME DB ACTIVITY B-VOLUME SERVICE C-THREAD ACTIVITY ===============================================================================> VOLUME DATABASE ACTIVITY OJV1 + Interval Time = 00:05:00 Interval Elapsed = 00:00:51+ Volume/Unit = PMOSDB/4C2F Total I/O Rate/sec = .0+ Device Type = 3390 DB2 I/O Rate/sec = .0+ * + Vol ------I/O Rates----- -------I/O Counts------+ Database DSNs Exts Use % Total Read Write Total Read Write + -------- ---- ---- ------ ------ ------ ------ ------- ------- -------+ DSN00212 1 1 50.0% .0 .0 .0 2 1 1+ DSN00217 1 1 50.0% .0 .0 .0 2 1 1===============================================================================
504 Classic Interface User's Guide
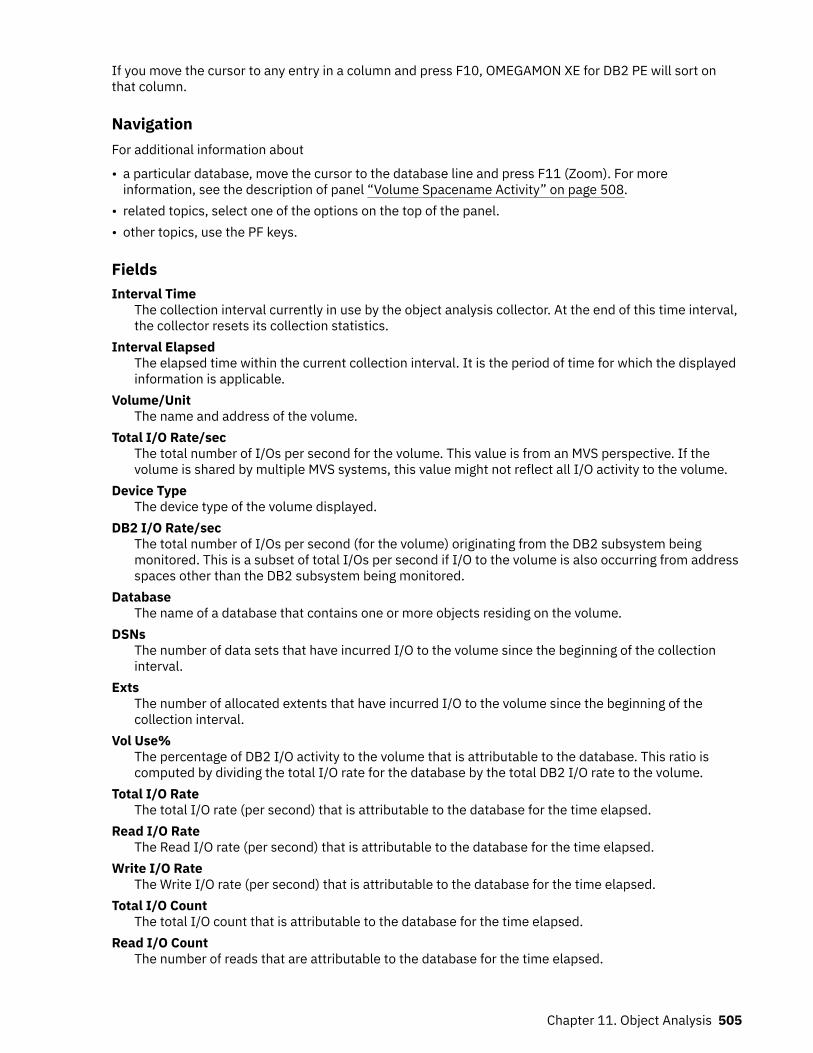
If you move the cursor to any entry in a column and press F10, OMEGAMON XE for DB2 PE will sort onthat column.
NavigationFor additional information about
• a particular database, move the cursor to the database line and press F11 (Zoom). For moreinformation, see the description of panel “Volume Spacename Activity” on page 508.
• related topics, select one of the options on the top of the panel.• other topics, use the PF keys.
FieldsInterval Time
The collection interval currently in use by the object analysis collector. At the end of this time interval,the collector resets its collection statistics.
Interval ElapsedThe elapsed time within the current collection interval. It is the period of time for which the displayedinformation is applicable.
Volume/UnitThe name and address of the volume.
Total I/O Rate/secThe total number of I/Os per second for the volume. This value is from an MVS perspective. If thevolume is shared by multiple MVS systems, this value might not reflect all I/O activity to the volume.
Device TypeThe device type of the volume displayed.
DB2 I/O Rate/secThe total number of I/Os per second (for the volume) originating from the DB2 subsystem beingmonitored. This is a subset of total I/Os per second if I/O to the volume is also occurring from addressspaces other than the DB2 subsystem being monitored.
DatabaseThe name of a database that contains one or more objects residing on the volume.
DSNsThe number of data sets that have incurred I/O to the volume since the beginning of the collectioninterval.
ExtsThe number of allocated extents that have incurred I/O to the volume since the beginning of thecollection interval.
Vol Use%The percentage of DB2 I/O activity to the volume that is attributable to the database. This ratio iscomputed by dividing the total I/O rate for the database by the total DB2 I/O rate to the volume.
Total I/O RateThe total I/O rate (per second) that is attributable to the database for the time elapsed.
Read I/O RateThe Read I/O rate (per second) that is attributable to the database for the time elapsed.
Write I/O RateThe Write I/O rate (per second) that is attributable to the database for the time elapsed.
Total I/O CountThe total I/O count that is attributable to the database for the time elapsed.
Read I/O CountThe number of reads that are attributable to the database for the time elapsed.
Chapter 11. Object Analysis 505
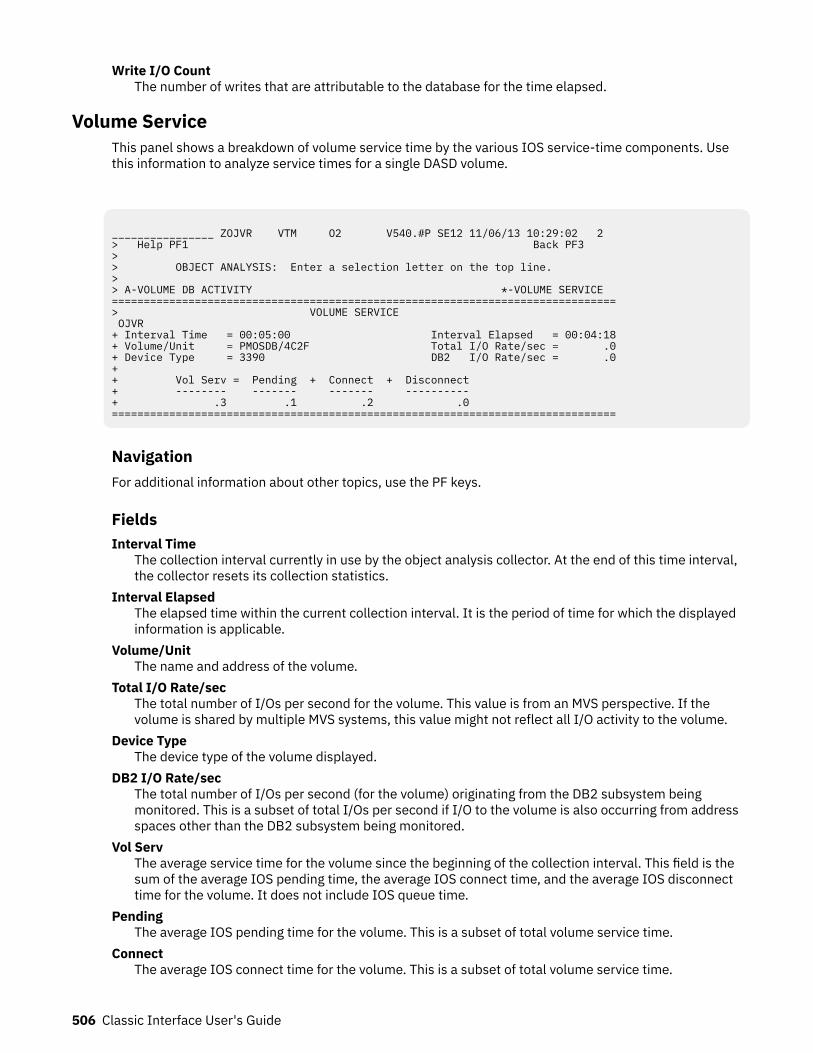
Write I/O CountThe number of writes that are attributable to the database for the time elapsed.
Volume ServiceThis panel shows a breakdown of volume service time by the various IOS service-time components. Usethis information to analyze service times for a single DASD volume.
________________ ZOJVR VTM O2 V540.#P SE12 11/06/13 10:29:02 2 > Help PF1 Back PF3 > > OBJECT ANALYSIS: Enter a selection letter on the top line. > > A-VOLUME DB ACTIVITY *-VOLUME SERVICE =============================================================================== > VOLUME SERVICE OJVR + Interval Time = 00:05:00 Interval Elapsed = 00:04:18 + Volume/Unit = PMOSDB/4C2F Total I/O Rate/sec = .0 + Device Type = 3390 DB2 I/O Rate/sec = .0 + + Vol Serv = Pending + Connect + Disconnect + -------- ------- ------- ---------- + .3 .1 .2 .0 ===============================================================================
NavigationFor additional information about other topics, use the PF keys.
FieldsInterval Time
The collection interval currently in use by the object analysis collector. At the end of this time interval,the collector resets its collection statistics.
Interval ElapsedThe elapsed time within the current collection interval. It is the period of time for which the displayedinformation is applicable.
Volume/UnitThe name and address of the volume.
Total I/O Rate/secThe total number of I/Os per second for the volume. This value is from an MVS perspective. If thevolume is shared by multiple MVS systems, this value might not reflect all I/O activity to the volume.
Device TypeThe device type of the volume displayed.
DB2 I/O Rate/secThe total number of I/Os per second (for the volume) originating from the DB2 subsystem beingmonitored. This is a subset of total I/Os per second if I/O to the volume is also occurring from addressspaces other than the DB2 subsystem being monitored.
Vol ServThe average service time for the volume since the beginning of the collection interval. This field is thesum of the average IOS pending time, the average IOS connect time, and the average IOS disconnecttime for the volume. It does not include IOS queue time.
PendingThe average IOS pending time for the volume. This is a subset of total volume service time.
ConnectThe average IOS connect time for the volume. This is a subset of total volume service time.
506 Classic Interface User's Guide
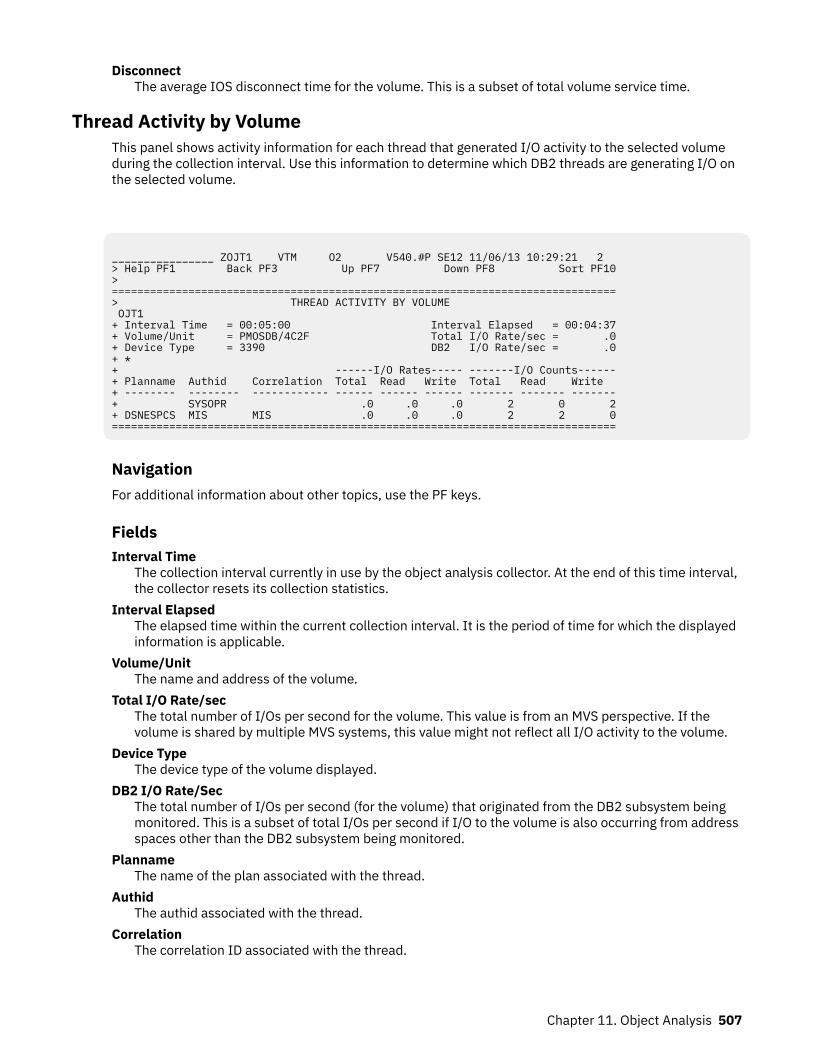
DisconnectThe average IOS disconnect time for the volume. This is a subset of total volume service time.
Thread Activity by VolumeThis panel shows activity information for each thread that generated I/O activity to the selected volumeduring the collection interval. Use this information to determine which DB2 threads are generating I/O onthe selected volume.
________________ ZOJT1 VTM O2 V540.#P SE12 11/06/13 10:29:21 2 > Help PF1 Back PF3 Up PF7 Down PF8 Sort PF10 > =============================================================================== > THREAD ACTIVITY BY VOLUME OJT1 + Interval Time = 00:05:00 Interval Elapsed = 00:04:37 + Volume/Unit = PMOSDB/4C2F Total I/O Rate/sec = .0 + Device Type = 3390 DB2 I/O Rate/sec = .0 + * + ------I/O Rates----- -------I/O Counts------ + Planname Authid Correlation Total Read Write Total Read Write + -------- -------- ------------ ------ ------ ------ ------- ------- ------- + SYSOPR .0 .0 .0 2 0 2 + DSNESPCS MIS MIS .0 .0 .0 2 2 0 ===============================================================================
NavigationFor additional information about other topics, use the PF keys.
FieldsInterval Time
The collection interval currently in use by the object analysis collector. At the end of this time interval,the collector resets its collection statistics.
Interval ElapsedThe elapsed time within the current collection interval. It is the period of time for which the displayedinformation is applicable.
Volume/UnitThe name and address of the volume.
Total I/O Rate/secThe total number of I/Os per second for the volume. This value is from an MVS perspective. If thevolume is shared by multiple MVS systems, this value might not reflect all I/O activity to the volume.
Device TypeThe device type of the volume displayed.
DB2 I/O Rate/SecThe total number of I/Os per second (for the volume) that originated from the DB2 subsystem beingmonitored. This is a subset of total I/Os per second if I/O to the volume is also occurring from addressspaces other than the DB2 subsystem being monitored.
PlannameThe name of the plan associated with the thread.
AuthidThe authid associated with the thread.
CorrelationThe correlation ID associated with the thread.
Chapter 11. Object Analysis 507
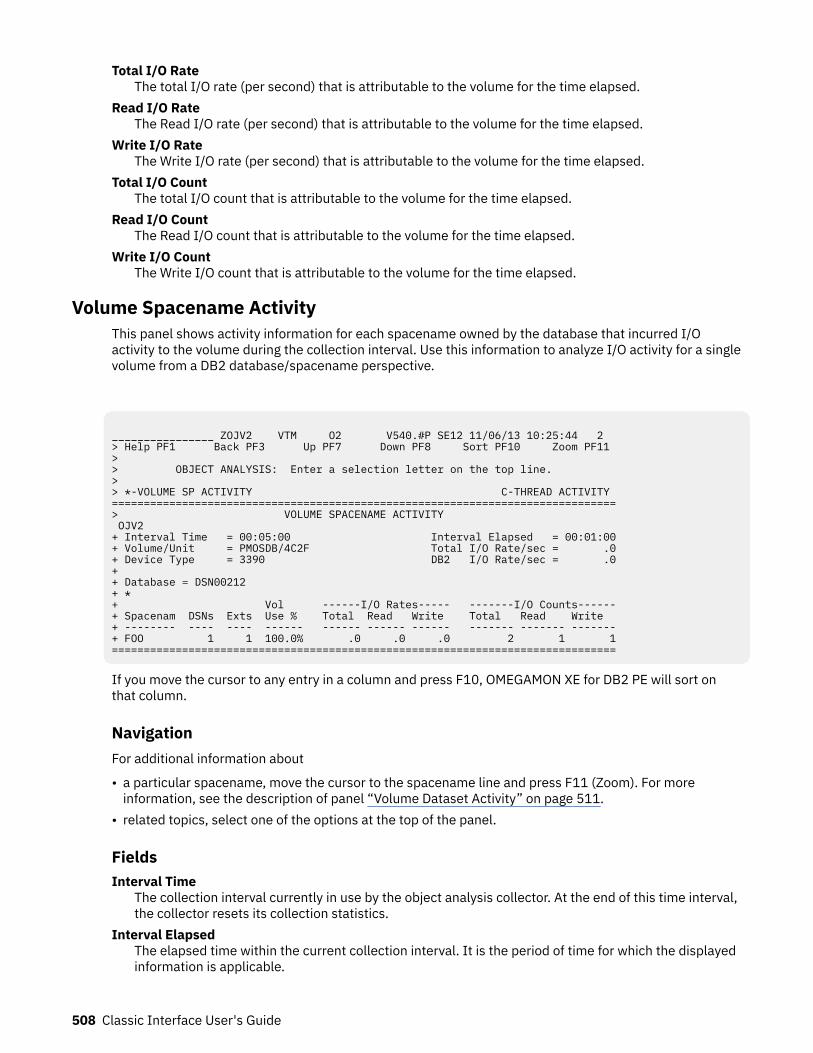
Total I/O RateThe total I/O rate (per second) that is attributable to the volume for the time elapsed.
Read I/O RateThe Read I/O rate (per second) that is attributable to the volume for the time elapsed.
Write I/O RateThe Write I/O rate (per second) that is attributable to the volume for the time elapsed.
Total I/O CountThe total I/O count that is attributable to the volume for the time elapsed.
Read I/O CountThe Read I/O count that is attributable to the volume for the time elapsed.
Write I/O CountThe Write I/O count that is attributable to the volume for the time elapsed.
Volume Spacename ActivityThis panel shows activity information for each spacename owned by the database that incurred I/Oactivity to the volume during the collection interval. Use this information to analyze I/O activity for a singlevolume from a DB2 database/spacename perspective.
________________ ZOJV2 VTM O2 V540.#P SE12 11/06/13 10:25:44 2 > Help PF1 Back PF3 Up PF7 Down PF8 Sort PF10 Zoom PF11 > > OBJECT ANALYSIS: Enter a selection letter on the top line. > > *-VOLUME SP ACTIVITY C-THREAD ACTIVITY =============================================================================== > VOLUME SPACENAME ACTIVITY OJV2 + Interval Time = 00:05:00 Interval Elapsed = 00:01:00 + Volume/Unit = PMOSDB/4C2F Total I/O Rate/sec = .0 + Device Type = 3390 DB2 I/O Rate/sec = .0 + + Database = DSN00212 + * + Vol ------I/O Rates----- -------I/O Counts------ + Spacenam DSNs Exts Use % Total Read Write Total Read Write + -------- ---- ---- ------ ------ ------ ------ ------- ------- ------- + FOO 1 1 100.0% .0 .0 .0 2 1 1 ===============================================================================
If you move the cursor to any entry in a column and press F10, OMEGAMON XE for DB2 PE will sort onthat column.
NavigationFor additional information about
• a particular spacename, move the cursor to the spacename line and press F11 (Zoom). For moreinformation, see the description of panel “Volume Dataset Activity” on page 511.
• related topics, select one of the options at the top of the panel.
FieldsInterval Time
The collection interval currently in use by the object analysis collector. At the end of this time interval,the collector resets its collection statistics.
Interval ElapsedThe elapsed time within the current collection interval. It is the period of time for which the displayedinformation is applicable.
508 Classic Interface User's Guide
Volume/UnitThe name and address of the volume.
Total I/O Rate/secThe total number of I/Os per second for the volume. This value is from an MVS perspective. If thevolume is shared by multiple MVS systems, this value might not reflect all I/O activity to the volume.
Device TypeThe device type of the volume displayed.
DB2 I/O Rate/secThe total number of I/Os per second (for the volume) originating from the DB2 subsystem beingmonitored. This is a subset of total I/Os per second if I/O to the volume is also occurring from addressspaces other than the DB2 subsystem being monitored.
DatabaseThe name of the selected database.
SpacenameThe name of a space that has incurred I/O activity since the beginning of the collection interval.
DSNsThe number of data sets that have incurred I/O to the volume since the beginning of the collectioninterval.
ExtsThe number of allocated extents that have incurred I/O activity since the beginning of the collectioninterval.
Vol Use %The percentage of DB2 I/O activity to the volume that is attributable to the spacename. This ratio iscomputed by dividing the total I/O rate for the database/spacename by the total database I/O rate tothe volume.
Total I/O RateThe total I/O rate (per second) that is attributable to the space for the time elapsed.
Read I/O RateThe Read I/O rate (per second) that is attributable to the space for the time elapsed.
Write I/O RateThe Write I/O rate (per second) that is attributable to the space for the time elapsed.
Total I/O CountThe total I/O count that is attributable to the space for the time elapsed.
Read I/O CountThe number of reads that are attributable to the space for the time elapsed.
Write I/O CountThe number of writes that are attributable to the space for the time elapsed.
Chapter 11. Object Analysis 509
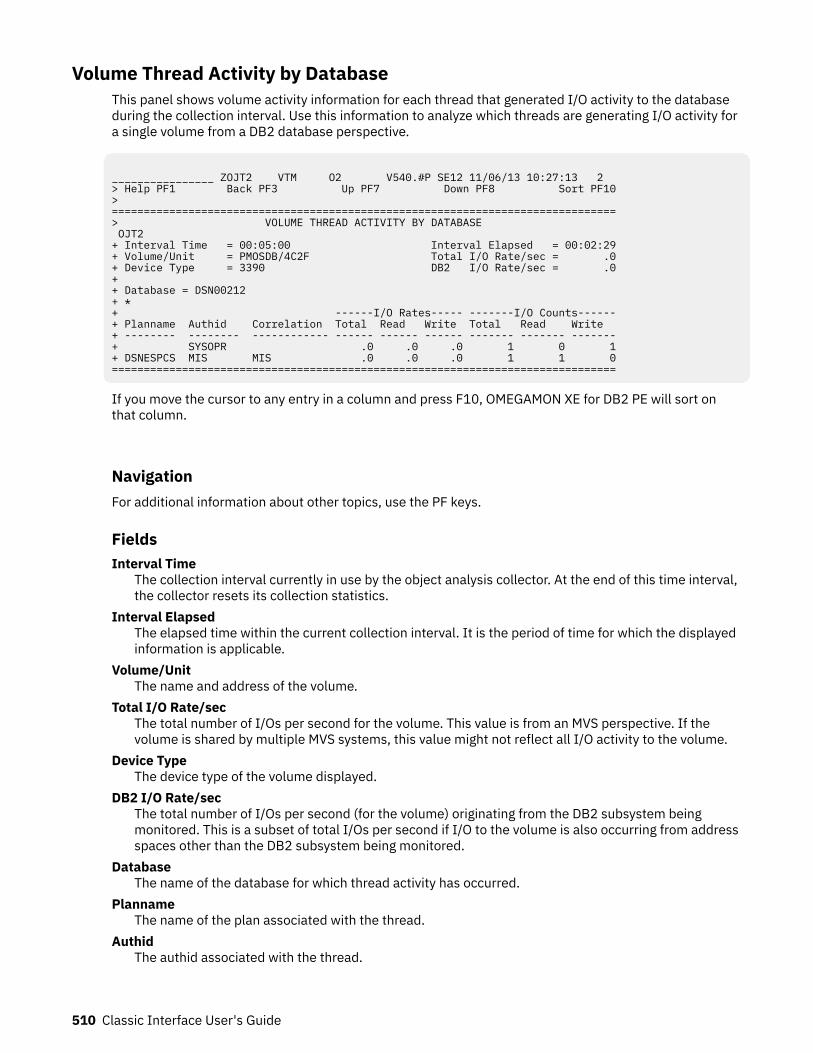
Volume Thread Activity by DatabaseThis panel shows volume activity information for each thread that generated I/O activity to the databaseduring the collection interval. Use this information to analyze which threads are generating I/O activity fora single volume from a DB2 database perspective.
________________ ZOJT2 VTM O2 V540.#P SE12 11/06/13 10:27:13 2 > Help PF1 Back PF3 Up PF7 Down PF8 Sort PF10> ===============================================================================> VOLUME THREAD ACTIVITY BY DATABASE OJT2 + Interval Time = 00:05:00 Interval Elapsed = 00:02:29+ Volume/Unit = PMOSDB/4C2F Total I/O Rate/sec = .0+ Device Type = 3390 DB2 I/O Rate/sec = .0+ + Database = DSN00212 + * + ------I/O Rates----- -------I/O Counts------+ Planname Authid Correlation Total Read Write Total Read Write + -------- -------- ------------ ------ ------ ------ ------- ------- -------+ SYSOPR .0 .0 .0 1 0 1+ DSNESPCS MIS MIS .0 .0 .0 1 1 0===============================================================================
If you move the cursor to any entry in a column and press F10, OMEGAMON XE for DB2 PE will sort onthat column.
NavigationFor additional information about other topics, use the PF keys.
FieldsInterval Time
The collection interval currently in use by the object analysis collector. At the end of this time interval,the collector resets its collection statistics.
Interval ElapsedThe elapsed time within the current collection interval. It is the period of time for which the displayedinformation is applicable.
Volume/UnitThe name and address of the volume.
Total I/O Rate/secThe total number of I/Os per second for the volume. This value is from an MVS perspective. If thevolume is shared by multiple MVS systems, this value might not reflect all I/O activity to the volume.
Device TypeThe device type of the volume displayed.
DB2 I/O Rate/secThe total number of I/Os per second (for the volume) originating from the DB2 subsystem beingmonitored. This is a subset of total I/Os per second if I/O to the volume is also occurring from addressspaces other than the DB2 subsystem being monitored.
DatabaseThe name of the database for which thread activity has occurred.
PlannameThe name of the plan associated with the thread.
AuthidThe authid associated with the thread.
510 Classic Interface User's Guide
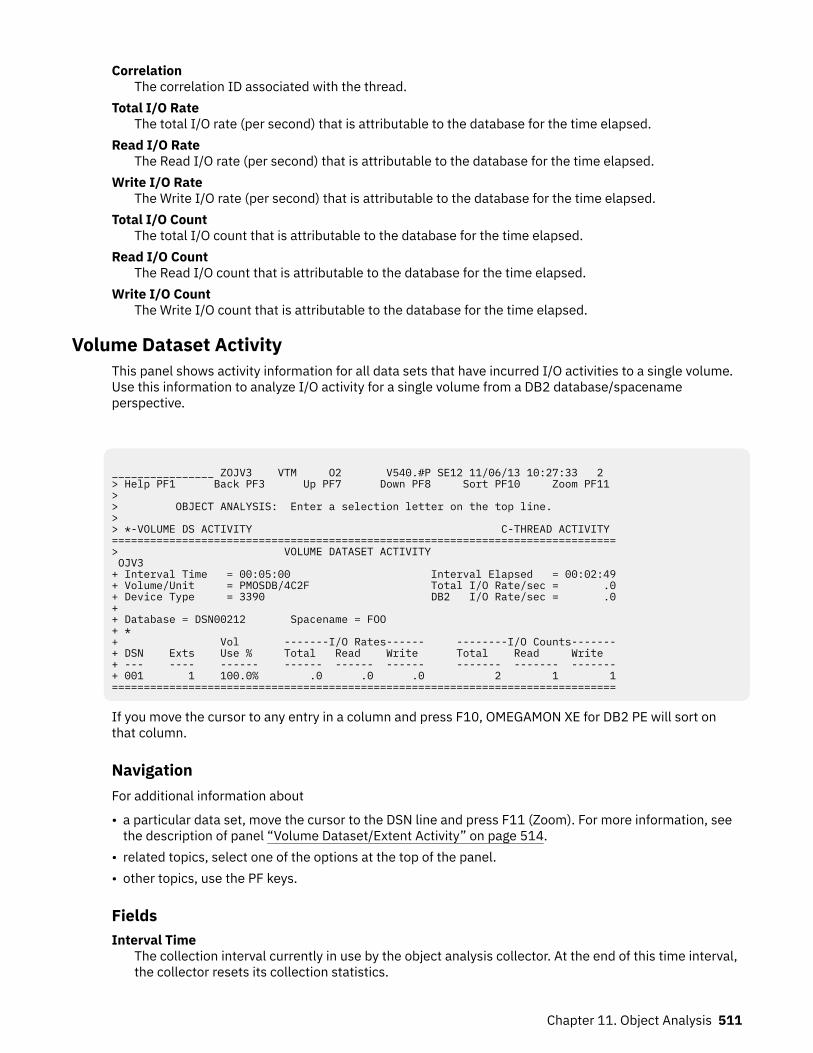
CorrelationThe correlation ID associated with the thread.
Total I/O RateThe total I/O rate (per second) that is attributable to the database for the time elapsed.
Read I/O RateThe Read I/O rate (per second) that is attributable to the database for the time elapsed.
Write I/O RateThe Write I/O rate (per second) that is attributable to the database for the time elapsed.
Total I/O CountThe total I/O count that is attributable to the database for the time elapsed.
Read I/O CountThe Read I/O count that is attributable to the database for the time elapsed.
Write I/O CountThe Write I/O count that is attributable to the database for the time elapsed.
Volume Dataset ActivityThis panel shows activity information for all data sets that have incurred I/O activities to a single volume.Use this information to analyze I/O activity for a single volume from a DB2 database/spacenameperspective.
________________ ZOJV3 VTM O2 V540.#P SE12 11/06/13 10:27:33 2 > Help PF1 Back PF3 Up PF7 Down PF8 Sort PF10 Zoom PF11 > > OBJECT ANALYSIS: Enter a selection letter on the top line. > > *-VOLUME DS ACTIVITY C-THREAD ACTIVITY ===============================================================================> VOLUME DATASET ACTIVITY OJV3 + Interval Time = 00:05:00 Interval Elapsed = 00:02:49+ Volume/Unit = PMOSDB/4C2F Total I/O Rate/sec = .0+ Device Type = 3390 DB2 I/O Rate/sec = .0+ + Database = DSN00212 Spacename = FOO + * + Vol -------I/O Rates------ --------I/O Counts-------+ DSN Exts Use % Total Read Write Total Read Write + --- ---- ------ ------ ------ ------ ------- ------- -------+ 001 1 100.0% .0 .0 .0 2 1 1===============================================================================
If you move the cursor to any entry in a column and press F10, OMEGAMON XE for DB2 PE will sort onthat column.
NavigationFor additional information about
• a particular data set, move the cursor to the DSN line and press F11 (Zoom). For more information, seethe description of panel “Volume Dataset/Extent Activity” on page 514.
• related topics, select one of the options at the top of the panel.• other topics, use the PF keys.
FieldsInterval Time
The collection interval currently in use by the object analysis collector. At the end of this time interval,the collector resets its collection statistics.
Chapter 11. Object Analysis 511
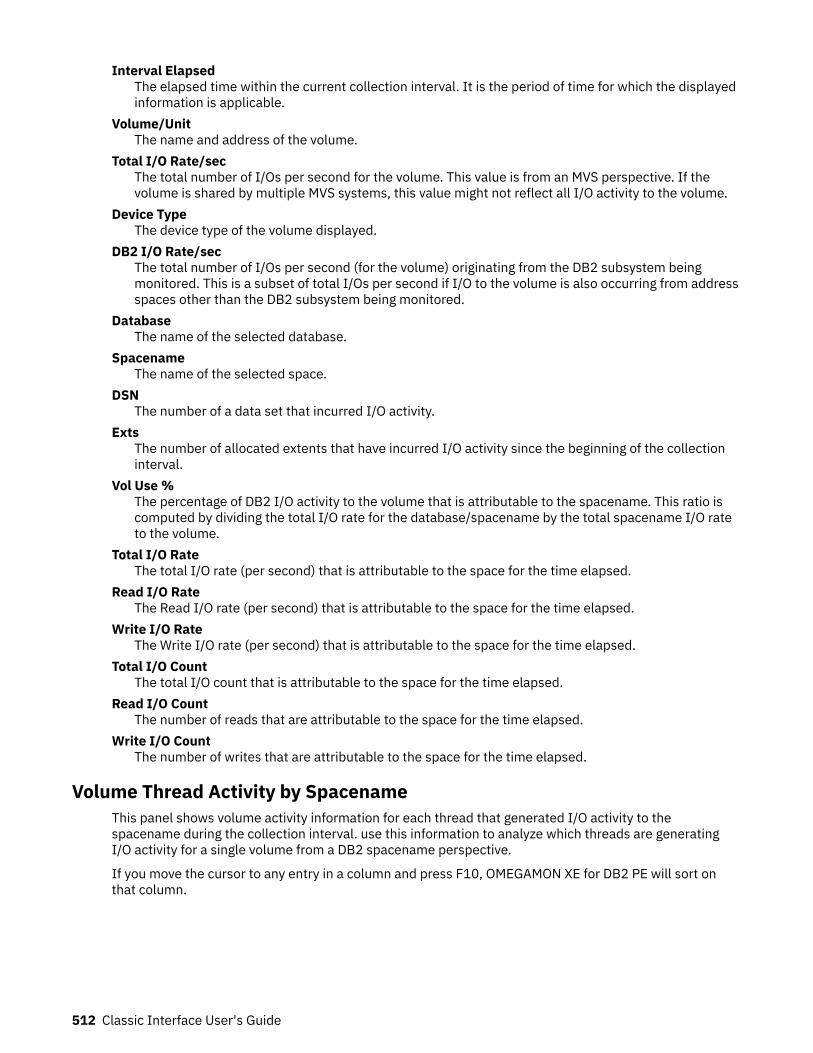
Interval ElapsedThe elapsed time within the current collection interval. It is the period of time for which the displayedinformation is applicable.
Volume/UnitThe name and address of the volume.
Total I/O Rate/secThe total number of I/Os per second for the volume. This value is from an MVS perspective. If thevolume is shared by multiple MVS systems, this value might not reflect all I/O activity to the volume.
Device TypeThe device type of the volume displayed.
DB2 I/O Rate/secThe total number of I/Os per second (for the volume) originating from the DB2 subsystem beingmonitored. This is a subset of total I/Os per second if I/O to the volume is also occurring from addressspaces other than the DB2 subsystem being monitored.
DatabaseThe name of the selected database.
SpacenameThe name of the selected space.
DSNThe number of a data set that incurred I/O activity.
ExtsThe number of allocated extents that have incurred I/O activity since the beginning of the collectioninterval.
Vol Use %The percentage of DB2 I/O activity to the volume that is attributable to the spacename. This ratio iscomputed by dividing the total I/O rate for the database/spacename by the total spacename I/O rateto the volume.
Total I/O RateThe total I/O rate (per second) that is attributable to the space for the time elapsed.
Read I/O RateThe Read I/O rate (per second) that is attributable to the space for the time elapsed.
Write I/O RateThe Write I/O rate (per second) that is attributable to the space for the time elapsed.
Total I/O CountThe total I/O count that is attributable to the space for the time elapsed.
Read I/O CountThe number of reads that are attributable to the space for the time elapsed.
Write I/O CountThe number of writes that are attributable to the space for the time elapsed.
Volume Thread Activity by SpacenameThis panel shows volume activity information for each thread that generated I/O activity to thespacename during the collection interval. use this information to analyze which threads are generatingI/O activity for a single volume from a DB2 spacename perspective.
If you move the cursor to any entry in a column and press F10, OMEGAMON XE for DB2 PE will sort onthat column.
512 Classic Interface User's Guide
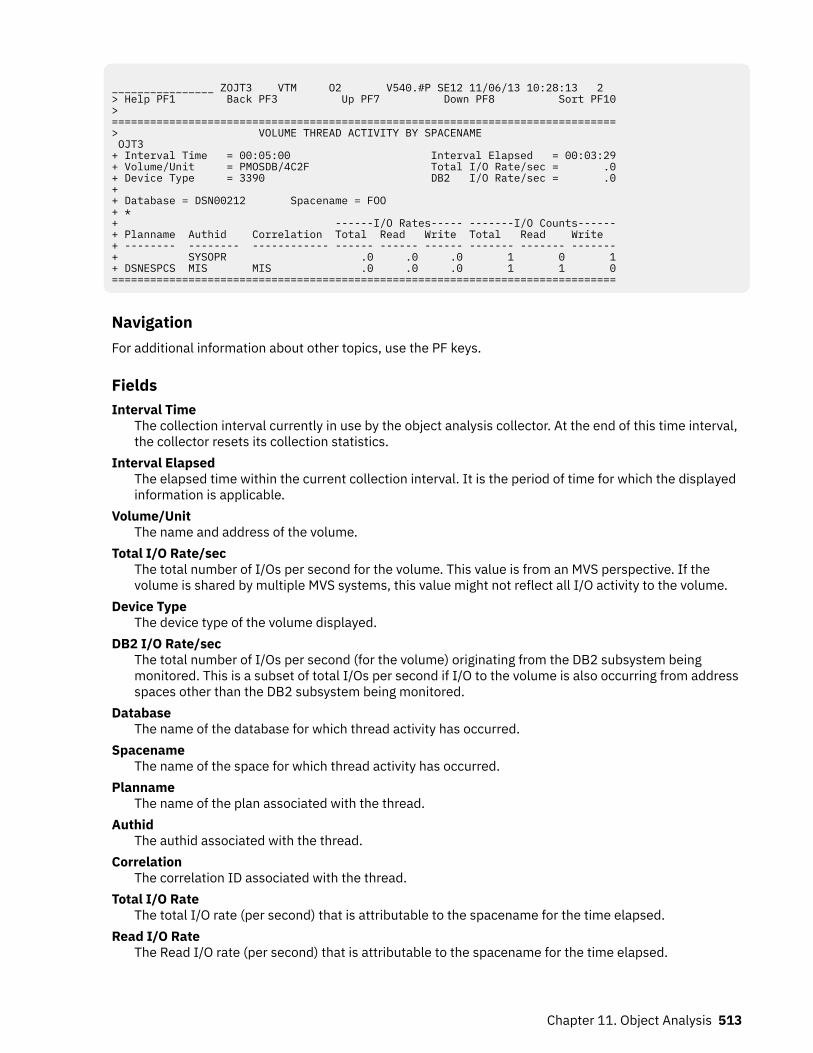
________________ ZOJT3 VTM O2 V540.#P SE12 11/06/13 10:28:13 2 > Help PF1 Back PF3 Up PF7 Down PF8 Sort PF10 > =============================================================================== > VOLUME THREAD ACTIVITY BY SPACENAME OJT3 + Interval Time = 00:05:00 Interval Elapsed = 00:03:29 + Volume/Unit = PMOSDB/4C2F Total I/O Rate/sec = .0 + Device Type = 3390 DB2 I/O Rate/sec = .0 + + Database = DSN00212 Spacename = FOO + * + ------I/O Rates----- -------I/O Counts------ + Planname Authid Correlation Total Read Write Total Read Write + -------- -------- ------------ ------ ------ ------ ------- ------- ------- + SYSOPR .0 .0 .0 1 0 1 + DSNESPCS MIS MIS .0 .0 .0 1 1 0 ===============================================================================
NavigationFor additional information about other topics, use the PF keys.
FieldsInterval Time
The collection interval currently in use by the object analysis collector. At the end of this time interval,the collector resets its collection statistics.
Interval ElapsedThe elapsed time within the current collection interval. It is the period of time for which the displayedinformation is applicable.
Volume/UnitThe name and address of the volume.
Total I/O Rate/secThe total number of I/Os per second for the volume. This value is from an MVS perspective. If thevolume is shared by multiple MVS systems, this value might not reflect all I/O activity to the volume.
Device TypeThe device type of the volume displayed.
DB2 I/O Rate/secThe total number of I/Os per second (for the volume) originating from the DB2 subsystem beingmonitored. This is a subset of total I/Os per second if I/O to the volume is also occurring from addressspaces other than the DB2 subsystem being monitored.
DatabaseThe name of the database for which thread activity has occurred.
SpacenameThe name of the space for which thread activity has occurred.
PlannameThe name of the plan associated with the thread.
AuthidThe authid associated with the thread.
CorrelationThe correlation ID associated with the thread.
Total I/O RateThe total I/O rate (per second) that is attributable to the spacename for the time elapsed.
Read I/O RateThe Read I/O rate (per second) that is attributable to the spacename for the time elapsed.
Chapter 11. Object Analysis 513
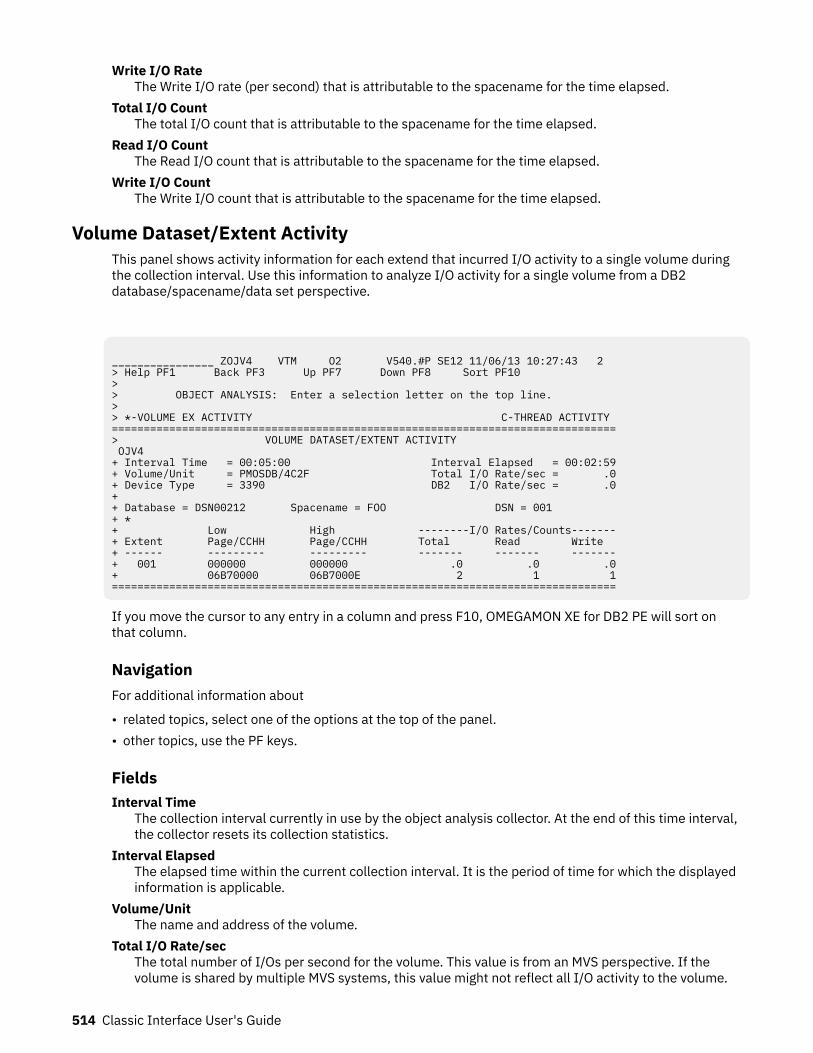
Write I/O RateThe Write I/O rate (per second) that is attributable to the spacename for the time elapsed.
Total I/O CountThe total I/O count that is attributable to the spacename for the time elapsed.
Read I/O CountThe Read I/O count that is attributable to the spacename for the time elapsed.
Write I/O CountThe Write I/O count that is attributable to the spacename for the time elapsed.
Volume Dataset/Extent ActivityThis panel shows activity information for each extend that incurred I/O activity to a single volume duringthe collection interval. Use this information to analyze I/O activity for a single volume from a DB2database/spacename/data set perspective.
________________ ZOJV4 VTM O2 V540.#P SE12 11/06/13 10:27:43 2 > Help PF1 Back PF3 Up PF7 Down PF8 Sort PF10 > > OBJECT ANALYSIS: Enter a selection letter on the top line. > > *-VOLUME EX ACTIVITY C-THREAD ACTIVITY =============================================================================== > VOLUME DATASET/EXTENT ACTIVITY OJV4 + Interval Time = 00:05:00 Interval Elapsed = 00:02:59 + Volume/Unit = PMOSDB/4C2F Total I/O Rate/sec = .0 + Device Type = 3390 DB2 I/O Rate/sec = .0 + + Database = DSN00212 Spacename = FOO DSN = 001 + * + Low High --------I/O Rates/Counts------- + Extent Page/CCHH Page/CCHH Total Read Write + ------ --------- --------- ------- ------- ------- + 001 000000 000000 .0 .0 .0 + 06B70000 06B7000E 2 1 1 ===============================================================================
If you move the cursor to any entry in a column and press F10, OMEGAMON XE for DB2 PE will sort onthat column.
NavigationFor additional information about
• related topics, select one of the options at the top of the panel.• other topics, use the PF keys.
FieldsInterval Time
The collection interval currently in use by the object analysis collector. At the end of this time interval,the collector resets its collection statistics.
Interval ElapsedThe elapsed time within the current collection interval. It is the period of time for which the displayedinformation is applicable.
Volume/UnitThe name and address of the volume.
Total I/O Rate/secThe total number of I/Os per second for the volume. This value is from an MVS perspective. If thevolume is shared by multiple MVS systems, this value might not reflect all I/O activity to the volume.
514 Classic Interface User's Guide
Device TypeThe device type of the volume displayed.
DB2 I/O Rate/secThe total number of I/Os per second (for the volume) originating from the DB2 subsystem beingmonitored. This is a subset of total I/Os per second if I/O to the volume is also occurring from addressspaces other than the DB2 subsystem being monitored.
DatabaseThe name of the selected database.
SpacenameThe name of the selected space.
DSNThe sequence number of the selected data set.
ExtentThe number of an extent that incurred I/O activity.
Each of the following fields includes two values for each extent. The values are displayed one above theother; for example, the Read I/O rate is displayed above the Read I/O count.
Low Page/CCHHThe starting page number (top line) and cylinder/head address (bottom line) of the extent.
High Page/CCHHThe ending page number (top line) and cylinder/head address (bottom line) of the extent.
Total I/O Rates/CountsThe total I/O rate per second (top line) and count (bottom line) that is attributable to the extent for thetime elapsed.
Read I/O Rates/CountsThe Read I/O rate per second (top line) and count (bottom line) that is attributable to the extent forthe time elapsed.
Write I/O Rates/CountsThe Write I/O rate per second (top line) and count (bottom line) that is attributable to the extent forthe time elapsed.
Volume Thread Activity by DatasetThis panel shows volume activity information for each thread that generated I/O activity to the data setduring the collection interval. Use this information to analyze which threads are generating I/O activity fora single volume from a DB2 data set perspective.
If you move the cursor to any entry in a column and press F10, OMEGAMON XE for DB2 PE will sort onthat column.
Chapter 11. Object Analysis 515
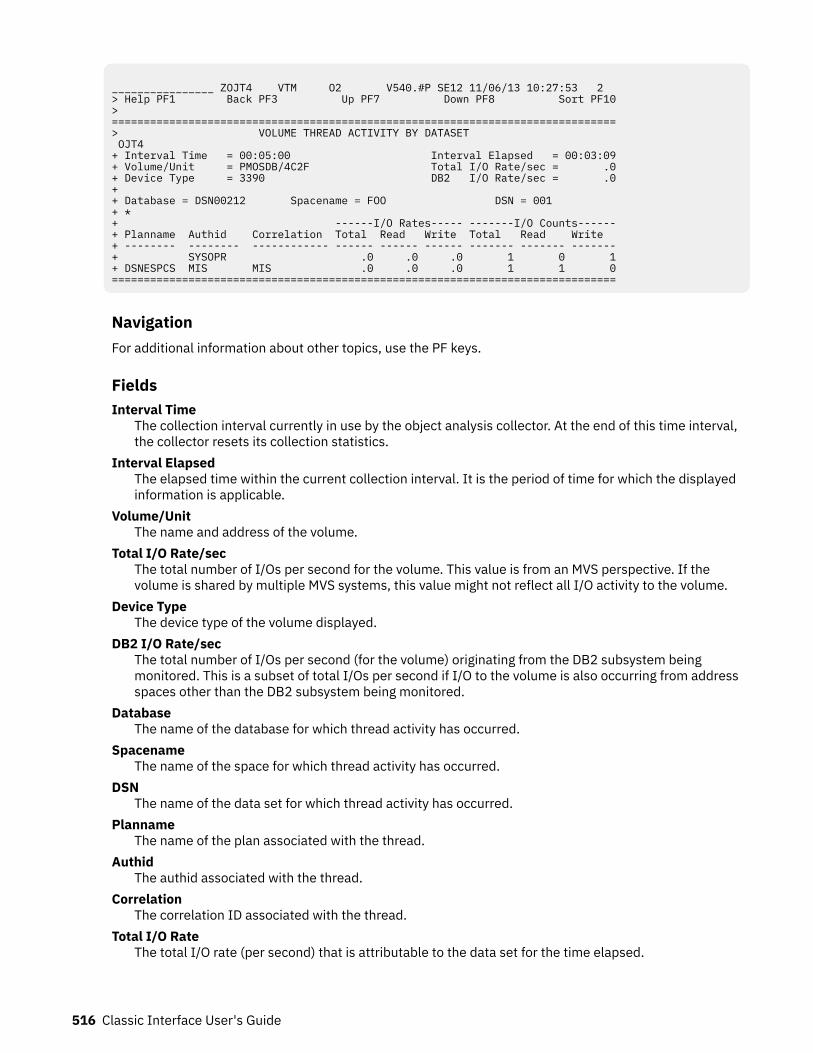
________________ ZOJT4 VTM O2 V540.#P SE12 11/06/13 10:27:53 2 > Help PF1 Back PF3 Up PF7 Down PF8 Sort PF10> ===============================================================================> VOLUME THREAD ACTIVITY BY DATASET OJT4 + Interval Time = 00:05:00 Interval Elapsed = 00:03:09+ Volume/Unit = PMOSDB/4C2F Total I/O Rate/sec = .0+ Device Type = 3390 DB2 I/O Rate/sec = .0+ + Database = DSN00212 Spacename = FOO DSN = 001 + * + ------I/O Rates----- -------I/O Counts------+ Planname Authid Correlation Total Read Write Total Read Write + -------- -------- ------------ ------ ------ ------ ------- ------- -------+ SYSOPR .0 .0 .0 1 0 1+ DSNESPCS MIS MIS .0 .0 .0 1 1 0===============================================================================
NavigationFor additional information about other topics, use the PF keys.
FieldsInterval Time
The collection interval currently in use by the object analysis collector. At the end of this time interval,the collector resets its collection statistics.
Interval ElapsedThe elapsed time within the current collection interval. It is the period of time for which the displayedinformation is applicable.
Volume/UnitThe name and address of the volume.
Total I/O Rate/secThe total number of I/Os per second for the volume. This value is from an MVS perspective. If thevolume is shared by multiple MVS systems, this value might not reflect all I/O activity to the volume.
Device TypeThe device type of the volume displayed.
DB2 I/O Rate/secThe total number of I/Os per second (for the volume) originating from the DB2 subsystem beingmonitored. This is a subset of total I/Os per second if I/O to the volume is also occurring from addressspaces other than the DB2 subsystem being monitored.
DatabaseThe name of the database for which thread activity has occurred.
SpacenameThe name of the space for which thread activity has occurred.
DSNThe name of the data set for which thread activity has occurred.
PlannameThe name of the plan associated with the thread.
AuthidThe authid associated with the thread.
CorrelationThe correlation ID associated with the thread.
Total I/O RateThe total I/O rate (per second) that is attributable to the data set for the time elapsed.
516 Classic Interface User's Guide
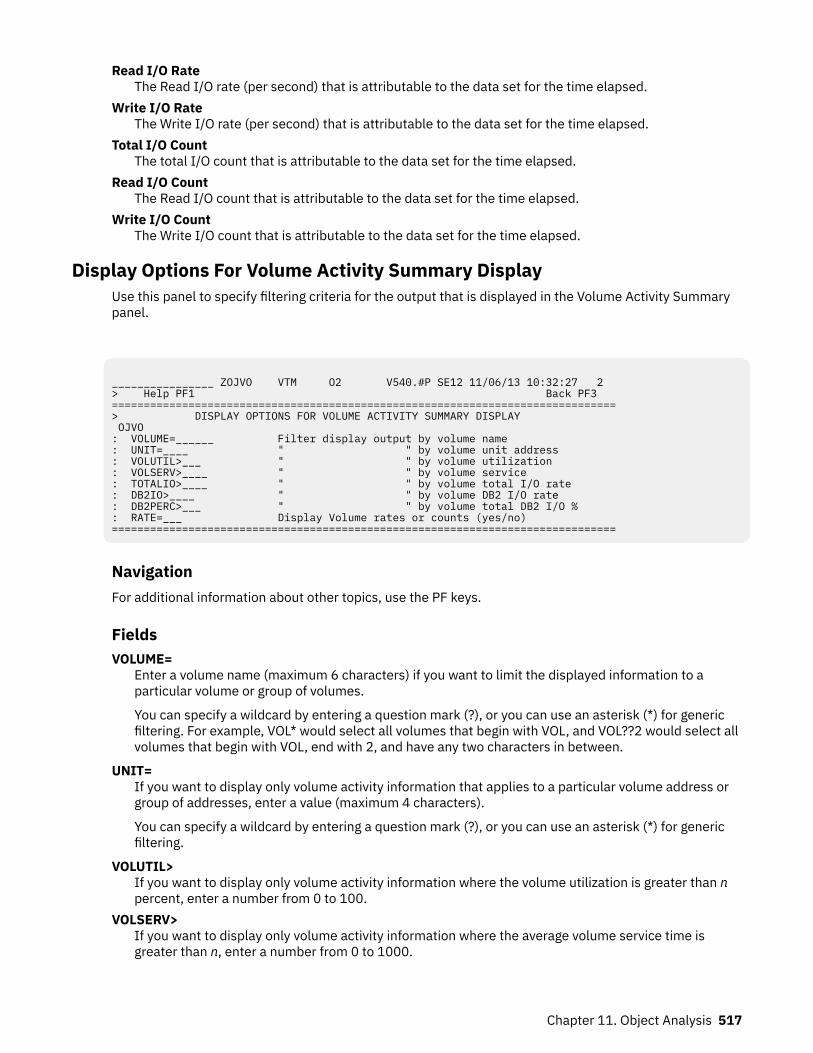
Read I/O RateThe Read I/O rate (per second) that is attributable to the data set for the time elapsed.
Write I/O RateThe Write I/O rate (per second) that is attributable to the data set for the time elapsed.
Total I/O CountThe total I/O count that is attributable to the data set for the time elapsed.
Read I/O CountThe Read I/O count that is attributable to the data set for the time elapsed.
Write I/O CountThe Write I/O count that is attributable to the data set for the time elapsed.
Display Options For Volume Activity Summary DisplayUse this panel to specify filtering criteria for the output that is displayed in the Volume Activity Summarypanel.
________________ ZOJVO VTM O2 V540.#P SE12 11/06/13 10:32:27 2 > Help PF1 Back PF3 =============================================================================== > DISPLAY OPTIONS FOR VOLUME ACTIVITY SUMMARY DISPLAY OJVO : VOLUME=______ Filter display output by volume name : UNIT=____ " " by volume unit address : VOLUTIL>___ " " by volume utilization : VOLSERV>____ " " by volume service : TOTALIO>____ " " by volume total I/O rate : DB2IO>____ " " by volume DB2 I/O rate : DB2PERC>___ " " by volume total DB2 I/O % : RATE=___ Display Volume rates or counts (yes/no) ===============================================================================
NavigationFor additional information about other topics, use the PF keys.
FieldsVOLUME=
Enter a volume name (maximum 6 characters) if you want to limit the displayed information to aparticular volume or group of volumes.
You can specify a wildcard by entering a question mark (?), or you can use an asterisk (*) for genericfiltering. For example, VOL* would select all volumes that begin with VOL, and VOL??2 would select allvolumes that begin with VOL, end with 2, and have any two characters in between.
UNIT=If you want to display only volume activity information that applies to a particular volume address orgroup of addresses, enter a value (maximum 4 characters).
You can specify a wildcard by entering a question mark (?), or you can use an asterisk (*) for genericfiltering.
VOLUTIL>If you want to display only volume activity information where the volume utilization is greater than npercent, enter a number from 0 to 100.
VOLSERV>If you want to display only volume activity information where the average volume service time isgreater than n, enter a number from 0 to 1000.
Chapter 11. Object Analysis 517
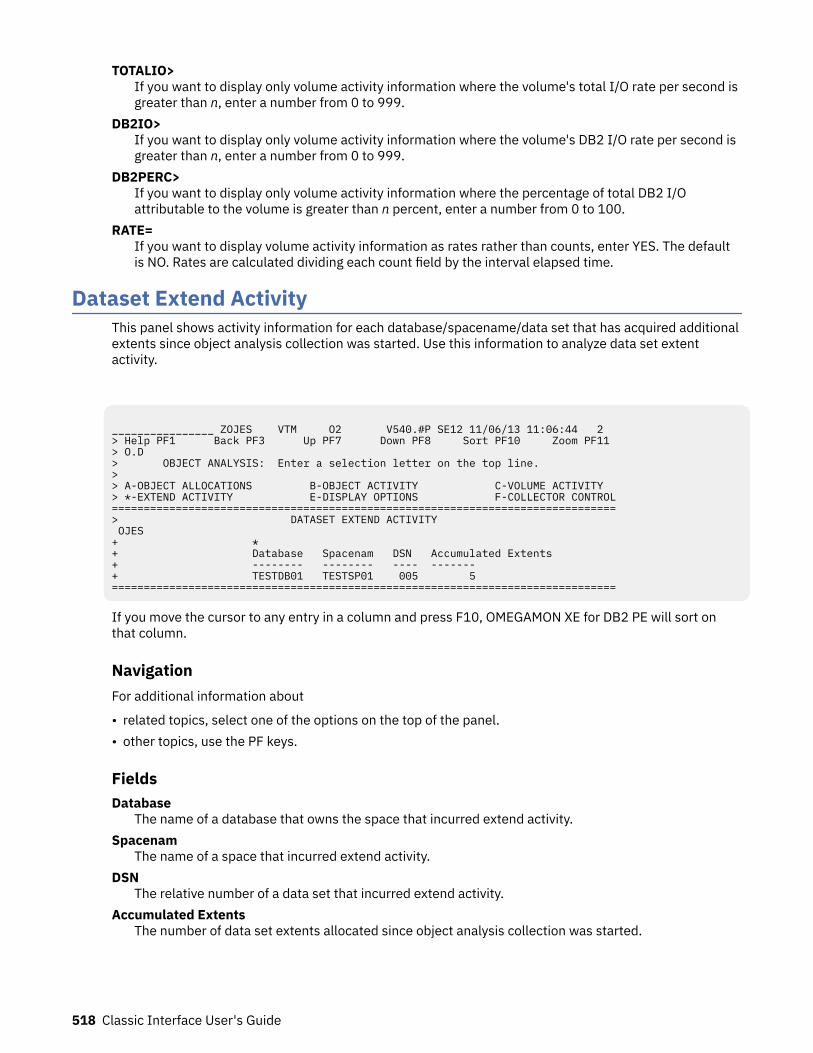
TOTALIO>If you want to display only volume activity information where the volume's total I/O rate per second isgreater than n, enter a number from 0 to 999.
DB2IO>If you want to display only volume activity information where the volume's DB2 I/O rate per second isgreater than n, enter a number from 0 to 999.
DB2PERC>If you want to display only volume activity information where the percentage of total DB2 I/Oattributable to the volume is greater than n percent, enter a number from 0 to 100.
RATE=If you want to display volume activity information as rates rather than counts, enter YES. The defaultis NO. Rates are calculated dividing each count field by the interval elapsed time.
Dataset Extend ActivityThis panel shows activity information for each database/spacename/data set that has acquired additionalextents since object analysis collection was started. Use this information to analyze data set extentactivity.
________________ ZOJES VTM O2 V540.#P SE12 11/06/13 11:06:44 2 > Help PF1 Back PF3 Up PF7 Down PF8 Sort PF10 Zoom PF11 > O.D > OBJECT ANALYSIS: Enter a selection letter on the top line. > > A-OBJECT ALLOCATIONS B-OBJECT ACTIVITY C-VOLUME ACTIVITY > *-EXTEND ACTIVITY E-DISPLAY OPTIONS F-COLLECTOR CONTROL===============================================================================> DATASET EXTEND ACTIVITY OJES + * + Database Spacenam DSN Accumulated Extents + -------- -------- ---- ------- + TESTDB01 TESTSP01 005 5 ===============================================================================
If you move the cursor to any entry in a column and press F10, OMEGAMON XE for DB2 PE will sort onthat column.
NavigationFor additional information about
• related topics, select one of the options on the top of the panel.• other topics, use the PF keys.
FieldsDatabase
The name of a database that owns the space that incurred extend activity.Spacenam
The name of a space that incurred extend activity.DSN
The relative number of a data set that incurred extend activity.Accumulated Extents
The number of data set extents allocated since object analysis collection was started.
518 Classic Interface User's Guide
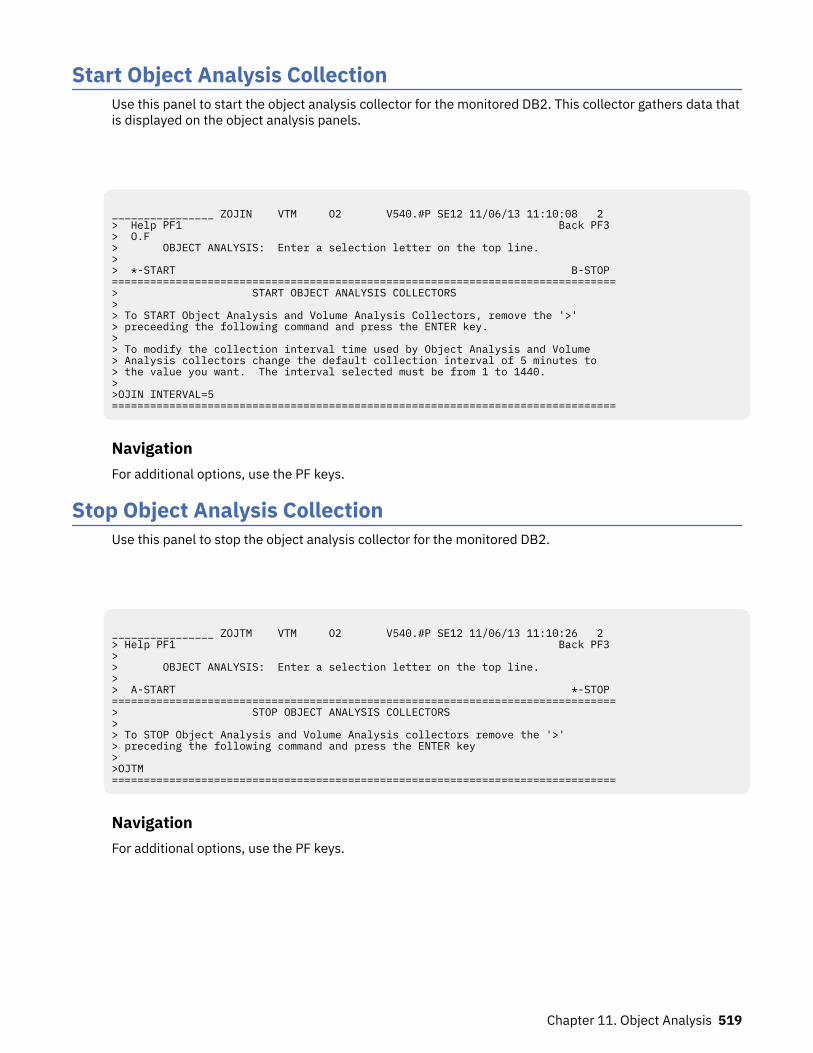
Start Object Analysis CollectionUse this panel to start the object analysis collector for the monitored DB2. This collector gathers data thatis displayed on the object analysis panels.
________________ ZOJIN VTM O2 V540.#P SE12 11/06/13 11:10:08 2 > Help PF1 Back PF3 > O.F > OBJECT ANALYSIS: Enter a selection letter on the top line. > > *-START B-STOP ===============================================================================> START OBJECT ANALYSIS COLLECTORS > > To START Object Analysis and Volume Analysis Collectors, remove the '>' > preceeding the following command and press the ENTER key. > > To modify the collection interval time used by Object Analysis and Volume > Analysis collectors change the default collection interval of 5 minutes to > the value you want. The interval selected must be from 1 to 1440. > >OJIN INTERVAL=5 ===============================================================================
NavigationFor additional options, use the PF keys.
Stop Object Analysis CollectionUse this panel to stop the object analysis collector for the monitored DB2.
________________ ZOJTM VTM O2 V540.#P SE12 11/06/13 11:10:26 2 > Help PF1 Back PF3 > > OBJECT ANALYSIS: Enter a selection letter on the top line. > > A-START *-STOP ===============================================================================> STOP OBJECT ANALYSIS COLLECTORS > > To STOP Object Analysis and Volume Analysis collectors remove the '>' > preceding the following command and press the ENTER key > >OJTM ===============================================================================
NavigationFor additional options, use the PF keys.
Chapter 11. Object Analysis 519

520 Classic Interface User's Guide
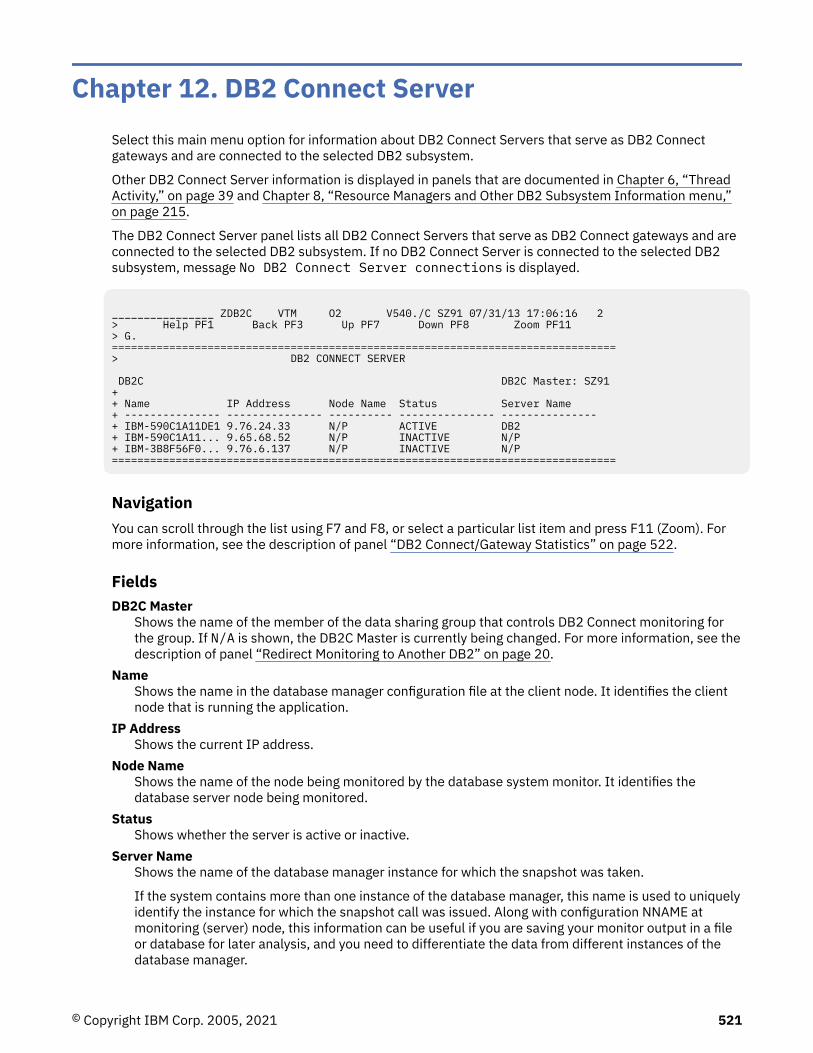
Chapter 12. DB2 Connect ServerSelect this main menu option for information about DB2 Connect Servers that serve as DB2 Connectgateways and are connected to the selected DB2 subsystem.
Other DB2 Connect Server information is displayed in panels that are documented in Chapter 6, “ThreadActivity,” on page 39 and Chapter 8, “Resource Managers and Other DB2 Subsystem Information menu,”on page 215.
The DB2 Connect Server panel lists all DB2 Connect Servers that serve as DB2 Connect gateways and areconnected to the selected DB2 subsystem. If no DB2 Connect Server is connected to the selected DB2subsystem, message No DB2 Connect Server connections is displayed.
________________ ZDB2C VTM O2 V540./C SZ91 07/31/13 17:06:16 2 > Help PF1 Back PF3 Up PF7 Down PF8 Zoom PF11 > G. =============================================================================== > DB2 CONNECT SERVER DB2C DB2C Master: SZ91 + + Name IP Address Node Name Status Server Name + --------------- --------------- ---------- --------------- --------------- + IBM-590C1A11DE1 9.76.24.33 N/P ACTIVE DB2 + IBM-590C1A11... 9.65.68.52 N/P INACTIVE N/P + IBM-3B8F56F0... 9.76.6.137 N/P INACTIVE N/P ===============================================================================
NavigationYou can scroll through the list using F7 and F8, or select a particular list item and press F11 (Zoom). Formore information, see the description of panel “DB2 Connect/Gateway Statistics” on page 522.
FieldsDB2C Master
Shows the name of the member of the data sharing group that controls DB2 Connect monitoring forthe group. If N/A is shown, the DB2C Master is currently being changed. For more information, see thedescription of panel “Redirect Monitoring to Another DB2” on page 20.
NameShows the name in the database manager configuration file at the client node. It identifies the clientnode that is running the application.
IP AddressShows the current IP address.
Node NameShows the name of the node being monitored by the database system monitor. It identifies thedatabase server node being monitored.
StatusShows whether the server is active or inactive.
Server NameShows the name of the database manager instance for which the snapshot was taken.
If the system contains more than one instance of the database manager, this name is used to uniquelyidentify the instance for which the snapshot call was issued. Along with configuration NNAME atmonitoring (server) node, this information can be useful if you are saving your monitor output in a fileor database for later analysis, and you need to differentiate the data from different instances of thedatabase manager.
© Copyright IBM Corp. 2005, 2021 521
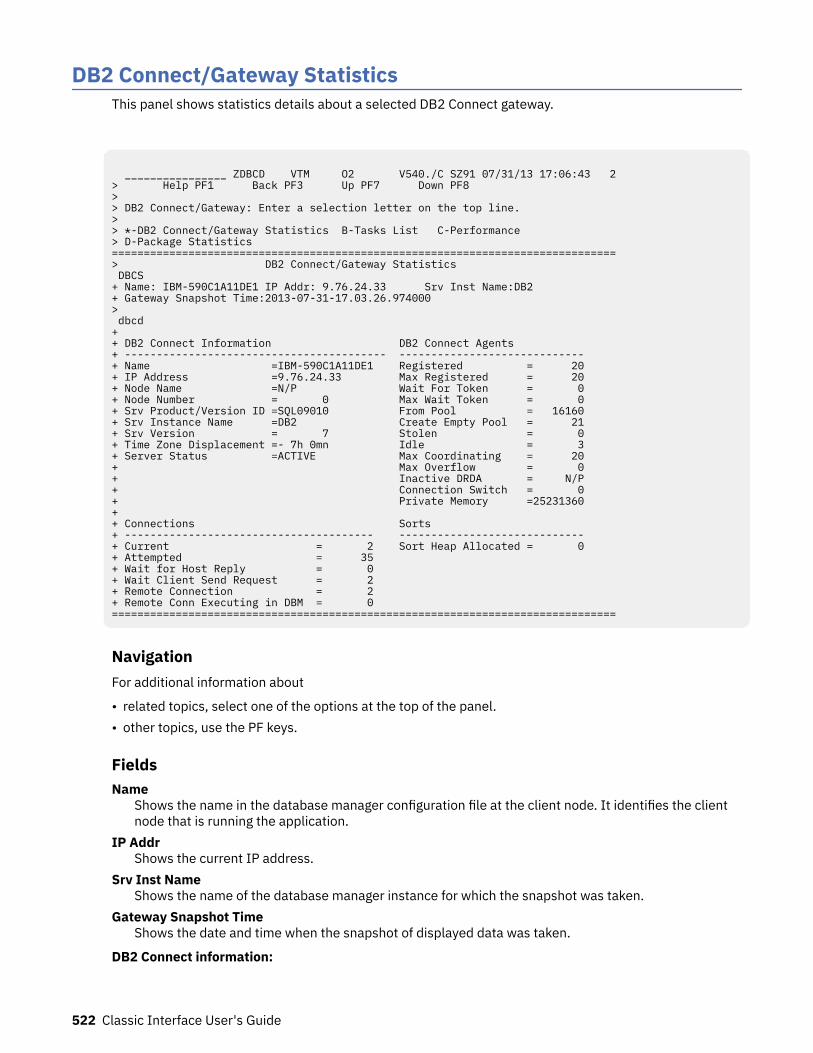
DB2 Connect/Gateway StatisticsThis panel shows statistics details about a selected DB2 Connect gateway.
________________ ZDBCD VTM O2 V540./C SZ91 07/31/13 17:06:43 2 > Help PF1 Back PF3 Up PF7 Down PF8 > > DB2 Connect/Gateway: Enter a selection letter on the top line. > > *-DB2 Connect/Gateway Statistics B-Tasks List C-Performance > D-Package Statistics =============================================================================== > DB2 Connect/Gateway Statistics DBCS + Name: IBM-590C1A11DE1 IP Addr: 9.76.24.33 Srv Inst Name:DB2 + Gateway Snapshot Time:2013-07-31-17.03.26.974000 > dbcd + + DB2 Connect Information DB2 Connect Agents + ----------------------------------------- ----------------------------- + Name =IBM-590C1A11DE1 Registered = 20 + IP Address =9.76.24.33 Max Registered = 20 + Node Name =N/P Wait For Token = 0 + Node Number = 0 Max Wait Token = 0 + Srv Product/Version ID =SQL09010 From Pool = 16160 + Srv Instance Name =DB2 Create Empty Pool = 21 + Srv Version = 7 Stolen = 0 + Time Zone Displacement =- 7h 0mn Idle = 3 + Server Status =ACTIVE Max Coordinating = 20 + Max Overflow = 0 + Inactive DRDA = N/P + Connection Switch = 0 + Private Memory =25231360 + + Connections Sorts + --------------------------------------- ----------------------------- + Current = 2 Sort Heap Allocated = 0 + Attempted = 35 + Wait for Host Reply = 0 + Wait Client Send Request = 2 + Remote Connection = 2 + Remote Conn Executing in DBM = 0 ===============================================================================
NavigationFor additional information about
• related topics, select one of the options at the top of the panel.• other topics, use the PF keys.
FieldsName
Shows the name in the database manager configuration file at the client node. It identifies the clientnode that is running the application.
IP AddrShows the current IP address.
Srv Inst NameShows the name of the database manager instance for which the snapshot was taken.
Gateway Snapshot TimeShows the date and time when the snapshot of displayed data was taken.
DB2 Connect information:
522 Classic Interface User's Guide
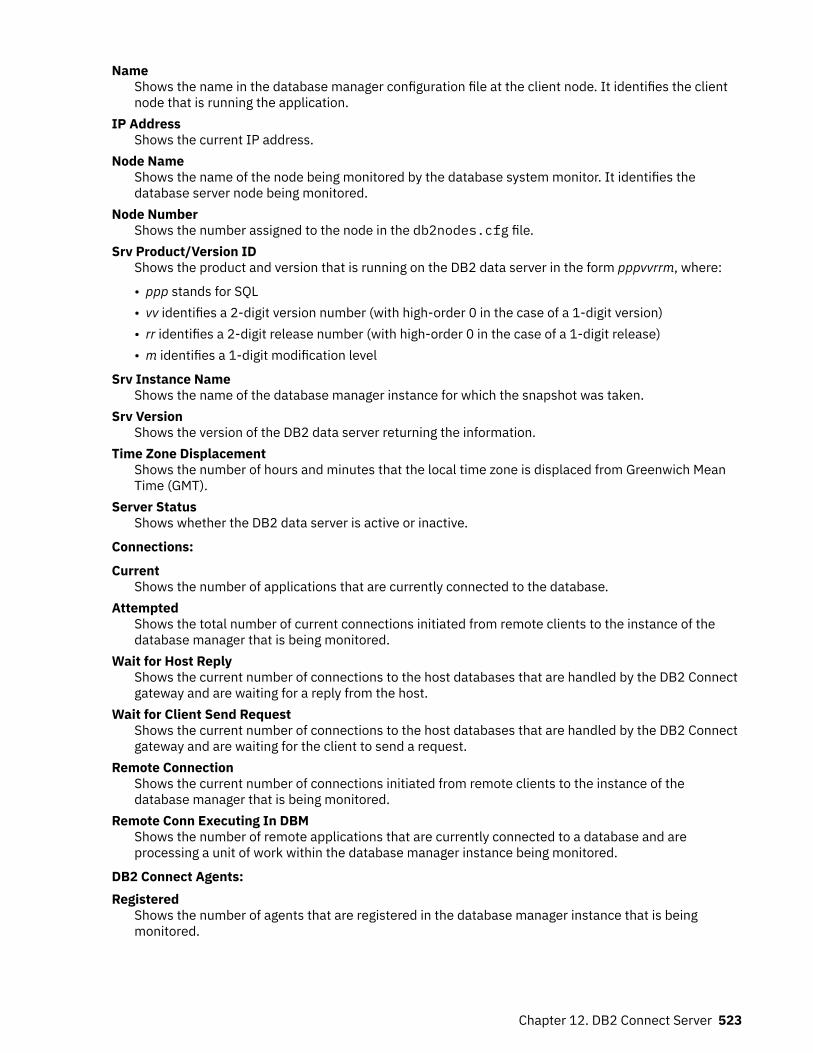
NameShows the name in the database manager configuration file at the client node. It identifies the clientnode that is running the application.
IP AddressShows the current IP address.
Node NameShows the name of the node being monitored by the database system monitor. It identifies thedatabase server node being monitored.
Node NumberShows the number assigned to the node in the db2nodes.cfg file.
Srv Product/Version IDShows the product and version that is running on the DB2 data server in the form pppvvrrm, where:
• ppp stands for SQL• vv identifies a 2-digit version number (with high-order 0 in the case of a 1-digit version)• rr identifies a 2-digit release number (with high-order 0 in the case of a 1-digit release)• m identifies a 1-digit modification level
Srv Instance NameShows the name of the database manager instance for which the snapshot was taken.
Srv VersionShows the version of the DB2 data server returning the information.
Time Zone DisplacementShows the number of hours and minutes that the local time zone is displaced from Greenwich MeanTime (GMT).
Server StatusShows whether the DB2 data server is active or inactive.
Connections:
CurrentShows the number of applications that are currently connected to the database.
AttemptedShows the total number of current connections initiated from remote clients to the instance of thedatabase manager that is being monitored.
Wait for Host ReplyShows the current number of connections to the host databases that are handled by the DB2 Connectgateway and are waiting for a reply from the host.
Wait for Client Send RequestShows the current number of connections to the host databases that are handled by the DB2 Connectgateway and are waiting for the client to send a request.
Remote ConnectionShows the current number of connections initiated from remote clients to the instance of thedatabase manager that is being monitored.
Remote Conn Executing In DBMShows the number of remote applications that are currently connected to a database and areprocessing a unit of work within the database manager instance being monitored.
DB2 Connect Agents:Registered
Shows the number of agents that are registered in the database manager instance that is beingmonitored.
Chapter 12. DB2 Connect Server 523
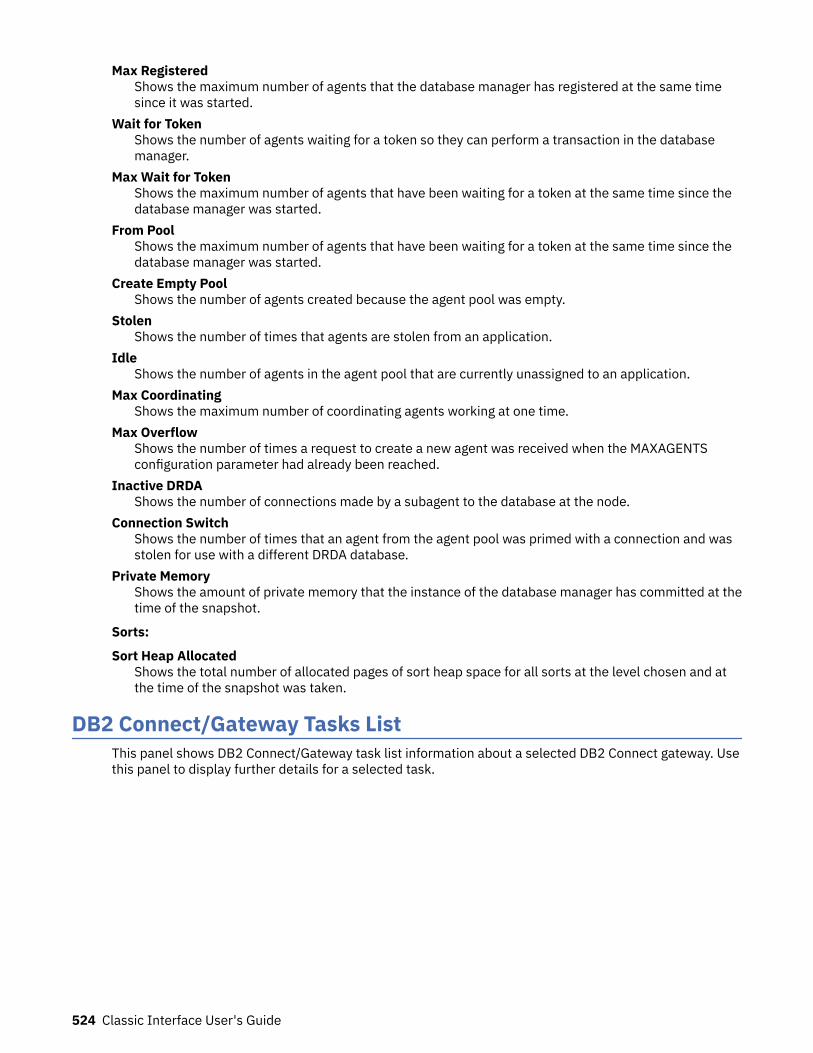
Max RegisteredShows the maximum number of agents that the database manager has registered at the same timesince it was started.
Wait for TokenShows the number of agents waiting for a token so they can perform a transaction in the databasemanager.
Max Wait for TokenShows the maximum number of agents that have been waiting for a token at the same time since thedatabase manager was started.
From PoolShows the maximum number of agents that have been waiting for a token at the same time since thedatabase manager was started.
Create Empty PoolShows the number of agents created because the agent pool was empty.
StolenShows the number of times that agents are stolen from an application.
IdleShows the number of agents in the agent pool that are currently unassigned to an application.
Max CoordinatingShows the maximum number of coordinating agents working at one time.
Max OverflowShows the number of times a request to create a new agent was received when the MAXAGENTSconfiguration parameter had already been reached.
Inactive DRDAShows the number of connections made by a subagent to the database at the node.
Connection SwitchShows the number of times that an agent from the agent pool was primed with a connection and wasstolen for use with a different DRDA database.
Private MemoryShows the amount of private memory that the instance of the database manager has committed at thetime of the snapshot.
Sorts:
Sort Heap AllocatedShows the total number of allocated pages of sort heap space for all sorts at the level chosen and atthe time of the snapshot was taken.
DB2 Connect/Gateway Tasks ListThis panel shows DB2 Connect/Gateway task list information about a selected DB2 Connect gateway. Usethis panel to display further details for a selected task.
524 Classic Interface User's Guide
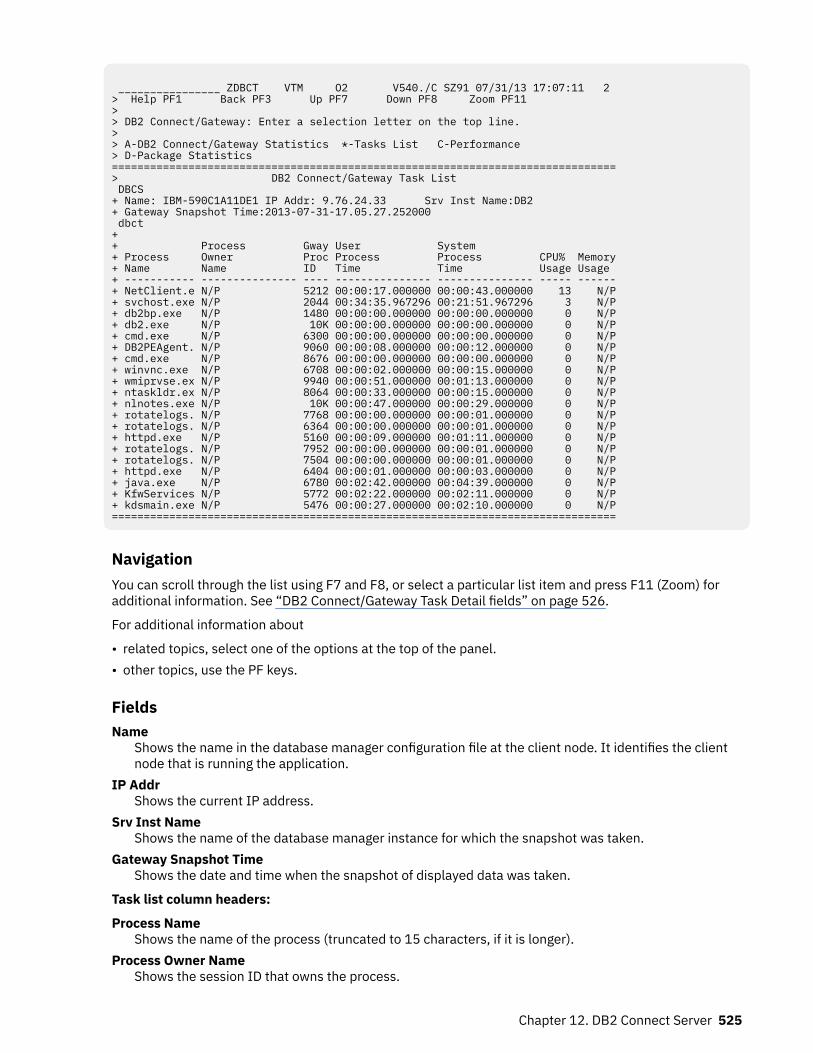
________________ ZDBCT VTM O2 V540./C SZ91 07/31/13 17:07:11 2 > Help PF1 Back PF3 Up PF7 Down PF8 Zoom PF11 > > DB2 Connect/Gateway: Enter a selection letter on the top line. > > A-DB2 Connect/Gateway Statistics *-Tasks List C-Performance > D-Package Statistics ===============================================================================> DB2 Connect/Gateway Task List DBCS + Name: IBM-590C1A11DE1 IP Addr: 9.76.24.33 Srv Inst Name:DB2 + Gateway Snapshot Time:2013-07-31-17.05.27.252000 dbct + + Process Gway User System + Process Owner Proc Process Process CPU% Memory+ Name Name ID Time Time Usage Usage + ----------- --------------- ---- --------------- --------------- ----- ------+ NetClient.e N/P 5212 00:00:17.000000 00:00:43.000000 13 N/P+ svchost.exe N/P 2044 00:34:35.967296 00:21:51.967296 3 N/P+ db2bp.exe N/P 1480 00:00:00.000000 00:00:00.000000 0 N/P+ db2.exe N/P 10K 00:00:00.000000 00:00:00.000000 0 N/P+ cmd.exe N/P 6300 00:00:00.000000 00:00:00.000000 0 N/P+ DB2PEAgent. N/P 9060 00:00:08.000000 00:00:12.000000 0 N/P+ cmd.exe N/P 8676 00:00:00.000000 00:00:00.000000 0 N/P+ winvnc.exe N/P 6708 00:00:02.000000 00:00:15.000000 0 N/P+ wmiprvse.ex N/P 9940 00:00:51.000000 00:01:13.000000 0 N/P+ ntaskldr.ex N/P 8064 00:00:33.000000 00:00:15.000000 0 N/P+ nlnotes.exe N/P 10K 00:00:47.000000 00:00:29.000000 0 N/P+ rotatelogs. N/P 7768 00:00:00.000000 00:00:01.000000 0 N/P+ rotatelogs. N/P 6364 00:00:00.000000 00:00:01.000000 0 N/P+ httpd.exe N/P 5160 00:00:09.000000 00:01:11.000000 0 N/P+ rotatelogs. N/P 7952 00:00:00.000000 00:00:01.000000 0 N/P+ rotatelogs. N/P 7504 00:00:00.000000 00:00:01.000000 0 N/P+ httpd.exe N/P 6404 00:00:01.000000 00:00:03.000000 0 N/P+ java.exe N/P 6780 00:02:42.000000 00:04:39.000000 0 N/P+ KfwServices N/P 5772 00:02:22.000000 00:02:11.000000 0 N/P+ kdsmain.exe N/P 5476 00:00:27.000000 00:02:10.000000 0 N/P===============================================================================
NavigationYou can scroll through the list using F7 and F8, or select a particular list item and press F11 (Zoom) foradditional information. See “DB2 Connect/Gateway Task Detail fields” on page 526.
For additional information about
• related topics, select one of the options at the top of the panel.• other topics, use the PF keys.
FieldsName
Shows the name in the database manager configuration file at the client node. It identifies the clientnode that is running the application.
IP AddrShows the current IP address.
Srv Inst NameShows the name of the database manager instance for which the snapshot was taken.
Gateway Snapshot TimeShows the date and time when the snapshot of displayed data was taken.
Task list column headers:
Process NameShows the name of the process (truncated to 15 characters, if it is longer).
Process Owner NameShows the session ID that owns the process.
Chapter 12. DB2 Connect Server 525
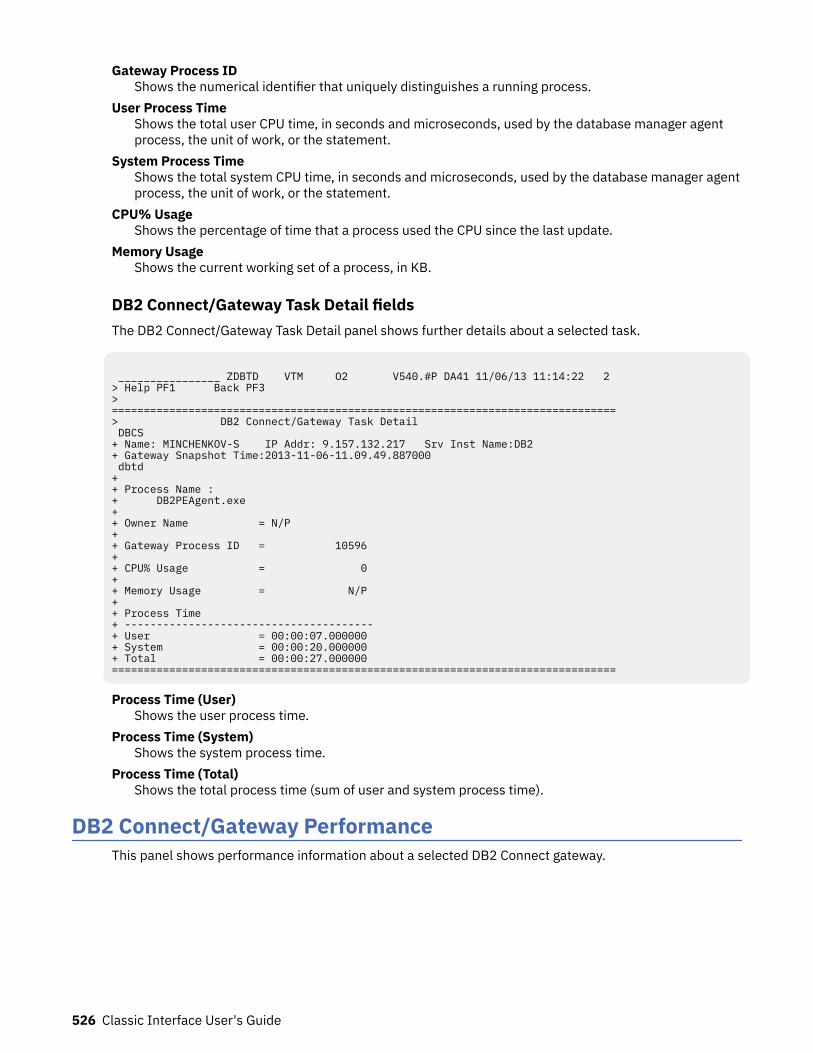
Gateway Process IDShows the numerical identifier that uniquely distinguishes a running process.
User Process TimeShows the total user CPU time, in seconds and microseconds, used by the database manager agentprocess, the unit of work, or the statement.
System Process TimeShows the total system CPU time, in seconds and microseconds, used by the database manager agentprocess, the unit of work, or the statement.
CPU% UsageShows the percentage of time that a process used the CPU since the last update.
Memory UsageShows the current working set of a process, in KB.
DB2 Connect/Gateway Task Detail fieldsThe DB2 Connect/Gateway Task Detail panel shows further details about a selected task.
________________ ZDBTD VTM O2 V540.#P DA41 11/06/13 11:14:22 2 > Help PF1 Back PF3 > ===============================================================================> DB2 Connect/Gateway Task Detail DBCS + Name: MINCHENKOV-S IP Addr: 9.157.132.217 Srv Inst Name:DB2 + Gateway Snapshot Time:2013-11-06-11.09.49.887000 dbtd + + Process Name : + DB2PEAgent.exe + + Owner Name = N/P + + Gateway Process ID = 10596 + + CPU% Usage = 0 + + Memory Usage = N/P + + Process Time + --------------------------------------- + User = 00:00:07.000000 + System = 00:00:20.000000 + Total = 00:00:27.000000 ===============================================================================
Process Time (User)Shows the user process time.
Process Time (System)Shows the system process time.
Process Time (Total)Shows the total process time (sum of user and system process time).
DB2 Connect/Gateway PerformanceThis panel shows performance information about a selected DB2 Connect gateway.
526 Classic Interface User's Guide
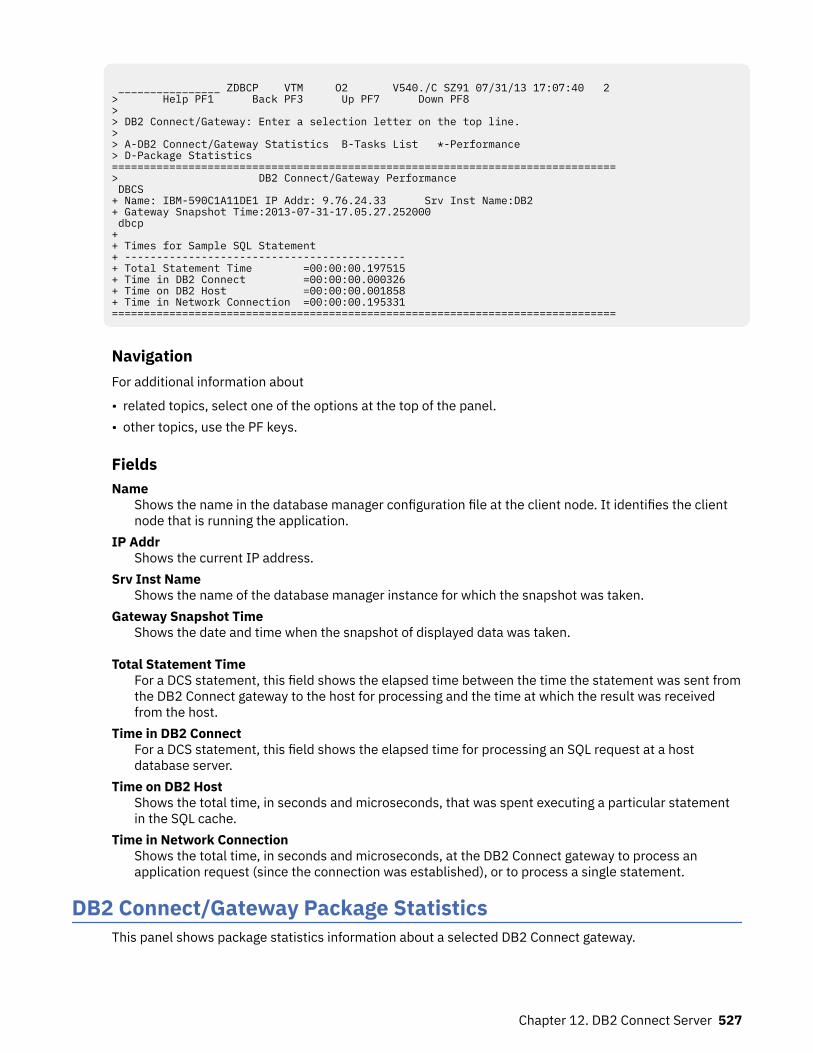
________________ ZDBCP VTM O2 V540./C SZ91 07/31/13 17:07:40 2 > Help PF1 Back PF3 Up PF7 Down PF8 > > DB2 Connect/Gateway: Enter a selection letter on the top line. > > A-DB2 Connect/Gateway Statistics B-Tasks List *-Performance > D-Package Statistics ===============================================================================> DB2 Connect/Gateway Performance DBCS + Name: IBM-590C1A11DE1 IP Addr: 9.76.24.33 Srv Inst Name:DB2 + Gateway Snapshot Time:2013-07-31-17.05.27.252000 dbcp + + Times for Sample SQL Statement + -------------------------------------------- + Total Statement Time =00:00:00.197515 + Time in DB2 Connect =00:00:00.000326 + Time on DB2 Host =00:00:00.001858 + Time in Network Connection =00:00:00.195331 ===============================================================================
NavigationFor additional information about
• related topics, select one of the options at the top of the panel.• other topics, use the PF keys.
FieldsName
Shows the name in the database manager configuration file at the client node. It identifies the clientnode that is running the application.
IP AddrShows the current IP address.
Srv Inst NameShows the name of the database manager instance for which the snapshot was taken.
Gateway Snapshot TimeShows the date and time when the snapshot of displayed data was taken.
Total Statement TimeFor a DCS statement, this field shows the elapsed time between the time the statement was sent fromthe DB2 Connect gateway to the host for processing and the time at which the result was receivedfrom the host.
Time in DB2 ConnectFor a DCS statement, this field shows the elapsed time for processing an SQL request at a hostdatabase server.
Time on DB2 HostShows the total time, in seconds and microseconds, that was spent executing a particular statementin the SQL cache.
Time in Network ConnectionShows the total time, in seconds and microseconds, at the DB2 Connect gateway to process anapplication request (since the connection was established), or to process a single statement.
DB2 Connect/Gateway Package StatisticsThis panel shows package statistics information about a selected DB2 Connect gateway.
Chapter 12. DB2 Connect Server 527
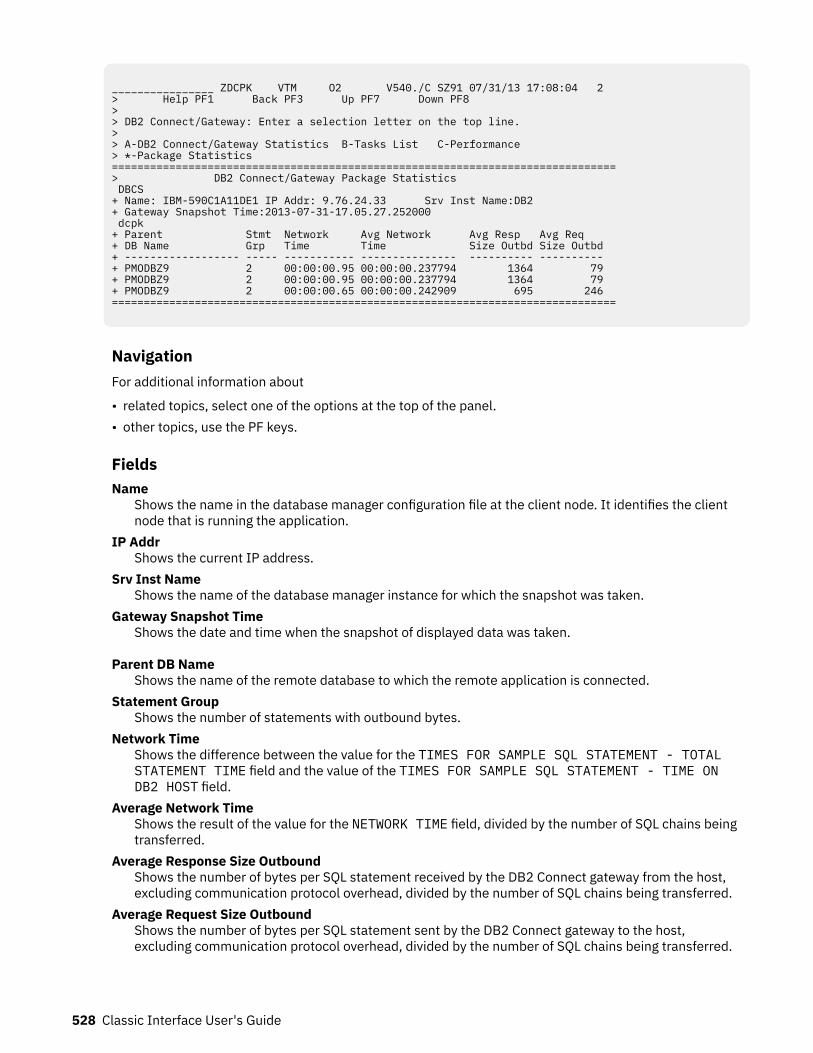
________________ ZDCPK VTM O2 V540./C SZ91 07/31/13 17:08:04 2 > Help PF1 Back PF3 Up PF7 Down PF8 > > DB2 Connect/Gateway: Enter a selection letter on the top line. > > A-DB2 Connect/Gateway Statistics B-Tasks List C-Performance > *-Package Statistics ===============================================================================> DB2 Connect/Gateway Package Statistics DBCS + Name: IBM-590C1A11DE1 IP Addr: 9.76.24.33 Srv Inst Name:DB2 + Gateway Snapshot Time:2013-07-31-17.05.27.252000 dcpk + Parent Stmt Network Avg Network Avg Resp Avg Req + DB Name Grp Time Time Size Outbd Size Outbd + ------------------ ----- ----------- --------------- ---------- ---------- + PMODBZ9 2 00:00:00.95 00:00:00.237794 1364 79 + PMODBZ9 2 00:00:00.95 00:00:00.237794 1364 79 + PMODBZ9 2 00:00:00.65 00:00:00.242909 695 246 ===============================================================================
NavigationFor additional information about
• related topics, select one of the options at the top of the panel.• other topics, use the PF keys.
FieldsName
Shows the name in the database manager configuration file at the client node. It identifies the clientnode that is running the application.
IP AddrShows the current IP address.
Srv Inst NameShows the name of the database manager instance for which the snapshot was taken.
Gateway Snapshot TimeShows the date and time when the snapshot of displayed data was taken.
Parent DB NameShows the name of the remote database to which the remote application is connected.
Statement GroupShows the number of statements with outbound bytes.
Network TimeShows the difference between the value for the TIMES FOR SAMPLE SQL STATEMENT - TOTALSTATEMENT TIME field and the value of the TIMES FOR SAMPLE SQL STATEMENT - TIME ONDB2 HOST field.
Average Network TimeShows the result of the value for the NETWORK TIME field, divided by the number of SQL chains beingtransferred.
Average Response Size OutboundShows the number of bytes per SQL statement received by the DB2 Connect gateway from the host,excluding communication protocol overhead, divided by the number of SQL chains being transferred.
Average Request Size OutboundShows the number of bytes per SQL statement sent by the DB2 Connect gateway to the host,excluding communication protocol overhead, divided by the number of SQL chains being transferred.
528 Classic Interface User's Guide
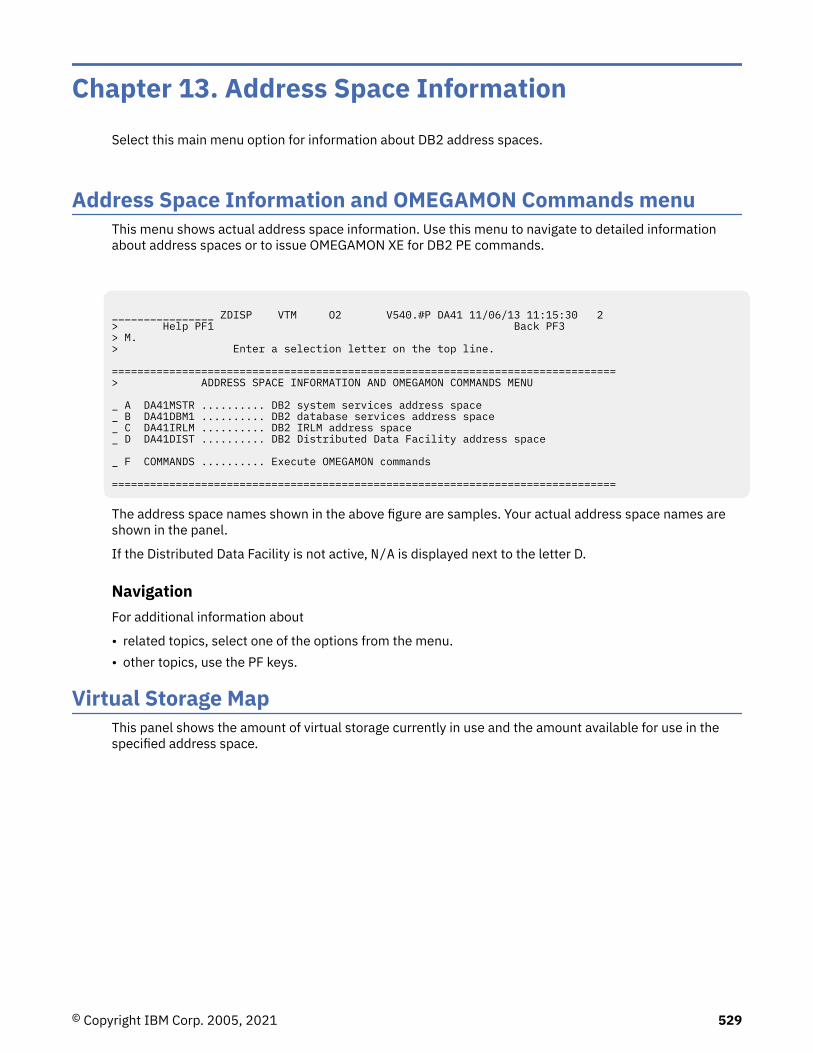
Chapter 13. Address Space InformationSelect this main menu option for information about DB2 address spaces.
Address Space Information and OMEGAMON Commands menuThis menu shows actual address space information. Use this menu to navigate to detailed informationabout address spaces or to issue OMEGAMON XE for DB2 PE commands.
________________ ZDISP VTM O2 V540.#P DA41 11/06/13 11:15:30 2 > Help PF1 Back PF3 > M. > Enter a selection letter on the top line. =============================================================================== > ADDRESS SPACE INFORMATION AND OMEGAMON COMMANDS MENU _ A DA41MSTR .......... DB2 system services address space _ B DA41DBM1 .......... DB2 database services address space _ C DA41IRLM .......... DB2 IRLM address space _ D DA41DIST .......... DB2 Distributed Data Facility address space _ F COMMANDS .......... Execute OMEGAMON commands ===============================================================================
The address space names shown in the above figure are samples. Your actual address space names areshown in the panel.
If the Distributed Data Facility is not active, N/A is displayed next to the letter D.
NavigationFor additional information about
• related topics, select one of the options from the menu.• other topics, use the PF keys.
Virtual Storage MapThis panel shows the amount of virtual storage currently in use and the amount available for use in thespecified address space.
© Copyright IBM Corp. 2005, 2021 529
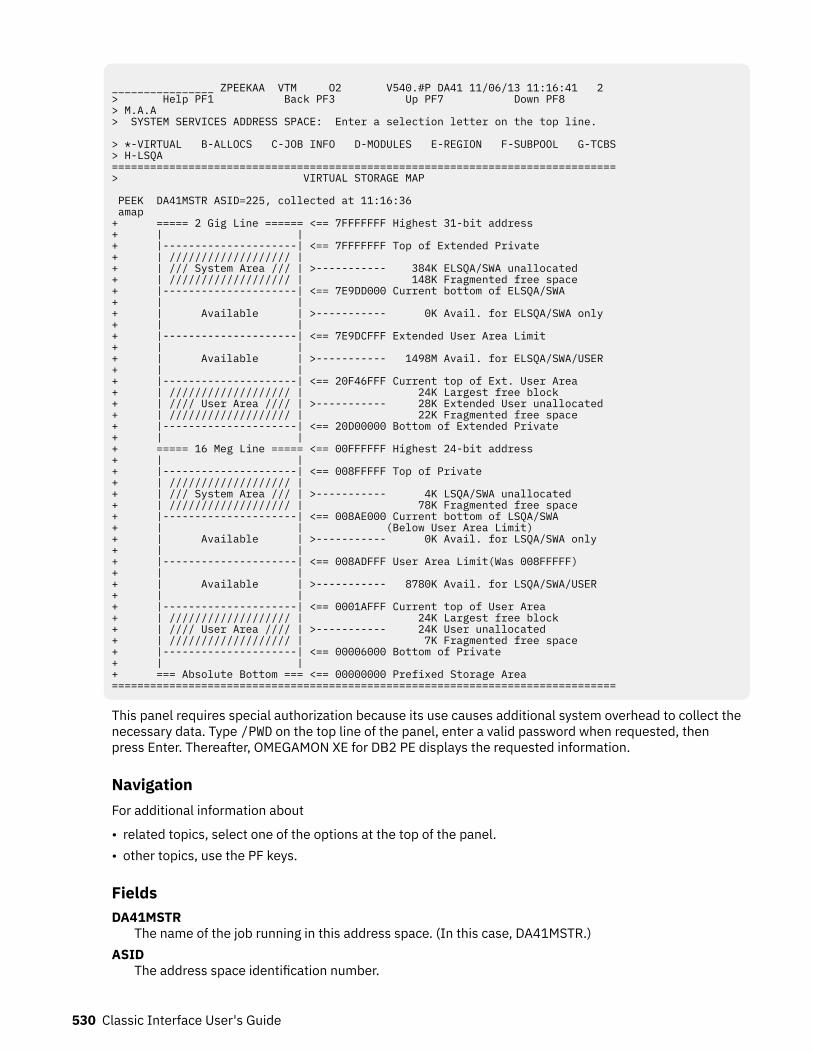
________________ ZPEEKAA VTM O2 V540.#P DA41 11/06/13 11:16:41 2 > Help PF1 Back PF3 Up PF7 Down PF8 > M.A.A > SYSTEM SERVICES ADDRESS SPACE: Enter a selection letter on the top line. > *-VIRTUAL B-ALLOCS C-JOB INFO D-MODULES E-REGION F-SUBPOOL G-TCBS > H-LSQA =============================================================================== > VIRTUAL STORAGE MAP PEEK DA41MSTR ASID=225, collected at 11:16:36 amap + ===== 2 Gig Line ====== <== 7FFFFFFF Highest 31-bit address + | | + |---------------------| <== 7FFFFFFF Top of Extended Private + | /////////////////// | + | /// System Area /// | >----------- 384K ELSQA/SWA unallocated + | /////////////////// | 148K Fragmented free space + |---------------------| <== 7E9DD000 Current bottom of ELSQA/SWA + | | + | Available | >----------- 0K Avail. for ELSQA/SWA only + | | + |---------------------| <== 7E9DCFFF Extended User Area Limit + | | + | Available | >----------- 1498M Avail. for ELSQA/SWA/USER + | | + |---------------------| <== 20F46FFF Current top of Ext. User Area + | /////////////////// | 24K Largest free block + | //// User Area //// | >----------- 28K Extended User unallocated + | /////////////////// | 22K Fragmented free space + |---------------------| <== 20D00000 Bottom of Extended Private + | | + ===== 16 Meg Line ===== <== 00FFFFFF Highest 24-bit address + | | + |---------------------| <== 008FFFFF Top of Private + | /////////////////// | + | /// System Area /// | >----------- 4K LSQA/SWA unallocated + | /////////////////// | 78K Fragmented free space + |---------------------| <== 008AE000 Current bottom of LSQA/SWA + | | (Below User Area Limit) + | Available | >----------- 0K Avail. for LSQA/SWA only + | | + |---------------------| <== 008ADFFF User Area Limit(Was 008FFFFF) + | | + | Available | >----------- 8780K Avail. for LSQA/SWA/USER + | | + |---------------------| <== 0001AFFF Current top of User Area + | /////////////////// | 24K Largest free block + | //// User Area //// | >----------- 24K User unallocated + | /////////////////// | 7K Fragmented free space + |---------------------| <== 00006000 Bottom of Private + | | + === Absolute Bottom === <== 00000000 Prefixed Storage Area ===============================================================================
This panel requires special authorization because its use causes additional system overhead to collect thenecessary data. Type /PWD on the top line of the panel, enter a valid password when requested, thenpress Enter. Thereafter, OMEGAMON XE for DB2 PE displays the requested information.
NavigationFor additional information about
• related topics, select one of the options at the top of the panel.• other topics, use the PF keys.
FieldsDA41MSTR
The name of the job running in this address space. (In this case, DA41MSTR.)ASID
The address space identification number.
530 Classic Interface User's Guide
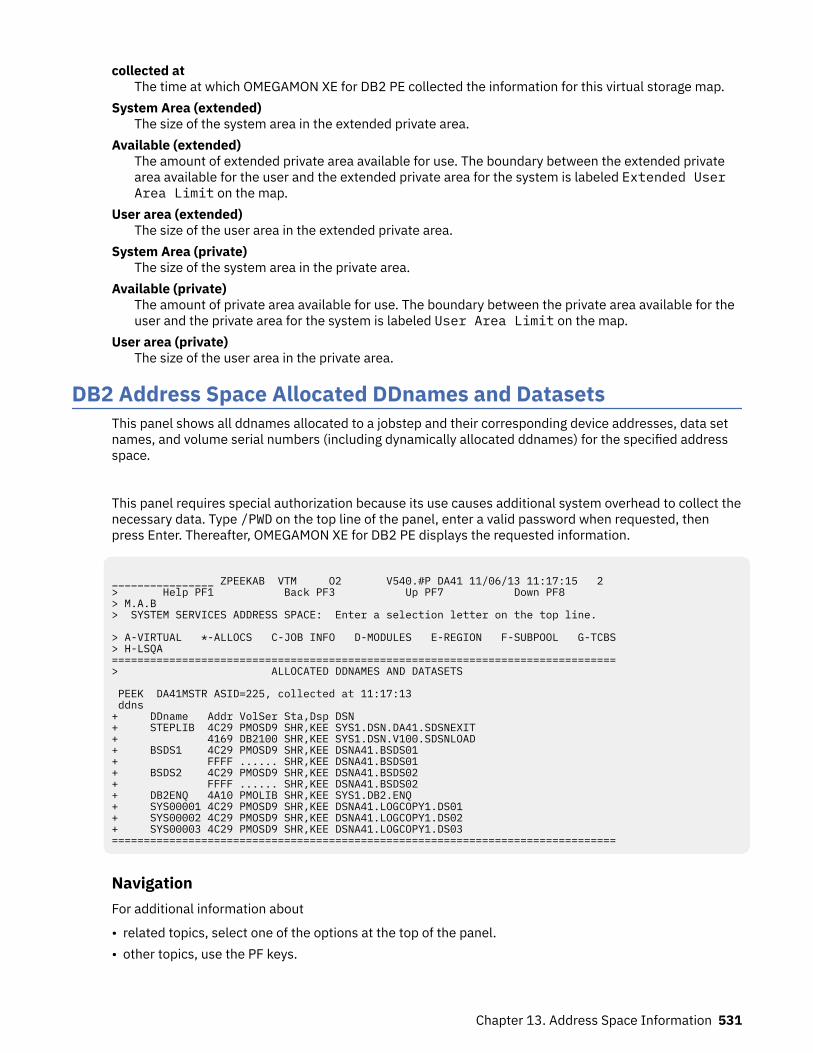
collected atThe time at which OMEGAMON XE for DB2 PE collected the information for this virtual storage map.
System Area (extended)The size of the system area in the extended private area.
Available (extended)The amount of extended private area available for use. The boundary between the extended privatearea available for the user and the extended private area for the system is labeled Extended UserArea Limit on the map.
User area (extended)The size of the user area in the extended private area.
System Area (private)The size of the system area in the private area.
Available (private)The amount of private area available for use. The boundary between the private area available for theuser and the private area for the system is labeled User Area Limit on the map.
User area (private)The size of the user area in the private area.
DB2 Address Space Allocated DDnames and DatasetsThis panel shows all ddnames allocated to a jobstep and their corresponding device addresses, data setnames, and volume serial numbers (including dynamically allocated ddnames) for the specified addressspace.
This panel requires special authorization because its use causes additional system overhead to collect thenecessary data. Type /PWD on the top line of the panel, enter a valid password when requested, thenpress Enter. Thereafter, OMEGAMON XE for DB2 PE displays the requested information.
________________ ZPEEKAB VTM O2 V540.#P DA41 11/06/13 11:17:15 2 > Help PF1 Back PF3 Up PF7 Down PF8 > M.A.B > SYSTEM SERVICES ADDRESS SPACE: Enter a selection letter on the top line. > A-VIRTUAL *-ALLOCS C-JOB INFO D-MODULES E-REGION F-SUBPOOL G-TCBS> H-LSQA ===============================================================================> ALLOCATED DDNAMES AND DATASETS PEEK DA41MSTR ASID=225, collected at 11:17:13 ddns + DDname Addr VolSer Sta,Dsp DSN + STEPLIB 4C29 PMOSD9 SHR,KEE SYS1.DSN.DA41.SDSNEXIT + 4169 DB2100 SHR,KEE SYS1.DSN.V100.SDSNLOAD + BSDS1 4C29 PMOSD9 SHR,KEE DSNA41.BSDS01 + FFFF ...... SHR,KEE DSNA41.BSDS01 + BSDS2 4C29 PMOSD9 SHR,KEE DSNA41.BSDS02 + FFFF ...... SHR,KEE DSNA41.BSDS02 + DB2ENQ 4A10 PMOLIB SHR,KEE SYS1.DB2.ENQ + SYS00001 4C29 PMOSD9 SHR,KEE DSNA41.LOGCOPY1.DS01 + SYS00002 4C29 PMOSD9 SHR,KEE DSNA41.LOGCOPY1.DS02 + SYS00003 4C29 PMOSD9 SHR,KEE DSNA41.LOGCOPY1.DS03 ===============================================================================
NavigationFor additional information about
• related topics, select one of the options at the top of the panel.• other topics, use the PF keys.
Chapter 13. Address Space Information 531
FieldsDA41MSTR
The name of the job running in this address space. (In this case, DA41MSTR.)ASID
The address space identification number.collected at
The time at which OMEGAMON XE for DB2 PE collected the information for this address space.DDname
The ddnames allocated to this job. If the DDname field is blank, the data set is part of a concatenationwith preceding data sets.
AdrThe addresses of the devices allocated to this job.
VolSerThe volume serial numbers of the devices allocated to this job.
Sta,DspThe status and disposition of the devices allocated to this job.
DSnameThe names of the data sets allocated to this job.
You can type a 2- or 3-digit number after DDNS (DDNSnn or DDNnnn) to suppress the display of the firstnn or nnn lines of output. This ability is useful if all of the ddnames do not fit on one panel.
If you type an X before DDNS (XDDNS), OMEGAMON XE for DB2 PE displays the following additionalinformation about the ddname:
• LRECL• BLKSZ• RECFM• ORG• Password protection• Number of EXCPs for each data set• TIOT address for each TCB group
No additional SRBs are scheduled to display this information. OMEGAMON XE for DB2 PE collected all ofthe data when you selected this panel but only displays it when you type the X.
Job Information and Start TimeThis panel displays miscellaneous information about the specified address space.
This panel requires special authorization because its use causes additional system overhead to collect thenecessary data. Type /PWD on the top line of the panel, enter a valid password when requested, thenpress Enter. Thereafter, OMEGAMON XE for DB2 PE displays the requested information.
532 Classic Interface User's Guide
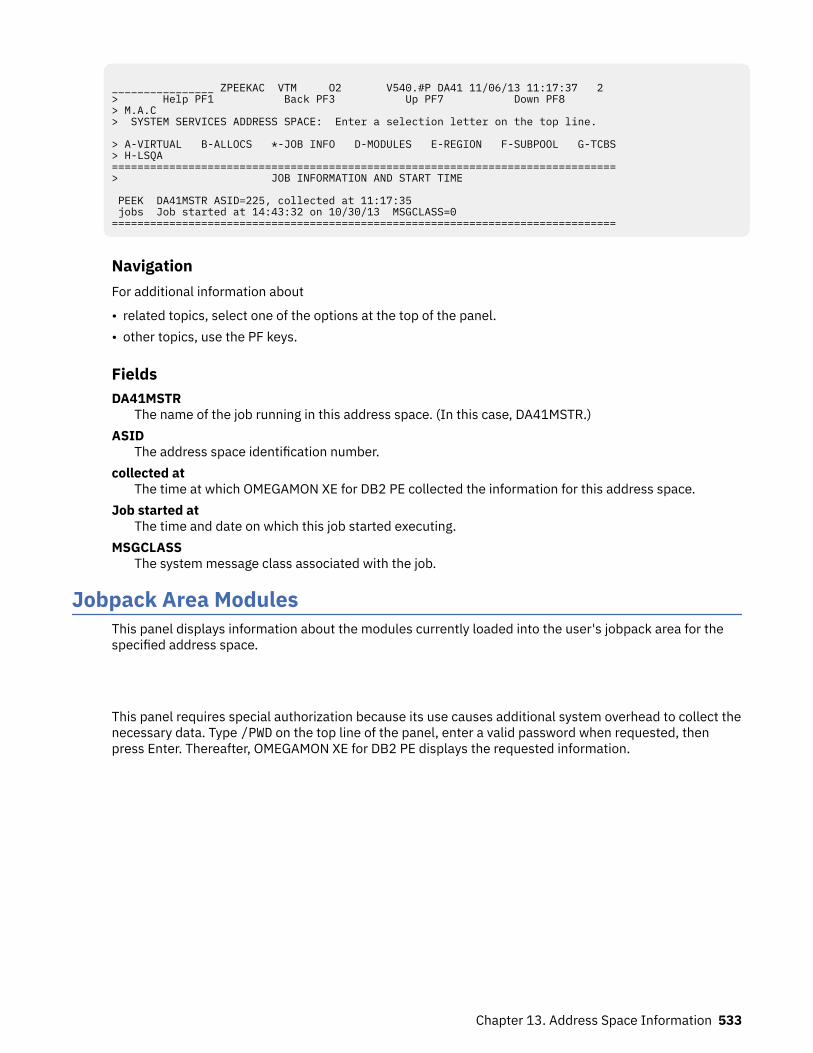
________________ ZPEEKAC VTM O2 V540.#P DA41 11/06/13 11:17:37 2 > Help PF1 Back PF3 Up PF7 Down PF8 > M.A.C > SYSTEM SERVICES ADDRESS SPACE: Enter a selection letter on the top line. > A-VIRTUAL B-ALLOCS *-JOB INFO D-MODULES E-REGION F-SUBPOOL G-TCBS> H-LSQA ===============================================================================> JOB INFORMATION AND START TIME PEEK DA41MSTR ASID=225, collected at 11:17:35 jobs Job started at 14:43:32 on 10/30/13 MSGCLASS=0 ===============================================================================
NavigationFor additional information about
• related topics, select one of the options at the top of the panel.• other topics, use the PF keys.
FieldsDA41MSTR
The name of the job running in this address space. (In this case, DA41MSTR.)ASID
The address space identification number.collected at
The time at which OMEGAMON XE for DB2 PE collected the information for this address space.Job started at
The time and date on which this job started executing.MSGCLASS
The system message class associated with the job.
Jobpack Area ModulesThis panel displays information about the modules currently loaded into the user's jobpack area for thespecified address space.
This panel requires special authorization because its use causes additional system overhead to collect thenecessary data. Type /PWD on the top line of the panel, enter a valid password when requested, thenpress Enter. Thereafter, OMEGAMON XE for DB2 PE displays the requested information.
Chapter 13. Address Space Information 533
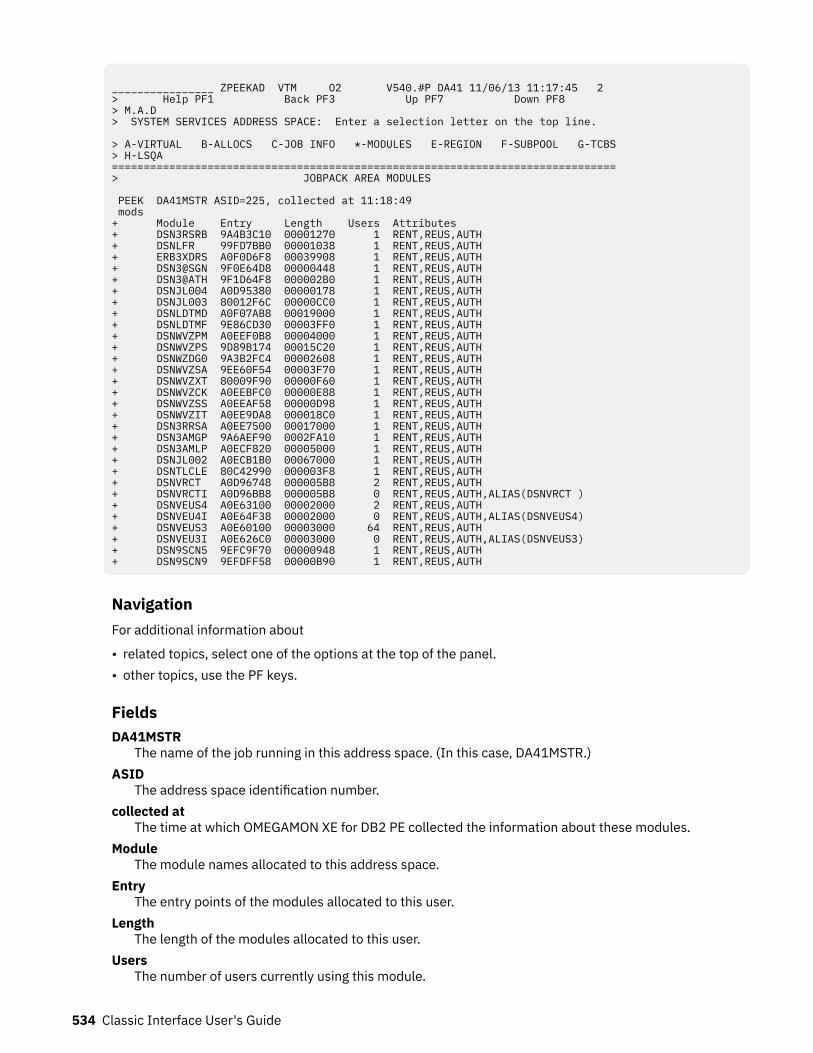
________________ ZPEEKAD VTM O2 V540.#P DA41 11/06/13 11:17:45 2 > Help PF1 Back PF3 Up PF7 Down PF8 > M.A.D > SYSTEM SERVICES ADDRESS SPACE: Enter a selection letter on the top line. > A-VIRTUAL B-ALLOCS C-JOB INFO *-MODULES E-REGION F-SUBPOOL G-TCBS> H-LSQA ===============================================================================> JOBPACK AREA MODULES PEEK DA41MSTR ASID=225, collected at 11:18:49 mods + Module Entry Length Users Attributes + DSN3RSRB 9A4B3C10 00001270 1 RENT,REUS,AUTH + DSNLFR 99FD7BB0 00001038 1 RENT,REUS,AUTH + ERB3XDRS A0F0D6F8 00039908 1 RENT,REUS,AUTH + DSN3@SGN 9F0E64D8 00000448 1 RENT,REUS,AUTH + DSN3@ATH 9F1D64F8 000002B0 1 RENT,REUS,AUTH + DSNJL004 A0D95380 00000178 1 RENT,REUS,AUTH + DSNJL003 80012F6C 00000CC0 1 RENT,REUS,AUTH + DSNLDTMD A0F07AB8 00019000 1 RENT,REUS,AUTH + DSNLDTMF 9E86CD30 00003FF0 1 RENT,REUS,AUTH + DSNWVZPM A0EEF0B8 00004000 1 RENT,REUS,AUTH + DSNWVZPS 9D89B174 00015C20 1 RENT,REUS,AUTH + DSNWZDG0 9A3B2FC4 00002608 1 RENT,REUS,AUTH + DSNWVZSA 9EE60F54 00003F70 1 RENT,REUS,AUTH + DSNWVZXT 80009F90 00000F60 1 RENT,REUS,AUTH + DSNWVZCK A0EEBFC0 00000E88 1 RENT,REUS,AUTH + DSNWVZSS A0EEAF58 00000D98 1 RENT,REUS,AUTH + DSNWVZIT A0EE9DA8 000018C0 1 RENT,REUS,AUTH + DSN3RRSA A0EE7500 00017000 1 RENT,REUS,AUTH + DSN3AMGP 9A6AEF90 0002FA10 1 RENT,REUS,AUTH + DSN3AMLP A0ECF820 00005000 1 RENT,REUS,AUTH + DSNJL002 A0ECB1B0 00067000 1 RENT,REUS,AUTH + DSNTLCLE 80C42990 000003F8 1 RENT,REUS,AUTH + DSNVRCT A0D96748 000005B8 2 RENT,REUS,AUTH + DSNVRCTI A0D96BB8 000005B8 0 RENT,REUS,AUTH,ALIAS(DSNVRCT ) + DSNVEUS4 A0E63100 00002000 2 RENT,REUS,AUTH + DSNVEU4I A0E64F38 00002000 0 RENT,REUS,AUTH,ALIAS(DSNVEUS4) + DSNVEUS3 A0E60100 00003000 64 RENT,REUS,AUTH + DSNVEU3I A0E626C0 00003000 0 RENT,REUS,AUTH,ALIAS(DSNVEUS3) + DSN9SCN5 9EFC9F70 00000948 1 RENT,REUS,AUTH + DSN9SCN9 9EFDFF58 00000B90 1 RENT,REUS,AUTH
NavigationFor additional information about
• related topics, select one of the options at the top of the panel.• other topics, use the PF keys.
FieldsDA41MSTR
The name of the job running in this address space. (In this case, DA41MSTR.)ASID
The address space identification number.collected at
The time at which OMEGAMON XE for DB2 PE collected the information about these modules.Module
The module names allocated to this address space.Entry
The entry points of the modules allocated to this user.Length
The length of the modules allocated to this user.Users
The number of users currently using this module.
534 Classic Interface User's Guide
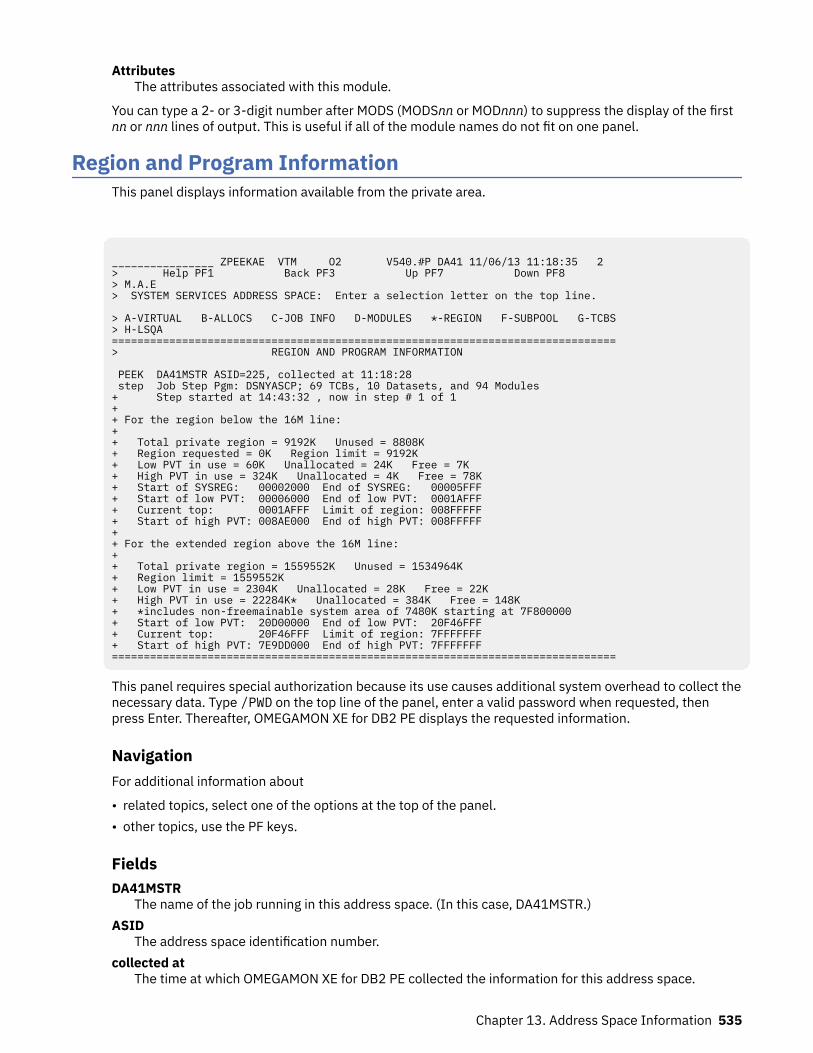
AttributesThe attributes associated with this module.
You can type a 2- or 3-digit number after MODS (MODSnn or MODnnn) to suppress the display of the firstnn or nnn lines of output. This is useful if all of the module names do not fit on one panel.
Region and Program InformationThis panel displays information available from the private area.
________________ ZPEEKAE VTM O2 V540.#P DA41 11/06/13 11:18:35 2 > Help PF1 Back PF3 Up PF7 Down PF8 > M.A.E > SYSTEM SERVICES ADDRESS SPACE: Enter a selection letter on the top line. > A-VIRTUAL B-ALLOCS C-JOB INFO D-MODULES *-REGION F-SUBPOOL G-TCBS> H-LSQA ===============================================================================> REGION AND PROGRAM INFORMATION PEEK DA41MSTR ASID=225, collected at 11:18:28 step Job Step Pgm: DSNYASCP; 69 TCBs, 10 Datasets, and 94 Modules + Step started at 14:43:32 , now in step # 1 of 1 + + For the region below the 16M line: + + Total private region = 9192K Unused = 8808K + Region requested = 0K Region limit = 9192K + Low PVT in use = 60K Unallocated = 24K Free = 7K + High PVT in use = 324K Unallocated = 4K Free = 78K + Start of SYSREG: 00002000 End of SYSREG: 00005FFF + Start of low PVT: 00006000 End of low PVT: 0001AFFF + Current top: 0001AFFF Limit of region: 008FFFFF + Start of high PVT: 008AE000 End of high PVT: 008FFFFF + + For the extended region above the 16M line: + + Total private region = 1559552K Unused = 1534964K + Region limit = 1559552K + Low PVT in use = 2304K Unallocated = 28K Free = 22K + High PVT in use = 22284K* Unallocated = 384K Free = 148K + *includes non-freemainable system area of 7480K starting at 7F800000 + Start of low PVT: 20D00000 End of low PVT: 20F46FFF + Current top: 20F46FFF Limit of region: 7FFFFFFF + Start of high PVT: 7E9DD000 End of high PVT: 7FFFFFFF ===============================================================================
This panel requires special authorization because its use causes additional system overhead to collect thenecessary data. Type /PWD on the top line of the panel, enter a valid password when requested, thenpress Enter. Thereafter, OMEGAMON XE for DB2 PE displays the requested information.
NavigationFor additional information about
• related topics, select one of the options at the top of the panel.• other topics, use the PF keys.
FieldsDA41MSTR
The name of the job running in this address space. (In this case, DA41MSTR.)ASID
The address space identification number.collected at
The time at which OMEGAMON XE for DB2 PE collected the information for this address space.
Chapter 13. Address Space Information 535
Job Step PgmThe name of the job step program currently executing.
TCBsThe number of TCBs currently attached.
DatasetsThe number of data sets currently in use.
ModulesThe number of modules currently in use.
Step started atThe time the current step started executing.
now in step # n of mThe number of the current step and the total number of steps in the job.
Each of the following fields is displayed twice: once to describe the region below the 16 MB line and onceto describe the region above that line.Total private region
The total size of the private area, including areas that cannot be allocated.Unused
The amount of the total private area not currently in use.Region requested
The amount specified on the REGION JCL parameter.Region limit
The region limit that the IEALIMIT exit imposes.Low PVT in use
The storage that the REGION parameter limits. This includes all of the user subpools.Unallocated
The storage not allocated to subpools.Free
The storage allocated to subpools but not currently GETMAINed.High PVT in use
Includes LSQA, SWA, and subpools 229 and 230. This value is allocated from the top of the user'sregion downward and is not limited by the REGION JCL parameter.
Start of SYSREGThe beginning address of the area of storage reserved for use by the region control task.
End of SYSREGThe ending address of the area of storage reserved for use by the region control task.
Start of low PVTThe beginning address of the storage that the REGION parameter limits.
End of low PVTThe ending address of the storage that the REGION parameter limits.
Current topThe highest allocated address in the low PVT area at the current time.
Limit of regionThe ending address of the low PVT area.
Start of high PVTThe beginning address of the high PVT area.
End of high PVTThe ending address of the high PVT area.
536 Classic Interface User's Guide
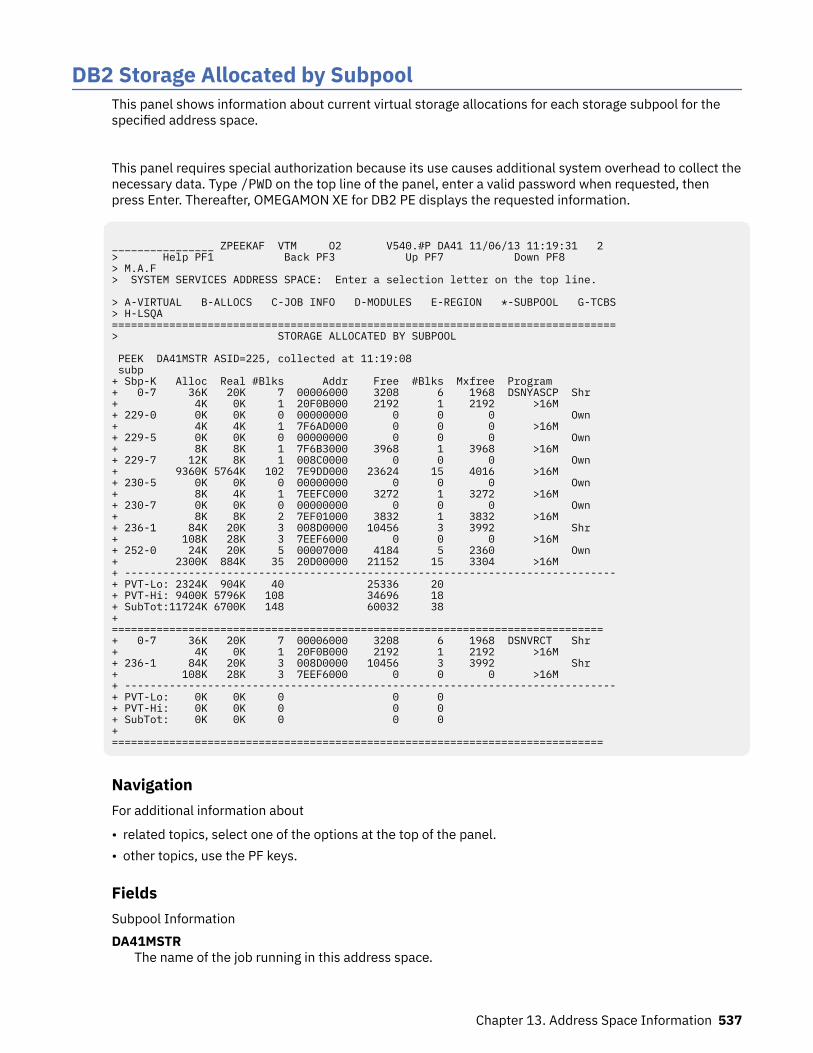
DB2 Storage Allocated by SubpoolThis panel shows information about current virtual storage allocations for each storage subpool for thespecified address space.
This panel requires special authorization because its use causes additional system overhead to collect thenecessary data. Type /PWD on the top line of the panel, enter a valid password when requested, thenpress Enter. Thereafter, OMEGAMON XE for DB2 PE displays the requested information.
________________ ZPEEKAF VTM O2 V540.#P DA41 11/06/13 11:19:31 2 > Help PF1 Back PF3 Up PF7 Down PF8 > M.A.F > SYSTEM SERVICES ADDRESS SPACE: Enter a selection letter on the top line. > A-VIRTUAL B-ALLOCS C-JOB INFO D-MODULES E-REGION *-SUBPOOL G-TCBS > H-LSQA =============================================================================== > STORAGE ALLOCATED BY SUBPOOL PEEK DA41MSTR ASID=225, collected at 11:19:08 subp + Sbp-K Alloc Real #Blks Addr Free #Blks Mxfree Program + 0-7 36K 20K 7 00006000 3208 6 1968 DSNYASCP Shr + 4K 0K 1 20F0B000 2192 1 2192 >16M + 229-0 0K 0K 0 00000000 0 0 0 Own + 4K 4K 1 7F6AD000 0 0 0 >16M + 229-5 0K 0K 0 00000000 0 0 0 Own + 8K 8K 1 7F6B3000 3968 1 3968 >16M + 229-7 12K 8K 1 008C0000 0 0 0 Own + 9360K 5764K 102 7E9DD000 23624 15 4016 >16M + 230-5 0K 0K 0 00000000 0 0 0 Own + 8K 4K 1 7EEFC000 3272 1 3272 >16M + 230-7 0K 0K 0 00000000 0 0 0 Own + 8K 8K 2 7EF01000 3832 1 3832 >16M + 236-1 84K 20K 3 008D0000 10456 3 3992 Shr + 108K 28K 3 7EEF6000 0 0 0 >16M + 252-0 24K 20K 5 00007000 4184 5 2360 Own + 2300K 884K 35 20D00000 21152 15 3304 >16M + ----------------------------------------------------------------------------- + PVT-Lo: 2324K 904K 40 25336 20 + PVT-Hi: 9400K 5796K 108 34696 18 + SubTot:11724K 6700K 148 60032 38 + ============================================================================= + 0-7 36K 20K 7 00006000 3208 6 1968 DSNVRCT Shr + 4K 0K 1 20F0B000 2192 1 2192 >16M + 236-1 84K 20K 3 008D0000 10456 3 3992 Shr + 108K 28K 3 7EEF6000 0 0 0 >16M + ----------------------------------------------------------------------------- + PVT-Lo: 0K 0K 0 0 0 + PVT-Hi: 0K 0K 0 0 0 + SubTot: 0K 0K 0 0 0 + =============================================================================
NavigationFor additional information about
• related topics, select one of the options at the top of the panel.• other topics, use the PF keys.
FieldsSubpool InformationDA41MSTR
The name of the job running in this address space.
Chapter 13. Address Space Information 537
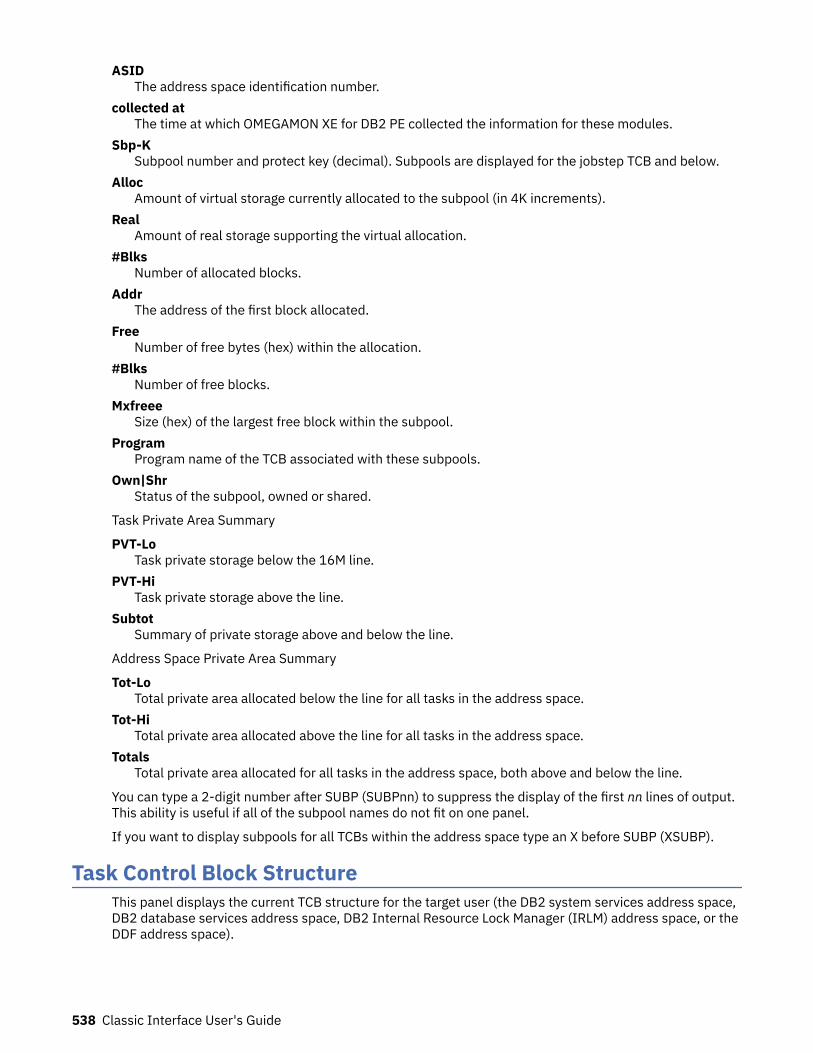
ASIDThe address space identification number.
collected atThe time at which OMEGAMON XE for DB2 PE collected the information for these modules.
Sbp-KSubpool number and protect key (decimal). Subpools are displayed for the jobstep TCB and below.
AllocAmount of virtual storage currently allocated to the subpool (in 4K increments).
RealAmount of real storage supporting the virtual allocation.
#BlksNumber of allocated blocks.
AddrThe address of the first block allocated.
FreeNumber of free bytes (hex) within the allocation.
#BlksNumber of free blocks.
MxfreeeSize (hex) of the largest free block within the subpool.
ProgramProgram name of the TCB associated with these subpools.
Own|ShrStatus of the subpool, owned or shared.
Task Private Area Summary
PVT-LoTask private storage below the 16M line.
PVT-HiTask private storage above the line.
SubtotSummary of private storage above and below the line.
Address Space Private Area Summary
Tot-LoTotal private area allocated below the line for all tasks in the address space.
Tot-HiTotal private area allocated above the line for all tasks in the address space.
TotalsTotal private area allocated for all tasks in the address space, both above and below the line.
You can type a 2-digit number after SUBP (SUBPnn) to suppress the display of the first nn lines of output.This ability is useful if all of the subpool names do not fit on one panel.
If you want to display subpools for all TCBs within the address space type an X before SUBP (XSUBP).
Task Control Block StructureThis panel displays the current TCB structure for the target user (the DB2 system services address space,DB2 database services address space, DB2 Internal Resource Lock Manager (IRLM) address space, or theDDF address space).
538 Classic Interface User's Guide
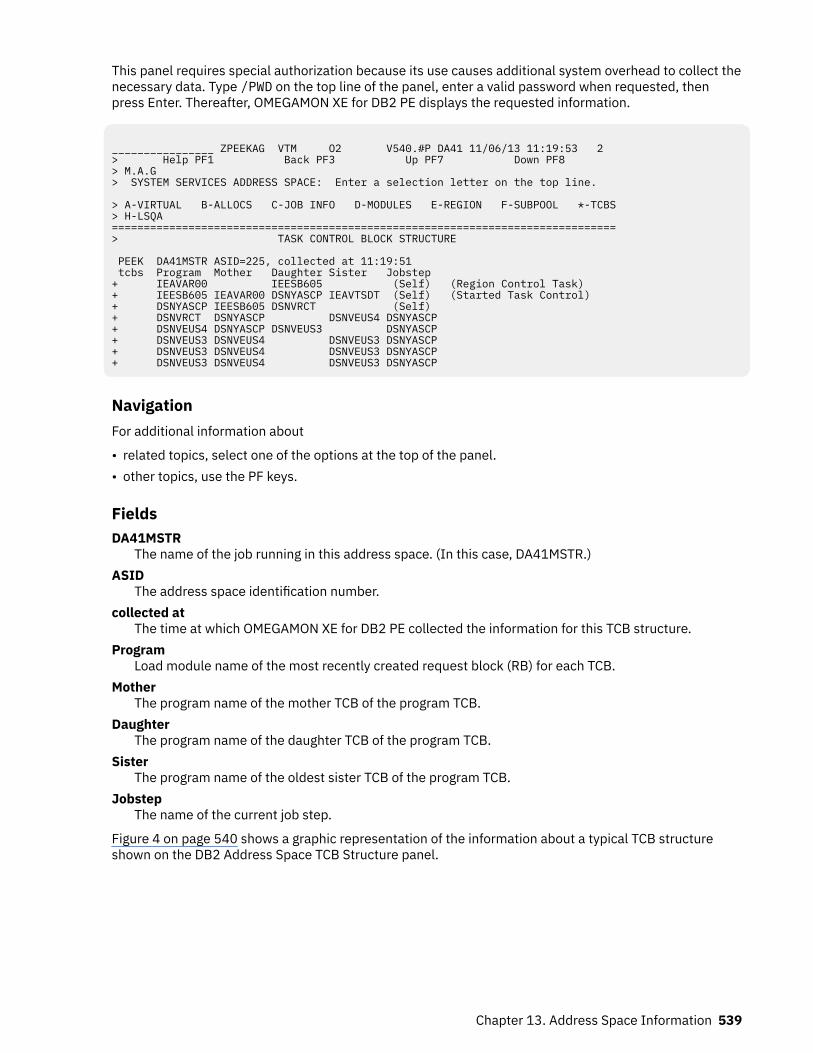
This panel requires special authorization because its use causes additional system overhead to collect thenecessary data. Type /PWD on the top line of the panel, enter a valid password when requested, thenpress Enter. Thereafter, OMEGAMON XE for DB2 PE displays the requested information.
________________ ZPEEKAG VTM O2 V540.#P DA41 11/06/13 11:19:53 2 > Help PF1 Back PF3 Up PF7 Down PF8 > M.A.G > SYSTEM SERVICES ADDRESS SPACE: Enter a selection letter on the top line. > A-VIRTUAL B-ALLOCS C-JOB INFO D-MODULES E-REGION F-SUBPOOL *-TCBS > H-LSQA =============================================================================== > TASK CONTROL BLOCK STRUCTURE PEEK DA41MSTR ASID=225, collected at 11:19:51 tcbs Program Mother Daughter Sister Jobstep + IEAVAR00 IEESB605 (Self) (Region Control Task) + IEESB605 IEAVAR00 DSNYASCP IEAVTSDT (Self) (Started Task Control) + DSNYASCP IEESB605 DSNVRCT (Self) + DSNVRCT DSNYASCP DSNVEUS4 DSNYASCP + DSNVEUS4 DSNYASCP DSNVEUS3 DSNYASCP + DSNVEUS3 DSNVEUS4 DSNVEUS3 DSNYASCP + DSNVEUS3 DSNVEUS4 DSNVEUS3 DSNYASCP + DSNVEUS3 DSNVEUS4 DSNVEUS3 DSNYASCP
NavigationFor additional information about
• related topics, select one of the options at the top of the panel.• other topics, use the PF keys.
FieldsDA41MSTR
The name of the job running in this address space. (In this case, DA41MSTR.)ASID
The address space identification number.collected at
The time at which OMEGAMON XE for DB2 PE collected the information for this TCB structure.Program
Load module name of the most recently created request block (RB) for each TCB.Mother
The program name of the mother TCB of the program TCB.Daughter
The program name of the daughter TCB of the program TCB.Sister
The program name of the oldest sister TCB of the program TCB.Jobstep
The name of the current job step.
Figure 4 on page 540 shows a graphic representation of the information about a typical TCB structureshown on the DB2 Address Space TCB Structure panel.
Chapter 13. Address Space Information 539
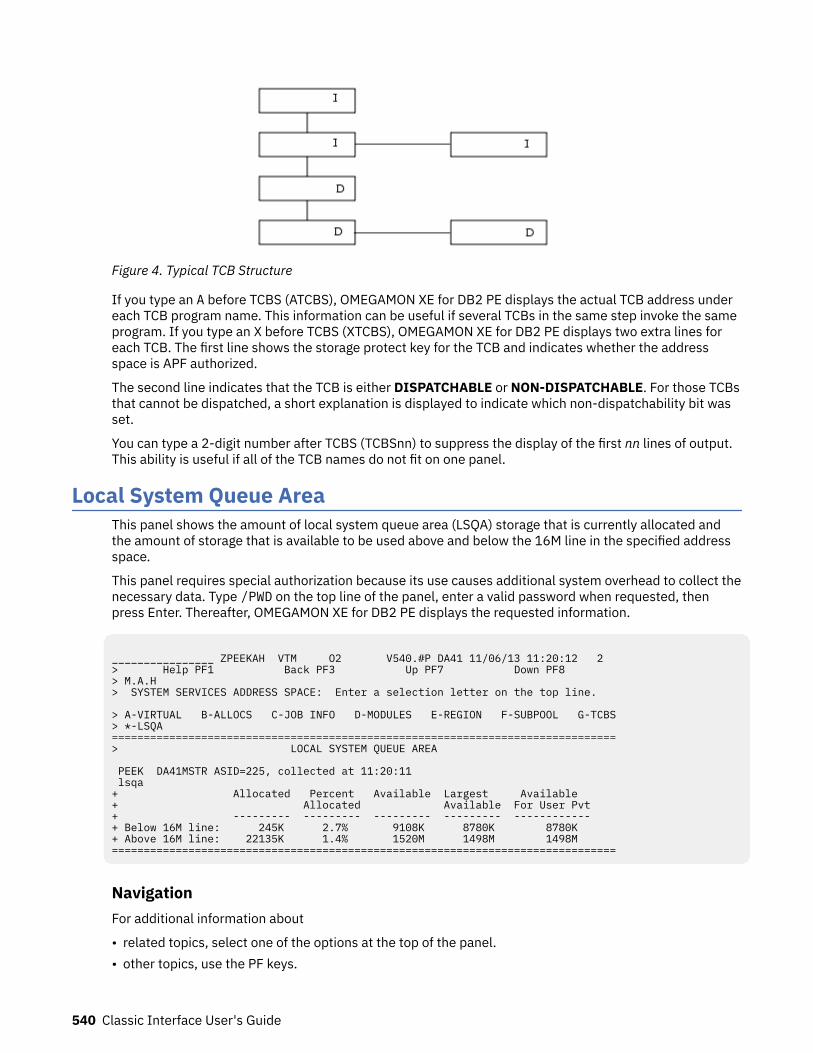
Figure 4. Typical TCB Structure
If you type an A before TCBS (ATCBS), OMEGAMON XE for DB2 PE displays the actual TCB address undereach TCB program name. This information can be useful if several TCBs in the same step invoke the sameprogram. If you type an X before TCBS (XTCBS), OMEGAMON XE for DB2 PE displays two extra lines foreach TCB. The first line shows the storage protect key for the TCB and indicates whether the addressspace is APF authorized.
The second line indicates that the TCB is either DISPATCHABLE or NON-DISPATCHABLE. For those TCBsthat cannot be dispatched, a short explanation is displayed to indicate which non-dispatchability bit wasset.
You can type a 2-digit number after TCBS (TCBSnn) to suppress the display of the first nn lines of output.This ability is useful if all of the TCB names do not fit on one panel.
Local System Queue AreaThis panel shows the amount of local system queue area (LSQA) storage that is currently allocated andthe amount of storage that is available to be used above and below the 16M line in the specified addressspace.
This panel requires special authorization because its use causes additional system overhead to collect thenecessary data. Type /PWD on the top line of the panel, enter a valid password when requested, thenpress Enter. Thereafter, OMEGAMON XE for DB2 PE displays the requested information.
________________ ZPEEKAH VTM O2 V540.#P DA41 11/06/13 11:20:12 2 > Help PF1 Back PF3 Up PF7 Down PF8 > M.A.H > SYSTEM SERVICES ADDRESS SPACE: Enter a selection letter on the top line. > A-VIRTUAL B-ALLOCS C-JOB INFO D-MODULES E-REGION F-SUBPOOL G-TCBS> *-LSQA ===============================================================================> LOCAL SYSTEM QUEUE AREA PEEK DA41MSTR ASID=225, collected at 11:20:11 lsqa + Allocated Percent Available Largest Available + Allocated Available For User Pvt + --------- --------- --------- --------- ------------ + Below 16M line: 245K 2.7% 9108K 8780K 8780K + Above 16M line: 22135K 1.4% 1520M 1498M 1498M ===============================================================================
NavigationFor additional information about
• related topics, select one of the options at the top of the panel.• other topics, use the PF keys.
540 Classic Interface User's Guide
FieldsDA41MSTR
The name of the job that is running in this address space. (In this case, DA41MSTR.)ASID
The address space identification number.collected at
The time at which OMEGAMON XE for DB2 PE collected the information for this TCB structure.Allocated
The size of the storage which is currently in use.Percent Allocated
The percentage of allocated memory versus the whole amount of memory (Allocated / Available *100).
AvailableThe overall available LSQA storage, this includes the allocated LSQA/SWA that is available plus theavailable user private.
Largest availableThe largest available contiguous storage area.
Available For User PvtThe LSQA eligible storage that is available for the private usage of the user.
Chapter 13. Address Space Information 541

542 Classic Interface User's Guide
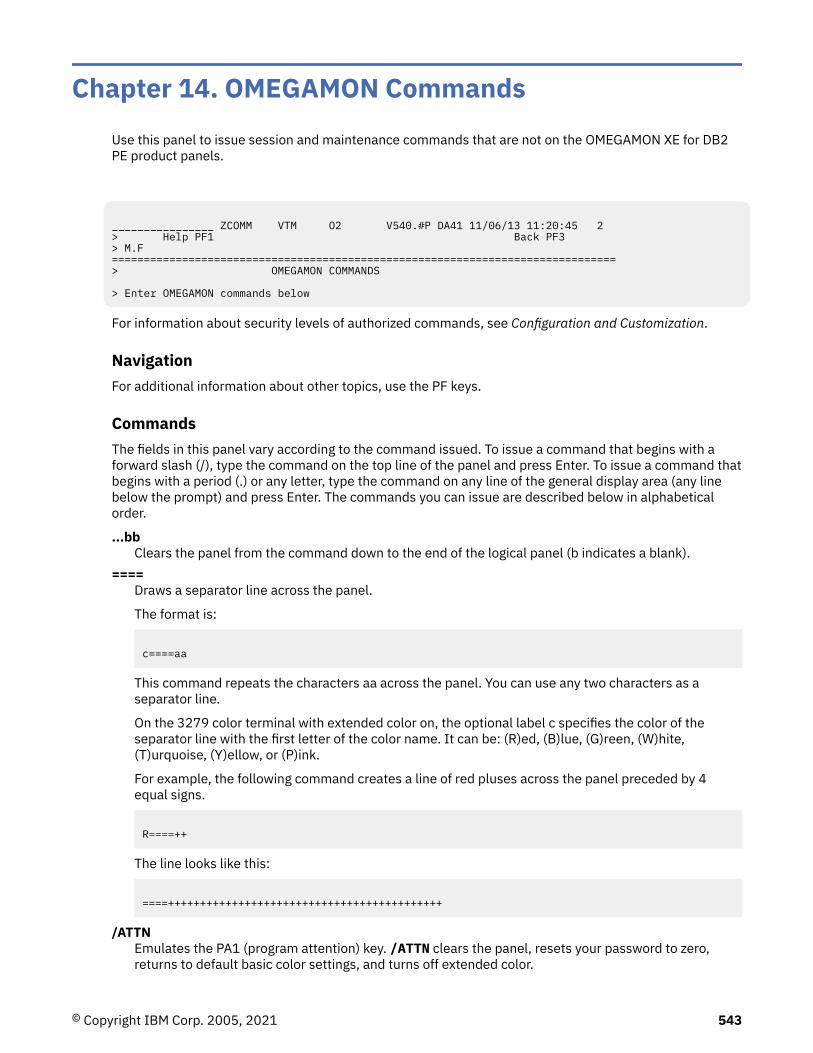
Chapter 14. OMEGAMON CommandsUse this panel to issue session and maintenance commands that are not on the OMEGAMON XE for DB2PE product panels.
________________ ZCOMM VTM O2 V540.#P DA41 11/06/13 11:20:45 2 > Help PF1 Back PF3 > M.F ===============================================================================> OMEGAMON COMMANDS > Enter OMEGAMON commands below
For information about security levels of authorized commands, see Configuration and Customization.
NavigationFor additional information about other topics, use the PF keys.
CommandsThe fields in this panel vary according to the command issued. To issue a command that begins with aforward slash (/), type the command on the top line of the panel and press Enter. To issue a command thatbegins with a period (.) or any letter, type the command on any line of the general display area (any linebelow the prompt) and press Enter. The commands you can issue are described below in alphabeticalorder.
...bbClears the panel from the command down to the end of the logical panel (b indicates a blank).
====Draws a separator line across the panel.
The format is:
c====aa
This command repeats the characters aa across the panel. You can use any two characters as aseparator line.
On the 3279 color terminal with extended color on, the optional label c specifies the color of theseparator line with the first letter of the color name. It can be: (R)ed, (B)lue, (G)reen, (W)hite,(T)urquoise, (Y)ellow, or (P)ink.
For example, the following command creates a line of red pluses across the panel preceded by 4equal signs.
R====++
The line looks like this:
====+++++++++++++++++++++++++++++++++++++++++++
/ATTNEmulates the PA1 (program attention) key. /ATTN clears the panel, resets your password to zero,returns to default basic color settings, and turns off extended color.
© Copyright IBM Corp. 2005, 2021 543
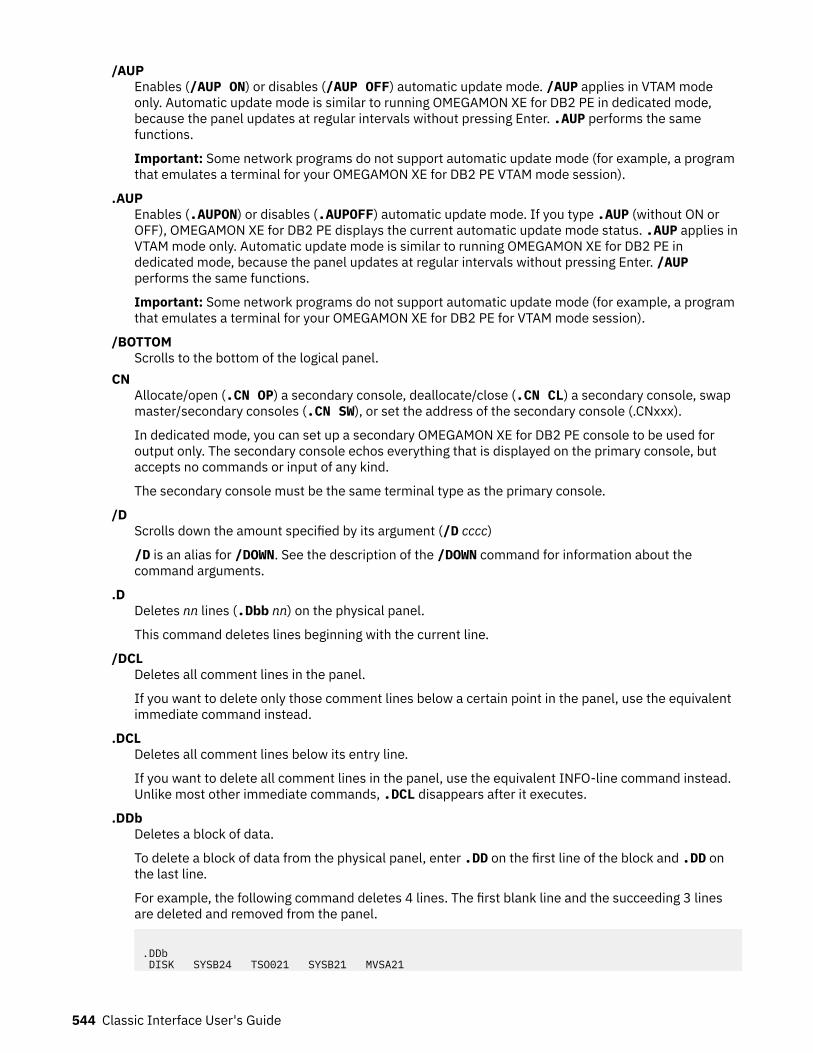
/AUPEnables (/AUP ON) or disables (/AUP OFF) automatic update mode. /AUP applies in VTAM modeonly. Automatic update mode is similar to running OMEGAMON XE for DB2 PE in dedicated mode,because the panel updates at regular intervals without pressing Enter. .AUP performs the samefunctions.
Important: Some network programs do not support automatic update mode (for example, a programthat emulates a terminal for your OMEGAMON XE for DB2 PE VTAM mode session).
.AUPEnables (.AUPON) or disables (.AUPOFF) automatic update mode. If you type .AUP (without ON orOFF), OMEGAMON XE for DB2 PE displays the current automatic update mode status. .AUP applies inVTAM mode only. Automatic update mode is similar to running OMEGAMON XE for DB2 PE indedicated mode, because the panel updates at regular intervals without pressing Enter. /AUPperforms the same functions.
Important: Some network programs do not support automatic update mode (for example, a programthat emulates a terminal for your OMEGAMON XE for DB2 PE for VTAM mode session).
/BOTTOMScrolls to the bottom of the logical panel.
CNAllocate/open (.CN OP) a secondary console, deallocate/close (.CN CL) a secondary console, swapmaster/secondary consoles (.CN SW), or set the address of the secondary console (.CNxxx).
In dedicated mode, you can set up a secondary OMEGAMON XE for DB2 PE console to be used foroutput only. The secondary console echos everything that is displayed on the primary console, butaccepts no commands or input of any kind.
The secondary console must be the same terminal type as the primary console.
/DScrolls down the amount specified by its argument (/D cccc)
/D is an alias for /DOWN. See the description of the /DOWN command for information about thecommand arguments.
.DDeletes nn lines (.Dbb nn) on the physical panel.
This command deletes lines beginning with the current line.
/DCLDeletes all comment lines in the panel.
If you want to delete only those comment lines below a certain point in the panel, use the equivalentimmediate command instead.
.DCLDeletes all comment lines below its entry line.
If you want to delete all comment lines in the panel, use the equivalent INFO-line command instead.Unlike most other immediate commands, .DCL disappears after it executes.
.DDbDeletes a block of data.
To delete a block of data from the physical panel, enter .DD on the first line of the block and .DD onthe last line.
For example, the following command deletes 4 lines. The first blank line and the succeeding 3 linesare deleted and removed from the panel.
.DDb DISK SYSB24 TSO021 SYSB21 MVSA21
544 Classic Interface User's Guide
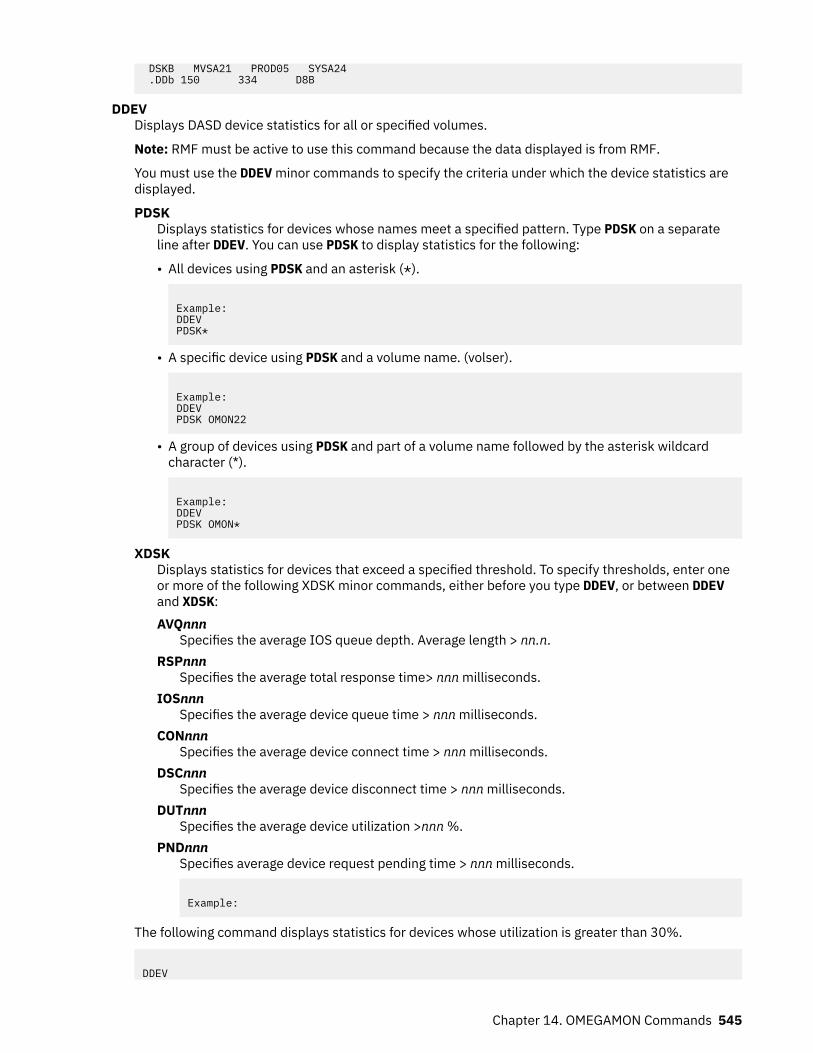
DSKB MVSA21 PROD05 SYSA24 .DDb 150 334 D8B
DDEVDisplays DASD device statistics for all or specified volumes.
Note: RMF must be active to use this command because the data displayed is from RMF.
You must use the DDEV minor commands to specify the criteria under which the device statistics aredisplayed.
PDSKDisplays statistics for devices whose names meet a specified pattern. Type PDSK on a separateline after DDEV. You can use PDSK to display statistics for the following:
• All devices using PDSK and an asterisk (*).
Example:DDEVPDSK*
• A specific device using PDSK and a volume name. (volser).
Example:DDEVPDSK OMON22
• A group of devices using PDSK and part of a volume name followed by the asterisk wildcardcharacter (*).
Example:DDEVPDSK OMON*
XDSKDisplays statistics for devices that exceed a specified threshold. To specify thresholds, enter oneor more of the following XDSK minor commands, either before you type DDEV, or between DDEVand XDSK:AVQnnn
Specifies the average IOS queue depth. Average length > nn.n.RSPnnn
Specifies the average total response time> nnn milliseconds.IOSnnn
Specifies the average device queue time > nnn milliseconds.CONnnn
Specifies the average device connect time > nnn milliseconds.DSCnnn
Specifies the average device disconnect time > nnn milliseconds.DUTnnn
Specifies the average device utilization >nnn %.PNDnnn
Specifies average device request pending time > nnn milliseconds.
Example:
The following command displays statistics for devices whose utilization is greater than 30%.
DDEV
Chapter 14. OMEGAMON Commands 545
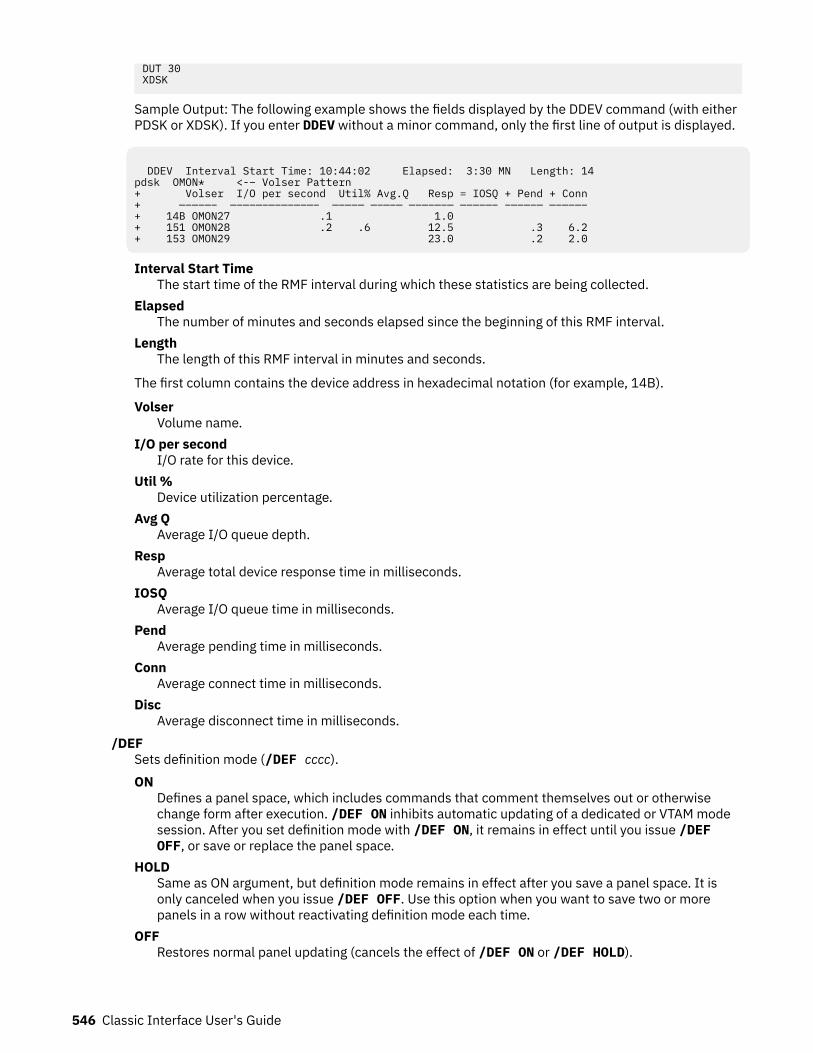
DUT 30XDSK
Sample Output: The following example shows the fields displayed by the DDEV command (with eitherPDSK or XDSK). If you enter DDEV without a minor command, only the first line of output is displayed.
DDEV Interval Start Time: 10:44:02 Elapsed: 3:30 MN Length: 14 pdsk OMON* <-– Volser Pattern + Volser I/O per second Util% Avg.Q Resp = IOSQ + Pend + Conn + —–—–—– —–—–—–—–—–—–—– —–—–— —–—–— —–—–—–— —–—–—– –—–—–— —–—–—– + 14B OMON27 .1 1.0 + 151 OMON28 .2 .6 12.5 .3 6.2 + 153 OMON29 23.0 .2 2.0
Interval Start TimeThe start time of the RMF interval during which these statistics are being collected.
ElapsedThe number of minutes and seconds elapsed since the beginning of this RMF interval.
LengthThe length of this RMF interval in minutes and seconds.
The first column contains the device address in hexadecimal notation (for example, 14B).
VolserVolume name.
I/O per secondI/O rate for this device.
Util %Device utilization percentage.
Avg QAverage I/O queue depth.
RespAverage total device response time in milliseconds.
IOSQAverage I/O queue time in milliseconds.
PendAverage pending time in milliseconds.
ConnAverage connect time in milliseconds.
DiscAverage disconnect time in milliseconds.
/DEFSets definition mode (/DEF cccc).ON
Defines a panel space, which includes commands that comment themselves out or otherwisechange form after execution. /DEF ON inhibits automatic updating of a dedicated or VTAM modesession. After you set definition mode with /DEF ON, it remains in effect until you issue /DEFOFF, or save or replace the panel space.
HOLDSame as ON argument, but definition mode remains in effect after you save a panel space. It isonly canceled when you issue /DEF OFF. Use this option when you want to save two or morepanels in a row without reactivating definition mode each time.
OFFRestores normal panel updating (cancels the effect of /DEF ON or /DEF HOLD).
546 Classic Interface User's Guide
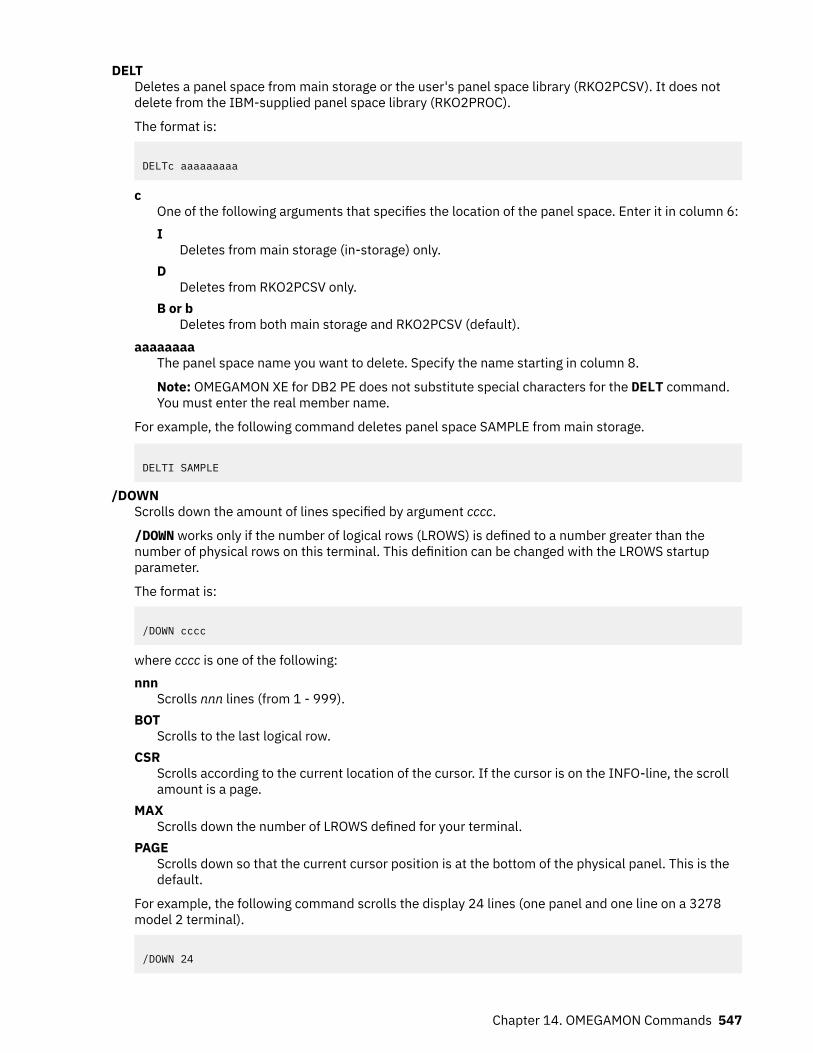
DELTDeletes a panel space from main storage or the user's panel space library (RKO2PCSV). It does notdelete from the IBM-supplied panel space library (RKO2PROC).
The format is:
DELTc aaaaaaaaa
cOne of the following arguments that specifies the location of the panel space. Enter it in column 6:I
Deletes from main storage (in-storage) only.D
Deletes from RKO2PCSV only.B or b
Deletes from both main storage and RKO2PCSV (default).aaaaaaaa
The panel space name you want to delete. Specify the name starting in column 8.
Note: OMEGAMON XE for DB2 PE does not substitute special characters for the DELT command.You must enter the real member name.
For example, the following command deletes panel space SAMPLE from main storage.
DELTI SAMPLE
/DOWNScrolls down the amount of lines specified by argument cccc.
/DOWN works only if the number of logical rows (LROWS) is defined to a number greater than thenumber of physical rows on this terminal. This definition can be changed with the LROWS startupparameter.
The format is:
/DOWN cccc
where cccc is one of the following:nnn
Scrolls nnn lines (from 1 - 999).BOT
Scrolls to the last logical row.CSR
Scrolls according to the current location of the cursor. If the cursor is on the INFO-line, the scrollamount is a page.
MAXScrolls down the number of LROWS defined for your terminal.
PAGEScrolls down so that the current cursor position is at the bottom of the physical panel. This is thedefault.
For example, the following command scrolls the display 24 lines (one panel and one line on a 3278model 2 terminal).
/DOWN 24
Chapter 14. OMEGAMON Commands 547
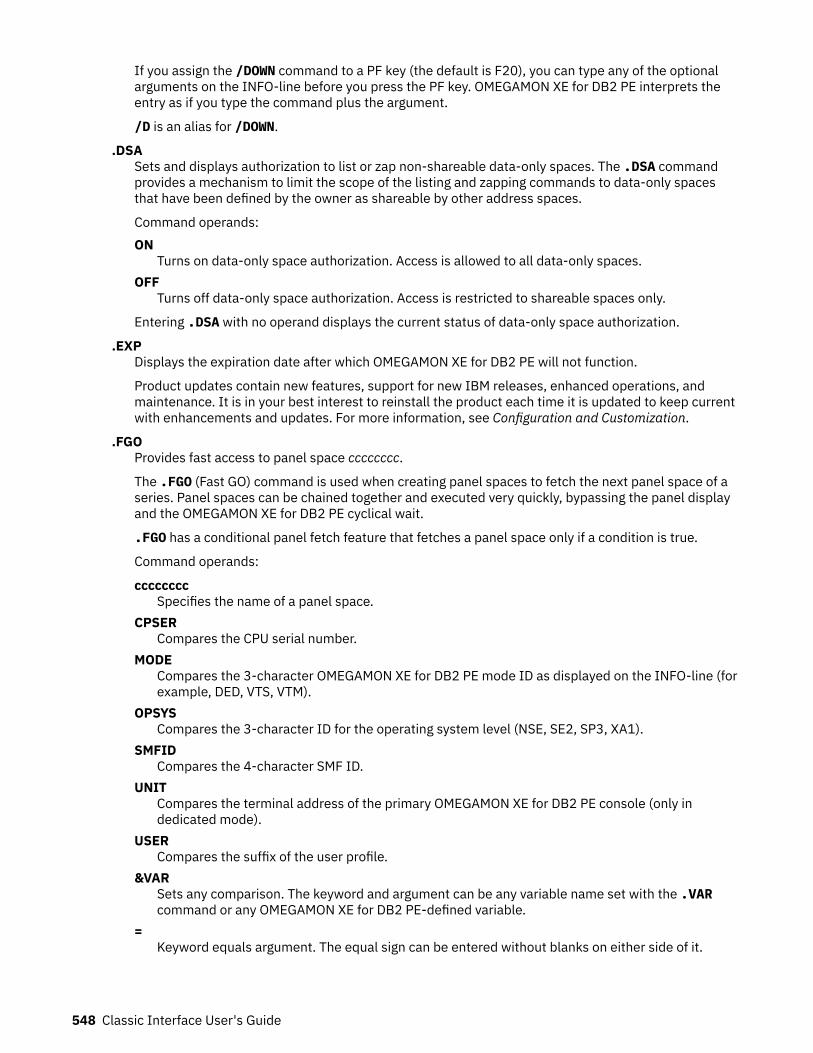
If you assign the /DOWN command to a PF key (the default is F20), you can type any of the optionalarguments on the INFO-line before you press the PF key. OMEGAMON XE for DB2 PE interprets theentry as if you type the command plus the argument.
/D is an alias for /DOWN.
.DSASets and displays authorization to list or zap non-shareable data-only spaces. The .DSA commandprovides a mechanism to limit the scope of the listing and zapping commands to data-only spacesthat have been defined by the owner as shareable by other address spaces.
Command operands:ON
Turns on data-only space authorization. Access is allowed to all data-only spaces.OFF
Turns off data-only space authorization. Access is restricted to shareable spaces only.
Entering .DSA with no operand displays the current status of data-only space authorization.
.EXPDisplays the expiration date after which OMEGAMON XE for DB2 PE will not function.
Product updates contain new features, support for new IBM releases, enhanced operations, andmaintenance. It is in your best interest to reinstall the product each time it is updated to keep currentwith enhancements and updates. For more information, see Configuration and Customization.
.FGOProvides fast access to panel space cccccccc.
The .FGO (Fast GO) command is used when creating panel spaces to fetch the next panel space of aseries. Panel spaces can be chained together and executed very quickly, bypassing the panel displayand the OMEGAMON XE for DB2 PE cyclical wait.
.FGO has a conditional panel fetch feature that fetches a panel space only if a condition is true.
Command operands:
ccccccccSpecifies the name of a panel space.
CPSERCompares the CPU serial number.
MODECompares the 3-character OMEGAMON XE for DB2 PE mode ID as displayed on the INFO-line (forexample, DED, VTS, VTM).
OPSYSCompares the 3-character ID for the operating system level (NSE, SE2, SP3, XA1).
SMFIDCompares the 4-character SMF ID.
UNITCompares the terminal address of the primary OMEGAMON XE for DB2 PE console (only indedicated mode).
USERCompares the suffix of the user profile.
&VARSets any comparison. The keyword and argument can be any variable name set with the .VARcommand or any OMEGAMON XE for DB2 PE-defined variable.
=Keyword equals argument. The equal sign can be entered without blanks on either side of it.
548 Classic Interface User's Guide
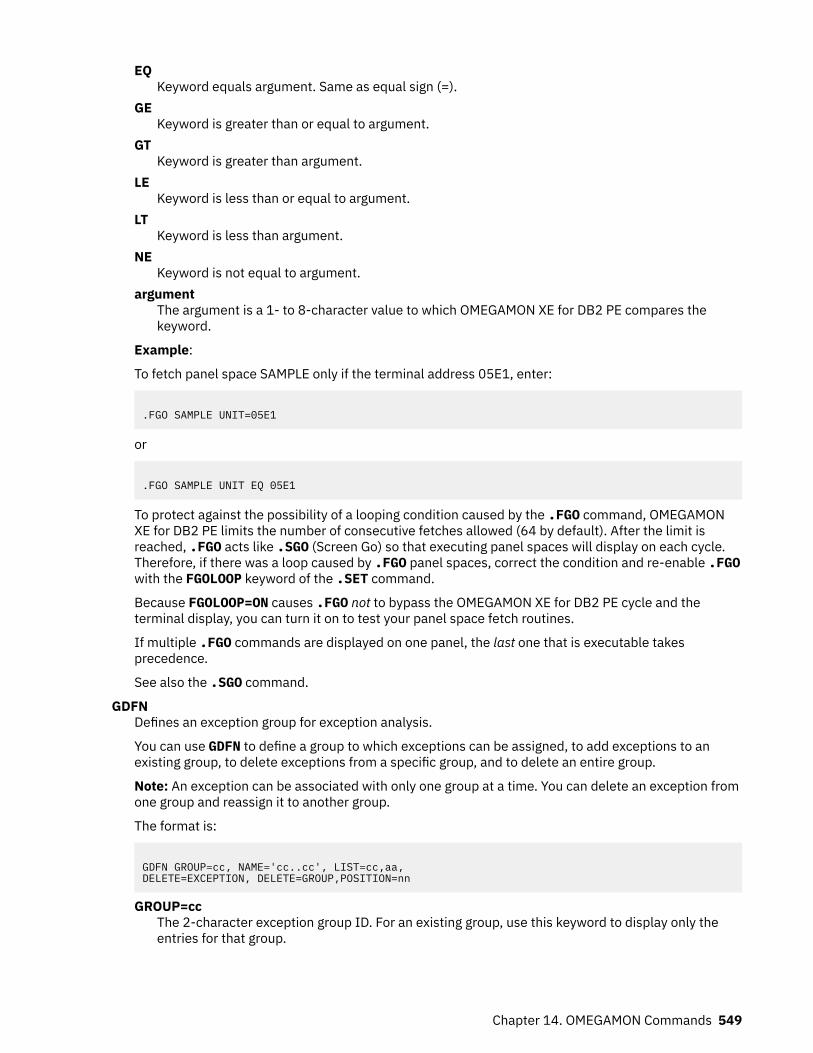
EQKeyword equals argument. Same as equal sign (=).
GEKeyword is greater than or equal to argument.
GTKeyword is greater than argument.
LEKeyword is less than or equal to argument.
LTKeyword is less than argument.
NEKeyword is not equal to argument.
argumentThe argument is a 1- to 8-character value to which OMEGAMON XE for DB2 PE compares thekeyword.
Example:
To fetch panel space SAMPLE only if the terminal address 05E1, enter:
.FGO SAMPLE UNIT=05E1
or
.FGO SAMPLE UNIT EQ 05E1
To protect against the possibility of a looping condition caused by the .FGO command, OMEGAMONXE for DB2 PE limits the number of consecutive fetches allowed (64 by default). After the limit isreached, .FGO acts like .SGO (Screen Go) so that executing panel spaces will display on each cycle.Therefore, if there was a loop caused by .FGO panel spaces, correct the condition and re-enable .FGOwith the FGOLOOP keyword of the .SET command.
Because FGOLOOP=ON causes .FGO not to bypass the OMEGAMON XE for DB2 PE cycle and theterminal display, you can turn it on to test your panel space fetch routines.
If multiple .FGO commands are displayed on one panel, the last one that is executable takesprecedence.
See also the .SGO command.
GDFNDefines an exception group for exception analysis.
You can use GDFN to define a group to which exceptions can be assigned, to add exceptions to anexisting group, to delete exceptions from a specific group, and to delete an entire group.
Note: An exception can be associated with only one group at a time. You can delete an exception fromone group and reassign it to another group.
The format is:
GDFN GROUP=cc, NAME='cc..cc', LIST=cc,aa, DELETE=EXCEPTION, DELETE=GROUP,POSITION=nn
GROUP=ccThe 2-character exception group ID. For an existing group, use this keyword to display only theentries for that group.
Chapter 14. OMEGAMON Commands 549
NAME='cc..cc'A 25-character user-defined description of the exception group. Enclose in single quotes (') ifthere are blanks, special characters, or single quotes (') in the name.
LIST=cc,aaIdentifies the exceptions to be added to or deleted from the specified exception group.
DELETE=EXCEPTIONCauses the deletion of the exceptions specified with LIST= from the group specified by GROUP=.
POSITION=nnSpecifies the order of the display.
/HDescribes the HELP facilities.
/H is an alias for /HELP
/HELPDescribes the HELP facilities.
The help panel space informs you how to find out more about the functions, features, and operation ofOMEGAMON XE for DB2 PE.
Note: This command works with or without a forward slash (/).
/HOLDControls the execution of OMEGAMON XE for DB2 PE commands.
/HOLD ON suspends command execution until you enter /HOLD OFF. /HOLD OFF returns to normalOMEGAMON XE for DB2 PE command execution.
The /HOLD command is designed for users of VM/PASSTHRU. If you are not a user of VM/PASSTHRU, /HOLD functions the same as placing the cursor in column 1, row 1.
.IInserts nn blank lines (.Ibbnn) in the panel.
.ILCDisplays INFO-line commands or their help text.
The format is:
.ILC /cccccc
The variable /cccccc is an INFO-line command name. (The forward slash (/) is optional.) To display allof the INFO-line commands and their aliases, enter the .ILC command without a command name.
To display help text for a specific INFO-line command, enter .ILC followed by the command.
.LOGControls the OMEGAMON XE for DB2 PE REPORT log:.LOGOUT
Prints the current log and leaves it open. The command comments itself out to prevent the logfrom automatically resetting again on the next cycle.
.LOGPUSHSaves the status of the log (ON or OFF), so that this status can be restored when youexecute .LOGPOP. This capability can be used to manipulate the log's status in panel spacesinvoked by .FGO or .SGO, then return it to its original state after these panel routines arecomplete. One of the following messages is displayed on the same line as the command:
>> Log inactive. Status saved. <<
550 Classic Interface User's Guide
or
>> Log active. Status saved. <<
.LOGPOPRestores the log to the status in effect when you executed the last .LOGPUSH. One of the followingmessages is displayed on the same line as the command.
>> Log status restored to inactive. <<
or
>> Log status restored to active. <<
If you enter .LOG without an argument, OMEGAMON XE for DB2 PE displays the current status of thelog.
/LOG is the equivalent INFO-line command; however, it does not accept the PUSH and POParguments.
/LOGOUTSends the current OMEGAMON XE for DB2 PE REPORT log to the printer.
/O is an alias for /LOG with the OUT argument.
OMEGAMON XE for DB2 PE dynamically allocates REPORT to a SYSOUT equals A file with FREE equalsCLOSE. This means that every time you enter the /LOGOUT command, the REPORT log isautomatically spun off.
.LOG performs the same functions as /LOG, and additionally accepts the PUSH and POP arguments.
LSCRLoads panel space members from the panel space library to main storage.
You can make panel spaces more available and more easily fetched by loading them into main storagewith LSCR. For example, if a disk is not available, you can continue to invoke the panel spaces that youloaded into main storage with LSCR.
The format is:
LSCR cccccccc cccccccc . . . cccccccc
The variables cccccccc are panel space names. Specify panel space member names starting in column8. You can load as many members as can fit on the input line.
For example, in the next command,OMEGAMON XE for DB2 PE attempts to load panel spaces ZZ1,ZZ2, and ZZ3 from the O2PROC data set to main storage.
LSCR ZZ1 ZZ2 ZZ3
If OMEGAMON XE for DB2 PE cannot find panel space ZZ1, it displays the following messages:
+ OB1507 Member not found - ZZ1+ OB1508 2 members loaded
MCHNScans common storage.
This command requires special authorization because its use causes additional system overhead tocollect the necessary data. Before OMEGAMON XE for DB2 PE displays this data, you must enter avalid password using the /PWD command.
Chapter 14. OMEGAMON Commands 551
MCHN scans the elements of a table for a string of hex or character values. If the scan is successful,OMEGAMON XE for DB2 PE displays the table element that contains the string.
MCHN searches the address space in which OMEGAMON XE for DB2 PE resides. Use this commandprimarily to examine the MVS common area. Use XMCH to search other address spaces.
The format is:
MCHNc addr,string,olen,chain,dlen
cThe format of the output:B or b
hex and character (default)C
character onlyX
hex onlyaddr
The address of the first table element that OMEGAMON XE for DB2 PE scans.string
The hex string that OMEGAMON XE for DB2 PE uses for the scan. If you enclose it in single quotes('), OMEGAMON XE for DB2 PE assumes it is a character string.
Note: OMEGAMON XE for DB2 PE interprets two single quotes (' '), within a character string as asingle quote (').
olenThe offset (in hex bytes) to the string in the table element; the comparison starts at this point. Youcan precede olen by a plus sign (+) or a minus sign (-).
chainThe offset (in hex bytes) to the chain pointer (the location in the table element that contains theaddress of the next table element). You can precede chain by a plus sign (+) or minus sign (-).
dlenThe number of bytes (1 to 8 hex digits) that OMEGAMON XE for DB2 PE displays if the scan issuccessful. The display starts at the beginning of the string. The default is 16 (X ` 10 `) bytes.
Ensure that addr is the starting point of a table element. The address at addr + chain points to thenext table element. The scan ends when the value at addr + chain is one of the following:
• 0• -1• addr (the table is a ring)
You can specify, modify, or pre-define an address (addr) for a storage display or modificationcommand. An address consists of an anchor, optional modifiers, and an optional pre-defined name.
An anchor is the base address of an address specification. It can be:
absoluteA hexadecimal number:370
1 to 6 digitsXA/ESA
1 to 8 digitssymbolic
1- to 8-alphanumeric characters, including @, #, and $.
552 Classic Interface User's Guide
You can supply one or more modifiers to change the location that the anchor points to. A modifier canbe:
offsetA plus sign (+) or minus sign (-), followed by a hexadecimal number:370
1 to 6 digitsXA/ESA
1 to 8 digitsThis modifier specifies a location at a known offset (positive or negative) from the anchor address.
indirectOne of the following symbols:%
for 24-bit (370) addressing?
for 31-bit (XA/ESA) addressingThis modifier indicates that the location pointed to is itself an address.
You can use these modifiers to create powerful and versatile address expressions. For example, thefollowing address expression locates the TIOT of the currently executing MVS task:
10%%+4%+C%
10%Treats the data at location X`10' as a 24-bit address. This is the address of the MVS CVT.
%This second % treats the data at the start of the CVT as a 24-bit address. The first word of the CVTcontains the address of a doubleword (8 bytes). The doubleword contains:
• the address of the next TCB to dispatch (bytes 0 to 3)• the address of the currently dispatched TCB (bytes 4 to 7)
+4%Adds X'04' to the address of the doubleword, and then treats the data at the displacement as a24-bit address. This is the address of the currently dispatched TCB.
+c%Adds X'0C' to the address of the TCB, and then treats the data at the displacement as a 24-bitaddress. This is the address of the TIOT.
You can specify or reference an address by a name consisting of 1- to 8-alphanumeric characters,including @, #, and $. The following command specifies address names.
The example below shows a typical MCHN command. In this example, MCHN scans a table that starts atlocation AAB6C8 and looks for the string D6C30199 that begins at the eighth byte of the tableelement; the address of the next table element is in the fourth word. By default, this commanddisplays 16 bytes of the table element in hex and character notation.
MCHN AAB6C8,D6C30199,8,4
The following output is displayed if the scan is successful:
Addr=007DA000MCHN AAB6C8,D6C30199,8,4+ 0000 E2E2C3E3 00000000 D6C30199 00000000 *SSCT OC r *
Chapter 14. OMEGAMON Commands 553
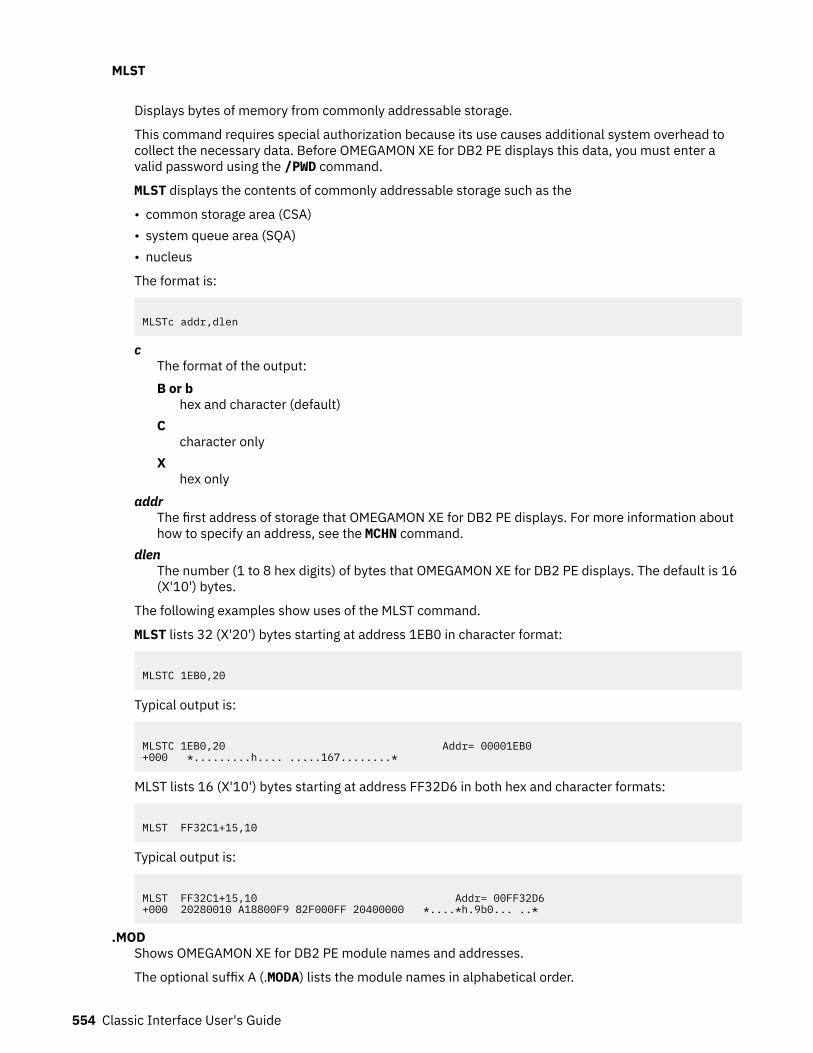
MLST
Displays bytes of memory from commonly addressable storage.
This command requires special authorization because its use causes additional system overhead tocollect the necessary data. Before OMEGAMON XE for DB2 PE displays this data, you must enter avalid password using the /PWD command.
MLST displays the contents of commonly addressable storage such as the
• common storage area (CSA)• system queue area (SQA)• nucleus
The format is:
MLSTc addr,dlen
cThe format of the output:B or b
hex and character (default)C
character onlyX
hex onlyaddr
The first address of storage that OMEGAMON XE for DB2 PE displays. For more information abouthow to specify an address, see the MCHN command.
dlenThe number (1 to 8 hex digits) of bytes that OMEGAMON XE for DB2 PE displays. The default is 16(X'10') bytes.
The following examples show uses of the MLST command.
MLST lists 32 (X'20') bytes starting at address 1EB0 in character format:
MLSTC 1EB0,20
Typical output is:
MLSTC 1EB0,20 Addr= 00001EB0+000 *.........h.... .....167........*
MLST lists 16 (X'10') bytes starting at address FF32D6 in both hex and character formats:
MLST FF32C1+15,10
Typical output is:
MLST FF32C1+15,10 Addr= 00FF32D6+000 20280010 A18800F9 82F000FF 20400000 *....*h.9b0... ..*
.MODShows OMEGAMON XE for DB2 PE module names and addresses.
The optional suffix A (.MODA) lists the module names in alphabetical order.
554 Classic Interface User's Guide
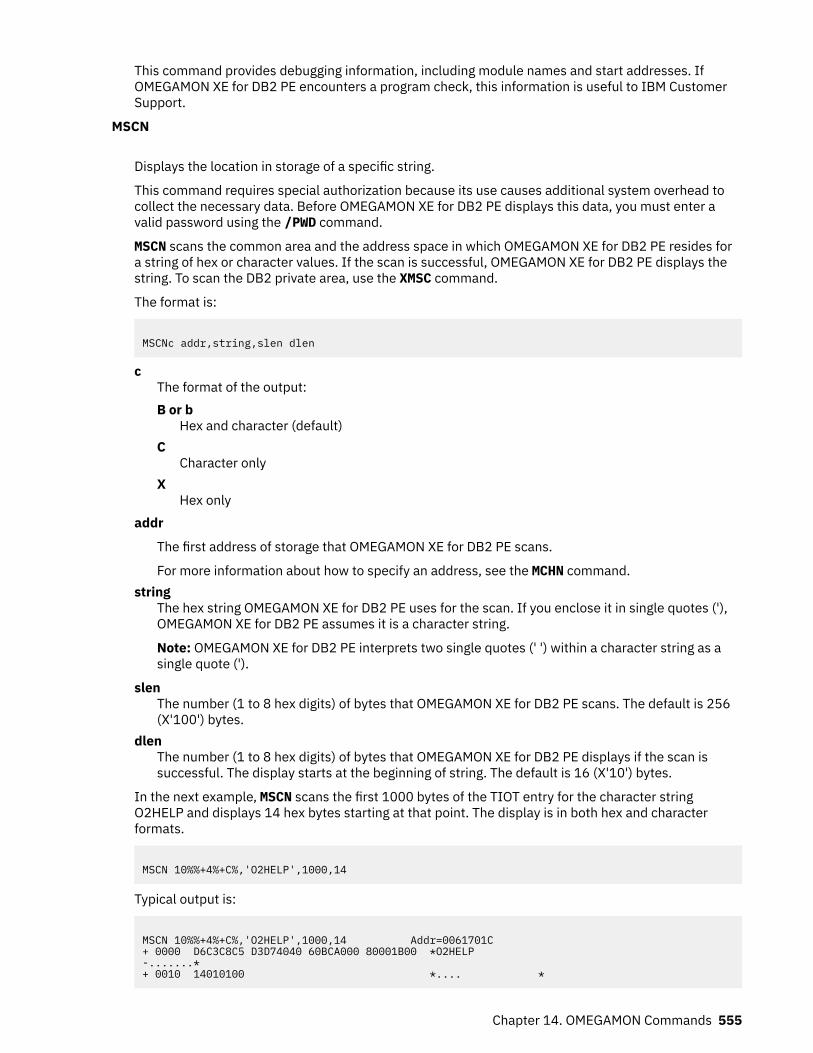
This command provides debugging information, including module names and start addresses. IfOMEGAMON XE for DB2 PE encounters a program check, this information is useful to IBM CustomerSupport.
MSCN
Displays the location in storage of a specific string.
This command requires special authorization because its use causes additional system overhead tocollect the necessary data. Before OMEGAMON XE for DB2 PE displays this data, you must enter avalid password using the /PWD command.
MSCN scans the common area and the address space in which OMEGAMON XE for DB2 PE resides fora string of hex or character values. If the scan is successful, OMEGAMON XE for DB2 PE displays thestring. To scan the DB2 private area, use the XMSC command.
The format is:
MSCNc addr,string,slen dlen
cThe format of the output:B or b
Hex and character (default)C
Character onlyX
Hex onlyaddr
The first address of storage that OMEGAMON XE for DB2 PE scans.
For more information about how to specify an address, see the MCHN command.string
The hex string OMEGAMON XE for DB2 PE uses for the scan. If you enclose it in single quotes ('),OMEGAMON XE for DB2 PE assumes it is a character string.
Note: OMEGAMON XE for DB2 PE interprets two single quotes (' ') within a character string as asingle quote (').
slenThe number (1 to 8 hex digits) of bytes that OMEGAMON XE for DB2 PE scans. The default is 256(X'100') bytes.
dlenThe number (1 to 8 hex digits) of bytes that OMEGAMON XE for DB2 PE displays if the scan issuccessful. The display starts at the beginning of string. The default is 16 (X'10') bytes.
In the next example, MSCN scans the first 1000 bytes of the TIOT entry for the character stringO2HELP and displays 14 hex bytes starting at that point. The display is in both hex and characterformats.
MSCN 10%%+4%+C%,'O2HELP',1000,14
Typical output is:
MSCN 10%%+4%+C%,'O2HELP',1000,14 Addr=0061701C+ 0000 D6C3C8C5 D3D74040 60BCA000 80001B00 *O2HELP -.......*+ 0010 14010100 *.... *
Chapter 14. OMEGAMON Commands 555
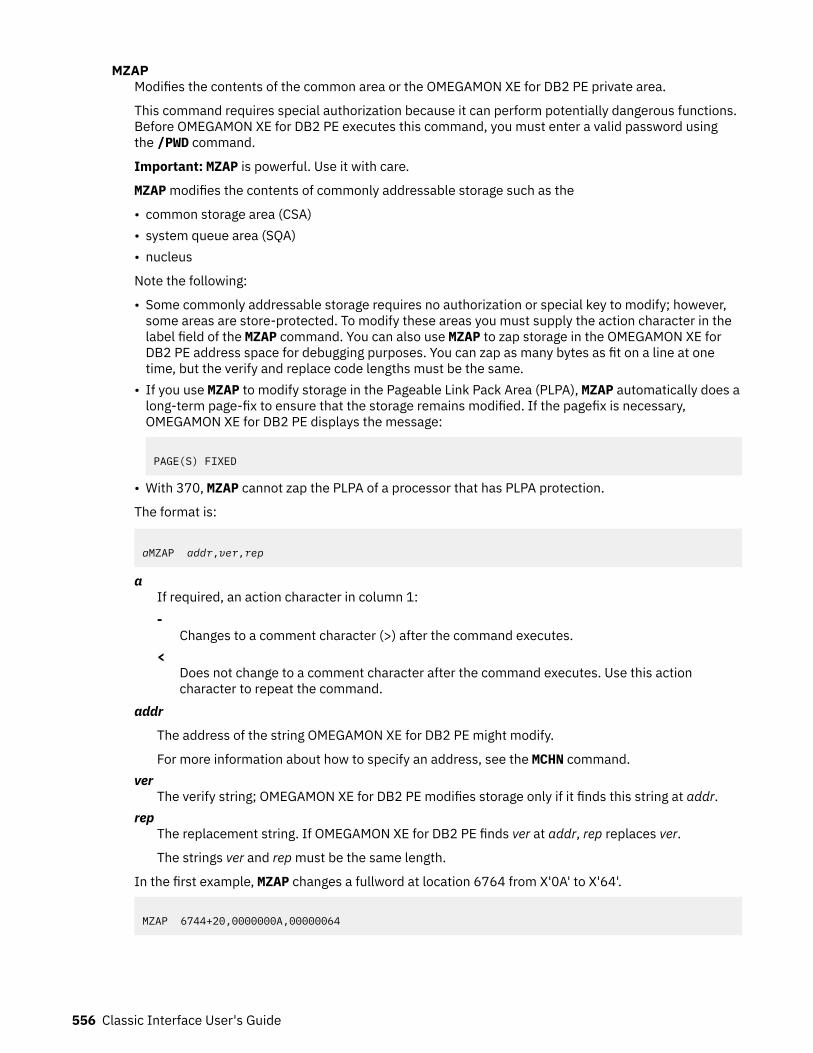
MZAPModifies the contents of the common area or the OMEGAMON XE for DB2 PE private area.
This command requires special authorization because it can perform potentially dangerous functions.Before OMEGAMON XE for DB2 PE executes this command, you must enter a valid password usingthe /PWD command.
Important: MZAP is powerful. Use it with care.
MZAP modifies the contents of commonly addressable storage such as the
• common storage area (CSA)• system queue area (SQA)• nucleus
Note the following:
• Some commonly addressable storage requires no authorization or special key to modify; however,some areas are store-protected. To modify these areas you must supply the action character in thelabel field of the MZAP command. You can also use MZAP to zap storage in the OMEGAMON XE forDB2 PE address space for debugging purposes. You can zap as many bytes as fit on a line at onetime, but the verify and replace code lengths must be the same.
• If you use MZAP to modify storage in the Pageable Link Pack Area (PLPA), MZAP automatically does along-term page-fix to ensure that the storage remains modified. If the pagefix is necessary,OMEGAMON XE for DB2 PE displays the message:
PAGE(S) FIXED
• With 370, MZAP cannot zap the PLPA of a processor that has PLPA protection.
The format is:
aMZAP addr,ver,rep
aIf required, an action character in column 1:-
Changes to a comment character (>) after the command executes.<
Does not change to a comment character after the command executes. Use this actioncharacter to repeat the command.
addr
The address of the string OMEGAMON XE for DB2 PE might modify.
For more information about how to specify an address, see the MCHN command.ver
The verify string; OMEGAMON XE for DB2 PE modifies storage only if it finds this string at addr.rep
The replacement string. If OMEGAMON XE for DB2 PE finds ver at addr, rep replaces ver.
The strings ver and rep must be the same length.
In the first example, MZAP changes a fullword at location 6764 from X'0A' to X'64'.
MZAP 6744+20,0000000A,00000064
556 Classic Interface User's Guide
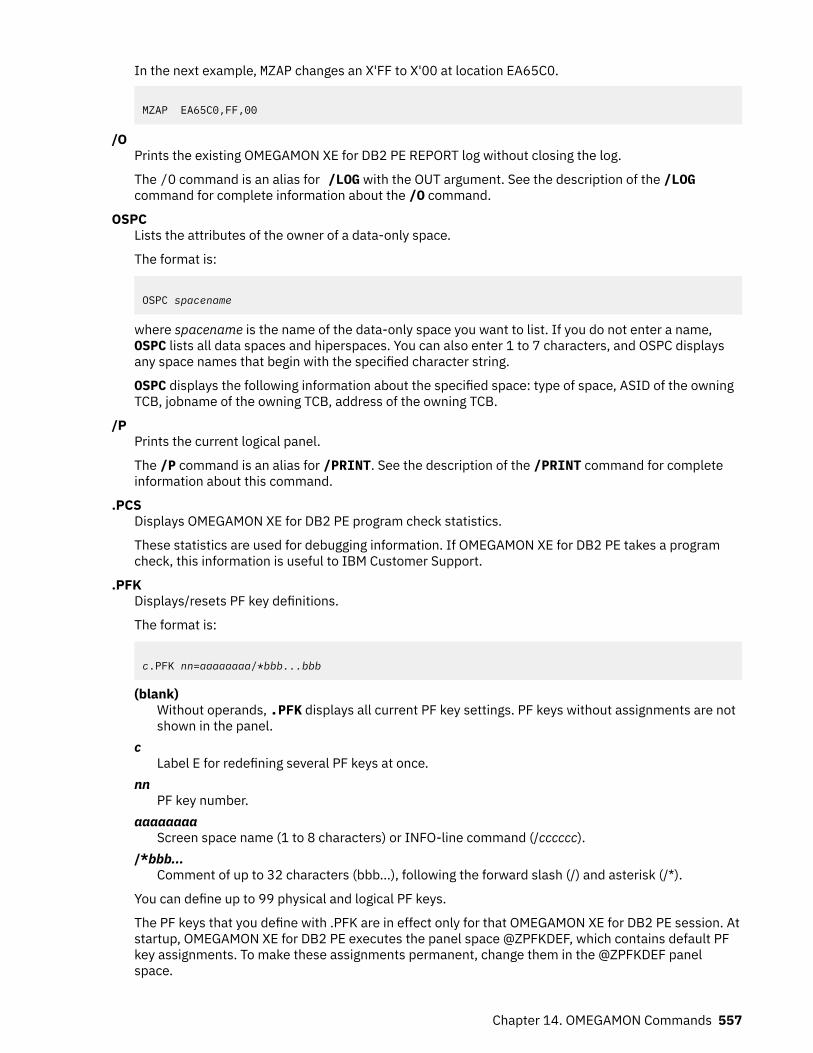
In the next example, MZAP changes an X'FF to X'00 at location EA65C0.
MZAP EA65C0,FF,00
/OPrints the existing OMEGAMON XE for DB2 PE REPORT log without closing the log.
The /O command is an alias for /LOG with the OUT argument. See the description of the /LOGcommand for complete information about the /O command.
OSPCLists the attributes of the owner of a data-only space.
The format is:
OSPC spacename
where spacename is the name of the data-only space you want to list. If you do not enter a name,OSPC lists all data spaces and hiperspaces. You can also enter 1 to 7 characters, and OSPC displaysany space names that begin with the specified character string.
OSPC displays the following information about the specified space: type of space, ASID of the owningTCB, jobname of the owning TCB, address of the owning TCB.
/PPrints the current logical panel.
The /P command is an alias for /PRINT. See the description of the /PRINT command for completeinformation about this command.
.PCSDisplays OMEGAMON XE for DB2 PE program check statistics.
These statistics are used for debugging information. If OMEGAMON XE for DB2 PE takes a programcheck, this information is useful to IBM Customer Support.
.PFKDisplays/resets PF key definitions.
The format is:
c.PFK nn=aaaaaaaa/*bbb...bbb
(blank)Without operands, .PFK displays all current PF key settings. PF keys without assignments are notshown in the panel.
cLabel E for redefining several PF keys at once.
nnPF key number.
aaaaaaaaScreen space name (1 to 8 characters) or INFO-line command (/cccccc).
/*bbb...Comment of up to 32 characters (bbb...), following the forward slash (/) and asterisk (/*).
You can define up to 99 physical and logical PF keys.
The PF keys that you define with .PFK are in effect only for that OMEGAMON XE for DB2 PE session. Atstartup, OMEGAMON XE for DB2 PE executes the panel space @ZPFKDEF, which contains default PFkey assignments. To make these assignments permanent, change them in the @ZPFKDEF panelspace.
Chapter 14. OMEGAMON Commands 557
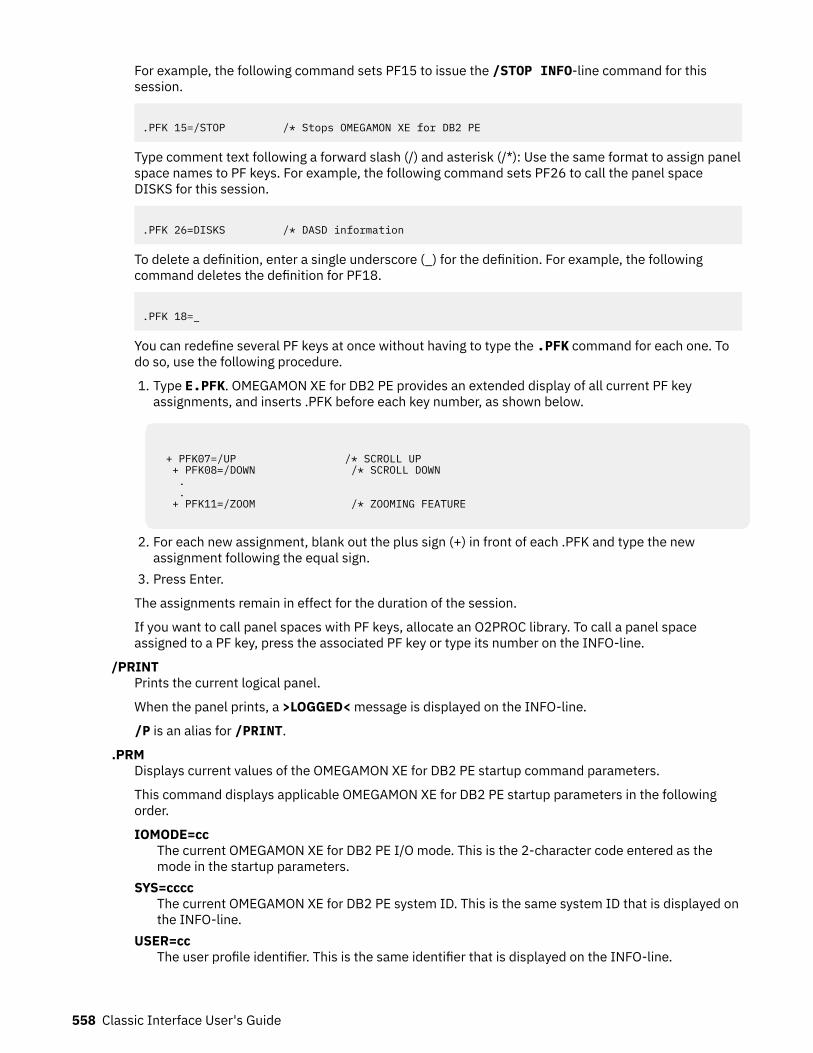
For example, the following command sets PF15 to issue the /STOP INFO-line command for thissession.
.PFK 15=/STOP /* Stops OMEGAMON XE for DB2 PE
Type comment text following a forward slash (/) and asterisk (/*): Use the same format to assign panelspace names to PF keys. For example, the following command sets PF26 to call the panel spaceDISKS for this session.
.PFK 26=DISKS /* DASD information
To delete a definition, enter a single underscore (_) for the definition. For example, the followingcommand deletes the definition for PF18.
.PFK 18=_
You can redefine several PF keys at once without having to type the .PFK command for each one. Todo so, use the following procedure.
1. Type E.PFK. OMEGAMON XE for DB2 PE provides an extended display of all current PF keyassignments, and inserts .PFK before each key number, as shown below.
+ PFK07=/UP /* SCROLL UP + PFK08=/DOWN /* SCROLL DOWN . . + PFK11=/ZOOM /* ZOOMING FEATURE
2. For each new assignment, blank out the plus sign (+) in front of each .PFK and type the newassignment following the equal sign.
3. Press Enter.
The assignments remain in effect for the duration of the session.
If you want to call panel spaces with PF keys, allocate an O2PROC library. To call a panel spaceassigned to a PF key, press the associated PF key or type its number on the INFO-line.
/PRINTPrints the current logical panel.
When the panel prints, a >LOGGED< message is displayed on the INFO-line.
/P is an alias for /PRINT.
.PRMDisplays current values of the OMEGAMON XE for DB2 PE startup command parameters.
This command displays applicable OMEGAMON XE for DB2 PE startup parameters in the followingorder.
IOMODE=ccThe current OMEGAMON XE for DB2 PE I/O mode. This is the 2-character code entered as themode in the startup parameters.
SYS=ccccThe current OMEGAMON XE for DB2 PE system ID. This is the same system ID that is displayed onthe INFO-line.
USER=ccThe user profile identifier. This is the same identifier that is displayed on the INFO-line.
558 Classic Interface User's Guide
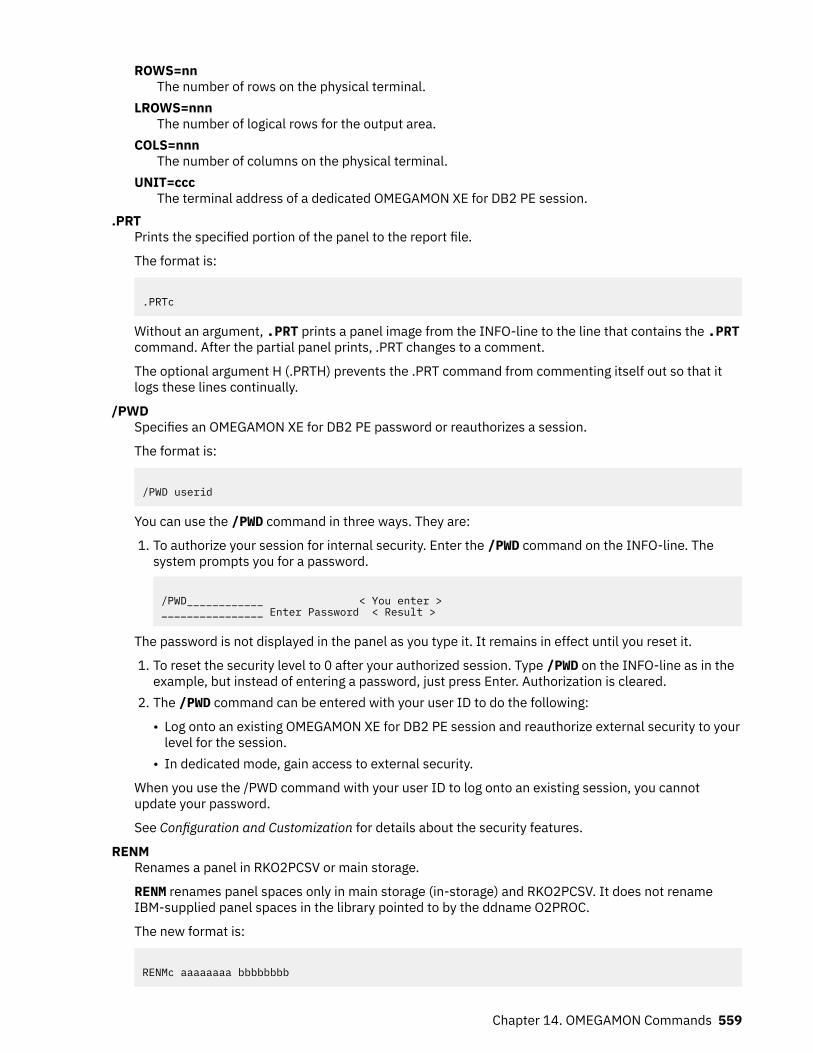
ROWS=nnThe number of rows on the physical terminal.
LROWS=nnnThe number of logical rows for the output area.
COLS=nnnThe number of columns on the physical terminal.
UNIT=cccThe terminal address of a dedicated OMEGAMON XE for DB2 PE session.
.PRTPrints the specified portion of the panel to the report file.
The format is:
.PRTc
Without an argument, .PRT prints a panel image from the INFO-line to the line that contains the .PRTcommand. After the partial panel prints, .PRT changes to a comment.
The optional argument H (.PRTH) prevents the .PRT command from commenting itself out so that itlogs these lines continually.
/PWDSpecifies an OMEGAMON XE for DB2 PE password or reauthorizes a session.
The format is:
/PWD userid
You can use the /PWD command in three ways. They are:
1. To authorize your session for internal security. Enter the /PWD command on the INFO-line. Thesystem prompts you for a password.
/PWD____________ < You enter >________________ Enter Password < Result >
The password is not displayed in the panel as you type it. It remains in effect until you reset it.
1. To reset the security level to 0 after your authorized session. Type /PWD on the INFO-line as in theexample, but instead of entering a password, just press Enter. Authorization is cleared.
2. The /PWD command can be entered with your user ID to do the following:
• Log onto an existing OMEGAMON XE for DB2 PE session and reauthorize external security to yourlevel for the session.
• In dedicated mode, gain access to external security.
When you use the /PWD command with your user ID to log onto an existing session, you cannotupdate your password.
See Configuration and Customization for details about the security features.
RENMRenames a panel in RKO2PCSV or main storage.
RENM renames panel spaces only in main storage (in-storage) and RKO2PCSV. It does not renameIBM-supplied panel spaces in the library pointed to by the ddname O2PROC.
The new format is:
RENMc aaaaaaaa bbbbbbbb
Chapter 14. OMEGAMON Commands 559
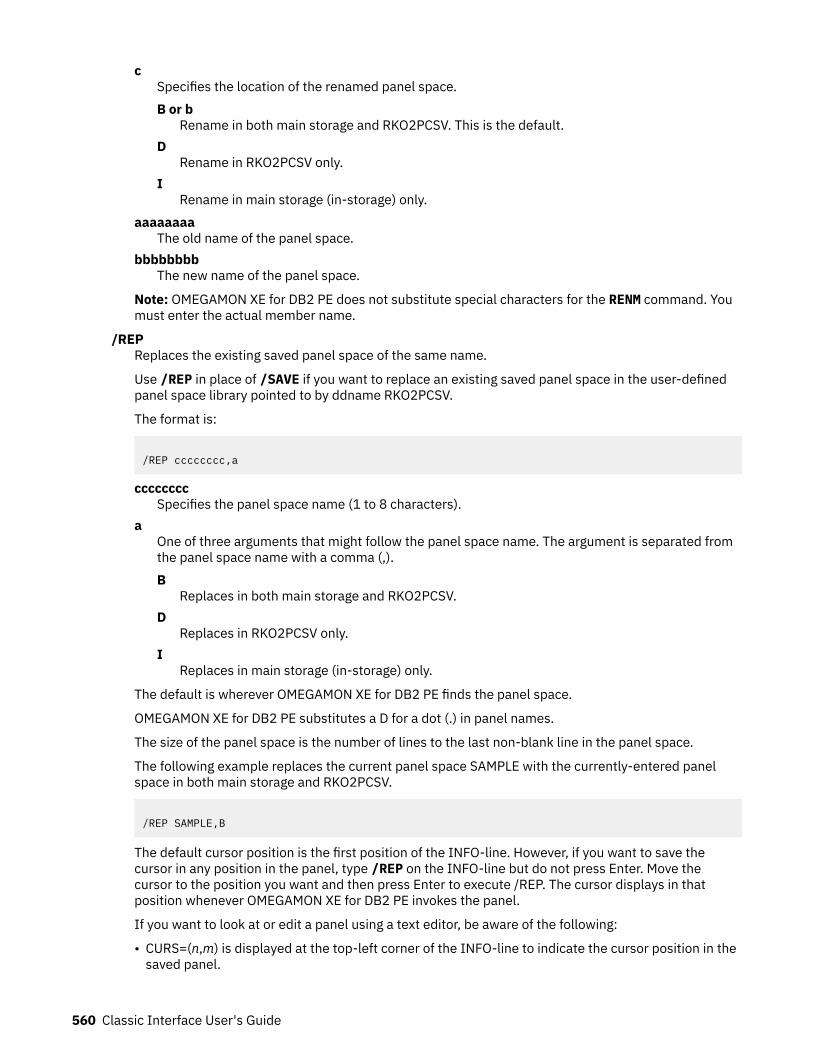
cSpecifies the location of the renamed panel space.B or b
Rename in both main storage and RKO2PCSV. This is the default.D
Rename in RKO2PCSV only.I
Rename in main storage (in-storage) only.aaaaaaaa
The old name of the panel space.bbbbbbbb
The new name of the panel space.
Note: OMEGAMON XE for DB2 PE does not substitute special characters for the RENM command. Youmust enter the actual member name.
/REPReplaces the existing saved panel space of the same name.
Use /REP in place of /SAVE if you want to replace an existing saved panel space in the user-definedpanel space library pointed to by ddname RKO2PCSV.
The format is:
/REP cccccccc,a
ccccccccSpecifies the panel space name (1 to 8 characters).
aOne of three arguments that might follow the panel space name. The argument is separated fromthe panel space name with a comma (,).B
Replaces in both main storage and RKO2PCSV.D
Replaces in RKO2PCSV only.I
Replaces in main storage (in-storage) only.
The default is wherever OMEGAMON XE for DB2 PE finds the panel space.
OMEGAMON XE for DB2 PE substitutes a D for a dot (.) in panel names.
The size of the panel space is the number of lines to the last non-blank line in the panel space.
The following example replaces the current panel space SAMPLE with the currently-entered panelspace in both main storage and RKO2PCSV.
/REP SAMPLE,B
The default cursor position is the first position of the INFO-line. However, if you want to save thecursor in any position in the panel, type /REP on the INFO-line but do not press Enter. Move thecursor to the position you want and then press Enter to execute /REP. The cursor displays in thatposition whenever OMEGAMON XE for DB2 PE invokes the panel.
If you want to look at or edit a panel using a text editor, be aware of the following:
• CURS=(n,m) is displayed at the top-left corner of the INFO-line to indicate the cursor position in thesaved panel.
560 Classic Interface User's Guide
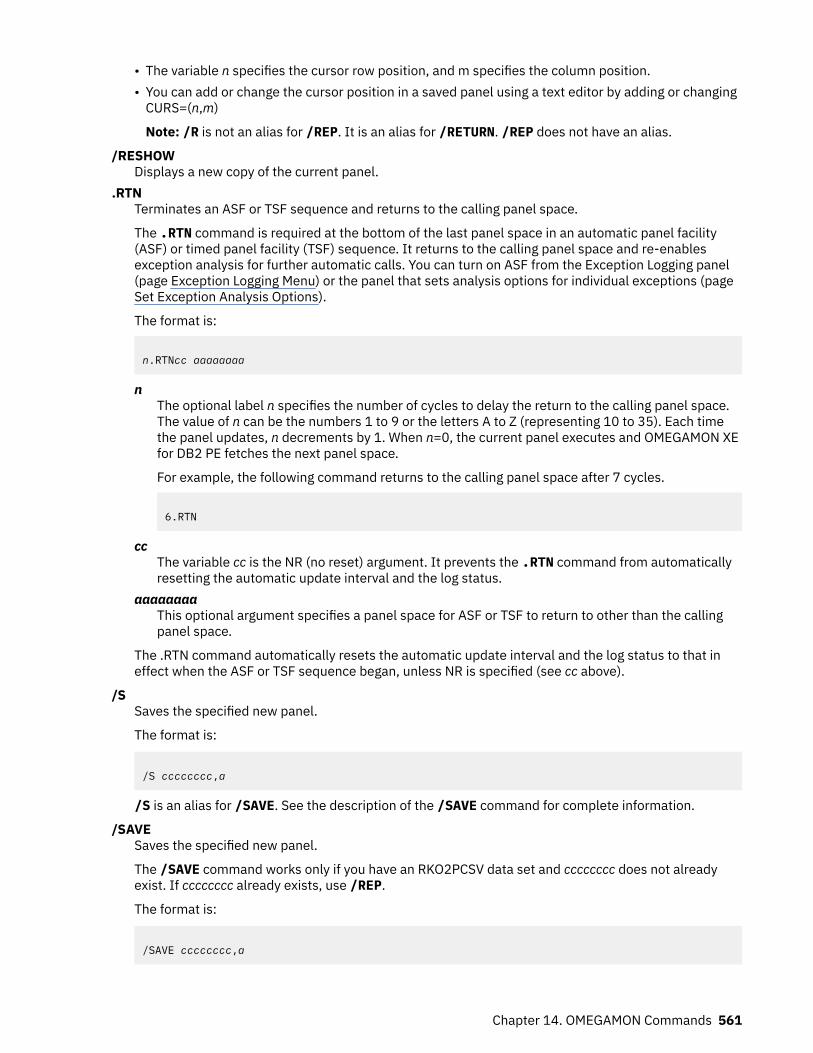
• The variable n specifies the cursor row position, and m specifies the column position.• You can add or change the cursor position in a saved panel using a text editor by adding or changing
CURS=(n,m)
Note: /R is not an alias for /REP. It is an alias for /RETURN. /REP does not have an alias.
/RESHOWDisplays a new copy of the current panel.
.RTNTerminates an ASF or TSF sequence and returns to the calling panel space.
The .RTN command is required at the bottom of the last panel space in an automatic panel facility(ASF) or timed panel facility (TSF) sequence. It returns to the calling panel space and re-enablesexception analysis for further automatic calls. You can turn on ASF from the Exception Logging panel(page Exception Logging Menu) or the panel that sets analysis options for individual exceptions (pageSet Exception Analysis Options).
The format is:
n.RTNcc aaaaaaaa
nThe optional label n specifies the number of cycles to delay the return to the calling panel space.The value of n can be the numbers 1 to 9 or the letters A to Z (representing 10 to 35). Each timethe panel updates, n decrements by 1. When n=0, the current panel executes and OMEGAMON XEfor DB2 PE fetches the next panel space.
For example, the following command returns to the calling panel space after 7 cycles.
6.RTN
ccThe variable cc is the NR (no reset) argument. It prevents the .RTN command from automaticallyresetting the automatic update interval and the log status.
aaaaaaaaThis optional argument specifies a panel space for ASF or TSF to return to other than the callingpanel space.
The .RTN command automatically resets the automatic update interval and the log status to that ineffect when the ASF or TSF sequence began, unless NR is specified (see cc above).
/SSaves the specified new panel.
The format is:
/S cccccccc,a
/S is an alias for /SAVE. See the description of the /SAVE command for complete information.
/SAVESaves the specified new panel.
The /SAVE command works only if you have an RKO2PCSV data set and cccccccc does not alreadyexist. If cccccccc already exists, use /REP.
The format is:
/SAVE cccccccc,a
Chapter 14. OMEGAMON Commands 561
ccccccccSpecifies the panel name (1 to 8 characters).
aOne of three arguments that might follow the panel space name. The argument is separated fromthe panel space with a comma (,).B
Saves the panel space to both RKO2PCSV and main storage (in-storage panel facility).D or b
Saves the panel space to RKO2PCSV only (default).I
Saves the panel space to main storage only.
OMEGAMON XE for DB2 PE substitutes a D for a dot (.) in panel space names.
This next example saves the current panel SAMPLE in both main storage and RKO2PCSV.
/SAVE SAMPLE,B
The default cursor position is the first position of the INFO-line. However, if you want to save thecursor in any position in the panel, type /SAVE on the INFO-line but do not press Enter. Move thecursor to the position you want and then press Enter to execute /SAVE. The cursor displays in thatposition whenever OMEGAMON XE for DB2 PE invokes the panel.
If you want to look at or edit a panel space using a text editor, be aware of the following
• CURS=(n,m) is displayed at the top left corner of the INFO-line to indicate the cursor position in thesaved panel.
• The variable n specifies the cursor row position, and m specifies the column position.• You can add or change the cursor position in a saved panel using a text editor by adding or changing
CURS=(n,m).
/S is an alias for /SAVE.
SCHNScans data-only space control blocks for a string of data and displays the location.
Use SCHN to search chained control blocks located in a data-only space for the occurrence of aspecific string of data. SCHN scans data-only space storage until either a match to the string is found,the chain loops, or the address of the next control block is zero.
The format is:
aSCHNc jobname,spacename,addr,string,off1,off2,plen
aA required action character in column 1:-
Changes to a comment character (>) after the command executes.<
Does not change to a comment character after the command executes. Use this actioncharacter to repeat the command.
cThe format of the output:B or b
hex and character (default)C
character only
562 Classic Interface User's Guide
Xhex only
jobnameThe jobname or ASID in decimal of the owner of the data-only space.
spacenameThe name of the data-only space.
addr
The starting address of the scan. For more information about how to specify an address, see theMCHN command.
stringThe comparison string for the scan, which can be either a hexadecimal string or a character stringsurrounded by single quotes (').
off1The offset from the beginning of the control block to the location of the comparison string. Thisvalue might be preceded by a plus (+) or a minus (-) sign.
off2The offset from the beginning of the control block to the fullword address of the next controlblock. This value might be preceded by a plus (+) or a minus (-) sign.
plenThe length of print display. The default is 1 line or 16 bytes.
SCRNLists panel member names.
The format is:
SCRNc aa bb
cEnter one of the following arguments in column 6 to specify the source of the member list.B or b
Lists all panels in both disk data sets (RKO2PCSV) and main storage (default).C
Lists all panels in disk data sets only.X
Lists all panels in main storage (in-storage) only.aa bb
Lists all panels beginning with characters aa to bb (start aa in column 8).a*
Lists all panels beginning with character(s) a (start a in column 8).
The following example lists all panels stored in both disk data sets and main storage that have namesstarting with C or D.
SCRNB C D
The next example lists all panels in main storage from PA to PA999999.
SCRNI PA*
Chapter 14. OMEGAMON Commands 563
or
SCRNI PA PA
.SGOGoes to panel cccccccc on next update.
The format is:
n.SGO cccccccc keyword{=| aa }argument
With the .SGO command panels can branch to other panels.
For example, the following command fetches panel SAMPLE on the next cycle.
SGO SAMPLE
With the optional value n you can delay the fetch of panel cccccccc for n cycles. The value of n can bebetween 1 and 35. Use the numbers 1 to 9 or the letters A to Z (to represent 10 to 35 cycles). Eachtime the panel updates, n decrements by one. When n equals 0, panel cccccccc is fetched on the nextcycle.
The next example delays fetch of panel SAMPLE for 11 cycles, and fetches it on the next cycle after nequals 0.
B.SGO SAMPLE
Conditional Parameters
The .SGO command also has a conditional panel fetch feature that fetches a panel only if a conditionis true. The condition is expressed as follows:
.SGO cccccccc keyword{=| aa }argument
The keyword can be one of the following:
CPSER=Compares the CPU serial number.
MODE=Compares the 3-character OMEGAMON XE for DB2 PE mode ID (displayed on the INFO-line). Forexample, DED, VTS, VTT, VTM.
OPSYS=Compares the 3-character ID for the operating system level (XA1).
SMFID=Compares the 4-character SMF ID.
UNIT=Compares the terminal address of the primary OMEGAMON XE for DB2 PE console (only indedicated mode).
USER=Compares the 2-character suffix of the user profile.
The relational operator is either an equal sign (=) or a 2-character operator aa separated by blanks.The operator aa can be:
EQKeyword equals argument. Same as equal sign (=).
564 Classic Interface User's Guide
GEKeyword is greater than or equal to argument.
GTKeyword is greater than argument.
LEKeyword is less than or equal to argument.
LTKeyword is less than argument.
NEKeyword is not equal to argument.
The argument is a 1- to 8-character value to which OMEGAMON XE for DB2 PE compares the keyword.
For example, to fetch panel SAMPLE only if you are running in an XA environment, enter:
.SGO SAMPLE OPSYS=XA1
or
.SGO SAMPLE OPSYS EQ XA1
Note: A blank is not a valid keyword, relation, or argument. Additionally, if you use a variable as thekeyword or argument, the variable cannot begin with a blank.
When you use the 2-character operator aa instead of the equal sign =, there must be at least oneblank separating the keyword, operator, and argument. The equal sign requires no separation.
If multiple .SGO commands are displayed on one panel, the last one that is executable takesprecedence.
See the .FGO command for other methods to fetch panels.
SLSTDisplays bytes of memory from data-only space storage.
The format is:
aSLSTc jobname,spacename,addr,plen
aA required action character in column 1:-
Changes to a comment character (>) after the command executes.<
Does not change to a comment character after the command executes. Use this actioncharacter to repeat the command.
cSpecifies the format of the output:B or b
dump format (default)C
character onlyX
hex onlyjobname
The jobname or ASID in decimal of the owner of the data-only space.
Chapter 14. OMEGAMON Commands 565
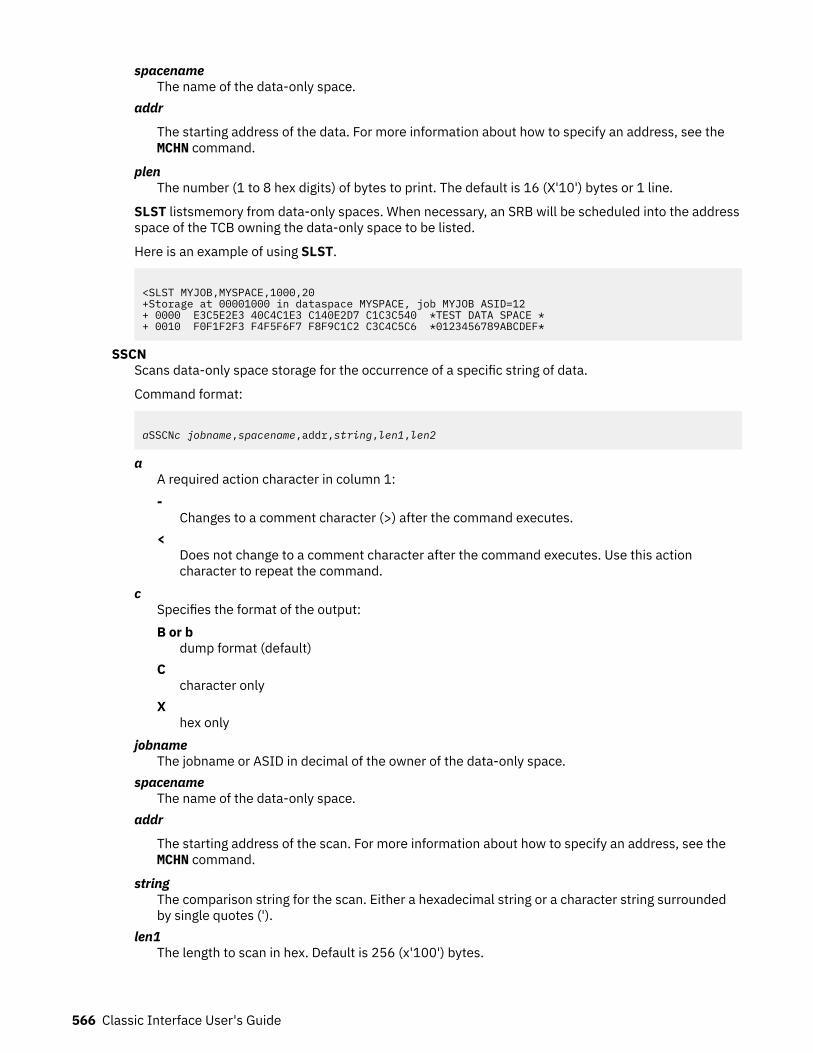
spacenameThe name of the data-only space.
addr
The starting address of the data. For more information about how to specify an address, see theMCHN command.
plenThe number (1 to 8 hex digits) of bytes to print. The default is 16 (X'10') bytes or 1 line.
SLST listsmemory from data-only spaces. When necessary, an SRB will be scheduled into the addressspace of the TCB owning the data-only space to be listed.
Here is an example of using SLST.
<SLST MYJOB,MYSPACE,1000,20+Storage at 00001000 in dataspace MYSPACE, job MYJOB ASID=12+ 0000 E3C5E2E3 40C4C1E3 C140E2D7 C1C3C540 *TEST DATA SPACE *+ 0010 F0F1F2F3 F4F5F6F7 F8F9C1C2 C3C4C5C6 *0123456789ABCDEF*
SSCNScans data-only space storage for the occurrence of a specific string of data.
Command format:
aSSCNc jobname,spacename,addr,string,len1,len2
aA required action character in column 1:-
Changes to a comment character (>) after the command executes.<
Does not change to a comment character after the command executes. Use this actioncharacter to repeat the command.
cSpecifies the format of the output:B or b
dump format (default)C
character onlyX
hex onlyjobname
The jobname or ASID in decimal of the owner of the data-only space.spacename
The name of the data-only space.addr
The starting address of the scan. For more information about how to specify an address, see theMCHN command.
stringThe comparison string for the scan. Either a hexadecimal string or a character string surroundedby single quotes (').
len1The length to scan in hex. Default is 256 (x'100') bytes.
566 Classic Interface User's Guide
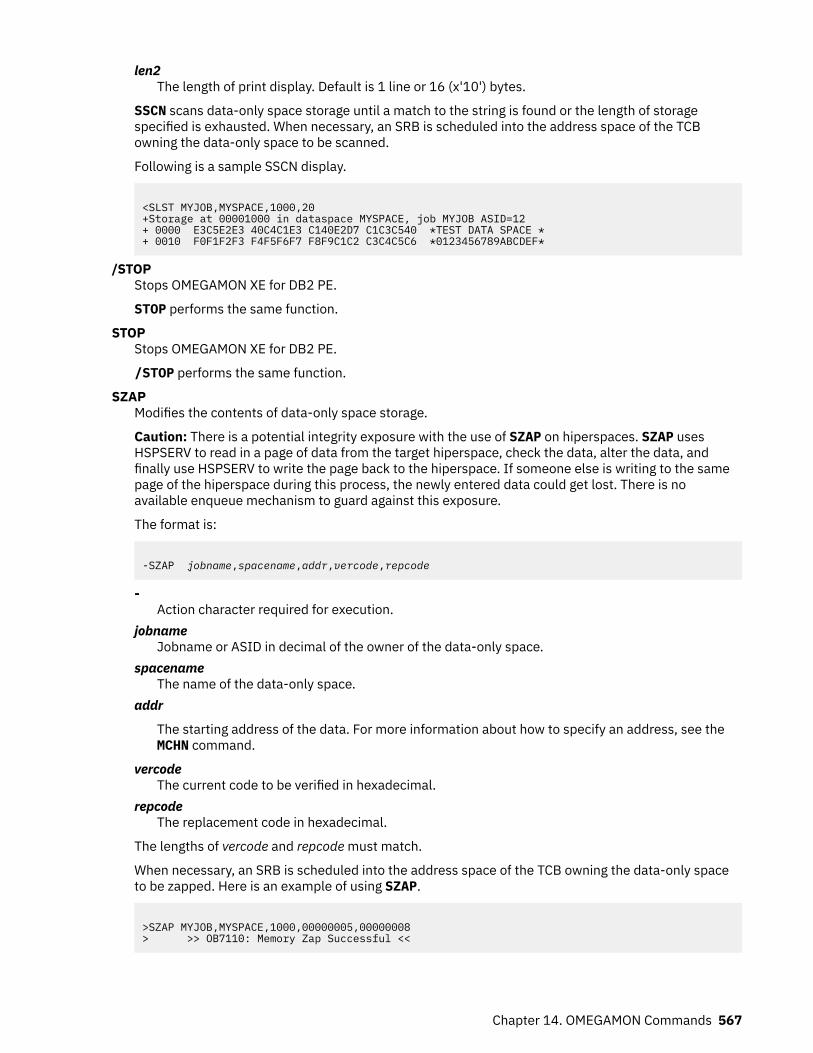
len2The length of print display. Default is 1 line or 16 (x'10') bytes.
SSCN scans data-only space storage until a match to the string is found or the length of storagespecified is exhausted. When necessary, an SRB is scheduled into the address space of the TCBowning the data-only space to be scanned.
Following is a sample SSCN display.
<SLST MYJOB,MYSPACE,1000,20+Storage at 00001000 in dataspace MYSPACE, job MYJOB ASID=12+ 0000 E3C5E2E3 40C4C1E3 C140E2D7 C1C3C540 *TEST DATA SPACE *+ 0010 F0F1F2F3 F4F5F6F7 F8F9C1C2 C3C4C5C6 *0123456789ABCDEF*
/STOPStops OMEGAMON XE for DB2 PE.
STOP performs the same function.
STOPStops OMEGAMON XE for DB2 PE.
/STOP performs the same function.
SZAPModifies the contents of data-only space storage.
Caution: There is a potential integrity exposure with the use of SZAP on hiperspaces. SZAP usesHSPSERV to read in a page of data from the target hiperspace, check the data, alter the data, andfinally use HSPSERV to write the page back to the hiperspace. If someone else is writing to the samepage of the hiperspace during this process, the newly entered data could get lost. There is noavailable enqueue mechanism to guard against this exposure.
The format is:
-SZAP jobname,spacename,addr,vercode,repcode
-Action character required for execution.
jobnameJobname or ASID in decimal of the owner of the data-only space.
spacenameThe name of the data-only space.
addr
The starting address of the data. For more information about how to specify an address, see theMCHN command.
vercodeThe current code to be verified in hexadecimal.
repcodeThe replacement code in hexadecimal.
The lengths of vercode and repcode must match.
When necessary, an SRB is scheduled into the address space of the TCB owning the data-only spaceto be zapped. Here is an example of using SZAP.
>SZAP MYJOB,MYSPACE,1000,00000005,00000008> >> OB7110: Memory Zap Successful <<
Chapter 14. OMEGAMON Commands 567
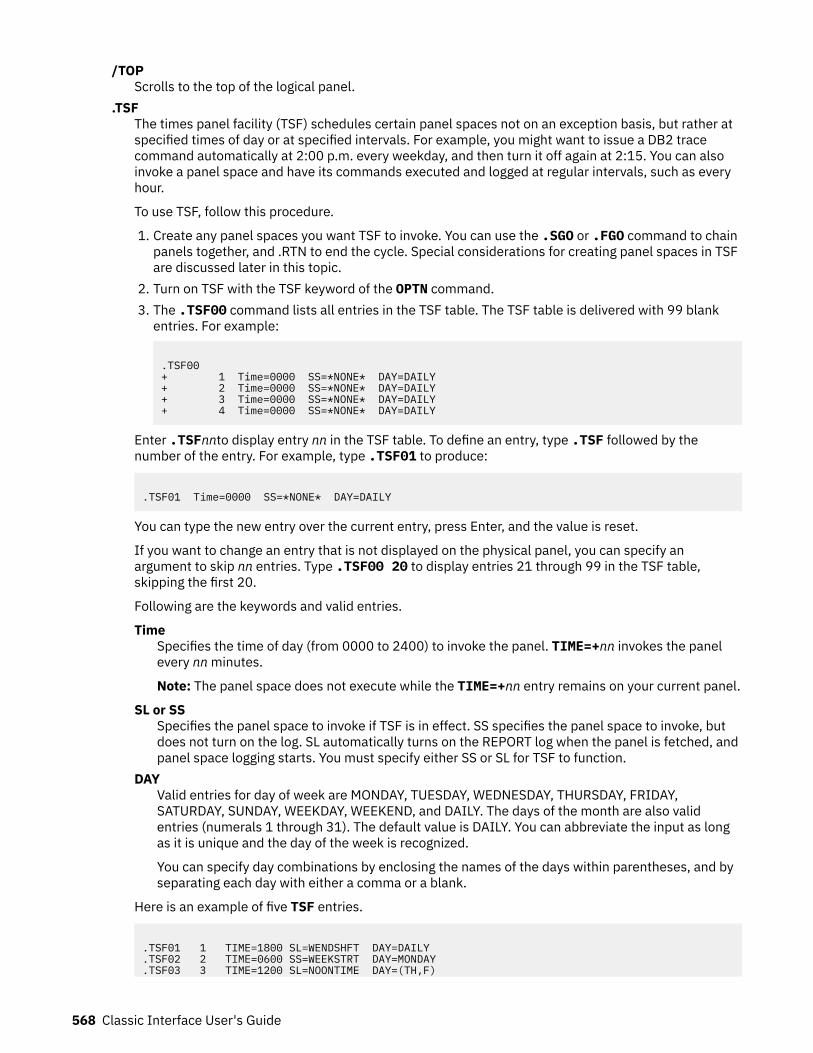
/TOPScrolls to the top of the logical panel.
.TSFThe times panel facility (TSF) schedules certain panel spaces not on an exception basis, but rather atspecified times of day or at specified intervals. For example, you might want to issue a DB2 tracecommand automatically at 2:00 p.m. every weekday, and then turn it off again at 2:15. You can alsoinvoke a panel space and have its commands executed and logged at regular intervals, such as everyhour.
To use TSF, follow this procedure.
1. Create any panel spaces you want TSF to invoke. You can use the .SGO or .FGO command to chainpanels together, and .RTN to end the cycle. Special considerations for creating panel spaces in TSFare discussed later in this topic.
2. Turn on TSF with the TSF keyword of the OPTN command.3. The .TSF00 command lists all entries in the TSF table. The TSF table is delivered with 99 blank
entries. For example:
.TSF00+ 1 Time=0000 SS=*NONE* DAY=DAILY+ 2 Time=0000 SS=*NONE* DAY=DAILY+ 3 Time=0000 SS=*NONE* DAY=DAILY+ 4 Time=0000 SS=*NONE* DAY=DAILY
Enter .TSFnnto display entry nn in the TSF table. To define an entry, type .TSF followed by thenumber of the entry. For example, type .TSF01 to produce:
.TSF01 Time=0000 SS=*NONE* DAY=DAILY
You can type the new entry over the current entry, press Enter, and the value is reset.
If you want to change an entry that is not displayed on the physical panel, you can specify anargument to skip nn entries. Type .TSF00 20 to display entries 21 through 99 in the TSF table,skipping the first 20.
Following are the keywords and valid entries.
TimeSpecifies the time of day (from 0000 to 2400) to invoke the panel. TIME=+nn invokes the panelevery nn minutes.
Note: The panel space does not execute while the TIME=+nn entry remains on your current panel.
SL or SSSpecifies the panel space to invoke if TSF is in effect. SS specifies the panel space to invoke, butdoes not turn on the log. SL automatically turns on the REPORT log when the panel is fetched, andpanel space logging starts. You must specify either SS or SL for TSF to function.
DAYValid entries for day of week are MONDAY, TUESDAY, WEDNESDAY, THURSDAY, FRIDAY,SATURDAY, SUNDAY, WEEKDAY, WEEKEND, and DAILY. The days of the month are also validentries (numerals 1 through 31). The default value is DAILY. You can abbreviate the input as longas it is unique and the day of the week is recognized.
You can specify day combinations by enclosing the names of the days within parentheses, and byseparating each day with either a comma or a blank.
Here is an example of five TSF entries.
.TSF01 1 TIME=1800 SL=WENDSHFT DAY=DAILY
.TSF02 2 TIME=0600 SS=WEEKSTRT DAY=MONDAY
.TSF03 3 TIME=1200 SL=NOONTIME DAY=(TH,F)
568 Classic Interface User's Guide
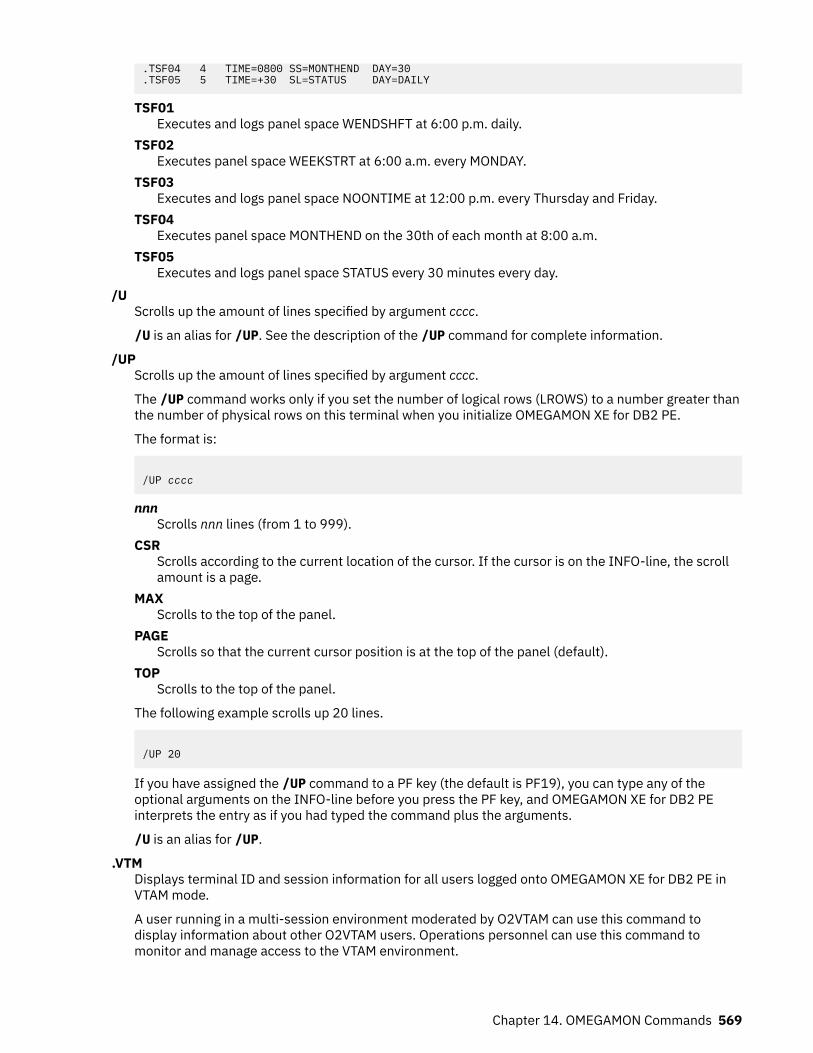
.TSF04 4 TIME=0800 SS=MONTHEND DAY=30
.TSF05 5 TIME=+30 SL=STATUS DAY=DAILY
TSF01Executes and logs panel space WENDSHFT at 6:00 p.m. daily.
TSF02Executes panel space WEEKSTRT at 6:00 a.m. every MONDAY.
TSF03Executes and logs panel space NOONTIME at 12:00 p.m. every Thursday and Friday.
TSF04Executes panel space MONTHEND on the 30th of each month at 8:00 a.m.
TSF05Executes and logs panel space STATUS every 30 minutes every day.
/UScrolls up the amount of lines specified by argument cccc.
/U is an alias for /UP. See the description of the /UP command for complete information.
/UPScrolls up the amount of lines specified by argument cccc.
The /UP command works only if you set the number of logical rows (LROWS) to a number greater thanthe number of physical rows on this terminal when you initialize OMEGAMON XE for DB2 PE.
The format is:
/UP cccc
nnnScrolls nnn lines (from 1 to 999).
CSRScrolls according to the current location of the cursor. If the cursor is on the INFO-line, the scrollamount is a page.
MAXScrolls to the top of the panel.
PAGEScrolls so that the current cursor position is at the top of the panel (default).
TOPScrolls to the top of the panel.
The following example scrolls up 20 lines.
/UP 20
If you have assigned the /UP command to a PF key (the default is PF19), you can type any of theoptional arguments on the INFO-line before you press the PF key, and OMEGAMON XE for DB2 PEinterprets the entry as if you had typed the command plus the arguments.
/U is an alias for /UP.
.VTMDisplays terminal ID and session information for all users logged onto OMEGAMON XE for DB2 PE inVTAM mode.
A user running in a multi-session environment moderated by O2VTAM can use this command todisplay information about other O2VTAM users. Operations personnel can use this command tomonitor and manage access to the VTAM environment.
Chapter 14. OMEGAMON Commands 569
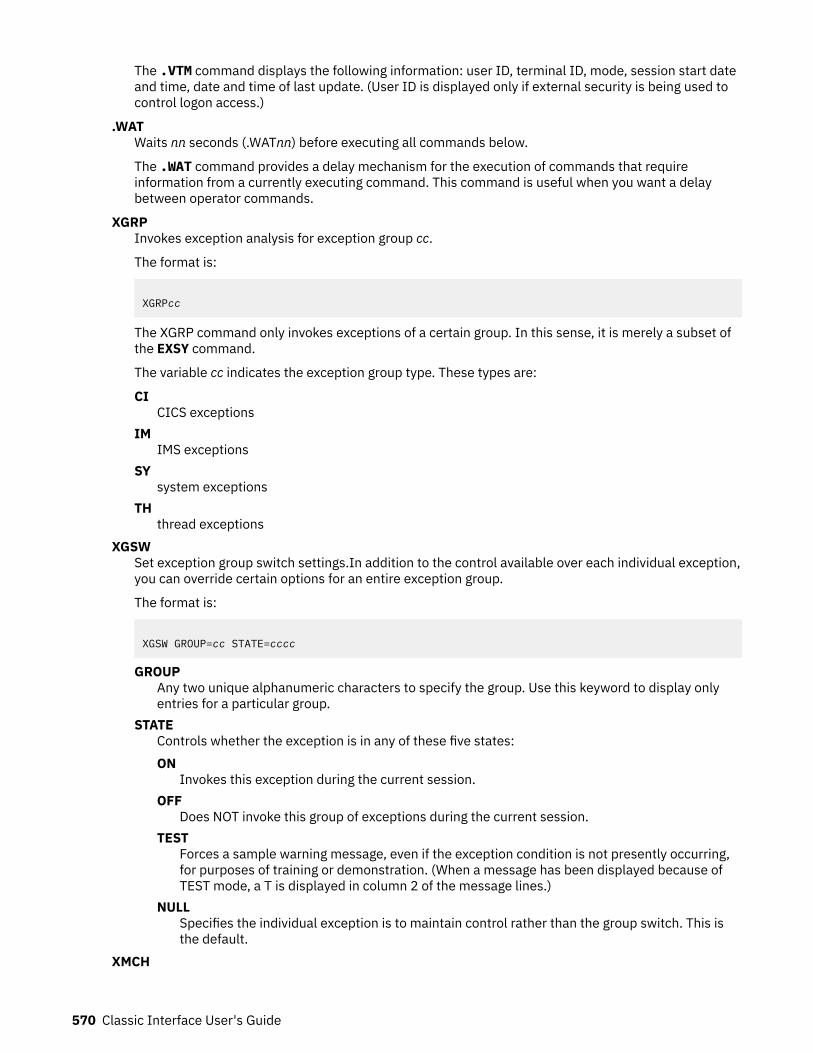
The .VTM command displays the following information: user ID, terminal ID, mode, session start dateand time, date and time of last update. (User ID is displayed only if external security is being used tocontrol logon access.)
.WATWaits nn seconds (.WATnn) before executing all commands below.
The .WAT command provides a delay mechanism for the execution of commands that requireinformation from a currently executing command. This command is useful when you want a delaybetween operator commands.
XGRPInvokes exception analysis for exception group cc.
The format is:
XGRPcc
The XGRP command only invokes exceptions of a certain group. In this sense, it is merely a subset ofthe EXSY command.
The variable cc indicates the exception group type. These types are:
CICICS exceptions
IMIMS exceptions
SYsystem exceptions
THthread exceptions
XGSWSet exception group switch settings.In addition to the control available over each individual exception,you can override certain options for an entire exception group.
The format is:
XGSW GROUP=cc STATE=cccc
GROUPAny two unique alphanumeric characters to specify the group. Use this keyword to display onlyentries for a particular group.
STATEControls whether the exception is in any of these five states:ON
Invokes this exception during the current session.OFF
Does NOT invoke this group of exceptions during the current session.TEST
Forces a sample warning message, even if the exception condition is not presently occurring,for purposes of training or demonstration. (When a message has been displayed because ofTEST mode, a T is displayed in column 2 of the message lines.)
NULLSpecifies the individual exception is to maintain control rather than the group switch. This isthe default.
XMCH
570 Classic Interface User's Guide
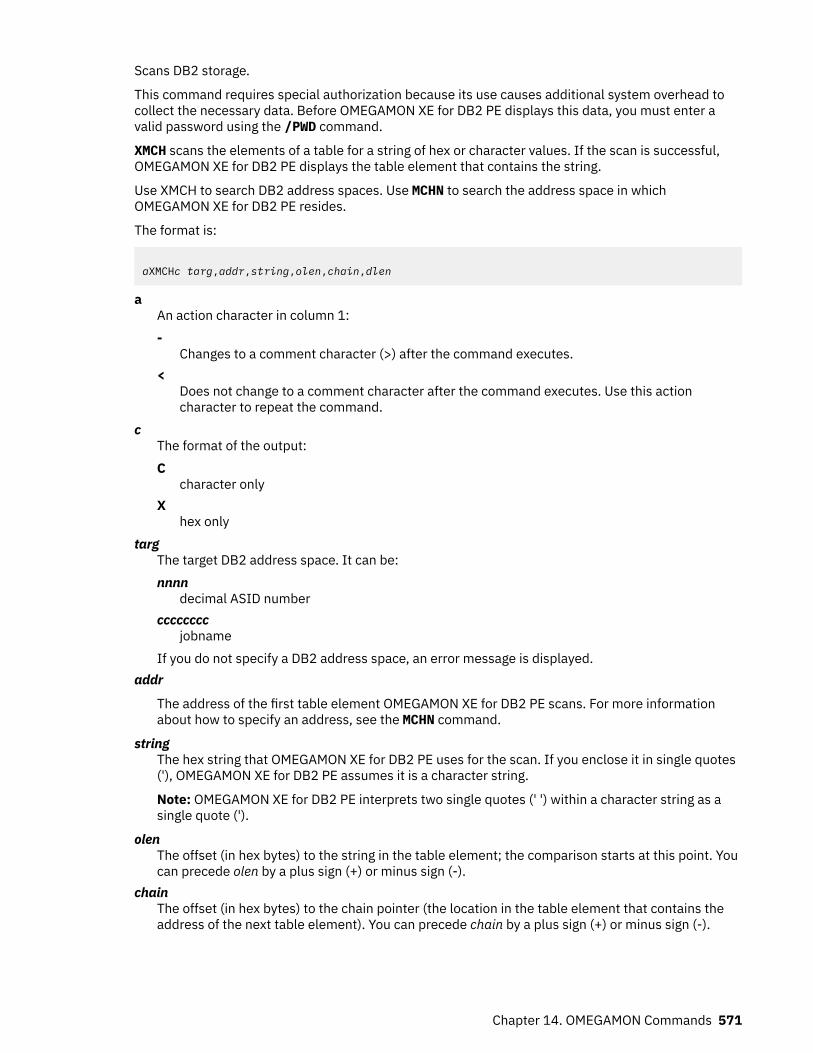
Scans DB2 storage.
This command requires special authorization because its use causes additional system overhead tocollect the necessary data. Before OMEGAMON XE for DB2 PE displays this data, you must enter avalid password using the /PWD command.
XMCH scans the elements of a table for a string of hex or character values. If the scan is successful,OMEGAMON XE for DB2 PE displays the table element that contains the string.
Use XMCH to search DB2 address spaces. Use MCHN to search the address space in whichOMEGAMON XE for DB2 PE resides.
The format is:
aXMCHc targ,addr,string,olen,chain,dlen
aAn action character in column 1:-
Changes to a comment character (>) after the command executes.<
Does not change to a comment character after the command executes. Use this actioncharacter to repeat the command.
cThe format of the output:C
character onlyX
hex onlytarg
The target DB2 address space. It can be:nnnn
decimal ASID numbercccccccc
jobnameIf you do not specify a DB2 address space, an error message is displayed.
addr
The address of the first table element OMEGAMON XE for DB2 PE scans. For more informationabout how to specify an address, see the MCHN command.
stringThe hex string that OMEGAMON XE for DB2 PE uses for the scan. If you enclose it in single quotes('), OMEGAMON XE for DB2 PE assumes it is a character string.
Note: OMEGAMON XE for DB2 PE interprets two single quotes (' ') within a character string as asingle quote (').
olenThe offset (in hex bytes) to the string in the table element; the comparison starts at this point. Youcan precede olen by a plus sign (+) or minus sign (-).
chainThe offset (in hex bytes) to the chain pointer (the location in the table element that contains theaddress of the next table element). You can precede chain by a plus sign (+) or minus sign (-).
Chapter 14. OMEGAMON Commands 571
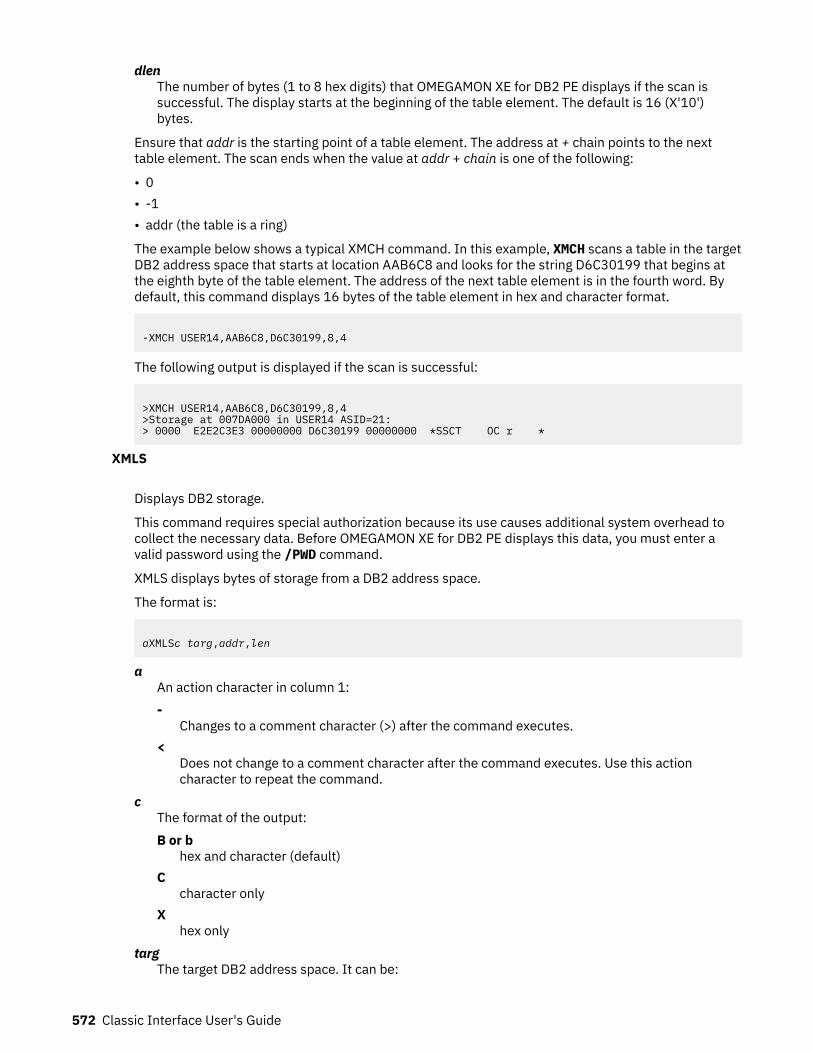
dlenThe number of bytes (1 to 8 hex digits) that OMEGAMON XE for DB2 PE displays if the scan issuccessful. The display starts at the beginning of the table element. The default is 16 (X'10')bytes.
Ensure that addr is the starting point of a table element. The address at + chain points to the nexttable element. The scan ends when the value at addr + chain is one of the following:
• 0• -1• addr (the table is a ring)
The example below shows a typical XMCH command. In this example, XMCH scans a table in the targetDB2 address space that starts at location AAB6C8 and looks for the string D6C30199 that begins atthe eighth byte of the table element. The address of the next table element is in the fourth word. Bydefault, this command displays 16 bytes of the table element in hex and character format.
-XMCH USER14,AAB6C8,D6C30199,8,4
The following output is displayed if the scan is successful:
>XMCH USER14,AAB6C8,D6C30199,8,4>Storage at 007DA000 in USER14 ASID=21:> 0000 E2E2C3E3 00000000 D6C30199 00000000 *SSCT OC r *
XMLS
Displays DB2 storage.
This command requires special authorization because its use causes additional system overhead tocollect the necessary data. Before OMEGAMON XE for DB2 PE displays this data, you must enter avalid password using the /PWD command.
XMLS displays bytes of storage from a DB2 address space.
The format is:
aXMLSc targ,addr,len
aAn action character in column 1:-
Changes to a comment character (>) after the command executes.<
Does not change to a comment character after the command executes. Use this actioncharacter to repeat the command.
cThe format of the output:B or b
hex and character (default)C
character onlyX
hex onlytarg
The target DB2 address space. It can be:
572 Classic Interface User's Guide
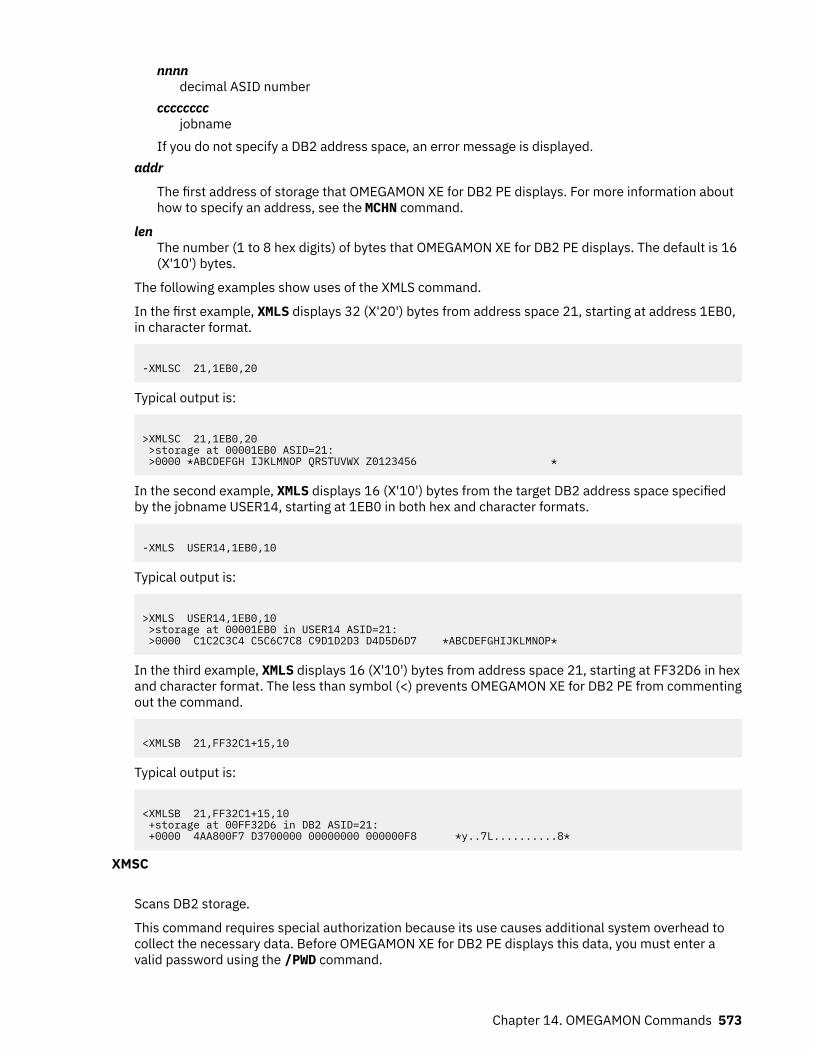
nnnndecimal ASID number
ccccccccjobname
If you do not specify a DB2 address space, an error message is displayed.addr
The first address of storage that OMEGAMON XE for DB2 PE displays. For more information abouthow to specify an address, see the MCHN command.
lenThe number (1 to 8 hex digits) of bytes that OMEGAMON XE for DB2 PE displays. The default is 16(X'10') bytes.
The following examples show uses of the XMLS command.
In the first example, XMLS displays 32 (X'20') bytes from address space 21, starting at address 1EB0,in character format.
-XMLSC 21,1EB0,20
Typical output is:
>XMLSC 21,1EB0,20 >storage at 00001EB0 ASID=21: >0000 *ABCDEFGH IJKLMNOP QRSTUVWX Z0123456 *
In the second example, XMLS displays 16 (X'10') bytes from the target DB2 address space specifiedby the jobname USER14, starting at 1EB0 in both hex and character formats.
-XMLS USER14,1EB0,10
Typical output is:
>XMLS USER14,1EB0,10 >storage at 00001EB0 in USER14 ASID=21: >0000 C1C2C3C4 C5C6C7C8 C9D1D2D3 D4D5D6D7 *ABCDEFGHIJKLMNOP*
In the third example, XMLS displays 16 (X'10') bytes from address space 21, starting at FF32D6 in hexand character format. The less than symbol (<) prevents OMEGAMON XE for DB2 PE from commentingout the command.
<XMLSB 21,FF32C1+15,10
Typical output is:
<XMLSB 21,FF32C1+15,10 +storage at 00FF32D6 in DB2 ASID=21: +0000 4AA800F7 D3700000 00000000 000000F8 *y..7L..........8*
XMSC
Scans DB2 storage.
This command requires special authorization because its use causes additional system overhead tocollect the necessary data. Before OMEGAMON XE for DB2 PE displays this data, you must enter avalid password using the /PWD command.
Chapter 14. OMEGAMON Commands 573
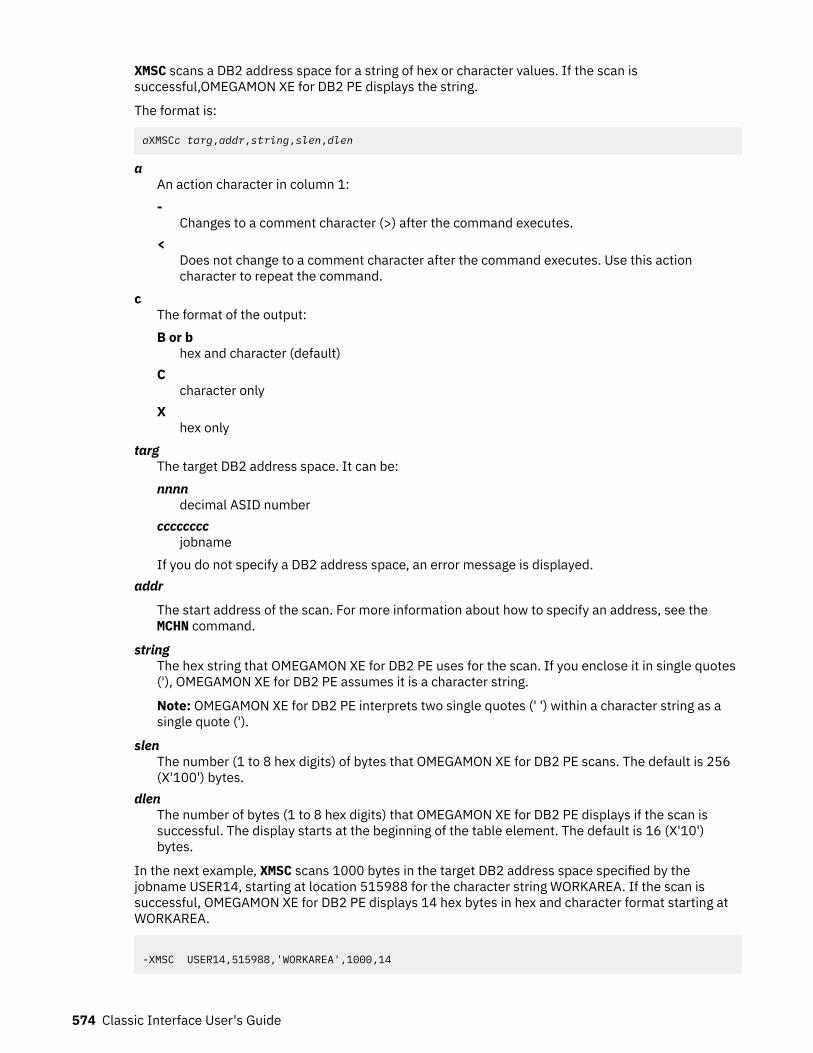
XMSC scans a DB2 address space for a string of hex or character values. If the scan issuccessful,OMEGAMON XE for DB2 PE displays the string.
The format is:
aXMSCc targ,addr,string,slen,dlen
aAn action character in column 1:-
Changes to a comment character (>) after the command executes.<
Does not change to a comment character after the command executes. Use this actioncharacter to repeat the command.
cThe format of the output:B or b
hex and character (default)C
character onlyX
hex onlytarg
The target DB2 address space. It can be:nnnn
decimal ASID numbercccccccc
jobnameIf you do not specify a DB2 address space, an error message is displayed.
addr
The start address of the scan. For more information about how to specify an address, see theMCHN command.
stringThe hex string that OMEGAMON XE for DB2 PE uses for the scan. If you enclose it in single quotes('), OMEGAMON XE for DB2 PE assumes it is a character string.
Note: OMEGAMON XE for DB2 PE interprets two single quotes (' ') within a character string as asingle quote (').
slenThe number (1 to 8 hex digits) of bytes that OMEGAMON XE for DB2 PE scans. The default is 256(X'100') bytes.
dlenThe number of bytes (1 to 8 hex digits) that OMEGAMON XE for DB2 PE displays if the scan issuccessful. The display starts at the beginning of the table element. The default is 16 (X'10')bytes.
In the next example, XMSC scans 1000 bytes in the target DB2 address space specified by thejobname USER14, starting at location 515988 for the character string WORKAREA. If the scan issuccessful, OMEGAMON XE for DB2 PE displays 14 hex bytes in hex and character format starting atWORKAREA.
-XMSC USER14,515988,'WORKAREA',1000,14
574 Classic Interface User's Guide
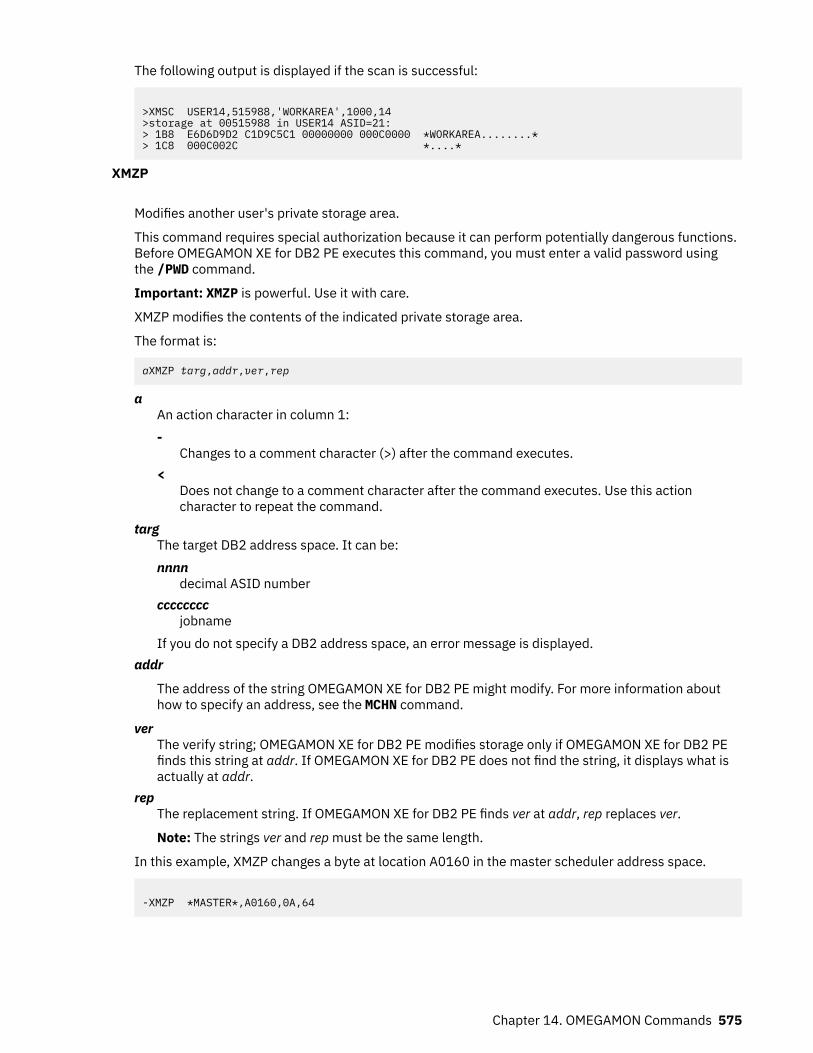
The following output is displayed if the scan is successful:
>XMSC USER14,515988,'WORKAREA',1000,14>storage at 00515988 in USER14 ASID=21:> 1B8 E6D6D9D2 C1D9C5C1 00000000 000C0000 *WORKAREA........*> 1C8 000C002C *....*
XMZP
Modifies another user's private storage area.
This command requires special authorization because it can perform potentially dangerous functions.Before OMEGAMON XE for DB2 PE executes this command, you must enter a valid password usingthe /PWD command.
Important: XMZP is powerful. Use it with care.
XMZP modifies the contents of the indicated private storage area.
The format is:
aXMZP targ,addr,ver,rep
aAn action character in column 1:-
Changes to a comment character (>) after the command executes.<
Does not change to a comment character after the command executes. Use this actioncharacter to repeat the command.
targThe target DB2 address space. It can be:nnnn
decimal ASID numbercccccccc
jobnameIf you do not specify a DB2 address space, an error message is displayed.
addr
The address of the string OMEGAMON XE for DB2 PE might modify. For more information abouthow to specify an address, see the MCHN command.
verThe verify string; OMEGAMON XE for DB2 PE modifies storage only if OMEGAMON XE for DB2 PEfinds this string at addr. If OMEGAMON XE for DB2 PE does not find the string, it displays what isactually at addr.
repThe replacement string. If OMEGAMON XE for DB2 PE finds ver at addr, rep replaces ver.
Note: The strings ver and rep must be the same length.
In this example, XMZP changes a byte at location A0160 in the master scheduler address space.
-XMZP *MASTER*,A0160,0A,64
Chapter 14. OMEGAMON Commands 575
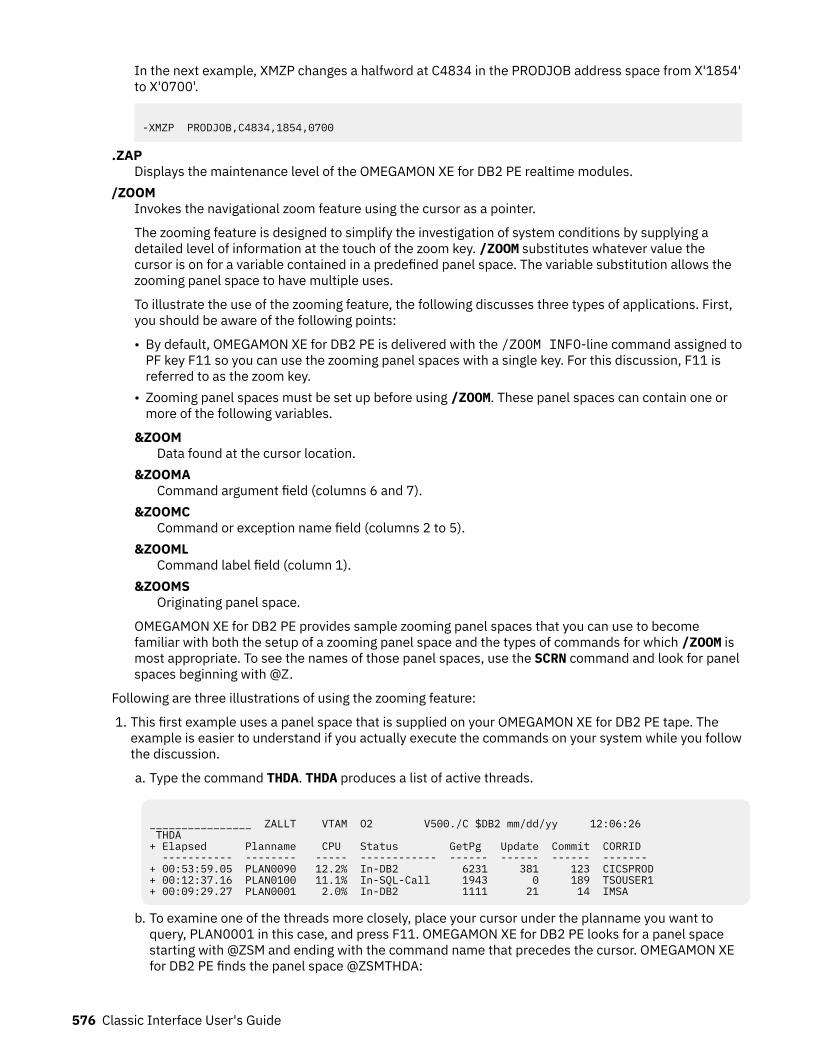
In the next example, XMZP changes a halfword at C4834 in the PRODJOB address space from X'1854'to X'0700'.
-XMZP PRODJOB,C4834,1854,0700
.ZAPDisplays the maintenance level of the OMEGAMON XE for DB2 PE realtime modules.
/ZOOMInvokes the navigational zoom feature using the cursor as a pointer.
The zooming feature is designed to simplify the investigation of system conditions by supplying adetailed level of information at the touch of the zoom key. /ZOOM substitutes whatever value thecursor is on for a variable contained in a predefined panel space. The variable substitution allows thezooming panel space to have multiple uses.
To illustrate the use of the zooming feature, the following discusses three types of applications. First,you should be aware of the following points:
• By default, OMEGAMON XE for DB2 PE is delivered with the /ZOOM INFO-line command assigned toPF key F11 so you can use the zooming panel spaces with a single key. For this discussion, F11 isreferred to as the zoom key.
• Zooming panel spaces must be set up before using /ZOOM. These panel spaces can contain one ormore of the following variables.
&ZOOMData found at the cursor location.
&ZOOMACommand argument field (columns 6 and 7).
&ZOOMCCommand or exception name field (columns 2 to 5).
&ZOOMLCommand label field (column 1).
&ZOOMSOriginating panel space.
OMEGAMON XE for DB2 PE provides sample zooming panel spaces that you can use to becomefamiliar with both the setup of a zooming panel space and the types of commands for which /ZOOM ismost appropriate. To see the names of those panel spaces, use the SCRN command and look for panelspaces beginning with @Z.
Following are three illustrations of using the zooming feature:
1. This first example uses a panel space that is supplied on your OMEGAMON XE for DB2 PE tape. Theexample is easier to understand if you actually execute the commands on your system while you followthe discussion.
a. Type the command THDA. THDA produces a list of active threads.
________________ ZALLT VTAM O2 V500./C $DB2 mm/dd/yy 12:06:26 THDA + Elapsed Planname CPU Status GetPg Update Commit CORRID ----------- -------- ----- ------------ ------ ------ ------ ------- + 00:53:59.05 PLAN0090 12.2% In-DB2 6231 381 123 CICSPROD + 00:12:37.16 PLAN0100 11.1% In-SQL-Call 1943 0 189 TSOUSER1 + 00:09:29.27 PLAN0001 2.0% In-DB2 1111 21 14 IMSA
b. To examine one of the threads more closely, place your cursor under the planname you want toquery, PLAN0001 in this case, and press F11. OMEGAMON XE for DB2 PE looks for a panel spacestarting with @ZSM and ending with the command name that precedes the cursor. OMEGAMON XEfor DB2 PE finds the panel space @ZSMTHDA:
576 Classic Interface User's Guide
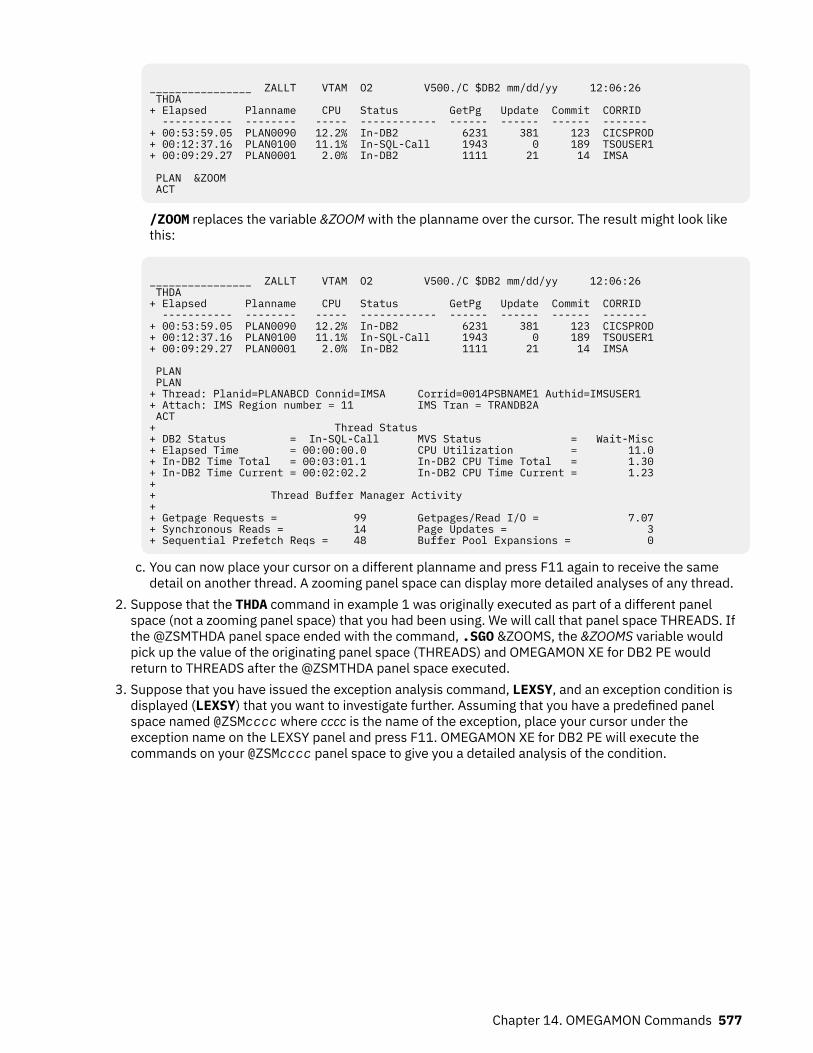
________________ ZALLT VTAM O2 V500./C $DB2 mm/dd/yy 12:06:26 THDA + Elapsed Planname CPU Status GetPg Update Commit CORRID ----------- -------- ----- ------------ ------ ------ ------ ------- + 00:53:59.05 PLAN0090 12.2% In-DB2 6231 381 123 CICSPROD + 00:12:37.16 PLAN0100 11.1% In-SQL-Call 1943 0 189 TSOUSER1 + 00:09:29.27 PLAN0001 2.0% In-DB2 1111 21 14 IMSA PLAN &ZOOM ACT
/ZOOM replaces the variable &ZOOM with the planname over the cursor. The result might look likethis:
________________ ZALLT VTAM O2 V500./C $DB2 mm/dd/yy 12:06:26 THDA + Elapsed Planname CPU Status GetPg Update Commit CORRID ----------- -------- ----- ------------ ------ ------ ------ ------- + 00:53:59.05 PLAN0090 12.2% In-DB2 6231 381 123 CICSPROD + 00:12:37.16 PLAN0100 11.1% In-SQL-Call 1943 0 189 TSOUSER1 + 00:09:29.27 PLAN0001 2.0% In-DB2 1111 21 14 IMSA PLAN PLAN + Thread: Planid=PLANABCD Connid=IMSA Corrid=0014PSBNAME1 Authid=IMSUSER1 + Attach: IMS Region number = 11 IMS Tran = TRANDB2A ACT + Thread Status + DB2 Status = In-SQL-Call MVS Status = Wait-Misc + Elapsed Time = 00:00:00.0 CPU Utilization = 11.0 + In-DB2 Time Total = 00:03:01.1 In-DB2 CPU Time Total = 1.30 + In-DB2 Time Current = 00:02:02.2 In-DB2 CPU Time Current = 1.23 + + Thread Buffer Manager Activity + + Getpage Requests = 99 Getpages/Read I/O = 7.07 + Synchronous Reads = 14 Page Updates = 3 + Sequential Prefetch Reqs = 48 Buffer Pool Expansions = 0
c. You can now place your cursor on a different planname and press F11 again to receive the samedetail on another thread. A zooming panel space can display more detailed analyses of any thread.
2. Suppose that the THDA command in example 1 was originally executed as part of a different panelspace (not a zooming panel space) that you had been using. We will call that panel space THREADS. Ifthe @ZSMTHDA panel space ended with the command, .SGO &ZOOMS, the &ZOOMS variable wouldpick up the value of the originating panel space (THREADS) and OMEGAMON XE for DB2 PE wouldreturn to THREADS after the @ZSMTHDA panel space executed.
3. Suppose that you have issued the exception analysis command, LEXSY, and an exception condition isdisplayed (LEXSY) that you want to investigate further. Assuming that you have a predefined panelspace named @ZSMcccc where cccc is the name of the exception, place your cursor under theexception name on the LEXSY panel and press F11. OMEGAMON XE for DB2 PE will execute thecommands on your @ZSMcccc panel space to give you a detailed analysis of the condition.
Chapter 14. OMEGAMON Commands 577

578 Classic Interface User's Guide
Chapter 15. Profile Maintenance FacilitySelect this main menu option for information about the Profile Maintenance Facility.
Customizing and storing session characteristics in profilesUse the Profile Maintenance Facility to customize characteristics of your active OMEGAMON XE for DB2PE session and to store these characteristics in a profile. You can also change and delete existing profiles.
Profiles are identified by 2-character profile suffixes. The profile to be used for an OMEGAMON XE for DB2PE session can be specified in the panel described in “Logging on to the Classic Interface” on page 8 or asparameter of the Logon command (see “Directly logging on to the Classic Interface from native VTAM” onpage 8).
The profile being in use in an active OMEGAMON XE for DB2 PE session is displayed on the top line ofmost panels after the version number (for example, V540.AZ indicates that the user profile AZ is in use).
The default IBM profileOMEGAMON XE for DB2 PE contains a default profile, identified by the 2-character profile suffix #P. Thisprofile contains session configuration options needed to initialize an OMEGAMON XE for DB2 PE sessionand default exception analysis thresholds.
The default IBM profile ensures that you can always initiate an OMEGAMON XE for DB2 PE session, even ifno other profiles are defined. This profile is always available and cannot be changed.
The installation profileA so called installation profile, identified by the 2-character profile suffix /I, can be set up during theinstallation of OMEGAMON XE for DB2 PE. This profile can contain a set of session and exception analysisoptions that the installer specifies for all OMEGAMON XE for DB2 PE sessions at your installation. Theinstallation profile can contain overrides of IBM profile options and additional options that areinstallation-specific or that are not contained in the IBM profile.
If an installation profile exists, your OMEGAMON XE for DB2 PE session is started with a concatenation ofthe default IBM profile and the installation profile.
User profilesOMEGAMON XE for DB2 PE users can create one or more user profiles, identified by two alphanumericcharacters, to customize their individual OMEGAMON XE for DB2 PE sessions. A user profile can containprofile options that override options specified in the default IBM profile and the installation profile, as wellas additional options.
Panels for profile managementYou can customize and maintain profiles through the following panels:
• “Profile Maintenance menu” on page 580• “Set Display Options” on page 581• “Set Control Function Options” on page 584• “Set Printer and Routing Options” on page 586
© Copyright IBM Corp. 2005, 2021 579
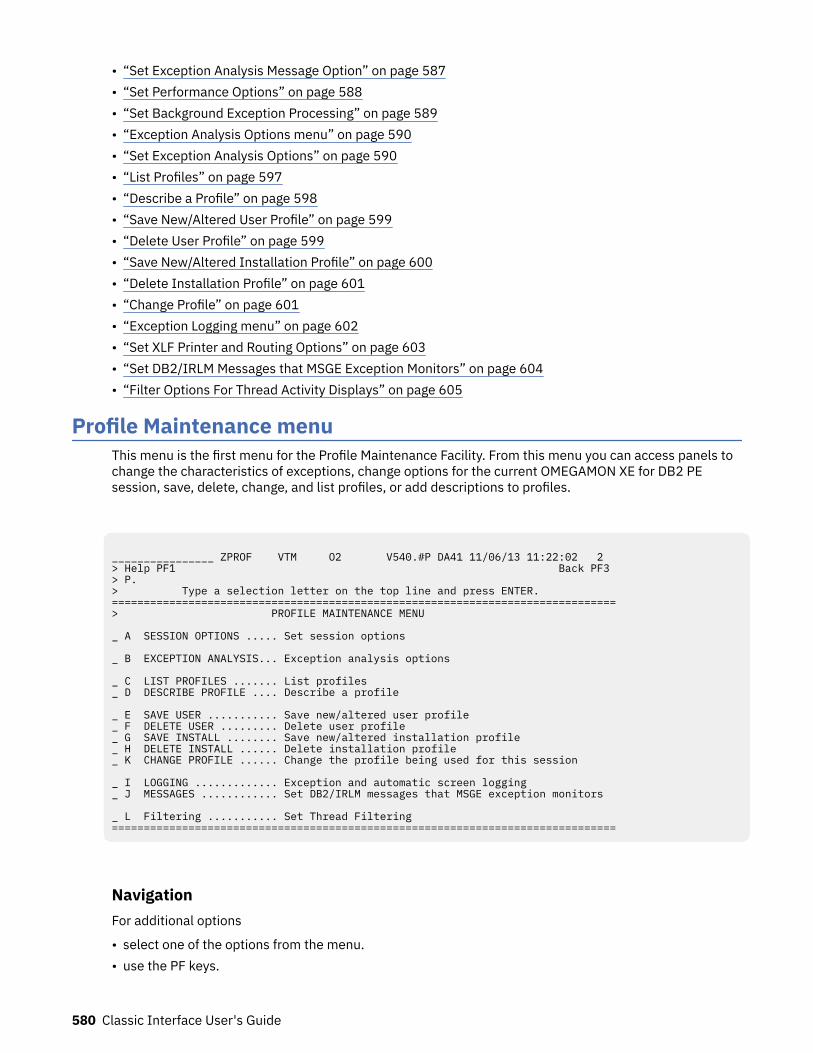
• “Set Exception Analysis Message Option” on page 587• “Set Performance Options” on page 588• “Set Background Exception Processing” on page 589• “Exception Analysis Options menu” on page 590• “Set Exception Analysis Options” on page 590• “List Profiles” on page 597• “Describe a Profile” on page 598• “Save New/Altered User Profile” on page 599• “Delete User Profile” on page 599• “Save New/Altered Installation Profile” on page 600• “Delete Installation Profile” on page 601• “Change Profile” on page 601• “Exception Logging menu” on page 602• “Set XLF Printer and Routing Options” on page 603• “Set DB2/IRLM Messages that MSGE Exception Monitors” on page 604• “Filter Options For Thread Activity Displays” on page 605
Profile Maintenance menuThis menu is the first menu for the Profile Maintenance Facility. From this menu you can access panels tochange the characteristics of exceptions, change options for the current OMEGAMON XE for DB2 PEsession, save, delete, change, and list profiles, or add descriptions to profiles.
________________ ZPROF VTM O2 V540.#P DA41 11/06/13 11:22:02 2 > Help PF1 Back PF3 > P. > Type a selection letter on the top line and press ENTER. ===============================================================================> PROFILE MAINTENANCE MENU _ A SESSION OPTIONS ..... Set session options _ B EXCEPTION ANALYSIS... Exception analysis options _ C LIST PROFILES ....... List profiles _ D DESCRIBE PROFILE .... Describe a profile _ E SAVE USER ........... Save new/altered user profile _ F DELETE USER ......... Delete user profile _ G SAVE INSTALL ........ Save new/altered installation profile _ H DELETE INSTALL ...... Delete installation profile _ K CHANGE PROFILE ...... Change the profile being used for this session _ I LOGGING ............. Exception and automatic screen logging _ J MESSAGES ............ Set DB2/IRLM messages that MSGE exception monitors _ L Filtering ........... Set Thread Filtering ===============================================================================
NavigationFor additional options
• select one of the options from the menu.• use the PF keys.
580 Classic Interface User's Guide
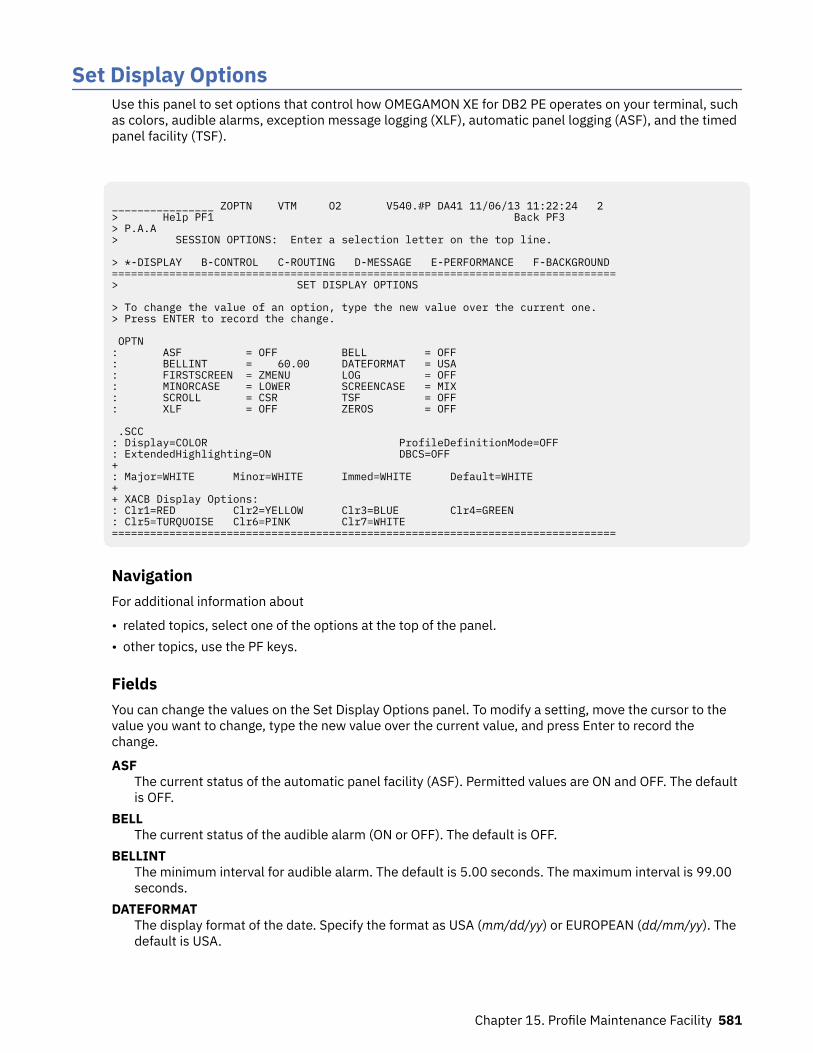
Set Display OptionsUse this panel to set options that control how OMEGAMON XE for DB2 PE operates on your terminal, suchas colors, audible alarms, exception message logging (XLF), automatic panel logging (ASF), and the timedpanel facility (TSF).
________________ ZOPTN VTM O2 V540.#P DA41 11/06/13 11:22:24 2 > Help PF1 Back PF3 > P.A.A > SESSION OPTIONS: Enter a selection letter on the top line. > *-DISPLAY B-CONTROL C-ROUTING D-MESSAGE E-PERFORMANCE F-BACKGROUND ===============================================================================> SET DISPLAY OPTIONS > To change the value of an option, type the new value over the current one. > Press ENTER to record the change. OPTN : ASF = OFF BELL = OFF : BELLINT = 60.00 DATEFORMAT = USA : FIRSTSCREEN = ZMENU LOG = OFF : MINORCASE = LOWER SCREENCASE = MIX : SCROLL = CSR TSF = OFF : XLF = OFF ZEROS = OFF .SCC : Display=COLOR ProfileDefinitionMode=OFF : ExtendedHighlighting=ON DBCS=OFF + : Major=WHITE Minor=WHITE Immed=WHITE Default=WHITE + + XACB Display Options: : Clr1=RED Clr2=YELLOW Clr3=BLUE Clr4=GREEN : Clr5=TURQUOISE Clr6=PINK Clr7=WHITE ===============================================================================
NavigationFor additional information about
• related topics, select one of the options at the top of the panel.• other topics, use the PF keys.
FieldsYou can change the values on the Set Display Options panel. To modify a setting, move the cursor to thevalue you want to change, type the new value over the current value, and press Enter to record thechange.
ASFThe current status of the automatic panel facility (ASF). Permitted values are ON and OFF. The defaultis OFF.
BELLThe current status of the audible alarm (ON or OFF). The default is OFF.
BELLINTThe minimum interval for audible alarm. The default is 5.00 seconds. The maximum interval is 99.00seconds.
DATEFORMATThe display format of the date. Specify the format as USA (mm/dd/yy) or EUROPEAN (dd/mm/yy). Thedefault is USA.
Chapter 15. Profile Maintenance Facility 581
FIRSTSCREENThe first panel that OMEGAMON XE for DB2 PE displays after the copyright panel. You cannot changethis value. The panels are arranged for easy access to product information.
LOGThe current status of the log function (ON or OFF). The default is OFF. When the log function is ON, thecurrent logical panel is logged each time you press Enter (or at regular intervals, if you are inautomatic update mode). See field PAGELIMIT in “Set Control Function Options” on page 584 aboutthe size of the REPORT file.
MINORCASEThe type of letters OMEGAMON XE for DB2 PE uses to display minor commands (upper or lower case).The default is LOWER.
SCREENCASEThe type of letters OMEGAMON XE for DB2 PE uses to display its output in the panel (upper or mixedcase). The default is MIX.
SCROLLThe amount to scroll the page. The default is a full page (PAGE). It can also be the position of thecursor (CSR).
TSFThe current status of the timed panel facility (TSF). Permitted values are ON and OFF. The default isOFF.
XLFThe current status of the Exception Logging Facility (XLF). Permitted values are ON and OFF. Thedefault is OFF.
ZEROSThe type of zero display. When this parameter is ON, OMEGAMON XE for DB2 PE displays the number0 in fields that have a value of 0. When this parameter is OFF, OMEGAMON XE for DB2 PE displays ablank in these fields. OMEGAMON XE for DB2 PE does not save the value of this field in a profile. Thisvalue will return to the default each session.
DisplayDetermines the type of entries that are acceptable in several other fields in this panel. If you want tochange the display settings and save the changes in a profile, Profile Definition Mode must be turnedON before you make the changes.BASIC
Sets the intensity of field types (for example, major and minor commands) on monochrometerminals and non-EDS (extended data stream) color terminals. Permitted values are High andLow.
Note: When the BASIC display option is used on color devices that can support EDS, OMEGAMONXE for DB2 PE will treat that device as a 4-base color terminal (non-EDS).
HIGHAll fields are displayed in high intensity.
LOWAll fields are displayed in low intensity.
COLORFor color EDS terminals only: Sets the color of each field. Color names are red, green, white, blue,pink, yellow, and turquoise.
Note: If you do not have a color terminal, setting Display to COLOR can cause your OMEGAMONXE for DB2 PE session to terminate.
If OMEGAMON XE for DB2 PE is provided a color value instead of an intensity value, or vice versa, itmakes the following internal conversion:
• On a non-EDS terminal, values of green and blue translate to low intensity. All other color valuestranslate to high intensity.
582 Classic Interface User's Guide
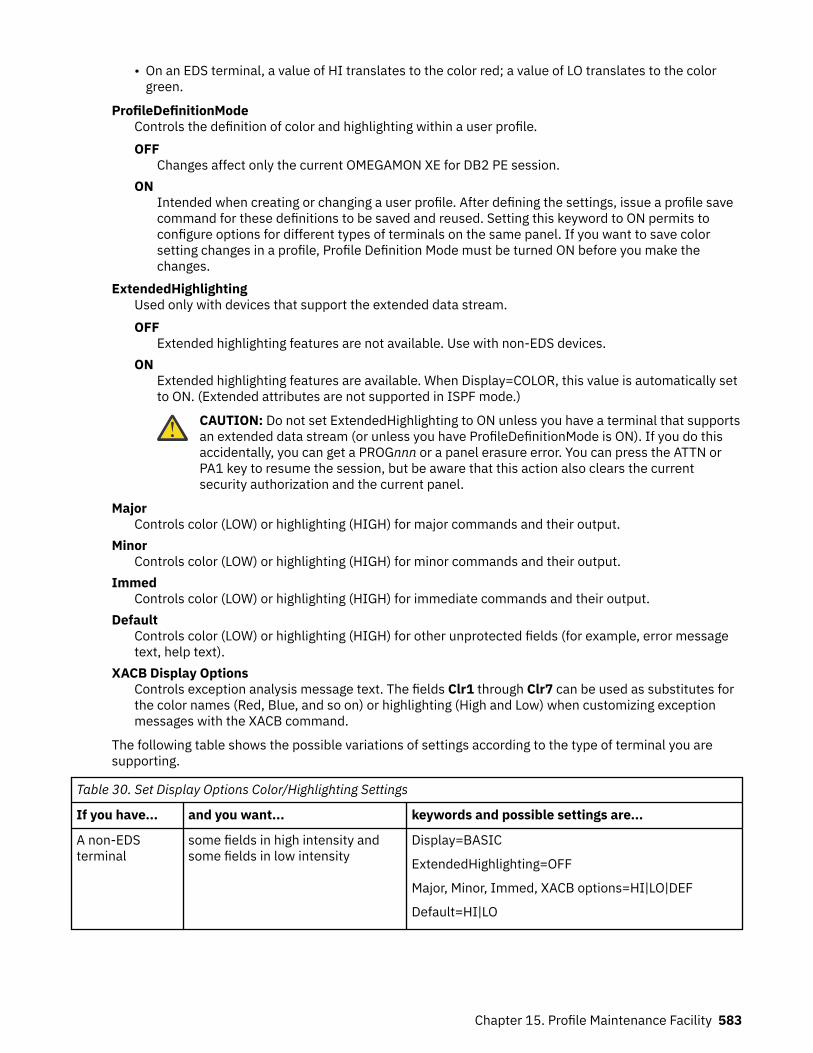
• On an EDS terminal, a value of HI translates to the color red; a value of LO translates to the colorgreen.
ProfileDefinitionModeControls the definition of color and highlighting within a user profile.OFF
Changes affect only the current OMEGAMON XE for DB2 PE session.ON
Intended when creating or changing a user profile. After defining the settings, issue a profile savecommand for these definitions to be saved and reused. Setting this keyword to ON permits toconfigure options for different types of terminals on the same panel. If you want to save colorsetting changes in a profile, Profile Definition Mode must be turned ON before you make thechanges.
ExtendedHighlightingUsed only with devices that support the extended data stream.OFF
Extended highlighting features are not available. Use with non-EDS devices.ON
Extended highlighting features are available. When Display=COLOR, this value is automatically setto ON. (Extended attributes are not supported in ISPF mode.)
CAUTION: Do not set ExtendedHighlighting to ON unless you have a terminal that supportsan extended data stream (or unless you have ProfileDefinitionMode is ON). If you do thisaccidentally, you can get a PROGnnn or a panel erasure error. You can press the ATTN orPA1 key to resume the session, but be aware that this action also clears the currentsecurity authorization and the current panel.
MajorControls color (LOW) or highlighting (HIGH) for major commands and their output.
MinorControls color (LOW) or highlighting (HIGH) for minor commands and their output.
ImmedControls color (LOW) or highlighting (HIGH) for immediate commands and their output.
DefaultControls color (LOW) or highlighting (HIGH) for other unprotected fields (for example, error messagetext, help text).
XACB Display OptionsControls exception analysis message text. The fields Clr1 through Clr7 can be used as substitutes forthe color names (Red, Blue, and so on) or highlighting (High and Low) when customizing exceptionmessages with the XACB command.
The following table shows the possible variations of settings according to the type of terminal you aresupporting.
Table 30. Set Display Options Color/Highlighting Settings
If you have... and you want... keywords and possible settings are...
A non-EDSterminal
some fields in high intensity andsome fields in low intensity
Display=BASIC
ExtendedHighlighting=OFF
Major, Minor, Immed, XACB options=HI|LO|DEF
Default=HI|LO
Chapter 15. Profile Maintenance Facility 583
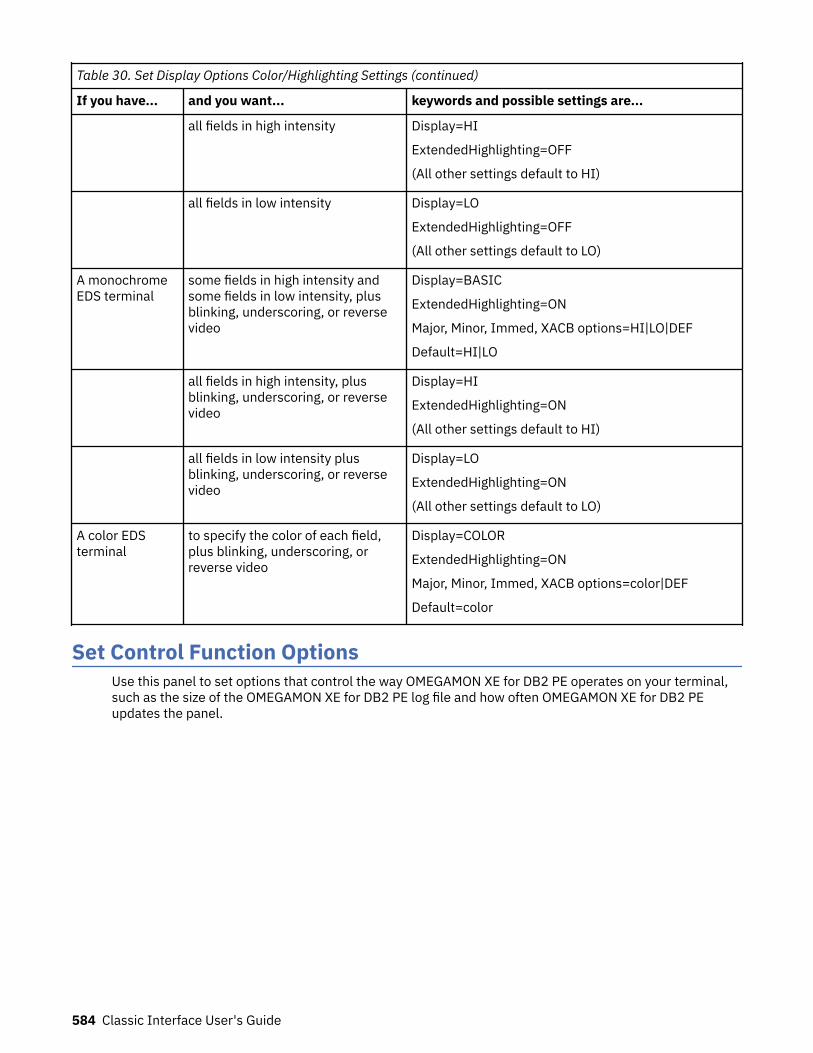
Table 30. Set Display Options Color/Highlighting Settings (continued)
If you have... and you want... keywords and possible settings are...
all fields in high intensity Display=HI
ExtendedHighlighting=OFF
(All other settings default to HI)
all fields in low intensity Display=LO
ExtendedHighlighting=OFF
(All other settings default to LO)
A monochromeEDS terminal
some fields in high intensity andsome fields in low intensity, plusblinking, underscoring, or reversevideo
Display=BASIC
ExtendedHighlighting=ON
Major, Minor, Immed, XACB options=HI|LO|DEF
Default=HI|LO
all fields in high intensity, plusblinking, underscoring, or reversevideo
Display=HI
ExtendedHighlighting=ON
(All other settings default to HI)
all fields in low intensity plusblinking, underscoring, or reversevideo
Display=LO
ExtendedHighlighting=ON
(All other settings default to LO)
A color EDSterminal
to specify the color of each field,plus blinking, underscoring, orreverse video
Display=COLOR
ExtendedHighlighting=ON
Major, Minor, Immed, XACB options=color|DEF
Default=color
Set Control Function OptionsUse this panel to set options that control the way OMEGAMON XE for DB2 PE operates on your terminal,such as the size of the OMEGAMON XE for DB2 PE log file and how often OMEGAMON XE for DB2 PEupdates the panel.
584 Classic Interface User's Guide
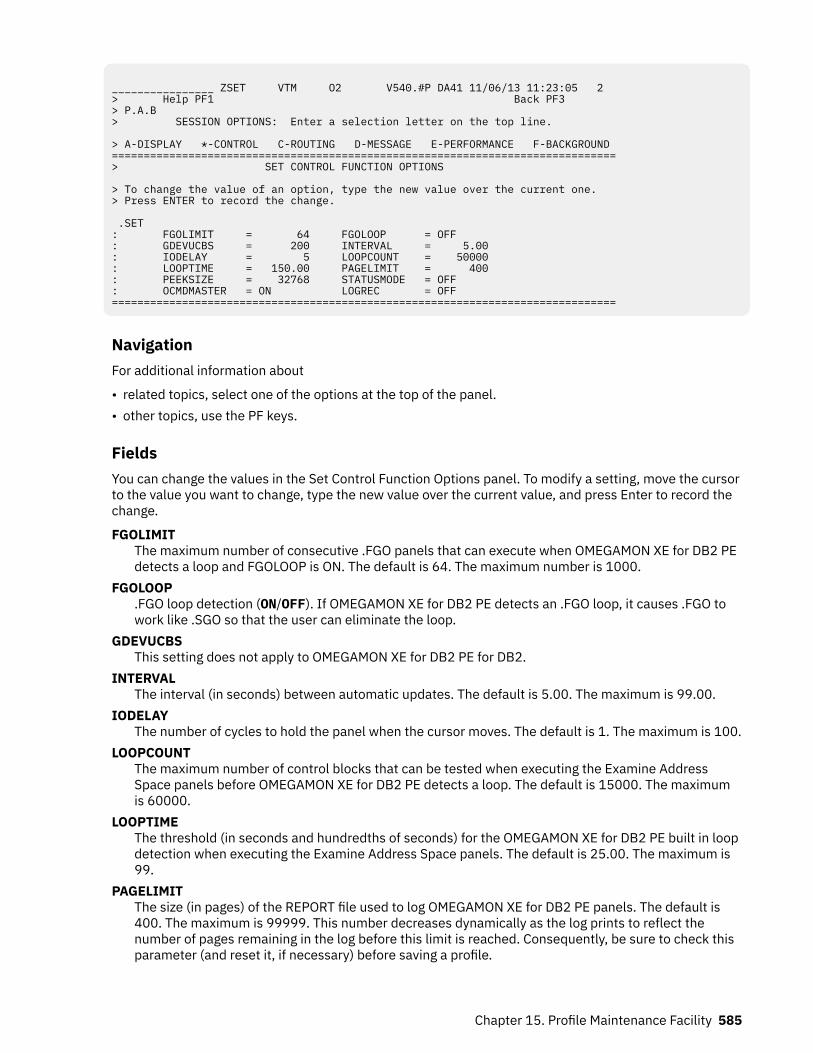
________________ ZSET VTM O2 V540.#P DA41 11/06/13 11:23:05 2 > Help PF1 Back PF3 > P.A.B > SESSION OPTIONS: Enter a selection letter on the top line. > A-DISPLAY *-CONTROL C-ROUTING D-MESSAGE E-PERFORMANCE F-BACKGROUND ===============================================================================> SET CONTROL FUNCTION OPTIONS > To change the value of an option, type the new value over the current one. > Press ENTER to record the change. .SET : FGOLIMIT = 64 FGOLOOP = OFF : GDEVUCBS = 200 INTERVAL = 5.00 : IODELAY = 5 LOOPCOUNT = 50000 : LOOPTIME = 150.00 PAGELIMIT = 400 : PEEKSIZE = 32768 STATUSMODE = OFF : OCMDMASTER = ON LOGREC = OFF ===============================================================================
NavigationFor additional information about
• related topics, select one of the options at the top of the panel.• other topics, use the PF keys.
FieldsYou can change the values in the Set Control Function Options panel. To modify a setting, move the cursorto the value you want to change, type the new value over the current value, and press Enter to record thechange.
FGOLIMITThe maximum number of consecutive .FGO panels that can execute when OMEGAMON XE for DB2 PEdetects a loop and FGOLOOP is ON. The default is 64. The maximum number is 1000.
FGOLOOP.FGO loop detection (ON/OFF). If OMEGAMON XE for DB2 PE detects an .FGO loop, it causes .FGO towork like .SGO so that the user can eliminate the loop.
GDEVUCBSThis setting does not apply to OMEGAMON XE for DB2 PE for DB2.
INTERVALThe interval (in seconds) between automatic updates. The default is 5.00. The maximum is 99.00.
IODELAYThe number of cycles to hold the panel when the cursor moves. The default is 1. The maximum is 100.
LOOPCOUNTThe maximum number of control blocks that can be tested when executing the Examine AddressSpace panels before OMEGAMON XE for DB2 PE detects a loop. The default is 15000. The maximumis 60000.
LOOPTIMEThe threshold (in seconds and hundredths of seconds) for the OMEGAMON XE for DB2 PE built in loopdetection when executing the Examine Address Space panels. The default is 25.00. The maximum is99.
PAGELIMITThe size (in pages) of the REPORT file used to log OMEGAMON XE for DB2 PE panels. The default is400. The maximum is 99999. This number decreases dynamically as the log prints to reflect thenumber of pages remaining in the log before this limit is reached. Consequently, be sure to check thisparameter (and reset it, if necessary) before saving a profile.
Chapter 15. Profile Maintenance Facility 585
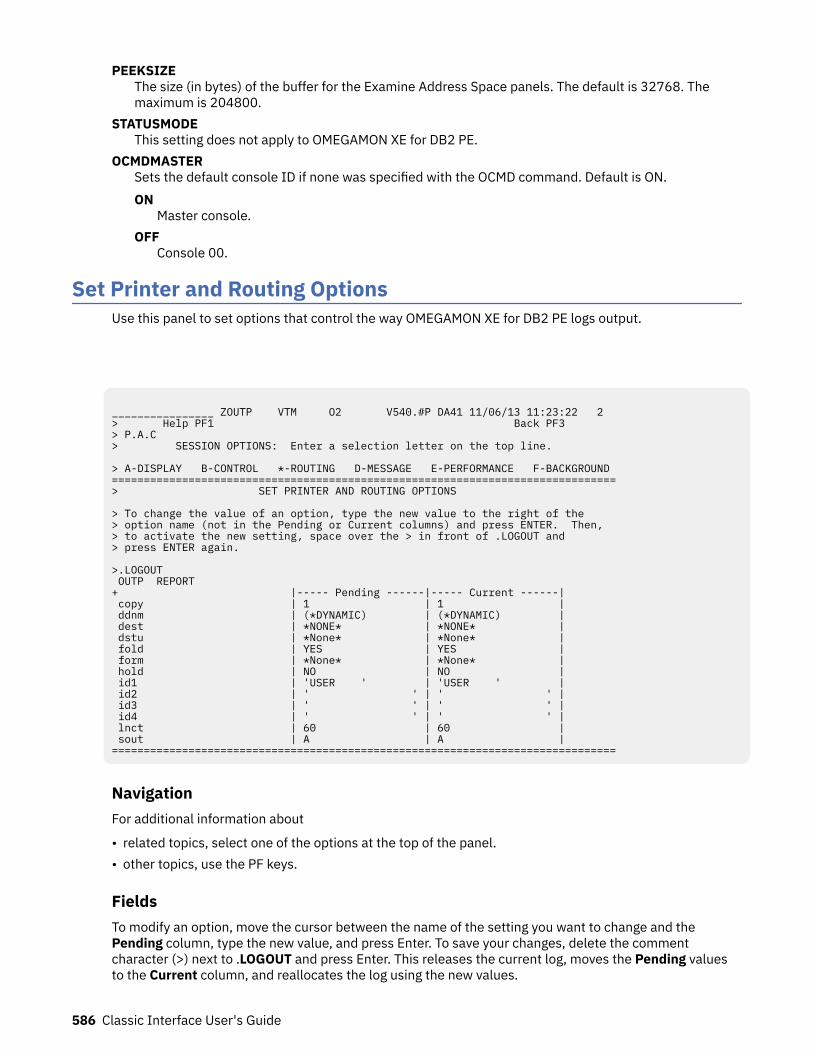
PEEKSIZEThe size (in bytes) of the buffer for the Examine Address Space panels. The default is 32768. Themaximum is 204800.
STATUSMODEThis setting does not apply to OMEGAMON XE for DB2 PE.
OCMDMASTERSets the default console ID if none was specified with the OCMD command. Default is ON.ON
Master console.OFF
Console 00.
Set Printer and Routing OptionsUse this panel to set options that control the way OMEGAMON XE for DB2 PE logs output.
________________ ZOUTP VTM O2 V540.#P DA41 11/06/13 11:23:22 2 > Help PF1 Back PF3 > P.A.C > SESSION OPTIONS: Enter a selection letter on the top line. > A-DISPLAY B-CONTROL *-ROUTING D-MESSAGE E-PERFORMANCE F-BACKGROUND ===============================================================================> SET PRINTER AND ROUTING OPTIONS > To change the value of an option, type the new value to the right of the > option name (not in the Pending or Current columns) and press ENTER. Then, > to activate the new setting, space over the > in front of .LOGOUT and > press ENTER again. >.LOGOUT OUTP REPORT + |----- Pending ------|----- Current ------| copy | 1 | 1 | ddnm | (*DYNAMIC) | (*DYNAMIC) | dest | *NONE* | *NONE* | dstu | *None* | *None* | fold | YES | YES | form | *None* | *None* | hold | NO | NO | id1 | 'USER ' | 'USER ' | id2 | ' ' | ' ' | id3 | ' ' | ' ' | id4 | ' ' | ' ' | lnct | 60 | 60 | sout | A | A | ===============================================================================
NavigationFor additional information about
• related topics, select one of the options at the top of the panel.• other topics, use the PF keys.
FieldsTo modify an option, move the cursor between the name of the setting you want to change and thePending column, type the new value, and press Enter. To save your changes, delete the commentcharacter (>) next to .LOGOUT and press Enter. This releases the current log, moves the Pending valuesto the Current column, and reallocates the log using the new values.
586 Classic Interface User's Guide
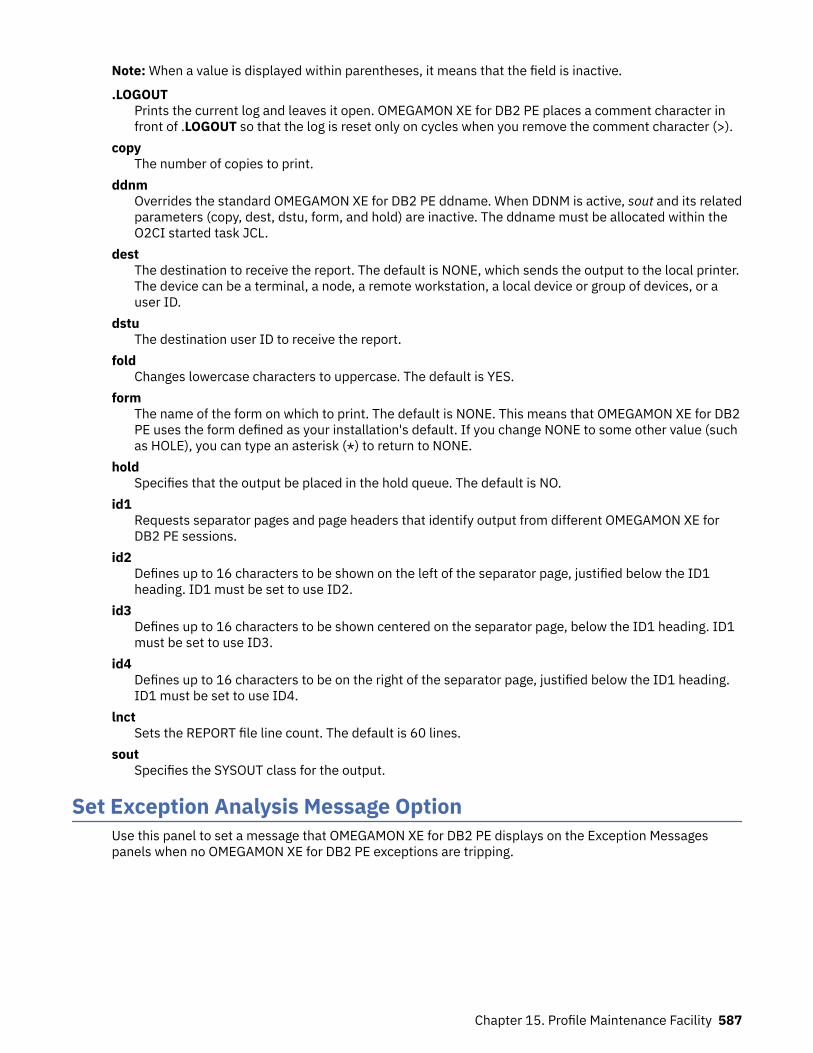
Note: When a value is displayed within parentheses, it means that the field is inactive.
.LOGOUTPrints the current log and leaves it open. OMEGAMON XE for DB2 PE places a comment character infront of .LOGOUT so that the log is reset only on cycles when you remove the comment character (>).
copyThe number of copies to print.
ddnmOverrides the standard OMEGAMON XE for DB2 PE ddname. When DDNM is active, sout and its relatedparameters (copy, dest, dstu, form, and hold) are inactive. The ddname must be allocated within theO2CI started task JCL.
destThe destination to receive the report. The default is NONE, which sends the output to the local printer.The device can be a terminal, a node, a remote workstation, a local device or group of devices, or auser ID.
dstuThe destination user ID to receive the report.
foldChanges lowercase characters to uppercase. The default is YES.
formThe name of the form on which to print. The default is NONE. This means that OMEGAMON XE for DB2PE uses the form defined as your installation's default. If you change NONE to some other value (suchas HOLE), you can type an asterisk (*) to return to NONE.
holdSpecifies that the output be placed in the hold queue. The default is NO.
id1Requests separator pages and page headers that identify output from different OMEGAMON XE forDB2 PE sessions.
id2Defines up to 16 characters to be shown on the left of the separator page, justified below the ID1heading. ID1 must be set to use ID2.
id3Defines up to 16 characters to be shown centered on the separator page, below the ID1 heading. ID1must be set to use ID3.
id4Defines up to 16 characters to be on the right of the separator page, justified below the ID1 heading.ID1 must be set to use ID4.
lnctSets the REPORT file line count. The default is 60 lines.
soutSpecifies the SYSOUT class for the output.
Set Exception Analysis Message OptionUse this panel to set a message that OMEGAMON XE for DB2 PE displays on the Exception Messagespanels when no OMEGAMON XE for DB2 PE exceptions are tripping.
Chapter 15. Profile Maintenance Facility 587
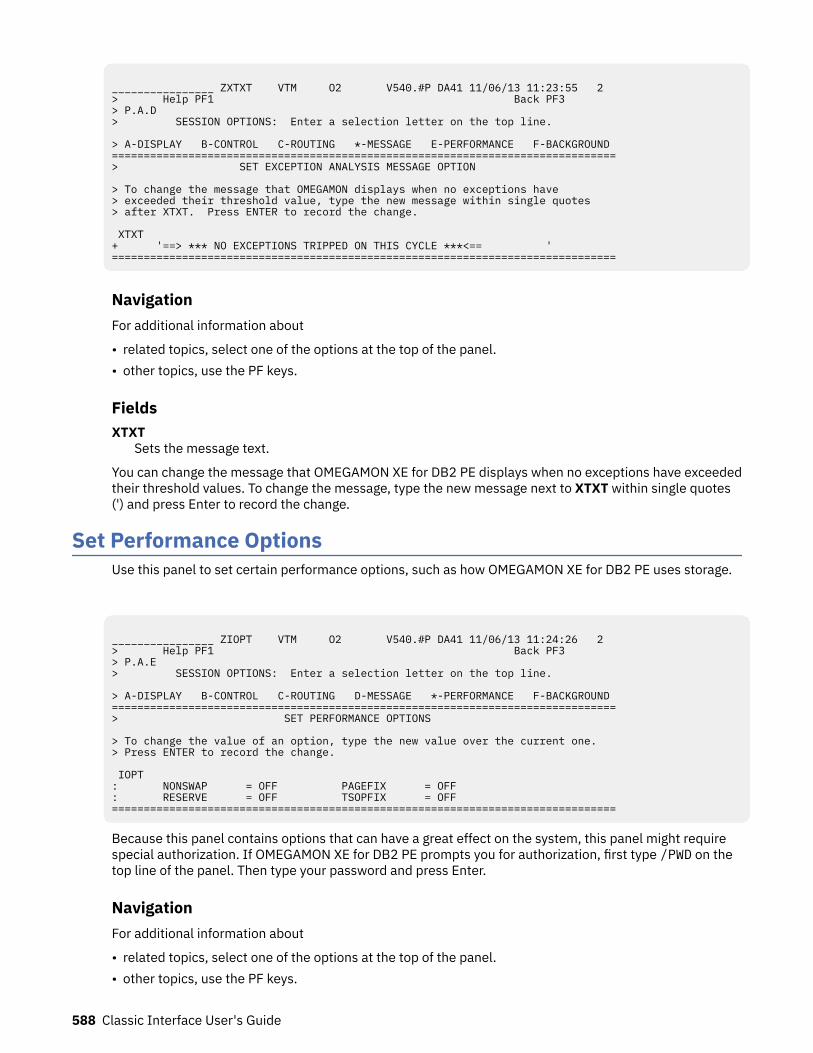
________________ ZXTXT VTM O2 V540.#P DA41 11/06/13 11:23:55 2 > Help PF1 Back PF3 > P.A.D > SESSION OPTIONS: Enter a selection letter on the top line. > A-DISPLAY B-CONTROL C-ROUTING *-MESSAGE E-PERFORMANCE F-BACKGROUND ===============================================================================> SET EXCEPTION ANALYSIS MESSAGE OPTION > To change the message that OMEGAMON displays when no exceptions have > exceeded their threshold value, type the new message within single quotes > after XTXT. Press ENTER to record the change. XTXT + '==> *** NO EXCEPTIONS TRIPPED ON THIS CYCLE ***<== ' ===============================================================================
NavigationFor additional information about
• related topics, select one of the options at the top of the panel.• other topics, use the PF keys.
FieldsXTXT
Sets the message text.
You can change the message that OMEGAMON XE for DB2 PE displays when no exceptions have exceededtheir threshold values. To change the message, type the new message next to XTXT within single quotes(') and press Enter to record the change.
Set Performance OptionsUse this panel to set certain performance options, such as how OMEGAMON XE for DB2 PE uses storage.
________________ ZIOPT VTM O2 V540.#P DA41 11/06/13 11:24:26 2 > Help PF1 Back PF3 > P.A.E > SESSION OPTIONS: Enter a selection letter on the top line. > A-DISPLAY B-CONTROL C-ROUTING D-MESSAGE *-PERFORMANCE F-BACKGROUND ===============================================================================> SET PERFORMANCE OPTIONS > To change the value of an option, type the new value over the current one. > Press ENTER to record the change. IOPT : NONSWAP = OFF PAGEFIX = OFF : RESERVE = OFF TSOPFIX = OFF ===============================================================================
Because this panel contains options that can have a great effect on the system, this panel might requirespecial authorization. If OMEGAMON XE for DB2 PE prompts you for authorization, first type /PWD on thetop line of the panel. Then type your password and press Enter.
NavigationFor additional information about
• related topics, select one of the options at the top of the panel.• other topics, use the PF keys.
588 Classic Interface User's Guide
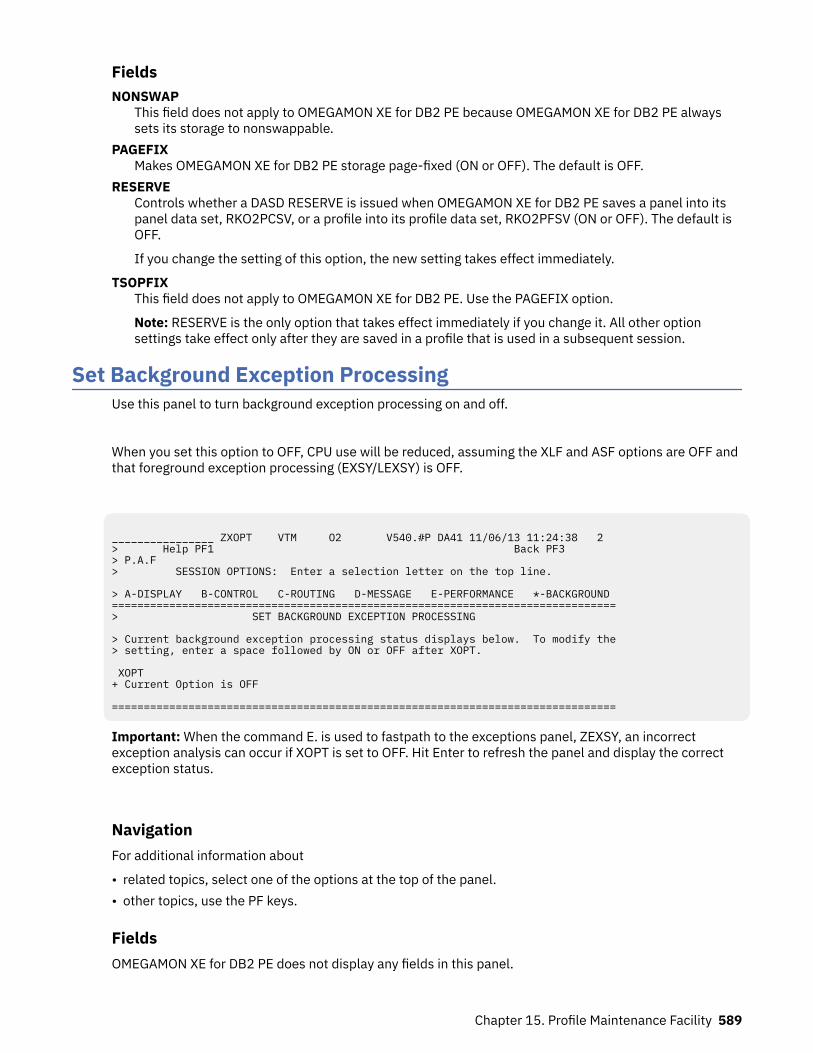
FieldsNONSWAP
This field does not apply to OMEGAMON XE for DB2 PE because OMEGAMON XE for DB2 PE alwayssets its storage to nonswappable.
PAGEFIXMakes OMEGAMON XE for DB2 PE storage page-fixed (ON or OFF). The default is OFF.
RESERVEControls whether a DASD RESERVE is issued when OMEGAMON XE for DB2 PE saves a panel into itspanel data set, RKO2PCSV, or a profile into its profile data set, RKO2PFSV (ON or OFF). The default isOFF.
If you change the setting of this option, the new setting takes effect immediately.
TSOPFIXThis field does not apply to OMEGAMON XE for DB2 PE. Use the PAGEFIX option.
Note: RESERVE is the only option that takes effect immediately if you change it. All other optionsettings take effect only after they are saved in a profile that is used in a subsequent session.
Set Background Exception ProcessingUse this panel to turn background exception processing on and off.
When you set this option to OFF, CPU use will be reduced, assuming the XLF and ASF options are OFF andthat foreground exception processing (EXSY/LEXSY) is OFF.
________________ ZXOPT VTM O2 V540.#P DA41 11/06/13 11:24:38 2 > Help PF1 Back PF3 > P.A.F > SESSION OPTIONS: Enter a selection letter on the top line. > A-DISPLAY B-CONTROL C-ROUTING D-MESSAGE E-PERFORMANCE *-BACKGROUND =============================================================================== > SET BACKGROUND EXCEPTION PROCESSING > Current background exception processing status displays below. To modify the > setting, enter a space followed by ON or OFF after XOPT. XOPT + Current Option is OFF ===============================================================================
Important: When the command E. is used to fastpath to the exceptions panel, ZEXSY, an incorrectexception analysis can occur if XOPT is set to OFF. Hit Enter to refresh the panel and display the correctexception status.
NavigationFor additional information about
• related topics, select one of the options at the top of the panel.• other topics, use the PF keys.
FieldsOMEGAMON XE for DB2 PE does not display any fields in this panel.
Chapter 15. Profile Maintenance Facility 589
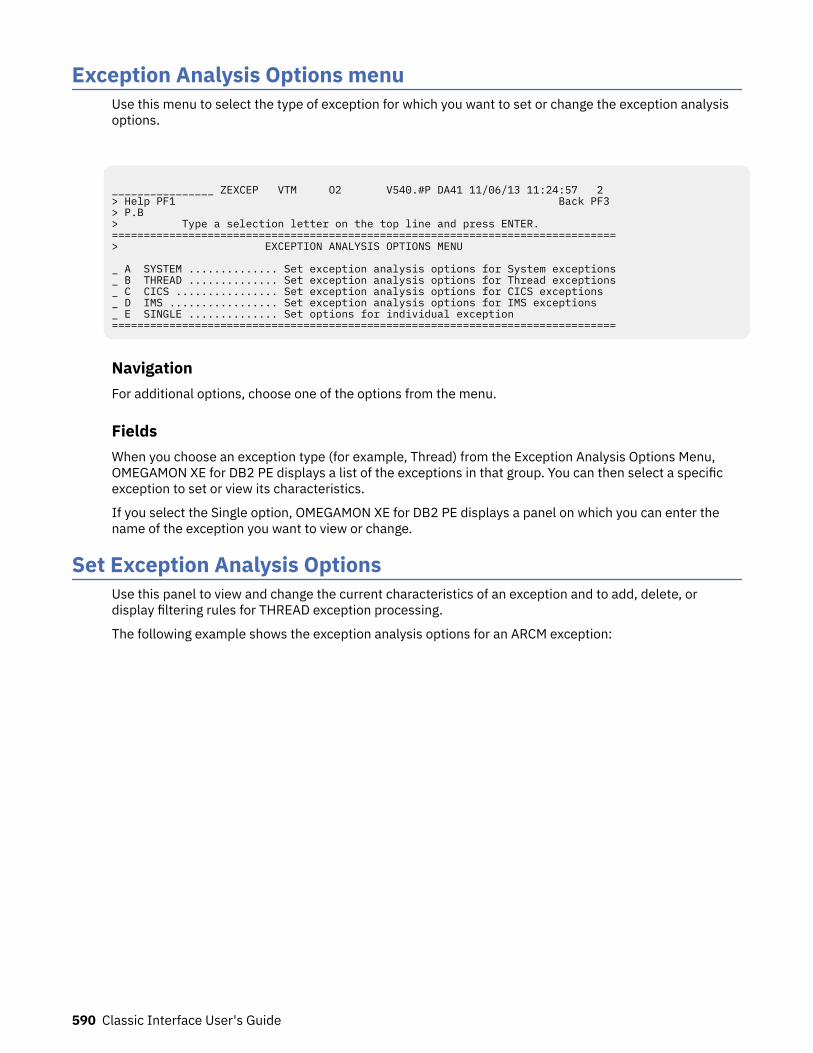
Exception Analysis Options menuUse this menu to select the type of exception for which you want to set or change the exception analysisoptions.
________________ ZEXCEP VTM O2 V540.#P DA41 11/06/13 11:24:57 2 > Help PF1 Back PF3 > P.B > Type a selection letter on the top line and press ENTER. ===============================================================================> EXCEPTION ANALYSIS OPTIONS MENU _ A SYSTEM .............. Set exception analysis options for System exceptions_ B THREAD .............. Set exception analysis options for Thread exceptions_ C CICS ................ Set exception analysis options for CICS exceptions _ D IMS ................. Set exception analysis options for IMS exceptions _ E SINGLE .............. Set options for individual exception ===============================================================================
NavigationFor additional options, choose one of the options from the menu.
FieldsWhen you choose an exception type (for example, Thread) from the Exception Analysis Options Menu,OMEGAMON XE for DB2 PE displays a list of the exceptions in that group. You can then select a specificexception to set or view its characteristics.
If you select the Single option, OMEGAMON XE for DB2 PE displays a panel on which you can enter thename of the exception you want to view or change.
Set Exception Analysis OptionsUse this panel to view and change the current characteristics of an exception and to add, delete, ordisplay filtering rules for THREAD exception processing.
The following example shows the exception analysis options for an ARCM exception:
590 Classic Interface User's Guide
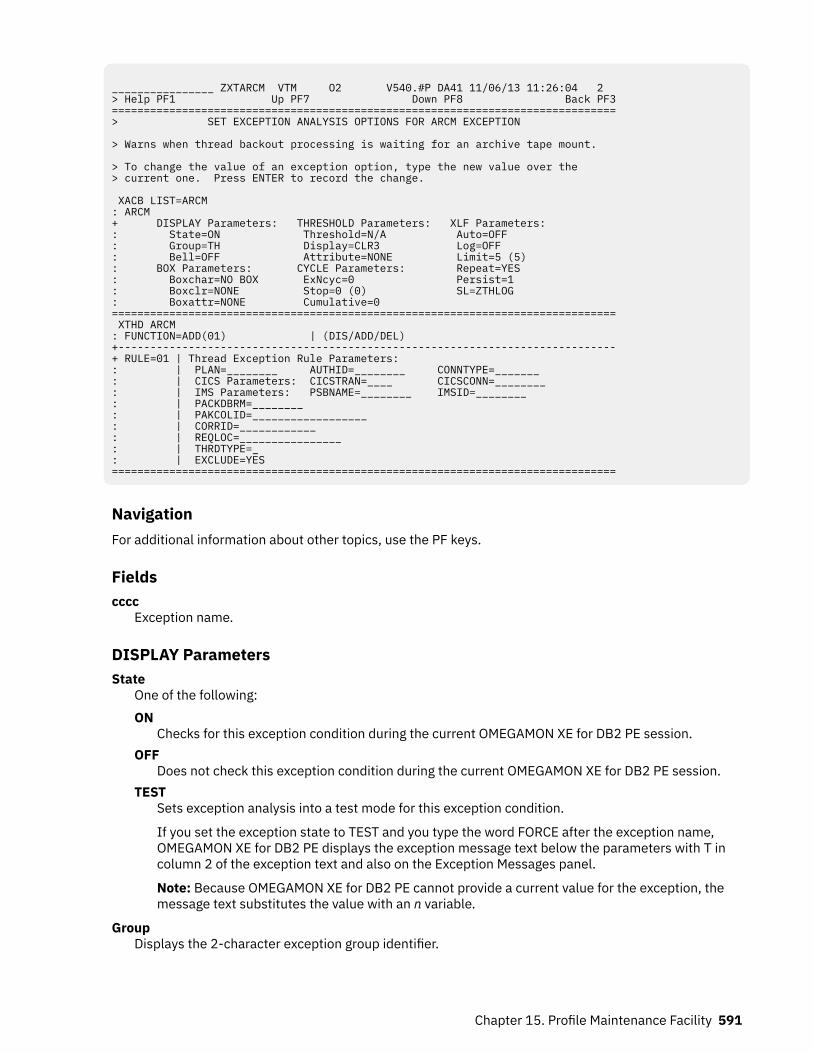
________________ ZXTARCM VTM O2 V540.#P DA41 11/06/13 11:26:04 2 > Help PF1 Up PF7 Down PF8 Back PF3===============================================================================> SET EXCEPTION ANALYSIS OPTIONS FOR ARCM EXCEPTION > Warns when thread backout processing is waiting for an archive tape mount. > To change the value of an exception option, type the new value over the > current one. Press ENTER to record the change. XACB LIST=ARCM : ARCM + DISPLAY Parameters: THRESHOLD Parameters: XLF Parameters: : State=ON Threshold=N/A Auto=OFF : Group=TH Display=CLR3 Log=OFF : Bell=OFF Attribute=NONE Limit=5 (5) : BOX Parameters: CYCLE Parameters: Repeat=YES : Boxchar=NO BOX ExNcyc=0 Persist=1 : Boxclr=NONE Stop=0 (0) SL=ZTHLOG : Boxattr=NONE Cumulative=0 =============================================================================== XTHD ARCM : FUNCTION=ADD(01) | (DIS/ADD/DEL) +------------------------------------------------------------------------------+ RULE=01 | Thread Exception Rule Parameters: : | PLAN=________ AUTHID=________ CONNTYPE=_______ : | CICS Parameters: CICSTRAN=____ CICSCONN=________ : | IMS Parameters: PSBNAME=________ IMSID=________ : | PACKDBRM=________ : | PAKCOLID=__________________ : | CORRID=____________ : | REQLOC=________________ : | THRDTYPE=_ : | EXCLUDE=YES ===============================================================================
NavigationFor additional information about other topics, use the PF keys.
Fieldscccc
Exception name.
DISPLAY ParametersState
One of the following:ON
Checks for this exception condition during the current OMEGAMON XE for DB2 PE session.OFF
Does not check this exception condition during the current OMEGAMON XE for DB2 PE session.TEST
Sets exception analysis into a test mode for this exception condition.
If you set the exception state to TEST and you type the word FORCE after the exception name,OMEGAMON XE for DB2 PE displays the exception message text below the parameters with T incolumn 2 of the exception text and also on the Exception Messages panel.
Note: Because OMEGAMON XE for DB2 PE cannot provide a current value for the exception, themessage text substitutes the value with an n variable.
GroupDisplays the 2-character exception group identifier.
Chapter 15. Profile Maintenance Facility 591
CIfor CICS
SYfor system
THfor thread
BellSpecifies whether the audible alarm on the terminal sounds when this exception occurs.ON
The bell sounds. This works only if the system bell is set to ON on the Set Display Options panel.OFF
The bell does not sound.
BOX ParametersBoxchar
Specifies a box character enclosed in single quotes, or the string NO BOX (without quotes), which isthe default. If Boxchar is NO BOX, OMEGAMON XE for DB2 PE does not place any box around theexception. Also, Boxclr and Boxattr is set to NONE.
Do not use a single quote (') as a box character, because it is the delimiter. To use an ampersand as abox character, type two ampersands (Boxchar is '&&').
BoxclrSets the color or intensity of the exception box. (If you set Boxchar=NO BOX, OMEGAMON XE for DB2PE sets Boxclr=NONE.)
On 4-color or noncolor terminals the value can be:HI
Highlights the message.LO
Does not highlight the message.DEFAULT
Uses the value of the default field on the Set Display Options panel.
On 7-color terminals the value can be:RE
Sets the box red.BL
Sets the box blue.YE
Sets the box yellow.PI
Sets the box pink.GR
Sets the box green.TU
Sets the box turquoise.WH
Sets the box white.DEFAULT
Uses the value of the default field on the Set Display Options panel.
592 Classic Interface User's Guide
Boxclr can also be set to the variables Clr1 through Clr7. They are associated with the colors listedbefore and follow the same order. To set these values, see the Set Display Options panel.
BoxattrFor 7-color terminals, sets one of the following additional highlight attributes (with extended colorsupport) for the box. (If you set Boxchar at NO BOX, OMEGAMON XE for DB2 PE sets Boxattr atNONE.)BLINK
Turns on blinking for the exception.RVRS
Displays message in reverse video.UNDR
Underscores message.NONE
Uses the default extended highlight attributes.
Note: If you do not set color and highlighting attributes for the box, OMEGAMON XE for DB2 PEuses those that you set for the exception.
THRESHOLD ParametersThreshold
Exception threshold. For exceptions that monitor an action, not a value, this setting is N/A.Display
Sets the exception message display color or intensity.
The variables Clr1 through Clr7 specify the exception display color. Set the associated values with theSet Display Options panel.
On terminals that use extended color support (set with the XACB Display Options field on the SetDisplay Options panel), the color codes are:
RESets message red.
BLSets message blue.
YESets message yellow.
PISets message pink.
GRSets message green.
TUSets message turquoise.
WHSets message white.
NONESpecifies the hardware default colors.
On terminals that do not use extended color support, the intensity can be:HI
Highlights the message.LO
Does not highlight the message.
Chapter 15. Profile Maintenance Facility 593
AttributeFor 7-color terminals, sets one of the following extended highlight attribute (with extended colorsupport) for the exception.BLINK
Turns on blinking for the exception.RVRS
Displays message in reverse video.UNDR
Underscores message.NONE
Uses the default extended highlight attributes.
CYCLE ParametersExNcyc
Sets the frequency for checking the exception at every n OMEGAMON cycles. If this parameter is setto 0 or 1, exception checking will occur during every OMEGAMON cycle. If this field is set to a highernumber, exception checking will only occur each time the specified number of cycles elapses. Thedefault setting for ExNcyc is 0.
StopSets a monitoring limit for an exception to n trips. After the exception trips n times, the exception willnot monitor or display it during the current OMEGAMON XE for DB2 PE session, unless you reset thisparameter. The (m) value indicates the number of times the exception has already tripped since youlast reset the STOP parameter. The default value for STOP is 0, which means that there is no limit tothe number of times the exception can be tested and displayed.
CumulativeIndicates how many times the exception has tripped during the current OMEGAMON XE for DB2 PEsession.
XLF ParametersAuto
Controls the status of ASF (automated panel facility) for this exception. Can be ON or OFF.Log
Controls the status of XLF (Exception Logging Facility) for this exception. Can be ON or OFF.Limit
Limits the number of times XLF or ASF is invoked if the exception occurs. If you enter 0, no events arelogged. If you enter NONE, the exception invokes XLF and/or ASF each time the exception occurs.
The number that is displayed in parentheses is the number of invocations remaining before the limit isreached. If Limit is NONE, the parenthetical value is not displayed, because there is no limit to thenumber of invocations.
RepeatSpecifies that the exception is to be logged each time the PERSIST threshold is reached (YES), or thatit is to be logged only the first time the PERSIST threshold is reached (NO).
PersistSpecifies the number of OMEGAMON XE for DB2 PE cycles during which the exception must tripbefore XLF or ASF logs the exception and/or detail panel.
SS/SLThis parameter might first be displayed on your panel as SS. Change the parameter to SL for properlogging.
• SS specifies the screen space to invoke if ASF is in effect.• SL logs the screen space execution on the REPORT LOG.
594 Classic Interface User's Guide
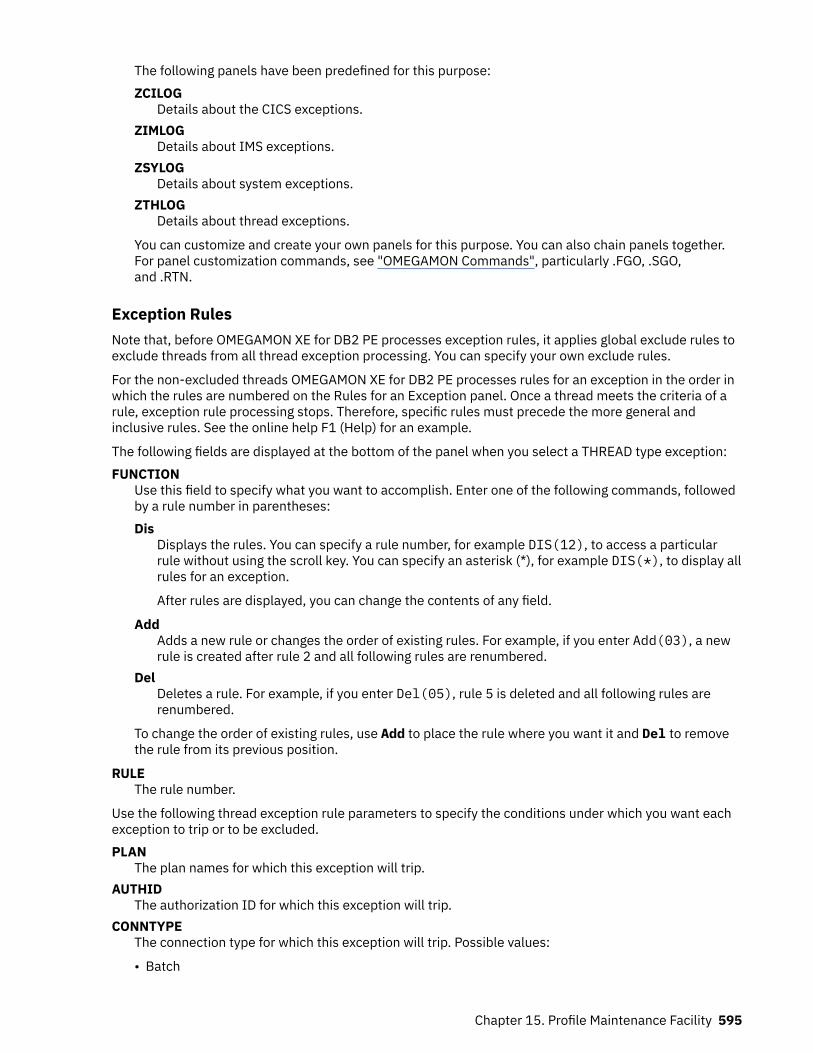
The following panels have been predefined for this purpose:ZCILOG
Details about the CICS exceptions.ZIMLOG
Details about IMS exceptions.ZSYLOG
Details about system exceptions.ZTHLOG
Details about thread exceptions.
You can customize and create your own panels for this purpose. You can also chain panels together.For panel customization commands, see "OMEGAMON Commands", particularly .FGO, .SGO,and .RTN.
Exception RulesNote that, before OMEGAMON XE for DB2 PE processes exception rules, it applies global exclude rules toexclude threads from all thread exception processing. You can specify your own exclude rules.
For the non-excluded threads OMEGAMON XE for DB2 PE processes rules for an exception in the order inwhich the rules are numbered on the Rules for an Exception panel. Once a thread meets the criteria of arule, exception rule processing stops. Therefore, specific rules must precede the more general andinclusive rules. See the online help F1 (Help) for an example.
The following fields are displayed at the bottom of the panel when you select a THREAD type exception:FUNCTION
Use this field to specify what you want to accomplish. Enter one of the following commands, followedby a rule number in parentheses:Dis
Displays the rules. You can specify a rule number, for example DIS(12), to access a particularrule without using the scroll key. You can specify an asterisk (*), for example DIS(*), to display allrules for an exception.
After rules are displayed, you can change the contents of any field.
AddAdds a new rule or changes the order of existing rules. For example, if you enter Add(03), a newrule is created after rule 2 and all following rules are renumbered.
DelDeletes a rule. For example, if you enter Del(05), rule 5 is deleted and all following rules arerenumbered.
To change the order of existing rules, use Add to place the rule where you want it and Del to removethe rule from its previous position.
RULEThe rule number.
Use the following thread exception rule parameters to specify the conditions under which you want eachexception to trip or to be excluded.PLAN
The plan names for which this exception will trip.AUTHID
The authorization ID for which this exception will trip.CONNTYPE
The connection type for which this exception will trip. Possible values:
• Batch
Chapter 15. Profile Maintenance Facility 595
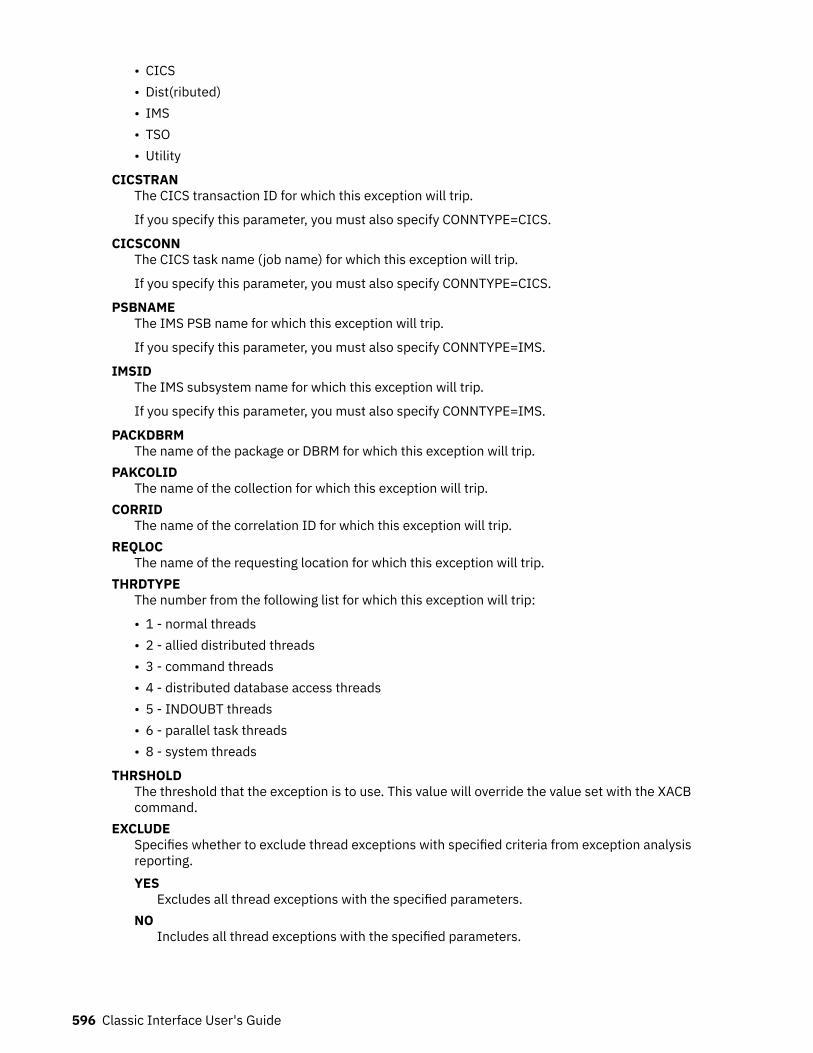
• CICS• Dist(ributed)• IMS• TSO• Utility
CICSTRANThe CICS transaction ID for which this exception will trip.
If you specify this parameter, you must also specify CONNTYPE=CICS.
CICSCONNThe CICS task name (job name) for which this exception will trip.
If you specify this parameter, you must also specify CONNTYPE=CICS.
PSBNAMEThe IMS PSB name for which this exception will trip.
If you specify this parameter, you must also specify CONNTYPE=IMS.
IMSIDThe IMS subsystem name for which this exception will trip.
If you specify this parameter, you must also specify CONNTYPE=IMS.
PACKDBRMThe name of the package or DBRM for which this exception will trip.
PAKCOLIDThe name of the collection for which this exception will trip.
CORRIDThe name of the correlation ID for which this exception will trip.
REQLOCThe name of the requesting location for which this exception will trip.
THRDTYPEThe number from the following list for which this exception will trip:
• 1 - normal threads• 2 - allied distributed threads• 3 - command threads• 4 - distributed database access threads• 5 - INDOUBT threads• 6 - parallel task threads• 8 - system threads
THRSHOLDThe threshold that the exception is to use. This value will override the value set with the XACBcommand.
EXCLUDESpecifies whether to exclude thread exceptions with specified criteria from exception analysisreporting.YES
Excludes all thread exceptions with the specified parameters.NO
Includes all thread exceptions with the specified parameters.
596 Classic Interface User's Guide
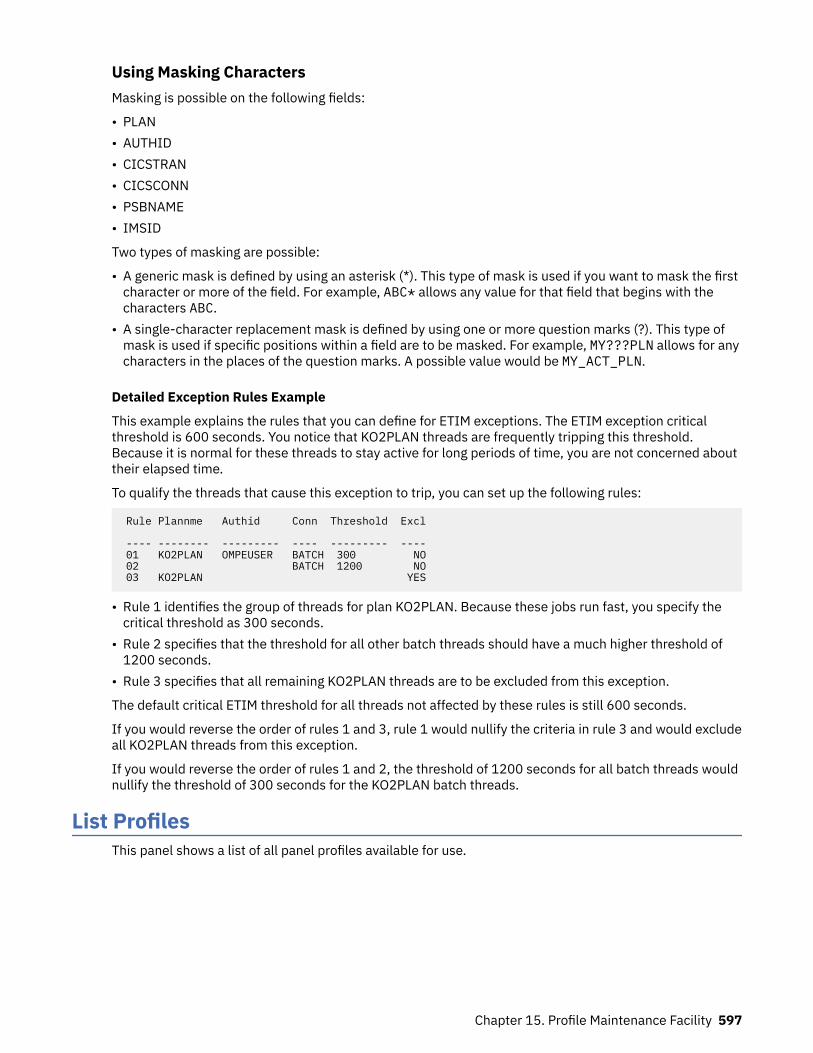
Using Masking CharactersMasking is possible on the following fields:
• PLAN• AUTHID• CICSTRAN• CICSCONN• PSBNAME• IMSID
Two types of masking are possible:
• A generic mask is defined by using an asterisk (*). This type of mask is used if you want to mask the firstcharacter or more of the field. For example, ABC* allows any value for that field that begins with thecharacters ABC.
• A single-character replacement mask is defined by using one or more question marks (?). This type ofmask is used if specific positions within a field are to be masked. For example, MY???PLN allows for anycharacters in the places of the question marks. A possible value would be MY_ACT_PLN.
Detailed Exception Rules Example
This example explains the rules that you can define for ETIM exceptions. The ETIM exception criticalthreshold is 600 seconds. You notice that KO2PLAN threads are frequently tripping this threshold.Because it is normal for these threads to stay active for long periods of time, you are not concerned abouttheir elapsed time.
To qualify the threads that cause this exception to trip, you can set up the following rules:
Rule Plannme Authid Conn Threshold Excl ---- -------- --------- ---- --------- ---- 01 KO2PLAN OMPEUSER BATCH 300 NO 02 BATCH 1200 NO 03 KO2PLAN YES
• Rule 1 identifies the group of threads for plan KO2PLAN. Because these jobs run fast, you specify thecritical threshold as 300 seconds.
• Rule 2 specifies that the threshold for all other batch threads should have a much higher threshold of1200 seconds.
• Rule 3 specifies that all remaining KO2PLAN threads are to be excluded from this exception.
The default critical ETIM threshold for all threads not affected by these rules is still 600 seconds.
If you would reverse the order of rules 1 and 3, rule 1 would nullify the criteria in rule 3 and would excludeall KO2PLAN threads from this exception.
If you would reverse the order of rules 1 and 2, the threshold of 1200 seconds for all batch threads wouldnullify the threshold of 300 seconds for the KO2PLAN batch threads.
List ProfilesThis panel shows a list of all panel profiles available for use.
Chapter 15. Profile Maintenance Facility 597
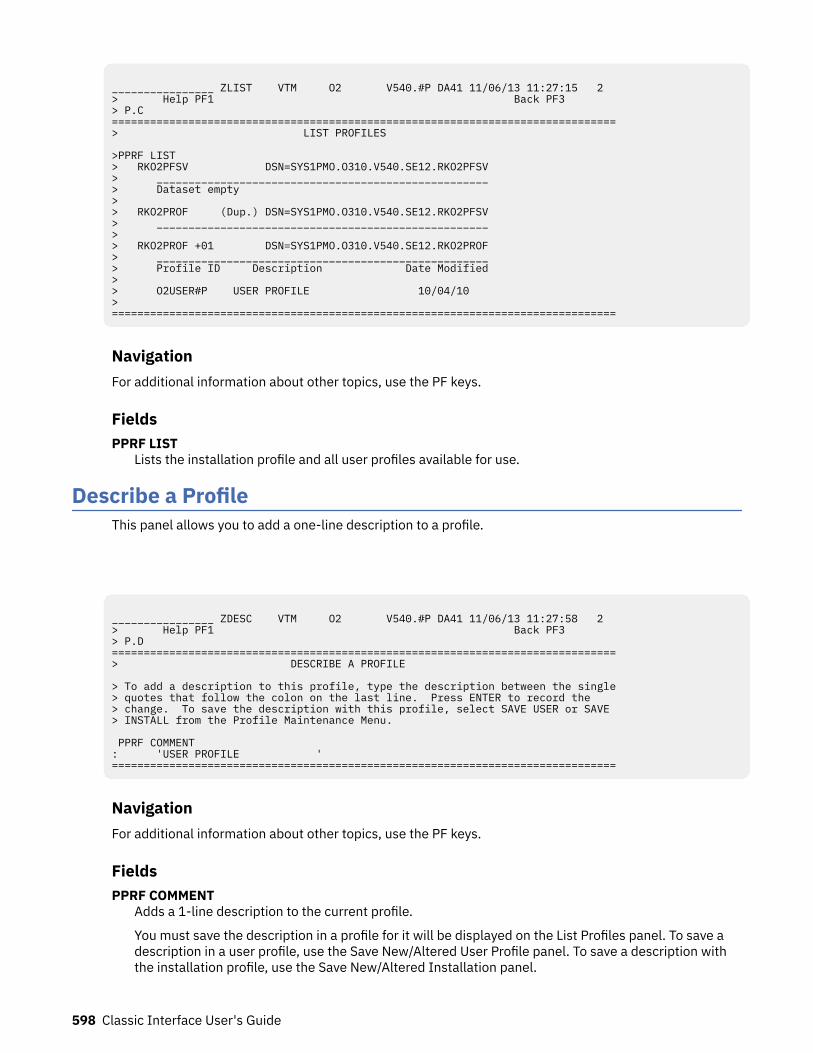
________________ ZLIST VTM O2 V540.#P DA41 11/06/13 11:27:15 2 > Help PF1 Back PF3 > P.C ===============================================================================> LIST PROFILES >PPRF LIST > RKO2PFSV DSN=SYS1PMO.O310.V540.SE12.RKO2PFSV > ____________________________________________________ > Dataset empty > > RKO2PROF (Dup.) DSN=SYS1PMO.O310.V540.SE12.RKO2PFSV > ____________________________________________________ > > RKO2PROF +01 DSN=SYS1PMO.O310.V540.SE12.RKO2PROF > ____________________________________________________ > Profile ID Description Date Modified > > O2USER#P USER PROFILE 10/04/10 > ===============================================================================
NavigationFor additional information about other topics, use the PF keys.
FieldsPPRF LIST
Lists the installation profile and all user profiles available for use.
Describe a ProfileThis panel allows you to add a one-line description to a profile.
________________ ZDESC VTM O2 V540.#P DA41 11/06/13 11:27:58 2 > Help PF1 Back PF3 > P.D =============================================================================== > DESCRIBE A PROFILE > To add a description to this profile, type the description between the single > quotes that follow the colon on the last line. Press ENTER to record the > change. To save the description with this profile, select SAVE USER or SAVE > INSTALL from the Profile Maintenance Menu. PPRF COMMENT : 'USER PROFILE ' ===============================================================================
NavigationFor additional information about other topics, use the PF keys.
FieldsPPRF COMMENT
Adds a 1-line description to the current profile.
You must save the description in a profile for it will be displayed on the List Profiles panel. To save adescription in a user profile, use the Save New/Altered User Profile panel. To save a description withthe installation profile, use the Save New/Altered Installation panel.
598 Classic Interface User's Guide
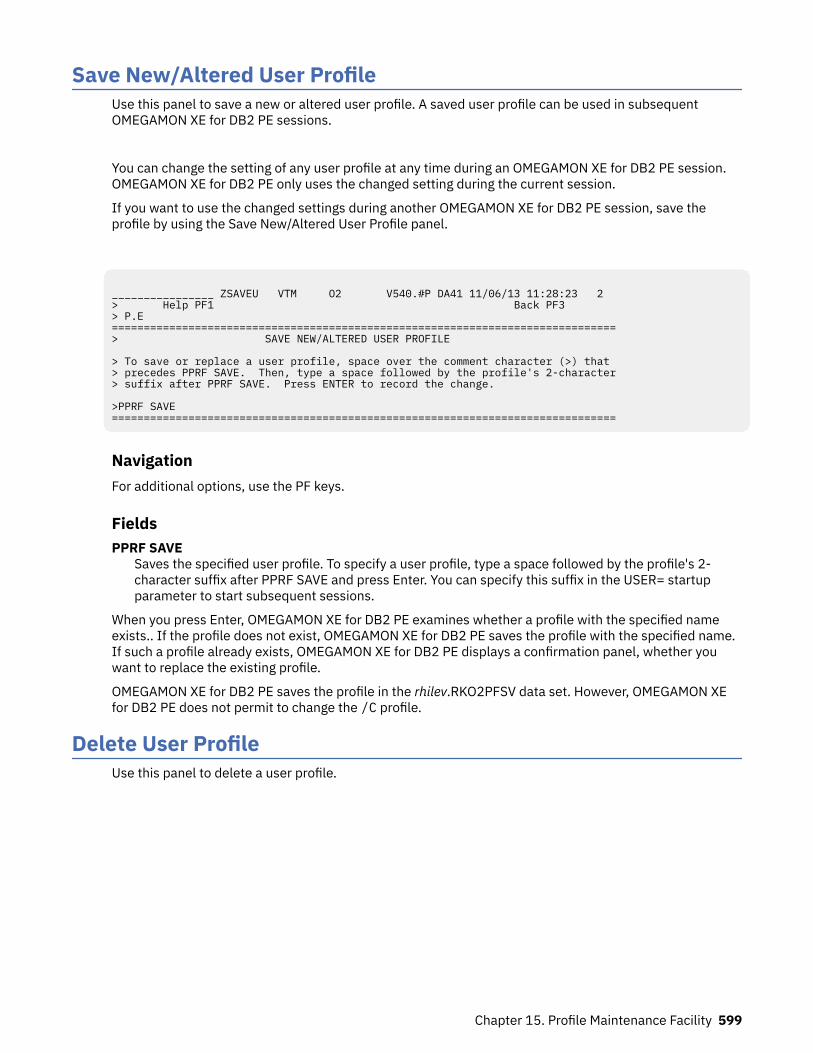
Save New/Altered User ProfileUse this panel to save a new or altered user profile. A saved user profile can be used in subsequentOMEGAMON XE for DB2 PE sessions.
You can change the setting of any user profile at any time during an OMEGAMON XE for DB2 PE session.OMEGAMON XE for DB2 PE only uses the changed setting during the current session.
If you want to use the changed settings during another OMEGAMON XE for DB2 PE session, save theprofile by using the Save New/Altered User Profile panel.
________________ ZSAVEU VTM O2 V540.#P DA41 11/06/13 11:28:23 2 > Help PF1 Back PF3 > P.E ===============================================================================> SAVE NEW/ALTERED USER PROFILE > To save or replace a user profile, space over the comment character (>) that > precedes PPRF SAVE. Then, type a space followed by the profile's 2-character> suffix after PPRF SAVE. Press ENTER to record the change. >PPRF SAVE ===============================================================================
NavigationFor additional options, use the PF keys.
FieldsPPRF SAVE
Saves the specified user profile. To specify a user profile, type a space followed by the profile's 2-character suffix after PPRF SAVE and press Enter. You can specify this suffix in the USER= startupparameter to start subsequent sessions.
When you press Enter, OMEGAMON XE for DB2 PE examines whether a profile with the specified nameexists.. If the profile does not exist, OMEGAMON XE for DB2 PE saves the profile with the specified name.If such a profile already exists, OMEGAMON XE for DB2 PE displays a confirmation panel, whether youwant to replace the existing profile.
OMEGAMON XE for DB2 PE saves the profile in the rhilev.RKO2PFSV data set. However, OMEGAMON XEfor DB2 PE does not permit to change the /C profile.
Delete User ProfileUse this panel to delete a user profile.
Chapter 15. Profile Maintenance Facility 599
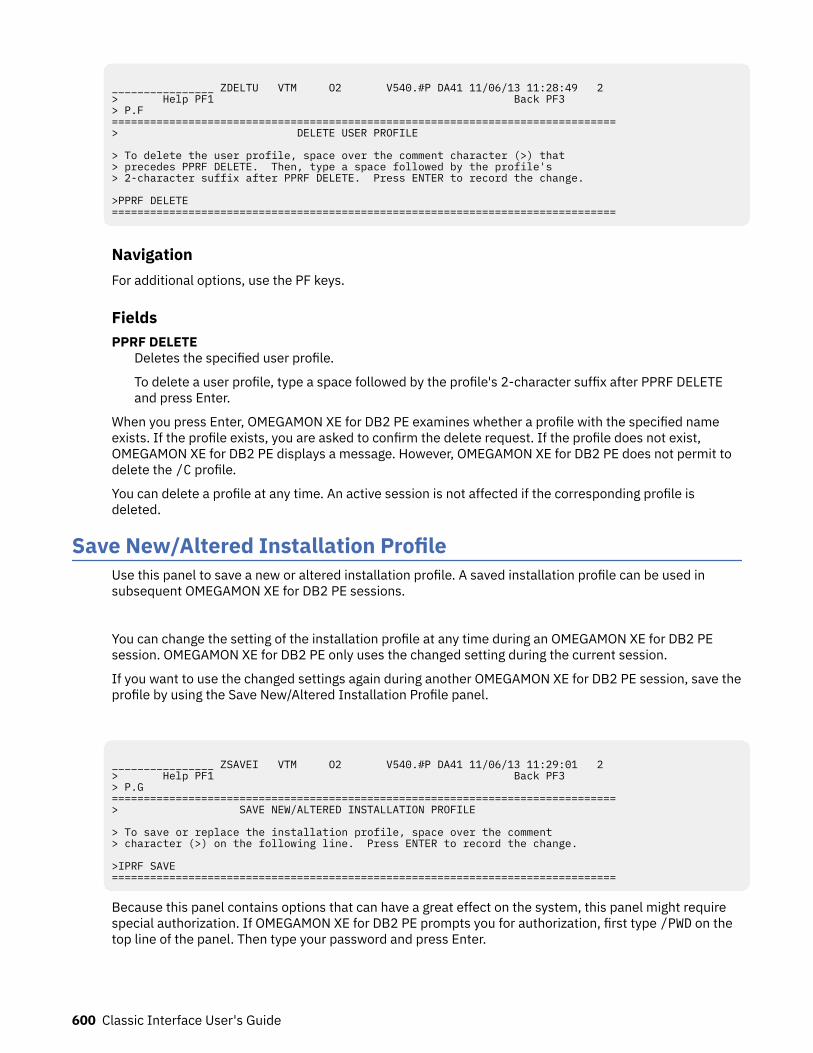
________________ ZDELTU VTM O2 V540.#P DA41 11/06/13 11:28:49 2 > Help PF1 Back PF3 > P.F ===============================================================================> DELETE USER PROFILE > To delete the user profile, space over the comment character (>) that > precedes PPRF DELETE. Then, type a space followed by the profile's > 2-character suffix after PPRF DELETE. Press ENTER to record the change. >PPRF DELETE ===============================================================================
NavigationFor additional options, use the PF keys.
FieldsPPRF DELETE
Deletes the specified user profile.
To delete a user profile, type a space followed by the profile's 2-character suffix after PPRF DELETEand press Enter.
When you press Enter, OMEGAMON XE for DB2 PE examines whether a profile with the specified nameexists. If the profile exists, you are asked to confirm the delete request. If the profile does not exist,OMEGAMON XE for DB2 PE displays a message. However, OMEGAMON XE for DB2 PE does not permit todelete the /C profile.
You can delete a profile at any time. An active session is not affected if the corresponding profile isdeleted.
Save New/Altered Installation ProfileUse this panel to save a new or altered installation profile. A saved installation profile can be used insubsequent OMEGAMON XE for DB2 PE sessions.
You can change the setting of the installation profile at any time during an OMEGAMON XE for DB2 PEsession. OMEGAMON XE for DB2 PE only uses the changed setting during the current session.
If you want to use the changed settings again during another OMEGAMON XE for DB2 PE session, save theprofile by using the Save New/Altered Installation Profile panel.
________________ ZSAVEI VTM O2 V540.#P DA41 11/06/13 11:29:01 2 > Help PF1 Back PF3 > P.G ===============================================================================> SAVE NEW/ALTERED INSTALLATION PROFILE > To save or replace the installation profile, space over the comment > character (>) on the following line. Press ENTER to record the change. >IPRF SAVE ===============================================================================
Because this panel contains options that can have a great effect on the system, this panel might requirespecial authorization. If OMEGAMON XE for DB2 PE prompts you for authorization, first type /PWD on thetop line of the panel. Then type your password and press Enter.
600 Classic Interface User's Guide
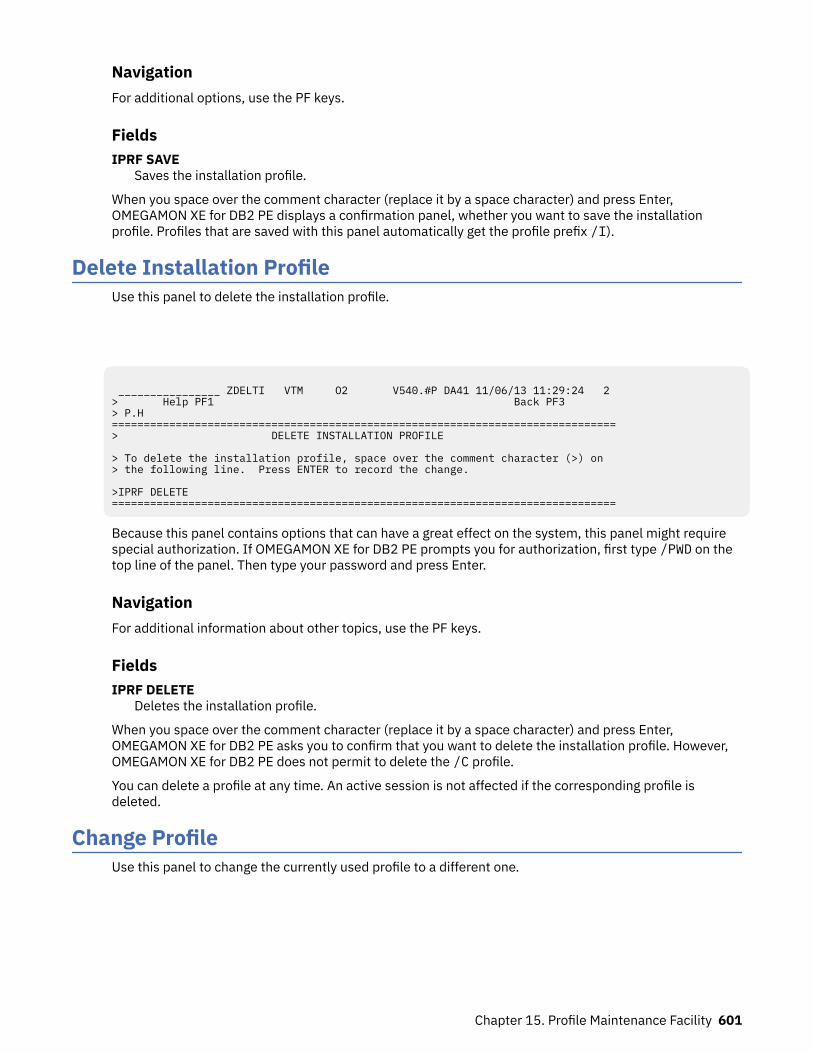
NavigationFor additional options, use the PF keys.
FieldsIPRF SAVE
Saves the installation profile.
When you space over the comment character (replace it by a space character) and press Enter,OMEGAMON XE for DB2 PE displays a confirmation panel, whether you want to save the installationprofile. Profiles that are saved with this panel automatically get the profile prefix /I).
Delete Installation ProfileUse this panel to delete the installation profile.
________________ ZDELTI VTM O2 V540.#P DA41 11/06/13 11:29:24 2 > Help PF1 Back PF3 > P.H ===============================================================================> DELETE INSTALLATION PROFILE > To delete the installation profile, space over the comment character (>) on > the following line. Press ENTER to record the change. >IPRF DELETE ===============================================================================
Because this panel contains options that can have a great effect on the system, this panel might requirespecial authorization. If OMEGAMON XE for DB2 PE prompts you for authorization, first type /PWD on thetop line of the panel. Then type your password and press Enter.
NavigationFor additional information about other topics, use the PF keys.
FieldsIPRF DELETE
Deletes the installation profile.
When you space over the comment character (replace it by a space character) and press Enter,OMEGAMON XE for DB2 PE asks you to confirm that you want to delete the installation profile. However,OMEGAMON XE for DB2 PE does not permit to delete the /C profile.
You can delete a profile at any time. An active session is not affected if the corresponding profile isdeleted.
Change ProfileUse this panel to change the currently used profile to a different one.
Chapter 15. Profile Maintenance Facility 601
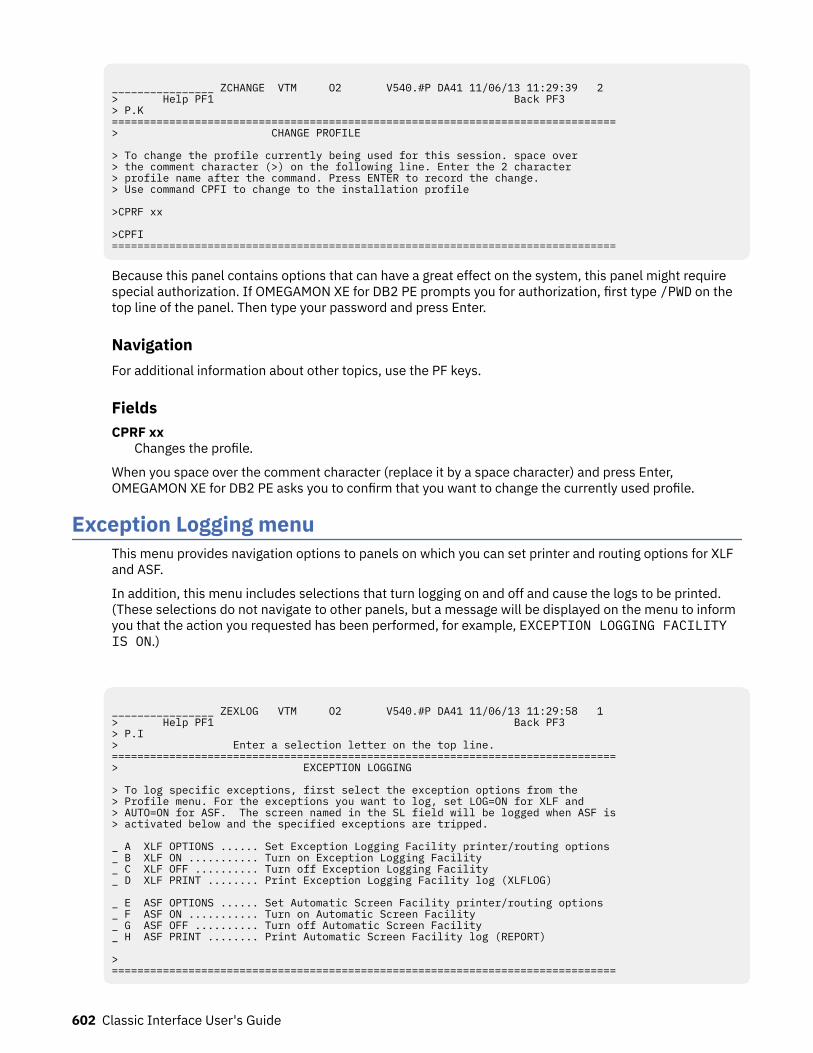
________________ ZCHANGE VTM O2 V540.#P DA41 11/06/13 11:29:39 2 > Help PF1 Back PF3 > P.K ===============================================================================> CHANGE PROFILE > To change the profile currently being used for this session. space over > the comment character (>) on the following line. Enter the 2 character > profile name after the command. Press ENTER to record the change. > Use command CPFI to change to the installation profile >CPRF xx >CPFI ===============================================================================
Because this panel contains options that can have a great effect on the system, this panel might requirespecial authorization. If OMEGAMON XE for DB2 PE prompts you for authorization, first type /PWD on thetop line of the panel. Then type your password and press Enter.
NavigationFor additional information about other topics, use the PF keys.
FieldsCPRF xx
Changes the profile.
When you space over the comment character (replace it by a space character) and press Enter,OMEGAMON XE for DB2 PE asks you to confirm that you want to change the currently used profile.
Exception Logging menuThis menu provides navigation options to panels on which you can set printer and routing options for XLFand ASF.
In addition, this menu includes selections that turn logging on and off and cause the logs to be printed.(These selections do not navigate to other panels, but a message will be displayed on the menu to informyou that the action you requested has been performed, for example, EXCEPTION LOGGING FACILITYIS ON.)
________________ ZEXLOG VTM O2 V540.#P DA41 11/06/13 11:29:58 1 > Help PF1 Back PF3 > P.I > Enter a selection letter on the top line. ===============================================================================> EXCEPTION LOGGING > To log specific exceptions, first select the exception options from the > Profile menu. For the exceptions you want to log, set LOG=ON for XLF and > AUTO=ON for ASF. The screen named in the SL field will be logged when ASF is> activated below and the specified exceptions are tripped. _ A XLF OPTIONS ...... Set Exception Logging Facility printer/routing options _ B XLF ON ........... Turn on Exception Logging Facility _ C XLF OFF .......... Turn off Exception Logging Facility _ D XLF PRINT ........ Print Exception Logging Facility log (XLFLOG) _ E ASF OPTIONS ...... Set Automatic Screen Facility printer/routing options _ F ASF ON ........... Turn on Automatic Screen Facility _ G ASF OFF .......... Turn off Automatic Screen Facility _ H ASF PRINT ........ Print Automatic Screen Facility log (REPORT) > ===============================================================================
602 Classic Interface User's Guide
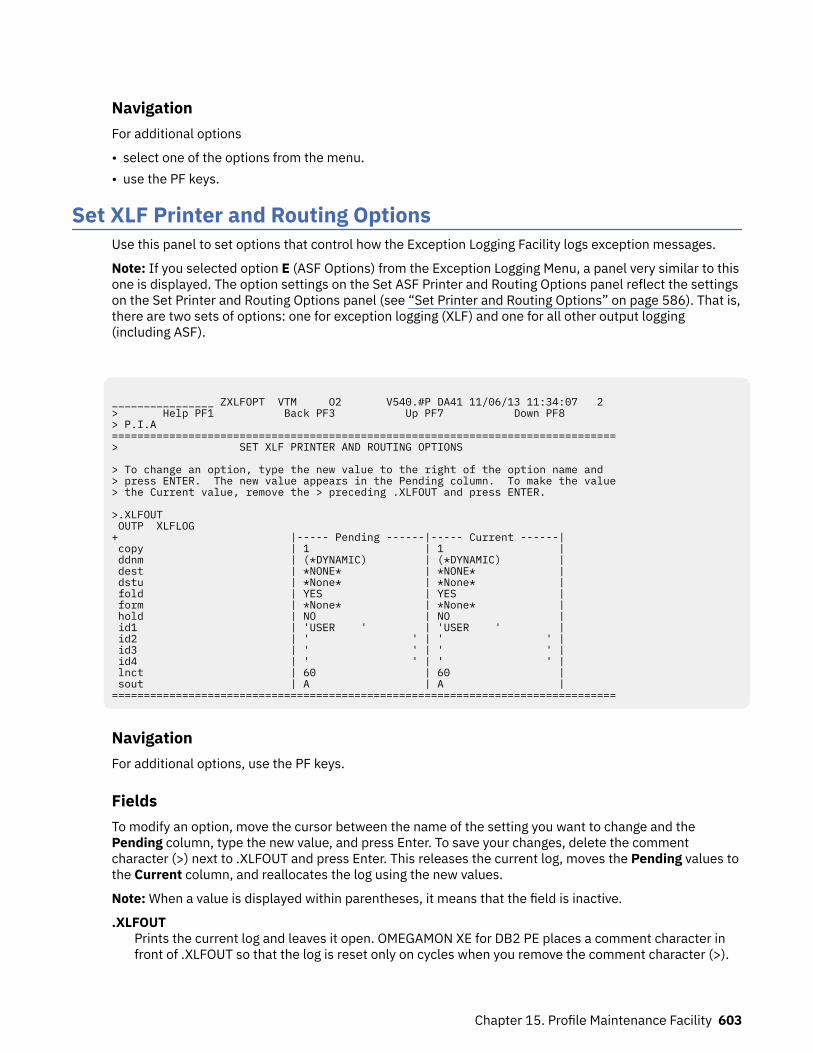
NavigationFor additional options
• select one of the options from the menu.• use the PF keys.
Set XLF Printer and Routing OptionsUse this panel to set options that control how the Exception Logging Facility logs exception messages.
Note: If you selected option E (ASF Options) from the Exception Logging Menu, a panel very similar to thisone is displayed. The option settings on the Set ASF Printer and Routing Options panel reflect the settingson the Set Printer and Routing Options panel (see “Set Printer and Routing Options” on page 586). That is,there are two sets of options: one for exception logging (XLF) and one for all other output logging(including ASF).
________________ ZXLFOPT VTM O2 V540.#P DA41 11/06/13 11:34:07 2 > Help PF1 Back PF3 Up PF7 Down PF8 > P.I.A =============================================================================== > SET XLF PRINTER AND ROUTING OPTIONS > To change an option, type the new value to the right of the option name and > press ENTER. The new value appears in the Pending column. To make the value > the Current value, remove the > preceding .XLFOUT and press ENTER. >.XLFOUT OUTP XLFLOG + |----- Pending ------|----- Current ------| copy | 1 | 1 | ddnm | (*DYNAMIC) | (*DYNAMIC) | dest | *NONE* | *NONE* | dstu | *None* | *None* | fold | YES | YES | form | *None* | *None* | hold | NO | NO | id1 | 'USER ' | 'USER ' | id2 | ' ' | ' ' | id3 | ' ' | ' ' | id4 | ' ' | ' ' | lnct | 60 | 60 | sout | A | A | ===============================================================================
NavigationFor additional options, use the PF keys.
FieldsTo modify an option, move the cursor between the name of the setting you want to change and thePending column, type the new value, and press Enter. To save your changes, delete the commentcharacter (>) next to .XLFOUT and press Enter. This releases the current log, moves the Pending values tothe Current column, and reallocates the log using the new values.
Note: When a value is displayed within parentheses, it means that the field is inactive.
.XLFOUTPrints the current log and leaves it open. OMEGAMON XE for DB2 PE places a comment character infront of .XLFOUT so that the log is reset only on cycles when you remove the comment character (>).
Chapter 15. Profile Maintenance Facility 603
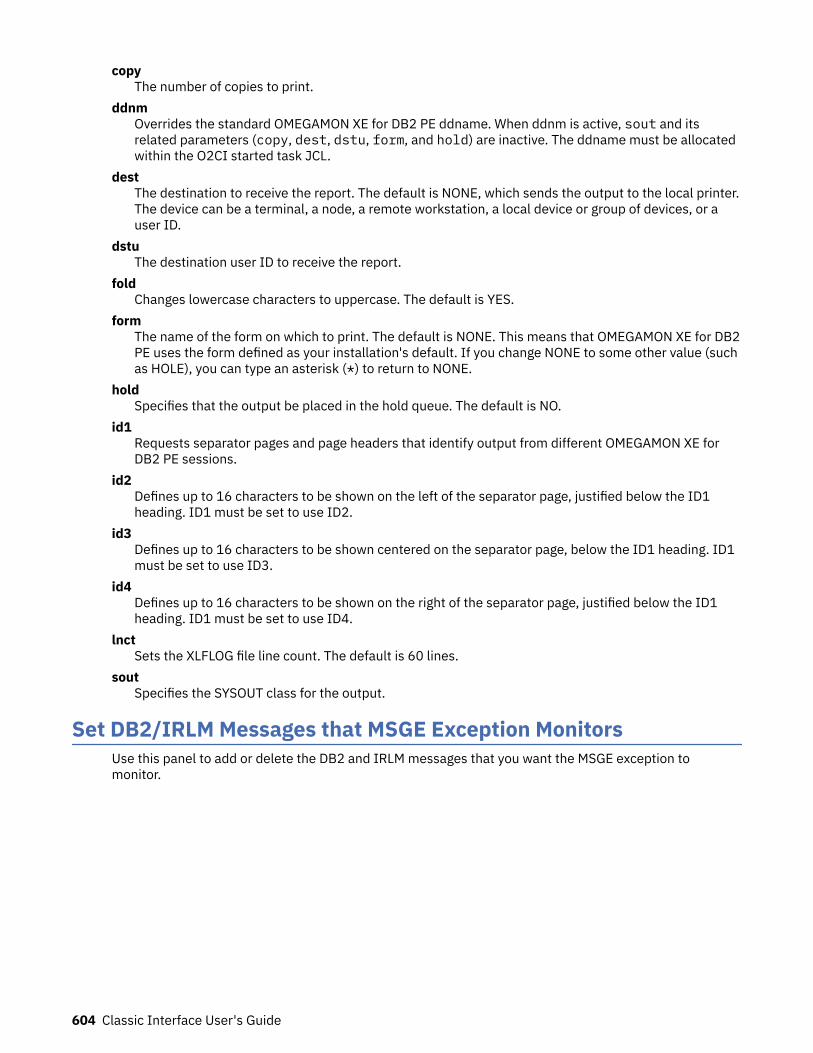
copyThe number of copies to print.
ddnmOverrides the standard OMEGAMON XE for DB2 PE ddname. When ddnm is active, sout and itsrelated parameters (copy, dest, dstu, form, and hold) are inactive. The ddname must be allocatedwithin the O2CI started task JCL.
destThe destination to receive the report. The default is NONE, which sends the output to the local printer.The device can be a terminal, a node, a remote workstation, a local device or group of devices, or auser ID.
dstuThe destination user ID to receive the report.
foldChanges lowercase characters to uppercase. The default is YES.
formThe name of the form on which to print. The default is NONE. This means that OMEGAMON XE for DB2PE uses the form defined as your installation's default. If you change NONE to some other value (suchas HOLE), you can type an asterisk (*) to return to NONE.
holdSpecifies that the output be placed in the hold queue. The default is NO.
id1Requests separator pages and page headers that identify output from different OMEGAMON XE forDB2 PE sessions.
id2Defines up to 16 characters to be shown on the left of the separator page, justified below the ID1heading. ID1 must be set to use ID2.
id3Defines up to 16 characters to be shown centered on the separator page, below the ID1 heading. ID1must be set to use ID3.
id4Defines up to 16 characters to be shown on the right of the separator page, justified below the ID1heading. ID1 must be set to use ID4.
lnctSets the XLFLOG file line count. The default is 60 lines.
soutSpecifies the SYSOUT class for the output.
Set DB2/IRLM Messages that MSGE Exception MonitorsUse this panel to add or delete the DB2 and IRLM messages that you want the MSGE exception tomonitor.
604 Classic Interface User's Guide
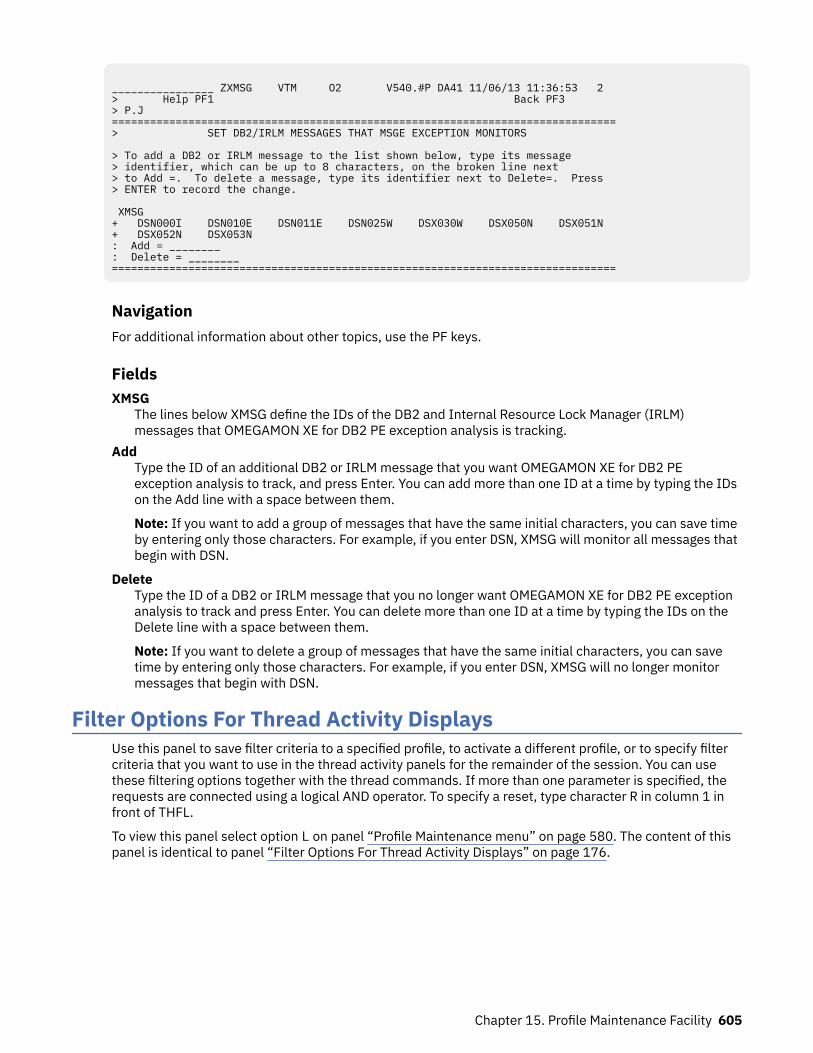
________________ ZXMSG VTM O2 V540.#P DA41 11/06/13 11:36:53 2 > Help PF1 Back PF3 > P.J ===============================================================================> SET DB2/IRLM MESSAGES THAT MSGE EXCEPTION MONITORS > To add a DB2 or IRLM message to the list shown below, type its message > identifier, which can be up to 8 characters, on the broken line next > to Add =. To delete a message, type its identifier next to Delete=. Press > ENTER to record the change. XMSG + DSN000I DSN010E DSN011E DSN025W DSX030W DSX050N DSX051N + DSX052N DSX053N : Add = ________ : Delete = ________ ===============================================================================
NavigationFor additional information about other topics, use the PF keys.
FieldsXMSG
The lines below XMSG define the IDs of the DB2 and Internal Resource Lock Manager (IRLM)messages that OMEGAMON XE for DB2 PE exception analysis is tracking.
AddType the ID of an additional DB2 or IRLM message that you want OMEGAMON XE for DB2 PEexception analysis to track, and press Enter. You can add more than one ID at a time by typing the IDson the Add line with a space between them.
Note: If you want to add a group of messages that have the same initial characters, you can save timeby entering only those characters. For example, if you enter DSN, XMSG will monitor all messages thatbegin with DSN.
DeleteType the ID of a DB2 or IRLM message that you no longer want OMEGAMON XE for DB2 PE exceptionanalysis to track and press Enter. You can delete more than one ID at a time by typing the IDs on theDelete line with a space between them.
Note: If you want to delete a group of messages that have the same initial characters, you can savetime by entering only those characters. For example, if you enter DSN, XMSG will no longer monitormessages that begin with DSN.
Filter Options For Thread Activity DisplaysUse this panel to save filter criteria to a specified profile, to activate a different profile, or to specify filtercriteria that you want to use in the thread activity panels for the remainder of the session. You can usethese filtering options together with the thread commands. If more than one parameter is specified, therequests are connected using a logical AND operator. To specify a reset, type character R in column 1 infront of THFL.
To view this panel select option L on panel “Profile Maintenance menu” on page 580. The content of thispanel is identical to panel “Filter Options For Thread Activity Displays” on page 176.
Chapter 15. Profile Maintenance Facility 605
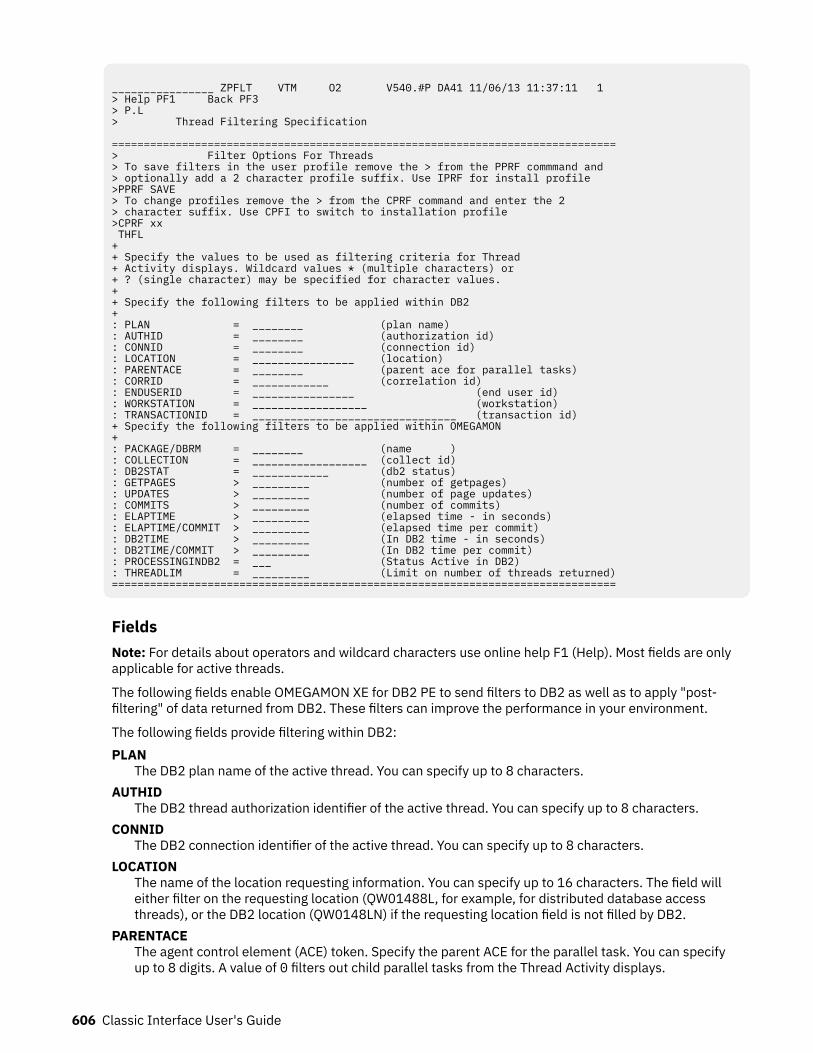
________________ ZPFLT VTM O2 V540.#P DA41 11/06/13 11:37:11 1 > Help PF1 Back PF3 > P.L > Thread Filtering Specification =============================================================================== > Filter Options For Threads > To save filters in the user profile remove the > from the PPRF commmand and > optionally add a 2 character profile suffix. Use IPRF for install profile >PPRF SAVE > To change profiles remove the > from the CPRF command and enter the 2 > character suffix. Use CPFI to switch to installation profile >CPRF xx THFL + + Specify the values to be used as filtering criteria for Thread + Activity displays. Wildcard values * (multiple characters) or + ? (single character) may be specified for character values. + + Specify the following filters to be applied within DB2 + : PLAN = ________ (plan name) : AUTHID = ________ (authorization id) : CONNID = ________ (connection id) : LOCATION = ________________ (location) : PARENTACE = ________ (parent ace for parallel tasks) : CORRID = ____________ (correlation id) : ENDUSERID = ________________ (end user id) : WORKSTATION = __________________ (workstation) : TRANSACTIONID = ________________________________ (transaction id) + Specify the following filters to be applied within OMEGAMON + : PACKAGE/DBRM = ________ (name ) : COLLECTION = __________________ (collect id) : DB2STAT = ____________ (db2 status) : GETPAGES > _________ (number of getpages) : UPDATES > _________ (number of page updates) : COMMITS > _________ (number of commits) : ELAPTIME > _________ (elapsed time - in seconds) : ELAPTIME/COMMIT > _________ (elapsed time per commit) : DB2TIME > _________ (In DB2 time - in seconds) : DB2TIME/COMMIT > _________ (In DB2 time per commit) : PROCESSINGINDB2 = ___ (Status Active in DB2) : THREADLIM = _________ (Limit on number of threads returned)===============================================================================
FieldsNote: For details about operators and wildcard characters use online help F1 (Help). Most fields are onlyapplicable for active threads.
The following fields enable OMEGAMON XE for DB2 PE to send filters to DB2 as well as to apply "post-filtering" of data returned from DB2. These filters can improve the performance in your environment.
The following fields provide filtering within DB2:PLAN
The DB2 plan name of the active thread. You can specify up to 8 characters.AUTHID
The DB2 thread authorization identifier of the active thread. You can specify up to 8 characters.CONNID
The DB2 connection identifier of the active thread. You can specify up to 8 characters.LOCATION
The name of the location requesting information. You can specify up to 16 characters. The field willeither filter on the requesting location (QW01488L, for example, for distributed database accessthreads), or the DB2 location (QW0148LN) if the requesting location field is not filled by DB2.
PARENTACEThe agent control element (ACE) token. Specify the parent ACE for the parallel task. You can specifyup to 8 digits. A value of 0 filters out child parallel tasks from the Thread Activity displays.
606 Classic Interface User's Guide
CORRIDThe correlation identifier. You can specify up to 12 characters. If the application requestor is a DB2system, this is the same correlation ID assigned at the requestor. If the application requestor is notDB2, this is the name of the job, task, or process that is being serviced.
Note: This field is case sensitive. It is not converted to uppercase.
ENDUSERIDThe end user's work station user ID. You can specify up to 16 characters. This can be different fromthe authorization ID used to connect to DB2. It contains blanks if the client does not supply thisinformation.
Note: This field is case sensitive. It is not converted to uppercase.
WORKSTATIONThe workstation identifier. You can specify up to 18 characters. It contains blanks if the client does notsupply this information.
Note: This field is case sensitive. It is not converted to uppercase.
TRANSACTIONIDThe name of the transaction or application that the end user is running. It identifies the applicationthat is currently running, not the product that is used to run the application. You can specify up to 32characters. This field contains blanks if the client does not supply this information.
Note: This field is case sensitive. It is not converted to uppercase.
The following fields enable filtering of the data returned from DB2 and are applied by OMEGAMON XE forDB2 PE:PACKAGE/DBRM
The DB2 package name or DBRM name of the active thread. You can specify up to 8 characters.COLLECTION
The package collection identifier of the active thread. You can specify up to 18 characters.DB2STAT
The DB2 status. You can specify up to 12 characters. For definitions of all possible status values, see"DB2 Thread Status".
GETPAGESThe number of Getpage requests issued by the active thread since thread creation. You can specify upto 9 digits.
UPDATESThe number of DB2 page updates made by the thread since thread creation. This value is incrementedeach time a row in a page is updated, not just once for each page updated. DB2 might update pageswhen it creates intermediate result tables because of a qualified SELECT statement, even thoughSELECT statements are generally thought of as read only operations. Pages that have been updatedare written asynchronously by DB2, according to DB2's internal Deferred Write algorithm, notimmediately after update or commit. DB2 resets the page update count at Create Thread and Signon.If Signon is not driven, the page update count is cumulative. This file is applicable for active threadsonly. You can specify up to 9 digits.
COMMITSThe number of times the thread successfully completed commit processing. DB2 resets the commitcount at thread create and signon. If signon is not driven, the count is cumulative. You can specify upto 9 digits.
ELAPTIMEThe elapsed time since thread creation. You can specify up to 9 digits.
ELAPTIME/COMMITAverage elapsed time between commits. If the number of commits is zero this field is the same asELAPTIME. You can specify up to 9 digits.
Chapter 15. Profile Maintenance Facility 607
DB2TIMEThe total In-DB2 elapsed time in seconds for an active thread. You can specify up to 9 digits.
DB2TIME/COMMITAverage In-DB2 elapsed time between commits. If the number of commits is zero this field is thesame as DB2TIME. You can specify up to 9 digits.
PROCESSING-IN-DB2Values YES, NO or blank.YES
Only threads that are in a status that is active in DB2 are shown. If a thread is executing in theapplication it is not shown. The following thread statuses are processing in DB2:
• IN-DB2• IN-TRIGGER• IN-COMMAND• IN-STOR-PROC• IN-USER-FUNC• IN-TERM-THRD• WAIT-LOCK• WAIT-GLBLOCK• WAIT-MSGSEND• WAIT-ARCHIVE• WAIT-REMSQL• WAIT-CONVLIM• WAIT-TERM-TH• WAIT-SP-STOP• WAIT-SP-SCHD• SP/UDF-INACT• WAIT-SYNC-IO• WAIT-SERVICE• WAIT-ASYNCRD• WAIT-ASYNCWR• WAIT-LOGQSCE• WAIT-PGLATCH• WAIT-DRNLOCK• WAIT-CLAIMER• WAIT-ARCREAD• WAIT-LOCKPIP• WAIT-LOCKPQS• WAIT-SWITCH• WAIT-ACCEL• WAIT-LOB• WAIT-COMMIT• WAIT-CL3LOCK• IN-SQL-SORT• IN-SQL-CALL• WAIT-REMREQ
608 Classic Interface User's Guide
• IN-BIND-DYNM• IN-ACCEL• IN-AUTO-PROC
NOOnly threads that are not in an active status in DB2 are shown.
BlankThis filter is not used.
Threads accelerated by the IBM Db2 Analytics Accelerator for z/OS are considered as being processedin DB2.
THREADLIMA numeric value causing OMEGAMON XE for DB2 PE to stop retrieving instrumentation records fromDB2. This field can have a positive impact on realtime and system performance, but can also result inan incomplete thread list if it is less than the number of threads actually running in DB2 at the time thelist is retrieved. The default setting (blank or 0) allows all records retrieved by DB2 to flow toOMEGAMON XE for DB2 PE. You can specify up to 9 digits.
Chapter 15. Profile Maintenance Facility 609

610 Classic Interface User's Guide
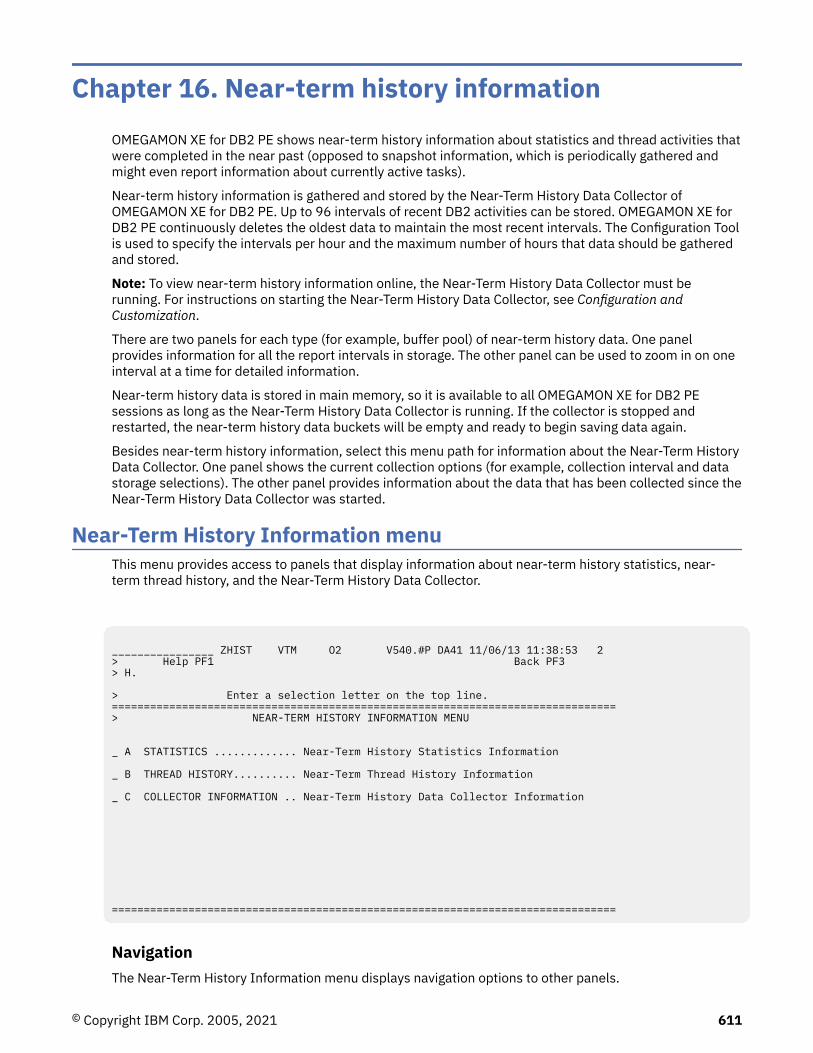
Chapter 16. Near-term history informationOMEGAMON XE for DB2 PE shows near-term history information about statistics and thread activities thatwere completed in the near past (opposed to snapshot information, which is periodically gathered andmight even report information about currently active tasks).
Near-term history information is gathered and stored by the Near-Term History Data Collector ofOMEGAMON XE for DB2 PE. Up to 96 intervals of recent DB2 activities can be stored. OMEGAMON XE forDB2 PE continuously deletes the oldest data to maintain the most recent intervals. The Configuration Toolis used to specify the intervals per hour and the maximum number of hours that data should be gatheredand stored.
Note: To view near-term history information online, the Near-Term History Data Collector must berunning. For instructions on starting the Near-Term History Data Collector, see Configuration andCustomization.
There are two panels for each type (for example, buffer pool) of near-term history data. One panelprovides information for all the report intervals in storage. The other panel can be used to zoom in on oneinterval at a time for detailed information.
Near-term history data is stored in main memory, so it is available to all OMEGAMON XE for DB2 PEsessions as long as the Near-Term History Data Collector is running. If the collector is stopped andrestarted, the near-term history data buckets will be empty and ready to begin saving data again.
Besides near-term history information, select this menu path for information about the Near-Term HistoryData Collector. One panel shows the current collection options (for example, collection interval and datastorage selections). The other panel provides information about the data that has been collected since theNear-Term History Data Collector was started.
Near-Term History Information menuThis menu provides access to panels that display information about near-term history statistics, near-term thread history, and the Near-Term History Data Collector.
________________ ZHIST VTM O2 V540.#P DA41 11/06/13 11:38:53 2 > Help PF1 Back PF3 > H. > Enter a selection letter on the top line. ===============================================================================> NEAR-TERM HISTORY INFORMATION MENU _ A STATISTICS ............. Near-Term History Statistics Information _ B THREAD HISTORY.......... Near-Term Thread History Information _ C COLLECTOR INFORMATION .. Near-Term History Data Collector Information ===============================================================================
NavigationThe Near-Term History Information menu displays navigation options to other panels.
© Copyright IBM Corp. 2005, 2021 611
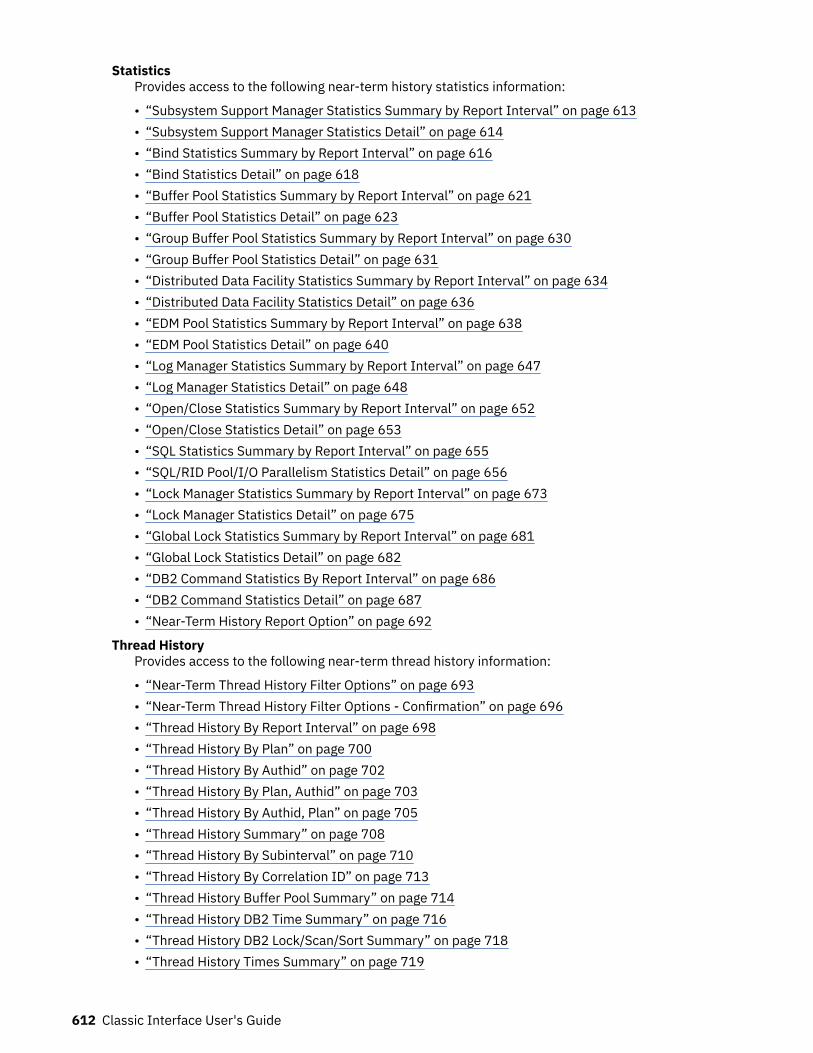
StatisticsProvides access to the following near-term history statistics information:
• “Subsystem Support Manager Statistics Summary by Report Interval” on page 613• “Subsystem Support Manager Statistics Detail” on page 614• “Bind Statistics Summary by Report Interval” on page 616• “Bind Statistics Detail” on page 618• “Buffer Pool Statistics Summary by Report Interval” on page 621• “Buffer Pool Statistics Detail” on page 623• “Group Buffer Pool Statistics Summary by Report Interval” on page 630• “Group Buffer Pool Statistics Detail” on page 631• “Distributed Data Facility Statistics Summary by Report Interval” on page 634• “Distributed Data Facility Statistics Detail” on page 636• “EDM Pool Statistics Summary by Report Interval” on page 638• “EDM Pool Statistics Detail” on page 640• “Log Manager Statistics Summary by Report Interval” on page 647• “Log Manager Statistics Detail” on page 648• “Open/Close Statistics Summary by Report Interval” on page 652• “Open/Close Statistics Detail” on page 653• “SQL Statistics Summary by Report Interval” on page 655• “SQL/RID Pool/I/O Parallelism Statistics Detail” on page 656• “Lock Manager Statistics Summary by Report Interval” on page 673• “Lock Manager Statistics Detail” on page 675• “Global Lock Statistics Summary by Report Interval” on page 681• “Global Lock Statistics Detail” on page 682• “DB2 Command Statistics By Report Interval” on page 686• “DB2 Command Statistics Detail” on page 687• “Near-Term History Report Option” on page 692
Thread HistoryProvides access to the following near-term thread history information:
• “Near-Term Thread History Filter Options” on page 693• “Near-Term Thread History Filter Options - Confirmation” on page 696• “Thread History By Report Interval” on page 698• “Thread History By Plan” on page 700• “Thread History By Authid” on page 702• “Thread History By Plan, Authid” on page 703• “Thread History By Authid, Plan” on page 705• “Thread History Summary” on page 708• “Thread History By Subinterval” on page 710• “Thread History By Correlation ID” on page 713• “Thread History Buffer Pool Summary” on page 714• “Thread History DB2 Time Summary” on page 716• “Thread History DB2 Lock/Scan/Sort Summary” on page 718• “Thread History Times Summary” on page 719
612 Classic Interface User's Guide
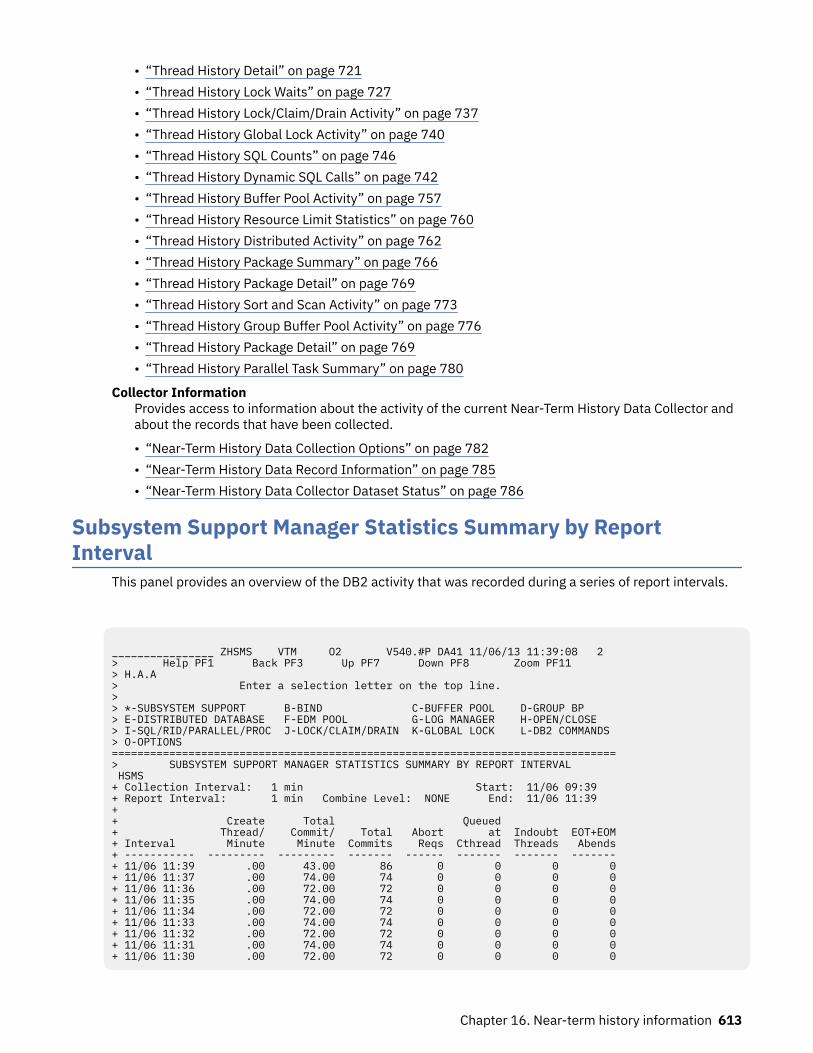
• “Thread History Detail” on page 721• “Thread History Lock Waits” on page 727• “Thread History Lock/Claim/Drain Activity” on page 737• “Thread History Global Lock Activity” on page 740• “Thread History SQL Counts” on page 746• “Thread History Dynamic SQL Calls” on page 742• “Thread History Buffer Pool Activity” on page 757• “Thread History Resource Limit Statistics” on page 760• “Thread History Distributed Activity” on page 762• “Thread History Package Summary” on page 766• “Thread History Package Detail” on page 769• “Thread History Sort and Scan Activity” on page 773• “Thread History Group Buffer Pool Activity” on page 776• “Thread History Package Detail” on page 769• “Thread History Parallel Task Summary” on page 780
Collector InformationProvides access to information about the activity of the current Near-Term History Data Collector andabout the records that have been collected.
• “Near-Term History Data Collection Options” on page 782• “Near-Term History Data Record Information” on page 785• “Near-Term History Data Collector Dataset Status” on page 786
Subsystem Support Manager Statistics Summary by ReportInterval
This panel provides an overview of the DB2 activity that was recorded during a series of report intervals.
________________ ZHSMS VTM O2 V540.#P DA41 11/06/13 11:39:08 2 > Help PF1 Back PF3 Up PF7 Down PF8 Zoom PF11 > H.A.A > Enter a selection letter on the top line. > > *-SUBSYSTEM SUPPORT B-BIND C-BUFFER POOL D-GROUP BP > E-DISTRIBUTED DATABASE F-EDM POOL G-LOG MANAGER H-OPEN/CLOSE > I-SQL/RID/PARALLEL/PROC J-LOCK/CLAIM/DRAIN K-GLOBAL LOCK L-DB2 COMMANDS > O-OPTIONS ===============================================================================> SUBSYSTEM SUPPORT MANAGER STATISTICS SUMMARY BY REPORT INTERVAL HSMS + Collection Interval: 1 min Start: 11/06 09:39 + Report Interval: 1 min Combine Level: NONE End: 11/06 11:39 + + Create Total Queued + Thread/ Commit/ Total Abort at Indoubt EOT+EOM+ Interval Minute Minute Commits Reqs Cthread Threads Abends+ ----------- --------- --------- ------- ------ ------- ------- -------+ 11/06 11:39 .00 43.00 86 0 0 0 0+ 11/06 11:37 .00 74.00 74 0 0 0 0+ 11/06 11:36 .00 72.00 72 0 0 0 0+ 11/06 11:35 .00 74.00 74 0 0 0 0+ 11/06 11:34 .00 72.00 72 0 0 0 0+ 11/06 11:33 .00 74.00 74 0 0 0 0+ 11/06 11:32 .00 72.00 72 0 0 0 0+ 11/06 11:31 .00 74.00 74 0 0 0 0+ 11/06 11:30 .00 72.00 72 0 0 0 0
Chapter 16. Near-term history information 613
NavigationFor additional information about
• a report interval, move the cursor to the line you want and press F11 (Zoom). (Each date/time displayedreflects the end of an interval.)
• related topics, select one of the options at the top of the panel.• other topics, use the PF keys.
FieldsCollection Interval
The time interval specified for the collection of near-term history data. This unit of time was specifiedwhen the Near-Term History Data Collector was started.
StartThe start time of the first interval in this display.
Report IntervalThis field determines the report interval. It is set on the Near-Term History Report Option panel.
Combine LevelThis field reflects the selected combine level. If Combine Level is NONE, the report interval is thesame as the collection interval. Possible values:HOURLY
Data will be reported in hourly intervals.NONE
Data will be reported in the time unit specified by the collection interval.End
The end time of the last interval in this display.Interval
Provides the date and time that mark the end of the report interval.Create Thread/Minute
The number of successful Create Thread requests per minute.Total Commit/Minute
The number of commit requests per minute.Total Commits
Includes read-only, single-phase, and phase 2 commit requests.Abort Reqs
The number of events that resulted in successfully backing out a unit of recovery.Queued at Cthread
The number of Create Thread requests that had to wait because no thread was available.Indoubt Threads
The number of indoubt threads. A unit of recovery (thread) goes indoubt when a failure occursbetween commit phase 1 and commit phase 2.
EOT+EOM AbendsThe total number of end-of-task and end-of-memory abends.
Subsystem Support Manager Statistics DetailThis panel shows detailed information about DB2 activity during a selected report interval, includingstatistics related to Create Thread, Signon, Commit, and abnormal termination activity.
614 Classic Interface User's Guide
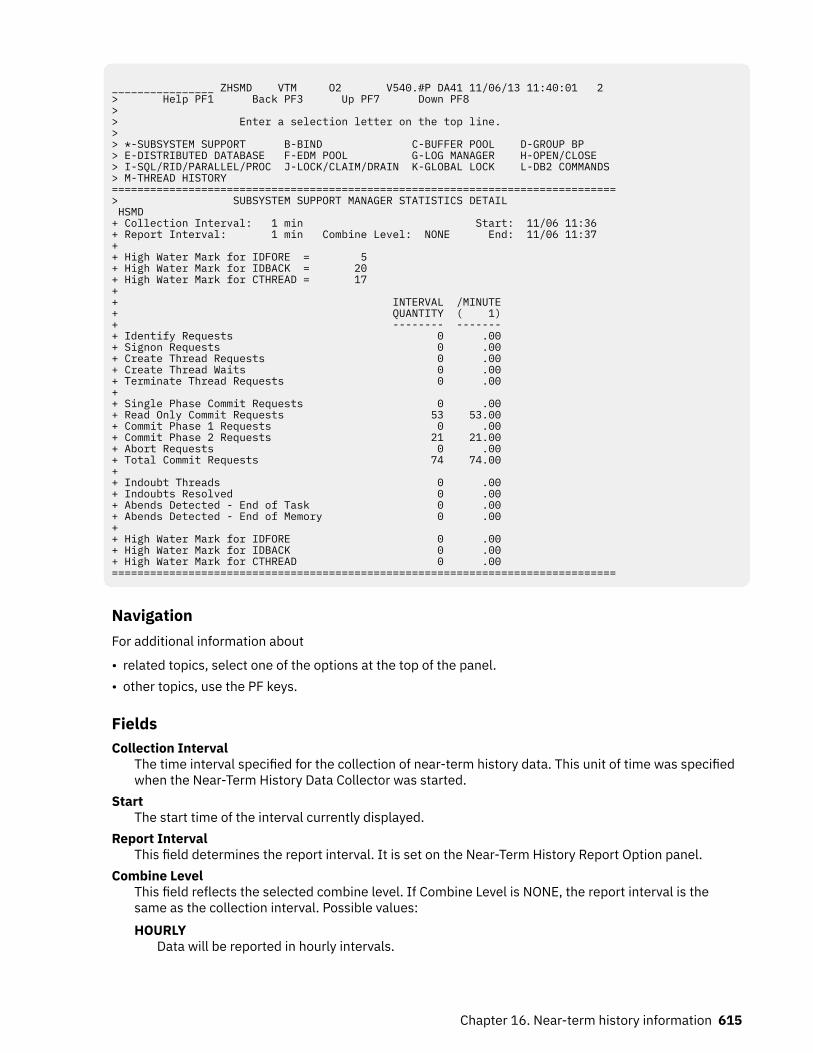
________________ ZHSMD VTM O2 V540.#P DA41 11/06/13 11:40:01 2 > Help PF1 Back PF3 Up PF7 Down PF8 > > Enter a selection letter on the top line. > > *-SUBSYSTEM SUPPORT B-BIND C-BUFFER POOL D-GROUP BP > E-DISTRIBUTED DATABASE F-EDM POOL G-LOG MANAGER H-OPEN/CLOSE > I-SQL/RID/PARALLEL/PROC J-LOCK/CLAIM/DRAIN K-GLOBAL LOCK L-DB2 COMMANDS > M-THREAD HISTORY ===============================================================================> SUBSYSTEM SUPPORT MANAGER STATISTICS DETAIL HSMD + Collection Interval: 1 min Start: 11/06 11:36 + Report Interval: 1 min Combine Level: NONE End: 11/06 11:37 + + High Water Mark for IDFORE = 5 + High Water Mark for IDBACK = 20 + High Water Mark for CTHREAD = 17 + + INTERVAL /MINUTE + QUANTITY ( 1) + -------- ------- + Identify Requests 0 .00 + Signon Requests 0 .00 + Create Thread Requests 0 .00 + Create Thread Waits 0 .00 + Terminate Thread Requests 0 .00 + + Single Phase Commit Requests 0 .00 + Read Only Commit Requests 53 53.00 + Commit Phase 1 Requests 0 .00 + Commit Phase 2 Requests 21 21.00 + Abort Requests 0 .00 + Total Commit Requests 74 74.00 + + Indoubt Threads 0 .00 + Indoubts Resolved 0 .00 + Abends Detected - End of Task 0 .00 + Abends Detected - End of Memory 0 .00 + + High Water Mark for IDFORE 0 .00 + High Water Mark for IDBACK 0 .00 + High Water Mark for CTHREAD 0 .00 ===============================================================================
NavigationFor additional information about
• related topics, select one of the options at the top of the panel.• other topics, use the PF keys.
FieldsCollection Interval
The time interval specified for the collection of near-term history data. This unit of time was specifiedwhen the Near-Term History Data Collector was started.
StartThe start time of the interval currently displayed.
Report IntervalThis field determines the report interval. It is set on the Near-Term History Report Option panel.
Combine LevelThis field reflects the selected combine level. If Combine Level is NONE, the report interval is thesame as the collection interval. Possible values:HOURLY
Data will be reported in hourly intervals.
Chapter 16. Near-term history information 615
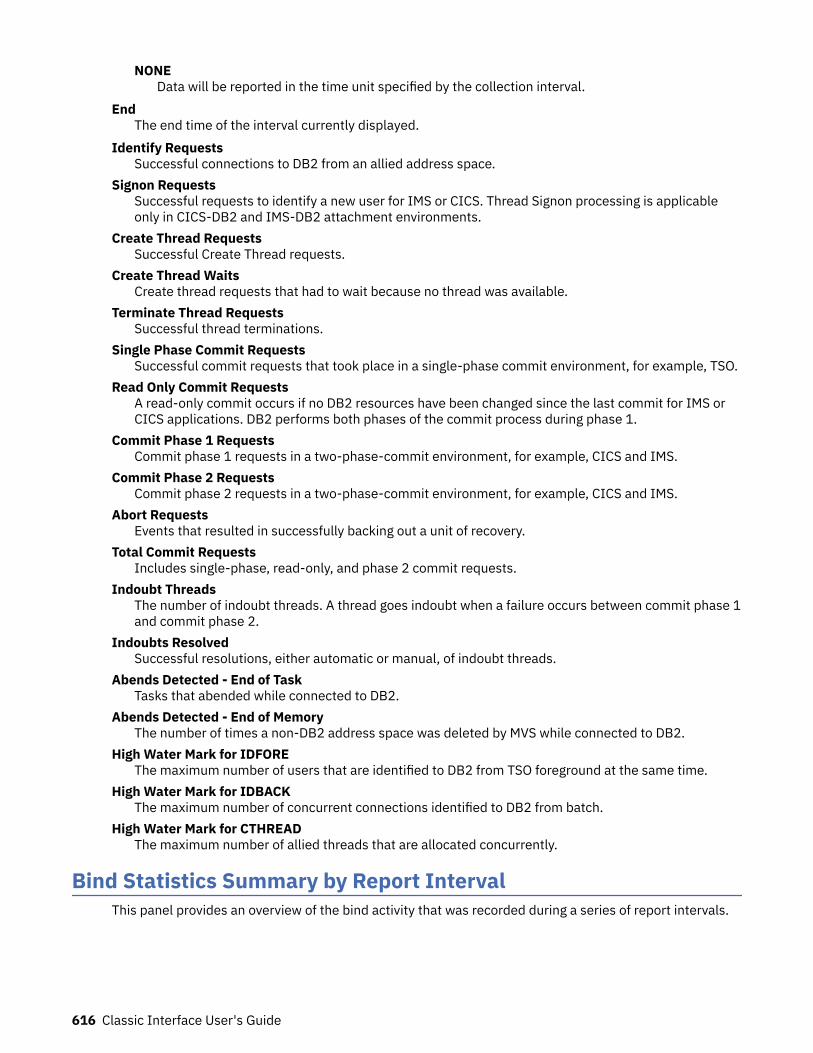
NONEData will be reported in the time unit specified by the collection interval.
EndThe end time of the interval currently displayed.
Identify RequestsSuccessful connections to DB2 from an allied address space.
Signon RequestsSuccessful requests to identify a new user for IMS or CICS. Thread Signon processing is applicableonly in CICS-DB2 and IMS-DB2 attachment environments.
Create Thread RequestsSuccessful Create Thread requests.
Create Thread WaitsCreate thread requests that had to wait because no thread was available.
Terminate Thread RequestsSuccessful thread terminations.
Single Phase Commit RequestsSuccessful commit requests that took place in a single-phase commit environment, for example, TSO.
Read Only Commit RequestsA read-only commit occurs if no DB2 resources have been changed since the last commit for IMS orCICS applications. DB2 performs both phases of the commit process during phase 1.
Commit Phase 1 RequestsCommit phase 1 requests in a two-phase-commit environment, for example, CICS and IMS.
Commit Phase 2 RequestsCommit phase 2 requests in a two-phase-commit environment, for example, CICS and IMS.
Abort RequestsEvents that resulted in successfully backing out a unit of recovery.
Total Commit RequestsIncludes single-phase, read-only, and phase 2 commit requests.
Indoubt ThreadsThe number of indoubt threads. A thread goes indoubt when a failure occurs between commit phase 1and commit phase 2.
Indoubts ResolvedSuccessful resolutions, either automatic or manual, of indoubt threads.
Abends Detected - End of TaskTasks that abended while connected to DB2.
Abends Detected - End of MemoryThe number of times a non-DB2 address space was deleted by MVS while connected to DB2.
High Water Mark for IDFOREThe maximum number of users that are identified to DB2 from TSO foreground at the same time.
High Water Mark for IDBACKThe maximum number of concurrent connections identified to DB2 from batch.
High Water Mark for CTHREADThe maximum number of allied threads that are allocated concurrently.
Bind Statistics Summary by Report IntervalThis panel provides an overview of the bind activity that was recorded during a series of report intervals.
616 Classic Interface User's Guide
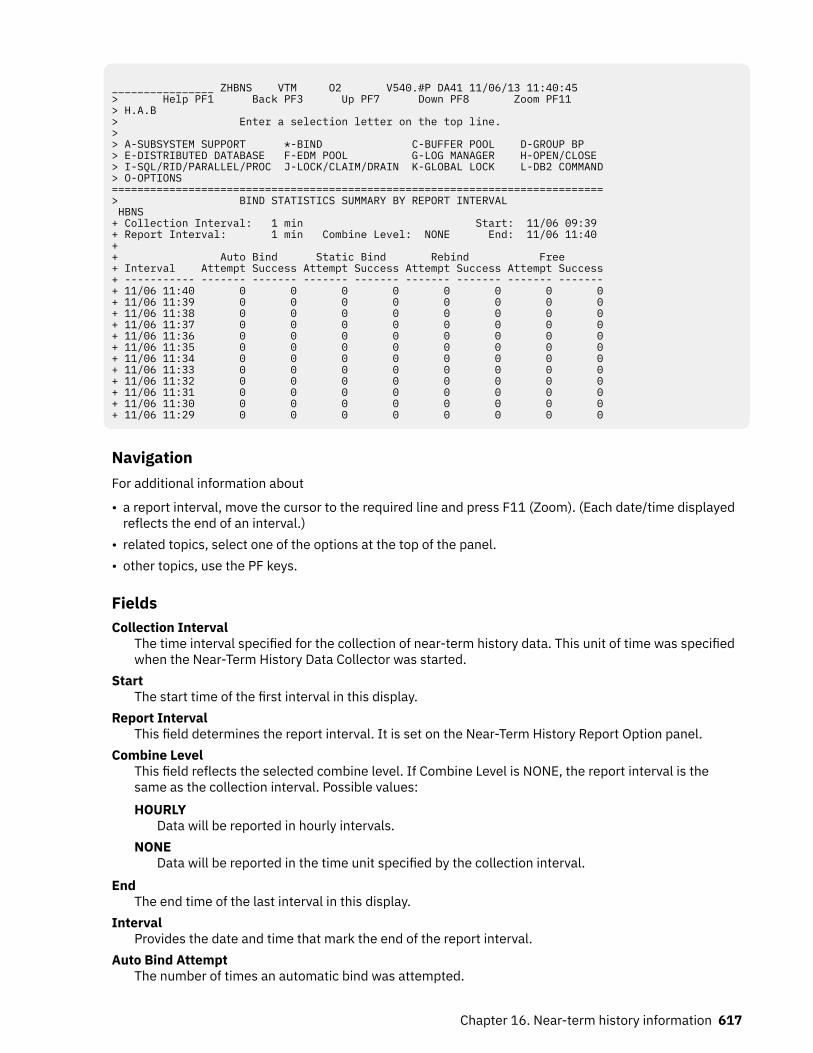
________________ ZHBNS VTM O2 V540.#P DA41 11/06/13 11:40:45 > Help PF1 Back PF3 Up PF7 Down PF8 Zoom PF11 > H.A.B > Enter a selection letter on the top line. > > A-SUBSYSTEM SUPPORT *-BIND C-BUFFER POOL D-GROUP BP > E-DISTRIBUTED DATABASE F-EDM POOL G-LOG MANAGER H-OPEN/CLOSE > I-SQL/RID/PARALLEL/PROC J-LOCK/CLAIM/DRAIN K-GLOBAL LOCK L-DB2 COMMAND> O-OPTIONS =============================================================================> BIND STATISTICS SUMMARY BY REPORT INTERVAL HBNS + Collection Interval: 1 min Start: 11/06 09:39 + Report Interval: 1 min Combine Level: NONE End: 11/06 11:40 + + Auto Bind Static Bind Rebind Free + Interval Attempt Success Attempt Success Attempt Success Attempt Success+ ----------- ------- ------- ------- ------- ------- ------- ------- -------+ 11/06 11:40 0 0 0 0 0 0 0 0+ 11/06 11:39 0 0 0 0 0 0 0 0+ 11/06 11:38 0 0 0 0 0 0 0 0+ 11/06 11:37 0 0 0 0 0 0 0 0+ 11/06 11:36 0 0 0 0 0 0 0 0+ 11/06 11:35 0 0 0 0 0 0 0 0+ 11/06 11:34 0 0 0 0 0 0 0 0+ 11/06 11:33 0 0 0 0 0 0 0 0+ 11/06 11:32 0 0 0 0 0 0 0 0+ 11/06 11:31 0 0 0 0 0 0 0 0+ 11/06 11:30 0 0 0 0 0 0 0 0+ 11/06 11:29 0 0 0 0 0 0 0 0
NavigationFor additional information about
• a report interval, move the cursor to the required line and press F11 (Zoom). (Each date/time displayedreflects the end of an interval.)
• related topics, select one of the options at the top of the panel.• other topics, use the PF keys.
FieldsCollection Interval
The time interval specified for the collection of near-term history data. This unit of time was specifiedwhen the Near-Term History Data Collector was started.
StartThe start time of the first interval in this display.
Report IntervalThis field determines the report interval. It is set on the Near-Term History Report Option panel.
Combine LevelThis field reflects the selected combine level. If Combine Level is NONE, the report interval is thesame as the collection interval. Possible values:HOURLY
Data will be reported in hourly intervals.NONE
Data will be reported in the time unit specified by the collection interval.End
The end time of the last interval in this display.Interval
Provides the date and time that mark the end of the report interval.Auto Bind Attempt
The number of times an automatic bind was attempted.
Chapter 16. Near-term history information 617
Auto Bind SuccessThe number of times an automatic bind attempt succeeded.
Static Bind AttemptThe number of bind subcommands issued, including the Bind Add and Bind Replace subcommandsfor plans or packages.
Static Bind SuccessThe number of bind subcommands that succeeded.
Rebind AttemptThe number of attempts to rebind a plan or package.
Rebind SuccessThe number of successful attempts to rebind a plan or package.
Free AttemptThe number of attempts to free a plan or package.
Free SuccessThe number of successful attempts to free a plan or package.
Bind Statistics DetailThis panel shows detailed information about bind activity during a selected report interval.
618 Classic Interface User's Guide
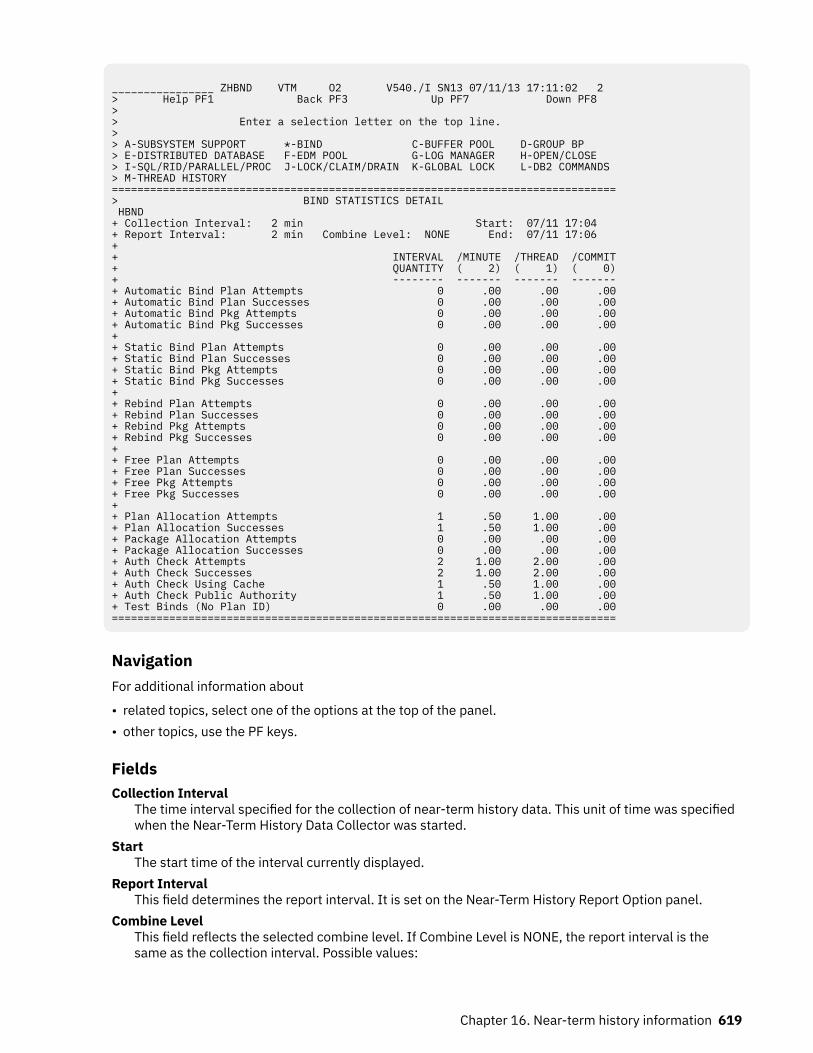
________________ ZHBND VTM O2 V540./I SN13 07/11/13 17:11:02 2 > Help PF1 Back PF3 Up PF7 Down PF8 > > Enter a selection letter on the top line. > > A-SUBSYSTEM SUPPORT *-BIND C-BUFFER POOL D-GROUP BP > E-DISTRIBUTED DATABASE F-EDM POOL G-LOG MANAGER H-OPEN/CLOSE > I-SQL/RID/PARALLEL/PROC J-LOCK/CLAIM/DRAIN K-GLOBAL LOCK L-DB2 COMMANDS > M-THREAD HISTORY =============================================================================== > BIND STATISTICS DETAIL HBND + Collection Interval: 2 min Start: 07/11 17:04 + Report Interval: 2 min Combine Level: NONE End: 07/11 17:06 + + INTERVAL /MINUTE /THREAD /COMMIT + QUANTITY ( 2) ( 1) ( 0) + -------- ------- ------- ------- + Automatic Bind Plan Attempts 0 .00 .00 .00 + Automatic Bind Plan Successes 0 .00 .00 .00 + Automatic Bind Pkg Attempts 0 .00 .00 .00 + Automatic Bind Pkg Successes 0 .00 .00 .00 + + Static Bind Plan Attempts 0 .00 .00 .00 + Static Bind Plan Successes 0 .00 .00 .00 + Static Bind Pkg Attempts 0 .00 .00 .00 + Static Bind Pkg Successes 0 .00 .00 .00 + + Rebind Plan Attempts 0 .00 .00 .00 + Rebind Plan Successes 0 .00 .00 .00 + Rebind Pkg Attempts 0 .00 .00 .00 + Rebind Pkg Successes 0 .00 .00 .00 + + Free Plan Attempts 0 .00 .00 .00 + Free Plan Successes 0 .00 .00 .00 + Free Pkg Attempts 0 .00 .00 .00 + Free Pkg Successes 0 .00 .00 .00 + + Plan Allocation Attempts 1 .50 1.00 .00 + Plan Allocation Successes 1 .50 1.00 .00 + Package Allocation Attempts 0 .00 .00 .00 + Package Allocation Successes 0 .00 .00 .00 + Auth Check Attempts 2 1.00 2.00 .00 + Auth Check Successes 2 1.00 2.00 .00 + Auth Check Using Cache 1 .50 1.00 .00 + Auth Check Public Authority 1 .50 1.00 .00 + Test Binds (No Plan ID) 0 .00 .00 .00 ===============================================================================
NavigationFor additional information about
• related topics, select one of the options at the top of the panel.• other topics, use the PF keys.
FieldsCollection Interval
The time interval specified for the collection of near-term history data. This unit of time was specifiedwhen the Near-Term History Data Collector was started.
StartThe start time of the interval currently displayed.
Report IntervalThis field determines the report interval. It is set on the Near-Term History Report Option panel.
Combine LevelThis field reflects the selected combine level. If Combine Level is NONE, the report interval is thesame as the collection interval. Possible values:
Chapter 16. Near-term history information 619
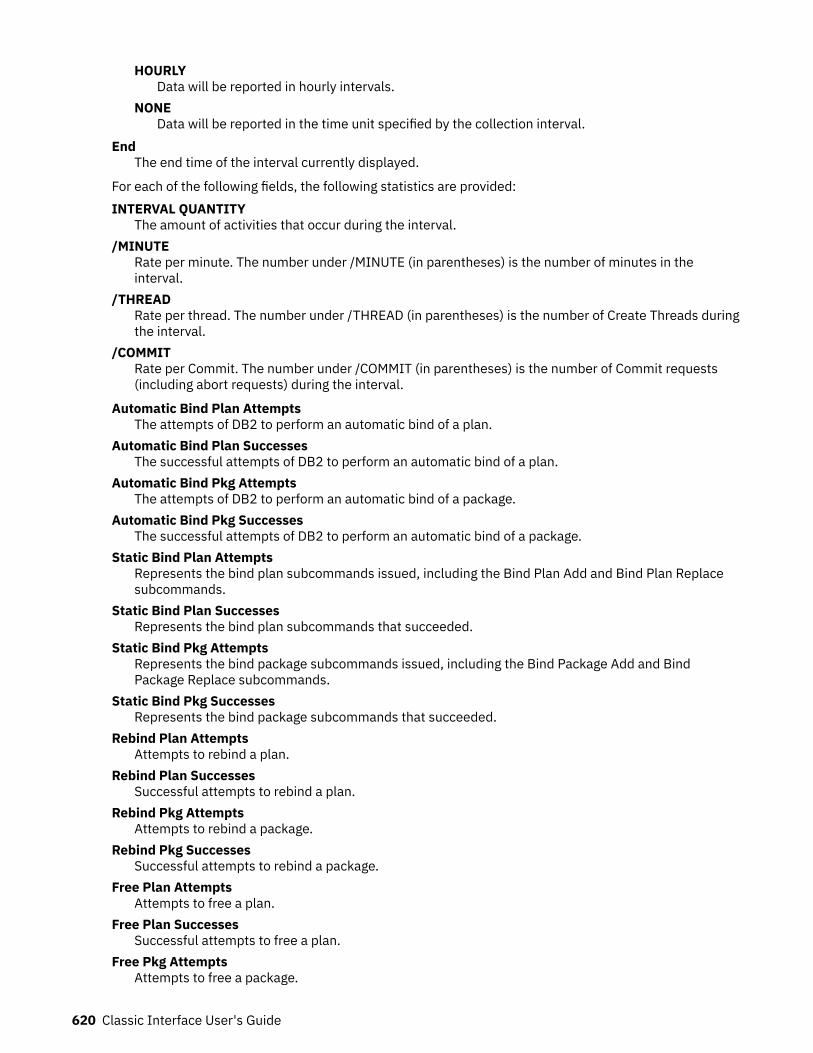
HOURLYData will be reported in hourly intervals.
NONEData will be reported in the time unit specified by the collection interval.
EndThe end time of the interval currently displayed.
For each of the following fields, the following statistics are provided:INTERVAL QUANTITY
The amount of activities that occur during the interval./MINUTE
Rate per minute. The number under /MINUTE (in parentheses) is the number of minutes in theinterval.
/THREADRate per thread. The number under /THREAD (in parentheses) is the number of Create Threads duringthe interval.
/COMMITRate per Commit. The number under /COMMIT (in parentheses) is the number of Commit requests(including abort requests) during the interval.
Automatic Bind Plan AttemptsThe attempts of DB2 to perform an automatic bind of a plan.
Automatic Bind Plan SuccessesThe successful attempts of DB2 to perform an automatic bind of a plan.
Automatic Bind Pkg AttemptsThe attempts of DB2 to perform an automatic bind of a package.
Automatic Bind Pkg SuccessesThe successful attempts of DB2 to perform an automatic bind of a package.
Static Bind Plan AttemptsRepresents the bind plan subcommands issued, including the Bind Plan Add and Bind Plan Replacesubcommands.
Static Bind Plan SuccessesRepresents the bind plan subcommands that succeeded.
Static Bind Pkg AttemptsRepresents the bind package subcommands issued, including the Bind Package Add and BindPackage Replace subcommands.
Static Bind Pkg SuccessesRepresents the bind package subcommands that succeeded.
Rebind Plan AttemptsAttempts to rebind a plan.
Rebind Plan SuccessesSuccessful attempts to rebind a plan.
Rebind Pkg AttemptsAttempts to rebind a package.
Rebind Pkg SuccessesSuccessful attempts to rebind a package.
Free Plan AttemptsAttempts to free a plan.
Free Plan SuccessesSuccessful attempts to free a plan.
Free Pkg AttemptsAttempts to free a package.
620 Classic Interface User's Guide
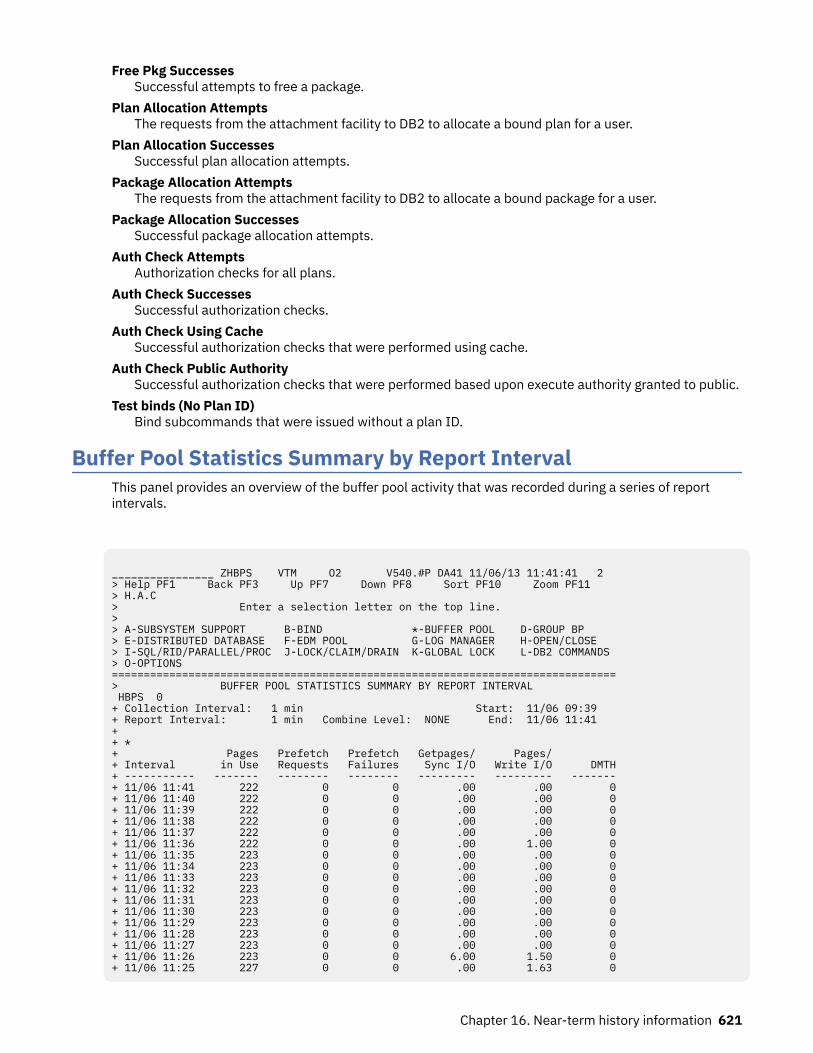
Free Pkg SuccessesSuccessful attempts to free a package.
Plan Allocation AttemptsThe requests from the attachment facility to DB2 to allocate a bound plan for a user.
Plan Allocation SuccessesSuccessful plan allocation attempts.
Package Allocation AttemptsThe requests from the attachment facility to DB2 to allocate a bound package for a user.
Package Allocation SuccessesSuccessful package allocation attempts.
Auth Check AttemptsAuthorization checks for all plans.
Auth Check SuccessesSuccessful authorization checks.
Auth Check Using CacheSuccessful authorization checks that were performed using cache.
Auth Check Public AuthoritySuccessful authorization checks that were performed based upon execute authority granted to public.
Test binds (No Plan ID)Bind subcommands that were issued without a plan ID.
Buffer Pool Statistics Summary by Report IntervalThis panel provides an overview of the buffer pool activity that was recorded during a series of reportintervals.
________________ ZHBPS VTM O2 V540.#P DA41 11/06/13 11:41:41 2 > Help PF1 Back PF3 Up PF7 Down PF8 Sort PF10 Zoom PF11 > H.A.C > Enter a selection letter on the top line. > > A-SUBSYSTEM SUPPORT B-BIND *-BUFFER POOL D-GROUP BP > E-DISTRIBUTED DATABASE F-EDM POOL G-LOG MANAGER H-OPEN/CLOSE > I-SQL/RID/PARALLEL/PROC J-LOCK/CLAIM/DRAIN K-GLOBAL LOCK L-DB2 COMMANDS > O-OPTIONS ===============================================================================> BUFFER POOL STATISTICS SUMMARY BY REPORT INTERVAL HBPS 0 + Collection Interval: 1 min Start: 11/06 09:39 + Report Interval: 1 min Combine Level: NONE End: 11/06 11:41 + + * + Pages Prefetch Prefetch Getpages/ Pages/ + Interval in Use Requests Failures Sync I/O Write I/O DMTH+ ----------- ------- -------- -------- --------- --------- -------+ 11/06 11:41 222 0 0 .00 .00 0+ 11/06 11:40 222 0 0 .00 .00 0+ 11/06 11:39 222 0 0 .00 .00 0+ 11/06 11:38 222 0 0 .00 .00 0+ 11/06 11:37 222 0 0 .00 .00 0+ 11/06 11:36 222 0 0 .00 1.00 0+ 11/06 11:35 223 0 0 .00 .00 0+ 11/06 11:34 223 0 0 .00 .00 0+ 11/06 11:33 223 0 0 .00 .00 0+ 11/06 11:32 223 0 0 .00 .00 0+ 11/06 11:31 223 0 0 .00 .00 0+ 11/06 11:30 223 0 0 .00 .00 0+ 11/06 11:29 223 0 0 .00 .00 0+ 11/06 11:28 223 0 0 .00 .00 0+ 11/06 11:27 223 0 0 .00 .00 0+ 11/06 11:26 223 0 0 6.00 1.50 0+ 11/06 11:25 227 0 0 .00 1.63 0
Chapter 16. Near-term history information 621
HighlightingOMEGAMON XE for DB2 PE highlights some fields in this panel to draw your attention to their currentstatus:
Table 31. Highlighted fields in Buffer Pool Statistics Summary by Report Interval panel
Field Exception Reason
Pages in Use BMTH The percentage of pages in usehas reached the predeterminedthreshold.
NavigationFor additional information about
• another buffer pool, enter the buffer pool ID next to HBPS.• a report interval, move the cursor to the required line and press F11 (Zoom). (Each date/time displayed
reflects the end of an interval.)• related topics, select one of the options at the top of the panel.• other topics, use the PF keys.
FieldsCollection Interval
The time interval specified for the collection of near-term history data. This unit of time was specifiedwhen the Near-Term History Data Collector was started.
StartThe start time of the first interval in this display.
Report IntervalThis field determines the report interval. It is set on the Near-Term History Report Option panel.
Combine LevelThis field reflects the selected combine level. If Combine Level is NONE, the report interval is thesame as the collection interval. Possible values:HOURLY
Data will be reported in hourly intervals.NONE
Data will be reported in the time unit specified by the collection interval.End
The end time of the last interval in this display.Interval
Provides the date and time that mark the end of the report interval.Pages in Use
A snapshot value of the current number of nonstealable buffers. A nonstealable buffer is either onewhich has an outstanding Getpage (that is, someone is currently looking at this page), or one whichhas been updated and not yet written out to DASD.
Prefetch RequestsThe total number of Prefetch requests. This is the sum of Sequential, List, and Dynamic Prefetchrequests.
Prefetch FailuresThe number of Sequential Prefetch failures for the buffer pool during the interval. This includesfailures that occurred because the SPTH threshold was reached and because the maximum number ofconcurrent prefetches was reached.
622 Classic Interface User's Guide
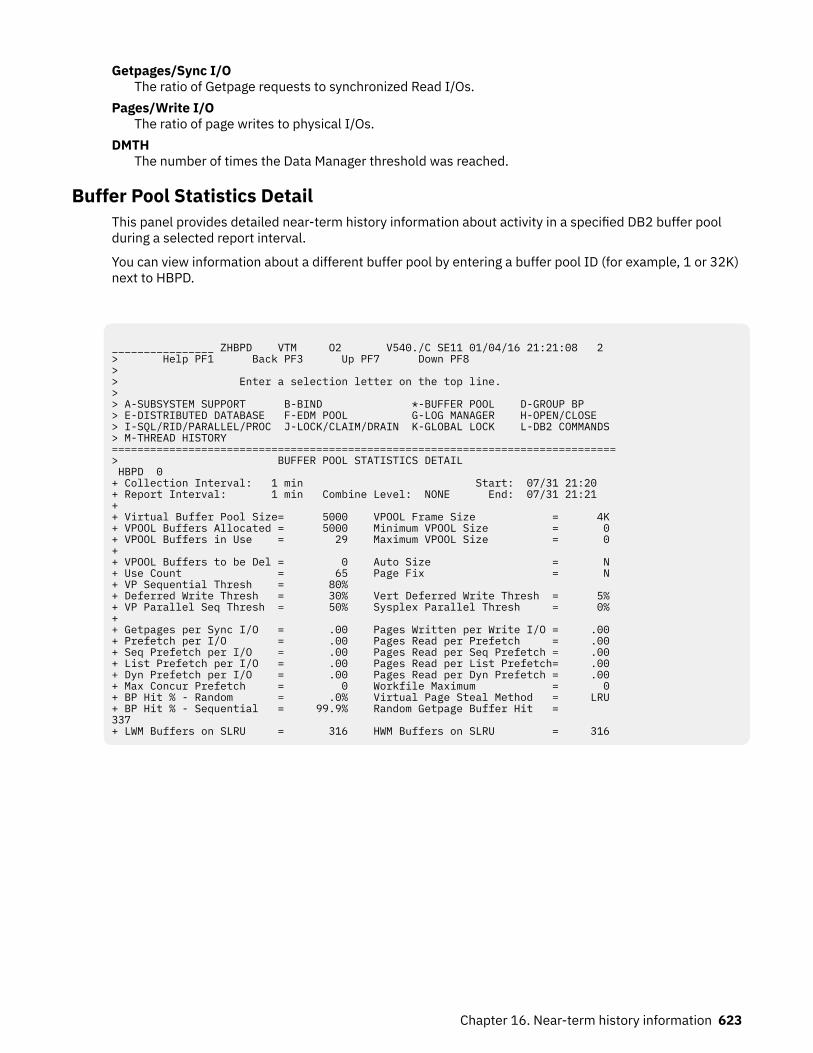
Getpages/Sync I/OThe ratio of Getpage requests to synchronized Read I/Os.
Pages/Write I/OThe ratio of page writes to physical I/Os.
DMTHThe number of times the Data Manager threshold was reached.
Buffer Pool Statistics DetailThis panel provides detailed near-term history information about activity in a specified DB2 buffer poolduring a selected report interval.
You can view information about a different buffer pool by entering a buffer pool ID (for example, 1 or 32K)next to HBPD.
________________ ZHBPD VTM O2 V540./C SE11 01/04/16 21:21:08 2 > Help PF1 Back PF3 Up PF7 Down PF8 > > Enter a selection letter on the top line. > > A-SUBSYSTEM SUPPORT B-BIND *-BUFFER POOL D-GROUP BP > E-DISTRIBUTED DATABASE F-EDM POOL G-LOG MANAGER H-OPEN/CLOSE > I-SQL/RID/PARALLEL/PROC J-LOCK/CLAIM/DRAIN K-GLOBAL LOCK L-DB2 COMMANDS > M-THREAD HISTORY =============================================================================== > BUFFER POOL STATISTICS DETAIL HBPD 0 + Collection Interval: 1 min Start: 07/31 21:20 + Report Interval: 1 min Combine Level: NONE End: 07/31 21:21 + + Virtual Buffer Pool Size= 5000 VPOOL Frame Size = 4K + VPOOL Buffers Allocated = 5000 Minimum VPOOL Size = 0 + VPOOL Buffers in Use = 29 Maximum VPOOL Size = 0 + + VPOOL Buffers to be Del = 0 Auto Size = N + Use Count = 65 Page Fix = N + VP Sequential Thresh = 80% + Deferred Write Thresh = 30% Vert Deferred Write Thresh = 5% + VP Parallel Seq Thresh = 50% Sysplex Parallel Thresh = 0% + + Getpages per Sync I/O = .00 Pages Written per Write I/O = .00 + Prefetch per I/O = .00 Pages Read per Prefetch = .00 + Seq Prefetch per I/O = .00 Pages Read per Seq Prefetch = .00 + List Prefetch per I/O = .00 Pages Read per List Prefetch= .00 + Dyn Prefetch per I/O = .00 Pages Read per Dyn Prefetch = .00 + Max Concur Prefetch = 0 Workfile Maximum = 0 + BP Hit % - Random = .0% Virtual Page Steal Method = LRU + BP Hit % - Sequential = 99.9% Random Getpage Buffer Hit = 337 + LWM Buffers on SLRU = 316 HWM Buffers on SLRU = 316
Chapter 16. Near-term history information 623
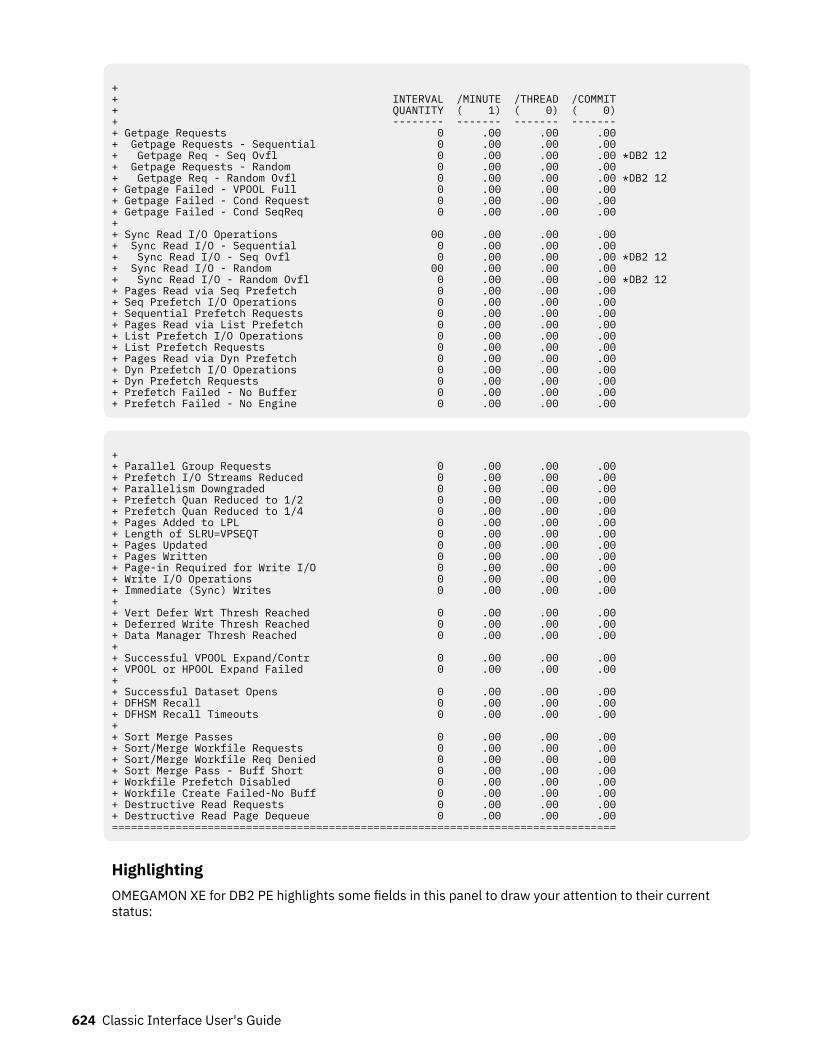
+ + INTERVAL /MINUTE /THREAD /COMMIT + QUANTITY ( 1) ( 0) ( 0) + -------- ------- ------- ------- + Getpage Requests 0 .00 .00 .00 + Getpage Requests - Sequential 0 .00 .00 .00 + Getpage Req - Seq Ovfl 0 .00 .00 .00 *DB2 12+ Getpage Requests - Random 0 .00 .00 .00 + Getpage Req - Random Ovfl 0 .00 .00 .00 *DB2 12+ Getpage Failed - VPOOL Full 0 .00 .00 .00 + Getpage Failed - Cond Request 0 .00 .00 .00 + Getpage Failed - Cond SeqReq 0 .00 .00 .00 + + Sync Read I/O Operations 00 .00 .00 .00 + Sync Read I/O - Sequential 0 .00 .00 .00 + Sync Read I/O - Seq Ovfl 0 .00 .00 .00 *DB2 12+ Sync Read I/O - Random 00 .00 .00 .00 + Sync Read I/O - Random Ovfl 0 .00 .00 .00 *DB2 12+ Pages Read via Seq Prefetch 0 .00 .00 .00 + Seq Prefetch I/O Operations 0 .00 .00 .00 + Sequential Prefetch Requests 0 .00 .00 .00 + Pages Read via List Prefetch 0 .00 .00 .00 + List Prefetch I/O Operations 0 .00 .00 .00 + List Prefetch Requests 0 .00 .00 .00 + Pages Read via Dyn Prefetch 0 .00 .00 .00 + Dyn Prefetch I/O Operations 0 .00 .00 .00 + Dyn Prefetch Requests 0 .00 .00 .00 + Prefetch Failed - No Buffer 0 .00 .00 .00 + Prefetch Failed - No Engine 0 .00 .00 .00
+ + Parallel Group Requests 0 .00 .00 .00 + Prefetch I/O Streams Reduced 0 .00 .00 .00 + Parallelism Downgraded 0 .00 .00 .00 + Prefetch Quan Reduced to 1/2 0 .00 .00 .00 + Prefetch Quan Reduced to 1/4 0 .00 .00 .00 + Pages Added to LPL 0 .00 .00 .00 + Length of SLRU=VPSEQT 0 .00 .00 .00 + Pages Updated 0 .00 .00 .00 + Pages Written 0 .00 .00 .00 + Page-in Required for Write I/O 0 .00 .00 .00 + Write I/O Operations 0 .00 .00 .00 + Immediate (Sync) Writes 0 .00 .00 .00 + + Vert Defer Wrt Thresh Reached 0 .00 .00 .00 + Deferred Write Thresh Reached 0 .00 .00 .00 + Data Manager Thresh Reached 0 .00 .00 .00+ + Successful VPOOL Expand/Contr 0 .00 .00 .00+ VPOOL or HPOOL Expand Failed 0 .00 .00 .00+ + Successful Dataset Opens 0 .00 .00 .00+ DFHSM Recall 0 .00 .00 .00+ DFHSM Recall Timeouts 0 .00 .00 .00+ + Sort Merge Passes 0 .00 .00 .00+ Sort/Merge Workfile Requests 0 .00 .00 .00+ Sort/Merge Workfile Req Denied 0 .00 .00 .00+ Sort Merge Pass - Buff Short 0 .00 .00 .00+ Workfile Prefetch Disabled 0 .00 .00 .00+ Workfile Create Failed-No Buff 0 .00 .00 .00+ Destructive Read Requests 0 .00 .00 .00+ Destructive Read Page Dequeue 0 .00 .00 .00===============================================================================
HighlightingOMEGAMON XE for DB2 PE highlights some fields in this panel to draw your attention to their currentstatus:
624 Classic Interface User's Guide
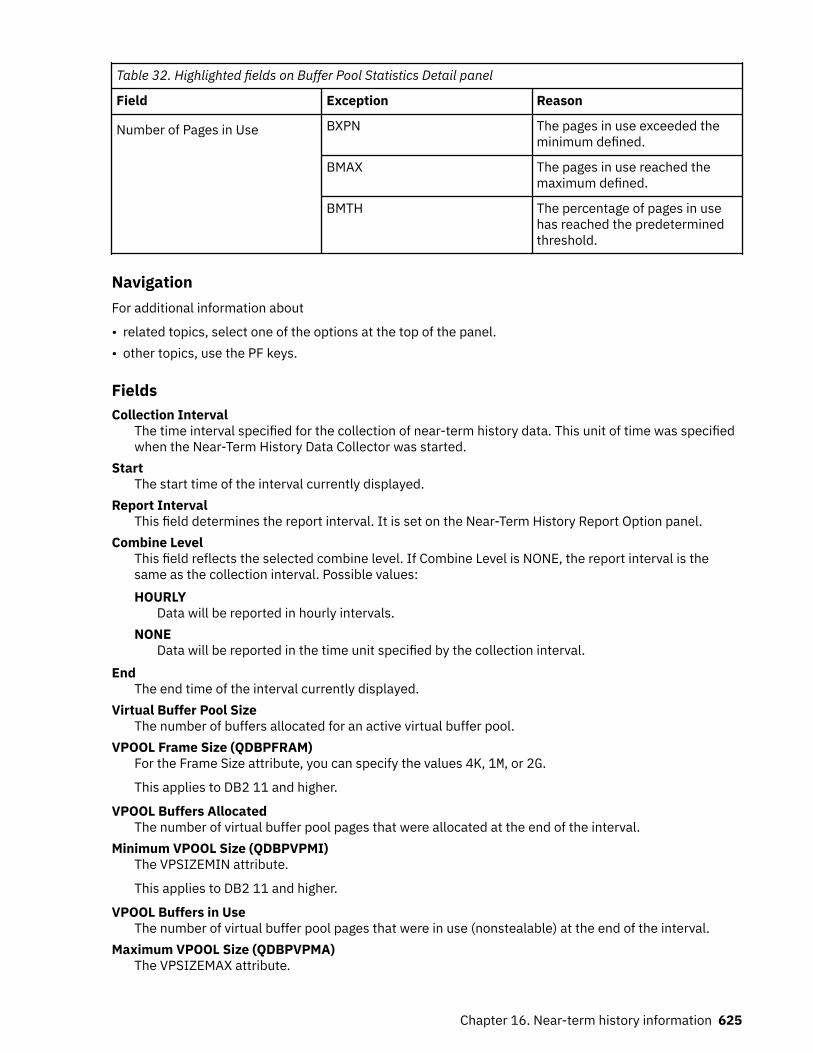
Table 32. Highlighted fields on Buffer Pool Statistics Detail panel
Field Exception Reason
Number of Pages in Use BXPN The pages in use exceeded theminimum defined.
BMAX The pages in use reached themaximum defined.
BMTH The percentage of pages in usehas reached the predeterminedthreshold.
NavigationFor additional information about
• related topics, select one of the options at the top of the panel.• other topics, use the PF keys.
FieldsCollection Interval
The time interval specified for the collection of near-term history data. This unit of time was specifiedwhen the Near-Term History Data Collector was started.
StartThe start time of the interval currently displayed.
Report IntervalThis field determines the report interval. It is set on the Near-Term History Report Option panel.
Combine LevelThis field reflects the selected combine level. If Combine Level is NONE, the report interval is thesame as the collection interval. Possible values:HOURLY
Data will be reported in hourly intervals.NONE
Data will be reported in the time unit specified by the collection interval.End
The end time of the interval currently displayed.Virtual Buffer Pool Size
The number of buffers allocated for an active virtual buffer pool.VPOOL Frame Size (QDBPFRAM)
For the Frame Size attribute, you can specify the values 4K, 1M, or 2G.
This applies to DB2 11 and higher.
VPOOL Buffers AllocatedThe number of virtual buffer pool pages that were allocated at the end of the interval.
Minimum VPOOL Size (QDBPVPMI)The VPSIZEMIN attribute.
This applies to DB2 11 and higher.
VPOOL Buffers in UseThe number of virtual buffer pool pages that were in use (nonstealable) at the end of the interval.
Maximum VPOOL Size (QDBPVPMA)The VPSIZEMAX attribute.
Chapter 16. Near-term history information 625
This applies to DB2 11 and higher.
VPOOL Buffers to be DelThe number of pages to be deleted from an active virtual buffer pool as a result of pool contraction.
Auto SizeDetermines whether Auto Size is used. You can specify Y (YES) or N (NO).
Use CountThe number of open tablespaces or indexspaces in this buffer pool.
Page FixDetermines whether a page is fixed in real storage when it is first used. You can specify Y (YES) or N(NO).
VP Sequential ThreshSequential Steal threshold for the virtual buffer pool VPSSEQT. The percentage of the virtual bufferpool that might be occupied by sequentially accessed pages. If set to zero, prefetch is disabled.
Vert Deferred Write ThreshVertical Deferred Write threshold for the virtual buffer pool VDWQT. The percentage of the buffer poolthat might be occupied by updated pages from a single data set.
VP Parallel Seq ThreshParallel I/O sequential threshold VPPSEQT. This threshold determines how much of the virtual bufferpool might be used for parallel I/O operations. It is expressed as a percentage of VPSEQT. If set tozero, I/O parallelism is disabled.
Sysplex Parallel ThreshVirtual buffer pool assisting parallel sequential threshold. This threshold determines how much of thevirtual buffer pool might support parallel I/O operations from another DB2 in a data sharing group.
Getpages per Sync I/OThe ratio of Getpage requests to Read I/Os.
Pages Written per Write I/OThe ratio of page writes to physical I/Os.
Prefetch per I/OThe ratio of Prefetch requests to physical I/Os.
Pages Read per PrefetchThe ratio of pages read by Prefetch processing to total Prefetch requests. This includes bothSequential Prefetch and List Prefetch.
Seq Prefetch per I/OThe ratio of pages read by Sequential Prefetch to Sequential Prefetch I/O.
Pages Read per Seq PrefetchThe ratio of pages read by Sequential Prefetch requests to Sequential Prefetch requests.
List Prefetch per I/OThe ratio of List Prefetch requests to List Prefetch I/Os.
Pages Read per List PrefetchThe ratio of pages read by List Prefetch to List Prefetch requests.
Dyn Prefetch per I/OThe ratio of Dynamic Prefetch request to Dynamic Prefetch I/Os.
Pages Read per Dyn PrefetchThe ratio of pages read by Dynamic Prefetch to Dynamic Prefetch request.
Max Concur Prefetch I/OThe highest number of concurrent prefetch I/O streams that were allocated to support I/Oparallelism.
Workfile MaximumThe maximum number of workfiles that have been allocated during sort/merge processing.
626 Classic Interface User's Guide
BP Hit % - RandomThe percentage of times that DB2 performed a Getpage operation with a random request and thepage was already in the buffer pool. A DASD read was not required.
Virtual Page Steal MethodDetermines when and whether performance-critical objects in buffer pools are removed from bufferpools when the space is needed by other objects. Valid values:LRU
"Least Recently Used" objects are removed first.FIFO
Oldest objects are removed first (First-In-First-Out).NONE
Objects are not removed from buffer pool (no page stealing). This setting provides the highestavailability for business-critical objects.
BP Hit % - SequentialThe percentage of times that DB2 performed a Getpage operation with a sequential request and thepage was already in the buffer pool. A DASD read was not required.
Random Getpage Buffer HitThe number of times that the random Getpage request has a buffer hit and the buffer is on the least-recently-used (SLRU) chain. DB2 11 and later. (Field name: QBSTRHS)
LWM Buffers on SLRUThe minimum number of buffers on the sequential least-recently-used (SLRU) chain in the laststatistical period. This is the low-water mark (LWM) within an interval. DB2 11 and later. (Field name:QBSTSMIN)
HWM Buffers on SLRUThe maximum number of buffers on the sequential least-recently-used (SLRU) chain in the laststatistical period,. This is the low water mark (LWM) within an interval. DB2 11 and later. (Field name:QBSTSMAX)
For each of the following fields, the following statistics are provided:INTERVAL QUANTITY
The amount of activities that occur during the interval./MINUTE
Rate per minute. The number under /MINUTE (in parentheses) is the number of minutes in theinterval.
/THREADRate per thread. The number under /THREAD (in parentheses) is the number of Create Threads duringthe interval.
/COMMITRate per Commit. The number under /COMMIT (in parentheses) is the number of Commit requests(including abort requests) during the interval.
Getpage RequestsGetpage request operations for the buffer pool during the interval.
Getpage Requests - SequentialNumber of Getpage requests issued by sequential access requestors.
Getpage Requests - RandomNumber of Getpage requests issued by random access requestors.
Getpage Requests - Seq OvflThe number of sequential GETPAGE requests using overflowed buffers. DB2 12 and later.
Getpage Requests - Random OvflThe number of non-sequential GETPAGE requests using overflowed buffers. DB2 12 and later.
Getpage Failed - VPOOL FullNumber of Getpage failures due to unavailable buffers because the virtual buffer pool was full.
Chapter 16. Near-term history information 627
Getpage Failed - Cond RequestNumber of conditional Getpage requests that could not be satisfied for this buffer pool. A conditionalGetpage is used with parallel I/O processing only.
Getpage Failed - Cond SeqReqThe number of conditional sequential getpage requests that failed because the page is not in thebuffer pool.
Sync Read I/O OperationsSynchronous read operations done by DB2 during the interval.
Sync Read I/Os - SequentialNumber of synchronous Read I/O operations performed by sequential requests.
Sync Read I/Os - RandomNumber of synchronous Read I/O operations performed by random requests.
Sync Read I/Os - Seq OvflThe number of synchronous Read I/O operations performed for sequential GETPAGE requests usingoverflowed buffers. DB2 12 and above. (QBSTASSE)
Sync Read I/Os - Random OvflThe number of synchronous Read I/O operations performed for non-sequential GETPAGE requestsusing overflowed buffers. DB12 and above. (QBSTASYN)
Page-in Required for Read I/ONumber of page-ins required for Read I/O.
Pages Read via Seq PrefetchPages read as a result of Sequential Prefetch requests.
Seq Prefetch I/O OperationsNumber of asynchronous Read I/Os caused by Sequential Prefetch.
Sequential Prefetch RequestsSequential Prefetch requests for the buffer pool during the interval.
Pages Read via List PrefetchNumber of pages read because of List Prefetch.
List Prefetch I/O OperationsNumber of asynchronous Read I/Os caused by List Prefetch.
List Prefetch RequestsList Prefetch requests for the buffer pool during the interval.
Pages Read via Dyn PrefetchNumber of pages read because of Dynamic Prefetch. Dynamic prefetch is triggered because ofsequential detection.
Dyn Prefetch I/O OperationsNumber of asynchronous Read I/Os caused by Dynamic Prefetch.
Dyn Prefetch RequestsDynamic Prefetch requests for the buffer pool.
Prefetch Failed - No BufferFailures of Sequential Prefetch because the Sequential Prefetch threshold (SPTH) was reached.
Prefetch Failed - No EngineFailures of Sequential Prefetch because the maximum number of concurrent Sequential Prefetcheswas reached. (You cannot change this maximum value.)
Parallel Group RequestsNumber of requests made for processing queries in parallel.
Prefetch I/O Streams ReducedNumber of requested prefetch I/O streams that were denied because of a buffer pool shortage. Thisapplies only for nonworkfile pagesets for queries that are processed in parallel.
628 Classic Interface User's Guide
I/O Parallelism DowngradedNumber of times the requested number of buffers to allow a parallel group to run to the planneddegree could not be allocated because of a buffer pool shortage.
Prefetch Quan Reduced to 1/2Number of times the Sequential Prefetch quantity was reduced from normal to one-half of normal.This is done to continue to allow execution concurrently with parallel I/O.
Prefetch Quan Reduced to 1/4Number of times the Sequential Prefetch quantity was reduced from one-half to one-quarter normal.
Pages Added to LPLThe number of times one or more pages are added to logical page lists (LPL). (Field name: QBSTLPL)
Length of SLRU=VPSEQTThe number of times when the length of the sequential least-recently-used (SLRU) chain equals thesequential steal threshold VPSEQT. DB11 and later. (Field name: QBSTHST)
Pages UpdatedUpdates to pages in the buffer pool during the interval.
Pages WrittenBuffer pool pages written to DASD during the interval.
Page-in Required for Write I/ONumber of page-ins required for Write I/O operations.
Write I/O OperationsWrites performed by media manager for both synchronous and asynchronous I/O.
Immediate (Sync) Writesimmediate Writes to DASD during the interval. This value is incremented when 97.5% of the bufferpool pages are in use. In addition, DB2 might flag buffer pool pages for immediate Write duringcheckpoint processing and when a database is stopped.
Note: Consider the value of DMTH (Data Manager threshold) when interpreting this value. If DMTH iszero, this value is probably insignificant.
Write Engine Not AvailableWrites that were deferred because DB2 reached its maximum number of concurrent Writes.
Vert Defer Wrt Thresh ReachedThe number of times the Vertical Deferred Write threshold was reached.
Deferred Write Thresh ReachedDeferred Write threshold (DWTH) was reached. This occurs when DB2 uses 50% of the buffer poolminimum value, or if a data set has updated 10% of the pages or 64 pages, whichever is greater. Atthis threshold, DB2 forces writes in an effort to free pool space.
Data Manager Thresh ReachedData Manager threshold (DMTH) was reached. This occurs when DB2 uses 95% of the buffer poolminimum value and begins to operate at the row level rather than the page level. When this occurs,CPU usage rises significantly.
Successful VPOOL Expand/ContrNumber of successful virtual buffer pool expansions or contractions because of the ALTERBUFFERPOOL command.
VPOOL Expand FailedNumber of virtual buffer pool expansion failures.
Successful Dataset OpensThe number of successful data set Open operations during the interval.
DFHSM RecallAttempts to access data sets that were migrated by DFHSM.
DFHSM Recall TimeoutsUnsuccessful attempts to recall data sets because the timeout threshold (DSNZPARM RECALLD) wasexceeded.
Chapter 16. Near-term history information 629
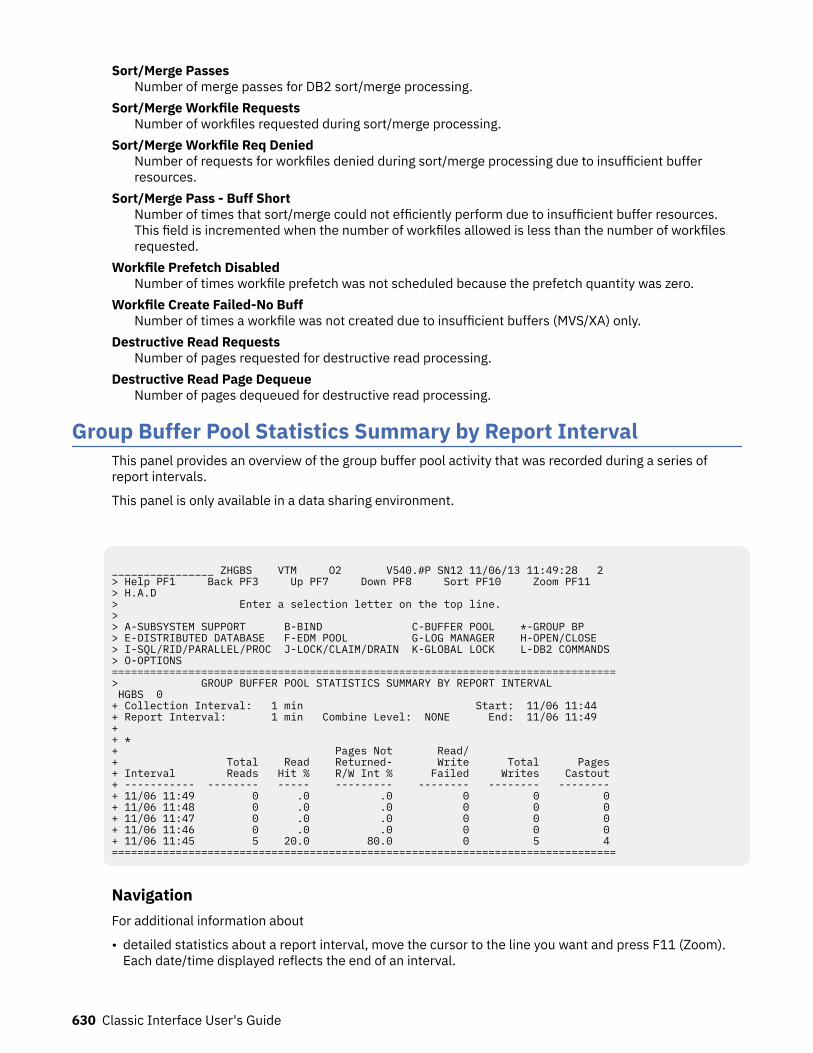
Sort/Merge PassesNumber of merge passes for DB2 sort/merge processing.
Sort/Merge Workfile RequestsNumber of workfiles requested during sort/merge processing.
Sort/Merge Workfile Req DeniedNumber of requests for workfiles denied during sort/merge processing due to insufficient bufferresources.
Sort/Merge Pass - Buff ShortNumber of times that sort/merge could not efficiently perform due to insufficient buffer resources.This field is incremented when the number of workfiles allowed is less than the number of workfilesrequested.
Workfile Prefetch DisabledNumber of times workfile prefetch was not scheduled because the prefetch quantity was zero.
Workfile Create Failed-No BuffNumber of times a workfile was not created due to insufficient buffers (MVS/XA) only.
Destructive Read RequestsNumber of pages requested for destructive read processing.
Destructive Read Page DequeueNumber of pages dequeued for destructive read processing.
Group Buffer Pool Statistics Summary by Report IntervalThis panel provides an overview of the group buffer pool activity that was recorded during a series ofreport intervals.
This panel is only available in a data sharing environment.
________________ ZHGBS VTM O2 V540.#P SN12 11/06/13 11:49:28 2 > Help PF1 Back PF3 Up PF7 Down PF8 Sort PF10 Zoom PF11 > H.A.D > Enter a selection letter on the top line. > > A-SUBSYSTEM SUPPORT B-BIND C-BUFFER POOL *-GROUP BP > E-DISTRIBUTED DATABASE F-EDM POOL G-LOG MANAGER H-OPEN/CLOSE > I-SQL/RID/PARALLEL/PROC J-LOCK/CLAIM/DRAIN K-GLOBAL LOCK L-DB2 COMMANDS > O-OPTIONS ===============================================================================> GROUP BUFFER POOL STATISTICS SUMMARY BY REPORT INTERVAL HGBS 0 + Collection Interval: 1 min Start: 11/06 11:44 + Report Interval: 1 min Combine Level: NONE End: 11/06 11:49 + + * + Pages Not Read/ + Total Read Returned- Write Total Pages + Interval Reads Hit % R/W Int % Failed Writes Castout + ----------- -------- ----- --------- -------- -------- -------- + 11/06 11:49 0 .0 .0 0 0 0 + 11/06 11:48 0 .0 .0 0 0 0 + 11/06 11:47 0 .0 .0 0 0 0 + 11/06 11:46 0 .0 .0 0 0 0 + 11/06 11:45 5 20.0 80.0 0 5 4 ===============================================================================
NavigationFor additional information about
• detailed statistics about a report interval, move the cursor to the line you want and press F11 (Zoom).Each date/time displayed reflects the end of an interval.
630 Classic Interface User's Guide
• a different buffer pool, enter a buffer pool ID next to HGBS.• related topics, select one of the options from the menu.• other topics, use the PF keys.
FieldsCollection Interval
The time interval specified for the collection of near-term history data. This unit of time was specifiedwhen the Near-Term History Data Collector was started.
StartThe start time of the first interval in this display.
Report IntervalThis field determines the report interval. It is set on the Near-Term History Report Option panel.
Combine LevelThis field reflects the selected combine level. If Combine Level is NONE, the report interval is thesame as the collection interval. Possible values:HOURLY
Data will be reported in hourly intervals.NONE
Data will be reported in the time unit specified by the collection interval.End
The end time of the last interval in this display.Interval
Provides the date and time that mark the end of the report interval.Total Reads
The total number of reads to the group buffer pool.Read Hit %
The percentage of all Reads to the group buffer pool for which the needed data was found andreturned to the member.
Pages Not Returned - R/W Int %The percentage of all Reads to the group buffer pool where
• the data was not found in the group buffer pool and the member had to go to DASD to read the page,and
• other members had read/write interest in the pageset, so DB2 created a directory entry for this pageif it did not already exist.
Read/Write FailedThe number of Read or Write requests to the group buffer pool that failed because of a lack of storageresources.
Total WritesThe total number of writes to the group buffer pool.
Pages CastoutThe number of pages that this member has castout to DASD from the group buffer pool.
Group Buffer Pool Statistics DetailThis panel shows detailed near-term history information about activities in a specified DB2 group bufferpool during a specified report interval.
This panel is only available in a data sharing environment.
You can view information about a different group buffer pool by entering a buffer pool ID next to HGBD.
Chapter 16. Near-term history information 631
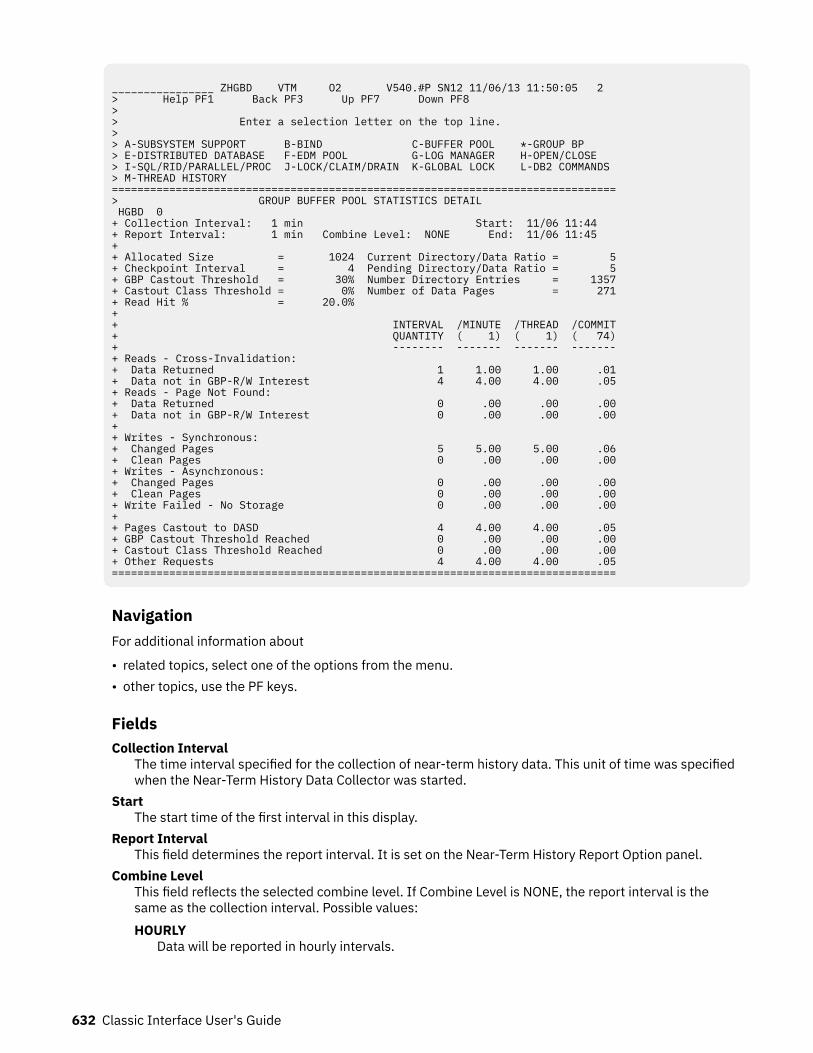
________________ ZHGBD VTM O2 V540.#P SN12 11/06/13 11:50:05 2 > Help PF1 Back PF3 Up PF7 Down PF8 > > Enter a selection letter on the top line. > > A-SUBSYSTEM SUPPORT B-BIND C-BUFFER POOL *-GROUP BP > E-DISTRIBUTED DATABASE F-EDM POOL G-LOG MANAGER H-OPEN/CLOSE > I-SQL/RID/PARALLEL/PROC J-LOCK/CLAIM/DRAIN K-GLOBAL LOCK L-DB2 COMMANDS > M-THREAD HISTORY ===============================================================================> GROUP BUFFER POOL STATISTICS DETAIL HGBD 0 + Collection Interval: 1 min Start: 11/06 11:44 + Report Interval: 1 min Combine Level: NONE End: 11/06 11:45 + + Allocated Size = 1024 Current Directory/Data Ratio = 5+ Checkpoint Interval = 4 Pending Directory/Data Ratio = 5+ GBP Castout Threshold = 30% Number Directory Entries = 1357+ Castout Class Threshold = 0% Number of Data Pages = 271+ Read Hit % = 20.0% + + INTERVAL /MINUTE /THREAD /COMMIT+ QUANTITY ( 1) ( 1) ( 74)+ -------- ------- ------- -------+ Reads - Cross-Invalidation: + Data Returned 1 1.00 1.00 .01+ Data not in GBP-R/W Interest 4 4.00 4.00 .05+ Reads - Page Not Found: + Data Returned 0 .00 .00 .00+ Data not in GBP-R/W Interest 0 .00 .00 .00+ + Writes - Synchronous: + Changed Pages 5 5.00 5.00 .06+ Clean Pages 0 .00 .00 .00+ Writes - Asynchronous: + Changed Pages 0 .00 .00 .00+ Clean Pages 0 .00 .00 .00+ Write Failed - No Storage 0 .00 .00 .00+ + Pages Castout to DASD 4 4.00 4.00 .05+ GBP Castout Threshold Reached 0 .00 .00 .00+ Castout Class Threshold Reached 0 .00 .00 .00+ Other Requests 4 4.00 4.00 .05===============================================================================
NavigationFor additional information about
• related topics, select one of the options from the menu.• other topics, use the PF keys.
FieldsCollection Interval
The time interval specified for the collection of near-term history data. This unit of time was specifiedwhen the Near-Term History Data Collector was started.
StartThe start time of the first interval in this display.
Report IntervalThis field determines the report interval. It is set on the Near-Term History Report Option panel.
Combine LevelThis field reflects the selected combine level. If Combine Level is NONE, the report interval is thesame as the collection interval. Possible values:HOURLY
Data will be reported in hourly intervals.
632 Classic Interface User's Guide
NONEData will be reported in the time unit specified by the collection interval.
EndThe end time of the last interval in this display.
Allocated SizeThe allocated size of the group buffer pool in 4KB blocks.
Current Directory/Data RatioThe current ratio of directory entries to data pages.
Checkpoint IntervalThe checkpoint interval for the group buffer pool, in minutes.
Pending Directory/Data RatioThe pending ratio of directory entries to data pages. This value will be different from the current ratioif an ALTER GROUPBUFFERPOOL command has been issued with a new value for the RATIOparameter. The change will not take effect until the next time the group buffer pool is allocated.
GBP Castout ThresholdGroup buffer pool castout threshold. When the number of changed pages in the group buffer poolexceeds this threshold, castout will be initiated. You can change this value with the GBPOOLTparameter on the ALTER GROUPBUFFERPOOL command.
Number Directory EntriesThe actual number of allocated directory entries.
Castout Class ThresholdGroup buffer pool castout class threshold. When the number of changed pages for a particular castoutclass exceeds this threshold, castout will be initiated. You can change this value with the CLASSTparameter on the ALTER GROUPBUFFERPOOL command.
Number of Data PagesThe actual number of allocated data pages.
Read Hit %The percentage of all Reads to the group buffer pool for which the needed data was found andreturned to the member.
For each of the following fields, the following statistics are provided:INTERVAL QUANTITY
The amount of activities that occur during the interval./MINUTE
Rate per minute. The number under /MINUTE (in parentheses) is the number of minutes in theinterval.
/THREADRate per thread. The number under /THREAD (in parentheses) is the number of Create Threads duringthe interval.
/COMMITRate per Commit. The number under /COMMIT (in parentheses) is the number of Commit requests(including abort requests) during the interval.
Reads - Cross Invalidation: Data ReturnedThe number of reads to the group buffer pool required because the page in the member's buffer poolwas invalidated, where the data was found and returned to the member.
Reads - Cross Invalidation: Data not in GBP-R/W InterestThe number of reads to the group buffer pool required because the page in the member's buffer poolwas invalidated, where:
• The data was not found in the group buffer pool and the member had to go to DASD to read the page• Other members had read/write interest in the pageset, so DB2 created a directory entry for this
page if it did not already exist.
Chapter 16. Near-term history information 633
Reads - Page Not Found: Data ReturnedThe number of reads to the group buffer pool required because the page was not in the member'sbuffer pool where the data was found and returned to the member.
Reads - Page Not Found: Data not in GBP-R/W InterestThe number of reads to the group buffer pool required because the page was not in the member'sbuffer pool, where:
• The data was not found in the group buffer pool and the member had to go to DASD to read the page• Other members had read/write interest in the pageset, so DB2 created a directory entry for this
page if it did not already exist.
Writes - Synchronous: Changed PagesThe number of changed pages that are synchronously written to the group buffer pool. Pages can beforced out before the application commits if a buffer pool threshold is reached, or when P-locknegotiation forces the pages on the Vertical Deferred Write queue to be written to the group bufferpool.
Writes - Synchronous: Clean PagesThe number of clean pages that are synchronously written to the group buffer pool. DB2 writes cleanpages for pagesets and partitions defined with GBPCACHE ALL.
Writes - Asynchronous: Changed PagesThe number of changed pages asynchronously written to the group buffer pool. Pages can be forcedout before the application commits if a buffer pool threshold is reached, or when P-lock negotiationforces the pages on the Vertical Deferred Write queue to be written to the group buffer pool.
Writes - Asynchronous: Clean PagesThe number of clean pages asynchronously written to the group buffer pool. DB2 writes clean pagesfor pagesets and partitions defined with GBPCACHE ALL.
Write Failed - No StorageThe number of group buffer pool write requests that failed because of a shortage of coupling facilityresources.
Pages Castout to DASDThe number of pages that this member has castout to DASD from the group buffer pool.
GBP Castout Threshold ReachedThe number of times that castout was initiated because the group buffer pool castout threshold wasreached.
Castout Class Threshold ReachedThe number of times that castout was initiated because the castout class threshold was reached.
Other RequestsThe number of other requests.
Distributed Data Facility Statistics Summary by Report IntervalThis panel provides an overview of the DDF activity that was recorded during a series of report intervals.
634 Classic Interface User's Guide
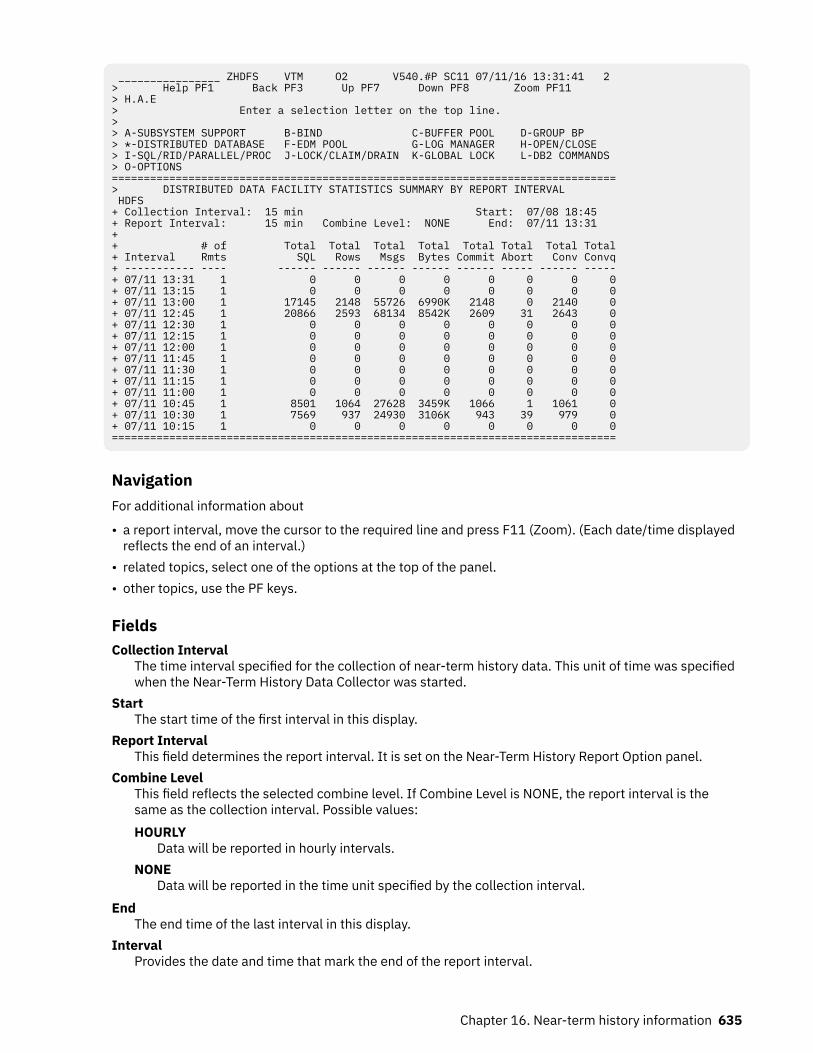
________________ ZHDFS VTM O2 V540.#P SC11 07/11/16 13:31:41 2 > Help PF1 Back PF3 Up PF7 Down PF8 Zoom PF11 > H.A.E > Enter a selection letter on the top line. > > A-SUBSYSTEM SUPPORT B-BIND C-BUFFER POOL D-GROUP BP > *-DISTRIBUTED DATABASE F-EDM POOL G-LOG MANAGER H-OPEN/CLOSE > I-SQL/RID/PARALLEL/PROC J-LOCK/CLAIM/DRAIN K-GLOBAL LOCK L-DB2 COMMANDS > O-OPTIONS =============================================================================== > DISTRIBUTED DATA FACILITY STATISTICS SUMMARY BY REPORT INTERVAL HDFS + Collection Interval: 15 min Start: 07/08 18:45 + Report Interval: 15 min Combine Level: NONE End: 07/11 13:31+ + # of Total Total Total Total Total Total Total Total + Interval Rmts SQL Rows Msgs Bytes Commit Abort Conv Convq + ----------- ---- ------ ------ ------ ------ ------ ----- ------ ----- + 07/11 13:31 1 0 0 0 0 0 0 0 0 + 07/11 13:15 1 0 0 0 0 0 0 0 0 + 07/11 13:00 1 17145 2148 55726 6990K 2148 0 2140 0+ 07/11 12:45 1 20866 2593 68134 8542K 2609 31 2643 0+ 07/11 12:30 1 0 0 0 0 0 0 0 0+ 07/11 12:15 1 0 0 0 0 0 0 0 0+ 07/11 12:00 1 0 0 0 0 0 0 0 0+ 07/11 11:45 1 0 0 0 0 0 0 0 0+ 07/11 11:30 1 0 0 0 0 0 0 0 0+ 07/11 11:15 1 0 0 0 0 0 0 0 0+ 07/11 11:00 1 0 0 0 0 0 0 0 0+ 07/11 10:45 1 8501 1064 27628 3459K 1066 1 1061 0+ 07/11 10:30 1 7569 937 24930 3106K 943 39 979 0+ 07/11 10:15 1 0 0 0 0 0 0 0 0===============================================================================
NavigationFor additional information about
• a report interval, move the cursor to the required line and press F11 (Zoom). (Each date/time displayedreflects the end of an interval.)
• related topics, select one of the options at the top of the panel.• other topics, use the PF keys.
FieldsCollection Interval
The time interval specified for the collection of near-term history data. This unit of time was specifiedwhen the Near-Term History Data Collector was started.
StartThe start time of the first interval in this display.
Report IntervalThis field determines the report interval. It is set on the Near-Term History Report Option panel.
Combine LevelThis field reflects the selected combine level. If Combine Level is NONE, the report interval is thesame as the collection interval. Possible values:HOURLY
Data will be reported in hourly intervals.NONE
Data will be reported in the time unit specified by the collection interval.End
The end time of the last interval in this display.Interval
Provides the date and time that mark the end of the report interval.
Chapter 16. Near-term history information 635
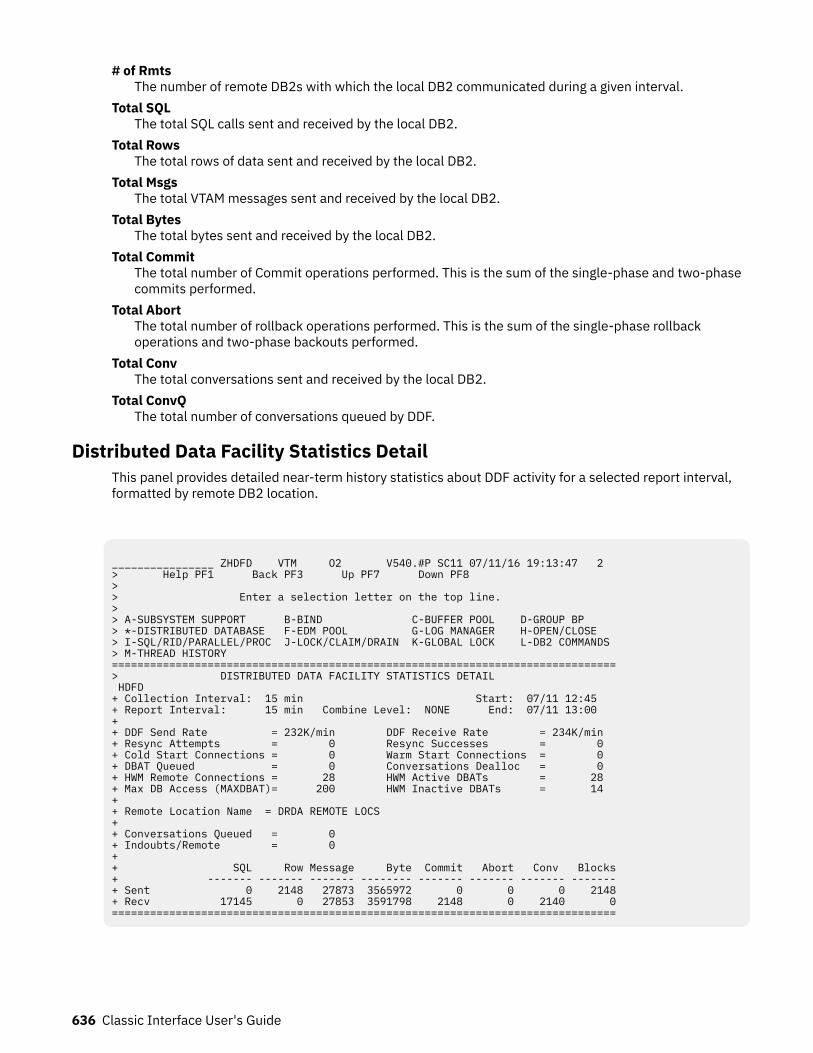
# of RmtsThe number of remote DB2s with which the local DB2 communicated during a given interval.
Total SQLThe total SQL calls sent and received by the local DB2.
Total RowsThe total rows of data sent and received by the local DB2.
Total MsgsThe total VTAM messages sent and received by the local DB2.
Total BytesThe total bytes sent and received by the local DB2.
Total CommitThe total number of Commit operations performed. This is the sum of the single-phase and two-phasecommits performed.
Total AbortThe total number of rollback operations performed. This is the sum of the single-phase rollbackoperations and two-phase backouts performed.
Total ConvThe total conversations sent and received by the local DB2.
Total ConvQThe total number of conversations queued by DDF.
Distributed Data Facility Statistics DetailThis panel provides detailed near-term history statistics about DDF activity for a selected report interval,formatted by remote DB2 location.
________________ ZHDFD VTM O2 V540.#P SC11 07/11/16 19:13:47 2 > Help PF1 Back PF3 Up PF7 Down PF8 > > Enter a selection letter on the top line. > > A-SUBSYSTEM SUPPORT B-BIND C-BUFFER POOL D-GROUP BP > *-DISTRIBUTED DATABASE F-EDM POOL G-LOG MANAGER H-OPEN/CLOSE > I-SQL/RID/PARALLEL/PROC J-LOCK/CLAIM/DRAIN K-GLOBAL LOCK L-DB2 COMMANDS > M-THREAD HISTORY =============================================================================== > DISTRIBUTED DATA FACILITY STATISTICS DETAIL HDFD + Collection Interval: 15 min Start: 07/11 12:45 + Report Interval: 15 min Combine Level: NONE End: 07/11 13:00 + + DDF Send Rate = 232K/min DDF Receive Rate = 234K/min + Resync Attempts = 0 Resync Successes = 0 + Cold Start Connections = 0 Warm Start Connections = 0 + DBAT Queued = 0 Conversations Dealloc = 0 + HWM Remote Connections = 28 HWM Active DBATs = 28 + Max DB Access (MAXDBAT)= 200 HWM Inactive DBATs = 14 + + Remote Location Name = DRDA REMOTE LOCS + + Conversations Queued = 0 + Indoubts/Remote = 0 + + SQL Row Message Byte Commit Abort Conv Blocks + ------- ------- ------- -------- ------- ------- ------- ------- + Sent 0 2148 27873 3565972 0 0 0 2148 + Recv 17145 0 27853 3591798 2148 0 2140 0 ===============================================================================
636 Classic Interface User's Guide
NavigationFor additional information about
• related topics, select one of the options at the top of the panel.• other topics, use the PF keys.
FieldsCollection Interval
The time interval specified for the collection of near-term history data. This unit of time was specifiedwhen the Near-Term History Data Collector was started.
StartThe start time of the interval currently displayed.
Report IntervalThis field determines the report interval. It is set on the Near-Term History Report Option panel.
Combine LevelThis field reflects the selected combine level. If Combine Level is NONE, the report interval is thesame as the collection interval. Possible values:HOURLY
Data will be reported in hourly intervals.NONE
Data will be reported in the time unit specified by the collection interval.End
The end time of the interval currently displayed.DDF Send Rate
The rate at which data was sent by DDF, in bytes, KB, MB, GB per minute.DDF Receive Rate
mighThe rate at which data was received by DDF, in bytes, KB, MB, GB per minute.Resync Attempts
The number of resynchronization connects attempted with all remote locations. Used only for two-phase commit.
Resync SuccessesThe number of resynchronization connects that succeeded with all remote locations. Used only fortwo-phase commit.
Cold Start ConnectionsThe number of Cold Start connections with all remote locations. Used only for two-phase commit.
Warm Start ConnectionsThe number of Warm Start connections with all remote locations. Used only for two-phase commit.
DBAT QueuedNumber of times a database access thread (DBAT) had to wait because the maximum number ofconcurrent DBATs (MAXDBAT) was reached.
Conversation DeallocThe number of conversations deallocated because the ZPARM limit for the maximum connectedremote threads (both active and inactive) was reached.
HWM Remote ConnectionsThe high-water mark (HWM) of inactive and active remote threads.
HWM Active DBATsThe high-water mark (HWM) of active database access threads (DBATs). If the INACTIVE option isspecified, it is possible for this value and the current number of active DBATs to exceed MAXDBAT.This occurs because DB2 allows CONNECTs to be processed even if MAXDBAT has been exceeded.After connect processing is complete, if MAXDBAT is still exceeded, then the DBAT is made inactive.
Chapter 16. Near-term history information 637
HWM Inactive DBATsThe high-water mark (HWM) of inactive database access threads.
Max DB Access (MAXDBAT)The maximum number of database access threads allowed for the Db2 being monitored (determinedby the setting of MAXDBAT in DSNZPARM).
Remote statistics: The following group of fields occurs for each remote DB2 location with which the localDB2 subsystem communicated, either as a requester or a responder, during the report interval. Each sent/received field generates two rows of output; the top row is the sent value, and the bottom row is thereceived value.
Remote Location NameThe name of a remote location with which the local DB2 communicated. The statistics immediatelybelow this field pertain to this location.
Conversations QueuedThe number of conversations queued by DDF.
Indoubts/RemoteThe number of threads that became indoubt with the remote location as coordinator.
SQL Sent/RecvThe number of SQL calls sent to and from the remote location.
Row Sent/RecvThe number of rows sent to and from the remote location.
Message Sent/RecvThe number of VTAM messages sent to and from the remote location.
Byte Sent/RecvThe number of bytes sent to and from the remote location.
Commit Sent/RecvThe number of Commits sent to and from the remote location.
Abort Sent/RecvThe number of aborts sent to and from the remote location.
Conv Sent/RecvThe number of conversations send to and from the remote location.
Blocks Sent/RecvNumber of blocks sent to and from the remote location, if using block fetch mode.
EDM Pool Statistics Summary by Report IntervalThis panel provides an overview of the Environmental Descriptor Manager (EDM) pool activity that wasrecorded during a series of report intervals.
638 Classic Interface User's Guide
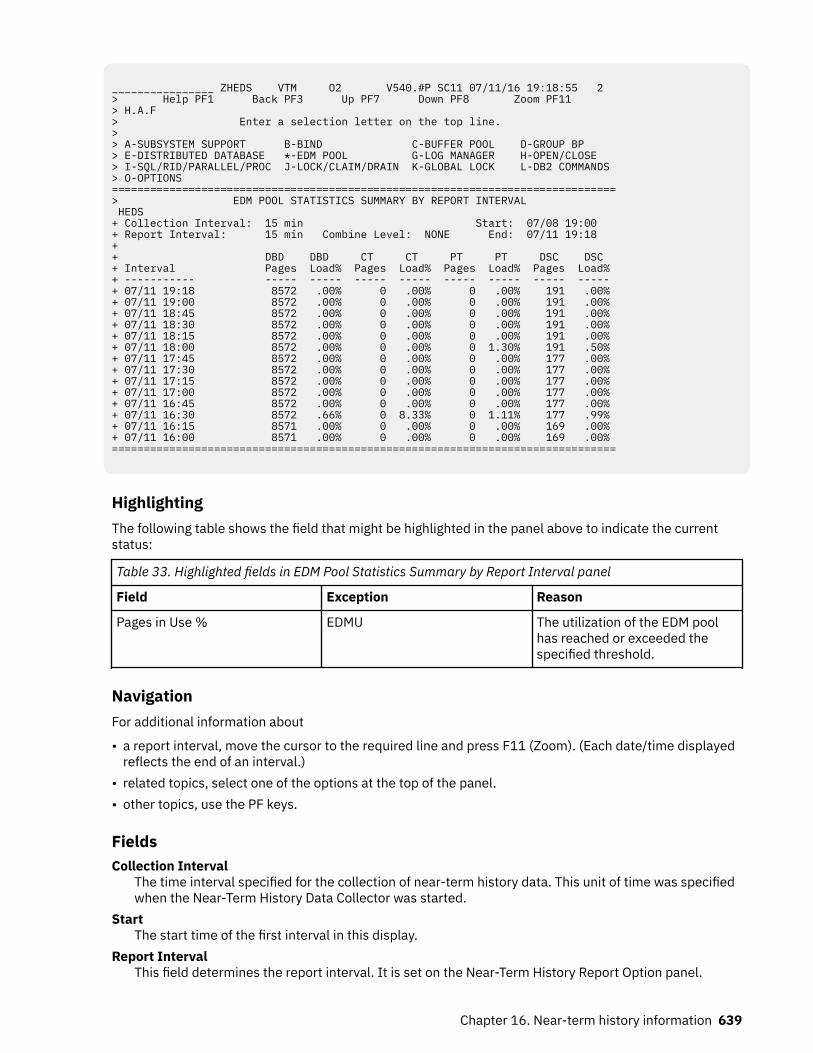
________________ ZHEDS VTM O2 V540.#P SC11 07/11/16 19:18:55 2 > Help PF1 Back PF3 Up PF7 Down PF8 Zoom PF11 > H.A.F > Enter a selection letter on the top line. > > A-SUBSYSTEM SUPPORT B-BIND C-BUFFER POOL D-GROUP BP > E-DISTRIBUTED DATABASE *-EDM POOL G-LOG MANAGER H-OPEN/CLOSE > I-SQL/RID/PARALLEL/PROC J-LOCK/CLAIM/DRAIN K-GLOBAL LOCK L-DB2 COMMANDS > O-OPTIONS =============================================================================== > EDM POOL STATISTICS SUMMARY BY REPORT INTERVAL HEDS + Collection Interval: 15 min Start: 07/08 19:00 + Report Interval: 15 min Combine Level: NONE End: 07/11 19:18 + + DBD DBD CT CT PT PT DSC DSC + Interval Pages Load% Pages Load% Pages Load% Pages Load% + ----------- ----- ----- ----- ----- ----- ----- ----- ----- + 07/11 19:18 8572 .00% 0 .00% 0 .00% 191 .00% + 07/11 19:00 8572 .00% 0 .00% 0 .00% 191 .00% + 07/11 18:45 8572 .00% 0 .00% 0 .00% 191 .00% + 07/11 18:30 8572 .00% 0 .00% 0 .00% 191 .00% + 07/11 18:15 8572 .00% 0 .00% 0 .00% 191 .00% + 07/11 18:00 8572 .00% 0 .00% 0 1.30% 191 .50% + 07/11 17:45 8572 .00% 0 .00% 0 .00% 177 .00% + 07/11 17:30 8572 .00% 0 .00% 0 .00% 177 .00% + 07/11 17:15 8572 .00% 0 .00% 0 .00% 177 .00% + 07/11 17:00 8572 .00% 0 .00% 0 .00% 177 .00% + 07/11 16:45 8572 .00% 0 .00% 0 .00% 177 .00% + 07/11 16:30 8572 .66% 0 8.33% 0 1.11% 177 .99% + 07/11 16:15 8571 .00% 0 .00% 0 .00% 169 .00% + 07/11 16:00 8571 .00% 0 .00% 0 .00% 169 .00% ===============================================================================
HighlightingThe following table shows the field that might be highlighted in the panel above to indicate the currentstatus:
Table 33. Highlighted fields in EDM Pool Statistics Summary by Report Interval panel
Field Exception Reason
Pages in Use % EDMU The utilization of the EDM poolhas reached or exceeded thespecified threshold.
NavigationFor additional information about
• a report interval, move the cursor to the required line and press F11 (Zoom). (Each date/time displayedreflects the end of an interval.)
• related topics, select one of the options at the top of the panel.• other topics, use the PF keys.
FieldsCollection Interval
The time interval specified for the collection of near-term history data. This unit of time was specifiedwhen the Near-Term History Data Collector was started.
StartThe start time of the first interval in this display.
Report IntervalThis field determines the report interval. It is set on the Near-Term History Report Option panel.
Chapter 16. Near-term history information 639
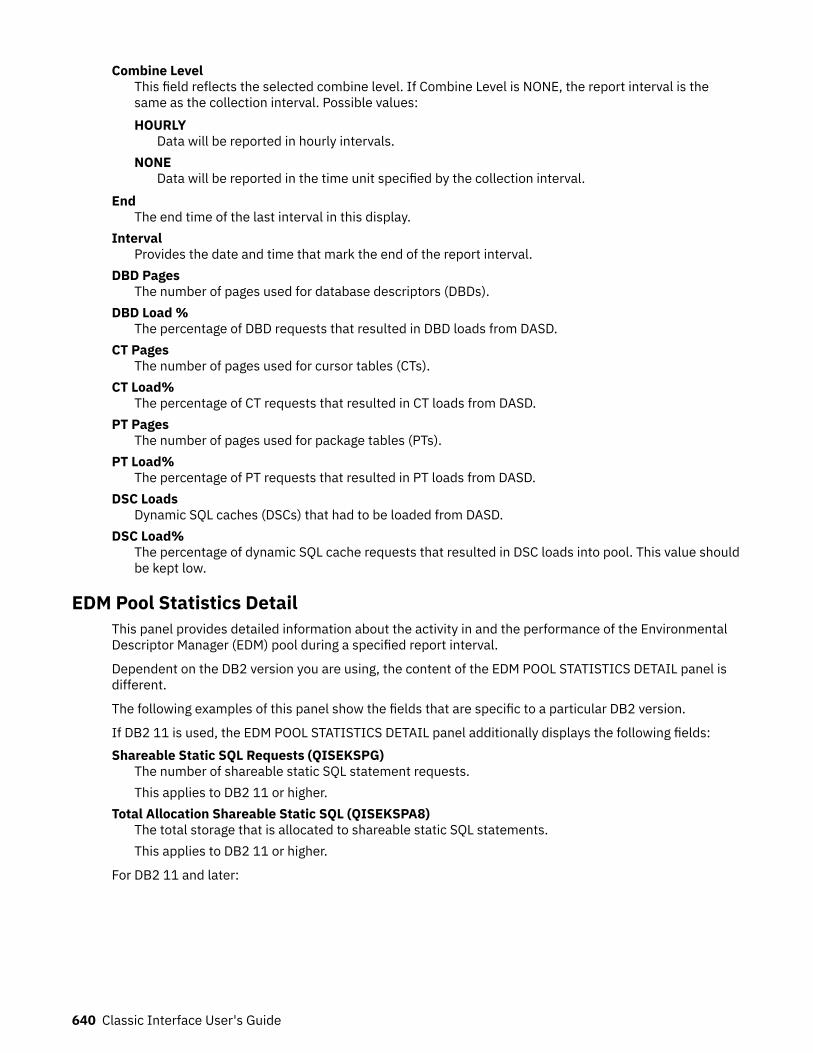
Combine LevelThis field reflects the selected combine level. If Combine Level is NONE, the report interval is thesame as the collection interval. Possible values:HOURLY
Data will be reported in hourly intervals.NONE
Data will be reported in the time unit specified by the collection interval.End
The end time of the last interval in this display.Interval
Provides the date and time that mark the end of the report interval.DBD Pages
The number of pages used for database descriptors (DBDs).DBD Load %
The percentage of DBD requests that resulted in DBD loads from DASD.CT Pages
The number of pages used for cursor tables (CTs).CT Load%
The percentage of CT requests that resulted in CT loads from DASD.PT Pages
The number of pages used for package tables (PTs).PT Load%
The percentage of PT requests that resulted in PT loads from DASD.DSC Loads
Dynamic SQL caches (DSCs) that had to be loaded from DASD.DSC Load%
The percentage of dynamic SQL cache requests that resulted in DSC loads into pool. This value shouldbe kept low.
EDM Pool Statistics DetailThis panel provides detailed information about the activity in and the performance of the EnvironmentalDescriptor Manager (EDM) pool during a specified report interval.
Dependent on the DB2 version you are using, the content of the EDM POOL STATISTICS DETAIL panel isdifferent.
The following examples of this panel show the fields that are specific to a particular DB2 version.
If DB2 11 is used, the EDM POOL STATISTICS DETAIL panel additionally displays the following fields:Shareable Static SQL Requests (QISEKSPG)
The number of shareable static SQL statement requests.This applies to DB2 11 or higher.
Total Allocation Shareable Static SQL (QISEKSPA8)The total storage that is allocated to shareable static SQL statements.This applies to DB2 11 or higher.
For DB2 11 and later:
640 Classic Interface User's Guide
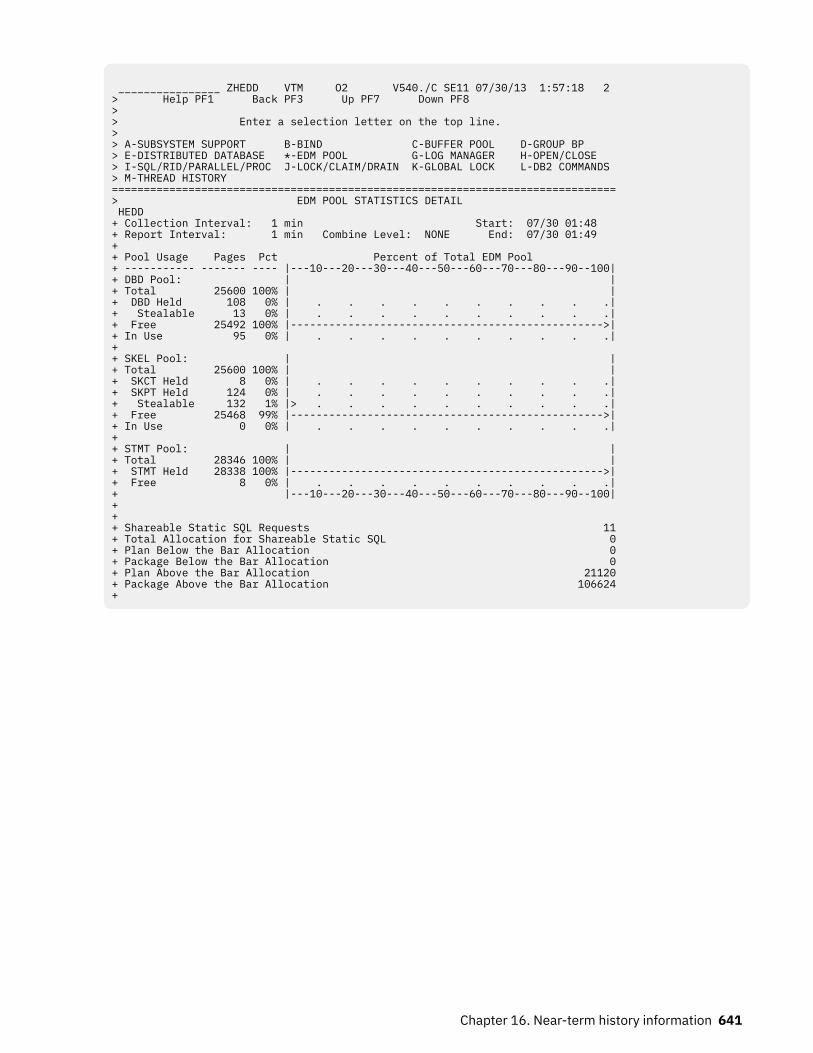
________________ ZHEDD VTM O2 V540./C SE11 07/30/13 1:57:18 2 > Help PF1 Back PF3 Up PF7 Down PF8 > > Enter a selection letter on the top line. > > A-SUBSYSTEM SUPPORT B-BIND C-BUFFER POOL D-GROUP BP > E-DISTRIBUTED DATABASE *-EDM POOL G-LOG MANAGER H-OPEN/CLOSE > I-SQL/RID/PARALLEL/PROC J-LOCK/CLAIM/DRAIN K-GLOBAL LOCK L-DB2 COMMANDS > M-THREAD HISTORY =============================================================================== > EDM POOL STATISTICS DETAIL HEDD + Collection Interval: 1 min Start: 07/30 01:48 + Report Interval: 1 min Combine Level: NONE End: 07/30 01:49 + + Pool Usage Pages Pct Percent of Total EDM Pool + ----------- ------- ---- |---10---20---30---40---50---60---70---80---90--100| + DBD Pool: | | + Total 25600 100% | | + DBD Held 108 0% | . . . . . . . . . .| + Stealable 13 0% | . . . . . . . . . .| + Free 25492 100% |------------------------------------------------->| + In Use 95 0% | . . . . . . . . . .| + + SKEL Pool: | | + Total 25600 100% | | + SKCT Held 8 0% | . . . . . . . . . .| + SKPT Held 124 0% | . . . . . . . . . .| + Stealable 132 1% |> . . . . . . . . . .| + Free 25468 99% |------------------------------------------------->| + In Use 0 0% | . . . . . . . . . .| + + STMT Pool: | | + Total 28346 100% | | + STMT Held 28338 100% |------------------------------------------------->| + Free 8 0% | . . . . . . . . . .| + |---10---20---30---40---50---60---70---80---90--100| + + + Shareable Static SQL Requests 11 + Total Allocation for Shareable Static SQL 0 + Plan Below the Bar Allocation 0 + Package Below the Bar Allocation 0 + Plan Above the Bar Allocation 21120 + Package Above the Bar Allocation 106624 +
Chapter 16. Near-term history information 641
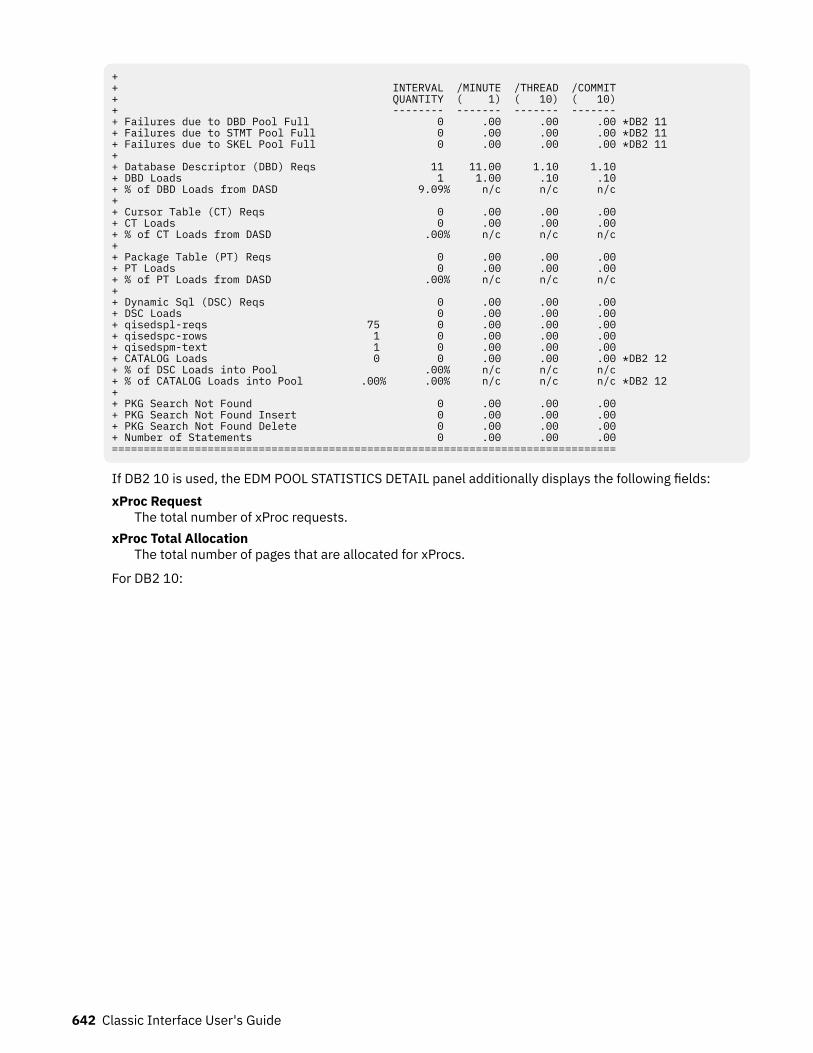
+ + INTERVAL /MINUTE /THREAD /COMMIT + QUANTITY ( 1) ( 10) ( 10) + -------- ------- ------- ------- + Failures due to DBD Pool Full 0 .00 .00 .00 *DB2 11+ Failures due to STMT Pool Full 0 .00 .00 .00 *DB2 11+ Failures due to SKEL Pool Full 0 .00 .00 .00 *DB2 11+ + Database Descriptor (DBD) Reqs 11 11.00 1.10 1.10 + DBD Loads 1 1.00 .10 .10 + % of DBD Loads from DASD 9.09% n/c n/c n/c + + Cursor Table (CT) Reqs 0 .00 .00 .00 + CT Loads 0 .00 .00 .00 + % of CT Loads from DASD .00% n/c n/c n/c + + Package Table (PT) Reqs 0 .00 .00 .00 + PT Loads 0 .00 .00 .00 + % of PT Loads from DASD .00% n/c n/c n/c + + Dynamic Sql (DSC) Reqs 0 .00 .00 .00 + DSC Loads 0 .00 .00 .00 + qisedspl-reqs 75 0 .00 .00 .00 + qisedspc-rows 1 0 .00 .00 .00 + qisedspm-text 1 0 .00 .00 .00 + CATALOG Loads 0 0 .00 .00 .00 *DB2 12+ % of DSC Loads into Pool .00% n/c n/c n/c+ % of CATALOG Loads into Pool .00% .00% n/c n/c n/c *DB2 12+ + PKG Search Not Found 0 .00 .00 .00 + PKG Search Not Found Insert 0 .00 .00 .00 + PKG Search Not Found Delete 0 .00 .00 .00 + Number of Statements 0 .00 .00 .00 ===============================================================================
If DB2 10 is used, the EDM POOL STATISTICS DETAIL panel additionally displays the following fields:xProc Request
The total number of xProc requests.xProc Total Allocation
The total number of pages that are allocated for xProcs.
For DB2 10:
642 Classic Interface User's Guide
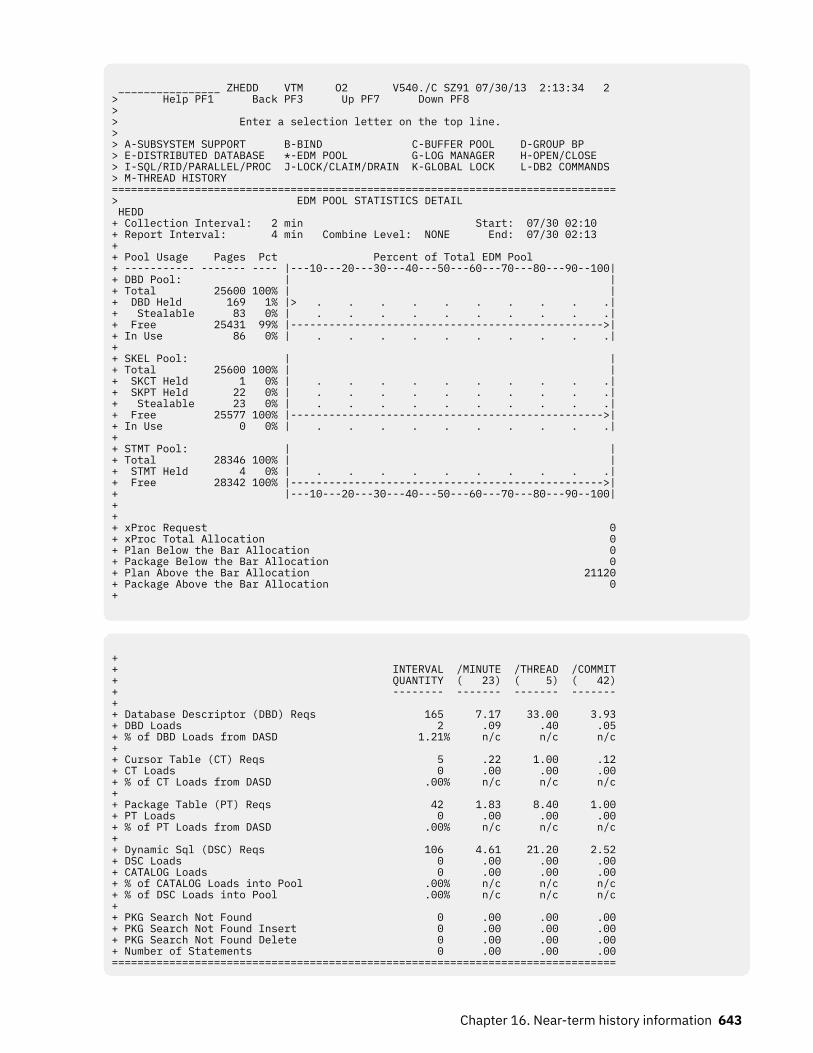
________________ ZHEDD VTM O2 V540./C SZ91 07/30/13 2:13:34 2 > Help PF1 Back PF3 Up PF7 Down PF8 > > Enter a selection letter on the top line. > > A-SUBSYSTEM SUPPORT B-BIND C-BUFFER POOL D-GROUP BP > E-DISTRIBUTED DATABASE *-EDM POOL G-LOG MANAGER H-OPEN/CLOSE > I-SQL/RID/PARALLEL/PROC J-LOCK/CLAIM/DRAIN K-GLOBAL LOCK L-DB2 COMMANDS > M-THREAD HISTORY =============================================================================== > EDM POOL STATISTICS DETAIL HEDD + Collection Interval: 2 min Start: 07/30 02:10 + Report Interval: 4 min Combine Level: NONE End: 07/30 02:13 + + Pool Usage Pages Pct Percent of Total EDM Pool + ----------- ------- ---- |---10---20---30---40---50---60---70---80---90--100| + DBD Pool: | | + Total 25600 100% | | + DBD Held 169 1% |> . . . . . . . . . .| + Stealable 83 0% | . . . . . . . . . .| + Free 25431 99% |------------------------------------------------->| + In Use 86 0% | . . . . . . . . . .| + + SKEL Pool: | | + Total 25600 100% | | + SKCT Held 1 0% | . . . . . . . . . .| + SKPT Held 22 0% | . . . . . . . . . .| + Stealable 23 0% | . . . . . . . . . .| + Free 25577 100% |------------------------------------------------->| + In Use 0 0% | . . . . . . . . . .| + + STMT Pool: | | + Total 28346 100% | | + STMT Held 4 0% | . . . . . . . . . .| + Free 28342 100% |------------------------------------------------->| + |---10---20---30---40---50---60---70---80---90--100| + + + xProc Request 0 + xProc Total Allocation 0 + Plan Below the Bar Allocation 0 + Package Below the Bar Allocation 0+ Plan Above the Bar Allocation 21120+ Package Above the Bar Allocation 0+
+ + INTERVAL /MINUTE /THREAD /COMMIT + QUANTITY ( 23) ( 5) ( 42) + -------- ------- ------- ------- + + Database Descriptor (DBD) Reqs 165 7.17 33.00 3.93 + DBD Loads 2 .09 .40 .05 + % of DBD Loads from DASD 1.21% n/c n/c n/c + + Cursor Table (CT) Reqs 5 .22 1.00 .12 + CT Loads 0 .00 .00 .00 + % of CT Loads from DASD .00% n/c n/c n/c + + Package Table (PT) Reqs 42 1.83 8.40 1.00 + PT Loads 0 .00 .00 .00 + % of PT Loads from DASD .00% n/c n/c n/c + + Dynamic Sql (DSC) Reqs 106 4.61 21.20 2.52 + DSC Loads 0 .00 .00 .00 + CATALOG Loads 0 .00 .00 .00 + % of CATALOG Loads into Pool .00% n/c n/c n/c + % of DSC Loads into Pool .00% n/c n/c n/c + + PKG Search Not Found 0 .00 .00 .00 + PKG Search Not Found Insert 0 .00 .00 .00 + PKG Search Not Found Delete 0 .00 .00 .00 + Number of Statements 0 .00 .00 .00 ===============================================================================
Chapter 16. Near-term history information 643
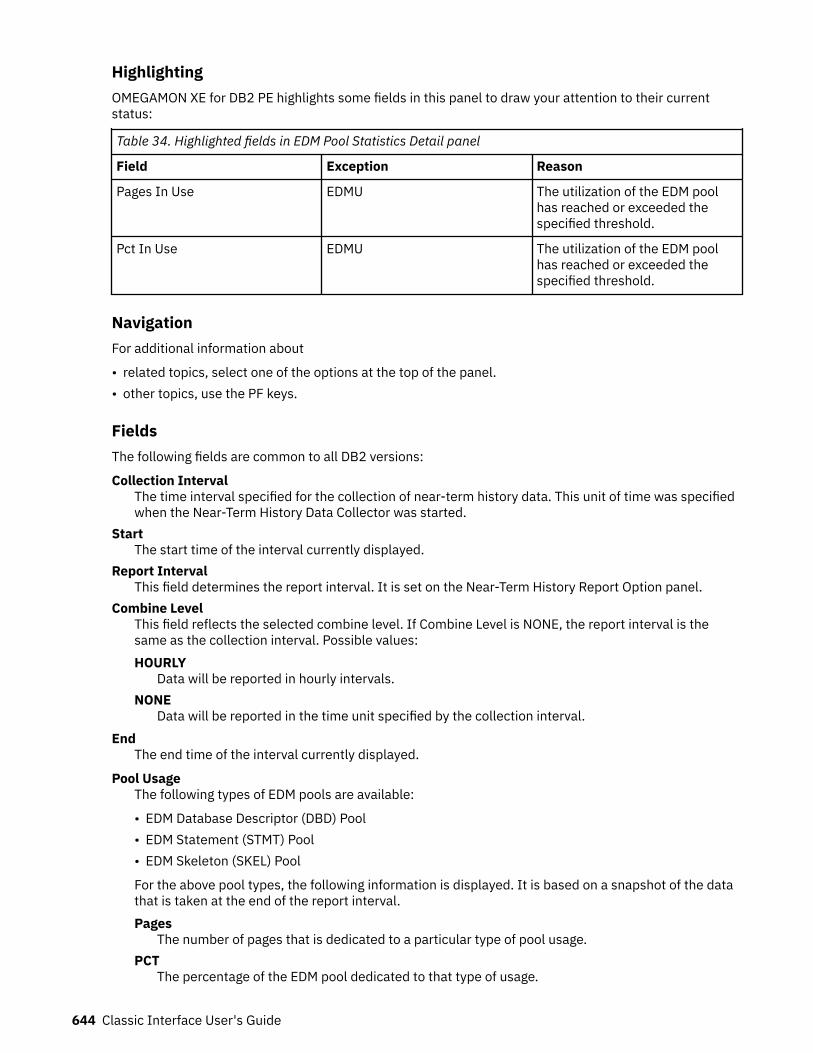
HighlightingOMEGAMON XE for DB2 PE highlights some fields in this panel to draw your attention to their currentstatus:
Table 34. Highlighted fields in EDM Pool Statistics Detail panel
Field Exception Reason
Pages In Use EDMU The utilization of the EDM poolhas reached or exceeded thespecified threshold.
Pct In Use EDMU The utilization of the EDM poolhas reached or exceeded thespecified threshold.
NavigationFor additional information about
• related topics, select one of the options at the top of the panel.• other topics, use the PF keys.
FieldsThe following fields are common to all DB2 versions:
Collection IntervalThe time interval specified for the collection of near-term history data. This unit of time was specifiedwhen the Near-Term History Data Collector was started.
StartThe start time of the interval currently displayed.
Report IntervalThis field determines the report interval. It is set on the Near-Term History Report Option panel.
Combine LevelThis field reflects the selected combine level. If Combine Level is NONE, the report interval is thesame as the collection interval. Possible values:HOURLY
Data will be reported in hourly intervals.NONE
Data will be reported in the time unit specified by the collection interval.End
The end time of the interval currently displayed.
Pool UsageThe following types of EDM pools are available:
• EDM Database Descriptor (DBD) Pool• EDM Statement (STMT) Pool• EDM Skeleton (SKEL) Pool
For the above pool types, the following information is displayed. It is based on a snapshot of the datathat is taken at the end of the report interval.Pages
The number of pages that is dedicated to a particular type of pool usage.PCT
The percentage of the EDM pool dedicated to that type of usage.
644 Classic Interface User's Guide
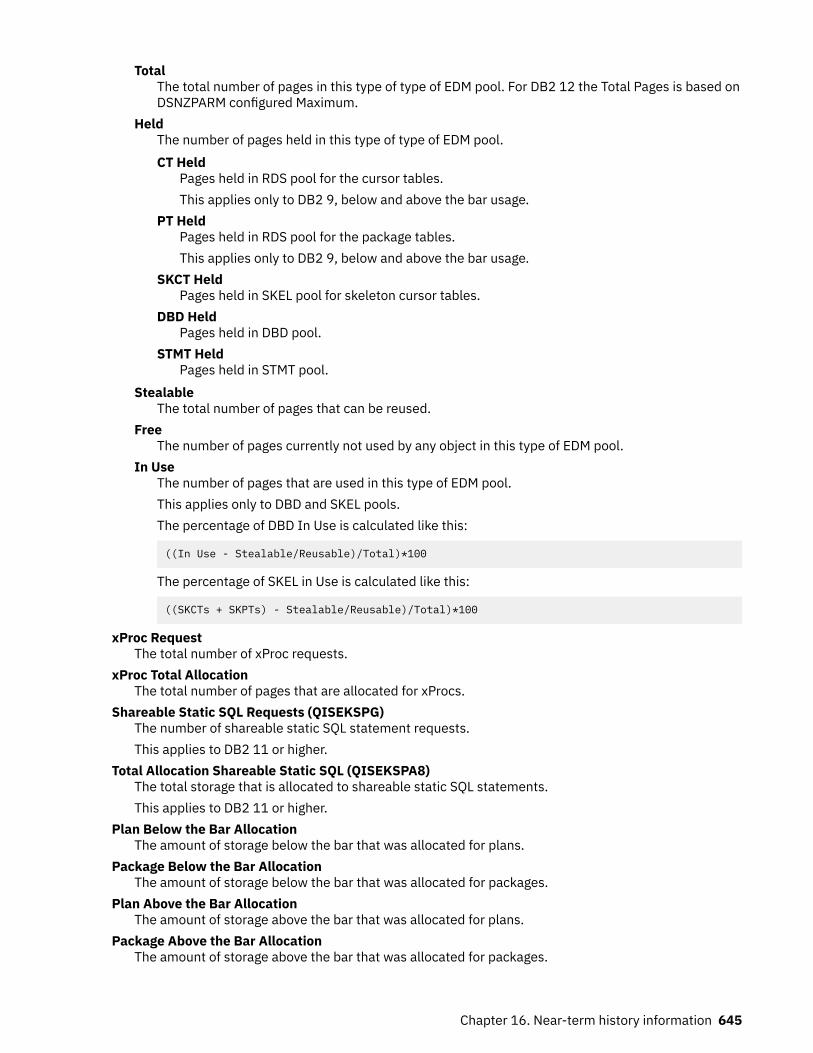
TotalThe total number of pages in this type of type of EDM pool. For DB2 12 the Total Pages is based onDSNZPARM configured Maximum.
HeldThe number of pages held in this type of type of EDM pool.CT Held
Pages held in RDS pool for the cursor tables.This applies only to DB2 9, below and above the bar usage.
PT HeldPages held in RDS pool for the package tables.This applies only to DB2 9, below and above the bar usage.
SKCT HeldPages held in SKEL pool for skeleton cursor tables.
DBD HeldPages held in DBD pool.
STMT HeldPages held in STMT pool.
StealableThe total number of pages that can be reused.
FreeThe number of pages currently not used by any object in this type of EDM pool.
In UseThe number of pages that are used in this type of EDM pool.This applies only to DBD and SKEL pools.The percentage of DBD In Use is calculated like this:
((In Use - Stealable/Reusable)/Total)*100
The percentage of SKEL in Use is calculated like this:
((SKCTs + SKPTs) - Stealable/Reusable)/Total)*100
xProc RequestThe total number of xProc requests.
xProc Total AllocationThe total number of pages that are allocated for xProcs.
Shareable Static SQL Requests (QISEKSPG)The number of shareable static SQL statement requests.This applies to DB2 11 or higher.
Total Allocation Shareable Static SQL (QISEKSPA8)The total storage that is allocated to shareable static SQL statements.This applies to DB2 11 or higher.
Plan Below the Bar AllocationThe amount of storage below the bar that was allocated for plans.
Package Below the Bar AllocationThe amount of storage below the bar that was allocated for packages.
Plan Above the Bar AllocationThe amount of storage above the bar that was allocated for plans.
Package Above the Bar AllocationThe amount of storage above the bar that was allocated for packages.
Chapter 16. Near-term history information 645
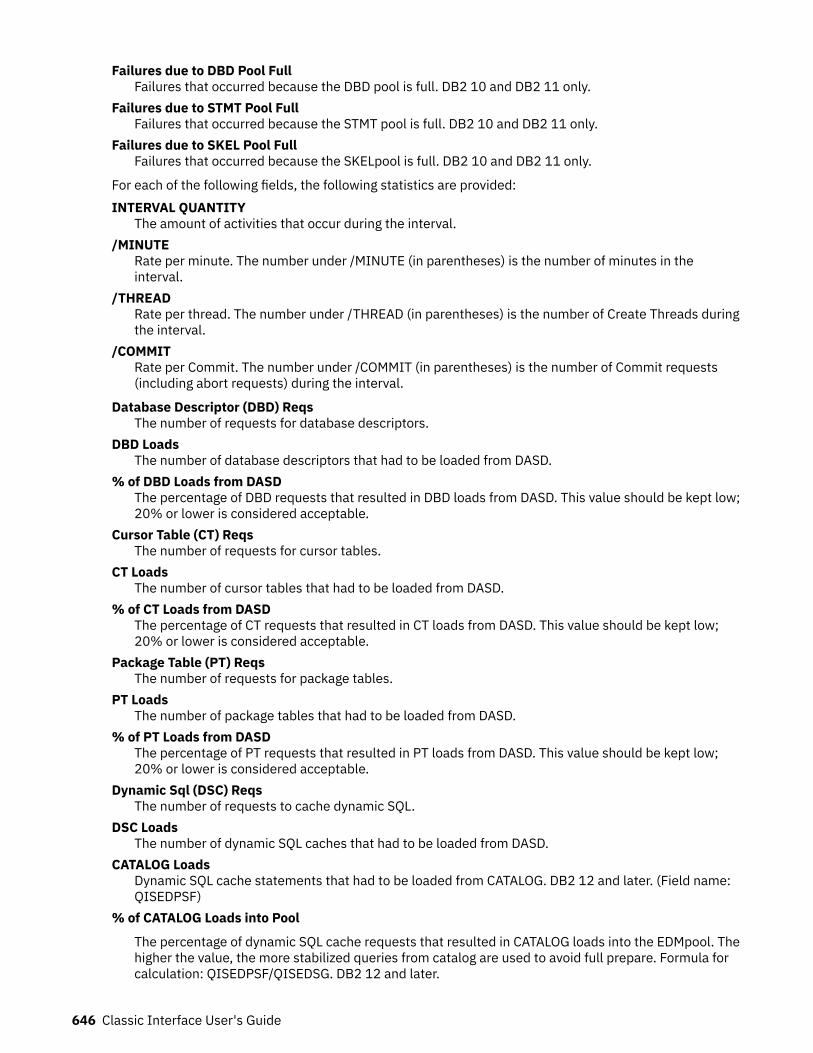
Failures due to DBD Pool FullFailures that occurred because the DBD pool is full. DB2 10 and DB2 11 only.
Failures due to STMT Pool FullFailures that occurred because the STMT pool is full. DB2 10 and DB2 11 only.
Failures due to SKEL Pool FullFailures that occurred because the SKELpool is full. DB2 10 and DB2 11 only.
For each of the following fields, the following statistics are provided:INTERVAL QUANTITY
The amount of activities that occur during the interval./MINUTE
Rate per minute. The number under /MINUTE (in parentheses) is the number of minutes in theinterval.
/THREADRate per thread. The number under /THREAD (in parentheses) is the number of Create Threads duringthe interval.
/COMMITRate per Commit. The number under /COMMIT (in parentheses) is the number of Commit requests(including abort requests) during the interval.
Database Descriptor (DBD) ReqsThe number of requests for database descriptors.
DBD LoadsThe number of database descriptors that had to be loaded from DASD.
% of DBD Loads from DASDThe percentage of DBD requests that resulted in DBD loads from DASD. This value should be kept low;20% or lower is considered acceptable.
Cursor Table (CT) ReqsThe number of requests for cursor tables.
CT LoadsThe number of cursor tables that had to be loaded from DASD.
% of CT Loads from DASDThe percentage of CT requests that resulted in CT loads from DASD. This value should be kept low;20% or lower is considered acceptable.
Package Table (PT) ReqsThe number of requests for package tables.
PT LoadsThe number of package tables that had to be loaded from DASD.
% of PT Loads from DASDThe percentage of PT requests that resulted in PT loads from DASD. This value should be kept low;20% or lower is considered acceptable.
Dynamic Sql (DSC) ReqsThe number of requests to cache dynamic SQL.
DSC LoadsThe number of dynamic SQL caches that had to be loaded from DASD.
CATALOG LoadsDynamic SQL cache statements that had to be loaded from CATALOG. DB2 12 and later. (Field name:QISEDPSF)
% of CATALOG Loads into Pool
The percentage of dynamic SQL cache requests that resulted in CATALOG loads into the EDMpool. Thehigher the value, the more stabilized queries from catalog are used to avoid full prepare. Formula forcalculation: QISEDPSF/QISEDSG. DB2 12 and later.
646 Classic Interface User's Guide
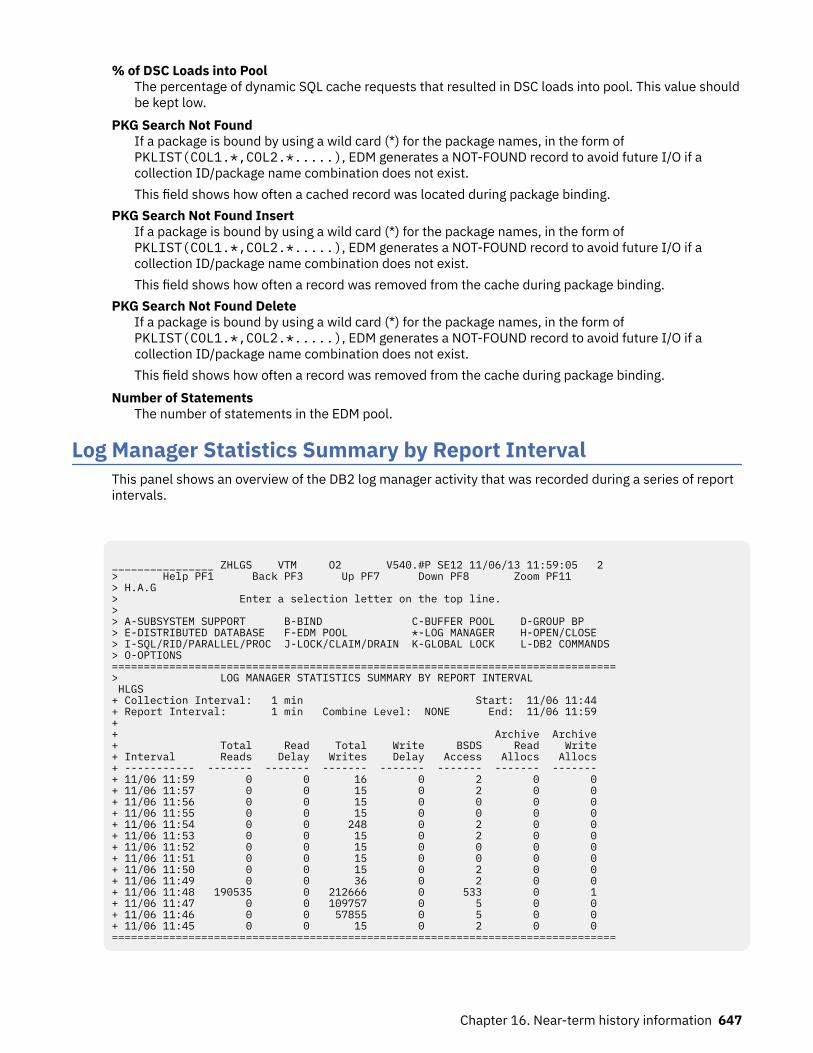
% of DSC Loads into PoolThe percentage of dynamic SQL cache requests that resulted in DSC loads into pool. This value shouldbe kept low.
PKG Search Not FoundIf a package is bound by using a wild card (*) for the package names, in the form ofPKLIST(COL1.*,COL2.*.....), EDM generates a NOT-FOUND record to avoid future I/O if acollection ID/package name combination does not exist.This field shows how often a cached record was located during package binding.
PKG Search Not Found InsertIf a package is bound by using a wild card (*) for the package names, in the form ofPKLIST(COL1.*,COL2.*.....), EDM generates a NOT-FOUND record to avoid future I/O if acollection ID/package name combination does not exist.This field shows how often a record was removed from the cache during package binding.
PKG Search Not Found DeleteIf a package is bound by using a wild card (*) for the package names, in the form ofPKLIST(COL1.*,COL2.*.....), EDM generates a NOT-FOUND record to avoid future I/O if acollection ID/package name combination does not exist.This field shows how often a record was removed from the cache during package binding.
Number of StatementsThe number of statements in the EDM pool.
Log Manager Statistics Summary by Report IntervalThis panel shows an overview of the DB2 log manager activity that was recorded during a series of reportintervals.
________________ ZHLGS VTM O2 V540.#P SE12 11/06/13 11:59:05 2 > Help PF1 Back PF3 Up PF7 Down PF8 Zoom PF11 > H.A.G > Enter a selection letter on the top line. > > A-SUBSYSTEM SUPPORT B-BIND C-BUFFER POOL D-GROUP BP > E-DISTRIBUTED DATABASE F-EDM POOL *-LOG MANAGER H-OPEN/CLOSE > I-SQL/RID/PARALLEL/PROC J-LOCK/CLAIM/DRAIN K-GLOBAL LOCK L-DB2 COMMANDS > O-OPTIONS ===============================================================================> LOG MANAGER STATISTICS SUMMARY BY REPORT INTERVAL HLGS + Collection Interval: 1 min Start: 11/06 11:44 + Report Interval: 1 min Combine Level: NONE End: 11/06 11:59 + + Archive Archive + Total Read Total Write BSDS Read Write + Interval Reads Delay Writes Delay Access Allocs Allocs + ----------- ------- ------- ------- ------- ------- ------- ------- + 11/06 11:59 0 0 16 0 2 0 0 + 11/06 11:57 0 0 15 0 2 0 0 + 11/06 11:56 0 0 15 0 0 0 0 + 11/06 11:55 0 0 15 0 0 0 0 + 11/06 11:54 0 0 248 0 2 0 0 + 11/06 11:53 0 0 15 0 2 0 0 + 11/06 11:52 0 0 15 0 0 0 0 + 11/06 11:51 0 0 15 0 0 0 0 + 11/06 11:50 0 0 15 0 2 0 0 + 11/06 11:49 0 0 36 0 2 0 0 + 11/06 11:48 190535 0 212666 0 533 0 1 + 11/06 11:47 0 0 109757 0 5 0 0 + 11/06 11:46 0 0 57855 0 5 0 0 + 11/06 11:45 0 0 15 0 2 0 0 ===============================================================================
Chapter 16. Near-term history information 647
NavigationFor additional information about
• a report interval, move the cursor to the line you want and press F11 (Zoom). (Each date/time displayedreflects the end of an interval.)
• related topics, select one of the options at the top of the panel.• other topics, use the PF keys.
FieldsCollection Interval
The time interval specified for the collection of near-term history data. This unit of time was specifiedwhen the Near-Term History Data Collector was started.
StartThe start time of the first interval in this display.
Report IntervalThis field determines the report interval. It is set on the Near-Term History Report Option panel.
Combine LevelThis field reflects the selected combine level. If Combine Level is NONE, the report interval is thesame as the collection interval. Possible values:HOURLY
Data will be reported in hourly intervals.NONE
Data will be reported in the time unit specified by the collection interval.End
The end time of the last interval in this display.Interval
Provides the date and time that mark the end of the report interval.Total Reads
The number of times DB2 read a log record.Read Delay
The number of log reads that were delayed.Total Writes
The number of times DB2 externalized log records, both synchronously and asynchronously.Write Delay
The number of times DB2 tried to place log records in the output buffer but could not find an availablebuffer.
BSDS AccessThe number of times the bootstrap data set access routine was called.
Archive Read AllocsThe number of archive read allocations, which is an indicator of archive log open/close activity.
Archive Write AllocsThe number of archive write allocations, which is an indicator of archive log open/close activity.
Log Manager Statistics DetailThis panel provides detailed information about the logging and archiving activity of the DB2 log managerduring a selected report interval.
648 Classic Interface User's Guide
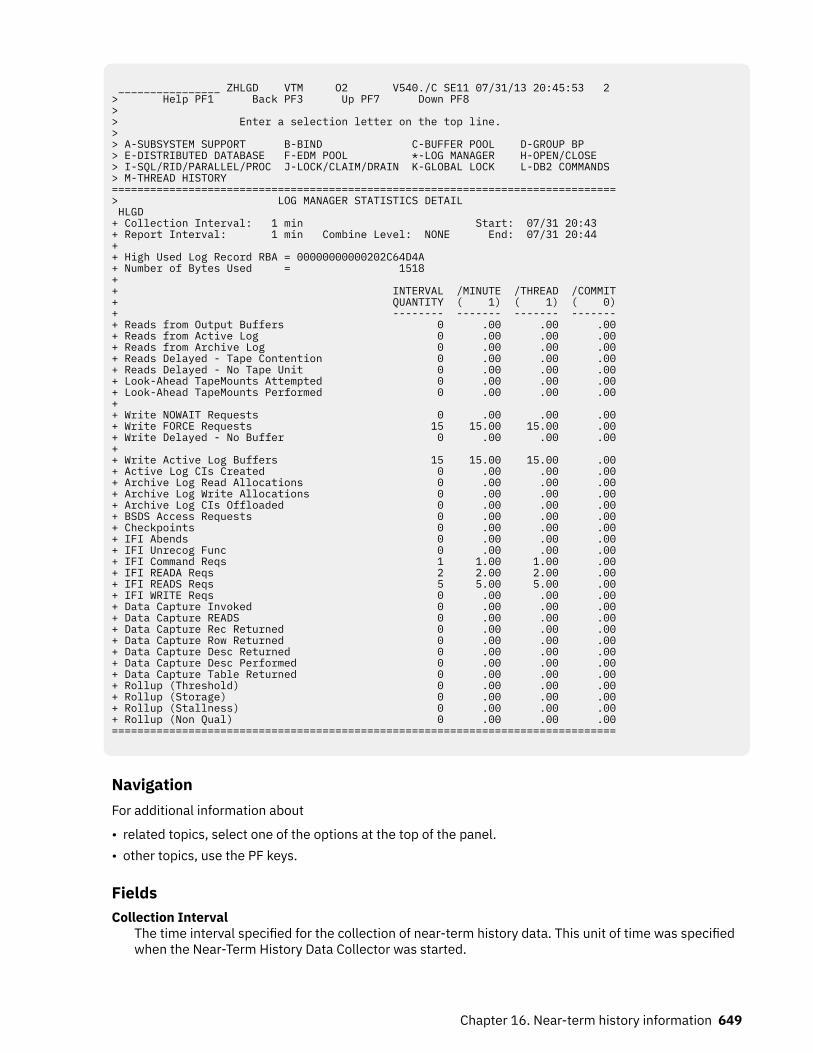
________________ ZHLGD VTM O2 V540./C SE11 07/31/13 20:45:53 2 > Help PF1 Back PF3 Up PF7 Down PF8 > > Enter a selection letter on the top line. > > A-SUBSYSTEM SUPPORT B-BIND C-BUFFER POOL D-GROUP BP > E-DISTRIBUTED DATABASE F-EDM POOL *-LOG MANAGER H-OPEN/CLOSE > I-SQL/RID/PARALLEL/PROC J-LOCK/CLAIM/DRAIN K-GLOBAL LOCK L-DB2 COMMANDS > M-THREAD HISTORY ===============================================================================> LOG MANAGER STATISTICS DETAIL HLGD + Collection Interval: 1 min Start: 07/31 20:43 + Report Interval: 1 min Combine Level: NONE End: 07/31 20:44 + + High Used Log Record RBA = 00000000000202C64D4A + Number of Bytes Used = 1518 + + INTERVAL /MINUTE /THREAD /COMMIT+ QUANTITY ( 1) ( 1) ( 0)+ -------- ------- ------- -------+ Reads from Output Buffers 0 .00 .00 .00+ Reads from Active Log 0 .00 .00 .00+ Reads from Archive Log 0 .00 .00 .00+ Reads Delayed - Tape Contention 0 .00 .00 .00+ Reads Delayed - No Tape Unit 0 .00 .00 .00+ Look-Ahead TapeMounts Attempted 0 .00 .00 .00+ Look-Ahead TapeMounts Performed 0 .00 .00 .00+ + Write NOWAIT Requests 0 .00 .00 .00+ Write FORCE Requests 15 15.00 15.00 .00+ Write Delayed - No Buffer 0 .00 .00 .00+ + Write Active Log Buffers 15 15.00 15.00 .00+ Active Log CIs Created 0 .00 .00 .00+ Archive Log Read Allocations 0 .00 .00 .00+ Archive Log Write Allocations 0 .00 .00 .00+ Archive Log CIs Offloaded 0 .00 .00 .00+ BSDS Access Requests 0 .00 .00 .00+ Checkpoints 0 .00 .00 .00+ IFI Abends 0 .00 .00 .00+ IFI Unrecog Func 0 .00 .00 .00+ IFI Command Reqs 1 1.00 1.00 .00 + IFI READA Reqs 2 2.00 2.00 .00 + IFI READS Reqs 5 5.00 5.00 .00 + IFI WRITE Reqs 0 .00 .00 .00 + Data Capture Invoked 0 .00 .00 .00 + Data Capture READS 0 .00 .00 .00 + Data Capture Rec Returned 0 .00 .00 .00 + Data Capture Row Returned 0 .00 .00 .00 + Data Capture Desc Returned 0 .00 .00 .00 + Data Capture Desc Performed 0 .00 .00 .00 + Data Capture Table Returned 0 .00 .00 .00 + Rollup (Threshold) 0 .00 .00 .00 + Rollup (Storage) 0 .00 .00 .00 + Rollup (Stallness) 0 .00 .00 .00 + Rollup (Non Qual) 0 .00 .00 .00 ===============================================================================
NavigationFor additional information about
• related topics, select one of the options at the top of the panel.• other topics, use the PF keys.
FieldsCollection Interval
The time interval specified for the collection of near-term history data. This unit of time was specifiedwhen the Near-Term History Data Collector was started.
Chapter 16. Near-term history information 649
StartThe start time of the interval currently displayed.
Report IntervalThis field determines the report interval. It is set on the Near-Term History Report Option panel.
Combine LevelThis field reflects the selected combine level. If Combine Level is NONE, the report interval is thesame as the collection interval. Possible values:HOURLY
Data will be reported in hourly intervals.NONE
Data will be reported in the time unit specified by the collection interval.End
The end time of the interval currently displayed.High Used Log Record RBA
The relative byte address (RBA) of the record that was being logged at the end of the interval.Number of Bytes Used
The number of bytes of the log data set that were used during the interval.
For each of the following fields, the following statistics are provided:INTERVAL QUANTITY
The amount of activities that occur during the interval./MINUTE
Rate per minute. The number under /MINUTE (in parentheses) is the number of minutes in theinterval.
/THREADRate per thread. The number under /THREAD (in parentheses) is the number of Create Threads duringthe interval.
/COMMITRate per Commit. The number under /COMMIT (in parentheses) is the number of Commit requests(including abort requests) during the interval.
Reads from Output BuffersThe Reads that were satisfied from the output buffers.
Reads from Active LogThe Reads that were satisfied from the active log.
Reads from Archive LogThe Reads that were satisfied from the archive log.
Reads Delayed - Tape ContentionThe number of reads delayed because a tape volume was already in use.
Reads Delayed - No Tape UnitNumber of archive log reads that were delayed because of unavailable tape units, or because themaximum amount of read parallelism is being used (not likely).
Look-Ahead Tape Mounts AttemptedNumber of look-ahead tape mounts attempted.
Look-Ahead Tape Mounts PerformedNumber of successful look-ahead tape mounts.
Write NOWAIT RequestsThe times DB2 externalized log records asynchronously.
Write FORCE RequestsThe times DB2 externalized log records synchronously.
Write Delayed - No BufferDB2 attempts to place log records in the output buffer when no log buffer could be found.
650 Classic Interface User's Guide
Write Active Log BuffersCalls to the log write routine.
Active Log CIs CreatedActive log control intervals created.
Archive Log Read AllocationsArchive read allocations, which reflect archive log open/close activity.
Archive Log Write AllocationsArchive write allocations, which reflect archive log open/close activity.
Archive Log CIs OffloadedNumber of active log control intervals offloaded to archive data sets.
BSDS Access RequestsCalls to the bootstrap data set access routine.
CheckpointsThe number of checkpoints DB2 takes since startup.
IFI AbendsThe count of IFI abends.
IFI Unrecog FuncThe count of IFI unrecognized functions.
IFI Command ReqsThe count of IFI command requests.
IFI READA ReqsThe count of IFI READA requests.
IFI READS ReqsThe count of IFI READS requests.
IFI WRITE ReqsThe count of IFI WRITE requests.
Data Capture InvokedThe number of log records retrieved for which data capture processing is invoked.
Data Capture READSThe number of data capture log reads for processing IFI requests for IFCID 0185.
Data Capture Rec ReturnedThe number of data capture log records returned.
Data Capture Row ReturnedThe number of data capture data rows returned.
Data Capture Desc ReturnedThe number of data capture data descriptions returned.
Data Capture Desc PerformedThe number of data capture describes performed.
Data Capture Table ReturnedThe number of data capture tables returned.
Rollup (Threshold)The number of rollup accounting records that are written because the rollup threshold is exceeded.
Rollup (Storage)The number of rollup accounting records that are written because the rollup accounting storagethreshold is exceeded.
Rollup (Stallness)The number of rollup accounting records that are written because the staleness threshold isexceeded.
Chapter 16. Near-term history information 651
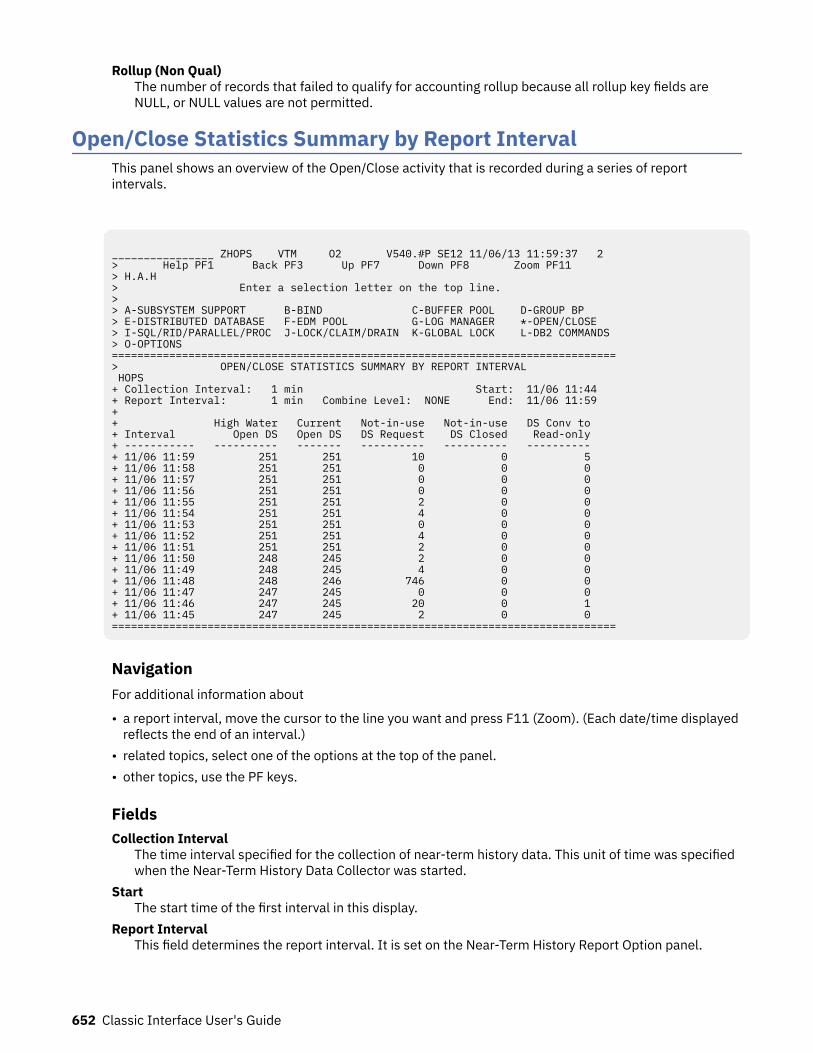
Rollup (Non Qual)The number of records that failed to qualify for accounting rollup because all rollup key fields areNULL, or NULL values are not permitted.
Open/Close Statistics Summary by Report IntervalThis panel shows an overview of the Open/Close activity that is recorded during a series of reportintervals.
________________ ZHOPS VTM O2 V540.#P SE12 11/06/13 11:59:37 2 > Help PF1 Back PF3 Up PF7 Down PF8 Zoom PF11 > H.A.H > Enter a selection letter on the top line. > > A-SUBSYSTEM SUPPORT B-BIND C-BUFFER POOL D-GROUP BP > E-DISTRIBUTED DATABASE F-EDM POOL G-LOG MANAGER *-OPEN/CLOSE > I-SQL/RID/PARALLEL/PROC J-LOCK/CLAIM/DRAIN K-GLOBAL LOCK L-DB2 COMMANDS > O-OPTIONS =============================================================================== > OPEN/CLOSE STATISTICS SUMMARY BY REPORT INTERVAL HOPS + Collection Interval: 1 min Start: 11/06 11:44 + Report Interval: 1 min Combine Level: NONE End: 11/06 11:59 + + High Water Current Not-in-use Not-in-use DS Conv to + Interval Open DS Open DS DS Request DS Closed Read-only + ----------- ---------- ------- ---------- ---------- ---------- + 11/06 11:59 251 251 10 0 5 + 11/06 11:58 251 251 0 0 0 + 11/06 11:57 251 251 0 0 0 + 11/06 11:56 251 251 0 0 0 + 11/06 11:55 251 251 2 0 0 + 11/06 11:54 251 251 4 0 0 + 11/06 11:53 251 251 0 0 0 + 11/06 11:52 251 251 4 0 0 + 11/06 11:51 251 251 2 0 0 + 11/06 11:50 248 245 2 0 0 + 11/06 11:49 248 245 4 0 0 + 11/06 11:48 248 246 746 0 0 + 11/06 11:47 247 245 0 0 0 + 11/06 11:46 247 245 20 0 1 + 11/06 11:45 247 245 2 0 0 ===============================================================================
NavigationFor additional information about
• a report interval, move the cursor to the line you want and press F11 (Zoom). (Each date/time displayedreflects the end of an interval.)
• related topics, select one of the options at the top of the panel.• other topics, use the PF keys.
FieldsCollection Interval
The time interval specified for the collection of near-term history data. This unit of time was specifiedwhen the Near-Term History Data Collector was started.
StartThe start time of the first interval in this display.
Report IntervalThis field determines the report interval. It is set on the Near-Term History Report Option panel.
652 Classic Interface User's Guide
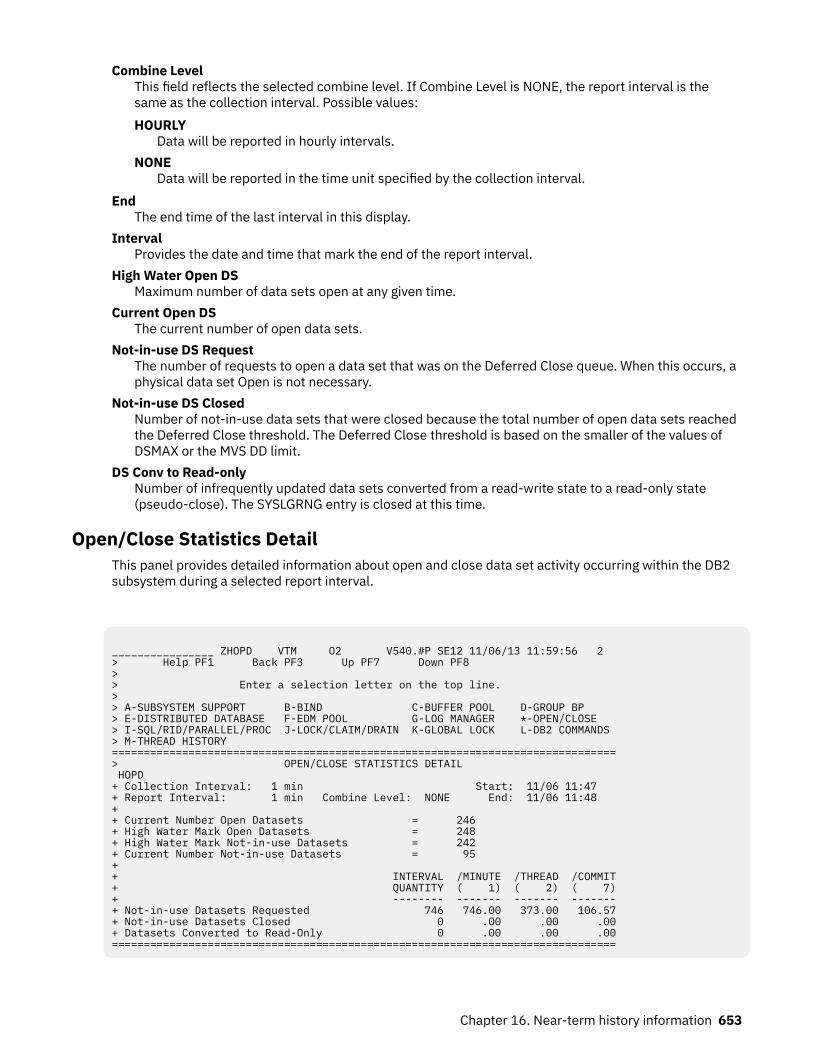
Combine LevelThis field reflects the selected combine level. If Combine Level is NONE, the report interval is thesame as the collection interval. Possible values:HOURLY
Data will be reported in hourly intervals.NONE
Data will be reported in the time unit specified by the collection interval.End
The end time of the last interval in this display.Interval
Provides the date and time that mark the end of the report interval.High Water Open DS
Maximum number of data sets open at any given time.Current Open DS
The current number of open data sets.Not-in-use DS Request
The number of requests to open a data set that was on the Deferred Close queue. When this occurs, aphysical data set Open is not necessary.
Not-in-use DS ClosedNumber of not-in-use data sets that were closed because the total number of open data sets reachedthe Deferred Close threshold. The Deferred Close threshold is based on the smaller of the values ofDSMAX or the MVS DD limit.
DS Conv to Read-onlyNumber of infrequently updated data sets converted from a read-write state to a read-only state(pseudo-close). The SYSLGRNG entry is closed at this time.
Open/Close Statistics DetailThis panel provides detailed information about open and close data set activity occurring within the DB2subsystem during a selected report interval.
________________ ZHOPD VTM O2 V540.#P SE12 11/06/13 11:59:56 2 > Help PF1 Back PF3 Up PF7 Down PF8 > > Enter a selection letter on the top line. > > A-SUBSYSTEM SUPPORT B-BIND C-BUFFER POOL D-GROUP BP > E-DISTRIBUTED DATABASE F-EDM POOL G-LOG MANAGER *-OPEN/CLOSE > I-SQL/RID/PARALLEL/PROC J-LOCK/CLAIM/DRAIN K-GLOBAL LOCK L-DB2 COMMANDS > M-THREAD HISTORY ===============================================================================> OPEN/CLOSE STATISTICS DETAIL HOPD + Collection Interval: 1 min Start: 11/06 11:47 + Report Interval: 1 min Combine Level: NONE End: 11/06 11:48 + + Current Number Open Datasets = 246 + High Water Mark Open Datasets = 248 + High Water Mark Not-in-use Datasets = 242 + Current Number Not-in-use Datasets = 95 + + INTERVAL /MINUTE /THREAD /COMMIT+ QUANTITY ( 1) ( 2) ( 7)+ -------- ------- ------- -------+ Not-in-use Datasets Requested 746 746.00 373.00 106.57+ Not-in-use Datasets Closed 0 .00 .00 .00+ Datasets Converted to Read-Only 0 .00 .00 .00===============================================================================
Chapter 16. Near-term history information 653
NavigationFor additional information about
• related topics, select one of the options at the top of the panel.• other topics, use the PF keys.
FieldsCollection Interval
The time interval specified for the collection of near-term history data. This unit of time was specifiedwhen the Near-Term History Data Collector was started.
StartThe start time of the interval currently displayed.
Report IntervalThis field determines the report interval. It is set on the Near-Term History Report Option panel.
Combine LevelThis field reflects the selected combine level. If Combine Level is NONE, the report interval is thesame as the collection interval. Possible values:HOURLY
Data will be reported in hourly intervals.NONE
Data will be reported in the time unit specified by the collection interval.End
The end time of the interval currently displayed.Current Number Open Datasets
A snapshot value of the current number of open database data sets.High-water Mark Open Datasets
The maximum number of data sets open at any one time since DB2 was started.High-water Mark Not-in-use Datasets
The maximum number of pagesets that are not in use but are not physically closed.Current Number Not-in-use Datasets
The current number of open pagesets that are not in use but are not physically closed.
For each of the following fields, the following statistics are provided:INTERVAL QUANTITY
The amount of activities that occur during the interval./MINUTE
Rate per minute. The number under /MINUTE (in parentheses) is the number of minutes in theinterval.
/THREADRate per thread. The number under /THREAD (in parentheses) is the number of Create Threads duringthe interval.
/COMMITRate per Commit. The number under /COMMIT (in parentheses) is the number of Commit requests(including abort requests) during the interval.
Not-in-use Datasets RequestedNumber of requests to open a data set that was on the Deferred Close queue. When this occurs, aphysical data set Open is not necessary.
Not-in-use Datasets ClosedNumber of not-in-use data sets that were closed because the total number of open data sets reachedthe Deferred Close threshold. The Deferred Close threshold is based on the smaller of the values ofDSMAX or the MVS DD limit.
654 Classic Interface User's Guide
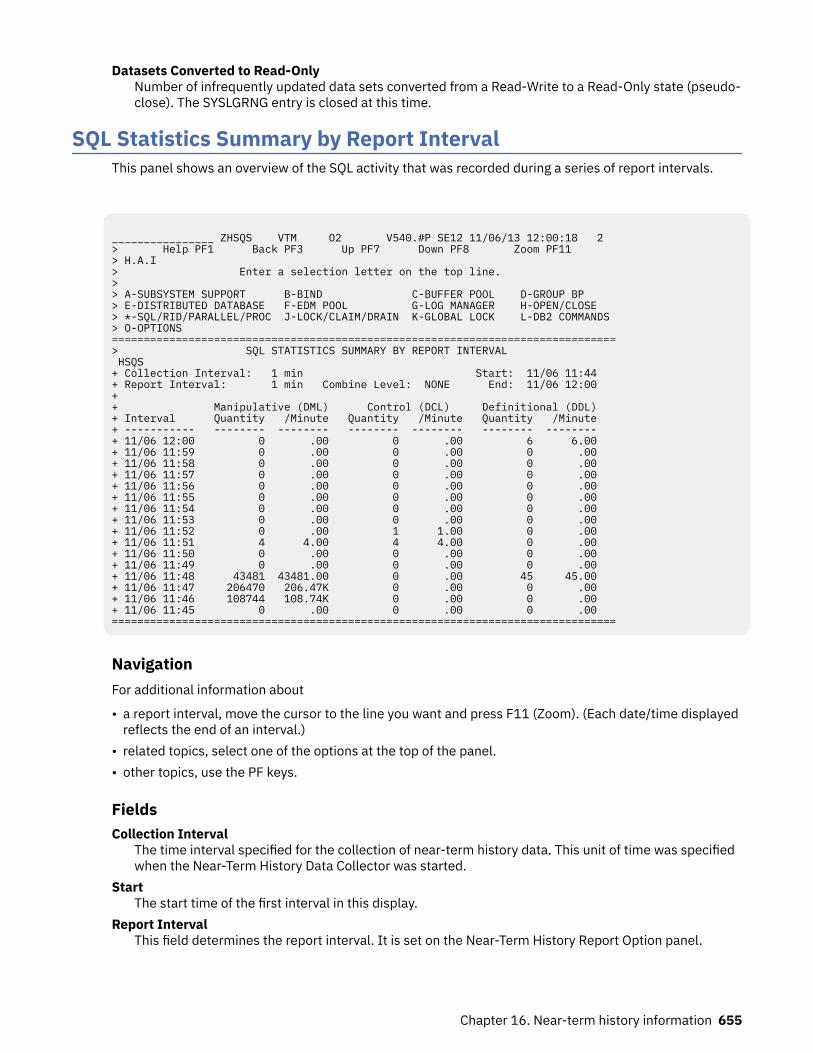
Datasets Converted to Read-OnlyNumber of infrequently updated data sets converted from a Read-Write to a Read-Only state (pseudo-close). The SYSLGRNG entry is closed at this time.
SQL Statistics Summary by Report IntervalThis panel shows an overview of the SQL activity that was recorded during a series of report intervals.
________________ ZHSQS VTM O2 V540.#P SE12 11/06/13 12:00:18 2 > Help PF1 Back PF3 Up PF7 Down PF8 Zoom PF11 > H.A.I > Enter a selection letter on the top line. > > A-SUBSYSTEM SUPPORT B-BIND C-BUFFER POOL D-GROUP BP > E-DISTRIBUTED DATABASE F-EDM POOL G-LOG MANAGER H-OPEN/CLOSE > *-SQL/RID/PARALLEL/PROC J-LOCK/CLAIM/DRAIN K-GLOBAL LOCK L-DB2 COMMANDS > O-OPTIONS =============================================================================== > SQL STATISTICS SUMMARY BY REPORT INTERVAL HSQS + Collection Interval: 1 min Start: 11/06 11:44 + Report Interval: 1 min Combine Level: NONE End: 11/06 12:00 + + Manipulative (DML) Control (DCL) Definitional (DDL) + Interval Quantity /Minute Quantity /Minute Quantity /Minute + ----------- -------- -------- -------- -------- -------- -------- + 11/06 12:00 0 .00 0 .00 6 6.00 + 11/06 11:59 0 .00 0 .00 0 .00 + 11/06 11:58 0 .00 0 .00 0 .00 + 11/06 11:57 0 .00 0 .00 0 .00 + 11/06 11:56 0 .00 0 .00 0 .00 + 11/06 11:55 0 .00 0 .00 0 .00 + 11/06 11:54 0 .00 0 .00 0 .00 + 11/06 11:53 0 .00 0 .00 0 .00 + 11/06 11:52 0 .00 1 1.00 0 .00 + 11/06 11:51 4 4.00 4 4.00 0 .00 + 11/06 11:50 0 .00 0 .00 0 .00 + 11/06 11:49 0 .00 0 .00 0 .00 + 11/06 11:48 43481 43481.00 0 .00 45 45.00 + 11/06 11:47 206470 206.47K 0 .00 0 .00 + 11/06 11:46 108744 108.74K 0 .00 0 .00 + 11/06 11:45 0 .00 0 .00 0 .00 ===============================================================================
NavigationFor additional information about
• a report interval, move the cursor to the line you want and press F11 (Zoom). (Each date/time displayedreflects the end of an interval.)
• related topics, select one of the options at the top of the panel.• other topics, use the PF keys.
FieldsCollection Interval
The time interval specified for the collection of near-term history data. This unit of time was specifiedwhen the Near-Term History Data Collector was started.
StartThe start time of the first interval in this display.
Report IntervalThis field determines the report interval. It is set on the Near-Term History Report Option panel.
Chapter 16. Near-term history information 655
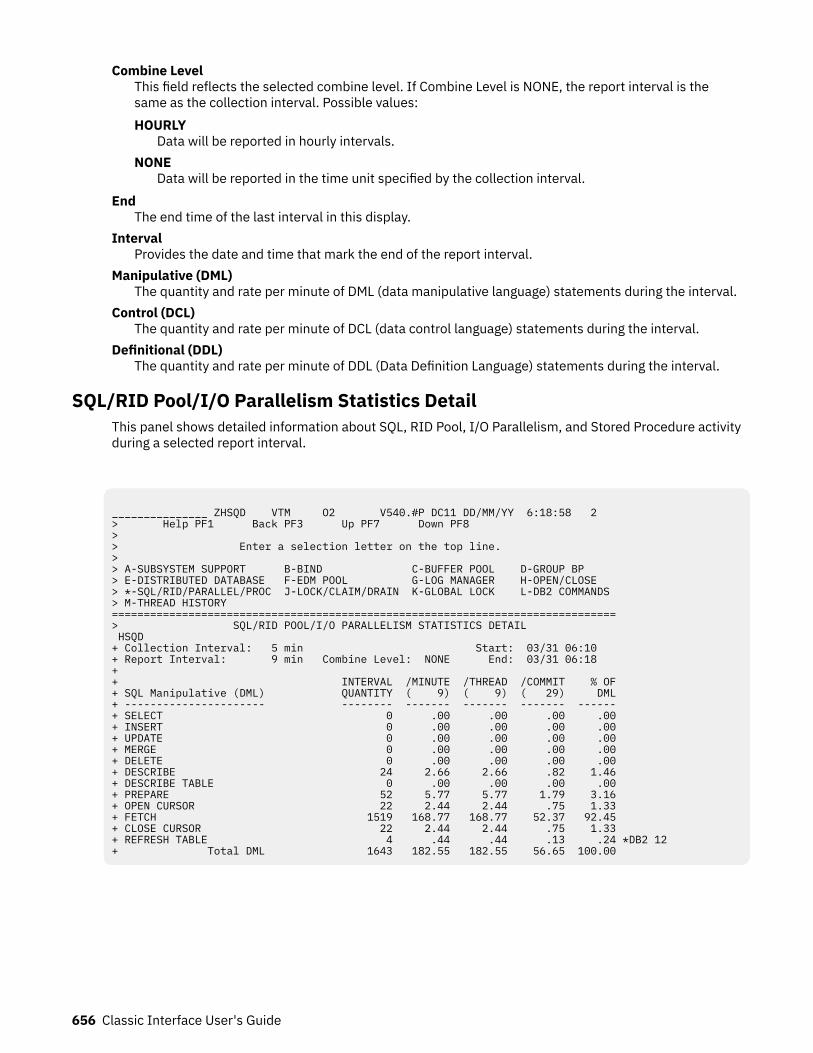
Combine LevelThis field reflects the selected combine level. If Combine Level is NONE, the report interval is thesame as the collection interval. Possible values:HOURLY
Data will be reported in hourly intervals.NONE
Data will be reported in the time unit specified by the collection interval.End
The end time of the last interval in this display.Interval
Provides the date and time that mark the end of the report interval.Manipulative (DML)
The quantity and rate per minute of DML (data manipulative language) statements during the interval.Control (DCL)
The quantity and rate per minute of DCL (data control language) statements during the interval.Definitional (DDL)
The quantity and rate per minute of DDL (Data Definition Language) statements during the interval.
SQL/RID Pool/I/O Parallelism Statistics DetailThis panel shows detailed information about SQL, RID Pool, I/O Parallelism, and Stored Procedure activityduring a selected report interval.
_______________ ZHSQD VTM O2 V540.#P DC11 DD/MM/YY 6:18:58 2 > Help PF1 Back PF3 Up PF7 Down PF8 > > Enter a selection letter on the top line. > > A-SUBSYSTEM SUPPORT B-BIND C-BUFFER POOL D-GROUP BP > E-DISTRIBUTED DATABASE F-EDM POOL G-LOG MANAGER H-OPEN/CLOSE > *-SQL/RID/PARALLEL/PROC J-LOCK/CLAIM/DRAIN K-GLOBAL LOCK L-DB2 COMMANDS > M-THREAD HISTORY =============================================================================== > SQL/RID POOL/I/O PARALLELISM STATISTICS DETAIL HSQD + Collection Interval: 5 min Start: 03/31 06:10 + Report Interval: 9 min Combine Level: NONE End: 03/31 06:18 + + INTERVAL /MINUTE /THREAD /COMMIT % OF + SQL Manipulative (DML) QUANTITY ( 9) ( 9) ( 29) DML + ---------------------- -------- ------- ------- ------- ------ + SELECT 0 .00 .00 .00 .00 + INSERT 0 .00 .00 .00 .00 + UPDATE 0 .00 .00 .00 .00 + MERGE 0 .00 .00 .00 .00 + DELETE 0 .00 .00 .00 .00 + DESCRIBE 24 2.66 2.66 .82 1.46 + DESCRIBE TABLE 0 .00 .00 .00 .00 + PREPARE 52 5.77 5.77 1.79 3.16 + OPEN CURSOR 22 2.44 2.44 .75 1.33 + FETCH 1519 168.77 168.77 52.37 92.45 + CLOSE CURSOR 22 2.44 2.44 .75 1.33 + REFRESH TABLE 4 .44 .44 .13 .24 *DB2 12+ Total DML 1643 182.55 182.55 56.65 100.00
656 Classic Interface User's Guide
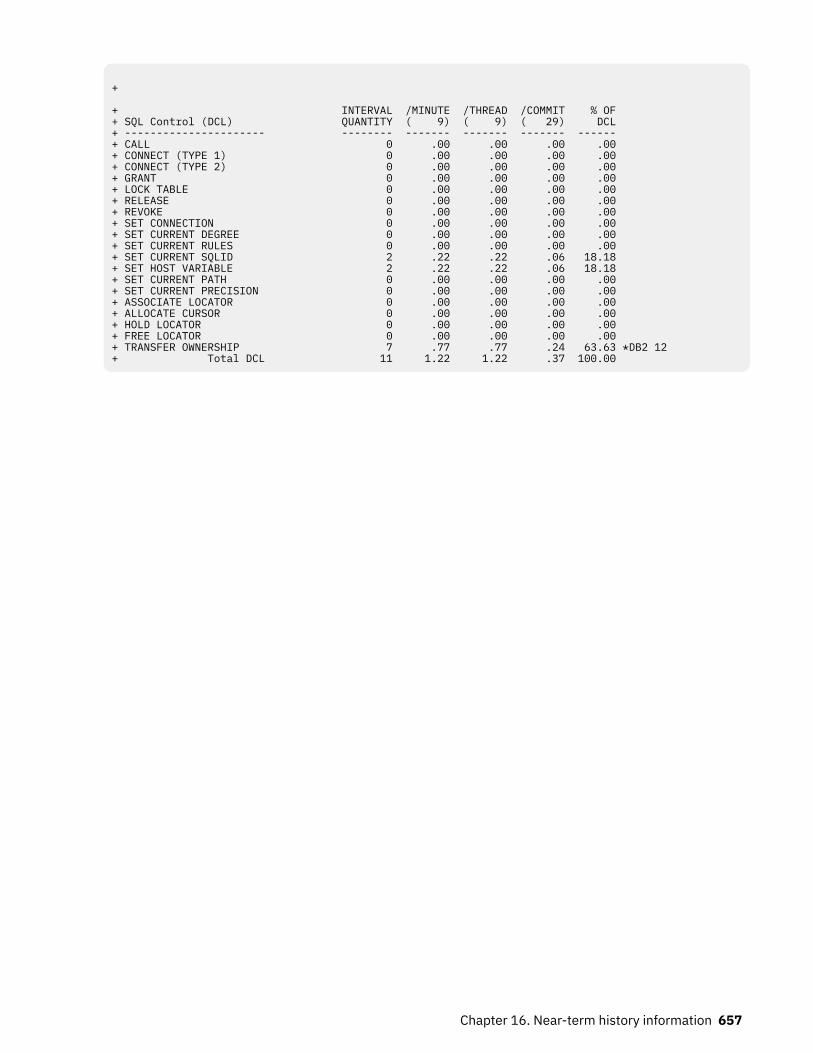
+ + INTERVAL /MINUTE /THREAD /COMMIT % OF + SQL Control (DCL) QUANTITY ( 9) ( 9) ( 29) DCL + ---------------------- -------- ------- ------- ------- ------ + CALL 0 .00 .00 .00 .00 + CONNECT (TYPE 1) 0 .00 .00 .00 .00 + CONNECT (TYPE 2) 0 .00 .00 .00 .00 + GRANT 0 .00 .00 .00 .00 + LOCK TABLE 0 .00 .00 .00 .00 + RELEASE 0 .00 .00 .00 .00 + REVOKE 0 .00 .00 .00 .00 + SET CONNECTION 0 .00 .00 .00 .00 + SET CURRENT DEGREE 0 .00 .00 .00 .00 + SET CURRENT RULES 0 .00 .00 .00 .00 + SET CURRENT SQLID 2 .22 .22 .06 18.18 + SET HOST VARIABLE 2 .22 .22 .06 18.18 + SET CURRENT PATH 0 .00 .00 .00 .00 + SET CURRENT PRECISION 0 .00 .00 .00 .00 + ASSOCIATE LOCATOR 0 .00 .00 .00 .00 + ALLOCATE CURSOR 0 .00 .00 .00 .00 + HOLD LOCATOR 0 .00 .00 .00 .00 + FREE LOCATOR 0 .00 .00 .00 .00 + TRANSFER OWNERSHIP 7 .77 .77 .24 63.63 *DB2 12+ Total DCL 11 1.22 1.22 .37 100.00
Chapter 16. Near-term history information 657
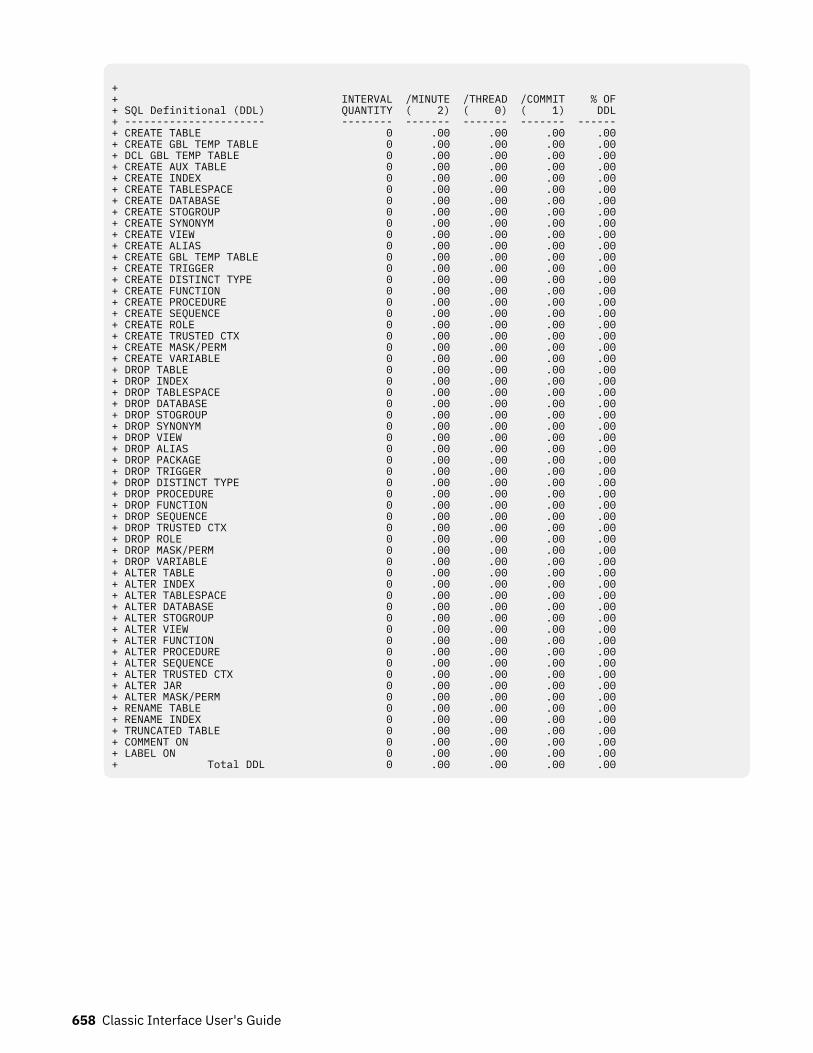
+ + INTERVAL /MINUTE /THREAD /COMMIT % OF + SQL Definitional (DDL) QUANTITY ( 2) ( 0) ( 1) DDL + ---------------------- -------- ------- ------- ------- ------ + CREATE TABLE 0 .00 .00 .00 .00 + CREATE GBL TEMP TABLE 0 .00 .00 .00 .00 + DCL GBL TEMP TABLE 0 .00 .00 .00 .00 + CREATE AUX TABLE 0 .00 .00 .00 .00 + CREATE INDEX 0 .00 .00 .00 .00 + CREATE TABLESPACE 0 .00 .00 .00 .00 + CREATE DATABASE 0 .00 .00 .00 .00 + CREATE STOGROUP 0 .00 .00 .00 .00 + CREATE SYNONYM 0 .00 .00 .00 .00 + CREATE VIEW 0 .00 .00 .00 .00 + CREATE ALIAS 0 .00 .00 .00 .00 + CREATE GBL TEMP TABLE 0 .00 .00 .00 .00 + CREATE TRIGGER 0 .00 .00 .00 .00 + CREATE DISTINCT TYPE 0 .00 .00 .00 .00 + CREATE FUNCTION 0 .00 .00 .00 .00 + CREATE PROCEDURE 0 .00 .00 .00 .00 + CREATE SEQUENCE 0 .00 .00 .00 .00 + CREATE ROLE 0 .00 .00 .00 .00 + CREATE TRUSTED CTX 0 .00 .00 .00 .00 + CREATE MASK/PERM 0 .00 .00 .00 .00 + CREATE VARIABLE 0 .00 .00 .00 .00+ DROP TABLE 0 .00 .00 .00 .00 + DROP INDEX 0 .00 .00 .00 .00 + DROP TABLESPACE 0 .00 .00 .00 .00 + DROP DATABASE 0 .00 .00 .00 .00 + DROP STOGROUP 0 .00 .00 .00 .00 + DROP SYNONYM 0 .00 .00 .00 .00 + DROP VIEW 0 .00 .00 .00 .00 + DROP ALIAS 0 .00 .00 .00 .00 + DROP PACKAGE 0 .00 .00 .00 .00 + DROP TRIGGER 0 .00 .00 .00 .00+ DROP DISTINCT TYPE 0 .00 .00 .00 .00 + DROP PROCEDURE 0 .00 .00 .00 .00 + DROP FUNCTION 0 .00 .00 .00 .00+ DROP SEQUENCE 0 .00 .00 .00 .00+ DROP TRUSTED CTX 0 .00 .00 .00 .00+ DROP ROLE 0 .00 .00 .00 .00+ DROP MASK/PERM 0 .00 .00 .00 .00+ DROP VARIABLE 0 .00 .00 .00 .00+ ALTER TABLE 0 .00 .00 .00 .00 + ALTER INDEX 0 .00 .00 .00 .00 + ALTER TABLESPACE 0 .00 .00 .00 .00 + ALTER DATABASE 0 .00 .00 .00 .00 + ALTER STOGROUP 0 .00 .00 .00 .00 + ALTER VIEW 0 .00 .00 .00 .00+ ALTER FUNCTION 0 .00 .00 .00 .00 + ALTER PROCEDURE 0 .00 .00 .00 .00 + ALTER SEQUENCE 0 .00 .00 .00 .00 + ALTER TRUSTED CTX 0 .00 .00 .00 .00 + ALTER JAR 0 .00 .00 .00 .00 + ALTER MASK/PERM 0 .00 .00 .00 .00 + RENAME TABLE 0 .00 .00 .00 .00 + RENAME INDEX 0 .00 .00 .00 .00 + TRUNCATED TABLE 0 .00 .00 .00 .00 + COMMENT ON 0 .00 .00 .00 .00 + LABEL ON 0 .00 .00 .00 .00 + Total DDL 0 .00 .00 .00 .00
658 Classic Interface User's Guide
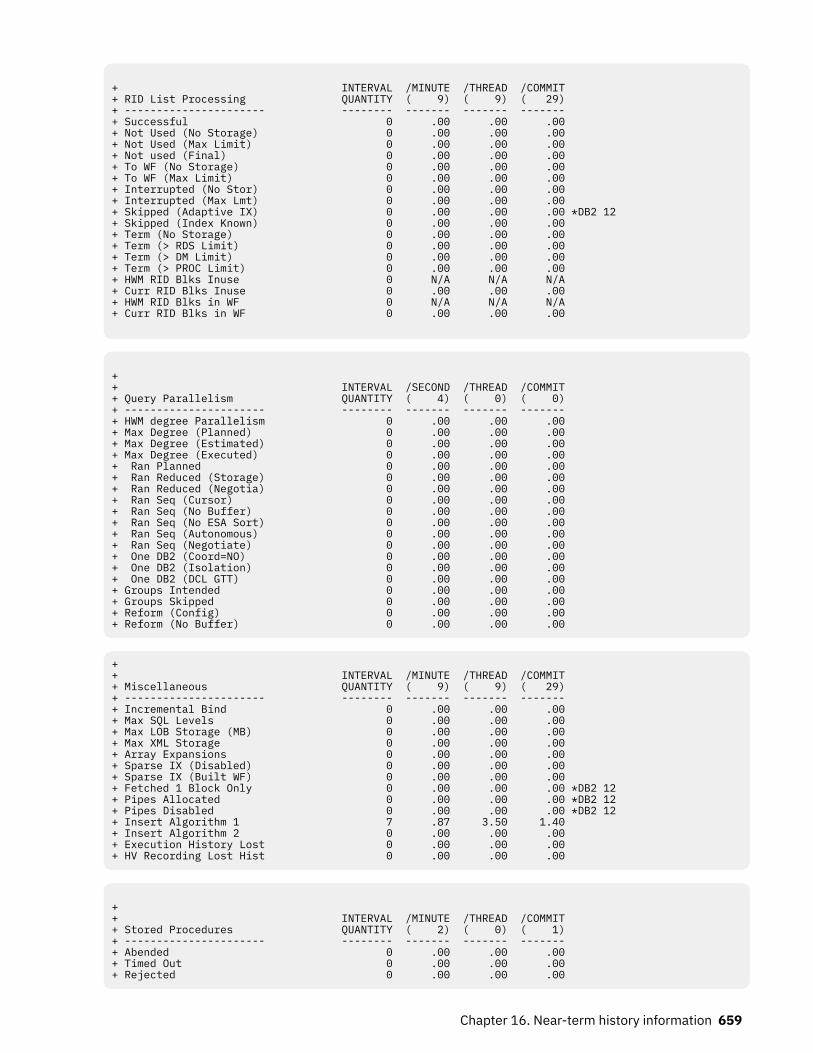
+ INTERVAL /MINUTE /THREAD /COMMIT + RID List Processing QUANTITY ( 9) ( 9) ( 29) + ---------------------- -------- ------- ------- ------- + Successful 0 .00 .00 .00 + Not Used (No Storage) 0 .00 .00 .00 + Not Used (Max Limit) 0 .00 .00 .00 + Not used (Final) 0 .00 .00 .00 + To WF (No Storage) 0 .00 .00 .00 + To WF (Max Limit) 0 .00 .00 .00 + Interrupted (No Stor) 0 .00 .00 .00 + Interrupted (Max Lmt) 0 .00 .00 .00 + Skipped (Adaptive IX) 0 .00 .00 .00 *DB2 12 + Skipped (Index Known) 0 .00 .00 .00 + Term (No Storage) 0 .00 .00 .00 + Term (> RDS Limit) 0 .00 .00 .00 + Term (> DM Limit) 0 .00 .00 .00 + Term (> PROC Limit) 0 .00 .00 .00 + HWM RID Blks Inuse 0 N/A N/A N/A + Curr RID Blks Inuse 0 .00 .00 .00 + HWM RID Blks in WF 0 N/A N/A N/A + Curr RID Blks in WF 0 .00 .00 .00
+ + INTERVAL /SECOND /THREAD /COMMIT + Query Parallelism QUANTITY ( 4) ( 0) ( 0) + ---------------------- -------- ------- ------- ------- + HWM degree Parallelism 0 .00 .00 .00 + Max Degree (Planned) 0 .00 .00 .00 + Max Degree (Estimated) 0 .00 .00 .00 + Max Degree (Executed) 0 .00 .00 .00 + Ran Planned 0 .00 .00 .00 + Ran Reduced (Storage) 0 .00 .00 .00 + Ran Reduced (Negotia) 0 .00 .00 .00 + Ran Seq (Cursor) 0 .00 .00 .00 + Ran Seq (No Buffer) 0 .00 .00 .00 + Ran Seq (No ESA Sort) 0 .00 .00 .00 + Ran Seq (Autonomous) 0 .00 .00 .00 + Ran Seq (Negotiate) 0 .00 .00 .00 + One DB2 (Coord=NO) 0 .00 .00 .00 + One DB2 (Isolation) 0 .00 .00 .00 + One DB2 (DCL GTT) 0 .00 .00 .00 + Groups Intended 0 .00 .00 .00 + Groups Skipped 0 .00 .00 .00 + Reform (Config) 0 .00 .00 .00 + Reform (No Buffer) 0 .00 .00 .00
+ + INTERVAL /MINUTE /THREAD /COMMIT + Miscellaneous QUANTITY ( 9) ( 9) ( 29) + ---------------------- -------- ------- ------- ------- + Incremental Bind 0 .00 .00 .00 + Max SQL Levels 0 .00 .00 .00 + Max LOB Storage (MB) 0 .00 .00 .00 + Max XML Storage 0 .00 .00 .00 + Array Expansions 0 .00 .00 .00 + Sparse IX (Disabled) 0 .00 .00 .00 + Sparse IX (Built WF) 0 .00 .00 .00 + Fetched 1 Block Only 0 .00 .00 .00 *DB2 12 + Pipes Allocated 0 .00 .00 .00 *DB2 12 + Pipes Disabled 0 .00 .00 .00 *DB2 12+ Insert Algorithm 1 7 .87 3.50 1.40+ Insert Algorithm 2 0 .00 .00 .00+ Execution History Lost 0 .00 .00 .00+ HV Recording Lost Hist 0 .00 .00 .00
+ + INTERVAL /MINUTE /THREAD /COMMIT + Stored Procedures QUANTITY ( 2) ( 0) ( 1) + ---------------------- -------- ------- ------- ------- + Abended 0 .00 .00 .00 + Timed Out 0 .00 .00 .00 + Rejected 0 .00 .00 .00
Chapter 16. Near-term history information 659
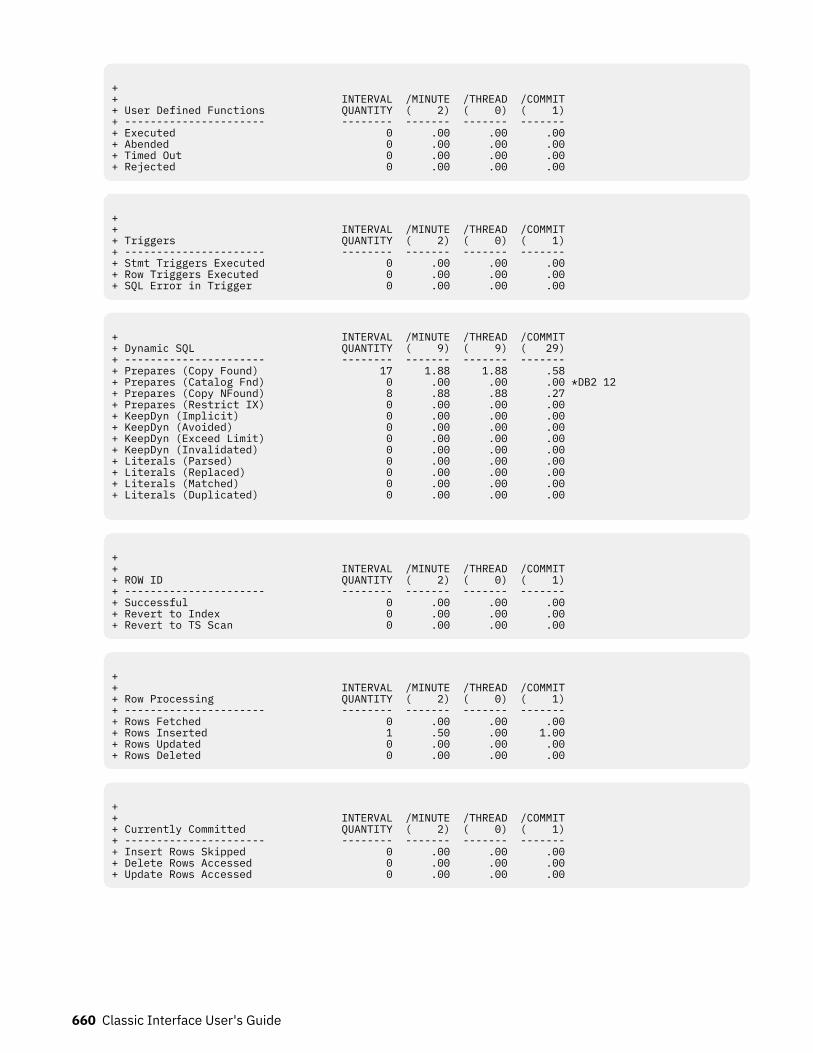
+ + INTERVAL /MINUTE /THREAD /COMMIT + User Defined Functions QUANTITY ( 2) ( 0) ( 1) + ---------------------- -------- ------- ------- ------- + Executed 0 .00 .00 .00 + Abended 0 .00 .00 .00 + Timed Out 0 .00 .00 .00 + Rejected 0 .00 .00 .00
+ + INTERVAL /MINUTE /THREAD /COMMIT + Triggers QUANTITY ( 2) ( 0) ( 1) + ---------------------- -------- ------- ------- ------- + Stmt Triggers Executed 0 .00 .00 .00 + Row Triggers Executed 0 .00 .00 .00 + SQL Error in Trigger 0 .00 .00 .00
+ INTERVAL /MINUTE /THREAD /COMMIT + Dynamic SQL QUANTITY ( 9) ( 9) ( 29) + ---------------------- -------- ------- ------- ------- + Prepares (Copy Found) 17 1.88 1.88 .58 + Prepares (Catalog Fnd) 0 .00 .00 .00 *DB2 12 + Prepares (Copy NFound) 8 .88 .88 .27 + Prepares (Restrict IX) 0 .00 .00 .00 + KeepDyn (Implicit) 0 .00 .00 .00 + KeepDyn (Avoided) 0 .00 .00 .00 + KeepDyn (Exceed Limit) 0 .00 .00 .00 + KeepDyn (Invalidated) 0 .00 .00 .00 + Literals (Parsed) 0 .00 .00 .00 + Literals (Replaced) 0 .00 .00 .00 + Literals (Matched) 0 .00 .00 .00 + Literals (Duplicated) 0 .00 .00 .00
+ + INTERVAL /MINUTE /THREAD /COMMIT + ROW ID QUANTITY ( 2) ( 0) ( 1) + ---------------------- -------- ------- ------- ------- + Successful 0 .00 .00 .00 + Revert to Index 0 .00 .00 .00 + Revert to TS Scan 0 .00 .00 .00
+ + INTERVAL /MINUTE /THREAD /COMMIT + Row Processing QUANTITY ( 2) ( 0) ( 1) + ---------------------- -------- ------- ------- ------- + Rows Fetched 0 .00 .00 .00 + Rows Inserted 1 .50 .00 1.00 + Rows Updated 0 .00 .00 .00 + Rows Deleted 0 .00 .00 .00
+ + INTERVAL /MINUTE /THREAD /COMMIT + Currently Committed QUANTITY ( 2) ( 0) ( 1) + ---------------------- -------- ------- ------- ------- + Insert Rows Skipped 0 .00 .00 .00 + Delete Rows Accessed 0 .00 .00 .00 + Update Rows Accessed 0 .00 .00 .00
660 Classic Interface User's Guide
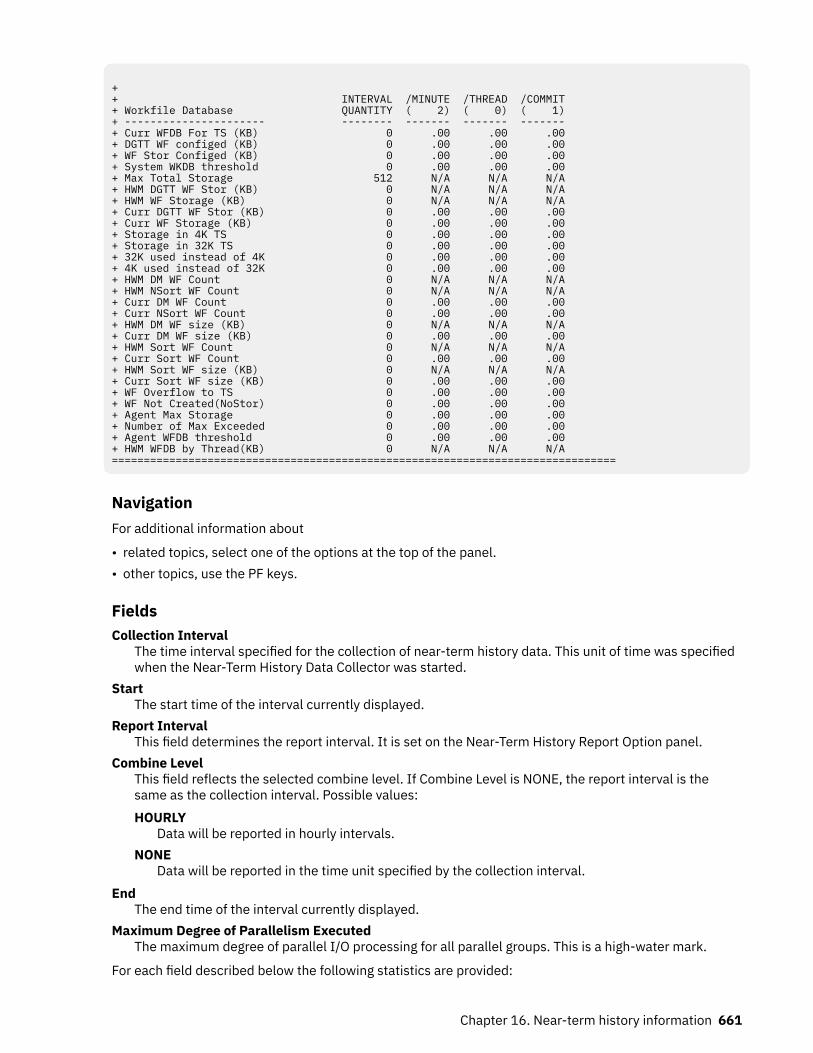
+ + INTERVAL /MINUTE /THREAD /COMMIT + Workfile Database QUANTITY ( 2) ( 0) ( 1) + ---------------------- -------- ------- ------- ------- + Curr WFDB For TS (KB) 0 .00 .00 .00 + DGTT WF configed (KB) 0 .00 .00 .00 + WF Stor Configed (KB) 0 .00 .00 .00 + System WKDB threshold 0 .00 .00 .00 + Max Total Storage 512 N/A N/A N/A + HWM DGTT WF Stor (KB) 0 N/A N/A N/A + HWM WF Storage (KB) 0 N/A N/A N/A + Curr DGTT WF Stor (KB) 0 .00 .00 .00 + Curr WF Storage (KB) 0 .00 .00 .00 + Storage in 4K TS 0 .00 .00 .00 + Storage in 32K TS 0 .00 .00 .00 + 32K used instead of 4K 0 .00 .00 .00 + 4K used instead of 32K 0 .00 .00 .00 + HWM DM WF Count 0 N/A N/A N/A + HWM NSort WF Count 0 N/A N/A N/A + Curr DM WF Count 0 .00 .00 .00 + Curr NSort WF Count 0 .00 .00 .00 + HWM DM WF size (KB) 0 N/A N/A N/A + Curr DM WF size (KB) 0 .00 .00 .00 + HWM Sort WF Count 0 N/A N/A N/A + Curr Sort WF Count 0 .00 .00 .00 + HWM Sort WF size (KB) 0 N/A N/A N/A + Curr Sort WF size (KB) 0 .00 .00 .00 + WF Overflow to TS 0 .00 .00 .00 + WF Not Created(NoStor) 0 .00 .00 .00 + Agent Max Storage 0 .00 .00 .00 + Number of Max Exceeded 0 .00 .00 .00 + Agent WFDB threshold 0 .00 .00 .00 + HWM WFDB by Thread(KB) 0 N/A N/A N/A ===============================================================================
NavigationFor additional information about
• related topics, select one of the options at the top of the panel.• other topics, use the PF keys.
FieldsCollection Interval
The time interval specified for the collection of near-term history data. This unit of time was specifiedwhen the Near-Term History Data Collector was started.
StartThe start time of the interval currently displayed.
Report IntervalThis field determines the report interval. It is set on the Near-Term History Report Option panel.
Combine LevelThis field reflects the selected combine level. If Combine Level is NONE, the report interval is thesame as the collection interval. Possible values:HOURLY
Data will be reported in hourly intervals.NONE
Data will be reported in the time unit specified by the collection interval.End
The end time of the interval currently displayed.Maximum Degree of Parallelism Executed
The maximum degree of parallel I/O processing for all parallel groups. This is a high-water mark.
For each field described below the following statistics are provided:
Chapter 16. Near-term history information 661
• The amount of activities that occur during the interval.• Rate per minute during the last cycle. The number under /MINUTE is the number of minutes in the
interval.• Rate per thread during the last cycle. The number under /THREAD is the number of Create Threads
during the interval.• Rate per Commit during the last cycle. The number under /COMMIT is the number of commit requests
(including abort requests) during the interval.• Percentage of DML, DCL, or DDL during the last cycle.
SQL Manipulative (DML):SELECT
SELECT statements executed to retrieve rows from a DB2 table.INSERT
INSERT statements executed to add rows to a DB2 table.UPDATE
UPDATE statements executed to alter existing rows in a DB2 table.MERGE
The number of times a MERGE statement is executed.DELETE
DELETE statements executed to remove rows from a DB2 table.DESCRIBE
DESCRIBE statements executed to obtain information about prepared SQL statements.DESCRIBE TABLE
DESCRIBE TABLE statements executed to obtain information about a table or view.PREPARE
Occasions when SQL statements were dynamically prepared for execution.OPEN CURSOR
OPEN statements executed to prepare cursors for subsequent Fetch operations.FETCH
FETCH statements executed to retrieve rows from DB2 tables.CLOSE CURSOR
CLOSE statements executed to close previously opened cursors.REFRESH TABLE
Number of refresh table statements. DB2 12 and later. (Field name: QXTREFTBL)Total DML
All data manipulative language statements.
SQL Control (DCL):CALL
CALL statements executed to invoke a stored procedure.CONNECT (Type 1)
CONNECT (Type 1) statements executed to connect an application process to a designated server.CONNECT (Type 2)
CONNECT (Type 2) statements executed to connect an application process to a designated server.GRANT
GRANT statements issued to extend DB2 privileges to users.LOCK TABLE
LOCK TABLE statements issued to lock a tablespace or table in a segmented tablespace.RELEASE
RELEASE statements executed to place one or more connections in the released state.
662 Classic Interface User's Guide
REVOKEREVOKE statements issued to revoke users' DB2 privileges.
SET CONNECTIONSET CONNECTION statements executed to establish the application server of the process.
SET CURRENT DEGREESET CURRENT DEGREE statements executed to assign a value to the CURRENT DEGREE specialregister.
SET CURRENT RULESSET CURRENT RULE statements executed to assign a value to the current rules special register.
SET CURRENT SQLIDSET CURRENT SQLID statements issued to change your current authorization ID.
SET HOST VARIABLESET host-variable statements issued.
SET CURRENT PATHSET CURRENT PATH statements issued to assign a value to the CURRENT PATH special register.
SET CURRENT PRECISIONThe number of Set Current Precision statements.
ASSOCIATE LOCATORThe number of ASSOCIATE LOCATOR statements issued.
ALLOCATE CURSORThe number of ALLOCATE CURSOR statements issued.
HOLD LOCATORThe number of Hold Locator statements.
FREE LOCATORThe number of Free Locator statements.
TRANSFER OWNERSHIPNumber of transfer ownership statements. DB2 12 and later. (Field name: QXTRNOWN)
Total DCLAll data control language statements.
SQL Definitional (DDL):CREATE TABLE
CREATE TABLE statements issued to define a DB2 table.CREATE GBL TEMP TABLE
The number of Create Global Temporary Table statements issued to create a description of atemporary table at the current server.
DCL GBL TEMP TABLE THThe number of SQL Declare Global Temporary Table statements.
CREATE AUX TABLEThe number of Create Auxiliary Table statements.
CREATE INDEXCREATE INDEX statements issued to establish indexes on DB2 tables.
CREATE TABLESPACECREATE TABLESPACE statements issued to establish DB2 tablespaces.
CREATE DATABASECREATE DATABASE statements issued to establish DB2 databases.
CREATE STOGROUPCREATE STOGROUP statements issued to establish DB2 storage groups.
CREATE SYNONYMCREATE SYNONYM statements issued to create alternate names for DB2 tables and views.
Chapter 16. Near-term history information 663
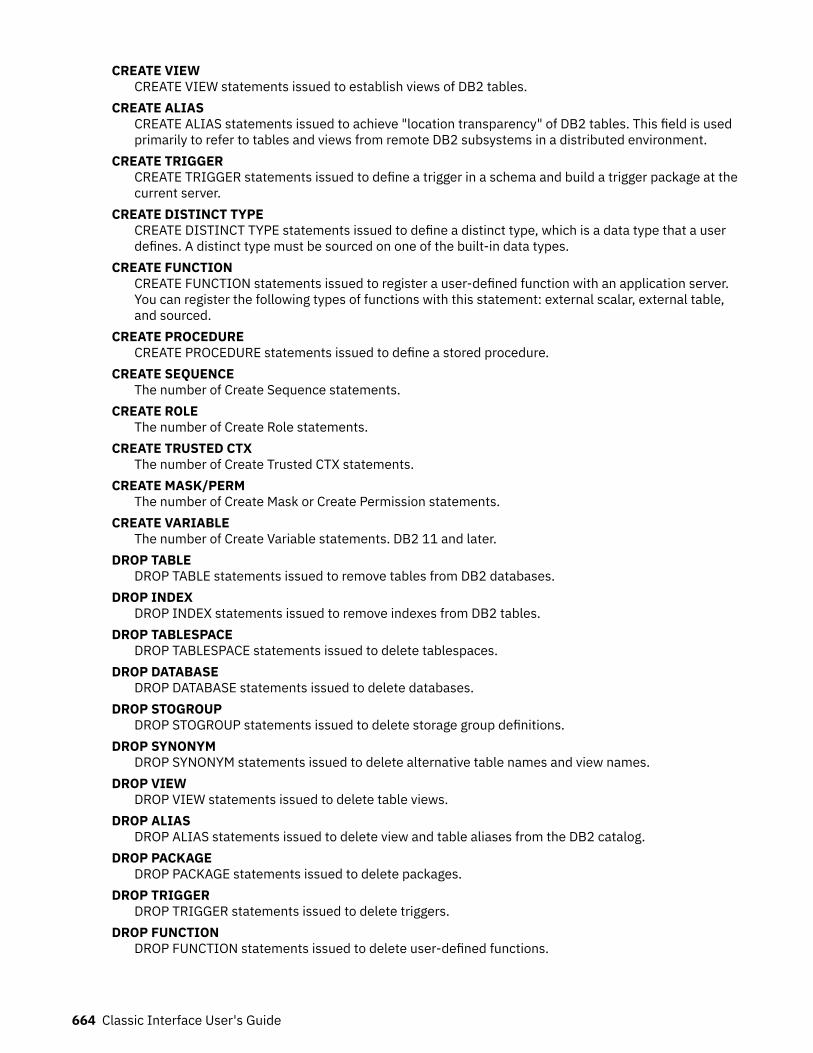
CREATE VIEWCREATE VIEW statements issued to establish views of DB2 tables.
CREATE ALIASCREATE ALIAS statements issued to achieve "location transparency" of DB2 tables. This field is usedprimarily to refer to tables and views from remote DB2 subsystems in a distributed environment.
CREATE TRIGGERCREATE TRIGGER statements issued to define a trigger in a schema and build a trigger package at thecurrent server.
CREATE DISTINCT TYPECREATE DISTINCT TYPE statements issued to define a distinct type, which is a data type that a userdefines. A distinct type must be sourced on one of the built-in data types.
CREATE FUNCTIONCREATE FUNCTION statements issued to register a user-defined function with an application server.You can register the following types of functions with this statement: external scalar, external table,and sourced.
CREATE PROCEDURECREATE PROCEDURE statements issued to define a stored procedure.
CREATE SEQUENCEThe number of Create Sequence statements.
CREATE ROLEThe number of Create Role statements.
CREATE TRUSTED CTXThe number of Create Trusted CTX statements.
CREATE MASK/PERMThe number of Create Mask or Create Permission statements.
CREATE VARIABLEThe number of Create Variable statements. DB2 11 and later.
DROP TABLEDROP TABLE statements issued to remove tables from DB2 databases.
DROP INDEXDROP INDEX statements issued to remove indexes from DB2 tables.
DROP TABLESPACEDROP TABLESPACE statements issued to delete tablespaces.
DROP DATABASEDROP DATABASE statements issued to delete databases.
DROP STOGROUPDROP STOGROUP statements issued to delete storage group definitions.
DROP SYNONYMDROP SYNONYM statements issued to delete alternative table names and view names.
DROP VIEWDROP VIEW statements issued to delete table views.
DROP ALIASDROP ALIAS statements issued to delete view and table aliases from the DB2 catalog.
DROP PACKAGEDROP PACKAGE statements issued to delete packages.
DROP TRIGGERDROP TRIGGER statements issued to delete triggers.
DROP FUNCTIONDROP FUNCTION statements issued to delete user-defined functions.
664 Classic Interface User's Guide
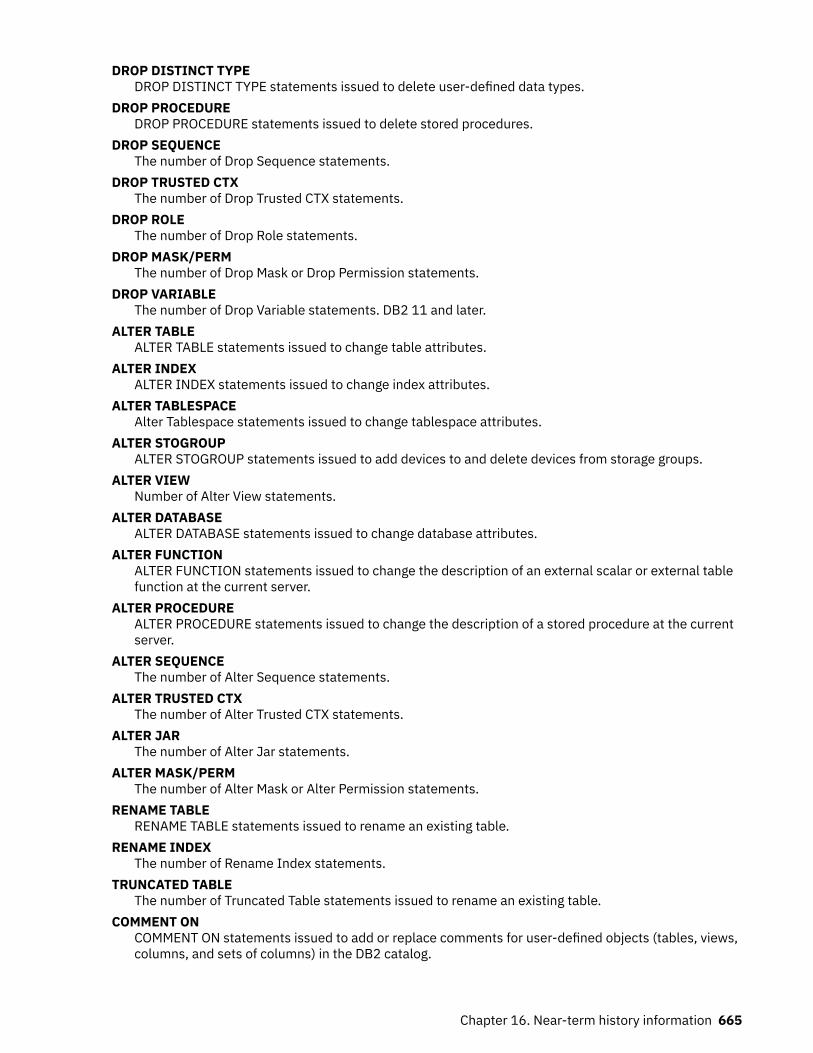
DROP DISTINCT TYPEDROP DISTINCT TYPE statements issued to delete user-defined data types.
DROP PROCEDUREDROP PROCEDURE statements issued to delete stored procedures.
DROP SEQUENCEThe number of Drop Sequence statements.
DROP TRUSTED CTXThe number of Drop Trusted CTX statements.
DROP ROLEThe number of Drop Role statements.
DROP MASK/PERMThe number of Drop Mask or Drop Permission statements.
DROP VARIABLEThe number of Drop Variable statements. DB2 11 and later.
ALTER TABLEALTER TABLE statements issued to change table attributes.
ALTER INDEXALTER INDEX statements issued to change index attributes.
ALTER TABLESPACEAlter Tablespace statements issued to change tablespace attributes.
ALTER STOGROUPALTER STOGROUP statements issued to add devices to and delete devices from storage groups.
ALTER VIEWNumber of Alter View statements.
ALTER DATABASEALTER DATABASE statements issued to change database attributes.
ALTER FUNCTIONALTER FUNCTION statements issued to change the description of an external scalar or external tablefunction at the current server.
ALTER PROCEDUREALTER PROCEDURE statements issued to change the description of a stored procedure at the currentserver.
ALTER SEQUENCEThe number of Alter Sequence statements.
ALTER TRUSTED CTXThe number of Alter Trusted CTX statements.
ALTER JARThe number of Alter Jar statements.
ALTER MASK/PERMThe number of Alter Mask or Alter Permission statements.
RENAME TABLERENAME TABLE statements issued to rename an existing table.
RENAME INDEXThe number of Rename Index statements.
TRUNCATED TABLEThe number of Truncated Table statements issued to rename an existing table.
COMMENT ONCOMMENT ON statements issued to add or replace comments for user-defined objects (tables, views,columns, and sets of columns) in the DB2 catalog.
Chapter 16. Near-term history information 665
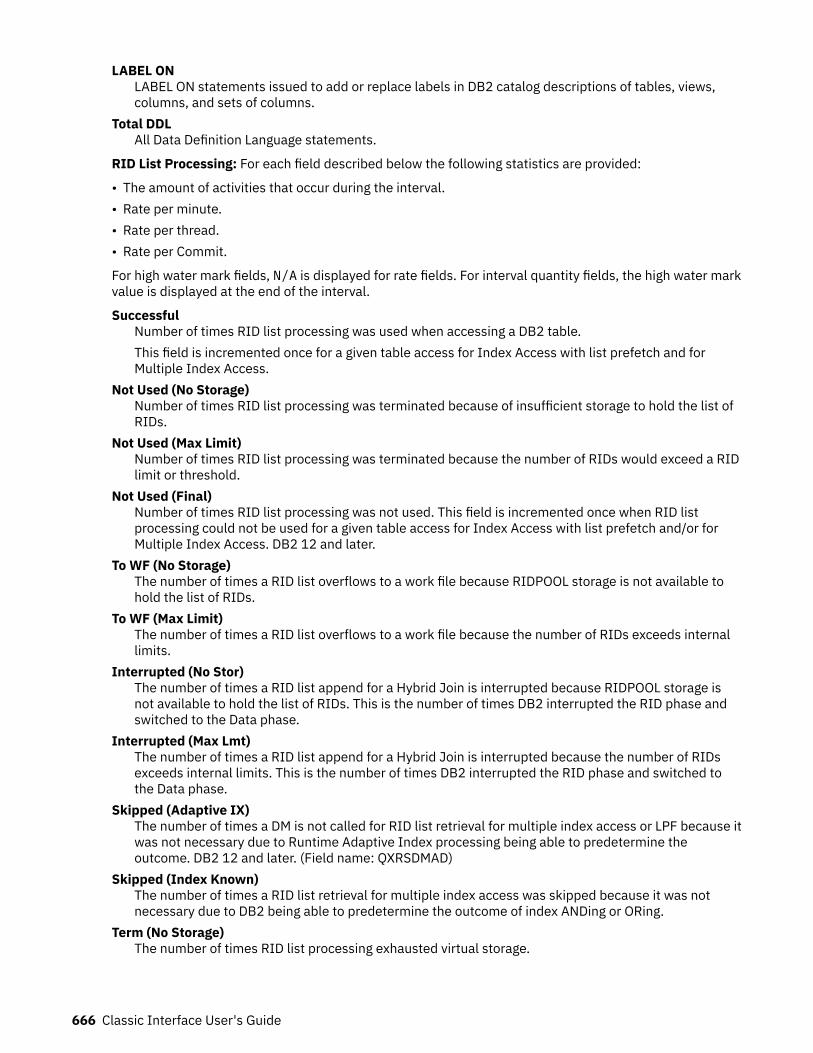
LABEL ONLABEL ON statements issued to add or replace labels in DB2 catalog descriptions of tables, views,columns, and sets of columns.
Total DDLAll Data Definition Language statements.
RID List Processing: For each field described below the following statistics are provided:
• The amount of activities that occur during the interval.• Rate per minute.• Rate per thread.• Rate per Commit.
For high water mark fields, N/A is displayed for rate fields. For interval quantity fields, the high water markvalue is displayed at the end of the interval.
SuccessfulNumber of times RID list processing was used when accessing a DB2 table.This field is incremented once for a given table access for Index Access with list prefetch and forMultiple Index Access.
Not Used (No Storage)Number of times RID list processing was terminated because of insufficient storage to hold the list ofRIDs.
Not Used (Max Limit)Number of times RID list processing was terminated because the number of RIDs would exceed a RIDlimit or threshold.
Not Used (Final)Number of times RID list processing was not used. This field is incremented once when RID listprocessing could not be used for a given table access for Index Access with list prefetch and/or forMultiple Index Access. DB2 12 and later.
To WF (No Storage)The number of times a RID list overflows to a work file because RIDPOOL storage is not available tohold the list of RIDs.
To WF (Max Limit)The number of times a RID list overflows to a work file because the number of RIDs exceeds internallimits.
Interrupted (No Stor)The number of times a RID list append for a Hybrid Join is interrupted because RIDPOOL storage isnot available to hold the list of RIDs. This is the number of times DB2 interrupted the RID phase andswitched to the Data phase.
Interrupted (Max Lmt)The number of times a RID list append for a Hybrid Join is interrupted because the number of RIDsexceeds internal limits. This is the number of times DB2 interrupted the RID phase and switched tothe Data phase.
Skipped (Adaptive IX)The number of times a DM is not called for RID list retrieval for multiple index access or LPF because itwas not necessary due to Runtime Adaptive Index processing being able to predetermine theoutcome. DB2 12 and later. (Field name: QXRSDMAD)
Skipped (Index Known)The number of times a RID list retrieval for multiple index access was skipped because it was notnecessary due to DB2 being able to predetermine the outcome of index ANDing or ORing.
Term (No Storage)The number of times RID list processing exhausted virtual storage.
666 Classic Interface User's Guide
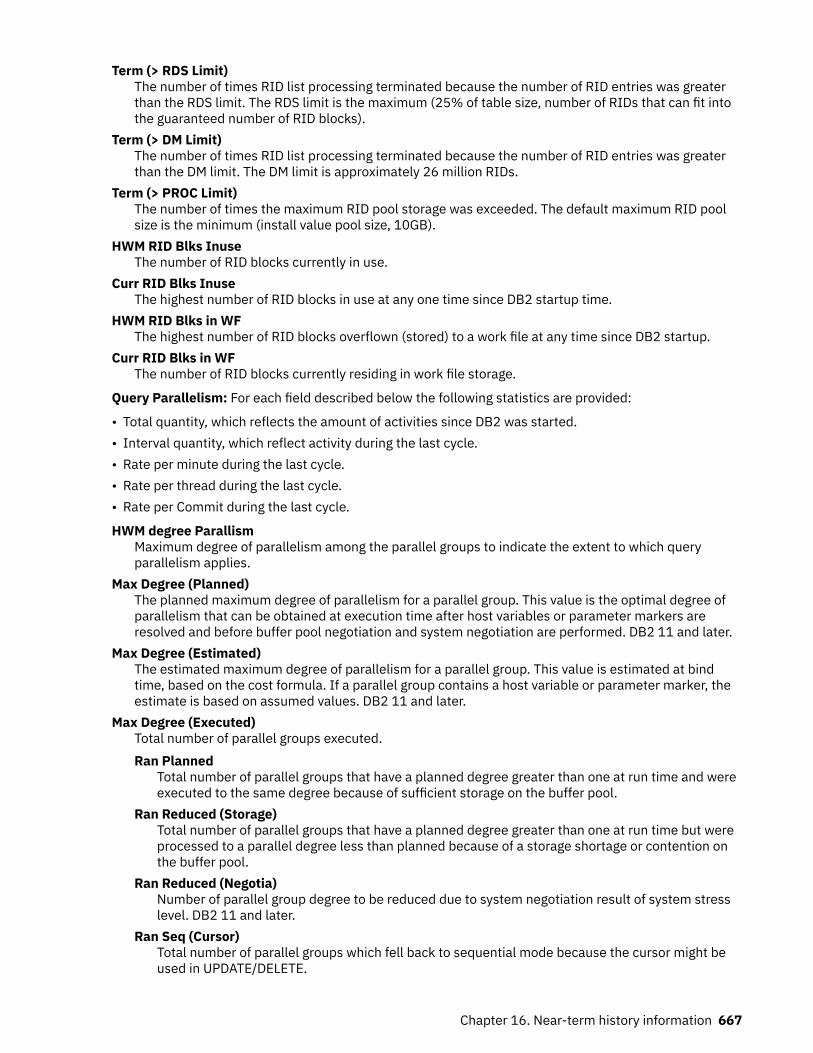
Term (> RDS Limit)The number of times RID list processing terminated because the number of RID entries was greaterthan the RDS limit. The RDS limit is the maximum (25% of table size, number of RIDs that can fit intothe guaranteed number of RID blocks).
Term (> DM Limit)The number of times RID list processing terminated because the number of RID entries was greaterthan the DM limit. The DM limit is approximately 26 million RIDs.
Term (> PROC Limit)The number of times the maximum RID pool storage was exceeded. The default maximum RID poolsize is the minimum (install value pool size, 10GB).
HWM RID Blks InuseThe number of RID blocks currently in use.
Curr RID Blks InuseThe highest number of RID blocks in use at any one time since DB2 startup time.
HWM RID Blks in WFThe highest number of RID blocks overflown (stored) to a work file at any time since DB2 startup.
Curr RID Blks in WFThe number of RID blocks currently residing in work file storage.
Query Parallelism: For each field described below the following statistics are provided:
• Total quantity, which reflects the amount of activities since DB2 was started.• Interval quantity, which reflect activity during the last cycle.• Rate per minute during the last cycle.• Rate per thread during the last cycle.• Rate per Commit during the last cycle.
HWM degree ParallismMaximum degree of parallelism among the parallel groups to indicate the extent to which queryparallelism applies.
Max Degree (Planned)The planned maximum degree of parallelism for a parallel group. This value is the optimal degree ofparallelism that can be obtained at execution time after host variables or parameter markers areresolved and before buffer pool negotiation and system negotiation are performed. DB2 11 and later.
Max Degree (Estimated)The estimated maximum degree of parallelism for a parallel group. This value is estimated at bindtime, based on the cost formula. If a parallel group contains a host variable or parameter marker, theestimate is based on assumed values. DB2 11 and later.
Max Degree (Executed)Total number of parallel groups executed.Ran Planned
Total number of parallel groups that have a planned degree greater than one at run time and wereexecuted to the same degree because of sufficient storage on the buffer pool.
Ran Reduced (Storage)Total number of parallel groups that have a planned degree greater than one at run time but wereprocessed to a parallel degree less than planned because of a storage shortage or contention onthe buffer pool.
Ran Reduced (Negotia)Number of parallel group degree to be reduced due to system negotiation result of system stresslevel. DB2 11 and later.
Ran Seq (Cursor)Total number of parallel groups which fell back to sequential mode because the cursor might beused in UPDATE/DELETE.
Chapter 16. Near-term history information 667
Ran Seq (No Buffer)Total number of parallel groups that have a planned degree greater than one at run time, but fellback to sequential mode because of storage shortage or contention on the buffer pool.
Ran Seq (No ESA Sort)Total number of parallel groups which fell back to sequential mode due to lack of ESA sortsupport.
Ran Seq (No ESA Enc)Total number of parallel groups executed in sequential mode due to the unavailable enclave. Thisapplies only to DB2 9.
Ran Seq (Autonomous)Total number of parallel groups which fell back to sequential mode due to executing under anautonomous procedure. This applies only to DB2 11 or higher.
Ran Seq (Negotiate)Number of parallel groups that is degenerated to sequential mode due to system negotiationresult of system stress level.This applies only to DB2 11 or higher.
One DB2 (Coord=No)Total number of parallel groups that are executed on a single DB2 because the COORDINATORsubsystem parameter is set to NO. When the statement is bound, the COORDINATOR subsystemparameter is set to YES. This situation might also occur when a plan or package is bound on a DB2where the COORDINATOR subsystem parameter is set to YES, but is run on a DB2 where thesubsystem parameter COORDINATOR is set to NO.
One DB2 (Isolation)Total number of parallel groups that are executed on a single DB2 because of repeatable-read orread-stability isolation.
One DB2 (DCL GTT)Total number of parallel groups that are part of a query block. The query block is using an UDF. Itis executed on a single DB2 because a Declared Temporary Table exists in the application process.Neither the query block nor the parallel group is referencing a Declared Temporary Table. Aparallel group might use or might not use an UDF.
Groups IntendedTotal number of parallel groups that are intended to run across the data sharing group. This count isonly incremented on the parallelism coordinator at run time.
Groups SkippedThe number of times that the parallelism coordinator must bypass a DB2 when distributing tasksbecause there is not enough buffer pool storage on one or more DB2 members.This field is incremented only on the parallelism coordinator. It is only incremented once per parallelgroup even though it is possible that more than one DB2 systems have a buffer pool shortage for thatparallel group. The purpose of this count is to indicate when there are not enough buffers on amember. Therefore, this count is incremented only when the buffer pool is defined to allowparallelism. For example, if VPXPSEQT is set to 0 on an assistant, DB2 does not send parallel work tothe assistant, but this count is not incremented.
Reform (Config)Total number of parallel groups for which DB2 reformulated the parallel portion of the access pathbecause the sysplex configuration is different from the sysplex configuration at bind time. Thiscounter is only incremented by the parallelism coordinator at run time.
Reform (No Buffer)Total number of parallel groups for which DB2 reformulated the paralllel portion of the access pathbecause there was not enough buffer pool resource. This counter is only incremented by theparallelism coordinator at run time.
Miscellaneous
668 Classic Interface User's Guide
Incremental BindOccurrences of incremental bind, which take place upon execution of a DB2 plan that is bound asVALIDATE(RUN).
Max SQL LevelsThe maximum level of nested SQL cascading. This includes cascading because of triggers, UDFs, andstored procedures.
Max LOB Storage (MB)Maximum storage that is used for LOB values.
Max XML StorageMaximum storage that is used for XML values.
Array ExpansionsThe number of times an array variable is expanded beyond 32K.This applies to DB2 11 or higher.
Sparse IX (Disabled)The number of times that sparse index is disabled because of insufficient storage.This applies to DB2 11 or higher.
Sparse IX (Built WF)The number of times that sparse index built a physical work file for probing.This applies to DB2 11 or higher.
Fetched 1 Block Only (QXR1BOAD)The number of times 1 block is fetched and there were no further fetches. DB2 12 and later.
Pipes Allocated (QXR1INPA)The number of data manager fast insert pipes allocated since DB2 restart. Db2 12 and later.
Pipes Disabled (QISTINPD)The number of data manager fast insert pipes disabled since DB2 restart. Db2 12 and later.
Insert Algorithm 1INSERT algorithm type 1. DB2 12 and later.
Insert Algorithm 2INSERT algorithm type 2. DB2 12 and later.
Execution History LostNumber of execution history lost. DB2 12 and later.
HV Recording Lost HistNumber of HV recordings lost in execution history. DB2 12 and later.
Stored procedures: For each field described below the following statistics are provided:
• Total quantity, which reflects the amount of activities since DB2 was started.• Interval quantity, which reflects activity during the last cycle.• Rate per minute during the last cycle.• Rate per thread during the last cycle.• Rate per Commit during the last cycle.
AbendedCALL statements executed to invoke a stored procedure that terminated abnormally.
Timed OutCALL statements executed to invoke a stored procedure that timed out while waiting to be scheduled.
RejectedCALL statements executed to invoke a stored procedure that was in the STOP ACTION(REJECT) state.
User Defined Functions: For each field described below the following statistics are provided:
• Total quantity, which reflects the amount of activities since DB2 was started.
Chapter 16. Near-term history information 669
• Interval quantity, which reflects activity during the last cycle.• Rate per minute during the last cycle.• Rate per thread during the last cycle.• Rate per Commit during the last cycle.
ExecutedThe number of user-defined functions (UDFs) executed.
AbendedThe number of times a UDF abended.
Timed OutThe number of times a UDF timed out when waiting to be scheduled.
RejectedThe number of times a UDF was rejected.
Triggers: For each field described below the following statistics are provided:
• Total quantity, which reflects the amount of activities since DB2 was started.• Interval quantity, which reflects activity during the last cycle.• Rate per minute during the last cycle.• Rate per thread during the last cycle.• Rate per Commit during the last cycle.
Stmt Triggers ExecutedThe number of times a statement trigger was activated.
Row Triggers ActivatedThe number of times a row trigger was activated.
SQL Error in TriggerThe number of times an SQL error occurred during execution of a triggered action.
Dynamic SQLPrepares (Copy Found)
The number of times a PREPARE request is satisfied by making a copy from the prepared statementcache.
Prepares (Catalog Found)The number of times a PREPARE request is satisfied by making a copy from the stabilized statement inSYSIBM.SYSDYNQRY catalog table. The stabilized statement search is done only when no matchingstatement is found in the prepared statement cache. DB2 12 and later. (Field name: QXSTSFND)
Prepares (Copy NFound)The number of times a PREPARE request is received but a matching statement is not found in theprepared statement cache. Cache search is only done for DML SQL and only if cache option is active.
Prepares (Restrict IX)The number of PREPARE requests for which the use of index/indexes are restricted because the indexis in a pending state.
KeepDyn (Implicit)The number of times the following actions occurred:
• An implicit PREPARE is performed because the KEEPDYNAMIC(YES) option is used• An OPEN, EXECUTE, or DESCRIBE of a dynamic statement occurred after a COMMIT, however, DB2
no longer had a valid copy of the executable version of the prepared statement.
KeepDyn (Avoided)The number of times that a PREPARE is avoided because KEEPDYNAMIC(YES) is used together withprepared statement caching, and DB2 still had the copy of the executable version of the preparedstatement.
670 Classic Interface User's Guide
KeepDyn (Exceed Limit)The number of times that an executable copy of a prepared statement is discarded because theMAXKEEPD system limit is exceeded.
KeepDyn (Invalidated)The number of times that a prepared statement is purged from the cache because a DROP, ALTER, orREVOKE statement is issued on a dependent object.
Literals (Parsed)The number of times DB2 parsed dynamic statements because CONCENTRATE STATEMENTS WITHLITERALS behavior is in effect for the prepare of the statement for the dynamic statement cache.
Literals (Replaced)The number of times DB2 replaced at least one literal in a dynamic statement becauseCONCENTRATE STATEMENTS WITH LITERALS is in effect for the prepare of the statement for dynamicstatement cache.
Literals (Matched)The number of times DB2 found a matching reusable copy of a dynamic statement in statement cacheduring preparation of a statement that had literals replaced because of CONCENTRATE.
Literals (Duplicated)The number of times DB2 created a duplicate statement instance in the statement cache for adynamic statement that had literals replaced by CONCENTRATE STATEMENTS WITH LITERALSbehavior and the duplicate statement instance was needed because a cache match failed because ofliteral reusability criteria.
Row IDSuccessful
The number of times that direct row access was successful.Revert to Index
The number of times an attempt to use direct row access reverted to using an index to locate a record.Revert to TS Scan
The number of times an attempt to use direct row access reverted to using a table space scan tolocate a record.
Rows ProcessingRows Fetched
The number of fetched rows.Rows Inserted
The number of inserted rows.Rows Updated
The number of updated rows.Rows Deleted
The number of deleted rows.
Currently CommittedInsert Rows Skipped
The number of rows that are skipped by read transactions because uncommitted inserts areperformed when current committed read is in effect for fetch operations.
Delete Rows AccessedThe number of rows that are skipped by read transactions because uncommitted deletes areperformed when current committed read is in effect for fetch operations.
Update Rows AccessedThe number of rows that are accessed by read transactions while uncommitted updates existedbecause currently committed read behavior is in effect for fetch operation.
Workfile Database (WFDB)
Chapter 16. Near-term history information 671
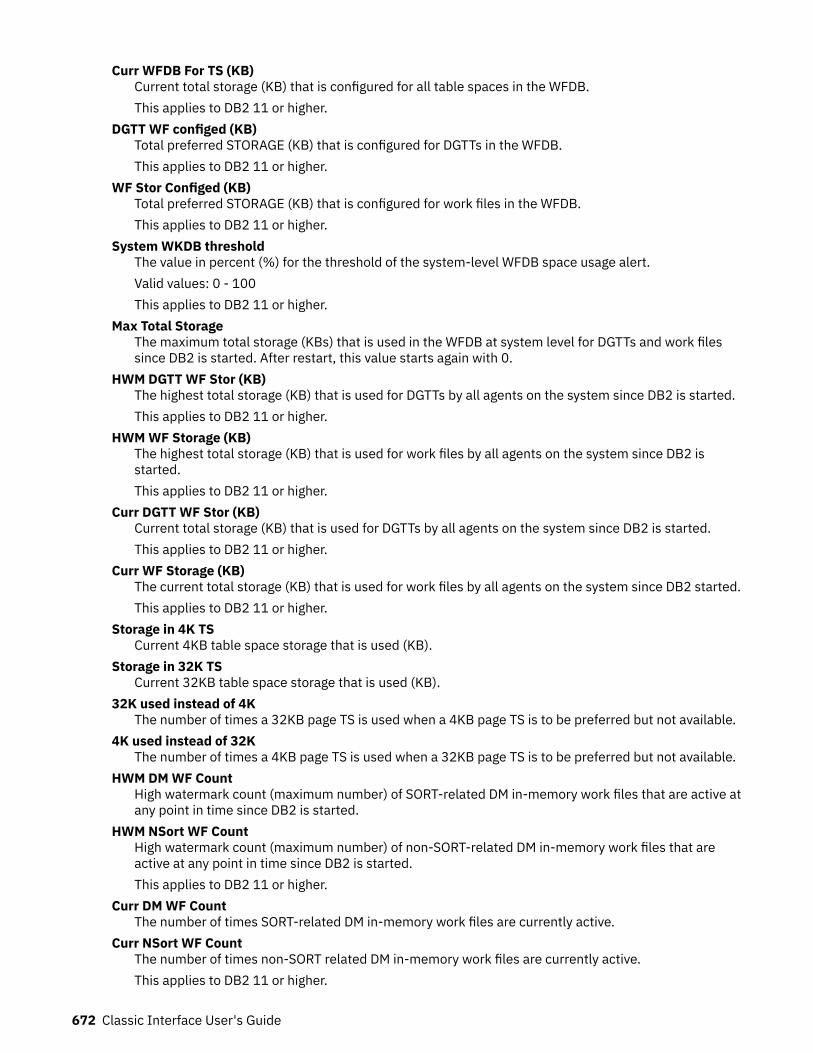
Curr WFDB For TS (KB)Current total storage (KB) that is configured for all table spaces in the WFDB.This applies to DB2 11 or higher.
DGTT WF configed (KB)Total preferred STORAGE (KB) that is configured for DGTTs in the WFDB.This applies to DB2 11 or higher.
WF Stor Configed (KB)Total preferred STORAGE (KB) that is configured for work files in the WFDB.This applies to DB2 11 or higher.
System WKDB thresholdThe value in percent (%) for the threshold of the system-level WFDB space usage alert.Valid values: 0 - 100This applies to DB2 11 or higher.
Max Total StorageThe maximum total storage (KBs) that is used in the WFDB at system level for DGTTs and work filessince DB2 is started. After restart, this value starts again with 0.
HWM DGTT WF Stor (KB)The highest total storage (KB) that is used for DGTTs by all agents on the system since DB2 is started.This applies to DB2 11 or higher.
HWM WF Storage (KB)The highest total storage (KB) that is used for work files by all agents on the system since DB2 isstarted.This applies to DB2 11 or higher.
Curr DGTT WF Stor (KB)Current total storage (KB) that is used for DGTTs by all agents on the system since DB2 is started.This applies to DB2 11 or higher.
Curr WF Storage (KB)The current total storage (KB) that is used for work files by all agents on the system since DB2 started.This applies to DB2 11 or higher.
Storage in 4K TSCurrent 4KB table space storage that is used (KB).
Storage in 32K TSCurrent 32KB table space storage that is used (KB).
32K used instead of 4KThe number of times a 32KB page TS is used when a 4KB page TS is to be preferred but not available.
4K used instead of 32KThe number of times a 4KB page TS is used when a 32KB page TS is to be preferred but not available.
HWM DM WF CountHigh watermark count (maximum number) of SORT-related DM in-memory work files that are active atany point in time since DB2 is started.
HWM NSort WF CountHigh watermark count (maximum number) of non-SORT-related DM in-memory work files that areactive at any point in time since DB2 is started.This applies to DB2 11 or higher.
Curr DM WF CountThe number of times SORT-related DM in-memory work files are currently active.
Curr NSort WF CountThe number of times non-SORT related DM in-memory work files are currently active.This applies to DB2 11 or higher.
672 Classic Interface User's Guide
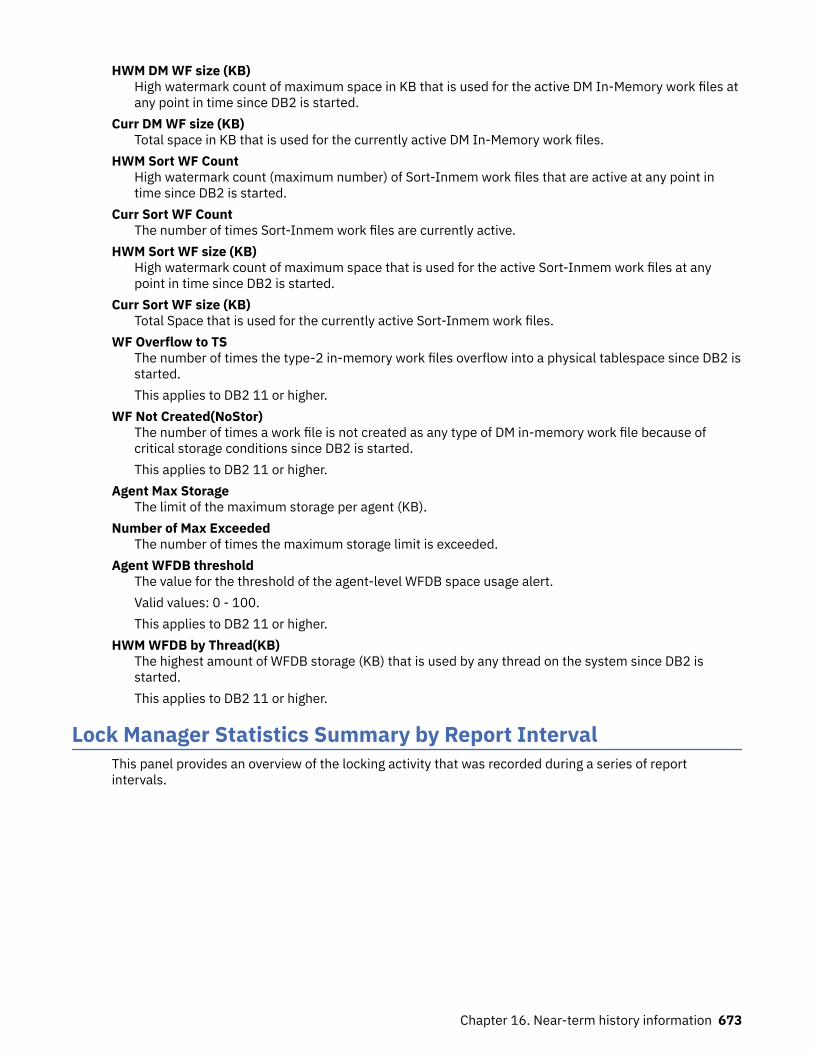
HWM DM WF size (KB)High watermark count of maximum space in KB that is used for the active DM In-Memory work files atany point in time since DB2 is started.
Curr DM WF size (KB)Total space in KB that is used for the currently active DM In-Memory work files.
HWM Sort WF CountHigh watermark count (maximum number) of Sort-Inmem work files that are active at any point intime since DB2 is started.
Curr Sort WF CountThe number of times Sort-Inmem work files are currently active.
HWM Sort WF size (KB)High watermark count of maximum space that is used for the active Sort-Inmem work files at anypoint in time since DB2 is started.
Curr Sort WF size (KB)Total Space that is used for the currently active Sort-Inmem work files.
WF Overflow to TSThe number of times the type-2 in-memory work files overflow into a physical tablespace since DB2 isstarted.This applies to DB2 11 or higher.
WF Not Created(NoStor)The number of times a work file is not created as any type of DM in-memory work file because ofcritical storage conditions since DB2 is started.This applies to DB2 11 or higher.
Agent Max StorageThe limit of the maximum storage per agent (KB).
Number of Max ExceededThe number of times the maximum storage limit is exceeded.
Agent WFDB thresholdThe value for the threshold of the agent-level WFDB space usage alert.Valid values: 0 - 100.This applies to DB2 11 or higher.
HWM WFDB by Thread(KB)The highest amount of WFDB storage (KB) that is used by any thread on the system since DB2 isstarted.This applies to DB2 11 or higher.
Lock Manager Statistics Summary by Report IntervalThis panel provides an overview of the locking activity that was recorded during a series of reportintervals.
Chapter 16. Near-term history information 673
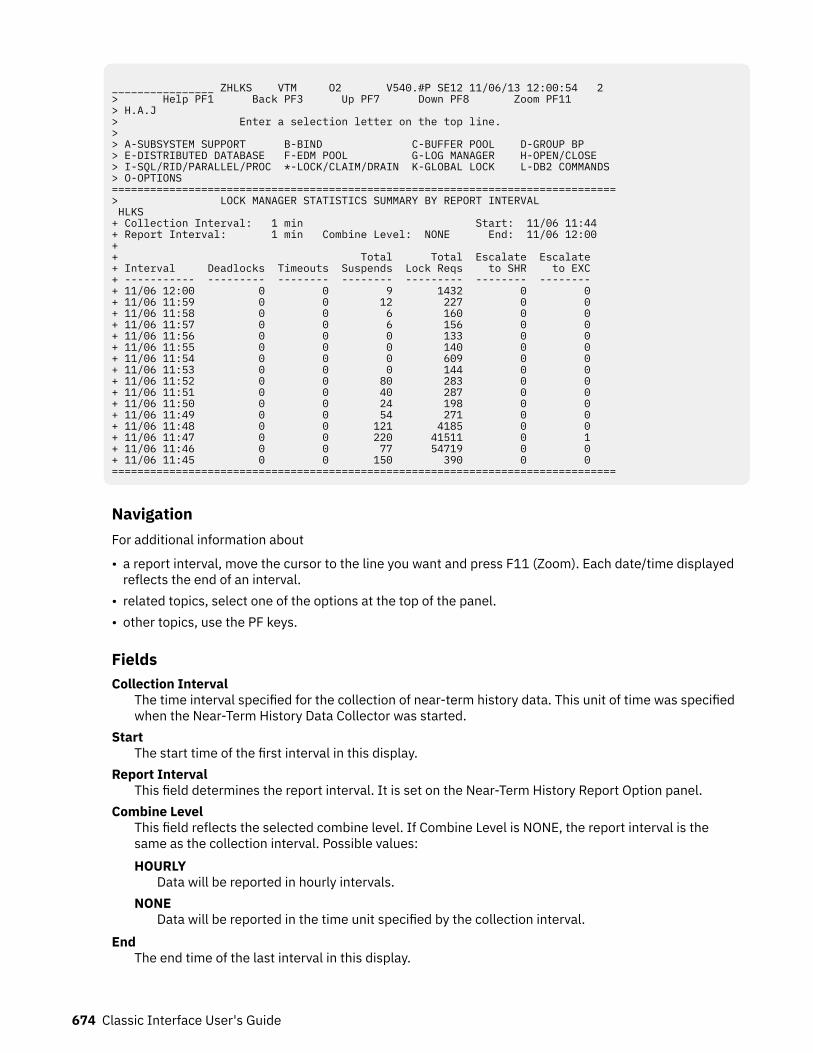
________________ ZHLKS VTM O2 V540.#P SE12 11/06/13 12:00:54 2 > Help PF1 Back PF3 Up PF7 Down PF8 Zoom PF11 > H.A.J > Enter a selection letter on the top line. > > A-SUBSYSTEM SUPPORT B-BIND C-BUFFER POOL D-GROUP BP > E-DISTRIBUTED DATABASE F-EDM POOL G-LOG MANAGER H-OPEN/CLOSE > I-SQL/RID/PARALLEL/PROC *-LOCK/CLAIM/DRAIN K-GLOBAL LOCK L-DB2 COMMANDS > O-OPTIONS ===============================================================================> LOCK MANAGER STATISTICS SUMMARY BY REPORT INTERVAL HLKS + Collection Interval: 1 min Start: 11/06 11:44 + Report Interval: 1 min Combine Level: NONE End: 11/06 12:00 + + Total Total Escalate Escalate + Interval Deadlocks Timeouts Suspends Lock Reqs to SHR to EXC + ----------- --------- -------- -------- --------- -------- -------- + 11/06 12:00 0 0 9 1432 0 0 + 11/06 11:59 0 0 12 227 0 0 + 11/06 11:58 0 0 6 160 0 0 + 11/06 11:57 0 0 6 156 0 0 + 11/06 11:56 0 0 0 133 0 0 + 11/06 11:55 0 0 0 140 0 0 + 11/06 11:54 0 0 0 609 0 0 + 11/06 11:53 0 0 0 144 0 0 + 11/06 11:52 0 0 80 283 0 0 + 11/06 11:51 0 0 40 287 0 0 + 11/06 11:50 0 0 24 198 0 0 + 11/06 11:49 0 0 54 271 0 0 + 11/06 11:48 0 0 121 4185 0 0 + 11/06 11:47 0 0 220 41511 0 1 + 11/06 11:46 0 0 77 54719 0 0 + 11/06 11:45 0 0 150 390 0 0 ===============================================================================
NavigationFor additional information about
• a report interval, move the cursor to the line you want and press F11 (Zoom). Each date/time displayedreflects the end of an interval.
• related topics, select one of the options at the top of the panel.• other topics, use the PF keys.
FieldsCollection Interval
The time interval specified for the collection of near-term history data. This unit of time was specifiedwhen the Near-Term History Data Collector was started.
StartThe start time of the first interval in this display.
Report IntervalThis field determines the report interval. It is set on the Near-Term History Report Option panel.
Combine LevelThis field reflects the selected combine level. If Combine Level is NONE, the report interval is thesame as the collection interval. Possible values:HOURLY
Data will be reported in hourly intervals.NONE
Data will be reported in the time unit specified by the collection interval.End
The end time of the last interval in this display.
674 Classic Interface User's Guide
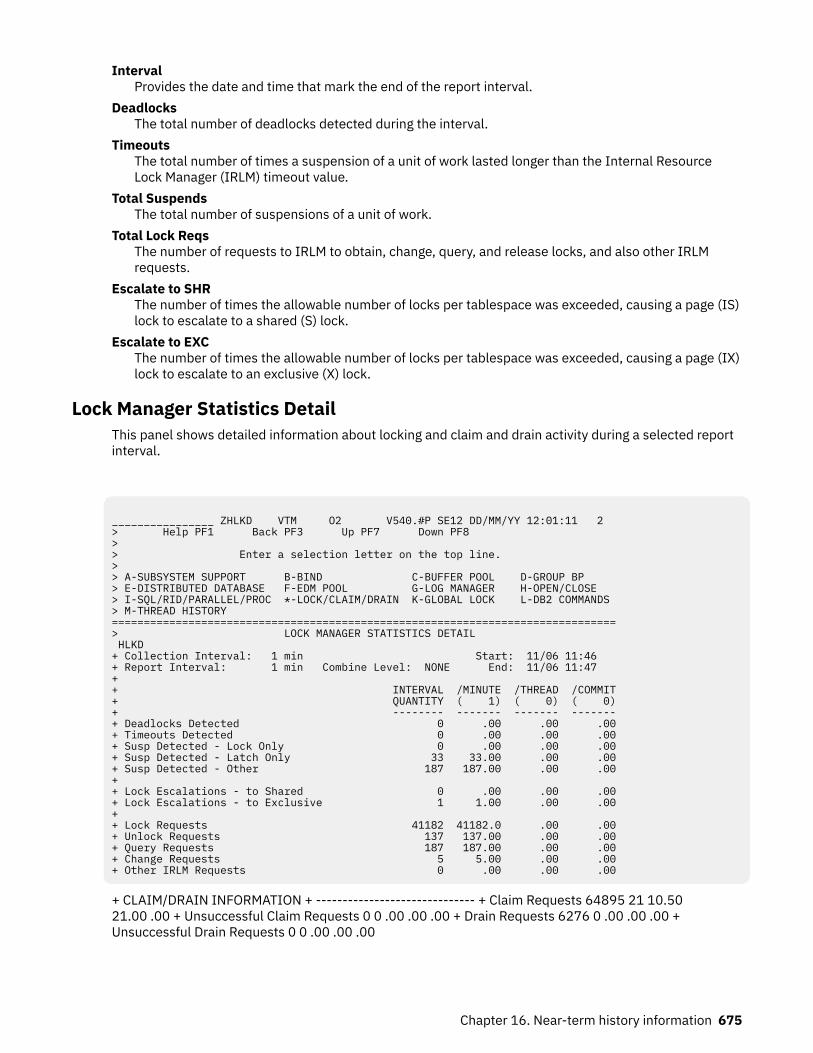
IntervalProvides the date and time that mark the end of the report interval.
DeadlocksThe total number of deadlocks detected during the interval.
TimeoutsThe total number of times a suspension of a unit of work lasted longer than the Internal ResourceLock Manager (IRLM) timeout value.
Total SuspendsThe total number of suspensions of a unit of work.
Total Lock ReqsThe number of requests to IRLM to obtain, change, query, and release locks, and also other IRLMrequests.
Escalate to SHRThe number of times the allowable number of locks per tablespace was exceeded, causing a page (IS)lock to escalate to a shared (S) lock.
Escalate to EXCThe number of times the allowable number of locks per tablespace was exceeded, causing a page (IX)lock to escalate to an exclusive (X) lock.
Lock Manager Statistics DetailThis panel shows detailed information about locking and claim and drain activity during a selected reportinterval.
________________ ZHLKD VTM O2 V540.#P SE12 DD/MM/YY 12:01:11 2 > Help PF1 Back PF3 Up PF7 Down PF8 > > Enter a selection letter on the top line. > > A-SUBSYSTEM SUPPORT B-BIND C-BUFFER POOL D-GROUP BP > E-DISTRIBUTED DATABASE F-EDM POOL G-LOG MANAGER H-OPEN/CLOSE > I-SQL/RID/PARALLEL/PROC *-LOCK/CLAIM/DRAIN K-GLOBAL LOCK L-DB2 COMMANDS > M-THREAD HISTORY =============================================================================== > LOCK MANAGER STATISTICS DETAIL HLKD + Collection Interval: 1 min Start: 11/06 11:46 + Report Interval: 1 min Combine Level: NONE End: 11/06 11:47 + + INTERVAL /MINUTE /THREAD /COMMIT + QUANTITY ( 1) ( 0) ( 0) + -------- ------- ------- ------- + Deadlocks Detected 0 .00 .00 .00 + Timeouts Detected 0 .00 .00 .00 + Susp Detected - Lock Only 0 .00 .00 .00 + Susp Detected - Latch Only 33 33.00 .00 .00 + Susp Detected - Other 187 187.00 .00 .00 + + Lock Escalations - to Shared 0 .00 .00 .00 + Lock Escalations - to Exclusive 1 1.00 .00 .00 + + Lock Requests 41182 41182.0 .00 .00 + Unlock Requests 137 137.00 .00 .00 + Query Requests 187 187.00 .00 .00 + Change Requests 5 5.00 .00 .00 + Other IRLM Requests 0 .00 .00 .00
+ CLAIM/DRAIN INFORMATION + ------------------------------ + Claim Requests 64895 21 10.5021.00 .00 + Unsuccessful Claim Requests 0 0 .00 .00 .00 + Drain Requests 6276 0 .00 .00 .00 +Unsuccessful Drain Requests 0 0 .00 .00 .00
Chapter 16. Near-term history information 675
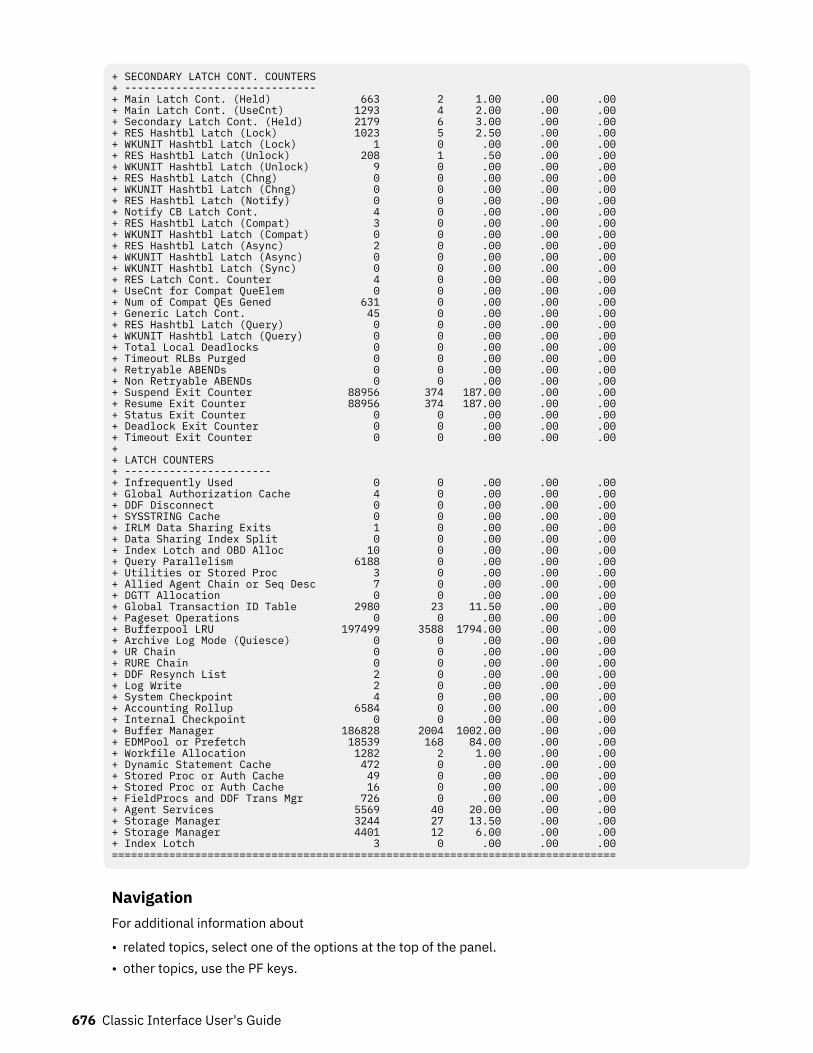
+ SECONDARY LATCH CONT. COUNTERS+ ------------------------------+ Main Latch Cont. (Held) 663 2 1.00 .00 .00 + Main Latch Cont. (UseCnt) 1293 4 2.00 .00 .00 + Secondary Latch Cont. (Held) 2179 6 3.00 .00 .00 + RES Hashtbl Latch (Lock) 1023 5 2.50 .00 .00 + WKUNIT Hashtbl Latch (Lock) 1 0 .00 .00 .00 + RES Hashtbl Latch (Unlock) 208 1 .50 .00 .00 + WKUNIT Hashtbl Latch (Unlock) 9 0 .00 .00 .00 + RES Hashtbl Latch (Chng) 0 0 .00 .00 .00 + WKUNIT Hashtbl Latch (Chng) 0 0 .00 .00 .00 + RES Hashtbl Latch (Notify) 0 0 .00 .00 .00 + Notify CB Latch Cont. 4 0 .00 .00 .00 + RES Hashtbl Latch (Compat) 3 0 .00 .00 .00 + WKUNIT Hashtbl Latch (Compat) 0 0 .00 .00 .00 + RES Hashtbl Latch (Async) 2 0 .00 .00 .00 + WKUNIT Hashtbl Latch (Async) 0 0 .00 .00 .00 + WKUNIT Hashtbl Latch (Sync) 0 0 .00 .00 .00 + RES Latch Cont. Counter 4 0 .00 .00 .00 + UseCnt for Compat QueElem 0 0 .00 .00 .00+ Num of Compat QEs Gened 631 0 .00 .00 .00+ Generic Latch Cont. 45 0 .00 .00 .00+ RES Hashtbl Latch (Query) 0 0 .00 .00 .00+ WKUNIT Hashtbl Latch (Query) 0 0 .00 .00 .00+ Total Local Deadlocks 0 0 .00 .00 .00+ Timeout RLBs Purged 0 0 .00 .00 .00+ Retryable ABENDs 0 0 .00 .00 .00+ Non Retryable ABENDs 0 0 .00 .00 .00+ Suspend Exit Counter 88956 374 187.00 .00 .00+ Resume Exit Counter 88956 374 187.00 .00 .00+ Status Exit Counter 0 0 .00 .00 .00+ Deadlock Exit Counter 0 0 .00 .00 .00+ Timeout Exit Counter 0 0 .00 .00 .00++ LATCH COUNTERS+ -----------------------+ Infrequently Used 0 0 .00 .00 .00 + Global Authorization Cache 4 0 .00 .00 .00 + DDF Disconnect 0 0 .00 .00 .00 + SYSSTRING Cache 0 0 .00 .00 .00 + IRLM Data Sharing Exits 1 0 .00 .00 .00 + Data Sharing Index Split 0 0 .00 .00 .00 + Index Lotch and OBD Alloc 10 0 .00 .00 .00 + Query Parallelism 6188 0 .00 .00 .00 + Utilities or Stored Proc 3 0 .00 .00 .00 + Allied Agent Chain or Seq Desc 7 0 .00 .00 .00 + DGTT Allocation 0 0 .00 .00 .00 + Global Transaction ID Table 2980 23 11.50 .00 .00 + Pageset Operations 0 0 .00 .00 .00 + Bufferpool LRU 197499 3588 1794.00 .00 .00 + Archive Log Mode (Quiesce) 0 0 .00 .00 .00 + UR Chain 0 0 .00 .00 .00 + RURE Chain 0 0 .00 .00 .00 + DDF Resynch List 2 0 .00 .00 .00 + Log Write 2 0 .00 .00 .00 + System Checkpoint 4 0 .00 .00 .00+ Accounting Rollup 6584 0 .00 .00 .00+ Internal Checkpoint 0 0 .00 .00 .00+ Buffer Manager 186828 2004 1002.00 .00 .00+ EDMPool or Prefetch 18539 168 84.00 .00 .00+ Workfile Allocation 1282 2 1.00 .00 .00+ Dynamic Statement Cache 472 0 .00 .00 .00+ Stored Proc or Auth Cache 49 0 .00 .00 .00+ Stored Proc or Auth Cache 16 0 .00 .00 .00+ FieldProcs and DDF Trans Mgr 726 0 .00 .00 .00+ Agent Services 5569 40 20.00 .00 .00+ Storage Manager 3244 27 13.50 .00 .00+ Storage Manager 4401 12 6.00 .00 .00+ Index Lotch 3 0 .00 .00 .00===============================================================================
NavigationFor additional information about
• related topics, select one of the options at the top of the panel.• other topics, use the PF keys.
676 Classic Interface User's Guide

FieldsCollection Interval
The time interval specified for the collection of near-term history data. This unit of time was specifiedwhen the Near-Term History Data Collector was started.
StartThe start time of the interval currently displayed.
Report IntervalThis field determines the report interval. It is set on the Near-Term History Report Option panel.
Combine LevelThis field reflects the selected combine level. If Combine Level is NONE, the report interval is thesame as the collection interval. Possible values:HOURLY
Data will be reported in hourly intervals.NONE
Data will be reported in the time unit specified by the collection interval.End
The end time of the interval currently displayed.
For each of the following fields, the following statistics are provided:INTERVAL QUANTITY
The amount of activities that occur during the interval./MINUTE
Rate per minute. The number under /MINUTE (in parentheses) is the number of minutes in theinterval.
/THREADRate per thread. The number under /THREAD (in parentheses) is the number of Create Threads duringthe interval.
/COMMITRate per Commit. The number under /COMMIT (in parentheses) is the number of Commit requests(including abort requests) during the interval.
Deadlocks DetectedThe number of deadlocks detected.
Timeouts DetectedOccasions when suspension of a unit of work lasted longer than the Internal Resource Lock Manager(IRLM) timeout value.
Susp Detected - Lock OnlySuspensions of a unit of work because a lock could not be obtained.
Susp Detected - Latch OnlyDB2 internal latch suspensions.
Susp Detected - OtherSuspensions caused by something other than locks and latches.
Lock Escalations - to SharedOccasions when the allowable number of locks per tablespace was exceeded, causing a page (IS) lockto escalate to a shared (S) lock.
Lock Escalations - to ExclusiveOccasions when the allowable number of locks per tablespace was exceeded, causing a page (IX) lockto escalate to an exclusive (X) lock.
Lock RequestsRequests to IRLM to obtain a lock on a resource.
Chapter 16. Near-term history information 677
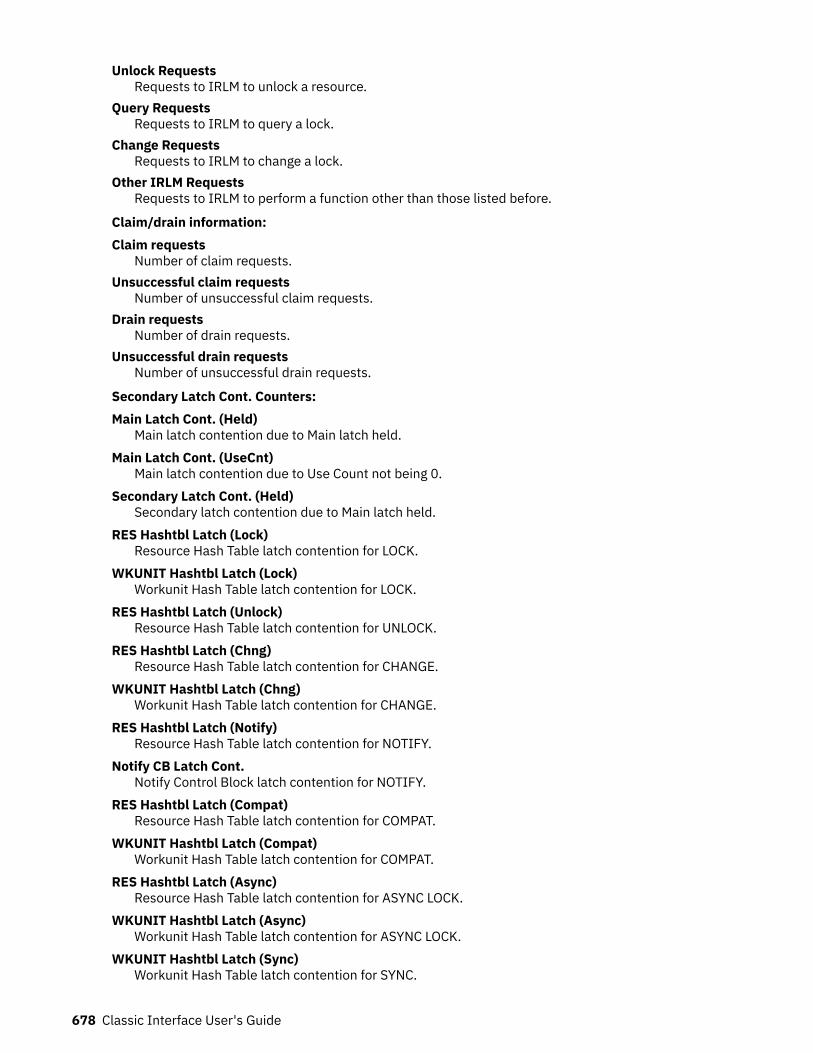
Unlock RequestsRequests to IRLM to unlock a resource.
Query RequestsRequests to IRLM to query a lock.
Change RequestsRequests to IRLM to change a lock.
Other IRLM RequestsRequests to IRLM to perform a function other than those listed before.
Claim/drain information:Claim requests
Number of claim requests.Unsuccessful claim requests
Number of unsuccessful claim requests.Drain requests
Number of drain requests.Unsuccessful drain requests
Number of unsuccessful drain requests.
Secondary Latch Cont. Counters:Main Latch Cont. (Held)
Main latch contention due to Main latch held.Main Latch Cont. (UseCnt)
Main latch contention due to Use Count not being 0.Secondary Latch Cont. (Held)
Secondary latch contention due to Main latch held.RES Hashtbl Latch (Lock)
Resource Hash Table latch contention for LOCK.WKUNIT Hashtbl Latch (Lock)
Workunit Hash Table latch contention for LOCK.RES Hashtbl Latch (Unlock)
Resource Hash Table latch contention for UNLOCK.RES Hashtbl Latch (Chng)
Resource Hash Table latch contention for CHANGE.WKUNIT Hashtbl Latch (Chng)
Workunit Hash Table latch contention for CHANGE.RES Hashtbl Latch (Notify)
Resource Hash Table latch contention for NOTIFY.Notify CB Latch Cont.
Notify Control Block latch contention for NOTIFY.RES Hashtbl Latch (Compat)
Resource Hash Table latch contention for COMPAT.WKUNIT Hashtbl Latch (Compat)
Workunit Hash Table latch contention for COMPAT.RES Hashtbl Latch (Async)
Resource Hash Table latch contention for ASYNC LOCK.WKUNIT Hashtbl Latch (Async)
Workunit Hash Table latch contention for ASYNC LOCK.WKUNIT Hashtbl Latch (Sync)
Workunit Hash Table latch contention for SYNC.
678 Classic Interface User's Guide
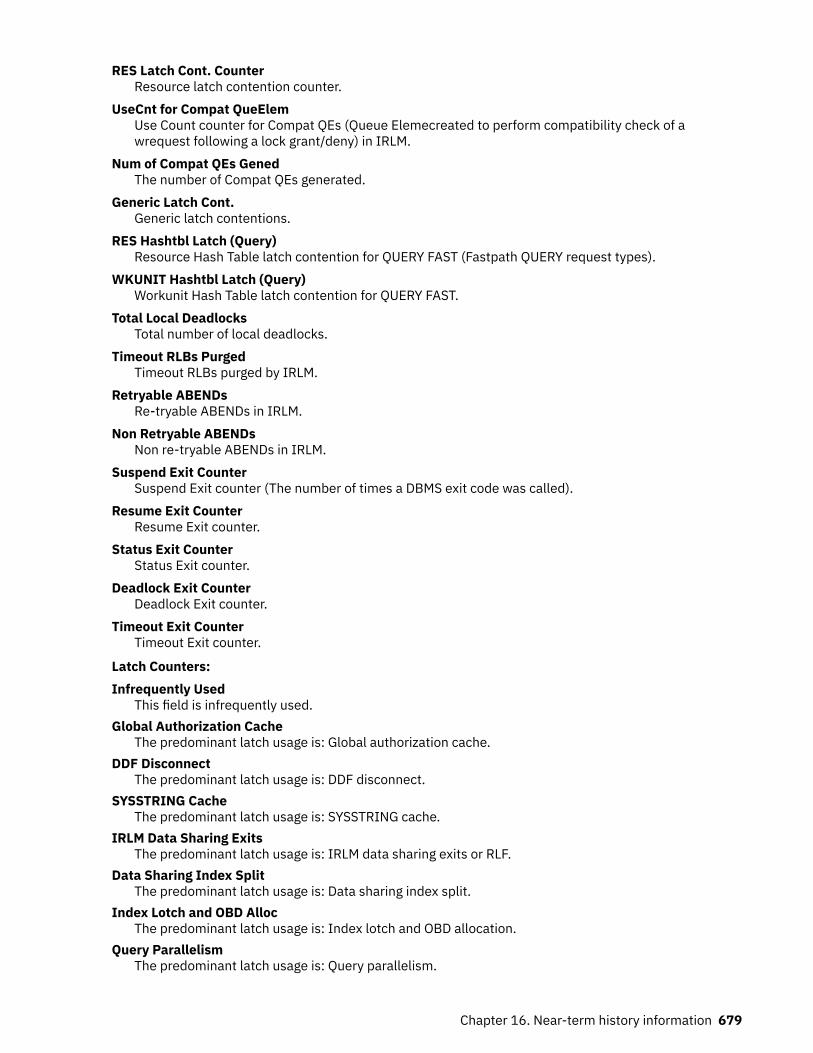
RES Latch Cont. CounterResource latch contention counter.
UseCnt for Compat QueElemUse Count counter for Compat QEs (Queue Elemecreated to perform compatibility check of awrequest following a lock grant/deny) in IRLM.
Num of Compat QEs GenedThe number of Compat QEs generated.
Generic Latch Cont.Generic latch contentions.
RES Hashtbl Latch (Query)Resource Hash Table latch contention for QUERY FAST (Fastpath QUERY request types).
WKUNIT Hashtbl Latch (Query)Workunit Hash Table latch contention for QUERY FAST.
Total Local DeadlocksTotal number of local deadlocks.
Timeout RLBs PurgedTimeout RLBs purged by IRLM.
Retryable ABENDsRe-tryable ABENDs in IRLM.
Non Retryable ABENDsNon re-tryable ABENDs in IRLM.
Suspend Exit CounterSuspend Exit counter (The number of times a DBMS exit code was called).
Resume Exit CounterResume Exit counter.
Status Exit CounterStatus Exit counter.
Deadlock Exit CounterDeadlock Exit counter.
Timeout Exit CounterTimeout Exit counter.
Latch Counters:Infrequently Used
This field is infrequently used.Global Authorization Cache
The predominant latch usage is: Global authorization cache.DDF Disconnect
The predominant latch usage is: DDF disconnect.SYSSTRING Cache
The predominant latch usage is: SYSSTRING cache.IRLM Data Sharing Exits
The predominant latch usage is: IRLM data sharing exits or RLF.Data Sharing Index Split
The predominant latch usage is: Data sharing index split.Index Lotch and OBD Alloc
The predominant latch usage is: Index lotch and OBD allocation.Query Parallelism
The predominant latch usage is: Query parallelism.
Chapter 16. Near-term history information 679
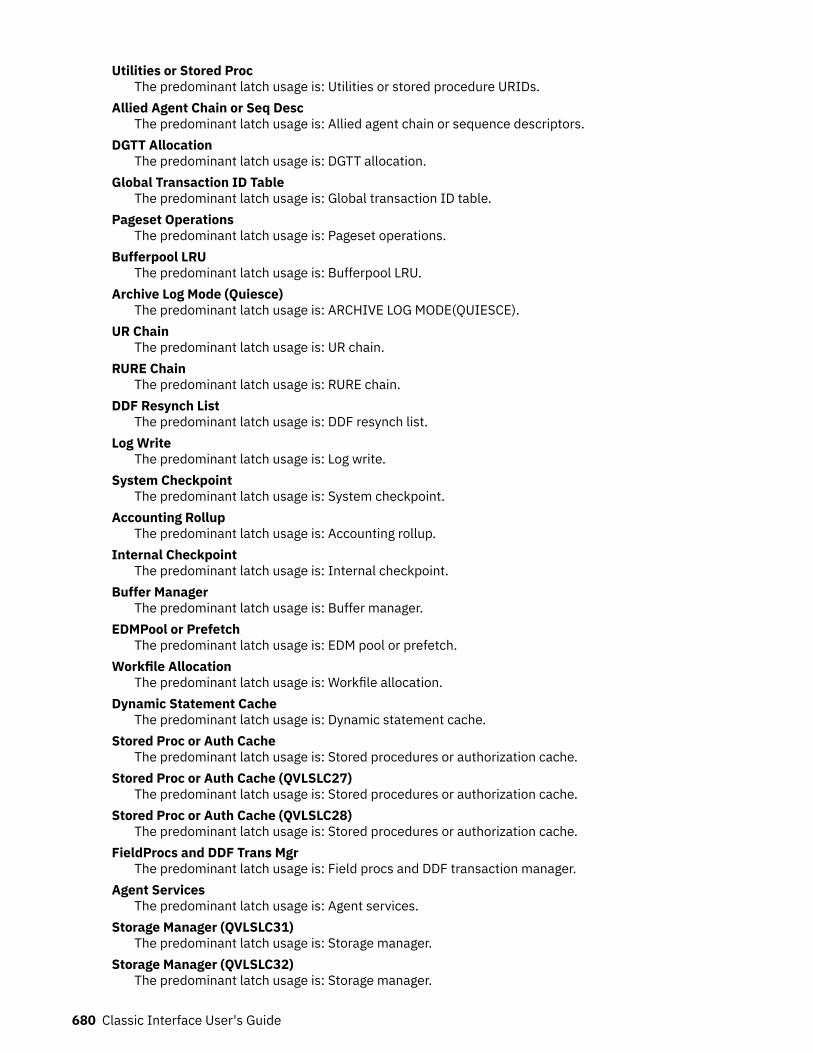
Utilities or Stored ProcThe predominant latch usage is: Utilities or stored procedure URIDs.
Allied Agent Chain or Seq DescThe predominant latch usage is: Allied agent chain or sequence descriptors.
DGTT AllocationThe predominant latch usage is: DGTT allocation.
Global Transaction ID TableThe predominant latch usage is: Global transaction ID table.
Pageset OperationsThe predominant latch usage is: Pageset operations.
Bufferpool LRUThe predominant latch usage is: Bufferpool LRU.
Archive Log Mode (Quiesce)The predominant latch usage is: ARCHIVE LOG MODE(QUIESCE).
UR ChainThe predominant latch usage is: UR chain.
RURE ChainThe predominant latch usage is: RURE chain.
DDF Resynch ListThe predominant latch usage is: DDF resynch list.
Log WriteThe predominant latch usage is: Log write.
System CheckpointThe predominant latch usage is: System checkpoint.
Accounting RollupThe predominant latch usage is: Accounting rollup.
Internal CheckpointThe predominant latch usage is: Internal checkpoint.
Buffer ManagerThe predominant latch usage is: Buffer manager.
EDMPool or PrefetchThe predominant latch usage is: EDM pool or prefetch.
Workfile AllocationThe predominant latch usage is: Workfile allocation.
Dynamic Statement CacheThe predominant latch usage is: Dynamic statement cache.
Stored Proc or Auth CacheThe predominant latch usage is: Stored procedures or authorization cache.
Stored Proc or Auth Cache (QVLSLC27)The predominant latch usage is: Stored procedures or authorization cache.
Stored Proc or Auth Cache (QVLSLC28)The predominant latch usage is: Stored procedures or authorization cache.
FieldProcs and DDF Trans MgrThe predominant latch usage is: Field procs and DDF transaction manager.
Agent ServicesThe predominant latch usage is: Agent services.
Storage Manager (QVLSLC31)The predominant latch usage is: Storage manager.
Storage Manager (QVLSLC32)The predominant latch usage is: Storage manager.
680 Classic Interface User's Guide
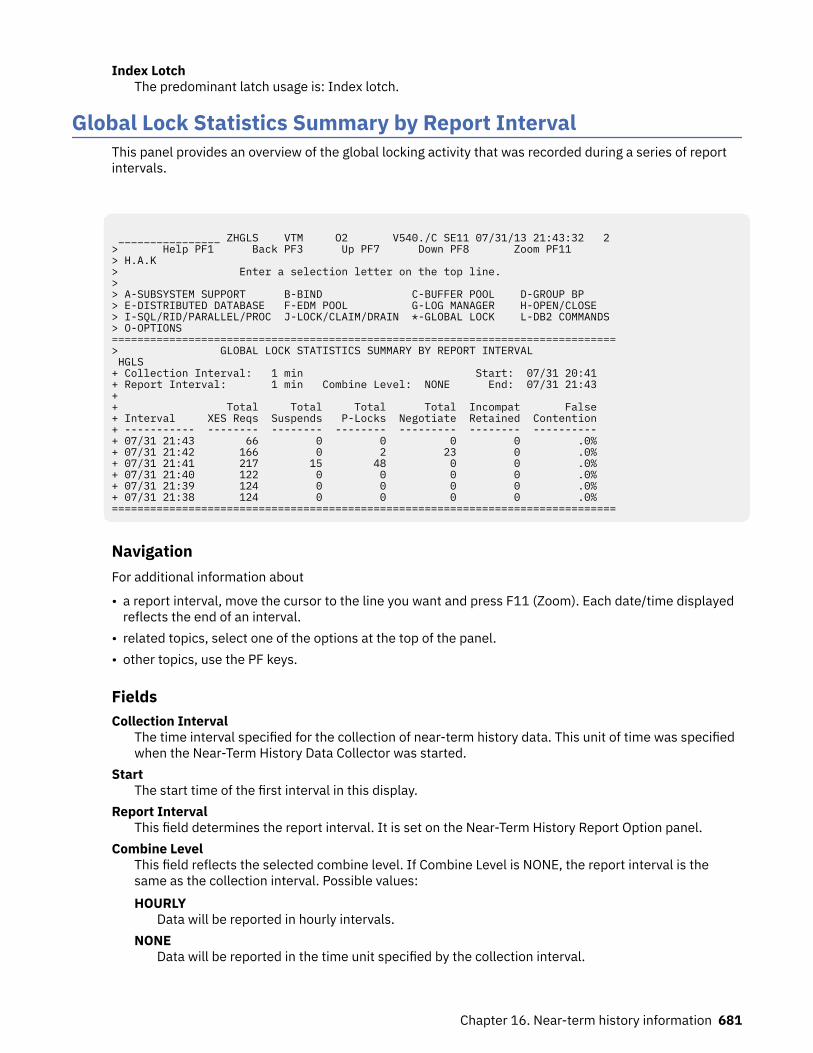
Index LotchThe predominant latch usage is: Index lotch.
Global Lock Statistics Summary by Report IntervalThis panel provides an overview of the global locking activity that was recorded during a series of reportintervals.
________________ ZHGLS VTM O2 V540./C SE11 07/31/13 21:43:32 2 > Help PF1 Back PF3 Up PF7 Down PF8 Zoom PF11 > H.A.K > Enter a selection letter on the top line. > > A-SUBSYSTEM SUPPORT B-BIND C-BUFFER POOL D-GROUP BP > E-DISTRIBUTED DATABASE F-EDM POOL G-LOG MANAGER H-OPEN/CLOSE > I-SQL/RID/PARALLEL/PROC J-LOCK/CLAIM/DRAIN *-GLOBAL LOCK L-DB2 COMMANDS > O-OPTIONS ===============================================================================> GLOBAL LOCK STATISTICS SUMMARY BY REPORT INTERVAL HGLS + Collection Interval: 1 min Start: 07/31 20:41 + Report Interval: 1 min Combine Level: NONE End: 07/31 21:43 + + Total Total Total Total Incompat False + Interval XES Reqs Suspends P-Locks Negotiate Retained Contention + ----------- -------- -------- -------- --------- -------- ---------- + 07/31 21:43 66 0 0 0 0 .0% + 07/31 21:42 166 0 2 23 0 .0% + 07/31 21:41 217 15 48 0 0 .0% + 07/31 21:40 122 0 0 0 0 .0% + 07/31 21:39 124 0 0 0 0 .0% + 07/31 21:38 124 0 0 0 0 .0% ===============================================================================
NavigationFor additional information about
• a report interval, move the cursor to the line you want and press F11 (Zoom). Each date/time displayedreflects the end of an interval.
• related topics, select one of the options at the top of the panel.• other topics, use the PF keys.
FieldsCollection Interval
The time interval specified for the collection of near-term history data. This unit of time was specifiedwhen the Near-Term History Data Collector was started.
StartThe start time of the first interval in this display.
Report IntervalThis field determines the report interval. It is set on the Near-Term History Report Option panel.
Combine LevelThis field reflects the selected combine level. If Combine Level is NONE, the report interval is thesame as the collection interval. Possible values:HOURLY
Data will be reported in hourly intervals.NONE
Data will be reported in the time unit specified by the collection interval.
Chapter 16. Near-term history information 681
EndThe end time of the last interval in this display.
IntervalProvides the date and time that mark the end of the report interval.
Total XES RequestsThe total number of lock, change, and unlock requests that were propagated to MVS eithersynchronously or asynchronously.
Total SuspendsThe total number of XES requests that resulted in a suspension. This includes suspends for InternalResource Lock Manager (IRLM) global contention, XES global contention, or false contention.
Total P-LocksThe total number of lock, change, and unlock requests for P-locks.
Total NegotiateThe number of times that this DB2 member was driven to negotiate a P-lock.
Incompat RetainedThe number of global lock or change requests that failed because of an incompatible retained lock.Certain P-locks can be retained because of a system failure. Another DB2 member cannot access thedata that the retained P-lock is protecting unless it requests a P-lock in a compatible state.
False ContentionThe rate of false contentions to real contentions.
Global Lock Statistics DetailThis panel shows detailed information about global locking activity in a data sharing environment during aselected report interval.
682 Classic Interface User's Guide
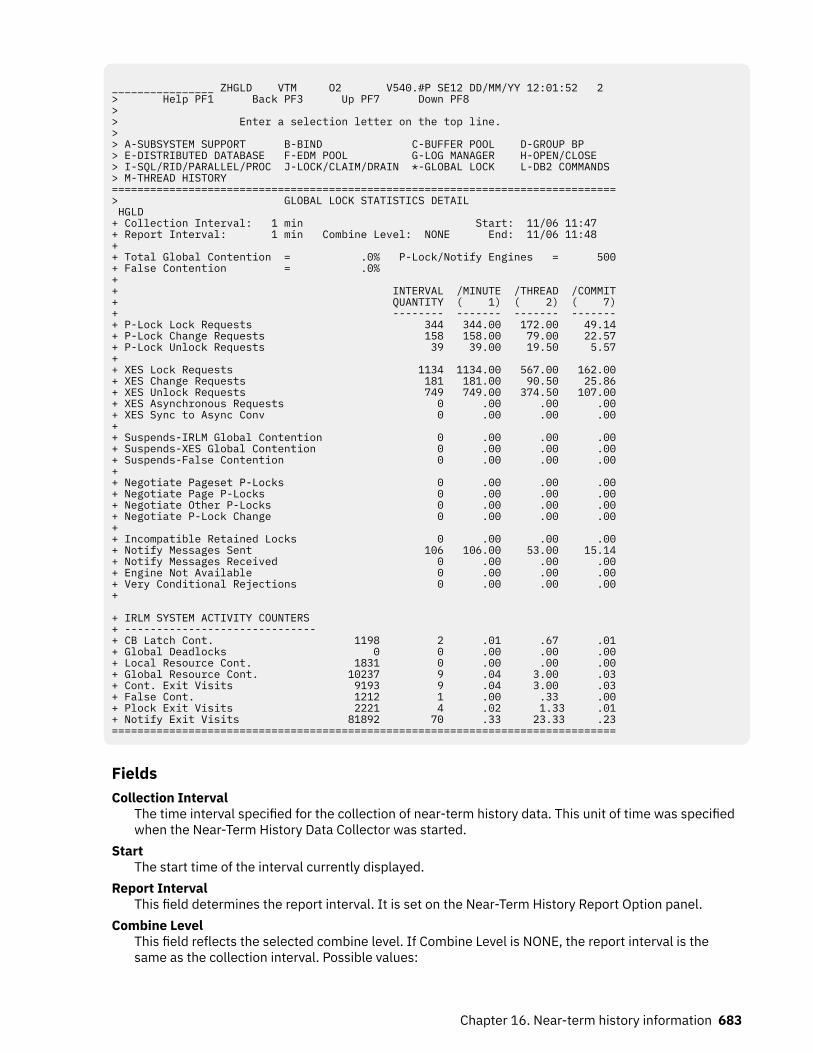
________________ ZHGLD VTM O2 V540.#P SE12 DD/MM/YY 12:01:52 2 > Help PF1 Back PF3 Up PF7 Down PF8 > > Enter a selection letter on the top line. > > A-SUBSYSTEM SUPPORT B-BIND C-BUFFER POOL D-GROUP BP > E-DISTRIBUTED DATABASE F-EDM POOL G-LOG MANAGER H-OPEN/CLOSE > I-SQL/RID/PARALLEL/PROC J-LOCK/CLAIM/DRAIN *-GLOBAL LOCK L-DB2 COMMANDS > M-THREAD HISTORY ===============================================================================> GLOBAL LOCK STATISTICS DETAIL HGLD + Collection Interval: 1 min Start: 11/06 11:47 + Report Interval: 1 min Combine Level: NONE End: 11/06 11:48 + + Total Global Contention = .0% P-Lock/Notify Engines = 500+ False Contention = .0% + + INTERVAL /MINUTE /THREAD /COMMIT+ QUANTITY ( 1) ( 2) ( 7)+ -------- ------- ------- -------+ P-Lock Lock Requests 344 344.00 172.00 49.14+ P-Lock Change Requests 158 158.00 79.00 22.57+ P-Lock Unlock Requests 39 39.00 19.50 5.57+ + XES Lock Requests 1134 1134.00 567.00 162.00+ XES Change Requests 181 181.00 90.50 25.86+ XES Unlock Requests 749 749.00 374.50 107.00+ XES Asynchronous Requests 0 .00 .00 .00+ XES Sync to Async Conv 0 .00 .00 .00+ + Suspends-IRLM Global Contention 0 .00 .00 .00+ Suspends-XES Global Contention 0 .00 .00 .00+ Suspends-False Contention 0 .00 .00 .00+ + Negotiate Pageset P-Locks 0 .00 .00 .00+ Negotiate Page P-Locks 0 .00 .00 .00+ Negotiate Other P-Locks 0 .00 .00 .00+ Negotiate P-Lock Change 0 .00 .00 .00+ + Incompatible Retained Locks 0 .00 .00 .00+ Notify Messages Sent 106 106.00 53.00 15.14+ Notify Messages Received 0 .00 .00 .00+ Engine Not Available 0 .00 .00 .00+ Very Conditional Rejections 0 .00 .00 .00+
+ IRLM SYSTEM ACTIVITY COUNTERS+ ------------------------------+ CB Latch Cont. 1198 2 .01 .67 .01+ Global Deadlocks 0 0 .00 .00 .00+ Local Resource Cont. 1831 0 .00 .00 .00 + Global Resource Cont. 10237 9 .04 3.00 .03+ Cont. Exit Visits 9193 9 .04 3.00 .03+ False Cont. 1212 1 .00 .33 .00+ Plock Exit Visits 2221 4 .02 1.33 .01+ Notify Exit Visits 81892 70 .33 23.33 .23===============================================================================
FieldsCollection Interval
The time interval specified for the collection of near-term history data. This unit of time was specifiedwhen the Near-Term History Data Collector was started.
StartThe start time of the interval currently displayed.
Report IntervalThis field determines the report interval. It is set on the Near-Term History Report Option panel.
Combine LevelThis field reflects the selected combine level. If Combine Level is NONE, the report interval is thesame as the collection interval. Possible values:
Chapter 16. Near-term history information 683
HOURLYData will be reported in hourly intervals.
NONEData will be reported in the time unit specified by the collection interval.
EndThe end time of the interval currently displayed.
Total Global ContentionThe percent of synchronous XES lock, change, or unlock requests that resulted in global contention.
False Contention PercentageThe rate of false contentions to real contentions. This number should be no more than 50%.
P-Lock/Notify EnginesThe number of engines available for P-lock exit or notify exit requests.
For each of the following fields, the following statistics are provided:INTERVAL QUANTITY
The amount of activities that occur during the interval./THREAD
Rate per thread. The number under /THREAD (in parentheses) is the number of Create Threads duringthe interval.
/COMMITRate per Commit. The number under /COMMIT (in parentheses) is the number of Commit requests(including abort requests) during the interval.
P-lock Lock RequestsNumber of lock requests for P-locks. A P-lock is a physical lock used only in a data sharingenvironment to provide consistency of data cached in different DB2 subsystems.
P-lock Change RequestsNumber of change requests for P-locks.
P-lock Unlock RequestsNumber of unlock requests for P-locks.
XES Lock RequestsThe number of lock requests (both logical and physical) that were propagated to MVS XESsynchronously under the caller's execution unit. This count does not include suspended requests.Only the most restrictive lock for a particular resource is propagated to XES and the coupling facility.
XES Unlock RequestsThe number of unlock requests (both logical and physical) that are propagated to MVS XESsynchronously under the caller's execution unit. This count does not include suspended requests.
XES Change RequestsThe number of change requests (both logical and physical) that were propagated to MVS XESsynchronously under the caller's execution unit. This count does not include suspended requests.
XES Asynchronous RequestsThe number of L-locks and P-locks propagated to XES asynchronously. This occurs when a new inter-DB2 interest occurs on a parent resource or when a request completes after the requestor's executionunit has been suspended.
XES Sync to Async ConvThe number of sync to async heuristic conversions for LOCK requests in XES. This conversion is donewhen XES determines that it is more efficient to drive the request asynchronously to the CF.
Suspends-IRLM Global ContentionThe number of suspends due to Internal Resource Lock Manager (IRLM) global resource contentions.IRLM lock states were in conflict and inter-system communication is required to resolve the conflict.
Suspends-XES Global ContentionThe number of suspends due to MVS XES global resource contentions that were not IRLM-levelcontentions. The XES lock states were in conflict, but the IRLM lock states were not.
684 Classic Interface User's Guide
Suspends-False ContentionThe number of suspends caused by MVS XES false contentions. XES detects hash class contentionwhen two different locks on different resources hash to the same entry in the coupling facility locktable. The requester is suspended until it is determined that no real lock contention exists.
Negotiate Pageset P-LocksThe number of times this DB2 member was driven to negotiate a pageset/partition P-lock because ofchanging inter-DB2 interest levels on the pageset/partition.
Negotiate Page P-LocksThe number of times this DB2 member was driven to negotiate a page P-lock because of inter-DB2 P-lock contention.
Negotiate Other P-LocksThe number of times this DB2 member was driven to negotiate a P-lock type other than pageset/partition or page.
Negotiate P-Lock ChangeThe number of times a P-lock change request was issued during P-lock negotiation.
Incompatible Retained LocksThe number of global lock or change requests that failed because of an incompatible retained lock.Certain P-locks can be retained because of a system failure. Another DB2 member cannot access thedata that the retained P-lock is protecting unless it requests a P-lock in a compatible state.
Notify Messages SentThe number of notify messages sent.
Notify Messages ReceivedThe number of notify messages received.
Engine Not AvailableThe number of times an engine was not available for a P-lock exit or a notify exit request.
Very Conditional RejectionsThe number of rejections of very conditional requests which could not get processed because of theheuristic algorithm used by XES.
IRLM System Activity Counters:CB Latch Cont.
Active IRLM Control Block latch contention counter.Global Deadlocks
Total number of global deadlocks.Local Resource Cont.
Local resource contentions.Global Resource Cont.
Global resource contentions.Cont. Exit Visits
Visits to the contention exit, and IRLM granted the request. How many times lock contention wasfound and the request was sent to IRLM contention Exit, and the request was granted.
False Cont.False contentions.
Plock Exit VisitsPlock Exit counter.
Notify Exit VisitsNotify Exit counter.
Chapter 16. Near-term history information 685
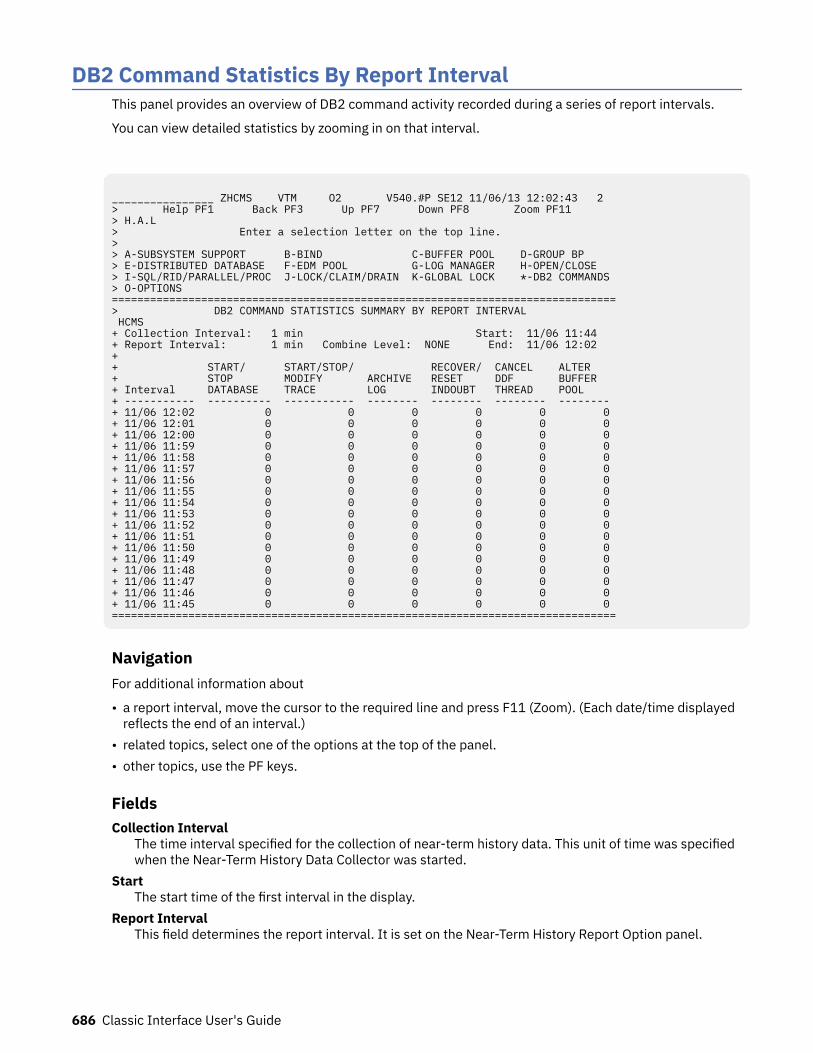
DB2 Command Statistics By Report IntervalThis panel provides an overview of DB2 command activity recorded during a series of report intervals.
You can view detailed statistics by zooming in on that interval.
________________ ZHCMS VTM O2 V540.#P SE12 11/06/13 12:02:43 2 > Help PF1 Back PF3 Up PF7 Down PF8 Zoom PF11 > H.A.L > Enter a selection letter on the top line. > > A-SUBSYSTEM SUPPORT B-BIND C-BUFFER POOL D-GROUP BP > E-DISTRIBUTED DATABASE F-EDM POOL G-LOG MANAGER H-OPEN/CLOSE > I-SQL/RID/PARALLEL/PROC J-LOCK/CLAIM/DRAIN K-GLOBAL LOCK *-DB2 COMMANDS > O-OPTIONS ===============================================================================> DB2 COMMAND STATISTICS SUMMARY BY REPORT INTERVAL HCMS + Collection Interval: 1 min Start: 11/06 11:44 + Report Interval: 1 min Combine Level: NONE End: 11/06 12:02 + + START/ START/STOP/ RECOVER/ CANCEL ALTER + STOP MODIFY ARCHIVE RESET DDF BUFFER + Interval DATABASE TRACE LOG INDOUBT THREAD POOL + ----------- ---------- ----------- -------- -------- -------- -------- + 11/06 12:02 0 0 0 0 0 0 + 11/06 12:01 0 0 0 0 0 0 + 11/06 12:00 0 0 0 0 0 0 + 11/06 11:59 0 0 0 0 0 0 + 11/06 11:58 0 0 0 0 0 0 + 11/06 11:57 0 0 0 0 0 0 + 11/06 11:56 0 0 0 0 0 0 + 11/06 11:55 0 0 0 0 0 0 + 11/06 11:54 0 0 0 0 0 0 + 11/06 11:53 0 0 0 0 0 0 + 11/06 11:52 0 0 0 0 0 0 + 11/06 11:51 0 0 0 0 0 0 + 11/06 11:50 0 0 0 0 0 0 + 11/06 11:49 0 0 0 0 0 0 + 11/06 11:48 0 0 0 0 0 0 + 11/06 11:47 0 0 0 0 0 0 + 11/06 11:46 0 0 0 0 0 0 + 11/06 11:45 0 0 0 0 0 0 ===============================================================================
NavigationFor additional information about
• a report interval, move the cursor to the required line and press F11 (Zoom). (Each date/time displayedreflects the end of an interval.)
• related topics, select one of the options at the top of the panel.• other topics, use the PF keys.
FieldsCollection Interval
The time interval specified for the collection of near-term history data. This unit of time was specifiedwhen the Near-Term History Data Collector was started.
StartThe start time of the first interval in the display.
Report IntervalThis field determines the report interval. It is set on the Near-Term History Report Option panel.
686 Classic Interface User's Guide
Combine LevelThis field reflects the selected combine level. If Combine Level is NONE, the report interval is thesame as the collection interval. Possible values:HOURLY
Data will be reported in hourly intervals.NONE
Data will be reported in the time unit specified by the collection interval.
For each field described below the following statistics are provided:
• The amount of activities that occur during the interval.• Rate per minute during the interval.• Percentage of total commands during the interval.
START/STOP DATABASEThe number of Start and Stop Database commands executed this interval to change the availability ofspecified databases.
START/STOP/MODIFY TRACEThe number of Start, Stop, and Modify Trace commands executed this interval to trace activity in theDB2 subsystem.
ARCHIVE LOGThe number Archive Log commands executed to initiate a DB2 active log switch.
RECOVER/RESET INDOUBTThe number of Recover and Reset Indoubt commands executed this interval to recover or purgeindoubt threads.
CANCEL DDF THREADThe number of Cancel DDF Thread commands executed this interval to cancel a distributed thread.
ALTER BUFFERPOOLThe number of ALTER BUFFERPOOL commands executed this interval to alter attributes for active orinactive buffer pools.
DB2 Command Statistics DetailThis panel provides detailed statistics about DB2 command activity during a selected report interval.
Chapter 16. Near-term history information 687
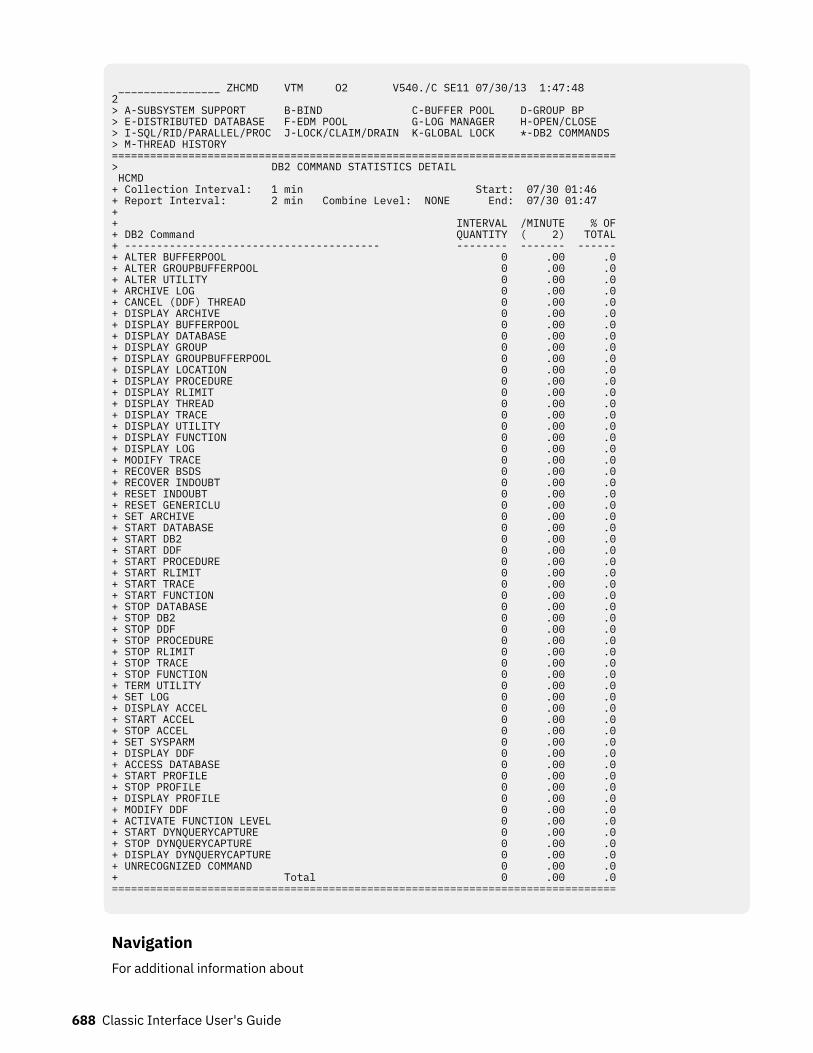
________________ ZHCMD VTM O2 V540./C SE11 07/30/13 1:47:48 2 > A-SUBSYSTEM SUPPORT B-BIND C-BUFFER POOL D-GROUP BP > E-DISTRIBUTED DATABASE F-EDM POOL G-LOG MANAGER H-OPEN/CLOSE > I-SQL/RID/PARALLEL/PROC J-LOCK/CLAIM/DRAIN K-GLOBAL LOCK *-DB2 COMMANDS > M-THREAD HISTORY =============================================================================== > DB2 COMMAND STATISTICS DETAIL HCMD + Collection Interval: 1 min Start: 07/30 01:46 + Report Interval: 2 min Combine Level: NONE End: 07/30 01:47 + + INTERVAL /MINUTE % OF + DB2 Command QUANTITY ( 2) TOTAL + ---------------------------------------- -------- ------- ------ + ALTER BUFFERPOOL 0 .00 .0 + ALTER GROUPBUFFERPOOL 0 .00 .0 + ALTER UTILITY 0 .00 .0 + ARCHIVE LOG 0 .00 .0 + CANCEL (DDF) THREAD 0 .00 .0 + DISPLAY ARCHIVE 0 .00 .0 + DISPLAY BUFFERPOOL 0 .00 .0 + DISPLAY DATABASE 0 .00 .0 + DISPLAY GROUP 0 .00 .0 + DISPLAY GROUPBUFFERPOOL 0 .00 .0 + DISPLAY LOCATION 0 .00 .0 + DISPLAY PROCEDURE 0 .00 .0 + DISPLAY RLIMIT 0 .00 .0 + DISPLAY THREAD 0 .00 .0 + DISPLAY TRACE 0 .00 .0 + DISPLAY UTILITY 0 .00 .0 + DISPLAY FUNCTION 0 .00 .0 + DISPLAY LOG 0 .00 .0 + MODIFY TRACE 0 .00 .0 + RECOVER BSDS 0 .00 .0 + RECOVER INDOUBT 0 .00 .0 + RESET INDOUBT 0 .00 .0 + RESET GENERICLU 0 .00 .0 + SET ARCHIVE 0 .00 .0 + START DATABASE 0 .00 .0+ START DB2 0 .00 .0+ START DDF 0 .00 .0+ START PROCEDURE 0 .00 .0+ START RLIMIT 0 .00 .0+ START TRACE 0 .00 .0+ START FUNCTION 0 .00 .0+ STOP DATABASE 0 .00 .0+ STOP DB2 0 .00 .0+ STOP DDF 0 .00 .0+ STOP PROCEDURE 0 .00 .0+ STOP RLIMIT 0 .00 .0+ STOP TRACE 0 .00 .0+ STOP FUNCTION 0 .00 .0+ TERM UTILITY 0 .00 .0+ SET LOG 0 .00 .0+ DISPLAY ACCEL 0 .00 .0+ START ACCEL 0 .00 .0+ STOP ACCEL 0 .00 .0+ SET SYSPARM 0 .00 .0+ DISPLAY DDF 0 .00 .0+ ACCESS DATABASE 0 .00 .0+ START PROFILE 0 .00 .0+ STOP PROFILE 0 .00 .0+ DISPLAY PROFILE 0 .00 .0+ MODIFY DDF 0 .00 .0+ ACTIVATE FUNCTION LEVEL 0 .00 .0 + START DYNQUERYCAPTURE 0 .00 .0 + STOP DYNQUERYCAPTURE 0 .00 .0 + DISPLAY DYNQUERYCAPTURE 0 .00 .0 + UNRECOGNIZED COMMAND 0 .00 .0+ Total 0 .00 .0===============================================================================
NavigationFor additional information about
688 Classic Interface User's Guide
• related topics, select one of the options at the top of the panel.• other topics, use the PF keys.
FieldsCollection Interval
The time interval specified for the collection of near-term history data. This unit of time was specifiedwhen the Near-Term History Data Collector was started.
StartThe start time of the interval currently displayed.
Report IntervalThis field determines the report interval. It is set on the Near-Term History Report Option panel.
Combine LevelThis field reflects the selected combine level. If Combine Level is NONE, the report interval is thesame as the collection interval. Possible values:HOURLY
Data will be reported in hourly intervals.NONE
Data will be reported in the time unit specified by the collection interval.End
The end time of the interval currently displayed.
For each field described below the following statistics are provided:
• Interval quantity, which is the activity during the interval.• Rate per minute during the interval.• Percentage of total commands during the interval.
ALTER BUFFERPOOLALTER BUFFERPOOL commands executed to alter attributes for active or inactive buffer pools.
ALTER GROUPBUFFERPOOLALTER GROUPBUFFERPOOL commands executed to alter attributes for group buffer pools.
ALTER UTILITYALTER UTILITY commands executed to change the values of certain parameters of an execution ofthe REORG utility that uses SHRLEVEL REFERENCE or CHANGE.
ARCHIVE LOGARCHIVE LOG commands executed to initiate a DB2 active log switch.
CANCEL (DDF) THREADCANCEL DDF THREAD commands executed to cancel a distributed thread.
DISPLAY ARCHIVEDISPLAY ARCHIVE commands executed to display input archive log information.
DISPLAY BUFFERPOOLDISPLAY BUFFERPOOL commands executed to display statistics for active or inactive buffer pools.
DISPLAY DATABASEDISPLAY DATABASE commands executed to display status information about tablespaces andindexspaces within a database.
DISPLAY GROUPDISPLAY GROUP commands executed to display statistics about the data sharing group to which theDB2 subsystem belongs.
DISPLAY GROUPBUFFERPOOLDISPLAY GROUPBUFFERPOOL commands executed to display attributes of group buffer pools.
Chapter 16. Near-term history information 689
DISPLAY LOCATIONDISPLAY LOCATION commands executed to display statistics of threads with distributedrelationships.
DISPLAY PROCEDUREDISPLAY PROCEDURE commands execute to display statistics about stored procedures.
DISPLAY RLIMITDISPLAY RLIMIT commands executed to display the current status of the resource limit facility.
DISPLAY THREADDISPLAY THREAD commands executed to display status information about DB2 threads.
DISPLAY TRACEDISPLAY TRACE commands executed to display a list of active traces.
DISPLAY UTILITYDISPLAY UTILITY commands executed to display status information about DB2 utility jobs.
DISPLAY FUNCTIONDISPLAY FUNCTION specific commands executed to display statistics about external user-definedfunctions accessed by DB2 applications.
DISPLAY LOGDISPLAY LOG commands executed to display log information and the status of the offload task.
MODIFY TRACEMODIFY TRACE commands executed to change the IFCIDs being traced for an active trace.
RECOVER BSDSRECOVER BSDS commands executed to recover a boot strap data set that has been disabled by anerror.
RECOVER INDOUBTRECOVER INDOUBT commands executed to recover threads left in the indoubt status.
RESET GENERICLURESET GENERICLU commands executed to purge information stored by VTAM in the coupling facilityfor one or more partners of a particular DB2 subsystem.
RESET INDOUBTRESET INDOUBT commands executed to purge indoubt thread information.
SET ARCHIVESET ARCHIVE commands executed to change the maximum tape units and the deallocation timeparameters originally set in the installation parameters.
START DATABASESTART DATABASE commands executed to make stopped databases available for use.
START DB2START DB2 commands executed.
START DDFSTART DDF commands executed to start the distributed data facility.
START PROCEDURESTART PROCEDURE commands executed to activate the definition of a stored procedure which isstopped, or which refreshes a stored procedure that is cached.
START RLIMITSTART RLIMIT commands executed to start the resource limit facility.
START TRACESTART TRACE commands executed to begin collection of DB2 trace records.
START FUNCTIONSTART FUNCTION specific commands executed to activate an external function that is stopped. Built-in functions or user-defined functions that are sourced on another function cannot be started.
STOP DATABASESTOP DATABASE commands executed to make specified databases unavailable for use.
690 Classic Interface User's Guide
STOP DB2STOP DB2 commands executed.
STOP DDFSTOP DDF commands executed to stop the distributed data facility.
STOP PROCEDURESTOP PROCEDURE commands executed to prevent DB2 from accepting SQL CALL statements for oneor more stored procedures.
STOP RLIMITSTOP RLIMIT commands executed to stop the resource limit facility.
STOP TRACESTOP TRACE commands executed to stop collection of DB2 trace records.
STOP FUNCTIONSTOP FUNCTION specific commands executed to prevent DB2 from accepting SQL statements withinvocations of the specified functions. You cannot stop built-in functions or user-defined functionsthat are sourced on another function.
TERM UTILITYTERM UTILITY commands executed to terminate execution of a utility job.
SET LOGSET LOG commands executed to modify the checkpoint frequency specified during installation.
DISPLAY ACCELDisplay Accelerator commands that are executed to display details about accelerators that areconnected to the current subsystem.
START ACCELStart Accelerator commands that are executed to activate an accelerator.
STOP ACCELStop Accelerator commands that are executed to deactivate an accelerator.
SET SYSPARMThe number of DB2 SET SYSPARM commands that are issued. This includes normal and abnormalcompletion of the command.
DISPLAY DDFThe number of DB2 DISPLAY DDF commands that are issued. This includes normal and abnormalcompletion of the command.
ACCESS DATABASEThe number of DB2 ACCESS DATABASE commands that are issued. This includes normal andabnormal completion of the command.
START PROFILEThe number of DB2 START PROFILE commands that are issued. This includes normal and abnormalcompletion of the command.
STOP PROFILEThe number of DB2 STOP PROFILE commands that are issued. This includes normal and abnormalcompletion of the command.
DISPLAY PROFILEThe number of DB2 DISPLAY PROFILE commands that are issued. This includes normal andabnormal completion of the command.
MODIFY DDFThe number of DB2 MODIFY DDF commands that are issued. This includes normal and abnormalcompletion of the command.This field is only displayed for DB2 10 or above.
ACTIVATE FUNCTION LEVEL (Q9STCTEN)The number of DB2 ACTIVATE FUNCTION LEVEL commands issued. This includes normal andabnormal completion of the command. DB2 12 and later.
Chapter 16. Near-term history information 691
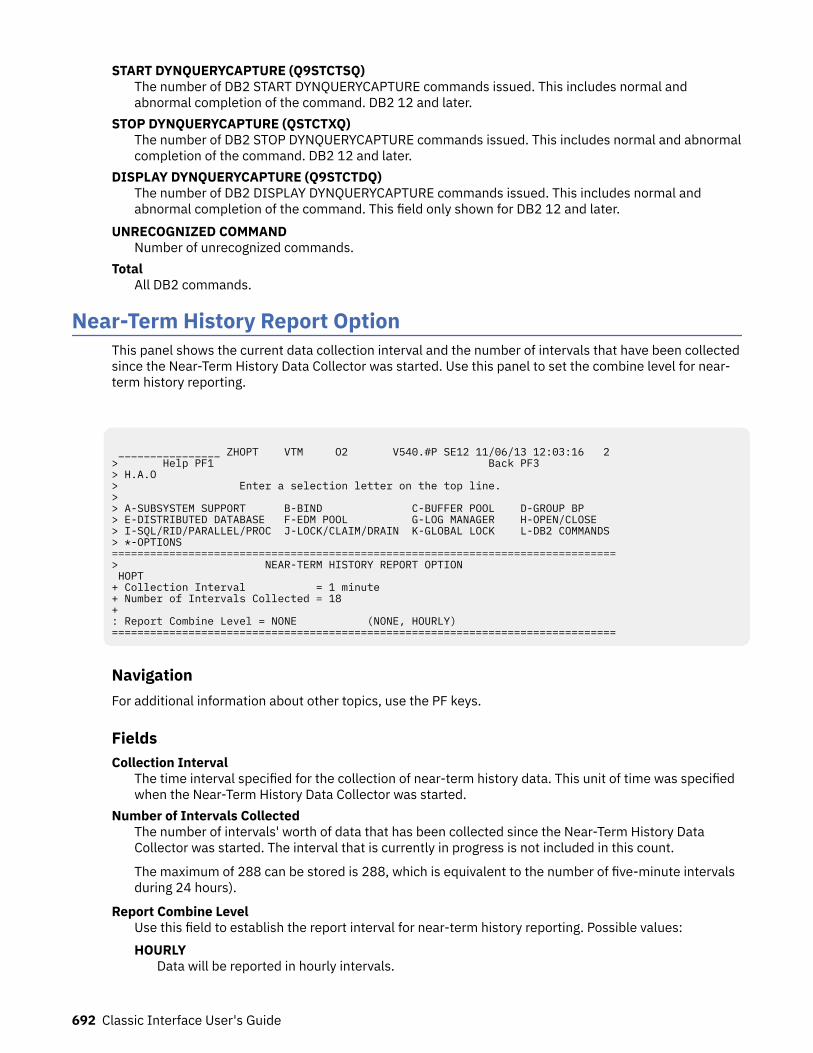
START DYNQUERYCAPTURE (Q9STCTSQ)The number of DB2 START DYNQUERYCAPTURE commands issued. This includes normal andabnormal completion of the command. DB2 12 and later.
STOP DYNQUERYCAPTURE (QSTCTXQ)The number of DB2 STOP DYNQUERYCAPTURE commands issued. This includes normal and abnormalcompletion of the command. DB2 12 and later.
DISPLAY DYNQUERYCAPTURE (Q9STCTDQ)The number of DB2 DISPLAY DYNQUERYCAPTURE commands issued. This includes normal andabnormal completion of the command. This field only shown for DB2 12 and later.
UNRECOGNIZED COMMANDNumber of unrecognized commands.
TotalAll DB2 commands.
Near-Term History Report OptionThis panel shows the current data collection interval and the number of intervals that have been collectedsince the Near-Term History Data Collector was started. Use this panel to set the combine level for near-term history reporting.
________________ ZHOPT VTM O2 V540.#P SE12 11/06/13 12:03:16 2 > Help PF1 Back PF3 > H.A.O > Enter a selection letter on the top line. > > A-SUBSYSTEM SUPPORT B-BIND C-BUFFER POOL D-GROUP BP > E-DISTRIBUTED DATABASE F-EDM POOL G-LOG MANAGER H-OPEN/CLOSE > I-SQL/RID/PARALLEL/PROC J-LOCK/CLAIM/DRAIN K-GLOBAL LOCK L-DB2 COMMANDS > *-OPTIONS =============================================================================== > NEAR-TERM HISTORY REPORT OPTION HOPT + Collection Interval = 1 minute + Number of Intervals Collected = 18 + : Report Combine Level = NONE (NONE, HOURLY) ===============================================================================
NavigationFor additional information about other topics, use the PF keys.
FieldsCollection Interval
The time interval specified for the collection of near-term history data. This unit of time was specifiedwhen the Near-Term History Data Collector was started.
Number of Intervals CollectedThe number of intervals' worth of data that has been collected since the Near-Term History DataCollector was started. The interval that is currently in progress is not included in this count.
The maximum of 288 can be stored is 288, which is equivalent to the number of five-minute intervalsduring 24 hours).
Report Combine LevelUse this field to establish the report interval for near-term history reporting. Possible values:HOURLY
Data will be reported in hourly intervals.
692 Classic Interface User's Guide
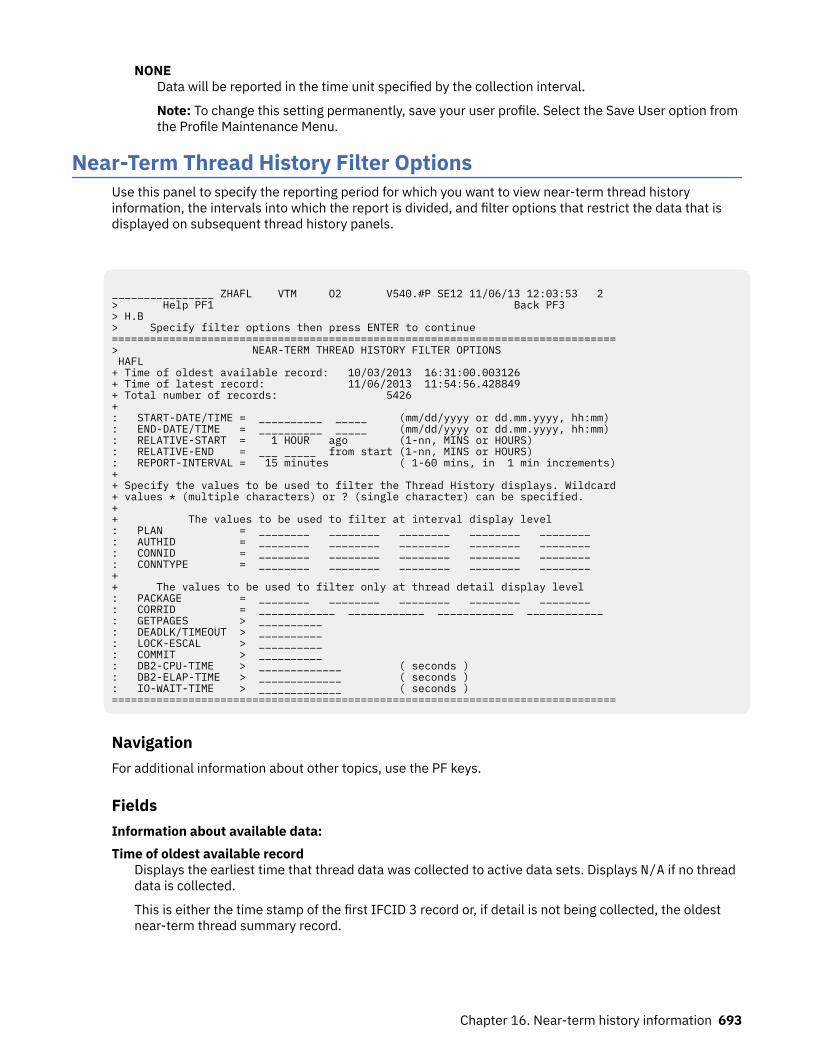
NONEData will be reported in the time unit specified by the collection interval.
Note: To change this setting permanently, save your user profile. Select the Save User option fromthe Profile Maintenance Menu.
Near-Term Thread History Filter OptionsUse this panel to specify the reporting period for which you want to view near-term thread historyinformation, the intervals into which the report is divided, and filter options that restrict the data that isdisplayed on subsequent thread history panels.
________________ ZHAFL VTM O2 V540.#P SE12 11/06/13 12:03:53 2 > Help PF1 Back PF3 > H.B > Specify filter options then press ENTER to continue =============================================================================== > NEAR-TERM THREAD HISTORY FILTER OPTIONS HAFL + Time of oldest available record: 10/03/2013 16:31:00.003126 + Time of latest record: 11/06/2013 11:54:56.428849 + Total number of records: 5426 + : START-DATE/TIME = __________ _____ (mm/dd/yyyy or dd.mm.yyyy, hh:mm) : END-DATE/TIME = __________ _____ (mm/dd/yyyy or dd.mm.yyyy, hh:mm) : RELATIVE-START = 1 HOUR ago (1-nn, MINS or HOURS) : RELATIVE-END = ___ _____ from start (1-nn, MINS or HOURS) : REPORT-INTERVAL = 15 minutes ( 1-60 mins, in 1 min increments) + + Specify the values to be used to filter the Thread History displays. Wildcard + values * (multiple characters) or ? (single character) can be specified. + + The values to be used to filter at interval display level : PLAN = ________ ________ ________ ________ ________ : AUTHID = ________ ________ ________ ________ ________ : CONNID = ________ ________ ________ ________ ________ : CONNTYPE = ________ ________ ________ ________ ________ + + The values to be used to filter only at thread detail display level : PACKAGE = ________ ________ ________ ________ ________ : CORRID = ____________ ____________ ____________ ____________ : GETPAGES > __________ : DEADLK/TIMEOUT > __________ : LOCK-ESCAL > __________ : COMMIT > __________ : DB2-CPU-TIME > _____________ ( seconds ) : DB2-ELAP-TIME > _____________ ( seconds ) : IO-WAIT-TIME > _____________ ( seconds ) ===============================================================================
NavigationFor additional information about other topics, use the PF keys.
FieldsInformation about available data:Time of oldest available record
Displays the earliest time that thread data was collected to active data sets. Displays N/A if no threaddata is collected.
This is either the time stamp of the first IFCID 3 record or, if detail is not being collected, the oldestnear-term thread summary record.
Chapter 16. Near-term history information 693
Time of latest recordDisplays the most recent time that thread data was collected to active data sets. Displays N/A if nothread data is collected.
This is either the time stamp of the last IFCID 3 record or, if detail is not being collected, the last near-term thread summary record.
Total number of recordsDisplays the number of thread records (IFCID 3) that are collected to active data sets. Displays 0 if nodetail thread records are collected.
Filter options limiting the time: Specify an absolute or relative time range of at most 24 hours for thereporting period for which you want to view near-term thread history information. The specified timerange should be within the range of collected data.START-DATE/TIME
Specify an absolute start date and time. START-DATE/TIME and RELATIVE-START are mutuallyexclusive.
You can specify the date and time in U.S., European, or ISO format.DATE
• mm/dd/yyyy (U.S.)• dd.mm.yyyy (European)• yyyy-mm-dd (ISO)
TIME
• hh:mm (U.S.)• hh.mm (European, ISO)
END-DATE/TIMESpecify an absolute end date and time. END-DATE/TIME and RELATIVE-END are mutually exclusive.
You can specify the date and time in U.S., European, or ISO format.DATE
• mm/dd/yyyy (U.S.)• dd.mm.yyyy (European)• yyyy-mm-dd (ISO)
TIME
• hh:mm (U.S.)• hh.mm (European, ISO)
RELATIVE-STARTSpecify a start time relative to the current time, as the number of minutes or hours before the currenttime. The default value is one hour. RELATIVE-START and START-DATE/TIME are mutuallyexclusive.
RELATIVE-ENDSpecify an end time relative to the specified start time, as the number of minutes or hours afterSTART-DATE/TIME or RELATIVE-START. RELATIVE-END and END-DATE/TIME are mutuallyexclusive.
REPORT-INTERVALSpecify a report interval by which the report period is partitioned, from 5 to 60 minutes, in five minuteincrements. The value must be some multiple of the Near-Term History Data Collector summaryrecord write frequency.
Filter options to be used at interval display level: You can use these options to filter near-term historydata at thread summary (interval) display level.
694 Classic Interface User's Guide
PLANYou can specify up to five plan names that you want to be displayed on subsequent thread historypanels. You can enter multiple values including wildcards. You can compare values using the equal (=)or not equal (^=, <>) comparison operators. Use the equal operator to OR multiple values. Use the notequal operator to AND multiple values.
AUTHIDYou can specify up to five authorization ids that you want to be displayed on subsequent threadhistory panels. You can enter multiple values including wildcards. You can compare values using theequal (=) or not equal (^=, <>) comparison operators. Use the equal operator to OR multiple values.Use the not equal operator to AND multiple values.
CONNIDYou can specify up to five connection ids that you want to be displayed on subsequent thread historypanels. You can enter multiple values including wildcards. You can compare values using the equal (=)or not equal (^=, <>) comparison operators. Use the equal operator to OR multiple values. Use the notequal operator to AND multiple values.
CONNTYPEYou can specify up to five connection types that you want to be displayed on subsequent threadhistory panels.TSO
TSO foreground and background (QWHCTSO)CALLATCH
DB2 call attach (QWHCDB2C)CICS
CICS attach (QWHCCICS)DLI
DL/I batch (QWHCDLIB)IMSBPP
IMS attach BMP (QWHCIMSB)IMSMPP
IMS attach MPP (QWHCIMSM)IMSCTRL
IMS control region (QWHCICTL)IMSBMP
IMS transaction BMP (QWHCTBMP)IMS
All IMS threads including DL/I batch (QWHCDLIB + QWHCIMSB + QWHCIMSM + QWHCICTL +QWHCTBMP)
SYSDIRSystem directed access (data base access threads) (QWHCDUW)
APPLDIRApplication directed access (data base access threads) (QWHCRUW)
DISTData base access threads (System-directed and Application-directed) (QWHCDUW + QWHCRUW)
BATCHDB2 call attach (QWHCDB2C)
Filter options to be used only at thread detail display level: You can use these options to filter near-term history data at thread detail display level.PACKAGE
You can specify up to five package ids that you want to be displayed on subsequent thread historypanels. You can enter multiple values including wildcards. You can compare values using the equal (=)
Chapter 16. Near-term history information 695
or not equal (^=, <>) comparison operators. Use the equal operator to OR multiple values. Use the notequal operator to AND multiple values.
CORRIDYou can specify up to five correlation ids that you want to be displayed on subsequent thread historypanels. You can enter multiple values including wildcards. You can compare values using the equal (=)or not equal (^=, <>) comparison operators. Use the equal operator to OR multiple values. Use the notequal operator to AND multiple values.
GETPAGESSpecify the minimum number of Getpage requests that you want to be displayed on subsequentthread history panels. You can compare values using the equal (=) or not equal (^=, <>) comparisonoperators. Use the equal operator to OR multiple values. Use the not equal operator to AND multiplevalues.
DEADLK/TIMEOUTSpecify the minimum number of deadlocks and lock timeouts that you want to be displayed onsubsequent thread history panels. You can compare values using the equal (=) or not equal (^=, <>)comparison operators. Use the equal operator to OR multiple values. Use the not equal operator toAND multiple values.
LOCK-ESCALSpecify the minimum number of lock escalations that you want to be displayed on subsequent threadhistory panels. You can compare values using the equal (=) or not equal (^=, <>) comparisonoperators. Use the equal operator to OR multiple values. Use the not equal operator to AND multiplevalues.
COMMITSpecify the minimum number of commits that you want to be displayed on subsequent thread historypanels. You can compare values using the equal (=) or not equal (^=, <>) comparison operators. Usethe equal operator to OR multiple values. Use the not equal operator to AND multiple values.
DB2-CPU-TIMESpecify the minimum amount of DB2 processor time that you want to be displayed on subsequentthread history panels. You can compare values using the equal (=) or not equal (^=, <>) comparisonoperators. Use the equal operator to OR multiple values. Use the not equal operator to AND multiplevalues.
DB2-ELAP-TIMESpecify the minimum amount of DB2 elapsed timethat you want to be displayed on subsequentthread history panels. You can compare values using the equal (=) or not equal (^=, <>) comparisonoperators. Use the equal operator to OR multiple values. Use the not equal operator to AND multiplevalues.
IO-WAIT-TIMESpecify the minimum amount of I/O wait time that you want to be displayed on subsequent threadhistory panels. You can compare values using the equal (=) or not equal (^=, <>) comparisonoperators. Use the equal operator to OR multiple values. Use the not equal operator to AND multiplevalues.
Near-Term Thread History Filter Options - ConfirmationThis panel shows the reporting and filtering options that you have specified on the Near-Term ThreadHistory Filter Options panel.
696 Classic Interface User's Guide
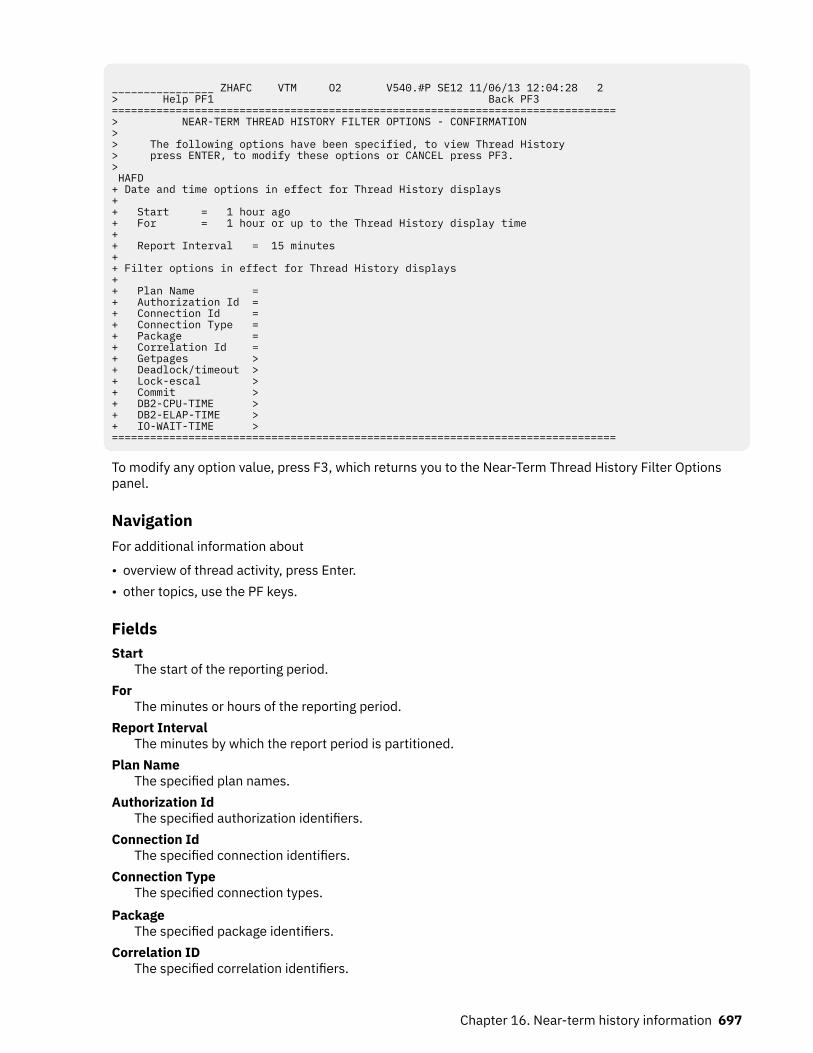
________________ ZHAFC VTM O2 V540.#P SE12 11/06/13 12:04:28 2 > Help PF1 Back PF3 =============================================================================== > NEAR-TERM THREAD HISTORY FILTER OPTIONS - CONFIRMATION > > The following options have been specified, to view Thread History > press ENTER, to modify these options or CANCEL press PF3. > HAFD + Date and time options in effect for Thread History displays + + Start = 1 hour ago + For = 1 hour or up to the Thread History display time + + Report Interval = 15 minutes + + Filter options in effect for Thread History displays + + Plan Name = + Authorization Id = + Connection Id = + Connection Type = + Package = + Correlation Id = + Getpages > + Deadlock/timeout > + Lock-escal > + Commit > + DB2-CPU-TIME > + DB2-ELAP-TIME > + IO-WAIT-TIME > ===============================================================================
To modify any option value, press F3, which returns you to the Near-Term Thread History Filter Optionspanel.
NavigationFor additional information about
• overview of thread activity, press Enter.• other topics, use the PF keys.
FieldsStart
The start of the reporting period.For
The minutes or hours of the reporting period.Report Interval
The minutes by which the report period is partitioned.Plan Name
The specified plan names.Authorization Id
The specified authorization identifiers.Connection Id
The specified connection identifiers.Connection Type
The specified connection types.Package
The specified package identifiers.Correlation ID
The specified correlation identifiers.
Chapter 16. Near-term history information 697
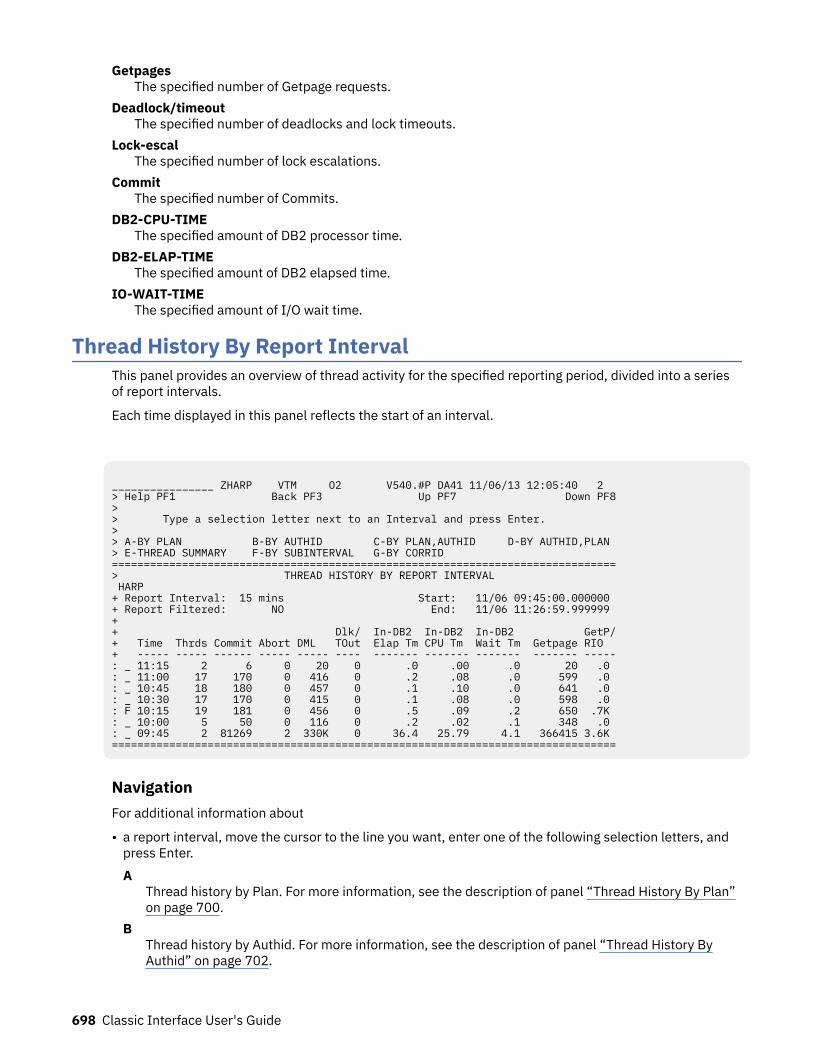
GetpagesThe specified number of Getpage requests.
Deadlock/timeoutThe specified number of deadlocks and lock timeouts.
Lock-escalThe specified number of lock escalations.
CommitThe specified number of Commits.
DB2-CPU-TIMEThe specified amount of DB2 processor time.
DB2-ELAP-TIMEThe specified amount of DB2 elapsed time.
IO-WAIT-TIMEThe specified amount of I/O wait time.
Thread History By Report IntervalThis panel provides an overview of thread activity for the specified reporting period, divided into a seriesof report intervals.
Each time displayed in this panel reflects the start of an interval.
________________ ZHARP VTM O2 V540.#P DA41 11/06/13 12:05:40 2 > Help PF1 Back PF3 Up PF7 Down PF8> > Type a selection letter next to an Interval and press Enter. > > A-BY PLAN B-BY AUTHID C-BY PLAN,AUTHID D-BY AUTHID,PLAN > E-THREAD SUMMARY F-BY SUBINTERVAL G-BY CORRID ===============================================================================> THREAD HISTORY BY REPORT INTERVAL HARP + Report Interval: 15 mins Start: 11/06 09:45:00.000000 + Report Filtered: NO End: 11/06 11:26:59.999999 + + Dlk/ In-DB2 In-DB2 In-DB2 GetP/+ Time Thrds Commit Abort DML TOut Elap Tm CPU Tm Wait Tm Getpage RIO + ----- ----- ------ ----- ----- ---- ------- ------- ------- ------- -----: _ 11:15 2 6 0 20 0 .0 .00 .0 20 .0 : _ 11:00 17 170 0 416 0 .2 .08 .0 599 .0 : _ 10:45 18 180 0 457 0 .1 .10 .0 641 .0 : _ 10:30 17 170 0 415 0 .1 .08 .0 598 .0 : F 10:15 19 181 0 456 0 .5 .09 .2 650 .7K : _ 10:00 5 50 0 116 0 .2 .02 .1 348 .0 : _ 09:45 2 81269 2 330K 0 36.4 25.79 4.1 366415 3.6K ===============================================================================
NavigationFor additional information about
• a report interval, move the cursor to the line you want, enter one of the following selection letters, andpress Enter.A
Thread history by Plan. For more information, see the description of panel “Thread History By Plan”on page 700.
BThread history by Authid. For more information, see the description of panel “Thread History ByAuthid” on page 702.
698 Classic Interface User's Guide
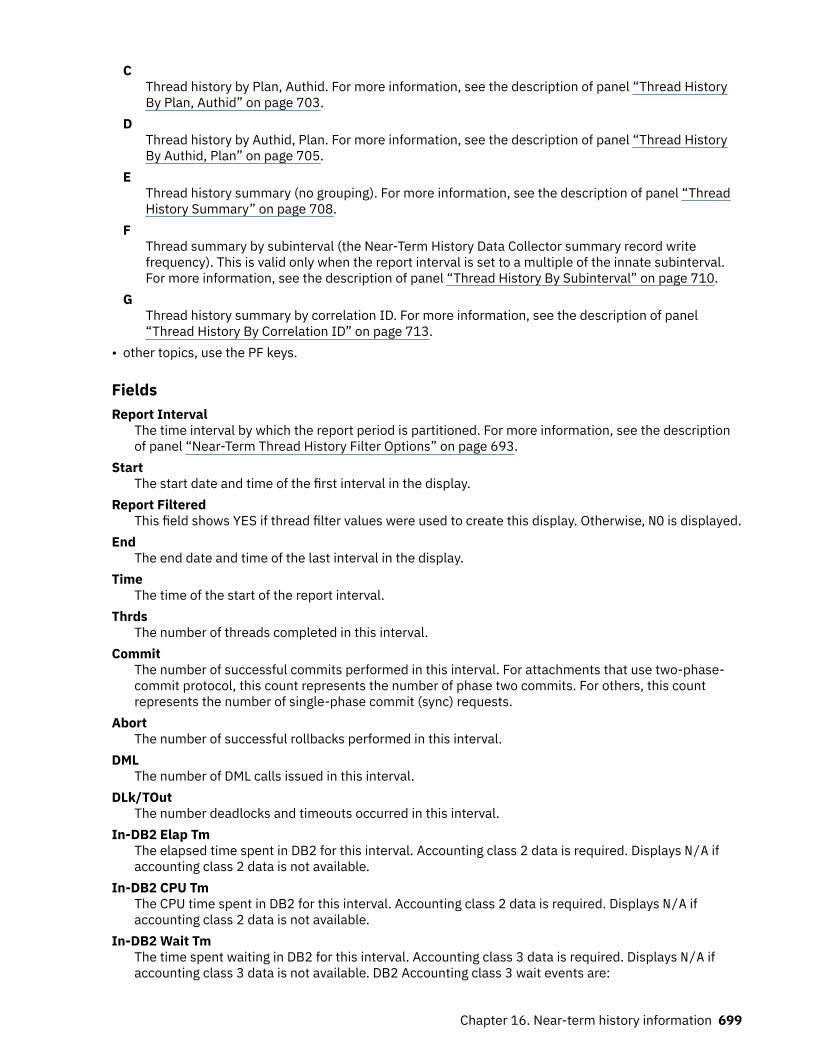
CThread history by Plan, Authid. For more information, see the description of panel “Thread HistoryBy Plan, Authid” on page 703.
DThread history by Authid, Plan. For more information, see the description of panel “Thread HistoryBy Authid, Plan” on page 705.
EThread history summary (no grouping). For more information, see the description of panel “ThreadHistory Summary” on page 708.
FThread summary by subinterval (the Near-Term History Data Collector summary record writefrequency). This is valid only when the report interval is set to a multiple of the innate subinterval.For more information, see the description of panel “Thread History By Subinterval” on page 710.
GThread history summary by correlation ID. For more information, see the description of panel“Thread History By Correlation ID” on page 713.
• other topics, use the PF keys.
FieldsReport Interval
The time interval by which the report period is partitioned. For more information, see the descriptionof panel “Near-Term Thread History Filter Options” on page 693.
StartThe start date and time of the first interval in the display.
Report FilteredThis field shows YES if thread filter values were used to create this display. Otherwise, NO is displayed.
EndThe end date and time of the last interval in the display.
TimeThe time of the start of the report interval.
ThrdsThe number of threads completed in this interval.
CommitThe number of successful commits performed in this interval. For attachments that use two-phase-commit protocol, this count represents the number of phase two commits. For others, this countrepresents the number of single-phase commit (sync) requests.
AbortThe number of successful rollbacks performed in this interval.
DMLThe number of DML calls issued in this interval.
DLk/TOutThe number deadlocks and timeouts occurred in this interval.
In-DB2 Elap TmThe elapsed time spent in DB2 for this interval. Accounting class 2 data is required. Displays N/A ifaccounting class 2 data is not available.
In-DB2 CPU TmThe CPU time spent in DB2 for this interval. Accounting class 2 data is required. Displays N/A ifaccounting class 2 data is not available.
In-DB2 Wait TmThe time spent waiting in DB2 for this interval. Accounting class 3 data is required. Displays N/A ifaccounting class 3 data is not available. DB2 Accounting class 3 wait events are:
Chapter 16. Near-term history information 699
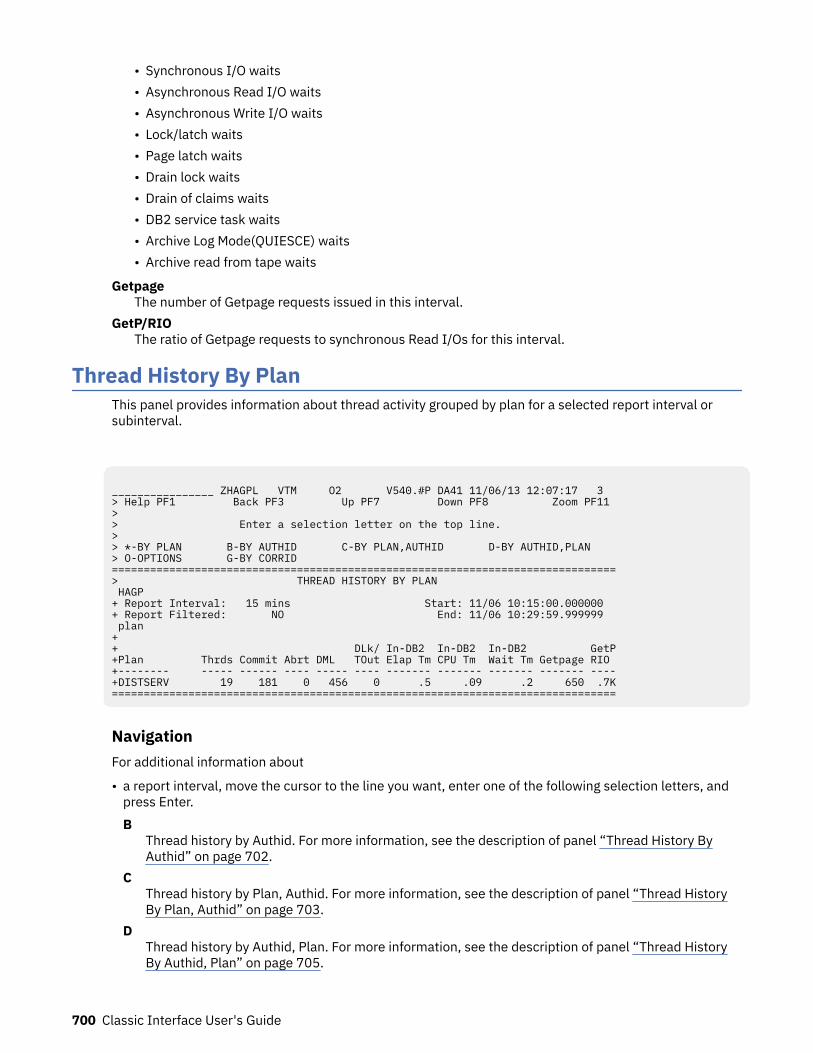
• Synchronous I/O waits• Asynchronous Read I/O waits• Asynchronous Write I/O waits• Lock/latch waits• Page latch waits• Drain lock waits• Drain of claims waits• DB2 service task waits• Archive Log Mode(QUIESCE) waits• Archive read from tape waits
GetpageThe number of Getpage requests issued in this interval.
GetP/RIOThe ratio of Getpage requests to synchronous Read I/Os for this interval.
Thread History By PlanThis panel provides information about thread activity grouped by plan for a selected report interval orsubinterval.
________________ ZHAGPL VTM O2 V540.#P DA41 11/06/13 12:07:17 3 > Help PF1 Back PF3 Up PF7 Down PF8 Zoom PF11 > > Enter a selection letter on the top line. > > *-BY PLAN B-BY AUTHID C-BY PLAN,AUTHID D-BY AUTHID,PLAN > O-OPTIONS G-BY CORRID ===============================================================================> THREAD HISTORY BY PLAN HAGP + Report Interval: 15 mins Start: 11/06 10:15:00.000000 + Report Filtered: NO End: 11/06 10:29:59.999999 plan + + DLk/ In-DB2 In-DB2 In-DB2 GetP+Plan Thrds Commit Abrt DML TOut Elap Tm CPU Tm Wait Tm Getpage RIO +-------- ----- ------ ---- ----- ---- ------- ------- ------- ------- ----+DISTSERV 19 181 0 456 0 .5 .09 .2 650 .7K===============================================================================
NavigationFor additional information about
• a report interval, move the cursor to the line you want, enter one of the following selection letters, andpress Enter.B
Thread history by Authid. For more information, see the description of panel “Thread History ByAuthid” on page 702.
CThread history by Plan, Authid. For more information, see the description of panel “Thread HistoryBy Plan, Authid” on page 703.
DThread history by Authid, Plan. For more information, see the description of panel “Thread HistoryBy Authid, Plan” on page 705.
700 Classic Interface User's Guide
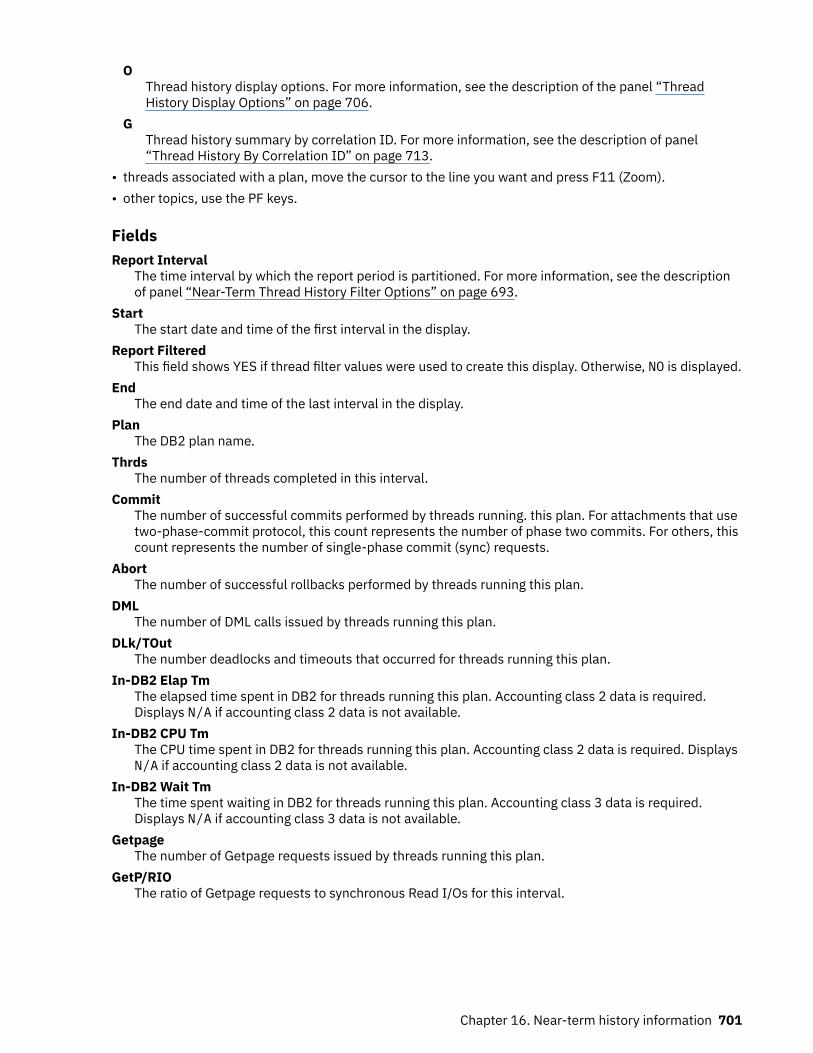
OThread history display options. For more information, see the description of the panel “ThreadHistory Display Options” on page 706.
GThread history summary by correlation ID. For more information, see the description of panel“Thread History By Correlation ID” on page 713.
• threads associated with a plan, move the cursor to the line you want and press F11 (Zoom).• other topics, use the PF keys.
FieldsReport Interval
The time interval by which the report period is partitioned. For more information, see the descriptionof panel “Near-Term Thread History Filter Options” on page 693.
StartThe start date and time of the first interval in the display.
Report FilteredThis field shows YES if thread filter values were used to create this display. Otherwise, NO is displayed.
EndThe end date and time of the last interval in the display.
PlanThe DB2 plan name.
ThrdsThe number of threads completed in this interval.
CommitThe number of successful commits performed by threads running. this plan. For attachments that usetwo-phase-commit protocol, this count represents the number of phase two commits. For others, thiscount represents the number of single-phase commit (sync) requests.
AbortThe number of successful rollbacks performed by threads running this plan.
DMLThe number of DML calls issued by threads running this plan.
DLk/TOutThe number deadlocks and timeouts that occurred for threads running this plan.
In-DB2 Elap TmThe elapsed time spent in DB2 for threads running this plan. Accounting class 2 data is required.Displays N/A if accounting class 2 data is not available.
In-DB2 CPU TmThe CPU time spent in DB2 for threads running this plan. Accounting class 2 data is required. DisplaysN/A if accounting class 2 data is not available.
In-DB2 Wait TmThe time spent waiting in DB2 for threads running this plan. Accounting class 3 data is required.Displays N/A if accounting class 3 data is not available.
GetpageThe number of Getpage requests issued by threads running this plan.
GetP/RIOThe ratio of Getpage requests to synchronous Read I/Os for this interval.
Chapter 16. Near-term history information 701
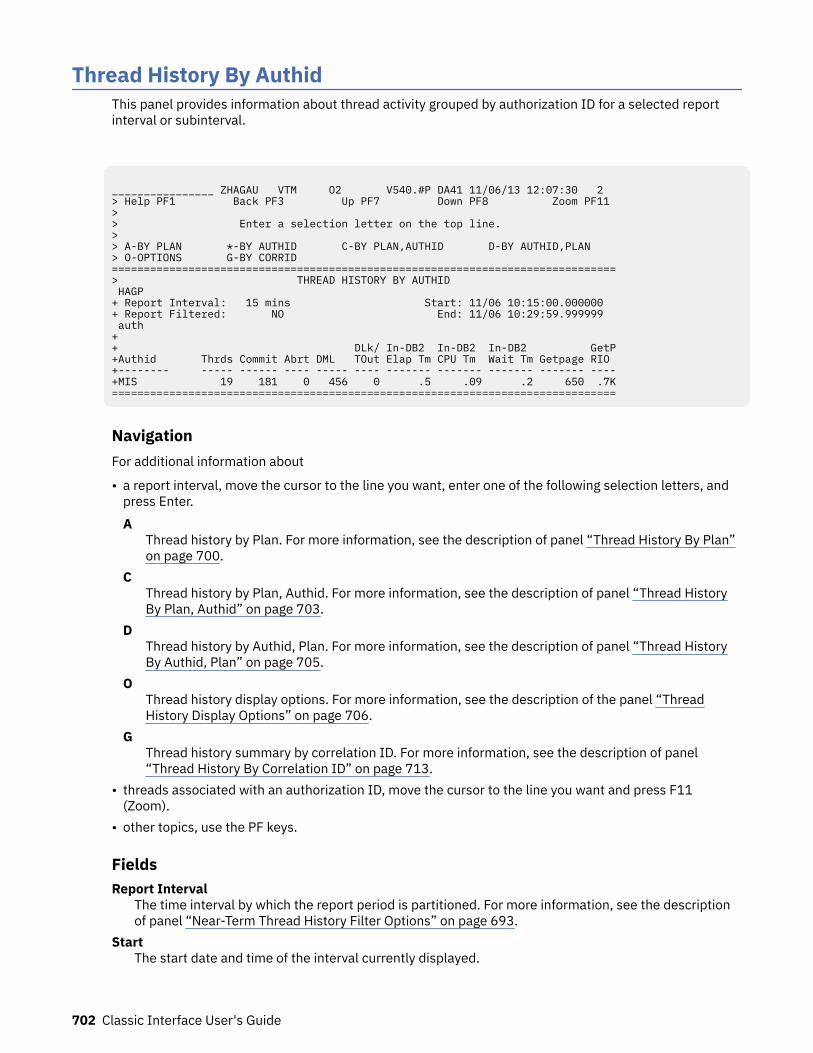
Thread History By AuthidThis panel provides information about thread activity grouped by authorization ID for a selected reportinterval or subinterval.
________________ ZHAGAU VTM O2 V540.#P DA41 11/06/13 12:07:30 2 > Help PF1 Back PF3 Up PF7 Down PF8 Zoom PF11 > > Enter a selection letter on the top line. > > A-BY PLAN *-BY AUTHID C-BY PLAN,AUTHID D-BY AUTHID,PLAN > O-OPTIONS G-BY CORRID ===============================================================================> THREAD HISTORY BY AUTHID HAGP + Report Interval: 15 mins Start: 11/06 10:15:00.000000 + Report Filtered: NO End: 11/06 10:29:59.999999 auth + + DLk/ In-DB2 In-DB2 In-DB2 GetP+Authid Thrds Commit Abrt DML TOut Elap Tm CPU Tm Wait Tm Getpage RIO +-------- ----- ------ ---- ----- ---- ------- ------- ------- ------- ----+MIS 19 181 0 456 0 .5 .09 .2 650 .7K===============================================================================
NavigationFor additional information about
• a report interval, move the cursor to the line you want, enter one of the following selection letters, andpress Enter.A
Thread history by Plan. For more information, see the description of panel “Thread History By Plan”on page 700.
CThread history by Plan, Authid. For more information, see the description of panel “Thread HistoryBy Plan, Authid” on page 703.
DThread history by Authid, Plan. For more information, see the description of panel “Thread HistoryBy Authid, Plan” on page 705.
OThread history display options. For more information, see the description of the panel “ThreadHistory Display Options” on page 706.
GThread history summary by correlation ID. For more information, see the description of panel“Thread History By Correlation ID” on page 713.
• threads associated with an authorization ID, move the cursor to the line you want and press F11(Zoom).
• other topics, use the PF keys.
FieldsReport Interval
The time interval by which the report period is partitioned. For more information, see the descriptionof panel “Near-Term Thread History Filter Options” on page 693.
StartThe start date and time of the interval currently displayed.
702 Classic Interface User's Guide
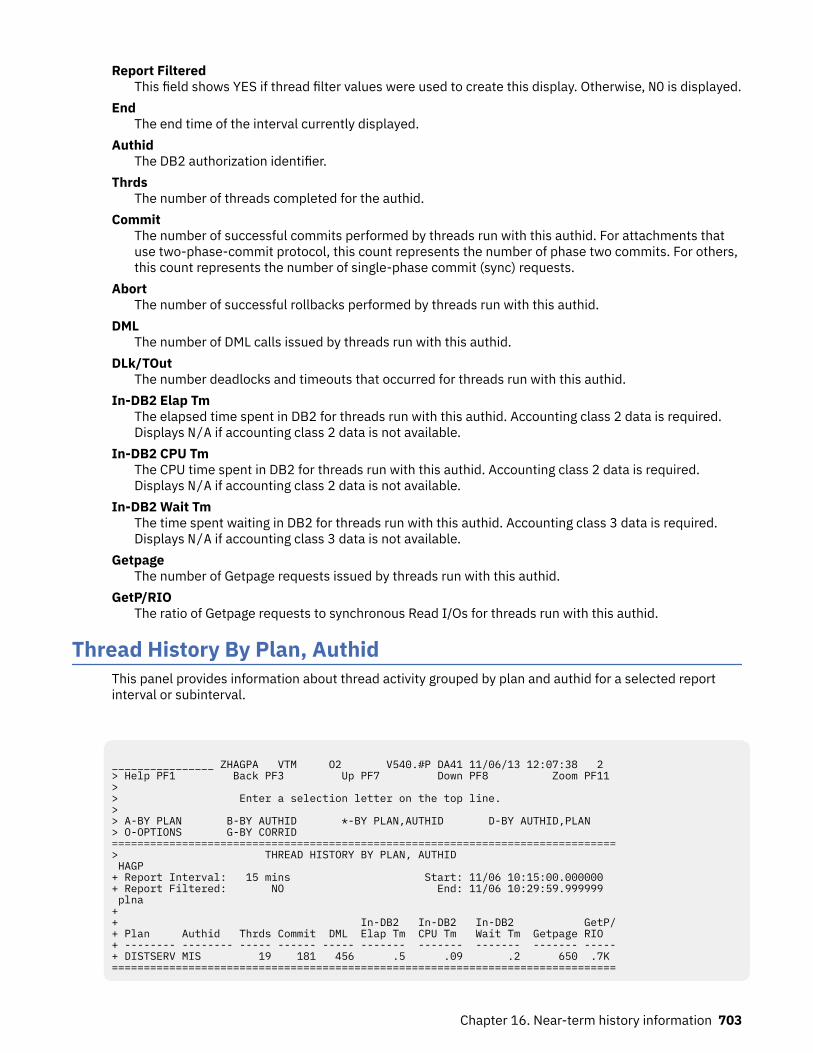
Report FilteredThis field shows YES if thread filter values were used to create this display. Otherwise, NO is displayed.
EndThe end time of the interval currently displayed.
AuthidThe DB2 authorization identifier.
ThrdsThe number of threads completed for the authid.
CommitThe number of successful commits performed by threads run with this authid. For attachments thatuse two-phase-commit protocol, this count represents the number of phase two commits. For others,this count represents the number of single-phase commit (sync) requests.
AbortThe number of successful rollbacks performed by threads run with this authid.
DMLThe number of DML calls issued by threads run with this authid.
DLk/TOutThe number deadlocks and timeouts that occurred for threads run with this authid.
In-DB2 Elap TmThe elapsed time spent in DB2 for threads run with this authid. Accounting class 2 data is required.Displays N/A if accounting class 2 data is not available.
In-DB2 CPU TmThe CPU time spent in DB2 for threads run with this authid. Accounting class 2 data is required.Displays N/A if accounting class 2 data is not available.
In-DB2 Wait TmThe time spent waiting in DB2 for threads run with this authid. Accounting class 3 data is required.Displays N/A if accounting class 3 data is not available.
GetpageThe number of Getpage requests issued by threads run with this authid.
GetP/RIOThe ratio of Getpage requests to synchronous Read I/Os for threads run with this authid.
Thread History By Plan, AuthidThis panel provides information about thread activity grouped by plan and authid for a selected reportinterval or subinterval.
________________ ZHAGPA VTM O2 V540.#P DA41 11/06/13 12:07:38 2 > Help PF1 Back PF3 Up PF7 Down PF8 Zoom PF11 > > Enter a selection letter on the top line. > > A-BY PLAN B-BY AUTHID *-BY PLAN,AUTHID D-BY AUTHID,PLAN > O-OPTIONS G-BY CORRID ===============================================================================> THREAD HISTORY BY PLAN, AUTHID HAGP + Report Interval: 15 mins Start: 11/06 10:15:00.000000 + Report Filtered: NO End: 11/06 10:29:59.999999 plna + + In-DB2 In-DB2 In-DB2 GetP/+ Plan Authid Thrds Commit DML Elap Tm CPU Tm Wait Tm Getpage RIO + -------- -------- ----- ------ ----- ------- ------- ------- ------- -----+ DISTSERV MIS 19 181 456 .5 .09 .2 650 .7K ===============================================================================
Chapter 16. Near-term history information 703
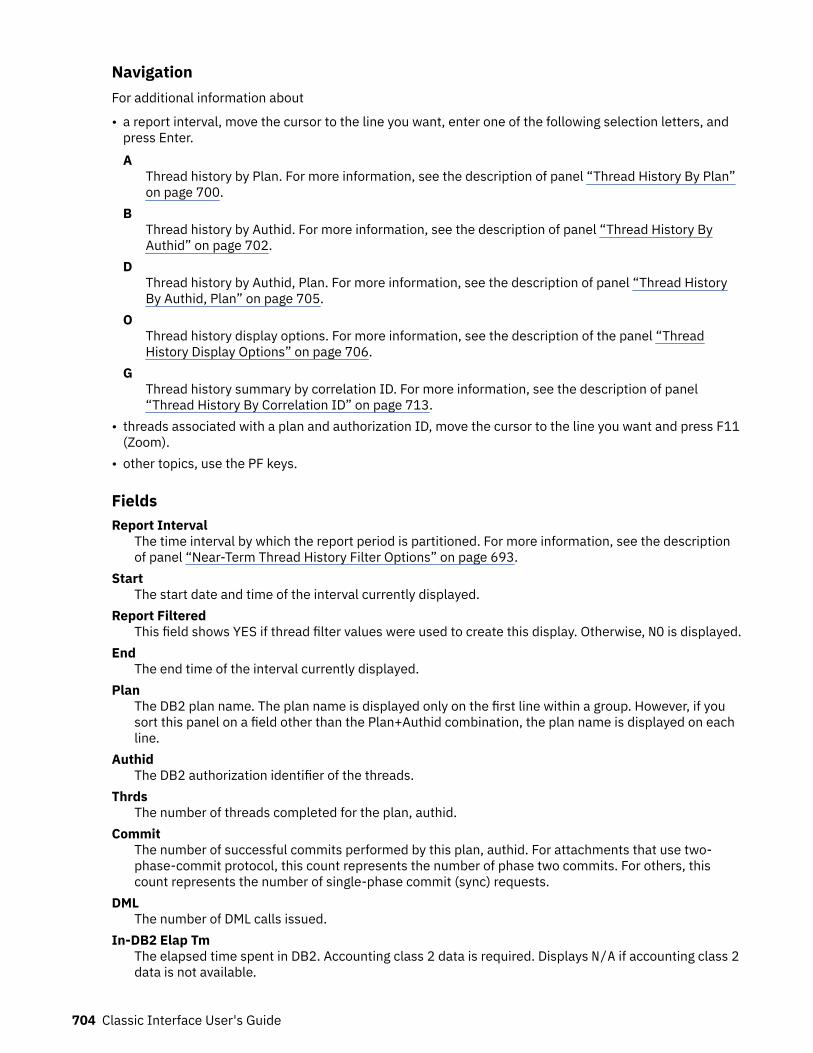
NavigationFor additional information about
• a report interval, move the cursor to the line you want, enter one of the following selection letters, andpress Enter.A
Thread history by Plan. For more information, see the description of panel “Thread History By Plan”on page 700.
BThread history by Authid. For more information, see the description of panel “Thread History ByAuthid” on page 702.
DThread history by Authid, Plan. For more information, see the description of panel “Thread HistoryBy Authid, Plan” on page 705.
OThread history display options. For more information, see the description of the panel “ThreadHistory Display Options” on page 706.
GThread history summary by correlation ID. For more information, see the description of panel“Thread History By Correlation ID” on page 713.
• threads associated with a plan and authorization ID, move the cursor to the line you want and press F11(Zoom).
• other topics, use the PF keys.
FieldsReport Interval
The time interval by which the report period is partitioned. For more information, see the descriptionof panel “Near-Term Thread History Filter Options” on page 693.
StartThe start date and time of the interval currently displayed.
Report FilteredThis field shows YES if thread filter values were used to create this display. Otherwise, NO is displayed.
EndThe end time of the interval currently displayed.
PlanThe DB2 plan name. The plan name is displayed only on the first line within a group. However, if yousort this panel on a field other than the Plan+Authid combination, the plan name is displayed on eachline.
AuthidThe DB2 authorization identifier of the threads.
ThrdsThe number of threads completed for the plan, authid.
CommitThe number of successful commits performed by this plan, authid. For attachments that use two-phase-commit protocol, this count represents the number of phase two commits. For others, thiscount represents the number of single-phase commit (sync) requests.
DMLThe number of DML calls issued.
In-DB2 Elap TmThe elapsed time spent in DB2. Accounting class 2 data is required. Displays N/A if accounting class 2data is not available.
704 Classic Interface User's Guide
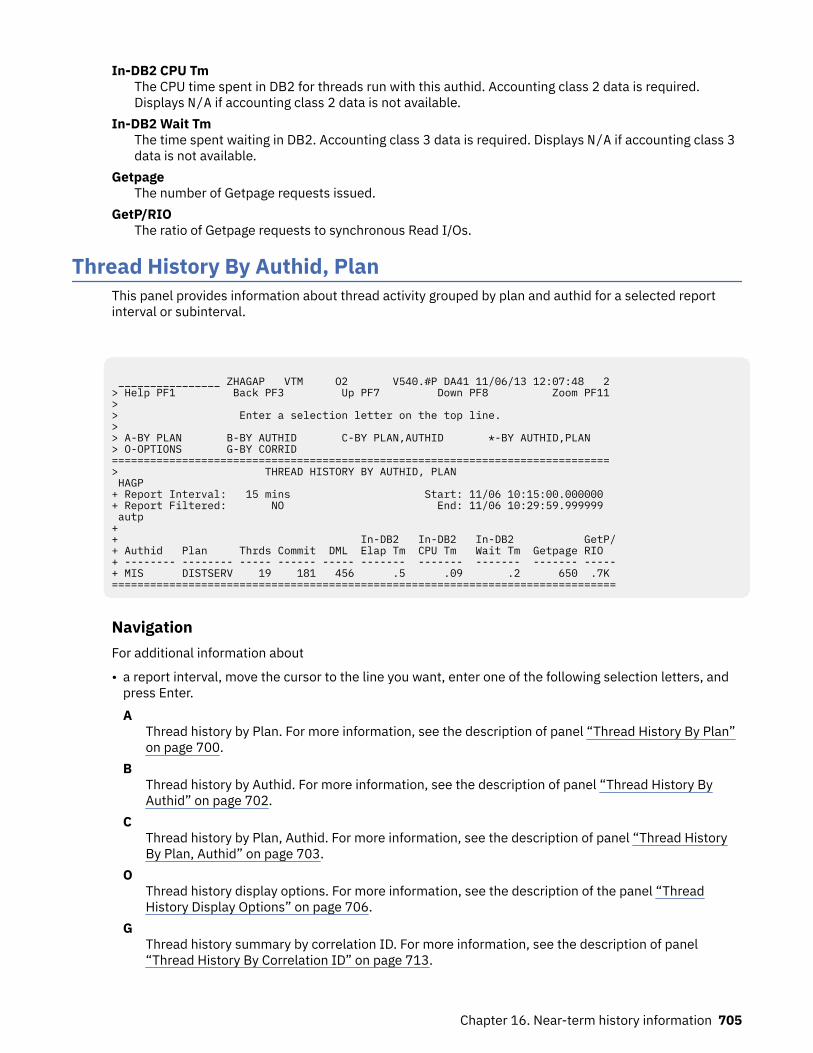
In-DB2 CPU TmThe CPU time spent in DB2 for threads run with this authid. Accounting class 2 data is required.Displays N/A if accounting class 2 data is not available.
In-DB2 Wait TmThe time spent waiting in DB2. Accounting class 3 data is required. Displays N/A if accounting class 3data is not available.
GetpageThe number of Getpage requests issued.
GetP/RIOThe ratio of Getpage requests to synchronous Read I/Os.
Thread History By Authid, PlanThis panel provides information about thread activity grouped by plan and authid for a selected reportinterval or subinterval.
________________ ZHAGAP VTM O2 V540.#P DA41 11/06/13 12:07:48 2 > Help PF1 Back PF3 Up PF7 Down PF8 Zoom PF11 > > Enter a selection letter on the top line. > > A-BY PLAN B-BY AUTHID C-BY PLAN,AUTHID *-BY AUTHID,PLAN > O-OPTIONS G-BY CORRID ==============================================================================> THREAD HISTORY BY AUTHID, PLAN HAGP + Report Interval: 15 mins Start: 11/06 10:15:00.000000 + Report Filtered: NO End: 11/06 10:29:59.999999 autp + + In-DB2 In-DB2 In-DB2 GetP/+ Authid Plan Thrds Commit DML Elap Tm CPU Tm Wait Tm Getpage RIO + -------- -------- ----- ------ ----- ------- ------- ------- ------- -----+ MIS DISTSERV 19 181 456 .5 .09 .2 650 .7K ===============================================================================
NavigationFor additional information about
• a report interval, move the cursor to the line you want, enter one of the following selection letters, andpress Enter.A
Thread history by Plan. For more information, see the description of panel “Thread History By Plan”on page 700.
BThread history by Authid. For more information, see the description of panel “Thread History ByAuthid” on page 702.
CThread history by Plan, Authid. For more information, see the description of panel “Thread HistoryBy Plan, Authid” on page 703.
OThread history display options. For more information, see the description of the panel “ThreadHistory Display Options” on page 706.
GThread history summary by correlation ID. For more information, see the description of panel“Thread History By Correlation ID” on page 713.
Chapter 16. Near-term history information 705
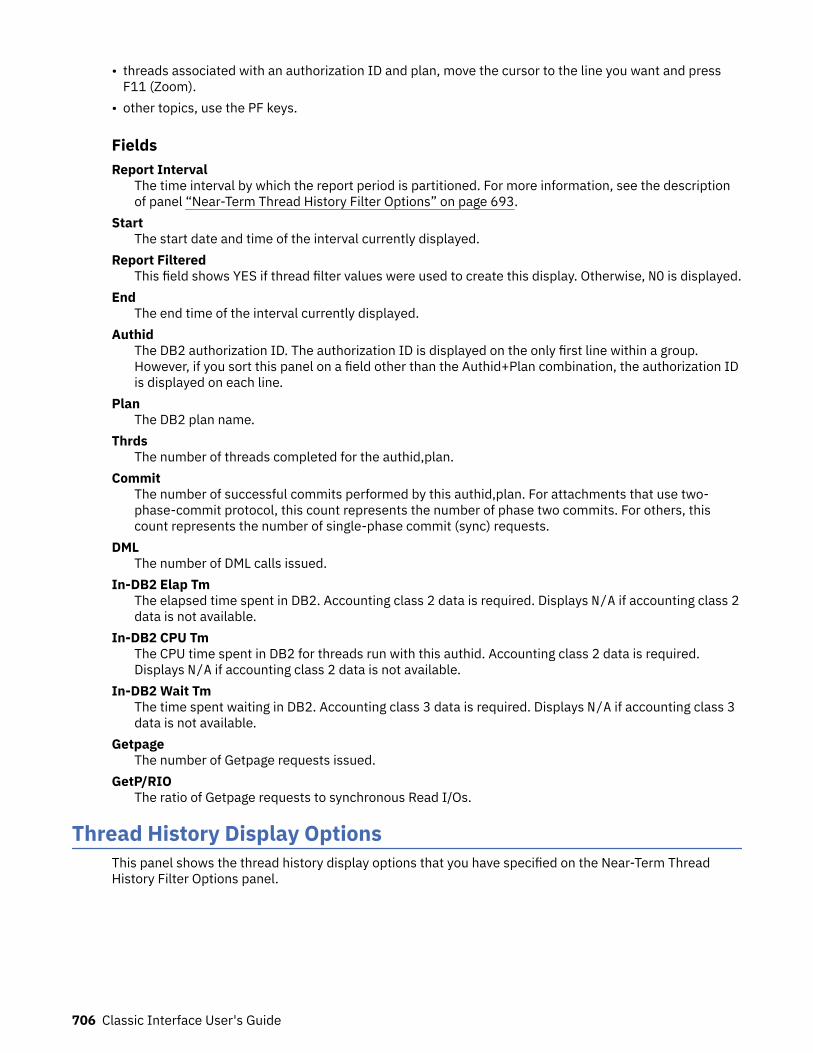
• threads associated with an authorization ID and plan, move the cursor to the line you want and pressF11 (Zoom).
• other topics, use the PF keys.
FieldsReport Interval
The time interval by which the report period is partitioned. For more information, see the descriptionof panel “Near-Term Thread History Filter Options” on page 693.
StartThe start date and time of the interval currently displayed.
Report FilteredThis field shows YES if thread filter values were used to create this display. Otherwise, NO is displayed.
EndThe end time of the interval currently displayed.
AuthidThe DB2 authorization ID. The authorization ID is displayed on the only first line within a group.However, if you sort this panel on a field other than the Authid+Plan combination, the authorization IDis displayed on each line.
PlanThe DB2 plan name.
ThrdsThe number of threads completed for the authid,plan.
CommitThe number of successful commits performed by this authid,plan. For attachments that use two-phase-commit protocol, this count represents the number of phase two commits. For others, thiscount represents the number of single-phase commit (sync) requests.
DMLThe number of DML calls issued.
In-DB2 Elap TmThe elapsed time spent in DB2. Accounting class 2 data is required. Displays N/A if accounting class 2data is not available.
In-DB2 CPU TmThe CPU time spent in DB2 for threads run with this authid. Accounting class 2 data is required.Displays N/A if accounting class 2 data is not available.
In-DB2 Wait TmThe time spent waiting in DB2. Accounting class 3 data is required. Displays N/A if accounting class 3data is not available.
GetpageThe number of Getpage requests issued.
GetP/RIOThe ratio of Getpage requests to synchronous Read I/Os.
Thread History Display OptionsThis panel shows the thread history display options that you have specified on the Near-Term ThreadHistory Filter Options panel.
706 Classic Interface User's Guide
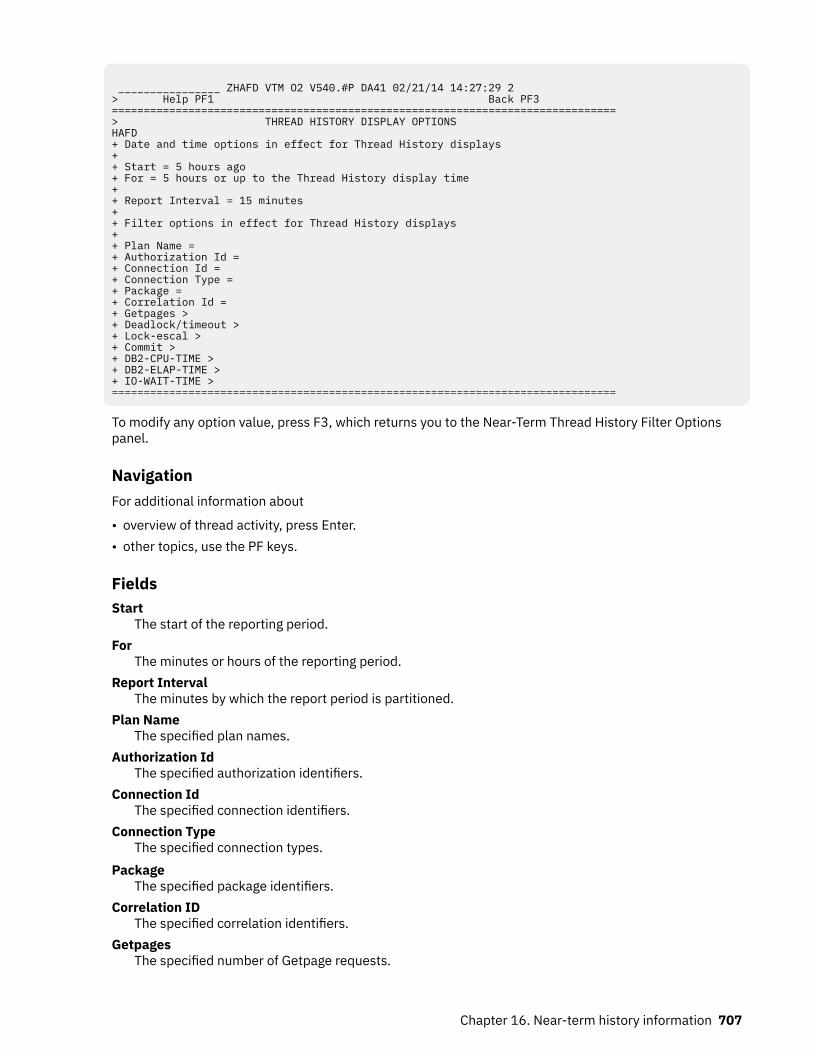
________________ ZHAFD VTM O2 V540.#P DA41 02/21/14 14:27:29 2> Help PF1 Back PF3 ===============================================================================> THREAD HISTORY DISPLAY OPTIONS HAFD+ Date and time options in effect for Thread History displays++ Start = 5 hours ago+ For = 5 hours or up to the Thread History display time++ Report Interval = 15 minutes++ Filter options in effect for Thread History displays++ Plan Name =+ Authorization Id =+ Connection Id =+ Connection Type =+ Package =+ Correlation Id =+ Getpages >+ Deadlock/timeout >+ Lock-escal >+ Commit >+ DB2-CPU-TIME >+ DB2-ELAP-TIME >+ IO-WAIT-TIME >===============================================================================
To modify any option value, press F3, which returns you to the Near-Term Thread History Filter Optionspanel.
NavigationFor additional information about
• overview of thread activity, press Enter.• other topics, use the PF keys.
FieldsStart
The start of the reporting period.For
The minutes or hours of the reporting period.Report Interval
The minutes by which the report period is partitioned.Plan Name
The specified plan names.Authorization Id
The specified authorization identifiers.Connection Id
The specified connection identifiers.Connection Type
The specified connection types.Package
The specified package identifiers.Correlation ID
The specified correlation identifiers.Getpages
The specified number of Getpage requests.
Chapter 16. Near-term history information 707
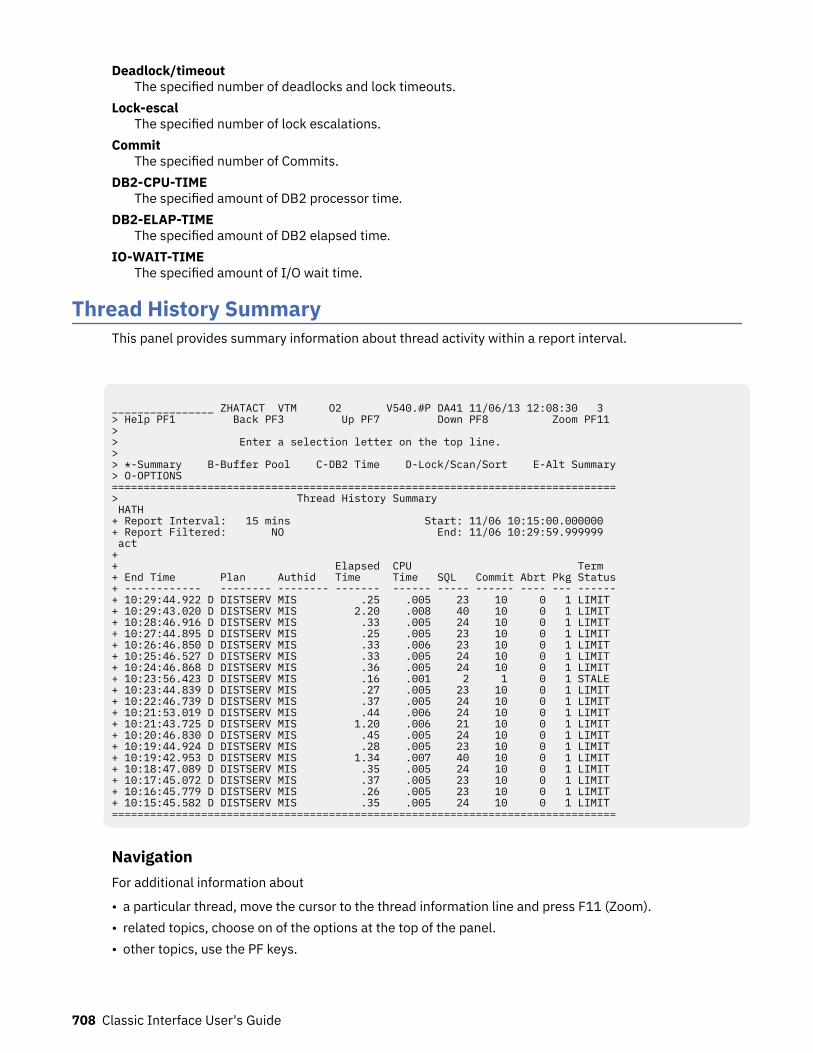
Deadlock/timeoutThe specified number of deadlocks and lock timeouts.
Lock-escalThe specified number of lock escalations.
CommitThe specified number of Commits.
DB2-CPU-TIMEThe specified amount of DB2 processor time.
DB2-ELAP-TIMEThe specified amount of DB2 elapsed time.
IO-WAIT-TIMEThe specified amount of I/O wait time.
Thread History SummaryThis panel provides summary information about thread activity within a report interval.
________________ ZHATACT VTM O2 V540.#P DA41 11/06/13 12:08:30 3 > Help PF1 Back PF3 Up PF7 Down PF8 Zoom PF11 > > Enter a selection letter on the top line. > > *-Summary B-Buffer Pool C-DB2 Time D-Lock/Scan/Sort E-Alt Summary> O-OPTIONS ===============================================================================> Thread History Summary HATH + Report Interval: 15 mins Start: 11/06 10:15:00.000000 + Report Filtered: NO End: 11/06 10:29:59.999999 act + + Elapsed CPU Term + End Time Plan Authid Time Time SQL Commit Abrt Pkg Status+ ------------ -------- -------- ------- ------ ----- ------ ---- --- ------+ 10:29:44.922 D DISTSERV MIS .25 .005 23 10 0 1 LIMIT + 10:29:43.020 D DISTSERV MIS 2.20 .008 40 10 0 1 LIMIT + 10:28:46.916 D DISTSERV MIS .33 .005 24 10 0 1 LIMIT + 10:27:44.895 D DISTSERV MIS .25 .005 23 10 0 1 LIMIT + 10:26:46.850 D DISTSERV MIS .33 .006 23 10 0 1 LIMIT + 10:25:46.527 D DISTSERV MIS .33 .005 24 10 0 1 LIMIT + 10:24:46.868 D DISTSERV MIS .36 .005 24 10 0 1 LIMIT + 10:23:56.423 D DISTSERV MIS .16 .001 2 1 0 1 STALE + 10:23:44.839 D DISTSERV MIS .27 .005 23 10 0 1 LIMIT + 10:22:46.739 D DISTSERV MIS .37 .005 24 10 0 1 LIMIT + 10:21:53.019 D DISTSERV MIS .44 .006 24 10 0 1 LIMIT + 10:21:43.725 D DISTSERV MIS 1.20 .006 21 10 0 1 LIMIT + 10:20:46.830 D DISTSERV MIS .45 .005 24 10 0 1 LIMIT + 10:19:44.924 D DISTSERV MIS .28 .005 23 10 0 1 LIMIT + 10:19:42.953 D DISTSERV MIS 1.34 .007 40 10 0 1 LIMIT + 10:18:47.089 D DISTSERV MIS .35 .005 24 10 0 1 LIMIT + 10:17:45.072 D DISTSERV MIS .37 .005 23 10 0 1 LIMIT + 10:16:45.779 D DISTSERV MIS .26 .005 23 10 0 1 LIMIT + 10:15:45.582 D DISTSERV MIS .35 .005 24 10 0 1 LIMIT ===============================================================================
NavigationFor additional information about
• a particular thread, move the cursor to the thread information line and press F11 (Zoom).• related topics, choose on of the options at the top of the panel.• other topics, use the PF keys.
708 Classic Interface User's Guide
FieldsReport Interval
The time interval by which the report period is partitioned. For more information, see the descriptionof panel “Near-Term Thread History Filter Options” on page 693.
StartThe start date and time of the interval currently displayed.
Report FilteredThis field shows YES if thread filter values were used to create this display. Otherwise, NO is displayed.
EndThe end time of the interval currently displayed.
End TimeThe end time of the DB2 thread execution.
If this thread involves parallel processing or if it invokes autonomous procedures, one of the followingidentifiers is displayed after the elapsed time to provide more information about this thread:*
This thread is a parallel task initiated on behalf of another (originating) thread to process a queryrequest in parallel.
AThis thread is an autonomous procedure rollup record.
DThis thread is a RRSAF/DDF rollup record due to ZPARM ACCUMACC >= 2.
OThis thread is the originating thread that invokes autonomous procedures.
PThis thread is the parent or the originating thread of the parallel tasks that are created to processa query request in parallel. Activity that is performed for this (originating) thread is reflected underthe parallel tasks.
RThis thread is a parallel task rollup record due to ZPARM PTASKROL = YES.
PlanThe DB2 plan name.
AuthidThe DB2 authorization identifier of the thread.
Elapsed TimeThe total elapsed time for the thread.
CPU TimeThe amount of CP time used by the thread. This value reflects MVS TCB time for non-database accessthreads and SRB time for database access threads and parallel tasks. This time represents CP timeonly and does not include SE (Specialty Engine) time.
SQLThe total number of DCL, DDL, and DML SQL calls issued by the thread. COMMIT and ROLLBACK/ABORT are not included.
CommitThe number of Commits performed by the thread.
AbrtThe number of aborts performed by the thread.
PkgThe number of package and DBRM executions for the thread. Accounting classes 7 and 8 are required.Displays N/A if accounting classes 7 and 8 are not available.
Chapter 16. Near-term history information 709
Term StatusThe status that indicates the reason for the thread termination.READS
IFI READ request.RESIGN
Same user signed on with same authentification identifier.NEWUSE
User signon.DDFINA
The distributed thread went inactive.DEALLO
Thread termination.COMMIT
RRSAF thread specified accounting interval = COMMIT.EOT/TE
End of task, application terminated normally.EOT/AB
End of task, application terminated abnormally.EOM/AB
End of memory, application terminated abnormally.RES/IN
Resolve indoubt processing.FORCE
Stop forced, MVS canceled DB2 or MVS forced DB2.IEOT/T
End of task, application terminated normally and is indoubt.IEOT/A
End of task, application terminated abnormally and is indoubt.IEOM/A
End of memory, application terminated abnormally and is indoubt.IFORCE
Stop forced, MVS canceled DB2 or MVS forced DB2, and the thread is indoubt.STALE
Staleness Threshold exceeded for DDF or RRSAF thread.LIMIT
DDF ROLLUP threshold limit exceeded.STORAG
Internal DB2 storage threshold was reached for DDF or RRSAF thread.INACT
Distributed database access thread termination.
Thread History By SubintervalThis panel provides information about thread activity for a selected interval from the Thread History byReport Interval panel.
Each time displayed in this panel reflects the start of a subinterval. The subinterval is determined by thenear-term history data collection options keyword NTAINTERVAL, which is specified by means of theConfiguration Tool. For more information, see Configuration and Customization.
710 Classic Interface User's Guide
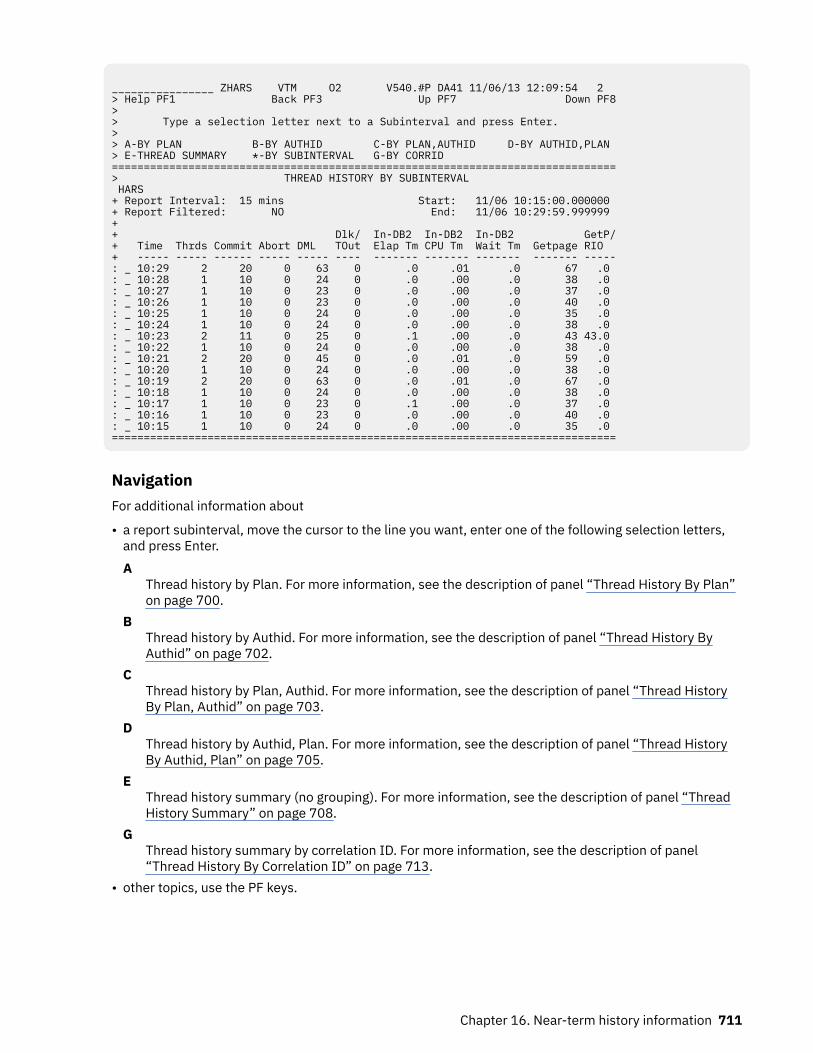
________________ ZHARS VTM O2 V540.#P DA41 11/06/13 12:09:54 2 > Help PF1 Back PF3 Up PF7 Down PF8> > Type a selection letter next to a Subinterval and press Enter. > > A-BY PLAN B-BY AUTHID C-BY PLAN,AUTHID D-BY AUTHID,PLAN > E-THREAD SUMMARY *-BY SUBINTERVAL G-BY CORRID ===============================================================================> THREAD HISTORY BY SUBINTERVAL HARS + Report Interval: 15 mins Start: 11/06 10:15:00.000000 + Report Filtered: NO End: 11/06 10:29:59.999999 + + Dlk/ In-DB2 In-DB2 In-DB2 GetP/+ Time Thrds Commit Abort DML TOut Elap Tm CPU Tm Wait Tm Getpage RIO + ----- ----- ------ ----- ----- ---- ------- ------- ------- ------- -----: _ 10:29 2 20 0 63 0 .0 .01 .0 67 .0 : _ 10:28 1 10 0 24 0 .0 .00 .0 38 .0 : _ 10:27 1 10 0 23 0 .0 .00 .0 37 .0 : _ 10:26 1 10 0 23 0 .0 .00 .0 40 .0 : _ 10:25 1 10 0 24 0 .0 .00 .0 35 .0 : _ 10:24 1 10 0 24 0 .0 .00 .0 38 .0 : _ 10:23 2 11 0 25 0 .1 .00 .0 43 43.0 : _ 10:22 1 10 0 24 0 .0 .00 .0 38 .0 : _ 10:21 2 20 0 45 0 .0 .01 .0 59 .0 : _ 10:20 1 10 0 24 0 .0 .00 .0 38 .0 : _ 10:19 2 20 0 63 0 .0 .01 .0 67 .0 : _ 10:18 1 10 0 24 0 .0 .00 .0 38 .0 : _ 10:17 1 10 0 23 0 .1 .00 .0 37 .0 : _ 10:16 1 10 0 23 0 .0 .00 .0 40 .0 : _ 10:15 1 10 0 24 0 .0 .00 .0 35 .0 ===============================================================================
NavigationFor additional information about
• a report subinterval, move the cursor to the line you want, enter one of the following selection letters,and press Enter.A
Thread history by Plan. For more information, see the description of panel “Thread History By Plan”on page 700.
BThread history by Authid. For more information, see the description of panel “Thread History ByAuthid” on page 702.
CThread history by Plan, Authid. For more information, see the description of panel “Thread HistoryBy Plan, Authid” on page 703.
DThread history by Authid, Plan. For more information, see the description of panel “Thread HistoryBy Authid, Plan” on page 705.
EThread history summary (no grouping). For more information, see the description of panel “ThreadHistory Summary” on page 708.
GThread history summary by correlation ID. For more information, see the description of panel“Thread History By Correlation ID” on page 713.
• other topics, use the PF keys.
Chapter 16. Near-term history information 711
FieldsReport Interval
The time interval by which the report period is partitioned. For more information, see the descriptionof panel “Near-Term Thread History Filter Options” on page 693.
StartThe start date and time of the first interval in the display.
Report FilteredThis field shows YES if thread filter values were used to create this display. Otherwise, NO is displayed.
EndThe end time of the last subinterval in the display.
TimeThe time of the start of the report subinterval.
ThrdsThe number of threads completed in this subinterval.
CommitThe number of successful commits performed in this subinterval. For attachments that use two-phase-commit protocol, this count represents the number of phase two commits. For others, thiscount represents the number of single-phase commit (sync) requests.
AbortThe number of successful rollbacks performed in this subinterval.
DMLThe number of DML calls issued in this subinterval.
DLk/TOutThe number deadlocks and timeouts occurred in this subinterval.
In-DB2 Elap TmThe elapsed time spent in DB2 for this subinterval. Accounting class 2 data is required. Displays N/A ifaccounting class 2 data is not available.
In-DB2 CPU TmThe CPU time spent in DB2 for this subinterval. Accounting class 2 data is required. Displays N/A ifaccounting class 2 data is not available.
In-DB2 Wait TmThe time spent waiting in DB2 for this subinterval. Accounting class 3 data is required. Displays N/A ifaccounting class 3 data is not available. DB2 Accounting class 3 wait events are:
• Synchronous I/O waits• Asynchronous Read I/O waits• Asynchronous Write I/O waits• Lock/latch waits• Page latch waits• Drain lock waits• Drain of claims waits• DB2 service task waits• Archive Log Mode(QUIESCE) waits• Archive read from tape waits
GetpageThe number of Getpage requests issued in this subinterval.
GetP/RIOThe ratio of Getpage requests to synchronous Read I/Os for this subinterval.
712 Classic Interface User's Guide
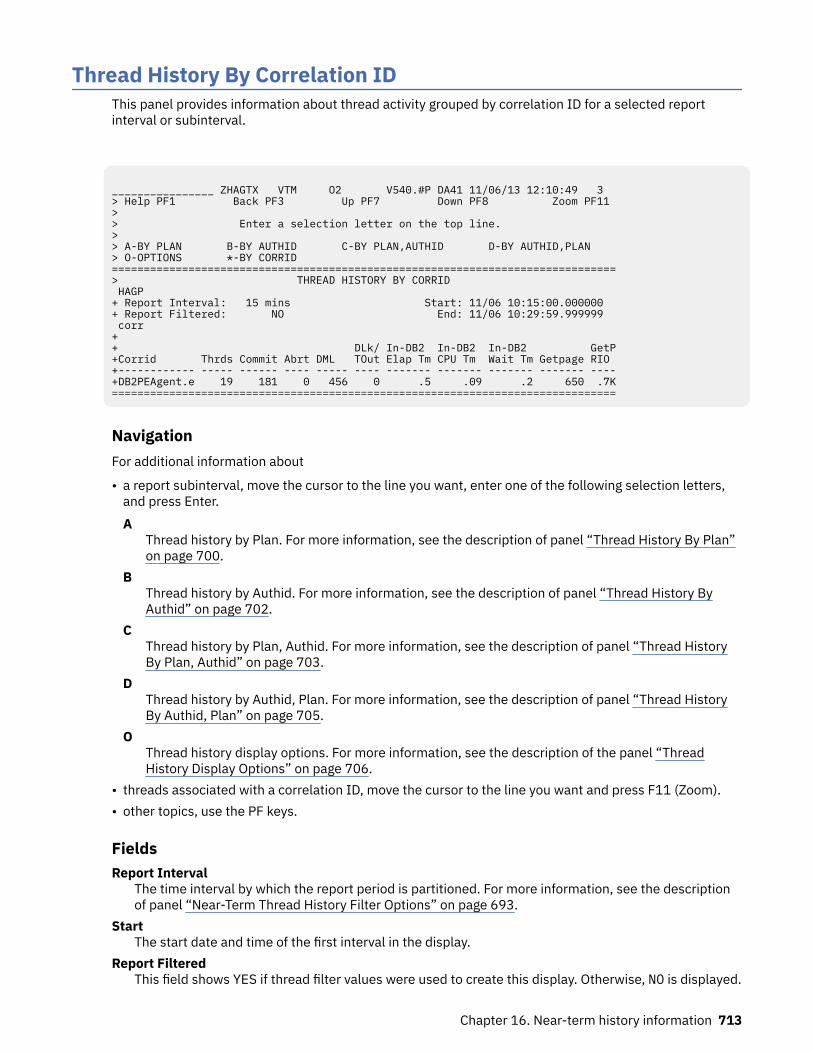
Thread History By Correlation IDThis panel provides information about thread activity grouped by correlation ID for a selected reportinterval or subinterval.
________________ ZHAGTX VTM O2 V540.#P DA41 11/06/13 12:10:49 3 > Help PF1 Back PF3 Up PF7 Down PF8 Zoom PF11 > > Enter a selection letter on the top line. > > A-BY PLAN B-BY AUTHID C-BY PLAN,AUTHID D-BY AUTHID,PLAN > O-OPTIONS *-BY CORRID ===============================================================================> THREAD HISTORY BY CORRID HAGP + Report Interval: 15 mins Start: 11/06 10:15:00.000000 + Report Filtered: NO End: 11/06 10:29:59.999999 corr + + DLk/ In-DB2 In-DB2 In-DB2 GetP+Corrid Thrds Commit Abrt DML TOut Elap Tm CPU Tm Wait Tm Getpage RIO +------------ ----- ------ ---- ----- ---- ------- ------- ------- ------- ----+DB2PEAgent.e 19 181 0 456 0 .5 .09 .2 650 .7K===============================================================================
NavigationFor additional information about
• a report subinterval, move the cursor to the line you want, enter one of the following selection letters,and press Enter.A
Thread history by Plan. For more information, see the description of panel “Thread History By Plan”on page 700.
BThread history by Authid. For more information, see the description of panel “Thread History ByAuthid” on page 702.
CThread history by Plan, Authid. For more information, see the description of panel “Thread HistoryBy Plan, Authid” on page 703.
DThread history by Authid, Plan. For more information, see the description of panel “Thread HistoryBy Authid, Plan” on page 705.
OThread history display options. For more information, see the description of the panel “ThreadHistory Display Options” on page 706.
• threads associated with a correlation ID, move the cursor to the line you want and press F11 (Zoom).• other topics, use the PF keys.
FieldsReport Interval
The time interval by which the report period is partitioned. For more information, see the descriptionof panel “Near-Term Thread History Filter Options” on page 693.
StartThe start date and time of the first interval in the display.
Report FilteredThis field shows YES if thread filter values were used to create this display. Otherwise, NO is displayed.
Chapter 16. Near-term history information 713
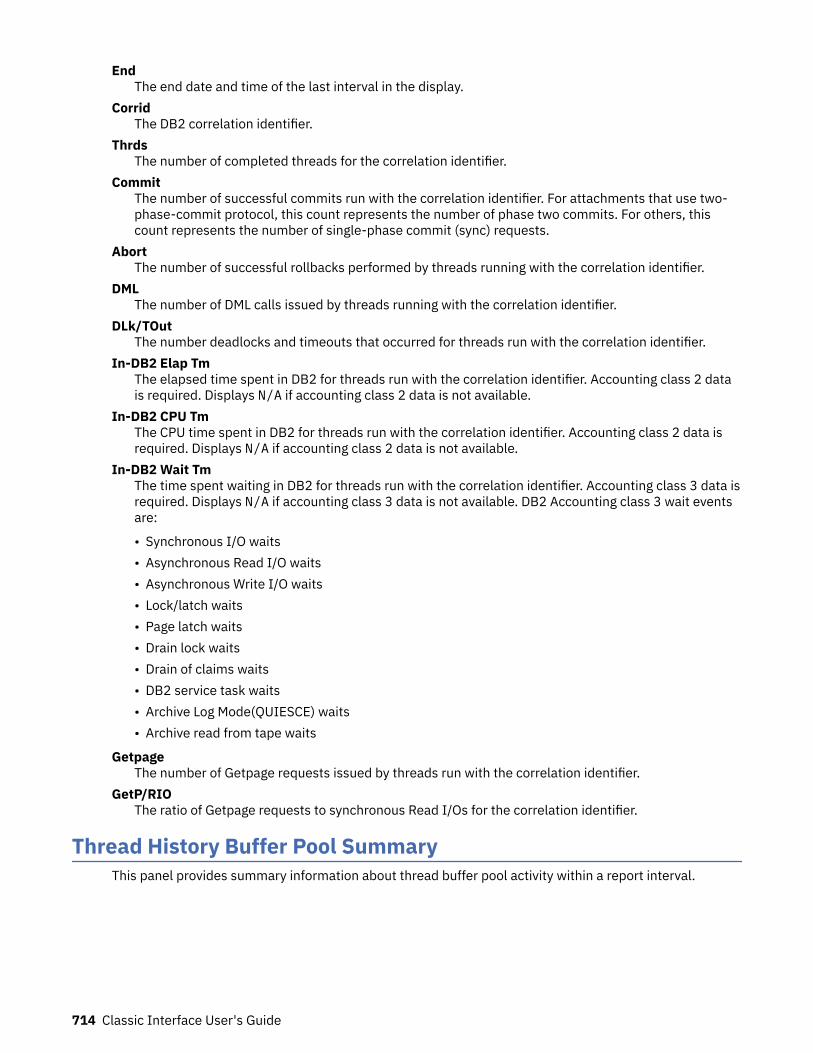
EndThe end date and time of the last interval in the display.
CorridThe DB2 correlation identifier.
ThrdsThe number of completed threads for the correlation identifier.
CommitThe number of successful commits run with the correlation identifier. For attachments that use two-phase-commit protocol, this count represents the number of phase two commits. For others, thiscount represents the number of single-phase commit (sync) requests.
AbortThe number of successful rollbacks performed by threads running with the correlation identifier.
DMLThe number of DML calls issued by threads running with the correlation identifier.
DLk/TOutThe number deadlocks and timeouts that occurred for threads run with the correlation identifier.
In-DB2 Elap TmThe elapsed time spent in DB2 for threads run with the correlation identifier. Accounting class 2 datais required. Displays N/A if accounting class 2 data is not available.
In-DB2 CPU TmThe CPU time spent in DB2 for threads run with the correlation identifier. Accounting class 2 data isrequired. Displays N/A if accounting class 2 data is not available.
In-DB2 Wait TmThe time spent waiting in DB2 for threads run with the correlation identifier. Accounting class 3 data isrequired. Displays N/A if accounting class 3 data is not available. DB2 Accounting class 3 wait eventsare:
• Synchronous I/O waits• Asynchronous Read I/O waits• Asynchronous Write I/O waits• Lock/latch waits• Page latch waits• Drain lock waits• Drain of claims waits• DB2 service task waits• Archive Log Mode(QUIESCE) waits• Archive read from tape waits
GetpageThe number of Getpage requests issued by threads run with the correlation identifier.
GetP/RIOThe ratio of Getpage requests to synchronous Read I/Os for the correlation identifier.
Thread History Buffer Pool SummaryThis panel provides summary information about thread buffer pool activity within a report interval.
714 Classic Interface User's Guide
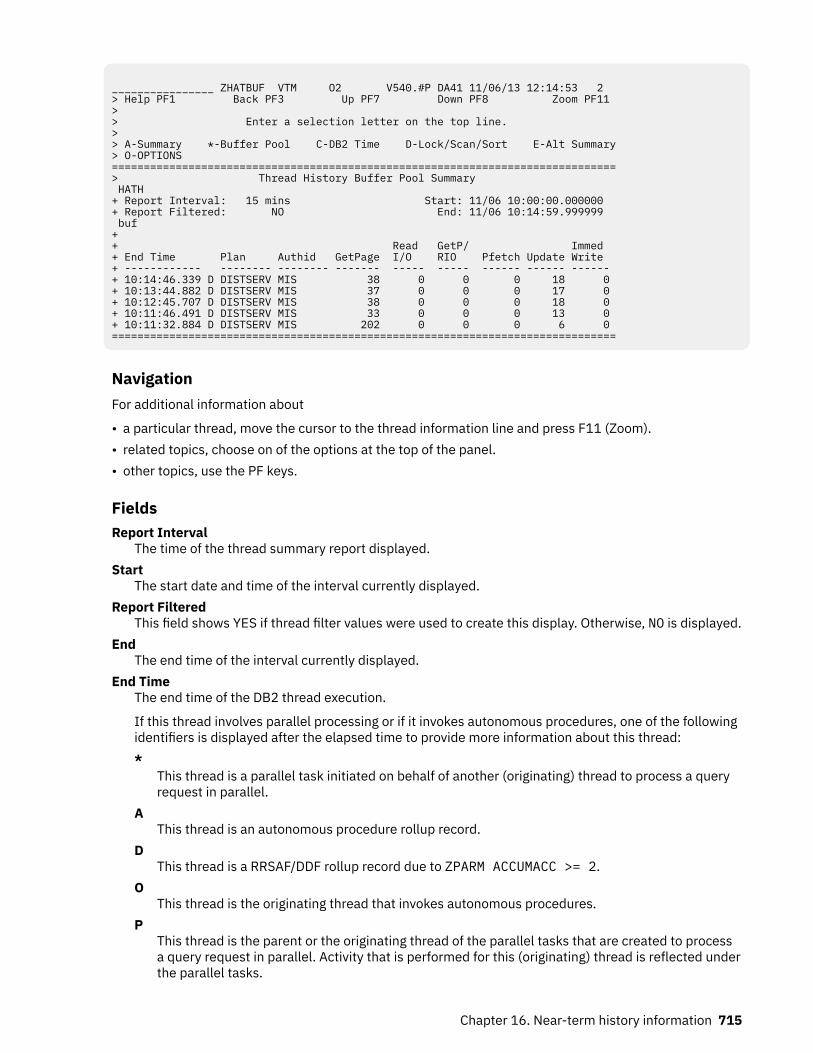
________________ ZHATBUF VTM O2 V540.#P DA41 11/06/13 12:14:53 2 > Help PF1 Back PF3 Up PF7 Down PF8 Zoom PF11 > > Enter a selection letter on the top line. > > A-Summary *-Buffer Pool C-DB2 Time D-Lock/Scan/Sort E-Alt Summary> O-OPTIONS ===============================================================================> Thread History Buffer Pool Summary HATH + Report Interval: 15 mins Start: 11/06 10:00:00.000000 + Report Filtered: NO End: 11/06 10:14:59.999999 buf + + Read GetP/ Immed + End Time Plan Authid GetPage I/O RIO Pfetch Update Write + ------------ -------- -------- ------- ----- ----- ------ ------ ------ + 10:14:46.339 D DISTSERV MIS 38 0 0 0 18 0 + 10:13:44.882 D DISTSERV MIS 37 0 0 0 17 0 + 10:12:45.707 D DISTSERV MIS 38 0 0 0 18 0 + 10:11:46.491 D DISTSERV MIS 33 0 0 0 13 0 + 10:11:32.884 D DISTSERV MIS 202 0 0 0 6 0 ===============================================================================
NavigationFor additional information about
• a particular thread, move the cursor to the thread information line and press F11 (Zoom).• related topics, choose on of the options at the top of the panel.• other topics, use the PF keys.
FieldsReport Interval
The time of the thread summary report displayed.Start
The start date and time of the interval currently displayed.Report Filtered
This field shows YES if thread filter values were used to create this display. Otherwise, NO is displayed.End
The end time of the interval currently displayed.End Time
The end time of the DB2 thread execution.
If this thread involves parallel processing or if it invokes autonomous procedures, one of the followingidentifiers is displayed after the elapsed time to provide more information about this thread:*
This thread is a parallel task initiated on behalf of another (originating) thread to process a queryrequest in parallel.
AThis thread is an autonomous procedure rollup record.
DThis thread is a RRSAF/DDF rollup record due to ZPARM ACCUMACC >= 2.
OThis thread is the originating thread that invokes autonomous procedures.
PThis thread is the parent or the originating thread of the parallel tasks that are created to processa query request in parallel. Activity that is performed for this (originating) thread is reflected underthe parallel tasks.
Chapter 16. Near-term history information 715
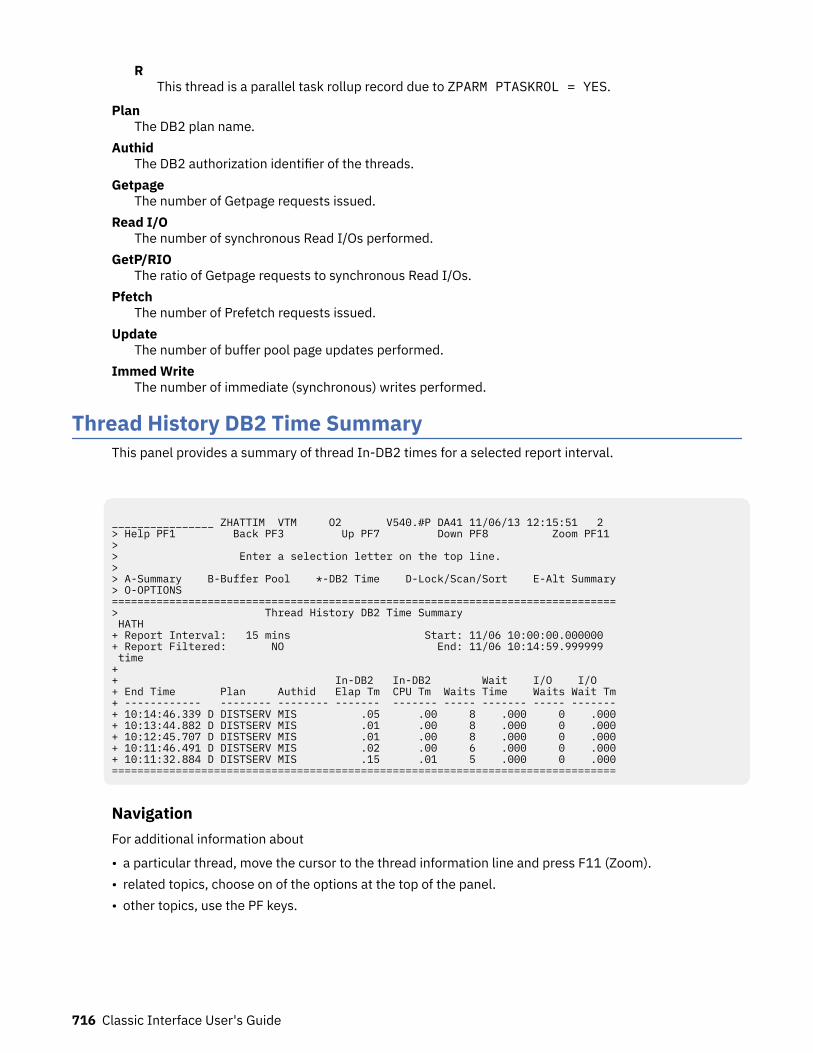
RThis thread is a parallel task rollup record due to ZPARM PTASKROL = YES.
PlanThe DB2 plan name.
AuthidThe DB2 authorization identifier of the threads.
GetpageThe number of Getpage requests issued.
Read I/OThe number of synchronous Read I/Os performed.
GetP/RIOThe ratio of Getpage requests to synchronous Read I/Os.
PfetchThe number of Prefetch requests issued.
UpdateThe number of buffer pool page updates performed.
Immed WriteThe number of immediate (synchronous) writes performed.
Thread History DB2 Time SummaryThis panel provides a summary of thread In-DB2 times for a selected report interval.
________________ ZHATTIM VTM O2 V540.#P DA41 11/06/13 12:15:51 2 > Help PF1 Back PF3 Up PF7 Down PF8 Zoom PF11 > > Enter a selection letter on the top line. > > A-Summary B-Buffer Pool *-DB2 Time D-Lock/Scan/Sort E-Alt Summary> O-OPTIONS ===============================================================================> Thread History DB2 Time Summary HATH + Report Interval: 15 mins Start: 11/06 10:00:00.000000 + Report Filtered: NO End: 11/06 10:14:59.999999 time + + In-DB2 In-DB2 Wait I/O I/O + End Time Plan Authid Elap Tm CPU Tm Waits Time Waits Wait Tm+ ------------ -------- -------- ------- ------- ----- ------- ----- -------+ 10:14:46.339 D DISTSERV MIS .05 .00 8 .000 0 .000+ 10:13:44.882 D DISTSERV MIS .01 .00 8 .000 0 .000+ 10:12:45.707 D DISTSERV MIS .01 .00 8 .000 0 .000+ 10:11:46.491 D DISTSERV MIS .02 .00 6 .000 0 .000+ 10:11:32.884 D DISTSERV MIS .15 .01 5 .000 0 .000===============================================================================
NavigationFor additional information about
• a particular thread, move the cursor to the thread information line and press F11 (Zoom).• related topics, choose on of the options at the top of the panel.• other topics, use the PF keys.
716 Classic Interface User's Guide
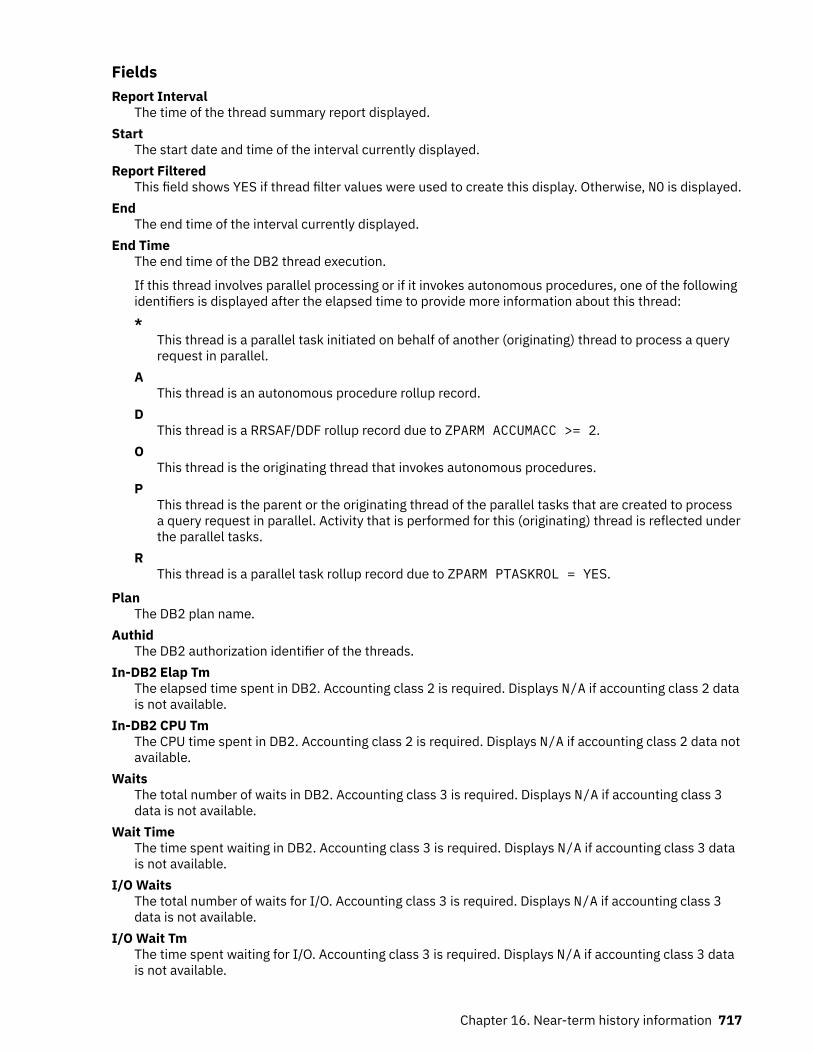
FieldsReport Interval
The time of the thread summary report displayed.Start
The start date and time of the interval currently displayed.Report Filtered
This field shows YES if thread filter values were used to create this display. Otherwise, NO is displayed.End
The end time of the interval currently displayed.End Time
The end time of the DB2 thread execution.
If this thread involves parallel processing or if it invokes autonomous procedures, one of the followingidentifiers is displayed after the elapsed time to provide more information about this thread:*
This thread is a parallel task initiated on behalf of another (originating) thread to process a queryrequest in parallel.
AThis thread is an autonomous procedure rollup record.
DThis thread is a RRSAF/DDF rollup record due to ZPARM ACCUMACC >= 2.
OThis thread is the originating thread that invokes autonomous procedures.
PThis thread is the parent or the originating thread of the parallel tasks that are created to processa query request in parallel. Activity that is performed for this (originating) thread is reflected underthe parallel tasks.
RThis thread is a parallel task rollup record due to ZPARM PTASKROL = YES.
PlanThe DB2 plan name.
AuthidThe DB2 authorization identifier of the threads.
In-DB2 Elap TmThe elapsed time spent in DB2. Accounting class 2 is required. Displays N/A if accounting class 2 datais not available.
In-DB2 CPU TmThe CPU time spent in DB2. Accounting class 2 is required. Displays N/A if accounting class 2 data notavailable.
WaitsThe total number of waits in DB2. Accounting class 3 is required. Displays N/A if accounting class 3data is not available.
Wait TimeThe time spent waiting in DB2. Accounting class 3 is required. Displays N/A if accounting class 3 datais not available.
I/O WaitsThe total number of waits for I/O. Accounting class 3 is required. Displays N/A if accounting class 3data is not available.
I/O Wait TmThe time spent waiting for I/O. Accounting class 3 is required. Displays N/A if accounting class 3 datais not available.
Chapter 16. Near-term history information 717
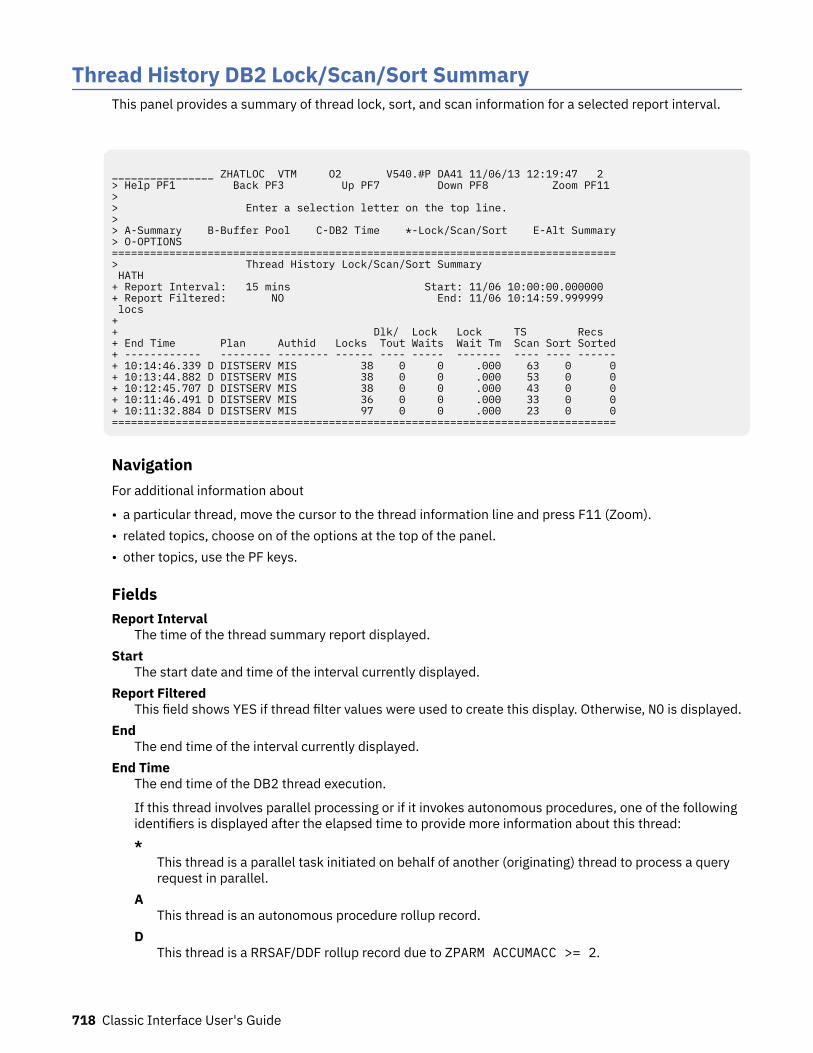
Thread History DB2 Lock/Scan/Sort SummaryThis panel provides a summary of thread lock, sort, and scan information for a selected report interval.
________________ ZHATLOC VTM O2 V540.#P DA41 11/06/13 12:19:47 2 > Help PF1 Back PF3 Up PF7 Down PF8 Zoom PF11 > > Enter a selection letter on the top line. > > A-Summary B-Buffer Pool C-DB2 Time *-Lock/Scan/Sort E-Alt Summary> O-OPTIONS ===============================================================================> Thread History Lock/Scan/Sort Summary HATH + Report Interval: 15 mins Start: 11/06 10:00:00.000000 + Report Filtered: NO End: 11/06 10:14:59.999999 locs + + Dlk/ Lock Lock TS Recs + End Time Plan Authid Locks Tout Waits Wait Tm Scan Sort Sorted+ ------------ -------- -------- ------ ---- ----- ------- ---- ---- ------+ 10:14:46.339 D DISTSERV MIS 38 0 0 .000 63 0 0+ 10:13:44.882 D DISTSERV MIS 38 0 0 .000 53 0 0+ 10:12:45.707 D DISTSERV MIS 38 0 0 .000 43 0 0+ 10:11:46.491 D DISTSERV MIS 36 0 0 .000 33 0 0+ 10:11:32.884 D DISTSERV MIS 97 0 0 .000 23 0 0===============================================================================
NavigationFor additional information about
• a particular thread, move the cursor to the thread information line and press F11 (Zoom).• related topics, choose on of the options at the top of the panel.• other topics, use the PF keys.
FieldsReport Interval
The time of the thread summary report displayed.Start
The start date and time of the interval currently displayed.Report Filtered
This field shows YES if thread filter values were used to create this display. Otherwise, NO is displayed.End
The end time of the interval currently displayed.End Time
The end time of the DB2 thread execution.
If this thread involves parallel processing or if it invokes autonomous procedures, one of the followingidentifiers is displayed after the elapsed time to provide more information about this thread:*
This thread is a parallel task initiated on behalf of another (originating) thread to process a queryrequest in parallel.
AThis thread is an autonomous procedure rollup record.
DThis thread is a RRSAF/DDF rollup record due to ZPARM ACCUMACC >= 2.
718 Classic Interface User's Guide
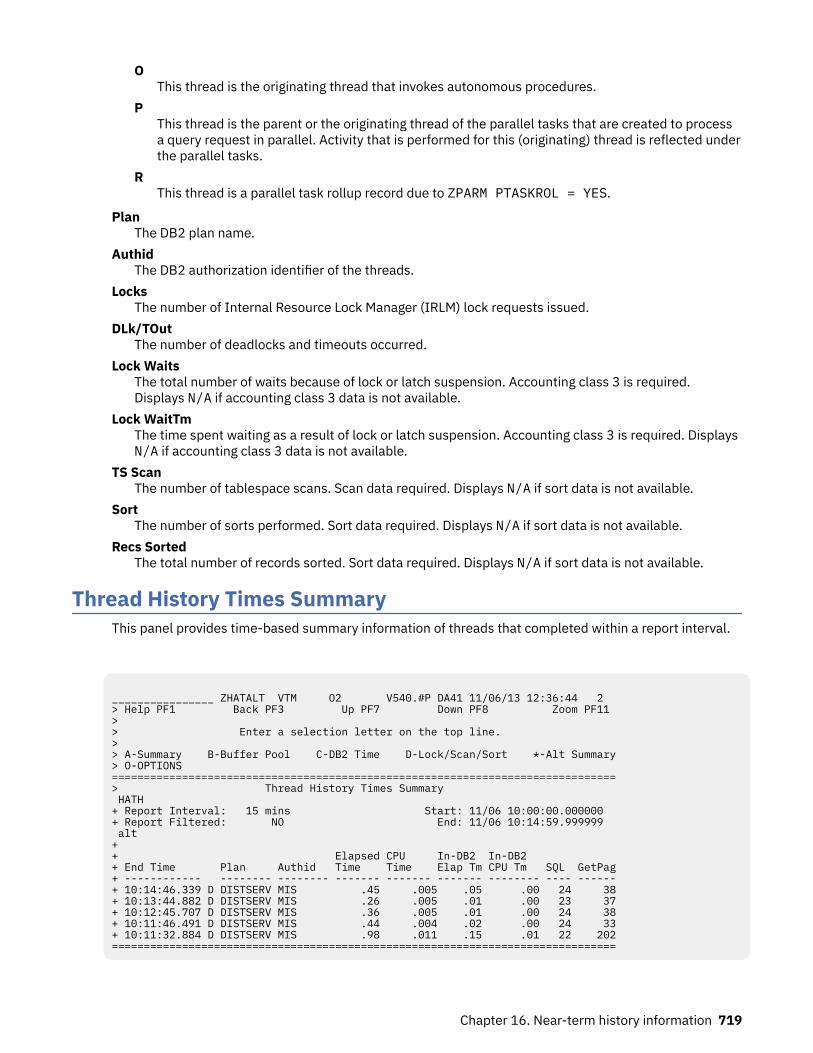
OThis thread is the originating thread that invokes autonomous procedures.
PThis thread is the parent or the originating thread of the parallel tasks that are created to processa query request in parallel. Activity that is performed for this (originating) thread is reflected underthe parallel tasks.
RThis thread is a parallel task rollup record due to ZPARM PTASKROL = YES.
PlanThe DB2 plan name.
AuthidThe DB2 authorization identifier of the threads.
LocksThe number of Internal Resource Lock Manager (IRLM) lock requests issued.
DLk/TOutThe number of deadlocks and timeouts occurred.
Lock WaitsThe total number of waits because of lock or latch suspension. Accounting class 3 is required.Displays N/A if accounting class 3 data is not available.
Lock WaitTmThe time spent waiting as a result of lock or latch suspension. Accounting class 3 is required. DisplaysN/A if accounting class 3 data is not available.
TS ScanThe number of tablespace scans. Scan data required. Displays N/A if sort data is not available.
SortThe number of sorts performed. Sort data required. Displays N/A if sort data is not available.
Recs SortedThe total number of records sorted. Sort data required. Displays N/A if sort data is not available.
Thread History Times SummaryThis panel provides time-based summary information of threads that completed within a report interval.
________________ ZHATALT VTM O2 V540.#P DA41 11/06/13 12:36:44 2 > Help PF1 Back PF3 Up PF7 Down PF8 Zoom PF11 > > Enter a selection letter on the top line. > > A-Summary B-Buffer Pool C-DB2 Time D-Lock/Scan/Sort *-Alt Summary> O-OPTIONS ===============================================================================> Thread History Times Summary HATH + Report Interval: 15 mins Start: 11/06 10:00:00.000000 + Report Filtered: NO End: 11/06 10:14:59.999999 alt + + Elapsed CPU In-DB2 In-DB2 + End Time Plan Authid Time Time Elap Tm CPU Tm SQL GetPag+ ------------ -------- -------- ------- ------- ------- -------- ---- ------+ 10:14:46.339 D DISTSERV MIS .45 .005 .05 .00 24 38+ 10:13:44.882 D DISTSERV MIS .26 .005 .01 .00 23 37+ 10:12:45.707 D DISTSERV MIS .36 .005 .01 .00 24 38+ 10:11:46.491 D DISTSERV MIS .44 .004 .02 .00 24 33+ 10:11:32.884 D DISTSERV MIS .98 .011 .15 .01 22 202===============================================================================
Chapter 16. Near-term history information 719
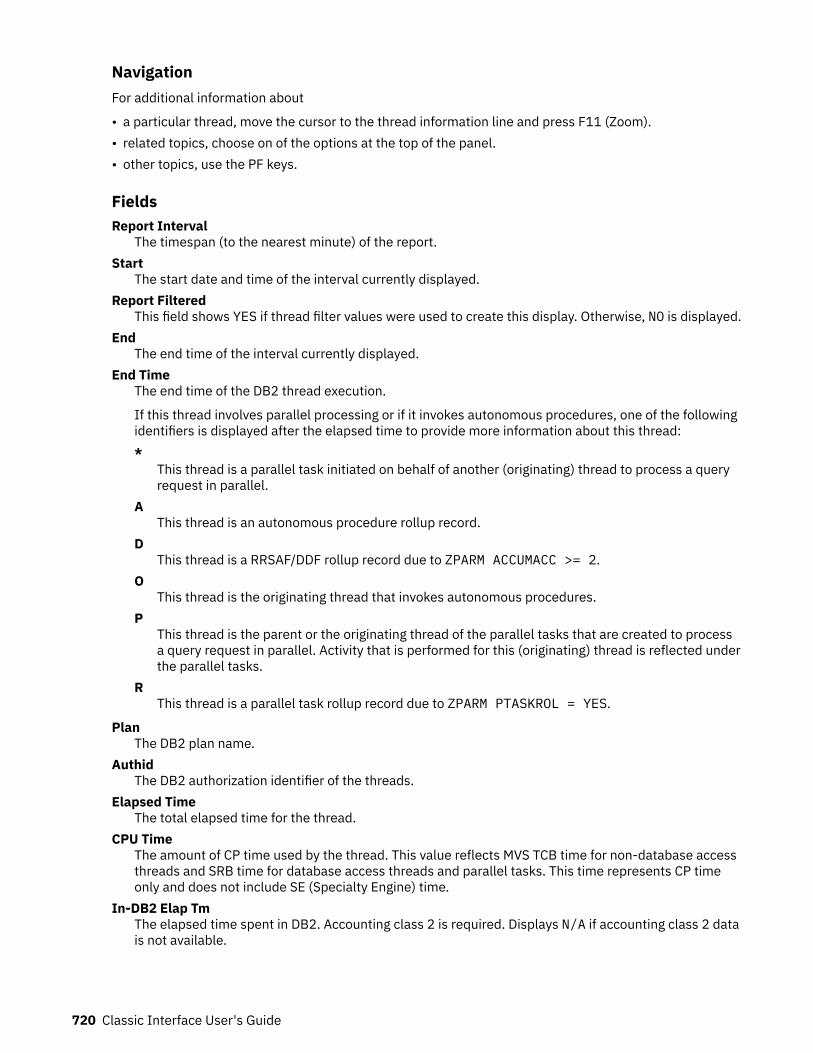
NavigationFor additional information about
• a particular thread, move the cursor to the thread information line and press F11 (Zoom).• related topics, choose on of the options at the top of the panel.• other topics, use the PF keys.
FieldsReport Interval
The timespan (to the nearest minute) of the report.Start
The start date and time of the interval currently displayed.Report Filtered
This field shows YES if thread filter values were used to create this display. Otherwise, NO is displayed.End
The end time of the interval currently displayed.End Time
The end time of the DB2 thread execution.
If this thread involves parallel processing or if it invokes autonomous procedures, one of the followingidentifiers is displayed after the elapsed time to provide more information about this thread:*
This thread is a parallel task initiated on behalf of another (originating) thread to process a queryrequest in parallel.
AThis thread is an autonomous procedure rollup record.
DThis thread is a RRSAF/DDF rollup record due to ZPARM ACCUMACC >= 2.
OThis thread is the originating thread that invokes autonomous procedures.
PThis thread is the parent or the originating thread of the parallel tasks that are created to processa query request in parallel. Activity that is performed for this (originating) thread is reflected underthe parallel tasks.
RThis thread is a parallel task rollup record due to ZPARM PTASKROL = YES.
PlanThe DB2 plan name.
AuthidThe DB2 authorization identifier of the threads.
Elapsed TimeThe total elapsed time for the thread.
CPU TimeThe amount of CP time used by the thread. This value reflects MVS TCB time for non-database accessthreads and SRB time for database access threads and parallel tasks. This time represents CP timeonly and does not include SE (Specialty Engine) time.
In-DB2 Elap TmThe elapsed time spent in DB2. Accounting class 2 is required. Displays N/A if accounting class 2 datais not available.
720 Classic Interface User's Guide
In-DB2 CPU TmThe CPU time spent in DB2. Accounting class 2 is required. Displays N/A if accounting class 2 data notavailable.
SQLThe total number of DCL, DDL, and DML SQL calls issued by the thread. COMMIT and ROLLBACK/ABORT are not included.
GetpagThe number of Getpage requests issued.
Thread History DetailThis panel provides detail information about the activity of a completed thread or parallel task.
A parallel task is a subtask that is created from an originating thread to process a part of a query.
Chapter 16. Near-term history information 721
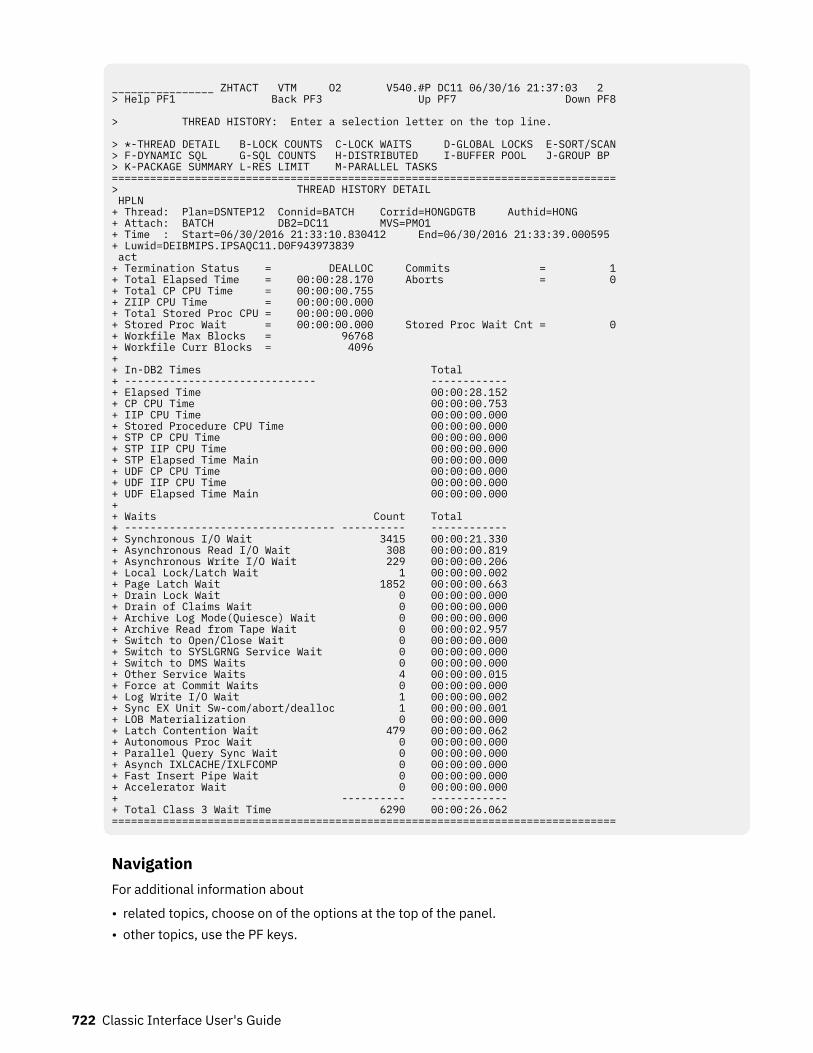
________________ ZHTACT VTM O2 V540.#P DC11 06/30/16 21:37:03 2 > Help PF1 Back PF3 Up PF7 Down PF8 > THREAD HISTORY: Enter a selection letter on the top line. > *-THREAD DETAIL B-LOCK COUNTS C-LOCK WAITS D-GLOBAL LOCKS E-SORT/SCAN > F-DYNAMIC SQL G-SQL COUNTS H-DISTRIBUTED I-BUFFER POOL J-GROUP BP > K-PACKAGE SUMMARY L-RES LIMIT M-PARALLEL TASKS =============================================================================== > THREAD HISTORY DETAIL HPLN + Thread: Plan=DSNTEP12 Connid=BATCH Corrid=HONGDGTB Authid=HONG + Attach: BATCH DB2=DC11 MVS=PMO1 + Time : Start=06/30/2016 21:33:10.830412 End=06/30/2016 21:33:39.000595 + Luwid=DEIBMIPS.IPSAQC11.D0F943973839 act + Termination Status = DEALLOC Commits = 1 + Total Elapsed Time = 00:00:28.170 Aborts = 0 + Total CP CPU Time = 00:00:00.755 + ZIIP CPU Time = 00:00:00.000 + Total Stored Proc CPU = 00:00:00.000 + Stored Proc Wait = 00:00:00.000 Stored Proc Wait Cnt = 0 + Workfile Max Blocks = 96768 + Workfile Curr Blocks = 4096 + + In-DB2 Times Total + ------------------------------ ------------ + Elapsed Time 00:00:28.152 + CP CPU Time 00:00:00.753 + IIP CPU Time 00:00:00.000 + Stored Procedure CPU Time 00:00:00.000 + STP CP CPU Time 00:00:00.000 + STP IIP CPU Time 00:00:00.000 + STP Elapsed Time Main 00:00:00.000 + UDF CP CPU Time 00:00:00.000 + UDF IIP CPU Time 00:00:00.000 + UDF Elapsed Time Main 00:00:00.000 + + Waits Count Total + --------------------------------- ---------- ------------ + Synchronous I/O Wait 3415 00:00:21.330 + Asynchronous Read I/O Wait 308 00:00:00.819 + Asynchronous Write I/O Wait 229 00:00:00.206 + Local Lock/Latch Wait 1 00:00:00.002 + Page Latch Wait 1852 00:00:00.663 + Drain Lock Wait 0 00:00:00.000 + Drain of Claims Wait 0 00:00:00.000 + Archive Log Mode(Quiesce) Wait 0 00:00:00.000 + Archive Read from Tape Wait 0 00:00:02.957 + Switch to Open/Close Wait 0 00:00:00.000 + Switch to SYSLGRNG Service Wait 0 00:00:00.000 + Switch to DMS Waits 0 00:00:00.000 + Other Service Waits 4 00:00:00.015 + Force at Commit Waits 0 00:00:00.000 + Log Write I/O Wait 1 00:00:00.002 + Sync EX Unit Sw-com/abort/dealloc 1 00:00:00.001 + LOB Materialization 0 00:00:00.000 + Latch Contention Wait 479 00:00:00.062 + Autonomous Proc Wait 0 00:00:00.000 + Parallel Query Sync Wait 0 00:00:00.000 + Asynch IXLCACHE/IXLFCOMP 0 00:00:00.000 + Fast Insert Pipe Wait 0 00:00:00.000 + Accelerator Wait 0 00:00:00.000 + ---------- ------------ + Total Class 3 Wait Time 6290 00:00:26.062 ===============================================================================
NavigationFor additional information about
• related topics, choose on of the options at the top of the panel.• other topics, use the PF keys.
722 Classic Interface User's Guide
FieldsThread identifier: This information identifies the thread to which the information in this panel applies.Plan
The Db2 plan name of the active thread.Connid
The Db2 connection identifier of the active thread.Corrid
The Db2 correlation identifier of the active thread. If the correlation is not set, N/A is displayed.Authid
The Db2 authorization identifier of the active thread.Attach
Depending on the type of connection, the appropriate information is displayed.Attach information is displayed only if the thread is a distributed allied thread (not for distributeddatabase access threads).
Attachment identifier:Connection Type
The connection type is displayed in the first field:APPLDIR
Application directed access (data base access threads)BATCH
Other DB2 batch threadsCALLATCH
DB2 call attachCICS
CICS attachDLI
DL/I batchIMSBMP
IMS attach BMPIMSMPP
IMS attach MPPIMSCTRL
IMS control regionIMSBMPB
IMS transaction BMPRRSAF
Recoverable Resource Manager Services Attachment FacilitySYSDIR
System directed access (data base access threads)TSO
TSO foreground and backgroundUtility
Utility threadDB2
The DB2 subsystem identifier.MVS
The MVS system identifier.
Chapter 16. Near-term history information 723
ORIGAUTHThe original (primary) DB2 authorization identifier of the thread. This field displays only when theoriginal identifier is different from the Authid.
Time identifier:Start
The start date and time of this thread execution.End
The end date and time of this thread execution.
Distributed thread identifier: The following fields are displayed if the thread has a distributedrelationship with a remote Db2 subsystem.Type
The distributed thread type.Distributed Allied
A requesting thread; one that has issued an SQL call to a remote Db2 location.Database Access
A responding thread; one that is serving a remote Db2 location by responding to an SQL call.Db2=
The Db2 subsystem ID, indicating the member of the data sharing group of this thread.Luwid
This value consists of two parts: the logical unit of work ID (luw-id) and a token. The token can beused in place of the luw-id in any Db2 command that accepts luw-id as input. Format:
luw-id=token
The luw-id consists of the network name, the originating VTAM LUNAME, and a unique identifier(separated by periods). Thus, the Luwid field displays data like in the following example:
USCACO01.O2D22A.A1FE8E04B9D4=8
SystemThe originating Db2 job name and the resource manager that is the source of the thread. An additionalline below the Attach line identifies the user thread, if any, being served by the system thread.
Data fields:Termination Status
The status that indicates the reason for the thread termination:
• READS• RESIGNON• NEWUSER• DDFINACT• DEALLOC• COMMIT• EOT/TERM• EOT/ABND• EOM/ABND• RES/INDT• FORCE• IEOT/TRM• IEOT/ABN• IEOM/ABN
724 Classic Interface User's Guide
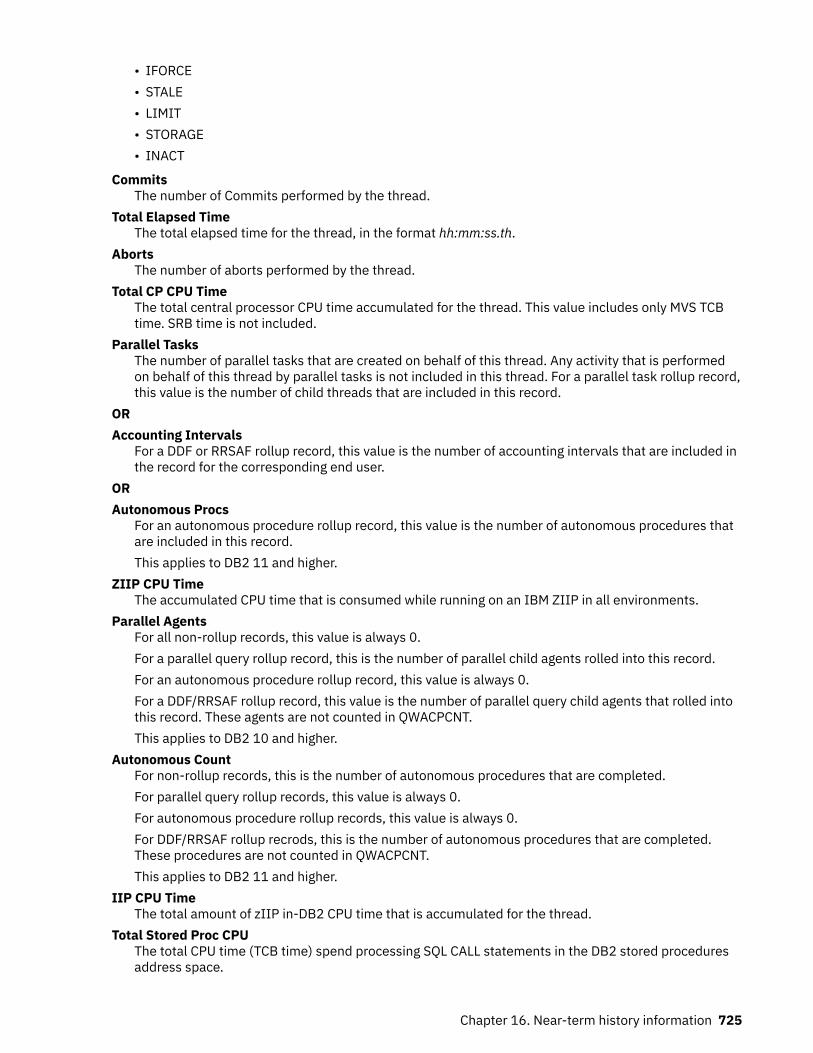
• IFORCE• STALE• LIMIT• STORAGE• INACT
CommitsThe number of Commits performed by the thread.
Total Elapsed TimeThe total elapsed time for the thread, in the format hh:mm:ss.th.
AbortsThe number of aborts performed by the thread.
Total CP CPU TimeThe total central processor CPU time accumulated for the thread. This value includes only MVS TCBtime. SRB time is not included.
Parallel TasksThe number of parallel tasks that are created on behalf of this thread. Any activity that is performedon behalf of this thread by parallel tasks is not included in this thread. For a parallel task rollup record,this value is the number of child threads that are included in this record.
ORAccounting Intervals
For a DDF or RRSAF rollup record, this value is the number of accounting intervals that are included inthe record for the corresponding end user.
ORAutonomous Procs
For an autonomous procedure rollup record, this value is the number of autonomous procedures thatare included in this record.This applies to DB2 11 and higher.
ZIIP CPU TimeThe accumulated CPU time that is consumed while running on an IBM ZIIP in all environments.
Parallel AgentsFor all non-rollup records, this value is always 0.For a parallel query rollup record, this is the number of parallel child agents rolled into this record.For an autonomous procedure rollup record, this value is always 0.For a DDF/RRSAF rollup record, this value is the number of parallel query child agents that rolled intothis record. These agents are not counted in QWACPCNT.This applies to DB2 10 and higher.
Autonomous CountFor non-rollup records, this is the number of autonomous procedures that are completed.For parallel query rollup records, this value is always 0.For autonomous procedure rollup records, this value is always 0.For DDF/RRSAF rollup recrods, this is the number of autonomous procedures that are completed.These procedures are not counted in QWACPCNT.This applies to DB2 11 and higher.
IIP CPU TimeThe total amount of zIIP in-DB2 CPU time that is accumulated for the thread.
Total Stored Proc CPUThe total CPU time (TCB time) spend processing SQL CALL statements in the DB2 stored proceduresaddress space.
Chapter 16. Near-term history information 725
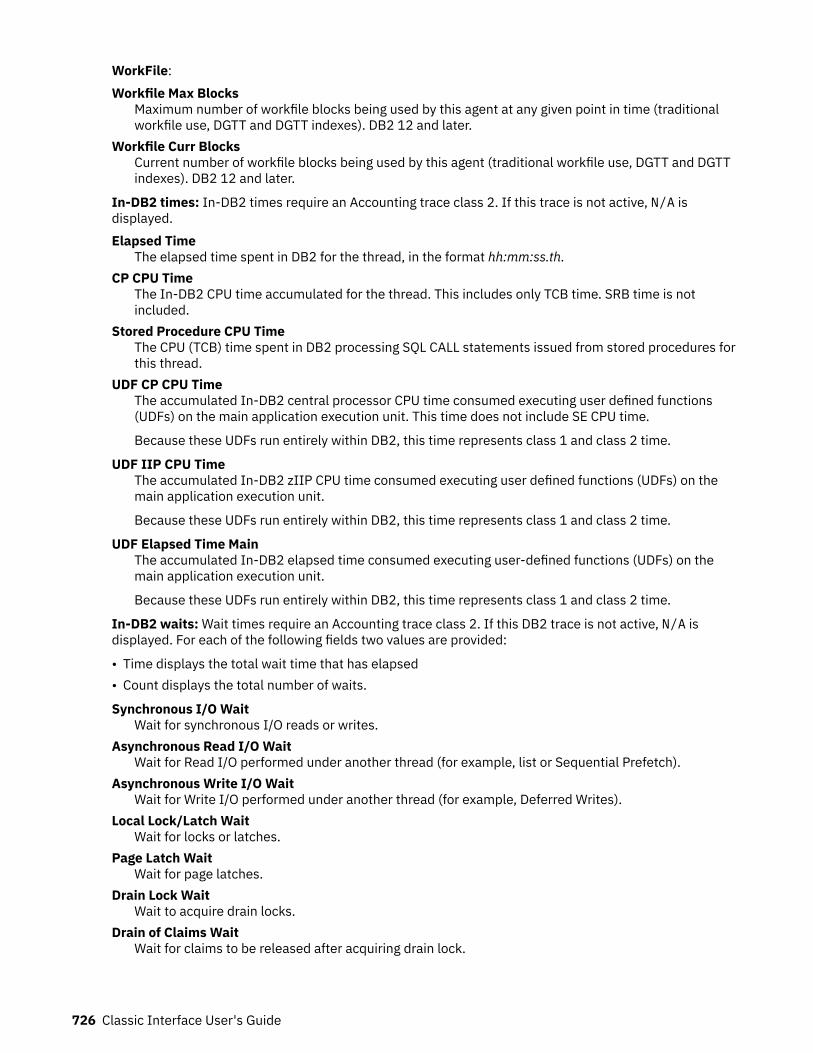
WorkFile:Workfile Max Blocks
Maximum number of workfile blocks being used by this agent at any given point in time (traditionalworkfile use, DGTT and DGTT indexes). DB2 12 and later.
Workfile Curr BlocksCurrent number of workfile blocks being used by this agent (traditional workfile use, DGTT and DGTTindexes). DB2 12 and later.
In-DB2 times: In-DB2 times require an Accounting trace class 2. If this trace is not active, N/A isdisplayed.Elapsed Time
The elapsed time spent in DB2 for the thread, in the format hh:mm:ss.th.CP CPU Time
The In-DB2 CPU time accumulated for the thread. This includes only TCB time. SRB time is notincluded.
Stored Procedure CPU TimeThe CPU (TCB) time spent in DB2 processing SQL CALL statements issued from stored procedures forthis thread.
UDF CP CPU TimeThe accumulated In-DB2 central processor CPU time consumed executing user defined functions(UDFs) on the main application execution unit. This time does not include SE CPU time.
Because these UDFs run entirely within DB2, this time represents class 1 and class 2 time.
UDF IIP CPU TimeThe accumulated In-DB2 zIIP CPU time consumed executing user defined functions (UDFs) on themain application execution unit.
Because these UDFs run entirely within DB2, this time represents class 1 and class 2 time.
UDF Elapsed Time MainThe accumulated In-DB2 elapsed time consumed executing user-defined functions (UDFs) on themain application execution unit.
Because these UDFs run entirely within DB2, this time represents class 1 and class 2 time.
In-DB2 waits: Wait times require an Accounting trace class 2. If this DB2 trace is not active, N/A isdisplayed. For each of the following fields two values are provided:
• Time displays the total wait time that has elapsed• Count displays the total number of waits.
Synchronous I/O WaitWait for synchronous I/O reads or writes.
Asynchronous Read I/O WaitWait for Read I/O performed under another thread (for example, list or Sequential Prefetch).
Asynchronous Write I/O WaitWait for Write I/O performed under another thread (for example, Deferred Writes).
Local Lock/Latch WaitWait for locks or latches.
Page Latch WaitWait for page latches.
Drain Lock WaitWait to acquire drain locks.
Drain of Claims WaitWait for claims to be released after acquiring drain lock.
726 Classic Interface User's Guide
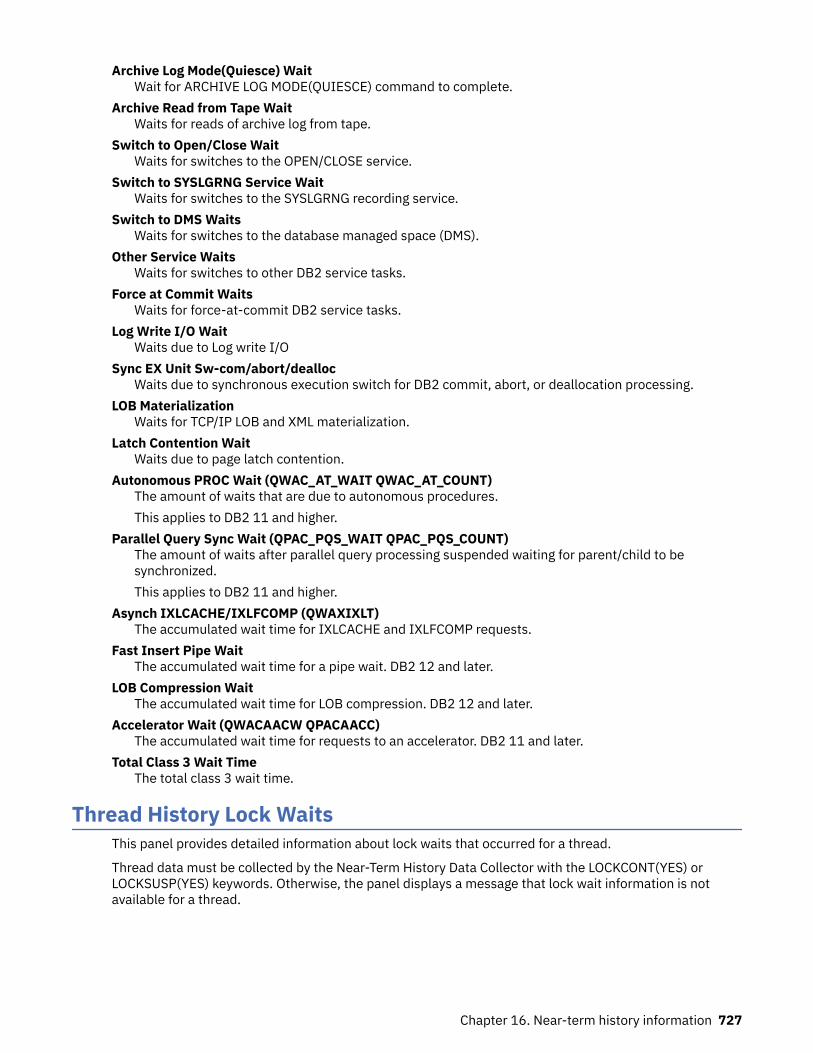
Archive Log Mode(Quiesce) WaitWait for ARCHIVE LOG MODE(QUIESCE) command to complete.
Archive Read from Tape WaitWaits for reads of archive log from tape.
Switch to Open/Close WaitWaits for switches to the OPEN/CLOSE service.
Switch to SYSLGRNG Service WaitWaits for switches to the SYSLGRNG recording service.
Switch to DMS WaitsWaits for switches to the database managed space (DMS).
Other Service WaitsWaits for switches to other DB2 service tasks.
Force at Commit WaitsWaits for force-at-commit DB2 service tasks.
Log Write I/O WaitWaits due to Log write I/O
Sync EX Unit Sw-com/abort/deallocWaits due to synchronous execution switch for DB2 commit, abort, or deallocation processing.
LOB MaterializationWaits for TCP/IP LOB and XML materialization.
Latch Contention WaitWaits due to page latch contention.
Autonomous PROC Wait (QWAC_AT_WAIT QWAC_AT_COUNT)The amount of waits that are due to autonomous procedures.This applies to DB2 11 and higher.
Parallel Query Sync Wait (QPAC_PQS_WAIT QPAC_PQS_COUNT)The amount of waits after parallel query processing suspended waiting for parent/child to besynchronized.This applies to DB2 11 and higher.
Asynch IXLCACHE/IXLFCOMP (QWAXIXLT)The accumulated wait time for IXLCACHE and IXLFCOMP requests.
Fast Insert Pipe WaitThe accumulated wait time for a pipe wait. DB2 12 and later.
LOB Compression WaitThe accumulated wait time for LOB compression. DB2 12 and later.
Accelerator Wait (QWACAACW QPACAACC)The accumulated wait time for requests to an accelerator. DB2 11 and later.
Total Class 3 Wait TimeThe total class 3 wait time.
Thread History Lock WaitsThis panel provides detailed information about lock waits that occurred for a thread.
Thread data must be collected by the Near-Term History Data Collector with the LOCKCONT(YES) orLOCKSUSP(YES) keywords. Otherwise, the panel displays a message that lock wait information is notavailable for a thread.
Chapter 16. Near-term history information 727
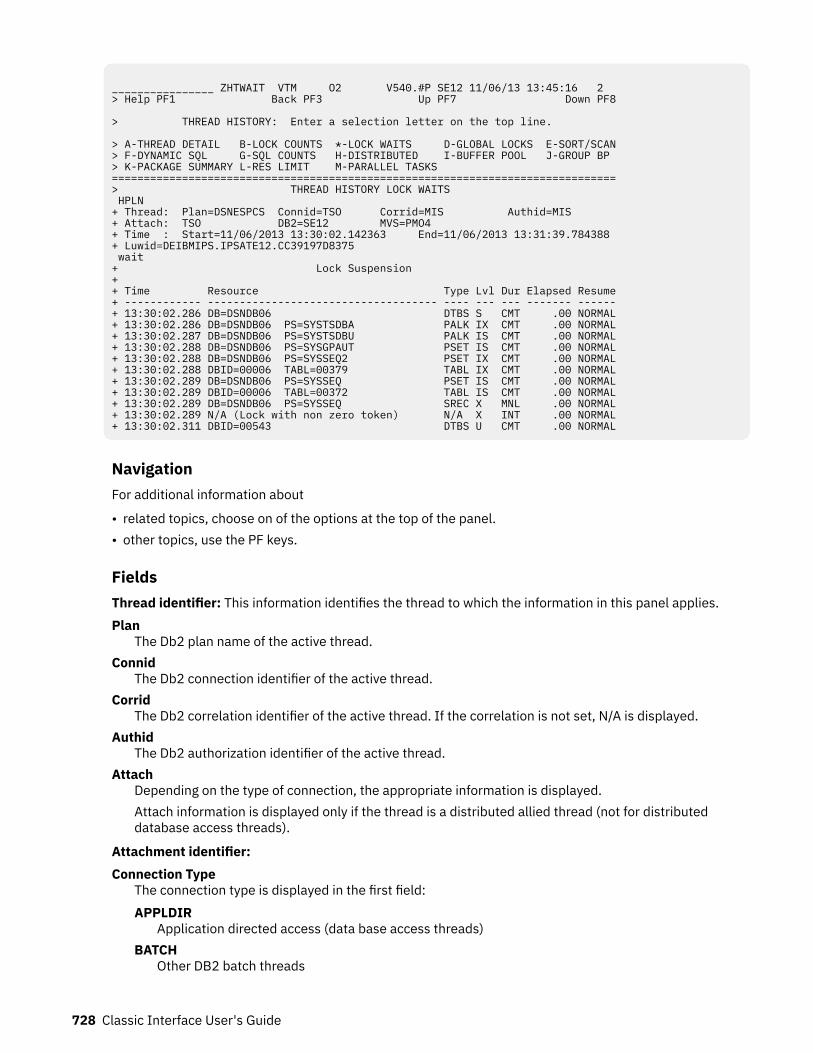
________________ ZHTWAIT VTM O2 V540.#P SE12 11/06/13 13:45:16 2 > Help PF1 Back PF3 Up PF7 Down PF8 > THREAD HISTORY: Enter a selection letter on the top line. > A-THREAD DETAIL B-LOCK COUNTS *-LOCK WAITS D-GLOBAL LOCKS E-SORT/SCAN > F-DYNAMIC SQL G-SQL COUNTS H-DISTRIBUTED I-BUFFER POOL J-GROUP BP > K-PACKAGE SUMMARY L-RES LIMIT M-PARALLEL TASKS =============================================================================== > THREAD HISTORY LOCK WAITS HPLN + Thread: Plan=DSNESPCS Connid=TSO Corrid=MIS Authid=MIS + Attach: TSO DB2=SE12 MVS=PMO4 + Time : Start=11/06/2013 13:30:02.142363 End=11/06/2013 13:31:39.784388 + Luwid=DEIBMIPS.IPSATE12.CC39197D8375 wait + Lock Suspension + + Time Resource Type Lvl Dur Elapsed Resume + ------------ ------------------------------------ ---- --- --- ------- ------ + 13:30:02.286 DB=DSNDB06 DTBS S CMT .00 NORMAL + 13:30:02.286 DB=DSNDB06 PS=SYSTSDBA PALK IX CMT .00 NORMAL + 13:30:02.287 DB=DSNDB06 PS=SYSTSDBU PALK IS CMT .00 NORMAL + 13:30:02.288 DB=DSNDB06 PS=SYSGPAUT PSET IS CMT .00 NORMAL + 13:30:02.288 DB=DSNDB06 PS=SYSSEQ2 PSET IX CMT .00 NORMAL + 13:30:02.288 DBID=00006 TABL=00379 TABL IX CMT .00 NORMAL + 13:30:02.289 DB=DSNDB06 PS=SYSSEQ PSET IS CMT .00 NORMAL + 13:30:02.289 DBID=00006 TABL=00372 TABL IS CMT .00 NORMAL + 13:30:02.289 DB=DSNDB06 PS=SYSSEQ SREC X MNL .00 NORMAL + 13:30:02.289 N/A (Lock with non zero token) N/A X INT .00 NORMAL + 13:30:02.311 DBID=00543 DTBS U CMT .00 NORMAL
NavigationFor additional information about
• related topics, choose on of the options at the top of the panel.• other topics, use the PF keys.
FieldsThread identifier: This information identifies the thread to which the information in this panel applies.Plan
The Db2 plan name of the active thread.Connid
The Db2 connection identifier of the active thread.Corrid
The Db2 correlation identifier of the active thread. If the correlation is not set, N/A is displayed.Authid
The Db2 authorization identifier of the active thread.Attach
Depending on the type of connection, the appropriate information is displayed.Attach information is displayed only if the thread is a distributed allied thread (not for distributeddatabase access threads).
Attachment identifier:Connection Type
The connection type is displayed in the first field:APPLDIR
Application directed access (data base access threads)BATCH
Other DB2 batch threads
728 Classic Interface User's Guide
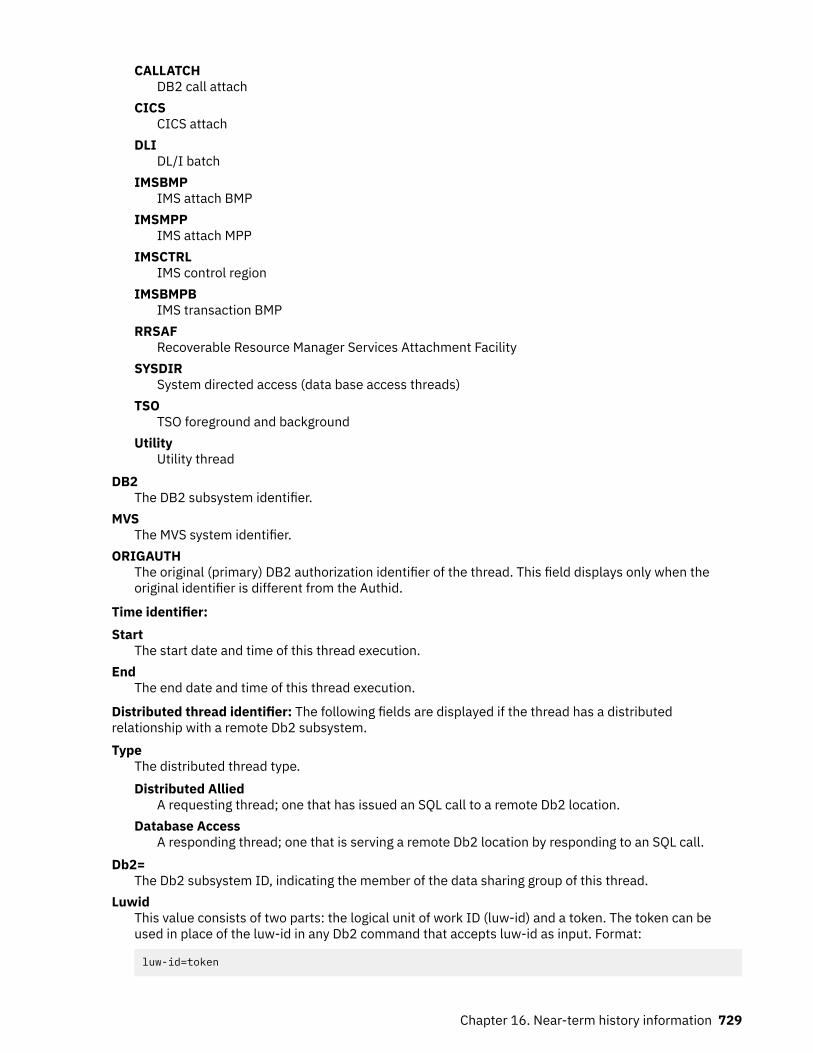
CALLATCHDB2 call attach
CICSCICS attach
DLIDL/I batch
IMSBMPIMS attach BMP
IMSMPPIMS attach MPP
IMSCTRLIMS control region
IMSBMPBIMS transaction BMP
RRSAFRecoverable Resource Manager Services Attachment Facility
SYSDIRSystem directed access (data base access threads)
TSOTSO foreground and background
UtilityUtility thread
DB2The DB2 subsystem identifier.
MVSThe MVS system identifier.
ORIGAUTHThe original (primary) DB2 authorization identifier of the thread. This field displays only when theoriginal identifier is different from the Authid.
Time identifier:Start
The start date and time of this thread execution.End
The end date and time of this thread execution.
Distributed thread identifier: The following fields are displayed if the thread has a distributedrelationship with a remote Db2 subsystem.Type
The distributed thread type.Distributed Allied
A requesting thread; one that has issued an SQL call to a remote Db2 location.Database Access
A responding thread; one that is serving a remote Db2 location by responding to an SQL call.Db2=
The Db2 subsystem ID, indicating the member of the data sharing group of this thread.Luwid
This value consists of two parts: the logical unit of work ID (luw-id) and a token. The token can beused in place of the luw-id in any Db2 command that accepts luw-id as input. Format:
luw-id=token
Chapter 16. Near-term history information 729
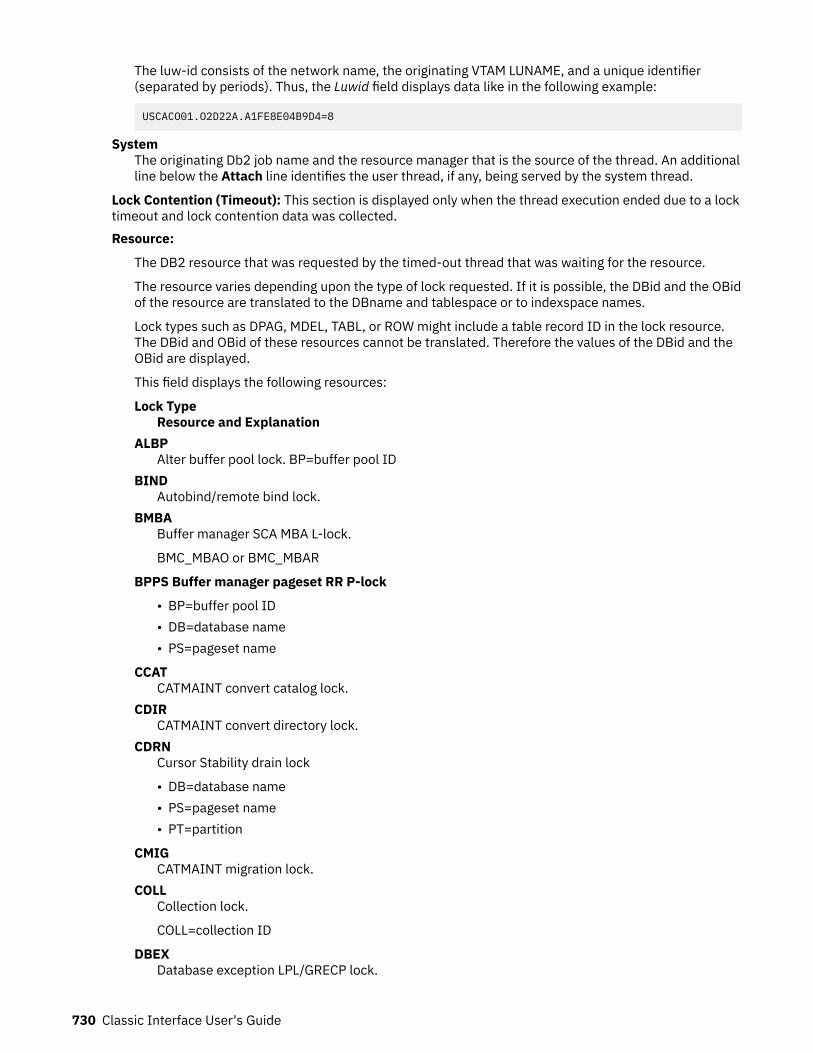
The luw-id consists of the network name, the originating VTAM LUNAME, and a unique identifier(separated by periods). Thus, the Luwid field displays data like in the following example:
USCACO01.O2D22A.A1FE8E04B9D4=8
SystemThe originating Db2 job name and the resource manager that is the source of the thread. An additionalline below the Attach line identifies the user thread, if any, being served by the system thread.
Lock Contention (Timeout): This section is displayed only when the thread execution ended due to a locktimeout and lock contention data was collected.Resource:
The DB2 resource that was requested by the timed-out thread that was waiting for the resource.
The resource varies depending upon the type of lock requested. If it is possible, the DBid and the OBidof the resource are translated to the DBname and tablespace or to indexspace names.
Lock types such as DPAG, MDEL, TABL, or ROW might include a table record ID in the lock resource.The DBid and OBid of these resources cannot be translated. Therefore the values of the DBid and theOBid are displayed.
This field displays the following resources:
Lock TypeResource and Explanation
ALBPAlter buffer pool lock. BP=buffer pool ID
BINDAutobind/remote bind lock.
BMBABuffer manager SCA MBA L-lock.
BMC_MBAO or BMC_MBAR
BPPS Buffer manager pageset RR P-lock
• BP=buffer pool ID• DB=database name• PS=pageset name
CCATCATMAINT convert catalog lock.
CDIRCATMAINT convert directory lock.
CDRNCursor Stability drain lock
• DB=database name• PS=pageset name• PT=partition
CMIGCATMAINT migration lock.
COLLCollection lock.
COLL=collection ID
DBEXDatabase exception LPL/GRECP lock.
730 Classic Interface User's Guide
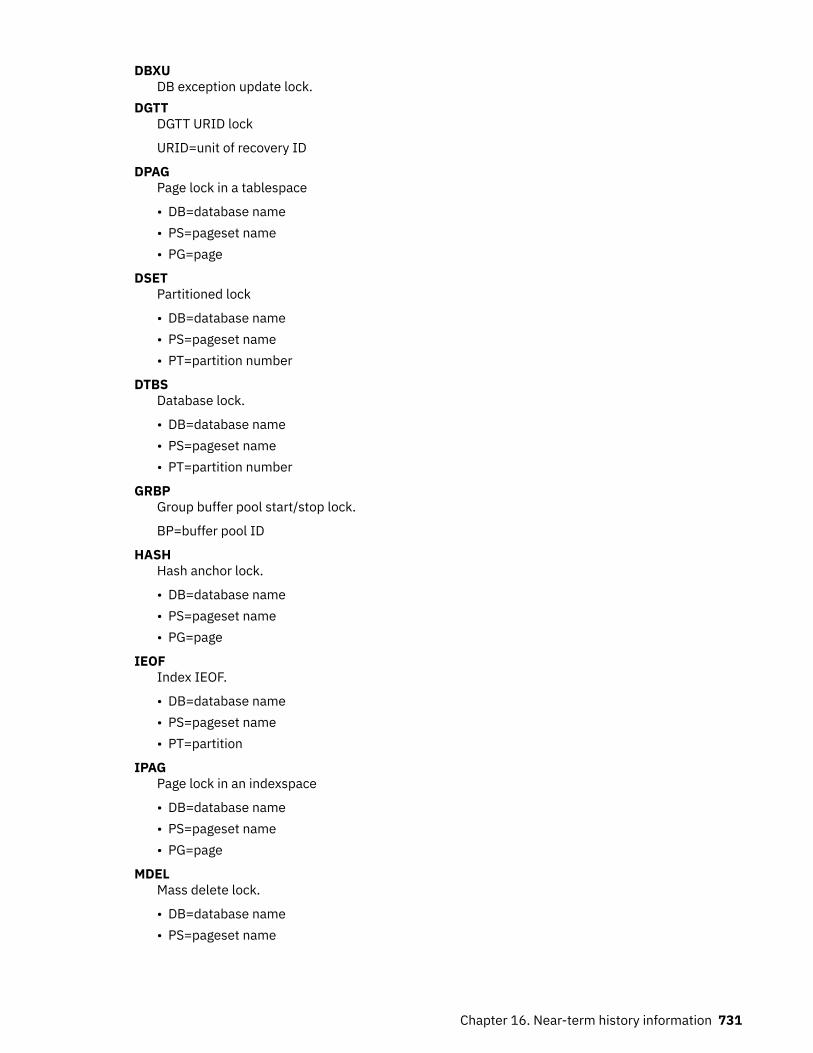
DBXUDB exception update lock.
DGTTDGTT URID lock
URID=unit of recovery ID
DPAGPage lock in a tablespace
• DB=database name• PS=pageset name• PG=page
DSETPartitioned lock
• DB=database name• PS=pageset name• PT=partition number
DTBSDatabase lock.
• DB=database name• PS=pageset name• PT=partition number
GRBPGroup buffer pool start/stop lock.
BP=buffer pool ID
HASHHash anchor lock.
• DB=database name• PS=pageset name• PG=page
IEOFIndex IEOF.
• DB=database name• PS=pageset name• PT=partition
IPAGPage lock in an indexspace
• DB=database name• PS=pageset name• PG=page
MDELMass delete lock.
• DB=database name• PS=pageset name
Chapter 16. Near-term history information 731
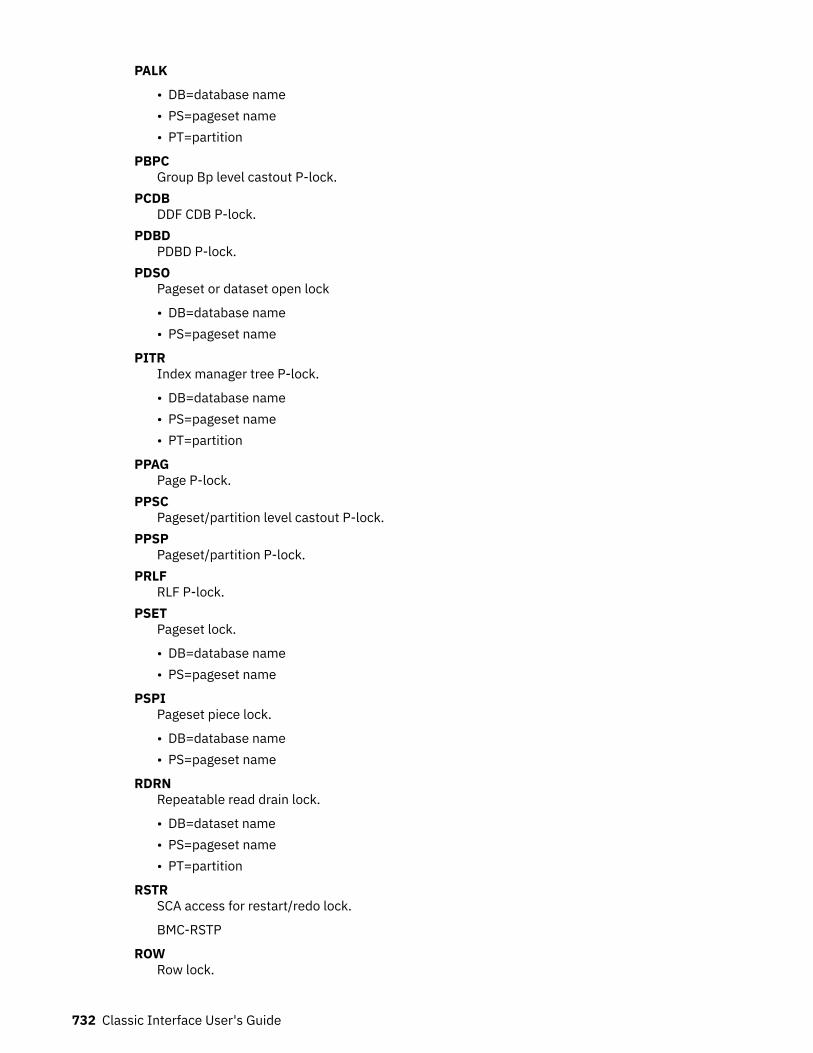
PALK
• DB=database name• PS=pageset name• PT=partition
PBPCGroup Bp level castout P-lock.
PCDBDDF CDB P-lock.
PDBDPDBD P-lock.
PDSOPageset or dataset open lock
• DB=database name• PS=pageset name
PITRIndex manager tree P-lock.
• DB=database name• PS=pageset name• PT=partition
PPAGPage P-lock.
PPSCPageset/partition level castout P-lock.
PPSPPageset/partition P-lock.
PRLFRLF P-lock.
PSETPageset lock.
• DB=database name• PS=pageset name
PSPIPageset piece lock.
• DB=database name• PS=pageset name
RDRNRepeatable read drain lock.
• DB=dataset name• PS=pageset name• PT=partition
RSTRSCA access for restart/redo lock.
BMC-RSTP
ROWRow lock.
732 Classic Interface User's Guide
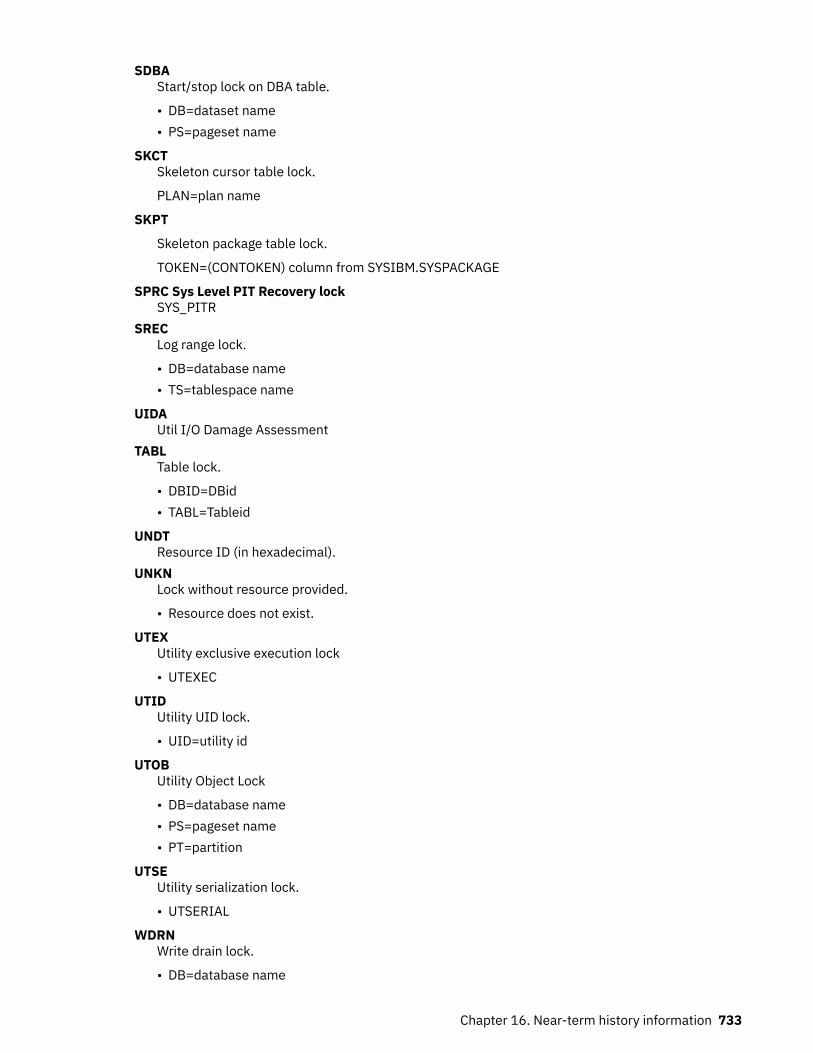
SDBAStart/stop lock on DBA table.
• DB=dataset name• PS=pageset name
SKCTSkeleton cursor table lock.
PLAN=plan name
SKPT
Skeleton package table lock.
TOKEN=(CONTOKEN) column from SYSIBM.SYSPACKAGE
SPRC Sys Level PIT Recovery lockSYS_PITR
SRECLog range lock.
• DB=database name• TS=tablespace name
UIDAUtil I/O Damage Assessment
TABLTable lock.
• DBID=DBid• TABL=Tableid
UNDTResource ID (in hexadecimal).
UNKNLock without resource provided.
• Resource does not exist.
UTEXUtility exclusive execution lock
• UTEXEC
UTIDUtility UID lock.
• UID=utility id
UTOBUtility Object Lock
• DB=database name• PS=pageset name• PT=partition
UTSEUtility serialization lock.
• UTSERIAL
WDRNWrite drain lock.
• DB=database name
Chapter 16. Near-term history information 733
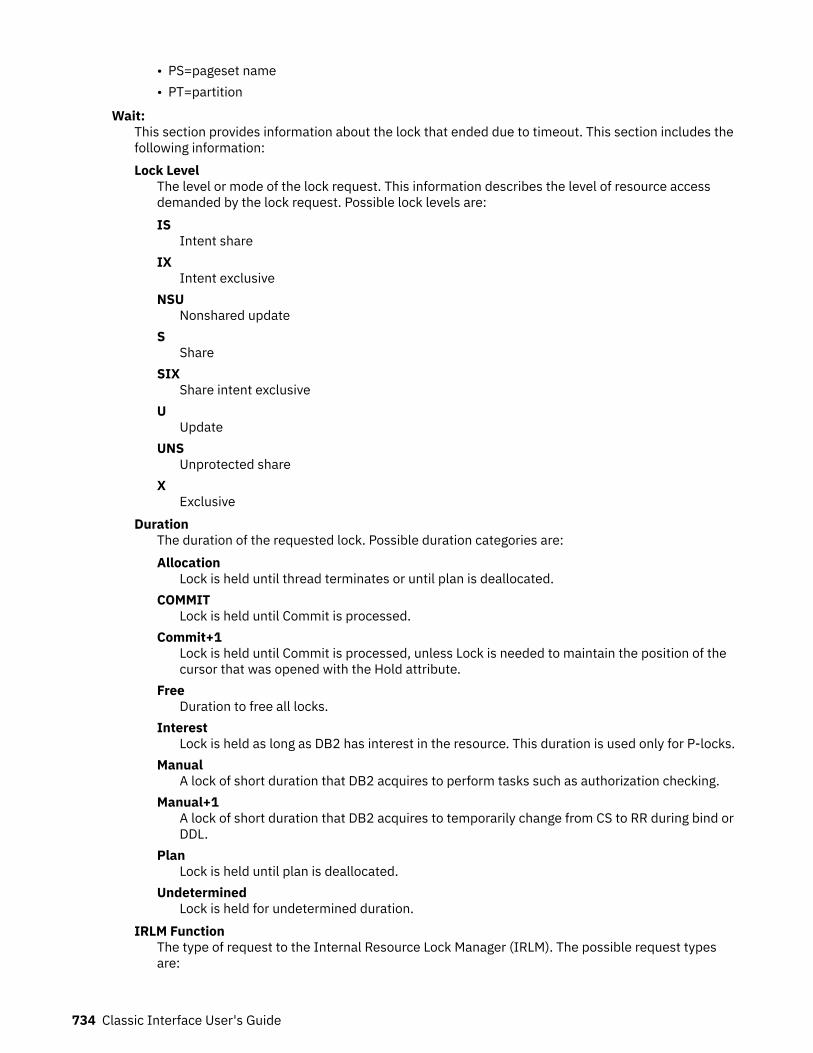
• PS=pageset name• PT=partition
Wait:This section provides information about the lock that ended due to timeout. This section includes thefollowing information:Lock Level
The level or mode of the lock request. This information describes the level of resource accessdemanded by the lock request. Possible lock levels are:IS
Intent shareIX
Intent exclusiveNSU
Nonshared updateS
ShareSIX
Share intent exclusiveU
UpdateUNS
Unprotected shareX
ExclusiveDuration
The duration of the requested lock. Possible duration categories are:Allocation
Lock is held until thread terminates or until plan is deallocated.COMMIT
Lock is held until Commit is processed.Commit+1
Lock is held until Commit is processed, unless Lock is needed to maintain the position of thecursor that was opened with the Hold attribute.
FreeDuration to free all locks.
InterestLock is held as long as DB2 has interest in the resource. This duration is used only for P-locks.
ManualA lock of short duration that DB2 acquires to perform tasks such as authorization checking.
Manual+1A lock of short duration that DB2 acquires to temporarily change from CS to RR during bind orDDL.
PlanLock is held until plan is deallocated.
UndeterminedLock is held for undetermined duration.
IRLM FunctionThe type of request to the Internal Resource Lock Manager (IRLM). The possible request typesare:
734 Classic Interface User's Guide
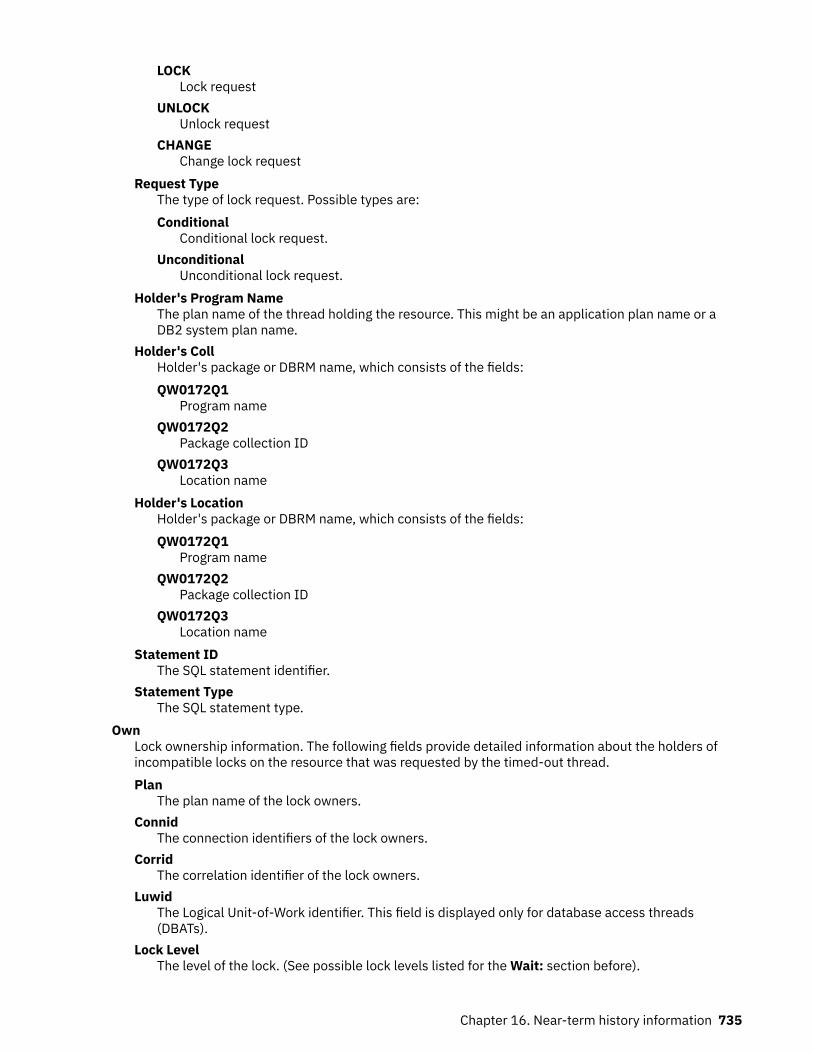
LOCKLock request
UNLOCKUnlock request
CHANGEChange lock request
Request TypeThe type of lock request. Possible types are:Conditional
Conditional lock request.Unconditional
Unconditional lock request.Holder's Program Name
The plan name of the thread holding the resource. This might be an application plan name or aDB2 system plan name.
Holder's CollHolder's package or DBRM name, which consists of the fields:QW0172Q1
Program nameQW0172Q2
Package collection IDQW0172Q3
Location nameHolder's Location
Holder's package or DBRM name, which consists of the fields:QW0172Q1
Program nameQW0172Q2
Package collection IDQW0172Q3
Location nameStatement ID
The SQL statement identifier.Statement Type
The SQL statement type.Own
Lock ownership information. The following fields provide detailed information about the holders ofincompatible locks on the resource that was requested by the timed-out thread.Plan
The plan name of the lock owners.Connid
The connection identifiers of the lock owners.Corrid
The correlation identifier of the lock owners.Luwid
The Logical Unit-of-Work identifier. This field is displayed only for database access threads(DBATs).
Lock LevelThe level of the lock. (See possible lock levels listed for the Wait: section before).
Chapter 16. Near-term history information 735
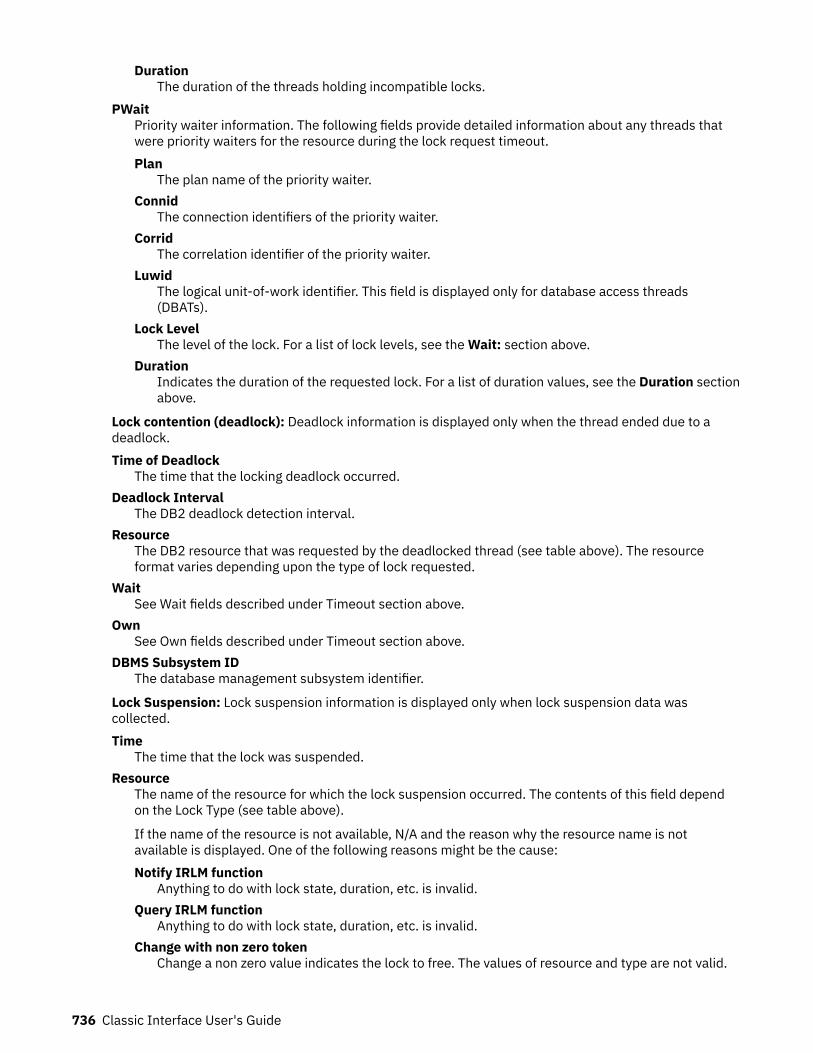
DurationThe duration of the threads holding incompatible locks.
PWaitPriority waiter information. The following fields provide detailed information about any threads thatwere priority waiters for the resource during the lock request timeout.Plan
The plan name of the priority waiter.Connid
The connection identifiers of the priority waiter.Corrid
The correlation identifier of the priority waiter.Luwid
The logical unit-of-work identifier. This field is displayed only for database access threads(DBATs).
Lock LevelThe level of the lock. For a list of lock levels, see the Wait: section above.
DurationIndicates the duration of the requested lock. For a list of duration values, see the Duration sectionabove.
Lock contention (deadlock): Deadlock information is displayed only when the thread ended due to adeadlock.Time of Deadlock
The time that the locking deadlock occurred.Deadlock Interval
The DB2 deadlock detection interval.Resource
The DB2 resource that was requested by the deadlocked thread (see table above). The resourceformat varies depending upon the type of lock requested.
WaitSee Wait fields described under Timeout section above.
OwnSee Own fields described under Timeout section above.
DBMS Subsystem IDThe database management subsystem identifier.
Lock Suspension: Lock suspension information is displayed only when lock suspension data wascollected.Time
The time that the lock was suspended.Resource
The name of the resource for which the lock suspension occurred. The contents of this field dependon the Lock Type (see table above).
If the name of the resource is not available, N/A and the reason why the resource name is notavailable is displayed. One of the following reasons might be the cause:Notify IRLM function
Anything to do with lock state, duration, etc. is invalid.Query IRLM function
Anything to do with lock state, duration, etc. is invalid.Change with non zero token
Change a non zero value indicates the lock to free. The values of resource and type are not valid.
736 Classic Interface User's Guide
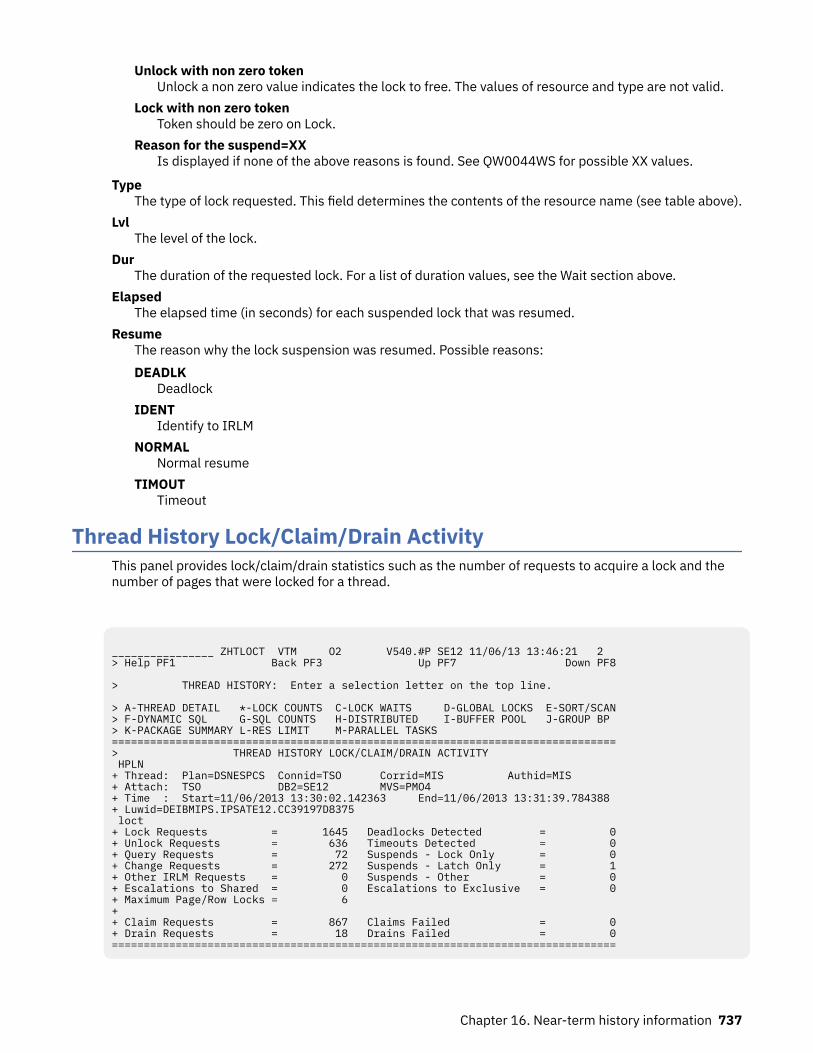
Unlock with non zero tokenUnlock a non zero value indicates the lock to free. The values of resource and type are not valid.
Lock with non zero tokenToken should be zero on Lock.
Reason for the suspend=XXIs displayed if none of the above reasons is found. See QW0044WS for possible XX values.
TypeThe type of lock requested. This field determines the contents of the resource name (see table above).
LvlThe level of the lock.
DurThe duration of the requested lock. For a list of duration values, see the Wait section above.
ElapsedThe elapsed time (in seconds) for each suspended lock that was resumed.
ResumeThe reason why the lock suspension was resumed. Possible reasons:DEADLK
DeadlockIDENT
Identify to IRLMNORMAL
Normal resumeTIMOUT
Timeout
Thread History Lock/Claim/Drain ActivityThis panel provides lock/claim/drain statistics such as the number of requests to acquire a lock and thenumber of pages that were locked for a thread.
________________ ZHTLOCT VTM O2 V540.#P SE12 11/06/13 13:46:21 2 > Help PF1 Back PF3 Up PF7 Down PF8 > THREAD HISTORY: Enter a selection letter on the top line. > A-THREAD DETAIL *-LOCK COUNTS C-LOCK WAITS D-GLOBAL LOCKS E-SORT/SCAN > F-DYNAMIC SQL G-SQL COUNTS H-DISTRIBUTED I-BUFFER POOL J-GROUP BP > K-PACKAGE SUMMARY L-RES LIMIT M-PARALLEL TASKS =============================================================================== > THREAD HISTORY LOCK/CLAIM/DRAIN ACTIVITY HPLN + Thread: Plan=DSNESPCS Connid=TSO Corrid=MIS Authid=MIS + Attach: TSO DB2=SE12 MVS=PMO4 + Time : Start=11/06/2013 13:30:02.142363 End=11/06/2013 13:31:39.784388 + Luwid=DEIBMIPS.IPSATE12.CC39197D8375 loct + Lock Requests = 1645 Deadlocks Detected = 0 + Unlock Requests = 636 Timeouts Detected = 0 + Query Requests = 72 Suspends - Lock Only = 0 + Change Requests = 272 Suspends - Latch Only = 1 + Other IRLM Requests = 0 Suspends - Other = 0 + Escalations to Shared = 0 Escalations to Exclusive = 0 + Maximum Page/Row Locks = 6 + + Claim Requests = 867 Claims Failed = 0 + Drain Requests = 18 Drains Failed = 0 ===============================================================================
Chapter 16. Near-term history information 737
NavigationFor additional information about
• related topics, choose on of the options at the top of the panel.• other topics, use the PF keys.
FieldsThread Identifier:
PlanThe DB2 plan name of the thread.
ConnidThe DB2 connection identifier of the thread.
CorridThe DB2 correlation identifier of the thread.
AuthidThe DB2 authorization identifier of the thread.
Attachment identifier:Connection Type
The connection type is displayed in the first field:APPLDIR
Application directed access (data base access threads)BATCH
Other DB2 batch threadsCALLATCH
DB2 call attachCICS
CICS attachDLI
DL/I batchIMSBMP
IMS attach BMPIMSMPP
IMS attach MPPIMSCTRL
IMS control regionIMSBMPB
IMS transaction BMPRRSAF
Recoverable Resource Manager Services Attachment FacilitySYSDIR
System directed access (data base access threads)TSO
TSO foreground and backgroundUtility
Utility threadDB2
The DB2 subsystem identifier.
738 Classic Interface User's Guide
MVSThe MVS system identifier.
ORIGAUTHThe original (primary) DB2 authorization identifier of the thread. This field displays only when theoriginal identifier is different from the Authid.
Distributed thread identifier: The following fields are displayed when the thread has a distributedrelationship with a remote DB2 subsystem.
TypeThe distributed thread type.Distributed Allied
A requesting thread; one that has issued an SQL call to a remote DB2 location.Database Access
A server thread; one that has received and is serving an SQL request from a remote DB2 location.Luwid
This value consists of two parts: the logical unit of work ID (luw-id) and a token. The token can beused in place of the luw-id in any DB2 command that accepts luw-id as input. Format:
luw-id=token
The luw-id consists of the network name, the originating VTAM LUNAME, and a unique identifier(separated by periods). Thus, the Luwid field displays data such as the following:
USCACO01.O2D22A.A1FE8E04B9D4=8
Time identifier:
StartThe start date and time of this thread execution.
EndThe end date and time of this thread execution.
Lock/Claim/Drain:
Lock RequestsRequests to Internal Resource Lock Manager (IRLM) to obtain a lock on a resource.
Deadlocks DetectedThe number of deadlocks detected.
Unlock RequestsRequests to IRLM to unlock a resource.
Timeouts DetectedOccasions when suspension of a unit of work lasted longer than the IRLM timeout value.
Query RequestsRequests to IRLM to query a lock.
Change RequestsRequests to IRLM to change a lock.
Suspends - Latch OnlyDB2 internal latch suspensions.
Other IRLM RequestsRequests to IRLM to perform a function other than those listed above.
Suspends - OtherSuspensions caused by something other than locks and latches.
Chapter 16. Near-term history information 739
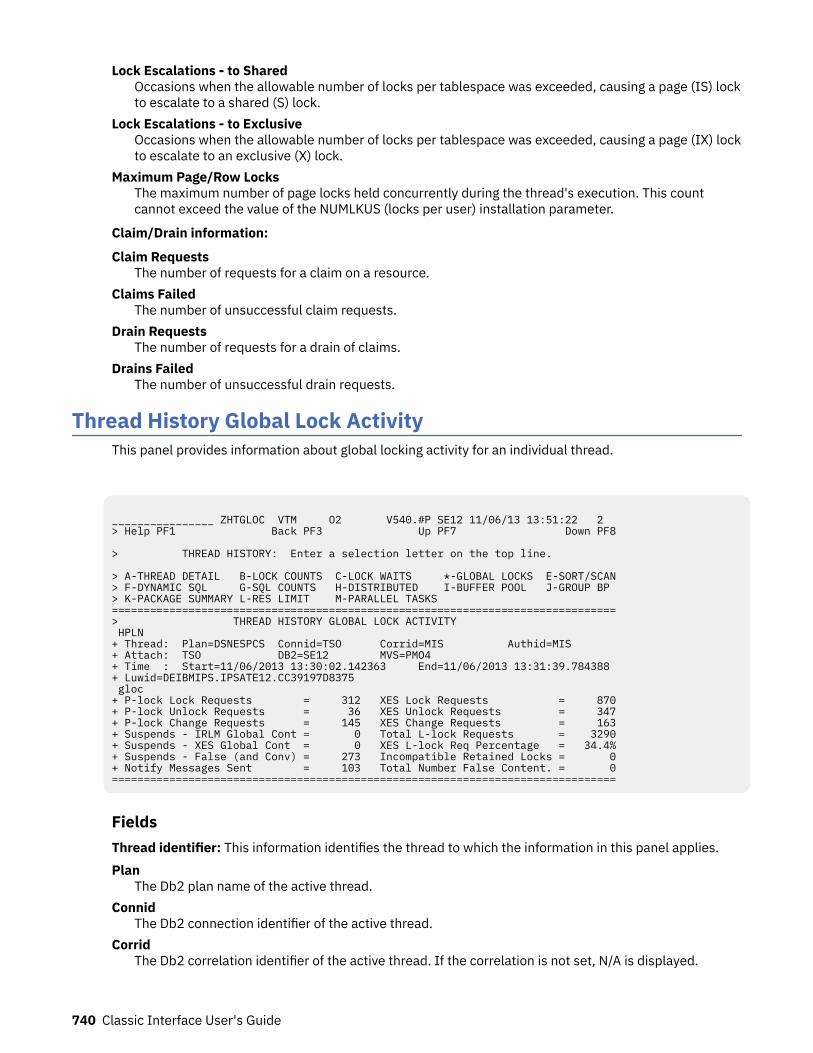
Lock Escalations - to SharedOccasions when the allowable number of locks per tablespace was exceeded, causing a page (IS) lockto escalate to a shared (S) lock.
Lock Escalations - to ExclusiveOccasions when the allowable number of locks per tablespace was exceeded, causing a page (IX) lockto escalate to an exclusive (X) lock.
Maximum Page/Row LocksThe maximum number of page locks held concurrently during the thread's execution. This countcannot exceed the value of the NUMLKUS (locks per user) installation parameter.
Claim/Drain information:
Claim RequestsThe number of requests for a claim on a resource.
Claims FailedThe number of unsuccessful claim requests.
Drain RequestsThe number of requests for a drain of claims.
Drains FailedThe number of unsuccessful drain requests.
Thread History Global Lock ActivityThis panel provides information about global locking activity for an individual thread.
________________ ZHTGLOC VTM O2 V540.#P SE12 11/06/13 13:51:22 2 > Help PF1 Back PF3 Up PF7 Down PF8 > THREAD HISTORY: Enter a selection letter on the top line. > A-THREAD DETAIL B-LOCK COUNTS C-LOCK WAITS *-GLOBAL LOCKS E-SORT/SCAN> F-DYNAMIC SQL G-SQL COUNTS H-DISTRIBUTED I-BUFFER POOL J-GROUP BP > K-PACKAGE SUMMARY L-RES LIMIT M-PARALLEL TASKS ===============================================================================> THREAD HISTORY GLOBAL LOCK ACTIVITY HPLN + Thread: Plan=DSNESPCS Connid=TSO Corrid=MIS Authid=MIS + Attach: TSO DB2=SE12 MVS=PMO4 + Time : Start=11/06/2013 13:30:02.142363 End=11/06/2013 13:31:39.784388 + Luwid=DEIBMIPS.IPSATE12.CC39197D8375 gloc + P-lock Lock Requests = 312 XES Lock Requests = 870+ P-lock Unlock Requests = 36 XES Unlock Requests = 347+ P-lock Change Requests = 145 XES Change Requests = 163+ Suspends - IRLM Global Cont = 0 Total L-lock Requests = 3290+ Suspends - XES Global Cont = 0 XES L-lock Req Percentage = 34.4%+ Suspends - False (and Conv) = 273 Incompatible Retained Locks = 0+ Notify Messages Sent = 103 Total Number False Content. = 0===============================================================================
FieldsThread identifier: This information identifies the thread to which the information in this panel applies.Plan
The Db2 plan name of the active thread.Connid
The Db2 connection identifier of the active thread.Corrid
The Db2 correlation identifier of the active thread. If the correlation is not set, N/A is displayed.
740 Classic Interface User's Guide
AuthidThe Db2 authorization identifier of the active thread.
AttachDepending on the type of connection, the appropriate information is displayed.Attach information is displayed only if the thread is a distributed allied thread (not for distributeddatabase access threads).
Attachment identifier:Connection Type
The connection type is displayed in the first field:APPLDIR
Application directed access (data base access threads)BATCH
Other DB2 batch threadsCALLATCH
DB2 call attachCICS
CICS attachDLI
DL/I batchIMSBMP
IMS attach BMPIMSMPP
IMS attach MPPIMSCTRL
IMS control regionIMSBMPB
IMS transaction BMPRRSAF
Recoverable Resource Manager Services Attachment FacilitySYSDIR
System directed access (data base access threads)TSO
TSO foreground and backgroundUtility
Utility threadDB2
The DB2 subsystem identifier.MVS
The MVS system identifier.ORIGAUTH
The original (primary) DB2 authorization identifier of the thread. This field displays only when theoriginal identifier is different from the Authid.
Time identifier:Start
The start date and time of this thread execution.End
The end date and time of this thread execution.
Distributed thread identifier: The following fields are displayed if the thread has a distributedrelationship with a remote Db2 subsystem.
Chapter 16. Near-term history information 741
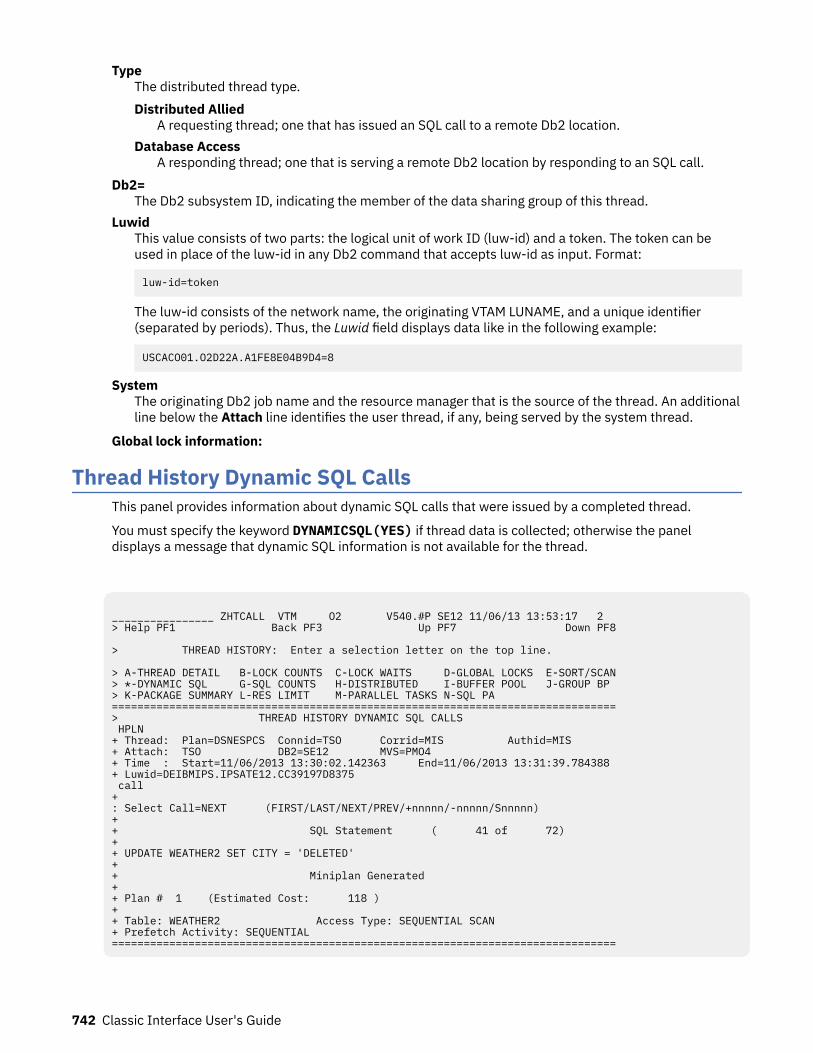
TypeThe distributed thread type.Distributed Allied
A requesting thread; one that has issued an SQL call to a remote Db2 location.Database Access
A responding thread; one that is serving a remote Db2 location by responding to an SQL call.Db2=
The Db2 subsystem ID, indicating the member of the data sharing group of this thread.Luwid
This value consists of two parts: the logical unit of work ID (luw-id) and a token. The token can beused in place of the luw-id in any Db2 command that accepts luw-id as input. Format:
luw-id=token
The luw-id consists of the network name, the originating VTAM LUNAME, and a unique identifier(separated by periods). Thus, the Luwid field displays data like in the following example:
USCACO01.O2D22A.A1FE8E04B9D4=8
SystemThe originating Db2 job name and the resource manager that is the source of the thread. An additionalline below the Attach line identifies the user thread, if any, being served by the system thread.
Global lock information:
Thread History Dynamic SQL CallsThis panel provides information about dynamic SQL calls that were issued by a completed thread.
You must specify the keyword DYNAMICSQL(YES) if thread data is collected; otherwise the paneldisplays a message that dynamic SQL information is not available for the thread.
________________ ZHTCALL VTM O2 V540.#P SE12 11/06/13 13:53:17 2 > Help PF1 Back PF3 Up PF7 Down PF8 > THREAD HISTORY: Enter a selection letter on the top line. > A-THREAD DETAIL B-LOCK COUNTS C-LOCK WAITS D-GLOBAL LOCKS E-SORT/SCAN > *-DYNAMIC SQL G-SQL COUNTS H-DISTRIBUTED I-BUFFER POOL J-GROUP BP > K-PACKAGE SUMMARY L-RES LIMIT M-PARALLEL TASKS N-SQL PA =============================================================================== > THREAD HISTORY DYNAMIC SQL CALLS HPLN + Thread: Plan=DSNESPCS Connid=TSO Corrid=MIS Authid=MIS + Attach: TSO DB2=SE12 MVS=PMO4 + Time : Start=11/06/2013 13:30:02.142363 End=11/06/2013 13:31:39.784388 + Luwid=DEIBMIPS.IPSATE12.CC39197D8375 call + : Select Call=NEXT (FIRST/LAST/NEXT/PREV/+nnnnn/-nnnnn/Snnnnn) + + SQL Statement ( 41 of 72) + + UPDATE WEATHER2 SET CITY = 'DELETED' + + Miniplan Generated + + Plan # 1 (Estimated Cost: 118 ) + + Table: WEATHER2 Access Type: SEQUENTIAL SCAN + Prefetch Activity: SEQUENTIAL ===============================================================================
742 Classic Interface User's Guide
NavigationFor additional information about
• related topics, choose on of the options at the top of the panel.• other topics, use the PF keys.
FieldsThread identifier: This information identifies the thread to which the information in this panel applies.Plan
The Db2 plan name of the active thread.Connid
The Db2 connection identifier of the active thread.Corrid
The Db2 correlation identifier of the active thread. If the correlation is not set, N/A is displayed.Authid
The Db2 authorization identifier of the active thread.Attach
Depending on the type of connection, the appropriate information is displayed.Attach information is displayed only if the thread is a distributed allied thread (not for distributeddatabase access threads).
Attachment identifier:Connection Type
The connection type is displayed in the first field:APPLDIR
Application directed access (data base access threads)BATCH
Other DB2 batch threadsCALLATCH
DB2 call attachCICS
CICS attachDLI
DL/I batchIMSBMP
IMS attach BMPIMSMPP
IMS attach MPPIMSCTRL
IMS control regionIMSBMPB
IMS transaction BMPRRSAF
Recoverable Resource Manager Services Attachment FacilitySYSDIR
System directed access (data base access threads)TSO
TSO foreground and backgroundUtility
Utility thread
Chapter 16. Near-term history information 743
DB2The DB2 subsystem identifier.
MVSThe MVS system identifier.
ORIGAUTHThe original (primary) DB2 authorization identifier of the thread. This field displays only when theoriginal identifier is different from the Authid.
Time identifier:Start
The start date and time of this thread execution.End
The end date and time of this thread execution.
Distributed thread identifier: The following fields are displayed if the thread has a distributedrelationship with a remote Db2 subsystem.Type
The distributed thread type.Distributed Allied
A requesting thread; one that has issued an SQL call to a remote Db2 location.Database Access
A responding thread; one that is serving a remote Db2 location by responding to an SQL call.Db2=
The Db2 subsystem ID, indicating the member of the data sharing group of this thread.Luwid
This value consists of two parts: the logical unit of work ID (luw-id) and a token. The token can beused in place of the luw-id in any Db2 command that accepts luw-id as input. Format:
luw-id=token
The luw-id consists of the network name, the originating VTAM LUNAME, and a unique identifier(separated by periods). Thus, the Luwid field displays data like in the following example:
USCACO01.O2D22A.A1FE8E04B9D4=8
SystemThe originating Db2 job name and the resource manager that is the source of the thread. An additionalline below the Attach line identifies the user thread, if any, being served by the system thread.
Miniplan:
Select CallSpecifies the next SQL statement that is displayed. Initially this panel displays the first SQL statementthat was collected for the thread. Use these keywords to control the display:FIRST
First SQL statement encountered for the thread.LAST
Last SQL statement encountered for the thread.NEXT
Next SQL statement encountered for the thread.PREV
Previous statement encountered for the thread.+nnnnn
The nnnnn (1-99999) entry after the currently displayed SQL statement.
744 Classic Interface User's Guide
-nnnnnThe nnnnn (1-99999) entry before the currently displayed SQL statement.
SnnnnnStatement number nnnnn.
Plan #The plan for a select block within the prepared SQL statement.
Estimated CostThe cost factor for this SQL statement, generated by the DB2 Optimizer.
TableThe name of the table that was accessed.
Access TypeThe method by which the table was accessed. Possible values are:Index
Index was used to access table data.Index (One-Fetch)
Index was used to determine which data page is needed for processing. This type of access isused for processing MIN and MAX functions.
Index (IN keyword)Index was used to access table data for processing the IN keyword in SQL statements.
Index (Page Range)Index was used to access table data in a particular page range.
Sequential Scan (Page Range)All pages within a particular page range of the partitioned tablespace were accessed sequentially.
Sequential ScanAll pages in the tablespace (or table if the tablespace is segmented) were accessed sequentially.
Join MethodThe type of join being performed. Possible values:
• Nested Loops• Hybrid• Merge Scan
Table TypeIndicates whether the table was the INNER or OUTER table for the join processing.
Prefetch ActivityThe type of prefetch activity performed. If no prefetch was performed, this field is not displayed.Possible values are:Sequential
Sequential Prefetch.List
List Prefetch for one or more indexes.Sort Activity
The reason for the sort. If no sort was performed, this field is not displayed. Possible values are:Uniq
Sort to remove duplicate rows.Join
Sort needed for join processing.Order
Sort needed to satisfy Order By clause.Group
Sort needed to satisfy Group By clause.
Chapter 16. Near-term history information 745
Uniq(C)Sort to remove duplicate rows (composite table).
Join(C)Sort needed for join processing (composite table).
Order(C)Sort needed to satisfy Order By clause (composite table).
Group(C)Sort needed to satisfy Group By clause (composite table).
Access DegreeThe degree of parallelism used by the query. This is the number of parallel I/O streams determined bythe optimizer at PREPARE time. The actual number of I/O streams used at execution time can bedifferent.
Access Group IDThe parallel group identifier used for accessing the new table. This is the identifier for a group ofconsecutive parallel operations. These parallel operations have the same number of I/O streams. Thevalue is determined at PREPARE time and can be changed at execution time.
Access TypeThe type of parallel processing to be used. Possible values are:CPU
CPU parallelismI/O
I/O parallelismJoin Degree
The degree of parallelism used in joining the composite table with the new table. This is the number ofparallel I/O streams used for the join. The value is set at PREPARE time and can change at executiontime.
Join Group IDThe value that is used to identify the parallel group when DB2 joins the composite table with the newtable. This is determined at PREPARE time and could be different at execution time.
Thread History SQL CountsThis panel provides information about SQL calls that were issued by a completed thread. It also providesdata definition and data manipulation statements.
With the information on this panel, you can obtain counts of the various SQL, RID pool, or Parallelactivities of a completed thread. This helps you to determine the activities that use resources excessively.For example, a single SELECT command might result in many physical FETCHes.
746 Classic Interface User's Guide
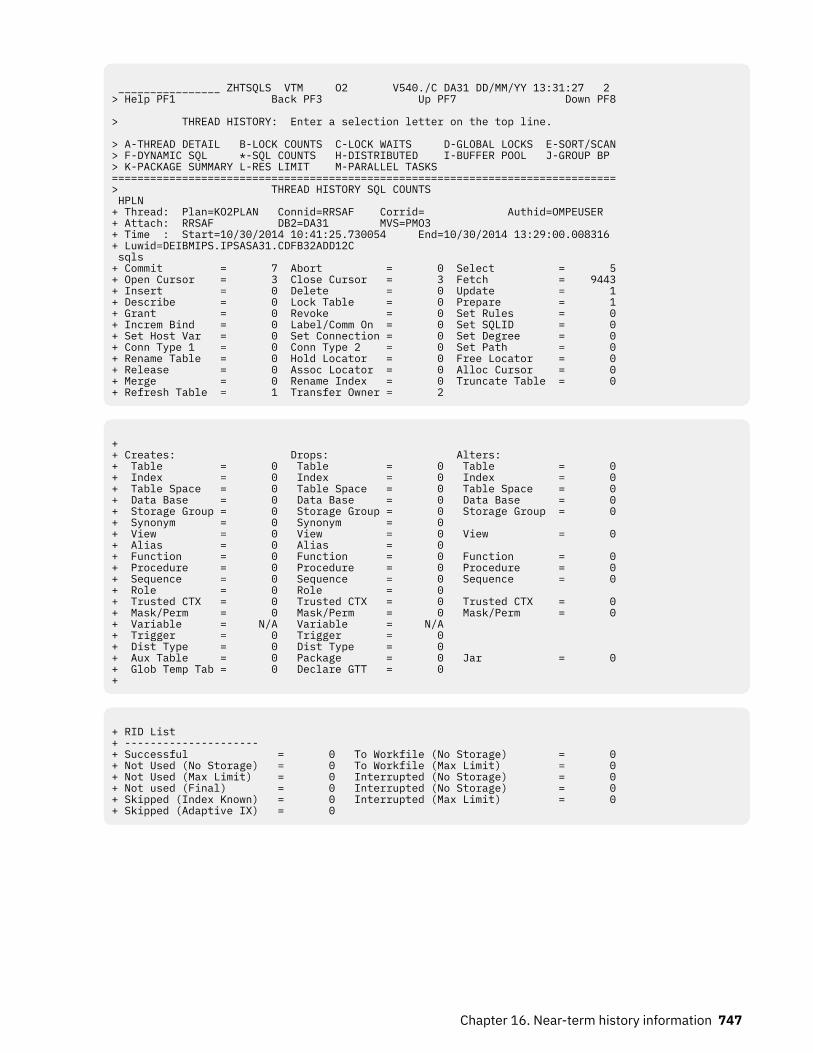
________________ ZHTSQLS VTM O2 V540./C DA31 DD/MM/YY 13:31:27 2 > Help PF1 Back PF3 Up PF7 Down PF8 > THREAD HISTORY: Enter a selection letter on the top line. > A-THREAD DETAIL B-LOCK COUNTS C-LOCK WAITS D-GLOBAL LOCKS E-SORT/SCAN > F-DYNAMIC SQL *-SQL COUNTS H-DISTRIBUTED I-BUFFER POOL J-GROUP BP > K-PACKAGE SUMMARY L-RES LIMIT M-PARALLEL TASKS =============================================================================== > THREAD HISTORY SQL COUNTS HPLN + Thread: Plan=KO2PLAN Connid=RRSAF Corrid= Authid=OMPEUSER + Attach: RRSAF DB2=DA31 MVS=PMO3 + Time : Start=10/30/2014 10:41:25.730054 End=10/30/2014 13:29:00.008316 + Luwid=DEIBMIPS.IPSASA31.CDFB32ADD12C sqls + Commit = 7 Abort = 0 Select = 5 + Open Cursor = 3 Close Cursor = 3 Fetch = 9443 + Insert = 0 Delete = 0 Update = 1 + Describe = 0 Lock Table = 0 Prepare = 1 + Grant = 0 Revoke = 0 Set Rules = 0 + Increm Bind = 0 Label/Comm On = 0 Set SQLID = 0 + Set Host Var = 0 Set Connection = 0 Set Degree = 0 + Conn Type 1 = 0 Conn Type 2 = 0 Set Path = 0 + Rename Table = 0 Hold Locator = 0 Free Locator = 0 + Release = 0 Assoc Locator = 0 Alloc Cursor = 0 + Merge = 0 Rename Index = 0 Truncate Table = 0 + Refresh Table = 1 Transfer Owner = 2
+ + Creates: Drops: Alters: + Table = 0 Table = 0 Table = 0 + Index = 0 Index = 0 Index = 0 + Table Space = 0 Table Space = 0 Table Space = 0 + Data Base = 0 Data Base = 0 Data Base = 0 + Storage Group = 0 Storage Group = 0 Storage Group = 0 + Synonym = 0 Synonym = 0 + View = 0 View = 0 View = 0 + Alias = 0 Alias = 0 + Function = 0 Function = 0 Function = 0 + Procedure = 0 Procedure = 0 Procedure = 0 + Sequence = 0 Sequence = 0 Sequence = 0 + Role = 0 Role = 0 + Trusted CTX = 0 Trusted CTX = 0 Trusted CTX = 0 + Mask/Perm = 0 Mask/Perm = 0 Mask/Perm = 0 + Variable = N/A Variable = N/A + Trigger = 0 Trigger = 0 + Dist Type = 0 Dist Type = 0 + Aux Table = 0 Package = 0 Jar = 0 + Glob Temp Tab = 0 Declare GTT = 0 +
+ RID List + --------------------- + Successful = 0 To Workfile (No Storage) = 0 + Not Used (No Storage) = 0 To Workfile (Max Limit) = 0 + Not Used (Max Limit) = 0 Interrupted (No Storage) = 0+ Not used (Final) = 0 Interrupted (No Storage) = 0 + Skipped (Index Known) = 0 Interrupted (Max Limit) = 0 + Skipped (Adaptive IX) = 0
Chapter 16. Near-term history information 747
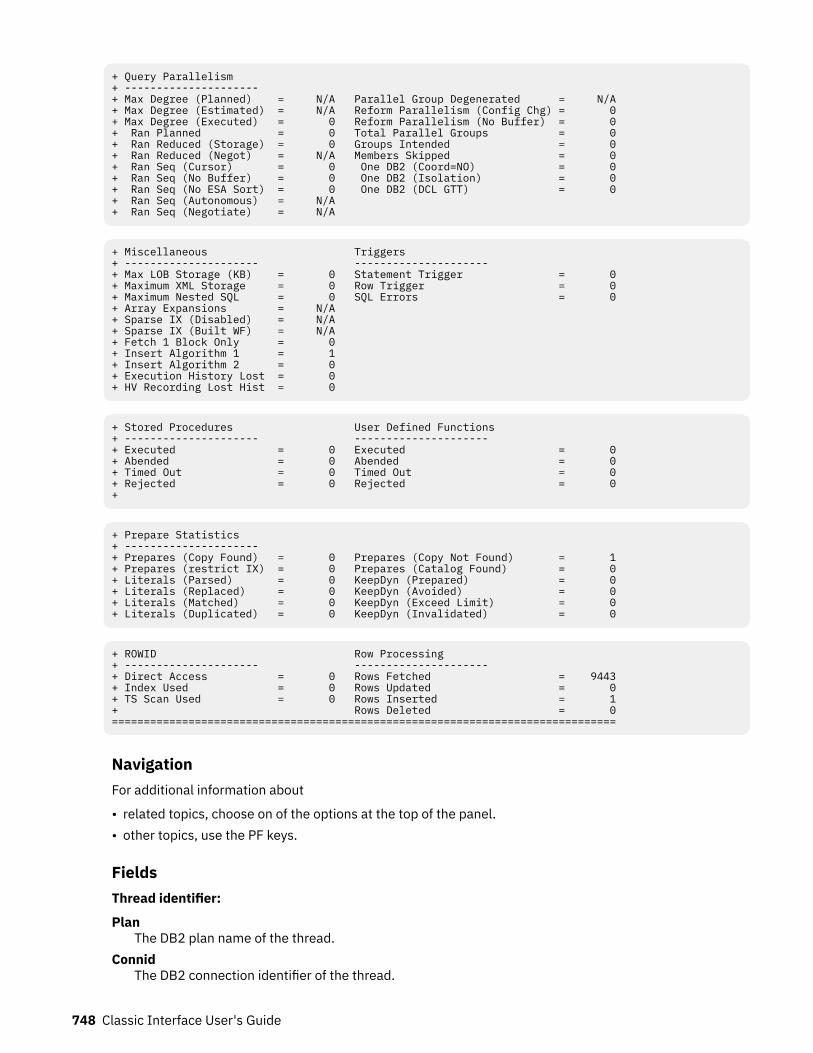
+ Query Parallelism + --------------------- + Max Degree (Planned) = N/A Parallel Group Degenerated = N/A + Max Degree (Estimated) = N/A Reform Parallelism (Config Chg) = 0 + Max Degree (Executed) = 0 Reform Parallelism (No Buffer) = 0 + Ran Planned = 0 Total Parallel Groups = 0 + Ran Reduced (Storage) = 0 Groups Intended = 0 + Ran Reduced (Negot) = N/A Members Skipped = 0 + Ran Seq (Cursor) = 0 One DB2 (Coord=NO) = 0 + Ran Seq (No Buffer) = 0 One DB2 (Isolation) = 0 + Ran Seq (No ESA Sort) = 0 One DB2 (DCL GTT) = 0 + Ran Seq (Autonomous) = N/A + Ran Seq (Negotiate) = N/A
+ Miscellaneous Triggers + --------------------- --------------------- + Max LOB Storage (KB) = 0 Statement Trigger = 0 + Maximum XML Storage = 0 Row Trigger = 0 + Maximum Nested SQL = 0 SQL Errors = 0 + Array Expansions = N/A + Sparse IX (Disabled) = N/A + Sparse IX (Built WF) = N/A + Fetch 1 Block Only = 0+ Insert Algorithm 1 = 1+ Insert Algorithm 2 = 0+ Execution History Lost = 0+ HV Recording Lost Hist = 0
+ Stored Procedures User Defined Functions + --------------------- --------------------- + Executed = 0 Executed = 0 + Abended = 0 Abended = 0 + Timed Out = 0 Timed Out = 0 + Rejected = 0 Rejected = 0 +
+ Prepare Statistics + --------------------- + Prepares (Copy Found) = 0 Prepares (Copy Not Found) = 1 + Prepares (restrict IX) = 0 Prepares (Catalog Found) = 0 + Literals (Parsed) = 0 KeepDyn (Prepared) = 0 + Literals (Replaced) = 0 KeepDyn (Avoided) = 0 + Literals (Matched) = 0 KeepDyn (Exceed Limit) = 0 + Literals (Duplicated) = 0 KeepDyn (Invalidated) = 0
+ ROWID Row Processing + --------------------- --------------------- + Direct Access = 0 Rows Fetched = 9443 + Index Used = 0 Rows Updated = 0 + TS Scan Used = 0 Rows Inserted = 1 + Rows Deleted = 0 ===============================================================================
NavigationFor additional information about
• related topics, choose on of the options at the top of the panel.• other topics, use the PF keys.
FieldsThread identifier:
PlanThe DB2 plan name of the thread.
ConnidThe DB2 connection identifier of the thread.
748 Classic Interface User's Guide
CorridThe DB2 correlation identifier of the thread.
AuthidThe DB2 authorization identifier of the thread.
Attachment identifier:Connection Type
The connection type is displayed in the first field:APPLDIR
Application directed access (data base access threads)BATCH
Other DB2 batch threadsCALLATCH
DB2 call attachCICS
CICS attachDLI
DL/I batchIMSBMP
IMS attach BMPIMSMPP
IMS attach MPPIMSCTRL
IMS control regionIMSBMPB
IMS transaction BMPRRSAF
Recoverable Resource Manager Services Attachment FacilitySYSDIR
System directed access (data base access threads)TSO
TSO foreground and backgroundUtility
Utility threadDB2
The DB2 subsystem identifier.MVS
The MVS system identifier.ORIGAUTH
The original (primary) DB2 authorization identifier of the thread. This field displays only when theoriginal identifier is different from the Authid.
Time identifier:Start
The start date and time of this thread execution.End
The end date and time of this thread execution.
Distributed thread identifier: The following fields are displayed if the thread has a distributedrelationship with a remote Db2 subsystem.Type
The distributed thread type.
Chapter 16. Near-term history information 749
Distributed AlliedA requesting thread; one that has issued an SQL call to a remote Db2 location.
Database AccessA responding thread; one that is serving a remote Db2 location by responding to an SQL call.
Db2=The Db2 subsystem ID, indicating the member of the data sharing group of this thread.
LuwidThis value consists of two parts: the logical unit of work ID (luw-id) and a token. The token can beused in place of the luw-id in any Db2 command that accepts luw-id as input. Format:
luw-id=token
The luw-id consists of the network name, the originating VTAM LUNAME, and a unique identifier(separated by periods). Thus, the Luwid field displays data like in the following example:
USCACO01.O2D22A.A1FE8E04B9D4=8
SystemThe originating Db2 job name and the resource manager that is the source of the thread. An additionalline below the Attach line identifies the user thread, if any, being served by the system thread.
SQL counts:Commit
The number of times the thread successfully concluded Commit phase 2 processing.Abort
A count of the number of times the thread has rolled back uncommitted data.Select
The number of SELECT requests.Open Cursor
The number of OPEN cursor statements issued by a thread.Close Cursor
The number of CLOSE cursor statements issued by a thread.Fetch
The number of FETCH requests.Insert
The number of INSERT statements executed by the thread.Delete
The number of DELETE statements issued by the thread.Update
The number of UPDATE statements executed by the thread.Describe
The number of DESCRIBE statements issued by the thread.Lock Table
A count of the number of LOCK TABLE statements issued by the application (not the total number oftables locked by the thread).
PrepareThe number of PREPARE statements issued by a thread.
GrantThe total number of times SQL GRANT requests were issued from within the program.
RevokeThe total number of times SQL REVOKE requests were issued from within the program.
Set RulesThe number of SET CURRENT RULES statements executed by the thread.
750 Classic Interface User's Guide
Increm BindA count of the number of times the plan active in the thread was rebound. PREPARES are notincluded. This value should be zero in a production environment. The plan can be rebound withVALIDATE(BIND) to prevent incremental binds.
Label/Comm OnThe number of LABEL ON and COMMENT ON statements issued by the thread.
Set SQLIDThe number of SET SQLID requests issued by the thread.
Set Host VarThe number of SET host variable requests executed by the thread.
Set ConnectionThe number of SET CONNECTION statements executed by the thread.
Set DegreeThe number of SET CURRENT DEGREE statements executed by the thread.
Connect Type 1The number of CONNECT type 1 statements executed by the thread.
Connect Type 2The number of CONNECT type 2 statements executed by the thread.
Set PathThe number of SET CURRENT PATH statements executed by the thread.
Rename tableThe number of RENAME TABLE statements executed by the thread.
Hold LocatorThe number of HOLD LOCATOR statements executed by the thread.
Free LocatorThe number of FREE LOCATOR statements executed by the thread.
ReleaseThe number of RELEASE statements executed by the thread.
Assoc LocatorThe number of ASSOCIATE LOCATOR statements executed by the thread.
Alloc CursorThe number of ALLOCATE CURSOR statements executed by the thread.
MergeThe number of MERGE statements executed by the thread.
Rename IndexThe number of RENAME INDEX statements executed by the thread.
Truncate TableThe number of TRUNCATE TABLE statements executed by the thread.
Refresh TableNumber of refresh table statements. DB2 12 and later. (Field name: QXTREFTBL)
Transfer OwnerNumber of transfer ownership statements. DB2 12 and later. (Field name: QXTRNOWN)
Creates, Drops, Alters:Table
The number of CREATE, DROP, or ALTER TABLE statements executed by the thread.Index
The number of CREATE, DROP, or ALTER INDEX statements executed by the thread.Table Space
The number of CREATE, DROP, or ALTER TABLESPACE statements executed by the thread.
Chapter 16. Near-term history information 751
Data BaseThe number of CREATE, DROP, or ALTER DATABASE statements executed by the thread.
Storage GroupThe number of CREATE, DROP, or ALTER STOGROUP statements executed by the thread.
SynonymThe number of CREATE or DROP SYNONYM statements executed by the thread.
ViewThe number of CREATE or DROP VIEW statements executed by the thread.
AliasThe number of CREATE or DROP ALIAS statements executed by the thread.
FunctionThe number of CREATE, DROP, or ALTER FUNCTION statements executed by the thread.
ProcedureThe number of CREATE, DROP, or ALTER PROCEDURE statements executed by the thread.
SequenceThe number of CREATE, DROP, or ALTER PROCEDURE statements executed by the thread.
RoleThe number of CREATE, DROP, or ROLE statements executed by the thread.
Trusted CTXThe number of CREATE, DROP, or ALTER TRUSTED CONTENT statements executed by the thread.
Mask/PermThe number of CREATE, DROP, or ALTER MASK/PERM statements executed by the thread.
VariableThe number of CREATE, or DROP Variable statements executed by the thread. DB2 11 and above.
TriggerThe number of CREATE or DROP DISTINCT TRIGGER statements executed by the thread.
Dist TypeThe number of CREATE or DROP DISTINCT TYPE statements executed by the thread.
Aux TableThe number of CREATE AUXILIARY TABLE statements executed by the thread.
PackageThe number of the DROP PACKAGE statements executed by the thread.
JARThe number of ALTER JAR statements executed by the thread.
Glob Temp TabThe number of CREATE GLOBAL TEMPORARY TABLE statements executed by the thread.
Declare GTTThe number of DECLARE GLOBAL TEMPORARY TABLE statements executed by the thread.
RID List:Successful
The number of times RID list processing used. This field is incremented once for a given table accessfor Index Access with list prefetch and for Multiple Index Access.
To Workfile (No Storage)The number of times a RID list was overflown to a work file because no RIDPOOL storage wasavailable to hold the list of RIDs. DB2 10 and above.
Not Used (No Storage)The number of times a RID list was not used for a given RID list process involving one index (IndexAccess with list prefetch) or involving multiple indexes (Multiple Index Access) because no storagewas available to hold the list of RIDs.
752 Classic Interface User's Guide
To Workfile (Max Limit)The number of times a RID list was overflown to a work file because the number of RIDs exceededone or more internal limits. DB2 10 and above.
Not Used (Max Limit)The number of times one or more RID lists were not used for a given RID list process involving oneindex (Index Access with list prefetch) or involving multiple indexes (Multiple Index Access) becausethe number of RIDs exceeded one or more internal limits.
Not Used (Final)Number of times RID list processing was not used. This field is incremented once when RID listprocessing could not be used for a given table access for Index Access with list prefetch and/or forMultiple Index Access. DB2 12 and later.
Interrupted (No Storage)The number of times a RID list append for a Hybrid Join was interrupted because no RIDPOOL storagewas available to hold the list of RIDs (that is, number of times DB2 interrupted the RID phase andswitched to the Data phase). DB2 10 and above.
Skipped (Index Known)The number of times a RID list retrieval for multiple index access was skipped because it was notnecessary due to DB2 being able to predetermine the outcome of index ANDing or ORing. DB2 10 andabove.
Interrupted (Max Limit)The number of times a RID list append for a Hybrid Join was interrupted because the number of RIDsexceeded one or more internal limits (that is, number of times DB2 interrupted the RID phase andswitched to the Data phase). DB2 10 and above.
Skipped (Adaptive IX)The number of times a DM is not called for RID list retrieval for multiple index access or LPF because itwas not necessary due to Runtime Adaptive Index processing being able to predetermine theoutcome. DB2 12 and later. (Field name: QXRSDMAD)
Query Parallelism:Max Degree (Planned)
The planned maximum degree of parallelism for a parall group. This value is the optimal degree ofparallelis that can be obtained at execution time, after host variables or parameter markers areresolved, and before buffer pool negotiation and system negotiation are performed. DB2 11 andabove.
Parallel Group DegeneratedTotal number of parallel groups that changed to sequential mode during optimization, for reasonssuch as, the result of evaluation of a parallel group is that zero rows are returned, or a parallel group ispartitioned on a single record. DB2 11 and above.
Max Degree (Estimated)The estimated maximum degree of parallelism for a parallel group. This value is estimated at bindtime, based on the cost formula. If a parallel group contains a host variable or parameter marker, theestimate is based on assumed values. DB2 11 and above.
Reform Parallelism (Config Chg)The total number of parallel groups for which DB2 reformulated the parallel portion of the access pathbecause the sysplex configuration was different from the sysplex configuration at bind time. Thiscounter is only incremented by the parallelism coordinator at run time.
Max Degree (Executed)Maximum degree of parallelism among the parallel groups to indicate the extent to which queryparallelism applies.
Reform Parallelism (No Buf)The total number of parallel groups for which DB2 reformulated the parallel portion of the access pathbecause there was not enough buffer pool resource. This counter is only incremented by theparallelism coordinator at run time.
Chapter 16. Near-term history information 753
Ran PlannedThe total number of parallel groups that have a planned degree greater than one at run time, and wereexecuted to the same degree because of sufficient storage on the buffer pool.
Total Parallel GroupsThe total number of parallel groups executed.
Ran Reduced (Storage)The total number of parallel groups that have a planned degree greater than one at run time, but wereprocessed to a parallel degree less than planned because of a storage shortage or contention on thebuffer pool.
Groups IntendedThe total number of parallel groups that were intended to run across the data sharing group. Thiscount is only incremented on the parallelism coordinator at run time.
Ran Reduced (Negot)The total number of parallel groups for which the degree of parallelism was reduced as a result ofparallel system negotiation because system resources were constrained. DB2 11 and above.
Members SkippedThe number of times that the parallelism coordinator had to bypass a DB2 when distributing tasksbecause there was not enough buffer pool storage on one or more DB2 members. This field isincremented only on the parallelism coordinator, and it is only incremented once per parallel group,even though it is possible that more than one DB2 had a buffer pool shortage for that parallel group.The purpose of this count is to indicate when there are not enough buffers on a member. Therefore,this count is incremented only when the buffer pool is defined to allow parallelism. For example, ifVPXPSEQT = 0 on an assistant, DB2 does not send parallel work there, but this count is notincremented.
Ran Seq (Cursor)The total number of parallel groups which fell back to sequential mode because the cursor may beused in UPDATE/DELETE.
One DB2 (Coord=NO)The total number of parallel groups executed on a single DB2 due to the COORDINATOR subsystemparameter being set to NO. When the statement was bound, the COORDINATOR subsystem parameterwas set to YES. This situation can also occur when a plan or package is bound on one DB2 whereCOORDINATOR=YES but is run on a DB2 where COORDINATOR=NO.
Ran Seq (No Buffer)The total number of parallel groups that have a planned degree greater than one at run time, but fellback to sequential mode because of storage shortage or contention on the buffer pool.
One DB2 (Isolation)The total number of parallel groups executed on a single DB2 due to repeatable-read or read-stabilityisolation.
Ran Seq (No ESA Sort)The total number of parallel groups that fell back to sequential operation because of a lack of ESA sortsupport.
One DB2 (DCL GTT)The total number of parallel groups that are part of a query block using a UDF and executed on asingle DB2 due to the existence of a Declared Temporary Table in the application process. Neither thequery block nor the parallel group references a Declared Temporary Table, and a parallel group may ormay not use a UDF.
Ran Seq (Autonomous)The total number of parallel groups that changed to sequential mode because they were executingunder an autonomous procedure. DB2 11 and above.
Ran Seq (Negotiate)The total number of parallel groups that changed to sequential mode as a result of parallel systemnegotiation because system resources were constrained. DB2 11 and above.
754 Classic Interface User's Guide
Ran Seq (No ESA Enc)The total number of parallel groups executed in sequential because Z/OS enclave services wereunavailable. DB2 9 only.
Miscellaneous:Maximum LOB Storage
The maximum storage used for LOB values, in Megabytes.Maximum XML Storage
The maximum storage used for XML values.Maximum Nested SQL
Maximum level of nested SQL cascading because of Triggers, User-Defined Functions, or StoredProcedures.
Array ExpansionsThe number of times an array variable was expanded to be larger than 32KB. DB2 11 and above.
Sparse IX (Disabled)The number of times that sparse index was disabled because of insufficient storage. DB2 11 andabove.
Sparse IX (Built WF)The number of times that sparse index built a physical work file for probing. DB2 11 and above.
Fetched 1 Block Only (QXR1BOAD)The number of times 1 block is fetched and there were no further fetches. DB2 12 and later.
Insert Algorithm 1INSERT algorithm type 1. DB2 12 and later.
Insert Algorithm 2INSERT algorithm type 2. DB2 12 and later.
Execution History LostNumber of execution histories lost. DB2 12 and later.
HV Recording Lost HistNumber of HV recordings lost in execution history. DB2 12 and later.
Triggers:Statement Trigger
Number of times a Statement Trigger is activated.Row Trigger
Number of times a Row Trigger is activated.SQL Errors
Number of times an SQL error occurred during execution of a triggered action.
Stored procedures: For each field described below the following statistics are provided:
• Total quantity, which reflects the amount of activities since DB2 was started.• Interval quantity, which reflects activity during the last cycle.• Rate per minute during the last cycle.• Rate per thread during the last cycle.• Rate per Commit during the last cycle.
AbendedCALL statements executed to invoke a stored procedure that terminated abnormally.
Timed OutCALL statements executed to invoke a stored procedure that timed out while waiting to be scheduled.
RejectedCALL statements executed to invoke a stored procedure that was in the STOP ACTION(REJECT) state.
User Defined Functions:
Chapter 16. Near-term history information 755
ExecutedThe number of user-defined functions (UDFs) executed.
AbendedThe number of times a UDF abended.
Timed OutThe number of times a UDF timed out when waiting to be scheduled.
RejectedThe number of times a UDF was rejected.
Prepare Statistics:Prepares (Copy Found)
The number of times that DB2 satisfied a prepare request by making a copy of a statement in thePrepared Statement Cache.
Prepare (Copy Not Found)The number of times that DB2 searched the Prepared Statement Cache but could not find a suitableprepared statement.
Prepares (Catalog Found)The number of times a PREPARE request is satisfied by making a copy from the stabilized statement inSYSIBM.SYSDYNQRY catalog table. The stabilized statement search is done only when no matchingstatement is found in the prepared statement cache. DB2 12 and later. (Field name: QXSTSFND)
Prepare (Restrict IX)The number of prepare statements for which the use of indexes was restricted because the indexeswere in a pending state.
Literals (Parsed)Number of times DB2 parsed dynamic statements because of CONCENTRATE STATEMENTS WITHLITERALS behaviour.
Literals (Replaced)Number of times DB2 replaced at least one literal in a dynamic statement because of CONCENTRATESTATEMENTS WITH LITERALS behaviour.
Literals (Matched)Number of times DB2 found a matching reusable copy of a dynamic statement in cache because ofCONCENTRATE STATEMENTS WITH LITERALS behaviour.
Literals (Duplicated)Number of times DB2 created a duplicate stmt instance in the statement cache because ofCONCENTRATE STATEMENTS WITH LITERALS behaviour.
KeepDyn (Prepared)The number of times that DB2 did an implicit prepare for a statement bound withKEEPDYNAMIC(YES), because the Prepared Statement Cache did not contain a valid copy of theprepared statement.
KeepDyn (Avoided)The number of times that DB2 did not prepare a statement bound with KEEPDYNAMIC(YES), becausethe Prepared Statement Cache contained a valid copy of the prepared statement.
KeepDyn (Exceed Limit)The number of times that DB2 discarded a prepared statement from the Prepared Statement Cache,because the number of prepared statements in the cache exceeded the value of subsystem parameterMAXKEEPD.
KeepDyn (Invalidated)The number of times that DB2 discarded a prepared statement from the Prepared Statement Cache,because a program executed a DROP, ALTER, or REVOKE statement against a dependent object.
Row IDSuccessful
The number of times that direct row access was successful.
756 Classic Interface User's Guide
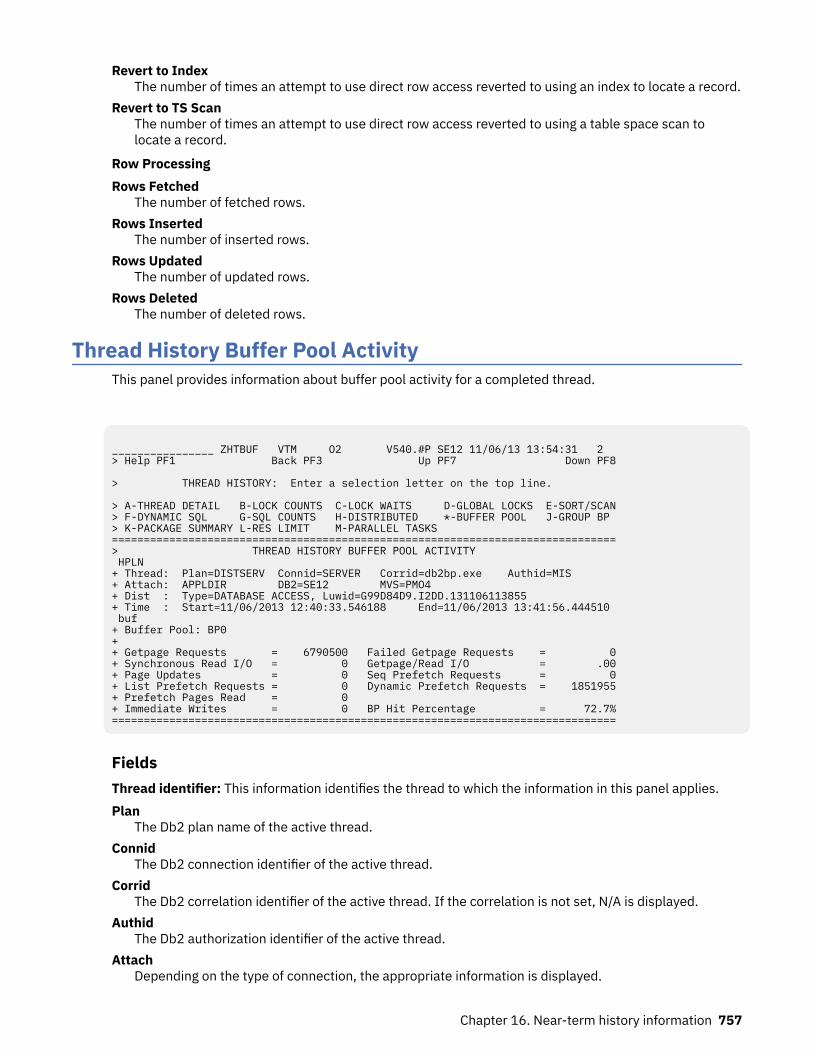
Revert to IndexThe number of times an attempt to use direct row access reverted to using an index to locate a record.
Revert to TS ScanThe number of times an attempt to use direct row access reverted to using a table space scan tolocate a record.
Row ProcessingRows Fetched
The number of fetched rows.Rows Inserted
The number of inserted rows.Rows Updated
The number of updated rows.Rows Deleted
The number of deleted rows.
Thread History Buffer Pool ActivityThis panel provides information about buffer pool activity for a completed thread.
________________ ZHTBUF VTM O2 V540.#P SE12 11/06/13 13:54:31 2 > Help PF1 Back PF3 Up PF7 Down PF8 > THREAD HISTORY: Enter a selection letter on the top line. > A-THREAD DETAIL B-LOCK COUNTS C-LOCK WAITS D-GLOBAL LOCKS E-SORT/SCAN> F-DYNAMIC SQL G-SQL COUNTS H-DISTRIBUTED *-BUFFER POOL J-GROUP BP > K-PACKAGE SUMMARY L-RES LIMIT M-PARALLEL TASKS ===============================================================================> THREAD HISTORY BUFFER POOL ACTIVITY HPLN + Thread: Plan=DISTSERV Connid=SERVER Corrid=db2bp.exe Authid=MIS + Attach: APPLDIR DB2=SE12 MVS=PMO4 + Dist : Type=DATABASE ACCESS, Luwid=G99D84D9.I2DD.131106113855 + Time : Start=11/06/2013 12:40:33.546188 End=11/06/2013 13:41:56.444510 buf + Buffer Pool: BP0 + + Getpage Requests = 6790500 Failed Getpage Requests = 0+ Synchronous Read I/O = 0 Getpage/Read I/O = .00+ Page Updates = 0 Seq Prefetch Requests = 0+ List Prefetch Requests = 0 Dynamic Prefetch Requests = 1851955+ Prefetch Pages Read = 0 + Immediate Writes = 0 BP Hit Percentage = 72.7%===============================================================================
FieldsThread identifier: This information identifies the thread to which the information in this panel applies.Plan
The Db2 plan name of the active thread.Connid
The Db2 connection identifier of the active thread.Corrid
The Db2 correlation identifier of the active thread. If the correlation is not set, N/A is displayed.Authid
The Db2 authorization identifier of the active thread.Attach
Depending on the type of connection, the appropriate information is displayed.
Chapter 16. Near-term history information 757
Attach information is displayed only if the thread is a distributed allied thread (not for distributeddatabase access threads).
Attachment identifier:Connection Type
The connection type is displayed in the first field:APPLDIR
Application directed access (data base access threads)BATCH
Other DB2 batch threadsCALLATCH
DB2 call attachCICS
CICS attachDLI
DL/I batchIMSBMP
IMS attach BMPIMSMPP
IMS attach MPPIMSCTRL
IMS control regionIMSBMPB
IMS transaction BMPRRSAF
Recoverable Resource Manager Services Attachment FacilitySYSDIR
System directed access (data base access threads)TSO
TSO foreground and backgroundUtility
Utility threadDB2
The DB2 subsystem identifier.MVS
The MVS system identifier.ORIGAUTH
The original (primary) DB2 authorization identifier of the thread. This field displays only when theoriginal identifier is different from the Authid.
Distributed thread identifier: The following fields are displayed if the thread has a distributedrelationship with a remote Db2 subsystem.Type
The distributed thread type.Distributed Allied
A requesting thread; one that has issued an SQL call to a remote Db2 location.Database Access
A responding thread; one that is serving a remote Db2 location by responding to an SQL call.Db2=
The Db2 subsystem ID, indicating the member of the data sharing group of this thread.
758 Classic Interface User's Guide
LuwidThis value consists of two parts: the logical unit of work ID (luw-id) and a token. The token can beused in place of the luw-id in any Db2 command that accepts luw-id as input. Format:
luw-id=token
The luw-id consists of the network name, the originating VTAM LUNAME, and a unique identifier(separated by periods). Thus, the Luwid field displays data like in the following example:
USCACO01.O2D22A.A1FE8E04B9D4=8
SystemThe originating Db2 job name and the resource manager that is the source of the thread. An additionalline below the Attach line identifies the user thread, if any, being served by the system thread.
Time identifier:Start
The start date and time of this thread execution.End
The end date and time of this thread execution.
Buffer pool:Getpage Requests
The number of thread Getpage requests. This value includes conditional, unconditional, successful,and unsuccessful requests. A Getpage request might not actually result in physical I/O if therequested page is in the buffer pool.
Failed Getpage RequestsThe number of times a conditional Getpage request could not be satisfied. A conditional Getpage willnot wait for a page that is not currently in the buffer pool. A conditional Getpage is used with parallelI/O processing only.
Synchronous Read I/OThe number of synchronous Read I/O requests issued by the thread.
Getpage/Read I/OThe ratio of Getpage requests to the number of synchronous Read I/O requests. This value does notinclude Prefetch requests.
Page UpdatesThe number of DB2 page updates made by the thread since thread creation. This value is incrementedeach time a row in a page is updated, not just once for each page updated. DB2 might update pageswhen it creates intermediate result tables because of a qualified SELECT statement, even thoughSELECT statements are generally thought of as read only operations. Pages that have been updatedare written asynchronously by DB2, according to DB2's internal Deferred Write algorithm, notimmediately after update or commit. DB2 resets the page update count at Create Thread and Signon.If Signon is not driven, the page update count is cumulative.
Seq Prefetch RequestsThe number of Sequential Prefetch requests issued by the thread. Sequential Prefetch Read I/O isperformed asynchronously to the user's request.
List Prefetch RequestsThe number of List Prefetch requests issued by the thread.
Dynamic Prefetch RequestsThe number of Dynamic Prefetch requests issued by the thread.
Prefetch Pages ReadThe number of pages read asynchronously for Prefetch.
Immediate WritesThe number of immediate (synchronous) Write I/O requests issued for a thread.
Chapter 16. Near-term history information 759
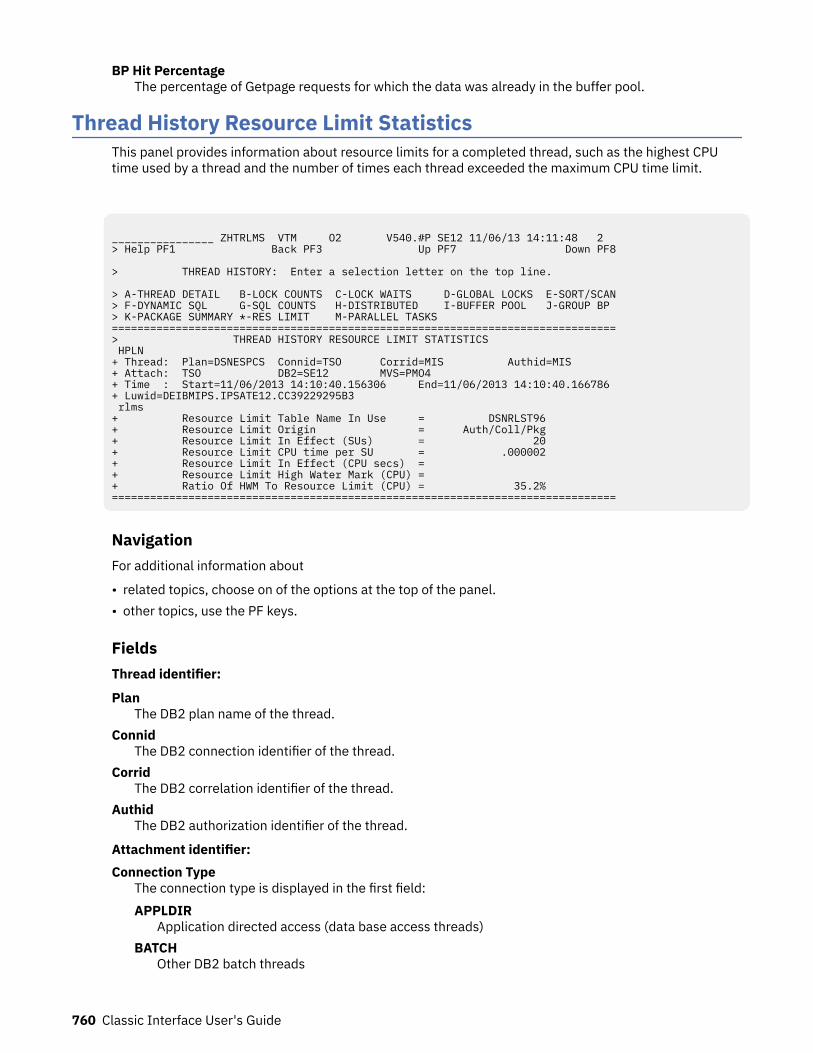
BP Hit PercentageThe percentage of Getpage requests for which the data was already in the buffer pool.
Thread History Resource Limit StatisticsThis panel provides information about resource limits for a completed thread, such as the highest CPUtime used by a thread and the number of times each thread exceeded the maximum CPU time limit.
________________ ZHTRLMS VTM O2 V540.#P SE12 11/06/13 14:11:48 2 > Help PF1 Back PF3 Up PF7 Down PF8 > THREAD HISTORY: Enter a selection letter on the top line. > A-THREAD DETAIL B-LOCK COUNTS C-LOCK WAITS D-GLOBAL LOCKS E-SORT/SCAN > F-DYNAMIC SQL G-SQL COUNTS H-DISTRIBUTED I-BUFFER POOL J-GROUP BP > K-PACKAGE SUMMARY *-RES LIMIT M-PARALLEL TASKS =============================================================================== > THREAD HISTORY RESOURCE LIMIT STATISTICS HPLN + Thread: Plan=DSNESPCS Connid=TSO Corrid=MIS Authid=MIS + Attach: TSO DB2=SE12 MVS=PMO4 + Time : Start=11/06/2013 14:10:40.156306 End=11/06/2013 14:10:40.166786 + Luwid=DEIBMIPS.IPSATE12.CC39229295B3 rlms + Resource Limit Table Name In Use = DSNRLST96 + Resource Limit Origin = Auth/Coll/Pkg + Resource Limit In Effect (SUs) = 20 + Resource Limit CPU time per SU = .000002 + Resource Limit In Effect (CPU secs) = + Resource Limit High Water Mark (CPU) = + Ratio Of HWM To Resource Limit (CPU) = 35.2% ===============================================================================
NavigationFor additional information about
• related topics, choose on of the options at the top of the panel.• other topics, use the PF keys.
FieldsThread identifier:
PlanThe DB2 plan name of the thread.
ConnidThe DB2 connection identifier of the thread.
CorridThe DB2 correlation identifier of the thread.
AuthidThe DB2 authorization identifier of the thread.
Attachment identifier:Connection Type
The connection type is displayed in the first field:APPLDIR
Application directed access (data base access threads)BATCH
Other DB2 batch threads
760 Classic Interface User's Guide
CALLATCHDB2 call attach
CICSCICS attach
DLIDL/I batch
IMSBMPIMS attach BMP
IMSMPPIMS attach MPP
IMSCTRLIMS control region
IMSBMPBIMS transaction BMP
RRSAFRecoverable Resource Manager Services Attachment Facility
SYSDIRSystem directed access (data base access threads)
TSOTSO foreground and background
UtilityUtility thread
DB2The DB2 subsystem identifier.
MVSThe MVS system identifier.
ORIGAUTHThe original (primary) DB2 authorization identifier of the thread. This field displays only when theoriginal identifier is different from the Authid.
Distributed thread identifier: The following fields are displayed when the thread has a distributedrelationship with a remote DB2 subsystem.
TypeThe distributed thread type.Distributed Allied
A requesting thread; one that has issued an SQL call to a remote DB2 location.Database Access
A server thread; one that has received and is serving an SQL request from a remote DB2 location.Luwid
This value consists of two parts: the logical unit of work ID (luw-id) and a token. The token can beused in place of the luw-id in any DB2 command that accepts luw-id as input. Format:
luw-id=token
The luw-id consists of the network name, the originating VTAM LUNAME, and a unique identifier(separated by periods). Thus, the Luwid field displays data such as the following:
USCACO01.O2D22A.A1FE8E04B9D4=8
Time identifier:
Chapter 16. Near-term history information 761
StartThe start date and time of this thread execution.
EndThe end date and time of this thread execution.
Resource limit:
Resource Limit Table Name in UseThe resource limit specification table used by the DB2 subsystem.
Resource Limit OriginThe origin of the resource limit in effect for this thread, if resource limiting was active.
Resource Limit in Effect (SUs)The resource limit in MVS service units for the thread.
Resource Limit CPU Time Per SUThe number of CPU seconds per service unit. This is the ratio of the limit in CPU seconds to the limit inservice units.
Resource Limit In Effect (CPU secs)The resource limit in effect in CPU seconds.
Resource Limit High Water Mark (CPU)The highest CPU time used for dynamic request since the thread was created.
Ratio of HWM to Resource Limit (CPU)The ratio (in percent) of the high- water mark (HWM) to the CPU resource limit in effect.
Thread History Distributed ActivityThis panel displays distributed SQL statistics for each remote DB2 location with which the thread hascommunicated either as a requestor or server.
762 Classic Interface User's Guide
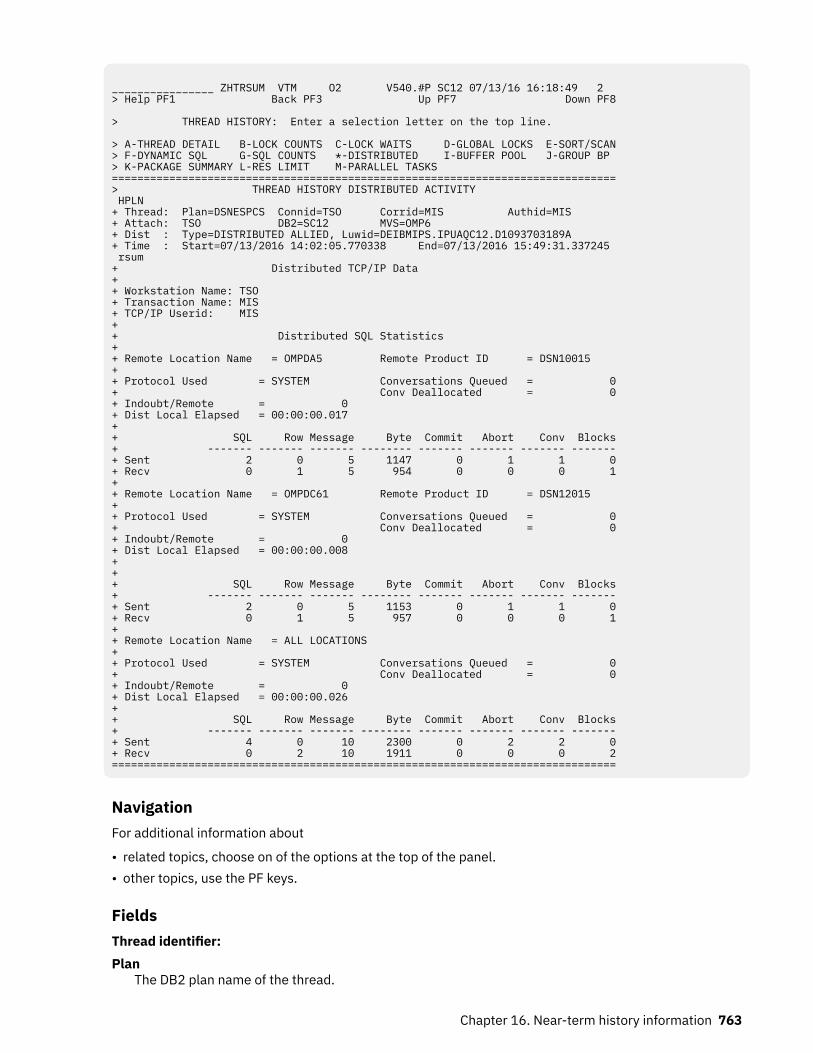
________________ ZHTRSUM VTM O2 V540.#P SC12 07/13/16 16:18:49 2 > Help PF1 Back PF3 Up PF7 Down PF8 > THREAD HISTORY: Enter a selection letter on the top line. > A-THREAD DETAIL B-LOCK COUNTS C-LOCK WAITS D-GLOBAL LOCKS E-SORT/SCAN > F-DYNAMIC SQL G-SQL COUNTS *-DISTRIBUTED I-BUFFER POOL J-GROUP BP > K-PACKAGE SUMMARY L-RES LIMIT M-PARALLEL TASKS =============================================================================== > THREAD HISTORY DISTRIBUTED ACTIVITY HPLN + Thread: Plan=DSNESPCS Connid=TSO Corrid=MIS Authid=MIS + Attach: TSO DB2=SC12 MVS=OMP6 + Dist : Type=DISTRIBUTED ALLIED, Luwid=DEIBMIPS.IPUAQC12.D1093703189A + Time : Start=07/13/2016 14:02:05.770338 End=07/13/2016 15:49:31.337245 rsum + Distributed TCP/IP Data + + Workstation Name: TSO + Transaction Name: MIS + TCP/IP Userid: MIS + + Distributed SQL Statistics + + Remote Location Name = OMPDA5 Remote Product ID = DSN10015 + + Protocol Used = SYSTEM Conversations Queued = 0 + Conv Deallocated = 0 + Indoubt/Remote = 0 + Dist Local Elapsed = 00:00:00.017 + + SQL Row Message Byte Commit Abort Conv Blocks + ------- ------- ------- -------- ------- ------- ------- ------- + Sent 2 0 5 1147 0 1 1 0 + Recv 0 1 5 954 0 0 0 1 + + Remote Location Name = OMPDC61 Remote Product ID = DSN12015 + + Protocol Used = SYSTEM Conversations Queued = 0 + Conv Deallocated = 0 + Indoubt/Remote = 0 + Dist Local Elapsed = 00:00:00.008 + + + SQL Row Message Byte Commit Abort Conv Blocks + ------- ------- ------- -------- ------- ------- ------- ------- + Sent 2 0 5 1153 0 1 1 0 + Recv 0 1 5 957 0 0 0 1 + + Remote Location Name = ALL LOCATIONS + + Protocol Used = SYSTEM Conversations Queued = 0 + Conv Deallocated = 0 + Indoubt/Remote = 0 + Dist Local Elapsed = 00:00:00.026 + + SQL Row Message Byte Commit Abort Conv Blocks + ------- ------- ------- -------- ------- ------- ------- ------- + Sent 4 0 10 2300 0 2 2 0 + Recv 0 2 10 1911 0 0 0 2 ===============================================================================
NavigationFor additional information about
• related topics, choose on of the options at the top of the panel.• other topics, use the PF keys.
FieldsThread identifier:Plan
The DB2 plan name of the thread.
Chapter 16. Near-term history information 763
ConnidThe DB2 connection identifier of the thread.
CorridThe DB2 correlation identifier of the thread.
AuthidThe DB2 authorization identifier of the thread.
Attachment identifier:Connection Type
The connection type is displayed in the first field:APPLDIR
Application directed access (data base access threads)BATCH
Other DB2 batch threadsCALLATCH
DB2 call attachCICS
CICS attachDLI
DL/I batchIMSBMP
IMS attach BMPIMSMPP
IMS attach MPPIMSCTRL
IMS control regionIMSBMPB
IMS transaction BMPRRSAF
Recoverable Resource Manager Services Attachment FacilitySYSDIR
System directed access (data base access threads)TSO
TSO foreground and backgroundUtility
Utility threadDB2
The DB2 subsystem identifier.MVS
The MVS system identifier.ORIGAUTH
The original (primary) DB2 authorization identifier of the thread. This field displays only when theoriginal identifier is different from the Authid.
Distributed thread identifier: The following fields are displayed when the thread has a distributedrelationship with a remote DB2 subsystem.Type
The distributed thread type.Distributed Allied
A requesting thread; one that has issued an SQL call to a remote DB2 location.
764 Classic Interface User's Guide
Database AccessA server thread; one that has received and is serving an SQL request from a remote DB2 location.
LuwidThis value consists of two parts: the logical unit of work ID (luw-id) and a token. The token can beused in place of the luw-id in any DB2 command that accepts luw-id as input. Format:
luw-id=token
The luw-id consists of the network name, the originating VTAM LUNAME, and a unique identifier(separated by periods). Thus, the Luwid field displays data such as the following:
USCACO01.O2D22A.A1FE8E04B9D4=8
Time identifier:Start
The start date and time of this thread execution.End
The end date and time of this thread execution.
Distributed TCP/IP Data: If no TCP/IP data is available, N/A is displayed.Workstation Name
The end user's workstation name.Transaction Name
The transaction or application name that the end user is running.TCP/IP Userid
The end user's user ID.
Distributed SQL Statistics:Remote Location Name
The name of the remote location with which the local DB2 communicated. The statistics in this panelpertain to the remote location.
Remote Product IDThe product identifier of the DB2 remote location. The format is: PPPVVRRM where PPP is the productidentifier, VV is the version number, RR is the release number, and M is the modification level.
Protocol UsedThe distributed protocol used to communicate with the remote server. Possible values areAPPLICATION for application directed access or SYSTEM for system directed access.
This field is blank if you are monitoring a database access thread.
Conversations QueuedThe number of conversations that were queued by DDF.
Conv DeallocatedThe number of conversations deallocated.
Dist Local ElapsedThe time spent waiting for a response to a remote SQL request (includes remote DB2 processing time,VTAM processing time, and network time). This field is displayed only for distributed allied threads.
SQL Sent/RecvThe number of SQL calls sent to the location and number of SQL calls received from the location.
Row Sent/RecvThe number of rows sent to the location and number of rows received from the location.
Message Sent/RecvThe number of VTAM messages sent to the location and number of VTAM messages received from thelocation.
Chapter 16. Near-term history information 765
Byte Sent/RecvThe number of bytes sent to the location and number of bytes received from the location.
Commit Sent/RecvThe number of Commits sent to the location and number of commits received from the location.
Abort Sent/RecvThe number of aborts sent to the location and number of aborts received from the location.
Conv Sent/RecvThe number of conversations initiated from this location to the remote location and the number ofconversations initiated from the remote location to this location.
Blocks Sent/RecvThe number of blocks sent to the location and number of blocks received from the location if usingblock mode.
The following field values are displayed only for 2-PHASE COMMIT:Prepare Sent/Recv
The number of Prepare requests sent to the participant and number of requests received from thecoordinator.
Last Agent Sent/RecvThe number of last agent requests sent to the coordinator and number of requests received from theinitiator.
Commit Sent/RecvThe number of committed requests sent to the participant and number of requests received from theinitiator.
Backout Sent/RecvThe number of backout requests sent to the participant and number of requests received from thecoordinator.
Forget Sent/RecvThe number of forget requests sent to the participant and number of requests received from thecoordinator.
Commit Resp Sent/RecvThe number of commit responses sent to the participant and number of requests received from thecoordinator.
Backout Resp Sent/RecvThe number of backout responses sent to the participant and number of requests received from thecoordinator.
Thread History Package SummaryThis panel provides a list of programs (DMRMs or packages) that were executed by a completed thread.
Accounting classes 7 or 8 are required to display package information.
766 Classic Interface User's Guide
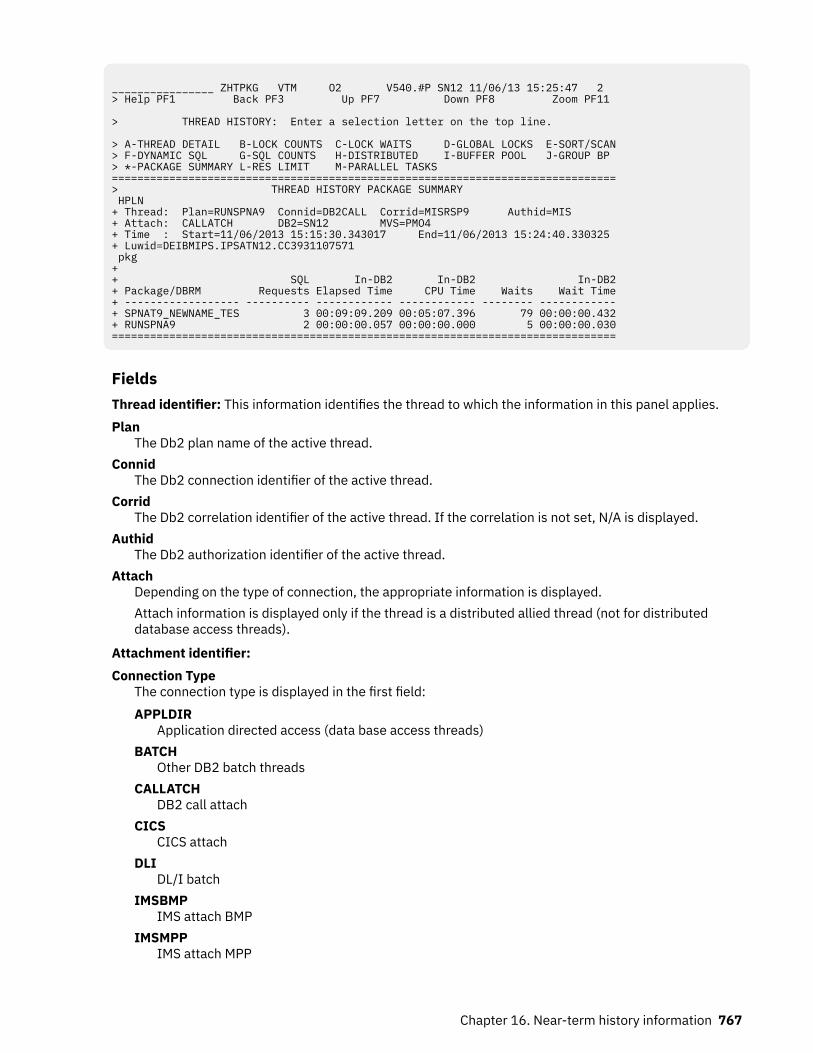
________________ ZHTPKG VTM O2 V540.#P SN12 11/06/13 15:25:47 2 > Help PF1 Back PF3 Up PF7 Down PF8 Zoom PF11 > THREAD HISTORY: Enter a selection letter on the top line. > A-THREAD DETAIL B-LOCK COUNTS C-LOCK WAITS D-GLOBAL LOCKS E-SORT/SCAN> F-DYNAMIC SQL G-SQL COUNTS H-DISTRIBUTED I-BUFFER POOL J-GROUP BP > *-PACKAGE SUMMARY L-RES LIMIT M-PARALLEL TASKS ===============================================================================> THREAD HISTORY PACKAGE SUMMARY HPLN + Thread: Plan=RUNSPNA9 Connid=DB2CALL Corrid=MISRSP9 Authid=MIS + Attach: CALLATCH DB2=SN12 MVS=PMO4 + Time : Start=11/06/2013 15:15:30.343017 End=11/06/2013 15:24:40.330325 + Luwid=DEIBMIPS.IPSATN12.CC3931107571 pkg + + SQL In-DB2 In-DB2 In-DB2+ Package/DBRM Requests Elapsed Time CPU Time Waits Wait Time+ ------------------ ---------- ------------ ------------ -------- ------------+ SPNAT9_NEWNAME_TES 3 00:09:09.209 00:05:07.396 79 00:00:00.432+ RUNSPNA9 2 00:00:00.057 00:00:00.000 5 00:00:00.030===============================================================================
FieldsThread identifier: This information identifies the thread to which the information in this panel applies.Plan
The Db2 plan name of the active thread.Connid
The Db2 connection identifier of the active thread.Corrid
The Db2 correlation identifier of the active thread. If the correlation is not set, N/A is displayed.Authid
The Db2 authorization identifier of the active thread.Attach
Depending on the type of connection, the appropriate information is displayed.Attach information is displayed only if the thread is a distributed allied thread (not for distributeddatabase access threads).
Attachment identifier:Connection Type
The connection type is displayed in the first field:APPLDIR
Application directed access (data base access threads)BATCH
Other DB2 batch threadsCALLATCH
DB2 call attachCICS
CICS attachDLI
DL/I batchIMSBMP
IMS attach BMPIMSMPP
IMS attach MPP
Chapter 16. Near-term history information 767
IMSCTRLIMS control region
IMSBMPBIMS transaction BMP
RRSAFRecoverable Resource Manager Services Attachment Facility
SYSDIRSystem directed access (data base access threads)
TSOTSO foreground and background
UtilityUtility thread
DB2The DB2 subsystem identifier.
MVSThe MVS system identifier.
ORIGAUTHThe original (primary) DB2 authorization identifier of the thread. This field displays only when theoriginal identifier is different from the Authid.
Time identifier:Start
The start date and time of this thread execution.End
The end date and time of this thread execution.
Distributed thread identifier: The following fields are displayed if the thread has a distributedrelationship with a remote Db2 subsystem.Type
The distributed thread type.Distributed Allied
A requesting thread; one that has issued an SQL call to a remote Db2 location.Database Access
A responding thread; one that is serving a remote Db2 location by responding to an SQL call.Db2=
The Db2 subsystem ID, indicating the member of the data sharing group of this thread.Luwid
This value consists of two parts: the logical unit of work ID (luw-id) and a token. The token can beused in place of the luw-id in any Db2 command that accepts luw-id as input. Format:
luw-id=token
The luw-id consists of the network name, the originating VTAM LUNAME, and a unique identifier(separated by periods). Thus, the Luwid field displays data like in the following example:
USCACO01.O2D22A.A1FE8E04B9D4=8
SystemThe originating Db2 job name and the resource manager that is the source of the thread. An additionalline below the Attach line identifies the user thread, if any, being served by the system thread.
Package summary:
768 Classic Interface User's Guide
Package/DBRMThe name of the program for which data is reported. Up to 18 characters of the package name arereturned. An asterisk (*) is displayed after the program name of the last executed program.
SQL RequestsThe number of SQL statements issued in this package or DBRM.
Total Elapsed TimeThe total DB2 time that has elapsed while executing in this package or DBRM.
Total CPU TimeThe total DB2 CPU time used while executing in this package or DBRM.
WaitsThe total number of times that the thread had to wait for a class 8 event to complete while executingin this package or DBRM.
Total Wait TimeThe total time spent waiting for a class 8 event to complete while executing in this package or DBRM.
Thread History Package DetailThis panel provides detailed Accounting information on a program (package or DBRM) that has beenexecuted by this thread.
It provides information collected for Accounting trace classes 7 and 8. If these traces are not active, thisinformation is not available.
DB2 accounting trace classes 7 and 8 must be started before the plan begins execution, or packageinformation is not displayed:
• If only class 7 was started, the In-DB2 Times fields display data, and N/A is displayed for the Waits andCount fields.
• If only class 8 was started, the Waits and Count fields display data, and N/A is displayed for In-DB2Times fields.
Chapter 16. Near-term history information 769
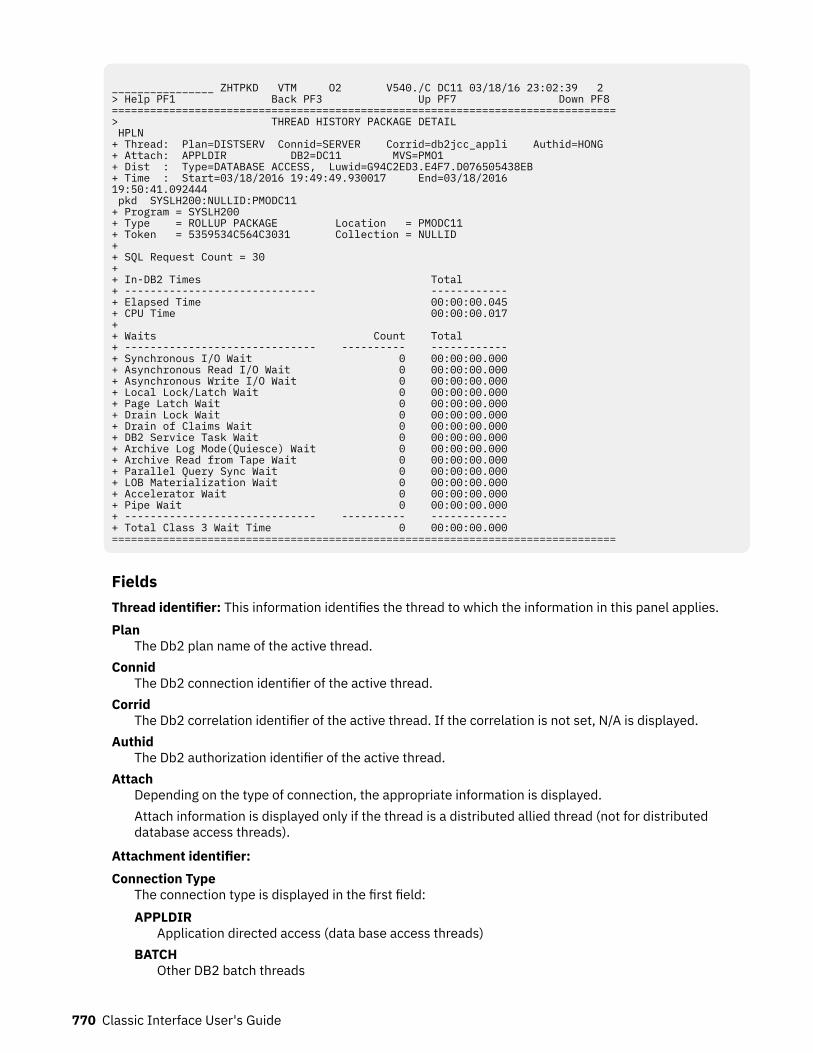
________________ ZHTPKD VTM O2 V540./C DC11 03/18/16 23:02:39 2 > Help PF1 Back PF3 Up PF7 Down PF8 =============================================================================== > THREAD HISTORY PACKAGE DETAIL HPLN + Thread: Plan=DISTSERV Connid=SERVER Corrid=db2jcc_appli Authid=HONG + Attach: APPLDIR DB2=DC11 MVS=PMO1 + Dist : Type=DATABASE ACCESS, Luwid=G94C2ED3.E4F7.D076505438EB + Time : Start=03/18/2016 19:49:49.930017 End=03/18/2016 19:50:41.092444 pkd SYSLH200:NULLID:PMODC11 + Program = SYSLH200 + Type = ROLLUP PACKAGE Location = PMODC11 + Token = 5359534C564C3031 Collection = NULLID + + SQL Request Count = 30 + + In-DB2 Times Total + ------------------------------ ------------ + Elapsed Time 00:00:00.045 + CPU Time 00:00:00.017 + + Waits Count Total + ------------------------------ ---------- ------------ + Synchronous I/O Wait 0 00:00:00.000 + Asynchronous Read I/O Wait 0 00:00:00.000 + Asynchronous Write I/O Wait 0 00:00:00.000 + Local Lock/Latch Wait 0 00:00:00.000 + Page Latch Wait 0 00:00:00.000 + Drain Lock Wait 0 00:00:00.000 + Drain of Claims Wait 0 00:00:00.000 + DB2 Service Task Wait 0 00:00:00.000 + Archive Log Mode(Quiesce) Wait 0 00:00:00.000 + Archive Read from Tape Wait 0 00:00:00.000 + Parallel Query Sync Wait 0 00:00:00.000 + LOB Materialization Wait 0 00:00:00.000+ Accelerator Wait 0 00:00:00.000+ Pipe Wait 0 00:00:00.000 + ------------------------------ ---------- ------------ + Total Class 3 Wait Time 0 00:00:00.000 ===============================================================================
FieldsThread identifier: This information identifies the thread to which the information in this panel applies.Plan
The Db2 plan name of the active thread.Connid
The Db2 connection identifier of the active thread.Corrid
The Db2 correlation identifier of the active thread. If the correlation is not set, N/A is displayed.Authid
The Db2 authorization identifier of the active thread.Attach
Depending on the type of connection, the appropriate information is displayed.Attach information is displayed only if the thread is a distributed allied thread (not for distributeddatabase access threads).
Attachment identifier:Connection Type
The connection type is displayed in the first field:APPLDIR
Application directed access (data base access threads)BATCH
Other DB2 batch threads
770 Classic Interface User's Guide

CALLATCHDB2 call attach
CICSCICS attach
DLIDL/I batch
IMSBMPIMS attach BMP
IMSMPPIMS attach MPP
IMSCTRLIMS control region
IMSBMPBIMS transaction BMP
RRSAFRecoverable Resource Manager Services Attachment Facility
SYSDIRSystem directed access (data base access threads)
TSOTSO foreground and background
UtilityUtility thread
DB2The DB2 subsystem identifier.
MVSThe MVS system identifier.
ORIGAUTHThe original (primary) DB2 authorization identifier of the thread. This field displays only when theoriginal identifier is different from the Authid.
Time identifier:Start
The start date and time of this thread execution.End
The end date and time of this thread execution.
Distributed thread identifier: The following fields are displayed if the thread has a distributedrelationship with a remote Db2 subsystem.Type
The distributed thread type.Distributed Allied
A requesting thread; one that has issued an SQL call to a remote Db2 location.Database Access
A responding thread; one that is serving a remote Db2 location by responding to an SQL call.Db2=
The Db2 subsystem ID, indicating the member of the data sharing group of this thread.Luwid
This value consists of two parts: the logical unit of work ID (luw-id) and a token. The token can beused in place of the luw-id in any Db2 command that accepts luw-id as input. Format:
luw-id=token
Chapter 16. Near-term history information 771
The luw-id consists of the network name, the originating VTAM LUNAME, and a unique identifier(separated by periods). Thus, the Luwid field displays data like in the following example:
USCACO01.O2D22A.A1FE8E04B9D4=8
SystemThe originating Db2 job name and the resource manager that is the source of the thread. An additionalline below the Attach line identifies the user thread, if any, being served by the system thread.
Package information:Program
The program name for which data is reported. Up to 18 characters of the package name are returned.Type
The program type can be:
• PACKAGE• DBRM• PACKAGE-STORPROC, which means that the program is a package that was loaded by a stored
procedure.
LocationThe name of the location where the package is executed. For remote packages, times displayedrepresent the time spent locally to execute the remote package.
TokenThe consistency token.
CollectionThe package collection ID. This field is displayed only if the program type is PACKAGE.
SQL Request CountThe number of SQL statements issued. All DCL, DDL, and DML SQL statements as well as someStatistic Counters from DSNDQXST are included. COMMIT and ROLLBACK/ABORT are not included.
In-DB2 Times: In-DB2 times require an Accounting trace class 7. If this trace is not active, N/A isdisplayed.In-DB2 elapsed time
The elapsed time while processing this package or DBRM:Total
The total time the thread spends processing this package or DBRM.Current
The total time spent processing the currently active SQL statement.In-DB2 CPU time
The CPU time spent processing this package or DBRM.Total
The total time the thread spends processing this package or DBRM.Current
The total time spent processing the currently active SQL statement.
Waits: Wait times require an Accounting trace class 8. If this trace is not active, N/A is displayed. Thefollowing Statistics information is provided for each field described below:Count
The total number of waits.Total
The total wait time.
Synchronous I/O WaitWaits for synchronous I/O reads or writes.
772 Classic Interface User's Guide
Asynchronous Read I/O WaitWaits for Read I/O performed under another thread (prefetch).
Asynchronous Write I/O WaitWaits for Write I/O performed under another thread (deferred writes).
Local Lock/Latch WaitWaits for locks or latches.
Page Latch WaitWaits for page latch.
Drain Lock WaitWaits to acquire DRAIN lock.
Drain of Claims WaitWaits for claimers to be released after acquiring DRAIN lock.
DB2 Service Task WaitWaits for DB2 services. The following types of DB2 services are included:
• Open/close of data set• DFHSM recall of a data set• SYSLGRNG update• Define/extend/delete of data set• Commit phase 2 for read only threads.
Starting from DB2 11, waits that are associated with autonomous procedures are also included.Archive Log Mode(Quiesce) Wait
Waits for MODE(QUIESCE) command to complete.Archive Read from Tape Wait
Waits for read of archive log from tape.Parallel Query Sync Wait (QPAC_PQS_WAIT QPAC_PQS_COUNT)
The amount of waits after parallel query processing suspended waiting for parent/child to besynchronized.This applies to DB2 11 and higher.
LOB Materialization Wait (QPACALBW QPACALBC)Waits for TCP/IP LOB and XML materialization.
Accelerator Wait (QWACAACW QPACAACC)The accumulated wait time for requests to an accelerator. DB2 11 and later.
Pipe Wait (QOAC_PIPE_WAIT QPAC_PIPEWAIT_COUNT)The accumulated wait time for a pipe while this package is being executed. DB2 12 and later.
Total Class 3 Wait TimeThe total class 3 wait time.
Thread History Sort and Scan ActivityThis panel displays sort and scan statistics, such as the number of sorts, the sort elapsed time, and thenumber of pages scanned by a completed thread.
You must specify SCAN(YES) or SORT(YES) when collecting thread data.
Chapter 16. Near-term history information 773
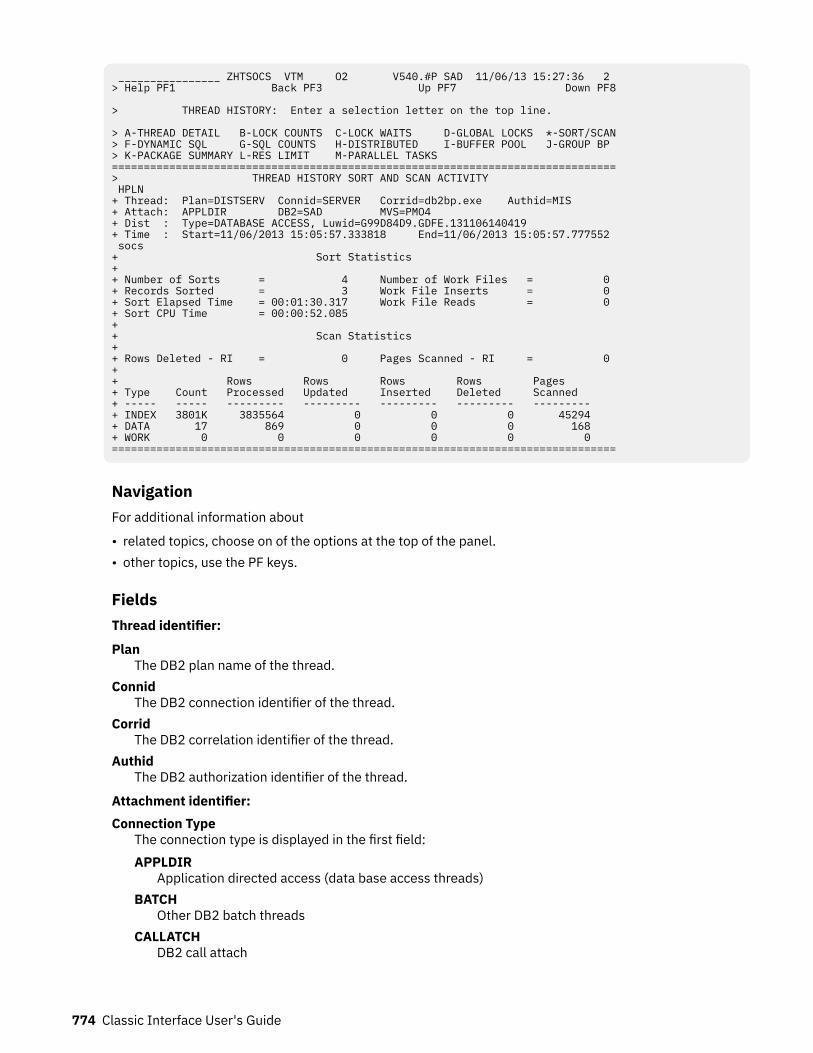
________________ ZHTSOCS VTM O2 V540.#P SAD 11/06/13 15:27:36 2 > Help PF1 Back PF3 Up PF7 Down PF8 > THREAD HISTORY: Enter a selection letter on the top line. > A-THREAD DETAIL B-LOCK COUNTS C-LOCK WAITS D-GLOBAL LOCKS *-SORT/SCAN> F-DYNAMIC SQL G-SQL COUNTS H-DISTRIBUTED I-BUFFER POOL J-GROUP BP > K-PACKAGE SUMMARY L-RES LIMIT M-PARALLEL TASKS ===============================================================================> THREAD HISTORY SORT AND SCAN ACTIVITY HPLN + Thread: Plan=DISTSERV Connid=SERVER Corrid=db2bp.exe Authid=MIS + Attach: APPLDIR DB2=SAD MVS=PMO4 + Dist : Type=DATABASE ACCESS, Luwid=G99D84D9.GDFE.131106140419 + Time : Start=11/06/2013 15:05:57.333818 End=11/06/2013 15:05:57.777552 socs + Sort Statistics + + Number of Sorts = 4 Number of Work Files = 0 + Records Sorted = 3 Work File Inserts = 0 + Sort Elapsed Time = 00:01:30.317 Work File Reads = 0 + Sort CPU Time = 00:00:52.085 + + Scan Statistics + + Rows Deleted - RI = 0 Pages Scanned - RI = 0 + + Rows Rows Rows Rows Pages + Type Count Processed Updated Inserted Deleted Scanned + ----- ----- --------- --------- --------- --------- --------- + INDEX 3801K 3835564 0 0 0 45294 + DATA 17 869 0 0 0 168 + WORK 0 0 0 0 0 0 ===============================================================================
NavigationFor additional information about
• related topics, choose on of the options at the top of the panel.• other topics, use the PF keys.
FieldsThread identifier:
PlanThe DB2 plan name of the thread.
ConnidThe DB2 connection identifier of the thread.
CorridThe DB2 correlation identifier of the thread.
AuthidThe DB2 authorization identifier of the thread.
Attachment identifier:Connection Type
The connection type is displayed in the first field:APPLDIR
Application directed access (data base access threads)BATCH
Other DB2 batch threadsCALLATCH
DB2 call attach
774 Classic Interface User's Guide
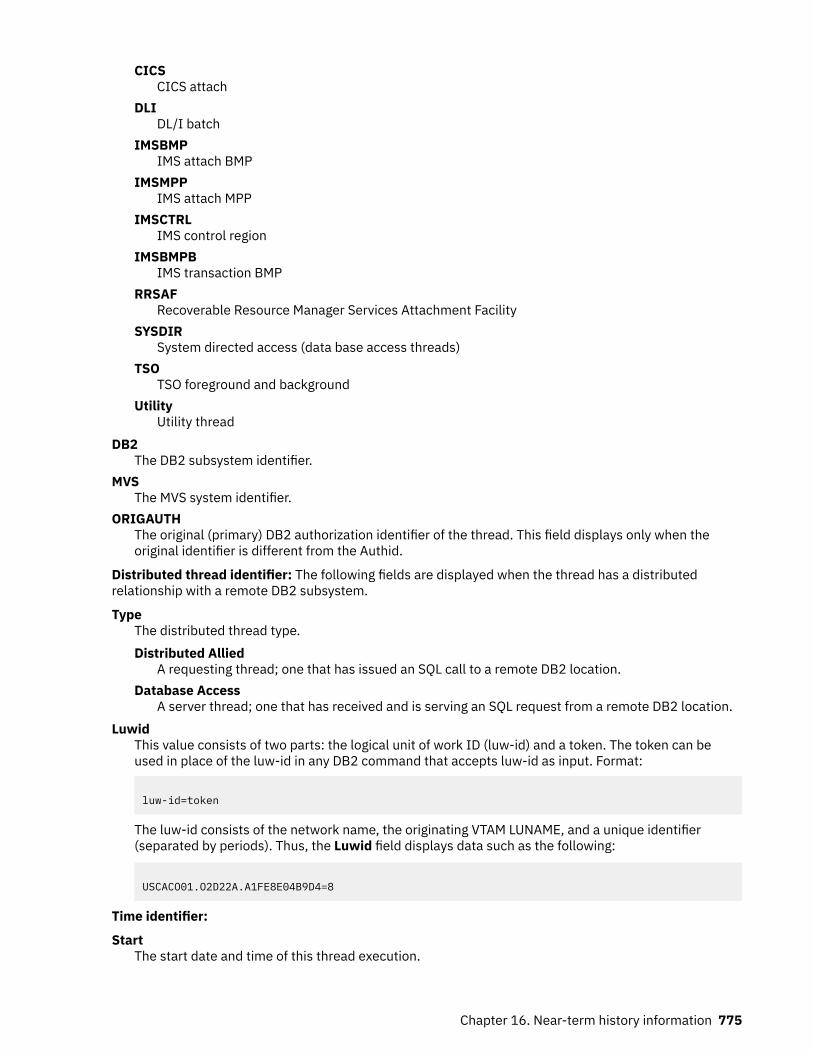
CICSCICS attach
DLIDL/I batch
IMSBMPIMS attach BMP
IMSMPPIMS attach MPP
IMSCTRLIMS control region
IMSBMPBIMS transaction BMP
RRSAFRecoverable Resource Manager Services Attachment Facility
SYSDIRSystem directed access (data base access threads)
TSOTSO foreground and background
UtilityUtility thread
DB2The DB2 subsystem identifier.
MVSThe MVS system identifier.
ORIGAUTHThe original (primary) DB2 authorization identifier of the thread. This field displays only when theoriginal identifier is different from the Authid.
Distributed thread identifier: The following fields are displayed when the thread has a distributedrelationship with a remote DB2 subsystem.
TypeThe distributed thread type.Distributed Allied
A requesting thread; one that has issued an SQL call to a remote DB2 location.Database Access
A server thread; one that has received and is serving an SQL request from a remote DB2 location.Luwid
This value consists of two parts: the logical unit of work ID (luw-id) and a token. The token can beused in place of the luw-id in any DB2 command that accepts luw-id as input. Format:
luw-id=token
The luw-id consists of the network name, the originating VTAM LUNAME, and a unique identifier(separated by periods). Thus, the Luwid field displays data such as the following:
USCACO01.O2D22A.A1FE8E04B9D4=8
Time identifier:
StartThe start date and time of this thread execution.
Chapter 16. Near-term history information 775
EndThe end date and time of this thread execution.
Sort statistics:
Number of SortsThe total number of sorts performed for this thread.
Records SortedThe total number of records sorted for this thread.
Sort Elapsed TimeThe total time spent performing sort processing.
Sort CPU TimeThe total CPU time spent performing sort processing.
Number of Work FilesThe number of logical work files used during sort processing. This is a high-water mark.
Work File InsertsThe number of records inserted into a work file during sort processing.
Work File ReadsThe number of records retrieved from a work file during sort processing.
Scan statistics:
Rows Deleted - RIThe number of rows that were deleted or set to null to enforce referential integrity constraints.
Pages Scanned - RIThe number of pages that were scanned to enforce referential integrity constraints.
TypeThe type of scan information displayed. Possible types:INDEX
Index scanDATA
Data row scanWORK
Work file scanCount
The number of times this thread generated a scan.Rows Processed
The number of rows processed by the Data Manager.Rows Updated
The number of rows updated by the Data Manager.Rows Inserted
The number of rows inserted by the Data Manager.Rows Deleted
The number rows deleted by the Data Manager.Pages Scanned
The number of pages scanned by the Data Manager.
Thread History Group Buffer Pool ActivityThis panel provides a summary of group buffer pool usage for an individual thread.
776 Classic Interface User's Guide
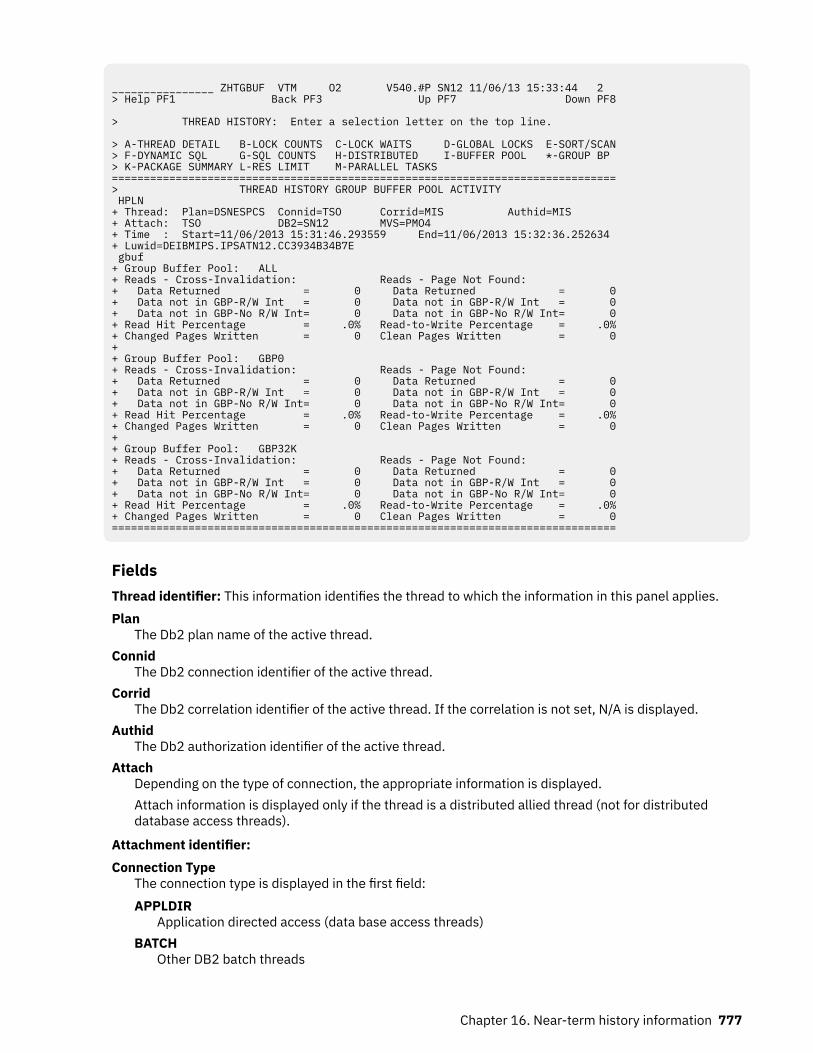
________________ ZHTGBUF VTM O2 V540.#P SN12 11/06/13 15:33:44 2 > Help PF1 Back PF3 Up PF7 Down PF8 > THREAD HISTORY: Enter a selection letter on the top line. > A-THREAD DETAIL B-LOCK COUNTS C-LOCK WAITS D-GLOBAL LOCKS E-SORT/SCAN > F-DYNAMIC SQL G-SQL COUNTS H-DISTRIBUTED I-BUFFER POOL *-GROUP BP > K-PACKAGE SUMMARY L-RES LIMIT M-PARALLEL TASKS =============================================================================== > THREAD HISTORY GROUP BUFFER POOL ACTIVITY HPLN + Thread: Plan=DSNESPCS Connid=TSO Corrid=MIS Authid=MIS + Attach: TSO DB2=SN12 MVS=PMO4 + Time : Start=11/06/2013 15:31:46.293559 End=11/06/2013 15:32:36.252634 + Luwid=DEIBMIPS.IPSATN12.CC3934B34B7E gbuf + Group Buffer Pool: ALL + Reads - Cross-Invalidation: Reads - Page Not Found: + Data Returned = 0 Data Returned = 0 + Data not in GBP-R/W Int = 0 Data not in GBP-R/W Int = 0 + Data not in GBP-No R/W Int= 0 Data not in GBP-No R/W Int= 0 + Read Hit Percentage = .0% Read-to-Write Percentage = .0% + Changed Pages Written = 0 Clean Pages Written = 0 + + Group Buffer Pool: GBP0 + Reads - Cross-Invalidation: Reads - Page Not Found: + Data Returned = 0 Data Returned = 0 + Data not in GBP-R/W Int = 0 Data not in GBP-R/W Int = 0 + Data not in GBP-No R/W Int= 0 Data not in GBP-No R/W Int= 0 + Read Hit Percentage = .0% Read-to-Write Percentage = .0% + Changed Pages Written = 0 Clean Pages Written = 0 + + Group Buffer Pool: GBP32K + Reads - Cross-Invalidation: Reads - Page Not Found: + Data Returned = 0 Data Returned = 0 + Data not in GBP-R/W Int = 0 Data not in GBP-R/W Int = 0 + Data not in GBP-No R/W Int= 0 Data not in GBP-No R/W Int= 0 + Read Hit Percentage = .0% Read-to-Write Percentage = .0% + Changed Pages Written = 0 Clean Pages Written = 0 ===============================================================================
FieldsThread identifier: This information identifies the thread to which the information in this panel applies.Plan
The Db2 plan name of the active thread.Connid
The Db2 connection identifier of the active thread.Corrid
The Db2 correlation identifier of the active thread. If the correlation is not set, N/A is displayed.Authid
The Db2 authorization identifier of the active thread.Attach
Depending on the type of connection, the appropriate information is displayed.Attach information is displayed only if the thread is a distributed allied thread (not for distributeddatabase access threads).
Attachment identifier:Connection Type
The connection type is displayed in the first field:APPLDIR
Application directed access (data base access threads)BATCH
Other DB2 batch threads
Chapter 16. Near-term history information 777
CALLATCHDB2 call attach
CICSCICS attach
DLIDL/I batch
IMSBMPIMS attach BMP
IMSMPPIMS attach MPP
IMSCTRLIMS control region
IMSBMPBIMS transaction BMP
RRSAFRecoverable Resource Manager Services Attachment Facility
SYSDIRSystem directed access (data base access threads)
TSOTSO foreground and background
UtilityUtility thread
DB2The DB2 subsystem identifier.
MVSThe MVS system identifier.
ORIGAUTHThe original (primary) DB2 authorization identifier of the thread. This field displays only when theoriginal identifier is different from the Authid.
Time identifier:Start
The start date and time of this thread execution.End
The end date and time of this thread execution.
Distributed thread identifier: The following fields are displayed if the thread has a distributedrelationship with a remote Db2 subsystem.Type
The distributed thread type.Distributed Allied
A requesting thread; one that has issued an SQL call to a remote Db2 location.Database Access
A responding thread; one that is serving a remote Db2 location by responding to an SQL call.Db2=
The Db2 subsystem ID, indicating the member of the data sharing group of this thread.Luwid
This value consists of two parts: the logical unit of work ID (luw-id) and a token. The token can beused in place of the luw-id in any Db2 command that accepts luw-id as input. Format:
luw-id=token
778 Classic Interface User's Guide
The luw-id consists of the network name, the originating VTAM LUNAME, and a unique identifier(separated by periods). Thus, the Luwid field displays data like in the following example:
USCACO01.O2D22A.A1FE8E04B9D4=8
SystemThe originating Db2 job name and the resource manager that is the source of the thread. An additionalline below the Attach line identifies the user thread, if any, being served by the system thread.
Group buffer pool information:
Group Buffer PoolThe group buffer pool ID.
Reads - Cross Invalidation: Data ReturnedThe number of reads to the group buffer pool required because the page in the member's buffer poolwas invalidated where the data was found and returned to the member.
Reads - Page Not Found: Data ReturnedThe number of reads to the group buffer pool required because the page was not in the member'sbuffer pool where the data was found and returned to the member.
Reads - Cross Invalidation: Data not in GBP-R/W IntThe number of reads to the group buffer pool required because the page in the member's buffer poolwas invalidated, where:
• The data was not found in the group buffer pool and the member had to go to DASD to read the page• Other members had read/write interest in the pageset, so DB2 created a directory entry for this
page if it did not already exist.
Reads - Page Not Found: Data not in GBP-R/W IntThe number of reads to the group buffer pool required because the page was not in the member'sbuffer pool, where:
• The data was not found in the group buffer pool and the member had to go to DASD to read the page• Other members had read/write interest in the pageset, so DB2 created a directory entry for this
page if it did not already exist.
Reads - Cross Invalidation: Data not in GBP-No R/W IntThe number of reads to the group buffer pool required because the page in the member's buffer poolwas invalidated, where:
• The data was not found in the group buffer pool and the member had to go to DASD to read the page• No other member had read/write interest in the pageset, so DB2 did not have to register the page,
since another member cannot cause a cross-invalidation by updating a page.
Reads - Page Not Found: Data not in GBP-No R/W IntThe number of reads to the group buffer pool required because the page was not in the member'sbuffer pool, where:
• The data was not found in the group buffer pool and the member had to go to DASD to read the page• No other member had read/write interest in the pageset, so DB2 did not have to register the page,
since another member cannot cause a cross-invalidation by updating a page.
Read Hit PercentageThe percentage of all Reads to the group buffer pool for which the needed data was found andreturned to the member.
Read-to-Write PercentageThe ratio of reads to writes expressed as a percentage for the group buffer pool.
Changed Pages WrittenThe number of changed pages written to the group buffer pool. Pages can be forced out before theapplication commits if a buffer pool threshold is reached, or when P-lock negotiation forces the pageson the vertical Deferred Write queue to be written to the group buffer pool.
Chapter 16. Near-term history information 779
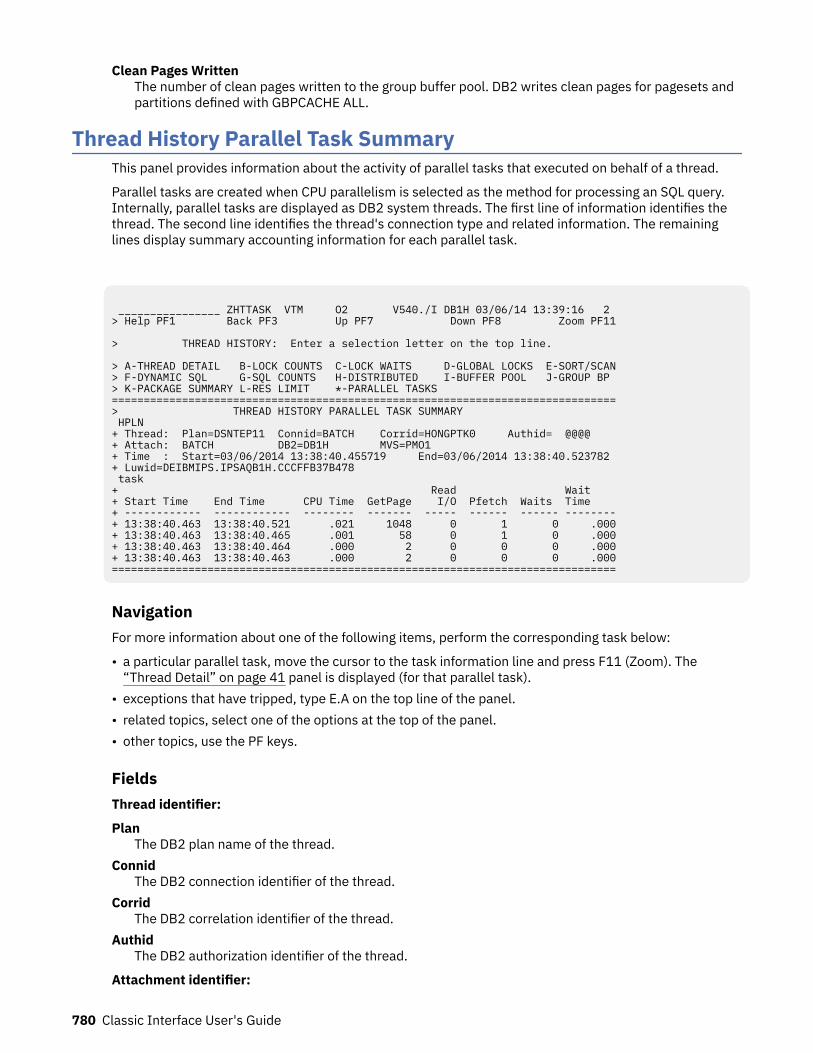
Clean Pages WrittenThe number of clean pages written to the group buffer pool. DB2 writes clean pages for pagesets andpartitions defined with GBPCACHE ALL.
Thread History Parallel Task SummaryThis panel provides information about the activity of parallel tasks that executed on behalf of a thread.
Parallel tasks are created when CPU parallelism is selected as the method for processing an SQL query.Internally, parallel tasks are displayed as DB2 system threads. The first line of information identifies thethread. The second line identifies the thread's connection type and related information. The remaininglines display summary accounting information for each parallel task.
________________ ZHTTASK VTM O2 V540./I DB1H 03/06/14 13:39:16 2 > Help PF1 Back PF3 Up PF7 Down PF8 Zoom PF11 > THREAD HISTORY: Enter a selection letter on the top line. > A-THREAD DETAIL B-LOCK COUNTS C-LOCK WAITS D-GLOBAL LOCKS E-SORT/SCAN > F-DYNAMIC SQL G-SQL COUNTS H-DISTRIBUTED I-BUFFER POOL J-GROUP BP > K-PACKAGE SUMMARY L-RES LIMIT *-PARALLEL TASKS =============================================================================== > THREAD HISTORY PARALLEL TASK SUMMARY HPLN + Thread: Plan=DSNTEP11 Connid=BATCH Corrid=HONGPTK0 Authid= @@@@ + Attach: BATCH DB2=DB1H MVS=PMO1 + Time : Start=03/06/2014 13:38:40.455719 End=03/06/2014 13:38:40.523782 + Luwid=DEIBMIPS.IPSAQB1H.CCCFFB37B478 task + Read Wait + Start Time End Time CPU Time GetPage I/O Pfetch Waits Time + ------------ ------------ -------- ------- ----- ------ ------ -------- + 13:38:40.463 13:38:40.521 .021 1048 0 1 0 .000 + 13:38:40.463 13:38:40.465 .001 58 0 1 0 .000 + 13:38:40.463 13:38:40.464 .000 2 0 0 0 .000 + 13:38:40.463 13:38:40.463 .000 2 0 0 0 .000 ===============================================================================
NavigationFor more information about one of the following items, perform the corresponding task below:
• a particular parallel task, move the cursor to the task information line and press F11 (Zoom). The“Thread Detail” on page 41 panel is displayed (for that parallel task).
• exceptions that have tripped, type E.A on the top line of the panel.• related topics, select one of the options at the top of the panel.• other topics, use the PF keys.
FieldsThread identifier:
PlanThe DB2 plan name of the thread.
ConnidThe DB2 connection identifier of the thread.
CorridThe DB2 correlation identifier of the thread.
AuthidThe DB2 authorization identifier of the thread.
Attachment identifier:
780 Classic Interface User's Guide
Connection TypeThe connection type is displayed in the first field:APPLDIR
Application directed access (data base access threads)BATCH
Other DB2 batch threadsCALLATCH
DB2 call attachCICS
CICS attachDLI
DL/I batchIMSBMP
IMS attach BMPIMSMPP
IMS attach MPPIMSCTRL
IMS control regionIMSBMPB
IMS transaction BMPRRSAF
Recoverable Resource Manager Services Attachment FacilitySYSDIR
System directed access (data base access threads)TSO
TSO foreground and backgroundUtility
Utility threadDB2
The DB2 subsystem identifier.MVS
The MVS system identifier.ORIGAUTH
The original (primary) DB2 authorization identifier of the thread. This field displays only when theoriginal identifier is different from the Authid.
Distributed thread identifier: The following fields are displayed when the thread has a distributedrelationship with a remote DB2 subsystem.Type
The distributed thread type.Distributed Allied
A requesting thread; one that has issued an SQL call to a remote DB2 location.Database Access
A server thread; one that has received and is serving an SQL request from a remote DB2 location.Luwid
This value consists of two parts: the logical unit of work ID (luw-id) and a token. The token can beused in place of the luw-id in any DB2 command that accepts luw-id as input. Format:
luw-id=token
Chapter 16. Near-term history information 781
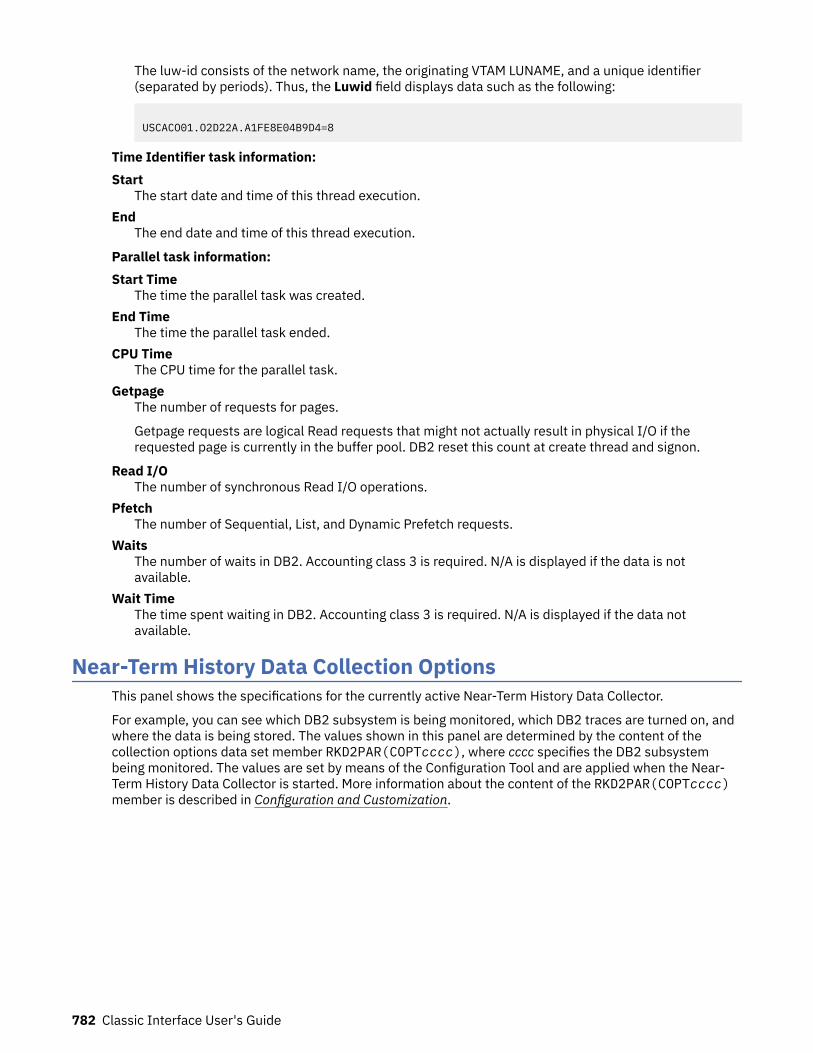
The luw-id consists of the network name, the originating VTAM LUNAME, and a unique identifier(separated by periods). Thus, the Luwid field displays data such as the following:
USCACO01.O2D22A.A1FE8E04B9D4=8
Time Identifier task information:Start
The start date and time of this thread execution.End
The end date and time of this thread execution.
Parallel task information:Start Time
The time the parallel task was created.End Time
The time the parallel task ended.CPU Time
The CPU time for the parallel task.Getpage
The number of requests for pages.
Getpage requests are logical Read requests that might not actually result in physical I/O if therequested page is currently in the buffer pool. DB2 reset this count at create thread and signon.
Read I/OThe number of synchronous Read I/O operations.
PfetchThe number of Sequential, List, and Dynamic Prefetch requests.
WaitsThe number of waits in DB2. Accounting class 3 is required. N/A is displayed if the data is notavailable.
Wait TimeThe time spent waiting in DB2. Accounting class 3 is required. N/A is displayed if the data notavailable.
Near-Term History Data Collection OptionsThis panel shows the specifications for the currently active Near-Term History Data Collector.
For example, you can see which DB2 subsystem is being monitored, which DB2 traces are turned on, andwhere the data is being stored. The values shown in this panel are determined by the content of thecollection options data set member RKD2PAR(COPTcccc), where cccc specifies the DB2 subsystembeing monitored. The values are set by means of the Configuration Tool and are applied when the Near-Term History Data Collector is started. More information about the content of the RKD2PAR(COPTcccc)member is described in Configuration and Customization.
782 Classic Interface User's Guide
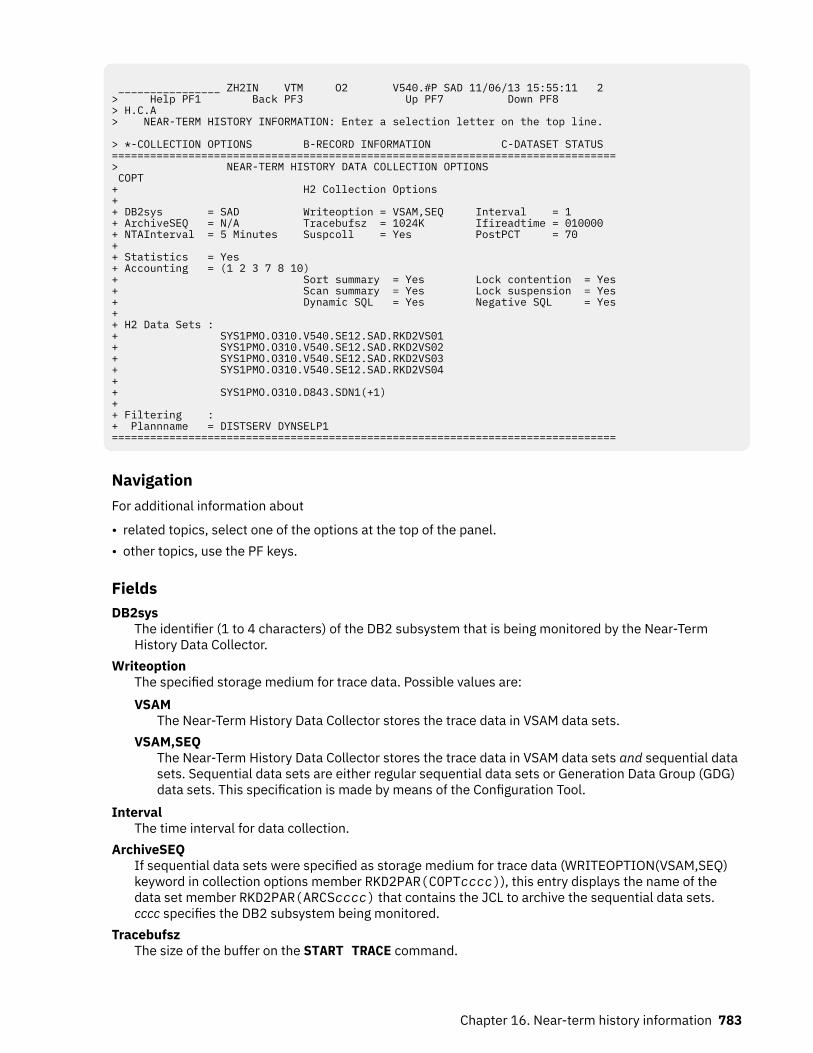
________________ ZH2IN VTM O2 V540.#P SAD 11/06/13 15:55:11 2 > Help PF1 Back PF3 Up PF7 Down PF8 > H.C.A > NEAR-TERM HISTORY INFORMATION: Enter a selection letter on the top line. > *-COLLECTION OPTIONS B-RECORD INFORMATION C-DATASET STATUS =============================================================================== > NEAR-TERM HISTORY DATA COLLECTION OPTIONS COPT + H2 Collection Options + + DB2sys = SAD Writeoption = VSAM,SEQ Interval = 1 + ArchiveSEQ = N/A Tracebufsz = 1024K Ifireadtime = 010000 + NTAInterval = 5 Minutes Suspcoll = Yes PostPCT = 70 + + Statistics = Yes + Accounting = (1 2 3 7 8 10) + Sort summary = Yes Lock contention = Yes + Scan summary = Yes Lock suspension = Yes + Dynamic SQL = Yes Negative SQL = Yes + + H2 Data Sets : + SYS1PMO.O310.V540.SE12.SAD.RKD2VS01 + SYS1PMO.O310.V540.SE12.SAD.RKD2VS02 + SYS1PMO.O310.V540.SE12.SAD.RKD2VS03 + SYS1PMO.O310.V540.SE12.SAD.RKD2VS04 + + SYS1PMO.O310.D843.SDN1(+1) + + Filtering : + Plannname = DISTSERV DYNSELP1 ===============================================================================
NavigationFor additional information about
• related topics, select one of the options at the top of the panel.• other topics, use the PF keys.
FieldsDB2sys
The identifier (1 to 4 characters) of the DB2 subsystem that is being monitored by the Near-TermHistory Data Collector.
WriteoptionThe specified storage medium for trace data. Possible values are:VSAM
The Near-Term History Data Collector stores the trace data in VSAM data sets.VSAM,SEQ
The Near-Term History Data Collector stores the trace data in VSAM data sets and sequential datasets. Sequential data sets are either regular sequential data sets or Generation Data Group (GDG)data sets. This specification is made by means of the Configuration Tool.
IntervalThe time interval for data collection.
ArchiveSEQIf sequential data sets were specified as storage medium for trace data (WRITEOPTION(VSAM,SEQ)keyword in collection options member RKD2PAR(COPTcccc)), this entry displays the name of thedata set member RKD2PAR(ARCScccc) that contains the JCL to archive the sequential data sets.cccc specifies the DB2 subsystem being monitored.
TracebufszThe size of the buffer on the START TRACE command.
Chapter 16. Near-term history information 783
IfireadtimeThe frequency of IFI reads on lightly loaded DB2s. The value is mmsshh, where mm stands forminutes, ss for seconds, and hh for 1/100s of a second.
SuspcollFlag indicating whether the data collection is to be suspended at times the VSAM data set is notavailable.
A near-term history VSAM data set is considered to be unavailable from the time all allocated filespace is used until the end of a successful execution of the archive job.
YesThe Near-Term History Data Collector is requested to discard all collected data in memory until aVSAM data set becomes available gain for use.
NoThe Near-Term History Data Collector is requested to accumulate all collected data in memoryuntil a VSAM data set becomes available gain for use.
PostPCTA percentage value that determines when the Near-Term History Data Collector drains its IFI buffer onbehalf of DB2.
Use this information to tune the Near-Term History Data Collector, if you often see the DB2 messageDSNW133I. This value is used to compute a "high water mark" or threshold, which is a percentage ofthe total number of bytes in the IFI buffer. When this threshold is exceeded, DB2 posts the Near-TermHistory Data Collector to drain the buffer.
NTAIntervalDisplays the Near-Term History sub-interval time. This value may be specified as minutes or seconds.This value is used to provide a secondary display of thread accounting data from a smaller period oftime. Sub-Interval periods may be displayed by entering F next to an interval of time on the THREADHISTORY BY REPORT INTERVAL screen.
StatisticsIndicates whether a Statistics trace is active.
AccountingDisplays the number of each accounting trace class that is turned on. Accounting class 11 is availablefrom DB2 11 and later. When class 11 is on, class 1, 7, 8, and 10 are suppressed.
Sort summaryIndicates whether sort processing is active.
Lock contentionIndicates whether lock timeout and deadlock information is being collected.
Scan summaryIndicates whether scan processing is active.
Lock suspensionIndicates whether lock wait information is being collected.
Dynamic SQLIndicates whether SQL text and access path information for dynamic SQL is being collected.
Negative SQLIndicates whether information about SQL statements returning negative SQLCODE is being collected.
This entry is only shown if Negative SQL is specified in the Near-Term History configuration.
H2 Data SetsThe fully qualified names of the data sets that hold the trace data. The list of names varies dependingon what media were specified with the Configuration Tool.
784 Classic Interface User's Guide
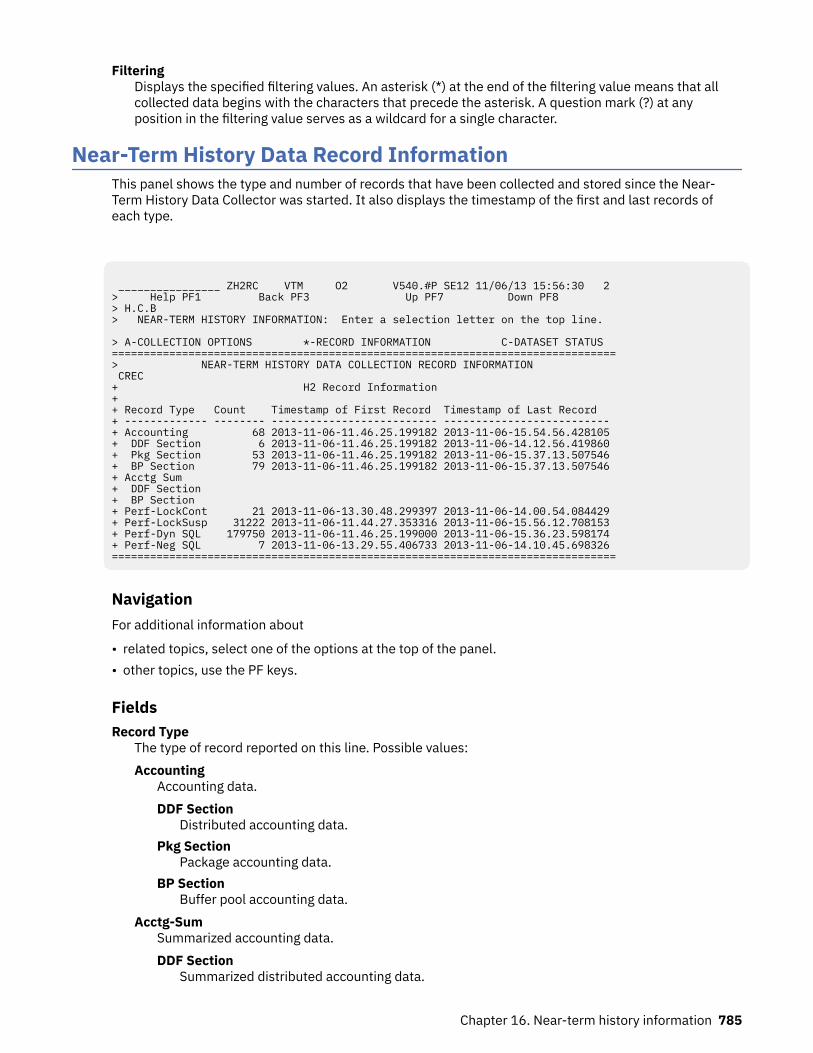
FilteringDisplays the specified filtering values. An asterisk (*) at the end of the filtering value means that allcollected data begins with the characters that precede the asterisk. A question mark (?) at anyposition in the filtering value serves as a wildcard for a single character.
Near-Term History Data Record InformationThis panel shows the type and number of records that have been collected and stored since the Near-Term History Data Collector was started. It also displays the timestamp of the first and last records ofeach type.
________________ ZH2RC VTM O2 V540.#P SE12 11/06/13 15:56:30 2 > Help PF1 Back PF3 Up PF7 Down PF8 > H.C.B > NEAR-TERM HISTORY INFORMATION: Enter a selection letter on the top line. > A-COLLECTION OPTIONS *-RECORD INFORMATION C-DATASET STATUS =============================================================================== > NEAR-TERM HISTORY DATA COLLECTION RECORD INFORMATION CREC + H2 Record Information + + Record Type Count Timestamp of First Record Timestamp of Last Record + ------------- -------- -------------------------- -------------------------- + Accounting 68 2013-11-06-11.46.25.199182 2013-11-06-15.54.56.428105 + DDF Section 6 2013-11-06-11.46.25.199182 2013-11-06-14.12.56.419860 + Pkg Section 53 2013-11-06-11.46.25.199182 2013-11-06-15.37.13.507546 + BP Section 79 2013-11-06-11.46.25.199182 2013-11-06-15.37.13.507546 + Acctg Sum + DDF Section + BP Section + Perf-LockCont 21 2013-11-06-13.30.48.299397 2013-11-06-14.00.54.084429 + Perf-LockSusp 31222 2013-11-06-11.44.27.353316 2013-11-06-15.56.12.708153 + Perf-Dyn SQL 179750 2013-11-06-11.46.25.199000 2013-11-06-15.36.23.598174 + Perf-Neg SQL 7 2013-11-06-13.29.55.406733 2013-11-06-14.10.45.698326 ===============================================================================
NavigationFor additional information about
• related topics, select one of the options at the top of the panel.• other topics, use the PF keys.
FieldsRecord Type
The type of record reported on this line. Possible values:Accounting
Accounting data.DDF Section
Distributed accounting data.Pkg Section
Package accounting data.BP Section
Buffer pool accounting data.Acctg-Sum
Summarized accounting data.DDF Section
Summarized distributed accounting data.
Chapter 16. Near-term history information 785
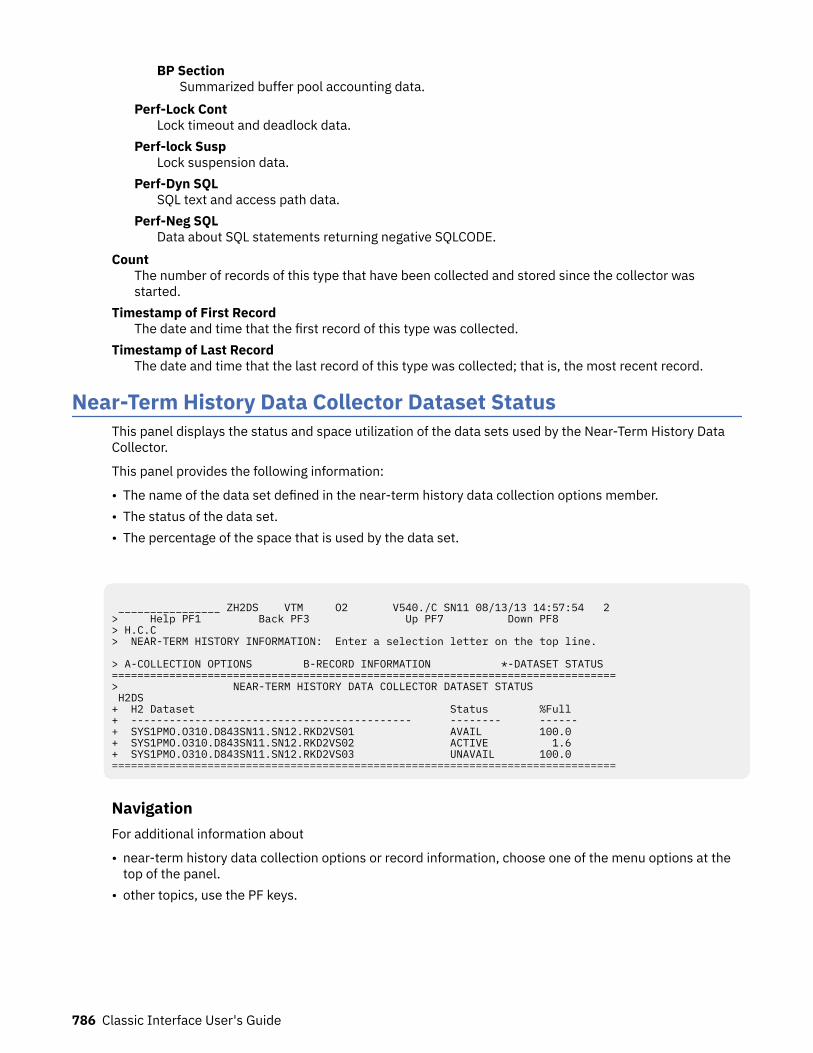
BP SectionSummarized buffer pool accounting data.
Perf-Lock ContLock timeout and deadlock data.
Perf-lock SuspLock suspension data.
Perf-Dyn SQLSQL text and access path data.
Perf-Neg SQLData about SQL statements returning negative SQLCODE.
CountThe number of records of this type that have been collected and stored since the collector wasstarted.
Timestamp of First RecordThe date and time that the first record of this type was collected.
Timestamp of Last RecordThe date and time that the last record of this type was collected; that is, the most recent record.
Near-Term History Data Collector Dataset StatusThis panel displays the status and space utilization of the data sets used by the Near-Term History DataCollector.
This panel provides the following information:
• The name of the data set defined in the near-term history data collection options member.• The status of the data set.• The percentage of the space that is used by the data set.
________________ ZH2DS VTM O2 V540./C SN11 08/13/13 14:57:54 2 > Help PF1 Back PF3 Up PF7 Down PF8 > H.C.C > NEAR-TERM HISTORY INFORMATION: Enter a selection letter on the top line. > A-COLLECTION OPTIONS B-RECORD INFORMATION *-DATASET STATUS =============================================================================== > NEAR-TERM HISTORY DATA COLLECTOR DATASET STATUS H2DS + H2 Dataset Status %Full + -------------------------------------------- -------- ------ + SYS1PMO.O310.D843SN11.SN12.RKD2VS01 AVAIL 100.0 + SYS1PMO.O310.D843SN11.SN12.RKD2VS02 ACTIVE 1.6 + SYS1PMO.O310.D843SN11.SN12.RKD2VS03 UNAVAIL 100.0 ===============================================================================
NavigationFor additional information about
• near-term history data collection options or record information, choose one of the menu options at thetop of the panel.
• other topics, use the PF keys.
786 Classic Interface User's Guide
FieldsH2 Dataset
The name of the H2 (near-term history) data set defined in the near-term history data collectionoptions member.
StatusThe status of the H2 data set. Possible values:
• ACTIVE• FULL• AVAIL(available)• UNAVAIL(unavailable)• ARCHIVE
% FullThe percentage of space used in this H2 data set.
Chapter 16. Near-term history information 787

788 Classic Interface User's Guide
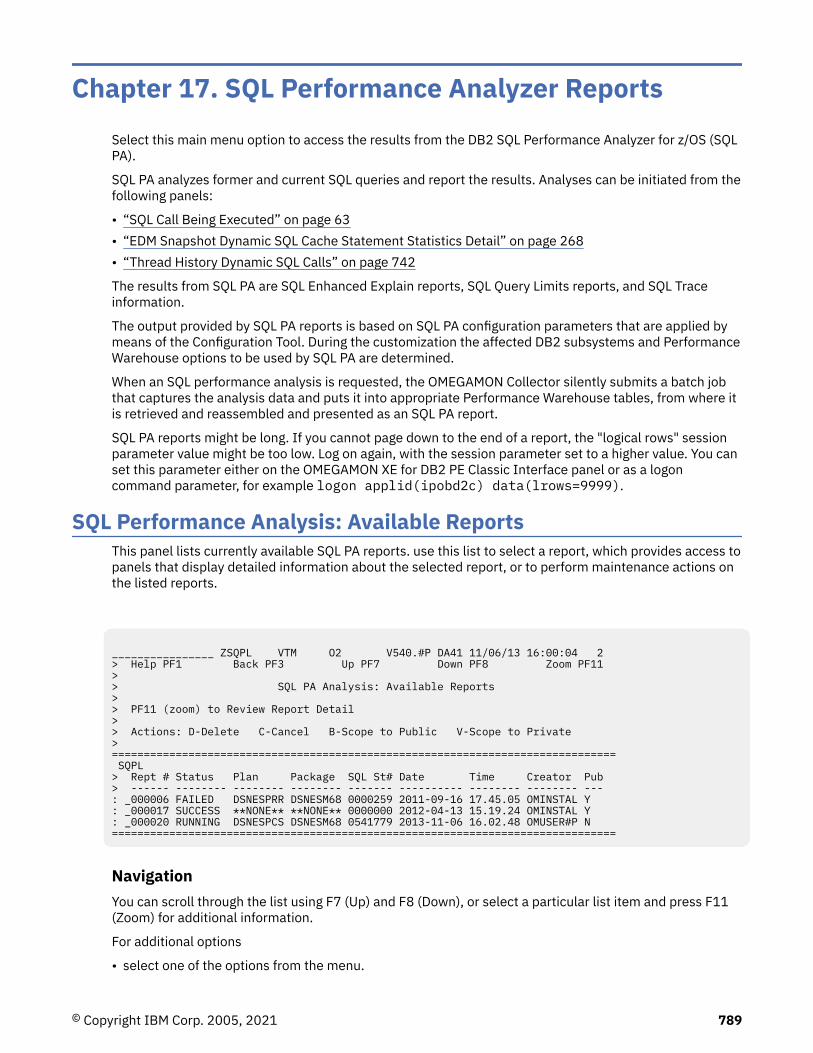
Chapter 17. SQL Performance Analyzer ReportsSelect this main menu option to access the results from the DB2 SQL Performance Analyzer for z/OS (SQLPA).
SQL PA analyzes former and current SQL queries and report the results. Analyses can be initiated from thefollowing panels:
• “SQL Call Being Executed” on page 63• “EDM Snapshot Dynamic SQL Cache Statement Statistics Detail” on page 268• “Thread History Dynamic SQL Calls” on page 742
The results from SQL PA are SQL Enhanced Explain reports, SQL Query Limits reports, and SQL Traceinformation.
The output provided by SQL PA reports is based on SQL PA configuration parameters that are applied bymeans of the Configuration Tool. During the customization the affected DB2 subsystems and PerformanceWarehouse options to be used by SQL PA are determined.
When an SQL performance analysis is requested, the OMEGAMON Collector silently submits a batch jobthat captures the analysis data and puts it into appropriate Performance Warehouse tables, from where itis retrieved and reassembled and presented as an SQL PA report.
SQL PA reports might be long. If you cannot page down to the end of a report, the "logical rows" sessionparameter value might be too low. Log on again, with the session parameter set to a higher value. You canset this parameter either on the OMEGAMON XE for DB2 PE Classic Interface panel or as a logoncommand parameter, for example logon applid(ipobd2c) data(lrows=9999).
SQL Performance Analysis: Available ReportsThis panel lists currently available SQL PA reports. use this list to select a report, which provides access topanels that display detailed information about the selected report, or to perform maintenance actions onthe listed reports.
________________ ZSQPL VTM O2 V540.#P DA41 11/06/13 16:00:04 2 > Help PF1 Back PF3 Up PF7 Down PF8 Zoom PF11 > > SQL PA Analysis: Available Reports > > PF11 (zoom) to Review Report Detail > > Actions: D-Delete C-Cancel B-Scope to Public V-Scope to Private > =============================================================================== SQPL > Rept # Status Plan Package SQL St# Date Time Creator Pub > ------ -------- -------- -------- ------- ---------- -------- -------- --- : _000006 FAILED DSNESPRR DSNESM68 0000259 2011-09-16 17.45.05 OMINSTAL Y : _000017 SUCCESS **NONE** **NONE** 0000000 2012-04-13 15.19.24 OMINSTAL Y : _000020 RUNNING DSNESPCS DSNESM68 0541779 2013-11-06 16.02.48 OMUSER#P N ===============================================================================
NavigationYou can scroll through the list using F7 (Up) and F8 (Down), or select a particular list item and press F11(Zoom) for additional information.
For additional options
• select one of the options from the menu.
© Copyright IBM Corp. 2005, 2021 789
• use the PF keys.
ActionsYou can refresh the list of current SQL PA reports by pressing Enter.
Use F11 (Zoom) to obtain access to the different report types (Enhanced Explain, Query Limits, Trace).
You can apply the following maintenance actions on a single SQL PA report by typing the correspondingletter left to one of the listed reports. Some actions are permitted only if you are the creator of the report.D-Delete
Creator only: Deletes a particular SQL PA report. Applicable if the report status is READY, FAILED, orCANCELED.
C-CancelCreator only: Cancels an active SQL PA invocation. Applicable if the report status is RUNNING. (Thestatus changes to CANCEL. Keep hitting the Enter key until the status changes to CANCELED.)
B-Scope to PublicCreator only: Marks the report as public so that other users can see the report output. Applicable if thereport status is READY, FAILED, or CANCELED.
P-Scope to PrivateCreator only: Marks the report as private so that other users cannot see the report output. Applicableif the report status is READY, FAILED, or CANCELED.
FieldsRept #
The unique report number (identical to the Performance Warehouse log identifier).Status
The current status of the report.SUCCESS
The report has completed successfully.RUNNING
The report is currently running.FAILED
The job for this reported has failed, based on the completion code from SQL PA.CANCEL
There is a pending Cancel request for this SQL PA invocation.CANCELED
The report request was canceled.Plan
The plan from which the SQL was taken.Package
The package from which the SQL was taken.SQL St#
The SQL statement number.Date
The date when the report was run.Time
The time when the report was run.Creator
The creator of the report. The ID of the creator is dependent on a couple of factors:
• If the signon security interface has been enabled, the creator ID is the identification used by theuser to sign on.
790 Classic Interface User's Guide
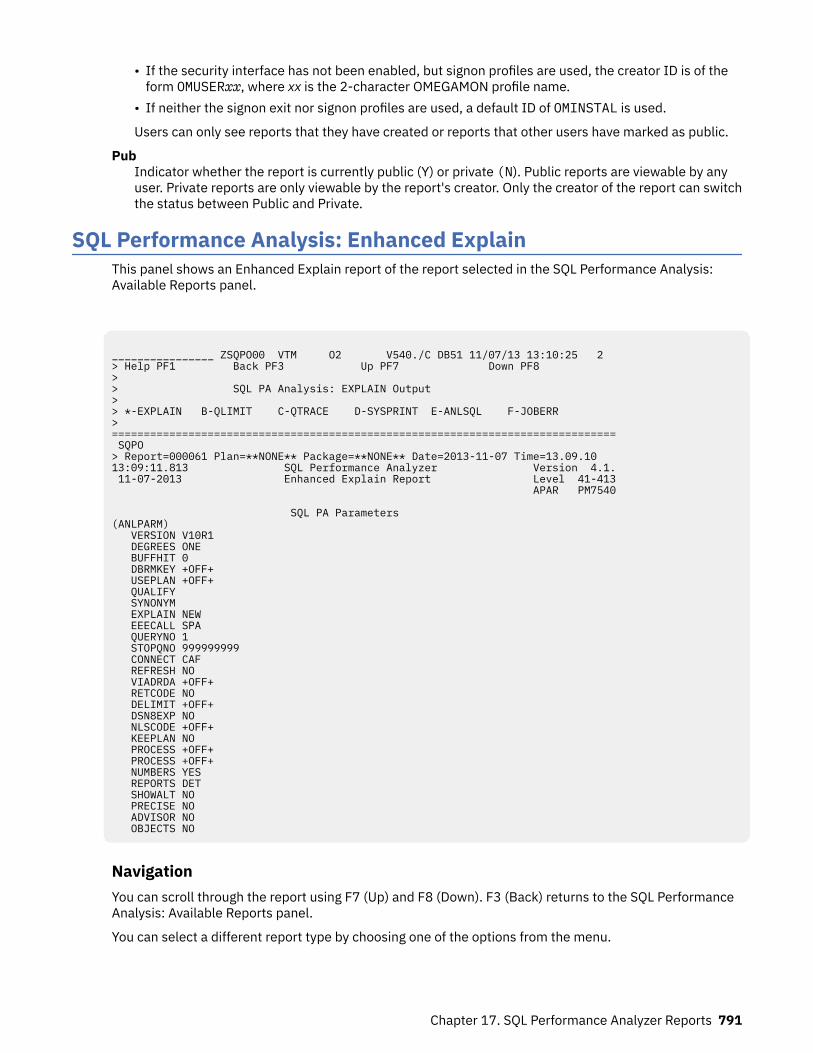
• If the security interface has not been enabled, but signon profiles are used, the creator ID is of theform OMUSERxx, where xx is the 2-character OMEGAMON profile name.
• If neither the signon exit nor signon profiles are used, a default ID of OMINSTAL is used.
Users can only see reports that they have created or reports that other users have marked as public.
PubIndicator whether the report is currently public (Y) or private (N). Public reports are viewable by anyuser. Private reports are only viewable by the report's creator. Only the creator of the report can switchthe status between Public and Private.
SQL Performance Analysis: Enhanced ExplainThis panel shows an Enhanced Explain report of the report selected in the SQL Performance Analysis:Available Reports panel.
________________ ZSQPO00 VTM O2 V540./C DB51 11/07/13 13:10:25 2 > Help PF1 Back PF3 Up PF7 Down PF8 > > SQL PA Analysis: EXPLAIN Output > > *-EXPLAIN B-QLIMIT C-QTRACE D-SYSPRINT E-ANLSQL F-JOBERR > =============================================================================== SQPO > Report=000061 Plan=**NONE** Package=**NONE** Date=2013-11-07 Time=13.09.10 13:09:11.813 SQL Performance Analyzer Version 4.1. 11-07-2013 Enhanced Explain Report Level 41-413 APAR PM7540 SQL PA Parameters (ANLPARM) VERSION V10R1 DEGREES ONE BUFFHIT 0 DBRMKEY +OFF+ USEPLAN +OFF+ QUALIFY SYNONYM EXPLAIN NEW EEECALL SPA QUERYNO 1 STOPQNO 999999999 CONNECT CAF REFRESH NO VIADRDA +OFF+ RETCODE NO DELIMIT +OFF+ DSN8EXP NO NLSCODE +OFF+ KEEPLAN NO PROCESS +OFF+ PROCESS +OFF+ NUMBERS YES REPORTS DET SHOWALT NO PRECISE NO ADVISOR NO OBJECTS NO
NavigationYou can scroll through the report using F7 (Up) and F8 (Down). F3 (Back) returns to the SQL PerformanceAnalysis: Available Reports panel.
You can select a different report type by choosing one of the options from the menu.
Chapter 17. SQL Performance Analyzer Reports 791
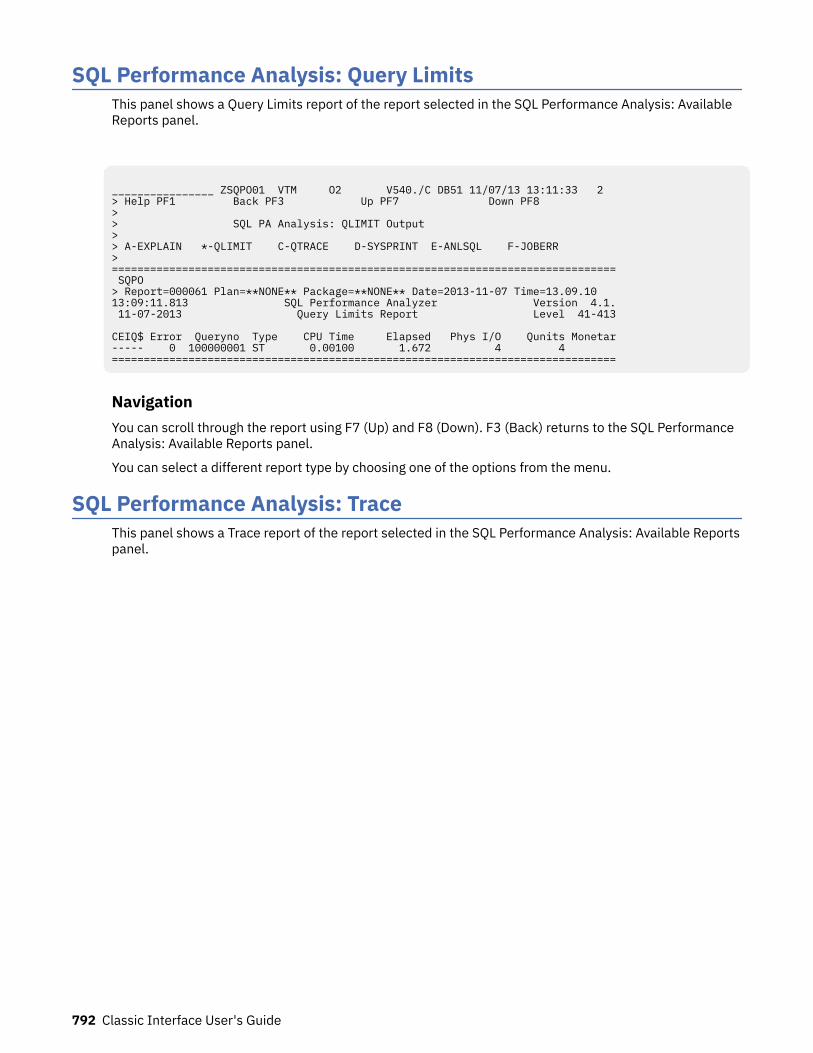
SQL Performance Analysis: Query LimitsThis panel shows a Query Limits report of the report selected in the SQL Performance Analysis: AvailableReports panel.
________________ ZSQPO01 VTM O2 V540./C DB51 11/07/13 13:11:33 2 > Help PF1 Back PF3 Up PF7 Down PF8 > > SQL PA Analysis: QLIMIT Output > > A-EXPLAIN *-QLIMIT C-QTRACE D-SYSPRINT E-ANLSQL F-JOBERR > =============================================================================== SQPO > Report=000061 Plan=**NONE** Package=**NONE** Date=2013-11-07 Time=13.09.10 13:09:11.813 SQL Performance Analyzer Version 4.1. 11-07-2013 Query Limits Report Level 41-413 CEIQ$ Error Queryno Type CPU Time Elapsed Phys I/O Qunits Monetar ----- 0 100000001 ST 0.00100 1.672 4 4 ===============================================================================
NavigationYou can scroll through the report using F7 (Up) and F8 (Down). F3 (Back) returns to the SQL PerformanceAnalysis: Available Reports panel.
You can select a different report type by choosing one of the options from the menu.
SQL Performance Analysis: TraceThis panel shows a Trace report of the report selected in the SQL Performance Analysis: Available Reportspanel.
792 Classic Interface User's Guide
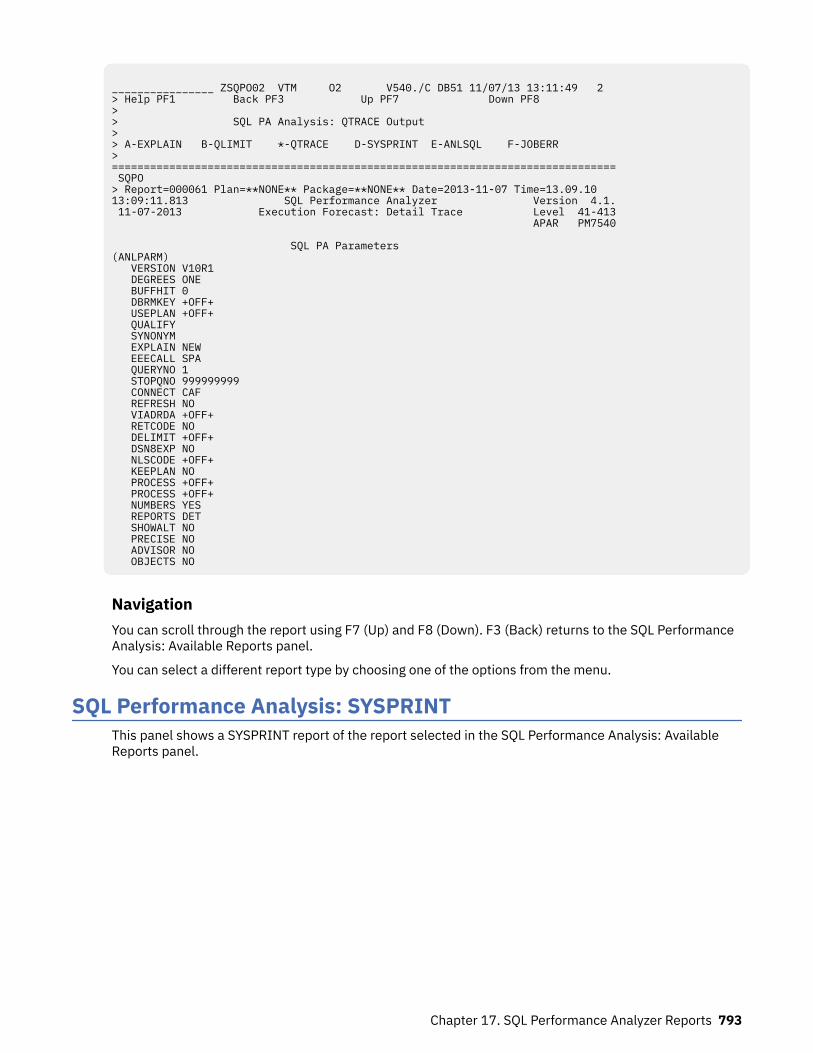
________________ ZSQPO02 VTM O2 V540./C DB51 11/07/13 13:11:49 2 > Help PF1 Back PF3 Up PF7 Down PF8 > > SQL PA Analysis: QTRACE Output > > A-EXPLAIN B-QLIMIT *-QTRACE D-SYSPRINT E-ANLSQL F-JOBERR > =============================================================================== SQPO > Report=000061 Plan=**NONE** Package=**NONE** Date=2013-11-07 Time=13.09.10 13:09:11.813 SQL Performance Analyzer Version 4.1. 11-07-2013 Execution Forecast: Detail Trace Level 41-413 APAR PM7540 SQL PA Parameters (ANLPARM) VERSION V10R1 DEGREES ONE BUFFHIT 0 DBRMKEY +OFF+ USEPLAN +OFF+ QUALIFY SYNONYM EXPLAIN NEW EEECALL SPA QUERYNO 1 STOPQNO 999999999 CONNECT CAF REFRESH NO VIADRDA +OFF+ RETCODE NO DELIMIT +OFF+ DSN8EXP NO NLSCODE +OFF+ KEEPLAN NO PROCESS +OFF+ PROCESS +OFF+ NUMBERS YES REPORTS DET SHOWALT NO PRECISE NO ADVISOR NO OBJECTS NO
NavigationYou can scroll through the report using F7 (Up) and F8 (Down). F3 (Back) returns to the SQL PerformanceAnalysis: Available Reports panel.
You can select a different report type by choosing one of the options from the menu.
SQL Performance Analysis: SYSPRINTThis panel shows a SYSPRINT report of the report selected in the SQL Performance Analysis: AvailableReports panel.
Chapter 17. SQL Performance Analyzer Reports 793
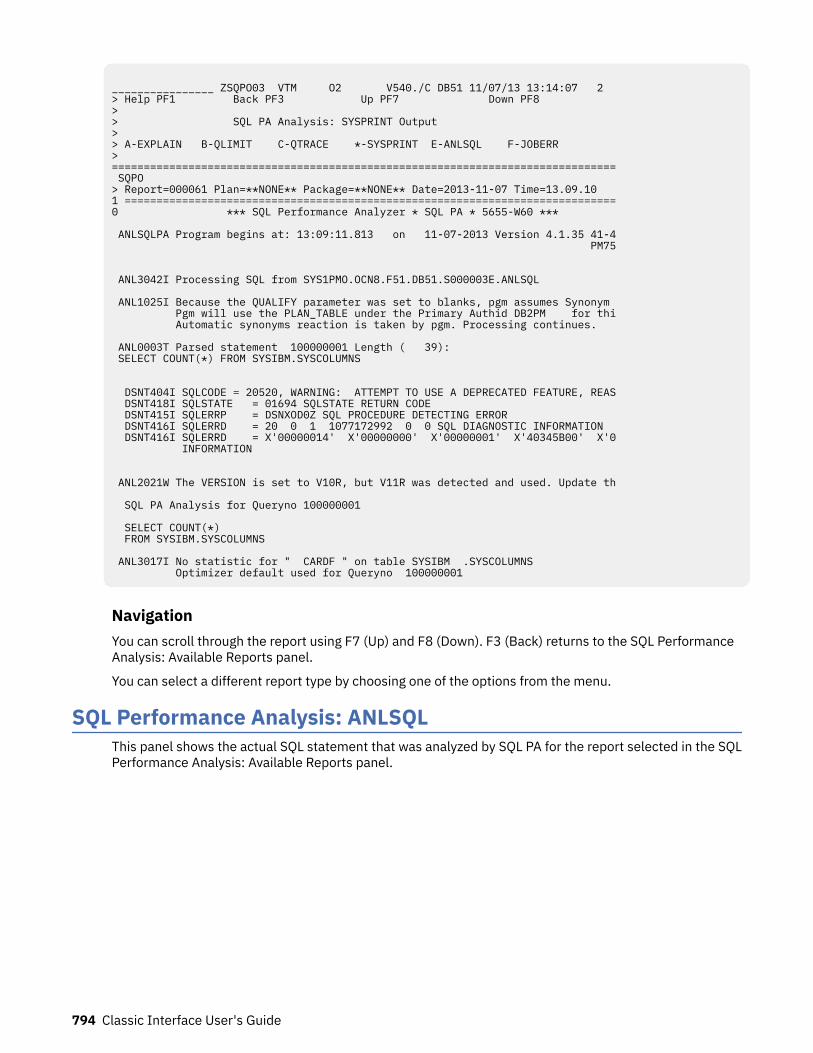
________________ ZSQPO03 VTM O2 V540./C DB51 11/07/13 13:14:07 2 > Help PF1 Back PF3 Up PF7 Down PF8 > > SQL PA Analysis: SYSPRINT Output > > A-EXPLAIN B-QLIMIT C-QTRACE *-SYSPRINT E-ANLSQL F-JOBERR > =============================================================================== SQPO > Report=000061 Plan=**NONE** Package=**NONE** Date=2013-11-07 Time=13.09.10 1 ============================================================================= 0 *** SQL Performance Analyzer * SQL PA * 5655-W60 *** ANLSQLPA Program begins at: 13:09:11.813 on 11-07-2013 Version 4.1.35 41-4 PM75 ANL3042I Processing SQL from SYS1PMO.OCN8.F51.DB51.S000003E.ANLSQL ANL1025I Because the QUALIFY parameter was set to blanks, pgm assumes Synonym Pgm will use the PLAN_TABLE under the Primary Authid DB2PM for thi Automatic synonyms reaction is taken by pgm. Processing continues. ANL0003T Parsed statement 100000001 Length ( 39): SELECT COUNT(*) FROM SYSIBM.SYSCOLUMNS DSNT404I SQLCODE = 20520, WARNING: ATTEMPT TO USE A DEPRECATED FEATURE, REAS DSNT418I SQLSTATE = 01694 SQLSTATE RETURN CODE DSNT415I SQLERRP = DSNXOD0Z SQL PROCEDURE DETECTING ERROR DSNT416I SQLERRD = 20 0 1 1077172992 0 0 SQL DIAGNOSTIC INFORMATION DSNT416I SQLERRD = X'00000014' X'00000000' X'00000001' X'40345B00' X'0 INFORMATION ANL2021W The VERSION is set to V10R, but V11R was detected and used. Update th SQL PA Analysis for Queryno 100000001 SELECT COUNT(*) FROM SYSIBM.SYSCOLUMNS ANL3017I No statistic for " CARDF " on table SYSIBM .SYSCOLUMNS Optimizer default used for Queryno 100000001
NavigationYou can scroll through the report using F7 (Up) and F8 (Down). F3 (Back) returns to the SQL PerformanceAnalysis: Available Reports panel.
You can select a different report type by choosing one of the options from the menu.
SQL Performance Analysis: ANLSQLThis panel shows the actual SQL statement that was analyzed by SQL PA for the report selected in the SQLPerformance Analysis: Available Reports panel.
794 Classic Interface User's Guide
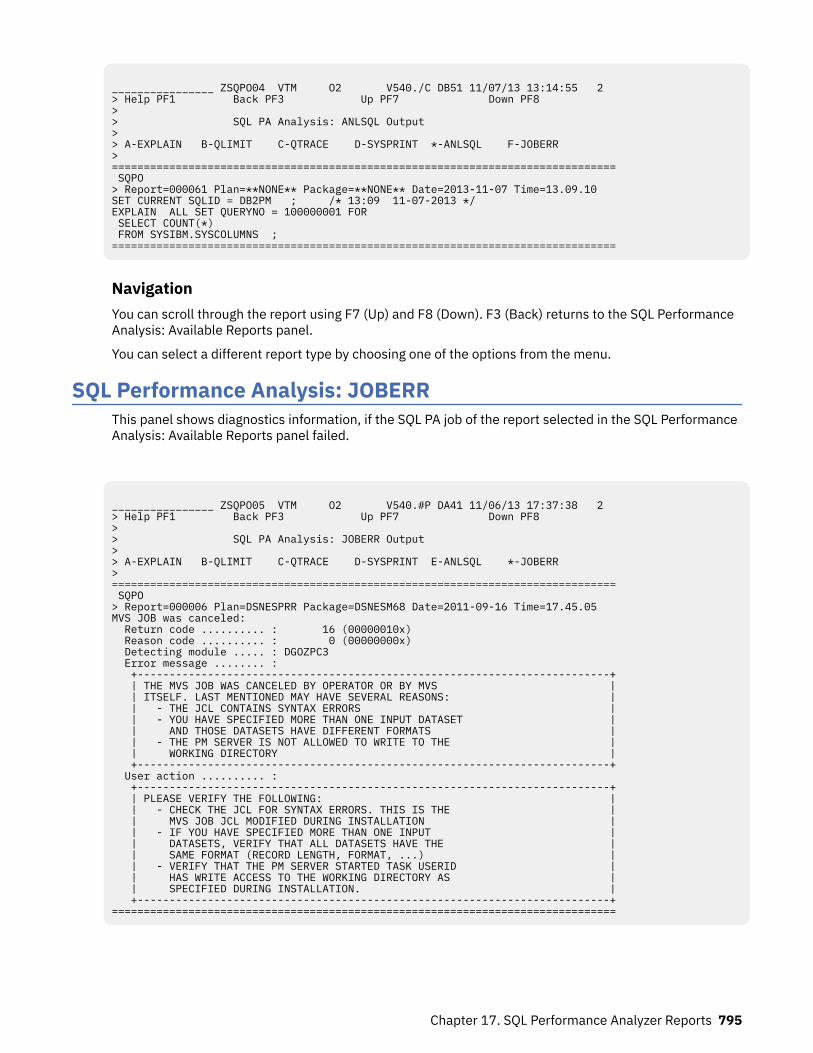
________________ ZSQPO04 VTM O2 V540./C DB51 11/07/13 13:14:55 2 > Help PF1 Back PF3 Up PF7 Down PF8 > > SQL PA Analysis: ANLSQL Output > > A-EXPLAIN B-QLIMIT C-QTRACE D-SYSPRINT *-ANLSQL F-JOBERR > =============================================================================== SQPO > Report=000061 Plan=**NONE** Package=**NONE** Date=2013-11-07 Time=13.09.10 SET CURRENT SQLID = DB2PM ; /* 13:09 11-07-2013 */ EXPLAIN ALL SET QUERYNO = 100000001 FOR SELECT COUNT(*) FROM SYSIBM.SYSCOLUMNS ; ===============================================================================
NavigationYou can scroll through the report using F7 (Up) and F8 (Down). F3 (Back) returns to the SQL PerformanceAnalysis: Available Reports panel.
You can select a different report type by choosing one of the options from the menu.
SQL Performance Analysis: JOBERRThis panel shows diagnostics information, if the SQL PA job of the report selected in the SQL PerformanceAnalysis: Available Reports panel failed.
________________ ZSQPO05 VTM O2 V540.#P DA41 11/06/13 17:37:38 2 > Help PF1 Back PF3 Up PF7 Down PF8 > > SQL PA Analysis: JOBERR Output > > A-EXPLAIN B-QLIMIT C-QTRACE D-SYSPRINT E-ANLSQL *-JOBERR > =============================================================================== SQPO > Report=000006 Plan=DSNESPRR Package=DSNESM68 Date=2011-09-16 Time=17.45.05 MVS JOB was canceled: Return code .......... : 16 (00000010x) Reason code .......... : 0 (00000000x) Detecting module ..... : DGOZPC3 Error message ........ : +--------------------------------------------------------------------------+ | THE MVS JOB WAS CANCELED BY OPERATOR OR BY MVS | | ITSELF. LAST MENTIONED MAY HAVE SEVERAL REASONS: | | - THE JCL CONTAINS SYNTAX ERRORS | | - YOU HAVE SPECIFIED MORE THAN ONE INPUT DATASET | | AND THOSE DATASETS HAVE DIFFERENT FORMATS | | - THE PM SERVER IS NOT ALLOWED TO WRITE TO THE | | WORKING DIRECTORY | +--------------------------------------------------------------------------+ User action .......... : +--------------------------------------------------------------------------+ | PLEASE VERIFY THE FOLLOWING: | | - CHECK THE JCL FOR SYNTAX ERRORS. THIS IS THE | | MVS JOB JCL MODIFIED DURING INSTALLATION | | - IF YOU HAVE SPECIFIED MORE THAN ONE INPUT | | DATASETS, VERIFY THAT ALL DATASETS HAVE THE | | SAME FORMAT (RECORD LENGTH, FORMAT, ...) | | - VERIFY THAT THE PM SERVER STARTED TASK USERID | | HAS WRITE ACCESS TO THE WORKING DIRECTORY AS | | SPECIFIED DURING INSTALLATION. | +--------------------------------------------------------------------------+ ===============================================================================
Chapter 17. SQL Performance Analyzer Reports 795
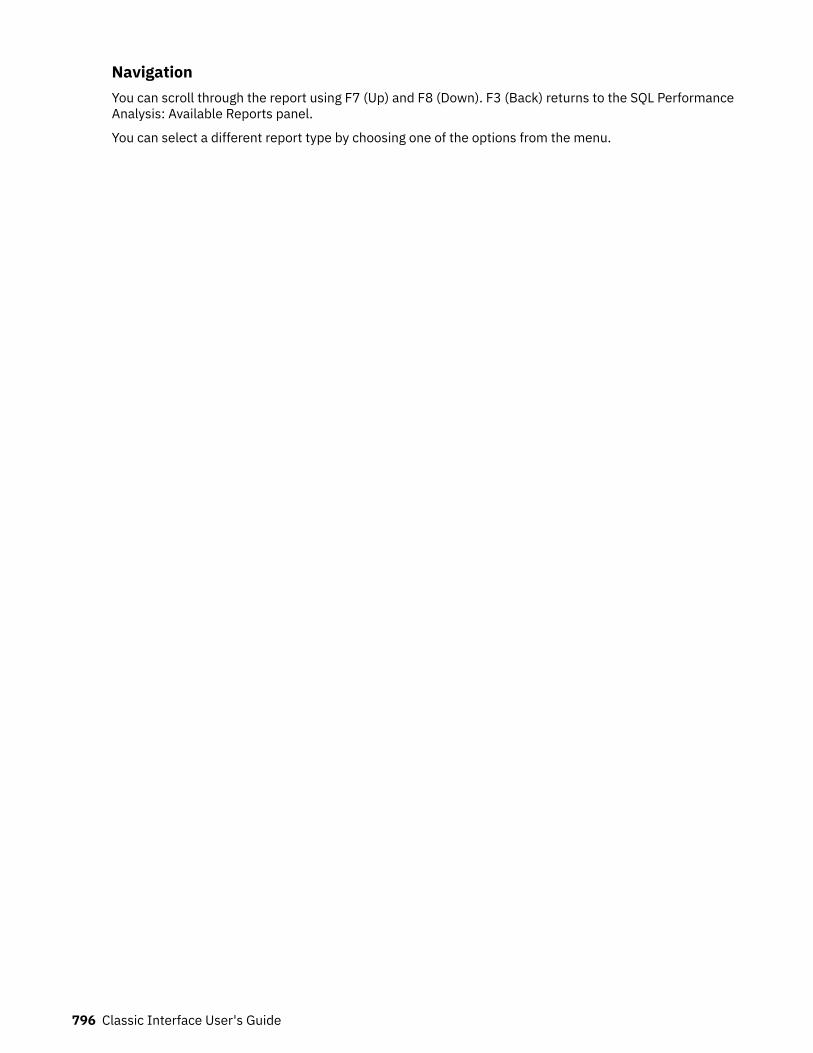
NavigationYou can scroll through the report using F7 (Up) and F8 (Down). F3 (Back) returns to the SQL PerformanceAnalysis: Available Reports panel.
You can select a different report type by choosing one of the options from the menu.
796 Classic Interface User's Guide
Chapter 18. Analyzing DB2 CPU Usage
This topic contains information about considerations for analyzing DB2 CPU usage.
DB2 CPU UsageDB2 uses MVS cross memory services extensively in processing application requests. As a result, themajority of CPU time consumed in processing thread activity is attributed by MVS SRM to the thread-originating (user's) address space, not to one of the DB2 system address spaces (SSAS, DBAS, IRLM).
OMEGAMON XE for DB2 PE provides CPU use information for threads within DB2. In all cases in whichCPU use is reported, the CPU rate is expressed in terms of 1-100%, regardless of the number of CPUsonline in the processor complex.
The discussion below is designed to help you interpret and make use of the information provided byOMEGAMON XE for DB2 PE regarding CPU usage.
DB2 exploits MVS CPU timing services introduced in MVS/XA SP2.2 and MVS/ESA.
OMEGAMON XE for DB2 PE also exploits the new CPU timing services as it monitors a DB2 subsystem. Toaccurately interpret CPU utilization data reported by OMEGAMON XE for DB2 PE, first consider the type ofDB2 attachment that is in use. That is, did the threads in question originate from a CICS attachment orfrom another type of attachment (IMS, TSO, and so on)?
CICS AttachmentsFor threads that originate from the CICS/DB2 attachment, the reported thread CPU usage is entirelyattributable to the CICS/DB2 thread. In other words, it is entirely attributable to the CICS/DB2 attachmentTCB servicing the thread. The CPU rate includes MVS TCB time only; SRB time is not included. Any CPUusage reported for CICS/DB2 threads is a subset of total CICS address space CPU utilization.
For example, assume that the total CICS address space CPU utilization is 50%, and two threads originatefrom the CICS connection. If one thread has a reported CPU rate of 5% and the other's rate is 10%, theconclusion is that 15% of CICS address space CPU utilization is attributable to servicing DB2 requests.Also, 30% (15% / 50% = 30%) of total CICS address space utilization is attributable to servicing DB2requests.
CPU utilization reported for CICS threads is the same, regardless of the version of the DB2 subsystembeing monitored.
Non-CICS AttachmentsAnalysis of CPU use in non-CICS environments (IMS, TSO, CAF, batch, and utilities) must take severalfactors into account:
• thread status• specific attachment environment
OMEGAMON XE for DB2 PE reports CPU use for the actual MVS TCB (subtask) that owns the active DB2thread. SRB time is not included.
Thread StatusUnlike the CICS attachment, non-CICS environments typically contain a single DB2 thread. Recognizingthe status of that thread will help you determine whether the reported CPU use can be attributed to DB2request activity.
© Copyright IBM Corp. 2005, 2021 797
For example, if thread status is In-SQL-Call, the CPU rate reported is indeed related to DB2 thread activity.However, if the thread status is Not-In-DB2, you can conclude that the CPU rate reported is attributable toapplication activity that is unrelated to DB2, although the application indeed still owns a DB2 thread (forexample, an IMS transaction doing DL/I requests).
Attachment EnvironmentThe non-CICS attachment environments vary in the MVS task structure they use to service DB2 threads.Thus, your analysis must take into account the attachment type in use.
For example, an IMS attachment does not result in the creation of an MVS subtask to service a thread. Ina TSO environment, however, an additional MVS TCB is created to service each thread.
The following examples explain the ways in which thread status, DB2 version, and attachmentenvironment jointly affect your interpretation of the OMEGAMON XE for DB2 PE CPU use data.
Example 1In a TSO attachment environment using SPUFI, program DSN is attached as an MVS daughter subtask inthe TSO address space. The DSN subtask then attaches program DSNECP10, which is a daughter subtaskof the DSN subtask. The DSNECP10 subtask is the actual MVS TCB that owns the DB2 thread. As a result,it is the CPU use of this MVS task that is being reported by OMEGAMON XE for DB2 PE.
If thread status indicates Not-In-DB2, OMEGAMON XE for DB2 PE will report that CPU use (MVS TCB CPUuse) is 0.
Example 2In an IMS environment, the IMS attachment does not attach a new MVS subtask to service the DB2thread. As a result, the CPU use reported for IMS threads can reflect CPU time that is attributable to non-DB2 work. This means that you must take into account the status of the DB2 thread, as discussed above.
Example 3Assume an application that creates multiple DB2 threads (executing concurrently), using the DB2 callattach facility (CAF).
The reported CPU use of a thread is always attributable to the MVS task that owns that thread. And youmust consider the thread's status to determine whether the reported CPU use is attributable to DB2 or tonon-DB2 application activity.
798 Classic Interface User's Guide
Chapter 19. Trace requirements for OMEGAMON XEfor DB2 PE
This topic contains information about the trace requirements for OMEGAMON XE for DB2 PE.
Trace activationTo fully exploit OMEGAMON XE for DB2 PE's realtime performance monitoring abilities, Accounting traceclass 1 and class 2 must be active while OMEGAMON XE for DB2 PE is monitoring your DB2 system. Ifthese traces are not active, specific data elements (listed in Table 35 on page 800) will not be availableto OMEGAMON XE for DB2 PE. Also, some data related to reusable threads becomes cumulative, insteadof reflecting a single transaction (see Table 36 on page 803).
To use the near-term history reporting facilities, you must activate some traces as well. Unlike therealtime portion of OMEGAMON XE for DB2 PE, near-term history reporting depends entirely on datasupplied by traces. To determine exactly which traces you must activate to report on specific dataelements, see the online data dictionary.
Realtime data fields for which data is unavailableThe following table lists the data fields that are available to OMEGAMON XE for DB2 PE's realtimecomponent only when certain Accounting traces are active. (When the required Accounting class is notactive, OMEGAMON XE for DB2 PE displays N/A in the affected fields.) Each row in the table contains thename of an OMEGAMON XE for DB2 PE panel, the affected fields on that panel, and the Accounting traceclass that makes data available to each field.
© Copyright IBM Corp. 2005, 2021 799
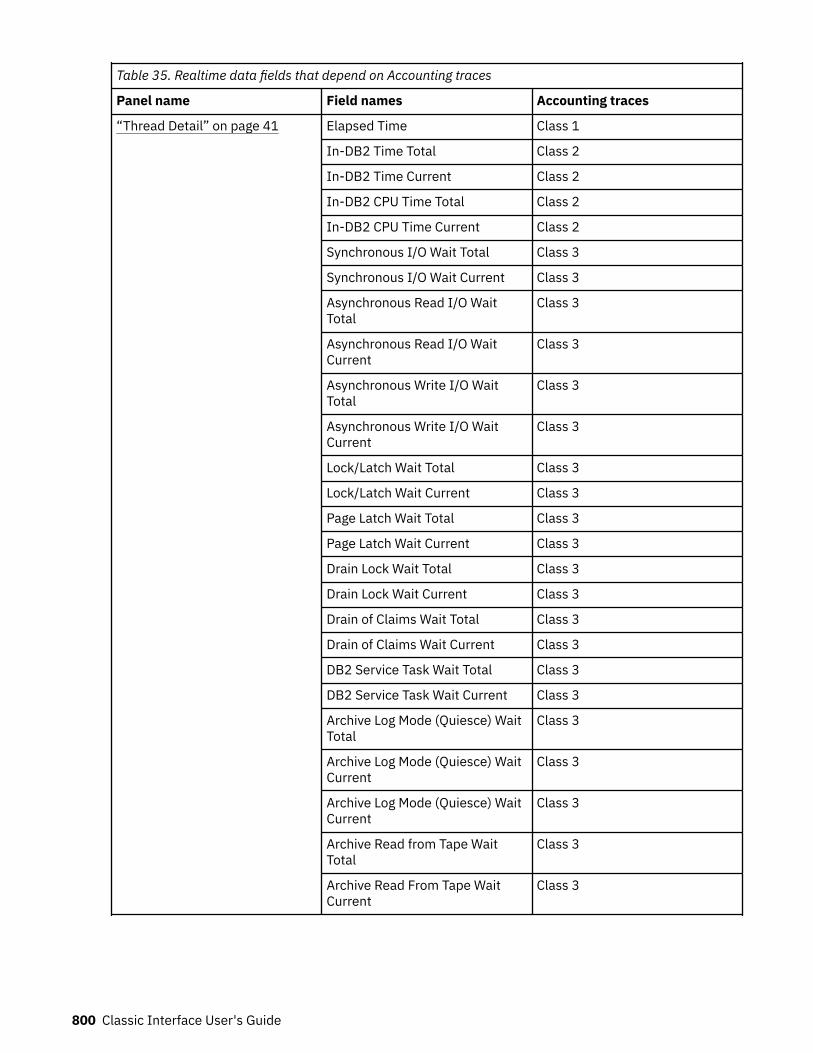
Table 35. Realtime data fields that depend on Accounting traces
Panel name Field names Accounting traces
“Thread Detail” on page 41 Elapsed Time Class 1
In-DB2 Time Total Class 2
In-DB2 Time Current Class 2
In-DB2 CPU Time Total Class 2
In-DB2 CPU Time Current Class 2
Synchronous I/O Wait Total Class 3
Synchronous I/O Wait Current Class 3
Asynchronous Read I/O WaitTotal
Class 3
Asynchronous Read I/O WaitCurrent
Class 3
Asynchronous Write I/O WaitTotal
Class 3
Asynchronous Write I/O WaitCurrent
Class 3
Lock/Latch Wait Total Class 3
Lock/Latch Wait Current Class 3
Page Latch Wait Total Class 3
Page Latch Wait Current Class 3
Drain Lock Wait Total Class 3
Drain Lock Wait Current Class 3
Drain of Claims Wait Total Class 3
Drain of Claims Wait Current Class 3
DB2 Service Task Wait Total Class 3
DB2 Service Task Wait Current Class 3
Archive Log Mode (Quiesce) WaitTotal
Class 3
Archive Log Mode (Quiesce) WaitCurrent
Class 3
Archive Log Mode (Quiesce) WaitCurrent
Class 3
Archive Read from Tape WaitTotal
Class 3
Archive Read From Tape WaitCurrent
Class 3
800 Classic Interface User's Guide
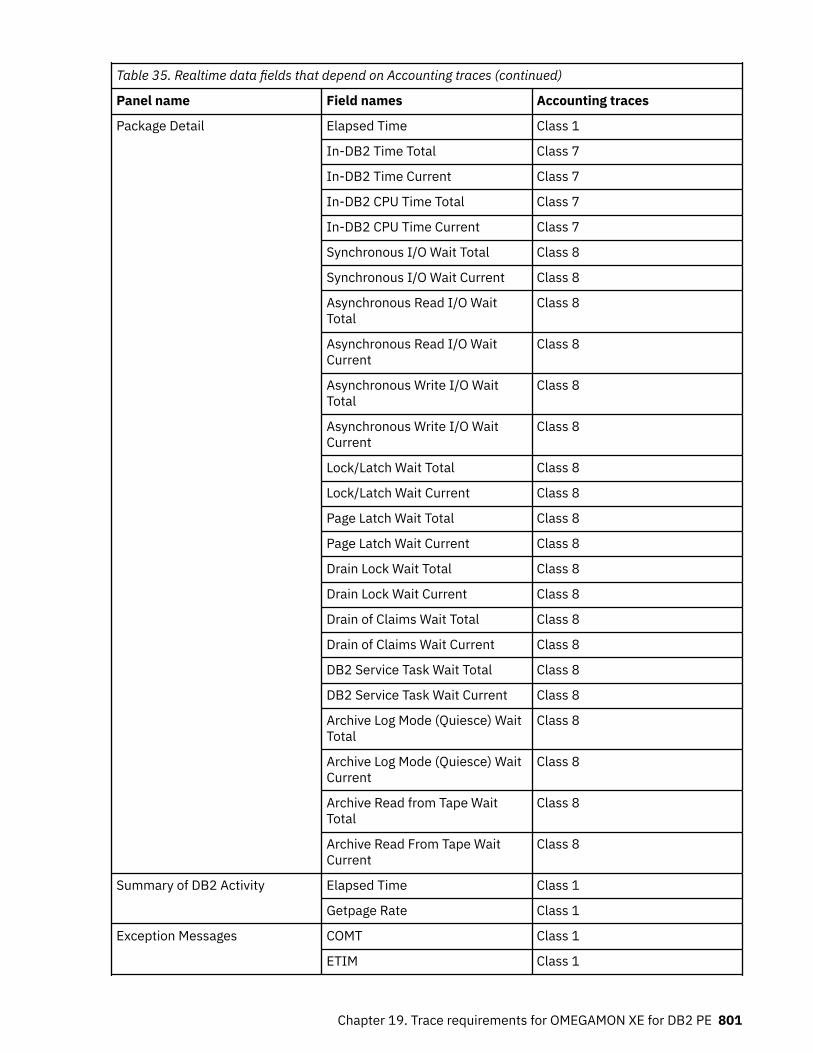
Table 35. Realtime data fields that depend on Accounting traces (continued)
Panel name Field names Accounting traces
Package Detail Elapsed Time Class 1
In-DB2 Time Total Class 7
In-DB2 Time Current Class 7
In-DB2 CPU Time Total Class 7
In-DB2 CPU Time Current Class 7
Synchronous I/O Wait Total Class 8
Synchronous I/O Wait Current Class 8
Asynchronous Read I/O WaitTotal
Class 8
Asynchronous Read I/O WaitCurrent
Class 8
Asynchronous Write I/O WaitTotal
Class 8
Asynchronous Write I/O WaitCurrent
Class 8
Lock/Latch Wait Total Class 8
Lock/Latch Wait Current Class 8
Page Latch Wait Total Class 8
Page Latch Wait Current Class 8
Drain Lock Wait Total Class 8
Drain Lock Wait Current Class 8
Drain of Claims Wait Total Class 8
Drain of Claims Wait Current Class 8
DB2 Service Task Wait Total Class 8
DB2 Service Task Wait Current Class 8
Archive Log Mode (Quiesce) WaitTotal
Class 8
Archive Log Mode (Quiesce) WaitCurrent
Class 8
Archive Read from Tape WaitTotal
Class 8
Archive Read From Tape WaitCurrent
Class 8
Summary of DB2 Activity Elapsed Time Class 1
Getpage Rate Class 1
Exception Messages COMT Class 1
ETIM Class 1
Chapter 19. Trace requirements for OMEGAMON XE for DB2 PE 801
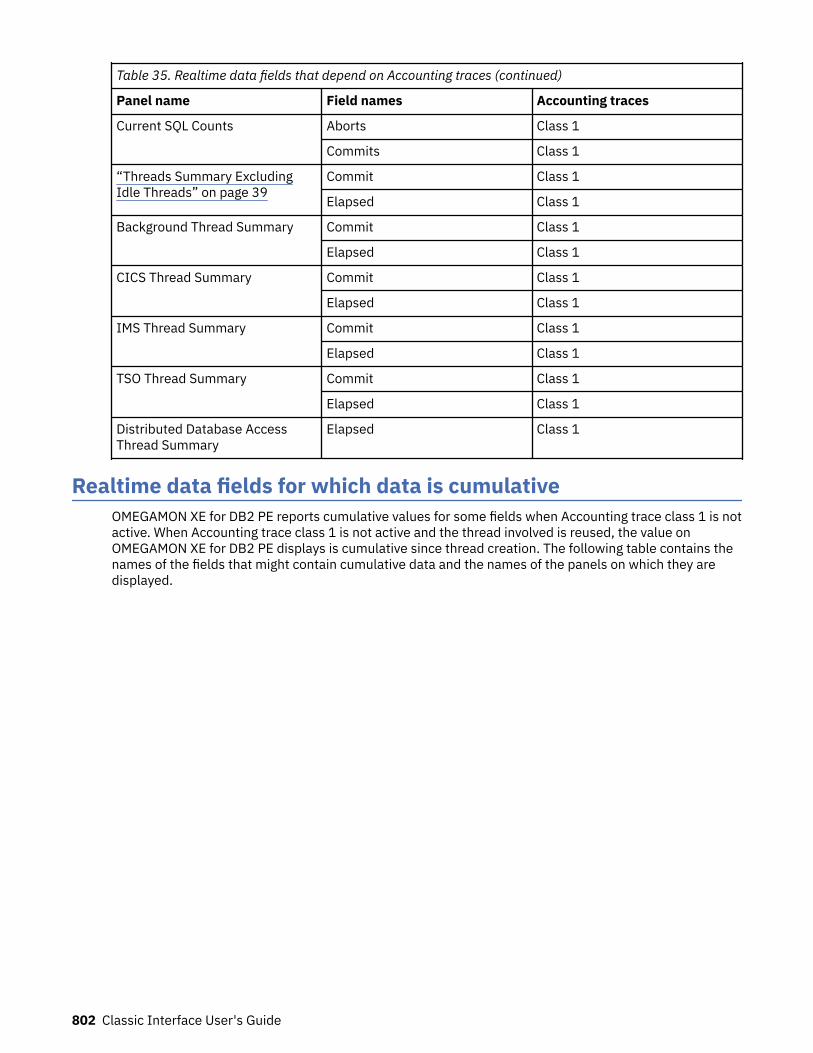
Table 35. Realtime data fields that depend on Accounting traces (continued)
Panel name Field names Accounting traces
Current SQL Counts Aborts Class 1
Commits Class 1
“Threads Summary ExcludingIdle Threads” on page 39
Commit Class 1
Elapsed Class 1
Background Thread Summary Commit Class 1
Elapsed Class 1
CICS Thread Summary Commit Class 1
Elapsed Class 1
IMS Thread Summary Commit Class 1
Elapsed Class 1
TSO Thread Summary Commit Class 1
Elapsed Class 1
Distributed Database AccessThread Summary
Elapsed Class 1
Realtime data fields for which data is cumulativeOMEGAMON XE for DB2 PE reports cumulative values for some fields when Accounting trace class 1 is notactive. When Accounting trace class 1 is not active and the thread involved is reused, the value onOMEGAMON XE for DB2 PE displays is cumulative since thread creation. The following table contains thenames of the fields that might contain cumulative data and the names of the panels on which they aredisplayed.
802 Classic Interface User's Guide
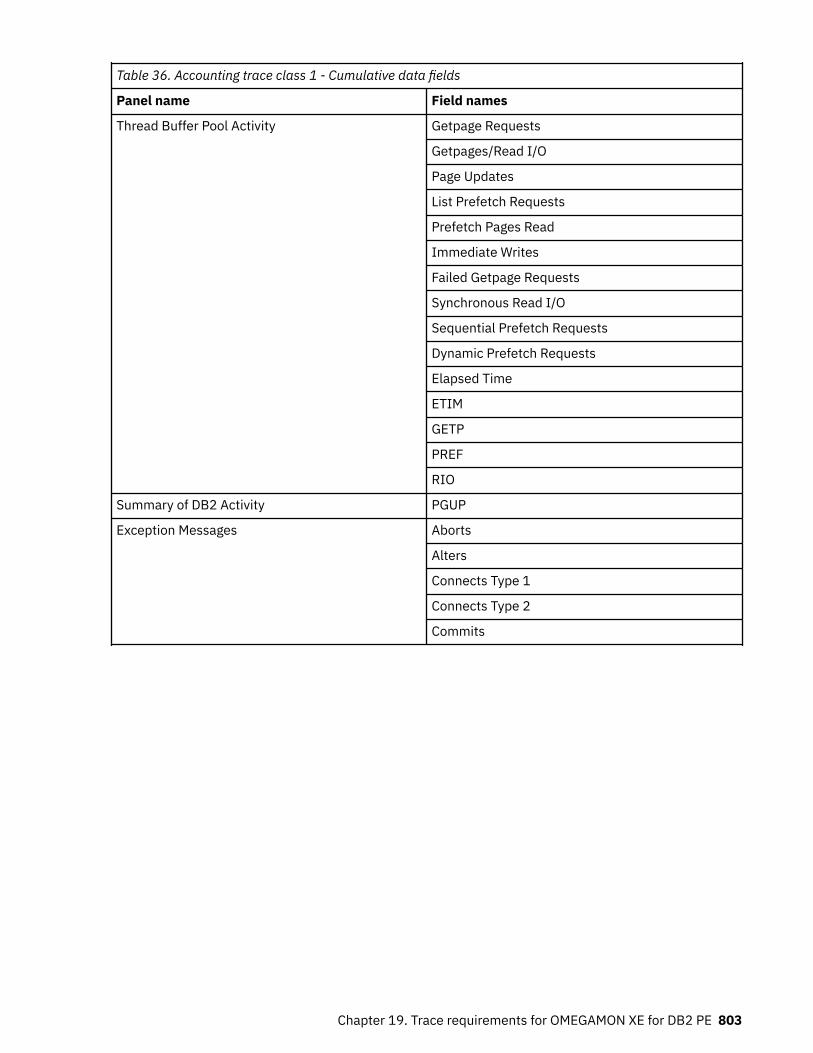
Table 36. Accounting trace class 1 - Cumulative data fields
Panel name Field names
Thread Buffer Pool Activity Getpage Requests
Getpages/Read I/O
Page Updates
List Prefetch Requests
Prefetch Pages Read
Immediate Writes
Failed Getpage Requests
Synchronous Read I/O
Sequential Prefetch Requests
Dynamic Prefetch Requests
Elapsed Time
ETIM
GETP
PREF
RIO
Summary of DB2 Activity PGUP
Exception Messages Aborts
Alters
Connects Type 1
Connects Type 2
Commits
Chapter 19. Trace requirements for OMEGAMON XE for DB2 PE 803
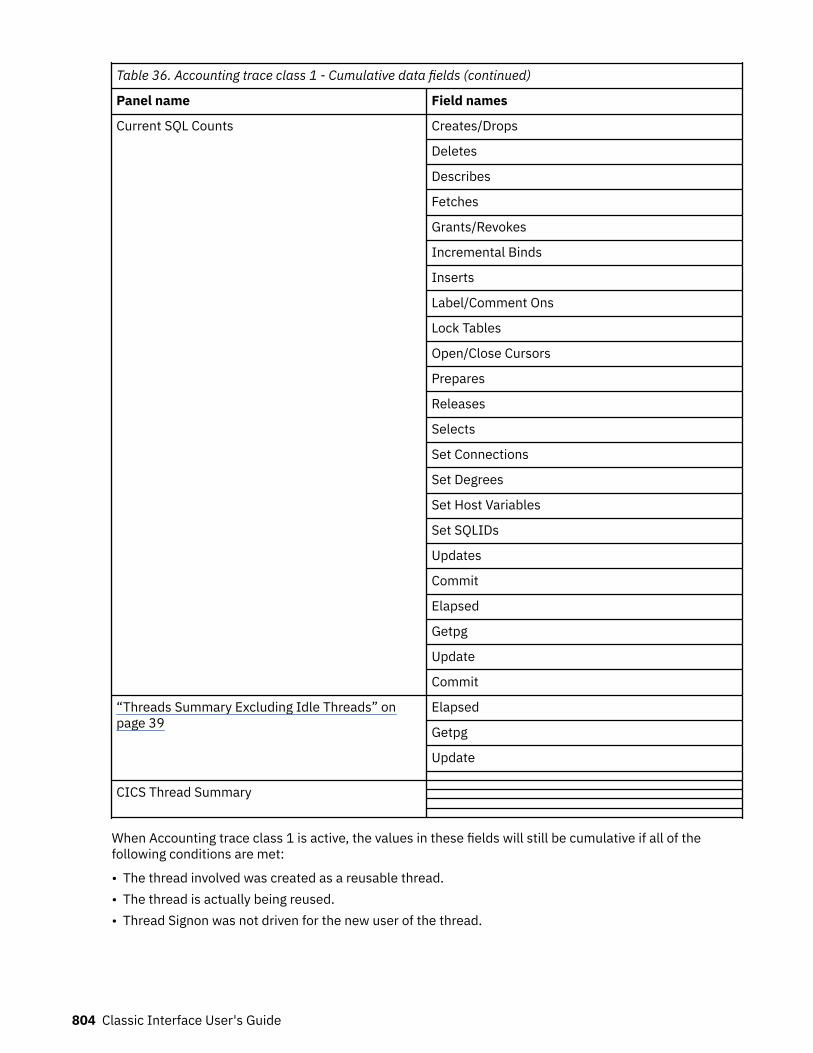
Table 36. Accounting trace class 1 - Cumulative data fields (continued)
Panel name Field names
Current SQL Counts Creates/Drops
Deletes
Describes
Fetches
Grants/Revokes
Incremental Binds
Inserts
Label/Comment Ons
Lock Tables
Open/Close Cursors
Prepares
Releases
Selects
Set Connections
Set Degrees
Set Host Variables
Set SQLIDs
Updates
Commit
Elapsed
Getpg
Update
Commit
“Threads Summary Excluding Idle Threads” onpage 39
Elapsed
Getpg
Update
CICS Thread Summary
When Accounting trace class 1 is active, the values in these fields will still be cumulative if all of thefollowing conditions are met:
• The thread involved was created as a reusable thread.• The thread is actually being reused.• Thread Signon was not driven for the new user of the thread.
804 Classic Interface User's Guide
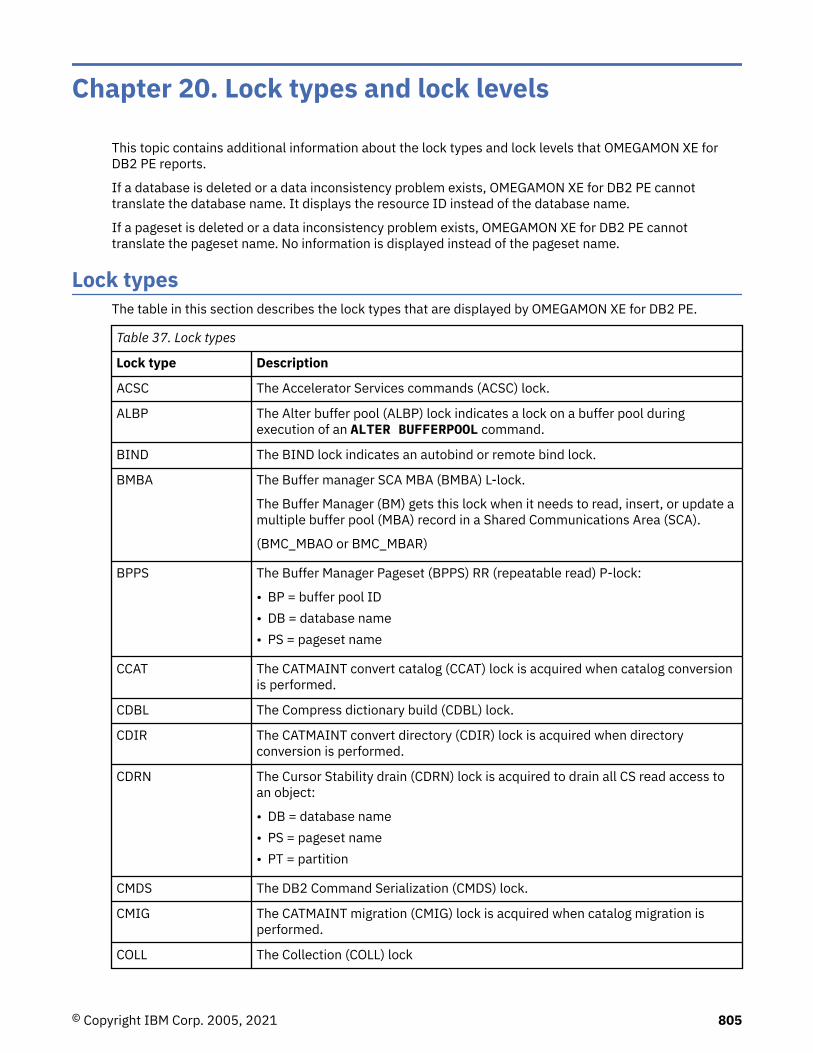
Chapter 20. Lock types and lock levels
This topic contains additional information about the lock types and lock levels that OMEGAMON XE forDB2 PE reports.
If a database is deleted or a data inconsistency problem exists, OMEGAMON XE for DB2 PE cannottranslate the database name. It displays the resource ID instead of the database name.
If a pageset is deleted or a data inconsistency problem exists, OMEGAMON XE for DB2 PE cannottranslate the pageset name. No information is displayed instead of the pageset name.
Lock typesThe table in this section describes the lock types that are displayed by OMEGAMON XE for DB2 PE.
Table 37. Lock types
Lock type Description
ACSC The Accelerator Services commands (ACSC) lock.
ALBP The Alter buffer pool (ALBP) lock indicates a lock on a buffer pool duringexecution of an ALTER BUFFERPOOL command.
BIND The BIND lock indicates an autobind or remote bind lock.
BMBA The Buffer manager SCA MBA (BMBA) L-lock.
The Buffer Manager (BM) gets this lock when it needs to read, insert, or update amultiple buffer pool (MBA) record in a Shared Communications Area (SCA).
(BMC_MBAO or BMC_MBAR)
BPPS The Buffer Manager Pageset (BPPS) RR (repeatable read) P-lock:
• BP = buffer pool ID• DB = database name• PS = pageset name
CCAT The CATMAINT convert catalog (CCAT) lock is acquired when catalog conversionis performed.
CDBL The Compress dictionary build (CDBL) lock.
CDIR The CATMAINT convert directory (CDIR) lock is acquired when directoryconversion is performed.
CDRN The Cursor Stability drain (CDRN) lock is acquired to drain all CS read access toan object:
• DB = database name• PS = pageset name• PT = partition
CMDS The DB2 Command Serialization (CMDS) lock.
CMIG The CATMAINT migration (CMIG) lock is acquired when catalog migration isperformed.
COLL The Collection (COLL) lock
© Copyright IBM Corp. 2005, 2021 805
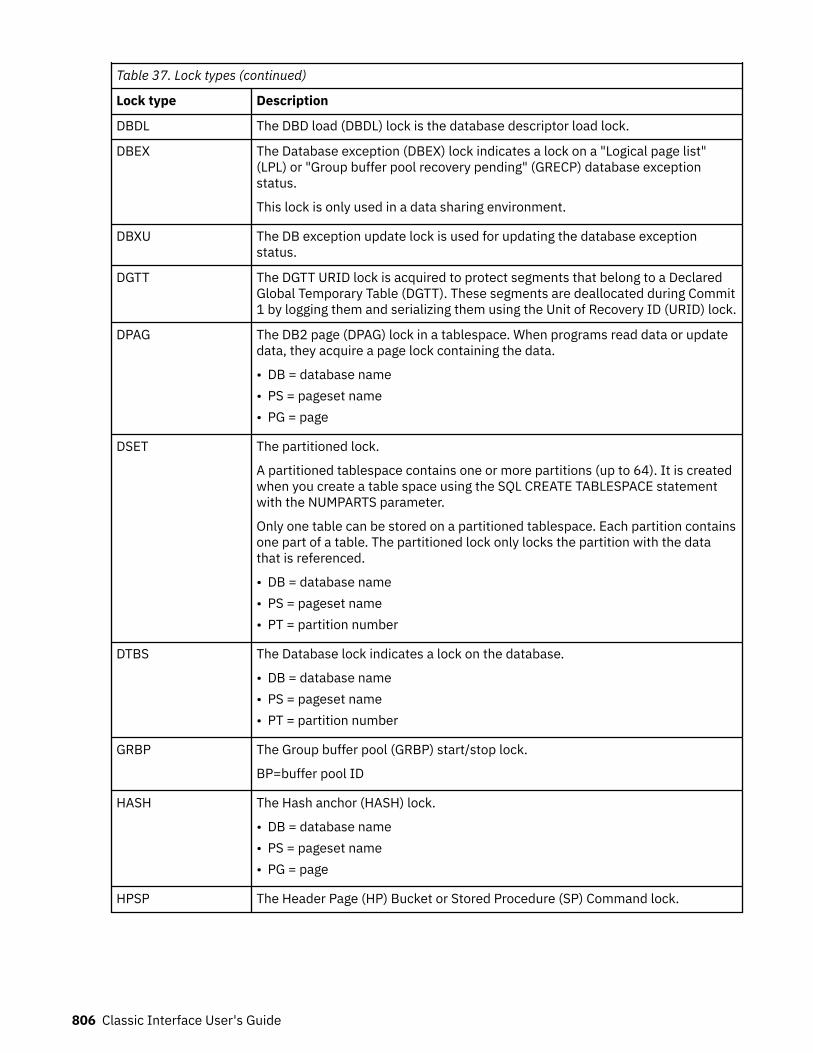
Table 37. Lock types (continued)
Lock type Description
DBDL The DBD load (DBDL) lock is the database descriptor load lock.
DBEX The Database exception (DBEX) lock indicates a lock on a "Logical page list"(LPL) or "Group buffer pool recovery pending" (GRECP) database exceptionstatus.
This lock is only used in a data sharing environment.
DBXU The DB exception update lock is used for updating the database exceptionstatus.
DGTT The DGTT URID lock is acquired to protect segments that belong to a DeclaredGlobal Temporary Table (DGTT). These segments are deallocated during Commit1 by logging them and serializing them using the Unit of Recovery ID (URID) lock.
DPAG The DB2 page (DPAG) lock in a tablespace. When programs read data or updatedata, they acquire a page lock containing the data.
• DB = database name• PS = pageset name• PG = page
DSET The partitioned lock.
A partitioned tablespace contains one or more partitions (up to 64). It is createdwhen you create a table space using the SQL CREATE TABLESPACE statementwith the NUMPARTS parameter.
Only one table can be stored on a partitioned tablespace. Each partition containsone part of a table. The partitioned lock only locks the partition with the datathat is referenced.
• DB = database name• PS = pageset name• PT = partition number
DTBS The Database lock indicates a lock on the database.
• DB = database name• PS = pageset name• PT = partition number
GRBP The Group buffer pool (GRBP) start/stop lock.
BP=buffer pool ID
HASH The Hash anchor (HASH) lock.
• DB = database name• PS = pageset name• PG = page
HPSP The Header Page (HP) Bucket or Stored Procedure (SP) Command lock.
806 Classic Interface User's Guide
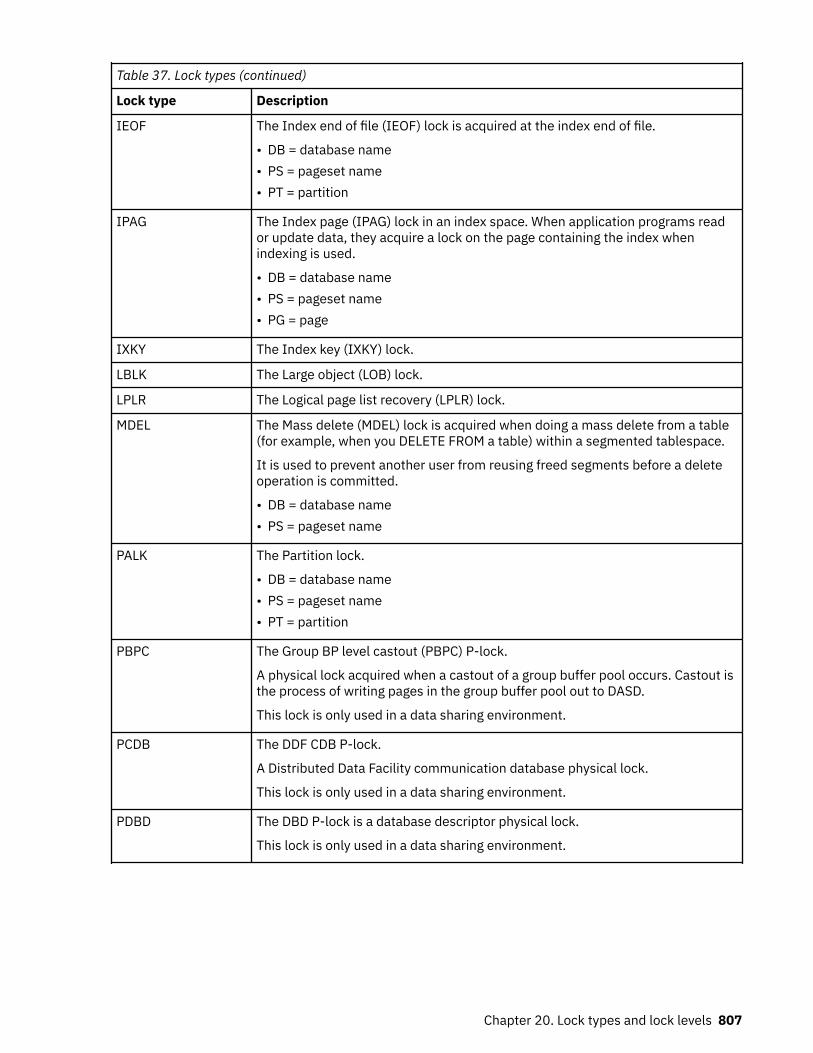
Table 37. Lock types (continued)
Lock type Description
IEOF The Index end of file (IEOF) lock is acquired at the index end of file.
• DB = database name• PS = pageset name• PT = partition
IPAG The Index page (IPAG) lock in an index space. When application programs reador update data, they acquire a lock on the page containing the index whenindexing is used.
• DB = database name• PS = pageset name• PG = page
IXKY The Index key (IXKY) lock.
LBLK The Large object (LOB) lock.
LPLR The Logical page list recovery (LPLR) lock.
MDEL The Mass delete (MDEL) lock is acquired when doing a mass delete from a table(for example, when you DELETE FROM a table) within a segmented tablespace.
It is used to prevent another user from reusing freed segments before a deleteoperation is committed.
• DB = database name• PS = pageset name
PALK The Partition lock.
• DB = database name• PS = pageset name• PT = partition
PBPC The Group BP level castout (PBPC) P-lock.
A physical lock acquired when a castout of a group buffer pool occurs. Castout isthe process of writing pages in the group buffer pool out to DASD.
This lock is only used in a data sharing environment.
PCDB The DDF CDB P-lock.
A Distributed Data Facility communication database physical lock.
This lock is only used in a data sharing environment.
PDBD The DBD P-lock is a database descriptor physical lock.
This lock is only used in a data sharing environment.
Chapter 20. Lock types and lock levels 807
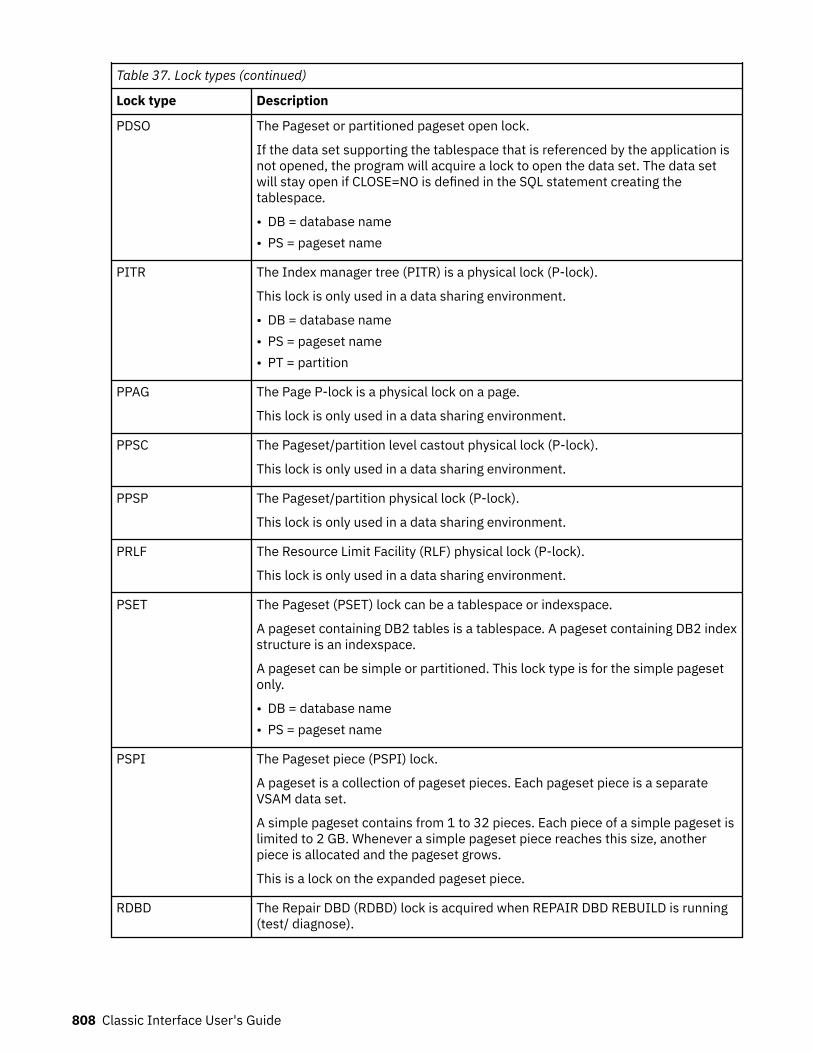
Table 37. Lock types (continued)
Lock type Description
PDSO The Pageset or partitioned pageset open lock.
If the data set supporting the tablespace that is referenced by the application isnot opened, the program will acquire a lock to open the data set. The data setwill stay open if CLOSE=NO is defined in the SQL statement creating thetablespace.
• DB = database name• PS = pageset name
PITR The Index manager tree (PITR) is a physical lock (P-lock).
This lock is only used in a data sharing environment.
• DB = database name• PS = pageset name• PT = partition
PPAG The Page P-lock is a physical lock on a page.
This lock is only used in a data sharing environment.
PPSC The Pageset/partition level castout physical lock (P-lock).
This lock is only used in a data sharing environment.
PPSP The Pageset/partition physical lock (P-lock).
This lock is only used in a data sharing environment.
PRLF The Resource Limit Facility (RLF) physical lock (P-lock).
This lock is only used in a data sharing environment.
PSET The Pageset (PSET) lock can be a tablespace or indexspace.
A pageset containing DB2 tables is a tablespace. A pageset containing DB2 indexstructure is an indexspace.
A pageset can be simple or partitioned. This lock type is for the simple pagesetonly.
• DB = database name• PS = pageset name
PSPI The Pageset piece (PSPI) lock.
A pageset is a collection of pageset pieces. Each pageset piece is a separateVSAM data set.
A simple pageset contains from 1 to 32 pieces. Each piece of a simple pageset islimited to 2 GB. Whenever a simple pageset piece reaches this size, anotherpiece is allocated and the pageset grows.
This is a lock on the expanded pageset piece.
RDBD The Repair DBD (RDBD) lock is acquired when REPAIR DBD REBUILD is running(test/ diagnose).
808 Classic Interface User's Guide
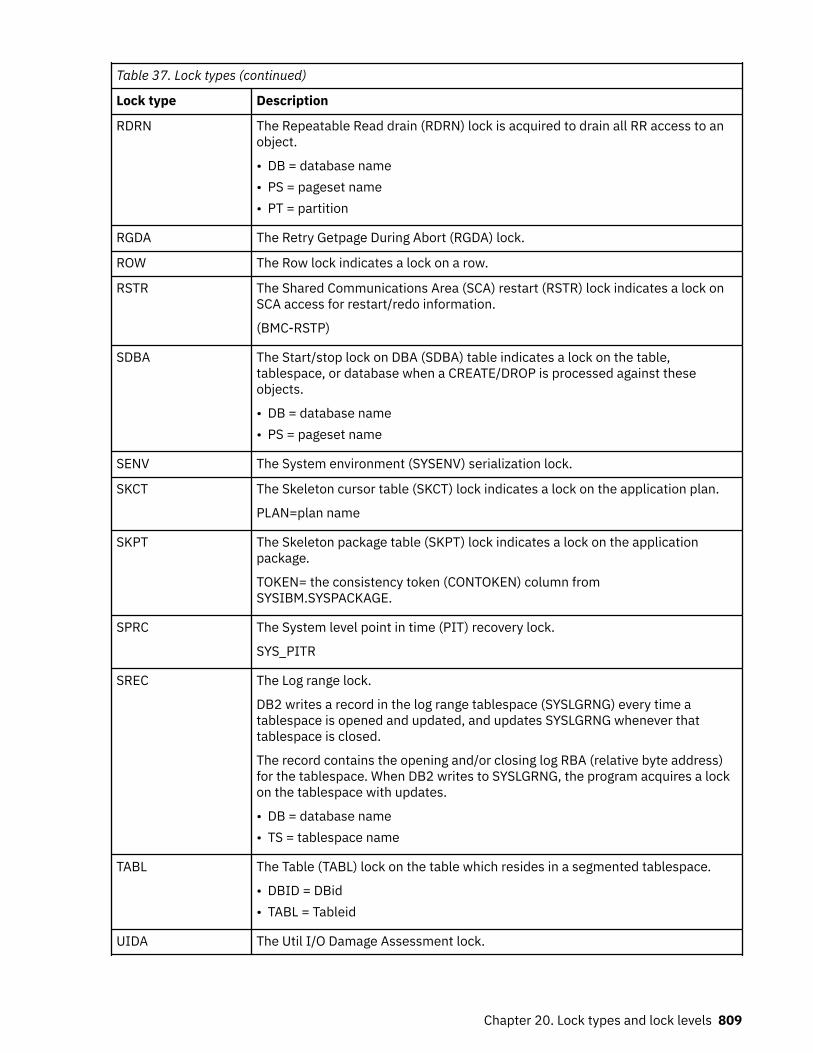
Table 37. Lock types (continued)
Lock type Description
RDRN The Repeatable Read drain (RDRN) lock is acquired to drain all RR access to anobject.
• DB = database name• PS = pageset name• PT = partition
RGDA The Retry Getpage During Abort (RGDA) lock.
ROW The Row lock indicates a lock on a row.
RSTR The Shared Communications Area (SCA) restart (RSTR) lock indicates a lock onSCA access for restart/redo information.
(BMC-RSTP)
SDBA The Start/stop lock on DBA (SDBA) table indicates a lock on the table,tablespace, or database when a CREATE/DROP is processed against theseobjects.
• DB = database name• PS = pageset name
SENV The System environment (SYSENV) serialization lock.
SKCT The Skeleton cursor table (SKCT) lock indicates a lock on the application plan.
PLAN=plan name
SKPT The Skeleton package table (SKPT) lock indicates a lock on the applicationpackage.
TOKEN= the consistency token (CONTOKEN) column fromSYSIBM.SYSPACKAGE.
SPRC The System level point in time (PIT) recovery lock.
SYS_PITR
SREC The Log range lock.
DB2 writes a record in the log range tablespace (SYSLGRNG) every time atablespace is opened and updated, and updates SYSLGRNG whenever thattablespace is closed.
The record contains the opening and/or closing log RBA (relative byte address)for the tablespace. When DB2 writes to SYSLGRNG, the program acquires a lockon the tablespace with updates.
• DB = database name• TS = tablespace name
TABL The Table (TABL) lock on the table which resides in a segmented tablespace.
• DBID = DBid• TABL = Tableid
UIDA The Util I/O Damage Assessment lock.
Chapter 20. Lock types and lock levels 809
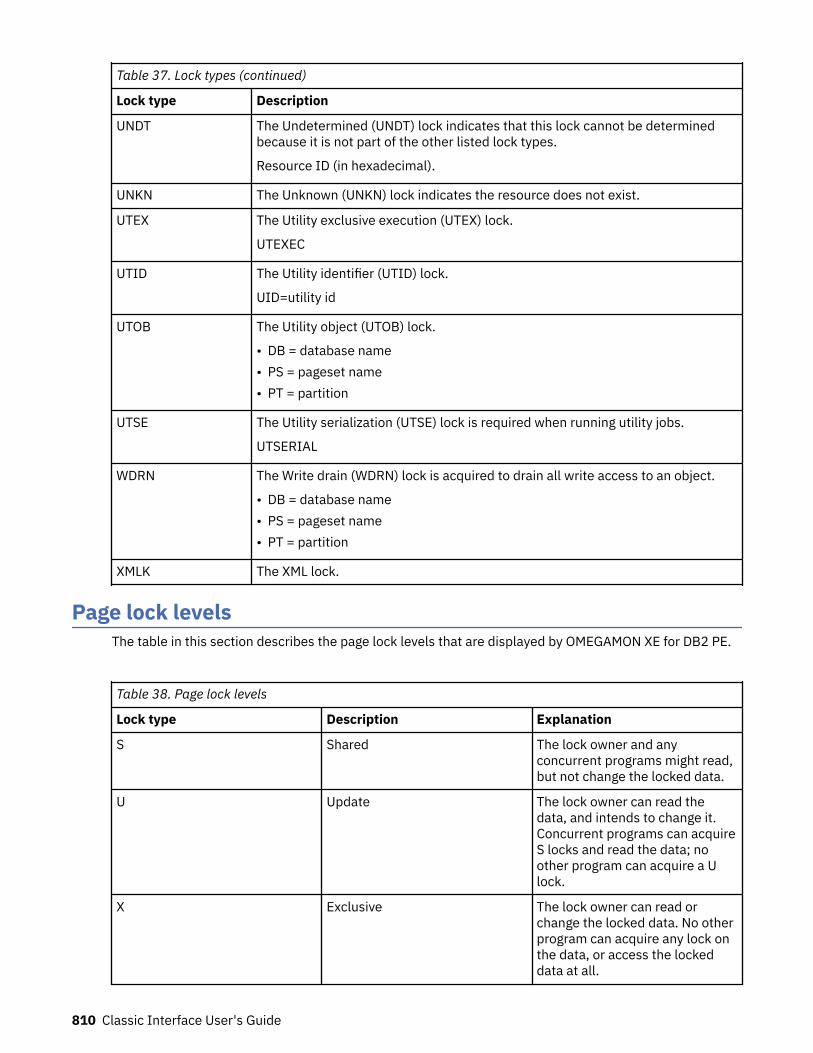
Table 37. Lock types (continued)
Lock type Description
UNDT The Undetermined (UNDT) lock indicates that this lock cannot be determinedbecause it is not part of the other listed lock types.
Resource ID (in hexadecimal).
UNKN The Unknown (UNKN) lock indicates the resource does not exist.
UTEX The Utility exclusive execution (UTEX) lock.
UTEXEC
UTID The Utility identifier (UTID) lock.
UID=utility id
UTOB The Utility object (UTOB) lock.
• DB = database name• PS = pageset name• PT = partition
UTSE The Utility serialization (UTSE) lock is required when running utility jobs.
UTSERIAL
WDRN The Write drain (WDRN) lock is acquired to drain all write access to an object.
• DB = database name• PS = pageset name• PT = partition
XMLK The XML lock.
Page lock levelsThe table in this section describes the page lock levels that are displayed by OMEGAMON XE for DB2 PE.
Table 38. Page lock levels
Lock type Description Explanation
S Shared The lock owner and anyconcurrent programs might read,but not change the locked data.
U Update The lock owner can read thedata, and intends to change it.Concurrent programs can acquireS locks and read the data; noother program can acquire a Ulock.
X Exclusive The lock owner can read orchange the locked data. No otherprogram can acquire any lock onthe data, or access the lockeddata at all.
810 Classic Interface User's Guide
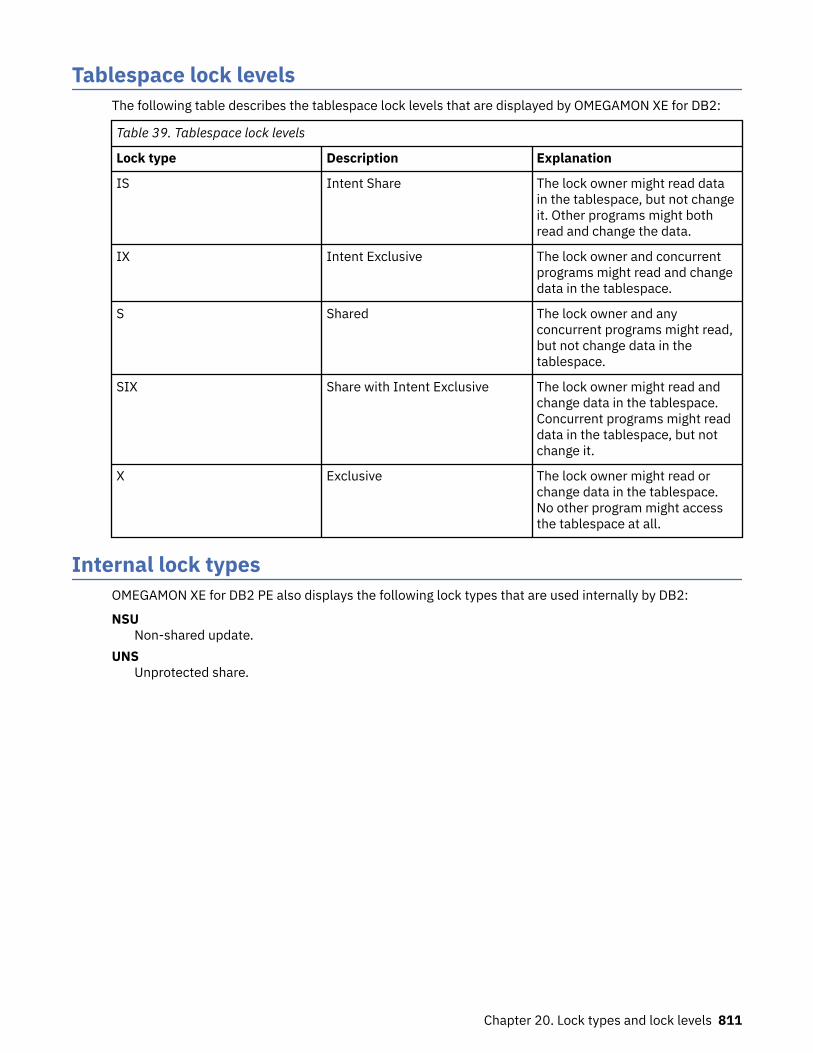
Tablespace lock levelsThe following table describes the tablespace lock levels that are displayed by OMEGAMON XE for DB2:
Table 39. Tablespace lock levels
Lock type Description Explanation
IS Intent Share The lock owner might read datain the tablespace, but not changeit. Other programs might bothread and change the data.
IX Intent Exclusive The lock owner and concurrentprograms might read and changedata in the tablespace.
S Shared The lock owner and anyconcurrent programs might read,but not change data in thetablespace.
SIX Share with Intent Exclusive The lock owner might read andchange data in the tablespace.Concurrent programs might readdata in the tablespace, but notchange it.
X Exclusive The lock owner might read orchange data in the tablespace.No other program might accessthe tablespace at all.
Internal lock typesOMEGAMON XE for DB2 PE also displays the following lock types that are used internally by DB2:
NSUNon-shared update.
UNSUnprotected share.
Chapter 20. Lock types and lock levels 811

812 Classic Interface User's Guide
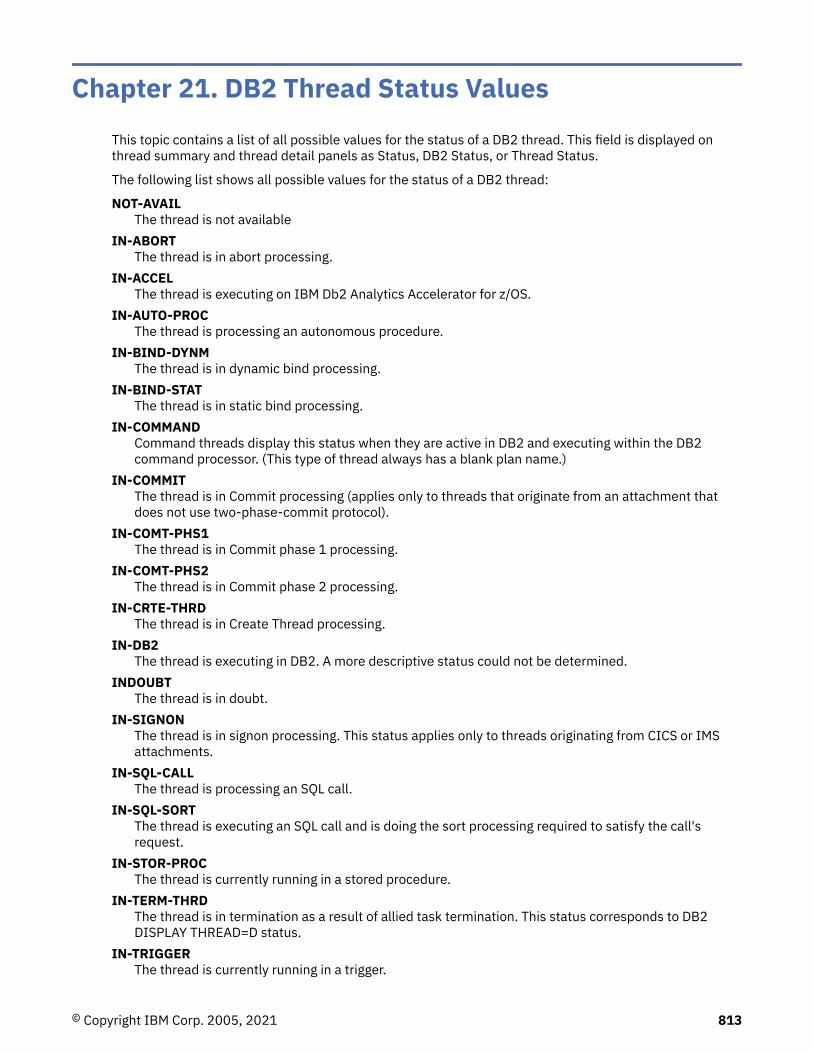
Chapter 21. DB2 Thread Status ValuesThis topic contains a list of all possible values for the status of a DB2 thread. This field is displayed onthread summary and thread detail panels as Status, DB2 Status, or Thread Status.
The following list shows all possible values for the status of a DB2 thread:
NOT-AVAILThe thread is not available
IN-ABORTThe thread is in abort processing.
IN-ACCELThe thread is executing on IBM Db2 Analytics Accelerator for z/OS.
IN-AUTO-PROCThe thread is processing an autonomous procedure.
IN-BIND-DYNMThe thread is in dynamic bind processing.
IN-BIND-STATThe thread is in static bind processing.
IN-COMMANDCommand threads display this status when they are active in DB2 and executing within the DB2command processor. (This type of thread always has a blank plan name.)
IN-COMMITThe thread is in Commit processing (applies only to threads that originate from an attachment thatdoes not use two-phase-commit protocol).
IN-COMT-PHS1The thread is in Commit phase 1 processing.
IN-COMT-PHS2The thread is in Commit phase 2 processing.
IN-CRTE-THRDThe thread is in Create Thread processing.
IN-DB2The thread is executing in DB2. A more descriptive status could not be determined.
INDOUBTThe thread is in doubt.
IN-SIGNONThe thread is in signon processing. This status applies only to threads originating from CICS or IMSattachments.
IN-SQL-CALLThe thread is processing an SQL call.
IN-SQL-SORTThe thread is executing an SQL call and is doing the sort processing required to satisfy the call'srequest.
IN-STOR-PROCThe thread is currently running in a stored procedure.
IN-TERM-THRDThe thread is in termination as a result of allied task termination. This status corresponds to DB2DISPLAY THREAD=D status.
IN-TRIGGERThe thread is currently running in a trigger.
© Copyright IBM Corp. 2005, 2021 813
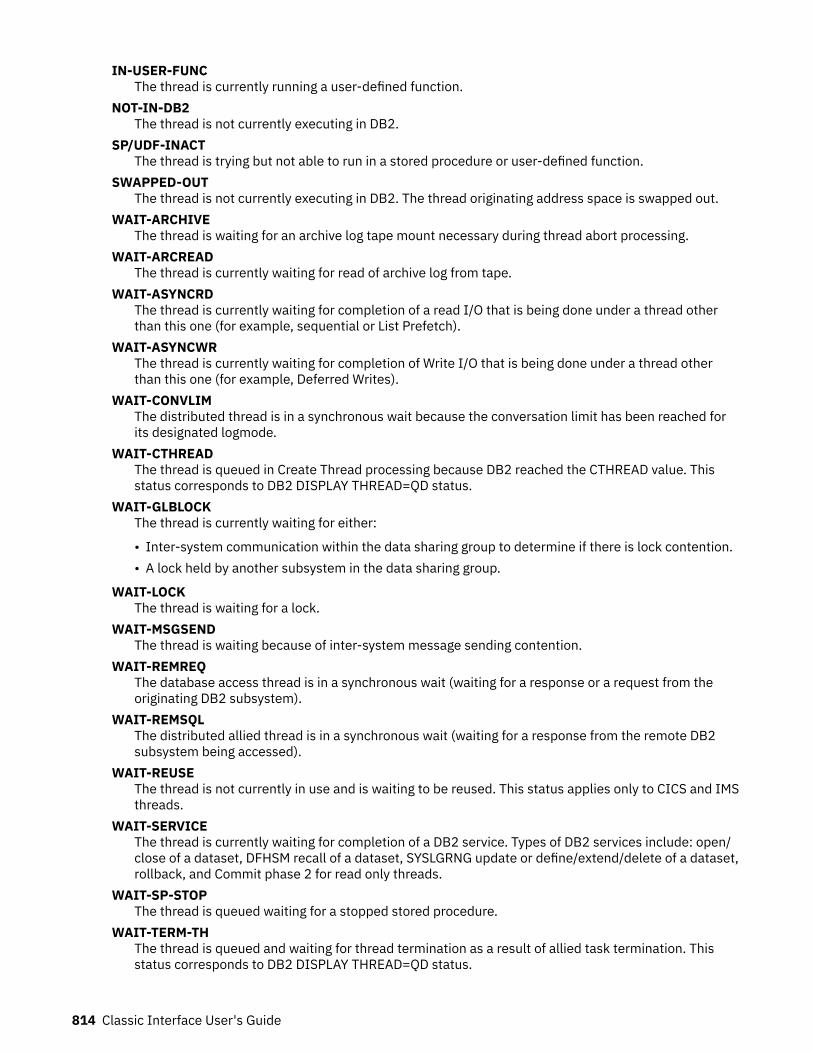
IN-USER-FUNCThe thread is currently running a user-defined function.
NOT-IN-DB2The thread is not currently executing in DB2.
SP/UDF-INACTThe thread is trying but not able to run in a stored procedure or user-defined function.
SWAPPED-OUTThe thread is not currently executing in DB2. The thread originating address space is swapped out.
WAIT-ARCHIVEThe thread is waiting for an archive log tape mount necessary during thread abort processing.
WAIT-ARCREADThe thread is currently waiting for read of archive log from tape.
WAIT-ASYNCRDThe thread is currently waiting for completion of a read I/O that is being done under a thread otherthan this one (for example, sequential or List Prefetch).
WAIT-ASYNCWRThe thread is currently waiting for completion of Write I/O that is being done under a thread otherthan this one (for example, Deferred Writes).
WAIT-CONVLIMThe distributed thread is in a synchronous wait because the conversation limit has been reached forits designated logmode.
WAIT-CTHREADThe thread is queued in Create Thread processing because DB2 reached the CTHREAD value. Thisstatus corresponds to DB2 DISPLAY THREAD=QD status.
WAIT-GLBLOCKThe thread is currently waiting for either:
• Inter-system communication within the data sharing group to determine if there is lock contention.• A lock held by another subsystem in the data sharing group.
WAIT-LOCKThe thread is waiting for a lock.
WAIT-MSGSENDThe thread is waiting because of inter-system message sending contention.
WAIT-REMREQThe database access thread is in a synchronous wait (waiting for a response or a request from theoriginating DB2 subsystem).
WAIT-REMSQLThe distributed allied thread is in a synchronous wait (waiting for a response from the remote DB2subsystem being accessed).
WAIT-REUSEThe thread is not currently in use and is waiting to be reused. This status applies only to CICS and IMSthreads.
WAIT-SERVICEThe thread is currently waiting for completion of a DB2 service. Types of DB2 services include: open/close of a dataset, DFHSM recall of a dataset, SYSLGRNG update or define/extend/delete of a dataset,rollback, and Commit phase 2 for read only threads.
WAIT-SP-STOPThe thread is queued waiting for a stopped stored procedure.
WAIT-TERM-THThe thread is queued and waiting for thread termination as a result of allied task termination. Thisstatus corresponds to DB2 DISPLAY THREAD=QD status.
814 Classic Interface User's Guide
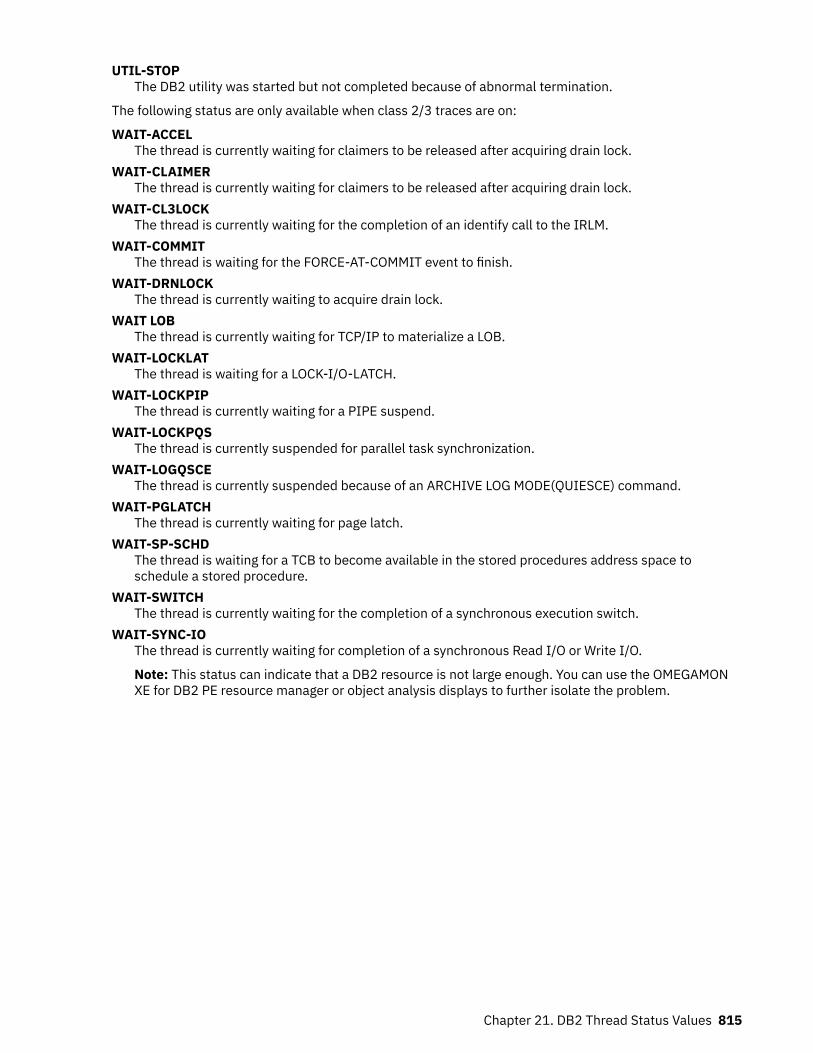
UTIL-STOPThe DB2 utility was started but not completed because of abnormal termination.
The following status are only available when class 2/3 traces are on:
WAIT-ACCELThe thread is currently waiting for claimers to be released after acquiring drain lock.
WAIT-CLAIMERThe thread is currently waiting for claimers to be released after acquiring drain lock.
WAIT-CL3LOCKThe thread is currently waiting for the completion of an identify call to the IRLM.
WAIT-COMMITThe thread is waiting for the FORCE-AT-COMMIT event to finish.
WAIT-DRNLOCKThe thread is currently waiting to acquire drain lock.
WAIT LOBThe thread is currently waiting for TCP/IP to materialize a LOB.
WAIT-LOCKLATThe thread is waiting for a LOCK-I/O-LATCH.
WAIT-LOCKPIPThe thread is currently waiting for a PIPE suspend.
WAIT-LOCKPQSThe thread is currently suspended for parallel task synchronization.
WAIT-LOGQSCEThe thread is currently suspended because of an ARCHIVE LOG MODE(QUIESCE) command.
WAIT-PGLATCHThe thread is currently waiting for page latch.
WAIT-SP-SCHDThe thread is waiting for a TCB to become available in the stored procedures address space toschedule a stored procedure.
WAIT-SWITCHThe thread is currently waiting for the completion of a synchronous execution switch.
WAIT-SYNC-IOThe thread is currently waiting for completion of a synchronous Read I/O or Write I/O.
Note: This status can indicate that a DB2 resource is not large enough. You can use the OMEGAMONXE for DB2 PE resource manager or object analysis displays to further isolate the problem.
Chapter 21. DB2 Thread Status Values 815

816 Classic Interface User's Guide
Product legal notices
This information was developed for products and services offered in the U.S.A.
This material may be available from IBM in other languages. However, you may be required to own a copyof the product or product version in that language in order to access it.
IBM may not offer the products, services, or features discussed in this document in other countries.Consult your local IBM representative for information on the products and services currently available inyour area. Any reference to an IBM product, program, or service is not intended to state or imply that onlythat IBM product, program, or service may be used. Any functionally equivalent product, program, orservice that does not infringe any IBM intellectual property right may be used instead. However, it is theuser's responsibility to evaluate and verify the operation of any non-IBM product, program, or service.
IBM may have patents or pending patent applications covering subject matter described in thisdocument. The furnishing of this document does not give you any license to these patents. You can sendlicense inquiries, in writing, to:
IBM Director of Licensing IBM Corporation North Castle Drive Armonk, NY 10504-1785 U.S.A.
For license inquiries regarding double-byte (DBCS) information, contact the IBM Intellectual PropertyDepartment in your country or send inquiries, in writing, to:
Intellectual Property Licensing Legal and Intellectual Property Law IBM Japan Ltd. 19-21, Nihonbashi-Hakozakicho, Chuo-ku Tokyo 103-8510, Japan
The following paragraph does not apply to the United Kingdom or any other country where suchprovisions are inconsistent with local law: INTERNATIONAL BUSINESS MACHINES CORPORATIONPROVIDES THIS PUBLICATION "AS IS" WITHOUT WARRANTY OF ANY KIND, EITHER EXPRESS ORIMPLIED, INCLUDING, BUT NOT LIMITED TO, THE IMPLIED WARRANTIES OF NON-INFRINGEMENT,MERCHANTABILITY OR FITNESS FOR A PARTICULAR PURPOSE. Some states do not allow disclaimer ofexpress or implied warranties in certain transactions, therefore, this statement may not apply to you.
This information could include technical inaccuracies or typographical errors. Changes are periodicallymade to the information herein; these changes will be incorporated in new editions of the publication.IBM may make improvements and/or changes in the product(s) and/or the program(s) described in thispublication at any time without notice.
Any references in this information to non-IBM Web sites are provided for convenience only and do not inany manner serve as an endorsement of those Web sites. The materials at those Web sites are not part ofthe materials for this IBM product and use of those Web sites is at your own risk.
IBM may use or distribute any of the information you supply in any way it believes appropriate withoutincurring any obligation to you.
Licensees of this program who wish to have information about it for the purpose of enabling: (i) theexchange of information between independently created programs and other programs (including thisone) and (ii) the mutual use of the information which has been exchanged, should contact:
IBM Director of Licensing IBM Corporation North Castle Drive Armonk, NY 10504-1785 U.S.A.
Such information may be available, subject to appropriate terms and conditions, including in some cases,payment of a fee.
The licensed program described in this information and all licensed material available for it are providedby IBM under terms of the IBM Customer Agreement, IBM International Program License Agreement, orany equivalent agreement between us.
Any performance data contained herein was determined in a controlled environment. Therefore, theresults obtained in other operating environments may vary significantly. Some measurements may havebeen made on development-level systems and there is no guarantee that these measurements will be thesame on generally available systems. Furthermore, some measurements may have been estimated
© Copyright IBM Corp. 2005, 2021 817
through extrapolation. Actual results may vary. Users of this document should verify the applicable datafor their specific environment.
Information concerning non-IBM products was obtained from the suppliers of those products, theirpublished announcements or other publicly available sources. IBM has not tested those products andcannot confirm the accuracy of performance, compatibility or any other claims related to non-IBMproducts. Questions on the capabilities of non-IBM products should be addressed to the suppliers ofthose products.
All statements regarding IBM's future direction or intent are subject to change or withdrawal withoutnotice, and represent goals and objectives only.
This information is for planning purposes only. The information herein is subject to change before theproducts described become available.
This information contains examples of data and reports used in daily business operations. To illustratethem as completely as possible, the examples include the names of individuals, companies, brands, andproducts. All of these names are fictitious and any similarity to the names and addresses used by anactual business enterprise is entirely coincidental.
COPYRIGHT LICENSE:
This information contains sample application programs in source language, which illustrate programmingtechniques on various operating platforms. You may copy, modify, and distribute these sample programsin any form without payment to IBM, for the purposes of developing, using, marketing or distributingapplication programs conforming to the application programming interface for the operating platform forwhich the sample programs are written. These examples have not been thoroughly tested under allconditions. IBM, therefore, cannot guarantee or imply reliability, serviceability, or function of theseprograms. The sample programs are provided "AS IS", without warranty of any kind. IBM shall not beliable for any damages arising out of your use of the sample programs.
Each copy or any portion of these sample programs or any derivative work, must include a copyrightnotice as follows:© (your company name) (year). Portions of this code are derived from IBM Corp. Sample Programs. ©Copyright IBM Corp. _enter the year or years_. All rights reserved.
If you are viewing this information softcopy, the photographs and color illustrations may not appear.
Programming interface information
This publication documents intended Programming Interfaces that allow the customer to write programsto obtain the services of OMEGAMON for Db2 Performance Expert.
This publication documents information that is NOT intended to be used as Programming Interfaces ofOMEGAMON for Db2 Performance Expert.
This publication primarily documents intended Programming Interfaces that allow the customer to writeprograms to obtain the services of OMEGAMON for Db2 Performance Expert.
This publication also documents information that is NOT intended to be used as Programming Interfacesof OMEGAMON for Db2 Performance Expert. This information is identified where it occurs by anintroductory statement to a topic or section.
This publication primarily documents information that is NOT intended to be used as ProgrammingInterfaces of OMEGAMON for Db2 Performance Expert.
This publication also documents intended Programming Interfaces that allow the customer to writeprograms to obtain the services of OMEGAMON for Db2 Performance Expert. This information is identifiedwhere it occurs by an introductory statement to a topic or section.
Trademarks
818 Product legal notices
IBM, the IBM logo, and ibm.com® are trademarks or registered trademarks of International BusinessMachines Corp., registered in many jurisdictions worldwide. Other product and service names might betrademarks of IBM or other companies. A current list of IBM trademarks is available on the web at"Copyright and trademark information" at http://www.ibm.com/legal/copytrade.html.
Adobe, the Adobe logo, PostScript, and the PostScript logo are either registered trademarks ortrademarks of Adobe Systems Incorporated in the United States, and/or other countries.
Intel, Intel logo, Intel Inside, Intel Inside logo, Intel Centrino, Intel Centrino logo, Celeron, Xeon, IntelSpeedStep, Itanium, and Pentium are trademarks or registered trademarks of Intel Corporation or itssubsidiaries in the United States and other countries.
Java™ and all Java-based trademarks and logos are trademarks or registered trademarks of Oracle and/orits affiliates.
Linux® is a registered trademark of Linus Torvalds in the United States, other countries, or both.
Microsoft, Windows, Windows NT, and the Windows logo are trademarks of Microsoft Corporation in theUnites States, other countries, or both.
UNIX is a registered trademark of The Open Group in the United States and other countries.
Other company, product, and service names may be trademarks or service marks of others.
Terms and conditions for product documentation
Permissions for the use of these publications are granted subject to the following terms and conditions:
Applicability: These terms and conditions are in addition to any terms of use for the IBM website.
Personal use: You may reproduce these publications for your personal, noncommercial use provided thatall proprietary notices are preserved. You may not distribute, display or make derivative work of thesepublications, or any portion thereof, without the express consent of IBM.
Commercial use: You may reproduce, distribute and display these publications solely within yourenterprise provided that all proprietary notices are preserved. You may not make derivative works ofthese publications, or reproduce, distribute or display these publications or any portion thereof outsideyour enterprise, without the express consent of IBM.
Rights: Except as expressly granted in this permission, no other permissions, licenses or rights aregranted, either express or implied, to the publications or any information, data, software or otherintellectual property contained therein.
IBM reserves the right to withdraw the permissions granted herein whenever, in its discretion, the use ofthe publications is detrimental to its interest or, as determined by IBM, the above instructions are notbeing properly followed.
You may not download, export or re-export this information except in full compliance with all applicablelaws and regulations, including all United States export laws and regulations.
IBM MAKES NO GUARANTEE ABOUT THE CONTENT OF THESE PUBLICATIONS. THE PUBLICATIONS AREPROVIDED "AS-IS" AND WITHOUT WARRANTY OF ANY KIND, EITHER EXPRESSED OR IMPLIED,INCLUDING BUT NOT LIMITED TO IMPLIED WARRANTIES OF MERCHANTABILITY, NON-INFRINGEMENT,AND FITNESS FOR A PARTICULAR PURPOSE.
Privacy policy considerations
IBM Software products, including software as a service solutions, ("Software Offerings") may use cookiesor other technologies to collect product usage information, to help improve the end user experience, totailor interactions with the end user or for other purposes. In many cases no personally identifiableinformation is collected by the Software Offerings. Some of our Software Offerings can help enable you tocollect personally identifiable information. If this Software Offering uses cookies to collect personallyidentifiable information, specific information about this offering’s use of cookies is set forth below.
Product legal notices 819
This Software Offering does not use cookies or other technologies to collect personally identifiableinformation.
If the configurations deployed for this Software Offering provide you as customer the ability to collectpersonally identifiable information from end users via cookies and other technologies, you should seekyour own legal advice about any laws applicable to such data collection, including any requirements fornotice and consent.
For more information about the use of various technologies, including cookies, for these purposes, seeIBM’s Privacy Policy at http://www.ibm.com/privacy and the section titled "Cookies, Web Beacons, andOther Technologies" in IBM’s Online Privacy Statement at http://www.ibm.com/privacy/details. Also, seethe "IBM Software Products and Software-as-a-Service Privacy Statement" at http://www.ibm.com/software/info/product-privacy.
820 Classic Interface User's Guide
Index
Special Characters? (64-bit integers) 7.DCL command 544.DD command 544.DSA command 548.FGO immediate
relational operators 548.I command 550.ILC command 550.log 550.LOG command 550.MOD command 554.PFK command 557.PRM command 558.RTN command 561.SGO command 564, 568.TSF command 568.TSF00 immediate 568.VTM command 569.WAT command 570.ZAP command 576'' (character string delimiter) 571, 574/ATTN command 543/AUP command 544/BOTTOM command 544/D command 544/DCL command 544/DEF command 546/H command 550/HELP command 550/HOLD command 550/LOG command 557/LOGOUT command 551/O command 557/P command 557/PRINT command 557, 558/PWD INFO-line 559/REP command 560/RESHOW command 561/S command 561/SAVE command 560, 561/STOP command 567/TOP command 568/U command 569/UP command 569/ZOOM INFO-line command 576< (as action character) 556, 573==== command 543> (as action character) 556> (character string delimiter) 571, 574> comment character 603
Numerics3270 Tab key 437
AAccelerator Detail Accelerator Perspective
fields 432navigation 431panel 430
Accelerator Detail Subsystem Perspectivefields 427navigation 427panel 425
Accelerator Statistics Detailfields 422navigation 422panel 421
Accelerator Statistics Overview 420accessibility features 2ACT command 43action character 556ACTIVE state of ATF 435Active Trace Detail panel 281Active Trace Summary panel 280address space information 529Address Space Information and OMEGAMON Commandspanel 529Address Space Private Area Summary 538Address Space Summary panel 403address, pre-defined 552address, specifying 552anchor 552Application Trace Event Detail panel 470Application Trace Facility
customizing 438output to VSAM data set 438states 435
Application Trace Facility Menu 435Application Trace Lock Detail panel 467Application Trace Program Detail panel 454Application Trace Program Summary panel (with activitycounts) 453Application Trace SQL Detail panel 461Application Trace SQL Index panel 459Application Trace Thread Summary - View Dataset panel 445Application Trace Unit of Work Activity Summary panel 452archive information 231, 236ARCM exception 24ARCV exception 25automatic logging facilities
TSF command 568automatic panel facility (ASF)
OPTN keyword 581printer and routing options 603terminating 561
Bbackground exception processing 589Background Thread Summary panel 166
Index 821
bb (blank) command 543Bind Statistics Detail panel 618Bind Statistics panel 275Bind Statistics Summary by Report Interval panel 616BMGR command 217BMTH exception 25BP command 219buffer manager 217Buffer Manager Information panel 216buffer pool
page stealing 222, 627PGSTEAL 222, 627
buffer pool activity 219Buffer Pool Detail panel 218Buffer Pool Snapshot Datasets panel 226Buffer Pool Snapshot Open Pagesets panel 225Buffer Pool Statistics Detail panel 623Buffer Pool Statistics Summary by Report Interval panel 621
CCancel Thread panel 130Change Profile panel 601CICA command 153CICS connection information 154CICS exceptions 570CICS RCT Detail panel 159CICS RCT Summary panel 156CICS thread information 155CICS Thread Summary panel 152CICT exception 25Classic Interface 5clear panel 543CN command 544color/highlighting settings 583command threads 813commands
help for 550HOPD command 653issuing DB2 system 133issuing MVS system 20
comment character> 603comments, sending 3common storage 408common storage area (CSA) 554, 556commonly addressable storage 556COMT exception 25consistency of data
DB2 storage management statistics 402cookie policy 817, 819correlation name 12correlation number 12CORRNAME (correlation name) 12CORRNMBR (correlation number) 12CP CPU utilization 46CPSER keyword (.FGO) 548CPU
exceptions 23utilization 17, 797
CPU serial number in .FGO 548Create Application Trace Data Set Name panel 446CSA. See common storage area (CSA) 577CTHD exception 25Current Parallel Task Summary panel 122
Current SQL Counts panel 66Current Status for Exceptions panel 35cursor pointing feature
/ZOOM INFO-line 576cycle delay 561
DData Manager threshold 25Data Sets Used by Threads panel 134data space
display memory 565modifying storage 567scan storage 566
Database Activity panel 496Database Allocations panel 488Dataset Allocations panel 492Dataset Extend Activity panel 518DAY keyword 568DB2 Address Space Allocated DDnames and Datasets panel531DB2 Address Space Job Information and Start Time panel532DB2 Address Space Jobpack Area Modules panel 533DB2 Address Space Region and Program Information panel535DB2 Address Space Storage Allocated by Subpool panel 537DB2 Address Space Virtual Storage Map panel 529DB2 Command Statistics by Report Interval panel 686DB2 Command Statistics Detail panel 687DB2 Command Statistics panel 398DB2 Connect group-scope monitoring master 22DB2 Connect master 86, 90, 96, 100, 521DB2 Connect Server panel 521DB2 Connect/Gateway Package Statistics panel 527DB2 Connect/Gateway Performance panel 526DB2 Connect/Gateway Statistics panel 522DB2 Connect/Gateway Task Detail panel 526DB2 Connect/Gateway Tasks List panel 524DB2 storage management statistics
consistency of data 402DB2 storage management statistics 402
DB2 summary information 18DB2 System Console and Message Traffic panel 133DB2 thread status 813DB2 version differences
unavailable data 402DB2C Master 22, 86, 90, 96, 100, 521DB2SYS keyword 783DDFS exception 25debugging 556defining exception groups 549definition
parallel task 721definition mode 546Delete Installation Profile panel 601Delete User Profile panel 599deleting entries 451DELT command 547Describe a Profile panel 598director segment in .FGO 548disk data set
RKO2PCSV 563display and set PF keys 557
822 Classic Interface User's Guide
Display Options For Database Allocations And DatabaseActivity Displays panel 501Display Options For Object Activity Summary And ObjectAllocation Summary Displays panel 494Display Options For Volume Activity Summary Display panel517Distributed Allied Thread Summary panel 169Distributed Data Facility Statistics Detail panel 636Distributed Data Facility Statistics panel 481Distributed Data Facility Statistics Summary by ReportInterval panel 634Distributed Data Facility VTAM Detail panel 484Distributed Data Facility VTAM Summary panel 483Distributed Database Access Thread Summary panel 170Distributed Thread Detail panel 76, 84DMTH 25DPMPARMS data set
CORRDATA member 12LOCDATA member 13MAINPACK member 13
DRCV exception 26DSN FULL state of ATF 435DSND exception 26DSNZPARM Application Parameters panel 325DSNZPARM Archiving Parameters panel 295DSNZPARM Authorization, RLF and DDF Parameters panel300DSNZPARM Buffer Pool Parameterspanel 346DSNZPARM Data Definition Control Support Parameterspanel 320DSNZPARM Data Parameters panel 332DSNZPARM data set and Database Parameters panel 313DSNZPARM Data Sharing Parameters panel 322DSNZPARM IRLM Parameters panel 308DSNZPARM Logging Parameters panel 291DSNZPARM Other System Parameterspanel 358DSNZPARM Performance and Optimization Parameters panel336DSNZPARM Storage Parameters panel 311DSNZPARM Stored Procedures Parameters panel 323DSNZPARM Thread Parameters panel 285DSNZPARM Trace parameters panel 288DSNZPARM Utility Parameters panel 348DWAT exception 26Dynamic SQL Cache by Authid panel 251Dynamic SQL Cache by Transaction ID panel 253Dynamic SQL Cache Statement Summary by Key Field panel257Dynamic SQL Cache Statistics by End User ID panel 256Dynamic SQL Cache Statistics by Workstation Name panel254Dynamic SQL Cache Statistics panel 258
EEDM pool 275EDM Pool Information panel 237EDM Pool Snapshot Summary panel 243EDM Pool Statistics Detail panel 640EDM Pool Statistics Summary by Report Interval panel 638EDM Snapshot Authorization Cache Storage panel 248EDM Snapshot Cursor Tables panel 245EDM Snapshot Database Descriptors panel 244
EDM Snapshot Dynamic SQL Cache Statement Statisticspanel 268EDM Snapshot Free Storage panel 275EDM snapshot package table detail 247EDM Snapshot Package Table Summary panel 246EDM Snapshot Skeleton Cursor Tables panel 247EDM snapshot skeleton package table detail 250EDM Snapshot Skeleton Package Table Summary panel 249EDM Snapshot static SQL cache statement detail panel 264Enclave Detail Information panel 138Enclave Thread Summary panel 186ENTO exception 26ENTU exception 27ENTW exception 27erasure error, panel 583ETIM exception 28Event Collection Manager (EVENTMGR) 487EVENTMGR (Event Collection Manager) 487exception
background processing 589defining exception groups 549groups (CICS) 23, 24groups (DB2 system) 23groups (DB2 System) 24groups (IMS) 23, 24groups (thread) 23groups (Thread) 23logging
.LOG command 550/LOGOUT command 551
reset 23set background exception 589settings 23, 580tripped 23values 23XOPT command 589
Exception Analysis Options menu 590exception logging facility (XLF)
printer and routing options 603Exception Logging Facility (XLF)
printer and routing options 603Exception Logging menu 602Exception Messages panel 23Exception Profiling panel 14EXP command 548expiration date 548Extended Highlighting 583
FF11 (Zoom) key, usage 7FACILITY resource class 181Fast GO command 548fetch, panel 564FGOLIMIT 585FGOLOOP 585Filter Options for Thread Activity Displays panel 176, 605function key
see F1 to Fn 7function key command 557Functions Thread Summary panel 180
Index 823
GG (64-bit integers) 7GBP Coupling Facility Cache Structure Statistics 418GBP Coupling Facility Cache Structure Statistics Summary
G mode 416S mode 416
GDEVUCBS 585GDFN command 549GETP exception 28Global Lock Statistics Detail panel 682Global Lock Statistics panel 377Global Lock Statistics Summary by Report Interval panel 681Group Buffer Pool Detail panel 229Group Buffer Pool Information 228Group Buffer Pool Statistics Detail panel 631Group Buffer Pool Statistics Summary by Report Intervalpanel 630group-scope monitoring master 22GTRC exception 28
HH2 (near-term history) data set 787help
INFO-line commands 550hex address 554highlighted information in panels 7hiperspace
display memory 565modifying storage 567scan storage 566
HOPD command 653
IIDBC exception 28IDBK exception 28IDBT exception 28IDFR exception 28IKT00405I panel error 583IMCN exception 28Immediate Write threshold 25IMND exception 29IMS Connection Detail panel 165IMS connection information 163IMS exceptions 570IMS thread information 164IMS Thread Summary panel 162IMSA command 162INACTIVE state of ATF 435Inactive Thread panel 173INDB exception 29INDT exception 29inserting blank lines 550installation profile, delete 601installation profile, save 600INTERVAL 585IODELAY 585IRLM Startup Options and CSA Usage panel 284IRLM storage usage 414ISPF Online Monitor main menu 12IWTH 25
KK (64-bit integers) 7keyword
DB2SYS 783
Llegal notices
cookie policy 817, 819notices 817programming interface information 817, 818trademarks 817–819
line, number of bytes in 554list panel space 563List Profiles panel 597LKUS exception 29load panel space 551local system queue area 540lock levels 810Lock Manager Information panel 370Lock Manager Statistics Summary by Report Interval panel673Lock Manager/Claim/Drain Statistics Detail panel 675lock resources 57, 192, 208Lock/Claims causing a Thread to Wait panel 53, 204locking conflicts 191Locking Conflicts panel 191Locks/Claims Owned by a Thread panel 195Locks/Claims Owned By a Thread panel 60log
print 550, 551, 557Log Dataset Information panel 236log manager 291Log Manager Information panel 231Log Manager Statistics Detail panel 648Log Manager Statistics Summary by Report Interval panel647LOGGED message 558LOGN exception 29logon
direct from native VTAM panel 8panel-driven 8specifying logon parameters 8specifying parameters 8
Long Names panel 145LOOPCOUNT 585LOOPTIME 585LSCR command 551
MM (64-bit integers) 7main storage 547MCHN command
format example 552typical use of 553
MCNV exception 29MDBT exception 30MDBW exception 30memory
displaying from data-only spaces 565scanning data-only spaces 566
824 Classic Interface User's Guide
menuApplication Trace Facility 435Exception Analysis Options 590Exception Logging 602ISPF Online Monitor 12Near-Term History Information 611Profile Maintenance 580Resource Managers and Other DB2 SubsystemInformation 215SQL Performance Analysis: Available Reports 789
messagesmonitoring 30, 604MSGE exception 30, 604viewing DB2 133viewing DB2/IRLM 133XTXT 587
MLST commandformat 554
MODE keyword (.FGO) 548modules 533MSCN command
example 555format 555
MSGE exception 30MVS System Console and Message Traffic panel 20MZAP command
cautions with 556examples 557format 556verify and replace text with 556
Nnavigating
with 3270 Tab key 11, 437near-term history data
archiving 783RKD2PAR(ARCScccc) 783
Near-Term History Data Collection Options panel 782Near-Term History Data Collector Dataset Status panel 786Near-Term History Data Record Information panel 785Near-Term History Information menu 611Near-Term History Report Option panel 692Near-Term Thread History Filter Options - Confirmationpanel 696Near-Term Thread History Filter Options panel 693not available data
DB2 version differences 402notices 817, 818NTAINTERVAL
near-term history data collection options keyword 710nucleus storage area 554
OO2PROC 551, 558O2REPORT file 551Object Activity Summary panel 495Object Allocation Summary panel 487object analysis
start collection 519stop collection 519
Objects Used By Thread panel 128
OCMDMASTER 586OMEGAMON Commands panel 543OMEGAMON XE for DB2 PE Classic Interface panel 8Open/Close Statistics Detail panel 653Open/Close Statistics panel 396Open/Close Statistics Summary by Report Interval panel 652operating system in .FGO 548OPSYS keyword (.FGO) 548OPTN immediate
TSF keyword 568owners
OWN command 196
PPA1 key 543Package Detail panel 112page locks 810page stealing method 222, 627page-fix 556pageable link pack area (PLPA) 556PAGELIMIT 585panel
/S INFO-line command 561/SAVE command 561Accelerator Statistics Overview 420Active Trace Detail 281Active Trace Summary 280Address Space Information and OMEGAMONCommands 529Application Trace Event Detail 470Application Trace Lock Detail 467Application Trace Program Detail 454Application Trace Program Summary (with activitycounts) 453Application Trace SQL Detail 461Application Trace SQL Index 459Application Trace Thread Summary - View Dataset 445Application Trace Unit of Work Activity Summary 452Background Thread Summary 166Bind Statistics 275Bind Statistics Detail 618Bind Statistics Summary by Report Interval 616Buffer Manager Information 216Buffer Pool Detail 218Buffer Pool Snapshot Datasets 226Buffer Pool Snapshot Open Pagesets 225Buffer Pool Statistics Detail 623Buffer Pool Statistics Summary by Report Interval 621Cancel Thread 130Change Profile 601CICS RCT Detail 159CICS RCT Summary 156CICS Thread Summary 152command 547conditional fetch 548Create Application Trace Data Set Name panel 446Current Parallel Task Summary 122Current SQL Counts 66Current Status for Exceptions 35Data Sets Used by Thread 134Database Activity 496Database Allocations 488Dataset Allocations 492
Index 825
panel (continued)Dataset Extend Activity 518DB2 Address Space Allocated DDnames and Datasets531DB2 Address Space Job Information and Start Time 532DB2 Address Space Jobpack Area Modules 533DB2 Address Space Region and Program Information535DB2 Address Space Storage Allocated by Subpool 537DB2 Address Space Virtual Storage Map 529DB2 Command Statistics 398DB2 Command Statistics by Report Interval 686DB2 Command Statistics Detail 687DB2 Connect monitoring 20DB2 Connect Server 521DB2 Connect/Gateway Package Statistics 527DB2 Connect/Gateway Performance 526DB2 Connect/Gateway Statistics 522DB2 Connect/Gateway Task Detail 526DB2 Connect/Gateway Tasks List 524DB2 System Console and Message Traffic 133Delete Installation Profile 601Delete User Profile 599deleting 547Describe a Profile 598display libraries 563Display Options For Database Allocations And DatabaseActivity Displays 501Display Options For Object Activity Summary And ObjectAllocation Summary Displays 494Display Options For Volume Activity Summary Display517Distributed Allied Thread Summary 169Distributed Data Facility Statistics 481Distributed Data Facility Statistics Detail 636Distributed Data Facility Statistics Summary by ReportInterval 634Distributed Data Facility VTAM Detail 484Distributed Data Facility VTAM Summary 483Distributed Database Access Thread Summary 170Distributed Thread Detail 76, 84DSNZPARM Archiving Parameters 295DSNZPARM Authorization, RLF and DDF Parameters 300DSNZPARM Data Definition Control Support Parameters320DSNZPARM data set and Database Parameters 313DSNZPARM Data Sharing Parameters 322DSNZPARM IRLM Parameters 308DSNZPARM Logging Parameters 291DSNZPARM Storage Parameters 311DSNZPARM Thread Parameters 285DSNZPARM Trace Parameters 288Dynamic SQL Cache by Authid 251Dynamic SQL Cache by Transaction ID 253Dynamic SQL Cache Statement Summary by Key Field257Dynamic SQL Cache Statistics 258Dynamic SQL Cache Statistics by End User ID 256Dynamic SQL Cache Statistics by Workstation Name 254EDM Pool Information 237EDM Pool Snapshot Summary 243EDM Pool Statistics Detail 640EDM Pool Statistics Summary by Report Interval 638EDM Snapshot Authorization Cache Storage 248
panel (continued)EDM Snapshot Cursor Tables 245EDM Snapshot Database Descriptors 244EDM Snapshot Dynamic SQL Cache Statement Statistics268EDM Snapshot Free Storage 275EDM Snapshot Package Table Summary 246EDM Snapshot Skeleton Cursor Tables 247EDM Snapshot Skeleton Package Table Summary 249EDM Snapshot Static SQL Cache Statement Detail 264Enclave Detail Information 138Enclave Thread Summary 186Exception Messages 23Exception Profiling 14fetch .FGO 548fetch delay 564Filter Options for Thread Activity Displays 176, 605Functions Thread Summary 180GBP Coupling Facility Cache Structure Statistics 418GBP Coupling Facility Cache Structure StatisticsSummary 416Global Lock Statistics 377Global Lock Statistics Detail 682Global Lock Statistics Summary by Report Interval 681Group Buffer Pool Detail 229Group Buffer Pool Information 228Group Buffer Pool Statistics Detail 631Group Buffer Pool Statistics Summary by Report Interval630IMS Connection Detail 165IMS Thread Summary 162Inactive Thread 173input field for switching DB2 subsystems 11IRLM Startup Options and CSA Usage 284IRLM storage 414List Profiles 597listing 563loading 551Lock Manager Information 370Lock Manager Statistics Summary by Report Interval673Lock Manager/Claim/Drain Statistics Detail 675Lock/Claims causing a Thread to Wait 53, 204Locking Conflicts 191Locks/Claims Owned by a Thread 195Locks/Claims Owned By a Thread 60Log Dataset Information 236Log Manager Information 231Log Manager Statistics Detail 648Log Manager Statistics Summary by Report Interval 647Long Names 145LSCR command 551MVS System Console and Message Traffic 20navigating with 3270 Tab key 11Near-Term History Data Collection Options 782Near-Term History Data Collector Dataset Status 786Near-Term History Data Record Information 785Near-Term History Report Option 692Near-Term Thread History Filter Options 693Near-Term Thread History Filter Options - Confirmation696Object Activity Summary 495Object Allocation Summary 487Objects Used By Thread 128
826 Classic Interface User's Guide
panel (continued)OMEGAMON Commands 543OMEGAMON XE for DB2 PE Classic Interface 8Open/Close Statistics 396Open/Close Statistics Detail 653Open/Close Statistics Summary by Report Interval 652Package Detail 112Pool Detail 413Redirect Monitoring to Another DB2 20Reset Last and Worst Values 38returning to 561Save New/Altered Installation Profile 600Save New/Altered User Profile 599saving 561SCRN immediate 563Select Data set and Trace Parameters 443Set Background Exception Processing 589Set Control Function Options 584Set DB2/IRLM Messages that MSGE Exception Monitors604Set Display Options 581Set Exception Analysis Message Option 587Set Exception Analysis Options 590Set Performance Options panel 588Set Printer And Routing Options 586Set XLF Printer and Routing Options panel 603Spacename Activity 499Spacename Allocations 490Specify Application Trace 137, 437SQL Call Being Executed 63SQL Performance Analysis: ANLSQL 794SQL Performance Analysis: Enhanced Explain 791SQL Performance Analysis: JOBERR 795SQL Performance Analysis: Query Limits 792SQL Performance Analysis: SYSPRINT 793SQL Performance Analysis: Trace 792SQL Statistics Summary by Report Interval 655SQL/RID Pool/Parallelism/Stored Procedure Information380SQL/RID Pool/Stored Procedures Statistics Detail 656Start Object Analysis Collection 519Static SQL cache statistics 259, 260Static SQL Cache Statistics with Package Information262Status for Tripped Exceptions 36Stop In-Memory Non-Dataset Trace Requests 442Stop Object Analysis Collection 519Stop Viewing Trace Dataset 446Stopped Utility Detail Information 127Stored Procedures Thread Summary 182Subsystem Support Manager Statistics 278Subsystem Support Manager Statistics Detail 614Subsystem Support Manager Statistics summary byReport Interval 613Summary of DB2 Activity 17Sysplex Parallel Thread Summary 184test 549The following panel shows a summary of the GBPCoupling Facility Cache Structure Statistics in G mode.416Thread Accelerator Detail 147Thread Activity by Database 497Thread Activity by Spacename 500Thread Activity by Volume 507
panel (continued)Thread Buffer Pool Activity 101Thread Detail 41Thread Global Lock Activity 60, 211Thread Group Buffer Pool Activity 105Thread History Buffer Pool Activity 757Thread History Buffer Pool Summary 714Thread History By Authid 702Thread History By Authid, Plan 705Thread History By Correlation ID 713Thread History By Plan 700Thread History By Plan, Authid 703Thread History By Report Interval 698Thread History By Subinterval 710Thread History DB2 Lock/Scan/Sort Summary 718Thread History DB2 Time Summary 716Thread History Detail 721Thread History Display Options 706Thread History Distributed Activity 762Thread History Dynamic SQL Calls 742Thread History Global Lock Activity 740Thread History Group Buffer Pool Activity 776Thread History Lock Waits 727Thread History Lock/Claim/Drain Activity 737Thread History Package Detail 769Thread History Package Summary 766Thread History Parallel Task Summary 780Thread History Resource Limit Statistics 760Thread History Sort and Scan Activity 773Thread History SQL Counts 746Thread History Summary 708Thread History Times Summary 719Thread Information 407Thread Lock/Claim Drain Activity 201Thread Lock/Claim/Drain Activity 52Thread Package Summary 109Thread Resource Limit Statistics 118Threads Having Remote ID Information 188Threads Summary Excluding Idle Threads 39Threads Summary Including Idle Threads 190Triggers Thread Summary 183TSO Thread Summary 150User-Tailored Reporting Layout Generation 14Utility Detail 124Utility Summary 172View the Active In-Memory Non-Dataset Trace (tomemory) 441Volume Activity Summary 503Volume Database Activity 504Volume Dataset Activity 511Volume Dataset/Extent Activity 514Volume Service panel 506Volume Spacename Activity 508Volume Thread Activity by Database 510Volume Thread Activity by Dataset 515Volume Thread Activity by Spacename 512VSAM Trace Entry Detail 448
panel erasure error 583panel fetch 564panels
printing 557, 558renaming 559
parallel taskdefinition 721
Index 827
password 559PEEKSIZE 586PF key
see F1 to Fn 7PF keys.See function key command 577PGSTEAL attribute 222, 627PGUP exception 30PLAN
thread detail 43PLAN command 54, 196, 205, 211POLU exception 30POLW exception 30Pool Detail panel 413PREF exception 31prefetch threshold, sequential 25printer and routing options
for XLF 603printing
.PRT command 559/O 557/P 557/PRINT command 558
private areazapping 575
processing traces written to VSAM datasets 447profile
changing 579creating 579deleting 579IBM profile 579identifying profile in use 579installation profile 579
Profile Maintenance menu 580profile, change 601profile, describe 598profile, installation 600, 601profile, list all 597profile, user 599ProfileDefinitionMode 583profiles
options 580saving color setting changes 583
programming interface information 817, 818PROGxxx program check 583
RRACF
MVSADMIN.WLM.POLICY profile 181RCT information 156, 159Redirect Monitoring to Another DB2 panel 20refreshing panels 561relational operators (.FGO) 548RELM exception 31renaming a panel 559RENM command 559replacing a panel 560reset
colors 543Reset Last and Worst Values panel 38resource limit specification table (RLST) 121Resource managers and Other DB2 Subsystem Informationmenu 215resources and lock types 57, 192, 208
return to calling panel 561RIO exception 31RKD2PAR(ARCScccc)
archiving near-term history data 783RKD2PAR(COPTcccc) 782RKO2PCSV 559, 561RKO2PFSV 599routing and printer options
for XLF 603
SSave New/Altered Installation Profile panel 600Save New/Altered User Profile panel 599saving a panel 562SCHN command 562screen
DSNZPARM Application Parameters 325DSNZPARM Buffer Pool Parameters 346DSNZPARM Data Parameters 332DSNZPARM Other System Parameters 358DSNZPARM Performance and Optimization Parameters336DSNZPARM Stored Procedures Parameters 323DSNZPARM Utility Parameters 348
SCRN command 563scrolling
/D command 544/DOWN command 544/U 569/UP 569
secondary terminals 544security features 559Select Data set and Trace Parameters panel 443sending comments 3separator line 543sequential prefetch threshold 25service 2set and display function keys 557Set Background Exception Processing panel 589Set Control Function Options panel 584Set DB2/IRLM Messages that MSGE Exception Monitorspanel 604Set Display Options panel 581Set Exception Analysis Message Option panel 587Set Exception Analysis Options panel 590Set Performance Options panel 588Set Printer and Routing Options panel 586Set XLF Printer and Routing Options panel 603shared storage 408SL keyword 568SLST command 565SMFID keyword (.FGO) 548Spacename Activity panel 499Spacename Allocations panel 490Specify Application Trace panel 137, 437SPTH 25SQA 554, 556SQL Call Being Executed panel 63SQL Performance Analysis: ANLSQL panel 794SQL Performance Analysis: Available Reports menu 789SQL Performance Analysis: Enhanced Explain panel 791SQL Performance Analysis: JOBERR panel 795SQL Performance Analysis: Query Limits panel 792
828 Classic Interface User's Guide
SQL Performance Analysis: SYSPRINT panel 793SQL Performance Analysis: Trace panel 792SQL Statistics Summary by Report Interval panel 655SQL/RID Pool/Parallelism/Stored Procedure Informationpanel 380SQL/RID Pool/Stored Procedures Statistics Detail panel 656SS keyword 568SSCN command 566Start Object Analysis Collection panel 519startup command parameters 558Static SQL cache statistics panel 259, 260Static SQL Cache Statistics with Package Information panel262Status for Tripped Exceptions panel 36status, thread 813STATUSMODE 586STOP command 567Stop In-Memory Non-Dataset Trace Requests panel 442Stop Object Analysis Collection panel 519Stop Viewing Trace Dataset panel 446Stopped Utility Detail Information panel 127stopping traces 451storage
default for listing 554displaying common area 554listing from data-only spaces 565modifying data-only space 567protect key 540scanning data-only spaces 566subpool allocations 537zapping private area 575
Stored Procedures Thread Summary panel 182subinterval
thread history information 710subpool allocations 537Subsystem Support Manager Statistics Detail panel 614Subsystem Support Manager Statistics panel 278Subsystem Support Manager Statistics Summary by ReportInterval panel 613Summary of DB2 Activity panel 17support home website 2SUSL exception 31Sysplex Parallel Thread Summary panel 184system exceptions 570SZAP command 567
TT (64-bit integers) 7Task Control Block Structure 538Task Control Block Structure panel 538Task Private Area Summary 538TCPU exception 32terminal address in .FGO 548THDA command 39THDC command 153THDI command 162THDQ exception 32THDT command 150, 185Thread Accelerator Detail panel 147Thread Activity by Database panel 497Thread Activity by Spacename panel 500Thread Activity by Volume 507Thread Buffer Pool Activity panel 101
Thread Detail panel 41thread details
CP CPU utilization 46thread exceptions 570Thread Global Lock Activity panel 60, 211Thread Group Buffer Pool Activity panel 105Thread History Buffer Pool Activity panel 757Thread History Buffer Pool Summary panel 714Thread History By Authid panel 702Thread History By Authid, Plan panel 705Thread History By Correlation ID panel 713Thread History By Plan panel 700Thread History By Plan, Authid panel 703Thread History By Report Interval panel 698Thread History By Subinterval panel 710Thread History DB2 Lock/Scan/Sort Summary panel 718Thread History DB2 Time Summary panel 716Thread History Detail panel 721Thread History Display Options 706Thread History Distributed Activity panel 762Thread History Dynamic SQL Calls panel 742Thread History Global Lock Activity panel 740Thread History Group Buffer Pool Activity panel 776thread history information by subinterval 710Thread History Lock Waits panel 727Thread History Lock/Claim/Drain Activity panel 737Thread History Package Detail panel 769Thread History Package Summary panel 766Thread History Parallel Task panel Summary 780Thread History Resource Limit Statistics panel 760Thread History Sort and Scan Activity panel 773Thread History SQL Counts panel 746Thread History Summary panel 708Thread History Times Summary panel 719Thread Information panel 407Thread Lock/Claim/Drain Activity panel 52, 201Thread Package Summary panel 109Thread Resource Limit Statistics panel 118threads
background 39CICS 39command 813connected to DB2 39details about 39distributed 39IMS 39parallel tasks of 39status of 813TSO 39
Threads Having Remote ID Information panel 188Threads Summary Excluding Idle Threads panel 39Threads Summary Including Idle Threads panel 190TIME keyword 568Timed Screen Facility (TSF)
terminating 561TKANSAM(KO2MOD01) 438TMAX exception 32trace, active
detail 281trademarks 817–819transition
of DB2C Master 22TRCV exception 32Triggers Thread Summary panel 183
Index 829
TSND exception 32TSO Thread Summary panel 150
UUNIT keyword (.FGO) 548updates 2USER keyword (.FGO) 548user mod TKANSAM(KO2MOD02) 41, 156user profile
compare in .FGO 548user profile, delete 599user profile, save 599User-Tailored Reporting Layout Generation panel 14Utility Detail panel 124Utility Summary panel 172UTIS exception 33
Vvariable names in .FGO 548VDIO exception 33VEDR exception 33View the Active In-Memory Non-Dataset Trace panel (tomemory) 441viewing datasets 450virtual page stealing method 222, 627virtual storage 529Volume Activity Summary panel 503Volume Database Activity panel 504Volume Dataset Activity panel 511Volume Dataset/Extent Activity panel 514Volume Service panel 506Volume Spacename Activity panel 508Volume Thread Activity by Database panel 510Volume Thread Activity by Dataset panel 515Volume Thread Activity by Spacename panel 512VSAM data set
as output for Application Trace Facility 438sizing 438
VSAM Trace Entry Detail panel 448VSRV exception 33VTAM
direct logon from 8VTIO exception 33VUTL exception 34
WWAIT command 54, 205, 211WCLM exception 34WDLK exception 34WGLK exception 34WLGQ exception 34WSPS exception 34WSRV exception 34WTRE exception 35
XXACB
display options 583XGRP command 570
XMCH commandexample 572format 571
XMLS commandusing character format 573using hex and character format 573
XMSC commandexample of hex and character 574
XMZP command 575XOPT exception 589
Zzapping data-only space storage 567zoom function key
see F11 7
830 Classic Interface User's Guide

IBM®
Product Number: 5655-W37
SH12-7068


