Embed Size (px)
Citation preview

Classification of Measured Indoor Volatile Organic Compounds
Based on Noncancer Health and Comfort Considerations
ALFRED T. HODGSONa,1 and HAL LEVINa,b a Indoor Environment Department, Environmental Energy Technologies Division, E.O. Lawrence Berkeley National Laboratory, Berkeley, CA, USA b Building Ecology Research Group, Santa Cruz, CA, USA
Abstract
Building occupants are exposed to complex mixtures of air pollutants including many volatile
organic compounds (VOCs). A recent review summarized the central tendency and upper limit
indoor VOC concentrations measured in North American residences and office buildings since
1990. Although this database is limited in many respects, it serves as a useful starting point for
evaluating the potential health and comfort effects of indoor VOC exposures. Excluding cancer
and birth defects, the primary concern is chronic inhalation exposure to toxicants that can cause
serious health problems. Additionally, building occupants react to the quality of indoor air
through their sensory perceptions and frequently experience unpleasant odors and irritation of the
eyes and upper respiratory tract.
In this paper, we conduct a simple screening-level assessment of indoor VOC concentrations.
We compare measured VOC concentrations to published odor thresholds, sensory irritation
levels derived for the general population, and noncancer chronic health guidelines. Hazard
quotients are individually calculated for these three effects by dividing maximum or derived 95th
percentile VOC concentrations by our selected best estimates of guidance levels for the general
population. These results provide a basis for broadly classifying commonly encountered VOCs
into groups according to the likelihood that they will produce effects among building occupants. 1 Corresponding author. Tel.: +1-510-486-5301. E-Mail: [email protected]
1
This methodology shows that only a small number of the more than 100 reported VOCs
exceed levels that are likely to be of concern with respect to the health and comfort endpoints
considered. Although data is lacking for a number of odorous compounds potentially present in
buildings, the results indicate that carboxylic acids, higher molecular weight aldehydes and less
volatile aromatic hydrocarbons are most likely to be perceived by olfaction and that there is more
probability of detection in residences than in offices. Sensory irritation levels were approached
or exceed by only a very small number of relatively potent, reactive VOCs. Of these, acrolein
was by far the most potent irritant. Although more detailed consideration of the underlying
toxicological data is needed, the results suggest that only a small number of commonly measured
VOCs, when considered singly, are likely to produce serious irreversible health effects not
associated with cancer. These compounds include lower molecular weight aldehydes, and
several aromatic hydrocarbons. Again, acrolein stands out as the most potent compound.
Based on these results, we recommend that studies to characterize indoor VOC
concentrations and exposures focus their resources on compounds that are most likely to impact
occupants as determined by the study objectives. For a very few compounds, such as acrolein
and formaldehyde, the evidence based on sensory irritation and chronic toxicity appears
sufficient to warrant efforts to reduce and control sources of these compounds in buildings.
Introduction
The number of air pollutants of concern with respect to potential human health effects
significantly expanded in 1990 with the introduction of the U.S. Clean Air Act (CAA)
Amendments. This law established Federal and State programs to regulate the ambient
emissions of 188 (originally 189) hazardous air pollutants (HAPs), consisting of chemical
substances including many volatile organic compounds (VOCs) that can cause cancer,
reproductive harm, other serious illness or environmental damage (U.S. EPA, 1994). The
interest in the outdoor environment and cancer risk has dominated governmental regulatory
efforts.
2

It is widely recognized, however, that indoor exposures to VOCs and other air pollutants are
at least as, if not more, important, than ambient exposures. Time activity studies show that
individuals spend, on average 87% of their time indoors (Jenkins et al., 1992; Klepeis et al,
2001). Most VOCs of outdoor origin penetrate indoors through ventilation and infiltration.
Numerous indoor VOC sources in residential, commercial and public buildings add to indoor
concentrations and exposures. Furthermore, the relatively low rates of outdoor air ventilation in
buildings prevent the rapid dispersal of indoor generated pollutants (Lai et al., 2000). Numerous
building studies confirm that indoor air concentrations of many toxic VOCs are significantly
higher than outdoor concentrations (e.g., Daisey et al., 1994; Shields et al., 1996).
Indoor VOC data collected in North America and western Europe from about 1978 through
the 1980’s were summarized in several reviews (Shah and Singh, 1988; Brown et al., 1994;
Holcomb and Seabrook, 1995). Central tendency and upper limit indoor VOC concentrations
measured in North America from 1990 through the present recently have been reviewed
(Hodgson and Levin, 2003). Twelve of the post-1989 studies were cross sectional investigations
of existing residences. Three cross sectional office building studies were identified. The
summary tables in the review list concentration data for more than 100 VOCs of which 35 are
classified as HAPs. An analysis of historical trends suggests that average indoor concentrations
of some HAPs, such as benzene, 1,2-dichloroethane, 1,1,1-trichloroethane and tetrachloroethene,
may have decreased since the 1980’s. In addition, the use of alternate VOCs in products with
indoor applications may have increased over the same time period. Due to such changes, the
more recent data have greater relevancy for assessments of potential occupant effects.
Unfortunately, the post-1989 database, like the previous summaries, is limited in many
respects. The limitations are due, in part, to the relatively high costs of conducting field studies
and to the restrictions imposed by the standard techniques that are employed for broad-spectrum
VOC sampling and analysis. The following deficiencies in the database are notable and have
been highlighted by others (e.g., Wolkoff et al., 1997). Only relatively small numbers of
building units are represented. In the current review, the maximum total number of residential
3

units for an individual VOC is about 1,000. Less than one-half of the reviewed studies employed
a probability-based design for selecting building units. Data is lacking for many important
indoor environments, such as schools, health-care facilities and small offices. Most studies
measured a small number of compounds. In many cases, the focus was on a limited suite of
aromatic and chlorinated hydrocarbons that are classified as carcinogens and are relatively easy
to analyze by standard techniques. Most sampling schemes relied solely on short-term
measurements made on a single day so that the range of variability within individual buildings
was not captured. Spatial variability within buildings often was not addressed. Only in a few
cases were personal exposure samples collected, so it is not possible to compare area
concentrations with breathing-zone concentrations that may be significantly higher (Rodes et al.,
1991; Wallace, 1987).
The potential importance of indoor exposures to VOCs goes beyond the question of low level
chronic exposures to toxicants. Building occupants initially react to the quality of indoor air
through their sensory perceptions. Their impressions may be of unpleasant odors, irritation of
the eyes and upper respiratory tract, or nonspecific sensations such as stuffiness. These sensory
responses still serve as the basis for modern ventilation standards that attempt to achieve
acceptable perceived air quality for a majority of occupants (ASHRAE, 1999). Viewed
conversely, this approach assures that there will be dissatisfaction among a substantial fraction of
building occupants even if code-minimum ventilation is provided. In fact, meta analyses of
epidemiological studies show office workers commonly report relatively high frequencies of eye,
nose, throat and lower respiratory tract symptoms that are associated with work (i.e., improve
when away from work) (Mendell 1993; Mendell et al., 1996). Although the etiology of these
sensory irritation and respiratory complaints among office workers has not been established, the
symptoms are generally associated with ventilation rate such that symptom prevalence often
decreases with increasing per person ventilation rate (Seppänen et al., 1999). This relationship
suggests that the causal agents are airborne.
4

Sensory irritation symptoms experienced by building occupants may be related to exposures
to VOCs, which as a group contain a large number of irritant species. However, such symptoms
are not associated with measures of total VOCs (Andersson et al., 1997). Direct relationships
between concentrations of individual VOCs and irritation symptoms also have not been
established with a few exceptions such as formaldehyde (Liu et al., 1991). It has been suggested
that these symptoms are caused by exposures to air pollutant components (either singly, in
combination, or produced as the result of oxidative chemistry) that are associated with indoor
sources of VOCs, but that are not easily measured (Ten Brinke et al. 1998; Wolkoff et al., 1997;
Wolkoff and Nielsen, 2001).
Odors in buildings caused by VOCs may not be of toxicological concern. However, the
detection of unusual or unpleasant odors can cause occupants to feel threatened or to be
concerned, precipitating complaints. Such complaints among office workers may be associated
with absenteeism and decreased worker productivity. Other financial loses can be incurred due
to expensive investigations and remedial actions.
The assessment of risks of serious health consequences associated with inhalation exposures
to VOCs is highly developed for the ambient environment. The U.S. EPA’s National Air Toxics
Assessment program has quantified the risks of 32 common HAPs (plus diesel PM) in order to
identify compounds that pose the greatest risk of cancer and adverse noncancer health effects on
a regional and a national basis (U.S. EPA, 2000; Woodruff et al. 1998). A similar risk
assessment has been performed for TACs in California (Morello-Frosch et al., 2000). The
general approach is to estimate ambient air concentrations by geographical region from source
emissions data using a dispersion model that incorporates simulations of atmospheric processes.
The modeled concentrations are compared to specified cancer risks and noncancer hazard levels.
Cancer risks are presented as the lifetime risks of developing cancer over a 70-year lifetime.
Noncancer risks are presented in terms of the ratio between exposure and a reference
concentration (i.e., a hazard quotient). The numbers of individuals exposed at these risk levels
5

are calculated to rank the HAPs and TACs that pose the greatest relative hazard on a regional
scale.
This risk assessment methodology cannot be applied fully to the indoor environment because
the indoor concentrations of HAPs/TACs are not well defined due to the noted deficiencies in the
database. An alternate or complementary approach is to model indoor concentrations and
exposures based on source characteristics including VOC emission rates, VOC removal
mechanisms, building parameters and human activity patterns. Significant progress has been
made in modeling VOC emissions from some indoor sources, but the assembly of all of the
relevant variables into a model to predict population exposures to commonly occurring VOCs is
a daunting task.
There have been several proposals and attempts to identify the compounds of most concern
with respect to potential occupant effects in buildings. Mølhave (1998 and 2003) has called for
the grouping of compounds according to their relevant toxicological principals as the first step in
establishing a list of the most pertinent compounds. The categories of health outcomes of
concern would include immunological, respiratory, cellular (cancer and reproductive),
neurogenic and sensory, and cardiovascular effects. Nielsen and colleagues (Nielsen et al.,
1998a-c) also have defined the categories of human health and comfort effects attributable to air
pollutants that are of concern in indoor environments. Following this system, they developed a
toxicology-based evaluation procedure for recommending guideline values specifically for
indoor air and applied this procedure to a small number of several VOCs including certain
organic acids, aromatic alcohols and glycol ethers. They proposed that the evaluations should
establish multiple values for each compound, an odor threshold, a sensory irritation threshold,
and a value for all other non-genotoxic effects; and in addition, should consider genotoxic and
carcinogenic effects. Similarly to the approach used by the U.S. EPA for developing inhalation
reference concentrations (RfCs) for chronic exposures, the available literature on human and
mammalian effects is to be critically assessed. Toxicokinetics are taken into account to
recommend safety factors for continuous indoor exposures for the general population.
6

In this paper, we conduct a simple screening-level assessment of VOC concentrations in
residences and office buildings. We compare measured VOC concentrations to published odor
thresholds, sensory irritation levels derived for the general population, and noncancer chronic
health risk levels. Hazard quotients calculated for these effects are used to classify commonly
encountered indoor VOCs into broad groups according to the likelihood that they will produce
effects among building occupants as the result of inhalation exposures. We have excluded
cancer from consideration as the risk assessment approach and the time period of interest (i.e., a
70-year lifetime) for cancer are substantially different than from noncancer effects for which no
adverse effect levels (NOAELs) can, at least theoretically, be determined. Other effects that may
be related to VOC exposures, such as immunological responses, are not considered due to the
lack of toxicological data. This assessment, while revealing the limitations of the available data
and present knowledge regarding health outcomes, can provide guidance for prioritizing indoor
air pollutants for monitoring and for efforts to limit indoor exposures through combinations of
ventilation and source controls.
Methods
North American Indoor VOC Concentrations
Indoor VOC concentrations summarized from cross-sectional studies of North American
residential and office buildings conducted from 1990 through the present (Hodgson and Levin,
2003, and herein termed the ‘Review’) serve as the database for this assessment. For all studies
combined, 106 VOCs were identified. A broad range of chemical classes and volatility were
represented. Central tendency and upper limit concentrations were summarized separately for
residences and office buildings. In the accompanying tables, the compounds are grouped into
chemical classes and then listed by increasing boiling point as a surrogate for volatility within
each class. All concentrations are given in molar volume units of parts-per-billion (ppb)
assuming standard indoor conditions (298o K, 101.3 kPa).
7

Odor, Sensory Irritation and Noncancer Chronic Toxicity Values
Standardized human odor thresholds (OTs) for VOCs in the Review were obtained from Devos
et al. (1990). This work compiled the scientific literature dating back to the late 1800’s. For
each compound, the source references were weighted based on their consistency with assumed
good data sets and then averaged. These values presumably represent points of 50 or 75% odor
detection (Cometto-Muñiz, 2000). One hundred percent odor detection thresholds were obtained
from the Cometto-Muñiz research group (Cometto-Muñiz and Cain, 1990, 1991, 1993, 1994;
Cometto-Muñiz et al., 1998a, 1998b). These studies employed uniform methodologies with
small intensely studied groups of subjects to obtain OTs and nasal pungency effects (see below).
We did not consider hedonistic odor tone.
The trigeminal nervous system with receptors in the facial area produces burning, tingling or
stinging sensations in the eye nose, or throat when stimulated by airborne chemical irritants and
functions as a warning system (Alarie, 1973). Exposures to high levels of sensory irritants result
in a reflex change in the breathing pattern. This change is a characteristic pause following
inspiration that results in a decrease in respiratory frequency. Alarie (1966) developed a
bioassay to exploit this physiological change. Groups of four mice are exposed head-only to
increasing concentrations of a sensory irritant. Their bodies are constrained in plethysomographs
and pressure transducers record their breathing patterns and frequency. Sensory irritation is
identified by the expiratory pause. Breathing frequency changes in proportion to the stimulus.
The dose response is plotted on a logarithmic scale to calculate the concentration that produces a
50% decrease in frequency. This is termed the RD50. The procedure is described as ASTM
standard method E 981 (ASTM, 2000). This method has been used to determine RD50s for a
large number of individual sensory irritants, with emphasis on industrial chemicals. Schaper
(1993) and Alarie et al. (2000) have summarized RD50s for 145 chemicals. Recent data for
terpene hydrocarbons were obtained from Wolkoff et al. (2000).
8

Human nasal pungency thresholds (NPTs) are a measure of the trigeminal response of the
nose when exposed to airborne sensory irritants. As noted above, the Cometto-Muñiz group has
used a uniform methodology to measure OTs and NPTs for small groups of subjects. Their
primary strategy has been to test homologous series of compounds in order to relate changes in
physicochemical properties to the sensory outcomes for study groups with and without a sense of
smell. In this way, they have been able to separate the trigeminal response from the olfactory
response for a number of VOCs in different chemical classes.
The California EPA OEHHA has developed acute Reference Exposure Levels (RELs) for
some hazardous airborne pollutants (Cal-EPA, 1999). An acute REL is an exposure
concentration that is not likely to cause adverse effects in humans, including sensitive individuals
that are exposed to the concentration for one hour on an intermittent basis. Acute RELs are all
based on human studies and incorporate a one order of magnitude uncertainty factor to account
for variability among individuals. Other factors are variously applied to adjust for the type of
observed endpoint and the time difference by Haber’s Law, which states that effect is determined
by the cumulative dose determined as the product of concentration and exposure time. The
severity of the effect is considered. Many of the acute RELs are based on sensory irritation,
which is classified as a mild effect.
Guidelines to protect workers from the adverse effects of exposure to industrial chemicals
have been developed over many years. Thresholds Limit Values (TLVs) promulgated by the
American Conference of Governmental Industrial Hygienists (ACGIH) constitute one of the
most widely used sets of occupational exposures levels (OELs) in the U.S. and elsewhere
(ACGIH, 2000 and 2001). TLVs are primarily health based with some consideration given to
analytical methods and practical detection limits. The rationale for TLVs is based on human or
animal experimental data, industrial case studies, or chemical analogy. The assessments are peer
reviewed. The derived time-weighted average (TWA) TLVs are intended to protect workers for
an eight-hour workday assuming a typical 40-h workweek. Central nervous system effects,
9

various noncancer systemic effects, and irritation either separately or in combination with more
serious outcomes, serve as the basis for many VOC TLVs.
Several North American governmental agencies have established health-based, noncancer
guidelines for chronic exposures of the general population to toxic air pollutants. The U.S. EPA
has developed noncancer inhalation reference concentrations (RfCs) for a number of toxic air
pollutants contained in the EPA’s Integrated Risk Information System (U.S. EPA, XXXX). The
RfCs are based on reviews and critical assessments of the toxicological and epidemiological
literature for both human and other mammalian species. Effects both directly on and peripheral
to the respiratory system are considered. Adjustments and uncertainty factors are applied to
account for the type of observed endpoint, the exposure duration and inter- and intraspecies
differences. The resulting RfCs are concentrations to which it is believed that the human
population including sensitive groups can be exposed over a lifetime without deleterious effects.
These values are peer reviewed. The Environmental Health Directorate, Health Canada (1996)
has developed analogous tolerable concentrations for inhalation for a few VOCs on the Canadian
Priority Substances List.
The Agency for Toxic Substances and Disease Registry (ATSDR) has identified a priority
list of hazardous industrial substances, including many VOCs, and has developed associated
acute, intermediate and chronic health effect guideline levels for oral and inhalation exposure
routes. For inhalation exposure, ATSDR determines Minimal Risk Levels (MRLs) utilizing a
practice similar to that used by the U.S. EPA for RfCs (ATSDR 2003). An MRL is an estimate
of the daily human exposure to a hazardous substance that is likely to be without appreciable risk
of adverse noncancer effects in sensitive populations over a specified duration of exposure.
MRLs are generally based on the most sensitive endpoint of relevance to humans exclusive of
very serious effects such as irreparable damage to liver or kidneys or birth defects. Here, we
have utilized the lowest inhalation MRLs derived for either the intermediate (>14 to 364 days) or
the chronic (365 days and longer) exposure duration as guidelines for chronic toxicity.
10

OEHHA has developed noncancer chronic Reference Exposure Levels (RELs) for 78
chemicals (Cal-EPA, 2002). OEHHA also follows the same general approach as used by the
U.S. EPA in establishing RfCs. Human inhalation exposure data have been emphasized where
possible. OEHHA’s approaches to time extrapolation and the application of uncertainty factors
have differed from those of the U.S. EPA in some cases. These guidelines are intended to
protect the general population including sensitive groups from disease for exposure periods of
ten years or more.
Scaling of Values
We first endeavored to place the various measures for each considered effect on a comparable
scale. For some measures, it was necessary to apply a scaling factor.
The Cometto-Muñiz group OTs were divided by one order of magnitude to adjust for the
difference between their 100% recognition criteria and an assumed 50% recognition threshold
for the Devos et al. values as suggested by Cometto-Muñiz (2000).
Others have estimated sensory irritation effects in humans by application of an uncertainty
factor to mouse RD50s. Schaper (1993) demonstrated a linear relationship between the
logarithm of RD50s multiplied by 0.03 and the logarithm of the TLVs of 89 chemicals, whose
TLVs had been based on irritation as a critical effect. The coefficient (r2) for the linear least-
squares regression was 0.78, and only a few compounds fell outside of the 95% confidence
intervals. This relationship gave additional support to Alarie’s (1981) original proposal for
estimating appropriate TLVs by setting them halfway between 0.1 and 0.01 times the RD50 on a
logarithmic scale (i.e., 1.5 orders of magnitude).
NPTs occur at elevated concentrations that are approximately equivalent to RD50
concentrations. This low sensitivity is likely attributable to the method of delivery in which one
nostril is exposed for only 1-3 seconds. For example, Hansen and Nielsen (1994) state that the
nose integrates the trigeminal effect by spatial summation and, therefore, the threshold
concentration is expected to be higher if only one nostril is exposed.
11

Cometto-Muñiz and Cain (1994) showed the relationship between log NPT and log RD50 in
ppm for 24, mostly nonreactive VOCs (i.e., alcohols, acetates, ketones, alkylbenzenes and some
miscellaneous compounds). Considering all 24 compounds, the best fitting regression line was
RD50 = 0.59 NPT + 1.23, r = 0.63. Excluding methyl, ethyl and propyl acetates, which were
less potent in humans, improved the regression to RD50 = 0.89 NPT + 0.36, r = 0.85. The
strength and near equivalency of the relationship when VOCs with clear interspecies differences
were excluded suggests that the same approximate scaling factor can be applied to the RD50s
and NPTs for nonreactive compounds when estimating effects for the general population.
As differentiated from a healthy industrial workforce, the general population is presumed to
contain sub-populations such as the very young, elderly and those with illnesses (e.g., respiratory
disease) that are more chemically sensitive. Governmental agencies and others have attempted
to establish inhalation exposure guidelines for the general population by applying uncertainty
factors to TLVs and other OELs. As Paustenbach (1997) has noted in his review, this general
approach has a number of potential disadvantages, but is backed by a wealth of data accumulated
over many years and, at a minimum, serves as a convenient starting point.
Paustenbach (1997) observes that the most popular approach has been to assume the OELs
are equivalent to human NOAELs. First an OEL is adjusted for the difference between a 40-h
work week and constant 24-h a day exposure by application of Haber’s Law. Thus, the TLV is
divided by a factor of 168/40 or 4.2. Then, uncertainty factors are applied to account for a
difference in sensitivity between the general population and healthy workers and to provide a
margin of safety. Paustenbach points out that the size of the overall uncertainty factor should
vary with the severity and reversibility of the effect. If the goal is to protect against irritation (or
odor), he states that the occupational TLVs will not need much adjustment but gives no specific
guidance.
Nielsen et al. (1995) reviewed the rationale for setting indoor exposure limits at ~1/40 of the
OELs for respiratory effects. They discussed examples of ozone and nitrogen dioxide exposures
in rats, which suggested that low-level responses estimated from Haber’s Law would
12

overestimate the real responses. Their review also indicated that the more susceptible
individuals might not be that much more sensitive than the general population. Thus, they
estimate that 1/40 of the OEL would be a conservative, preliminary indoor-air guideline for
respiratory effects. Neilsen et al. (1998a) make the point that Haber’s Law is not applicable to
sensory irritation effects as these are more directly dependent upon concentration than on the
product of concentration and time. They carefully evaluated the literature on the sensory and
health effects of several compounds in this Review, including formic acid, acetic acid, phenol
and butylated hydroxytoluene (Neilsen et al. 1998a and b). They set the indoor guideline for
sensory irritation at 1 ppm for formic acid, acetic acid and phenol. This value is five to ten times
lower than the respective TLVs (i.e., less than the general 1/40 guideline).
Based on this information, we have adopted the approach of adjusting the TLVs of
compounds with irritancy as the sole or principal effect by a one order of magnitude uncertainty
factor (TLV/10) to account for sensitive sub-populations and individuals. By extension, the
mouse RD50s were adjusted by a factor of 2.5 orders of magnitude (i.e., the 1.5 orders of
magnitude factor to equate RD50s with TLVs plus a one order of magnitude uncertainty factor
for sensitive groups). The same adjustment factor was applied to NPTs. According to the Alarie
et al. (2000) scheme for extrapolating RD50s to humans, RD50/100 would not be expected to
produce a sensory irritation response and RD50/1000 would not be expected to produce an effect
of any kind. Our use of 2.5 orders of magnitude (RD50/316) is the midpoint of this range.
Acceptable noncancer chronic exposure levels can be estimated for the general population
from TLVs, which are not based on cancer or irritation as the primary effect. The procedures
described by Nielsen et al. (1995) and Paustenbach (1997) were utilized. First a factor of 1/40
was applied to approximately account for the difference between a 40-h workweek and a
constant 24-h a day exposure and the presumed increased susceptibility of the general public
versus industrial workers. Then, a worst-case pharmacokinetic factor of 0.2 was applied to
account for the lack of a recovery period for chemicals with a biological half-live of over eight
hours. Thus, the total adjustment is TLV/200.
13

Calculation of Indoor Hazard Quotients
We next selected best estimates of odor thresholds and protective sensory irritation and
noncancer chronic health levels for the general population and compared these levels to the VOC
concentrations measured in residences and office buildings. This was accomplished by dividing
maximum or estimated 95th percentile concentrations by the selected values to derive indoor
effect, or hazard, quotients.
For those VOCs with OT data from both sources, we have assumed the adjusted Cometto-
Muñiz et al. values are likely to be more reliable because they were determined with consistent
contemporary methodologies. Odor quotients were then calculated by dividing the maximum
VOC concentrations measured in existing residences, new residences and office buildings by our
best estimates of the corresponding odor thresholds.
We have assumed that the human sensory irritation response is best characterized by human
measures (NPTs, TLVs, and RELs); that among the human measures NPTs are the most directly
applicable; and that acute RELs represent more current and thorough reviews of the literature on
human response than TLVs. However, we question the use of Haber’s Law in the establishment
of the acute RELs based on Neilsen et al.’s (1998a) argument. Sensory irritation quotients were
calculated as described for OTs; maximum VOC concentrations in new and existing residences
and in office buildings were divided by our best estimates of sensory irritation.
We have assumed that chronic REL, RfC and MRL concentrations are better measures of
chronic toxicity than the TLV-based measures due to the uncertainty inherent in our application
of a universal adjustment factor to TLVs. We gave preference to the OEHHA chronic RELs
since they generally are based on assessments of the most current toxicological literature for the
largest set of compounds. Our second preference was the lower of the two other measures.
Alternately, since the three measures used the same general methodology, the lowest agency
value could be selected as the value of interest. An adjusted TLV was selected only if an agency
health assessment had not been performed.
14

To determine hazard quotients for noncancer chronic health risks, we first derived 95th
percentile concentrations from the central tendency VOC concentrations summarized in the
Review as geometric means (GMs) for existing residences and office buildings. Our rational for
selecting 95th percentile concentrations versus central tendency or maximum values is that
sustained exposures to relatively high, but not maximum concentration may occur in some
indoor environments. Typical geometric standard deviations (GSDs) for distributions of VOC
concentrations in residences and office buildings appear to be approximately 2.2 based on
several studies that have reported this statistic (Daisey et al., 1994; Shields et al., 1996; Hodgson
et al., 2000). Assuming this distribution, a one-tailed Student’s t value of 1.64 was used to
calculate 95th percentile concentrations as:
loge 95%ile = loge GM + 1.64 loge GSD (1)
Hazard quotients for noncancer chronic toxicity were then calculated by dividing the derived 95th
percentile concentrations for residences and office buildings by the selected guideline
concentrations.
Measured VOCs were classified with respect to the different effects based on their hazard
quotients. We consider compounds with quotients in excess of unity to be of primary concern.
Quotients within one order of magnitude of unity define the next level of concern. Since this is a
screening level assessment based on limited data, we do not ascribe any particular importance to
compound ranking within or between the two categories of concern with the exception of a few
cases where the quotients are substantially in excess of unity.
Results
Maximum reported VOC concentrations in residences and office buildings were uniformly less
than 1 ppm. Thus, we have focused on those compounds with the highest indicated potencies
(i.e., compounds with effect levels equal to or less than approximately 1 ppm) for the effects
under consideration.
15

Odor Thresholds
Odor thresholds were obtained from Devos et al. for 67 VOCs and from the Cometto-Muñiz
group for 25 VOCs in the Review. The Devos et al. values and the adjusted Cometto-Muñiz et
al. values are listed and compared in Table 1 for the most odorous VOCs in the Review. This
list is dominated by oxygenated compounds (principally carboxylic acids, alcohols, aldehydes,
and ketones) and aromatic hydrocarbons including chlorinated aromatics. OTs are available
from both sources for 16 compounds in the Review. These values are compared on a logarithmic
scale in Figure 1. Substantial differences are apparent. The adjusted Cometto-Muñiz et al. OTs
for acetic acid, hexanoic acid, and formic acid (not plotted, off scale) are more than one order of
magnitude lower than the Devos et al. values, while the adjusted Cometto-Muñiz et al. OTs for
ethylbenzene, p-cymene, butanal and hexanal are more than one order of magnitude higher.
Our selected OT values of interest are given in the right-hand column of Table 1. These
values indicate that the most odorous compounds (i.e., OTs <10 ppb) from the Review are 1-
octanol; the aldehydes 3-methylbutanal, hexanal, heptanal, octanal, and nonanal; acetic acid; and
hexanoic acid. The next decade of odorous compounds (OTs approximately100 ppb, or less)
includes phenol, propionaldehyde, benzaldehyde, naphthalene, dichlorobenzenes and carbon
disulfide.
Sensory Irritation Levels
Forty-three of the VOCs in the Review have reported RD50 values, and 20 have reported NPT
values. Of the 13 VOCs in the Review with both RD50s and NPTs, ten have values, which are
within approximately one order of magnitude of each other. The three exceptions are ethyl
acetate, butanal and pentanal, which are indicated to be less potent in humans. Twenty-six of the
VOCs in the Review have occupational TWA TLVs for which irritation is given as the sole
critical effect or as the primary basis for establishment of the TLV (ACGIH, 2000 and 2001).
OEHHA acute RELs with sensory irritation as the effect also are available for 13 VOCs in the
Review.
16

The adjusted RD50, NPT and TLV concentrations and the acute RELs are listed and
compared in Table 2 for the 14 most potent sensory irritants in the Review. Oxygenated
compounds and chlorinated aromatic hydrocarbons are the only represented chemical categories.
Seven of the VOCs have irritation values derived from more than one source. With the
exception of acrolein, the multiple values for individual compounds are within one order of
magnitude or less of each other. The values selected based on our criteria and their sources are
given on the right side of Table 2. These indicate that acrolein is, by far, the most potent irritant
among the compounds identified by the Review.
For the two most potent reactive compounds, acrolein and formaldehyde, the irritation levels
are lower than their odor thresholds, which is expected. It also is expected that irritation levels
should be higher than odor thresholds for most nonreactive compounds based on the work of the
Cometto-Muñiz group, which has shown odor to be protective of irritation for a number of
different classes of VOCs. This is true for the large majority of the compounds listed in Table 2.
However, for two nonreactive compounds with sensory irritation measures below 1 ppb (2-ethyl-
1-hexanol and 2-furaldehyde), the selected irritation levels are somewhat lower than their odor
thresholds. This inconsistency points to possible uncertainty in one or both measures.
Noncancer Chronic Toxicity Levels
TLVs adjusted to estimate acceptable noncancer chronic exposure levels are available for 38
VOCs in the Review. ATSDR intermediate or chronic inhalation MRLs (23 VOCs), EPA RfCs
(19 VOCs) and OEHHA chronic RELs (27 VOCs) are available for a number of compounds.
Adjusted TLVs and chronic RELs for 20 VOCs are compared on a logarithmic scale in Figure 2.
The values agree within approximately one order of magnitude except for acrolein (not shown,
off scale), naphthalene and tetrachloroethene, which have distinctly lower chronic RELs.
Table 3 lists and compares chronic toxicity levels for the 35 most potent VOCs in the
Review. Aromatic hydrocarbons and halogenated compounds are well represented on this list.
Acrolein is indicated to be the most potent compound. Other compounds with low chronic
17

toxicity levels (i.e., <10 ppb) include, formaldehyde, acetaldehyde, 1,3-butadiene, naphthalene,
1,2,4-trichorobenzene, bromomethane, carbon tetrachloride, tetrachloroethene and acrylonitrile.
Hazard Quotients
The Review summarized maximum concentrations of VOCs measured in existing and new
residences and in office buildings. Table 4 lists the maximum concentrations and calculated
odor quotients by building type for the 38 compounds whose selected OTs are 1 ppm or less.
For a number of the VOCs, their reported maximum concentrations do not approach levels of
concern with respect to odor. VOCs with odor quotients exceeding one, indicating under some
realistic circumstances that building occupants will perceive their presence through olfaction, are
hexanoic acid and the aldehydes hexanal, heptanal, octanal, and nonanal in new residences and
acetic acid in existing and new residences. Compounds in residences and office buildings with
odor quotients in the next decade (i.e., quotients between 0.1 and 1) are 1-butanol, formaldehyde,
acetaldehyde, propionaldehyde, 3-methylbutanal, m/p-xylene, naphthalene, and
1,4-dichlorobenzene. Due to limited building data, a quotient was not determined for the highly
odorous compound, 1-octanol.
Only 11 VOCs whose maximum concentrations in residences and office buildings were
summarized by the Review are considered to be relatively potent sensory irritants. The
maximum concentrations of these compounds are listed by building type along with their
respective sensory irritation quotients in Table 5. Due to its very low sensory irritation value,
acrolein has the singularly highest quotient in residences. Formaldehyde and acetic acid with
quotients near or in excess of unity also are indicated to be of relatively high concern with
respect to sensory discomfort in residences.
Derived 95th percentile concentrations of VOCs measured in existing residences and office
buildings and their corresponding chronic toxicity hazard quotients are listed in Table 6 by
building type for the 28 compounds whose chronic toxicity guidelines are 1 ppm or less. VOCs
with hazard quotients of approximately one or more are formaldehyde, acetaldehyde and
18

acrolein, for which only residential data are available. Of these, acrolein has the singularly
highest hazard quotient. VOCs with hazard quotients within one order of magnitude below unity
are the aromatic hydrocarbons, benzene, toluene and naphthalene and the chlorinated solvent
tetrachloroethene.
Discussion
Limitations of Methodology
The methodology presented here is imperfect due to the shortcomings of the data on which it is
based. The limitations of the indoor VOC database are broadly outlined in the introduction.
Additionally, a number of compounds known or suspected to occur in indoor air have not been
reported in the literature, and potentially important compounds with respect to comfort and
health have not been measured because of the inadequacies of conventional methods. Many
potentially important health effects associated with VOC inhalation exposures are not included in
the analysis. We purposefully did not attempt to assess cancer or reproductive toxicity. Other
serious irreversible effects and less threatening reversible effects have been omitted in part due to
the lack of readily accessible risk data relevant to exposures in the indoor environment. Among
these concerns are lower respiratory effects, allergies, hypersensitivity reactions, and subtle
neurological effects such as headache, drowsiness and memory loss. Even for the effects being
considered, the amount and robustness of the comfort and health data are limited. We have
relied, in part, on occupational studies both directly through the use of TLVs and indirectly
though the use of agency health hazard assessments, which attempt to use human data whenever
possible. Such data most often are obtained from occupational studies. Many of these studies
may be imperfect bases for the establishment of indoor air guidelines. For example,
occupational exposures often occur at exceptionally high concentrations that are inadequately
characterized, and frequently dose-response relationships have not been determined. Studies of
other mammalian species, which form the basis of other health hazard assessments involve the
application of large policy-mandated uncertainty factors to account for unmeasured effects (e.g.,
19

extrapolation to humans from animals, failure to identify a NOAEL, and accommodation of
sensitive populations) that may equal or exceed three orders of magnitude.
Odor
The complexity of the olfactory system makes it impossible to entirely substitute instrumental
measurements for human judgement. Consequently, the cause of odor problems in buildings
often cannot be deduced analytically. For example, a number of VOCs such as alcohols,
unsaturated aldehydes, carboxylic acids and amines may not be detected with sufficient
sensitivity or may be missed entirely by standard techniques (Wolkoff, 2003). Thus, the
calculation of odor quotients based on reported VOC concentrations is a valuable, but very
incomplete assessment of potential odor impacts in buildings. The assessment does show that
most measured VOCs are unlikely to be perceived by olfaction. Among the measured VOCs
with the lowest OTs, there is more probability of detection in residences than in offices. In new
residences particularly, the concentrations of acetic acid, hexanoic acid and higher molecular
weight aldehydes have exceeded OTs. These aldehydes, and probably the carboxylic acids, are
emitted by a variety of composite wood materials that are used in substantial quantities to
construct and finish the interiors of houses (Hodgson et al., 2000). These materials also may
emit unsaturated aldehydes and other oxidized species with even lower OTs. Among non-
oxygenated compounds, less volatile aromatic hydrocarbons and chlorinated aromatic
compounds such as naphthalene and 1,4-dichlorobenzene are the most likely to approach OTs.
Sensory Irritation
Of the small number of relatively potent, measured VOCs, only acrolein, which is emitted by
tobacco and wood smoke, was shown to substantially exceed its irritation level indoors. Daily
average indoor concentrations of HAPs including acrolein were estimated for houses where
smoking occurs using typical values for number of smokers, cigarette consumption rate, house
ventilation rate and house volume (Nazaroff and Singer, Submitted). This exercise predicted an
indoor acrolein concentration of 0.8 ppb, an order of magnitude above the irritation level. Only
20

one study in the Review (Sheldon et al., 1992) reported acrolein concentrations by a method
judged to be reliable (Hodgson and Levin, 2003). A number of the residences in the study had
significant smoking (i.e., more than 20 cigarettes per day), but the data were not presented or
analyzed as a function of smoking. The median concentration was 1.8 ppb, and the maximum
value was 13 ppb (presumably from a smoking residence). Formaldehyde and acetic acid were
the two other measured VOCs that approached or exceeded irritation levels, and only in
residences.
The effect of mixtures of reactive aldehydes such as acrolein and formaldehyde has been
shown in rats to be consistent with competition for a common trigeminal nerve receptor such that
that the response was increased, but less than additive, relative to the individual compounds (i.e.,
competitive agonism) (Cassee et al., 1996). Competitive agonism was also shown for a mixture
of acrolein and formaldehyde in mice (Kane and Alarie, 1978). The receptor binding site is
believed to be a thiol group (Nielsen, 1991). Alarie et al. (1998a and b) used physiochemical
descriptors to separate non-reactive from reactive compounds and to estimate the potency of
non-reactive compounds. For non-reactive chemicals, it is assumed that the mechanism for
stimulation occurs via physical interaction rather than chemical binding with the receptor protein
(Nielsen and Alarie, 1982). Furthermore, it often is assumed that at low concentration the
potency of non-reactive chemicals in a mixture is approximately described by simple additivity
and that there is a threshold below which irritation is unlikely (Alarie et al., 1996). However,
this assumption rarely has been tested. One such study of the additive effects of mixtures
showed that the mixtures increased their stimulus agonism with the increasing number of
components and the increasing lipophilicity of these components suggesting that the effects of
mixtures may not be so easily predicted (Cometto-Muñiz et al., 1997).
The irritant potency of mixtures of non-reactive VOCs (i.e., compounds acting by a common
mechanism) has been estimated using a hazard index, which is the sum of the hazard quotients of
the individual compounds. The potencies of 22 compounds comprising a 25-mg m-3 mixture of
VOCs evaluated for sensory irritation in human exposure studies were predicted using
21

physiochemical variables (Alarie et al., 1996). These estimated RD50s were adjusted downward
by a factor of 1,333 through multiplication by a 0.03 scaling factor to approximate TLV levels
and division by 40 to achieve protection for the general population. The calculated hazard index
was in the range of 7-9, depending upon the method used to estimate the RD50s, indicating
likely sensory irritation with the two predominant compounds (butyl acetate and p-xylene)
contributing 50% of the effect.
VOC concentrations in buildings rarely approach such high levels and yet irritant symptoms
are a common complaint among occupants. Several VOC exposure metrics were developed and
tested for their ability to predict self-reported irritant symptoms among ~500 workers in 12
California office buildings (Ten Brinke et al., 1998). One metric was the sum of irritancy-
weighted individual compounds with RD50 as the measure of irritancy and toluene as the
reference compound. This metric was not effective in predicting irritancy symptoms in a logistic
regression model, suggesting that simple addition of the effects for mixtures of non-reactive
VOCs may not account for irritant symptoms in office buildings. A new metric was developed
using principal component analysis of VOCs selected of their irritancy and associations with
known sources. The metric variously accounts for irritant potencies, the highly correlated nature
of indoor VOC mixtures and the probable presence of highly potent, but unmeasured VOCs.
Eye, skin and irritated mucus membrane symptoms were successfully predicted by the metric.
This result is consistent with a hypothesis, proposed by others, that irritant symptoms are related
to oxidation processes in indoor air involving ozone and possibly nitrogen oxides that produce
potent irritants not detected by standard methods (Wolkoff et al., 1997).
Noncancer Chronic Toxicity
Our limited analysis of noncancer chronic toxicity did not include the identification of the
toxicological endpoint or the type of study and the uncertainty factors applied by agencies to
make their derivations. Careful consideration of the underlying toxicological data may modify
the comparisons among acceptable exposure levels and adjusted TLVs and influence the
22

selection of concentrations of interest. However, the simple comparison and classification
suggest there are only a relatively small number of commonly measured VOCs that, when
considered singly, may be of concern with respect to serious irreversible health effects not
associated with cancer.
Since humans clearly are exposed daily to complex mixtures of VOCs and other air
pollutants in both their residences and other indoor environments, a cumulative risk assessment
should be considered. The common approach for assessing the risks of exposures to mixtures is
to assume dose additivity for chemicals producing a concurrent exposure and acting through a
common mechanism of toxicity. The hazard index method (i.e., summation of the hazard
quotients for the individual compounds) that uses agency-determined reference exposures levels
as the denominators has been criticized because these reference exposures levels are not true
measures of potency (Wilkinson et al., 2000). Other methods have been proposed, but a clear
consensus about how to proceed has yet to be developed (ibid.).
Conclusions
We have presented a methodology for classifying the relative importance of individual VOCs
that commonly occur in indoor air with respect to odor, sensory irritation and noncancer chronic
toxicity. Although both the concentration distribution and the health effects data upon which this
methodology is based are imperfect, only a small number of the more than 100 reported VOCs
were shown to exceed levels that might be of concern with respect to the comfort and health
endpoints considered. A more rigorous ranking of importance among these identified
compounds will require assessments of the populations and number of individuals that are
routinely exposed. At this early assessment stage, we recommend that future studies to
characterize VOC concentrations and exposures in buildings focus their resources on
measurements of those compounds that are most likely to impact occupants as determined by the
objectives of the investigations. The lists of target compounds likely would be relatively small.
In addition to the compounds identified here, other compounds with similar physiochemical
23

properties (e.g., potential sensory irritants such as reactive aldehydes and carboxylic acids)
should be included in monitoring studies. For a very few compounds, such as acrolein and
formaldehyde, the evidence based on sensory irritation and chronic toxicity is sufficient to
warrant efforts to reduce and otherwise control the sources of these compounds in buildings.
Acknowledgements
This work was supported by the Assistant Secretary for Energy Efficiency and Renewable
Energy, Building Technologies Program, U.S. Department of Energy under Contract No. DE-
AC-03-76SF00098. The authors thank Tosh Hotchi of LBNL for assistance with the database.
References ATSDR. 2003. Minimal Risk Levels (MRLs) for Hazardous Substances. Altlanta GA, Agency for
Toxic Substances and Disease Registry. ATSDR web site http://www.atsdr.cec.gov/mrls.html.
Alarie Y. 1966. Irritating properties of airborne materials to the upper respiratory tract. Arch. Environ. Health 13: 433-449.
Alarie Y. 1973. Sensory irritation by airborne chemicals. CRC Crit. Rev. Toxicol. 2: 299-363.
Alarie Y. 1981. A bioassay to evaluate the potency of airborne sensory irritants and predict acceptable levels of exposure in man. Fd. Cosmet. Toxicol. 19: 623-626.
Alarie Y, Nielsen GD and Abraham MH. 1998a. A theoretical approach to the Ferguson principle and its use with non-reactive and reactive airborne chemicals. Pharmacology & Toxicology 83: 270-279.
Alarie Y, Nielsen GD and Schaper MM. 2000. Animal bioassays for evaluation of indoor air quality. In Indoor Air Quality Handbook, Spengler JD, Samet JM and McCarthy JF (Eds.). McGraw-Hill, New York, NY, pp. 23.1-23.49.
Alarie Y, Schaper M, Nielsen GD and Abraham MH. 1996. Estimating the sensory irritating potency of airborne nonreactive volatile organic chemicals and their mixtures. SAR and QSAR in Environmental Research 5: 151-165.
Alarie Y, Schaper M, Nielsen GD and Abraham MH. 1998b. Structure activity relationships of volatile organic chemicals as sensory irritants. Arch. Toxicol. 72: 125-140.
ACGIH. 2001. Documentation of the Threshold Limit Values for Chemical Substances, 7th Ed., Cincinnati OH, American Conference of Governmental Industrial Hygienists.
ACGIH. 2000. 2000 TLVs and BEIs, Threshold Limit Values for chemical substances and physical agents and Biological Exposure Indices, Cincinnati OH, American Conference of Governmental Industrial Hygienists.
24
ASTM. 2000. E981-84(2000) Standard Test Method for Estimating Sensory Irritancy of Airborne Chemicals, West Conshohocken, PA, American Society for Testing and Materials International.
ASHRAE. 1999. Ventilation for acceptable indoor air quality, Atlanta GA, American Society of Heating, Refrigerating, and Air Conditioning Engineers, Inc. (ASHRAE Standard 62-1999).
Andersson K, Bakke JV, Bjørseth O, et al. 1997. TVOC and health in non-industrial indoor environments. Reports from a Nordic scientific consensus meeting at Langholmen in Stockholm, 1996. Indoor Air 7: 78-91.
Brown SK, Sim MR, Abramson MJ and Gray CN. 1994. Concentrations of volatile organic compounds in indoor air – a review. Indoor Air 4: 123-134.
Cal-EPA. 1999. Air Toxics “Hot Spots” Program Risk Assessment Guidelines. Part I. Technical Support Document for the Determination of Acute Reference Exposures Levels for Airborne Toxicants. Office of Environmental Health Hazard Assessment, Air Toxicology and Epidemiology Section, California Environmental Protection Agency, Berkeley, CA. Cal-EPA Air Toxics Hot Spots web site: http://www.oehha.org/air/acute_rels/.
Cal-EPA. 2002. Air Toxics “Hot Spots” Program Risk Assessment Guidelines. Part III. Technical Support Document for the Determination of Chronic Reference Exposures Levels for Airborne Toxicants. Office of Environmental Health Hazard Assessment, Air Toxicology and Epidemiology Section, California Environmental Protection Agency, Berkeley, CA. Cal-EPA Air Toxics Hot Spots web site: http://www.oehha.org/air/chronic_rels/.
Cassee FR, Arts JHE, Groten JP and Feron VJ. 1996. Sensory irritation to mixtures of formaldehyde, acrolein and acetaldehyde in rats. Arch. Toxicol. 70: 329-337.
Cometto-Muñiz, JE. 2000. Physicochemical basis for odor and irritation potency of VOCs. In Indoor Air Quality Handbook, Spengler JD, Samet JM and McCarthy JF (Eds.). McGraw-Hill, New York, NY, pp. 20.1-20.21.
Cometto-Muñiz JE and Cain WS. 1990. Thresholds for odor and nasal pungency. Physiol. Behav. 48: 719-725.
Cometto-Muñiz JE and Cain WS. 1991. Nasal pungency, odor, and eye irritation thresholds for homologous acetates. Pharmacol. Biochem. Behav. 39: 983-989.
Cometto-Muñiz JE and Cain WS. 1993. Efficacy of volatile organic compounds in evoking nasal pungency and odor. Arch. Environ. Health 48: 309-314.
Cometto-Muñiz JE and Cain WS. 1994. Sensory reactions of nasal pungency and odor to volatile organic compounds: the alkylbenzenes. Am. Ind. Hyg. Assoc. J. 55: 811-817.
Cometto-Muñiz JE, Cain WS and Abraham MH. 1998a. Nasal pungency and odor of homologous aldehydes and carboxylic acids. Exp. Brain Res. 118: 180-188.
Cometto-Muñiz JE, Cain WS, Abraham MH and Kumarsingh. 1998b. Trigeminal and olfactory chemosensory impact of selected terpenes. Pharacol. Biochem. Behav. 60: 765-770.
Cometto-Muñiz JE, Cain WS and Hudnell HK. 1997. Agonistic sensory effects of airborne chemicals in mixtures: odor, nasal pungency, and eye irritation. Perception & Psychophysics 59: 665-67.
25

Daisey JM, Hodgson AT, Fisk WJ. Mendell MJ and Ten Brinke J. 1994. Volatile organic compounds in twelve California office buildings: classes, concentrations and sources. Atmos. Environ. 28: 3557-3562.
Devos M, Patte, F, Rouault J, Laffort P and van Gemert LJ (Eds.). 1990. Standardized Human Olfactory Thresholds. IRL Press, Oxford, England.
Hansen LF and Nielsen GD. 1994. Sensory irritation, pulmonary irritation and structure-activity relationships of alcohols. Toxicology 88: 81-99.
Health Canada. 1996. Health-based tolerable daily intakes/concentrations and tumorigenic doses/concentrations for priority substances, Ottawa Ontario, Environmental Health Directorate, Health Protection Branch, Health Canada.
Hodgson AT and Levin H. 2003. Volatile organic compounds in indoor air: a review of concentrations measured in North America since 1990. Report LBNL-51715, Lawrence Berkeley National Laboratory, Berkeley, CA.
Hodgson AT, Rudd AF, Beal D and Chandra S. 2000. Volatile organic compound concentrations and emission rates in new manufactured and site-built houses. Indoor Air 10: 178-192.
Holcomb LC and Seabrook BS. 1995. Indoor concentrations of volatile organic compounds: implications for comfort, health and regulation. Indoor Environment 4: 7-26.
Jenkins PL, Phillips TJ, Mulberg EJ and Hui SP. 1992. Activity patterns of Californians: use of and proximity to indoor pollutant sources. Atmos. Environ. 26A: 2141-2148.
Kane LE and Alarie Y. 1977. Sensory irritation to formaldehyde and acrolein during single and repeated exposures to mice. Am. Ind. Hyg. Assoc. J. 38: 509-522.
Klepeis NE, Nelson WC, Ott WR, et al. 2001. The National Human Activity Pattern Survey (NHAPS): a resource for assessing exposure to environmental pollutants. J. Expos. Anal. Environ. Epidemiol. 11: 231-252.
Lai ACK, Thatcher TL and Nazaroff WW. 2000. Inhalation transfer factors for air pollution health-risk assessments. J. Air Waste Manage. Assoc. 50: 1688-1699.
Liu K-S, Huang F-Y, Hayward SB, Wesolowski J and Sexton K. 1991. Irritant effects of formaldehyde exposure in mobile homes. Environ. Health Perspect. 94: 91-94.
Mendell MJ. 1993. Non-specific symptoms in office workers: a review and summary of the epidemiologic literature. Indoor Air 3: 227-236.
Mendell MJ, Fisk WJ, Deddens JA, et al. 1996. Elevated symptom prevalence associated with ventilation type in office buildings. Epidemiology 7: 583-589.
Mølhave L. 1998. Principles for evaluation of health and comfort hazards caused by indoor air pollution. Indoor Air (Suppl. 4): 17-25.
Mølhave L. 2003. Organic compounds as indicators of air pollution. Indoor Air 13 (Suppl. 6): 12-19.
Morello-Frosch RA, Woodruff TJ, Axelrad DA and Caldwell JC. 2000. Air toxics and health risks in California: the public health implications of outdoor concentrations. Risk Analysis 20: 273-291.
26
Nazaroff WW and Singer BC. Submitted. Inhalation of hazardous air pollutants from environmental tobacco smoke in U.S. residences. J. Exposure Anal. Environ. Epi.
Nielsen GD. 1991. Mechanisms of activation of the sensory irritant receptor by airborne chemicals. CRC Crit. Rev. Toxicol. 21:183-208.
Nielsen GD and Alarie Y. 1982. Sensory irritation, pulmonary irritation, and respiratory stimulation by airborne benzene and alkylbenzenes: prediction of safe industrial exposure levels and correlation with their thermodynamic properties. Toxicol. Appl. Pharmacol. 65: 459-477.
Nielsen GD, Alarie Y, Poulsen OM and Nexø BA. 1995. Possible mechanisms for the respiratory tract effects of noncarcinogenic indoor-climate pollutants and bases for their risk assessment. Scand. J. Work Environ. Health 21: 165-178.
Nielsen GD, Hansen LF, Nexø BA and Poulsen OM. 1998a. Indoor air guideline levels for formic, acetic, propionic and butyric acid. Indoor Air Suppl. 5: 8-24.
Nielsen GD, Hansen LF, Nexø BA and Poulsen OM. 1998b. Indoor air guideline levels for phenol and butylated hydroxytoluene (BHT). Indoor Air Suppl. 5: 25-36.
Nielsen GD, Hansen LF, Nexø BA and Poulsen OM. 1998c. Indoor air guideline levels for 2-ethoxyethanol, 2-(2-ethoxyethoxy)ethanol, 2-(2-butoxyethoxy)ethanol and 1-methoxy-2-propanol. Indoor Air Suppl. 5: 37-54.
Paustenbach DJ. 1997. Methods for setting limits for acute and chronic toxic ambient air contaminants. Appl. Occup. Environ. Hyg. 12: 418-428.
Rodes CE, Kamens RM and Wiener RW. 1991. The significance and characteristics of the personal activity cloud on exposure assessment measurement for indoor contaminants. Indoor Air 1: 123-145.
Schaper, M. 1993. Development of a database for sensory irritants and its use in establishing occupational exposure limits. Am. Ind. Hyg. Assoc. J. 54: 488-544.
Seppänen OA, Fisk WJ and Mendell MJ. 1999. Association of ventilation rates and CO2 concentrations with health and other responses in commercial and institutional buildings. Indoor Air 9: 226-252.
Shah JJ and Singh HB. 1988. Distribution of volatile organic chemicals in outdoor and indoor air. Environ. Sci. Technol. 22: 1381-1388.
Sheldon LS, Clayton A, Jones B, et al. 1991. Indoor Pollutant Concentrations and Exposures. Final report. Sacramento, CA: California Air Resources Board.
Shields HC, Fleischer DM and Weschler CJ. 1996. Comparisons among VOCs measured in three types of U.S. commercial buildings with different occupant densities. Indoor Air 6: 2-17.
Ten Brinke J, Selvin S, Hodgson AT, et al. 1998. Development of new volatile organic compound (VOC) exposure metrics and their relationship to “sick building syndrome” symptoms. Indoor Air 8: 140-152.
U.S. EPA. 1994. EPA Health Effects Notebook for Hazardous Air Pollutants−Draft. Air Risk Information Support Center, Office of Air Quality Planning and Standards, U.S.
27

Environmental Protection Agency, Washington, DC. EPA-452/D-95-00. U.S. EPA Air Toxics web site: http://www.epa.gov/ttn/atw/.
U.S. EPA. 2000. National Air Toxics Program: The Integrated Urban Strategy Report to Congress. Office of Air Quality Planning and Standards, U.S. Environmental Protection Agency, Research Triangle Park, NC. U.S. EPA Air Toxics web site: http://www.epa.gov/ttn/atw/nata/.
U.S. EPA. XXXX. Integrated Risk Information System. Office of Research and Development, National Center for Environmental Assessment, U.S. Environmental Protection Agency, Washington, DC. U.S. EPA IRIS web site: http://www.epa.gov/iriswebp/iris/.
Wallace LA. 1987. The Total Exposure Assessment Methodology (TEAM) Study: Summary and Analysis: Volume I. EPA/600/6-87/002a. Washington, DC: Office of Research and Development, US EPA.
Wilkinson CF, Christoph GR, Julien E, et al. 2000. Assessing the risks of exposures to multiple chemicals with a common mechanism of toxicity: how to cumulate? Regulatory Toxicology and Pharmacology 31: 30-43.
Wolkoff P, Clausen PA, Jensen B, Nielsen GD and Wilkins CK. 1997. Are we measuring the relevant indoor pollutants? Indoor Air 7: 92-106.
Wolkoff P, Clausen PA, Wilkins CK and Nielsen GD. 2000. Formation of strong airway irritants in terpene/ozone mixtures. Indoor Air 10:82-91.
Wolkoff P and Nielsen GD. 2001. Organic compounds in indoor air – their relevance for perceived indoor air quality. Atmos. Environ. 35: 4407-4417.
Wolkoff P. 2003. Trends in Europe to reduce the indoor pollution of VOCs. Indoor Air 13 (Suppl. 6): 5-11.
Woodruff TJ, Axelrad DA, Caldwell J, Morello-Frosch RA and Rosenbaum AS. 1998. Public health implications of 1990 air toxic concentrations across the United States. Environ. Health Perspect. 106: 245-251.
28

Table 1. Odor thresholds (OTs) for VOCs measured in residences and office buildings. Values reported by Cometto-Muñiz et al. are adjusted downward by one order of magnitude to estimate 50% OT detection. Only compounds with selected OTs less than or equal to 1000 ppb are shown. Selected OTs of interest that are less than 10 ppb are indicated in bold text.
Odor Threshold (ppb) Chem. Cometto- Value of Compound Classa Devos et al.b Muñizc/10 Interestd 1-Butanol Alc 490 200 200 Phenol Alc 110 110 2-Ethyl-1-hexanol Alc 240 240 1-Octanol Alc 5.8 0.7 0.7 2-Butoxyethanol Gly 340 340 4-Methyl-2-pentanone Ket 540 540 Cyclohexanone Ket 710 710 1-Phenylethanone Ket 360 360 Formaldehyde Ald 870 870 Acetaldehyde Ald 190 190 Propionaldehyde Ald 27 27 Acrolein Ald 170 170 Butanal Ald 8.9 320 320 3-Methylbutanal Ald 2.2 2.2 Pentanal Ald 6.0 500 500 Hexanal Ald 14 7.9 7.9 Heptanal Ald 4.8 3.2 3.2 2-Furaldehyde Ald 780 780 Octanal Ald 1.4 0.4 0.4 Benzaldehyde Ald 42 42 Nonanal Ald 2.2 2.2 Butyl acetate Estr 200 240 240 Formic acid Acid 28000 790 790 Acetic acid Acid 140 1.0 1.0 Hexanoic acid Acid 13 0.5 0.5 n-Decane Alka 740 740 β-Pinene Terp 1000 1000 d-Limonene Terp 440 790 790 p-Cymene Terp 2.1 130 130 m/p-Xylene Arom 320 320 o-Xylene Arom 850 850 Styrene Arom 140 140 Isopropylbenzene Arom 24 100 100 Propylbenzene Arom 320 320 1,3,5-Trimethylbenzene Arom 230 230 1,2,4-Trimethylbenzene Arom 160 160
29

Table 1. Continued.
Odor Threshold (ppb) Chem. Cometto- Value of Compound Classa Devos et al.b Muñizc/10 Interestd Naphthalene Arom 15 15 1,4-Dichlorobenzene ClAro 48 48 1,2-Dichlorobenzene ClAro 72 72 Carbon disulfide Misc 96 96 Pyridine Misc 85 130 130
a. Alc = alcohol, Gly = glycol ether, Ket = ketone, Ald = aldehyde, Estr = ester, Acid = carboxylic acid, Alka = alkane hydrocarbon (HC), Terp = terpene HC, Arom = aromatic HC, ClAro = chlorinated aromatic HC, Misc = miscellaneous chemical classes
b. Values from Devos et al. (1990) are assumed to represent 50% odor detection c. Values reported between 1990 and 1998 by Cometto-Muñiz et al. (see text) and
summarized by Cometto-Muñiz (2001) are divided by 10 to estimate 50% OT detection
d. If available, values reported by Cometto-Muñiz et al. and adjusted for 50% detection are selected as OTs of interest
30

Table 2. Sensory irritation thresholds (ITs) for VOCs measured in residences and office buildings. Mouse RD50 values and human nasal pungency thresholds (NPTs) are adjusted downward by 1.5 orders of magnitude (see text). Threshold Limit Values (TLVs) with irritation as the primary effect are adjusted downward by one order of magnitude to account for more sensitive populations. Only compounds with selected ITs less than or equal to 1000 ppb are shown.
Concentration (ppb) Chem. RD50/ NPT/ TLV/ Acute Value of Compound Classa 316 316 10 RELb Interestc Basis 2-Ethyl-1-hexanol Alc 140 140 RD50 1-Octanol Alc 150 310 310 NPT Butylated hydroxytoluene Alc 22 22 TLV 1,4-Dioxane Ethr 830 830 REL 1-Phenylethanone Ket 320 1000 1000 TLV Formaldehyde Ald 13 30d 77 77 REL Acrolein Ald 6.6 10d 0.08 0.08 REL 2-Furaldehyde Ald 910 200 200 TLV Diethyl phthalate Estr 55 55 TLV Formic acid Acid 1000 500 1000 NPT Acetic acid Acid 1200 130 1000 130 NPT 1,4-Dichlorobenzene ClAro 570 570 RD50 1,2-Dichlorobenzene ClAro 570 570 RD50 1,2,4-Trichlorobenzene ClAro 500 500 TLV
a. Defined in Table 1 b. Cal-EPA (1999) acute Reference Exposure Level c. Selection order for IT values of interest: 1) acute REL, 2) adjusted NPT, 3) adjusted TLV,
and 4) adjusted mouse RD50 d. TLV is ceiling value
31

Table 3. Agency determined and estimated acceptable non-cancer, chronic exposure levels for VOCs measured in residences and office buildings. Threshold Limit Values (TLVs) for which primary effect is not cancer or irritation only are adjusted downward by a factor of 200 (see text). Only compounds with selected chronic exposure levels less than or equal to 1000 ppb are shown. Selected values of interest less than 10 ppb are indicated in bold text.
Concentration (ppb) Chem. TLV/ ATSDR EPA Chronic Value of Compound Classa 200 MRLb RfCc RELd Intereste Basis 1-Butanol Alc 100 100 TLV Phenol Alc 25 52 52 REL 1,4-Dioxane Ethr 100 830 830 REL Ethylene glycol Gly 160 160 REL 2-Butoxyethanol Gly 100 200, C 270 200 MRL 2-Butanone Ket 1000 340 340 RfC 4-Methyl-2-pentanone Ket 250 720 720 RfC Cyclohexanone Ket 120 120 TLV Formaldehyde Ald 1.5 8, C 2.4 2.4 REL Acetaldehyde Ald 5.0 5.0 5.0 REL Acrolein Ald 0.50 0.009, I 0.01 0.03 0.03 REL n-Nonane Alka 1000 1000 TLV 1,3-Butadiene Alke 0.9 9.0 9.0 REL Benzene Arom 4, I 9.4 19 19 REL Toluene Arom 250 80, C 110 80 80 REL Ethylbenzene Arom 500 1000, I 230 460 460 REL Xylenes (combined) Arom 100, C 23 160 160 REL Styrene Arom 100 60, C 240 210 210 REL Isopropylbenzene Arom 250 81 81 RfC 1,3,5-Trimethylbenzene Arom 120 120 TLV 1,2,4-Trimethylbenzene Arom 120 120 TLV 1,2,3-Trimethylbenzene Arom 120 120 TLV Naphthalene Arom 50 2, C 0.6 1.7 1.7 REL Chlorobenzene ClAro 50 220 220 REL 1,4-Dichlorobenzene ClAro 50 100, C 130 130 130 REL 1,2-Dichlorobenzene ClAro 120 120 TLV Vinyl chloride Halo 30, I 39 30 MRL Bromomethane Halo 5.0 5, C 1.3 1.3 1.3 REL Dichloromethane Halo 250 300, C 120 120 REL Chloroform Halo 50 20, C 61 61 REL 1,1,1-Trichloroethane Halo 1800 700, I 180 180 REL Carbon tetrachloride Halo 25 50, I 6.4 6.4 REL 1,2-Dichloroethane Halo 50 600, I 99 99 REL
32

Table 3. Continued.
Concentration (ppb) Chem. TLV/ ATSDR EPA Chronic Value of Compound Classa 200 MRLb RfCc RELd Intereste Basis Trichloroethene Halo 250 100, I 110 110 REL Tetrachloroethene Halo 120 40, C 5.2 5.2 REL Carbon disulfide Misc 50 300, C 220 260 260 REL Acrylonitrile Misc 0.9 2.3 2.3 REL Pyridine Misc 25 25 TLV
a. Defined in Table 1 b. ASTDR (2003) Minimal Risk Level for inhalation exposures of intermediate (I, >14-364
days) or chronic (C, 365 days and longer) duration c. U.S. EPA (XXXX) Inhalation Reference Concentration d. Cal-EPA (2002) noncancer chronic Reference Exposure Level e. Selection order for chronic exposure levels of interest: 1) REL, 2) lowest RfC or MRL, and
3) adjusted TLV
33

Table 4. Maximum VOC concentrations measured in existing residences, new residences and office buildings, and odor quotients (OQs) calculated for each compound as maximum concentration divided by selected odor threshold of interest from Table 1. OQs exceeding or within one order of magnitude of unity are indicated in bold text.
Maximum Conc. (ppb) Odor Quotient Chem. Exist. New Office Exist. New Office Compound Class* Res. Res. Build. Res. Res. Build. 1-Butanol Alc 21 5.0 0.11 0.03 Phenol Alc 5.8 2.5 0.05 0.02 2-Ethyl-1-hexanol Alc 9.0 0.04 2-Butoxyethanol Gly 12 14 0.04 0.04 4-Methyl-2-pentanone Ket 6.8 0.01 1-Phenylethanone Ket 2.8 0.01 Formaldehyde Ald 180 62 0.21 0.07 Acetaldehyde Ald 16 43 0.08 0.23 Propionaldehyde Ald 5.6 19 0.21 0.70 Acrolein Ald 13 0.08 Butanal Ald 2.4 2.0 0.01 0.01 3-Methylbutanal Ald 1.2 0.55 Pentanal Ald 2.0 9.8 1.3 0.02 Hexanal Ald 36 2.4 4.6 0.30 Heptanal Ald 4.9 1.5 2-Furaldehyde Ald 1.5 Octanal Ald 7.2 18 Benzaldehyde Ald 1.3 3.7 1.5 0.03 0.09 0.04 Nonanal Ald 7.6 1.4 3.5 0.64 Butyl acetate Estr 14 3.9 0.06 0.02 Formic acid Acid 19 0.02 Acetic acid Acid 81 280 81 280 Hexanoic acid Acid 5.5 11 n-Decane Alka 13 22 5.8 0.02 0.03 0.01 β-Pinene Terp 26 0.03 d-Limonene Terp 12 12 0.02 0.02 m/p-Xylene Arom 67 11 10 0.21 0.03 0.03 o-Xylene Arom 14 4.4 3.5 0.02 0.01 0.01 Styrene Arom 5.5 7.8 12 0.04 0.06 0.09 Isopropylbenzene Arom 1.2 0.01 Propylbenzene Arom 3.5 0.01 1,3,5-Trimethylbenzene Arom 6.5 1.1 0.03 0.01 1,2,4-Trimethylbenzene Arom 2.9 0.02 Naphthalene Arom 0.95 1.9 0.06 0.13
34

Table 4. Continued.
Maximum Conc. (ppb) Odor Hazard Quotient Chem. Exist. New Office Exist. New Office Compound Class* Res. Res. Build. Res. Res. Build. 1,4-Dichlorobenzene ClAro 26 7.0 0.54 0.15 1,2-Dichlorobenzene ClAro 0.09 0.54 2.2 0.01 0.03 Carbon disulfide Misc 5.8 0.06 Pyridine Misc 2.0 0.02
*Defined in Table 1
35

Table 5. Maximum VOC concentrations measured in existing residences, new residences and office buildings, and sensory irritation quotients (SIQs) calculated for each compound as maximum concentration divided by selected irritation threshold of interest from Table 2. SIQs exceeding or within one order of magnitude of unity are indicated in bold text.
Maximum Conc. (ppb) Sensory Irritation Quotient Chem. Exist. New Office Exist. New Office Compound Class* Res. Res. Build. Res. Res. Build. 2-Ethyl-1-hexanol Alc 9.0 0.06 1,4-Dioxane Ethr 39 0.05 1-Phenylethanone Ket 2.8 0.03 Formaldehyde Ald 180 62 2.3 0.81 Acrolein Ald 13 160 2-Furaldehyde Ald 1.5 0.01 Formic acid Acid 19 0.02 Acetic acid Acid 81 280 0.62 2.2 1,4-Dichlorobenzene ClAro 26 7.0 0.05 0.01 1,2-Dichlorobenzene ClAro 0.09 0.54 2.2 <0.01 <0.01 <0.01 1,2,4-Trichlorobenzene ClAro 0.16 <0.01
*Defined in Table 1
36

Table 6. Central tendency VOC concentrations measured in existing residences and office buildings, derived 95th percentile concentrations (see text), and non-cancer chronic toxicity quotients (CTQs) calculated for each compounds as 95th percentile concentration divided by selected chronic exposure levels from Table 3. CTQs exceeding or within one order of magnitude of unity are indicated in bold text.
Concentration (ppb) Chronic Toxicity Central Tendency Derived 95%ile Quotient Chem. Exist. Office Exist. Office Exist. Office Compound Class* Res. Build. Res. Build. Res. Build. 2-Butoxyethanol Gly 0.65 3.6 0.02 1,4-Dioxane Ethr 0.03 0.11 <0.01 Formaldehyde Ald 17 61 26 Acetaldehyde Ald 3.0 11 2.2 Acrolein Ald 1.8 6.5 217 n-Nonane Alka 0.25 0.36 0.90 1.3 <0.01 <0.01 1,3-Butadiene Alke 0.23 0.83 0.09 Benzene Arom 0.90 1.0 3.2 3.6 0.17 0.19 Toluene Arom 3.3 2.1 12 7.6 0.15 0.09 Ethylbenzene Arom 0.53 0.48 1.9 1.7 <0.01 <0.01 m/p-Xylene Arom 1.3 1.4 4.7 5.1 0.03 0.03 o-Xylene Arom 0.51 0.66 1.8 2.4 0.01 0.01 Styrene Arom 0.23 0.40 0.83 1.4 <0.01 <0.01 Isopropylbenzene Arom 0.07 0.25 <0.01 1,3,5-Trimethylbenzene Arom 0.25 0.38 0.90 1.4 0.01 0.01 1,2,4-Trimethylbenzene Arom 0.79 0.88 2.9 3.2 0.02 0.03 1,2,3-Trimethylbenzene Arom 0.20 0.29 0.72 1.0 0.01 0.01 Naphthalene Arom 0.09 0.32 0.19 1,4-Dichlorobenzene ClAro 0.09 0.03 0.32 0.11 <0.01 <0.01 Vinyl chloride Halo 0.01 0.04 <0.01 Dichloromethane Halo 1.4 0.40 5.1 1.4 0.04 0.01 Chloroform Halo 0.22 0.79 0.01 1,1,1-Trichloroethane Halo 0.35 1.6 1.3 5.8 0.01 0.03 Carbon tetrachloride Halo 0.09 0.32 0.05 1,2-Dichloroethane Halo 0.01 0.04 <0.01 Trichloroethene Halo 0.07 1.8 0.25 6.5 <0.01 0.06 Tetrachloroethene Halo 0.14 0.47 0.51 1.7 0.10 0.33 Pyridine Misc 0.17 0.61 0.02
*Defined in Table 1
37
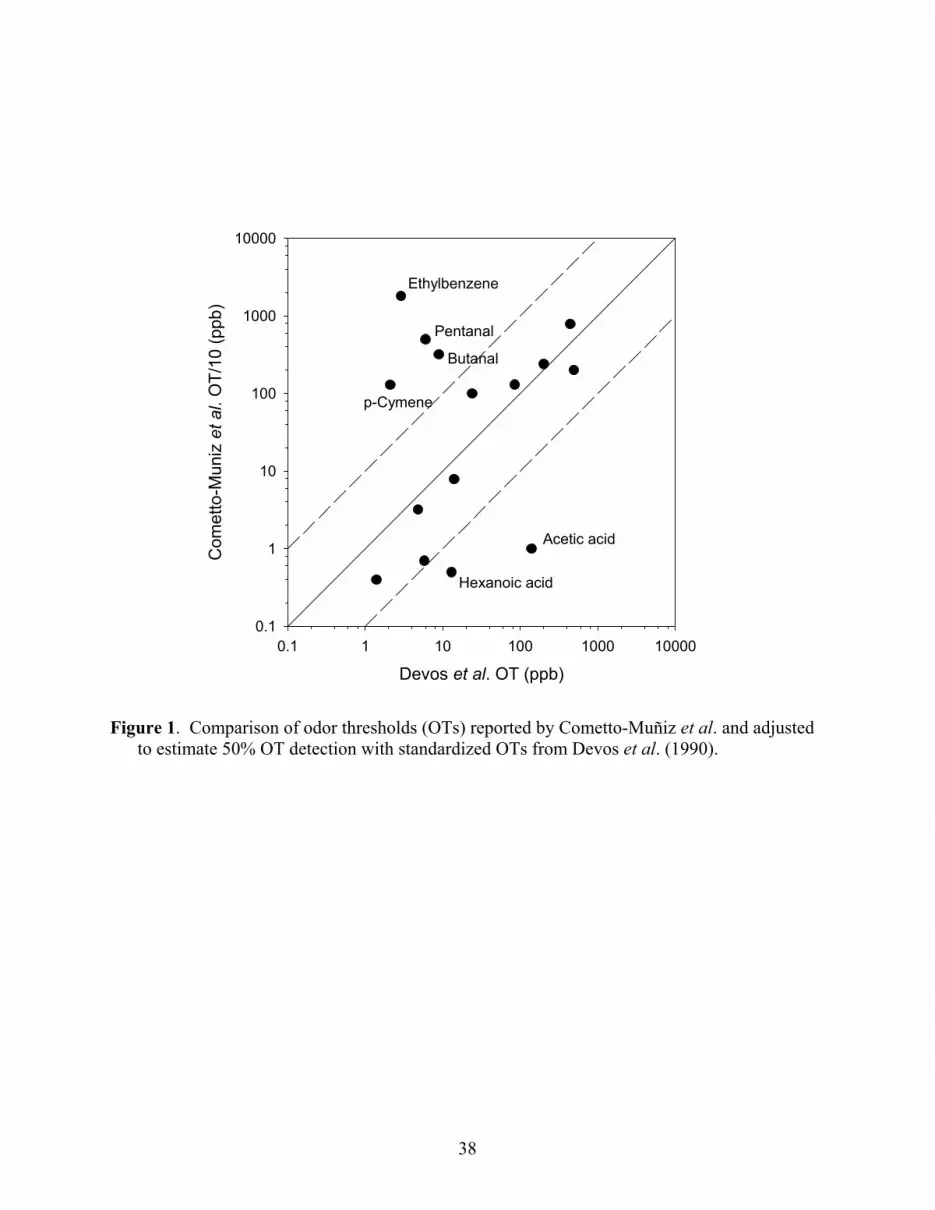
Figure 1. Comparison of odor thresholds (OTs) reported by Cometto-Muñiz et al. and adjusted
to estimate 50% OT detection with standardized OTs from Devos et al. (1990).
Devos et al. OT (ppb)0.1 1 10 100 1000 10000
Com
etto
-Mun
iz e
t al.
OT/
10 (p
pb)
0.1
1
10
100
1000
10000
p-Cymene
Butanal
Pentanal
Hexanoic acid
Acetic acid
Ethylbenzene
38

Figure 2. Comparison of ACGIH Threshold Limit Values (TLVs) for which primary effect is
not cancer or irritation only and adjusted to accommodate continuous exposure of the general population with Cal-EPA noncancer chronic Reference Exposure Levels (RELs).
Chronic REL (ppb)1 10 100 1000 10000
TLV/
200
(ppb
)
1
10
100
1000
10000
Naphthalene
Tetrachloroethene
39