Embed Size (px)
Citation preview

RIVER RESEARCH AND APPLICATIONS
River Res. Applic. 18: 31–42 (2002)
DOI: 10.1002/rra.635
CLASSIFICATION OF REACHES IN THE MISSOURI AND LOWERYELLOWSTONE RIVERS BASED ON FLOW CHARACTERISTICS
MARK A. PEGG* AND CLAY L. PIERCEUS Geological Survey, Biological Resources Division, Iowa Cooperative Fish and Wildlife Research Unit, Department of Animal
Ecology, Iowa State University, Ames, IA, USA
ABSTRACT
Several aspects of flow have been shown to be important determinants of biological community structure and functionin streams, yet direct application of this approach to large rivers has been limited. Using a multivariate approach, wegrouped flow gauges into hydrologically similar units in the Missouri and lower Yellowstone Rivers and developed amodel based on flow variability parameters that could be used to test hypotheses about the role of flow in determiningaquatic community structure. This model could also be used for future comparisons as the hydrological regime changes.A suite of hydrological parameters for the recent, post-impoundment period (1 October 1966–30 September 1996) foreach of 15 gauges along the Missouri and lower Yellowstone Rivers were initially used. Preliminary graphical explorationidentified five variables for use in further multivariate analyses. Six hydrologically distinct units composed of gaugesexhibiting similar flow characteristics were then identified using cluster analysis. Discriminant analyses identified the threemost influential variables as flow per unit drainage area, coefficient of variation of mean annual flow, and flow constancy.One surprising result was the relative similarity of flow regimes between the two uppermost and three lowermost gauges,despite large differences in magnitude of flow and separation by roughly 3000 km. Our results synthesize, simplifyand interpret the complex changes in flow occurring along the Missouri and lower Yellowstone Rivers, and provide anobjective grouping for future tests of how these changes may affect biological communities. Copyright 2002 JohnWiley & Sons, Ltd.
KEY WORDS: human alteration; hydrology; multivariate analyses; river ecology
INTRODUCTION
Management of flow in regulated rivers and streams typically focuses on maintaining maximum, minimum andmean flows in direct response to flood control, navigation, hydropower generation, irrigation and other humandemands (Poff et al., 1997). However, when evaluating responses of biological communities to differencesin flow, it may be necessary to take a more refined approach to analyzing hydrological data (Church, 1995).Several stream flow variables have been used to describe the physical environment of streams and howorganisms respond to these factors (Schlosser, 1985; Statzner and Higler, 1986; Bain et al., 1988; Poff andWard, 1989; Poff, 1992; Townsend and Hildrew, 1994). Indeed, several studies have reported that hydrologicalfactors, specifically flow variability, can influence aquatic community structure (Horwitz, 1978; Coon, 1987;Bain et al., 1988; Fausch and Bramblett, 1991; DiMaio and Corkum, 1995; Poff and Allan, 1995) and thatthis variability can occur at different temporal scales (e.g. seasonally or annually; Townsend and Hildrew,1994).
Because of the many ways that magnitude and variability of flow can be characterized (Poff and Ward,1989), analyzing flow variables using a multivariate approach is an effective means to determine similari-ties or differences among and/or within lotic systems. Hydrologically similar reaches can be grouped intohomogeneous units where they can then be used as a basis for testing whether hydrology influences the biolog-ical community among the units. When relating characteristics of the biological community to hydrologicalconditions, it is necessary that these groupings are objectively determined and made a priori to assessment.
* Correspondence to: Mark A. Pegg, Illinois Natural History Survey, Illinois River Biological Station, 704 North Schrader, Havana,Illinois 62644, USA. E-mail: [email protected]
Copyright 2002 John Wiley & Sons, Ltd.
Received 3 July 2000Revised 15 November 2000Accepted 12 January 2001

32 M. A. PEGG AND C. L. PIERCE
Most previous studies characterizing and grouping lotic reaches by flow regime have focused primarilyon small-order streams. Poff and Ward (1989) characterized and classified 78 streams (mean annual flows<30 m3 s−1) located across the United States using a suite of variables calculated from daily and peak flowvalues for each stream. They speculated on the biological significance of these different hydrological regimes,and Poff and Allan (1995) subsequently confirmed several predictions for fish communities in small andmedium sized streams.
Classification of reaches exhibiting similar hydrological conditions within a system also has potential(Richter et al., 1998). This may be especially important in assessing hydrological conditions in larger rivers,which are limited in number but may exhibit great variation in flow conditions from headwaters to mouth.Many large rivers, such as the Missouri, have undergone modification (e.g. impoundment and channelization)to support human demands that can influence flow characteristics (Nilsson et al., 1991; Hesse and Mestl,1993; Poff et al., 1997; Parasiewicz et al., 1998; Pegg, 2000). The result could potentially be several uniquehydrological areas within one large river system. Furthermore, many of these changes may not necessarilybe simple, linear functions of the longitudinal increase in drainage area and discharge.
The Missouri River is the longest river in the United States stretching 3768 km from western Montana to itsconfluence with the Mississippi River in Missouri (Figure 1). In addition to its great length, the Missouri Riversystem also drains about one-sixth of the total area of the United States (Berner, 1951). Prior to channelizationand impoundment in the early to mid-1900s, the Missouri River was characterized as a meandering, turbidriver laden with islands (Funk and Robinson, 1974). After channelization, however, the Missouri River belowSioux City, Iowa, was changed into a fairly narrow and swift flowing river, resulting in a shortening of thechannel by 125 km and reduction of the wetted area by nearly 64% (Whitley and Campbell, 1974). Likewise,the construction of six major reservoirs in the middle reaches of the river has changed water quality aboveand below the dams (Morris et al., 1968) and altered the hydrology of the river (Hesse and Mestl, 1993).These major alterations have essentially divided the Missouri River into three zones, an upper zone upstreamfrom the major alterations, a middle zone with short free-flowing reaches between reservoirs, and a zonedownstream of the impoundments which is entirely channelized except for the reach between Yankton, SouthDakota and Sioux City, Iowa (Figure 1).
Figure 1. Location of the 15 flow gauges (�) used on the Missouri and lower Yellowstone Rivers to identify flow variability units.Inset shows location of the Missouri and Yellowstone River basins within the United States
Copyright 2002 John Wiley & Sons, Ltd. River Res. Applic. 18: 31–42 (2002)

CLASSIFICATION OF MISSOURI RIVER REACHES 33
The objective of this study was to identify hydrologically similar reaches from the Missouri and lowerYellowstone Rivers using a suite of variables calculated from daily mean flow values. These results providean objective grouping of river reaches for future tests of how these differences affect biological communities.
METHODS
Long-term discharge records are available for several gauges along the mainstem Missouri and lower Yellow-stone Rivers from the United States Geological Survey (USGS) via electronic media. These gauges yielda point measure for a given reach, providing insight into the general conditions within that river reach.For purposes of this study, we used the 15 gauges (Figure 1) with complete flow data from water year(October–September) 1967 to 1996. These dates define the years after closure of the impoundments alongthe mainstem Missouri River and therefore generally reflect the current, post-impoundment hydrologicalregime (Galat and Lipkin, 2000; Pegg, unpublished data). We also included a site on the lower YellowstoneRiver (Sydney, Montana) because it is a large tributary (discharge greater than the Missouri River at theirconfluence) that has undergone a limited amount of alteration (Benke, 1990). Thus, in terms of flow alteration,the lower Yellowstone River is similar to the Missouri River above Fort Peck Reservoir (Figure 1). Inclusionof this site provided further information from a relatively pristine zone for comparisons of flow variability withthe more heavily human-influenced downstream zones of the Missouri River. We did not use gauges locatedwithin water storage areas of impoundments because we wanted to focus solely on riverine flow variability.
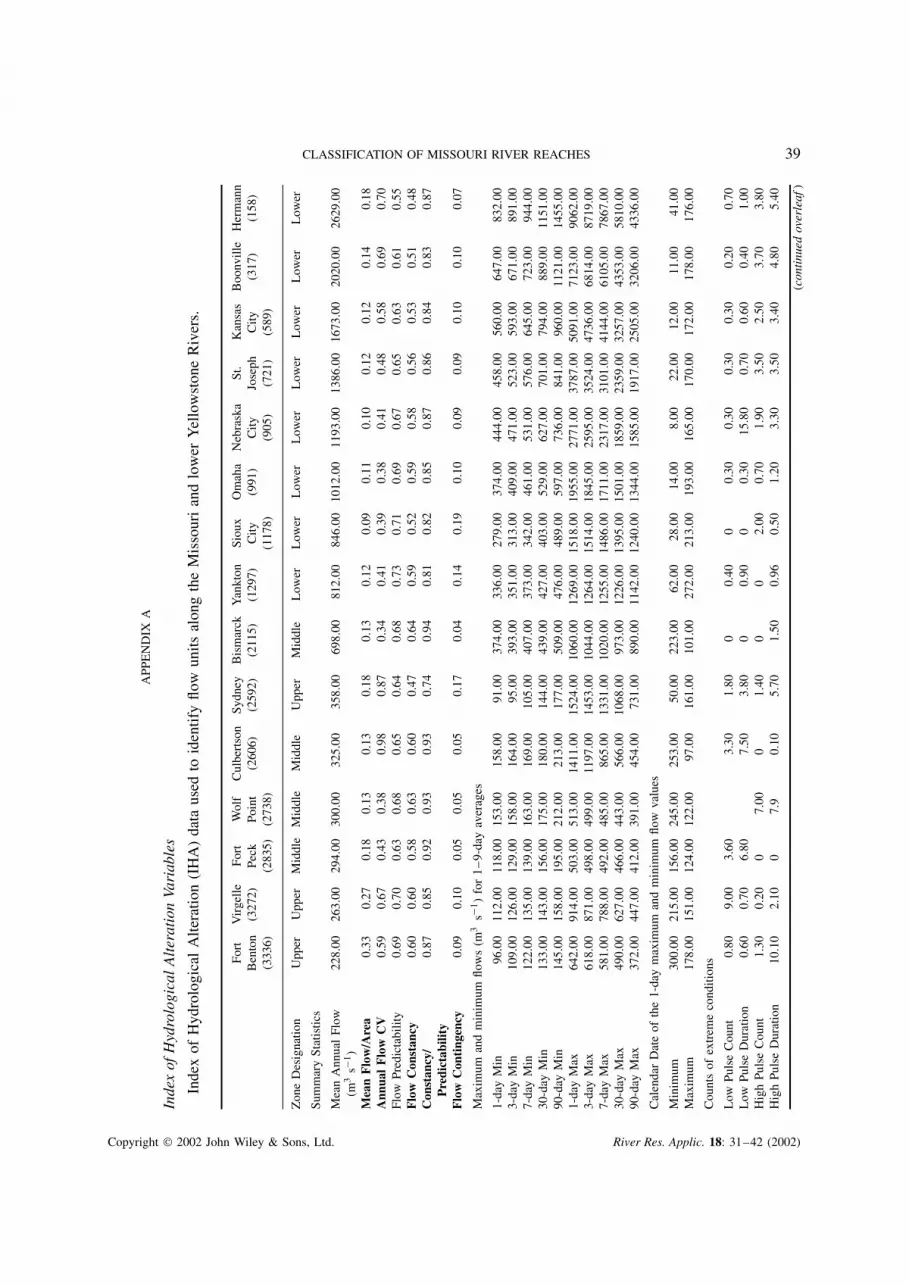
A suite of hydrological variables was calculated for each gauge from mean daily flow data using theIndicators of Hydrologic Alteration (IHA) methodology (Richter et al., 1996). Resulting data from the IHAcalculations were reported by Galat and Lipkin (2000) for eleven of the fifteen gauges reported here. Wecalculated the IHA variables for the remaining gauges using the IHA software (Nature Conservancy, 1997).This suite of variables provides information on flow conditions (e.g. variability, predictability, magnitude)at each gauge over the period of record. The IHA method places each of these variables into one of fivecategories: (1) monthly flows, which focuses on the mean monthly flows; (2) magnitude and duration ofextremes, giving insight into the extent and duration of both high and low flow extremes; (3) time of extremeevents, giving the mean date of the extreme events; (4) characteristics of flow pulses, providing informationon the number and length of flow extremes; and (5) rate of change, which gives the rate and mean number ofchanges in flow conditions (e.g. rising or falling) from day to day (Richter et al., 1996). Several other variablesthat further summarize conditions over the entire period of record are included in these flow summaries. Flowper unit drainage area is the ratio of daily mean discharge at the gauge to the watershed area above the gaugeover all years. Coefficient of variation for mean annual flow is a dimensionless parameter that represents theratio of standard deviation of the mean daily flow to its mean. Flow predictability is the measure of variationamong successive periods (Colwell, 1974) and ranges from zero to one where high predictability valuesindicate low variability. Predictability is comprised of two components: (1) flow contingency and (2) flowconstancy. Flow contingency is a measure of periodicity, meaning that flows can vary quite dramaticallyyet still have a high flow predictability score if similar flows occur at a consistent periodicity. Conversely,relatively stable flows would also have high predictability, but the major component would be constancyrather than contingency. See Colwell (1974) and Poff and Ward (1989) for further explanation and rationaleof these variables.
The large number of variables calculated for a relatively small number of gauges precluded immediateapplication of some common multivariate procedures so we attempted to identify a meaningful subset ofvariables that would describe flow characteristics for each gauge. A common problem with having multiple,independent variables is that identification of variables to delineate the data is difficult and has typicallybeen limited to pairwise comparisons of many variables (Swayne et al., 1998). Assessing multivariate databeyond these types of comparisons has been hindered due to the inability to identify relations beyond thistwo-dimensional perspective. Recent innovations in computer aided visualization have helped remedy thisproblem by going beyond pairwise comparisons via interactive data exploration analyses (Swayne et al., 1998).Therefore, we used a high dimensional, graphical data exploration application (XGobi) to identify and interpret
Copyright 2002 John Wiley & Sons, Ltd. River Res. Applic. 18: 31–42 (2002)

34 M. A. PEGG AND C. L. PIERCE
variables that could be useful in further analyses (Swayne et al., 1998). XGobi was specifically designedfor interactive, multivariate data visualization and provides n-dimensional plots to assist with exploratoryanalyses and identification of patterns in the data. Specifically, this application provided a graphical meansto simultaneously assess relations among many variables beyond two or three dimensions. Through thisvisualization process, we were able to identify several variables that appeared to distinguish among gaugesthat could be used for multivariate analyses.
Multivariate analysis of the IHA variables followed two steps. In the first step, we placed the most closelylinked gauges into common flow variability units using cluster analysis (SAS, 1987). There are several methodsof clustering available and there is no generally accepted optimal method (Manly, 1994). However, becausewe had no reason to assume equal sample sizes within each cluster, we used the centroid method to avoidundue bias (SAS, 1987). Euclidean distances for all gauges were established using the variables identifiedin the data exploration stage. We then determined meaningful cluster breaks using a minimum thresholdcriterion from the distance between two clusters (Sharma, 1996). Distances greater than the threshold wereconsidered to indicate distinct units. The resulting flow variability units were then considered to be relativelyhomogenous.
The second step determined which variables accounted for the most variation among these units. We initiallyused stepwise discriminant analysis to identify which variables best discriminated among the groupings fromthe cluster analysis. Once these variables were ascertained, we then used discriminant analysis to determine themis-classification rate using only the most descriptive variables. Determination of mis-classification providesinsight into the validity of groups based upon the empirical data used in defining the groups (Sharma, 1996).Because the number of gauges was relatively small in our data set, we were not able to split the data intoa training data set, used to establish classification criteria, and then apply those criteria to a test data setor use cross-validation techniques to estimate our mis-classification rate. Therefore, we used a randomizedresubstitution of gauges into different groups (gauges were randomly assigned to groups) to ensure that thefinal variables did not provide significant discrimination by chance alone (Manly, 1994).
RESULTS
Our initial attempts to reduce the number of descriptive variables through data exploration techniques quicklyidentified several variables that were not well suited for grouping the 15 gauges (Appendix A). Nearly allof the variables that specifically dealt with central tendencies of the flow values (e.g. mean annual flow,mean monthly flow, etc.) were strongly correlated with watershed size. Furthermore, the location of gaugesin longitudinal sequence along the Missouri River resulted in pronounced serial autocorrelation among thesevariables. Hence, we removed those variables that were directly influenced by watershed size (increasingtrend moving downstream). Further graphical exploration of this data subset indicated that six variables couldbe used to identify hydrologically different reaches of the Missouri and lower Yellowstone Rivers: flow perunit area, coefficient of variation of annual flow, flow predictability, flow contingency, flow constancy, andthe ratio of flow constancy to flow predictability. Flow predictability is the sum of flow contingency and flowconstancy and not truly an independent measure so we omitted this variable from further analyses.
From these five flow variables, we identified six hydrologically distinct flow variability units from thecluster analysis: (1) inter-reservoir I; (2) upper channelized; (3) lower channelized; (4) upper unchannelized;(5) inter-reservoir II; and (6) unchannelized Yellowstone (Figure 2). Units often clustered more closely withdistant rather than adjacent units (Figures 2 and 3). Interestingly, although they include the most spatiallydistant gauges, the upper unchannelized and lower channelized units clustered closer to each other than tounits consisting of nearby gauges.
Stepwise discriminant analysis indicated that three of the original five variables significantly contributed toclustering the gauges into similar hydrological units (Figure 3). Univariate F -tests identified the contributingvariables as coefficient of variation for mean annual flow (F = 41.2; p = 0.0001), flow per unit area(F = 15.25; p = 0.0007); and flow constancy (F = 4.2; p = 0.05) and pairwise correlations among thesethree variables were generally low and not statistically significant (p > 0.10). Our discriminant analysis
Copyright 2002 John Wiley & Sons, Ltd. River Res. Applic. 18: 31–42 (2002)

CLASSIFICATION OF MISSOURI RIVER REACHES 35
Figure 2. Flow variability unit groupings of the 15 gauges used in cluster analysis along the Missouri and lower Yellowstone Rivers
correctly classified all 15 gauges into their appropriate unit based on these three variables. We observedmis-classification rates that exceeded 20% through our resubstitution procedure indicating that these variablesdo not discriminate by chance alone.
Generally, the upper unchannelized, inter-reservoir II, and unchannelized Yellowstone units were char-acterized as having higher values for the three influential variables identified in the discriminant analysis(Figure 3). The upper channelized unit had the overall lowest values; whereas, the inter-reservoir I and lowerchannelized unit values were somewhat intermediate.
In contrast to the steady increase in annual mean discharge downstream (Figure 3), there was no evidence ofcontinuous longitudinal trends throughout the entire length of the Missouri River in any of the flow variableswe analyzed. However, there were continuous trends evident over considerable lengths of the uppermost andlowermost river reaches for several variables. Flow per unit area declined steadily in the upper reaches andincreased steadily in the lower reaches. Flow constancy declined steadily in the lower reaches. Coefficient ofvariation for mean annual flow in the lower reaches of the river exhibited a sigmoid pattern, with low valuesfor the first four gauges below the lowest reservoir, followed by a sharp increase over the next three gauges,finally stabilizing at the lowest two gauges (Figure 3).
In addition to separating flow variability units of the river where breaks in continuous flow occurred,the mainstem reservoirs also corresponded with other flow discontinuities. Coefficient of variation for meanannual flow on the Missouri River decreased dramatically between gauges directly above and below FortPeck Reservoir, increased dramatically between Wolf Point and Culbertson, and decreased dramatically againbetween Culbertson and Bismarck (Figure 3). The decline in coefficient of variation for mean annual flowbetween Sydney on the lower Yellowstone River and Bismarck was very similar to the decline betweenCulbertson and Bismarck. The Yellowstone River gauge at Sydney had distinctly lower values for flowconstancy and proportion of constancy within predictability than Missouri River gauges below Fort PeckReservoir (Figures 1 and 3). Additionally, the Fort Benton and Virgelle gauges are affected by flow regulation
Copyright 2002 John Wiley & Sons, Ltd. River Res. Applic. 18: 31–42 (2002)

36 M. A. PEGG AND C. L. PIERCE
Figure 3. Hydrological variable scores (a) and resulting flow variability unit classification of gauges in relation to mean discharge andlocation along the Missouri and lower Yellowstone rivers (b). Scores for all five variables used in the cluster analysis are shown; thethree variables best discriminating among hydrological units are identified by solid symbols (FPA = flow per unit area; FCV = annual
flow coefficient of variation; FC = flow constancy; FCTG = flow contingency; CP = proportion of constancy within predictability)
more than the Sydney gauge because there are several reservoirs further upstream, but these gauges stillgrouped outside the inter-reservoir units.
DISCUSSION
The grouping of gauges into six flow variability units by our analyses generally followed a longitudinalcontinuum along the river system. This makes intuitive sense due to the cumulative nature of flow along theriver’s course. However, the division of the river into discrete units begs the questions of where and why theseunit breaks occur. There are two likely reasons for the majority of the unit differences. The first is that theMissouri River has essentially been divided into three zones due to the massive alterations to the river duringthe early to mid-1900s. Impoundments and channelization in the middle and lower river have effectivelydivided the river into an upper least-altered zone, a middle inter-reservoir zone, and a lower channelized
Copyright 2002 John Wiley & Sons, Ltd. River Res. Applic. 18: 31–42 (2002)

CLASSIFICATION OF MISSOURI RIVER REACHES 37
zone. These management practices have had a strong influence on the channel morphology and hydrology ofthe middle and lower Missouri River (Hesse and Mestl, 1993; Galat and Lipkin, 2000). Large-scale humanalteration to the Missouri River system explains a coarse step in the delineation of major reaches. However,our detailed analysis of flow variability suggests further subdivision within these broad zones as flow patternsnot intuitively linked with river alteration were evident from our analyses.
The upper unchannelized unit is characterized as having the highest flow per unit area values in all thegauges we studied (Figure 3). The coefficient of variation for mean annual flow tended to be relatively high inthis unit as well. The high coefficient of variation for mean annual flow score indicates a substantial amountof annual flow variability within this unit, but the high flow predictability indicates that this variability occurswith some periodicity.
The inter-reservoir I unit had the lowest coefficient of variation for mean annual flow values when comparedto the other units (Figure 3). Flow constancy was also high which played a large role in classifying this unit.Flow variability immediately downstream of dams tends to be reduced (Ligon et al., 1995). Thus, constancyis a consequence of the close downstream proximity of gauges to dams in the inter-reservoir I unit. The resultis stable flow throughout the recent, post-regulation period of record.
The inter-reservoir II unit was similar to inter-reservoir I except that coefficient of variation for mean annualflow was markedly higher. The higher annual variation is most likely due to flow input from tributaries. Thereare tributaries that contribute to total flow in both units. However, between the Wolf Point and Culbertsongauges (Figure 1), two tributaries (Poplar River and Big Muddy Creek) enter the Missouri River. Streams inthis region tend to be quite variable and dependent upon snowmelt in the spring and unpredictable precipitationthroughout the remainder of the year (Poff and Ward, 1989). These tributaries typically contribute 1–2% ofthe mean annual flow to the Missouri River at the Culbertson gauge. However, during high precipitationperiods, the tributaries contribute as much as 5–15% to the total Missouri River outflow (USGS, 2000). Thisadded variability has created a point of separation between the two inter-reservoir units.
Similar to the inter-reservoir II unit, the unchannelized Yellowstone unit also had a high coefficient ofvariation for mean annual flow value in addition to the lowest flow constancy of all units. This would indicatethat, while predictability is fairly similar to the other units, there is a large amount of annual variation.Consequently, the lower constancy suggests that there is a fair amount of daily and monthly variability, albeitoccurring with some regularity, which can be attributed to its relatively free-flowing nature (Benke, 1990).This conclusion is also supported by Galat and Lipkin (2000) who reported the lower Yellowstone River tobe the least hydrologically altered reach of the Missouri and lower Yellowstone Rivers. Thus, flows in theunchannelized Yellowstone unit tend to be more variable than the units of the Missouri River due to thisnatural heterogeneity.
Located directly below the six mainstem reservoirs and in the upstream reach of the channelized navigationcorridor, the upper channelized unit is in a unique position on the Missouri River (Figure 3). The regulatedflows coming out of the inter-reservoir units and reservoirs resulted in the lowest coefficient of variation formean annual flow values of any in the system. Additionally, there are few major tributaries that contributeadditional flow. The one exception to this is the Platte River which provides about 8% of mean annual flowat Hermann, Missouri (the lowermost gauge on the Missouri River; Hedman and Jorgensen, 1990). The lowflow per unit area scores throughout this unit may reflect this lack of tributary contribution (Figure 3). Thecombination of upstream influence from impoundments and the scarcity of major tributaries results in one ofthe more stable flow units.
Finally, the lower channelized unit exhibits more variability than the upper channelized unit as the MissouriRiver approaches the confluence with the Mississippi River. Geographically, this unit’s watershed area drainsabout 38% of the entire Missouri River basin, but supplies 61% of the average annual flow to the system (Galatand Lipkin, 2000). Additionally, major tributaries within the lower channelized unit (e.g. Kansas River, GrandRiver, Osage River) contributed nearly half (44%) of the total annual flows at Hermann, Missouri between1951 and 1980 (Hedman and Jorgensen, 1990). Input from these tributaries ameliorates some of the influencethat the impoundments have on the middle river reaches, resulting in much higher flow per unit area valuescompared to the upper channelized unit. The result is a relatively variable unit, giving the flows in this areaa less regulated characteristic.
Copyright 2002 John Wiley & Sons, Ltd. River Res. Applic. 18: 31–42 (2002)

38 M. A. PEGG AND C. L. PIERCE
A consequence of this renewed variability, revealed by the cluster analysis, is the linkage between theextreme upstream and downstream flow variability units. The cluster analysis dendrogram (Figure 2) showsthat the upper unchannelized and lower channelized units are more closely related with each other than withany of the other units. Galat and Lipkin (2000) and Pegg (2000) reported similar results from their analysessuggesting lower levels of flow alteration in the extreme upstream and downstream reaches of the MissouriRiver.
Hydrological effects of reservoirs are most notably observed on flow variations within a year (Allan, 1995;Hesse and Mestl, 1993). Specifically, mainstem Missouri River impoundments have typically been thoughtto change the timing rather than total discharge by depressing maximum flows and raising minimum flowsthroughout the year (Hesse and Mestl, 1993). Each reservoir has specific operating requirements that mandateparticular water levels at certain times of year (USACOE, 1998). There are exceptions to this as evaporationremoves some water and filling takes place in wet years that were preceded by dry years, but generally thesame amount of water flowing into a reservoir flows out. If the total amount of discharge does not greatlychange over the length of the reservoirs, then our coefficient of variation for mean annual flow estimatesshould reflect similar values at each gauge along the river because they are calculated at the inter-annualscale. Figure 3 illustrates that this is not the case, as variability in the inter-reservoir units is markedly lowerthan the other units. This suggests that the inter-annual effects from reservoirs may be greater than previouslythought and warrants further investigation.
Our approach has identified six hydrologically distinct units along the Missouri and lower Yellowstoneriver system based on inter-annual patterns in flow variability. An important utility of this classification in thefuture will be testing for responses of lotic organisms to the differing flow conditions occurring in these units.Studies investigating among-stream differences at the intra-annual scale have shown that flow characteristicscan influence the composition and structure of biological communities (DiMaio and Corkum, 1995; Poffand Allan, 1995). For fish, one premise is that assemblages in hydrologically stable environments generallyconsist of species with specialized life histories. Conversely, highly variable conditions are more conducive togeneralist life-history traits. Application of this theory at the inter-annual temporal scale and to larger rivers hasbeen limited due to the lack of multiple systems with similar characteristics for hypothesis testing. Comparingcommunity attributes within one large system is especially difficult because of the inherent longitudinalgradient of species richness and diversity (Statzner and Higler, 1986), and perhaps further complicated by thedisruptive nature of impoundments upon this gradient (Ward and Stanford, 1995). Many factors like habitatavailability, flow regulation, and biotic interactions influence fish community structure in these large, complexsystems. However, in a general context, we would expect the lower channelized unit to have the highest aquaticspecies diversity due, in part, to its position in the drainage network, lack of barriers to upstream migrationfrom downstream source populations in the Mississippi River, and the somewhat less regulated nature ofthe flows. Conversely, the inter-reservoir units would be expected to have lower diversity due to influenceof the reservoirs, position between physical barriers, and longitudinal position. The next step will be to testthese predictions using biological data from the Missouri and lower Yellowstone Rivers and we are currentlyaddressing some of these questions, along with a collaborating group of researchers (Young et al., 1997).
In large systems such as the Missouri River, there are reasons to group river reaches in various ways tomeet specific needs (e.g. political, climatical, topographical, biological). The division of the river into threezones defined by human alteration, discussed earlier, is a useful first step in identifying regions sharing basicflow characteristics. However, we believe that objectively creating units based on a suite of driving variableswith demonstrated biological significance, as we have done here, can set the stage for further exploration intohow these factors influence biological communities in large river systems.
ACKNOWLEDGEMENTS
The authors thank the US Army Corps of Engineers, especially B. Latka and D. Latka who were instru-mental in initiating this project, and the Iowa Department of Natural Resources for financial support. Theauthors would also like to thank G. Atchison, L. Bergstedt, D. Debinski, D. Galat, W. Meeker, and J. Morris,forconstructive discussion and comments on an earlier version of this manuscript. Members of the Benthic
Copyright 2002 John Wiley & Sons, Ltd. River Res. Applic. 18: 31–42 (2002)
CLASSIFICATION OF MISSOURI RIVER REACHES 39A
PPE
ND
IXA
Inde
xof
Hyd
rolo
gica
lA
lter
atio
nVa
riab
les
Inde
xof
Hyd
rolo
gica
lA
ltera
tion
(IH
A)
data
used
toid
entif
yfl
owun
itsal
ong
the
Mis
sour
ian
dlo
wer
Yel
low
ston
eR
iver
s.
Fort
Vir
gelle
Fort
Wol
fC
ulbe
rtso
nSy
dney
Bis
mar
ckY
ankt
onSi
oux
Om
aha
Neb
rask
aSt
.K
ansa
sB
oonv
ille
Her
man
nB
ento
n(3
272)
Peck
Poin
t(2
606)
(259
2)(2
115)
(129
7)C
ity(9
91)
City
Jose
phC
ity(3
17)
(158
)(3
336)
(283
5)(2
738)
(117
8)(9
05)
(721
)(5
89)
Zon
eD
esig
natio
nU
pper
Upp
erM
iddl
eM
iddl
eM
iddl
eU
pper
Mid
dle
Low
erL
ower
Low
erL
ower
Low
erL
ower
Low
erL
ower
Sum
mar
ySt
atis
tics
Mea
nA
nnua
lFl
ow(m
3s−
1)
228.
0026
3.00
294.
0030
0.00
325.
0035
8.00
698.
0081
2.00
846.
0010
12.0
011
93.0
013
86.0
016
73.0
020
20.0
026
29.0
0
Mea
nF
low
/Are
a0.
330.
270.
180.
130.
130.
180.
130.
120.
090.
110.
100.
120.
120.
140.
18A
nnua
lF
low
CV
0.59
0.67
0.43
0.38
0.98
0.87
0.34
0.41
0.39
0.38
0.41
0.48
0.58
0.69
0.70
Flow
Pred
icta
bilit
y0.
690.
700.
630.
680.
650.
640.
680.
730.
710.
690.
670.
650.
630.
610.
55F
low
Con
stan
cy0.
600.
600.
580.
630.
600.
470.
640.
590.
520.
590.
580.
560.
530.
510.
48C
onst
ancy
/P
redi
ctab
ility
0.87
0.85
0.92
0.93
0.93
0.74
0.94
0.81
0.82
0.85
0.87
0.86
0.84
0.83
0.87
Flo
wC
onti
ngen
cy0.
090.
100.
050.
050.
050.
170.
040.
140.
190.
100.
090.
090.
100.
100.
07
Max
imum
and
min
imum
flow
s(m
3s−
1)
for
1–
9-da
yav
erag
es
1-da
yM
in96
.00
112.
0011
8.00
153.
0015
8.00
91.0
037
4.00
336.
0027
9.00
374.
0044
4.00
458.
0056
0.00
647.
0083
2.00
3-da
yM
in10
9.00
126.
0012
9.00
158.
0016
4.00
95.0
039
3.00
351.
0031
3.00
409.
0047
1.00
523.
0059
3.00
671.
0089
1.00
7-da
yM
in12
2.00
135.
0013
9.00
163.
0016
9.00
105.
0040
7.00
373.
0034
2.00
461.
0053
1.00
576.
0064
5.00
723.
0094
4.00
30-d
ayM
in13
3.00
143.
0015
6.00
175.
0018
0.00
144.
0043
9.00
427.
0040
3.00
529.
0062
7.00
701.
0079
4.00
889.
0011
51.0
090
-day
Min
145.
0015
8.00
195.
0021
2.00
213.
0017
7.00
509.
0047
6.00
489.
0059
7.00
736.
0084
1.00
960.
0011
21.0
014
55.0
01-
day
Max
642.
0091
4.00
503.
0051
3.00
1411
.00
1524
.00
1060
.00
1269
.00
1518
.00
1955
.00
2771
.00
3787
.00
5091
.00
7123
.00
9062
.00
3-da
yM
ax61
8.00
871.
0049
8.00
499.
0011
97.0
014
53.0
010
44.0
012
64.0
015
14.0
018
45.0
025
95.0
035
24.0
047
36.0
068
14.0
087
19.0
07-
day
Max
581.
0078
8.00
492.
0048
5.00
865.
0013
31.0
010
20.0
012
55.0
014
86.0
017
11.0
023
17.0
031
01.0
041
44.0
061
05.0
078
67.0
030
-day
Max
490.
0062
7.00
466.
0044
3.00
566.
0010
68.0
097
3.00
1226
.00
1395
.00
1501
.00
1859
.00
2359
.00
3257
.00
4353
.00
5810
.00
90-d
ayM
ax37
2.00
447.
0041
2.00
391.
0045
4.00
731.
0089
0.00
1142
.00
1240
.00
1344
.00
1585
.00
1917
.00
2505
.00
3206
.00
4336
.00
Cal
enda
rD
ate
ofth
e1-
day
max
imum
and
min
imum
flow
valu
es
Min
imum
300.
0021
5.00
156.
0024
5.00
253.
0050
.00
223.
0062
.00
28.0
014
.00
8.00
22.0
012
.00
11.0
041
.00
Max
imum
178.
0015
1.00
124.
0012
2.00
97.0
016
1.00
101.
0027
2.00
213.
0019
3.00
165.
0017
0.00
172.
0017
8.00
176.
00
Cou
nts
ofex
trem
eco
nditi
ons
Low
Puls
eC
ount
0.80
9.00
3.60
3.30
1.80
00.
400
0.30
0.30
0.30
0.30
0.20
0.70
Low
Puls
eD
urat
ion
0.60
0.70
6.80
7.50
3.80
00.
900
0.30
15.8
00.
700.
600.
401.
00H
igh
Puls
eC
ount
1.30
0.20
07.
000
1.40
00
2.00
0.70
1.90
3.50
2.50
3.70
3.80
Hig
hPu
lse
Dur
atio
n10
.10
2.10
07.
90.
105.
701.
500.
960.
501.
203.
303.
503.
404.
805.
40
(con
tinu
edov
erle
af)
Copyright 2002 John Wiley & Sons, Ltd. River Res. Applic. 18: 31–42 (2002)

40 M. A. PEGG AND C. L. PIERCEA
PPE
ND
IXA
(Con
tinu
ed)
Fort
Vir
gelle
Fort
Wol
fC
ulbe
rtso
nSy
dney
Bis
mar
ckY
ankt
onSi
oux
Om
aha
Neb
rask
aSt
.K
ansa
sB
oonv
ille
Her
man
nB
ento
n(3
272)
Peck
Poin
t(2
606)
(259
2)(2
115)
(129
7)C
ity(9
91)
City
Jose
phC
ity(3
17)
(158
)(3
336)
(283
5)(2
738)
(117
8)(9
05)
(721
)(5
89)
Ris
eR
ate
473.
1055
5.70
451.
4043
1.00
450.
9010
52.5
082
9.50
676.
4010
27.7
013
91.4
020
15.9
036
65.1
048
44.7
051
8.90
9545
.10
Fall
Rat
e−4
42.5
0−5
49.5
0−4
86.6
0−4
25.2
0−5
86.5
0−7
53.0
0−8
64.9
0−7
52.6
0−1
048.
90−1
198.
60−1
566.
70−2
529.
70−3
237.
30−4
828.
60−6
136.
20N
umbe
rof
Rev
ersa
ls16
2.50
157.
4015
4.70
153.
7010
9.10
86.1
016
1.10
119.
9012
7.10
124.
9011
9.20
115.
9010
8.80
95.4
010
6.20
Mon
thly
aver
age
flow
s(m
3s−
1)
and
Coe
ffici
ents
ofV
aria
tion
(CV
)
Oct
ober
167.
0018
8.00
268.
0025
1.00
267.
0025
0.00
615.
0010
44.0
010
79.0
011
61.0
012
86.0
014
29.0
016
71.0
019
39.0
023
62.0
0O
ctob
erC
V0.
260.
250.
340.
40.
360.
280.
390.
280.
270.
250.
240.
250.
40.
550.
69N
ovem
ber
177.
0019
4.00
277.
0026
0.00
267.
0023
2.00
642.
0094
1.00
982.
0010
76.0
012
11.0
013
43.0
015
37.0
017
93.0
023
86.0
0N
ovem
ber
CV
0.25
0.24
0.31
0.37
0.34
0.25
0.34
0.42
0.41
0.38
0.34
0.32
0.34
0.34
0.41
Dec
embe
r17
9.00
200.
0029
5.00
289.
0029
6.00
197.
0065
5.00
565.
0060
7.00
679.
0081
3.00
937.
0011
18.0
013
91.0
020
15.0
0D
ecem
ber
CV
0.19
0.2
0.12
0.15
0.14
0.18
0.16
0.31
0.32
0.34
0.33
0.34
0.37
0.44
0.53
Janu
ary
113.
0021
3.00
335.
0033
2.00
342.
0019
3.00
731.
0048
9.00
508.
0056
4.00
670.
0076
7.00
882.
0010
70.0
015
61.0
0Ja
nuar
yC
V0.
160.
170.
130.
160.
120.
20.
150.
210.
220.
260.
280.
310.
370.
440.
5Fe
brua
ry19
6.00
223.
0036
1.00
357.
0038
6.00
229.
0080
0.00
492.
0054
3.00
627.
0082
3.00
964.
0011
44.0
014
34.0
020
23.0
0Fe
brua
ryC
V0.
180.
160.
140.
20.
120.
320.
190.
230.
230.
260.
290.
330.
380.
450.
45M
arch
206.
0022
7.00
264.
0030
9.00
424.
0032
9.00
696.
0057
1.00
605.
0087
2.00
1167
.00
1387
.00
1684
.00
2083
.00
2863
.00
Mar
chC
V0.
260.
30.
290.
270.
750.
460.
270.
250.
360.
290.
320.
390.
480.
550.
54A
pril
231.
0025
2.00
234.
0028
9.00
348.
0027
5.00
643.
0076
1.00
898.
0011
41.0
013
94.0
016
22.0
020
29.0
025
89.0
035
60.0
0A
pril
CV
0.3
0.32
0.41
0.48
0.5
0.29
0.33
0.26
0.21
0.23
0.29
0.32
0.43
0.5
0.52
May
358.
0040
7.00
257.
0029
8.00
318.
0052
2.00
674.
0085
5.00
912.
0011
53.0
014
20.0
017
23.0
021
67.0
027
85.0
036
68.0
0M
ayC
V0.
400.
380.
430.
400.
450.
300.
380.
190.
190.
190.
250.
310.
390.
450.
46Ju
ne42
3.00
563.
0027
8.00
316.
0032
9.00
986.
0072
7.00
893.
0097
2.00
1249
.00
1554
.00
1834
.00
2312
.00
2786
.00
3605
.00
June
CV
0.52
0.49
0.51
0.42
0.44
0.36
0.34
0.23
0.27
0.24
0.33
0.36
0.41
0.46
0.46
July
270.
0031
3.00
321.
0032
2.00
334.
0062
9.00
770.
0098
5.00
996.
0012
34.0
014
06.0
016
99.0
020
90.0
024
96.0
029
89.0
0Ju
lyC
V0.
550.
480.
540.
470.
490.
530.
370.
410.
210.
250.
330.
490.
620.
70.
62A
ugus
t17
8.00
197.
0032
9.00
304.
0030
3.00
237.
0077
3.00
1065
.00
1031
.00
1189
.00
1283
.00
1448
.00
1710
.00
1922
.00
2265
.00
Aug
ust
CV
0.26
0.27
0.48
0.30
0.34
0.42
0.32
0.29
0.25
0.24
0.22
0.23
0.34
0.46
0.59
Sept
embe
r16
6.00
180.
0032
0.00
276.
0029
1.00
218.
0066
2.00
1078
.00
1018
.00
589.
0012
88.0
014
68.0
017
14.0
019
42.0
022
48.0
0Se
ptem
ber
CV
0.29
0.28
0.53
0.35
0.32
0.35
0.34
0.27
0.25
0.23
0.22
0.22
0.32
0.4
0.49
Num
bers
inpa
rent
hese
sbe
low
each
gaug
ein
dica
tedi
stan
ce(k
m)
upst
ream
from
Mis
sour
iR
iver
mou
th.
Zon
ede
sign
atio
npl
aces
each
gaug
ein
toth
eth
ree
zone
sth
atre
sulte
dfr
omm
ajor
hum
anal
tera
tion
onth
eM
isso
uri
Riv
er(U
pper
=up
stre
amfr
omm
ajor
mai
nste
mim
poun
dmen
ts;
Mid
dle
=ri
ver
reac
hes
betw
een
impo
undm
ents
;L
ower
=ri
ver
dow
nstr
eam
ofim
poun
dmen
ts).
Var
iabl
eshi
ghlig
hted
inbo
ldw
ere
used
for
initi
alflo
wva
riab
ility
unit
iden
tifica
tion
incl
uste
ran
alys
is.
Copyright 2002 John Wiley & Sons, Ltd. River Res. Applic. 18: 31–42 (2002)

CLASSIFICATION OF MISSOURI RIVER REACHES 41
Fish Consortium also provided useful discussion on the role of flow variability in lotic systems. D. Cookprovided assistance with statistical analyses. Additional support was provided by the Iowa Cooperative Fishand Wildlife Research Unit.
REFERENCES
Allan JD. 1995. Stream Ecology: Structure and Function of Running Waters. Chapman and Hall: New York.Bain MB, Finn JT, Brooke HE. 1988. Streamflow regulation and fish community structure. Ecology 69: 382–392.Benke AC. 1990. A perspective on America’s vanishing streams. Journal of the North American Benthological Society 97: 77–88.Berner LM. 1951. Limnology of the lower Missouri River. Ecology 32: 1–12.Church M. 1995. Geomorphic response to river flow regulation: case studies and time-scales. Regulated Rivers: Research and
Management 11: 3–22.Colwell RK. 1974. Predictability, constancy, and contingency of periodic phenomena. Ecology 55: 1148–1153.Coon TG. 1987. Responses of benthic riffle fishes to variation in stream discharge and temperature. In Community and Evolutionary
Ecology of North American Stream Fishes, Matthews WJ, Heins DC (eds). University of Oklahoma Press: Norman; 77–92.DiMaio J, Corkum LD. 1995. Relationship between the spatial distribution of freshwater mussels (Bivalva: Unionidae) and the
hydrological variability of rivers. Canadian Journal of Zoology 73: 663–671.Fausch KD, Bramblett RG. 1991. Disturbance and fish communities in intermittent tributaries of a western Great Plains River. Copeia
1991: 659–674.Funk JL, Robinson JW. 1974. Changes in the Channel of the Lower Missouri River and Effects on Fish and Wildlife. Missouri Department
of Conservation Aquatic Series No. 11: Columbia.Galat DL, Lipkin R. 2000. Restoring ecological integrity of great rivers: historical hydrographs aid in defining reference conditions for
the Missouri River. Hydrobiologia 422/423: 29–48.Hedman ER, Jorgensen DG. 1990. Surface and Ground-water Interactions and Hydrologic Budget of the Missouri Valley Aquifer between
Yankton, South Dakota, and St. Louis, Missouri. Atlas HA-721. US Geological Survey: Denver, CO.Hesse LW, Mestl GE. 1993. An alternative hydrograph for the Missouri River based on the precontrol condition. North American
Journal of Fisheries Management 13: 360–366.Horwitz RJ. 1978. Temporal variability patterns and the distributional patterns of stream fishes. Ecological Monographs 48: 307–321.Ligon FK, Dietrich WE, Trush WJ. 1995. Downstream ecological effects of dams. BioScience 45: 183–192.Manly BFJ. 1994. Multivariate Statistical Methods: a Primer. Chapman and Hall: New York.Morris LA, Langermeier RN, Russel TR, Witt AW Jr. 1968. Effects of main stem impoundments and channelization upon the limnology
of the Missouri River, Nebraska. Transactions of the American Fisheries Society 106: 602–608.Nature Conservancy. 1997. Indicators of Hydrologic Alteration: Users Manual. Smythe Scientific Software: Boulder, CO.Nilsson C, Ekblad A, Gardfjell M, Carlberg B. 1991. Long-term effects of river regulation on river margin vegetation. Journal of Applied
Ecology 28: 963–987.Parasiewicz P, Schmutz S, Moog O. 1998. The effect of managed hydropower peaking on the physical habitat, benthos and fish fauna
in the River Bregenzerach in Austria. Fisheries Management and Ecology 5: 403–417.Pegg MA. 2000. Hydrological variation along the Missouri River and its effect on the fish community. PhD dissertation, Iowa State
University, Ames.Poff NL. 1992. Why disturbances can be predictable: a perspective on the definition of disturbance in streams. Journal of the North
American Benthological Society 11: 86–92.Poff NL, Allan JD. 1995. Functional organization of stream fish assemblages in relation to hydrological variability. Ecology 76: 606–627.Poff NL, Ward JV. 1989. Implications of streamflow variability and predictability for lotic community structure: a regional analysis of
streamflow patterns. Canadian Journal of Fisheries and Aquatic Sciences 46: 1805–1818.Poff NL, Allan JD, Bain MB, Karr JR, Prestegaard KL, Richter BD, Sparks RE, Stromberg JC. 1997. The natural flow regime: a
paradigm for river conservation and restoration. BioScience 47: 769–784.Richter BD, Baumgartner JV, Braun DP, Powell J. 1998. A spatial assessment of hydrologic alteration within a river network. Regulated
Rivers: Research and Management 14: 329–340.Richter BD, Baumgartner JV, Powell J, Braun D. 1996. A method for assessing hydrologic alteration within ecosystems. Conservation
Biology 10: 1163–1174.SAS Institute Inc. 1987. SAS/STAT Guide for Personal Computers (6th edn). SAS Institute: Cary, IA.Schlosser IJ. 1985. Flow regime, juvenile abundance, and the assemblage structure of stream fishes. Ecology 66: 1484–1490.Sharma S. 1996. Applied Multivariate Techniques. John Wiley and Sons: New York.Statzner B, Higler B. 1986. Stream hydraulics as a major determinant of benthic invertebrate zonation patterns. Freshwater Biology 16:
127–139.Swayne DF, Cook D, Buja A. 1998. XGobi: Interactive dynamic data visualization in the X Window system. Journal of Computer
Graphics and Statistics 7: 113–130.Townsend CR, Hildrew AG. 1994. Species traits in relation to a habitat templet for river systems. Freshwater Biology 31: 265–275.USACOE. 1998. Missouri River Master Water Control Manual: Review and Update Study. United States Army Corps of Engineers,
Missouri River Region, Northwestern Division: Omaha. Preliminary revised draft EIS alternatives.
Copyright 2002 John Wiley & Sons, Ltd. River Res. Applic. 18: 31–42 (2002)

42 M. A. PEGG AND C. L. PIERCE
USGS. 2000. Historical streamflow daily values. On-line database, United States Geological Survey (http://waterdata.usgs.gov/nws-w/MT/) [Accessed 12 May 2000].
Ward JV, Stanford JA. 1995. Ecological connectivity in alluvial river ecosystems and its disruption by flow regulation. Regulated Rivers:Research and Management 11: 105–119.
Whitley JR, Campbell RS. 1974. Some aspects of water quality and biology of the Missouri River. Transactions of the Missouri Academyof Science 8: 60–72.
Young BA, Welker TL, Wildhaber ML, Berry CR, Scharnecchia D. 1997. Population structure and habitat use of benthic fishes alongthe Missouri and Lower Yellowstone Rivers. 1997 Annual Report of Missouri River Benthic Fish Study PD-95-5832 to US ArmyCorps of Engineers and US Bureau of Reclamation.
Copyright 2002 John Wiley & Sons, Ltd. River Res. Applic. 18: 31–42 (2002)