Embed Size (px)
Citation preview

Engineering Management Research; Vol. 3, No. 1; 2014 ISSN 1927-7318E-ISSN 1927-7326
Published by Canadian Center of Science and Education
68
Classifying and Ranking Healthcare Quality Attributes Using Integrated Kano- Fuzzy Analytical Hierarchy Process Model
Amer Momani1, Tarek Al-Hawari1, Hesham Al-Shebami1 & Omar Al-Araidah1 1 Industrial Engineering Department, Jordan University of Science and Technology, Irbid, Jordan
Correspondence: Amer Momani, Industrial Engineering Department, Jordan University of Science and Technology, Irbid, Jordan. Tel: 962-2-720-1000 ext. 22361. E-mail: [email protected]
Received: February 18, 2014 Accepted: March 7, 2014 Online Published: March 19, 2014
doi:10.5539/emr.v3n1p68 URL: http://dx.doi.org/10.5539/emr.v3n1p68
Abstract
Healthcare is a vital service sector that provides quality treatment services to patients aiming at achieving individual satisfaction. In order to improve the quality of the healthcare sector, patients should be involved in the improvement process. The aim of this study is to provide a systematic approach for determining and prioritizing healthcare quality attributes that affect patients’ satisfaction. This is accomplished using an integrated Kano-FAHP model that would provide the basis for better improvement strategies and resource allocation. Based on Kano model principles the collected attributes are analyzed and classified into four main classes: must-be, performance, attractive, and indifferent needs. Statistical tests are performed to ensure the reliability of Kano classification. The classified healthcare quality attributes are structured in hierarchal form, and then prioritized by using FAHP method. Conventional AHP is integrated with fuzzy set theory to capture the uncertainty and ambiguity of patients while concluding judgments. Results indicate that must-be attributes gain the largest weights where “correct information given” and “employee friendless and respectfulness” are the first and second attributes with weights of 0.098 and 0.092, respectively.
Keywords: healthcare quality, patients’ satisfaction, Kano model, fuzzy analytic hierarchy process
1. Introduction
Patients’ satisfaction in healthcare is based on many attributes. In addition to medical expertise and the availability of technology, patients consider other dimensions of the care process to be important and necessary to enhance their experience at the healthcare facility. Raposo, Alves, and Duarte (2009) defined patients’ satisfaction as the attitude resulting from both output and process perspectives. That is, patients’ satisfaction is not only affected when the actual treatment is provided, but also patients’ feelings and activities during time spent in a healthcare facility.
In past years and to stay competitive, healthcare providers invested in understanding the importance of each dimension of care for enhancing patients’ satisfaction. Such dimensions include medical and administrative staff, facility location and design, procedures, compliance to regulations, local and international recognition (Raposo et al., 2009). Moreover these dimensions are represented by some attributes, which are not equally important to patients and have different impacts on their satisfaction (Kano, Seraku, Takahashi, & Tsuji, 1984). Hence, it is necessary to classify and rank these attributes to provide an insight to those that are most important so that healthcare providers can allocate and prioritize their resources to gain the highest customer satisfaction.
To identify customers’ needs based on their perspective, studies recommend integrating customers in the design process of products and/or services through their direct and indirect inputs and listening to their voices; the voice of customer (VOC) (Y. Hsu, C. Hsu, & Bing, 2007). Direct meetings, focus groups, surveys and observations are most appropriate and effective tools used to listen to customers and identify their problems and their improvement recommendations.
To distinguish between needs and wishes, Kano model classifies customers’ requirements to three main classifications: must be (dissatisfiers), performance (satisfiers) and attractive dimensions (delighters). Must-be represent the attributes that if not fulfilled, customers would be extremely dissatisfied and would simply move to another provider. In other words, the resulting product or service would not be functional if such attributes are missing. Performance attributes refer to dimensions that make the customer happier if they are fulfilled or
www.ccsenet.org/emr Engineering Management Research Vol. 3 No. 1; 2014
69
improved and dissatisfied if not fulfilled. Attractive attributes represent dimensions that are not expected by customers and are provided at no additional charge to achieve customer loyalty (Kano et al., 1984). This classification provides useful information regarding the critical to quality aspects that should be fulfilled to keep providers competitive and gives insight to future improvements that affect customer attitude and satisfaction.
Better improvements and outcomes result from better resource allocation and utilization which is achieved when the most important attributes and aspects are fulfilled first with least effort. One approach for better resources allocation is to prioritize service elements based on their importance and effects on customers’ satisfaction. Analytical Hierarchy Process (AHP) is an effective tool that can be used for ranking attributes based on a certain objective such as customer preference. It provides a systematic and simple to use procedure for ranking alternatives in addition to a numerical check for the consistency of final results.
The large variation and uncertainty in patients’ assessments of their needs and the degree of importance of each requirement, disperses improvement efforts and limits outcomes. To overcome the effects of uncertainty of patients’ preferences, fuzzy set theory is integrated with conventional AHP. Fuzzy Analytical Hierarchy Process (FAHP) enables decision makers to evaluate their preferences between attributes via linguistic values rather than crisp values (Büyüközkan, Kahraman, & Ruan, 2004). FAHP has been applied by many researches in different fields either separately or integrally with other tools to solve decision making problems and determine the best strategies for improvement, better resource allocation, or to select the best alternative (Chan, Kumar, Tiwari, Lau, & Choy, 2008; Lee, Chen, & Chang, 2008; Singh & Sharma, 2011; Vahidnia, Alesheikh, & Alimohammadi, 2009)
In this research, Kano model is integrated with FAHP to provide a systematic approach to classify and rank healthcare quality attributes for better improvement strategies selection to enhance patients’ satisfaction. To investigate the effectiveness of the proposed methodology in classifying and ranking attributes under uncertainty; healthcare quality attributes related to administrative staff and healthcare facility design are chosen for the study.
2. Literature Review
In this section a review of the previous work related to healthcare quality, patients' satisfaction, Kano model and FAHP is presented.
2.1 Healthcare Quality and Patients’ Satisfaction
Many researchers have studied healthcare quality attributes that affect patients’ satisfaction directly and indirectly. For example, Harteloh (2004) applied the semantic rule in medicine to explore how the meaning of quality could be mediated in medical practice. The semantic rule is used to translate the quality model; Deming cycle-sequences of plan, do, check, and act, to a structure of quality in medical practices.Raposo et al. (2009) focused on measuring patients’ satisfaction levels as a measure of healthcare quality. The analysis showed that patient-doctor relationship, the quality of facilities, and the interaction with administrative staff have the most positive effects on patient satisfaction.
Song, Zhou, and Wang (2011) defined the meaning of patients’ satisfaction. Also, they proposed several quality dimensions that should be given attention for improvement. These quality dimensions are cost, external environment, commitments and promises, and perceptions of payment.Yildirim, Kocoglu, Goksu, Gunay, and Savas (2005) stated that waiting time strongly affects patients’ satisfaction.Jenkinson, Coulter, Bruster, Richards, and Chandola (2002) performed a study to identify the most important quality attributes that affect patients’ satisfaction. A postal survey was designed and sent to more than 3000 patients. After analyzing the results of the survey using multiple regression analysis, it determined that physical comfort, emotional support, and respect for patient preferences are the most important attributes that affect patients’ satisfaction.Nerney et al. (2001) proposed that patients’ satisfaction is influenced by information or obvious answers received from medical staff, and by appropriate explanation of tests’ results.
2.2 Kano Model
Kano model is a quality evaluation technique that could be utilized to prioritize customer needs depending on their effect on customer satisfaction. Previous research clearly stated its advantages, its capability to identify customer needs and their impact on customer satisfaction (Chiou & Cheng, 2008; Matzler & Hinterhuber, 1998; Zielke, 2008). Kano’s theory has been applied widely in services and product development fields (Arefi, Heidari, & Zandi, 2012; Chen, 2012; Kuo, 2004; Lai, Xie, & Tan, 2004; Ting & Chen, 2002; Tontini, 2007; Witell & Fundin, 2005). For example, Hsu et al. (2007) captured the service requirements of passengers in the airline industry. Measurement indices for improvement have been determined by measuring the impact of service needs on passenger satisfaction and dissatisfaction. Bayraktaroglu and Özgen (2008) implemented Kano model to

www.ccsenet.org/emr Engineering Management Research Vol. 3 No. 1; 2014
70
categorize quality library services for users in details. The most important quality attributes were determined by an integrated Kano model, AHP and Quality Function Deployment (QFD) to determine the most strategically important requirements for better budget allocation, service arrangement and development of marketing strategies.
W. Chang and Y. Chang (2012) studied 30 dental care quality elements based on Kano’s perspective. They found that physical characteristics of structural aspects and administration of process aspects are essential dimensions that affect patients’ satisfaction in the dental care industry. They also have concluded that the opportunities for improvement rise with aspects of the lowest level of satisfaction. Chiou and Cheng (2008) presented an integrated methodology of Kano model and QFD as a systematic method of identifying patients’ needs. They concluded that their approach can help healthcare providers develop improvement strategies.Sireli, Kauffmann, and Ozan (2007) combined Kano model and QFD in simultaneous multiple product design to determine the requirements of the cockpit weather information system (CWIS).
Xu et al. (2009) proposed an analytical Kano model to manage the disagreement that exists around the quality attributes classification using traditional Kano model. They concluded that the resultant categories of Kano model do not represent a true quantitative measure. Lee, Wang, and Lin (2012) modified the analytical Kano model to overcome its complexity in both practical applications and the scoring scheme used. In addition, they discussed how quality attributes could be prioritized for improvement, which was not discussed by Xu et al. (2009). The priority of improvements is based on quality attributes categories, attributes performance, and asymmetric impact of attributes performance on overall satisfaction.
Matzler, Fuchs, and Schubert (2004) investigated whether Kano model can also be applied to employee satisfaction by specifying their satisfaction attributes and classifying them. They found an asymmetric relationship between the satisfaction with different factors and overall employee satisfaction, thereby confirming Kano model in the context of employee satisfaction.
2.3 Fuzzy Analytical Hierarchy Process Singh and Sharma (2011) have identified performance indicators for global supplier and then evaluated them using FAHP model to select the best suppliers for a manufacturing firm. They concluded that FAHP has the ability to capture the vagueness of human thinking style and effectively solve Multi-Criteria Decision Making (MCDM) problems. Kahraman, Cebeci, and Ulukan (2003) utilized FAHP to select the best supplier based on criteria determined for a manufacturing company. Dağdeviren, Yavuz, and Kılınç (2009) showed the effectiveness and feasibility of using AHP and the technique for order of preference by similarity to ideal solution (TOPSIS) method with fuzzy improvement in the selection of the optimal weapon among many alternatives in MCDM problems. They constructed an evaluation model for weapon selection and selected the best weapon based on weights gained from fuzzy (TOPSIS).
Vahidnia et al. (2009) used FAHP to determine the optimal site for a new hospital. They used Geographical Information System (GIS) analysis to classify governing criteria in site selection. They then used FAHP to evaluate alternatives and determine the best site. Amiri (2010) used AHP and Fuzzy (TOPSIS) method for selection oil-field development projects. He used AHP to construct the structure of the project selection problem and determine criteria weights. Final ranking of alternative was obtained by fuzzy TOPSIS. He concluded that the alternatives’ ranks could be changed by fuzzy preference evaluation.
Lee, Chen, and Chang (2008) utilized FAHP and balance scored card (BSC) to evaluate information technology departments in the manufacturing industry. The authors used BSC to identify the hierarchy of the problem based on four major perspectives of performance measures, which was then prioritized using FAHP to suggest the best improvement strategies. Büyüközkan, Kahraman, and Ruan (2004) applied FAHP in quality improvement of software development projects in which economic aspects and quality were evaluated and combined to obtain degree of importance associated with each project’s strategy.
2.4 Integrated Kano Model and FAHP Very few researchers combined Kano model and FAHP to classify and rank customer's needs. For example, Hemati and Ghorbanian (2011) presented an empirical study based on integrated Kano model and FAHP to measure and rank customers’ requirements in a transportation system. Alroaia and Ardekani (2012) combined Kano model and FAHP to analyze and prioritize indicators affecting customers’ needs in electronic banking. The results indicated that services' security and assurance is the customers' first priority. Up to our knowledge, no research has been found that integrates Kano model and FAHP to classify and prioritize quality attributes in the healthcare industry such that patients’ voice is represented.
www.ccsenet.org/emr Engineering Management Research Vol. 3 No. 1; 2014
71
In this research Kano model theory is first used to formulate the hierarchy of multi-attributes decision making problem, that represent the healthcare quality attributes based on their effects on patients’ satisfaction. Then, these quality attributes are prioritized using FAHP to guide providers during resource allocation process and during formulating the improvement strategies.
3. Theoretical Background
3.1 Kano Model Theory
Generally, quality attributes are not equally important for different populations. Therefore, some quality attributes could cause a product to be more satisfactory to the customer while others do not. Regarding the assumption of inequality of attributes effects on customer satisfaction, Kano model (Kano et al., 1984) guides providers of service or products to focus on two dimensions to gain the best satisfaction and predict future trends of customer needs. The two dimensions are:
(1) Needs fulfillment, which evaluates the degree of customer requirement fulfillment.
(2) Customer subjective response to fulfillment of the quality attributes.
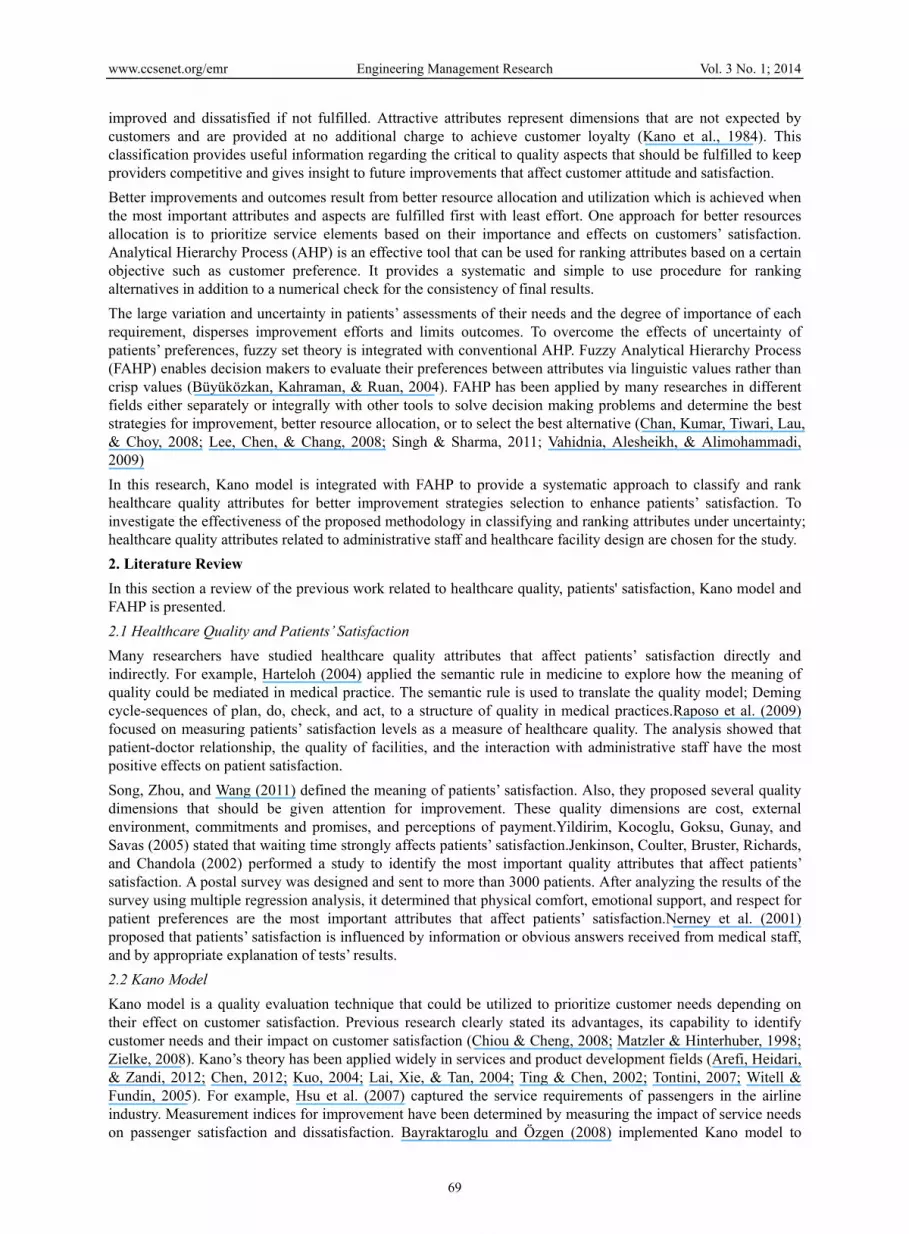
These dimensions can be drawn on a graph with two axes, as shown in Figure 1. The x-axis represents need fulfillment, and the y-axis represents customer satisfaction. Figure 1simply describes requirement fulfillment and customer satisfaction relationship based on the attributes category. That is, attractive attributes make customers more satisfied and never make them unsatisfied. Performance attributes make customers satisfied or unsatisfied depending on how they are fulfilled. Must-be requirements fulfillment prevent customers from being unsatisfied.
Figure 1. Kano model of customer satisfaction (Kano et al., 1984)
3.2 Kano Model Categories
Kano model divides customer requirements based on their effect on satisfaction to five different categories as follows (Berger et al., 1993; Kano et al., 1984):
Basic requirements/Must-be needs: customers expect to find some attributes and aspects in a product/ service as essential even though they are not expressed. Unfortunately, customers will be extremely dissatisfied if these basic quality attributes do not exist or are not properly fulfilled.Moreover, the existence of these quality attributes does not make customers more satisfied even if they perform well.
One-dimensional/ Performance Needs: The quality attributes in this category will make customers happier and more satisfied if they are presented well in the product and dissatisfied if they are not properly fulfilled. In other words, customer satisfaction is linearly proportional to attribute performance.
Attractive/ Delighter requirements: The quality attributes in this category are not expected by customers. If a quality attribute is presented without extra fees, customers will be surprised, delighted and their loyalty will increase. However, the absence of the same quality attribute does not make customers unsatisfied.
Indifferent quality needs: customers are usually not interested in some quality attributes if they exist or not; they do not affect their satisfaction.
Reverse quality attributes: The existence of some quality attributes make customers unsatisfied; they simply wish them to not exist.
3.3 Satisfaction and Dissatisfaction Coefficients
Customer satisfaction (CS+) and dissatisfaction (CS-) coefficients for each attribute are calculated in order to
Attractive requirements -not expressed-customer tailored -cause delight
Must-be requirements -implied -self-evident
t d
Requirements not fulfilled
Customer satisfied
Customer dissatisfied
Requirements fulfilled
Quadrant 1
Quadrant 3
Quadrant 2
Quadrant 4
Performance requirements -specified-measurable-technical

www.ccsenet.org/emr Engineering Management Research Vol. 3 No. 1; 2014
72
analyze patient requirements comprehensively and study the effect of the existence and absence of a specific attribute on patient satisfaction. The CS+ coefficient indicates the positive effects if an attribute is fulfilled on customer satisfaction and CS- indicates the negative effects if an attribute is not fulfilled (Matzler&Hinterhuber, 1998). CS+ coefficient is calculated by dividing the sum of frequent observations of the attractive and performance category over the sum of frequent observations of the must-be, performance, attractive and indifferent categories as indicated in equation (1). CS- coefficient is calculated by dividing the sum of frequent observations of the must-be and performance categories over the sum of frequent observations of the must-be, performance, attractive and indifferent categories as indicated in equation (2) (Bayraktaroglu&Özgen, 2008; Hsu et al., 2007; Zielke, 2008).
IPM
PACS
(1)
IPM
PMCS
(2)
Where:
M, P, A and I are the number of times an attribute is considered in a must-be, Performance, attractive and indifferent category, respectively.
3.4 The Absolute Largest Weight Ranking Method Sireli et al. (2007) proposed the absolute largest CS+ and CS- weights to rank Kano attributes assuming that achieving customer’s satisfaction and preventing customer’s dissatisfaction are equally important. That is the largest importance weights of CS+ and CS- are considered as the attribute’s weights according to the following equation:
iii DSw ,max (3)
Where:
wi: attribute’s weight,
m
i i
ii
CS
CSS
1
,
m
i i
ii
CS
CSD
1
,
m: number of attributes.
This method considers only one side of satisfaction or dissatisfaction; the one with the largest weights.
3.5 Fuzzy Set Theory
Fuzzy set theory is “a mathematical theory designed to model fuzziness of human cognitive process” [Vahidnia et al., (2009), p. 3050]. It is basically a set theory where the class lacks sharp boundaries. The membership function µA(x) represents the degree to which any given element x in the domain X belongs to the fuzzy number A. The following are basic definitions of fuzzy sets and triangle fuzzy numbers (Vahidnia et al., 2009):
Definition 1: A fuzzy set A in the universe of discourse X is characterized by a membership function. This membership function µA which associates with each element x in X is a real number in the interval [0, 1]. The function value µA is termed the grade of membership of x in A.
Definition 2:A triangular fuzzy number (TFN) A can be defined by a triplet (l, m, u) as shown in figure 2.
Figure 2. Triangular fuzzy number A
l m u x
µA
1 0

www.ccsenet.org/emr Engineering Management Research Vol. 3 No. 1; 2014
73
The membership function µA is defined as:
otherwise
uxmmu
xu
mxllm
lx
xA
,0
,
,
(4)
Where l, m, u are the lower, mode, and upper bounds of the triangular membership function.
Triangular fuzzy membership functions are generally used to represent fuzzy numbers and are very popular in fuzzy application (Xu & Chen, 2007). They are easy for decision makers to use and calculate and have proven to be an effective way for formulating decision problems where the information available is subjective and imprecise. TFNs generally operate over the range of real values in scale between [0,1], although any scale could be used depending on the decision makers’ fuzziness and vagueness, and usually range between [1,9] in FAHP applications (Amiri, 2010; Dağdeviren et al., 2009).
To convert a fuzzy triangle number (l,m,u) to a crisp value many methods such as fuzzy extend analysis, center-of-area defuzzification and α-cut methods can be used. Fuzzy extend analysis is the easiest to compute and correctly determines priorities. The α-cut method is less controversial and takes into account decision makers’ attitudes to risk (Amiri, 2010; Dağdeviren et al., 2009; Lee et al., 2008). In this study α-cut method is used for converting healthcare quality attributes TFN weights gained by FAHP to crisp values based on the following formula:
LeftRightC 1 (5)
and
llmLeft (6)
muuRight (7)
Where Cλ represents the average crisp value and λ represents the degree of optimism, which ranges between [0, 1] (pessimistic, moderate, optimistic situations).
3.6 Fuzzy Analytical Hierarchy Process
In conventional AHP the decision maker is asked to compare two criteria with crisp values to indicate his/her preference. It is supposed that the decision maker is certain and confident about his/her preferences, which is not always the case. As the criteria become more complicated and difficult to estimate, misleading results and decisions will be concluded. Most decision makers prefer to give their preferences and pairwise comparisons using a wide range of values that express their imprecise judgment regarding fuzzy multi-criteria decision making problems (FMCDM). In order to reduce the effects of uncertainty and vagueness in decision making, FAHP approach is used, where Fuzzy set theory and its operations are integrated with the conventional AHP. FAHP is designed to allow decision makers express their uncertain judgments and preferences with linguistic variable values rather than crisp values that are used in conventional AHP. These linguistic variable values are transformed to fuzzy membership functions which represent fuzziness and uncertainty. The steps of constructing FAHP models are the same as in conventional AHP with the only difference being in using fuzzy membership values rather than crisp values for comparative purposes.
Table 1 represents the linguistic values and their TFNs (Vahidnia et al., 2009) used in FAHP these numbers can be changed and evaluated to fit with the decision maker’s fuzziness. The membership functions’ relationships are represented in Figure 2. The gained fuzzy values are normalized to a single crisp value using α-cut method as described previously.
Table 1. Triangular fuzzy number of linguistic variable
Linguistic values TFNs Reciprocal TFNs Equally important (1,1,2) (0.5,1,1) Moderately important (2,3,4) (0.250,0.333,0.500) Important (4,5,6) (0.167,0.200,0.250) Very important (6,7,8) (0.125,0.143,0.167) Absolutely important (8,9,9) (0.111,0.111,0.125)

www.ccsenet.org/emr Engineering Management Research Vol. 3 No. 1; 2014
74
Figure 3. Triangular fuzzy numbers corresponding to linguistic variables
4. Proposed Methodology
The current study consists of three phases. In phase I, patient requirements concerning the administrative staff and those concerning the healthcare facility design are identified by direct meetings with patients, focus groups, observations and patients' complaints and recommendations. In phase II, Kano model is used to classify requirements attained from listening to voice of patients into three major classes namely; must-be, performance and attractive. In phase III, FAHP is used to rank attributes within each class in the attained Kano hierarchy based on their relative importance. Figure 4 summarizes the proposed methodology to classify and rank healthcare quality attributes using an integrated Kano-FAHP approach. The ranking of attributes will facilitate directing the improvement strategies in the healthcare services by providers based on their importance and their effects on patients’ satisfaction. The following sections describe the proposed model in details.
4.1 Phase One: Patients’ Requirements Identification
To identify the healthcare quality attributes that are important to patients, we first listen to patients themselves, listen to their problems and difficulties, their suggestions and recommendations before, during, and after delivery of services and treatments.The “voice of customer” or “the voice of patients” process is effectively used to capture attributes or aspects that are foremost in the mind of the patients (Lloyd, 2004).These attributes can be captured in a variety of ways such as surveys, focus groups, observations, personal interviews, compliance and recommendation boxes, feedbacks on websites and social networks. Then patients’ requirements are translated to healthcare quality attributes related to administrative staff and healthcare facility design based on clustering analysis where the similar attributes are gathered under the same dimension.
4.2 Phase Two: Kano Model Classification
In this phase, patients are asked about their feelings towards the existence or absence of these attributes. Classifications are then inferred based on Kano matrix.
Data Collection
Kano model is used to analyze the dimensions proposed for healthcare quality, which relate to administrative staff and healthcare facilities’ design. In order to elicit patient opinion about a particular dimension’s attributes, a set of paired questions are asked. The patient or the respondent is asked two opposite questions to ensure that he/she understand the question properly and to avoid inconsistency of answering these questions.The first question takes a positive form (functional question), where the patient is asked about his/her feeling if a specific healthcare quality attribute exists, and the second one takes a negative form (dysfunctional question) where the patient is asked about his/her feeling if the same healthcare qualityattribute is not fulfilled. The respondent/ patient record his/her feeling on a scale that has five categories. This scale has been proposed by Berger et al. (1993). The categories of this scale are: I like it that way, it must be that way, I am neutral, I can live with it that way, and I dislike it that way. A sample of a functional and dysfunctional question is shown in table 2.
Attributes Classification
In this step Kano Evaluation Matrix, shown in table 3, is used to analyze the outcome of functional and dysfunctional questions. Cross-matching for patients' answers to the pair of questions is performed to infer attributes’ categories. For example, a patient is asked to evaluate the “employee appearance” attribute, the following questions are asked:
How do you feel if employee appearance is tidy and stylish?
How do you feel if employee appearance is not tidy and stylish?
1 2 3 4 5 6 7 8
1
0 x
µA (x)

www.ccsenet.org/emr Engineering Management Research Vol. 3 No. 1; 2014
75
Figure 4. The proposed methodology for classifying and ranking healthcare quality attributes via integrated
Kano-FAHP model
Table 2. Functional and dysfunctional question sample
Functional form of the question Dysfunctional form of the question Quality attributes How do you feel if employee
appearance is tidy and stylish? How do you feel if employee appearance is not tidy and stylish??
Employee appearance
□ I like it that way □ I like it that way □ It must be that way □ It must be that way □ I am neutral □ I am neutral □ I can live with it that way □ I can live with it that way □ I dislike it that way □ I dislike it that way
Suppose that he/she feels that employees must appear tidy and wear stylish cloths, and he/she dislikes the appearance of the employees if they do not look tidy and their cloths are not stylish, then this attribute is classified as must-be attribute. While if he/she feels that employees must appear tidy and wear stylish cloths, and he/she is neutral toward the appearance of the employee if they do not look tidy or do not wear stylish clothes, then this attribute is classified as indifferent. The frequencies of attributes’ categories gained from patients’ answers are counted, and the highest category frequency gained for each attribute is deemed as that attribute's classification (Hsu et al., 2007). For instance the number of times “employee appearance” was classified as must-be, performance, attractive and indifferent were 45, 30, 25 and 10 respectively, then this attribute is classified as must be.

www.ccsenet.org/emr Engineering Management Research Vol. 3 No. 1; 2014
76
Table 3. Kano Evaluation Matrix (Berger et al., 1993)
Negative form of question (dysfunctional ) I like it
that way It must be that way
I am neutral
I can live that way
I dislike it that way
Positive form of question ( functional )
I like it that way Q A A A O It must be that way R I I I M I am neutral R I I I M I can live that way R I I I M I dislike it that way R R R R Q
Q: questionable result, A: Attractive needs, I: Indifferent needs, O: One-dimension needs, M: Must-be needs, R: Reversed requirements
Statistical Significant Test
A statistical significant test is performed to examine the reliability of Kano's categories of attributes based on the statistical significance of the difference between the highest two of frequency observations. Sireli et al., (2007) made two assumptions before conducting the significance test: (1) Kano model survey answers are binomially distributed (2) normal distribution is used to approximate the binomial distribution as a result of the large number of answers received. According to these assumptions and based on (Fong, 1996) a hypothesis tests are conducted to determine the statistical significance of Kano responses at 90% confidence level. The following hypothesis is used to examine the statistical significance of attribute classification:
0:0 baH
and
0:0 baH
If condition (8) is true, then do not reject null hypothesis. This happens when the difference between the two most frequent observations is not statistically significant. This means that the attribute's category is inconclusive and more data should be collected.
N
baNbaZba
2
)2)(( (8)
Where:
a: the first most frequent, and
b: the second most frequent, and
N: the total number of observations
α: the confidence level
Zα: the standard normal number according to α- confidence level.
4.3 Phase Three: Prioritizing Healthcare Quality Attributes Using FAHP
The following steps represent the FAHP procedures and calculations to compute the attributes weights:
Step 1: developing hierarchical structure of patients’ requirements/ healthcare quality attributes
Hierarchical structure form is widely used to represent attributes or criteria, sub criteria and alternatives, in which pairwise comparisons are clearly defined. The hierarchal structure for ranking healthcare quality attributes based on Kano's classification consists of four levels as shown in figure 5:
Level 1 represents the goal of the problem under study, for example: “healthcare quality attributes ranking based on overall patients’ satisfaction”.
Level 2 represents healthcare quality dimensions such as administrative staff and healthcare facility design, etc.
Level 3 represents Kano's classifications under each dimension; must-be, performance, and attractive.
Level 4 represents healthcare quality attributes under each classification.

www.ccsenet.org/emr Engineering Management Research Vol. 3 No. 1; 2014
77
Figure 5. Hierarchal form of Kano model classification
Step 2: Constructing fuzzy pairwise comparison matrices (FCM) and relative linguistic importance values
Fuzzy pairwise comparison matrices (FCM) are constructed based on the hierarchy of the FMCDM problem in which all lower-level attributes are compared with each other with respect to the direct upper level in the hierarchy. The comparisons are performed by using linguistic importance values such as: equally important, moderately important, important, very important, or absolutely important.
Step 3: Converting the relative linguistic importance values to TFNs values
The relative linguistic importance values are converted to equivalent TFN values according to the scale adopted by the decision maker that best describes his/her fuzziness. Table 1 showed the most used linguistic importance values and their TFNs. In practical FAHP application, TFN values operate in the range [1-9] (Lee et al., 2008).The converted FCM results in the following n×n matrix, where n represents the number of comparisons with respect to the upper level:
nnnn
n
n
j
TFNTFNTFN
TFNTFNTFN
TFNTFNTFN
FCM
21
22221
11211
Step 4: Computing importance weights of patients’ requirements based on fuzzy set theory calculations
To compute the importance weights of the requirements; each column in the FCM is normalized then each row is averaged according the following equation:
innninin
innii
innii
j
TFNTFNTFNTFNTFNTFN
TFNTFNTFNTFNTFNTFN
TFNTFNTFNTFNTFNTFN
FCM
///
///
///
2211
2222121
1212111
nnnn
n
n
TFNTFNTFN
TFNTFNTFN
TFNTFNTFN
21
22221
11211
(9)
nTFN
nTFN
nTFN
w
w
w
W
ni
i
i
j
jT
/
/
/
2
1
2
1
(10)

www.ccsenet.org/emr Engineering Management Research Vol. 3 No. 1; 2014
78
Where WTjis the attributes’ weights.
Step 5: Checking the consistency of patients’ preferences
Patients’ preferences and importance weights between attributes should be consistent to provide reliable results and make strong decisions. For this purpose the consistency ratio (CR) is calculated and compared to 0.1 as in conventional AHP. If CR is less than 0.1 then the evaluator of the matrix is consistence, if CR is greater than 0.1 the patient should reevaluate his/her preferences. CR is calculated using equation (16) in which CI represents consistency index and RI represents the ration index taken from table 4 (Saaty, 1980) based on the number of pairwise comparisons.
RI
CICR
(11)
Where
1max
n
nCI
(12)
And
nW
WFCM
jT
jT
j
max (13)
Table 4. Ratio index values according to the number of pairwise comparison elements (Saaty, 1980)
n 1 2 3 4 5 6 7 8 9 RI 0.00 0.00 0.58 0.90 1.12 1.24 1.32 1.41 1.45
Step 6: Computing attributes’ TFNs total weights
The total weight of an attribute is calculated by multiplying the weight of the attribute by the weights of the upper levels in the hierarchy as follows:
Attribute total weight = attribute wt x classification wt x dimension wt (14) Step 7: Converting total attributes’ TFNs weights to crisp values
The final step in FAHP calculation is to convert the obtained TFN weights to crisp value using α-cut method.
Step 8: Ranking healthcare quality attributes
Healthcare quality attributes are prioritized according to their weights where larger weights have more priority improvement. Efforts should focus on these attributes.
5. Results and Discussions
In this section the analysis and results of identifying, classifying and ranking healthcare quality attributes related to administrative staff and healthcare facility design dimensions, which affect patients’ satisfaction from process perspective, are summarized and discussed. Data was collected at a local primary healthcare center located in Jordan.
5.1 Phase one: Identification of Healthcare Quality Attributes
Based on the analysis of the voice of patients, 28 attributes are considered to be studied in this research. Eight attributes related to administrative staff and twenty related to healthcare facility are specified.
5.2 Phase Two: Classification of Healthcare Quality Attributes via Kano Model
In this phase, attributes' importance and their effects on patients’ satisfaction are determined using Kano model. To infer attributes classification, 150 surveys in the form of functional and dysfunctional questions for each of the 28 attributes were distributed to patients to express their feeling if an attribute exists or not on the five attitude scale described previously. Then, they are analyzed according to Kano matrix to infer attributes’ classifications. Finally, a statistical test was performed to check classifications' reliability. The statistical significance tests of the resulting healthcare quality attributes’ classifications related to administrative staff and healthcare facility design were done based on Sireli et al. (2007) assumptions with 90% confidence level. Table 5 summarizes the resulting classes of each attribute, the frequency of observations, and the result of the statistical significance test. Results indicate that twelve attributes were classified as must-be, four, five and seven attributes

www.ccsenet.org/emr Engineering Management Research Vol. 3 No. 1; 2014
79
were classified as performance, attractive and indifferent, respectively. Moreover, all tests were statistically significant.
5.3 Phase Three: Prioritize Healthcare Quality Attributes Using FAHP
In this phase FAHP is used to prioritize the healthcare quality attributes based on patient’s preference and importance of the attributes. The following steps describe the procedure to formulate healthcare quality attributes as FMCDM and FAHP calculations.
In step one, the hierarchical structure of patient’s needs is built based on the effect of healthcare quality attributes on patient’s satisfaction and their classification via Kano model as shown in figure 6. In step two, eight fuzzy pairwise comparison matrices are constructed to formulate the FMCDM to prioritize the healthcare quality attributes related to administrative staff and healthcare facility design. Tables 6 to 13 show these comparison matrices of patients’ preferences with TFNs. In step three, importance weights of customer requirements based on fuzzy set theory calculations is computed. The column of the FCM is normalized then the row is averaged according to equations 9 and 10. TFN weights of the eight FCMs are computed and summarized in table 14. In step four, the consistency ratio (CR) for each FCM is calculated according to equations 11, 12 and 13 and assures that all are smaller than 0.1. CR for each FCM is presented in tables 6-13. The final step in FAHP calculation is to convert the obtained total attributes’ TFN weights to crisp values. In this study α-cut method is used, where α= 0.7 and λ=0.8.Table 15 shows the total attributes TFNs weights, their crisp value, and their final overall ranks.
Table 5. Attribute’s classification and their statistical significance
Attributes Frequency Classification Statistical SignificanceM P A I
Attributes related to administrative staff A1 Employee uniform 17 4 16 28 Indifferent significant A2 Employee appearance 48 20 7 12 Must-be significant A3 Employee friendliness and respectfulness 46 3 6 28 Must-be significant A4 Employee attention and care 23 60 4 7 Performance significant A5 Administrative awareness 13 10 23 38 Indifferent significant A6 Special employee to guide and direct patients 14 14 15 23 Indifferent significant A7 Transaction time 24 35 18 12 Performance significant A8 Correct information given 59 15 8 11 Must-be significant Attributes related to healthcare facility design A9 External appearance 16 8 27 16 Attractive significant A10 Internal decoration and services 19 12 32 21 Attractive significant A11 External and internal cleanliness 70 12 5 3 Must-be significant A12 Waiting room and WC cleanliness 50 15 8 13 Must-be significant A13 Internal temperature 38 15 20 19 Must-be significant A14 Waiting room location 3 2 8 68 Indifferent significant A15 Guidance sign simplicity and traceability 43 12 15 18 Must-be significant A16 Officehour of the healthcarefacility 20 34 23 18 Performance significant A17 Waiting room décor and services 51 9 17 18 Must-be significant A18 Ease of movement for people with special
needs 34 22 23 12 Must-be significant
A19 Parking availability and proximity to entrance 7 6 39 28 Attractive significant A20 Special waiting rooms for children 27 5 19 38 Indifferent significant A21 Cafeteria availability 48 14 16 10 Must-be significant A22 Rest andprayer room existence 24 12 18 30 Indifferent significant A23 Location and transportation availability 42 17 12 12 Must-be significant A24 Parks and green area availability within
thehealthcarefacility 3 5 46 34 Attractive significant
A25 Examination rooms space and décor 27 38 13 16 Performance significant A26 Closeness of managerial and accounting
offices 20 20 32 18 Attractive significant
A27 Ease of movement within the facility 43 30 11 10 Must-be significant A28 Healthcare facility design 6 3 25 37 Indifferent significant

www.ccsenet.org/emr Engineering Management Research Vol. 3 No. 1; 2014
80
Table 6. Pairwise comparison triangle fuzzy number matrix for administrative staff and healthcare facility design
AS HFD AS (1,1,1) (0.250,0.333,0.500) HFD (2,3,4) (1,1,1) CR=0.071 < 0.1
Figure 6. Healthcare quality attributes hierarchy as multi-attribute decision making problem
Table 7. Pairwise comparison triangle fuzzy number matrix for must-be, performance and attractive categories with respect to healthcare facility design
HFD-M HFD-P HFD-A HFD-M (1,1,1) (6,7,8) (8,9,9) HFD-P (0.125,0.143,0.167) (1,1,1) (2,3,4) HFD-A (0.111,0.111,0.125) (0.250,0.333,0.500) (1,1,1)
AR=3.082 CI=0.041 RI=0.58 CR=0.071 < 0.1
Table 8. Pairwise comparison triangle fuzzy number matrix for must-be, performance and attractive categories with respect to administrative staff
AS-M AS-O AS-M (1,1,1) (4,5,6) AS-O (0.167,0.200,0.250) (1,1,1) CR < 0.1

www.ccsenet.org/emr Engineering Management Research Vol. 3 No. 1; 2014
81
Table 9. Pairwise comparison triangle fuzzy number matrix for must-be healthcare quality attributes with respect to administrative staff
A2 A3 A8 A2 (1,1,1) (0.250,0.333,0.500) (0.167,0.200,0.250) A3 (2,3,4) (1,1,1) (1,1,2) A8 (4,5,6) (0.5,1,1) (1,1,1) AR=3.029 CI=0.015 RI=0.58 CR=0.025 < 0.1
Table 10. Pairwise comparison triangle fuzzy number matrix for performance healthcare quality attributes with respect to administrative staff
A4 A7 A4 (1,1,1) (1,1,2) A7 (0.5,1,1) (1,1,1) CR < 0.1
Table 11. Pairwise comparison triangle fuzzy number matrix for attractive healthcare quality attributes with respect to healthcare facility design
A9 A10 A19 A24 A26 A9 (1,1,1) (0.250,0.333,0.500) (0.250,0.333,0.500) (1,1,2) (0.250,0.333,0.500)A10 (2,3,4) (1,1,1) (0.250,0.333,0.500) (2,3,4) (1,1,2) A19 (2,3,4) (2,3,4) (1,1,1) (2,3,4) (1,1,2) A24 (0.5,1,1) (0.250,0.333,0.500) (0.250,0.333,0.500) (1,1,1) (0.250,0.333,0.500)A26 (2,3,4) (0.5,1,1) (0.5,1,1) (2,3,4) (1,1,1) AR=5.15 CI=0.037 RI=1.12 CR=0.033 < 0.1
Table 12. Pairwise comparison triangle fuzzy number matrix for performance healthcare quality attributes with respect to healthcare facility design
A16 A25 A16 (1,1,1) (1,1,2) A25 (0.5,1,1) (1,1,1) CR < 0.1
Table 13. Pairwise comparison triangle fuzzy matrix for must-be healthcare quality attributes with respect to healthcare facility design
A11 A12 A13 A15 A17 A18 A21 A23 A27
A11 (1,1,1) (1,1,2) (1,1,2) (1,1,2) (2,3,4) (1,1,2) (2,3,4) (1,1,2) (1,1,2) A12 (0.5,1,1) (1,1,1) (2,3,4) (1,1,2) (1,1,2) (1,1,2) (2,3,4) (1,1,2) (1,1,2) A13 (0.5,1,1) (0.25,0.33
,0.50) (1,1,1) (1,1,2) (2,3,4) (1,1,2) (2,3,4) (1,1,2) (1,1,2)
A15 (0.5,1,1) (0.5,1,1) (0.5,1,1) (1,1,1) (2,3,4) (1,1,2) (2,3,4) (1,1,2) (1,1,2) A17 (0.25,0.3
3,0.50) (0.5,1,1) (0.25,0.33
,0.50) (0.25,0.33
,0.50) (1,1,1) (0.25,0.33
,0.50) (2,3,4) (0.25,0.33
,0.50) (0.25,0.33
,0.50) A18 (0.5,1,1) (0.5,1,1) (0.5,1,1) (0.5,1,1) (2,3,4) (1,1,1) (2,3,4) (1,1,2) (1,1,2) A21 (0.25,0.3
3,0.50) (0.25,0.33
,0.50) (0.25,0.33
,0.50) (0.25,0.33
,0.50) (0.25,0.33
,0.50) (0.25,0.33
,0.50) (1,1,1) (1,1,2) (1,1,2)
A23 (0.5,1,1) (0.5,1,1) (0.5,1,1) (0.5,1,1) (2,3,4) (0.5,1,1) (0.5,1,1) (1,1,1) (2,3,4) A27 (0.5,1,1) (0.5,1,1) (0.5,1,1) (0.5,1,1) (2,3,4) (0.5,1,1) (0.5,1,1) (0.25,0.33
,0.50) (1,1,1)
AR=9.56 CI=0.07 RI=0.145 CR=0.048

www.ccsenet.org/emr Engineering Management Research Vol. 3 No. 1; 2014
82
Table 14. Weights of healthcare dimensions, Kano classes, and healthcare quality attributes as TFNs
Healthcare
Dimension
Weights (TFNs) Kano
classes
Weights (TFNs) Quality
attributes
Weights (TFNs) Total Weights (TFNs)
Administrative
staff
(0.267,0.250,0.267) Performance (0.138,0.167,0.207) A4 (0.417,0.500,0.833) (0.015,0.021,0.046)
A7 (0.292,0.500,0.583) (0.011,0.021,0.032)
Must-be (0.686,0.833,1.029) A2 (0.081,0.115,0.181) (0.015,0.024,0.050)
A3 (0.297,0.405,0.689) (0.054,0.084,0.189)
A8 (0.290,0.480,0.630) (0.053,0.100,0.173)
Facility design (0.733,0.750,0.733) Performance (0.140,0.155,0.173) A16 (0.417,0.500,0.833) (0.043,0.058,0.106)
A25 (0.292,0.500,0.583) (0.030,0.058,0.074)
Attractive (0.072,0.069,0.074) A9 (0.058,0.090,0.181) (0.003,0.005,0.009)
A10 (0.117,0.206,0.400) (0.007,0.011,0.022)
A19 (0.201,0.339,0.620) (0.011,0.017,0.033)
A24 (0.053,0.096,0.177) (0.003,0.005,0.008)
A26 (0.132,0.270,0.416) (0.007,0.014,0.022)
Msut-be (0.788,0.777,0.753) A11 (0.075,0.121,0.299) (0.050,0.075,0.163)
A12 (0.069,0.127,0.287) (0.049,0.082,0.162)
A13 (0.062,0.114,0.258) (0.040,0.069,0.136)
A15 (0.059,0.121,0.240) (0.039,0.075,0.132)
A17 (0.031,0.068,0.152) (0.017,0.034,0.060)
A18 (0.064,0.134,0.245) (0.036,0.075,0.122)
A21 (0.037,0.068,0.170) (0.019,0.033,0.068)
A23 (0.051,0.132,0.207) (0.030,0.075,0.107)
A27 (0.046,0.113,0.180) (0.027,0.064,0.092)
According to the FAHP weights of attributes, table 15,it is concluded that must-be attributes have the largest weights and have the first priority in ranking, which indicates that healthcare providers should give more attention to these attributes to eliminate patients’ dissatisfaction, and maintain their competitiveness in the healthcare industry. The second rank is for performance healthcare quality attributes and third rank is for attractive attributes with the least weights.
Must-be healthcare quality attributes have the highest weights where “A8: Correct information given” was the first attribute with 0.098, and “A3: employee friendless and respectfulness” and “A12: waiting room and WC cleanliness” were second and third attributes, in must-be classifications, with 0.092 and 0.085, respectively, as shown in table 16. Performance healthcare quality attributes have intermediate weights where “A16: office hour” and “A25: examination rooms space and décor” were first and second attribute, in performance classifications, with 0.059 and 0.052, respectively, as shown in table 17. Attractive healthcare quality attributes have the least weights where “A19: parking availability and proximity to entrance” and “A26: closeness of managerial and accounting office” were first and second attributes, in attractive classifications, with 0.018 and 0.013, respectively as shown in table 18.
As a consequence, healthcare providers should fulfill the must-be attributes first with conservative improvement strategy to achieve the minimum requirements, and to prevent patients move to another competitor.After that performance attributes should be fulfilled for better patients’ satisfaction. The third priority should go to attractive attributes to delight and surprise the patients.

www.ccsenet.org/emr Engineering Management Research Vol. 3 No. 1; 2014
83
Table 15. Healthcare quality attributes' weights and rank using FAHP
Healthcare
Dimension
Kano classes Quality
attributes
TFNs Crisp
value
Normalized crisp value Rank
Administrative staff Performance A4 (0.015,0.021,0.046) 0.021 0.022 16
A7 (0.011,0.021,0.032) 0.019 0.020 15
Must-be A2 (0.015,0.024,0.050) 0.023 0.025 14
A3 (0.054,0.084,0.189) 0.083 0.089 2
A8 (0.053,0.100,0.173) 0.093 0.099 1
Facility design Performance A16 (0.043,0.058,0.106) 0.057 0.061 9
A25 (0.030,0.058,0.074) 0.052 0.056 11
Attractive A9 (0.003,0.005,0.009) 0.004 0.005 21
A10 (0.007,0.011,0.022) 0.011 0.012 19
A19 (0.011,0.017,0.033) 0.017 0.018 17
A24 (0.003,0.005,0.008) 0.004 0.005 20
A26 (0.007,0.014,0.022) 0.013 0.013 18
Must-be A11 (0.050,0.075,0.163) 0.074 0.079 4
A12 (0.049,0.082,0.162) 0.079 0.084 3
A13 (0.040,0.069,0.136) 0.066 0.070 7
A15 (0.039,0.075,0.132) 0.070 0.074 5
A17 (0.017,0.034,0.060) 0.031 0.033 13
A18 (0.036,0.075,0.122) 0.068 0.073 6
A21 (0.019,0.033,0.068) 0.032 0.034 12
A23 (0.030,0.075,0.107) 0.066 0.070 8
A27 (0.027,0.064,0.092) 0.057 0.060 10
Table 16. Ranks of attributes within must-be category
Must-be attributes Crisp weight Normalized weight Rank
A2 Employee appearance 0.025 0.032 12
A3 Employee friendliness and respectfulness 0.092 0.116 2
A8 Correct information given 0.098 0.123 1
A11 External and internal cleanliness 0.081 0.102 4
A12 Waiting room and WC cleanliness 0.085 0.107 3
A13 Internal temperature 0.071 0.090 7
A15 Guidance sign simplicity and traceability 0.074 0.093 5
A17 Waiting room décor and services 0.033 0.042 11
A18 Ease of movement for people with special needs 0.072 0.090 6
A21 Cafeteria availability 0.035 0.044 10
A23 Location and transportation availability 0.069 0.086 8
A27 Ease of movement within the facility 0.059 0.074 9
Total 0.795 1

www.ccsenet.org/emr Engineering Management Research Vol. 3 No. 1; 2014
84
Table 17. Ranks of attributes within Performance category
Performance attributes Crisp weight Normalized weight Rank
A4 Employee attention and care 0.023 0.149 3
A7 Transaction time 0.020 0.129 4
A16 Officehour of the healthcarefacility 0.059 0.385 1
A25 Examination rooms space and décor 0.052 0.338 2
Total 0.153 1
Table 18. Ranks of attributes within attractive category
Attractive attributes Crisp weight Normalized weight Rank
A9 Healthcare facility external appearance 0.005 0.093 4
A10 Healthcare facility interiorand décor 0.012 0.227 3
A19 Parking availability and proximity to entrance 0.018 0.341 1
A24 Parks availability within thehealthcarefacility 0.005 0.087 5
A26 Closeness of managerial and accounting offices 0.013 0.251 2
Total 0.052 1
5.4 Comparing Integrated Kano-FAHP with Absolute Largest Weights
The ranking of Healthcare quality attributes computed by integrated Kano-FAHP method is compared with the absolute largest weights method suggested by Sireli et al., (2007) to investigate the difference between them and the effect of including uncertainty in the preference of patients in decision problems.
5.4.1 Attributes Ranking Using Absolute Largest Weights
In order to rank attributes classified by Kano model using absolute largest weights, customers’ satisfaction and dissatisfaction coefficients are calculated using equations (1&2). Table 19 shows extent of satisfaction and dissatisfaction, satisfaction weight and dissatisfaction weight, absolute largest weight and attributes rank.
5.4.2 Absolute Largest Weights Method and Integrated Kano-FAHP Rank Comparison
Healthcare quality attributes ranking using Kano-FAHP and largest absolute weights are summarized in table 20.For example “A2: Employee appearance” decreased in priority from having a rank of 9 in absolute largest weights method to having a rank of 14 using the Kano-FAHP. Table 20 presents the ranking changes within the same classification.
The proposed methodology for ranking the attributes, Kano-FAHP, is more accurate than the absolute largest weights method because (1) the proposed model take into account the uncertainty of patients in decision making (2) the overall satisfaction level, which includes both satisfaction and dissatisfaction of patients, is considered to prioritize attributes rather than ranking them based on satisfaction or dissatisfaction alone.

www.ccsenet.org/emr Engineering Management Research Vol. 3 No. 1; 2014
85
Table 19. Healthcare quality attributes CS coefficients’ weights and ranks
Attributes CS+ CS- Si Di Absolute largest weight Rank Attributes related to administrative staff Must be A2 Employee appearance 0.31 -0.78 0.035 0.062 0.062 9A3 Employee friendliness and respectfulness 0.11 -0.59 0.012 0.046 0.046 20A8 Correct information given 0.25 -0.80 0.028 0.063 0.063 8 Performance A4 Employee attention and care 0.68 -0.88 0.077 0.069 0.077 1A7 Transaction time 0.60 -0.66 0.067 0.052 0.067 4 Attributes related to healthcare facility design Must be A11 External and internal cleanliness 0.19 -0.91 0.021 0.072 0.072 2A12 Waiting room and WC cleanliness 0.27 -0.76 0.030 0.059 0.059 12A13 Internal temperature 0.38 -0.58 0.043 0.045 0.045 21A15 Guidance sign simplicity and traceability 0.31 -0.63 0.035 0.049 0.049 19A17 Waiting room décor and services 0.27 -0.63 0.031 0.050 0.050 18A18 Ease of movement for people with special
needs 0.49 -0.62 0.056 0.048 0.056 16
A21 Cafeteria availability 0.34 -0.70 0.038 0.055 0.055 17A23 Location and transportation availability 0.35 -0.71 0.039 0.056 0.056 15A27 Ease of movement within the facility 0.44 -0.78 0.049 0.061 0.061 10 Performance A16 Officehour of the healthcarefacility 0.60 -0.57 0.067 0.045 0.067 3A25 Examination rooms space and décor 0.54 -0.69 0.061 0.054 0.061 11 Attractive (delighters) A9 External appearance 0.52 -0.36 0.059 0.028 0.059 14A10 Internal decoration and services 0.52 -0.37 0.059 0.029 0.059 13A19 Parking availability and proximity to entrance 0.56 -0.16 0.063 0.013 0.063 7A24 Parks and green area availability within
thehealthcarefacility 0.58 -0.09 0.065 0.007 0.065 5
A26 Closeness of managerial and accounting offices
0.58 -0.44 0.065 0.035 0.065 6
Table 20. Rank of healthcare attributes using absolute largest weights and FAHP
Healthcare quality attribute Rank RemarkAbsolutelargest weight Integrated Kano-FAHP
Administrative staff quality attributesMust-be attributes A2 9 14 ↓A3 20 2 ↑A8 8 1 ↑Performance attributes A4 1 16 ↓A7 4 15 ↓
Healthcare facility design quality attributesMust-be attributes A11 2 4 ↓A12 12 3 ↑A13 21 7 ↑A15 19 5 ↑A17 18 13 ↑A18 16 6 ↑A21 17 12 ↑A23 15 8 ↓A27 10 10 □Performance attributes A16 3 9 ↓A25 11 11 □Attractive attributes A9 14 21 ↓A10 13 19 ↓A19 7 17 ↓A24 5 20 ↓A26 6 18 ↓↑ ascended, ↓ descended, □ unchanged

www.ccsenet.org/emr Engineering Management Research Vol. 3 No. 1; 2014
86
6. Concluding Remarks
In this research Kano model is applied to classify healthcare quality attributes into four main categories based on their effects on patients’ satisfaction. They are then prioritized using FAHP. The results show that must-be attributes gain the largest weights followed by performance attributes and finally attractive attributes. The contribution of this research to the literature includes several points. First, the survey results identifies and classifies specific attributes that affect patient’s satisfaction in dimensions that are not thoroughly covered in the literature such as administrative staff and healthcare facilities design. Second, the proposed integrated Kano-FAHP model prioritizes healthcare quality attributes within each Kano class. This investigation gives insights to providers to select the most appropriate improvement strategies. Third, the proposed model enables healthcare providers to capture the uncertainty and ambiguity in representing patients’ preferences and importance. Moreover, Kano-FAHP model enables decision makers to classify and rank attributes taking into account the overall patients’ satisfaction rather than ranking them based on satisfaction or dissatisfaction alone.
References
Alroaia, Y., & Ardekani, M. (2012). Representing a combination algorithm (AHP and Kano) in order to priority effective factors on customer needs in e-banking: The case of Bank-e-Saderat of Tehran Province. African Journal of Business Management, 6(26), 7727-7735.
Amiri, M. P. (2010). Project selection for oil-fields development by using the AHP and fuzzy TOPSIS methods. Expert Systems with Applications, 37(9), 6218-6224. http://dx.doi.org/10.1016/j.eswa.2010.02.103
Arefi, M., Heidari, M., & Zandi, K. (2012). Application of Kano Model in Higher Education Quality Improvement: Study Master’s Degree Program of Educational Psychology in State Universities of Tehran. World Applied Sciences Journal, 17(3), 347-353.
Bayraktaroglu, G., & Özgen, Ö. (2008). Integrating the Kano model, AHP and planning matrix: QFD application in library services. Library Management, 29(4/5), 327-351. http://dx.doi.org/10.1108/01435120810869110
Berger, C., Blauth, R., Borger, D., Burchill, G., Bolster, C., DuMouchel, … Walden, D. (1993). Kano’s methods for understanding customer-defined quality. Center for Quality Management Journal, 2(4), 1-37.
Büyüközkan, G., Kahraman, C., & Ruan, D. (2004). A fuzzy multi-criteria decision approach for software development strategy selection. International Journal of General Systems, 33(2-3), 259-280. http://dx.doi.org/10.1080/03081070310001633581
Chan, F., Kumar, N., Tiwari, M., Lau, H., & Choy, K. (2008). Global supplier selection: A fuzzy-AHP approach. International Journal of Production Research, 46(14), 3825-3857. http://dx.doi.org/10.1080 /00207540600787200
Chang, W. -J., & Chang, Y. -H. (2013). Patient satisfaction analysis: Identifying key drivers and enhancing service quality of dental care. Journal of Dental Sciences, 8(3), 239-247. http://dx.doi.org/10.1016 /j.jds.2012.10.006
Chen, L. -F. (2012).A novel approach to regression analysis for the classification of quality attributes in the Kano model: An empirical test in the food and beverage industry. Omega, 40(5), 651-659. http://dx.doi.org/ 10.1016/j.omega.2011.12.004
Chiou, C. -C., & Cheng, Y. -S. (2008). An integrated method of Kano model and QFD for designing impressive qualities of healthcare service. IEEM 2008: Proceedings of the IEEE International Conference On Industrial Engineering and Engineering Management (pp. 590-594). Singapore.
Dağdeviren, M., Yavuz, S., & Kılınç, N. (2009).Weapon selection using the AHP and TOPSIS methods under fuzzy environment. Expert Systems with Applications, 36(4). 8143-8151. http://dx.doi.org/10.1016 /j.eswa.2008.10.016
Fong, D. (1996). Using the self-stated importance questionnaire to interpret Kano questionnaire results.Center for Quality of Management Journal, 5(3), 21-23.
Harteloh, P. (2004). Understanding the quality concept in health care.Journal for Quality, Comparability and Reliability in Chemical Measurement, 9(1), 92-95.
Hemati, M., & Ghorbanian, F. (2011). A hybrid Kano-fuzzy AHP method for measuring customer satisfaction: A case study of transportation system. Management Science Letters, 1, 263-270. http://dx.doi.org/10.5267 /j.msl.2010.04.003

www.ccsenet.org/emr Engineering Management Research Vol. 3 No. 1; 2014
87
Hsu, Y. -L., Hsu, C. -C., & Bing, P. -C. (2007). Capturing passengers’ voices: The application of Kano’s model in the airline industry. Proceedings of the International Conference on Logistics, Shipping and Port Management (pp. 1-14). Taiyuan.
Jenkinson, C., Coulter, A., Bruster, S., Richards, N., & Chandola, T. (2002). Patients’ experiences and satisfaction with health care: Results Of a questionnaire study of specific aspects of care. Quality and Safety in Health Care, 11(4), 335-339. http://dx.doi.org/10.1136/qhc.11.4.335
Kahraman, C., Cebeci, U., & Ulukan, Z. (2003). Multi-criteria supplier selection using fuzzy AHP. Logistics Information Management, 16(6), 382-394. http://dx.doi.org/10.1108/09576050310503367
Kano, N. (2001). Life cycle and creation of attractive quality. Paper presented at the Fourth International QMOD Conference on Quality Management and Organizational Development. 12-14 September 2001. University of Linkoping, Linkoping, Sweden.
Kano, N., Seraku, N., Takahashi, F., & Tsuji, S. (1984). Attractive quality and must-be quality. Journal of Japan Society fo rQuality Control, 14, 39-48.
Kuo, Y. F. (2004). Integrating Kano’s model into web-community service quality. Total Quality Management and Business Excellence, 15(7), 925-939. http://dx.doi.org/10.1080/14783360410001681854
Lai, X., Xie, M., & Tan, T. (2004).Optimizing product design using the Kano model and QFD. IEEE 2004: Proceedings of International Engineering Management Conference (pp. 1085-1089). Singapore.
Lee, A., Chen, W., & Chang, C. (2008). A fuzzy AHP and BSC approach for evaluating performance of IT department in the manufacturing industry in Taiwan. Expert Systems with Applications, 34(1), 96-107. http://dx.doi.org/10.1016/j.eswa.2006.08.022
Lee, Y. -C., Wang, Y. -L., & Lin, S. -B. (2012). The reformed analytical Kano model. ICSSSM 2012: Proceedings of the 9th International Conference on Service Systems and Service Management (pp. 676-679). Shanghai, China.
Lloyd, R. (2004). Quality Health care: A Guide to Developing and Using Indicators. Sudbury, Massachusetts: Jones & Bartlett Publishers, Inc.
Matzler, K., & Hinterhuber, H. (1998). How to make product development projects more successful by integrating Kano’s model of customer satisfaction into quality function deployment. Technovation, 18(1), 25-38. http://dx.doi.org/10.1016/S0166-4972(97)00072-2
Matzler, K., Fuchs, M., & Schubert, A. (2004). Employee Satisfaction: Does Kano’s Model Apply?. Total Quality Management and Business Excellence, 15(9-10), 1179-1198. http://dx.doi.org/10.1080 /1478336042000255569
Nerney, M., Chin, M., Jin, L., Karrison, T., Walter, J., Mulliken, R., … Friedmann, P. (2001). Factors associated with older patients’ satisfaction with care in an inner-city emergency department. Annals of Emergency Medicine, 38(2), 140-145. http://dx.doi.org/10.1067/mem.2001.114304
Raposo, M. L., Alves, H. M., & Duarte, P. A. (2009). Dimensions of service quality and satisfaction in healthcare: A patients’ satisfaction index. Service Business, 3(1), 85-100. http://dx.doi.org/10.1007/s11628-008-0055-1
Saaty, T. (1980). The analytic hierarchy process. New York: McGraw- Hill.
Singh, R., & Sharma, S. (2011). Supplier selection: Fuzzy-AHP approach. International Journal of Engineering Science and Technology (IJEST), 3(10), 7426-7431.
Sireli, Y., Kauffmann, P., & Ozan, E. (2007). Integration of Kano’s Model into QFD for Multiple Product Design. IEEE Transactions on Engineering Management, 54(2), 380-390. http://dx.doi.org/10.1109 /TEM.2007.893990
Song, M., Zhou, L., & Wang, S. (2011). Measures to enhance the hospital patient satisfaction based on perceived service quality. AIMSEC 2011: Proceedings of the 2nd International Conference on Artificial Intelligence, Management Science and Electronic Commerce (pp. 4667-4669). Deng Feng, China.
Ting, C., & Chen, N. (2002). The asymmetrical and non-linear effects of store quality attributes on customer satisfaction. Total Quality Management, 13(4), 547-569. http://dx.doi.org/10.1080/09544120220149331
Tontini, G. (2007). Integrating the Kano Model and QFD for Designing New Products. Total Quality Management and Business Excellence, 18(6), 599-612. http://dx.doi.org/10.1080/14783360701349351
www.ccsenet.org/emr Engineering Management Research Vol. 3 No. 1; 2014
88
Vahidnia, M., Alesheikh, A., & Alimohammadi, A. (2009). Hospital site selection using fuzzy AHP and its derivatives. Journal of Environmental Management, 90(10), 3048-3056. http://dx.doi.org/10.1016 /j.jenvman.2009.04.010
Witell, N., & Fundin, A. (2005). Dynamics of service attributes: A test of Kano’s theory of attractive quality. International Journal of Service Industry Management, 16(2), 152-168. http://dx.doi.org/10.1108 /09564230510592289
Xu, Q., Jiao, R., Yang, X., Helander, M., Khalid, H., & Opperud, A. (2009). An analytical Kano model for customer need analysis. Design Studies, 30(1), 87-110. http://dx.doi.org/10.1016/j.destud.2008.07.001
Xu, Z. -S., & Chen, J. (2007). An interactive method for fuzzy multiple attribute group decision making. Information Science, 177(1), 248-263. http://dx.doi.org/10.1016/j.ins.2006.03.001
Yildirim C., Kocoglu H., Goksu S., Gunay N., & Savas H. (2005). Patient satisfaction in a university hospital emergency department in Turkey. ActaMedica (Hradec Kralove), 48(1), 59-62.
Zielke, S. (2008). Exploring asymmetric effects in the formation of retail price satisfaction. Journal of Retailing and Consumer Services, 15(5), 335-347. http://dx.doi.org/10.1016/j.jretconser.2007.08.005
Copyrights Copyright for this article is retained by the author(s), with first publication rights granted to the journal.
This is an open-access article distributed under the terms and conditions of the Creative Commons Attribution license (http://creativecommons.org/licenses/by/3.0/).