Embed Size (px)
Citation preview

Clicks, Discontinuities, and Firm
Demand Online
MICHAEL R. BAYE
Department of Business EconomicsKelley School of Business
Indiana University1309 East Tenth StreetBloomington, IN 47405
J. RUPERT J. GATTI
Trinity CollegeUniversity of Cambridge
Trinity StreetCambridge, CB2 1TQ
United [email protected]
PAUL KATTUMAN
Judge Business SchoolUniversity of Cambridge
Trumpington StreetCambridge, CB2 1AG
United [email protected]
JOHN MORGAN
Yahoo! and Haas School of BusinessUniversity of California
Berkeley, 545 Student Services Building#1900, Berkeley, CA 94720-1900
We exploit a unique dataset from a price comparison site to estimate thedeterminants of clicks received by online retailers. We find that a firm enjoysa 60% jump in its clicks when it offers the lowest price at the site, and failure
We are grateful to a coeditor and two referees for suggestions that substantially improvedthis offering. We thank Jennifer Brown and Nels Leader for research assistance, andPatrick Scholten for helpful conversations. We also thank seminar participants at Berkeley,the Canadian Competition Bureau, FTC, Harvard-MIT, Indiana, Louisville, New YorkUniversity, Temple, Virginia, and participants at the IIOC meetings in Atlanta. Researchsupport from the ESRC and NSF are gratefully acknowledged.
C© 2009, The Author(s)Journal Compilation C© 2009 Wiley Periodicals, Inc.Journal of Economics & Management Strategy, Volume 18, Number 4, Winter 2009, 935–975

936 Journal of Economics & Management Strategy
to account for discontinuities distorts parameter estimates by nearly 100%.This discontinuity is consistent with a variety of models that have been used torationalize online price dispersion. Finally, we show that one may use estimatesof the determinants of a firm’s clicks to obtain bounds on its underlying demandparameters, including standard elasticities of demand.
1. Introduction
Clicks are the currency of the realm in online markets. Google derivesnearly all of its revenues from clicks, and boasts a market capitalizationof over $140 billion (as of 11/1/06). Google is not alone in benefitingfrom this business model; the largest online portal, Yahoo, derived 87%of its $5.3 billion in total revenues from pageviews in 2005. Clicks are notonly the lifeblood of search providers and portals, they also representa significant (and often essential) marketing cost to firms competingin the online channel. For example, the largest price listing service inthe world (Yahoo’s European-based Kelkoo site) charges retailers feesranging from 40 cents to $1.90 per click and attracts over 10 millionconsumers per month in the United Kingdom alone. Price comparisonsites in the United States, including CNet and Pricewatch, charge onlineretailers similar clickthrough fees and have conversion rates of about5% in 2002.1 At a price of $1 per click, this means that an online retailerpays the platform an average of $20 to generate a single sale.
At price comparison sites, it is widely recognized that a particularseller’s price has a lot to do with its clickthroughs and that having the“low product price is key.”2 But how “key” is it to have the low price?And how do other factors, such as screen location, firm characteristics,the number of rivals, and their prices affect its clicks? The answers tothese questions are important to a variety of stakeholders includingplatforms, investors, and the retail firms themselves.
The extant literature on clearinghouse models offers guidance onhow “key” it is to have the low price.3 These models postulate that amass of consumers, sometimes referred to as “shoppers,” consult thecomplete list of prices displayed on the platform and buy exclusivelyfrom the firm offering the lowest price. Other consumers, who maybe viewed as “loyal” or simply uninformed, will purchase from a
1. “Comparison Search Engines Tested,” http://www.marketingexperiments.com onNovember 14, 2006.
2. See, for instance, http://www.marketingexperiments.com.3. See, for instance, Salop and Stiglitz (1977), Shilony (1977), Rosenthal (1980), Varian
(1980), Narasimhan (1988), Spulber (1995), Iyer and Pazgal (2003), Ju et al. (2006), andBaye et al. (2006) provide a survey of clearinghouse and closely related search-theoreticmodels which include Stahl (1989), Dana (1994), Brown and Goolsbee (2002), and Janssenand Moraga-Gonzalez (2004).
Clicks and Firm Demand Online 937
firm even if it does not offer the lowest price. Clearinghouse modelshave two important implications for online markets. The first—thatprices for homogeneous products are dispersed in equilibrium—hasbeen amply documented empirically.4 The second implication of thesemodels is that a firm experiences a discontinuous “jump” in its demand(which corresponds to clicks in these simple models) when it offers thelowest price. Indeed, this discontinuity is a theoretical driver for pricedispersion, yet, to the best of our knowledge, whether such a jump evenexists—let alone its economic significance—has never been examinedempirically. In terms of the relationship between clicks and prices, thesize of the jump (if any) determines just how “key” it is to have thelowest price in an online market.
Using a unique dataset from Kelkoo, we estimate the size of thejump and find it is economically and statistically significant. A firmoffering the best price gains 60% more clicks than if it had not chargedthe lowest price. In addition, we estimate that a firm’s elasticity of clickswith respect to price (having accounted for the jump) is more elastic inonline markets where competition is keener. We find that a monopolyseller faces an elasticity of about −2, while in the most competitivemarkets we analyze (15 sellers), the elasticity for a representative firmis about −6.
Failing to account for the discontinuity in clicks at the lowest pricegenerates significant distortions. For example, a firm that competesagainst the average number of rivals in our sample and ignores thediscontinuity will erroneously conclude that a 10% increase in its pricewill reduce its clicks by 44%. In contrast, a firm that correctly accountsfor the discontinuity realizes that a 10% price increase only reduces itsclicks by 30% if it is not currently offering the lowest price in the market(or if, after the price increase, it remains the lowest price offering in themarket). However, if the 10% price increase moves the firm out of thelowest price position in the market, its clicks will decrease by 90%. Thus,firms that do not take the discontinuity into account will systematicallymisestimate the impact of a price change on their clickthrough rates.Likewise, a platform (or financial analyst) interested in the impact of achange in the platform’s fee structure that raises the prices of all firmsby same percentage will overstate the impact on the platform’s clicksby 45%.
We also find that a firm’s screen location is an important deter-minant of its clicks, a result that is well-documented in the literature
4. Brynjolfsson and Smith (2000b) were among the first to document this phenomenon;see Table Ib in Baye et al. (2006) for a list of nearly 20 different studies that documentsignificant levels of price dispersion in online markets in the United States and abroad.

938 Journal of Economics & Management Strategy
on sponsored search.5 Our results imply that, other things equal, a firmreceives about 17% fewer clicks for every competitor listed above it onthe screen. Remarkably, screen position has more than four times theimpact on a firm’s clicks than the presence of an additional competitoron the price comparison site.
Our analysis takes into account some of the unique features ofthe online marketplace, including rapid changes in the number ofcompeting firms, the identity of the low-price firm, and screen location.At price comparison sites, the number of firms listing prices for a givenproduct, and the identity of the firm charging the lowest price, changealmost daily. 6 Likewise, “virtual” real estate in the online world changesrapidly. In purchasing “adwords” (advertising space at the top and sideof search results on Google), for instance, retailers realize the advantageof being the first listing on the page—and bid aggressively to obtain sucha position. At any moment, a retailer can find itself displaced from this“prime” real estate to a less favorable screen location. Variation in theidentity of the low-priced firm enables us to disentangle the jump fromother determinants of clicks. Variation in the number of competitorspermits us to identify the marginal impact of the number of rivals on afirm’s clicks elasticity. Finally, variation in screen location allows us toidentify the value of the virtual real estate separately from other firmcharacteristics.
To the extent one is interested in estimating a firm’s demand ratherthan its number of clicks, the ideal dataset would include a list of allfirms’ prices at the price comparison site, their number of clicks and finalsales. Unfortunately, the principal-agent problem between the ownersof price-comparison sites and e-retailers means that such data generallydo not exist.7 We show that, under plausible assumptions, one may usethe estimates of clicks elasticities discussed previously to place boundson the actual demand elasticities for products sold in online markets.Intuitively, if the conversion rate is independent of a firm’s price,then the clicks elasticity exactly corresponds to the demand elasticity.Directional assumptions about the relationship between conversionrates and underlying variables of interest, such as a firm’s price, allow
5. See, for example, Ghose and Yang (2007), Rutz and Bucklin (2007), Dreze andZufryden (2004), and Ansari and Mela (2003).
6. See Baye et al. (2004b) and Ellison and Ellison (2005). Baye and Morgan (2001) showtheoretically that variation in the degree of rivalry of a given online market is essentialfor firms to avoid pure Bertrand competition and for the information “gatekeeper”—theentity running the price comparison site—to profitably operate.
7. We know of only one demand study (Ellison and Ellison, 2009) that is basedon actual sales data. Chevalier and Goolsbee (2003) rather ingeniously impute priceelasticities for new books at two bookstores (Amazon and Barnes & Noble) using pricesand relative sales rankings obtained directly from the retailers’ websites.

Clicks and Firm Demand Online 939
one to obtain useful bounds on actual demand elasticities using onlyclicks data. Viewed in this context, our results also suggest that there aresignificant discontinuities in firms’ demand functions in online markets,and that failing to account for this may distort estimates of demandelasticities. Because demand elasticities play a central role in welfareanalysis, we believe that our finding of significant discontinuities inonline markets is potentially important for Internet-related tax policies.8
In addition, demand elasticities also play an important role in antitrustpolicy and trade policy.
The remainder of the paper proceeds as follows: The next sectiondescribes our data and provides an overview of the shopping envi-ronment at Kelkoo. In Section 3 we present the theory underlyingour estimation methodology, which is based on “distribution free”pseudo-maximum likelihood (PML) count data methods. Section 4provides estimates of the determinants of a firm’s clicks under theassumption that a firm’s number of clicks is a continuous functionof its price. These latter estimates are nested as a special case of thediscontinuous specification, which is detailed in Section 5. We showthat the results discussed above are robust to a variety of specificationsthat attempt to account for endogeneity, unobserved heterogeneity, andcontinuous cross-price effects. Section 6 offers conditions under whichclicks estimates may be used to obtain bounds on underlying demandparameters, such as a firm’s own- and cross-price elasticities of demand.In Section 7, we briefly discuss the potential implications of our resultsfor discrete choice models of individual consumer behavior. Finally,Section 8 discusses the potential ramifications of our results for onlineretailers, platforms, and policymakers.
2. Data
The proprietary data used in this paper were provided by the UK pricecomparison site, Kelkoo.com, which was owned by Yahoo. Within theUnited Kingdom, Kelkoo is the third largest retail website and attractsover 10 million individual users per month—more than twice that of itsclosest rival. Over 1800 individual retailers—including 18 of the largest20 online retailers in the UK—list prices on Kelkoo. According to Yahoo,Kelkoo is the largest price listing service in the world, operating in seven
8. For instance, it is well-known that the excess burden of a tax is roughly proportionalto the demand elasticity for the product. Thus, if demand was estimated to be twice aselastic as the true elasticity, then the evaluation of the excess burden of the tax would beoverstated by 100%.

940 Journal of Economics & Management Strategy
other European countries besides the United Kingdom. It is recognizedas one of the six most accessed websites in all of Europe.9
Consumers interested in purchasing a broad range of productsaccess the Kelkoo site to obtain information about the product and/or toobtain a list of retailers selling the product, the prices charged, and otherrelevant information such as shipping charges. Consumers interested inmaking a purchase must do so from the website of the specific retailerand may easily transfer from the Kelkoo site to a retailer’s site by clickingon one of the links provided.
Kelkoo’s revenue is generated by charging retailers a fee for eachreferral made—that is, each time a consumer transfers from the Kelkoosite to a retailer’s site. The fees charged vary across products andretailers, but typically range from £0.20 to £1.00 per click. Kelkoo doesnot charge consumers any fees for using its site.
The products in our dataset consist of all of the personal digitalassistants (PDAs) sold by independent retailers at the Kelkoo site on18 September 2003.10 This set contained 18 PDAs, including modelsby Palm, HP, Sony, and Toshiba, that span a wide range in prices.The lowest priced item is the Palm Handspring Treo, which has amedian price of about £ 130, while the highest priced item is theSony Clie nz90, with a median price of about £537. During our sampleperiod, 19 different retailers were active in selling these PDAs throughKelkoo.
Figure 1 shows a typical return from a price search on Kelkoo,which lists 12 retailers selling the HP iPAQ H5550 PDA. The informationdisplayed includes a brief description of the product, the names ofretailers selling the product, and price information detailed into itemprice, shipping charges (“P & P” in Kelkoo’s terminology) and the totalprice inclusive of sales tax (VAT). A consumer interested in purchasingthe item may click on the “More” button, or the retailer’s name or logo,to be transferred directly to the retailer’s website. Figure 1 illustrates theheterogeneity in the types of retailers using the site and the wide rangeof prices charged for an identical product. Some retailers, such as Cometand PC World, are “bricks-and-clicks” retailers who have physical storesin addition to an online presence. Others, such as Amazon, are well-known pure e-retailers, while firms such as Big Gray Cat are less well-known specialty e-retailers.
The Kelkoo dataset has certain advantages relative to clicks datafrom a US price comparison site. First, because of differences in thesales tax rates on interstate versus intrastate transactions, as well as
9. Data taken from Hitwise Statistics and company information provided by Kelkoo.10. We omitted a small number of Dell PDAs that were sold exclusively through Dell’s
own website.

Clicks and Firm Demand Online 941
FIG
UR
E1.
KE
LKO
OSC
RE
EN
SHO
T

942 Journal of Economics & Management Strategy
differences in tax rates across states, it is difficult to identify the firmthat offers the lowest price in US data. For instance, a California-basedfirm offering the lowest (pre-tax) price may offer the lowest final priceto a customer domiciled in Indiana (where sales tax would typicallybe absent from the transaction) but not to a consumer from California(where sales tax would be charged). In contrast, the tax component ofa firm’s price is identical for all UK consumers shopping at the Kelkoosite regardless of whether they are domiciled in Scotland, England, orWales.
Second, unlike many price comparison sites, a firm’s screenposition at Kelkoo was not determined by its price or its bid in anauction. Instead, Kelkoo used a proprietary algorithm.11 This resultedin considerable day-to-day fluctuation in a firm’s screen position andlow correlation (as discussed subsequently) between a firm’s locationand its price. Finally, the complete list of prices is always displayed ona single page in our data. Thus, a change in a firm’s screen location isnever associated with a consumer having to click to “page two” in orderto view the listing.
Kelkoo maintains an information log for each “referral” generatedat its site.12 The log registers the retailer name, product name, priceinformation, time of referral, location of the retailer on the screen,and a cookie-specific reference. Kelkoo provided us with informationextracted from its daily log files for the 18 PDA models for the periodfrom 18 September 2003 to 6 January 2004, a period which generatedover 40% of Kelkoo’s annual traffic.13
For the 18 PDAs in our sample, this traffic amounted to 39,568clicks generated by 20,509 separate cookies. The majority (60.1%) ofcookies generated only one click, while a small number of cookies(0.56%) generated more than 10 clicks.14 Over the period of our study,there were 6,151 individual product, retailer, and day specific pricelistings across the 18 PDA models. Our analysis is based on these
11. Over our sample period the Kelkoo management believed retailers in the UnitedKingdom were still learning how best to incorporate Kelkoo into their business strategies,and that it was too early for them to attempt to charge for screen location. Since thenKelkoo has begun to indirectly charge for screen location.
12. Throughout the paper we use the terms “referral,” “lead,” and “click” interchange-ably.
13. Kelkoo is bound to protect the anonymity of retailers and consumers in disclosinginformation about the referrals they obtain. So in providing the information from their logfiles, the retailers were identified in the dataset by codes, and by some key characteristics,such as whether they had a brick and mortar presence.
14. Following Brynjolfsson et al. (2002), in instances where a consumer’s cookiegenerated multiple clicks, we use the consumer’s last click as an indicator of her finalchoice. We also performed the analysis reported subsequently using all clicks as well asonly first-clicks data, and the results are qualitatively similar.
Clicks and Firm Demand Online 943
observations, along with the number of last clicks generated for eachPDA during the day of each listing.
The price used in our analysis is total purchase price—the actualcost to a consumer (including shipping and taxes) of purchasing aspecific PDA model. To ensure an “apples to apples” comparison, wecleaned the data such that our analysis is based on listings of productsthat are identical in every respect (including condition). We note thatKelkoo verifies and updates the information it displays daily. Firmsupdated both prices and their “feed” (the number of products to be listedat the Kelkoo site) on a daily basis. This led to considerable day-to-dayvariation in both price levels and the “depth” of the market for a givenproduct. As discussed previously, variation in the number of sellers,and their prices, is consistent with clearinghouse models of online pricecompetition. This variation is also consistent with “stockouts,” as firmswithout inventory are exposed to click-through fees and thus may havean incentive not to list a price until new inventory materializes.
Table I provides descriptive statistics for the data. The PDAs inour sample are somewhat pricey, and shipping accounts for only asmall fraction of the total purchase price. The average total price of aPDA in our sample is £309.04 ($497.55 at exchange rates as of 9/03),of which an average of £4.16 is accounted for by shipping charges.The number of sellers for a given product on any given day rangesfrom 1 to 15, with a mean of 4. The median number of clicks perday for a firm selling a specific PDA in our sample is 2. Consistentwith the pattern observed in many traditional retail environments,referrals occur disproportionately in the fourth quarter of the year.However, we do find that online shopping disproportionately occurson weekdays rather than weekends—opposite to the pattern observedin many traditional retail environments.
Figure 2 suggests that price and screen location play a potentiallyimportant role in determining the business enjoyed by a particularonline retailer. Consumers appear to be very sensitive to price, as isevidenced by the dramatic decline in clicks enjoyed by firms offeringless favorable prices. Likewise, consumers tend to frequent firms thatare listed above others on the screen. While the data indicate that pricerank is not the primary determinant of screen location, it is possible thatthe results displayed in Figure 2 are the result of joint correlation witha third variable.15 We deal with this issue formally in Section 4 of thepaper.
15. Note that the relationship in Figure 2 does not control for the fact that screenswith only n listings never have price ranks or locations greater than n. Controlling forthe number of listings, the weighted average correlation between price rank and screenlocation is −0.075 in our data.

944 Journal of Economics & Management Strategy
Table I.
Descriptive Statistics
Standard First ThirdVariable Mean Deviation Quartile Median Quartile Maximum Minimum
Clicks 3.33 4.27 0 2 5 36 0Price 304.88 106.84 229.99 279.98 396.63 601.95 104.57Shipping 4.16 4.50 0 3.95 5.82 17.63 0Total price 309.04 107.01 234.42 283.94 396.63 607.77 108.10Number of 4.05 2.93 2 3 6 15 1
sellersLocation on 3.40 2.43 1 3 5 15 1
screenBricks and 0.29
clicks retailerWeekend 0.28September 0.11October 0.29November 0.29December 0.27January 0.05
Total number 18of products
Total number 19of firms
Total number 111of dates
Total number 6151of observations
3. Estimation Methodology
We now describe our methodology for estimating the factors thatdetermine a firm’s number of clicks at the Kelkoo site.
3.1 How Firms Obtain Clicks
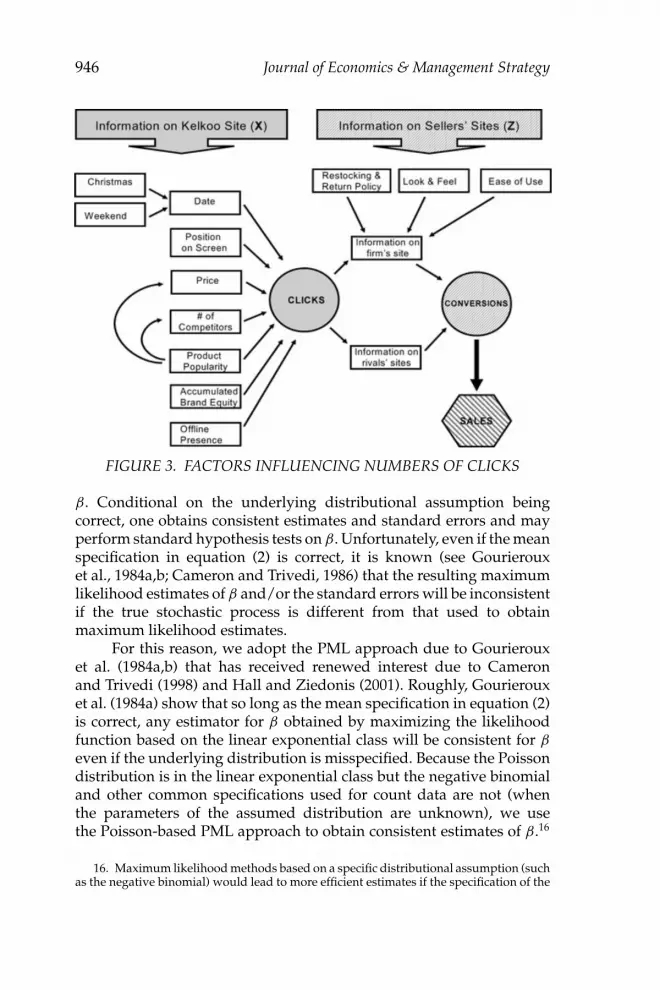
The number of clicks a firm receives for a given product on a given datedepends on many factors, the most important of which are highlightedin Figure 3. As the figure shows, a firm’s clicks depend on the price itcharges, the number and prices of rival firms offering the same product,the identity of the firm and its rivals, the location of the firm’s listingon the “page,” and the date. Formally, let X denote this and otherinformation that consumers obtain directly from the Kelkoo site. Notethat X may include dummy variables to control for product-specificcharacteristics (some products are more popular and receive more clicks,

Clicks and Firm Demand Online 945
05
1015
2025
3035
4045
50
1 2 3 4 5 6 7 8 9 10Price Rank / Screen Location
Per
cent
age
of C
licks
Price Rank
Screen Location
FIGURE 2. HISTOGRAM OF CLICKS BY PRICE RANK AND SCREENLOCATION
on average, than others), firm characteristics (some firms may have abrick-and-mortar presence while others do not), and time effects (firmsmay receive fewer clicks on weekends or products may exhibit life-cycle effects that cause clicks to vary systematically over time). Letthe quantity of clicks that firm i receives, Qi , be drawn from somedistribution F i (· |X). Thus,
E[Qi | X] =∫
qd Fi (q | X), (1)
where we use a Lebesque integral to account for the fact that Qi is dis-crete. The information in X—and this information alone—determinesthe number of clicks a firm obtains from the Kelkoo site. To estimate theparameters associated with the determinants of a firm’s clicks, we usea PML approach that does not require us to make specific assumptionsabout the underlying distribution generating a firm’s number of clicks;instead, we initially assume the underlying stochastic process has finitemean, given by
E[Qi | X] = exp[Xβ]. (2)
In order to estimate the vector of unknown parameters, β, onemust account for the fact our clicks data consist of integer numbers ofclicks. In fact, as shown in Table I, over 50% of the data consist of daysin which a firm selling a particular PDA received two or fewer clicks.For this reason, analysis of these data requires regression techniquessuitable for count data.
One approach is to make a specific distributional assumptionregarding the underlying stochastic process (Poisson or negative bino-mial, for instance), and use standard maximum likelihood estimation(MLE) methods to obtain estimates of the underlying parameters,
946 Journal of Economics & Management Strategy
FIGURE 3. FACTORS INFLUENCING NUMBERS OF CLICKS
β. Conditional on the underlying distributional assumption beingcorrect, one obtains consistent estimates and standard errors and mayperform standard hypothesis tests on β. Unfortunately, even if the meanspecification in equation (2) is correct, it is known (see Gourierouxet al., 1984a,b; Cameron and Trivedi, 1986) that the resulting maximumlikelihood estimates of β and/or the standard errors will be inconsistentif the true stochastic process is different from that used to obtainmaximum likelihood estimates.
For this reason, we adopt the PML approach due to Gourierouxet al. (1984a,b) that has received renewed interest due to Cameronand Trivedi (1998) and Hall and Ziedonis (2001). Roughly, Gourierouxet al. (1984a) show that so long as the mean specification in equation (2)is correct, any estimator for β obtained by maximizing the likelihoodfunction based on the linear exponential class will be consistent for β
even if the underlying distribution is misspecified. Because the Poissondistribution is in the linear exponential class but the negative binomialand other common specifications used for count data are not (whenthe parameters of the assumed distribution are unknown), we usethe Poisson-based PML approach to obtain consistent estimates of β.16
16. Maximum likelihood methods based on a specific distributional assumption (suchas the negative binomial) would lead to more efficient estimates if the specification of the

Clicks and Firm Demand Online 947
Following Hall and Ziedonis (2001), we use robust standard errors toobtain consistent estimates of the variance–covariance matrix. We alsoprovide MLE estimates based on specific distributional assumptions,including the negative binomial (see Cameron and Trivedi, 1998), as wellas specifications that allow for unobserved firm heterogeneity (usingboth random and firm specific effects, as in Hausman et al., 1984). Ourresults are robust to these alternative specifications.
4. Continuous Models
In this section we provide estimates of the determinants of a firm’s clicksunder the assumption that its expected number of clicks is a continuousfunction of its price.
4.1 Estimates by Product
As a starting point, we pool across firms (i) and dates (t), but estimateseparate elasticities for each of the 18 different models of PDAs in ourdata using the PML procedure described previousl. Specifically, weassume
E[Qi jt | Xi jt] = exp[β j ln pi jt + γ j X1,i j t], (3)
where Qijt is the number clicks firm i received on product j at time t,pijt is the total price (including VAT and shipping) firm i charged forproduct j at time t, and X1,ijt is a vector of controls. Notice that β j may beinterpreted as the own price elasticity of clicks for a representative sellerof a model j PDA. The vector X1,ijt consists of the following controls:
Position on screen: As we showed earlier in Figure 2, when a firm’sprice is listed above its rivals, it tends to receive more clicks. Clicks tendto decrease as the position on the screen gets lower. Hence, we includea linear position on screen variable to capture this effect.17
Weekend: Firms systematically receive fewer clicks on weekends.Hence, we include a weekend dummy variable to control for this effecton clicks.
data generating process is correct, but inconsistent estimates if the distribution is notcorrect. Similarly, if one used a discrete choice framework to estimate behavior at theindividual consumer level rather than the firm level, one would likewise obtain moreefficient estimates if the underlying distributional assumption on the random utilitycomponent of the choice generating process were correct.
17. We investigated nonlinear specifications of screen location as well and obtainedsimilar results to those reported here. We chose the linear specification for parsimony.

948 Journal of Economics & Management Strategy
Month: We include month dummies to control for seasonal effects onclicks.
Table II reports the results of the individual product regressions.Notice that 13 of the estimated own price elasticities in Table II arestatistically significantly different from zero at the 1% level, with valuesranging from −1.75 (for the Toshiba E770) to −14.691 (for the HPCompaq iPAQ 1940). These estimates vary widely across PDAs. Ininterpreting these results, and to better understand the widely differentestimates obtained for different models of PDAs, it is important torecognize that these estimates are firm clicks elasticities—not marketclicks elasticities. One of the key theoretical determinants of a firm’sprice elasticity of demand is the availability of substitutes—the moresellers offering the same product, the more elastic is the demand facinga firm selling that product. For instance, it is well-known that in asymmetric n-firm capacity-constrained price-setting environment, theelasticity of demand facing an individual firm (E F ) is n times the marketelasticity (E M): E F = nEM. One might expect clicks behavior to have asimilar property.18 If this is the case and different numbers of firms solddifferent types of PDAs, firms’ clicks elasticities would vary widelyacross PDA models even if the market elasticity of clicks were the samefor each model of PDA.
Thus, it seems useful to investigate the relationship between theclicks elasticity estimates reported in Table II and the average numberof firms selling each PDA. This relationship is plotted in Figure 4. Theestimates are divided into those that are not statistically significant atconventional levels (shown as open circles) and those that are significantat the 1% level (shown as filled-in diamonds). As Figure 4 shows, thereis a strong negative relationship between the elasticity estimates foreach of the products and the average number of firms offering pricequotes for the product. This suggests the need to control for the numberof sellers were one to pool across all products.
4.2 Pooled Estimates
We now report estimates obtained by pooling across firms (i), dates(t), and different models of PDAs using the PML procedure. Here weconsider two models: a baseline model that does not allow elasticitiesto vary with the number of sellers, and a more general model thattakes into account our preliminary findings in the individual product
18. For instance, if a firm’s demand were proportional to clicks, a firm’s clicks elasticitywould correspond to its demand elasticity and thus be a function of the number of sellersin the market.

Clicks and Firm Demand Online 949
Table II.
Product Specific Estimates
Likelihood Specification for Clicks: Poisson PML
Log Position AverageTotal on Month Number of
Product Price Screen Weekend Dummies # of Obs. Sellers
Toshiba E740 −1.75 0.272 −0.214 4 216 2.093WIFI (8.64)∗∗ (3.23)∗∗ (2.35)∗
HP Compaq −3.281 −0.591 −0.215 2 171 3.012IPAQ 1910 (5.68)∗∗ (4.73)∗∗ (2.29)∗
HP Compaq −14.691 −0.165 −0.255 4 898 8.942IPAQ 1940 (20.39)∗∗ (13.98)∗∗ (4.45)∗∗
HP Compaq −11.725 −0.058 −0.251 1 184 6.652IPAQ 2210 (10.54)∗∗ (2.04)∗ (2.43)∗
HP Compaq 1.961 −0.351 −0.152 3 91 1.462IPAQ 3950 (1.56) (1.02) (0.62)
HP Compaq −1.53 −0.262 −0.12 4 131 1.809IPAQ 3970 (1.91) (3.10)∗∗ (1.14)
HP Compaq −13.712 −0.153 −0.288 4 851 8.055IPAQ 5550 (22.97)∗∗ (13.92)∗∗ (5.17)∗∗
Palm m515 −2.503 −0.458 −0.444 2 44 1.091(3.88)∗∗ (0.99) (2.82)∗∗
Sony Clie NX70V −2.455 −0.227 −0.116 3 164 2.354(9.41)∗∗ (2.99)∗∗ (0.91)
Sony Clie NX73V −5.941 −0.258 −0.163 4 501 4.928(10.82)∗∗ (7.18)∗∗ (1.73)
Sony Clie NZ90 −2.884 −0.144 −0.331 4 151 1.821(1.51) (0.82) (1.60)
Sony Clie SJ22 −3.263 −0.085 −0.278 4 368 3.728(8.65)∗∗ (3.04)∗∗ (3.54)∗∗
Sony Clie SJ33 0.182 −0.215 2 44 1.045(0.08) (1.51)
Sony Clie TG50 −6.188 −0.049 −0.202 4 428 5.178(6.28)∗∗ (1.22) (1.87)
Handspring −4.375 −0.723 −0.225 2 136 1.985Treo 90 (1.67) (0.79) (2.92)∗∗
Palm Tungsten T2 −6.096 −0.153 −0.265 4 678 6.587(11.90)∗∗ (6.30)∗∗ (3.04)∗∗
Palm Tungsten W −3.902 −0.328 −0.406 4 295 3.115(4.37)∗∗ (4.08)∗∗ (2.30)∗
Palm Zire 71 −11.115 −0.157 −0.316 4 800 7.978(11.47)∗∗ (7.71)∗∗ (3.65)∗∗
Note: Dependent variable: Clicks per firm per product-date. Robust z statistics in parentheses. ∗Significant at 5%;∗∗Significant at 1%.Toshiba products: Toshiba, Tokyo, Japan; HP Compaq products: Agilent Technologies, Palo Alto, CA; Palm andHandspring products: Palm, Sunnyvale, CA; Sony products: Sony, Tokyo, Japan.

950 Journal of Economics & Management Strategy
-15
-13
-11
-9
-7
-5
-3
-1
1
1 2 3 4 5 6 7 8 9
Ela
stic
ity
Average Number of Sellers
Coefficient Estimate Significant at the 1% Level
Coefficient Estimate Not Significant at any Conventional Level
FIGURE 4. ESTIMATED CLICKS ELASTICITY AND NUMBER OFSELLERS
specifications. The baseline model assumes
E[Qi jt | Xi jt] = exp[β ln pi jt + γ X1,i j t]. (4)
The controls for this specification include all of those in equation (3) aswell as the following:
Product: As the previous specification revealed, there are differencesin clicks for each of the different PDA models. For instance, PDAs differfrom one another in terms of their popularity, their operating system,various performance characteristics, add-on software, and so on. Thuswe include product dummies for each of the 18 PDA models.
Product–month interactions: In addition, the popularity of a PDAvaries depending on new entrants in the PDA product space. As tech-nology and performance improve with the introduction of new models,the popularity of an existing PDA can decline—sometimes dramatically.To control for these effects, we include dummies interacting each of theproduct dummies with the month dummies mentioned above. This, inprinciple, allows PDA “life cycles” to differ during the time horizon ofour study.
Bricks-and-clicks retailer: Some of the firms in our dataset have anestablished physical presence in addition to their online presence.Clearly, the reputation as well as the ease of returns and accumulatedbrand equity of these retailers may differ from pure online sellers. Thus,we include a dummy variable for whether a particular firm is a bricks-and-clicks retailer.

Clicks and Firm Demand Online 951
With these controls in place, we report PML estimates(Table III, Model 1) based on the mean specification in equation (4).The bottom of Table III also reports the results of a likelihood ratiotest for overdispersion of the negative binomial (2) type (cf. Cameronand Trivedi, 1990). This is a test of the null hypothesis that the meanand variance of the click generating process are equal, as would bethe case were the data generating process truly coming from a Poissondistribution. As the table shows, we overwhelmingly reject this hy-pothesis, indicating that the underlying distribution is not Poisson. Asdiscussed previously, the parameter estimates are nonetheless consis-tent (provided the mean specification in equation (4) is correct), but theoverdispersion test indicates that Poisson-based maximum likelihoodestimates of their standard errors are not consistent. To obtain consistentvariance–covariance estimates, we employ the standard error correctiontechniques of Rogers (1993), Huber (1967), and White (1980, 1982).19 Thecorresponding z-statistics are reported in Table III.20
The results show a price elasticity of clicks of −4.61, which is fairlyclose to the average over the individual product elasticities reported inTable II. More favorable screen positions lead to increased clicks: All elseequal, a firm that moves up one screen position enjoys an 18.6% increasein clicks. These results confirm what we saw earlier in Figure 2: There isa strong tendency for consumers to click on firms listed at the top of thedisplay screen, all else equal. This may also explain why search enginesthat auction screen positions, such as Google, receive significant premiafor positions located near the top of the screen. Interestingly, whilethe coefficient associated with being a bricks-and-clicks retailer has theexpected positive sign (0.262), it is not significant at conventional levelsin this continuous specification.
To account for a potential relationship between a firm’s clickselasticity and the number of competing sellers in the pooled model, wegeneralize equation (4) to allow individual firm elasticities to dependon the number of sellers as follows:
E[Qi jt | Xi jt] = exp[(β0 + (njt − 1)β1) ln pi jt + β2njt + γ X1,i j t], (5)
where njt denotes the number of sellers of type j PDA on date t. Noticethat, in this specification, the clicks elasticity for a representative firm is
19. Specifically, we use the grouping technique of Rogers (1993) to relax the indepen-dence of observations for a given firm i across products and time. This allows potentialautocorrelation and heteroskedasticity in the errors.
20. Some researchers have taken the view that the rejection of the null hypothesis ofno overdispersion warrants the use of a negative binomial specification. For this reason,we report ML estimates based on the negative binomial (2) specification in Table AI. Asthat table shows, the parameter estimates are very similar.

952 Journal of Economics & Management Strategy
Table III.
Continuous Clicks Specifications
Model 1 Model 2 Model 3 Model 2Likelihood Specification Poisson Poisson Poisson Poissonfor Clicks PML PML CML PML
Log lotal price −4.61 −3.761 −3.614 −3.613(8.91)∗∗ (7.45)∗∗ (38.19)∗∗ (38.08)∗∗
Log total price × −0.288 −0.156 −0.154(Number of Sellers − 1) (4.14)∗∗ (9.25)∗∗ (9.14)∗∗
Number of sellers 1.593 0.858 0.847(4.05)∗∗ (9.05)∗∗ (8.93)∗∗
Position on screen −0.186 −0.175 −0.159 −0.158(4.54)∗∗ (4.47)∗∗ (22.93)∗∗ (22.66)∗∗
Bricks and clicks retailer 0.262 0.236 0.241(1.58) (1.67) (1.15)
Weekend −0.242 −0.265 −0.259 −0.259(10.82)∗∗ (11.46)∗∗ (15.42)∗∗ (15.42)∗∗
Product dummies 17 17 17 17Month dummies 4 4 4 4Product x month 55 55 55 55
dummiesRobust standard errors Yes Yes No No
clustered by firmControls for unobserved No No 19 19
firm heterogeneityRandom FixedEffects Effects
Observations 6151 6151 6151 6151
Overdispersiontest Test Statistic 2656.46 2488.77
P-Value 0 0
Note: Dependent variable: Clicks per firm per product-date. Robust z statistics in parentheses. ∗Significant at 5%;∗∗Significant at 1%.
given by
β0 + (njt − 1)β1.
Thus, the coefficient of total price (β0 represents the clicks elasticity fora monopoly seller, β0 + β1 represents the elasticity in duopoly PDAmarkets, and more generally, β1 represents the impact on a firm’s clickselasticity of facing an additional competitor. In addition to our earliercontrols, we include the following:
The number of sellers: Besides the theoretical rationale for permitting arepresentative firm’s clicks elasticity to depend on the number of sellers,one might expect the number of clicks received by a particular firm to

Clicks and Firm Demand Online 953
directly depend on the number of sellers. For a given consumer base,adding additional sellers would tend to reduce the expected number ofclicks enjoyed by any particular firm. In addition, one might speculatethat consumers are more likely to click and purchase PDAs that aresold by more firms, as additional firms might stimulate online sales bymaking the market appear more credible in the eyes of consumers. Aswe will see subsequently, our framework permits one to disentanglethese two competing effects. We include a linear term for the number ofsellers.21
The resulting estimates are displayed in the Model 2 column ofTable III. As the table shows, the number of sellers has a significanteffect—both in terms of levels as well as on clicks elasticities. Controllingfor the number of firms listing prices, we find that the price elasticityof clicks for a monopoly seller is −3.761, which implies that a 10%increase in price leads to a 38% decline in clicks. Adding a second firmto the market raises the elasticity to around −4.049. When 10 firms listprices, the estimated elasticity becomes −6.64, which implies that a 10%increase in price results in a 66% decline in a firm’s number of clicks.
What is the impact of a change in the number of sellers on afirm’s overall number of clicks? As we mentioned previously, there is adirect effect as well as an indirect effect from increased competitiveness.Taking the derivative of equation (5) and evaluating it at the mean ofour data yields
∂ ln E[Qi jt | X]∂njt
| pi j t = β1 ln pi j t + β2
= −.288 × 5.67 + 1.593,
or about −0.04 (p = .0155). It is useful to contrast the magnitude ofthis “rivalry” effect with that of a change in a firm’s screen position. AsTable III shows, a reduction of one screen position decreases the firm’sclicks 17.5%. Thus, our estimates suggest that the impact of screenposition is more than four times larger than the impact of an additionalcompetitor appearing on the price comparison site.
Finally, Models 3 and 4 allow for the possibility of unobserved firmheterogeneity by using random and fixed effects conditional maximumlikelihood specifications of equation (5). As Table III shows, the resultsare similar except that allowing for unobserved firm heterogeneityreduces the estimated effect of the number of competing sellers on afirm’s clicks and its price elasticity.
21. We also ran dummy specifications for the number of sellers and obtained similarresults.

954 Journal of Economics & Management Strategy
4.3 Potential Misspecification
One may have a number of concerns regarding the estimates basedon the continuous clicks specification in equation (5). As we haveemphasized, the PML approach is robust against alternative distribu-tional assumptions but not to the misspecification of the underlyingmean of the stochastic process.
First and foremost, price comparison sites are often used byconsumers looking to obtain a given product at the best price. Forinstance, Brynjolfsson and Smith (2000a) have provided evidence that49% of consumers using price comparison sites in the United Statesmake purchase decisions based purely on price. The results of Ghoseet al. (2006) seem to indicate a jump in a firm’s demand when it setsthe lowest price. Moreover, recall that in our data (see Figure 2), 45%of the clicks are at the lowest price. These observations, coupled withthe recent literature discussed in the introduction that rationalizes theobserved levels of price dispersion in online markets, suggest that a firmlowering its price from the second-lowest to the lowest price enjoys adiscontinuous jump in its number of clicks.
To see the potential effects of a discontinuity at the lowest price (asimplied by clearinghouse models) on clicks estimation, suppose there isa unit mass of consumers, half of which are “shoppers” (who click on thefirm offering the lowest price) and the other half are “loyals” (who havea preference for a particular seller). Consumers within each group haveidentical and constant clicks elasticities, θ ; thus, a firm’s number of clicksis given by Q = p−θ . A firm that charges the lowest price in the marketenjoys clicks from both groups, while a firm charging a price abovethe minimum price in the market only receives clicks from its loyalcustomers. Figure 5 illustrates the ramifications on clicks estimation.The slope of the two steep lines through the data are the same, andrepresent the true clicks elasticity, −θ , for prices above or below theminimum price. At the minimum price, there is a discontinuous jumpin clicks owing to the fact that the firm attracts all of the shoppers at thisprice.
The dashed line through the data represents the elasticity estimatethat results from failing to take into account the discontinuous jump thatoccurs when the firm charges the lowest price. Notice that, by ignoringthe jump in clicks at the lowest price, one obtains an elasticity estimatethat overstates how responsive consumers are to a change in price.
In addition to the potential problem caused by using a continuousspecification in the presence of “shoppers,” two additional econometricissues are potentially relevant. First, while there are sound theoreticalreasons for elasticities (and per-firm clicks) to depend on the number

Clicks and Firm Demand Online 955
Best Price
Ln(Price)
Ln(Clicks)Jump at lowest price
Firm i’sEstimated Clicks Behavior
Firm i’s Actual Clicks Behavior
FIGURE 5. MISSPECIFICATION FROM USING CONTINUOUSCLICKS MODEL IN DISCONTINUOUS MARKET SETTING
of firms listing prices, the estimates may be biased due to potentialendogeneity. In particular, popular products are likely to (for a givennumber of firms) result in a firm receiving more clicks, and this mayencourage additional firms to enter the market.
Second, while we have controlled for one firm characteristic—whether a firm is a bricks-and-clicks retailer—a variety of unobservedfirm characteristics, such as the degree of accumulated brand equityor differences in consumers’ perceptions of firm quality, could alsopotentially bias our results. Thus, it may be important to account forunobserved firm characteristics in estimating a firm’s clicks.
We address these and other issues in the next section.
5. Discontinuous Models
Clearinghouse models (e.g., the seminal models of Varian, 1980 andRosenthal, 1980) postulate that firms compete for two types of con-sumers: price-sensitive shoppers (who always purchase at the lowestprice) and loyals (who do not). In this section we use these modelsto derive functional forms that allow for a possible jump in a firm’sclicks when it charges the lowest price. We then describe the estimatingequation and report results. Finally, we examine issues associated with

956 Journal of Economics & Management Strategy
endogeneity, unobserved firm characteristics, and potential continuouscross-price effects.
5.1 Theory and Estimation Strategy
Suppose that njt firms numbered i = 1, 2 , . . . , njt sell product j ata price comparison site on date t. Let pijt denote the total price offirm i in this market. A firm in this market competes for two typesof consumers: loyals and shoppers. Conditional on clicking, loyals clickon their preferred firm, and shoppers click on a firm charging the lowestprice. Because of the extreme price sensitivity of shoppers, it is usefulto define the set of firms offering the “best” (lowest) price for product jat time t as:
B jt = {i : pi jt ≤ pk jt for all k �= i}.Let QS
ijt and QLijt denote the number of product j clicks that firm i
obtains from shoppers and loyals, respectively, when charging the pricepijt. Recall that firm i obtains clicks from shoppers only if it is in the setB jt; that is, if it offers one of the best prices. The number of clicks firmi obtains when it charges a price pijt, given the prices charged by otherfirms, is
Qijt ={
QSi jt + QL
i jt if i ∈ B jt
QLi jt if i /∈ B jt
.
Thus, firm i faces a jump in clicks for product j when it is among thosefirms offering the best price for product j on date t.
To put structure on the model, we assume
QLi jt ≡ αL
i jt(X)p−θ j t
i j t ,
QSi jt ≡ 1
#B jtαS
i jt(X)p−θ j t
i j t .
Notice that that θ j t represents firm i’s elasticity when it sells productj , αL
i jt(X) and αSijt (X) represent the nonprice determinants of clicks (such
as screen location) on loyals and shoppers. The expression, #B jt , denotesthe number of firms offering the best price for product j at time t, thusaccounting for the fact that a firm’s clicks from shoppers are reducedwhen it shares low price status with other firms. This specificationallows the number of clicks firm i receives to depend on X, whichincludes factors such as numbers of firms, screen location, as well asproduct- and time-specific variables.

Clicks and Firm Demand Online 957
Let I j t be an indicator function that equals unity when i ∈ B jt andzero otherwise, then we may write
Qi jt = αLi jt(X)p−θ j t
i j t + I j t1
#B jtαS
i jt(X)p−θ j t
i j t
=(
αLi jt(X) + I j t
#B jtαS
i jt(X))
p−θ j t
i j t
=(
1 + I j t
#B jλi j t(X)
)αL
i jt(X)p−θ j t
i j t ,
where
λi j t(X) = αSi jt(X)
αLi jt(X)
.
Taking logs (and noting that ln[1 + I j t
#B jtλi j t(X)] ≈ I j t
#B jtλi j t(X)) yields
ln Qi jt ≈ I j t
#B jtλi j t(X) + ln αL
i jt(X) − θ j t ln pi jt. (6)
Estimation requires imposing additional structure on the param-eters in equation (6). We assume
θ j t = β0 + (njt − 1)β1. (7)
As in the previous section, this parsimonious specification allows afirm’s clicks elasticity for product j to depend on the number of sellersat time t. While we allow the levels of shoppers and loyals to vary by firmas well as over time and by product, we assume that the ratio of shoppersto loyals is a fixed constant. Formally, this amounts to assuming that
αSi jt(X) = a Sαi j t(X)
αLi jt(X) = a Lαi j t(X),
which then implies that
λi j t = a S
a L× αi j t(X)
αi j t(X)= a S
a L= λ. (8)
Finally, we assume that αijt(X) = exp[β2njt + γ X1,ijt], where X1,ijt isthe matrix of controls discussed earlier (position on screen, bricks-and-clicks retailer, weekend, month, and product dummies as well asproduct–month interaction dummies).

958 Journal of Economics & Management Strategy
Under these assumptions, equation (6) leads to the mean specifi-cation:
E[Qi jt | X] = exp[λ
I j t
#B jt+ β2njt + γ X1,i j t + (β0 + (njt − 1)β1) ln pi jt
].
(9)
As previously mentioned, we may interpret the expression β0 +(njt − 1)β1 as the price elasticity of clicks for a firm that faces njt −1 rivals. Similarly, we may interpret λ as the jump from shoppers; thatis, the size of the discontinuous jump in clicks that a firm enjoys whenit offers the “best” price. Notice that the continuous model is nested inthe specification of equation (9) when λ = 0; thus, we may readily testthe null hypothesis implied by the continuous clicks specification.
5.2 Parameter Estimates
Model 1 in Table IV reports PML estimates of the parameters inequation (9). Recall that under the nested continuous clicks specifi-cation, the coefficient associated with the jump in clicks at the lowestprice (λ) is equal to zero. The alternative hypothesis, predicted fromthe clearinghouse models, is that this coefficient should be positive.The coefficient estimate for this effect is 0.603. Moreover, we can rejectthe null hypothesis of the continuous model in favor of the (one-sided)alternative discontinuous specification at the 1% significance level. Inshort, we find considerable evidence for a jump in clicks when a firmoffers the lowest price.
Figure 5 suggested that, in the presence of such a jump, estimatesbased on the continuous specification imply a greater sensitivity of afirm’s clicks to its price than in the discontinuous specification. Theresults shown in Model 1 of Table IV compared to those in Model 2of Table III are consistent with this observation. Accounting for thediscontinuity in clicks, the estimated elasticity for a monopoly sellerbecomes less elastic—going from −3.761 (in Model 2 of Table III) to−2.459 (in Model 1 of Table IV). The difference in the elasticity estimatesis greater for markets with more than one seller: The effect of anadditional rival on the clicks elasticity is reduced by around 12.5%(from −0.288 in Model 2 of Table III to −0.252 in Model 1 of Table IV).We also note that, in contrast to the continuous specification, the effectof a change in the number of firms on a firm’s overall number ofclicks (∂ ln E[Qi jt | X]/∂njt| pi j t ) is not statistically different from zero(p = 0.4674).
It is of some interest to note the economic relevance of our estimateof the jump at the lowest price (λ = 0.603). Other things equal, a firmthat sets the lowest price in the market enjoys a 60.3% increase in clicks.

Clicks and Firm Demand Online 959
Table IV.
Discontinuous Clicks Specifications
Model 1 Model 2 Model 3 Model 4Likelihood Specification Poisson Poisson Poisson Poissonfor Clicks PML PML CML PML
Log total price −2.459 −2.386 −2.446 −2.449(9.11)∗∗ (9.64)∗∗ (23.78)∗∗ (23.75)∗∗
Log total price x −0.252 −0.289 −0.175 −0.173(number of sellers − 1) (4.60)∗∗ (5.44)∗∗ (9.94)∗∗ (9.83)∗∗
Jump at lowest price 0.603 0.591 0.599 0.6(7.11)∗∗ (6.61)∗∗ (26.60)∗∗ (26.55)∗∗
Number of sellers 1.415 1.614 0.98 0.97(4.52)∗∗ (5.31)∗∗ (9.93)∗∗ (9.82)∗∗
Position on screen −0.175 −0.174 −0.149 −0.149(4.37)∗∗ (4.46)∗∗ (21.61)∗∗ (21.32)∗∗
Bricks and clicks retailer 0.321 0.317 0.367(2.41)∗ (2.43)∗ (−1.87)
Weekend −0.268 −0.272 −0.263 −0.263(13.79)∗∗ (14.24)∗∗ (15.44)∗∗ (15.43)∗∗
Product dummies 17 17 17 17Month dummies 4 4 4 4Product x month 55 55 55 55
dummiesUS product rank No 52 52 52
dummiesRobust standard errors Yes Yes No No
clustered by firmControls for unobserved No No 19 19
firm heterogeneityRandom FixedEffects Effects
Observations 6151 6151 6151 6151
Overdispersiontest Test Statistic 1942.27 1822.4
P-Value 0 0
Note: Dependent variable: Clicks per firm per product-date. z statistics in parentheses. ∗Significant at 5%; ∗∗Significantat 1%.
In contrast, notice that the “position on screen” coefficient implies thata firm would have to move up 3 screen positions to generate the sameincrease in clicks that results from setting the lowest price in the market.Also, note that setting the lowest price in the market entails a jump inclicks that is about twice as large as the 32.1% shift associated with beinga bricks-and-clicks retailer.
One may use our estimates of λ to obtain a very crude estimate ofthe fraction of consumers using the Kelkoo site who are shoppers. The

960 Journal of Economics & Management Strategy
total number of clicks for product j on a given date is
njt∑i=1
Qi jt =njt∑i=1
(αL
i jt + I j t
#B jtαS
i jt
)p−θ j t
i j t ;
while the corresponding number of clicks stemming from shoppers is
njt∑i=1
QSi jt = 1
#B jt
∑i∈B jt
αSi jt p−θ j t
i j t ;
Hence, shoppers as a fraction of all consumers is given by
SS + L
=
njt∑i=1
QSi jt
n jt∑i=1
Qi jt
=
1#B jt
∑i∈B jt
αSi jt p−θ j t
i j t
n jt∑i=1
(αL
i jt + I j t
#B jtαS
i jt
)p−θ j t
i j t
=
1#B jt
∑i∈B jt
a Sαi j t(Xi jt)p−θ j t
i j t
n jt∑i=1
a Lαi j t(Xi jt)p−θ j t
i j t + 1#B jt
∑i∈B jt
a Sαi j t(Xi jt)p−θ j t
i j t
.
Imposing symmetry across firms (so that all of the above terms areindependent of i), one obtains
SS + L
=
1#B jt
∑i∈B jt
a Sα j t(Xjt)p−θ j t
j t
n jt∑i=1
a Lα j t(Xjt)p−θ j t
j t + 1#B jt
∑i∈B jt
a Sα j t(Xjt)p−θ j t
j t
= a Sα j t(Xjt)p−θ j t
j t
n jta Lα j t(Xjt)p−θ j t
j t + a Sα j t(Xjt)p−θ j t
j t
= λ
njt + λ.

Clicks and Firm Demand Online 961
Given the estimate of λ = 0.603 reported in Model 1 of Table IV andthe mean number of listings (4.05) in our data, this crude calculationimplies that about 13% of consumers at Kelkoo are shoppers. It isimportant to stress that this figure is only as good as the assumptionson which it is based, some of which are at odds with the data. Thesymmetry assumption is clearly wrong as bricks-and-clicks sellersreceive 32.1% more clicks than pure online sellers. Nonetheless, thiscalculation illustrates that, even in an online market where only 13%of consumers are shoppers, demand discontinuities can significantlyaffect estimates of a firm’s clicks elasticity.
5.3 Potential Misspecification
While the PML approach used to obtain the estimates reported pre-viously does not make specific distributional assumptions about theunderlying clicks generating process (apart from assuming that theconditional mean specification is correct), it is nonetheless usefulto compare the shape of the empirical distribution with the distri-bution based on the number of clicks predicted by the model. AsFigure 6 reveals, the distribution of predicted clicks (based onModel 1 in Table IV) resembles that observed in the data. Whilethis is somewhat reassuring, it does not rule out the possibil-ity that Model 1 in Table IV is misspecified due to endogene-ity, unobserved heterogeneity across firms, or the failure to incor-porate additional cross-price effects. While data limitations meanthat we will not be able to fully address all of these concerns,we show robustness to a number of particular misspecificationssubsequently.
5.3.1 Endogeneity
One concern that might be raised with the preceding analysis isthat two of the key variables of interest—price and the numberof listing firms—might be endogenous. Ideally, we would obtainvalid instruments for these two variables and use an instrumentalvariables approach to the estimation. Unfortunately, we lack theseinstruments.
However, we are able to control for the possibility that pricesand the number of firms may be correlated with an omitted variable—product popularity. Product popularity may be correlated with thenumber of sellers (an increase in popularity would presumably inducemore sellers to enter) as well as the prices charged for the product(firms would raise prices for “hot” products and reduce them for “cold”products).

962 Journal of Economics & Management Strategy
0
0.05
0.1
0.15
0.2
0.25
0.3
0 1 2 3 4 5 6 7 8 9 10 11 12 13 14 15 16 17 18 19 20 21 22 23 24 25 26 27 28 29 30 31 32 33 34 35 36
Frequency
Clicks
Actual Predicted
FIGURE 6. ACTUAL VERSUS PREDICTED CLICKS FREQUENCY
To be concrete, suppose that the correct clicks generating processis given by
Qi jt = exp[
(β0 + (njt − 1)β1) ln pi jt + β2njt
+ λI j t
#B jt+ γ X1,i j t + pop jt
]+ εi j t, (10)
where pop jt denotes an unobserved latent variable and εijt is a zero meanerror term. Then, the correct conditional mean specification is:
E[Qi jt | Xi jt, pop jt] = exp[
(β0 + (njt − 1)β1) ln pi jt + β2njt
+ λI j t
#B jt+ γ X1,i j t + pop jt
],
and hence equation (9) is misspecified. However, the parameter esti-mates based on equation (9) remain consistent provided:
E[Qi jt | Xi jt, pop jt] = E[Qi jt | Xi jt]. (11)
That is, to the extent that fluctuations in pop jt only occur inter-month,any influence of pop jt on E[Qijt |Xijt, pop jt] will be absorbed in the

Clicks and Firm Demand Online 963
product–time interaction dummies contained in X1,ijt, and equation (11)will hold—the mean specification given in equation (9) will be correct.If there is intra-month variation in pop jt, however, this variation will notbe absorbed in the product-time interaction dummies. Furthermore, forthe reasons described previously, pop jt is likely to be correlated withpijt and njt . In this case, equation (11) will not hold, and the parameterestimates reported previously will be inconsistent.
To deal with this problem, we collected additional data fromthe United States to serve as a proxy for unobserved factors thatinfluence clicks in the United Kingdom (i.e., the variable pop jt). Inparticular, for each of the PDAs in our UK sample and for each date, weobtained data on that PDA’s product popularity ranking (for that sameday) from Shopper.com—a US price comparison site.22 The productpopularity ranking are integers (1 represents the most popular product,2 the second most popular product, and so on), and are constructedby Shopper.com based on consumer pageviews at its site.23 It seemsplausible that the product popularity ranking of an identical PDA modelin the United States on a given date is a valid proxy for its popularityin the United Kingdom for that same date, as it is likely correlatedwith pop jt but uncorrelated with the other UK regressors included inequation (10). Note that this variable is used as a proxy for the omittedvariable, and not as an instrument.
Formally, suppose that
pop jt = ηDUSPOPjt + ν j t,
where DUSPOPjt is a matrix of dummy variables for the popularity of
product j at time t from the US data, η is a vector of parametersassociated with each product rank, and ν j t is an error term. Substitutingthis relation into equation (10), one obtains
Qi jt = exp[
(β0 + (njt − 1)β1) ln pi jt + β2njt
+ λI j t
#B jt+ γ X1,i j t + ηDUSPOP
jt
]exp[ν j t] + εi j t.
22. The US data is discussed in more detail in Baye et al. (2004a).23. Shopper.com only ranks the top 50 products in each category, so we created a sep-
arate dummy for products outside the top 50. Additionally, changes in the Shopper.comsite meant that we were occasionally unable to obtain ranking data. We created a separatedummy to deal with this.

964 Journal of Economics & Management Strategy
Assuming ν j t is independent of the other regressors, this implies aconditional mean specification of
E[Qi jt | Xi jt, pop jt] = exp[
(β0 + (njt − 1)β1) ln pi jt + β2njt
+ λI j t
#B jt+ γ X1,i j t + ηDUSP OP
jt
]. (12)
where we have assumed, without loss of generality, that E[exp [ν j t]] =1.
Under the stated assumptions, PML estimation of equation (12)gives consistent parameter estimates. We report the results of thisspecification as Model 2 in Table IV. As the table shows, controllingfor omitted variable bias brings little change to the magnitude or thesignificance of the coefficient estimates.24
5.3.2 Unobserved Firm Heterogeneity
Another potential shortcoming of the PML approach used in Models 1and 2 of Table IV is that the specification presumes there is nounobserved heterogeneity across firms. While we have attempted tocontrol for differences across firms that stem from their having differentonline and offline presences, as well as different screen locations, it isstill possible that a particular firm’s clicks are also driven by unobservedfactors. For this reason, we also report in Table IV results that allow forthe effects of unobserved firm heterogeneity.
Model 3 in Table IV reports maximum likelihood estimates of thediscontinuous model based on the random effects specification for un-observed firm heterogeneity pioneered by Hausman et al. (1984), whileModel 4 reports conditional maximum likelihood estimates based on afixed effects specification for unobserved firm heterogeneity. Note thatthese results require the specification of the actual likelihood function,which we take to be Poisson. However, Table A2 in the appendix showsthat the results reported in Table IV and discussed subsequently aresimilar if one uses the likelihood function for a negative binomial (2)specification.
Notice that, in both the random effects (Model 3) and fixed effects(Model 4) specifications, the coefficients of interest are comparable tothose obtained ignoring potential unobserved heterogeneity (Models 1and 2). As the coefficient on the dummy for lowest price reveals, we
24. There is some evidence that the US popularity dummies address the endogeneityissues discussed previously. In all specifications that include US popularity dummies, wereject the null hypothesis that the coefficients on DUSPOP
jt are jointly equal to zero (p <
0.001).

Clicks and Firm Demand Online 965
still reject the null hypothesis of the continuous model in favor ofthe discontinuous specification. Further, the economic value of thecoefficient associated with the dummy for lowest price is largely un-changed by allowing for potential unobserved heterogeneity. Likewise,the coefficient associated with the clicks elasticity for a monopoly firmremains at about −2.5, similar to the estimate obtained in Model 1.
In contrast, both the effect of a change in the number of rivals ona firm’s clicks elasticity as well as the effect of change in screen positionon a firm’s clicks are dampened in Models 3 and 4 compared to Model 1.This suggests that part of the effect that was previously attributed tochanges in screen position or rivalry is more properly accounted for byunobserved firm heterogeneities. Nonetheless, the coefficients on thesevariables remain economically and statistically significant.
5.3.3 Cross-Price Effects
A final potential concern with the clicks estimates presented previouslyis that, although the discontinuous specification is consistent withtheoretical clearinghouse models, it does not allow for cross-price effects(except for the discontinuous jump in clicks a firm enjoys when theminimum rival’s price rises above its price). One might conjecturethat our relatively inelastic estimates of clicks elasticities, as well asthe significant discontinuity in clicks (jump from shoppers) stem frommisspecification—that is, a failure to allow for continuous cross-priceeffects and/or discontinuities at other price ranks.
To investigate these alternatives, we generalize the specificationsto allow for continuous cross-price effects by including the logarithmof the lowest rival’s price as a regressor.25 In this specification, theestimated coefficient for the logarithm of the lowest rival’s pricerepresents a firm’s cross-price elasticity of clicks with respect to thatprice.26
The results are displayed in Table V, and reveal that the findingsdiscussed previously are robust to the inclusion of continuous cross-price effects. For the continuous specification (Model 1), the coefficientestimate is 1.017, indicating that a 1% increase in the lowest rival’sprice leads to about 1% more clicks for a firm. The discontinuousspecification (Model 2) shows that the coefficient for the cross priceelasticity of clicks is relatively small (0.38) and not significantly different
25. Because cross-price effects are only relevant for product-dates in which two ormore firms compete, for product dates in which only a single firm listed a price, we codedthe logarithm of the lowest rival’s price as zero and included a dummy that equaled onefor these events and zero otherwise.
26. The results discussed subsequently are robust to other specifications of thecontinuous cross-price effect, including using logarithm of the geometric average of rivals’prices as a regressor.

966 Journal of Economics & Management Strategy
Table V.
Clicks Specifications with Cross Price Effects
and Multiple Jumps in Demand
Model 1 Model 2 Model 3Likelihood Specification for Clicks Poisson PML Poisson PML Poisson PML
Log total price −3.213 −2.109 −1.771(6.16)∗∗ (6.33)∗∗ (7.60)∗∗
Log total price x −0.379 −0.315 −0.155(number of sellers − 1) (5.06)∗∗ (5.02)∗∗ (3.52)∗∗
Jump at lowest price 0.600 1.237(6.19)∗∗ (8.32)∗∗
Jump at second lowest price 0.939(7.68)∗∗
Jump at third lowest price 0.530(3.65)∗∗
Jump at fourth lowest price 0.386(2.95)∗∗
Log lowest rival’s price 1.017 0.381 0.73(2.93)∗∗ (1.34) (3.21)∗∗
Absence of rivals dummy 5.704 1.849 3.939(3.00)∗∗ (1.16) (3.08)∗∗
Number of sellers 2.102 1.753 0.895(4.93)∗∗ (4.89)∗∗ (3.61)∗∗
Position on screen −0.174 −0.175 −0.163(4.56)∗∗ (4.49)∗∗ (5.10)∗∗
Bricks and clicks retailer 0.237 0.324 0.273(1.72) (2.46)∗ (3.16)∗∗
Weekend −0.272 −0.273 −0.266(12.63)∗∗ (13.93)∗∗ (13.26)∗∗
Product dummies 17 17 17Month dummies 4 4 4Product x month dummies 55 55 55US product rank dummies 52 52 52Robust standard errors Yes Yes Yes
clustered by firmObservations 6151 6151 6151Joint test of continuous
cross−price effectsTest statistic 13.81 11.13 15.29p-Value 0.001 0.004 0.001
Note: Dependent variable: Clicks per firm per product-date. Robust z statistics in parentheses. ∗Significant at 5%;∗∗Significant at 1%.
from zero at conventional levels.27 More importantly, our finding that afirm enjoys a significant 60% jump in clicks when it succeeds in offering
27. Note, however, that one can reject the joint hypothesis that the coefficients ofabsence of rivals dummy and log lowest rival’s prices are zero at the 1% level in allmodels.

Clicks and Firm Demand Online 967
the lowest price is robust to the inclusion of continuous cross-priceeffects.
Model 3 further generalizes the discontinuous clicks specificationto allow for demand discontinuities at the second, third, and fourthlowest prices as well as continuous cross-price effects. As Table Vshows, compared to offering a price that is fifth lowest or higher, afirm enjoys 124% more clicks when offering the lowest price, 94%more clicks when offering the second-lowest, 53% more clicks whenoffering the third lowest, and 39% more clicks when offering thefourth lowest price.28 Furthermore, the continuous cross-price effectis now statistically significant and indicates that a 1% increase in thelowest rival’s price raises a firm’s clicks at 0.7%. Finally, notice that thecoefficients on screen location and bricks-and-clicks status are all similarto our earlier discontinuous specifications.
6. Implications for Firm Demand
In this section, we offer conditions under which the previously men-tioned parameter estimates may be used to recover or place boundson the elasticities of demand facing individual firms operating in theKelkoo marketplace.
Toward this end, recall the process by which a click leads to a saleshown in Figure 3. After having observed information X at the Kelkoosite, consumers clicking through to a firm’s site receive additionalinformation (denoted Zi ) that influences their decision to purchase. Thisinformation might include the firm’s attempt at obfuscation along thelines described by Ellison and Ellison (2009), the visual attractivenessand usability of the firm’s site, whether the firm is offering anyguarantees on the product over and above those provided by themanufacturer, the exact restocking and return policies of the firm, andso on. Of course, consumers’ perceptions of these factors may be coloredby the previous information, X, obtained on the Kelkoo site. To accountfor the possibility that consumers may observe Zi ’s for all firms beforemaking purchase decisions, let Z = (Z1, Z2 . . . Zn) denote the vector ofall such information. In this case, the probability that a click on firm i isconverted into a sale, given (Z, X), is
Pr(salei | Z, X) = Gi (Z, X).
28. We also considered specifications allowing discontinuities beyond the fourthlowest price rank and found that these produced statistically insignificant estimates;hence, we only report specifications with discontinuities at the lowest four price ranks.

968 Journal of Economics & Management Strategy
Using equation (2), we may write the expected demand for a givenproduct sold by firm i, conditional on (X, Z), as
E[Di | X, Z] = Gi (Z, X) × E[Qi | X]
= Gi (Z, X) × exp[Xβ].
The multiplicative separability of the probability of conversion, Gi , andthe clicks generating process follows naturally from the Kelkoo searchand buying environment. Of central interest is the effect of informationobtained from the Kelkoo site (various components of X) on finaldemand. Suppose one wished to measure the effect on firm i’s demandof a change in xi (some component of i’s information posted at Kelkoo).It is useful to rewrite X = (xi , X1) where X1 represents all componentsof X other than xi . If xi influences firm i’s clicks but does not affect itsconversion rate for that product, one may recover the firm’s elasticityof demand with respect to xi from its elasticity of clicks. Formally,
Proposition 1: Suppose that Gi (Z, (xi , X1)) = Gi (Z, (x′i , X1)) for all xi ,
x′i . Then
E[Di | xi , X1, Z] − E[Di | x′i , X1, Z]
E[Di | xi , X1, Z]= E[Qi | xi , X1] − E[Qi | x′
i , X1]E[Qi | xi , X1]
,
and furthermore, if demand is differentiable,
∂ ln E[Di | X, Z]∂ ln xi
= ∂ ln E[Qi | X]∂ ln xi
.
Proof. We first prove the result for the differentiable case. Recall thatlog expected demand is given by
ln E [Di | X, Z] = ln Gi (Z, X) + ln E [Qi | X] .
Differentiating with respect to xi yields
∂ ln E [Di | X, Z]∂ ln xi
= ∂ ln Gi (Z, X)∂ ln xi
+ ∂ ln E [Qi | X]∂ ln xi
and because Gi (Z, (xi , X1)) = Gi (Z, (x′i , X1)) for all xi , x′
i ,∂ ln Gi (Z, X)
∂ ln xi= 0.
Hence
∂ ln E [Di | X, Z]∂ ln xi
= ∂ ln E [Qi | X]∂ ln xi
.

Clicks and Firm Demand Online 969
Next, we prove the result for the nondifferentiable case.
%�E[Di | (xi , X1), Z]
= Gi (Z, (xi , X1))E[Qi | xi , X1] − Gi (Z, (x′i , X1))E[Qi | x′
i , X1]Gi (Z, (xi , X1))E[Qi | xi , X1]
= E[Qi | xi , X1] − E[Qi | x′i , X1]
E[Qi | xi , X1],
where we have again used the fact that Gi (Z, (xi , X1)) = Gi (Z, (x′i , X1))
for all xi , x′i . �
Notice that the conditions of the Proposition allows firm i’sconversion rate for product j to depend on additional informationobtained from all firms’ individual websites (Z), as well as all theother information posted at the Kelkoo site (X1)—including informationother than xi posted by firm i. Provided that firm i’s conversion rateis insensitive to xi —that is, conditional on (xi , X1) being sufficiently“favorable” to induce the consumer to click through to firm i’s site inthe first place, the level of xi does not influence the likelihood that theclickthrough is converted into a sale—the Proposition shows how torecover the associated demand parameter from clicks estimates.
The Proposition has several potentially useful implications. First,when xi is firm i’s price listed on the Kelkoo site, and the conversion rateis independent of firm i’s price, then one may interpret a firm’s elasticityof “clicks” with respect to price as its own price elasticity of demand.Second, when xi is a discrete variable (such as a dummy variable), onemay use estimates based on clicks data to infer the percentage impactof a discrete change in xi on a firm’s demand.
More importantly, one may use clicks estimates to obtain boundsfor underlying demand parameters. For instance, if firm i’s conversionrate is increasing in xi , then the estimated clickthrough elasticity is alower bound for the associated demand elasticity (because in this case,∂ ln Gi (Z, X)
∂ ln xi+ ∂ ln E[Qi | X]
∂ ln xi>
∂ ln E[Qi | X]∂ ln xi
). Consequently, the clicks elasticityof −2.091 reported in Model 2 of Table V implies that a 10% increase in amonopoly seller’s price reduces its quantity demanded by at least 20.91%if conversion rates are nonincreasing in price. Similarly, our estimatesimply that bricks-and-clicks retailers enjoy at least 32.6% higher salesthan their purely online competitors if conversion rates for these firmsare at least as high as their purely online rivals.
7. Implications for Discrete Choice Models
of Individual Behavior
Our analysis has focused on the determinants of the total numbers ofclicks that firms receive in an online marketplace, treating the firm as

970 Journal of Economics & Management Strategy
the unit of observation. One possible worry concerns the relationshipbetween the specification of clicks at the firm level, given in equation(12), and underlying individual behavior. However, we showed thatthis specification arises when one aggregates individual behavior as itis specified in standard clearinghouse models: Exogenous differencesin preferences induce some consumers to only click the low-pricefirm and others to click their preferred firm. These models predictthat there exists a jump in a firm’s clicks (stemming from the choicebehavior of shoppers) when it charges the lowest price in the market.As documented previously and in the Appendix, there is considerableevidence that this jump is economically and statistically significant.Moreover, failing to account for the jump distorts the estimates of theparameters associated with the determinants of a firm’s total numberof clicks.
To the extent that one is interested in a more detailed analysisof individual consumer choice rather than the total number of clicksthat a firm (or platform) receives, discrete choice models of individualbehavior (such as the multinomial logit family of models) are appropri-ate alternatives. Standard versions of these models postulate that eachconsumer has the same propensity to click on a particular firm, giventhat firm’s characteristics and the characteristics of the other firms inthe choice set. Variation in choices across consumers is assumed to arisefrom a random utility component, which is typically assumed to be iidacross consumers. Our results suggest that it might be appropriate toaccount for jumps when estimating click propensities at the individualconsumer level. In particular, a “shopper’s” propensity to click a givenfirm critically depends on whether it offers the lowest price, while a“loyal’s” propensity does not. Given appropriate assumptions on thestructure of loyal and shopper behavior, one could, in principle, use adiscrete choice framework to obtain estimates of the determinants ofindividual consumer’s propensities to click on a particular firm. Ourresults based on analysis at the firm-level suggest that accounting forsuch asymmetries in individual choice is a potentially fruitful avenuefor future research.
8. Discussion
Standard models of online price competition predict a discontinuousjump in a firm’s clicks when it succeeds in charging the lowest pricein the market. These models also predict that the responsiveness of afirm’s clicks to a change in its price depends on the number of rivals.Our results indicate that both the number of competing sellers and

Clicks and Firm Demand Online 971
the firm’s rank in the list of prices are important determinants of anonline retailer’s clicks. We find that an online monopolist faces a clickselasticity of about −2, while sellers competing against 10 other sellersface an elasticity of about −6. We also find empirical evidence of a 60%jump in a firm’s clicks as its price declines from the second-lowest tothe lowest price, and a 17% rise when it is listed one position higher onthe screen.
We conclude by illustrating the potential relevance of our findingsfor stakeholders in online markets, including firms that advertise pricesat comparison sites, the sites themselves, and policymakers.
Consider the low-priced firm in a market with one other rival thatis contemplating a price increase. Based on the estimates in Model 1of Table V, if the firm ignored the discontinuity in clicks it wouldconclude that a 10% price increase would reduce clicks by 37%. Afirm that properly accounted for the jump would recognize that theimpact of a price increase critically depends on whether it remainedthe low-priced firm. If the firm can increase its price by 10% and retainlow-priced status, Model 2 of Table V indicates that its clicks woulddecline by only 24%. However, if the 10% price increase moves the firmout of the low-price position, the firm’s clicks would decline by 85%.Regardless of whether conversion rates are independent of the firm’sprice, this translates into a discrepancy in the firm’s estimated clicks(and clickthrough fees) of 13% to 48%.
Next, consider the situation from the viewpoint of a price com-parison site such as Kelkoo. Suppose Kelkoo correctly forecasts that a3% increase in its clickthrough fees would lead to a 1% increase in theprices charged by each firm in a duopoly market. If the platform usedModel 1 of Table V to estimate the clicks elasticity, it would erroneouslyconclude that the 3% increase in clickthrough fees would reduce itsclicks by 3.7%—an unprofitable move. On the other hand, if it usedModel 2 in Table V, the comparison site would (correctly) concludethat the 3% increase in clickthrough fees would reduce clicks by only2.4%—a profitable move.
Finally, consider a policymaker contemplating the imposition ofa national ad valorem tax on Internet transactions that would increaseeach firm’s price by a factor of 1 + τ . The policymaker’s first-orderapproximation of the excess burden of the tax (EBT) paid by a con-sumer k who purchased q k units at the initial price of pk is given bythe well-known formula, E BT = 1
2θτ 2 pkqk , where θ is the own-priceelasticity of demand. Our results suggest that, because the elasticityestimates under the continuous specifications are significantly moreelastic than in the discontinuous specifications, the failure to accountfor discontinuities leads to potential biases in the welfare analysis of

972 Journal of Economics & Management Strategy
such a tax. For example, if the policymaker’s estimate of the elasticityof demand were based on the continuous specification in Model 1 ofTable V and a duopoly market, the ratio of the excess burden underthe two specifications is 1.54.29 In other words, failure to account fordiscontinuities in estimation and policy analysis could lead to excessburden calculations that are 54% higher than that actually experiencedby any individual consumer in the market (shopper or loyal). While aproper analysis of taxes and Internet transactions obviously requiresmore detailed analysis, this simple calculation illustrates that failing toaccount for discontinuities in online data may lead to significant biasesin policy analysis.
Appendix
Table A1.
Continuous Clicks—Alternative Specifications
Model 1 Model 2Negative Negative
Likelihood Specification for Clicks Binomial ML Binomial ML
Log total price −4.81 −3.696(10.29)∗∗ (8.66)∗∗
Log total price × (number of sellers − 1) −0.343(5.54)∗∗
Number of sellers 1.897(5.37)∗∗
Position on screen −0.178 −0.166(4.70)∗∗ (4.46)∗∗
Bricks and clicks retailer 0.316 0.272(2.26)∗ (2.23)∗
Weekend −0.263 −0.288(11.62)∗∗ (13.42)∗∗
Product dummies 17 17Month dummies 4 4Product × month dummies 55 55Robust standard errors clustered by firm Yes Yes
Observations 6151 6151
Note: Dependent variable: Clicks per firm per product-date. Robust z statistics in parentheses. ∗Significant at 5%;∗∗Significant at 1%.
29. To see this, note that EBT under the continuous and discontinuous specifications areeach proportional to the θ in each specification, so that the ratio of of the EBT is simply3.7/2.4 = 1.54.

Clicks and Firm Demand Online 973
Table A2.
Discontinuous Clicks—Alternative Specifications
Model 1 Model 2 Model 3 Model 4Likelihood Specification Negative Negative Negative Negativefor Clicks Binomial ML Binomial ML Binomial CML Binomial CML
Log total price −2.343 −2.304 −2.334 −2.333(8.18)∗∗ (8.89)∗∗ (16.72)∗∗ (16.64)∗∗
Log total price × −0.314 −0.342 −0.168 −0.165(number of sellers − 1) (5.38)∗∗ (5.95)∗∗ (7.22)∗∗ (7.09)∗∗
Jump at lowest price 0.619 0.608 0.578 0.579(8.24)∗∗ (7.78)∗∗ (18.92)∗∗ (18.84)∗∗
Number of sellers 1.77 1.912 0.932 0.918(5.30)∗∗ (5.82)∗∗ (7.15)∗∗ (7.02)∗∗
Position on screen −0.166 −0.165 −0.145 −0.144(4.31)∗∗ (4.35)∗∗ (15.93)∗∗ (15.57)∗∗
Bricks and clicks retailer 0.324 0.319 0.272(2.66)∗∗ (2.64)∗∗ (2.81)∗∗
Weekend −0.29 −0.297 −0.247 −0.247(14.86)∗∗ (15.13)∗∗ (10.96)∗∗ (10.95)∗∗
Product dummies 17 17 17 17Month dummies 4 4 4 4Product × month 55 55 55 55
dummiesUS product rank No 52 52 52
dummiesRobust standard errors Yes Yes No No
clustered by firmControls for unobserved No No 19 19
firm heterogeneityRandom Effects Fixed Effects
Observations 6151 6151 6151 6151
Note: Dependent variable: Clicks per firm per product-date. z statistics in parentheses. ∗Significant at 5%; ∗∗Significantat 1%.
References
Ansari, A. and C.F. Mela, 2003, “E-customization,” Journal of Marketing Research, 40, 131–145.
Baye, M.R. and J. Morgan, 2001, “Information Gatekeepers on the Internet and theCompetitiveness of Homogeneous Product Markets,” American Economic Review, 91,454–474.
——, ——, and P. Scholten, 2004a, “Price Dispersion in the Small and in the Large:Evidence from an Internet Price Comparison Site,” Journal of Industrial Economics,52, 463–496.
——, ——, and ——, 2004b, “Temporal Price Dispersion: Evidence from an OnlineConsumer Electronics Market,” Journal of Interactive Marketing, 18, 101–115.
——, ——, and ——, 2006, “Information, Search, and Price Dispersion,” in T. Hendershott,ed., Handbook of Economics and Information Systems, Amsterdam: Elsevier, 323–375.

974 Journal of Economics & Management Strategy
Baye, M.R., J.R.J. Gatti, P. Kattuman, and J. Morgan, 2007, “A Dashboard for OnlinePricing,” California Management Review, 50, 202–216.
Brown, J.R. and A. Goolsbee, 2002, “Does the Internet Make Markets More Competitive?Evidence from the Life Insurance Industry,” Journal of Political Economy, 110, 481–507.
Brynjolfsson, E., A. Dick, and M. D. Smith, 2002, “Consumer Heterogeneity and SearchCosts on the Internet,” Working paper, Carnegie Mellon University.
Brynjolfsson, E. and M.D. Smith, 2000a, “The Great Equalizer? Consumer Choice Behaviorat Internet Shopbots,” Working paper, MIT, Cambridge.
—— and ——, 2000b, “Frictionless Commerce? A Comparison of Internet and Conven-tional Retailers,” Management Science 46, 563–585.
Chevalier, J. and A. Goolsbee, 2003, “Measuring Prices and Price Competition Online:Amazon.com and BarnesandNoble.com,” Quantitative Marketing and Economics, 1, 203–222.
Cameron, A. and P. Trivedi, 1986, “Econometric Models Based on Count Data: Compar-isons and Applications of Some Estimators,” Journal of Applied Econometrics, 1, 29–53.
—— and ——, 1990, “Regression-Based Tests for Overdispersion in the Poisson Model,”Journal of Econometrics, 46, 347–364.
—— and ——, 1998, Regression Analysis of Count Data, Econometric Society MonographNo. 30.
Dana, J.D., 1994, “Learning in an Equilibrium Search Model,” International EconomicReview, 35, 745–771.
Dreze, X. and F. Zufryden, 2004, “The Measurement of Online Visibility and its Impact onInternet Traffic,” Journal of Interactive Marketing, 18, 20–37.
Ellison, G. and S.F. Ellison, 2005, “Lessons About Markets from the Internet,” Journal ofEconomic Perspectives, 19, 139–158.
Ellison, G. and S.F. Ellison, 2009, “Search, Obfuscation, and Price Elasticities on theInternet,” Econometrica, 77, 427–452.
Ghose, A., M. Smith, and R. Telang, 2006, “Internet Exchanges for Used Books: AnEmpirical Analysis of Product Cannibalization and Welfare Impact,” InformationSystems Research, 17, 3–19.
—— and S. Yang, 2007, “An Empirical Analysis of Search Engine Advertising: SponsoredSearch in Electronic Markets,” Working paper, New York University, New York.
Gourieroux, C., A. Monfort, and A. Trognon, 1984a, “Pseudo Maximum LikelihoodMethods: Theory,” Econometrica, 52, 681–700.
——, ——, and ——, 1984b, “Pseudo Maximum Likelihood Methods: Applications toPoisson Models,” Econometrica, 52, 701–720.
Hausman, J., B. Hall, and Z. Griliches, 1984, “Econometric Models for Count Data withan Application to the Patents-R&D Relationship,” Econometrica, 52, 909–938.
Hall, B. and R. Ziedonis, 2001, “The Patent Paradox Revisited: An Empirical Study ofPatenting in the US Semiconductor Industry, 1979–1995,” RAND Journal of Economics,32, 101–128.
Huber, P., 1967, “The Behavior of Maximum Likelihood Estimates under Non-standardConditions,” Proceedings of the Fifth Berkeley Symposium on Mathematical Statistics andProbability, 1, 221–233.
Iyer, G. and A. Pazgal, 2003, “Internet Shopping Agents: Virtual Co-Location andCompetition,” Marketing Science, 22, 85–106.
Janssen, M. and J. L. Moraga-Gonzalez, 2004, “Strategic Pricing, Consumer Search, andthe Number of Firms,” Review of Economic Studies, 71, 1089–1118.
Ju, J., S. Linn, and Z. Zhu, 2006, “Price Dispersion in a Model with Middlemen andOligopolistic Market Makers: A Theory and an Application to the North AmericanNatural Gas Market,” Working paper, University of Oklahoma, Norman.
Clicks and Firm Demand Online 975
Narasimhan, C., 1988, “Competitive Promotional Strategies,” Journal of Business, 61, 427–449.
Rogers, W., 1993, “Regression Standard Errors in Clustered Samples,” Stata TechnicalBulletin, 13, 19–23.
Rosenthal, R.W., 1980, “A Model in Which an Increase in the Number of Sellers Leads toa Higher Price,” Econometrica, 48, 1575–1580.
Rutz, O. and R.E. Bucklin, 2007, “A Model of Individual Keyword Performance in PaidSearch Advertising,” Working paper, Yale University, New Haven.
Salop, S.C. and J.E. Stiglitz, 1977, “Bargains and Ripoffs: A Model of MonopolisticallyCompetitive Price Dispersion,” Review of Economic Studies, 44, 493–510.
Shilony, Y., 1977, “Mixed Pricing in Oligopoly,” Journal of Economic Theory, 14, 373–388.Spulber, D., 1995, “Bertrand Competition when Rivals’ Costs are Unknown,” Journal of
Industrial Economics, 43, 1–11.Stahl, D.O., 1989, “Oligopolistic Pricing with Sequential Consumer Search,” American
Economic Review, 79, 700–712.Varian, H., 1980, “A Model of Sales,” American Economic Review, 70, 651–659.White, H., 1980, “A Heteroskedasticity-Consistent Covariance Matrix Estimator and a
Direct Test for Heteroskedasticity,” Econometrica, 48, 817–830.——, 1982, “Maximum Likelihood Estimation for Misspecified Models,” Econometrica, 50,
1–25.


