Embed Size (px)
Citation preview
Clientelism in Indian Villages∗
Siwan Anderson†, Patrick Francois‡, and Ashok Kotwal§
Vancouver School of Economics
October 2014
Abstract
In many developing countries, institutional set-ups often feature a key group of players, the elite,seeking to manipulate extant institutions to their advantage. Their means of doing this vary acrosscontexts and greatly affect the prospects of institutional reform. We explore this process for village levelgoverning institutions in India, using a survey that we designed for this end. The region we chose, ruralMaharashtra, is known to exhibit functional local democracies, but also shows tremendous governmentinaction on poverty alleviation; perhaps due to elite control. We find a stunningly robust and participatorydemocratic process: elections are freely contested, fairly tallied, highly participatory, non-coerced and leadto appointment of representative politicians. However, beneath this veneer of ideal democracy we findevidence of deeply ingrained clientelist vote-trading structures maintained through extra-political means.Elite minorities seek power to undermine policies that would redistribute income towards the majoritypoor. We explore theoretically the means by which the elite are able to use their dominance of land-ownership and traditional positions of social superiority to achieve political control. Our theory predictsa large set of observables that should covary with the presence of a socially ascendant group (the Marathacaste). Our estimates suggest how the dominant elite have been able to maintain power in light ofsuccessful majoritarian institutional reforms.
∗This project would not have been possible without the tireless work of Ashiwini Kulkarni and her team in collecting thedata on which it is based. We thank seminar audiences at the World Bank, BREAD (NYU), University of Montreal, Queen’sUniversity, Bristol University, CEPR Public Economics (LSE), Monash University, Chicago Booth, and the Canadian Institutefor Advanced Research, IOG group for their insightful comments. We have also benefited from detailed discussions withAshwini Kulkarni, Milind Murugkar, Tim Besley, Gustavo Bobonis, Anil Deolalikar, Thomas Fujiwara , Jim Fearon, Biju Rao,Jim Robinson, Francesco Trebbi, John Hoddinott, Debraj Ray, Nava Ashraf, Robin Burgess, Garance Genicot, Dilip Mookherjeewith special thanks to David Green and Paul Schrimpf for extensive comments, and Maja Krzic a Soil Scientist at UBC forguidance in our measurement of land quality. We are also very grateful for the helpful insights from Marianne Bertrand andfour anonymous referees.†CIFAR and University of British Columbia, Vancouver School of Economics, [email protected]‡CIFAR, CEPR and University of British Columbia, Vancouver School of Economics, [email protected]§University of British Columbia, Vancouver School of Economics, [email protected]
0
1 Introduction
There is a fair amount of consensus that successful development depends on the development of the right
institutions.1 By ‘Institutions’, we mean the rules of the game. Has a particular society been a democracy
or a dictatorship? If it has been a democracy, what have been the voting rules? Is there universal franchise
or only eligibility for property owners or educated elites?
India has long been characterized by functional and representative democratic political institutions – at
federal, state and local levels. But at the same time, these democratically elected governments have been
extremely rare champions of the interests of the poor; who are the vast majority of their constituents. Local
governance in the Indian state of Maharashtra is a prime example. Though it is a state purported to have
active political competition, and thought to feature free and fair elections, it is also a state where local
governing bodies – Gram Panchayats – who are mandated and funded to deliver a raft of pro-poor policies,
are known to perform this task poorly. The common view of Maharashtrian local politics is that beneath
the veneer of representative democracy minority local elites are somehow able to capture majoritarian local
institutions and run them in their own interests.
In a representative democracy, with high rates of voter participation, and a vast majority of the electorate
exceedingly poor, it is somewhat puzzling that democratically elected governments should so rarely act in
the interests of the poor. A possible explanation has been posited by the ‘clientelist’ hypothesis. Clientelism
amounts to the buying of votes and hence power, by a cadre of political elite (patrons) in return for the
delivery of direct benefits to the non-elite (clients) whose support is essential for maintenance of power.
Elite patrons control government but promote benefits to their clients in a quid pro quo arrangement that
may see direct transfers to clients, but that will feature governance largely in the interests of the elite.
Case studies describing this in numerous settings abound.2 But case studies can only be suggestive of
the pervasiveness of clientelist phenomena. Ultimately they leave us with little idea of how widespread it is,
nor whether the factors that make it occur in the documented cases also contribute elsewhere.
We undertook an extensive data collection program in rural Maharashtra, India, in an attempt to under-
stand the root causes of local (Gram Panchayat) level misgovernance.3 Though a long-standing institution
in village India, only since 1993 have Gram Panchayats in Maharashtra been responsible for program imple-
mentation, local public good provision, implementation of pro-poor policies and been subject to a regular
electoral process. Since 1993 these rules have been uniformly applied and well respected throughout the
state.
A problem with assessing the clientelism hypothesis is the difficulty of observing it. Poor governance
may arise for a number of reasons, and omitted unobserved factors may lead both to local elites running the
1Consider, among many others, the seminal study of Acemoglu, Johnson, and Robinson (2001).2Refer to Kitschelt and Wilkinson (2007) for an overview.3Other work has focused on leader characterisitcs of Gram Panchayats (Besley, Pande, and Rao (2012) and Chattopadhyay
and Duflo (2004)).
1
political show and poor governance outcomes, without a causal link. Ideally the researcher would like to
identify some source of variation that would allow one to predict when a government is likely to be subject
to elite capture, and for this variation to not directly affect governance outcomes except through the channel
of capture.
For the case of clientelism, an opportunity presents itself in the Maharashtrian village context. Clien-
telism is a complicated social undertaking, it depends on an often dense network of interactions between
patrons and clients. Patrons must be sure that the clients they deliver benefits to will vote as promised
when the election presents itself. Clients must be sure that when they return a patron to power, the patron
will deliver the promised benefits. Clientelist structures are generally necessary to make this vote-buying
arrangement feasible. They are facilitated by the presence of a traditionally dominant group who naturally
play the role of patrons, and who can exploit long-standing social networks to help maintain clientelist
undertakings. In Maharashtrian villages such ‘natural’ patrons are members of the Maratha caste. They
are the politically dominant caste within the region, and have been for centuries.4 The economic elite within
a village are the large land-owners and the electoral majority in it are the small holders and landless. We
measure Maratha presence in a village on both dimensions: as economic elite through their land-holdings,
and as electoral majorities through their population numbers. The literature on Maharashtrian villages
identifies two prominent reasons for this caste’s continued dominance of local politics; superior within group
social-cohesion, and superior within caste trading networks. We embed these two reasons into a simple
model of village governance that we use to predict when clientelism is likely to arise as a function of the
variation in land holding and population numbers of this caste.
Our model considers the incentives of landlords (the elite) to obtain power, the incentives of workers (the
majority) to cede power in return for benefits, and the instruments available to enact clientelist vote-trading
transactions. The model suggests a large set of observables that should co-vary with the presence of the
Maratha caste if clientelist vote-trading is at work. We map from this model to an estimating equation, the
coefficients of which are interpretable directly in terms of the model’s parameters. The model thus places
a set of sign restrictions on these estimated parameters, and moreover allows us to explore the relative
importance of long-standing postulates for the continued hegemony of the region’s dominant (Maratha)
caste.
In a broad sense, our paper is close to the work of Acemoglu and Robinson (2008). They have as their
central motivation, analyzing how political institutions influence economic outcomes and distribution. At
a simple level, democracies should favor ‘citizens’, and dictatorships the ‘elite’. But there needs to be a
clear distinction between ‘de jure’ and ‘de facto’ political power. In the course of history, a society may
4Maharashtra is almost unique in the Indian context by the degree to which its politics has been dominated by a singlecaste (Palshikar and Deshpande 1999, Vora 1996, Palshikar (2007)); the Marathas. They are an intermediate ranking group(sub-caste (or jati), traditionally from a Warrior Caste), that are both the most populous, and the largest land owning caste inthe state. It is impossible to understand Indian village politics without taking some account of caste (Munshi and Rosenzweig(2009), Banerjee and Pande (2007)).
2
move from being a dictatorship to a democracy (a change in de jure political power) but the elite may
take actions to neutralize this change by building their de facto power, using it to their advantage, and in
turn perhaps retarding development in the process. Similar forces highlighted in their general treatment of
this phenomenon are at play in our context. A subtle perversion of democracy, leveraging existing social
and economic hierarchies, can explain persistence of elite (minority) control despite the implementation of
democratic (majoritarian) structures.
Bardhan and Mookherjee (2011) present a model of ‘political clientelism’ that characterizes democracies
in developing societies and how it differs from the phenomenon of ‘elite capture’.5 The clientelism they
analyze has a few things in common with what we observe in Maharashtra, but also some marked differences
which we will argue are explicable with our model given the institutional context.6 Other papers that have
explored evidence of clientelistic politics are Wantchekon (2003), Wantchekon and Fujiwara (2014), and
Vicente and Wantchekon (2009) in West Africa. Finan and Shechter (2012) demonstrate how vote-buying
can be sustained by an internalized norm of reciprocity using data from Paraguay.7 In Maharashtrian
villages, cases of clientelism have also been documented by Vora (1996).
Our identification strategy here relies on land holding leading to political leverage and so resembles
Baland and Robinson (2008). In their analysis of Chile, landowners “bought” the support of their workers,
and owning lands meant owning votes. The quid pro quo arrangement was higher wages in return for votes.
Our model predicts the opposite for Maharashtra where income security seems paramount for workers. In
our context, the clientelist undertaking takes the form of insurance for workers in return for their support of
landlord candidates. In fact, a primary reason we identify for landlords to control governance is to thwart
implementation of centrally mandated initiatives that would raise wages at the village level. We predict
clientelism leading to fewer programs, more insurance, but lower wages when vote trading occurs - this is
precisely what we find.
An interesting finding is that the gratitude the clients feel toward their patrons is so internalized that
answers to social capital questions in our survey give a very positive picture of the social relations in villages
where the historical elite dominate. A recent paper by Acemoglu, Reed, and Robinson (2013) examines the
role of chieftaincy in Sierra Leone. They find that villages with fewer ruling families and more powerful
chiefs have lower economic development but higher social capital. They conjecture this reflects the capture
of civil society organizations by chiefs whose authority is highly respected because people rely on them for
patronage. Our evidence is consistent with a similar story occurring within rural Maharashtrian villages.
5Robinson and Verdier (2013) also provide a theory of clientilsm, wherein the two sided problems of enforcement explainwhy the redistribution often takes the form of public sector employment rather than income transfers.
6Their model is based on the political process in the state of West Bengal where the ruling party used this sort of clientelismto win elections; the caste of the patrons plays no role there and the vote buying is also accomplished by using governmentresources. Other work of theirs, Bardhan and Mookherjee (2000, 2005, 2006), analyses whether a move toward decentralizedgovernance in India has been effective in delivering government services and poverty alleviation schemes to the poor.
7Acemoglu et al. (2013) find some muted effects of democratic structures on economic outcomes that are consistent with atype of elite capture.
3
Our paper proceeds as follows. We start with a description of our context and the main hypotheses
guiding both our modeling and data analysis. In Section 3 we develop the theoretical model that we use to
determine our main estimating equations. Section 4 provides the empirical results and their interpretation.
Section 5 considers alternative explanations and Section 6 concludes.
2 The Context
From November 2006 to May 2007, we surveyed 9132 households from a sample of 320 villages in the state
of Maharashtra, which is located on the west coast of central India. Our data are from three main regions:
Western Maharashtra, Marathwada, and Vidarbha (we excluded only the Konkan coastal region whose
economic hub is Mumbai). To focus on villages which are primarily agricultural (as opposed to factory
based or small market towns), which are large enough to generally have their own Gram Panchayat, and
where society is caste based, rather than tribal, our criteria for village selection was a total population of
1500-2500 with a tribal population representing less than 10%.8 From the universe of such villages within
our geographic area (a total of 22 565) 320 were randomly chosen and visited by our enumeration teams.
Within the villages, neighbourhoods were identified and their approximate population shares computed.
Surveying intensity within a neighbourhood was proportional to its population share and households within
neighbourhoods were randomly selected. Our sample ends up extremely poor; 42% are below the state
poverty line (less than $1.25 ppp/day/capita).
We administered questionnaires at the household level, village level, and to the Gram Panchayats (GPs
from now on) directly. Some information, particularly the balance sheets of the GPs, were accessed from
higher level state government offices using the “Right to Information Act”. In Maharashtra, a given GP
typically covers a population of approximately 2000. As a result, in our data the GPs are generally village
specific.
GPs implement centrally funded poverty alleviation programs, provide some public goods, represent
village interests to higher level administrative units, and obtain resources from centralized funds for village
projects. There is substantial variation in all of these performance indicators across our sample of villages.9
An important GP activity is pro-poor policy delivery; supposed to be available in the full universe of our
sample. There are programs directly targeted to individuals below the poverty line (BPL). There are also
non-targeted programs that are still primarily intensively utilized by the poor but nominally available to all
residents. The mean number of programs available in a village is 5.33 out of a possible 19 major programs
that we asked about, and when restricted to those directly targeted to BPL individuals it is 1.71 out of a
total of 8 (refer to Table A1 in Appendix A). Another important pro-poor policy is the state’s Employment
Guarantee Scheme (EGS), the precursor to the federal government’s National Rural Employment Guarantee
8Indigenous Tribal society exists in a somewhat parallel relationship to the Caste system in India. It differs markedly insocial organization, and will not be amenable to the identification procedures we use here.
9Refer to Table A1 in Appendix A for a summary of these outcomes.
4
Act (NREGA).10 The EGS is a legal guarantee for 365 days of employment to adult members of rural
households willing to do public work-related unskilled manual labour at the statutory minimum wage. To
operate in a village, EGS projects must be activated by the GP from a set of possible projects, after
petitioning for particular project approval from a higher level authority. The scheme is evident in only 20%
of villages. This scheme, like all listed programs, is funded externally and administered by the GP upon
request for implementation. The GP draws up lists of eligible recipients, and disburses entitlements to them.
The dominance of the Maratha caste in Maharashtra in terms of land control, political alliances, and
rural networks of power has been well documented by political scientists (Deshpande 2004). From the Village
questionnaires we obtained: (1) Maratha population numbers; and (2) Maratha landholdings, both at the
village level. As will be clear subsequently, these variables will play a key role in our identification strategy.
As seen in Table A4 in Appendix A, Marathas are the main landowners and the economically domi-
nant class. This pattern of relative economic advancement occurs within villages where land ownership is
dominated by Marathas (what we call Maratha Land Dominated from hereon) and also over the sample
as a whole. Maratha dominance is seen in village politics too. Taking into account reserved positions for
the Pradhan, the leader of the GP, (that if applied, always exclude a Maratha Male from standing), Table
A5 in Appendix A demonstrates that though Marathas comprise about 40% of the population, they are
the Pradhan in over 60% of villages where a Maratha can stand. In Maratha Land Dominated villages, an
unreserved Pradhan is more than 80% likely to be a Maratha. Even when non-Marathas are the village
majority, a Maratha is village Pradhan in almost two thirds of cases. This over-representation of Marathas
is even more pronounced where positions are reserved for women – reaching 78% even when the village is
majority non-Maratha.
All of our villages contain a well recognized economic elite – large land-holders.11 Large land-holders
are relatively wealthy, they own the most important agricultural asset (land), control key employment
opportunities, and trade in the most important village goods (agricultural output).
But the elite are a tiny electoral minority, as there are extraordinarily high rates of political participation.
Over 89% of eligible individuals voted in the last GP elections in all the major caste groups (Refer to Table
A3 in Appendix A). The main reason for the approximate 10% who did not vote is that they were in villages
where candidates stood unopposed. Almost no one reported being forced to vote (less than 0.2 of one per
cent for any caste), over 95% had met their Pradhan (GP head), and nearly everyone felt comfortable raising
concerns directly with their Pradhan.12 Approximately 83% of our sample rank the Pradhan medium to
high (4-5 on a scale of 1-5) in terms of honesty and fairness, and roughly 85% of individuals feel that the
representatives of the GP have the most support in the village.
10“The EGS in Maharashtra India is the most famous and most successful direct governmental effort at reducing absolutepoverty in rural areas....” Ravallion, Datt, Chaudhuri (1991).
11There simply do not exist villages with equally distributed medium sized land-holdings in our sample, and this is typical ofIndia as a whole. Exceptions are the Tribal villages which are numerically small, and which we have purposefully not sampled.
12These are documented more explicitly in Table A2 in Appendix A. Voters elect the council members of the GP, which thenelects among its members a Pradhan (leader). The Pradhan is the only member of the GP with a full-time appointment.
5
There is little direct value of political control to the elite since most of the resources that come to a
village through the GP are tied to recipients. But land-owning elites may still be concerned about schemes
that target the poor. The single greatest expenditure category for large landowners is labor. Keeping
labour’s costs low and maintaining a compliant work force is of great importance. Laborers without access
to government programs, or employment opportunities outside the village, are more likely to comprise such
a work force.
In summary, we observe: 1. High electoral turnout, accountable political leaders, and a strong majority
of poor voters. 2. Weak local provision of centrally funded pro-poor programs. 3. Land-owning elites who
would prefer to not have pro-poor policies in place. This brings us to our clientelism hypothesis.
2.1 Clientelism Hypothesis
Workers always comprise a majority and GPs are accountable and participatory local democracies.13 Why
would this majority be willing to give up access to centrally provided benefits, and the employment generation
scheme that they could secure with GP effort? We conjecture an explanation based on Scott’s (1979) classic
analysis: Large landowners seek political power because they can use it to undermine implementation of
programs that directly benefit the poor. This provides no direct benefits to the landlords, but keeps labor
compliant and cheap. Landlords are never a majority, and democracy is functional in these villages, so
landlords attain power only with support of the poor. The poor, on the other hand, would like to have the
programs. The cheapest way for landlords to buy their support and thus gain control of village politics is by
providing the poor majority with insurance guarantees. The poor understand that a consequence of ceding
political control is losing programs and the EGS. Moreover wages may be lower than they otherwise would
have been, but the insurance they get from the landlords is the price they extract for this.
2.2 Empirical Strategy
We have information about programs implemented in the village, resources available to the GP, wages,
yields, and profits. We also know the villagers’ views of how the GP operates, program availability and
the presence of the EGS. We further asked who villagers receive help from in times of need. We will
thus be able to observe the correlations between these variables. But showing correlations amongst these
variables consistent with our hypothesized clientelism will not be enough to prove it. These correlations
may be a consequence of omitted factors. Moreover the variables that form the clientelism conjecture are
all endogenous to each other.
To get around these problems we exploit village level information we have about the politically dominant
upper caste, Marathas. We know whether the largest landholding group in the village is Maratha, we also
know Maratha population numbers. The relevance of population and land ownership variables is in how
13By “workers” we mean agricultural laborers as well as small cultivators whose main source of income is derived from wagelabor.
6

they affect feasible clientelist structures. Clientelist vote-trading is organizationally complex. Politicians, or
their functionaries, who receive votes for promised benefits, are not obliged to deliver the benefits once in
office. Voters may not want to vote as they have promised if they have already received benefits.14 Central
to our identification strategy is the advantage that Maratha landlords have in managing these clientelist
vote trading opportunities over landlords from lower castes. After a brief discussion of the reasons for this
Maratha political advantage in the subsequent section, we construct a model of clientelist vote-trading.15
This model builds in two potential contributing factors to Maratha landlord advantage, and shows how with
them at play we can use the observed village level population distribution of the Maratha caste, and the
variation in village landholdings by Marathas, to map to policy, insurance transfers, and economic outcomes
implied by the conjectured clientelism. If the model is correct, information on Maratha landholding and
population frequencies allows us to predict village level outcomes. For this variation to identify clientelism we
need a number of independence restrictions to be satisfied which are made clear in the model development.
But prior to even considering these, we briefly discuss the history of Maharashtra’s settlement patterns to
understand where this variation comes from.
At least since the fourteenth century Marathas have been the dominant land owners in Maharashstra,
owing to their hegemony as a military caste. Overall prevalence as landowners persists today but we also
see village-level variation in its distribution. This is because of legislated large scale land reforms which
were enacted after national independence in the 1950s. These acts, diligently implemented in the state of
Maharashtra, effectively redistributed land from the large holders to their former permanent tenants (“Other
Backward Castes” or OBCs under today’s classification) leading to a dramatic change in ownership (but
not cultivation) patterns. In villages where large landowning Marathas were mostly absentee landlords, the
dominant land-owning caste today can be a low caste (OBCs, former tenants). In villages where Maratha
landlords resided, although the lower castes typically also own some land, Marathas are highly likely to still
constitute the dominant landowning caste.16
One implication of this history is a potentially direct correlation between agricultural productivity and
14Kitschelt and Wilkinson (2007) discuss at length the central impediment to clientelist vote trading which is the incentivecompatibility of such agreements. Voter moral hazard is compounded with a secret ballot, mandatory in all our villages, sothat monitoring individual votes is difficult. But we make little of this side of the problem in the present paper. As Bardhanand Mookherjee (2011) note, successful clientelist politicians build surveillance and enforcement structures. In Maharashtrianvillages, a great advantage is provided by the ward based system of voting, with directly elected community representativesdrawn from small clusters of households. With the right sort of collective organization, clientelist political transactions arefeasible even under anonymous balloting. In our villages, there are about 5 to 6 wards in a GP and each one comprises onaverage 300 to 400 individuals which is about 70 to 80 households. Each ward elects two representatives. This implies that, atmost, 50 households should be enough to deliver a seat on the GP, implying a not implausible level of monitoring by patronsof clients votes undert vote trading. Organized voting is common in the Indian context, and numerous schemes have beendevised to circumvent the anonymity of secret balloting, see Chandra (2004) and Subramanian (1999) for in depth analysis andexamples.
15We are not the first to attempt a measure of elite capture through an indirect strategy. Another way is to use underlyingsocio-economic inequality as an indicator for locales likely to be subject to elite capture, which is then related to the allocationof public services across socio-economic classes or corruption among elected officials (Bardhan and Mookherjee 2011).
16Refer to Appendix D for historical evidence that that our key measures Maratha dominance are historically pre-determined.
7
Maratha prevalence. Marathas – as the militarily dominant group – may have resided where the highest
quality lands were found, choosing to maintain indirect control as absentee landlords over the rest. To control
for this possibility, we measured an extensive set of village geographic variables using the FAO-UNESCO soil
maps, using GPS data matched to the 2001 census of India, and using information obtained from our own
village surveys. Table 1 reports the averages of these variables across Maratha Land Dominated (MLD) and
non-MLD villages demonstrating no significant differences on any dimensions across the two. Population
sizes and proportions of scheduled castes also do not differ. [**Insert Table 1**]
With land quality correctly measured, the Maratha variables (landholdings and population numbers)
should be exerting no additional effect on productivity through this direct channel. We recognize, however,
that despite these controls, omitted factors might still be at play, and we return to an extensive discussion
of the main potential ones in Section 5 after our main results. What will be clear is it is extremely unlikely
that alternative channels of omitted influence can explain the patterns we find in the data.
2.3 Sources of Maratha Advantage
The sociological and political science literature on rural Maharashtra suggests two prominent reasons why
Maratha landlords may be more effective than other caste groups at establishing clientelist politics in the
villages they dominate.17
2.3.1 Superior Social Cohesion
The fact of social cohesion being present between same caste members is not disputable. But it has ad-
ditionally been argued that Marathas may be better at achieving such social cohesion today due to their
greater experience of collective social organization. Carter (1974) describes a history of collective political
deals between Marathas in Maharashtrian rural politics. Conceptually, superior social cohesion could sus-
tain enhanced cooperation if a Maratha cheating another (in a political or other form of transaction) suffers
a higher cost than a non-Maratha suffers cheating his own caste mate. Such costs are easier to impose
in a socially cohesive group. For example, they could involve withdrawing/reducing or excluding violators
from social exchanges (marriages, festivals, celebrations). The greater the costs, the easier for Marathas
to sustain cooperative outcomes. This hypothesis is in the spirit of Munshi and Rosenzweig (2008), who
postulate that the internal disciplining mechanisms within caste groups can act as an effective check on
politician misbehaviour. It adds to that basic insight, which is generally true for all caste groups, an added
weight for Marathas, for whom these links and internal disciplining mechanisms are posited to be stronger
than in other castes. This is consistent with recent experimental evidence on within caste-group punishment
obtained by Hoff, Kshetramade and Fehr (2012). In their experiment, conducted between members of high
and low castes in Uttar Pradesh (North India), high caste members were found to be systematically more
willing to impose costly sanctions on norm violators than were the low castes. Marathas are almost always
17Refer to Carter (1974), Lele (1981), and Sirsikar (1970).
8
the highest ranked caste present in our villages, suggesting a possible advantage vis-a-vis the others. From
hereon, we refer to this as the “superior social cohesion” explanation for Maratha political dominance.
2.3.2 Maratha Trading Networks
Another potential underpinning of Maratha power advantages is from their unique system of caste-based
trading networks in the state. Rosenthal (1977) describes how a small producer is typically at the mercy of
Maratha agents with substantial commercial ties across rural areas. Maratha trading networks deal in seeds,
fertilizers, credit and agricultural output marketing. Most agricultural and credit cooperative institutions
are either owned or controlled by Marathas (Palshikar 2007). Almost all agricultural transactions in the
rural parts of Maharashtra, and in our data, are conducted through either a Maratha trading network or
using members of the traditional itinerant trading caste (the Marwaris). Since Marwaris are not resident in
villages (there are almost none living in our sample) there are no caste based connections between farmers
and Marwaris in our sample. A potential explanation for Maratha landlords’ political power is that access
to, and use of, these networks is a benefit that Maratha patrons grant to political clients in return for
political support. This would make support relatively cheap for Marathas to ‘buy’.
3 The Model
3.1 Formalities
Workers, denoted W, own negligible land and sell labor. Landlords, denoted L, hire labor and derive income
from landholding. There are 2n workers in each village and 1 << n landlords. Workers are a majority, so
landlord political control can only occur if they ‘buy’ at least n worker votes. Each individual has a caste
(denoted ci for person i). Either ci = M, or ci = N , denoting Maratha and Non-Maratha respectively. Each
agent is identified by both class (W,L) and caste (M,N).
Programs
The GP is tasked with implementing pro-poor policies. If implemented correctly, they generate worker
value P . If implemented badly, they generate P̃ < P . Landlords do not value programs. Reducing program
availability lowers wages and raises labor compliance.18 Denote wages when programs are implemented by
wP , and those when not by wP̃ < wP . The full benefit to a worker from programs in a village is denoted
∆wP ≡ P − P̃ +wP −wP̃ . Finally, denote land rents when programs are implemented by πP and those when
not by πP̃ > πP .
Maratha advantages
Maratha trading network access generates benefit of amount T for both workers and landlords. Only
Marathas have access directly, but any Maratha can grant it to a non-Maratha costlessly. We asked extensive
questions about the use of such networks and as will be seen, the prevalence of their use by non-Marathas
18This can be micro-founded (see Appendix C) but is an assumption here.
9
does seem to depend critically on Maratha landlord presence. Workers utilize these networks to procure
inputs for their own small plots, loans for business activities, and for sale of output. The majority of workers
(roughly 70%) in our sample live in households with a small amount of land or running a small business.
Landlords divide vote buying responsibilities symmetrically. Since landlords are of measure 1 each is
responsible for the votes of n workers. Landlords have incentive to free-ride on the vote-buying of their
colleagues. To overcome this, landlords impose social punishments on individuals who cheat. Marathas
potentially have advantages in the strength of these punishments. Let XM denote the social punishments
imposed on a cheating Maratha landlord, by other Marathas. Let XN denote a Non-Maratha landlord
group’s analogous punishments with XM ≥ XN ≥ 0. Additionally, Maratha workers are unique in being
able to impose social punishments on Maratha landlords who cheat them, denoted by X ≥ 0.19
Insurance
Votes are bought by promising insurance transfers in a state of ‘need’. Such transfers would be needed to
cover medical expenses, loss or damage to a household asset such as livestock, employment/sickness shocks
to an earner etc. An insurance promise is a commitment by the landlord to a transfer when needed by the
worker. We assume that the need state is observable to both landlords and workers but not enforceable
by formal/legal mechanisms. Denote the net present value to worker j of the transfer committment from
landlord, i, to to be Sji , where the magnitude of S depends on the extent of the insurance commitment.20
Incentive compatibility of insurance promises
The timing is as follows: (1) Worker and Landlord can strike a vote trading deal specifying a transfer Sji
from landlord to worker in state of need in return for the worker’s vote. (2) The state is revealed to both
parties. (3) The landlord chooses the transfer level if the need state arises. (4) Elections occur. If the need
state arose and the transfer received is (at least) Sji , the worker votes for the landlord’s candidate. If the
need state arose and the transfer received is less than Sji , the worker votes for someone else, and social
sanctions are imposed on the landlord. If the need state does not arise, the worker votes as promised.21
In addition to social costs common to all individuals we allow for each pair to share a common idiosyn-
cratic history (not observed by the researcher) which may allow some level of social cost to be imposed on
the landlord if he cheats the worker. This pair’s history is summarized by a non-negative number, xji , which
is randomly and independently drawn from the distribution F (xji ) defined on a finite support. The following
assumption plays a key role in identifying the model:
19Only Marathas are able to impose these as they are the only Jati (sub-caste) on both sides of a clientelist agreement –i.e., Marathas can be both landlords and workers in the same village. Occasional exceptions will arise in non-Maratha landlorddominated villages, but these are rare and are ignored here.
20As shown in a previous version of the paper available from the authors on request, modeling the state contingency of thetransfers rather than collapsing the valuation to its expected value has no impact on the analysis.
21We only focus on the incentive compatibility of promises made by landlords to workers in return for their votes. A morecomplicated version of the model would also analyze the incentive compatibility of worker promises to vote in favour of thelandlord’s candidate after having received insurance. Since any patron group must assure clients vote as promised, this is aproblem that is common and for which no caste has a particular advantage. In the model, we thus focus on the landlord’s(patron’s) side of the problem, where Maratha landlord advantages are more likely to arise.
10
Assumption 1: The pairwise idiosyncratic terms, xji , are independent of village level landholdings by caste,
and caste population numbers.
Purely at the individual level, this is a reasonable assumption. The working relationship between a
landlord and his employees is likely to reflect their personal history which is unlikely to be systematically
affected by village level variables such as the caste frequencies or aggregate landholding patterns. But it
is possible that more than the pair’s personal history could be involved. Coordination amongst workers
to punish landlords who transgress could possibly be affected by village caste frequencies. For instance,
worker level social capital or social cohesion may vary with the share of land held by Marathas. This
would make it more difficult for workers to punish landlords in MLD villages. Since our surveys asked
respondents about social cohesion, we are able to verify in Table B7 of Appendix B that such an effect is
not evident; our measures of worker social cohesion do not vary across MLD and non-MLD villages.22 We
also demonstrate, in Appendix C section 9.5, that all of our model results will continue to hold under this
violation of assumption 1.
Additionally, the cheating landlord incurs social costs imposed by other landlords for not delivering his
n votes; the Xi defined above. Both of these punishments bound the transfers that a landlord can credibly
promise in return for the worker’s support in a clientelist arrangement. Specifically, incentive compatible
insurance transfers between landlord i and worker j must satisfy:
Sji ≤ Xi + IjiX + xji . (1)
where Iji = 1 if ci = M and cj = M , and Iji = 0 otherwise.
The cost of a vote
Individual rationality of vote trading for landlord i buying the votes of n workers j requires:
πP̃ − nSji ≥ πP . (2)
For the worker (j), similarly, individual rationality of vote trading with landlord (i) in village k requires:
Ujk (Li) ≥ Ujk (W ) , where U denotes the expected utility outcome corresponding to the group in parentheses
controlling the GP. Without vote trading, workers (W ) are the majority. As we will see, this implies control
of the GP. Consequently programs are implemented at value P, there is no insurance, and if the worker is
not Maratha, there is no trading network access. In that case worker utility is:
Ujk (W ) = wP + P + djT (3)
where dj = 1 if cj = M, and dj = 0 if cj = N . In contrast, with vote trading, landlords (Li) control the
GP. Programs are reduced to P̃ but there is insurance provided and network benefits arise for workers, so
that only if both parties are non-Maratha does a worker not receive network benefits in this case; dji = 0.
22We show that the landless are not more likely to share information with other workers or trust people like themselves inMLD villages.
11
An additional cost of vote trading to workers is that they must support the landlord’s candidate instead
of their own preferred one. We capture the cost to the workers of village k doing this via the term xk. A
higher quality landlord candidate increases xk. The variable xk is drawn from distribution G(xk).
Ujk (Li) = wP̃ + P̃ + Sji + djiT + xk (4)
Once again, model identification depends on the draw of candidate specific quality being independent of
village level caste characteristics. Similarly, we assume:
Assumption 2: The realization of xk is independent of village level landholdings by caste, and caste popu-
lation numbers.
This amounts to assuming that the random variation in the quality of landlord candidates across villages
is not related to landlord or population caste numbers. An indirect indication can be obtained by checking for
systematic differences in worker perceptions of leader quality in MLD and non-MLD villages. Table B7 of
Appendix B shows that in terms of the perceptions that workers have of panchayat leaders in MLD villages
versus non-MLD villages, there do not seem to be systematic differences. Though this is not an aspect
directly addressed by the literature on Maharashtrian villages, numerous contributors to this literature have
argued that the history of domination by the Marathas has made them resented by lower castes and the
poor (Mandavdhare 1989). This would suggest that if Assumption 2 is violated at all it would likely be
in the direction of landlord candidates in MLD villages being seen less favorably by workers than such
candidates in non-MLD villages. If so, the xk term in Maratha land dominated (MLD) villages would be
drawn from a distribution that is stochastically dominated by that in non-Maratha land dominated villages;
clearly violating Assumption 2. Since this cannot be ruled out, we explore the implications of this departure
from Assumption 2 in Appendix C section 9.6. This also has no effect on model results.
We state here the conditions under which, given that Marathas control access to trade, a clientelistic
relationship produces a surplus of a given worker/landlord pair:
Proposition 1 Clientelist vote trading is both individually rational and incentive compatible for a worker
(j)/landlord (i) pair if and only if:
xji + xk ≥
∆wP −XM −X, for ci = M and cj = M.
∆wP −XM − T, for ci = M and cj = N.
∆wP −XN , for ci = N and cj = M or N.
(5)
(6)
(7)
Proofs of all propositions are in Appendix C.
A high value of xk makes it less costly to workers to vote for the landlord’s preferred candidate, and
individual rationality of vote trading easier to satisfy. A high value of xji makes landlord reneging on
promised worker transfers costly, and hence supports a greater range of incentive compatible transfers from
them in return for workers’ votes. These terms do not vary by caste but the right hand side of this expression
12
does. When both worker and landlord are Maratha, equation (5), superior caste cohesion sustains higher
punishments, X, and hence makes higher transfers incentive compatible. This adds to the within landlord
punishment effect XM . When only landlords are Maratha, (6), the X term disappears to be replaced by
trading network access, T , which can be granted to non-Maratha workers for their support; hence benefiting
vote trading. In the final case – that of non-Maratha landlords in equation (7) – there is neither trading
network access, nor superior caste cohesion between workers and landlord, but non-Maratha landlords can
still punish landlord digressions, XN .
3.2 Computing the likelihood of vote trading
To move from individual level vote trading incentives to village level predictions, we now consider the
relationship between these individual conditions and the likelihood of vote trading occurring in the village
as a whole. We already know that no single landowner acting as a patron can orchestrate control of the GP
by vote trading with his own workers alone. The landowners as a group must be able to contract votes from
enough workers to ensure a majority in the village. We make the following assumption about how many:
Assumption 3: If and only if a majority of workers find it individually rational to accept incentive compat-
ible transfers from landlords for vote trading, then vote trading occurs, and landlords exert political control.
This assumption allows us to map from the incentive compatibility/individual rationality conditions for
worker/landlord pairs, and the frequency of such pairs to vote trading at the village level. It amounts to
assuming that landlords have the wherewithal to act in their collective interests; if there are gains to be
made from vote trading, we assume vote trading occurs. If, however, the votes that can be feasibly bought
by landlord patrons are not sufficient for them to wrest control of the GP, they do not bother.
3.2.1 Deriving the estimating equation
The model predicts outcome variables, denoted vk, – wages, profits, programs, insurance – that will be
affected by clientelism occurring in village k; these will be discussed further in Section 3.4. These variables
are also potentially affected by the village level co-variates listed in Table 1. So we include such controls, as
well as individual level controls for education, land ownership, and caste identity.23 We denote these by the
vector Zk. Thus for an outcome variable vk, in village k we have:
vk = αvIV Tk + αZk + µvk, (8)
where IV Tk = 1 if vote trading occurs in village k and 0 otherwise, and µvk is a mean zero village and
variable specific error term. By now assuming an explicit process for the idiosyncratic shock term, xk,
we are able to map population frequencies by caste in to the proportion of likely vote traders, hence the
likelihood of clientelism occurring, and in turn to the set of outcome variables in the village. Let σjik denote
the frequency of worker caste j, landlord caste i pairs in village k. Then:
23In Appendix B we show that all results are robust to omiting these controls.
13
Proposition 2 If xk is drawn from a uniform distribution, the expected value of variable vk in a village
with population frequencies σijk and characteristics Zk is given by:
E[vk|σijk,Zk] = αv[C + σMMk(XM +X) + σNMk(XM + T ) + σNNk(XN ) + σMNk(XN )] + αZk, (9)
with C a constant.
The assumption of uniformity on the xks makes for an extremely simple relationship between the prob-
ability of clientelism occurring and the caste landlord/worker frequencies. In Appendix C (Section 9.4) we
show that the interpretation of coefficients and the inferences drawn from the model are identical under any
well-behaved alternative distributions satisfying Assumption 2.
Intuitively, the probability that a high enough proportion of the village are willing vote traders – and
hence that clientelism occurs – depends on the frequency of worker/landlord pairs by caste type (the σjis)
because each pairing differs in its propensity to vote trade depending on its caste composition via Proposition
1. We compute the σjis from land ownership and population frequencies by caste under the following
assumption.
Assumption 4: Political clients are randomly matched with political patrons.
Assumption 4 implies that the probability of a particular clientelist pair occurring in a village will be
directly related to the population frequencies of such pairs in the overall village population; caste members
are neither more nor less likely to be matched in landlord/worker pairs. Random matching may seem a
strong (and unlikely) restriction in India where segregation by caste can occur. We show, in Appendix C
Section 9.7, that the perhaps more natural “positive assortative matching” by caste case does not alter the
model interpretation of coefficients.
We can use our data to estimate the σjis directly. We know the population distribution of each caste
group in the village, and from this we construct the continuous variable, MPROP ∈ [0, 1], which equals the
proportion of the village population that is from the Maratha caste. We also have from the Talathi (village
administrator) the dominant land owning caste group in the village. We code this as the binary variable,
MLD, which equals 1 if Marathas are the Land Dominant group, and 0 otherwise.24 Using these, we can
obtain a relationship between observables as follows:
Proposition 3 Under Assumption 4, expression (9) re-arranges to
E[vk|MLDk,MPROPk,Zk] = αvC +MLDk · αv [T +XM −XN ] +MPROPk · αv [0]
+MLDk ·MPROPk · αv [X − T ] + αZk + µvk, (10)
where C is a constant.24We have an alternative source of Maratha land holdings from our household surveys. From these 30 households per village
we obtain an estimate of the overall proportion of village lands held by Marathas M̃LD ∈ [0, 1]. We utilize the Talathi variablethroughout the body of the paper as it is not subject to sampling error and hence more accurate, but show that all results arerobust to instead using M̃LD in Appendix B.
14
3.3 Predicted Outcome Variables
Equations (3) and (4) generate the set of workers’ dependent variables predicted to be affected by clientelist
vote trading. For each one of the dependent variables (v) below we elicit its directional change by comparing
its model predicted value when vote trading happens (equation (4)) with its value without vote trading
(equation (3)). The comparison determines the sign of αvin equation (10).
For worker variables: 1. Programs (αv < 0): Without vote trading programs are P , they fall to
P̃ under vote trading. 2. Insurance Receipts (αv > 0): Without vote trading, the value of insurance
received by workers from landlords is 0, under vote trading this rises to Sji . 3. Wages (αv < 0): Without
vote trading wages are wP , they fall to wP̃ with vote trading. 4. Trading Networks (αv > 0): Without
vote trading, djT are Maratha trading benefits, where dj = 1 if and only if worker j′s caste is Maratha.
With vote trading, Maratha trading benefits are djiT where dji = 1 if either worker j′s caste is Maratha or
landlord i′s caste is Maratha, and dji = 0 otherwise.
For landlords the relevant variables are computed using equation (2), the landlords’ individual rationality
conditions. These are: 1. Profits (αv > 0): Without vote trading, the value of profits is πP , which rises to
πp̃ under vote trading. 2. Insurance Liabilities (αv > 0): Without vote trading, the value of insurance
liabilities from landlords is 0; under vote trading this rises to Sji .
3.4 Interpretation
We estimate equation (10) using a linear regression of the following form:
vk = β0 + β1MLDk + β2MPROPk + β3MLDk ·MPROPk + γZk + εk. (11)
Given Assumptions 1 and 2, and that MLDk and MPROPk do not directly affect the outcome variables
– the implications of which we discuss later – the linear regressions that we estimate will yield consistent
estimates. The regression coefficients directly map to the model’s parameters as follows:
β1 = [T +XM −XN ]αv. Since T > 0 and XM ≥ XN , the model implies this coefficient should be positive
(negative) for αv > 0 (< 0). Maratha land dominance should have a direct positive effect on the probability
of vote trading, thus raising (lowering) the value of variables the theory predicts are larger (smaller) under
vote trading.
β2 = [0]αv . There should be no direct effect of Maratha population numbers, and hence the prevalence of
Maratha workers, on a clientelist vote trading variable. This is because having Maratha versus non-Maratha
workers only effects Maratha landlords, and so is picked up via the interaction term. Non-Maratha landlords
have the same capacity to enter into vote trading with workers of any caste as the costs imposed on cheating
are XN in both cases.
15
β3 = [X − T ]αv . The sign of this variable tell us the relative importance of the two posited explanations
for the political prominence of the Maratha caste; their greater social cohesion or their trading network
access respectively. Intuitively, the interaction term applies where Marathas are both the landlords and the
workers. In such cases jati benefits, X, affect the feasibility of vote trading but trading network benefits
that are of use to Maratha landlords with non-Maratha workers cease to be relevant as Maratha workers
already have access directly; hence the negative sign on T . So for αv > 0, a positive (negative) interaction
term, β3 > (<)0, suggests superior caste cohesion is more (less) important than trading network advantages.
β1+β3 = [XM −XN+X]αv. This is the magnitude of the total clientelism advantage of Marathas
that derives exclusively from their superior social cohesion. The term XM − XN reflects the superior
punishment capacity on a transgressing landlord by other landlords when Maratha. The term X is the
superior punishment of a transgressing landlord by a worker. The summation of these coefficients suggests
the total extra help in sustaining clientelism deriving from Maratha social cohesion. If this summation
exceeds zero (for αv > 0) then social cohesion generates benefits for Marathas in maintaining clientelist
structures. If not, the total benefits of superior social cohesion do not aid Marathas in sustaining clientelist
structures.
4 Estimation and Results
Based on (11), we run two main estimating equations depending on whether the dependent variable is village
or household level. The household level regression is represented by the following:
Yik = β0 + β1MLDk + β2MPROPk + β3MLDk ·MPROPk +ψZik + γZk + εik. (12)
Yik is an outcome of household i, residing in village k. Zik includes household controls (education,
land ownership, and caste identity); Zk includes village level geographic, demographic, and climate controls
(latitude, longitude, elevation, presence of river/canal, distance to natural water sources, railways and
national roads, soil quality measures, rainfall levels, proportion of the population that is SC/ST, total
village population, and reservation status of Gram Pradhan). MLDk is equal to 1 if a village k is Maratha
land dominated and equal to 0 if the village is land dominated by a lower caste. MPROPk is the proportion
of Marathas in a village k.25 εik is a regression disturbance term clustered at the village level.26 Refer to
Tables A1, A2, and A3 in Appendix A for summary statistics on all of the variables used in the estimations.
We also explore the impact of Maratha dominance on GP performance using village level outcome
measures. Similarly we estimate the following:
25We also include region fixed effects to control for variation in historical land revenue systems, but we do not report these.26In one set of estimations on daily wage, we instead cluster errors at the village and household level (using the approach of
Cameron, Gelbach, and Miller 2011). The information on daily wages comes from the sample of all labourers. As a result, wehave multiple observations per household.
16
Yk = β0 + β1MLDk + β2MPROPk + β3MLDk ·MPROPk + γZk + εk. (13)
Yk is a village level GP outcome measure in village k and εk is a regression disturbance term.
The pairwise correlation between MLDk and MPROPkis only 0.54, so estimations should not suffer
from multicollinearity. Also, the villages where Marathas dominate (by either of these measures) are ge-
ographically dispersed throughout our sample. Our results are robust to including regional fixed effects
defined in several ways.27
MLDk is equal to one for 59% of the villages in our sample. The remaining villages are dominated by
a lower ranked caste group (primarily two cultivating castes, the Kunbis and Dhangars, both OBCs under
today’s classification). In the empirical estimation we leave these two sub-castes (or jatis) grouped together.
All of our main results persist if we instead separate them in the analysis.
4.1 Evidence on Model Variables
4.1.1 Worker Cost of Vote Trading: Programs (αv < 0)
We obtain direct information about the availability of mandated and centrally funded programs from our
household level surveys and from our survey of the village government. There are two broad types of
programs that are relevant. Firstly, there are programs directly targeted to individuals below the poverty
line (BPL). There are also non-targeted programs that are still primarily intensively utilized by the poor
but nominally available to all village residents. For each one of these programs, household members were
surveyed on the availability of the program within the resident village. The model predicts a negative
effect of MLD on programs, represented by the coefficient β1 = αv[T + XM − XN ]; since T > 0 and
XM ≥ XN . The model also predicts that MPROP , represented by β2 (of (12)), should have no effect
on the level of programs once MLD and the interaction between MLD and MPROP are included in the
regression.[**Insert Table 2**]
As can be seen from Table 2, the results are consistent with these predictions of the model. Programs
(1) and BPL Programs (1), from the household surveys are, on average, 1.01 and 0.42 lower respectively in
MLD villages. Both are significantly different from zero at the 1% level. The means for these variables were
5.36 and 1.73 respectively, so the percentage decline in programs is 19% and 24% respectively. Since the
interaction term captures the effects of MLD in villages with a positive MPROP , these numbers should
be interpreted as the percentage decline in the availability of programs due to the effect of MLD in villages
where MPROP is negligible. Since MLD villages have approximately 30% more Marathas than the others,
we can compute the effect of programs when moving from the average MLD village to the average non-
MLD village by adding 0.3 times the coefficient on the interaction term to the direct effect. This equals
1.01 - 0.3*1.84 = 0.46 or an 8.5 % decline in Programs (1) and correspondingly 0.42 - 0.3*0.81 = 0.177 or a
27That is, at the level relevant to administrative divisions today, at colonial administrative units, or at the district level.Results are also robust to excluding the few areas where no Marathas are present.
17
decline in BPL Programs (1) of 10%. We also aggregated individual level information and ran village level
regressions (represented by (13)), Programs (2) and BPL Programs (2). These are almost identical.
Our model predicts that we should see the greatest sensitivity to MLD for those government programs
which are expected to impact wages or income directly, as these are the ones landlords should have greatest
interest in limiting. To this end, we separated out the set of programs that directly or indirectly affect
household labour decisions and income (such as public good and housing improvement schemes which do
rely on villagers’ labour in their construction and the targeted public distribution system), from those which
would not (such as those targeted towards children (child development and mid-day meals) and the elderly
(social security pensions and foodgrain transfers)). We refer to these as “Income Programs” and “Non-
Income Programs” respectively. We also asked information from both household and village records on
the availability of the state’s Employment Guarantee Scheme (EGS), which is the precursor to the present
NREGA, in the village. Under the clientelist hypothesis the EGS program and the Income Programs should
be negatively related to MLD and unaffected by MPROP . Again this is borne out by the data. As we see
in Table 2, the EGS is 0.10 times less likely to be reported as existing by households in MLD villages. With
a mean of 0.20 for this variable, this implies that the decline in the average MLD village, when adjusted
for the interaction term and the proportion of Maratha villagers difference, is about 21% compared to the
average non-MLD village. Income Programs are 0.98 lower in MLD villages, implying a decline of around
9% in the average village when accounting for the interaction term. As also expected, we find no significant
effects of MLD on Non-Income Programs.
We further use the GP survey and access to the accounts of the GP to check the consistency of individuals’
reports with formal records. Programs are funded by the state government but must be activated by the
GP. If a lower level of reported program availability is occurring because the GP is petitioning for fewer
recipients, and expending less effort in activating them, then this should imply lower revenue inflows into
the GP. Revenue (1) and Revenue (2) are per-capita village revenues from two independent sources. The
first is from our own access to the village balance sheets – much of which was obtained from our petitioning
of this information through the state’s Right to Information Act.28 As our sample size indicates, despite
our petitioning through the act, the books were not available in almost a third of our villages. Revenue
(2) is information we obtained from the government’s Village Census (2001). Both coefficients are negative
and significantly different from zero, suggesting that, indeed, MLD villages have lower revenues. Again
MPROP has no significant effect on this as predicted.
Turning to the coefficient on the interaction term, β3 (in (13)). The model’s interpretation of this
coefficient is as: αv[X − T ]. So its sign indicates the relative importance of the posited underlying sources
of Maratha clientelist advantage, X or T . The evidence in Table 2 is supportive of trading networks being
key, since αv < 0 for programs and the coefficient on the interaction term is positive in all cases. Specifically
28An act that mandates delivery of the relevant documentation within 30 days of written request, or the imposition of penaltieson the GP.
18
Programs (1), BPL Programs (1), Income Programs (1) are positive and significant at the 1% level. EGS (1)
is positive and significant at the 5% level. There is again no corresponding significant effect for Non-Income
Programs. For Revenue (2) and Expenditure this coefficient is also significant and positive at the 5% level
and hence also consistent with a key role being played by trading network benefits of Marathas.29
Column 4 reports the significance of β1 + β3. Recall from Section 3.4 that the model implies β1 + β3 =
αv[XM − XN + X] representing the total social cohesion benefit of Marathas. As can be seen from the
column, in very few cases is the summation of these coefficients statistically significant. In the few cases
that it is, this significance is typically lost in the robustness checks conducted in Appendix B (refer to
Section 4.3). Overall it is not possible to reject the hypothesis that, with respect to program availability,
superior Maratha social cohesion provides no direct benefit to Marathas in sustaining clientelism. This,
together with the sign of the coefficient on β3 points to trading network access being crucially important in
explaining Maratha hegemony; a finding we will see repeated for the variables that follow.
Finally, we explore the reasons programs and revenues may be affected by these variables using the GP
Survey. Specifically, the survey asked about the number of meetings between the village Pradhan and higher
levels of government. Since programs are activated by the village government through requests to higher
level officials, a more active Pradhan should indicate a village where greater attempts are being made to
implement programs; conversely for a village under clientelist vote trading where programs are diminished.
The coefficients β1 and β2 (from (13)) are consistent with this interpretation. MLD leads to around 2 to 3
fewer meetings between the Pradhan and higher level functionaries – the Block Development Officer (BDO),
the District Collector (DC), and the Member of Parliament (MP). We also estimated an average effect size
(AES) of these three dependent variables following Kling, Liebman, Katz and Sanbonmatsu (2004). The AES
estimates confirm the findings on the β1 and β2 coefficients when examining the outcomes independently.
The interaction term β3 is positive and significant for meetings with the MP and DC. The latter is the most
important contact of the three, as the DC makes the final allocation decision and distributes the government
transfers to the GPs. The sign on β3 is thus also consistent with the importance of trading benefits; T > X.
4.1.2 Landlord Cost and Worker Benefit of Vote Trading: Insurance (Sji )
The clientelism hypothesis suggests that the counterpart of reduced programs that provides incentives for
workers to partake in vote trading is increased insurance. The term Sji should appear when vote trading
occurs. Thus insurance related dependent variables should exhibit opposite signs to those predicted for
programs: β1 > 0, β2 = 0, and β3 = αv[X − T ] in (11).
Information about insurance was obtained from the household surveys. Seven questions were asked in
a hypothetical form, describing transfers, in both cash and kind, by individuals of different social status.
Specifically: Insured (1): “Would most people in your village help you with some money in times of crisis?”;
29If trading network advantages are themselves due to superior caste cohesion then the correct interpretation of T > X is thatcaste cohesion supports dominance indirectly through trading networks and not directly via intra-caste contract enforcement.
19
Insured (2): “Would a higher caste member of your village help you with some money in times of crisis?”;
Insured (3): “Would most people in your village help a lower caste villager with some money in times of
crisis?”; Insured (4): “Would most people in your village help you with some grain in times of crisis?”;
Insured (5): “Would a higher caste member of your village help you with some grain in times of crisis?”;
Insured (6): “Would most people in your village help a lower caste villager with some grain in times of
crisis?”; Insurer: “Suppose a lower caste man asks to borrow a good sum of money from you because
someone in his family has fallen ill. He is from the village and has the ability to repay the amount. Would
you lend it to him?”.[**Insert Table 3**]
The results in Table 3 are once more consistent with the sign restrictions of the model. The point
estimate of β1 run for the landless is positive at around 0.15 for each of the first six questions. Implying that
landless households are 15% more likely to report provision of help in a state of need in MLD villages.30 The
AES estimate of these six dependent variables confirms the findings on the β1 coefficient when examining
the outcomes independently.
The increased prevalence of Marathas (upper castes) in a village should make the reported provision of
insurance from “upper castes” more likely, even if insurance is simply provided at random. This introduces
a bias into the estimation of the coefficient β2. Specifically, clientelist vote-trading predicts the effects of
MPROP through clientelist vote trading to be zero, but the regression that we run also picks up a direct
effect of MPROP through this mechanical channel. So the interpretation of this parameter’s magnitude is
confounded in this case due to the direct effect.
The model interpretation of the coefficient on the interaction term, β3, however is uncontaminated by
the direct effect of MPROP . These results are reported in the third column. Since β3 < 0, and always
significantly so, the finding is that X < T , again suggesting the relative importance of Maratha trading
networks.
Column 4 reports estimates of β1 + β3. Here, once again, this linear combination of coefficients is rarely
significant. The implication in terms of model parameters is again that αv[XM−XN +X] is not significantly
different from zero, and hence that superior social cohesion amongst Marathas does not seem to directly
contribute to their political power.
Considering now the other side of the insurance relationship, we again see a similar pattern. Large
landowners answer that they are more likely to lend to a hypothetical “lower caste man in need” (Insurer)
in MLD villages. This is mitigated by an increase in MPROP . We also ran regressions for this insurance
liability question (Insurer) over restricted samples: large land holders, Marathas with low and large land
ownership, and low castes with large and low land ownership. Again, consistent with the theory, the
estimated coefficients are only significant for Marathas with large land holdings. Lower castes with large
landholdings and Marathas with small land holdings are not more likely to lend to lower castes in MLD
villages, nor are they less likely to lend in villages with greater MPROP . This is again consistent with the
30When adjusting for the interaction term, in the average village this falls to about an 8% increase.
20
Maratha land owners being the ones who act cohesively in providing insurance, and with that happening in
return for vote-trading.
4.1.3 Landlord Benefit/Worker Cost of Vote Trading: Wages (w(P̃ )− w(P ) < 0)
According to the clientelism hypothesis, vote trading is a means to make labor cheaper, so wages should
fall with the probability of clientelist vote trading; (αv < 0), a negative coefficient for β1. As the first
row of estimations in Table 4 documents, β1 = −2.2 for the average worker in a village. This implies that
the average daily wage of workers in MLD villages with negligible MPROP compared with non-MLD
villages is 2.2 rupees lower, which is significant at the 1% level. This is 6-7% of the average daily wage, or
about 2% when adjusting for the interaction term. According to the model, the lowering of wages through
clientelist vote trading should be indiscriminate since it works through a village general equilibrium channel
by reducing external labor demand (EGS) as well as lowering labor’s opportunity cost (Programs). This
is in contrast with other vote trading schemes, for instance the one highlighted in Chile by Baland and
Robinson (2008). There, the finding was that wages rose as a reward for political support. Here wages are
predicted to fall as a general equilibrium consequence of landlord village control. Consequently, we should
observe wage declines across the village as a whole, not just for the workers who report increased insurance
benefits. To check for across the board effects, we measure whether lower wages are restricted to workers
reporting insurance benefits, low caste workers, low caste and insured, or workers of either gender. The
remaining rows in the first panel of Table 4 indicate an effect that is consistent with a general equilibrium
channel. The magnitude of wages for all categories of workers falls by about the same amount irrespective
of gender, insurance access and caste.[**Insert Table 4**]
The coefficient β2 is, as expected, again generally not significantly different from zero. The sign of β3 is
in all cases positive, and usually highly significant; again consistent with T > X.31 Finally, the implication
of column 4, that β1 + β3 is in almost all cases not statistically different from zero, again suggests that the
direct benefits of Maratha superior social cohesion are likely to be small.
4.1.4 Landlord Benefit of Vote Trading: Yields and Profits (π(P̃ )− π(P ) > 0)
We obtain information about yields and profits from surveys of large agricultural producers. We focus on
the kharif – 4 month wet season – growing period which is the main one in our villages. In our data, kharif
crops are grown on 77% of cultivated land, they generate 73% of total annual yields and form 81% of total
annual profits. Typical crops include grains and pulses (tur, bajra, jowar, chana, soybean, and wheat) as well
as cotton. Labour comprises 31% of total kharif input expenses, fertilizer 30%, and seeds 24% (irrigation
expenses are neglible as these are rain-fed).
31Note these findings also strongly suggest that mismeasured land quality is unlikely to be an important contributor to ourresults. As conjectured earlier, mismeasured land quality would tend to manifest through land being higher quality in Marathaland dominated villages than we have controlled for. If this is the case, it makes the lower wages found in such villages evenmore difficult to understand.
21
The model predicts increased yields and profits to be the main source of benefit for farmers from vote
trading, so αv > 0 and hence β1 > 0. As the first row in the second panel of Table 4 indicates, the model’s
sign restriction on β1 is again respected by the data. Log yields are higher in MLD villages, and this is
significantly different from zero at the 1% level. The coefficient is very large. A MLD village has the log of
kharif yields that are 0.32 higher (32% higher) than a non-MLD village (again for a village with negligible
MPROP ). When adjusting for the differences in Maratha population numbers using the interaction term,
the overall rise in yields when moving from the average MLD to non-MLD villages is: 0.32−0.3x0.51 or an
increase of around 17%. Log profits are 48% higher in such villages, but similarly adjusting for the higher
MPROP in such villages yields 17% higher profits.
Since we do not have information on the hourly wages paid to workers by specific farmers, nor how many
hours worked, we can only use the information on hired and total workers, for a given farmer, to estimate
the channels through which yields and profits may be higher in MLD villages. Paid workers, and total
workers have higher point estimates, but are not significant statistically. If worker compliance is the channel
of effect, we should expect that clientelist vote trading will be associated with a lower proportion of total
input expenditures going to labor. This implies a negative prediction of the model on β1 for this variable.
The ratio of labor costs to total costs, the last row in the middle panel of Table 4, is lower in MLD villages,
suggesting some contribution to increased profits could be arising through lower wages. But the effect here
is statistically weak; significant only at the 10% level.
The coefficient on β2 is again not different from zero; as expected. The negative sign of β3 again suggests
a stronger contribution of trading networks than superior caste cohesion to Maratha dominance; this is
statistically significant at the 1% level. Similarly, the sign of β3 when Labor/Total Costs is the dependent
variable is also consistent with trading networks being the more important cause of Maratha dominance. A
similar conclusion about the relative unimportance of direct effects of Maratha social cohesion is shown in
column 4 where β1 + β3 is not statistically different from zero (the exception is the case of kharif profits).
4.1.5 Worker Benefit Trading Network Access (T > 0)
So far, coefficient signs are consistent with the predictions of the model and consistent with trading network
access being a more important determinant of Maratha dominance than direct benefits from superior social
cohesion. We should therefore see this also directly reflected in the patterns of reported trading network
access, which we now consider.
A number of survey questions allow us to obtain information about access to Maratha trading networks.
We asked individuals about their trade in inputs and outputs, if they traded inputs, we asked them what
the terms were for payment. Since agricultural inputs must be utilized before returns are realized (often
with a lengthy delay), small scale producers often receive a form of implicit loan by being able to defer
payment for inputs until returns are had. We also asked if individuals received loans, and if so what the
interest rate was on the loan. For all of these variables we obtained the caste of the individual with whom
22
the respondent was trading, and we asked whether the trader was a village resident, or someone residing
outside the village. As mentioned earlier, there are effectively only two castes in our villages who perform
these trading functions. The Marwaris, an itinerant trading caste, and Marathas. The variable ‘Maratha
Trader’ equals one if the household has traded with a Maratha for any tradeable good (which includes
agricultural inputs and outputs, farm enterprise and non-farm enterprise goods). ‘Terms of payments’ is an
index variable equal to 0 if the trader requires advanced payments, 1 if full payment is required at the time
of sale; and 2 if instead payment in installments is acceptable.
According to the model, if clientelist vote trading occurs, low caste individuals should report increased
access to various forms of Maratha trading network. They should be: more likely to transact with a Maratha,
on better terms, and to borrow at a lower interest rate. Thus for each measure of trading network access
we should see αv > 0 which implies β1 > 0. There should be no such pattern for Marathas however, as
they have access independent of vote trading. The final panel in Table 4 shows that this sign restriction
of the model is again observed in the estimates. Low caste individuals in MLD villages are 0.09 more
likely to trade with a Maratha (5% significance), 0.10 more likely to trade with a Maratha trader who is
a non-resident of the village (1% significance), and 0.24 more likely to obtain a loan from a Maratha (1%
significance). These all reflect increases of more than 50% since the averages of these probabilities are 0.18,
0.19, and 0.24 respectively for low castes.32 They are also more likely to obtain input trade on beneficial
terms (non-advance or deferred repayment), and pay 8.4% lower annualized interest rates on their loans (5%
significance). Note again that this does not simply reflect an increased village wide prevalence of Marathas as
we are controlling for Maratha population in this regression. In contrast, again as predicted, the coefficient
does not generally differ from zero for Marathas, except for terms of payments which also appear better for
them; a finding for which the model provides no direct explanation.
The model’s prediction on β2 = 0 however is more problematic to test for this variable. This is because
trading with a Maratha is mechanically more likely to occur in villages where there is a large Maratha
population. Thus the coefficient β2 should directly reflect not just the vote trading effect (0) but also the
greater frequency of Marathas. Accordingly, we see positive and large effects of Maratha population numbers
on a number of the Maratha trader variables due to this mechanical effect.
The coefficient on β3 again indicates the relative strength of trading network benefits versus superior
caste cohesion. The point estimates are always negative, and with αv < 0 would again imply T > X. Though
these estimates are not all significantly different from zero at conventional levels. This evidence again points
in the same direction: trading networks seem a more important underpinning of Maratha Dominance than
superior Maratha social cohesion.
32These magnitudes are similar when controlling for population numbers as the interaction terms are small, with the exceptionof the outsider trader term which is halved in effect across the average village.
23
4.2 Indirect Evidence
There are a number of variables that we may intuitively expect to be affected under a system of clientelist
vote trading even though we do not include them in the formal model. We consider those variables here.
Maratha Pradhan
One direct prediction of elite capture is that the caste of the elected village government leader (Pradhan)
is a Maratha. As seen in Table A5 in Appendix A, though Marathas comprise about 40% of the population,
they are significantly over-represented as the Pradhan. We now check the correspondence between this
over-representation and our Maratha variables. Estimates reported in the village level results (Table 2)
confirm that controlling for MPROP , MLD villages are 0.43 more likely to elect a Maratha Pradhan,
this relationship is statistically significant at the 1% level. Again, this effect is over and above that arising
through the mechanical effect of increased Maratha population numbers captured through the coefficient
β2. Moreover, there is a negative and statistically significant coefficient on the interaction term MLD ∗MPROP . Marathas are thus less likely to become pradhan in MLD villages the more Marathas in the
village population. This is a highly surprising result on a priori grounds, but would again be consistent with
clientelist vote trading where the Maratha landlord advantage in sustaining such vote trading derives from
trading network access.
Voter Motivation
We also asked respondents why they voted the way they did in the last election, suggesting a list of
reasons ranging from candidate qualifications, personal characteristics, party affiliation and policies, to
reasons related to a personal connection with the candidate. We construct the variable ‘voted-personal’
equal to one if the household voted for a candidate due to a personal connection rather than due to the
other reasons, which are coded zero.
We break up the sample and report results for ‘voted-personal’ for low caste individuals separately from
Marathas. We would expect the coefficient β1 on MLD to be positive for low caste individuals. Vote trading
should be more likely in MLD villages, and if this is more likely, the probability that low caste individuals
report that they ‘voted-personal’ should be higher. This should not, however, be the case for high castes
(Marathas), as if trading network access is at the heart of the Maratha advantage, this is not a benefit
that can be traded with a Maratha worker in return for vote support. As before, MPROP should have no
effect on ‘voted-personal’ once MLD and the interaction between MLD and MPROP are included in the
regression.[**Insert Table 5**]
The data is again consistent with these predictions; results from an estimation of (12) with ‘voted-
personal’ as the dependent variable are reported in the top two rows of Table 5. The coefficient on ‘voted-
personal’ for low caste individuals, β1(of (12)), is equal to 0.11 (and significant at the 1% level), suggesting
that in a MLD village, with negligible MPROP , lower caste individuals are more likely to report that
they voted based on personal connections to the candidate than in villages where another caste is land
24
dominant.33 The average of this variable is 0.24 so this reflects a 46% increase, or an increase of 25% when
accounting for Maratha population number differences across the two types of village. The coefficient on
MPROP , β2 (of (12)), is not significantly different from zero. No such pattern of response was found for
Marathas, the coefficient β1 for Marathas is negative but not significantly different from zero. The model
interpretation of this is that Maratha landlords do not have a comparative advantage in vote-buying from
Maratha workers, again consistent with trading network access being a key benefit to be traded.
This is corroborated by the sign of the coefficient on β3. The negative and significant sign indicating that
MLD has weaker effects on vote trading from lower castes the larger is MPROP . The larger is MPROP ,
the less important for achieving GP control it is for landlords to ‘buy’ votes from non-Marathas.
Social Capital/Village Cohesion
A natural alternative to the clientelist explanation for the low level of programs in MLD villages could
be that the traditionally dominant Maratha landlords and majority non-Maratha workers are unable to
coordinate on effective governance that would yield a good level of programs. A large literature (an early
prominent example of which is Putnam et. al. 1993) suggests that local governance depends critically on
good grass roots level social cohesion – or social capital. This would suggest that less functionality in local
government arises where Marathas are dominant land holders because of a legacy of mistrust between upper
caste landowners and the poor that persists to the present day.34
We asked a number of questions about trust and social capital. The variable ‘Trust’ is the response
to: “Would you say that the large landholders can be trusted? (1=Almost none, 2=Some; 3=Majority;
4=Almost All). ‘No Cheat’ refers to answering someone from a higher caste is less likely to cheat you
(compared to individuals from other castes or wealth levels). ‘Repair’ is the answer to “If someone from your
village noticed something wrong on your farm they would?” repair it themselves (compared to conditional
answers, such as “alert you if he is from a lower caste”....etc.). Another measure of social capital, suggested
by Robert Putnam, is indicated by voluntary donations on the part of individuals – both time and money.
Accordingly, we include the variables, ‘donated cash’ and ‘donated labour’ , which are dummy variables
equal to one if the household did donate (cash or labour respectively) in the past year to a development
project within the village. ‘Share Water’ is equal to 1 if the household shares a water source with members
of the Maratha caste. We report the answers to these questions for low castes.
If clientelist vote trading is a voluntary quid pro quo, then we may expect this to actually build social
capital, or at least not lower it. Workers willingly reduce access to programs (benefits from the government)
in return for insurance (benefits from patrons). If however this is a consequence of forced landlord hegemony,
33We also ran analogous estimations where we conditioned on being in an unreserved area (so that Marathas are free tostand for election). We then distinguished between whether there is a Maratha Pradhan or not. Interestingly, the sign of thecoefficient β1 is consistent with the model’s predictions only when the outcome of voting is a Maratha pradhan. This coefficientis insignificant if the Pradhan is non-Maratha.
34The recent and growing literature on the historical determinants of social capital (Nunn and Wantchekon 2011, Guiso et.al. 2009 Tabellini 2010, Algan and Cahuc 2010) emphasizes the importance of such historical factors in affecting contemporarysocial capital.
25
then the low castes should be more likely to report ill of their higher caste neighbours. As the sign of β1
from the second panel of Table 5 makes clear, caste relations are clearly no worse, and indeed probably
better, in villages where the dominant land owners are Marathas. Low caste individuals are more likely to
report that large landowners in their village can be trusted, that they are less likely to be cheated by higher
castes and that someone from their village will “repair themselves” damage they notice on the respondent’s
land. Low caste households are also more likely to have donated cash, or labor to village level development
initiatives in the last year if they reside in MLD villages.
The interaction term, β3, again informs the relative importance of the sources of Maratha dominance.
As the trading network explanation suggests, the effects of MLD are mitigated by an increase in MPROP ;
β3 < 0. This result is particularly striking as it suggests that the positive social capital enhancing effect of
MLD is less likely to arise even as MPROP increases. That is, there is a negative effect on social capital
with increased caste coherence between the two economic classes; an a priori surprising finding. Once
again, Maratha trading networks being a key factor in sustaining clientelism would predict this. Increased
MPROP in a MLD village makes trading network access less usable in vote trading. and thus lowers the
probability of clientelist vote trading. If clientelism induces improved social relations between the classes,
this explains the signs on both β1 and β3.
Additional variables of interest, include ‘Agree’ which refers to answering “that most people in the
village would agree on the type of development project the village should have” (compared to differences of
opinions). ‘Target Village’ refers to GP funds should be targeted to village as a whole, compared to poor or
low caste individuals. Similarly ‘Shared Funds’ refers to GP funds are shared across the village compared
to going directly to poor or low caste individuals. ‘Festivals’ is equal to one if there are village funds for
festivals. All of these variables are significantly higher in MLD villages. These results suggest that clients
are not simply acceding to Maratha power in these villages grudgingly. Instead they view the village more
as a collective undertaking, and the GP not as a possible source of redistribution, but as an expression
of this collective will. This is consistent with good social capital in a village not being correlated with
good governance but with its converse; the capture of democratic political structures by the landed elite.
Consistent with Acemoglu and Robinson’s (2008) argument, and the examples discussed in Acemoglu et. al.
(2013), the advent of democratic structures may induce the elite to switch strategies in order to maintain
control. Here this is consistent with their cultivating better social relations with the non-elite (workers) via
insurance provision and would explain the higher social capital in MLD villages.
4.3 Robustness Checks
In Appendix B, we report the results from a number of robustness checks. Tables B1 and B2 exclude all
village controls.35 Tables B3 and B4 also interact all the key village-level variables with MPROP . Tables
B5 and B6 utilize an alternative continuous measure of MLD constructed from household surveys. The
35Though not reported here, the main results are also robust to excluding the household level control variables.
26
main results discussed above all continue to hold.
5 Alternative Interpretations
In line with the theory we have developed, we have used MLD, MPROP , and their interaction to identify
clientelism occurring in a village. We have estimated reduced form relationships between these variables
and a set of outcome variables that our theory predicts will be affected when clientelism arises. The theory
predicts that MLD should make clientelism more likely, that MPROP has no independent effect on it,
and that the sign of the interaction term indicates which one of two prominent explanations for Maratha
political hegemony is most important. The two predictions almost always hold for all dependent variables,
and the implication from the interaction term consistently favours Maratha trading networks as a key source
of Maratha political dominance.
As discussed, interpreting the evidence this way depends on the outcome variables we have reported not
themselves being directly affected by either MLD or MPROP . In Section 2.2, we pointed to some main
threats to our exclusion restrictions, we now further assess these.
Mismeasured Land Productivity
One threat we have already discussed is through a potential correlation between village productivity and
Maratha prevalence - quite conceivably Marathas, as the dominant caste, expropriated the highest quality
lands for themselves. We do not find any significant differences on observable dimensions of soil quality and
the geographic and climatic cultivatability of land across MLD and non-MLD villages. However, if these
are inadequately controlled for and either of our Maratha variables are correlated with land productivity
then the interpretation of the coefficients we have forwarded above is not correct. It it impossible to measure
this directly, but we will now argue that the sign of our results suggest that even if there is some direct
effect of our Maratha variables on land quality, and we have not picked it up with our controls, this cannot
explain the findings we have presented.
If MLD is positively correlated with an unobserved land quality dimension then consider our specifi-
cations with log yields, log profits and wages as dependent variables. For any one of these, then the true
relationship between the dependent variable and the co-variates includes, in addition to the effects of our
clientelism channel (measured through the β variables as before) a direct effect (denoted α1 and α2 below):
Yik = β0 + β1MLDk + β2MPROPk + β3MLDk ·MPROPk +ψZik + γZk + α1MLDk + α2MPROPk + εik
Thus the estimated coefficient on MLD includes β1 interpretable through the model and α1 via direct
effects of land quality (similarly for MPROP ). Consider how such mismeasurement would tend to bias these
dependent variables. For yields and profits the bias introduced by mismeasured land quality, correlated with
either of our Maratha variables, makes α1 and α2 > 0. This biases upwards our estimates of β1 and β2 and
indeed could explain the positive coefficient that we reported on MLD in the middle panel of Table 4. But
27
another implication of such mismeasurement of productivity would also be higher wages. Similarly, this
would imply that MLD in the top panel of Table 4 where wages are the dependent variable are also upward
biased. Here, however, we find a strong and significant negative coefficient on MLD. Mismeasured land
productivity correlated with MLD would then suggest a true effect operating through our model larger
than that reflected in the coefficient on β1. Mismeasured land productivity cannot consistently account for
the full pattern of results. To the extent that it explains some part of the coefficient on log profits and
yields, it makes the negative coefficient on wages from MLD even harder to understand. Further, such
mismeasurement provides no clear implication for the sign of the interaction term. It is positive for wages
and strongly negative for log profits and yields. MLD villages having higher unmeasured productivity could
not explain an interaction term that always enters in the opposite direction to the effect of MLD.
With respect to the other dependent variables – insurance, social capital and Maratha traders – there are
simply no obvious implications of mismeasured land productivity in MLD villages. One may hypothesize
that mismeasurement could perhaps rationalize insurance and social capital being higher in MLD villages
– a wealth effect could perhaps be at play – but it would not be possible to explain why such insurance or
social capital would be mitigated by increasing MPROP , as implied by the sign of the interaction term.
Moreover, this channel seems inconsistent with any systematic pattern of Maratha trader access.
Direct Maratha Power
Another threat to the exclusion restriction may arise through the power of Maratha landlords and population
numbers making the village more effective in receiving state level support. In a direct form, this is entirely
inconsistent with the data. Marathas’ traditional positions of prominence and power in state organizations
should lead them to be favoured in receipt of programs, the EGS, and have greater GP budgets. We find
the opposite for all of these, and a zero coefficient on MPROP . Again, predictions that are expected with
the clientelism channels of the model.
A more subtle variant of such a channel arises if Maratha landlords are able to use their power to get
what they want from the state – i.e., as we have argued, reduce programs. This could then lead to knock
on effects consistent with our model, and as observed in the data; higher yields, profits and lower wages in
MLD villages. Extending this story further, where Maratha workers are numerous, the capacity of Maratha
landlords to exert their power and block programs from the centre is mitigated. So the interaction term on
MPROP for programs is positive and the knock-on effect is similarly to mitigate higher profits/yields and
the lower wages in MLD villages.
The difference between this explanation and one based on the quid pro quo of clientelism that we have
explored comes from other elements of the posited vote trading. Since clients are not forced by their patrons,
but must be coopted, landlords must “pay” workers for their political support. As predicted by the clientelist
story then, workers in such villages should report greater insurance provision from landlords – something
we would not see if landlords are able to force policy reduction on their own. We also see greater access
to Maratha trading networks, again consistent with clientelism, and not something that would arise were it
28
simply the case that Maratha landlords are able to get their way. Such an explanation would also be unable
to account for the higher social capital we see in MLD villages – especially that reported from low castes
to Marathas – if the Maratha landlords are merely forcing the policies that they want. In contrast, with
the clientelism explanation, social capital is higher because the workers are in a voluntary agreement with
the landlords. They obtain fewer programs due to their support, but receive valuable insurance instead. A
further implication of this alternative explanation can be checked through our household surveys. In these
we also asked individuals to report their approval of the GP’s personnel and behavior. If Maratha landlords
are forcing the policies they want, then workers should report lower approval of the GP and its personnel
in such villages. In contrast, under clientelism, workers understand the price they pay for their personal
benefits is landlord control of the GP, so they will not report dissatisfaction with the activities of the GP
and more so than in villages without clientelism. The latter is what we find. Table B7 in Appendix B
reports that the landless are not significantly more dissatisfied in MLD villages with regards to the quality
and performance of the GP. In particular, they do not report significantly more dissatisfaction with regards
to honesty and fairness, qualifications, providing public goods, allocating funds fairly, not discriminating
across villagers, obtaining upper level government funds, and solving village disputes. Even though, as we
have shown, programs are lower, the EGS is less frequent, and village level expenditures are diminished.
Overall, it is not possible to definitively rule out that mismeasurement of land productivity or other
factors of the village correlated with its Maratha variables – such as Maratha influence at higher government
levels – could be biasing some of the estimates we report for some of the dependent variables. However,
it is extremely unlikely that such channels of omitted influence could either explain the patterns that we
have documented in the data, or not lead to inconsistencies on numerous other dimensions of the data. In
contrast, the patterns in the data are consistent with the channels of the postulated clientelism model, and
consistent with Maratha trading networks providing a key underpinning of Maratha landlord power. The
model can also explain the reported reasons for voting, the provision of insurance, and the inferred levels of
social capital.
However, we emphasize again that the test of the model we provide here is indirect. We do not observe
vote trading directly, nor do we observe the provision of benefits directly in return for an individual’s vote.
It is thus impossible to rule out alternative explanations of the empirical regularities we had documented,
perhaps due to omitted factors that we have not considered. Alternatively, a combination of the factors that
we have argued are insufficient to explain the results on their own could also conceivably be behind these
patterns.
6 Conclusions
An extensive data collection exercise in the Indian state of Maharasthra has allowed us to study the perfor-
mance of local democracies there. We conclude that local governments – though elected through a process
29
that is fully consistent with a vibrant democracy – do not act to benefit the poor majority that elects them.
We have argued that government behavior, wages, profits, yields, the patterns of help in contingencies and
trading network access observed across these villages all line up as predicted by clientelist vote-trading
between large landowners who are buyers of votes, and workers who are selling them.
Our analysis makes an unambiguous conclusion about the welfare implications of vote trading. It is bad
for the majority worker group taken as a whole. But we take this conclusion with some caution as it rests on
modeling assumptions that, though defensible, cannot be definitively proved from our data. Two aspects are
important. Firstly, we have assumed that all of the surplus generated by vote trading goes to the landlords
as they are able to make take-it-or-leave-it offers to workers. The offers thus make workers just indifferent
to the clientelist vote trading and hence no better off than if they were to control the GP themselves. That
landlords should hold such control over surplus division is certainly consistent with a degree of monopsony
power, with many other studies, both in Maharashtra and in other agrarian contexts (Padhi 2007) but not
an assumption that we can directly prove. A second assumption makes workers as a whole worse off even
while the vote-trading subset are not. This derives from our modeling of the local democratic process where
it was posited that landlord control of the GP necessitated a mere half of the village’s workers to vote in
support of their candidate. So the vote-trading half is no worse off – they receive insurance and trading
network access in return for their political support which costs them lower wages and reduced programs.
But the remaining half – whose support is superfluous – just suffer the lower wages and programs. Perhaps,
in some villages, workers as a whole can stand together against such divided support. In that case, a simple
majoritarian calculus – where 50% of votes buys control – understates the degree to which landlords must
extend benefits to workers across the village. Though there is no organized labor in our villages, and almost
no organized worker political movements, there may still be informal coalitions amongst workers able to
hold out for both better conditions in the vote trade, and for the broader extension of benefits that we
cannot observe. To the extent these are present, such welfare implications will be mitigated, and perhaps
even overturned. This appears unlikely, but is impossible to rule out.36
Persisting with a negative welfare implication, the results here nod toward policy that removes pro-
poor policy discretion to a higher level of government that may not be so easily captured by local landed
interests. It also suggests, more generally, that progressive policies designed to improve welfare are less likely
to spread if a single cohesive group dominates access to key economic opportunities such as insurance or labor
markets. Again, administering benefits from higher levels of government should weaken the cohesiveness of
such blocking agents – it is easier for landlords in a village rather than a coalition spanning a larger region
36Since clientelism reduces resources flowing in to the village, it is also possible to imagine a welfare improving Coasianbargain between workers and landlords acting as cohesive groups. In it, landlords would agree to allow programs in, whichinject resources to the village but also raise wages. In return, workers would agree to share some of these benefits with landlords.In reality, such a scheme is unworkable due to standard commitment problems. It would not be possible for workers to agree totransfer benefits to landlords ex post, after the programs are implemented. Workers would be unable to resolve this by makingex ante transfers as they are likely to be liquidity constrained. Perhaps more importantly, such a bargain would require solvinga large collective action problem.
30
to agree on a course of action. A national level program directly targeting beneficiaries is currently being
trialed in India – the Unique Identification Project (commonly referred to as UID). The benefits of this
cannot be bartered for votes locally, and should benefit all workers. Which, given the overwhelmingly poor
nature of our worker sample, should also lead to declines in measured poverty too.
Taking local interests as given and immovable, the analysis suggests that policies uniformly beneficial in
their distributional impacts should be preferred. It may be necessary to trade off the magnitude of benefits
to the poor in order to coopt landlords in to accepting such policies. For instance, many of the policies here
would raise worker wages without benefiting landlords. But policies that benefited landlords as well, even
if these had lower effects on wages – such as private well construction projects – may be preferable as they
would be more likely to pass through with elite support.
31
References
[1] Acemoglu, Daron, Simon Johnson, and James A. Robinson (2001) “The Colonial Origins of ComparativeDevelopment: An Empirical Investigation” American Economic Review, 91(5), 1369–1401.
[2] Acemoglu, Daron, Tristan Reed, and James A. Robinson (2013) “Chiefs: Elite control of civic societyand economic development in Sierra Leone” Journal of Political Economy, forthcoming.
[3] Acemoglu, Daron and James A. Robinson (2008) “Persistence of Power, Elites, and Institutions” Amer-ican Economic Review, 98(1), 267-293.
[4] Acemoglu, Daron, Suresh Naidu, Pascual Restrepo and James A. Robinson (2013) “Democracy Redis-tribution and Inequality” NBER Working Paper 19746.
[5] Algan, Yann and Pierre Cahuc (2010) “Inherited Trust and Growth” American Economic Review,100(5), 2060-92.
[6] Baland, Jean-Marie and James A. Robinson (2008) “Land and power: Theory and Evidence fromChile” American Economic Review, 98(5), 1737-1765.
[7] Banerjee, Abhijit and Rohini Pande (2007) “Parochial Politics: Ethnic Preferences and Politician Cor-ruption”. BREAD Working Paper No. 152.
[8] Bardhan Pranab K. and Dilip Mookherjee (2000). “Capture and Governance at Local and NationalLevels,” American Economic Review, 90(2), 135-139. .
[9] Bardhan, Pranab and Dilip Mookherjee (2005). “Decentralizing antipoverty program delivery in devel-oping countries,” Journal of Public Economics, Elsevier, 89(4), 675-704.
[10] Bardhan, Pranab and Dilip Mookherjee, (2006) “Pro-poor targeting and accountability of local gov-ernments in West Bengal” Journal of Development Economics, 79, 303-327.
[11] Bardhan Pranab K. & Dilip Mookherjee (2011). “Political Clientelism-cum-Capture: Theory and evi-dence from West Bengal,” Working Paper, Institute for Economic Development, Boston University.
[12] Besley, Timothy, Rohini Pande, and Vijayendra Rao (2012) “Just Rewards? Local Politics and PublicResource Allocation in South India” World Bank Economic Review, 26(2), 191-216.
[13] Cameron, C. A., J. Gelbach, and D. Miller (2011) “Robust inference with multi-way clustering”. Journalof Business and Economic Statistics, 28(2), 238-249.
[14] Carter, Anthony T. (1974) Elite Politics on Rural India: Political Stratification and Political Alliancesin Western Maharashtra. Cambridge University Press, Cambridge.
[15] Chattopadhyay, Raghabendra and Esther Duflo (2004) “Women as policy makers: Evidence from aRandomized Policy Experiment in India” Econometrica, 72 (1409-1443).
[16] Chandra, Kanchan, (2004) Why Ethnic Parties Succeed: Patronage and Ethnic Headcounts in India.Cambridge: Cambridge University Press.
[17] Deshpande, Rajeshwari (2004) “Kunbi Maratha as OBC: Backward Journey of a Caste” Economic andPolitical Weekly, 39(14/15), April 3-16, 1448-1449.
32
[18] Finan, Frederico and Laura Schechter (2012)“Vote-buying and reciprocity” Econometrica, 80(2), 863-882.
[19] Guiso, Luigi, Paola Sapienza, and Luigi Zingales (2009). “Cultural Biases in Economic Exchange?”Quarterly Journal of Economics, 124(3), 1095-1131.
[20] Hoff, Karla, Kshetramade, Mayur and Fehr, Ernst (2012) “Caste and Punishment: The Legacy of CasteCulture in Norm Enforcement,” Economic Journal, 121: F449-F475.
[21] Kitschelt, H. and S. Wilkinson (2007) Patrons, clients and policies: Patterns of democratic account-ability and political competition. Cambridge: Cambridge University Press.
[22] Kling, J. R., J.B. Leibman, L. F. Katz, and L. Sanbonmatsu (2004) “Moving to opportunity andtranquility: Neighborhood effects on adult economic self-sufficiency and health from a randomizedhousing voucher experiment” Working Paper 481, Industrial Relations Section, Princeton University.
[23] Lele, Jayant (1981) Elite Pluralism and Class Rule: Political Development in Maharashtra India. NewYork.
[24] Mandavdhare, Surendra (1989) Caste and Land Relations in India: A Study of Marathwada, New Delhi:Uppal Publishing House.
[25] Munshi, Kaivan. and Mark Rosenzweig. 2008.“The Efficacy of Parochial Politics: Caste, Commitment,and Competence in Indian Local Governments.” BREAD Working Paper No. 182..
[26] Nunn, Nathan and Leonard Wantchekon (2011) “The Slave Trade and the Origins of Mistrust in Africa,”American Economic Review, 101(7), 3221-52.
[27] Padhi, Kulamani (2007) “Agricultural Labour in India - A Close Look” Orissa Review, February-March,23-28.
[28] Palshikar, Suhas (2007) Politics of Maharashtra: Local Context of the Political Process, PratimaPrasashan, Pune.
[29] Palshikar, Suhas, and Rajeshwari Deshpande (1999) “Electoral Competition and Structures of Domi-nation in Maharashtra” Economic and Political Weekly, 34 (34/35), 2409-2422.
[30] Putnam, Robert, Robert Leonardi and Raffaella Y. Nanetti (1993) Making Democracy Work: CivicTraditions in Modern Italy, Princeton University Press.
[31] Ravallion, Martin, Gaurav Datt, and Shubham Chaudhuri (1991) “Higher wages for relief work can makemany of the poor worse off: Recent evidence from Maharashtra’s Employment Guarantee Scheme”,Policy Research Working Paper Series 587, The World Bank.
[32] Robinson, James. A. and Thierry Verdier (2013) “The political economy of clientelism” ScandinavianJournal of Economics, forthcoming.
[33] Rosenthal, Donald B. (1977) The Expansive Elite: District Politics and State Policy-Making in India.University of California Press, Berkeley.
[34] Scott, James (1979) The Moral Economy of the Peasant: Rebellion and Subsistence in Southeast Asia,Yale University Press.
33
[35] Sirsikar, V. M. (1970) The Rural Elite in a Developing Society: A Study in Political Sociology. NewDelhi.
[36] Subramanian, Narendra (1999) Ethnicity and Populist Mobilization: Political Parties, Citizens andDemocracy in South India. Delhi: Oxford University Press
[37] Tabellini, Guido (2010) “Culture and Institutions: Economic Development in the Regions of Europe”Journal of the European Economic Association, 8(4), 677-716.
[38] Vicente, Pedro and Leonard Wantchekon (2009) “Clientelism and vote buying: Lessons from fieldexperiments in west Africa” Oxford Review of Economic Policy, 25(2), 292-205.
[39] Vora, Rajendra (1996) “Shift in Power from Rural to Urban Sector” Economic and Political Weekly,January, 13-20.
[40] Wantchekon, Leonard (2003) “Clientelism and voting behavior: Evidence from a field experiment inBenin” World Politics, 55(3), 399-422.
[41] Wantchekon, Leonard and Thomas Fujiwara (2014) “Can informed public deliberation overcome clien-telism? Experimental evidence from Benin” American Economic Journal: Applied Economics, forth-coming.
34
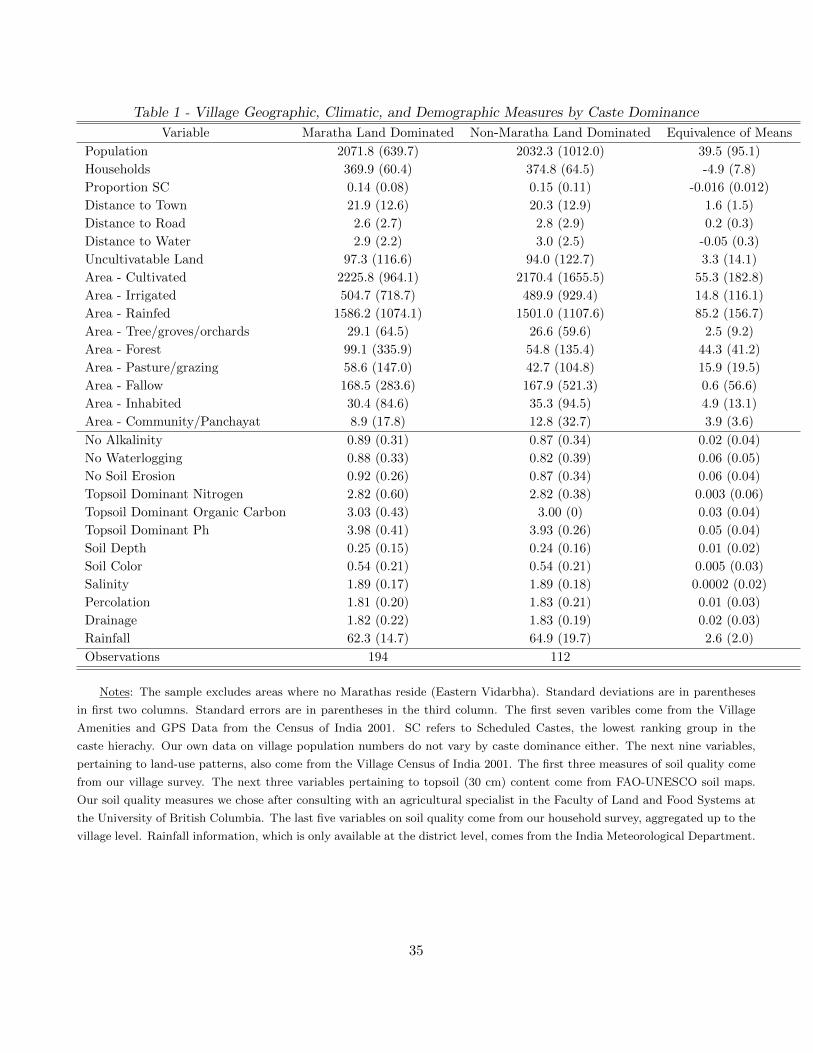
Table 1 - Village Geographic, Climatic, and Demographic Measures by Caste Dominance
Variable Maratha Land Dominated Non-Maratha Land Dominated Equivalence of Means
Population 2071.8 (639.7) 2032.3 (1012.0) 39.5 (95.1)
Households 369.9 (60.4) 374.8 (64.5) -4.9 (7.8)
Proportion SC 0.14 (0.08) 0.15 (0.11) -0.016 (0.012)
Distance to Town 21.9 (12.6) 20.3 (12.9) 1.6 (1.5)
Distance to Road 2.6 (2.7) 2.8 (2.9) 0.2 (0.3)
Distance to Water 2.9 (2.2) 3.0 (2.5) -0.05 (0.3)
Uncultivatable Land 97.3 (116.6) 94.0 (122.7) 3.3 (14.1)
Area - Cultivated 2225.8 (964.1) 2170.4 (1655.5) 55.3 (182.8)
Area - Irrigated 504.7 (718.7) 489.9 (929.4) 14.8 (116.1)
Area - Rainfed 1586.2 (1074.1) 1501.0 (1107.6) 85.2 (156.7)
Area - Tree/groves/orchards 29.1 (64.5) 26.6 (59.6) 2.5 (9.2)
Area - Forest 99.1 (335.9) 54.8 (135.4) 44.3 (41.2)
Area - Pasture/grazing 58.6 (147.0) 42.7 (104.8) 15.9 (19.5)
Area - Fallow 168.5 (283.6) 167.9 (521.3) 0.6 (56.6)
Area - Inhabited 30.4 (84.6) 35.3 (94.5) 4.9 (13.1)
Area - Community/Panchayat 8.9 (17.8) 12.8 (32.7) 3.9 (3.6)
No Alkalinity 0.89 (0.31) 0.87 (0.34) 0.02 (0.04)
No Waterlogging 0.88 (0.33) 0.82 (0.39) 0.06 (0.05)
No Soil Erosion 0.92 (0.26) 0.87 (0.34) 0.06 (0.04)
Topsoil Dominant Nitrogen 2.82 (0.60) 2.82 (0.38) 0.003 (0.06)
Topsoil Dominant Organic Carbon 3.03 (0.43) 3.00 (0) 0.03 (0.04)
Topsoil Dominant Ph 3.98 (0.41) 3.93 (0.26) 0.05 (0.04)
Soil Depth 0.25 (0.15) 0.24 (0.16) 0.01 (0.02)
Soil Color 0.54 (0.21) 0.54 (0.21) 0.005 (0.03)
Salinity 1.89 (0.17) 1.89 (0.18) 0.0002 (0.02)
Percolation 1.81 (0.20) 1.83 (0.21) 0.01 (0.03)
Drainage 1.82 (0.22) 1.83 (0.19) 0.02 (0.03)
Rainfall 62.3 (14.7) 64.9 (19.7) 2.6 (2.0)
Observations 194 112
Notes: The sample excludes areas where no Marathas reside (Eastern Vidarbha). Standard deviations are in parentheses
in first two columns. Standard errors are in parentheses in the third column. The first seven varibles come from the Village
Amenities and GPS Data from the Census of India 2001. SC refers to Scheduled Castes, the lowest ranking group in the
caste hierachy. Our own data on village population numbers do not vary by caste dominance either. The next nine variables,
pertaining to land-use patterns, also come from the Village Census of India 2001. The first three measures of soil quality come
from our village survey. The next three variables pertaining to topsoil (30 cm) content come from FAO-UNESCO soil maps.
Our soil quality measures we chose after consulting with an agricultural specialist in the Faculty of Land and Food Systems at
the University of British Columbia. The last five variables on soil quality come from our household survey, aggregated up to the
village level. Rainfall information, which is only available at the district level, comes from the India Meteorological Department.
35
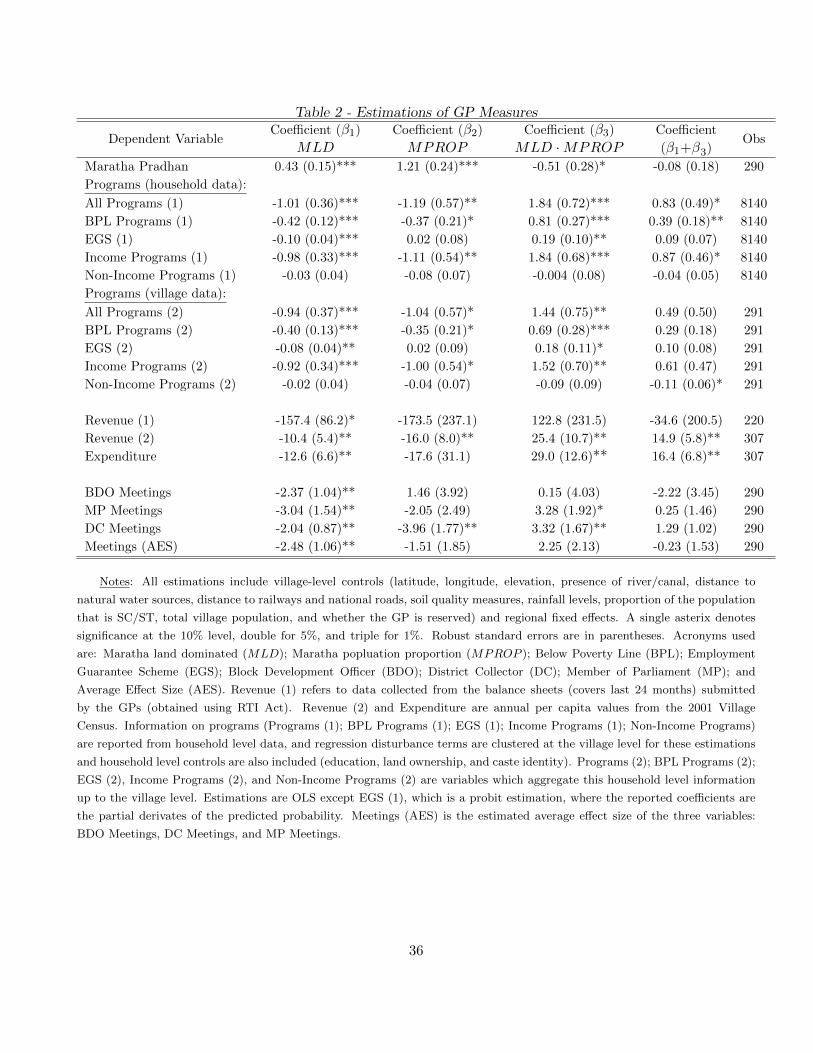
Table 2 - Estimations of GP Measures
Dependent VariableCoefficient (β1)
MLDCoefficient (β2)
MPROPCoefficient (β3)
MLD ·MPROPCoefficient
(β1+β3)Obs
Maratha Pradhan 0.43 (0.15)*** 1.21 (0.24)*** -0.51 (0.28)* -0.08 (0.18) 290
Programs (household data):
All Programs (1) -1.01 (0.36)*** -1.19 (0.57)** 1.84 (0.72)*** 0.83 (0.49)* 8140
BPL Programs (1) -0.42 (0.12)*** -0.37 (0.21)* 0.81 (0.27)*** 0.39 (0.18)** 8140
EGS (1) -0.10 (0.04)*** 0.02 (0.08) 0.19 (0.10)** 0.09 (0.07) 8140
Income Programs (1) -0.98 (0.33)*** -1.11 (0.54)** 1.84 (0.68)*** 0.87 (0.46)* 8140
Non-Income Programs (1) -0.03 (0.04) -0.08 (0.07) -0.004 (0.08) -0.04 (0.05) 8140
Programs (village data):
All Programs (2) -0.94 (0.37)*** -1.04 (0.57)* 1.44 (0.75)** 0.49 (0.50) 291
BPL Programs (2) -0.40 (0.13)*** -0.35 (0.21)* 0.69 (0.28)*** 0.29 (0.18) 291
EGS (2) -0.08 (0.04)** 0.02 (0.09) 0.18 (0.11)* 0.10 (0.08) 291
Income Programs (2) -0.92 (0.34)*** -1.00 (0.54)* 1.52 (0.70)** 0.61 (0.47) 291
Non-Income Programs (2) -0.02 (0.04) -0.04 (0.07) -0.09 (0.09) -0.11 (0.06)* 291
Revenue (1) -157.4 (86.2)* -173.5 (237.1) 122.8 (231.5) -34.6 (200.5) 220
Revenue (2) -10.4 (5.4)** -16.0 (8.0)** 25.4 (10.7)** 14.9 (5.8)** 307
Expenditure -12.6 (6.6)** -17.6 (31.1) 29.0 (12.6)** 16.4 (6.8)** 307
BDO Meetings -2.37 (1.04)** 1.46 (3.92) 0.15 (4.03) -2.22 (3.45) 290
MP Meetings -3.04 (1.54)** -2.05 (2.49) 3.28 (1.92)* 0.25 (1.46) 290
DC Meetings -2.04 (0.87)** -3.96 (1.77)** 3.32 (1.67)** 1.29 (1.02) 290
Meetings (AES) -2.48 (1.06)** -1.51 (1.85) 2.25 (2.13) -0.23 (1.53) 290
Notes: All estimations include village-level controls (latitude, longitude, elevation, presence of river/canal, distance to
natural water sources, distance to railways and national roads, soil quality measures, rainfall levels, proportion of the population
that is SC/ST, total village population, and whether the GP is reserved) and regional fixed effects. A single asterix denotes
significance at the 10% level, double for 5%, and triple for 1%. Robust standard errors are in parentheses. Acronyms used
are: Maratha land dominated (MLD); Maratha popluation proportion (MPROP ); Below Poverty Line (BPL); Employment
Guarantee Scheme (EGS); Block Development Officer (BDO); District Collector (DC); Member of Parliament (MP); and
Average Effect Size (AES). Revenue (1) refers to data collected from the balance sheets (covers last 24 months) submitted
by the GPs (obtained using RTI Act). Revenue (2) and Expenditure are annual per capita values from the 2001 Village
Census. Information on programs (Programs (1); BPL Programs (1); EGS (1); Income Programs (1); Non-Income Programs)
are reported from household level data, and regression disturbance terms are clustered at the village level for these estimations
and household level controls are also included (education, land ownership, and caste identity). Programs (2); BPL Programs (2);
EGS (2), Income Programs (2), and Non-Income Programs (2) are variables which aggregate this household level information
up to the village level. Estimations are OLS except EGS (1), which is a probit estimation, where the reported coefficients are
the partial derivates of the predicted probability. Meetings (AES) is the estimated average effect size of the three variables:
BDO Meetings, DC Meetings, and MP Meetings.
36
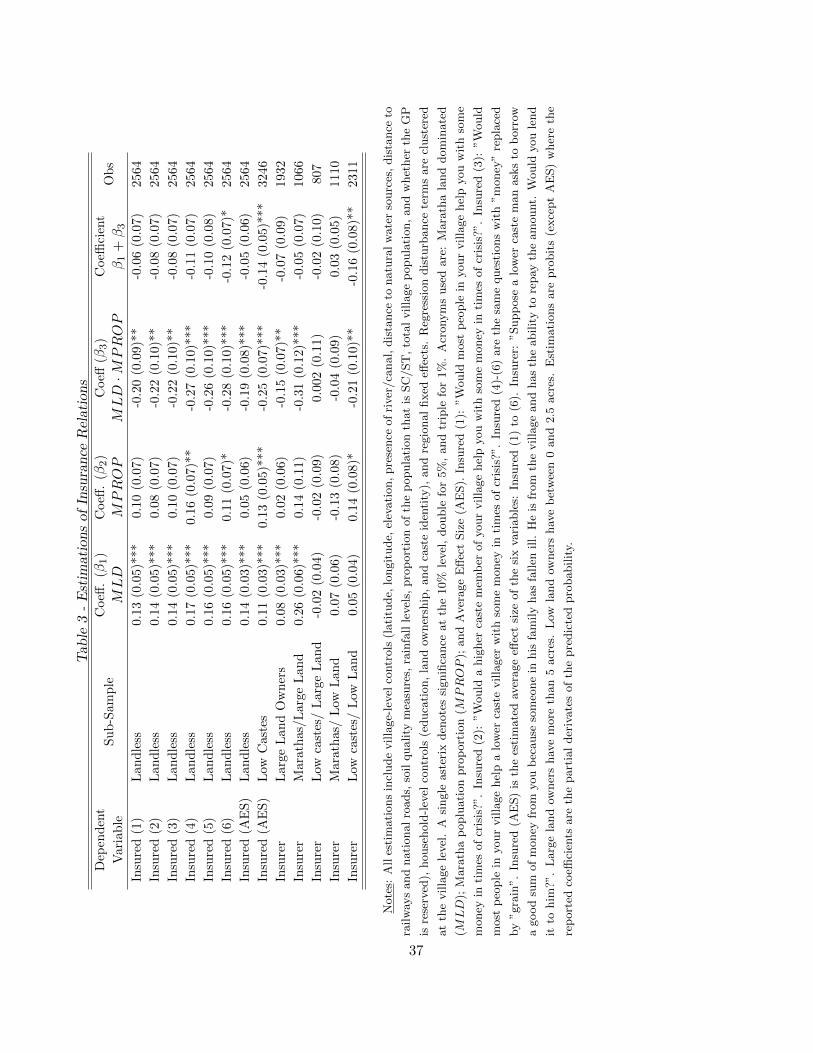
Tab
le3
-Estim
ationsof
Insurance
Relations
Dep
end
ent
Var
iab
leS
ub
-Sam
ple
Coeff
.(β
1)
MLD
Coeff
.(β
2)
MPROP
Coeff
(β3)
MLD·M
PROP
Coeffi
cien
t
β1
+β3
Ob
s
Insu
red
(1)
Lan
dle
ss0.1
3(0
.05)*
**
0.1
0(0
.07)
-0.2
0(0
.09)*
*-0
.06
(0.0
7)
2564
Insu
red
(2)
Lan
dle
ss0.1
4(0
.05)*
**
0.0
8(0
.07)
-0.2
2(0
.10)*
*-0
.08
(0.0
7)
2564
Insu
red
(3)
Lan
dle
ss0.1
4(0
.05)*
**
0.1
0(0
.07)
-0.2
2(0
.10)*
*-0
.08
(0.0
7)
2564
Insu
red
(4)
Lan
dle
ss0.1
7(0
.05)*
**
0.1
6(0
.07)*
*-0
.27
(0.1
0)*
**
-0.1
1(0
.07)
2564
Insu
red
(5)
Lan
dle
ss0.1
6(0
.05)*
**
0.0
9(0
.07)
-0.2
6(0
.10)*
**
-0.1
0(0
.08)
2564
Insu
red
(6)
Lan
dle
ss0.1
6(0
.05)*
**
0.1
1(0
.07)*
-0.2
8(0
.10)*
**
-0.1
2(0
.07)*
2564
Insu
red
(AE
S)
Lan
dle
ss0.1
4(0
.03)*
**
0.0
5(0
.06)
-0.1
9(0
.08)*
**
-0.0
5(0
.06)
2564
Insu
red
(AE
S)
Low
Cas
tes
0.1
1(0
.03)*
**
0.1
3(0
.05)*
**
-0.2
5(0
.07)*
**
-0.1
4(0
.05)*
**
3246
Insu
rer
Lar
geL
and
Ow
ner
s0.0
8(0
.03)*
**
0.0
2(0
.06)
-0.1
5(0
.07)*
*-0
.07
(0.0
9)
1932
Insu
rer
Mar
ath
as/L
arge
Lan
d0.2
6(0
.06)*
**
0.1
4(0
.11)
-0.3
1(0
.12)*
**
-0.0
5(0
.07)
1066
Insu
rer
Low
cast
es/
Lar
geL
and
-0.0
2(0
.04)
-0.0
2(0
.09)
0.0
02
(0.1
1)
-0.0
2(0
.10)
807
Insu
rer
Mar
ath
as/
Low
Lan
d0.0
7(0
.06)
-0.1
3(0
.08)
-0.0
4(0
.09)
0.0
3(0
.05)
1110
Insu
rer
Low
cast
es/
Low
Lan
d0.0
5(0
.04)
0.1
4(0
.08)*
-0.2
1(0
.10)*
*-0
.16
(0.0
8)*
*2311
Note
s:A
lles
tim
ati
ons
incl
ude
villa
ge-
level
contr
ols
(lati
tude,
longit
ude,
elev
ati
on,
pre
sence
of
river
/ca
nal,
dis
tance
tonatu
ral
wate
rso
urc
es,
dis
tance
to
railw
ays
and
nati
onal
roads,
soil
quality
mea
sure
s,ra
infa
llle
vel
s,pro
port
ion
of
the
popula
tion
that
isSC
/ST
,to
tal
villa
ge
popula
tion,
and
whet
her
the
GP
isre
serv
ed),
house
hold
-lev
elco
ntr
ols
(educa
tion,
land
owner
ship
,and
cast
eid
enti
ty),
and
regio
nal
fixed
effec
ts.
Reg
ress
ion
dis
turb
ance
term
sare
clust
ered
at
the
villa
ge
level
.A
single
ast
erix
den
ote
ssi
gnifi
cance
at
the
10%
level
,double
for
5%
,and
trip
lefo
r1%
.A
cronym
suse
dare
:M
ara
tha
land
dom
inate
d
(MLD
);M
ara
tha
poplu
ati
on
pro
port
ion
(MPROP
);and
Aver
age
Eff
ect
Siz
e(A
ES).
Insu
red
(1):
”W
ould
most
peo
ple
inyour
villa
ge
hel
pyou
wit
hso
me
money
inti
mes
of
cris
is?”
.In
sure
d(2
):”W
ould
ahig
her
cast
em
emb
erof
your
villa
ge
hel
pyou
wit
hso
me
money
inti
mes
of
cris
is?”
.In
sure
d(3
):”W
ould
most
peo
ple
inyour
villa
ge
hel
pa
low
erca
ste
villa
ger
wit
hso
me
money
inti
mes
of
cris
is?”
.In
sure
d(4
)-(6
)are
the
sam
eques
tions
wit
h”m
oney
”re
pla
ced
by
”gra
in”.
Insu
red
(AE
S)
isth
ees
tim
ate
dav
erage
effec
tsi
zeof
the
six
vari
able
s:In
sure
d(1
)to
(6).
Insu
rer:
”Supp
ose
alo
wer
cast
em
an
ask
sto
borr
ow
agood
sum
of
money
from
you
bec
ause
som
eone
inhis
fam
ily
has
fallen
ill.
He
isfr
om
the
villa
ge
and
has
the
abilit
yto
repay
the
am
ount.
Would
you
lend
itto
him
?”.
Larg
ela
nd
owner
shav
em
ore
than
5acr
es.
Low
land
owner
shav
eb
etw
een
0and
2.5
acr
es.
Est
imati
ons
are
pro
bit
s(e
xce
pt
AE
S)
wher
eth
e
rep
ort
edco
effici
ents
are
the
part
ial
der
ivate
sof
the
pre
dic
ted
pro
babilit
y.
37
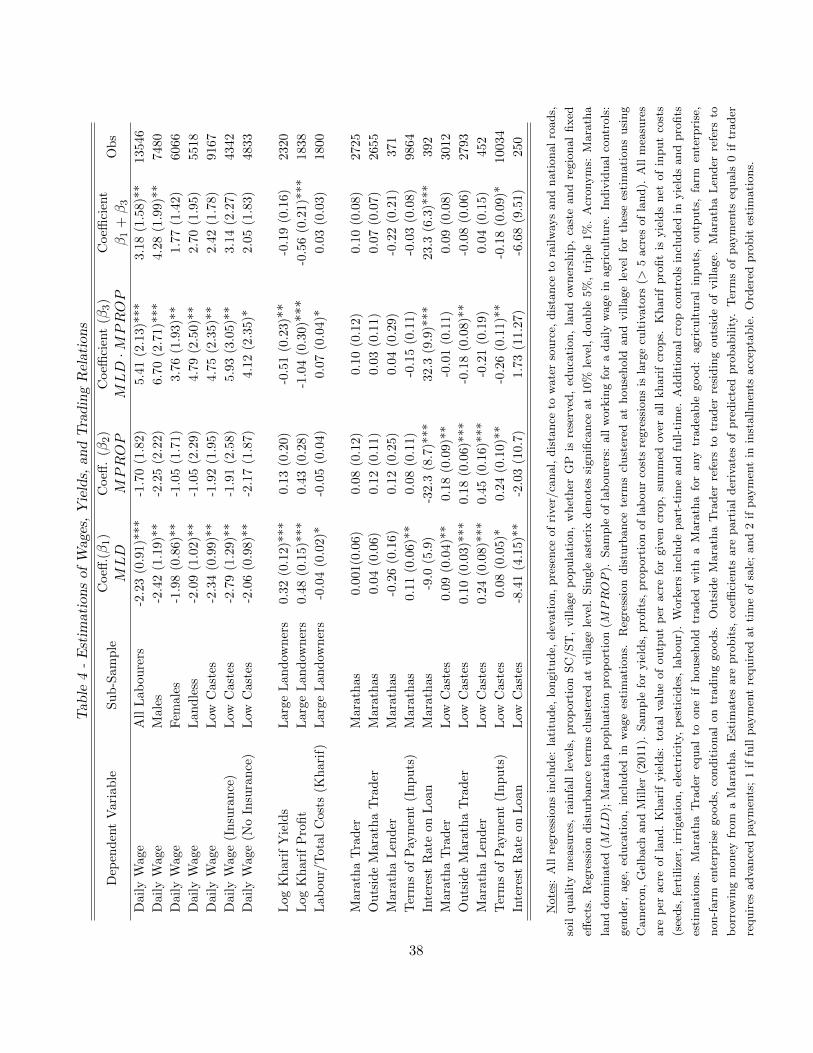
Tab
le4
-Estim
ationsof
Wag
es,Yields,
andTradingRelations
Dep
end
ent
Var
iab
leS
ub
-Sam
ple
Coeff
.(β1)
MLD
Coeff
.(β
2)
MPROP
Coeffi
cien
t(β
3)
MLD·M
PROP
Coeffi
cien
t
β1
+β3
Ob
s
Dai
lyW
age
All
Lab
ou
rers
-2.2
3(0
.91)*
**
-1.7
0(1
.82)
5.4
1(2
.13)*
**
3.1
8(1
.58)*
*13546
Dai
lyW
age
Mal
es-2
.42
(1.1
9)*
*-2
.25
(2.2
2)
6.7
0(2
.71)*
**
4.2
8(1
.99)*
*7480
Dai
lyW
age
Fem
ales
-1.9
8(0
.86)*
*-1
.05
(1.7
1)
3.7
6(1
.93)*
*1.7
7(1
.42)
6066
Dai
lyW
age
Lan
dle
ss-2
.09
(1.0
2)*
*-1
.05
(2.2
9)
4.7
9(2
.50)*
*2.7
0(1
.95)
5518
Dai
lyW
age
Low
Cas
tes
-2.3
4(0
.99)*
*-1
.92
(1.9
5)
4.7
5(2
.35)*
*2.4
2(1
.78)
9167
Dai
lyW
age
(In
sura
nce
)L
owC
aste
s-2
.79
(1.2
9)*
*-1
.91
(2.5
8)
5.9
3(3
.05)*
*3.1
4(2
.27)
4342
Dai
lyW
age
(No
Insu
ran
ce)
Low
Cas
tes
-2.0
6(0
.98)*
*-2
.17
(1.8
7)
4.1
2(2
.35)*
2.0
5(1
.83)
4833
Log
Kh
arif
Yie
lds
Lar
geL
and
own
ers
0.3
2(0
.12)*
**
0.1
3(0
.20)
-0.5
1(0
.23)*
*-0
.19
(0.1
6)
2320
Log
Kh
arif
Pro
fit
Lar
geL
and
own
ers
0.4
8(0
.15)*
**
0.4
3(0
.28)
-1.0
4(0
.30)*
**
-0.5
6(0
.21)*
**
1838
Lab
our/
Tot
alC
osts
(Kh
arif
)L
arge
Lan
dow
ner
s-0
.04
(0.0
2)*
-0.0
5(0
.04)
0.07
(0.0
4)*
0.0
3(0
.03)
1800
Mar
ath
aT
rad
erM
arat
has
0.0
01(0
.06)
0.0
8(0
.12)
0.10
(0.1
2)
0.1
0(0
.08)
2725
Ou
tsid
eM
arat
ha
Tra
der
Mar
ath
as
0.0
4(0
.06)
0.1
2(0
.11)
0.03
(0.1
1)
0.0
7(0
.07)
2655
Mar
ath
aL
end
erM
arat
has
-0.2
6(0
.16)
0.1
2(0
.25)
0.04
(0.2
9)
-0.2
2(0
.21)
371
Ter
ms
ofP
aym
ent
(In
pu
ts)
Mar
athas
0.1
1(0
.06)*
*0.0
8(0
.11)
-0.1
5(0
.11)
-0.0
3(0
.08)
9864
Inte
rest
Rat
eon
Loa
nM
arat
has
-9.0
(5.9
)-3
2.3
(8.7
)***
32.
3(9
.9)*
**
23.3
(6.3
)***
392
Mar
ath
aT
rad
erL
owC
aste
s0.0
9(0
.04)*
*0.1
8(0
.09)*
*-0
.01
(0.1
1)
0.0
9(0
.08)
3012
Ou
tsid
eM
arat
ha
Tra
der
Low
Cas
tes
0.1
0(0
.03)*
**
0.1
8(0
.06)*
**
-0.1
8(0
.08)*
*-0
.08
(0.0
6)
2793
Mar
ath
aL
end
erL
owC
aste
s0.2
4(0
.08)*
**
0.4
5(0
.16)*
**
-0.2
1(0
.19)
0.0
4(0
.15)
452
Ter
ms
ofP
aym
ent
(In
pu
ts)
Low
Cas
tes
0.0
8(0
.05)*
0.2
4(0
.10)*
*-0
.26
(0.1
1)*
*-0
.18
(0.0
9)*
10034
Inte
rest
Rat
eon
Loa
nL
owC
aste
s-8
.41
(4.1
5)*
*-2
.03
(10.7
)1.7
3(1
1.2
7)
-6.6
8(9
.51)
250
Note
s:A
llre
gre
ssio
ns
incl
ude:
lati
tude,
longit
ude,
elev
ati
on,
pre
sence
of
river
/ca
nal,
dis
tance
tow
ate
rso
urc
e,dis
tance
tora
ilw
ays
and
nati
onal
roads,
soil
quality
mea
sure
s,ra
infa
llle
vel
s,pro
port
ion
SC
/ST
,villa
ge
popula
tion,
whet
her
GP
isre
serv
ed,
educa
tion,
land
owner
ship
,ca
ste
and
regio
nal
fixed
effec
ts.
Reg
ress
ion
dis
turb
ance
term
scl
ust
ered
at
villa
ge
level
.Sin
gle
ast
erix
den
ote
ssi
gnifi
cance
at
10%
level
,double
5%
,tr
iple
1%
.A
cronym
s:M
ara
tha
land
dom
inate
d(M
LD
);M
ara
tha
poplu
ati
on
pro
port
ion
(MPROP
).Sam
ple
of
lab
oure
rs:
all
work
ing
for
adaily
wage
inagri
cult
ure
.In
div
idual
contr
ols
:
gen
der
,age,
educa
tion,
incl
uded
inw
age
esti
mati
ons.
Reg
ress
ion
dis
turb
ance
term
scl
ust
ered
at
house
hold
and
villa
ge
level
for
thes
ees
tim
ati
ons
usi
ng
Cam
eron,
Gel
bach
and
Mille
r(2
011).
Sam
ple
for
yie
lds,
pro
fits
,pro
port
ion
of
lab
our
cost
sre
gre
ssio
ns
isla
rge
cult
ivato
rs(>
5acr
esof
land).
All
mea
sure
s
are
per
acr
eof
land.
Khari
fyie
lds:
tota
lva
lue
of
outp
ut
per
acr
efo
rgiv
encr
op,
sum
med
over
all
khari
fcr
ops.
Khari
fpro
fit
isyie
lds
net
of
input
cost
s
(see
ds,
fert
iliz
er,
irri
gati
on,
elec
tric
ity,
pes
tici
des
,la
bour)
.W
ork
ers
incl
ude
part
-tim
eand
full-t
ime.
Addit
ional
crop
contr
ols
incl
uded
inyie
lds
and
pro
fits
esti
mati
ons.
Mara
tha
Tra
der
equal
toone
ifhouse
hold
traded
wit
ha
Mara
tha
for
any
tradea
ble
good:
agri
cult
ura
lin
puts
,outp
uts
,fa
rmen
terp
rise
,
non-f
arm
ente
rpri
segoods,
condit
ional
on
tradin
ggoods.
Outs
ide
Mara
tha
Tra
der
refe
rsto
trader
resi
din
gouts
ide
of
villa
ge.
Mara
tha
Len
der
refe
rsto
borr
owin
gm
oney
from
aM
ara
tha.
Est
imate
sare
pro
bit
s,co
effici
ents
are
part
ial
der
ivate
sof
pre
dic
ted
pro
babilit
y.T
erm
sof
pay
men
tseq
uals
0if
trader
requir
esadva
nce
dpay
men
ts;
1if
full
pay
men
tre
quir
edat
tim
eof
sale
;and
2if
pay
men
tin
inst
allm
ents
acc
epta
ble
.O
rder
edpro
bit
esti
mati
ons.
38
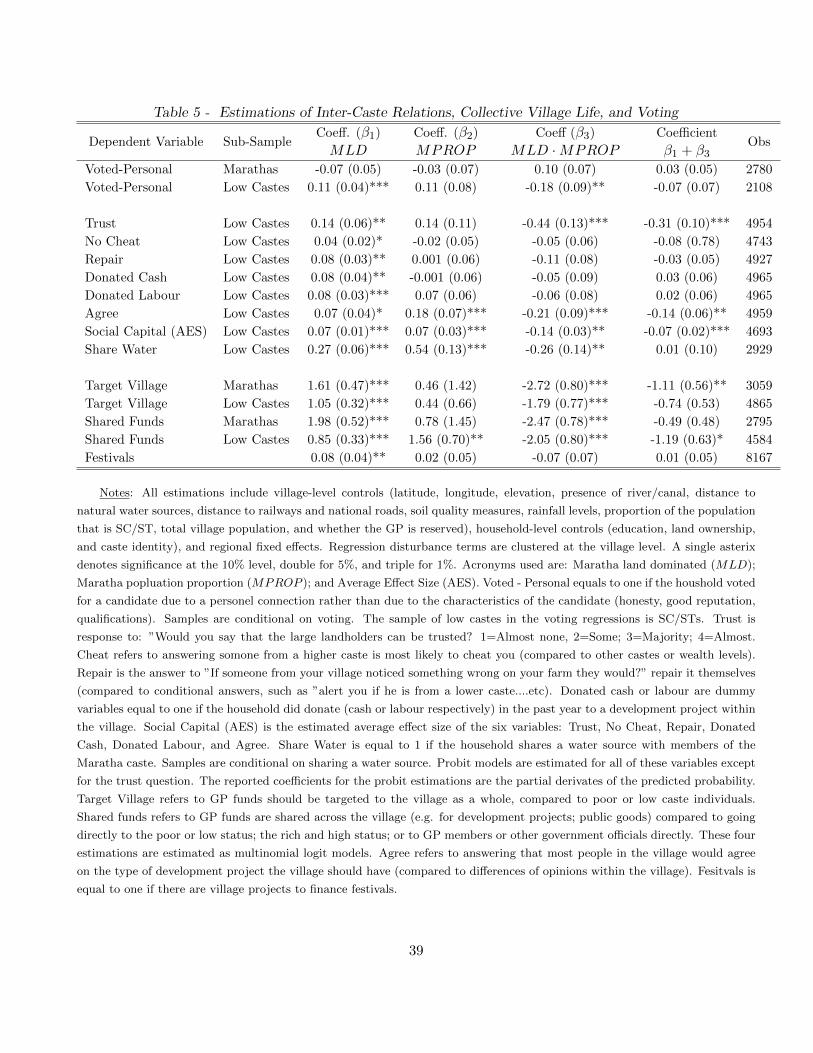
Table 5 - Estimations of Inter-Caste Relations, Collective Village Life, and Voting
Dependent Variable Sub-SampleCoeff. (β1)
MLDCoeff. (β2)
MPROPCoeff (β3)
MLD ·MPROPCoefficient
β1 + β3Obs
Voted-Personal Marathas -0.07 (0.05) -0.03 (0.07) 0.10 (0.07) 0.03 (0.05) 2780
Voted-Personal Low Castes 0.11 (0.04)*** 0.11 (0.08) -0.18 (0.09)** -0.07 (0.07) 2108
Trust Low Castes 0.14 (0.06)** 0.14 (0.11) -0.44 (0.13)*** -0.31 (0.10)*** 4954
No Cheat Low Castes 0.04 (0.02)* -0.02 (0.05) -0.05 (0.06) -0.08 (0.78) 4743
Repair Low Castes 0.08 (0.03)** 0.001 (0.06) -0.11 (0.08) -0.03 (0.05) 4927
Donated Cash Low Castes 0.08 (0.04)** -0.001 (0.06) -0.05 (0.09) 0.03 (0.06) 4965
Donated Labour Low Castes 0.08 (0.03)*** 0.07 (0.06) -0.06 (0.08) 0.02 (0.06) 4965
Agree Low Castes 0.07 (0.04)* 0.18 (0.07)*** -0.21 (0.09)*** -0.14 (0.06)** 4959
Social Capital (AES) Low Castes 0.07 (0.01)*** 0.07 (0.03)*** -0.14 (0.03)** -0.07 (0.02)*** 4693
Share Water Low Castes 0.27 (0.06)*** 0.54 (0.13)*** -0.26 (0.14)** 0.01 (0.10) 2929
Target Village Marathas 1.61 (0.47)*** 0.46 (1.42) -2.72 (0.80)*** -1.11 (0.56)** 3059
Target Village Low Castes 1.05 (0.32)*** 0.44 (0.66) -1.79 (0.77)*** -0.74 (0.53) 4865
Shared Funds Marathas 1.98 (0.52)*** 0.78 (1.45) -2.47 (0.78)*** -0.49 (0.48) 2795
Shared Funds Low Castes 0.85 (0.33)*** 1.56 (0.70)** -2.05 (0.80)*** -1.19 (0.63)* 4584
Festivals 0.08 (0.04)** 0.02 (0.05) -0.07 (0.07) 0.01 (0.05) 8167
Notes: All estimations include village-level controls (latitude, longitude, elevation, presence of river/canal, distance to
natural water sources, distance to railways and national roads, soil quality measures, rainfall levels, proportion of the population
that is SC/ST, total village population, and whether the GP is reserved), household-level controls (education, land ownership,
and caste identity), and regional fixed effects. Regression disturbance terms are clustered at the village level. A single asterix
denotes significance at the 10% level, double for 5%, and triple for 1%. Acronyms used are: Maratha land dominated (MLD);
Maratha popluation proportion (MPROP ); and Average Effect Size (AES). Voted - Personal equals to one if the houshold voted
for a candidate due to a personel connection rather than due to the characteristics of the candidate (honesty, good reputation,
qualifications). Samples are conditional on voting. The sample of low castes in the voting regressions is SC/STs. Trust is
response to: ”Would you say that the large landholders can be trusted? 1=Almost none, 2=Some; 3=Majority; 4=Almost.
Cheat refers to answering somone from a higher caste is most likely to cheat you (compared to other castes or wealth levels).
Repair is the answer to ”If someone from your village noticed something wrong on your farm they would?” repair it themselves
(compared to conditional answers, such as ”alert you if he is from a lower caste....etc). Donated cash or labour are dummy
variables equal to one if the household did donate (cash or labour respectively) in the past year to a development project within
the village. Social Capital (AES) is the estimated average effect size of the six variables: Trust, No Cheat, Repair, Donated
Cash, Donated Labour, and Agree. Share Water is equal to 1 if the household shares a water source with members of the
Maratha caste. Samples are conditional on sharing a water source. Probit models are estimated for all of these variables except
for the trust question. The reported coefficients for the probit estimations are the partial derivates of the predicted probability.
Target Village refers to GP funds should be targeted to the village as a whole, compared to poor or low caste individuals.
Shared funds refers to GP funds are shared across the village (e.g. for development projects; public goods) compared to going
directly to the poor or low status; the rich and high status; or to GP members or other government officials directly. These four
estimations are estimated as multinomial logit models. Agree refers to answering that most people in the village would agree
on the type of development project the village should have (compared to differences of opinions within the village). Fesitvals is
equal to one if there are village projects to finance festivals.
39
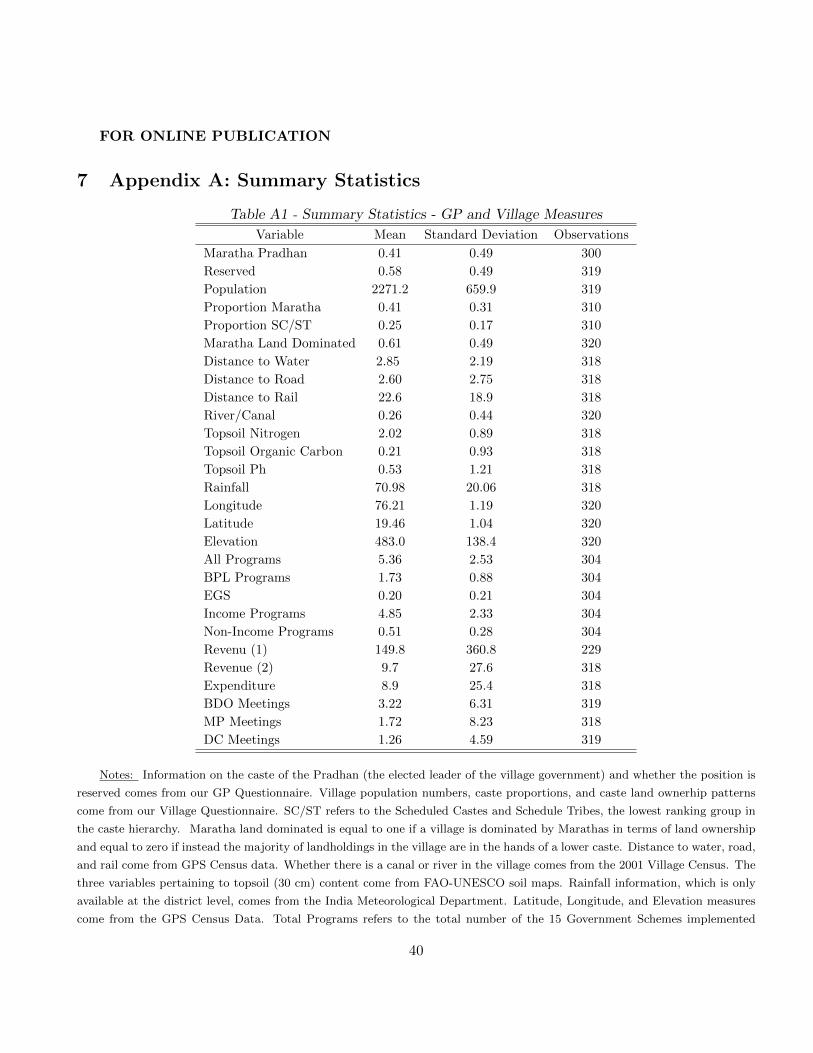
FOR ONLINE PUBLICATION
7 Appendix A: Summary Statistics
Table A1 - Summary Statistics - GP and Village Measures
Variable Mean Standard Deviation Observations
Maratha Pradhan 0.41 0.49 300
Reserved 0.58 0.49 319
Population 2271.2 659.9 319
Proportion Maratha 0.41 0.31 310
Proportion SC/ST 0.25 0.17 310
Maratha Land Dominated 0.61 0.49 320
Distance to Water 2.85 2.19 318
Distance to Road 2.60 2.75 318
Distance to Rail 22.6 18.9 318
River/Canal 0.26 0.44 320
Topsoil Nitrogen 2.02 0.89 318
Topsoil Organic Carbon 0.21 0.93 318
Topsoil Ph 0.53 1.21 318
Rainfall 70.98 20.06 318
Longitude 76.21 1.19 320
Latitude 19.46 1.04 320
Elevation 483.0 138.4 320
All Programs 5.36 2.53 304
BPL Programs 1.73 0.88 304
EGS 0.20 0.21 304
Income Programs 4.85 2.33 304
Non-Income Programs 0.51 0.28 304
Revenu (1) 149.8 360.8 229
Revenue (2) 9.7 27.6 318
Expenditure 8.9 25.4 318
BDO Meetings 3.22 6.31 319
MP Meetings 1.72 8.23 318
DC Meetings 1.26 4.59 319
Notes: Information on the caste of the Pradhan (the elected leader of the village government) and whether the position is
reserved comes from our GP Questionnaire. Village population numbers, caste proportions, and caste land ownerhip patterns
come from our Village Questionnaire. SC/ST refers to the Scheduled Castes and Schedule Tribes, the lowest ranking group in
the caste hierarchy. Maratha land dominated is equal to one if a village is dominated by Marathas in terms of land ownership
and equal to zero if instead the majority of landholdings in the village are in the hands of a lower caste. Distance to water, road,
and rail come from GPS Census data. Whether there is a canal or river in the village comes from the 2001 Village Census. The
three variables pertaining to topsoil (30 cm) content come from FAO-UNESCO soil maps. Rainfall information, which is only
available at the district level, comes from the India Meteorological Department. Latitude, Longitude, and Elevation measures
come from the GPS Census Data. Total Programs refers to the total number of the 15 Government Schemes implemented
40
in the village37. BPL refers to the number of the possible 8 programs targeted at individuals below the poverty line (these
include: Housing Support Scheme; Sanitation Support Scheme; Indira Awas Yojana IAY, a housing construction program;
Targeted Public Distribution System (TPDS)). EGS refers to the Employment Guarantee Scheme, which is the precursor to the
present NREGA. Income programs is the set of programs that likely directly or indirectly affect household labour decisions and
income (such as public good and housing improvement schemes which do rely on villagers’ labour in their construction and the
targeted public distribution system). Non-Income Programs refers to programs which do not directly affect household labour
decisions such as those targeted towards children (child development (ICDS) and mid-day meals) and the elderly (social security
pensions and foodgrains (Annapurna)). We obtained information on the availability of programs from our household survey
and aggreated this information to the village level. Revenue (1) refers to data collected from the balance sheets of submitted by
the GPs, these are computed per capita of the GP population. We obtained the majority of this information using the RTI Act.
The information covers the last 24 months. Revenue (2) and Expenditure are annual per capita values from the 2001 Village
Census. BDO (Block Development Officer) , MP (Member of Parliament), and DC (District Collector) meetings all refer to the
number of times in the last year that the Gram Pradhan has met with officials from higher level governments to seek resources.
This information is from the GP Questionnaire.
37The complete list of programs: Housing Support Scheme; Sanitation Support Scheme; EGS; SGYR (Sampoom Gram RojgarYojana); IAY (Indira Awas Yojana); SGSY (Swamjayanti Grameen Sawa Rogar Yojana); ICDS (Integrated Child DevelopmentScheme); Social Security Pension, Mid-day Meal Program; ARWSP (Accelerated Rural Water Supply Program); PMGSY(Pradhan Mantri Gram Sadak Yojana); TPDS (Targeted Public Distribution System); Annapurna; Watershed DevelopmentPrograms under DRAP and DDP; Total Sanitation Campaign; Swajaidhara; Business Support Program; FFW (Food for workprogram); PDS.
41
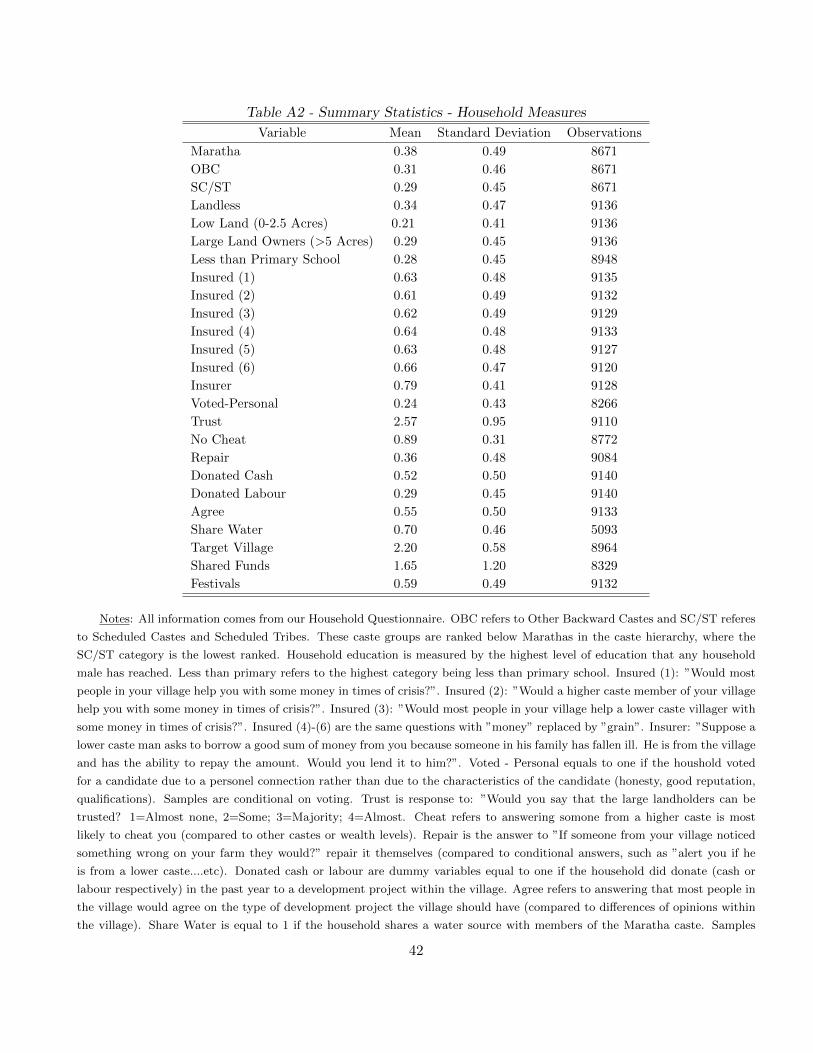
Table A2 - Summary Statistics - Household Measures
Variable Mean Standard Deviation Observations
Maratha 0.38 0.49 8671
OBC 0.31 0.46 8671
SC/ST 0.29 0.45 8671
Landless 0.34 0.47 9136
Low Land (0-2.5 Acres) 0.21 0.41 9136
Large Land Owners (>5 Acres) 0.29 0.45 9136
Less than Primary School 0.28 0.45 8948
Insured (1) 0.63 0.48 9135
Insured (2) 0.61 0.49 9132
Insured (3) 0.62 0.49 9129
Insured (4) 0.64 0.48 9133
Insured (5) 0.63 0.48 9127
Insured (6) 0.66 0.47 9120
Insurer 0.79 0.41 9128
Voted-Personal 0.24 0.43 8266
Trust 2.57 0.95 9110
No Cheat 0.89 0.31 8772
Repair 0.36 0.48 9084
Donated Cash 0.52 0.50 9140
Donated Labour 0.29 0.45 9140
Agree 0.55 0.50 9133
Share Water 0.70 0.46 5093
Target Village 2.20 0.58 8964
Shared Funds 1.65 1.20 8329
Festivals 0.59 0.49 9132
Notes: All information comes from our Household Questionnaire. OBC refers to Other Backward Castes and SC/ST referes
to Scheduled Castes and Scheduled Tribes. These caste groups are ranked below Marathas in the caste hierarchy, where the
SC/ST category is the lowest ranked. Household education is measured by the highest level of education that any household
male has reached. Less than primary refers to the highest category being less than primary school. Insured (1): ”Would most
people in your village help you with some money in times of crisis?”. Insured (2): ”Would a higher caste member of your village
help you with some money in times of crisis?”. Insured (3): ”Would most people in your village help a lower caste villager with
some money in times of crisis?”. Insured (4)-(6) are the same questions with ”money” replaced by ”grain”. Insurer: ”Suppose a
lower caste man asks to borrow a good sum of money from you because someone in his family has fallen ill. He is from the village
and has the ability to repay the amount. Would you lend it to him?”. Voted - Personal equals to one if the houshold voted
for a candidate due to a personel connection rather than due to the characteristics of the candidate (honesty, good reputation,
qualifications). Samples are conditional on voting. Trust is response to: ”Would you say that the large landholders can be
trusted? 1=Almost none, 2=Some; 3=Majority; 4=Almost. Cheat refers to answering somone from a higher caste is most
likely to cheat you (compared to other castes or wealth levels). Repair is the answer to ”If someone from your village noticed
something wrong on your farm they would?” repair it themselves (compared to conditional answers, such as ”alert you if he
is from a lower caste....etc). Donated cash or labour are dummy variables equal to one if the household did donate (cash or
labour respectively) in the past year to a development project within the village. Agree refers to answering that most people in
the village would agree on the type of development project the village should have (compared to differences of opinions within
the village). Share Water is equal to 1 if the household shares a water source with members of the Maratha caste. Samples
42
are conditional on sharing a water source. Target Village refers to GP funds should be targeted to the village as a whole,
compared to poor or low caste individuals. Shared funds refers to GP funds are shared across the village (e.g. for development
projects; public goods) compared to going directly to the poor or low status; the rich and high status; or to GP members or
other government officials directly. Fesitvals is equal to one if there are village projects to finance festivals.
43
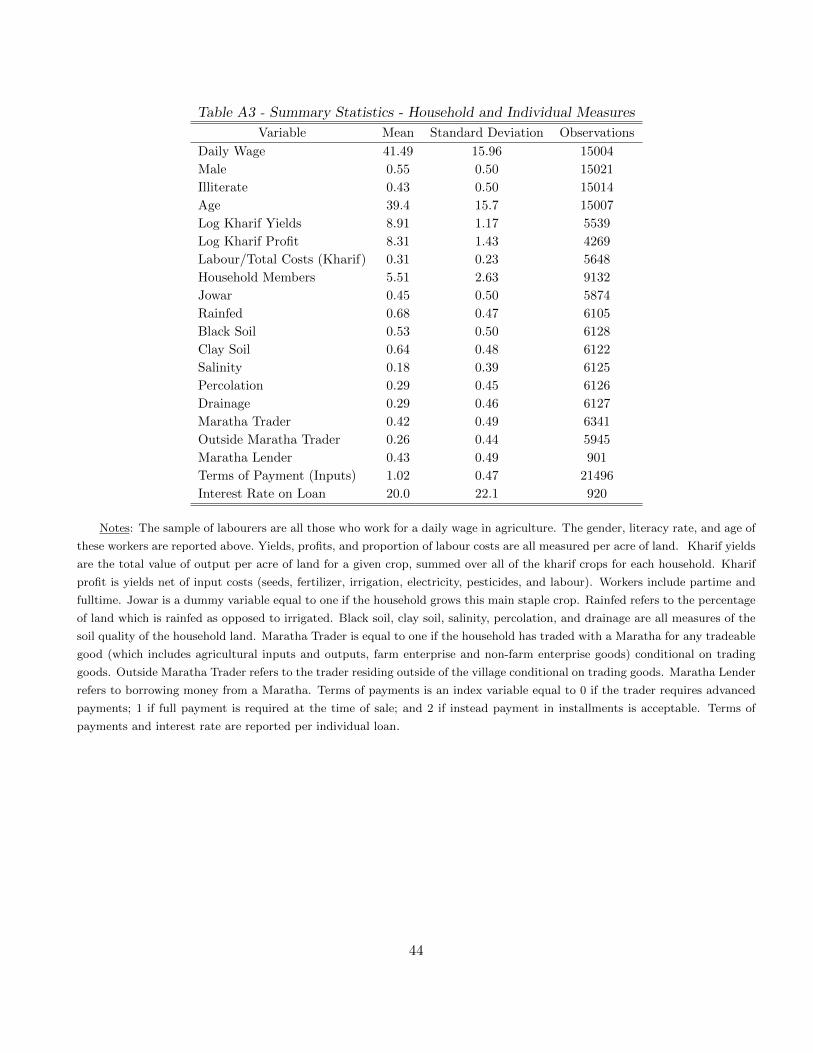
Table A3 - Summary Statistics - Household and Individual Measures
Variable Mean Standard Deviation Observations
Daily Wage 41.49 15.96 15004
Male 0.55 0.50 15021
Illiterate 0.43 0.50 15014
Age 39.4 15.7 15007
Log Kharif Yields 8.91 1.17 5539
Log Kharif Profit 8.31 1.43 4269
Labour/Total Costs (Kharif) 0.31 0.23 5648
Household Members 5.51 2.63 9132
Jowar 0.45 0.50 5874
Rainfed 0.68 0.47 6105
Black Soil 0.53 0.50 6128
Clay Soil 0.64 0.48 6122
Salinity 0.18 0.39 6125
Percolation 0.29 0.45 6126
Drainage 0.29 0.46 6127
Maratha Trader 0.42 0.49 6341
Outside Maratha Trader 0.26 0.44 5945
Maratha Lender 0.43 0.49 901
Terms of Payment (Inputs) 1.02 0.47 21496
Interest Rate on Loan 20.0 22.1 920
Notes: The sample of labourers are all those who work for a daily wage in agriculture. The gender, literacy rate, and age of
these workers are reported above. Yields, profits, and proportion of labour costs are all measured per acre of land. Kharif yields
are the total value of output per acre of land for a given crop, summed over all of the kharif crops for each household. Kharif
profit is yields net of input costs (seeds, fertilizer, irrigation, electricity, pesticides, and labour). Workers include partime and
fulltime. Jowar is a dummy variable equal to one if the household grows this main staple crop. Rainfed refers to the percentage
of land which is rainfed as opposed to irrigated. Black soil, clay soil, salinity, percolation, and drainage are all measures of the
soil quality of the household land. Maratha Trader is equal to one if the household has traded with a Maratha for any tradeable
good (which includes agricultural inputs and outputs, farm enterprise and non-farm enterprise goods) conditional on trading
goods. Outside Maratha Trader refers to the trader residing outside of the village conditional on trading goods. Maratha Lender
refers to borrowing money from a Maratha. Terms of payments is an index variable equal to 0 if the trader requires advanced
payments; 1 if full payment is required at the time of sale; and 2 if instead payment in installments is acceptable. Terms of
payments and interest rate are reported per individual loan.
44
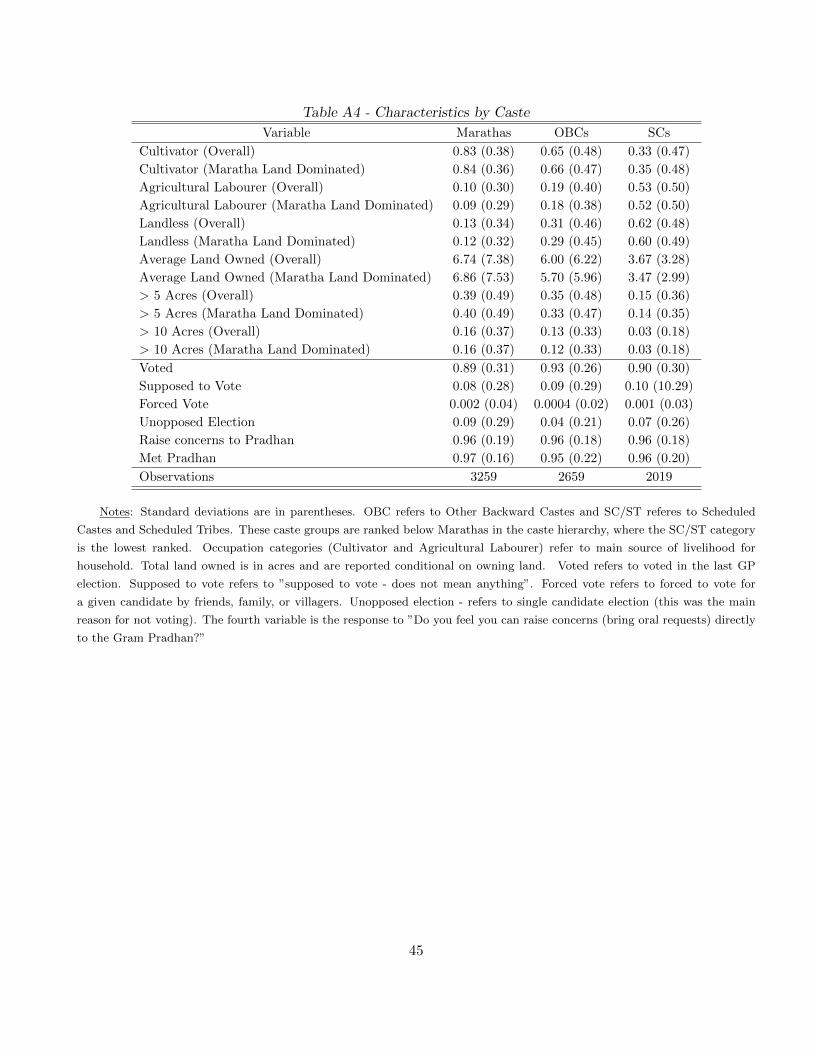
Table A4 - Characteristics by Caste
Variable Marathas OBCs SCs
Cultivator (Overall) 0.83 (0.38) 0.65 (0.48) 0.33 (0.47)
Cultivator (Maratha Land Dominated) 0.84 (0.36) 0.66 (0.47) 0.35 (0.48)
Agricultural Labourer (Overall) 0.10 (0.30) 0.19 (0.40) 0.53 (0.50)
Agricultural Labourer (Maratha Land Dominated) 0.09 (0.29) 0.18 (0.38) 0.52 (0.50)
Landless (Overall) 0.13 (0.34) 0.31 (0.46) 0.62 (0.48)
Landless (Maratha Land Dominated) 0.12 (0.32) 0.29 (0.45) 0.60 (0.49)
Average Land Owned (Overall) 6.74 (7.38) 6.00 (6.22) 3.67 (3.28)
Average Land Owned (Maratha Land Dominated) 6.86 (7.53) 5.70 (5.96) 3.47 (2.99)
> 5 Acres (Overall) 0.39 (0.49) 0.35 (0.48) 0.15 (0.36)
> 5 Acres (Maratha Land Dominated) 0.40 (0.49) 0.33 (0.47) 0.14 (0.35)
> 10 Acres (Overall) 0.16 (0.37) 0.13 (0.33) 0.03 (0.18)
> 10 Acres (Maratha Land Dominated) 0.16 (0.37) 0.12 (0.33) 0.03 (0.18)
Voted 0.89 (0.31) 0.93 (0.26) 0.90 (0.30)
Supposed to Vote 0.08 (0.28) 0.09 (0.29) 0.10 (10.29)
Forced Vote 0.002 (0.04) 0.0004 (0.02) 0.001 (0.03)
Unopposed Election 0.09 (0.29) 0.04 (0.21) 0.07 (0.26)
Raise concerns to Pradhan 0.96 (0.19) 0.96 (0.18) 0.96 (0.18)
Met Pradhan 0.97 (0.16) 0.95 (0.22) 0.96 (0.20)
Observations 3259 2659 2019
Notes: Standard deviations are in parentheses. OBC refers to Other Backward Castes and SC/ST referes to Scheduled
Castes and Scheduled Tribes. These caste groups are ranked below Marathas in the caste hierarchy, where the SC/ST category
is the lowest ranked. Occupation categories (Cultivator and Agricultural Labourer) refer to main source of livelihood for
household. Total land owned is in acres and are reported conditional on owning land. Voted refers to voted in the last GP
election. Supposed to vote refers to ”supposed to vote - does not mean anything”. Forced vote refers to forced to vote for
a given candidate by friends, family, or villagers. Unopposed election - refers to single candidate election (this was the main
reason for not voting). The fourth variable is the response to ”Do you feel you can raise concerns (bring oral requests) directly
to the Gram Pradhan?”
45
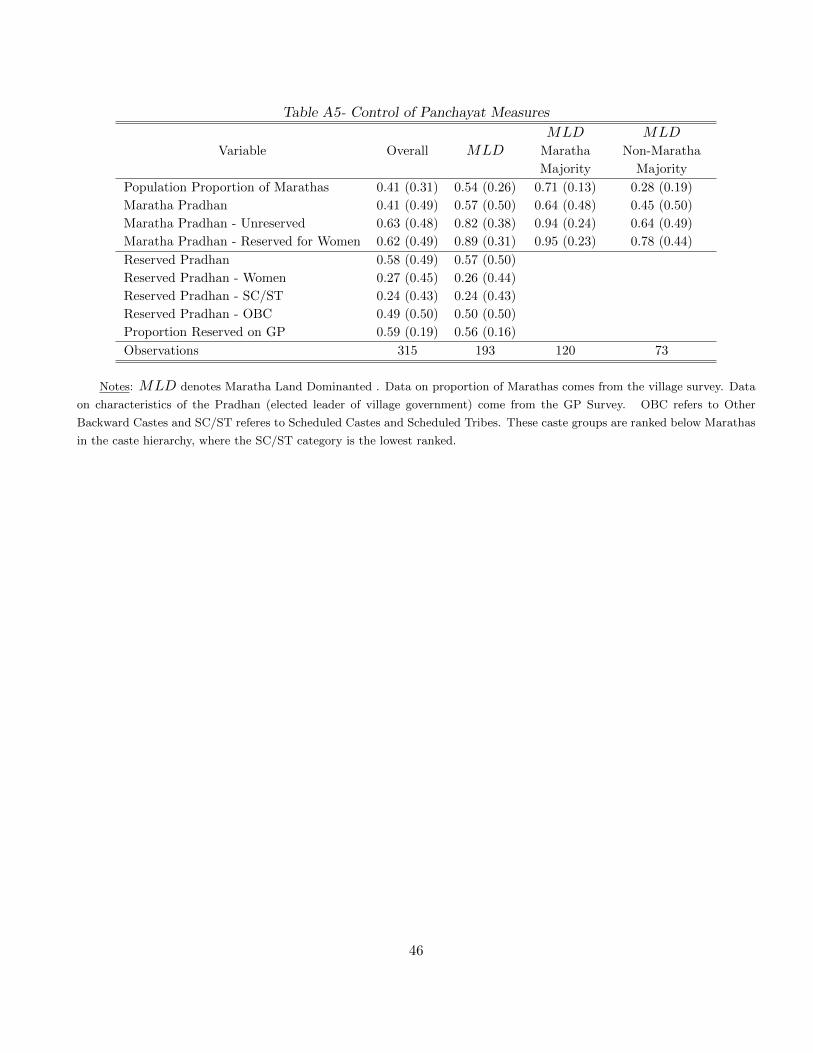
Table A5- Control of Panchayat Measures
Variable Overall MLDMLD
Maratha
Majority
MLDNon-Maratha
Majority
Population Proportion of Marathas 0.41 (0.31) 0.54 (0.26) 0.71 (0.13) 0.28 (0.19)
Maratha Pradhan 0.41 (0.49) 0.57 (0.50) 0.64 (0.48) 0.45 (0.50)
Maratha Pradhan - Unreserved 0.63 (0.48) 0.82 (0.38) 0.94 (0.24) 0.64 (0.49)
Maratha Pradhan - Reserved for Women 0.62 (0.49) 0.89 (0.31) 0.95 (0.23) 0.78 (0.44)
Reserved Pradhan 0.58 (0.49) 0.57 (0.50)
Reserved Pradhan - Women 0.27 (0.45) 0.26 (0.44)
Reserved Pradhan - SC/ST 0.24 (0.43) 0.24 (0.43)
Reserved Pradhan - OBC 0.49 (0.50) 0.50 (0.50)
Proportion Reserved on GP 0.59 (0.19) 0.56 (0.16)
Observations 315 193 120 73
Notes: MLD denotes Maratha Land Dominanted . Data on proportion of Marathas comes from the village survey. Data
on characteristics of the Pradhan (elected leader of village government) come from the GP Survey. OBC refers to Other
Backward Castes and SC/ST referes to Scheduled Castes and Scheduled Tribes. These caste groups are ranked below Marathas
in the caste hierarchy, where the SC/ST category is the lowest ranked.
46
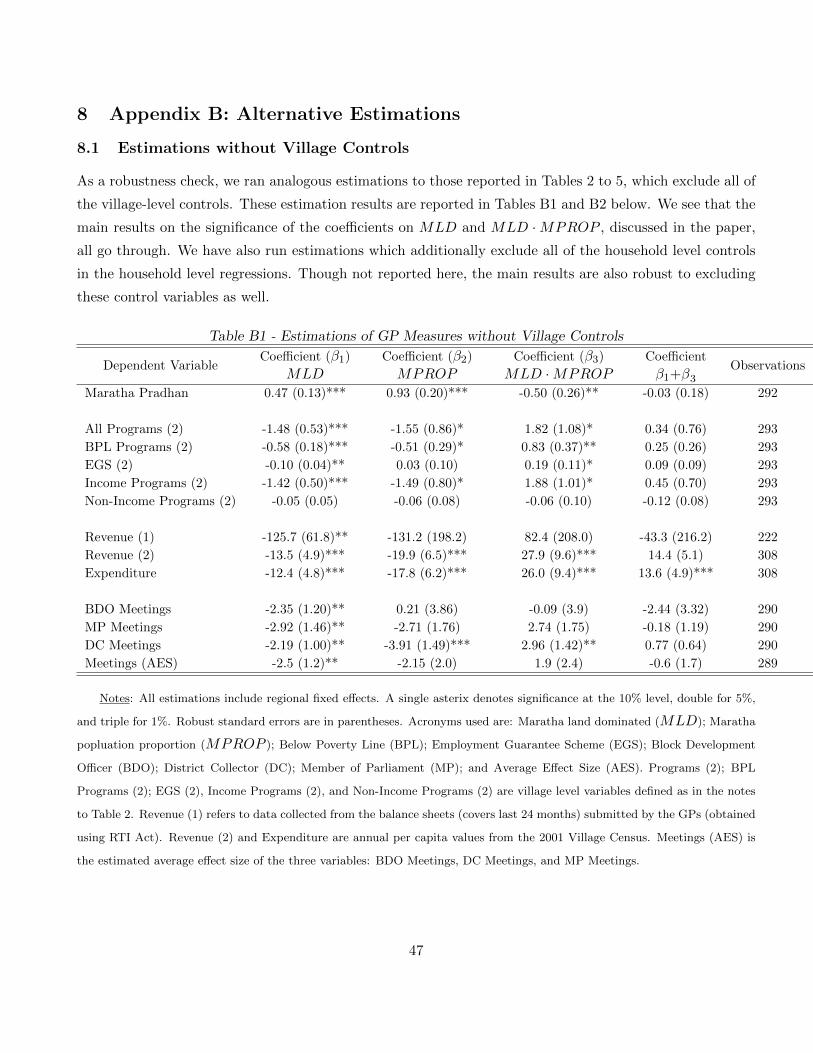
8 Appendix B: Alternative Estimations
8.1 Estimations without Village Controls
As a robustness check, we ran analogous estimations to those reported in Tables 2 to 5, which exclude all of
the village-level controls. These estimation results are reported in Tables B1 and B2 below. We see that the
main results on the significance of the coefficients on MLD and MLD ·MPROP , discussed in the paper,
all go through. We have also run estimations which additionally exclude all of the household level controls
in the household level regressions. Though not reported here, the main results are also robust to excluding
these control variables as well.
Table B1 - Estimations of GP Measures without Village Controls
Dependent VariableCoefficient (β1)
MLDCoefficient (β2)
MPROPCoefficient (β3)
MLD ·MPROPCoefficient
β1+β3Observations
Maratha Pradhan 0.47 (0.13)*** 0.93 (0.20)*** -0.50 (0.26)** -0.03 (0.18) 292
All Programs (2) -1.48 (0.53)*** -1.55 (0.86)* 1.82 (1.08)* 0.34 (0.76) 293
BPL Programs (2) -0.58 (0.18)*** -0.51 (0.29)* 0.83 (0.37)** 0.25 (0.26) 293
EGS (2) -0.10 (0.04)** 0.03 (0.10) 0.19 (0.11)* 0.09 (0.09) 293
Income Programs (2) -1.42 (0.50)*** -1.49 (0.80)* 1.88 (1.01)* 0.45 (0.70) 293
Non-Income Programs (2) -0.05 (0.05) -0.06 (0.08) -0.06 (0.10) -0.12 (0.08) 293
Revenue (1) -125.7 (61.8)** -131.2 (198.2) 82.4 (208.0) -43.3 (216.2) 222
Revenue (2) -13.5 (4.9)*** -19.9 (6.5)*** 27.9 (9.6)*** 14.4 (5.1) 308
Expenditure -12.4 (4.8)*** -17.8 (6.2)*** 26.0 (9.4)*** 13.6 (4.9)*** 308
BDO Meetings -2.35 (1.20)** 0.21 (3.86) -0.09 (3.9) -2.44 (3.32) 290
MP Meetings -2.92 (1.46)** -2.71 (1.76) 2.74 (1.75) -0.18 (1.19) 290
DC Meetings -2.19 (1.00)** -3.91 (1.49)*** 2.96 (1.42)** 0.77 (0.64) 290
Meetings (AES) -2.5 (1.2)** -2.15 (2.0) 1.9 (2.4) -0.6 (1.7) 289
Notes: All estimations include regional fixed effects. A single asterix denotes significance at the 10% level, double for 5%,
and triple for 1%. Robust standard errors are in parentheses. Acronyms used are: Maratha land dominated (MLD); Maratha
popluation proportion (MPROP ); Below Poverty Line (BPL); Employment Guarantee Scheme (EGS); Block Development
Officer (BDO); District Collector (DC); Member of Parliament (MP); and Average Effect Size (AES). Programs (2); BPL
Programs (2); EGS (2), Income Programs (2), and Non-Income Programs (2) are village level variables defined as in the notes
to Table 2. Revenue (1) refers to data collected from the balance sheets (covers last 24 months) submitted by the GPs (obtained
using RTI Act). Revenue (2) and Expenditure are annual per capita values from the 2001 Village Census. Meetings (AES) is
the estimated average effect size of the three variables: BDO Meetings, DC Meetings, and MP Meetings.
47
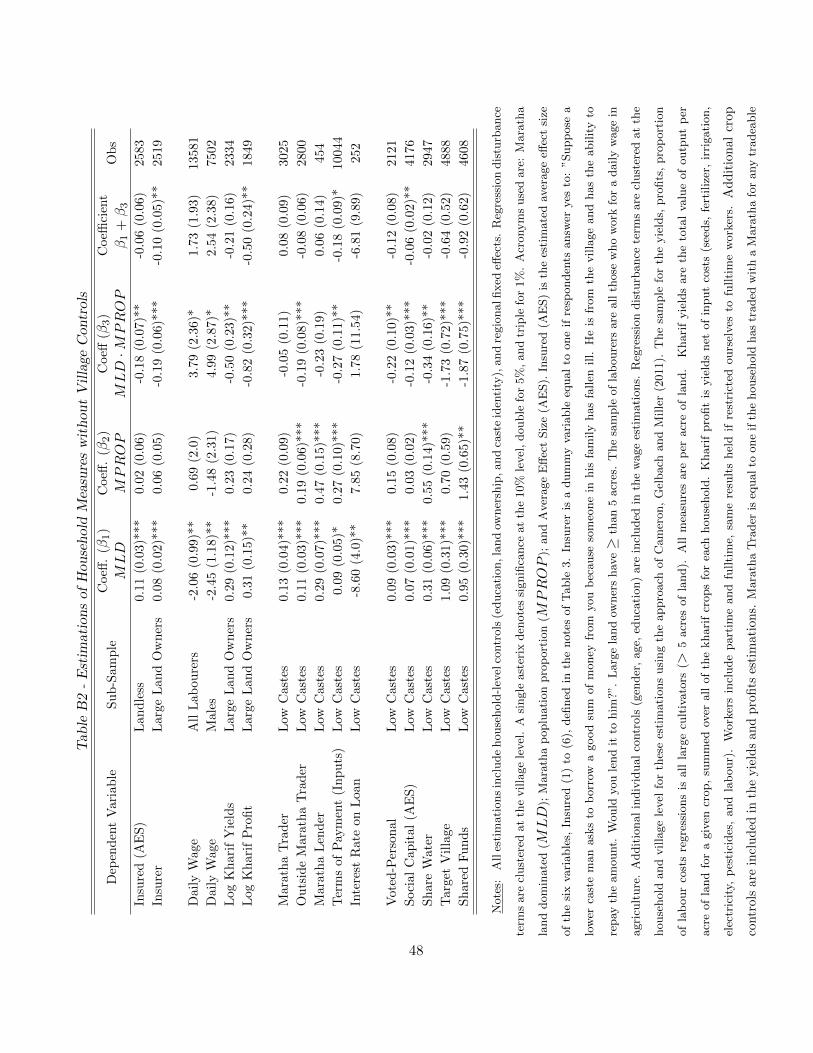
Table
B2
-Estim
ationsof
Hou
seholdMeasureswithou
tVillage
Controls
Dep
end
ent
Var
iab
leS
ub
-Sam
ple
Coeff
.(β
1)
MLD
Coeff
.(β
2)
MPROP
Coeff
(β3)
MLD·M
PROP
Coeffi
cien
t
β1
+β3
Ob
s
Insu
red
(AE
S)
Lan
dle
ss0.1
1(0
.03)*
**
0.0
2(0
.06)
-0.1
8(0
.07)*
*-0
.06
(0.0
6)
2583
Insu
rer
Lar
geL
and
Ow
ner
s0.0
8(0
.02)*
**
0.0
6(0
.05)
-0.1
9(0
.06)*
**
-0.1
0(0
.05)*
*2519
Dai
lyW
age
All
Lab
oure
rs-2
.06
(0.9
9)*
*0.6
9(2
.0)
3.79
(2.3
6)*
1.7
3(1
.93)
13581
Dai
lyW
age
Mal
es-2
.45
(1.1
8)*
*-1
.48
(2.3
1)
4.99
(2.8
7)*
2.5
4(2
.38)
7502
Log
Kh
arif
Yie
lds
Lar
geL
and
Ow
ner
s0.2
9(0
.12)*
**
0.2
3(0
.17)
-0.5
0(0
.23)*
*-0
.21
(0.1
6)
2334
Log
Kh
arif
Pro
fit
Lar
geL
and
Ow
ner
s0.3
1(0
.15)*
*0.2
4(0
.28)
-0.8
2(0
.32)*
**
-0.5
0(0
.24)*
*1849
Mar
ath
aT
rad
erL
owC
aste
s0.1
3(0
.04)*
**
0.2
2(0
.09)
-0.0
5(0
.11)
0.0
8(0
.09)
3025
Ou
tsid
eM
arat
ha
Tra
der
Low
Cas
tes
0.1
1(0
.03)*
**
0.1
9(0
.06)*
**
-0.1
9(0
.08)*
**
-0.0
8(0
.06)
2800
Mar
ath
aL
end
erL
owC
aste
s0.2
9(0
.07)*
**
0.4
7(0
.15)*
**
-0.2
3(0
.19)
0.0
6(0
.14)
454
Ter
ms
ofP
aym
ent
(In
pu
ts)
Low
Cas
tes
0.0
9(0
.05)*
0.2
7(0
.10)*
**
-0.2
7(0
.11)*
*-0
.18
(0.0
9)*
10044
Inte
rest
Rat
eon
Loa
nL
owC
aste
s-8
.60
(4.0
)**
7.8
5(8
.70)
1.7
8(1
1.5
4)
-6.8
1(9
.89)
252
Vot
ed-P
erso
nal
Low
Cas
tes
0.0
9(0
.03)*
**
0.1
5(0
.08)
-0.2
2(0
.10)*
*-0
.12
(0.0
8)
2121
Soci
alC
apit
al(A
ES
)L
owC
aste
s0.0
7(0
.01)*
**
0.0
3(0
.02)
-0.1
2(0
.03)*
**
-0.0
6(0
.02)*
*4176
Sh
are
Wat
erL
owC
aste
s0.3
1(0
.06)*
**
0.5
5(0
.14)*
**
-0.3
4(0
.16)*
*-0
.02
(0.1
2)
2947
Tar
get
Vil
lage
Low
Cas
tes
1.0
9(0
.31)*
**
0.7
0(0
.59)
-1.7
3(0
.72)*
**
-0.6
4(0
.52)
4888
Sh
ared
Fu
nd
sL
owC
aste
s0.9
5(0
.30)*
**
1.4
3(0
.65)*
*-1
.87
(0.7
5)*
**
-0.9
2(0
.62)
4608
Note
s:A
lles
tim
ati
ons
incl
ude
house
hold
-lev
elco
ntr
ols
(educa
tion,la
nd
owner
ship
,and
cast
eid
enti
ty),
and
regio
nalfixed
effec
ts.
Reg
ress
ion
dis
turb
ance
term
sare
clust
ered
at
the
villa
ge
level
.A
single
ast
erix
den
ote
ssi
gnifi
cance
at
the
10%
level
,double
for
5%
,and
trip
lefo
r1%
.A
cronym
suse
dare
:M
ara
tha
land
dom
inate
d(M
LD
);M
ara
tha
poplu
ati
on
pro
port
ion
(MPROP
);and
Aver
age
Eff
ect
Siz
e(A
ES).
Insu
red
(AE
S)
isth
ees
tim
ate
dav
erage
effec
tsi
ze
of
the
six
vari
able
s,In
sure
d(1
)to
(6),
defi
ned
inth
enote
sof
Table
3.
Insu
rer
isa
dum
my
vari
able
equal
toone
ifre
sponden
tsansw
eryes
to:
”Supp
ose
a
low
erca
ste
man
ask
sto
borr
owa
good
sum
of
money
from
you
bec
ause
som
eone
inhis
fam
ily
has
fallen
ill.
He
isfr
om
the
villa
ge
and
has
the
abilit
yto
repay
the
am
ount.
Would
you
lend
itto
him
?”.
Larg
ela
nd
owner
shav
e≥
than
5acr
es.
The
sam
ple
of
lab
oure
rsare
all
those
who
work
for
adaily
wage
in
agri
cult
ure
.A
ddit
ional
indiv
idual
contr
ols
(gen
der
,age,
educa
tion)
are
incl
uded
inth
ew
age
esti
mati
ons.
Reg
ress
ion
dis
turb
ance
term
sare
clust
ered
at
the
house
hold
and
villa
ge
level
for
thes
ees
tim
ati
ons
usi
ng
the
appro
ach
of
Cam
eron,
Gel
bach
and
Mille
r(2
011).
The
sam
ple
for
the
yie
lds,
pro
fits
,pro
port
ion
of
lab
our
cost
sre
gre
ssio
ns
isall
larg
ecu
ltiv
ato
rs(>
5acr
esof
land).
All
mea
sure
sare
per
acr
eof
land.
Khari
fyie
lds
are
the
tota
lva
lue
of
outp
ut
per
acr
eof
land
for
agiv
encr
op,
sum
med
over
all
of
the
khari
fcr
ops
for
each
house
hold
.K
hari
fpro
fit
isyie
lds
net
of
input
cost
s(s
eeds,
fert
iliz
er,
irri
gati
on,
elec
tric
ity,
pes
tici
des
,and
lab
our)
.W
ork
ers
incl
ude
part
ime
and
fullti
me,
sam
ere
sult
shel
dif
rest
rict
edours
elves
tofu
llti
me
work
ers.
Ad
dit
ion
al
crop
contr
ols
are
incl
ud
edin
the
yie
lds
and
pro
fits
esti
mati
on
s.M
ara
tha
Tra
der
iseq
ual
toone
ifth
ehouse
hold
has
traded
wit
ha
Mara
tha
for
any
tradea
ble
48
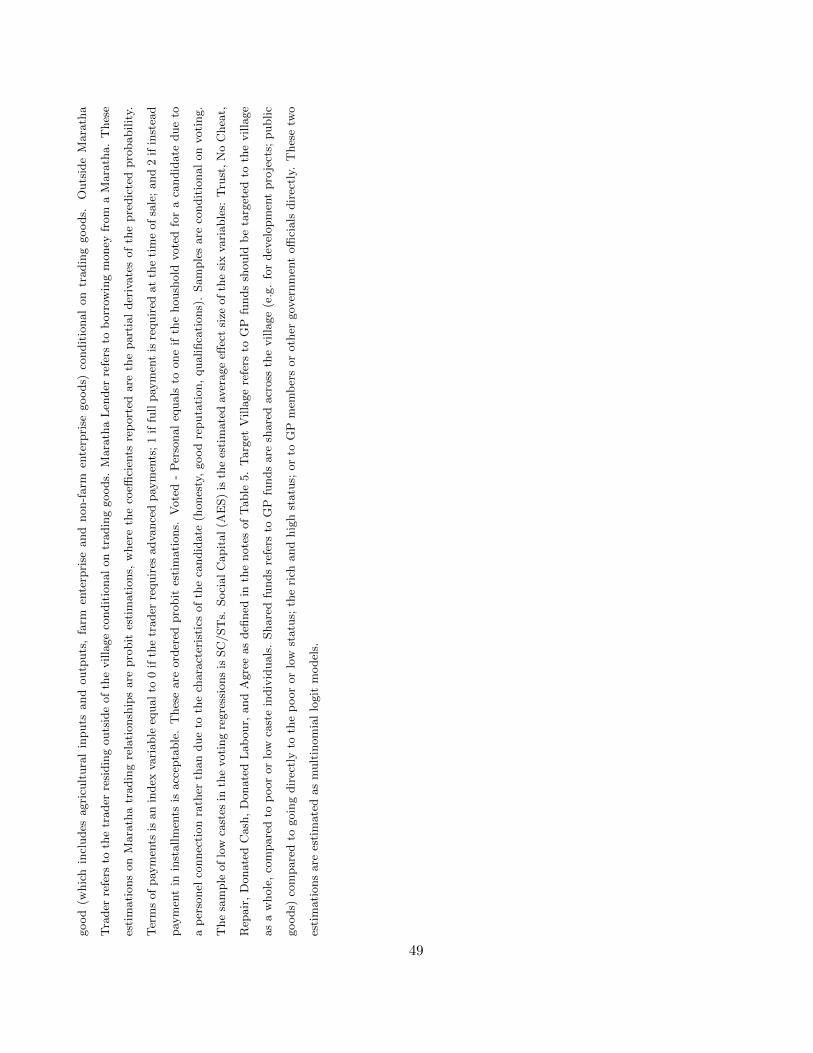
good
(whic
hin
cludes
agri
cult
ura
lin
puts
and
outp
uts
,fa
rmen
terp
rise
and
non-f
arm
ente
rpri
segoods)
condit
ional
on
tradin
ggoods.
Outs
ide
Mara
tha
Tra
der
refe
rsto
the
trader
resi
din
gouts
ide
of
the
villa
ge
condit
ional
on
tradin
ggoods.
Mara
tha
Len
der
refe
rsto
borr
owin
gm
oney
from
aM
ara
tha.
Thes
e
esti
mati
ons
on
Mara
tha
tradin
gre
lati
onsh
ips
are
pro
bit
esti
mati
ons,
wher
eth
eco
effici
ents
rep
ort
edare
the
part
ial
der
ivate
sof
the
pre
dic
ted
pro
babilit
y.
Ter
ms
of
pay
men
tsis
an
index
vari
able
equal
to0
ifth
etr
ader
requir
esadva
nce
dpay
men
ts;
1if
full
pay
men
tis
requir
edat
the
tim
eof
sale
;and
2if
inst
ead
pay
men
tin
inst
allm
ents
isacc
epta
ble
.T
hes
eare
ord
ered
pro
bit
esti
mati
ons.
Vote
d-
Per
sonal
equals
toone
ifth
ehoush
old
vote
dfo
ra
candid
ate
due
to
ap
erso
nel
connec
tion
rath
erth
an
due
toth
ech
ara
cter
isti
csof
the
candid
ate
(hones
ty,
good
reputa
tion,
qualifica
tions)
.Sam
ple
sare
condit
ional
on
voti
ng.
The
sam
ple
of
low
cast
esin
the
voti
ng
regre
ssio
ns
isSC
/ST
s.Soci
al
Capit
al
(AE
S)
isth
ees
tim
ate
dav
erage
effec
tsi
zeof
the
six
vari
able
s:T
rust
,N
oC
hea
t,
Rep
air
,D
onate
dC
ash
,D
onate
dL
ab
our,
and
Agre
eas
defi
ned
inth
enote
sof
Table
5.
Targ
etV
illa
ge
refe
rsto
GP
funds
should
be
targ
eted
toth
evilla
ge
as
aw
hole
,co
mpare
dto
poor
or
low
cast
ein
div
iduals
.Share
dfu
nds
refe
rsto
GP
funds
are
share
dacr
oss
the
villa
ge
(e.g
.fo
rdev
elopm
ent
pro
ject
s;public
goods)
com
pare
dto
goin
gdir
ectl
yto
the
poor
or
low
statu
s;th
eri
chand
hig
hst
atu
s;or
toG
Pm
emb
ers
or
oth
ergov
ernm
ent
offi
cials
dir
ectl
y.T
hes
etw
o
esti
mati
ons
are
esti
mate
das
mult
inom
ial
logit
model
s.
49
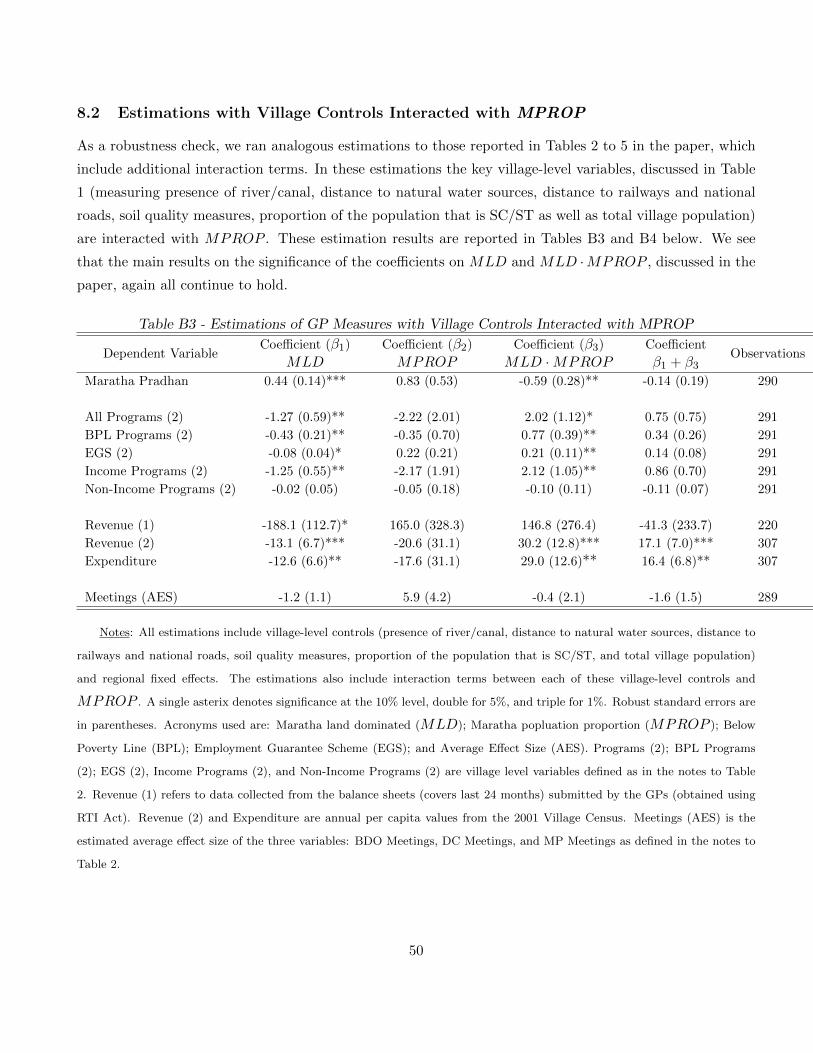
8.2 Estimations with Village Controls Interacted with MPROP
As a robustness check, we ran analogous estimations to those reported in Tables 2 to 5 in the paper, which
include additional interaction terms. In these estimations the key village-level variables, discussed in Table
1 (measuring presence of river/canal, distance to natural water sources, distance to railways and national
roads, soil quality measures, proportion of the population that is SC/ST as well as total village population)
are interacted with MPROP . These estimation results are reported in Tables B3 and B4 below. We see
that the main results on the significance of the coefficients on MLD and MLD ·MPROP , discussed in the
paper, again all continue to hold.
Table B3 - Estimations of GP Measures with Village Controls Interacted with MPROP
Dependent VariableCoefficient (β1)
MLDCoefficient (β2)
MPROPCoefficient (β3)
MLD ·MPROPCoefficient
β1 + β3Observations
Maratha Pradhan 0.44 (0.14)*** 0.83 (0.53) -0.59 (0.28)** -0.14 (0.19) 290
All Programs (2) -1.27 (0.59)** -2.22 (2.01) 2.02 (1.12)* 0.75 (0.75) 291
BPL Programs (2) -0.43 (0.21)** -0.35 (0.70) 0.77 (0.39)** 0.34 (0.26) 291
EGS (2) -0.08 (0.04)* 0.22 (0.21) 0.21 (0.11)** 0.14 (0.08) 291
Income Programs (2) -1.25 (0.55)** -2.17 (1.91) 2.12 (1.05)** 0.86 (0.70) 291
Non-Income Programs (2) -0.02 (0.05) -0.05 (0.18) -0.10 (0.11) -0.11 (0.07) 291
Revenue (1) -188.1 (112.7)* 165.0 (328.3) 146.8 (276.4) -41.3 (233.7) 220
Revenue (2) -13.1 (6.7)*** -20.6 (31.1) 30.2 (12.8)*** 17.1 (7.0)*** 307
Expenditure -12.6 (6.6)** -17.6 (31.1) 29.0 (12.6)** 16.4 (6.8)** 307
Meetings (AES) -1.2 (1.1) 5.9 (4.2) -0.4 (2.1) -1.6 (1.5) 289
Notes: All estimations include village-level controls (presence of river/canal, distance to natural water sources, distance to
railways and national roads, soil quality measures, proportion of the population that is SC/ST, and total village population)
and regional fixed effects. The estimations also include interaction terms between each of these village-level controls and
MPROP . A single asterix denotes significance at the 10% level, double for 5%, and triple for 1%. Robust standard errors are
in parentheses. Acronyms used are: Maratha land dominated (MLD); Maratha popluation proportion (MPROP ); Below
Poverty Line (BPL); Employment Guarantee Scheme (EGS); and Average Effect Size (AES). Programs (2); BPL Programs
(2); EGS (2), Income Programs (2), and Non-Income Programs (2) are village level variables defined as in the notes to Table
2. Revenue (1) refers to data collected from the balance sheets (covers last 24 months) submitted by the GPs (obtained using
RTI Act). Revenue (2) and Expenditure are annual per capita values from the 2001 Village Census. Meetings (AES) is the
estimated average effect size of the three variables: BDO Meetings, DC Meetings, and MP Meetings as defined in the notes to
Table 2.
50
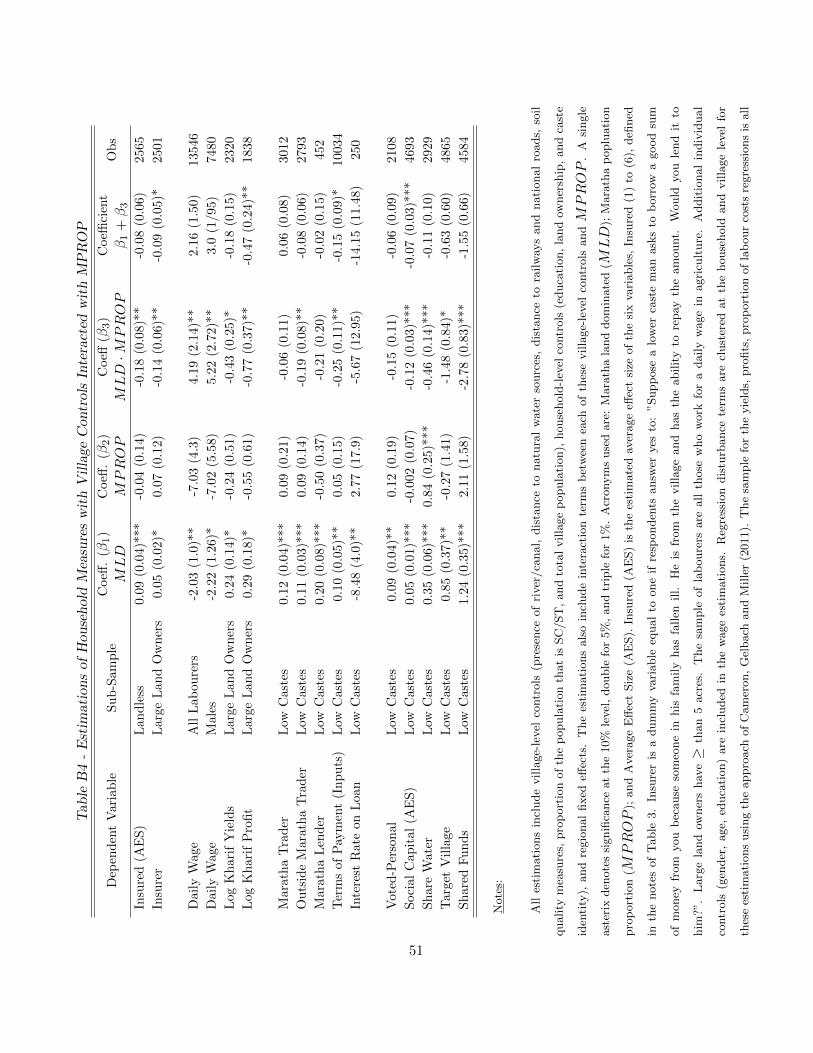
Tab
leB4
-Estim
ationsof
Hou
seholdMeasureswithVillage
Con
trolsInteracted
withMPROP
Dep
end
ent
Var
iab
leS
ub
-Sam
ple
Coeff
.(β
1)
MLD
Coeff
.(β
2)
MPROP
Coeff
(β3)
MLD·M
PROP
Coeffi
cien
t
β1
+β3
Ob
s
Insu
red
(AE
S)
Lan
dle
ss0.0
9(0
.04)*
**
-0.0
4(0
.14)
-0.1
8(0
.08)*
*-0
.08
(0.0
6)
2565
Insu
rer
Lar
geL
and
Ow
ner
s0.0
5(0
.02)*
0.0
7(0
.12)
-0.1
4(0
.06)*
*-0
.09
(0.0
5)*
2501
Dai
lyW
age
All
Lab
oure
rs-2
.03
(1.0
)**
-7.0
3(4
.3)
4.1
9(2
.14)*
*2.1
6(1
.50)
13546
Dai
lyW
age
Mal
es-2
.22
(1.2
6)*
-7.0
2(5
.58)
5.2
2(2
.72)*
*3.0
(1/95)
7480
Log
Kh
arif
Yie
lds
Lar
geL
and
Ow
ner
s0.2
4(0
.14)*
-0.2
4(0
.51)
-0.4
3(0
.25)*
-0.1
8(0
.15)
2320
Log
Kh
arif
Pro
fit
Lar
geL
and
Ow
ner
s0.2
9(0
.18)*
-0.5
5(0
.61)
-0.7
7(0
.37)*
*-0
.47
(0.2
4)*
*1838
Mar
ath
aT
rad
erL
owC
aste
s0.1
2(0
.04)*
**
0.0
9(0
.21)
-0.0
6(0
.11)
0.0
6(0
.08)
3012
Ou
tsid
eM
arat
ha
Tra
der
Low
Cas
tes
0.1
1(0
.03)*
**
0.0
9(0
.14)
-0.1
9(0
.08)*
*-0
.08
(0.0
6)
2793
Mar
ath
aL
end
erL
owC
aste
s0.2
0(0
.08)*
**
-0.5
0(0
.37)
-0.2
1(0
.20)
-0.0
2(0
.15)
452
Ter
ms
ofP
aym
ent
(In
pu
ts)
Low
Cas
tes
0.1
0(0
.05)*
*0.0
5(0
.15)
-0.2
5(0
.11)*
*-0
.15
(0.0
9)*
10034
Inte
rest
Rat
eon
Loa
nL
owC
aste
s-8
.48
(4.0
)**
2.7
7(1
7.9
)-5
.67
(12.9
5)
-14.1
5(1
1.4
8)
250
Vot
ed-P
erso
nal
Low
Cas
tes
0.0
9(0
.04)*
*0.1
2(0
.19)
-0.1
5(0
.11)
-0.0
6(0
.09)
2108
Soci
alC
apit
al(A
ES
)L
owC
aste
s0.0
5(0
.01)*
**
-0.0
02
(0.0
7)
-0.1
2(0
.03)*
**
-0.0
7(0
.03)*
**
4693
Sh
are
Wat
erL
owC
aste
s0.3
5(0
.06)*
**
0.8
4(0
.25)*
**
-0.4
6(0
.14)*
**
-0.1
1(0
.10)
2929
Tar
get
Vil
lage
Low
Cas
tes
0.8
5(0
.37)*
*-0
.27
(1.4
1)
-1.4
8(0
.84)*
-0.6
3(0
.60)
4865
Sh
ared
Fu
nd
sL
owC
aste
s1.2
4(0
.35)*
**
2.1
1(1
.58)
-2.7
8(0
.83)*
**
-1.5
5(0
.66)
4584
Note
s:
All
esti
mati
ons
incl
ude
villa
ge-
level
contr
ols
(pre
sence
of
river
/ca
nal,
dis
tance
tonatu
ral
wate
rso
urc
es,
dis
tance
tora
ilw
ays
and
nati
onal
roads,
soil
quality
mea
sure
s,pro
port
ion
of
the
popula
tion
that
isSC
/ST
,and
tota
lvilla
ge
popula
tion),
house
hold
-lev
elco
ntr
ols
(educa
tion,
land
owner
ship
,and
cast
e
iden
tity
),and
regio
nal
fixed
effec
ts.
The
esti
mati
ons
als
oin
clude
inte
ract
ion
term
sb
etw
een
each
of
thes
evilla
ge-
level
contr
ols
andMPROP
.A
single
ast
erix
den
ote
ssi
gnifi
cance
at
the
10%
level
,double
for
5%
,and
trip
lefo
r1%
.A
cronym
suse
dare
:M
ara
tha
land
dom
inate
d(M
LD
);M
ara
tha
poplu
ati
on
pro
port
ion
(MPROP
);and
Aver
age
Eff
ect
Siz
e(A
ES).
Insu
red
(AE
S)
isth
ees
tim
ate
dav
erage
effec
tsi
zeof
the
six
vari
able
s,In
sure
d(1
)to
(6),
defi
ned
inth
enote
sof
Table
3.
Insu
rer
isa
dum
my
vari
able
equal
toone
ifre
sponden
tsansw
eryes
to:
”Supp
ose
alo
wer
cast
em
an
ask
sto
borr
owa
good
sum
of
money
from
you
bec
ause
som
eone
inhis
fam
ily
has
fallen
ill.
He
isfr
om
the
villa
ge
and
has
the
abilit
yto
repay
the
am
ount.
Would
you
lend
itto
him
?”.
Larg
ela
nd
owner
shav
e≥
than
5acr
es.
The
sam
ple
of
lab
oure
rsare
all
those
who
work
for
adaily
wage
inagri
cult
ure
.A
ddit
ional
indiv
idual
contr
ols
(gen
der
,age,
educa
tion)
are
incl
uded
inth
ew
age
esti
mati
ons.
Reg
ress
ion
dis
turb
ance
term
sare
clust
ered
at
the
house
hold
and
villa
ge
level
for
thes
ees
tim
ati
ons
usi
ng
the
appro
ach
of
Cam
eron,
Gel
bach
and
Mille
r(2
011).
The
sam
ple
for
the
yie
lds,
pro
fits
,pro
port
ion
of
lab
our
cost
sre
gre
ssio
ns
isall
51
larg
ecu
ltiv
ato
rs(>
5acr
esof
land).
All
mea
sure
sare
per
acr
eof
land.
Khari
fyie
lds
are
the
tota
lva
lue
of
outp
ut
per
acr
eof
land
for
agiv
encr
op,
sum
med
over
all
of
the
khari
fcr
ops
for
each
house
hold
.K
hari
fpro
fit
isyie
lds
net
of
input
cost
s(s
eeds,
fert
iliz
er,
irri
gati
on,
elec
tric
ity,
pes
tici
des
,and
lab
our)
.
Work
ers
incl
ude
part
ime
and
fullti
me,
sam
ere
sult
shel
dif
rest
rict
edours
elves
tofu
llti
me
work
ers.
Ad
dit
ion
al
crop
contr
ols
are
incl
ud
edin
the
yie
lds
and
pro
fits
esti
mat
ion
s.M
ara
tha
Tra
der
iseq
ual
toone
ifth
ehouse
hold
has
traded
wit
ha
Mara
tha
for
any
tradea
ble
good
(whic
hin
cludes
agri
cult
ura
l
inputs
and
outp
uts
,fa
rmen
terp
rise
and
non-f
arm
ente
rpri
segoods)
condit
ional
on
tradin
ggoods.
Outs
ide
Mara
tha
Tra
der
refe
rsto
the
trader
resi
din
g
outs
ide
of
the
villa
ge
condit
ional
on
tradin
ggoods.
Mara
tha
Len
der
refe
rsto
borr
owin
gm
oney
from
aM
ara
tha.
Thes
ees
tim
ati
ons
on
Mara
tha
tradin
g
rela
tionsh
ips
are
pro
bit
esti
mati
ons,
wher
eth
eco
effici
ents
rep
ort
edare
the
part
ial
der
ivate
sof
the
pre
dic
ted
pro
babilit
y.T
erm
sof
pay
men
tsis
an
index
vari
able
equal
to0
ifth
etr
ader
requir
esadva
nce
dpay
men
ts;
1if
full
pay
men
tis
requir
edat
the
tim
eof
sale
;and
2if
inst
ead
pay
men
tin
inst
allm
ents
is
acc
epta
ble
.T
hes
eare
ord
ered
pro
bit
esti
mati
ons.
Vote
d-
Per
sonal
equals
toone
ifth
ehoush
old
vote
dfo
ra
candid
ate
due
toa
per
sonel
connec
tion
rath
er
than
due
toth
ech
ara
cter
isti
csof
the
candid
ate
(hones
ty,
good
reputa
tion,
qualifica
tions)
.Sam
ple
sare
condit
ional
on
voti
ng.
The
sam
ple
of
low
cast
esin
the
voti
ng
regre
ssio
ns
isSC
/ST
s.Soci
al
Capit
al
(AE
S)
isth
ees
tim
ate
dav
erage
effec
tsi
zeof
the
six
vari
able
s:T
rust
,N
oC
hea
t,R
epair
,D
onate
dC
ash
,
Donate
dL
ab
our,
and
Agre
eas
defi
ned
inth
enote
sof
Table
5.
Targ
etV
illa
ge
refe
rsto
GP
funds
should
be
targ
eted
toth
evilla
ge
as
aw
hole
,co
mpare
dto
poor
or
low
cast
ein
div
iduals
.Share
dfu
nds
refe
rsto
GP
funds
are
share
dacr
oss
the
villa
ge
(e.g
.fo
rdev
elopm
ent
pro
ject
s;public
goods)
com
pare
dto
goin
g
dir
ectl
yto
the
poor
or
low
statu
s;th
eri
chand
hig
hst
atu
s;or
toG
Pm
emb
ers
or
oth
ergov
ernm
ent
offi
cials
dir
ectl
y.T
hes
etw
oes
tim
ati
ons
are
esti
mate
d
as
mult
inom
ial
logit
model
s.
52
8.3 Estimations with Maratha Land Holdings
We now report the results from analagous regressions to those estimated in the paper. Here, instead of using
a binary variable, MLD which equals 1 if Marathas are the land dominant group, and 0 otherwise, as we
did in the paper, we use an alternative source of information on Maratha land holdings from our household
surveys. From these 30 households per village we obtain an estimate of the overall proportion of village
lands held by Marathas M̃LD ∈ [0, 1] for each village. Refer to Section 10.1 in Appendix D for more details
on this variable.
These estimation results are reported in Tables B5 and B6 below. Importantly, the main results discussed
in the paper all go through as well in these alternative estimations.
53
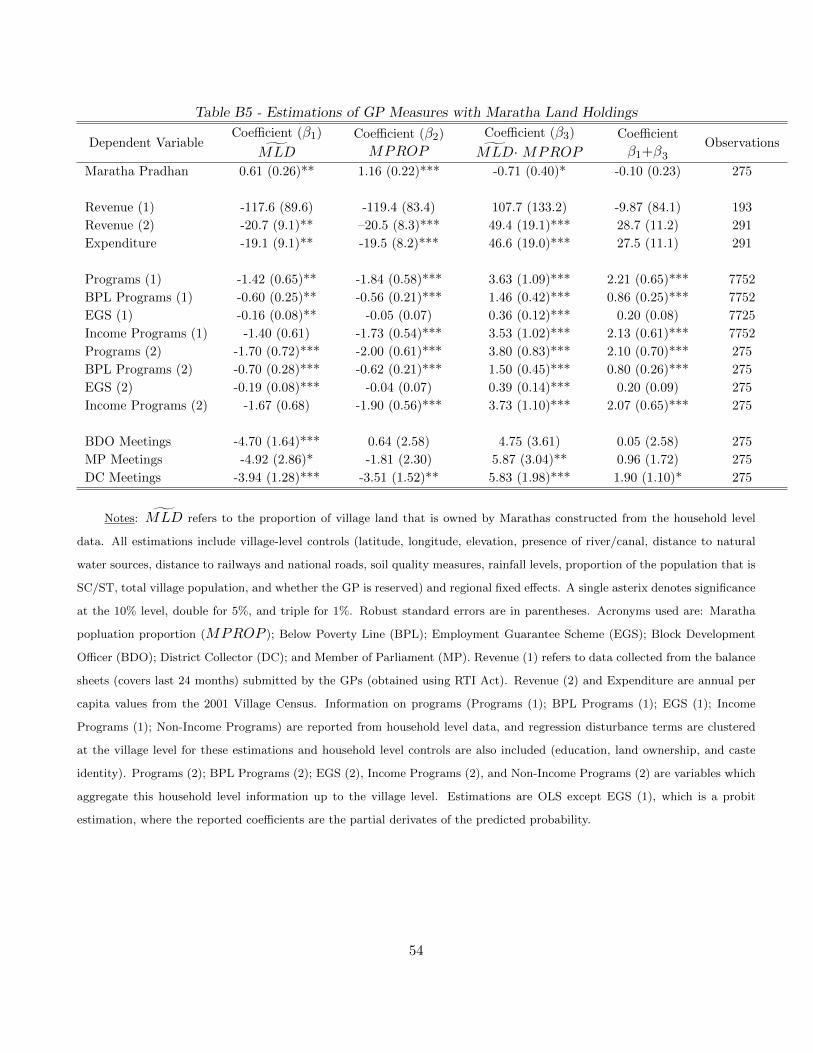
Table B5 - Estimations of GP Measures with Maratha Land Holdings
Dependent VariableCoefficient (β1)
M̃LD
Coefficient (β2)
MPROP
Coefficient (β3)
M̃LD· MPROP
Coefficient
β1+β3Observations
Maratha Pradhan 0.61 (0.26)** 1.16 (0.22)*** -0.71 (0.40)* -0.10 (0.23) 275
Revenue (1) -117.6 (89.6) -119.4 (83.4) 107.7 (133.2) -9.87 (84.1) 193
Revenue (2) -20.7 (9.1)** –20.5 (8.3)*** 49.4 (19.1)*** 28.7 (11.2) 291
Expenditure -19.1 (9.1)** -19.5 (8.2)*** 46.6 (19.0)*** 27.5 (11.1) 291
Programs (1) -1.42 (0.65)** -1.84 (0.58)*** 3.63 (1.09)*** 2.21 (0.65)*** 7752
BPL Programs (1) -0.60 (0.25)** -0.56 (0.21)*** 1.46 (0.42)*** 0.86 (0.25)*** 7752
EGS (1) -0.16 (0.08)** -0.05 (0.07) 0.36 (0.12)*** 0.20 (0.08) 7725
Income Programs (1) -1.40 (0.61) -1.73 (0.54)*** 3.53 (1.02)*** 2.13 (0.61)*** 7752
Programs (2) -1.70 (0.72)*** -2.00 (0.61)*** 3.80 (0.83)*** 2.10 (0.70)*** 275
BPL Programs (2) -0.70 (0.28)*** -0.62 (0.21)*** 1.50 (0.45)*** 0.80 (0.26)*** 275
EGS (2) -0.19 (0.08)*** -0.04 (0.07) 0.39 (0.14)*** 0.20 (0.09) 275
Income Programs (2) -1.67 (0.68) -1.90 (0.56)*** 3.73 (1.10)*** 2.07 (0.65)*** 275
BDO Meetings -4.70 (1.64)*** 0.64 (2.58) 4.75 (3.61) 0.05 (2.58) 275
MP Meetings -4.92 (2.86)* -1.81 (2.30) 5.87 (3.04)** 0.96 (1.72) 275
DC Meetings -3.94 (1.28)*** -3.51 (1.52)** 5.83 (1.98)*** 1.90 (1.10)* 275
Notes: M̃LD refers to the proportion of village land that is owned by Marathas constructed from the household level
data. All estimations include village-level controls (latitude, longitude, elevation, presence of river/canal, distance to natural
water sources, distance to railways and national roads, soil quality measures, rainfall levels, proportion of the population that is
SC/ST, total village population, and whether the GP is reserved) and regional fixed effects. A single asterix denotes significance
at the 10% level, double for 5%, and triple for 1%. Robust standard errors are in parentheses. Acronyms used are: Maratha
popluation proportion (MPROP ); Below Poverty Line (BPL); Employment Guarantee Scheme (EGS); Block Development
Officer (BDO); District Collector (DC); and Member of Parliament (MP). Revenue (1) refers to data collected from the balance
sheets (covers last 24 months) submitted by the GPs (obtained using RTI Act). Revenue (2) and Expenditure are annual per
capita values from the 2001 Village Census. Information on programs (Programs (1); BPL Programs (1); EGS (1); Income
Programs (1); Non-Income Programs) are reported from household level data, and regression disturbance terms are clustered
at the village level for these estimations and household level controls are also included (education, land ownership, and caste
identity). Programs (2); BPL Programs (2); EGS (2), Income Programs (2), and Non-Income Programs (2) are variables which
aggregate this household level information up to the village level. Estimations are OLS except EGS (1), which is a probit
estimation, where the reported coefficients are the partial derivates of the predicted probability.
54
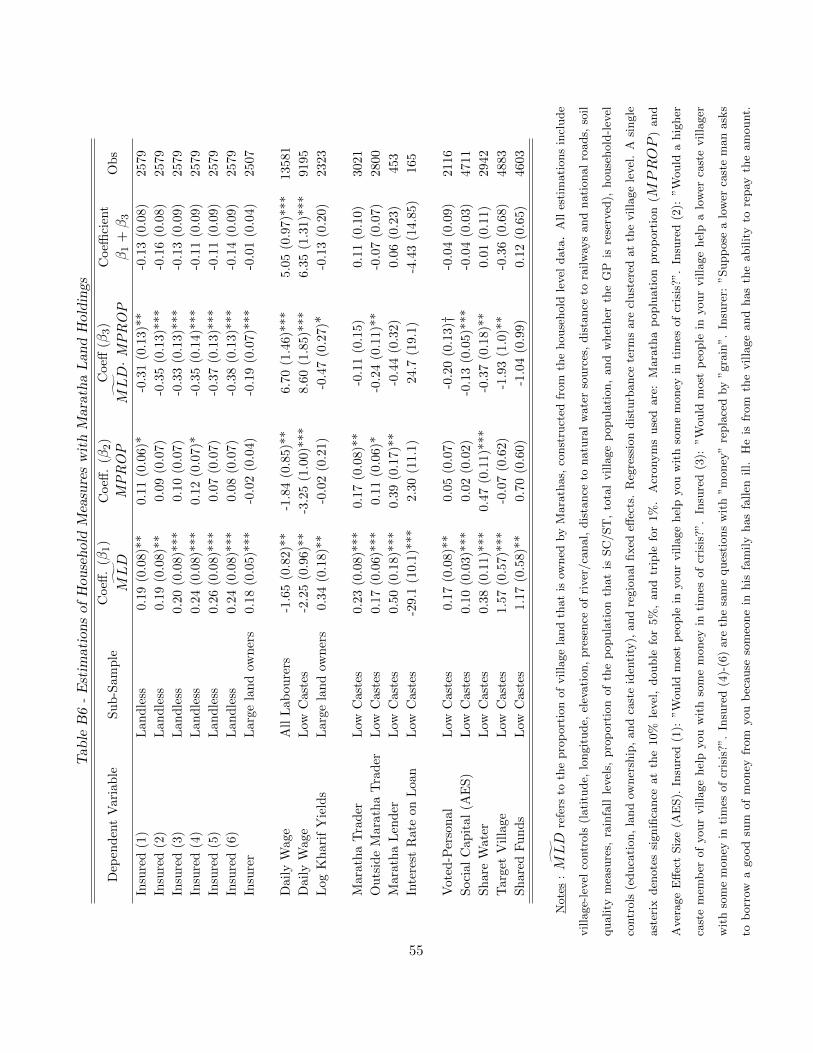
Table
B6
-Estim
ationsof
Hou
seholdMeasureswithMarathaLandHoldings
Dep
end
ent
Var
iab
leSu
b-S
amp
leC
oeff
.(β
1)
M̃LD
Coeff
.(β
2)
MP
RO
P
Coeff
(β3)
M̃LD·M
PR
OP
Coeffi
cien
t
β1
+β3
Ob
s
Insu
red
(1)
Lan
dle
ss0.1
9(0
.08)*
*0.1
1(0
.06)*
-0.3
1(0
.13)*
*-0
.13
(0.0
8)
2579
Insu
red
(2)
Lan
dle
ss0.1
9(0
.08)*
*0.0
9(0
.07)
-0.3
5(0
.13)*
**
-0.1
6(0
.08)
2579
Insu
red
(3)
Lan
dle
ss0.2
0(0
.08)*
**
0.1
0(0
.07)
-0.3
3(0
.13)*
**
-0.1
3(0
.09)
2579
Insu
red
(4)
Lan
dle
ss0.2
4(0
.08)*
**
0.1
2(0
.07)*
-0.3
5(0
.14)*
**
-0.1
1(0
.09)
2579
Insu
red
(5)
Lan
dle
ss0.2
6(0
.08)*
**
0.0
7(0
.07)
-0.3
7(0
.13)*
**
-0.1
1(0
.09)
2579
Insu
red
(6)
Lan
dle
ss0.2
4(0
.08)*
**
0.0
8(0
.07)
-0.3
8(0
.13)*
**
-0.1
4(0
.09)
2579
Insu
rer
Lar
gela
nd
own
ers
0.1
8(0
.05)*
**
-0.0
2(0
.04)
-0.1
9(0
.07)*
**
-0.0
1(0
.04)
2507
Dai
lyW
age
All
Lab
oure
rs-1
.65
(0.8
2)*
*-1
.84
(0.8
5)*
*6.7
0(1
.46)*
**
5.0
5(0
.97)*
**
13581
Dai
lyW
age
Low
Cas
tes
-2.2
5(0
.96)*
*-3
.25
(1.0
0)*
**
8.6
0(1
.85)*
**
6.3
5(1
.31)*
**
9195
Log
Kh
arif
Yie
lds
Lar
gela
nd
own
ers
0.3
4(0
.18)*
*-0
.02
(0.2
1)
-0.4
7(0
.27)*
-0.1
3(0
.20)
2323
Mar
ath
aT
rad
erL
owC
aste
s0.2
3(0
.08)*
**
0.1
7(0
.08)*
*-0
.11
(0.1
5)
0.1
1(0
.10)
3021
Ou
tsid
eM
arat
ha
Tra
der
Low
Cas
tes
0.1
7(0
.06)*
**
0.1
1(0
.06)*
-0.2
4(0
.11)*
*-0
.07
(0.0
7)
2800
Mar
ath
aL
end
erL
owC
aste
s0.5
0(0
.18)*
**
0.3
9(0
.17)*
*-0
.44
(0.3
2)
0.0
6(0
.23)
453
Inte
rest
Rat
eon
Loa
nL
owC
aste
s-2
9.1
(10.1
)***
2.3
0(1
1.1
)24.
7(1
9.1
)-4
.43
(14.8
5)
165
Vot
ed-P
erso
nal
Low
Cas
tes
0.1
7(0
.08)*
*0.0
5(0
.07)
-0.2
0(0
.13)†
-0.0
4(0
.09)
2116
Soci
alC
apit
al(A
ES
)L
owC
aste
s0.1
0(0
.03)*
**
0.0
2(0
.02)
-0.1
3(0
.05)*
**
-0.0
4(0
.03)
4711
Sh
are
Wat
erL
owC
aste
s0.3
8(0
.11)*
**
0.4
7(0
.11)*
**
-0.3
7(0
.18)*
*0.0
1(0
.11)
2942
Tar
get
Vil
lage
Low
Cas
tes
1.5
7(0
.57)*
**
-0.0
7(0
.62)
-1.9
3(1
.0)*
*-0
.36
(0.6
8)
4883
Sh
ared
Fu
nd
sL
owC
aste
s1.1
7(0
.58)*
*0.7
0(0
.60)
-1.0
4(0
.99)
0.1
2(0
.65)
4603
Note
s:M̃LD
refe
rsto
the
pro
port
ion
of
villa
ge
land
that
isow
ned
by
Mara
thas,
const
ruct
edfr
om
the
house
hold
level
data
.A
lles
tim
ati
ons
incl
ude
villa
ge-
level
contr
ols
(lati
tude,
longit
ude,
elev
ati
on,
pre
sence
of
river
/ca
nal,
dis
tance
tonatu
ral
wate
rso
urc
es,
dis
tance
tora
ilw
ays
and
nati
onal
roads,
soil
quality
mea
sure
s,ra
infa
llle
vel
s,pro
port
ion
of
the
popula
tion
that
isSC
/ST
,to
tal
villa
ge
popula
tion,
and
whet
her
the
GP
isre
serv
ed),
house
hold
-lev
el
contr
ols
(educa
tion,
land
owner
ship
,and
cast
eid
enti
ty),
and
regio
nal
fixed
effec
ts.
Reg
ress
ion
dis
turb
ance
term
sare
clust
ered
at
the
villa
ge
level
.A
single
ast
erix
den
ote
ssi
gnifi
cance
at
the
10%
level
,double
for
5%
,and
trip
lefo
r1%
.A
cronym
suse
dare
:M
ara
tha
poplu
ati
on
pro
port
ion
(MPROP
)and
Aver
age
Eff
ect
Siz
e(A
ES).
Insu
red
(1):
”W
ould
most
peo
ple
inyour
villa
ge
hel
pyou
wit
hso
me
money
inti
mes
of
cris
is?”
.In
sure
d(2
):”W
ould
ahig
her
cast
em
emb
erof
your
villa
ge
hel
pyou
wit
hso
me
money
inti
mes
of
cris
is?”
.In
sure
d(3
):”W
ould
most
peo
ple
inyour
villa
ge
hel
pa
low
erca
ste
villa
ger
wit
hso
me
money
inti
mes
of
cris
is?”
.In
sure
d(4
)-(6
)are
the
sam
eques
tions
wit
h”m
oney
”re
pla
ced
by
”gra
in”.
Insu
rer:
”Supp
ose
alo
wer
cast
em
an
ask
s
tob
orr
owa
good
sum
of
money
from
you
bec
ause
som
eone
inhis
fam
ily
has
fallen
ill.
He
isfr
om
the
villa
ge
and
has
the
abilit
yto
repay
the
am
ount.
55
Would
you
lend
itto
him
?”.
Larg
ela
nd
owner
shav
e≥
than
5acr
es.
The
sam
ple
of
lab
oure
rsare
all
those
who
work
for
adaily
wage
inagri
cult
ure
.
Addit
ional
indiv
idual
contr
ols
(gen
der
,age,
educa
tion)
are
incl
uded
inth
ew
age
esti
mati
ons.
Reg
ress
ion
dis
turb
ance
term
sare
clust
ered
at
the
house
hold
and
villa
ge
level
for
thes
ees
tim
ati
ons
usi
ng
the
appro
ach
of
Cam
eron,
Gel
bach
and
Mille
r(2
011).
The
sam
ple
for
the
yie
lds
and
pro
fits
regre
ssio
ns
isall
larg
ecu
ltiv
ato
rs(>
5acr
esof
land).
All
mea
sure
sare
per
acr
eof
land.
Khari
fyie
lds
are
the
tota
lva
lue
of
outp
ut
per
acr
eof
land
for
agiv
encr
op,
sum
med
over
all
of
the
khari
fcr
ops
for
each
house
hold
.K
hari
fpro
fit
isyie
lds
net
of
input
cost
s(s
eeds,
fert
iliz
er,
irri
gati
on,
elec
tric
ity,
pes
tici
des
,and
lab
our)
.A
dd
itio
nal
crop
contr
ols
are
incl
ud
edin
the
yie
lds
an
dp
rofi
tses
tim
ati
on
s.M
ara
tha
Tra
der
iseq
ual
toone
ifth
ehouse
hold
has
traded
wit
h
aM
ara
tha
for
any
tradea
ble
good
(whic
hin
cludes
agri
cult
ura
lin
puts
and
outp
uts
,fa
rmen
terp
rise
and
non-f
arm
ente
rpri
segoods)
condit
ional
on
tradin
g
goods.
Outs
ide
Mara
tha
Tra
der
refe
rsto
the
trader
resi
din
gouts
ide
of
the
villa
ge
condit
ional
on
tradin
ggoods.
Mara
tha
Len
der
refe
rsto
borr
owin
gm
oney
from
aM
ara
tha.
Thes
ees
tim
ati
ons
on
Mara
tha
tradin
gre
lati
onsh
ips
are
pro
bit
esti
mati
ons,
wher
eth
eco
effici
ents
rep
ort
edare
the
part
ial
der
ivate
sof
the
pre
dic
ted
pro
babilit
y.T
erm
sof
pay
men
tsis
an
index
vari
able
equal
to0
ifth
etr
ader
requir
esadva
nce
dpay
men
ts;
1if
full
pay
men
tis
requir
edat
the
tim
e
of
sale
;and
2if
inst
ead
pay
men
tin
inst
allm
ents
isacc
epta
ble
.T
hes
eare
ord
ered
pro
bit
esti
mati
ons.
Vote
d-
Per
sonal
equals
toone
ifth
ehoush
old
vote
d
for
aca
ndid
ate
due
toa
per
sonel
connec
tion
rath
erth
an
due
toth
ech
ara
cter
isti
csof
the
candid
ate
(hones
ty,
good
reputa
tion,
qualifica
tions)
.Sam
ple
sare
condit
ional
on
voti
ng.
The
sam
ple
of
low
cast
esin
the
voti
ng
regre
ssio
ns
isSC
/ST
s.Soci
al
Capit
al
(AE
S)
isth
ees
tim
ate
dav
erage
effec
tsi
zeof
the
six
vari
able
s:T
rust
,N
oC
hea
t,R
epair
,D
onate
dC
ash
,D
onate
dL
ab
our,
and
Agre
eas
defi
ned
inth
enote
sof
Table
5.
Targ
etV
illa
ge
refe
rsto
GP
funds
should
be
targ
eted
toth
evilla
ge
as
aw
hole
,co
mpare
dto
poor
or
low
cast
ein
div
iduals
.Share
dfu
nds
refe
rsto
GP
funds
are
share
dacr
oss
the
villa
ge
(e.g
.fo
r
dev
elopm
ent
pro
ject
s;public
goods)
com
pare
dto
goin
gdir
ectl
yto
the
poor
or
low
statu
s;th
eri
chand
hig
hst
atu
s;or
toG
Pm
emb
ers
or
oth
ergov
ernm
ent
offi
cials
dir
ectl
y.T
hes
etw
oes
tim
ati
ons
are
esti
mate
das
mult
inom
ial
logit
model
s.
56
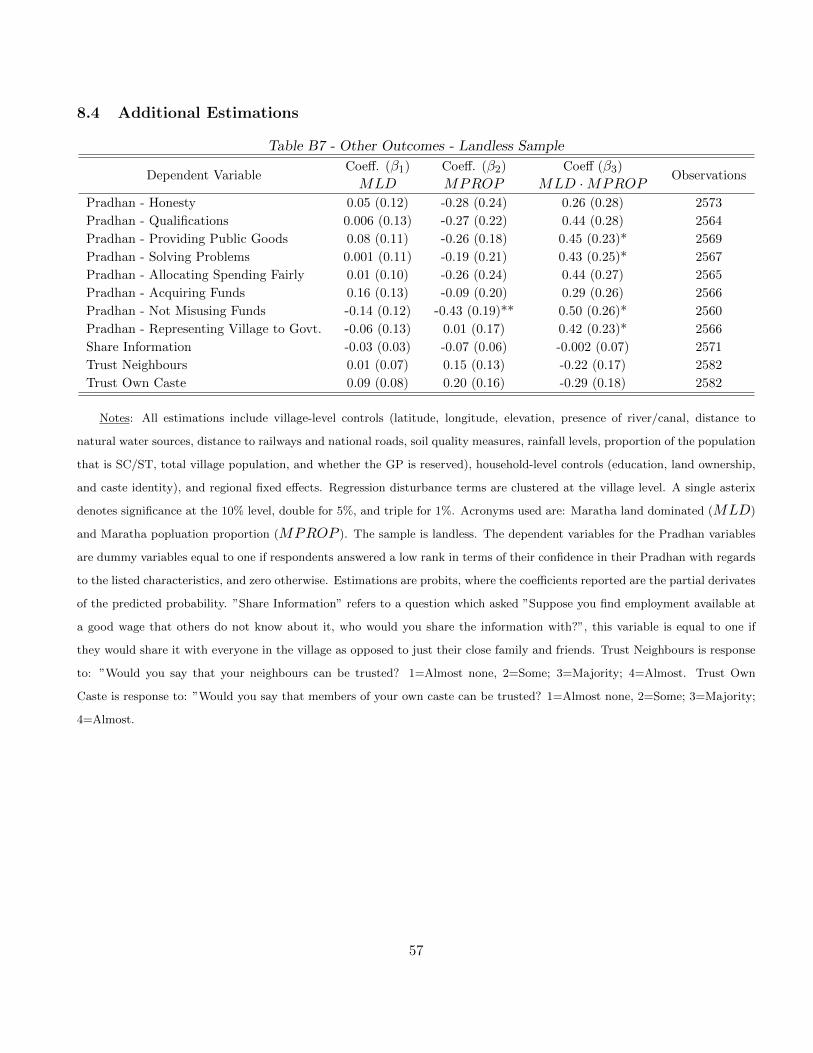
8.4 Additional Estimations
Table B7 - Other Outcomes - Landless Sample
Dependent VariableCoeff. (β1)
MLDCoeff. (β2)
MPROPCoeff (β3)
MLD ·MPROPObservations
Pradhan - Honesty 0.05 (0.12) -0.28 (0.24) 0.26 (0.28) 2573
Pradhan - Qualifications 0.006 (0.13) -0.27 (0.22) 0.44 (0.28) 2564
Pradhan - Providing Public Goods 0.08 (0.11) -0.26 (0.18) 0.45 (0.23)* 2569
Pradhan - Solving Problems 0.001 (0.11) -0.19 (0.21) 0.43 (0.25)* 2567
Pradhan - Allocating Spending Fairly 0.01 (0.10) -0.26 (0.24) 0.44 (0.27) 2565
Pradhan - Acquiring Funds 0.16 (0.13) -0.09 (0.20) 0.29 (0.26) 2566
Pradhan - Not Misusing Funds -0.14 (0.12) -0.43 (0.19)** 0.50 (0.26)* 2560
Pradhan - Representing Village to Govt. -0.06 (0.13) 0.01 (0.17) 0.42 (0.23)* 2566
Share Information -0.03 (0.03) -0.07 (0.06) -0.002 (0.07) 2571
Trust Neighbours 0.01 (0.07) 0.15 (0.13) -0.22 (0.17) 2582
Trust Own Caste 0.09 (0.08) 0.20 (0.16) -0.29 (0.18) 2582
Notes: All estimations include village-level controls (latitude, longitude, elevation, presence of river/canal, distance to
natural water sources, distance to railways and national roads, soil quality measures, rainfall levels, proportion of the population
that is SC/ST, total village population, and whether the GP is reserved), household-level controls (education, land ownership,
and caste identity), and regional fixed effects. Regression disturbance terms are clustered at the village level. A single asterix
denotes significance at the 10% level, double for 5%, and triple for 1%. Acronyms used are: Maratha land dominated (MLD)
and Maratha popluation proportion (MPROP ). The sample is landless. The dependent variables for the Pradhan variables
are dummy variables equal to one if respondents answered a low rank in terms of their confidence in their Pradhan with regards
to the listed characteristics, and zero otherwise. Estimations are probits, where the coefficients reported are the partial derivates
of the predicted probability. ”Share Information” refers to a question which asked ”Suppose you find employment available at
a good wage that others do not know about it, who would you share the information with?”, this variable is equal to one if
they would share it with everyone in the village as opposed to just their close family and friends. Trust Neighbours is response
to: ”Would you say that your neighbours can be trusted? 1=Almost none, 2=Some; 3=Majority; 4=Almost. Trust Own
Caste is response to: ”Would you say that members of your own caste can be trusted? 1=Almost none, 2=Some; 3=Majority;
4=Almost.
57
9 Appendix C: Additional Theoretical Results
9.1 Explicit Treatment of State Contingent Transfers
Instead of modeling the value of insurance in expected value, suppose instead that there are two possible
states; a normal state with consumption valued at 1, and a state of need where a worker’s marginal valuation
of consumption is φ > 1. Suppose the need state arises with probability µ. It is drawn each period
independently from a distribution common to all workers. An insurance promise from a landlord, i, to a
worker, j, is a commitment by the landlord to a transfer of Sji in the worker’s need state. Such a state
is observable to both landlords and workers but not enforceable by formal/legal mechanisms. Under the
assumption that µ · φ = 1, the analysis exactly yields the equations in the body of the paper. Relaxing this
assumption will imply that the parameters φ and µ enter into the interpretation of the estimated coefficients.
But since we restrict intepretation of coefficients in terms of model parameters to sign implications, the way
the model is interpreted is invariant to relaxing this normalization.
9.2 Wages and Yields Affected by Programs and EGS
Most landless individuals sell their labor to large landowners. Most large landowners have as their largest
input cost labor. The way labor relations work in these villages is that the landless people or small landhold-
ers who rely mainly on labor income for their livelihood typically work on the farm of a large landowner in
a permanent or semi-permanent capacity. Much of what workers need to do can only be partly or very im-
perfectly supervised, suggesting that asymmetries of information in production may arise. Such permanent
working arrangements are coveted by workers, and though there is a spot market for some labor, it seems
that workers prefer the permanent working arrangements greatly. The threat of losing such employment dis-
ciplines the use of discretionary effort. For individuals primarily relying on labor income for their livelihood
the threat of employment loss, which would send them into poverty, provides great incentive for them to
keep contributing un- or partially monitored discretionary effort in their employment on large landholders
farms. Large landholders grow various crops and their labor needs, timing of application, and other inputs
use are largely fixed through the crop cycle. However, the quality of crop obtained depends critically on
good labor input and diligence through the production process.
These ingredients suggest an efficiency wage model. Workers are required, by the implicit contract of
the landlord, to provide e∗ units of labor effort and receive a wage w∗. Landlords imperfectly ascertain, ex
post, the effort contribution of their worker and decide whether to rehire them in the next period, or dismiss
them from their employ. Since production is largely of a fixed factor variety, we can for simplicity simply
characterize the optimal incentive compatible contract (e∗, w∗) offered to each worker by the landlord while
letting the landlord’s landholding and crop choice (which is a function of the conditions) determine the
number of workers required.
In this sort of labor market, even though much of the year sees labor only partially employed or un-
58
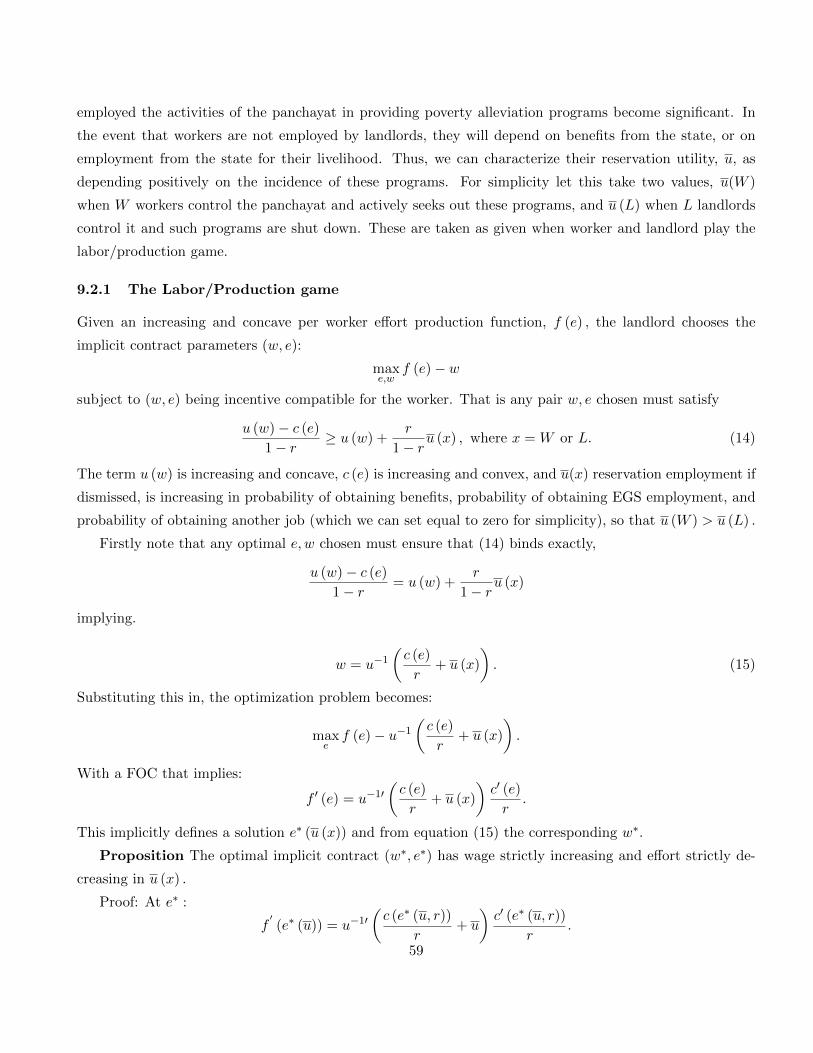
employed the activities of the panchayat in providing poverty alleviation programs become significant. In
the event that workers are not employed by landlords, they will depend on benefits from the state, or on
employment from the state for their livelihood. Thus, we can characterize their reservation utility, u, as
depending positively on the incidence of these programs. For simplicity let this take two values, u(W )
when W workers control the panchayat and actively seeks out these programs, and u (L) when L landlords
control it and such programs are shut down. These are taken as given when worker and landlord play the
labor/production game.
9.2.1 The Labor/Production game
Given an increasing and concave per worker effort production function, f (e) , the landlord chooses the
implicit contract parameters (w, e):
maxe,w
f (e)− w
subject to (w, e) being incentive compatible for the worker. That is any pair w, e chosen must satisfy
u (w)− c (e)
1− r≥ u (w) +
r
1− ru (x) , where x = W or L. (14)
The term u (w) is increasing and concave, c (e) is increasing and convex, and u(x) reservation employment if
dismissed, is increasing in probability of obtaining benefits, probability of obtaining EGS employment, and
probability of obtaining another job (which we can set equal to zero for simplicity), so that u (W ) > u (L) .
Firstly note that any optimal e, w chosen must ensure that (14) binds exactly,
u (w)− c (e)
1− r= u (w) +
r
1− ru (x)
implying.
w = u−1(c (e)
r+ u (x)
). (15)
Substituting this in, the optimization problem becomes:
maxef (e)− u−1
(c (e)
r+ u (x)
).
With a FOC that implies:
f ′ (e) = u−1′(c (e)
r+ u (x)
)c′ (e)
r.
This implicitly defines a solution e∗ (u (x)) and from equation (15) the corresponding w∗.
Proposition The optimal implicit contract (w∗, e∗) has wage strictly increasing and effort strictly de-
creasing in u (x) .
Proof: At e∗ :
f′(e∗ (u)) = u−1′
(c (e∗ (u, r))
r+ u
)c′ (e∗ (u, r))
r.
59
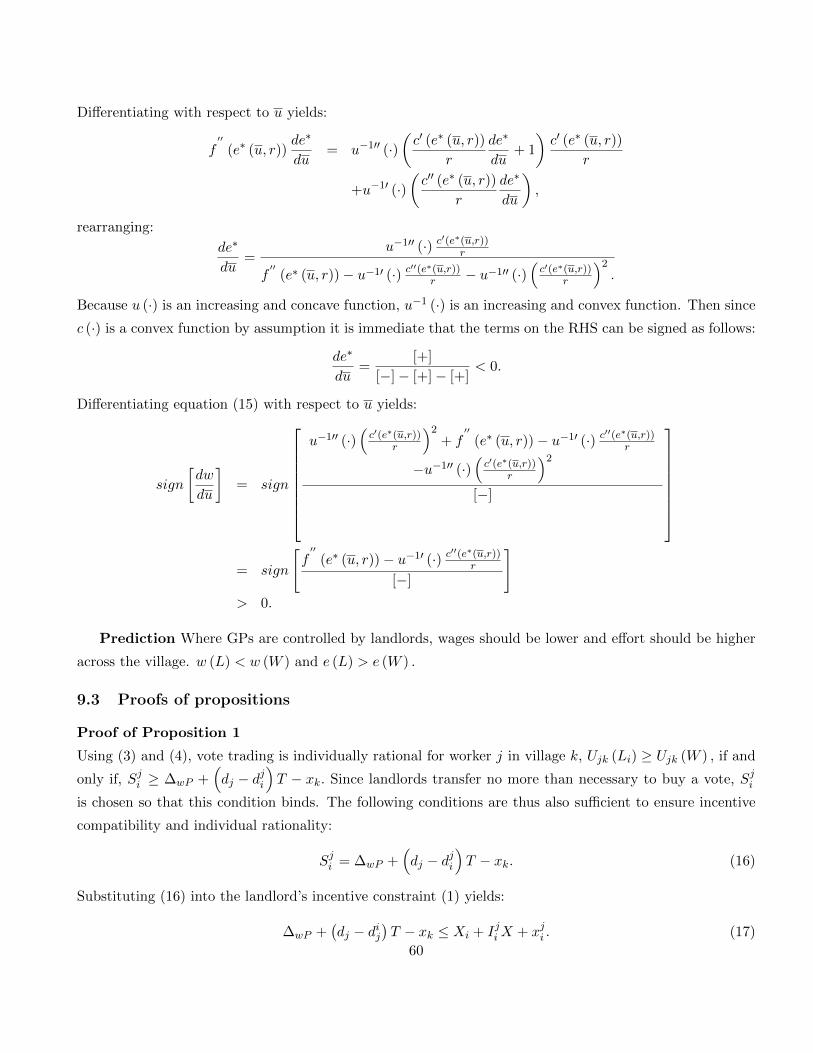
Differentiating with respect to u yields:
f′′
(e∗ (u, r))de∗
du= u−1′′ (·)
(c′ (e∗ (u, r))
r
de∗
du+ 1
)c′ (e∗ (u, r))
r
+u−1′ (·)(c′′ (e∗ (u, r))
r
de∗
du
),
rearranging:
de∗
du=
u−1′′ (·) c′(e∗(u,r))r
f′′
(e∗ (u, r))− u−1′ (·) c′′(e∗(u,r))r − u−1′′ (·)
(c′(e∗(u,r))
r
)2.
Because u (·) is an increasing and concave function, u−1 (·) is an increasing and convex function. Then since
c (·) is a convex function by assumption it is immediate that the terms on the RHS can be signed as follows:
de∗
du=
[+]
[−]− [+]− [+]< 0.
Differentiating equation (15) with respect to u yields:
sign
[dw
du
]= sign
u−1′′ (·)(c′(e∗(u,r))
r
)2+ f
′′(e∗ (u, r))− u−1′ (·) c′′(e∗(u,r))
r
−u−1′′ (·)(c′(e∗(u,r))
r
)2[−]
= sign
[f′′
(e∗ (u, r))− u−1′ (·) c′′(e∗(u,r))r
[−]
]> 0.
Prediction Where GPs are controlled by landlords, wages should be lower and effort should be higher
across the village. w (L) < w (W ) and e (L) > e (W ) .
9.3 Proofs of propositions
Proof of Proposition 1
Using (3) and (4), vote trading is individually rational for worker j in village k, Ujk (Li) ≥ Ujk (W ) , if and
only if, Sji ≥ ∆wP +
(dj − dji
)T − xk. Since landlords transfer no more than necessary to buy a vote, Sj
i
is chosen so that this condition binds. The following conditions are thus also sufficient to ensure incentive
compatibility and individual rationality:
Sji = ∆wP +
(dj − dji
)T − xk. (16)
Substituting (16) into the landlord’s incentive constraint (1) yields:
∆wP +(dj − dij
)T − xk ≤ Xi + IjiX + xji . (17)
60
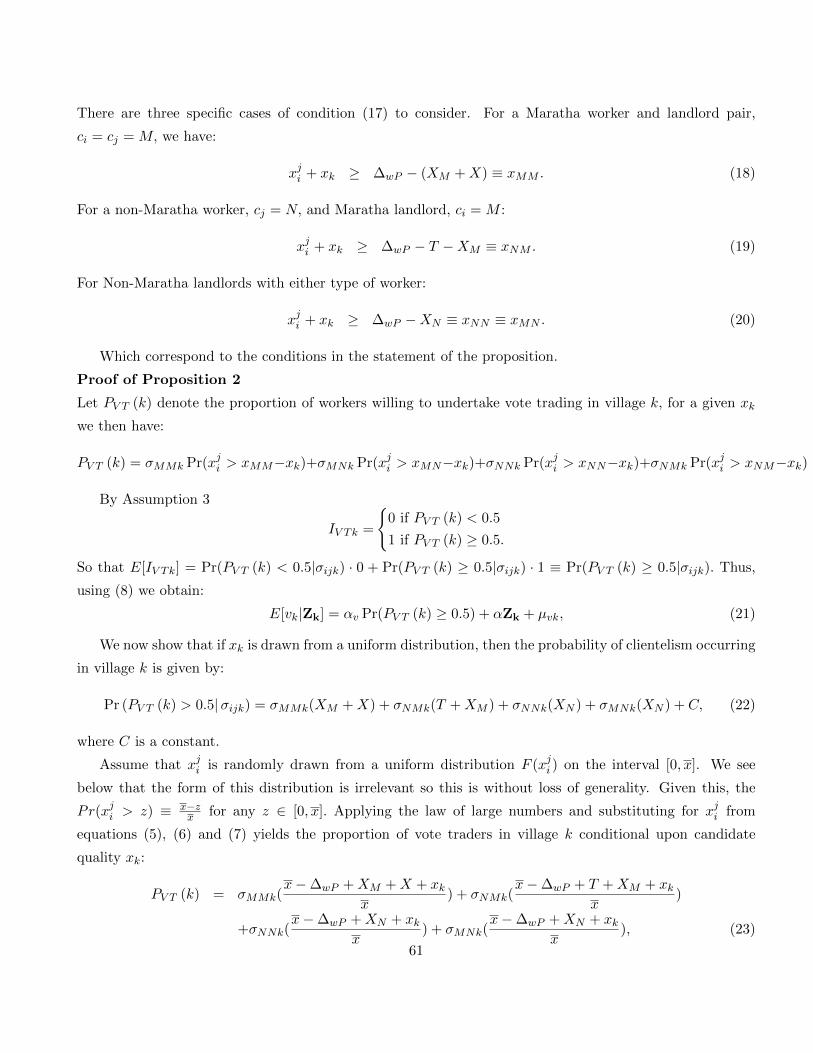
There are three specific cases of condition (17) to consider. For a Maratha worker and landlord pair,
ci = cj = M, we have:
xji + xk ≥ ∆wP − (XM +X) ≡ xMM . (18)
For a non-Maratha worker, cj = N, and Maratha landlord, ci = M :
xji + xk ≥ ∆wP − T −XM ≡ xNM . (19)
For Non-Maratha landlords with either type of worker:
xji + xk ≥ ∆wP −XN ≡ xNN ≡ xMN . (20)
Which correspond to the conditions in the statement of the proposition.
Proof of Proposition 2
Let PV T (k) denote the proportion of workers willing to undertake vote trading in village k, for a given xk
we then have:
PV T (k) = σMMk Pr(xji > xMM−xk)+σMNk Pr(xji > xMN−xk)+σNNk Pr(xji > xNN−xk)+σNMk Pr(xji > xNM−xk)
By Assumption 3
IV Tk =
{0 if PV T (k) < 0.5
1 if PV T (k) ≥ 0.5.
So that E[IV Tk] = Pr(PV T (k) < 0.5|σijk) · 0 + Pr(PV T (k) ≥ 0.5|σijk) · 1 ≡ Pr(PV T (k) ≥ 0.5|σijk). Thus,
using (8) we obtain:
E[vk|Zk] = αv Pr(PV T (k) ≥ 0.5) + αZk + µvk, (21)
We now show that if xk is drawn from a uniform distribution, then the probability of clientelism occurring
in village k is given by:
Pr (PV T (k) > 0.5|σijk) = σMMk(XM +X) + σNMk(T +XM ) + σNNk(XN ) + σMNk(XN ) + C, (22)
where C is a constant.
Assume that xji is randomly drawn from a uniform distribution F (xji ) on the interval [0, x]. We see
below that the form of this distribution is irrelevant so this is without loss of generality. Given this, the
Pr(xji > z) ≡ x−zx for any z ∈ [0, x]. Applying the law of large numbers and substituting for xji from
equations (5), (6) and (7) yields the proportion of vote traders in village k conditional upon candidate
quality xk:
PV T (k) = σMMk(x−∆wP +XM +X + xk
x) + σNMk(
x−∆wP + T +XM + xkx
)
+σNNk(x−∆wP +XN + xk
x) + σMNk(
x−∆wP +XN + xkx
), (23)
61
which, since the σijs sum to one, rearranges to:
PV T (k) = σMMk(XM +X
x) + σNMk(
T +XM
x) + σNNk(
XN
x) + σMNk(
XN
x) +
x−∆wP + xkx
, (24)
Since we assume the law of large numbers within the village, the first moment of the distribution determines
the number of vote traders arising from within each of the landlord/worker groups fully. Hence the invariance
with respect to the distribution of the xji .
For clientelism in village k, necessarily PV T (k) > 0.5, which is equivalent to:
xk > 0.5x− x+ ∆wP − σMMk(XM +X)− σNMk(T +XM )− σNNk(XN )− σMNk(XN ). (25)
Let G(x) denote the uniform distribution of the xk, with support [0, 1]. An additional interval restriction
on the variable x derives from the assumed support of G() and is required for the likelihood of clientelism
to be a well defined probability. It is that 2(∆wp − T − XM ) ≥ x ≥ 2(∆wp − 1 − XN ). The probability
that PV T (k) > 0.5, and hence the probability of clientelism, then lies in the unit interval and is given by
(1−RHS(25)), which rearranges to equation (22) above with C = 1 + 0.5x−∆wP .
Now substituting using (22) into (21) yields:
E[vk|σijk,Zk] = αv[C + σMMk(XM +X) + σNMk(T +XM ) + σNNk(XN ) + σMNk(XN )] +αZk + µvk, (26)
which is the statement in the proposition.
Proof of Proposition 3
Under random matching: σMMk = MLDk ·MPROPk, σNMk = MLDk · (1 −MPROPk), σNNk = (1 −MLDk) · (1 −MPROPk) and σMNk = (1 −MLDk) ·MPROPk. Substituting these into equation (9) and
rearranging yields the expression in the statement of the proposition.
9.4 Generalized Distributions
Here we demonstrate invariance with respect to the distributional assumptions we made for computing the
likelihood of vote trading in Section 3.2. Recalling that PV T (k) denotes the proportion of workers willing
to undertake vote trading in village k, we have:
PV T (k) = SMMk Pr(xji > xMM−xk)+SMNk Pr(xji > xMN−xk)+SNNk Pr(xji > xNN−xk)+SNMk Pr(xji > xNM−xk)
This again applies the law of large numbers within the village. Substituting for the xji from equations (5),
(6) and (7), we have:
PV T (k) = σMMk Pr(xji > ∆wP − (XM +X)− xk) + σNMk Pr(xji > ∆wP − T −XM − xk) +
σNNk Pr(xji > ∆wP −XN − xk) + σMNk Pr(xji > ∆wP −XN − xk).
62
Substituting for the σijs using Assumption 4:
PV T (k) = MLDk ·MPROPk Pr(xji > ∆wP − (XM +X)− xk) +
MLDk · (1−MPROPk) Pr(xji > ∆wP − T −XM − xk) +
(1−MLDk) · (1−MPROPk)Pr.(xji > ∆wP −XN − xk) + (1−MLDk) ·MPROPk Pr(xji > ∆wP −XN − xk).
Rearranging:
PV T (k) = MLDk ·MPROPk
[Pr(xji > ∆wP −XM −X − xk)− Pr(xji > ∆wP − T −XM − xk)
]+MLDk
[Pr(xji > ∆wP − T −XM − xk)− Pr(xji > ∆wP −XN − xk)
]+MPROPk [0]
Without the assumption of uniformity on F and G, but instead persisting with general distributions, we
cannot specify the linear form of this equation in Section 3.2, but can instead express this equation directly
in terms of the respective CDFs. Substituting from the CDF for F .
PV T (k) = MLDk ·MPROPk [1− F (∆wP −XM −X − xk)− 1 + F (∆wP − T −XM − xk)]
+MLDk [1− F (∆wP − T −XM − xk)− 1 + F (∆wP −XN − xk)]
+MPROPk [0]
Since, from Assumption 3, we have vote trading in village k if and only if PV T (k) > 0.5, then the probability
of vote trading is
Pr (PV T (k) > 0.5) ≡ Pr
MLDk ·MPROPk [F (∆wP − T −XM − xk)− F (∆wP −XM −X − xk)]+MLDk [F (∆wP −XN − xk)− F (∆wP − T −XM − xk)]+MPROPk [0] > 0.5
The law of large numbers removes the idiosyncratic (pairwise between landlord and worker) uncertainty,
the remaining uncertainty in this equation (the outer probability) is driven by the stochastic nature of the
candidate quality variable, xk. This is determined by the distribution G. Using the equation before (9) we
have:
E[vk|Zk] = αv Pr(PV T (k) ≥ 0.5) + αZk + µvk
Now insert this object into the estimating equation to obtain, instead of (9):
E[vk|Zk] = αv Pr
MLDk ·MPROPk [F (∆wP − T −XM − xk)− F (∆wP −XM −X − xk)]+MLDk [F (∆wP −XN − xk)− F (∆wP − T −XM − xk)]+MPROPk [0] > 0.5
+
αZk + µvk
The outer probability arises from the random draw on xk. The sign restrictions on coefficients and interpre-
tations obtained from a linear regression as specified in equation (12) or (13) are the same as in the body
63
of the paper. The fact that the distribution of G is no longer uniform does not affect the interpretations,
as the precise form of this distribution simply governs the draws of xk. The effect of the model parameters
T,X,XM and XN is to simply shift the required cutoff level of xk (for a given xji ) beyond which vote
trading is preferred for a landlord/worker pair. The shifts vary by the type of pairing, so that the relative
magnitudes of these parameters is identified by observing differences in the outcome variables (the vs) as a
function of the distribution of landlord/worker pairings (the σij that we infer from MPROP and MLD) in
a village.
To see that the sign interpretations are the same when using the equation immediately above, consider
each coefficient in turn: The coefficient on MPROPk is again predicted to be zero. Since this variable is
multiplied by zero, its magnitude in the village will not affect the likelihood that the proportion of vote
traders is above a half. For variable v such that αv > 0(< 0), the coefficient on MLDk is again predicted
positive (negative) since T > 0 and XM−XN > 0. Intuitively, vote trading is more likely if there are Maratha
landlords since they possess two benefits in clientelism relative to non-Maratha landlords – access to trading
networks and more powerful social cohesion. Consequently, the larger proportion of Maratha landlords,
the larger the number of worker/landlord pairs tipped into vote trading by the existence of these clientelist
benefits. The coefficient on the interaction MLDk ·MPROPk again allows us to identify the relative power of
trading network access and social cohesion. It is again positive iff XM +X > XM +T or X > T . So that, for
αv > 0,MLDk ·MPROPk > (<) 0 implies X > (<)T. The sign of [coeff ]MLDk ·MPROPk+[coeff ]MLDk >
0 iff F (∆wP −XN − xk) > F (∆wP −XM −X − xk), i.e., iff. X+XM > XN . So the sign of this expression
again yields an upper bound for the benefits of Maratha social cohesion relative to social cohesion in non-
Maratha groups XM −XN .
9.5 Workers Less able to Punish Landlords in MLD
Assume now a violation of Assumption 1 where workers in MLD villages are less able to punish a promise
violating landlord than in non-MLD villages. In non-MLD villages then continue to assume that xji is drawn
from distribution F (·) which continues to be defined over support [0, x], but now suppose that xji in MLD
villages is drawn from F̂ (·) defined over [0− ζ, x− ζ] with ζ > 0. F̂ (·) is first-order stochastically dominated
by F . Equation (23) now becomes:
PV T (k) = σMMk(x− ζ −∆wP +XM +X + xk
x) + σNMk(
x− ζ −∆wP + T +XM + xkx
)
+σNNk(x−∆wP +XN + xk
x) + σMNk(
x−∆wP +XN + xkx
), (27)
and equation (24) now rearranges to:
PV T (k) = σMMk(XM +X − ζ
x) +σNMk(
T +XM − ζx
) +σNNk(XN
x) +σMNk(
XN
x) +
x−∆wP + xkx
, (28)
Using (28) substituting for the σs and proceeding identically, expression (10) of Proposition 3 now
64
rearranges to:
E[vk|MLDk,MPROPk,Zk] = αvC +MLDk · αv [T +XM −XN − ζ] +MPROPk · αv [0]
+MLDk ·MPROPk · αv [X − T ] + αZk + µvk, (29)
where C is a constant. This expression thus yields identical implications to those previously obtained under
expression (10) except that now the predicted coefficient on MLD in the baseline model is biased towards
zero by the ζ term. This implies that the interpretation provided by the model for the sign of the coefficient
on MLD, given that it is significant and in the direction predicted by the baseline model, is unchanged.
The predictions on all other coefficients are also unchanged. There is now, however, a slight difference in
interpretation of the magnitude of the coefficient on MLD under this extension of the model – it is reduced
by the ζ which represents less worker cohesion in MLD villages. However, since we have already argued
that the normalizations imposed in the model render interpretation of coefficients directly in terms of model
parameters meaningless, this has no effect.
9.6 Landlord Candidates Less Appealing in MLD
Assumption 2 of the baseline model asserts that whether landlords are Maratha or not does not affect the
(dis)utility that workers obtain from lending political support to the landlord’s candidate in Panchayat
elections. Consider a violation of this assumption where, in MLD villages, villagers resent landlords more
than in non-MLD villages, perhaps due to their always having been the dominant caste, then the disutility
workers experience by supporting an otherwise identical landlord’s candidate may be worse in the MLD
case. A simple modification of the model captures this. Continue to assume that the variable xk, capturing
the cost to workers from voting for a landlord’s candidate is drawn from distribution G(·) in all villages.
Now, however the realization of the term xk has subtracted from it the amount (in utility metric) ι in MLD
villages. This implies that the same quality draw of candidate from G(·) generates ι less utility for voters if
this candidate is drawn in a MLD villages rather than in a non-MLD village. Equation (23) now becomes:
PV T (k) = σMMk(x−∆wP +XM +X + xk − ι
x) + σNMk(
x−∆wP + T +XM + xk − ιx
)
+σNNk(x−∆wP +XN + xk
x) + σMNk(
x−∆wP +XN + xkx
). (30)
But notice that this modification of the model is equivalent to the modification introduced in Section 9.5
above and yields an equation that is identical to equation (27) above. This violation of Assumption 2 is thus
isomorphic in its effect to the violation of Assumption 1 explored there. The interpretation of coefficients
under the model is identical.
9.7 Positive Assortative Matching
Assumption 4 of the baseline model asserts random matching, so that caste wise matching simply reflects
population frequencies. Now assume that Maratha landlords are matched with Maratha workers at rate µ
65
times their relative frequency. Hence with the proportion of Maratha workers in the village denotedMPROP
the probability of a single Maratha landlord being matched with a Maratha worker is MPROP · µ. This
implies that the frequency of Maratha landlord/Maratha worker pairs will be given by MLD ·MPROP ·µ =
σMM as opposed to MLD ·MPROP from the baseline model. Similarly for the other frequencies: σNM =
MLD·(1−MPROP ·µ), σNN = (1−MLD)·(1−MPROP )·µ and σMN = (1−MLD)·[1−(1−MPROP )·µ].
Substitute for these values of σij into equation (9 to obtain:
E[vk|MLDk,MPROPk,Zk] = αv
C +MLDk ·MPROPk · µ(XM +X)+MLDk · (1−MPROPk · µ)(T +XM )
+(1−MLDk) · (1−MPROPk) · µ(XN )+(1−MLDk) · (1− [1−MPROPk] · µ)(XN )
+ αZk + µvk
Rearranging:
E[vk|MLDk,MPROPk,Zk] = αvC +MLDk · αv [T +XM −XN ] +MPROPk · αv [0]
+MLDk ·MPROPk · µ · αv [X − T ] + αZk + µvk (31)
This is equivalent to the expression in the baseline model (equation 10) without assortative matching up
to the positive multiplicative term µ multiplying the coefficient on the interaction term MLD ·MPROP .
Clearly this term does not affect the sign of the coefficient on the interaction term, and therefore does not
affect our interpretation of the relative sizes of X and T .
10 Appendix D: Independence of MLDk and MPROPk
Our two key measures are Maratha population numbers, MPROPk, and landholdings, MLDk, both at the
village level. In what follows we discuss how these measures were obtained, and argue that both of these
measures are historically pre-determined, and importantly not endogenous to our outcome variables.
10.1 Dominance Measures
Both Maratha population (MPROPk) and landholdings (MLDk) were collected in the village surveys.
These surveys were conducted on a focus group discussion model, which included key villagers such as
members of the GPs and upper level governments (particularly the Gram Sevak and Talathi) as well as
school teachers and health care workers. The Gram Sevak represents the development wing of the state
government and is well versed with the village population, since all of the benefit applications go through
him. He, or members of the GP, readily provided the population numbers by caste group in the villages.
The Talathi, who is from the Revenue department, is responsible for keeping and updating all land records.
It was typically the Talathi who provided us with a ranking of total land ownership by caste group (at the
66
sub-caste or jati level) in the villages. Both the Talathi and Gram Sevak are members of the higher levels
of government and do not usually reside in the surveyed village.
We can create an alternative measure of Maratha land dominance ( M̃LDk) using our household surveys,
where we collected information on land ownership (refer to Section 8.3 in Appendix B). We can aggregate
this data up to the village level to obtain a measure of land distribution by caste group at the village level.
Since only 30 households per village were surveyed, these measures are quite noisy. Nevertheless, if we
construct a Maratha land dominance variable from this household level data, it matches our village level
data (obtained from the Talathi) for 85% of villages. For those 15% of villages which did not match, the
total land ownership of the top two ranked (in terms of land ownership) castes was very close using the
household level data. In these cases, according to our village level data, Marathas were typically the second
ranked caste in terms of land ownership. In other words, these were villages where two castes were fairly
close in terms of their total land ownership, and this explains why the noisy household level data did not
match up perfectly to the village level data.
In our baseline empirical analysis we use the village level data to construct our measure of Maratha
land dominance (MLDk). Results are robust to instead using the alternative aggregate measure ( M̃LDk),
constructed from our household level data, as we have reported in Appendix B.
10.2 Distribution of Caste Groups
We have no direct proof that caste population numbers are historically pre-determined at the village level,
and not the consequence of any of our subsequent outcome variables, because no historical records reside
at the village level on caste population numbers. However, at the district level, others have exploited
the temporal invariance of caste numbers, and used caste composition measures from the historical census
to predict outcomes today (Banerjee and Somanathan 2007). The assumption of time invariant caste
distributions at the village level has also been exploited in other states of India (see Anderson (2011) for
Uttar Pradesh and Bihar). Similarly, using the historical censuses of India (1891 - 1931), we can compare
the relative population distribution of Marathas across the districts in our sample to the distribution in
our current data. Despite our sampling of only non-tribal rural areas, the historical census variation closely
matches the current variation found in our data. Of particular note is the virtual absence of Marathas in the
most eastern part of the state (East Vidarbha). This part of the state was part of the Central Provinces in
colonial times, a region where the Rajput caste were traditionally dominant.38 All of the empirical results
that we report are robust to excluding this region in our estimations.
In 41% of villages, Marathas form the majority of the population, but we see considerable village level
38The present state of Maharashtra came into being in 1960. The state unites the Marathi speaking people (who haveexisted for centuries). During British rule, Marathi speakers were geographically divided between Bombay Presidency, CentralProvinces and Berar, and the Nizam’s state of Hyderabad. After Independence (1947) they continued as respective parts ofthese states until the formation of the bilingual state of Bombay in 1956 (two languages Marathi and Gujarati). The unilingualstate of Maharashtra was formed in 1960.
67
variation in caste population numbers, which is the norm in India. Villages are typically multi-caste and
rarely identical in either the number of castes or in the numerical strength (Srinivas 1987, Mandelbaum
1970, Marriott 1955). In general, Indian village anthropological studies link the origins of distributions at
the village level back hundreds of years (Srinivas 1987, Mandelbaum 1970, Marriott 1955), and the Marathas
are no exception.39 The early settlement of the original tribes that grew into the prominent caste groups
in Maharashtra dates to the 6th century BC (Kosambi 1955). The prominence of Marathas in the region
dates back to at least the fourth century AD (Altekar 1927, Kosambi 1969).40
In our Village survey, we asked directly about the historical origin of caste groups in the village. In
more than 95% of cases, the caste groups were reported to have resided in the village since well before
independence. A possible concern is the possibility of migration in response to contemporary governance
and economic outcomes, which would in turn directly alter village level caste composition. At the individual
or household level, these concerns are not warranted. Firstly, this is almost unheard of in our sample of
villagers. Secondly, given the strict rules governing hereditary caste rankings, there is virtually no mobility
of individuals across different caste groups. Moreover, there is very little migration in India as a whole; see
Munshi and Rosenzweig (2005) for an extensive analysis. This seems to be primarily because of reliance on
sub-caste networks of mutual insurance that do not seem to cross village boundaries. At the caste level as
a whole, there is no evidence of large scale migrations that could explain the variation in caste population
dominance that we observe today.41
10.3 Land Ownership of Caste Groups
Marathas own the most land in 59% of the villages of our survey. Throughout history, Marathas have
been the dominant land owners in Maharashtra and their prominence has been traced back to at least the
fourth century AD when major chieftainships were under their control (Altekar 1927, Kosambi 1969). With
respect to landholdings, their documented dominance of landowning extends back to at least the fourteenth
century. Prior to independence, under either foreign rule or during their own Maratha empire, Marathas
were the dominant land owners.42 Under both Muslim and British regimes, land was allocated to Marathas
by outside rulers to buy the loyalty of dominant lineages, and in return for supply of armies (Altekar
39For example, in the case of Palanpur, a village in western Uttar Pradesh, events which took place some two hundred yearsago explain the dominance of an upper caste group (Dreze et. al. 1999). Another village level study in northwest Uttar Pradeshdates the origins of present caste composition to more than 600 years ago (Danda 1987).
40Basic elements of the village organization, the balutedari system, were developed by the fourth century AD. This systemwas a reciprocal arrangement between the hereditary farming and artisan castes (OBCs in today’s classification), service castes(SCs), and the higher landholding castes.
41With the exception of the movement of a small population of Brahmins from rural to urban areas in the early 20th century.They are less than 1% of our sample, and it is this exodus of Brahmins from rural areas that further solidified the dominanceof Marathas in this region.
42Under the leadership of Chhatrapati Shivaji, the Maratha Empire was founded in 1674. At it’s height in the 18th century,the empire extended from present-day Pakistan to Orissa in the east and from Punjab to central Karnataka in the south. It alsoincluded Tamil Nadu. The vast empire was in decline by 1818 when Maharahstra had fallen to the British East India Company,however remnants of it lasted until Independence in 1947.
68
1927, Kosambi 1969, Drekmeier 1962, Dahiwale 1995). During colonial rule, the regions of present-day
Maharashtra fell under different administrative units and systems of land revenue collection.43 However,
irrespective of the land revenue system used, Marathas continued to own the large majority of agricultural
land. (This is documented in the Imperial Gazetteers of India which report the break down of caste land
ownership patterns at the district level.44).
Upon Independence, Indian states legislated large scale land reforms. In Maharashtra, the Tenancy
and Agricultural Lands Act of 1948 placed a ceiling on all landholdings and transferred ownership rights to
tenant cultivators. These acts effectively redistributed land from large land owners to their former permanent
tenants (“Other Backward Castes” or OBCs under today’s classification). This lead to a dramatic change
in ownership (but not cultivation) patterns.45 These land reforms thus represent a striking break with the
past. They gave rise to a new class of landowners drawn from a previously non-landowning caste. The land
reforms thus fully account for villages where a non-Maratha caste are the largest landowning group in our
sample.
Since the reforms, other changes in land ownership and distribution have been almost entirely due to the
process of inheritance and partition (land is typically divided amongst sons), with the combined ownership
of each dynasty remaining fairly constant. Formal sales of land are rare. In our sample less than 2% had
bought or sold land within the past 5 years (almost all distress sales) and 86% of our sample of landowners
report that they inherited their land. Almost 12% report that they purchased some of their land, but this
was, in almost all cases, a purchase from a relative or co-caste member.
This settlement history, and the fact that land reforms managed the redistribution of large landlord
holdings ensures a distinct pattern of caste and land ownership in Maharashtrian villages today.46 In
villages where few Marathas reside, the dominant land-owning caste can be a low caste (OBCs, former
tenants). In villages where Marathas are populous, although the lower castes typically also own some land,
Marathas are highly likely to constitute the dominant landowning caste.
Marathas may own the highest quality land today because they historically chose to reside in the high
43In particular, Western Maharashtra was part of the Bombay Presidency which had a ryotwari (cultivator-based) systemof land revenue collection. Eastern Vidarbha was part of Central Provinces which had a zamindari (landlord-based) system.Western Vidarbha was a part of Berar, formerly part of the princely state of Hyderabad, which was given to the East IndiaCompany as a debt payment in 1860 and made into a ryotwari region at that time. Marathawada never fell under Britishrule and remained a part of the princely state of Hyderabad until Independence in 1947. Land there was divided betweengovernment and feudal ownership. The former was run similarly to the ryotwari system whereas the latter was more similarto the landlord system. Refer to Banerjee and Iyer (2004) who analyse the impact of these different land systems on outcomestoday. Our estimation results include regressors which control for these different land revenue systems.
44The relevant publications are Imperial Gazetteer of India, Provincial Series (1909) for Bombay Presidency; HyderabadState; Central Provinces; and Berar.
45Maharashtra is one of the few states where the agricultural lands acts were comprehensively and successfully implemented,effectively granting of ownership rights to former tenants. Land ceilings were sometimes circumvented via transfers to extendedfamily members, but land redistributions away from intermediaries and absentee landlords were highly effective. (Kamat 1980).
46Anderson (2011) similarly treats land dominance by caste groups at the village level as pre-determined using data fromUttar Pradesh and Bihar. The empirical strategy used here is also related to Besley and Burgess (2000) who estimate theimpact of state-level land reforms on outcomes today.
69
quality land villages, and ran the lower quality land as absentee landlords. This is an issue we already
discussed in Section 2.2. There it was demonstrated, in Table 1, that there are no significant differences
in village land use patterns and soil quality measures across Maratha land dominated villages compared to
others. Table 1 also demonstrates no significant differences across Maratha and lower (OBC) caste land
dominated villages in key demographic and geographic variables. There are no significant differences in
terms of total population numbers, proportion SC (the lowest ranked caste group), cultivatability of the
land, rainfall patterns, and also distance to exogenous (to the GP responsibilities) measures of amenities.47
These include distance to a national main road, major rivers, and the nearest town. We checked these
differences using our own household and village level data and also using the Village Amenities data from
the Census of India 2001.
References
[1] Altekar, A. S. (1927) A History of Village Communities in Western India. Bombay: Oxford University
Press.
[2] Anderson, Siwan (2011) “Caste as an Impediment to Trade” American Economic Journal: Applied
Economics, 3(1), 239-63.
[3] Banerjee, A. and L. Iyer (2005) “History, Institutions, and Economic Performance: The Legacy of
Colonial Land Tenure Systems in India”. American Economic Review, 95(4), 1190-1213.
[4] Banerjee, Abhijit and Somanathan, Rohini (2007). ”The political economy of public goods: Some evi-
dence from India,” Journal of Development Economics, 82(2), 287-314.
[5] Besley, Timothy and Robin Burgess (2000). “Land Reform, Poverty Reduction, And Growth: Evidence
From India” Quarterly Journal of Economics, 115(2), 389-430.
[6] Danda, Ajit K. (1987) “Ethnic Status: Identity and hierarchy” Journal of Indian Anthropological Society,
22(1), 52-64.
[7] Dahiwale, S. M. (1995) “Consolidation of Maratha Dominance in Maharashtra” Economic and Political
Weekly, 30(6), 336-342.
[8] Drekmeier, Charles (1962) Kingship and Community in Early India. Stanford: Stanford University Press.
47The SC group, Scheduled Castes, are the lowest ranked castes, formerly known as the untouchable castes. They are rankedlower than the OBC category which refers to the backward caste groups. OBCs are the traditional farming and artisan casteswhile SCs traditionally performed menial tasks not directly related to agriculture, and hence they were not direct recipients ofland during reforms.
70
[9] Dreze, Jean, Peter Lanjouw, and Naresh Sharma (1999) “Economic development in Palanpur, 1957-93”
in Economic Development of Palanpur Over Five Decades, ed. Peter Lanjouw and Nicholas Stern, 114-242.
Oxford University Press.
[10] Kamat, A. R. (1980) “Politico-Economic Developments in Maharashtra: A Review of the Post-
Independence Period” Economic and Political Weekly, 15(39), 1627-1630.
[11] Kosambi, D. D. (1955) “The basis of ancient Indian History, I” Journal of the American Oriental
Society, 74(4), 330-337.
[12] Kosambi, D. D. (1969) Ancient India: A History of its Culture and Civilization. New York: World
Publishing Company.
[13] Mandelbaum, David, G. (1970) Society in India, University of California Press.
[14] Marriott, M. (1955) Village India: Studies in Little Community. Bombay, Asia Publishing House.
[15] Munshi, K. and M. Rosenzweig (2005) “Why is Mobility in India so Low? Social Insurance, Inequality,
and Growth” BREAD Working Paper No. 97.
[16] Srinivas, M.N. (1987) The Dominant Caste and Other Essays. New Delhi, Oxford University Press.
71