Embed Size (px)
Citation preview
Vol. 34, no. 1 Journal of Vector Ecology 119
Climate and geographic trends in hatch delay of the treehole mosquito, Aedes triseriatus Say (Diptera: Culicidae)
Camilo E. Khatchikian1, John J. Dennehy2, Christopher J. Vitek3, and Todd Livdahl1
1Department of Biology, Clark University, Worcester, MA 01610, U.S.A.2Department of Biology, Queens College and the Graduate Center of the City University of New York,
New York, NY 11367, U.S.A.3University of Texas-Pan American, Edinburgh, TX 78539, U.S.A.
Received 2 October 2008; Accepted 16 December 2008
ABSTRACT: Eggs of Aedes triseriatus mosquitoes are stimulated to hatch when inundated with water, but only a small fraction of eggs from the same batch will hatch for any given stimulus. Similar hatching or germination patterns are observed in desert plants, copepods, rotifers, insects, and many other species. Bet hedging theory suggests that parents stagger offspring emergence into vulnerable life history stages in order to avoid catastrophic reproductive failures. For Ae. triseriatus, a treehole breeding mosquito, immediate hatching of an entire clutch leaves all of the parent’s progeny vulnerable to extinction in the event of a severe drought. Natural selection has likely favored parents that pursued a bet hedging strategy where the risk of reproductive failure is distributed over time. Considering treehole mosquitoes, bet hedging theory could be used to predict that hatch delay would be positively correlated with the likelihood of drought. To test this prediction, we collected Ae. triseriatus from habitats that varied widely in mean annual precipitation and exposed them to several hatch stimuli in the laboratory. Here we report that, as predicted, Ae. triseriatus eggs from high precipitation regions showed less hatch delay than areas of low precipitation. This strategy probably allows Ae. triseriatus to cope with the wide variety of climatic conditions that it faces in its extensive geographical range. Journal of Vector Ecology 34 (1): 119-128. 2009.
Keyword Index: Environmental variability, bet hedging, egg banking, uncertainty, geographical prediction, GIS, precipitation, temperature, mosquito, Culicidae, hatch delay.
INTRODUCTION
Organisms that occupy habitats that are subject to rapid, unpredictable environmental fluctuations often produce offspring with different phenotypes in order to decrease the risk of a complete reproductive failure in case of a radical change in the environment (Seger and Brockman 1987). The offspring’s phenotypic variation ensures that at least a fraction of their reproductive effort survives. Spreading the emergence of their offspring from life stages that are environmentally-resistant into environmentally-vulnerable ones over time is a common strategy in these situations. This phenomenon has been suggested in several organisms, such as plants (Cohen 1966; During 2001; Gutterman 2002), insects (Livdahl 1979; Hopper 1999), crustaceans (Hairston and Kearns 2002), vertebrates (Wourms 1972; Martin 1999), and poriferans (Fell 1995), and has been the focus of numerous theoretical considerations (e.g., Livdahl 1979, Benton and Grant 2000, Neubert and Caswell 2000, Tuljapurkar and Istock 1993, Wilbur and Rudolf 2006, King and Masel 2007).
Bet-hedging theories describe how organisms adapt their life history to cope with temporal and spatial environmental uncertainty and were mainly developed after Cohen’s (1966, 1970) work on desert plants. Desert plant seeds germinating after a rainfall enter a highly variable, desiccation-prone environment as the next rainfall may occur next week or next year. New seedlings are particularly
vulnerable to drought so any extended period without water will result in widespread mortality. Thus, natural selection may have favored seed banking, the distribution of risk of germination failure over time. In some cases, seeds produced at one time may scatter their germination over many years, even after they have been exposed to similar conditions, due to a variety of maternal influences, such as hatch inhibitors or physical constraints (see Cohen 1966).
Seger and Brockman (1987) define bet-hedging as an evolutionary tradeoff between mean fitness and variance of fitness. Taking into account that one measure of fitness is the average number of surviving offspring produced by individuals of a certain genotype, average fitness in a variable environment is best described by the geometric mean of fitness rather than the arithmetic mean (Lewontin and Cohen 1969, Gillespie 1977). The small-noise approximation for the geometric mean is a function of the arithmetic mean, discounted by a factor proportional to the variance in fitness. Hence, variation in absolute fitness reduces long-term fitness. The theory predicts that genotypes may forfeit some of their potential fitness in order to reduce the chance of reproductive failure in unpredictable environments (for a more detailed development, see King and Masel 2007).
The treehole-breeding mosquito Aedes triseriatus (Say) (Diptera: Culicidae) is a native species found in the eastern United States. Several studies have shown that in this species, and closely related ones, only a fraction of the eggs from a single batch will hatch following a hatch stimulus (Gillett
120 Journal of Vector Ecology June 2009
1955a, 1955b, Wilson and Horsfall 1970, Livdahl et al. 1984, Livdahl and Koenekoop 1985, Andreadis 1990). Treeholes, the natural larval habitats of Ae. triseriatus, are the type of environment that could impose selective pressure favoring adaptive hatch delays as they frequently and unpredictably dry completely during summer droughts. Since any larvae that have not been able to complete their development before the habitat dries up will die, Ae. triseriatus may hedge its bets by staggering egg hatching.
In northern areas of Ae. triseriatus distribution, only the egg stage survives through the winter. In the middle regions, where treehole water may not freeze completely, a combination of overwintering eggs and diapausing larvae coexist. Survivorship in these conditions, as for similar species, is probably not complete (Danks 1978, Hanson and Craig 1995). In the middle and northern portion of Ae. triseriatus range, failure to hatch before the diapause-mediated end of the growing season (e.g., Kappus and Venard 1967, Shroyer and Craig 1980) would expose the eggs to winter rigors, with its corresponding mortality risks. Hatch delay could be reduced in these areas in order to reduce this risk of winter mortality where desiccation risk is negligible.
Although hatch time variation has been reported (see above) in several mosquito species, no association of hatch delay with the environment has been reported. We hypothesized that hatch time variation in Ae. triseriatus has evolved in response to environmental conditions, and thus, populations from geographical localities with different climatic patterns should show different hatching patterns. Divergent population hatch patterns may be an adaptation that allows Ae. triseriatus to cope with different environ-ments across its range. Populations from desiccation-prone areas should present longer hatching delays, and populations from milder, less stochastic environments should maximize their arithmetic fitness (Gillespie 1977).
The hatch delay phenotype could be controlled by the egg’s genotype, maternal determination, environmental cues, or by interactions among those factors. Alternatively, the hatching response could remain similar for different environments and could result from unrelated genetic hatching determinants, other environmental factors such as predator abundance, competition, cohort structure, or interactions among those factors.
In this study, we examined the relationship between hatch delay and environmental conditions for Ae. triseriatus mosquitoes. Our goals in these analyses were: (1) to determine whether egg hatch delay of Ae. triseriatus eggs collected from populations that experience different environmental conditions are different by developing and evaluating statistical models (i.e., multiple regressions) predicting hatch delay as a function of temperature and precipitation patterns; and (2) to produce coarse scale predictions of the hatching delay response for Ae. triseriatus in the eastern United States as a function of environmental variables.
MATERIALS AND METHODS
Site selectionTwenty-three locations within the geographical
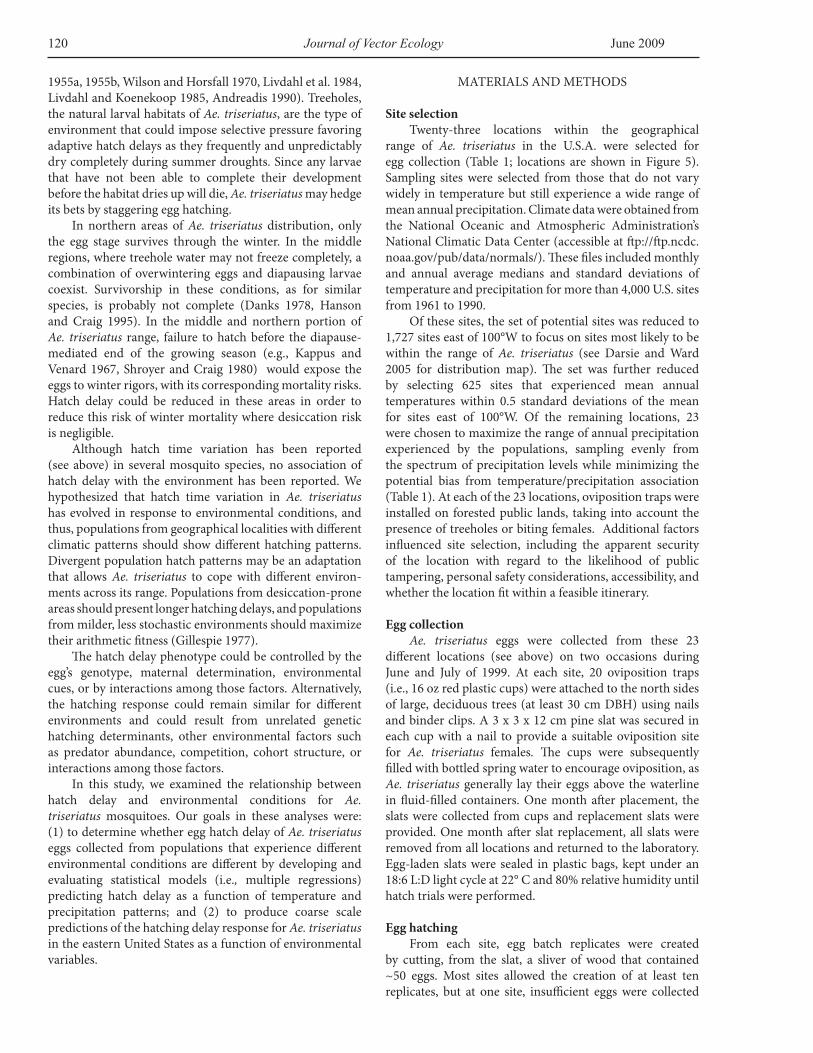
range of Ae. triseriatus in the U.S.A. were selected for egg collection (Table 1; locations are shown in Figure 5). Sampling sites were selected from those that do not vary widely in temperature but still experience a wide range of mean annual precipitation. Climate data were obtained from the National Oceanic and Atmospheric Administration’s National Climatic Data Center (accessible at ftp://ftp.ncdc.noaa.gov/pub/data/normals/). These files included monthly and annual average medians and standard deviations of temperature and precipitation for more than 4,000 U.S. sites from 1961 to 1990.
Of these sites, the set of potential sites was reduced to 1,727 sites east of 100°W to focus on sites most likely to be within the range of Ae. triseriatus (see Darsie and Ward 2005 for distribution map). The set was further reduced by selecting 625 sites that experienced mean annual temperatures within 0.5 standard deviations of the mean for sites east of 100°W. Of the remaining locations, 23 were chosen to maximize the range of annual precipitation experienced by the populations, sampling evenly from the spectrum of precipitation levels while minimizing the potential bias from temperature/precipitation association (Table 1). At each of the 23 locations, oviposition traps were installed on forested public lands, taking into account the presence of treeholes or biting females. Additional factors influenced site selection, including the apparent security of the location with regard to the likelihood of public tampering, personal safety considerations, accessibility, and whether the location fit within a feasible itinerary.
Egg collectionAe. triseriatus eggs were collected from these 23
different locations (see above) on two occasions during June and July of 1999. At each site, 20 oviposition traps (i.e., 16 oz red plastic cups) were attached to the north sides of large, deciduous trees (at least 30 cm DBH) using nails and binder clips. A 3 x 3 x 12 cm pine slat was secured in each cup with a nail to provide a suitable oviposition site for Ae. triseriatus females. The cups were subsequently filled with bottled spring water to encourage oviposition, as Ae. triseriatus generally lay their eggs above the waterline in fluid-filled containers. One month after placement, the slats were collected from cups and replacement slats were provided. One month after slat replacement, all slats were removed from all locations and returned to the laboratory. Egg-laden slats were sealed in plastic bags, kept under an 18:6 L:D light cycle at 22° C and 80% relative humidity until hatch trials were performed.
Egg hatchingFrom each site, egg batch replicates were created
by cutting, from the slat, a sliver of wood that contained ~50 eggs. Most sites allowed the creation of at least ten replicates, but at one site, insufficient eggs were collected
Vol. 34, no. 1 Journal of Vector Ecology 121
Localities * Latitude(°N)
Longitude(°W)
Precipitation(cm)
Temperature(°C)
# of egg batches used
for model development
# of egg batches used for model
validation
Pisgah Forest, NC 34.88 83.41 180.34 13.89 6 4
Coweeta Exp. Forest, NC 35.05 83.48 190.50 12.22 6 4
Highlands, NC 35.05 83.20 208.28 10.56 6 4
Caesar’s HeadState Park, SC 35.13 82.64 198.12 12.22 5 4
Clayton, GA 35.28 82.70 170.18 11.67 6 4
Elkins, WV 38.65 79.68 129.54 10.00 3 -
Franklin, WV 38.65 79.33 81.28 10.56 6 4
Chantilly, VA 38.88 77.41 99.06 12.22 6 4
Hendricks, WV 39.08 79.65 132.08 7.78 6 4
Capon Bridge, WV 39.10 78.22 93.98 11.67 8 6
Poolesville, MD 39.14 77.41 99.06 12.22 10 8
Berryville, VA 39.15 77.98 91.44 11.67 6 4
Stephens City, VA 39.17 78.18 93.98 11.67 6 4
Green Valley, MD 39.34 77.25 99.06 10.56 6 4
Rowlesburg, WV 39.35 79.68 139.70 10.00 6 4
Middletown, DE 39.43 75.66 106.68 13.33 6 4
Morgantown, WV 39.63 79.95 104.14 11.11 6 4
Taneytown, MD 39.66 77.18 104.14 11.67 6 4
Columbia, PA 40.03 76.50 104.14 11.11 6 4
Phoenixville, PA 40.14 75.52 109.22 11.11 6 4
Horsham, PA 40.18 75.14 124.46 11.11 5 4
Hershey, PA 40.28 76.65 111.76 11.11 6 4
Tinton Falls, NJ 40.29 74.17 119.38 11.11 6 4
Table 1. Locations of sampling sites and their associated mean annual precipitation and temperature values.
*Abbreviations for U.S. states: DE: Delaware; GA: Georgia; MD: Maryland; NC: North Carolina; PA: Pennsylvania; SC: South Carolina; VA: Virginia; WV: West Virginia.
122 Journal of Vector Ecology June 2009
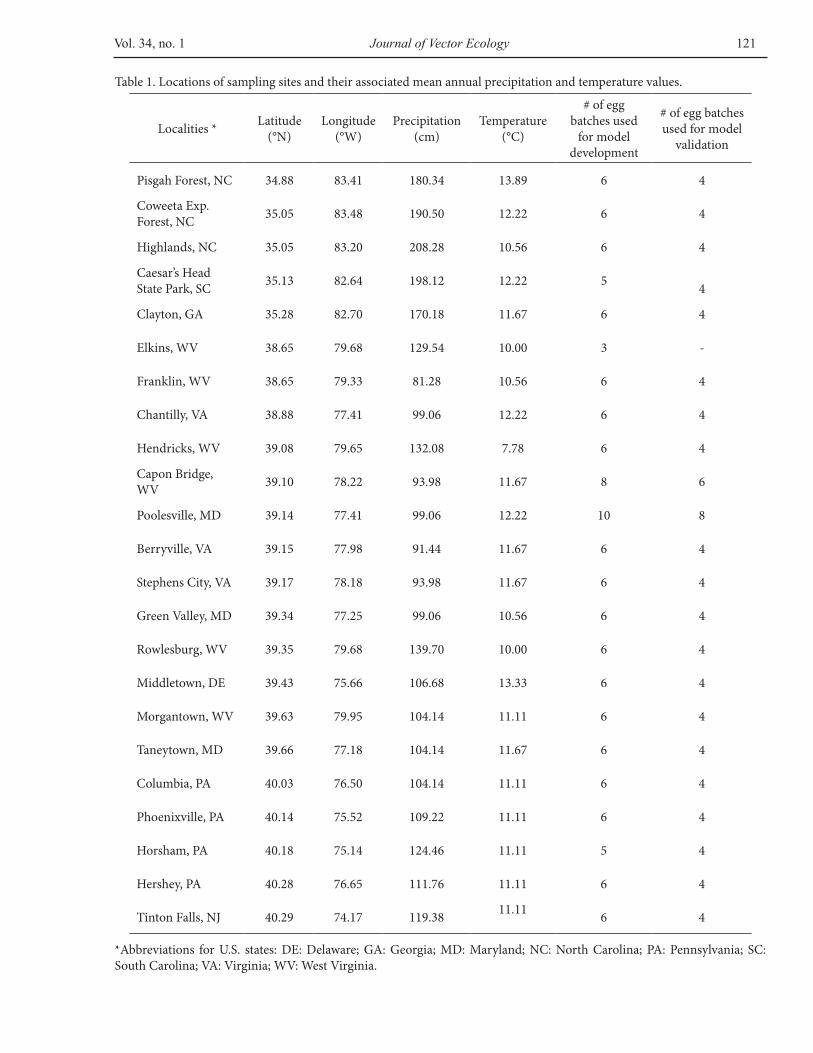
Multiple Regression Model for f (fraction of eggs hatching in the first stimuli); R2 = 0.72
Parameter Estimate S. E. F (d.f.) PIntercept -8.07 x 10⁻¹ 8.98 x 10⁻¹
MTWQ 5.97 x 10⁻³ 3.47 x 10⁻³ 0.24 (1, 22) 0.1065AP 2.36 x 10⁻⁴ 4.87 x 10⁻⁴ 0.01 (1, 22) 0.634PWQ 1.93 x 10⁻⁴ 2.34 x 10⁻³ 0.06 (1, 22) 0.9353MTWQ * AP 1.35 x 10⁻⁵ 5.75 x 10⁻⁵ 1.01 (1, 22) 0.8175MTWQ * PWQ 2.46 x 10⁻⁴ 2.45 x 10⁻⁴ 9.93 (1, 22) 0.3307AP * PWQ -5.94 x 10⁻⁶ 1.89 x 10⁻⁶ 24.51 (1, 22) <0.0066MTWQ * AP * PWQ -5.38 x 10⁻⁷ 1.09 x 10⁻⁷ 2.95 (1, 22) <0.0002Overall Model 5.56 (7, 22) 0.0026
Multiple Regression Model for h (delay index); R2 = 0.34
Parameter Estimate S. E. F (d.f.) PIntercept -9.42 x 10⁻¹ 6.59 x 10⁻¹
MAT -4.69 x 10⁻¹ 3.94 x 10⁻¹ 8.05 (1, 22) 0.0105AP 7.56 x 10⁻² 4.01 x 10⁻² 0.78 (1, 22) 0.3891MAT * AP -6.62 x 10⁻¹ 3.26 x 10⁻¹ 5.13 (1, 22) 0.0355 a
Overall Model 3.21 (3, 22) 0.0166
Table 2. Regression models developed to test for effects of environmental variables; mean annual temperature (MAT, °C), mean annual diurnal range (MADR, °C), mean temperature of the warmest quarter (MTWQ, °C), annual precipitation (AP, mm), precipitation seasonality (PS, mm), and precipitation of the warmest quarter (PWQ, mm) over f (fraction of eggs hatching in the first stimuli), and h (hatch delay index). Statistics presented include the standard error term (S.E.), the F-statistic with associated degrees of freedom (d.f.) and the probability value (P). Significant values are in bold face.
aNon-significant value after Bonferroni adjustment.
Figure 1. Simple regression plots of the predicted values obtained from the multiple regression models against validation data points produced from 40% of egg batches randomly excluded from the model development data points. (A) f (fraction of eggs hatched in the first stimuli), p=0.0056; and (B) h (hatch delay index, see Methods), p=0.0027.
Vol. 34, no. 1 Journal of Vector Ecology 123
and only three egg batch replicates were created (see Table 1). The eggs on each sliver were counted under a dissecting microscope. Once a week for nine weeks, egg batches were placed in 35 ml open vials and exposed to a hatch stimulus. Stimulation consisted of a 24 h inundation in fresh nutrient broth solution (BactoTM, 0.5 g/l). After each stimulus, egg batches were removed from the hatch solution and placed in containers lined with damp paper towels until the next weekly stimulus. Hatched larvae were removed and counted (see below). Following the ninth weekly stimulus, all remaining unhatched eggs were dissected to determine the presence of a developed embryo within. When nonviable eggs were found, adjustments were made to the corresponding batch size data prior to the ensuing calculations (see below).
Species contaminationOvitraps were placed basally to minimize the likelihood
of sample contamination by Aedes hendersoni, which prefers habitats in the forest canopy (Scholl and DeFoliart 1977). Larvae hatching from each stimulus were reared to adult emergence. Adults were examined for additional potential contaminating species, Aedes albopictus and Aedes japonicus, both of which are easily distinguished (Huang 1979, Andreadis et al. 2005, Darsie and Ward 2005). Ae. japonicus was not detected at any collection site, and Ae. albopictus was found only in one location (Clayton, GA). Batches that indicated a mixture of species were discarded from the analysis.
Hatch parametersFor each egg batch, two hatch index parameters were
calculated: the mean fraction of eggs that hatched after the first stimulus (f); and a hatch delay index (h) that takes into consideration egg hatch pattern in the remaining series of stimuli. The hatch delay index was calculated as:
where h is the hatch delay index, and c is the cumulative hatch fraction for the i hatch stimuli for the remaining unhatched eggs after the first hatch stimulus; measuring the relative extent of delay among eggs that delay their hatch. This index takes its lowest value when all remaining eggs hatch in the second stimulus (h = 1), and its maximum when all remaining eggs hatch in the final stimulus (h = 3.05). These statistics were developed a posteriori. Our intended statistic, which we developed a priori, involved a nonlinear fitting of a geometric series of the hatch proportions over stimuli to determine the average probability of hatch per stimulus; that parameter was too sensitive to the hatch fraction hatching in the first stimuli, and many batches did not fit a geometric series satisfactorily. The two resulting statistics for each batch (f vs h) were uncorrelated with each other (p>0.09), and the h statistic was not significantly correlated with the number of unhatched eggs after the first stimulus (p>0.35).
Spatial dataSpatial data layers were used to determine
environmental conditions associated with the hatch response for the 23 populations. Climatic data were extracted from the Worldclim interpolated climate data with 30 arcseconds resolution (Hijmans et al. 2005, accessible at www.worldclim.org), representing 50-year averages (1950-2000). The spatial data layers included in the analyses were selected taking into consideration the variable’s potential relationship with desiccation risk: mean annual temperature (ºC), mean annual diurnal range (ºC), mean temperature of the warmest quarter (ºC; May-August in the study area), annual precipitation (mm), precipitation seasonality (mm; standard deviation of monthly precipitations x 100), and precipitation of the warmest quarter (mm; temporal range as above). The georeferenced point locations of the 23 sampled populations and Worldclim spatial data layers were imported into ArcMap 9.2 (ESRI 2006). The climatic data for the sampled locations were extracted from the raster layers using the intersect point tool from the Hawth’s analysis tool (Beyer 2004, accessible at www.spatialecology.com).
Regression modelsFrom each sampled location, 40% of the batches were
randomly selected for model validation, following a data-splitting validation procedure (see Snee 1977), and were not used for model development (except the site with only three batches, from which all batches were used in model development; see Table 1). For both groups of batches, model development and model validation, mean f and h values were calculated. Regression models were developed for the hatch statistics after a forward stepwise selection; all climatic variables and their factorial combinations that showed a 5% significance level in the stepwise procedure were retained in the model. Batch numbers for all populations were used as weighting factors, as implemented in JMP 6 (SAS Institute, 2000). Significance of effects was evaluated using both the standard statistical approach and the Bonferroni adjustment (see Bland and Altman 1995).
Model validationThe predicted values obtained from the regression
models were compared with the validation data excluded from the model development (see above) in two different ways: using a paired non-parametric Wilcoxon Signed Rank test (the data failed either the normality or homocedasticity assumptions), and fitting a simple regression with number of batches use for model validation as weights. All statistical analyses used JMP v. 6 (SAS Institute, Inc., 2005).
Prediction mapsThe climatic variables selected for the regression
models were imported into IDRISI Los Andes (Clark Labs 2006), and the full predicted surfaces were produced using the predicted function with the Image Calculator module within IDRISI Los Andes. Predicted surfaces were restricted to east of 100°W to include the likely range of Ae. triseriatus. Additional spatial processing was performed
124 Journal of Vector Ecology June 2009
using RECLASS and CROSSTAB modules in IDRISI to highlight areas of extreme predicted responses, i.e., areas with low first hatch (f) response and high delay (h), and areas with high first hatch (f) response and low delay (h).
RESULTS
Statistical modelsThe multiple regressions following the stepwise
procedure provided significant models for the two dependent variables investigated (f, fraction of eggs hatching in the first stimulus, and h, hatch delay index). The regression coefficients for selected terms, R2, and p values for the statistical models are shown in Table 2. The predicted values generated by these models were not significantly different from the validation data points in paired comparisons (Wilcoxon Sign-Rank; for f p>0.05 [46.5, d.f.=21]; for h p>0.05 [-50.5, d.f.=21]).The predicted values generated by the models significantly fit the validation data points in single regressions (Figure 1).
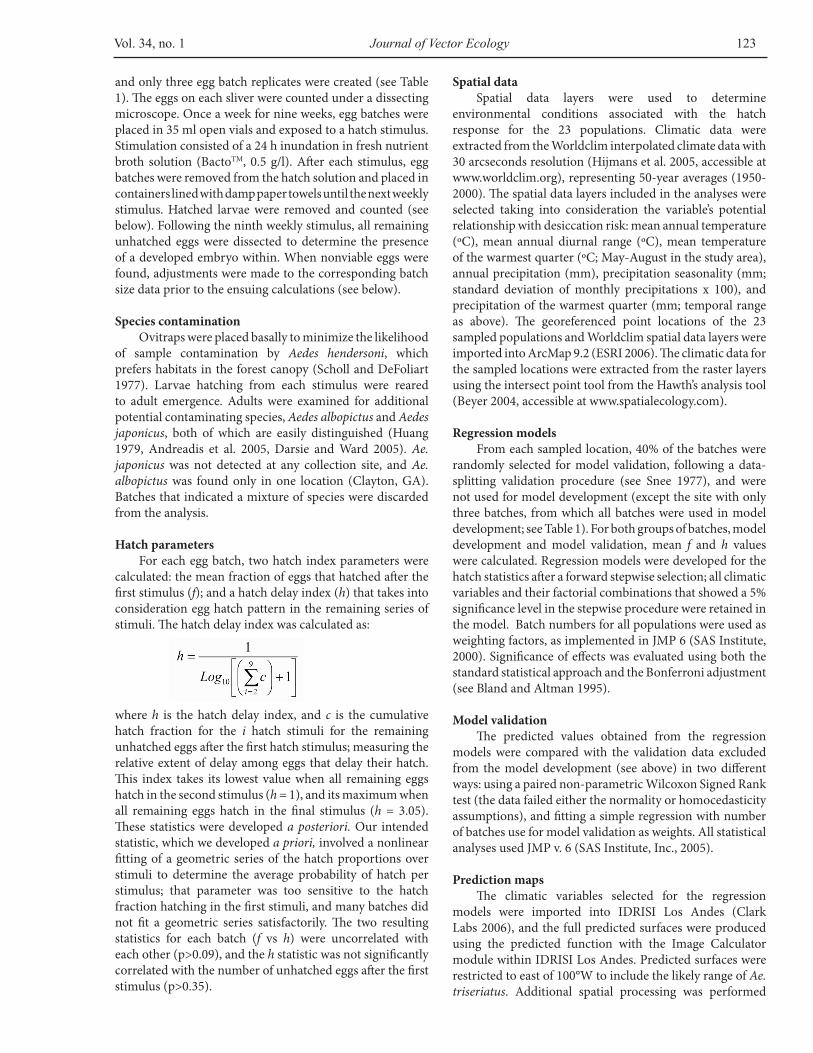
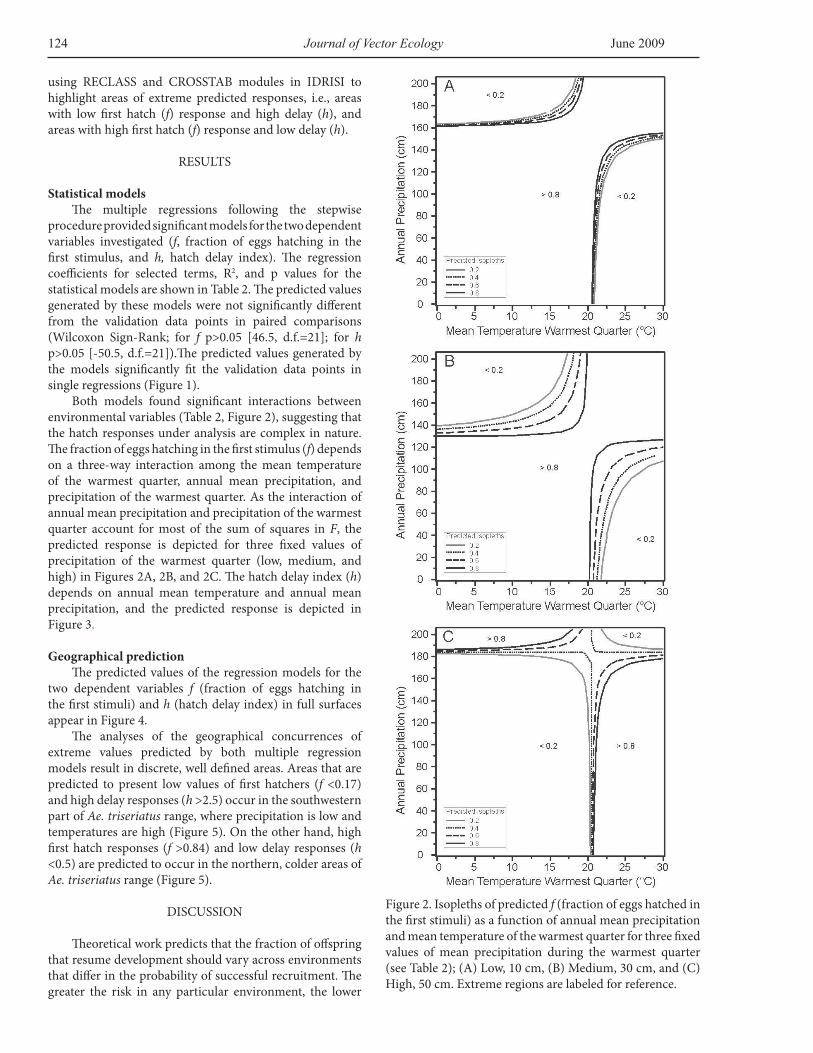
Both models found significant interactions between environmental variables (Table 2, Figure 2), suggesting that the hatch responses under analysis are complex in nature. The fraction of eggs hatching in the first stimulus (f) depends on a three-way interaction among the mean temperature of the warmest quarter, annual mean precipitation, and precipitation of the warmest quarter. As the interaction of annual mean precipitation and precipitation of the warmest quarter account for most of the sum of squares in F, the predicted response is depicted for three fixed values of precipitation of the warmest quarter (low, medium, and high) in Figures 2A, 2B, and 2C. The hatch delay index (h) depends on annual mean temperature and annual mean precipitation, and the predicted response is depicted in Figure 3.
Geographical predictionThe predicted values of the regression models for the
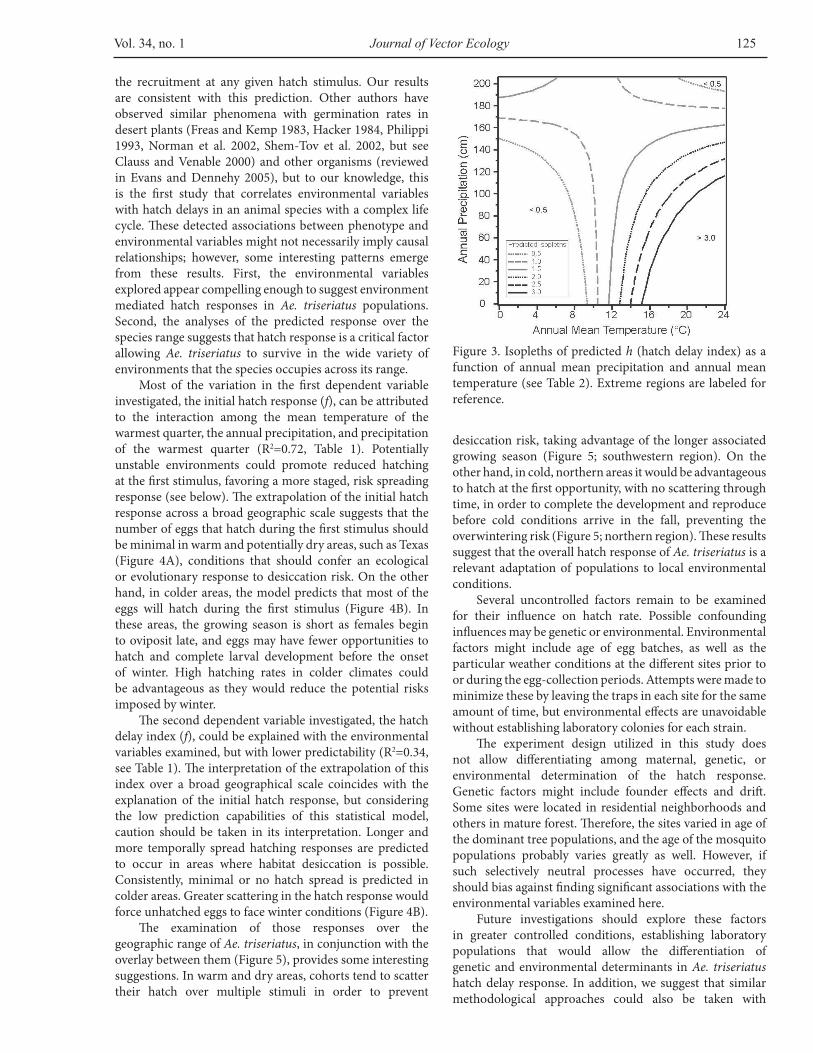
two dependent variables f (fraction of eggs hatching in the first stimuli) and h (hatch delay index) in full surfaces appear in Figure 4.
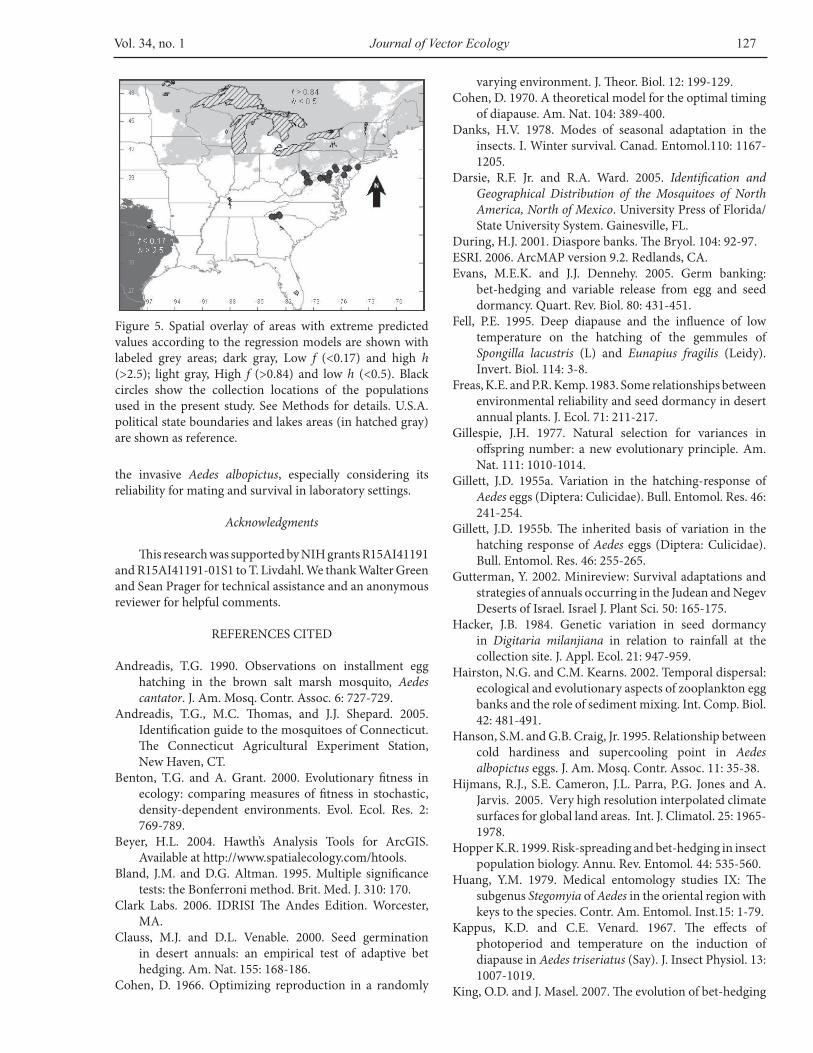
The analyses of the geographical concurrences of extreme values predicted by both multiple regression models result in discrete, well defined areas. Areas that are predicted to present low values of first hatchers (f <0.17) and high delay responses (h >2.5) occur in the southwestern part of Ae. triseriatus range, where precipitation is low and temperatures are high (Figure 5). On the other hand, high first hatch responses (f >0.84) and low delay responses (h <0.5) are predicted to occur in the northern, colder areas of Ae. triseriatus range (Figure 5).
DISCUSSION
Theoretical work predicts that the fraction of offspring that resume development should vary across environments that differ in the probability of successful recruitment. The greater the risk in any particular environment, the lower
Figure 2. Isopleths of predicted f (fraction of eggs hatched in the first stimuli) as a function of annual mean precipitation and mean temperature of the warmest quarter for three fixed values of mean precipitation during the warmest quarter (see Table 2); (A) Low, 10 cm, (B) Medium, 30 cm, and (C) High, 50 cm. Extreme regions are labeled for reference.
Vol. 34, no. 1 Journal of Vector Ecology 125
the recruitment at any given hatch stimulus. Our results are consistent with this prediction. Other authors have observed similar phenomena with germination rates in desert plants (Freas and Kemp 1983, Hacker 1984, Philippi 1993, Norman et al. 2002, Shem-Tov et al. 2002, but see Clauss and Venable 2000) and other organisms (reviewed in Evans and Dennehy 2005), but to our knowledge, this is the first study that correlates environmental variables with hatch delays in an animal species with a complex life cycle. These detected associations between phenotype and environmental variables might not necessarily imply causal relationships; however, some interesting patterns emerge from these results. First, the environmental variables explored appear compelling enough to suggest environment mediated hatch responses in Ae. triseriatus populations. Second, the analyses of the predicted response over the species range suggests that hatch response is a critical factor allowing Ae. triseriatus to survive in the wide variety of environments that the species occupies across its range.
Most of the variation in the first dependent variable investigated, the initial hatch response (f), can be attributed to the interaction among the mean temperature of the warmest quarter, the annual precipitation, and precipitation of the warmest quarter (R2=0.72, Table 1). Potentially unstable environments could promote reduced hatching at the first stimulus, favoring a more staged, risk spreading response (see below). The extrapolation of the initial hatch response across a broad geographic scale suggests that the number of eggs that hatch during the first stimulus should be minimal in warm and potentially dry areas, such as Texas (Figure 4A), conditions that should confer an ecological or evolutionary response to desiccation risk. On the other hand, in colder areas, the model predicts that most of the eggs will hatch during the first stimulus (Figure 4B). In these areas, the growing season is short as females begin to oviposit late, and eggs may have fewer opportunities to hatch and complete larval development before the onset of winter. High hatching rates in colder climates could be advantageous as they would reduce the potential risks imposed by winter.
The second dependent variable investigated, the hatch delay index (f), could be explained with the environmental variables examined, but with lower predictability (R2=0.34, see Table 1). The interpretation of the extrapolation of this index over a broad geographical scale coincides with the explanation of the initial hatch response, but considering the low prediction capabilities of this statistical model, caution should be taken in its interpretation. Longer and more temporally spread hatching responses are predicted to occur in areas where habitat desiccation is possible. Consistently, minimal or no hatch spread is predicted in colder areas. Greater scattering in the hatch response would force unhatched eggs to face winter conditions (Figure 4B).
The examination of those responses over the geographic range of Ae. triseriatus, in conjunction with the overlay between them (Figure 5), provides some interesting suggestions. In warm and dry areas, cohorts tend to scatter their hatch over multiple stimuli in order to prevent
Figure 3. Isopleths of predicted h (hatch delay index) as a function of annual mean precipitation and annual mean temperature (see Table 2). Extreme regions are labeled for reference.
desiccation risk, taking advantage of the longer associated growing season (Figure 5; southwestern region). On the other hand, in cold, northern areas it would be advantageous to hatch at the first opportunity, with no scattering through time, in order to complete the development and reproduce before cold conditions arrive in the fall, preventing the overwintering risk (Figure 5; northern region). These results suggest that the overall hatch response of Ae. triseriatus is a relevant adaptation of populations to local environmental conditions.
Several uncontrolled factors remain to be examined for their influence on hatch rate. Possible confounding influences may be genetic or environmental. Environmental factors might include age of egg batches, as well as the particular weather conditions at the different sites prior to or during the egg-collection periods. Attempts were made to minimize these by leaving the traps in each site for the same amount of time, but environmental effects are unavoidable without establishing laboratory colonies for each strain.
The experiment design utilized in this study does not allow differentiating among maternal, genetic, or environmental determination of the hatch response. Genetic factors might include founder effects and drift. Some sites were located in residential neighborhoods and others in mature forest. Therefore, the sites varied in age of the dominant tree populations, and the age of the mosquito populations probably varies greatly as well. However, if such selectively neutral processes have occurred, they should bias against finding significant associations with the environmental variables examined here.
Future investigations should explore these factors in greater controlled conditions, establishing laboratory populations that would allow the differentiation of genetic and environmental determinants in Ae. triseriatus hatch delay response. In addition, we suggest that similar methodological approaches could also be taken with
126 Journal of Vector Ecology June 2009
Figure 4. Predicted values obtained from the multiple regression models. U.S.A. political state boundaries and lakes areas (in hatched gray) are shown for reference. (A) Predicted f (fraction of eggs hatched in the first stimuli); (B) predicted h (delay index, see Methods).
Vol. 34, no. 1 Journal of Vector Ecology 127
the invasive Aedes albopictus, especially considering its reliability for mating and survival in laboratory settings.
Acknowledgments
This research was supported by NIH grants R15AI41191 and R15AI41191-01S1 to T. Livdahl. We thank Walter Green and Sean Prager for technical assistance and an anonymous reviewer for helpful comments.
REFERENCES CITED
Andreadis, T.G. 1990. Observations on installment egg hatching in the brown salt marsh mosquito, Aedes cantator. J. Am. Mosq. Contr. Assoc. 6: 727-729.
Andreadis, T.G., M.C. Thomas, and J.J. Shepard. 2005. Identification guide to the mosquitoes of Connecticut. The Connecticut Agricultural Experiment Station, New Haven, CT.
Benton, T.G. and A. Grant. 2000. Evolutionary fitness in ecology: comparing measures of fitness in stochastic, density-dependent environments. Evol. Ecol. Res. 2: 769-789.
Beyer, H.L. 2004. Hawth’s Analysis Tools for ArcGIS. Available at http://www.spatialecology.com/htools.
Bland, J.M. and D.G. Altman. 1995. Multiple significance tests: the Bonferroni method. Brit. Med. J. 310: 170.
Clark Labs. 2006. IDRISI The Andes Edition. Worcester, MA.
Clauss, M.J. and D.L. Venable. 2000. Seed germination in desert annuals: an empirical test of adaptive bet hedging. Am. Nat. 155: 168-186.
Cohen, D. 1966. Optimizing reproduction in a randomly
varying environment. J. Theor. Biol. 12: 199-129.Cohen, D. 1970. A theoretical model for the optimal timing
of diapause. Am. Nat. 104: 389-400.Danks, H.V. 1978. Modes of seasonal adaptation in the
insects. I. Winter survival. Canad. Entomol.110: 1167-1205.
Darsie, R.F. Jr. and R.A. Ward. 2005. Identification and Geographical Distribution of the Mosquitoes of North America, North of Mexico. University Press of Florida/State University System. Gainesville, FL.
During, H.J. 2001. Diaspore banks. The Bryol. 104: 92-97. ESRI. 2006. ArcMAP version 9.2. Redlands, CA.Evans, M.E.K. and J.J. Dennehy. 2005. Germ banking:
bet-hedging and variable release from egg and seed dormancy. Quart. Rev. Biol. 80: 431-451.
Fell, P.E. 1995. Deep diapause and the influence of low temperature on the hatching of the gemmules of Spongilla lacustris (L) and Eunapius fragilis (Leidy). Invert. Biol. 114: 3-8.
Freas, K.E. and P.R. Kemp. 1983. Some relationships between environmental reliability and seed dormancy in desert annual plants. J. Ecol. 71: 211-217.
Gillespie, J.H. 1977. Natural selection for variances in offspring number: a new evolutionary principle. Am. Nat. 111: 1010-1014.
Gillett, J.D. 1955a. Variation in the hatching-response of Aedes eggs (Diptera: Culicidae). Bull. Entomol. Res. 46: 241-254.
Gillett, J.D. 1955b. The inherited basis of variation in the hatching response of Aedes eggs (Diptera: Culicidae). Bull. Entomol. Res. 46: 255-265.
Gutterman, Y. 2002. Minireview: Survival adaptations and strategies of annuals occurring in the Judean and Negev Deserts of Israel. Israel J. Plant Sci. 50: 165-175.
Hacker, J.B. 1984. Genetic variation in seed dormancy in Digitaria milanjiana in relation to rainfall at the collection site. J. Appl. Ecol. 21: 947-959.
Hairston, N.G. and C.M. Kearns. 2002. Temporal dispersal: ecological and evolutionary aspects of zooplankton egg banks and the role of sediment mixing. Int. Comp. Biol. 42: 481-491.
Hanson, S.M. and G.B. Craig, Jr. 1995. Relationship between cold hardiness and supercooling point in Aedes albopictus eggs. J. Am. Mosq. Contr. Assoc. 11: 35-38.
Hijmans, R.J., S.E. Cameron, J.L. Parra, P.G. Jones and A. Jarvis. 2005. Very high resolution interpolated climate surfaces for global land areas. Int. J. Climatol. 25: 1965-1978.
Hopper K.R. 1999. Risk-spreading and bet-hedging in insect population biology. Annu. Rev. Entomol. 44: 535-560.
Huang, Y.M. 1979. Medical entomology studies IX: The subgenus Stegomyia of Aedes in the oriental region with keys to the species. Contr. Am. Entomol. Inst.15: 1-79.
Kappus, K.D. and C.E. Venard. 1967. The effects of photoperiod and temperature on the induction of diapause in Aedes triseriatus (Say). J. Insect Physiol. 13: 1007-1019.
King, O.D. and J. Masel. 2007. The evolution of bet-hedging
Figure 5. Spatial overlay of areas with extreme predicted values according to the regression models are shown with labeled grey areas; dark gray, Low f (<0.17) and high h (>2.5); light gray, High f (>0.84) and low h (<0.5). Black circles show the collection locations of the populations used in the present study. See Methods for details. U.S.A. political state boundaries and lakes areas (in hatched gray) are shown as reference.
128 Journal of Vector Ecology June 2009
adaptations to rare scenarios. Theor. Pop. Biol. 72: 560-575.
Lewontin, R.C. and D. Cohen. 1969. On population growth in a randomly varying environment. Proc. Natl. Acad. Sci. USA 62: 1056-1059.
Livdahl, T. 1979. Environmental uncertainty and selection for life cycle delays in opportunistic species. Am. Nat. 113: 835-842.
Livdahl, T. and R.K. Koenekoop. 1985. The nature of egg hatching in Aedes triseriatus: ecological implications and evolutionary consequences. In: L.P. Lounibos, J.R. Rey, and J.H. Frank (eds.) Ecology of Mosquitoes: Proceedings of a Workshop. pp. 439-458.Florida Medical Entomology Laboratory, Vero Beach, FL.
Livdahl, T., R. Koenekoop, and S. Futterweit. 1984. The complex hatching response of Aedes eggs to larval density. Ecol. Entomol. 9: 437-442.
Martin, K.M. 1999. Ready and waiting: delayed hatching and extended incubation of anamniotic vertebrate terrestrial eggs. Am. Zool. 39: 279-288.
Neubert, M.G. and H. Caswell. 2000. Density-dependent vital rates and their population dynamic consequences. J. Math. Biol. 41: 103-121.
Norman, H.C., P.S. Cocks, and N.W. Galwey. 2002. Hardseededness in annual clovers: variation between populations from wet and dry environments. Austr. J. Agric. Res. 53: 821-829.
Philippi, T. 1993. Bet hedging germination of desert annuals: variation among populations and maternal effects in Lepidum lasiocarpum. Am. Nat. 142: 488-507.
SAS Institute, Inc. 2005. JMP version 6.0. Cary, NC.Scholl, P.J. and G.R. DeFoliart. 1977. Aedes triseriatus and
Aedes hendersoni: vertical and temporal distribution as measured by oviposition. Envir. Entomol. 6: 355-358.
Seger, J. and H.J. Brockmann. 1987. What is bet hedging? Oxf. Surv. Evol. Biol. 4: 182-211.
Shem-Tov, S., E. Zaady, and Y. Gutterman. 2002. Germ-ination of Carrichtera annua (Brassicaceae) seeds on soil samples collected along a rainfall gradient in the Negev Desert of Israel. Isr. J. Plant Sci. 50: 113-118.
Shroyer, D.A. and G.B. Craig Jr. 1980. Egg hatchability and diapause in Aedes triseriatus (Diptera: Culicidae): temperature- and photoperiod-induced latencies. Ann. Entomol. Soc. Am. 73(1): 39-43.
Snee, R.D. 1977. Validation of regression models: methods and examples. Technometrics 19: 415-428.
Tuljapurkar, S. and C. Istock. 1993. Environmental uncertainty and variable diapause. Theor. Pop. Biol. 43: 251-280.
Wilbur, H.M. and V.H.W. Rudolf. 2006. Life history evolu-tion in uncertain environment: bet-hedging in time. Am. Nat. 168: 398-411.
Wilson, G.R. and W.R. Horsfall. 1970. Eggs of floodwater mosquitoes. XII. Installment hatching of Aedes vexans (Diptera: Culicidae). Ann. Entomol. Soc. Am. 63: 1644-1647.
Wourms, J.P. 1972. The developmental biology of annual fishes. III. Pre-embryonic and embryonic diapause of variable duration in the eggs of annual fishes. J. Exp. Zool. 182: 389-414.


![Hypnosis Antenatal Training for Childbirth (HATCh): a randomised controlled trial [NCT00282204]](https://img.pdfslide.net/doc/110x75/635a9be878abe3be930dbc65/hypnosis-antenatal-training-for-childbirth-hatch-a-randomised-controlled-trial.jpg)


