Embed Size (px)
Citation preview

1
Coarse filter assessment of contribution of hardwoods to sustaining biodiversity on TFL 48
Progress Report
April 2008
Fred L. Bunnell and Laurie L. Kremsater

2
Table of Contents 1 Introduction ................................................................................................................. 3
2 Defining stand types .................................................................................................... 3
3 Species within the DFA associated with hardwoods ..................................................... 3
4 Current forest practices and hardwoods ...................................................................... 6
4.1 Reduction of amounts of older age classes of hardwood or mixed wood types ..... 6
4.2 Reduction of the proportion of hardwoods in mixed wood types below the level at which the mixed wood contribution to species richness is sustained ............................. 9
4.3 Reduction of amount of hardwoods through vegetation management ................. 10
4.4 Conversion of deciduous or mixed wood types to conifer-leading types ............. 10
4.5 Retention of riparian and associated hardwoods ................................................. 11
5 Probable future status of hardwood types ................................................................... 11
5.1 Amounts of older hardwood and mixed wood forest .......................................... 11
5.2 Reduction of the proportion of hardwoods in mixed wood types below the level at which the mixed wood contribution to species richness is sustained ........................... 14
5.3 Reduction of amount of hardwoods through vegetation management ................. 15
5.4 Conversion of deciduous or mixed wood types to conifer-leading types ............. 16
5.5 Retention of riparian and associated hardwoods ................................................. 16
5.6 Cumulative affects .............................................................................................. 16
6 Summary ................................................................................................................... 17
6.1 Major findings ..................................................................................................... 17
6.2 Recommendations for practice ............................................................................ 18
6.3 Recommendations for monitoring ....................................................................... 18
7 Literature cited .......................................................................................................... 20

3
1 Introduction Hardwoods are deciduous, broadleaved trees. None of the broadleaved trees on the TFL are evergreen. Larch, a conifer, is deciduous. There are four steps in the assessment:
1) Review species present in the DFA and dependent on or strongly associated with hardwoods (can be reasonably complete only for vertebrates)
2) Review impacts of current forest practices on hardwoods. 3) Assess the likelihood of ‘unmixing’ the mixed wood to an extent that expected
contributions to biodiversity are reduced. 4) Assess probable future amounts of hardwoods and their apparent adequacy.
2 Defining stand types Practical definition of stand types is necessarily somewhat arbitrary. In the Northeast, Canfor participates in a regional working group that is formulating recommendations on boreal mixed wood management. Stand types are designated into one of four forest type groups – pure deciduous, deciduous-leading mixed wood, conifer-leading mixed wood, and pure conifer. That classification is based on the British Columbia Land Classification System.
• Coniferous: greater than 75% of total tree cover is coniferous • Mixed-Coniferous: greater than 50% but less than 75% of total tree cover is coniferous • Mixed-Deciduous: greater than 50% but less than 75% of total tree cover is deciduous • Deciduous: greater than 75% of total tree cover is deciduous.
Currently, coniferous forest makes up 80% of the forested land base in the DFA; mixed-coniferous makes up 5%, mixed-deciduous makes up 3% and deciduous makes up 12%. There are sound silvicultural reasons for distinguishing between conifer- and deciduous-leading mixed woods. It is less clear that there are measurable consequences to biodiversity. Because of the small portion of mixed wood on the tenure (about 8%) current sample sizes of potential species responses are small and show no significant differences between hardwood- and conifer-leading mixed wood. Stand types of Table 1 aggregate mixed wood into a single class. The three classes used are:
• Conifer-leading: Coniferous: greater than 75% of total tree cover is coniferous • Mixed wood: <75% hardwood or conifer • Hardwood leading: >75% hardwood species
These three types and their boundaries are the three forest types distinguished in level 4 of The B.C. Land Cover Classification Scheme (BC MoSRM 2002). 3 Species within the DFA associated with hardwoods Data are most complete for vertebrates and among vertebrates are most complete for birds. Birds: From the literature we estimated that 19 bird species would be associated primarily with hardwood or mixed wood forest types (Table 1). Of these there were sufficient data to test associations statistically for 10 species; nine species showed strong preferences (p < 0.05). Table 1 assesses the degree to which birds present on the DFA are associated with forest types having a significant portion of hardwoods. Habitat types in the table are designated: RC = Recently cut (0-30 yrs); H1 = Hardwood (30-90 yrs), H2 = Hardwood (90+ yrs), C1 = Conifer (30-90 yrs), C2 = Conifer (90+ yrs), MW1 = Mixed wood (30-90 yrs), MW2 = Mixed wood (90+ yrs). Bold in the table indicates a significant preference for the habitat (p < 0.05). Habitat types in [ ] represent types to which the species has been assigned within the species accounting system, but data are insufficient to permit statistical assessment. Blank spaces indicate that the species has not been recorded from survey routes for the TFL but is known or believed to be present.

4
Primary, secondary and tertiary indicate the apparent habitat preferences as expressed in the data; where primary is most preferred. Table 1. Habitat affinity of birds present in the DFA for hardwood forest types.
Habitat affinity Territory Size (ha)
Trenda Species Records Primary Secondary Tertiary Hardwood leading
American Redstart 215 54/16 H2 8/4 MW1 25/15 MW2 0.4-0.7 -1.4 Baltimore Oriole R [Riparian] 0.6-1.7 -1.5 Broad-winged Hawk [H2] 1.5 kmb 1.3 Connecticut Warbler [H2] 0.25-0.5 3.1 Least Flycatcher 101 54/8 H2 10/3 H1 14/7 MW2 0.1-0.2 -0.3 Magnolia Warbler 85 21/6 H2 14/6 MW2 5/3 H1 0.6-0.7 -0.6 Ovenbird 44 8/1 H2 16/3 H2 4/1 MW1 0.6-1.6 -0.7 Philadelphia Vireo 1 1/0 0.3-4.0 -0.7 Red-eyed Vireo 34 6/1 H2 14/3 H2 5/2 MW2 0.9-3.7 -0.9 Rose-breasted Grosbeak 47 15/4 H2 3/1 MW1 4/1 H1 0.3-1.3 -0.9 Ruffed Grouse 16 4/1 1/0 MW1 1/0 H1 2.1-2.3 -3.3 Veery R [Riparian] 0.25-0.5 0.0 Warbling VireoR 479 18/10 MW1 58/33 MW2 62/36 H2 1.2-1.5 1.1 Yellow WarblerR 152 39/11 H2 11/5 H1 20/10 NF 0.05-0.8 0.0
Mixed wood
Merlin 1 1/0 C2 [MW2]
0.16-4.6 kmb
5.0
Sharp-shinned Hawk [MW2] 1.1-6 kmb 8.7 Swainson’s Hawk [MW2]
1.2-
2.5kmb -0.2
Swainson's Thrush 638 66/43 MW2 67/48 H2 47/42 C1 0.9-2.1 -0.2 Western Tanager 47 11/4 H2 10/3 MW2 4/1 H1 1.4-4.0 0.9
R = primarily riparian; a Population trend in western BBS routes as analyzed by CWS; %/yr; significant trends in bold (positive in blue; negative in red); sample sizes are usually too small to yield significant estimates; b Mean distance between nests Values in Table 1 can be interpreted as a simple selection ratio of times observed over times expected. For example, American Redstart has a ratio of 54/16 in H2. That means it was observed 54 times in H2 although only expected 16 times given: 1) the allocation of sampling across the 9 surveyed habitat types, and 2) that it was detected 215 times in total across all habitat types. The sample distribution was 332 from H2 and 4444 across all types. The denominator (16) = 215 x 332/4444. For the redstart the selection index for its most preferred (primary) habitat is 3.38 (54/16), 2.0 for is secondary preference and 1.67 for its third ranked habitat. The selection ratios provide a repeatable index how highly the species itself ranked the different habitat classes. Bird species in Table 1 do not include cavity nesters. A total of 33 cavity nesters occur within the DFA. Some of these show preferences for hardwood-leading or mixed wood stands that are not statistically significant with current data. Within the sparse data currently available from the region, for the 33 species nest sites have been recorded only from hardwoods for 8 species and only from conifers for 5 species; 13 species have been recorded nesting in both hardwoods and conifers (Bunnell et al. 2008a). Local nest tree data are lacking for some species. It is noteworthy that the major keystone species, yellow-bellied sapsucker, has been recorded only from hardwoods (28 nests). This will change once latest data are incorporated. Amphibians: The four amphibians present within the DFA – boreal chorus frog, Columbia Spotted Frog, long-toed salamander and western toad – all occur more commonly in wetland or

5
riparian areas. These areas typically host more abundant hardwoods, so associations with hardwoods are apparent, but perhaps as a secondary effect. Generally, current field data suggest that the boreal chorus frog is more likely to occur in wetlands within hardwood or mixed wood stands while the wood frog occurs more often in conifer stands (often near edges). Reptiles: The Common Garter Snake also frequents riparian areas, so shows an association with hardwoods that are frequent there. However, hardwoods are not necessary. Mammals: Arctic shrew, beaver and muskrat seek wetland areas where hardwoods are prevalent. Only the beaver is dependent on them. The American water shrew and river otter seek riparian areas where hardwoods often are prevalent. The shrew likely profits from hardwood cover because insects are more abundant in hardwood than in conifer litter. Some representatives of organism groups other than vertebrates frequently demonstrate stronger reliance on hardwood cover than is found among vertebrates. For all of these groups inventory is incomplete for northeastern BC and only generalities are summarized below. Fungi: Some species of fungi show strong preferences for either hardwoods or conifers. Generally, hardwood logs will host fewer species than conifer logs. In Sweden, spruce logs hosted more fungal species than did aspen, birch or oak (Lindhe et al. 2004). Generally, host specificity appears to decline as decay progresses. Among fungal species, host specificity is highest in living or newly dead wood (Kaila et al. 1994), and declines as wood is decomposed. Lichens: Many cryptogams are strongly associated with hardwood trees (Gustafsson et al. 1992; Kuusinen 1996; Rambo 2001), primarily because of specific bark characteristics (Barkman 1958; Culberson 1955). Host specificity among conifer species also has been attributed to differences in bark chemistry (Kalgutkar and Bird 1969). Although there are species-specific relations that are poorly or totally undocumented, a key distinction in terms of provision of habitat to biodiversity is that hardwoods decay and return to the soil more rapidly than do conifers (Harmon et al. 1986). Because epiphyte affinities to tree species are associated with bark characteristics, Bunnell et al. (2008b) suggested that they become less discriminating of tree species as the tree dies, loses bark and becomes partially decayed. Wood chemistry could influence affinities of epixylic lichens and bryophytes, but any patterns are inadequately quantified. Generally, the suggestion of Bunnell et al. (2008b) appears true. Associations with particular tree species are less well expressed in lichens and bryophytes than among fungi and insects where they persist into advanced decay (Ǻs 1993; Mills and Macdonald 2005; Savely 1939). Of the 127 species of lichens in the Pacific Northwest and Fennoscandia restricted to wood without bark. 79 appear restricted to conifers, 13 occur on both hardwoods and conifers and only 9 appear restricted to hardwoods.
Bryophytes: Associations of bryophytes and other cryptogams with particular or broad groups of tree species are much more strongly expressed on living trees than on dead wood (e.g., Brodo 1974; Kuusinen 1994; Gustafsson & Ahlén 1996). That is particularly true for bryophytes. Generally, by the time bryophytes become abundant on dead wood bark is shed and tree species are more difficult to distinguish. More importantly, on the well rotted state that encourages high moisture levels and high bryophyte richness, many tree species differences have been degraded by decay. Bryophytes and lichens are unable to grow on the ground of pure trembling aspen stands forests because of the thick litter layer and the blanketing effect of autumn leaf-drop (Longton 1992). In such forests, bryophytes and lichens are largely confined to tree bases and downed woody material. In Albertan mixed wood, 33 mosses and 7 liverworts were reported from down wood, but no distinction was reported between conifer and hardwood logs (Crites and Dale 1998). Vascular plants: Both hardwood and conifer logs host vascular plants. Conifer logs make a greater contribution primarily because they last longer. Rotting wood is particularly important in conifer forests of the Pacific Northwest because it covers more of the forest floor there than in

6
other regions (6 to 25%; Harmon et al. 1986), and because seedling density is greater on rotten wood than on the forest floor (Christy and Mack 1984: McKee et al. 1982). In aspen forests, logs and stumps > 20 cm diameter captured 95 percent of the colonizing vascular plant species (Lee and Sturgess 2002). Smaller diameter logs and stumps were only colonized by small forbs such as Mitella nuda, Linnaea borealis, and Cornus canadensis, whereas larger diameter logs and stumps were colonized by shrubs and saplings as well. Wood-inhabiting invertebrates: Insects colonizing living or freshly dead wood often show narrow host specificity (Hamilton 1978), but specificity declines as decay progresses although large differences remain between hardwood and conifer trees (Grove 2002).
Butterflies: We have not yet completed the assignment of butterfly species to monitoring groups within the species accounting system, but it is clear that some have strong associations with hardwoods. For example, striped hairstreak (Satyrium liparops subspecies fletcheri) relies on chokecherry in riparian habitats as a larval food source; other butterflies are closely linked to Salix species. 4 Current forest practices and hardwoods Practices that can have a deleterious effect on amounts and kinds of hardwoods within the DFA are those that:
1) reduce the amount of older age classes of hardwood or mixed wood types, 2) reduce the proportion of hardwoods in mixed wood types below the level at which the
mixed wood contribution to species richness is sustained. 3) reduce the amount of hardwoods through vegetation management, 4) convert significant amounts of hardwood or mixed wood types to conifer-leading types,
and 5) inadequately protect riparian areas that are predominantly hardwoods.
There is a sixth potential impact – the combined or cumulative effects of all actions. The ways in which each of these effects can be influenced by forest practices and key measures of the potential impact are briefly reviewed before assessing current practices. 4.1 Reduction of amounts of older age classes of hardwood or mixed wood types There are three potentially useful descriptors for assessing the amounts of older age classes of hardwoods or mixed wood types: 1) total and protected area of the types, 2) age distribution within types, and 3) patch size distribution (particularly of older age classes where these are more limited. Total area provides the initial descriptor of available habitat. Older age classes are a key feature of hardwoods because these provide cavities necessary for several cavity users and substrate for various lichens, mosses, and habitat for invertebrates. Age is the major refinement to total area. In some forest types, organisms avoid forest edge and use only larger patches, but that tendency is not pronounced in hardwood or mixed wood types (see below). Because age is such an important modifier of suitable area of hardwood or mixed wood types, we treat age first. Age of trees CanFor has used natural patterns to estimate targets for features that influence how dying and dead wood is provided. One of these is late seral targets. Late seral stages are the major source of dying and dead wood. Within its SFM plan for TFL 48 CanFor specifies late seral targets by Natural Disturbance Units (NDUs; Table 2). The targets are based on work of Delong (2002, 2007), and where there were clear spatial distinctions between conifer and hardwood provide a separate target for each.

7
Table 2. Current late seral forest targets for TFL 48 by Natural Disturbance Units (NDUs) and major associated BEC variants. NDU Late seral target Associated BEC variants Boreal plains deciduous 10% BWBSmw2, BWBSwk1,ESSFmv2, SBS
wk2 Boreal foothills valley deciduous
10% BWBS mw1, BWBS wk1, BWBS wk2 SBS wk2
Boreal foothills valley conifer
23% BWBS mw1, BWBS wk1, BWBS wk2 SBS wk2
Boreal plains conifer 17% BWBSmw1, BWBSmw2 (BWBSwk1, BWBSwk2, SWBmk)
Boreal foothills mountain 33% ESSFmv2, (ESSFwk2, ESSFwc3) Omineca valley 23% BWBSmw1, SBSwk2 Omineca mountain 58% ESSFmv2 Wet mountain 84% SBSwk2, ESSFwk2, ESSFwc3,
ESSFmv2 This needs a final check Employing data derived from NDUs is helpful in planning because natural conditions represent the least equivocal benchmark available. TFL 48 employs NDU/BEC combinations, which are particularly helpful because some species show strong affiliations with particular BEC variants and NDUs typically encompass several variants. That condition results because BEC variants often reflect changes in elevation that may occur as a relatively narrow strip along sloping terrain, whereas NDUs reflect the pattern of natural disturbance. In this area the major natural disturbance is fire, which shows little restriction to elevation and may range from valley bottom to upper slope. As a result, on average, the NDUs may better reflect natural structural conditions in an area than do BEC units, although BEC units better reflect the presence of particular trees species and other organisms. Moreover, NDUs are so large relative to the TFL that they could easily become misleading as targets if not stratified by BEC unit (e.g., the proportion of each NDU within the TFL varies from <1% to 43%). As well, relationships employing BEC units apply to the TFL and can in some instances be generalized to other areas of the province whereas relationships derived for NDUs may prove more difficult to generalize to other Canfor areas. The major challenge to the use of NDUs as targets is that climate change undoubtedly has already shifted the disturbances used to define the boundaries of NDUs, whereas distribution of tree species defining BEC units will shift more slowly (other organisms resident in BEC units may shift more quickly in response to climate change). While NDUs provide helpful initial estimates of appropriate targets, we have based the coarse filter evaluation largely on BEC units. That is because organisms’ affinities for BEC units can be strongly expressed and they show is less affinity for NDUs. Some lower age boundary has to be established to designate late seral. In its SFM plan, CanFor follows guidelines of Craig Delong (pers. comm.) that 10 to 15% of deciduous dominated landscapes will be maintained in stands greater than 100 years old. This boundary is younger than that used to define late-seral conifer-leading stands (>140 years). There are no data to support a firm boundary. Generally, hardwood trees are shorter lived than conifer trees, and when hardwood stands are left undisturbed for long periods (>150 years) they either die and cycle back to a similar species composition or convert to coniferous stands. In Alberta, hardwood stands greater than 120 years old are structurally distinct from young and mature stands (Stelfox 1995). Such older stands contain fewer stems, larger diameter trees, higher levels of coarse woody debris and may be preferred by some organisms. Stelfox (1995) described forest structure and composition of plant and animal communities in young (20–30years), mature (50–65 years) and old (120+years) aspen mixed wood stands of fire origin. However, data

8
summarized by Stelfox (1995) are little help in establishing a biologically meaningful boundary atbecause there is a large gap between stands 50 to 65 years old and 120+ years old. An initial step is to seek evidence of a biologically meaningful boundary. Within the DFA about 20 canopy-, ground- or shrub-nesting bird species appear strongly associated with hardwood tree species. These species seek deciduous cover because that is where their prey is concentrated. Four of these species are hawks hunting from the air. Among the other 16, nine nest in shrubs or on the ground under shrubs and 12 focus much of their foraging for insects or fruits on shrubs. Magnolia warbler, for example, preferentially nests in conifers, but forages in shrubs which often are more abundant in aspen stands than under conifers. For most of these species, age is of stand is not important provided shrubs are present. The Swainson’s thrush may be an exception because it seeks taller shrubs that are sometimes better developed within older stands that have begun to open up. Stand age is important primarily for the cavity users because of the role that decay and size play in cavity-tree selection. Bunnell et al. (2008a) report an additional 12 cavity-nesting species of birds that show a strong preference for hardwoods, including the keystone excavator for the region (yellow-bellied sapsucker) and 2 cavity using mammals (all reported dens of little brown myotis and silver-haired bat have been in hardwoods). Two maternal dens of fisher were reported by Weir (2006), both in hardwoods (39.5 and 51.5 cm dbh; smaller than diameters from studies farther south). Weir also reported resting dens from standing trembling aspen and balsam poplar trees 40 to 80 cm dbh (Weir 2006). Based on their review of documented vertebrate use and volume over age curves, Bunnell et al. (2008a) estimated that 90 years was a biologically meaningful lower threshold for late-seral hardwood or mixed wood stands. Reviews of other organisms, including fungi (Heilmann-Clausen and Christensen 2004; Kruys and Jonsson 1999; Nordén and Paltto 2001), lichens (Bunnell et al. 2008b), bryophytes (Samuelsson et al. 1994) and wood-inhabiting invertebrates (Grove 2002), suggest that 90 years is appropriate in terms of diameter. Literature from other locations suggests that in some instances, forest continuity or age itself is important for some species of fungi, lichens, bryophytes and invertebrates (e.g., Rose 1976, Selva 1994). Patch size The SFM plan for TFL 48 also relies on data derived from NDUs to estimate a naturally-based target for the cumulative amount of early seral stages and opening size during harvest. Delong (2002, 2007) estimated both relative rates of disturbance and the distribution of patch sizes within disturbance areas for each NDU. These estimates reveal a wide range: the percent of patches resulting from natural disturbance >1000 ha is 70% in Boreal Plains Upland area, 10% in Wet Mountains and 0% in Boreal Plains Alluvial (part of this difference is natural disturbance regime and part is relative area). Using NDUs to establish early seral targets has similar advantages and disadvantages as noted for late seral targets. There are more challenging difficulties in employing ‘opening size’ to evaluate effectiveness of hardwood contributions. Specifically, sustaining portions of biodiversity sensitive to amounts and character of hardwoods may be better assessed by the sizes of treed patches retained, than by the sizes of openings created. When clearcutting with reserves is undertaken, even small retention patches (0.25 ha) can make significant contributions to species using hardwoods and help reduce any negative effects of opening size. Although, broad targets for early seral stages are appropriate planning guidelines, assessing the effectiveness of practice likely proceeds best by considering a range of patch sizes (see Section 5.1). Potential effects of patch size on the quality of deciduous forest habitats are not well documented. As for conifer forests, edge effects likely benefit some species and negatively affect others. Certainly stand structures vary around edges, where there may be more blowdown (although blowdown is likely less in tree species that lose their leaves during winter than for most conifers). In terms of responses of organisms to patch size of hardwood forest, none of the species listed in Table 1 are reported to avoid edges, and many in fact prefer edges. Ruffed grouse during winter,

9
may be an exception but effects are not documented. Nor are cavity nesters showing preference for hardwoods negatively affected by edge. Because microclimate varies near edge (e.g., more light, less humidity), organisms smaller than vertebrates are more likely to be affected by edge. North American work evaluating effects of edge on epiphytic lichens and mosses has concentrated on species preferring conifers. Work in Scandinavia addressing epiphytic species with affinities for hardwoods has included species also present in North America and found few negative edge effects (REFS). The common structure of hardwood types makes edge effects unlikely, but prudence suggests some larger patches should be retained. Our evaluation of potential edge effects (Section 5.1) includes a range of patch sizes. The most useful coarse-filter measure of amount of hardwoods is the total area of age classes >90 years old. Changes in age class distribution over time can foretell potential problems resulting from gaps in the age distribution. Changes in patch distribution (e.g., towards ever small average patch size) also can foretell problems. 4.2 Reduction of the proportion of hardwoods in mixed wood types below the level at which the mixed wood contribution to species richness is sustained Mixed wood stands are recognized as supporting uncommonly high levels of biodiversity and contributing disproportionately to species richness. It is for that reason that mixed wood types were treated separately in evaluating species associations with broad forest types. Concern has been expressed about ‘unmixing’ the mixed wood and losing that contribution to sustaining biodiversity (Cumming et al. 1994; Grover and Greenway 1999; Harper and Kabzems 2003). It is a concern primarily where mixed wood types are common, as in the boreal, sub-boreal and southern interior, but small inclusions of hardwoods increase species richness in coastal forests as well (Huff and Rarely 1991). Currently, the principles in CanFor’s SFM plan for TFL 48 include providing for stand compositions and stand structure that relate to natural baseline information. Targets for forest type composition are based on the proportion of these types found in the landscape at the time of writing of the SFMP (2004). Targets as percent of the DFA area are: conifer – 75 to 85%, deciduous – 9 to 15%, conifer mixed wood – 4 to 6%, deciduous mixed wood – 2 to 4%. These guidelines will influence future composition of the contributions hardwood stands. Coniferous and mixed coniferous types contribute to the coniferous timber harvesting land base; deciduous and mixed deciduous types contribute to deciduous timber harvesting land base. The SFM plan identifies a strategy for mixed wood stands that attempts to blend them into the harvest profile. Mixed stands, although composed of different species, tend to be even-aged as a result of forest succession following disturbance. In coniferous-leading mixed stands, the conifers may not have reached harvesting age while the deciduous is in decline. It is not CanFor’s intention to consistently regenerate an area back to the same species composition as was harvested. Instead, over the broader landscape and through time the distribution of forest types will be maintained within the baseline target range for each forest type group. Management does not plan for mid-rotation deciduous entries, but anticipates waiting until conifers are large enough to form a saw log. Such planning helps to ensure the presence of older deciduous. The management intent is to regenerate these sites back to a similar species composition when tracked at the landscape level. The current SFMP suggests biological constraints must also be considered within a mixed wood management strategy (but does not elaborate on those constraints). Similarly, the SFMP suggests that minor components of commercial deciduous species that occur in coniferous stands will be managed over the total land base to achieve a variety of landscape level objectives (but doesn’t expand on what the objectives and impacts on deciduous might be). If the proportion of each type over the entire DFA remains similar to baselines, the various treatments of deciduous should result in deciduous of a variety of age classes over the landscape. Management regimes will range from maintaining mature deciduous stems on site to contribute to non-timber resource values to removing all deciduous volumes where resource

10
values will not be compromised and economic conditions permit. Deciduous that is harvested incidentally from conifer leading stands contributes to the conifer AAC and is accounted for accordingly. While first principles suggest that current practices will maintain varying forms of deciduous cover, lack of clarity about the ecological contributions of hardwoods to mixed wood remains. It is possible that quite small amounts of either hardwoods or conifers make a significant contribution to maintaining species richness within mixed wood types. Consequences of forestry practices on mixed wood cannot be evaluated well without an ecologically based appraisal of the apparent boundaries of percent deciduous and coniferous that are important to maintaining species richness. Assessing the amount of conifer or deciduous trees that confer increases in species richness is a helpful step in assessing the degree to which the amount of mixed wood is altered in terms of the contribution it makes to sustaining biodiversity. Currently, there is no simple measure of amount of mixed wood as defined on the basis of its contribution to biodiversity. Analyses working towards a credible definition are noted in Section 5.2 under ‘Probable future states’ below. 4.3 Reduction of amount of hardwoods through vegetation management Vegetation management to permit establishment of crop trees can deliberately or inadvertently reduce the amount of hardwood tree species. Vegetation targeted during vegetation management is diverse and includes grasses, herbs, shrubs and young hardwood trees. During vegetation management hardwood species are reduced, but frequently only temporarily. Questions helpful in assessing the long-term consequences of vegetation management on sustained provision of hardwoods and associated biodiversity include:
• What area is treated by vegetation management annually specifically to control hardwoods?
• How quickly do hardwood tree species (including willow) recover? • What proportion, if any, of hardwood species is ‘permanently’ removed by vegetation
management? The latter question can be addressed only through long-term study. Addressing the first two questions can estimate the short-term reduction in hardwood cover below that which would follow harvest without subsequent treatment. Much of this reduction is likely temporary and relevant only if amounts of hardwood and mixed types appear limiting. 4.4 Conversion of deciduous or mixed wood types to conifer-leading types Like 4.2 and 4.3 above this issue reflects concern about the relative mix of deciduous and coniferous species. Within the SFM Plan it is governed by the same principles noted under concern about unmixing the mixed wood. Deliberate conversion is noted separately because local conditions (e.g., milling opportunities) in some instances are much more likely to favour conversion to conifer-leading than to sustaining deciduous-leading stands. Vegetation management (4.3 above) is most likely to reduce amounts of hardwoods in small, localized areas for short periods; that is, temporarily. Other practices (e.g., planting, selective harvesting) together with vegetation management can convert deciduous or mixed wood types to conifer-leading types on a permanent basis. As noted under 4.2 conversion to conifer-leading may be deliberately planned for some sites, but the intent is maintain the mix of forest types across the DFA that existed at time of writing the plan. The simplest measure is the area of hardwood or mixed wood forest type being converted to conifer-leading stands. However, ecological consequences of increasing the proportion of conifers in stands are difficult to evaluate without a better understanding of the proportions of deciduous or coniferous trees that confer the mixed wood advantage to biodiversity.

11
4.5 Retention of riparian and associated hardwoods Hardwoods are abundant in riparian areas in the DFA. Some of these hardwood species are non-commercial (e.g., willows), but still make significant contributions to biodiversity. In some instances there is pressure to convert riparian areas to conifers because: i) conifers often are more valuable species, ii) some down wood in streams is beneficial and conifer wood lasts longer. To assess the impacts of forest practices on hardwoods within riparian areas the simplest set of questions is:
• To what degree are riparian areas protected? • To what extent are hardwood elements in riparian areas mapped? • Do practices in the RMZ sustain hardwoods?
Canfor’s SFMP follows regulatory widths for Riparian reserves and or Riparian Management Zone by appropriate stream, lake or wetland classification within cutblocks. The SFM plan for TFL 48 clearly specifies the riparian reserve zone (RRZ) and Riparian Management Zone (RMZ) widths and the percent retention in RRZs and RMZs by riparian class. It is likely these levels of protection will maintain a significant proportion of hardwoods. What is unevaluated is whether or not the failure to buffer small wetlands and lakes (<5 ha) leaves some portion of biodiversity exposed to habitat degradation. 5 Probable future status of hardwood types The probable future status of hardwood types is assessed for each of the potential impacts noted. 5.1 Amounts of older hardwood and mixed wood forest Trees in the non-harvestable land base (NHLB) are allowed to die a natural death. The current area of forest currently reserved from harvest (NHLB) for various reasons is summarized in summarized in Table 3. Neither Tables 2 nor 3 make a distinction between conifer- and hardwood- leading mixed wood. Of the 19 hardwood associations identified in Table 2, current data show only one species, oven bird, as making a clear distinction. It favours deciduous-leading mixed wood (p = 0.064). Both the non-harvestable land base (NHLB) and timber harvesting land base (THLB) can contribute to sustaining older hardwoods; the latter through various forms of retention. Currently about 25,000 ha of hardwood-leading stands and 17,000 ha of mixed wood stands (simple definition) occur in the NHLB (Table 3). That represents 41.5% [ /60,342] and 39.8.1%, [ 17,166/43,730] respectively, of hardwood-leading and mixed wood that are excluded from harvest. Within the NHLB, proportions older than 90 years are 44.1% and 56.1%, respectively. Table 3. Areas of different habitat types within TFL 48 (ha) as of 2004. THLB Age (years)
NHLB >90 All NHLB Habitat Type 0-30 31 to 90 >90 Recently cut 41309 NA NA NA NA Conifer leading NA 47838 1018361 461841 149964 Hardwood leading NA 18499 16807 11039 25036 Mixed wood NA 10025 16539 9637 17166 1 Age class for conifers is 140 years plus. Harvesting activities should not modify the proportion of NHLB, but will modify the age distribution within the timber harvesting land base (THLB). Older age classes of the hardwood and mixed wood forest types are particularly important to sustaining biodiversity. Projected amounts of these older age classes at the end of the current 20-year plan are summarized in Table 4. Amounts are projected for the five BEC variants currently having the largest areas of recently disturbed habitat (<30 years old). Recent disturbance could be either natural or through harvesting, and provides and index of BEC units most likely to be further disturbed in the future.

12
Table 4. Current and projected areas (ha) of older forest (>90 years for hardwoods and mixed wood) in the THLB and NHLB.
Variant
THLB NHLB Hardwood > 90 Mixed wood > 90 Hardwood > 90 Mixed wood > 90 2004 +20 yrs 2004 +20 yrs 2004 +20 yrs 2004 + 20 yrs
BWBSmw1 12921 16773 10788 7328 8500 12768 5297 6518 SBSwk2 771 1109 3189 3283 1169 2140 2617 4142 ESSFmv2 0 62 398 517 181 396 565 1031 ESSFwk2 0 10 152 183 60 170 260 577 BWBSwk1 719 1261 1288 1188 495 1096 590 990
Total 14411 19215 15815 12499 10405 16570 9329 13258 % change +33.3 -21.0 +59.3 +42.1
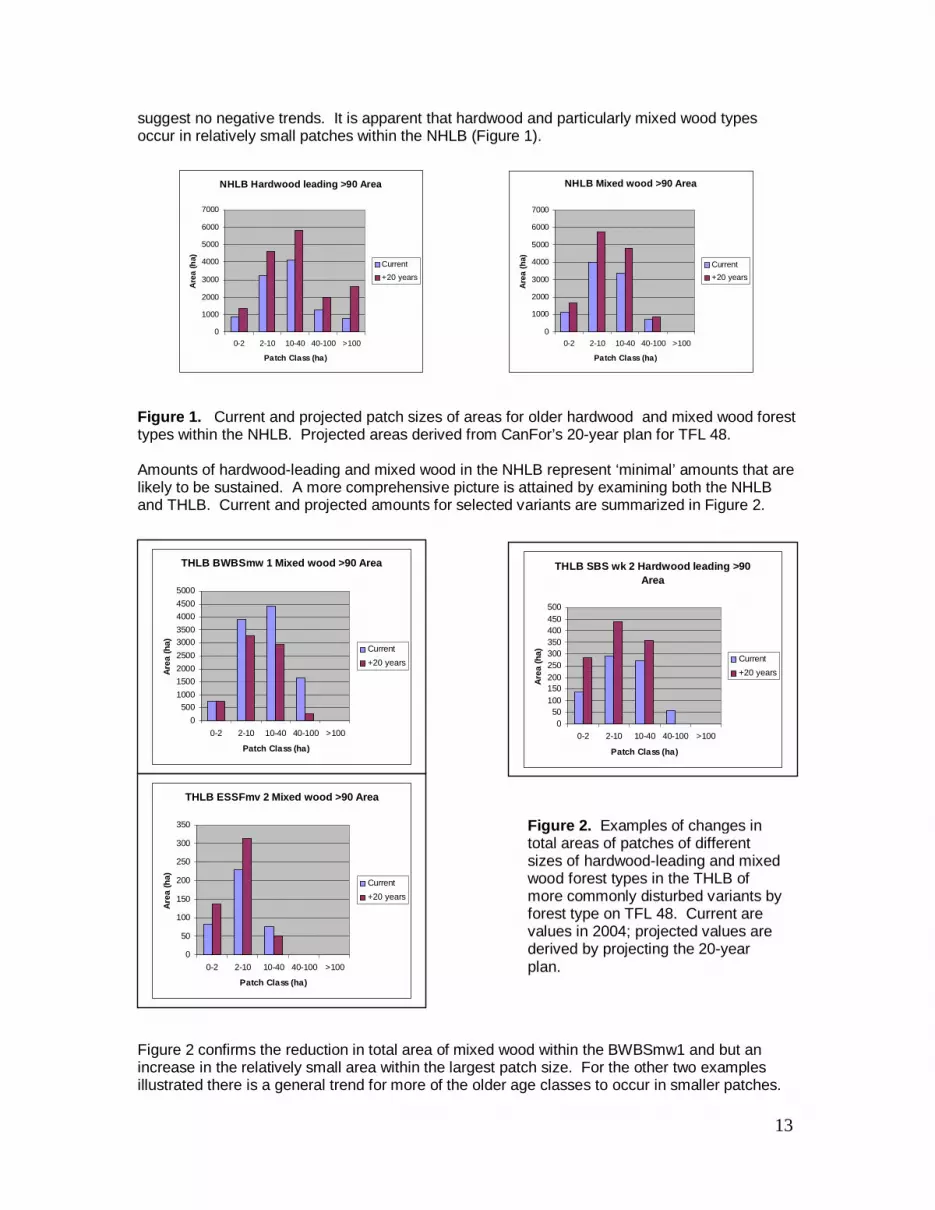
Given the number of events that influence harvest schedules even a 20-year projection is unlikely to be correct, particularly with regard to individual cutblock boundaries. The potentially troubling trend is the impact of fire and other natural disturbance. The annual rate of burn DON Current analyses suggest an increase in the amounts of older hardwoods and mixed wood within the NHLB. To some extent this is a product of ingrowth into late seral stages as stands age, but it also reflects the lack of natural disturbance in the projection. The most troubling feature is a decline of 21% in the amount of older mixed wood in the THLB over 20 years. Most of this decline occurs within the BWBSmw1. That decline appears to be matched by an increase in late-seral mixed wood within the NHLB, but the apparent increase does not include natural disturbance. Whether this decline is an artifact of projection or a consequence of silvicultural practices ‘unmixing’ the mixed wood is unclear. Given the value of mixed wood stands in sustaining biodiversity, it suggests the potential trend merits high priority in long-term monitoring. Age is the primary modifier of suitability of amounts of hardwood and mixed wood stands. Patch size is less influential on the contributions of hardwoods than it is for other habitat elements, but a precautionary approach should include examining potential trends. We examined the distribution of patch sizes using five size classes we considered biologically or socially meaningful. The smallest size (<2 ha) is less applicable to the NHLB and is poorly represented there. It was chosen specifically for the THLB on the basis of estimates for the smallest effective size for sustaining snags in retention patches within the THLB; it is no more than a reasoned estimate from coastal data. Assuming a tree height of 30 m and a no-work zone of 1.5 times tree height the smallest patch sustaining a single tree is about 0.16 ha. We suggest that the lower boundary for effective patches should be set at 0.25 ha,1 until further evaluated. No patches less than 0.25 were tallied (in most instances these are GIS ‘slivers’). The patch size class of 2-10 ha encompasses home range or territory size of many forest-dwelling species; 10 to 40 ha reflects a common regulatory constraint restricting size of cutblocks to 40 ha. The sizes 40 to 100 ha and 100+ ha reflect two classes that clearly contain interior forest conditions, the latter contributing to even the most wide-ranging species. We found no evidence of any species strongly associated with hardwoods being restricted to the two larger size classes. Patch sizes for older hardwood-leading and mixed wood forest types within the NHLB in 2004 and as projected under the 20-year plan are summarized in Figure 1. Figure 1 illustrates that in the absence of fire or other natural disturbance areas >90 years old increase for all patch sizes as trees age. The same projection shows that the area <30 years old decreases for all patch sizes. We cannot predict the impact fire or other natural disturbances will have, but existing data
1 This value is consistent with BC MoWLP (2005) for the Omineca Region, based on reasoned estimates from coastal experience.
13
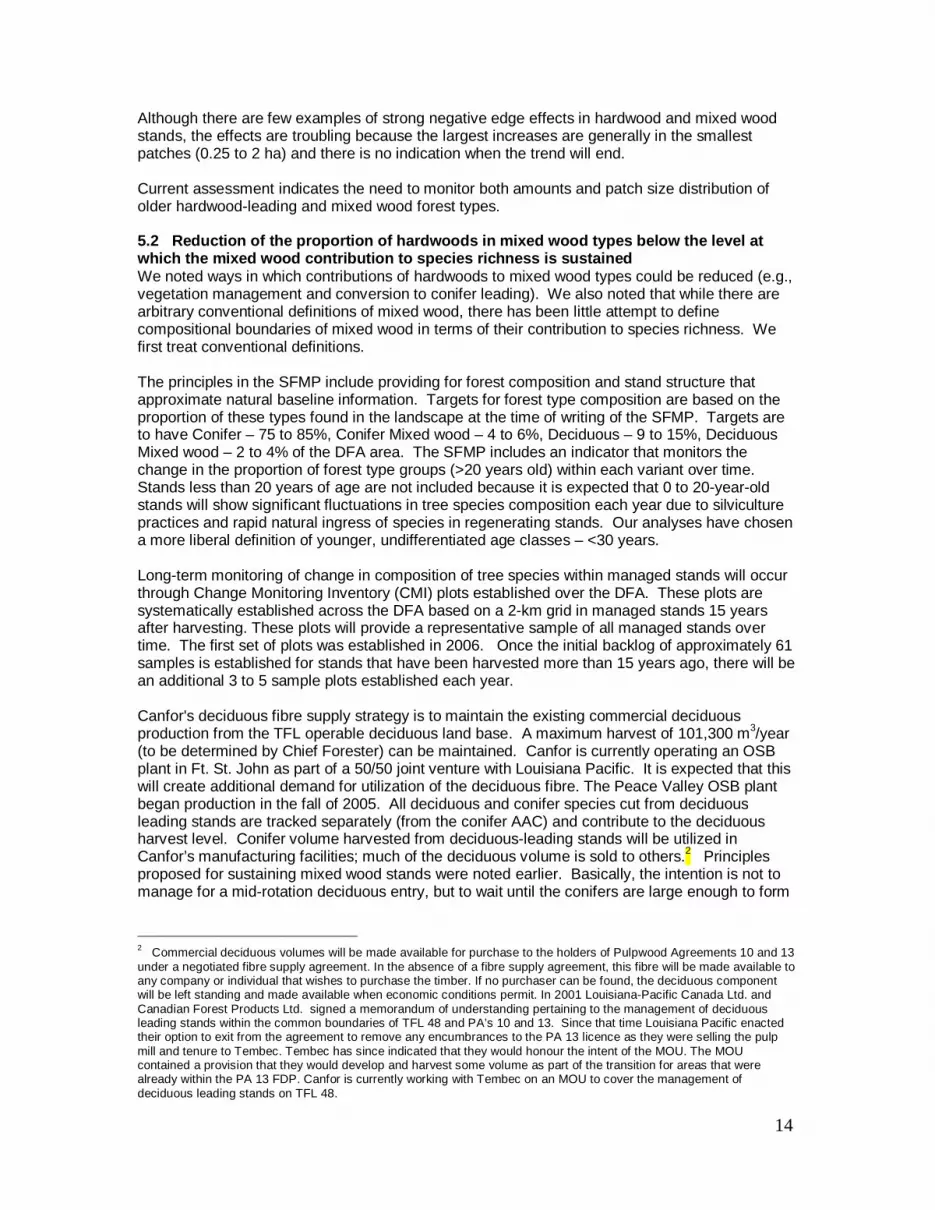
suggest no negative trends. It is apparent that hardwood and particularly mixed wood types occur in relatively small patches within the NHLB (Figure 1). Figure 1. Current and projected patch sizes of areas for older hardwood and mixed wood forest types within the NHLB. Projected areas derived from CanFor’s 20-year plan for TFL 48. Amounts of hardwood-leading and mixed wood in the NHLB represent ‘minimal’ amounts that are likely to be sustained. A more comprehensive picture is attained by examining both the NHLB and THLB. Current and projected amounts for selected variants are summarized in Figure 2. Figure 2 confirms the reduction in total area of mixed wood within the BWBSmw1 and but an increase in the relatively small area within the largest patch size. For the other two examples illustrated there is a general trend for more of the older age classes to occur in smaller patches.
NHLB Hardwood leading >90 Area
0
1000
2000
3000
4000
5000
6000
7000
0-2 2-10 10-40 40-100 >100
Patch Class (ha)
Are
a (h
a)
Current
+20 years
NHLB Mixed wood >90 Area
0
1000
2000
3000
4000
5000
6000
7000
0-2 2-10 10-40 40-100 >100
Patch Class (ha)
Are
a (h
a)
Current
+20 years
THLB BWBSmw 1 Mixed wood >90 Area
0
500
1000
1500
2000
2500
3000
3500
4000
4500
5000
0-2 2-10 10-40 40-100 >100
Patch Class (ha)
Are
a (h
a)
Current
+20 years
THLB SBS wk 2 Hardwood leading >90 Area
050
100150200250300350400450500
0-2 2-10 10-40 40-100 >100
Patch Class (ha)
Are
a (h
a)
Current
+20 years
THLB ESSFmv 2 Mixed wood >90 Area
0
50
100
150
200
250
300
350
0-2 2-10 10-40 40-100 >100
Patch Class (ha)
Are
a (h
a)
Current
+20 years
Figure 2. Examples of changes in total areas of patches of different sizes of hardwood-leading and mixed wood forest types in the THLB of more commonly disturbed variants by forest type on TFL 48. Current are values in 2004; projected values are derived by projecting the 20-year plan.
14
Although there are few examples of strong negative edge effects in hardwood and mixed wood stands, the effects are troubling because the largest increases are generally in the smallest patches (0.25 to 2 ha) and there is no indication when the trend will end. Current assessment indicates the need to monitor both amounts and patch size distribution of older hardwood-leading and mixed wood forest types. 5.2 Reduction of the proportion of hardwoods in mixed wood types below the level at which the mixed wood contribution to species richness is sustained We noted ways in which contributions of hardwoods to mixed wood types could be reduced (e.g., vegetation management and conversion to conifer leading). We also noted that while there are arbitrary conventional definitions of mixed wood, there has been little attempt to define compositional boundaries of mixed wood in terms of their contribution to species richness. We first treat conventional definitions. The principles in the SFMP include providing for forest composition and stand structure that approximate natural baseline information. Targets for forest type composition are based on the proportion of these types found in the landscape at the time of writing of the SFMP. Targets are to have Conifer – 75 to 85%, Conifer Mixed wood – 4 to 6%, Deciduous – 9 to 15%, Deciduous Mixed wood – 2 to 4% of the DFA area. The SFMP includes an indicator that monitors the change in the proportion of forest type groups (>20 years old) within each variant over time. Stands less than 20 years of age are not included because it is expected that 0 to 20-year-old stands will show significant fluctuations in tree species composition each year due to silviculture practices and rapid natural ingress of species in regenerating stands. Our analyses have chosen a more liberal definition of younger, undifferentiated age classes – <30 years. Long-term monitoring of change in composition of tree species within managed stands will occur through Change Monitoring Inventory (CMI) plots established over the DFA. These plots are systematically established across the DFA based on a 2-km grid in managed stands 15 years after harvesting. These plots will provide a representative sample of all managed stands over time. The first set of plots was established in 2006. Once the initial backlog of approximately 61 samples is established for stands that have been harvested more than 15 years ago, there will be an additional 3 to 5 sample plots established each year. Canfor's deciduous fibre supply strategy is to maintain the existing commercial deciduous production from the TFL operable deciduous land base. A maximum harvest of 101,300 m3/year (to be determined by Chief Forester) can be maintained. Canfor is currently operating an OSB plant in Ft. St. John as part of a 50/50 joint venture with Louisiana Pacific. It is expected that this will create additional demand for utilization of the deciduous fibre. The Peace Valley OSB plant began production in the fall of 2005. All deciduous and conifer species cut from deciduous leading stands are tracked separately (from the conifer AAC) and contribute to the deciduous harvest level. Conifer volume harvested from deciduous-leading stands will be utilized in Canfor’s manufacturing facilities; much of the deciduous volume is sold to others.2 Principles proposed for sustaining mixed wood stands were noted earlier. Basically, the intention is not to manage for a mid-rotation deciduous entry, but to wait until the conifers are large enough to form
2 Commercial deciduous volumes will be made available for purchase to the holders of Pulpwood Agreements 10 and 13 under a negotiated fibre supply agreement. In the absence of a fibre supply agreement, this fibre will be made available to any company or individual that wishes to purchase the timber. If no purchaser can be found, the deciduous component will be left standing and made available when economic conditions permit. In 2001 Louisiana-Pacific Canada Ltd. and Canadian Forest Products Ltd. signed a memorandum of understanding pertaining to the management of deciduous leading stands within the common boundaries of TFL 48 and PA’s 10 and 13. Since that time Louisiana Pacific enacted their option to exit from the agreement to remove any encumbrances to the PA 13 licence as they were selling the pulp mill and tenure to Tembec. Tembec has since indicated that they would honour the intent of the MOU. The MOU contained a provision that they would develop and harvest some volume as part of the transition for areas that were already within the PA 13 FDP. Canfor is currently working with Tembec on an MOU to cover the management of deciduous leading stands on TFL 48.

15
saw logs. The intent is to regenerate these sites back to a similar forest type composition as tracked at the landscape level. Progress has been made in including deciduous species into managed stand growth models (although not in time for inclusion in SFMP 4) and ongoing work on developing mixed wood stocking standards. Research projecting bird responses to salvaging scenarios in response to mountain pine beetle found than the species modeled tracked deciduous and conifer volume quite closely (and pine to a very minor extent). Depending on the salvaging scenario, there was often stability in deciduous volume in the near term (first 25 years), a reduction in the medium term (up to 75 years), and a subsequent increase in the long term (100 years). Accuracy of these projections in unclear, but they suggest no long-term decrease in suitable habitats for hardwood and mixed wood associates. Mixed wood stocking standards are not yet defined. While these projections suggest no long term decline in hardwood volume, they do not address the amounts of hardwood or conifer necessary in a mixed wood stand to confer the common mixed wood advantage to sustaining species richness. We initiated synthesis of existing data to determine whether or not any clear threshold exists (Bunnell et al. 2008c). Analyses to date are incomplete but document that mixed wood stands do host greater species richness that either pure conifer or pure hardwood stands and suggest that only small amounts of hardwood or conifer inclusions are required to increase species richness. Presently, the apparent projected declines in mixed wood apparent in Table 4 and Figure 2 cannot be evaluated in terms of their effect on species richness and sustaining biodiversity. 5.3 Reduction of amount of hardwoods through vegetation management The SFM plan for TFL 48 is silent on principles guiding vegetation management. It is apparent, however, that >80% of prescribed blocks are treated over at least a portion of the prescribed area. That treatment is intended to reduce competition with crop trees, primarily by shrubs and grass. Manual treatment is rare and most treatment is chemical applied aerially. Over a … period the proportion of harvested area on which CanFor applied vegetation management averaged xx%, or about yy ha per year. From the perspective of biodiversity the period of recovery can be estimated only in terms of species’ response. Reductions in hardwood types through vegetation management could be either permanent or temporary. Because hardwood species in the region regenerate readily both vegetatively and by seed, the period immediately after vegetation management is unrevealing of longer-term consequences. Hardwoods could be absent immediately following treatment but gradually return to the site. Long-term reduction is significant primarily in terms of conversion to form hardwood-leading to conifer leading types and addressed under conversion below. Short-term reduction is significant only if hardwoods are limiting overall. However, of 16 hardwood associates that are not aerial hunters (Table 1), nine nest in shrubs or samplings, or on the ground under shrubs and 12 focus much of their foraging for insects or fruits on shrubs. All shrubby growth, including young hardwoods such as willow, is thus important to these species. The magnitude and duration of potential impact can be addressed by answering these questions:
• What area is treated by vegetation management annually specifically to control hardwoods?
• How quickly do hardwood tree species (including willow) recover? • What is the response of shrub associated species in terms of shrub measures and time
since treatment? We were unable to answer any but the first question. That finding stimulated a project specifically evaluating responses of vegetation and organisms to vegetation management.

16
5.4 Conversion of deciduous or mixed wood types to conifer-leading types Within its SFM plan for TFL 48 Canfor addresses the potential conversion of forest types by maintaining the proportion of hardwood and mixed wood types at time of writing the plan. Major hardwood species in the area reproduce readily by suckering and by seeds. Canfor has not planted any deciduous seedlings or vegetative propagates on TFL 48. If planting or seed collecting was embarked on, it would be done according to regulations that seek to conserve genetic diversity of tree stock. As noted, conditions immediately after harvest do not reveal long-term trends because hardwoods may reappear after vegetation management. The only available long-term projections are volume-based and suggest no long-term decrease in suitable habitats for hardwood and mixed wood associates. The simpler, area-based projections employed here are only 20-years but are not vulnerable to the propagation of small errors. They suggest a reduction in the total area of older mixed wood over the 20-year horizon of CanFor’s current plan and a trend towards smaller patch sizes. (Table 4, Figure 2). There is potential for error in these projections, but they suggest that trends in mixed wood stands should be monitored. 5.5 Retention of riparian and associated hardwoods Within its SFM plan Canfor follows regulatory widths for Riparian Reserves and or Riparian Management Zone by appropriate stream, lake or wetland classification within cutblocks. This protection represents ‘potential’ hardwoods because riparian areas typically contain hardwoods. Coarse-filter evaluation relies largely on map-based data. The actual classification of riparian areas within GIS is not consistent. Along rivers and around lakes riparian areas often are large enough to be typed as hardwood leading. Along many smaller streams they are too narrow to be mapped discretely so appear as part of a larger polygon, which may or may not be hardwood leading. Ideally we would know: 1) the amount of riparian retained, 2) the proportion of that riparian that is hardwood leading or mixed wood, 3) the portion of these latter types in riparian that are >90 years old. Those measures will establish what current guidelines are achieving on-site, but do not address effectiveness of the practices. Current monitoring has relied largely on BBS routes and does not assess riparian areas well. 5.6 Cumulative affects It is apparent from the preceding discussion that variables used to index the suitability of provision of hardwoods influence each other. Amount of hardwood area reserved from harvest (NHLB) and uninfluenced by current practice influences the need for provision of hardwoods within the THLB. Because of the dependency of many cavity nesters on hardwoods, measures of tree size and decay influence the suitability of areas reserved from harvest. All variables change with time – e.g., tree diameter and decay state with age. In Table 5 we have summarized the affect of these cumulative interactions across two time frames: short-term or 20 years (the extent of detailed forward planning) and activities likely to result in ‘permanent’ reduction of desirable attributes. An example of permanent or long-term reduction would be the conversion of mixed wood to conifer or hardwood stands. Practices noted represent management ‘levers’ that could modify undesirable trends.

17
Table 5. Apparent trends in key variables determining effectiveness of hardwoods in sustaining biodiversity for TFL 48. (HL = hardwood leading, MW = mixed wood. The most troubling trends are ↓. Practices governing trend are noted. Variable
Apparent trend Practices Short term Permanent
Area old HL ↑ ↔ Harvest; retention guidelines Area old MW ↓ ↓ Harvest; retention guidelines Proportion HL ↑ ↔ Conversion to conifer; Veg management Proportion MW ↓ ↓ Conversion to conifer; Veg management Patch size old HL ↓ ↓ Harvest planning; Conversion to conifer Patch size old MW ↓ ↓ Harvest planning; Conversion to conifer Tree Ø HL & MW ↓ ↓ Retention guidelines; Riparian
guidelines Log Ø HL & MW ↓ ↓ Waste management; Ø retained trees;
Riparian guidelines Decay range HL & MW ↔ ↔ Waste management;; Ø retained trees;
Riparian guidelines Table 5 summarizes several negative trends that, when combined, will produce cumulative effects. Late seral targets are derived from natural disturbance and current trends in total amounts of old hardwood and mixed wood stands are not troubling provided other negative trends are modified. The potentially most troubling trends are in amounts, proportion and patch seizes of mixed wood. Currently it is not possible to assess whether these trends are real, nor is there a credible biological definition of mixed wood in terms of its contribution to biodiversity. Those trends should be monitored and potential thresholds determining mixed wood’s contribution should be evaluated. Patch size, for example, may not have strong effects in mixed wood stands. While most potentially negative trends are candidates for monitoring, two are candidates for action. Review of Bunnell et al. (2008a) documents that minimum diameters in current retention guidelines are too small. Simple modifications to retention guidelines and to waste management would do much to ameliorate trends to the point where they no longer represent a threat. Impacts of oil and gas development were not included in cumulative assessment in part because the location and total area impacted change so rapidly. It is likely that a portion of the area denuded by these activities impacts total amounts of hardwoods. 6 Summary The coarse filter evaluation is meant to evaluate effectiveness of practices intended to sustain biodiversity. In some instances (e.g., appropriate patch size, definition of mixed wood) effectiveness cannot be evaluated against data collected on site, but must be estimated from sparse literature. The evaluation is thus largely limited to specific findings that can be supported from data collected on site and relevant literature, and to recommendations for implementation and effectiveness monitoring. 6.1 Major findings Generally, the coarse filter approaches of the SFM plan for TFL 48 appear well reasoned, well integrated and should act to maintain hardwoods and mixed woods into the future. Downward trends in some key variables (Table 5) are not worrisome unless they continue for decades yet. A few are potentially troubling. For example, current analyses suggest a large reduction in mixed wood forest over the next 20 years, primarily within the BWBSmw1. Whether this is an artifact of projection or a consequence of silvicultural practices ‘unmixing’ the mixed wood is unclear. Given

18
the value of mixed wood stands in sustaining biodiversity, it suggests the potential trend merits high priority in long-term monitoring. Unclear or negative trends in amounts of hardwood and mixed wood stands, coupled with declining diameter (see Bunnell et al. 2008a) are likewise troubling. Many species, including some of social concern, use hardwood trees of larger diameter (Table 6). Large numbers of such trees are not necessary, and concern could be alleviated by modifying minimum diameters of retained hardwood trees. We recommend minimum values summarized in Table 6. Table 6. Estimates of suitable diameters and densities of dead wood for TFL 48 that include data relevant to the DFA (summarized from Bunnell et al. 2008a).
Living, dying & dead trees Logs Species Group Diameter # per ha Diameter Most cavity nesters >23 cm1 3 >17.5 Larger bird species, some mammals >30 cm1 0.2 >30 cm Lichens, bryophytes, insects >17.5 cm >17.5 cm
1 The values for nest and den trees are the somewhat smaller than those recommended for the Omineca region by BC MoWLP (2005). Targets are generally well reasoned but some should be evaluated through effectiveness monitoring. For example, there currently is no biologically-based definition of mixed wood that can serve to guide practice. 6.2 Recommendations for practice From our review we derive only one recommendation regarding current practice.
• Guidelines for retained wildlife trees should be tree sizes >23 cm, and densities of 3 per ha. Ideally, greater densities of small snags also should be retained.
6.3 Recommendations for monitoring Recommendations are summarized separately for implementation and effectiveness monitoring. Implementation monitoring Monitoring should focus on areas where direct or cumulative effects current appear negative (Table 1). It should be directly linked to practices that offer opportunity for improvement. All variables noted for implementation monitoring are of high priority. Late seral targets: Status relative to established targets should be assessed every 5 years for the three broad forest types. Late seral is defined as 90 years plus for hardwoods and mixed woods. Late seral patch sizes: Trends in size of older forest patches should be tracked by forest type within BEC variant. Current analyses suggest a reduction in patch size distribution among hardwood and mixed wood types that merits evaluating. Periodic, long-term monitoring (every 5 years) should not show sustained decline in the mean size of patches with appropriate attributes (age, tree size). The state and trend in older blocks or patches across the landscape should be monitored within both the NHLB and THLB. Total amounts of late seral are expected to decline in the near term as harvest is initiated. Species composition: There is some indication that the relative amounts of mixed wood stands will be reduced. Current natural targets are unlikely to represent a critical limit, but are the only available natural target. Hardwoods make a disproportionate contribution to sustaining

19
biodiversity. It is important that the area of hardwood-leading and mixed wood types, particularly late-seral classes are tracked over time to ensure there is no strong trend away from present proportions. Retention patches: Within the THLB the state (size, age, anchor points) should be monitored to assess trend in older blocks or patches across the landscape. Size: The lower boundary for effective patches should be set at 0.25 ha,3 until further evaluated. Age: Current target for age in hardwood and mixed wood stands is >90 years). Actual age should be estimated. Anchor points: Rationale for patch locations should be noted. Natural anchor points may be riparian boundaries, wetlands, appropriate wildlife trees, rocky outcrops, etc. Minimum limits for wildlife trees should be 23 cm for hardwoods and 30 cm for conifers. The limits are particularly important when retained patches are small (< 2 ha). Larger retention patches need not target particular tree sizes, but can use age as a surrogate. In these cases the age classes should be at least age class 6 for hardwood and mixed wood stands. Minimum densities of wildlife trees should be 3/ha in patches less than 2 ha. Actual conditions should be recorded. Riparian guidelines: Most measures relevant to assessing riparian contributions to sustaining hardwoods are inadequately expressed within GIS, so elude coarse-filter approaches. It is important to assess what existing riparian guidelines actually achieve. Tree species composition and age of trees retained in riparian management zones should be assessed after harvest. Vegetation management: Area treated annually should be tracked by broad forest type and BEC unit. Effectiveness monitoring Effectiveness for biodiversity can only be credibly assessed in terms of organisms themselves. While those data accumulate effectiveness can be inferred. Note that portions of implementation monitoring inform effectiveness monitoring. Major management ‘levers’ that can be used to counter unfavourable trends are summarized in Table 5. We have estimated priorities for specific attributes (VH = very high; H = high; M = moderate; L = low). Late seral: Probable effectiveness of current target age classes could be rigorously evaluated only for diameter of cavity trees sought by vertebrates in the area. It is not known whether they are they are effective for other organisms. Forest-interior plots should be used to assess projected effectiveness for cavity-nesting birds (H priority) and for bryophytes and lichens (M). See also organisms below. Wildlife tree patches: Given the projected trend towards smaller patch sizes of older hardwood-leading and mixed wood it is important to assess the effectiveness of small leave patches within the THLB (VH priority). It is important that this assessment be stratified by type of patch anchor point. Species composition: Monitoring should address the potential of threshold values for hardwoods and conifers that confer an additional contribution to richness of forest-dwelling organisms. This can be accomplished by relatively small changes to existing BBS surveys, and could begin by acquiring the simple habitat measures used while sampling the routes established in the Fort St. John TSA (M priority because small inclusions may confer the mixed wood contribution to species richness). The apparent trends in reductions in the total amount and patch sizes of older mixed wood (Table 4, Figure 2) need to be confirmed or rejected. This is necessarily a longer-term monitoring
3 This value is consistent with BC MoWLP (2005) for the Omineca Region .

20
project, but should evaluate the effectiveness of current guidelines in maintaining mixed wood (VH priority to ensure the approach to tracking is in place). Effects of vegetation management: Currently the magnitude of effects of vegetation management on either subsequent hardwood recruitment or hardwood and understory associated species is unknown. The extent of vegetation management indicates the potential for it to be large. To address effectiveness of treatments both vegetation and shrub associates (e.g., Table 1) should be monitored pretreatment and at intervals after treatment to determine duration of any effects, so these can be scaled up across the tenure (H priority). Riparian areas: The effectiveness of riparian management guidelines at maintaining hardwood cover in riparian management zones and the species associated with riparian areas has not been assessed. The species accounting system notes 23 vertebrates species are closely associated with riparian areas, but the current major approach to monitoring organism (Breeding Bird Survey routes) assess riparian areas only poorly. A focused evaluation of the effectiveness of riparian practices is needed (H priority). An additional 45 species are associated with wetlands. Current guidelines do not buffer small lakes and wetlands (< 5 ha). We do not know whether that leaves some portion of biodiversity exposed to habitat degradation. Monitoring should assess species presence in small wetlands with and without adjacent harvesting; these should be stratified by size class (H priority). If establishing the survey discovers that proportionately few small lakes and wetlands receive adjacent harvest the priority should be lowered. 7 Literature cited Ǻs, S. 1993. Are habitat islands islands? Woodliving beetles (Coleoptera) in deciduous forest
fragments in boreal forest. Ecography 16: 219-228. Barkman, J.J. 1958. Phytosociology and ecology of cryptogamic epiphytes. Van Gorcum
Publishers, Assen, Netherlands. BC MoSRM. 2002. Vegetation Resources Inventory. The B.C. Land Cover Classification
Scheme. Version 1.3. Prepared by Ministry of Sustainable Resource Management, Terrestrial Information Branch, for the Terrestrial Ecosystems Task Force – Vegetation Resources Inventory Committee. Victoria, BC. URL: ilmbwww.gov.bc.ca/risc/pubs/teveg/bcland2k2/landcover-02.pdf
BC MoWLAP. 2005. Omineca Regional Wildlife Tree Patch (WTP) Retention Guideline. Ecosystem Section, BC Ministry of Water, Land and Air Protection, Victoria, BC. Brodo, I.M. 1974. Substrate ecology. Pp. 401-441 in V. Ahmadjiian & M.E. Hale (eds.). The
lichens. Academic Press, New York, NY. Bunnell, F.L., Kremsater, L.L., and Moy, A. 2008a. Coarse filter assessment of contribution of
dying and dead wood to sustaining biodiversity on TFL 48. FSP report. Bunnell, F.L., Spribille, T., Houde, I., Goward, T., and Björk, C. 2008b. Lichens on downed wood
in young and old stands. Canadian Journal of Forest Research (in press). Bunnell, F.L., Squires, K.A., and Preston, M.I. 2008c. Responses of forest-dwelling birds to
deciduous trees and shrubs: management implications. Can. J. For. Res. (in prep). Christy, F.J., and Mack. R.N. 1984. Variation in demography of juvenile Tsuga heterophylla
across the substratum mosaic. Journal of Ecology 72: 75-91. Crites, S. and Dale, M.R.T. 1998. Diversity and abundance of bryophytes, lichens and fungi in
relation to woody substrate and successional stage in aspen mixedwood boreal forests. Canadian Journal of Botany 76: 641-651.
Culberson, W.L. 1955. The corticolous communities of lichens and bryophytes in the upland forests of northern Wisconsin. Ecological Monographs 25:215-231.
Cumming, S.G., Burton, P.J., Prahacs, S. and Garland, M.R. 1994. Potential conflicts between timber supply and habitat protection in the boreal mixedwood of Alberta: a simulation study. For. Ecol. Manage. 68:281-302.

21
Delong, C. 2002. Natural Disturbance Units of the Prince George Forest Region: Guidance for Sustainable Forest Management. Ministry of Forests. Prince George Forest Region, Prince George, BC.
DeLong, C.S. 2007. Implementation of natural disturbance-based management in northern British Columbia. Forestry Chronicle 83: 338-346.
Grove, S.J. 2002. Saproxylic insect ecology and the sustainable management of forests. Annual Review of Ecology and Systematics 33:1-23.
Grover, B.E. and Greenway, K.J. 1999. The ecological and economic basis for mixedwood management. In T.S Veeman, D.W. Smith, B.G. Purdy, F.J. Salkle and G. A. Larkin (eds.). Proc. 1999 Sustainable Forest Management Network Conference: Science and practice: sustaining the boreal forest. Univ. Alberta, Edmonton, Alta., pp 419-428.
Gustafsson, L. & I. Ahlén. 1996. The geography of plants and animals. The national atlas of Sweden. SNA Publishing, Stockholm, Sweden.
Gustafsson, L., Fiskesjö, A., Ingelög, T., Pettersson, B. and Thor, G. 1992. Factors of importance to some lichen species of deciduous broad-leaved woods in southern Sweden. Lichenologist 24:255-266.
Hamilton, W.D. 1978. Evolution and diversity under bark. Pp. 154-175in Diversity of insect faunas, L.A. Mound and N. Waloff (eds.) Royal Entomological Society of London, London, UK.
Harmon, M.E., Franklin, J.F. , Swanson, F.J. Sollins, P., Gregory, S.V., Lattin, D., Anderson, N.H. Cline, S.P., Asumne, N.G., Sedell, J.R., Lienkaemper, W., Cromack, K. Jr., and Cummings, K.W. 1986. Ecology of coarse woody debris in temperate ecosystems. Advances in Ecological Research 5:133-302.
Harper, G. and R. Kabzems. 2003. Growing-space management in boreal mixedwood forests – the establishment of EP 1192.01, Fort Nelson River site. Extension Note 64, BC Ministry of Forests, Forest Science Program, Victoria, BC.
Heilmann-Clausen, J. and Christensen, M. 2004. Does size matter. On the importance of various dead wood fragments for fungal diversity in Danish beech forests. Forest Ecology and Management 201(1): 105-117.
Huff, M.H. and C.M. Raley. 1991. Regional patterns of diurnal breeding bird communities in Oregon and Washington. Pp. 177-205 in L.F. Ruggiero, K.B. Aubry, A.B. Carey, and M.F. Huff (eds). Wildlife and vegetation of unmanaged Douglas-fir forests. USDA Forest Service, General Technical Report PNW-GTR-285, Portland, OR.
Kaila, L., Martikainen, P., Puntilla, P., and Yakovlev, E. 1994. Saproxylic beetles (Coleoptera) on dead birch trunks decayed by different polypore species. Annales Zoologici Fennici 31: 97-107.
Kalgutkar, R.M. and Bird, C.D. 1969. Lichens found on Larix lyalli and Pinus albicaulis in southwestern Alberta, Canada. Canadian Journal of Botany 47:627-648.
Kruys, N. and Jonsson, B.G. 1999. Fine woody debris is important for species richness on logs in managed boreal spruce forests of northern Sweden. Canadian Journal of Forest Research 29: 1295-99.
Kuusinen, M. 1994. Epiphytic lichen flora and diversity on Populus tremula in old-growth and managed forests of southern and middle boreal Finland. Annales Botanici Fennici 31: 245-260.
Kuusinen, M. 1996. Epiphyte flora and diversity on basal trunks of six old-growth forest tree species in southern and middle boreal Finland. Lichenologist 28: 443-463.
Lee, P. and Sturgess, K. 2002. Assemblages of vascular plants on logs and stumps within 28-year-old aspen dominated boreal forests. USDA Forest Service Gen. Tech. Rep. PSW-GTR-181: 369-380.
Lindhe, A. N. Åsenblad, N. and Toresson, H-G. 2004. Cut logs and high stumps of spruce, birch, aspen and oak – nine years of saproxylic fungi succession. Biological Conservation 119: 443-454.
Longton, R.E. 1992. The role of bryophytes and lichens in terrestrial ecosystems. Pp.32-76 in J.W. Bates and A.M. Farmer (eds.). Bryophytes and lichens in a changing environment. Oxford University Press, New York, NY.

22
McKee, A., Laroi, G., and Franklin, J.F. 1982. Structure, composition and reproductive behavior of terrace forests, South Fork Hoh River, Olympic National Park. Pp. 22-29 in E.E. Starkey, J.F. Franklin, and J.W. Mathews (eds.). Ecological research in national parks of the Pacific Northwest. Forest Research Laboratory, Corvallis State University, Corvallis, OR.
Mills, S.E., and Macdonald, S.E. 2005. Factors influencing bryophyte assemblage at different scales in the western Canadian boreal forest. Bryologist 108: 86-100.
Nordén, B., and Paltto, H. 2001. Wood-decay fungi in hazel wood: species richness correlated to stand age and dead wood features. Biological Conservation 101: 1-8.
Rambo, T.R, 2001. Decaying logs and habitat heterogeneity: implications for bryophyte diversity in western Oregon forests. Northwest Science 75: 270-277.
Rose, F. 1976. Lichenological indicators of age and environmental continuity in woodlands. Pp. 279-307 in D.H. Brown, D.L. Hawksworth, and R.H. Bailey (Eds.) Lichenology: progress and problems. Systematics Association Special Vol 8, Academic Press, New York, NY.
Samuelsson, J., Gustaffson, L., and Ingelog, T. 1994. Dying and dead trees: a review of their importance for biodiversity. Swedish Threatened Species Unit, Uppsala, Sweden.
Savely, H.E. 1939. Ecological relations of certain animals in dead pine and oak logs. Ecological Monographs 9: 321-385.
Selva S.B. 1994. Lichen diversity and stand continuity in the northern hardwoods and spruce-fir forests of northern New England and western New Brunswick. The Bryologist 97: 424-429.
Stelfox, J. B. (ed.). 1995. Relationships between stand age, stand structure, and biodiversity in aspen mixedwood forests in Alberta, Edmonton, Alberta, Canada. Alberta Environmental Centre (AECV95-R1), Vegreville, Alberta, Canada.
Weir, R.F. 2006. Fisher Ecology in the BWBS: Inventory and Research. Year-end Report. March 2006. Prepared for Mark Phinney, Louisiana-Pacific Canada Ltd. and Eric Lofroth, BC Ministry of Environment.


