Embed Size (px)
Citation preview

T h e C o a s t a l U n i o n
D i e K ü s t e n U n i o n D e u t s c h l a n d
2 0 1 0 - 1 6C O A S T L I N E
R E P O R T S
Editors:K. Schwarzer, K. Schrottke & K. Stattegger
EUCC
From Brazil to Thailand -New Results in Coastal Research


Coastline Reports 16 (2010)
From Brazil to Thailand -New Results in Coastal Research
Editors:
Klaus Schwarzer, Kerstin Schrottke & Karl Stattegger
Christian-Albrechts-Universität Kiel
Kiel, 2010
ISSN 0928-2734 ISBN 978-3-9811839-9-3

Imprint
Photo front: Inner Lübeck Bay (Timmendorf to Haffkrug) showing a crescentic nearshore bar system (Photo: Klaus Schwarzer)
Coastline Reports is published by: EUCC – Die Küsten Union Deutschland e.V. c/o Leibniz-Institut für Ostseeforschung Warnemünde Seestr. 15, 18119 Rostock, Germany [email protected]
Coastline Reports are available online under http://www.eucc-d.de/ and http://www.eucc.net/. For hardcopies please contact the editors or the EUCC.

Vorwort der Herausgeber Die 27. Jahrestagung des Arbeitskreises „Geographie der Meere und Küsten“ (AMK) fand vom 24.-26. April 2009 in Kiel statt. Schon mehrfach waren Einrichtungen der Christian-Albrechts-Universität zu Kiel Gastgeber dieser Veranstaltungsreihe, doch erstmals waren das Institut für Geowissenschaften (IfG), AG Sedimentologie, Küsten- und Schelfgeologie, gemeinsam mit dem Exzellenzcluster „Ozean der Zukunft, AG Meeresspiegelanstieg und Küstenerosion“ die Ausrichter. Dieser Standort an der Kieler Förde hat einen besonderen Bezug zur maritimen Forschung. Von hier aus nahmen viele Bereiche der deutschen, aber auch der internationalen Meeresforschung ihren Ursprung. Der Stellenwert der marinen Forschung in Kiel wird auch dadurch unterstrichen, dass hier 1987 das Forschungszentrum für marine Geowissenschaften GEOMAR gegründet wurde, welches sich am 1. Januar 2004 mit dem ehemaligen Institut für Meereskunde zum Leibniz-Institut für Meereswissenschaften IFM-GEOMAR vereinigte, welches heute seinen Hauptsitz an der Schwentinemündung auf dem Ostufer hat. Keine andere Stadt der Welt kann auf eine Tradition von über 300 Jahren interdisziplinärer Meeresforschung zurückblicken und in keiner anderen Stadt kann man mit ein bisschen Glück vier Forschungsschiffe (POLARFUCHS, LITTORINA, ALKOR und POSEIDON) nahe der Innenstadt an der Institutspier des IFM-GEOMAR gleichzeitig versammelt sehen. Die aktive Arbeit im Arbeitskreis findet ihren Höhepunkt in einer alljährlichen Tagung. Die Vielzahl der im Küstenbereich aktiven Disziplinen schlug sich diesmal in 26 Vorträgen und 10 Postern nieder, die neben der geowissenschaftlichen Seite auch die Ingenieurwissenschaften und die Biologie einschlossen. Aber auch die Umsetzung und Nutzung der im Feld und im Labor erarbeiteten Daten durch die unterschiedlichsten Bundes- und Landesbehörden und Einrichtungen der Wasserwirtschaftsverwaltung ist in den Vorträgen vertreten. Beispielsweise wurden Risikoabschätzungen für den Küstenraum, mit seinen Flussmündungen sowie das Datenmanagement auf nationaler und internationaler Ebene diskutiert. In diesem Band werden 17 der insgesamt 36 Beiträge vorgestellt. Der Veranstaltungsort in Schleswig-Holstein, als einziges Bundesland an zwei Meeren gelegen, führt fast automatisch zu den regionalen Schwerpunkten Nord- und Ostsee. Aber auch die Elbe, als die südliche Begrenzung von Schleswig-Holstein findet ihren Raum in den Vorträgen. Hamburg, als eine der größten Hafenstädte Europas an der Elbe gelegen, präsentierte seinen Fluss und die damit zusammenhängenden vielfältigen Herausforderungen. Hier wird die interdisziplinäre Zusammenarbeit besonders deutlich. Auch andere Küstenregionen Europas und der Welt wurden in Vorträgen und Postern präsentiert. Inhaltlich waren die Themen vielfältiger Art, sie handelten von Sedimentumlagerungen in Flussmündungen bis hin zu Kulturlandschaftsänderungen an der Küste durch Biokraftstoffproduktion. Als ein weiterer fachlicher Schwerpunkt kristallisiert sich seit einigen Jahren die Tsunami-Forschung heraus. Stets ist auch eine Exkursion mit der AMK-Jahrestagung verknüpft. Es gibt in Schleswig-Holstein wohl keine bessere Lokalität für die Darstellung des großen Spektrums der Küstenforschung als die Nordseeinsel Sylt. Von der natürlicher Küstenentwicklung der Wattbereiche und der sandigen Brandungsküsten bis hin zu den vielfältigen Maßnahmen des modernen, technischen Küstenschutzes hat diese Insel alles zu bieten. Die Bandbreite der Küstenforschung spiegelt sich schon beim Titel beginnend, in diesem Tagungsband wider. Das ist für die Tagungen des Arbeitskreises der Meere und Küsten durchaus

gewollt, aufweist Die KuJahrestagLogistiscvielen fKüstenfoZukunft
Klaus SChristiaExzellen
da auch diet.
nsthalle zu gung, und diche Unterstüfreiwillig heorschung zeiblicken.
chwarzer, Kan-Albrechtsnzcluster Oz
e geologisch
Kiel unterie Nähe zu dützung erfolelfenden Stigen, lassen,
Kerstin Schrs-Universitäzean der Zu
h-geographis
rstützte mit den Kunstobjlgte auch votudentinnen was den wis
rottke & Kaät Kiel, Instikunft, Chris
che Küsten-
all ihren lekten gab di
om IFM-GEund Studen
ssenschaftlic
arl Statteggeitut für Geostian-Albrec
- und Meere
logistischen ieser Veranst
EOMAR undnten, die echen Nachwu
er wissenschafchts-Univer
esforschung
Möglichkeitaltung ein gd dem Präsiein großes uchs angeht,
ften sität Kiel
ein großes S
iten die 27ganz besondedium der CInteresse a hoffnungsv
Spektrum
7. AMK-eres Flair.
CAU. Die an dieser voll in die

Vorwort des Sprechers Die 27. Jahrestagung des Arbeitskreises „Geographie der Meere und Küsten“ (AMK) fand auf Einladung von Klaus Schwarzer und Karl Stattegger vom Institut für Geowissenschaften, Küsten- und Schelfgeologie der Christian-Albrechts-Universität zu Kiel, sowie von Kerstin Schrottke vom Exzellenzcluster „Ozean der Zukunft, AG Meeresspiegelanstieg und Küstenerosion“ in der Kunsthalle zu Kiel statt. Rund 90 Teilnehmerinnen und Teilnehmer gestalteten ein vielseitiges Programm mit 26 Vorträgen und 10 Posterbeiträgen. An der 27. Jahrestagung des AMK waren Arbeitsgruppen geographischer und geologischer Institute der Universitätsstandorte Göttingen, Greifswald, Hamburg, Jena, Kiel, Köln, Marburg und Oldenburg sowie zahlreiche Wissenschaftler internationaler Forschungseinrichtungen beteiligt, beispielsweise aus Brasilien, Polen, Thailand und Vietnam. Besonders hervorzuheben ist die aktive Einbindung offizieller Stellen, Behörden und außeruniversitärer Forschungseinrichtungen wie zum Beispiel des Landesbetriebs für Straßen, Brücken und Gewässer in Hamburg, der Hamburg Port Authority, des Forschungsinstituts Senckenberg, des Alfred-Wegener-Instituts für Polar- und Meeresforschung, des GKSS-Forschungszentrums Geesthacht, des Leibniz-Instituts für Ostseeforschung Warnemünde sowie des Ministeriums für Landwirtschaft, Umwelt und ländliche Räume, des gleichnamigen Landesamts und des Landesbetriebs für Küstenschutz, Nationalpark und Meeresschutz des Landes Schleswig-Holstein. Diese anregende Mischung dokumentiert sowohl gelebte Interdisziplinarität innerhalb des Arbeitskreises als auch die unmittelbare Umsetzung von Forschungsergebnissen in die Praxis. Die Vorträge der 27. Jahrestagung deckten eine Vielzahl hochaktueller Themen ab. Schwerpunkte lagen im Küstenzonen- und Küstenrisikomanagement, im Meeresmonitoring und in der Modellierung von „Ecosystem Services“. Ein weiterer Vortragsblock befasste sich mit Extremflut- und Hochwasserereignissen an Elbe und Weser und mit historischen Aufwachsraten und der Sturmgefährdung ausgewählter Halligen, insbesondere vor dem Hintergrund der globalen Klimaänderung. Es folgten Studien zum Sedimenttransport im Wattenmeer und in der Tideweser, zum Monitoring von Kolken an Offshore-Pfeilern und zur ökosystemar relevanten Temperaturverteilung in Wattsedimenten. Ein weiterer Vortragsblock thematisierte event-stratigraphische, geomorphologische und paläogeographische Studien zur Erfassung und Rekonstruktion von Tsunami-Ereignissen in Griechenland, Portugal und Thailand. Zudem wurden Modellierungsergebnisse für eine Tsunami-Risikoanalyse für die thailändische Küste vorgestellt. Für das Mekong-Delta (Vietnam) wurden neue Ergebnisse zum Deltavorbau und zum postglazialen Meeresspiegelanstieg präsentiert. Der abschließende Vortragsblock befasste sich mit der holozänen Küstenentwicklung der südlichen Ostsee und der Dynamik von Dreissena-Muschelbänken und ihrer ökologischen Bedeutung im Oderhaff. Ein Beitrag zeigte Möglichkeiten und Grenzen der Datierung von Küsten- und Meeressedimenten mittels Lumineszenzmethoden auf. Mit diesem Buch liegt ein weiterer Band der seit 1983 durchgehenden Reihe wissenschaftlicher Veröffentlichungen zu den Jahrestagungen des AMK vor. Den Organisatoren gebührt größter Dank für die Organisation und Durchführung der Tagung in Kiel sowie für die Redaktion des Tagungsbandes in der Reihe Coastline Reports. Andreas Vött Sprecher des AMK


Inhaltsverzeichnis Simon Matthias May, Timo Willershäuser & Andreas Vött Boulder transport by high-energy wave events at Cap Bon (NE Tunisia) ........................ 1 Ulrich Floth, Andreas Vött, Simon Matthias May, Helmut Brückner & Svenja Brockmüller Estimating tsunami hazards between Lefkada and Preveza, NW Greece, by means of computer modeling ........................................................................................................... 11 Peter Feldens, Daroonwan. Sakuna, Penjai Somgpongchaiykul & Klaus Schwarzer
Shallow water sediment structures in a tsunami-affected area (Pakarang Cape, Thailand) ................................................................................................................................ 15 Gunilla Kaiser, Hannes Römer, Daniela Arp, Horst Sterr & Ralf Ludwig Use of high resolution geodata for inundation modelling as part of a tsunami risk assessment in Thailand ......................................................................................................... 25 Nélida Rostock Zoning instruments for “Coastal and Marine Protected Areas of Multiple Use” – An Example in Southern Chile ........................................................................................... 35 André Giskard Aquino da Silva & Helenice Vital Estimation of Presídio’s Barrier Island (Guamaré-NE/Brazil) Migration by Means of GIS and Remote Sensing. ................................................................................................. 45 Christiane Fenske, Sven Dahlke, Philip Riel & Adam Woźniczka
Dynamics of mussel beds in the Szczecin Lagoon .............................................................. 49 Henning May, Kerstin Schrottke & Klaus Schwarzer Coarse-grained sediment distribution in shallow water of the south-western Baltic Sea (Germany) ........................................................................................................... 55 Tobias Dolch Coarsening of tidal flat sediments - long-term mud depletion in a tidal bay in the northern Wadden Sea (SE North Sea) ................................................................................ 59 Caroline Radegast, Thomas Strotmann & Ulrich Ferk Studies on the Development of Wind set-up in the River Elbe ......................................... 63 Svenja Papenmeier, Kerstin Schrottke & Alexander Bartholomä
Total volume concentration and size distribution of suspended matter at sites affected by water injection dredging of subaqueous dunes in the German Weser Estuary ....................................................................................................................... 71 Gabriele Gönnert & Sigrid Thumm Das Risiko von Extremsturmfluten in Ästuaren angesichts globalen Klimawandels ..... 77 Kristina Sossidi, Gabriele Gönnert & Dieter Ackermann GIS-gestützte Analyse des Überflutungsrisikos in Hamburg unter Berücksichtigung der EG-Hochwasserrichtlinie .............................................................................................. 87

Ingrid Holzwarth & Frank Kösters
Effects of Changes in Sea Level on the Tidal Dynamics of the River Weser ................... 97 Heike Munderloh Costs of sea-level rise under different climatic and socio-economic scenarios: an application of the DIVA model .......................................................................................... 101 Jacobus Hofstede From coastal flood defence towards coastal flood risk management ............................. 105 Jörn Kohlus & Hans-Christian Reimers Das Projekt MDI-DE - Marine Daten-Infrastruktur in Deutschland ............................ 115 Marie Naulin & Thorsten Albers Feasibility Study for Optimisation of Land Drainage by Using Renewable Energy .... 127

AbstracTha hlastsuextsedrocweThcosevthegenpo
1 IntrThe devatsunami catastropdemonstevents. AestimatioApparendimensiothis contone of thFirst sed1980s (Adescribesuch as Howevemarine oon the diinstance 2003a, 22010, Sw
SchwarzerFrom BrazCoastlineS. 01-10
B
Sim
2Insti
ct he Mediterranehigh tsunamigst decades, nuunami events treme wave ediments foundcky shorelineere accumulatehis paper presasts of Tunisveral block fiee form of imnerations allo
oint to a tsunam
roduction astating Dechazards all
phic wave-intrates the neeA comprehenon of tsunantly, reliableon of wave intext, geo–scihe most promdimentary stuAtwater 198d: (i) fine glagoons or r, in many origin and thistinguishabiGoff et al. 2
2003b, Robinwitzer & Jon
r, Schrottke &zil to Thailand e Reports 16 (
Boulder t
mon Matthi1Institu
itute for Geog
ean is charactgenic potentiaumerous studie
in the Medievent depositsd in near-coas. However, ied by tsunamisents, for the ia induced byelds and wave
mbrication traowing for a remi-induced tra
cember 26th, 2l over the wnduced enered for intensnsive knowleami hazard informationnundation arentific inves
mising approaudies about 87). Since t
grained alloccoastal swamcases the de
he high-energility between2004, Korteknson et al. 2es 2008a, 20
Stattegger (e– New Result
(2010), ISSN 0
transportat Cap B
ias May1, T
ute for Geogragraphy, Johann
terized by a coal, particularlyes dealing witterranean thros have been d
ast geological in many casesi or storm evefirst time, ev
y extreme wae-transported bains up to 4 elative chronolansport of the
2004 Indian world. Howrgy of tsunasified geosciedge about cin a distincn on tsunamre inevitable tigations, beaches in palatsunami imp
then, two mhthonous mamps, and (ii)eterminationgy nature of n tsunami ankaas 2002, K2006, Scheff008b, William
eds.): ts in Coastal R0928-2734, IS
by high-eBon (NE
imo Willers
aphy, Universines Gutenberg
onsiderable sey for the centth deposits caoughout the described so archives and
s, there is an ents. vidence of blave events. Aboulders werem a.s.l. Manlogical interprblocks rather
Ocean tsunawever, the evami and its ientific reseacomparable tct area and
mi recurrencfor an appro
esides the anaaeo-tsunami prints in geo
main types oarine sedime) wave emp
n of the evenf the deposit d storm depo
Kortekaas & Dfers & Kelletms & Hall 20
Research SBN 978-3-98
energy waTunisia)
shäuser2 &
ity of Köln, Gg-University o
eismic and geotral and easteaused by extreHolocene. Infar: (i) fine-g
d (ii) wave-emongoing deba
lock accumulaAlong the norte detected. Theny boulders sretation. Furth
r than to a stor
ami dramaticvent not onpotential fo
arch on tsunatsunami even
for effective intervals
opriate hazardalysis of histand palaeo-e
ological archof extreme wents found inlaced block nt source recan be prov
osits in the gDawson 200tat 2001; Sch007).
11839-9-3
ave event
Andreas Vö
Germany of Mainz, Ger
odynamic actirn Mediterraneme events re
n general, twograined allochmplaced blockate on whethe
ations from tth-western coe blocks are pshow two dishermore, the prm-induced di
cally changednly showed or destructioami events ants in the pasve coastal pas well as d assessmenttorical accouevent researchives were cwave event n near-coastdeposits alo
emains problved. Thereforgeological re07, Morton etheffers 2005
ts
ött2
rmany
ivity resultingnean. Within evealed recurro main types hthonous mark deposits aloer these depo
the north-eastast of Cap B
partly arrangedstinct rock ppresented resuislocation.
d public awathe tremend
on - in partand on extrest is necessarprotection mon the intent (Bondevik
unts, are consch. arried out indeposits ha
t geological ong rocky shlematic and re, a vivid dcord has evot al. 2007, N5; Switzer &
g in the
rent of
rine ong sits
tern on,
d in ool ults
areness of dous and ticular, it me wave ry for the measures. nsity and 2008). In
sidered as
n the late ave been archives,
horelines. only the
discussion olved (for
Nott 1997, & Burston

2 May et al.
In this paper, we present first evidence of block accumulations from the north-eastern coasts of Tunisia induced by extreme wave events. Chronological aspects of the block movement and possible event sources are discussed.
2 Palaeotsunami studies in the Mediterranean Evidence for extreme wave events during the Holocene is known from a number of areas in the Mediterranean, and in most cases these events are associated to tsunami. In particular, numerous historical reports on tsunamis exist for the central and eastern Mediterranean, especially for Italy and Greece, summarized in tsunami catalogues (for instance Soloviev et al. 2000, Tinti et al. 2004). In these catalogues, additional information on event-related earthquakes, tsunami wave heights, inundated areas and other effects is recorded.
Figure 1: a) Overview of the Mediterranean with main tectonic structures (map based on Facenna et al. 2001, Wortel & Spakman 2000). White boxes mark reports on sedimentary tsunami imprints. The study area presented in this paper is marked by a grey box. b) Study area, north-western coast of Cap Bon, NE Tunisia, with presented locations of block findings. The coastal morphology shows a typical bay and headland configuration.
Sedimentary evidence for palaeotsunami events in the central Mediterranean proves the occurrence of tsunami events since the mid-Holocene. Especially the eruption of Santorini in the Bronze Age was subject to geological investigations (Bruins et al. 2008, Dominey-Howes et al. 2000a, McCoy & Heiken 2000, Minoura et al. 2000, Scheffers & Scheffers 2007). More recent events also left sedimentary signatures such as the 1956 tsunami in the southern Aegean Sea for which imbricated pebbles on the island of Astypalaea are described (Dominey-Howes et al. 2000b). Korteekaas (2002) and Kontopoulos & Avramidis (2003) gave evidence for tsunamigenic sediments in the Corinthian Gulf. Scheffers et al. (2008) found palaeotsunami imprints on the coasts of the southern and south-western Peloponnese. For northwestern Greece, Vött et al. (2006, 2007, 2008, 2009, 2010), May (2010) and May et al. (2008) presented manifold sedimentary evidence of tsunami influence on the Preveza-Lefkada coastal zone. Several studies were also conducted on tsunami induced changes of coastal morphology such as boulder and block accumulations along rocky shorelines (Mastronuzzi & Sanso 2000, 2004; Scicchitano et al. 2007) and washover fans (Gianfreda et al. 2001) in southern Italy. Further evidence for extreme wave events was presented by Reinhardt et al. (2006) for the Israeli coast close to the

Boulder transport by high-energy wave events 3
ancient harbour of Cesarea, and Morhange et al. (2006) gave evidence for wave emplaced boulders at the coast of Lebanon. From the North African coast, Maouche et al. (2009) report on large boulder accumulations in northern Algeria and suggest a tsunamigenic origin and Kelletat (2005) describes wave transported boulders in southern Mallorca. Frébourg et al. (2007) describe a possible tsunami layer found within eolianites from eastern Tunisia. Block accumulations are also known from Morocco (Mhammudi et al. 2008), but may be related to event sources in the Atlantic Ocean, comparable to the 1755 earthquake and tsunami of Lisbon (Andrade 1992, Whelan & Kelletat 2005). When considering possible source mechanisms for tsunami events in the Mediterranean, several potential triggers must be taken into account (see also figure 1). Especially the central Mediterranean exhibits a high seismic activity. Numerous strong earthquakes are reported from the subduction zone of the Hellenic Arc or major fault zones. It is well known, that vertical crustal movements of terrestrial and submarine origin have a high tsunamigenic potential in this region (for instance Benetatos et al. 2004, Pirazzoli 1986). In northwestern Greece, the Cefalonia transform fault (CF), situated west of the Ionian Islands Cefalonia and Lefkada, connects this zone of subduction with an area of continent-continent collision beginning off the coast of southern Epirus (figure 1). The CF also shows a remarkably high seismic activity and has been responsible for numerous strong earthquakes during history (Benetatos et al. 2005, Cocard et al. 1999, Louvari et al. 1999, Sachpazi et al. 2000, Papadopoulos et al. 2003). In the western Mediterranean, several tsunamigenic earthquakes are known from south-eastern Spain and North Africa (Alasset et al. 2003, Gràcia et al. 2006). Moreover, Pareschi et al. (2006) suggest that flank collapses of the Etna volcano, occurring during the middle Holocene, resulted in mega tsunami events effecting large parts of the Mediterranean. From the central Ionian Sea and the Sirte basin to the north of the African coast, several turbidite layers have been detected in the deep sea geological record. These layers suggest repeated and extensive submarine mass movements in the area that may also have produced large tsunami events in the central Mediterranean (Hieke 2000, Hieke & Werner 2000). Further potential tsunami triggers are cosmic impacts for which, however, no evidence has yet been found in the Mediterranean.
3 Study area Field survey was carried out along the north-western coast of Cap Bon, NE Tunisia (figure 1). In general, the Geology of the low lying coastal areas at Cap Bon is dominated by Tertiary and early Pleistocene sequences, mainly consisting of marine sandstones and aeolianites (Mensching 1979). The coastal morphology is characterized by slightly elevated marine terraces, most likely of late Pleistocene origin (Jedoui et al. 1998, Morhange & Pirazzoli 2005).
Figure 2: Cliff top platform with field of dislocated blocks, around 50 m distant from the sea. Inlay: View of Pleistocene terrace with cliff top platform reaching up to 4 m a.s.l. Elevation of cliff ~ 2 m. Note typical coastal configuration with bays and headlands.

4 May et al.
They form, in most cases, small headlands, which are characterized by a well-developed cliff, up to 5 m high, and a cliff top platform, up to 200 m wide (figure 2). These promontories are separated from each other by small and narrow bays with, at some locations, sandy beaches. Well-defined notches document a comparatively stable relative sea level for the area for the late Holocene. The cliff top platforms are free of vegetation and characterized by intense karstification and, in the littoral and supralittoral zone, extensive rock pool formation.
4 Methods During August 2008, a geomorphological field survey was carried out along the northern shorelines of Tunisia in order to detect geo-scientific imprints of extreme wave events. In this context, we found evidence for extreme wave emplaced blocks, up to at least ~ 5 m³ and 11 t. Block fields detected during the geomorphological survey were documented and partly measured. The sizes of selected boulders were estimated based on measurements of the x-, y- and z-axes using a measuring tape. All the dislocated blocks and boulders were examined for rock pools on their surfaces. The number and the dimension of different rock pool generations were studied in order to get information on different phases of boulder transport. For weight calculation of the transported boulders, rock density was estimated to ~2.2 g/cm³ (Scicchitano et al. 2007). GPS points were measured for the study areas and for the sampling points.
5 Results and discussion Location one (El Haouaria A, 37°03'9.08"N; 10°56'46.91"E, figs. 1 and 3) is situated 5.5 km west of the City of El Haouaria. Here, the cliff top platform reaches an elevation of around 4 m a.s.l. (above mean sea level) and is covered by numerous blocks and boulders, up to 3 m³ in size. The blocks are assembled in block fields and can be followed up to a distance of 50 m onshore.
Figure 3: a) Block field at El Haouaria site A. Cliff top platform lies at around 3 m a.s.l. Note person (around 1.80 m) as scale. b) Overturned block of ca. 2.7 m³ in size with former surface (rock pool generation I) at its bottom side. c) Rock pool generation II on top of the recent surface.

Boulder transport by high-energy wave events 5
Most blocks show extensive rock pools at their surface. These rock pools are usually formed by bio-erosional processes in the littoral zone (Laborel & Laborel-Deguen 1994). Found in the present constellation, they clearly prove that the blocks were transported from the littoral zone to their current position. Most probably, the rock slabs and blocks originate from the cliff front area. Some of the dislocated blocks are overturned, with the former surface facing downwards. For the block depicted in figure 3, which is around 2.7 m³ in size and weighing approximately 6 t, this is indicated by well-developed rock pools, up to 35 cm deep and 1 m wide, found on the lower side of the block (figure 3b, rock pool generation I). A comparatively long period of rock pool formation was thus needed before the block was dislocated and transported to its recent position. Clear indications of bio-erosion by gastropods point to the formation of the rock pool in a littoral environment. Moreover, a second generation of rock pools (rock pool generation II) was observed on top of the recent surface. This rock pool generation shows a much smaller depth and width of around 8 cm and 40 cm, respectively, and must have developed subsequent to the transportation of the block (figure 3c). Thus, for this block, the period of time between the start of the formation of rock pool generation I and its displacement must have been much longer than the period of time since its transport. As not more than two rock pool generations could be observed, a displacement of the block during one singular event can be assumed.
Figure 4: a) Block field at El Haouaria site B showing several imbrication trains; the cliff top platform lies at around 1 m a.s.l. Note person (around 1.80 m) as scale. b) and c) Imbrication trains – blocks are typically tilted in wave direction. Inlay in b) shows two rock pool generations found for the second block within the imbrication train (grey – rock pool generation I, white – rock pool generation II).
Location two (El Haouaria B, 37°03'5.00"N; 10°58'9.20"E, figure 1 and 4) is located around 2 km east of location one and some 3.5 km west of El Haouaria. Dislocated blocks and boulders were encountered on top of an elevated marine terrace, about 1 m a.s.l. As illustrated in figure 4, blocks and rock-slabs are abundant and are assembled in a block field, extending approximately 3000 m². Within the block field, several trains of imbricated blocks, up to 5 m3 in size, were found, consisting of up to 6 tilted blocks or rock-slabs. The imbrication of the blocks proves their extreme wave generated displacement and deposition.
6 May et al.
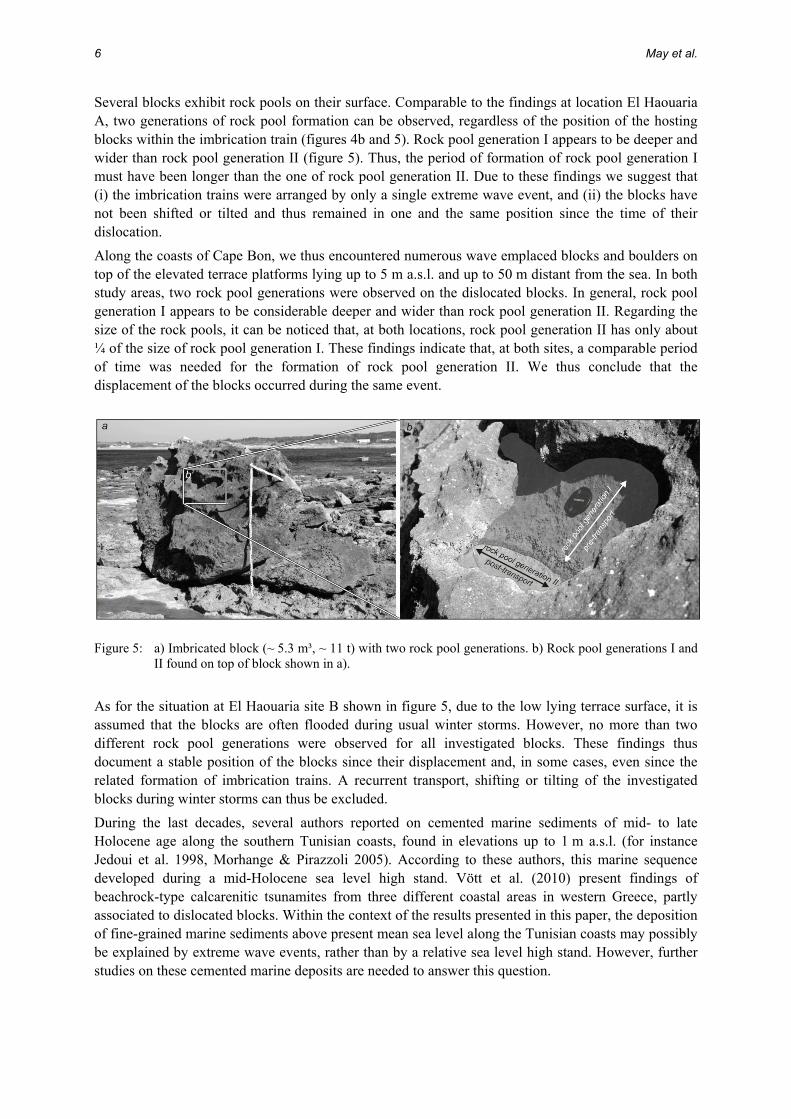
Several blocks exhibit rock pools on their surface. Comparable to the findings at location El Haouaria A, two generations of rock pool formation can be observed, regardless of the position of the hosting blocks within the imbrication train (figures 4b and 5). Rock pool generation I appears to be deeper and wider than rock pool generation II (figure 5). Thus, the period of formation of rock pool generation I must have been longer than the one of rock pool generation II. Due to these findings we suggest that (i) the imbrication trains were arranged by only a single extreme wave event, and (ii) the blocks have not been shifted or tilted and thus remained in one and the same position since the time of their dislocation. Along the coasts of Cape Bon, we thus encountered numerous wave emplaced blocks and boulders on top of the elevated terrace platforms lying up to 5 m a.s.l. and up to 50 m distant from the sea. In both study areas, two rock pool generations were observed on the dislocated blocks. In general, rock pool generation I appears to be considerable deeper and wider than rock pool generation II. Regarding the size of the rock pools, it can be noticed that, at both locations, rock pool generation II has only about ¼ of the size of rock pool generation I. These findings indicate that, at both sites, a comparable period of time was needed for the formation of rock pool generation II. We thus conclude that the displacement of the blocks occurred during the same event.
Figure 5: a) Imbricated block (~ 5.3 m³, ~ 11 t) with two rock pool generations. b) Rock pool generations I and II found on top of block shown in a).
As for the situation at El Haouaria site B shown in figure 5, due to the low lying terrace surface, it is assumed that the blocks are often flooded during usual winter storms. However, no more than two different rock pool generations were observed for all investigated blocks. These findings thus document a stable position of the blocks since their displacement and, in some cases, even since the related formation of imbrication trains. A recurrent transport, shifting or tilting of the investigated blocks during winter storms can thus be excluded. During the last decades, several authors reported on cemented marine sediments of mid- to late Holocene age along the southern Tunisian coasts, found in elevations up to 1 m a.s.l. (for instance Jedoui et al. 1998, Morhange & Pirazzoli 2005). According to these authors, this marine sequence developed during a mid-Holocene sea level high stand. Vött et al. (2010) present findings of beachrock-type calcarenitic tsunamites from three different coastal areas in western Greece, partly associated to dislocated blocks. Within the context of the results presented in this paper, the deposition of fine-grained marine sediments above present mean sea level along the Tunisian coasts may possibly be explained by extreme wave events, rather than by a relative sea level high stand. However, further studies on these cemented marine deposits are needed to answer this question.

Boulder transport by high-energy wave events 7
6 Conclusions Block fields along rocky shorelines, consisting of rock-slabs, blocks and boulders, partly imbricated, are reported from all over the world. Their formation is linked to tsunami- or other extreme wave events, such as huge winter storm surges or hurricanes (for instance Goto et al. 2009, Kelletat & Schellmann 2001, Nott 2003a, Scheffers et al. 2005, Scicchitano et al. 2007, Switzer & Burston 2010, Williams & Hall 2007). However, it remains difficult to realize an appropriate determination of the event source, and the application of hydraulic equations dealing with the wave energy necessary for the wave induced transportation of blocks, which may be helpful to estimate the event source and intensity, still exhibits considerable uncertainties (see for instance Nott 2003a, 2003b, Switzer & Burston 2010). This paper documents, for the first time, extreme wave emplaced blocks and boulders on the coast of northeastern Tunisia. Due to our findings, the following conclusions can be made considering the formation of the block fields: 1. At the north-western shore of Cap Bon peninsula, block dislocation and deposition occurred up to
5 m a.s.l. The emplaced blocks are assembled in fields on top of elevated marine terraces and have been transported up to 50 m inland.
2. Several blocks and slabs were overturned or tilted by wave activity. Numerous blocks exhibit two rock pool generations. At study site El Haouaria B, blocks show distinct imbrication and are arranged in imbrication trains of up to 6 tilted blocks.
3. The existence of two rock pool generations on top of numerous displaced blocks suggests one singular event responsible for displacement. Considering the dimensions of the rock pool generations, the period of time since dislocation of the blocks is considerably shorter than the period of time before their displacement when the blocks were lying in their original positions.
4. A stable position of the blocks before and since the time of movement can be assumed. Therefore annually recurring winter storm activities do not shift or move the blocks, although, due to the low lying cliff top platform, some of the blocks most likely are overflown by sea water during winter storms.
5. Due to these findings, a tsunami event rather than a storm has to be assumed for the deposition of the observed block fields. Also regarding the stable position of the blocks since their displacement, a storm-generated origin seems to be unlikely.
In general, the question of determining and localizing the event source and the ability to distinguish between tsunami and storm origin is important in palaeo-event research; further analytical studies are required to improve our understanding of the geomorphological and sedimentological fingerprints of the different kinds of extreme wave event deposits.
References Alasset, P.-J., H. Hébert, S. Maouche, V. Calbini & M. Meghraoui (2006): The tsunami induced by the 2003
Zemmouri earthqauke (Mw = 6.9, Algeria): modelling and results. In: Geophysical Journal International 166: 213–226.
Andrade, C. (1992): Tsunami Generated Forms in the Algarve Barrier Islands (South Portugal). In: Science of Tsunami Hazards 10 (1): 21–34.
Atwater, B.F. (1987): Evidence for Great Holocene Earthquakes along the Outer Coast of Washington State. In: Science 236: 942–944.
Benetatos, C., A. Kiratzi, C. Papazachos & G. Karakaisis (2004): Focal mechanisms of shallow and intermediate depth earthquakes along the Hellenic Arc. In: Journal of Geodynamics 37: 253–296.
Benetatos, C., A. Kiratzi, Z. Roumelioti, G. Stavrakakis, G. Drakatos & I. Latoussakis (2005): The 14 August 2003 Lefkada Island (Greece) earthquake: Focal mechanisms of the mainshock and of the aftershock sequence. In: Journal of Seismology 9: 171–190.

8 May et al.
Bondevik, S. (2008): The sands of tsunami time. In: Nature 455: 1183–1184. Bruins, H.J., J.A. MacGillivray, C.E. Synolakis, C. Benjamini, J. Keller, H.J. Kisch, A. Klügel & J. van der
Plicht (2008): Geoarchaeological tsunami deposits at Palaikastro (Crete) and the Late Minoan IA eruption of Santorini. In: Journal of Archaeological Science 35: 191–212.
Cocard, A., H.-G. Kahle, Y. Peter, A. Geiger, G. Veis, S. Felekis, D. Paradissis, H. Billiris (1999): New constraints on the rapid crustal motion of the Aegean region: recent results inferred from GPS measurements (1993-1998) across the West Hellenic Arc, Greece. In: Earth and Planetary Science letters 172: 39–47.
Dominey-Howes, D.T.M., G.A. Papadopoulos & A.G. Dawson (2000a): Geological and Historical Investigation of the 1650 Mt. Columbo (Thera Island) Eruption and Tsunami, Aegean Sea, Greece. In: Natural Hazards 21: 83–96.
Dominey-Howes, D.T.M., A. Cundy & I. Croudace (2000b): High energy marine flood deposits on Astypalaea Island, Greece: posible evidence for the AD 1956 southern Aegean tsunami. In: Marine Geology 163: 303–315.
Faccenna, C., T.W. Becker, F.P. Lucente, L. Jolivet & F. Rossetti (2001): History of subduction and back-arc extension in the Central Mediterranean. In: Geophysical Journal International 145: 809–820.
Frébourg, G., C.-A. Hasler & E. Davaud (2007): Etna collapse of 8000 BP: A possible supratidal tsunami record in Sidi Salem Formation, South-Eastern coast of Tunisia. In: Book of Abstracts, 25th IAS Meeting of Sedimentology, Patras – Greece, p. 82.
Gianfreda, F., G. Mastronuzzi & P. Sanso (2001): Impact of historical tsunamis on a sandy coastal barrier: an example from the northern Gargano coast, southern Italy. In: Natural Hazards and Earth System Sciences 1: 213–219.
Goff, J., B.G. McFadgen & C. Chagué-Goff (2004): Sedimentary differences between the 2002 Easter storm and the 15th-century Okoropunga tsunami, southeastern North Island, New Zealand. In: Marine Geology 204: 235–250.
Goto, K., K. Okada & F. Imamura (2009): Characteristics and hydrodynamics of boulders transported by storm waves at Kudaka Island, Japan. In: Marine Geology 262: 14–24.
Gràcia, E., R. Pallas, J.I. Soto, M. Comas, X. Moreno, E. Masana, P. Santanach, S. Diez, M. García & J. Dañobeitia (2006): Active faulting offshore SE Spain (Alboran Sea): Implications for earthquake hazard assessment in the Southern Iberian Margin." In: Earth and Planetary Science Letters 241 (3-4): 734–749.
Hieke, W. (2000): Transparent layers in seismic reflection records from the central Ionian Sea (Mediterranean) - evidence for repeated catastrophic turbidite sedimentation during the Quaternary. In: Sedimentary Geology 135: 89–98.
Hieke, W. & F. Werner (2000): The Augias megaturbidite in the central Ionian Sea (central Mediterranean) and its relation to the Holocene Santorini event. In: Sedimentary Geology 135: 205–218.
Jedoui, Y., N. Kallel, F. Michel, H.B. Ismail, A. M’Rabet & M. Montacer (1998): A high relative sea-level stand in the middle Holocene of southeastern Tunisia. In: Marine Geology 147 (1-4): 123–130.
Kelletat, D. & G. Schellmann (2001): Sedimentologische und geomorphologische Belege starker tsunami-Ereignisse jung-historischer Zeitstellung im Westen und Südosten Zyperns. In: Kelletat, D. & G. Schellmann (Hrsg.): Küstenforschung auf Zypern - Tsunami-Ereignisse und Chronostratigraphische Untersuchungen. - Essener Geographische Arbeiten 32: 1–74.
Kelletat, D. (2005): Neue Beobachtungen zu Paläo-Tsunami im Mittelmeergebiet: Mallorca und Bucht von Alanya, türkische Südküste. In: Beck, N. (Hrsg.): Neue Ergebnisse der Meeres- und Küstenforschung. Schriften des Arbeitskreises Landes- und Volkskunde 4: 1–14.
Kontopoulos, N. & P. Avramidis (2003): A late Holocene record of environmental changes from the Aliki lagoon, Egion, North Peloponnesus, Greece. In: Quaternary International 111: 75–90.
Kortekaas, S. (2002): Tsunamis, storms and earthquakes: Distinguishing coastal flooding events. Thesis submitted in partial fulfillment of the University’s requirements for the degree of Doctor of Philosophy. Coventry, Coventry University, p. 171.
Kortekaas, S. & A. G. Dawson (2007): Distinguishing tsunami and storm deposits: An example from Martinhal, SW Portugal. In: Sedimentary Geology 200: 208–221.
Laborel, J. & F. Laborel-Deguen (1994): Biological indicators of relative sea level variations and of coseismic displacements in the Mediterranean region, In: Journal of Coastal Research 10: 395–415.
Louvari, E., A. A. Kiratzi & B.C. Papazachos (1999): The Cephalonia Transform Fault and its extension to western Lefkada Island (Greece) In: Tectonophysics 308: 223–236.

Boulder transport by high-energy wave events 9
Maouche, S., C. Morhange & M. Meghraoui (2009): Large boulder accumulation on the Algerian coast evidence tsunami events in the western Mediterranean. In: Marine Geology 262: 96–104.
Mastronuzzi, G. & P. Sanso (2000): Boulders transport by catastrophic waves along the Ionian coast of Apulia (southern Italy). In: Marine Geology 170: 93–103.
Mastronuzzi, G. & P. Sanso (2004): Large Boulder accumulations by extreme waves along the Adriatic coast of southern Apulia (Italy). In: Quaternary International 120: 173–184.
May, S.M. (2010): Sedimentological, geomorphological and geochronological studies on Holocene tsunamis in the Lefkada – Preveza area (NW Greece) and their implications for coastal evolution, PhD thesis, Universität zu Köln, Köln (http://kups.ub.uni-koeln.de/volltexte/2010/3189/).
May, S. M., A. Vött, H. Brückner & S. Brockmüller (2007): Evidence of tsunamigenic impact on Actio headland near Preveza, NW Greece. In: Coastline Reports 9: 115–125.
McCoy, F. W. & G. Heiken (2000): Tsunami Generated by the Late Bronze Age Eruption of Thera (Santorini), Greece. In: Pure applied geophysics 157: 1227–1256.
Mensching, H. (1979): Tunesien. Eine Geographische Landeskunde. Wissenschaftliche Buchgesellschaft, Darmstadt.
Mhammudi, N., F. Medina, D. Kelletat, A. M’Fedal & L. Aloussi (2008): Large boulders along the Rabat Coast (Morocco); possible emplacement by the November, 1st, 1755 A.D. tsunami. In: Science of Tsunami Hazards 27 (1): 17–30.
Minoura, K., F. Imamura, U. Kuran, T. Nakamura, G.A. Papadopoulos, T. Takahashi & A.C. Yalciner (2000): Discovery of Minoan tsunami deposits. In: Geology 28(1): 59–62.
Morhange, C., N. Marriner & P.A. Pirazzoli (2006): Evidence of Late-Holocene tsunami events from Lebanon. In: Zeitschrift für Geomorphologie N.F. 146: 81–95.
Morhange, C. & P. A. Pirazzoli (2005): Mid-Holocene emergence of southern Tunisian coasts In: Marine Geology 220 (1-4): 205–213.
Morton, R. A., G. Gelfenbaum & B.E. Jaffe (2007): Physical criteria for distinguishing sandy tsunami and storm deposits using modern examples. In: Sedimentary Geology 200: 184–207.
Nott, J. (1997): Extremely high-energy wave deposits inside the Great Barrier Reef, Australia: determining the cause - tsunami or tropical cyclone. In: Marine Geology 141: 193–207.
Nott, J. (2003a): Tsunami or Storm Waves? - Determining the Origin of a Spectacular Field of Wave Emplaced Boulders Using Numerical Storm Surge and Wave Models and Hydrodynamic Transport Equations. In: Journal of Coastal Research 19(2): 348–356.
Nott, J. (2003b): Waves, coastal boulder deposits and the importance of the pre-transport setting. In: Earth and Planetary Science Letters 210: 269–276.
Papadopoulos, G. A. (2003): Tsunami Hazard in the Eastern Mediterranean: Strong Earthquakes and Tsunamis in the Corinth Gulf, Central Greece. In: Natural hazards 29: 437–464.
Pareschi, M.T., E. Boschi & M. Favalli (2006): Lost tsunami. In: Geophysical Research Letters 33: L22608. Pirazzoli, P.A. (1986): The early Byzantine Tectonic Paroxysm. In: Zeitschrift für Geomorphologie, N.F., 62:
31–49. Reinhardt, E. G., B. N. Goodman, J. I. Boyce, G. Lopez, P. van Hengstum, W. J. Rink, Y. Mart & A. Raban
(2006): The tsunami of 13 December A.D. 115 and the destruction of Herod the Great’s harbor at Caesarea Maritima, Israel. In: Geology 34(12): 1061–1064.
Robinson, E., D.-A.C. Rowe & S. Khan (2006): Wave-Emplaced Boulders on Jamaica’s Rocky Shores. In: Zeitschrift für Geomorphologie N.F. 146: 39–57.
Sachpazi, M., C. Clément, M. Laigle, A. Hirn & N. Roussos (2003): Rift Structure, evolution, and earthquakes in the Gulf of Corinth, from reflection seismic images. In: Earth and Planetary Science Letters 216: 243–257.
Scheffers, A. (2005): Argumente und Methoden zur Unterscheidung von Sturm und Tsunami-Schutt und das Problem der Datierung von Paläo-Tsunamis. In: Die Erde 136(4): 413–429.
Scheffers, A. & D. Kelletat (2001): Hurricanes and Tsunamis - Dynamik und küstengestaltende Wirkungen. In: Bamberger Geographische Schriften 20: 29–54.
Scheffers, A. & S. Scheffers (2007): Tsunami deposits on the coastline of west Crete (Greece). In: Earth and Planetary Science Letters 259: 613–624.

10 May et al.
Scheffers, A., D. Kelletat, A. Vött, S.M. May & S. Scheffers (2008): Late Holocene tsunami traces on the western and southern coastlines of the Peloponnesus (Greece). In: Earth and Planetary Science Letters 269(1-2): 271–279.
Scheffers, A., S. Scheffers & D. Kelletat (2005): Paleo-Tsunami Relics on the Southern and Central Antillean Island Arc. In: Journal of Coastal Research 21: 263–273.
Scicchitano, G., C. Monaco & L. Tortorici (2007): Large boulder deposits by tsunami waves along the Ionian coast of south-eastern Sicily (Italy). In: Marine Geology 238(1-4): 75–91
Soloviev, S. L., O.N. Solovieva, C.N. Go, K.S. Kim & N.A. Shchetnikov (2000): Tsunamis in the Mediterranean Sea 2000 B.C.-2000 A.D. Kluwer, Dordrecht.
Switzer, A.D. & B.G. Jones (2008a): Large-scale washover sedimentation in a freshwater lagoon from the southeast Australian coast: sea-level change, tsunami or exceptionally large storm? In: The Holocene 18(5): 787–803.
Switzer, A.D. & B.G. Jones (2008b): Setup, Deposition, and Sedimentary Characteristics of two Storm Overwash Deposits, Abrahams Bosom Beach, Southeastern Australia. In: Journal of Coastal Research 24 (1): 189–200.
Switzer, A.D. & J.M. Burston (2010): Competing mechanisms for boulder deposition on the southeast Australian coast. In: Geomorphology 114(1-2): 42–54.
Tinti, S., A. Maramai & L. Graziani (2004): The New Catalogue of Italian Tsunamis. In: Natural Hazards 33: 439–465.
Vött, A., M. May, H. Brückner & S. Brockmüller (2006): Sedimentary Evidence of Late Holocene Tsunami Events near Lefkada Island (NW Greece). In: Zeitschrift für Geomorphologie N.F., 146: 139–172.
Vött, A., H. Brückner, S.M. May, F. Lang & S. Brockmüller (2007): Late Holocene tsunami imprint at the entrance of the Ambrakian Gulf (NW Greece). In: Mediterranée 108: 43–57.
Vött, A., H. Brückner, S.M. May, F. Lang, R. Herd & S. Brockmüller (2008): Strong tsunami impact on the Bay of Aghios Nikolaos and its environs (NW Greece) during Classical-Hellenistic times. In: Quaternary International 181(1): 105–122.
Vött, A., H. Brückner, S. Brockmüller, M. Handl, S.M. May, K. Gaki-Papanastassiou, R. Herd, F. Lang, H. Maroukian, O. Nelle & D. Papanastassiou (2009): Traces of Holocene tsunamis across the Sound of Lefkada, NW Greece. In: Global and Planetary Change 66 (1-2): 112–128.
Vött, A., G. Bareth, H. Brückner, C. Curdt, I. Fountoulis, R. Grapmayer, H. Hadler, D. Hoffmeister, N. Klasen, F. Lang, P. Masberg, S.M. May, K. Ntageretzis, D. Sakellariou & T. Willershäuser (2010): Beachrock-type calcarenitic tsunamites along the shores of the eastern Ionian Sea – case studies from Akarnania, the Ionian Islands and the western Peloponnese. In: Zeitschrift für Geomorphologie N.F., Suppl. Issue 54 (3): 1–50.
Whelan, F. & D. Kelletat (2005): Boulder Deposits on the Southern Spanish Atlantic Coast: Possible Evidence for the 1755 AD Lisbon Tsunami? In: Science of Tsunami Hazards 23(3): 25–38.
Williams, D.M. & A.M. Hall (2007): Cliff-top megaclast deposits of Ireland, a record of extreme waves in the North Atlantic – storms or tsunamis? In: Marine Geology 206: 101–117.
Wortel, M.J.R. & W. Spakman (2000): Subduction and slab detachment in the Mediterranean-Carpathian region. In: Science 290 (5498): 1910–1917.
Acknowledgements We gratefully acknowledge funding of this study by the German Research Foundation (Bonn, VO 938/2-1).
Address Dr. Simon Matthias May University of Köln - Institute for Geography Albertus-Magnus-Platz 50923 Köln, Germany

Estim
U
1Inst
AbstracThtheMohavev
1 IntWithin t(Vött et Lefkada beachrocthe nearbetweencatalogu2400 yea2006).
Figure 1:
SchwarzerFrom BrazCoastlineS. 11-14
mating tsun
Ulrich Floth
titute for Envi
4Institute
ct he intention ofe present coasodeling resultve been foundents on the sh
troduction:he study areaal. 2007, 200Island and
ck, were obvrby Lake V units of lim
ues revealed ars, eight of
Situation ofNASA Wor
r, Schrottke &zil to Thailand e Reports 16 (
nami hazm
h1, Andreas
ironmental En2Institu
3Faculty of Gof Natural Sc
f this paper isstlines betweets are compard during the la
hores of the Le
Tsunami ia, several hin08, 2009a, M
Akarnania. viously mobi
Voulkaria, a mnic mud (the occurrenwhich were
f the study arrldWind 1.4, L
Stattegger (e– New Result
(2010), ISSN 0
ards betwmeans of c
Vött², SimoB
ngineering, Coute for GeograGeography, Phciences and Ed
s to outline seen Lefkada Islred to geoscieast years. Morefkada-Prevez
in the studynts for forme
May et al. 200Numerous
ilized and dilayer of m
(Vött et al. nce of at leaalso observe
rea showing thLandsat 7 ETM
eds.): ts in Coastal R0928-2734, IS
ween Lefkcomputer
on Matthias Brockmüller
oastal Engineeaphy, Universihilipps-Univerducation, Univ
lected results land and the senctific field reover, possib
za coastal zone
y area er tsunami im07). Widesprlarge block
islocated, pamarine high-e
2009b). Furast 46 tsunamed around th
he location ofM Satellite Im
Research SBN 978-3-98
kada and r modelin
May², Helmr4
ering Group, Uity of Köln, Grsity of Marbuversity of Kob
of modeling southernmost evidence of p
ble consequene are discusse
mpacts were read wash-ov
ks of up to artly appearinenergy deporthermore, amis in the ehe study area
f the towns ofmage, modified
11839-9-3
Preveza, ng
mut Brückn
University of RGermany urg, Germanyblenz-Landau,
hypothetic tsuareas of Epir
palaeotsunamnces of modeleed.
identified duver fans strik14 tons in ng in an imb
osits was idan evaluationastern Ionian
a (Soloviev e
f Lefkada Cityd)
NW Gree
ner³ & Svenj
Rostock, Germ
y , Germany
unami events ros, NW Gree
mi landfall whed extreme wa
uring previouke at the spitweight, mad
bricated assedentified, sann of severaln Sea withinet al. 2000, V
y and Preveza
ece, by
ja
many
for ece. hich ave
us studies t between de up of embly. In ndwiched l tsunami n the last Vött et al.
a (Source:

12
2 ThAnuGA consequeof tsunawestern origin (Wmaximumm = mod
3 PotWithin tof the Sentrancethe SounThose shbetweenimportanundersea
4 CaLike all tsunami-Ambrakievent woshow thethey trigremain uquarters
Figure 2:
e Model was devel
ence of the tami affecting
boundary. TWNW, W, Wm generationderate, 10 m
tentially enthe study areSound of Lee to the Ambnd of Lefkadhow a numbe the cities ofnce are the ca tunnel conn
se study Prother parts
-events (figuian Gulf andould cause de strongest efgger highest untouched balong the co
Potentially Landsat 7 E
loped by thtsunami-eveng the coasts The idea was
WSW) and wn height of th= severe, 20
ndangered oea, two majorfkada with a
brakian Gulf da, predominer of up to 10f Lefkada ancivil-/Nato-anecting the P
reveza of the study
ure 2). This isd thus averte
damages or effects, althouinundation v
by tsunami woast. (Floth e
flooded areaETM Satellite
he Australiant of late Decof the studys to computeith five qualhe waves at
0 m = strong,
objects r towns can ba populationwith approxantly on the 000 residentsd Preveza shirport of Ac
Preveza Penin
y area, the res mostly dueed from the ven fatalitiesugh hitting thvalues for thwave action, t al. 2009).
s of Preveza Images) for ts
an Nationalcember 2004y area was oe 15 scenariitative degrethe western
, 50 m = extr
be identifiedn of approx.x. 20.000 inhwesternmoss. The villaghows a popultio Headlandnsula with A
egion of Pree to the fact t
open sea. Os in edge arehe coast with
he harbour arwhile the s
in case of tssunami catego
l University4 (Nielsen 20on generatingos on the ba
ees of intensiboundary of
reme; Floth 2
d: Lefkada C 11.000 peo
habitants. Fust part of Akage Aghios Nilation of appd with some
Actio Headlan
eveza seems that the town
Our data shoeas. Surprisinh an almost prea. Especialsimulations s
unami from Wories “modera
y and Geos007). The focg a sinusoidase of three ity, the latterf the studied2008, Floth e
City, lying at ople, and Preurther villagearnania, callekolaos, situa
prox. 500 peo 3000 flightnd (Floth 200
to be well pn is built on tow that only ngly, tsunamperpendiculally the northshow stronge
WNW (Imageate”, “severe”
F
science Auscus for the sidal wave trai
distinct direr correspondid area (2 m =et al. 2009).
the northweeveza, locate
es are situateed Plaghia Pated on the coople. Other ots per year ju08).
protected frothe shore of a severe or
mis from WSWar direction. Hh of Preveza est impact t
e based on Ikand “strong”.
Floth et al.
stralia in imulation in on the ections of ing to the
= slight, 5
stern end ed at the
ed around Peninsula. oast right objects of ust as the
om minor the inner
r stronger W do not However, seems to o the SE
konos and

Estimating tsunami hazards between Lefkada and Preveza 13
Sedimentary evidence of tsunamigenic flooding was found for the entire coastal zone between the cities of Lefkada and Preveza, locally testifying to multiple tsunami landfall during the Holocene (May et al. 2007, Vött et al. 2009a). Geomorphological and geoarchaeological traces document the more or less complete inundation of Actio Headland directly opposite to city of Preveza (Vött et al. 2007). These results also imply tsunami-borne damages to modern Preveza and distal areas of the nearby Louros River delta. Geo-scientific studies to the immediate NNE of the city revealed at least one major tsunami impact during the past millennia. Compared to geo-scientific field data, our modeling results strongly corroborate the tsunami hazard for the Preveza-Lefkada coastal zone concerning both flow direction and spatial dimensions of extreme wave events (Floth et al. 2009).
5 Conclusion Our modeling results clearly show that all locations in the study area are well secure from minor tsunami-events. This is explained by their sheltered position behind spits and beach ridges (Aghios Nikolaos, Lefkada City) or on the lee-side of a peninsula (Preveza) and by their sheer elevation (Plaghia villages) or distance from the sea (Airport facilities). In case of major events, however, almost all inhabitated sites are endangered of peripheral to an entire flooding.
References Floth, U. (2008): The tsunami hazard between Lefkada and Preveza, based on computer modelling as well as
field and laboratory evidence. Unpublished diploma thesis, Faculty of Geography, Philipps-Universität Marburg.
Floth, U., A. Vött, S.M. May, H. Brückner & S. Brockmüller (2009): Geo-scientific evidence versus computer models of tsunami landfall in the Lefkada coastal zone (NW Greece). In: Marburger Geographische Schriften 145:. 140–156.
May, S.M., A. Vött, H. Brückner & S. Brockmüller (2007): Evidence of tsunamigenic impact on Actio headland near Preveza, NW Greece. In: Coastline Reports 9: 115–125.
Nielsen, O. (2007): ANUGA v1.0 User Manual. Soloviev, S.L., O.N. Solovieva, C. Go, K. Kim & A. Shchetnikov (2000): Tsunamis in the Mediterranean Sea
2000 BC – 2000 AD. Kluwer Academic Publishers. Dordrecht. Vött, A., H. Brückner, M. Handl & A. Schriever (2006a): Holocene palaeogeographies and the
geoarchaeological setting of the Mytikas coastal plain (Akarnania, NW Greece). In: Zeitschrift für Geomorphologie N.F. 142: 85–108.
Vött, A., H. Brückner, S.M. May, F. Lang & S. Brockmüller (2007): Late Holocene tsunami imprint on Actio headland at the entrance of the Ambrakian Gulf. In: Méditerranée, revue géographique des pays méditerranées 108: 43–57.
Vött, A., H. Brückner, M. May, F. Lang & S. Brockmüller (2008): Strong tsunami impact on the Bay of Aghios Nikolaos and its environs (NW Greece) during Classical-Hellenistic times. In: Quaternary International. Amsterdam 181: 105–122.
Vött, A., H. Brückner, S. Brockmüller, M. Handl, S.M. May, K. Gaki-Papanastassiou, R. Herd, F. Lang, H. Maroukian, O. Nelle & D. Papanastassiou (2009a): Traces of Holocene tsunamis across the Sound of Lefkada, NW Greece. In: Global and Planetary Change 66: 112–128.
Vött, A., H. Brückner, S.M. May, D. Sakellariou, O. Nelle, F. Lang, V. Kapsimalis, S. Jahns, R. Herd, M. Handl & I. Fountoulis (2009b): The Lake Voulkaria (Akarnania, NW Greece) palaeoenvironmental archive – a sediment trap for multiple tsunami impact since the mid-Holocene. In: Zeitschrift für Geomorphologie N.F., 53 (1): 1-37 (in press).

14 Floth et al.
Acknowledgement We express our thanks to Dr. C. Reudenbach (Philipps-Universität Marburg), the Greek Institute of Geology and Mineral Exploration (Athens), and the developers of the Anuga software for various support. Financial support by the German Research Foundation (Bonn, Az. VO 938/2-1) is gratefully acknowledged.
Addresses Dipl.-Geogr. Ulrich Floth University of Rostock - Institute for Environmental Engineering, Coastal Engineering Justus-von-Liebig-Weg 6 18059 Rostock, Germany

Shal
Peter
3Bi
AbstracThsed(Thin in Cadumibaor ent
1 IntTsunamitimes anrelease athe northIndo-Aumany SE CompareoffshoreVan denal. (2009unknowngeologicthereforemissing continentsunami present recordedand coas1) offsho
SchwarzerFrom BrazCoastlineS. 15-24
llow water
r Feldens1, D
iogeochemica
ct he influence odiment samplhailand) to cadetermining t15 m water d
ape. Elongateduring the annuight coincide se of a sand ristrong floodster the geolog
troduction is are amongnd numerousalong coastlihwest coast
ustralian plateE Asian coas
ed to the inf environmen
n Bergh et al9), but influen. Dawson &cal record the be of great
data about ntal shelf arehit the area, observations
d during cruistal waters ofore the tsuna
r, Schrottke &zil to Thailand e Reports 16 (
r sedimen
Daroonwan
2Pal and Environ
f tsunami on tling campaig
atalogue the gtsunami influedepth, a systed sediment traual cycle, indiwith the 2004idge is compo
s during the mgical record.
g the largests investigatioines. On Decof the Indone and the Su
stlines, reach
fluence of thnt is not well . (2003), No
ence and phy& Stewart (2han onshore t value for th
pre-tsunameas. It has to
were createds and first ises in the frf Thailand; f
ami impacted
Stattegger (e– New Result
(2010), ISSN 0
nt structuCap
n. Sakuna1,2,1Kiel U
Phuket Marinenmental Chang
the seafloor isgns were carreomarine effeence in offshoem of sand ridansport structuicate the pres4 Indian Oceaosed of silty se
monsoon. Thes
t catastrophicons have beecember 26th, nesian islandunda-Plate. Ting to the Ea
he 2004 Indunderstood.
oda et al. (20ysical proper007) proposdeposits. A
he recognitiomi conditions
be carefullyd during the results of
ramework offunded by thd coastline of
eds.): ts in Coastal R0928-2734, IS
ures in a tspe, Thaila
, Penjai Som
University, Gee Biological Cge Research U
s poorly underied out in 2ects of the 200ore deposits is dges composeures on the Nsence of a curan Tsunami. Aediment, whicse event depos
c events in ten done abo2004 an M
d Sumatra duThis generateast-coast of A
dian Ocean T Only few st
007), Abranterties of the see that offshosecure ident
on of paleotsus when wory consideredtsunami eveselected sed
f the TUNWhe Human Ref Khao Lak, P
Research SBN 978-3-98
sunami-aand)
mgpongchai
ermany Centre, ThailanUnit, Prince of
erstood. Detail2007 and 2004 Indian Ocethe lack of pr
ed of coarse sNW-flanks of t
rrent oblique A several cm-ch could be relsits are covere
the world. Tut their orig9.3 submari
ue to a comped a giant tsuAfrica (Lay e
Tsunami to tudies documes et al. (200ediment-loadore tsunami dtification of unamis. A mrking on rec, if observed
ent or were adimentologic
WAT project esearch FounPhang Nga P
11839-9-3
affected ar
iyakul3 & K
nd f Songkla Uni
led hydroacou008 offshore ean tsunami. Are-tsunami masand exists ofthe sand ridgeto the coastlithick event lalated to the tsu
ed by coarse s
They are recogin, wave disine earthquaplex tectonicunami which
et al. 2005).
onshore areament tsunami08), Feldens ded tsunami deposits are offshore tsu
major, but comcent tsunamd structures haltered by thecal and mo(Tsunami de
ndation (DFGProvince, Th
rea (Paka
Klaus Schwa
iversity, Thail
ustic surveys aPakarang Ca
A major problappings. Startffshore Pakaraes, slowly fadine. This currayer found at unami backwa
sand. They mi
orded since hstribution an
ake was gene activity beth had an imp
as, the impai effects offshet al. (2009)backwash armore comm
unami deposimmon probl
migenic struchave existede tsunami imrphological eposits in neG), Grant: SChailand.
arang
arzer1
and
and ape lem ting ang
ding rent the ash ght
historical nd energy erated off tween the pact over
act to the hore (e.g. ), Paris et re largely
mon in the its would em is the ctures on d before a mpact. We
features, ear-shore- CHW/11-
16 Feldens et al.
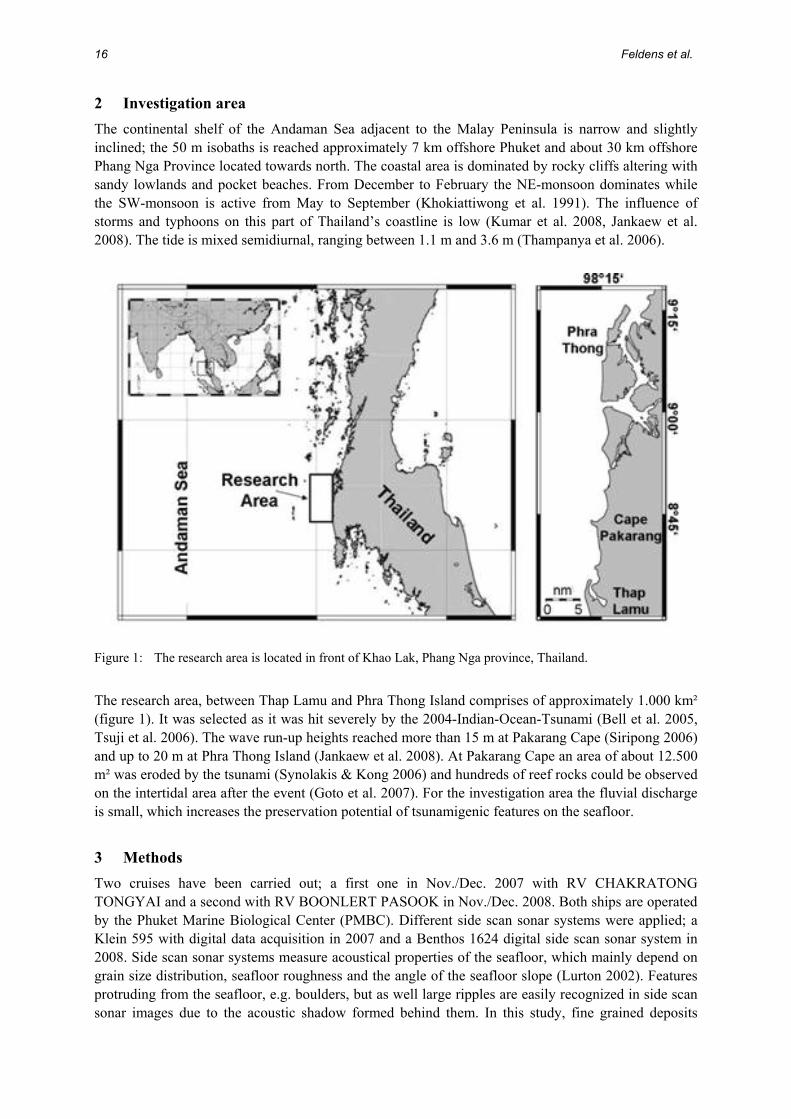
2 Investigation area The continental shelf of the Andaman Sea adjacent to the Malay Peninsula is narrow and slightly inclined; the 50 m isobaths is reached approximately 7 km offshore Phuket and about 30 km offshore Phang Nga Province located towards north. The coastal area is dominated by rocky cliffs altering with sandy lowlands and pocket beaches. From December to February the NE-monsoon dominates while the SW-monsoon is active from May to September (Khokiattiwong et al. 1991). The influence of storms and typhoons on this part of Thailand’s coastline is low (Kumar et al. 2008, Jankaew et al. 2008). The tide is mixed semidiurnal, ranging between 1.1 m and 3.6 m (Thampanya et al. 2006).
Figure 1: The research area is located in front of Khao Lak, Phang Nga province, Thailand.
The research area, between Thap Lamu and Phra Thong Island comprises of approximately 1.000 km² (figure 1). It was selected as it was hit severely by the 2004-Indian-Ocean-Tsunami (Bell et al. 2005, Tsuji et al. 2006). The wave run-up heights reached more than 15 m at Pakarang Cape (Siripong 2006) and up to 20 m at Phra Thong Island (Jankaew et al. 2008). At Pakarang Cape an area of about 12.500 m² was eroded by the tsunami (Synolakis & Kong 2006) and hundreds of reef rocks could be observed on the intertidal area after the event (Goto et al. 2007). For the investigation area the fluvial discharge is small, which increases the preservation potential of tsunamigenic features on the seafloor.
3 Methods Two cruises have been carried out; a first one in Nov./Dec. 2007 with RV CHAKRATONG TONGYAI and a second with RV BOONLERT PASOOK in Nov./Dec. 2008. Both ships are operated by the Phuket Marine Biological Center (PMBC). Different side scan sonar systems were applied; a Klein 595 with digital data acquisition in 2007 and a Benthos 1624 digital side scan sonar system in 2008. Side scan sonar systems measure acoustical properties of the seafloor, which mainly depend on grain size distribution, seafloor roughness and the angle of the seafloor slope (Lurton 2002). Features protruding from the seafloor, e.g. boulders, but as well large ripples are easily recognized in side scan sonar images due to the acoustic shadow formed behind them. In this study, fine grained deposits

Shallow water sediment structures in a tsunami-affected area 17
appear in lighter colours, while coarse grained material is represented by darker colours. For ground-truthing of the side-scan sonar data grab samples were taken on selected positions. A shallow water multibeam echosounder (ELAC SeaBeam 1185) was used to acquire bathymetric data. Multibeam echo sounders provide many simultaneous depth measurements over a narrow section of the seafloor. The SeaBeam 1185 system is working with a frequency of 180 kHz, which is suitable for a high resolution mapping in shallow waters. The acoustic beam of the system has a fan width of 153°, giving a theoretical swath width of 8.3 times the water depths. Calibration for tidal fluctuations was done by using the software WX-Tide32 (www.wxtide32.com), as no direct water level measurements are available in or close to the research area. Shallow water high resolution reflections seismics (C-Boom System), in combination with the recovery of short gravity cores, was used to obtain information about the uppermost layers of the seafloor. X-radiography images of thin slabs taken from the core surface were prepared to detect sedimentary structures that cannot be seen otherwise (Jackson et al. 1996). The database of the cruises carried out in 2007 and 2008 include about 1500 nautical miles (nm) of hydroacoustic profiles, 112 Surface sediment samples and 42 short sediment cores.
4 Results Side scan sonar images offshore Khao Lak show several different sedimentary structures in depths from 7 to 30 m (figure 2). In water depths between 7 and 15 m, extended patches of fine grained sediments are deposited. Connected to these patches is a small scale channel system starting at 10 m water depth. Here we focus on structures appearing at 15 m water-depth. Elongated SW-NE striking morphological ridges are visible in the hydroacoustic data (Figure 2). These structures are common along the whole coastline between Thap Lamu and Pakarang Cape, and up to Phra Thong Island towards north. The continuation of the ridges into deeper waters is yet unknown. The ridges, with a steep NW- and a gently dipping SE flank reach heights of about 2 m, while their length exceeds several kilometres. The distance between two ridge crests varies from several hundred meters to several kilometres. In front of the steep north-eastern side of these ridges, small channels with incision depths of approximately 1 m are sometimes cut into the seafloor. According to seismic data, the ridges are not connected to subsurface structures, but are clearly separated from the sedimentological structures below by an unconformity (figure 5). For one ridge, a side scan sonar mosaic was draped over the bathymetry (figure 3) to correlate sedimentology and morphology. Grab samples taken around the ridge (figure 3) reveal the presence of different sediment properties in a small area: Generally, the south-western, landward flank of the ridge and the surface of the seafloor surrounding the ridge are composed of coarse sand. Bright elongated sediment structures are deposited on the seaward flank of the ridge and are composed of well sorted fine to medium sand. The patches are separated from each other by thin bands of coarser sediment. From their appearance in the side scan sonar image, the structures resemble large-scale flaser beddings. However, as the genesis of the observed features is different to flaser beddings, which are formed due to tidal activities, the term will not be used. The sediment patches are commonly observed on the seaward, northern flank of sand ridges along the coastline. Rarely, they are found on the flat seafloor. Boulders are sometimes exposed in close vicinity (figure 3, figure 4). At the base of the ridge flank shown in figure 3, grab samples contain muddy material just a few centimetres below the seafloor.

18 Feldens et al.
Figure 2: Side scan sonar data around Pakarang Cape. Sampling stations and the positions of fig. 3 and fig. 4 are indicated. Sediment core 051207-37 is shown in fig. 7. This article is focusing on SW-NE striking sediment structures visible as lighter-coloured bands in the side-scan sonar image (a). Closer to the coastline, extended areas of fine grained sediment (b) and a small scale channels (c) are visible.
Core 051207-37 (figure 7) is divided in four sedimentary units. Unit 1 (0-8 cm core depth) is mainly composed of brown sand, including some shell fragments. Between 8 and 11 cm, a layer composed of silt, containing no sand, is apparent (unit 2). The lower boundary of unit 2 is sharp, while its upper boundary is not well defined. Between app. 11 to 12 cm core depth, unit 3A is composed of well sorted sand. Below, unit 3B (12 to 20 cm core depth) contains higher amounts of clay and silt. Various shell fragments are abundant in unit 3B. From 20 cm to the base of the core, unit 4 is composed of sandy silt, and includes some shell fragments. Partly, layers containing higher amounts of sediments in the sand fraction are recognized in the x-ray images.

Shallow water sediment structures in a tsunami-affected area 19
Figure 3: Side scan sonar draped over the bathymetric dataset. For position see figure 2. The length of the ridge is approx. 1500 m (perspective view). a) elongated sediment patches, consisting of fine to medium sand b) coarse sand c) carbonatic gravel and boulders (notice video image) d) sand at the surface, muddy material below e) position of short core (051207-37, fig. 7), composed of sandy material on top and a fine grained layer at 10 cm depth.
5 Discussion Sand ridges are formed due to regular hydrodynamic processes, e.g. tidal currents in inlets, ocean currents at the shelf margin or during storms (Ernstsen et al. 2006, Flemming 1978, Holland & Elmore 2008), although moribund ridges as remnants from times with a lower sea level are known (Dyer & Huntley 1999). Goff et al. (1999) report that sand ridges on the northeast US Atlantic shelf are asymmetric, having steeper seaward flanks. Holland & Elmore (2008) report that grain sizes across sand ridges typically range from coarse to fine sand. The typical height of storm generated sand ridges is given with 3 to 12 m (van de Meene & van Rijn 2000). Commonly, sand ridges are oblique to the coastline, with the acute angle opening into the prevailing flow direction (Swift et al. 1978, Holland & Elmoore 2008). Most of these features are found in the observed ridge system. The strike direction of the ridges indicates an approximately south-north directed current which was responsible for their formation. This was not the main current direction observed during the tsunami (images of the IKONOS satellite, Goto et al. 2007). Therefore, the ridge system existed prior to the tsunami, although the definite process responsible for its formation has not yet been identified.

20 Feldens et al.
Figure 4: Elongated sedimentary structures offshore Phra Thong. Frequently, boulders are exposed in close vicinity to these structures. Water depth at A: 27 m. Water depth at B: 21 m.
Notable are elongated sediment patches commonly found on the northern flanks of the sand ridges. While finer sediment on the steeper slope of asymmetrical sand ridges is common, in front of storm dominated coasts (Holland & Elmore 2008). Here fine sediments are not visible over the entire length of the flank, but instead they are deposited in small patches separated by coarser sediment. Similar bedforms on the continental shelf offshore Brazil have been formed due to storm events (Moscon & Bastos 2010). The comparison of side scan sonar images from 2007 and 2008 (figure 6) indicates that the general shape of the patches is preserved, but smaller parts begin to fade during one annual cycle, indicating an out-of-equilibrium event based deposition and ongoing reworking of the sediment. Additionally, the existence of identical sediment structures on the flat seafloor further indicates that their formation is not connected with the formation of the sand ridges. Therefore these elongated patches of fine grained sediment have to be interpreted as bedforms created by currents along the north-east/south-west direction. The general stability of these bedforms, combined with the slow fading of delicate structures suggests that no frequently occurring event is responsible for their formation. Since strong storms are rare in the area, and none occurred between the 2004 tsunami and our measurements (based on tracks published by the Regional Specialised Meteorological Centre – Tropical Cyclones (RMSC), New Delhi), it is reasonable to assume that the observed sediment pattern was influenced by the 2004 tsunami, either during the run-up or the backwash. It is assumed that the muddy material frequently found in grab samples at the base of the sand ridge corresponds to unit 2 in core 051207-37. Therefore, such material is present over a larger area at the base of the sand ridge, and not only locally in one core. Considering the silt separating two units of coarse sand, its deposition likely corresponds to a single event. Similar deposits in cores offshore the Eel River have been described by Crocket & Nittrouer (2004) as flood deposits, which could be generated in the research area by strong monsoon events. But also a tsunami backwash transports large amounts of fine-grained material offshore (Shi & Smith 2003). The process responsible for the formation cannot be determined with certainty. However, a deposition of this material during the monsoon is unlikely, as more regularly occurring structures would be expected. Regardless of the origin of their formation, these event deposits were preserved in the comparably sheltered environments at the base of the sand ridges. They are covered by coarse sand (unit 1), typical for this area of the shelf, indicating some sediment dynamics in the area. This agrees to the change of sedimentological boundaries observed in side scan sonar mosaics between 2007 and 2008 (figure 6). A
Shallow water sediment structures in a tsunami-affected area 21
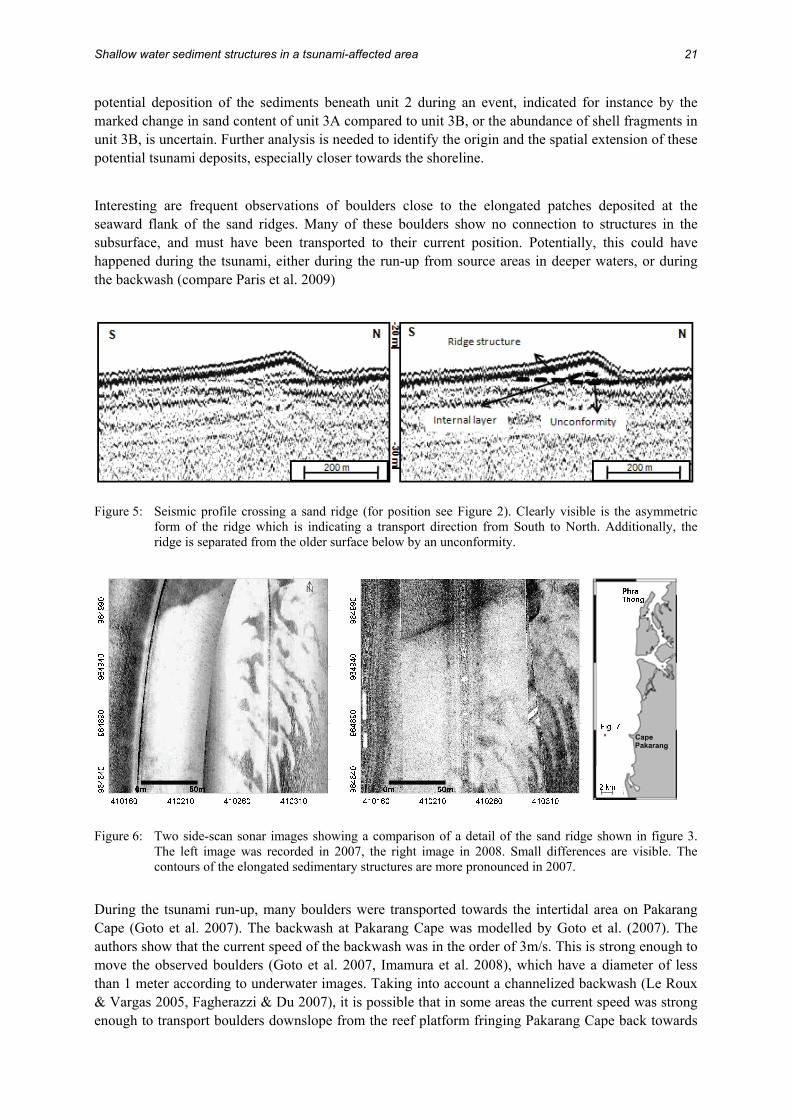
potential deposition of the sediments beneath unit 2 during an event, indicated for instance by the marked change in sand content of unit 3A compared to unit 3B, or the abundance of shell fragments in unit 3B, is uncertain. Further analysis is needed to identify the origin and the spatial extension of these potential tsunami deposits, especially closer towards the shoreline. Interesting are frequent observations of boulders close to the elongated patches deposited at the seaward flank of the sand ridges. Many of these boulders show no connection to structures in the subsurface, and must have been transported to their current position. Potentially, this could have happened during the tsunami, either during the run-up from source areas in deeper waters, or during the backwash (compare Paris et al. 2009)
Figure 5: Seismic profile crossing a sand ridge (for position see Figure 2). Clearly visible is the asymmetric form of the ridge which is indicating a transport direction from South to North. Additionally, the ridge is separated from the older surface below by an unconformity.
Figure 6: Two side-scan sonar images showing a comparison of a detail of the sand ridge shown in figure 3. The left image was recorded in 2007, the right image in 2008. Small differences are visible. The contours of the elongated sedimentary structures are more pronounced in 2007.
During the tsunami run-up, many boulders were transported towards the intertidal area on Pakarang Cape (Goto et al. 2007). The backwash at Pakarang Cape was modelled by Goto et al. (2007). The authors show that the current speed of the backwash was in the order of 3m/s. This is strong enough to move the observed boulders (Goto et al. 2007, Imamura et al. 2008), which have a diameter of less than 1 meter according to underwater images. Taking into account a channelized backwash (Le Roux & Vargas 2005, Fagherazzi & Du 2007), it is possible that in some areas the current speed was strong enough to transport boulders downslope from the reef platform fringing Pakarang Cape back towards

22 Feldens et al.
the sea. However, this cannot explain the presence of boulders found several kilometers offshore (Fig. 4).
Figure 7: Properties of core 051207-37. From left to right, photo, x-ray image, first mode in phi-degrees, sand content and sedimentary units are presented. For position, refer to Fig.2.
6 Conclusion Detailed hydroacoustic surveys have been carried out offshore Phang Nga province (Thailand) in 2007 and 2008 and sediment samples have been collected. Starting at 15 m water depth, a system of sand ridges, formed by coarse sand, was discovered. The sand ridges existed prior to the 2004 Indian Ocean Tsunami. Elongated sediment patches on the seaward flank of the sand ridges consist of fine to medium sand, and indicate a current oblique to the coastline. They fade slowly during the annual cycle, and were potentially reworked during the 2004 Indian Ocean Tsunami. An event layer found at the base of a sand ridge is composed of silty sediment, which could be related to the tsunami backwash or floods during the monsoon. These event deposits are covered by coarse sand, and might enter the geological record.

Shallow water sediment structures in a tsunami-affected area 23
References Abrantes, F., U. Alt-Epping, S. Lebreiro, A. Voelker & R. Schneider (2008): Sedimentological record of
tsunamis on shallow-shelf areas: The case of the 1969 AD and 1755 AD tsunamis on the Portugese Shelf off Lisbon. In: Marine Geology 249: 283–293.
Bell, R., H. Cowan, E. Dalziell, N. Evans, M. O`Leary, B. Rush & L. Yule (2005): Survey of impacts on the Andaman Coast, Southern Thailand following the great Sumatra-Andaman earthquake and tsunami of December 26, 2004. In: Bull. of The New Zealand Soc. For Earthquake Eng. 38 (3), 123–148.
Crockett, J.S. & C.A. Nittrouer (2004): The sandy inner shelf as a repository for muddy sediment: an example from Northern California. In: Continental Shelf Research 24: 55–73.
Dawson, A.G. & I. Stewart (2007): Tsunami deposits in the geological record. In: Sedimentary Geology 200: 166–183.
Dyer, K.R. & D.A. Huntley (1999): The origin, classification and modelling of sand banks and ridges. In: Continental Shelf Research 19 (10), 1285–1330.
Ernstsen, V.B., R. Noormets, C. Winter, D. Hebbeln, A. Bartholomä, B.W. Flemming & J. Bartholdy (2006): Qunatification of dune dynamics during a tidle cycle in an inlet channel of the Danish Wadden Sea. In: Geo-Mar Lett 26 (3): 151–163.
Fagherazzi, S. & X. Du (2007): Tsunamigenic incisions produced by the December 2004 earthquake along the coasts of Thailand, Indonesia and Sri Lanka. In: Geomorphology 99: 120–129.
Feldens, P., K. Schwarzer, W. Sczcuciński, K. Stattegger, D. Sakuna & P. Sompongchaiykul (2009): Impact of 2004 Tsunami on seafloor morphology and offshore sediments, Pakarang Cape, Thailand. In: Polish J. of Environ. Stud. 18: 63–68.
Flemming, B.W. (1978): Underwater sand dunes along the southeast African continental margin – observations and implications. In: Mar. Geol. 26: 177–198
Geronimo, I.D., M. Choowong, S. Phantuwongraj (2009): Geomorphology and superficial bottom sediments of Khao Lak coastal area (SW Thailand). In: Polish J. of Environ. Stud. 18(1): 111–121.
Holland, K.T. & P.A. Elmore (2008): A review of heterogenous sediments in coastal environments. In: Earth-Science Reviews 89: 116–134.
Goff, J.A., D.J.P. Swift, C.S. Duncan, L.A. Mayer & J. Hughes-Clarke (1999): High-resolution swath sonar investigation of sand ridge, dune and ribbon morphology in the offshore environment of the New Jersey margin. In: Marine Geology 161: 307–337.
Goto, K. S.A. Chavanich, F. Imamura, P. Kunthasap, T. Matsui, K. Minoura, D. Sugawara & H. Yanagisawa (2007): Distribution, origin and transport process of boulders deposited by the 2004 Indian Ocean tsunami at Pakarang Cape, In: Thailand. Sed. Geol. 202: 821–837.
Imamura, F., K. Goto & S. Ohkubo (2008): A numerical model for the transport of a boulder by tsunami. In: Journal of Geophysical Research 113, C01008, doi:10.1029/2007JC004170.
Jackson, P.D., K.B. Briggs & R.C. Flint (1996): Evaluation of sediment heterogeneity using microresistivity imaging and X-radiography. In: Geo-Marine Latters 16: 219–225.
Jankaew, K., B.F. Atwater, Y. Sawai, M. Choowong, T. Charoentitirat, M.E. Martin & A. Prendergast (2008): Medieval forewarning of the 2004 Indian Ocean tsunami in Thailand. In: Nature 455: 1228–1231.
Kelletat, D., S.R. Scheffers & A. Scheffers (2007): Field signatures of the SE-Asian Mega-Tsunami along the West Coast of Thailand compared to Holocene Paleo-Tsunami from the Atlantic Region. In: Pure appl. Geophys. 164: 413–431.
Khokiattiwong, S., P. Limpsaichol, S. Petpiroon, P. Sojisuporn & B. Kjerfve (1991): Oceanographic variations in Phangnga Bay, Thailand under monsoonal effects. In: Phuket Marine Biological Center Research Bulletin, 55: 43–76.
Kumar, V.S, V. Ramesh Babu, M.T. Babu, G. Dhinakaran & G.V. Rajamanickam (2008): Assessment of Storm Surge Disaster Potential for the Andaman Islands. In: Journal of Coastal Research 24(2):171–177.
Lay, T., H. Kanamori, J.C. Ammon & M. Nettles (2005): The great Sumatra-Andaman earthquake of 26 December 2004. In: Science 306: 1127–1133.
Le Roux, J.P. & G. Vargas (2005): Hydraulic behaviour of tsunami backflows: insights from their modern and ancient deposits. In: Environ. Geol 49: 65–75.
Lurton, X. (2002): Underwater Acoustics: An introduction. Springer (Berlin) 347 S.

24 Feldens et al.
Moscon, D.M.C. & A.C. Bastos (2010): Occurence of storm-generated bedforms along the inner continental shelf - southeastern Brazil. In: Brazilian Journal of Oceanography 58: 45–56.
Noda A., H. Katayama, T. Sagayama, K. Suga, Y. Uchida, K. Satake, K. Abe & Y. Okamura (2007): Evaluation of tsunami impacts on shallow marine sediments: An example from the tsunami caused by the 2003 Tokachioki earthquake, northern Japan. In: Sed. Geol. 200: 314–327.
Paris, R., J. Fournier, E. Poizot, S. Etienne, J. Morin, F. Lavigne & P. Wassmer (2010): Boulder and fine sediment transport and deposition by the 2004 tsunami in Lhok Nga (western Banda Aceh, Sumatra, Indonesia): A coupled offshore-onshore model. In: Marine Geology 268 (1-4): 43–54
Pälike, H., N.J. Shackleton & U. Röhl (2001): Astronomical forcing in Late Eocene marine sediments. In: Earth Planet. Sci. Lett. 193: 589–602.
Shi, S. & D.E. Smith (2003): Coastal tsunami geomorphological impacts and sedimentation processes: Case studies of modern and prehistorical events. International Conference on Estuaries and Coasts. November 9-11, 2003, Hangzhou, China
Siripong, A. (2006): Andaman Seacoast of Thailand Field Survey after the December 2004 Indian Ocean Tsunami. In: Earthquake Spectra 22 (S3): 187–202.
Swift, D.J.P., G. Parker, N.W. Lanfredi, G. Perillo & K. Figge (1978): Shoreface-connected Sand Ridges on American and European Shelves: A Comparison. In: Estuarine and Coastal Marine Science 7: 257–271.
Synolakis, C.E. & L. Kong (2006): Runup measurements of the December 2004 Indian Ocean Tsuanmi. In: Earthquake Spectra 22 (S3): 67–91.
Thampanya, U., J.E. Vermaat, S. Sinsakul & N. Panapitukkul (2006): Coastal erosion and mangrove progradation of Southern Thailand. In: Estuar., Coast. Shelf Sci. 68: 75–85.
Tsuji, Y., Y. Namegaya, H. Matsumoto, S.I. Iwasaki, W. Kanbua, M. Sriwichai & V. Meesuk (2006): The 2004 Indian tsunami in Thailand. Surveyed runup heights and tide gauge records. In: Earth Planets Space 58: 223–232.
Van Den Bergh G.D., W. Boer, H. De Haas, TJ.C.E. Van Weering & R. Van Wijhe (2003): Shallow marine tsunami deposits in Teluk Banten (NW Java, Indonesia), generated by the 1883 Krakatau eruption. In: Marine Geology 197: 13–34.
Van de Meene, J.W.H. & L.C. van Rijn (2000): The shoreface-connected ridges along the central Dutch coast – part 1: field observations. In: Continental Shelf Research 20: 2295–2323.
Weiss, R. & H. Bahlburg (2006): The Coast of Kenya Field Survey after the December 2004 Indian Ocean Tsunami. In: Earthquake Spectra 22 (S3): 235–240.
Acknowledgement We are grateful to NRCT (National Research Council Thailand) and PMBC (Phuket Marine Biological Center) for providing us with the research vessels CHAKRATONG TONGAI and BOONLERT SOOK. We thank masters and crew of both vessels for their outstanding support during the cruise. The German part of this study was supported by DFG through research grant SCHW/11-1. Many thanks go to Witold Sczcuciński and Karl Stattegger for good discussions.
Address Peter Feldens University of Kiel - Institute of Geosciences Otto-Hahn Platz 1 24418 Kiel, Germany

AbstracThdevmawaToareIn conto weinvmoHaflosencamregspetoptsuresapp
1 BacThe Indhistory. the SumdestroyeAndamaaffected m observHowevethan othfuture tsat the AnTo studyRegion offshore
SchwarzerFrom BrazCoastlineS. 25-34
Use oa
Gunilla K
ct he mega-tsunavastated settlany lives, the ater & power so mitigate futueas at the And
the bilateralnsequences odesign a comp
ell as for vulnvestigations, odelling. This azard analysisow dynamics.nsing data. Mmpaign was gion. Based onecific roughnpographic dataunami inundatsolution of theplicability of
ckground aian Ocean TTriggered by
matra subducted buildings,an Sea coast
the provinceved near Khar not all reg
hers. Thus, inunami risk, tndaman Sea y the complethe German in the And
r, Schrottke &zil to Thailand e Reports 16 (
of high ress part of a
Kaiser1, Hann1Departm
2Departme
ami of Dec. 2ements, touridestruction orsupply causedure tsunami i
daman Sea coal German-Thf the 2004 tsuprehensive ris
nerability analyhousehold an paper deals w
s on a local sc Thus a high
Moreover, to inconducted ton an object-or
ness map. Incla, roughness mtion simulatione geo basis dainundation ma
and objectiTsunami on y a Mw ~9.1tion zone the, infrastructuof Thailand es of Phang Nao Lak (Tsuj
gions sufferen order to dthere is a necoast. ex interaction-Thai Resedaman Sea R
& Stattegger (e– New Result
(2010), ISSN 0
solution ga tsunam
nes Römer1
ment of Geogent of Geograp
26, 2004 stronsm resorts anr damage of li
d high economimpacts there ast and to devhai research unami are invesk analysis tooysis of the socnd company
with the hazardcale requires dh resolution dnclude the damo derive roughriented land-uluding a deepmaps and infon could be peata strongly inaps for risk as
ives 26.12.2004
1-9.3 megathe tsunami kiure and coawas the nexNga and Phuji et al. 2006)ed the same determine theed to assess
ons of tsunamearch cooperRegion) was
eds.): ts in Coastal R0928-2734, IS
geodata foi risk asse
, Daniela A
graphy, Univerphy, Universit
ngly impactednd coastal ecoife-supporting
mic losses in this a need to
elop adequateproject TRAestigated in orol. Methods arcio-economic
surveys, red analysis as o
detailed knowldigital elevatiomping effect ohness parame
use classificatip sea and neaormation on strerformed. A confluences the ssessment and
caused one hrust earthquilled about 2
astal ecosystext most heaviuket 1:45-2h ). degree of fle spatial disthe tsunami
mi related imration TRIAs initiated, f
Research SBN 978-3-98
or inundaessment in
Arp1, Horst S
rsity of Kiel, Gty of München
d the Andamaosystems. In g infrastructurhe region. assess tsunam
e risk managemAIT mechanis
rder to condure developed fand the ecolo
mote sensingone part of a rledge of the toon model waof vegetation eters for diffeion these valuar shore bathyructural patteromparison of accuracy of in
d management
of the mostuake (Lay et230.000 peopems. Besideily impactedafter the ear
ood impactsstribution of hazard and v
mpacts on anAS (Tracing funded by th
11839-9-3
ation modn Thailan
Sterr1 & Ra
Germany n, Germany
an Sea coast addition to th
re, such as bui
mi risks in vument strategiems, impacts
uct a local riskfor detailed haogical system g techniques risk assessmenopography ans generated bon the tsunamerent land usues were transymetry, mult-rns like buildithe first resultnundation simt.
t devastatingt al. 2006, Stple around tes Banda Acd area. The tsrthquake wit
s, some localrisk and to
vulnerability
nd offshore Tsunami Im
he German R
delling nd
alf Ludwig2
of Thailand ahe tragic lossildings, roads,
ulnerable coases.
and long tek assessment aazard analysiscombining fiand numeri
nt. nd the inundatbased on remmi waves, a fie classes in
sferred into a s-scale resolutings, a numerits shows that
mulations and
g natural distein & Okal the Indian Oceh in Indonsunami mostth run-ups of
lities were hmanage pre
y in flood pro
in the Andampacts onshResearch Fo
and s of , or
stal
erm and s as ield ical
tion mote ield the site tion ical the the
sasters in 2005) in
Ocean and nesia the t severely f up to 15
hit harder esent and one areas
aman Sea hore and oundation

26 Kaiser et al.
(DFG) and the National Research Council of Thailand (NRCT). This research cooperation focuses on tsunami-related issues in order to gain a better understanding of the physical impacts of tsunamis on the seafloor and on land, resulting in sediment mobility and destruction, and to develop methods and tools for tsunami risk assessment and management. Six German-Thai research projects are part of the TRIAS cooperation addressing the whole transection of the tsunami from the deep sea, across the shelf to the coast and the coastal hinterland. The work presented here is about one work package in one of the six projects, TRAIT (Tsunami Risks, Vulnerability and Resilience in the Phang Nga and Phuket provinces, Thailand). In TRAIT a detailed, local risk assessment is conducted for the Provinces Phang Nga and Phuket. The overall objectives of TRAIT are: 1. Providing a quantitative approach for risk assessment including the analysis of hazard mechanisms
as well as an assessment of social, economic and ecological vulnerability 2. Investigating the potentials of earth observation for vulnerability assessment, resilience monitoring
and as an inherent part of a tsunami risk analysis tool 3. Developing a comprehensive risk analysis tool that assists risk mitigation and management This paper highlights the factors and data requirements for inundation modelling as part of the hazard analysis. As TRAIT is an ongoing project and work is still in progress only preliminary outcomes are presented.
2 Study areas The area of investigation reaches from approximately 8°52’10’’N to 7°45’30”N and covers the coastal lowlands of the provinces Phang Nga and Phuket at the Adaman Sea coast in southern Thailand. Within this region four different types of study areas have been selected in order to cover the different aspects of risk (figure 1). Ban Nam Khem is a small community in the North of the Phang Nga province dominated by fishery and agriculture. The community was severely affected by the 2004 tsunami due to the very flat and exposed location and the poor quality of buildings. More than 1000 out of 6000 inhabitants lost their lives by the tsunami and infrastructure as well as fishing facilities were destroyed (Paphavasit et al. 2009). Further to the south Khao Lak represents a young booming tourism resort which was also strongly impacted in 2004 due to two reasons: a) the largest tsunami wave heights were measured in this area and b) many tourists were on the beaches or in hotels close to the beaches as the tsunami occurred during high season. Thousands lost their lives, among them many foreign tourists. Dozens of hotels and resorts were destroyed or damaged. Thai Muang national park located on a spit around a tidal inlet hosts large areas of intact coastal ecosystems like mangroves or beach forests. Hence this site represents a study area where the impacts of the tsunami on vegetation and coastal habitats can be investigated. Patong Beach on Phuket island represents the most populated and urbanized community in the area of investigation. Due to the high density of large buildings the tsunami mainly damaged the first road parallel to the coast and the buildings at the beach front. Nevertheless, the water was channelled in the streets, perpendicular to the coast and spread further into the hinterland. Due to the dense infrastructure of shops, hotels, and restaurants, the economic damage was estimated to be about 217 million €.

Use of high resolution geodata for inundation modeling 27
Figure 1: The study areas Ban Nam Khem, Khao Lak, Thai Muang national park (upper right) and Patong Beach (lower right) at the Andaman Sea coast of Thailand
3 Methodology Risk assessment and the development of a risk analysis tool carried out in TRAIT are based on a common concept of risk, hazard and vulnerability widely applied in natural hazards research (amongst others Wisner et al. 2004, UNDP 2004), flood risk management (Schanze et al. 2006), and environmental science (Turner et al. 2003). Tsunami hazard analysis in this study includes the geophysical sources of an earthquake, the modelling of the generation and propagation of waves to the coast and its landward inundation characteristics including small scale landforms like coastal forests, buildings, rivers, tidal inlets and ponds. Vulnerability analysis is conducted by assessing the exposure of the elements at risk of the social, economic and ecological coastal system, their susceptibility to be harmed by the tsunami and their resilience, i.e. their ability to cope and recover. This means that the tsunami impacts are a function of various risk parameters which vary with time and space.

28 Kaiser et al.
In TRAIT an integrated approach is applied including extensive field investigations, numerical modelling, household and company surveys as well as GIS and earth observation. Special focus is given to the application of remote sensing techniques, not only for quick assessment of damages caused by the tsunami but also for monitoring processes. A time-series of multi-scale remote sensing data (i.e. SRTM, ASTER, IKONOS, MFC) is used to derive digital surface and elevation models, to assess damages to buildings, to detect beach erosion or uprooting of vegetation, and to gain information on how the recovery process has proceeded until today (e.g. recovery of coastal forests, restoration of tidal inlets). As the Asian Tsunami of 2004 and its impacts are documented very well, a detailed analysis of mechanisms and consequences of this event is conducted. From this detailed analysis key parameters of tsunami risk will be derived to allow for comprehensive, quantitative risk assessment. The combination of the numerical modelling and a GIS database with quantitative vulnerability criteria provides a comprehensive GIS-based tsunami risk analysis tool.
Hazard analysis The tsunami hazard analysis, as part of the overall risk assessment, comprises modelling of the tsunami generation, propagation and inundation including the interaction of the tsunami with vegetation or buildings (figure 2). The analysis is performed for the 2004 event as well as for different scenarios for the study areas Patong Beach, Khao Lak, Thai Muang national park and Ban Nam Khem. Special consideration is given to the inundation simulation as inundation depth, velocity, and expansion are crucial for risk analysis, risk management and evacuation planning.
Figure 2: Tsunami risk model
As the quality of the model results strongly depends on the detail and the resolution of the input data, we check how different data sets on different scales influence the results of the tsunami modelling. The key data sets are bathymetry, topography and a roughness maps, representing bottom friction caused by land cover.
Source Pathway Receptor
Inundation areaRisk zone
ReefTsunami
Elements at riskBeach
coastal forestsOcean > 100m depthOcean < 100m depth
slope
ComMIT/MOST
GEBCO 30 arc-sec
ComMIT/MOST
Thai Marine charts ~400 m
ComMIT/MOST/MIKE 21FM
DEM 90 m – 0.15 m

Use of high resolution geodata for inundation modeling 29
Land use classification A detailed land use map is an important basis for hazard and vulnerability assessment as it provides information on the spatial characteristics of land cover in the area of investigation. The land use information was derived from high-resolution satellite images (IKONOS) with a horizontal resolution of 4 m in the multispectral channels. With a rule-based object-oriented classification scheme (Definiens Developer 7.0 software) land use information could be extracted very accurately from the multispectral image. The preliminary step of the object oriented classification is to segment a raster image into image objects or segments which fulfil a user defined homogeneity criteria (Blaschke & Strobl 2001). The multi-resolution segmentation, which is a patented segmentation algorithm of Definiens AG, was realized by using two hierarchical segment levels. Subsequently the image objects could be assigned to a respective land use class by analyzing the spectral, shape-specific, textural and neighbourhood-specific characteristics of the segments. For this, a complex system of rules (rule set) was created which incorporates both crisp and fuzzy rule definitions. Finally the quality and robustness of the developed rule set was evaluated by transferring the rule set to a different IKONOS scene. The final classification map for the coastal zone between Ban Nam Khem and Thai Muang city includes 42 different land use classes which are organized in the following nine super-classes:
Agriculture and Aquaculture: includes plantations, orchards and aquaculture Barren land: sandy beaches, sand mining, mudflats etc. Buildings and infrastructure Grassland and Herbaceous vegetation: dense and sparse grassland with scattered trees Scrubland: predominance of scrubs Semi-open landscapes: mixture of woodland, scrubland and grassland, comparable to savannahs Water: water surfaces like ponds, rivers, bays Woodland: different types of natural forests, e.g. Mangroves, Casuarina forest, Primary Rain
forest Other: clouds, shadows and no data values.
In connection with the hazard analysis, the land use map contributed to generating digital elevation models and to provide the spatial distribution of roughness values.
Hydrological roughness Coastal forests like mangroves or beach forests are assumed to have a damping effect on the tsunami wave (Dahdouh-Guebas et al. 2005, Wolanski 2007, Danielsen et al. 2005). To prove this for the study areas, IKONOS data from 2003 and 2005 were compared with change detection techniques to identify areas with damaged vegetation and to gain rough information on the protective function of vegetation during the 2004 tsunami. To include the effect of wave attenuation in the inundation simulation a method was developed to calculate the appropriate Mannings roughness coefficients for each land use class in the study areas. To use this aforementioned method seven vegetation classes, defined as coastal habitats, were investigated in the field, which included three types of plantations with a large extent in the study areas: coconut plantations, oil palm plantations and rubber plantations as well as natural habitats: mangrove forest, beach forest (outer beach forest fringing the sandy beach and inner beach forest adjacent to the outer area), and a temporary swamp forest (Melaleuca area). For these habitats tree parameters like the “diameter at breast height” or “vegetation density” were measured and transferred into Manning values according to Petryk & Bosmajian (1975).
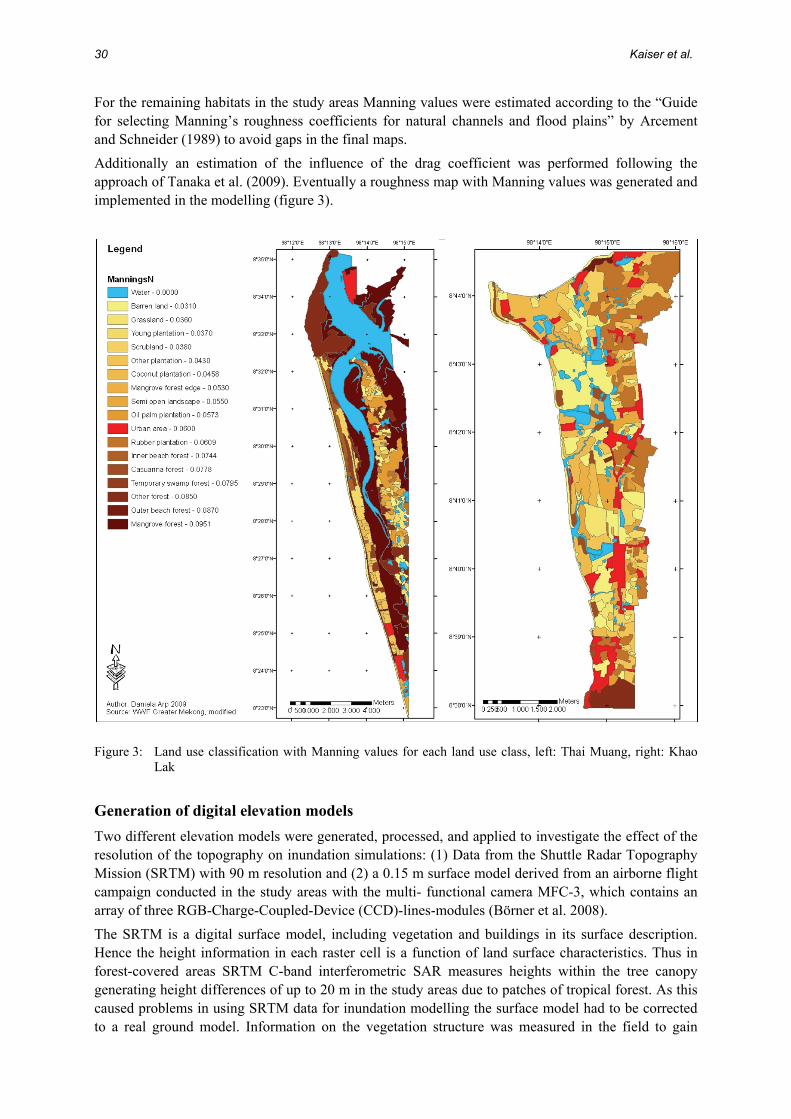
30 Kaiser et al.
For the remaining habitats in the study areas Manning values were estimated according to the “Guide for selecting Manning’s roughness coefficients for natural channels and flood plains” by Arcement and Schneider (1989) to avoid gaps in the final maps. Additionally an estimation of the influence of the drag coefficient was performed following the approach of Tanaka et al. (2009). Eventually a roughness map with Manning values was generated and implemented in the modelling (figure 3).
Figure 3: Land use classification with Manning values for each land use class, left: Thai Muang, right: Khao Lak
Generation of digital elevation models Two different elevation models were generated, processed, and applied to investigate the effect of the resolution of the topography on inundation simulations: (1) Data from the Shuttle Radar Topography Mission (SRTM) with 90 m resolution and (2) a 0.15 m surface model derived from an airborne flight campaign conducted in the study areas with the multi- functional camera MFC-3, which contains an array of three RGB-Charge-Coupled-Device (CCD)-lines-modules (Börner et al. 2008). The SRTM is a digital surface model, including vegetation and buildings in its surface description. Hence the height information in each raster cell is a function of land surface characteristics. Thus in forest-covered areas SRTM C-band interferometric SAR measures heights within the tree canopy generating height differences of up to 20 m in the study areas due to patches of tropical forest. As this caused problems in using SRTM data for inundation modelling the surface model had to be corrected to a real ground model. Information on the vegetation structure was measured in the field to gain

Use of high resolution geodata for inundation modeling 31
surface heights of typical land use classes. The mean height values of every land use class and the ground coverage were then added to the land use classification which was converted into a raster, resampled and eventually subtracted from the SRTM data using GIS techniques. Finally a filter was applied to smooth the results, and rivers, ponds and tidal inlets were corrected with additional vector files. The results were validated with GPS elevation measurements gained in the field. Although this methodology generated good results in homogenous land use classes, some restrictions became obvious: The vegetation heights to be subtracted as well as the SRTM raster cell information represent mean values leading to inaccuracies. Moreover the land use classification is based on 2003 imagery, while SRTM data were collected in 2000, when land use may have been different. To get a more detailed elevation model including buildings, river mouths and small scale changes in the topography, which influence tsunami flow patterns, a MFC surface model with 0.15 m resolution was generated from the aforementioned airborne flight campaign (figure 4). In this model vegetation was removed by filtering. However, in densely urban areas (e.g. Patong Beach) buildings were not removed from the surface model, as resistant buildings are supposed to influence flow dynamics.
Figure 4: Digital surface models of Patong Beach with SRTM/90 m (left) and MFC DSM/0.15 m (right) resolution
Inundation maps Based on the GEBCO 30 arc-second bathymetry combined with digitized marine charts in the near shore zone (resolution ~ 400 m), the topography and roughness maps, nested grids were generated with different resolution to model tsunami inundation in the study areas. For the tsunami modeling two numerical models are being applied, which are boths based on the non-linear shallow water equations including bottom friction using Manning values. The MOST/ComMIT model (Method of Splitting Tsunami, (Titov & Gonzalez 1997)) uses a seismic deformation model to compute wave propagation and run-up over a set of three nested rectangular computational grids. Here, ComMIT is used for tsunami generation and propagation of the tsunami over the ocean. The model is connected to the MIKE 21 HD FM model (DHI) for inundation modelling. MIKE 21, which is based on an unstructured mesh, allows the inclusion of a detailed roughness map in the inundation simulations. To validate the model results, computed values are compared with measured tsunami heights provided by several research groups (e.g. Tsuji et al. 2006, Thailand Group 2005). Various inundation maps have been produced based on different elevation models and for different roughness. Analysis of the first results has shown that a correction and filtering of digital surface models is inevitable for inundation modelling in densely vegetated areas. The SRTM elevation data are a useful source as they are available for most areas in the world. Nevertheless, for risk management the resolution turned out to be too coarse as small scale changes in topography, fluvial structures, or buildings can not be differentiated. For an analysis of the flow dynamics including barriers like buildings and different roughness within urban areas high resolution data are required. An

32 Kaiser et al.
analysis of the effect of buildings shows that including buildings as height information in the model generates a much more realistic indundation according to the measured inundation in the field. Figure 5 examplifies this in a difference image for the inundation depth with and without buildings, showing that the inundation extent increases significantly without including buildings in the model. At the same time backwater effects occur when including buildings as height values.
Figure 5: Inundation depth in Patong Beach showing the difference of an inundation simulation including buildings as height values and a simulation without buildings in the model grid, based on MFC data (resampled to 3 m)
4 Conclusions and outlook In the German-Thai research project TRAIT research is performed on local tsunami risk assessment at the Andaman Sea coast of Thailand including a hazard analysis and a vulnerability analysis. The tsunami inundation modeling provides hazard maps including the inundation depths, the maximum inundation area and flow dynamics. They build a basis for a detailed analysis of the 2004 tsunami impacts, for risk assessment and management at the Andaman Sea coast of Thailand. First outcomes of this study show that the accuracy and the resolution of the geodata used as input for the hazard analysis are crucial not only to understand the small scale mechanisms of tsunami impacts but also to provide inundation maps as a reliable basis for risk assessment, evacuation planning and risk management. Since this paper presents work in progress further analysis will be conducted on multi-scale topography, the influence of detailed roughness information, inundation flow dynamics in urban and rural areas as well as inundation mapping.

Use of high resolution geodata for inundation modeling 33
References Arcement, G. & V. Schneider (1989): Guide for Selecting Manning’s Roughness Coefficients for Natural
Channels and Flood Plains. U.S. Geological Survey Water Supply Paper 2339, 67 p. Blaschke, T. & J. Strobl (2001): What’s wrong with pixels? Some recent developments interfacing remote
sensing and GIS. GIS. In: Zeitschrift für Geoinformationssysteme 6: 12–17. Börner , A., H. Hirschmüller, K. Scheibe, M. Suppa & J. Wohlfeil (2008): MFC – A Modular Line Camera for
3D World Modulling. International Workshop on Robot Vision (RobVis), Auckland, NZ, pp. 319–326. Dahdouh-Guebas, F., L.P. Jayatissa, D. Di Nitto, J.O. Bosire, D. Lo Seen & N. Koedam (2005): How effective
were mangroves as a defence against the recent tsunami? In: Current Biology 15: 443–447. Danielsen, F., M.K. Sorensen, M.F. Olwig, V. Selvam, F. Parish, N.D. Burgess, T. Hiraishi, V.M. Karunagaran,
M.S. Rasmussen, L.B. Hansen, A. Quarto & N. Suryadiputra (2005): The Asian Tsunami: A Protective Role for Coastal Vegetation. In: Science 310: 643.
Lay, T., H. Kanamori, C.J. Ammon, M. Nettles, S.N. Ward, R.C. Aster, S.L. Beck, S.L. Bilek, M.L. Brudzinski, R. Butler, H.R. DeShon, G. Ekström, K. Satake & S. Sipkin (2005): The great Sumatra-Andaman earthquake of 26 December 2004. In: Science 308: 1127–1133.
Paphavasit, N., S. Aksornkoae & J. De Silva (2009): Tsunami Impact on Mangrove Ecosystem. Thailand Environmental Institute, Nonthaburi, 211 p.
Petryk, S. & G. Bosmajian (1975): Analysis of flow through vegetation. In: Journal of the Hydraulics Division 101(7): 871–884.
Titov V. & F. Gonzalez (1997): Implementation and Testing of the Method of Splitting Tsunami (MOST) (National Oceanic and Atmospheric Administration, Washington, DC), Technical Memorandum ERL PMEL-112, 14 p.
Tanaka, N., N.A.K. Nandasena, K.B.S.N. Jinadasa, Y. Sasaki, K. Tanimoto & M.I.M. Mowjood (2009): Developing effective vegetation bioshield for tsunami protection. In: Civil Engineering and Environmental Systems 26 (2): 163–180.
Tsuji, Y., Y. Namegaya, H. Matsumoto, S.-I. Iwasaki, W. Kanbua, M. Siriwchai & V. Meesuk (2006): 2004 Indian tsunami in Thailand: Surveyed runup heights and tide gauge records. In: Earth Planets Space 58: 223–232.
Turner, B.L., R.E. Kasperson, P.A. Matson, J.J. McCarthy, R.W. Corell, L. Christensen, N. Eckley, J.X. Kasperson, A. Luers, M.L. Martello, C. Polsky, A. Pulsipher & A. Schiller (2003): A framework for vulnerability analysis in sustainable science. In: Proceedings of the National Academy of Sciences of the United States of America 100 (14): 8074–8079.
Schanze, J., E. Zernan & J. Marsalek (2006): Flood Risk Management: Hazards, Vulnerability and Mitigation Measures. Dordrecht: Springer (NATO Science Series - IV. Earth and Environmental Sciences; 67), 319 p.
Stein, S. & E. Okal (2005): Speed and size of the Sumatra earthquake. In: Nature 434: 581–582. Thailand Group, International Tsunami Survey Team of Indian Ocean Tsunami Disaster (2005): The December
26, 2004 Sumatra Earthquake Tsunami, Thailand Field Survey around Phuket, Thailand. (www.drs.dpri.kyoto-u.ac.jp/sumatra/thailand/phuket_survey_e.html).
UNDP (2004): Reducing Disaster Risk. A challenge for Development. New York, 161 p. Wolanski, E. (2007): Synthesis of the protective functions of coastal forests and trees against natural hazards. In:
Braatz, S., S. Fortuna, J. Broadhead & R. Leslie (eds.): Regional Technical Workshop on Coastal Protection in the Aftermath of the Indian Ocean Tsunami: What Role for Forests and Trees?, Khao Lak, FAO, pp. 161–183.
Wisner, B., P. Blaikie, T. Cannon & I. Davis (2004): At risk. Natural hazards, people’s vulnerability and disasters. 2nd edition, 496 p.
Acknowledgement The work has been carried out within the project TRAIT (Tsunami Risks, Vulnerability and Resilience in the Phang Nga and Phuket provinces, Thailand) funded by the German Research Foundation (DFG) in the period 2007-2010.

34 Kaiser et al.
Address Gunilla Kaiser Christian-Abrechts University of Kiel - Department of Geography Ludewig-Meynstr. 14 24098 Kiel, Germany
Zonin
AbstracChnatcouDeareresareProresimThconsciinsproChMa
1 BacIn order(OECD)includingdemandethe politthis poinbecause The CoaGovernmresource
2 ObThe firsChilean approachprocess o
SchwarzerFrom BrazCoastlineS. 35-43
ng instrum
ct hile is a threshtural resourceurse of applievelopment (Oeas under proserved. The peeas. In order totected Areassource prote
mplementation here exists nonservation anientific experstruments in oposal of a rhilean governmarine Protecte
ckground ar to become), Chile has tg the surrouned the zoningtic did not prnt this aim hof insufficie
astal and Mament to obtaes with a sust
bjectives t and most coasts. How
h. A zoning of developin
r, Schrottke &zil to Thailand e Reports 16 (
ments forUse”
Chri
hold country wes. Within thaication for mOECD), Chileotection. Howercentage of mto increase ths of Multipleection, susta
approaches ot only a lacknd protection rience in thiChile and core-categorisatiment with a ued Areas of M
and motivae a member to achieve thnding maring of the coasrovide the nehas not yet
ent technical arine Protectain OECD mtainable use o
important owever, some
is necessaryng a zoning, a
& Stattegger (e– New Result
(2010), ISSN 0
r “Coasta– An Exa
N
istian-Albrech
whose economat context, the membership ine has to commwever, until tmarine areas ishe percentage e Use” was einable use, regarding thek of financia
of natural ris field. Thisompares themion of these
useful conceptultiple Use”.
ation of the Orga
he aim of rese areas. Add
stal strip alonecessary toolbeen accomknowledge oted Areas ofmembership.of the same a
objective is te aspects muy and reasona suitable co
eds.): ts in Coastal R0928-2734, IS
al and Maample in S
Nélida Rosto
hts-University
mic developmefishery secto
nto the Orgamit to put 10 %today, a verys extremely loof marine are
established. Tand econo
e declaration al means and resources, esps paper exam
m to respectivinstruments i
t for future pla
anisation forserving 10 %ditionally, thng the entire ls which are
mplished in Cof the executf Multiple U Their purpand with eco
to elaborate ust be considnable to inte
oncept or inst
Research SBN 978-3-98
arine ProtSouthern
ock
y of Kiel, Germ
ent is primarilor and its prodanisation for % of its total y small fractiow compared eas, the instruThe aim of thomic develop
of these areaof acceptanc
pecially marinmines the exe internationain order to panning and im
r Economic % of its territ
e National Ccountry by tneeded to o
Chile due toting authoriti
Use constitutepose is to coonomic devel
an approacdered previoegrate multiptrument is ad
11839-9-3
tected AreChile
many
ly based on thducts play a mEconomic Cterritory inclu
ion of its terto the percent
ument of “Coahis instrumenpment. Howas were not ce regarding ne ones, but xisting categoal categories. provide policymplementation
Co-operatioory for envir
Coastal Politithe end of Mbtain this tar
o limited finies. e one instrumombine the plopment (Sub
ch of zoningously in ordple uses in dvisable, i.e.
eas of Mu
he exploitationmajor role. In Co-operation a
uding its marrritory has betage of terrestrastal and Mar
nt is to combwever, previo
very successfthe necessity also a lack
ories of zonThe result i
y makers in n of “Coastal a
on and Devronmental pric (SubSecM
March 2009. Hrget. Therefo
nancial resou
ment for theprotection obSecMar 199
g instrumentder to unders
practice. Buto be able in
ultiple
n of the and rine een rial rine bine ous ful.
of of
ing s a the and
elopment rotection,
Mar 1995) However, ore, up to urces and
e Chilean of natural 95).
s for the stand the ut for the n the first

36 Rostock
place to integrate different uses of resources. It is precisely the presence of such an instrument that is currently lacking in Chile. The second objective is to apply the elaborated approach accordingly in a preliminary zoning proposal for the pilot region Fresia, a commune in the Llanquihue Province in South Chile.
Figure 1: The Los Lagos Region in South Chile: overview and spatial distribution of main economic activities in coastal waters. The circle indicates the location of the pilot region Fresia (Data Source: Regional Government of the Los Lagos Region; modified by the Author)

Zoning instruments for “Coastal and Marine Protected Areas of Multiple Use 37
3 Regional setting The study area is located in the southern part of Chile approximately around 41°S latitude in the Los Lagos Region. This region is influenced by the west wind drift with high precipitation rates of around 2,000 mm/year and relatively low differences in temperature between the seasons (Jan. 14.4°C; July 6.6°C) (Mühr 2000). The adjacent marine areas are strongly influenced by the Humboldt-Current-System and the Cape Horn Current. These currents are shifting in accordance to changes in the overlying atmospheric pressure systems: the subtropical high-pressure area and the subpolar low-pressure area. In winter (July), the region is dominated by the Cape Horn current because both pressure systems are moved towards North. During summer (Jan.) it is dominated by the Humboldt Current because of the southward movement of the pressure systems which leads to seasonal upwelling events near the coast (Thiel et al. 2007). The mountains of the Andes at this latitude are characterised by a chain of glacial lakes and active volcanoes (figure 1). The coasts of the Los Lagos Region can be divided into two distinct sub regions with respect to location, morphology and origin. The open Pacific coast is a rugged rocky shore characterised by cliffs and small bays (figure 2). It is a high energy environment where the swell and waves reach the coast nearly without previous energy dissipation. The beach material consists mainly of gravel and boulders. Few smaller sandy stretches exist only in the vicinity of river mouths or in calm and small cliff protected embayments.
Figure 2: The Pacific coast in the Los Lagos Region, South Chile (Photo: N. Rostock, May 31st 2008)
The second sub region is the Inner Sea, east of the Big Island of Chiloé. It is an enclosed part of the sea consisting of the Gulfs of Reloncaví, Ancud and Corcovado (figure 3). It was formed under the influence of the Pleistocene glaciations as observed in the fjords at the eastern rim of the Inner Sea. It comprises many small islands grouped into archipelagos which are divided by channels. The same characteristics continue to the south. The beaches are often sandy with a relatively low energy environment. Locally the formation of marshlands is in progress. Fishing and aquaculture are the main economic activities in the coastal and marine areas. These include small-scale coastal and offshore industrial fisheries as well as the cultivation of fishes, mussels and algae (figure 1). In official Management Areas (Spanish: Areas de Manejo y Explotación de Recursos Bentónicos) near the shore all kinds of benthic resources are allowed to be extracted from

38 Rostock
their natural environment. Each Management Area comprises a strip of sea of approximately half a nautic mile in width and varying extension up to kilometres alongshore. Onshore economic sectors are agriculture, forestry and tourism.
Figure 3: The coast of the Inner Sea in the Los Lagos Region, South Chile (Photo: N. Rostock, June 7th 2008)
4 Methods The basic assumption for this method was that every activity is a use and therefore can be defined as a use category. It is a necessary prerequisite so that in the process of zoning each zone can be defined by a use category. At the end, the zoning integrates all different kinds of uses. In this approach the instruments for zoning are the suggested use categories (table 1). The basic procedure was a category assessment which was followed by analysis of the usefulness of these categories for the purpose of zoning. At first, an assessment and analysis of the legislative framework in Chile regarding marine and coastal areas was conducted. The most important law is the Fishing and Aquaculture Act (FAA) from 1991. This law defines and regulates nearly all permitted activities carried out in Chilean waters: fishing and aquaculture, the extraction of benthic resources in the Management Areas (see above) as well as environmental protection in Marine Parks and Reserves. Subsequent regulations and changes of the law are set in additional declarations such as Supreme Decrees. The second step was an assessment and analysis of international categories such as the United Nations Biosphere Reserves Programme and the Management Categories of the International Union for Conservation (IUCN). These were compared with the Chilean categories. If necessary, they were used to complete use categories which were not yet represented in the current Chilean legislation. Additional possible uses which have not been taken into account by all these previous categories but seemed reasonable were considered. Their usefulness was analysed and if proven worthy an additional use category was defined. Finally, all worked out categories were evaluated and integrated into one common approach of re-categorisation. This re-categorisation relates especially to the contents of these categories. The categories themselves might have existed before but not necessarily in this form or context, respectively. So, only their contents and possible meanings were re-defined.

Zoning instruments for “Coastal and Marine Protected Areas of Multiple Use 39
5 Results
An approach for zoning instruments The categories presented here constitute an approach for zoning instruments (table 1). However, they should be considered as a concept and not as a rigid instrument. These categories are use categories which can be assigned to an area or a site inside the area to be be zoned. Then, this area is bound to a specific use according to the use category. In this way, a zoning can be obtained for the whole area needed. Thus, all multiple uses can be integrated. According to the FAA, the first category, fishery, is divided into three subcategories: small-scale coastal fishery within the five-nautic-mile-zone; industrial fishery in the exclusive economic zone (EEZ) which in exceptional cases only are allowed to operate within the five-nautic-mile-zone, but never further onshore than one nautic mile; and last but not least the sports fishery. A similar subdivision is applied to the aquaculture activities and the extraction of benthic resources in Management Areas reported in the FAA. These last two categories are divided according to the species cultivated or extracted, respectively. Tourism is not specified in the FAA. Nevertheless, it plays an important role for coastal areas all over the world, including Chile. Therefore, it will be considered and given a separate category. This category will also be divided into two subcategories according to the activities carried out. It is already an attractive activity to watch Blue Whales and Humpback Whales in the Inner Sea, but also sea lions, dolphins and a variety of sea birds can be seen. Regarding the rich benthic flora and fauna, they could be considered as possible basis for participative activities such as diving. Besides all that, the protection of these natural environments must be taken into consideration. For this category the basic concepts of preservation and conservation (table 1) were provided by the FAA in terms of Marine Parks and Marine Reserves, respectively. Both concepts form the basis for a further division into subcategories. However, a buffer area and an area with restricted access are still missing. The buffer area concept originates in the UN-Biosphere Reserves but until now it does not exist in Chile. The areas with restricted access originated from the IUCN categories and their conditions of protection degrees – another aspect which has not been considered in Chilean legislation. The next main category is transportation. After all the consideration of possible activities carried out in the coastal and marine areas in Chile, the transportation as the main supporting action has not been taken into account. However, without marine transport none of these activities can be realised. In order to perform them there will be subcategories for each transaction, basically to conduct the associated operations and to prevent misuses of the according traffic routes. As a result, routes will be designated for tourism such as animal watching, for productive activities such as fishery, and finally for surveillance in order to monitor all activities and to assure their correct use plus scientific monitoring. Last but not least, a category for infrastructure installations at onshore sites of such Coastal and Marine Protected Areas of Multiple Use will be included. They are also subdivided into the following subcategories: quays or other anchoring and landing places in order to alleviate the access to the coast and to transfer the catch; processing centres for subsequent treatment of the catch like storage, drying and slaughtering; and finally, buildings and other installations for scientific and administrative purposes.
Proposal for a preliminary zoning in the pilot region Fresia Fresia is a coastal municipality in the Llanquihue province, located northwest of Puerto Montt. The access to the coast is relatively difficult. The single road has only one lane, it is unpaved and might temporarily be intrafficable. It leads to the southern end of Fresia, the mouth of the Llico River. The northern parts can only be reached by boat, on horseback or by foot. However, all these ways take various hours and might be impassable during bad weather conditions.

40 Rostock
The economy of this municipality is characterised by agriculture and forestry as well as small-scale coastal fishery and the extraction of benthic resources in Management Areas (figure 2). However, no official infrastructure installations of any kind are constructed onshore.
Table 1: Suggested use categories for coastal and marine areas according to the new approach
Main category Subcategory Application and/or purpose to CMPA-MU Authorized individuals and/or users
Fishery Artisanal Industrial Sport
Artisanal fishermen Industrial fishermen Person with licence for sports fishing
Aquaculture Fishes Mussels Algae
If not already present, they will not be allowed to develop, due to high potential environmental impact and alterations of the environment itself; if already present they might continue, but under conditions of ecological keeping (best practices)
Benthic Resources Mussels Crustaceans Algae
Permission to extract resources in a sustainable way, consequently the permissions will be granted temporarily for each economically important species, not effecting the non-commercial species
Tourism Whale and Bird Watching Participative Activities
Such as marine mammals and sea birds with certified and/ or licensed guides only Showing the practice of extracting benthic resources such as Loco and Algae for demonstration purposes only
Ecosystem and Habitat Protection
Conservation Preservation Restricted Areas Buffer
Keep the present state and avoid destructive or wasteful use; through management the conservation shall be granted Keep safe from harm, destruction or decay; provide access for scientific purposes only “No take zone”: neither access nor extraction is allowed in order to protect the ecosystems itself including all living species; such areas could be spawning grounds or nurseries A transitional area between the protection area and the other uses to obtain a spatial separation allowing access for scientific purposes only
Transportation and Transit Traffic Routes
Tourism Productive Surveillance
The routes for animal watching to get to the linger places The routes for vessels of industrial fishery to get passed the five-nautic-mile-zone, between their allowed fishing grounds and the harbour; The routes for artisanal fishermen to go to their fishing grounds, that lie within the five-nautic-mile-zone, they may be allowed to pass that zone further offshore to get there The routes for authorities to supervise and monitor the activities, included are passages for scientific reasons
Buildings and Infrastructure (coastal-productive and coastal-scientific)
Quays Processing centres Observation facilities
Anchor places for local fishermen and to unload the catch Catch to be processed (storage, drying and slaughtering) Buildings and installations for scientific and administrative purposes

Zoning instruments for “Coastal and Marine Protected Areas of Multiple Use 41
Figure 4: Suggested zoning in the pilot region Fresia according to the new approach (Data Source: Regional Government of the Region of the Lakes; modified by the Author)
Hopefully, this will change with the implementation of a Coastal and Marine Protected Area of Multiple Use in this municipality. The preliminary zoning (figure 4) proposes a minimum area of a width of five nautic miles. This minimum area will not be negotiable. The adjoining seven-nautic-mile-zone shall be negotiable with the responsible authorities (e.g. the Regional Coastal

42 Rostock
Commissions). At best, this future Coastal and Marine Protected Area of Multiple Use will comprise a total of 12 nautic miles along the entire coastline of Fresia. If possible the parts now belonging to the Management Areas (figure 4) will be included as well. The five-nautic-mile-zone shall include a buffer zone of half a nautic mile in width that surrounds the Transition or Mixed Zone in the North, East and South. In the Mixed zone, several uses of the suggested use categories shall be integrated such as small-scale fishery and tourism. The next zone toward shore is an Ecosystem Management Zone. In this proposal a width of about one and a half nautic mile is suggested. This zone shall integrate the protection of coastal habitats and the sustainable extraction of benthic nearshore resources. Both zones, the Mixed Zone and Ecosystem Management Zone, need further subdivision according to the use categories. Unfortunately, the data available for this municipality are not sufficient to develop a more detailed zoning. Especially, specific data about ecology and the impacts of extracting benthic resources are lacking.
6 Discussion and conclusion These categories are suggested to be used by policy makers in coastal and marine affairs in Chile. They shall provide a new concept or even instrument to conduct zoning at the Chilean coasts. During the process of zoning all desired uses can be combined, and undesirable uses can be excluded for certain reasons. However, final decision has to be made by persons which are competent or executing authorities. For this reason all possible uses were included in the present approach. Until now this re-categorisation has been used to elaborate the zoning of the coastal strip of Fresia by the Non-Governmental Organisation CODESOSUR-SINERGIAS as it was demanded by the National Coastal Commission. Together with the preliminary zoning presented in this paper, both proposed zonings constitute an attempt of Integrated Coastal Zone Management in Chile for the first time. It is clear that this approach still needs to prove its value in practice. But due to the lack of feasible nearshore zoning in Chile up to now, it is a step forward toward future Integrated Coastal Zone Management.
References Bundesministerium für wirtschaftliche Zusammenarbeit und Entwicklung (2007): Länderbericht Chile. Bonn.
(http://chile.ahk.de/fileadmin/user_upload/28032007/Landerbericht_Chile_BMZ.pdf, June 18th 2009). Gobierno de Chile (1991): Ley General de Pesca y Acuicultura (Fishing and Aquaculture Act, FAA). Valparaíso.
(http://www.navarro.cl/ambiente/pesca/doc/Ley_de_Pesca.pdf, June 19th 2009). International Union for Conservation of Nature (IUCN) (1994): Guidelines for Protected Area Management
Categories. CNPPA with the assistance of WCMC. Gland, Cambridge. (http://www.unep-wcmc.org/protected_areas/categories/eng/index.html, February 12th 2009).
Ministerio de Defensa Nacional – Subsecretaría de Marina (SubSecMar) (1995): Establece Política Nacional del Uso del Borde Costero del Litoral (PNUBC) de la República y Crea Comisión Nacional que indica. Santiago. (http://www.bordecostero.cl/prontus_borde/site/artic/20060801/asocfile/20060801185450/pnubc.pdf, May 7th 2009).
Mühr, B. (2000): Klimadiagramm Puerto Montt. (http://www.klimadiagramme.de/Samerika/puertomontt.html, June 25th 2009).

Zoning instruments for “Coastal and Marine Protected Areas of Multiple Use 43
Thiel, M., E.C. Macaya, E. Acuña, W.E. Arntz, H. Bastias, K. Brokordt, P.A. Camus, J.C. Castilla, L.R. Castro, M. Cortés, C.P. Dumont, R. Escribano, M. Fernandez, J.A. Gajardo, C.F. Gaymer, I. Gomez, A.E. González, H.E. González, P.A. Haye, J.-E. Illanes, J.L. Iriarte, D.A. Lancelotti, G. Luna-Jorquera, C. Luxoro, P.H. Manriquez, V. Marín, P. Muñoz, S.A. Navarrete, E. Perez, E. Poulin, J. Sellanes, H. Hito Sepúlveda, W. Stotz, F. Tala, A. Thomas, C.A. Vargas, J.A. Vasquez & J.M. Alonso Vega (2007): The Humboldt Current System of Northern and Central Chile – Oceanographic Processes, Ecological Interactions and Socioeconomic Feedback. In: Oceanography and Marine Biology: An Annual Review 45: 195–344 (http://www.ieb-chile.cl/publications/pdf/Thiel_et_al_2007_OMBAR.pdf, June 12th 2009).
UNESCO (no date): The Statutory Framework of the World Network of Biosphere Reserves. (http://www.sovereignty.net/p/land/mab-stat.htm, March 19th 2009)
Acknowledgement The work has been carried out within the project “Coastal Future for Chilean Coast” between the Christian-Albrechts-University and the Company for Environment and Coast, Kiel, Germany, and the Non-Governmental Organisation Strategic Centre for Sustainable Development (CODESOSUR- SINERGIAS) in Puerto Montt, Chile. The project also allowed me a stay in Puerto Montt to get to know the situation at hand and also the wonderful people living there. Without their support this work would not have been possible. I am very thankful to all participants. Especially I want to thank Professor Horst Sterr from the University Kiel for his support and trust in my thesis, and also Dr. Kai Ahrendt for supporting the project. My very thanks also go to Dra. Marcia Morales Gómez and Sr. Aldo Palacios Courret in Puerto Montt whose support, help and guidance was very appreciated, during my stay with them in Chile. Last but not least I want to thank all my lectors for their attentive and thoroughly reading of this paper which resulted in very valuable comments for me.
Address Nélida Rostock Christian-Albrechts-University of Kiel - Department of Geography Ludewig-Meyn-Str. 14 24098 Kiel, Germany


Estim
1Christia
AbstracCorisdimentforIn Th09(GproregW
1 IntDuring tsome cacoast theavailabilet al. 20this regi(and sho2003, PeThere arimages ttechniquBrazil) bacquired
2 GeThe studNW of Ndomains(Araújo
SchwarzeFrom BrazCoastlineS. 45-48
mation of P
an Albrechts U
ct oastal zone ocse in the densminution on tertainment pur the coastlinethis sense a s
he images w9/03/2006. TheGuamare-RN, Nogradation obgion. Attachedest extremity
troduction the last decases this occue erosion is lity is attribu06). This staon indicatin
owing a geneeltier 1998). re a numberturned to be
ue on the mebetween 200d from INPE
ographicaldy area is loNatal (figure
s of the Potiget al. 2004).
er, Schrottke &zil to Thailande Reports 16
Presídio’sMea
André G
University of K
2Unive
ccupation has ity of coastalthe coastal zurposes, and t
e against wavespatio-temporere obtained ey main goal oNE Brazil) du
bserved for thd to the progrof the island.
and objectiades coastal urrence is lindue to the s
uted to tectonatement is sug that arouneral falling tr
r of technique very populeasurement o04 and 2006 (Instituto Br
l and geologocated close e 1), the capguar Basin (B
& Stattegger (ed – New Resul(2010), ISSN
s Barrier Ians of GIS
Giskard Aqu
Kiel, Institute Re
ersidade Feder
been increasi zone populat
zone land arethey also repre and tide actioral triennial an
from CBERof this study iuring the periohe referred islradation, a shThe total retr
ives erosion has
nked with rissedimentary nic activitiesupported by nd 5000 yearrend during t
ues used to mlar during thof the coasta
by using thrasileiro de P
gical settinto the city opital of the Bertani et al.
eds.): lts in Coastal R0928-2734, IS
Island (GS and Rem
uino da Silva
of Geosciencesearch, Germral do Rio Gra
ing in the lastion. A relativea. Barrier isresent a naturaon. nalysis, using
RS, satellite s to quantify tod from 2004 and, pointing
horeline retreaeat measured
been observse in sea levbudget (Domin this regiodata from se
rs B.P. sea lethe last 5000
measure coahe past decaal erosion ochree images Pesquisas Esp
gs of Guamaré State Rio G. 1990). It is
Research SBN 978-3-98
Guamaré-Nmote Sens
a1 & Heleni
ces, Sediemntomany
ande do Norte
t decades, whve rising in mlands have bal protection t
g satellite imadated from the progradati- 2006. Approut high mo
at was observwas around 1
ved along mvel. Howeverminguez & Bon (Bezerra eea level curvevel was a f0 years B.P (
astal erosion ade. This woccurring on tform the satpaciais).
(Brazil-NE) Grande do N
subjected to
811839-9-3
NE/Brazising.
ice Vital2
ology, Coastal
e, Brazil
hich has causemean sea levebeen used forto the coast ac
ages, was don14/08/2004, ion of Presidioroximately 20rphodynamic
ved at the area30m.
many coasts r, in the caseBittencourt 1et al. 1998, Vves which wefew meters a(Caldas et al
or coastlineork will focuthe N coast otellite CBER
which is aporte. The ar
o a semi-diur
il) Migrat
l and Continen
ed an expressl has provider habitation acting as a shel
e for NE Bra13/08/2005 ao’s barrier isla0m/year was process for t
a adjacent to
around the we of the NE-1996). Low
Vital et al. 20ere reconstru
above the actl. 2006, Beze
e retreat andus on the usof the RN st
RS. The ima
pproximatelyrea is inserternal mesotida
tion by
ntal Shelf
sive d a and lter
azil. and and the this the
world. In Brazilian sediment
003, Vital ucted fort tual level erra et al.
d satellite se of this tate (NE-
ages were
y 170 km ed on the al regime

46 Silva & Vital
Presidio’s barrier island is elongated in E-W direction. It is composed of quaternary sediments deposited due to a wave and tide dominated environment.
Figure 1: Geographical setting of the study area.
3 Methods In order to estimate the progradation of the western part of the island, three images (14/08/2004, 13/08/2005 and 09/03/2006) obtained from the satellite CBERS which has 20m spatial resolution were used. Image processing was done using the software ErMapper 6.0 and the spatio-temporal analysis using ArcGIS.
4 Results From 2004 to 2006 a fast progradation of the West extremity of the island was observed reaching approximately 670 m which results in an average of approximately 423 m/year (figure 2), however, the rate of progradation was not the same along this whole period as between 2004 and 2005 the progradation observed was higher than between 2005 and 2006. The progradation of the island triggered an intensive coastline retreat on the Minhoto’s which was approximately 130 m during this period. This resulted in a rate of retreat of approximately 82 m/year (figure 2).
5 Conclusion and discussions The sediment from Presídio’s barrier island beach is reworked by waves and transported by longshore current and deposited on the westernmost part of Presidio’s Barrier Island causing its progradation. In addition during ebb phase the complex of tidal channels placed eastward of the area act as conduits transporting sediment toward the continental shelf. These sediments may also be caught by the longshore current, transported and deposited on the western part of Presidio’s barrier island. The progradation of the island triggered an intense coastline retreat at Minhoto’s beach which is located adjacent to the western extremity of the island (figure 1). On this part the water exchange of the back barrier lagoon is done through the tidal channel which separates Presídio’s Barrier Island from Minhoto’s Beach (figure 1). The narrowing of the tidal channel mouth (caused by the island progradation) increased the hydrodynamic conditions on this place in order to maintain the balance of

Estimation of Presídio’s Barrier Island 47
sea water going in and coming out of the back barrier lagoon during flood and ebb phases. Therefore, the erosion observed on Minhoto’s beach is the result of the new hydrodynamic conditions of the tidal channel mouth.
Figure 2: Progradation of the west extremity Presídio’s Barrier Island and the resultant coast line retreat on Minhoto’s Beach.
References Araújo, M., H. Vital, V.E. Amaro & M.A. Silva (2004): Caracterização Das Forçantes Hidrodinâmicas-
Correntes, Ondas E Marés - Na Região Costeira De Guamaré-Rn. In: WORKSHOP TÉCNICO-CIENTÍFICO PROJ. PETRORISCO (Rede 05/01-CTPETRO/FINEP/CNPq), 3., Belém. Anais.
Bertani R.T., I.G. Costa & R.D.M. Matos (1990): Evolução tectono-sedimentar estilo estrutural e habitat de petróleo da Bacia Potiguar. In: Raje Gabaglia G.P. & E.J. Milani (eds.): Origem e evolução das bacias sedimentares. Rio de Janeiro: PETROBRÁS, pp. 291–301.
Bezerra, F.H.R., A.M.F. Barreto & K. Suguio (2003): Holocene sealevel history on the Rio Grande do Norte State Coast, Brazil. In: Marine Geology 196: 73–89.
Bezerra, F.H.R. F.P. Lima-Filho, R.F. Amaral, L.H.O. Caldas & L.X. Costa-Neto (1998): Holocene coastal tectonics in NE Brazil. In: Stewart, I.S. & C. Vita-Finzi (eds.): Coastal Tectonics, London, 146: 279–293.
Caldas, L.H.O., K. Stattegger & H. Vital (2006): Holocene sea-level history: Evidence from coastal sediments of the northern Rio Grande do Norte coast, NE Brazil. In: Marine Geology 228 (1-4): 39–53.
Vital, H., V.E. Amaro & I.M. Silveira (2006): Coastal Erosion On The Rio Grande Do Norte State (NE Brazil): Causes And Factors Versus Effects And Associated Processes. In: Jour Coast Res 39: 1307–1310.
Vital, H., K. Stattegger, W.F. Tabosa & K. Riedel (2003): Why does erosion occur on the northeastern coast of Brazil? The Caiçara do Norte beach example. In: Jour Coast Res 35: 525–529.
Acknowledgement This study was supported by the Program Alßan, the European Union Program of High Level Scholarships for Latin America, scholarship no. E07M402918BR and UFRN-Brazil. I would like to thank Prof. Dra. Helenice Vital for the financial, logistic support and personal and technical advises

48 Silva & Vital
and my friends from Brazil. As well as to the Prof. Dr. Karl Stattegger, Dr. Klaus Schwarzer for the guidance and technical advises.
Address André Giskard Aquino da Silva Christian Albrechts University of Kiel - Institute of Geosciences, Sedimentology, Coastal and Continental Shelf Research Otto-Hahn-Platz 1 24118 Kiel, Germany

AbstracMuBaIn poIn to in divApdudeprePo
1 BacMussels “habitat offer maMussel bwhere onlead to mRecently(Smith eIn the W2) the inspace. Inof mussebed comet al. 200Besides they filteof a wateto allowpopulatio
SchwarzerFrom BrazCoastlineS. 49-54
D
Christ
ct ussel beds plaaltic Sea. Man
the very eutrolymorpha) mi
preparation foevaluate the mthe Szczecin
ving team andpparently the ue to the highficiencies. Oeceding studie
olish interdisci
ckground such as blueengineers” (
any niches abeds are thernly few spec
more effectivy many muset al. 2006, B
Wadden Sea, nvasion of thn North Ameels (Mytilus s
mmunity dive06). providing h
er the water. er body) (Re
w for a betteon.
r, Schrottke &zil to Thailand e Reports 16 (
Dynamics
tiane Fenske1Ernst M
2S
ay an importany species livrophic Szczecight help to re
for a pilot projmussels’ statuLagoon in su
d benthos sampmussel beds hh trophic statther reasons es. We plan tiplinary projec
e mussels (M(Jones et al. 1and hard subrefore often icies can liveve resource cssel beds in
Büttger et al. the Mytilus
he Pacific oyerica, a stronspp.), causedersity (about
hard substratThis capacit
eeders & Bij er water qua
& Stattegger (e– New Result
(2010), ISSN 0
of mussel
e1, Sven Da
Moritz Arndt USea Fisheries I
ant role as sece on them, stacin Lagoon aestore more naject for biologus quo. We theummer 2007,ples taken withave stronglyte in combinmay be stro
to continue inct.
Mytilus edulis1994) becausbstrate for a islands of hig
e. By enhanconsumption Germany a
2008), raisindecrease is aster Crassosg winter (19
d by ice scou60 % from
e for many ty can be usede Vaate 19
ality, it is e
eds.): ts in Coastal R0928-2734, IS
l beds in t
ahlke1, Phili
University of Institute, Świn
condary hard abilise the sed
at the Germanatural conditiogical restoratioerefore mappe using underwth Van Veen g
y decreased innation with gong predator
nvestigating th
s) or zebra mse they live iwide variet
gh biodiverscing interspecand better ec
and North Ang the questioattributed to
strea gigas, a79/80) cause
ur (Cousson&1960/70 to 2
other specieed for biorem90). In order
essential to k
Research SBN 978-3-98
the Szczec
ip Riel1 & A
Greifswald, Gnoujście, Pola
substrate bothdiment and fon-Polish bordons by filterinon methods used the currentwater video imgrabs and boxn size over theglobal warminry pressure ohe dynamics
mussels (Dreiin clumps or ty of other sity, especiallcific facilitatcosystem fun
America haveon of the cau1) mild win
a neozoon wed a massive & Bourget 202002) is attri
es, mussels hmediation (rer to calculateknow the st
11839-9-3
cin Lagoo
Adam Woźn
Germany and
h in the Northoster bentho-pder, zebra mung and thus clesing zebra mut distribution omaging, a sci corers. e last 14 yearng, causing teor methodicalof mussel bed
issena polymbigger aggre
species dwelly in areas wtion, a high nctioning (Cae decreased uses. nters causing
which is a comreduction in
005). The recibuted to clim
have anotherestoration of e the necessartatus quo of
on
niczka2
h Sea and in pelagic couplissels (Dreisseeaning the waussels we wanof zebra mussientific SCUB
rs. This couldemporal oxygl differences ds in a Germ
morpha) are kegations (“belling on the
with muddy sbiodiversity ardinale et alin size and
g low recruitmmpetitor for n density andcent decline omate warmin
r important f a less eutropry amount of
f the existing
the ing. ena ter.
nted sels BA-
d be gen
in man-
known as eds”) that mussels.
sediments can thus
l. 2002). biomass
ment and food and
d biomass of mussel ng (Smith
function: phic state f mussels g mussel

50
2 ObThe aimGerman prerequinumber interdiscexisting
3 LocThe studLagoon, it has thdata) andof Greifsm²) and A total owith samrandomldivers mAs the vOn boarsamples with a sttap watetaken foFenske e
Figure 1:
bjective m of the pres
part of the Ssites to estimand bioma
ciplinary GerDreissena m
cation and dy was carrie
called Kleinhe highest vid water temp
fswald UniveGünther boxof 701 statio
mpling pointy because th
measured the isibility was
rd and in thewere sievedtereomicrosc
er. Additionaor the analyset al. (in prep
Mussel bed(=2.4%).
sent study wSzczecin Lagmate their aass of musrman-Polish
mussels to inc
Methods ed out in Junnes Haff, whisibility in superatures thaersity and a rx corers (0.06ons were chets every 0.5 hey do not oexact sizes overy low, th
e laboratory,d (0.5 mm mecope in the lally, the Seccsis of nutrienp.)).
ds in the Klein
was to map thgoon (Kleineactive filtratissels necessproject to t
crease water
ne and July hich is situateummer accorat enable longrubber boat. 6 m² surface,ecked for Dnautical mil
offer suitableof the musselhey often had, the lengthsesh size) andlab after watchi depth annts, seston,
nes Haff, sum
he existing mes Haff). Theion potentialsary to amtest biologicclarity and e
2007 (4.6.-5ed at the Gerrding to long diving perSediment sa
, penetrationDreissena mu
les. The verye substrate fl beds, usingd to rely on hs of the sheld preserved wtering the sand oxygen saBOD5, and
mmer 2007. Th
mussel beds e distributionl. The result
meliorate theal restoratioenable remes
5.7.2007) in rman-Polish g-term moniiods. We useamples weredepth: abou
ussels. Investy deep and
for mussel atg GPS, a comhaptic insteadlls were meawith 10 % fo
amples overnaturation wachlorophyll
he total area c
of Dreissenn and populats are a basie water qun methods,
sotrophicatio
the Germanborder. Juneitoring data ed the resear
e taken with ut 20 cm). tigations toomuddy areattachment. A
mpass and vand of optic eviasured with ormalin. Spenight and thos measured. content (me
overed by zeb
Fen
na polymorphation compois for calculuality. We especially a
on.
n part of the e was chosen(LUNG MV
rch vessel “BVan-Veen g
ok place alons were only
At sites with n Veen grab idence. digital callip
ecies were deoroughly rins
Water sampethods and r
bra mussels is
nske et al.
ha in the sition are lating the plan an
aiding the
Szczecin n because V unpubl. Bornhöft” grabs (0.1
ng a grid sampled mussels, samples.
pers. The etermined sing with ples were results in
s 6.56 km²

Dynamics of mussel beds in the Szczecin Lagoon 51
4 Results Twelve mussel beds were found in the “Kleines Haff”, covering a total area of 6.56 km² (656 ha) which corresponds to 2.4 % of the area. Most of the mussel beds were found in sandy areas in 2.0-3.5 m water-depth, surrounding the lagoon like a belt (figure 1). One exception is the central mussel bed (MB 3), which lies on a prelitorine elevation. The macrozoobenthos comprised 40 taxa. The average abundances of the most dominant taxa are shown in table 1. The zebra mussels (3,951 inds/m²) had a calculated total biomass of 8812.65 t (for calculation see Fenske 2003). The total average abundance of macrozoobenthic species on 7 mussel beds (26 samples) was 14,554 individuals/m².
Table 1: Average abundances of the most dominant taxa on mussel beds in the Kleines Haff
Taxon Average abundance (individuals/m²) Dreissena polymorpha (Mollusca, Bivalvia) 3951 Oligochaeta (Tubificidae) 4543 Chironomidae (Diptera) 2647 Helobdella stagnalis (Annelida, Hirudinea) 486 Bithynia tentaculata (Mollusca, Gastropoda) 237
5 Discussion Mussel beds can persist over years or even decades, but they depend on many factors: 1. offspring and recruitment success (how many larvae develop successfully into adult mussels?) 2. underground (in general, hard substrate is necessary for attachment) 3. currents (too strong currents hinder settlement; low to medium current velocity secures food
supply and higher chances of sufficient oxygen conditions compared to a stagnant water body) 4. temperature (if too high, mussels die) 5. oxygen supply 6. predators 7. parasites, pathogens 8. pollutants 9. intraspecific competition (within the same species) 10. interspecific competition (between different species) No reports exist from the beginning of the 20th century about the mussel bed cover or total biomass of mussels in Szczecin Lagoon. Brandt (1894) investigated the eastern part of the lagoon and found Dreissena polymorpha in typical places (about 2 m depth, in areas not too exposed). However, there are no quantitative results. In the North Sea (Wadden Sea area near Sylt), mussel beds clearly increased in size during the 20th century (Reise & Lackschewitz 1998). This may be due to positive effects of eutrophication providing more food (phytoplankton) for suspension feeders. Recently, eutrophication has been considered as a negative factor, one reason being the potential oxygen deficiency which it can entail. Blue mussels (especially Mytilus edulis living in the eulitoral) can suffer from ice scour and strong winds. These reasons accounted for a strong decrease in the St. Lawrence River during the winter 1979/80 and for high mortalities in the Sylt Wadden Sea area (Nehls et al. 1998). However, Dreissena polymorpha only lives in areas which are permanently submerged and most of them in depths of at least 2 m, so that in general, even strong winters should not cause them to die off completely.

52 Fenske et al.
On the other hand, very mild winters may also affect the mussels: It has been reported that recruitment success after mild winters is particularly low (Büttger et al. 2008). However, for several bivalve species in the North Sea, post-settlement processes decide reproductive success (Straßer et al. 2001). While we found a total area of 6.56 km² of Dreissena mussel beds (= 2.4 % of the area of the Kleines Haff), a former mapping describes 19.2 km² (= 6.9. %) (figure 2, Andres 1993). The methods used were similar (scientific divers, underwater video camera recording, van Veen grab samples), but the former study was carried out over 2 weeks in August 1993 while our investigation took place for a 5 weeks period in June/July. At this time of the year, far fewer juveniles can be expected. However, this does not affect the area of the existing mussel beds. Estimates based on sediment samples taken on grid points of 1 nautical mile across the Kleines Haff in 1993 and 1994 gave a total area of Dreissena beds of 57.0 km² (20.6 % of the area) (Günther 1998). In these last investigations, the size may have been overestimated, as the rim of the mussel beds were not confirmed by divers.
Figure 2: Mussel beds mapped by Andres (1993). The total area in 1993 was 19.2 km², about 3 times the size of mussel beds in 2007.
The “rise and fall” of mussel beds At least one living mussel bed had vanished between 1998 and 2009. It was the one in the middle of the German-Polish border which was present (and repeatedly sampled) in 1998 (Fenske 2003), while in 2007, only dead shells but no living mussels could be found (this study). At the recorded GPS positions divers searched intensively, but there was no living mussel bed anymore. A similar fate may have occurred to the field of empty mussel shells off the south shore between Ueckermünde and Mönkebude (near K25, figure 2). Some mussel beds discovered by Andres (1993) had vanished as well, e.g. K9 and K13 at the north-western end. K70 on the south-east side had clearly decreased in size. On the other hand, at least two mussel beds found in our study (MB1 and MB3) are not mentioned by Andres (1993). They may not have searched intensively enough in the central part (which is mostly muddy and therefore an unlikely settling ground for Dreissena mussels). Still, the differences in size of the total mussel beds recorded are so large that we can assume a strong decrease in mussel beds over the last decade. Some Dreissena mussel populations have been reported to vary strongly. In Lake Mikolajskie (Mazurian Lakes, Poland) abundances ranged from 100 mussels/m² to 2200 mussels/m² over the time span of 31 years (1959-1989) with abrupt changes in density (Stańczykowska & Lewandowski 1993).

Dynamics of mussel beds in the Szczecin Lagoon 53
A strong decrease was also observed by Wolnomiejski and Woźniczka (2008) for the Skoszewska Cove, a sheltered bay in the east of Szczecin Lagoon. Comparing the years 2001/2002 and 2005, the mussel bed area in Skoszewska Cove remained the same (10.70 km² = 51.6 % of the bay), but the average abundance (2172 mussels/m²) went down to half the number before (4691 mussels/m²). Biomass was reduced to little more than 10 % of the previous value (192 g freshweight/m², compared to 1760 g/m²). Even the high values of 2001/2002 are one order of magnitude below those from the 1950s: Wiktor (1969) describes maximum densities of 114000 mussels/m² and a maximum biomass of 20 kg/m²! Does this imply an internal cycle of rising and falling of mussel beds? Do they reproduce and recruit so successfully that after some years they start to cause their own (intraspecific) competition? Phytoplankton production in the Szczecin Lagoon is still very high (polytrophic conditions) and competitors such as Anodonta anatina or Unio pictorum occur in comparably low numbers (about 2/ m² in our investigation). Despite their larger filtration capacity, their total impact is much lower than that of zebra mussels. In a semi-enclosed bay like Skoszewska Cove, it is possible that the stagnant water is filtered several times by the mussels so that in the end not enough food is left. However high densities of one single species (monoculture!) also favour parasites and illnesses. These factors have not been checked in Skoszewska Cove. In Lake Zürich, internal cycles of Dreissena polymorpha abundances were positively correlated to predator densities (birds). From 1976 to 1988 no total gain or loss of Dreissena was observed (Burla & Ribi 1998). One reason for a decrease or break-down of mussel populations could be oxygen deficiency caused by eutrophication in combination with warmer water temperatures. Compared to the long-term average (1975-2000), average water temperatures between 2002 and 2006 were 0.8°C higher (LUNG Gewässergütebericht 2006). Once a mussel bed has disappeared, it may take several years to re-establish, as pelagic larvae might not be drawn to that particular place. Even though larvae might be ingested by adult mussels, as suggested by Mörtl & Rothhaupt (2003), the normal settling size (200-300 µm) is above the preferred size of food particles of adult mussels (15-40 µm, Ten Winkel & Davids 1982). This suggests that the filtering activity of adult mussels should attract larvae and help them settle in suitable places. For Lake Zürich, Burla & Ribi (1998) found a positive correlation between the number of adult mussels and the number of larvae. With a small current mussel population in the Szczecin Lagoon, it might therefore take several years before the total population and size of mussel bed regains its potential size and filtering capacity.
6 Conclusion Mussel beds in the Szczecin Lagoon decreased in size, average abundance and biomass between 1993 and 2007. Whether this was caused by single factors (e.g. food shortage, oxygen deficiency, mild winters and little recruitment) or whether this represents a long-term cycle remains an open question. We intend to investigate some of the influential parameters, such as predation impact and population dynamics in a joint German-Polish project on biological restoration methods.
References Andres, D. (1993): Video- und Fotodokumentation der Bestände von Dreissena polymorpha Phallas (sic!) im
Oderhaff. Aldebaran Marine research and broadcast, Kiel, 29 pp. Büttger, H., H. Asmus, R. Asmus, C. Buschbaum, S. Dittmann & G. Nehls (2008): Community dynamics of
intertidal soft-bottom mussel beds over two decades. In: Helgol Mar Res 62: 23–36. Burla, H. & G. Ribi (1998): Density variation of the zebra mussel Dreissena polymorpha in Lake Zürich, from
1976 to 1988. In: Aquat. sci. 60: 145–156.

54 Fenske et al.
Cardinale, B.J., M.A. Palmer & S.L. Collins (2002): Species diversity enhances ecosystem functioning through interspecific facilitation. In: Nature 415: 426–429.
Cousson, M. & E. Bourget (2005): Small-scale variation in mussel (Mytilus spp.) dynamics and local production. In: Journal of Sea Research 53(4): 255–268.
Fenske, C. (2003): Die Wandermuschel Dreissena polymorpha im Oderhaff und ihre Bedeutung für das Küstenzonenmanagement. PhD Thesis, University of Greifswald, 185 pp.
Günther, B. (1998): Die Bedeutung des Makrozoobenthos für den Kohlenstoffumsatz im Sediment. In: Greifswalder Geographische Arbeiten 16: 286–315.
Jones, C.G., J.H. Lawton & M. Shachak (1994): Organisms as ecosystem engineers. In: Oikos 69: 373–386. LUNG (Landesamt für Umwelt, Naturschutz und Geologie) (2006) : Gewässergütebericht
2003/2004/2005/2006: Ergebnisse der Güteüberwachung der Fließ-, Stand- und Küstengewässer und des Grundwassers in Mecklenburg-Vorpommern. Güstrow.
Mörtl, M. & K.-O. Rothhaupt (2003): Effects of adult Dreissena polymorpha on settling juveniles and associated macroinvertebrates. In: Internat. Rev. Hydrobiol. 88: 561–569.
Nehls, G., I. Hertzler, C. Ketzenberg & G. Scheiffarth (1998): Die Nutzung stabiler Miesmuschelbänke durch Vögel. In: Gätje, C. & K. Reise (eds): ): Ökosystem Wattenmeer - Austausch-, Transport- und Stoffumwandlungsprozesse. Springer Verlag Berlin, pp. 421–435.
Reeders, H.H. & A. Bij de Vaate (1990): Zebra mussels (Dreissena polymorpha): a new perspective for water quality management. In: Hydrobiologia 200/201: 437–450.
Smith, J.R., P. Fong & R.F. Ambrose (2006): Dramatic declines in mussel bed community diversity: Response to climate change? In: Ecology 87(5): 1153–1161.
Reise, K. & D. Lackschewitz (1998): Benthos des Wattenmeeres zwischen Sylt und Rømø. In: Gätje, C. & K. Reise (eds.): Ökosystem Wattenmeer - Austausch-, Transport- und Stoffumwandlungsprozesse. Springer Verlag Berlin, pp. 55–64.
Stańczykowska & Lewandowski (1993): Effect of filtering activity of Dreissena polymorpha (Pall.) on the nutrient budget of the littoral of Lake Mikolajskie. In: Hydrobiologia 251: 73–79.
Straßer, M., A. Hertlein & K. Reise (2001): Differential recruitment of bivalve species in the northern Wadden Sea after the severe winter of 1995/96 and of subsequent milder winters. In: Helgoland Marine Research 55 (3): 182–189.
Ten Winkel, E.H. & C. Davids (1982): Food selection by Dreissena polymorpha Pallas (Mollusca: Bivalvia). In: Freshwater Biology 12: 553–558.
Wiktor, J. (1969): Biologia Dreissena polymorpha (Pall.) i jej ekologiczne znaczenie w Zalewie Szczecińskim. (The Biology of Dreissena polymorpha (Pall.) and its ecological importance in the Firth of Szczecin). Studia i Materiały, Seria A Nr. 5: 88 pp. Morski Instytut Rybacki, Gdynia.
Wolnomiejski, N. & A. Woźniczka (2008): A drastic reduction in abundance of Dreissena polymorpha Pall. in the Skoszewska Cove (Szczecin Lagoon, River Odra estuary): effects in the population and habitat. In: Ecological Questions 9: 103–111.
Acknowledgement The study was supported by the International Bureau of the German Ministry of Education and Research (BMBF), Förderkennzeichen MOE 07/R58. We also acknowledge the support of the University of Greifswald.
Address Dr. Christiane Fenske University of Greifswald - Institute for Biochemistry Felix-Hausdorff-Str. 4 17489 Greifswald, Germany

Coars
1
2Sedime
AbstracCoBaThbelowscasoudetin
1 IntCliff-coaalternateabrasiongrain-sizsedimensedimendirectiontidal conseem to beach ripathwayespecialldistributthese gap
2 RegThe sitesHeiligenlowlandsTidal eff
SchwarzerFrom BrazCoastlineS. 55-57
se-grained
1Cluster of Exentologie, Coa
ct oarse-grained altic Sea, maihese residual ach ridges, wwlands. A nealed distributiuth-western Btailed mappin2009, reflecti
troduction asts composee with coastan of the adjaczes ranging fts are relatits are regula
n with a longnditions (e.g.play an impidges of coa
ys and transply with resption of residups.
gional settis are located
nhafen (figurs. They are dfects are neg
r, Schrottke &zil to Thailand e Reports 16 (
d sedimen
Henning M
xcellence “Theastal and Cont
sediments likinly on submasediments see
which play anew small-scaleion pattern an
Baltic Sea. Grng of sedimenng a broad sp
and objectied of morainal lowlands.cent seafloorfrom clay to ively stable
arly moved og-shore com Osborne 20ortant role aastal lowlanport rates unpect to climaual sediments
ing d at the Germre 1a-c). Eacdifferently exligible. Meas
& Stattegger (e– New Result
(2010), ISSN 0
nt distribuBaltic
May1, Kersti
e Future Oceatinental Shelf
ke cobbles, stoarine abrasionem to be an in essential roed, high freqund characteriround-truthingt distribution atial distributi
ives nic material At many sr (e.g. Gurwboulder size
in positionon submarine
mponent. The005, Curtiss eas sediment snd (Schrottkender differentate-related ses in the near-
man south-wech site compxposed to thsurements co
eds.): ts in Coastal R0928-2734, IS
ution in shSea (Ger
n Schrottke
an“, Institute of Research, Ins
ones and bouln platforms inimportant souole as shore puency side-scistics of residg is done by from the wateion of differen
are widespreites, wind-in
well 1991, Sce is supplied.n. Schrottkee abrasion plaese findings et al. 2009). Isource for thee et al. 200t hydrodynamea-level rise-shore zone i
estern Balticprises an ace main windover areas fro
Research SBN 978-3-98
hallow warmany)
e1 & Klaus S
of Geosciencestitute of Geos
lders commonn front of ret
urce for the deprotection elecan sonar (SSdual sediment
scientific scuer line down tnt residual sed
ead along thnduced wavechrottke 2006 Healy & W
e et al. (200atforms of thmatch with It has been pe developme
06). Detailedmic conditio and coastalis retrieved i
c Sea coast, ntive cliff-co
d-wave directom the water
11839-9-3
ater of the
Schwarzer 2
s, Kiel Universciences, Kiel
nly occur in thtreating soft-revelopment o
ement of the SS) is used, tts in near-shouba divers. Foto 8 m water ddiments and sa
e south-weste impact cau6). Under er
Wefer (1980) a06) showedhe Baltic Seaother studies
postulated, thent and stabild informatioons is still lal erosion. Inn a first step
near the villaast section wtion with divr-line to abou
e south-w
2
rsity, Germanl University, G
he south-westrock cliff coaof coarse-grain
adjacent coaso analyse lar
ore zones of or the first timdepth were doand bar system
tern Baltic Suses cliff rerosion, sedimassumed that
d that coarsea, mainly in s, although rhat residual slity of coarsen on sourceacking, but information op of new stud
ages Schönhwith adjacenverging fetchut 8 m water
western
ny Germany
tern sts. ned stal rge-the me, one ms.
Sea. They etreat and ment with t residual e-grained landward reflecting sediments e-grained e to sink is needed on spatial dies to fill
hagen and nt coastal h lengths. r depth.

56
Figure 1a
3 MeA small-used to mboat. Thof 20 m DifferenGround-
4 ResFigure 2by dashedistance relatively
Figure 2a
a-c: a) Locatioc) Heiligenh
ethods -scaled, dualmeasure eve
he system hasin water dep
ntial Global P-truthing is d
sults 2a exemplariled lines conbetween rip
y light areas
a-b: a) Side-scSediment m
on of the studhafen.
l channel, trien in very shs an across-tpths < 5 m aPositioning.
done by scien
ly shows an nsists of a npple crests de
(figure 2a).
can sonar momap based on S
dy sites along
iple-frequenchallow water track range rand 40 m inA grid reso
ntific scuba d
SSS mosaic nearshore barecrease towa
saic from theSSS data.
the German s
cy (260, 330(< 1 m) by
resolution of water depth
olution of 10divers.
from the sear identifiableards onshore
e near-shore z
south-western
, 770 kHz) Sdeployment
f 0.01 m. High > 5 m. Geo0 cm is used
afloor close te by wave-in from 95 to
one of Schön
n Baltic Sea, n
SSS (Yellowin a fixed po
gh frequencyographical lo
d for mosaici
to Schönhagenduced, cros10 cm. Sma
nhagen mappe
M
near b) Schönh
w Fin, Imagenosition from
y is used withocations are ing (Triton I
en. The area ss-shore ripp
aller ripples a
ed on 23 Apri
May et al.
hagen and
nex™) is m a rubber
h a range given by
IlicsTM).
bounded ples. The appear as
il 2009. b)

Coarse-grained sediment distribution in shallow water 57
The nearshore bar is bordered by heterogeneous sediments varying from gravel to boulder size. Boulders, which are not used as settling ground by macrophyto- and macrozoobenthos, are clearly detectable by dark spots with white acoustic shadows (figure 2a). Large areas of high backscatter indicate cobble coverage, as found eastwards of the nearshore bar. The black lines, which are surrounded by low backscatter, are allocated to device-specific artefacts. However, boulders still can be identified in these zones (figure 2a). The sediment map (figure 2b) reflects a broad, spatial distribution of residual sediments. They are particularly dominant in shallow waters in front of the cliffs and in water depths > 4m. Sandy deposits are widespread in the nearshore zones of the coastal lowlands. The nearshore bar in front of the cliff is almost rudimentary, covering residual sediments.
5 Discussion and conclusion So far, spatial information on sediment distribution patterns in near-shore zones has been mostly based on aerial or satellite images and sediment sampling in rigid grids. Single cobbles of 10 cm in diameter could not be identified, as possible in the SSS mosaics of this new measuring device. Data of the new SSS now clearly reflect the option of detecting coarse-grained sediments and distribution patterns with high spatial coverage, especially in very shallow water, which has not been done before. In a next step, resurveys are now used to analyse coarse-grained sediment transport, combined by high resolution tracer experiments.
References Curtiss, G.M., P.D. Osborne & A.R. Horner-Devine (2009): Seasonal patterns of coarse sediment transport on a
mixed sand and gravel beach due to vessel wakes, wind waves & tidal currents. Marine Geol 259: 73–85. Gurwell, B.R. (1991): Bestimmung der langfristigen Abrasion und der Sedimentschüttung von Abtragsküsten.
Wiss. Beiträge der Ernst-Moritz-Arndt-Universität Greifswald 4-8. Healy, T. & G. Wefer (1980): The efficiacy of submarine erosion vs cliff retreat as a supplier of marine sediment
in the Kieler Bucht, Western Baltic. In: Meyniana 32: 89–96. Osborne, P.D. (2005): Transport of gravel and copple on a mixed-sediment inner bank shoreline of a large inlet,
Grays Harbor, Washington. In: Marine Geology 224: 145–156. Schrottke, K., K. Schwarzer & P. Fröhle (2006): Mobility and Transport Directions of Residual Sediments on
Abrasion Platforms in Front of Active Cliffs (SW Baltic Sea). In: Jour Coast Res 39: 459–464.
Acknowledgement This project is carried out in the frame of the Cluster of Excellence ‘The Future Ocean’, research group ‘Sea-Level Rise & Coastal Erosion’ at the University of Kiel, funded by the Deutsche Forschungsgemeinschaft. Thank is also given to the crew of the research vessel LITTORINA of IFM-GEOMAR for their excellent support and to the scientific scuba diving group of Kiel University.
Address Prof. Dr. K. Schrottke University of Kiel - Institute of Geosciences Cluster of Excellence: The Future Ocean, Sea-Level Rise & Coastal Erosion Otto-Hahn-Platz 1, 24118 Kiel, Germany


AbstracThcontiddevsemhyDewacochrescoint
1 IntThe shalhighly ddriven bfeatures sedimeninformatpossible
2 StuThe studin the noThe currin the inmixed seSurface low tide averagedwide mapattern w
SchwarzerFrom BrazCoastlineS. 59-62
Coarsenin a tid
Alfred Wege
ct he Wadden Sntinuous chan
dal flats reflevelopment of mi-enclosed b
ydrodynamic fecember 2006as compared tarsening of thanging hydrosponsible for astal protectiotertidal seagra
troduction llow sedimen
dynamic systby waves, cuare the tidalts reflects intion on long-relation to a
udy area andy area is Köorthern Waddrent velocitienner Königshediments occsediment samin 15 sampl
d sediment daps calculatewas compare
r, Schrottke &zil to Thailand e Reports 16 (
ning of tiddal bay in
ener Institute f
Sea is a highlnges which arects informat
f the grain sizebay in the nforces. Surfac6. The outcomto earlier survhe surface sedodynamic conthe mud deplon measures, wass and mussel
ntary coastalem characterurrents, tidel flats whichnformation o-term change
a shift in the h
nd methodsönigshafen (5den Sea (figues vary fromhafen (Backhcur in sheltermples of 129ling campaigdata were ged. The outco
ed to earlier s
& Stattegger (e– New Result
(2010), ISSN 0
dal flat sen the nort
T
for Polar and
ly dynamic se mainly drivtion on the e composition northern Wadce sediments wme was a geneveys conductediments can bnditions, thatletion. The cowhich increasl beds which m
l zone of the rised by unc
es (hydrodyn are exposedon the prevaes in the grahydrodynam
s 55° 02' N, 8ure 1). The t
m 0.6 m s-1 inhaus et al. 1red locations 9 equally distgns at regulaeoreferenced ome was a gsurveys cond
eds.): ts in Coastal R0928-2734, IS
ediments -thern Wa
Tobias Dolc
Marine Resea
system characen by hydrodyprevailing hof tidal flat su
dden Sea in were samplederal spatial died in 1932 - 1be observed ot accompany
oarsening of sese energy levemeans a reduc
south-easterconsolidated namics) and d during lowailing hydroain size comp
mic regime th
° 25' E), a shtides are semn a tidal chan989). The ti(figure 2, 20
tributed statiar intervals fr
with a Geogeneral spatiaducted in 193
Research SBN 978-3-98
- long-terdden Sea
ch
arch, Wadden
cterised by uynamics. The
hydrodynamicurface sedime
order to gad during low istribution pat933, 1981 an
over the last ongoing cli
ediments is fuels in the bay,ction of shelte
rn North Seasediments anwind. The
w tide. The grodynamics. Tposition of th
hat might acc
heltered tidamidiurnal witnnel near theidal flats are004 - 2006).ions in the Kfrom Novembographic Infoal distributio32 - 1933, 19
11839-9-3
rm mud d (SE Nort
Sea Station S
unconsolidated grain size co
c conditions. ents was surveain informatiotide from No
ttern of sedimnd 1989. A sig70 years. It iimate changeurthermore su and a reduce
ered areas.
a is called thnd continuouWadden Serain size comThe aim of hese sedimeompany ong
l bay at the ith a mean tide opening ofe primarily s
Königshafen wber 2004 to ormation Syson pattern of 981 and 1989
depletion th Sea)
Sylt, Germany
d sediments amposition of The long-te
eyed in a shallon on changovember 2004ment types whgnificant geneis suggested te, are primarupported by ried areal extent
e Wadden Sus changes w
ea’s most remmposition of this study is
ents in order going climate
island of Syldal range of f the bay to 0sandy but mu
were collecteDecember 2stem (GIS) a
f sediment ty9.
and the
erm low ing
4 to hich eral that rily gid t of
ea. It is a which are markable
f tidal flat s to gain to reveal
e change.
lt located 1.8 -2 m. 0.1 m s-1 uddy and
ed during 2006. The and area-
ypes. This

60 Dolch
0%
20%
40%
60%
80%
100%
1932-1933
1981 1989 2004-2006
coarsesand
sand
mixedsedimentsmud
unmapped area
0%
20%
40%
60%
80%
100%
1932-1933
1981 1989 2004-2006
coarsesand
sand
mixedsedimentsmud
unmapped areaunmapped area
Figure 1: The sampling stations on the tidal flats of the study area Königshafen (B) at the northern top of the island of Sylt, located in the Wadden Sea (A)
3 Results The current sediment distribution pattern reveals that finest sediments occur in the inner part while coarser sediments occur in the eastern half of Königshafen (figure 2, 2004 - 2006). From 1932 - 1933 to 2004 - 2006, the intertidal mud cover decreased from 21 % to 2 % while sand cover increased from 68 % to 90 % (figure 2). The increasing sand dominance results from a loss of mud flats. The decrease of mud flats occurred primarily in the more exposed eastern half of Königshafen near the opening which is bordered by a major tidal channel (figure 1).
Figure 2: Sediment distribution in Königshafen in 1932 – 1933 (Wohlenberg 1937), 1981 (by Felix), 1989 (by Austen) and 2004 - 2006 (own data)

Coarsening of tidal flat sediments 61
4 Discussion and conclusions It is suggested that changing hydrodynamic conditions that accompany ongoing climate change are primarily responsible for the mud depletion. Long-term records from the gauge List show that the mean low tide level remained relatively stable at 402.9 cm (1936 – 2005), while the mean high tide level rose from 567.81 cm (1936 – 1945) to 585.23 cm (1996 – 2005). This results not only in an increased high tide level but also in an increased tidal range. Both phenomena are associated with stronger currents. The increased hydrodynamic conditions cause selective removal of fine-grained sediments and hamper mud deposition. As the opening of Königshafen is located in vicinity to a major tidal channel, the eastern half is more exposed and a decline of mud flats is predominant here. Increased hydrodynamics are also caused by a reduction of the tidal catchment area which leads to higher energy levels within a bay (Flemming & Nyandwi 1994). Considerable embankment took place in Königshafen and the associated List tidal basin over the past 500 years, resulting in a loss of 1/3 of the tidal flat area (Reise 1998). Mud depletion is furthermore supported by a severe decline in seagrass bed and mussel bed area (with algae cover): from 31 % (1936) to 9 % (2005) referring to the tidal flat area of Königshafen (own data). Both structures provide shelter from stronger currents and the decline of seagrass and mussel beds means fewer areas where mud flats can establish or remain. However, coarsening of sediments is not just a local phenomenon but is reported from the entire Wadden Sea, e.g. the Dutch Wadden Sea, the East Frisian Islands and from the Hörnum tidal basin south of the island of Sylt (Flemming & Bartholomä 1997, Mai & Bartholomä 2000, Zwarts 2003, Van Bernem, pers. comm.). The change in sediment composition does not only reveal changed hydrodynamic conditions but surely has also an impact on the benthic fauna.
References Backhaus, J., D. Hartke, U. Hübner, H. Lohse & A. Müller (1998): Hydrographie und Klima im Lister
Tidebecken. In: Gätje, C. & K. Reise (eds.): Ökosystem Wattenmeer - Austausch-, Transport- und Stoffumwandlungsprozesse. Springer, Berlin, Heidelberg and New York, pp. 39–54.
Flemming, B.W. & N. Nyandwi (1994): Land reclamation as a cause of fine-grained sediment depletion in backbarrier tidal flats (s North Sea). In: Netherlands Journal of Aquatic Ecology 28 (3-4): 299–307.
Flemming, B.W. & A. Bartholomä (1997): Response of the Wadden Sea to a Rising Sea Level: a Predictive Empirical Model. In: Deutsche Hydrographische Zeitschrift 49 (2/3): 343–353.
Mai, S. & A. Bartholomä (2000): The missing mud flats of the Wadden Sea: a reconstruction of sediments and accommodation space lost in the wake of land reclamation. In: Flemming, B.W., M.T. Delafontaine & G. Liebezeit (eds.): Muddy Coast Dynamics and Resource Management, pp. 257–272.
Reise, K. (1998): Coastal Change in a Tidal Backbarrier Basin of the Northern Wadden Sea: Are Tidal Flats Fading Away? In: Senckenbergiana maritima 29: 121–127.
Wohlenberg, E. (1937): Die Wattenmeer-Lebensgemeinschaften im Königshafen von Sylt. In: Helgoländer wissenschaftliche Meeresuntersuchungen 1: 1–92.
Zwarts, L. (2003): Bodemgesteldheid en mechanische kokkelvisserij in de Waddenzee. RIZA Rapport. RIZA Lelystad.
Acknowledgement Ingrid Austen and Karl-Michael Felix are gratefully acknowledged for providing results and data of their sediment surveys. I would also like to thank the Regional State Office for the Rural Areas, Husum (ALR) for providing aerial photographs and the Waterways and Shipping Board in Tönning for the long-term data from the gauge List.

62 Dolch
Address Tobias Dolch Alfred Wegener Institute for Polar and Marine Research - Wadden Sea Station Sylt Hafenstr. 43 25992 List, Germany

AbstracStocasneanproinsWtidproin for
1 BacHamburgBulk carthe last cRiver Elfairway To imprresearchRiver Elproject iwater levEngineerThe FedResearchweather – B) andsurges, tIn this ar
2 ObIn 1962 workingwas neveHamburg
SchwarzerFrom BrazCoastlineS. 63-70
Studies
ct orm surges aresualities. To cessities. Anod the applicatotect areas likstalled. In Hamithin a resear
dal River Elbocesses contaithe project ge
r storm surges
ckground ag Port is thergo and contcenturies resulbe is subjecas exactly asrove the pro project OPTlbe – fundeds the developvels and currring Researc
deral Maritimh Institute (BForecast Ag
d the HPA atheir causes article first stu
bjectives a storm sur
on the reseaer recorded bger Sturmflu
r, Schrottke &zil to Thailand e Reports 16 (
on the De
Caroline R
e often the reaminimize da
other importantion of this kke ports or lomburg an apprch project the
be. Additionained by empirenerate numers is also based
and Motivae most importainers reachulted in grow
cted to the tids possible. ognoses for TEL – Wind d by the Fedpment of an rents of the R
ch Council. me and HydroBAW) gene
gency “Deutsassumes the and characterudies and res
rge caused march of stormbefore. Afterutwarndienst
& Stattegger (e– New Result
(2010), ISSN 0
evelopme
Radegast, T
Hamburg P
ason for crevaamages the cnt issue is to
knowledge to ower laying aroach to forece main objectally Hamburgrical and statisrical models t
d on statistical
ation rtant port of h Hamburg bwing length ade it is nece
storm surgeset-up Studi
deral Ministryoperational nRiver Elbe. O
ographic Agerate the moscher Wetterdcollection anristics (OPTEsults on the m
many crevasm surges. Dur 1962 the re(WADI). Th
eds.): ts in Coastal R0928-2734, IS
ent of Win
Thomas Stro
Port Authority
asses, floodingconstruction understand thforecast wateareas where pcast water leveive is to impr
g Port Authostical researchto forecast wainterpretation
Germany anby vessel viaand width of essary to fore
es, Hamburgies and Devey of Educatinumerical mOPTEL rece
gency (BSH) odels for thedienst” (DWnd preparatiEL – D). main topic of
sses and mouring this storesearch on stohis service a
Research SBN 978-3-98
nd set-up
otmann & U
y, Germany
g, damages anof stable and
he physical prer levels. Thesportable floodels of storm surove the forec
ority deals wh especially onater levels indn.
nd one of thea the River Ef vessels and ecast the wa
g Port Authoelopment of ion and Rese
model which sives scientifi
and the Fede forecasts (
WD) handles won of all req
f HPA - the s
ore than 300rm tide the worm surges halerts the por
11839-9-3
in the Riv
Ulrich Ferk
nd if it comes td high dikesrocesses causise forecasts cd protection murges exists alcasting water
with the analyn storm surgeduced by tides
e most imporElbe. Increasof course de
ater levels of
ority (HPA) an Operationearch. The msupplies contfic support by
deral WaterwOPTEL – Awind data forquired data a
storm surges
0 casualitieswater level reheaded to thert and the cit
ver Elbe
to the worst fas is one of ing storm surg
can save life ameasures can lready. levels along
ysis of physies, while partns. The validat
rtant ports insing econom
eeper draughtf all gauges a
is a membenal Model ofmain intentiotinous informy the German
ways EngineeA & C), ther the modelsand focuses
are presente
. Since theneached a vale establishmetizens of Ha
atal the ges and be
the ical ners tion
n Europe. my during
ts. As the along the
er of the f the tidal on of this mation on n Coastal
ering and German (OPTEL on storm
ed.
n HPA is ue which ent of the mburg in

64 Radegast et al.
case of a storm surge. An empirical and statistical approach provides forecasts of the water level in Hamburg. In most of the cases these forecasts are precise, but there are of course some storm surges, where forecasted and measured water levels differ more than 20 cm. Results of OPTEL – D hopefully lead to further improvement of that approach to reduce such rough results. Storm surges are mainly caused by wind. In detail the aim of OPTEL – D is to define more precisely the influence of wind in the German Bight and the Waddensea. Are there similarities between wind directions, constancy of the wind and duration of wind velocities? Where is the major influence on the water levels by the wind: from the mouth of the River Elbe up to Hamburg, in the German Bight or further offshore in the North Sea? The analysis of the development of the rising water levels from the North Sea to Hamburg is another important component of OPTEL – D. Another topic is the analysis of the upstream water discharge of the River Elbe, measured in Neu Darchau upstream of the weir of Geesthacht. The standardization of the water levels can show the influence of discharge on storm surge water levels.
3 Location and Approaches The first step by the project team was to agree on the main gauges to analyse the water levels, the wind recording stations to investigate the wind set-ups and to define other important data necessary for the studies besides the upstream water discharge. The collected data for OPTEL and its storm surges refers to the period from 1980 to 2008. In addition to this period the storm surges, defined in OPTEL, needed to have the following characteristics:
the water level in Cuxhaven exceeds more than 2.0 m above high water (mean high water in Cuxhaven: + 1.5 m NN) and
the water level in Hamburg – St. Pauli is higher than + 4.0 m NN. Both characteristics are independent of the phase of the tide. These basic principles lead to approximately 150 storm surges. In the proposal of OPTEL the names of different gauges of the River Elbe which are the basic for the research, are mentioned:
Table 1: Gauges of the River Elbe considered in OPTEL
Gauge Short River Elbe Station [km] Cuxhaven CUX 724 Brunsbüttel BRU 697 Brokdorf BRO 684 Glückstadt GLÜ 674 Grauerort GRA 661 Schulau SCH 641 Hamburg – St. Pauli STP 623 Bunthaus BUN 610 Zollenspieker ZOL 598 Geesthacht (weir) GST 586
To analyse the wind blowing from the North Sea to Hamburg the project team agreed to use the following wind recording stations: Borkum (located north of the Ems Estuary, border between Germany and the Netherlands), Scharhörn and Neuwerk (located outside of the mouth of the Elbe Estuary) and Cuxhaven, Brunsbüttel, Ruthenstrom and Finkenwerder all along the River Elbe. Figure 1 gives an overview of all relevant gauges and wind recording stations.

Studies on the Development of Wind set-up 65
Figure 1: Review of the River Elbe, position of the gauges, wind recording stations
and upstream water discharge (www.google.de)
Wind set-up is defined as the difference between an expected and an actually reached water level. This difference is mainly produced by wind and leads to higher water levels. To estimate the difference the astronomical or the mean tide is required. The astronomical tide has been calculated by the BSH for the period from 1980 to 2008. The mean tide is calculated from the averaged water levels over five years. The discrepancy of the results will be analysed for both wind set-up graphs. To identify the causes for wind set-up is the main aim of the analysis in OPTEL – D, especially to improve the forecasts. To survey a status quo for analysis of storm surges three different statistical and empirical approaches were used. All of them exclusively consider the peak values in Cuxhaven and Hamburg – St. Pauli at high water time. The first approach is a comparison between the forecasted water level and the measured water level for Hamburg – St. Pauli by WADI and its empirical statistical method at the moment of high tide in Cuxhaven. This comparison gives information about the accuracy of the forecast by this method. The difference between low water tide and the following high water tide is the second approach. This difference, called tidal rise, from Cuxhaven and Hamburg will be set in contrast with each other in a scatter diagram. To obtain a relation between the wind set-up during high tide (independent of high water time) of Cuxhaven and Hamburg is the third approach. Figure 2 shows two outlines to explain the calculation of the wind set-up and the tidal rise. The relation for wind set-up and tidal rise between Cuxhaven and Hamburg is presented in scatter diagrams in figure 3. The values of Cuxhaven are shown on the x-axis while on the y-axis the values of Hamburg – St. Pauli are presented. The first diagram displays the results of the wind set-up. The second diagram shows the result of tidal rise comparison as well as the linear regression.
North Sea

66 Radegast et al.
Figure 2: Outlines for the explanation of wind set-up (left) and tidal rise (right)
At first glance the results of the tidal rise look much better than the results of the wind set-up comparison. However, the different scaling of the axis and the standard error of these two approaches indicates that the wind set-up comparison provides better results.
Figure 3: Scatter diagrams for wind set-up s (left) and tidal rise (right)
Another form of presentation for these scatter diagrams is a chronological order of the storm surges and their results of wind set-up / tidal rise. The difference between function value and regression line is labelled by the pink scatters in figure 4 – only shown for the wind set-up approach. Additionally it is possible to show the correction of the upstream water discharge in this figure. By means of a multiple regression the effect of the upstream water discharge can be described. The white scatters show the dimension of the effect. The mean deviation for wind set-up averages here about ± 7.6 cm / 1000 m3. For the tidal rise approach the discharge shows an influence of ± 16 cm / 1000 m3. It can be seen that the influence of the discharge in case of storm surges is not critical. The means are less than 20 cm which is the boundary value. This boundary value results of the WADI – approach. The forecast error should be less than 20 cm for storm surges.
wind set-upSTP
mean tide with predated
astronomical times of setting in
real tide
wind set-upCUX
Cuxhaven St. Pauli
Mean high water CUX
Mean high water STP
high water CUX
high water STP
wind set-upSTP
mean tide with predated
astronomical times of setting in
real tide
wind set-upCUX
Cuxhaven St. Pauli
Mean high water CUX
Mean high water STP
high water CUX
high water STP
high water CUX
low water CUX
high water STP
low water STP
tidal
rise
CU
X tidal
rise
STP
Cuxhaven St. Pauli
mean tide level
mean tide level
high water CUX
low water CUX
high water STP
low water STP
tidal
rise
CU
X tidal
rise
STP
Cuxhaven St. Pauli
mean tide level
mean tide level
FPot (x) = 4,7799 x 0,7729 ⇒ std error: 25,62FLin (x) = 1,0347 x +79,039 ⇒ std error: 25,79
(1,3057 x + 0)
0
100
200
300
400
500
600
700
0 100 200 300 400 500 600 700Stieg Cuxhaven
Stie
g St
Paul
i
tidal rise Cuxhaven
tidal
rise
St.P
auli
FPot (x) = 1,4362 x 0,9724 ⇒ std error: 19,94FLin (x) = 1,2103 x +6,460 ⇒ std error: 19,88
(1,2502 x + 0)
0
50
100
150
200
250
300
350
400
0 50 100 150 200 250 300 350 400Stau CUX
Stau
STP
wind set-up Cuxhaven
win
d se
t-up
St.P
auli

Studies on the Development of Wind set-up 67
Figure 4: Difference between the function value of wind set-up and the regression line as well as
the influence of the upstream water discharge
The same form of presentation demonstrates the results of all three approaches (wind set-up, tidal rise and the WADI – approach) for every storm surge in figure 5. Wind set-up and tidal rise are available for every event; unfortunately the results of the WADI – approach are incomplete. Due to the enlargement of the lists of events there is no WADI – data for every storm surge. If there has not been made a forecast by WADI, no data have been stored and it is very complex to reproduce the missing data. Therefore some gaps in data appear which will be filled contemporary. None the less one tendency is obvious. Since 1993 – the last optimisation after the beginning of the development in 1978 – the WADI-approach supplies very good results, except a few. The continuous advancement of this approach shows that many influencing factors are already considered in this empirical and statistical procedure. The spreading of the tidal rise approach and the wind set-up approach are clearly larger than the spreading for WADI. Especially the values of the tidal rise seem to be very discontinuous, but the standard error is nearly the same as that of the WADI – approach. The standard error of the wind set-up is a bit lower. To conclude, the wind set-up between Cuxhaven and Hamburg appears to be the best approach for further analysis. The next step was a research along all gauges of the River Elbe to show the development of the tidal wave in the estuary. The two different approaches, tidal rise and wind set-up, were used to analyse this effect. The tidal wave runs from Cuxhaven along Brunsbüttel, Brokdorf, Glückstadt, Grauerort and Schulau to Hamburg – St. Pauli. Figure 6 shows the relation of the wind set-up between every gauge to Hamburg – St. Pauli exemplarily for both approaches. Red circled black values give information about the forecast error. From Cuxhaven and Brunsbüttel to St. Pauli the forecast errors are about 25 and 14 cm. Upstream Brokdorf the errors are less than 10 cm, which is a very good result. Therefore the progression of the storm surges from Brokdorf to Hamburg along the inner estuary can be described quite well as linear.
Correction of the model results by considering the influence of the upstream water discharge
-100
-80
-60
-40
-20
0
20
40
60
80
100
138
/ 18.
11.1
980
140
/ 1.1
.198
1
142
/ 8.1
0.19
81
/ 31
.10.
1981
147
/ 24.
11.1
981
150
/ 20.
11.1
982
153
/ 4.1
.198
3
155
/ 19.
1.19
83
158
/ 2.2
.198
316
1 / 8
.1.1
984
165
/ 15.
1.19
84
167
/ 21.
10.1
984
169
/ 6.1
1.19
85
172
/ 20.
1.19
86
175
/ 24.
9.19
8817
8 / 2
9.11
.198
8
181
/ 14.
2.19
89
184
/ 26.
1.19
9018
7 / 2
6.2.
1990
190
/ 28.
2.19
90
192
/ 21.
8.19
9019
4 / 2
2.9.
1990
196
/ 27.
12.1
990
197a
/ 9.
1.19
91
200
/ 18.
10.1
991
202a
/ 20
.12.
1991
205
/ 13.
1.19
93
/ 22
.1.1
993
209
/ 25.
1.19
93 /
19.2
.199
3
213
/ 9.1
2.19
93
216
/ 24.
1.19
9421
9 / 3
1.1.
1994
220a
/ 1.
1.19
95
222
/ 10.
1.19
9522
3 / 3
0.10
.199
6
/ 4.
1.19
98
226
/ 29.
10.1
998
/ 17
.2.1
999
230
/ 3.1
2.19
9923
2a /
9.2.
2000
235
/ 13.
12.2
000
238
/ 23.
2.20
0224
1 / 2
8.10
.200
2
244
/ 1.2
.200
4
245
/ 21.
10.2
004
247a
/ 2.
1.20
05
250
/ 12.
2.20
05
252
/ 1.1
1.20
0625
4 / 1
2.1.
2007
257
/ 26.
6.20
07
Storm surge number / Date
Diff
eren
ce b
etw
een
the
func
tion
valu
e of
win
d se
t-up
and
the
regr
essi
on li
ne fr
om C
UX
to S
TP
analysis of the wind set-up without consideration of the upstream water dischargeanalysis of the wind set-up with consideration of the upstream water discharge

68 Radegast et al.
Figure 5: Comparison of the three analysing approaches and their standard error
Figure 6: The run of the tidal wave from the mouth of the River Elbe to Hamburg – St. Pauli for the tidal rise
approach
Comparison of the approaches
-120
-100
-80
-60
-40
-20
0
20
40
60
80
100
120
Flut
Nr.
/ Dat
um
140
/ 01.
01.1
981
143
/ 10.
10.1
981
146
/ 23.
11.1
981
150
/ 19.
11.1
982
154a
/ 17
.01.
1983
157
/ 01.
02.1
983
161
/ 07.
01.1
984
166
/ 17.
01.1
984
168
/ 05.
11.1
985
172
/ 20.
01.1
986
176
/ 07.
10.1
988
180
/ 24.
12.1
988
184
/ 25.
01.1
990
188
/ 26.
02.1
990
191a
/ 01
.03.
1990
194
/ 21.
09.1
990
197
/ 28.
12.1
990
199
/ 17.
10.1
991
202a
/ 20
.12.
1991
206
/ 13.
01.1
993
208
/ 24.
01.1
993
211a
/ 19
.02.
1993
214
/ 19.
12.1
993
218
/ 28.
01.1
994
220a
/ 01
.01.
1995
222b
/ 20
.03.
1995
223b
/ 10
.10.
1997
226
/ 29.
10.1
998
228a
/ 01
.12.
1999
232
/ 30.
01.2
000
235
/ 13.
12.2
000
239
/ 26.
02.2
002
243
/ 21.
12.2
003
245
/ 21.
10.2
004
248
/ 08.
01.2
005
251a
/ 08
.02.
2006
254
/ 11.
01.2
007
258
/ 09.
11.2
007
storm surge number and date
Diff
eren
ces
betw
een
the
fore
cast
ed a
nd
mes
sure
d w
ater
leve
l [cm
]
WADI-approach (standard error = 24,53 cm)
Wind set-up approach (standard error = 19,55 cm)
Tidal rise approach (standard error = 24,82 cm)
FPot (x) = 1,4362 x 0,9724 ⇒ Std.Fehler : 19,94 FPot (x) = 0,5169 x 1,1518 ⇒ Std.Fehler : 16,10 FPot (x) = 0,3635 x 1,2073 ⇒ Std.Fehler : 14,32FLin (x) = 1,2103 x +6,460 ⇒ Std.Fehler : 19,88 FLin (x) = 1,2047 x - 11,049 ⇒ Std.Fehler : 14,70 FLin (x) = 1,1623 x - 14,711 ⇒ Std.Fehler : 10,84
FPot (x) = 0,3890 x 1,1894 ⇒ Std.Fehler : 13,82 FPot (x) = 0,5044 x 1,1369 ⇒ Std.Fehler : 10,59 FPot (x) = 0,5876 x 1,1041 ⇒ Std.Fehler : 8,16FLin (x) = 1,1273 x - 12,852 ⇒ Std.Fehler : 10,51 FLin (x) = 1,0809 x - 7,542 ⇒ Std.Fehler : 7,45 FLin (x) = 1,0406 x - 3,818 ⇒ Std.Fehler : 4,62
(1,0600 x + 0)
(1,1424 x + 0) (1,0836 x + 0) (1,2502 x + 0)
(1,0420 x + 0) (1,0214 x + 0)
0
50
100
150
200
250
300
350
400
0 50 100 150 200 250 300 350 400Stau CUX
Stau
STP
0
50
100
150
200
250
300
350
400
0 50 100 150 200 250 300 350 400Stau BRU
Stau
STP
0
50
100
150
200
250
300
350
400
0 50 100 150 200 250 300 350 400Stau BRO
Stau
STP
0
50
100
150
200
250
300
350
400
0 50 100 150 200 250 300 350 400Stau GLÜ
Stau
STP
0
50
100
150
200
250
300
350
400
0 50 100 150 200 250 300 350 400Stau GRA
Stau
STP
0
50
100
150
200
250
300
350
400
0 50 100 150 200 250 300 350 400Stau SCH
Stau
STP
wind set-up Cuxhaven wind set-up Brunsbüttel wind set-up Brokdorf
wind set-up Glückstadt wind set-up Grauerort wind set-up Schulau
win
d se
t-up
St. P
auli
win
d se
t-up
St. P
auli
win
d se
t-up
St. P
auli
win
d se
t-up
St. P
auli
win
d se
t-up
St. P
auli
win
d se
t-up
St. P
auli

Studies on the Development of Wind set-up 69
The results of this effect are a very important result. This implicates that the influences on the water levels are located outside the mouth of the River Elbe. Certainly this fact is just a little help for the forecasts. The tidal wave needs about 2-3 hours from Cuxhaven to St. Pauli and it would be too late for an alert. But this knowledge can be used for a specification of the forecasts and about ceasing the handling of cargo or not. The wind is probably the most important influence on water levels, because it causes the wind set-up. Therefore it is necessary to research the main factors on that. There are three important parameters: wind direction, wind speed and the difference of wind set-up between Cuxhaven and Brokdorf. The aim is to find the main wind set-up causing direction and period of time. Is there a time period before high tide in Cuxhaven that has a great influence on the wind set-up heights and would the consideration of this result lead to better forecasts? Research of this fact is still at the beginning. Wind data from Scharhörn are currently used but probably there will be a concentration on the wind data of Cuxhaven and Brunsbüttel too.
4 Results At the beginning data collection, controlling and validation were the main part of OPTEL - D. The following data are collected: water level, wind speed and direction, degree of salinity, flow velocity and direction, water temperature, upstream water discharge, mean and astronomical tide. The water level data were used for the analysis of three different approaches. The evaluation of the approaches showed, that the wind set-up approach gives the best results. But to minimise the standard errors the understanding of the physical effects causing the increasing water levels is necessary. The factor of the upstream water discharge is not responsible for high variations between expected and measured water level. There is an influence but it is not essential. Another factor is the linear describable movement of the tidal wave from Brokdorf through the estuary up to Hamburg - St. Pauli. There is evidence to imply, that all influences causing the wind set-up are located in the German Bight and the mouth of the River Elbe. The wind along the River Elbe is not that important for the water levels, which are reached in Hamburg - St. Pauli. This increase is created by the narrowing shape of the River Elbe. At least the wind outside the estuary is the main cause for the height of the wind set-ups. But it is very difficult to apportion the different elements of the wind as direction, speed, duration and produced wind set-up height. Therefore - as a next step - all storm surges are needed to be analysed individually.
5 Discussion and conclusion Further analyses for improved statistical and empirical models for storm surges are still necessary. Other appendages for the research in OPTEL - D are for example the variation of the gradient of the individual tide or the filling degree of the estuary, when a storm surges is expected. The co-partners of OPTEL are dealing with other components. OPTEL - A establishes a model of the River Elbe based on BSHcmod and designed by BSH. BAW also works on a model, but based on UnTRIM. This part is OPTEL - C. Both partners need to calibrate and validate their models. They also need to accomplish an interface to transfer hydrodynamic parameters like water levels, flow and degree of salinity from the model of the North Sea to the model of the River Elbe. DWD computes the roughness of the surface and the topography along the River Elbe up to the weir Geesthacht. Additionally the production of coefficients for the correction of wind speed dependent on the direction is required. The coefficients are part of the meteorological models COSMO-DE and COSMO-EU.

70 Radegast et al.
The work proceeds very well. DWD has almost finished. BSH and BAW are arranging the parameters for each model to get comparable results. In the near future the first test runs will start. The validation and calibration of the models will proceed with six scenarios of different hydrological situations of the River Elbe. For example: outstanding low water levels caused by longer lasting southeast wind, two storm surges with different wind set-up curves and a period with high upstream water discharge.
References Antfang, H. (1983): Aufbau und Organisation des Hamburger Sturmflutwarndienstes. In: Hamburger
Küstenforschung 42. Bremer, J.-A. (2008): Entwicklung der Sturmfluten entlang der Tideelbe von Cuxhaven bis Hamburg-St. Pauli.
Diplomarbeit am Fachbereich Geographie, Philipps-Universität Marburg. Duensing, G., O. Höflich, L. Kaufeld, H. Schmidt, G. Olbrück & B. Brandt (1985): Meteorologische
Untersuchungen über Stürme an der deutschen Nordseeküste. Deutscher Wetterdienst Seewetteramt. Gönnert, G. & U. Ferk (1996): Natürliche und anthropogen beeinflusste Entwicklung von Sturmfluten in der
Deutschen Bucht und der Unterelbe. In: Vechtaer Studien zur Angewandten Geographie und Regionalwissenschaft 18: 13–31.
Gönnert, G. in Zusammenarbeit mit Strom- und Hafenbau Hamburg (1999): Windstauanalysen in der Nordsee Lehmann, H.-A. (2007): Sturmfluten treten nach dem Gesetz der größten anzunehmenden Gemeinheit meist
nachts und an Wochenenden auf. In: KFKI aktuell 2/2007. Müller-Navarra, S. (2006): Modellstudien zur Sturmflut und zu dem Hamburg-Orkan 1962. In: Hansa
international maritime journal: 143 (12): 72–88. Ney, H. (1983): Windmessgeräte auf den Inseln Scharhörn und Neuwerk. In: Hamburger Küstenforschung: 42. Siefert, W. (1994): Das Sturmflutgeschehen in der Tideelbe und der Einfluss von Fahrrinnenvertiefungen. In:
HANSA – Schifffahrt – Schiffbau – Hafen 9/1994. Siefert, W. & K. Havnø (1989): Sturmflutuntersuchungen für die Elbe mit den mathematisch-hydraulischen
Modellen des Dänischen Hydraulischen Instituts. In: Hamburger Küstenforschung 46. Siefert, W. & H. Christiansen (1983): Entwicklung und Stand der Sturmflutvorhersagen des Hamburger
Sturmflutwarndienstes. In: Hamburger Küstenforschung 42.
Acknowledgement The work has been carried out within the project OPTEL - Wind set-up Studies and Development of an Operational Model of the tidal River Elbe. This project started in April 2008 and will be finished in September 2010. All results support the models of the Federal Maritime and Hydrographic Agency and the Waterways Engineering and Research Institute to establish a continuous forecast of water levels along the River Elbe for daily business and extreme events.
Address Caroline Radegast Hamburg Port Authority Neuer Wandrahm 4 20457 Hamburg, Germany
Totasite
AbstracA totmaestbraneSP
1 BacMigratinintensiveship accinjectionwidely bfrom thesurface. intensivemuddy (frequentonly fewHamburgsedimen200 m (Aas foundestuarinePSD in tfine, poodevice.
2 ObThis stunavigatioestuarineor freshw
SchwarzerFrom BrazCoastlineS. 71-76
al volumees affecte
Svenj1Institute of G
ct laser based intal volume coatter (SPM) dtuary. Groundackish and freap tides and
PM amount an
ckground ang subaqueoe sediment dess. Interest
n dredging (Wbeen increasee river surfaPumping ca
e sediment t(Aster 1993,tly used in hw studies deg and Emdet concentratiAster 1993), d in Hambure SPM are nthe Scandinaorly sorted t
bjectives dy focuses oon channel oe suspended water conditi
r, Schrottke &zil to Thailand e Reports 16 (
concentrd by wate
nja Papenme
Geosciences a2Sen
n-situ particle oncentration (during water-ind-truthing waseshwater zonelow river-disc
nd sizes are rec
and Motivaous dunes ardredging is fr
is given to WID), whiched (Meyer-Nace to a dreapacity and transfer to d Woltering 1
harbours (Speeal with dreen harbor (Gions (SSC) orespectivelyrg harbor (Mnot known. Mavian, non-tio coarse, mo
on potential of the Wesesediment dy
ions.
& Stattegger (e– New Result
(2010), ISSN 0
ration ander injectio
Germa
eier1, Kersti
and Cluster of nckenberg Inst
sizer (LISST(TVC) and panjection dredgs done by wae, respectivelycharge. TVC cognisable, bu
ation re well kno
frequently ondredging tec
h was introduNehls et al. 2edging sledg
water pressudumping site1996) and saencer et al. 2edging-induc
Germany) haonly occurredy. Vertical inMeyer-NehlsMikkelsen &idal Øresundoderately sor
changes of er estuary toynamics. Tw
eds.): ts in Coastal R0928-2734, IS
d size diston dredgin Weser E
in Schrottke
Excellence ‘Ftitute Wilhelm
T) was used toarticle-size diging (WID) o
ater sampling.y. Measuremeof SPM is ti
ut dredging im
own featuresngoing in estchniques, whuced in the e2000). Durine, equipped ure can mos
es is redundaandy deposit2006) and inced dispersaave shown, td over a disttrusion did n
s et al. 2000& Pejrup (20d. Due to parrted particle
TVC and P assess spat
wo sites are ch
Research SBN 978-3-98
tribution ing of subEstuary
e1 & Alexan
Future Ocean’mshaven, Germ
o analyse spatiistribution (PSof subaqueous Investigated ents were conidal controlledmpact is hardly
s of estuarintuarine navighich reduce meighties. Sinng WID, hug
with jets instly be adapant. Efficients (Clausner n navigation al and behavthat dredgingtance of 100 not exceed 1-0). So far, W000) reportedrticle flocculs with increa
SD during Wial and temphosen to ver
11839-9-3
of suspenbaqueous
nder Barthol
’, Kiel Univermany
ial and tempoSD) of suspes dunes in the
WID sites arnducted in Jud. Site-specifiy visible in the
ne systems. gation channmaintenancece then, worge amounts njecting watpted to bed ncy of WID
1993, Nasnchannels (S
viour of SPg induced inm (Meyer-N
-2 m in heighWID-inducedd on dredginlation, size sasing distanc
WID of subaporal relatedrify differenc
nded mattdunes in
lomä2
sity, Germany
oral variabilityended particule German Were located in
une 2008, duric differencese data.
Consequentnels to guarane costs such rldwide operof water areter into the characteristihas been prer 1992). It
Stengel 2006M. Investig
ncrease of suNehls et al. 2ht above the d changes inng-related chspectra changce from the
aqueous dund dredging imces linked to
ter at the
y
y of late eser the
ring s of
tly, cost-ntee save as water-
ration has e pumped sediment cs. Cost-roven for has been ). So far, ations in uspended
2000) and riverbed,
n PSD of hanges of ged from dredging
nes in the mpact on brackish

72 Papenmeier et al.
3 Study area The meso- to macro-tidal Weser estuary is located at the German North Sea coast (figure 1).
Figure 1: Left: Overview of the Weser estuary with markings of the two sites A and B. Centre and right: study sites in detail with subsections.
Site A was located at the southern end of the brackish reach and of the turbidity maximum zone (TMZ) during the experiments (figure 1). Depending on tidal phase, meteorological conditions and freshwater discharge, this zone can be shifted further up or down-stream (Grabemann & Krause 2001). The water column is well mixed due to tidal flow velocities of 1-1.3 m/s on average. SSC can reach values of up to 1.5 g/l in the water column of the TMZ (Grabemann & Krause 1989, 2001) with increasing values in the near-bed zone (Schrottke et al. 2006). Spatial distribution of SSC strongly depends on the tides. Whereas SPM is well distributed during ebb and flood phases, particle settling starts with decreasing tidal flow. Large particle aggregates of > 100 µm are formed (Wellershaus 1981). Site B represents the freshwater reach (figure 1). Tidal currents, which amount to 1 m/s, are slightly lower (Schuchardt et al. 1993). SSC is mainly controlled by riverine input. Generally, SSC values do not exceed 0.05 g/l in the tidal dominated freshwater zone (Grabemann & Krause 2001, Schuchardt et al. 1993). Tidal induced SSC variation is less pronounced. Riverbed morphology in the channel sections of both sites is characterised by subaqueous dunes of up to 6 m in height and of up to 150 m in length (Schrottke et al. 2006). The dunes are mainly two- or three-dimensional, lateral orientated to the main flow direction in the navigation channel and reflect ebb dominance (Schrottke et al. 2006). Dunes are mainly consist of medium-sized sands (Stengel 2006). Dune morphology and grain-size composition are frequently impact by dredging.
4 Material and Methods In-situ PSD is detected by laser diffraction with a ‘Laser In-Situ Scattering & Transmissometry’ system LISST-100x (type-C, Sequoia® Scientific Inc.). A collimated laser beam is scattered at small particles in the water column and processed at a multi-ring detector. PSD is displayed in 32 logarithmically-spaced size classes, ranging from 2.5 to 500 µm (8.6 to 1.0 Phi). Particles beyond the measuring range are assigned either to the finest or largest size class, respectively (Agrawal & Pottsmith 2000). This can cause rising tails at the boundaries. There is no option for differentiation between particles and air bubbles. PSD is presented as volume concentration (VC) of each size class, summed-up to TVC. This is related to optical transmission (τ) detected with a photodiode. Multiple scattering can appear at τ < 0.3, which leads to an overestimation of small particles (Agrawal & Pottsmith 2000). A path reduction module (50 %) was installed to reduce the optical path length and thus the sample volume. Checking the overall health of the instrument and in order to correct for

Total volume concentration and size distribution of suspended matter 73
optical attenuation by water and microscopic imperfections on the optical surfaces, a background scattering was acquired in the morning of each measuring day. A full technical description of the LISST is done by Agrawal and Pottsmith (2000) and Agrawal et al. (2008). The LISST was applied from a drifting vessel in profiling mode down to the near riverbed. Minimum distance between dredging and research vessel amounted to ~30 m. TVC calibration was done by horizontal water sampling (2.2 litre, Hydro Bios©), at two different water depth. In the laboratory, an aliquot of defined volume was vacuum-filtered (glass-fibre filters, 1.2 µ). The filters were dried at 60°C for 12 hours. SSC was calculated by dry mass per unit sample volume. Measurements were done on 10 June 2008 at site A and on 24 June 2008 at site B under low river discharge (180 m³/s, Water & Shipping Authority Bremen, pers. comm.) and neap tides. Both sites were subdivided in 4-5 subsections, representing the type of dredging impact such as maintenance or constructional work or unaffected subsections (reference), displayed in figure 1. All subsections exhibited comparable hydrodynamics and sedimentology. Profile indexes indicate relation of measuring position to WID: a) luv-site, b) lee-site c) on-site.
5 Results TVC and τ significantly correlate, as found at both sites with R²=0.89 (figure 2). Overall, τ did not exceed 0.6, more often it decreased below 0.3, as found for 80 % and 15 % of all measurements, carried out at site A and B, respectively (table 1).
Figure 2: Correlation of optical transmission (τ) and TVC for site A and B
PSD changed within seconds from unimodal curves to the ones with rising tails at the coarse end of the size spectra. Depth-related changes of PSD and VC at site A are displayed in figure 3. Mean particles sizes range from 2.0 to 4.9 Phi (table 1) with a downward particle coarsening of 0.6 Phi on average as well as a slight increase of VC for size spectra > 8 Phi. A distinct development in mean particle size between the profiles is not obvious. Several times, water turbidity was announced to be too high before reaching the ground at subsections b and c without specific changes of TVC or particle sizes, as found by comparing measurements 7b and 8a in figure 3. At site B, mean particle-size range with 1.9 to 3.3 Phi (table 1) was slightly smaller, but again with no depth-related change (figure 4). Mean particle size only varied among the subsections. Highest TVC at site A amounted to ~1,600 µl/l during slack-water ebb (figure 3: 7c, 8a) and ~470 µl/l for site B around slack-water flood (figure 4: 1b - 3a, 15a -18c). SSC values ranged from 22 to 320 mg/l and 26 to 128 mg/l at site A and B, respectively.
0 0.2 0.4 0.6 0.8 1τ
0
400
800
1,200
1,600
TVC
[µl/l
]
A
B
A & B
Y = exp(-6.60 * X) * 1982.73R² = 0.89
Y = exp(-9.40 * X) * 5724.86R² = 0.87
Y = exp(-6.57 * X) * 2111.62R² = 0.89

74 Papenmeier et al.
Figure 3: Depth-related VC and PSD at site A (brackish water zone). Solid curves represent mean particle size; dashed lines visualise TVC.
Figure 4: Depth-related VC and PSD at site B (freshwater zone). Solid curves represent mean particle size; dashed lines visualise TVC.

Total volume concentration and size distribution of suspended matter 75
Table 1: Measured parameter at site A and B.
site A B
Ø size [Phi]
TVC [µl/l] τ
SSC [mg/l]
Ø size [Phi]
TVC [µl/l] τ
SSC [mg/l]
min 2.0 29.9 0.06 22 1.9 103.7 0.2 26 max 4.9 1598.4 0.58 320 3.3 469.4 0.4 128 Ø 2.9 650.2 0.22 113 2.8 239.2 0.3 47
τ < 0.3 80% 15%
6 Discussion and conclusion In the Weser estuary, suspended sediment dynamics are mainly controlled by tides and river-discharge. This is clearly reflected in data sets of TVC, PSD and SSC, especially at site A, which was located in the brackish zone, at the southern end of the TMZ. Whereas no clear indication of WID impact is given at site B, some dredging induced effects can be derived from data-sets of site A. It is assumed that WID induces temporary increase of near-bed suspended particles (Meyer-Nehls et al. 2000, Stengel 2006). Based on that, TVC must consequently increase. This might have caused repeated near-bed interruption of LISST measurements at site A during WID, where background TVC, SSC and mean particle size are side-specifically higher (brackish zone) as found at site B (freshwater reach). SSC did not rise simultaneously. This seems to be reasonable, taking into account that τ can also be considerably reduced by only few large particles or air bubbles (Mikkelsen & Pejrup 2000). Large particle-aggregates can enhance TVC without affecting mass concentration. Indeed, measured PSD indicated rising tails at the coarse particle-size spectra, repeatedly. Overall, it can be concluded that WID does not seem to have a significant impact on suspended sediment dynamics at the sites investigated with these methods.
References Agrawal, Y.C. & H.C. Pottsmith (2000): Instruments for particle size and settling velocity observations in
sediment transport. In: Marine Geology 168: 89–114. Agrawal, Y.C., A. Whitmire, O.A. Mikkelsen & H.C. Pottsmith (2008): Light scattering by random shaped
particles and consequences on measuring suspended sediments by laser diffraction. In: Journal of Geophysical Research 113: 11.
Aster, D. (1993): Der Einfluss von Wasseinjetionsbaggerung auf die Wassertrübung. In: Hansa 130: 64–65. Clausner, J.E. (1993): Water injection dredging demonstration on the Upper Mississippi River. U.S. Army Corps
of Engineers, Waterways Eperiment Station. Dredging Research, DRP-93-3. Grabemann, I. & G. Krause (1989): Transport proccesses of suspended matter derived from time series in a tidal
estuary. In: Journal of Geophysical Research 94: 14373–14379. Grabemann, I. & G. Krause (2001): On different time scales of suspended matter dynamics in the Weser estuary.
In: Estuaries and Coasts 24: 688–698. Meyer-Nehls, R., G. Gönnert, H. Christiansen & H. Rahlf (2000): Das Wasserinjektionsverfahren: Ergebnisse
einer Literaturstudie sowie von Untersuchungen im Hamburger Hafen und in der Unterelbe. Ergebnisse aus dem Baggeruntersuchungsprogramm 8: 111.
Mikkelsen, O.A. & M. Pejrup (2000): In situ particle size spectra and density of particle aggregates in a dredging plume. In: Marine Geology 170: 443–459.
Nasner, H. (1992): Injektionsbaggerung von Tideriffeln. In: Hansa 129: 195–196.

76 Papenmeier et al.
Schrottke, K., M. Becker, A. Bartholomä, B.W. Flemming & D. Hebbeln (2006): Fluid mud dynamics in the Weser estuary turbidity zone tracked by high-resolution side-scan sonar and parametric sub-bottom profiler In: Geo-Marine Letters 26: 185–198.
Schuchardt, B.,U. Haseloop & M. Schirmer (1993): The tidal freshwater reach of the Weser estuary: riverine or estuarine? In: Netherlands Journal of Aquatic Ecology 27: 215–226.
Spencer, K.L., R.E. Dewhurst & P. Penna (2006): Potential impacts of water injection dredging on water quality and ecotoxicity in Limehouse Basin, River Thames, SE England, UK. In: Chemosphere 63: 509–521.
Stengel, T. (2006): Wasserinjektionsbaggerung in der Unterweser: Eine ökologische und ökonomische Alternative zu Hopper Baggerung. PIANC Deutschland - Schifffahrt, Häfen, Waserstraßen, S. 204–208.
Wellershaus, S. (1981): Turbidity maximum and mud shoaling in the Weser estuary. In: Archiv für Hydrobiologie 92: 161–198.
Woltering, S. (1996): Einsatz eines Wasserinjektionsgerätes zur Hafenunterhaltung. In: Hansa 133: 62–66.
Acknowledgement This study was funded by the Deutsche Forschungsgemeinschaft in the frame of the Cluster of Excellence‚The Future Ocean’. It was part of the interdisciplinary project ‘Weser adaptation’, coordinated by the Water & Shipping Authority (WSA) Bremen and Bremerhaven, together with other German partner institutions. Thanks are given to the WSA Wilhelmshaven for providing additional ship capacity and support as well as to all partners for the good cooperation.
Address Svenja Papenmeier University of Kiel - Institute of Geosciences Cluster of Excellence: The Future Ocean, Sea-Level Rise & Coastal Erosion Otto-Hahn-Platz 1 24118 Kiel, Germany

D
AbstracClstoassstolocThRiGouseThtodcli
1 EinNeben dunauswedes langerste AuIntensitämöglicheKlimawabegegneSiedlungund daheDie Auseiner nac1. Zu g
KlimRisiklokazur (Bat
2. Das langKomBemim
SchwarzerFrom BrazCoastlineS. 77-86
as Risiko
Land
ct imate Change
orm surges. Thsets behind thorm surge evcations and dehe joint researsk assessmenovernment wiled as a basis f
he project offeday. Building imate change.
nleitung dem Anstieg eichlichen Fogsamen Meeufgabe darinät und Verwe Katastropandels in Fon, ergibt si
gs- und Wirter als vorransarbeitung vechhaltigen Agroße Unsichmawandels, koquelle "St
aler KlimamoSturmflut-
thymetrie) unFehlen von
gfristiger undmponenten dmessungsseeg
Küstenberei
r, Schrottke &zil to Thailand e Reports 16 (
von Extr
G
desbetrieb Str
e will cause ahis has seriou
he dikes. It is ent designes.
evelop strategirch project Xtnt and mitigatll help answerfor risk analysers methods ton this found
des mittlerenolgen des Klresspiegel-A
n, die Folgeweildauer füphen abzuworm von veich unmitteltschaftsräumgig gefährdeerlässlicher H
Anpassung stöherheiten beiinsbesonder
turmflut" (Wodelle mit deund Seegannd sozio-ökon prozessoried großräumigder Sturmflugang maßgebich vorwie
& Stattegger (e– New Result
(2010), ISSN 0
remsturmKl
Gabriele Gö
raßen, Brücke
a rise of the sus consequenc
therefore inev In a secondies. tremRisk – Extion under clring these quesis and develoto assess the ddation it tries
n Meeresspielimawandels
Anstiegs und en der Zunaür den Insewenden. Dieränderten Slbar daraus,
me sowie Räuet gelten. Handlungsemößt noch auf i den langfrisre hinsichtli
Windstau und er entsprechengsvorhersagonomischen Bentierten, wi
ger morpholout - und somblich beeinflugend durch
eds.): ts in Coastal R0928-2734, IS
mfluten in limawand
önnert & Sig
n und Gewäss
sea level and es for the safevitable to firs
d step it is p
xtreme storm limate changeestions. The „pment of newdevelopment to design extr
egels gehörenin Küsten- uder bessere
ahme extremel-, Küsten-e Dringlichturmflutverhdass Küste
ume wertvol
mpfehlungenf folgende Wstigen Prognich der meSeegang). D
enden Auflösge unter lanBedingungenissenschaftli
ogischer Verämit die Bemussen. Insbeh die Was
Research SBN 978-3-98
Ästuarendels
grid Thumm
ser Hamburg (
probably moety of people st assess how ossible to de
surges at opee aspects, funSource-Pathw
w strategies. of extreme evreme events u
n häufigere uund Ästuarg
en Möglichkmer Sturmflu
und Hochhkeit, den hältnissen voen- und Ästlster Ökosys
n und konkrWissenslücken
nosen der loketeorologischDies ist vor asung sowie angfristig verän (Landnutzuch fundierteänderungen imessungswasondere werssertiefe un
11839-9-3
n angesich
m
(LSBG), Germ
ore frequent aas well as forsea level rise
etermine the r
en coasts andnded by the
way-Receptor“
vents under thunder conditio
und verstärktgebieten (IPCkeiten zur Anuten hinsichthwasserschut
lokalen Foorausschauentuargebiete steme unsere
eter Gegenmn und Schwiekalen Auswirh bedingtenallem auf dasauf das Fehleänderten küung) zurückzen Modellenim Küstenra
asserstände -rden die Bemnd die Soh
hts global
many
and more violr their values ae and an extrerisk for speci
d estuarine areGerman Fede“ concept will
he conditionsons reflecting
te SturmfluteCC 2007). Annpassung betlich der Häz abzuschätolgen des nd und prävweltweit be
es Planeten d
maßnahmen erigkeiten: rkungen des
n Komponens Fehlen verlen geeigneterüstenmorpholzuführen. n für die Voum, die nich-, sondern amessungswelhlneigung b
len
lent and eme ific
eas: eral l be
s of the
en zu den ngesichts
esteht die äufigkeit, tzen, um globalen
ventiv zu evorzugte darstellen
im Sinne
globalen nten der lässlicher r Modelle logischen
orhersage ht nur alle auch den llenhöhen bestimmt

78 Gönnert & Thumm
(Brechkriterien), so dass große Unsicherheiten auch bei der Vorhersage des Bemessungsseegangs unvermeidlich sind.
3. Das Fehlen grundlegender Kenntnisse darüber, wie der Sturmflutverlauf und Seegang in einer bislang von der Natur noch nicht ausgespielten Kombination zu (Sturmflut-) Szenarien zusammengeführt werden können, bei denen es zu inakzeptablen gesamtwirtschaftlichen Schäden kommt ("Perfekte Sturmflut").
Das Schließen der o.g. Wissenslücken und die Schaffung der erforderlichen grundlegenden Kenntnisse und Methoden, die es ermöglichen, wissenschaftlich fundierte Vorhersagemodelle zu entwickeln und die damit verbundenen Unsicherheiten verlässlich abzuschätzen, werden wahrscheinlich mehr als zehn Jahre in Anspruch nehmen (Oumeraci 2004). Seit dem 1. Oktober 2008 wird daher ein vom Bundesministerium für Bildung und Forschung (BMBF) finanziertes Verbundprojekt durchgeführt, in dem Wissenschaftler der Universitäten Siegen, Braunschweig, Hamburg - Harburg sowie des Landesbetriebs für Straßen, Brücken und Gewässer Hamburg unter der Leitung von Prof. Dr.-Ing. Hocine Oumeraci des Leichtweiß-Instituts für Wasserbau der TU Braunschweig das Auftreten und die Auswirkungen extremer Sturmfluten analysieren. Aufgrund der hohen Variabilität der Einflussparameter, der Stochastik der verschiedenen Prozesse und deren Wechselwirkungen sowie der o.g. Modell-Unsicherheiten werden neben den Unsicherheitsanalysen (z.B. Monte-Carlo-Simulation, Latin-Hypercube-Sampling) auch systematische Sensitivitätsanalysen für die Untersuchung der relativen Bedeutung der Einflussparameter sowie der praktischen Implikationen für die abzuleitenden Handlungsempfehlungen durchgeführt.
Flutgefährdetes Gebiet
Städtische
InfrastrukturMeer (Sturmflut)
Deich-brüche
Landwirtschaft
Industr. InfrastrukturÜberflutung
Ästuar (Sturmflut + Oberwasserzufluß)
Hochwasserschutzwerk
Überflutung
Überflutung
ÜberflutungÜberflutung
Source Pathway Receptor
Überflutungsrisiko R = Pf ·E(D)Überflutungsrisiko R = Pf ·E(D)
Sturmflut
Abb. 1: “Source-Pathway-Receptor” Konzept (Oumerci 2009)

Das Risiko von Extremsturmfluten in Ästuaren angesichts globalen Klimawandels 79
Zu diesem Zweck wird das "Source-Pathway-Receptor"-Konzept (Abb. 1) als Grundlage für ein integriertes Vorgehen für die Risikoanalyse und das Risikomanagement offener Küsten und eines Ästuargebietes, die durch Extremsturmfluten im Klimawandel gefährdet sind, herangezogen. Das gesamtheitliche Vorgehen erfordert vier Teilprojekte, die sich jeweils mit der Risikoquelle, den Risikowegen, den Risikoempfängern sowie deren Integration befassen. Für die Implementierung der vier Teilprojekte werden zwei Untersuchungsgebiete, die Insel Sylt und die Stadt Hamburg, ausgewählt. Grundlage der Untersuchung ist die Risikoquelle, d.h. die Sturmflut in ihrer möglichen Höhe und ihrem möglichen Verlauf. Im Folgenden werden am Beispiel für Hamburg die Vorgehensweise zur Ermittlung eines extremen Sturmflutverlaufes und die hierzu wichtigen Faktoren aufgezeigt. Für die emprische Analyse muss für Hamburg der Pegel Cuxhaven verwendet werden. Für die Charakterisierung von Sturmfluten ist es essentiell wichtig eine lange, ungestörte Zeitreihe vorliegen zu haben. Durch anthropogene Eingriffe wie Eindeichungen und Fahrrinnenanpassungen wurde das Regime der Elbe verändert. Somit liegt für den Pegel Hamburg keine ungestörte Zeitreihe vor. Diese Maßnahmen haben deutlich geringeren Einfluss auf die Pegelstände am Pegel Cuxhaven, so dass hier von einer quasi ungestörten Zeitreihe gesprochen werden kann. Deshalb bildet dieser Pegel die Grundlage der Untersuchung. Für die Entwicklung der Sturmflut von Cuxhaven die Elbe hinauf nach Hamburg wird die dort berechnete Sturmflut über numerische Modellrechnungen elbaufwärts bis nach Hamburg berechnet.
2 Sturmflutdefinition Zu Beginn einer jeden Untersuchung zum Thema Sturmfluten stellt sich stets die Frage: “Was ist eine Sturmflut?” Ein Sturm kennzeichnet sich durch starke Winde. Eine Flut ist ein hoher Wasserstand. Demnach ist eine Sturmflut ein durch starke Winde erzeugter hoher Wasserstand. Neben dieser allgemeinen Umschreibung des Begriffes Sturmflut gibt es in der Praxis und in der Forschung verschiedene Ansätze zur Definition von Sturmfluten. Für die Deutsche Bucht mit dem Bezugspegel Cuxhaven sei hier zum einen die anwenderbezogene Definition des Bundesamtes für Seeschifffahrt und Hydrographie zu nennen. Ab einem Wasserstand von 150 cm über dem mittleren Tidehochwasser (MThw) wird öffentlich vor Sturmfluten gewarnt, da ab diesem Wasserstand die ersten Schutzmaßnahmen (z.B. Sielverschlüsse) ergriffen werden müssen (Müller-Navarra 2008). Nach DIN 4049 gilt ein Wasserstand mit einer jährlichen Häufigkeit von 10 bis 0,5 als Sturmflut. Dieser statistische Grenzwert ergibt sich für den Pegel Cuxhaven zu 150 cm über MThw (DIN 4049-3 1994). Neben diesen beiden scheitelwertbezogenen Definitionen wird hier eine physikalisch basierte Definition bevorzugt. Eine für den Pegel Cuxhaven erstellte Definition stammt von Siefert (1968): Das Ereignis Sturmflut wird über die Höhe des Windstaus definiert. Der Windstau ist die Differenz zwischen dem vorausberechneten und dem eingetretenen Wasserstand. Es liegt ein Sturmflutereignis vor, wenn der Windstau zu irgendeiner Tidephase 200 cm beträgt. Die Definition wurde von Gönnert (2003) um das Kriterium des BSHs (MThw + 150 cm) erweitert, „weil nur die Wasserstände ausgewählt werden sollen, auf die eine bestimmte minimale Energieeinwirkung Einfluss genommen hat“. Diese Definitionen berücksichtigen, dass die maximalen Windgeschwindigkeiten eines Sturmes unabhängig von der Tidephase auftreten. Für die vorliegende Arbeit wurde eine physikalisch-phänomenologische Definition gewählt. Zunächst wurde der Frage nachgegangen „Was ist ein Sturm?“. Nach der Beaufort-Skala werden Windgeschwindigkeiten ab 17 m/s als Sturm bezeichnet. Für den Pegel Cuxhaven liegt die sturmflutrelevante Windrichtung zwischen 230° und 350° (Gönnert 2003). Ein Abgleich dieser meteorologischen Randbedinugungen in der Deutschen Bucht mit den Ereignissen des Kollektivs „Windstau größer 200 cm zu irgendeiner Tidephase“ von 1901 bis 2008 zeigte, das 70 % der erfassten Ereignisse zusammen mit einem Sturm auftraten. Bei den restlichen 30 % der registrierten Ereignisse

80 Gönnert & Thumm
kann der erhöhte Wasserstand durch die Überlagerung von Fernwellen und Windstau aus starken jedoch nicht stürmischen Winden zustandekommen. Um für die kontinuierliche Fortschreibung des Kollektivs die Auswahl der Ereignisse mit geringem Datenaufwand digital zu ermöglichen, wurde überprüft, mittels welcher Grenzwerte bezogen auf die statistischen Scheitelwerten MThw und MTnw diese physikalisch definierten Ereignisse gefiltert werden können. Die Definition für Sturmfluten am Pegel Cuxhaven ergibt sich nach diesen Auswertungen zu:
Am Pegel Cuxhaven liegt eine Sturmflut vor, wenn der Wasserstand die Grenzwerte 150 cm über dem MThw oder 190 cm über dem MTnw überschreitet.
Das physikalisch-phänomenologisch hergeleitete Kriterium, dass der Wasserstand 150 cm über dem MThw eintreten muß, deckt sich mit den zuvor erläuterten Definitionen des BSHs, der DIN 4049 und von Gönnert (2003). Das Verhältnis der beiden ermittelten Überschreitungsgrenzen 150 cm / 190 cm, welche dem Windstau zum entsprechenden Zeitpunkt entsprechen, beträgt 79 %. Die Länderarbeitsgruppe (1988) ermittelte durch Abgleich der eingetretenen Windstauhöhen ein mittleres Verhältnis des Windstaus von MThw zu MTnw von 73 %. Somit wird dieses Verhältnis bestätigt. Über die hier hergeleitete Definition treten nach wie vor rund 70 % der Ereignisse zusammen mit Stürmen auf. In den anschließenden Analysen werden die verbleibenden 30 % der Ereignisse mit betrachtet, da bei der Ermittlung der Extremereignisse jegliche wasserstandserhöhenden Faktoren untersucht werden müssen. Zudem wird an dieser Stelle explizit darauf hingewiesen, dass, obwohl die Definition scheitelwertbasiert ist, im Folgenden die gesamte Windstaukurve analysiert wird, da eine Sturmflut nicht nur über ihren Scheitelwasserstand sondern auch über ihre gesamten Kurvenform charakterisiert werden muss.
3 Sturmflutkomponenten Aus der Betrachtung der Sturmflutdefinitionen geht hervor, dass der Scheitelwasserstand einer Sturmflut nicht nur meteorologisch bedingt ist. Vielmehr setzt er sich aus den Komponenten vorausberechnete astronomische Tide, Fernwelle, Windstau und Seegang zusammmen (Abb. 2).
Abb. 2: Komponenten einer Sturmflut

Das Risiko von Extremsturmfluten in Ästuaren angesichts globalen Klimawandels 81
Bei der Untersuchung von Sturmfluten liegt der vorhergesagte Wasserstand zugrunde. Dieser kann, muss aber nicht durch eine Fernwelle aus dem Atlantik überlagert werden. Durch ein Sturmtief über der Deutschen Bucht werden die Wassermassen an die Küste gedrängt. Aufgrund der behinderten Strömung staut sich das Wasser auf. Diese Wasserstandserhöhung über den vorhergesagten Wasserstand hinaus wird Windstau genannt. Der erhöhte Wasserstand wird am Betrachtungsort von dem durch lokale Winde erzeugten Seegang überlagert.
3.1 Astronomische Tidekurve Die astronomische Tidekurve gibt die periodische Schwingung des Meeres wieder, die verursacht wird durch das Zusammenwirken von Schwer- und Fliehkräften, die bei der Bewegung des Mondes um die Erde und der Erde um die Sonne entstehen. Bei Neu- und bei Vollmond verstärken sich die Gezeiten bedingt durch die Überlagerung der Gezeitenkräfte von Mond und Sonne zur Springtide. Bei Halbmond werden die Gezeitenkräfte des Mondes zum Teil von der Sonne aufgehoben, es entsteht die flachere Kurve der Nipptide. Die mittlere Tidekurve ist die Ganglinie der arithmetisch gemittelten, einander zur Tidephase entsprechenden Wasserstände mehrerer Tidekurven für einen bestimmten Ort über eine bestimmte Zeitspanne (DIN 4049-3 1994), zumeist der letzten fünf Jahre. Dabei werden Tidekurven unterschiedlicher Mondphasen gemittelt, so dass die Differenzen von Spring- und Nipptide nicht mehr erkennbar sind. Bisher wurde für Untersuchungen zu Sturmfluten am Pegel Cuxhaven die mittlere Tidekurve verwendet. Diese Auswahl wurde aus rein pragmatischen Gründen getroffen: Die mittlere Tidekurve ist eine mit relativ geringem Rechenaufwand erzeugbare statistische Größe (Siefert 1968). Daneben bilden die mittleren Verhältnisse gut die mittlere physikalische Wechselwirkung Sturmflut – Tide ab, so dass sie einen guten Anhaltswert über die Stauentwicklung im jeweiligen Gebiet geben. (Siefert 1992) Die astronomische Tidekurve für jeden beliebigen Tag zu berechnen stellte in der Vergangenheit eine große Herausforderung an mathematischem Können und Zeitaufwand dar. Inzwischen stehen Programme zur Verfügung, mit denen die Berechnung der astronomischen Tidekurve mit vergleichbarem Aufwand durchgeführt werden kann. Auf diese Wiese wird es möglich, den astronomischen Einfluss von der Windwirkung formal zu trennen. Zudem erlaubt es empirische Untersuchungen zur Wechselwirkung zwischen Tide und Sturmflut. Somit besteht nun die Möglichkeit die auf Basis der mittleren Tidekurve ermittelten Anhaltswerte zum Charakter von Sturmfluten hinsichtlich der physikalischen Wechselwirkungen detaillierter zu untersuchen. Zur Berechnung der astronomischen Tidekurve gibt es zwei verschiedene Verfahren, die harmonische Synthese der Gezeiten und das nonharmonische Verfahren. Diese beiden Verfahren unterscheiden sich im Wesentlichen durch ihre räumlichen Anwendungsbereiche. Mittels der harmonischen Synthese kann der gesamte Verlauf der astronomischen Tidekurve berechnet werden. Dies ist jedoch nur für tiefes Wasser möglich, da die Flachwassereffekte nicht berücksichtigt werden können (Müller-Navarra 2008). Astronomische Kenngrößen, die diese Effekte beinhalten, können mit dem nonharmonischen Verfahren berechnet werden. Es können allerdings lediglich die Höhe und die Eintrittszeit der astronomischen Hoch- und Niedrigwasser bestimmt werden.
Harmonische Synthese der Gezeiten Die sichtbare Gezeitenbewegung setzt sich im Detail aus vielen einzelnen Tidekurven zusammen. Diese einzelnen Komponenten werden Partialtiden genannt. Dabei ist eine Partialtide „nichts weiteres, als eine Sinusfunktion, die über Frequenz f, Amplitude A und Phase ϕ beschrieben werden kann“ (Kastens 2007). Die Frequenzen f der Partialtiden sind aus der Lehre von den Bewegungen des Mondes und der Sonne bekannt und für jeden Ort gleich. Die Amplitude und die Phase hingegen sind ortsabhängig und können aus Zeitreihen der Wasserstände mittels der Harmonischen Analyse

82 Gönnert & Thumm
abgeleitet werden. Die Harmonische Analyse der Gezeiten ist eine spezielle Form der Fourierzerlegung einer Zeitreihe (BAW 2008) und beruht auf der Zerlegung der Gezeiten in ihre streng periodischen harmonischen Partialtiden (BSH 2008). Sind die Amplituden und Phasen der einzelnen Partialtiden an einem Ort bekannt, kann mittels der Harmonischen Synthese, d.h. Summation aller Partialtiden, eine Vorhersage des Wasserstandes für einen vorgegeben Zeitraum erfolgen (BAW 2008).
Nonharmonisches Verfahren Mit dem Nonharmonischen Verfahren können für Orte mit halbtägiger Gezeit die Eintrittszeiten und Höhen der Hoch- und Niedrigwasser vorausberechnet werden. Hierbei werden die Meridiandurchgangszeiten des Mondes mit den mittleren Hoch- und Niedrigwasser-Intervallen sowie den Ungleichheiten in Höhe und Zeit verrechnet. Gegebenfalls können Verbesserungen zur Berücksichtigung von lokalen Besonderheiten mit einbezogen werden (BSH 2008). Zur Abschätzung von Höhen und Zeiten zwischen den nonharmonisch ermittelten Hoch- und Niedrigwassern wird zu Zwecken der Schifffahrt vom BSH zum einen eine graphische und zum anderen eine rechnerische Einspannung der mittleren Spring- und Nipptidekurven zwischen dem Hoch- und Niedrigwasser empfohlen. Verfahrensbedingt können diese Werte bis zu 10 cm voneinander abweichen (BSH 2008).
Verknüpfung der Verfahren Für die wissenschaftliche Analyse von Sturmflutereignissen ist eine Ungenauigkeit von 10 cm zu hoch, so dass für die hier dargestellten Ergebnisse das harmonische mit dem nonharmonischen Verfahren mathematisch verknüpft wird. Diese Verknüpfung erfolgt dadurch, dass die harmonisch berechnete astronomische Tidekurve zwischen die nonharmonisch ermittelten Hoch- und Niedrigwasserwerte linear eingehängt wird. Hierdurch erhalten sowohl die zum jeweiligen Zeitpunkt wirkenden gezeitenverursachenden Kräfte sowie die lokalen Reibungs- und Reflektionsanteile Berücksichtigung (Thumm & Gönnert 2009).
3.2 Fernwelle Fernwellen entstehen durch Änderungen des Luftdrucks, die bei schnell ziehenden Tiefdruckgebieten über dem nördlichen Atlantik in Form von stark ausgeprägten Luftdruckgradienten auftreten. Dies führt zu einer Veränderung des Wasserspiegels in Form einer sowohl an der Oberfläche sichtbaren Welle, als auch einer internen Welle im Wasserkörper. Unabhängig zur Tidephase und ohne periodische Regelmäßigkeit laufen diese Wellen, ähnlich einer Tidewelle und in Abhängigkeit der Zugbahnen der Tiefdruckgebiete in die Nordsee ein (Gönnert 2003). Das die Fernwelle auslösende Tief und das sturmflutverursachende Tief können ein und dasselbe Tief jedoch auch zwei meteorologisch von einander unabhängige Ereignisse sein. Das bedeutet, dass Fernwellen und Sturmfluten getrennt von einander aber auch zeitgleich auftreten können. Anhand von Analysen von Aufzeichnungen des BSHs aus 20 Beobachtungsjahren (1971-1995, nicht 1974-1978) wurden 15 Fernwellen mit einer Höhe von 60 cm und mehr ermittelt. Die höchste Fernwelle erreichte ein Maximum von 109 cm. Jede fünfte bis sechste Sturmflut tritt zeitgleich mit einer Fernwelle größer 60 cm ein. Sie erreichen in Cuxhaven in etwa die Höhe der in Aberdeen einlaufenden Fernwellenhöhen mit Schwankungen von etwa +/- 20 % (Gönnert 2003).
3.3 Windstau Für die Ermittlung extremer Sturmfluten ist es wichtig zu verstehen, wie sich eine Sturmflut zeitlich entwickelt. Dieses ist nur bedingt über den Scheitelwasserstand zu erfassen, da in diesem der windinduzierte Wasserstand von der zugrunde liegenden Tide überdeckt wird. Von Interesse ist also

Das Risiko von Extremsturmfluten in Ästuaren angesichts globalen Klimawandels 83
die Betrachtung des Windstaus, der die Differenz zwischen dem eingetretenen und dem vorausberechneten Wasserstand ist. Er spiegelt den zeitlichen Verlauf und die Höhe der in den Wasserkörper eingetragenen Energie und somit den physikalischen Wert einer Sturmflut wieder. Der Windstau am Pegel Cuxhaven wird maßgeblich durch die Windverhältnisse in der Deutschen Bucht geprägt. Desweiteren enthält er Einflüsse aus dem statischen Luftdruck, Änderungen des Luftdrucks, Wassertempereatur und Temperaturdifferenz Luft-Wasser. (Siefert 1968, Gönnert 2003) Für die Charakterisierung einer Sturmflut sind drei Merkmale der Windstaukurve von Interesse: Die Höhe des Windstaumaximums, dessen Lage zur Tidephase und der Windstauverlauf. Durch die Höhe eines Windstaumaximums kann der Energieeintrag des Windes erfasst werden, durch die Eintrittszeit des Windstaumaximums und die Kurvenform die Auswirkungen auf den absoluten Wasserstand. (Gönnert 2003) Bei bisherigen Untersuchungen für den Pegel Cuxhaven basiert die Windstauberechnung auf der mittleren Tidekurve. Diese Untersuchungen umfassen ein Kollektiv, das alle Sturmfluten seit 1901 beinhaltet, die 200 cm Windstau und einen Scheitelwasserstand größer MThw + 150 cm erreichten. Bis 2008 umfasst das Kollekitiv 259 Sturmflutscheitel. Sie bilden die Grundlage für die Bemessung des Hochwasserschutzes entlang der Elbe. Das diesem Projekt zugrunde liegende Kollektiv wird auf Basis der astronomischen Tidekurve berechnet, da es erklärtes Ziel des Projektes ist, nicht nur die Sturmflutkurve, die alle Einflüsse auf den Wasserstand umfasst, sondern auch die Einzelkomponenten und deren Wechselwirkungen physikalisch zu untersuchen. Werden Untersuchungen, die die Grundlage für den Schutz eines großen Lebensraumes sind, auf veränderter Basis erstellt, muss eine Gegenüberstellung der Ergebnisse erfolgen, so dass erkennbar wird, inwieweit sich maßgebende Grenzwerte bzw. Schlüsselereignisse verändert darstellen. Zum Erlangen eines ersten Überblickes über die Unterschiede zwischen den auf verschiedenen Tidekurven basierenden Windstaukurven wurden die Windstaumaxima der erfassten Sturmfluten mit einander verglichen. Es wurden für jede Sturmflut die Windstaukurve basierend auf der astronomischen und der mittleren Tidekurve berechnet und jeweils die Höhe und die Eintrittszeit des Windstaumaximums erfasst. Des Weiteren wurden die Höhenabweichungen der Windstaumaxima und die Unterschiede ihrer Eintrittszeiten ermittelt. Im Durchschnitt liegt das Maximum der Windstaukurve basierend auf der astronomischen Tidekurve 6,5 cm niedriger als das Maximum der Windstaukurve basierend auf der mittleren Tidekurve. Die Abweichungen liegen insgesamt zwischen -59 cm und +51 cm. Die Hälfte der Windstaumaxima weisen eine Differenz von ±15 cm auf. Die maximalen Abweichungen treten zum einen bei Sturmfluten auf, bei denen die Windstaumaxima zeitnah zu den vorausberechneten Hoch- und Niedrigwasserzeiten eintreten, so dass die am Pegel Cuxhaven durch Spring- und Nipptide bedingten Unterschiede in den Tidekurven in den Windstaumaxima wiederzuerkennen sind. Zum anderen ergeben sich die maximalen Abweichungen im Bereich der Tideäste, da die astronomische Tidekurve bedingt durch die täglichen Ungleichheiten auch in diesen Bereichen von der mittleren Tidekurve abweicht. Die zeitliche Differenz zwischen den Eintrittszeiten der Windstaumaxima beträgt zu 90 % ±90 Minuten. Bei Windstaukurven mit langen Scheitelbereichen kann ein großer zeitlicher Versatz der Windstaumaxima von bis zu 3 Tidezyklen entstehen. Detaillierte Betrachtungen zeigen jedoch, dass es sich hier um in der Höhe variierende Spitzen der Scheitelbereiche handelt, die auch jeweils in der anderen Windstaukurve zu erkennen sind. Es handelt sich nicht um neu ausgeprägte Windstauscheitelbereiche. Die beiden Sturmfluten, die bei Berücksichtigung der mittleren Tidekurve den höchsten Windstau um Tnw bzw. Thw aufwiesen, wurden aufgrund der neuen Untersuchungen nicht von anderen Ereignissen abgelöst. Das Windstaumaximum lag jedoch in beide Fällen höher als die bisher bekannten Werte, so

84 Gönnert & Thumm
dass die für den derzeitigen Bemessungswasserstand relevante Windstauhöhe von 385 cm auf 400 cm angehoben werden müsste. Ergänzende statistische Analysen der beiden so entstandenen Kollektive haben gezeigt, dass sich die statistischen Verteilungsfunktionen über die Jährlichkeit nicht wesentlich voneinander unterscheiden. Dieses Ergebnis ist plausibel, da es erklärtes Ziel der Statistik ist, die mittleren Abweichungen auszugleichen, dies bedeutet, dass auch die Statitisik auf Basis der astronomischen Tidekurve Auskunft über die mittleren Verhältnisse gibt. (Mudersbach & Jensen 2009) Analysen von Gönnert (2003) haben ergeben, dass die Höhe des Windstaumaximums von der Anstiegsneigung der Windstaukurve abhängt. So können z.B. am Pegel Cuxhaven extrem hohe Windstaumaxima (> 390 cm) nur bei sehr steilem Windstauanstieg entstehen, am Pegel Helgoland sind hierfür flache, langsame Antiege nötig. Desweiteren ist bekannt, dass der maßgebende Einfluss auf die Form der Windstaukurve bei einer gewissen Windgeschwindigkeit von der Tidekurve auf den Wind übergeht (Bremer & Gönnert 2009). Zudem hat ein Vergleich der Windstaukurven auf Basis der astronomischen und der mittleren Tidekurve ergeben, dass die astronomisch basierte Windstaukurve die Windverhältnisse wesentlich besser wiederspiegelt (Abb. 3) (Gerkensmeier 2009). Diese Ergebnisse zeigen, dass es relevante Unterschiede in der Kurvenform gibt. Diese Unterschiede liefern plausible Indizien dafür, dass die Betrachtung eines Sturmflutereignisses basierend auf der astronomischen Tidekurve physikalisch exakter ist.
Abb. 3: Vergleich des Windstaus auf Basis der astronomischen und mittleren Tidekurve am Beispiel der Sturmflut vom 02.11.1965 (Gerkensmeier 2009)
3.4 Seegang Der Seegang wird vom lokalen Wind verursacht. Da die vorliegenden Untersuchungen am Pegel Cuxhaven die Grundlage für die Sturmfluten im 130 km elbaufwärts liegenden Hamburg sind, werden diese lokalen Effekte momentan nicht mit untersucht. Für die letztendlichen Untersuchungen der extremen Sturmfluten in Hamburg werden die dortigen Seegangsbedingungen miteinbezogen.
Das Risiko von Extremsturmfluten in Ästuaren angesichts globalen Klimawandels 85
4 Überlagerung der Sturmflutkomponenten Eine Wasserstandserhöhung an der Küste entsteht durch die behinderte Rückströmung (Abb. 2). Das Ausmaß der Behinderung hängt von der über die Höhe des Wasserkörpers wirkenden Sohlreibung ab. Bei niedrigem Wasserstand hat die Sohlreibung eine größere aufstauende Wirkung als bei hohen Wasserständen. Aufgrund dieser grundlegenden physikalischen Prozesse bei der Entstehung einer Sturmflut ist davon auszugehen, dass sich die Einzelkomponenten einer Sturmflut nicht linear überlagern. Ziel dieser Untersuchungen ist es herauszufinden, wie sich diese Einzelkomponenten bei zeitgleichem Auftreten gegenseitig beeinflussen. Untersuchungen zur Fragestellung, wie sich eine Fernwelle auf den Windstau auswirkt, ergaben, dass die zugrundeliegenden Datenauswertungen des BSHs keine ausreichende Grundlage für physikalisch plausible Untersuchungen bilden. Bei der Bestimmung der Fernwellenhöhen wurde mittels der Windbedingungen ein statistisch ermittelter Windstau von dem gemessenen Wasserstand abgezogen. Somit ist bei den zugrunde liegenden Daten unklar, inwieweit die Verläufe des berechneten Windstaus und der berechneten Fernwelle die vorliegenden Prozesse physikalisch korrekt widerspiegeln. Da bekannt ist, dass der Windstau an der Küste durch die behinderte Rückströmung entsteht, also bei konstantem Wind bei niedrigem Wasserstand höher ist als bei hohem Wasserstand, kann davon ausgegangen werden, dass beim Zusammentreffen einer Sturmflut mit einer Fernwelle, die Komponenten des Windstaus kleiner und die der Fernwelle größer sind als vom BSH berechnet. Aus verschiedenen numerischen Untersuchungen ist bekannt, dass eine Springtideerhöhung im Vergleich zu einer mittleren Tide bei schweren Sturmfluten nur eine geringe bis hin zu gar keine Auswirkung auf den Sturmflutscheitel hat (Dick 2000; Mayerle et al. 2009). Erste Ergebnisse von zurzeit noch andauernden empirischen Untersuchungen im Rahmen des Projektes zeigen, dass bei der Betrachtung des Zusammenhangs zwischen Wind und Windstau die zum betrachteten Zeitpunkt vorausberechnete Tide für die Höhe des Windstaus nicht relevant ist. Vielmehr ist analog zu den Erkenntnissen, dass für den Windstau der drei Stunden vor dem Betrachtungszeitpunkt vorherrschende Wind maßgebend ist (Siefert 1968), ein diesem Zeitfenster zugrundeliegender Wasserstand in die Betrachtung mit einzubeziehen. Es ist davon auszugehen, dass dieser zugrundeliegende Wasserstand nicht wie bisher angenommen die vorausberechnete Tidekurve sondern der tatsächlich eingetretene Wasserstand ist. Anhand dieser Ergebnisse ist es plausibel, dass eine Springtideerhöhung sich im Scheitelbereich des Wasserstandes schwerer Sturmfluten nicht niederschlägt, da zu diesem Zeitpunkt und 3 Stunden vorher der vorausberechnete Wasserstand schon um mehr als 300 cm erhöht ist. Aus diesen Ergebnissen kann gefolgert werden, dass es für den Verlauf der Windstaukurve, d.h. ihre Anstiegsneigung, welche die Höhe des Windstauscheitels maßgeblich beeinflusst, relevant ist, ob eine Spring- oder eine Nipptide vorliegt. Der Höhenunterschied am Pegel Cuxhaven zwischen den Scheitelwerten von Spring- und Nipptide beträgt bis zu 120 cm, welche sich bei schwachen Winden und niedrigen Windstauwerten im eingetretenen Wasserstand niederschlagen. Zusätzlich zu diesen Untersuchungen der Physik von Sturmfluten unter heutigen Klimabedingungen sollen im weiteren Verlauf des Projektes die Folgen eines möglichen Klimawandels in Form von Meeresspiegelanstieg und Zunahme der Sturmintensität auf die Entstehung von Sturmfluten betrachtet werden.
Literatur BAW (2008): Bundesanstalt für Wasserbau: Gezeitenanalyse des Wasserstandes
(www.baw.de/vip/abteilungen/wbk/Methoden/kenn/frqw/frqw-de.html, Zugriff vom 16.06.2008). BSH (2008): Bundesamt für Seeschifffahrt und Hydrographie: Gezeitentafeln Europäische Gewässer 2008.

86 Gönnert & Thumm
Bremer, J.-A. & G. Gönnert (2009): Das Zusammenwirken von Tide und Sturmflut im Ästuar. In: Vött, A. & H. Brückner (Hrsg.): Beiträge zur 26. Jahrestagung des Arbeitskreises „Geographie der Meere und Küsten“, Marburger Geographische Schriften (MGS), Band 145, Marburg.
Dick, S. (2000):Die Sturmflut am 03. Dezember 1999, Fallstudien mit dem Windstaumodell des BSH, Vortrag BAW-Kolloqium November 2000, Hamburg.
DIN 4049-3 (1994): Deutsche Norm: Hydrologie. Teil 3: Begriffe zur quantitativen Hydrologie. Gerkensmeier, B. (2009): Zur Interaktion von Tide und Windstau bei Starkwindlagen – Eine erste
Grundlagenanalyse über Windstauvergleiche. Universität Bremen, Bachelorarbeit (unveröffentlicht). Gönnert, G. (2003): Sturmfluten und Windstau in der Deutschen Bucht. In: Die Küste 67: 185–365. IPCC (2007): Climate change (2007): The physical science basis - Summary for policymakers. Intergovermental
Panel on Climate Change (IPCC), Genf, Schweiz, 21 p. Kastens, M. (2007): Gutachten Tidewasserstandsanalysen in Ästuaren am Beispiel der Unter- und Außenelbe.
Bundesanstalt für Wasserbau, Hamburg, 72 S. Länder-Arbeitsgruppe (1988): Bemessungswasserstände entlang der Elbe. In: Die Küste 47: 31–50. Mayerle, R., G. Bruss & R. Osinski (2009): Zwischenbericht zur Untersuchung „Sturmflutsituationen Nordsee“
(unveröffentlicht). Mudersbach, C. & J. Jensen (2009): Statistische Analysen zum Windstau am Pegel Cuxhaven, Universität
Siegen (unveröffentlicht). Müller-Navarra (2008): Sturmfluten und Verfahren zur Berechnung der astronomischen Tidekurve (mündliche
Auskunft). Oumeraci, H. (2004): Sustainable coastal flood defences: scientific and modelling challenges towards an
integrated risk-based design concept. Keynote lecture, Proceedings First IMA International Conference on Flood Risk Assessment, Session 1, Institute of Mathematics and its Applications, Bath, UK, pp. 9–24.
Oumeraci, H. (2009): Vortrag beim XtremRisk-Workshop März 2009, Hamburg. Siefert, W. (1968): Sturmflutvorhersagen für den Tidebereich der Elbe aus dem Verlauf der Windstaukurven in
Cuxhaven. In: Mitteilungen des Franzius-Institutes für Grund- und Wasserbau der TU Hannover 30: 1–142. Siefert, W. (1992): Zur Windstauentwicklung in der südöstlichen Nordsee. In: Die Küste 53: 1–28. Thumm, S. & G. Gönnert (2009): Windstauanalyse: Vergleich der Windstaumaxima basierend auf der
astronomischen und der mittleren Tidekurve am Pegel Cuxhaven. Freie und Hansestadt Hamburg, Landesbetrieb Straßen, Brücken und Gewässer (unveröffentlicht).
Addresse Dr. habil. Gabriele Gönnert Landesbetrieb Strassen, Brücken und Gewässer Sachsenkamp 1-3 20007 Hamburg, Germany

G
AbstracThassrishaFuIn anEuThbadikThristhe
1 EinDie EG-HochwaHochwaunterglieErstellunEreignisDarauf erfolgenDa die RminimalFestleguUnter deLand, daÜberfluteindringder Richder hochUmwelt,
SchwarzerFrom BrazCoastlineS. 87-96
GIS-gestüB
K
ct he “Directive sessment and sk managemenzard maps an
urthermore it dthis study an
alysis and risuropean Commhe damage potsed inundationke in Hamburghe procedure’ssk managemene Directive.
nleitung -Richtlinie 2asserrisiken asserrisikomaedert. Sie sieng von Hocse mit mittaufbauend
n. Richtlinie zwe Festlegung
ung von einheem Begriff „as normalerwtung kann endes Meerw
htlinie als „Khwasserbedi, das Kulture
r, Schrottke &zil to Thailand e Reports 16 (
ützte AnalBerücksic
Kristina Sos1Univers
2Landesbetrie
of the Euromanagement nt. It intends
nd flood risk demands the en analysis of sk assessmenmunity. tential evaluatn model is useg. s suitability font plans. More
007/60/EG vlegt ein EU
anagements eht neben einchwassergefatlerer Wahrssoll bis En
war die einzgen trifft, weitlichen Vor„Hochwasseweise nicht sowohl durwasser hervo
Kombination ingten potenerbe und wirt
& Stattegger (e– New Result
(2010), ISSN 0
lyse des Ühtigung d
ssidi1, Gabri
sität Hamburgeb Straßen, Br
opean Parliamof flood risksbeside a pre
maps for extrestablishing off the storm sunt – is carried
tion is based oed for the sim
or the implemeover drafts h
vom 23. OktU-weit einhefest. Die Riner vorläufigahren- und scheinlichkende 2015 d
zelnen Schriwird über die
rgehensweiser“ ist laut d
mit Wasserrch Flüsse orgerufen weder Wahrsch
nziellen nachtschaftliche T
eds.): ts in Coastal R0928-2734, IS
Überflutunder EG-H
iele Gönner
g, Fachbereichrücken und Ge
ment and of s” contitutes stliminary flooreme event scf flood risk maurge risk – cod out for Ha
on the digital cmulation of sto
mentation of thave been prep
tober 2007 üeitliches unichtlinie ist gen BewertuHochwasserit und Extr
die Erstellun
itte des Risie Möglichkeen viel disku
der Richtlinir bedeckt istoder Gebirgerden. Das Hheinlichkeit dhteiligen FoTätigkeiten“
Research SBN 978-3-98
ngsrisikosHochwasse
rt2 & Dieter
h Geographie, ewässer Hamb
the Council tandardized and risk assessmcenarios and eanagement plaonsisting of h
amburg in res
cadastral maporm surge even
he Directive ipared for haza
über die Bewnd koordiniein drei aufe
ung des Hochrrisikokartenremereignisseng von Hoc
ikomanagemeiten zur Umutiert. e die „zeitlit“ zu verstehgsbäche alsHochwasserrdes Eintritts olgen auf di
definiert.
11839-9-3
s in Hamberrichtlini
Ackermann
Germany burg, Germany
of 23 Octobnd coordinatement the prodevents of medans. hazard analysspect of the D
p and official snts and possib
s examined inard and risk m
wertung und dertes Vorgehinander aufbhwasserrisiko
n bis Ende e berücksichchwasserrisik
ments vorgibtmsetzung der
ich beschränhen (Artikel auch durcrisiko wird ieines Hochwie menschli
burg unteie
n2
y
ber 2007 on ed action in floduction of flodium likeliho
sis, vulnerabilDirective of
statistics. A Gble burstings o
n regard to flomaps according
das Managemhen im Berbauende Teios bis Ende 2013 vor, ihtigt werdenkomanageme
t, inhaltlich r Richtlinie
nkte Überflul 2 Absatz ch in Küstein Artikel 2 wasserereignche Gesund
er
the ood ood od.
lity the
GIS-of a
ood g to
ment von reich des lbereiche 2011 die in denen n sollen. entplänen
aber nur und eine
tung von 1). Diese engebiete Absatz 2
nisses und dheit, die

88 Sossidi et al.
Die durchgeführte Analyse soll einen Beitrag zu dieser Diskussion leisten, indem sie am Beispiel Hamburgs untersucht, wie die Vorgaben der Richtlinie umgesetzt werden könnten. Dabei liegt der Fokus auf dem Sturmflutrisiko. Der Schwerpunkt der Untersuchung liegt auf der Entwicklung einer GIS-gestützten Methodik zur Abschätzung der Schäden in verschiedenen Sturmflutszenarien, die auch als Grundlage für die Maßnahmenplanung im Risikomanagement herangezogen werden kann. Diese soll möglichst genau und dabei schnell durchführbar und aktualisierbar sein. Ein weiteres Ziel ist die Entwicklung eines möglichen Vorgehens zur Erstellung von Gefahren- und Risikokarten. Dafür wird auf die im Landesbetrieb Straßen, Brücken und Gewässer (LSBG) der Stadt Hamburg zur Verfügung stehenden Daten und Programme zurückgegriffen und deren Eignung für die Umsetzung der Richtlinie untersucht.
2 Untersuchungsgebiete Um im Rahmen dieser Untersuchung möglichst unterschiedlich strukturierte Gebiete berücksichtigen zu können, wurden als Untersuchungsgebiete zum einen der dicht bebaute Stadtteil Veddel und zum anderen das vergleichsweise ländlich geprägte Überschwemmungsgebiet der Dove-Elbe ausgewählt. Abb. 1 zeigt die Lage der beiden Untersuchungsgebiete (schwarz umrandete Flächen) innerhalb der tief liegenden Gebiete (hellgraue Fläche).
Abb. 1: Lage der Untersuchungsgebiete in Hamburg (Datenquelle: LSBG)
Der Stadtteil Veddel hat eine Fläche von 4,37 km2. Er liegt östlich des Hamburger Hafens und umfasst die Insel Peute, den östlichen Teil der Insel Veddel sowie einen schmalen Streifen im Norden der Insel Wilhelmsburg. Im Westen des Stadtteils Veddel befindet sich ein vollständig eingedeichtes Wohngebiet, das an seinem westlichen Rand durch den S-Bahn-Damm begrenzt wird. Die Autobahn 255 trennt das Wohngebiet vom Industrie- und Gewerbegebiet auf der Peute im Osten der Veddel. Das Überschwemmungsgebiet der Dove-Elbe ist 5,31 km2 groß und wird durch Deiche begrenzt. Im Westen ist es durch die Tatenberger Schleuse von der Elbe abgetrennt. Das Überschwemmungsgebiet der Dove-Elbe liegt in den Vier- und Marschlanden, die für den Blumen- und Gemüseanbau bekannt sind. Im Nordwesten des Gebietes befindet sich ein Wohngebiet; an mehreren Stellen im östlichen
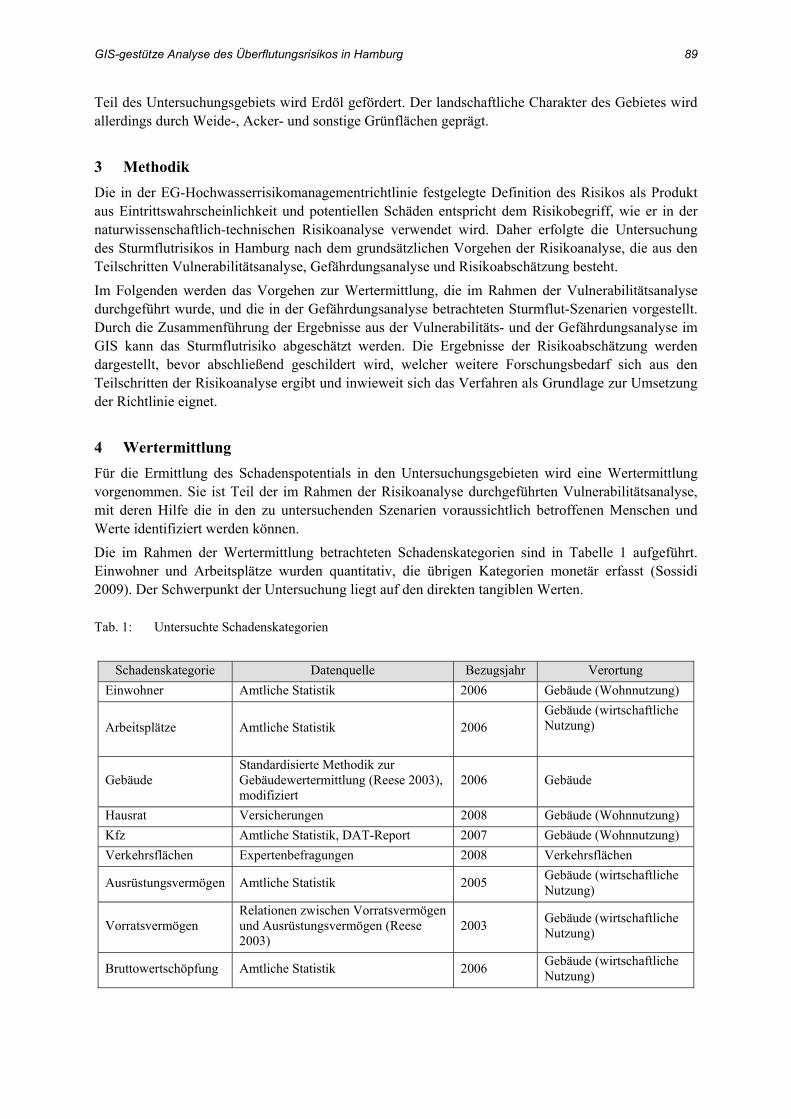
GIS-gestütze Analyse des Überflutungsrisikos in Hamburg 89
Teil des Untersuchungsgebiets wird Erdöl gefördert. Der landschaftliche Charakter des Gebietes wird allerdings durch Weide-, Acker- und sonstige Grünflächen geprägt.
3 Methodik Die in der EG-Hochwasserrisikomanagementrichtlinie festgelegte Definition des Risikos als Produkt aus Eintrittswahrscheinlichkeit und potentiellen Schäden entspricht dem Risikobegriff, wie er in der naturwissenschaftlich-technischen Risikoanalyse verwendet wird. Daher erfolgte die Untersuchung des Sturmflutrisikos in Hamburg nach dem grundsätzlichen Vorgehen der Risikoanalyse, die aus den Teilschritten Vulnerabilitätsanalyse, Gefährdungsanalyse und Risikoabschätzung besteht. Im Folgenden werden das Vorgehen zur Wertermittlung, die im Rahmen der Vulnerabilitätsanalyse durchgeführt wurde, und die in der Gefährdungsanalyse betrachteten Sturmflut-Szenarien vorgestellt. Durch die Zusammenführung der Ergebnisse aus der Vulnerabilitäts- und der Gefährdungsanalyse im GIS kann das Sturmflutrisiko abgeschätzt werden. Die Ergebnisse der Risikoabschätzung werden dargestellt, bevor abschließend geschildert wird, welcher weitere Forschungsbedarf sich aus den Teilschritten der Risikoanalyse ergibt und inwieweit sich das Verfahren als Grundlage zur Umsetzung der Richtlinie eignet.
4 Wertermittlung Für die Ermittlung des Schadenspotentials in den Untersuchungsgebieten wird eine Wertermittlung vorgenommen. Sie ist Teil der im Rahmen der Risikoanalyse durchgeführten Vulnerabilitätsanalyse, mit deren Hilfe die in den zu untersuchenden Szenarien voraussichtlich betroffenen Menschen und Werte identifiziert werden können. Die im Rahmen der Wertermittlung betrachteten Schadenskategorien sind in Tabelle 1 aufgeführt. Einwohner und Arbeitsplätze wurden quantitativ, die übrigen Kategorien monetär erfasst (Sossidi 2009). Der Schwerpunkt der Untersuchung liegt auf den direkten tangiblen Werten.
Tab. 1: Untersuchte Schadenskategorien
Schadenskategorie Datenquelle Bezugsjahr Verortung Einwohner Amtliche Statistik 2006 Gebäude (Wohnnutzung)
Arbeitsplätze Amtliche Statistik 2006 Gebäude (wirtschaftliche Nutzung)
Gebäude Standardisierte Methodik zur Gebäudewertermittlung (Reese 2003), modifiziert
2006 Gebäude
Hausrat Versicherungen 2008 Gebäude (Wohnnutzung) Kfz Amtliche Statistik, DAT-Report 2007 Gebäude (Wohnnutzung) Verkehrsflächen Expertenbefragungen 2008 Verkehrsflächen
Ausrüstungsvermögen Amtliche Statistik 2005 Gebäude (wirtschaftliche Nutzung)
Vorratsvermögen Relationen zwischen Vorratsvermögen und Ausrüstungsvermögen (Reese 2003)
2003 Gebäude (wirtschaftliche Nutzung)
Bruttowertschöpfung Amtliche Statistik 2006 Gebäude (wirtschaftliche Nutzung)
90 Sossidi et al.
Die Methodik greift zu einem großen Teil auf Daten der amtlichen Statistik zurück, um eine einfache Aktualisierbarkeit der Wertermittlung zu gewährleisten. Diese Daten lagen allerdings in unterschiedlicher Genauigkeit vor. So wird beispielsweise das Ausrüstungsvermögen für 14 Wirtschaftsbereiche getrennt aufgeführt, die Anzahl der Erwerbstätigen und die Höhe der Bruttowertschöpfung dagegen werden nur für sechs übergeordnete Wirtschaftsbereiche angegeben. Während diese Daten sich auf ganz Hamburg beziehen, gab es für die Anzahl der Einwohner und Pkws Daten auf Stadtteilbasis. Waren keine Daten aus der Statistik verfügbar, wurden diese durch Expertenbefragungen gewonnen oder wissenschaftlichen Veröffentlichungen entnommen. Die ermittelten Werte werden in ArcGIS in Gebäuden unterschiedlicher Nutzung verortet bzw. den Verkehrsflächen zugeordnet. Als Grundlage hierfür dient die Digitale Stadtgrundkarte (DSGK) 1:1.000. In ihr sind neben anderen thematischen Layern auch die Gebäude Hamburgs als Polygone enthalten. Zu jedem Gebäude finden sich in der Attributtabelle u.a. Angaben zur Adresse, der Grundfläche, der Anzahl der Geschosse und der Gebäudenutzung. Die Verkehrsflächen werden aus der Digitalen Karte 1:5.000 (DK5) übernommen.
5 Sturmflut-Szenarien Die Untersuchung von Sturmflut-Szenarien fällt in den Bereich der Gefährdungsanalyse. Durch die Verknüpfung der Ergebnisse der hier vorgenommenen Sturmflutsimulation mit den Ergebnissen der Wertermittlung im GIS können die in den Szenarien zu erwartenden Schäden abgeschätzt werden. Die Simulation der Szenarien erfolgte mit dem Programm HWSIM, das im Folgenden vorgestellt wird. Anschließend erfolgt eine Beschreibung der betrachteten Szenarien und der getroffenen Annahmen zur Identifizierung möglicher Deichbrüche.
Das Programm HWSIM Das Programm HWSIM wurde als Erweiterung unter ArcGIS für die Durchführung von Hochwassersimulationen für die Elbmarsch entwickelt. Im Programm wurde die öffentliche Hochwasserschutzlinie Hamburgs berücksichtigt, so dass es möglich ist, Deichbrüche und ihre Auswirkungen in der Simulation zu untersuchen. Da die öffentlichen Hochwasserschutzanlagen in Hamburg im Rahmen des “Bauprogramm Hochwasserschutz” laufend bis voraussichtlich 2012 an die Bemessungswasserstände angepasst werden, spiegeln die in der Programmdatenbank enthaltenen Informationen allerdings nicht immer den aktuellen Ausbauzustand der Hochwasserschutzanlagen wider. Im Rahmen des Bauprogramms werden alle Hochwasserschutzanlagen um durchschnittlich 1 m erhöht (Landesbetrieb Straßen, Brücken und Gewässer 2007). An der Aktualisierung der Datenbank wird zur Zeit gearbeitet.
Sturmflutwasserstände am Pegel St. Pauli Sturmflutscheitelwasserstände einer bestimmten Jährlichkeit können mit Hilfe statistischer Analysen von Pegelaufzeichnungen bestimmt werden. Für die Ermittlung von seltenen und sehr seltenen Scheitelwasserständen in Tideästuaren wie dem Elbeästuar ist die Anwendung von statistischen Verfahren allerdings nicht geeignet, da die Zeitreihen an diesen Pegelstandorten stark durch Ausbaumaßnahmen beeinflusst sind (Gönnert & Ferk 1996) und daher nicht den Anforderungen für Zeitreihenuntersuchungen genügen. Hinzu kommt die Problematik der Tidedynamik im Ästuar und der Einfluss des Oberwasserzuflusses (Jensen et al. 2003). Scheitelwasserstände mit einem Wiederkehrintervall von 100 Jahren wurden dagegen sowohl für Küstenpegel als auch für die Pegel im Elbeästuar mit statistischen Verfahren ermittelt und durch umfangreiche Untersuchungen verifiziert. Am Pegel St. Pauli beträgt dieser Scheitelwasserstand NN + 6,60 m (Jensen & Frank 2003). Zur Abschätzung eines Scheitelwasserstandes für ein Extremereignis am Pegel St. Pauli wurden die im MUSE-Projekt (Jensen & Mudersbach 2005) für den Pegel Cuxhaven berechneten extremen

GIS-gestütze Analyse des Überflutungsrisikos in Hamburg 91
Scheitelwasserstände herangezogen. Anhand der Differenz der für ein 100-jährliches Sturmflutereignis ermittelten Scheitelwasserstände an den Pegeln Cuxhaven und St. Pauli wurde aus den Angaben für den Pegel Cuxhaven ein seltener Sturmflutscheitelwasserstand für den Pegel St. Pauli abgeleitet. Dieser entspricht mit NN + 7,22 m in etwa dem Bemessungswasserstand, auf den die Hochwasserschutzanlagen im Rahmen des Bauprogramms angepasst werden (Gönnert 2007). In der Datenbank des verwendeten Simulationsprogramms sind bislang nicht für alle Deiche die Sollhöhen entsprechend der neuen Bemessungswasserstände enthalten. Daher ist zu erwarten, dass es bei der Simulation von Sturmfluten mit Scheitelwasserständen in der Größenordnung des Bemessungswasserstands in HWSIM an den noch zu aktualisierenden Deichabschnitten zu Deichbrüchen kommen kann. Ein solcher Sturmflutscheitelwasserstand eignet sich somit gut, um das im nächsten Abschnitt dargestellte Verfahren zur Identifizierung möglicher Deichbrüche anzuwenden. Auf Grundlage dieser Überlegungen wurden folgende Szenarien berechnet:
Szenario 1 Scheitelwasserstand Pegel St. Pauli: 6,60 m NN Oberwasserzufluss: 1000 m3/s
Szenario 2 Scheitelwasserstand Pegel St. Pauli: 7,22 m NN Oberwasserzufluss: 1000 m3/s
Deichbrüche Da während der Sturmfluten 1962 und 1976 Deichbrüche meist an Stellen auftraten, die vorher bereits durch Überströmen oder Wellenüberlauf beschädigt worden waren (Freistadt 1962, Traeger 1962, Zitscher et al. 1979), wurden in der Simulation von Strumflutereignissen diese beiden Schadensmechanismen als mögliche Ursachen eines Deichbruchs in den Mittelpunkt gestellt. Für die Szenarioberechnungen wurden folgende Annahmen getroffen (Sossidi 2009):
Ein Deichbruch durch Wellenüberlauf erfolgt bei einer Überlaufmenge > 0,03 m3 pro s pro m; er beginnt 5 Minuten nach Überschreiten dieses Grenzwertes, hat nach 30 Minuten seine maximale Tiefe (die Deichsohle) und nach 60 Minuten seine maximale Breite (100 m) erreicht.
Ein Deichbruch durch Überströmen erfolgt bei einer Überströmmenge > 0,0005 m3 pro s pro m; er beginnt auf der gesamten Breite des betroffenen Deichabschnitts, sobald diese zulässige Überströmrate überschritten wird, und hat nach 30 Minuten seine maximale Tiefe (die Deichsohle) erreicht.
Der Bruch einer Hochwasserschutzwand erfolgt bei einer Überlauf- bzw. Überströmmenge > 0,2 m3 pro s pro m sofort auf maximaler Breite und Tiefe (abhängig von den Maßen der Hochwasserschutzwand).
6 Auswertung Unter den genannten Annahmen ist in Szenario 1 die Deichsicherheit nicht gefährdet. In Szenario 2 kommt es an zwei Deichabschnitten zu Deichbrüchen. Ein Vergleich der Deichhöhen aus der HWSIM-Datenbank mit den in der vom Landesbetrieb Straßen, Brücken und Gewässer der Stadt Hamburg herausgegebenen Karte “Tiefliegende Gebiete in Hamburg mit Hochwasserschutzanlagen“ (Stand: Januar 2007) angegebenen Sollhöhen der Hochwasserschutzanlagen zeigt, dass die Deichabschnitte, an denen es in der Szenarioberechnung zu Deichbrüchen kommt, inzwischen um bis zu 0,9 m erhöht worden sind. Es kann also davon ausgegangen werden, dass eine Sturmflut mit einem Scheitelwasserstand von 7,22 m NN am Pegel St. Pauli unter Berücksichtigung des heutigen Ausbauzustandes der Hochwasserschutzanlagen nicht zu Deichbrüchen führt.

92 Sossidi et al.
Abbildung 2 zeigt den jeweiligen Anteil der in den Szenarien betroffenen Landfläche der Untersuchungsgebiete. Das Überschwemmungsgebiet der Dove-Elbe ist in keinem der Szenarien von Überflutung betroffen. Dies ist auf die Tatenberger Schleuse zurückzuführen, welche die Dove-Elbe von der Elbe und der Gezeiteneinwirkung im Ästuar abtrennt. Solange die Schleuse während einer Sturmflut geschlossen ist, muss in diesem Gebiet also nicht mit Überflutungen gerechnet werden.
Abb. 2: Anteil der in den Szenarien betroffenen Landfläche
In Szenario 1 sind auf der Veddel 55 der 755 Gebäude von Überflutungen betroffen, in Szenario 2 sind es 505 Gebäude. Abbildung 3 zeigt, dass in beiden Szenarien der größte Teil der betroffenen Gebäude (Szenario 1: 48 Gebäude, Szenario 2: 388 Gebäude) nur über ein Stockwerk verfügt. Betrachtet man nun die Wohngebäude gesondert, zeigt sich, dass in Szenario 1 von den acht betroffenen Wohngebäuden fünf keine Rückzugsmöglichkeit in ein höher gelegenes Stockwerk bieten. In Szenario 2 sind 27 Wohngebäude betroffen, von denen 13 nur ein Stockwerk besitzen.
Abb. 3: Betroffene Gebäude auf der Veddel nach Stockwerkszahl
In Szenario 1 wurden ca. 73 Einwohner im überfluteten Gebiet lokalisiert; dies entspricht 1,5 % der Einwohner des Stadtteils. In Szenario 2 leben ca. 539 Personen (bzw. 10,9 % der Einwohner des Stadtteils) im potentiell überfluteten Gebiet. Das direkte tangible Schadenspotential im betroffenen Gebiet liegt in Szenario 1 bei 31.272.200 €. In Szenario 2 beträgt der Wert 3.791.969.600 €. Diese Angaben beziffern nicht den zu erwartenden Schaden, sondern den Wert des direkten tangiblen Schadenspotentials im überfluteten Gebiet. Abbildung 4 und 5 zeigen den Anteil der einzelnen Schadenskategorien an diesen Gesamtwerten.

GIS-gestütze Analyse des Überflutungsrisikos in Hamburg 93
Abb. 4: Anteil der Schadenskategorien am monetären Schadenspotential der betroffenen Gebiete in Szenario 1
In Szenario 1 werden ca. 107 Arbeitsplätze (0,6 % der Arbeitsplätze im Stadtteil) im betroffenen Gebiet lokalisert. Mit diesen ist eine jährliche Bruttowertschöpfung in Höhe von 7.374.412 € verbunden. In Szenario 2 sind es 15.272 Arbeitsplätze (84,8 %) und eine Bruttowertschöpfung von jährlich 1.307.798.659 €.
Abb. 5: Anteil der Schadenskategorien am monetären Schadenspotential der betroffenen Gebiete in Szenario 2
Auf Grundlage der in dieser Untersuchung erzielten Ergebnisse konnten Entwürfe für Hochwassergefahren- und Hochwasserrisikokarten entsprechend den Mindestanforderungen der EG-Hochwasserrisikomanagementrichtlinie erstellt werden. Abbildung 6 zeigt die Hochwasserrisikokarte für das Szenario 2. In dieser wird die Überflutungshöhe in 5 Klassen angegeben. Als weitere Informationen sind die Scheitelwasserstände an nahe gelegenen Pegeln sowie die Lage der öffentlichen Hochwasserschutzanlagen eingezeichnet Als Kartengrundlage wird die Digitale Stadtgrundkarte (DSGK) mit dem Basismaßstab 1:1.000 verwendet. In der Risikokarte (Abb. 7) ist die Landnutzung in den in Szenario 2 betroffenen Gebieten dargestellt. Straßenflächen sind in den verwendeten Landnutzungsdaten nicht berücksichtigt, so dass diese in der Karte nicht dargestellt werden, obwohl sie im überfluteten Gebiet liegen. Als weitere Informationen sind die Standorte von Anlagen eingezeichnet, die bei Überflutung Wasserverschmutzungen verursa-chen können. Diese wurden aus der Online-Datenbank des Europäischen Schadstoffemissionsregisters (EPER) übernommen. Die Anzahl der potentiell betroffenen Einwohner wird durch die Zahl der Einwohner in den einzelnen Stadtteilen repräsentiert, die aus der Amtlichen Statistik (Statistisches Amt für Hamburg und Schleswig-Holstein 2008) übernommen wurden. Diese Angabe bezieht sich somit nicht speziell auf die im von Überflutung betroffenen Gebiet lebenden Menschen. Als Kartenhintergrund wurde die Digitale Stadtkarte (DK) mit dem Basismaßstab 1:20.000 verwendet.

94 Sossidi et al.
Abb. 6: Entwurf einer Hochwassergefahrenkarte (Veddel): Szenario Pegel St. Pauli 7,22 m NN
Abb. 7: Entwurf einer Hochwasserrisikokarte (Veddel): Szenario Pegel St. Pauli 7,22 m NN
7 Fazit Die im Rahmen der Hochwasserrisiko-Analyse vorgenommene Wertermittlung sollte auf der einen Seite möglichst genau erfolgen, auf der anderen Seite schnell und kostengünstig durchführbar sowie aktualisierbar sein. Die Aktualisierbarkeit ist durch die Verwendung von Statistiken gewährleistet, da diese jährlich erstellt und veröffentlicht werden. Auch die verwendeten Kartengrundlagen werden in regelmäßigem Abstand aktualisiert, so dass Veränderungen des Baubestandes oder der Gebäude-nutzung ohne großen Aufwand Rechnung getragen werden kann. Für die Überprüfung der Werte, die nicht auf Statistiken beruhen, kann eine erneute Expertenbefragung durchgeführt werden. Für eine

GIS-gestütze Analyse des Überflutungsrisikos in Hamburg 95
nutzungs- bzw. gebietsspezifische Bestimmung von Gebäudewerten wären Vor-Ort-Untersuchungen zur stichprobenhaften Ermittlung von Gebäudewerten in Hamburg nötig. Aus den so ermittelten Daten könnten Durchschnittsangaben zum Wert einzelner Gebäudeklassen entwickelt werden. Statistische Analysen von Pegeldaten im Elbeästuar sind nicht möglich, da aufgrund einer Vielzahl von Eingriffen in das hydrologische System keine homogene Datenreihe vorhanden ist. Die Ableitung eines Sturmflutscheitelwasserstands einer für den Pegel Cuxhaven ermittelten Eintrittswahrscheinlichkeit stellt eine Möglichkeit dar, Sturmflutscheitelwasserstände für Extremereignisse in Ästuaren abzuschätzen. Dieses Vorgehen ermöglicht allerdings nicht die Angabe einer Eintrittswahrscheinlichkeit für den Scheitelwasserstand am Pegel St. Pauli, da bei diesem Verfahren weder die Tidedynamik im Ästuar noch der Einfluss des Oberwasserzuflusses ausreichend berücksichtigt werden können. Für die Bestimmung von Scheitelwasserständen mit einem bestimmten Wiederkehrintervall für einzelne Pegel im Elbeästuar sind demnach weitere Untersuchungen nötig. Die Simulation von Sturmflutszenarien mit dem Programm HWSIM bietet eine gute Möglichkeit, die in Folge einer Sturmflut mit einem bestimmten Scheitelwasserstand voraussichtlich von Überflutungen betroffenen Gebiete abzuschätzen. Da die überfluteten Flächen als Grid mit einer Auflösung von 10 x 10 m berechnet werden, können die räumliche Ausdehnung und die Höhe der Überflutung im Gelände allerdings bisher nur sehr ungenau bestimmt werden. Das gewählte Vorgehen bei der Simulation von Sturmflutereignissen lässt keine Quantifizierung von Unsicherheiten bezüglich des Überflutungsverlaufes im Allgemeinen und der Deichbrüche im Speziellen zu. Für die Bestimmung solcher Unsicherheiten sind weitere Untersuchungen notwendig. Für eine belastbare Ermittlung der Folgen verschiedener Sturmflutszenarien als Grundlage für Karten und Planungen, wie sie die EG-Hochwasserrisikomanagementrichtlinie erforderlich macht, sind außerdem zusätzliche Modifikationen des Programms notwenig, um einen höheren Detailgrad der Simulationsergebnisse erreichen zu können. Eine Abschätzung von Schäden auf Grundlage von Überflutungscharakteristika wie beispielsweise der Überflutungshöhe war im Rahmen dieser Untersuchung nicht möglich. Hierfür wäre die Entwicklung von Schadensfunktionen erforderlich. Da das letzte große Schadensereignis mehr als 30 Jahre zurückliegt und es daher keine umfangreiche Datenbasis zur Aufstellung solcher Schadensfunktionen gibt, müssten die benötigten Schadensinformationen durch eine “Was-wäre-wenn”-Analyse (Buck 2006) ermittelt werden. Auf Grundlage der für die durchgeführte Untersuchung herangezogenen Daten ist es außerdem nicht möglich, die Überflutungshöhe für einzelne Gebäude zu ermitteln. Zwar lässt sich die Überflutungshöhe für jeden Punkt im GIS abfragen, doch bezieht sich diese Angabe auf die Überflutungshöhe im Gelände und lässt keine Aussage über die Höhe des Wasserstandes in den einzelnen Gebäuden zu, da das Höhenniveau des Erdgeschosses nicht automatisch mit dem Geländeniveau gleichzusetzen ist. Auch wenn eine Schadensschätzung in Abhängigkeit von der Überflutungshöhe ohne die Verwendung von Schadensfunktionen nicht möglich ist, bietet das hier vorgestellte Verfahren eine gute Möglichkeit, sich einen Eindruck über die Anzahl der möglicherweise betroffenen Personen und die Höhe der möglichen Schäden in den im Sturmflutfall voraussichtlich von Überflutung betroffenen Gebieten zu verschaffen. Auf dieser Grundlage können im Bedarfsfall (beispielsweise in Gebieten, in denen Wertekonzentrationen ermittelt wurden) genauere Untersuchungen zum Schadenspotential durchgeführt werden. Die Digitale Stadtgrundkarte (DSGK) stellt eine gute Grundlage für die Planung von Risikomanagementmaßnahmen dar. So ist mit ihrer Hilfe beispielsweise die Ermittlung und Lokalisie-rung von Gebäuden ohne Rückzugsmöglichkeit in ein höheres Stockwerk oder Gebäuden, in denen sich möglicherweise hilfsbedürftige Menschen aufhalten (Krankenhäuser, Kindergärten), möglich. Die Erstellung von Entwürfen für Hochwassergefahren- und Hochwasserrisikokarten gemäß der EG-Hochwasserrisikomanagementrichtlinie war im Rahmen der durchgeführten Untersuchung möglich. Die für die Gefahrenkarten notwendigen Informationen konnten mit Hilfe des Programms HWSIM

96 Sossidi et al.
generiert werden. Aufgrund der groben Auflösung der berechneten Ergebnisse ist die Darstellung der überfluteten Flächen in Gefahrenkarten in einem Maßstab größer als 1:15.000 nicht zu empfehlen. Für die Darstellung der wirtschaftlichen Tätigkeiten in den betroffenen Gebieten wurden die von Überflu-tung betroffenen Gebiete im GIS mit Landnutzungsinformationen verschnitten. Da diese nicht alle erforderlichen Informationen enthielten, sollte für die Erstellung von Risikokarten der Empfehlung der LAWA (Länderarbeitsgemeinschaft Wasser 2008) gefolgt werden, auf die Flächennutzungs-informationen des Amtlichen Topographisch-Kartographischen Informationssystems (ATKIS-Basis-DLM) zurückzugreifen.
Literatur Buck, W. (2006): Zweckorientierte Aufstellung von Wasserstand-Schadensfunktionen. In: Jüpner, R. (Hrsg.):
Beiträge zur Konferenz „Strategien und Instrumente zur Verbesserung des vorbeugenden Hochwasserschutzes“, 23.-25. November 2006 in Tangermünde. Aachen, S. 165–172.
Freistadt, H. (1962): Die Sturmflut vom 16./17. Februar in Hamburg. In: Die Küste 10 (1): 81–-92. Gönnert, G. & U. Ferk (1996): Natürliche und anthropogen beeinflusste Entwicklung von Sturmfluten in der
Deutschen Bucht und der Unterelbe. In: Vechtaer Studien zur Angewandten Geographie und Regionalwissenschaft 18: 13–31.
Gönnert, G. (2007): Sturmfluten und der Umgang mit ihrem Risiko im Elbeästuar. In: Berichte zur Deutschen Landeskunde 81 (3): 247–266.
Jensen, J. & T. Frank (2003): Zur Abschätzung von Sturmflutwasserständen mit sehr kleinen Überschreitungswahrscheinlichkeiten. In: Die Küste 67: 367–405.
Jensen, J., T. Frank, C. Zimmermann, S. Mai, W. Rosenhauer, R. Meiswinkel & G. Barg (2003): Neue Verfahren zur Abschätzung von seltenen Sturmflutwasserständen. In: Hansa 140 (1): 68–79.
Jensen, J. & C. Mudersbach (2005): Modellgestützte Untersuchungen zu Sturmfluten mit sehr geringen Eintrittswahrscheinlichkeiten (MUSE) – Teilprojekt 3: Statistisch-probabilistische Extremwertanalyse. Siegen, 94 S.
Landesbetrieb Straßen, Brücken und Gewässer der Freien und Hansestadt Hamburg (2007): Hochwasserschutz in Hamburg. Bauprogramm 2007. Hamburg, 16 S.
Länderarbeitsgemeinschaft Wasser (2008): Strategie zur Umsetzung der Hochwasserrisikomanagement-Richtlinie in Deutschland vom 15. September 2008. 15 S. (http://www.hochwassernotgemeinschaft-rhein.de/pdf/LAWA%20Strategiepapier%20EU-HWRM-RL.pdf; 21. Februar 2009).
Reese, S. (2003): Die Vulnerabilität der schleswig-holsteinischen Küstenraumes durch Sturmfluten – Fallstudien von der Nord- und Ostsee. Kiel, 305 S.
Sossidi, K. (2009): GIS-gestützte Analyse des Überflutungsrisikos in Hamburg unter Berücksichtigung der EU-Hochwasserrichtlinie dargestellt am Beispiel der Veddel und Teilen der Vier- und Marschlande. (unv.) Diplomarbeit. Hamburg, 125 S.
Statistisches Amt für Hamburg & Schleswig-Holstein (2008): Hamburger Stadtteilprofile 2008. Hamburg, 258 S. Traeger, G. (1962): Die Sturmflut vom 16./17. Februar 1962 im Lande Bremen. In: Die Küste 10 (1): 93–112. Zitscher, F.-F., R. Scherenberg & U. Varow (1979): Die Sturmflut vom 3. und 21. Januar 1976 an den Küsten
Schleswig-Holsteins. In: Die Küste 33: 71–100.
Address Kristina Sossidi

Effec
AbstracA imDusubincparupest
1 BacThe rise River Wchanges affectingAs a stareaction parametethe mean
2 MoThe inveUnTRIMflow pr(MalcheThe modtransportconditionthe seawperiod oThe bouThe chanboundaryin all var
SchwarzerFrom BrazCoastlineS. 97-100
cts of Cha
Federal
ct system study
mpact of changuring the studbsequently ancrease in the rticular in the
pstream was otuary reacted l
ckground in mean sea
Weser. In addin the phase
g the tidal ranarting point f
of the estuers “mean tidn conditions
odel and coestigations w
M numerical roblems (Carek et al 200del covered t were calcuns using me
ward boundaf time selectndary conditnges in MTLy conditionsriations of th
r, Schrottke &zil to Thailand e Reports 16 (
anges in S
I
Waterways E
was conducteges in sea levedy the mean nalysed with
tidal range e flood currenobserved. Witlinearly to the
a level (IPCCdition, the ames and amplinge which defor modellinuary to suchde level” (Min the estuar
oncept of thwere conducmethod was
asulli & Za05) was used the entire ar
ulated in a hiasured data
ary and the fed for the antions for MT
L ranged froms in the modehe model and
& Stattegger (e– New Result
(2010), ISSN 0
ea Level o
Ingrid Holz
Engineering an
ed with the aiel on the estutide level an
regard to thein the estuaryt velocity. In thin the rangee changes intro
C 2007) is dmphidromic pitudes of the etermines ho
ng climate chh changes a
MTL) and “tidry analysed in
he investigated with the
s used to solanolli 2002)
to calculate rea of the Jaigh resolutioand it delivefresh water
nalysis was aTL and TR wm -20 cm to +el were identd was therefo
eds.): ts in Coastal R0928-2734, IS
on the Tid
zwarth & Fr
nd Research In
id of a 3D hyary of the Rivnd mean tida tide-related y along withaddition, an ie of values eoduced at the
directly affecpoints in the partial tides
ow much enehange scenarand to undedal range” (Tn the system
ation e combined Ulve non-stead. The morpthe bottom f
ade-Weser eson 3D data sers realistic rinflow from spring-neap
were varied bo+80 cm and tical. Thus th
ore in the ran
Research SBN 978-3-98
dal Dynam
rank Köster
nstitute, Hamb
drodynamic nver Weser to bal range werecharacteristic
h an increase intrusion of hiexamined, theboundaries of
cting the meaNorth Sea a
s can be expeergy enters thrios it is imperstand theirTR) were the
m study descr
UnTRIM-Sedy state, nonphodynamic friction. stuary, for wset. The modresults. It wa
m the Weser p cycle. oth separatelthose in TR he freshwate
nge of the mo
11839-9-3
mics of th
s
burg Branch, G
numerical modbe estimated m
e raised and tvalues. The in the curre
igh salt concee system variaf the model.
an tide levelare likely to ected (Plüß 2
he estuary. portant to ber causes anerefore varieibed in this p
ediMorph mon-linear equa
modelling
which the hyddel was validas steered vion the land
ly and jointlyfrom -20 cm
er inflow wasost frequent f
he River W
Germany
del to enable more accuratethe results wresults show
ent velocities,entrations furtables within
l in the estuabe influence2004). This
e able to estind relationshed and the chpaper.
odelling sysations for fre
method Se
drodynamicsdated for preia the water dward bound
y in the system to +40 cm.
s a constant freshwater in
Weser
the ely.
were an
in her the
ary of the ed so that in turn is
imate the hips. The hanges in
tem. The ee surface ediMorph
s and salt esent-day levels on
dary. The
em study. All other 180 m³/s
nflow.

98
3 ResAn increincrease changes Increasinwhile, bintroducincreasedbetweenIt is notiin the bovarying betweensimulatioFurthermcurrent vin the ebsubsequeAn increfurther ufurther u
Figure 1:
sults – Tideease in the tin the high win the bound
ng TR in thby contrast, ed at the sed in the dire W-km 20 aniceable that toundary valuMTL and T the characteon (Figure 1
more, an incvelocities. Thbb current veently dominaease in MTLupstream. Thupstream for
High watertidal limit adepth-averatide level (change (relwith the hel
e-related chtwo parametwater elevatidary values whe boundary
raising MTLeaward bounection of thend W-km 10the tide-relatues. Thus theTR by meanseristic values, right panel)
crease in TRhe increase ielocities so thated by the fl and TR at thhus, for examMTL +55 cm
r (HW) and loand km-125 aaged results of(MTL) respeclative to the rlp of linear reg
haracteristers TR and ion (HW) alowere sustaine
conditions rL led to an
ndary decrease tidal limit. 0 compared
ted charactere changes in s of regressis of the wate).
R and MTL in the flood hat several o
flood current he seaward bmple, water m and TR +3
ow water (LWat the end of tf the reference
ctively and oneference run)gression equa
tic values oMTL in the
ong the Weseed virtually uresulted in a
increase insed towards At the samewith the dur
ristic values rthe tide-relaon equationsr level obtain
in the seawcurrent veloc
of the areas p(Figure 2).
boundary of with a mea
30 cm.
W) along the Wthe navigatione run, two runne with variat in HW and L
ations and com
f water leve seaward boer estuary (Funaltered in Ha lowering on LW. Figur
the tidal lime time, the dration of the freacted apprated charactes. In particuned in this w
ward boundarcities was mpreviously do
the model alan salt conten
Weser navigan channel in t
ns with variatiotion of TR anLW for MTL
mpared to simu
el, current oundary condFigure 1, left HW up to theof the low wre 1 shows mit, in contrduration of thflood tide. roximately lieristic valueslar, there wa
way and the v
ry conditionmore pronoun
ominated by
lso resulted int of 5 psu
ation channel the North Seaon only of tidand MTL. The
L +55 cm and ulated values.
Holzwarth &
and salt coditions resulpanel). The e tidal limit.
water elevatithat changerast to HW. he ebb tide i
nearly to thes can be expras a good covalues obtain
ns resulted innced than the
the ebb curr
in saltwater intruded up
with km-0 cla. The left paal range (TR)
e right panel TR +30 cm
& Kösters
ontent ted in an specified
ion (LW) s in LW TR thus
increased
e changes ressed by orrelation ned in the
n greater e increase rent were
intruding to 5 km
lose to the nel shows and mean
shows the calculated

Effects of
Figure 2:
4 DisThe invelevel areat high level at lhigher ccurrent vThe strecurrent btransportthe floodThe intrulevel pririver watFinally, climate sconditiontemperatpaper waonly app
ReferenCasulli, V
EnviIPCC (20
FourR.K.
MalchereDocu
Plüß, A. (ÜberProb
f Changes in S
Ratio of mcurrent dom
scussion anestigations dee basically siwater are sulow water deurrent veloc
velocities owngthening ofbecomes weated upstreamd current. usion of watincipally affeter for agricuit should bescenarios buns. Climate ture, wind spas conductedply to the sele
nces V. & P. Zanollironmental Pro007): Climate rth Assessmen and A. Reisin
ek, A., F. Piecument Version(2004): Nichtlrgangsbereichst, H. von Sto
Sea Level on t
mean flood curminated section
nd conclusioescribed aboimilar to thosustained virtuecrease in thities, with th
wing to the lef the flood caker than the
m by the flood
ter with a hiects the floraulture. e pointed outut to analyse
scenarios wpeed, wind
d with a fixedected fresh w
li (2002).: Semoblems. In: MChange 2007
nt Report of thnger (eds.)]. Ghotta & D. Knn 1.1, Techniclineare Wechs
h Küste/Ästuarorch & J. Sünd
the Tidal Dyna
rrent velocityns.
on ove show thase caused byually unchane upstream dhe flood curress pronouncecurrent is sige flood curred current. Th
igher salt coa and fauna
t that the aimthe behaviouwould covedirection and fresh waterwater inflow
mi-Implicit NuMathematical a
: Synthesis Rehe IntergovernGeneva, Switznoch (2005): Mcal Report. Buselwirkungen r am Beispiel dermann (Hrsg
amics of the R
y to mean ebb
at the reactiony a deepeningnged throughdirection. Thrent velocitieed effect of b
gnificant for ent it will nohis can result
ontent furthein those area
m of the systur of certain r additionald freshwaterr inflow, i.e. situation.
umerical Modand Computer eport. Contrib
nmental Panel zerland, 104 ppMathematical undesanstalt füder Tide auf Äder Elbe. In: Gg.): Klimaänd
River Weser
b current velo
ns in the sysg of the estuhout the estu
he resultant ines increasingbottom frictithe transpor
o longer be ct in greater s
r inland owias and has a
tem study destate variab
l boundary r inflow. Ththe quantitat
deling of NonhModeling 36:
bution of Workon Climate Cp. Module SediM
ür Wasserbau.Änderungen dGönnert, G., H
derung und Kü
ocity. Values
tem caused bary. Thus chuary while cncrease in thg to a greateon.
rt of suspendcapable of reiltation of th
ing to the risan impact on
escribed aboles under twconditions,
he system stutive statemen
hydrostatic Fr: 1131–1149. king Groups I
Change [Core W
Morph - Stand. des MeeresspiH. Grassl, D. Küstenschutz. H
above 1 indic
by a rise in mhanges in wachanges in t
he tidal rangeer extent than
ded matter. Iemoving the he areas dom
se in the men the suitabili
ove was not wo modified b
such as chudy describents made in t
ree-surface Flo
I, II and III to Writing Team
dard Validatio
iegels im Kelletat, H. K
Hamburg.
99
cate flood
mean tide ater levels the water e leads to n the ebb
If the ebb sediment inated by
ean water ity of the
to model boundary
hanges in ed in this this study
ows for
the m, Pachuri,
on
Kunz, B.

100 Holzwarth & Kösters
Address Ingrid Holzwarth Bundesanstalt für Wasserbau Dienststelle Hamburg Wedeler Landstraße 157 22559 Hamburg, Germany

C
AbstracThamToevveranUnadsceadadphins
1 IntThe coasthat aroua high cothrough in the wo1.40 m vulnerabchange. mostly stheir socalso mosdata for limitatioaccount
2 MeIn this wmodel vcoastal dconsists to each o
SchwarzerFrom BrazCoastlineS. 101-103
Costs of se
ct he world’s coamong the mosto better protealuate the potrsion 2.0.2 wd socio-econonited Kingdomaptation undeenario. They aptation. The aptation. Even
hysical and sosights on the v
troduction stal zones cound 50 % of oncentrationclimate chanorld. New esuntil 2100
bility assessmUntil now t
static and docio-economicstly performe
regional anons as it is a adaptation.
ethodology work the DIVversion 2.0.2database, theof various m
other as well
r, Schrottke &zil to Thailand e Reports 16 (3
ea-level riscenario
Chri
astal zones aret vulnerable aect these potetential risks, as applied to omic scenariom with the IPCer all three sc
clearly showresults also on if the DIVAcio-economicvulnerability f
ontain a largthe world’s
n on material nge altered, sstimates abou
(Rahmstorfments are nethere are numo not take inc consequenced to inform nd global puglobal and d
VA (Dynami2 was appliee integrated modules whic as to the dat
& Stattegger (e– New Result
(2010), ISSN 0
ise under s: an app
He
istian-Albrech
e due to a higareas in the wential endangimpacts and cindentify the
os. The DIVACC SRES scencenarios withw that the coutline the hugA model is a conditions o
for long-term c
ge part of thepopulation lassets with
sea-level riseut sea-level rf et al. 2007ecessary to emerous conc
nto account tces as well aslocal and na
urposes. Thedynamic tool
ic Interactived. This modmodel (figu
ch provide ktabase.
eds.): ts in Coastal R0928-2734, IS
differentplication o
eike Munder
hts-University
gh population world to a, throgered areas vcosts of climapotential cos
A runs were mnarios A1FI, A
h highest valuosts will rapige benefit of p
global modelf the countriecoastal manag
e world’s polives within 5large socio-ee the coastalrise indicate t7). To betteevaluate the cepts of vulnthe dynamic s the way huational decisie relatively l to assess th
e Vulnerabilidel is part oure 1) and aknowledge ab
Research SBN 978-3-98
t climatic of the DIV
rloh
y of Kiel, Germ
and a high coough climate
vulnerability aate change. Ints of sea-leve
made for GermA2 and B2. T
ues in the A1idly increase
proactive adapl the results a
es and scenarigement even o
pulation. Da50 km of theeconomic relregions are
that it possiber protect thpotential risnerability asfeedback be
umans responion-makers rnew DIVA
he vulnerabil
ity Assessmeof the DIVAa graphical ubout the coa
11839-9-3
and socioVA model
many
oncentration onchange altereassessments an this work th
el rise under dmany, the NethThe results out
FI and the loat least afte
ptation comparare in a logicaos applied anon smaller sca
aschkeit and e shoreline. Tlevance. Theamong the m
bly could risehese potentisks, impacts ssessments aetween variond in form ofrather than tomodel addr
lity on differ
ent) global imA tool which
user interfacstal sub-syst
o-economl
n material assd, sea-level ri
are necessaryhe DIVA mo
different climaherlands and tline the need owest in the er 2070 withred with reactal context to
nd provide useales.
Sterr (2003)These areas aerefore and dmost vulnerae between 0.ial endangerand costs o
available but ous coastal pf adaptation. o provide comresses some rent scales ta
mpact and aconsists of
ce. The DIVtems. They a
ic
sets ise. to
odel atic the for B2 out tive the
eful
) indicate also have due to an, able areas 55 m and red areas
of climate they are
processes, They are mparable of these
aking into
daptation f a global
VA model are linked

102 Munderloh
Figure 1: Schematic overview of the DIVA model
The cases in DIVA are a combination of the selected SRES based scenarios (A1FI, A2 and B2) in land use, population and economic concerns, the climate scenario, the input data and the selected adaptation option. Next to the three SRES scenarios three different adaptation options have been applied: Costs-benefit-analyse based adaptation, full adaptation and no adaptation. Within this work the following output parameter are used: 1. Total costs compounded of total adaptation costs and total residual damage costs. 2. Total adaptation costs compounded of sea-and river dike costs, and costs for beach-, wetland-, and
tidal basin nourishment. 3. Total residual damage costs compounded of costs for land loss, migration, salinity intrusion as
well as sea- and river floods. 4. Number of people actually endangered by flooding. These output parameters were applied for Germany, the Netherlands and the United Kingdom and for a time frame from 2000 until 2100.
3 Results The results clearly show that without any adaptation the costs and the number of people at risk will increase rapidly at least after 2070 (figure 2). This applies for all countries and in all scenarios. With adaptation however the damage costs and the number of people at risk will decrease significantly. The two adaptation scenarios are used as a proactive adaptation option and the no adaptation scenario as a reactive adaptation option. The results show the benefit of proactive adaptation versus reactive adaptation (figure 3).
Fig. 2: Trends of total costs in Germany in A1FI Fig. 3: Proactive versus reactive adaptation

Costs of sea-level rise under different climatic and socio-economic scenarios 103
The main trends between the scenarios are nearly the same but the costs will be highest in the A1FI scenario and lowest in the B2 scenario. The main contributors to the damage costs are salinity intrusion into deltas and estuaries, sea flood costs and within the no adaptation scenario migration costs. The main contributors to the adaptation costs are sea dike costs, beach and tidal basin nourishment. The percentage distribution of the contributors is extremely different between the countries reflecting the different physical conditions and main hazards. The A2 scenario is not the most vulnerable scenario for the three countries studied in this thesis despite its high population growth because these countries have a declining population. The most vulnerable country in this work based on size, population and GDP compared to the costs is the Netherlands followed by the UK and lastly Germany.
4 Discussion and conclusion The results reflect how the projected future the socio-economic- and the climatic development in the countries together with climate change contribute to the impacts to climate change. They outline the large impact of different socio-economic developments and show that the impacts of sea-level rise are only detectable after 2030. The results also show that even if a country have a high adaptive capacity like all three countries used in this work the protection level will fall over time if they are not adjusted to climate change which will lead to an increase of impacts and costs. For the interpretation of the DIVA results there are three key limitations to be aware of. Firstly, the DIVA model is a global model. Due to a spacious data resolution DIVA is not suitable to be used on smaller scales than on country level. Secondly, there are more adaptation options available than implemented in DIVA and thirdly, the assessment of DIVA is limited because it only represents a sub-set of possible impacts. Besides these limitations the results are in a logical context to the physical and socio-economic conditions of the countries and scenarios applied and yield information about the nature of the most serious impacts, about the possible affected land area, and about the number of people at risk as well as about vulnerable hotspots.
References Daschkeit, A. & H. Sterr (2003): Klimawandel in Küstenzonen. In: UWSF 2003b (3): 199–207. Rahmstorf, S., A. Cazenave, J. Church, J. Hansen, R. Keeling, D. Parker & R. Sommerville (2007): Recent
climate observations compared to projections. In: Science 315: 1529–1532.
Acknowledgement The work has been carried out within my diploma thesis supervised by Prof. Dr. A. Vafeidis.
Address Heike Munderloh Christian-Abrechts University of Kiel - Department of Geography Ludewig-Meyn-Str. 14 24098 Kiel, Germany


F
S
AbstracClin thischfloresIn Ge
1 IntStorm susociety amanagemharmfulnmay be iby contrlimit thedesignedToday, acoastal l
Figure 1:
SchwarzerFrom BrazCoastlineS. 105-114
rom coas
Schleswig-Ho
ct imate change Germany trad
is paper, after hemes are desood risk manasponse, recovean outlook, t
ermany are de
troduction urges may cas a threat toment. Risk mness for sociimplementedrolling the de risk of coad with a certaafter more towlands of G
Schematic p
OccOcc
r, Schrottke &zil to Thailand e Reports 16 (4
tal flood d
olstein State M
induced sea lditionally focur a short discuscribed. It is agement consiery and reviewthe EU Floodescribed.
cause temporo life and pr
may be definety, i.e., the
d by controllidamage expeastal floodingain safety stathan 2,000 yGermany.
presentation o
currence probabof storm surge
Fap
Occu
currence probabof storm surge
Fap
Occu
& Stattegger (e– New Result
(2010), ISSN 0
defence to
Jac
Ministry for Ag
level rise willus on technica
ussion of sea largued that a sting of the elw. These integ
d Directive an
ral flooding roperty, it be
ned as a comdamage exping the occur
ectations (figg is protectioandard in ordyears of coa
of coastal floo
bility e p
ailure probabilityrotective structu
urrence probabcoastal flooding
=
bility e p
ailure probabilityrotective structu
urrence probabcoastal flooding
=
eds.): ts in Coastal R0928-2734, IS
owards co
cobus Hofst
griculture, the
l lead to higheal flood defenevel rise scensustainable adlements prevegral compone
nd its implicat
of coastal loecomes a ha
mbination of tpectations. Hrrence proba
gure 1). The on by technder to preven
astal flood d
d risk (adapte
Strength of therotective structu
y ofure
Coastal ris
ility ofg
Strength of therotective structu
y ofure
Coastal ris
ility ofg
Research SBN 978-3-98
oastal floo
tede
e Environmen
er coastal floonces that ensurnarios, possibldaptation stratention, protectnts are describtions for coas
owlands. Whazard that nethe occurrenence, coastal
ability of flooclassical ap
ical measurent flooding uefence, abou
ed from Probst
e ure
Dain
sk
e ure
Dain
sk
11839-9-3
od risk m
t and Rural A
od risks. Adapre defined safle constraints tegy implies ation, preparedbed as parts o
stal flood risk
hen the flooeeds considece probabilitl flood risk moding (by tecpproach in Ges like dikesup to a definut 2.5 millio
t 1994)
amage expectatin coastal lowlanamage expectatin coastal lowlan
manageme
Areas, Germany
ptation strategfety standards.of flood defena holistic coas
dness, emergenof a control lok management
oding is percration or, raty of a hazarmanagement chnical mean
Germany to rs. These defened storm waon people liv
ionsdsionsds
ent
y
gies . In nce stal ncy
oop. t in
ceived by ather, risk rd and its (CFRM)
ns) and/or reduce or ences are ater level. ve in the
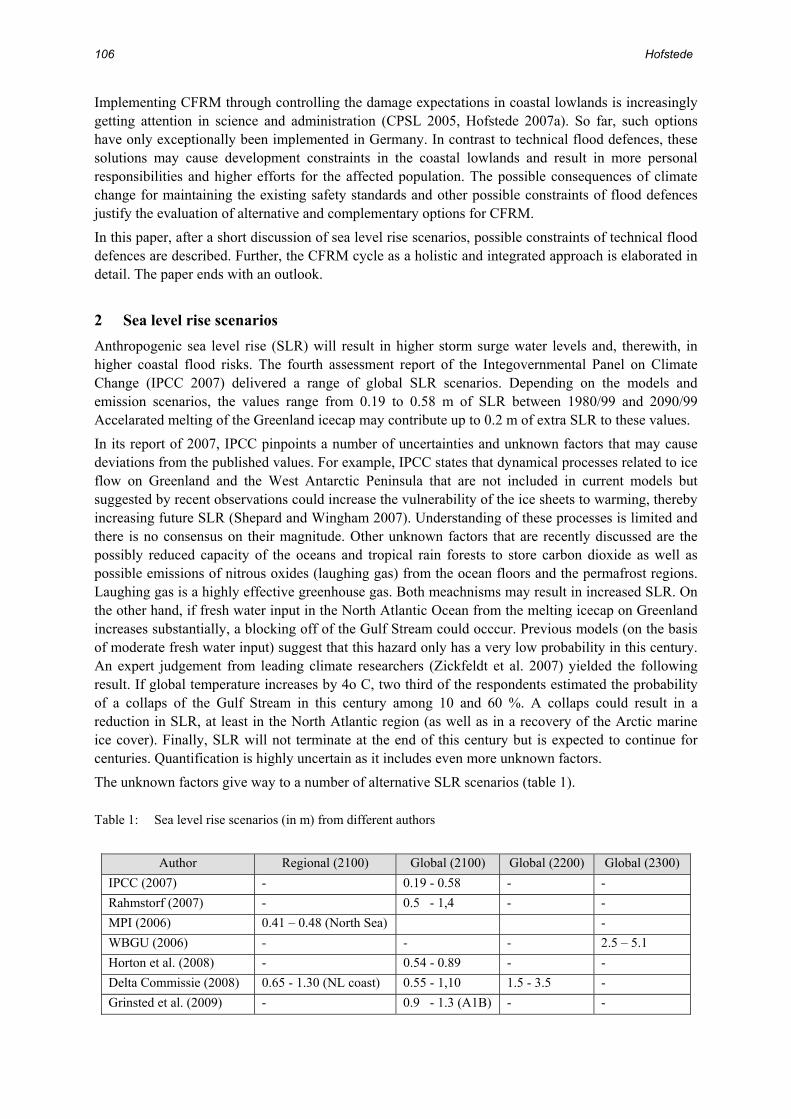
106 Hofstede
Implementing CFRM through controlling the damage expectations in coastal lowlands is increasingly getting attention in science and administration (CPSL 2005, Hofstede 2007a). So far, such options have only exceptionally been implemented in Germany. In contrast to technical flood defences, these solutions may cause development constraints in the coastal lowlands and result in more personal responsibilities and higher efforts for the affected population. The possible consequences of climate change for maintaining the existing safety standards and other possible constraints of flood defences justify the evaluation of alternative and complementary options for CFRM. In this paper, after a short discussion of sea level rise scenarios, possible constraints of technical flood defences are described. Further, the CFRM cycle as a holistic and integrated approach is elaborated in detail. The paper ends with an outlook.
2 Sea level rise scenarios Anthropogenic sea level rise (SLR) will result in higher storm surge water levels and, therewith, in higher coastal flood risks. The fourth assessment report of the Integovernmental Panel on Climate Change (IPCC 2007) delivered a range of global SLR scenarios. Depending on the models and emission scenarios, the values range from 0.19 to 0.58 m of SLR between 1980/99 and 2090/99 Accelarated melting of the Greenland icecap may contribute up to 0.2 m of extra SLR to these values. In its report of 2007, IPCC pinpoints a number of uncertainties and unknown factors that may cause deviations from the published values. For example, IPCC states that dynamical processes related to ice flow on Greenland and the West Antarctic Peninsula that are not included in current models but suggested by recent observations could increase the vulnerability of the ice sheets to warming, thereby increasing future SLR (Shepard and Wingham 2007). Understanding of these processes is limited and there is no consensus on their magnitude. Other unknown factors that are recently discussed are the possibly reduced capacity of the oceans and tropical rain forests to store carbon dioxide as well as possible emissions of nitrous oxides (laughing gas) from the ocean floors and the permafrost regions. Laughing gas is a highly effective greenhouse gas. Both meachnisms may result in increased SLR. On the other hand, if fresh water input in the North Atlantic Ocean from the melting icecap on Greenland increases substantially, a blocking off of the Gulf Stream could occcur. Previous models (on the basis of moderate fresh water input) suggest that this hazard only has a very low probability in this century. An expert judgement from leading climate researchers (Zickfeldt et al. 2007) yielded the following result. If global temperature increases by 4o C, two third of the respondents estimated the probability of a collaps of the Gulf Stream in this century among 10 and 60 %. A collaps could result in a reduction in SLR, at least in the North Atlantic region (as well as in a recovery of the Arctic marine ice cover). Finally, SLR will not terminate at the end of this century but is expected to continue for centuries. Quantification is highly uncertain as it includes even more unknown factors. The unknown factors give way to a number of alternative SLR scenarios (table 1).
Table 1: Sea level rise scenarios (in m) from different authors
Author Regional (2100) Global (2100) Global (2200) Global (2300) IPCC (2007) - 0.19 - 0.58 - - Rahmstorf (2007) - 0.5 - 1,4 - - MPI (2006) 0.41 – 0.48 (North Sea) - WBGU (2006) - - - 2.5 – 5.1 Horton et al. (2008) - 0.54 - 0.89 - - Delta Commissie (2008) 0.65 - 1.30 (NL coast) 0.55 - 1,10 1.5 - 3.5 - Grinsted et al. (2009) - 0.9 - 1.3 (A1B) - -

From coastal flood defence towards coastal flood risk management 107
Rahmstorf (2007) published a semi-empirical approach to estimate SLR among 1990 and 2100. His relationship connects observed global SLR to observed global mean surface temperature rise during the 20th century. Applying this relationship for the IPCC temperature scenarios, Rahmstorf delivered SLR projections until 2100 among 0.5 and 1.4 m. His approach is controversially discussed in the scientific community. The Max-Planck-Institute for Meteorology (MPI 2006) delivered global SLR projections among 0.21 and 0.28 m until 2100. They calculated that changes in the ocean circulation may lead to an extra SLR of about 0.2 m in the North Sea. If global temperature increase is limited to 3°C, the Scientific Advisory Board of the German Government on Global Environmental Changes (WBGU 2006) expects a long-term SLR until 2,300 among 2.5 and 5.1 m, mainly due to melting of the large icesheets on Greenland and the West Antarctic Peninsula. Horton et al. (2008) applied the semi-empirical relationship from Rahmstorf to the coupled global climate models that were used for the fourth IPCC report. With a mean of 0.71 m, the resulting global scenario values ranged among 0.54 and 0.89 m. Horton et al. (2008) states that: “Both the IPCC values and the semi-empirical SLR projections are likely to underestimate future SLR if recent trends in the Polar Regions accelerate.” Grinsted et al. (2009) used a physically plausible four parameter linear response equation to relate 2,000 years of global temperatures and sea level. Future sea level was projected from IPCC temperature scenarios and past sea level from multi-proxy reconstructions (assuming that the established relationship between temperature and sea level holds from 200 to 2100). In result, SLR until 2090/99 was projected to be 0.9 to 1.3 m for the IPCC A1B scenario, with low probability of the rise being within IPCC confidence limits. In 2007, the Dutch Government installed an independent Delta Commission with the merit to evaluate and recommend possible flood risk adaptation strategies and measures (Delta Commissie 2008). The Commission decided to apply regional “worst-case scenarios” varying among 0.65 and 1.3 m of SLR until 2100 and among 2 and 4 m until 2200. From this discussion it becomes clear that SLR will probably be higher than the lower IPCC values; a range among 0.5 and 1.4 m may be more realistic. Apart from the magnitude, the large range calls for flexible and sustainable (i.e., no-regret) adaptation measures and strategies. With respect to the starting date for most SLR projections (1990), it is interesting to note that, at least along the Dutch and German coasts, in 2008 (i.e., after 20 % of projection period) no indications of an accelerating SLR could be observed (figure 2; Hofstede 2007b).
Figure 2: Development of mean sea level since 1900 AD along the Baltic and North Sea coastlines of Germany and the Netherlands, averaged from 17 long-term tidal gauge stations (Hofstede 2007b)
Apart from SLR, meteorological processes control the height of future storm surge water levels and, therewith, the necessary dimensions of flood defences. According to Woth et al. (2006), storm surges
-20
-15
-10
-5
0
5
10
1900 1920 1940 1960 1980 2000
Mitt
lere
r Mee
ress
pieg
el (N
N +
cm)
Jahre

108 Hofstede
in the Inner German Bight may become up to 0.4 m higher in the period 2071-2100 compared to 1980-1999. Grosmann et al. (2006) included projections for SLR and came with a mean extreme water level projection of 0.50 m in 2085 for the city of Cuxhaven at the mouth of the Elb-estuary. Depending on the models and emission scenarios applied, the values range from 0.42 to 0.61 m. For Hamburg, the corresponding values amount to 0.48, 0.63 (mean) and 0.82 m. As with the SLR projections, these values include many uncertainties and assumptions. Further, due to the governing meteorological processes, the projections show strong local variations. For the German Baltic Sea coast, no projections are available.
3 Constraints of the present approach CFRM in Germany focusses mainly on flood defences. Due to the fact that almost 2.5 million inhabitants of the coastal lowlands rely upon flood defences, maintaining and adapting these defences will remain a corner stone of CFRM in Germany. Dike relocation on a large scale would be financially unfeasible and ecologically unfavourable (e.g., huge costs and vast energy consumption to relocate people and activities, creation of extensive – former natural – areas for housing, infrastructure and other purposes). It is highly probable that such a massive migration would cause major economic and social disruption. Finally, at least for administration, it is clear that acceptance of the affected cannot be expected. On a local scale, dike relocations may be attractive, especially when they increase coastal resilience against climate change, when they have positive ecological effects and when the area is uninhabited. Some successful examples of dike relocation in Germany exist, for example on the barrier island Langeoog, at Geltinger Birk outer Flensburg Fjord and at the Karrendorfer Wiesen near Greifswald. Technical flood defences underly a number of constraints.
Flood defences are designed to withstand a defined maximum storm surge water level (figure 3). This level does not only result from technical elaborations, but also includes financial and social considerations. The result is a safety standard that is accepted by society. Higher water levels and other loading cases (e.g. terror attack, ice load) may result in failure of the structure and flooding. Hence, technical flood defences cannot guarantee absolute safety. The residual risk needs to be managed (Oumeraci 2005).
Figure 3: Dimensions of a State dike in Schleswig-Holstein

From coastal flood defence towards coastal flood risk management 109
The safety level directly depends on the willingness of society to spend money on flood defence. This willingness is governed by the awareness for coastal flood risks that rapidly sinks with time passing by since the last flooding event. Low public budgets together with low risk awareness may reduce the funds available for flood defences. Although it is questionable that a (politically) fixed safety standard will officially be reduced, a cut in financial means may lead to this. Examples are neglected maintenance or delayed strengthening of the defences (determined by SLR).
Climate change and its consequences may reveal the financial limits of technical flood defences. Above a certain threshold the necessary financial efforts to maintain safety standards could become unacceptable for society. In this case, alternative and additional coastal risk management options become inevitable. It should be stated that technical solutions to counteract a SLR of several meters in a long-term perspective exist.
Technical flood defences interfere with nature and may reduce the natural resilience of the coasts with respect to SLR. Examples are the fixation of the coastline in an unfavourable and artificial location or the interruption of natural sand redistribution patterns. Hence, wherever possible, natural hydromorphological processes should be allowed or furthered. In this case, however, alternative measures to reduce the risk of flooding (i.e., the damage expectations) of the hinterland may become necessary.
Apart from these constraints, focussing on (ever higher) dikes has some inherent disadvantages. The higher the dike, the stronger the inundation processes (currents, water depths) after dike breach, and the more severe the consequences will be. Further, high and strong dikes may lead to the (false) impression of absolute safety. Hence, the dependence on one single measure or dike line makes society more vulnerable.
4 The coastal flood risk management cycle From the above considerations it becomes clear that a sectoral approach towards CFRM that only focuses on technical measures is not sufficient. The challenges arising from climate change as well as the constraints of technical structures imply that the classical flood defence schemes should be an integral part of a holistic management that combines technical measures with non-structural methods (Hofstede et al. 2005a). Sustainable CFRM may be defined as a cycle (control loop) that consists of six integral components: prevention, protection, preparedness, emergency response, recovery, and review (figure 4).
Figure 4: The coastal risk management cycle (Hofstede 2007a)
Recovery
Emergencyresponse
PreparednessAwareness
Prevention
Protection
Review
CoastalRisk
ManagementCycle
Recovery
Emergencyresponse
PreparednessAwareness
Prevention
Protection
Review
Recovery
Emergencyresponse
PreparednessAwareness
Prevention
Protection
Review
CoastalRisk
ManagementCycle

110 Hofstede
Prevention to avoid or minimize damages from flooding. As stated in the introduction, coastal flooding is a natural event. Some environments like salt marshes depend on regular inundations. Flooding becomes a hazard when society starts to utilize the flood-prone area for infrastructure, housing, etc. Controlling the development in flood-prone coastal lowlands is, thus, the first step in the CFRM cycle. Main tool to control utilization of coastal lowlands is spatial planning. It constitutes a formalized and systematic way to influence (regulate) the distribution of people and activities geographically. The guiding principle of spatial plans and programs is a sustainable spatial utilization and development which balances the social and economic requests upon a region with its ecological functions (ROG 1998). Spatial planning in Germany is realized at regional, State and national levels. At the local level, municipalities are responsible for building or town planning. The local and regional levels have the most potential for CFRM. On a local level, specific regulations for building areas may substantially reduce damage expectations due to coastal flooding. For example, in the 1970ies, a new building area was established near the Baltic Sea in Germany. Flood defence consisted of relatively low dikes. To keep damage expectations low, in the local building code, it was regulated that living room should be realized in the upper floors. On ground-floor level, only garages and/or storage rooms were allowed. Three decades later, these stipulations are not abided anymore. The absence of flooding events and lacking risk communication resulted in very low risk awareness and corresponding behaviour. Another actual example is the “Hafencity Hamburg”. This new building area lies outside the public flood defence line in the harbour area of Hamburg. In the building code for the area it is stipulated that the whole area has to be raised up to a level that cannot be reached by extreme floods. This regulation became well-known as the “dwelling-mound-principle”. In order to control the residual risks (see chapter 3), houses at the waterfront should have special arrangements for flooding, and evacuation routes are foreseen. On a regional level, the identification of buffer zones and flood hazard zones constitute promising non-structural measures to control coastal flood risks (CPSL 2005). Coastal buffer zones, demarcated by setback lines in spatial plans may provide protected zones between the sea and the hinterland, where human utilization and development are strongly restricted. As the term “buffer” already implies, this measure provides a zone that allows for retreat of the coastal flood defence line or reserves space for necessary flood defence measures. In this way, the natural resilience of the coast is enhanced as well. In coastal flood hazard zones, human activities can be managed (regulated) in such a way that the vulnerability of the area is reduced. This could be realized by specific requirements or recommendations defined in the spatial plans. For example, certain roads could be constructed in elevated position (like dams) to allow for evacuation and to limit the inundated area. In specific high hazard zones, the “dwelling-mound-principle” for new building areas could be prescribed. The simple fact that flood hazard zones are depicted in the spatial plans could already increase the awareness of the risk. Protection constitutes the second element of the CFRM cycle. It becomes necessary when flood-prone lowlands are utilized or, rather, when potential flooding is perceived by society as a threat to life and property. As stated before, with respect to the 2.5 million inhabitants of coastal lowlands, protection by technical flood defences will remain a corner stone in future CFRM in Germany. With reference to climate change and SLR, reserving space for strengthening campaigns by depicting buffer zones in regional plans is a sustainable measure. Necessary measures may be implemented in a more sustainable way that minimizes the impacts on ecology and the natural resilience of the coasts. CPSL (2005) list a number of such solutions like performing sand nourishments (figure 5) to balance SLR as well as dune management techniques to stabilize and sustain the dune systems as natural flood defences. Necessary dike maintenance and strengthening may be performed in a sustainable way that minimizes the ecological interferences. Coastal defence administration already implements this minimizing principle, e.g. by performing dike

From coastal flood defence towards coastal flood risk management 111
relocations where appropriate (see above), by strengthening dikes to the landward side and by taking the necessary clay from the inland (wherever possible). Unavoidable interferences with nature are compensated.
Figure 5: Sand nourishment on the island of Sylt (Germany)
With respect to the large uncertainties in the scenarios, more flexible (no-regret) flood defence measures are investigated and implemented. Sand nourishments balance the observed SLR or, rather, the sediment deficit resulting from SLR (figure 5). If SLR increases, more sand may be deposited and vice versa. Nourihments, thus, present a flexible no-regret measure. Further, they increase the natural resilience of the coast and pose a relatively low impact on nature. On the other hand, strengthening a dike for an expected SLR of 1.5 m may turn out to be highly ineffective, namely if SLR takes two centuries to reach this level. In this case, it is much more cost-effective to spread the costs over the centuries by performing two or three strengthening campaigns. Considering building reserves (for extra heighthening) may be more appropriate and flexible. In its almost finished strengthening campaign, the city of Hamburg included a static building reserve of 0.8 m to allow for future heighthening of its flood defences (sheet pile walls, sluices, etc.). Preparedness, being the third component in the CFRM cycle, is closely related to risk awareness. Aware people are prepared to personally undertake preventive and emergency actions. Further, they (are prepared to) accept the high costs for flood defences and other possible constraints of CFRM like flood-proof housing or living in the upper floor. In consequence, appropriate coastal risk awareness or, rather, a high level of preparedness may significantly reduce the damages resulting from flooding. The main tool to achieve coastal risk awareness (apart from flooding) is risk communication. A public opinion poll consisting of 2,000 questionnaires that were distributed in five coastal towns around the North Sea showed that the awareness for coastal risks is not well developed (Hofstede et al. 2005b). Although the cities are situated in protected coastal lowlands, 30 % of the 411 respondents thought that their house could not be flooded after dike-breach (figure 6). Furthermore, 90 % of the respondents who estimated the probability of flooding in their region to be very high had not taken any precautionary measures. This indicates that the information flow about the risk towards the population is either insufficient, does not reach the recipients or is not taken seriously (ignored or disclaimed). The study concluded that there is an apparent deficit in coastal risk communication.

112 Hofstede
Figure 6: Response to the question: “could your house be hit by floodwater in case of a coastal flooding?” (Hofstede et al. 2005b)
Emergency response in the CFRM cycle includes all measures related to impending or real coastal floodings. The aim is to prevent or reduce catastrophic consequences and, therewith, the flood risks. Emergency response includes measures like flood warnings (based on flood forecasts by hydrological services), evacuation, placing sand bags, and aftercare. During an emergency, the responsible disaster management authority may access the capacities of other authorities like health services, fire departments, flood defence administration, etc. SLR and, in reaction, higher dikes as well as increased utilization of coastal lowlands have the potential to intensify flooding catastrophies. If a dike-breach occurs, the water levels in the flooded area will rise faster and higher, thereby increasing the damage expectations. Accordingly, the importance of adequate emergency response increases. Recovery aims at restoring the affected area to its previous state. It starts after immediate needs like closing the breaches or social and medical aftercare, are addressed. Recovery actions are primarily concerned with measures that involve repair of essential infrastructure and rebuilding of destroyed property. Hence, in a strict sense, recovery is not part of the CFRM cycle as it does not directly control or reduce the risks. However, effective recovery should take advantage of a “window of opportunity” (Alexander 2002) for the implementation of preventive and protective measures that might otherwise be unpopular. Citzens of affected areas are more likely to accept these measures when a recent disaster is in fresh memory. Implemented in this way recovery can contribute to the aims of CFRM. Review stands for monitoring and regular (scientific) evaluation of all integrated CFRM components. In a broader sense, it also includes research on changes in SLR, storm surges and spatial development in coastal lowlands as these factors determine future coastal flood risk. Based on the outcomes of the evaluations and research, the next CFRM cycle may be optimized. In an administrational structure, CFRM may be seen as a safety chain. It starts with spatial planning authorities that control/minimize the vulnerability of lowlands (prevention). Coastal flood defence

From coastal flood defence towards coastal flood risk management 113
administration is the next chain that guarantees a certain safety standard in the utilized flood-prone lowlands (protection). Disaster management – the third administrative body in the chain – starts with preparation, mainly through risk communication (but also by training and exercising). Conducting emergency response measures (from warnings till aftercare) is the second and main task of disaster management. Rebuilding society after the disaster (recovery) is not a public responsibility and, last but not least, the reviewing process is a task for all responsible authorities. From the above elaborations it becomes clear that all CFRM elements complement one another. For example, depicting buffer zones in spatial plans facilitates the long-term implementation of coastal flood defence. Raising awareness by effective information or “intelligent” recovery inceases the acceptance of necessary planning measures like living in the second floor. Vice versa, the depiction of flood hazard zones in spatial plans increases the awareness and preparedness. Finally, an appropriate reviewing process is prerequisite for developing optimal information tools like travel exhibitions. Hence, in combination, the six integral components present a holistic approach towards CFRM.
5 Outlook Justified by the common goal (controlled coastal flood risks), the complementary character of and the interactions among the elements, holistic implementation of the cycle is a precondition to achieve sustainable CFRM. This fact is acknowledged by the EU-Flood Directive. Purpose of this Directive is to establish a framework for the assessment and management of flood risks, aiming at the reduction of the adverse consequences for human health, the environment, cultural heritage and economic activity associated with floods in the Community. Based upon a preliminary flood risk assessment, flood risk areas shall be delineated. For these areas, flood hazard and risk maps as well as flood risk management plans shall be established. Focussing on prevention, protection and preparedness, all aspects of the CFRM cycle should be addressed in these plans. In order to achieve tailor-made solutions and to raise risk awareness, Member States shall make all products available to the public. Further, active involvement of interested parties in the production, review and updating of the flood risk management plans shall be encouraged. Concordingly, the implementation requires close coordination among competent authorities (coastal flood defence, disaster management, spatial planning) and active involvement of the affected parties. In Germany, where public procedures still show sectoral aspects, the Flood Directive may be seen as a chance. This paper focusses on public-administrational aspects of CFRM. It is evident to realize that the most important partners in CFRM are the affected; the inhabitants and private investors in the coastal lowlands. Only if they adequately perceive the risks, accept their personal responsibility, and act accordingly, coastal flood risks remain manageable and a long-term sustainable development in the coastal lowlands is possible.
References Alexander, D. (2002): Principles of emergency planning and management. Terra publishing, Harpenden, p. 316. CPSL (2005): Solutions for a sustainable coastal protection in the Wadden Sea region. Wadden Sea Ecosystem
21, 47 p. Delta Commissie (2008): Samen werken met water – een land dat leeft, bouwt aan zijn toekomst. Den Haag, 134
p. (www.deltacommissie.com). Grinsted, A., J.C. Moore & S. Jevrejeva (2008): Reconstructing sea level from paleo and projected temperatures
200 to 2100 AD. In: Climate Dynamics 34 (4): 461–472. Grossmann, I.; K. Woth, H. v. Storch (2006): Localization of global climate change: storm surge scenarios for
Hamburg in 2030 and 2085. In: Die Küste 71: 169–182.

114 Hofstede
Hofstede, J.L.A. et al. (2005a): COMRISK - Common strategies to reduce the risk of storm floods in coastal lowlands: a synthesis. In: Hofstede (ed.): COMRISK – common strategies to reduce the risk of storm floods in coastal lowlands. Die Küste special edition 70: 133–150.
Hofstede, J.L.A. et al. (2005b): Risk perception and public participation – COMRISK subproject 3. In: Hofstede (ed.): COMRISK – common strategies to reduce the risk of storm floods in coastal lowlands. Die Küste special edition 70: 33–46.
Hofstede, J.L.A. (2007a): Küstenschutz im Küstenrisikomanagement. In: Hansa 2007 (6): 102–104. Hofstede, J.L.A. (2007b): Entwicklung des Meeresspiegels und der Sturmfluten: ist der anthropogene
Klimawandel bereits sichtbar? In: Coastline Reports 9: 139–148. Horton, R. et al. (2008): Sea level rise projections for current generation CGCMs based on the semi-empirical
method. In: Geophysical Research Letters 35, L02715, doi: 10.1029/2007GL032486. IPCC – Intergovernmental Panel on Climate Change (2001): Climate Change 2001: the scientific basis –
summary for policy makers. (http:\\www.ipcc.ch). IPCC – Intergovernmental Panel on Climate Change (2007): Climate Change 2007: the Physical Science base -
summary for policy makers. (http:\\www.ipcc.ch). MPI – Max-Planck-Institut für Meteorologie (2006): Klimaprojektionen für das 21. Jahrhundert. Hamburg, 32 p. Oumeraci, H. (2005): Integrated risk-based design and management of coastal defences. In: Hofstede (ed.):
COMRISK – common strategies to reduce the risk of storm floods in coastal lowlands. Die Küste special edition 70: 151–172.
Probst, B. (1994): Küstenschutz 2000 - neue Küstenschutzstrategien erforderlich? In: Wasser und Boden 11: 54–59.
Rahmstorf, S. (2007): A semi-empirical approach to projecting future sea level rise. In: Science 315: 368–370. ROG (1998): Raumordnungsgesetz Deutschland. Berlin, 14 p. Shepard, A. & D. Wingham (2007): Recent sea-level contributions of the Antarctic and Greenland ice sheets. In:
Science 315: 1529–1532. WBGU – Wissenchaftliche Beirat der Bundesregierung, Globale Umweltveränderungen (2006): Die Zukunft der
Meere – zu warm, zu hoch, zu sauer. Berlin, 130 p. Woth, K., R. Weisse & H. v. Storch (2006): Climate change and North Sea storm surge extremes: an ensemble
study of storm surge extremes expected in a changed climate projected by four different regional climate models. In: Ocean Dynamics, doi: 10.1007/s10236005-0024-3.
Zickfeldt, K. et al. (2007): Expert judgement on the response of the Atlantic meridional overturning circulation to climate Change. In: Climate Change 82:235–265.
Address Jacobus Hofstede Schleswig-Holstein State Ministry for Agriculture, the Environment and Rural Areas Mercatorstraße 3, D-24106 Kiel, Germany
1Lan2La
AbstracThanAdquchdirDistrAtforinfreqImCogoalldeexp
1 KuDer steigthemenüden Schsind in anthropodaraus rgesetzlicWasserragetreteneDabei soRichtliniherangezdie diese
SchwarzerFrom BrazCoastlineS. 115-126
N
ndesbetrieb fürandesamt für L
ct he increasing palysis of all dditional needuestions targetallenges for rectives in theirective and inrongly requiret the same timr Spatial Infofrastructure aquirements of
mportant netwooastal Informaovernment andl requirementcisive role to perts on marin
urzfassung gende Druck
übergreifendehutz erforder
der zunehmogenen Veräresultierendechen Anfoahmenrichtlie Meeresstraollen Fachdie (Infrastruzogen werdee technischen
r, Schrottke &zil to Thailand e Reports 16 (6
Neue Herafür da
Marine D
Jörn
r KüstenschutLandwirtschaf
pressure on threquired data
ds for a commting anthropogcoastal prote
e marine arean particular th a certain data
me data of the mormation in Eand appropriaf EU directivesorking compoation System
d the federal ss, the projectsupport the inne and coastal
und Einleitk auf die intee Auswertunrlicher Datenmenden Koänderungen en Anforderuorderungen inie, der Floategie-Rahmeaten aus deucture for en können. Hn Möglichke
& Stattegger (e– New Result
(2010), ISSN 0
ausforderas europä
Das PDaten-Inf
n Kohlus1 &
tz, Nationalpaft, Umwelt und
he intensively a for the con
mon marine dagenic changesection. Not le, as for the EU
he Marine Stra managementmarine monitoEurope) shouate software s.
onents have alm (NOKIS) an
tates by develt "MDI DE ntegration of dl data.
tung ensiv genutzng aller für dn. Weitere Gomplexität amariner Ökungen an de
der euroora-Fauna-Haenrichtlinie em MeeresmSpatial Info
Hierzu bedarf iten mit den
eds.): ts in Coastal R0928-2734, IS
rungen imäische Me
rojekt MDfrastruktu
& Hans-Chr
ark und Meered ländliche Rä
used coastal aservation of ta infrastructus in marine eceast the repoU Water Fram
rategy Framewt. oring accordinuld be providtools, which
lready been dnd also at thloping local d- Marine dat
different techn
ten Küstenreden Erhalt deGründe für eaktueller Frakosysteme, inen Küstenscopäischen abitat-Richtlein spezielles
monitoring naormation inf es einer InfrAnforderung
Research SBN 978-3-98
m Datenmeresmoni
DI-DE ur in Deu
ristian Reim
esschutz Schleäume Schlesw
and marine arehabitats, their
ure are the inccosystems, gloorting obligatmework Direcwork Directiv
ng to the INSPded for a com
join the tec
developed withhe participatindata infrastructta infrastructunical infrastruc
egionen und er Lebensräueine übergreiagestellungen der globachutz zu sehBerichtspfli
linie sowie is Datenmanaach Maßgab
n Europe) frastruktur ungen aus den E
11839-9-3
anagemenitoring
utschland
mers2
eswig-Holsteinwig-Holstein (L
eas demands ar functioning
creasing compobal change aions for the ctive, the Flore, recently en
PIRE Directivmmon use. Tchnical capab
hin the Northng data nodetures. Since th
ure in Germactures and dis
Meere erforume, ihrer Fuifende marinn im Zusa
alen Klimavhen. Nicht zchten, wieinsbesondereagement. be der übergfür eine ge
nd geeigneterEU-Richtlin
nt
n (LKN), GermLLUR), Germ
a thematic croand protecti
plexity of currand the resultmain Europe
ra-Fauna-Habntered into for
ve (InfrastructThis requires bilities with
h- and Baltic Ss of the centhese do not many" will playstributed skills
rdert zunehmunktionsfähigne Dateninfrmmenhang
veränderung zuletzt erfore die dee der jüngst
greifenden INemeinsame r Softwareweien verbinde
many many
oss-ion. rent ting ean itat rce,
ture an
the
Sea tral
meet y a s of
mend eine gkeit und rastruktur mit den und den
rdern die er EU-in Kraft
NSPIRE-Nutzung
erkzeuge, et.

116
WichtigeInformatden AuAnfordeInfrastrutechnischzu.
2 AuEinen wnachfolgBerichts
AbkomGenerellTMAP sGegensajedoch k
HELCOHELCOMeeresuOstsee-Atrat im Ja
OSPAROSPAR Schutz dbenannt,(PARCOBegriff wverwend
TrilaterIm RahprogramDeutschlAnfordeBasis dewurde eParametechemischBesucheeinheitlicErgebniseinen ÜbSchadstogemeins
e Bausteinetionssystem
ufbau lokalerungen eben
uktur für Dehen Infrastru
fbau und Zwesentlichen gend beschpflichten geg
mmen und Rl muss zwiscsowie den voatz zu den Ekeine gesetzli
OM
M selbst ist umwelt im OAnrainern. Dahre 2002 in
R (auch OSP
der Meeresum, der Oslo-KOM) von 197wird für den
det.
rales Monihmen des
mms (TMAPland sowie irungen an d
er dringlicheneine Auswaher, wie die hen Belastu
erzahlen. Diechen Datenssse in einemberblick überoffeinträgen am formulie
e zur notwNOKIS mit
er Dateninfrnfalls noch neutschland“ ukturen und
Ziele der MAnstoß zum
hriebene Abgeben.
Richtlinien chen den tradon der EuropEU-Richtlinieich wirksame
eine zwischOstseeraum aDas entsprechn Kraft.
PARCOM) imwelt des NoKonvention 74. Vertragsan Vertrag an
toring- undtrilateral ab
P; CWSS 20in den Niededas Monitorin Problemfehl der zu erzeitliche un
ungen z. Be Daten werstruktur gesp
m Qualitätszur die Entwickauf das Öko
erten Ziele (T
wendigen Vden beteiligt
rastrukturen nicht gerechteine wichtigverteilten K
MDI-DE m Aufbau ein
bkommen
zum Schutditionellen Mäischen Unioen können den Beschlüss
henstaatlicheagiert. Gegrühende Abkom
ist die Abküordost-Atlan(OSCOM)
abschluss wan sich und fü
d Bewertunbgestimmten008), das serlanden im Wing bereits slder und denrfassenden Pnd räumlicheB. in Sedimrden nach apeichert. Sieustandsbericklung der erf
osystem und Targets) sowi
Vernetzung ten Datenknbereits ent
t werden, koge unterstütz
Kompetenzen
ner Marinen und EU-R
tz der MeerMeeresschutzon erlassenendurch die Abse verabschie
e Kommissioündet wurde mmen wurd
ürzung für ntiks. Es ist n
von 1972 uar am 22. Sefür die exeku
ngsprogramn Beobachtueit 1994 geWattenmeer sehr konkretn bereits bekParametern fe Verteilungmenten, abeabgestimmtene werden allht veröffentfassten Parambietet eine Bie Empfehlun
konnten doten des Buntwickelt we
ommt dem Pzende Rollen der Expert
DateninfrastRichtlinien
resumwelt zabkommen wn Richtlinienbkommen nuedet werden.
on, die für ddie Kommie 1992 vera
das Übereinnach den beidund der Pareptember 199utive OSPAR
mm (TMAPungs- und emeinsam inumgesetzt w
t festgelegt kannten Wirkfestgelegt. D von Vogel
er auch sozn Methodenle fünf bis slicht (z. B. meter, die A
Bilanz über dngen (Recom
durch das ndes und der
erden. Da drojekt „MDI
e bei der Zuten für Meer
truktur in Dund die
wie HELCOn (s. u.) unterur Empfehlu.
den Schutz dssion von de
abschiedet un
nkommen zuden Vorläuferis-Konventi92 in Paris DR-Kommissi
P) Bewertungs
n Dänemarkwird, sind diworden. Au
kungsgefügeDies sind vo- und Robbzioökonomis
n erhoben unsechs Jahre Essink et a
Auswirkungendas Erreichenmmendations
Kohlus &
Nord-Ostseer Länder sowdiese den gI-DE - Mariusammenführes- und Küs
eutschland hdamit verb
OM, OSPAR rschieden we
ungen ausges
der en nd
um ern ion Der ion
s-k, ie uf n
or allem ökoenbeständensche Paramnd in einer ausgewertetl. 2005). Din z. B. von Nn der wattenms) für ein ver
& Reimers
e-Küsten-wie durch gestellten ne Daten
hrung der stendaten
haben die bundenen
und dem erden. Im sprochen,
ologische n und die eter wie trilateral
t und die ieser gibt Nähr- und meerweit rbessertes

Das Projekt MDI-DE - Marine Daten-Infrastruktur in Deutschland 117
Management. Im Gegensatz zu den Monitoring-Anforderungen und Datenformaten ist die Berichtsform wenig formalisiert.
Natura2000 Natura 2000 ist ein EU-weites Netz von Schutzgebieten zum Erhalt der in der EU gefährdeten Lebensräume und Arten. Es setzt sich zusammen aus den Schutzgebieten der Vogelschutz-Richtlinie und denen der Flora-Fauna-Habitat-Richtlinie.
Flora-Fauna-Habitat-Richtlinie (FFH) Die FFH-Richtlinie (Richtlinie 92/43/EWG) sieht nicht nur die Einrichtung eines einheitlichen, europaweiten Schutzgebietsnetzes vor, in denen ein Mindestschutz gewährleistet und Eingriffe und Veränderungen zuvor auf ihre Verträglichkeit mit den Schutzzielen hin geprüft werden. Es sollen auch Schutzregelungen für europaweit gefährdete Arten mit großräumig genutzten Lebensräumen getroffen werden, die nicht durch Schutzgebiete geschützt werden können. Die Mitgliedstaaten müssen regelmäßig alle sechs Jahre über den Stand der Umsetzung, die Situation der Lebensraumtypen und Arten in und außerhalb der FFH-Gebiete sowie über ergriffene Schutzmaßnahmen berichten. Die Berichtsform ist EU-weit standardisiert vorgeschrieben.
Vogelschutz-Richtlinie (VSR) Bereits in der 1979 in Kraft getretenen Vogelschutzrichtlinie (Richtlinie 79/409/EWG) ist eine regelmäßige Berichtspflicht im Abstand von drei Jahren vorgesehen. Die Richtlinie ist mit dem Ziel des Schutzes wildlebender Vogelarten und ihrer Lebensräume innerhalb der EU erlassen worden. Sie schreibt die Einschränkung und Kontrolle der Jagd sowie die Einrichtung von Vogelschutzgebieten als wesentliche Maßnahme zur Erhaltung der Lebensräume von Arten vor und beinhaltet gleichzeitig ein Verschlechterungsverbot. Seit 1983 wurde aufgrund der herausragenden Bedeutung für viele Watt- und Wasservogelarten das Gebiet des Schleswig-Holsteinischen Wattenmeers und Nationalparks zum Vogelschutzgebiet erklärt.
Abb. 1: Monitoring der NATURA2000 Programme

118
EuropäDie EUSchutz ades GVerschlechemischvon denMonitoriweniger vielmehrbiologiscRichtliniFolge, dwerden mderzeit nfestgelegBewirtsc
Abb. 2:
EuropäDie im (Richtlinder EU-Wdie Beric
äische WassU-Wasserrahmaller GewässGrundwasserechterungsvehen Zustand
n Mitgliedstaings verlangauf der Er
r auf der Echen, physie findet im
dass das bestmuss. Wie bnational wie gten Zeitabchaftungsplä
MonitoringRahmenrich
äische MeerJahr 2008
nie 2008/56/EWRRL und dchtsaufgaben
serrahmenmenrichtlinieser inkl. der rs zum erbot und ddes bis zum Jaaten wie begt (Art. 8, Wrfassung undErfassung uikalisch-chemBereich des
tehende Monei der FFH-Rinternationalbständen v
äne an das W
g und Dathtlinie und IN
resstrategie8 in KraftEG) verknüpder INSPIREn im Rahmen
nrichtlinie (e (Richtlinie
Fließ- und Ziel. M
das ErreichJahr 2015. Aei den bei d
WRRL). Im Gd Bewertungund Bewertumischen uns Schleswig-nitoring an dRichtlinie gibl im Detail avon maxim
Water Informa
enmanagemenNSPIRE
e-Rahmenrt getretene pft die AnfoE-Richtlinie, n der MSRL
(EU-WRRLe 2000/60/EKüstengewä
Maßgabe ihen eines gAls wichtigesen zuvor ge
Gegensatz zug des Zustaung von abnd hydro-m-Holsteinischdie spezifischbt es Vorgab
ausgearbeitetmal 6 Jaation System
nt für die
richtlinie (MMeeresstrat
rderungen auderen Vorgazu verwende
L) G) hat den
ässer sowie dist ein guten ökolos Kontrollinsenannten Ricur FFH-Richandes von Abgegrenzten
morphologischen Wattenmhen Erforderben für die Et, abgestimmahren sindfor Europe (
EU-Wasse
MSRL) tegie-Rahmeus der FFH-aben und Veren sind.
n holistischeder Seen un
allgemeineogischen unstrument wirchtlinien diehtlinie liegt dArten und L
Wasserkörpchen Parammeeres Anwernisse dieserrfassungen u
mt und operatd thematisc(WISE) zu li
errahmenrichtl
enrichtlinie -Richtlinie, rfahren für
Kohlus &
en nd es nd rd Durchführu
der SchwerpLebensraumtypern mit H
metern. Aucendung. Dier Richtlinie aund Bewertuionalisiert wche Berichiefern.
linie, Meere
& Reimers
ung eines unkt hier ypen, als
Hilfe von ch diese s hat zur angepasst ngen, die
werden. In hte und
esstartegie

Das Projekt MDI-DE - Marine Daten-Infrastruktur in Deutschland 119
Inhaltlich ist wie in den zuvor genannten Richtlinien die Analyse der wesentlichen Kennzeichen und Merkmale der marinen Gewässer unter Berücksichtigung der verschiedenen Lebensraumtypen, biologischen Komponenten, physikalisch-chemischen Merkmale und der Hydromorphologie vorgeschrieben. Auch hier soll ein guter Umweltzustand erzielt werden. Qualitative Deskriptoren für die Beschreibung des guten Umweltzustandes sind z. B. die Verbreitung und Populationsdichte von Arten wie Seevögeln und Meeressäugern, das Vorkommen nicht-heimischer Arten sowie der Zustand kommerziell befischter Fisch- und Schalentierbestände. Überwachungsprogramme sind für die laufende Bewertung des Umweltzustandes der Meeresgewässer auch außerhalb des Hoheitsgebietes im Bereich der ausschließlichen Wirtschaftszone durchzuführen. Die Meeresstrategie-Rahmenrichtlinie geht über die anderen Richtlinien hinaus, da sie nicht nur die Bereitstellung von Umweltdaten sondern auch die von Daten mit Umweltbezug (Anhang I, II, III) verlangt und mit dieser Anforderung dem Ansatz von INSPIRE entspricht (Abb. 2).
INSPIRE-Richtlinie Im Gegensatz zu den anderen bisher genannten Richtlinien wird durch INSPIRE (Richtlinie 2007/2/EG) nicht die Erfassung und Bewertung von Daten, sondern deren Bereitstellung geregelt. Diese EU-Richtlinie ist im Mai 2007 in Kraft getreten und verpflichtet die Mitgliedstaaten, stufenweise interoperable Geobasisdaten wie Karten und Luftbilder sowie bereits vorhandene Geofachdaten - zunächst zur Umwelt und Landwirtschaft - bereit zu stellen. Als erster Schritt ist die Erstellung einheitlicher Metadaten (Informationen über Herkunft, Inhalt, Erhebungszeitraum, Zugriffsrechte usw.) vorgesehen. Bei der Nationalparkverwaltung in Schleswig-Holstein wird hierfür die Software des Nord- und Ostsee Küsteninformationssystems NOKIS (Lehfeldt et al. 2006) eingesetzt, mit dem bereits ein Großteil der Metadaten über Geodaten aus dem schleswig-holsteinischen Wattenmeer EU-kompatibel bereitgestellt wird. Ziel ist es, alle verfügbaren und entsprechend aufbereiteten Daten Nutzern aller EU-Staaten über Portale bereitzustellen. Um dies zu erreichen, wird die strenge Ausrichtung an bestimmten technischen Vorgaben vorgeschrieben. Durch die Veröffentlichung der Daten soll den Bürgern ein sehr umfassendes Instrument an die Hand gegeben werden, um sich über räumliche Vorgänge (z.B. Planungen und Bauvorhaben) zu informieren. Die Bereitstellung von Geo- und Fachdaten im Internet wird als Pilotprojekt von der Nationalpark- und Umweltverwaltung Schleswig-Holsteins mit dem Tool Cadenza der Firma disy durchgeführt. Es ist auch ein Werkzeug zur Recherche, Analyse und Auswertung von Daten, mit der Möglichkeit, PDF-Berichte dynamisch zu erzeugen. Ein direkter Zugriff von NOKIS-Metadaten auf die Geodaten wurde testweise bei der Nationalparkverwaltung erfolgreich umgesetzt.
Besondere Anforderungen im Küsten- und Meeresgebiet Geodateninfrastrukturen entstehen in den letzten Jahren für die unterschiedlichsten Aufgaben. Deren Ansprüche und Regeln gelten auch für eine Marine Dateninfrastruktur. Allerdings bestehen im Bereich der Küsten- und Meere besondere Bedingungen, aus denen sich veränderte Schwerpunkte und zusätzliche Erfordernisse für den Aufbau einer Dateninfrastruktur ergeben. Dies ist allein schon aufgrund der hohen Dynamik in diesem Gebiet ersichtlich: Alle sechs Stunden fallen mehrer tausend Quadratkilometer Watten trocken oder werden überflutet. Sände, Watten und Inseln werden verlagert, verschwinden oder entstehen neu, so dass Schiffsrouten teilweise mehrmals im Jahr angepasst werden müssen. Bei einem zur Infrastruktur gehörenden Gazetteer, einem Instrument zur Verknüpfung von Ortsnamen mit ihrer Ortslage (Kohlus 2009), ist daher nicht nur die Zeitgültigkeit bei den Namen zu berücksichtigen sondern auch dass die benannten Objekte temporären Charakter haben, sich ihre Form und Lage verändert oder sie gar zerstört werden. Ob Messungen der Algendichte, der Wassertemperatur oder Beobachtungen des Verhaltens von Vögeln, sie gelten nur für ein kurzes

120 Kohlus & Reimers
Zeitfenster. Die Beschreibung von Messwerten und Zeitreihen, von Messzeitpunkten und Periodizitäten nimmt damit einen anderen Stellenwert als im terrestrischen Gebiet ein. Um diese dynamischen Prozesse zu verstehen oder Wirkung von Eingriffen abschätzen zu können, werden zunehmend hydro- und morphodynamische Modelle benötigt. Daher müssen beim Aufbau einer marinen Dateninfrastruktur Anknüpfungspunkte und Einbindungsmöglichkeiten für Computermodelle berücksichtigt werden. Die Wandelbarkeit des Raumes schlägt sich auch direkt bei den rechtlich-organisatorischen Aufgaben nieder. So werden die unter Hoheit und Recht der Bundesländer stehenden Wattenmeernationalparke während der Flut zu großen Teilen zu einer Bundeswasserstrasse. Die Verknüpfung von Aufgaben der Länder und des Bundes sind im marinen Milieu komplexer miteinander verwoben und unterliegen oft Sonderbedingungen. So ist z. B. abweichend vom gesamten nationalen Hoheitsgebiet der Bundesstaat im Bereich der Ausschließlichen Wirtschaftszone für den Naturschutz zuständig.
Architektur der MDI-DE Um den Anforderungen verschiedener Zielsysteme und bestehender Berichtspflichten bei der Bereitstellung von Fachdaten und Informationen besser zu entsprechen, werden die unabhängig voneinander entwickelten Systeme NOKIS und GDI-BSH in einer neuen „Marinen Daten Infrastruktur“ für Daten und Informationen der deutschen Küstenzone und dem angrenzenden Meeresbereich verknüpft. Mit dieser neuen technischen Grundlage wird die notwendige integrative und harmonisierte Vernetzung von weiteren Informationssystemen durchgeführt und deren effiziente Nutzung unterstützt.
NOKIS und die Geodateninfrastruktur des BSH Die Produkte aus den Projekten NOKIS (2001-2004) und NOKIS++ (2004-2008) bilden den ersten wichtigen Schritt zu einer konsistenten Informationsinfrastruktur. Sie werden inzwischen in den meisten Küstendienststellen im Routinebetrieb eingesetzt. Speziell für die Dokumentation von Daten aus der Küstenzone wurde das NOKIS Metadatenprofil aus dem ISO 19115 abgeleitet. Es kann durch standard-konforme Erweiterungen für alle Fragestellungen im Küstenraum verwendet werden. Das Küstenzonenprofil enthält das Profil der Geodateninfrastruktur Deutschland (GDI-DE). So können die Metainformationssysteme PortalU und GeoPortal.Bund auf Bundes- wie auf Länderebene (z.B. SH-MIS in Schleswig-Holstein, Kohlus et al. 2009b) bedient werden. Das Küstenzonenprofil hat darüber hinaus drei weitere Ausprägungen, mit denen sich Forschungsprojekte, Simulations-Szenarien und Modelle sowie Messstellen und Messplattformen (z.B. Forschungsschiffe) beschreiben lassen. Die Metadatenerfassung und -pflege erfolgt mit dem browserbasierten NOKIS Metadaten-Editor, der bei allen Datenlieferanten im Einsatz ist. Interaktive Online-Visualisierungen von numerischen Simulationen sind mit digitalen Atlanten für Wind, Strömungen und Seegang implementiert. Mit den Datendiensten für Zeitreihen, flächenhafte Verteilungen und Bewertungen liegen exemplarisch implementierte Web-Services vor, die für weitere Datenbestände genutzt werden können (www.nokis.org).

Das Proje
Abb. 3:
In der GGeobasisInternetznach DainteraktieingerichDas BSGeodate(GDI-DE
IntegraDie MDDauerauwasserbaSystemaInformatdem PorWeise. Dvon Servder BunUmsetzubesonderAbbildun
ekt MDI-DE - M
Bestandteil
Geodateninfras- und Geofzugang des aten und Infven Web-GIhtet, die im I
SH liefert mnbasis von DE) die Daten
ation in die DI-DE stellufgaben im aulichen, ra
analysen sowtionsplattformrtalU (KruseDie MDI-DEvices, die Bendesanstalt ung der MSre Rolle zung 4 zu entn
Marine Daten-
e und Aufbau
astruktur desfachdaten deGeoSeaPortformationen IS darstellenInternet als Omit seiner GDeutschland des BSH für
nationalenlt Informati
Zusammenaumplaneriscwie zur Unm für die Ne et al. 2009E unterstützt richtsdaten afür Gewäss
SRL kommt . Weiter Einehmen.
-Infrastruktur i
u der Marinen
Bundesamtees BSH (Meal (www.bshsuchen, die
n. Für eine OGC-konformGeodateninfr
(NGDB). Gr INSPIRE b
n und internionen und nhang mit chen, natursnterstützung
Nord- und Os9) ein und erden Reportin
auf dem Wegserkunde a
der MDI-Dnbindungen
in Deutschland
Dateninfrastru
es für Seeschelles & Soeh.de/de/Meeese auf versVielzahl vome WMS verastruktur eiGleichzeitig wbereitgestellt
nationalen Werkzeuge den EU-R
schutzfachlicder Schifff
stsee in bestrgänzt und hngprozess füg zum Berichaggregieren DE bei der
in bestehen
d
uktur Deutsch
hifffahrt undetje 2006) zueresdaten/Geoschiedene A
on Fachsysterfügbar sindinen wichtigwerden über.
Infrastrukzur Verfü
Richtlinien chen, wissenfahrt verwenehende Infraharmonisiert ür die EU-Rihtsportal „W
und harmogeforderten
nde Infrastru
hland (MDI-D
d Hydrographur Verfügunodaten/index
Arten kombinemen wurden. gen Bausteir das Geodat
kturen ügung, die notwendig nschaftlichenndet werdenastrukturen w
den Informchtlinien dur
Wasser“ (wwwonisieren. Inn Bereitstelluukturen und
DE).
hie (BSH) wng gestellt. Üx.jsp) könnenieren und n Web-Karte
in für die tenportal des
zur Erfüllusind und
n und ökoln. Sie fügt wie der GDI
mationsfluss irch die Bere
w.wasserblicknsbesondere ung von DaNetzwerke
121
erden die Über den n Nutzer in einem endienste
nationale s Bundes
ung von die bei
logischen sich als
I-DE und in idealer itstellung k.net) bei
für die aten eine sind der

122
Abb. 4:
DatenkFür die Verpflicauf euroDaten daBerichtsEinrichtuSich wader VerwBereitsteGeodatedie beschPartner iInformatzusätzlicgeringemKnotensDopplunvorgenom
Integration
knoten bei doben dargeshtungen eingpäischer Ebeagegen bei dwesen, dennungen digita
andelnde Aufwaltungen wellung in Fon, Zeitreihenhreibenden Min solch einetionen für diche Teilnehmm Aufwand i zusammen
ng des alten mmen werde
der MDI-DE
den Partnetellten Richtgeht und Anene ist, die k
den Bundeslän die zugrul einsehbar sfgaben, wec
waren schon borm der Vendaten, gegebMetadaten füer Infrastrukie Dateninfra
mer an der Min das Netz ischließen odbestehendenen.
in die nationa
rn tlinien gilt insprechpartne
kostenintensivändern liegt. unde liegendsein, d.h. konchselnde Zusbei NOKIS (ernetzung eibenenfalls W
ür die Nutzerktur können astruktur un
MDI-DE könnintegriert weder bei Tre
n Knotens ein
alen und intern
n den meisteer für den Nave UmsetzunMit der INSPden Daten
ntrollierbar vständigkeiten(Kohlus 200inzelner Kno
Webservices fr bereit. hierbei eined deren Auf
nen jederzeit erden kann. Tennung in nne nahtlose,
nationalen Be
en Fällen, daachweis zur Eng der MesspPIRE Richtlisollen mög
vorliegen. n sowie die 05) Gründe, doten zu orgfür die Darst
n eigenständfgaben verfüeinen eigene
Teilnehmer kneue organis
sukzessive Ü
richtssysteme
ass zwar der Erfüllungen programme uinie geht die
glichst nah
fortlaufendedie Informat
ganisieren. Dtellung und T
digen Knotenügbar gemachen Knoten aukönnen sich satorische EÜberführung
Kohlus &
e
Bund die nder Berichtsund Aufbere EU neue Wbei den erh
e UmstrukturtionsaufbereiDiese KnoteTransformati
n betreiben, ht werden. Nufbauen, der für den Betrinheiten kan
g in die neue
& Reimers
nationalen spflichten eitung der
Wege beim hebenden
rierungen itung und en stellen ion sowie
mit dem Neue und dann mit
rieb eines nn durch e Struktur

Das Proje
Abb. 5:
SemantDie größnur zögequalitativsind. Ihrin einen oder hieSchlüsseEine übeFür manFällen kThesaurials übergEin Gazräumlichdie BennSemantisverwendzuzuordnTransforaber aucLösungeMesswerbeschränVerwend
3 Ein
Vom MVon decharaktein der Reder Dat
ekt MDI-DE - M
Flexible Inf
tik ßte Hürde beerlich angegve Bezeichnre Nutzung asemantisch h
erarchisch veelbegriffe derergreifende,
nche Arten gikönnen Lebewi können dazgeordnete Grzetteer schafhe Referenz mnungsformensche Problem
deten Methonen. Die Vrmationen auch auf Dateen hierfür sirte für spenkt. Somit bdung leisten,
nsatz im Um
Monitoring zer Felderheberistischen Vegel grafischten hinsichtl
Marine Daten-
frastruktur dur
ei der gemeingangen wird.ner Synonymals Stichworthierarchische
erwandten Ar Hydrologiebesonders anibt es zahlreiwesen nicht zu beitragenruppe zu nutzfft ein ähnlimittels Erdko
n als auch fürme liegen nioden, derenVerwendunguflösen. Um n angewendind allerdingzifizierte Frbilden Serv, notwendige
mweltberic
zum Berichbung bis zuerarbeitungs
h als Karten olich der Fr
-Infrastruktur i
rch kaskadierb
nsamen Nutz Entscheiden
me auffindbat wird durchen Zusamme
Ausdrücken ee, Morpholognspruchsvolliche Synonymmit akzepta
n, verwandte zen. iches begriffoordinaten ur die Georefeicht nur in dn Beschreibug unterschie
eine gemeindet werden, gs meist auragestellunge
vices, die eie Bestandteile
chtswesen
ht ur Erstellunsablauf (Kohoder Diagramagestellung
in Deutschland
bares Knotenp
zung von Datnd für die gr, übersetzba
h Thesauri unenhang stelleermöglichen.gie und des Kle Aufgabe eme und konkablem Aufw
oder synony
ffliches Scheund sollte im erenz ermöglder Terminolung und dedlicher Mansame Nutzudie nach un
uf beschränken unter Bine Transfore einer Daten
ng von Datelus et al. 200
mme dargestder Berich
d
prinzip
ten liegt in dgemeinsame ar, kategorisnterstützt, dien und damit Für die Au
Küstenzonenergibt sich dukurrierende sand bis auf yme Bezeich
ema für Ortmarinen Ber
lichen (Kohlogie. So sin
der Definitioaße lässt sung zu ermönterschiedlickte Wertebererücksichtigrmation vonninfrastruktu
enprodukten09 a, Reimerellt, wobei mtsanforderun
der SemantikNutzung vo
sierbar und ve die Verwet z. B. eine Sufgaben der Mnmangementsurch das biosystematischdas Artnive
hner miteina
snamen, gibreich zeitlichus 2009). d Messwerteon den Dasich meist öglich, könnchen Methodreiche und
gung weiteren Werten füur.
n und Berics 2008, 2009
meist eine spengen erfolgt
k. Ein Feld, don Daten ist,vergleichbar endung von Buche mit SynMDI-DE sins zu erschließologische Mohe Ansätze. Inau bestimmt
ander oder ab
bt ihnen zudhe Bezüge so
e nur im Koaten nachvo
vollständignen Transformden erhoben die Ausdeu
er Randbedür eine gem
chten gibt 9). Messdateezifische Aut. Bewertung
123
das bisher dass für definiert
Begriffen nonymen
nd zudem ßen. onitoring. n einigen t werden. bstrahiert
dem eine owohl für
ontext der ollziehbar g mittels mationen wurden.
utung der ingungen
meinsame
es einen n werden
uswertung gen sind

124 Kohlus & Reimers
entweder in beschreibender Form abzugeben oder haben wie bei der Wasserrahmenrichtlinie einem festen Klassifizierungsschema zu folgen. In diesem 5-stufigen Schema werden ähnlich wie bei der Arbeit mit Grenzwerten Messkriterien festgelegt, die vom sehr guten bis zum schlechten Qualitätszustand reichen. Das Bewertungsschema kann sich dabei auf ein Qualitätskriterium aber auch mehrere differenziert erfasste Faktoren stützen. Auch bei einem Qualitätsfaktor kann es erforderlich sein, dass Ergebnisse unterschiedlicher Monitoringaktivitäten dabei eingehen. Diese werden dann auf der Ebene der Bewertung miteinander verknüpft.
Abb. 6: Ablauf der Bearbeitung beim Monitoring
Als Beispiel sei hier der ökologische Zustand der am Anfang des 20. Jh. weiträumig ausgestorbenen Seegräser genannt. Dieser bildet für die WRRL einen wichtigen Qualitätsfaktor. Einerseits wird durch die Nationalparkverwaltung im Landesbetrieb für Küstenschutz, Nationalpark und Meeresschutz (LKN) die räumliche Ausbreitung von Seegraswiesen per Fernerkundung untersucht (Reise & Kohlus 2008 a). Anderseits ist nicht nur die Ausbreitung sondern auch der Zustand der Bestände entscheidend für die Beurteilung (Reise & Kohlus 2008 b). So werden einzelne Seegraswiesen im Rahmen eines Programms des Landesamtes für Landwirtschaft, Umwelt und Ländliche Räume (LLUR) durch Begehung und Probennahme untersucht. Das Verfahren wurde für die Bewertung im Sinne der Wasserrahmenrichtlinie angepasst und mit der räumlichen Erfassung gekoppelt. Die Ergebnisse der Fernerkundung können damit Verifiziert und räumlich differenzierte Zustandsunterschiede auf Dauer erkannt werden. Für die Bewertung der Wasserkörper nach diesem Qualitätskriterium müssen dann die qualitativen Beobachtungen über sechs Jahre mit den jährlichen Beobachtungen der Ausbreitung verknüpft werden. Die Verknüpfung beider Verfahren kann nach bisherigem Kenntnisstand nur auf der Ebene der Bewertung der jeweiligen Untersuchungen vorgenommen werden. Hierfür wurden vorläufige algorithmisch formulierbare Regeln vereinbart.
Servicebasierte Bewertungsverfahren Es wird allgemein erwartet, dass Warn- oder Belastungssituationen des ökologischen Zustandes von den Spezialisten in einfacher Form kommuniziert werden. Dabei besteht der nachvollziehbare Wunsch, dass Untersuchungsergebnisse in einen vordefinierten Ablauf der Analyse und Bewertung einfließen. Automatisierte algorithmische – und damit nachvollziehbare – Auswertungen brauchen definierte Verfahrenswege. Einfache und gegen Sekundärwirkungen robuste Verfahren, die eine eindeutige Interpretation und Auswertbarkeit der gemessenen Monitoringparameter ermöglichen, wird es nur wenige geben.

Das Projekt MDI-DE - Marine Daten-Infrastruktur in Deutschland 125
Zu bedenken ist auch, dass wenn Verfahren angepasst und verbessert werden müssen, die technische Umsetzung erneut zu fassen ist. Kostensparend und effektiv sind automatische Verfahren nur dann, wenn Beurteilungsregeln längerfristig gelten und eine Kontinuität bei den verwendeten Bewertungsfaktoren besteht. Für die Umsetzung automatisierter Services zur Bewertung heißt dies, dass die Ergebnisse von den jeweiligen Experten interaktiv kommentierbar und veränderbar sein müssen. Zudem muss eine explizite Freigabe einer solchen automatisierten Vorbewertung erfolgen. Trotz dieser Schwierigkeiten sollen für einige Parameter testweise Umsetzungen auch von bewertenden Services im Rahmen des den Aufbau der MDI-DE tragenden Projektes entwickelt werden.
Literatur CWSS – Common Wadden Sea Secretariat (2008): TMAP Monitoring Handbook. (http://www.waddensea-
secretariat.org/TMAP/Monitoring.html). Essink, K., C. Dettmann, H. Farke, K. Laursen, G. Lüerßen, H. Marencic & W. Wiersinga (2005): Wadden Sea
Quality Status Report 2004. Wadden Sea Ecosystem No. 19. Trilateral Monitoring and Assessment Group, Common Wadden Sea Secretariat, Wilhelmshaven.
Kohlus, J. (2005): North Sea and Baltic Sea Coastal Information System - Nord- und Ostsee KüstenInformationsSystem, Posterpresentation, CoastGIS 2005, Aberdeen.
Kohlus, J. (2009): Ein Gazetteer für die deutsche Küste. In: Vött, A. & H. Brückner (Hrsg.): Ergebnisse aktueller Küstenforschung - Beiträge der 26. Jahrestagung des Arbeitskreises 'Geographie der Meere und Küsten', 25.-27. April 2008 in Marburg, In: Marburger geographische Schriften 145: 50–65.
Kohlus, J., B. Diederichs, W. Kazakos & C. Heidmann (2009a): Von den Metadaten zum Bericht. In: Traub, K-P., J. Kohlus & T. Lüllwitz (Hrsg.): Geoinformationen für die Küstenzone - Band 2, Beiträge des 2. Hamburger Symposiums zur Küstenzone und Beiträge des 7. Strategie-Workshops zur Nutzung der Fernerkundung im Bereich der BfG/Wasser- und Schifffahrtsverwaltung, Norden, Halmstad S. 137–152.
Kohlus, J., N. Ruhe, R. Bayer & M. Bellin (2009b): Geodateninfrastruktur Schleswig-Holstein und NOKIS. In: Traub, K-P., J. Kohlus & T. Lüllwitz (Hrsg.): Geoinformationen für die Küstenzone - Band 2, Beiträge des 2. Hamburger Symposiums zur Küstenzone und Beiträge des 7. Strategie-Workshops zur Nutzung der Fernerkundung im Bereich der BfG/Wasser- und Schifffahrtsverwaltung, Norden, Halmstad S. 137–152.
Kruse F., S. Uhrich, M. Klenke, H. Lehmann, C. Giffeia & S. Töpker (2009): PortalU®, a Tool to Support the Implementation of the Shared Environmental Information System (SEIS) in Germany. In Hřebíček, J., J. Hradec, E. Pelikán, O. Mírovský, W. Pillmann, I.Holoubek & T. Bandholtz (eds.): Proceedings of the European conference TOWARDS eENVIRONMENT - Opportunities of SEIS and SISE: Integrating Environmental Knowledge in Europe. Masaryk University, March 25–27 2009, Prague, pp. 637–642.
Lehfeldt, R., H.-C. Reimers, F. Simmering & F. Sellerhoff (2006): The use of metadata in coastal engineering and the protection of coastal waters. In: German Coastal Engineering Research Council - GCERC newsletter, 6th year Edition, 2/2006, Hamburg, pp. 4–5.
Melles, J. & K.C. Soetje (2006): Die GDI-BSH und das Nautisch-Hydrographische Informationssystem (NAUTHIS). In Traub, K.-P. & J. Kohlus (Hrsg.): Geoinformationen für die Küstenzone. Beiträge des 1. Hamburger Symposiums zur Küstenzone. Heidelberg, S. 118–124.
Reimers, H.-C. (2008): New Approaches for operational Sediment Monitoring – A Workflow based on Metadata. International Conference on Coastal Engineering, 31st ICCE 2008, 31.8.-5.9., Hamburg, Germany. Abstract 406.
Reimers, H.-C. (2009): Vom Messwert zum Monitoring am Beispiel des operativen Sediment- und Habitatmonitorings. In Traub, K.-P., J. Kohlus & T. Lüllwitz (Hrsg.) Geoinformationen für die Küstenzone Band 2, Points Verlag Norden- Halmstad, pp. 45–50.
Reise K. & J. Kohlus (2008a): Seagrass, an indicator goes astray. In: Colijn, F., R. Doerffer & J. Beusekom (eds.): Observing the Coastal Sea. An Atlas of Advanced Monitoring Techniques. Helmholtz Centres - GKSS Research Centre and Alfred Wegner Institute for Polar and Marine Research, Geesthacht, 1/2008, pp. 64–67.

126 Kohlus & Reimers
Reise K. & J. Kohlus (2008b): Seagrass recovery in the Northern Wadden Sea? In: Helgol Mar Res 62 (1): 77–84.
Adresse Jörn Kohlus Landesbetrieb für Küstenschutz, Nationalpark und Meeresschutz Schleswig-Holstein (LKN) - Nationalparkverwaltung Schlossgarten 1 25832 Tönning, Germany

AbstracWparsucdecogreThcoThforanof qucououanecoapp
1 Int
MotivaWater mof flood are drainstations energy stide dueproblemresult thethe dikedrained. renunciabeyond energy denergy is
SchwarzerFrom BrazCoastlineS. 127-133
Fea
1L
2Institute of
ct ater managemrt of flood proch as silting gradation or astal pumpingeat financial bhe aim of this astal regions b
he historical dr the drainaged the supply othe North Se
uantities and auld be predom
ut for an invesd/or hydro poonomic efficipropriate for u
troduction
tion and Omanagement a
protection aned off in a in order to
supply for dr to the wate
matic due to cere is a short
e is reduced Moreover, c
ation of naturthe dike thro
demand. This increasing
r, Schrottke &zil to Thailand e Reports 16 (3
asibility Stb
Leichtweiss-InTec
f River and Co
ment at the cootection and tof the outer renunciation
g stations repburdens for th
study is to anby using renewevelopment o
e of the land. of wind energea in Dithmaras a result it cminantly supptigation area iower were reiency. The anuse in sustaina
Objectives at the coastsand to guaransystem of dpass the di
ainage is reqer level diffechanges in cotening of thewhich leads
climatic chanral drainage ough the uses results in grapidly.
& Stattegger (e– New Result
(2010), ISSN 0
tudy for Oby Using
Marie Naul
nstitute for Hychnische Univoastal Enginee
oasts secures tto guarantee adeep and cliof natural dr
presents an inhe drainage asnalyse sustainwable energy.
of drainage meFor this reaso
gy were carrierschen. It wascould be showlied by a windin Dithmarsch
eviewed for fenalysis indicaable drainage
secures the ntee a produitches and chke. Sluices
quired since terences. Nowoastal morphe sluice time s to a highernges such as(Maniak et ae of coastal great financi
eds.): ts in Coastal R0928-2734, IS
OptimisatRenewab
lin1 & Thor
ydraulic Enginersität Braunsering, Hambu
the drainage oa productive aimatic changerainage. A co
ntervention wissociations sinnable solution. ethods shows on, analyses oed out over a s found that thwn that the end energy planthen in Northereasibility andated that elecsystems.
drainage of uctive agriculhannels that are preferrethe sluice gawadays naturhology whereat low tide ar risk of flos the rise of al. 2005). A cpumping sta
ial burdens f
Research SBN 978-3-98
tion of Lable Energy
sten Albers
neering and Wschweig, Germurg University
of the marsh ragriculture. Ches such as thonventional sith a high en
nce the cost ofns in order to
that wind-drivof the energy period of threhere is a relat
nergy demandt. In addition rn Germany. T
d evaluated onctric wind pu
the marsh relture. Therefleads the w
d as drainagates close at hral drainage e the slope oand the amouooding since
the sea leveconventionalations represfor the draina
11839-9-3
and Drainy
2
Water Resourcemany
of Technolog
region along thanges in coahe sea level rsolution, replanergy demandf energy is incoptimise the
ven pumps aredemand of a
ee years in thetion between
d of a coastal a feasibility sThree alternatn the basis ofumping system
egion along fore in the hi
water to eithege structureshigh tide respusing sluice
of the outer dunt of water the run-offs
el will also lel solution, susents an inteage associati
nage
es,
gy, Germany
the North Seaastal morpholorise will leadacing sluices
d. This resultscreasing rapidland drainage
e highly relevpumping state coastal regiothe investigapumping stattudy was carrtives to use wf calculationsms were hig
the North Seinterland the
er sluices or s since no apectively opes is becomdeep is reducdischarge th
fs are not suead to degrauch as pumpiervention witions since th
a as ogy d to
by s in dly. e in
vant tion ons
ated tion ried
wind s of hly
ea as part e run-offs pumping
additional en at low ing more ced. As a
hat passes ufficiently adation or ing water th a high
he cost of

128
A new cthis purppumpingdocumenareas inrepresenthe wateanalyse renewab
InvestigDithmarGermanyhinterlansluices ofloods freconomiFor the catchmein more Steertlocmanagempumpingconditionthe nearb
Figure 1:
2 AnAs windthe energcarried ocounty D
concept for opose, wind eg stations. Tnted. For exn The Nethents hydro power discharge i
sustainable ble energy.
gation Arearschen is a coy (figure1). nd the run-ofor pumping sfrom inland ic sector of thfeasibility stnt area of 1.2detail. Due
ch is reducedment of this g station Hilln in form ofby sites.
Investigatio
nalysis of end energy was gy demand oout in more Dithmarschen
optimisation energy repre
The historicaample wind-erlands sincwer that coulis increased bsolutions in
a ounty on theThe coast ar
ffs are drainestations in ordischarges ahis region. tudy, the pum200 ha and thto changes
d and therefarea has to blgroven weref water level
on Area in Dit
nergy demaidentified as
of a pumpindetail over an.
of land drainesents one aal importanc-driven watece the 15th
ld be utilizedby a high lyin order to o
e North Sea rea consists ed off in a syrder to pass and to main
mping statiohe sluice Steof the coast
fore gravity dbe improvede used as a l differences
thmarschen, N
and of a pus being highl
ng station ana period of t
nage by usinappropriate ae of using w
er pumps havcentury. An
d within the ping polder. Toptimise the
coast of the of polder su
ystem of ditchthe dike. Th
ntain an effi
on Hillgroveneertloch withtal morpholodrainage bec
d and sustainfirst estimatiof high and
Northern Germ
umping statly relevant fod the energythree years i
ng renewablealternative aswind energyve been usednother possiprocess of a
Therefore the land draina
federal stateurrounded byhes and chan
his water manicient agricu
n with a pumh a catchmentogy the slopcomes insuffable solutionion of the pu
d low tide are
many
tion and suor drainage my supply of an the coasta
e energy is ths a possible
y for the drad in order toible renewacascading dr
e main objectage in coast
e Schleswig-y dikes as flnnels that leanagement is
ulture which
mping capact area of 6.30e of the outficient. For tns were analumping timee assumed to
pply of winmethods (IPAa wind energ
al regions of
Naulin
herefore reque energy resoainage of tho drain the lable energy rainage systetive of this sttal regions
-Holstein in flood defenceads the water
important torepresents
city of 160 k00 ha are invter deep of tthis reason, tlysed. The daes since the bo be almost
nd energy AT 1989), angy plant (WEthe North S
n & Albers
uired. For ource for e land is low lying
resource em where tudy is to by using
Northern es. In the r to either o prevent the main
kW and a vestigated the sluice the water ata of the boundary equal for
nalyses of EP) were
Sea in the

Feasibility
EnergyIn order producticonsumpanalysedDeich- uof the C(LKSH 2in Schles
Figure 2:
The resustation aSeptemb22 % of lower anEspecialdemand %). Duriproducti
EnergyThe resuenergy daveragespumpingperiods hourly danalysedinvestigaWEP ansupply syFor the provided
y Study for Op
y Balance wto compare on of WEP aption of a cod. The data und HauptsieChamber of 2008) whereswig-Holstei
Comparisonof Schleswitill 2007)
ults show seaas well as ofber a very lowf the mean annd amounts lly during this recorded. ing the monton 28 % of t
y Balance wults of the fidemand of as it is not pg station sincsuch as hou
data of the ed over a perate the perced how high tystem. energy dem
d by the drain
ptimisation of L
with Monththe distributan energy ba
oastal pumpinwere provid
elverband Dif Agriculturee the productiin.
n of energy deig-Holstein (A
asonal fluctuf the producw energy dennual need is39 % of thehe months JIn the same
ths October the annual de
with Hourlyirst energy ba pumping sossible to cce there is a urs. For this energy demariod of threeentage of enthe percentag
mand the datanage associa
Land Drainag
ly Data ion in time o
alance with mng station wided for the pithmarschene Schleswigion of wind
emand of a puAverage month
uations of thection of winmand with ms required. L
e mean annuJanuary till e time periodtill Decembeemand respec
y Data balance on thstation and wonclude whegreat variatireason, the
and of a pume years fromnergy supplyge of the rem
a of pumpination Deich-
e
of the energymonthly dataith monthly pumping sta. Furthermor-Holstein Laenergy was i
umping stationhly values of
e annual distnd energy (fimonthly valuLikewise dural output. DMarch almo
d the producter the energyctively produ
he basis of mwind energyether the wion in wind stemporal re
mping stationm 2005 untily of a pumpimaining energ
ng times of tund Hauptsi
y demand of a was carriedvalues over
ation Hillgrore, the wind andwirtschafinvestigated
n and wind enthe annual de
tribution of tigure2). Durues of 3 % toing summer
During winterost half (46tion of wind y demand amuction.
monthly datay productionind energy sspeed with siesolution of n and the en 2007. The ing station thgy is that has
the coastal pielverband D
a pumping sd out. Therefo
a period fromoven by the data were taftskammer Sfor the coast
nergy productiemand/ produc
the energy dring summero 5 % and inthe producti
r time highe%) of the energy is al
mounts 32 %
a show the an. From thessupply woulignificant chthe calculat
nergy producmain goal o
hat can be ds to be taken
pumping statDithmarschen
station and thore the electrm 2005 till 2drainage as
aken from anSchleswig - tline of the N
ion along the wction for the y
demand of a r time from n total a percion of wind
er values are mean annualso slightly l
% and the win
annual distribse results of ld be sufficihanges in shotion is increction of a Wof this analydirectly covefrom the loc
tion Hillgrovn. In order to
129
he energy ric power 2007 was ssociation n analysis
Holstein North Sea
west coast years 2005
pumping April till entage of energy is reached.
al energy arger (33
nd energy
bution of f monthly ent for a
orter time eased and
WEP were ysis is to ered by a cal power
ven were o consider

130
a varian220 kW constantconstantIn reality
Figure 3:
nce in pumpto 660 kW. I
t value, viz. t value is equy the pump c
Electrical p2005, 2006system
ing power tIt should be 220 kW or
ualized to thecapacity is di
power supply 6 and 2007 di
the total engnoted that fo660 kW for e rate of the ivided into se
of a pumpingifferentiated in
gine power or the followeach calcularequired pumeveral pumps
station with an energy supp
of the pumping calculatiation. This cmp capacity s which are o
a constant pumply by a WEP
ps was rangions the pumcould be an depending ooperated as r
mp capacity oP (800 kW) a
Naulin
ged with valumping power i
overestimatin the catchm
required.
of 220 kW forand by the lo
n & Albers
ues from is set to a ion if the
ment area.
r the years cal power

Feasibility
For the ppower cuWEP theusing thdata werstation BAs an exof 220 kthat the eof WEP pumping660 kW.220 kW
3 FeaIn order and/or heconomistation wtransfer
Figure 4:
AlternaThe firstturbine possibiliwaterboais well apower owith hou86 % de
y Study for Op
production ourve relates e model Enere power curre measured
Büsum in Ditxample the rkW for the yeenergy demasupply was
g station. Fu. As a resultpumps and 7
asibility Stuto analyse d
hydro poweric efficiencywith WEP, (2and (3) casca
Sketches of
ative 1: pumt alternativeand the pumity to receiveard Bremischapproved. In f 560 kW av
urly data shoepending on t
ptimisation of L
of wind energwind speed trcon E 48 wi
rve of the mod by the Gerthmarschen. results in formears 2005 tilland of the pus calculated urthermore, int the mean a72.1 % for 66
udy for Dradifferent drair were reviey for the slu2) reservoir wading draina
f the alternativ
mping statie is composemps there ise energy fromher DeichverBremen the
verages 50 %wed for the the pumping
Land Drainag
gy the data wto the electriith 800 kW wodel E 48 horman Meteor m of the elecl 2007 are sh
umps can be pfrom 83.7 %n this calcul
annual power60 kW pump
ainage Metinage methoewed for feuice Steertlowith wind-d
age system us
ves analysed in
ion with Wed of a pums an electricm the power rband am ree energy sup% of the annusite in Dithm
g capacity ca
e
were estimateical power owind turbineourly data ofrological Se
ctrical supplhown with mpredominant
% (2006) up lation the pur supply by ps.
thods Usingods using renasibility and
och in Dithmdriven pump sing WEP an
n the feasibili
WEP mping stationc power transupply syste
chten Weserply of a WEual demand
marschen a han be expecte
ed using a poutput of a W
e was appliedf the mean wrvice Deutsc
ly of a pumpmonthly value
tly supplied bto 89.8 % (2
ump capacitythe WEP wa
g Renewabnewable enerd evaluated marschen as with a mech
nd hydro pow
ty study (with
n combined nsfer. Durinem. This alte
rufer for the EP (600 kW)(DVR-Brem
higher wind eed since the
ower curve oWEP. As an ed. As input dwind speed wcher Wetterd
ping station wes in figure 3by a WEP. In2007) of they was rangedas estimated
ble Energy rgy three alteon the basifollows (fi
hanical (a) orwer.
h M = motor a
with a WEPng windless ernative is alpumping sta) for the pum
men 2008). Aenergy supplycapacity of t
of a wind turbexample of aata of this cawere used. Tdienst at the
with an engin3. The diagran total the pe
e annual need from 220 kd between 86
ernatives to is of calculagure 4): (1) r electrical (
and G = gener
P. Between periods the
lready realiseation Wasserhmps with a toAs the energyy from abouthe WEP (80
131
bine. The a possible alculation The wind e weather
ne power ams show ercentage ed for the kW up to 6.5 % for
use wind ations of pumping
(b) power
ator)
the wind re is the ed by the horst and otal rated y balance
ut 72 % to 00 kW) is
132 Naulin & Albers
higher and the surface roughness of the terrain affects the wind to a lesser extent. For the catchment area of Steertloch the total required pump capacity was estimated to about 600 kW. This equates a possible wind energy supply from approx. 75 % which represents 240 MWh. Moreover, there is a remaining energy production of 2,400 MWh by the WEP.
Alternative 2: reservoir with wind-driven pump As the second alternative the feasibility of a reservoir with wind-driven pumps was examined. It is noted that a mechanical power transfer between the wind turbine and the pumps is not feasible since mechanical pumping systems only achieve a maximum of 10 kW as rated capacity (Gasch & Twele 2005) which falls below the value of the required pump capacity of 600 kW. With an electrical power transfer the alternative 2b corresponds to alternative 1 including an additional reservoir. By means of the reservoir there is the advantage of adopting the operation of the pumps. Since the water can be stored in the reservoir the pumping times are adjustable to periods with sufficient wind energy supply. For the existing reservoir of the sluice Steertloch the storage volume was calculated by an elevation model covering the data of the bathymetry and the terrain with the software ESRI ArcView. Between the water levels -1.5 mNN and 0.0 mNN the storage volume was estimated to 425,000 m³. With a design discharge of 12.6 m³/s the storage time amounts 9.3 hours. This alternative offers the use of control and feedback control systems where the operation of the pumps can be adjusted to the wind energy supply. Therefore the wind energy supply is estimated as a greater value than in alternative 1, viz. greater than 75 %.
Alternative 3: cascading drainage system using WEP and hydro power The third alternative is composed of a cascading drainage system using wind energy and hydro power. Therefore at first the water is pumped by a WEP into a high lying polder. From the higher polder the water can be drained by gravity and at the same time hydro power can be gained by powering a generator with the discharge of the water. As a type of generator, pumps as turbines can be applied since the boundary conditions of a changing flow rate and a low head have to be considered. Compared to the wind energy production with a total of 2,600 MWh the production of hydro power with 240 MWh is rather low.
4 Results Besides the review of technical feasibility the alternatives were evaluated on the basis of calculation of their economic efficiency. The costs have been estimated considering the investment and operating costs as well as the tariffs for wind energy and hydro power due to the Renewable Energy Sources Act (Erneuerbare-Energien-Gesetz/ EEG). In order to give some example of the expanses the investment costs of a WEP comparable to the model Enercon E-48 (800 kW) amount to 1.2 million euro. The investment costs of the pumping system were neglected since these values are the same for each alternative. The operating costs mainly consist of energy costs which average up to 310,000 euro/year with an electricity tariff of 15 cent/kWh for a conventional pumping station. For wind energy the tariffs following EEG 2009 are summed up to 160,000 till 170,000 euro/year for a period of 20 years. The tariffs of hydro power result in a maximum of 30,000 euro/year. Table 1 shows the results in terms of the annuities for the different pump capacities of 220 kW and 660 kW. It can be seen that alternative 3 with the cascading drainage system using hydro power is not economic. By contrast the alternatives using energy of a WEP for a pumping system are profitable. In comparison with a conventional pumping system annual costs of up to 47,000 euro/year can be saved.

Feasibility Study for Optimisation of Land Drainage 133
Table 1: Results of evaluation of economic efficiency in terms of annuities considering investment, operating coast as well as tariffs for wind energy and hydro power after EEG (2009) for a period of 20 years
Pump capacity Alternative 0: Conventional
pumping station
Alternative 1: Pumping station
with WEP
Alternative 2: Reservoir with WEP
pumping system
Alternative 3: Cascading drainage using hydro power
220 kW -16,000 euro/year +20,000 euro/year > +20,000 euro/year -337,000 euro/year 660 kW -48,000 euro/year -1,000 euro/year < -1,000 euro/year -338,000 euro/year
5 Summary Wind energy was identified as being highly relevant for drainage methods, therefore analyses of the energy demand of a pumping station and the supply of wind energy were carried out over a period of three years in the coastal regions of the North Sea in Dithmarschen. It was found that there is a relation between the investigated quantities and as a result it could be shown that the energy demand of a coastal pumping station could be predominantly supplied by a wind energy plant. Three alternatives to use wind and/ or hydro power were reviewed for feasibility and evaluated on the basis of calculations of economic efficiency. The analysis indicates that electric wind pumping systems are highly appropriate for use in sustainable drainage systems and from the economic point of view the annual costs can be reduced by a factor of 48 compared to conventional pumping systems.
References DVR-Bremen (2008): Bremischer Deichverband am rechten Weserufer. Personal communication with Mr.
Döscher and Mr. Dülge at May 30th 2008. Gasch, R. & J. Twele (2005): Windkraftanlagen,. Teubner Verlag, Wiesbaden, 540 S. IPAT - Internationale Projektgruppe für angepasste Technologien (1989): Der Einsatz von Windpumpsystemen
zur Be- und Entwässerung. Fachbereich Internationale Agrarentwicklung der TU Berlin. Berlin, 219 S. LKSH - Landwirtschaftskammer Schleswig-Holstein (2008): Windenergie XX Praxisergebnisse 2007,, 98 S. Maniak, U., A. Weihrauch & G. Riedel (2005): Die wasserwirtschaftliche Situation in der Unterwesermarsch
unter der Einwirkung der Klimaänderung. In: Schuchardt, B.& M. Schirmer (Hrsg.): Klimawandel und Küste, Die Zukunft der Unterweserregion. Springer Verlag, Berlin und Heidelberg, S. 79–100.
Acknowledgement The work has been carried out as part of the first authors diploma thesis at the Hamburg University of Technology in collaboration with the water board Deich- und Hauptsielverband Dithmarschen. The supervision and provision of data by the latter is gratefully acknowledged. Moreover, special thanks for additional support goes to DVR Bremen, Enercon, Köster Heide, KSB, BSU and FHTW.
Address Marie Naulin Technische Universität Braunschweig, Leichtweiss-Institute for Hydraulic Engineering and Water Resources Beethovenstrasse 51 a 38106 Braunschweig, Germany [email protected]


Coastline Reports published by EUCC - The Coastal Union are available online under: http://www.eucc-d.de/coastline_reports.php Coastline Reports 1 (2004) Geographie der Meere und Küsten (Geography of Seas and Coasts) G. Schernewski & T. Dolch (Hrsg./eds.) (Mostly in German with English abstract) Coastline Reports 2 (2004) Managing the Baltic Sea G. Schernewski & N. Löser (eds.) (In English) Coastline Reports 3 (2004) Retrospektive Analyse größerer Planverfahren in der Küstenzone unter der Perspektive “IKZM-Tauglichkeit” (Retrospective analysis of large scale planning procedures under the perspective of their ICZM-compatibility) B. Schuchardt, T. Bildstein, H. Lange, J. Lange, C. Lee, S. Pestke, W. Osthorst, M. Schirmer, D. Wille & G. Winter (In German with English abstract) Coastline Reports 4 (2004) Baltic Sea Typology G. Schernewski & M. Wielgat (eds.) (In English) Coastline Reports 5 (2005) The INTERREG III B BaltCoast Project A pilot initiative on Integrated Coastal Zone Management in the Baltic Sea (2002-2005) B. Heinrichs, A. Schultz-Zehden & S. Toben (eds.) (In English) Coastline Reports 6 (2005) Integrated Coastal Zone Management at the Szczecin Lagoon: Exchange of experiences in the region (Integriertes Küstenzonenmanagement am Stettiner Haff: Erfahrungsaustausch der Regionen / Zintegrowane Zarządzanie Obszarami Przybrzeżnymi nad Zalewem Szczecińskim: wymiana doświadczeń między regionami) B. Glaeser, A. Sekścińska & N. Löser (eds. / Hrsg./ wyd.) (Mostly in German with English and Polish abstracts) Coastline Reports 7 (2007) Restoration of Coastal Ecosystems M. Isermann & K. Kiehl (eds.) (In English)

Coastline Reports 8 (2007) Coastal Development: The Oder Estuary and beyond G. Schernewski, B. Glaeser, R. Scheibe, A. Sekścińska & R. Thamm (eds.) (In English and German) Coastline Reports 9 (2007) Von der Geoarchäologie über die Küstendynamik zum Küstenzonenmanagement (From Geoarchaeology via Coastal Dynamic to Coastal Zone Management) G. Gönnert, B. Pflüger & J.-A. Bremer (Hrsg./eds.): (Mostly in German with English abstracts) Coastline Reports 10 (2007) The Benefits of Inter-linking Coastal and River Management Twenty case studies world-wide indicate opportunities and constraints A. Pickaver & D. Sadacharan (eds.) (In English) Coastline Reports 11 (2008) The INTERREG IIIB ToLearn Project Developing Sustainable Tourism in the North Sea Region G. von Rohr, C. Corves & H. Sterr (eds.) (In English) Coastline Reports 12 (2009) Coastal Change in the southern Baltic Sea Region G. Schernewski, H. Janßen & S. Schumacher (eds.) (Mostly in German with English abstracts) Coastline Reports 13 (2009) International approaches of coastal research in theory and practice EUCC – Die Küsten Union Deutschland e.V. (In English and German) Coastline Reports 14 (2009) Klimawandel und Raumplanung – Flächen- und Risikomanagement überschwemmungsgefährdeter Gebiete am Beispiel der Hamburger Elbinsel (Climate change and urbanism – urban management and risk management of flood-prone areas using the example of the Elbinsel Hamburg) J. Knieling, M. Schaerffer & S. Tressl (In German) Coastline Reports 15 (2010) Forschung für ein Integriertes Küstenzonenmanagement: Fallbeispiele Odermündungsregion und Offshore-Windkraft in der Nordsee (Research for an Integrated Coastal Zone Management: case studies Odra Lagoon and Offshore-wind power in the North Sea) A. Kannen, G. Schernewski, I. Krämer, M. Lange, H. Janßen & N. Stybel (In German)

Coastline Reports 16 (2010) From Brazil to Thailand – New Results in Coastal Research K. Schwarzer, K. Schrottke & K. Stattegger (eds.) (In English and German)


