Embed Size (px)
Citation preview
Wednesday May 31 2017 4:27 PM
Codebook
1969 Family Data: Final Release
584
Number of Variables
1969 Family Data: Final Release
Page 2 of 174
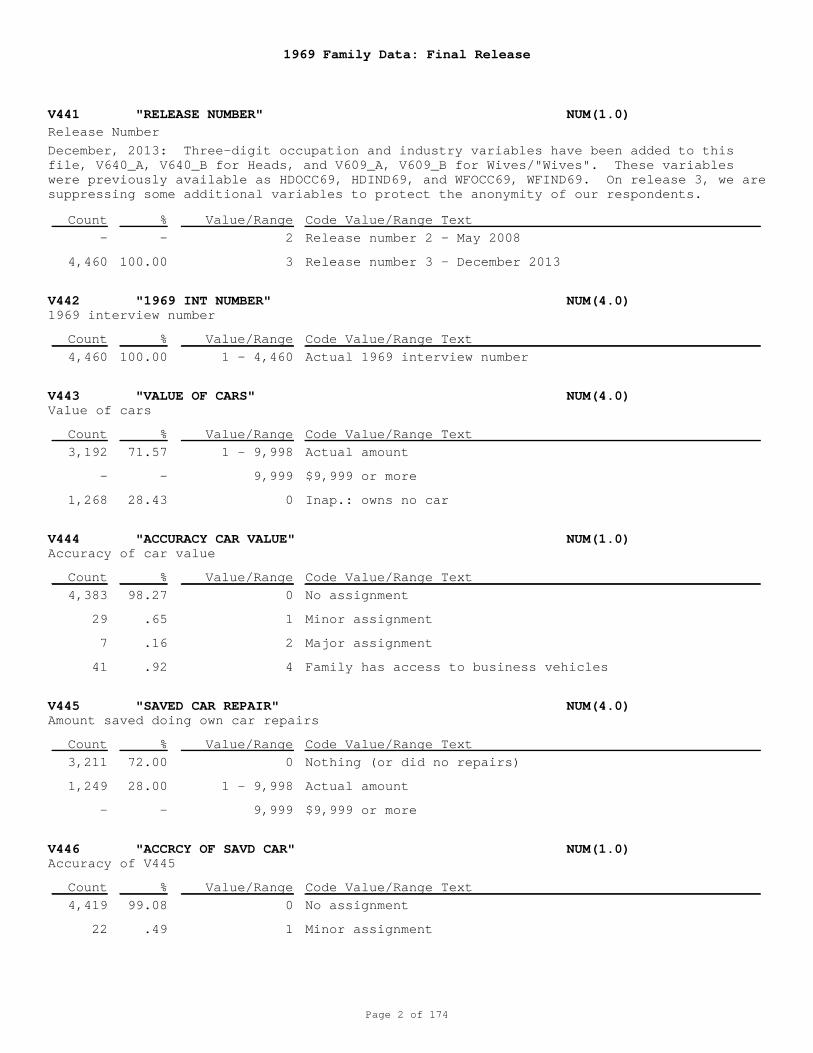
V441 "RELEASE NUMBER" NUM(1.0)
V442 "1969 INT NUMBER" NUM(4.0)
V443 "VALUE OF CARS" NUM(4.0)
V444 "ACCURACY CAR VALUE" NUM(1.0)
V445 "SAVED CAR REPAIR" NUM(4.0)
V446 "ACCRCY OF SAVD CAR" NUM(1.0)
Release Number
1969 interview number
Value of cars
Accuracy of car value
Amount saved doing own car repairs
Accuracy of V445
2
3
1 - 4,460
1 - 9,998
9,999
0
0
1
2
4
0
1 - 9,998
9,999
0
1
Release number 2 - May 2008
Release number 3 - December 2013
Actual 1969 interview number
Actual amount
$9,999 or more
Inap.: owns no car
No assignment
Minor assignment
Major assignment
Family has access to business vehicles
Nothing (or did no repairs)
Actual amount
$9,999 or more
No assignment
Minor assignment
December, 2013: Three-digit occupation and industry variables have been added to thisfile, V640_A, V640_B for Heads, and V609_A, V609_B for Wives/"Wives". These variableswere previously available as HDOCC69, HDIND69, and WFOCC69, WFIND69. On release 3, we aresuppressing some additional variables to protect the anonymity of our respondents.
-
4,460
4,460
3,192
-
1,268
4,383
29
7
41
3,211
1,249
-
4,419
22
-
100.00
100.00
71.57
-
28.43
98.27
.65
.16
.92
72.00
28.00
-
99.08
.49
Count
Count
Count
Count
Count
Count
%
%
%
%
%
%
Value/Range
Value/Range
Value/Range
Value/Range
Value/Range
Value/Range
Code Value/Range Text
Code Value/Range Text
Code Value/Range Text
Code Value/Range Text
Code Value/Range Text
Code Value/Range Text
1969 Family Data: Final Release
Page 3 of 174
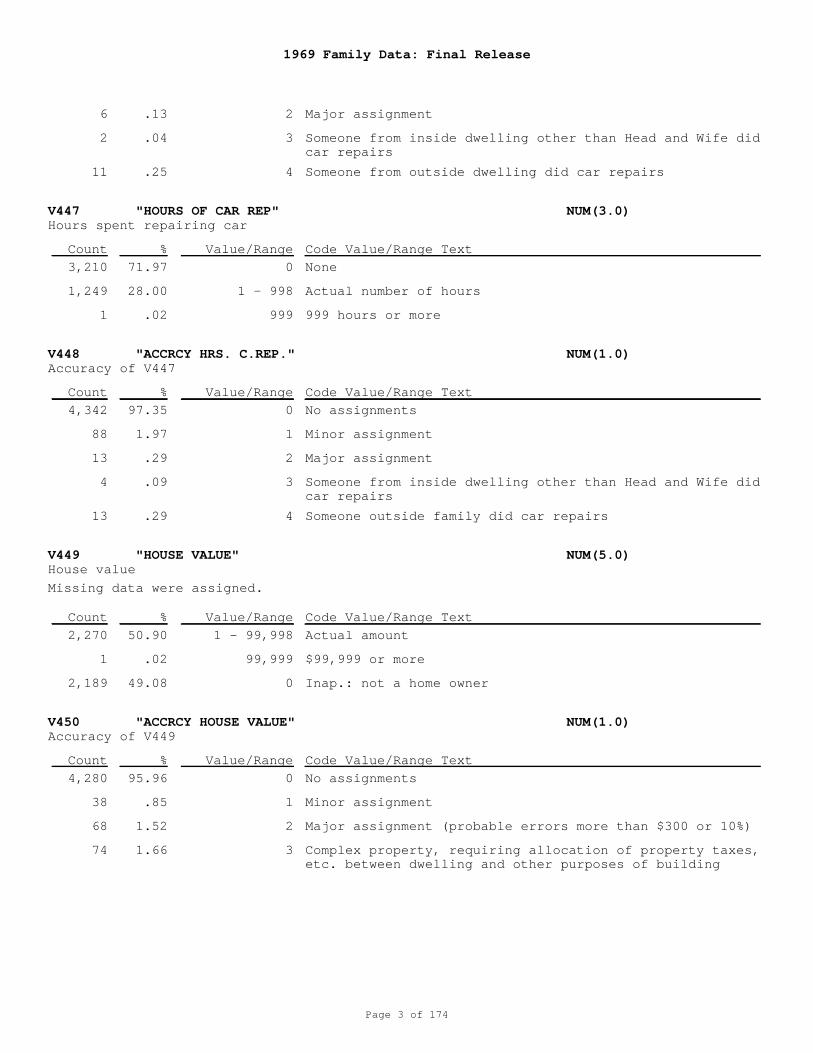
V447 "HOURS OF CAR REP" NUM(3.0)
V448 "ACCRCY HRS. C.REP." NUM(1.0)
V449 "HOUSE VALUE" NUM(5.0)
V450 "ACCRCY HOUSE VALUE" NUM(1.0)
Hours spent repairing car
Accuracy of V447
House value
Accuracy of V449
2
3
4
0
1 - 998
999
0
1
2
3
4
1 - 99,998
99,999
0
0
1
2
3
Major assignment
Someone from inside dwelling other than Head and Wife didcar repairs
Someone from outside dwelling did car repairs
None
Actual number of hours
999 hours or more
No assignments
Minor assignment
Major assignment
Someone from inside dwelling other than Head and Wife didcar repairs
Someone outside family did car repairs
Actual amount
$99,999 or more
Inap.: not a home owner
No assignments
Minor assignment
Major assignment (probable errors more than $300 or 10%)
Complex property, requiring allocation of property taxes,etc. between dwelling and other purposes of building
Missing data were assigned.
6
2
11
3,210
1,249
1
4,342
88
13
4
13
2,270
1
2,189
4,280
38
68
74
.13
.04
.25
71.97
28.00
.02
97.35
1.97
.29
.09
.29
50.90
.02
49.08
95.96
.85
1.52
1.66
Count
Count
Count
Count
%
%
%
%
Value/Range
Value/Range
Value/Range
Value/Range
Code Value/Range Text
Code Value/Range Text
Code Value/Range Text
Code Value/Range Text
1969 Family Data: Final Release
Page 4 of 174
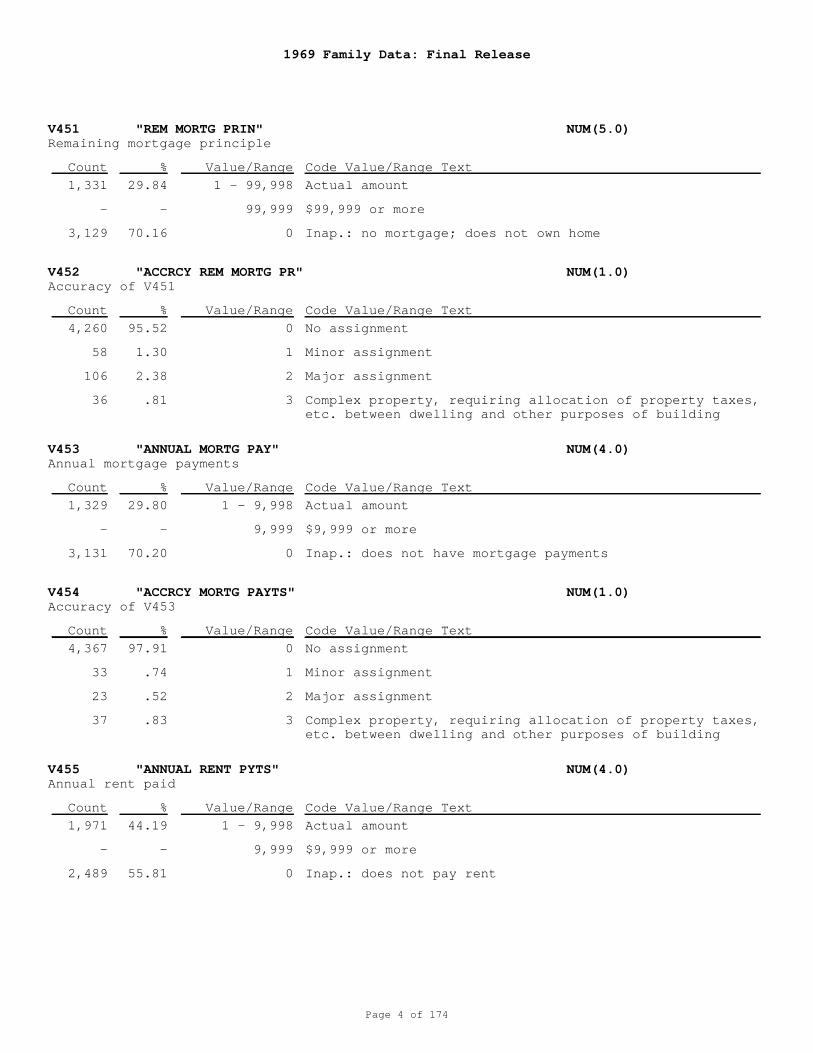
V451 "REM MORTG PRIN" NUM(5.0)
V452 "ACCRCY REM MORTG PR" NUM(1.0)
V453 "ANNUAL MORTG PAY" NUM(4.0)
V454 "ACCRCY MORTG PAYTS" NUM(1.0)
V455 "ANNUAL RENT PYTS" NUM(4.0)
Remaining mortgage principle
Accuracy of V451
Annual mortgage payments
Accuracy of V453
Annual rent paid
1 - 99,998
99,999
0
0
1
2
3
1 - 9,998
9,999
0
0
1
2
3
1 - 9,998
9,999
0
Actual amount
$99,999 or more
Inap.: no mortgage; does not own home
No assignment
Minor assignment
Major assignment
Complex property, requiring allocation of property taxes,etc. between dwelling and other purposes of building
Actual amount
$9,999 or more
Inap.: does not have mortgage payments
No assignment
Minor assignment
Major assignment
Complex property, requiring allocation of property taxes,etc. between dwelling and other purposes of building
Actual amount
$9,999 or more
Inap.: does not pay rent
1,331
-
3,129
4,260
58
106
36
1,329
-
3,131
4,367
33
23
37
1,971
-
2,489
29.84
-
70.16
95.52
1.30
2.38
.81
29.80
-
70.20
97.91
.74
.52
.83
44.19
-
55.81
Count
Count
Count
Count
Count
%
%
%
%
%
Value/Range
Value/Range
Value/Range
Value/Range
Value/Range
Code Value/Range Text
Code Value/Range Text
Code Value/Range Text
Code Value/Range Text
Code Value/Range Text
1969 Family Data: Final Release
Page 5 of 174
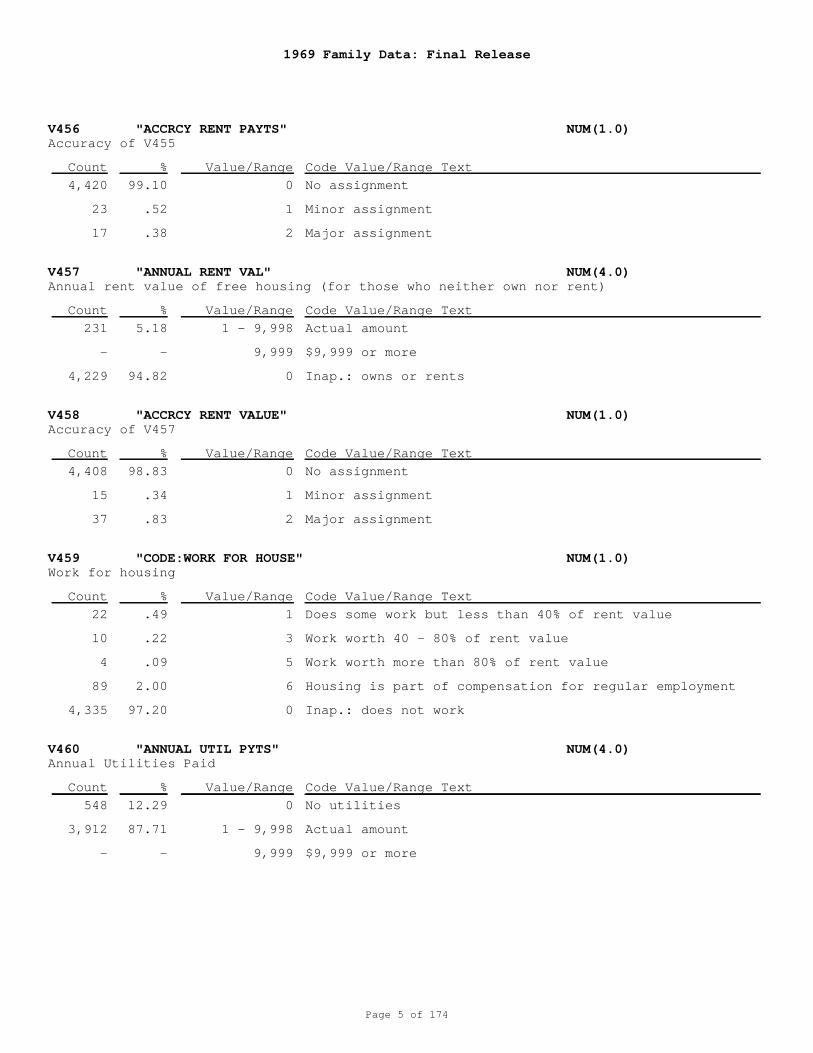
V456 "ACCRCY RENT PAYTS" NUM(1.0)
V457 "ANNUAL RENT VAL" NUM(4.0)
V458 "ACCRCY RENT VALUE" NUM(1.0)
V459 "CODE:WORK FOR HOUSE" NUM(1.0)
V460 "ANNUAL UTIL PYTS" NUM(4.0)
Accuracy of V455
Annual rent value of free housing (for those who neither own nor rent)
Accuracy of V457
Work for housing
Annual Utilities Paid
0
1
2
1 - 9,998
9,999
0
0
1
2
1
3
5
6
0
0
1 - 9,998
9,999
No assignment
Minor assignment
Major assignment
Actual amount
$9,999 or more
Inap.: owns or rents
No assignment
Minor assignment
Major assignment
Does some work but less than 40% of rent value
Work worth 40 - 80% of rent value
Work worth more than 80% of rent value
Housing is part of compensation for regular employment
Inap.: does not work
No utilities
Actual amount
$9,999 or more
4,420
23
17
231
-
4,229
4,408
15
37
22
10
4
89
4,335
548
3,912
-
99.10
.52
.38
5.18
-
94.82
98.83
.34
.83
.49
.22
.09
2.00
97.20
12.29
87.71
-
Count
Count
Count
Count
Count
%
%
%
%
%
Value/Range
Value/Range
Value/Range
Value/Range
Value/Range
Code Value/Range Text
Code Value/Range Text
Code Value/Range Text
Code Value/Range Text
Code Value/Range Text
1969 Family Data: Final Release
Page 6 of 174
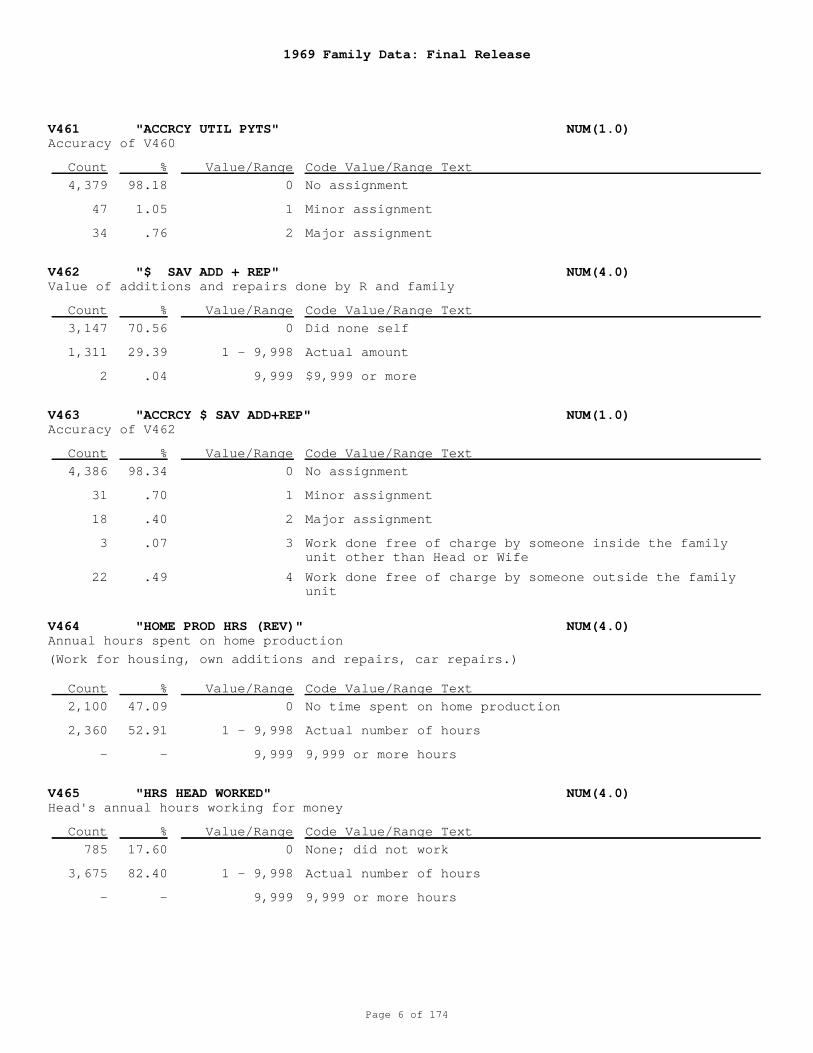
V461 "ACCRCY UTIL PYTS" NUM(1.0)
V462 "$ SAV ADD + REP" NUM(4.0)
V463 "ACCRCY $ SAV ADD+REP" NUM(1.0)
V464 "HOME PROD HRS (REV)" NUM(4.0)
V465 "HRS HEAD WORKED" NUM(4.0)
Accuracy of V460
Value of additions and repairs done by R and family
Accuracy of V462
Annual hours spent on home production
Head's annual hours working for money
0
1
2
0
1 - 9,998
9,999
0
1
2
3
4
0
1 - 9,998
9,999
0
1 - 9,998
9,999
No assignment
Minor assignment
Major assignment
Did none self
Actual amount
$9,999 or more
No assignment
Minor assignment
Major assignment
Work done free of charge by someone inside the familyunit other than Head or Wife
Work done free of charge by someone outside the familyunit
No time spent on home production
Actual number of hours
9,999 or more hours
None; did not work
Actual number of hours
9,999 or more hours
(Work for housing, own additions and repairs, car repairs.)
4,379
47
34
3,147
1,311
2
4,386
31
18
3
22
2,100
2,360
-
785
3,675
-
98.18
1.05
.76
70.56
29.39
.04
98.34
.70
.40
.07
.49
47.09
52.91
-
17.60
82.40
-
Count
Count
Count
Count
Count
%
%
%
%
%
Value/Range
Value/Range
Value/Range
Value/Range
Value/Range
Code Value/Range Text
Code Value/Range Text
Code Value/Range Text
Code Value/Range Text
Code Value/Range Text
1969 Family Data: Final Release
Page 7 of 174
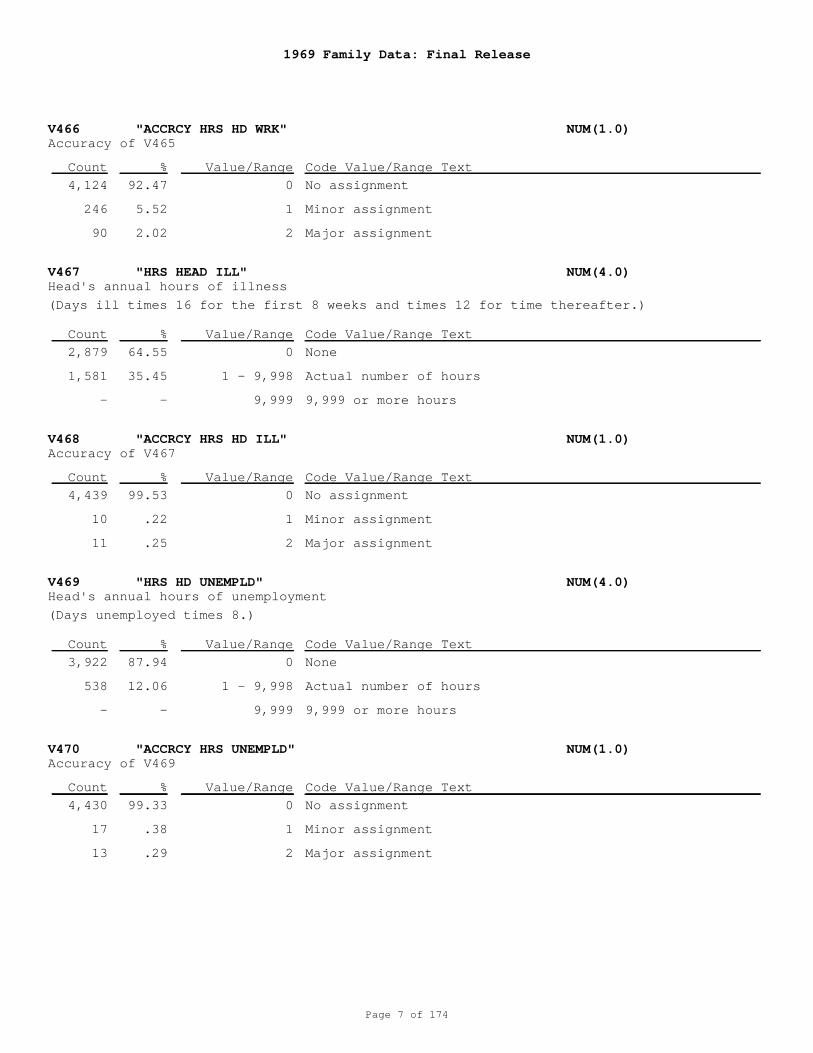
V466 "ACCRCY HRS HD WRK" NUM(1.0)
V467 "HRS HEAD ILL" NUM(4.0)
V468 "ACCRCY HRS HD ILL" NUM(1.0)
V469 "HRS HD UNEMPLD" NUM(4.0)
V470 "ACCRCY HRS UNEMPLD" NUM(1.0)
Accuracy of V465
Head's annual hours of illness
Accuracy of V467
Head's annual hours of unemployment
Accuracy of V469
0
1
2
0
1 - 9,998
9,999
0
1
2
0
1 - 9,998
9,999
0
1
2
No assignment
Minor assignment
Major assignment
None
Actual number of hours
9,999 or more hours
No assignment
Minor assignment
Major assignment
None
Actual number of hours
9,999 or more hours
No assignment
Minor assignment
Major assignment
(Days ill times 16 for the first 8 weeks and times 12 for time thereafter.)
(Days unemployed times 8.)
4,124
246
90
2,879
1,581
-
4,439
10
11
3,922
538
-
4,430
17
13
92.47
5.52
2.02
64.55
35.45
-
99.53
.22
.25
87.94
12.06
-
99.33
.38
.29
Count
Count
Count
Count
Count
%
%
%
%
%
Value/Range
Value/Range
Value/Range
Value/Range
Value/Range
Code Value/Range Text
Code Value/Range Text
Code Value/Range Text
Code Value/Range Text
Code Value/Range Text
1969 Family Data: Final Release
Page 8 of 174
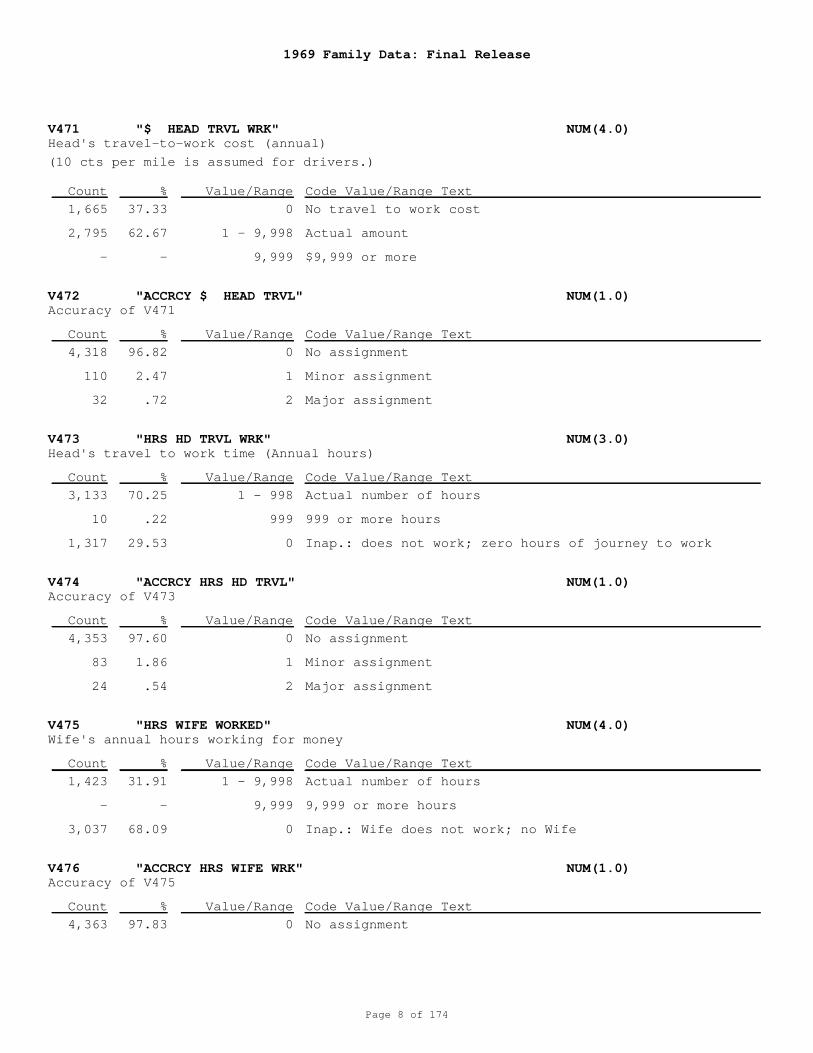
V471 "$ HEAD TRVL WRK" NUM(4.0)
V472 "ACCRCY $ HEAD TRVL" NUM(1.0)
V473 "HRS HD TRVL WRK" NUM(3.0)
V474 "ACCRCY HRS HD TRVL" NUM(1.0)
V475 "HRS WIFE WORKED" NUM(4.0)
V476 "ACCRCY HRS WIFE WRK" NUM(1.0)
Head's travel-to-work cost (annual)
Accuracy of V471
Head's travel to work time (Annual hours)
Accuracy of V473
Wife's annual hours working for money
Accuracy of V475
0
1 - 9,998
9,999
0
1
2
1 - 998
999
0
0
1
2
1 - 9,998
9,999
0
0
No travel to work cost
Actual amount
$9,999 or more
No assignment
Minor assignment
Major assignment
Actual number of hours
999 or more hours
Inap.: does not work; zero hours of journey to work
No assignment
Minor assignment
Major assignment
Actual number of hours
9,999 or more hours
Inap.: Wife does not work; no Wife
No assignment
(10 cts per mile is assumed for drivers.)
1,665
2,795
-
4,318
110
32
3,133
10
1,317
4,353
83
24
1,423
-
3,037
4,363
37.33
62.67
-
96.82
2.47
.72
70.25
.22
29.53
97.60
1.86
.54
31.91
-
68.09
97.83
Count
Count
Count
Count
Count
Count
%
%
%
%
%
%
Value/Range
Value/Range
Value/Range
Value/Range
Value/Range
Value/Range
Code Value/Range Text
Code Value/Range Text
Code Value/Range Text
Code Value/Range Text
Code Value/Range Text
Code Value/Range Text
1969 Family Data: Final Release
Page 9 of 174
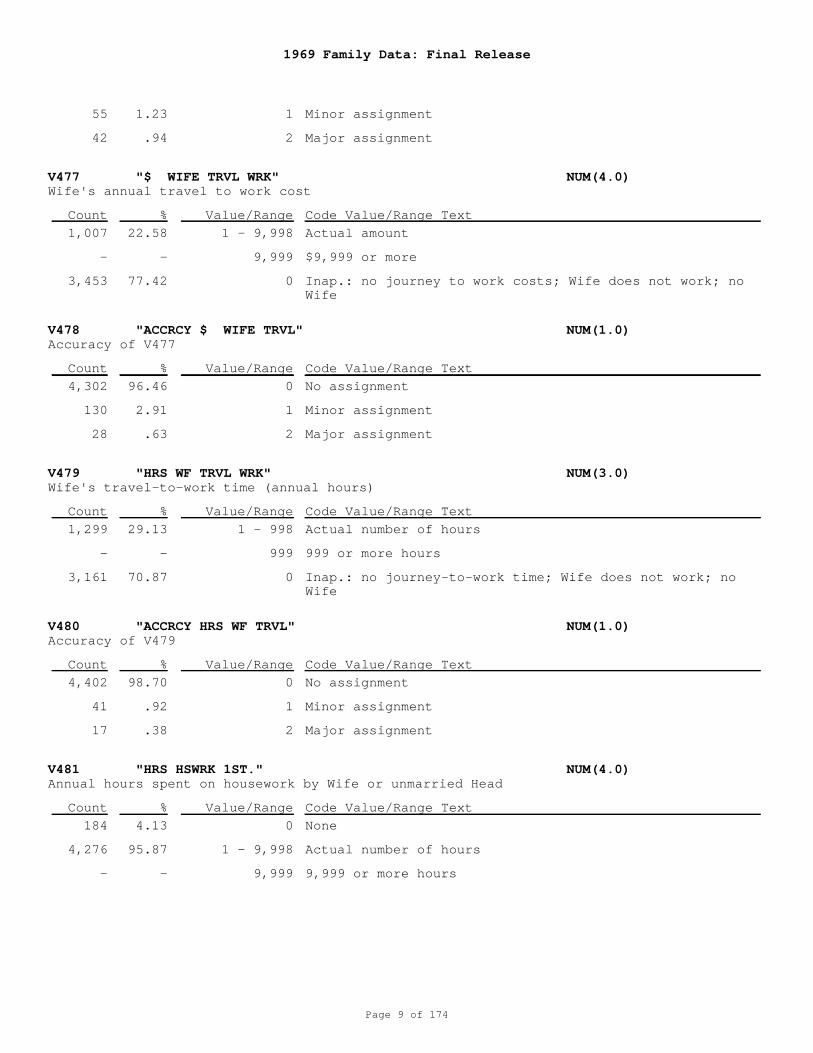
V477 "$ WIFE TRVL WRK" NUM(4.0)
V478 "ACCRCY $ WIFE TRVL" NUM(1.0)
V479 "HRS WF TRVL WRK" NUM(3.0)
V480 "ACCRCY HRS WF TRVL" NUM(1.0)
V481 "HRS HSWRK 1ST." NUM(4.0)
Wife's annual travel to work cost
Accuracy of V477
Wife's travel-to-work time (annual hours)
Accuracy of V479
Annual hours spent on housework by Wife or unmarried Head
1
2
1 - 9,998
9,999
0
0
1
2
1 - 998
999
0
0
1
2
0
1 - 9,998
9,999
Minor assignment
Major assignment
Actual amount
$9,999 or more
Inap.: no journey to work costs; Wife does not work; noWife
No assignment
Minor assignment
Major assignment
Actual number of hours
999 or more hours
Inap.: no journey-to-work time; Wife does not work; noWife
No assignment
Minor assignment
Major assignment
None
Actual number of hours
9,999 or more hours
55
42
1,007
-
3,453
4,302
130
28
1,299
-
3,161
4,402
41
17
184
4,276
-
1.23
.94
22.58
-
77.42
96.46
2.91
.63
29.13
-
70.87
98.70
.92
.38
4.13
95.87
-
Count
Count
Count
Count
Count
%
%
%
%
%
Value/Range
Value/Range
Value/Range
Value/Range
Value/Range
Code Value/Range Text
Code Value/Range Text
Code Value/Range Text
Code Value/Range Text
Code Value/Range Text
1969 Family Data: Final Release
Page 10 of 174
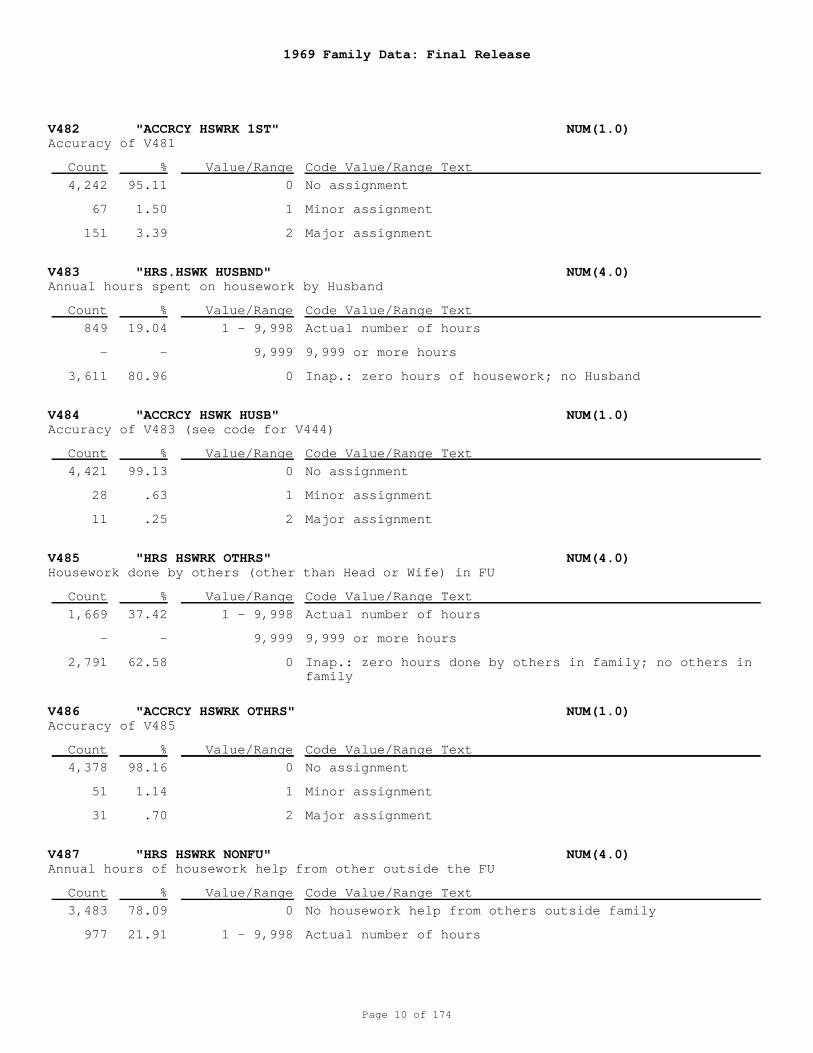
V482 "ACCRCY HSWRK 1ST" NUM(1.0)
V483 "HRS.HSWK HUSBND" NUM(4.0)
V484 "ACCRCY HSWK HUSB" NUM(1.0)
V485 "HRS HSWRK OTHRS" NUM(4.0)
V486 "ACCRCY HSWRK OTHRS" NUM(1.0)
V487 "HRS HSWRK NONFU" NUM(4.0)
Accuracy of V481
Annual hours spent on housework by Husband
Accuracy of V483 (see code for V444)
Housework done by others (other than Head or Wife) in FU
Accuracy of V485
Annual hours of housework help from other outside the FU
0
1
2
1 - 9,998
9,999
0
0
1
2
1 - 9,998
9,999
0
0
1
2
0
1 - 9,998
No assignment
Minor assignment
Major assignment
Actual number of hours
9,999 or more hours
Inap.: zero hours of housework; no Husband
No assignment
Minor assignment
Major assignment
Actual number of hours
9,999 or more hours
Inap.: zero hours done by others in family; no others infamily
No assignment
Minor assignment
Major assignment
No housework help from others outside family
Actual number of hours
4,242
67
151
849
-
3,611
4,421
28
11
1,669
-
2,791
4,378
51
31
3,483
977
95.11
1.50
3.39
19.04
-
80.96
99.13
.63
.25
37.42
-
62.58
98.16
1.14
.70
78.09
21.91
Count
Count
Count
Count
Count
Count
%
%
%
%
%
%
Value/Range
Value/Range
Value/Range
Value/Range
Value/Range
Value/Range
Code Value/Range Text
Code Value/Range Text
Code Value/Range Text
Code Value/Range Text
Code Value/Range Text
Code Value/Range Text
1969 Family Data: Final Release
Page 11 of 174
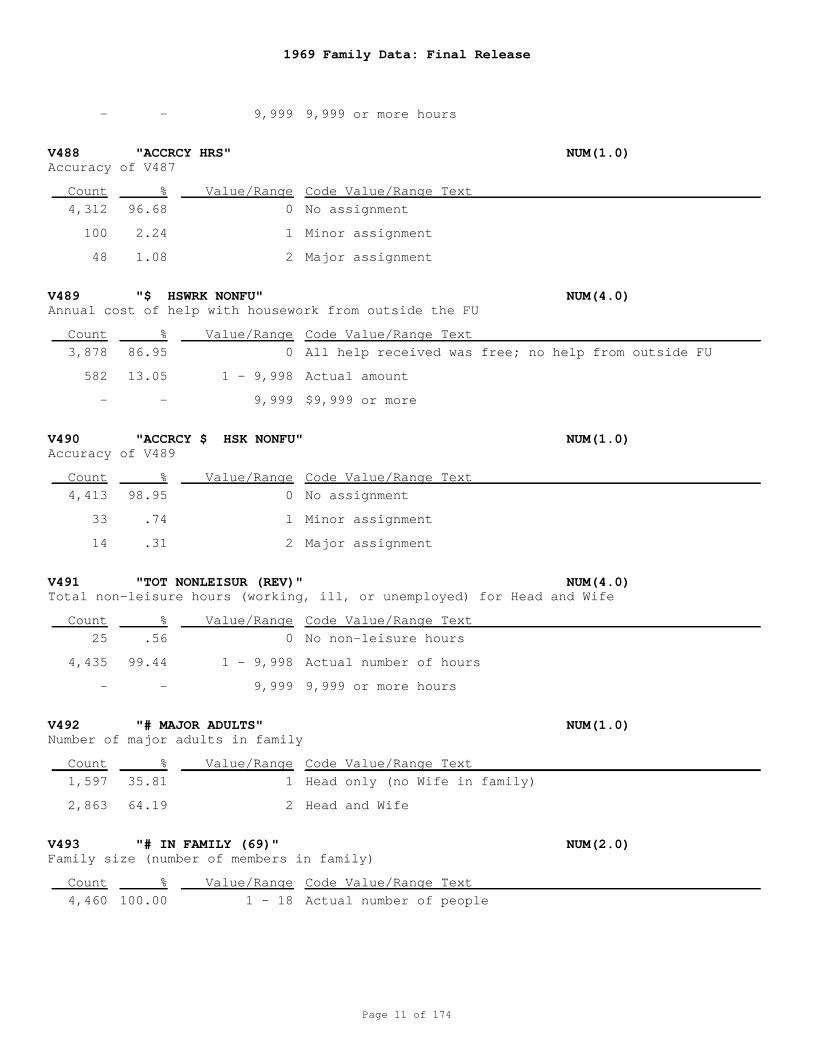
V488 "ACCRCY HRS" NUM(1.0)
V489 "$ HSWRK NONFU" NUM(4.0)
V490 "ACCRCY $ HSK NONFU" NUM(1.0)
V491 "TOT NONLEISUR (REV)" NUM(4.0)
V492 "# MAJOR ADULTS" NUM(1.0)
V493 "# IN FAMILY (69)" NUM(2.0)
Accuracy of V487
Annual cost of help with housework from outside the FU
Accuracy of V489
Total non-leisure hours (working, ill, or unemployed) for Head and Wife
Number of major adults in family
Family size (number of members in family)
9,999
0
1
2
0
1 - 9,998
9,999
0
1
2
0
1 - 9,998
9,999
1
2
1 - 18
9,999 or more hours
No assignment
Minor assignment
Major assignment
All help received was free; no help from outside FU
Actual amount
$9,999 or more
No assignment
Minor assignment
Major assignment
No non-leisure hours
Actual number of hours
9,999 or more hours
Head only (no Wife in family)
Head and Wife
Actual number of people
-
4,312
100
48
3,878
582
-
4,413
33
14
25
4,435
-
1,597
2,863
4,460
-
96.68
2.24
1.08
86.95
13.05
-
98.95
.74
.31
.56
99.44
-
35.81
64.19
100.00
Count
Count
Count
Count
Count
Count
%
%
%
%
%
%
Value/Range
Value/Range
Value/Range
Value/Range
Value/Range
Value/Range
Code Value/Range Text
Code Value/Range Text
Code Value/Range Text
Code Value/Range Text
Code Value/Range Text
Code Value/Range Text
1969 Family Data: Final Release
Page 12 of 174
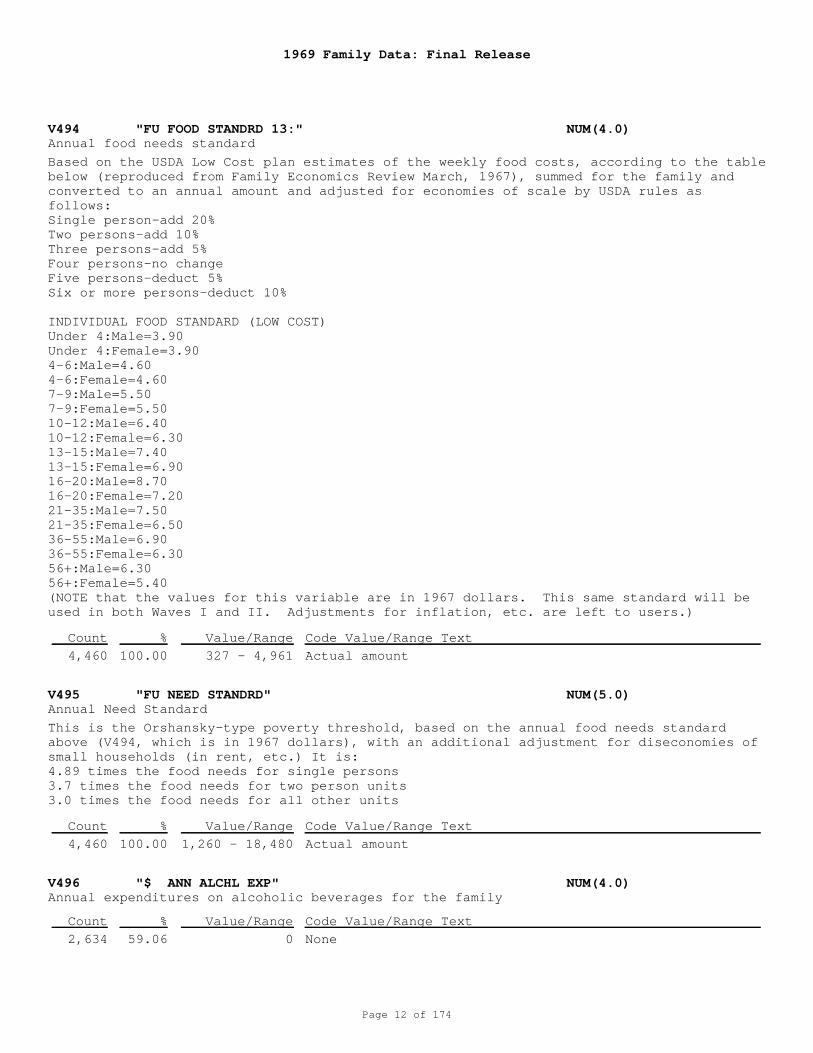
V494 "FU FOOD STANDRD 13:" NUM(4.0)
V495 "FU NEED STANDRD" NUM(5.0)
V496 "$ ANN ALCHL EXP" NUM(4.0)
Annual food needs standard
Annual Need Standard
Annual expenditures on alcoholic beverages for the family
327 - 4,961
1,260 - 18,480
0
Actual amount
Actual amount
None
Based on the USDA Low Cost plan estimates of the weekly food costs, according to the tablebelow (reproduced from Family Economics Review March, 1967), summed for the family andconverted to an annual amount and adjusted for economies of scale by USDA rules asfollows: Single person-add 20%Two persons-add 10%Three persons-add 5%Four persons-no changeFive persons-deduct 5%Six or more persons-deduct 10%
INDIVIDUAL FOOD STANDARD (LOW COST)Under 4:Male=3.90Under 4:Female=3.904-6:Male=4.604-6:Female=4.607-9:Male=5.507-9:Female=5.5010-12:Male=6.4010-12:Female=6.3013-15:Male=7.4013-15:Female=6.9016-20:Male=8.7016-20:Female=7.2021-35:Male=7.5021-35:Female=6.5036-55:Male=6.9036-55:Female=6.3056+:Male=6.3056+:Female=5.40(NOTE that the values for this variable are in 1967 dollars. This same standard will beused in both Waves I and II. Adjustments for inflation, etc. are left to users.)
This is the Orshansky-type poverty threshold, based on the annual food needs standardabove (V494, which is in 1967 dollars), with an additional adjustment for diseconomies ofsmall households (in rent, etc.) It is: 4.89 times the food needs for single persons 3.7 times the food needs for two person units 3.0 times the food needs for all other units
4,460
4,460
2,634
100.00
100.00
59.06
Count
Count
Count
%
%
%
Value/Range
Value/Range
Value/Range
Code Value/Range Text
Code Value/Range Text
Code Value/Range Text
1969 Family Data: Final Release
Page 13 of 174
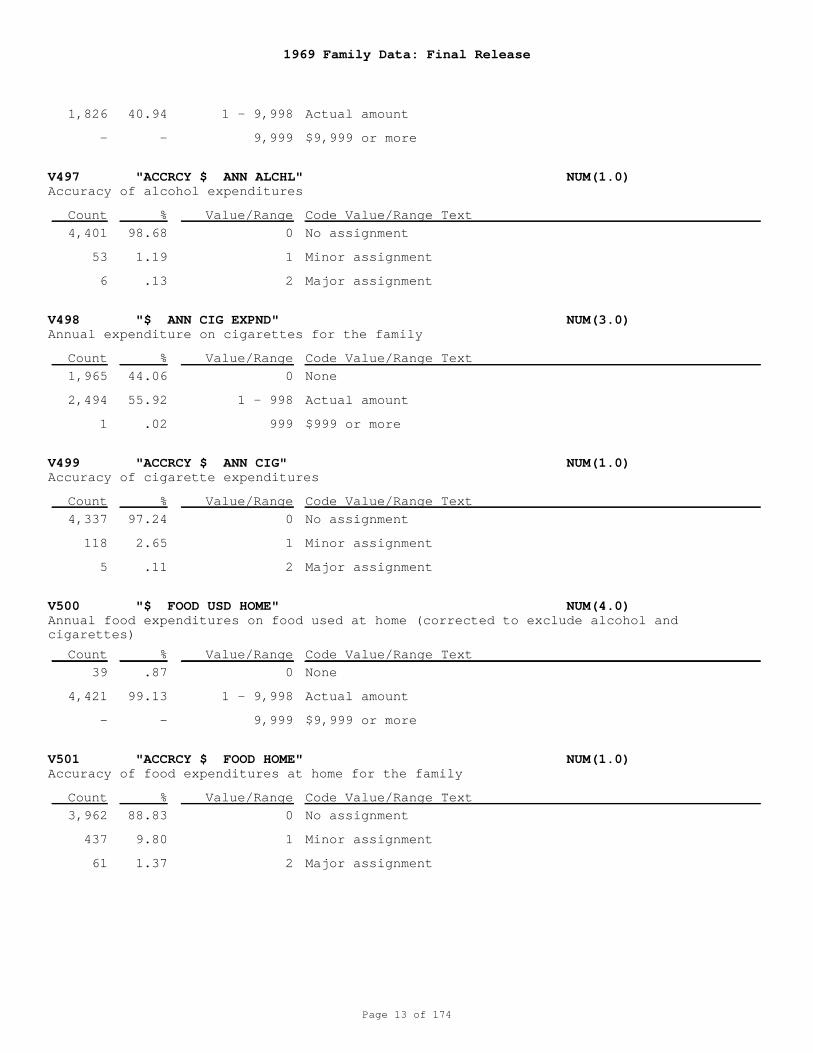
V497 "ACCRCY $ ANN ALCHL" NUM(1.0)
V498 "$ ANN CIG EXPND" NUM(3.0)
V499 "ACCRCY $ ANN CIG" NUM(1.0)
V500 "$ FOOD USD HOME" NUM(4.0)
V501 "ACCRCY $ FOOD HOME" NUM(1.0)
Accuracy of alcohol expenditures
Annual expenditure on cigarettes for the family
Accuracy of cigarette expenditures
Annual food expenditures on food used at home (corrected to exclude alcohol andcigarettes)
Accuracy of food expenditures at home for the family
1 - 9,998
9,999
0
1
2
0
1 - 998
999
0
1
2
0
1 - 9,998
9,999
0
1
2
Actual amount
$9,999 or more
No assignment
Minor assignment
Major assignment
None
Actual amount
$999 or more
No assignment
Minor assignment
Major assignment
None
Actual amount
$9,999 or more
No assignment
Minor assignment
Major assignment
1,826
-
4,401
53
6
1,965
2,494
1
4,337
118
5
39
4,421
-
3,962
437
61
40.94
-
98.68
1.19
.13
44.06
55.92
.02
97.24
2.65
.11
.87
99.13
-
88.83
9.80
1.37
Count
Count
Count
Count
Count
%
%
%
%
%
Value/Range
Value/Range
Value/Range
Value/Range
Value/Range
Code Value/Range Text
Code Value/Range Text
Code Value/Range Text
Code Value/Range Text
Code Value/Range Text
1969 Family Data: Final Release
Page 14 of 174
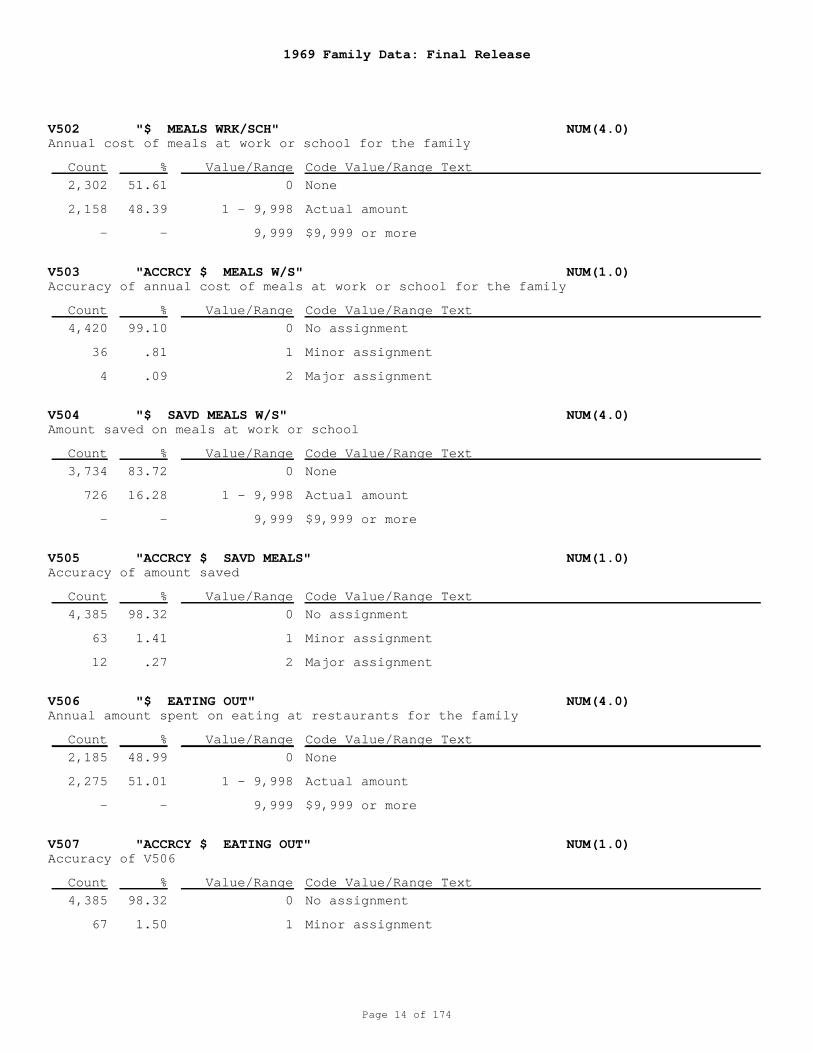
V502 "$ MEALS WRK/SCH" NUM(4.0)
V503 "ACCRCY $ MEALS W/S" NUM(1.0)
V504 "$ SAVD MEALS W/S" NUM(4.0)
V505 "ACCRCY $ SAVD MEALS" NUM(1.0)
V506 "$ EATING OUT" NUM(4.0)
V507 "ACCRCY $ EATING OUT" NUM(1.0)
Annual cost of meals at work or school for the family
Accuracy of annual cost of meals at work or school for the family
Amount saved on meals at work or school
Accuracy of amount saved
Annual amount spent on eating at restaurants for the family
Accuracy of V506
0
1 - 9,998
9,999
0
1
2
0
1 - 9,998
9,999
0
1
2
0
1 - 9,998
9,999
0
1
None
Actual amount
$9,999 or more
No assignment
Minor assignment
Major assignment
None
Actual amount
$9,999 or more
No assignment
Minor assignment
Major assignment
None
Actual amount
$9,999 or more
No assignment
Minor assignment
2,302
2,158
-
4,420
36
4
3,734
726
-
4,385
63
12
2,185
2,275
-
4,385
67
51.61
48.39
-
99.10
.81
.09
83.72
16.28
-
98.32
1.41
.27
48.99
51.01
-
98.32
1.50
Count
Count
Count
Count
Count
Count
%
%
%
%
%
%
Value/Range
Value/Range
Value/Range
Value/Range
Value/Range
Value/Range
Code Value/Range Text
Code Value/Range Text
Code Value/Range Text
Code Value/Range Text
Code Value/Range Text
Code Value/Range Text
1969 Family Data: Final Release
Page 15 of 174
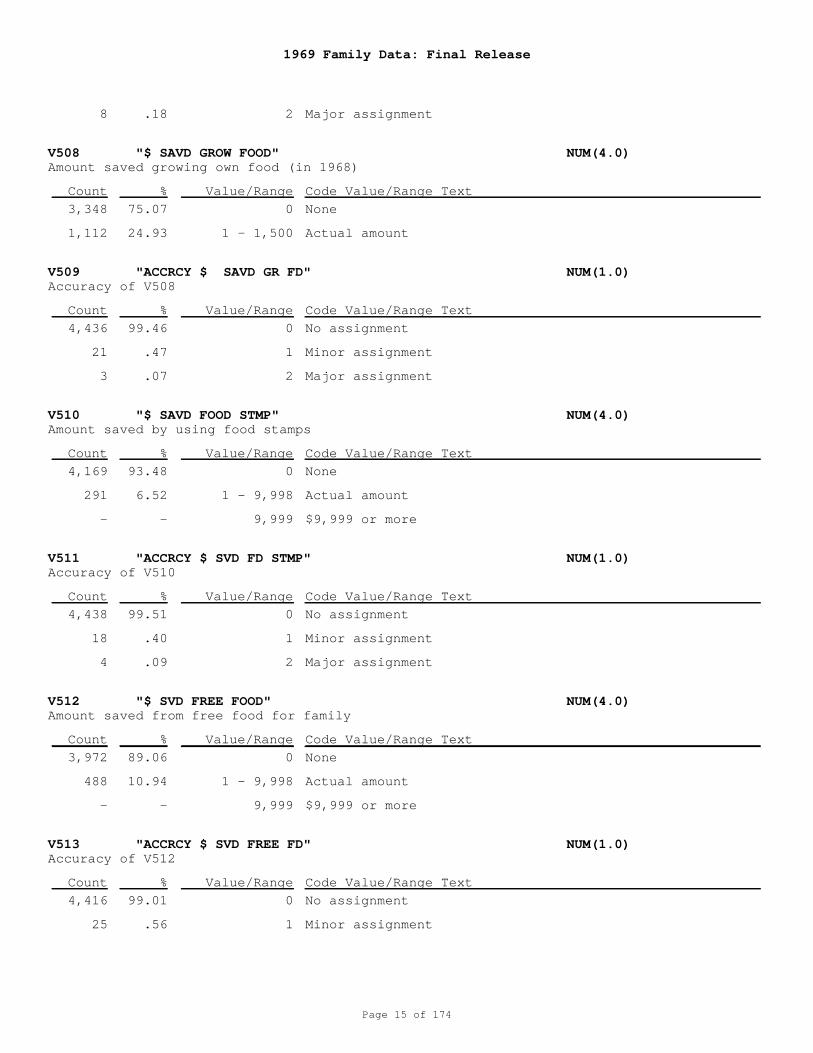
V508 "$ SAVD GROW FOOD" NUM(4.0)
V509 "ACCRCY $ SAVD GR FD" NUM(1.0)
V510 "$ SAVD FOOD STMP" NUM(4.0)
V511 "ACCRCY $ SVD FD STMP" NUM(1.0)
V512 "$ SVD FREE FOOD" NUM(4.0)
V513 "ACCRCY $ SVD FREE FD" NUM(1.0)
Amount saved growing own food (in 1968)
Accuracy of V508
Amount saved by using food stamps
Accuracy of V510
Amount saved from free food for family
Accuracy of V512
2
0
1 - 1,500
0
1
2
0
1 - 9,998
9,999
0
1
2
0
1 - 9,998
9,999
0
1
Major assignment
None
Actual amount
No assignment
Minor assignment
Major assignment
None
Actual amount
$9,999 or more
No assignment
Minor assignment
Major assignment
None
Actual amount
$9,999 or more
No assignment
Minor assignment
8
3,348
1,112
4,436
21
3
4,169
291
-
4,438
18
4
3,972
488
-
4,416
25
.18
75.07
24.93
99.46
.47
.07
93.48
6.52
-
99.51
.40
.09
89.06
10.94
-
99.01
.56
Count
Count
Count
Count
Count
Count
%
%
%
%
%
%
Value/Range
Value/Range
Value/Range
Value/Range
Value/Range
Value/Range
Code Value/Range Text
Code Value/Range Text
Code Value/Range Text
Code Value/Range Text
Code Value/Range Text
Code Value/Range Text
1969 Family Data: Final Release
Page 16 of 174
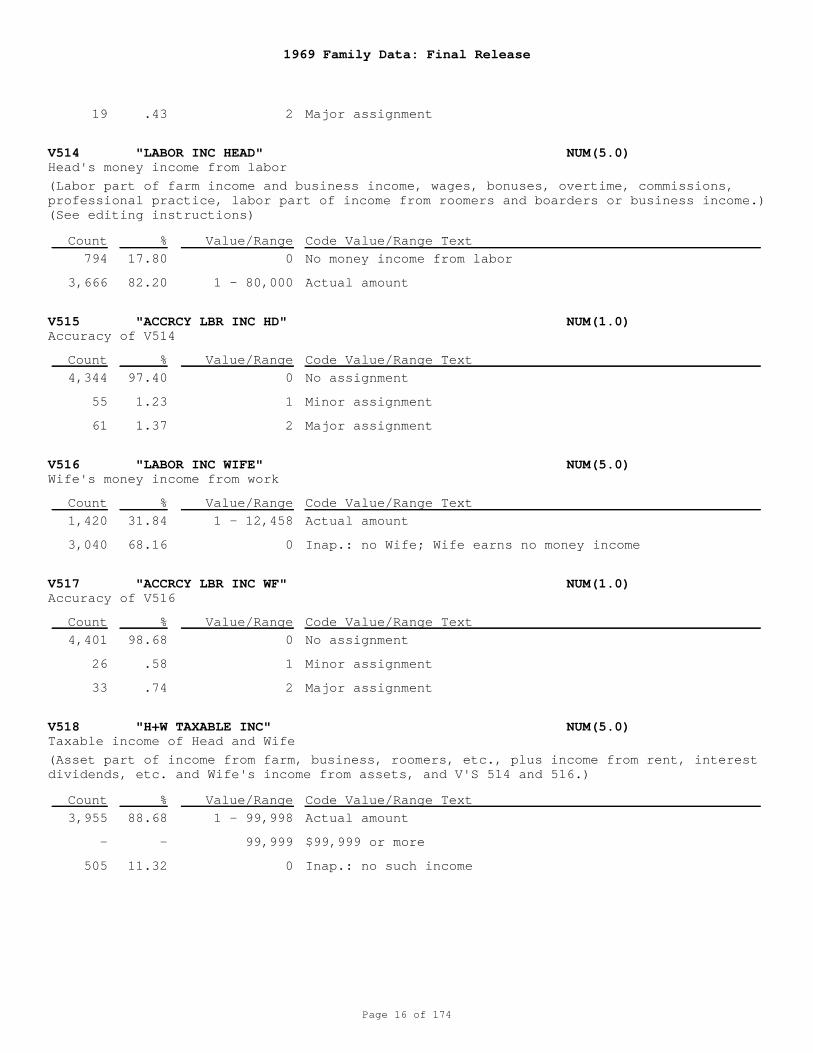
V514 "LABOR INC HEAD" NUM(5.0)
V515 "ACCRCY LBR INC HD" NUM(1.0)
V516 "LABOR INC WIFE" NUM(5.0)
V517 "ACCRCY LBR INC WF" NUM(1.0)
V518 "H+W TAXABLE INC" NUM(5.0)
Head's money income from labor
Accuracy of V514
Wife's money income from work
Accuracy of V516
Taxable income of Head and Wife
2
0
1 - 80,000
0
1
2
1 - 12,458
0
0
1
2
1 - 99,998
99,999
0
Major assignment
No money income from labor
Actual amount
No assignment
Minor assignment
Major assignment
Actual amount
Inap.: no Wife; Wife earns no money income
No assignment
Minor assignment
Major assignment
Actual amount
$99,999 or more
Inap.: no such income
(Labor part of farm income and business income, wages, bonuses, overtime, commissions,professional practice, labor part of income from roomers and boarders or business income.)(See editing instructions)
(Asset part of income from farm, business, roomers, etc., plus income from rent, interestdividends, etc. and Wife's income from assets, and V'S 514 and 516.)
19
794
3,666
4,344
55
61
1,420
3,040
4,401
26
33
3,955
-
505
.43
17.80
82.20
97.40
1.23
1.37
31.84
68.16
98.68
.58
.74
88.68
-
11.32
Count
Count
Count
Count
Count
%
%
%
%
%
Value/Range
Value/Range
Value/Range
Value/Range
Value/Range
Code Value/Range Text
Code Value/Range Text
Code Value/Range Text
Code Value/Range Text
Code Value/Range Text
1969 Family Data: Final Release
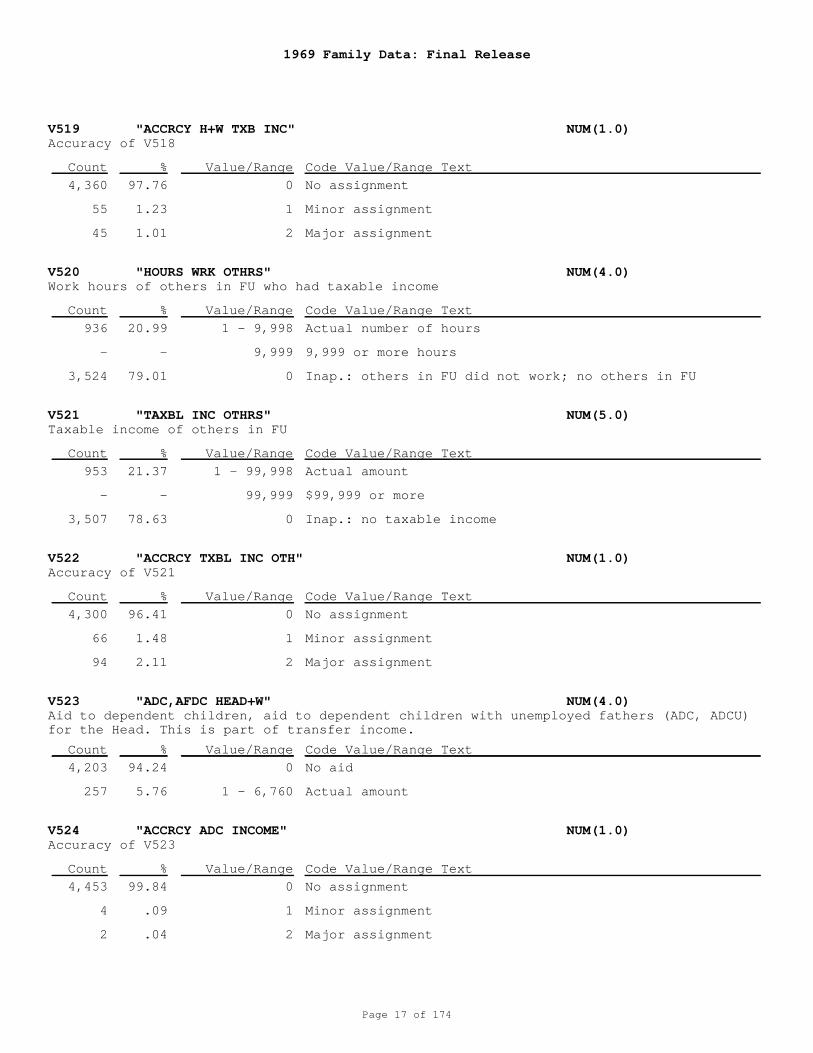
Page 17 of 174
V519 "ACCRCY H+W TXB INC" NUM(1.0)
V520 "HOURS WRK OTHRS" NUM(4.0)
V521 "TAXBL INC OTHRS" NUM(5.0)
V522 "ACCRCY TXBL INC OTH" NUM(1.0)
V523 "ADC,AFDC HEAD+W" NUM(4.0)
V524 "ACCRCY ADC INCOME" NUM(1.0)
Accuracy of V518
Work hours of others in FU who had taxable income
Taxable income of others in FU
Accuracy of V521
Aid to dependent children, aid to dependent children with unemployed fathers (ADC, ADCU)for the Head. This is part of transfer income.
Accuracy of V523
0
1
2
1 - 9,998
9,999
0
1 - 99,998
99,999
0
0
1
2
0
1 - 6,760
0
1
2
No assignment
Minor assignment
Major assignment
Actual number of hours
9,999 or more hours
Inap.: others in FU did not work; no others in FU
Actual amount
$99,999 or more
Inap.: no taxable income
No assignment
Minor assignment
Major assignment
No aid
Actual amount
No assignment
Minor assignment
Major assignment
4,360
55
45
936
-
3,524
953
-
3,507
4,300
66
94
4,203
257
4,453
4
2
97.76
1.23
1.01
20.99
-
79.01
21.37
-
78.63
96.41
1.48
2.11
94.24
5.76
99.84
.09
.04
Count
Count
Count
Count
Count
Count
%
%
%
%
%
%
Value/Range
Value/Range
Value/Range
Value/Range
Value/Range
Value/Range
Code Value/Range Text
Code Value/Range Text
Code Value/Range Text
Code Value/Range Text
Code Value/Range Text
Code Value/Range Text
1969 Family Data: Final Release
Page 18 of 174
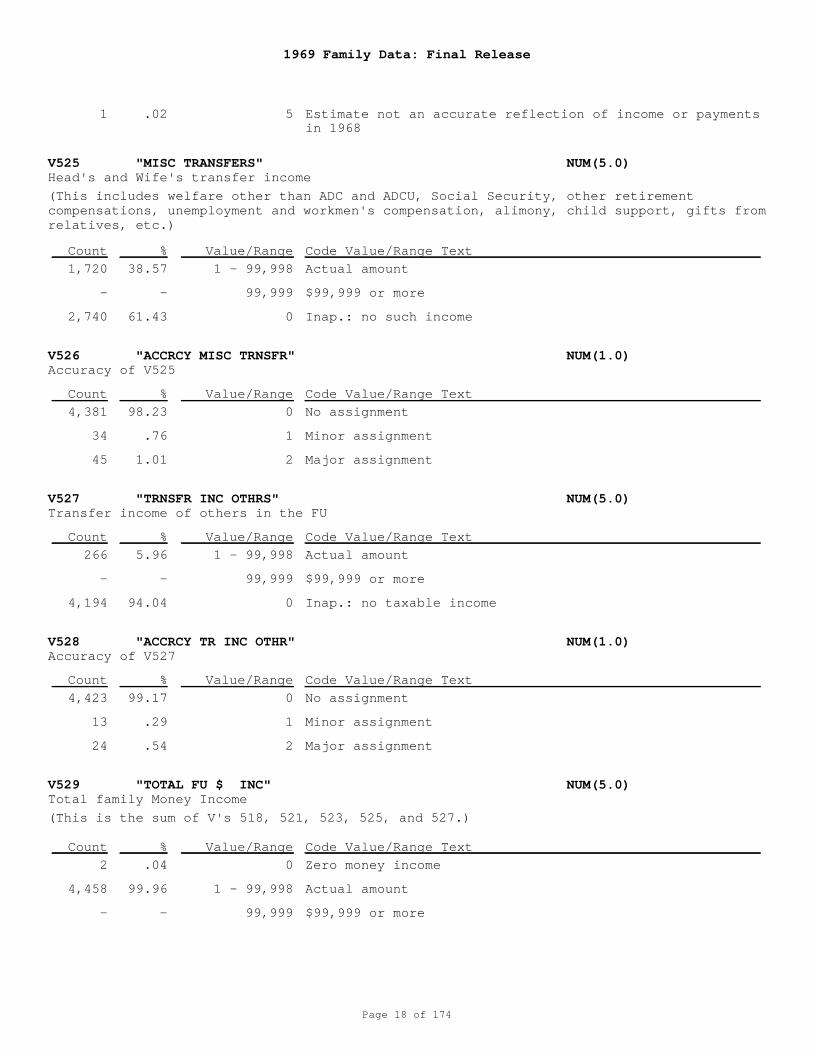
V525 "MISC TRANSFERS" NUM(5.0)
V526 "ACCRCY MISC TRNSFR" NUM(1.0)
V527 "TRNSFR INC OTHRS" NUM(5.0)
V528 "ACCRCY TR INC OTHR" NUM(1.0)
V529 "TOTAL FU $ INC" NUM(5.0)
Head's and Wife's transfer income
Accuracy of V525
Transfer income of others in the FU
Accuracy of V527
Total family Money Income
5
1 - 99,998
99,999
0
0
1
2
1 - 99,998
99,999
0
0
1
2
0
1 - 99,998
99,999
Estimate not an accurate reflection of income or paymentsin 1968
Actual amount
$99,999 or more
Inap.: no such income
No assignment
Minor assignment
Major assignment
Actual amount
$99,999 or more
Inap.: no taxable income
No assignment
Minor assignment
Major assignment
Zero money income
Actual amount
$99,999 or more
(This includes welfare other than ADC and ADCU, Social Security, other retirementcompensations, unemployment and workmen's compensation, alimony, child support, gifts fromrelatives, etc.)
(This is the sum of V's 518, 521, 523, 525, and 527.)
1
1,720
-
2,740
4,381
34
45
266
-
4,194
4,423
13
24
2
4,458
-
.02
38.57
-
61.43
98.23
.76
1.01
5.96
-
94.04
99.17
.29
.54
.04
99.96
-
Count
Count
Count
Count
Count
%
%
%
%
%
Value/Range
Value/Range
Value/Range
Value/Range
Value/Range
Code Value/Range Text
Code Value/Range Text
Code Value/Range Text
Code Value/Range Text
Code Value/Range Text
1969 Family Data: Final Release
Page 19 of 174
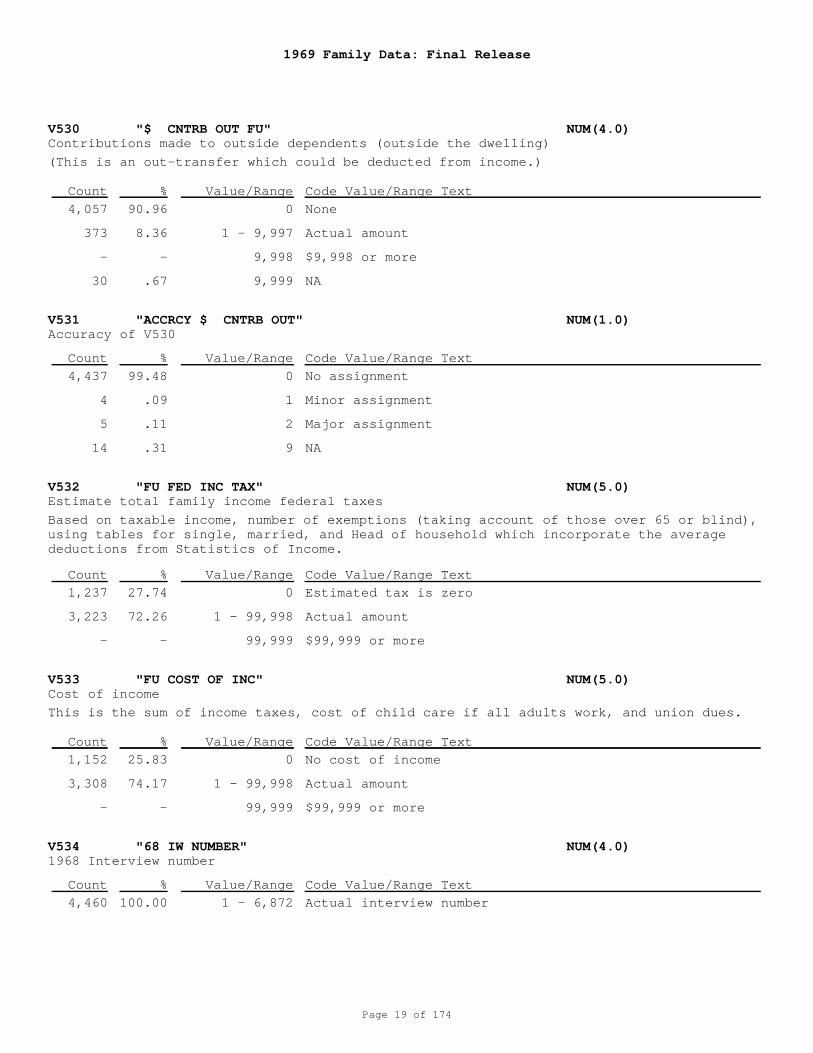
V530 "$ CNTRB OUT FU" NUM(4.0)
V531 "ACCRCY $ CNTRB OUT" NUM(1.0)
V532 "FU FED INC TAX" NUM(5.0)
V533 "FU COST OF INC" NUM(5.0)
V534 "68 IW NUMBER" NUM(4.0)
Contributions made to outside dependents (outside the dwelling)
Accuracy of V530
Estimate total family income federal taxes
Cost of income
1968 Interview number
0
1 - 9,997
9,998
9,999
0
1
2
9
0
1 - 99,998
99,999
0
1 - 99,998
99,999
1 - 6,872
None
Actual amount
$9,998 or more
NA
No assignment
Minor assignment
Major assignment
NA
Estimated tax is zero
Actual amount
$99,999 or more
No cost of income
Actual amount
$99,999 or more
Actual interview number
(This is an out-transfer which could be deducted from income.)
Based on taxable income, number of exemptions (taking account of those over 65 or blind),using tables for single, married, and Head of household which incorporate the averagedeductions from Statistics of Income.
This is the sum of income taxes, cost of child care if all adults work, and union dues.
4,057
373
-
30
4,437
4
5
14
1,237
3,223
-
1,152
3,308
-
4,460
90.96
8.36
-
.67
99.48
.09
.11
.31
27.74
72.26
-
25.83
74.17
-
100.00
Count
Count
Count
Count
Count
%
%
%
%
%
Value/Range
Value/Range
Value/Range
Value/Range
Value/Range
Code Value/Range Text
Code Value/Range Text
Code Value/Range Text
Code Value/Range Text
Code Value/Range Text
1969 Family Data: Final Release
Page 20 of 174
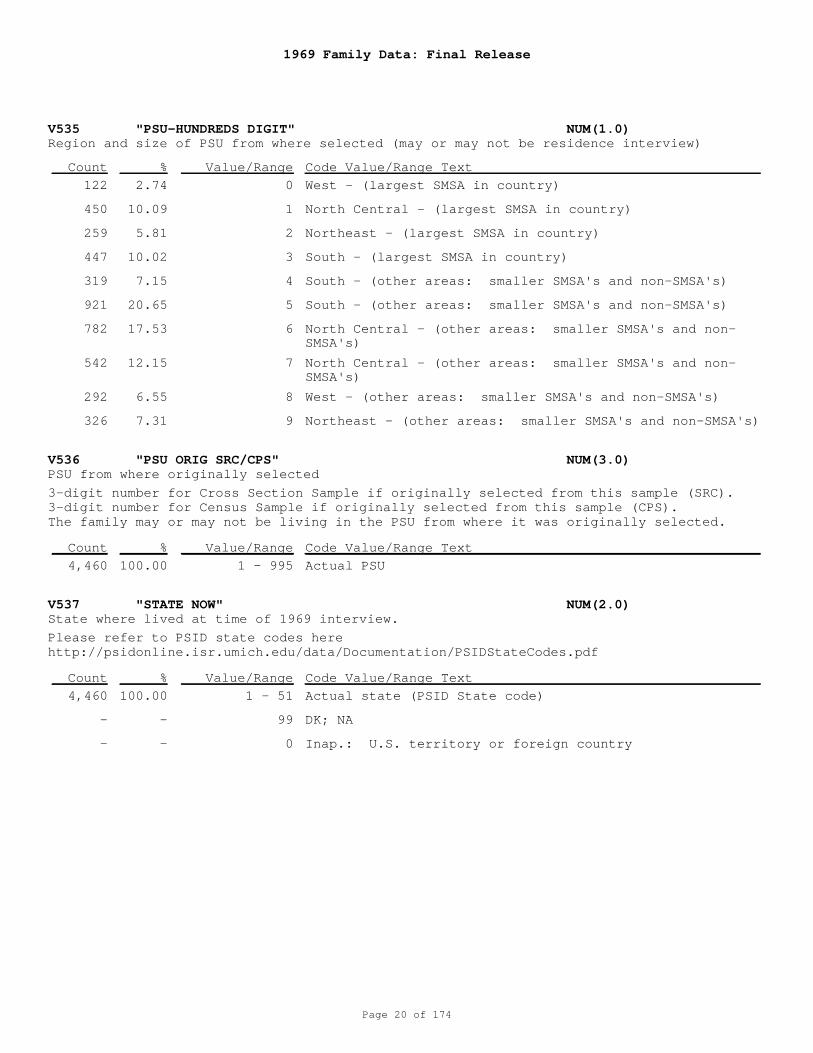
V535 "PSU-HUNDREDS DIGIT" NUM(1.0)
V536 "PSU ORIG SRC/CPS" NUM(3.0)
V537 "STATE NOW" NUM(2.0)
Region and size of PSU from where selected (may or may not be residence interview)
PSU from where originally selected
State where lived at time of 1969 interview.
0
1
2
3
4
5
6
7
8
9
1 - 995
1 - 51
99
0
West - (largest SMSA in country)
North Central - (largest SMSA in country)
Northeast - (largest SMSA in country)
South - (largest SMSA in country)
South - (other areas: smaller SMSA's and non-SMSA's)
South - (other areas: smaller SMSA's and non-SMSA's)
North Central - (other areas: smaller SMSA's and non-SMSA's)
North Central - (other areas: smaller SMSA's and non-SMSA's)
West - (other areas: smaller SMSA's and non-SMSA's)
Northeast - (other areas: smaller SMSA's and non-SMSA's)
Actual PSU
Actual state (PSID State code)
DK; NA
Inap.: U.S. territory or foreign country
3-digit number for Cross Section Sample if originally selected from this sample (SRC).3-digit number for Census Sample if originally selected from this sample (CPS).The family may or may not be living in the PSU from where it was originally selected.
Please refer to PSID state codes herehttp://psidonline.isr.umich.edu/data/Documentation/PSIDStateCodes.pdf
122
450
259
447
319
921
782
542
292
326
4,460
4,460
-
-
2.74
10.09
5.81
10.02
7.15
20.65
17.53
12.15
6.55
7.31
100.00
100.00
-
-
Count
Count
Count
%
%
%
Value/Range
Value/Range
Value/Range
Code Value/Range Text
Code Value/Range Text
Code Value/Range Text
1969 Family Data: Final Release
Page 21 of 174
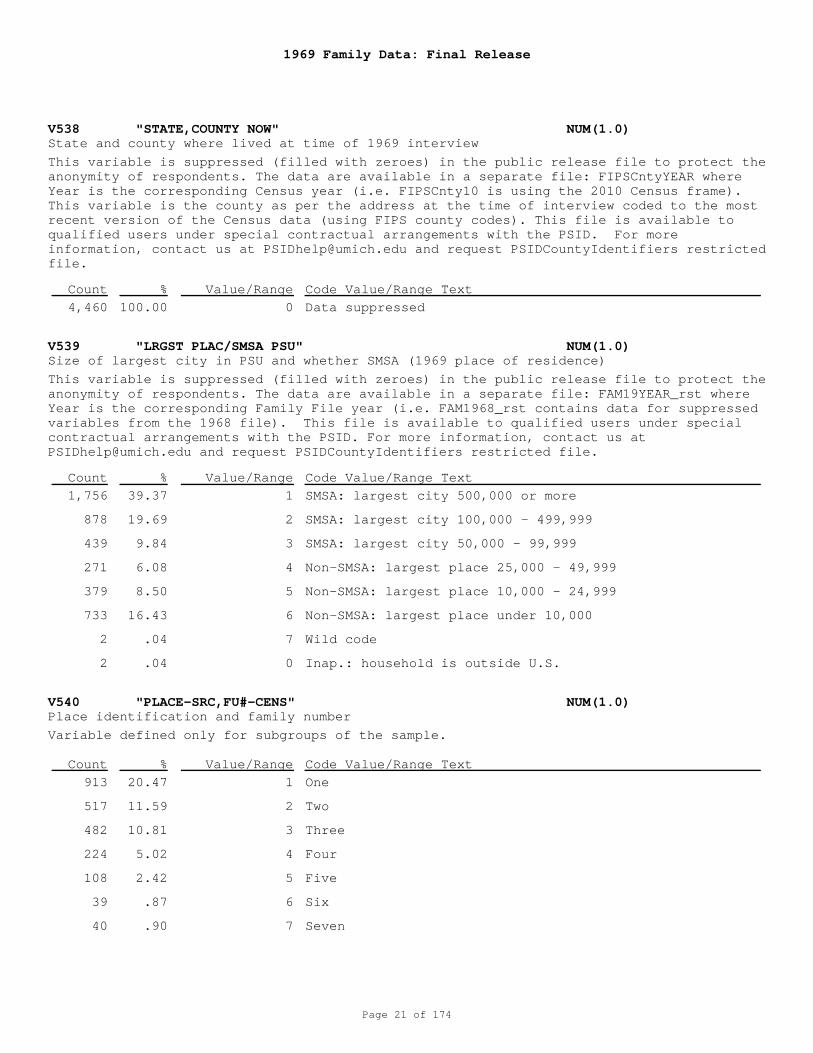
V538 "STATE,COUNTY NOW" NUM(1.0)
V539 "LRGST PLAC/SMSA PSU" NUM(1.0)
V540 "PLACE-SRC,FU#-CENS" NUM(1.0)
State and county where lived at time of 1969 interview
Size of largest city in PSU and whether SMSA (1969 place of residence)
Place identification and family number
0
1
2
3
4
5
6
7
0
1
2
3
4
5
6
7
Data suppressed
SMSA: largest city 500,000 or more
SMSA: largest city 100,000 - 499,999
SMSA: largest city 50,000 - 99,999
Non-SMSA: largest place 25,000 - 49,999
Non-SMSA: largest place 10,000 - 24,999
Non-SMSA: largest place under 10,000
Wild code
Inap.: household is outside U.S.
One
Two
Three
Four
Five
Six
Seven
This variable is suppressed (filled with zeroes) in the public release file to protect theanonymity of respondents. The data are available in a separate file: FIPSCntyYEAR whereYear is the corresponding Census year (i.e. FIPSCnty10 is using the 2010 Census frame).This variable is the county as per the address at the time of interview coded to the mostrecent version of the Census data (using FIPS county codes). This file is available toqualified users under special contractual arrangements with the PSID. For moreinformation, contact us at [email protected] and request PSIDCountyIdentifiers restrictedfile.
This variable is suppressed (filled with zeroes) in the public release file to protect theanonymity of respondents. The data are available in a separate file: FAM19YEAR_rst whereYear is the corresponding Family File year (i.e. FAM1968_rst contains data for suppressedvariables from the 1968 file). This file is available to qualified users under specialcontractual arrangements with the PSID. For more information, contact us [email protected] and request PSIDCountyIdentifiers restricted file.
Variable defined only for subgroups of the sample.
4,460
1,756
878
439
271
379
733
2
2
913
517
482
224
108
39
40
100.00
39.37
19.69
9.84
6.08
8.50
16.43
.04
.04
20.47
11.59
10.81
5.02
2.42
.87
.90
Count
Count
Count
%
%
%
Value/Range
Value/Range
Value/Range
Code Value/Range Text
Code Value/Range Text
Code Value/Range Text
1969 Family Data: Final Release
Page 22 of 174
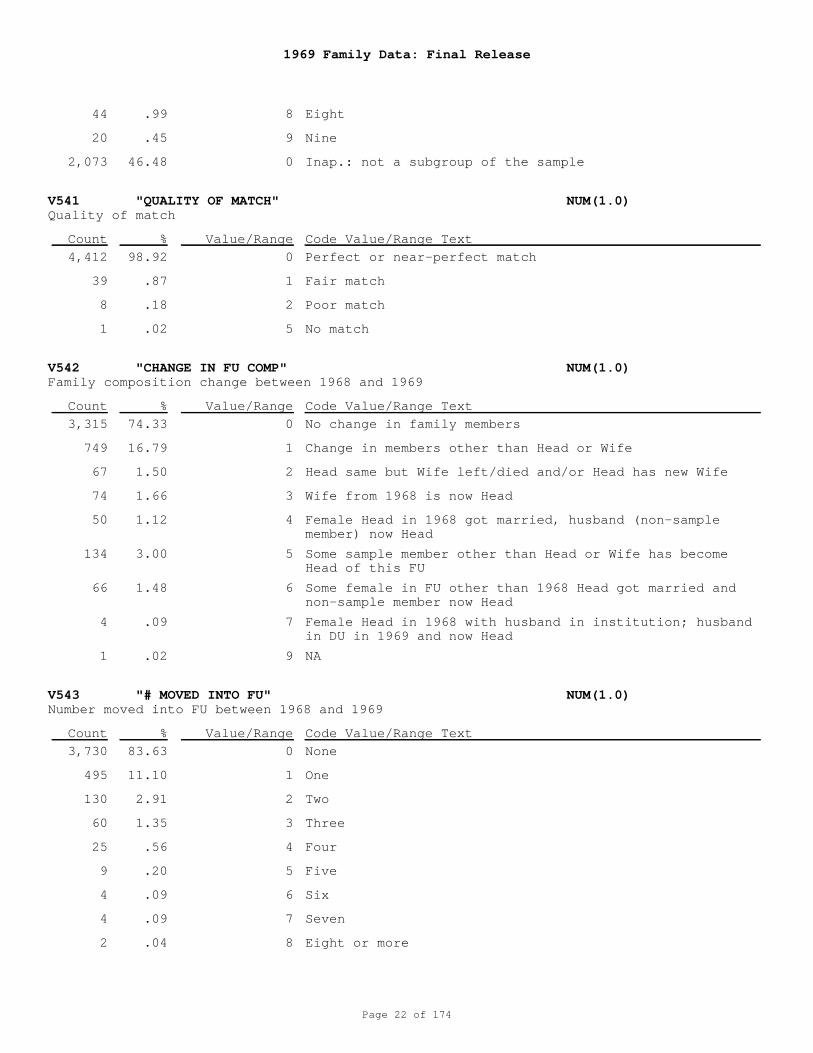
V541 "QUALITY OF MATCH" NUM(1.0)
V542 "CHANGE IN FU COMP" NUM(1.0)
V543 "# MOVED INTO FU" NUM(1.0)
Quality of match
Family composition change between 1968 and 1969
Number moved into FU between 1968 and 1969
8
9
0
0
1
2
5
0
1
2
3
4
5
6
7
9
0
1
2
3
4
5
6
7
8
Eight
Nine
Inap.: not a subgroup of the sample
Perfect or near-perfect match
Fair match
Poor match
No match
No change in family members
Change in members other than Head or Wife
Head same but Wife left/died and/or Head has new Wife
Wife from 1968 is now Head
Female Head in 1968 got married, husband (non-samplemember) now Head
Some sample member other than Head or Wife has becomeHead of this FU
Some female in FU other than 1968 Head got married andnon-sample member now Head
Female Head in 1968 with husband in institution; husbandin DU in 1969 and now Head
NA
None
One
Two
Three
Four
Five
Six
Seven
Eight or more
44
20
2,073
4,412
39
8
1
3,315
749
67
74
50
134
66
4
1
3,730
495
130
60
25
9
4
4
2
.99
.45
46.48
98.92
.87
.18
.02
74.33
16.79
1.50
1.66
1.12
3.00
1.48
.09
.02
83.63
11.10
2.91
1.35
.56
.20
.09
.09
.04
Count
Count
Count
%
%
%
Value/Range
Value/Range
Value/Range
Code Value/Range Text
Code Value/Range Text
Code Value/Range Text
1969 Family Data: Final Release
Page 23 of 174
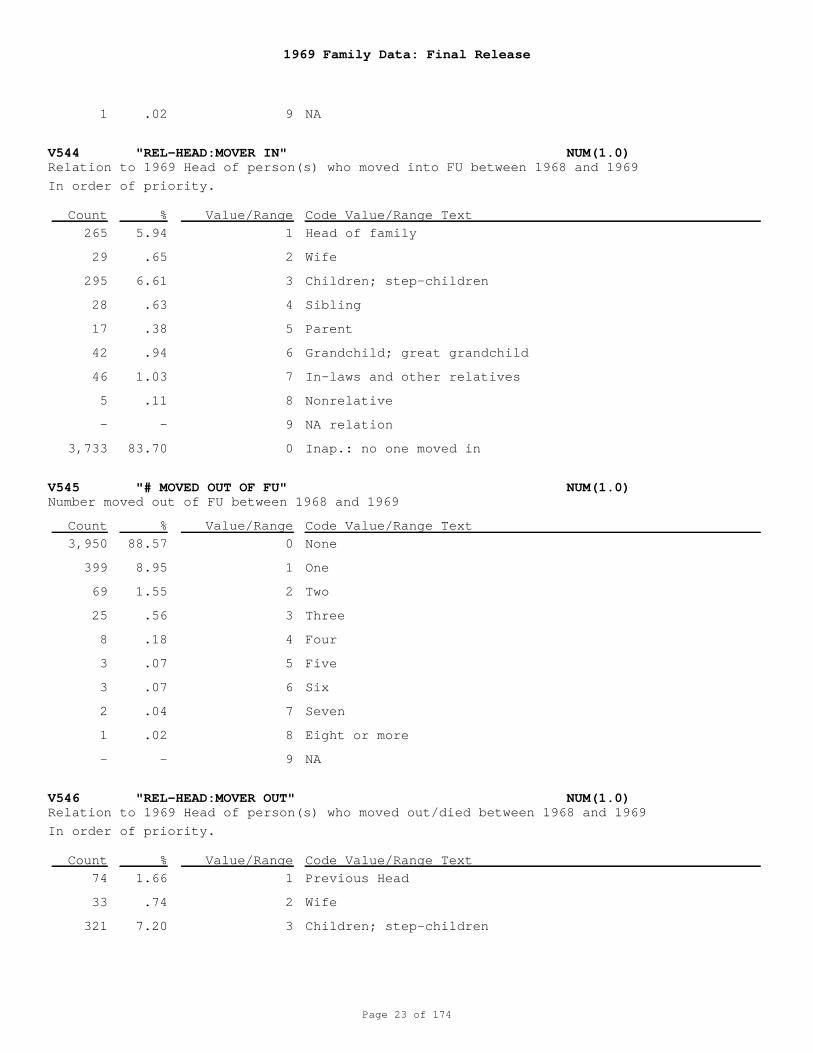
V544 "REL-HEAD:MOVER IN" NUM(1.0)
V545 "# MOVED OUT OF FU" NUM(1.0)
V546 "REL-HEAD:MOVER OUT" NUM(1.0)
Relation to 1969 Head of person(s) who moved into FU between 1968 and 1969
Number moved out of FU between 1968 and 1969
Relation to 1969 Head of person(s) who moved out/died between 1968 and 1969
9
1
2
3
4
5
6
7
8
9
0
0
1
2
3
4
5
6
7
8
9
1
2
3
NA
Head of family
Wife
Children; step-children
Sibling
Parent
Grandchild; great grandchild
In-laws and other relatives
Nonrelative
NA relation
Inap.: no one moved in
None
One
Two
Three
Four
Five
Six
Seven
Eight or more
NA
Previous Head
Wife
Children; step-children
In order of priority.
In order of priority.
1
265
29
295
28
17
42
46
5
-
3,733
3,950
399
69
25
8
3
3
2
1
-
74
33
321
.02
5.94
.65
6.61
.63
.38
.94
1.03
.11
-
83.70
88.57
8.95
1.55
.56
.18
.07
.07
.04
.02
-
1.66
.74
7.20
Count
Count
Count
%
%
%
Value/Range
Value/Range
Value/Range
Code Value/Range Text
Code Value/Range Text
Code Value/Range Text
1969 Family Data: Final Release
Page 24 of 174
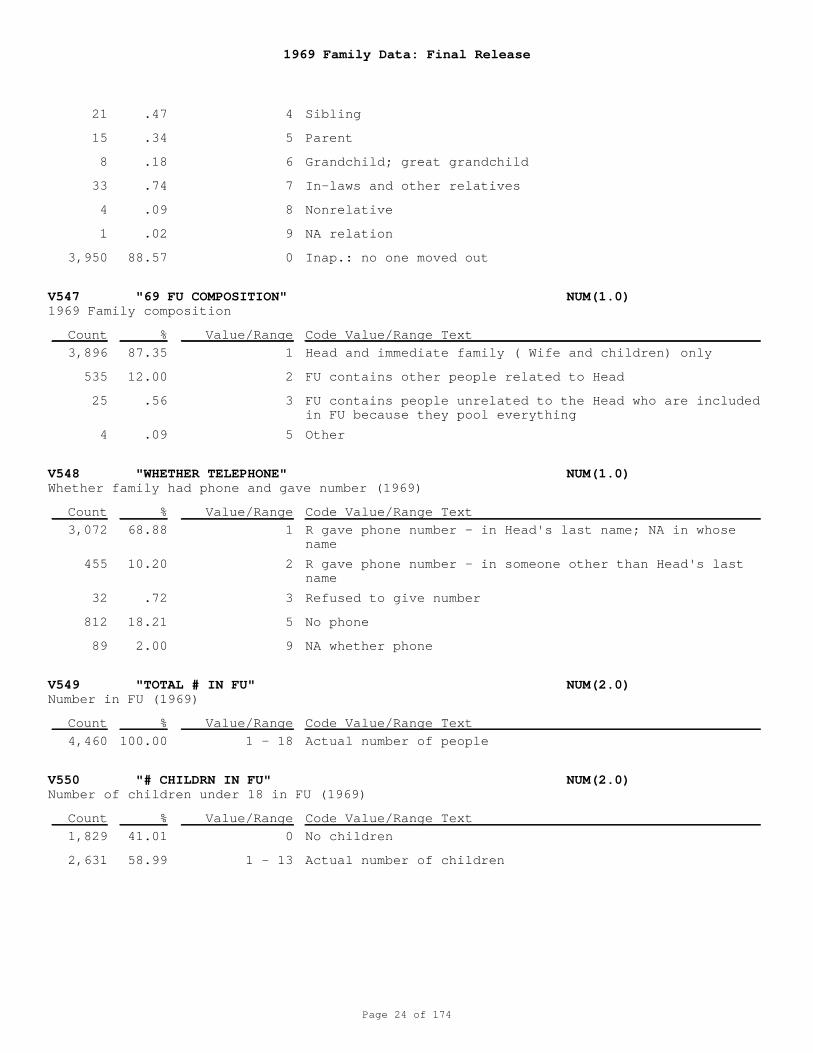
V547 "69 FU COMPOSITION" NUM(1.0)
V548 "WHETHER TELEPHONE" NUM(1.0)
V549 "TOTAL # IN FU" NUM(2.0)
V550 "# CHILDRN IN FU" NUM(2.0)
1969 Family composition
Whether family had phone and gave number (1969)
Number in FU (1969)
Number of children under 18 in FU (1969)
4
5
6
7
8
9
0
1
2
3
5
1
2
3
5
9
1 - 18
0
1 - 13
Sibling
Parent
Grandchild; great grandchild
In-laws and other relatives
Nonrelative
NA relation
Inap.: no one moved out
Head and immediate family ( Wife and children) only
FU contains other people related to Head
FU contains people unrelated to the Head who are includedin FU because they pool everything
Other
R gave phone number - in Head's last name; NA in whosename
R gave phone number - in someone other than Head's lastname
Refused to give number
No phone
NA whether phone
Actual number of people
No children
Actual number of children
21
15
8
33
4
1
3,950
3,896
535
25
4
3,072
455
32
812
89
4,460
1,829
2,631
.47
.34
.18
.74
.09
.02
88.57
87.35
12.00
.56
.09
68.88
10.20
.72
18.21
2.00
100.00
41.01
58.99
Count
Count
Count
Count
%
%
%
%
Value/Range
Value/Range
Value/Range
Value/Range
Code Value/Range Text
Code Value/Range Text
Code Value/Range Text
Code Value/Range Text
1969 Family Data: Final Release
Page 25 of 174
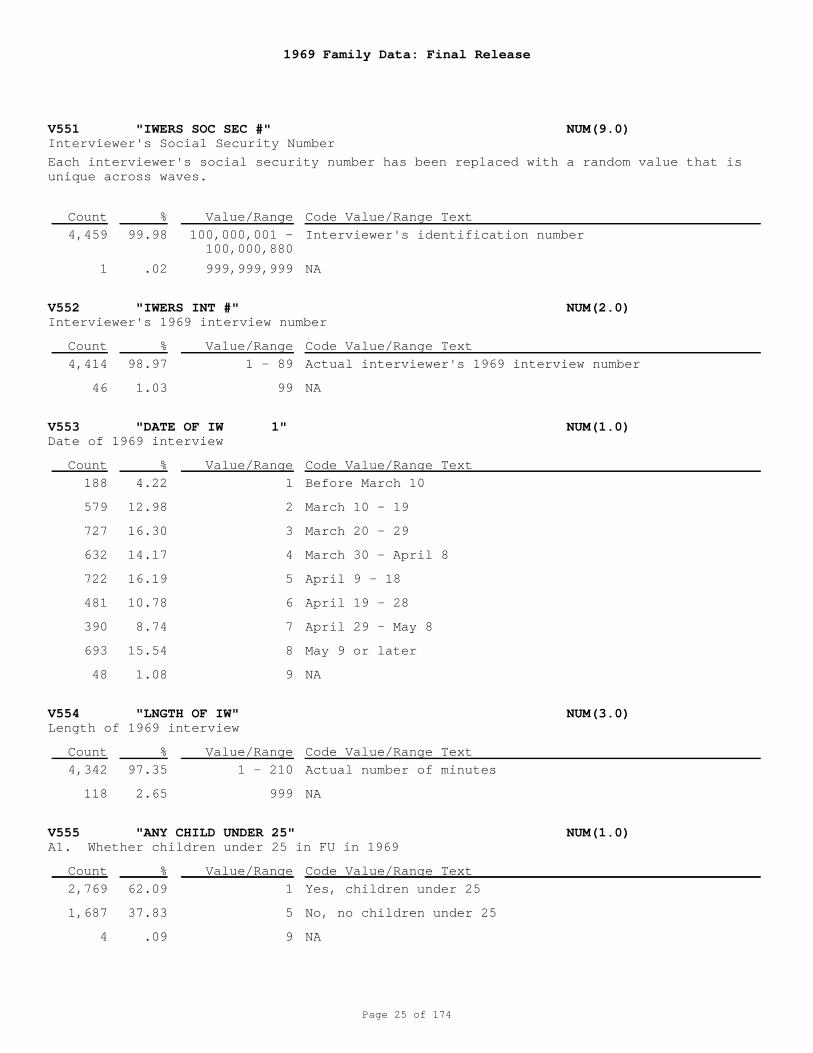
V551 "IWERS SOC SEC #" NUM(9.0)
V552 "IWERS INT #" NUM(2.0)
V553 "DATE OF IW 1" NUM(1.0)
V554 "LNGTH OF IW" NUM(3.0)
V555 "ANY CHILD UNDER 25" NUM(1.0)
Interviewer's Social Security Number
Interviewer's 1969 interview number
Date of 1969 interview
Length of 1969 interview
A1. Whether children under 25 in FU in 1969
100,000,001 -100,000,880
999,999,999
1 - 89
99
1
2
3
4
5
6
7
8
9
1 - 210
999
1
5
9
Interviewer's identification number
NA
Actual interviewer's 1969 interview number
NA
Before March 10
March 10 - 19
March 20 - 29
March 30 - April 8
April 9 - 18
April 19 - 28
April 29 - May 8
May 9 or later
NA
Actual number of minutes
NA
Yes, children under 25
No, no children under 25
NA
Each interviewer's social security number has been replaced with a random value that isunique across waves.
4,459
1
4,414
46
188
579
727
632
722
481
390
693
48
4,342
118
2,769
1,687
4
99.98
.02
98.97
1.03
4.22
12.98
16.30
14.17
16.19
10.78
8.74
15.54
1.08
97.35
2.65
62.09
37.83
.09
Count
Count
Count
Count
Count
%
%
%
%
%
Value/Range
Value/Range
Value/Range
Value/Range
Value/Range
Code Value/Range Text
Code Value/Range Text
Code Value/Range Text
Code Value/Range Text
Code Value/Range Text
1969 Family Data: Final Release
Page 26 of 174
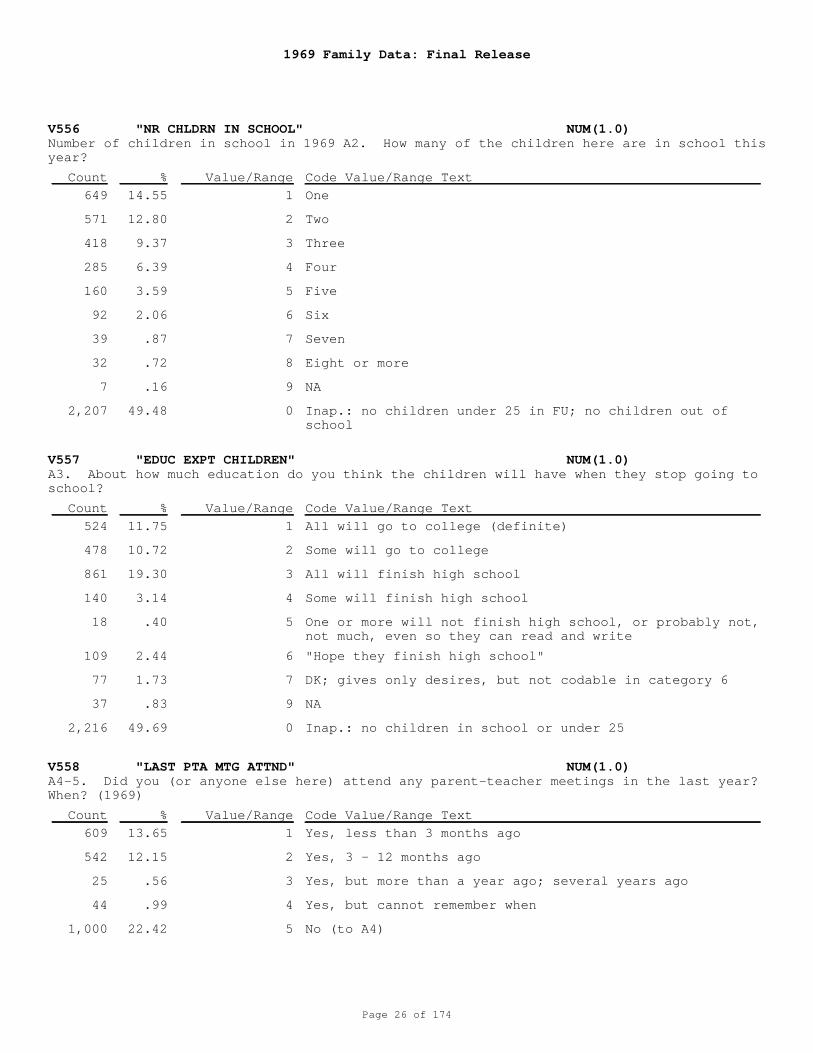
V556 "NR CHLDRN IN SCHOOL" NUM(1.0)
V557 "EDUC EXPT CHILDREN" NUM(1.0)
V558 "LAST PTA MTG ATTND" NUM(1.0)
Number of children in school in 1969 A2. How many of the children here are in school thisyear?
A3. About how much education do you think the children will have when they stop going toschool?
A4-5. Did you (or anyone else here) attend any parent-teacher meetings in the last year?When? (1969)
1
2
3
4
5
6
7
8
9
0
1
2
3
4
5
6
7
9
0
1
2
3
4
5
One
Two
Three
Four
Five
Six
Seven
Eight or more
NA
Inap.: no children under 25 in FU; no children out ofschool
All will go to college (definite)
Some will go to college
All will finish high school
Some will finish high school
One or more will not finish high school, or probably not,not much, even so they can read and write
"Hope they finish high school"
DK; gives only desires, but not codable in category 6
NA
Inap.: no children in school or under 25
Yes, less than 3 months ago
Yes, 3 - 12 months ago
Yes, but more than a year ago; several years ago
Yes, but cannot remember when
No (to A4)
649
571
418
285
160
92
39
32
7
2,207
524
478
861
140
18
109
77
37
2,216
609
542
25
44
1,000
14.55
12.80
9.37
6.39
3.59
2.06
.87
.72
.16
49.48
11.75
10.72
19.30
3.14
.40
2.44
1.73
.83
49.69
13.65
12.15
.56
.99
22.42
Count
Count
Count
%
%
%
Value/Range
Value/Range
Value/Range
Code Value/Range Text
Code Value/Range Text
Code Value/Range Text
1969 Family Data: Final Release
Page 27 of 174
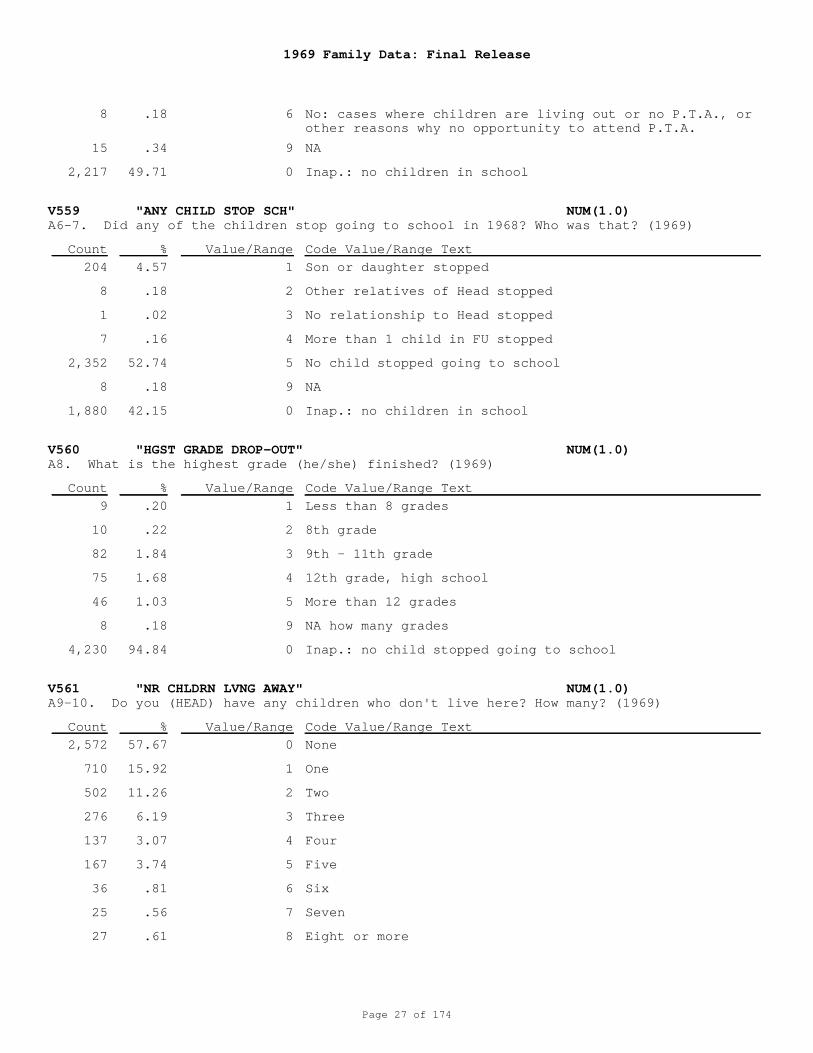
V559 "ANY CHILD STOP SCH" NUM(1.0)
V560 "HGST GRADE DROP-OUT" NUM(1.0)
V561 "NR CHLDRN LVNG AWAY" NUM(1.0)
A6-7. Did any of the children stop going to school in 1968? Who was that? (1969)
A8. What is the highest grade (he/she) finished? (1969)
A9-10. Do you (HEAD) have any children who don't live here? How many? (1969)
6
9
0
1
2
3
4
5
9
0
1
2
3
4
5
9
0
0
1
2
3
4
5
6
7
8
No: cases where children are living out or no P.T.A., orother reasons why no opportunity to attend P.T.A.
NA
Inap.: no children in school
Son or daughter stopped
Other relatives of Head stopped
No relationship to Head stopped
More than 1 child in FU stopped
No child stopped going to school
NA
Inap.: no children in school
Less than 8 grades
8th grade
9th - 11th grade
12th grade, high school
More than 12 grades
NA how many grades
Inap.: no child stopped going to school
None
One
Two
Three
Four
Five
Six
Seven
Eight or more
8
15
2,217
204
8
1
7
2,352
8
1,880
9
10
82
75
46
8
4,230
2,572
710
502
276
137
167
36
25
27
.18
.34
49.71
4.57
.18
.02
.16
52.74
.18
42.15
.20
.22
1.84
1.68
1.03
.18
94.84
57.67
15.92
11.26
6.19
3.07
3.74
.81
.56
.61
Count
Count
Count
%
%
%
Value/Range
Value/Range
Value/Range
Code Value/Range Text
Code Value/Range Text
Code Value/Range Text
1969 Family Data: Final Release
Page 28 of 174
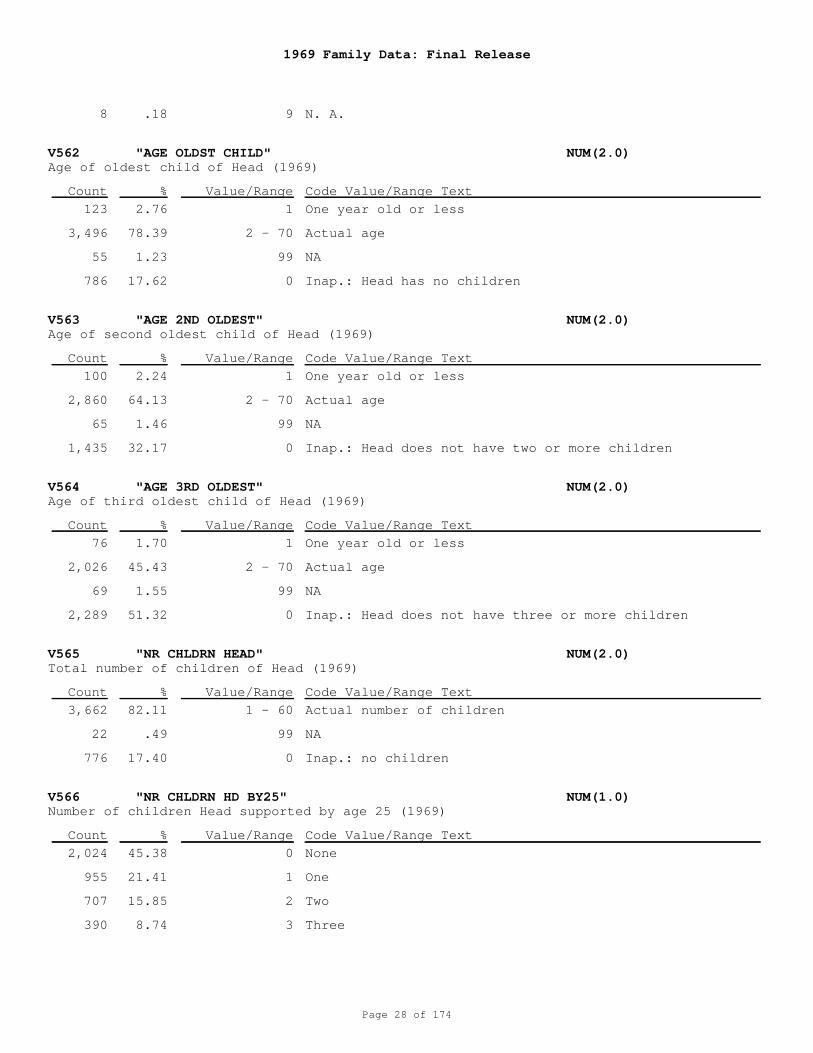
V562 "AGE OLDST CHILD" NUM(2.0)
V563 "AGE 2ND OLDEST" NUM(2.0)
V564 "AGE 3RD OLDEST" NUM(2.0)
V565 "NR CHLDRN HEAD" NUM(2.0)
V566 "NR CHLDRN HD BY25" NUM(1.0)
Age of oldest child of Head (1969)
Age of second oldest child of Head (1969)
Age of third oldest child of Head (1969)
Total number of children of Head (1969)
Number of children Head supported by age 25 (1969)
9
1
2 - 70
99
0
1
2 - 70
99
0
1
2 - 70
99
0
1 - 60
99
0
0
1
2
3
N. A.
One year old or less
Actual age
NA
Inap.: Head has no children
One year old or less
Actual age
NA
Inap.: Head does not have two or more children
One year old or less
Actual age
NA
Inap.: Head does not have three or more children
Actual number of children
NA
Inap.: no children
None
One
Two
Three
8
123
3,496
55
786
100
2,860
65
1,435
76
2,026
69
2,289
3,662
22
776
2,024
955
707
390
.18
2.76
78.39
1.23
17.62
2.24
64.13
1.46
32.17
1.70
45.43
1.55
51.32
82.11
.49
17.40
45.38
21.41
15.85
8.74
Count
Count
Count
Count
Count
%
%
%
%
%
Value/Range
Value/Range
Value/Range
Value/Range
Value/Range
Code Value/Range Text
Code Value/Range Text
Code Value/Range Text
Code Value/Range Text
Code Value/Range Text
1969 Family Data: Final Release
Page 29 of 174
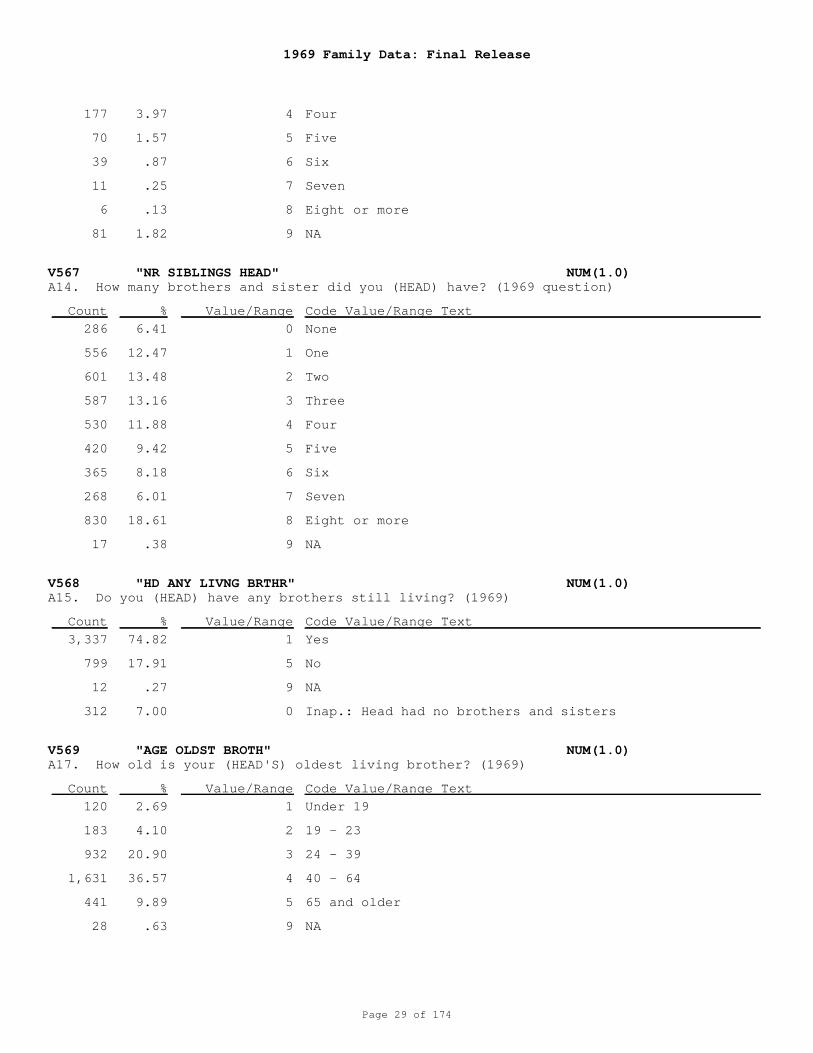
V567 "NR SIBLINGS HEAD" NUM(1.0)
V568 "HD ANY LIVNG BRTHR" NUM(1.0)
V569 "AGE OLDST BROTH" NUM(1.0)
A14. How many brothers and sister did you (HEAD) have? (1969 question)
A15. Do you (HEAD) have any brothers still living? (1969)
A17. How old is your (HEAD'S) oldest living brother? (1969)
4
5
6
7
8
9
0
1
2
3
4
5
6
7
8
9
1
5
9
0
1
2
3
4
5
9
Four
Five
Six
Seven
Eight or more
NA
None
One
Two
Three
Four
Five
Six
Seven
Eight or more
NA
Yes
No
NA
Inap.: Head had no brothers and sisters
Under 19
19 - 23
24 - 39
40 - 64
65 and older
NA
177
70
39
11
6
81
286
556
601
587
530
420
365
268
830
17
3,337
799
12
312
120
183
932
1,631
441
28
3.97
1.57
.87
.25
.13
1.82
6.41
12.47
13.48
13.16
11.88
9.42
8.18
6.01
18.61
.38
74.82
17.91
.27
7.00
2.69
4.10
20.90
36.57
9.89
.63
Count
Count
Count
%
%
%
Value/Range
Value/Range
Value/Range
Code Value/Range Text
Code Value/Range Text
Code Value/Range Text
1969 Family Data: Final Release
Page 30 of 174
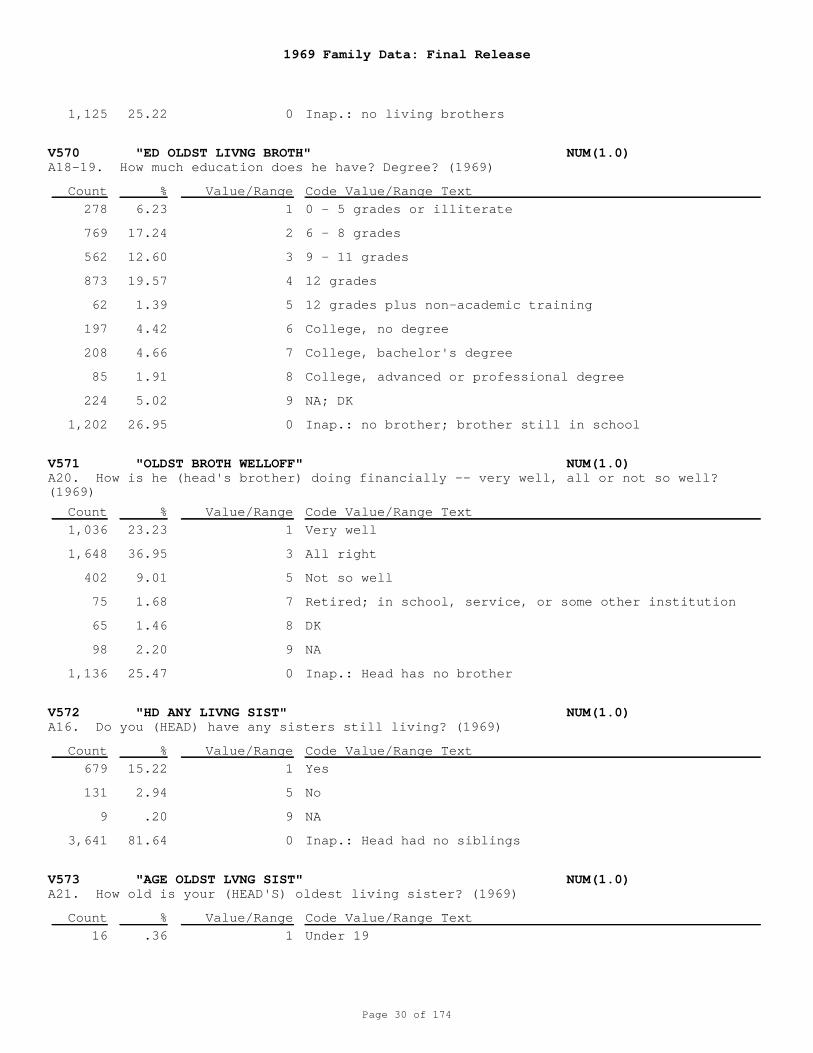
V570 "ED OLDST LIVNG BROTH" NUM(1.0)
V571 "OLDST BROTH WELLOFF" NUM(1.0)
V572 "HD ANY LIVNG SIST" NUM(1.0)
V573 "AGE OLDST LVNG SIST" NUM(1.0)
A18-19. How much education does he have? Degree? (1969)
A20. How is he (head's brother) doing financially -- very well, all or not so well?(1969)
A16. Do you (HEAD) have any sisters still living? (1969)
A21. How old is your (HEAD'S) oldest living sister? (1969)
0
1
2
3
4
5
6
7
8
9
0
1
3
5
7
8
9
0
1
5
9
0
1
Inap.: no living brothers
0 - 5 grades or illiterate
6 - 8 grades
9 - 11 grades
12 grades
12 grades plus non-academic training
College, no degree
College, bachelor's degree
College, advanced or professional degree
NA; DK
Inap.: no brother; brother still in school
Very well
All right
Not so well
Retired; in school, service, or some other institution
DK
NA
Inap.: Head has no brother
Yes
No
NA
Inap.: Head had no siblings
Under 19
1,125
278
769
562
873
62
197
208
85
224
1,202
1,036
1,648
402
75
65
98
1,136
679
131
9
3,641
16
25.22
6.23
17.24
12.60
19.57
1.39
4.42
4.66
1.91
5.02
26.95
23.23
36.95
9.01
1.68
1.46
2.20
25.47
15.22
2.94
.20
81.64
.36
Count
Count
Count
Count
%
%
%
%
Value/Range
Value/Range
Value/Range
Value/Range
Code Value/Range Text
Code Value/Range Text
Code Value/Range Text
Code Value/Range Text
1969 Family Data: Final Release
Page 31 of 174
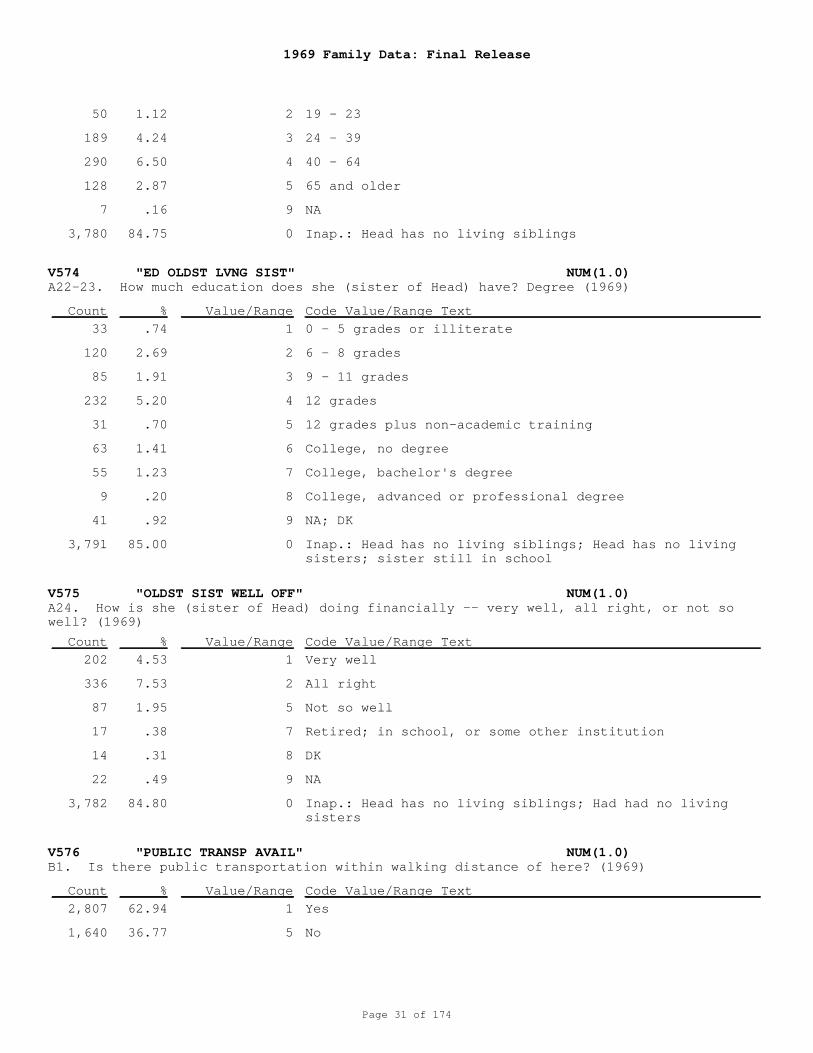
V574 "ED OLDST LVNG SIST" NUM(1.0)
V575 "OLDST SIST WELL OFF" NUM(1.0)
V576 "PUBLIC TRANSP AVAIL" NUM(1.0)
A22-23. How much education does she (sister of Head) have? Degree (1969)
A24. How is she (sister of Head) doing financially -- very well, all right, or not sowell? (1969)
B1. Is there public transportation within walking distance of here? (1969)
2
3
4
5
9
0
1
2
3
4
5
6
7
8
9
0
1
2
5
7
8
9
0
1
5
19 - 23
24 - 39
40 - 64
65 and older
NA
Inap.: Head has no living siblings
0 - 5 grades or illiterate
6 - 8 grades
9 - 11 grades
12 grades
12 grades plus non-academic training
College, no degree
College, bachelor's degree
College, advanced or professional degree
NA; DK
Inap.: Head has no living siblings; Head has no livingsisters; sister still in school
Very well
All right
Not so well
Retired; in school, or some other institution
DK
NA
Inap.: Head has no living siblings; Had had no livingsisters
Yes
No
50
189
290
128
7
3,780
33
120
85
232
31
63
55
9
41
3,791
202
336
87
17
14
22
3,782
2,807
1,640
1.12
4.24
6.50
2.87
.16
84.75
.74
2.69
1.91
5.20
.70
1.41
1.23
.20
.92
85.00
4.53
7.53
1.95
.38
.31
.49
84.80
62.94
36.77
Count
Count
Count
%
%
%
Value/Range
Value/Range
Value/Range
Code Value/Range Text
Code Value/Range Text
Code Value/Range Text
1969 Family Data: Final Release
Page 32 of 174
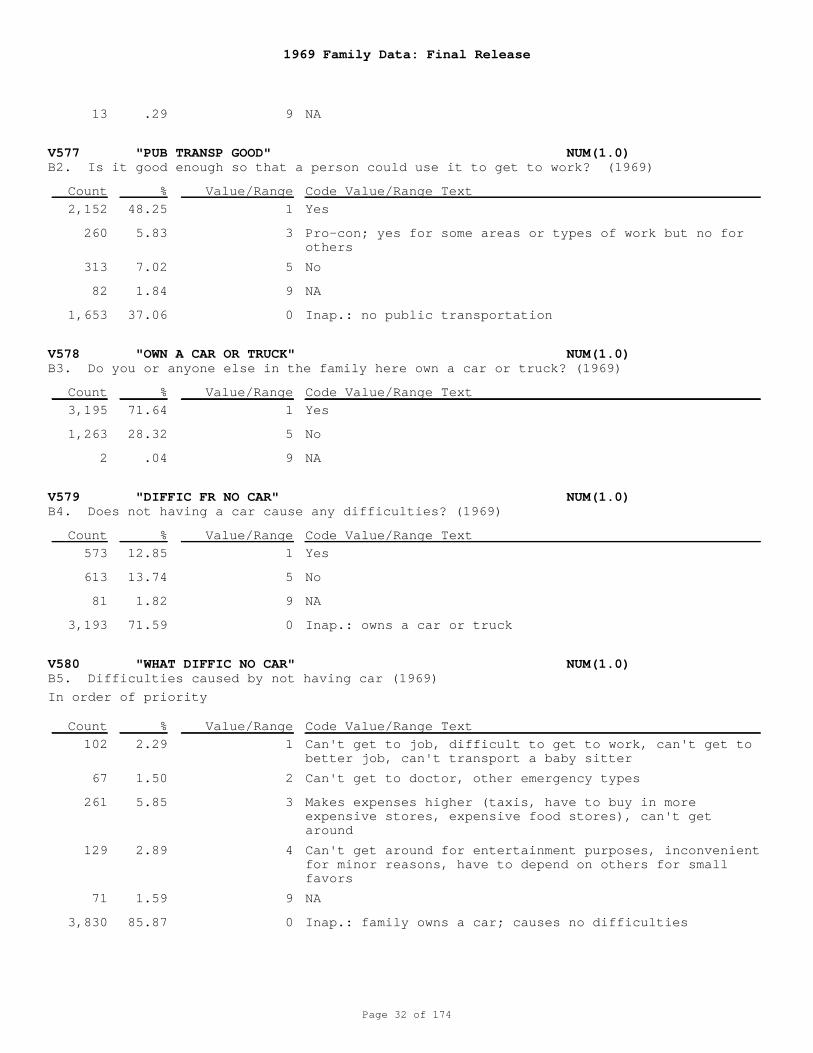
V577 "PUB TRANSP GOOD" NUM(1.0)
V578 "OWN A CAR OR TRUCK" NUM(1.0)
V579 "DIFFIC FR NO CAR" NUM(1.0)
V580 "WHAT DIFFIC NO CAR" NUM(1.0)
B2. Is it good enough so that a person could use it to get to work? (1969)
B3. Do you or anyone else in the family here own a car or truck? (1969)
B4. Does not having a car cause any difficulties? (1969)
B5. Difficulties caused by not having car (1969)
9
1
3
5
9
0
1
5
9
1
5
9
0
1
2
3
4
9
0
NA
Yes
Pro-con; yes for some areas or types of work but no forothers
No
NA
Inap.: no public transportation
Yes
No
NA
Yes
No
NA
Inap.: owns a car or truck
Can't get to job, difficult to get to work, can't get tobetter job, can't transport a baby sitter
Can't get to doctor, other emergency types
Makes expenses higher (taxis, have to buy in moreexpensive stores, expensive food stores), can't getaround
Can't get around for entertainment purposes, inconvenientfor minor reasons, have to depend on others for smallfavors
NA
Inap.: family owns a car; causes no difficulties
In order of priority
13
2,152
260
313
82
1,653
3,195
1,263
2
573
613
81
3,193
102
67
261
129
71
3,830
.29
48.25
5.83
7.02
1.84
37.06
71.64
28.32
.04
12.85
13.74
1.82
71.59
2.29
1.50
5.85
2.89
1.59
85.87
Count
Count
Count
Count
%
%
%
%
Value/Range
Value/Range
Value/Range
Value/Range
Code Value/Range Text
Code Value/Range Text
Code Value/Range Text
Code Value/Range Text
1969 Family Data: Final Release
Page 33 of 174
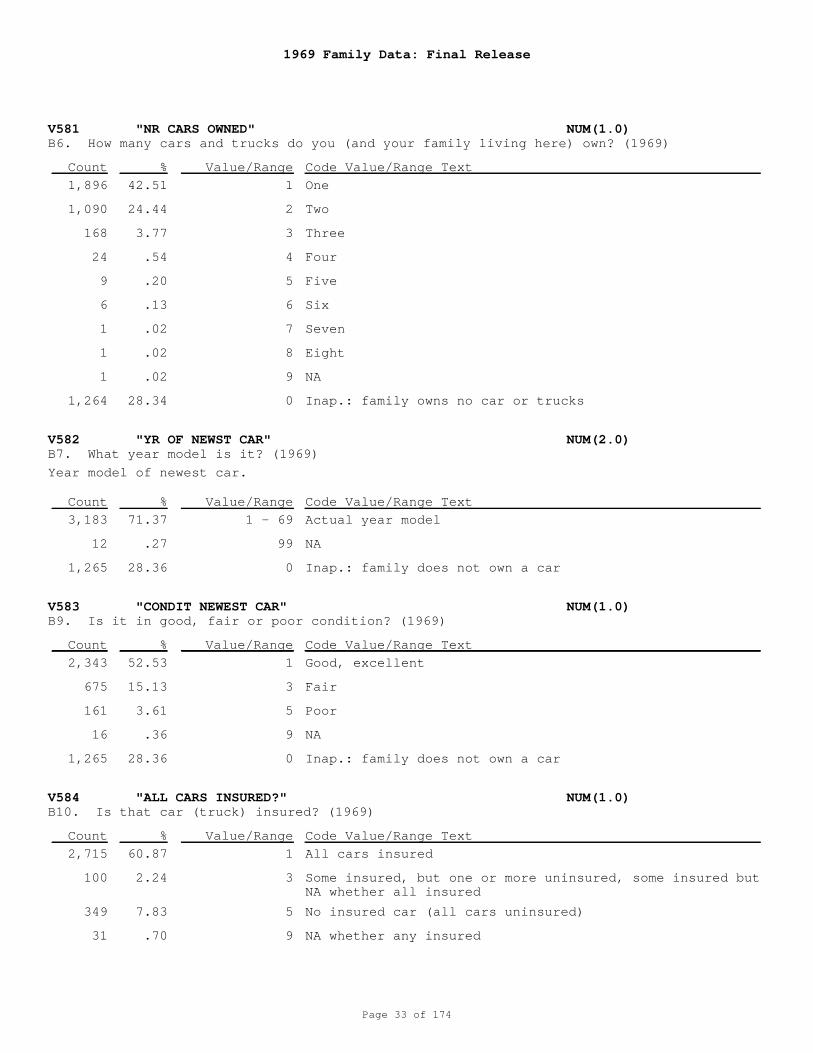
V581 "NR CARS OWNED" NUM(1.0)
V582 "YR OF NEWST CAR" NUM(2.0)
V583 "CONDIT NEWEST CAR" NUM(1.0)
V584 "ALL CARS INSURED?" NUM(1.0)
B6. How many cars and trucks do you (and your family living here) own? (1969)
B7. What year model is it? (1969)
B9. Is it in good, fair or poor condition? (1969)
B10. Is that car (truck) insured? (1969)
1
2
3
4
5
6
7
8
9
0
1 - 69
99
0
1
3
5
9
0
1
3
5
9
One
Two
Three
Four
Five
Six
Seven
Eight
NA
Inap.: family owns no car or trucks
Actual year model
NA
Inap.: family does not own a car
Good, excellent
Fair
Poor
NA
Inap.: family does not own a car
All cars insured
Some insured, but one or more uninsured, some insured butNA whether all insured
No insured car (all cars uninsured)
NA whether any insured
Year model of newest car.
1,896
1,090
168
24
9
6
1
1
1
1,264
3,183
12
1,265
2,343
675
161
16
1,265
2,715
100
349
31
42.51
24.44
3.77
.54
.20
.13
.02
.02
.02
28.34
71.37
.27
28.36
52.53
15.13
3.61
.36
28.36
60.87
2.24
7.83
.70
Count
Count
Count
Count
%
%
%
%
Value/Range
Value/Range
Value/Range
Value/Range
Code Value/Range Text
Code Value/Range Text
Code Value/Range Text
Code Value/Range Text
1969 Family Data: Final Release
Page 34 of 174
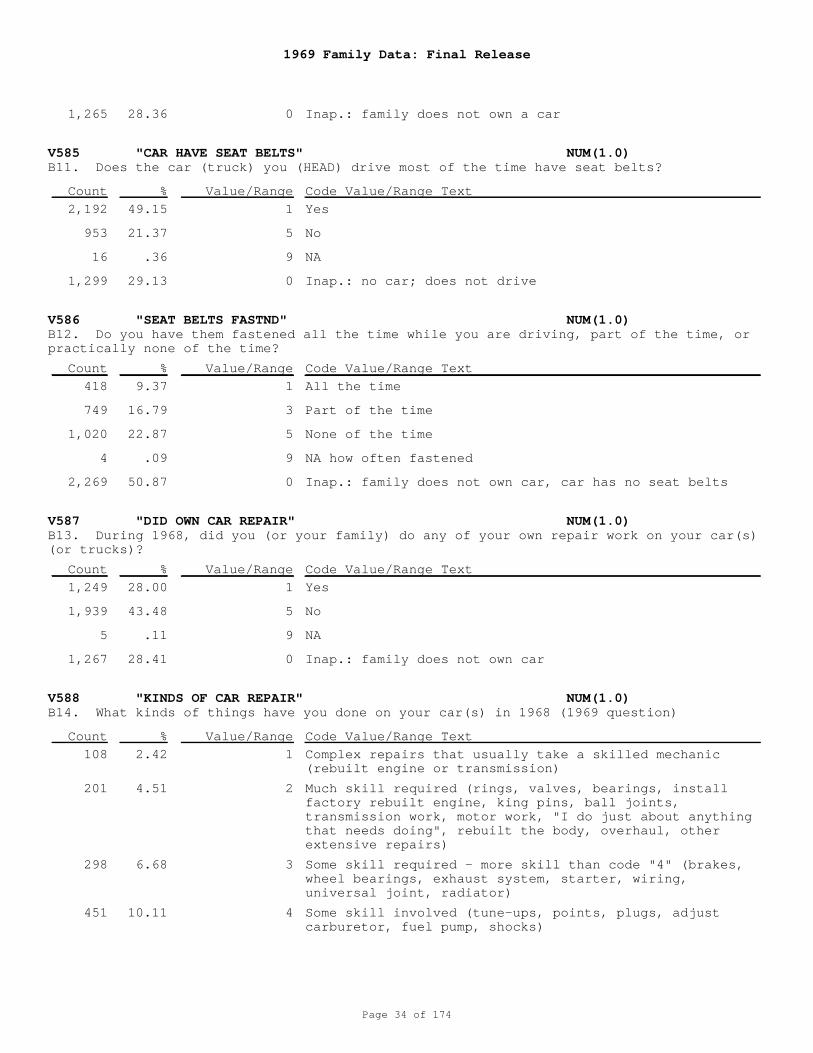
V585 "CAR HAVE SEAT BELTS" NUM(1.0)
V586 "SEAT BELTS FASTND" NUM(1.0)
V587 "DID OWN CAR REPAIR" NUM(1.0)
V588 "KINDS OF CAR REPAIR" NUM(1.0)
B11. Does the car (truck) you (HEAD) drive most of the time have seat belts?
B12. Do you have them fastened all the time while you are driving, part of the time, orpractically none of the time?
B13. During 1968, did you (or your family) do any of your own repair work on your car(s)(or trucks)?
B14. What kinds of things have you done on your car(s) in 1968 (1969 question)
0
1
5
9
0
1
3
5
9
0
1
5
9
0
1
2
3
4
Inap.: family does not own a car
Yes
No
NA
Inap.: no car; does not drive
All the time
Part of the time
None of the time
NA how often fastened
Inap.: family does not own car, car has no seat belts
Yes
No
NA
Inap.: family does not own car
Complex repairs that usually take a skilled mechanic(rebuilt engine or transmission)
Much skill required (rings, valves, bearings, installfactory rebuilt engine, king pins, ball joints,transmission work, motor work, "I do just about anythingthat needs doing", rebuilt the body, overhaul, otherextensive repairs)
Some skill required - more skill than code "4" (brakes,wheel bearings, exhaust system, starter, wiring,universal joint, radiator)
Some skill involved (tune-ups, points, plugs, adjustcarburetor, fuel pump, shocks)
1,265
2,192
953
16
1,299
418
749
1,020
4
2,269
1,249
1,939
5
1,267
108
201
298
451
28.36
49.15
21.37
.36
29.13
9.37
16.79
22.87
.09
50.87
28.00
43.48
.11
28.41
2.42
4.51
6.68
10.11
Count
Count
Count
Count
%
%
%
%
Value/Range
Value/Range
Value/Range
Value/Range
Code Value/Range Text
Code Value/Range Text
Code Value/Range Text
Code Value/Range Text
1969 Family Data: Final Release
Page 35 of 174
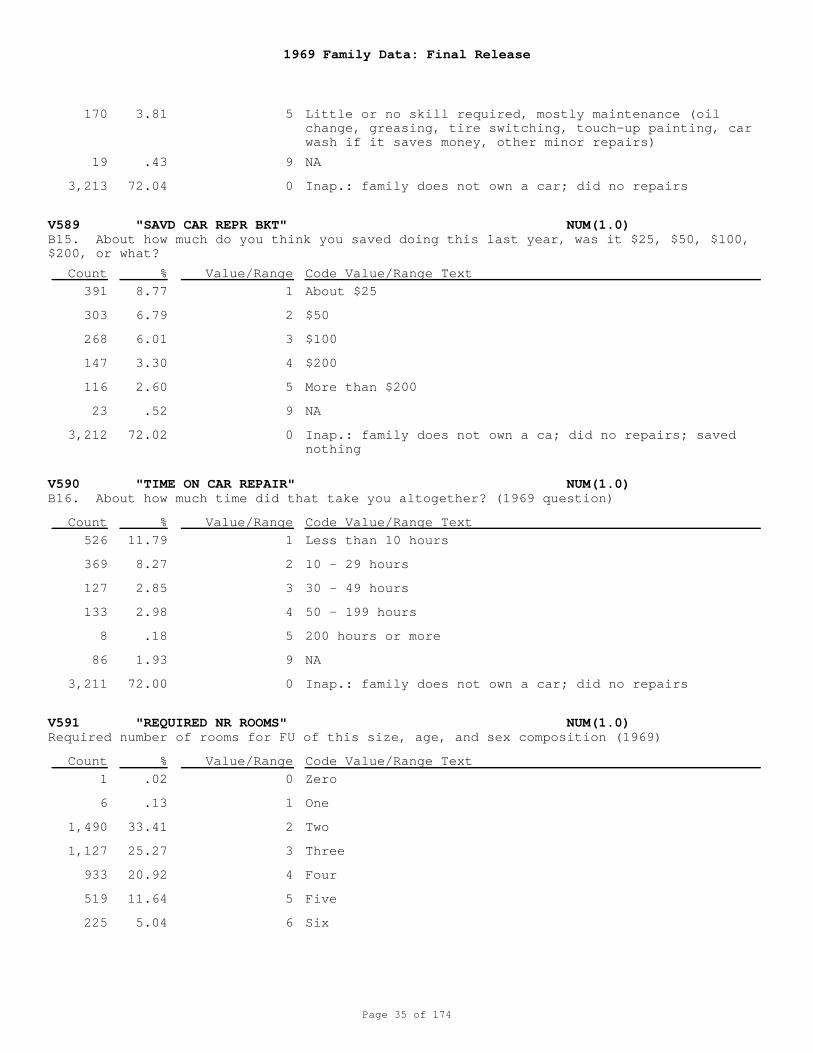
V589 "SAVD CAR REPR BKT" NUM(1.0)
V590 "TIME ON CAR REPAIR" NUM(1.0)
V591 "REQUIRED NR ROOMS" NUM(1.0)
B15. About how much do you think you saved doing this last year, was it $25, $50, $100,$200, or what?
B16. About how much time did that take you altogether? (1969 question)
Required number of rooms for FU of this size, age, and sex composition (1969)
5
9
0
1
2
3
4
5
9
0
1
2
3
4
5
9
0
0
1
2
3
4
5
6
Little or no skill required, mostly maintenance (oilchange, greasing, tire switching, touch-up painting, carwash if it saves money, other minor repairs)
NA
Inap.: family does not own a car; did no repairs
About $25
$50
$100
$200
More than $200
NA
Inap.: family does not own a ca; did no repairs; savednothing
Less than 10 hours
10 - 29 hours
30 - 49 hours
50 - 199 hours
200 hours or more
NA
Inap.: family does not own a car; did no repairs
Zero
One
Two
Three
Four
Five
Six
170
19
3,213
391
303
268
147
116
23
3,212
526
369
127
133
8
86
3,211
1
6
1,490
1,127
933
519
225
3.81
.43
72.04
8.77
6.79
6.01
3.30
2.60
.52
72.02
11.79
8.27
2.85
2.98
.18
1.93
72.00
.02
.13
33.41
25.27
20.92
11.64
5.04
Count
Count
Count
%
%
%
Value/Range
Value/Range
Value/Range
Code Value/Range Text
Code Value/Range Text
Code Value/Range Text
1969 Family Data: Final Release
Page 36 of 174
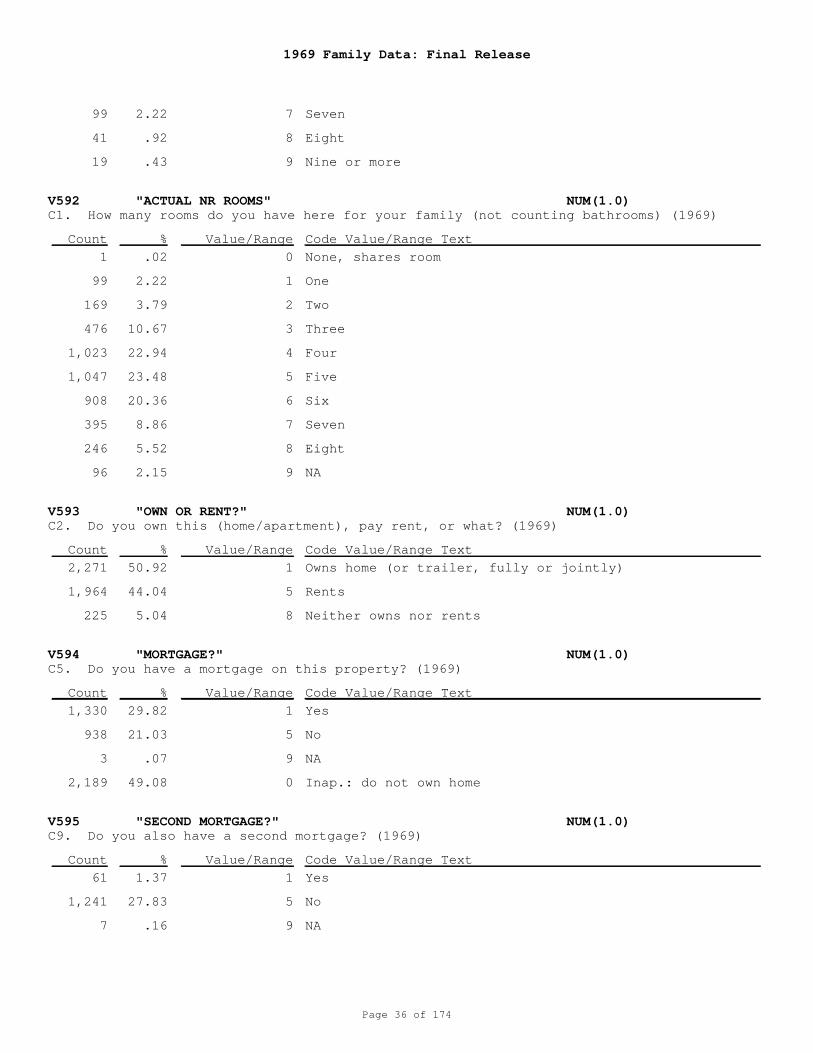
V592 "ACTUAL NR ROOMS" NUM(1.0)
V593 "OWN OR RENT?" NUM(1.0)
V594 "MORTGAGE?" NUM(1.0)
V595 "SECOND MORTGAGE?" NUM(1.0)
C1. How many rooms do you have here for your family (not counting bathrooms) (1969)
C2. Do you own this (home/apartment), pay rent, or what? (1969)
C5. Do you have a mortgage on this property? (1969)
C9. Do you also have a second mortgage? (1969)
7
8
9
0
1
2
3
4
5
6
7
8
9
1
5
8
1
5
9
0
1
5
9
Seven
Eight
Nine or more
None, shares room
One
Two
Three
Four
Five
Six
Seven
Eight
NA
Owns home (or trailer, fully or jointly)
Rents
Neither owns nor rents
Yes
No
NA
Inap.: do not own home
Yes
No
NA
99
41
19
1
99
169
476
1,023
1,047
908
395
246
96
2,271
1,964
225
1,330
938
3
2,189
61
1,241
7
2.22
.92
.43
.02
2.22
3.79
10.67
22.94
23.48
20.36
8.86
5.52
2.15
50.92
44.04
5.04
29.82
21.03
.07
49.08
1.37
27.83
.16
Count
Count
Count
Count
%
%
%
%
Value/Range
Value/Range
Value/Range
Value/Range
Code Value/Range Text
Code Value/Range Text
Code Value/Range Text
Code Value/Range Text
1969 Family Data: Final Release
Page 37 of 174
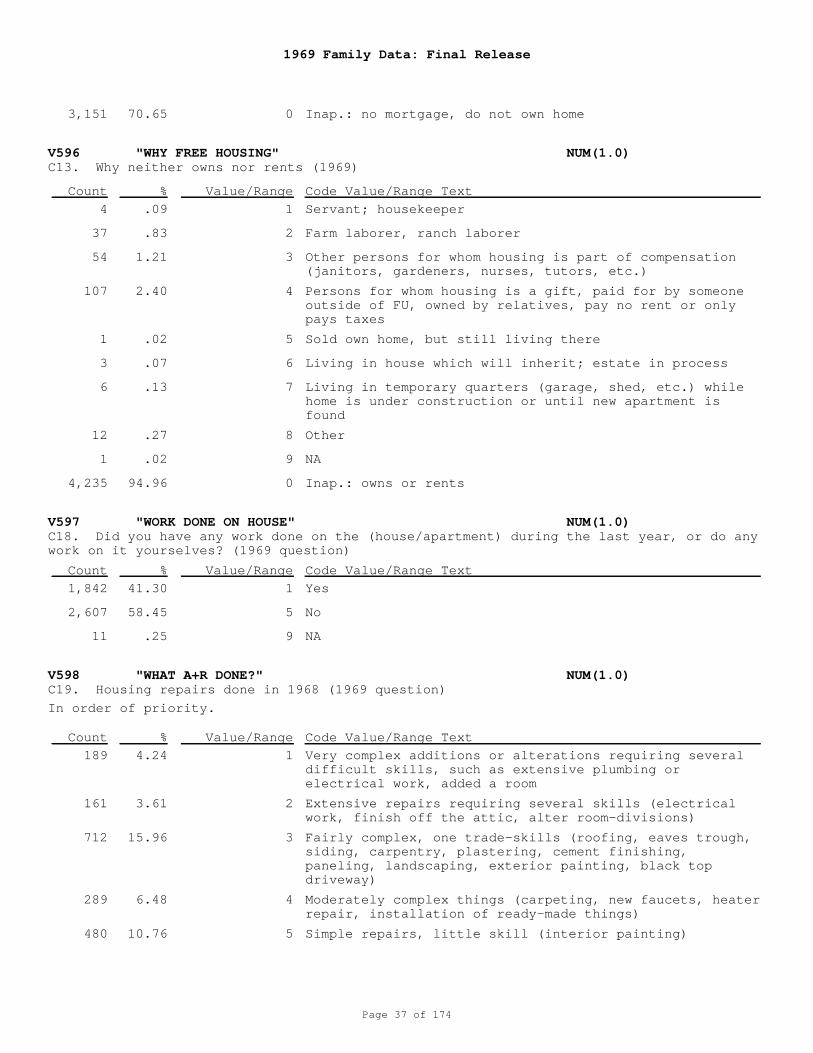
V596 "WHY FREE HOUSING" NUM(1.0)
V597 "WORK DONE ON HOUSE" NUM(1.0)
V598 "WHAT A+R DONE?" NUM(1.0)
C13. Why neither owns nor rents (1969)
C18. Did you have any work done on the (house/apartment) during the last year, or do anywork on it yourselves? (1969 question)
C19. Housing repairs done in 1968 (1969 question)
0
1
2
3
4
5
6
7
8
9
0
1
5
9
1
2
3
4
5
Inap.: no mortgage, do not own home
Servant; housekeeper
Farm laborer, ranch laborer
Other persons for whom housing is part of compensation(janitors, gardeners, nurses, tutors, etc.)
Persons for whom housing is a gift, paid for by someoneoutside of FU, owned by relatives, pay no rent or onlypays taxes
Sold own home, but still living there
Living in house which will inherit; estate in process
Living in temporary quarters (garage, shed, etc.) whilehome is under construction or until new apartment isfound
Other
NA
Inap.: owns or rents
Yes
No
NA
Very complex additions or alterations requiring severaldifficult skills, such as extensive plumbing orelectrical work, added a room
Extensive repairs requiring several skills (electricalwork, finish off the attic, alter room-divisions)
Fairly complex, one trade-skills (roofing, eaves trough,siding, carpentry, plastering, cement finishing,paneling, landscaping, exterior painting, black topdriveway)
Moderately complex things (carpeting, new faucets, heaterrepair, installation of ready-made things)
Simple repairs, little skill (interior painting)
In order of priority.
3,151
4
37
54
107
1
3
6
12
1
4,235
1,842
2,607
11
189
161
712
289
480
70.65
.09
.83
1.21
2.40
.02
.07
.13
.27
.02
94.96
41.30
58.45
.25
4.24
3.61
15.96
6.48
10.76
Count
Count
Count
%
%
%
Value/Range
Value/Range
Value/Range
Code Value/Range Text
Code Value/Range Text
Code Value/Range Text
1969 Family Data: Final Release
Page 38 of 174
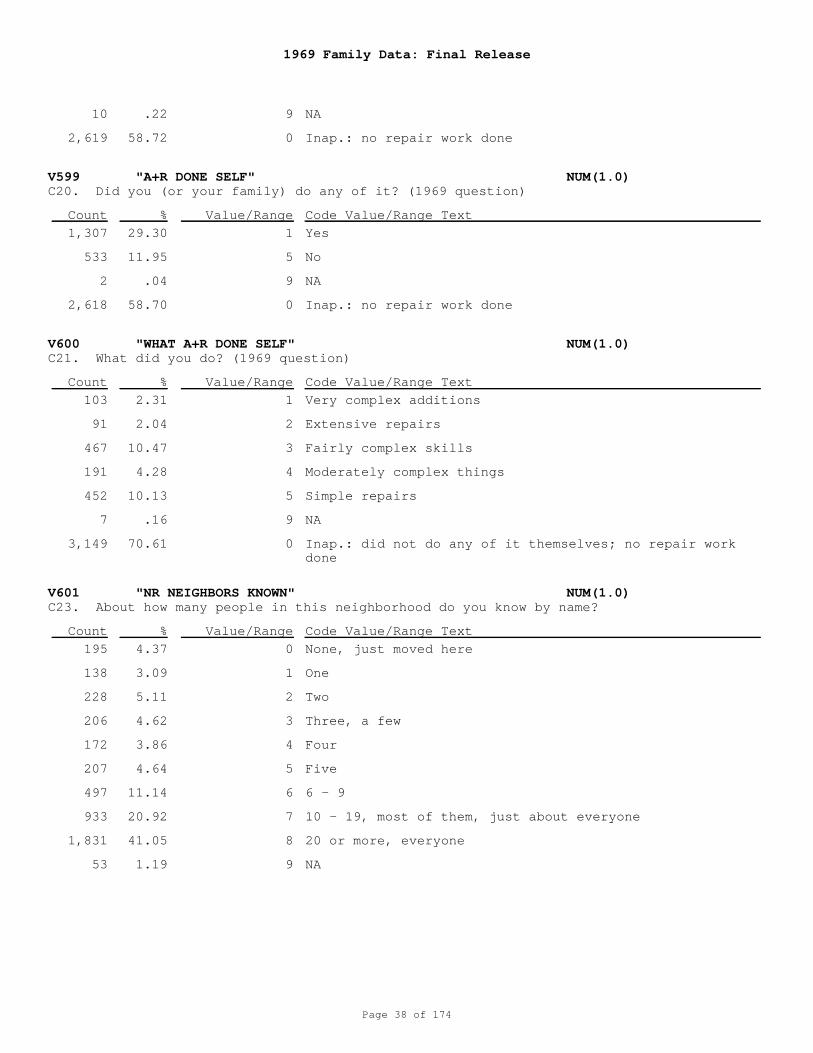
V599 "A+R DONE SELF" NUM(1.0)
V600 "WHAT A+R DONE SELF" NUM(1.0)
V601 "NR NEIGHBORS KNOWN" NUM(1.0)
C20. Did you (or your family) do any of it? (1969 question)
C21. What did you do? (1969 question)
C23. About how many people in this neighborhood do you know by name?
9
0
1
5
9
0
1
2
3
4
5
9
0
0
1
2
3
4
5
6
7
8
9
NA
Inap.: no repair work done
Yes
No
NA
Inap.: no repair work done
Very complex additions
Extensive repairs
Fairly complex skills
Moderately complex things
Simple repairs
NA
Inap.: did not do any of it themselves; no repair workdone
None, just moved here
One
Two
Three, a few
Four
Five
6 - 9
10 - 19, most of them, just about everyone
20 or more, everyone
NA
10
2,619
1,307
533
2
2,618
103
91
467
191
452
7
3,149
195
138
228
206
172
207
497
933
1,831
53
.22
58.72
29.30
11.95
.04
58.70
2.31
2.04
10.47
4.28
10.13
.16
70.61
4.37
3.09
5.11
4.62
3.86
4.64
11.14
20.92
41.05
1.19
Count
Count
Count
%
%
%
Value/Range
Value/Range
Value/Range
Code Value/Range Text
Code Value/Range Text
Code Value/Range Text
1969 Family Data: Final Release
Page 39 of 174
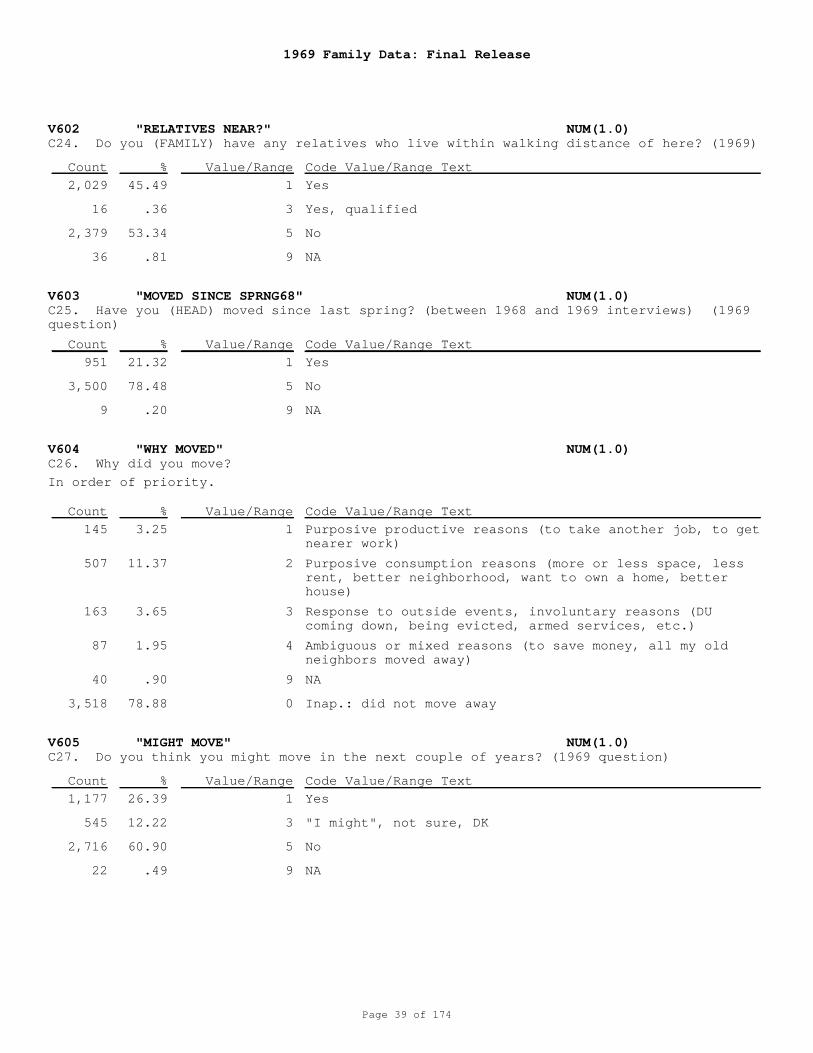
V602 "RELATIVES NEAR?" NUM(1.0)
V603 "MOVED SINCE SPRNG68" NUM(1.0)
V604 "WHY MOVED" NUM(1.0)
V605 "MIGHT MOVE" NUM(1.0)
C24. Do you (FAMILY) have any relatives who live within walking distance of here? (1969)
C25. Have you (HEAD) moved since last spring? (between 1968 and 1969 interviews) (1969question)
C26. Why did you move?
C27. Do you think you might move in the next couple of years? (1969 question)
1
3
5
9
1
5
9
1
2
3
4
9
0
1
3
5
9
Yes
Yes, qualified
No
NA
Yes
No
NA
Purposive productive reasons (to take another job, to getnearer work)
Purposive consumption reasons (more or less space, lessrent, better neighborhood, want to own a home, betterhouse)
Response to outside events, involuntary reasons (DUcoming down, being evicted, armed services, etc.)
Ambiguous or mixed reasons (to save money, all my oldneighbors moved away)
NA
Inap.: did not move away
Yes
"I might", not sure, DK
No
NA
In order of priority.
2,029
16
2,379
36
951
3,500
9
145
507
163
87
40
3,518
1,177
545
2,716
22
45.49
.36
53.34
.81
21.32
78.48
.20
3.25
11.37
3.65
1.95
.90
78.88
26.39
12.22
60.90
.49
Count
Count
Count
Count
%
%
%
%
Value/Range
Value/Range
Value/Range
Value/Range
Code Value/Range Text
Code Value/Range Text
Code Value/Range Text
Code Value/Range Text
1969 Family Data: Final Release
Page 40 of 174
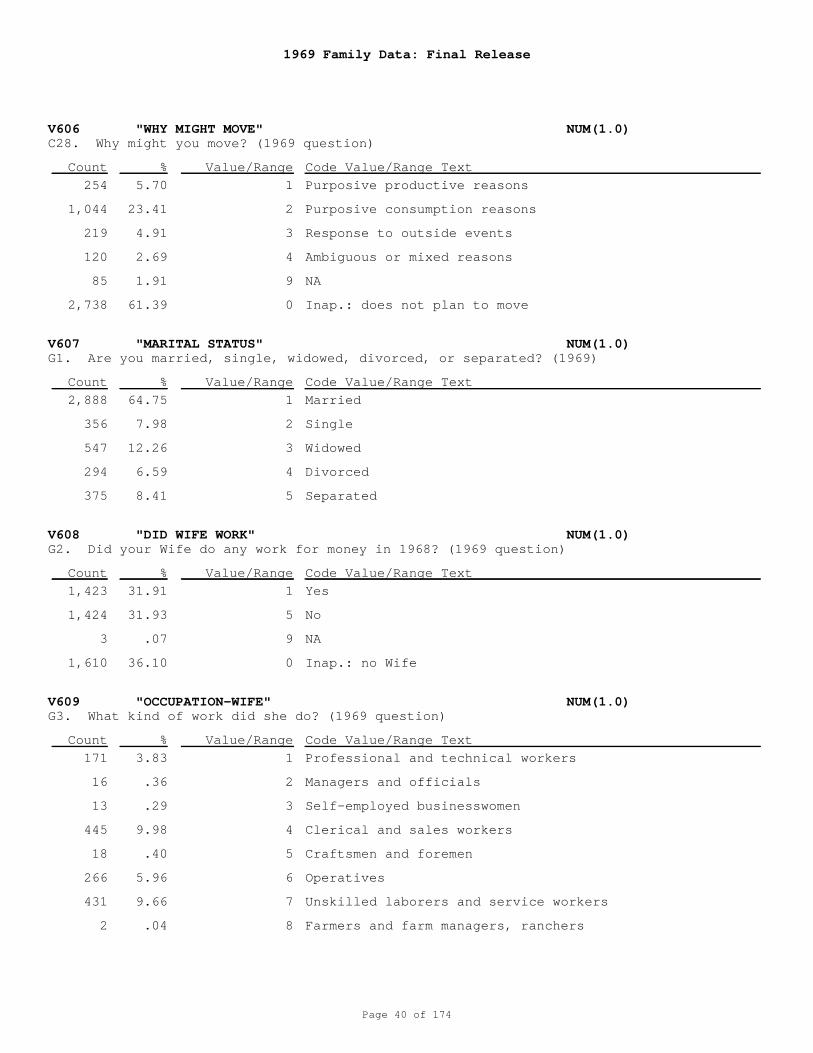
V606 "WHY MIGHT MOVE" NUM(1.0)
V607 "MARITAL STATUS" NUM(1.0)
V608 "DID WIFE WORK" NUM(1.0)
V609 "OCCUPATION-WIFE" NUM(1.0)
C28. Why might you move? (1969 question)
G1. Are you married, single, widowed, divorced, or separated? (1969)
G2. Did your Wife do any work for money in 1968? (1969 question)
G3. What kind of work did she do? (1969 question)
1
2
3
4
9
0
1
2
3
4
5
1
5
9
0
1
2
3
4
5
6
7
8
Purposive productive reasons
Purposive consumption reasons
Response to outside events
Ambiguous or mixed reasons
NA
Inap.: does not plan to move
Married
Single
Widowed
Divorced
Separated
Yes
No
NA
Inap.: no Wife
Professional and technical workers
Managers and officials
Self-employed businesswomen
Clerical and sales workers
Craftsmen and foremen
Operatives
Unskilled laborers and service workers
Farmers and farm managers, ranchers
254
1,044
219
120
85
2,738
2,888
356
547
294
375
1,423
1,424
3
1,610
171
16
13
445
18
266
431
2
5.70
23.41
4.91
2.69
1.91
61.39
64.75
7.98
12.26
6.59
8.41
31.91
31.93
.07
36.10
3.83
.36
.29
9.98
.40
5.96
9.66
.04
Count
Count
Count
Count
%
%
%
%
Value/Range
Value/Range
Value/Range
Value/Range
Code Value/Range Text
Code Value/Range Text
Code Value/Range Text
Code Value/Range Text
1969 Family Data: Final Release
Page 41 of 174
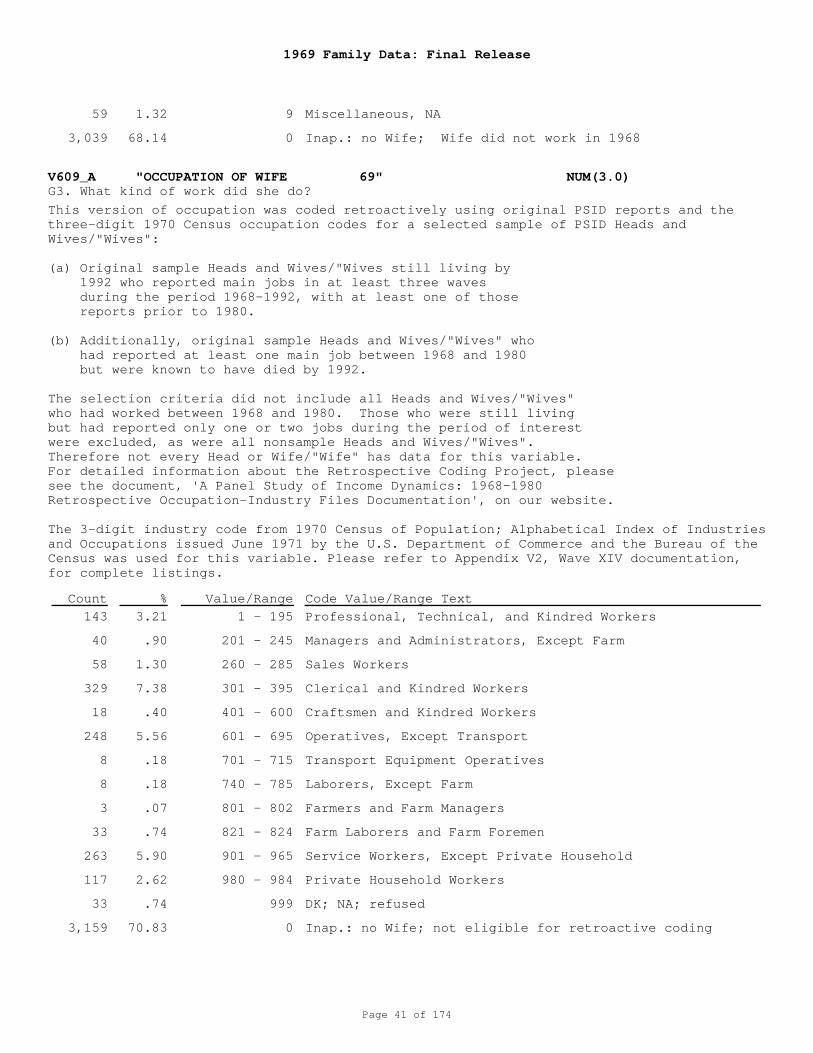
V609_A "OCCUPATION OF WIFE 69" NUM(3.0)G3. What kind of work did she do?
9
0
1 - 195
201 - 245
260 - 285
301 - 395
401 - 600
601 - 695
701 - 715
740 - 785
801 - 802
821 - 824
901 - 965
980 - 984
999
0
Miscellaneous, NA
Inap.: no Wife; Wife did not work in 1968
Professional, Technical, and Kindred Workers
Managers and Administrators, Except Farm
Sales Workers
Clerical and Kindred Workers
Craftsmen and Kindred Workers
Operatives, Except Transport
Transport Equipment Operatives
Laborers, Except Farm
Farmers and Farm Managers
Farm Laborers and Farm Foremen
Service Workers, Except Private Household
Private Household Workers
DK; NA; refused
Inap.: no Wife; not eligible for retroactive coding
This version of occupation was coded retroactively using original PSID reports and thethree-digit 1970 Census occupation codes for a selected sample of PSID Heads andWives/"Wives":
(a) Original sample Heads and Wives/"Wives still living by 1992 who reported main jobs in at least three waves during the period 1968-1992, with at least one of those reports prior to 1980.
(b) Additionally, original sample Heads and Wives/"Wives" who had reported at least one main job between 1968 and 1980 but were known to have died by 1992.
The selection criteria did not include all Heads and Wives/"Wives"who had worked between 1968 and 1980. Those who were still livingbut had reported only one or two jobs during the period of interestwere excluded, as were all nonsample Heads and Wives/"Wives". Therefore not every Head or Wife/"Wife" has data for this variable.For detailed information about the Retrospective Coding Project, please see the document, 'A Panel Study of Income Dynamics: 1968-1980 Retrospective Occupation-Industry Files Documentation', on our website.
The 3-digit industry code from 1970 Census of Population; Alphabetical Index of Industriesand Occupations issued June 1971 by the U.S. Department of Commerce and the Bureau of theCensus was used for this variable. Please refer to Appendix V2, Wave XIV documentation,for complete listings.
59
3,039
143
40
58
329
18
248
8
8
3
33
263
117
33
3,159
1.32
68.14
3.21
.90
1.30
7.38
.40
5.56
.18
.18
.07
.74
5.90
2.62
.74
70.83
Count % Value/Range Code Value/Range Text
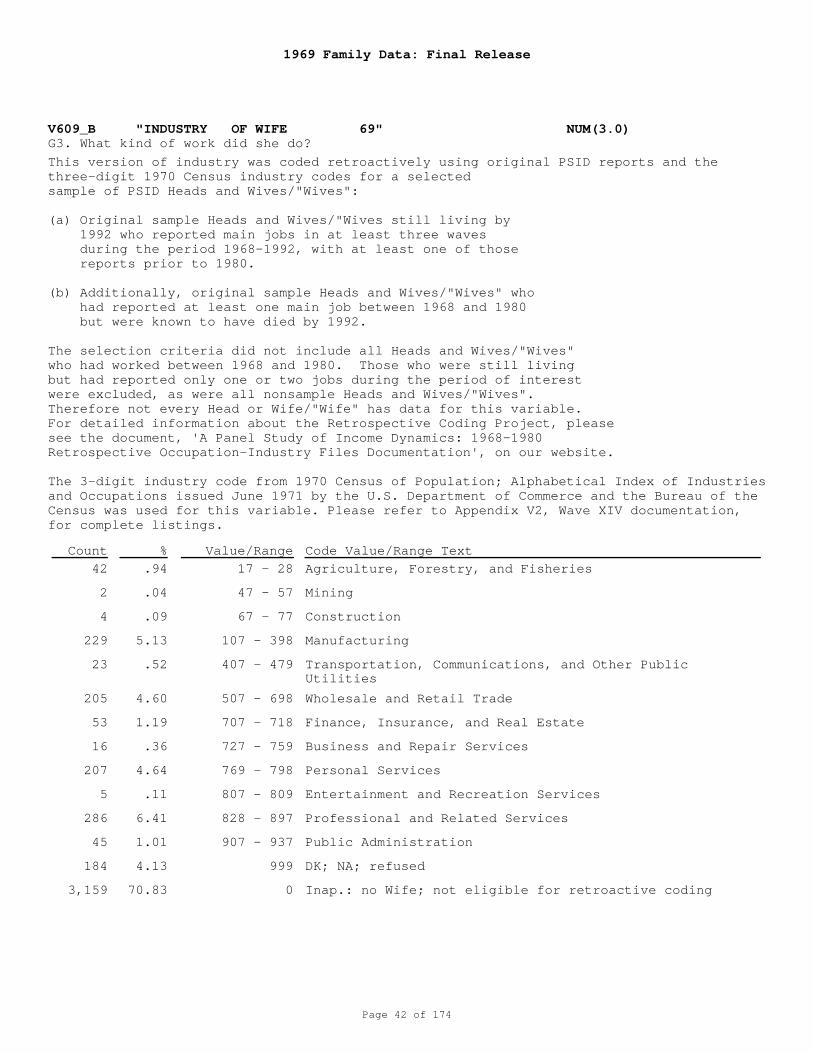
1969 Family Data: Final Release
Page 42 of 174
V609_B "INDUSTRY OF WIFE 69" NUM(3.0)G3. What kind of work did she do?
17 - 28
47 - 57
67 - 77
107 - 398
407 - 479
507 - 698
707 - 718
727 - 759
769 - 798
807 - 809
828 - 897
907 - 937
999
0
Agriculture, Forestry, and Fisheries
Mining
Construction
Manufacturing
Transportation, Communications, and Other PublicUtilities
Wholesale and Retail Trade
Finance, Insurance, and Real Estate
Business and Repair Services
Personal Services
Entertainment and Recreation Services
Professional and Related Services
Public Administration
DK; NA; refused
Inap.: no Wife; not eligible for retroactive coding
This version of industry was coded retroactively using original PSID reports and thethree-digit 1970 Census industry codes for a selectedsample of PSID Heads and Wives/"Wives":
(a) Original sample Heads and Wives/"Wives still living by 1992 who reported main jobs in at least three waves during the period 1968-1992, with at least one of those reports prior to 1980.
(b) Additionally, original sample Heads and Wives/"Wives" who had reported at least one main job between 1968 and 1980 but were known to have died by 1992.
The selection criteria did not include all Heads and Wives/"Wives"who had worked between 1968 and 1980. Those who were still livingbut had reported only one or two jobs during the period of interestwere excluded, as were all nonsample Heads and Wives/"Wives". Therefore not every Head or Wife/"Wife" has data for this variable.For detailed information about the Retrospective Coding Project, please see the document, 'A Panel Study of Income Dynamics: 1968-1980 Retrospective Occupation-Industry Files Documentation', on our website.
The 3-digit industry code from 1970 Census of Population; Alphabetical Index of Industriesand Occupations issued June 1971 by the U.S. Department of Commerce and the Bureau of theCensus was used for this variable. Please refer to Appendix V2, Wave XIV documentation,for complete listings.
42
2
4
229
23
205
53
16
207
5
286
45
184
3,159
.94
.04
.09
5.13
.52
4.60
1.19
.36
4.64
.11
6.41
1.01
4.13
70.83
Count % Value/Range Code Value/Range Text
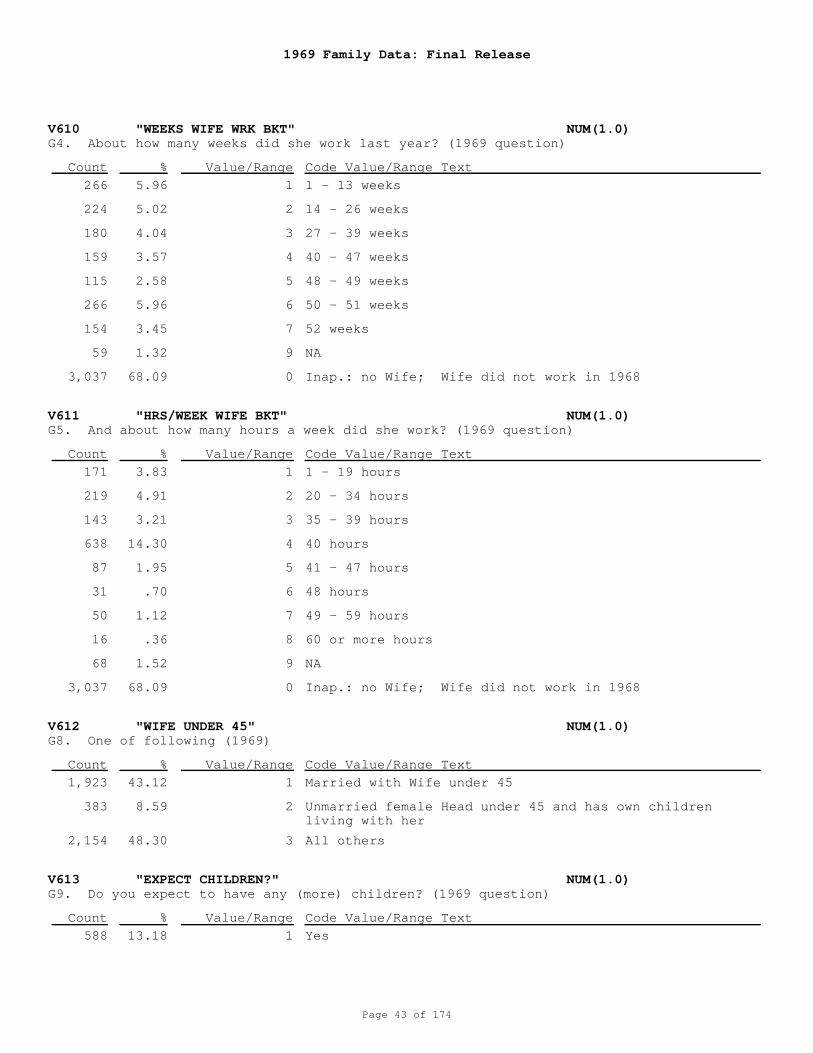
1969 Family Data: Final Release
Page 43 of 174
V610 "WEEKS WIFE WRK BKT" NUM(1.0)
V611 "HRS/WEEK WIFE BKT" NUM(1.0)
V612 "WIFE UNDER 45" NUM(1.0)
V613 "EXPECT CHILDREN?" NUM(1.0)
G4. About how many weeks did she work last year? (1969 question)
G5. And about how many hours a week did she work? (1969 question)
G8. One of following (1969)
G9. Do you expect to have any (more) children? (1969 question)
1
2
3
4
5
6
7
9
0
1
2
3
4
5
6
7
8
9
0
1
2
3
1
1 - 13 weeks
14 - 26 weeks
27 - 39 weeks
40 - 47 weeks
48 - 49 weeks
50 - 51 weeks
52 weeks
NA
Inap.: no Wife; Wife did not work in 1968
1 - 19 hours
20 - 34 hours
35 - 39 hours
40 hours
41 - 47 hours
48 hours
49 - 59 hours
60 or more hours
NA
Inap.: no Wife; Wife did not work in 1968
Married with Wife under 45
Unmarried female Head under 45 and has own childrenliving with her
All others
Yes
266
224
180
159
115
266
154
59
3,037
171
219
143
638
87
31
50
16
68
3,037
1,923
383
2,154
588
5.96
5.02
4.04
3.57
2.58
5.96
3.45
1.32
68.09
3.83
4.91
3.21
14.30
1.95
.70
1.12
.36
1.52
68.09
43.12
8.59
48.30
13.18
Count
Count
Count
Count
%
%
%
%
Value/Range
Value/Range
Value/Range
Value/Range
Code Value/Range Text
Code Value/Range Text
Code Value/Range Text
Code Value/Range Text
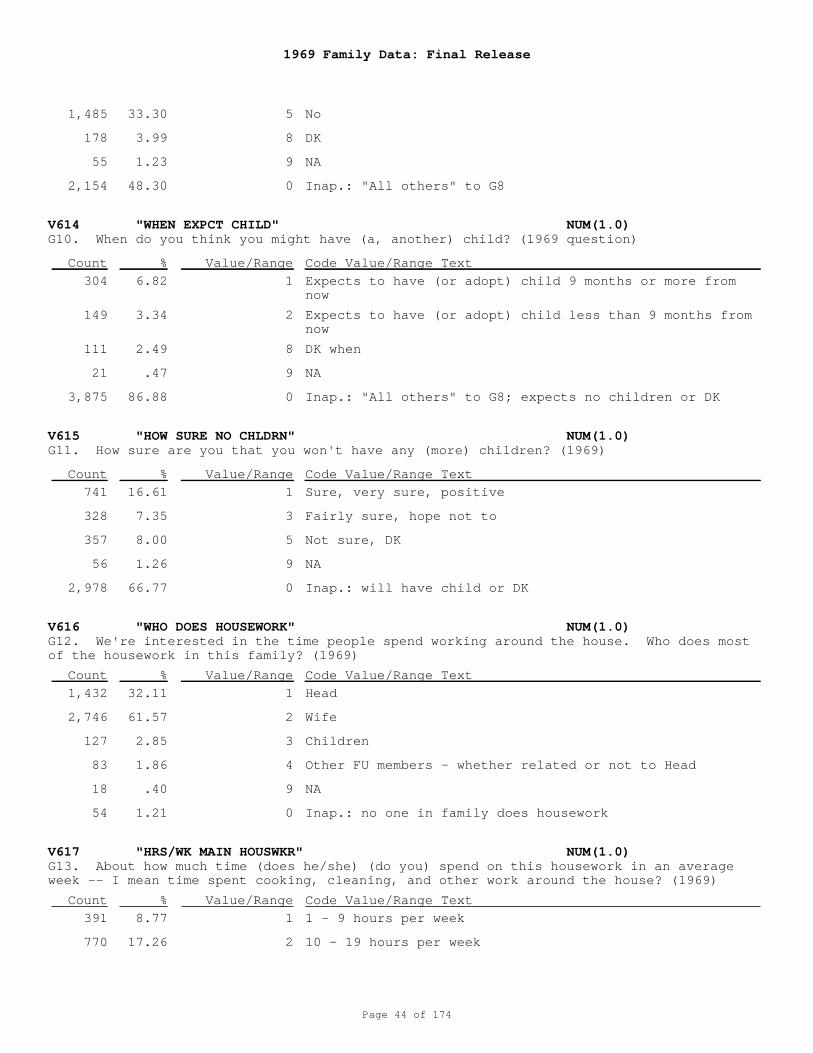
1969 Family Data: Final Release
Page 44 of 174
V614 "WHEN EXPCT CHILD" NUM(1.0)
V615 "HOW SURE NO CHLDRN" NUM(1.0)
V616 "WHO DOES HOUSEWORK" NUM(1.0)
V617 "HRS/WK MAIN HOUSWKR" NUM(1.0)
G10. When do you think you might have (a, another) child? (1969 question)
G11. How sure are you that you won't have any (more) children? (1969)
G12. We're interested in the time people spend working around the house. Who does mostof the housework in this family? (1969)
G13. About how much time (does he/she) (do you) spend on this housework in an averageweek -- I mean time spent cooking, cleaning, and other work around the house? (1969)
5
8
9
0
1
2
8
9
0
1
3
5
9
0
1
2
3
4
9
0
1
2
No
DK
NA
Inap.: "All others" to G8
Expects to have (or adopt) child 9 months or more fromnow
Expects to have (or adopt) child less than 9 months fromnow
DK when
NA
Inap.: "All others" to G8; expects no children or DK
Sure, very sure, positive
Fairly sure, hope not to
Not sure, DK
NA
Inap.: will have child or DK
Head
Wife
Children
Other FU members - whether related or not to Head
NA
Inap.: no one in family does housework
1 - 9 hours per week
10 - 19 hours per week
1,485
178
55
2,154
304
149
111
21
3,875
741
328
357
56
2,978
1,432
2,746
127
83
18
54
391
770
33.30
3.99
1.23
48.30
6.82
3.34
2.49
.47
86.88
16.61
7.35
8.00
1.26
66.77
32.11
61.57
2.85
1.86
.40
1.21
8.77
17.26
Count
Count
Count
Count
%
%
%
%
Value/Range
Value/Range
Value/Range
Value/Range
Code Value/Range Text
Code Value/Range Text
Code Value/Range Text
Code Value/Range Text
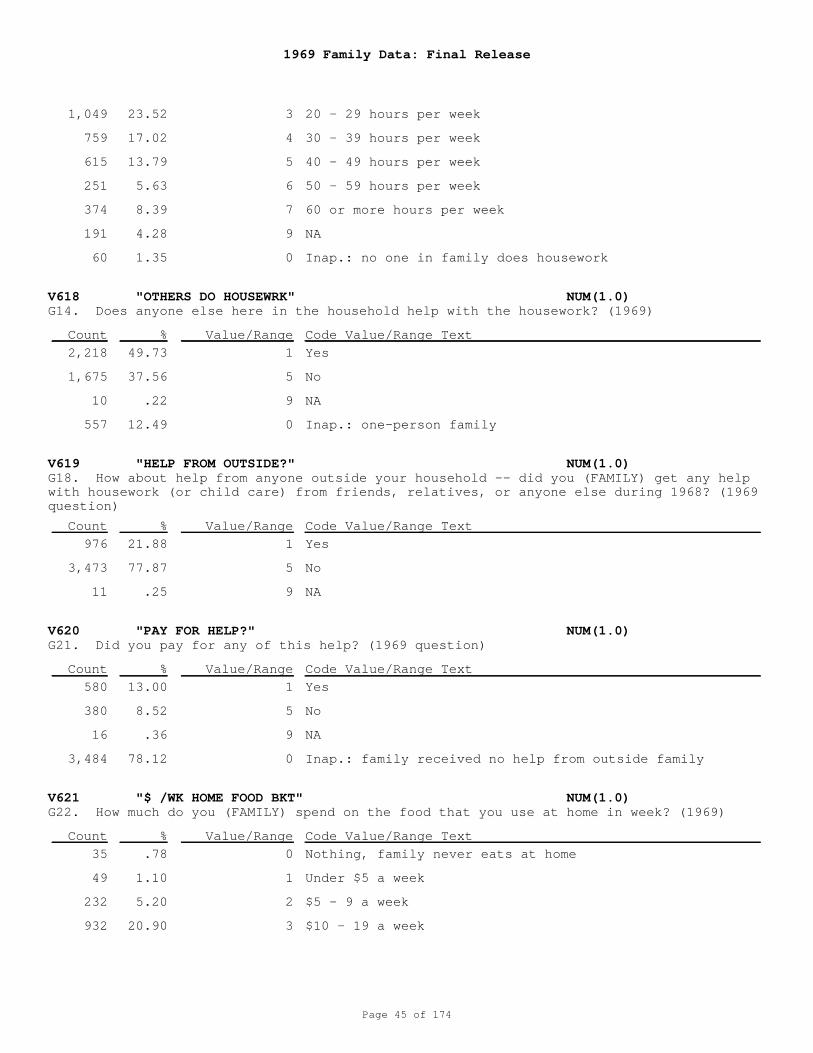
1969 Family Data: Final Release
Page 45 of 174
V618 "OTHERS DO HOUSEWRK" NUM(1.0)
V619 "HELP FROM OUTSIDE?" NUM(1.0)
V620 "PAY FOR HELP?" NUM(1.0)
V621 "$ /WK HOME FOOD BKT" NUM(1.0)
G14. Does anyone else here in the household help with the housework? (1969)
G18. How about help from anyone outside your household -- did you (FAMILY) get any helpwith housework (or child care) from friends, relatives, or anyone else during 1968? (1969question)
G21. Did you pay for any of this help? (1969 question)
G22. How much do you (FAMILY) spend on the food that you use at home in week? (1969)
3
4
5
6
7
9
0
1
5
9
0
1
5
9
1
5
9
0
0
1
2
3
20 - 29 hours per week
30 - 39 hours per week
40 - 49 hours per week
50 - 59 hours per week
60 or more hours per week
NA
Inap.: no one in family does housework
Yes
No
NA
Inap.: one-person family
Yes
No
NA
Yes
No
NA
Inap.: family received no help from outside family
Nothing, family never eats at home
Under $5 a week
$5 - 9 a week
$10 - 19 a week
1,049
759
615
251
374
191
60
2,218
1,675
10
557
976
3,473
11
580
380
16
3,484
35
49
232
932
23.52
17.02
13.79
5.63
8.39
4.28
1.35
49.73
37.56
.22
12.49
21.88
77.87
.25
13.00
8.52
.36
78.12
.78
1.10
5.20
20.90
Count
Count
Count
Count
%
%
%
%
Value/Range
Value/Range
Value/Range
Value/Range
Code Value/Range Text
Code Value/Range Text
Code Value/Range Text
Code Value/Range Text
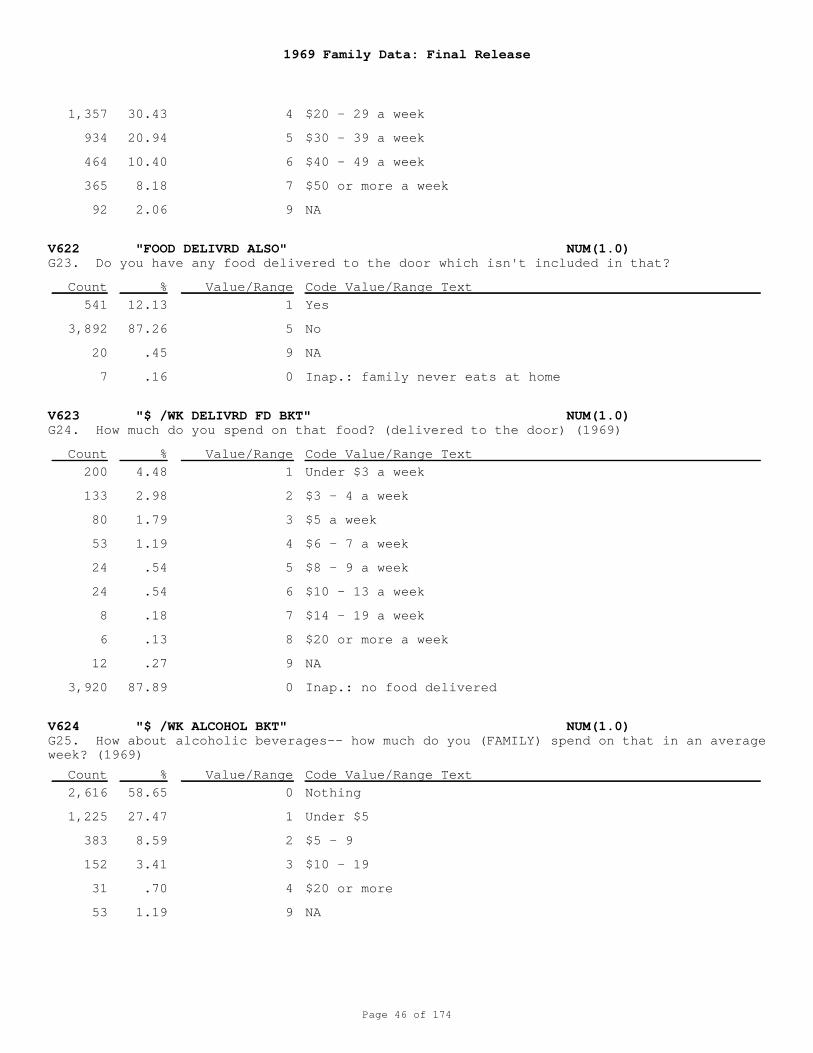
1969 Family Data: Final Release
Page 46 of 174
V622 "FOOD DELIVRD ALSO" NUM(1.0)
V623 "$ /WK DELIVRD FD BKT" NUM(1.0)
V624 "$ /WK ALCOHOL BKT" NUM(1.0)
G23. Do you have any food delivered to the door which isn't included in that?
G24. How much do you spend on that food? (delivered to the door) (1969)
G25. How about alcoholic beverages-- how much do you (FAMILY) spend on that in an averageweek? (1969)
4
5
6
7
9
1
5
9
0
1
2
3
4
5
6
7
8
9
0
0
1
2
3
4
9
$20 - 29 a week
$30 - 39 a week
$40 - 49 a week
$50 or more a week
NA
Yes
No
NA
Inap.: family never eats at home
Under $3 a week
$3 - 4 a week
$5 a week
$6 - 7 a week
$8 - 9 a week
$10 - 13 a week
$14 - 19 a week
$20 or more a week
NA
Inap.: no food delivered
Nothing
Under $5
$5 - 9
$10 - 19
$20 or more
NA
1,357
934
464
365
92
541
3,892
20
7
200
133
80
53
24
24
8
6
12
3,920
2,616
1,225
383
152
31
53
30.43
20.94
10.40
8.18
2.06
12.13
87.26
.45
.16
4.48
2.98
1.79
1.19
.54
.54
.18
.13
.27
87.89
58.65
27.47
8.59
3.41
.70
1.19
Count
Count
Count
%
%
%
Value/Range
Value/Range
Value/Range
Code Value/Range Text
Code Value/Range Text
Code Value/Range Text
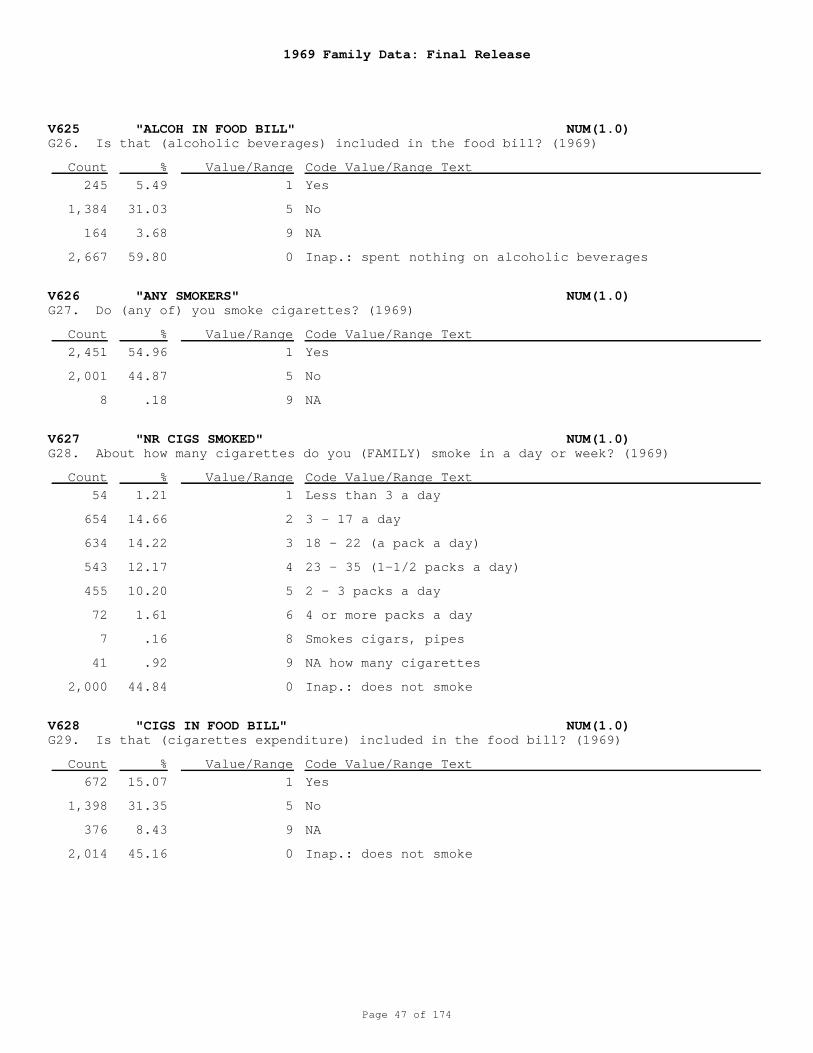
1969 Family Data: Final Release
Page 47 of 174
V625 "ALCOH IN FOOD BILL" NUM(1.0)
V626 "ANY SMOKERS" NUM(1.0)
V627 "NR CIGS SMOKED" NUM(1.0)
V628 "CIGS IN FOOD BILL" NUM(1.0)
G26. Is that (alcoholic beverages) included in the food bill? (1969)
G27. Do (any of) you smoke cigarettes? (1969)
G28. About how many cigarettes do you (FAMILY) smoke in a day or week? (1969)
G29. Is that (cigarettes expenditure) included in the food bill? (1969)
1
5
9
0
1
5
9
1
2
3
4
5
6
8
9
0
1
5
9
0
Yes
No
NA
Inap.: spent nothing on alcoholic beverages
Yes
No
NA
Less than 3 a day
3 - 17 a day
18 - 22 (a pack a day)
23 - 35 (1-1/2 packs a day)
2 - 3 packs a day
4 or more packs a day
Smokes cigars, pipes
NA how many cigarettes
Inap.: does not smoke
Yes
No
NA
Inap.: does not smoke
245
1,384
164
2,667
2,451
2,001
8
54
654
634
543
455
72
7
41
2,000
672
1,398
376
2,014
5.49
31.03
3.68
59.80
54.96
44.87
.18
1.21
14.66
14.22
12.17
10.20
1.61
.16
.92
44.84
15.07
31.35
8.43
45.16
Count
Count
Count
Count
%
%
%
%
Value/Range
Value/Range
Value/Range
Value/Range
Code Value/Range Text
Code Value/Range Text
Code Value/Range Text
Code Value/Range Text
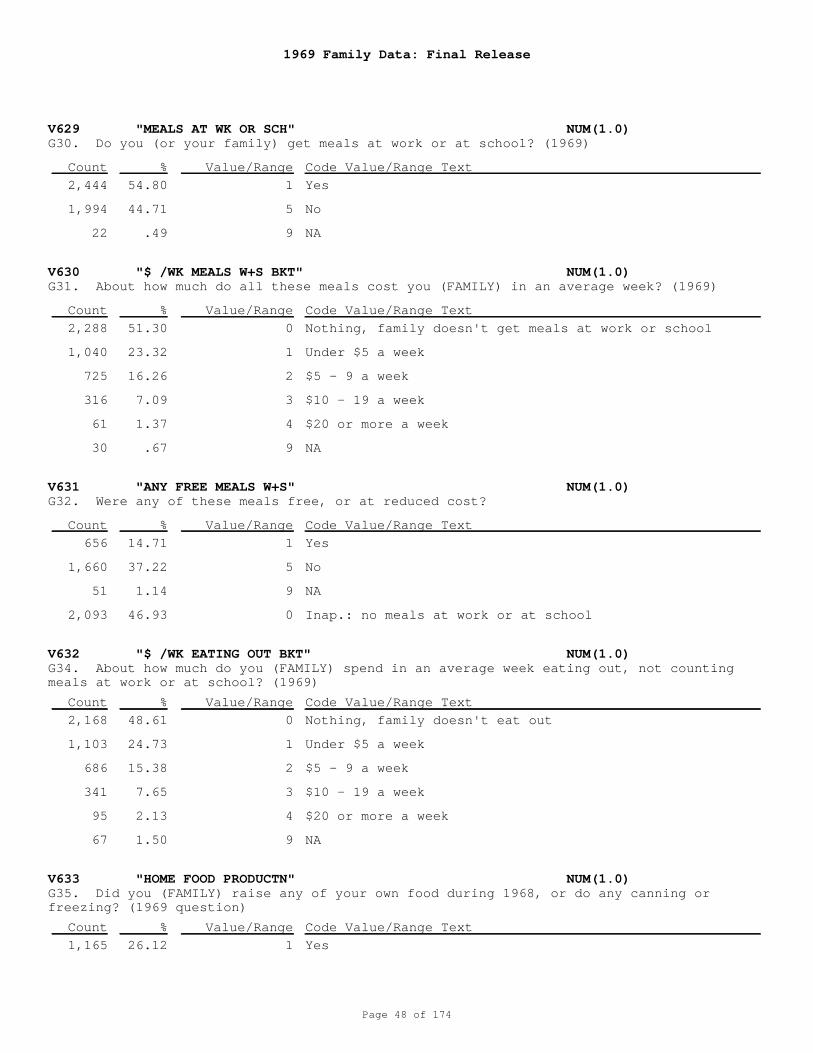
1969 Family Data: Final Release
Page 48 of 174
V629 "MEALS AT WK OR SCH" NUM(1.0)
V630 "$ /WK MEALS W+S BKT" NUM(1.0)
V631 "ANY FREE MEALS W+S" NUM(1.0)
V632 "$ /WK EATING OUT BKT" NUM(1.0)
V633 "HOME FOOD PRODUCTN" NUM(1.0)
G30. Do you (or your family) get meals at work or at school? (1969)
G31. About how much do all these meals cost you (FAMILY) in an average week? (1969)
G32. Were any of these meals free, or at reduced cost?
G34. About how much do you (FAMILY) spend in an average week eating out, not countingmeals at work or at school? (1969)
G35. Did you (FAMILY) raise any of your own food during 1968, or do any canning orfreezing? (1969 question)
1
5
9
0
1
2
3
4
9
1
5
9
0
0
1
2
3
4
9
1
Yes
No
NA
Nothing, family doesn't get meals at work or school
Under $5 a week
$5 - 9 a week
$10 - 19 a week
$20 or more a week
NA
Yes
No
NA
Inap.: no meals at work or at school
Nothing, family doesn't eat out
Under $5 a week
$5 - 9 a week
$10 - 19 a week
$20 or more a week
NA
Yes
2,444
1,994
22
2,288
1,040
725
316
61
30
656
1,660
51
2,093
2,168
1,103
686
341
95
67
1,165
54.80
44.71
.49
51.30
23.32
16.26
7.09
1.37
.67
14.71
37.22
1.14
46.93
48.61
24.73
15.38
7.65
2.13
1.50
26.12
Count
Count
Count
Count
Count
%
%
%
%
%
Value/Range
Value/Range
Value/Range
Value/Range
Value/Range
Code Value/Range Text
Code Value/Range Text
Code Value/Range Text
Code Value/Range Text
Code Value/Range Text
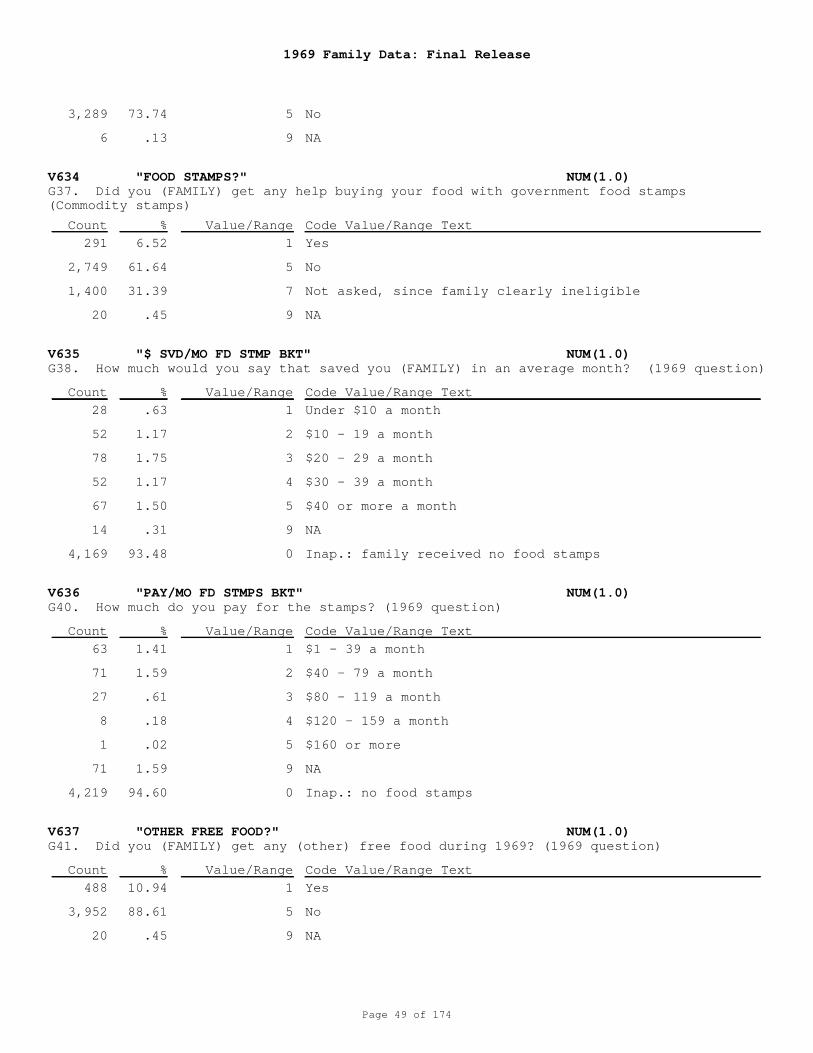
1969 Family Data: Final Release
Page 49 of 174
V634 "FOOD STAMPS?" NUM(1.0)
V635 "$ SVD/MO FD STMP BKT" NUM(1.0)
V636 "PAY/MO FD STMPS BKT" NUM(1.0)
V637 "OTHER FREE FOOD?" NUM(1.0)
G37. Did you (FAMILY) get any help buying your food with government food stamps(Commodity stamps)
G38. How much would you say that saved you (FAMILY) in an average month? (1969 question)
G40. How much do you pay for the stamps? (1969 question)
G41. Did you (FAMILY) get any (other) free food during 1969? (1969 question)
5
9
1
5
7
9
1
2
3
4
5
9
0
1
2
3
4
5
9
0
1
5
9
No
NA
Yes
No
Not asked, since family clearly ineligible
NA
Under $10 a month
$10 - 19 a month
$20 - 29 a month
$30 - 39 a month
$40 or more a month
NA
Inap.: family received no food stamps
$1 - 39 a month
$40 - 79 a month
$80 - 119 a month
$120 - 159 a month
$160 or more
NA
Inap.: no food stamps
Yes
No
NA
3,289
6
291
2,749
1,400
20
28
52
78
52
67
14
4,169
63
71
27
8
1
71
4,219
488
3,952
20
73.74
.13
6.52
61.64
31.39
.45
.63
1.17
1.75
1.17
1.50
.31
93.48
1.41
1.59
.61
.18
.02
1.59
94.60
10.94
88.61
.45
Count
Count
Count
Count
%
%
%
%
Value/Range
Value/Range
Value/Range
Value/Range
Code Value/Range Text
Code Value/Range Text
Code Value/Range Text
Code Value/Range Text
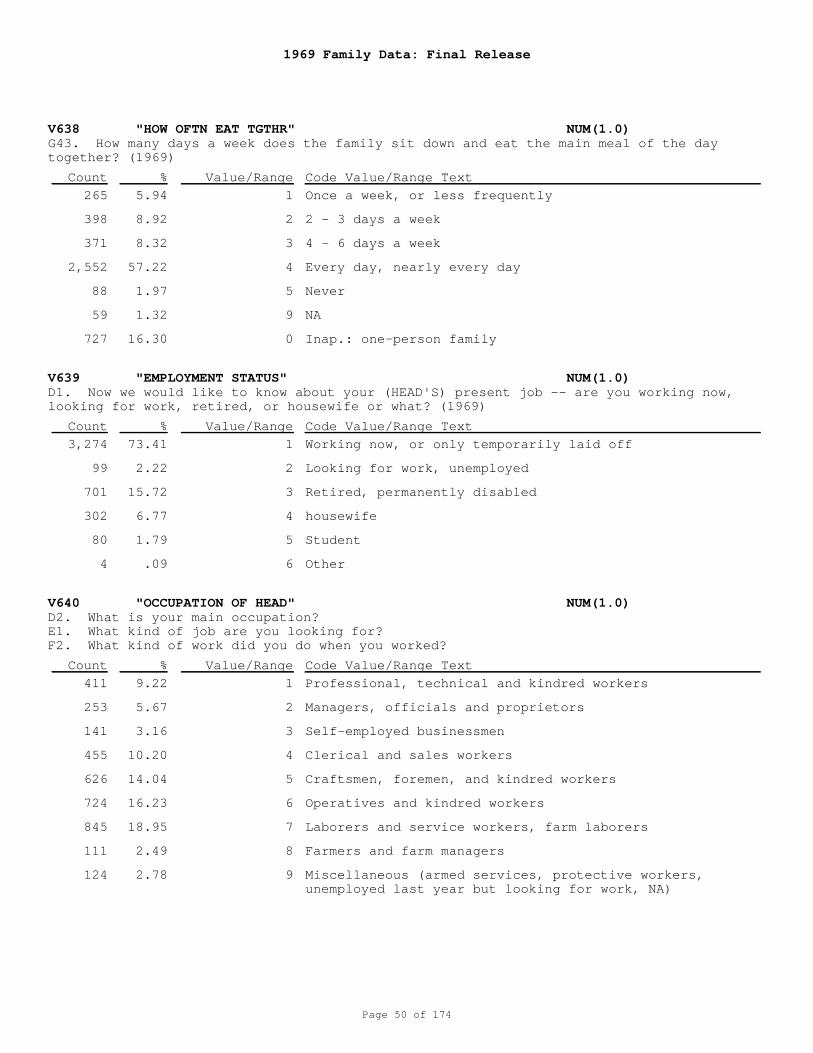
1969 Family Data: Final Release
Page 50 of 174
V638 "HOW OFTN EAT TGTHR" NUM(1.0)
V639 "EMPLOYMENT STATUS" NUM(1.0)
V640 "OCCUPATION OF HEAD" NUM(1.0)
G43. How many days a week does the family sit down and eat the main meal of the daytogether? (1969)
D1. Now we would like to know about your (HEAD'S) present job -- are you working now,looking for work, retired, or housewife or what? (1969)
D2. What is your main occupation? E1. What kind of job are you looking for?F2. What kind of work did you do when you worked?
1
2
3
4
5
9
0
1
2
3
4
5
6
1
2
3
4
5
6
7
8
9
Once a week, or less frequently
2 - 3 days a week
4 - 6 days a week
Every day, nearly every day
Never
NA
Inap.: one-person family
Working now, or only temporarily laid off
Looking for work, unemployed
Retired, permanently disabled
housewife
Student
Other
Professional, technical and kindred workers
Managers, officials and proprietors
Self-employed businessmen
Clerical and sales workers
Craftsmen, foremen, and kindred workers
Operatives and kindred workers
Laborers and service workers, farm laborers
Farmers and farm managers
Miscellaneous (armed services, protective workers,unemployed last year but looking for work, NA)
265
398
371
2,552
88
59
727
3,274
99
701
302
80
4
411
253
141
455
626
724
845
111
124
5.94
8.92
8.32
57.22
1.97
1.32
16.30
73.41
2.22
15.72
6.77
1.79
.09
9.22
5.67
3.16
10.20
14.04
16.23
18.95
2.49
2.78
Count
Count
Count
%
%
%
Value/Range
Value/Range
Value/Range
Code Value/Range Text
Code Value/Range Text
Code Value/Range Text
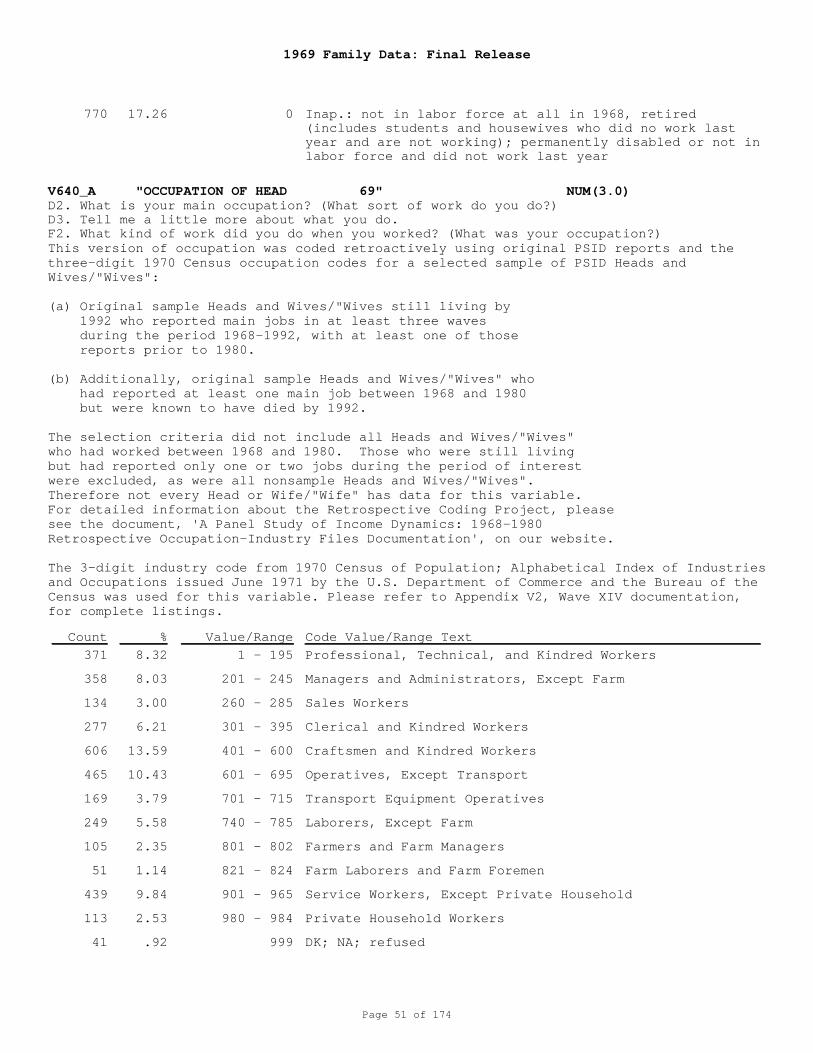
1969 Family Data: Final Release
Page 51 of 174
V640_A "OCCUPATION OF HEAD 69" NUM(3.0)D2. What is your main occupation? (What sort of work do you do?)D3. Tell me a little more about what you do.F2. What kind of work did you do when you worked? (What was your occupation?)
0
1 - 195
201 - 245
260 - 285
301 - 395
401 - 600
601 - 695
701 - 715
740 - 785
801 - 802
821 - 824
901 - 965
980 - 984
999
Inap.: not in labor force at all in 1968, retired(includes students and housewives who did no work lastyear and are not working); permanently disabled or not inlabor force and did not work last year
Professional, Technical, and Kindred Workers
Managers and Administrators, Except Farm
Sales Workers
Clerical and Kindred Workers
Craftsmen and Kindred Workers
Operatives, Except Transport
Transport Equipment Operatives
Laborers, Except Farm
Farmers and Farm Managers
Farm Laborers and Farm Foremen
Service Workers, Except Private Household
Private Household Workers
DK; NA; refused
This version of occupation was coded retroactively using original PSID reports and thethree-digit 1970 Census occupation codes for a selected sample of PSID Heads andWives/"Wives":
(a) Original sample Heads and Wives/"Wives still living by 1992 who reported main jobs in at least three waves during the period 1968-1992, with at least one of those reports prior to 1980.
(b) Additionally, original sample Heads and Wives/"Wives" who had reported at least one main job between 1968 and 1980 but were known to have died by 1992.
The selection criteria did not include all Heads and Wives/"Wives"who had worked between 1968 and 1980. Those who were still livingbut had reported only one or two jobs during the period of interestwere excluded, as were all nonsample Heads and Wives/"Wives". Therefore not every Head or Wife/"Wife" has data for this variable.For detailed information about the Retrospective Coding Project, please see the document, 'A Panel Study of Income Dynamics: 1968-1980 Retrospective Occupation-Industry Files Documentation', on our website.
The 3-digit industry code from 1970 Census of Population; Alphabetical Index of Industriesand Occupations issued June 1971 by the U.S. Department of Commerce and the Bureau of theCensus was used for this variable. Please refer to Appendix V2, Wave XIV documentation,for complete listings.
770
371
358
134
277
606
465
169
249
105
51
439
113
41
17.26
8.32
8.03
3.00
6.21
13.59
10.43
3.79
5.58
2.35
1.14
9.84
2.53
.92
Count % Value/Range Code Value/Range Text
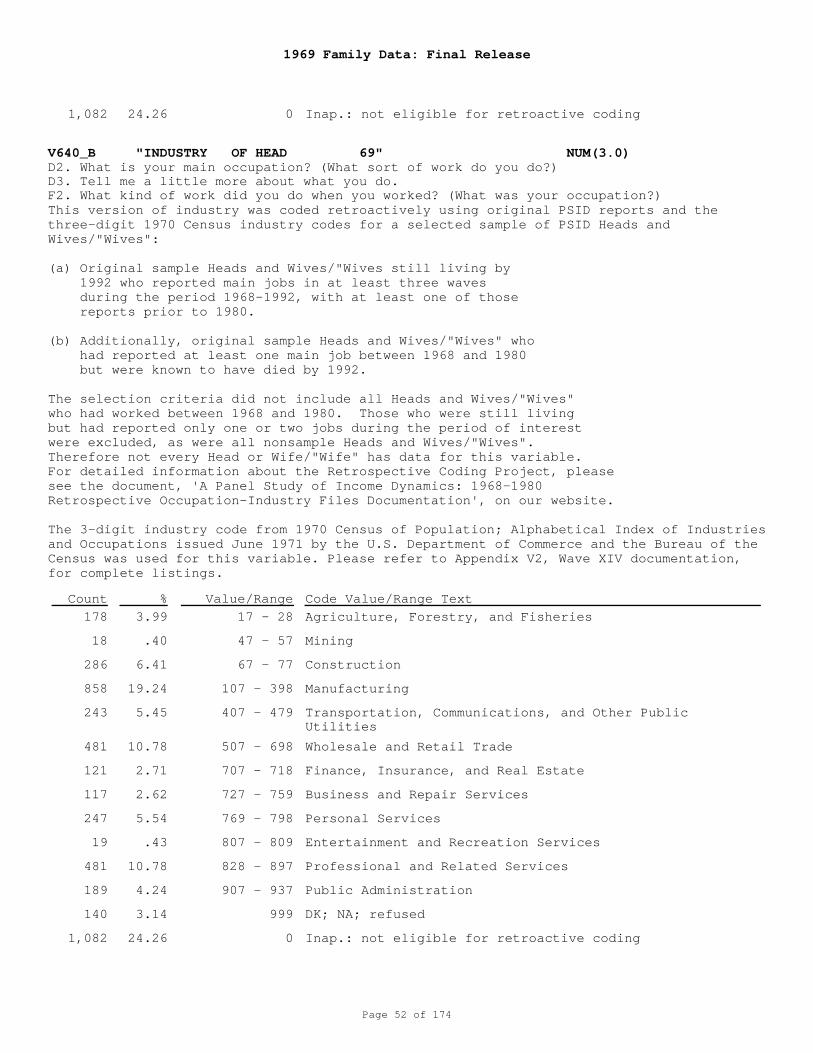
1969 Family Data: Final Release
Page 52 of 174
V640_B "INDUSTRY OF HEAD 69" NUM(3.0)D2. What is your main occupation? (What sort of work do you do?)D3. Tell me a little more about what you do.F2. What kind of work did you do when you worked? (What was your occupation?)
0
17 - 28
47 - 57
67 - 77
107 - 398
407 - 479
507 - 698
707 - 718
727 - 759
769 - 798
807 - 809
828 - 897
907 - 937
999
0
Inap.: not eligible for retroactive coding
Agriculture, Forestry, and Fisheries
Mining
Construction
Manufacturing
Transportation, Communications, and Other PublicUtilities
Wholesale and Retail Trade
Finance, Insurance, and Real Estate
Business and Repair Services
Personal Services
Entertainment and Recreation Services
Professional and Related Services
Public Administration
DK; NA; refused
Inap.: not eligible for retroactive coding
This version of industry was coded retroactively using original PSID reports and thethree-digit 1970 Census industry codes for a selected sample of PSID Heads andWives/"Wives":
(a) Original sample Heads and Wives/"Wives still living by 1992 who reported main jobs in at least three waves during the period 1968-1992, with at least one of those reports prior to 1980.
(b) Additionally, original sample Heads and Wives/"Wives" who had reported at least one main job between 1968 and 1980 but were known to have died by 1992.
The selection criteria did not include all Heads and Wives/"Wives"who had worked between 1968 and 1980. Those who were still livingbut had reported only one or two jobs during the period of interestwere excluded, as were all nonsample Heads and Wives/"Wives". Therefore not every Head or Wife/"Wife" has data for this variable.For detailed information about the Retrospective Coding Project, please see the document, 'A Panel Study of Income Dynamics: 1968-1980 Retrospective Occupation-Industry Files Documentation', on our website.
The 3-digit industry code from 1970 Census of Population; Alphabetical Index of Industriesand Occupations issued June 1971 by the U.S. Department of Commerce and the Bureau of theCensus was used for this variable. Please refer to Appendix V2, Wave XIV documentation,for complete listings.
1,082
178
18
286
858
243
481
121
117
247
19
481
189
140
1,082
24.26
3.99
.40
6.41
19.24
5.45
10.78
2.71
2.62
5.54
.43
10.78
4.24
3.14
24.26
Count % Value/Range Code Value/Range Text
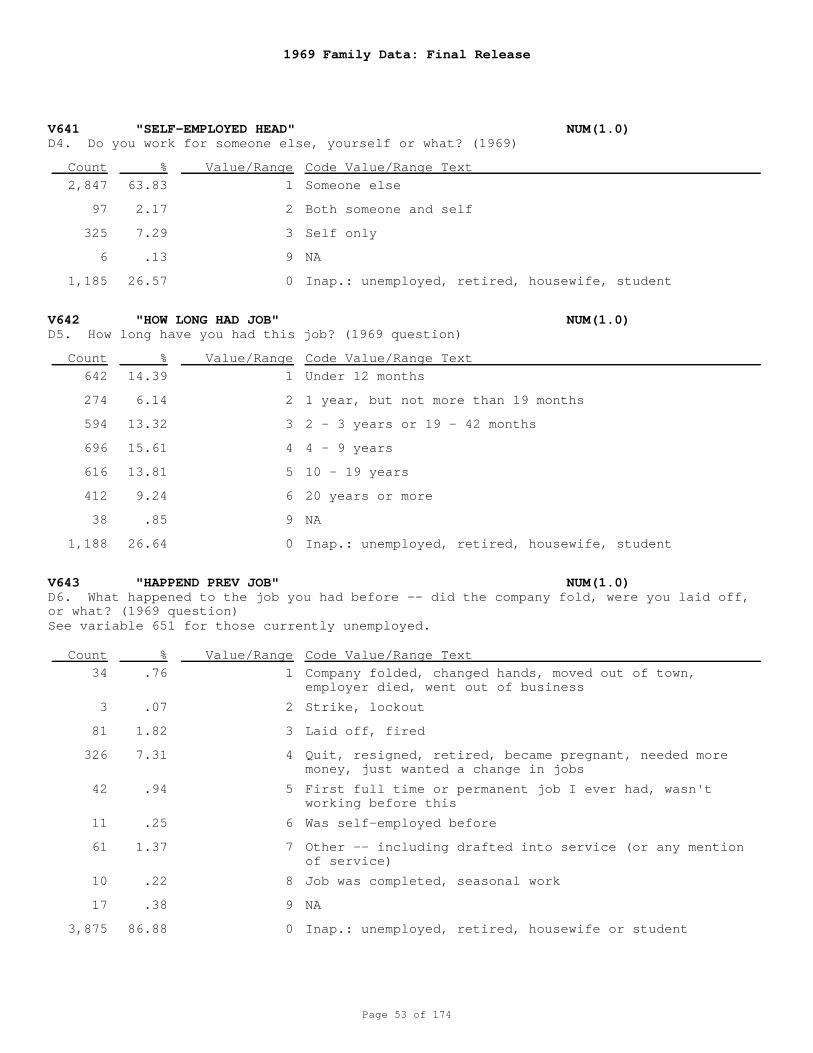
1969 Family Data: Final Release
Page 53 of 174
V641 "SELF-EMPLOYED HEAD" NUM(1.0)
V642 "HOW LONG HAD JOB" NUM(1.0)
V643 "HAPPEND PREV JOB" NUM(1.0)
D4. Do you work for someone else, yourself or what? (1969)
D5. How long have you had this job? (1969 question)
D6. What happened to the job you had before -- did the company fold, were you laid off,or what? (1969 question)
1
2
3
9
0
1
2
3
4
5
6
9
0
1
2
3
4
5
6
7
8
9
0
Someone else
Both someone and self
Self only
NA
Inap.: unemployed, retired, housewife, student
Under 12 months
1 year, but not more than 19 months
2 - 3 years or 19 - 42 months
4 - 9 years
10 - 19 years
20 years or more
NA
Inap.: unemployed, retired, housewife, student
Company folded, changed hands, moved out of town,employer died, went out of business
Strike, lockout
Laid off, fired
Quit, resigned, retired, became pregnant, needed moremoney, just wanted a change in jobs
First full time or permanent job I ever had, wasn'tworking before this
Was self-employed before
Other -- including drafted into service (or any mentionof service)
Job was completed, seasonal work
NA
Inap.: unemployed, retired, housewife or student
See variable 651 for those currently unemployed.
2,847
97
325
6
1,185
642
274
594
696
616
412
38
1,188
34
3
81
326
42
11
61
10
17
3,875
63.83
2.17
7.29
.13
26.57
14.39
6.14
13.32
15.61
13.81
9.24
.85
26.64
.76
.07
1.82
7.31
.94
.25
1.37
.22
.38
86.88
Count
Count
Count
%
%
%
Value/Range
Value/Range
Value/Range
Code Value/Range Text
Code Value/Range Text
Code Value/Range Text
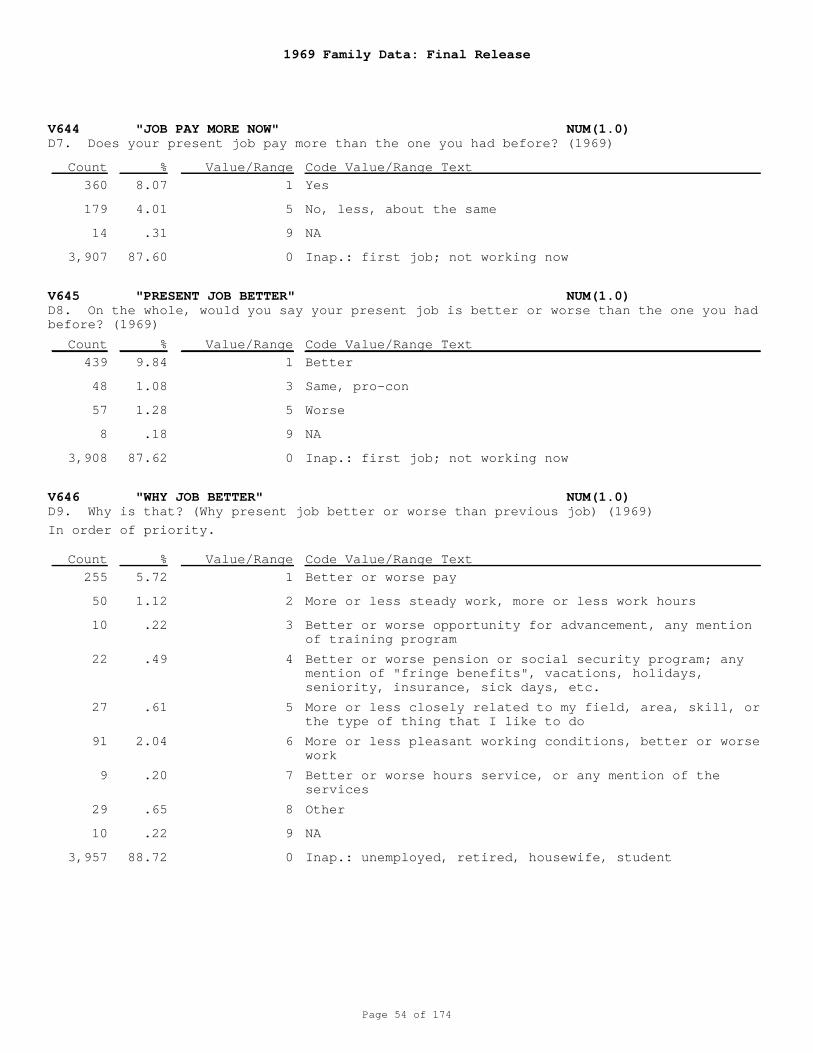
1969 Family Data: Final Release
Page 54 of 174
V644 "JOB PAY MORE NOW" NUM(1.0)
V645 "PRESENT JOB BETTER" NUM(1.0)
V646 "WHY JOB BETTER" NUM(1.0)
D7. Does your present job pay more than the one you had before? (1969)
D8. On the whole, would you say your present job is better or worse than the one you hadbefore? (1969)
D9. Why is that? (Why present job better or worse than previous job) (1969)
1
5
9
0
1
3
5
9
0
1
2
3
4
5
6
7
8
9
0
Yes
No, less, about the same
NA
Inap.: first job; not working now
Better
Same, pro-con
Worse
NA
Inap.: first job; not working now
Better or worse pay
More or less steady work, more or less work hours
Better or worse opportunity for advancement, any mentionof training program
Better or worse pension or social security program; anymention of "fringe benefits", vacations, holidays,seniority, insurance, sick days, etc.
More or less closely related to my field, area, skill, orthe type of thing that I like to do
More or less pleasant working conditions, better or worsework
Better or worse hours service, or any mention of theservices
Other
NA
Inap.: unemployed, retired, housewife, student
In order of priority.
360
179
14
3,907
439
48
57
8
3,908
255
50
10
22
27
91
9
29
10
3,957
8.07
4.01
.31
87.60
9.84
1.08
1.28
.18
87.62
5.72
1.12
.22
.49
.61
2.04
.20
.65
.22
88.72
Count
Count
Count
%
%
%
Value/Range
Value/Range
Value/Range
Code Value/Range Text
Code Value/Range Text
Code Value/Range Text
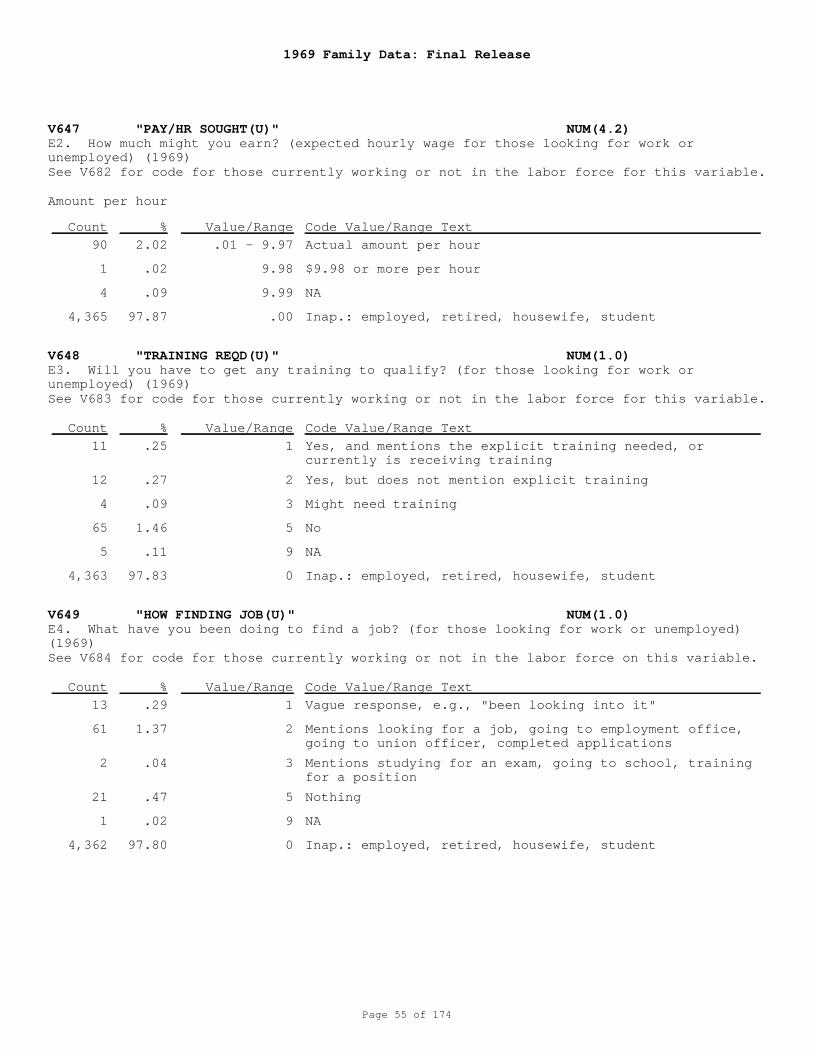
1969 Family Data: Final Release
Page 55 of 174
V647 "PAY/HR SOUGHT(U)" NUM(4.2)
V648 "TRAINING REQD(U)" NUM(1.0)
V649 "HOW FINDING JOB(U)" NUM(1.0)
E2. How much might you earn? (expected hourly wage for those looking for work orunemployed) (1969)
E3. Will you have to get any training to qualify? (for those looking for work orunemployed) (1969)
E4. What have you been doing to find a job? (for those looking for work or unemployed)(1969)
.01 - 9.97
9.98
9.99
.00
1
2
3
5
9
0
1
2
3
5
9
0
Actual amount per hour
$9.98 or more per hour
NA
Inap.: employed, retired, housewife, student
Yes, and mentions the explicit training needed, orcurrently is receiving training
Yes, but does not mention explicit training
Might need training
No
NA
Inap.: employed, retired, housewife, student
Vague response, e.g., "been looking into it"
Mentions looking for a job, going to employment office,going to union officer, completed applications
Mentions studying for an exam, going to school, trainingfor a position
Nothing
NA
Inap.: employed, retired, housewife, student
See V682 for code for those currently working or not in the labor force for this variable.
Amount per hour
See V683 for code for those currently working or not in the labor force for this variable.
See V684 for code for those currently working or not in the labor force on this variable.
90
1
4
4,365
11
12
4
65
5
4,363
13
61
2
21
1
4,362
2.02
.02
.09
97.87
.25
.27
.09
1.46
.11
97.83
.29
1.37
.04
.47
.02
97.80
Count
Count
Count
%
%
%
Value/Range
Value/Range
Value/Range
Code Value/Range Text
Code Value/Range Text
Code Value/Range Text
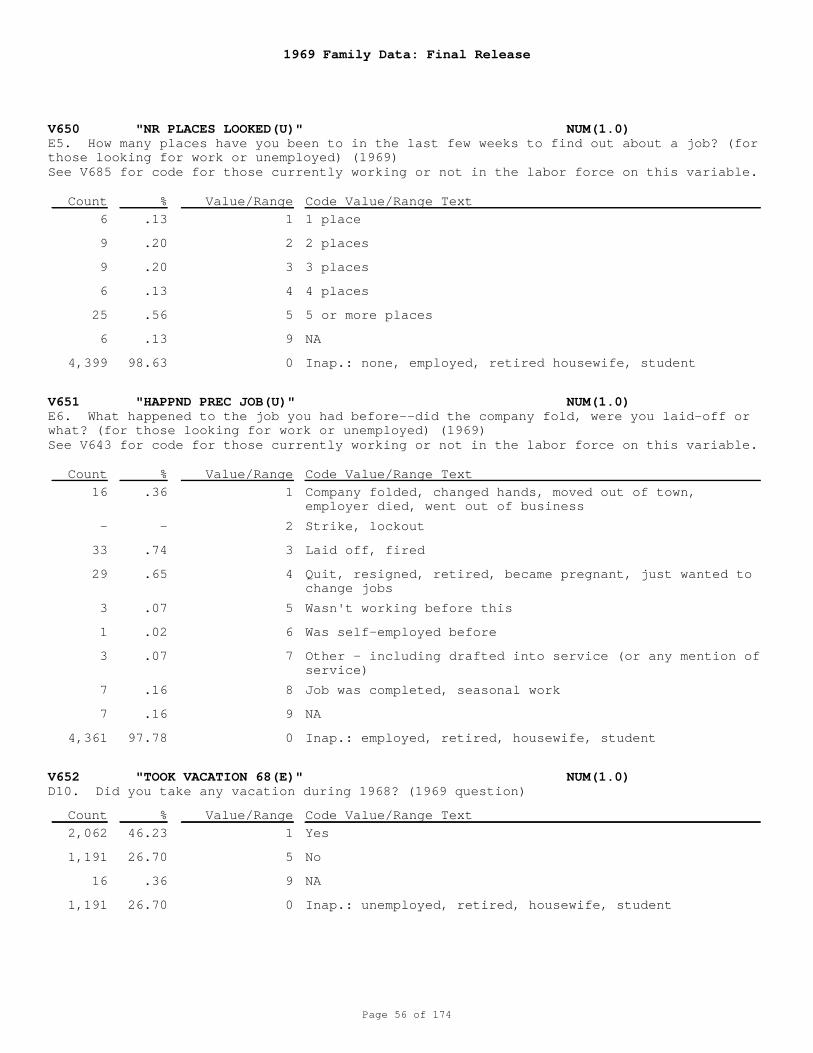
1969 Family Data: Final Release
Page 56 of 174
V650 "NR PLACES LOOKED(U)" NUM(1.0)
V651 "HAPPND PREC JOB(U)" NUM(1.0)
V652 "TOOK VACATION 68(E)" NUM(1.0)
E5. How many places have you been to in the last few weeks to find out about a job? (forthose looking for work or unemployed) (1969)
E6. What happened to the job you had before--did the company fold, were you laid-off orwhat? (for those looking for work or unemployed) (1969)
D10. Did you take any vacation during 1968? (1969 question)
1
2
3
4
5
9
0
1
2
3
4
5
6
7
8
9
0
1
5
9
0
1 place
2 places
3 places
4 places
5 or more places
NA
Inap.: none, employed, retired housewife, student
Company folded, changed hands, moved out of town,employer died, went out of business
Strike, lockout
Laid off, fired
Quit, resigned, retired, became pregnant, just wanted tochange jobs
Wasn't working before this
Was self-employed before
Other - including drafted into service (or any mention ofservice)
Job was completed, seasonal work
NA
Inap.: employed, retired, housewife, student
Yes
No
NA
Inap.: unemployed, retired, housewife, student
See V685 for code for those currently working or not in the labor force on this variable.
See V643 for code for those currently working or not in the labor force on this variable.
6
9
9
6
25
6
4,399
16
-
33
29
3
1
3
7
7
4,361
2,062
1,191
16
1,191
.13
.20
.20
.13
.56
.13
98.63
.36
-
.74
.65
.07
.02
.07
.16
.16
97.78
46.23
26.70
.36
26.70
Count
Count
Count
%
%
%
Value/Range
Value/Range
Value/Range
Code Value/Range Text
Code Value/Range Text
Code Value/Range Text
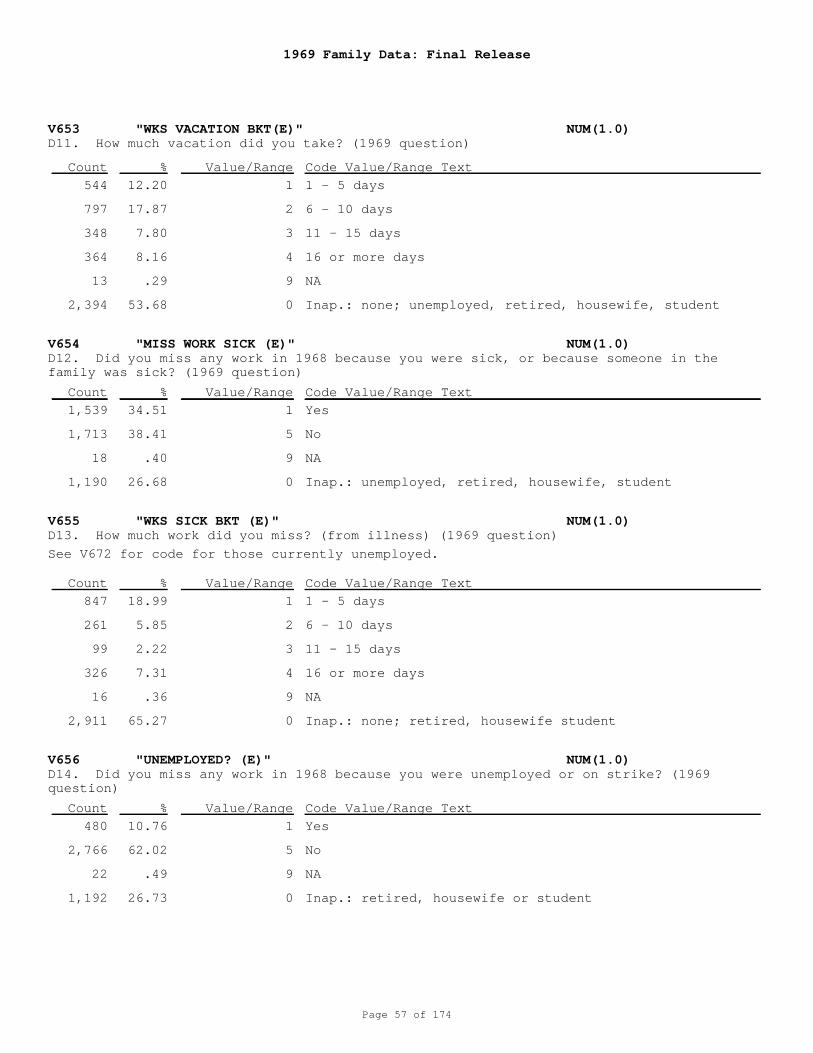
1969 Family Data: Final Release
Page 57 of 174
V653 "WKS VACATION BKT(E)" NUM(1.0)
V654 "MISS WORK SICK (E)" NUM(1.0)
V655 "WKS SICK BKT (E)" NUM(1.0)
V656 "UNEMPLOYED? (E)" NUM(1.0)
D11. How much vacation did you take? (1969 question)
D12. Did you miss any work in 1968 because you were sick, or because someone in thefamily was sick? (1969 question)
D13. How much work did you miss? (from illness) (1969 question)
D14. Did you miss any work in 1968 because you were unemployed or on strike? (1969question)
1
2
3
4
9
0
1
5
9
0
1
2
3
4
9
0
1
5
9
0
1 - 5 days
6 - 10 days
11 - 15 days
16 or more days
NA
Inap.: none; unemployed, retired, housewife, student
Yes
No
NA
Inap.: unemployed, retired, housewife, student
1 - 5 days
6 - 10 days
11 - 15 days
16 or more days
NA
Inap.: none; retired, housewife student
Yes
No
NA
Inap.: retired, housewife or student
See V672 for code for those currently unemployed.
544
797
348
364
13
2,394
1,539
1,713
18
1,190
847
261
99
326
16
2,911
480
2,766
22
1,192
12.20
17.87
7.80
8.16
.29
53.68
34.51
38.41
.40
26.68
18.99
5.85
2.22
7.31
.36
65.27
10.76
62.02
.49
26.73
Count
Count
Count
Count
%
%
%
%
Value/Range
Value/Range
Value/Range
Value/Range
Code Value/Range Text
Code Value/Range Text
Code Value/Range Text
Code Value/Range Text
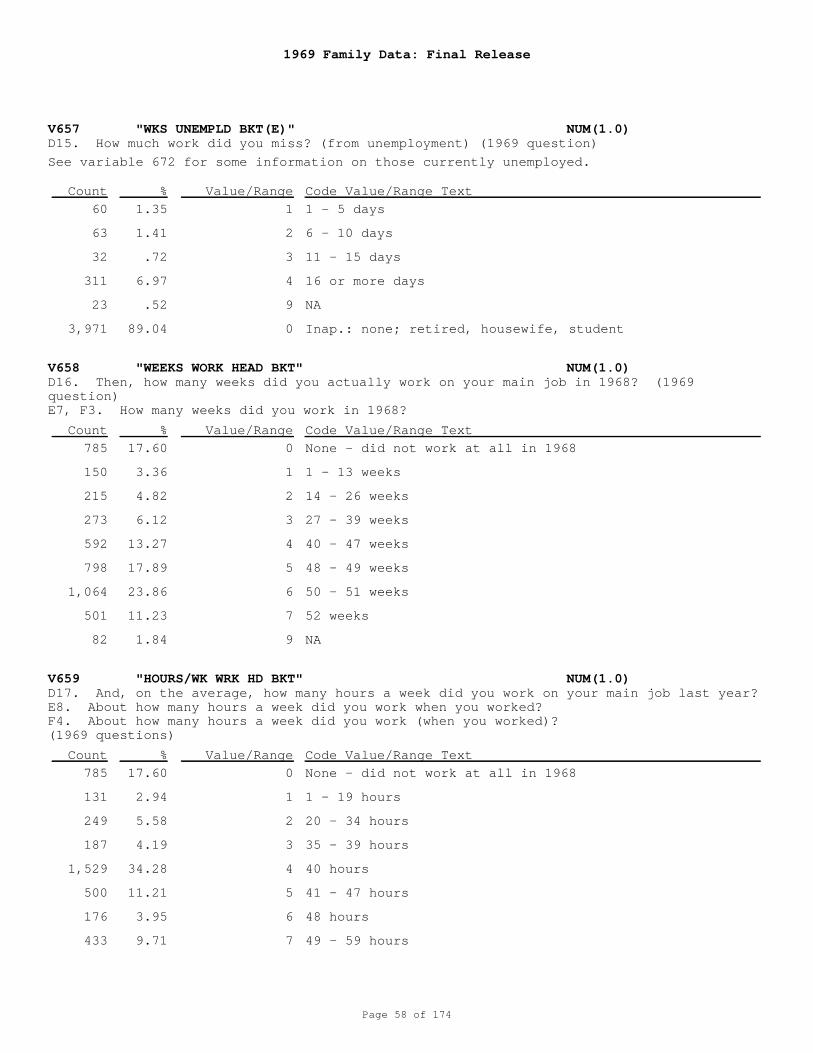
1969 Family Data: Final Release
Page 58 of 174
V657 "WKS UNEMPLD BKT(E)" NUM(1.0)
V658 "WEEKS WORK HEAD BKT" NUM(1.0)
V659 "HOURS/WK WRK HD BKT" NUM(1.0)
D15. How much work did you miss? (from unemployment) (1969 question)
D16. Then, how many weeks did you actually work on your main job in 1968? (1969question) E7, F3. How many weeks did you work in 1968?
D17. And, on the average, how many hours a week did you work on your main job last year? E8. About how many hours a week did you work when you worked? F4. About how many hours a week did you work (when you worked)? (1969 questions)
1
2
3
4
9
0
0
1
2
3
4
5
6
7
9
0
1
2
3
4
5
6
7
1 - 5 days
6 - 10 days
11 - 15 days
16 or more days
NA
Inap.: none; retired, housewife, student
None - did not work at all in 1968
1 - 13 weeks
14 - 26 weeks
27 - 39 weeks
40 - 47 weeks
48 - 49 weeks
50 - 51 weeks
52 weeks
NA
None - did not work at all in 1968
1 - 19 hours
20 - 34 hours
35 - 39 hours
40 hours
41 - 47 hours
48 hours
49 - 59 hours
See variable 672 for some information on those currently unemployed.
60
63
32
311
23
3,971
785
150
215
273
592
798
1,064
501
82
785
131
249
187
1,529
500
176
433
1.35
1.41
.72
6.97
.52
89.04
17.60
3.36
4.82
6.12
13.27
17.89
23.86
11.23
1.84
17.60
2.94
5.58
4.19
34.28
11.21
3.95
9.71
Count
Count
Count
%
%
%
Value/Range
Value/Range
Value/Range
Code Value/Range Text
Code Value/Range Text
Code Value/Range Text
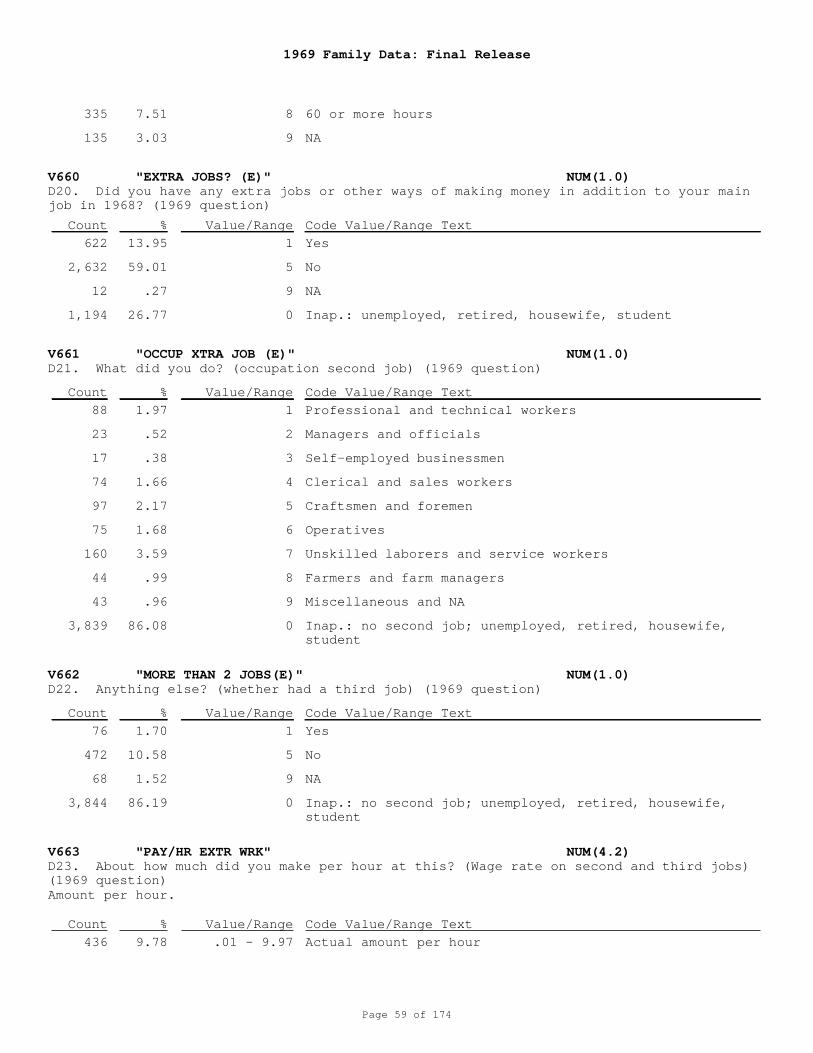
1969 Family Data: Final Release
Page 59 of 174
V660 "EXTRA JOBS? (E)" NUM(1.0)
V661 "OCCUP XTRA JOB (E)" NUM(1.0)
V662 "MORE THAN 2 JOBS(E)" NUM(1.0)
V663 "PAY/HR EXTR WRK" NUM(4.2)
D20. Did you have any extra jobs or other ways of making money in addition to your mainjob in 1968? (1969 question)
D21. What did you do? (occupation second job) (1969 question)
D22. Anything else? (whether had a third job) (1969 question)
D23. About how much did you make per hour at this? (Wage rate on second and third jobs)(1969 question)
8
9
1
5
9
0
1
2
3
4
5
6
7
8
9
0
1
5
9
0
.01 - 9.97
60 or more hours
NA
Yes
No
NA
Inap.: unemployed, retired, housewife, student
Professional and technical workers
Managers and officials
Self-employed businessmen
Clerical and sales workers
Craftsmen and foremen
Operatives
Unskilled laborers and service workers
Farmers and farm managers
Miscellaneous and NA
Inap.: no second job; unemployed, retired, housewife,student
Yes
No
NA
Inap.: no second job; unemployed, retired, housewife,student
Actual amount per hour
Amount per hour.
335
135
622
2,632
12
1,194
88
23
17
74
97
75
160
44
43
3,839
76
472
68
3,844
436
7.51
3.03
13.95
59.01
.27
26.77
1.97
.52
.38
1.66
2.17
1.68
3.59
.99
.96
86.08
1.70
10.58
1.52
86.19
9.78
Count
Count
Count
Count
%
%
%
%
Value/Range
Value/Range
Value/Range
Value/Range
Code Value/Range Text
Code Value/Range Text
Code Value/Range Text
Code Value/Range Text
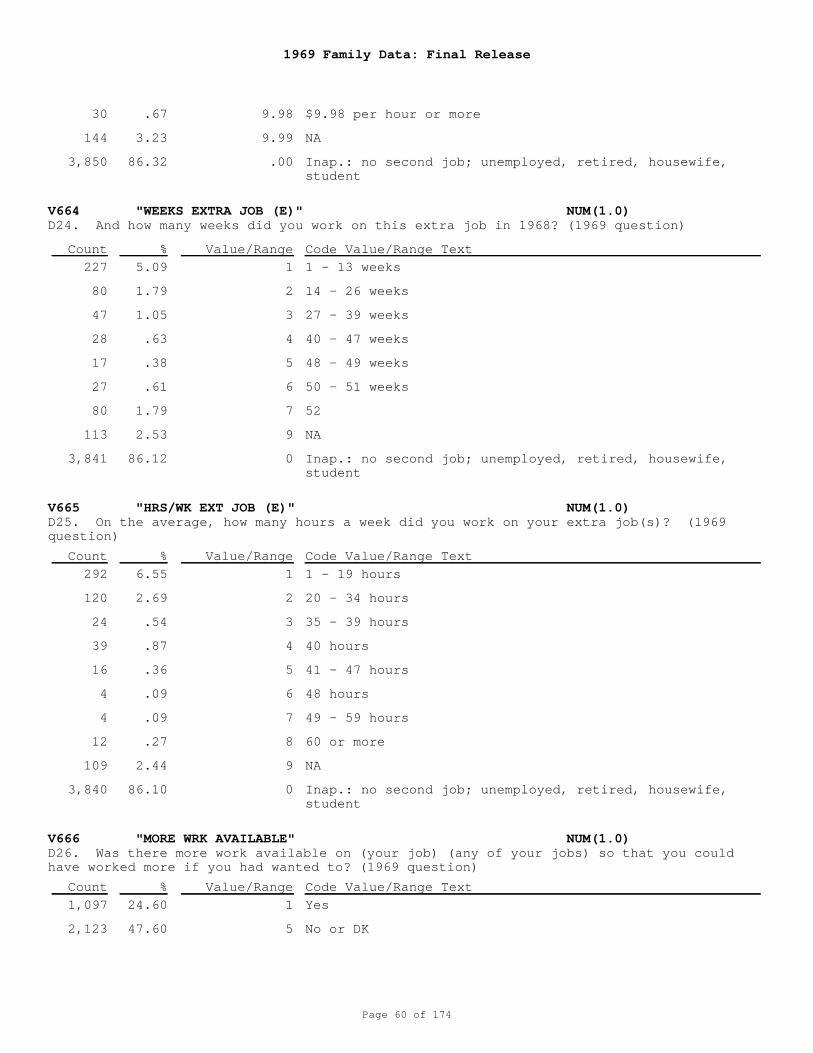
1969 Family Data: Final Release
Page 60 of 174
V664 "WEEKS EXTRA JOB (E)" NUM(1.0)
V665 "HRS/WK EXT JOB (E)" NUM(1.0)
V666 "MORE WRK AVAILABLE" NUM(1.0)
D24. And how many weeks did you work on this extra job in 1968? (1969 question)
D25. On the average, how many hours a week did you work on your extra job(s)? (1969question)
D26. Was there more work available on (your job) (any of your jobs) so that you couldhave worked more if you had wanted to? (1969 question)
9.98
9.99
.00
1
2
3
4
5
6
7
9
0
1
2
3
4
5
6
7
8
9
0
1
5
$9.98 per hour or more
NA
Inap.: no second job; unemployed, retired, housewife,student
1 - 13 weeks
14 - 26 weeks
27 - 39 weeks
40 - 47 weeks
48 - 49 weeks
50 - 51 weeks
52
NA
Inap.: no second job; unemployed, retired, housewife,student
1 - 19 hours
20 - 34 hours
35 - 39 hours
40 hours
41 - 47 hours
48 hours
49 - 59 hours
60 or more
NA
Inap.: no second job; unemployed, retired, housewife,student
Yes
No or DK
30
144
3,850
227
80
47
28
17
27
80
113
3,841
292
120
24
39
16
4
4
12
109
3,840
1,097
2,123
.67
3.23
86.32
5.09
1.79
1.05
.63
.38
.61
1.79
2.53
86.12
6.55
2.69
.54
.87
.36
.09
.09
.27
2.44
86.10
24.60
47.60
Count
Count
Count
%
%
%
Value/Range
Value/Range
Value/Range
Code Value/Range Text
Code Value/Range Text
Code Value/Range Text
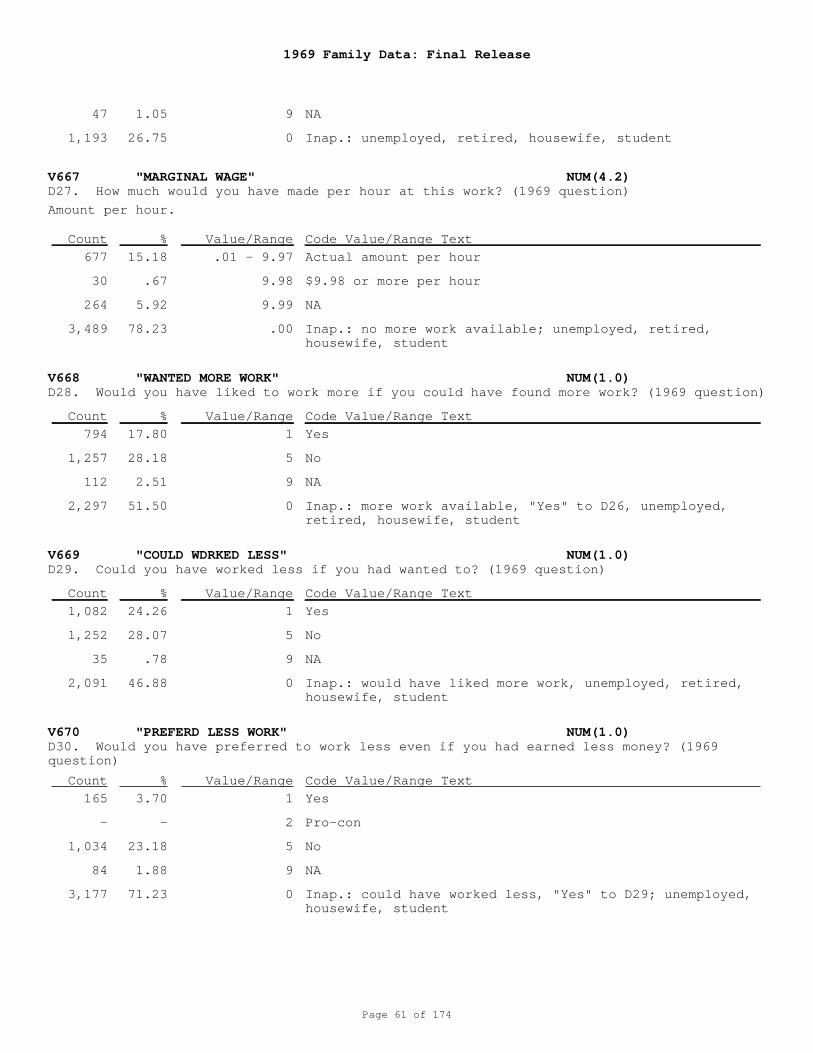
1969 Family Data: Final Release
Page 61 of 174
V667 "MARGINAL WAGE" NUM(4.2)
V668 "WANTED MORE WORK" NUM(1.0)
V669 "COULD WDRKED LESS" NUM(1.0)
V670 "PREFERD LESS WORK" NUM(1.0)
D27. How much would you have made per hour at this work? (1969 question)
D28. Would you have liked to work more if you could have found more work? (1969 question)
D29. Could you have worked less if you had wanted to? (1969 question)
D30. Would you have preferred to work less even if you had earned less money? (1969question)
9
0
.01 - 9.97
9.98
9.99
.00
1
5
9
0
1
5
9
0
1
2
5
9
0
NA
Inap.: unemployed, retired, housewife, student
Actual amount per hour
$9.98 or more per hour
NA
Inap.: no more work available; unemployed, retired,housewife, student
Yes
No
NA
Inap.: more work available, "Yes" to D26, unemployed,retired, housewife, student
Yes
No
NA
Inap.: would have liked more work, unemployed, retired,housewife, student
Yes
Pro-con
No
NA
Inap.: could have worked less, "Yes" to D29; unemployed,housewife, student
Amount per hour.
47
1,193
677
30
264
3,489
794
1,257
112
2,297
1,082
1,252
35
2,091
165
-
1,034
84
3,177
1.05
26.75
15.18
.67
5.92
78.23
17.80
28.18
2.51
51.50
24.26
28.07
.78
46.88
3.70
-
23.18
1.88
71.23
Count
Count
Count
Count
%
%
%
%
Value/Range
Value/Range
Value/Range
Value/Range
Code Value/Range Text
Code Value/Range Text
Code Value/Range Text
Code Value/Range Text
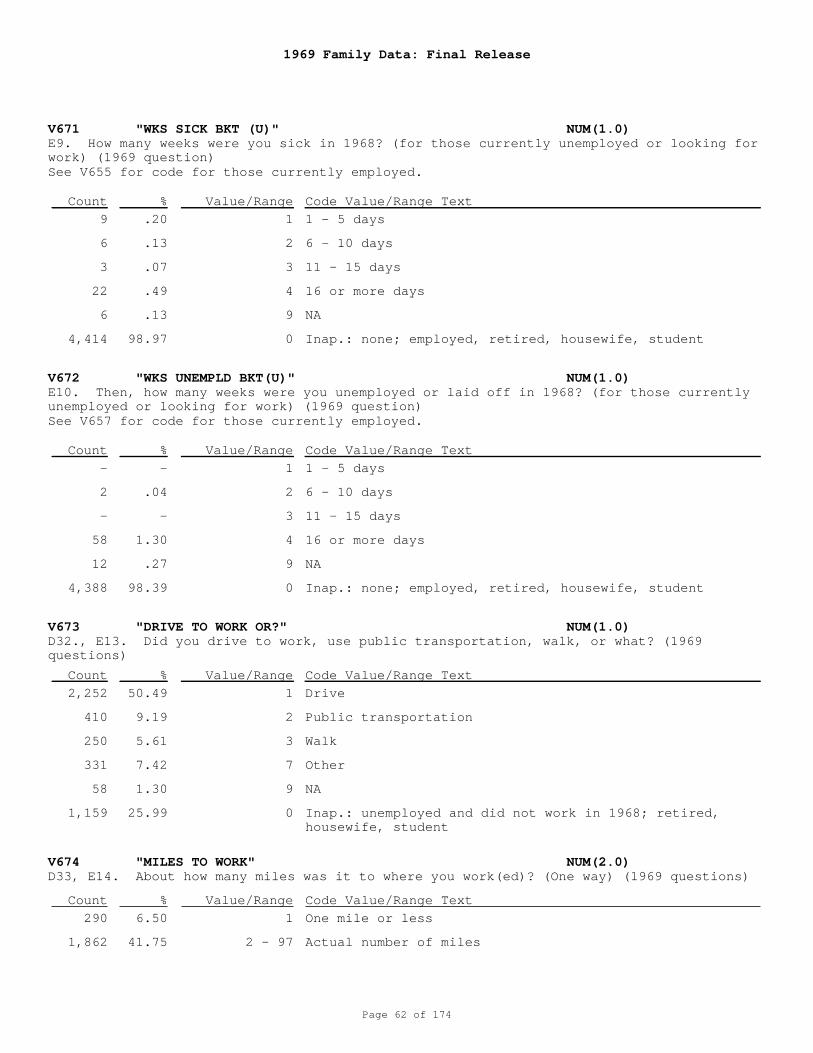
1969 Family Data: Final Release
Page 62 of 174
V671 "WKS SICK BKT (U)" NUM(1.0)
V672 "WKS UNEMPLD BKT(U)" NUM(1.0)
V673 "DRIVE TO WORK OR?" NUM(1.0)
V674 "MILES TO WORK" NUM(2.0)
E9. How many weeks were you sick in 1968? (for those currently unemployed or looking forwork) (1969 question)
E10. Then, how many weeks were you unemployed or laid off in 1968? (for those currentlyunemployed or looking for work) (1969 question)
D32., E13. Did you drive to work, use public transportation, walk, or what? (1969questions)
D33, E14. About how many miles was it to where you work(ed)? (One way) (1969 questions)
1
2
3
4
9
0
1
2
3
4
9
0
1
2
3
7
9
0
1
2 - 97
1 - 5 days
6 - 10 days
11 - 15 days
16 or more days
NA
Inap.: none; employed, retired, housewife, student
1 - 5 days
6 - 10 days
11 - 15 days
16 or more days
NA
Inap.: none; employed, retired, housewife, student
Drive
Public transportation
Walk
Other
NA
Inap.: unemployed and did not work in 1968; retired,housewife, student
One mile or less
Actual number of miles
See V655 for code for those currently employed.
See V657 for code for those currently employed.
9
6
3
22
6
4,414
-
2
-
58
12
4,388
2,252
410
250
331
58
1,159
290
1,862
.20
.13
.07
.49
.13
98.97
-
.04
-
1.30
.27
98.39
50.49
9.19
5.61
7.42
1.30
25.99
6.50
41.75
Count
Count
Count
Count
%
%
%
%
Value/Range
Value/Range
Value/Range
Value/Range
Code Value/Range Text
Code Value/Range Text
Code Value/Range Text
Code Value/Range Text
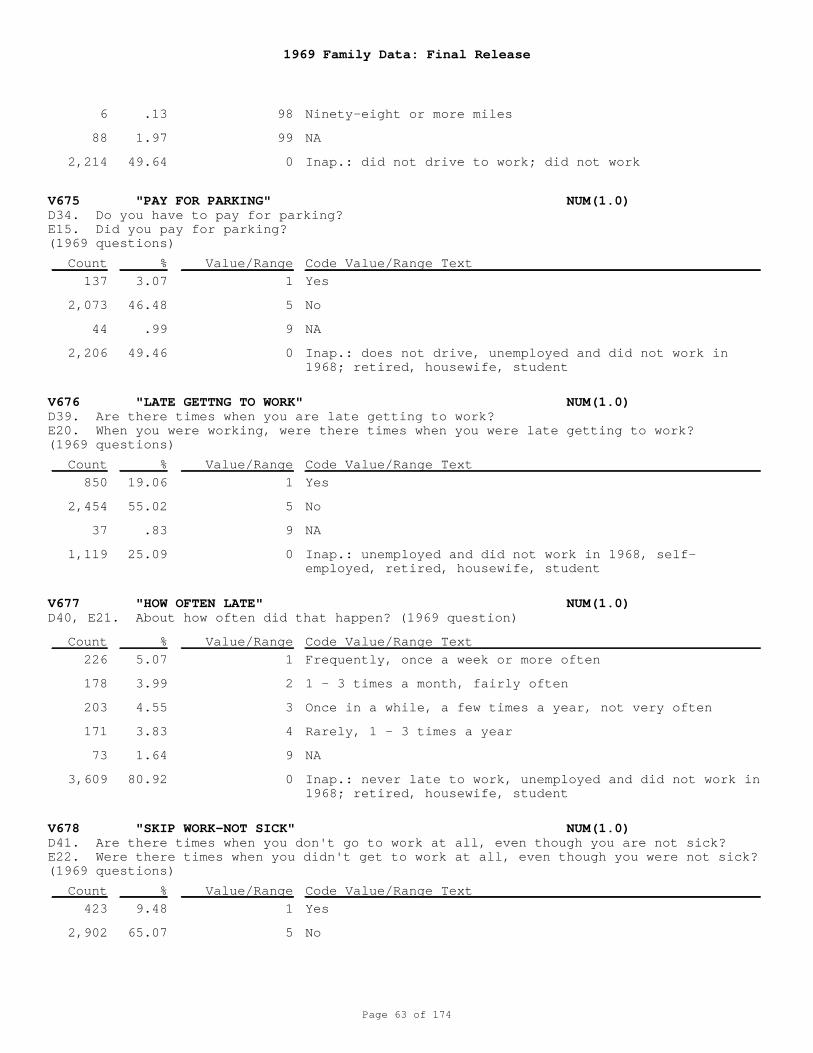
1969 Family Data: Final Release
Page 63 of 174
V675 "PAY FOR PARKING" NUM(1.0)
V676 "LATE GETTNG TO WORK" NUM(1.0)
V677 "HOW OFTEN LATE" NUM(1.0)
V678 "SKIP WORK-NOT SICK" NUM(1.0)
D34. Do you have to pay for parking?E15. Did you pay for parking?(1969 questions)
D39. Are there times when you are late getting to work? E20. When you were working, were there times when you were late getting to work? (1969 questions)
D40, E21. About how often did that happen? (1969 question)
D41. Are there times when you don't go to work at all, even though you are not sick?E22. Were there times when you didn't get to work at all, even though you were not sick?(1969 questions)
98
99
0
1
5
9
0
1
5
9
0
1
2
3
4
9
0
1
5
Ninety-eight or more miles
NA
Inap.: did not drive to work; did not work
Yes
No
NA
Inap.: does not drive, unemployed and did not work in1968; retired, housewife, student
Yes
No
NA
Inap.: unemployed and did not work in 1968, self-employed, retired, housewife, student
Frequently, once a week or more often
1 - 3 times a month, fairly often
Once in a while, a few times a year, not very often
Rarely, 1 - 3 times a year
NA
Inap.: never late to work, unemployed and did not work in1968; retired, housewife, student
Yes
No
6
88
2,214
137
2,073
44
2,206
850
2,454
37
1,119
226
178
203
171
73
3,609
423
2,902
.13
1.97
49.64
3.07
46.48
.99
49.46
19.06
55.02
.83
25.09
5.07
3.99
4.55
3.83
1.64
80.92
9.48
65.07
Count
Count
Count
Count
%
%
%
%
Value/Range
Value/Range
Value/Range
Value/Range
Code Value/Range Text
Code Value/Range Text
Code Value/Range Text
Code Value/Range Text
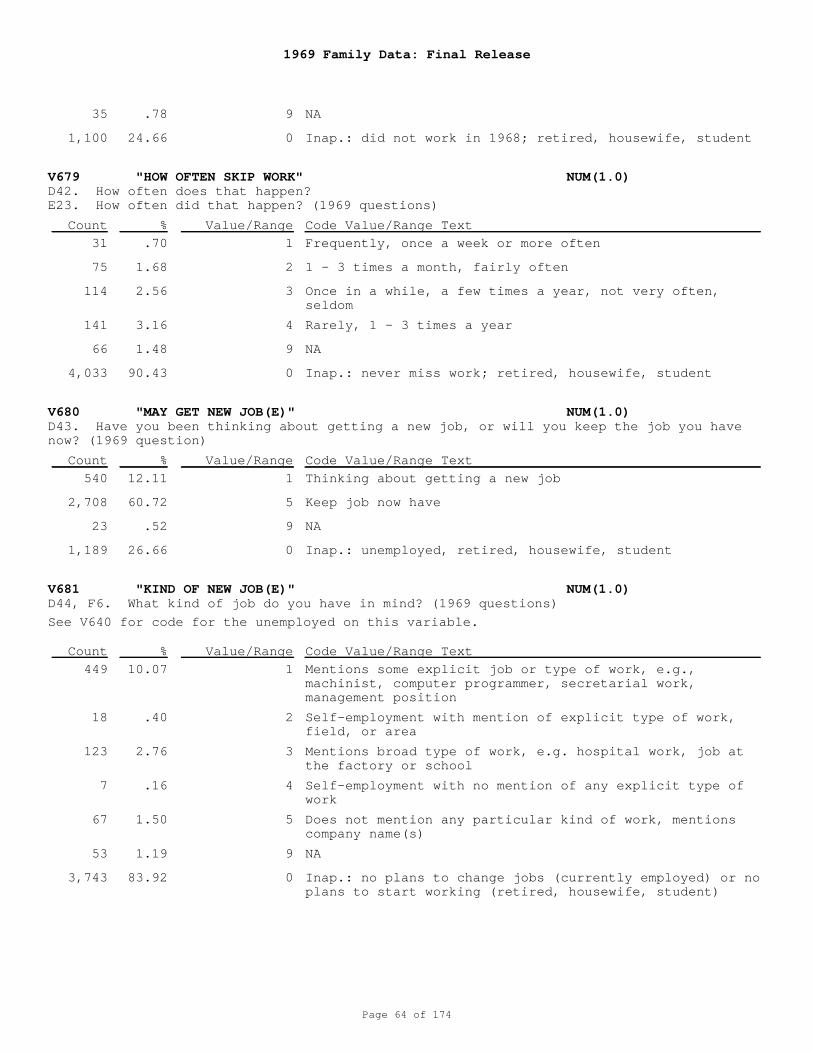
1969 Family Data: Final Release
Page 64 of 174
V679 "HOW OFTEN SKIP WORK" NUM(1.0)
V680 "MAY GET NEW JOB(E)" NUM(1.0)
V681 "KIND OF NEW JOB(E)" NUM(1.0)
D42. How often does that happen? E23. How often did that happen? (1969 questions)
D43. Have you been thinking about getting a new job, or will you keep the job you havenow? (1969 question)
D44, F6. What kind of job do you have in mind? (1969 questions)
9
0
1
2
3
4
9
0
1
5
9
0
1
2
3
4
5
9
0
NA
Inap.: did not work in 1968; retired, housewife, student
Frequently, once a week or more often
1 - 3 times a month, fairly often
Once in a while, a few times a year, not very often,seldom
Rarely, 1 - 3 times a year
NA
Inap.: never miss work; retired, housewife, student
Thinking about getting a new job
Keep job now have
NA
Inap.: unemployed, retired, housewife, student
Mentions some explicit job or type of work, e.g.,machinist, computer programmer, secretarial work,management position
Self-employment with mention of explicit type of work,field, or area
Mentions broad type of work, e.g. hospital work, job atthe factory or school
Self-employment with no mention of any explicit type ofwork
Does not mention any particular kind of work, mentionscompany name(s)
NA
Inap.: no plans to change jobs (currently employed) or noplans to start working (retired, housewife, student)
See V640 for code for the unemployed on this variable.
35
1,100
31
75
114
141
66
4,033
540
2,708
23
1,189
449
18
123
7
67
53
3,743
.78
24.66
.70
1.68
2.56
3.16
1.48
90.43
12.11
60.72
.52
26.66
10.07
.40
2.76
.16
1.50
1.19
83.92
Count
Count
Count
%
%
%
Value/Range
Value/Range
Value/Range
Code Value/Range Text
Code Value/Range Text
Code Value/Range Text
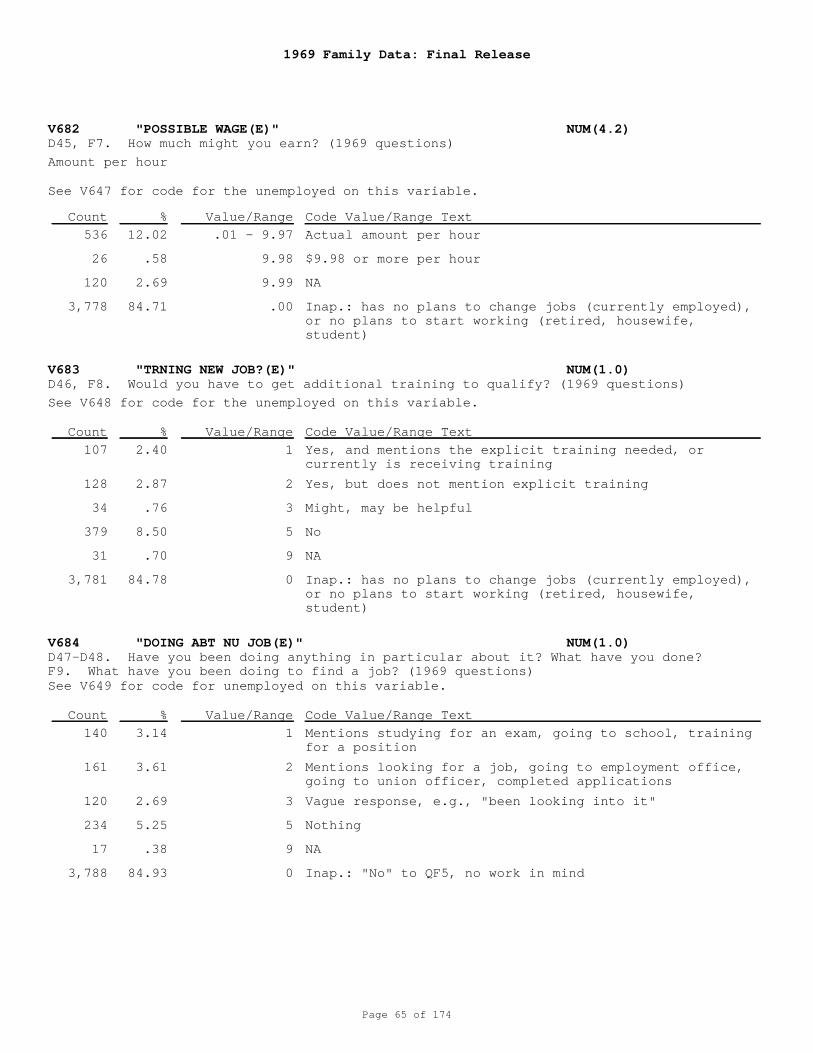
1969 Family Data: Final Release
Page 65 of 174
V682 "POSSIBLE WAGE(E)" NUM(4.2)
V683 "TRNING NEW JOB?(E)" NUM(1.0)
V684 "DOING ABT NU JOB(E)" NUM(1.0)
D45, F7. How much might you earn? (1969 questions)
D46, F8. Would you have to get additional training to qualify? (1969 questions)
D47-D48. Have you been doing anything in particular about it? What have you done? F9. What have you been doing to find a job? (1969 questions)
.01 - 9.97
9.98
9.99
.00
1
2
3
5
9
0
1
2
3
5
9
0
Actual amount per hour
$9.98 or more per hour
NA
Inap.: has no plans to change jobs (currently employed),or no plans to start working (retired, housewife,student)
Yes, and mentions the explicit training needed, orcurrently is receiving training
Yes, but does not mention explicit training
Might, may be helpful
No
NA
Inap.: has no plans to change jobs (currently employed),or no plans to start working (retired, housewife,student)
Mentions studying for an exam, going to school, trainingfor a position
Mentions looking for a job, going to employment office,going to union officer, completed applications
Vague response, e.g., "been looking into it"
Nothing
NA
Inap.: "No" to QF5, no work in mind
Amount per hour
See V647 for code for the unemployed on this variable.
See V648 for code for the unemployed on this variable.
See V649 for code for unemployed on this variable.
536
26
120
3,778
107
128
34
379
31
3,781
140
161
120
234
17
3,788
12.02
.58
2.69
84.71
2.40
2.87
.76
8.50
.70
84.78
3.14
3.61
2.69
5.25
.38
84.93
Count
Count
Count
%
%
%
Value/Range
Value/Range
Value/Range
Code Value/Range Text
Code Value/Range Text
Code Value/Range Text
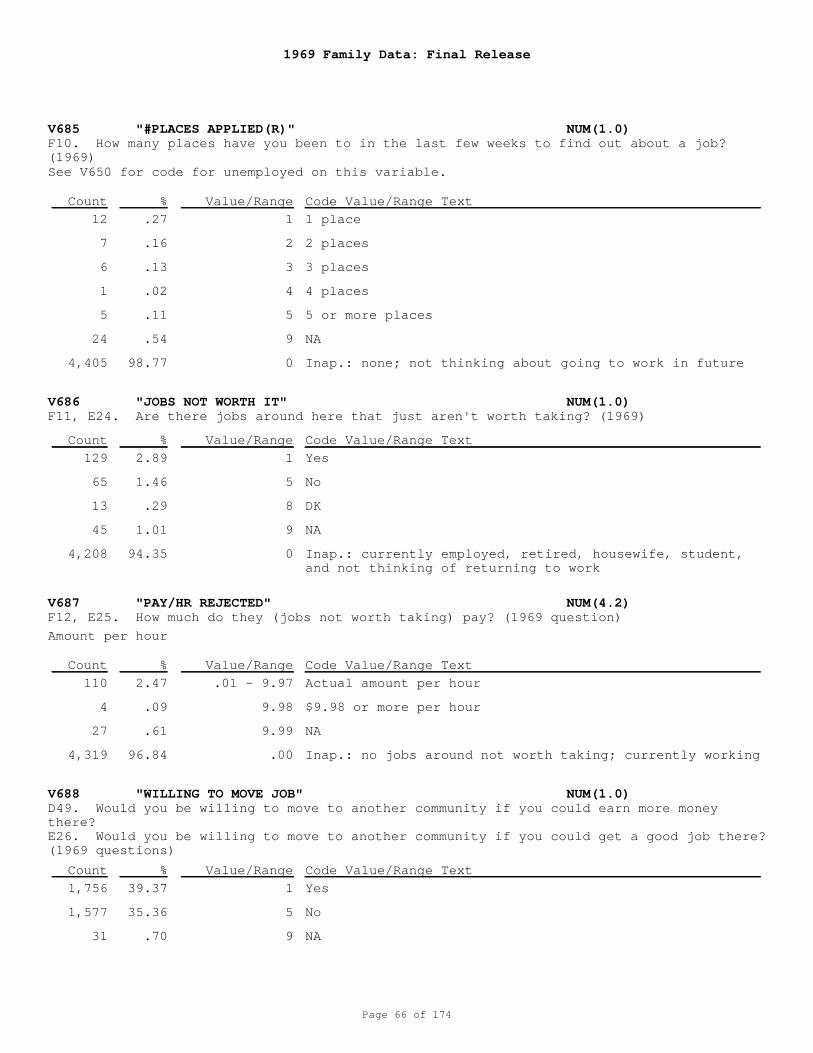
1969 Family Data: Final Release
Page 66 of 174
V685 "#PLACES APPLIED(R)" NUM(1.0)
V686 "JOBS NOT WORTH IT" NUM(1.0)
V687 "PAY/HR REJECTED" NUM(4.2)
V688 "WILLING TO MOVE JOB" NUM(1.0)
F10. How many places have you been to in the last few weeks to find out about a job?(1969)
F11, E24. Are there jobs around here that just aren't worth taking? (1969)
F12, E25. How much do they (jobs not worth taking) pay? (1969 question)
D49. Would you be willing to move to another community if you could earn more moneythere? E26. Would you be willing to move to another community if you could get a good job there?(1969 questions)
1
2
3
4
5
9
0
1
5
8
9
0
.01 - 9.97
9.98
9.99
.00
1
5
9
1 place
2 places
3 places
4 places
5 or more places
NA
Inap.: none; not thinking about going to work in future
Yes
No
DK
NA
Inap.: currently employed, retired, housewife, student,and not thinking of returning to work
Actual amount per hour
$9.98 or more per hour
NA
Inap.: no jobs around not worth taking; currently working
Yes
No
NA
See V650 for code for unemployed on this variable.
Amount per hour
12
7
6
1
5
24
4,405
129
65
13
45
4,208
110
4
27
4,319
1,756
1,577
31
.27
.16
.13
.02
.11
.54
98.77
2.89
1.46
.29
1.01
94.35
2.47
.09
.61
96.84
39.37
35.36
.70
Count
Count
Count
Count
%
%
%
%
Value/Range
Value/Range
Value/Range
Value/Range
Code Value/Range Text
Code Value/Range Text
Code Value/Range Text
Code Value/Range Text
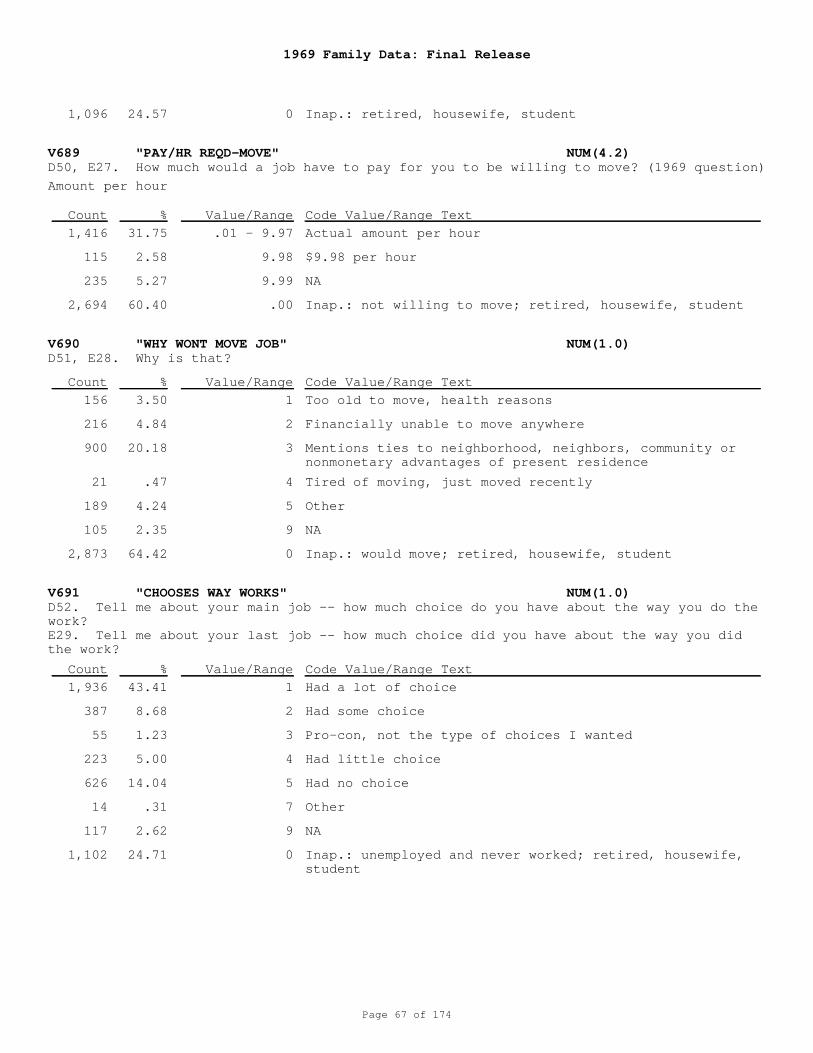
1969 Family Data: Final Release
Page 67 of 174
V689 "PAY/HR REQD-MOVE" NUM(4.2)
V690 "WHY WONT MOVE JOB" NUM(1.0)
V691 "CHOOSES WAY WORKS" NUM(1.0)
D50, E27. How much would a job have to pay for you to be willing to move? (1969 question)
D51, E28. Why is that?
D52. Tell me about your main job -- how much choice do you have about the way you do thework? E29. Tell me about your last job -- how much choice did you have about the way you didthe work?
0
.01 - 9.97
9.98
9.99
.00
1
2
3
4
5
9
0
1
2
3
4
5
7
9
0
Inap.: retired, housewife, student
Actual amount per hour
$9.98 per hour
NA
Inap.: not willing to move; retired, housewife, student
Too old to move, health reasons
Financially unable to move anywhere
Mentions ties to neighborhood, neighbors, community ornonmonetary advantages of present residence
Tired of moving, just moved recently
Other
NA
Inap.: would move; retired, housewife, student
Had a lot of choice
Had some choice
Pro-con, not the type of choices I wanted
Had little choice
Had no choice
Other
NA
Inap.: unemployed and never worked; retired, housewife,student
Amount per hour
1,096
1,416
115
235
2,694
156
216
900
21
189
105
2,873
1,936
387
55
223
626
14
117
1,102
24.57
31.75
2.58
5.27
60.40
3.50
4.84
20.18
.47
4.24
2.35
64.42
43.41
8.68
1.23
5.00
14.04
.31
2.62
24.71
Count
Count
Count
%
%
%
Value/Range
Value/Range
Value/Range
Code Value/Range Text
Code Value/Range Text
Code Value/Range Text
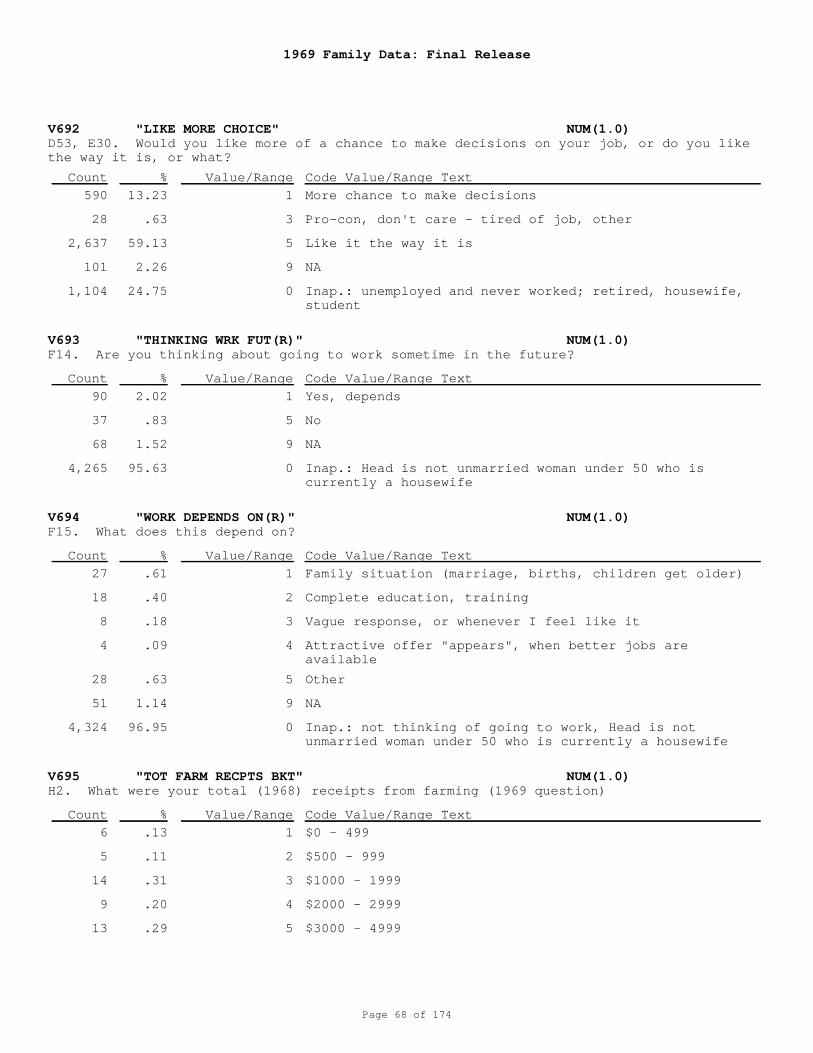
1969 Family Data: Final Release
Page 68 of 174
V692 "LIKE MORE CHOICE" NUM(1.0)
V693 "THINKING WRK FUT(R)" NUM(1.0)
V694 "WORK DEPENDS ON(R)" NUM(1.0)
V695 "TOT FARM RECPTS BKT" NUM(1.0)
D53, E30. Would you like more of a chance to make decisions on your job, or do you likethe way it is, or what?
F14. Are you thinking about going to work sometime in the future?
F15. What does this depend on?
H2. What were your total (1968) receipts from farming (1969 question)
1
3
5
9
0
1
5
9
0
1
2
3
4
5
9
0
1
2
3
4
5
More chance to make decisions
Pro-con, don't care - tired of job, other
Like it the way it is
NA
Inap.: unemployed and never worked; retired, housewife,student
Yes, depends
No
NA
Inap.: Head is not unmarried woman under 50 who iscurrently a housewife
Family situation (marriage, births, children get older)
Complete education, training
Vague response, or whenever I feel like it
Attractive offer "appears", when better jobs areavailable
Other
NA
Inap.: not thinking of going to work, Head is notunmarried woman under 50 who is currently a housewife
$0 - 499
$500 - 999
$1000 - 1999
$2000 - 2999
$3000 - 4999
590
28
2,637
101
1,104
90
37
68
4,265
27
18
8
4
28
51
4,324
6
5
14
9
13
13.23
.63
59.13
2.26
24.75
2.02
.83
1.52
95.63
.61
.40
.18
.09
.63
1.14
96.95
.13
.11
.31
.20
.29
Count
Count
Count
Count
%
%
%
%
Value/Range
Value/Range
Value/Range
Value/Range
Code Value/Range Text
Code Value/Range Text
Code Value/Range Text
Code Value/Range Text
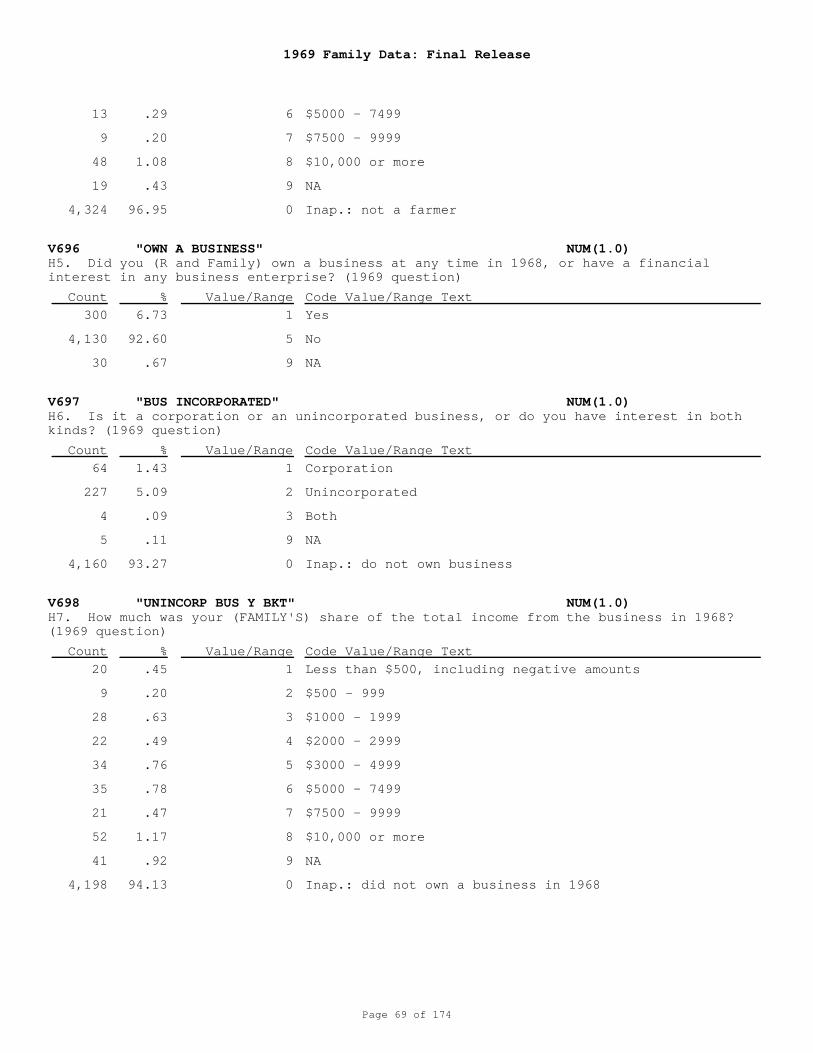
1969 Family Data: Final Release
Page 69 of 174
V696 "OWN A BUSINESS" NUM(1.0)
V697 "BUS INCORPORATED" NUM(1.0)
V698 "UNINCORP BUS Y BKT" NUM(1.0)
H5. Did you (R and Family) own a business at any time in 1968, or have a financialinterest in any business enterprise? (1969 question)
H6. Is it a corporation or an unincorporated business, or do you have interest in bothkinds? (1969 question)
H7. How much was your (FAMILY'S) share of the total income from the business in 1968?(1969 question)
6
7
8
9
0
1
5
9
1
2
3
9
0
1
2
3
4
5
6
7
8
9
0
$5000 - 7499
$7500 - 9999
$10,000 or more
NA
Inap.: not a farmer
Yes
No
NA
Corporation
Unincorporated
Both
NA
Inap.: do not own business
Less than $500, including negative amounts
$500 - 999
$1000 - 1999
$2000 - 2999
$3000 - 4999
$5000 - 7499
$7500 - 9999
$10,000 or more
NA
Inap.: did not own a business in 1968
13
9
48
19
4,324
300
4,130
30
64
227
4
5
4,160
20
9
28
22
34
35
21
52
41
4,198
.29
.20
1.08
.43
96.95
6.73
92.60
.67
1.43
5.09
.09
.11
93.27
.45
.20
.63
.49
.76
.78
.47
1.17
.92
94.13
Count
Count
Count
%
%
%
Value/Range
Value/Range
Value/Range
Code Value/Range Text
Code Value/Range Text
Code Value/Range Text
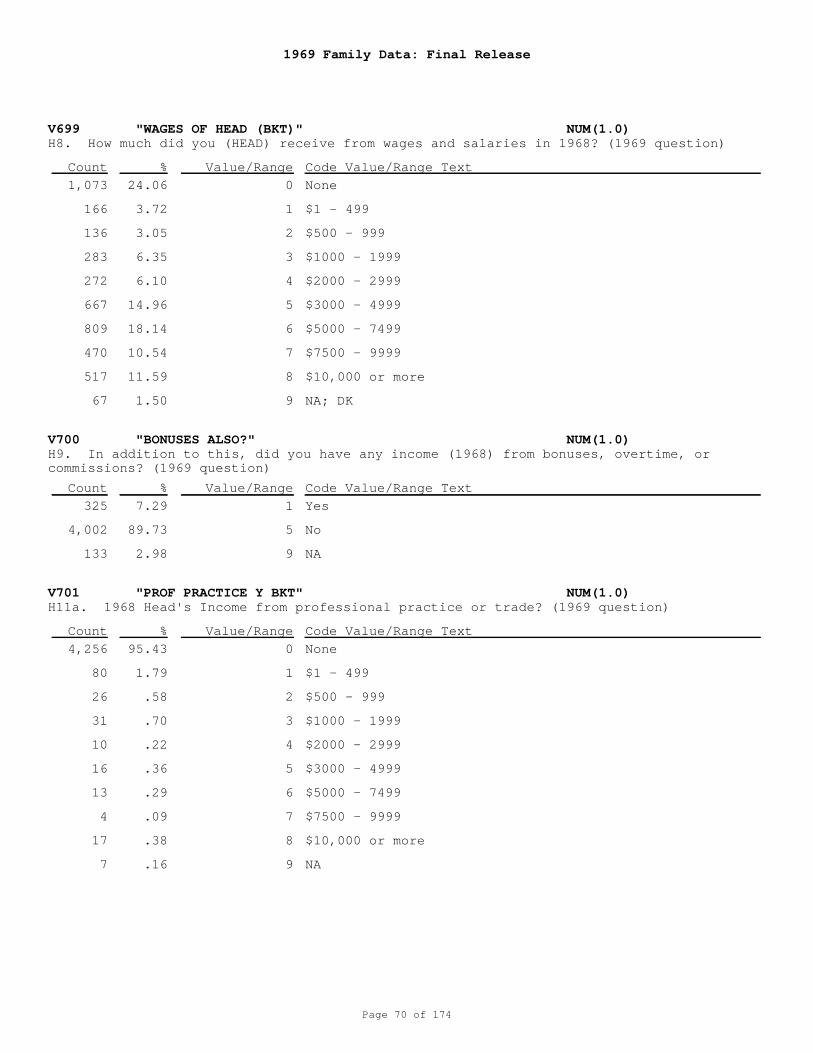
1969 Family Data: Final Release
Page 70 of 174
V699 "WAGES OF HEAD (BKT)" NUM(1.0)
V700 "BONUSES ALSO?" NUM(1.0)
V701 "PROF PRACTICE Y BKT" NUM(1.0)
H8. How much did you (HEAD) receive from wages and salaries in 1968? (1969 question)
H9. In addition to this, did you have any income (1968) from bonuses, overtime, orcommissions? (1969 question)
H11a. 1968 Head's Income from professional practice or trade? (1969 question)
0
1
2
3
4
5
6
7
8
9
1
5
9
0
1
2
3
4
5
6
7
8
9
None
$1 - 499
$500 - 999
$1000 - 1999
$2000 - 2999
$3000 - 4999
$5000 - 7499
$7500 - 9999
$10,000 or more
NA; DK
Yes
No
NA
None
$1 - 499
$500 - 999
$1000 - 1999
$2000 - 2999
$3000 - 4999
$5000 - 7499
$7500 - 9999
$10,000 or more
NA
1,073
166
136
283
272
667
809
470
517
67
325
4,002
133
4,256
80
26
31
10
16
13
4
17
7
24.06
3.72
3.05
6.35
6.10
14.96
18.14
10.54
11.59
1.50
7.29
89.73
2.98
95.43
1.79
.58
.70
.22
.36
.29
.09
.38
.16
Count
Count
Count
%
%
%
Value/Range
Value/Range
Value/Range
Code Value/Range Text
Code Value/Range Text
Code Value/Range Text
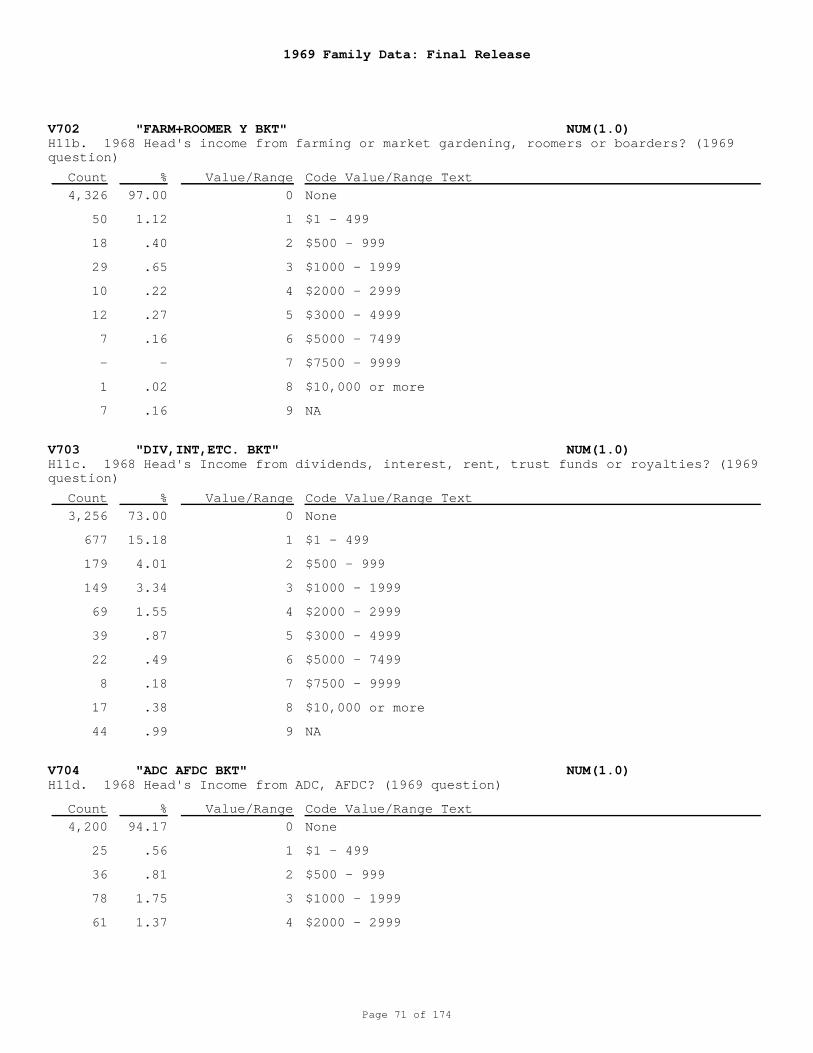
1969 Family Data: Final Release
Page 71 of 174
V702 "FARM+ROOMER Y BKT" NUM(1.0)
V703 "DIV,INT,ETC. BKT" NUM(1.0)
V704 "ADC AFDC BKT" NUM(1.0)
H11b. 1968 Head's income from farming or market gardening, roomers or boarders? (1969question)
H11c. 1968 Head's Income from dividends, interest, rent, trust funds or royalties? (1969question)
H11d. 1968 Head's Income from ADC, AFDC? (1969 question)
0
1
2
3
4
5
6
7
8
9
0
1
2
3
4
5
6
7
8
9
0
1
2
3
4
None
$1 - 499
$500 - 999
$1000 - 1999
$2000 - 2999
$3000 - 4999
$5000 - 7499
$7500 - 9999
$10,000 or more
NA
None
$1 - 499
$500 - 999
$1000 - 1999
$2000 - 2999
$3000 - 4999
$5000 - 7499
$7500 - 9999
$10,000 or more
NA
None
$1 - 499
$500 - 999
$1000 - 1999
$2000 - 2999
4,326
50
18
29
10
12
7
-
1
7
3,256
677
179
149
69
39
22
8
17
44
4,200
25
36
78
61
97.00
1.12
.40
.65
.22
.27
.16
-
.02
.16
73.00
15.18
4.01
3.34
1.55
.87
.49
.18
.38
.99
94.17
.56
.81
1.75
1.37
Count
Count
Count
%
%
%
Value/Range
Value/Range
Value/Range
Code Value/Range Text
Code Value/Range Text
Code Value/Range Text
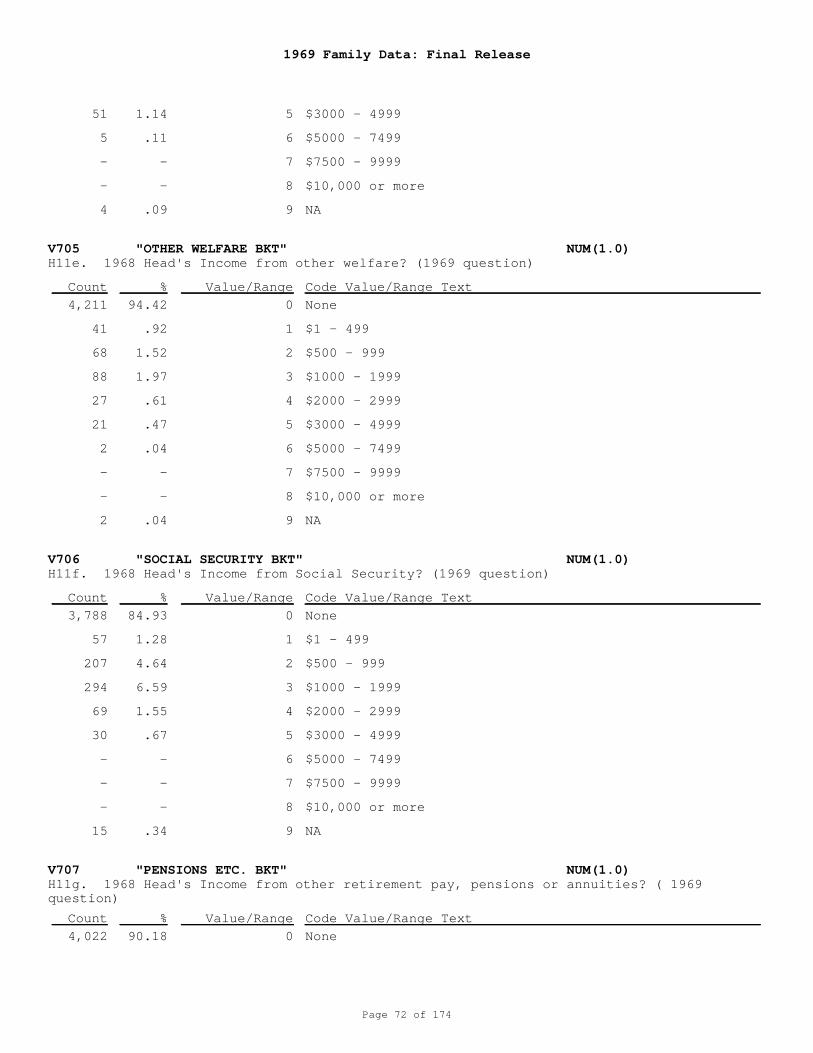
1969 Family Data: Final Release
Page 72 of 174
V705 "OTHER WELFARE BKT" NUM(1.0)
V706 "SOCIAL SECURITY BKT" NUM(1.0)
V707 "PENSIONS ETC. BKT" NUM(1.0)
H11e. 1968 Head's Income from other welfare? (1969 question)
H11f. 1968 Head's Income from Social Security? (1969 question)
H11g. 1968 Head's Income from other retirement pay, pensions or annuities? ( 1969question)
5
6
7
8
9
0
1
2
3
4
5
6
7
8
9
0
1
2
3
4
5
6
7
8
9
0
$3000 - 4999
$5000 - 7499
$7500 - 9999
$10,000 or more
NA
None
$1 - 499
$500 - 999
$1000 - 1999
$2000 - 2999
$3000 - 4999
$5000 - 7499
$7500 - 9999
$10,000 or more
NA
None
$1 - 499
$500 - 999
$1000 - 1999
$2000 - 2999
$3000 - 4999
$5000 - 7499
$7500 - 9999
$10,000 or more
NA
None
51
5
-
-
4
4,211
41
68
88
27
21
2
-
-
2
3,788
57
207
294
69
30
-
-
-
15
4,022
1.14
.11
-
-
.09
94.42
.92
1.52
1.97
.61
.47
.04
-
-
.04
84.93
1.28
4.64
6.59
1.55
.67
-
-
-
.34
90.18
Count
Count
Count
%
%
%
Value/Range
Value/Range
Value/Range
Code Value/Range Text
Code Value/Range Text
Code Value/Range Text
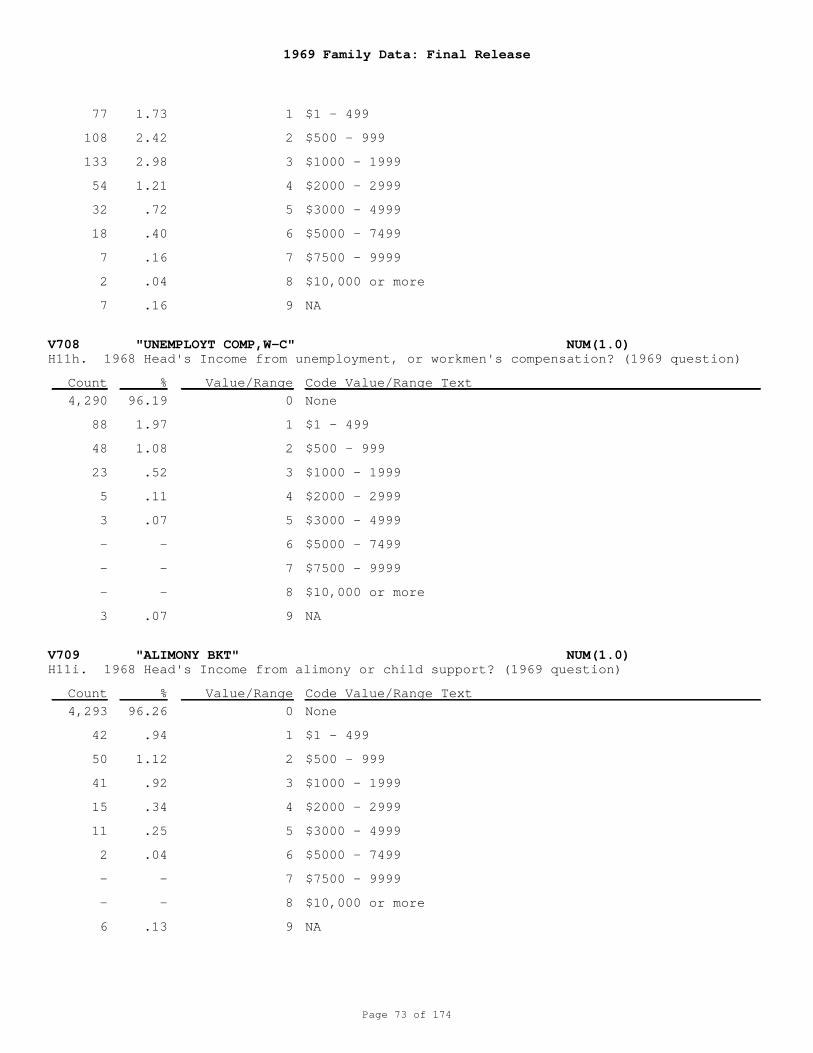
1969 Family Data: Final Release
Page 73 of 174
V708 "UNEMPLOYT COMP,W-C" NUM(1.0)
V709 "ALIMONY BKT" NUM(1.0)
H11h. 1968 Head's Income from unemployment, or workmen's compensation? (1969 question)
H11i. 1968 Head's Income from alimony or child support? (1969 question)
1
2
3
4
5
6
7
8
9
0
1
2
3
4
5
6
7
8
9
0
1
2
3
4
5
6
7
8
9
$1 - 499
$500 - 999
$1000 - 1999
$2000 - 2999
$3000 - 4999
$5000 - 7499
$7500 - 9999
$10,000 or more
NA
None
$1 - 499
$500 - 999
$1000 - 1999
$2000 - 2999
$3000 - 4999
$5000 - 7499
$7500 - 9999
$10,000 or more
NA
None
$1 - 499
$500 - 999
$1000 - 1999
$2000 - 2999
$3000 - 4999
$5000 - 7499
$7500 - 9999
$10,000 or more
NA
77
108
133
54
32
18
7
2
7
4,290
88
48
23
5
3
-
-
-
3
4,293
42
50
41
15
11
2
-
-
6
1.73
2.42
2.98
1.21
.72
.40
.16
.04
.16
96.19
1.97
1.08
.52
.11
.07
-
-
-
.07
96.26
.94
1.12
.92
.34
.25
.04
-
-
.13
Count
Count
%
%
Value/Range
Value/Range
Code Value/Range Text
Code Value/Range Text
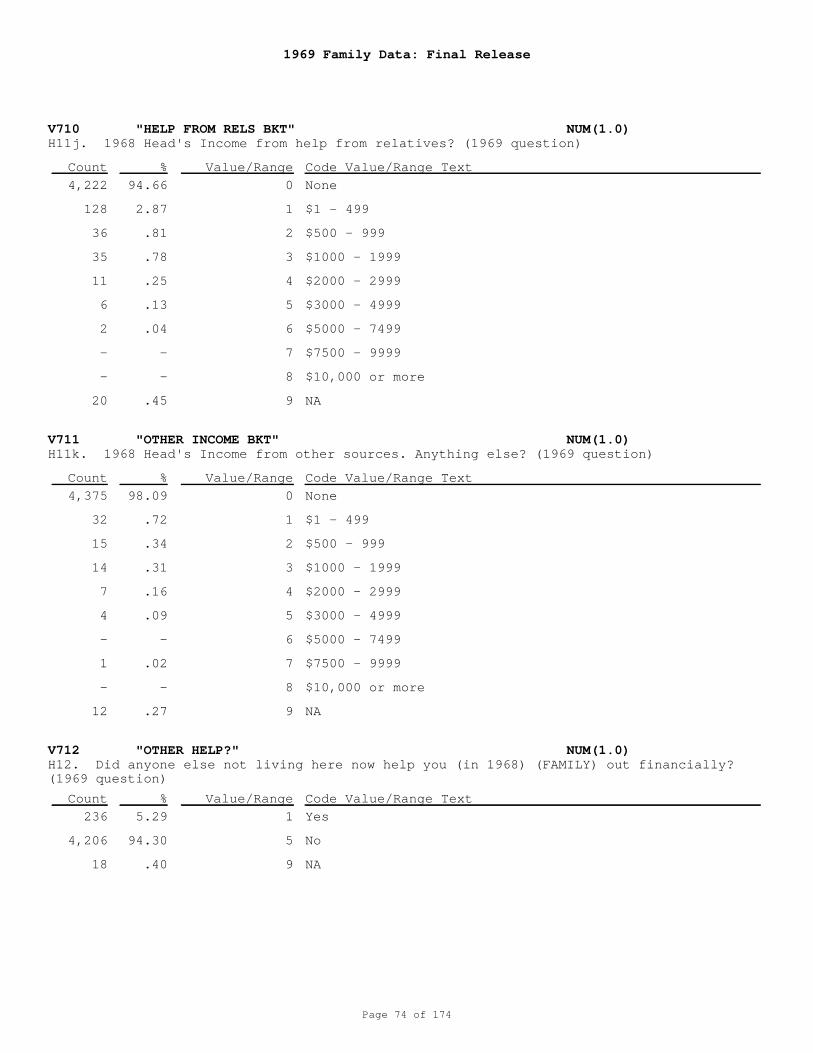
1969 Family Data: Final Release
Page 74 of 174
V710 "HELP FROM RELS BKT" NUM(1.0)
V711 "OTHER INCOME BKT" NUM(1.0)
V712 "OTHER HELP?" NUM(1.0)
H11j. 1968 Head's Income from help from relatives? (1969 question)
H11k. 1968 Head's Income from other sources. Anything else? (1969 question)
H12. Did anyone else not living here now help you (in 1968) (FAMILY) out financially?(1969 question)
0
1
2
3
4
5
6
7
8
9
0
1
2
3
4
5
6
7
8
9
1
5
9
None
$1 - 499
$500 - 999
$1000 - 1999
$2000 - 2999
$3000 - 4999
$5000 - 7499
$7500 - 9999
$10,000 or more
NA
None
$1 - 499
$500 - 999
$1000 - 1999
$2000 - 2999
$3000 - 4999
$5000 - 7499
$7500 - 9999
$10,000 or more
NA
Yes
No
NA
4,222
128
36
35
11
6
2
-
-
20
4,375
32
15
14
7
4
-
1
-
12
236
4,206
18
94.66
2.87
.81
.78
.25
.13
.04
-
-
.45
98.09
.72
.34
.31
.16
.09
-
.02
-
.27
5.29
94.30
.40
Count
Count
Count
%
%
%
Value/Range
Value/Range
Value/Range
Code Value/Range Text
Code Value/Range Text
Code Value/Range Text
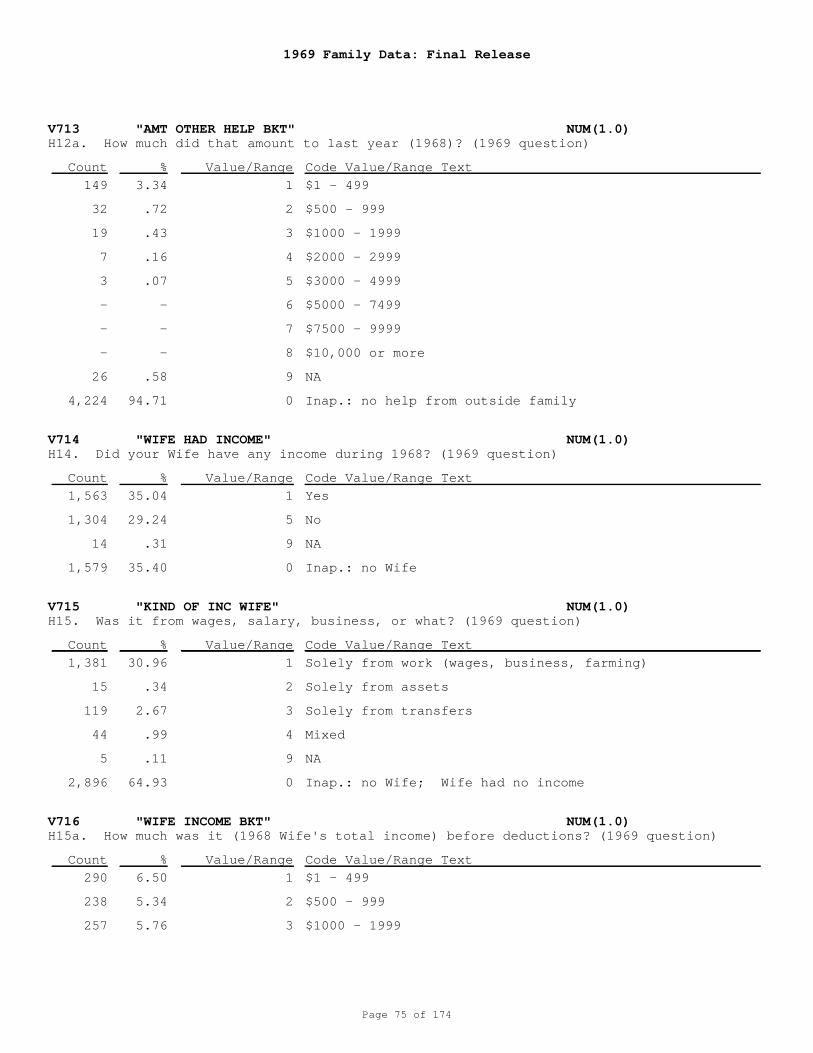
1969 Family Data: Final Release
Page 75 of 174
V713 "AMT OTHER HELP BKT" NUM(1.0)
V714 "WIFE HAD INCOME" NUM(1.0)
V715 "KIND OF INC WIFE" NUM(1.0)
V716 "WIFE INCOME BKT" NUM(1.0)
H12a. How much did that amount to last year (1968)? (1969 question)
H14. Did your Wife have any income during 1968? (1969 question)
H15. Was it from wages, salary, business, or what? (1969 question)
H15a. How much was it (1968 Wife's total income) before deductions? (1969 question)
1
2
3
4
5
6
7
8
9
0
1
5
9
0
1
2
3
4
9
0
1
2
3
$1 - 499
$500 - 999
$1000 - 1999
$2000 - 2999
$3000 - 4999
$5000 - 7499
$7500 - 9999
$10,000 or more
NA
Inap.: no help from outside family
Yes
No
NA
Inap.: no Wife
Solely from work (wages, business, farming)
Solely from assets
Solely from transfers
Mixed
NA
Inap.: no Wife; Wife had no income
$1 - 499
$500 - 999
$1000 - 1999
149
32
19
7
3
-
-
-
26
4,224
1,563
1,304
14
1,579
1,381
15
119
44
5
2,896
290
238
257
3.34
.72
.43
.16
.07
-
-
-
.58
94.71
35.04
29.24
.31
35.40
30.96
.34
2.67
.99
.11
64.93
6.50
5.34
5.76
Count
Count
Count
Count
%
%
%
%
Value/Range
Value/Range
Value/Range
Value/Range
Code Value/Range Text
Code Value/Range Text
Code Value/Range Text
Code Value/Range Text
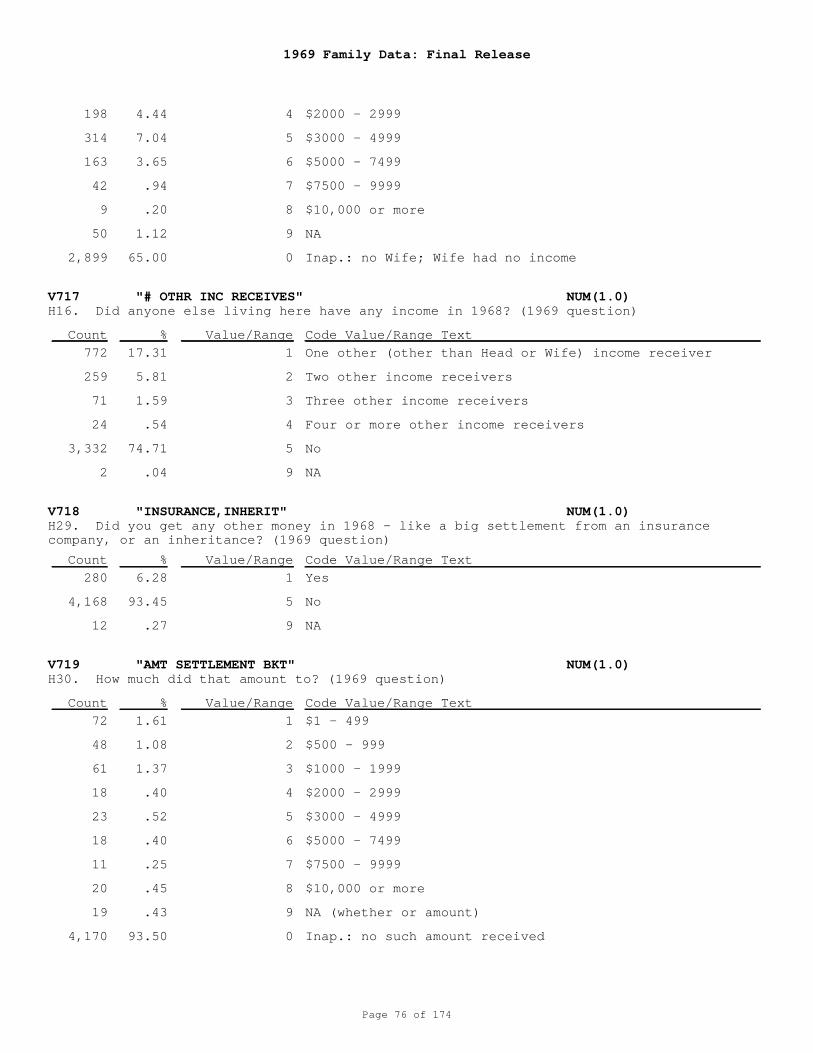
1969 Family Data: Final Release
Page 76 of 174
V717 "# OTHR INC RECEIVES" NUM(1.0)
V718 "INSURANCE,INHERIT" NUM(1.0)
V719 "AMT SETTLEMENT BKT" NUM(1.0)
H16. Did anyone else living here have any income in 1968? (1969 question)
H29. Did you get any other money in 1968 - like a big settlement from an insurancecompany, or an inheritance? (1969 question)
H30. How much did that amount to? (1969 question)
4
5
6
7
8
9
0
1
2
3
4
5
9
1
5
9
1
2
3
4
5
6
7
8
9
0
$2000 - 2999
$3000 - 4999
$5000 - 7499
$7500 - 9999
$10,000 or more
NA
Inap.: no Wife; Wife had no income
One other (other than Head or Wife) income receiver
Two other income receivers
Three other income receivers
Four or more other income receivers
No
NA
Yes
No
NA
$1 - 499
$500 - 999
$1000 - 1999
$2000 - 2999
$3000 - 4999
$5000 - 7499
$7500 - 9999
$10,000 or more
NA (whether or amount)
Inap.: no such amount received
198
314
163
42
9
50
2,899
772
259
71
24
3,332
2
280
4,168
12
72
48
61
18
23
18
11
20
19
4,170
4.44
7.04
3.65
.94
.20
1.12
65.00
17.31
5.81
1.59
.54
74.71
.04
6.28
93.45
.27
1.61
1.08
1.37
.40
.52
.40
.25
.45
.43
93.50
Count
Count
Count
%
%
%
Value/Range
Value/Range
Value/Range
Code Value/Range Text
Code Value/Range Text
Code Value/Range Text
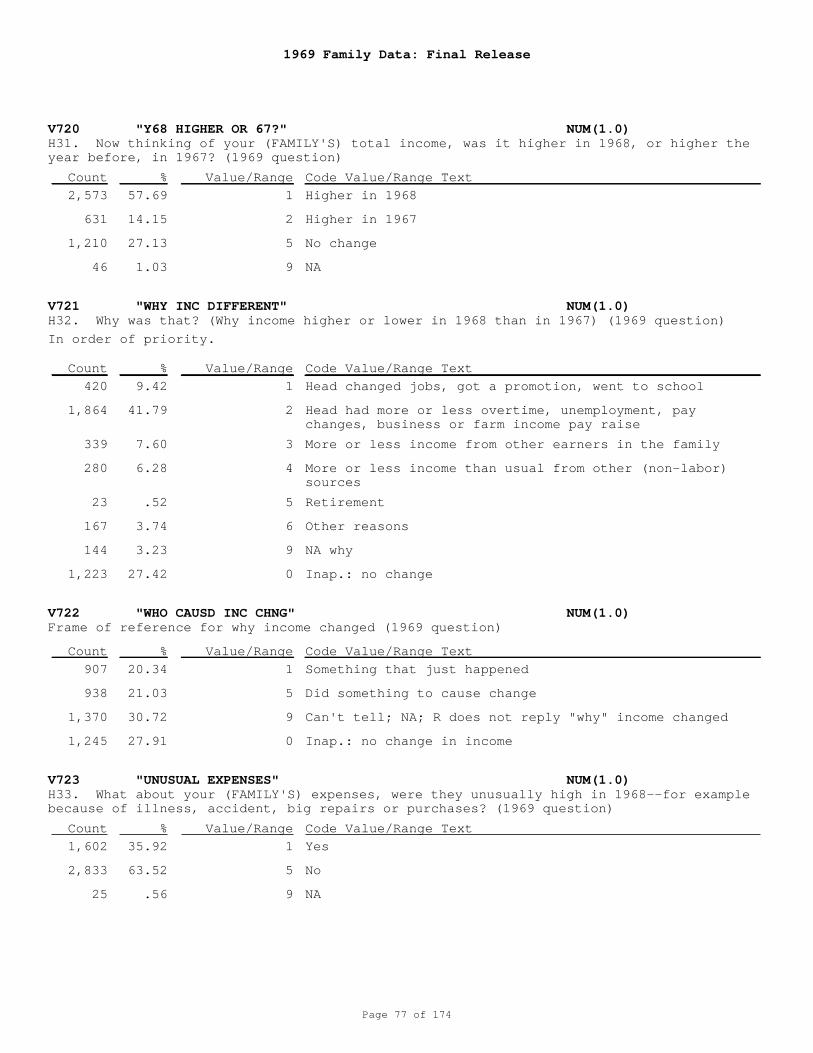
1969 Family Data: Final Release
Page 77 of 174
V720 "Y68 HIGHER OR 67?" NUM(1.0)
V721 "WHY INC DIFFERENT" NUM(1.0)
V722 "WHO CAUSD INC CHNG" NUM(1.0)
V723 "UNUSUAL EXPENSES" NUM(1.0)
H31. Now thinking of your (FAMILY'S) total income, was it higher in 1968, or higher theyear before, in 1967? (1969 question)
H32. Why was that? (Why income higher or lower in 1968 than in 1967) (1969 question)
Frame of reference for why income changed (1969 question)
H33. What about your (FAMILY'S) expenses, were they unusually high in 1968--for examplebecause of illness, accident, big repairs or purchases? (1969 question)
1
2
5
9
1
2
3
4
5
6
9
0
1
5
9
0
1
5
9
Higher in 1968
Higher in 1967
No change
NA
Head changed jobs, got a promotion, went to school
Head had more or less overtime, unemployment, paychanges, business or farm income pay raise
More or less income from other earners in the family
More or less income than usual from other (non-labor)sources
Retirement
Other reasons
NA why
Inap.: no change
Something that just happened
Did something to cause change
Can't tell; NA; R does not reply "why" income changed
Inap.: no change in income
Yes
No
NA
In order of priority.
2,573
631
1,210
46
420
1,864
339
280
23
167
144
1,223
907
938
1,370
1,245
1,602
2,833
25
57.69
14.15
27.13
1.03
9.42
41.79
7.60
6.28
.52
3.74
3.23
27.42
20.34
21.03
30.72
27.91
35.92
63.52
.56
Count
Count
Count
Count
%
%
%
%
Value/Range
Value/Range
Value/Range
Value/Range
Code Value/Range Text
Code Value/Range Text
Code Value/Range Text
Code Value/Range Text
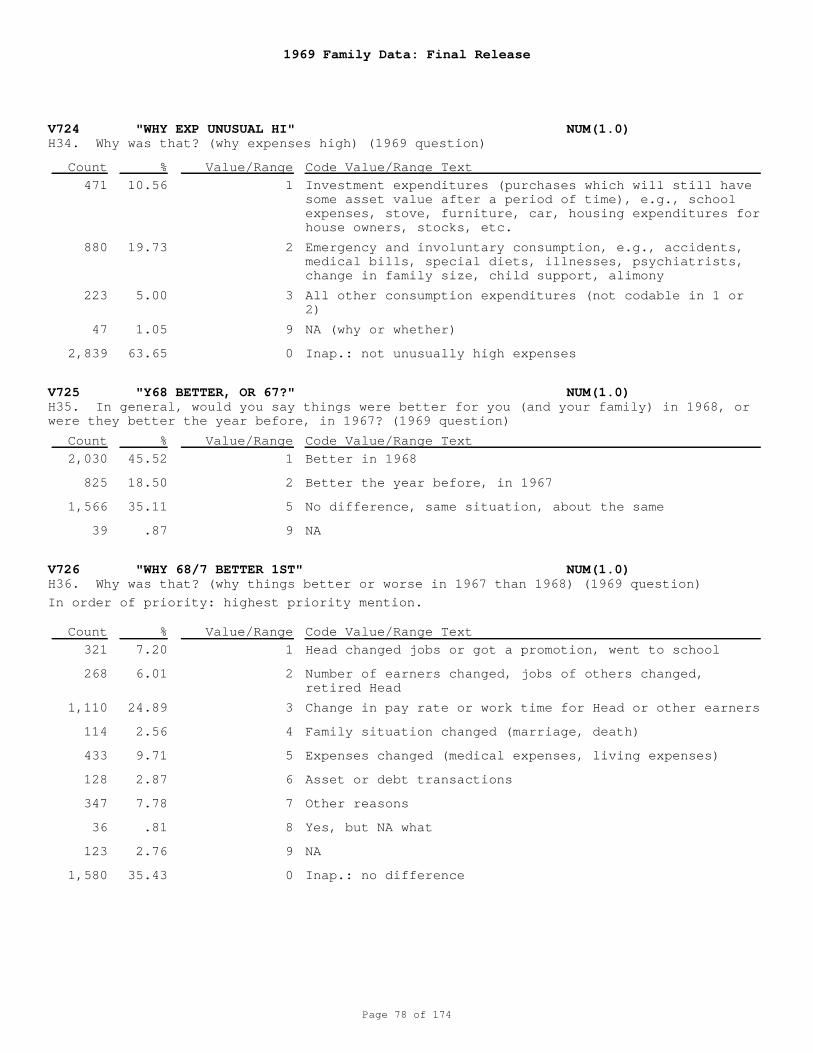
1969 Family Data: Final Release
Page 78 of 174
V724 "WHY EXP UNUSUAL HI" NUM(1.0)
V725 "Y68 BETTER, OR 67?" NUM(1.0)
V726 "WHY 68/7 BETTER 1ST" NUM(1.0)
H34. Why was that? (why expenses high) (1969 question)
H35. In general, would you say things were better for you (and your family) in 1968, orwere they better the year before, in 1967? (1969 question)
H36. Why was that? (why things better or worse in 1967 than 1968) (1969 question)
1
2
3
9
0
1
2
5
9
1
2
3
4
5
6
7
8
9
0
Investment expenditures (purchases which will still havesome asset value after a period of time), e.g., schoolexpenses, stove, furniture, car, housing expenditures forhouse owners, stocks, etc.
Emergency and involuntary consumption, e.g., accidents,medical bills, special diets, illnesses, psychiatrists,change in family size, child support, alimony
All other consumption expenditures (not codable in 1 or2)
NA (why or whether)
Inap.: not unusually high expenses
Better in 1968
Better the year before, in 1967
No difference, same situation, about the same
NA
Head changed jobs or got a promotion, went to school
Number of earners changed, jobs of others changed,retired Head
Change in pay rate or work time for Head or other earners
Family situation changed (marriage, death)
Expenses changed (medical expenses, living expenses)
Asset or debt transactions
Other reasons
Yes, but NA what
NA
Inap.: no difference
In order of priority: highest priority mention.
471
880
223
47
2,839
2,030
825
1,566
39
321
268
1,110
114
433
128
347
36
123
1,580
10.56
19.73
5.00
1.05
63.65
45.52
18.50
35.11
.87
7.20
6.01
24.89
2.56
9.71
2.87
7.78
.81
2.76
35.43
Count
Count
Count
%
%
%
Value/Range
Value/Range
Value/Range
Code Value/Range Text
Code Value/Range Text
Code Value/Range Text
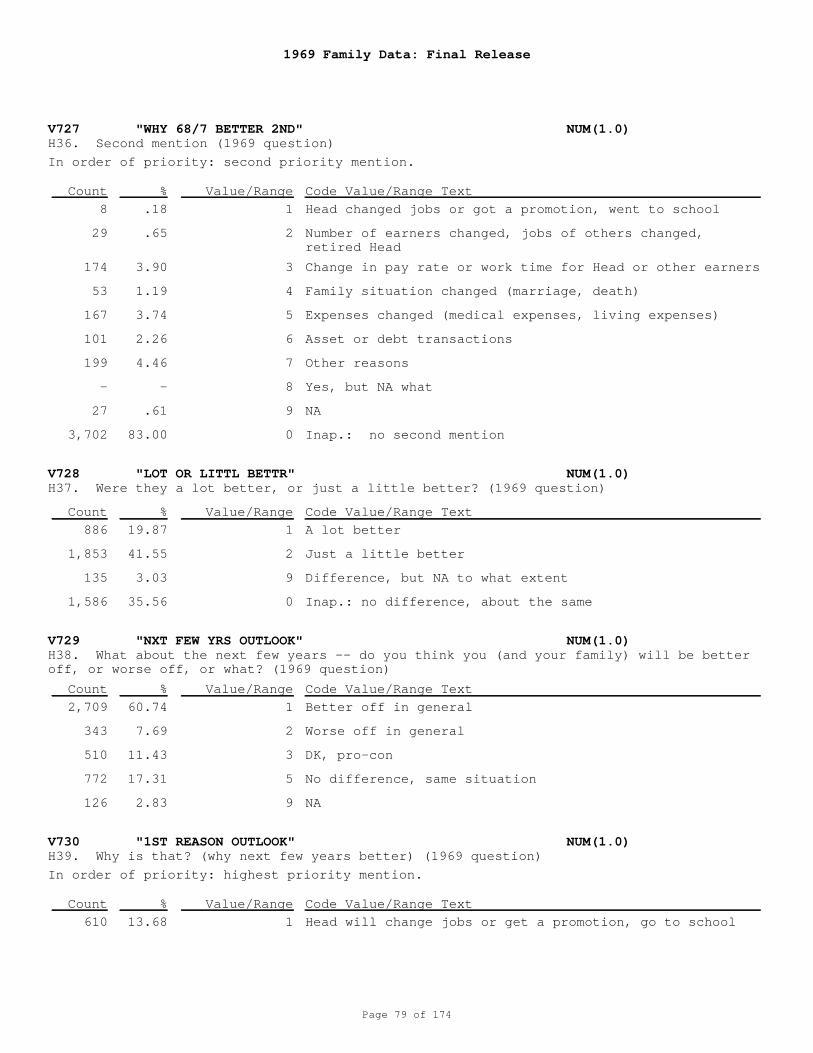
1969 Family Data: Final Release
Page 79 of 174
V727 "WHY 68/7 BETTER 2ND" NUM(1.0)
V728 "LOT OR LITTL BETTR" NUM(1.0)
V729 "NXT FEW YRS OUTLOOK" NUM(1.0)
V730 "1ST REASON OUTLOOK" NUM(1.0)
H36. Second mention (1969 question)
H37. Were they a lot better, or just a little better? (1969 question)
H38. What about the next few years -- do you think you (and your family) will be betteroff, or worse off, or what? (1969 question)
H39. Why is that? (why next few years better) (1969 question)
1
2
3
4
5
6
7
8
9
0
1
2
9
0
1
2
3
5
9
1
Head changed jobs or got a promotion, went to school
Number of earners changed, jobs of others changed,retired Head
Change in pay rate or work time for Head or other earners
Family situation changed (marriage, death)
Expenses changed (medical expenses, living expenses)
Asset or debt transactions
Other reasons
Yes, but NA what
NA
Inap.: no second mention
A lot better
Just a little better
Difference, but NA to what extent
Inap.: no difference, about the same
Better off in general
Worse off in general
DK, pro-con
No difference, same situation
NA
Head will change jobs or get a promotion, go to school
In order of priority: second priority mention.
In order of priority: highest priority mention.
8
29
174
53
167
101
199
-
27
3,702
886
1,853
135
1,586
2,709
343
510
772
126
610
.18
.65
3.90
1.19
3.74
2.26
4.46
-
.61
83.00
19.87
41.55
3.03
35.56
60.74
7.69
11.43
17.31
2.83
13.68
Count
Count
Count
Count
%
%
%
%
Value/Range
Value/Range
Value/Range
Value/Range
Code Value/Range Text
Code Value/Range Text
Code Value/Range Text
Code Value/Range Text
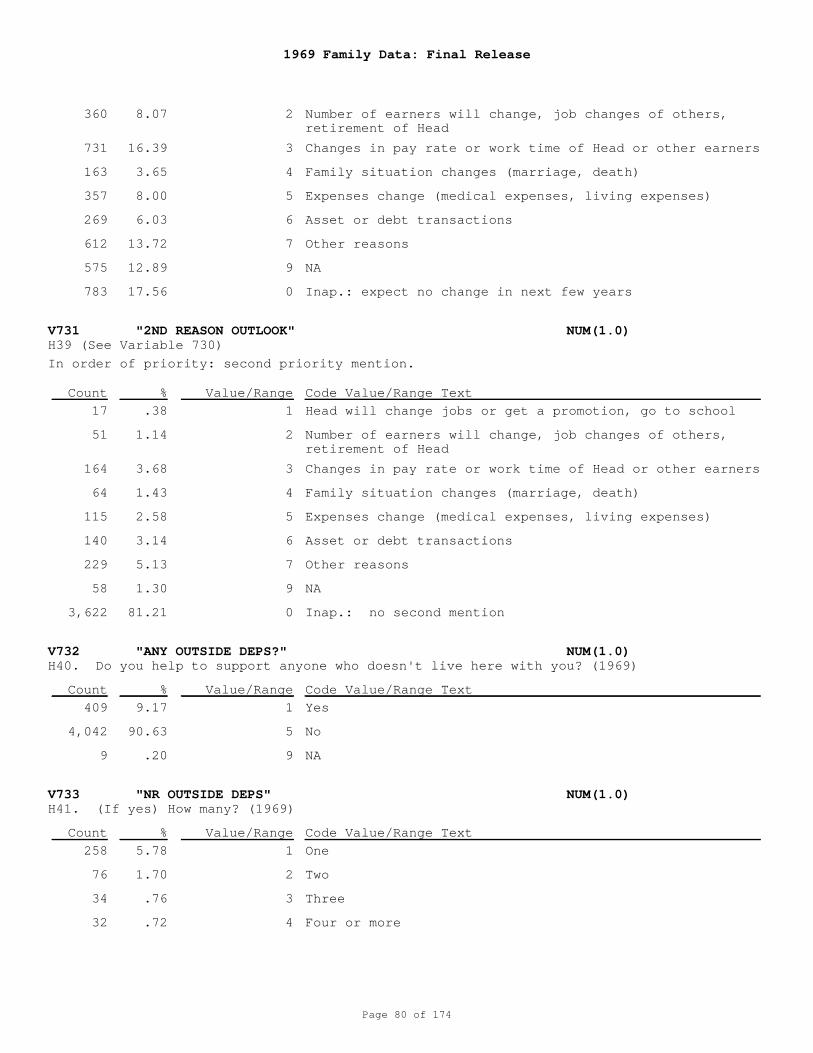
1969 Family Data: Final Release
Page 80 of 174
V731 "2ND REASON OUTLOOK" NUM(1.0)
V732 "ANY OUTSIDE DEPS?" NUM(1.0)
V733 "NR OUTSIDE DEPS" NUM(1.0)
H39 (See Variable 730)
H40. Do you help to support anyone who doesn't live here with you? (1969)
H41. (If yes) How many? (1969)
2
3
4
5
6
7
9
0
1
2
3
4
5
6
7
9
0
1
5
9
1
2
3
4
Number of earners will change, job changes of others,retirement of Head
Changes in pay rate or work time of Head or other earners
Family situation changes (marriage, death)
Expenses change (medical expenses, living expenses)
Asset or debt transactions
Other reasons
NA
Inap.: expect no change in next few years
Head will change jobs or get a promotion, go to school
Number of earners will change, job changes of others,retirement of Head
Changes in pay rate or work time of Head or other earners
Family situation changes (marriage, death)
Expenses change (medical expenses, living expenses)
Asset or debt transactions
Other reasons
NA
Inap.: no second mention
Yes
No
NA
One
Two
Three
Four or more
In order of priority: second priority mention.
360
731
163
357
269
612
575
783
17
51
164
64
115
140
229
58
3,622
409
4,042
9
258
76
34
32
8.07
16.39
3.65
8.00
6.03
13.72
12.89
17.56
.38
1.14
3.68
1.43
2.58
3.14
5.13
1.30
81.21
9.17
90.63
.20
5.78
1.70
.76
.72
Count
Count
Count
%
%
%
Value/Range
Value/Range
Value/Range
Code Value/Range Text
Code Value/Range Text
Code Value/Range Text
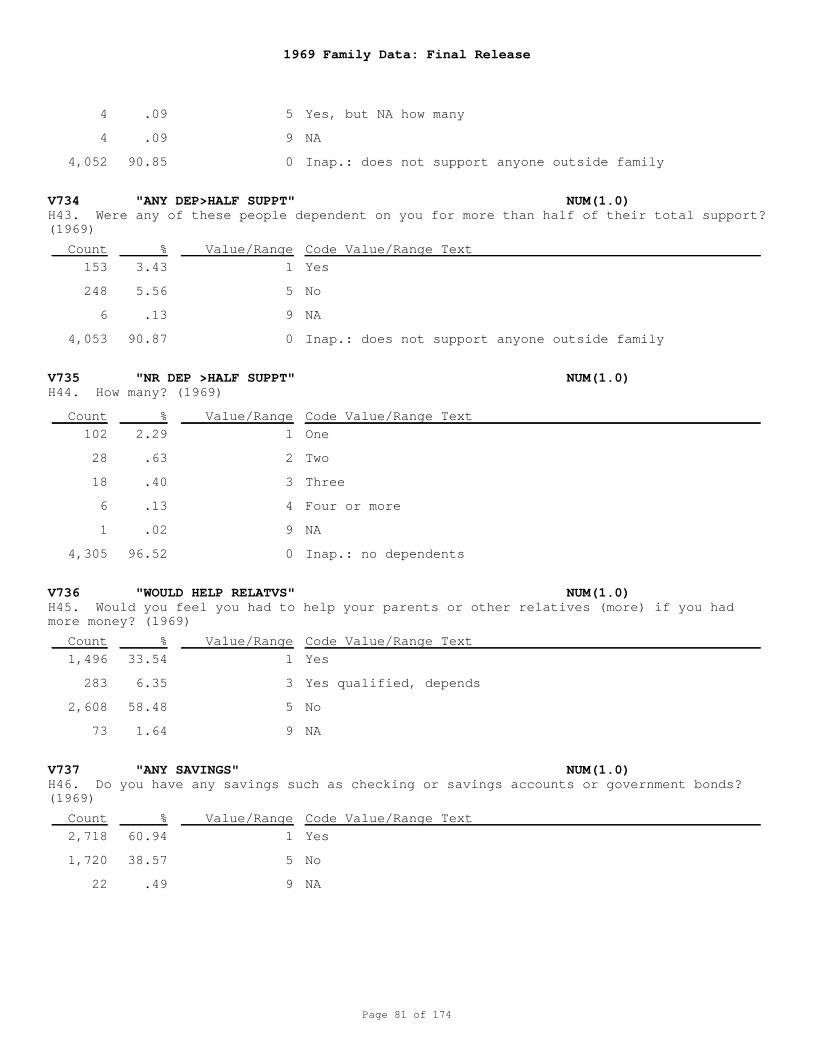
1969 Family Data: Final Release
Page 81 of 174
V734 "ANY DEP>HALF SUPPT" NUM(1.0)
V735 "NR DEP >HALF SUPPT" NUM(1.0)
V736 "WOULD HELP RELATVS" NUM(1.0)
V737 "ANY SAVINGS" NUM(1.0)
H43. Were any of these people dependent on you for more than half of their total support?(1969)
H44. How many? (1969)
H45. Would you feel you had to help your parents or other relatives (more) if you hadmore money? (1969)
H46. Do you have any savings such as checking or savings accounts or government bonds?(1969)
5
9
0
1
5
9
0
1
2
3
4
9
0
1
3
5
9
1
5
9
Yes, but NA how many
NA
Inap.: does not support anyone outside family
Yes
No
NA
Inap.: does not support anyone outside family
One
Two
Three
Four or more
NA
Inap.: no dependents
Yes
Yes qualified, depends
No
NA
Yes
No
NA
4
4
4,052
153
248
6
4,053
102
28
18
6
1
4,305
1,496
283
2,608
73
2,718
1,720
22
.09
.09
90.85
3.43
5.56
.13
90.87
2.29
.63
.40
.13
.02
96.52
33.54
6.35
58.48
1.64
60.94
38.57
.49
Count
Count
Count
Count
%
%
%
%
Value/Range
Value/Range
Value/Range
Value/Range
Code Value/Range Text
Code Value/Range Text
Code Value/Range Text
Code Value/Range Text
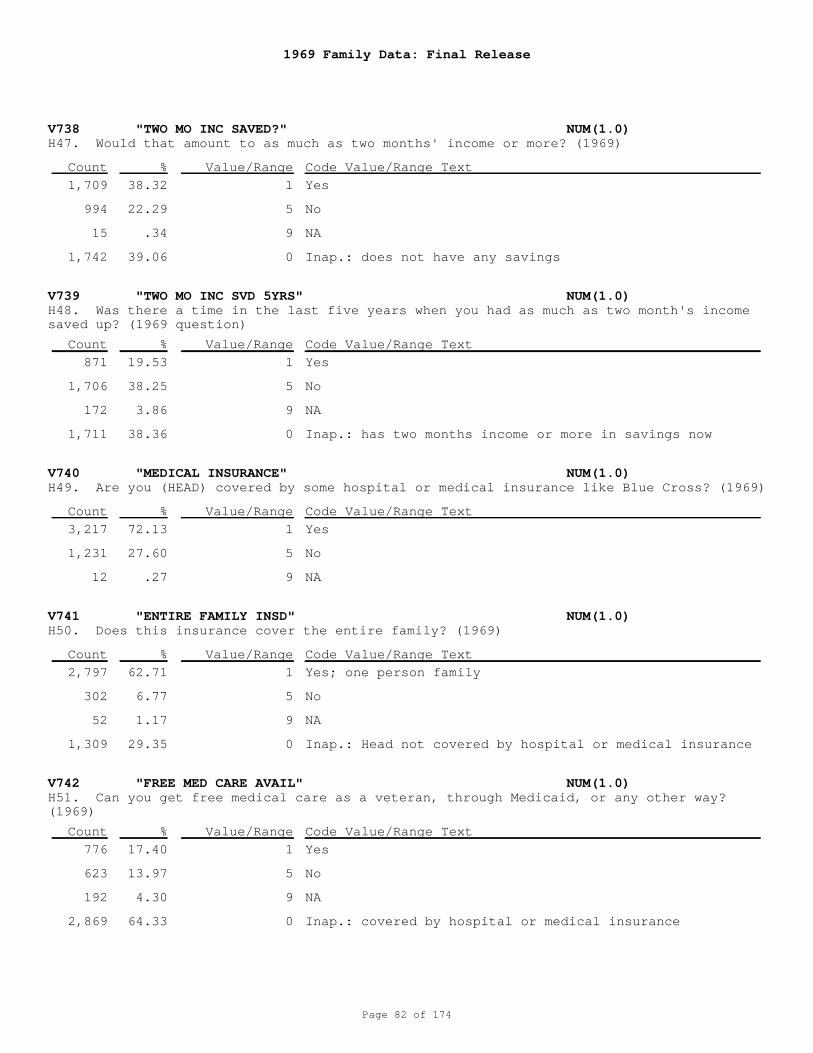
1969 Family Data: Final Release
Page 82 of 174
V738 "TWO MO INC SAVED?" NUM(1.0)
V739 "TWO MO INC SVD 5YRS" NUM(1.0)
V740 "MEDICAL INSURANCE" NUM(1.0)
V741 "ENTIRE FAMILY INSD" NUM(1.0)
V742 "FREE MED CARE AVAIL" NUM(1.0)
H47. Would that amount to as much as two months' income or more? (1969)
H48. Was there a time in the last five years when you had as much as two month's incomesaved up? (1969 question)
H49. Are you (HEAD) covered by some hospital or medical insurance like Blue Cross? (1969)
H50. Does this insurance cover the entire family? (1969)
H51. Can you get free medical care as a veteran, through Medicaid, or any other way?(1969)
1
5
9
0
1
5
9
0
1
5
9
1
5
9
0
1
5
9
0
Yes
No
NA
Inap.: does not have any savings
Yes
No
NA
Inap.: has two months income or more in savings now
Yes
No
NA
Yes; one person family
No
NA
Inap.: Head not covered by hospital or medical insurance
Yes
No
NA
Inap.: covered by hospital or medical insurance
1,709
994
15
1,742
871
1,706
172
1,711
3,217
1,231
12
2,797
302
52
1,309
776
623
192
2,869
38.32
22.29
.34
39.06
19.53
38.25
3.86
38.36
72.13
27.60
.27
62.71
6.77
1.17
29.35
17.40
13.97
4.30
64.33
Count
Count
Count
Count
Count
%
%
%
%
%
Value/Range
Value/Range
Value/Range
Value/Range
Value/Range
Code Value/Range Text
Code Value/Range Text
Code Value/Range Text
Code Value/Range Text
Code Value/Range Text
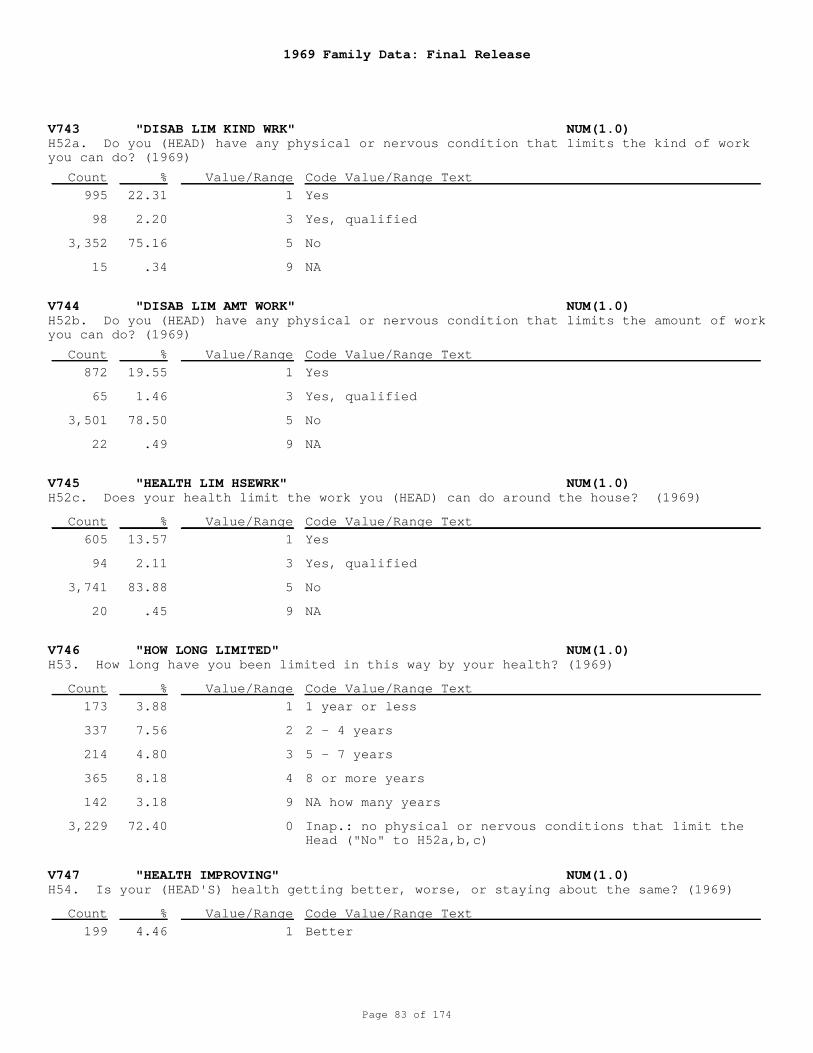
1969 Family Data: Final Release
Page 83 of 174
V743 "DISAB LIM KIND WRK" NUM(1.0)
V744 "DISAB LIM AMT WORK" NUM(1.0)
V745 "HEALTH LIM HSEWRK" NUM(1.0)
V746 "HOW LONG LIMITED" NUM(1.0)
V747 "HEALTH IMPROVING" NUM(1.0)
H52a. Do you (HEAD) have any physical or nervous condition that limits the kind of workyou can do? (1969)
H52b. Do you (HEAD) have any physical or nervous condition that limits the amount of workyou can do? (1969)
H52c. Does your health limit the work you (HEAD) can do around the house? (1969)
H53. How long have you been limited in this way by your health? (1969)
H54. Is your (HEAD'S) health getting better, worse, or staying about the same? (1969)
1
3
5
9
1
3
5
9
1
3
5
9
1
2
3
4
9
0
1
Yes
Yes, qualified
No
NA
Yes
Yes, qualified
No
NA
Yes
Yes, qualified
No
NA
1 year or less
2 - 4 years
5 - 7 years
8 or more years
NA how many years
Inap.: no physical or nervous conditions that limit theHead ("No" to H52a,b,c)
Better
995
98
3,352
15
872
65
3,501
22
605
94
3,741
20
173
337
214
365
142
3,229
199
22.31
2.20
75.16
.34
19.55
1.46
78.50
.49
13.57
2.11
83.88
.45
3.88
7.56
4.80
8.18
3.18
72.40
4.46
Count
Count
Count
Count
Count
%
%
%
%
%
Value/Range
Value/Range
Value/Range
Value/Range
Value/Range
Code Value/Range Text
Code Value/Range Text
Code Value/Range Text
Code Value/Range Text
Code Value/Range Text
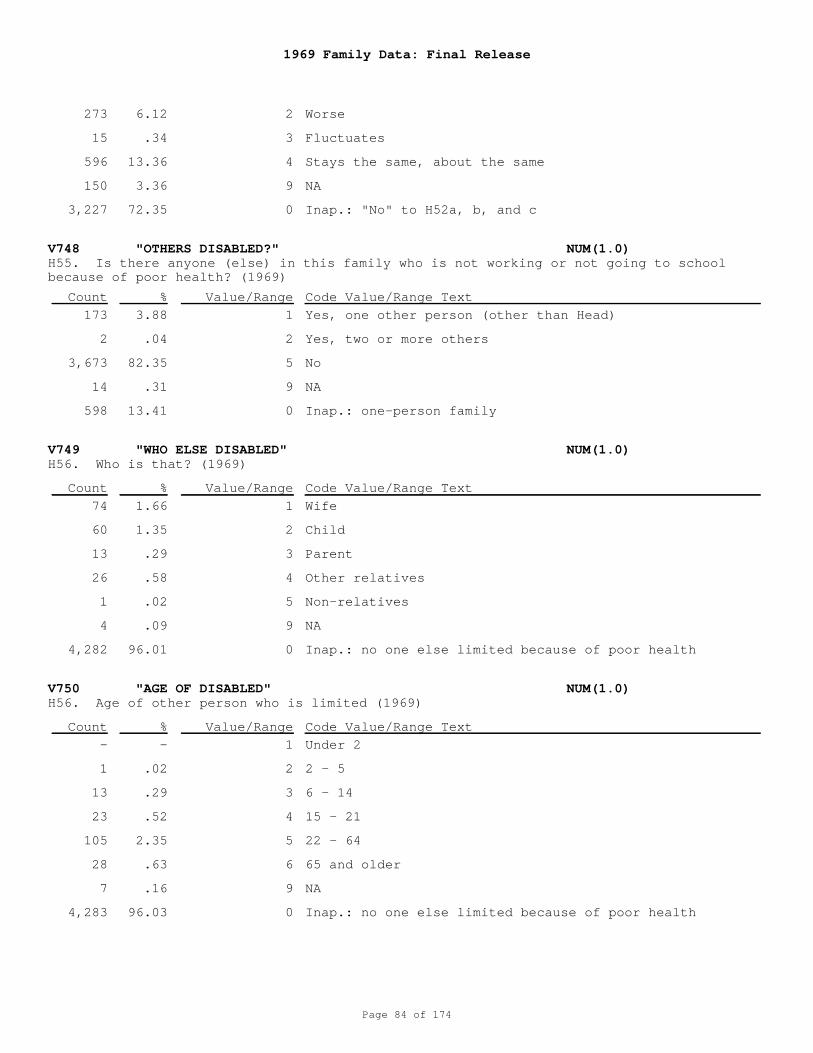
1969 Family Data: Final Release
Page 84 of 174
V748 "OTHERS DISABLED?" NUM(1.0)
V749 "WHO ELSE DISABLED" NUM(1.0)
V750 "AGE OF DISABLED" NUM(1.0)
H55. Is there anyone (else) in this family who is not working or not going to schoolbecause of poor health? (1969)
H56. Who is that? (1969)
H56. Age of other person who is limited (1969)
2
3
4
9
0
1
2
5
9
0
1
2
3
4
5
9
0
1
2
3
4
5
6
9
0
Worse
Fluctuates
Stays the same, about the same
NA
Inap.: "No" to H52a, b, and c
Yes, one other person (other than Head)
Yes, two or more others
No
NA
Inap.: one-person family
Wife
Child
Parent
Other relatives
Non-relatives
NA
Inap.: no one else limited because of poor health
Under 2
2 - 5
6 - 14
15 - 21
22 - 64
65 and older
NA
Inap.: no one else limited because of poor health
273
15
596
150
3,227
173
2
3,673
14
598
74
60
13
26
1
4
4,282
-
1
13
23
105
28
7
4,283
6.12
.34
13.36
3.36
72.35
3.88
.04
82.35
.31
13.41
1.66
1.35
.29
.58
.02
.09
96.01
-
.02
.29
.52
2.35
.63
.16
96.03
Count
Count
Count
%
%
%
Value/Range
Value/Range
Value/Range
Code Value/Range Text
Code Value/Range Text
Code Value/Range Text
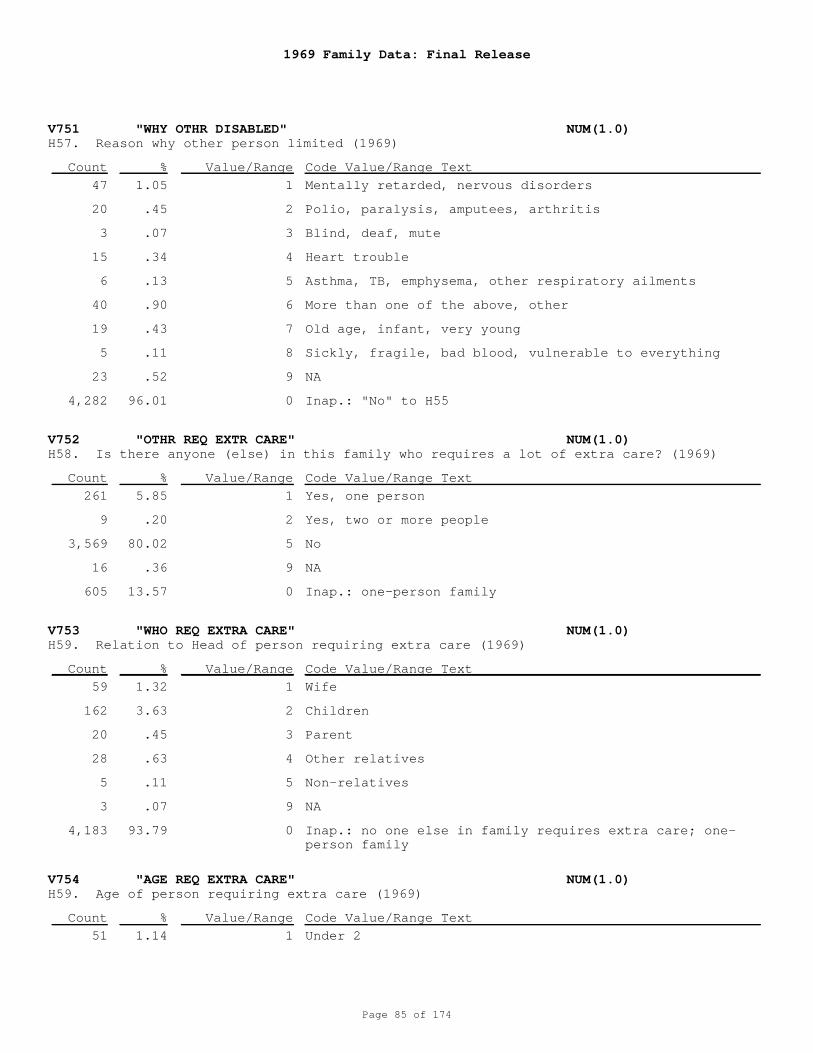
1969 Family Data: Final Release
Page 85 of 174
V751 "WHY OTHR DISABLED" NUM(1.0)
V752 "OTHR REQ EXTR CARE" NUM(1.0)
V753 "WHO REQ EXTRA CARE" NUM(1.0)
V754 "AGE REQ EXTRA CARE" NUM(1.0)
H57. Reason why other person limited (1969)
H58. Is there anyone (else) in this family who requires a lot of extra care? (1969)
H59. Relation to Head of person requiring extra care (1969)
H59. Age of person requiring extra care (1969)
1
2
3
4
5
6
7
8
9
0
1
2
5
9
0
1
2
3
4
5
9
0
1
Mentally retarded, nervous disorders
Polio, paralysis, amputees, arthritis
Blind, deaf, mute
Heart trouble
Asthma, TB, emphysema, other respiratory ailments
More than one of the above, other
Old age, infant, very young
Sickly, fragile, bad blood, vulnerable to everything
NA
Inap.: "No" to H55
Yes, one person
Yes, two or more people
No
NA
Inap.: one-person family
Wife
Children
Parent
Other relatives
Non-relatives
NA
Inap.: no one else in family requires extra care; one-person family
Under 2
47
20
3
15
6
40
19
5
23
4,282
261
9
3,569
16
605
59
162
20
28
5
3
4,183
51
1.05
.45
.07
.34
.13
.90
.43
.11
.52
96.01
5.85
.20
80.02
.36
13.57
1.32
3.63
.45
.63
.11
.07
93.79
1.14
Count
Count
Count
Count
%
%
%
%
Value/Range
Value/Range
Value/Range
Value/Range
Code Value/Range Text
Code Value/Range Text
Code Value/Range Text
Code Value/Range Text
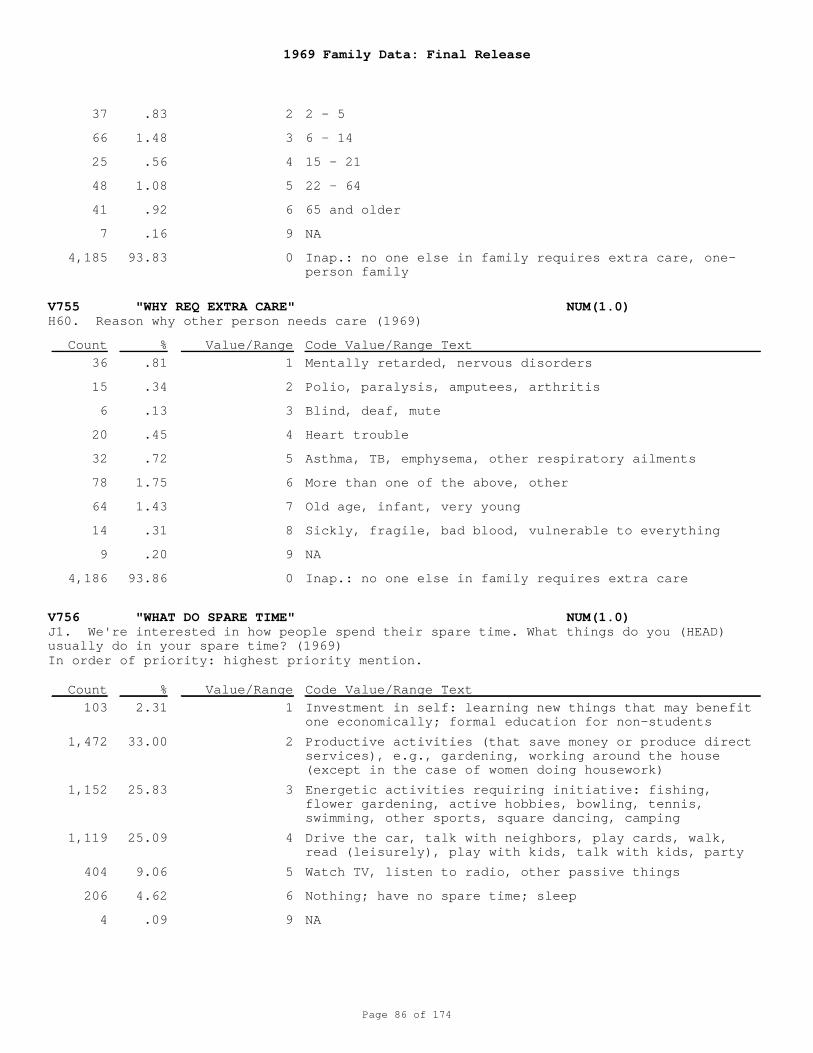
1969 Family Data: Final Release
Page 86 of 174
V755 "WHY REQ EXTRA CARE" NUM(1.0)
V756 "WHAT DO SPARE TIME" NUM(1.0)
H60. Reason why other person needs care (1969)
J1. We're interested in how people spend their spare time. What things do you (HEAD)usually do in your spare time? (1969)
2
3
4
5
6
9
0
1
2
3
4
5
6
7
8
9
0
1
2
3
4
5
6
9
2 - 5
6 - 14
15 - 21
22 - 64
65 and older
NA
Inap.: no one else in family requires extra care, one-person family
Mentally retarded, nervous disorders
Polio, paralysis, amputees, arthritis
Blind, deaf, mute
Heart trouble
Asthma, TB, emphysema, other respiratory ailments
More than one of the above, other
Old age, infant, very young
Sickly, fragile, bad blood, vulnerable to everything
NA
Inap.: no one else in family requires extra care
Investment in self: learning new things that may benefitone economically; formal education for non-students
Productive activities (that save money or produce directservices), e.g., gardening, working around the house(except in the case of women doing housework)
Energetic activities requiring initiative: fishing,flower gardening, active hobbies, bowling, tennis,swimming, other sports, square dancing, camping
Drive the car, talk with neighbors, play cards, walk,read (leisurely), play with kids, talk with kids, party
Watch TV, listen to radio, other passive things
Nothing; have no spare time; sleep
NA
In order of priority: highest priority mention.
37
66
25
48
41
7
4,185
36
15
6
20
32
78
64
14
9
4,186
103
1,472
1,152
1,119
404
206
4
.83
1.48
.56
1.08
.92
.16
93.83
.81
.34
.13
.45
.72
1.75
1.43
.31
.20
93.86
2.31
33.00
25.83
25.09
9.06
4.62
.09
Count
Count
%
%
Value/Range
Value/Range
Code Value/Range Text
Code Value/Range Text
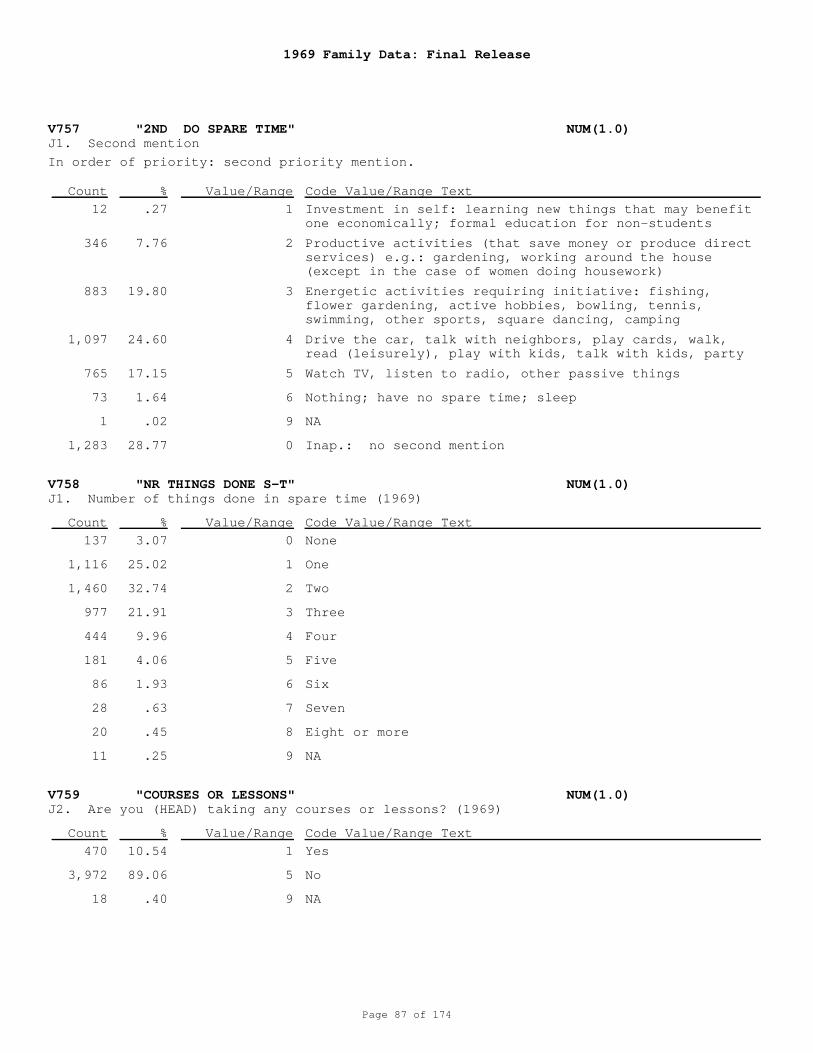
1969 Family Data: Final Release
Page 87 of 174
V757 "2ND DO SPARE TIME" NUM(1.0)
V758 "NR THINGS DONE S-T" NUM(1.0)
V759 "COURSES OR LESSONS" NUM(1.0)
J1. Second mention
J1. Number of things done in spare time (1969)
J2. Are you (HEAD) taking any courses or lessons? (1969)
1
2
3
4
5
6
9
0
0
1
2
3
4
5
6
7
8
9
1
5
9
Investment in self: learning new things that may benefitone economically; formal education for non-students
Productive activities (that save money or produce directservices) e.g.: gardening, working around the house(except in the case of women doing housework)
Energetic activities requiring initiative: fishing,flower gardening, active hobbies, bowling, tennis,swimming, other sports, square dancing, camping
Drive the car, talk with neighbors, play cards, walk,read (leisurely), play with kids, talk with kids, party
Watch TV, listen to radio, other passive things
Nothing; have no spare time; sleep
NA
Inap.: no second mention
None
One
Two
Three
Four
Five
Six
Seven
Eight or more
NA
Yes
No
NA
In order of priority: second priority mention.
12
346
883
1,097
765
73
1
1,283
137
1,116
1,460
977
444
181
86
28
20
11
470
3,972
18
.27
7.76
19.80
24.60
17.15
1.64
.02
28.77
3.07
25.02
32.74
21.91
9.96
4.06
1.93
.63
.45
.25
10.54
89.06
.40
Count
Count
Count
%
%
%
Value/Range
Value/Range
Value/Range
Code Value/Range Text
Code Value/Range Text
Code Value/Range Text
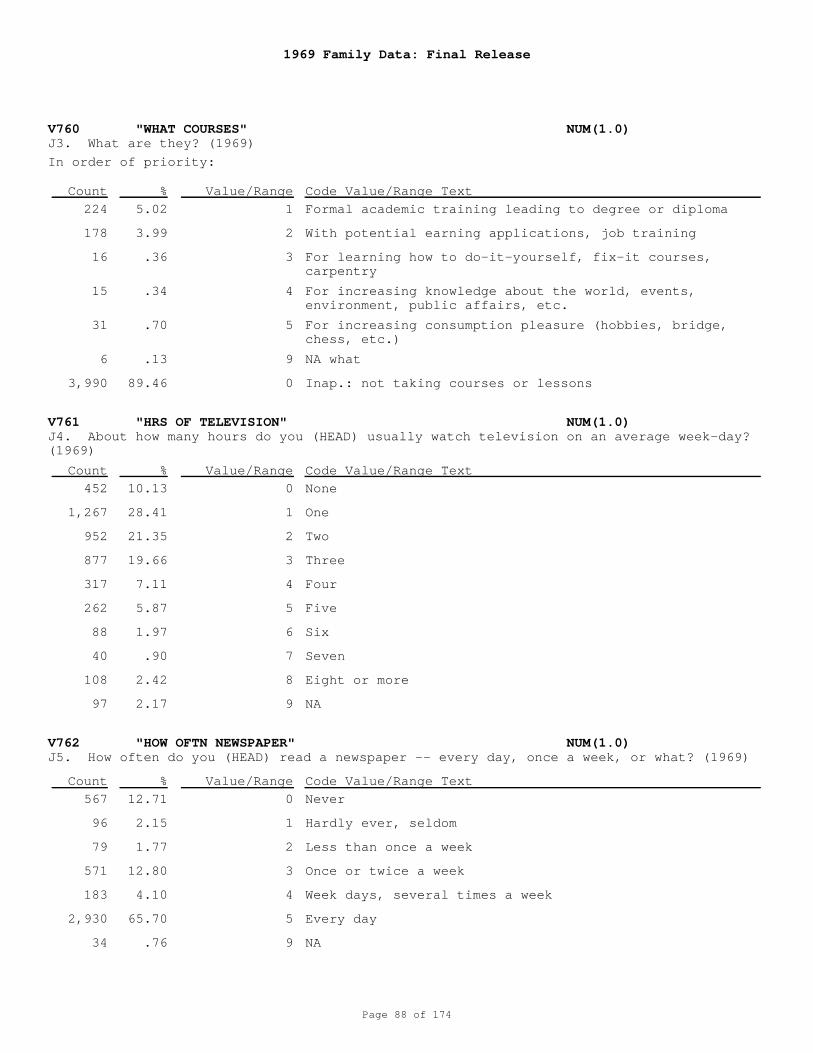
1969 Family Data: Final Release
Page 88 of 174
V760 "WHAT COURSES" NUM(1.0)
V761 "HRS OF TELEVISION" NUM(1.0)
V762 "HOW OFTN NEWSPAPER" NUM(1.0)
J3. What are they? (1969)
J4. About how many hours do you (HEAD) usually watch television on an average week-day?(1969)
J5. How often do you (HEAD) read a newspaper -- every day, once a week, or what? (1969)
1
2
3
4
5
9
0
0
1
2
3
4
5
6
7
8
9
0
1
2
3
4
5
9
Formal academic training leading to degree or diploma
With potential earning applications, job training
For learning how to do-it-yourself, fix-it courses,carpentry
For increasing knowledge about the world, events,environment, public affairs, etc.
For increasing consumption pleasure (hobbies, bridge,chess, etc.)
NA what
Inap.: not taking courses or lessons
None
One
Two
Three
Four
Five
Six
Seven
Eight or more
NA
Never
Hardly ever, seldom
Less than once a week
Once or twice a week
Week days, several times a week
Every day
NA
In order of priority:
224
178
16
15
31
6
3,990
452
1,267
952
877
317
262
88
40
108
97
567
96
79
571
183
2,930
34
5.02
3.99
.36
.34
.70
.13
89.46
10.13
28.41
21.35
19.66
7.11
5.87
1.97
.90
2.42
2.17
12.71
2.15
1.77
12.80
4.10
65.70
.76
Count
Count
Count
%
%
%
Value/Range
Value/Range
Value/Range
Code Value/Range Text
Code Value/Range Text
Code Value/Range Text
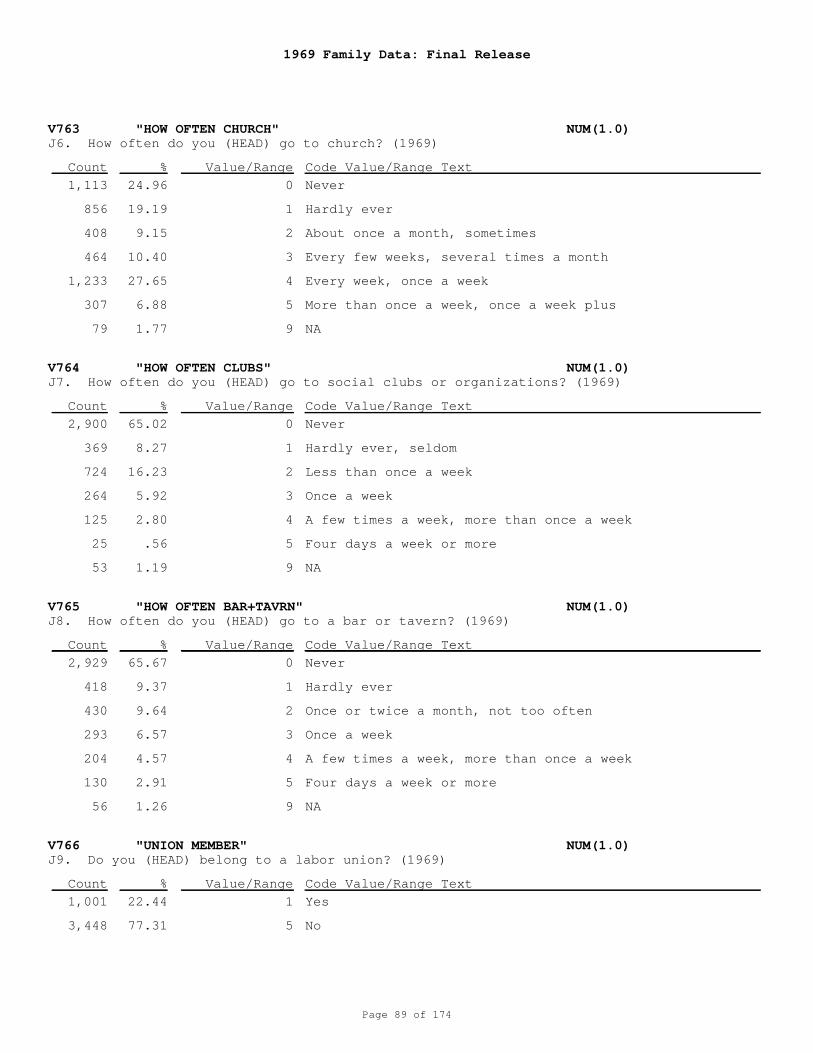
1969 Family Data: Final Release
Page 89 of 174
V763 "HOW OFTEN CHURCH" NUM(1.0)
V764 "HOW OFTEN CLUBS" NUM(1.0)
V765 "HOW OFTEN BAR+TAVRN" NUM(1.0)
V766 "UNION MEMBER" NUM(1.0)
J6. How often do you (HEAD) go to church? (1969)
J7. How often do you (HEAD) go to social clubs or organizations? (1969)
J8. How often do you (HEAD) go to a bar or tavern? (1969)
J9. Do you (HEAD) belong to a labor union? (1969)
0
1
2
3
4
5
9
0
1
2
3
4
5
9
0
1
2
3
4
5
9
1
5
Never
Hardly ever
About once a month, sometimes
Every few weeks, several times a month
Every week, once a week
More than once a week, once a week plus
NA
Never
Hardly ever, seldom
Less than once a week
Once a week
A few times a week, more than once a week
Four days a week or more
NA
Never
Hardly ever
Once or twice a month, not too often
Once a week
A few times a week, more than once a week
Four days a week or more
NA
Yes
No
1,113
856
408
464
1,233
307
79
2,900
369
724
264
125
25
53
2,929
418
430
293
204
130
56
1,001
3,448
24.96
19.19
9.15
10.40
27.65
6.88
1.77
65.02
8.27
16.23
5.92
2.80
.56
1.19
65.67
9.37
9.64
6.57
4.57
2.91
1.26
22.44
77.31
Count
Count
Count
Count
%
%
%
%
Value/Range
Value/Range
Value/Range
Value/Range
Code Value/Range Text
Code Value/Range Text
Code Value/Range Text
Code Value/Range Text
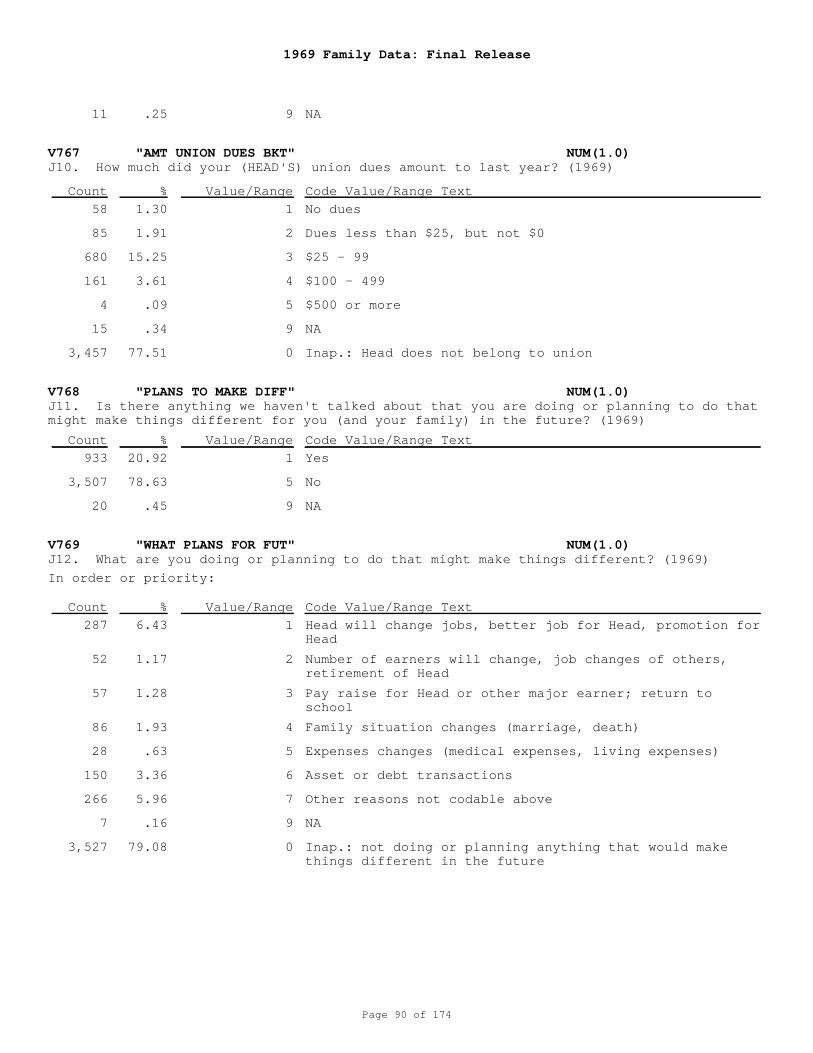
1969 Family Data: Final Release
Page 90 of 174
V767 "AMT UNION DUES BKT" NUM(1.0)
V768 "PLANS TO MAKE DIFF" NUM(1.0)
V769 "WHAT PLANS FOR FUT" NUM(1.0)
J10. How much did your (HEAD'S) union dues amount to last year? (1969)
J11. Is there anything we haven't talked about that you are doing or planning to do thatmight make things different for you (and your family) in the future? (1969)
J12. What are you doing or planning to do that might make things different? (1969)
9
1
2
3
4
5
9
0
1
5
9
1
2
3
4
5
6
7
9
0
NA
No dues
Dues less than $25, but not $0
$25 - 99
$100 - 499
$500 or more
NA
Inap.: Head does not belong to union
Yes
No
NA
Head will change jobs, better job for Head, promotion forHead
Number of earners will change, job changes of others,retirement of Head
Pay raise for Head or other major earner; return toschool
Family situation changes (marriage, death)
Expenses changes (medical expenses, living expenses)
Asset or debt transactions
Other reasons not codable above
NA
Inap.: not doing or planning anything that would makethings different in the future
In order or priority:
11
58
85
680
161
4
15
3,457
933
3,507
20
287
52
57
86
28
150
266
7
3,527
.25
1.30
1.91
15.25
3.61
.09
.34
77.51
20.92
78.63
.45
6.43
1.17
1.28
1.93
.63
3.36
5.96
.16
79.08
Count
Count
Count
%
%
%
Value/Range
Value/Range
Value/Range
Code Value/Range Text
Code Value/Range Text
Code Value/Range Text
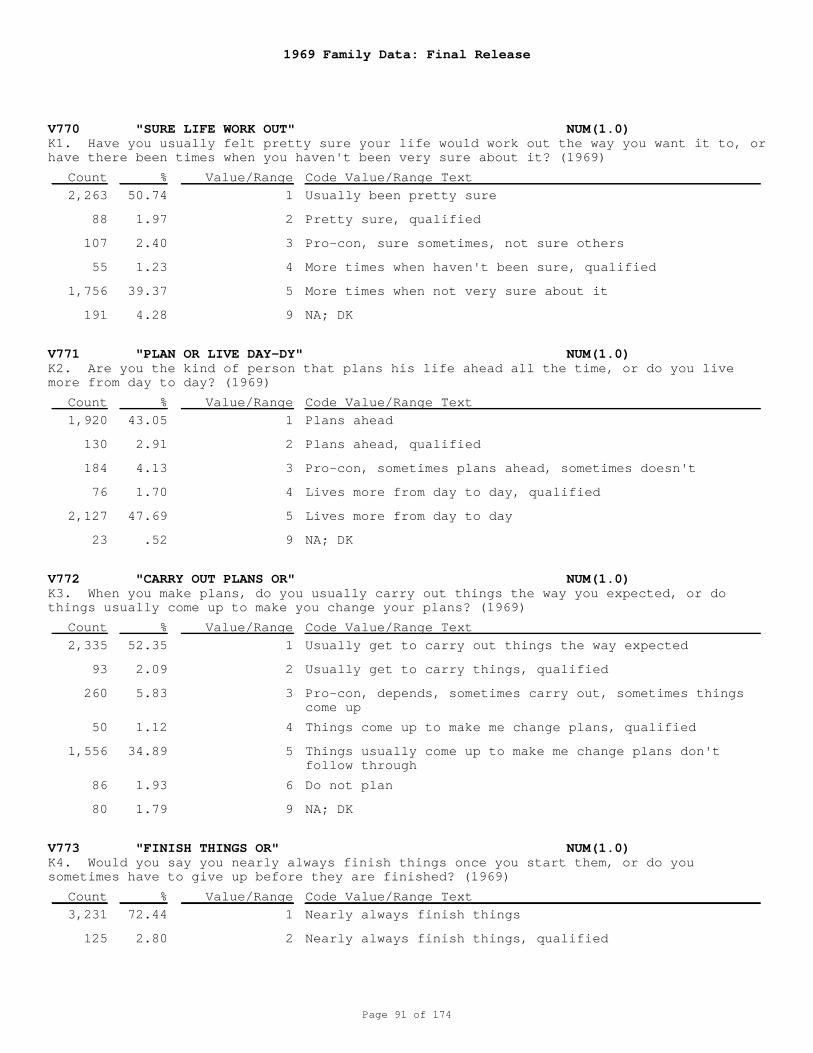
1969 Family Data: Final Release
Page 91 of 174
V770 "SURE LIFE WORK OUT" NUM(1.0)
V771 "PLAN OR LIVE DAY-DY" NUM(1.0)
V772 "CARRY OUT PLANS OR" NUM(1.0)
V773 "FINISH THINGS OR" NUM(1.0)
K1. Have you usually felt pretty sure your life would work out the way you want it to, orhave there been times when you haven't been very sure about it? (1969)
K2. Are you the kind of person that plans his life ahead all the time, or do you livemore from day to day? (1969)
K3. When you make plans, do you usually carry out things the way you expected, or dothings usually come up to make you change your plans? (1969)
K4. Would you say you nearly always finish things once you start them, or do yousometimes have to give up before they are finished? (1969)
1
2
3
4
5
9
1
2
3
4
5
9
1
2
3
4
5
6
9
1
2
Usually been pretty sure
Pretty sure, qualified
Pro-con, sure sometimes, not sure others
More times when haven't been sure, qualified
More times when not very sure about it
NA; DK
Plans ahead
Plans ahead, qualified
Pro-con, sometimes plans ahead, sometimes doesn't
Lives more from day to day, qualified
Lives more from day to day
NA; DK
Usually get to carry out things the way expected
Usually get to carry things, qualified
Pro-con, depends, sometimes carry out, sometimes thingscome up
Things come up to make me change plans, qualified
Things usually come up to make me change plans don'tfollow through
Do not plan
NA; DK
Nearly always finish things
Nearly always finish things, qualified
2,263
88
107
55
1,756
191
1,920
130
184
76
2,127
23
2,335
93
260
50
1,556
86
80
3,231
125
50.74
1.97
2.40
1.23
39.37
4.28
43.05
2.91
4.13
1.70
47.69
.52
52.35
2.09
5.83
1.12
34.89
1.93
1.79
72.44
2.80
Count
Count
Count
Count
%
%
%
%
Value/Range
Value/Range
Value/Range
Value/Range
Code Value/Range Text
Code Value/Range Text
Code Value/Range Text
Code Value/Range Text
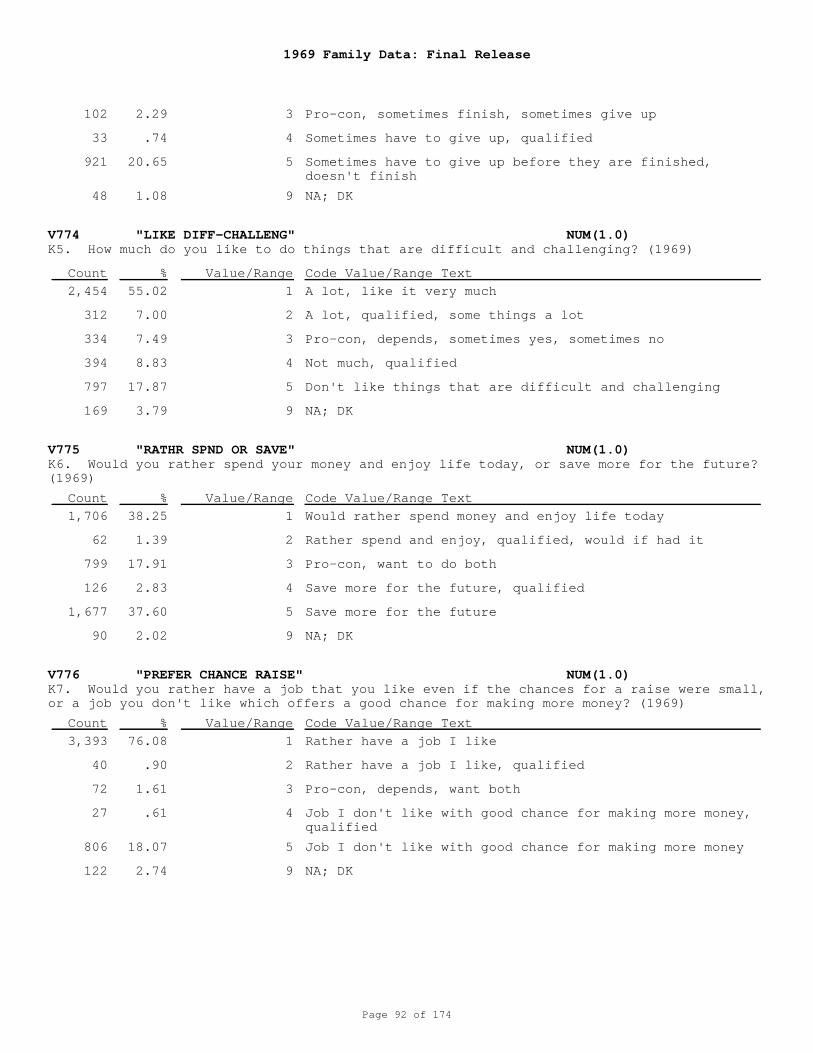
1969 Family Data: Final Release
Page 92 of 174
V774 "LIKE DIFF-CHALLENG" NUM(1.0)
V775 "RATHR SPND OR SAVE" NUM(1.0)
V776 "PREFER CHANCE RAISE" NUM(1.0)
K5. How much do you like to do things that are difficult and challenging? (1969)
K6. Would you rather spend your money and enjoy life today, or save more for the future?(1969)
K7. Would you rather have a job that you like even if the chances for a raise were small,or a job you don't like which offers a good chance for making more money? (1969)
3
4
5
9
1
2
3
4
5
9
1
2
3
4
5
9
1
2
3
4
5
9
Pro-con, sometimes finish, sometimes give up
Sometimes have to give up, qualified
Sometimes have to give up before they are finished,doesn't finish
NA; DK
A lot, like it very much
A lot, qualified, some things a lot
Pro-con, depends, sometimes yes, sometimes no
Not much, qualified
Don't like things that are difficult and challenging
NA; DK
Would rather spend money and enjoy life today
Rather spend and enjoy, qualified, would if had it
Pro-con, want to do both
Save more for the future, qualified
Save more for the future
NA; DK
Rather have a job I like
Rather have a job I like, qualified
Pro-con, depends, want both
Job I don't like with good chance for making more money,qualified
Job I don't like with good chance for making more money
NA; DK
102
33
921
48
2,454
312
334
394
797
169
1,706
62
799
126
1,677
90
3,393
40
72
27
806
122
2.29
.74
20.65
1.08
55.02
7.00
7.49
8.83
17.87
3.79
38.25
1.39
17.91
2.83
37.60
2.02
76.08
.90
1.61
.61
18.07
2.74
Count
Count
Count
%
%
%
Value/Range
Value/Range
Value/Range
Code Value/Range Text
Code Value/Range Text
Code Value/Range Text
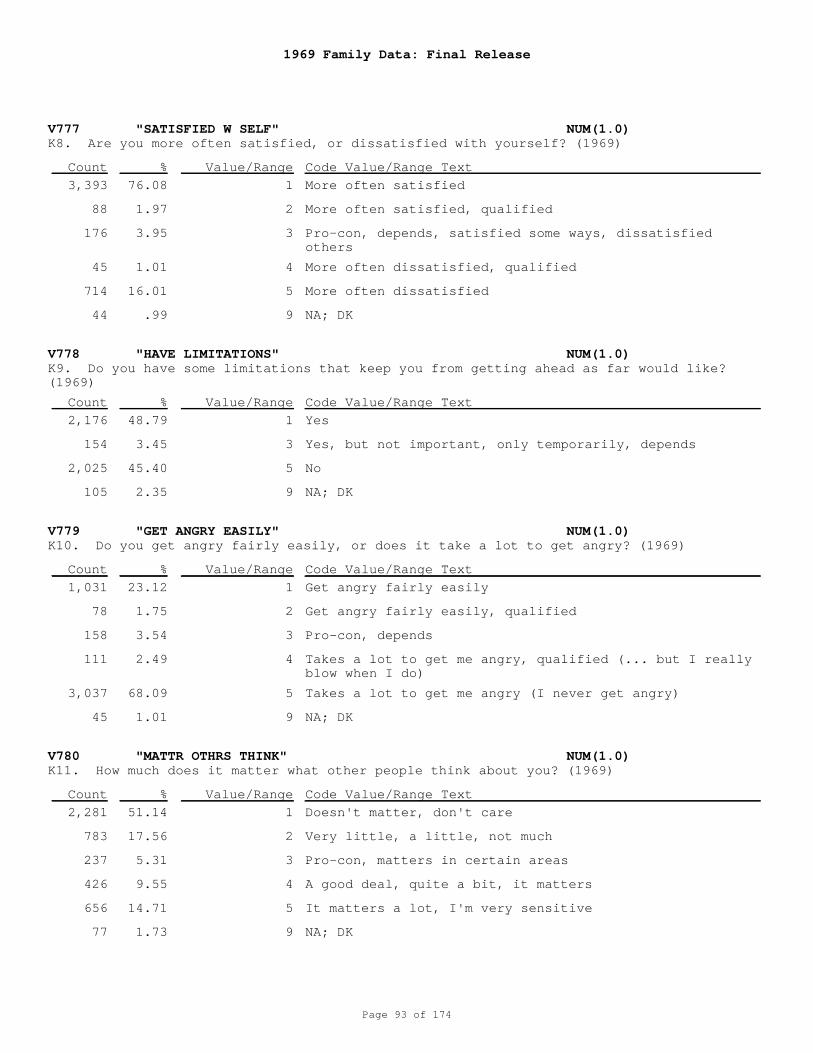
1969 Family Data: Final Release
Page 93 of 174
V777 "SATISFIED W SELF" NUM(1.0)
V778 "HAVE LIMITATIONS" NUM(1.0)
V779 "GET ANGRY EASILY" NUM(1.0)
V780 "MATTR OTHRS THINK" NUM(1.0)
K8. Are you more often satisfied, or dissatisfied with yourself? (1969)
K9. Do you have some limitations that keep you from getting ahead as far would like?(1969)
K10. Do you get angry fairly easily, or does it take a lot to get angry? (1969)
K11. How much does it matter what other people think about you? (1969)
1
2
3
4
5
9
1
3
5
9
1
2
3
4
5
9
1
2
3
4
5
9
More often satisfied
More often satisfied, qualified
Pro-con, depends, satisfied some ways, dissatisfiedothers
More often dissatisfied, qualified
More often dissatisfied
NA; DK
Yes
Yes, but not important, only temporarily, depends
No
NA; DK
Get angry fairly easily
Get angry fairly easily, qualified
Pro-con, depends
Takes a lot to get me angry, qualified (... but I reallyblow when I do)
Takes a lot to get me angry (I never get angry)
NA; DK
Doesn't matter, don't care
Very little, a little, not much
Pro-con, matters in certain areas
A good deal, quite a bit, it matters
It matters a lot, I'm very sensitive
NA; DK
3,393
88
176
45
714
44
2,176
154
2,025
105
1,031
78
158
111
3,037
45
2,281
783
237
426
656
77
76.08
1.97
3.95
1.01
16.01
.99
48.79
3.45
45.40
2.35
23.12
1.75
3.54
2.49
68.09
1.01
51.14
17.56
5.31
9.55
14.71
1.73
Count
Count
Count
Count
%
%
%
%
Value/Range
Value/Range
Value/Range
Value/Range
Code Value/Range Text
Code Value/Range Text
Code Value/Range Text
Code Value/Range Text
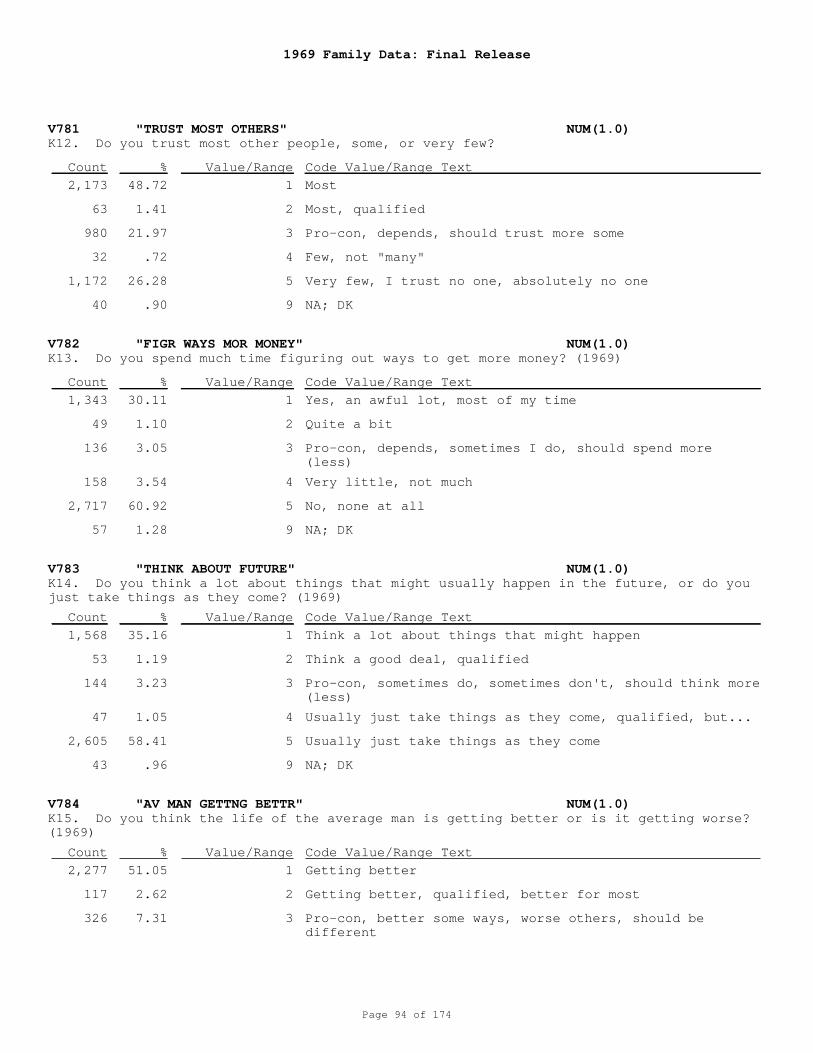
1969 Family Data: Final Release
Page 94 of 174
V781 "TRUST MOST OTHERS" NUM(1.0)
V782 "FIGR WAYS MOR MONEY" NUM(1.0)
V783 "THINK ABOUT FUTURE" NUM(1.0)
V784 "AV MAN GETTNG BETTR" NUM(1.0)
K12. Do you trust most other people, some, or very few?
K13. Do you spend much time figuring out ways to get more money? (1969)
K14. Do you think a lot about things that might usually happen in the future, or do youjust take things as they come? (1969)
K15. Do you think the life of the average man is getting better or is it getting worse?(1969)
1
2
3
4
5
9
1
2
3
4
5
9
1
2
3
4
5
9
1
2
3
Most
Most, qualified
Pro-con, depends, should trust more some
Few, not "many"
Very few, I trust no one, absolutely no one
NA; DK
Yes, an awful lot, most of my time
Quite a bit
Pro-con, depends, sometimes I do, should spend more(less)
Very little, not much
No, none at all
NA; DK
Think a lot about things that might happen
Think a good deal, qualified
Pro-con, sometimes do, sometimes don't, should think more(less)
Usually just take things as they come, qualified, but...
Usually just take things as they come
NA; DK
Getting better
Getting better, qualified, better for most
Pro-con, better some ways, worse others, should bedifferent
2,173
63
980
32
1,172
40
1,343
49
136
158
2,717
57
1,568
53
144
47
2,605
43
2,277
117
326
48.72
1.41
21.97
.72
26.28
.90
30.11
1.10
3.05
3.54
60.92
1.28
35.16
1.19
3.23
1.05
58.41
.96
51.05
2.62
7.31
Count
Count
Count
Count
%
%
%
%
Value/Range
Value/Range
Value/Range
Value/Range
Code Value/Range Text
Code Value/Range Text
Code Value/Range Text
Code Value/Range Text
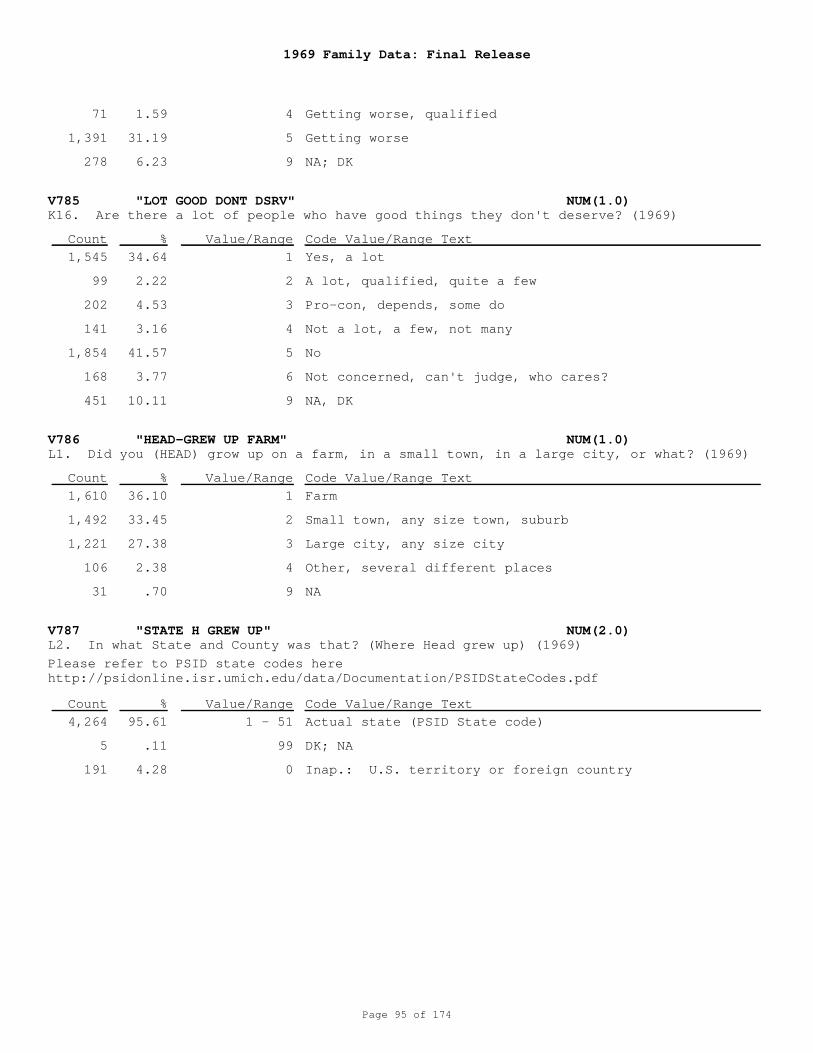
1969 Family Data: Final Release
Page 95 of 174
V785 "LOT GOOD DONT DSRV" NUM(1.0)
V786 "HEAD-GREW UP FARM" NUM(1.0)
V787 "STATE H GREW UP" NUM(2.0)
K16. Are there a lot of people who have good things they don't deserve? (1969)
L1. Did you (HEAD) grow up on a farm, in a small town, in a large city, or what? (1969)
L2. In what State and County was that? (Where Head grew up) (1969)
4
5
9
1
2
3
4
5
6
9
1
2
3
4
9
1 - 51
99
0
Getting worse, qualified
Getting worse
NA; DK
Yes, a lot
A lot, qualified, quite a few
Pro-con, depends, some do
Not a lot, a few, not many
No
Not concerned, can't judge, who cares?
NA, DK
Farm
Small town, any size town, suburb
Large city, any size city
Other, several different places
NA
Actual state (PSID State code)
DK; NA
Inap.: U.S. territory or foreign country
Please refer to PSID state codes herehttp://psidonline.isr.umich.edu/data/Documentation/PSIDStateCodes.pdf
71
1,391
278
1,545
99
202
141
1,854
168
451
1,610
1,492
1,221
106
31
4,264
5
191
1.59
31.19
6.23
34.64
2.22
4.53
3.16
41.57
3.77
10.11
36.10
33.45
27.38
2.38
.70
95.61
.11
4.28
Count
Count
Count
%
%
%
Value/Range
Value/Range
Value/Range
Code Value/Range Text
Code Value/Range Text
Code Value/Range Text
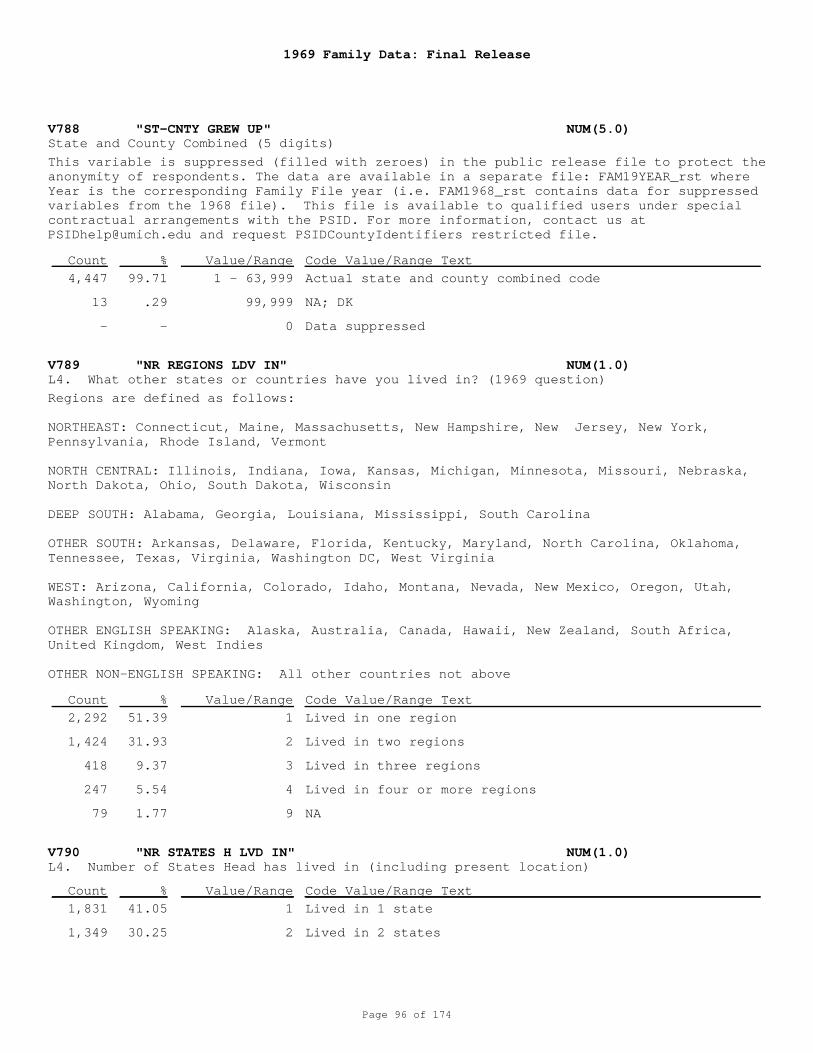
1969 Family Data: Final Release
Page 96 of 174
V788 "ST-CNTY GREW UP" NUM(5.0)
V789 "NR REGIONS LDV IN" NUM(1.0)
V790 "NR STATES H LVD IN" NUM(1.0)
State and County Combined (5 digits)
L4. What other states or countries have you lived in? (1969 question)
L4. Number of States Head has lived in (including present location)
1 - 63,999
99,999
0
1
2
3
4
9
1
2
Actual state and county combined code
NA; DK
Data suppressed
Lived in one region
Lived in two regions
Lived in three regions
Lived in four or more regions
NA
Lived in 1 state
Lived in 2 states
This variable is suppressed (filled with zeroes) in the public release file to protect theanonymity of respondents. The data are available in a separate file: FAM19YEAR_rst whereYear is the corresponding Family File year (i.e. FAM1968_rst contains data for suppressedvariables from the 1968 file). This file is available to qualified users under specialcontractual arrangements with the PSID. For more information, contact us [email protected] and request PSIDCountyIdentifiers restricted file.
Regions are defined as follows:
NORTHEAST: Connecticut, Maine, Massachusetts, New Hampshire, New Jersey, New York,Pennsylvania, Rhode Island, Vermont NORTH CENTRAL: Illinois, Indiana, Iowa, Kansas, Michigan, Minnesota, Missouri, Nebraska,North Dakota, Ohio, South Dakota, Wisconsin DEEP SOUTH: Alabama, Georgia, Louisiana, Mississippi, South Carolina
OTHER SOUTH: Arkansas, Delaware, Florida, Kentucky, Maryland, North Carolina, Oklahoma,Tennessee, Texas, Virginia, Washington DC, West Virginia WEST: Arizona, California, Colorado, Idaho, Montana, Nevada, New Mexico, Oregon, Utah,Washington, Wyoming
OTHER ENGLISH SPEAKING: Alaska, Australia, Canada, Hawaii, New Zealand, South Africa,United Kingdom, West Indies
OTHER NON-ENGLISH SPEAKING: All other countries not above
4,447
13
-
2,292
1,424
418
247
79
1,831
1,349
99.71
.29
-
51.39
31.93
9.37
5.54
1.77
41.05
30.25
Count
Count
Count
%
%
%
Value/Range
Value/Range
Value/Range
Code Value/Range Text
Code Value/Range Text
Code Value/Range Text
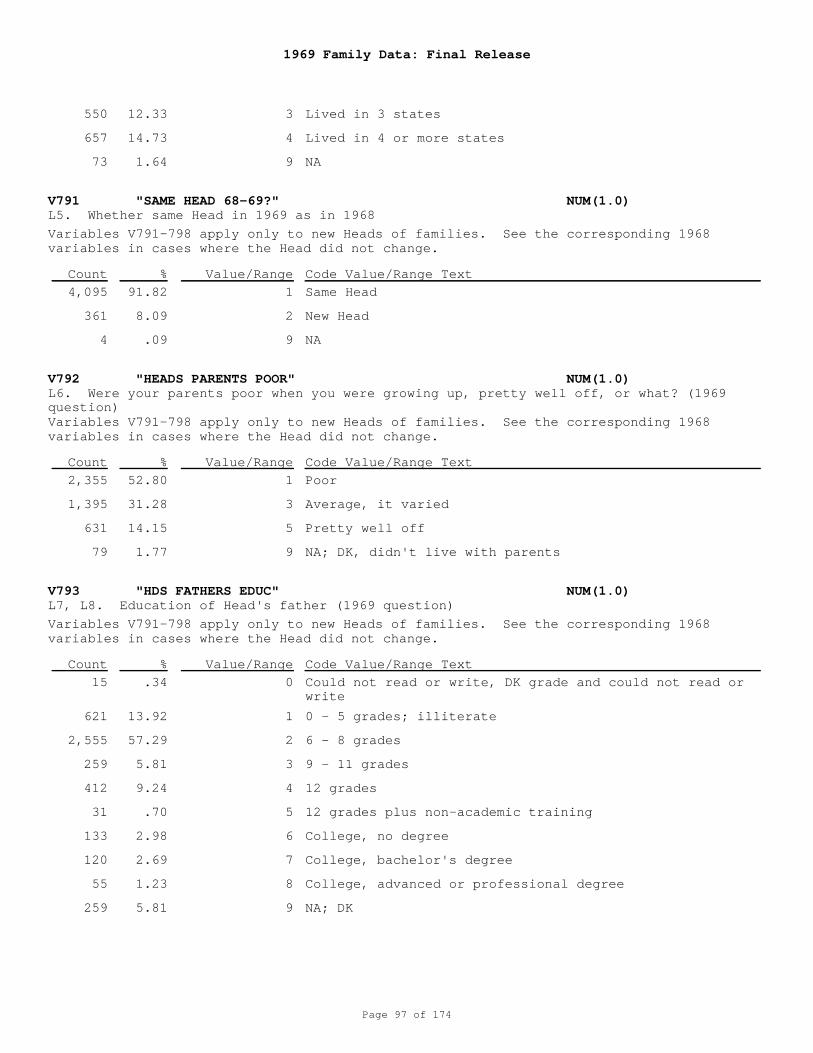
1969 Family Data: Final Release
Page 97 of 174
V791 "SAME HEAD 68-69?" NUM(1.0)
V792 "HEADS PARENTS POOR" NUM(1.0)
V793 "HDS FATHERS EDUC" NUM(1.0)
L5. Whether same Head in 1969 as in 1968
L6. Were your parents poor when you were growing up, pretty well off, or what? (1969question)
L7, L8. Education of Head's father (1969 question)
3
4
9
1
2
9
1
3
5
9
0
1
2
3
4
5
6
7
8
9
Lived in 3 states
Lived in 4 or more states
NA
Same Head
New Head
NA
Poor
Average, it varied
Pretty well off
NA; DK, didn't live with parents
Could not read or write, DK grade and could not read orwrite
0 - 5 grades; illiterate
6 - 8 grades
9 - 11 grades
12 grades
12 grades plus non-academic training
College, no degree
College, bachelor's degree
College, advanced or professional degree
NA; DK
Variables V791-798 apply only to new Heads of families. See the corresponding 1968variables in cases where the Head did not change.
Variables V791-798 apply only to new Heads of families. See the corresponding 1968variables in cases where the Head did not change.
Variables V791-798 apply only to new Heads of families. See the corresponding 1968variables in cases where the Head did not change.
550
657
73
4,095
361
4
2,355
1,395
631
79
15
621
2,555
259
412
31
133
120
55
259
12.33
14.73
1.64
91.82
8.09
.09
52.80
31.28
14.15
1.77
.34
13.92
57.29
5.81
9.24
.70
2.98
2.69
1.23
5.81
Count
Count
Count
%
%
%
Value/Range
Value/Range
Value/Range
Code Value/Range Text
Code Value/Range Text
Code Value/Range Text
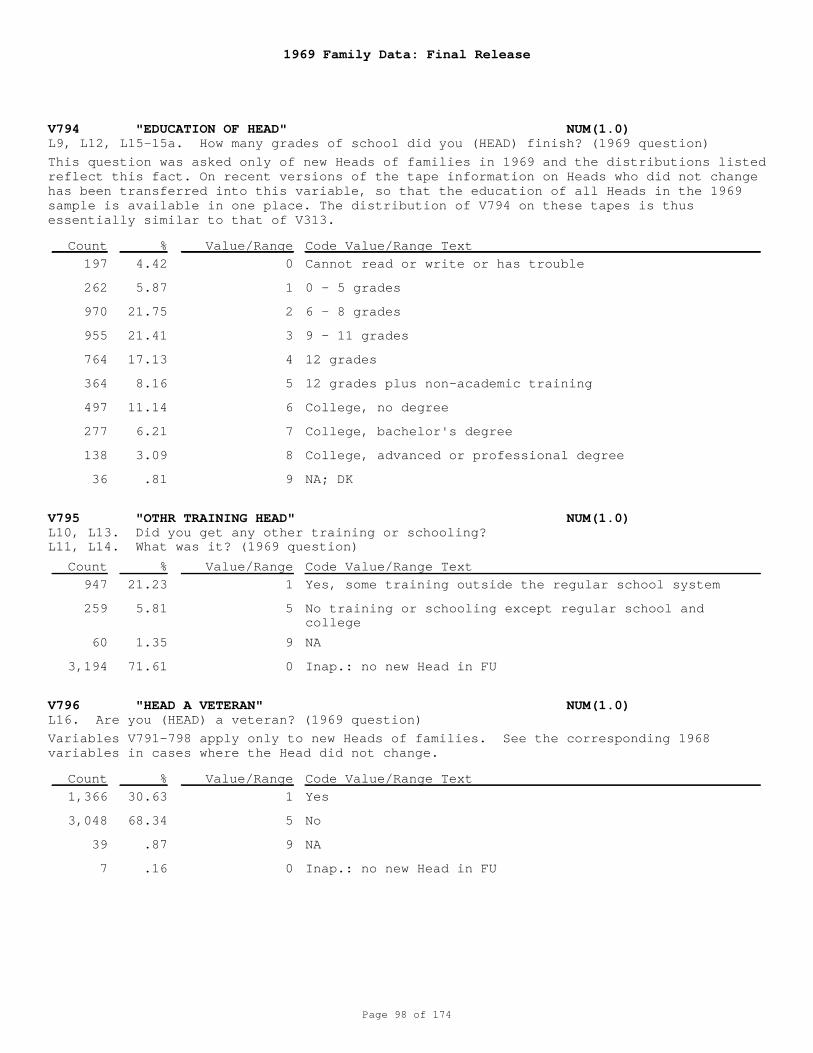
1969 Family Data: Final Release
Page 98 of 174
V794 "EDUCATION OF HEAD" NUM(1.0)
V795 "OTHR TRAINING HEAD" NUM(1.0)
V796 "HEAD A VETERAN" NUM(1.0)
L9, L12, L15-15a. How many grades of school did you (HEAD) finish? (1969 question)
L10, L13. Did you get any other training or schooling? L11, L14. What was it? (1969 question)
L16. Are you (HEAD) a veteran? (1969 question)
0
1
2
3
4
5
6
7
8
9
1
5
9
0
1
5
9
0
Cannot read or write or has trouble
0 - 5 grades
6 - 8 grades
9 - 11 grades
12 grades
12 grades plus non-academic training
College, no degree
College, bachelor's degree
College, advanced or professional degree
NA; DK
Yes, some training outside the regular school system
No training or schooling except regular school andcollege
NA
Inap.: no new Head in FU
Yes
No
NA
Inap.: no new Head in FU
This question was asked only of new Heads of families in 1969 and the distributions listedreflect this fact. On recent versions of the tape information on Heads who did not changehas been transferred into this variable, so that the education of all Heads in the 1969sample is available in one place. The distribution of V794 on these tapes is thusessentially similar to that of V313.
Variables V791-798 apply only to new Heads of families. See the corresponding 1968variables in cases where the Head did not change.
197
262
970
955
764
364
497
277
138
36
947
259
60
3,194
1,366
3,048
39
7
4.42
5.87
21.75
21.41
17.13
8.16
11.14
6.21
3.09
.81
21.23
5.81
1.35
71.61
30.63
68.34
.87
.16
Count
Count
Count
%
%
%
Value/Range
Value/Range
Value/Range
Code Value/Range Text
Code Value/Range Text
Code Value/Range Text
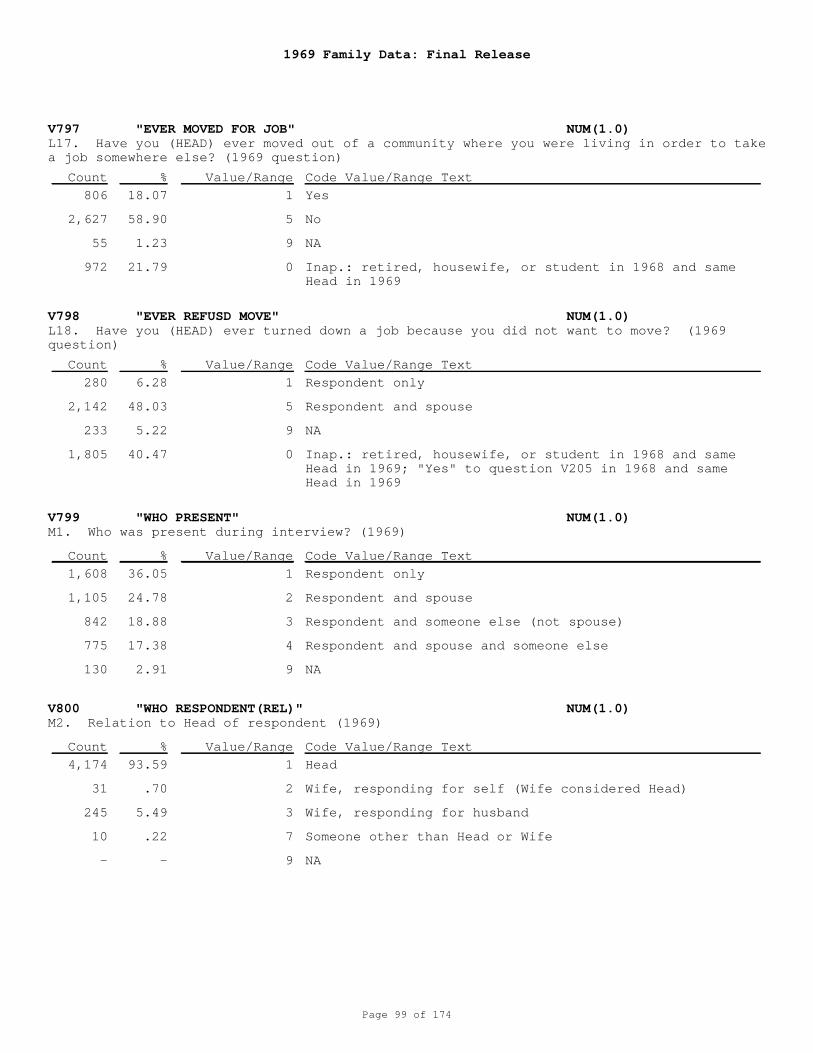
1969 Family Data: Final Release
Page 99 of 174
V797 "EVER MOVED FOR JOB" NUM(1.0)
V798 "EVER REFUSD MOVE" NUM(1.0)
V799 "WHO PRESENT" NUM(1.0)
V800 "WHO RESPONDENT(REL)" NUM(1.0)
L17. Have you (HEAD) ever moved out of a community where you were living in order to takea job somewhere else? (1969 question)
L18. Have you (HEAD) ever turned down a job because you did not want to move? (1969question)
M1. Who was present during interview? (1969)
M2. Relation to Head of respondent (1969)
1
5
9
0
1
5
9
0
1
2
3
4
9
1
2
3
7
9
Yes
No
NA
Inap.: retired, housewife, or student in 1968 and sameHead in 1969
Respondent only
Respondent and spouse
NA
Inap.: retired, housewife, or student in 1968 and sameHead in 1969; "Yes" to question V205 in 1968 and sameHead in 1969
Respondent only
Respondent and spouse
Respondent and someone else (not spouse)
Respondent and spouse and someone else
NA
Head
Wife, responding for self (Wife considered Head)
Wife, responding for husband
Someone other than Head or Wife
NA
806
2,627
55
972
280
2,142
233
1,805
1,608
1,105
842
775
130
4,174
31
245
10
-
18.07
58.90
1.23
21.79
6.28
48.03
5.22
40.47
36.05
24.78
18.88
17.38
2.91
93.59
.70
5.49
.22
-
Count
Count
Count
Count
%
%
%
%
Value/Range
Value/Range
Value/Range
Value/Range
Code Value/Range Text
Code Value/Range Text
Code Value/Range Text
Code Value/Range Text
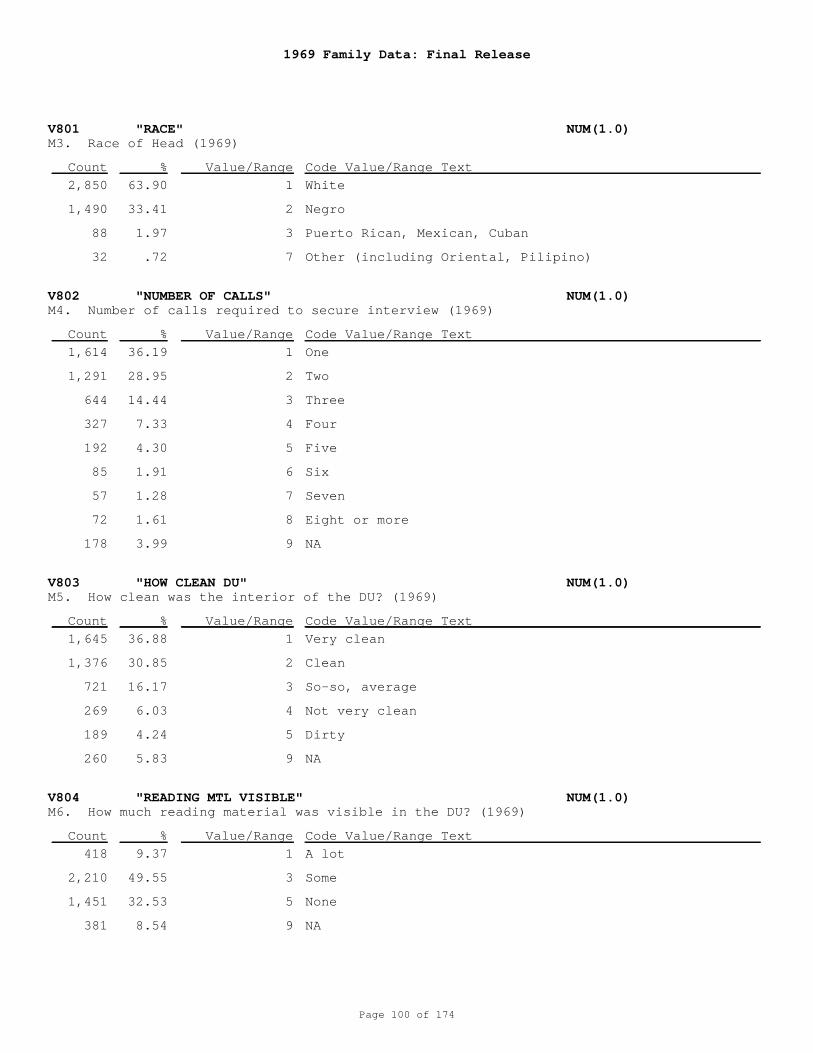
1969 Family Data: Final Release
Page 100 of 174
V801 "RACE" NUM(1.0)
V802 "NUMBER OF CALLS" NUM(1.0)
V803 "HOW CLEAN DU" NUM(1.0)
V804 "READING MTL VISIBLE" NUM(1.0)
M3. Race of Head (1969)
M4. Number of calls required to secure interview (1969)
M5. How clean was the interior of the DU? (1969)
M6. How much reading material was visible in the DU? (1969)
1
2
3
7
1
2
3
4
5
6
7
8
9
1
2
3
4
5
9
1
3
5
9
White
Negro
Puerto Rican, Mexican, Cuban
Other (including Oriental, Pilipino)
One
Two
Three
Four
Five
Six
Seven
Eight or more
NA
Very clean
Clean
So-so, average
Not very clean
Dirty
NA
A lot
Some
None
NA
2,850
1,490
88
32
1,614
1,291
644
327
192
85
57
72
178
1,645
1,376
721
269
189
260
418
2,210
1,451
381
63.90
33.41
1.97
.72
36.19
28.95
14.44
7.33
4.30
1.91
1.28
1.61
3.99
36.88
30.85
16.17
6.03
4.24
5.83
9.37
49.55
32.53
8.54
Count
Count
Count
Count
%
%
%
%
Value/Range
Value/Range
Value/Range
Value/Range
Code Value/Range Text
Code Value/Range Text
Code Value/Range Text
Code Value/Range Text
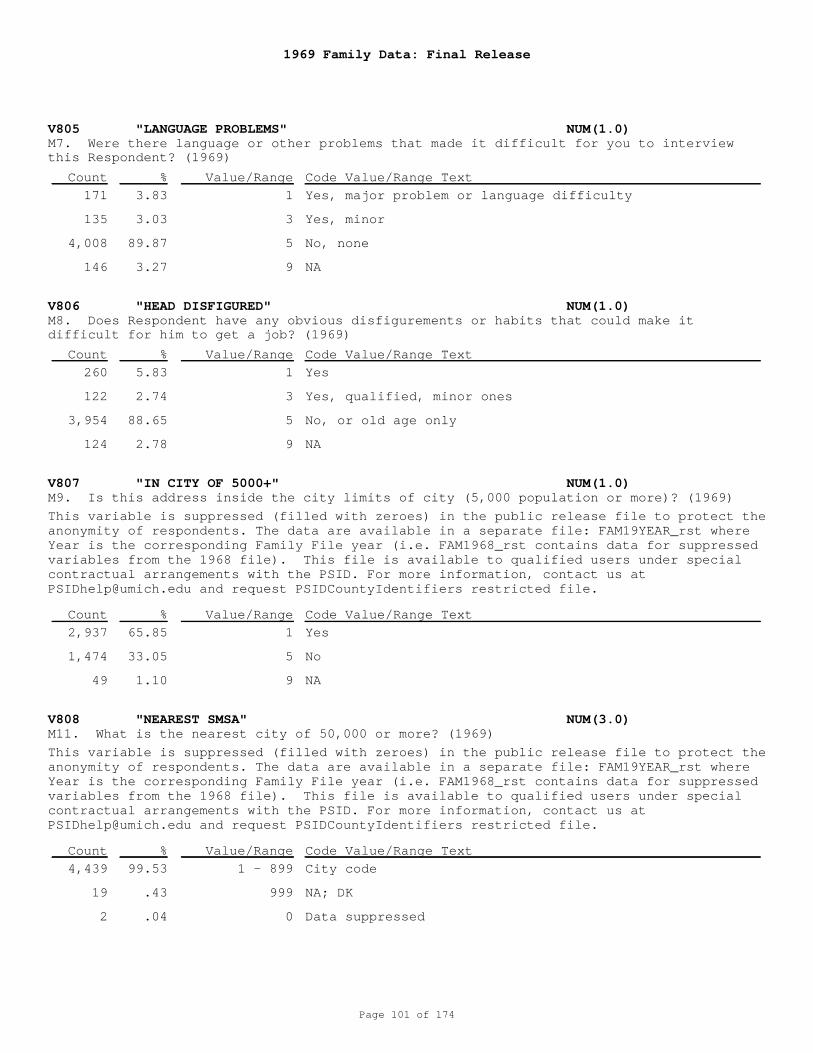
1969 Family Data: Final Release
Page 101 of 174
V805 "LANGUAGE PROBLEMS" NUM(1.0)
V806 "HEAD DISFIGURED" NUM(1.0)
V807 "IN CITY OF 5000+" NUM(1.0)
V808 "NEAREST SMSA" NUM(3.0)
M7. Were there language or other problems that made it difficult for you to interviewthis Respondent? (1969)
M8. Does Respondent have any obvious disfigurements or habits that could make itdifficult for him to get a job? (1969)
M9. Is this address inside the city limits of city (5,000 population or more)? (1969)
M11. What is the nearest city of 50,000 or more? (1969)
1
3
5
9
1
3
5
9
1
5
9
1 - 899
999
0
Yes, major problem or language difficulty
Yes, minor
No, none
NA
Yes
Yes, qualified, minor ones
No, or old age only
NA
Yes
No
NA
City code
NA; DK
Data suppressed
This variable is suppressed (filled with zeroes) in the public release file to protect theanonymity of respondents. The data are available in a separate file: FAM19YEAR_rst whereYear is the corresponding Family File year (i.e. FAM1968_rst contains data for suppressedvariables from the 1968 file). This file is available to qualified users under specialcontractual arrangements with the PSID. For more information, contact us [email protected] and request PSIDCountyIdentifiers restricted file.
This variable is suppressed (filled with zeroes) in the public release file to protect theanonymity of respondents. The data are available in a separate file: FAM19YEAR_rst whereYear is the corresponding Family File year (i.e. FAM1968_rst contains data for suppressedvariables from the 1968 file). This file is available to qualified users under specialcontractual arrangements with the PSID. For more information, contact us [email protected] and request PSIDCountyIdentifiers restricted file.
171
135
4,008
146
260
122
3,954
124
2,937
1,474
49
4,439
19
2
3.83
3.03
89.87
3.27
5.83
2.74
88.65
2.78
65.85
33.05
1.10
99.53
.43
.04
Count
Count
Count
Count
%
%
%
%
Value/Range
Value/Range
Value/Range
Value/Range
Code Value/Range Text
Code Value/Range Text
Code Value/Range Text
Code Value/Range Text
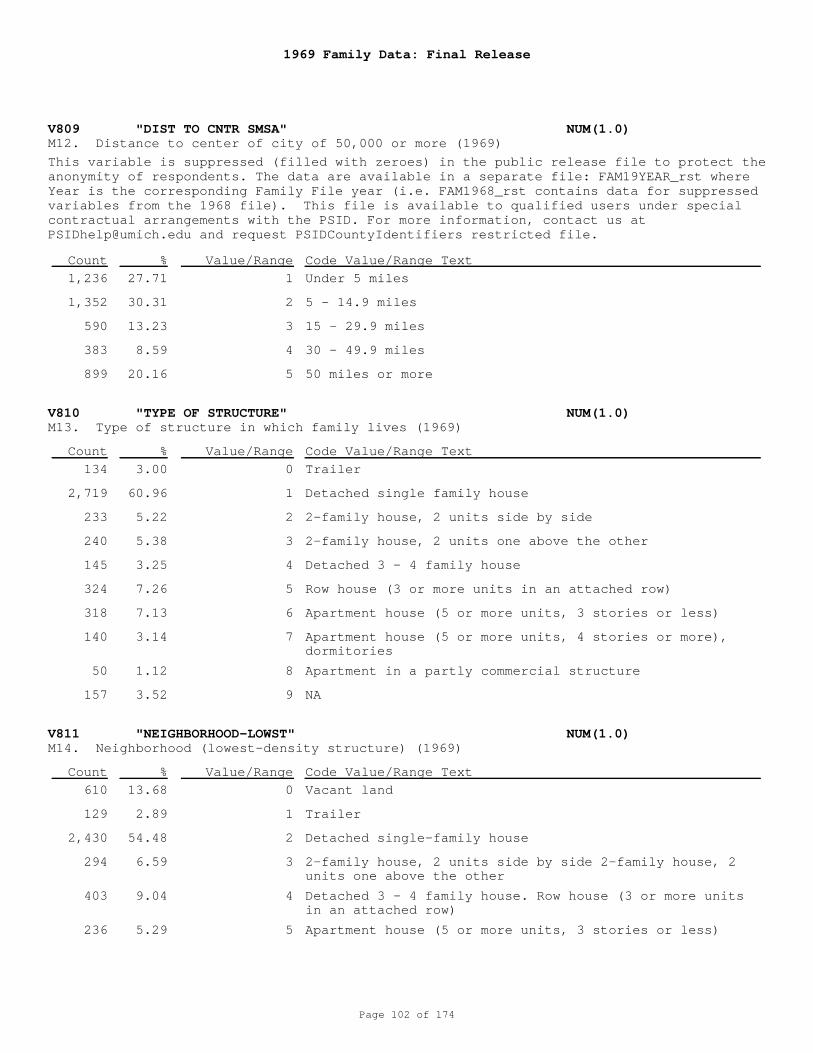
1969 Family Data: Final Release
Page 102 of 174
V809 "DIST TO CNTR SMSA" NUM(1.0)
V810 "TYPE OF STRUCTURE" NUM(1.0)
V811 "NEIGHBORHOOD-LOWST" NUM(1.0)
M12. Distance to center of city of 50,000 or more (1969)
M13. Type of structure in which family lives (1969)
M14. Neighborhood (lowest-density structure) (1969)
1
2
3
4
5
0
1
2
3
4
5
6
7
8
9
0
1
2
3
4
5
Under 5 miles
5 - 14.9 miles
15 - 29.9 miles
30 - 49.9 miles
50 miles or more
Trailer
Detached single family house
2-family house, 2 units side by side
2-family house, 2 units one above the other
Detached 3 - 4 family house
Row house (3 or more units in an attached row)
Apartment house (5 or more units, 3 stories or less)
Apartment house (5 or more units, 4 stories or more),dormitories
Apartment in a partly commercial structure
NA
Vacant land
Trailer
Detached single-family house
2-family house, 2 units side by side 2-family house, 2units one above the other
Detached 3 - 4 family house. Row house (3 or more unitsin an attached row)
Apartment house (5 or more units, 3 stories or less)
This variable is suppressed (filled with zeroes) in the public release file to protect theanonymity of respondents. The data are available in a separate file: FAM19YEAR_rst whereYear is the corresponding Family File year (i.e. FAM1968_rst contains data for suppressedvariables from the 1968 file). This file is available to qualified users under specialcontractual arrangements with the PSID. For more information, contact us [email protected] and request PSIDCountyIdentifiers restricted file.
1,236
1,352
590
383
899
134
2,719
233
240
145
324
318
140
50
157
610
129
2,430
294
403
236
27.71
30.31
13.23
8.59
20.16
3.00
60.96
5.22
5.38
3.25
7.26
7.13
3.14
1.12
3.52
13.68
2.89
54.48
6.59
9.04
5.29
Count
Count
Count
%
%
%
Value/Range
Value/Range
Value/Range
Code Value/Range Text
Code Value/Range Text
Code Value/Range Text
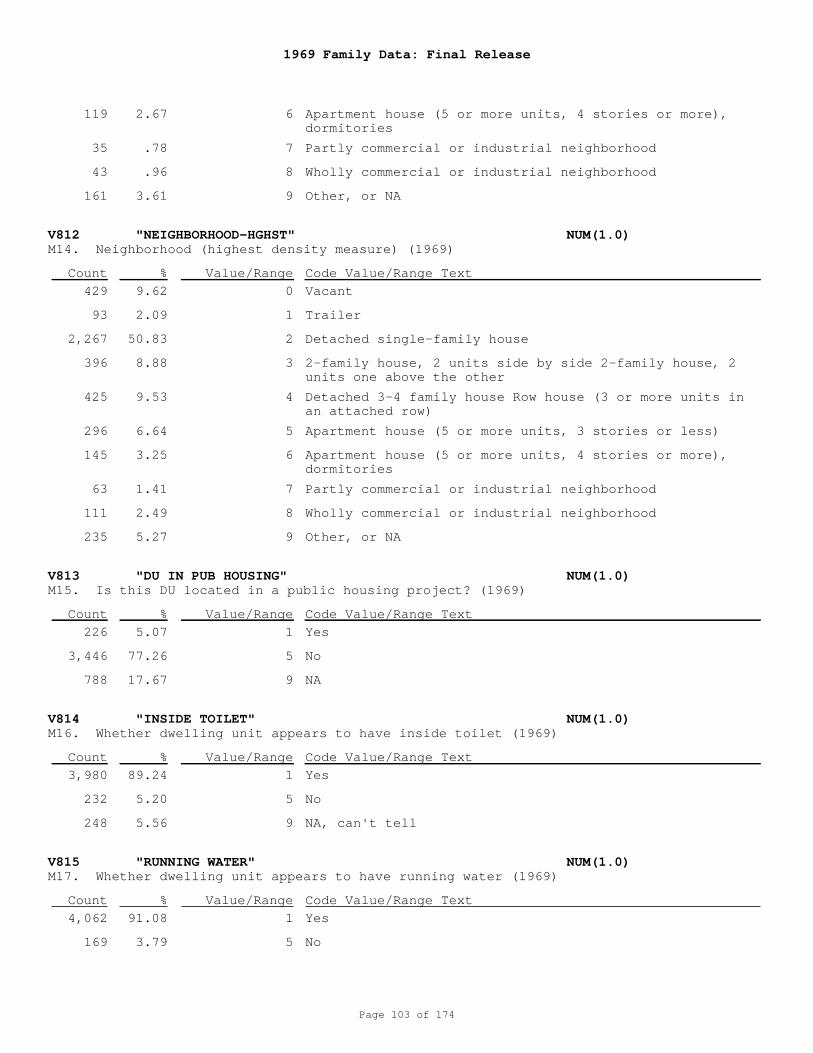
1969 Family Data: Final Release
Page 103 of 174
V812 "NEIGHBORHOOD-HGHST" NUM(1.0)
V813 "DU IN PUB HOUSING" NUM(1.0)
V814 "INSIDE TOILET" NUM(1.0)
V815 "RUNNING WATER" NUM(1.0)
M14. Neighborhood (highest density measure) (1969)
M15. Is this DU located in a public housing project? (1969)
M16. Whether dwelling unit appears to have inside toilet (1969)
M17. Whether dwelling unit appears to have running water (1969)
6
7
8
9
0
1
2
3
4
5
6
7
8
9
1
5
9
1
5
9
1
5
Apartment house (5 or more units, 4 stories or more),dormitories
Partly commercial or industrial neighborhood
Wholly commercial or industrial neighborhood
Other, or NA
Vacant
Trailer
Detached single-family house
2-family house, 2 units side by side 2-family house, 2units one above the other
Detached 3-4 family house Row house (3 or more units inan attached row)
Apartment house (5 or more units, 3 stories or less)
Apartment house (5 or more units, 4 stories or more),dormitories
Partly commercial or industrial neighborhood
Wholly commercial or industrial neighborhood
Other, or NA
Yes
No
NA
Yes
No
NA, can't tell
Yes
No
119
35
43
161
429
93
2,267
396
425
296
145
63
111
235
226
3,446
788
3,980
232
248
4,062
169
2.67
.78
.96
3.61
9.62
2.09
50.83
8.88
9.53
6.64
3.25
1.41
2.49
5.27
5.07
77.26
17.67
89.24
5.20
5.56
91.08
3.79
Count
Count
Count
Count
%
%
%
%
Value/Range
Value/Range
Value/Range
Value/Range
Code Value/Range Text
Code Value/Range Text
Code Value/Range Text
Code Value/Range Text
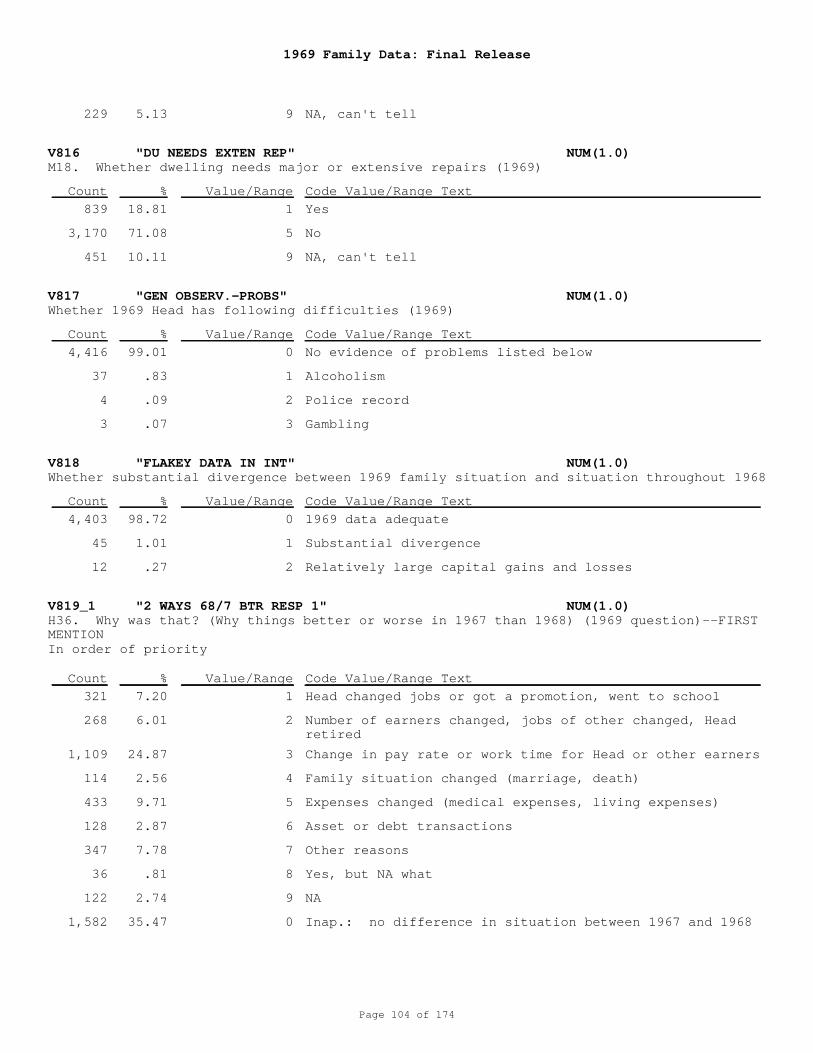
1969 Family Data: Final Release
Page 104 of 174
V816 "DU NEEDS EXTEN REP" NUM(1.0)
V817 "GEN OBSERV.-PROBS" NUM(1.0)
V818 "FLAKEY DATA IN INT" NUM(1.0)
V819_1 "2 WAYS 68/7 BTR RESP 1" NUM(1.0)
M18. Whether dwelling needs major or extensive repairs (1969)
Whether 1969 Head has following difficulties (1969)
Whether substantial divergence between 1969 family situation and situation throughout 1968
H36. Why was that? (Why things better or worse in 1967 than 1968) (1969 question)--FIRSTMENTION
9
1
5
9
0
1
2
3
0
1
2
1
2
3
4
5
6
7
8
9
0
NA, can't tell
Yes
No
NA, can't tell
No evidence of problems listed below
Alcoholism
Police record
Gambling
1969 data adequate
Substantial divergence
Relatively large capital gains and losses
Head changed jobs or got a promotion, went to school
Number of earners changed, jobs of other changed, Headretired
Change in pay rate or work time for Head or other earners
Family situation changed (marriage, death)
Expenses changed (medical expenses, living expenses)
Asset or debt transactions
Other reasons
Yes, but NA what
NA
Inap.: no difference in situation between 1967 and 1968
In order of priority
229
839
3,170
451
4,416
37
4
3
4,403
45
12
321
268
1,109
114
433
128
347
36
122
1,582
5.13
18.81
71.08
10.11
99.01
.83
.09
.07
98.72
1.01
.27
7.20
6.01
24.87
2.56
9.71
2.87
7.78
.81
2.74
35.47
Count
Count
Count
Count
%
%
%
%
Value/Range
Value/Range
Value/Range
Value/Range
Code Value/Range Text
Code Value/Range Text
Code Value/Range Text
Code Value/Range Text
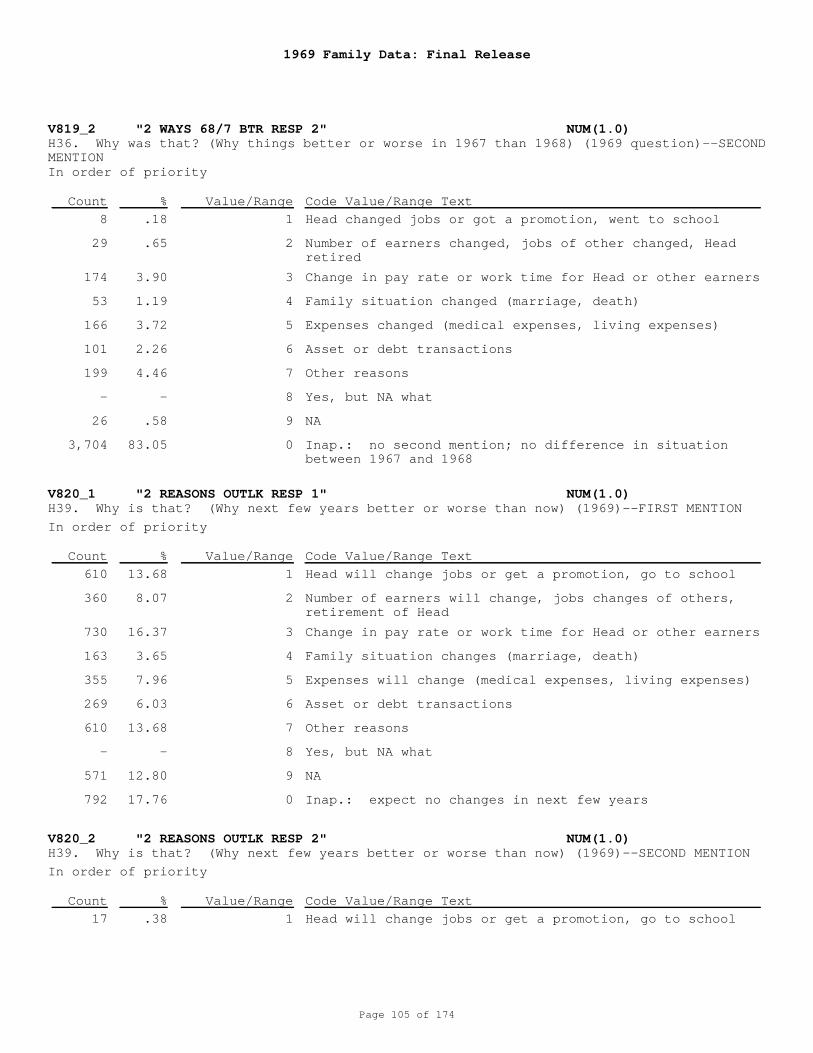
1969 Family Data: Final Release
Page 105 of 174
V819_2 "2 WAYS 68/7 BTR RESP 2" NUM(1.0)
V820_1 "2 REASONS OUTLK RESP 1" NUM(1.0)
V820_2 "2 REASONS OUTLK RESP 2" NUM(1.0)
H36. Why was that? (Why things better or worse in 1967 than 1968) (1969 question)--SECONDMENTION
H39. Why is that? (Why next few years better or worse than now) (1969)--FIRST MENTION
H39. Why is that? (Why next few years better or worse than now) (1969)--SECOND MENTION
1
2
3
4
5
6
7
8
9
0
1
2
3
4
5
6
7
8
9
0
1
Head changed jobs or got a promotion, went to school
Number of earners changed, jobs of other changed, Headretired
Change in pay rate or work time for Head or other earners
Family situation changed (marriage, death)
Expenses changed (medical expenses, living expenses)
Asset or debt transactions
Other reasons
Yes, but NA what
NA
Inap.: no second mention; no difference in situationbetween 1967 and 1968
Head will change jobs or get a promotion, go to school
Number of earners will change, jobs changes of others,retirement of Head
Change in pay rate or work time for Head or other earners
Family situation changes (marriage, death)
Expenses will change (medical expenses, living expenses)
Asset or debt transactions
Other reasons
Yes, but NA what
NA
Inap.: expect no changes in next few years
Head will change jobs or get a promotion, go to school
In order of priority
In order of priority
In order of priority
8
29
174
53
166
101
199
-
26
3,704
610
360
730
163
355
269
610
-
571
792
17
.18
.65
3.90
1.19
3.72
2.26
4.46
-
.58
83.05
13.68
8.07
16.37
3.65
7.96
6.03
13.68
-
12.80
17.76
.38
Count
Count
Count
%
%
%
Value/Range
Value/Range
Value/Range
Code Value/Range Text
Code Value/Range Text
Code Value/Range Text
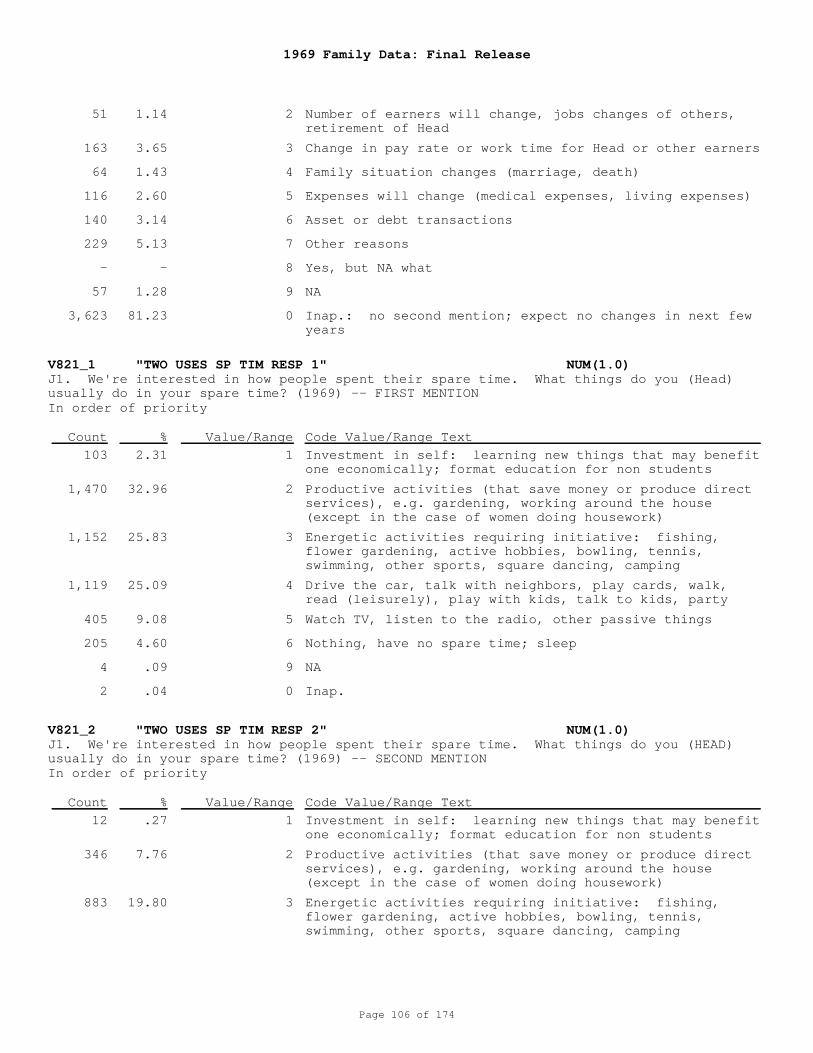
1969 Family Data: Final Release
Page 106 of 174
V821_1 "TWO USES SP TIM RESP 1" NUM(1.0)
V821_2 "TWO USES SP TIM RESP 2" NUM(1.0)
J1. We're interested in how people spent their spare time. What things do you (Head)usually do in your spare time? (1969) -- FIRST MENTION
J1. We're interested in how people spent their spare time. What things do you (HEAD)usually do in your spare time? (1969) -- SECOND MENTION
2
3
4
5
6
7
8
9
0
1
2
3
4
5
6
9
0
1
2
3
Number of earners will change, jobs changes of others,retirement of Head
Change in pay rate or work time for Head or other earners
Family situation changes (marriage, death)
Expenses will change (medical expenses, living expenses)
Asset or debt transactions
Other reasons
Yes, but NA what
NA
Inap.: no second mention; expect no changes in next fewyears
Investment in self: learning new things that may benefitone economically; format education for non students
Productive activities (that save money or produce directservices), e.g. gardening, working around the house(except in the case of women doing housework)
Energetic activities requiring initiative: fishing,flower gardening, active hobbies, bowling, tennis,swimming, other sports, square dancing, camping
Drive the car, talk with neighbors, play cards, walk,read (leisurely), play with kids, talk to kids, party
Watch TV, listen to the radio, other passive things
Nothing, have no spare time; sleep
NA
Inap.
Investment in self: learning new things that may benefitone economically; format education for non students
Productive activities (that save money or produce directservices), e.g. gardening, working around the house(except in the case of women doing housework)
Energetic activities requiring initiative: fishing,flower gardening, active hobbies, bowling, tennis,swimming, other sports, square dancing, camping
In order of priority
In order of priority
51
163
64
116
140
229
-
57
3,623
103
1,470
1,152
1,119
405
205
4
2
12
346
883
1.14
3.65
1.43
2.60
3.14
5.13
-
1.28
81.23
2.31
32.96
25.83
25.09
9.08
4.60
.09
.04
.27
7.76
19.80
Count
Count
%
%
Value/Range
Value/Range
Code Value/Range Text
Code Value/Range Text
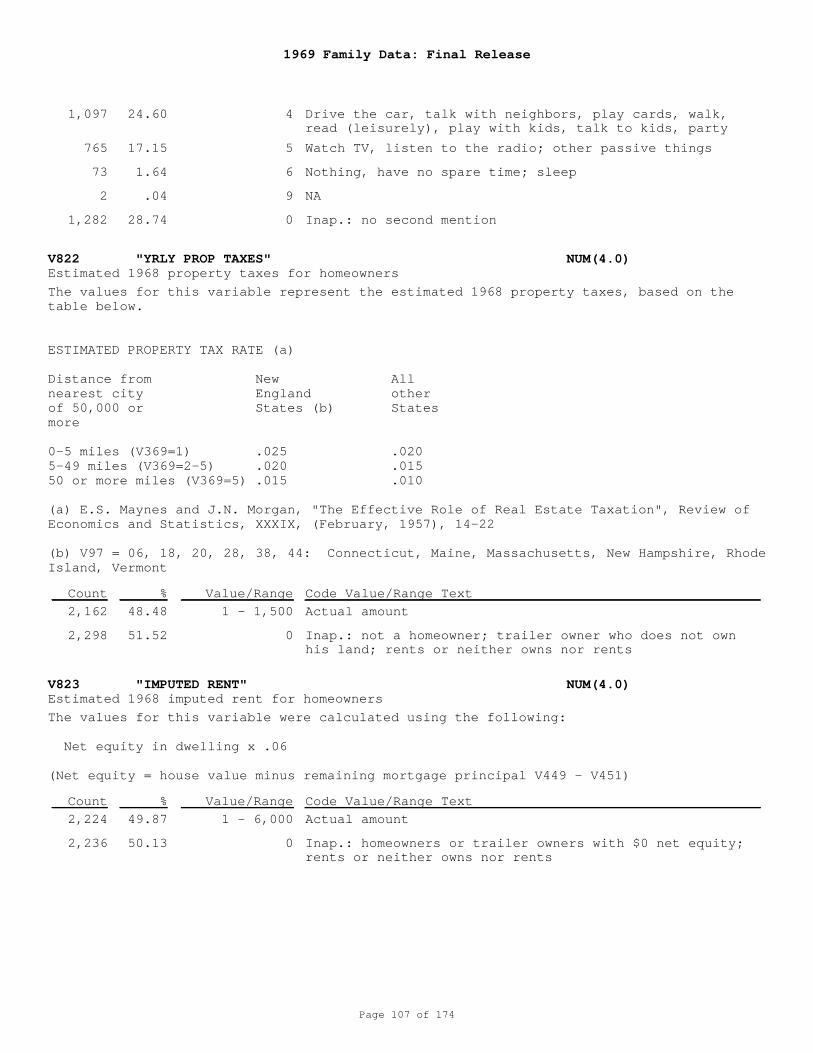
1969 Family Data: Final Release
Page 107 of 174
V822 "YRLY PROP TAXES" NUM(4.0)
V823 "IMPUTED RENT" NUM(4.0)
Estimated 1968 property taxes for homeowners
Estimated 1968 imputed rent for homeowners
4
5
6
9
0
1 - 1,500
0
1 - 6,000
0
Drive the car, talk with neighbors, play cards, walk,read (leisurely), play with kids, talk to kids, party
Watch TV, listen to the radio; other passive things
Nothing, have no spare time; sleep
NA
Inap.: no second mention
Actual amount
Inap.: not a homeowner; trailer owner who does not ownhis land; rents or neither owns nor rents
Actual amount
Inap.: homeowners or trailer owners with $0 net equity;rents or neither owns nor rents
The values for this variable represent the estimated 1968 property taxes, based on thetable below.
ESTIMATED PROPERTY TAX RATE (a)
Distance from New Allnearest city England otherof 50,000 or States (b) States more
0-5 miles (V369=1) .025 .0205-49 miles (V369=2-5) .020 .01550 or more miles (V369=5) .015 .010
(a) E.S. Maynes and J.N. Morgan, "The Effective Role of Real Estate Taxation", Review ofEconomics and Statistics, XXXIX, (February, 1957), 14-22
(b) V97 = 06, 18, 20, 28, 38, 44: Connecticut, Maine, Massachusetts, New Hampshire, RhodeIsland, Vermont
The values for this variable were calculated using the following:
Net equity in dwelling x .06
(Net equity = house value minus remaining mortgage principal V449 - V451)
1,097
765
73
2
1,282
2,162
2,298
2,224
2,236
24.60
17.15
1.64
.04
28.74
48.48
51.52
49.87
50.13
Count
Count
%
%
Value/Range
Value/Range
Code Value/Range Text
Code Value/Range Text
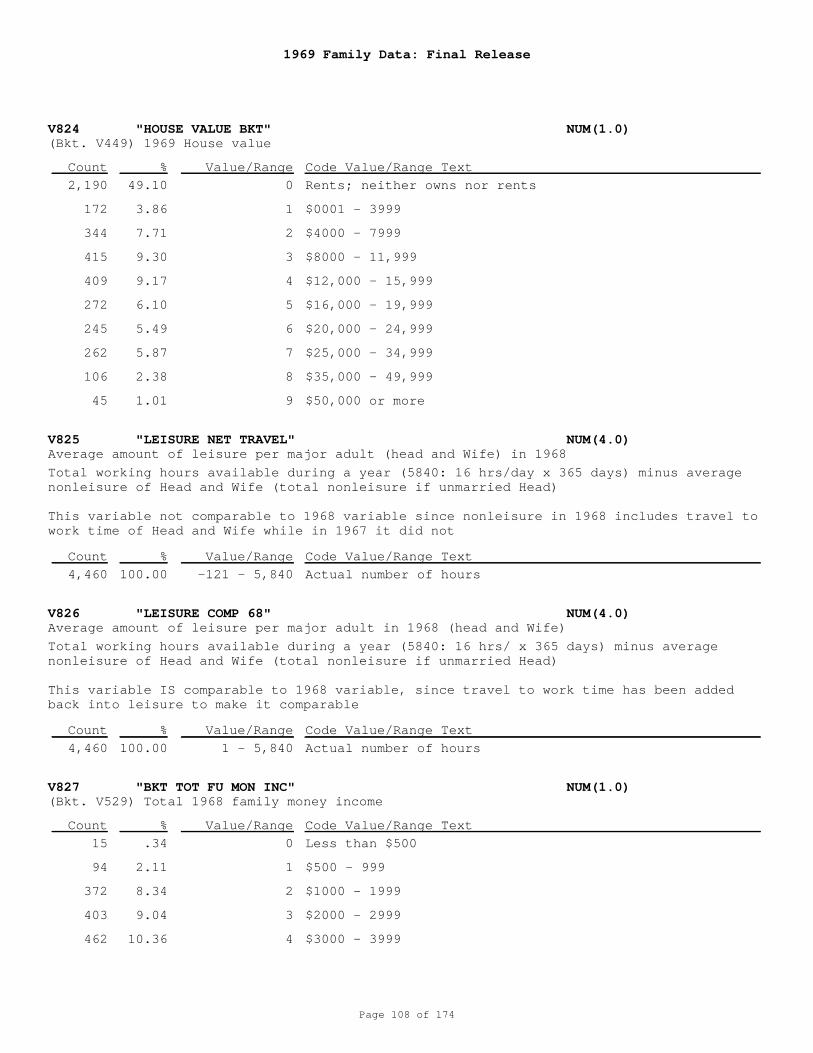
1969 Family Data: Final Release
Page 108 of 174
V824 "HOUSE VALUE BKT" NUM(1.0)
V825 "LEISURE NET TRAVEL" NUM(4.0)
V826 "LEISURE COMP 68" NUM(4.0)
V827 "BKT TOT FU MON INC" NUM(1.0)
(Bkt. V449) 1969 House value
Average amount of leisure per major adult (head and Wife) in 1968
Average amount of leisure per major adult in 1968 (head and Wife)
(Bkt. V529) Total 1968 family money income
0
1
2
3
4
5
6
7
8
9
-121 - 5,840
1 - 5,840
0
1
2
3
4
Rents; neither owns nor rents
$0001 - 3999
$4000 - 7999
$8000 - 11,999
$12,000 - 15,999
$16,000 - 19,999
$20,000 - 24,999
$25,000 - 34,999
$35,000 - 49,999
$50,000 or more
Actual number of hours
Actual number of hours
Less than $500
$500 - 999
$1000 - 1999
$2000 - 2999
$3000 - 3999
Total working hours available during a year (5840: 16 hrs/day x 365 days) minus averagenonleisure of Head and Wife (total nonleisure if unmarried Head)
This variable not comparable to 1968 variable since nonleisure in 1968 includes travel towork time of Head and Wife while in 1967 it did not
Total working hours available during a year (5840: 16 hrs/ x 365 days) minus averagenonleisure of Head and Wife (total nonleisure if unmarried Head)
This variable IS comparable to 1968 variable, since travel to work time has been addedback into leisure to make it comparable
2,190
172
344
415
409
272
245
262
106
45
4,460
4,460
15
94
372
403
462
49.10
3.86
7.71
9.30
9.17
6.10
5.49
5.87
2.38
1.01
100.00
100.00
.34
2.11
8.34
9.04
10.36
Count
Count
Count
Count
%
%
%
%
Value/Range
Value/Range
Value/Range
Value/Range
Code Value/Range Text
Code Value/Range Text
Code Value/Range Text
Code Value/Range Text
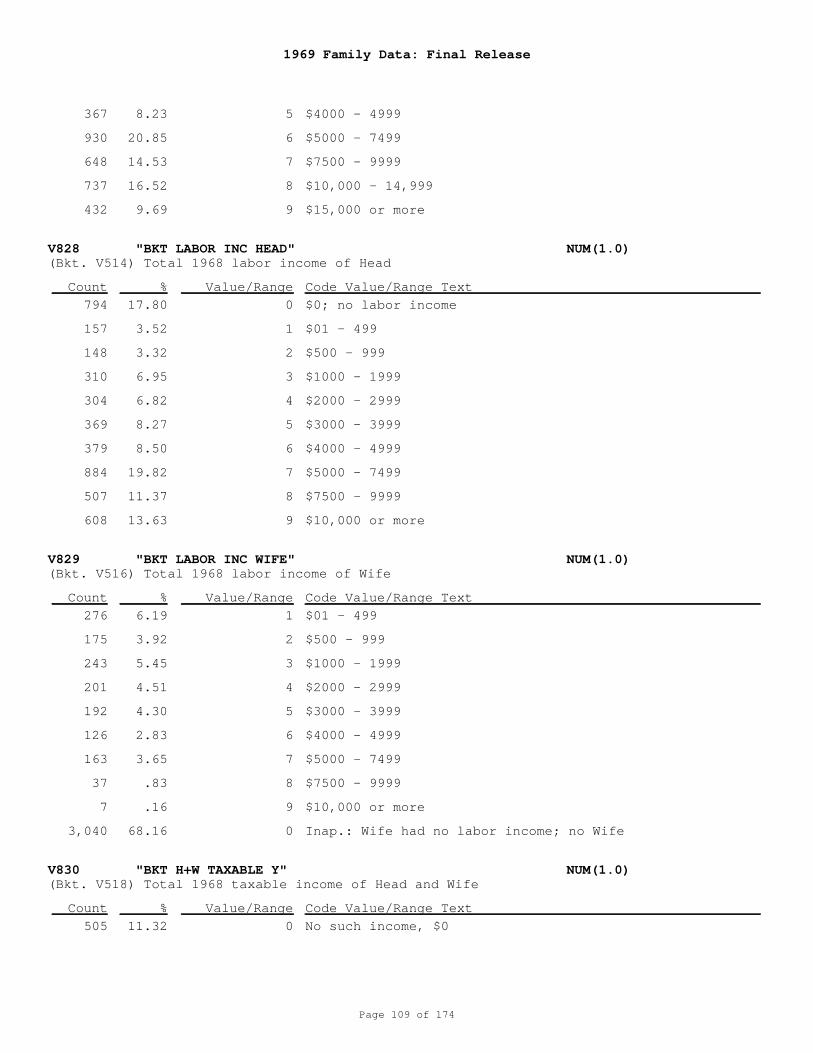
1969 Family Data: Final Release
Page 109 of 174
V828 "BKT LABOR INC HEAD" NUM(1.0)
V829 "BKT LABOR INC WIFE" NUM(1.0)
V830 "BKT H+W TAXABLE Y" NUM(1.0)
(Bkt. V514) Total 1968 labor income of Head
(Bkt. V516) Total 1968 labor income of Wife
(Bkt. V518) Total 1968 taxable income of Head and Wife
5
6
7
8
9
0
1
2
3
4
5
6
7
8
9
1
2
3
4
5
6
7
8
9
0
0
$4000 - 4999
$5000 - 7499
$7500 - 9999
$10,000 - 14,999
$15,000 or more
$0; no labor income
$01 - 499
$500 - 999
$1000 - 1999
$2000 - 2999
$3000 - 3999
$4000 - 4999
$5000 - 7499
$7500 - 9999
$10,000 or more
$01 - 499
$500 - 999
$1000 - 1999
$2000 - 2999
$3000 - 3999
$4000 - 4999
$5000 - 7499
$7500 - 9999
$10,000 or more
Inap.: Wife had no labor income; no Wife
No such income, $0
367
930
648
737
432
794
157
148
310
304
369
379
884
507
608
276
175
243
201
192
126
163
37
7
3,040
505
8.23
20.85
14.53
16.52
9.69
17.80
3.52
3.32
6.95
6.82
8.27
8.50
19.82
11.37
13.63
6.19
3.92
5.45
4.51
4.30
2.83
3.65
.83
.16
68.16
11.32
Count
Count
Count
%
%
%
Value/Range
Value/Range
Value/Range
Code Value/Range Text
Code Value/Range Text
Code Value/Range Text
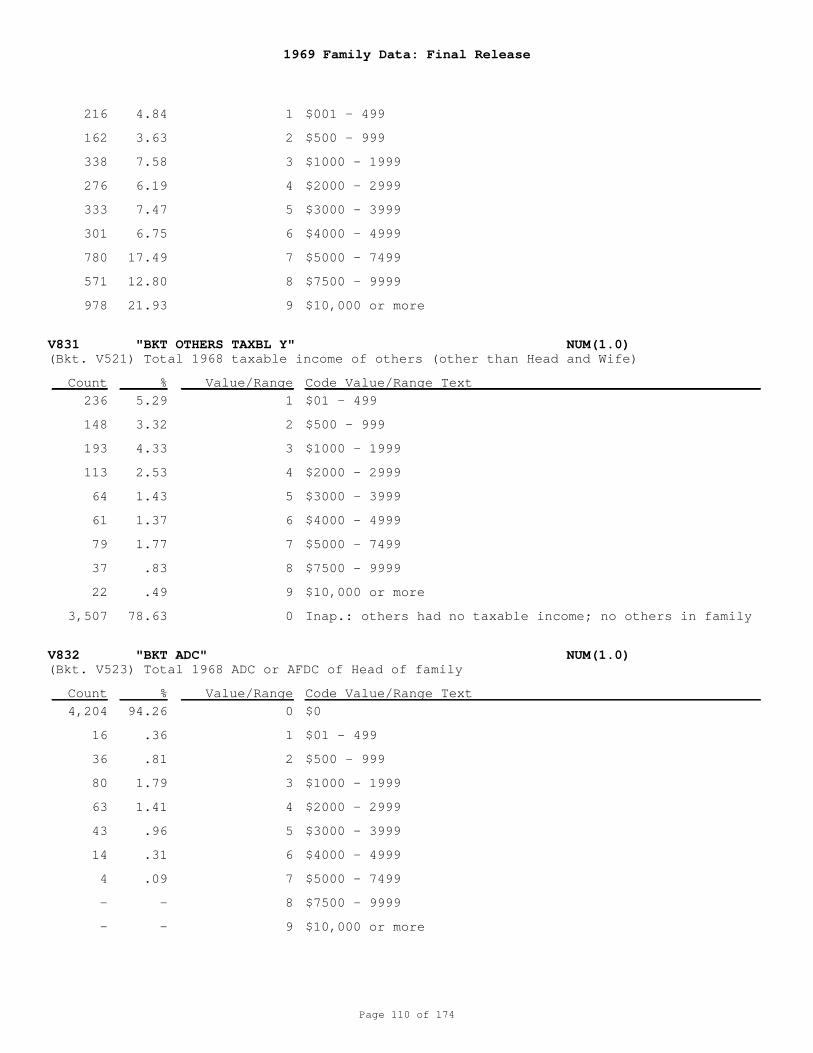
1969 Family Data: Final Release
Page 110 of 174
V831 "BKT OTHERS TAXBL Y" NUM(1.0)
V832 "BKT ADC" NUM(1.0)
(Bkt. V521) Total 1968 taxable income of others (other than Head and Wife)
(Bkt. V523) Total 1968 ADC or AFDC of Head of family
1
2
3
4
5
6
7
8
9
1
2
3
4
5
6
7
8
9
0
0
1
2
3
4
5
6
7
8
9
$001 - 499
$500 - 999
$1000 - 1999
$2000 - 2999
$3000 - 3999
$4000 - 4999
$5000 - 7499
$7500 - 9999
$10,000 or more
$01 - 499
$500 - 999
$1000 - 1999
$2000 - 2999
$3000 - 3999
$4000 - 4999
$5000 - 7499
$7500 - 9999
$10,000 or more
Inap.: others had no taxable income; no others in family
$0
$01 - 499
$500 - 999
$1000 - 1999
$2000 - 2999
$3000 - 3999
$4000 - 4999
$5000 - 7499
$7500 - 9999
$10,000 or more
216
162
338
276
333
301
780
571
978
236
148
193
113
64
61
79
37
22
3,507
4,204
16
36
80
63
43
14
4
-
-
4.84
3.63
7.58
6.19
7.47
6.75
17.49
12.80
21.93
5.29
3.32
4.33
2.53
1.43
1.37
1.77
.83
.49
78.63
94.26
.36
.81
1.79
1.41
.96
.31
.09
-
-
Count
Count
%
%
Value/Range
Value/Range
Code Value/Range Text
Code Value/Range Text
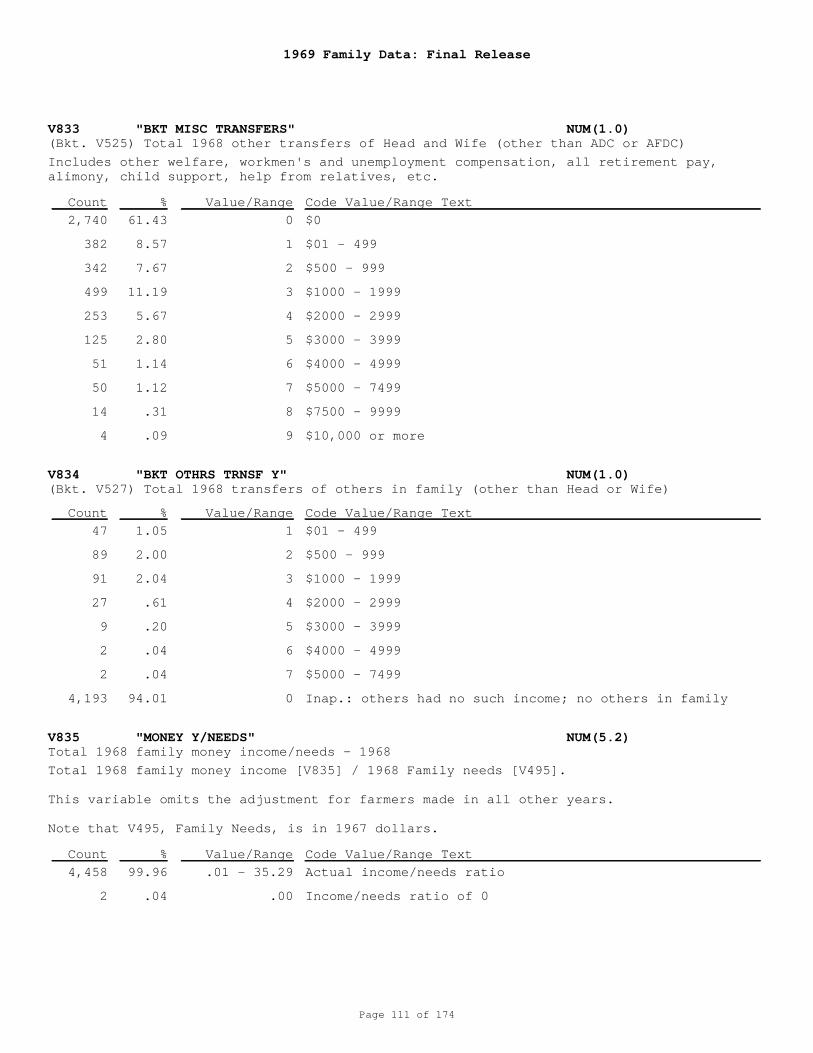
1969 Family Data: Final Release
Page 111 of 174
V833 "BKT MISC TRANSFERS" NUM(1.0)
V834 "BKT OTHRS TRNSF Y" NUM(1.0)
V835 "MONEY Y/NEEDS" NUM(5.2)
(Bkt. V525) Total 1968 other transfers of Head and Wife (other than ADC or AFDC)
(Bkt. V527) Total 1968 transfers of others in family (other than Head or Wife)
Total 1968 family money income/needs - 1968
0
1
2
3
4
5
6
7
8
9
1
2
3
4
5
6
7
0
.01 - 35.29
.00
$0
$01 - 499
$500 - 999
$1000 - 1999
$2000 - 2999
$3000 - 3999
$4000 - 4999
$5000 - 7499
$7500 - 9999
$10,000 or more
$01 - 499
$500 - 999
$1000 - 1999
$2000 - 2999
$3000 - 3999
$4000 - 4999
$5000 - 7499
Inap.: others had no such income; no others in family
Actual income/needs ratio
Income/needs ratio of 0
Includes other welfare, workmen's and unemployment compensation, all retirement pay,alimony, child support, help from relatives, etc.
Total 1968 family money income [V835] / 1968 Family needs [V495].
This variable omits the adjustment for farmers made in all other years.
Note that V495, Family Needs, is in 1967 dollars.
2,740
382
342
499
253
125
51
50
14
4
47
89
91
27
9
2
2
4,193
4,458
2
61.43
8.57
7.67
11.19
5.67
2.80
1.14
1.12
.31
.09
1.05
2.00
2.04
.61
.20
.04
.04
94.01
99.96
.04
Count
Count
Count
%
%
%
Value/Range
Value/Range
Value/Range
Code Value/Range Text
Code Value/Range Text
Code Value/Range Text
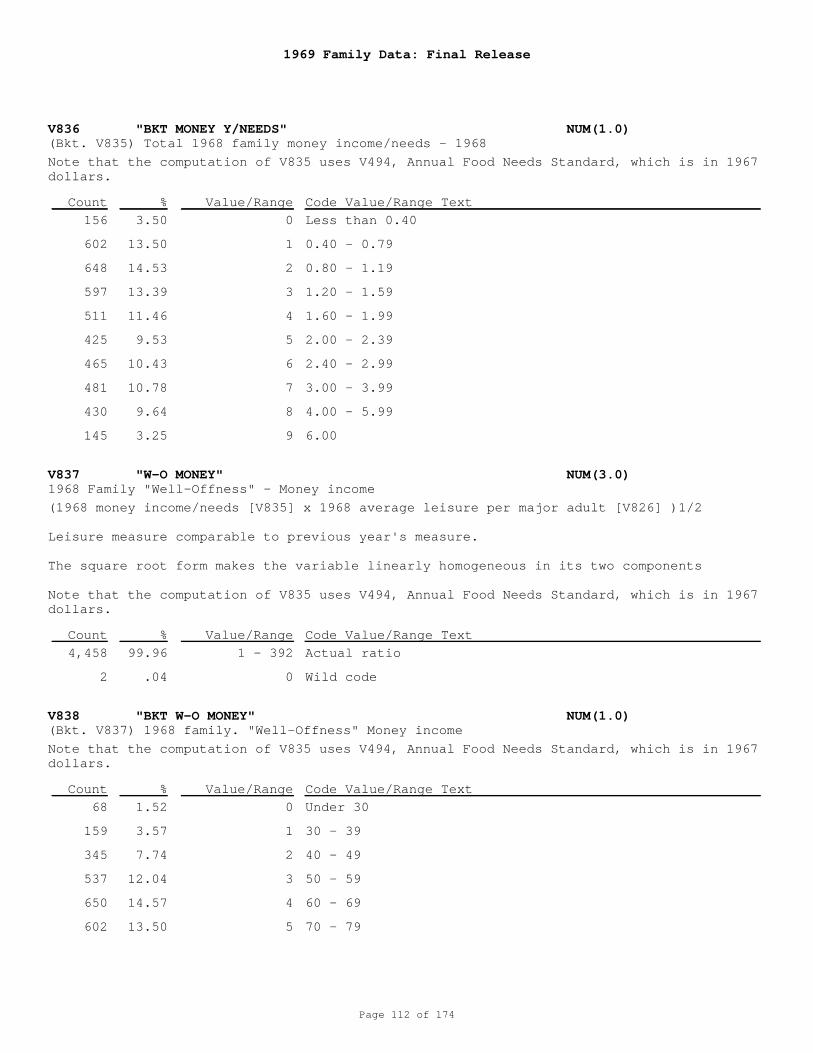
1969 Family Data: Final Release
Page 112 of 174
V836 "BKT MONEY Y/NEEDS" NUM(1.0)
V837 "W-O MONEY" NUM(3.0)
V838 "BKT W-O MONEY" NUM(1.0)
(Bkt. V835) Total 1968 family money income/needs - 1968
1968 Family "Well-Offness" - Money income
(Bkt. V837) 1968 family. "Well-Offness" Money income
0
1
2
3
4
5
6
7
8
9
1 - 392
0
0
1
2
3
4
5
Less than 0.40
0.40 - 0.79
0.80 - 1.19
1.20 - 1.59
1.60 - 1.99
2.00 - 2.39
2.40 - 2.99
3.00 - 3.99
4.00 - 5.99
6.00
Actual ratio
Wild code
Under 30
30 - 39
40 - 49
50 - 59
60 - 69
70 - 79
Note that the computation of V835 uses V494, Annual Food Needs Standard, which is in 1967dollars.
(1968 money income/needs [V835] x 1968 average leisure per major adult [V826] )1/2
Leisure measure comparable to previous year's measure.
The square root form makes the variable linearly homogeneous in its two components
Note that the computation of V835 uses V494, Annual Food Needs Standard, which is in 1967dollars.
Note that the computation of V835 uses V494, Annual Food Needs Standard, which is in 1967dollars.
156
602
648
597
511
425
465
481
430
145
4,458
2
68
159
345
537
650
602
3.50
13.50
14.53
13.39
11.46
9.53
10.43
10.78
9.64
3.25
99.96
.04
1.52
3.57
7.74
12.04
14.57
13.50
Count
Count
Count
%
%
%
Value/Range
Value/Range
Value/Range
Code Value/Range Text
Code Value/Range Text
Code Value/Range Text
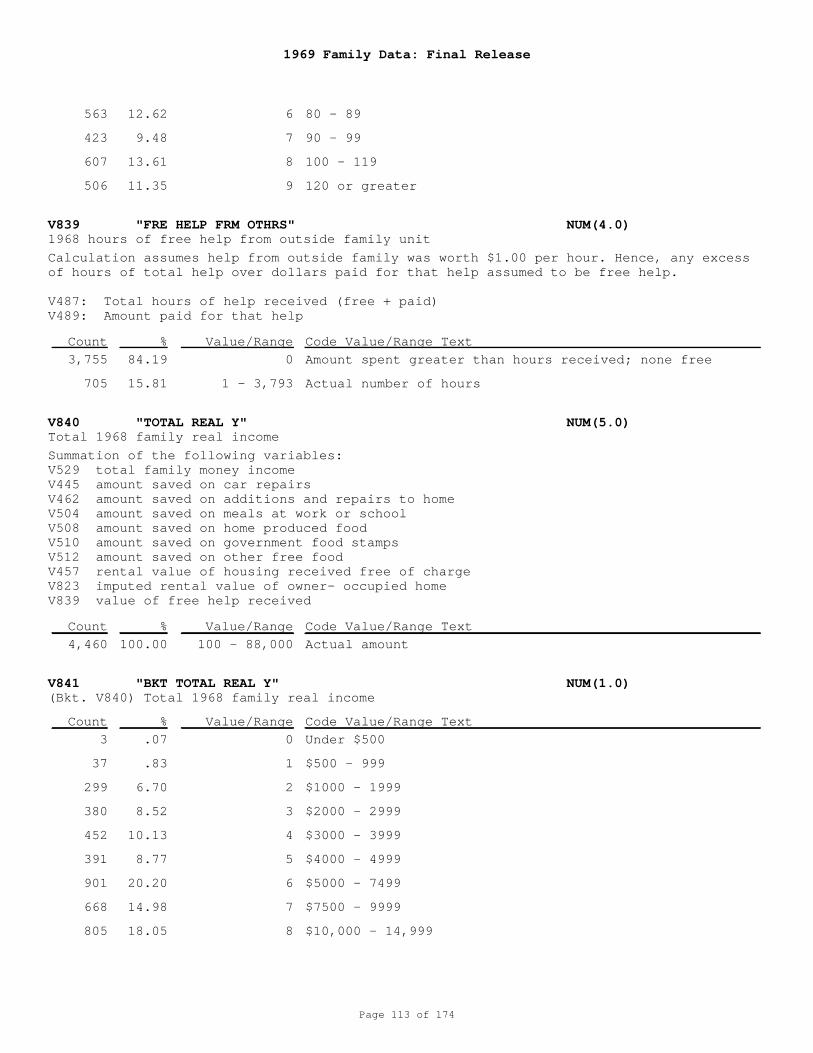
1969 Family Data: Final Release
Page 113 of 174
V839 "FRE HELP FRM OTHRS" NUM(4.0)
V840 "TOTAL REAL Y" NUM(5.0)
V841 "BKT TOTAL REAL Y" NUM(1.0)
1968 hours of free help from outside family unit
Total 1968 family real income
(Bkt. V840) Total 1968 family real income
6
7
8
9
0
1 - 3,793
100 - 88,000
0
1
2
3
4
5
6
7
8
80 - 89
90 - 99
100 - 119
120 or greater
Amount spent greater than hours received; none free
Actual number of hours
Actual amount
Under $500
$500 - 999
$1000 - 1999
$2000 - 2999
$3000 - 3999
$4000 - 4999
$5000 - 7499
$7500 - 9999
$10,000 - 14,999
Calculation assumes help from outside family was worth $1.00 per hour. Hence, any excessof hours of total help over dollars paid for that help assumed to be free help.
V487: Total hours of help received (free + paid) V489: Amount paid for that help
Summation of the following variables: V529 total family money income V445 amount saved on car repairs V462 amount saved on additions and repairs to home V504 amount saved on meals at work or school V508 amount saved on home produced food V510 amount saved on government food stamps V512 amount saved on other free food V457 rental value of housing received free of charge V823 imputed rental value of owner- occupied home V839 value of free help received
563
423
607
506
3,755
705
4,460
3
37
299
380
452
391
901
668
805
12.62
9.48
13.61
11.35
84.19
15.81
100.00
.07
.83
6.70
8.52
10.13
8.77
20.20
14.98
18.05
Count
Count
Count
%
%
%
Value/Range
Value/Range
Value/Range
Code Value/Range Text
Code Value/Range Text
Code Value/Range Text
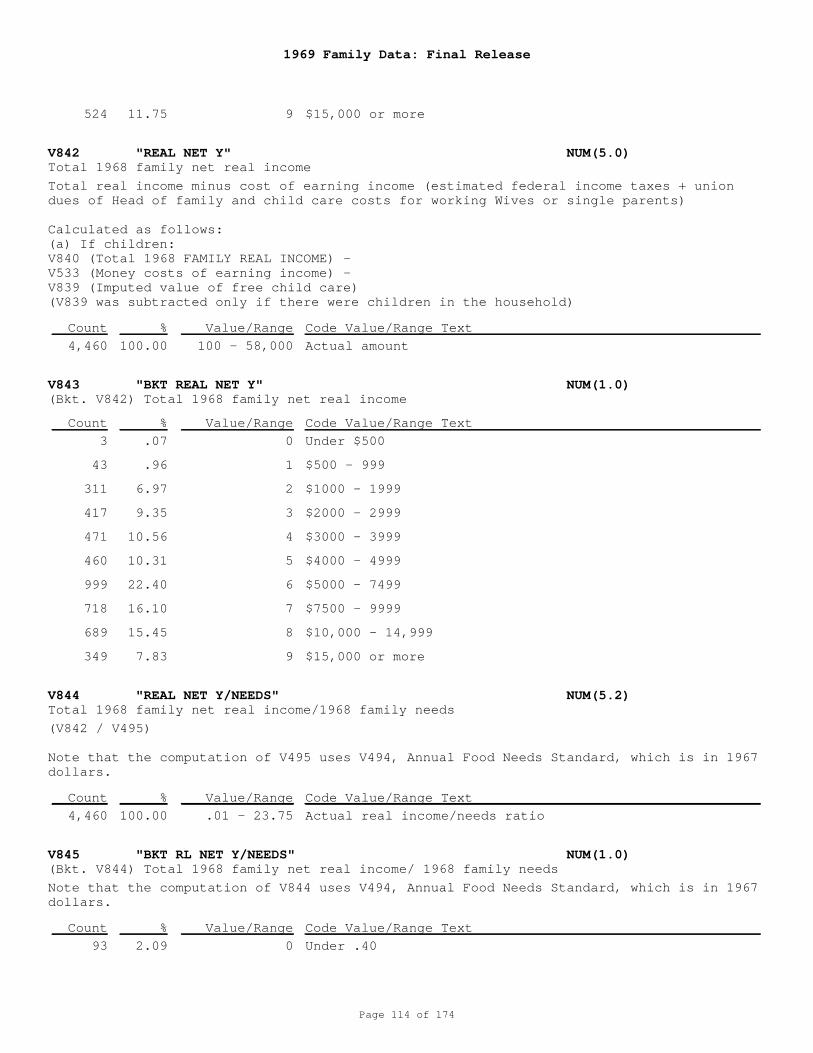
1969 Family Data: Final Release
Page 114 of 174
V842 "REAL NET Y" NUM(5.0)
V843 "BKT REAL NET Y" NUM(1.0)
V844 "REAL NET Y/NEEDS" NUM(5.2)
V845 "BKT RL NET Y/NEEDS" NUM(1.0)
Total 1968 family net real income
(Bkt. V842) Total 1968 family net real income
Total 1968 family net real income/1968 family needs
(Bkt. V844) Total 1968 family net real income/ 1968 family needs
9
100 - 58,000
0
1
2
3
4
5
6
7
8
9
.01 - 23.75
0
$15,000 or more
Actual amount
Under $500
$500 - 999
$1000 - 1999
$2000 - 2999
$3000 - 3999
$4000 - 4999
$5000 - 7499
$7500 - 9999
$10,000 - 14,999
$15,000 or more
Actual real income/needs ratio
Under .40
Total real income minus cost of earning income (estimated federal income taxes + uniondues of Head of family and child care costs for working Wives or single parents)
Calculated as follows: (a) If children: V840 (Total 1968 FAMILY REAL INCOME) -V533 (Money costs of earning income) -V839 (Imputed value of free child care) (V839 was subtracted only if there were children in the household)
(V842 / V495)
Note that the computation of V495 uses V494, Annual Food Needs Standard, which is in 1967dollars.
Note that the computation of V844 uses V494, Annual Food Needs Standard, which is in 1967dollars.
524
4,460
3
43
311
417
471
460
999
718
689
349
4,460
93
11.75
100.00
.07
.96
6.97
9.35
10.56
10.31
22.40
16.10
15.45
7.83
100.00
2.09
Count
Count
Count
Count
%
%
%
%
Value/Range
Value/Range
Value/Range
Value/Range
Code Value/Range Text
Code Value/Range Text
Code Value/Range Text
Code Value/Range Text
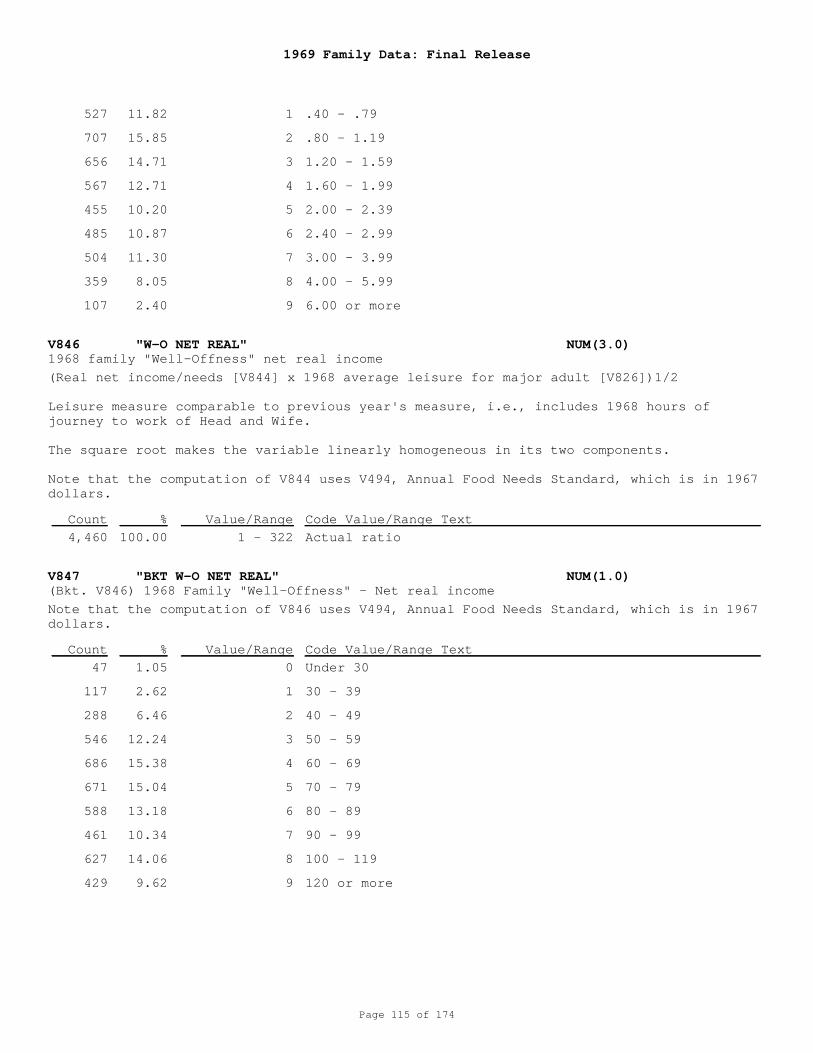
1969 Family Data: Final Release
Page 115 of 174
V846 "W-O NET REAL" NUM(3.0)
V847 "BKT W-O NET REAL" NUM(1.0)
1968 family "Well-Offness" net real income
(Bkt. V846) 1968 Family "Well-Offness" - Net real income
1
2
3
4
5
6
7
8
9
1 - 322
0
1
2
3
4
5
6
7
8
9
.40 - .79
.80 - 1.19
1.20 - 1.59
1.60 - 1.99
2.00 - 2.39
2.40 - 2.99
3.00 - 3.99
4.00 - 5.99
6.00 or more
Actual ratio
Under 30
30 - 39
40 - 49
50 - 59
60 - 69
70 - 79
80 - 89
90 - 99
100 - 119
120 or more
(Real net income/needs [V844] x 1968 average leisure for major adult [V826])1/2
Leisure measure comparable to previous year's measure, i.e., includes 1968 hours ofjourney to work of Head and Wife. The square root makes the variable linearly homogeneous in its two components.
Note that the computation of V844 uses V494, Annual Food Needs Standard, which is in 1967dollars.
Note that the computation of V846 uses V494, Annual Food Needs Standard, which is in 1967dollars.
527
707
656
567
455
485
504
359
107
4,460
47
117
288
546
686
671
588
461
627
429
11.82
15.85
14.71
12.71
10.20
10.87
11.30
8.05
2.40
100.00
1.05
2.62
6.46
12.24
15.38
15.04
13.18
10.34
14.06
9.62
Count
Count
%
%
Value/Range
Value/Range
Code Value/Range Text
Code Value/Range Text
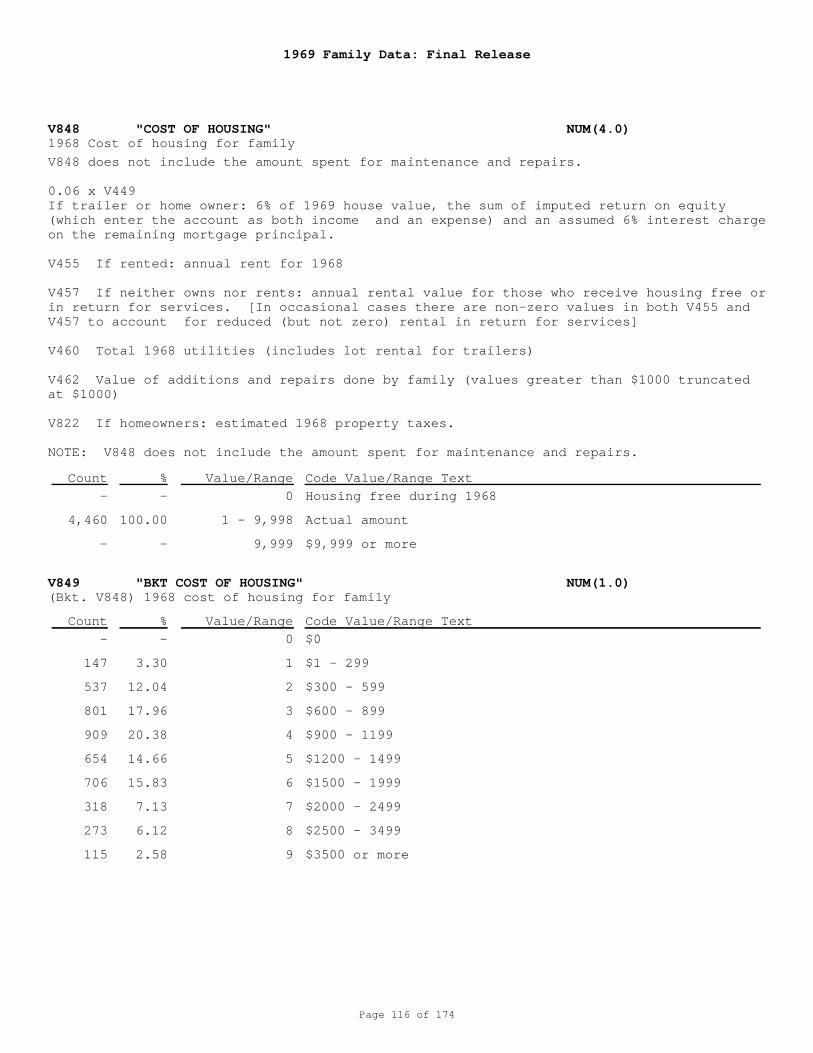
1969 Family Data: Final Release
Page 116 of 174
V848 "COST OF HOUSING" NUM(4.0)
V849 "BKT COST OF HOUSING" NUM(1.0)
1968 Cost of housing for family
(Bkt. V848) 1968 cost of housing for family
0
1 - 9,998
9,999
0
1
2
3
4
5
6
7
8
9
Housing free during 1968
Actual amount
$9,999 or more
$0
$1 - 299
$300 - 599
$600 - 899
$900 - 1199
$1200 - 1499
$1500 - 1999
$2000 - 2499
$2500 - 3499
$3500 or more
V848 does not include the amount spent for maintenance and repairs.
0.06 x V449 If trailer or home owner: 6% of 1969 house value, the sum of imputed return on equity(which enter the account as both income and an expense) and an assumed 6% interest chargeon the remaining mortgage principal. V455 If rented: annual rent for 1968
V457 If neither owns nor rents: annual rental value for those who receive housing free orin return for services. [In occasional cases there are non-zero values in both V455 andV457 to account for reduced (but not zero) rental in return for services]
V460 Total 1968 utilities (includes lot rental for trailers)
V462 Value of additions and repairs done by family (values greater than $1000 truncatedat $1000)
V822 If homeowners: estimated 1968 property taxes.
NOTE: V848 does not include the amount spent for maintenance and repairs.
-
4,460
-
-
147
537
801
909
654
706
318
273
115
-
100.00
-
-
3.30
12.04
17.96
20.38
14.66
15.83
7.13
6.12
2.58
Count
Count
%
%
Value/Range
Value/Range
Code Value/Range Text
Code Value/Range Text
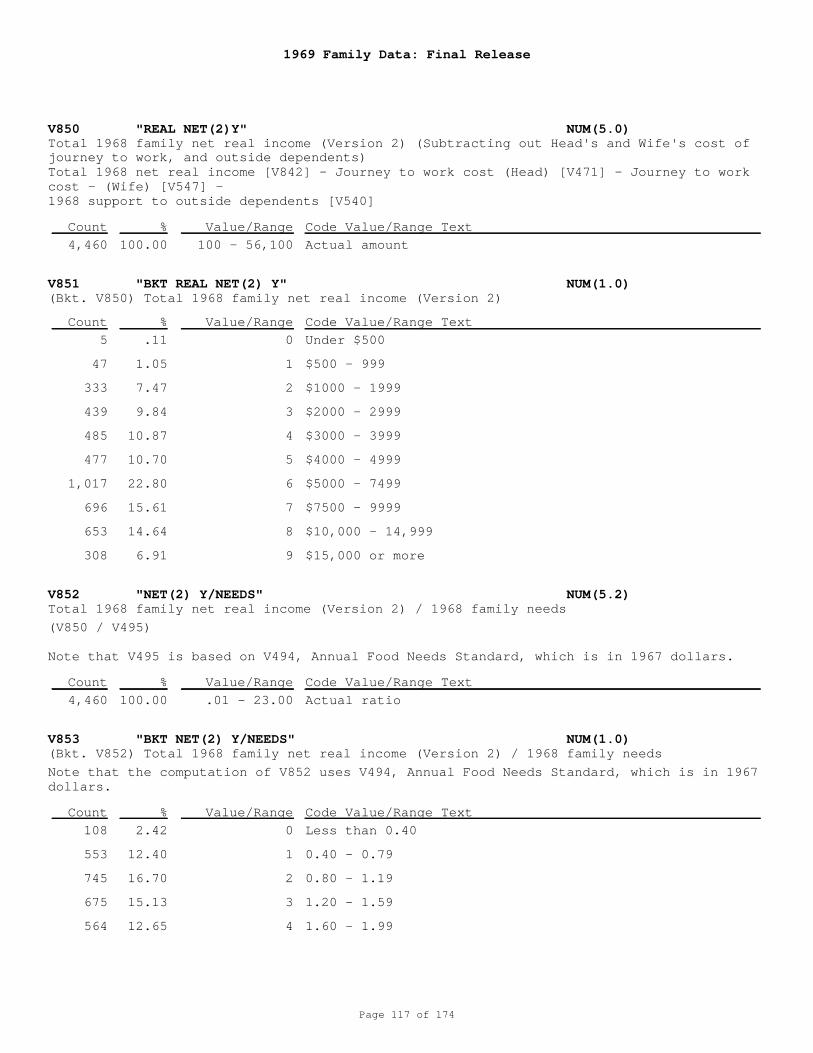
1969 Family Data: Final Release
Page 117 of 174
V850 "REAL NET(2)Y" NUM(5.0)
V851 "BKT REAL NET(2) Y" NUM(1.0)
V852 "NET(2) Y/NEEDS" NUM(5.2)
V853 "BKT NET(2) Y/NEEDS" NUM(1.0)
Total 1968 family net real income (Version 2) (Subtracting out Head's and Wife's cost ofjourney to work, and outside dependents)
(Bkt. V850) Total 1968 family net real income (Version 2)
Total 1968 family net real income (Version 2) / 1968 family needs
(Bkt. V852) Total 1968 family net real income (Version 2) / 1968 family needs
100 - 56,100
0
1
2
3
4
5
6
7
8
9
.01 - 23.00
0
1
2
3
4
Actual amount
Under $500
$500 - 999
$1000 - 1999
$2000 - 2999
$3000 - 3999
$4000 - 4999
$5000 - 7499
$7500 - 9999
$10,000 - 14,999
$15,000 or more
Actual ratio
Less than 0.40
0.40 - 0.79
0.80 - 1.19
1.20 - 1.59
1.60 - 1.99
Total 1968 net real income [V842] - Journey to work cost (Head) [V471] - Journey to workcost - (Wife) [V547] - 1968 support to outside dependents [V540]
(V850 / V495)
Note that V495 is based on V494, Annual Food Needs Standard, which is in 1967 dollars.
Note that the computation of V852 uses V494, Annual Food Needs Standard, which is in 1967dollars.
4,460
5
47
333
439
485
477
1,017
696
653
308
4,460
108
553
745
675
564
100.00
.11
1.05
7.47
9.84
10.87
10.70
22.80
15.61
14.64
6.91
100.00
2.42
12.40
16.70
15.13
12.65
Count
Count
Count
Count
%
%
%
%
Value/Range
Value/Range
Value/Range
Value/Range
Code Value/Range Text
Code Value/Range Text
Code Value/Range Text
Code Value/Range Text
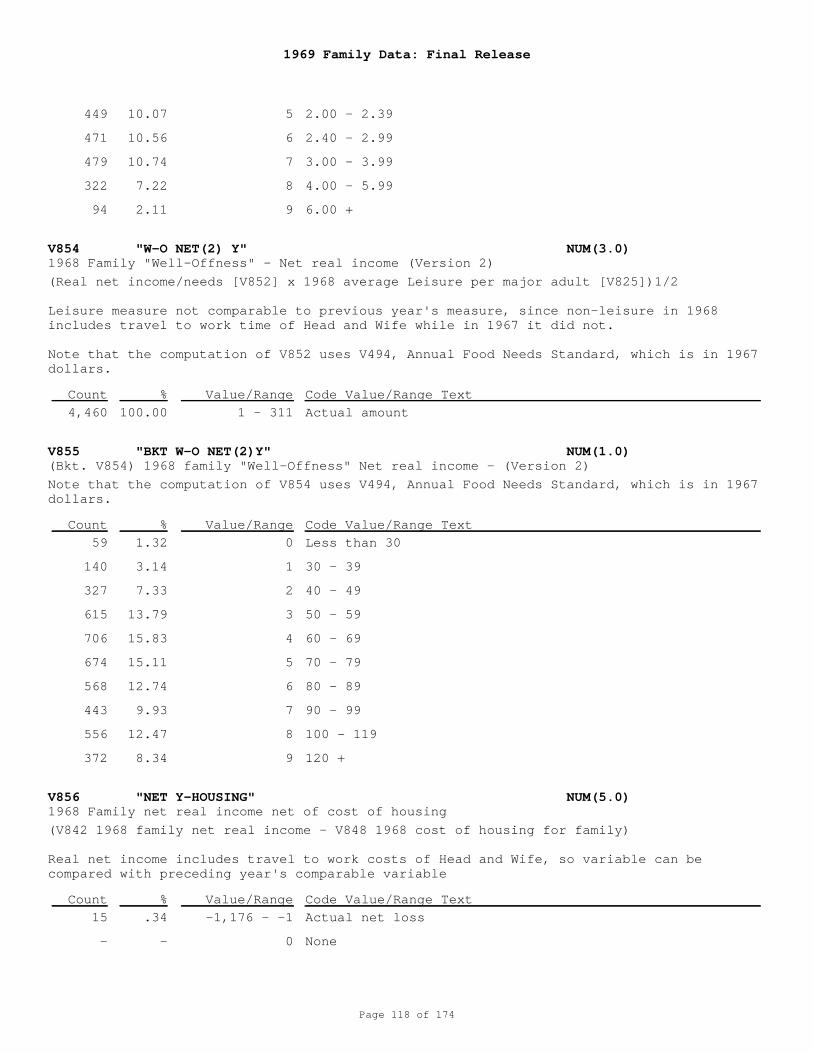
1969 Family Data: Final Release
Page 118 of 174
V854 "W-O NET(2) Y" NUM(3.0)
V855 "BKT W-O NET(2)Y" NUM(1.0)
V856 "NET Y-HOUSING" NUM(5.0)
1968 Family "Well-Offness" - Net real income (Version 2)
(Bkt. V854) 1968 family "Well-Offness" Net real income - (Version 2)
1968 Family net real income net of cost of housing
5
6
7
8
9
1 - 311
0
1
2
3
4
5
6
7
8
9
-1,176 - -1
0
2.00 - 2.39
2.40 - 2.99
3.00 - 3.99
4.00 - 5.99
6.00 +
Actual amount
Less than 30
30 - 39
40 - 49
50 - 59
60 - 69
70 - 79
80 - 89
90 - 99
100 - 119
120 +
Actual net loss
None
(Real net income/needs [V852] x 1968 average Leisure per major adult [V825])1/2
Leisure measure not comparable to previous year's measure, since non-leisure in 1968includes travel to work time of Head and Wife while in 1967 it did not.
Note that the computation of V852 uses V494, Annual Food Needs Standard, which is in 1967dollars.
Note that the computation of V854 uses V494, Annual Food Needs Standard, which is in 1967dollars.
(V842 1968 family net real income - V848 1968 cost of housing for family)
Real net income includes travel to work costs of Head and Wife, so variable can becompared with preceding year's comparable variable
449
471
479
322
94
4,460
59
140
327
615
706
674
568
443
556
372
15
-
10.07
10.56
10.74
7.22
2.11
100.00
1.32
3.14
7.33
13.79
15.83
15.11
12.74
9.93
12.47
8.34
.34
-
Count
Count
Count
%
%
%
Value/Range
Value/Range
Value/Range
Code Value/Range Text
Code Value/Range Text
Code Value/Range Text
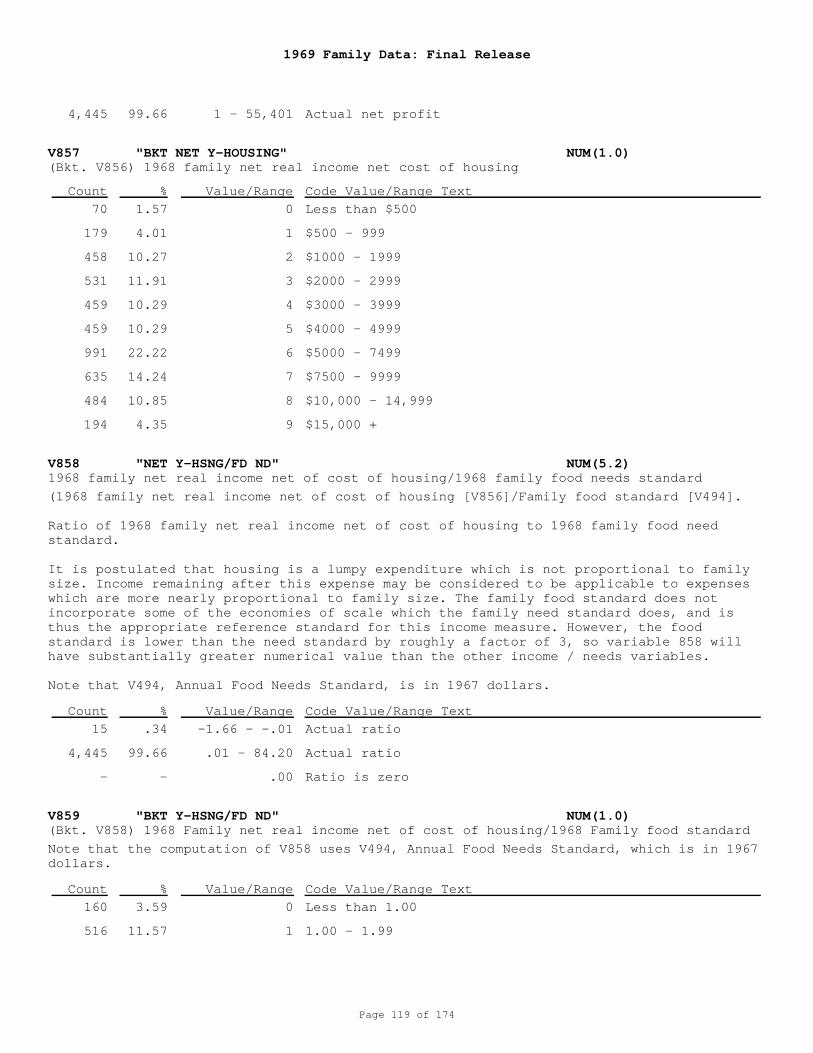
1969 Family Data: Final Release
Page 119 of 174
V857 "BKT NET Y-HOUSING" NUM(1.0)
V858 "NET Y-HSNG/FD ND" NUM(5.2)
V859 "BKT Y-HSNG/FD ND" NUM(1.0)
(Bkt. V856) 1968 family net real income net cost of housing
1968 family net real income net of cost of housing/1968 family food needs standard
(Bkt. V858) 1968 Family net real income net of cost of housing/1968 Family food standard
1 - 55,401
0
1
2
3
4
5
6
7
8
9
-1.66 - -.01
.01 - 84.20
.00
0
1
Actual net profit
Less than $500
$500 - 999
$1000 - 1999
$2000 - 2999
$3000 - 3999
$4000 - 4999
$5000 - 7499
$7500 - 9999
$10,000 - 14,999
$15,000 +
Actual ratio
Actual ratio
Ratio is zero
Less than 1.00
1.00 - 1.99
(1968 family net real income net of cost of housing [V856]/Family food standard [V494].
Ratio of 1968 family net real income net of cost of housing to 1968 family food needstandard.
It is postulated that housing is a lumpy expenditure which is not proportional to familysize. Income remaining after this expense may be considered to be applicable to expenseswhich are more nearly proportional to family size. The family food standard does notincorporate some of the economies of scale which the family need standard does, and isthus the appropriate reference standard for this income measure. However, the foodstandard is lower than the need standard by roughly a factor of 3, so variable 858 willhave substantially greater numerical value than the other income / needs variables.
Note that V494, Annual Food Needs Standard, is in 1967 dollars.
Note that the computation of V858 uses V494, Annual Food Needs Standard, which is in 1967dollars.
4,445
70
179
458
531
459
459
991
635
484
194
15
4,445
-
160
516
99.66
1.57
4.01
10.27
11.91
10.29
10.29
22.22
14.24
10.85
4.35
.34
99.66
-
3.59
11.57
Count
Count
Count
%
%
%
Value/Range
Value/Range
Value/Range
Code Value/Range Text
Code Value/Range Text
Code Value/Range Text
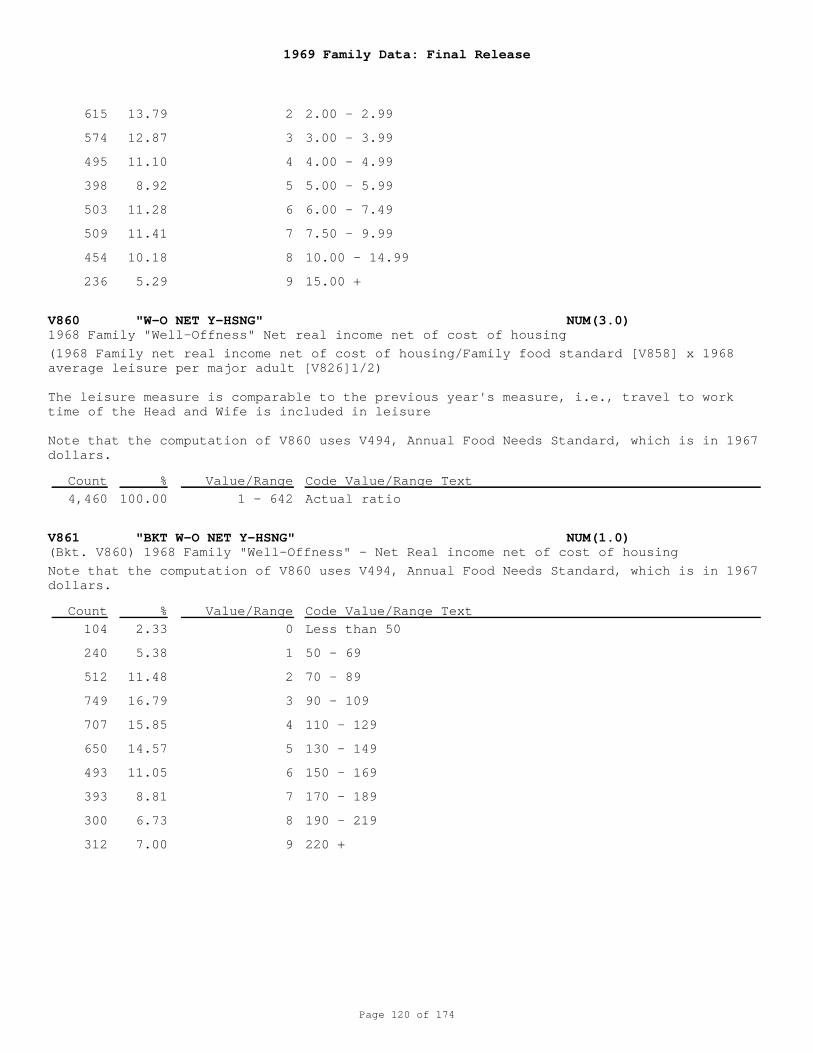
1969 Family Data: Final Release
Page 120 of 174
V860 "W-O NET Y-HSNG" NUM(3.0)
V861 "BKT W-O NET Y-HSNG" NUM(1.0)
1968 Family "Well-Offness" Net real income net of cost of housing
(Bkt. V860) 1968 Family "Well-Offness" - Net Real income net of cost of housing
2
3
4
5
6
7
8
9
1 - 642
0
1
2
3
4
5
6
7
8
9
2.00 - 2.99
3.00 - 3.99
4.00 - 4.99
5.00 - 5.99
6.00 - 7.49
7.50 - 9.99
10.00 - 14.99
15.00 +
Actual ratio
Less than 50
50 - 69
70 - 89
90 - 109
110 - 129
130 - 149
150 - 169
170 - 189
190 - 219
220 +
(1968 Family net real income net of cost of housing/Family food standard [V858] x 1968average leisure per major adult [V826]1/2)
The leisure measure is comparable to the previous year's measure, i.e., travel to worktime of the Head and Wife is included in leisure
Note that the computation of V860 uses V494, Annual Food Needs Standard, which is in 1967dollars.
Note that the computation of V860 uses V494, Annual Food Needs Standard, which is in 1967dollars.
615
574
495
398
503
509
454
236
4,460
104
240
512
749
707
650
493
393
300
312
13.79
12.87
11.10
8.92
11.28
11.41
10.18
5.29
100.00
2.33
5.38
11.48
16.79
15.85
14.57
11.05
8.81
6.73
7.00
Count
Count
%
%
Value/Range
Value/Range
Code Value/Range Text
Code Value/Range Text
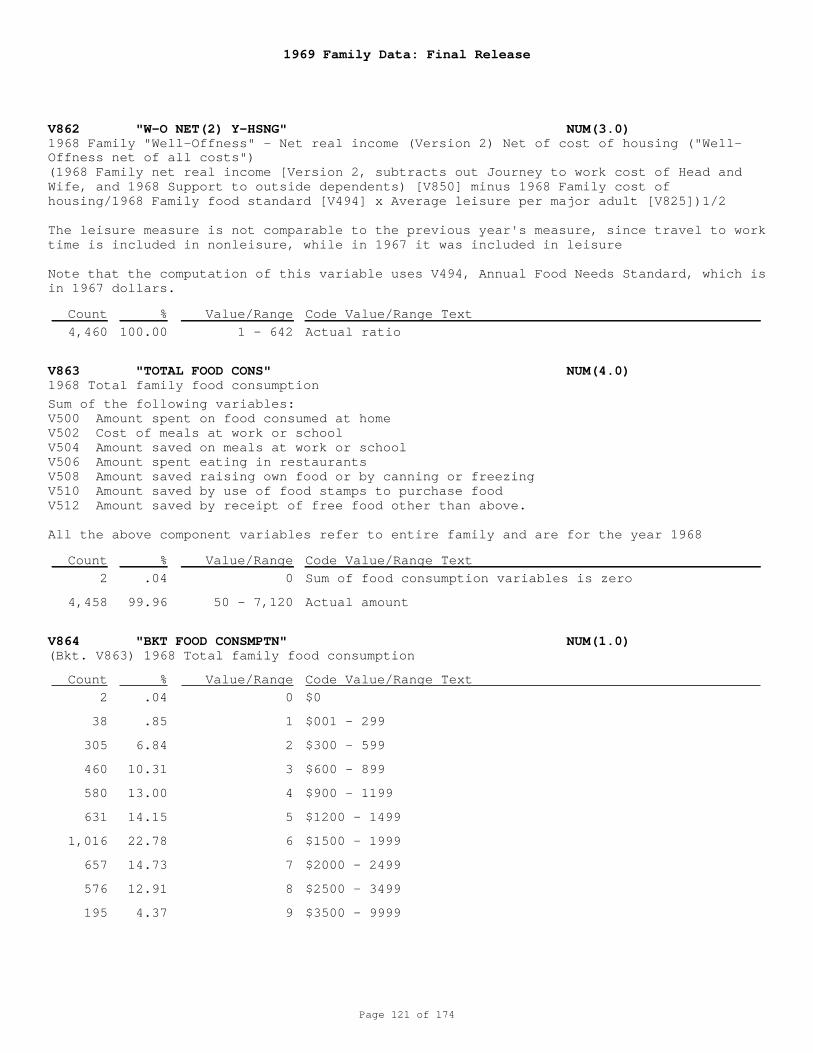
1969 Family Data: Final Release
Page 121 of 174
V862 "W-O NET(2) Y-HSNG" NUM(3.0)
V863 "TOTAL FOOD CONS" NUM(4.0)
V864 "BKT FOOD CONSMPTN" NUM(1.0)
1968 Family "Well-Offness" - Net real income (Version 2) Net of cost of housing ("Well-Offness net of all costs")
1968 Total family food consumption
(Bkt. V863) 1968 Total family food consumption
1 - 642
0
50 - 7,120
0
1
2
3
4
5
6
7
8
9
Actual ratio
Sum of food consumption variables is zero
Actual amount
$0
$001 - 299
$300 - 599
$600 - 899
$900 - 1199
$1200 - 1499
$1500 - 1999
$2000 - 2499
$2500 - 3499
$3500 - 9999
(1968 Family net real income [Version 2, subtracts out Journey to work cost of Head andWife, and 1968 Support to outside dependents) [V850] minus 1968 Family cost ofhousing/1968 Family food standard [V494] x Average leisure per major adult [V825])1/2
The leisure measure is not comparable to the previous year's measure, since travel to worktime is included in nonleisure, while in 1967 it was included in leisure
Note that the computation of this variable uses V494, Annual Food Needs Standard, which isin 1967 dollars.
Sum of the following variables: V500 Amount spent on food consumed at home V502 Cost of meals at work or school V504 Amount saved on meals at work or school V506 Amount spent eating in restaurants V508 Amount saved raising own food or by canning or freezing V510 Amount saved by use of food stamps to purchase food V512 Amount saved by receipt of free food other than above.
All the above component variables refer to entire family and are for the year 1968
4,460
2
4,458
2
38
305
460
580
631
1,016
657
576
195
100.00
.04
99.96
.04
.85
6.84
10.31
13.00
14.15
22.78
14.73
12.91
4.37
Count
Count
Count
%
%
%
Value/Range
Value/Range
Value/Range
Code Value/Range Text
Code Value/Range Text
Code Value/Range Text
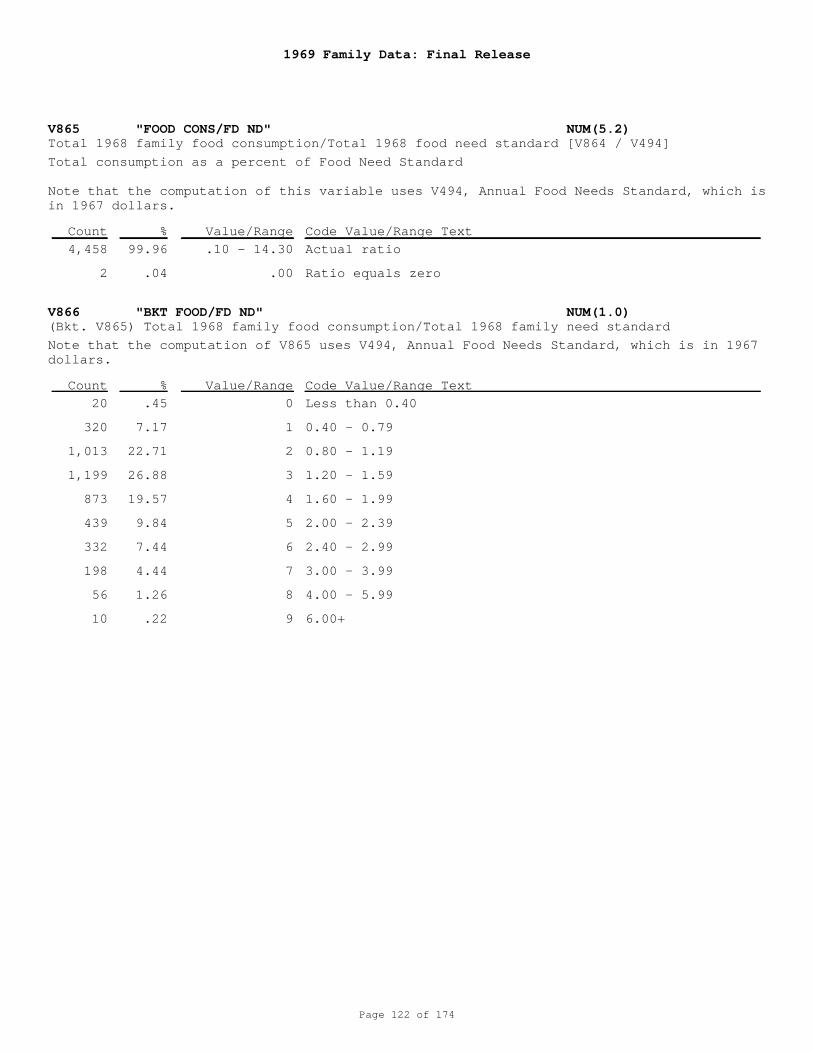
1969 Family Data: Final Release
Page 122 of 174
V865 "FOOD CONS/FD ND" NUM(5.2)
V866 "BKT FOOD/FD ND" NUM(1.0)
Total 1968 family food consumption/Total 1968 food need standard [V864 / V494]
(Bkt. V865) Total 1968 family food consumption/Total 1968 family need standard
.10 - 14.30
.00
0
1
2
3
4
5
6
7
8
9
Actual ratio
Ratio equals zero
Less than 0.40
0.40 - 0.79
0.80 - 1.19
1.20 - 1.59
1.60 - 1.99
2.00 - 2.39
2.40 - 2.99
3.00 - 3.99
4.00 - 5.99
6.00+
Total consumption as a percent of Food Need Standard
Note that the computation of this variable uses V494, Annual Food Needs Standard, which isin 1967 dollars.
Note that the computation of V865 uses V494, Annual Food Needs Standard, which is in 1967dollars.
4,458
2
20
320
1,013
1,199
873
439
332
198
56
10
99.96
.04
.45
7.17
22.71
26.88
19.57
9.84
7.44
4.44
1.26
.22
Count
Count
%
%
Value/Range
Value/Range
Code Value/Range Text
Code Value/Range Text
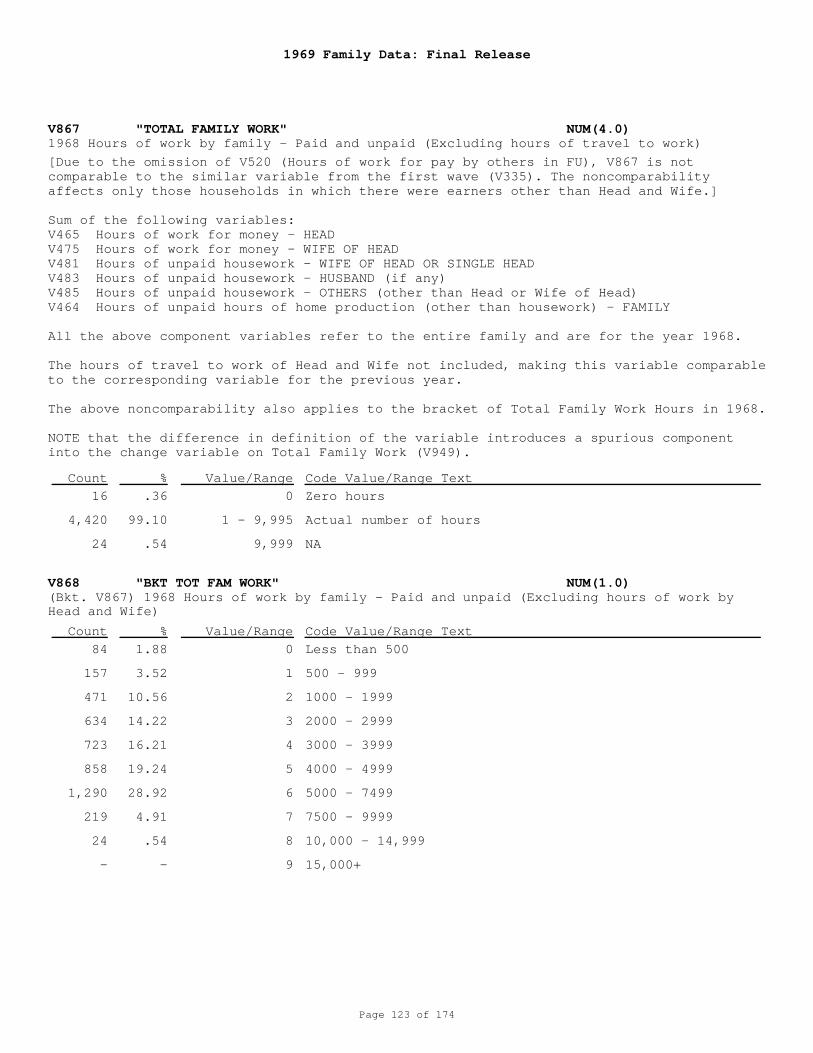
1969 Family Data: Final Release
Page 123 of 174
V867 "TOTAL FAMILY WORK" NUM(4.0)
V868 "BKT TOT FAM WORK" NUM(1.0)
1968 Hours of work by family - Paid and unpaid (Excluding hours of travel to work)
(Bkt. V867) 1968 Hours of work by family - Paid and unpaid (Excluding hours of work byHead and Wife)
0
1 - 9,995
9,999
0
1
2
3
4
5
6
7
8
9
Zero hours
Actual number of hours
NA
Less than 500
500 - 999
1000 - 1999
2000 - 2999
3000 - 3999
4000 - 4999
5000 - 7499
7500 - 9999
10,000 - 14,999
15,000+
[Due to the omission of V520 (Hours of work for pay by others in FU), V867 is notcomparable to the similar variable from the first wave (V335). The noncomparabilityaffects only those households in which there were earners other than Head and Wife.]
Sum of the following variables: V465 Hours of work for money - HEAD V475 Hours of work for money - WIFE OF HEAD V481 Hours of unpaid housework - WIFE OF HEAD OR SINGLE HEAD V483 Hours of unpaid housework - HUSBAND (if any) V485 Hours of unpaid housework - OTHERS (other than Head or Wife of Head) V464 Hours of unpaid hours of home production (other than housework) - FAMILY
All the above component variables refer to the entire family and are for the year 1968.
The hours of travel to work of Head and Wife not included, making this variable comparableto the corresponding variable for the previous year.
The above noncomparability also applies to the bracket of Total Family Work Hours in 1968.
NOTE that the difference in definition of the variable introduces a spurious componentinto the change variable on Total Family Work (V949).
16
4,420
24
84
157
471
634
723
858
1,290
219
24
-
.36
99.10
.54
1.88
3.52
10.56
14.22
16.21
19.24
28.92
4.91
.54
-
Count
Count
%
%
Value/Range
Value/Range
Code Value/Range Text
Code Value/Range Text
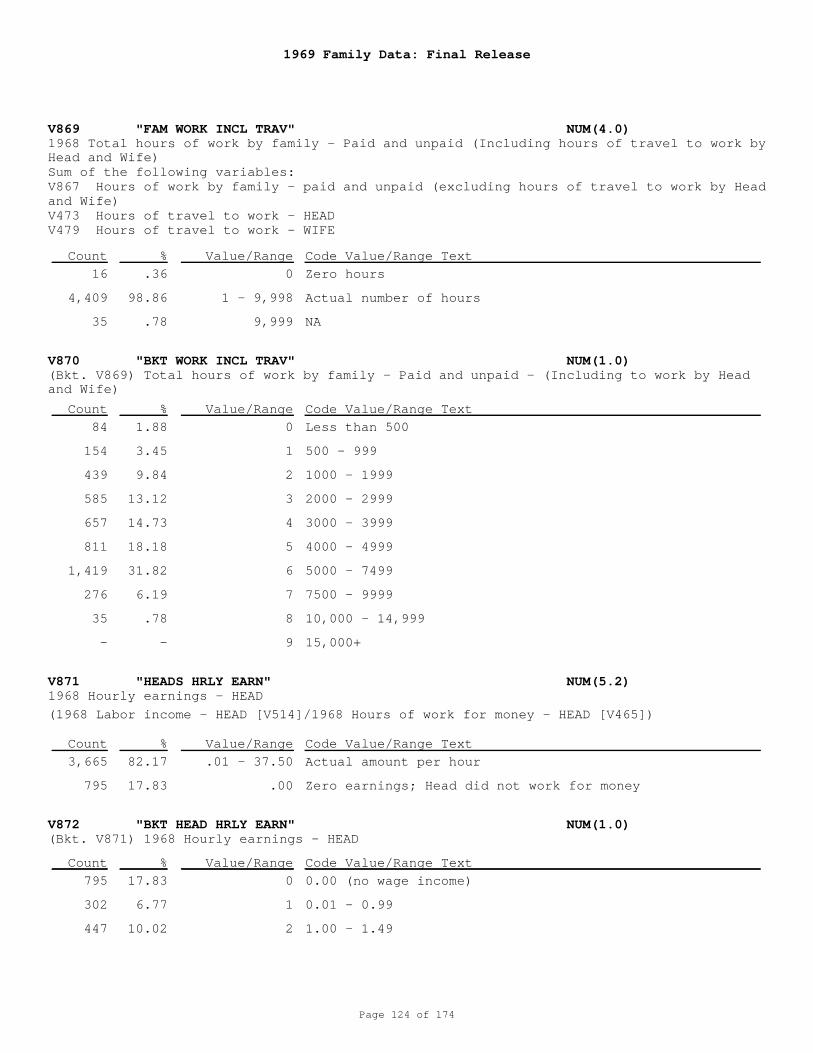
1969 Family Data: Final Release
Page 124 of 174
V869 "FAM WORK INCL TRAV" NUM(4.0)
V870 "BKT WORK INCL TRAV" NUM(1.0)
V871 "HEADS HRLY EARN" NUM(5.2)
V872 "BKT HEAD HRLY EARN" NUM(1.0)
1968 Total hours of work by family - Paid and unpaid (Including hours of travel to work byHead and Wife)
(Bkt. V869) Total hours of work by family - Paid and unpaid - (Including to work by Headand Wife)
1968 Hourly earnings - HEAD
(Bkt. V871) 1968 Hourly earnings - HEAD
0
1 - 9,998
9,999
0
1
2
3
4
5
6
7
8
9
.01 - 37.50
.00
0
1
2
Zero hours
Actual number of hours
NA
Less than 500
500 - 999
1000 - 1999
2000 - 2999
3000 - 3999
4000 - 4999
5000 - 7499
7500 - 9999
10,000 - 14,999
15,000+
Actual amount per hour
Zero earnings; Head did not work for money
0.00 (no wage income)
0.01 - 0.99
1.00 - 1.49
Sum of the following variables: V867 Hours of work by family - paid and unpaid (excluding hours of travel to work by Headand Wife) V473 Hours of travel to work - HEAD V479 Hours of travel to work - WIFE
(1968 Labor income - HEAD [V514]/1968 Hours of work for money - HEAD [V465])
16
4,409
35
84
154
439
585
657
811
1,419
276
35
-
3,665
795
795
302
447
.36
98.86
.78
1.88
3.45
9.84
13.12
14.73
18.18
31.82
6.19
.78
-
82.17
17.83
17.83
6.77
10.02
Count
Count
Count
Count
%
%
%
%
Value/Range
Value/Range
Value/Range
Value/Range
Code Value/Range Text
Code Value/Range Text
Code Value/Range Text
Code Value/Range Text
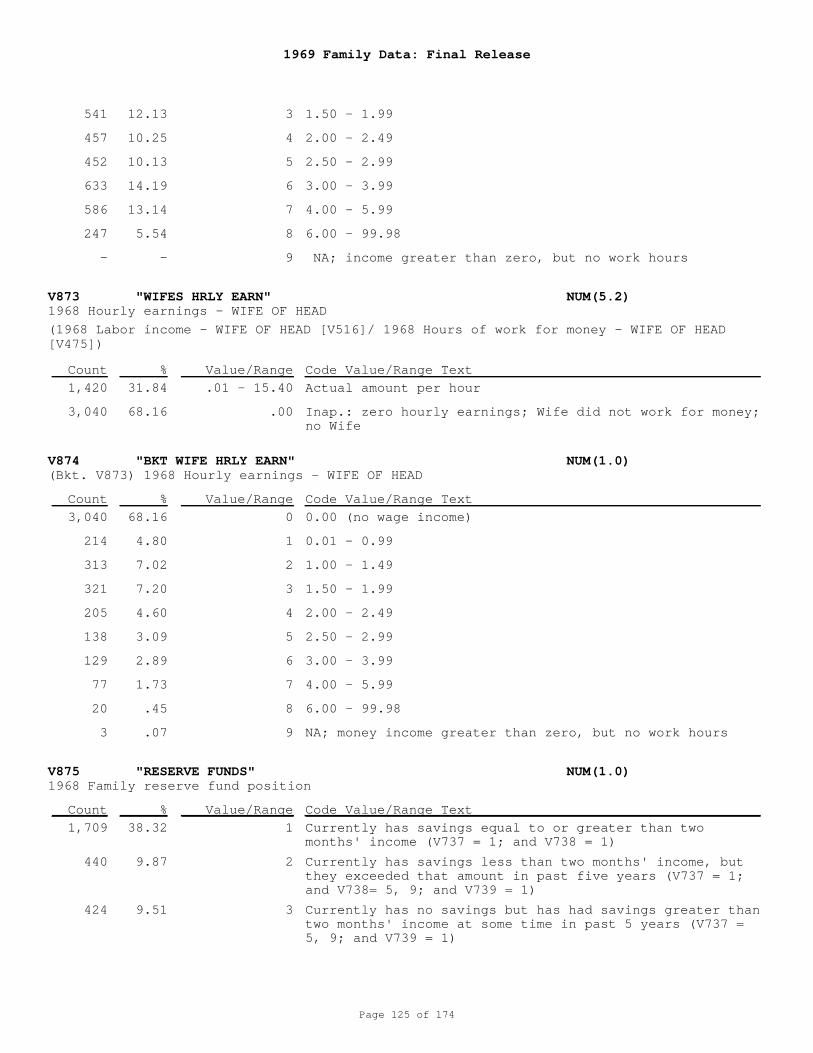
1969 Family Data: Final Release
Page 125 of 174
V873 "WIFES HRLY EARN" NUM(5.2)
V874 "BKT WIFE HRLY EARN" NUM(1.0)
V875 "RESERVE FUNDS" NUM(1.0)
1968 Hourly earnings - WIFE OF HEAD
(Bkt. V873) 1968 Hourly earnings - WIFE OF HEAD
1968 Family reserve fund position
3
4
5
6
7
8
9
.01 - 15.40
.00
0
1
2
3
4
5
6
7
8
9
1
2
3
1.50 - 1.99
2.00 - 2.49
2.50 - 2.99
3.00 - 3.99
4.00 - 5.99
6.00 - 99.98
NA; income greater than zero, but no work hours
Actual amount per hour
Inap.: zero hourly earnings; Wife did not work for money;no Wife
0.00 (no wage income)
0.01 - 0.99
1.00 - 1.49
1.50 - 1.99
2.00 - 2.49
2.50 - 2.99
3.00 - 3.99
4.00 - 5.99
6.00 - 99.98
NA; money income greater than zero, but no work hours
Currently has savings equal to or greater than twomonths' income (V737 = 1; and V738 = 1)
Currently has savings less than two months' income, butthey exceeded that amount in past five years (V737 = 1;and V738= 5, 9; and V739 = 1)
Currently has no savings but has had savings greater thantwo months' income at some time in past 5 years (V737 =5, 9; and V739 = 1)
(1968 Labor income - WIFE OF HEAD [V516]/ 1968 Hours of work for money - WIFE OF HEAD[V475])
541
457
452
633
586
247
-
1,420
3,040
3,040
214
313
321
205
138
129
77
20
3
1,709
440
424
12.13
10.25
10.13
14.19
13.14
5.54
-
31.84
68.16
68.16
4.80
7.02
7.20
4.60
3.09
2.89
1.73
.45
.07
38.32
9.87
9.51
Count
Count
Count
%
%
%
Value/Range
Value/Range
Value/Range
Code Value/Range Text
Code Value/Range Text
Code Value/Range Text
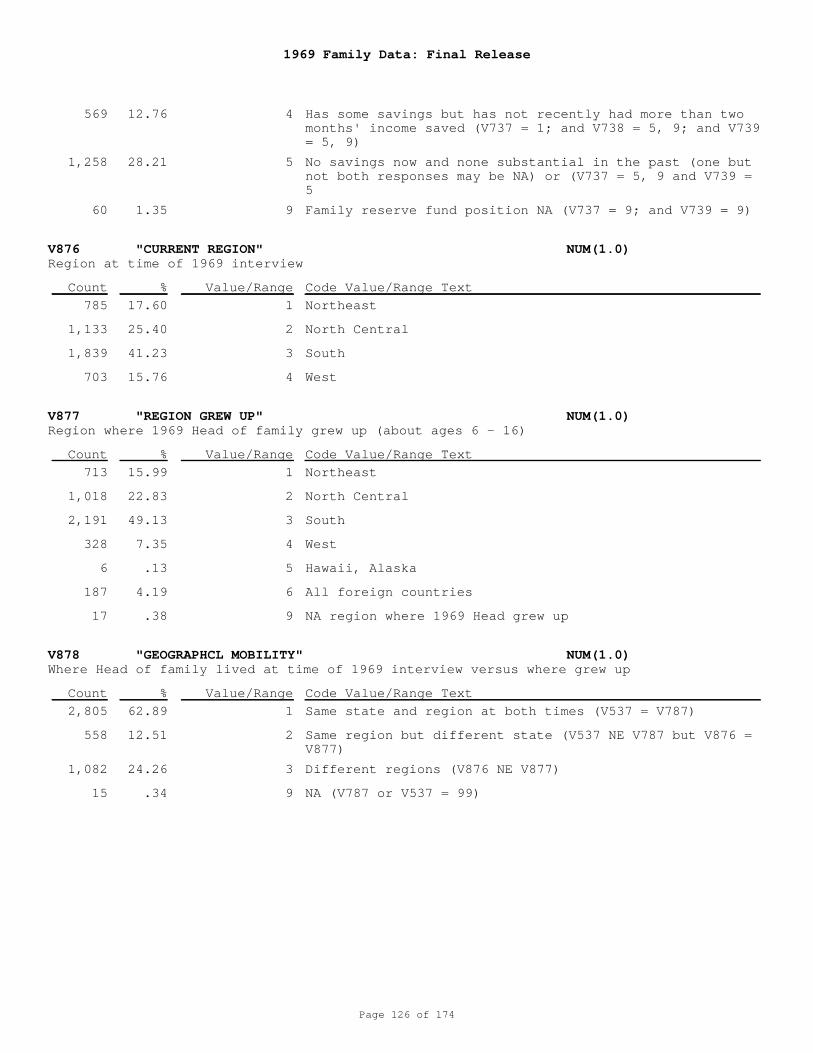
1969 Family Data: Final Release
Page 126 of 174
V876 "CURRENT REGION" NUM(1.0)
V877 "REGION GREW UP" NUM(1.0)
V878 "GEOGRAPHCL MOBILITY" NUM(1.0)
Region at time of 1969 interview
Region where 1969 Head of family grew up (about ages 6 - 16)
Where Head of family lived at time of 1969 interview versus where grew up
4
5
9
1
2
3
4
1
2
3
4
5
6
9
1
2
3
9
Has some savings but has not recently had more than twomonths' income saved (V737 = 1; and V738 = 5, 9; and V739= 5, 9)
No savings now and none substantial in the past (one butnot both responses may be NA) or (V737 = 5, 9 and V739 =5
Family reserve fund position NA (V737 = 9; and V739 = 9)
Northeast
North Central
South
West
Northeast
North Central
South
West
Hawaii, Alaska
All foreign countries
NA region where 1969 Head grew up
Same state and region at both times (V537 = V787)
Same region but different state (V537 NE V787 but V876 =V877)
Different regions (V876 NE V877)
NA (V787 or V537 = 99)
569
1,258
60
785
1,133
1,839
703
713
1,018
2,191
328
6
187
17
2,805
558
1,082
15
12.76
28.21
1.35
17.60
25.40
41.23
15.76
15.99
22.83
49.13
7.35
.13
4.19
.38
62.89
12.51
24.26
.34
Count
Count
Count
%
%
%
Value/Range
Value/Range
Value/Range
Code Value/Range Text
Code Value/Range Text
Code Value/Range Text
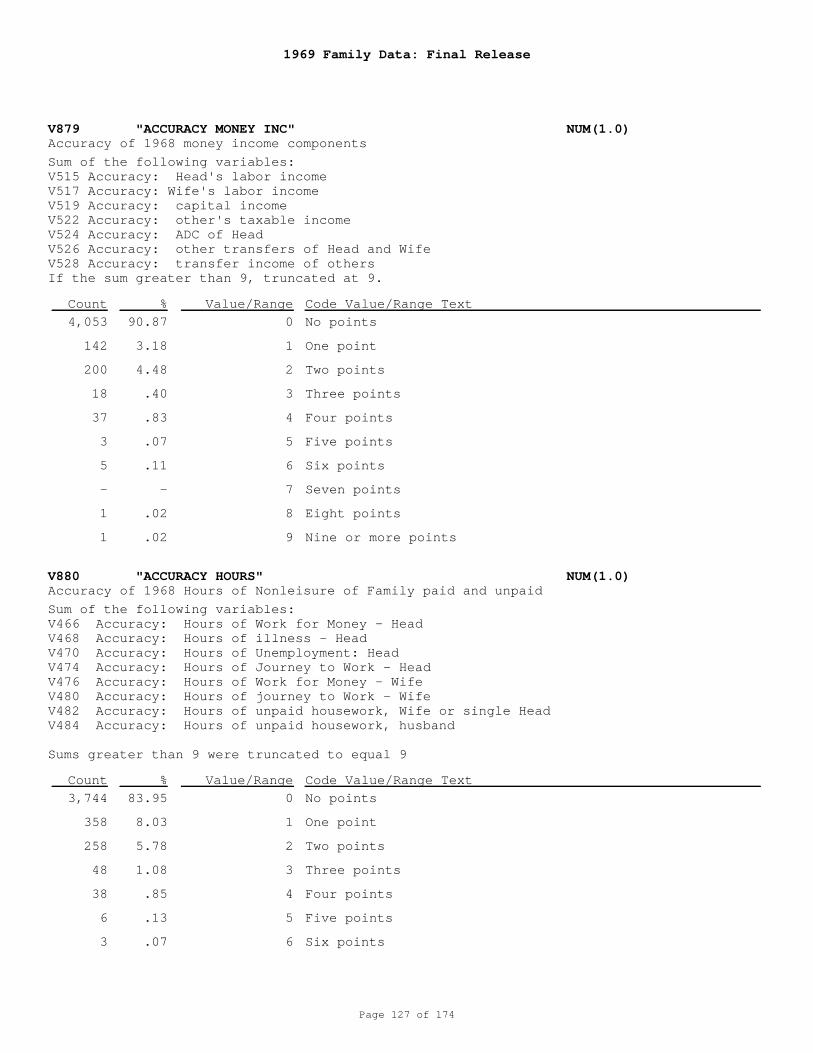
1969 Family Data: Final Release
Page 127 of 174
V879 "ACCURACY MONEY INC" NUM(1.0)
V880 "ACCURACY HOURS" NUM(1.0)
Accuracy of 1968 money income components
Accuracy of 1968 Hours of Nonleisure of Family paid and unpaid
0
1
2
3
4
5
6
7
8
9
0
1
2
3
4
5
6
No points
One point
Two points
Three points
Four points
Five points
Six points
Seven points
Eight points
Nine or more points
No points
One point
Two points
Three points
Four points
Five points
Six points
Sum of the following variables: V515 Accuracy: Head's labor income V517 Accuracy: Wife's labor income V519 Accuracy: capital income V522 Accuracy: other's taxable income V524 Accuracy: ADC of Head V526 Accuracy: other transfers of Head and Wife V528 Accuracy: transfer income of others If the sum greater than 9, truncated at 9.
Sum of the following variables: V466 Accuracy: Hours of Work for Money - Head V468 Accuracy: Hours of illness - Head V470 Accuracy: Hours of Unemployment: Head V474 Accuracy: Hours of Journey to Work - Head V476 Accuracy: Hours of Work for Money - Wife V480 Accuracy: Hours of journey to Work - Wife V482 Accuracy: Hours of unpaid housework, Wife or single Head V484 Accuracy: Hours of unpaid housework, husband
Sums greater than 9 were truncated to equal 9
4,053
142
200
18
37
3
5
-
1
1
3,744
358
258
48
38
6
3
90.87
3.18
4.48
.40
.83
.07
.11
-
.02
.02
83.95
8.03
5.78
1.08
.85
.13
.07
Count
Count
%
%
Value/Range
Value/Range
Code Value/Range Text
Code Value/Range Text
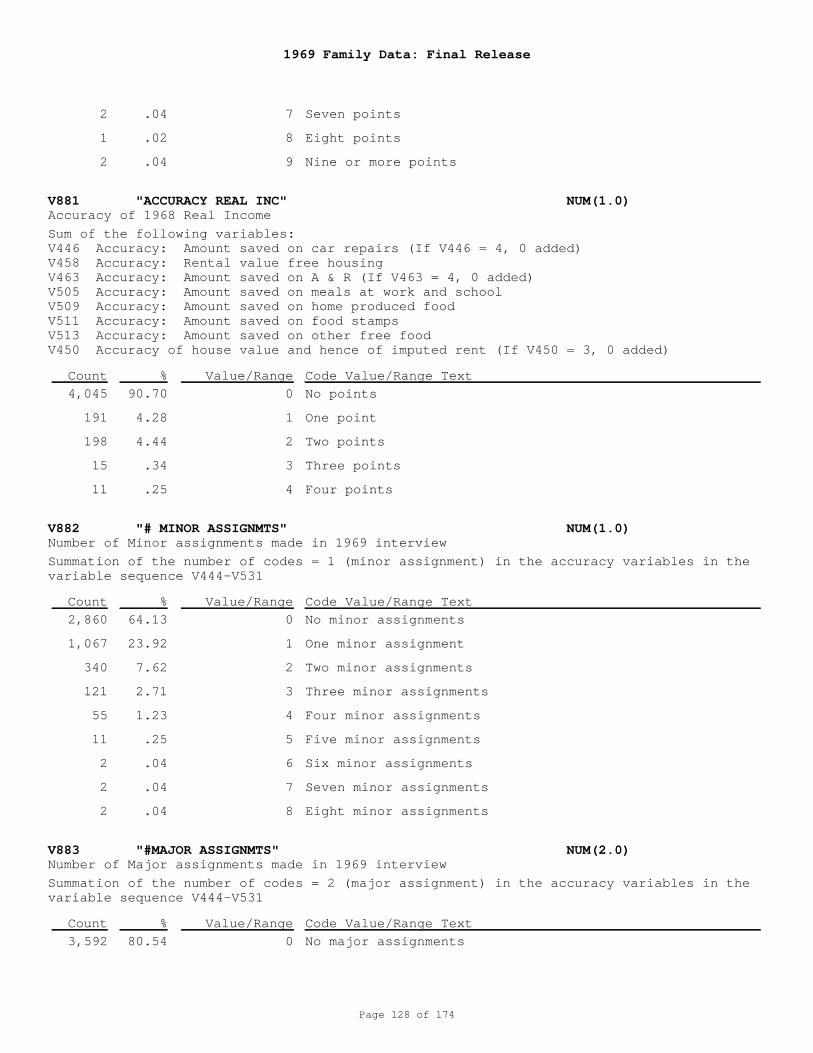
1969 Family Data: Final Release
Page 128 of 174
V881 "ACCURACY REAL INC" NUM(1.0)
V882 "# MINOR ASSIGNMTS" NUM(1.0)
V883 "#MAJOR ASSIGNMTS" NUM(2.0)
Accuracy of 1968 Real Income
Number of Minor assignments made in 1969 interview
Number of Major assignments made in 1969 interview
7
8
9
0
1
2
3
4
0
1
2
3
4
5
6
7
8
0
Seven points
Eight points
Nine or more points
No points
One point
Two points
Three points
Four points
No minor assignments
One minor assignment
Two minor assignments
Three minor assignments
Four minor assignments
Five minor assignments
Six minor assignments
Seven minor assignments
Eight minor assignments
No major assignments
Sum of the following variables: V446 Accuracy: Amount saved on car repairs (If V446 = 4, 0 added) V458 Accuracy: Rental value free housing V463 Accuracy: Amount saved on A & R (If V463 = 4, 0 added) V505 Accuracy: Amount saved on meals at work and school V509 Accuracy: Amount saved on home produced food V511 Accuracy: Amount saved on food stamps V513 Accuracy: Amount saved on other free food V450 Accuracy of house value and hence of imputed rent (If V450 = 3, 0 added)
Summation of the number of codes = 1 (minor assignment) in the accuracy variables in thevariable sequence V444-V531
Summation of the number of codes = 2 (major assignment) in the accuracy variables in thevariable sequence V444-V531
2
1
2
4,045
191
198
15
11
2,860
1,067
340
121
55
11
2
2
2
3,592
.04
.02
.04
90.70
4.28
4.44
.34
.25
64.13
23.92
7.62
2.71
1.23
.25
.04
.04
.04
80.54
Count
Count
Count
%
%
%
Value/Range
Value/Range
Value/Range
Code Value/Range Text
Code Value/Range Text
Code Value/Range Text
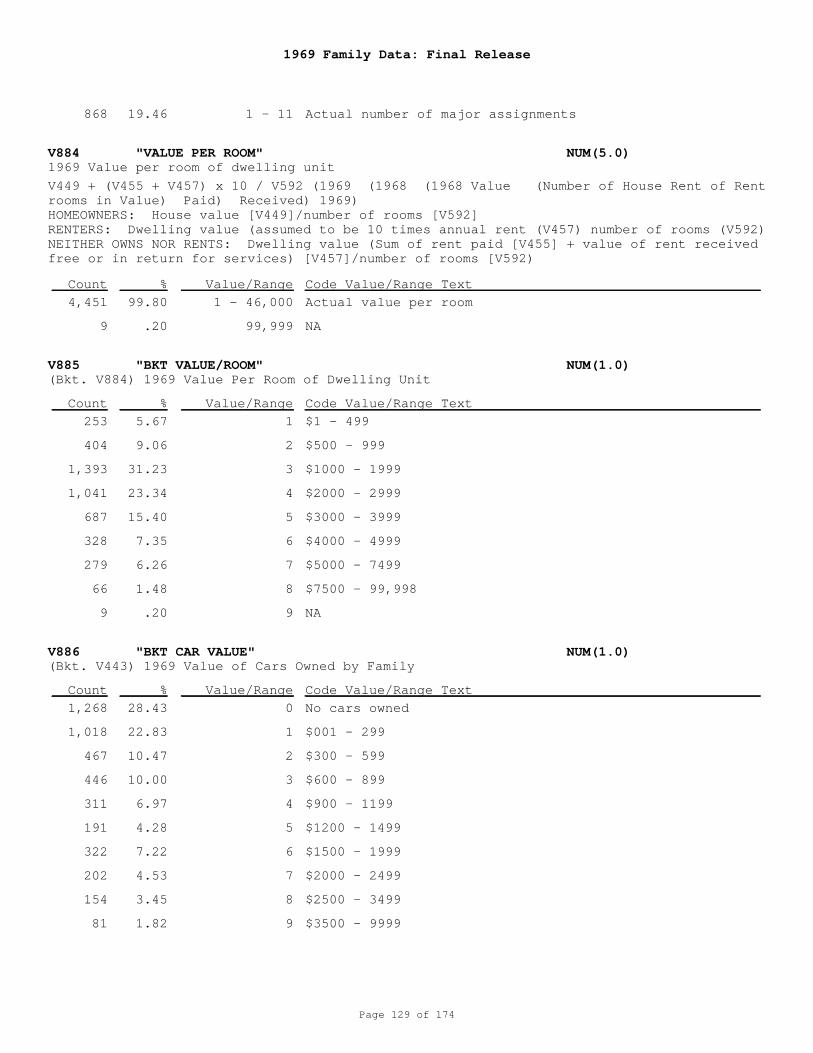
1969 Family Data: Final Release
Page 129 of 174
V884 "VALUE PER ROOM" NUM(5.0)
V885 "BKT VALUE/ROOM" NUM(1.0)
V886 "BKT CAR VALUE" NUM(1.0)
1969 Value per room of dwelling unit
(Bkt. V884) 1969 Value Per Room of Dwelling Unit
(Bkt. V443) 1969 Value of Cars Owned by Family
1 - 11
1 - 46,000
99,999
1
2
3
4
5
6
7
8
9
0
1
2
3
4
5
6
7
8
9
Actual number of major assignments
Actual value per room
NA
$1 - 499
$500 - 999
$1000 - 1999
$2000 - 2999
$3000 - 3999
$4000 - 4999
$5000 - 7499
$7500 - 99,998
NA
No cars owned
$001 - 299
$300 - 599
$600 - 899
$900 - 1199
$1200 - 1499
$1500 - 1999
$2000 - 2499
$2500 - 3499
$3500 - 9999
V449 + (V455 + V457) x 10 / V592 (1969 (1968 (1968 Value (Number of House Rent of Rentrooms in Value) Paid) Received) 1969)HOMEOWNERS: House value [V449]/number of rooms [V592] RENTERS: Dwelling value (assumed to be 10 times annual rent (V457) number of rooms (V592)NEITHER OWNS NOR RENTS: Dwelling value (Sum of rent paid [V455] + value of rent receivedfree or in return for services) [V457]/number of rooms [V592)
868
4,451
9
253
404
1,393
1,041
687
328
279
66
9
1,268
1,018
467
446
311
191
322
202
154
81
19.46
99.80
.20
5.67
9.06
31.23
23.34
15.40
7.35
6.26
1.48
.20
28.43
22.83
10.47
10.00
6.97
4.28
7.22
4.53
3.45
1.82
Count
Count
Count
%
%
%
Value/Range
Value/Range
Value/Range
Code Value/Range Text
Code Value/Range Text
Code Value/Range Text
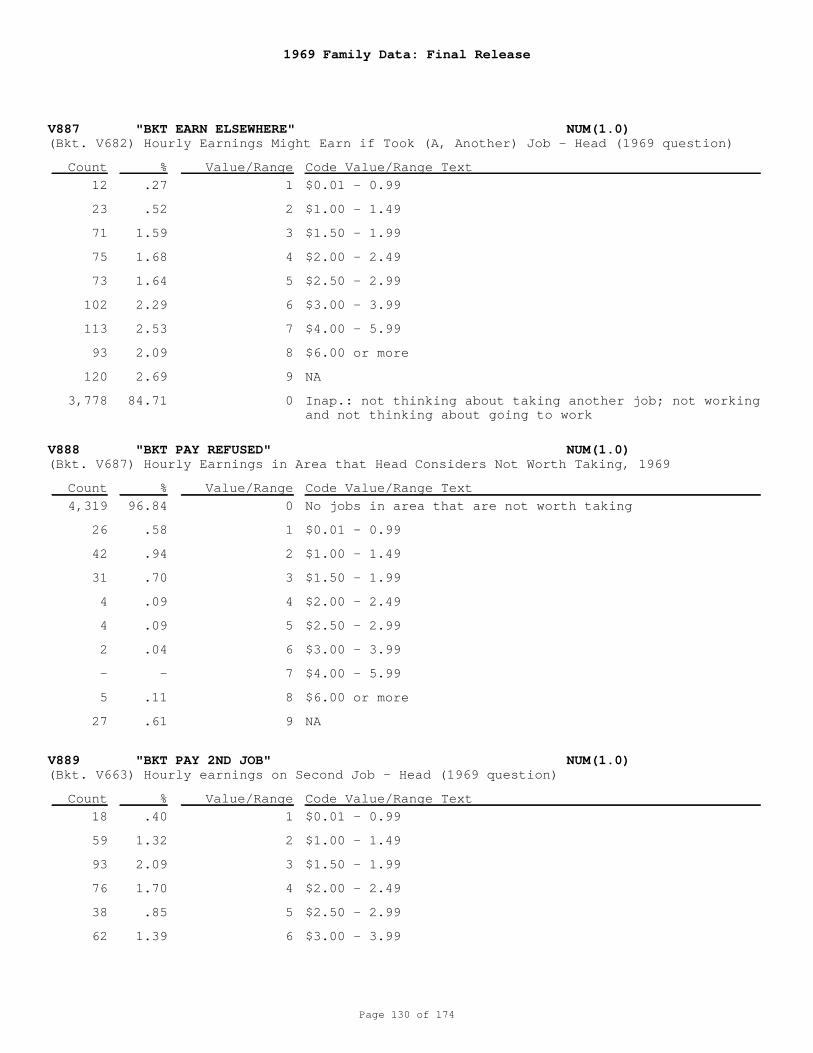
1969 Family Data: Final Release
Page 130 of 174
V887 "BKT EARN ELSEWHERE" NUM(1.0)
V888 "BKT PAY REFUSED" NUM(1.0)
V889 "BKT PAY 2ND JOB" NUM(1.0)
(Bkt. V682) Hourly Earnings Might Earn if Took (A, Another) Job - Head (1969 question)
(Bkt. V687) Hourly Earnings in Area that Head Considers Not Worth Taking, 1969
(Bkt. V663) Hourly earnings on Second Job - Head (1969 question)
1
2
3
4
5
6
7
8
9
0
0
1
2
3
4
5
6
7
8
9
1
2
3
4
5
6
$0.01 - 0.99
$1.00 - 1.49
$1.50 - 1.99
$2.00 - 2.49
$2.50 - 2.99
$3.00 - 3.99
$4.00 - 5.99
$6.00 or more
NA
Inap.: not thinking about taking another job; not workingand not thinking about going to work
No jobs in area that are not worth taking
$0.01 - 0.99
$1.00 - 1.49
$1.50 - 1.99
$2.00 - 2.49
$2.50 - 2.99
$3.00 - 3.99
$4.00 - 5.99
$6.00 or more
NA
$0.01 - 0.99
$1.00 - 1.49
$1.50 - 1.99
$2.00 - 2.49
$2.50 - 2.99
$3.00 - 3.99
12
23
71
75
73
102
113
93
120
3,778
4,319
26
42
31
4
4
2
-
5
27
18
59
93
76
38
62
.27
.52
1.59
1.68
1.64
2.29
2.53
2.09
2.69
84.71
96.84
.58
.94
.70
.09
.09
.04
-
.11
.61
.40
1.32
2.09
1.70
.85
1.39
Count
Count
Count
%
%
%
Value/Range
Value/Range
Value/Range
Code Value/Range Text
Code Value/Range Text
Code Value/Range Text
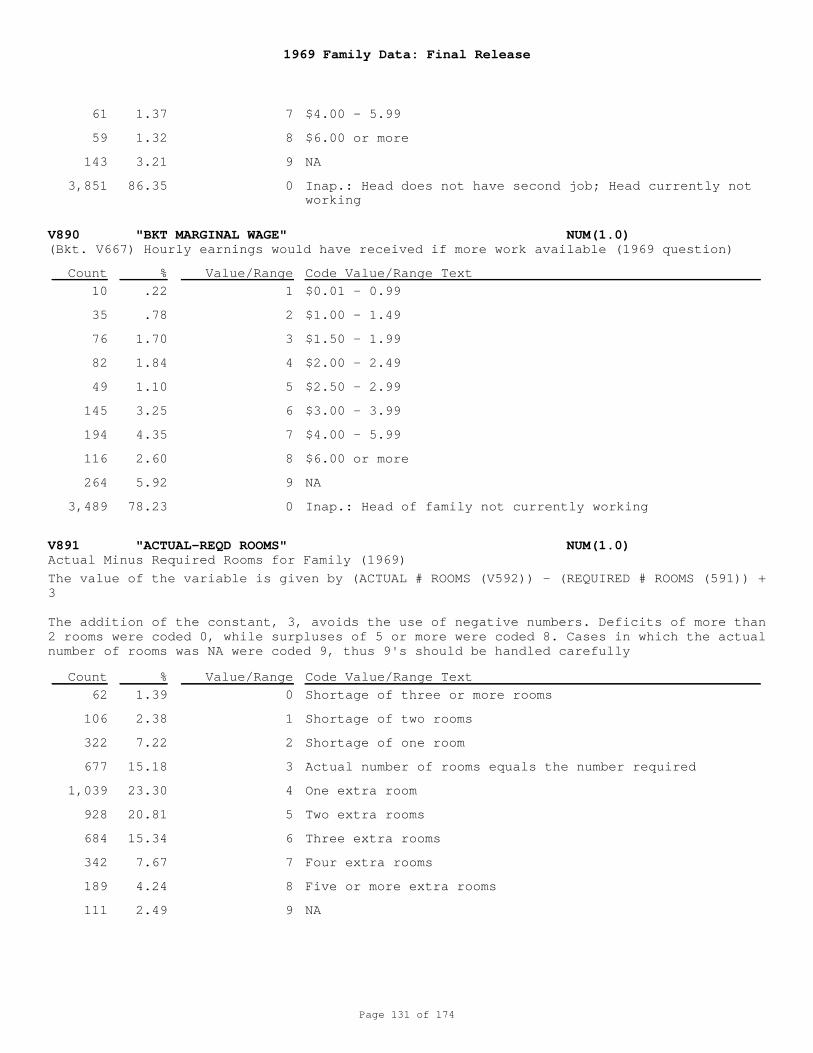
1969 Family Data: Final Release
Page 131 of 174
V890 "BKT MARGINAL WAGE" NUM(1.0)
V891 "ACTUAL-REQD ROOMS" NUM(1.0)
(Bkt. V667) Hourly earnings would have received if more work available (1969 question)
Actual Minus Required Rooms for Family (1969)
7
8
9
0
1
2
3
4
5
6
7
8
9
0
0
1
2
3
4
5
6
7
8
9
$4.00 - 5.99
$6.00 or more
NA
Inap.: Head does not have second job; Head currently notworking
$0.01 - 0.99
$1.00 - 1.49
$1.50 - 1.99
$2.00 - 2.49
$2.50 - 2.99
$3.00 - 3.99
$4.00 - 5.99
$6.00 or more
NA
Inap.: Head of family not currently working
Shortage of three or more rooms
Shortage of two rooms
Shortage of one room
Actual number of rooms equals the number required
One extra room
Two extra rooms
Three extra rooms
Four extra rooms
Five or more extra rooms
NA
The value of the variable is given by (ACTUAL # ROOMS (V592)) - (REQUIRED # ROOMS (591)) +3
The addition of the constant, 3, avoids the use of negative numbers. Deficits of more than2 rooms were coded 0, while surpluses of 5 or more were coded 8. Cases in which the actualnumber of rooms was NA were coded 9, thus 9's should be handled carefully
61
59
143
3,851
10
35
76
82
49
145
194
116
264
3,489
62
106
322
677
1,039
928
684
342
189
111
1.37
1.32
3.21
86.35
.22
.78
1.70
1.84
1.10
3.25
4.35
2.60
5.92
78.23
1.39
2.38
7.22
15.18
23.30
20.81
15.34
7.67
4.24
2.49
Count
Count
%
%
Value/Range
Value/Range
Code Value/Range Text
Code Value/Range Text
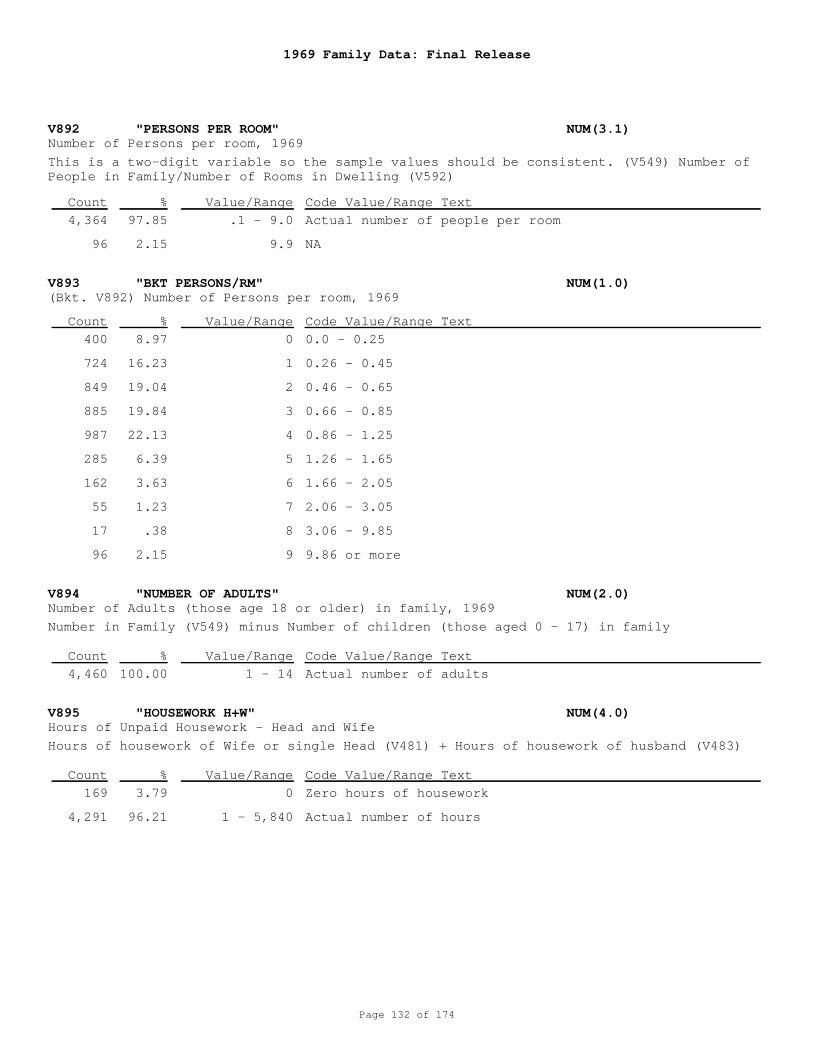
1969 Family Data: Final Release
Page 132 of 174
V892 "PERSONS PER ROOM" NUM(3.1)
V893 "BKT PERSONS/RM" NUM(1.0)
V894 "NUMBER OF ADULTS" NUM(2.0)
V895 "HOUSEWORK H+W" NUM(4.0)
Number of Persons per room, 1969
(Bkt. V892) Number of Persons per room, 1969
Number of Adults (those age 18 or older) in family, 1969
Hours of Unpaid Housework - Head and Wife
.1 - 9.0
9.9
0
1
2
3
4
5
6
7
8
9
1 - 14
0
1 - 5,840
Actual number of people per room
NA
0.0 - 0.25
0.26 - 0.45
0.46 - 0.65
0.66 - 0.85
0.86 - 1.25
1.26 - 1.65
1.66 - 2.05
2.06 - 3.05
3.06 - 9.85
9.86 or more
Actual number of adults
Zero hours of housework
Actual number of hours
This is a two-digit variable so the sample values should be consistent. (V549) Number ofPeople in Family/Number of Rooms in Dwelling (V592)
Number in Family (V549) minus Number of children (those aged 0 - 17) in family
Hours of housework of Wife or single Head (V481) + Hours of housework of husband (V483)
4,364
96
400
724
849
885
987
285
162
55
17
96
4,460
169
4,291
97.85
2.15
8.97
16.23
19.04
19.84
22.13
6.39
3.63
1.23
.38
2.15
100.00
3.79
96.21
Count
Count
Count
Count
%
%
%
%
Value/Range
Value/Range
Value/Range
Value/Range
Code Value/Range Text
Code Value/Range Text
Code Value/Range Text
Code Value/Range Text
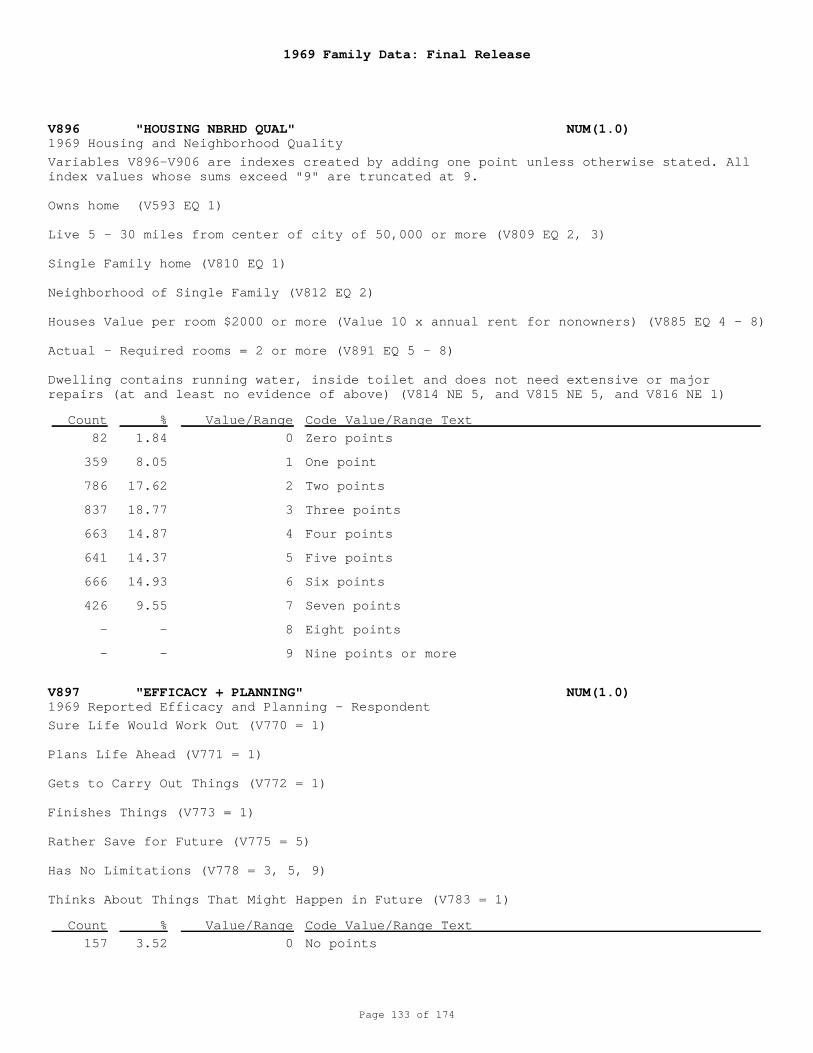
1969 Family Data: Final Release
Page 133 of 174
V896 "HOUSING NBRHD QUAL" NUM(1.0)
V897 "EFFICACY + PLANNING" NUM(1.0)
1969 Housing and Neighborhood Quality
1969 Reported Efficacy and Planning - Respondent
0
1
2
3
4
5
6
7
8
9
0
Zero points
One point
Two points
Three points
Four points
Five points
Six points
Seven points
Eight points
Nine points or more
No points
Variables V896-V906 are indexes created by adding one point unless otherwise stated. Allindex values whose sums exceed "9" are truncated at 9.
Owns home (V593 EQ 1)
Live 5 - 30 miles from center of city of 50,000 or more (V809 EQ 2, 3)
Single Family home (V810 EQ 1) Neighborhood of Single Family (V812 EQ 2) Houses Value per room $2000 or more (Value 10 x annual rent for nonowners) (V885 EQ 4 - 8)
Actual - Required rooms = 2 or more (V891 EQ 5 - 8)
Dwelling contains running water, inside toilet and does not need extensive or majorrepairs (at and least no evidence of above) (V814 NE 5, and V815 NE 5, and V816 NE 1)
Sure Life Would Work Out (V770 = 1)
Plans Life Ahead (V771 = 1)
Gets to Carry Out Things (V772 = 1)
Finishes Things (V773 = 1)
Rather Save for Future (V775 = 5)
Has No Limitations (V778 = 3, 5, 9)
Thinks About Things That Might Happen in Future (V783 = 1)
82
359
786
837
663
641
666
426
-
-
157
1.84
8.05
17.62
18.77
14.87
14.37
14.93
9.55
-
-
3.52
Count
Count
%
%
Value/Range
Value/Range
Code Value/Range Text
Code Value/Range Text
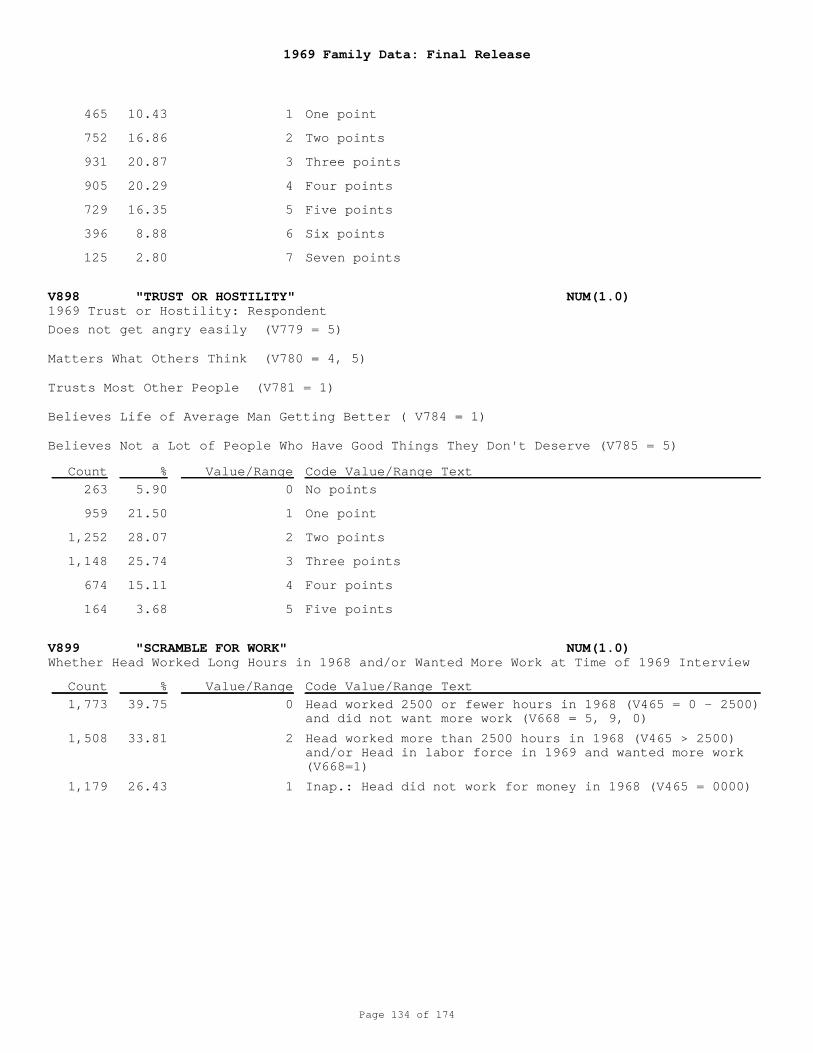
1969 Family Data: Final Release
Page 134 of 174
V898 "TRUST OR HOSTILITY" NUM(1.0)
V899 "SCRAMBLE FOR WORK" NUM(1.0)
1969 Trust or Hostility: Respondent
Whether Head Worked Long Hours in 1968 and/or Wanted More Work at Time of 1969 Interview
1
2
3
4
5
6
7
0
1
2
3
4
5
0
2
1
One point
Two points
Three points
Four points
Five points
Six points
Seven points
No points
One point
Two points
Three points
Four points
Five points
Head worked 2500 or fewer hours in 1968 (V465 = 0 - 2500)and did not want more work (V668 = 5, 9, 0)
Head worked more than 2500 hours in 1968 (V465 > 2500)and/or Head in labor force in 1969 and wanted more work(V668=1)
Inap.: Head did not work for money in 1968 (V465 = 0000)
Does not get angry easily (V779 = 5)
Matters What Others Think (V780 = 4, 5)
Trusts Most Other People (V781 = 1)
Believes Life of Average Man Getting Better ( V784 = 1)
Believes Not a Lot of People Who Have Good Things They Don't Deserve (V785 = 5)
465
752
931
905
729
396
125
263
959
1,252
1,148
674
164
1,773
1,508
1,179
10.43
16.86
20.87
20.29
16.35
8.88
2.80
5.90
21.50
28.07
25.74
15.11
3.68
39.75
33.81
26.43
Count
Count
%
%
Value/Range
Value/Range
Code Value/Range Text
Code Value/Range Text
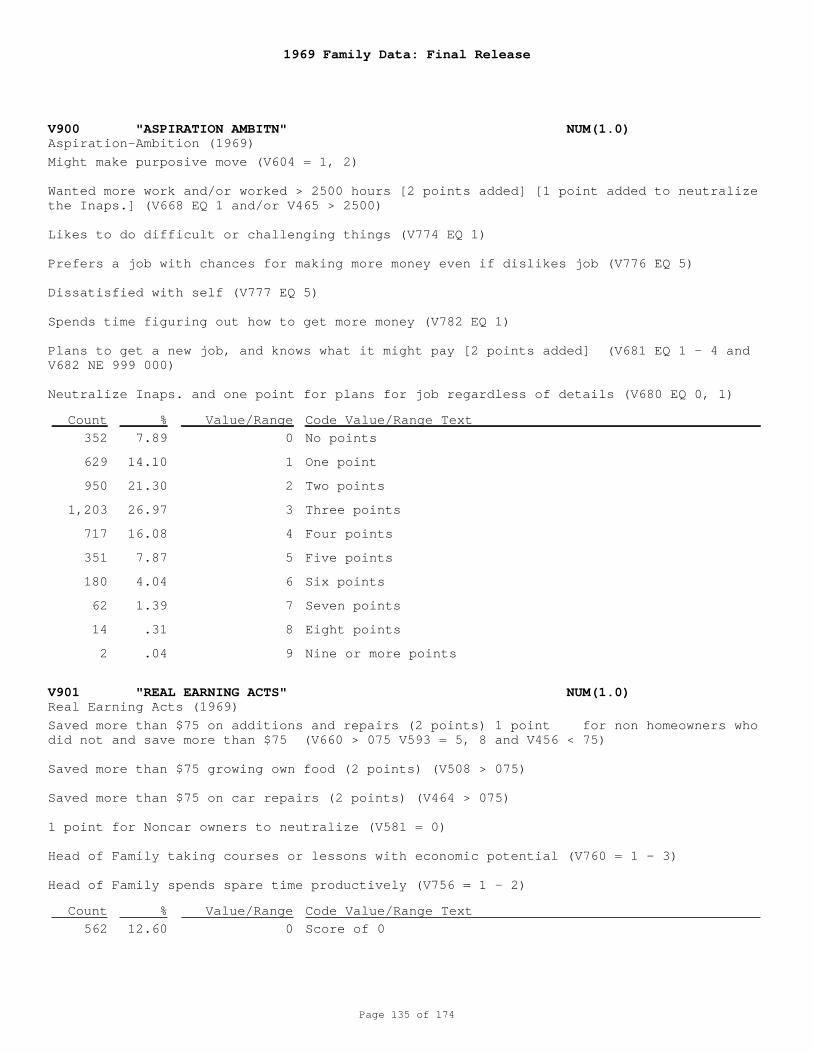
1969 Family Data: Final Release
Page 135 of 174
V900 "ASPIRATION AMBITN" NUM(1.0)
V901 "REAL EARNING ACTS" NUM(1.0)
Aspiration-Ambition (1969)
Real Earning Acts (1969)
0
1
2
3
4
5
6
7
8
9
0
No points
One point
Two points
Three points
Four points
Five points
Six points
Seven points
Eight points
Nine or more points
Score of 0
Might make purposive move (V604 = 1, 2)
Wanted more work and/or worked > 2500 hours [2 points added] [1 point added to neutralizethe Inaps.] (V668 EQ 1 and/or V465 > 2500)
Likes to do difficult or challenging things (V774 EQ 1)
Prefers a job with chances for making more money even if dislikes job (V776 EQ 5)
Dissatisfied with self (V777 EQ 5)
Spends time figuring out how to get more money (V782 EQ 1)
Plans to get a new job, and knows what it might pay [2 points added] (V681 EQ 1 - 4 andV682 NE 999 000)
Neutralize Inaps. and one point for plans for job regardless of details (V680 EQ 0, 1)
Saved more than $75 on additions and repairs (2 points) 1 point for non homeowners whodid not and save more than $75 (V660 > 075 V593 = 5, 8 and V456 < 75)
Saved more than $75 growing own food (2 points) (V508 > 075)
Saved more than $75 on car repairs (2 points) (V464 > 075)
1 point for Noncar owners to neutralize (V581 = 0)
Head of Family taking courses or lessons with economic potential (V760 = 1 - 3)
Head of Family spends spare time productively (V756 = 1 - 2)
352
629
950
1,203
717
351
180
62
14
2
562
7.89
14.10
21.30
26.97
16.08
7.87
4.04
1.39
.31
.04
12.60
Count
Count
%
%
Value/Range
Value/Range
Code Value/Range Text
Code Value/Range Text
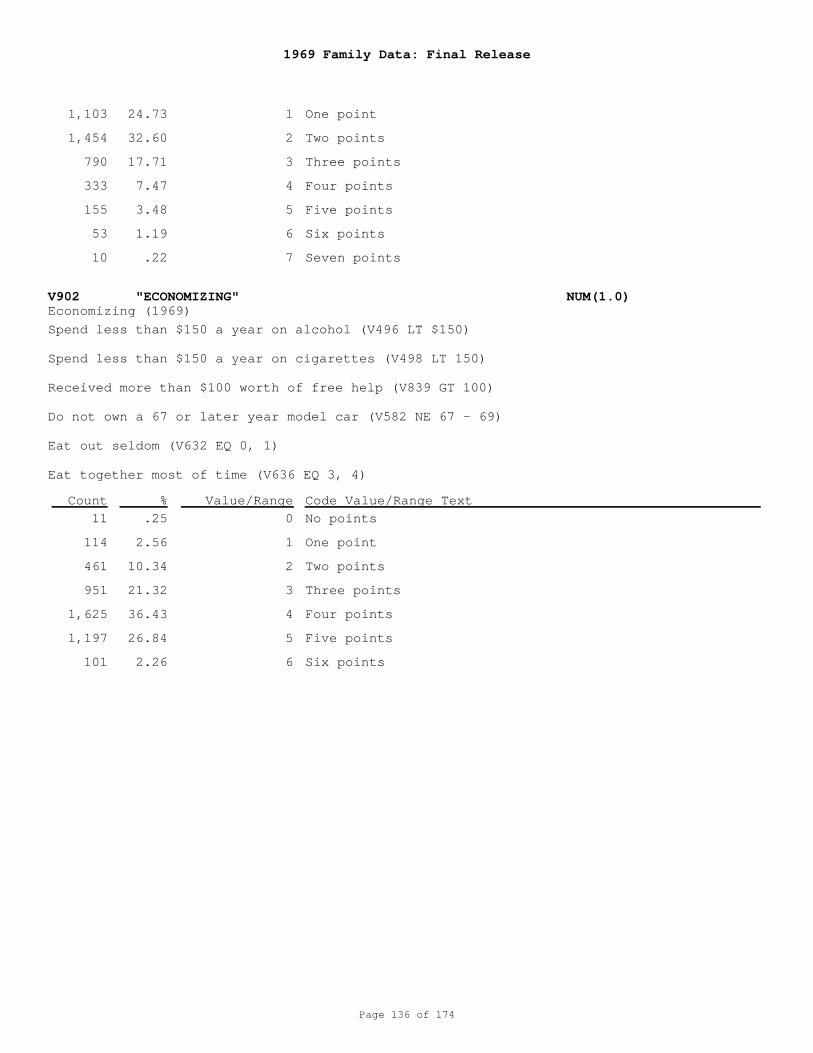
1969 Family Data: Final Release
Page 136 of 174
V902 "ECONOMIZING" NUM(1.0)Economizing (1969)
1
2
3
4
5
6
7
0
1
2
3
4
5
6
One point
Two points
Three points
Four points
Five points
Six points
Seven points
No points
One point
Two points
Three points
Four points
Five points
Six points
Spend less than $150 a year on alcohol (V496 LT $150)
Spend less than $150 a year on cigarettes (V498 LT 150)
Received more than $100 worth of free help (V839 GT 100)
Do not own a 67 or later year model car (V582 NE 67 - 69)
Eat out seldom (V632 EQ 0, 1)
Eat together most of time (V636 EQ 3, 4)
1,103
1,454
790
333
155
53
10
11
114
461
951
1,625
1,197
101
24.73
32.60
17.71
7.47
3.48
1.19
.22
.25
2.56
10.34
21.32
36.43
26.84
2.26
Count % Value/Range Code Value/Range Text
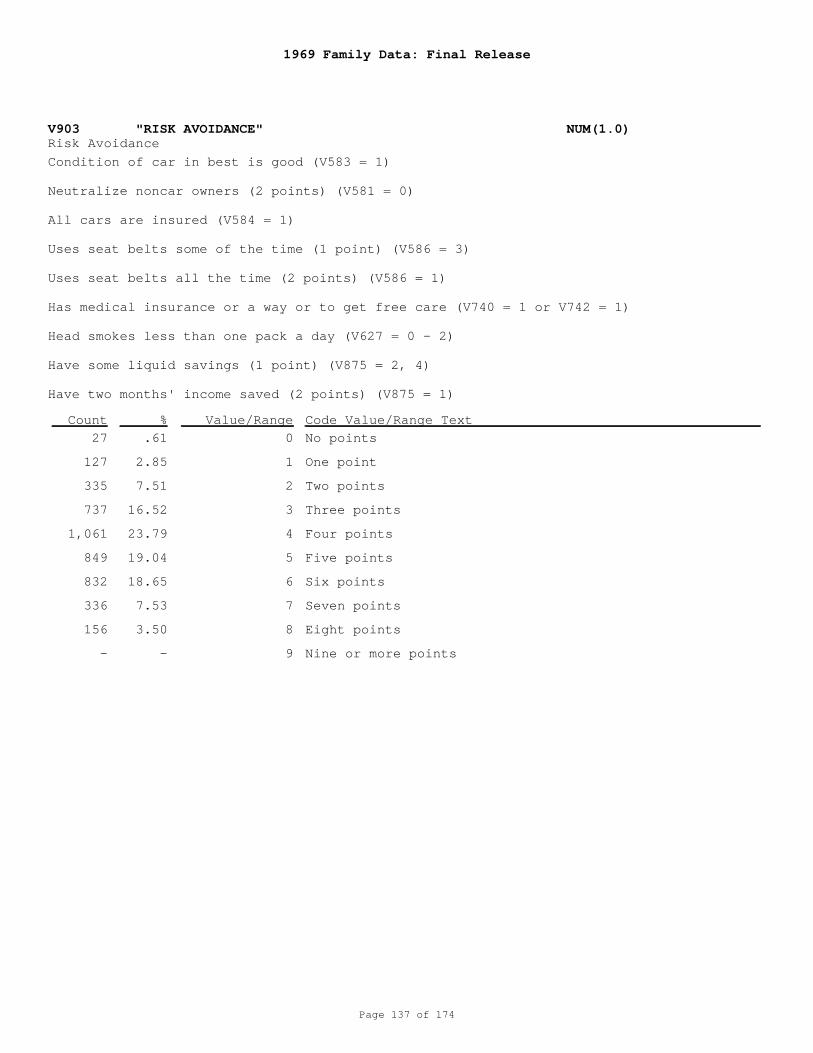
1969 Family Data: Final Release
Page 137 of 174
V903 "RISK AVOIDANCE" NUM(1.0)Risk Avoidance
0
1
2
3
4
5
6
7
8
9
No points
One point
Two points
Three points
Four points
Five points
Six points
Seven points
Eight points
Nine or more points
Condition of car in best is good (V583 = 1)
Neutralize noncar owners (2 points) (V581 = 0)
All cars are insured (V584 = 1)
Uses seat belts some of the time (1 point) (V586 = 3)
Uses seat belts all the time (2 points) (V586 = 1)
Has medical insurance or a way or to get free care (V740 = 1 or V742 = 1)
Head smokes less than one pack a day (V627 = 0 - 2)
Have some liquid savings (1 point) (V875 = 2, 4)
Have two months' income saved (2 points) (V875 = 1)
27
127
335
737
1,061
849
832
336
156
-
.61
2.85
7.51
16.52
23.79
19.04
18.65
7.53
3.50
-
Count % Value/Range Code Value/Range Text
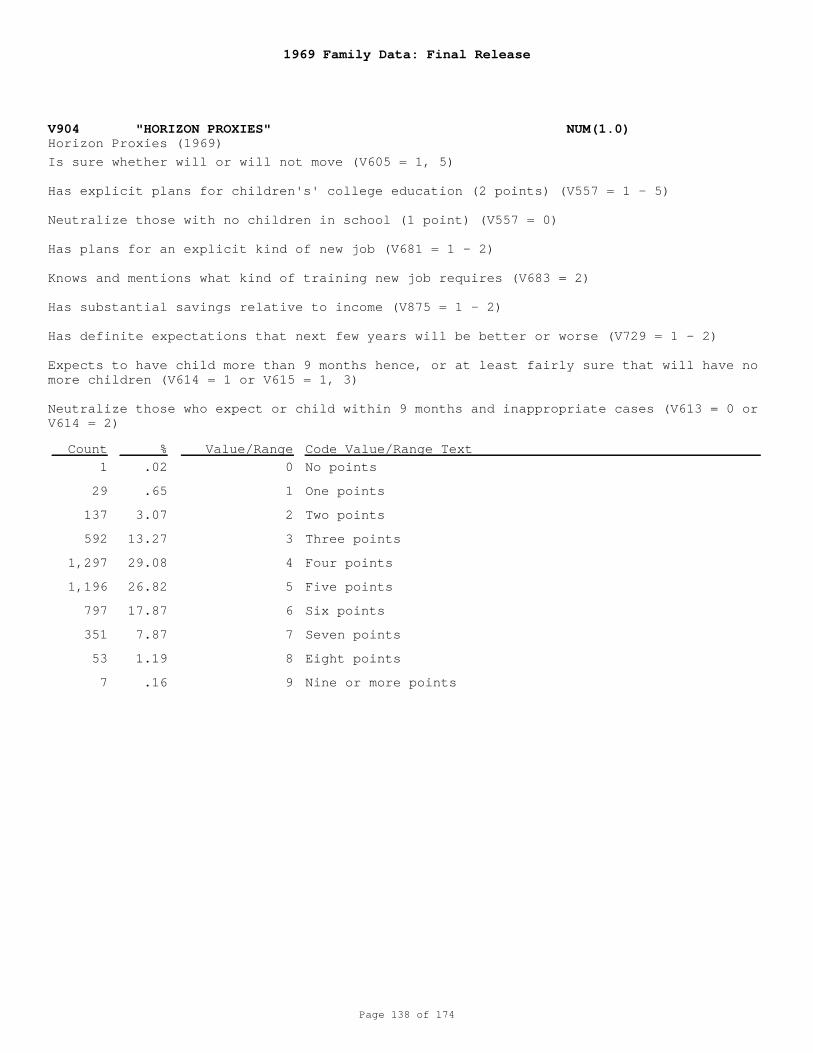
1969 Family Data: Final Release
Page 138 of 174
V904 "HORIZON PROXIES" NUM(1.0)Horizon Proxies (1969)
0
1
2
3
4
5
6
7
8
9
No points
One points
Two points
Three points
Four points
Five points
Six points
Seven points
Eight points
Nine or more points
Is sure whether will or will not move (V605 = 1, 5)
Has explicit plans for children's' college education (2 points) (V557 = 1 - 5)
Neutralize those with no children in school (1 point) (V557 = 0)
Has plans for an explicit kind of new job (V681 = 1 - 2)
Knows and mentions what kind of training new job requires (V683 = 2)
Has substantial savings relative to income (V875 = 1 - 2)
Has definite expectations that next few years will be better or worse (V729 = 1 - 2)
Expects to have child more than 9 months hence, or at least fairly sure that will have nomore children (V614 = 1 or V615 = 1, 3)
Neutralize those who expect or child within 9 months and inappropriate cases (V613 = 0 orV614 = 2)
1
29
137
592
1,297
1,196
797
351
53
7
.02
.65
3.07
13.27
29.08
26.82
17.87
7.87
1.19
.16
Count % Value/Range Code Value/Range Text
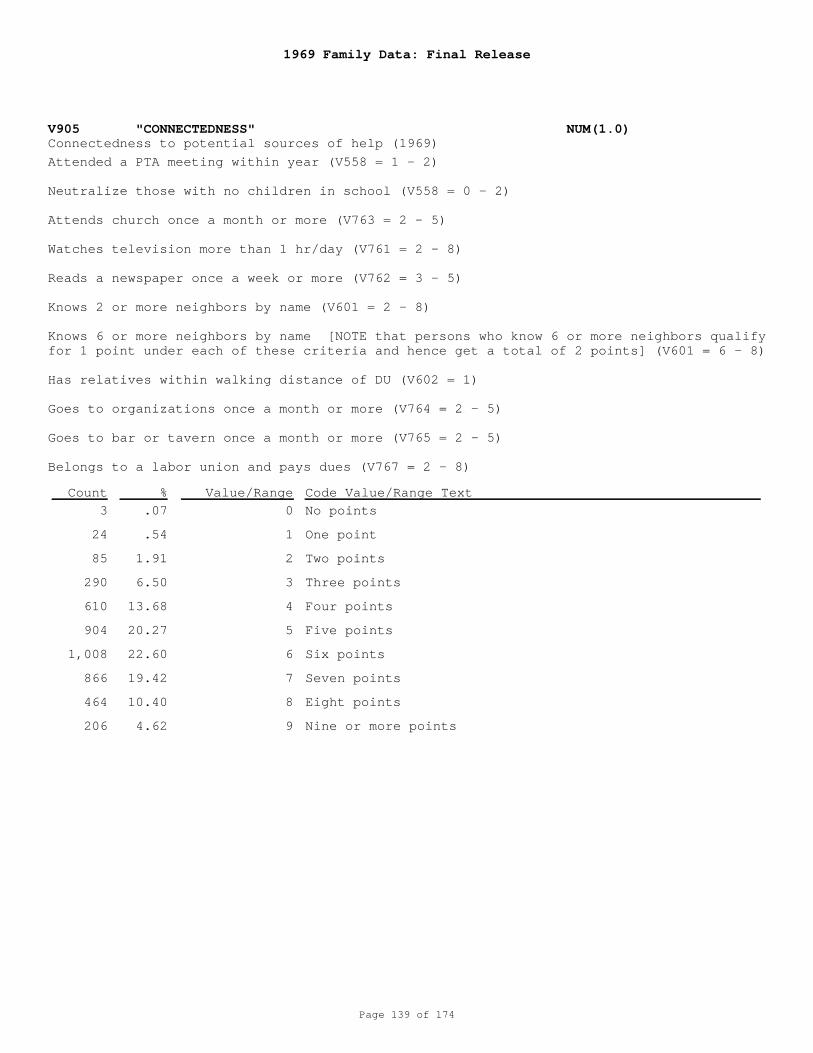
1969 Family Data: Final Release
Page 139 of 174
V905 "CONNECTEDNESS" NUM(1.0)Connectedness to potential sources of help (1969)
0
1
2
3
4
5
6
7
8
9
No points
One point
Two points
Three points
Four points
Five points
Six points
Seven points
Eight points
Nine or more points
Attended a PTA meeting within year (V558 = 1 - 2)
Neutralize those with no children in school (V558 = 0 - 2)
Attends church once a month or more (V763 = 2 - 5)
Watches television more than 1 hr/day (V761 = 2 - 8)
Reads a newspaper once a week or more (V762 = 3 - 5)
Knows 2 or more neighbors by name (V601 = 2 - 8)
Knows 6 or more neighbors by name [NOTE that persons who know 6 or more neighbors qualifyfor 1 point under each of these criteria and hence get a total of 2 points] (V601 = 6 - 8)
Has relatives within walking distance of DU (V602 = 1)
Goes to organizations once a month or more (V764 = 2 - 5)
Goes to bar or tavern once a month or more (V765 = 2 - 5)
Belongs to a labor union and pays dues (V767 = 2 - 8)
3
24
85
290
610
904
1,008
866
464
206
.07
.54
1.91
6.50
13.68
20.27
22.60
19.42
10.40
4.62
Count % Value/Range Code Value/Range Text
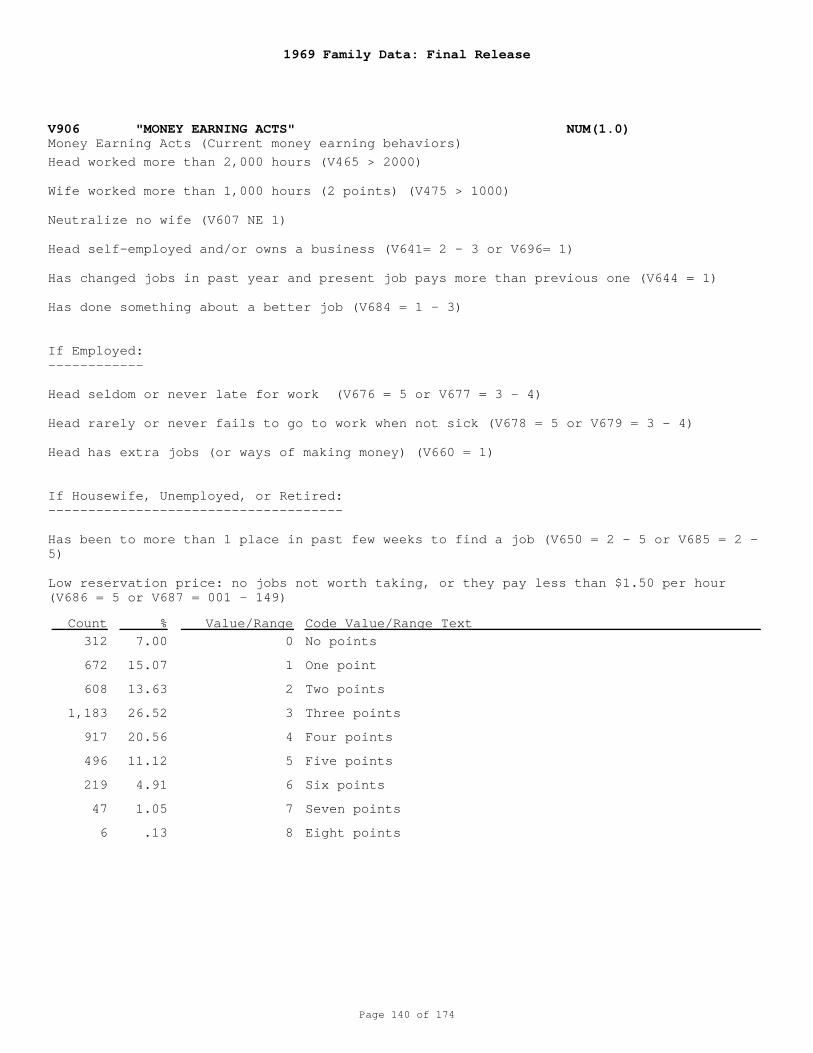
1969 Family Data: Final Release
Page 140 of 174
V906 "MONEY EARNING ACTS" NUM(1.0)Money Earning Acts (Current money earning behaviors)
0
1
2
3
4
5
6
7
8
No points
One point
Two points
Three points
Four points
Five points
Six points
Seven points
Eight points
Head worked more than 2,000 hours (V465 > 2000) Wife worked more than 1,000 hours (2 points) (V475 > 1000)
Neutralize no wife (V607 NE 1) Head self-employed and/or owns a business (V641= 2 - 3 or V696= 1)
Has changed jobs in past year and present job pays more than previous one (V644 = 1) Has done something about a better job (V684 = 1 - 3)
If Employed:------------
Head seldom or never late for work (V676 = 5 or V677 = 3 - 4)
Head rarely or never fails to go to work when not sick (V678 = 5 or V679 = 3 - 4)
Head has extra jobs (or ways of making money) (V660 = 1)
If Housewife, Unemployed, or Retired:-------------------------------------
Has been to more than 1 place in past few weeks to find a job (V650 = 2 - 5 or V685 = 2 -5)
Low reservation price: no jobs not worth taking, or they pay less than $1.50 per hour(V686 = 5 or V687 = 001 - 149)
312
672
608
1,183
917
496
219
47
6
7.00
15.07
13.63
26.52
20.56
11.12
4.91
1.05
.13
Count % Value/Range Code Value/Range Text
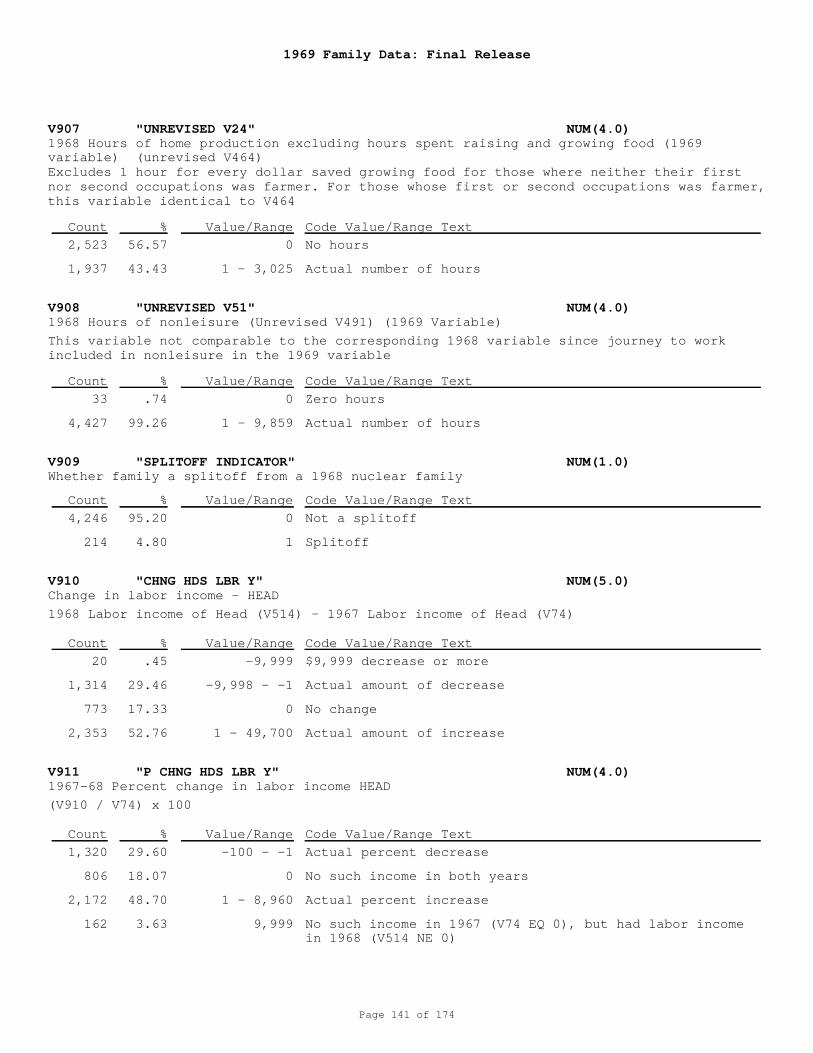
1969 Family Data: Final Release
Page 141 of 174
V907 "UNREVISED V24" NUM(4.0)
V908 "UNREVISED V51" NUM(4.0)
V909 "SPLITOFF INDICATOR" NUM(1.0)
V910 "CHNG HDS LBR Y" NUM(5.0)
V911 "P CHNG HDS LBR Y" NUM(4.0)
1968 Hours of home production excluding hours spent raising and growing food (1969variable) (unrevised V464)
1968 Hours of nonleisure (Unrevised V491) (1969 Variable)
Whether family a splitoff from a 1968 nuclear family
Change in labor income - HEAD
1967-68 Percent change in labor income HEAD
0
1 - 3,025
0
1 - 9,859
0
1
-9,999
-9,998 - -1
0
1 - 49,700
-100 - -1
0
1 - 8,960
9,999
No hours
Actual number of hours
Zero hours
Actual number of hours
Not a splitoff
Splitoff
$9,999 decrease or more
Actual amount of decrease
No change
Actual amount of increase
Actual percent decrease
No such income in both years
Actual percent increase
No such income in 1967 (V74 EQ 0), but had labor incomein 1968 (V514 NE 0)
Excludes 1 hour for every dollar saved growing food for those where neither their firstnor second occupations was farmer. For those whose first or second occupations was farmer,this variable identical to V464
This variable not comparable to the corresponding 1968 variable since journey to workincluded in nonleisure in the 1969 variable
1968 Labor income of Head (V514) - 1967 Labor income of Head (V74)
(V910 / V74) x 100
2,523
1,937
33
4,427
4,246
214
20
1,314
773
2,353
1,320
806
2,172
162
56.57
43.43
.74
99.26
95.20
4.80
.45
29.46
17.33
52.76
29.60
18.07
48.70
3.63
Count
Count
Count
Count
Count
%
%
%
%
%
Value/Range
Value/Range
Value/Range
Value/Range
Value/Range
Code Value/Range Text
Code Value/Range Text
Code Value/Range Text
Code Value/Range Text
Code Value/Range Text
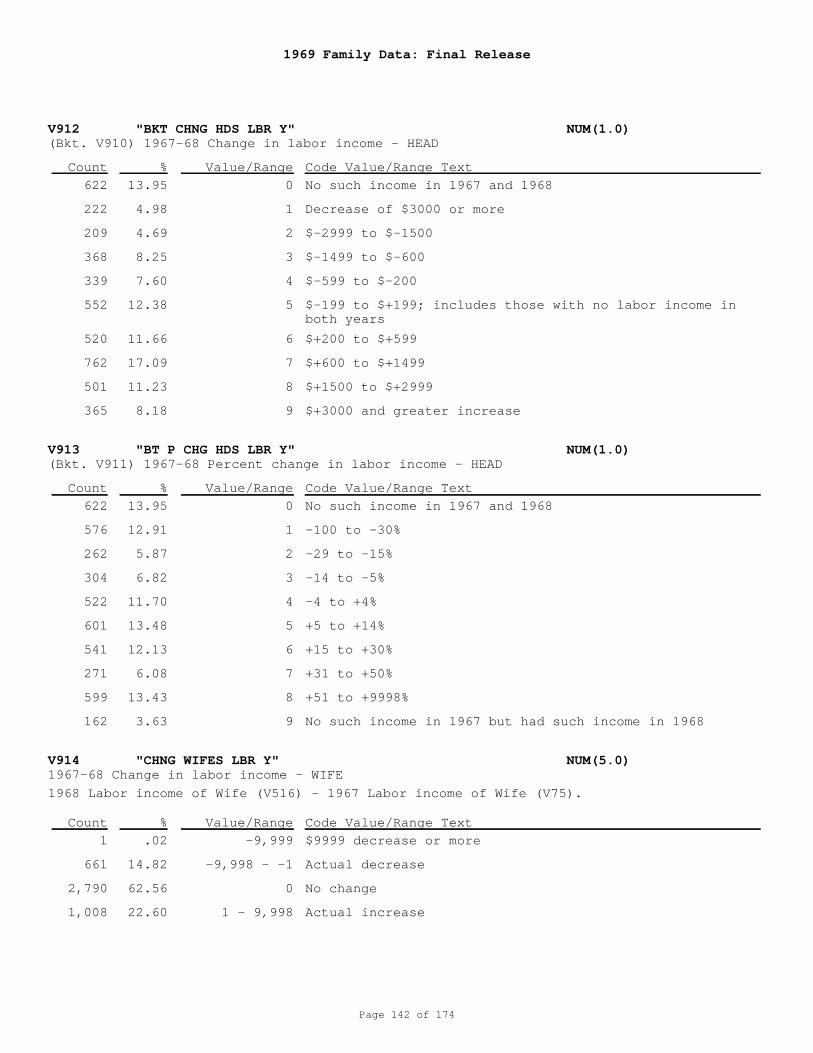
1969 Family Data: Final Release
Page 142 of 174
V912 "BKT CHNG HDS LBR Y" NUM(1.0)
V913 "BT P CHG HDS LBR Y" NUM(1.0)
V914 "CHNG WIFES LBR Y" NUM(5.0)
(Bkt. V910) 1967-68 Change in labor income - HEAD
(Bkt. V911) 1967-68 Percent change in labor income - HEAD
1967-68 Change in labor income - WIFE
0
1
2
3
4
5
6
7
8
9
0
1
2
3
4
5
6
7
8
9
-9,999
-9,998 - -1
0
1 - 9,998
No such income in 1967 and 1968
Decrease of $3000 or more
$-2999 to $-1500
$-1499 to $-600
$-599 to $-200
$-199 to $+199; includes those with no labor income inboth years
$+200 to $+599
$+600 to $+1499
$+1500 to $+2999
$+3000 and greater increase
No such income in 1967 and 1968
-100 to -30%
-29 to -15%
-14 to -5%
-4 to +4%
+5 to +14%
+15 to +30%
+31 to +50%
+51 to +9998%
No such income in 1967 but had such income in 1968
$9999 decrease or more
Actual decrease
No change
Actual increase
1968 Labor income of Wife (V516) - 1967 Labor income of Wife (V75).
622
222
209
368
339
552
520
762
501
365
622
576
262
304
522
601
541
271
599
162
1
661
2,790
1,008
13.95
4.98
4.69
8.25
7.60
12.38
11.66
17.09
11.23
8.18
13.95
12.91
5.87
6.82
11.70
13.48
12.13
6.08
13.43
3.63
.02
14.82
62.56
22.60
Count
Count
Count
%
%
%
Value/Range
Value/Range
Value/Range
Code Value/Range Text
Code Value/Range Text
Code Value/Range Text
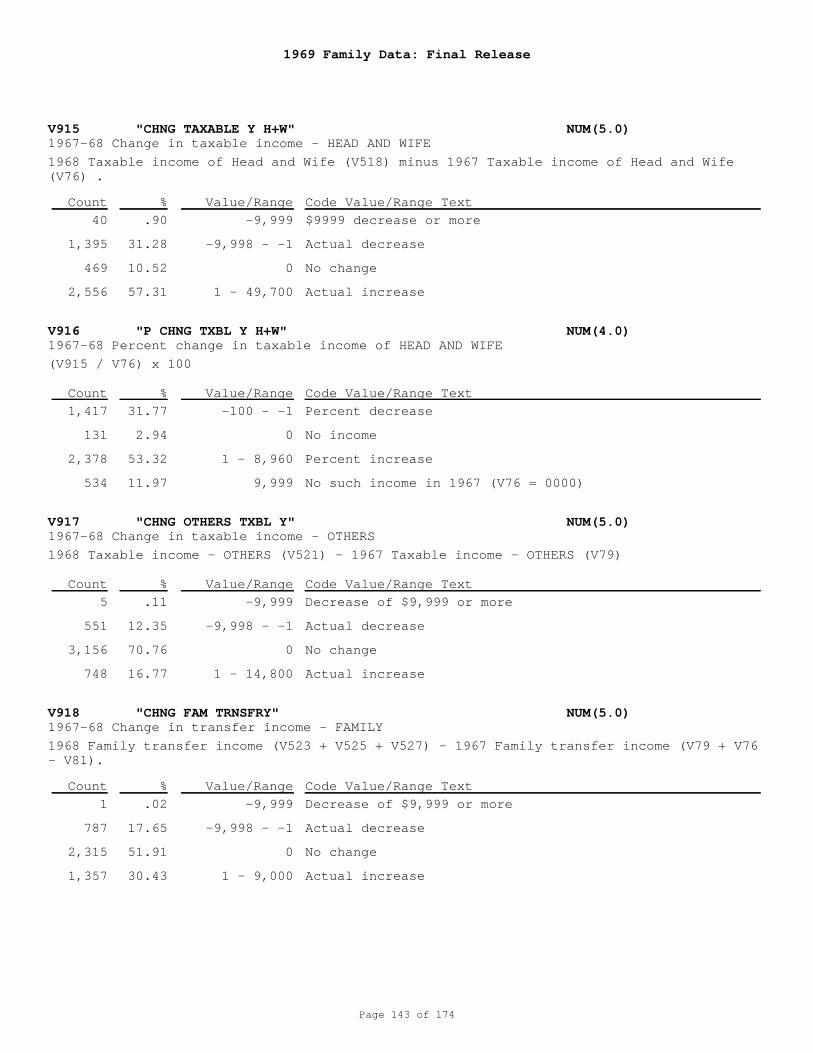
1969 Family Data: Final Release
Page 143 of 174
V915 "CHNG TAXABLE Y H+W" NUM(5.0)
V916 "P CHNG TXBL Y H+W" NUM(4.0)
V917 "CHNG OTHERS TXBL Y" NUM(5.0)
V918 "CHNG FAM TRNSFRY" NUM(5.0)
1967-68 Change in taxable income - HEAD AND WIFE
1967-68 Percent change in taxable income of HEAD AND WIFE
1967-68 Change in taxable income - OTHERS
1967-68 Change in transfer income - FAMILY
-9,999
-9,998 - -1
0
1 - 49,700
-100 - -1
0
1 - 8,960
9,999
-9,999
-9,998 - -1
0
1 - 14,800
-9,999
-9,998 - -1
0
1 - 9,000
$9999 decrease or more
Actual decrease
No change
Actual increase
Percent decrease
No income
Percent increase
No such income in 1967 (V76 = 0000)
Decrease of $9,999 or more
Actual decrease
No change
Actual increase
Decrease of $9,999 or more
Actual decrease
No change
Actual increase
1968 Taxable income of Head and Wife (V518) minus 1967 Taxable income of Head and Wife(V76) .
(V915 / V76) x 100
1968 Taxable income - OTHERS (V521) - 1967 Taxable income - OTHERS (V79)
1968 Family transfer income (V523 + V525 + V527) - 1967 Family transfer income (V79 + V76- V81).
40
1,395
469
2,556
1,417
131
2,378
534
5
551
3,156
748
1
787
2,315
1,357
.90
31.28
10.52
57.31
31.77
2.94
53.32
11.97
.11
12.35
70.76
16.77
.02
17.65
51.91
30.43
Count
Count
Count
Count
%
%
%
%
Value/Range
Value/Range
Value/Range
Value/Range
Code Value/Range Text
Code Value/Range Text
Code Value/Range Text
Code Value/Range Text
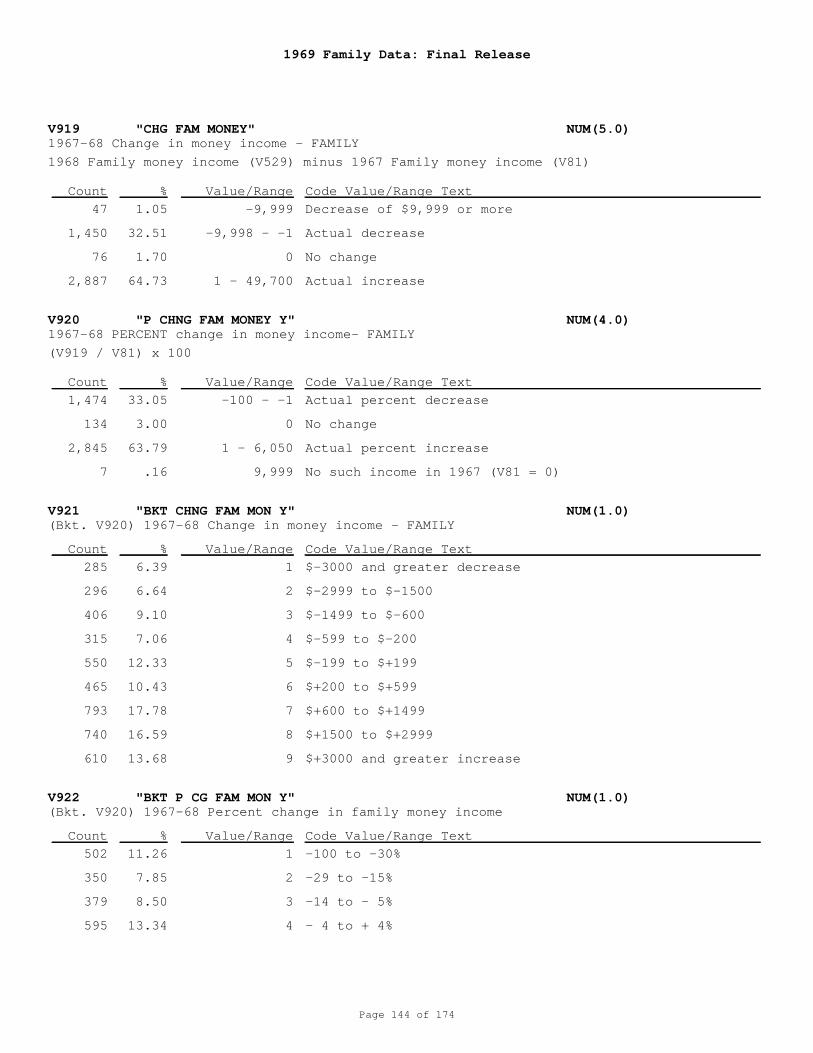
1969 Family Data: Final Release
Page 144 of 174
V919 "CHG FAM MONEY" NUM(5.0)
V920 "P CHNG FAM MONEY Y" NUM(4.0)
V921 "BKT CHNG FAM MON Y" NUM(1.0)
V922 "BKT P CG FAM MON Y" NUM(1.0)
1967-68 Change in money income - FAMILY
1967-68 PERCENT change in money income- FAMILY
(Bkt. V920) 1967-68 Change in money income - FAMILY
(Bkt. V920) 1967-68 Percent change in family money income
-9,999
-9,998 - -1
0
1 - 49,700
-100 - -1
0
1 - 6,050
9,999
1
2
3
4
5
6
7
8
9
1
2
3
4
Decrease of $9,999 or more
Actual decrease
No change
Actual increase
Actual percent decrease
No change
Actual percent increase
No such income in 1967 (V81 = 0)
$-3000 and greater decrease
$-2999 to $-1500
$-1499 to $-600
$-599 to $-200
$-199 to $+199
$+200 to $+599
$+600 to $+1499
$+1500 to $+2999
$+3000 and greater increase
-100 to -30%
-29 to -15%
-14 to - 5%
- 4 to + 4%
1968 Family money income (V529) minus 1967 Family money income (V81)
(V919 / V81) x 100
47
1,450
76
2,887
1,474
134
2,845
7
285
296
406
315
550
465
793
740
610
502
350
379
595
1.05
32.51
1.70
64.73
33.05
3.00
63.79
.16
6.39
6.64
9.10
7.06
12.33
10.43
17.78
16.59
13.68
11.26
7.85
8.50
13.34
Count
Count
Count
Count
%
%
%
%
Value/Range
Value/Range
Value/Range
Value/Range
Code Value/Range Text
Code Value/Range Text
Code Value/Range Text
Code Value/Range Text
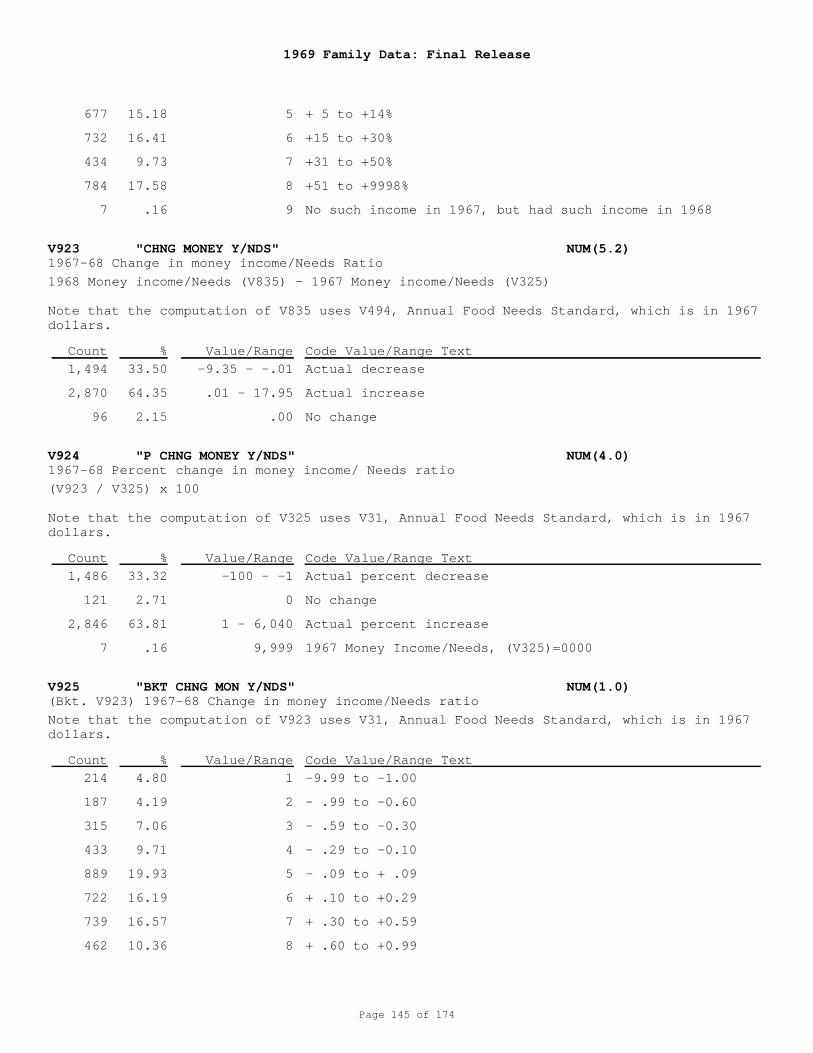
1969 Family Data: Final Release
Page 145 of 174
V923 "CHNG MONEY Y/NDS" NUM(5.2)
V924 "P CHNG MONEY Y/NDS" NUM(4.0)
V925 "BKT CHNG MON Y/NDS" NUM(1.0)
1967-68 Change in money income/Needs Ratio
1967-68 Percent change in money income/ Needs ratio
(Bkt. V923) 1967-68 Change in money income/Needs ratio
5
6
7
8
9
-9.35 - -.01
.01 - 17.95
.00
-100 - -1
0
1 - 6,040
9,999
1
2
3
4
5
6
7
8
+ 5 to +14%
+15 to +30%
+31 to +50%
+51 to +9998%
No such income in 1967, but had such income in 1968
Actual decrease
Actual increase
No change
Actual percent decrease
No change
Actual percent increase
1967 Money Income/Needs, (V325)=0000
-9.99 to -1.00
- .99 to -0.60
- .59 to -0.30
- .29 to -0.10
- .09 to + .09
+ .10 to +0.29
+ .30 to +0.59
+ .60 to +0.99
1968 Money income/Needs (V835) - 1967 Money income/Needs (V325)
Note that the computation of V835 uses V494, Annual Food Needs Standard, which is in 1967dollars.
(V923 / V325) x 100
Note that the computation of V325 uses V31, Annual Food Needs Standard, which is in 1967dollars.
Note that the computation of V923 uses V31, Annual Food Needs Standard, which is in 1967dollars.
677
732
434
784
7
1,494
2,870
96
1,486
121
2,846
7
214
187
315
433
889
722
739
462
15.18
16.41
9.73
17.58
.16
33.50
64.35
2.15
33.32
2.71
63.81
.16
4.80
4.19
7.06
9.71
19.93
16.19
16.57
10.36
Count
Count
Count
%
%
%
Value/Range
Value/Range
Value/Range
Code Value/Range Text
Code Value/Range Text
Code Value/Range Text
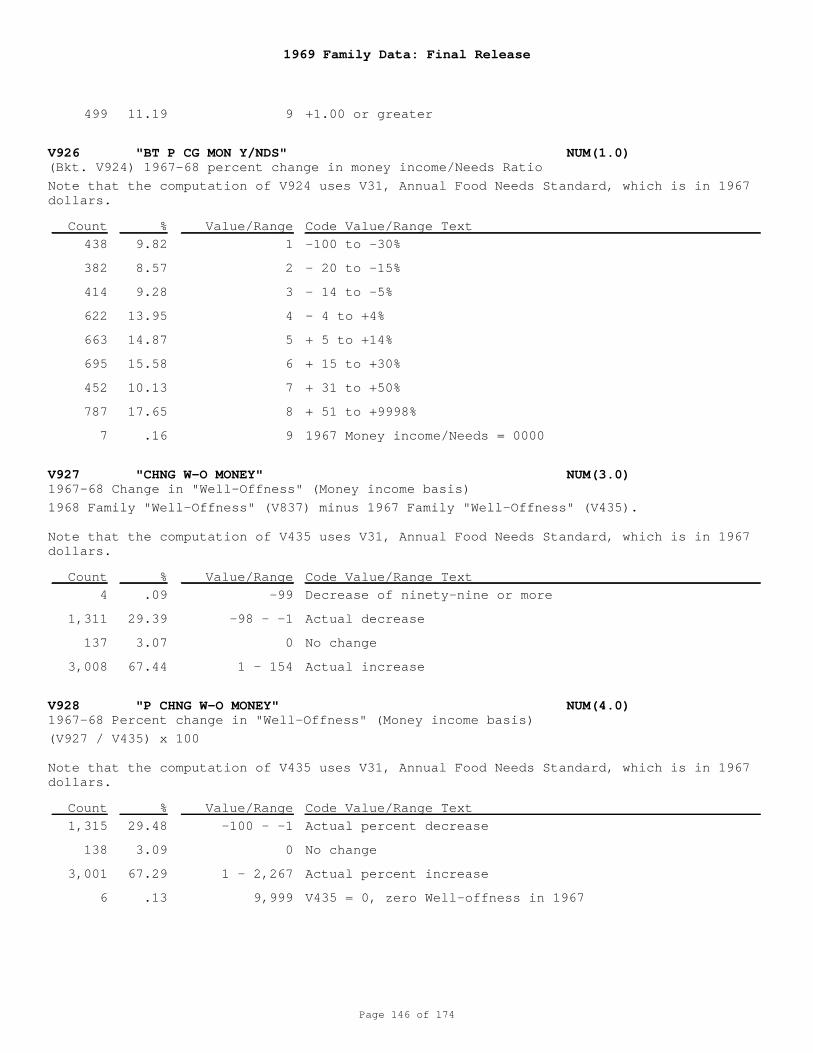
1969 Family Data: Final Release
Page 146 of 174
V926 "BT P CG MON Y/NDS" NUM(1.0)
V927 "CHNG W-O MONEY" NUM(3.0)
V928 "P CHNG W-O MONEY" NUM(4.0)
(Bkt. V924) 1967-68 percent change in money income/Needs Ratio
1967-68 Change in "Well-Offness" (Money income basis)
1967-68 Percent change in "Well-Offness" (Money income basis)
9
1
2
3
4
5
6
7
8
9
-99
-98 - -1
0
1 - 154
-100 - -1
0
1 - 2,267
9,999
+1.00 or greater
-100 to -30%
- 20 to -15%
- 14 to -5%
- 4 to +4%
+ 5 to +14%
+ 15 to +30%
+ 31 to +50%
+ 51 to +9998%
1967 Money income/Needs = 0000
Decrease of ninety-nine or more
Actual decrease
No change
Actual increase
Actual percent decrease
No change
Actual percent increase
V435 = 0, zero Well-offness in 1967
Note that the computation of V924 uses V31, Annual Food Needs Standard, which is in 1967dollars.
1968 Family "Well-Offness" (V837) minus 1967 Family "Well-Offness" (V435).
Note that the computation of V435 uses V31, Annual Food Needs Standard, which is in 1967dollars.
(V927 / V435) x 100
Note that the computation of V435 uses V31, Annual Food Needs Standard, which is in 1967dollars.
499
438
382
414
622
663
695
452
787
7
4
1,311
137
3,008
1,315
138
3,001
6
11.19
9.82
8.57
9.28
13.95
14.87
15.58
10.13
17.65
.16
.09
29.39
3.07
67.44
29.48
3.09
67.29
.13
Count
Count
Count
%
%
%
Value/Range
Value/Range
Value/Range
Code Value/Range Text
Code Value/Range Text
Code Value/Range Text
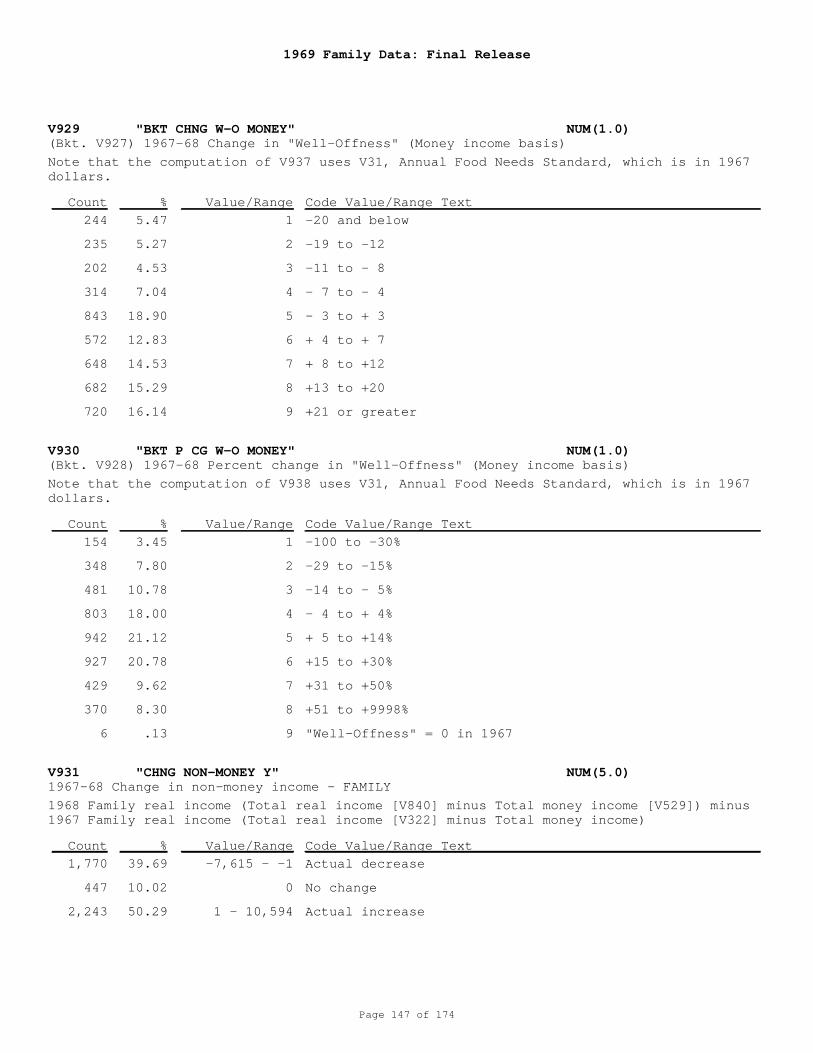
1969 Family Data: Final Release
Page 147 of 174
V929 "BKT CHNG W-O MONEY" NUM(1.0)
V930 "BKT P CG W-O MONEY" NUM(1.0)
V931 "CHNG NON-MONEY Y" NUM(5.0)
(Bkt. V927) 1967-68 Change in "Well-Offness" (Money income basis)
(Bkt. V928) 1967-68 Percent change in "Well-Offness" (Money income basis)
1967-68 Change in non-money income - FAMILY
1
2
3
4
5
6
7
8
9
1
2
3
4
5
6
7
8
9
-7,615 - -1
0
1 - 10,594
-20 and below
-19 to -12
-11 to - 8
- 7 to - 4
- 3 to + 3
+ 4 to + 7
+ 8 to +12
+13 to +20
+21 or greater
-100 to -30%
-29 to -15%
-14 to - 5%
- 4 to + 4%
+ 5 to +14%
+15 to +30%
+31 to +50%
+51 to +9998%
"Well-Offness" = 0 in 1967
Actual decrease
No change
Actual increase
Note that the computation of V937 uses V31, Annual Food Needs Standard, which is in 1967dollars.
Note that the computation of V938 uses V31, Annual Food Needs Standard, which is in 1967dollars.
1968 Family real income (Total real income [V840] minus Total money income [V529]) minus1967 Family real income (Total real income [V322] minus Total money income)
244
235
202
314
843
572
648
682
720
154
348
481
803
942
927
429
370
6
1,770
447
2,243
5.47
5.27
4.53
7.04
18.90
12.83
14.53
15.29
16.14
3.45
7.80
10.78
18.00
21.12
20.78
9.62
8.30
.13
39.69
10.02
50.29
Count
Count
Count
%
%
%
Value/Range
Value/Range
Value/Range
Code Value/Range Text
Code Value/Range Text
Code Value/Range Text
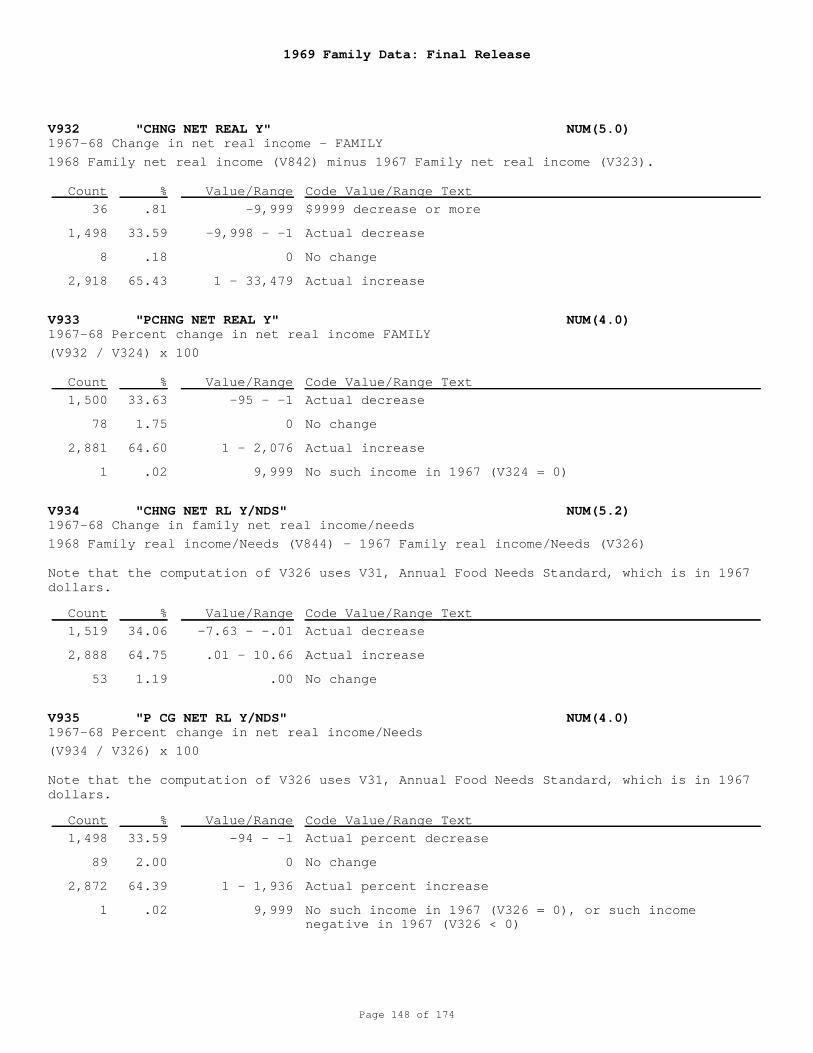
1969 Family Data: Final Release
Page 148 of 174
V932 "CHNG NET REAL Y" NUM(5.0)
V933 "PCHNG NET REAL Y" NUM(4.0)
V934 "CHNG NET RL Y/NDS" NUM(5.2)
V935 "P CG NET RL Y/NDS" NUM(4.0)
1967-68 Change in net real income - FAMILY
1967-68 Percent change in net real income FAMILY
1967-68 Change in family net real income/needs
1967-68 Percent change in net real income/Needs
-9,999
-9,998 - -1
0
1 - 33,479
-95 - -1
0
1 - 2,076
9,999
-7.63 - -.01
.01 - 10.66
.00
-94 - -1
0
1 - 1,936
9,999
$9999 decrease or more
Actual decrease
No change
Actual increase
Actual decrease
No change
Actual increase
No such income in 1967 (V324 = 0)
Actual decrease
Actual increase
No change
Actual percent decrease
No change
Actual percent increase
No such income in 1967 (V326 = 0), or such incomenegative in 1967 (V326 < 0)
1968 Family net real income (V842) minus 1967 Family net real income (V323).
(V932 / V324) x 100
1968 Family real income/Needs (V844) - 1967 Family real income/Needs (V326)
Note that the computation of V326 uses V31, Annual Food Needs Standard, which is in 1967dollars.
(V934 / V326) x 100
Note that the computation of V326 uses V31, Annual Food Needs Standard, which is in 1967dollars.
36
1,498
8
2,918
1,500
78
2,881
1
1,519
2,888
53
1,498
89
2,872
1
.81
33.59
.18
65.43
33.63
1.75
64.60
.02
34.06
64.75
1.19
33.59
2.00
64.39
.02
Count
Count
Count
Count
%
%
%
%
Value/Range
Value/Range
Value/Range
Value/Range
Code Value/Range Text
Code Value/Range Text
Code Value/Range Text
Code Value/Range Text
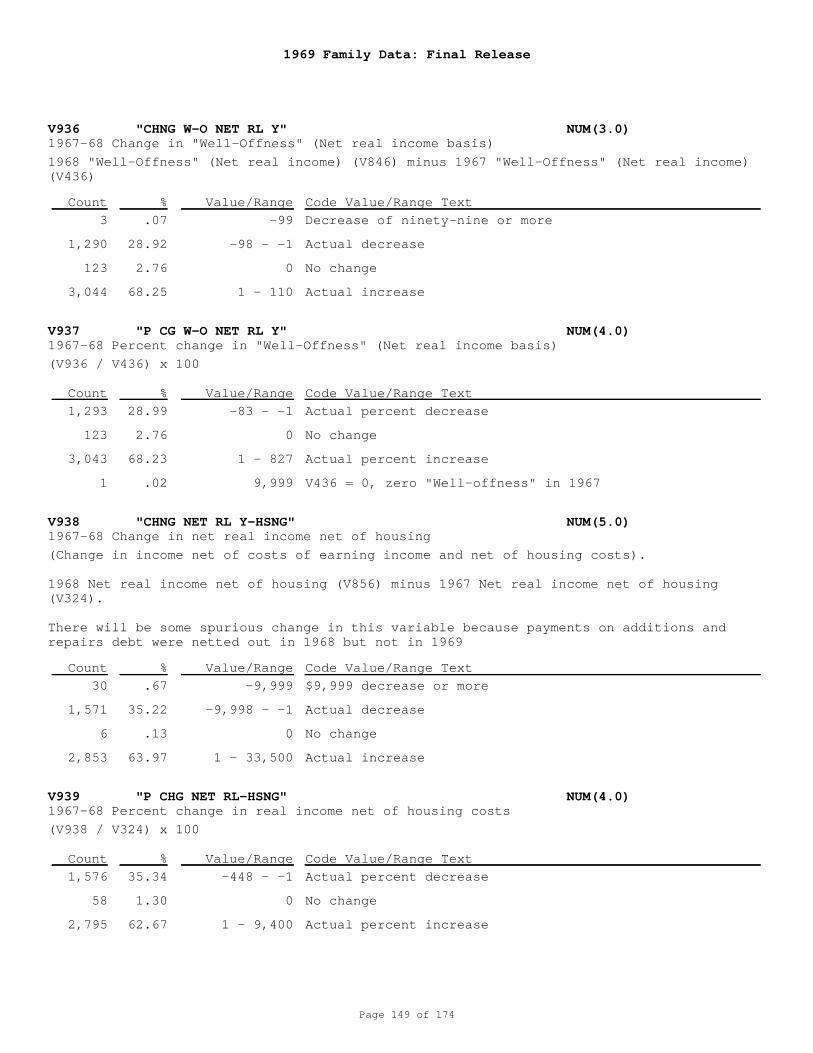
1969 Family Data: Final Release
Page 149 of 174
V936 "CHNG W-O NET RL Y" NUM(3.0)
V937 "P CG W-O NET RL Y" NUM(4.0)
V938 "CHNG NET RL Y-HSNG" NUM(5.0)
V939 "P CHG NET RL-HSNG" NUM(4.0)
1967-68 Change in "Well-Offness" (Net real income basis)
1967-68 Percent change in "Well-Offness" (Net real income basis)
1967-68 Change in net real income net of housing
1967-68 Percent change in real income net of housing costs
-99
-98 - -1
0
1 - 110
-83 - -1
0
1 - 827
9,999
-9,999
-9,998 - -1
0
1 - 33,500
-448 - -1
0
1 - 9,400
Decrease of ninety-nine or more
Actual decrease
No change
Actual increase
Actual percent decrease
No change
Actual percent increase
V436 = 0, zero "Well-offness" in 1967
$9,999 decrease or more
Actual decrease
No change
Actual increase
Actual percent decrease
No change
Actual percent increase
1968 "Well-Offness" (Net real income) (V846) minus 1967 "Well-Offness" (Net real income)(V436)
(V936 / V436) x 100
(Change in income net of costs of earning income and net of housing costs).
1968 Net real income net of housing (V856) minus 1967 Net real income net of housing(V324).
There will be some spurious change in this variable because payments on additions andrepairs debt were netted out in 1968 but not in 1969
(V938 / V324) x 100
3
1,290
123
3,044
1,293
123
3,043
1
30
1,571
6
2,853
1,576
58
2,795
.07
28.92
2.76
68.25
28.99
2.76
68.23
.02
.67
35.22
.13
63.97
35.34
1.30
62.67
Count
Count
Count
Count
%
%
%
%
Value/Range
Value/Range
Value/Range
Value/Range
Code Value/Range Text
Code Value/Range Text
Code Value/Range Text
Code Value/Range Text
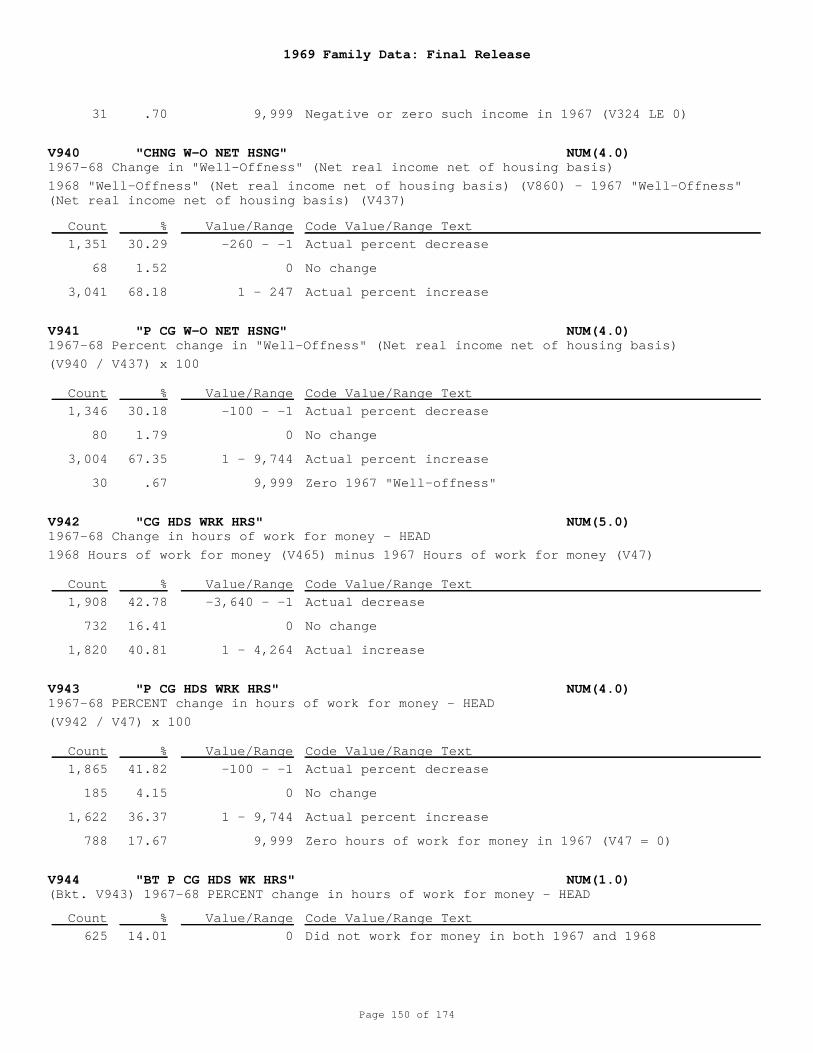
1969 Family Data: Final Release
Page 150 of 174
V940 "CHNG W-O NET HSNG" NUM(4.0)
V941 "P CG W-O NET HSNG" NUM(4.0)
V942 "CG HDS WRK HRS" NUM(5.0)
V943 "P CG HDS WRK HRS" NUM(4.0)
V944 "BT P CG HDS WK HRS" NUM(1.0)
1967-68 Change in "Well-Offness" (Net real income net of housing basis)
1967-68 Percent change in "Well-Offness" (Net real income net of housing basis)
1967-68 Change in hours of work for money - HEAD
1967-68 PERCENT change in hours of work for money - HEAD
(Bkt. V943) 1967-68 PERCENT change in hours of work for money - HEAD
9,999
-260 - -1
0
1 - 247
-100 - -1
0
1 - 9,744
9,999
-3,640 - -1
0
1 - 4,264
-100 - -1
0
1 - 9,744
9,999
0
Negative or zero such income in 1967 (V324 LE 0)
Actual percent decrease
No change
Actual percent increase
Actual percent decrease
No change
Actual percent increase
Zero 1967 "Well-offness"
Actual decrease
No change
Actual increase
Actual percent decrease
No change
Actual percent increase
Zero hours of work for money in 1967 (V47 = 0)
Did not work for money in both 1967 and 1968
1968 "Well-Offness" (Net real income net of housing basis) (V860) - 1967 "Well-Offness"(Net real income net of housing basis) (V437)
(V940 / V437) x 100
1968 Hours of work for money (V465) minus 1967 Hours of work for money (V47)
(V942 / V47) x 100
31
1,351
68
3,041
1,346
80
3,004
30
1,908
732
1,820
1,865
185
1,622
788
625
.70
30.29
1.52
68.18
30.18
1.79
67.35
.67
42.78
16.41
40.81
41.82
4.15
36.37
17.67
14.01
Count
Count
Count
Count
Count
%
%
%
%
%
Value/Range
Value/Range
Value/Range
Value/Range
Value/Range
Code Value/Range Text
Code Value/Range Text
Code Value/Range Text
Code Value/Range Text
Code Value/Range Text
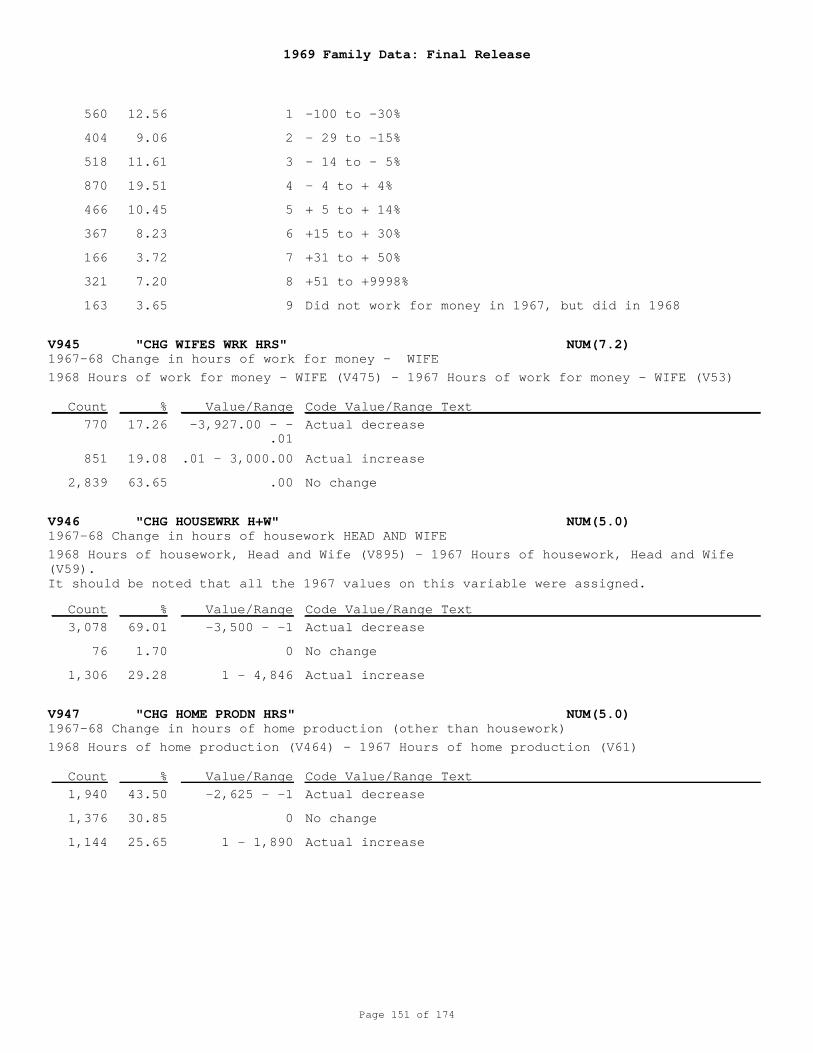
1969 Family Data: Final Release
Page 151 of 174
V945 "CHG WIFES WRK HRS" NUM(7.2)
V946 "CHG HOUSEWRK H+W" NUM(5.0)
V947 "CHG HOME PRODN HRS" NUM(5.0)
1967-68 Change in hours of work for money - WIFE
1967-68 Change in hours of housework HEAD AND WIFE
1967-68 Change in hours of home production (other than housework)
1
2
3
4
5
6
7
8
9
-3,927.00 - -.01
.01 - 3,000.00
.00
-3,500 - -1
0
1 - 4,846
-2,625 - -1
0
1 - 1,890
-100 to -30%
- 29 to -15%
- 14 to - 5%
- 4 to + 4%
+ 5 to + 14%
+15 to + 30%
+31 to + 50%
+51 to +9998%
Did not work for money in 1967, but did in 1968
Actual decrease
Actual increase
No change
Actual decrease
No change
Actual increase
Actual decrease
No change
Actual increase
1968 Hours of work for money - WIFE (V475) - 1967 Hours of work for money - WIFE (V53)
1968 Hours of housework, Head and Wife (V895) - 1967 Hours of housework, Head and Wife(V59). It should be noted that all the 1967 values on this variable were assigned.
1968 Hours of home production (V464) - 1967 Hours of home production (V61)
560
404
518
870
466
367
166
321
163
770
851
2,839
3,078
76
1,306
1,940
1,376
1,144
12.56
9.06
11.61
19.51
10.45
8.23
3.72
7.20
3.65
17.26
19.08
63.65
69.01
1.70
29.28
43.50
30.85
25.65
Count
Count
Count
%
%
%
Value/Range
Value/Range
Value/Range
Code Value/Range Text
Code Value/Range Text
Code Value/Range Text
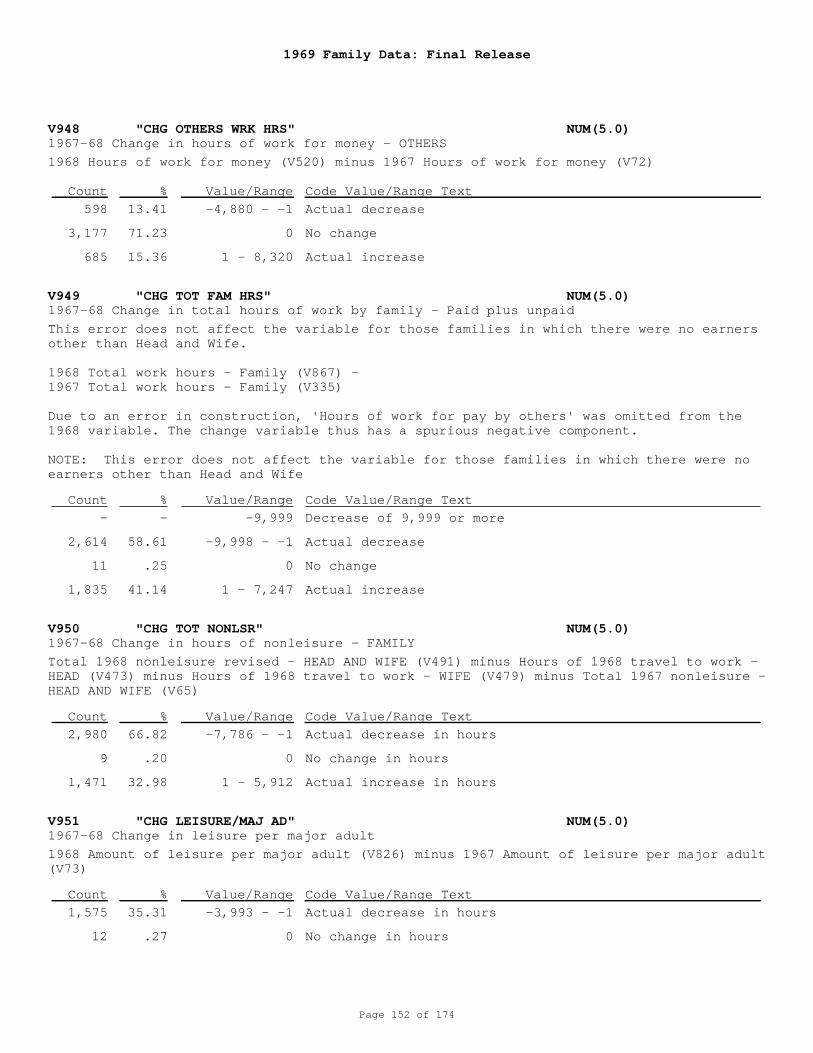
1969 Family Data: Final Release
Page 152 of 174
V948 "CHG OTHERS WRK HRS" NUM(5.0)
V949 "CHG TOT FAM HRS" NUM(5.0)
V950 "CHG TOT NONLSR" NUM(5.0)
V951 "CHG LEISURE/MAJ AD" NUM(5.0)
1967-68 Change in hours of work for money - OTHERS
1967-68 Change in total hours of work by family - Paid plus unpaid
1967-68 Change in hours of nonleisure - FAMILY
1967-68 Change in leisure per major adult
-4,880 - -1
0
1 - 8,320
-9,999
-9,998 - -1
0
1 - 7,247
-7,786 - -1
0
1 - 5,912
-3,993 - -1
0
Actual decrease
No change
Actual increase
Decrease of 9,999 or more
Actual decrease
No change
Actual increase
Actual decrease in hours
No change in hours
Actual increase in hours
Actual decrease in hours
No change in hours
1968 Hours of work for money (V520) minus 1967 Hours of work for money (V72)
This error does not affect the variable for those families in which there were no earnersother than Head and Wife.
1968 Total work hours - Family (V867) - 1967 Total work hours - Family (V335)
Due to an error in construction, 'Hours of work for pay by others' was omitted from the1968 variable. The change variable thus has a spurious negative component.
NOTE: This error does not affect the variable for those families in which there were noearners other than Head and Wife
Total 1968 nonleisure revised - HEAD AND WIFE (V491) minus Hours of 1968 travel to work -HEAD (V473) minus Hours of 1968 travel to work - WIFE (V479) minus Total 1967 nonleisure -HEAD AND WIFE (V65)
1968 Amount of leisure per major adult (V826) minus 1967 Amount of leisure per major adult(V73)
598
3,177
685
-
2,614
11
1,835
2,980
9
1,471
1,575
12
13.41
71.23
15.36
-
58.61
.25
41.14
66.82
.20
32.98
35.31
.27
Count
Count
Count
Count
%
%
%
%
Value/Range
Value/Range
Value/Range
Value/Range
Code Value/Range Text
Code Value/Range Text
Code Value/Range Text
Code Value/Range Text
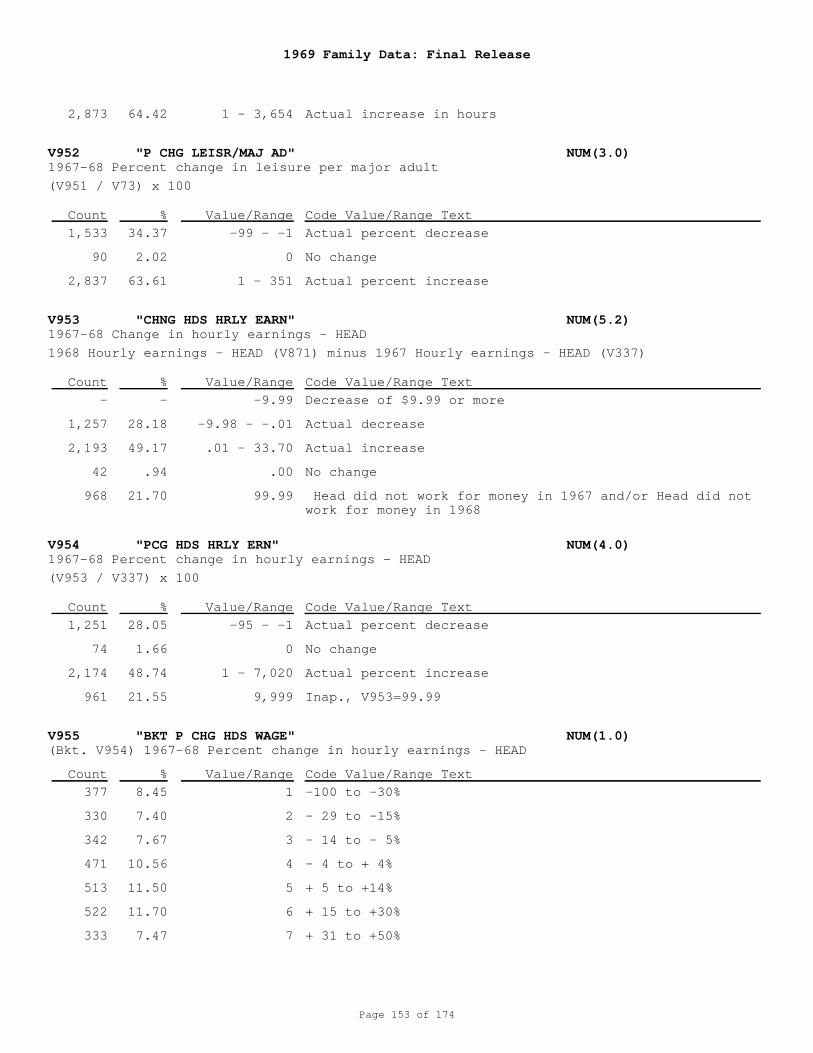
1969 Family Data: Final Release
Page 153 of 174
V952 "P CHG LEISR/MAJ AD" NUM(3.0)
V953 "CHNG HDS HRLY EARN" NUM(5.2)
V954 "PCG HDS HRLY ERN" NUM(4.0)
V955 "BKT P CHG HDS WAGE" NUM(1.0)
1967-68 Percent change in leisure per major adult
1967-68 Change in hourly earnings - HEAD
1967-68 Percent change in hourly earnings - HEAD
(Bkt. V954) 1967-68 Percent change in hourly earnings - HEAD
1 - 3,654
-99 - -1
0
1 - 351
-9.99
-9.98 - -.01
.01 - 33.70
.00
99.99
-95 - -1
0
1 - 7,020
9,999
1
2
3
4
5
6
7
Actual increase in hours
Actual percent decrease
No change
Actual percent increase
Decrease of $9.99 or more
Actual decrease
Actual increase
No change
Head did not work for money in 1967 and/or Head did notwork for money in 1968
Actual percent decrease
No change
Actual percent increase
Inap., V953=99.99
-100 to -30%
- 29 to -15%
- 14 to - 5%
- 4 to + 4%
+ 5 to +14%
+ 15 to +30%
+ 31 to +50%
(V951 / V73) x 100
1968 Hourly earnings - HEAD (V871) minus 1967 Hourly earnings - HEAD (V337)
(V953 / V337) x 100
2,873
1,533
90
2,837
-
1,257
2,193
42
968
1,251
74
2,174
961
377
330
342
471
513
522
333
64.42
34.37
2.02
63.61
-
28.18
49.17
.94
21.70
28.05
1.66
48.74
21.55
8.45
7.40
7.67
10.56
11.50
11.70
7.47
Count
Count
Count
Count
%
%
%
%
Value/Range
Value/Range
Value/Range
Value/Range
Code Value/Range Text
Code Value/Range Text
Code Value/Range Text
Code Value/Range Text
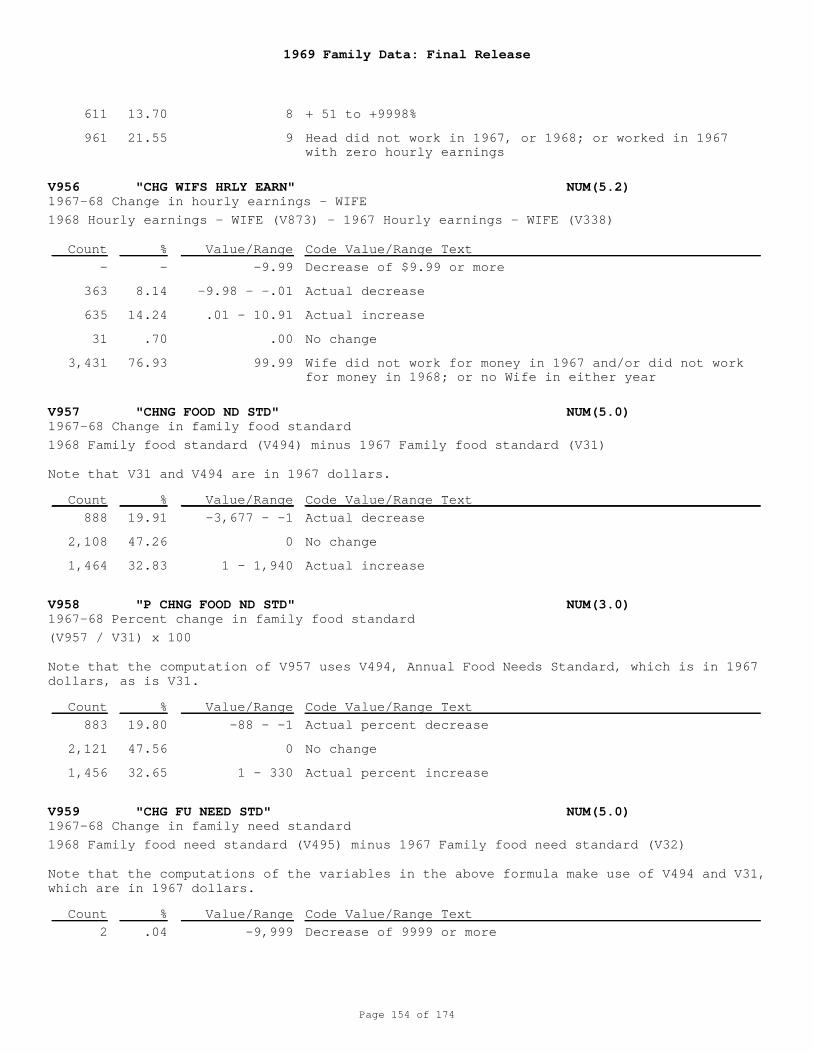
1969 Family Data: Final Release
Page 154 of 174
V956 "CHG WIFS HRLY EARN" NUM(5.2)
V957 "CHNG FOOD ND STD" NUM(5.0)
V958 "P CHNG FOOD ND STD" NUM(3.0)
V959 "CHG FU NEED STD" NUM(5.0)
1967-68 Change in hourly earnings - WIFE
1967-68 Change in family food standard
1967-68 Percent change in family food standard
1967-68 Change in family need standard
8
9
-9.99
-9.98 - -.01
.01 - 10.91
.00
99.99
-3,677 - -1
0
1 - 1,940
-88 - -1
0
1 - 330
-9,999
+ 51 to +9998%
Head did not work in 1967, or 1968; or worked in 1967with zero hourly earnings
Decrease of $9.99 or more
Actual decrease
Actual increase
No change
Wife did not work for money in 1967 and/or did not workfor money in 1968; or no Wife in either year
Actual decrease
No change
Actual increase
Actual percent decrease
No change
Actual percent increase
Decrease of 9999 or more
1968 Hourly earnings - WIFE (V873) - 1967 Hourly earnings - WIFE (V338)
1968 Family food standard (V494) minus 1967 Family food standard (V31)
Note that V31 and V494 are in 1967 dollars.
(V957 / V31) x 100
Note that the computation of V957 uses V494, Annual Food Needs Standard, which is in 1967dollars, as is V31.
1968 Family food need standard (V495) minus 1967 Family food need standard (V32)
Note that the computations of the variables in the above formula make use of V494 and V31,which are in 1967 dollars.
611
961
-
363
635
31
3,431
888
2,108
1,464
883
2,121
1,456
2
13.70
21.55
-
8.14
14.24
.70
76.93
19.91
47.26
32.83
19.80
47.56
32.65
.04
Count
Count
Count
Count
%
%
%
%
Value/Range
Value/Range
Value/Range
Value/Range
Code Value/Range Text
Code Value/Range Text
Code Value/Range Text
Code Value/Range Text
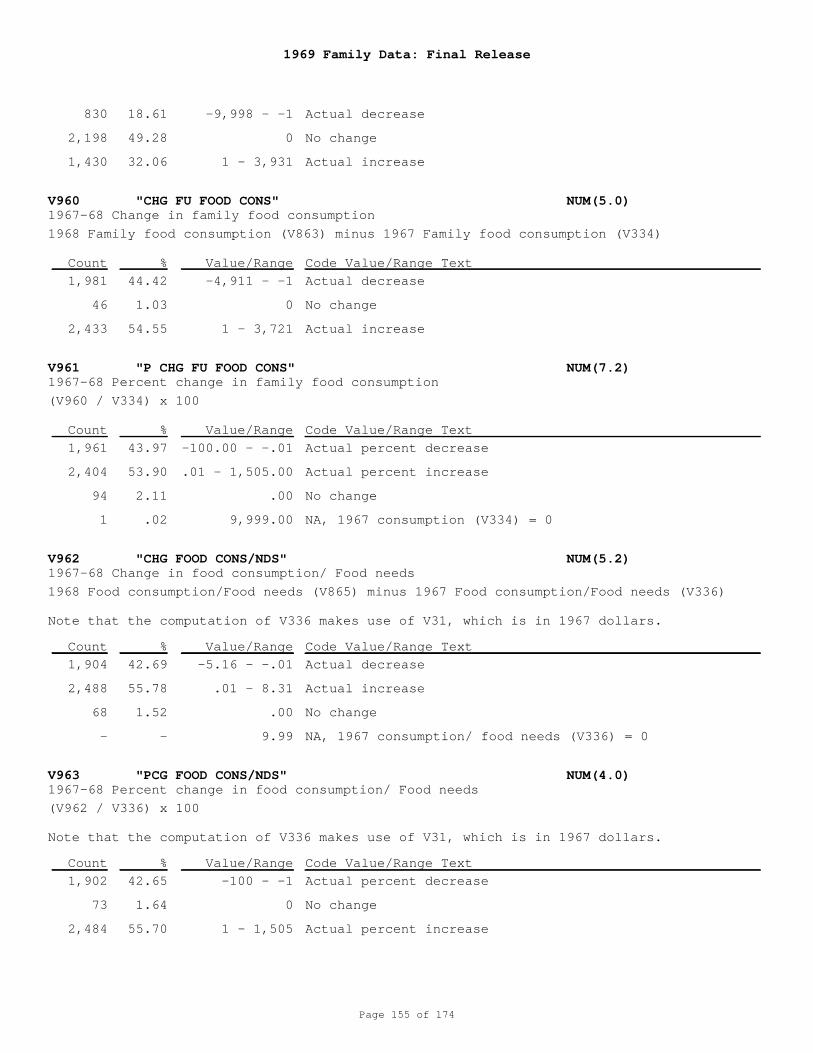
1969 Family Data: Final Release
Page 155 of 174
V960 "CHG FU FOOD CONS" NUM(5.0)
V961 "P CHG FU FOOD CONS" NUM(7.2)
V962 "CHG FOOD CONS/NDS" NUM(5.2)
V963 "PCG FOOD CONS/NDS" NUM(4.0)
1967-68 Change in family food consumption
1967-68 Percent change in family food consumption
1967-68 Change in food consumption/ Food needs
1967-68 Percent change in food consumption/ Food needs
-9,998 - -1
0
1 - 3,931
-4,911 - -1
0
1 - 3,721
-100.00 - -.01
.01 - 1,505.00
.00
9,999.00
-5.16 - -.01
.01 - 8.31
.00
9.99
-100 - -1
0
1 - 1,505
Actual decrease
No change
Actual increase
Actual decrease
No change
Actual increase
Actual percent decrease
Actual percent increase
No change
NA, 1967 consumption (V334) = 0
Actual decrease
Actual increase
No change
NA, 1967 consumption/ food needs (V336) = 0
Actual percent decrease
No change
Actual percent increase
1968 Family food consumption (V863) minus 1967 Family food consumption (V334)
(V960 / V334) x 100
1968 Food consumption/Food needs (V865) minus 1967 Food consumption/Food needs (V336)
Note that the computation of V336 makes use of V31, which is in 1967 dollars.
(V962 / V336) x 100
Note that the computation of V336 makes use of V31, which is in 1967 dollars.
830
2,198
1,430
1,981
46
2,433
1,961
2,404
94
1
1,904
2,488
68
-
1,902
73
2,484
18.61
49.28
32.06
44.42
1.03
54.55
43.97
53.90
2.11
.02
42.69
55.78
1.52
-
42.65
1.64
55.70
Count
Count
Count
Count
%
%
%
%
Value/Range
Value/Range
Value/Range
Value/Range
Code Value/Range Text
Code Value/Range Text
Code Value/Range Text
Code Value/Range Text
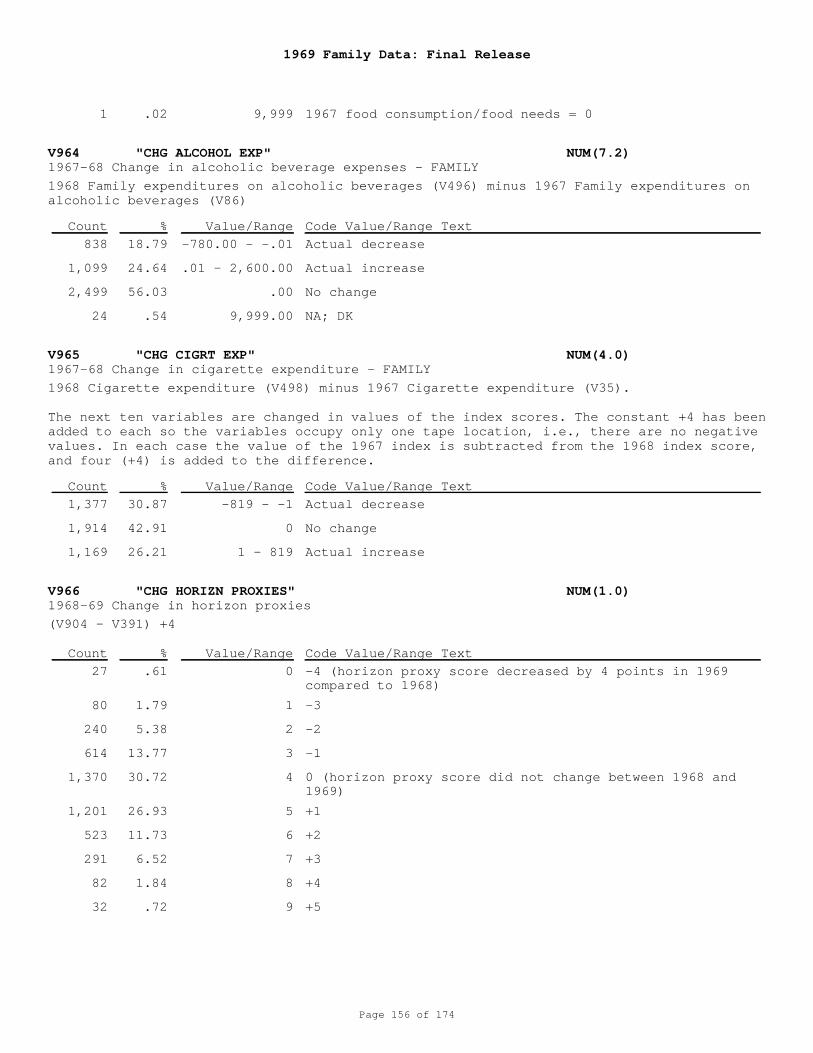
1969 Family Data: Final Release
Page 156 of 174
V964 "CHG ALCOHOL EXP" NUM(7.2)
V965 "CHG CIGRT EXP" NUM(4.0)
V966 "CHG HORIZN PROXIES" NUM(1.0)
1967-68 Change in alcoholic beverage expenses - FAMILY
1967-68 Change in cigarette expenditure - FAMILY
1968-69 Change in horizon proxies
9,999
-780.00 - -.01
.01 - 2,600.00
.00
9,999.00
-819 - -1
0
1 - 819
0
1
2
3
4
5
6
7
8
9
1967 food consumption/food needs = 0
Actual decrease
Actual increase
No change
NA; DK
Actual decrease
No change
Actual increase
-4 (horizon proxy score decreased by 4 points in 1969compared to 1968)
-3
-2
-1
0 (horizon proxy score did not change between 1968 and1969)
+1
+2
+3
+4
+5
1968 Family expenditures on alcoholic beverages (V496) minus 1967 Family expenditures onalcoholic beverages (V86)
1968 Cigarette expenditure (V498) minus 1967 Cigarette expenditure (V35).
The next ten variables are changed in values of the index scores. The constant +4 has beenadded to each so the variables occupy only one tape location, i.e., there are no negativevalues. In each case the value of the 1967 index is subtracted from the 1968 index score,and four (+4) is added to the difference.
(V904 - V391) +4
1
838
1,099
2,499
24
1,377
1,914
1,169
27
80
240
614
1,370
1,201
523
291
82
32
.02
18.79
24.64
56.03
.54
30.87
42.91
26.21
.61
1.79
5.38
13.77
30.72
26.93
11.73
6.52
1.84
.72
Count
Count
Count
%
%
%
Value/Range
Value/Range
Value/Range
Code Value/Range Text
Code Value/Range Text
Code Value/Range Text
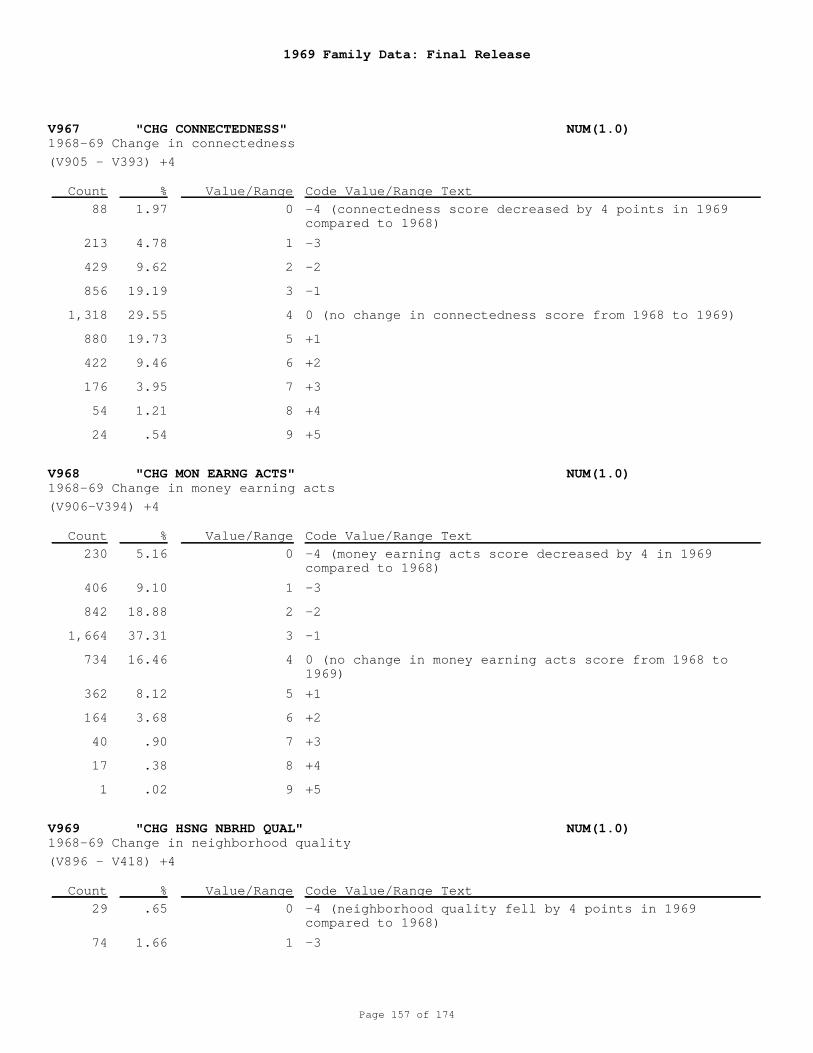
1969 Family Data: Final Release
Page 157 of 174
V967 "CHG CONNECTEDNESS" NUM(1.0)
V968 "CHG MON EARNG ACTS" NUM(1.0)
V969 "CHG HSNG NBRHD QUAL" NUM(1.0)
1968-69 Change in connectedness
1968-69 Change in money earning acts
1968-69 Change in neighborhood quality
0
1
2
3
4
5
6
7
8
9
0
1
2
3
4
5
6
7
8
9
0
1
-4 (connectedness score decreased by 4 points in 1969compared to 1968)
-3
-2
-1
0 (no change in connectedness score from 1968 to 1969)
+1
+2
+3
+4
+5
-4 (money earning acts score decreased by 4 in 1969compared to 1968)
-3
-2
-1
0 (no change in money earning acts score from 1968 to1969)
+1
+2
+3
+4
+5
-4 (neighborhood quality fell by 4 points in 1969compared to 1968)
-3
(V905 - V393) +4
(V906-V394) +4
(V896 - V418) +4
88
213
429
856
1,318
880
422
176
54
24
230
406
842
1,664
734
362
164
40
17
1
29
74
1.97
4.78
9.62
19.19
29.55
19.73
9.46
3.95
1.21
.54
5.16
9.10
18.88
37.31
16.46
8.12
3.68
.90
.38
.02
.65
1.66
Count
Count
Count
%
%
%
Value/Range
Value/Range
Value/Range
Code Value/Range Text
Code Value/Range Text
Code Value/Range Text
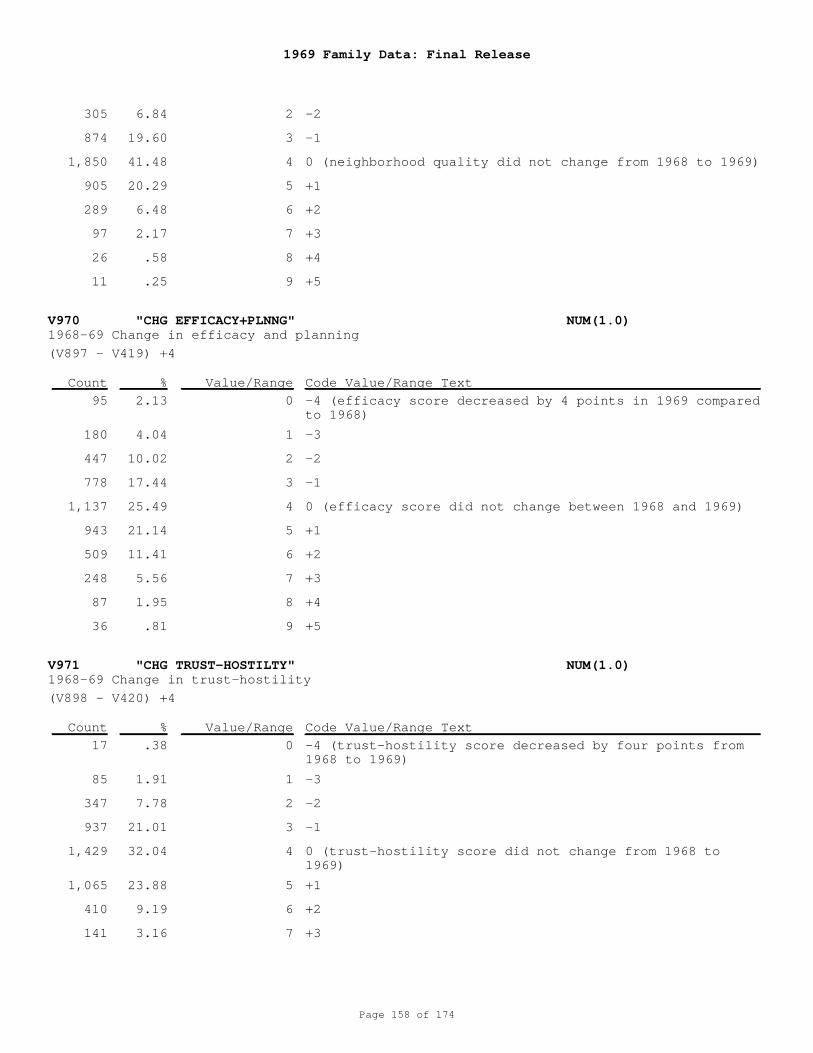
1969 Family Data: Final Release
Page 158 of 174
V970 "CHG EFFICACY+PLNNG" NUM(1.0)
V971 "CHG TRUST-HOSTILTY" NUM(1.0)
1968-69 Change in efficacy and planning
1968-69 Change in trust-hostility
2
3
4
5
6
7
8
9
0
1
2
3
4
5
6
7
8
9
0
1
2
3
4
5
6
7
-2
-1
0 (neighborhood quality did not change from 1968 to 1969)
+1
+2
+3
+4
+5
-4 (efficacy score decreased by 4 points in 1969 comparedto 1968)
-3
-2
-1
0 (efficacy score did not change between 1968 and 1969)
+1
+2
+3
+4
+5
-4 (trust-hostility score decreased by four points from1968 to 1969)
-3
-2
-1
0 (trust-hostility score did not change from 1968 to1969)
+1
+2
+3
(V897 - V419) +4
(V898 - V420) +4
305
874
1,850
905
289
97
26
11
95
180
447
778
1,137
943
509
248
87
36
17
85
347
937
1,429
1,065
410
141
6.84
19.60
41.48
20.29
6.48
2.17
.58
.25
2.13
4.04
10.02
17.44
25.49
21.14
11.41
5.56
1.95
.81
.38
1.91
7.78
21.01
32.04
23.88
9.19
3.16
Count
Count
%
%
Value/Range
Value/Range
Code Value/Range Text
Code Value/Range Text
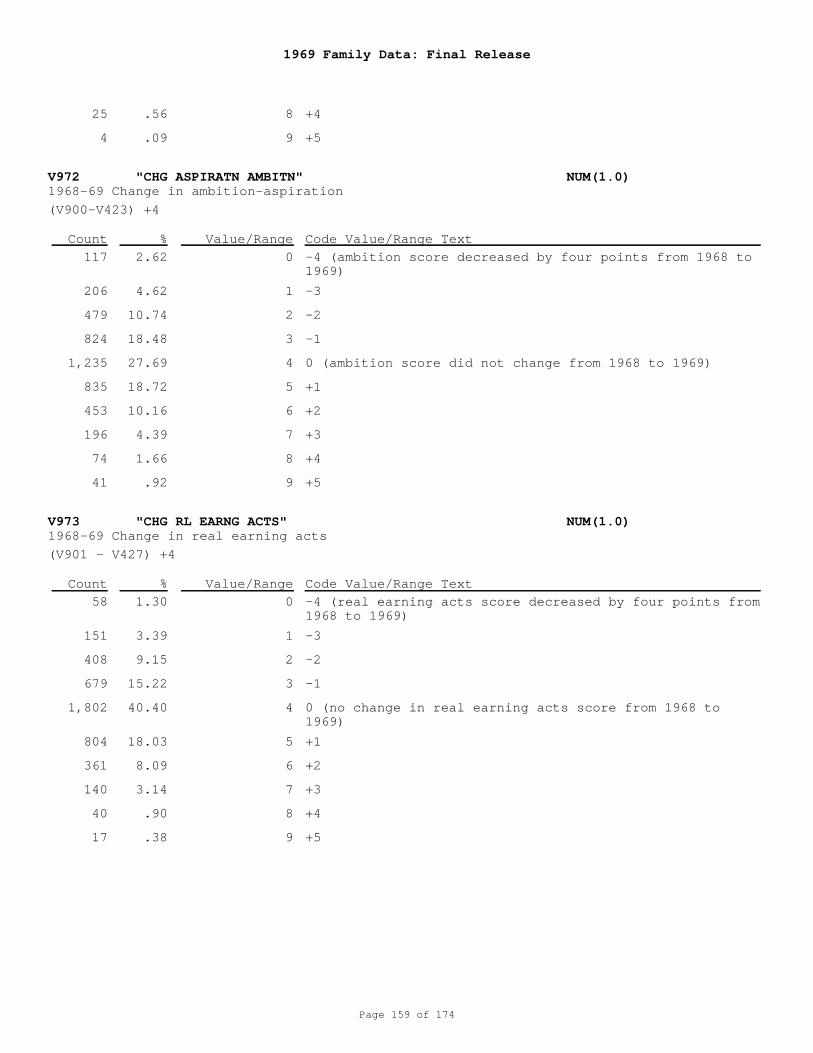
1969 Family Data: Final Release
Page 159 of 174
V972 "CHG ASPIRATN AMBITN" NUM(1.0)
V973 "CHG RL EARNG ACTS" NUM(1.0)
1968-69 Change in ambition-aspiration
1968-69 Change in real earning acts
8
9
0
1
2
3
4
5
6
7
8
9
0
1
2
3
4
5
6
7
8
9
+4
+5
-4 (ambition score decreased by four points from 1968 to1969)
-3
-2
-1
0 (ambition score did not change from 1968 to 1969)
+1
+2
+3
+4
+5
-4 (real earning acts score decreased by four points from1968 to 1969)
-3
-2
-1
0 (no change in real earning acts score from 1968 to1969)
+1
+2
+3
+4
+5
(V900-V423) +4
(V901 - V427) +4
25
4
117
206
479
824
1,235
835
453
196
74
41
58
151
408
679
1,802
804
361
140
40
17
.56
.09
2.62
4.62
10.74
18.48
27.69
18.72
10.16
4.39
1.66
.92
1.30
3.39
9.15
15.22
40.40
18.03
8.09
3.14
.90
.38
Count
Count
%
%
Value/Range
Value/Range
Code Value/Range Text
Code Value/Range Text
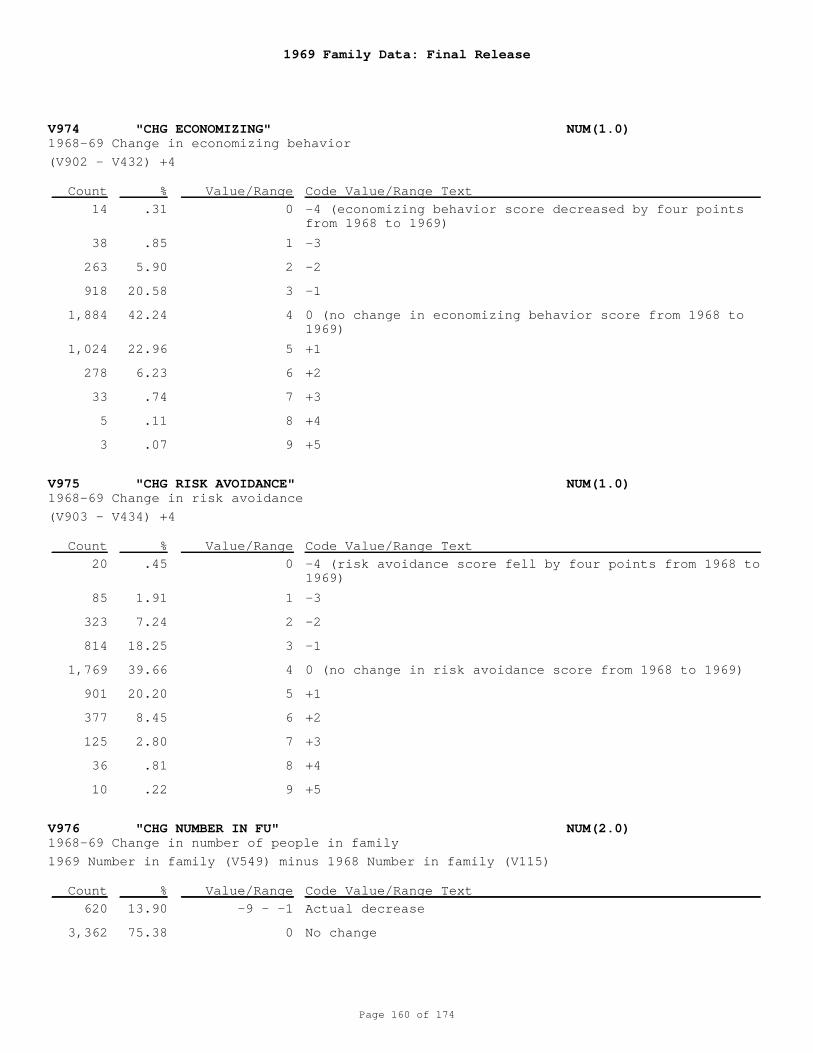
1969 Family Data: Final Release
Page 160 of 174
V974 "CHG ECONOMIZING" NUM(1.0)
V975 "CHG RISK AVOIDANCE" NUM(1.0)
V976 "CHG NUMBER IN FU" NUM(2.0)
1968-69 Change in economizing behavior
1968-69 Change in risk avoidance
1968-69 Change in number of people in family
0
1
2
3
4
5
6
7
8
9
0
1
2
3
4
5
6
7
8
9
-9 - -1
0
-4 (economizing behavior score decreased by four pointsfrom 1968 to 1969)
-3
-2
-1
0 (no change in economizing behavior score from 1968 to1969)
+1
+2
+3
+4
+5
-4 (risk avoidance score fell by four points from 1968 to1969)
-3
-2
-1
0 (no change in risk avoidance score from 1968 to 1969)
+1
+2
+3
+4
+5
Actual decrease
No change
(V902 - V432) +4
(V903 - V434) +4
1969 Number in family (V549) minus 1968 Number in family (V115)
14
38
263
918
1,884
1,024
278
33
5
3
20
85
323
814
1,769
901
377
125
36
10
620
3,362
.31
.85
5.90
20.58
42.24
22.96
6.23
.74
.11
.07
.45
1.91
7.24
18.25
39.66
20.20
8.45
2.80
.81
.22
13.90
75.38
Count
Count
Count
%
%
%
Value/Range
Value/Range
Value/Range
Code Value/Range Text
Code Value/Range Text
Code Value/Range Text
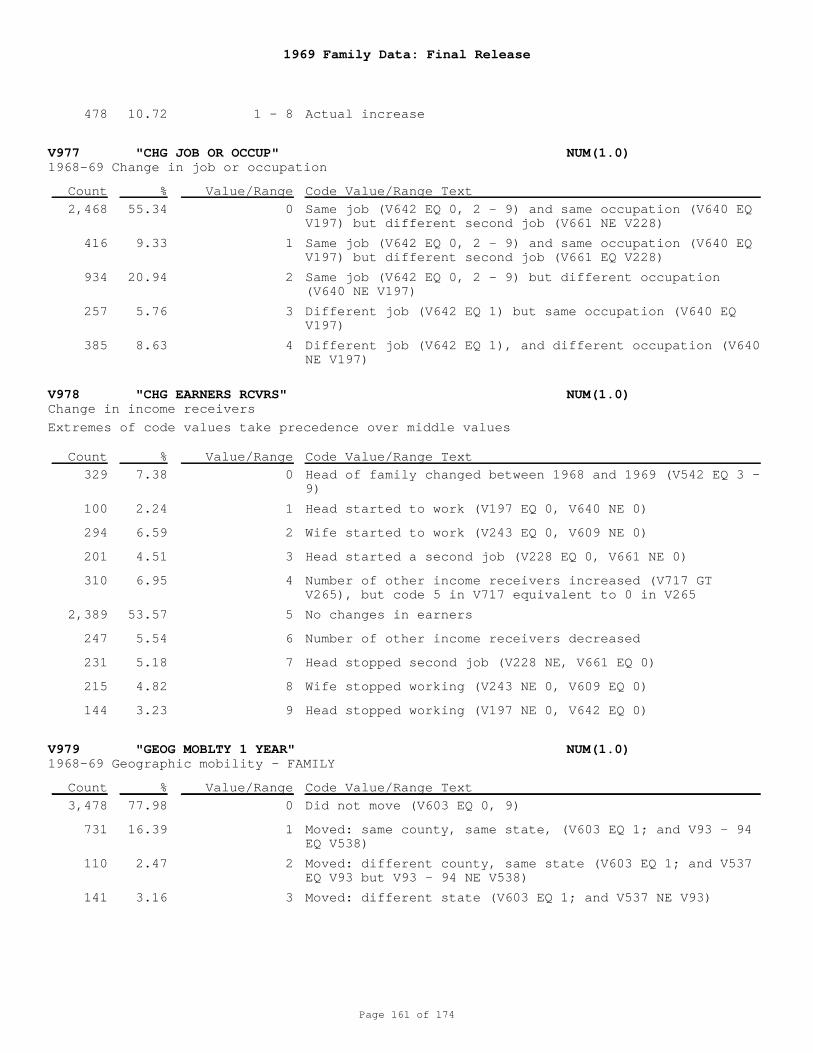
1969 Family Data: Final Release
Page 161 of 174
V977 "CHG JOB OR OCCUP" NUM(1.0)
V978 "CHG EARNERS RCVRS" NUM(1.0)
V979 "GEOG MOBLTY 1 YEAR" NUM(1.0)
1968-69 Change in job or occupation
Change in income receivers
1968-69 Geographic mobility - FAMILY
1 - 8
0
1
2
3
4
0
1
2
3
4
5
6
7
8
9
0
1
2
3
Actual increase
Same job (V642 EQ 0, 2 - 9) and same occupation (V640 EQV197) but different second job (V661 NE V228)
Same job (V642 EQ 0, 2 - 9) and same occupation (V640 EQV197) but different second job (V661 EQ V228)
Same job (V642 EQ 0, 2 - 9) but different occupation(V640 NE V197)
Different job (V642 EQ 1) but same occupation (V640 EQV197)
Different job (V642 EQ 1), and different occupation (V640NE V197)
Head of family changed between 1968 and 1969 (V542 EQ 3 -9)
Head started to work (V197 EQ 0, V640 NE 0)
Wife started to work (V243 EQ 0, V609 NE 0)
Head started a second job (V228 EQ 0, V661 NE 0)
Number of other income receivers increased (V717 GTV265), but code 5 in V717 equivalent to 0 in V265
No changes in earners
Number of other income receivers decreased
Head stopped second job (V228 NE, V661 EQ 0)
Wife stopped working (V243 NE 0, V609 EQ 0)
Head stopped working (V197 NE 0, V642 EQ 0)
Did not move (V603 EQ 0, 9)
Moved: same county, same state, (V603 EQ 1; and V93 - 94EQ V538)
Moved: different county, same state (V603 EQ 1; and V537EQ V93 but V93 - 94 NE V538)
Moved: different state (V603 EQ 1; and V537 NE V93)
Extremes of code values take precedence over middle values
478
2,468
416
934
257
385
329
100
294
201
310
2,389
247
231
215
144
3,478
731
110
141
10.72
55.34
9.33
20.94
5.76
8.63
7.38
2.24
6.59
4.51
6.95
53.57
5.54
5.18
4.82
3.23
77.98
16.39
2.47
3.16
Count
Count
Count
%
%
%
Value/Range
Value/Range
Value/Range
Code Value/Range Text
Code Value/Range Text
Code Value/Range Text
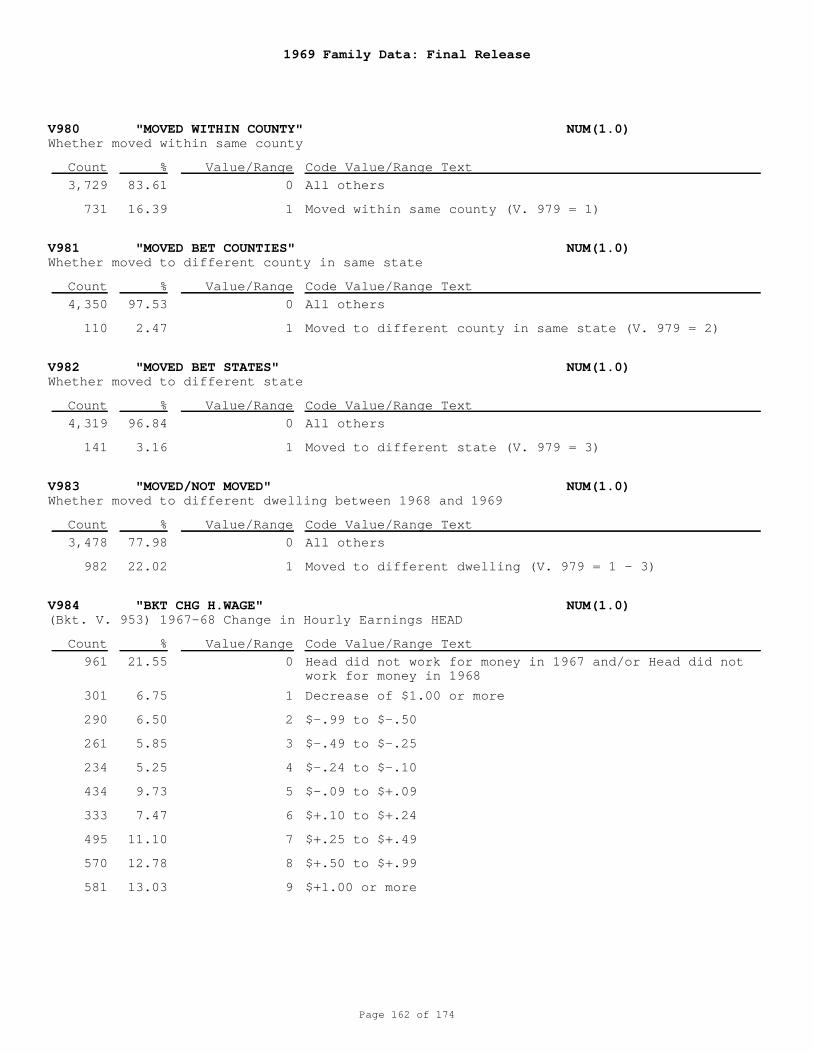
1969 Family Data: Final Release
Page 162 of 174
V980 "MOVED WITHIN COUNTY" NUM(1.0)
V981 "MOVED BET COUNTIES" NUM(1.0)
V982 "MOVED BET STATES" NUM(1.0)
V983 "MOVED/NOT MOVED" NUM(1.0)
V984 "BKT CHG H.WAGE" NUM(1.0)
Whether moved within same county
Whether moved to different county in same state
Whether moved to different state
Whether moved to different dwelling between 1968 and 1969
(Bkt. V. 953) 1967-68 Change in Hourly Earnings HEAD
0
1
0
1
0
1
0
1
0
1
2
3
4
5
6
7
8
9
All others
Moved within same county (V. 979 = 1)
All others
Moved to different county in same state (V. 979 = 2)
All others
Moved to different state (V. 979 = 3)
All others
Moved to different dwelling (V. 979 = 1 - 3)
Head did not work for money in 1967 and/or Head did notwork for money in 1968
Decrease of $1.00 or more
$-.99 to $-.50
$-.49 to $-.25
$-.24 to $-.10
$-.09 to $+.09
$+.10 to $+.24
$+.25 to $+.49
$+.50 to $+.99
$+1.00 or more
3,729
731
4,350
110
4,319
141
3,478
982
961
301
290
261
234
434
333
495
570
581
83.61
16.39
97.53
2.47
96.84
3.16
77.98
22.02
21.55
6.75
6.50
5.85
5.25
9.73
7.47
11.10
12.78
13.03
Count
Count
Count
Count
Count
%
%
%
%
%
Value/Range
Value/Range
Value/Range
Value/Range
Value/Range
Code Value/Range Text
Code Value/Range Text
Code Value/Range Text
Code Value/Range Text
Code Value/Range Text
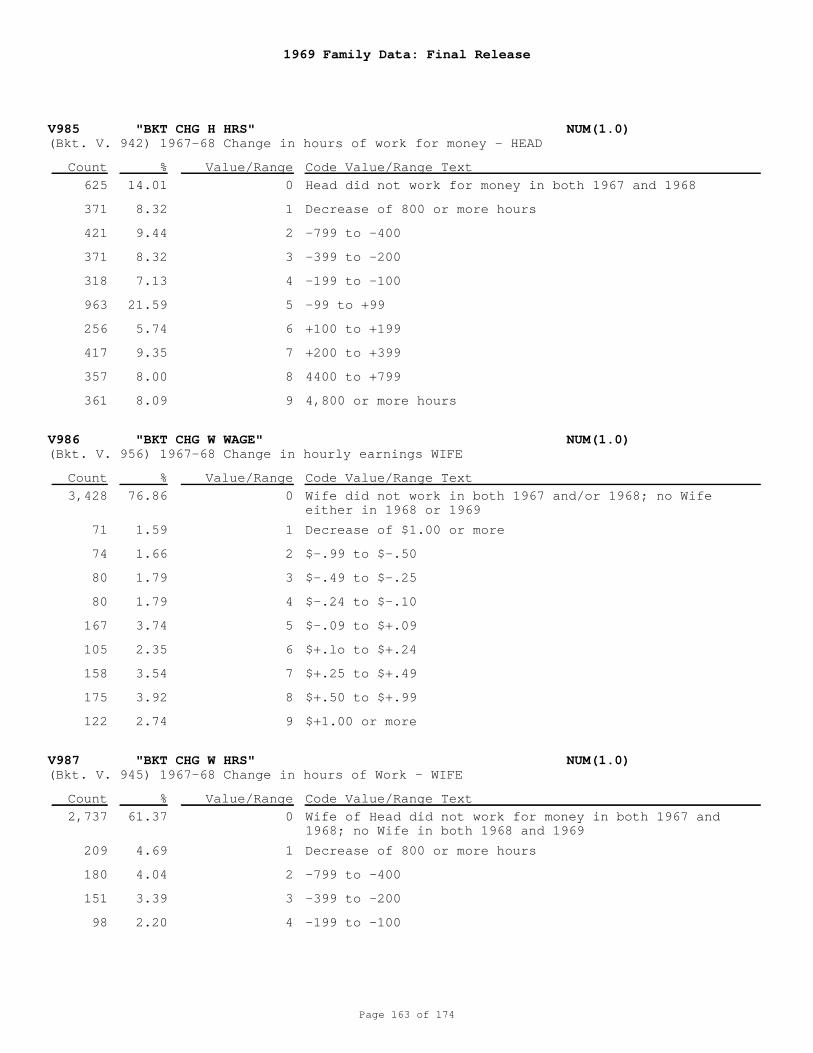
1969 Family Data: Final Release
Page 163 of 174
V985 "BKT CHG H HRS" NUM(1.0)
V986 "BKT CHG W WAGE" NUM(1.0)
V987 "BKT CHG W HRS" NUM(1.0)
(Bkt. V. 942) 1967-68 Change in hours of work for money - HEAD
(Bkt. V. 956) 1967-68 Change in hourly earnings WIFE
(Bkt. V. 945) 1967-68 Change in hours of Work - WIFE
0
1
2
3
4
5
6
7
8
9
0
1
2
3
4
5
6
7
8
9
0
1
2
3
4
Head did not work for money in both 1967 and 1968
Decrease of 800 or more hours
-799 to -400
-399 to -200
-199 to -100
-99 to +99
+100 to +199
+200 to +399
4400 to +799
4,800 or more hours
Wife did not work in both 1967 and/or 1968; no Wifeeither in 1968 or 1969
Decrease of $1.00 or more
$-.99 to $-.50
$-.49 to $-.25
$-.24 to $-.10
$-.09 to $+.09
$+.lo to $+.24
$+.25 to $+.49
$+.50 to $+.99
$+1.00 or more
Wife of Head did not work for money in both 1967 and1968; no Wife in both 1968 and 1969
Decrease of 800 or more hours
-799 to -400
-399 to -200
-199 to -100
625
371
421
371
318
963
256
417
357
361
3,428
71
74
80
80
167
105
158
175
122
2,737
209
180
151
98
14.01
8.32
9.44
8.32
7.13
21.59
5.74
9.35
8.00
8.09
76.86
1.59
1.66
1.79
1.79
3.74
2.35
3.54
3.92
2.74
61.37
4.69
4.04
3.39
2.20
Count
Count
Count
%
%
%
Value/Range
Value/Range
Value/Range
Code Value/Range Text
Code Value/Range Text
Code Value/Range Text
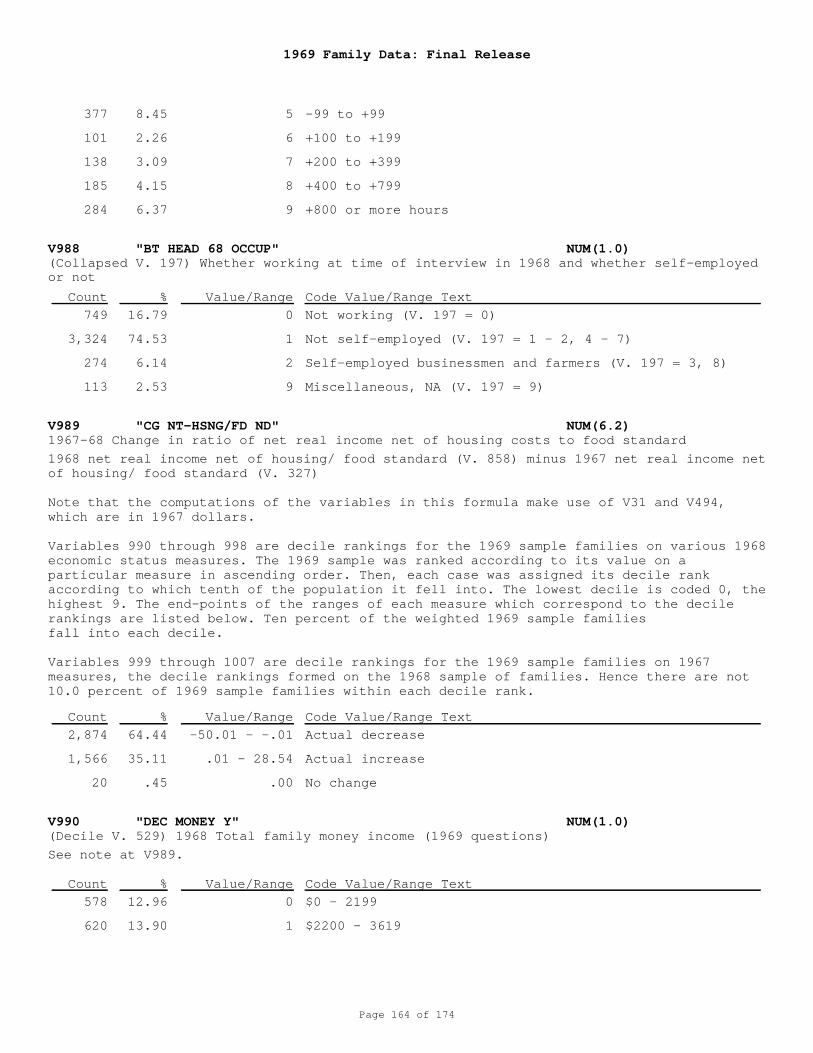
1969 Family Data: Final Release
Page 164 of 174
V988 "BT HEAD 68 OCCUP" NUM(1.0)
V989 "CG NT-HSNG/FD ND" NUM(6.2)
V990 "DEC MONEY Y" NUM(1.0)
(Collapsed V. 197) Whether working at time of interview in 1968 and whether self-employedor not
1967-68 Change in ratio of net real income net of housing costs to food standard
(Decile V. 529) 1968 Total family money income (1969 questions)
5
6
7
8
9
0
1
2
9
-50.01 - -.01
.01 - 28.54
.00
0
1
-99 to +99
+100 to +199
+200 to +399
+400 to +799
+800 or more hours
Not working (V. 197 = 0)
Not self-employed (V. 197 = 1 - 2, 4 - 7)
Self-employed businessmen and farmers (V. 197 = 3, 8)
Miscellaneous, NA (V. 197 = 9)
Actual decrease
Actual increase
No change
$0 - 2199
$2200 - 3619
1968 net real income net of housing/ food standard (V. 858) minus 1967 net real income netof housing/ food standard (V. 327)
Note that the computations of the variables in this formula make use of V31 and V494,which are in 1967 dollars.
Variables 990 through 998 are decile rankings for the 1969 sample families on various 1968economic status measures. The 1969 sample was ranked according to its value on aparticular measure in ascending order. Then, each case was assigned its decile rankaccording to which tenth of the population it fell into. The lowest decile is coded 0, thehighest 9. The end-points of the ranges of each measure which correspond to the decilerankings are listed below. Ten percent of the weighted 1969 sample families fall into each decile.
Variables 999 through 1007 are decile rankings for the 1969 sample families on 1967measures, the decile rankings formed on the 1968 sample of families. Hence there are not10.0 percent of 1969 sample families within each decile rank.
See note at V989.
377
101
138
185
284
749
3,324
274
113
2,874
1,566
20
578
620
8.45
2.26
3.09
4.15
6.37
16.79
74.53
6.14
2.53
64.44
35.11
.45
12.96
13.90
Count
Count
Count
%
%
%
Value/Range
Value/Range
Value/Range
Code Value/Range Text
Code Value/Range Text
Code Value/Range Text
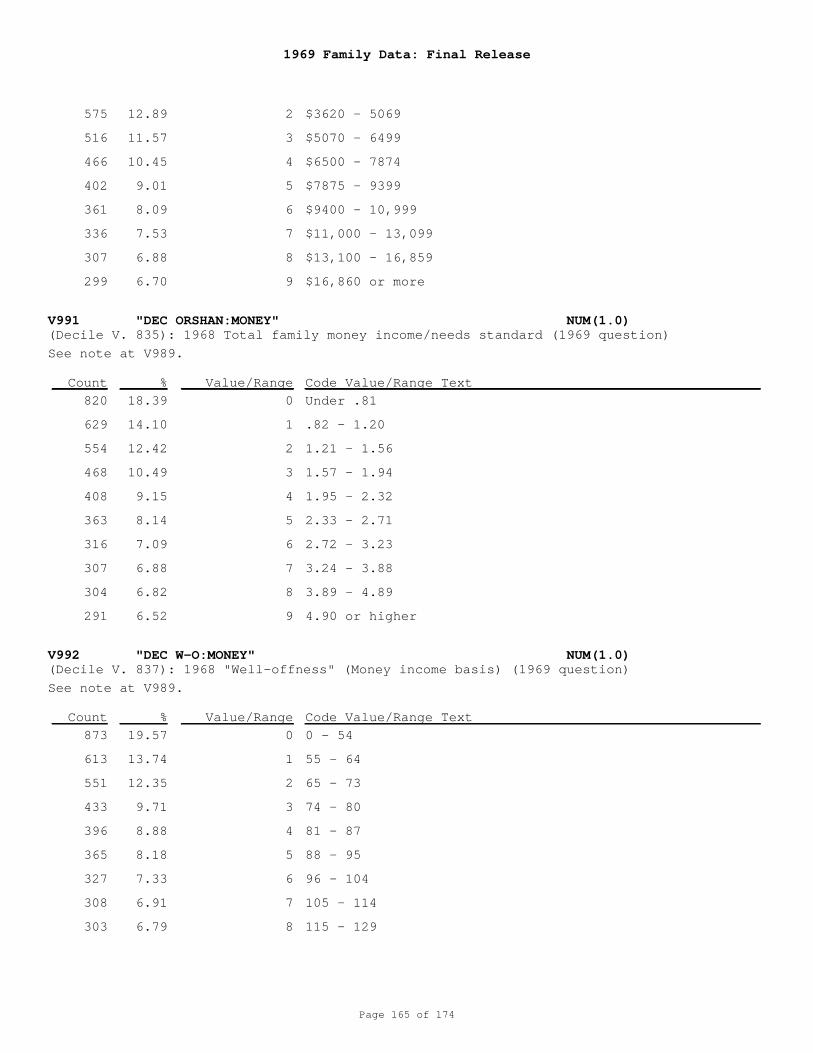
1969 Family Data: Final Release
Page 165 of 174
V991 "DEC ORSHAN:MONEY" NUM(1.0)
V992 "DEC W-O:MONEY" NUM(1.0)
(Decile V. 835): 1968 Total family money income/needs standard (1969 question)
(Decile V. 837): 1968 "Well-offness" (Money income basis) (1969 question)
2
3
4
5
6
7
8
9
0
1
2
3
4
5
6
7
8
9
0
1
2
3
4
5
6
7
8
$3620 - 5069
$5070 - 6499
$6500 - 7874
$7875 - 9399
$9400 - 10,999
$11,000 - 13,099
$13,100 - 16,859
$16,860 or more
Under .81
.82 - 1.20
1.21 - 1.56
1.57 - 1.94
1.95 - 2.32
2.33 - 2.71
2.72 - 3.23
3.24 - 3.88
3.89 - 4.89
4.90 or higher
0 - 54
55 - 64
65 - 73
74 - 80
81 - 87
88 - 95
96 - 104
105 - 114
115 - 129
See note at V989.
See note at V989.
575
516
466
402
361
336
307
299
820
629
554
468
408
363
316
307
304
291
873
613
551
433
396
365
327
308
303
12.89
11.57
10.45
9.01
8.09
7.53
6.88
6.70
18.39
14.10
12.42
10.49
9.15
8.14
7.09
6.88
6.82
6.52
19.57
13.74
12.35
9.71
8.88
8.18
7.33
6.91
6.79
Count
Count
%
%
Value/Range
Value/Range
Code Value/Range Text
Code Value/Range Text
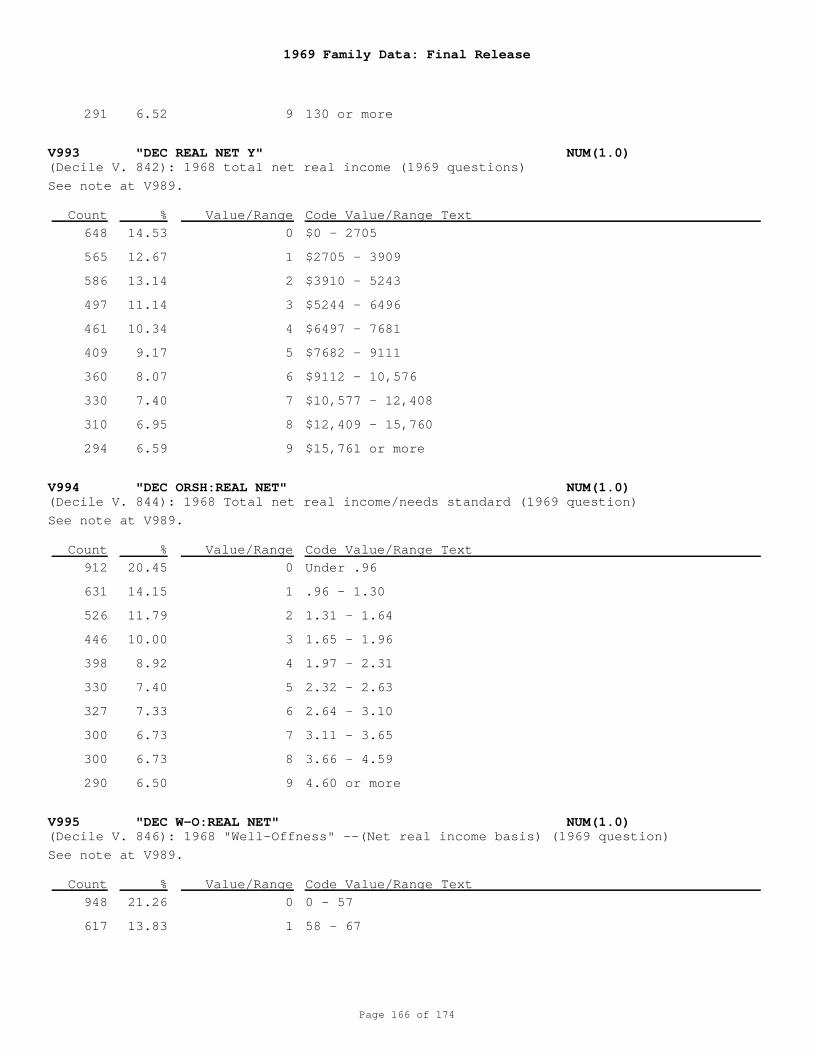
1969 Family Data: Final Release
Page 166 of 174
V993 "DEC REAL NET Y" NUM(1.0)
V994 "DEC ORSH:REAL NET" NUM(1.0)
V995 "DEC W-O:REAL NET" NUM(1.0)
(Decile V. 842): 1968 total net real income (1969 questions)
(Decile V. 844): 1968 Total net real income/needs standard (1969 question)
(Decile V. 846): 1968 "Well-Offness" --(Net real income basis) (1969 question)
9
0
1
2
3
4
5
6
7
8
9
0
1
2
3
4
5
6
7
8
9
0
1
130 or more
$0 - 2705
$2705 - 3909
$3910 - 5243
$5244 - 6496
$6497 - 7681
$7682 - 9111
$9112 - 10,576
$10,577 - 12,408
$12,409 - 15,760
$15,761 or more
Under .96
.96 - 1.30
1.31 - 1.64
1.65 - 1.96
1.97 - 2.31
2.32 - 2.63
2.64 - 3.10
3.11 - 3.65
3.66 - 4.59
4.60 or more
0 - 57
58 - 67
See note at V989.
See note at V989.
See note at V989.
291
648
565
586
497
461
409
360
330
310
294
912
631
526
446
398
330
327
300
300
290
948
617
6.52
14.53
12.67
13.14
11.14
10.34
9.17
8.07
7.40
6.95
6.59
20.45
14.15
11.79
10.00
8.92
7.40
7.33
6.73
6.73
6.50
21.26
13.83
Count
Count
Count
%
%
%
Value/Range
Value/Range
Value/Range
Code Value/Range Text
Code Value/Range Text
Code Value/Range Text
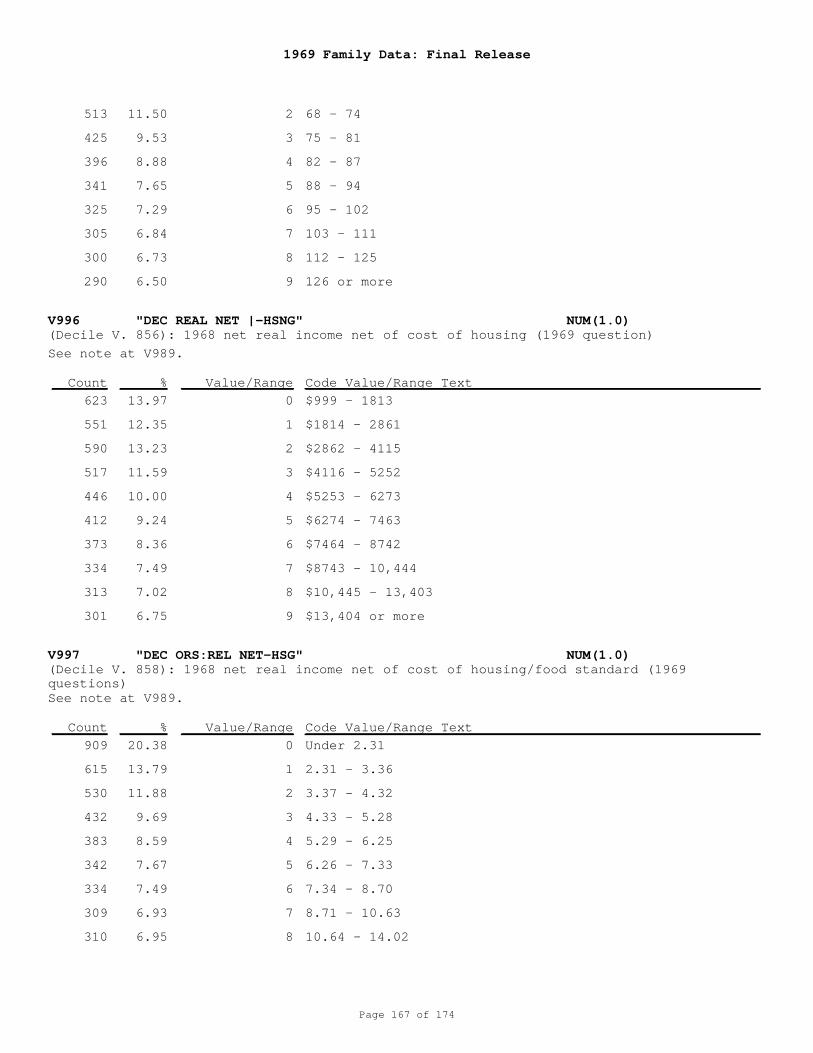
1969 Family Data: Final Release
Page 167 of 174
V996 "DEC REAL NET |-HSNG" NUM(1.0)
V997 "DEC ORS:REL NET-HSG" NUM(1.0)
(Decile V. 856): 1968 net real income net of cost of housing (1969 question)
(Decile V. 858): 1968 net real income net of cost of housing/food standard (1969questions)
2
3
4
5
6
7
8
9
0
1
2
3
4
5
6
7
8
9
0
1
2
3
4
5
6
7
8
68 - 74
75 - 81
82 - 87
88 - 94
95 - 102
103 - 111
112 - 125
126 or more
$999 - 1813
$1814 - 2861
$2862 - 4115
$4116 - 5252
$5253 - 6273
$6274 - 7463
$7464 - 8742
$8743 - 10,444
$10,445 - 13,403
$13,404 or more
Under 2.31
2.31 - 3.36
3.37 - 4.32
4.33 - 5.28
5.29 - 6.25
6.26 - 7.33
7.34 - 8.70
8.71 - 10.63
10.64 - 14.02
See note at V989.
See note at V989.
513
425
396
341
325
305
300
290
623
551
590
517
446
412
373
334
313
301
909
615
530
432
383
342
334
309
310
11.50
9.53
8.88
7.65
7.29
6.84
6.73
6.50
13.97
12.35
13.23
11.59
10.00
9.24
8.36
7.49
7.02
6.75
20.38
13.79
11.88
9.69
8.59
7.67
7.49
6.93
6.95
Count
Count
%
%
Value/Range
Value/Range
Code Value/Range Text
Code Value/Range Text
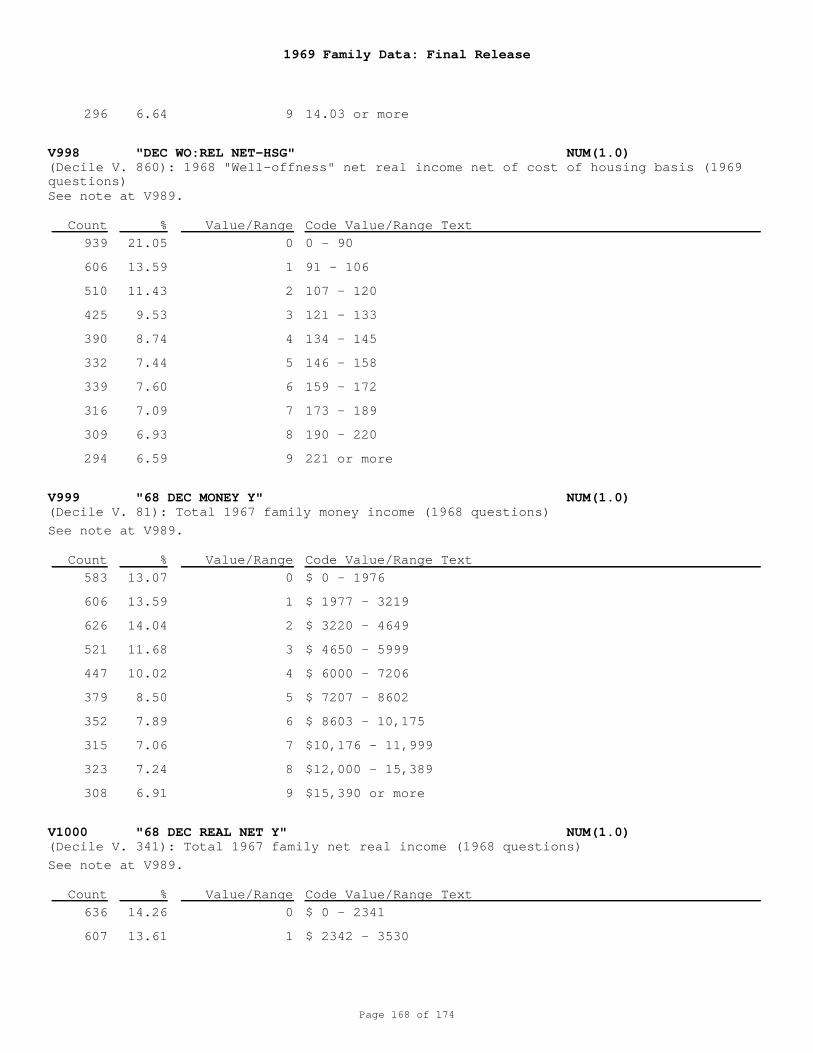
1969 Family Data: Final Release
Page 168 of 174
V998 "DEC WO:REL NET-HSG" NUM(1.0)
V999 "68 DEC MONEY Y" NUM(1.0)
V1000 "68 DEC REAL NET Y" NUM(1.0)
(Decile V. 860): 1968 "Well-offness" net real income net of cost of housing basis (1969questions)
(Decile V. 81): Total 1967 family money income (1968 questions)
(Decile V. 341): Total 1967 family net real income (1968 questions)
9
0
1
2
3
4
5
6
7
8
9
0
1
2
3
4
5
6
7
8
9
0
1
14.03 or more
0 - 90
91 - 106
107 - 120
121 - 133
134 - 145
146 - 158
159 - 172
173 - 189
190 - 220
221 or more
$ 0 - 1976
$ 1977 - 3219
$ 3220 - 4649
$ 4650 - 5999
$ 6000 - 7206
$ 7207 - 8602
$ 8603 - 10,175
$10,176 - 11,999
$12,000 - 15,389
$15,390 or more
$ 0 - 2341
$ 2342 - 3530
See note at V989.
See note at V989.
See note at V989.
296
939
606
510
425
390
332
339
316
309
294
583
606
626
521
447
379
352
315
323
308
636
607
6.64
21.05
13.59
11.43
9.53
8.74
7.44
7.60
7.09
6.93
6.59
13.07
13.59
14.04
11.68
10.02
8.50
7.89
7.06
7.24
6.91
14.26
13.61
Count
Count
Count
%
%
%
Value/Range
Value/Range
Value/Range
Code Value/Range Text
Code Value/Range Text
Code Value/Range Text
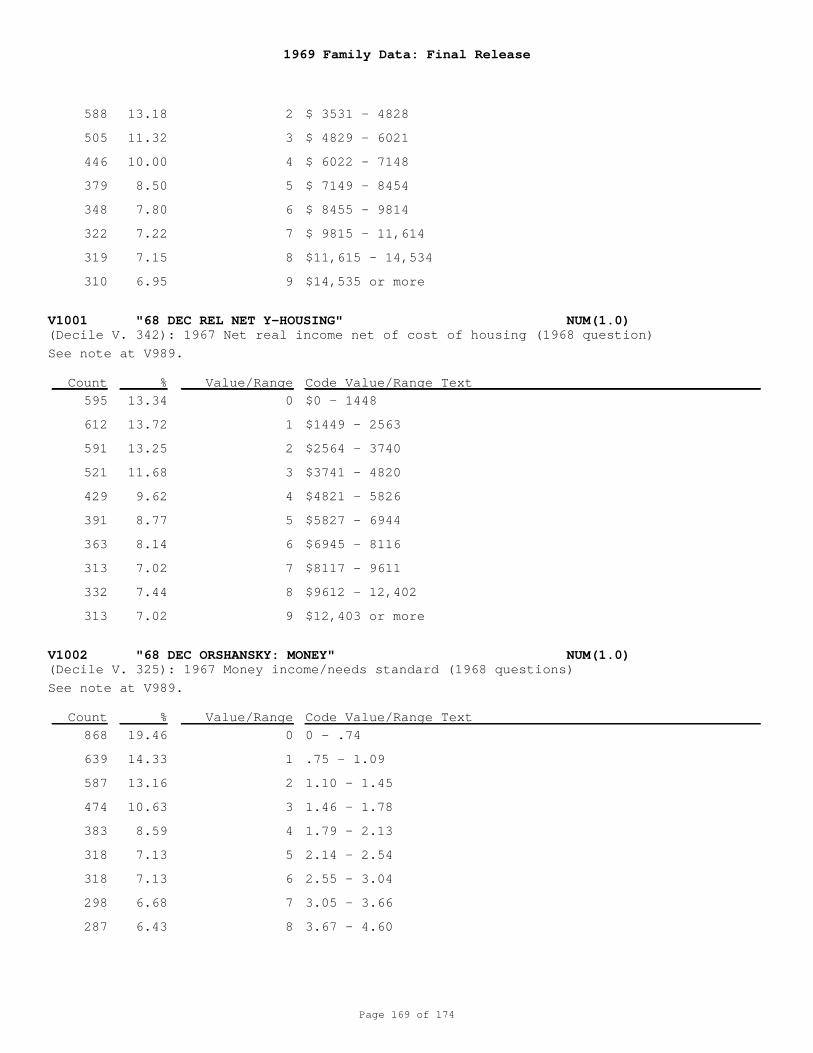
1969 Family Data: Final Release
Page 169 of 174
V1001 "68 DEC REL NET Y-HOUSING" NUM(1.0)
V1002 "68 DEC ORSHANSKY: MONEY" NUM(1.0)
(Decile V. 342): 1967 Net real income net of cost of housing (1968 question)
(Decile V. 325): 1967 Money income/needs standard (1968 questions)
2
3
4
5
6
7
8
9
0
1
2
3
4
5
6
7
8
9
0
1
2
3
4
5
6
7
8
$ 3531 - 4828
$ 4829 - 6021
$ 6022 - 7148
$ 7149 - 8454
$ 8455 - 9814
$ 9815 - 11,614
$11,615 - 14,534
$14,535 or more
$0 - 1448
$1449 - 2563
$2564 - 3740
$3741 - 4820
$4821 - 5826
$5827 - 6944
$6945 - 8116
$8117 - 9611
$9612 - 12,402
$12,403 or more
0 - .74
.75 - 1.09
1.10 - 1.45
1.46 - 1.78
1.79 - 2.13
2.14 - 2.54
2.55 - 3.04
3.05 - 3.66
3.67 - 4.60
See note at V989.
See note at V989.
588
505
446
379
348
322
319
310
595
612
591
521
429
391
363
313
332
313
868
639
587
474
383
318
318
298
287
13.18
11.32
10.00
8.50
7.80
7.22
7.15
6.95
13.34
13.72
13.25
11.68
9.62
8.77
8.14
7.02
7.44
7.02
19.46
14.33
13.16
10.63
8.59
7.13
7.13
6.68
6.43
Count
Count
%
%
Value/Range
Value/Range
Code Value/Range Text
Code Value/Range Text
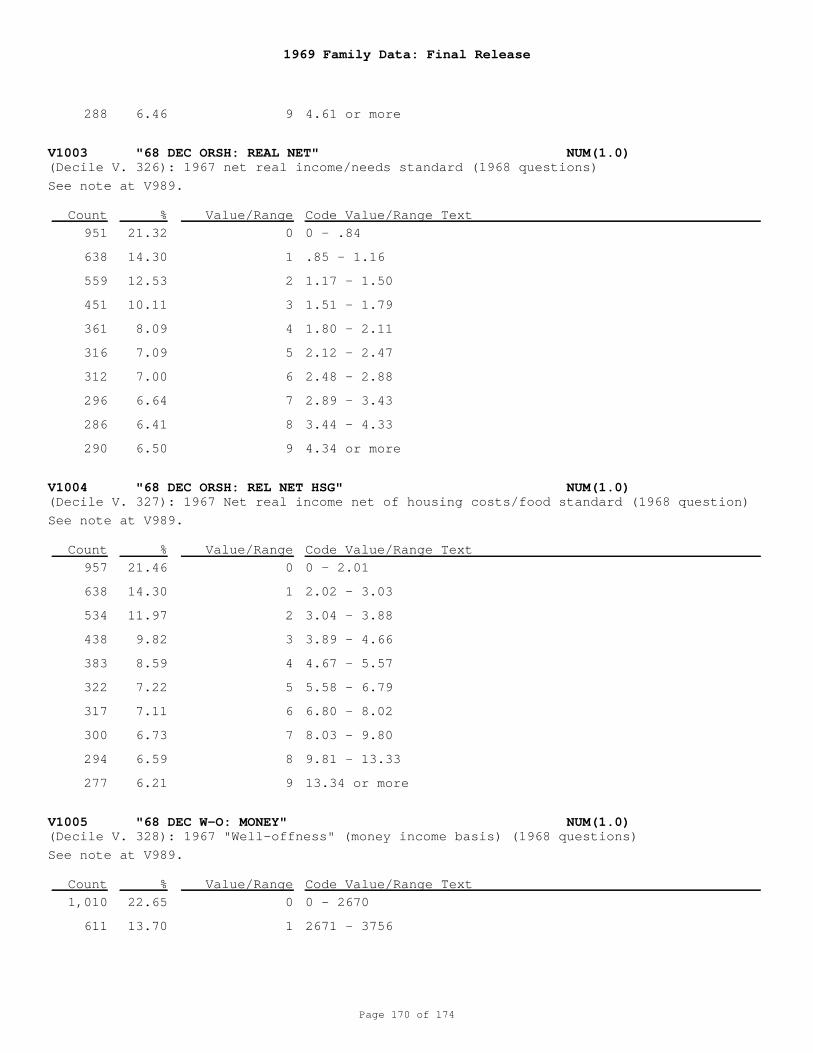
1969 Family Data: Final Release
Page 170 of 174
V1003 "68 DEC ORSH: REAL NET" NUM(1.0)
V1004 "68 DEC ORSH: REL NET HSG" NUM(1.0)
V1005 "68 DEC W-O: MONEY" NUM(1.0)
(Decile V. 326): 1967 net real income/needs standard (1968 questions)
(Decile V. 327): 1967 Net real income net of housing costs/food standard (1968 question)
(Decile V. 328): 1967 "Well-offness" (money income basis) (1968 questions)
9
0
1
2
3
4
5
6
7
8
9
0
1
2
3
4
5
6
7
8
9
0
1
4.61 or more
0 - .84
.85 - 1.16
1.17 - 1.50
1.51 - 1.79
1.80 - 2.11
2.12 - 2.47
2.48 - 2.88
2.89 - 3.43
3.44 - 4.33
4.34 or more
0 - 2.01
2.02 - 3.03
3.04 - 3.88
3.89 - 4.66
4.67 - 5.57
5.58 - 6.79
6.80 - 8.02
8.03 - 9.80
9.81 - 13.33
13.34 or more
0 - 2670
2671 - 3756
See note at V989.
See note at V989.
See note at V989.
288
951
638
559
451
361
316
312
296
286
290
957
638
534
438
383
322
317
300
294
277
1,010
611
6.46
21.32
14.30
12.53
10.11
8.09
7.09
7.00
6.64
6.41
6.50
21.46
14.30
11.97
9.82
8.59
7.22
7.11
6.73
6.59
6.21
22.65
13.70
Count
Count
Count
%
%
%
Value/Range
Value/Range
Value/Range
Code Value/Range Text
Code Value/Range Text
Code Value/Range Text
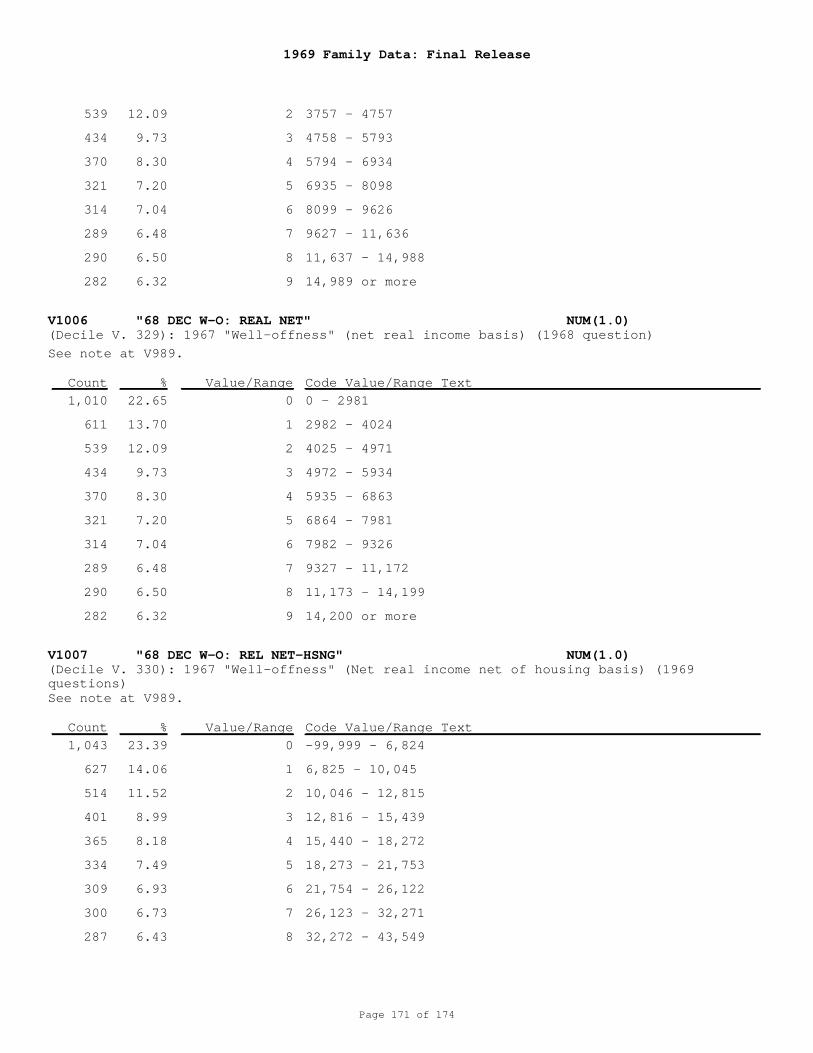
1969 Family Data: Final Release
Page 171 of 174
V1006 "68 DEC W-O: REAL NET" NUM(1.0)
V1007 "68 DEC W-O: REL NET-HSNG" NUM(1.0)
(Decile V. 329): 1967 "Well-offness" (net real income basis) (1968 question)
(Decile V. 330): 1967 "Well-offness" (Net real income net of housing basis) (1969questions)
2
3
4
5
6
7
8
9
0
1
2
3
4
5
6
7
8
9
0
1
2
3
4
5
6
7
8
3757 - 4757
4758 - 5793
5794 - 6934
6935 - 8098
8099 - 9626
9627 - 11,636
11,637 - 14,988
14,989 or more
0 - 2981
2982 - 4024
4025 - 4971
4972 - 5934
5935 - 6863
6864 - 7981
7982 - 9326
9327 - 11,172
11,173 - 14,199
14,200 or more
-99,999 - 6,824
6,825 - 10,045
10,046 - 12,815
12,816 - 15,439
15,440 - 18,272
18,273 - 21,753
21,754 - 26,122
26,123 - 32,271
32,272 - 43,549
See note at V989.
See note at V989.
539
434
370
321
314
289
290
282
1,010
611
539
434
370
321
314
289
290
282
1,043
627
514
401
365
334
309
300
287
12.09
9.73
8.30
7.20
7.04
6.48
6.50
6.32
22.65
13.70
12.09
9.73
8.30
7.20
7.04
6.48
6.50
6.32
23.39
14.06
11.52
8.99
8.18
7.49
6.93
6.73
6.43
Count
Count
%
%
Value/Range
Value/Range
Code Value/Range Text
Code Value/Range Text
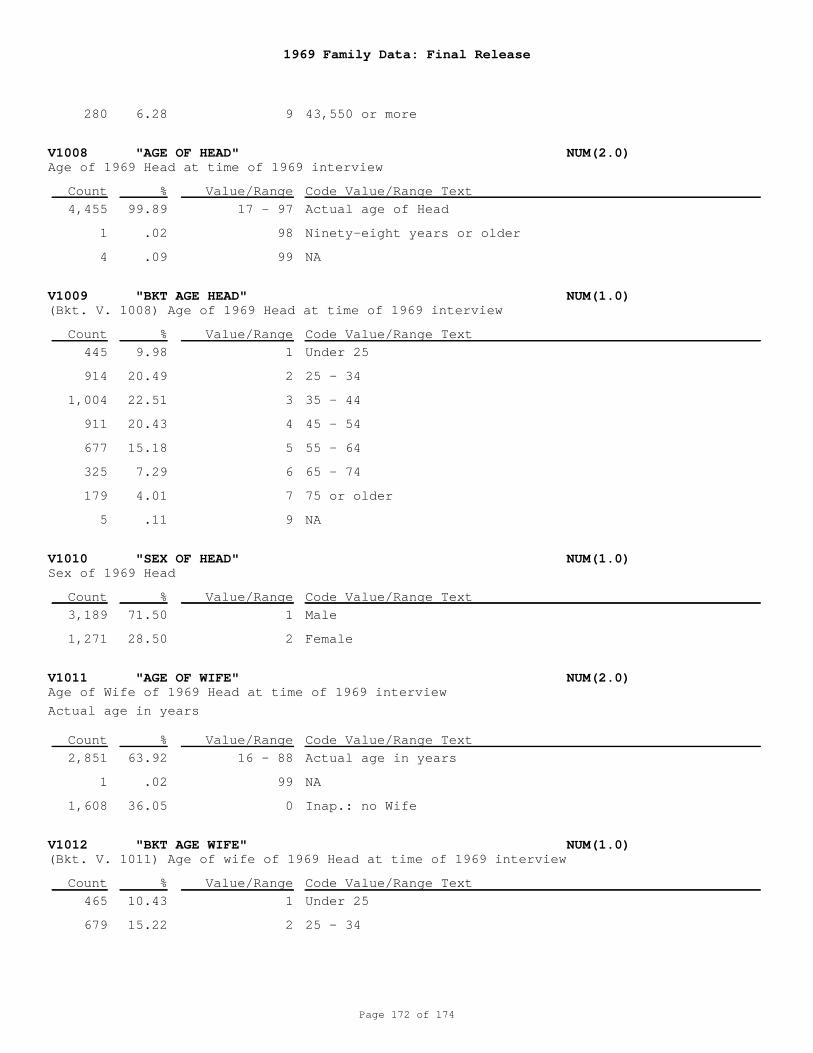
1969 Family Data: Final Release
Page 172 of 174
V1008 "AGE OF HEAD" NUM(2.0)
V1009 "BKT AGE HEAD" NUM(1.0)
V1010 "SEX OF HEAD" NUM(1.0)
V1011 "AGE OF WIFE" NUM(2.0)
V1012 "BKT AGE WIFE" NUM(1.0)
Age of 1969 Head at time of 1969 interview
(Bkt. V. 1008) Age of 1969 Head at time of 1969 interview
Sex of 1969 Head
Age of Wife of 1969 Head at time of 1969 interview
(Bkt. V. 1011) Age of wife of 1969 Head at time of 1969 interview
9
17 - 97
98
99
1
2
3
4
5
6
7
9
1
2
16 - 88
99
0
1
2
43,550 or more
Actual age of Head
Ninety-eight years or older
NA
Under 25
25 - 34
35 - 44
45 - 54
55 - 64
65 - 74
75 or older
NA
Male
Female
Actual age in years
NA
Inap.: no Wife
Under 25
25 - 34
Actual age in years
280
4,455
1
4
445
914
1,004
911
677
325
179
5
3,189
1,271
2,851
1
1,608
465
679
6.28
99.89
.02
.09
9.98
20.49
22.51
20.43
15.18
7.29
4.01
.11
71.50
28.50
63.92
.02
36.05
10.43
15.22
Count
Count
Count
Count
Count
%
%
%
%
%
Value/Range
Value/Range
Value/Range
Value/Range
Value/Range
Code Value/Range Text
Code Value/Range Text
Code Value/Range Text
Code Value/Range Text
Code Value/Range Text
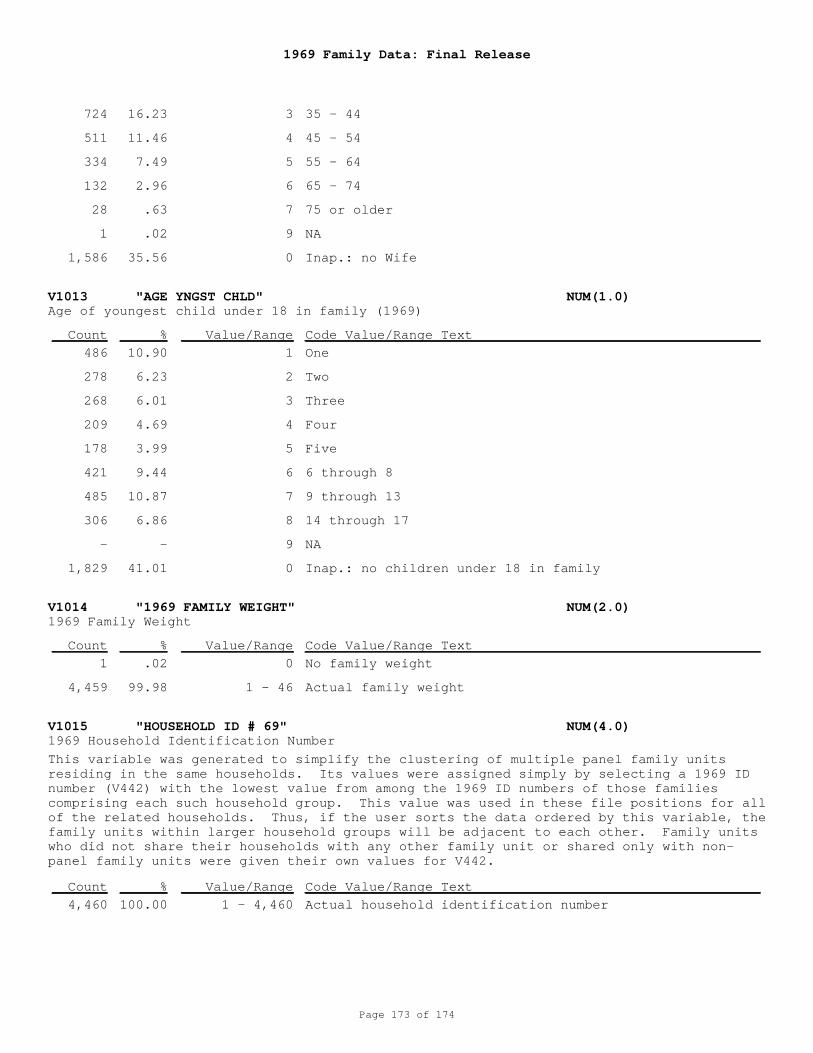
1969 Family Data: Final Release
Page 173 of 174
V1013 "AGE YNGST CHLD" NUM(1.0)
V1014 "1969 FAMILY WEIGHT" NUM(2.0)
V1015 "HOUSEHOLD ID # 69" NUM(4.0)
Age of youngest child under 18 in family (1969)
1969 Family Weight
1969 Household Identification Number
3
4
5
6
7
9
0
1
2
3
4
5
6
7
8
9
0
0
1 - 46
1 - 4,460
35 - 44
45 - 54
55 - 64
65 - 74
75 or older
NA
Inap.: no Wife
One
Two
Three
Four
Five
6 through 8
9 through 13
14 through 17
NA
Inap.: no children under 18 in family
No family weight
Actual family weight
Actual household identification number
This variable was generated to simplify the clustering of multiple panel family unitsresiding in the same households. Its values were assigned simply by selecting a 1969 IDnumber (V442) with the lowest value from among the 1969 ID numbers of those familiescomprising each such household group. This value was used in these file positions for allof the related households. Thus, if the user sorts the data ordered by this variable, thefamily units within larger household groups will be adjacent to each other. Family unitswho did not share their households with any other family unit or shared only with non-panel family units were given their own values for V442.
724
511
334
132
28
1
1,586
486
278
268
209
178
421
485
306
-
1,829
1
4,459
4,460
16.23
11.46
7.49
2.96
.63
.02
35.56
10.90
6.23
6.01
4.69
3.99
9.44
10.87
6.86
-
41.01
.02
99.98
100.00
Count
Count
Count
%
%
%
Value/Range
Value/Range
Value/Range
Code Value/Range Text
Code Value/Range Text
Code Value/Range Text
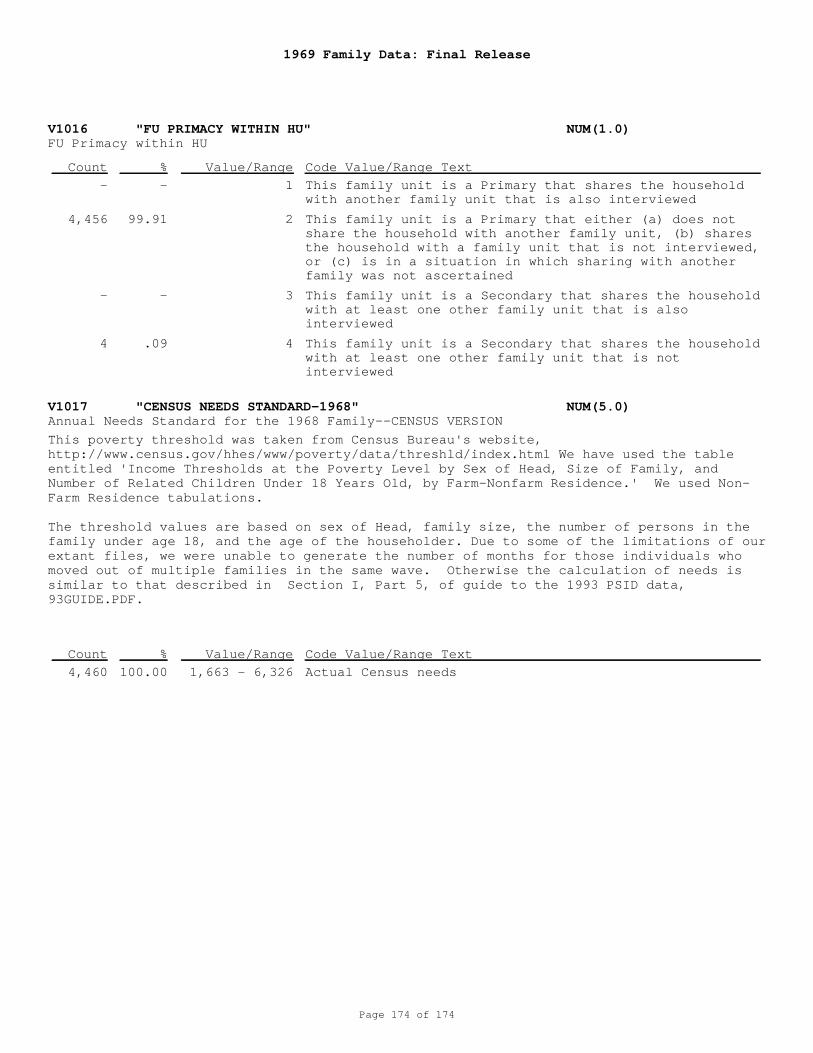
1969 Family Data: Final Release
Page 174 of 174
V1016 "FU PRIMACY WITHIN HU" NUM(1.0)
V1017 "CENSUS NEEDS STANDARD-1968" NUM(5.0)
FU Primacy within HU
Annual Needs Standard for the 1968 Family--CENSUS VERSION
1
2
3
4
1,663 - 6,326
This family unit is a Primary that shares the householdwith another family unit that is also interviewed
This family unit is a Primary that either (a) does notshare the household with another family unit, (b) sharesthe household with a family unit that is not interviewed,or (c) is in a situation in which sharing with anotherfamily was not ascertained
This family unit is a Secondary that shares the householdwith at least one other family unit that is alsointerviewed
This family unit is a Secondary that shares the householdwith at least one other family unit that is notinterviewed
Actual Census needs
This poverty threshold was taken from Census Bureau's website,http://www.census.gov/hhes/www/poverty/data/threshld/index.html We have used the tableentitled 'Income Thresholds at the Poverty Level by Sex of Head, Size of Family, andNumber of Related Children Under 18 Years Old, by Farm-Nonfarm Residence.' We used Non-Farm Residence tabulations. The threshold values are based on sex of Head, family size, the number of persons in thefamily under age 18, and the age of the householder. Due to some of the limitations of ourextant files, we were unable to generate the number of months for those individuals whomoved out of multiple families in the same wave. Otherwise the calculation of needs issimilar to that described in Section I, Part 5, of guide to the 1993 PSID data,93GUIDE.PDF.
-
4,456
-
4
4,460
-
99.91
-
.09
100.00
Count
Count
%
%
Value/Range
Value/Range
Code Value/Range Text
Code Value/Range Text


![The Pricean [1969] - Internet Archive](https://img.pdfslide.net/doc/110x75/6325f0726d480576770c88f7/the-pricean-1969-internet-archive.jpg)


