Embed Size (px)
Citation preview
1
FOR IMMEDIATE RELEASE
CONTACT
Mr. Albert Arhin
CODEO National Coordinator
Phone: +233 (0) 24 474 6791 / (0) 20 822 1068
Secretariat: +233 (0) 244 350 266/ 0277 744 777
Email: [email protected]
Website: www.codeoghana.org
Thursday, December 10, 2020
Accra, Ghana
Introduction
On Sunday, December 6, 2020, the Coalition of Domestic Election Observers (CODEO), in its press
statement, communicated to the nation its intention to once again employ the Parallel Vote Tabulation
(PVT) methodology to observe the 2020 presidential election, just as it did in 2008, 2012 and 2016.
The PVT methodology is a reliable tool available to independent and non-partisan citizens’ election
observer groups around the world for verifying the accuracy of official presidential elections results.
In keeping with our protocols, which is that CODEO releases its PVT findings after the official results
have been announced by the Electoral Commission, CODEO is here to release its PVT estimates for
the presidential election. CODEO’s PVT estimates for the presidential results form part of its
comprehensive election observation activities for the 2020 elections that covered voter registration
exercise, pre-election environment observation for three months (September to November), and
election day observation.
The PVT Methodology
The PVT is an advanced and scientific election observation technique that combines well-established
statistical principles and Information Communication Technology (ICT) to observe elections. The
PVT involves deploying trained accredited Observers to a nationally representative random sample
of polling stations. On Election-Day, PVT Observers observe the entire polling process and transmit
reports about the conduct of the polls and the official vote count in real-time to a central election
observation database, using the Short Message Service (SMS) platform.
The PVT technique has been deployed successfully around the world to promote electoral integrity
and help defend the rights of citizens to vote and to protect such rights when exercised. The first PVT
was conducted in the Philippines in 1986. Since then, the methodology has been deployed in election
observation in Bulgaria, Chile, Croatia, Guyana, Albania, Bangladesh, Belarus, Indonesia, Georgia,
Macedonia, Slovakia, Montenegro, Nicaragua, Panama, Peru and Ukraine. In Africa, the
methodology has been deployed successfully in Madagascar, Malawi, Mozambique, Uganda,
Burundi, Sierra Leone, Zambia, Ghana, Nigeria, Zimbabwe, Burkina Faso, Cote d’Ivoire, Kenya and
Tunisia.
Unlike pre-election surveys (which track voter intentions) or exit polls (which track voter re-
collections), the PVT is based on the actual behavior of electorates in an election. In other words,
PVT Observers do not speak to voters about the choices they made at the polls to predict the outcome
of an election. Rather, after observing the entire voting and counting process, PVT Observers record
CODEO’S STATEMENT ON THE OFFICIAL
RESULTS OF THE 2020 PRESIDENTIAL
ELECTIONS
2
the official vote count as announced by election officials at polling stations and rapidly transmit this
information to an observation center via coded text message. Consequently, the PVT data is collected
directly from polling stations.
PVT in Ghana in Retrospect
CODEO applied the PVT methodology for the first time in its election observation work in the year
2008 and has since used it in all subsequent presidential elections, including the current one (i.e. 2012,
2016 and 2020). As presented in Tables 1 to 3, CODEO’s previous PVT estimates of the presidential
election results have been consistent with the official results announced by the EC in 2008, 2012 and
2016 (See Appendix A, Tables A1 to A4). Similarly, CODEO’s PVT voter turnout and rejected ballot
rates in the previous elections have also been consistent with figures announced by the EC (See
Appendix A, Table A5).
The 2020 PVT Estimates of the Presidential Election
By midnight of December 7, 2020, CODEO had received data of vote count from its 1,502 PVT
Observers who were deployed to a nationally representative random sample of polling stations located
in every region and constituency of the country. CODEO at this point can confidently verify the
outcomes of the presidential election results as announced by the EC. The findings presented in this
statement are based on data received from all 1,502 PVT polling stations across the 275 constituencies
in the country’s 16 regions. The data was thoroughly checked for accuracy and internal consistency.
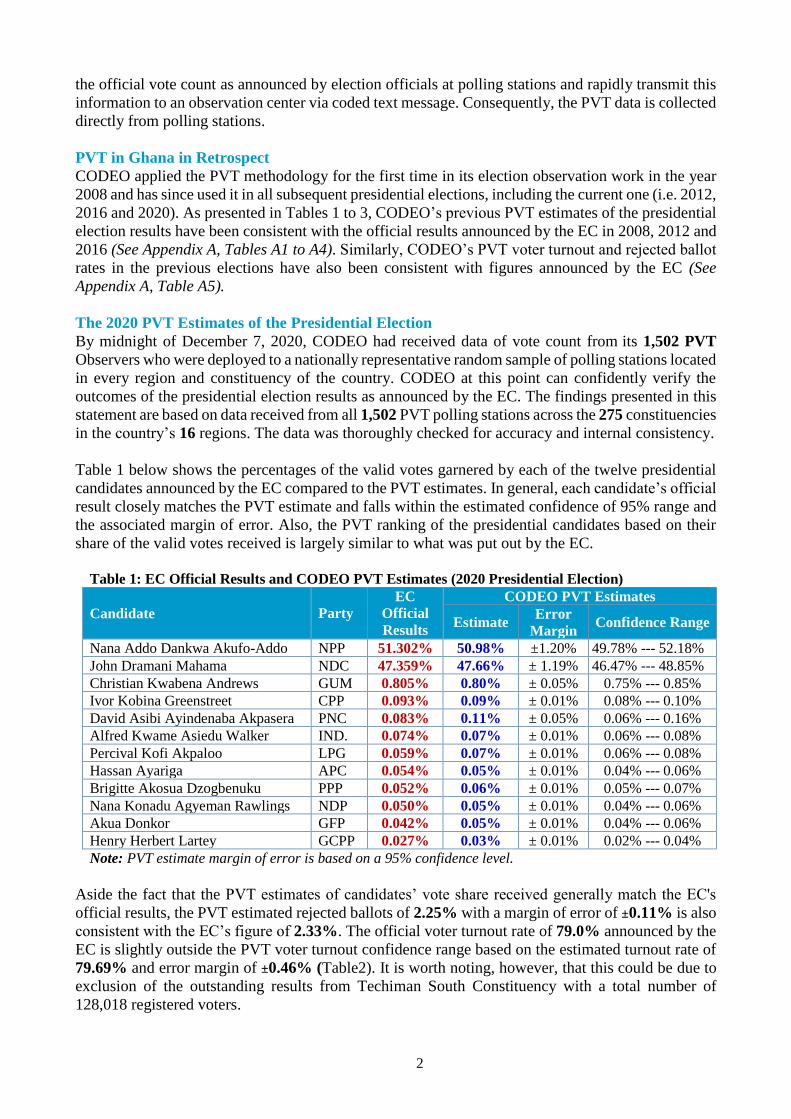
Table 1 below shows the percentages of the valid votes garnered by each of the twelve presidential
candidates announced by the EC compared to the PVT estimates. In general, each candidate’s official
result closely matches the PVT estimate and falls within the estimated confidence of 95% range and
the associated margin of error. Also, the PVT ranking of the presidential candidates based on their
share of the valid votes received is largely similar to what was put out by the EC.
Table 1: EC Official Results and CODEO PVT Estimates (2020 Presidential Election)
Candidate
Party
EC
Official
Results
CODEO PVT Estimates
Estimate Error
Margin
Confidence Range
Nana Addo Dankwa Akufo-Addo NPP 51.302% 50.98% ±1.20% 49.78% --- 52.18%
John Dramani Mahama NDC 47.359% 47.66% ± 1.19% 46.47% --- 48.85%
Christian Kwabena Andrews GUM 0.805% 0.80% ± 0.05% 0.75% --- 0.85%
Ivor Kobina Greenstreet CPP 0.093% 0.09% ± 0.01% 0.08% --- 0.10%
David Asibi Ayindenaba Akpasera PNC 0.083% 0.11% ± 0.05% 0.06% --- 0.16%
Alfred Kwame Asiedu Walker IND. 0.074% 0.07% ± 0.01% 0.06% --- 0.08%
Percival Kofi Akpaloo LPG 0.059% 0.07% ± 0.01% 0.06% --- 0.08%
Hassan Ayariga APC 0.054% 0.05% ± 0.01% 0.04% --- 0.06%
Brigitte Akosua Dzogbenuku PPP 0.052% 0.06% ± 0.01% 0.05% --- 0.07%
Nana Konadu Agyeman Rawlings NDP 0.050% 0.05% ± 0.01% 0.04% --- 0.06%
Akua Donkor GFP 0.042% 0.05% ± 0.01% 0.04% --- 0.06%
Henry Herbert Lartey GCPP 0.027% 0.03% ± 0.01% 0.02% --- 0.04%
Note: PVT estimate margin of error is based on a 95% confidence level.
Aside the fact that the PVT estimates of candidates’ vote share received generally match the EC's
official results, the PVT estimated rejected ballots of 2.25% with a margin of error of ±0.11% is also
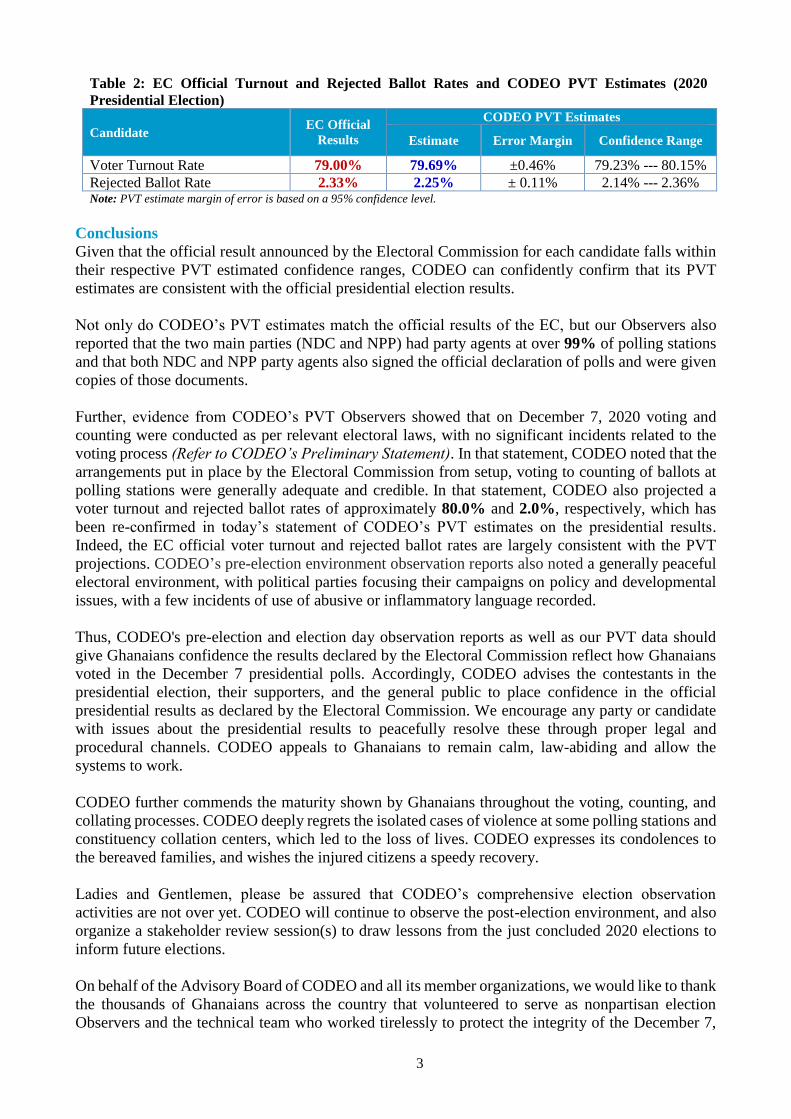
consistent with the EC’s figure of 2.33%. The official voter turnout rate of 79.0% announced by the
EC is slightly outside the PVT voter turnout confidence range based on the estimated turnout rate of
79.69% and error margin of ±0.46% (Table2). It is worth noting, however, that this could be due to
exclusion of the outstanding results from Techiman South Constituency with a total number of
128,018 registered voters.
3
Table 2: EC Official Turnout and Rejected Ballot Rates and CODEO PVT Estimates (2020
Presidential Election)
Candidate
EC Official
Results
CODEO PVT Estimates
Estimate
Error Margin
Confidence Range
Voter Turnout Rate 79.00% 79.69% ±0.46% 79.23% --- 80.15%
Rejected Ballot Rate 2.33% 2.25% ± 0.11% 2.14% --- 2.36% Note: PVT estimate margin of error is based on a 95% confidence level.
Conclusions
Given that the official result announced by the Electoral Commission for each candidate falls within
their respective PVT estimated confidence ranges, CODEO can confidently confirm that its PVT
estimates are consistent with the official presidential election results.
Not only do CODEO’s PVT estimates match the official results of the EC, but our Observers also
reported that the two main parties (NDC and NPP) had party agents at over 99% of polling stations
and that both NDC and NPP party agents also signed the official declaration of polls and were given
copies of those documents.
Further, evidence from CODEO’s PVT Observers showed that on December 7, 2020 voting and
counting were conducted as per relevant electoral laws, with no significant incidents related to the
voting process (Refer to CODEO’s Preliminary Statement). In that statement, CODEO noted that the
arrangements put in place by the Electoral Commission from setup, voting to counting of ballots at
polling stations were generally adequate and credible. In that statement, CODEO also projected a
voter turnout and rejected ballot rates of approximately 80.0% and 2.0%, respectively, which has
been re-confirmed in today’s statement of CODEO’s PVT estimates on the presidential results.
Indeed, the EC official voter turnout and rejected ballot rates are largely consistent with the PVT
projections. CODEO’s pre-election environment observation reports also noted a generally peaceful
electoral environment, with political parties focusing their campaigns on policy and developmental
issues, with a few incidents of use of abusive or inflammatory language recorded.
Thus, CODEO's pre-election and election day observation reports as well as our PVT data should
give Ghanaians confidence the results declared by the Electoral Commission reflect how Ghanaians
voted in the December 7 presidential polls. Accordingly, CODEO advises the contestants in the
presidential election, their supporters, and the general public to place confidence in the official
presidential results as declared by the Electoral Commission. We encourage any party or candidate
with issues about the presidential results to peacefully resolve these through proper legal and
procedural channels. CODEO appeals to Ghanaians to remain calm, law-abiding and allow the
systems to work.
CODEO further commends the maturity shown by Ghanaians throughout the voting, counting, and
collating processes. CODEO deeply regrets the isolated cases of violence at some polling stations and
constituency collation centers, which led to the loss of lives. CODEO expresses its condolences to
the bereaved families, and wishes the injured citizens a speedy recovery.
Ladies and Gentlemen, please be assured that CODEO’s comprehensive election observation
activities are not over yet. CODEO will continue to observe the post-election environment, and also
organize a stakeholder review session(s) to draw lessons from the just concluded 2020 elections to
inform future elections.
On behalf of the Advisory Board of CODEO and all its member organizations, we would like to thank
the thousands of Ghanaians across the country that volunteered to serve as nonpartisan election
Observers and the technical team who worked tirelessly to protect the integrity of the December 7,
4
2020 polls. CODEO also commends the security agencies for their professionalism in maintaining
peace during voting, counting, and collation of results. The Coalition acknowledges and commends
other stakeholders, including other local and international observer groups, and the entire population
for the high sense of comportment during the elections.
CODEO would also like to acknowledge the generous support of the American people through the
United States Agency for International Development (USAID). The Coalition further acknowledges
the additional support of the STAR-Ghana Foundation with funding from UKAID and the European
Union.
GOD BLESS OUR HOME LAND GHANA!!!!!
Signed:
Sheikh Arimiyawo Shaibu
Acting Chair, CODEO
(For and on Behalf of the Advisory Board)
CODEO Secretariat
Thursday, December 10, 2020
5
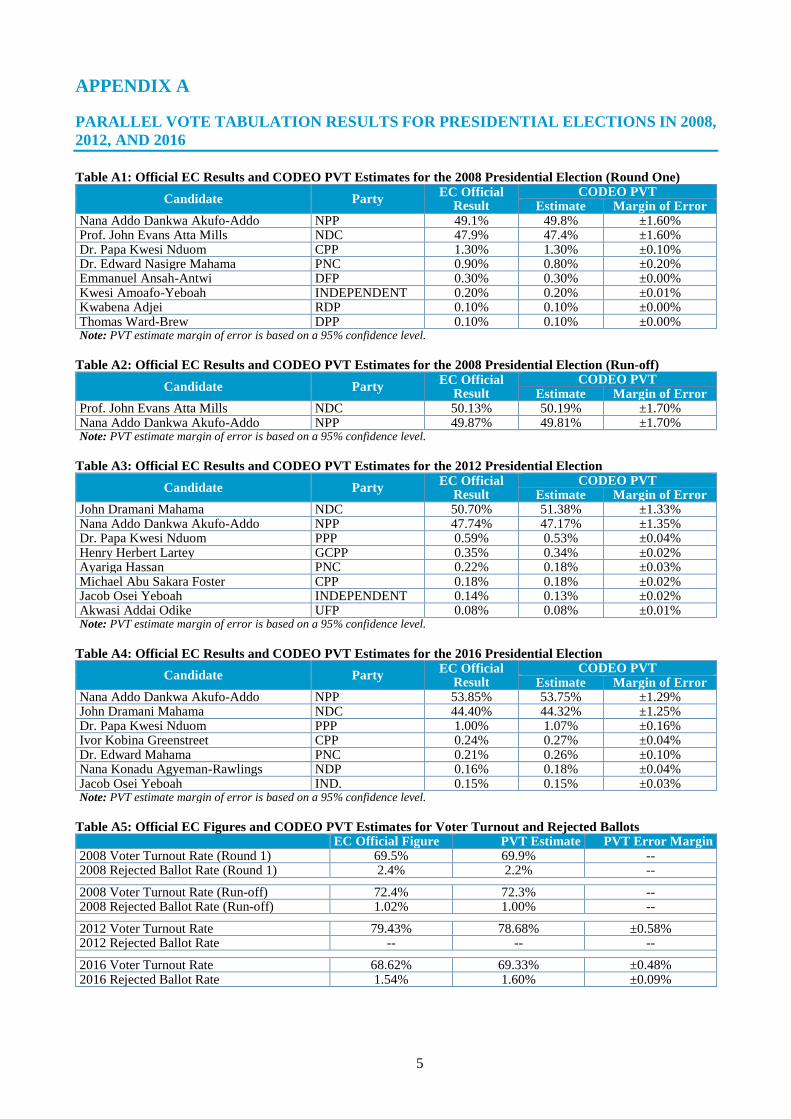
APPENDIX A
PARALLEL VOTE TABULATION RESULTS FOR PRESIDENTIAL ELECTIONS IN 2008,
2012, AND 2016
Table A1: Official EC Results and CODEO PVT Estimates for the 2008 Presidential Election (Round One)
Candidate Party EC Official
Result CODEO PVT
Estimate Margin of Error Nana Addo Dankwa Akufo-Addo NPP 49.1% 49.8% ±1.60% Prof. John Evans Atta Mills NDC 47.9% 47.4% ±1.60% Dr. Papa Kwesi Nduom CPP 1.30% 1.30% ±0.10% Dr. Edward Nasigre Mahama PNC 0.90% 0.80% ±0.20% Emmanuel Ansah-Antwi DFP 0.30% 0.30% ±0.00% Kwesi Amoafo-Yeboah INDEPENDENT 0.20% 0.20% ±0.01% Kwabena Adjei RDP 0.10% 0.10% ±0.00% Thomas Ward-Brew DPP 0.10% 0.10% ±0.00% Note: PVT estimate margin of error is based on a 95% confidence level.
Table A2: Official EC Results and CODEO PVT Estimates for the 2008 Presidential Election (Run-off)
Candidate Party EC Official
Result CODEO PVT
Estimate Margin of Error Prof. John Evans Atta Mills NDC 50.13% 50.19% ±1.70% Nana Addo Dankwa Akufo-Addo NPP 49.87% 49.81% ±1.70% Note: PVT estimate margin of error is based on a 95% confidence level.
Table A3: Official EC Results and CODEO PVT Estimates for the 2012 Presidential Election
Candidate Party EC Official
Result CODEO PVT
Estimate Margin of Error John Dramani Mahama NDC 50.70% 51.38% ±1.33% Nana Addo Dankwa Akufo-Addo NPP 47.74% 47.17% ±1.35% Dr. Papa Kwesi Nduom PPP 0.59% 0.53% ±0.04% Henry Herbert Lartey GCPP 0.35% 0.34% ±0.02% Ayariga Hassan PNC 0.22% 0.18% ±0.03% Michael Abu Sakara Foster CPP 0.18% 0.18% ±0.02% Jacob Osei Yeboah INDEPENDENT 0.14% 0.13% ±0.02% Akwasi Addai Odike UFP 0.08% 0.08% ±0.01% Note: PVT estimate margin of error is based on a 95% confidence level.
Table A4: Official EC Results and CODEO PVT Estimates for the 2016 Presidential Election
Candidate Party EC Official
Result CODEO PVT
Estimate Margin of Error Nana Addo Dankwa Akufo-Addo NPP 53.85% 53.75% ±1.29% John Dramani Mahama NDC 44.40% 44.32% ±1.25% Dr. Papa Kwesi Nduom PPP 1.00% 1.07% ±0.16% Ivor Kobina Greenstreet CPP 0.24% 0.27% ±0.04% Dr. Edward Mahama PNC 0.21% 0.26% ±0.10% Nana Konadu Agyeman-Rawlings NDP 0.16% 0.18% ±0.04% Jacob Osei Yeboah IND. 0.15% 0.15% ±0.03% Note: PVT estimate margin of error is based on a 95% confidence level.
Table A5: Official EC Figures and CODEO PVT Estimates for Voter Turnout and Rejected Ballots EC Official Figure PVT Estimate PVT Error Margin 2008 Voter Turnout Rate (Round 1) 69.5% 69.9% -- 2008 Rejected Ballot Rate (Round 1) 2.4% 2.2% --
2008 Voter Turnout Rate (Run-off) 72.4% 72.3% -- 2008 Rejected Ballot Rate (Run-off) 1.02% 1.00% --
2012 Voter Turnout Rate 79.43% 78.68% ±0.58% 2012 Rejected Ballot Rate -- -- --
2016 Voter Turnout Rate 68.62% 69.33% ±0.48% 2016 Rejected Ballot Rate 1.54% 1.60% ±0.09%
6
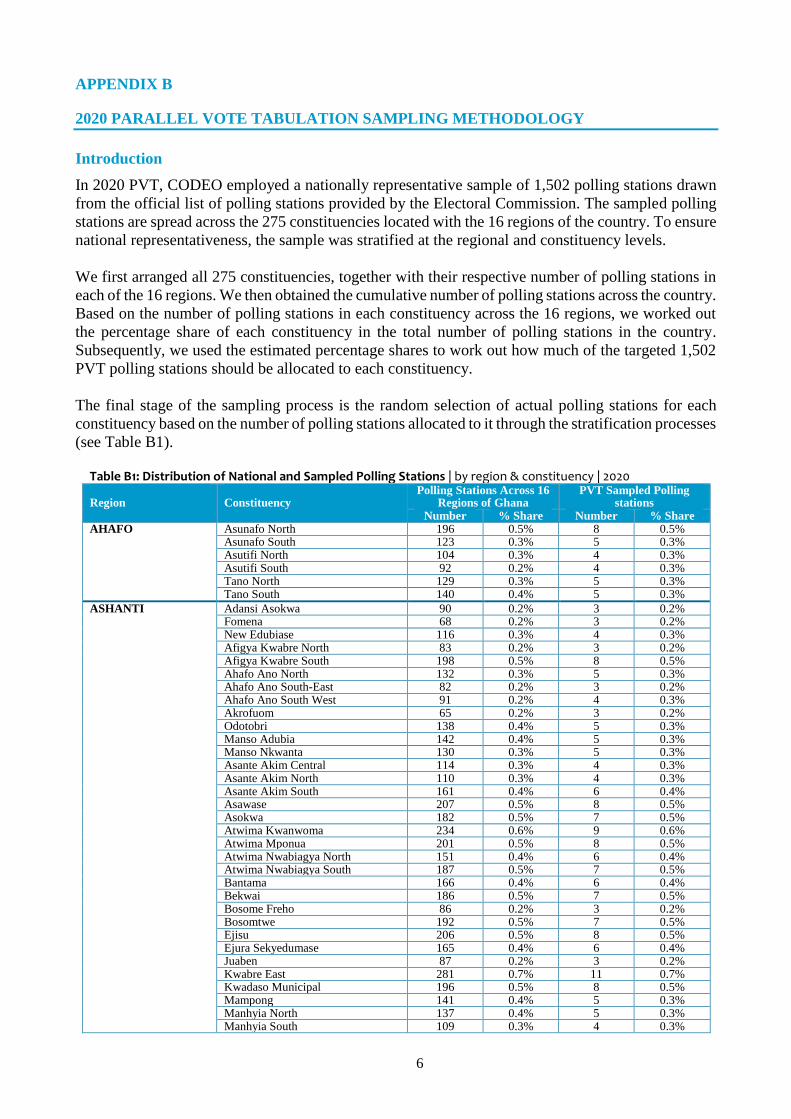
APPENDIX B
2020 PARALLEL VOTE TABULATION SAMPLING METHODOLOGY
Introduction
In 2020 PVT, CODEO employed a nationally representative sample of 1,502 polling stations drawn
from the official list of polling stations provided by the Electoral Commission. The sampled polling
stations are spread across the 275 constituencies located with the 16 regions of the country. To ensure
national representativeness, the sample was stratified at the regional and constituency levels.
We first arranged all 275 constituencies, together with their respective number of polling stations in
each of the 16 regions. We then obtained the cumulative number of polling stations across the country.
Based on the number of polling stations in each constituency across the 16 regions, we worked out
the percentage share of each constituency in the total number of polling stations in the country.
Subsequently, we used the estimated percentage shares to work out how much of the targeted 1,502
PVT polling stations should be allocated to each constituency.
The final stage of the sampling process is the random selection of actual polling stations for each
constituency based on the number of polling stations allocated to it through the stratification processes
(see Table B1).
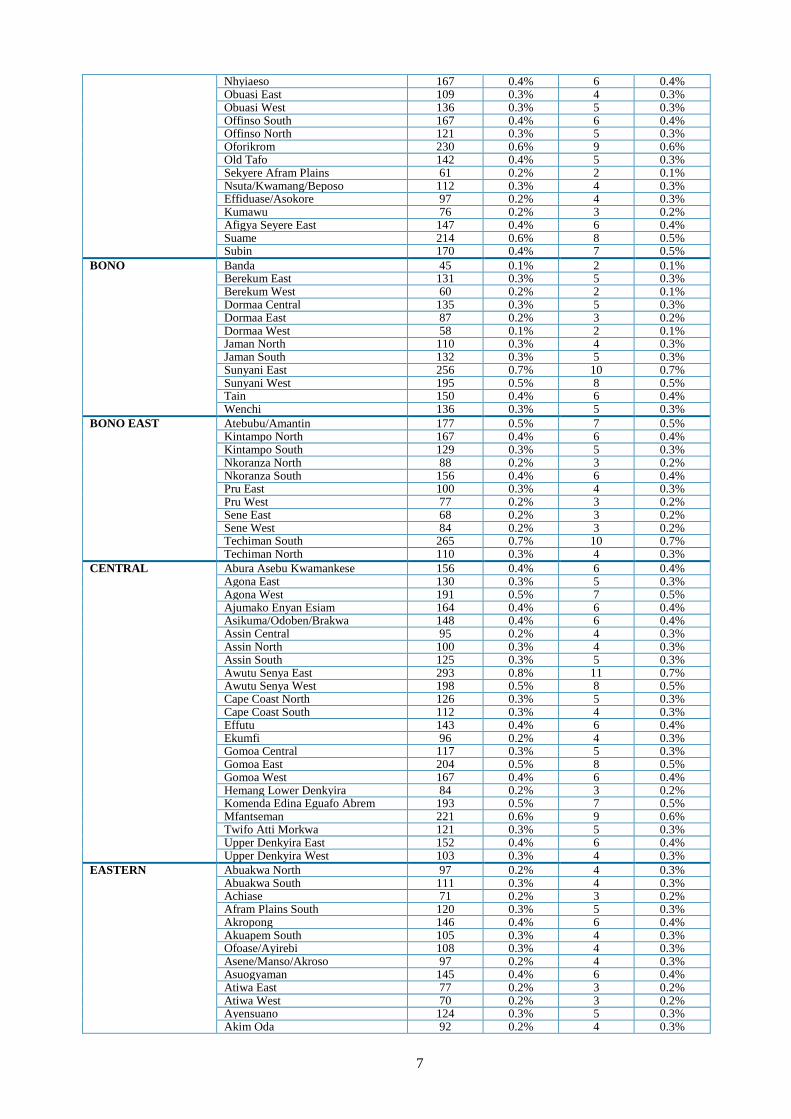
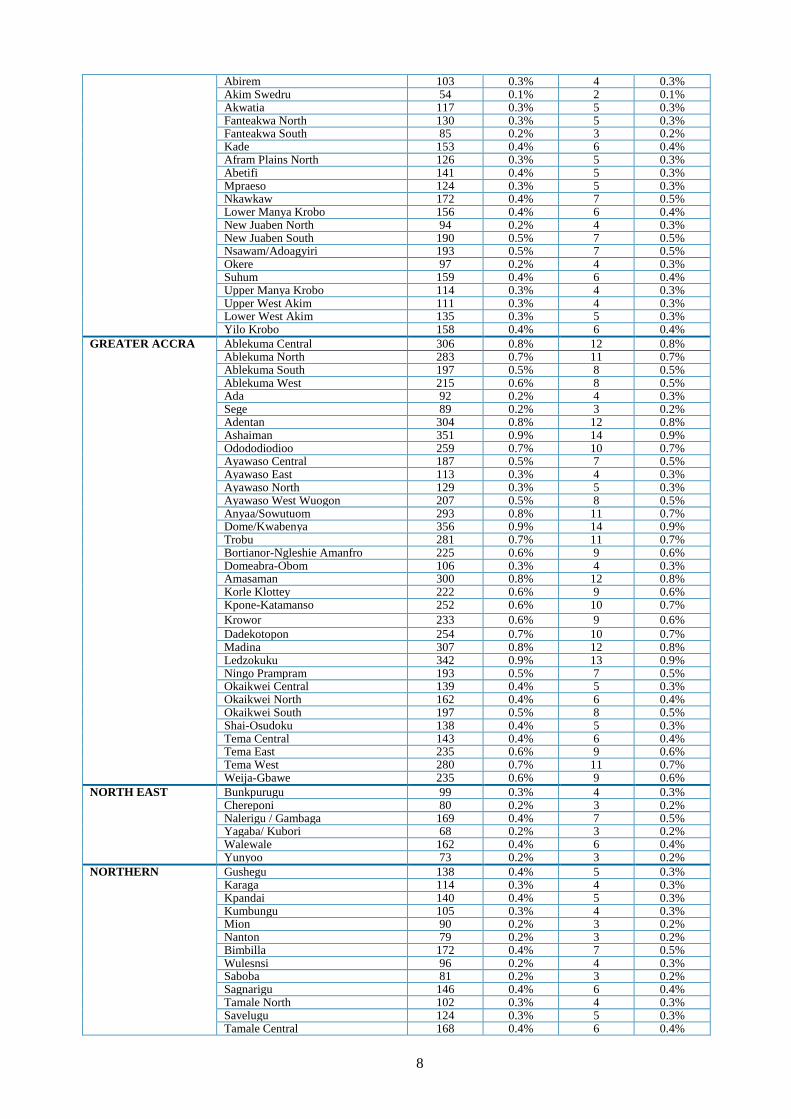
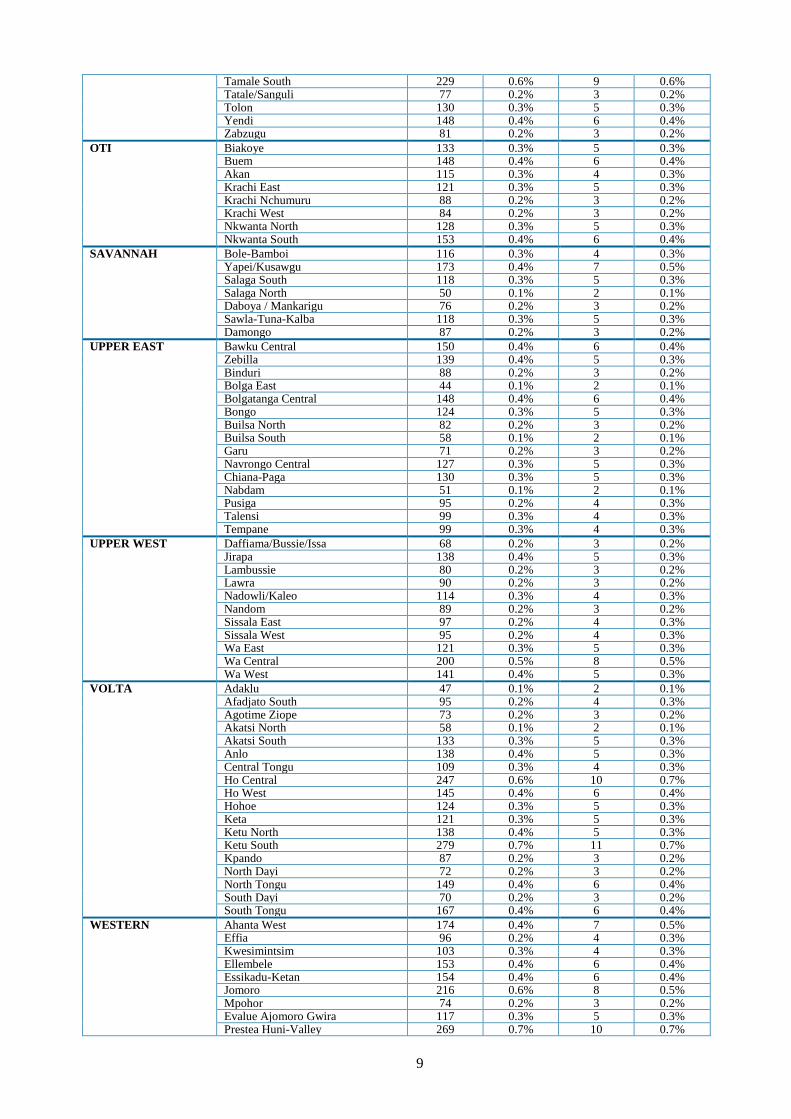
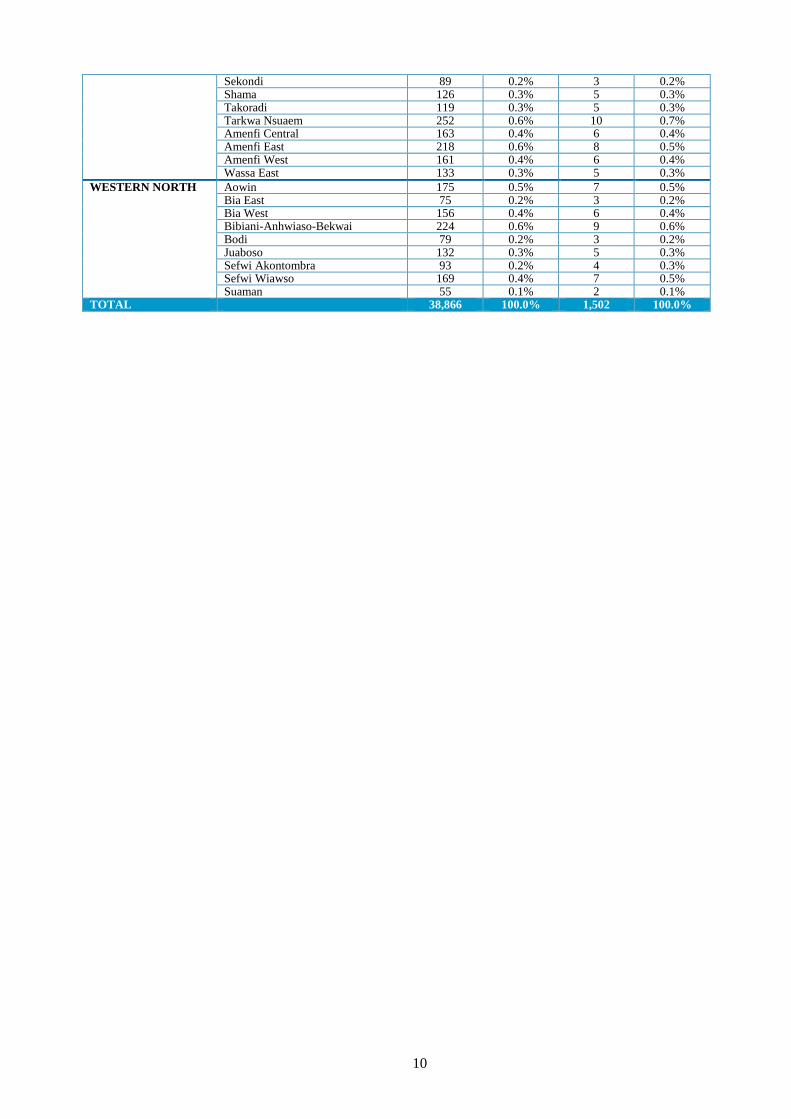
Table B1: Distribution of National and Sampled Polling Stations | by region & constituency | 2020
Region
Constituency
Polling Stations Across 16 Regions of Ghana
PVT Sampled Polling stations
Number % Share Number % Share AHAFO Asunafo North 196 0.5% 8 0.5%
Asunafo South 123 0.3% 5 0.3% Asutifi North 104 0.3% 4 0.3% Asutifi South 92 0.2% 4 0.3% Tano North 129 0.3% 5 0.3% Tano South 140 0.4% 5 0.3%
ASHANTI Adansi Asokwa 90 0.2% 3 0.2% Fomena 68 0.2% 3 0.2% New Edubiase 116 0.3% 4 0.3% Afigya Kwabre North 83 0.2% 3 0.2% Afigya Kwabre South 198 0.5% 8 0.5% Ahafo Ano North 132 0.3% 5 0.3% Ahafo Ano South-East 82 0.2% 3 0.2% Ahafo Ano South West 91 0.2% 4 0.3% Akrofuom 65 0.2% 3 0.2% Odotobri 138 0.4% 5 0.3% Manso Adubia 142 0.4% 5 0.3% Manso Nkwanta 130 0.3% 5 0.3% Asante Akim Central 114 0.3% 4 0.3% Asante Akim North 110 0.3% 4 0.3% Asante Akim South 161 0.4% 6 0.4% Asawase 207 0.5% 8 0.5% Asokwa 182 0.5% 7 0.5% Atwima Kwanwoma 234 0.6% 9 0.6% Atwima Mponua 201 0.5% 8 0.5% Atwima Nwabiagya North 151 0.4% 6 0.4% Atwima Nwabiagya South 187 0.5% 7 0.5% Bantama 166 0.4% 6 0.4% Bekwai 186 0.5% 7 0.5% Bosome Freho 86 0.2% 3 0.2% Bosomtwe 192 0.5% 7 0.5% Ejisu 206 0.5% 8 0.5% Ejura Sekyedumase 165 0.4% 6 0.4% Juaben 87 0.2% 3 0.2% Kwabre East 281 0.7% 11 0.7% Kwadaso Municipal 196 0.5% 8 0.5% Mampong 141 0.4% 5 0.3% Manhyia North 137 0.4% 5 0.3% Manhyia South 109 0.3% 4 0.3%
7
Nhyiaeso 167 0.4% 6 0.4% Obuasi East 109 0.3% 4 0.3% Obuasi West 136 0.3% 5 0.3% Offinso South 167 0.4% 6 0.4% Offinso North 121 0.3% 5 0.3% Oforikrom 230 0.6% 9 0.6% Old Tafo 142 0.4% 5 0.3% Sekyere Afram Plains 61 0.2% 2 0.1% Nsuta/Kwamang/Beposo 112 0.3% 4 0.3% Effiduase/Asokore 97 0.2% 4 0.3% Kumawu 76 0.2% 3 0.2% Afigya Seyere East 147 0.4% 6 0.4% Suame 214 0.6% 8 0.5% Subin 170 0.4% 7 0.5%
BONO Banda 45 0.1% 2 0.1% Berekum East 131 0.3% 5 0.3% Berekum West 60 0.2% 2 0.1% Dormaa Central 135 0.3% 5 0.3% Dormaa East 87 0.2% 3 0.2% Dormaa West 58 0.1% 2 0.1% Jaman North 110 0.3% 4 0.3% Jaman South 132 0.3% 5 0.3% Sunyani East 256 0.7% 10 0.7% Sunyani West 195 0.5% 8 0.5% Tain 150 0.4% 6 0.4% Wenchi 136 0.3% 5 0.3%
BONO EAST Atebubu/Amantin 177 0.5% 7 0.5% Kintampo North 167 0.4% 6 0.4% Kintampo South 129 0.3% 5 0.3% Nkoranza North 88 0.2% 3 0.2% Nkoranza South 156 0.4% 6 0.4% Pru East 100 0.3% 4 0.3% Pru West 77 0.2% 3 0.2% Sene East 68 0.2% 3 0.2% Sene West 84 0.2% 3 0.2% Techiman South 265 0.7% 10 0.7% Techiman North 110 0.3% 4 0.3%
CENTRAL Abura Asebu Kwamankese 156 0.4% 6 0.4% Agona East 130 0.3% 5 0.3% Agona West 191 0.5% 7 0.5% Ajumako Enyan Esiam 164 0.4% 6 0.4% Asikuma/Odoben/Brakwa 148 0.4% 6 0.4% Assin Central 95 0.2% 4 0.3% Assin North 100 0.3% 4 0.3% Assin South 125 0.3% 5 0.3% Awutu Senya East 293 0.8% 11 0.7% Awutu Senya West 198 0.5% 8 0.5% Cape Coast North 126 0.3% 5 0.3% Cape Coast South 112 0.3% 4 0.3% Effutu 143 0.4% 6 0.4% Ekumfi 96 0.2% 4 0.3% Gomoa Central 117 0.3% 5 0.3% Gomoa East 204 0.5% 8 0.5% Gomoa West 167 0.4% 6 0.4% Hemang Lower Denkyira 84 0.2% 3 0.2% Komenda Edina Eguafo Abrem 193 0.5% 7 0.5% Mfantseman 221 0.6% 9 0.6% Twifo Atti Morkwa 121 0.3% 5 0.3% Upper Denkyira East 152 0.4% 6 0.4% Upper Denkyira West 103 0.3% 4 0.3%
EASTERN Abuakwa North 97 0.2% 4 0.3% Abuakwa South 111 0.3% 4 0.3% Achiase 71 0.2% 3 0.2% Afram Plains South 120 0.3% 5 0.3% Akropong 146 0.4% 6 0.4% Akuapem South 105 0.3% 4 0.3% Ofoase/Ayirebi 108 0.3% 4 0.3% Asene/Manso/Akroso 97 0.2% 4 0.3% Asuogyaman 145 0.4% 6 0.4% Atiwa East 77 0.2% 3 0.2% Atiwa West 70 0.2% 3 0.2% Ayensuano 124 0.3% 5 0.3% Akim Oda 92 0.2% 4 0.3%
8
Abirem 103 0.3% 4 0.3% Akim Swedru 54 0.1% 2 0.1% Akwatia 117 0.3% 5 0.3% Fanteakwa North 130 0.3% 5 0.3% Fanteakwa South 85 0.2% 3 0.2% Kade 153 0.4% 6 0.4% Afram Plains North 126 0.3% 5 0.3% Abetifi 141 0.4% 5 0.3% Mpraeso 124 0.3% 5 0.3% Nkawkaw 172 0.4% 7 0.5% Lower Manya Krobo 156 0.4% 6 0.4% New Juaben North 94 0.2% 4 0.3% New Juaben South 190 0.5% 7 0.5% Nsawam/Adoagyiri 193 0.5% 7 0.5% Okere 97 0.2% 4 0.3% Suhum 159 0.4% 6 0.4% Upper Manya Krobo 114 0.3% 4 0.3% Upper West Akim 111 0.3% 4 0.3% Lower West Akim 135 0.3% 5 0.3% Yilo Krobo 158 0.4% 6 0.4%
GREATER ACCRA Ablekuma Central 306 0.8% 12 0.8% Ablekuma North 283 0.7% 11 0.7% Ablekuma South 197 0.5% 8 0.5% Ablekuma West 215 0.6% 8 0.5% Ada 92 0.2% 4 0.3% Sege 89 0.2% 3 0.2% Adentan 304 0.8% 12 0.8% Ashaiman 351 0.9% 14 0.9% Odododiodioo 259 0.7% 10 0.7% Ayawaso Central 187 0.5% 7 0.5% Ayawaso East 113 0.3% 4 0.3% Ayawaso North 129 0.3% 5 0.3% Ayawaso West Wuogon 207 0.5% 8 0.5% Anyaa/Sowutuom 293 0.8% 11 0.7% Dome/Kwabenya 356 0.9% 14 0.9% Trobu 281 0.7% 11 0.7% Bortianor-Ngleshie Amanfro 225 0.6% 9 0.6% Domeabra-Obom 106 0.3% 4 0.3% Amasaman 300 0.8% 12 0.8% Korle Klottey 222 0.6% 9 0.6% Kpone-Katamanso 252 0.6% 10 0.7%
Krowor 233 0.6% 9 0.6%
Dadekotopon 254 0.7% 10 0.7% Madina 307 0.8% 12 0.8% Ledzokuku 342 0.9% 13 0.9% Ningo Prampram 193 0.5% 7 0.5% Okaikwei Central 139 0.4% 5 0.3% Okaikwei North 162 0.4% 6 0.4% Okaikwei South 197 0.5% 8 0.5% Shai-Osudoku 138 0.4% 5 0.3% Tema Central 143 0.4% 6 0.4% Tema East 235 0.6% 9 0.6% Tema West 280 0.7% 11 0.7% Weija-Gbawe 235 0.6% 9 0.6%
NORTH EAST Bunkpurugu 99 0.3% 4 0.3% Chereponi 80 0.2% 3 0.2% Nalerigu / Gambaga 169 0.4% 7 0.5% Yagaba/ Kubori 68 0.2% 3 0.2% Walewale 162 0.4% 6 0.4% Yunyoo 73 0.2% 3 0.2%
NORTHERN Gushegu 138 0.4% 5 0.3% Karaga 114 0.3% 4 0.3% Kpandai 140 0.4% 5 0.3% Kumbungu 105 0.3% 4 0.3% Mion 90 0.2% 3 0.2% Nanton 79 0.2% 3 0.2% Bimbilla 172 0.4% 7 0.5% Wulesnsi 96 0.2% 4 0.3% Saboba 81 0.2% 3 0.2% Sagnarigu 146 0.4% 6 0.4% Tamale North 102 0.3% 4 0.3% Savelugu 124 0.3% 5 0.3% Tamale Central 168 0.4% 6 0.4%
9
Tamale South 229 0.6% 9 0.6% Tatale/Sanguli 77 0.2% 3 0.2% Tolon 130 0.3% 5 0.3% Yendi 148 0.4% 6 0.4% Zabzugu 81 0.2% 3 0.2%
OTI Biakoye 133 0.3% 5 0.3% Buem 148 0.4% 6 0.4% Akan 115 0.3% 4 0.3% Krachi East 121 0.3% 5 0.3% Krachi Nchumuru 88 0.2% 3 0.2% Krachi West 84 0.2% 3 0.2% Nkwanta North 128 0.3% 5 0.3% Nkwanta South 153 0.4% 6 0.4%
SAVANNAH Bole-Bamboi 116 0.3% 4 0.3% Yapei/Kusawgu 173 0.4% 7 0.5% Salaga South 118 0.3% 5 0.3% Salaga North 50 0.1% 2 0.1% Daboya / Mankarigu 76 0.2% 3 0.2% Sawla-Tuna-Kalba 118 0.3% 5 0.3% Damongo 87 0.2% 3 0.2%
UPPER EAST Bawku Central 150 0.4% 6 0.4% Zebilla 139 0.4% 5 0.3% Binduri 88 0.2% 3 0.2% Bolga East 44 0.1% 2 0.1% Bolgatanga Central 148 0.4% 6 0.4% Bongo 124 0.3% 5 0.3% Builsa North 82 0.2% 3 0.2% Builsa South 58 0.1% 2 0.1% Garu 71 0.2% 3 0.2% Navrongo Central 127 0.3% 5 0.3% Chiana-Paga 130 0.3% 5 0.3% Nabdam 51 0.1% 2 0.1% Pusiga 95 0.2% 4 0.3% Talensi 99 0.3% 4 0.3% Tempane 99 0.3% 4 0.3%
UPPER WEST Daffiama/Bussie/Issa 68 0.2% 3 0.2% Jirapa 138 0.4% 5 0.3% Lambussie 80 0.2% 3 0.2% Lawra 90 0.2% 3 0.2% Nadowli/Kaleo 114 0.3% 4 0.3% Nandom 89 0.2% 3 0.2% Sissala East 97 0.2% 4 0.3% Sissala West 95 0.2% 4 0.3% Wa East 121 0.3% 5 0.3% Wa Central 200 0.5% 8 0.5% Wa West 141 0.4% 5 0.3%
VOLTA Adaklu 47 0.1% 2 0.1% Afadjato South 95 0.2% 4 0.3% Agotime Ziope 73 0.2% 3 0.2% Akatsi North 58 0.1% 2 0.1% Akatsi South 133 0.3% 5 0.3% Anlo 138 0.4% 5 0.3% Central Tongu 109 0.3% 4 0.3% Ho Central 247 0.6% 10 0.7% Ho West 145 0.4% 6 0.4% Hohoe 124 0.3% 5 0.3% Keta 121 0.3% 5 0.3% Ketu North 138 0.4% 5 0.3% Ketu South 279 0.7% 11 0.7% Kpando 87 0.2% 3 0.2% North Dayi 72 0.2% 3 0.2% North Tongu 149 0.4% 6 0.4% South Dayi 70 0.2% 3 0.2% South Tongu 167 0.4% 6 0.4%
WESTERN Ahanta West 174 0.4% 7 0.5% Effia 96 0.2% 4 0.3% Kwesimintsim 103 0.3% 4 0.3% Ellembele 153 0.4% 6 0.4% Essikadu-Ketan 154 0.4% 6 0.4% Jomoro 216 0.6% 8 0.5% Mpohor 74 0.2% 3 0.2% Evalue Ajomoro Gwira 117 0.3% 5 0.3% Prestea Huni-Valley 269 0.7% 10 0.7%
10
Sekondi 89 0.2% 3 0.2% Shama 126 0.3% 5 0.3% Takoradi 119 0.3% 5 0.3% Tarkwa Nsuaem 252 0.6% 10 0.7% Amenfi Central 163 0.4% 6 0.4% Amenfi East 218 0.6% 8 0.5% Amenfi West 161 0.4% 6 0.4% Wassa East 133 0.3% 5 0.3%
WESTERN NORTH Aowin 175 0.5% 7 0.5% Bia East 75 0.2% 3 0.2% Bia West 156 0.4% 6 0.4% Bibiani-Anhwiaso-Bekwai 224 0.6% 9 0.6% Bodi 79 0.2% 3 0.2% Juaboso 132 0.3% 5 0.3% Sefwi Akontombra 93 0.2% 4 0.3% Sefwi Wiawso 169 0.4% 7 0.5% Suaman 55 0.1% 2 0.1%
TOTAL 38,866 100.0% 1,502 100.0%


