Embed Size (px)
Citation preview

ELSEVIER Electroencephalography and clinical Neurophysiology 95 (1995) 434-443
Cognitive brain potentials and regional cerebral blood flow equivalents during two- and three-sound auditory "oddball tasks"
K.P. Ebmeier a, *, J.D. Steele d, D.M. MacKenzie a, R.E. O'Carroll a, R.R. Kydd b, M.F. Glabus c, D.H.R. Blackwood d, M.D. Rugg e, G.M. Goodwin a
a MRC Brain Metabolism Unit, Royal Edinburgh Hospital, Morningside Park, Edinburgh EHIO 5HF, UK b Department of Psychiatry and Behavioural Science, University of Auckland, Auckland, New Zealand
c Department of Medical Physics, Royal Infirmary of Edinburgh, Edinburgh, UK d Department of Psychiatry, University of Edinburgh, Edinburgh, UK
e Wellcome Brain Research Group, School of Psychology, University of St. Andrews, Edinburgh, UK
Accepted for publication: 20 July 1995
Abstract
Ten healthy volunteers were examined with single photon emission tomography and 99~Tc-exametazime. They were studied on 2 occasions, during a 2- and a 3-sound auditory discrimination (oddball) task. Twenty healthy volunteers were used as controls, studied once at rest. During the 2-tone task there was a bilateral posterior (occipito-) temporal and medial frontal activation, a left pericentral increase, and posterior cingulate suppression. During the 3-sound task activation was again found in posterior (occipito-) temporal, medial frontal cortex, left pericentral, with a small non-significant reduction in posterior cingulate uptake. Compared with the 2-tone task, there was a trend towards higher activity in left medial frontal, right posterior temporal and posterior cingulate cortex in the 3-sound task. P3b amplitudes were negatively correlated with posterior cingulate tracer uptake during both tasks. Positive correlations with P3b amplitudes were found in various frontal and temporal regions. These results are consistent with more invasive localisation studies of P3b. Posterior cingulate cortex appears to be inhibited during the oddball tasks, the more so, the more restricted the range of stimuli, and the greater the task-related recruitment of neurones (P3b amplitude). As expected from its more frontal distribution, P3a amplitude was positively correlated with anterior cingulate tracer uptake, and negatively correlated with temporal cortical activity.
Keywords: Cerebral perfusion; P300; Oddball task; Orienting response; Statistical parametric mapping
1. Introduct ion
Event-related potentials (ERPs) have been widely used to examine the brain activity associated with the perfor- mance of simple tasks requiring sustained attention and rapid response. ERPs provide an objective measure of low level information processing, in the millisecond domain (Rugg, 1992). Oddball tasks, which involve the presenta- tion of rare targets amongst more frequently occurring non-targets, have been widely used in volunteers and clinical groups. The classical P300, a positive deflection between 300 and 600 msec after the target stimulus is reduced in amplitude or delayed in latency in a variety of
* Corresponding author. Fax: + 44 131 5376110.
clinical conditions (Squires et al., 1979; Hansch et al., 1982; Goodin et al., 1983; Pfefferbaum et al., 1984; St. Clair et al., 1985). In contrast to the target P300 (or P3b), the novelty P300 (P3a) occurs after novel, non-target stimuli. It is a large positive deflection in the averaged ERP, of slightly earlier latency than the P3b, and with a more anterior distribution. It is thought to reflect processes necessary, but not sufficient for the orienting response (Knight, 1984; N~it~inen, 1990).
While ERPs are capable of measuring brain activity related to cognitive function with a very high time resolu- tion (in msec), the recording of ERPs by surface electrodes does not allow any direct conclusions about their site of origin. The introduction of 3-dimensional functional brain imaging using radioactive tracers has made it possible to localise brain mechanisms associated with specific psycho-
0013-4694/95/$09.50 © 1995 Elsevier Science Ireland Ltd. All rights reserved SSDI 001 3 - 4 6 9 4 ( 9 5 ) 0 0 1 7 3 -5 EEG 94762

K.P. Ebmeier et al. / Electroencephalography and clinical Neurophysiology 95 (1995) 434-443 435
logical activation procedures, achieving a relatively high spatial resolution. The temporal resolution of these meth- ods varies between 30--45 min for [18F]fluoro-2-de- oxyglucose uptake and 31)-60 sec for dynamic measure- ments of the distribution of [150]oxygen labelled water with regional cerebral blood flow. Positron emission to- mography (PET) usually requires a rather demanding ex- perimental procedure involving arterial catheterisation, the performance of activation tasks inside the scanner, and a large team of physicists, technicians, and radiochemists to prepare and administer the: radioactive tracer. The introduc- tion of highly lipophilic blood flow tracers which are injected intravenously and distribute in proportion to re- gional blood flow, has made it possible to examine corre- lates of brain activity with single photon emission tomog- raphy (SPET), achieving relatively high spatial (7-10 mm) and intermediate temporal[ (1-2 min) resolution.
Under physiological conditions, regional cerebral blood flow is tightly associated with regional substrate demand. The lipophilic blood flow tracer 99mTechnetium-exameta- zime is taken up into the brain on first pass and is trapped there, giving an estimate of regional cerebral perfusion (Neirinckx et al., 1987). There is now good empirical evidence that 99mTc-exarnetazime distributes in a mono- tonic relationship with regional cerebral blood flow during resting studies, as well as during physiological and psycho- logical activation (Andersen et al., 1987; Inugami et al., 1988; Yonekura et al., 1988; Pupi et al., 1989; Gemmell et al., 1990; Heiss et al., 1990; Ebmeier et al., 1991, 1992; Shedlack et al., 1991; 'Woods et al., 1991). We have developed a split-dose technique which makes it possible to detect activation effects during psychological tasks (5- 10% change in tracer uptake), with relatively small subject groups, using a region-of-interest approach (Ebmeier et al., 1991). The radioactive dose equivalent of this tracer allows for 2 examinations during a single research protocol.
The aim of the present: study was to look at differential effects of target detectio~ and the orienting of attention to novel stimuli during a target detection task. Ohyama and colleagues (Ohyama et al., 1993) have previously de- scribed in abstract form tlaat a 2-tone auditory oddball task was associated with a localised 15% increase in cerebral blood flow measured by ~50-H20-PET in the anterior cingulate cortex, with increases also in bilateral auditory association cortex, frontal cortex and parietal cortex. In this study we employed the Statistical Parametric Mapping method developed by workers at the MRC Cyclotron Unit (Friston, 1994). This is a pixel-by-pixel method of analy- sis, which operates independently of any preconceived functional anatomical boundaries (regions of interest), by removing intersubject variability of brain position, size, and shape, of gyral anatomy and global tracer uptake. It is probably more powerful than region-of-interest analysis which does not detect activation in small parts of regions of interest or activation crossing regional boundaries. It is also fully automated, i.e., objective and reliable.
Mathews (1994) has previously described a reduction of P3a amplitudes over the right hemisphere in groups of elderly subjects, but not in younger healthy volunteers. Friedman and colleagues (Friedman et al., 1993) found a similar lateralisation to the left, particular in their older subjects, for a later positive wave after novel stimuli but not after targets. We, therefore, predicted that brain activ- ity during the 3-sound task would be greater on the left side in elderly subjects. It was also our preference for radiation protection reasons to recruit elderly subjects.
2. Methods
2.1. Subjects
Ten elderly healthy volunteers were recruited from a community study of the elderly (MacKenzie et al., in preparation). Two men and 8 women were recruited, with a mean age of 79 years (S.D.: 3). These subjects were not suffering from any major illness, and showed normal levels of cognitive functioning as measured with the Mini- Mental State Examination (Folstein et al., 1975), with scores between 26 and 29 (mean: 28, S.D.: 1). Total Cambridge Cognitive Examination (CAMCOG) scores (Roth et al., 1986) were in the normal range (83-99, mean: 93, S.D.: 6). IQ was estimated with the National Adult Reading Test-Revised (Nelson and Willison, 1991) and ranged from 91 to 124 (mean: 112, S.D.: 10). Subjects were not clinically depressed, with geriatric depression scale scores of 2-16 (mean: 7, S.D.: 4) (Woods et al., 1991). Handedness was determined with the Anett Scale, and all subjects were right handed.
Twenty further healthy right-handed volunteers from our "resting scan" control pool were compared with the above subjects in order to achieve an estimate of the 2 activation tasks over resting state. These subjects were on average younger than the activation group (66, S.D.: 9 years, P = 0.001), had a comparable sex distribution (m: 7, f: 13, X 2 =0.18, P = 0 . 6 7 ) and an identical NART performance (mean: 112, S.D.: 8.5, P = 0.98).
2.2. Imaging protocol
The study was approved by the local ethics committee and the Administration of Radioactive Substances Advi- sory Committee (ARSAC) at the UK Department of Health. All subjects were imaged with a high resolution single slice multi-detector head scanner (Neuro 900, Strichman Medical Equipment Inc., Boston, MA, USA). The scanner consists of 12 detectors with a maximum in-slice and z axis resolution of 7.5 mm. Each subject received 2 × 250 MBq during a 2-tone oddball task and a 3-sound oddball task, respectively, balanced for order (for a description see Section 2.4. During the injection, the subject was lying comfortably on the imaging table with eyes closed and

4 3 6 K.P. Ebmeier et al. / Electroencephalography and clinical Neurophysiology 95 (1995) 434-443
a sogit[ol coronal soglttol coronal ~:::: :..:.! .. : : 7 -y:~::~:-72[:~-? : ~ ~ ~ i ~ : ~ ..... i..... i..- :.......:]...i-.-..-i- 72
o . . . . . . . . . o . . . . . . . . . . . . .
-IO¢ sa -IO~ aa VPC VAC VPC VAC
. . . . ~ ; ~ " ~ SPM SPM ~:.:., , ,
o p r o j e c t i o n s °~..._....i' '~" pro jec t i ons
8 4 84 L - ~ : . transverse transverse
sogittol coronal . . . . . . . 72
0t~-!-+-~' , - t1 0[ . . . . . . . . ~-tq
-104- 6B VPC VAC
a,~°E][-i' ......... ~ projections
transverse
sugittol coronal ::::::::::::::::::::::::::::: : - 7 - - 72. . ,__. i . .i . . . . . . - . . i .. e
o
i::::::: :::::::::::::::::::::: ~N:!!i!i:i!!~i!!!!i!!!~ -10¢ 88
VPC VAC
e¢ transverse
sogittal coronol
O ~ 3 . . . . . : ~ 4 1 : : : : " ! . . : : ~ 1 1 1 : : ~ : . : : : : : ..... . ,..:' " ...... " . . . . . . ' .~:11:
-104- 88 VPC VAC
S P M p r o j e c t i o n s
sogittol coronol {.,.,,,!.... ~ ........ ._ .~_. . . .~ . ._ 7 2 . . . ~ . i..,-.~ . . . . . i.,-.,i -~l~.
:::::,::,,.,.t ::i::i: .... i : : : : : i . : : , t : : : t : . : : : i : : l ; :z : :
-10 ~- 88 VPC VAC
SPM p ro jec t i ons
transverse transverse
soeittol coronal 7~
. . . . . ' . . . . . . ; . . - . .4 . . . . . . . . . . . . . . . . . . . . . . ~ . . - 4 . . . . . . . . . . . .
=============================================================
~ 3 2 4 -104- 6B
VPC VAC
s P M ' ~ ~ ~ ' ._.$. . . ;_; . . . . . .L? projections
itronsveme
sogitt~l coronal . . . . . & - . - . ! . . . . . . . . . . . . . . . . . i - ; . . . . ~ . . . 72_.4.. . . . . . . ; . J - ; ~ .
~ XXXL-: :i IiEL-$L.- K :4L-KiX::X~Z_I ._ii::ii... 4. :
10¢ 6B VPC VAC
SPM pro jec t i ons
6¢ transverse
K.P. Ebmeier et al. / Electroencephalography and clinical Neurophysiology 95 (1995) 434-443 437
b a sog i t to l corono l r : : - . : : > - : : ~-::::,~:: 7 % : : .r.~.:.~
---i.-.. " ... . . . . . . .~.i~.~- ~ .......... i : , .... : . . . . . . . . . . . ::;-: o+ ' ......... i'-'r 4"" o -4 ; .....
-10~ as V P C V A C
~ ~ ~ projectionsSPM
t ronsverse
~1 sog i t to l coronul , , . . . . 7 2 . . . . .
-10¢ 6a V P C V A C
, , - = =
S P M
0 ..... ~ .... t- projections
6J; t runsve rse
C
iiiii}ii::::iii!!::: 0
-10~-
~ogittol coronal , , , 72
V P C V A C O 6 4
~8 VPC VAC ~ ~i-..!._,..t.:.~ .4. ! ' ....
.... ....... : i "' ................. S P M
":_~.....;._.~,. ......... , .~ ~.. projections
t r o n N v e r s e
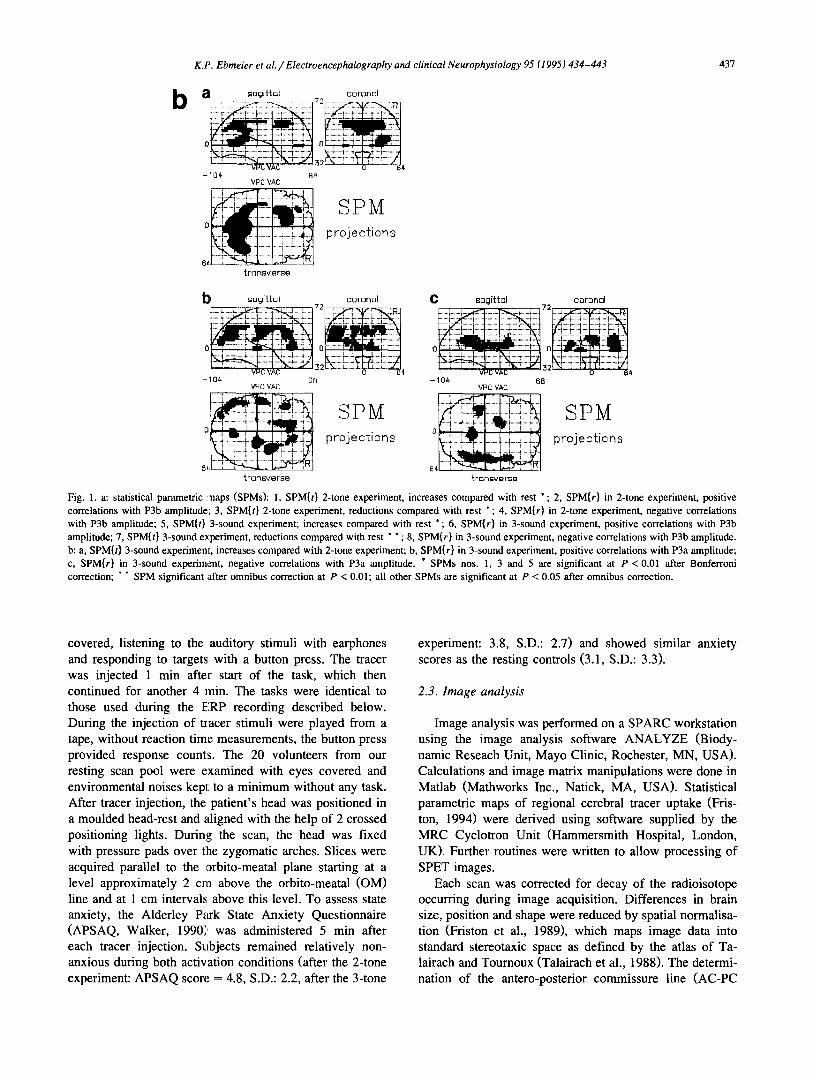
Fig. 1. a: statistical parametric maps (SPMs): 1, SPM{t} 2-tone experiment, increases compared with rest *; 2, SPM{r} in 2-tone experiment, positive correlations with P3b amplitude; 3, SPM{t} 2-tone experiment, reductions compared with rest * ; 4, SPM{r} in 2-tone experiment, negative correlations with P3b amplitude; 5, SPM{t} 3-sound experiment; increases compared with rest "; 6, SPM{r} in 3-sound experiment, positive correlations with P3b amplitude; 7, SPM{t} 3-sound e~:periment, reductions compared with rest * ° ; 8, SPM{r} in 3-sound experiment, negative correlations with P3b amplitude. b: a, SPM{t} 3-sound experiment, increases compared with 2-tone experiment; b, SPM{r} in 3-sound experiment, positive correlations with P3a amplitude; c, SPM{r} in 3-sound experiment, negative correlations with P3a amplitude. * SPMs nos. 1, 3 and 5 are significant at P < 0.01 after Bonferroni correction; * * SPM significant after omnibus correction at P < 0.01; all other SPMs are significant at P < 0.05 after omnibus correction.
covered, listening to the auditory stimuli with earphones and responding to targets with a button press. The tracer was injected 1 min after start of the task, which then continued for another 4 rain. The tasks were identical to those used during the ERP recording described below. During the injection of tracer stimuli were played from a tape, without reaction time measurements, the button press provided response counts. The 20 volunteers from our resting scan pool were examined with eyes covered and environmental noises kept to a minimum without any task. After tracer injection, the patient's head was positioned in a moulded head-rest and aligned with the help of 2 crossed positioning lights. During the scan, the head was fixed with pressure pads over the zygomatic arches. Slices were acquired parallel to the orbito-meatal plane starting at a level approximately 2 cm above the orbito-meatal (OM) line and at 1 cm intervals above this level. To assess state anxiety, the Alderley Park State Anxiety Questionnaire (APSAQ, Walker, 19901' was administered 5 min after each tracer injection. Subjects remained relatively non- anxious during both activation conditions (after the 2-tone experiment: APSAQ scon," = 4.8, S.D.: 2.2, after the 3-tone
experiment: 3.8, S.D.: 2.7) and showed similar anxiety scores as the resting controls (3.1, S.D.: 3.3).
2.3. lmage analysis
Image analysis was performed on a SPARC workstation using the image analysis software ANALYZE (Biody- namic Reseach Unit, Mayo Clinic, Rochester, MN, USA). Calculations and image matrix manipulations were done in Matlab (Mathworks Inc., Natick, MA, USA). Statistical parametric maps of regional cerebral tracer uptake (Fris- ton, 1994) were derived using software supplied by the MRC Cyclotron Unit (Hammersmith Hospital, London, UK). Further routines were written to allow processing of SPET images.
Each scan was corrected for decay of the radioisotope occurring during image acquisition. Differences in brain size, position and shape were reduced by spatial normalisa- tion (Friston et al., 1989), which maps image data into standard stereotaxic space as defined by the atlas of Ta- lairach and Tournoux (Talairach et al., 1988). The determi- nation of the antero-posterior commissure line (AC-PC

438 K.P. Ebmeier et al. / Electroencephalography and clinical Neurophysiology 95 (1995) 434-443
Table 1 Maximum effect sizes with co-ordinates in Talairach stereotactic space
Region Coordinates Z value P
(a) Group differences and activation effects Decreases Two-tone vs. rest Posterior cingulate - 4, - 44, 28 4.4 < 0.00001 Three-sound vs. rest Posterior cingulate - 6, - 30, 32 2.7 < 0.005
Increases Two-tone vs. rest R ant. cingulate 26, 42, 16 4.9 < 0.00001 R post. temporal 52, -48 , 0 5.4 < 0.00001 R occipital 22, -86 , 0 5.5 < 0.00001 L ant. cingulate - 14, 32, 0 5.4 < 0.00001 L pericentral - 30, 2, 16 5.5 < 0.00001 L post. temporal - 42, - 64, 0 5.4 < 0.000131 Three-sound vs. rest R ant. cingulate 12, 42, 0 4.9 < 0.00001 R post. temporal 34, -72 , 0 5.2 < 0.00001 R occipital 22, - 80, 20 4.9 < 0.00001 L ant. cingulate -20 , 36, 0 5.8 < 0.00001 L post. temporal - 38, - 46, 0 5.0 < 0.00001 L pericentral - 30, - 6, 24 6.3 < 0.00001 Three-sound vs. 2-tone Posterior cingulate 4, - 48, 28 2.4 < 0.01 L med. frontal, - 24, 24, 36 2.0 < 0.025 ant. cingulate
Region Coordinates Pear- P son's g
(b) Correlations with P3a / b amplitudes Two-tone experiment P3b amplitude Right medial frontal 26, 40, 8 Left medial frontal - 30, 32, 24 Right mid. sup. temporaB2, - 78, 0 Left mid. sup. temporal -44 , -52 , 16 Posterior cingulate - 8, - 32, 24
Three-sound experiment
0.77 < 0.025 0.75 < 0.025 0.86 < 0.005 0.80 < 0.01 - 0.74 < 0.025
P3b amplitude Right thalamus 24, - 20, 0 0.89 < 0.005 Left temporal - 40, - 62, 28 0.89 < 0.005 Left lentiform nucleus - 24, - 8, 0 0.80 < 0.01 Left post. insular cortex - 42, - 28, 0 0.82 < 0.01 Posterior cingulate - 8, - 32, 24 - 0.74 < 0.025
P3a amplitude Right anterior cingulate 12, 36, 4 0.77 < 0.025 Left anterior cingulate - 10, 34, 4 0.81 < 0.01 Right thalamus 20, - 26, 0 0.84 < 0.005 Left globus pallidus - 18, - 2, 0 - 0.79 < 0.01 Right sup. temporal 40, - 38, 12 - 0.82 < 0.01 Left sup, temporal - 42, - 34, 0 - 0.84 < 0.005 Posterior cingulate 4, - 46, 20 - 0.78 < 0.025
l ine) was ca r r ied out by least squares m a t c h i n g o f co rona l
s l ices to s t andard t empla tes wi th s u b s e q u e n t r eg re s s ion o f
the m e a s u r e d z d i s p l a c e m e n t s on the y ( an te ro -pos te r io r )
axis (Fr i s ton , 1994). T he pixel d i s t r ibu t ion due to the
s econd in jec t ion was ca lcu la ted by sub t rac t ing the f i rs t
s can f r o m the s e c o n d scan on a p ixe l -by -p ixe l bas is , t ak ing
a c c o u n t o f the ac t iv i ty o f r ad io i so tope p re sen t in each
sub jec t at the t ime o f the scans, and the t ime e lapsed
b e t w e e n scans.
T o c o m p a r e the effects o f the 2- and 3 - sound s t imulus
s e q u e n c e s wi th res t ing cond i t ion , and of the 2- wi th the
3 - s o u n d cond i t ion , d i f f e rences in g loba l b ra in act iv i ty were
r e m o v e d af ter an ana lys i s o f c o v a r i a n c e ( A N C O V A , Fris-
ton et al., 1990). The A N C O V A cor rec t ion t reats g lobal
c o u n t s as a covar ia te , the ac t iva t ion cond i t i on as the
i n d e p e n d e n t var iab le , and gene ra t e s ad jus ted p ixe l means
wi th assoc ia ted e r ror var iances . The d i f fe rence be tween
one s t imulus s equence and a n o t h e r was assessed us ing the
t s ta t is t ic ( W i l d t and Ahto la , 1978). The ana lys i s was
ca r r ied out for e ach pixel ; the r e su l t ing set o f t va lues
cons t i tu te the t s tat is t ical pa rame t r i c map , SPM{t} (Fr i s ton
et al., 1991). Inc reases and dec reases in t racer up take were
e x a m i n e d separa te ly .
To c o m p a r e the cor re la t ions b e t w e e n act iv i ty du r ing the
2- and 3 - sound sequences and the r eco rded P3a and P3b
a m p l i t u d e s at Pz (see be low) , an A N C O V A cor rec t ion was
aga in done first. Pea r son co r re la t ion coef f ic ien t s be tween
a m p l i t u d e s and cor rec ted p ixe l va lues were ca lcu la ted to
fo rm the r s tat is t ical map, SPM{r} . Pos i t ive and nega t ive
co r re l a t ions were e x a m i n e d separa te ly .
In o rder to ident i fy ac t iva t ion and suppres s ion ef fec ts in
the m o r e power fu l c o m p a r i s o n o f res t ing and ac t iva ted
sub jec t s SPM{t} were ca lcu la ted u s ing P < 0.01 af ter cor-
r ec t ion for mul t ip le compar i sons . W h e r e such Bonfe r ron i -
co r rec ted SPM{t} could no t be c o m p u t e d due to smal le r
e f fec t sizes, SPM{t} af ter o m n i b u s s ign i f i cance tests ( P <
0 .01) were genera ted . W h i l e o m n i b u s s ign i f i cance he lps to
re jec t the nul l hypo thes i s tha t the n u m b e r o f p ixels wi th
s ign i f i can t e f fec t s ize is no t g rea te r than c h a n c e expec ta -
t ion, the B o n f e r r o n i co r rec t ion a l lows to address the ques-
t ion o f the loca l i sa t ion of ac t iva t ion ef fec ts by cor rec t ing
for mul t ip le compa r i sons . Fo r the s u b s e q u e n t con f i rma to ry
c o m p a r i s o n b e t w e e n the ac t iva t ion states, and for the
Table 2 Amplitudes and latency measures of P3a and P3b peaks at the midline electrode sites
ERP measure Amplitude Latency
Two-tone experiment reaction time 404 + 97 Target P3b at Fz 8.0 + 4.8 397 + 34 Cz 8.1 +6.4 398+44 Pz 12.0 + 4.9 420 + 78
Three-tone experiment reaction time 501 + 84 Target P3b at Fz 8.1 +7.1 397+32 Cz 7.5+7.0 409+48 Pz 11.3+6.0 414±48
Novelty P3a at Fz 10.5+6.3 364+52 Cz 12.2+6.9 370+54 Pz 12.7+5.2 385+57

K.P. Ebmeier et al. / Electroencephalography and clinical Neurophysiology 95 (1995) 434-443 439
computation of correlational maps (SPM{r}) pixels with P < 0.05 after omnibus significance tests were included in SPMs. This lower level of significance was selected, be- cause in confirmatory analyses planned comparisons could be made, that did not need correction for multiple compar- isons.
2.4. ERP procedures
For operational reasons ERP procedures were carried out first. This allowed us to screen out any subjects who were not able to co-operate with the task before radioac- tive tracer injection. The order of the single tasks was randomised, in that 2- arid 3-sound auditory tasks were balanced for order on each occasion. The auditory stimuli employed in the tasks consisted of computer synthesised 1500 and 1000 Hz sinusoiLdal tones (40 msec duration, 80 dB SPL) and a set of 32 "nove l" stimuli. These stimuli comprised digitised epochs of a variety of environmental noises culled from a recording of sound effects. The procedure and stimuli were adapted from Rugg et al. (1993). An experimental 3-tone run consisted of 300 stim- uli, with a random sequence of 1000 Hz frequent tones (P = 0.70), 1500 Hz targets (P = 0.15), and novels ( P = 0.15). For the control 2-tone condition, novels were re- placed by non-target tones. The interstimulus interval was 1.1 sec, and the task was to respond quickly and accurately by squeezing a button held in the dominant hand, when- ever a target tone was heard. During both the tracer injection and the ERP recording, eyes were closed. We have, therefore, no reason to assume that the amount of eye movements differed between the 2 settings. ERPs were
recorded in a shielded room, from silver/silver chloride electrodes at the midline sites of Fz, Cz and Pz, and 2 lateral sites (T3 and T4) against a linked ear reference. EOG was recorded from pairs of electrodes placed on the supra-orbital ridge and the outer canthus of the right eye.
EEG and EOG were amplified using a gain of 10 4 and a bandwidth of 0.16-30 Hz ( - 3 dB points), and sampled on-line at 4 msec/point. Sampling began 250 msec before stimulus onset and continued until 750 msec post stimulus. Separate ERP averages were computed for each stimulus type in each experimental run. In all subjects, ERPs were computed from error-free trials which were also free from EOG artefacts. Trials with deflections greater than 45 /xV were automatically excluded. P 3 a / b latencies were deter- mined in the N2-N3 window with a least-means-square method described previously (Glabus et al., 1994); ampli- tudes were taken as the maximum peak in the same window. Repeated measures multivariate analysis of vari- ance was performed on the amplitudes and latency mea- sures using SPSS for the Macintosh (version 4.0). Where second order interactions with electrode site for amplitude data were studied, data were normalised using the root- mean-square method proposed by McCarthy and Wood (1985) to preserve true topographic differences. To reduce comparisons to a minimum, we used P3 amplitude mea- sures only from Pz for the correlational analyses with tracer activity. This is where all P3 peak amplitudes were highest (Table 2). We do not assume that ERP recording from Pz has any localising power, so that it is legitimate to compute correlations with tracer uptake values across the whole brain.
, Fz
RARE FREQUENT
1 0 0 t tm x
NOVEL
Fig. 2. Grand mean event-related potentials (n = 10) for rare and frequent tones in the 2-tone, and rare, frequent and novel sounds in the 3-sound experiment. Positive voltages up.

440 K.P. Ebmeier et al. / Electroencephalography and clinical Neurophysiology 95 (1995) 434-443
3. Results
Fig. la shows the SPM{t}, comparing the 2- and 3-sound conditions with rest, juxtaposed with the corresponding correlational maps (SPM{r}) for adjusted pixel values with P3b amplitude; Fig. lb gives the SPM{t} for the 2- versus 3-sound experiment, as well as the SPM{r} maps for positive and negative correlations of P3a amplitude with corrected pixel values during the 3-sound task. Both 2- and 3-sound conditions were associated with significant (P < 0.01) increases of tracer uptake in posterior (occipito-) temporal cortex (Brodman areas 21, 22, 37 in both tasks, and 17, 18 in the 2-tone task only), and in medial frontal cortex (areas 24, 32), as well as left unilateral pericentral and prefrontal cortex (areas 3, 4, 45, 46). Reductions in posterior cingulate gyrus were found in both activation states (areas 23, 31); only for the 2-tone task did such reductions survive a correction for multiple comparisons (P<0.01) . During the 3-sound experiment relatively higher uptake compared with the 2-tone condition (P < 0.05) was found in the posterior cingulate gyrus, in right posterior middle and superior temporal gyrus, and in left medial frontal cortex.
In the 2-tone experiment positive correlations of ad- justed pixel values with P3b amplitude were found in posterior middle and superior temporal gyri (right > left), and bilateral in medial frontal cortex, and negative correla- tions in the posterior cingulate gyms. In the 3-sound experiment, positive correlations with P3b amplitude were found in posterior middle and superior temporal gyri (left > right) and in right thalamus, and negative correlations in the left lenticular nucleus, the left posterior insular cortex and the posterior cingulate gyrus. Finally, in the 3-sound experiment, positive correlations with P3a amplitude were found in right thalamus, and bilateral anterior cingulate cortex, and negative correlations in the posterior cingulate gyms, the left globus pallidus, and the superior temporal gyrus, especially on the right side. Table 1 gives coordi- nates and effect size maxima for the regional group differ- ences surviving the Bonferroni correction, and for within- subject differences and correlations.
Fig. 2 illustrates the grand averages of the 3- and the 2-tone experiment at the 3 central leads. Table 2 gives means and standard deviations for the amplitudes and latencies of P3a and P3b in the 3-tone experiment, and for P3b only in the 2-tone experiment. As judged from the (normalised) amplitudes at different electrode sites in the 3-tone experiment, P3a had a more anterior distribution compared with P3b (multivariate analysis of variance, electrode site X stimulus type interaction: F4. 6 = 21.2, P = 0.001). Reaction times during the 2-tone task were shorter than during the 3-tone task (P = 0.005, paired t test), possibly indicating an increase in task difficulty with the introduction of the novel stimuli, or a higher state of motor readiness during the 2-tone task. This was not paralleled by a difference of P3b amplitudes between the 2
experiments (multivariate analysis of variance, effect of experiment (raw amplitudes): F1, 9 = 0.67, P = 0.43; ex- periment X electrode site interaction (normalised ampli- tudes): F4, 6 = 2.98, P = 0.11)
4. Discussion
The present study provides preliminary data on the localisation of brain activity during auditory discrimination tasks. We were able to replicate the result of Ohyama et al. (1993), in particular the activation in temporal and medial frontal (containing anterior cingulate) cortex. This comple- ments other lines of evidence, including topographic analy- sis (Lovrich et al., 1988), depth electrode recording (Halgren et al., 1980; Smith et al., 1986, 1990; Meador et al., 1987; Stapleton and Halgren, 1987; Richer et al., 1989), and studies on patients with discrete neural lesions (Knight et al., 1988, 1989), all of which have suggested that areas in the superior temporal and inferior parietal regions are essential for the generation of P300. The present study provides such evidence both from the group differences between resting and performing subjects, and from the correlations of amplitude measures with tracer uptake within the activated group, which largely replicated the group differences. Similarly, reduced activity in poste- rior cingulate, which occurs during both activation experi- ments, but is more pronounced during the 2-tone task, was correlated with higher P3b amplitude.
The relative function of the anterior and posterior cingu- late cortices, obviously of significance during our tasks, has previously been examined in animal studies. Suther- land et al. (1988), using the Morris Water Maze and rats, claimed that anterior cingulate (medial frontal) cortex has a special role in the "temporal ordering of movements required for the execution of relatively complex chains of behaviours," whereas lesions to posterior cingulate cortex lead to a "specific difficulty in forming topographical representations" (Sutherland et al., 1988). Gabriel (1990) described experiments using an avoidance learning task in rabbits, and found that the anterior cingulate rapidly en- coded the properties of significant cues, but that "these plasticities (could) be quickly abandoned and replaced by new plasticities." He therefore proposed the anterior cin- gulate as a recency system, that is, a system that abandons older stored information in order to capture novel informa- tion (Gabriel, 1990). In contrast, "the more gradual acqui- sition of plasticity in the posterior (cingulate) system (was) completed as the anterior system contribution (began) to decline." Thus, "the posterior system is the principal mediator of conditioned response performance during asymptotic and post-asymptotic task performance" (Gabriel, 1990). His results also suggest that conditioned stimulus (CS) rareness per se enhances anterior cingulate discharges, while the discharges of the neurones in the posterior cingulate in response to the CS appear to be

K.P. Ebmeier et al. / Electroencephalography and clinical Neurophysiology 95 (1995) 434-443 441
governed primarily by CS novelty-familiarity. This quali- fies the anterior system as part of a recency or working memory system, whereas the properties of the posterior system implicate it in pri,raacy or intermediate/long-term memory function (Gabriel, 1990).
In an analogous fashion it can be argued that novel stimuli activate a posterior sound catalogue search to identify biologically significant noises, whereas the ante- rior cingulate is involved in the detection of targets, and the maintenance of the target search programme, which requires the retention of characteristics of the target and non-target stimuli. Such an interpretation is in accord with information derived from human imaging studies. Posner and Petersen (1990) have suggested that the anterior cingu- late appeared to be particularly sensitive to the operations involved in target detection. This is particularly based on the finding that midline frontal areas, including anterior cingulate gyrus and the supplementary motor area, were active during semantic processing of words (Petersen et al., 1988) and that the delvee of blood flow in the anterior cingulate increased as the number of targets to be detected increased (Posner et al., 1988). Tulving et al. (1994) found an involvement of anterior cingulate and dorsolateral pre- frontal frontal cortex in the recognition of previously heard sentences compared with new sentences, replicating an oddball task at the semantic level. Similarly, Pardo et al. (1990) and partially Bench et al. (1993) found that the most robust rCBF respon~es to the conflict condition of the Stroop task are found in anterior cingulate cortex. In our experiments, posterior cingulate activity appeared to be related to openess for external stimuli. This makes it explicable that at rest, i.e., when subjects were perhaps listening to faint irregular noises coming from the hospital, posterior cingulate uptake was highest. The largest poste- rior cingulate suppression was found during the task which excluded all but sine wave tones, while the task involving novel sounds was intermediate in posterior cingulate activ- ity. Additional evidence supporting the notion of posterior cingulate suppression wil~a an attentional focussing task is the negative correlation between P3b amplitude and poste- rior cingulate tracer uptake in both the 2-tone and the 3-sound tasks, If P3b amplitude reflects the number of cells recruited for target detection, posterior cingulate ac- tivity appears to be inhibited by target detection.
Finally, a number of methodological points need to be addressed. Exametazime SPECT only allows for 2 re- peated measures. In comparing 3 different brain states, we, therefore, had to include between-subject comparisons. We decided to choose the greatest likely effect, that is, the difference between resting brain and activated brain for this between-subject coraparison, which of course is less powerful. In order to increase power, we used 20 rather than 10 control subjects. The comparison with predicted smaller effect sizes was the one between 2- and 3-tone experiments. We reserved this for the more powerful within-subject comparison. Please note that this contrast
allowed us to dissect out the effect of a novel stimulus from the total oddball performance. It would not easily be possible to contrast oddball with a pure non-target tone " t a sk" because there is no recognition component in the latter. Comparing activation tasks wi th in subjects also allowed us to minimise the number of dual injection studies in healthy volunteers, which are restricted to the absolute minimum by the regulatory authorities.
The differences between rest and activation states could have come about by systematic differences between the 2 subject groups. Age was greater in the activated group, so that the age differences might have been responsible for the "activation effects" primarily in limbic cortex (Martin et al., 1991). The confirmative correlations and within-sub- ject differences cannot be explained by confounder effects, and therefore make the finding more robust.
The majority of the novel stimuli were not interpretable in any semantic or associative fashion. One reason for this is their short duration (100 msec). Most of the novel sounds are so distorted that no obvious environmental association can be made, apart from two which sound like ducks quacking and doors banging.
Acknowledgements
We would like to thank the Wellcome Trust and the Gordon Small Trust for financial assistance, M. Van Beck, C. Murray, N, Dougall, and M. Walker for technical support, and Norma Brearley for the careful preparation of the manuscript. We are indebted to Prof. R.S.J. Fra- ckowiak and Dr. K.J. Friston for supplying the SPM software and assisting in its implementation.
References
Andersen, A.R., Friberg, H., Lassen, N.A., Kristensen, K. and Neirinckx, R.D. Serial studies of cerebral blood flow using 99mTc-HMPAO: a comparison with ~33Xe. Nucl. Med. Commun., 1987, 8: 549.
Bench, C.J., Frith, C.D., Grasby, P.M., Friston, K.J., Panlesu, E., Fra- ckowiak, R.S.J. and Dolan, R.J. Investigations of the functional anatomy of attention using the Stroop test. Nettropsychologia, 1993, 31: 907-922.
Ebmeier, K.P., Dougall, N.J., Austin, M.-P., Murray, C.L., Curran, S.M., O'Carroll, R., Moffoot, A.P.R., Hannan, J. and Goodwin, G.M. The split-dose technique for the study of psychological and pharmacologi- cal activation with the cerebral blood flow marker exametazime and single photon emission computed tomography (SPECT): reproducibil- ity and rater reliability. Int. J. Meth. Psychiat. Res., 1991, 1: 27-38.
Ebmeier, K.P., Murray, C.L., Dougall, N.J., O'Carroll, R.E. and Good- win, G.M. Unilateral voluntary hand movement and regional cerebral uptake of Technetium-99m-exametazime in human control subjects. J. Nucl. Med., 1992, 33: 1623-1627.
Folstein, M.F., Folstein, S.E. and McHugh, P.A. Mini-mental state: a practical method for grading the cognitive state of patients for the clinician. J. Psychiat. Res., 1975, 12: 189-198.
Friedman, D., Simpson, G. and Hamberger, M. Age-related changes in scalp topography to novel and target stimuli. Psychophysiology, 1993, 30: 383-396.
442 K.P. Ebmeier et al. / Electroencephalography and clinical Neurophysiology 95 (1995) 434-443
Friston, R.J. Statistical Parametric Mapping. In: R.W. Thatcher, M. Hallett, T. Zefflro, E.R. John and M. Huerta (Eds.), Functional Neuroimaging. Academic Press, New York, 1994: 79-93.
Friston, K.J., Passingham, R.E., Nutt, J.G., Heather, J.D., Sawle, G.V. and Frackowiak, R.S.J. Localisation in PET images: direct fitting of the intercommissural (AC-PC) line. J. Cereb. Blood Flow Metab., 1989, 9: 690-695.
Friston, K.J., Frith, C.D., Liddle, P.F., Dolan, R.J., Lammertsma, A.A. and Frackowiak, R.S.J. The relationship between global and local changes in PET scans. J. Cereb. Blood Flow Metab., 1990, 10: 458-466.
Friston, K.J., Frith, C.D., Liddle, P.F. and Frackowiak, R.S.J. Comparing functional (PET) images: the assessment of significant change. J. Cereb. Blood Flow Metab., 1991, 11: 690-699.
Gabriel, M. Functions of anterior and posterior cingulate cortex during avoidance learning in rabbits. In: H.B.M. Uylings, C.G. Van Eden, J,P.C. De Bruin, M.A. Comer and M.G.P. Feenstra (Eds.), The Prefrontal Cortex: its Structure, Function and Pathology. Progress in Brain Research. Elsevier Science, Amsterdam, 1990: 467-483.
Gemmell, H.G., Evans, N.T.S., Besson, J.A.O., Roeda, D., Davidson, J., Dodd, M.G., Sharp, P.F., Smith, F.W., Crawford, J.R., Newton, R.H., Kulkarni, V. and Mallard, J.R. Regional cerebral blood flow imaging: a quantitative comparison of Technetium-99m-HMPAO SPECT with CI502 PET. J. Nucl. Med., 1990, 31: 1595-1600.
Glabus, M.F., Blackwood, D.H.R., Ebmeier, K.P., Walker, M.T., Souza, V., Sharp, C.W. and Muir, W. Methodological considerations in measurement of the P300 component of the auditory ERP in schizophrenia. Electroenceph. clin. Neurophysiol., 1994, 90:123-134.
Goodin, D.S., Start, A., Chippendale, T. and Squires, K.S. Sequential changes in the P3 component of the auditory evoked potential in confusional states and dementing illness. Neurology, 1983, 33: 1215- 1218.
Halgren, E., Squires, N.K., Rohrbaugh, J.W., Babb, T.L. and Crandall, P,H. Endogenous potentials generated in the human hippocampal formation and amygdala by infrequent events. Science, 1980, 210: 803-805.
Hansch, E.C., Syndulko, K., Cohen, S., Goldberg, Z., Potvin, A. and Tourtellotte, W.W. Cognition in Parkinson's disease: an event-related potential perspective. Ann. Neurol., 1982, 11: 599-607.
Heiss, W.-D., Herholz, K., Podreka, I., Neubauer, I. and Pietrzyk, U. Comparison of [99m Tc]HMPAO SPECT with [18 F]fluoromethane PET in cerebrovascular disease. J. Cereb. Blood Flow Metab., 1990, 10: 687-697.
Inugami, A., Kanno, I., Uemura, K., Shishido, F., Murakami, M., To- mum, N., Fujita, H. and Higano, S. Linearisation correction of Tc-labelled HMPAO image in terms of regional CBF distribution: comparison to C1502 inhalation steady state method measured by positron emission tomography. J. Cereb. Blood Flow Metab., 1988, 8: $52-$60.
Knight, R.T. Decreased response to novel stimuli after prefrontal lesions in humans. Electroenceph. clin. Neurophysiol., 1984, 59: 9-20.
Knight, R.T., Scabini, D., Woods, D.L. and Clayworth, C. The effects of lesions of superior temporal gyrus and inferior parietal lobe on temporal and vertex components of the human AEP. Electroenceph. clin. Neurophysiol., 1988, 70: 499-509.
Knight, R.T., Scabini, D., Woods, D.L. and Clayworth, C.C. Contribu- tions of temporal-parietal junction to the human auditory P3. Brain Res., 1989, 498: 190-194.
Lovrich, R.B., Novick, B. and Vaughan, H.G. Topographic analysis of auditory event related potentials associated with acoustic and seman- tic focussing. Electroenceph. clin. Neurophysiol., 1988, 71: 40-54.
Martin, A.J., Friston, K.J., Colebatch, J.G. and Frackowiak, R.S.J. De- creases in regional cerebral blood flow with normal aging. J. Cereb. Blood Flow Metab., 1991, 11: 684-689.
Mathews, D. Dissociation of P300 Brain Potentials Evoked by Rare Visual Stimuli. Unpublished Ph.D. Thesis, University of St. Andrews, 1994.
McCarthy, G. and Wood, C.C. Scalp distributions of event-related poten- tials: an ambiguity associated with analysis of variance models. Electroenceph. clin. Neurophysiol., 1985, 62: 203-208.
Meador, K.J., Loring, D.W., King, D.W., Gallagher, B.B., Gould, M.J., Flanigin, H.F. and Smith, J.R. Limbic evoked potentials predict site of epileptic focus. Neurology, 1987, 37: 494-497.
N~i~it;4nen, R. The role of attention in auditory information processing as revealed by event-related potentials and other brain measures of cognitive function. Behav. Brain Sci., 1990, 13: 201-288.
Neirinckx, R.D., Canning, L.R., Piper, I.M. et al. Technetium-99m-D,L- HMPAO; a new radiopharmaceutical for SPECT imaging of regional cerebral blood flow perfusion. J. Nucl. Med., 1987, 28: 191-202.
Nelson, H.E. and Willison, J.R. Supplement to the National Adult Reading Test Manual: Restandardisation of the NART against the WAIS-R. NFER Nelson, Windsor, 1991.
Ohyama, M., Senda, M., Terashi, A., Kitamura, S., Toyama, H., Ishii, K., Ishiwata, K., Oda, K. and Sasaki, T. PET measurement of the activation patterns during auditory cognitive tasks in normal subjects and P300 prolonged subjects. J. Cereb. Blood Flow Metab., 1993, 13: $403.
Pardo, J.V., Pardo, P.J., Janer, K.W. and Raichle, M.E. The anterior cingulate cortex mediates processing selection in the Stroop atten- tional conflict paradigm. Proc. Nat. Acad. Sci. USA, 1990, 87: 256-259.
Petersen, S.E., Fox, P.T., Posner, M.I., Minton, M, and Raichle, M.E. Positron emission tomographic studies of the cortical anatomy of single-word processing. Nature, 1988, 331: 585-589.
Pfefferbaum, A., Wenegrat, B.G., Ford, J.M., Roth, W.T. and Kopell, B.S. Clinical application of the P3 component of event related potentials. II. Dementia, depression and schizophrenia. Electroenceph. clin. Neurophysiol., 1984, 59: 104-124.
Posner, M.I. and Petersen, S.E. The attention system of the human brain. Annu. Rev. Neurosci., 1990, 13: 25-42.
Posner, M.I., Petersen, S.E., Fox, P.T. and Raichle, M.E. Localization of cognitive operations in the human brain. Science, 1988, 240: 1627- 1631.
Pupi, A., Bisi, G., Sciagra, R., Santoro, G., De Cristofaro, M.T.R., Formiconi, A.R. and Meldolesi, U. The comparison of brain distribu- tion of HMPAO and microspheres in humans. J. Cereb. Blood Flow Metab., 1989, 9: $411.
Richer, F., Alaln, C., Achim, A., Bouvier, G. and Saint-Hilalre, J.M. Intracerebral amplitude distributions of the auditory evoked potential. Electroenceph. clin. Neurophysiol., 1989, 74: 202-208.
Roth, M., Tym, E., Mountjoy, C.Q., Huppert, F.A., Hendrie, H., Verma, S. and Goddard, R. CAMDEX: a standardised instrument for the diagnosis of mental disorder in the elderly with special reference to the early detection of dementia. Br. J. Psychiat., 1986, 149: 698-709.
Rugg, M.D. Event-related potentials in clinical neuropsychology. In: J.R. Crawford, W.A. McKinlay and D.M. Parker (Eds.), The Handbook of Neuropsychological Assessment. Lawrence Erlbaum, Hove, 1992: 393-411.
Rugg, M.D., Pickles, C.D., Potter, D.D., Doyle, M.C., Pentland, B. and Roberts, R.C. Cognitive brain potentials in a three-stimulus auditory "oddball" task after closed head injury. Neuropsychologia, 1993, 31: 373-393.
Shedlack, K.J., Hunter, R., Wyper, D., McLuskie, R., Fink, G. and Goodwin, G.M. The pattern of cerebral activity underlying verbal fluency shown by split-dose single photon emission tomography (SPET or SPECT) in normal volunteers. Psychol. Med., 1991, 21: 687-696.
Smith, M.E., Stapleton, J.M. and Halgren, E. Human medial temporal lobe potentials evoked in memory and language tests. Electroenceph. clin. Neurophysiol., 1986, 63: 145-159.
Smith, M.E., Halgren, E., Sokolik, M., Baudena, P., Musolino, A., Lidgeois-Chauvel, C. and Chauvel, P. The intracranial topography of the P3 event-related potential elicited during auditory oddball. Elec- troenceph, clin. Neurophysiol., 1990, 76: 235-248.

K.P. Ebmeier et al. / Electroencephalography and clinical Neurophysiology 95 (1995) 434-443 443
Squires, N., Galbraith, G. and Aine, C. Event-related potential assessment of sensory and cognitive deficits in the mentally retarded. In: D. Lehmann and E. Callaway (Eds.), Human Evoked Potentials: Applica- tions and Problems. Plenum Press, New York, 1979.
Stapleton, J.M. and Halgren, E. Endogenous potentials evoked in simple cognitive tasks: depth components and task correlates. Electroenceph. clin. Neurophysiol., 1987, 67: 44-52.
St. Clair, D.M., Blackwood, D.tt.R. and Christie, J.E. P3 and other long latency auditory evoked potentials in presenile dementia Alzheimer type and alcoholic Korsakoff syndrome. Br. J. Psychiat., 1985, 147: 702-706.
Sutherland, R.J., Wishaw, I.Q. and Kolb, B. Contributions of cingulate cortex to two forms of spatial learning and memory. J. Neurosci., 1988, 8: 1863-1872.
Talairach, J., Zilkha, G., Tourr~oux, P., Prosalentis, A., Bordas-Ferrier, M., Covello, L., Iacob, M. and Mempel, E. Atlas d'Anatomie St~rtotactique du T~lenc~phale. Masson, Paris, 1988.
Tulving, E., Kapur, S., Markowitsch, H.J., Craik, F.1.M., Habib, R. and
Houle, S. Neuroanatomical correlates of retrieval in episodic memory: auditory sentence recognition. Proc. Nat. Acad. Sci. USA, 1994, 91: 2012-2015.
Walker, L.G. The measurement of anxiety. Postgrad. Med. J., li990, 66: Sl1-S17.
Wildt, A.R. and Ahtola, O.T. Analysis of covariance. In: Sage University Paper Series on Quantitative Applications in the Social Sciences. Sage Publications, Beverly Hills, CA, 1978.
Woods, S.W., Hegeman, I.M., Zubal, I.G., Krystal, J.H., Koster, K., Smith, E.O., Heninger, G.R. and Hoffer, P.B. Visual stimulation increases Technetium-99m-HMPAO distribution in human visual cor- tex. J. Nucl. Med., 1991, 32: 210-214.
Yonekura, Y., Nishizawa, S., Mukai, T., Fujita, T., Fukuyama, H., Iokikawa, M., Kikuchi, H., Konishi, J., Andersen, A.R. and Lassen, N.A. SPECT with Tc-HMPAO compared with regional cerebral blood flow measured by PET: effects of linearisation. J. Cereb. Blood Flow Metab., 1988, 8: $82-$89.