Embed Size (px)
Citation preview
DRAFT NOT FOR CITATION
COLLECTIVE ACTION FOR GRAZING LAND MANAGEMENT IN CROP-LIVESTOCK MIXED SYSTEMS IN THE HIGHLANDS OF NORTHERN
ETHIOPIA
by
Berhanu Gebremedhin*, John Pender** and Girmay Tesfay***
February 2002
Background paper for the CAPRi Workshop on Methods for Studying Collective Action,
February 25 � March 1, 2002, in Nyeri, Kenya.
* Agricultural Economist, International Livestock Research Institute (ILRI), Addis Ababa ** Senior Research Fellow, International Food Policy Research Institute (IFPRI), Washington D.C. *** Professor of Agricultural Economics, Mekelle University, Mekelle
DRAFT NOT FOR CITATION
We gratefully acknowledge the financial support of the Swiss Agency for Development and Cooperation. We are also grateful to Mekelle University for institutional support and collaboration during the field work and data analysis, the Tigray Regional Bureau Agriculture and Natural Resource Development and the Tigray Regional Bureau of Planning and Economic Development for logistical support and collaboration in the work. We thank Nancy McCarthy of IFPRI for her comments on earlier draft of the manuscript. We are especially thankful to the many farmers and officials who patiently responded to our numerous questions. The usual disclaimer applies.
1
Abstract Communal grazing lands are important sources of feed in developing countries. The
uncontrolled and free grazing system prevalent in many developing countries has caused
sever degradation of the grazing lands. Several alternative management options have
been recommended to solve the degradation of common property resources, including
state ownership, imposition and enforcement of use rules and regulations by external
organizations such as the government, private ownership, and community resource
management. This paper examines the nature and determinants of collective action for
grazing land management in the highlands of Tigray, northern Ethiopia. Results are based
on a survey of 100 villages in 1998/99. Indicators of collective action used in the study
include area of grazing land under use rules and regulations per household, whether
community pays for guard to protect the grazing land, average value of household
contributions for grazing land management, whether community established penalty
system for violations of use rules and regulations, and whether violations of use rules and
regulations occurred. Total number of households per village, involvement of external
organizations, distance to nearest market town, if cattle rearing is second most important
source of livelihood in village, total number of local organizations in village,
heterogeneity in oxen ownership and total area of village were used as determinants of
collective action for grazing land management. Analysis of descriptive information, and
Tobit and Probit statistical models have been employed. We find that collective action for
grazing land management is widespread in the highlands of Tigray and reportedly
contribute to sustainable use of the resource. Most collective action is locally initiated
and is organized at the village level. We find evidence for an inverted U-shape
2
relationship between population and collective action. Market access detracts from
collective action as does wealth heterogeneity of community. Community experience
with local organizations favour collective action. These results imply that collective
action for grazing land management may be more beneficial and more effective in areas
with intermediate population that are far from market places, and with higher social
capital. In communities with higher wealth heterogeneity and closer to markets,
alternative resource management arrangements such as privatisation may be more
effective.
3
1. Introduction
Communal grazing lands are important sources of livestock feed in developing
countries (ILRI, 1998). In the presence of sufficient demand for livestock or livestock
products, unrestricted access to the grazing lands may result in overexploitation of the
resource and the scarcity rent of the resource would remain unappropriated. Each
individual user of the resource enjoys the full benefit of her use of the resource but bears
only a fractional part of the cost. As a result, the traditional uncontrolled and free grazing
system in many developing countries has caused severe degradation of the grazing lands.
Alternative solutions have been proposed to solve this problem including
privatisation, imposition and enforcement of use rules by external forces such as the
government, or state ownership of the resource (Wade, 1986). It is unlikely that natural
resource problems can be solved by private or state property alone. The transaction cost
of enforcing use rules imposed on the community by an external force is likely to be
prohibitively high due to the high incentives of individual users to shirk or the
community members to collude against the use rules. Privatisation is not always superior
to community resource management. For example, McCarthy et al. (2001) argue that
private property of communal rangelands will become optimal only when collective
action is so poor that it becomes welfare improving to appropriate land individually.
In the presence of collective action, institutional and organisational development,
and the development of infrastructure, population pressure is more likely to have a
positive impact on natural resources than in the absence of these developments (Pender,
1999). The success of public policies to improve natural resource management depends
4
to a large extent on the presence and effectiveness of local level institutions and
organisations (Rasmussen and Meinzen-Dick, 1995).
Community natural resource management is increasingly recognised as a viable
alternative to privatisation or state ownership of the resource. As a result, local level
resource management institutions and organisations to enforce them are receiving greater
attention (Baland and Platteau, 1996; Rasmussen and Meinzen-Dick, 1995).
However, devolving rights to local communities to manage resources, establish
use rules and regulations, and enforce the rules is only a necessary condition for
successful community resource management. Sustainable resource management also
requires that community rules and regulations be effectively observed (Swallow and
Bromley, 1995; Turner et al., 1994). Hence, identification of the factors that favour or
retard the development and effectiveness of local institutions and organisations becomes
important.
Although livestock contribute to land degradation, allegations against them are
sometimes exaggerated or even unfounded (Ehui et al., 1998). The underlying causes of
land degradation may be incomplete property right systems including tenure insecurity,
and perverse financial incentives rather than increasing livestock numbers per se. With
appropriate livestock development policies and public interventions in technology
transfer, livestock have the potential to contribute significantly to the development of
sustainable and environment friendly mixed crop-livestock systems. For example,
livestock have the potential to speed up the cycling of nutrients in crops back to the soil.
Ethiopia has the largest livestock population in Africa and stands 10th in the
world. The livestock sub-sector is an important and integral component of the agricultural
5
sector supplying draught power for cultivation, food and income to households, and
insurance against risk. However, the contribution of the sub-sector to the country's
economy remains far below its potential due to feed, disease and management problems.
Communal grazing lands have been important sources of livestock forage in the country.
Recently, however, many communal grazing lands have become severely degraded due
to the free and uncontrolled grazing system.
The degradation of grazing lands is especially severe in the northern Ethiopian
region of Tigray. Cognisant of this problem, the improvement of animal feed production
has become one major component in the regional livestock development strategy (Fitsum
Hagos et al., 1998). In addition to efforts to increase the number of feed trial and seed
multiplication sites, communities have been empowered to develop and enforce use rules
and regulations of communal grazing lands. However, there is a paucity of evidence
regarding the nature of local level institutions and organisations for grazing land
management in Tigray, or their effectiveness. More generally, since community resource
management is likely to be context specific, there is a need for more research on
community resource management in developing countries. In this regard, Runge (1992,
p.34) posits �Much more attention in research needs to be given, however, to the rich
variety of contemporary resource management strategies that result from alternative
environmental conditions and constraints.�
This paper attempts to provide evidence on the determinants of collective action
and its effectiveness in communal grazing land management in a low potential highland
setting where mixed crop livestock system predominates. The paper has two interrelated
objectives. First, using analysis of descriptive information, it evaluates the nature of
6
community grazing land management in Tigray. Second, it analyses, using multivariate
econometric methods, the factors influencing collective action and its effectiveness in
managing grazing lands. Results are based on a survey of 50 communities and 100
villages in the highlands1 of Tigray in 1998/999. In this paper, communal grazing lands
with use restrictions and regulations are referred to as �restricted grazing lands.�
2. Livestock feeding systems in the highlands of Tigray
The study area, Tigray, is the northern most region of Ethiopia located on the
Sudano-Sahelian dry lands zone. It covers an approximate area of 50, 000 km2 with an
average population density of about 65 per km2, and population growth rate of about 3%.
Most of the area is arid or semiarid with annual precipitation of 450 to 980 mm. Most of
the rain falls within the months of June, July and August exhibiting high intensity, and
high temporal and spatial variability (Berhanu Gebremedhin, 1998). More than 85% of
the regional population lives in the rural areas and depends on mixed crop-livestock
subsistence agriculture.
According to the 1998 livestock census, the region has about 3.04 million cattle,
0.94 million sheep, 1.47 million goats, 0.41 million equines, and 0.013 million camels
(BoANRD, 1999). Livestock play an important role in the rural economy of Tigray. They
are sources of draught power for traction and transportation, cash income from sale of
livestock and livestock products, food such as milk for household consumption and
manure to maintain soil fertility. The primary purpose of cattle production in the crop-
livestock mixed farming systems of the region is draught power.
1 Highlands are defined as those areas which are above 1500 meters above sea level.
7
The contribution of the livestock sub-sector to the regional economy has been
constrained primarily by lack of adequate and quality feed, and livestock diseases. For
instance, the annual financial loss due to inadequate feed and management problems was
once estimated to reach as high as 46.9 million Birr2 for beef production and 230.9
million Birr for milk production (Desta Hagos, 1997).
The major livestock feed sources in the region include crop residues (45%),
grazing lands (35%), browse (10 %) and crop aftermath (8%) derived from 3.6 million ha
of cultivated land, and 3.2 million ha of grazing land (BOANRD, 1997; UNECA, 1997).
Crop residues consist of straw, stalk, stovers, sheath and chaff. About 68% of the crop
residue is fed to oxen, 20% to milking cows and newly castrated bulls while the
remaining balance is fed to other livestock during critical periods (UNECA, 1997).
Prickly pear is also increasingly being used as animal feed, mainly in the southern and
eastern zones of the region. The spineless cactus is chopped and given to animals while
the spiny cactus is treated for spine removal with fire and knives. Considering the total
number of livestock and the contributions of different sources of feed, the grazing lands
in Tigray are supporting livestock far beyond their carrying capacity (BoANRD, 1997;
UNECA, 1997; Gebrekidan Teklu, 1994).
The livestock feed sources in the highlands of Tigray shows slight difference by
season (Tsigeweyni Tekleab, 1997). Livestock feed mostly on weeds, and green grass
from farm strips and bunds from July to September. From October to December, the
dominant feed sources are crop aftermath and range lands. From January to June, crop
residues, hay, and cactus in some places are the primary sources of feed. In this altitude
2 In 1998, USD 1 = 7 Birr.
8
zone, the critical feed shortage is observed in the period from July to September, while
moderate feed shortage is observed during April to June. The period from October to
March is the period of relatively adequate feed.
The grazing system in the region also varies by season. During the rainy season,
when most arable lands are under crops, livestock are confined to graze on valley
bottoms, farm strips and steep hillsides (Tsigeweyni Tekleab, 1997). The grazing animals
cause significant soil disturbance by trampling on the hillsides during the wet season,
thus contributing to soil erosion. During the dry season, arable lands become grazing
areas.
Free and uncontrolled grazing is the dominant grazing system in the region. In
most parts of the region, grazing lands are common property resources3. Most of the
grazing lands are grazed and trampled the whole year round without any resting period,
resulting in depletion of the palatable species and invasion by less palatable or
unpalatable ones. Moreover, grazing on crop land contributes to soil compaction and the
need for frequent tillage to prepare fields for crops, making practices such as reduced
tillage less feasible.
In addition to its contribution to the degradation of grazing lands, the grazing
system has a negative effect on the conservation efforts underway in the region. Physical
conservation structures such as stone terraces and soil bunds are damaged by the freely
roaming livestock. Biological conservation practices such as grass strips and tree
plantations are also being destroyed or trampled, reducing the chance for establishment
and regeneration.
3 Common property resources are defined as those resources which are collectively owned and managed by a given community. They are to be contrasted with open access resources that have no defined owner.
9
The free grazing system results in externality costs and benefits to those who do
not own livestock. Fallow lands and cultivated lands after harvest are considered as
grazing lands without access restrictions. Free grazing reduces vegetative cover thus
contributing to soil erosion, reduction of soil fertility, decrease in soil organic matter and
deterioration of the soil structure. The farmers who own the land but who own no
livestock are forced to bear the cost of maintaining the fertility of the land (for example,
by applying commercial fertiliser or manure), or face the consequence of declining
yields. However, landowners may also benefit from increased soil fertility due to the
manure left by the grazing animals. Whether the externality costs outweigh the benefits
remains an empirical question.
Most rural communities in Tigray reserve some grazing areas for dry season feed.
In the southern zone, reserved grazing areas are mostly grazed by oxen from February
until the onset of the next rainy season, while in the central zone reserved grazing areas
are used for hay making or are grazed by the whole livestock herd starting from October.
However, the reserved grazing areas appear to be mainly the valley bottoms, thus
contributing to the continuous degradation of the hillsides during the rainy season.
In the eastern zone, private ownership of grazing lands is practised, in addition to
using reserved grazing areas for hay making. In some woredas (districts) of the zone such
as Eurob and Hauzen, the privately held grazing areas are converted to communal grazing
lands after about two months of private grazing, while in Saesi Tsaeda Emba, private
grazing is practised all year round (Tsigeweyni Tekleab, 1997). In some areas of Saesi
Tsaeda Emba, farmers separate reserved grazing lands intended for cows and oxen. While
valley bottoms are reserved for oxen, marginal grazing lands are reserved for cows.
10
Stall feeding of livestock is not practised in rural Tigray. The shift towards stall
feeding needs to be seen within the overall context of agricultural production in the
region (Berhanu Gebremedhin, 1998). Stall feeding can increase availability of manure
and reduce the energy loss of livestock due to walking in search of feed where there is
usually little. On the other hand, stall feeding requires more labour for watering, housing,
and breeding. Oxen and pack animals also need the physical exercise required for
ploughing and transporting. Stall feeding may, however, be more feasible in more
intensive dairy production close to cities.
3. Conceptual Framework
The conceptual framework for this study is based on the theory of collective
action (Balland and Platteau, 1996; Ostrom, 1990; wade, 1988), institutional analysis
(North, 1990) and transaction cost economics (Williamson, 1986). Common property
resources can be defined as having two basic characteristics, viz., exclusion is difficult
albeit possible, and yield is subtractable (Vanderlinden, 1999). Community members
involved in the joint exploitation of a common property resource, therefore, face a
dilemma of whether to compete for as big a share from the resource pie as possible or
cooperate to increase the resource pie through collective action to manage the resource
(Vanderlinden, 1999).
Analysis of individual incentives to contribute to collective action for common
property resource management has been the most dominant economic approach to the
study of the determinants and effectiveness of collective action (Baland and Platteau,
1999). Underlying these incentives is the perceived distribution of benefits and costs,
which may in turn be influenced by factors related to the nature of the resource, the
11
characteristics of the community, the interrelationships between the community and the
resource, and external environment such as the role of external organizations and
programs and access to markets (Agrawal, 2001).
Both institutional analysis (North, 1990) and transactions cost economics
(Williamson, 1986) hold that individuals weigh costs and benefits of their decisions in
specific action situations. Perceived obstacles and inducements in a given environment
condition individual choices (Oakerson, 1992). Hence, in this study factors related to the
number of and characteristics of participants involved (by facilitating or hindering trust
and cooperation), types of choices available (by raising or decreasing opportunity cost of
cooperation), the external environment (through the effect on costs and benefits of the
involvement of external organizations or programs), importance of the resource for
livelihood, and past experience of community in establishing and running local
organizations are considered important in determining collective action for grazing land
management..
4. Research Methods and Hypotheses 4.1 Research methods
The results are based on data collected from a survey of 50 tabias (the lowest
administrative unit in Tigray consisting usually of four to five villages) in the highlands
of Tigray in the 1998-99 cropping year. Sample tabias were selected using a stratified
random sampling. Tabias were stratified based on distance from the nearest market town
and presence of an irrigation project. Two villages were selected randomly from each
tabia. A semi-structured questionnaire was administered in a group interview with
community representatives at both the tabia and village levels. Each interview involved
12
ten respondents chosen to represent different age groups, villages, primary occupations
and gender. The survey collected information about changes in agricultural and natural
resource conditions between 1991 and 1998, and their causes and effects.
Descriptive analysis of survey data was used to identify the nature and impact of
community management on grazing lands, the role of local and external organisations in
managing them, the institutions that evolved and their enforcement mechanisms.
Econometric analysis was used to examine the determinants of collective action and its
effectiveness in managing grazing lands.
Effective collective action for resource management requires that the beneficiaries
prepare and agree on a set of rules of restrained access to the resource; make
arrangements for financial, labor or other contributions required for the management of
the resource; and lay out a system of enforcement of the use restrictions and community
contributions. Thus, the indicators of collective action and its effectiveness used in the
econometric analysis include (1) area of restricted grazing land per household (2) whether
communities pay for guard to protect the grazing land (3) the monetary value of
contribution per household for grazing land management (4) whether communities
established penalty systems for violations of use restrictions and (5) whether violations
of use rules and regulations occurred in 1998. Communal grazing lands are used in every
village, and the total area of the communal grazing land under use restrictions (restricted
grazing area) is considered as an indicator of collective action. Community members may
respond to non-cooperation by cooperating to increase each other�s incentive to
cooperate, through exhortation and penalties. Thus, establishment of penalty system is
13
used as an indicator of collective action. Violations of use restrictions and regulations is
used as an indicator of failure of collective action.
The type of regression model to use depends on the nature of the dependent
variable. We use binary probit models to examine the determinants of whether
communities pay for guard, whether penalties were established, and whether any
violations occurred in 1998. We use a Tobit model for area of restricted grazing land per
household and contributions per household for grazing land management since the data
are censored. We corrected for sampling stratification and weights using the survey data
estimation version for probit models (SVYPROBT), and the Tobit model (SVYINTRG)
using STATA software.
4.2 Hypotheses
The factors used to explain differences in collective action include the number of
total households in a village, heterogeneity in oxen ownership of the community,
experience with local organizations, distance to market, involvement of external
organizations or programs, whether cattle production is the second most important source
of livelihood in a community, and the total area of the community.
When the number of households is small, collective action may be low due to
fixed costs, while when number of households is very high collective action may be low
due to increasing variable transaction costs of attaining and enforcing collective action, or
higher competition for the resource (Pender and Scherr, 1999; Berhanu Gebremedhin et
al. 2001; Otsuka and Place, 2001). Hence we hypothesize an inverted U-shape
relationship between number of households in a village and collective action for grazing
14
land management with intermediate levels of population density favouring collective
action, while low and very high population densities retarding collective action.
The effect of heterogeneity on collective action is unresolved since communities
may be heterogeneous in several aspects including socio-cultural background, interests
and endowments, and each of these aspects may affect collective action differently
(Baland and Platteau, 1999; Baland and Platteau, 1996). The conditions under which
certain aspects of heterogeneity enhance or undermine collective action also remains
unknown (Varughese and Ostrom, 2001). In this study, we considered heterogeneity in
terms of oxen ownership in the community. We hypothesize that heterogeneity in oxen
ownership may undermine collective action for grazing land management because of
possible divergence of interests in and perceived benefits from use of the grazing lands.
Since land in the study area is equitably distributed based on family size, oxen ownership
remains an important differentiation factor of economic classes. We measured
heterogeneity by the coefficient of variation of the distribution of the proportion of
households with no oxen, one ox, two oxen, and more than two oxen.
External organisations can favour collective action by providing technical support
and inputs, provided that these interventions are complementary to local collective action
and demand driven. On the other hand, external organisations may retard collective
action if their role substitutes for local collective action (such as by replacing local effort
or dictating management decisions) or otherwise undermining collective action (such as
by increasing "exit options" of local community members) (Berhanu Gebremedhin et al.,
2001; Pender and Scherr, 1999). We investigated the effect of external organizations by
including a dummy variable for whether the restricted grazing area was promoted by an
15
external organization. Since almost all restricted grazing areas are managed at the village
level, we are not able to test for the effect of the level of management (i.e., village vs.
tabia) on collective action.
Experience with local organizations should favour collective action due to
possible learning effects, and the effect of social capital on the costs or ability to enforce
collective action (Baland and Platteau, 1996; Pender and Scherr, 1999; Rasmussen and
Meinzen-Dick, 1995). Up to ten different local organizations operate in the study area.
Not all communities have all the local organizations. We measured differences in
community experience with local organizations by the number of local organizations
operating in a given community.
Communities who depend on a common property resource and are likely to use
the resource over a long time horizon may be more likely to self-organize to manage the
resource collectively (Varughese and Ostrom, 2001). The primary source of livelihood
for rural communities in the study area is cereal crops production. Communities showed
difference in their second most important source of livelihood. We include a dummy
variable of whether the second most important livelihood source in a given community is
cattle rearing. We expect that where cattle rearing is important livelihood strategy,
collective action for grazing land management will be high.
The effect of market access on collective action is mixed. While better market
access may increase the value of the resource and the return from managing the resource
effectively, thus favouring collective action, better market access may also decrease the
incentive of members to abide by community rules by increasing the opportunity cost of
labor or by providing more "exit" options, making enforcement of rules more difficult
16
(Berhanu Gebremedhin, et al., 2001; Pender and Scherr, 1999; Baland and Platteau,
1996). We measured market access by the walking time to the nearest market town from
the village.
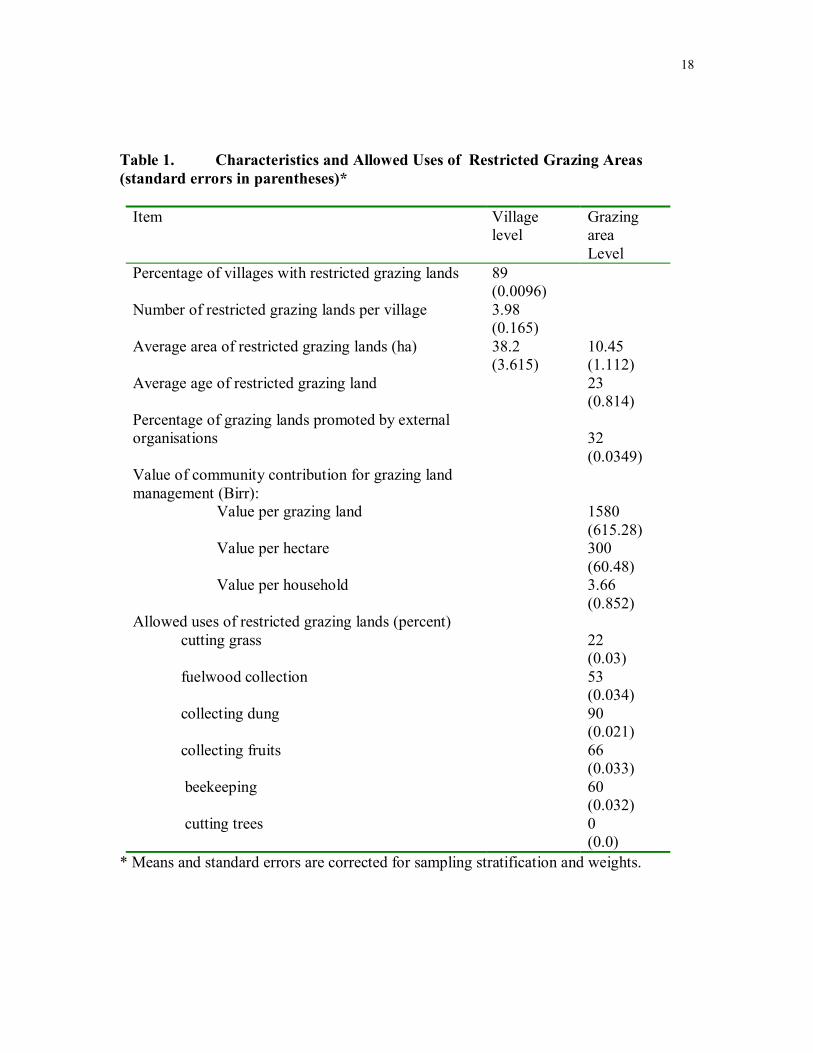
5. Results 5.1 Descriptive Analysis Grazing areas with some regulations of use (restricted grazing areas) are common
in rural communities in the highlands of Tigray. All villages in the highlands have some
type of grazing land (including both unrestricted and restricted grazing areas), and almost
90% of villages have one or more restricted grazing areas. The average total restricted
grazing land area per village is 38 ha and the average area of a particular grazing land is
10.5 ha (Table 1). On average, each village in the highlands has about four restricted
grazing areas. However, there is a wide variation in the number and area of restricted
grazing lands per village.
Almost all restricted grazing areas are used exclusively by the village that
manages them. More than half of the restricted grazing areas are used for grazing only by
oxen while the remaining are grazed by all animals. There is a variation in the period
during which the grazing lands are used for grazing. In 42% of the cases the grazing
lands are used only from September to December, 29% from January to May, and 13%
from June to August. Only oxen are allowed to graze in the rainy season from June to
August. In a few cases, grazing is allowed after the grass is cut.
In addition to grazing livestock, other allowed uses of the restricted grazing areas
include cutting grass for feed or construction, fuel wood collection from dead trees, dung
17
collection, and bee keeping. However, cutting trees or shrubs is not allowed. All
communities reported that the grazing lands have regenerated significantly due to the
restricted uses.
There appears to be a long tradition of developing and enforcing use regulations
of grazing areas in Tigray. More than 58% of the restricted grazing areas in the surveyed
villages were established prior to 1966, while only about 17% percent have been
established since 1991. On average a restricted grazing area in the highlands was
established 23 years ago. The village administration is the local organisation principally
mandated for the management of the grazing areas. In a few cases, a group of elders has
the management responsibility. In addition to the village organisations, the regional
Bureau of Agriculture is also involved in management of the grazing areas. The village
administration is mostly involved in organizing potential beneficiaries, drafting of use
rules and regulations, and enforcement of the rules once they are ratified by beneficiaries.
In a few cases the village administration finances guards. The Bureau of Agriculture is
mainly involved in the provision of material and technical assistance, with limited role in
organizing beneficiaries. The Bureau is not involved in the preparation of use rules and
regulations.
The most frequent contribution of village members in management of the grazing
lands is cash or in kind contribution for guard payment. Other contributions of village
residents include uncompensated labor contribution for the construction of soil and water
conservation practices, guarding the area on rotation basis, and fencing and weeding.
The average Birr value of total community contributions for management of a grazing
land in 1998 was 1, 580 (US$ 226) per grazing land, with per ha average value of Birr
300 (US$ 43). The average contribution per household was Birr 3.66.
18
Table 1. Characteristics and Allowed Uses of Restricted Grazing Areas (standard errors in parentheses)*
Item
Village level
Grazing area Level
Percentage of villages with restricted grazing lands 89 (0.0096)
Number of restricted grazing lands per village 3.98 (0.165)
Average area of restricted grazing lands (ha) 38.2 (3.615)
10.45 (1.112)
Average age of restricted grazing land 23 (0.814)
Percentage of grazing lands promoted by external organisations
32 (0.0349)
Value of community contribution for grazing land management (Birr): Value per grazing land Value per hectare Value per household
1580 (615.28) 300 (60.48) 3.66 (0.852)
Allowed uses of restricted grazing lands (percent) cutting grass fuelwood collection collecting dung collecting fruits beekeeping cutting trees
22 (0.03) 53 (0.034) 90 (0.021) 66 (0.033) 60 (0.032) 0 (0.0)
* Means and standard errors are corrected for sampling stratification and weights.
19
Most grazing areas in the highlands (68%) were not promoted by an external
organisation or program, indicating the prevalence of local initiative for collective action
in managing grazing lands. In cases where the grazing areas were promoted by an
organisation or a program, the Bureau of Agriculture took the lead.
The most common way of protecting the grazing lands is by hiring guards (77%
of restricted grazing areas) paid by contributions from households in cash or in kind, or in
return for benefits from using the grazing areas. The dominant way of compensating
guards is payment in cash or in kind. In a few cases guards are paid from food-for-work
programs. When cash payment is used, a guard is paid 40 Birr/month (US $6.00) on
average. In some villages only those who own oxen contribute for guard payment. When
a guard is not hired, village households rotate the responsibility for guarding the grazing
lands (21.5 % of restricted grazing areas) or fence the grazing land (0.8% of restricted
grazing areas). Mutual trust among villagers is used in 0.4% of the cases.
Penalties for violations of use restrictions of grazing lands are widely used in the
highlands of Tigray. In 1998, violations of use restrictions were reported in 26% of the
restricted grazing lands. In about 81% of the cases, violations were penalized when they
occurred. Farmers do not perceive any problems as a result of the use restrictions of the
grazing areas in terms of shortage of grass, harbouring pests, fire hazard, shortage of fuel
wood, or uncertainty about receiving benefit from them. All restricted areas remained
restricted once they were established.
The most frequent violations of use restrictions of the grazing lands reported in
1998 were letting animals graze while grazing was not allowed, and cutting grass for feed
and construction without permission. Other violations include cutting roots, branches,
20
leaves or trees, and collecting fuel wood. Communities mostly use penalty in cash for
violations.
The survey asked about penalties used by communities for violations of use
restrictions when the area was first established and in 1998. Among the violations that
were penalized by cash fine, 61% of cash penalties during establishment and 72% of cash
penalties in 1998 were applied to violations of grazing animals and cutting grass and
trees. In some cases (21% of penalties during establishment and 18% in 1998) the village
courts were mandated to decide on penalties for violations. Confiscation of the cut grass
and trees, and implements were used in few cases.
Compared to during establishment the frequency of use of cash penalties and
imprisonment increased by 1998, while mandating the village court to decide on
penalties, penalty in kind and confiscation decreased in 1998. In a few cases penalties
were not initially developed when the use restrictions were first established.
The most frequently cited benefit received from the grazing lands in 1998 is
grazing animals while feed is in short supply. On average, 42% of households in each
village received benefit from grazing animals in 1998. Other benefits to rural households
include cutting grass for feed and other purposes, collecting dung, and collecting fuel
wood from dead trees.
Some indicators of collective action showed significant differences by market
access4 (Table2). Villages with relatively lower market access reported significantly
higher violations of use rules and regulations but made significantly higher contributions
4 Communities were classified into high market access if the distance to the nearest market place is less than or equal to 10 km, while of low market access if the distance is more than 10 km.
21
per household for grazing land management. There was no significant difference in the
other indicators of collective action based on market access.
Table 2: Indicators of Collective Action for Grazing Land Management by
Market Access�� (standard error)
Indicator Low market access
High market Access
Percentage of villages with restricted grazing area
75.62a (0.059)
63.65a (0.089)
Average restricted area per household (ha)
0.349a (0.064)
0.403a (0.157)
If community pays for guard (percent of restricted grazing areas)
74.49a (0.050)
67.21a (0.069)
If community established penalty system (percent of restricted grazing areas)
98.21a (0.009)
95.30a (0.023)
If violations of use restrictions occurred (percent of restricted grazing areas)
43.10a (0.044)
5.20b (0.021)
Average per household contributions for restricted grazing land management (Birr)
4.239a (1.081)
1.573b (0.414)
Average per hectare value of community contribution for restricted grazing land management in 1998 (Birr)
192.30a (53.23)
326.31a (74.89)
� Figures (in the same row) followed by different letters are significantly different from each other at least at 5% level. � Means were corrected for sampling stratification and weights, and standard errors are robust to hetroskedasticity and non-independence within the primary sampling units (tabias).
When communities are classified in to high and low population densities5, most of
the indicators of collective action were significantly different (Table 3). Average area of
restricted grazing land per household, percentage of villages which
22
established penalty system, percentage of violations of uyse rules and regulation in 1998,
and average household contribution for grazing land management were higher at low
population density, while the percentage of communities paying for guard was higher at
higher population density.
Table 3: Indicators of Collective Action for Grazing Land Management by
Population Density in Community�� (standard error)
Indicator Low population density
High population density
Percentage of villages with restricted grazing area
80.08a (0.083)
73.32a (0.0612)
Average restricted area per household (ha)
0.133a (0.041)
0.040b (0.010)
If community pays for guard (percent of restricted grazing land)
60.58a (0.087)
78.26b (0.043)
If community established penalty system (percent of restricted grazing area)
99.27a (0.007)
96.77b (0.012)
If violations of use restrictions occurred (percent of restricted grazing land)
40.24a (0.067)
32.78b (0.042)
Average per household contribution for restricted grazing land management (Birr)
7.694a (2.331)
1.569b (0.306)
Average per hectare value of community contribution for restricted grazing land management in 1998 (Birr)
281.80a (86.10)
305.28a (78.91)
� Figures (in the same row) followed by different letters are significantly different from each other at least at the 5% level. � Means were corrected for sampling stratification and weights, and standard errors are robust to hetroskedasticity and non-independence within the primary sampling units (tabias).
5 Communities were classified as low population density areas if population density is less than or equal to 100 per km2 and high population density if higher than 100 per km2.
23
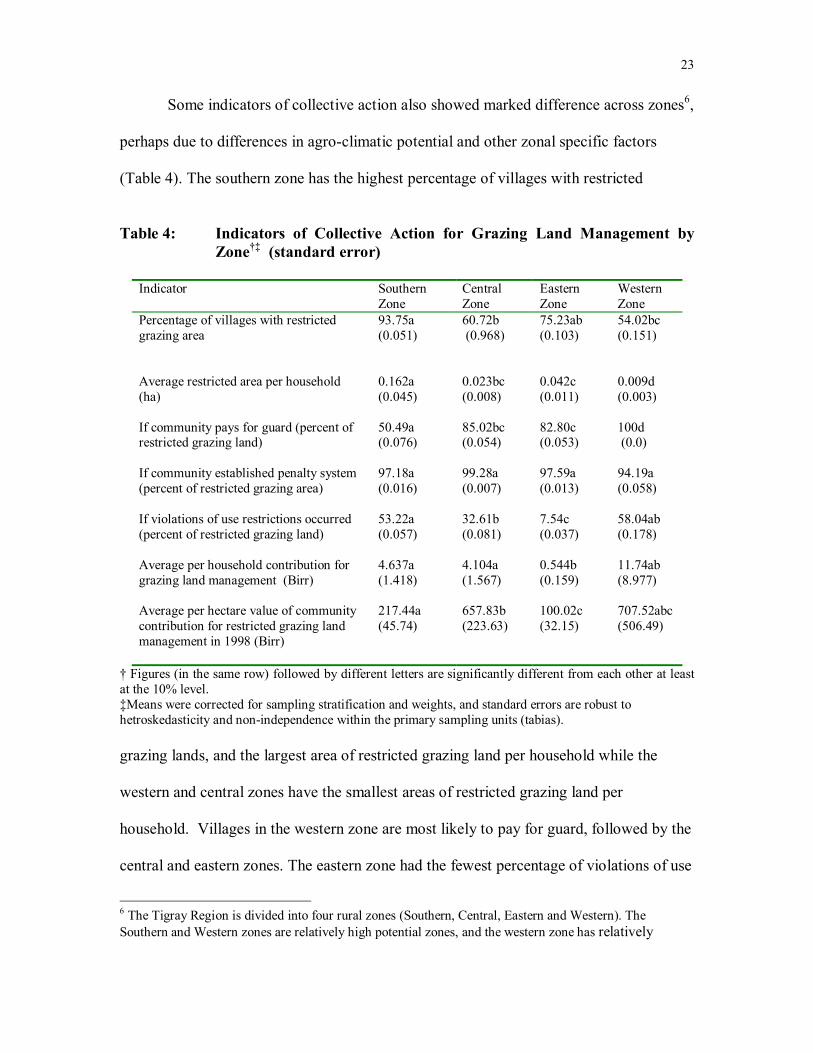
Some indicators of collective action also showed marked difference across zones6,
perhaps due to differences in agro-climatic potential and other zonal specific factors
(Table 4). The southern zone has the highest percentage of villages with restricted
Table 4: Indicators of Collective Action for Grazing Land Management by
Zone�� (standard error)
Indicator Southern
Zone Central Zone
Eastern Zone
Western Zone
Percentage of villages with restricted grazing area
93.75a (0.051)
60.72b (0.968)
75.23ab (0.103)
54.02bc (0.151)
Average restricted area per household (ha)
0.162a (0.045)
0.023bc (0.008)
0.042c (0.011)
0.009d (0.003)
If community pays for guard (percent of restricted grazing land)
50.49a (0.076)
85.02bc (0.054)
82.80c (0.053)
100d (0.0)
If community established penalty system (percent of restricted grazing area)
97.18a (0.016)
99.28a (0.007)
97.59a (0.013)
94.19a (0.058)
If violations of use restrictions occurred (percent of restricted grazing land)
53.22a (0.057)
32.61b (0.081)
7.54c (0.037)
58.04ab (0.178)
Average per household contribution for grazing land management (Birr)
4.637a (1.418)
4.104a (1.567)
0.544b (0.159)
11.74ab (8.977)
Average per hectare value of community contribution for restricted grazing land management in 1998 (Birr)
217.44a (45.74)
657.83b (223.63)
100.02c (32.15)
707.52abc (506.49)
� Figures (in the same row) followed by different letters are significantly different from each other at least at the 10% level. �Means were corrected for sampling stratification and weights, and standard errors are robust to hetroskedasticity and non-independence within the primary sampling units (tabias). grazing lands, and the largest area of restricted grazing land per household while the
western and central zones have the smallest areas of restricted grazing land per
household. Villages in the western zone are most likely to pay for guard, followed by the
central and eastern zones. The eastern zone had the fewest percentage of violations of use
6 The Tigray Region is divided into four rural zones (Southern, Central, Eastern and Western). The Southern and Western zones are relatively high potential zones, and the western zone has relatively
24
restrictions and regulations in 1998, and the lowest value of per household and per
hectare contributions for grazing land management. The econometric analysis shows
whether the differences in collective action by market access, population and zones are
significant after controlling for other variables.
To summarize the descriptive analysis, we find that restricted grazing areas are
widespread in the highlands of Tigray, and are managed only at the village level. Most
grazing areas are established through local initiative, and village administrations are
principally involved in management. Village members contribute cash or in kind for
guard payment, and contribute uncompensated labour for management. When a guard is
not used for protection, village members take turns to protect the land or use fences. The
regional Bureau of Agriculture is involved mainly in the provision of technical and
material assistance. Since oxen supply draught power for traction, a critical input for crop
production, the restricted lands are mainly used for grazing oxen. Communities use cash
penalties for violations. The level and effectiveness of collective action for grazing land
management appears to differ by population density and market access, as well as across
zones. In the next section, we present results of econometric analysis on the determinants
of collective action and its effectiveness.
5.2 Econometric Analysis
The results of econometric analysis are given presented in Table 3. We include
dummy variables for the different zones of Tigray to proxy for differences in agro-
climatic potential (the Southern and Western zones have generally higher potential, due
to better soils and higher rainfall), as well as other zone specific differences. We include
higher availability of communal grazing lands.
25
population density and population density squared to test for an inverted U-shape
relationship between population density and collective action
We find that the Western zone has the least area of restricted grazing lands per
household, consistent with the existence of a relatively more abundant grazing land in the
zone compared to other zones of the region, thus perhaps reducing the need for restricted
grazing areas. The Central and Eastern zones also have less area of restricted grazing
lands per household compared with the Southern zone. We also find that communities in
the Central zone are more likely to pay for guard and are more likely to establish penalty
systems for violations of use restrictions and regulations than in the Southern zone.
Communities in the Eastern zone are less likely to violate use rules and restrictions and
more likely to establish penalty systems than in the Southern zone.
Communities are more likely to pay for guard at intermediate population than at
low or very high total population. The turning point in this relationship (where maximum
probability of communities paying for guard occurs) is 450 households per village, well
within the range of total number of households per village and very close to the average
number of households per village (total number of households per village in the study
area ranged from 85 to 1050 with an average value of 410). We also find violations of
use restrictions are least likely to occur at intermediate population (368 households per
village). These results of the effect of population on collective action for grazing land
management are consistent with the hypothesis of an inverted U-shape relationship
between population and collective action. Collective action is probably low at low
population due to the effect of fixed costs associated with collective action and at very
26
high population due to the increasing marginal costs of collective action as population
increases.
The involvement of external organizations in promoting restricted grazing areas
reduced the likelihood of communities paying for guard, suggesting that the need for
communities to pay for guard is eliminated by the payment made by the external
organizations. Involvement of external organizations has a positive (but statistically
insignificant) effect on household contributions for grazing land management.
Communities with greater presence of local organizations make higher
contributions per household for grazing land management, are more likely to establish a
penalty system and are less likely to have violations of use restrictions and regulations.
These results are consistent with the hypothesised effect of experience with local
organizations on collective action for resource management. However, we also find a
negative effect of experience with local organizations on the likelihood of communities
paying for a guard; similar to the effect of involvement of external organizations.
Perhaps a guard is less necessary in communities with greater investment in such local
social capital.
Communities that are more distant from the nearest market town are more likely
to pay for guard and to establish a penalty system for grazing land management,
suggesting that more distant communities have higher need for restricted grazing lands,
and that collective action may be more likely because of lower opportunity cost of labour
or limited exit options in such areas. These results suggest that in areas closer to markets,
private management of grazing lands may be a better option.
27
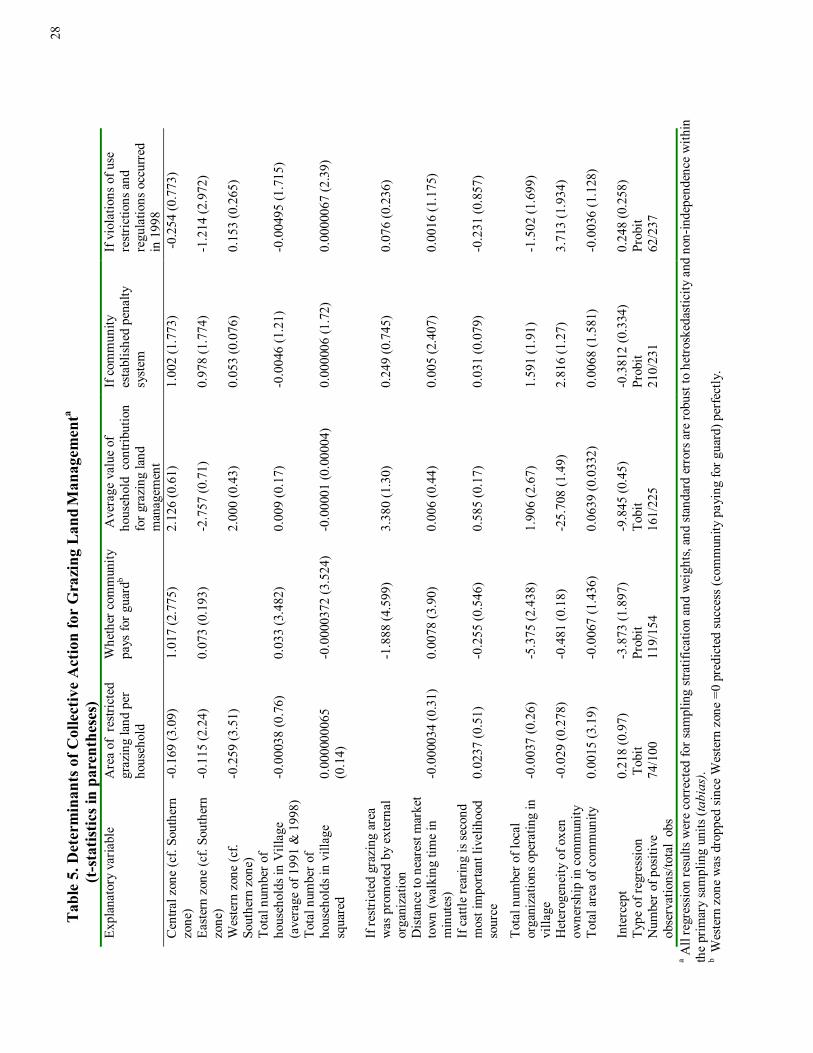
Whether or not cattle rearing is a second most important source of livelihood in a
community failed to affect any of the indicators of collective action significantly. This
may be because of the fact that cereal crops production is the first most important source
of livelihood in all communities and cattle rearing is considered as supplementary to crop
production.
Heterogeneity in oxen ownership tends to detract from collective action for
grazing land management. Heterogeneity increases the likelihood of violations of use
restrictions and regulations (an indicator of failure of collective action). Heterogeneity
explained household contribution for grazing land management negatively but was
statistically insignificant. We also find that total area of community has a positive effect
on area of restricted grazing land per household.
A possible explanation for the weak influence of some of the explanatory
variables is that there may be multicollinearity among the explanatory variables. We
tested for problems of multicollinearity and found that potential problems only between
the total number of households in village and its squared value. We have retained both
variables as they were necessary to test the hypothesized inverted U-shaped relationship.
The variance inflation factors of all other variables were below 3
28
Tab
le 5
. Det
erm
inan
ts o
f Col
lect
ive
Act
ion
for
Gra
zing
Lan
d Man
agem
enta
(t-s
tatis
tics i
n pa
rent
hese
s)
Expl
anat
ory
varia
ble
Are
a of
res
trict
ed
graz
ing
land
per
ho
useh
old
Whe
ther
com
mun
ity
pays
for g
uard
b A
vera
ge v
alue
of
hous
ehol
d c
ontri
butio
n fo
r gra
zing
land
m
anag
emen
t
If co
mm
unity
es
tabl
ishe
d pe
nalty
sy
stem
If vi
olat
ions
of u
se
restr
ictio
ns a
nd
regu
latio
ns o
ccur
red
in 1
998
Cen
tral z
one
(cf.
Sout
hern
zo
ne)
-0.1
69 (3
.09)
1.01
7 (2
.775
) 2.
126
(0.6
1)
1.
002
(1.7
73)
-0.2
54 (0
.773
)
East
ern
zone
(cf.
Sout
hern
zo
ne)
-0.1
15 (2
.24)
0.07
3 (0
.193
) -2
.757
(0.7
1)
0.
978
(1.7
74)
-1.2
14 (2
.972
)
Wes
tern
zon
e (c
f. So
uthe
rn z
one)
-0
.259
(3.5
1)
2.00
0 (0
.43)
0.05
3 (0
.076
) 0.
153
(0.2
65)
To
tal n
umbe
r of
hous
ehol
ds in
Vill
age
(ave
rage
of 1
991
& 1
998)
-0.0
0038
(0.7
6)
0.03
3 (3
.482
) 0.
009
(0.1
7)
-0.0
046
(1.2
1)
-0.0
0495
(1.7
15)
To
tal n
umbe
r of
hous
ehol
ds in
vill
age
squa
red
0.00
0000
065
(0.1
4)
-0.0
0003
72 (3
.524
) -0
.000
01 (0
.000
04)
0.00
0006
(1.7
2)
0.00
0006
7 (2
.39)
If re
stric
ted
graz
ing
area
w
as p
rom
oted
by
exte
rnal
or
gani
zatio
n
-1
.888
(4.5
99)
3.38
0 (1
.30)
0.24
9 (0
.745
) 0.
076
(0.2
36)
D
ista
nce
to n
eare
st m
arke
t to
wn
(wal
king
tim
e in
m
inut
es)
-0.0
0003
4 (0
.31)
0.00
78 (3
.90)
0.
006
(0.4
4)
0.00
5 (2
.407
) 0.
0016
(1.1
75)
If
cattl
e re
arin
g is
seco
nd
mos
t im
porta
nt li
velih
ood
sour
ce
0.02
37 (0
.51)
-0.2
55 (0
.546
) 0.
585
(0.1
7)
0.03
1 (0
.079
) -0
.231
(0.8
57)
Tota
l num
ber o
f loc
al
orga
niza
tions
ope
ratin
g in
vi
llage
-0.0
037
(0.2
6)
-5.3
75 (2
.438
) 1.
906
(2.6
7)
1.59
1 (1
.91)
-1
.502
(1.6
99)
H
eter
ogen
eity
of o
xen
owne
rshi
p in
com
mun
ity
-0.0
29 (0
.278
)
-0.4
81 (0
.18)
-2
5.70
8 (1
.49)
2.81
6 (1
.27)
3.
713
(1.9
34)
To
tal a
rea
of c
omm
unity
0.
0015
(3.1
9)
-0
.006
7 (1
.436
) 0.
0639
(0.0
332)
0.00
68 (1
.581
) -0
.003
6 (1
.128
)
Inte
rcep
t 0.
218
(0.9
7)
-3.8
73 (1
.897
) -9
.845
(0.4
5)
-0.3
812
(0.3
34)
0.24
8 (0
.258
) Ty
pe o
f reg
ress
ion
Tob
it Pr
obit
Tobi
t Pr
obit
Prob
it N
umbe
r of p
ositi
ve
obse
rvat
ions
/tota
l ob
s 74
/100
11
9/15
4 16
1/22
5 21
0/23
1 62
/237
a All
regr
essi
on re
sults
wer
e co
rrec
ted
for s
ampl
ing
strat
ifica
tion
and
wei
ghts,
and
stan
dard
err
ors a
re ro
bust
to h
etro
sked
astic
ity a
nd n
on-in
depe
nden
ce w
ithin
th
e pr
imar
y sa
mpl
ing
units
(tab
ias)
. b
Wes
tern
zon
e w
as d
ropp
ed si
nce
Wes
tern
zon
e =0
pre
dict
ed su
cces
s (co
mm
unity
pay
ing
for g
uard
) per
fect
ly.
29
6. Conclusions and Implications Rural communities in Tigray have long tradition of developing and enforcing use
regulations of grazing areas. According to survey respondents, use regulations reportedly
contribute to significant regeneration of grazing lands, supporting the role of community resource
management in redressing resource degradation. Restricted use of grazing lands are maintained
once established. Village organisations are primarily responsible for the management of restricted
grazing areas by organising and informing beneficiaries, and establishing and enforcing use
regulations; with technical and material assistance from the regional Bureau of Agriculture.
Beneficiaries contribute to grazing land management through cash and in kind contributions for
protection and uncompensated labour contribution for the development of the grazing lands. Given
the crucial role of traction for crop production, oxen are the priority users of the restricted grazing
lands.
Communities which have smaller areas of restricted grazing lands per household exhibited
higher levels of various indicators of collective action for grazing land management, such as
communities paying for guard, establishment of penalty systems and reporting less violations.
These results, combined with the finding that restricted grazing areas remain enforced once
established, suggest that once the hurdle of establishment of restricted grazing areas is overcome,
collective action is likely to be effective.
We found evidence for an inverted U-shape relationship between population level and
collective action for grazing land management. Collective action is highest at intermediate
population level. When population is low the fixed costs of collective action per head is high, thus
30
undermining cooperation. At high population level, the increasing variable costs of collective
action detract cooperative efforts.
Experience in organizing and running local organizations encourages collective actions for
grazing land management, perhaps due to the learning effect of managing cooperative effort, or
because social capital helps to reduce the cost of attaining and enforcing collective action. Market
access may detract from collective action by increasing the opportunity cost of labour or by
providing more exit options to rural communities. Heterogeneity in oxen ownership appears to
detract from collective action for grazing land management.
The findings imply that community grazing land management can contribute to a more
sustainable use of grazing lands and the alleviation of feed shortage problems. Collective action
for grazing land management may be more beneficial and more effective in areas with
intermediate population, that are far from market places. In communities with higher wealth
heterogeneity and closer to markets, alternative resource management arrangements such as
privatization may be more effective.
31
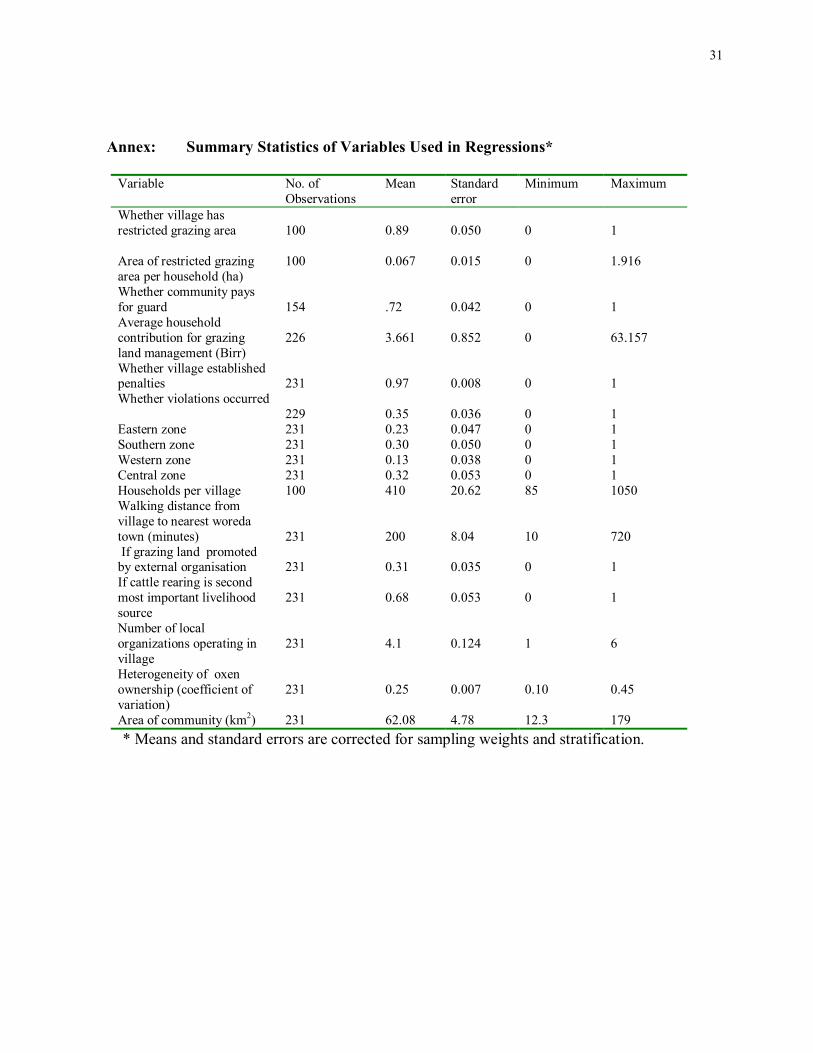
Annex: Summary Statistics of Variables Used in Regressions*
Variable No. of Observations
Mean Standard error
Minimum Maximum
Whether village has restricted grazing area
100
0.89
0.050
0
1
Area of restricted grazing area per household (ha)
100 0.067 0.015 0 1.916
Whether community pays for guard
154
.72
0.042
0
1
Average household contribution for grazing land management (Birr)
226
3.661
0.852
0
63.157
Whether village established penalties
231
0.97
0.008
0
1
Whether violations occurred 229
0.35
0.036
0
1
Eastern zone 231 0.23 0.047 0 1 Southern zone 231 0.30 0.050 0 1 Western zone 231 0.13 0.038 0 1 Central zone 231 0.32 0.053 0 1 Households per village 100 410 20.62 85 1050 Walking distance from village to nearest woreda town (minutes)
231
200
8.04
10
720
If grazing land promoted by external organisation
231
0.31
0.035
0
1
If cattle rearing is second most important livelihood source
231
0.68
0.053
0
1
Number of local organizations operating in village
231
4.1
0.124
1
6
Heterogeneity of oxen ownership (coefficient of variation)
231
0.25
0.007
0.10
0.45
Area of community (km2) 231 62.08 4.78 12.3 179 * Means and standard errors are corrected for sampling weights and stratification.
32
References Agrawal, A. 2001. Common Property Institutions and Sustainable Governance of Resources.
World development, 29(10):1649-1672. Baland J-M and Platteau, J-P. 1999. The Ambiguous Impact of Inequality on Local Resource
Management. World development, 27(5): 773-788. Baland, J-M and Platteau, J-P. 1996. Halting Degradation of Natural Resources: Is there a role
forRrural Communities? Oxford University Press, Oxford, UK. 423 pp. Berhanu Gebremedhin , Pender, J. and Girmay Tesfay. 2001. "Community natural resource
management: The case of woodlots in northern Ethiopia." Forthcoming Environment and Development Economics.
Berhanu Gebremedhin and Swinton, S. 2000. �Investment in Soil Conservation in Ethiopia: The
role of Land Tenure Security and Public Programs.� Unpublished manuscript, Department of Agricultural Economics, Michigan State University, East Lansing, USA.
Berhanu Gebremedhin, 1998. "The economics of soil conservation investments in the Tigray
region of Ethiopia." Ph D Dissertation. Department of Agricultural Economics: Michigan State University, East Lansing, USA. 258 pp.
Bureau of Agriculture and Natural Resource Development (BoANRD). 1999. "Livestock census
analysis results." Mekelle, Ethiopia. 230 pp. Bureau of Agriculture and Natural Resource Development (BoANRD). 1997. "Tigray Livestock
Development Action Program: Executive Summary, Volume II." Mekelle. 23 pp. Desta Hagos. 1997 "Tigray Livestock Development Action Program." Tigray Bureau of
Agriculture and Natural Resource Development: Mekelle. Mimeo. Ehui, S, Li Pun, H., Mares, V. and Shapiro, B. 1998. "The role of livestock in food security and
environmental protection." Outlook on Agriculture 27(2):81-87. Fitsum Hagos, Pender, J. and Nega Gebreselassie. 1999. Land degradation in the highlands of
Tigray and strategies for sustainable land management. Socio-economics and Policy Research Working Paper 25. ILRI (International Livestock Research Institute), Addis Ababa, Ethiopia. 80 pp.
33
Gebrekidan Teklu, 1994. A need for change in policy in the traditional grazing system and ownership right on communal lands. Natural Resource and Environmental Protection (NRDEP): Mekelle, Ethiopia. mimeo. 27 pp.
ILRI (International Livestock Research Institute). 1999. ILRI 19998: Linking livestock and natural
resource management. ILRI, Nairobi, Kenya. McCarthy, N., A. Kamara and M. Kirk. 2001. The Effect of environmental Variability on Livestock
and Land-Use management: The Borena Plateau, Southern Ethiopia. Environment and Production Technology Division Discussion Paper 75. Washington D.C.: iFPRI (International Food Policy Research Institute), Washington, D.C. USA.33 pp.
North, D.C. 1990. Institutions, Institutional Change and economic performance. Cambridge
University Press: Cambridge, UK. 152 pp. Oakerson, R.J. 1992. Analyzing the Commons: A Framework. In Bromely (ed), Making the
Commons Work: Theory, Practice and Policy:41-62. International Center for Self-Governance: San Fransisco.
Olson, M.. 1965. The logic of collective action. Public goods and the theory of groups. Harvard
University Press: Cambridge, Massachusetts, USA. 176 pp. Ostrom, E. 1990. Governing the commons: The evolution of institutions for collective action.
Cambridge University Press: Cambridge, UK. 280 pp. Pearce, D.W. and Turner, R.K. 1990. Economics of Natural Resources and the Environment.
Harvester wheatsheaf: Hertfordshire. Pender, J. 1999. Rural population growth, agricultural change and natural resource management
in developing countries: a review of hypotheses and some evidence from Honduras. Environment and Production Technology Division Discussion Paper 48. IFPRI (International Food Policy Research Institute),Washington D.C.,USA. 59 pp.
Pender, J. and S. Scherr. 1999. Organisational development and natural resource management:
Evidence from central Honduras. Environment and Production Technology Division Discussion Paper 49. IFPRI (International; Food Policy Research Institute),Washington D.C., USA. 59 pp.
Rasmusen, L.N. and R. Meinzen-Dick. 1995. Local Organisations for natural resource
management: Lessons from theoretical and empirical literature. Environment and Production Technology Division Discussion Paper 11. IFPRI (International Food Policy Research Institute),Washington D.C, USA. 37 pp.
34
Runge, C. F. 1981. Common Property Externalties: Isolation, Assurance, and Resource Depletion in a Traditional Grazing Context. American Journal of Agricultural Economics, 63:595-606.
Runge, C. F. 1992. Common Property and Collective Action in Economic Development. World Development, 14(5): 623-635.
Swallow, B.W. and. Bromley, D.W. 1995. "Institutions, governance and incentives in common
property regimes for African rangelands." Environment and Resource Economics 6:99-118.
Tsigeweyni Tekleab. 1997. Tigray Soil and water conservation action program: Livestock
management and forage production. Tigray Bureau of Agricultur and Natural Resource Development, Mekelle, Ethiopia. Mimeo. 37 pp.
Turner, R.K., D. Pearce and I. Bateman. 1994. Environmental economics: An introduction.
Hertfordshire: Harvester Wheatsheaf, UK. 189 pp. United Nations Economic Commission for Africa (UNECA). 1997. Livestock development in
Tigray: Forage development strategy as a major entry point towards a sustainable minimum grazing system, Part I. Sustainable Development and Environmental Rehabilitation Program (SAERP): UNECA, Addis Ababa. 167 pp.
Vanderlinden, J-P. 1999. Conflicts and Cooperation over the Commons: A Conceptual and
Methodological Framework for Assessing the Role of Local Institutions. In McCarthy, N. B. Swallow, M. Kirk and P. Hazzel (eds). Property Rights, Risk and livestock Development in Africa: 351-370. IFPRI (International Food Policy Research Institute), Washington D.C., USA.
Varughese, G. and Ostrom, E. 2001. �The Contested role of heterogeneity in collective Action:
Some Evidence from Community Forestry in Nepal.� World development, 29(5):747-765. Wade, R. 1988.Village republics: Economic conditions for collective action in South India. ICS
Press: Oakland, USA. 276 pp. Wade, R.1986. "The management of common property resources: collective action as an
alternative to privatisation and state regulation." Discussion paper No.54. Agricultural and Rural Development Department, The World Bank: Washington DC, USA. 36 pp.
Williamson, O.E. 1986. �The Economics of governance: framework and implications.� In
Langlois, R.N., (ed) Economics as a process: essays in new institutional economics: 31-65. Cambridge University Press: Cambridge, UK.


