Embed Size (px)
Citation preview
Colonialism, European Descendants and
Democracy
Luis Angeles�
November 16, 2009
Abstract
This paper advances that the share of European descendants in
the population is a major determinant of democracy in former colo-
nial countries. We test this hypothesis using cross-section and panel
regressions with 60 developing and developed countries that were once
colonies. We �nd that the share of European descendants can explain
more than half of the di¤erence in measures of democracy between the
least and the most democratic countries in our sample. We control for
other potential determinants of democracy and test for endogeneity
bias using instrumental variables.
JEL classi�cation: P16, N46.
Keywords: democracy, European descendants, colonialism.
�Department of Economics, University of Glasgow. Adam Smith Building, GlasgowG12 8RT. Tel: +44 141 330 8517. Email: [email protected]
1
1 Introduction
Why are some countries more democratic than others? This paper proposes
that the share of European descendants in the population of former colonized
countries is a major explanatory factor of their democratic development to-
day. We test this hypothesis using both cross-section and panel regressions
and �nd robust evidence in its favor. The share of European descendants in
the total population has a large positive e¤ect on democracy scores, an e¤ect
that is larger than that of any of our control variables and that can account
for a major part of the di¤erences observed between democratic and nonde-
mocratic societies. Our interpretation of this relationship and the di¤erences
with other interpretations that exist in the literature are presented below.
A product of the unique in�uence that European nations have had through-
out the world, European descendants constitute a numerous group in a large
number of countries. In some, like the United States or Australia, the large
majority of the population is of European origin. In others, such as most
of Latin America, European descendants are a large group but the majority
of the population is of mixed ancestry, children of Europeans, Amerindians
and Africans. Yet in others, such as most of Sub-Saharan Africa or the In-
dian subcontinent, European descendants are just a very small fraction of
the population.
Europeans arrived to these very diverse corners of the world �rst as colo-
nizers, during a colonial period that in some regions extended for as much as
2
three centuries, and then as immigrants, once some of these regions had be-
come attractive newly independent countries. They brought with them their
culture, language and religion; and in the process transformed the societies
they were settling in.
There are several good reasons to believe that a higher share of European
descendants in a country will lead to a more democratic society today. First
and foremost, Europeans and their descendants were typically in a better
economic condition than the local population. Thanks partly to their higher
levels of human and physical capital, and partly to policies which allocated
key resources such as land in their favor, people of European origin were
much better-o¤ than non-Europeans throughout the colonial world. This
economic preeminence raised their bargaining power at the moment of asking
for political rights and democratization.
The Europeans�higher human capital was a natural consequence of their
belonging to a technically advanced and highly literate society, as opposed to
the colonized regions of the Americas and Sub-Saharan Africa (most of Asia
and the Middle East did not trail much behind Europe in technical knowledge
at the beginning of the colonial period, though this was no longer true by
the 19th century). The policies that favored Europeans can be exempli�ed
by the concession of large tracts of agricultural land to Spanish colonizers
in the Americas, a concession which typically included rights over the labor
force of the inhabitants of the land in question.
3
A second reason is the fact that in many former colonies the governing
elite remained overwhelmingly of European origin after independence (Latin
America, South Africa). Such an elite would be more willing to make demo-
cratic concessions if the share of the population that it regards as similar to
itself in terms of culture and preferences is relatively large. Thus, in coun-
tries such as the United States or Canada, but also Argentina or Uruguay,
we would expect democratic rights to be granted earlier than in countries
with a large indigenous population such as Bolivia or Peru.
A third and �nal reason is that, thanks largely to Europe�s rich network
of universities and large production of books, the concept of democracy was
known and discussed by the continent�s intellectual elite. Democracy was,
after all, a characteristic of classical Athens; and the classical authors from
ancient Greece were among the most read and studied in Europe at the time.
European settlers brought this knowledge with them wherever they settled
in considerable numbers: witness the very early establishment of universities
in the Americas (University of San Marcos in Lima, 1551; Royal and Pon-
ti�cal University of Mexico, 1551; Harvard University, 1636). Knowledge of
democracy was probably much more limited among other cultures.
We chose to limit the range of our thesis to former colonized countries.
The reason is that the arguments presented above have much more force
for colonized than for non-colonized countries. The advantages enjoyed by
European settlers, for instance, were possible because of the enforcement
4
power of the colonial regime. The removal of the local governing elite and
the establishment of an elite of European origin was also possible only in col-
onized countries. However, while we will focus on former colonized countries
our analysis will not be limited to the colonial period. As we discuss be-
low, much European immigration took place after the independence of some
colonial countries and this kept on a¤ecting the composition of the local
population and the share of European descendants in it.
Our paper is related to a growing literature exploring the importance of
colonial heritage in areas such as long-run economic development (Acemoglu
et al. 2001, 2002, Engerman and Sokolo¤ 1997, 2005) or income inequality
(Angeles 2007). The in�uential work of Acemoglu et al. (2001) advances that
colonial experience was a major determinant of a country�s economic insti-
tutions, such as property rights enforcement. These institutions persisted
over time and came to determine the degree of economic development, in the
spirit of North and Thomas (1973) and North (1981).
A more explicit discussion of the in�uence of colonialism on democratic
development can be found in Engerman and Sokolo¤ (1997, 2005). The
authors document the evolution of democracy in the Americas north and
south of the Rio Grande. The di¤erent degree of European settlement in
these two regions is invoked as a major reason behind the large and persistent
democratic gap between them.
A second literature to which we are closely related is the empirical study
5
of the determinants of democracy. Contributors to this literature have tra-
ditionally come from political science (Lipset 1959, Londregan and Poole
1996, Przeworski and Limongi 1997, Przeworski et al. 2000, Papaioannou
and Siourounis 2008), but economists have also addressed the issue (Barro
1999, Acemoglu et al. 2008, 2009). Lipset�s (1959) in�uential "modern-
ization hypothesis" can be found in most of this literature, as GDP per
capita is usually the �rst variable to be tested as a potential determinant of
democracy.
Of special interest to the present paper is the work of Acemoglu et al.
(2008, 2009). The objective of these authors is to disprove the modernization
hypothesis, which they do by focusing on the within-country variation of
income and democracy by means of �xed-e¤ects regressions. While they show
that there is no relationship between income and democracy within countries,
they also feel compelled to give a rationale for the existence of the well-known
cross-sectional correlation between these two magnitudes. Their explanation
is that both income and democracy are caused by the institutional framework
of the country, which was determined in a large number of cases by the
colonial past. Acemoglu et al. (2009) show that some plausible proxies for
the quality of the country�s early institutions, such as its year of independence
or the constraints on the executive in the �rst ten years of independence, are
good predictors of democracy1.
1The use of the word "institutions" can be confusing in this literature. We assumentthat Acemoglu et al. (2009) have in mind economic institutions, such as enforcement
6
Though related, there are several di¤erences between our work and Ace-
moglu et al. (2009). First of all, we do not make any assumptions regarding
the institutional framework of the country, or whether this one was deter-
mined by its colonial past or not. We believe our mechanism is more direct
and transparent: countries where Europeans became more numerous turned
more democratic because Europeans and their descendants where in a better
position to bargain for democratic rights, because the governing elites had
more trust in them and because they brought their knowledge of democracy
to the country.
Like Acemoglu et al. (2009), we believe that the colonial past exercises a
large in�uence on today�s democratic outcomes; but we think this in�uence
plays essentially through the degree of European immigration to the country.
The regressor of interest in our empirical investigation will be the share of
European descendants in total population, a variable that is not considered
by Acemoglu et al. (2009).
Our explanation, �nally, is not limited by what took place in the colonial
period. As mentioned above, Europeans migrated to many countries long
after these became independent. This later �ow ought not to be ignored, as
it concerned far greater numbers than those from the colonial period (though
of property rights, in line with their thinking in Acemoglu et al. (2001). It would notbe very insightful if democracy itself was encompassed in their concept of institutionsfor then their thesis would be just that countries are more democratic today because theywere more democratic in the past; begging the question of what made some countries moredemocratic in the past anyway. Thus, throughout this paper references to "institutions"can be thought of as economic institutions such as enforcement of property rights.
7
concentrated in just a handful of countries). Accordingly, our measure of
European descendants in the population corresponds to the situation in the
late 20th century and incorporates these post-colonial �ows.
The empirical part of this paper tests explicitly our explanation against
that of Acemoglu et al. (2009) by including as a control variable the institu-
tional quality of each country, measured by the risk of expropiation. Results
are strongly supportive of our thesis.
The rest of the paper is organized as follows. Section 2 presents the
data and the methodology. Section 3 carries out our empirical work using
a cross-section of countries, the dependent variable being the average value
of a democracy index over the period 1972-2006. Our results are challenged
by the inclusion of a large set of control variables, by the use of alterna-
tive measures of both democracy and European settlement, by considering
the exclusion of certain regions and by controlling for institutional quality.
We also discuss potential endogeneity problems due to reverse causality and
address them by instrumenting our measure of European descendants with
climate-related variables. Section 4 presents a similar analysis as in section
3 but in a panel setting covering the period 1960-2005. Section 5 o¤ers some
concluding remarks.
8
2 Data and methodology
Our empirical analysis requires data on democracy, European descendants
and on alternative explanatory factors of democracy. For democracy, we use
two well-known and widely accepted measures that have �gured prominently
in the literature: Freedom House�s Political Rights index and Polity IV�s
composite Polity index.
Freedom House�s Political Rights index ranges from 1 to 7 and ratings
are assigned according to how well a country ful�lls a series of criteria estab-
lished by the data publishers. These criteria are expressed in the form of ten
questions, grouped themselves in three areas: electoral process, political plu-
ralism and participation, and functioning of government. For instance, the
�rst question relating to electoral processes asks: "Is the head of government
or other chief national authority elected through free and fair elections?";
while the second question relating to political pluralism and participation
asks "Is there a signi�cant opposition vote and a realistic possibility for the
opposition to increase its support or gain power through elections?" (See
Freedom House 2009 for a full description of the questions and formation of
the index ). The Freedom House measure will be our primary measure of
democracy.
The Polity composite index takes values between -10 and 10 according to
how well a country scores along the following dimensions: competitiveness
of executive recruitment, competitiveness of political participation, openness
9
of executive recruitment, constraints on chief executive and regulation of
participation (see Marshall and Jaggers 2007 for more details). We use the
Polity measure to test the robustness of our results to an alternative index of
democracy. Following the literature, we normalize both indices so that they
take values between 0 and 1, with higher values denoting a more democratic
regime.
The Freedom House Political Rights index is available since 1972 and we
will use its average value over the period 1972-2006 as endogenous variable
in our cross-section analysis. The Polity index is available for a much longer
period, and we will take the average over 1960-2006 as an alternative measure
of democracy. There is not much point in going before 1960 since most
colonized countries outside the Americas did not become independent before
this date. For our panel regressions we take the approach of Acemoglu et
al. (2008) and construct a panel using observations separated by �ve year
intervals from 1960 to 20052.
Our main explanatory factor will be the share of European descendants
in total population in the last quarter of the 20th century. We start from the
data provided by McEvedy and Jones (1975), as reported by Acemoglu et al.
(2001). McEvedy and Jones (1975) report for each country the percentage
2For the Polity index we take the observations for 1960, 1965, ..., 2005. For the FreedomHouse index we take the observations for 1975, 1980, ... 2005 and then, as in Barro (1999)and Acemoglu et al. (2008), we assign the value of 1972 to the year 1970 and use the datain Bollen (1990) to �ll in the observations for 1960 and 1965.
10
of the population that is "white" or "European"3. This is good enough for
countries were ethnic mixing did not take place in a large scale, but would
underestimate the European component in the population in countries were a
large part of those who are not "white" or "European" are actually of mixed
ancestry. This is precisely the case in today�s Latin America.
To address this issue, we use data on ethnic composition from the CIA
(2008) which lists, for every Latin American country, the percentage of
the population belonging to the "mestizo" group (of mixed European and
Amerindian ancestry4). We then adjust the values of McEvedy and Jones
(1975) by adding to the percentage of the population classi�ed as "white" or
"European" one half of the percentage of the population classi�ed as mes-
tizo. For countries outside Latin America no information is provided on the
number of mestizos, which are probably a small group anyway, so we keep
the numbers of McEvedy and Jones (1975). We call this variable "European
descendants" and use it in most of our regressions; but we run some robust-
ness checks in which we substitute it with the data from McEvedy and Jones
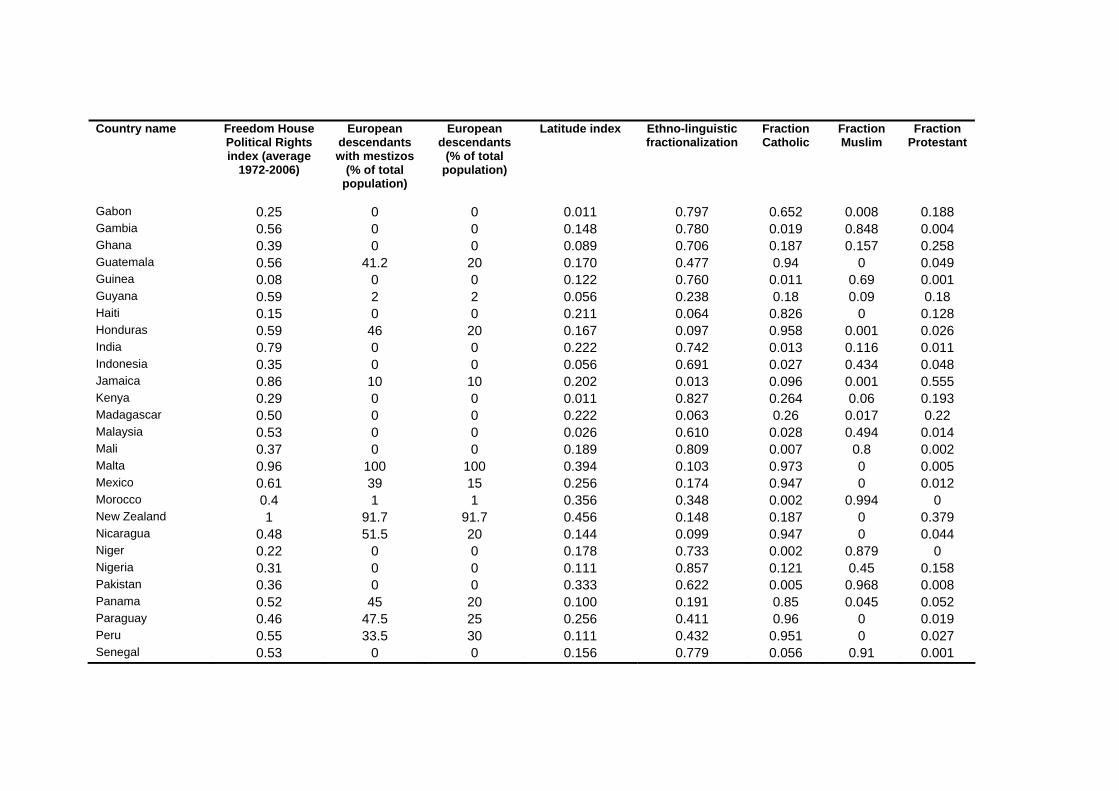
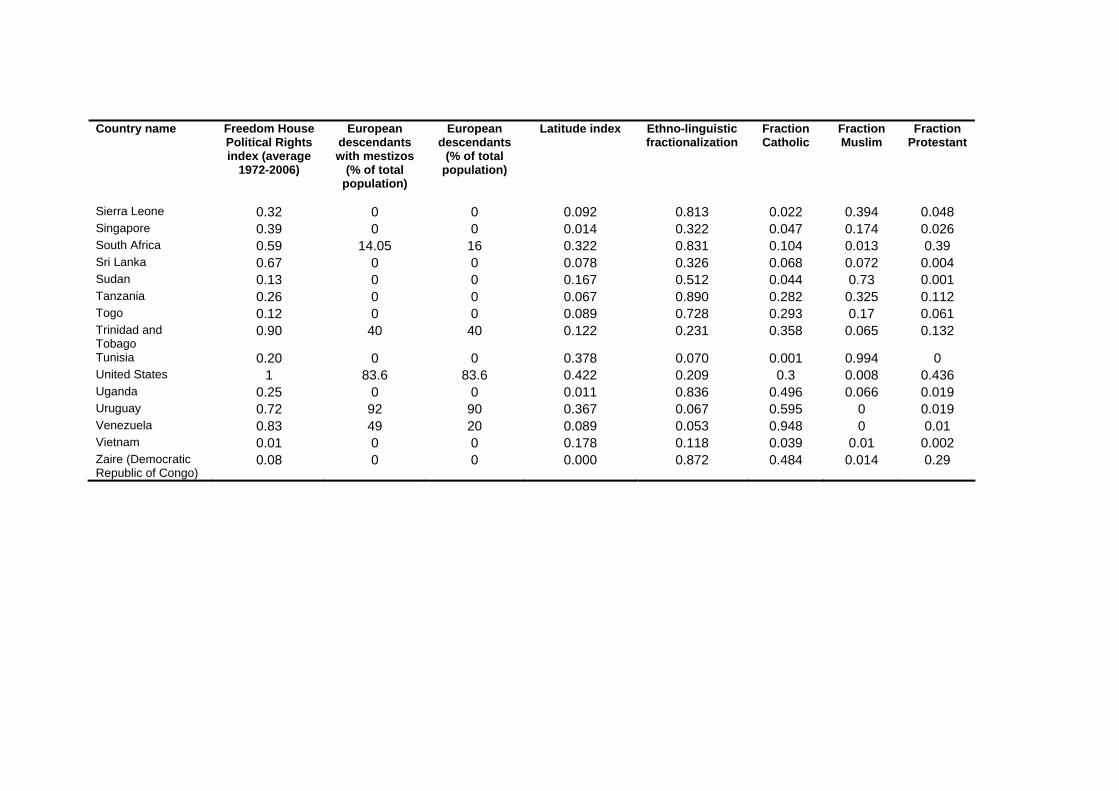
without any modi�cation. Table A1 in the Appendix reports this variable for
all the countries in our sample together with the average level of democracy
for 1972-2006 and several other control variables5.3The data from McEvedy and Jones are estimates for 1975, but there shouldn�t be any
major changes in them over the next quarter century since the age of European migrationwas over well before the second world war.
4There is no data on people of mixed European and African ancestry, but this groupis certainly much less numerous.
5Our sample consists of the same 64 former colonial countries considered by Acemogluet al. (2001) with the exception Hong Kong, for which data on democracy is not available.
11
A �rst look at the bivariate relationship between democracy and Eu-
ropean descendants is provided in Figure 1. This �gure plots the average
value of the Freedom House Political Rights index over the period 1972-2006
against the percentage of European descendants in the population. A posi-
tive relationship between the two variables is apparent and does not seem to
be caused by the presence of outliers.
The relationship between these two variables will be studied more for-
mally using the following cross-sectional speci�cation:
Di = �+ �1Ei +BX + "i (1)
and the following panel speci�cation:
Di;t = �+ �1Ei +BX + �t + "i;t (2)
In equations (1) and (2) D is a measure of democracy, i and t are country
and time indices, Ei is the percentage of European descendants in the total
population in country i, X is a set of control variables and �t a full set of
time dummies. Equation (2) does not include country �xed e¤ects because
of the presence of the time-invariant variable Ei. We focus our attention on
coe¢ cient �1, which is meant to capture the e¤ect of European descendants
on democracy, but the vector of coe¢ cients B is also of interest and will be
The sample includes most former colonies from all continents and allows for comparisonwith the literature.
12
commented as we include di¤erent sets of control variables.
Our main set of control variables includes: variables identifying former
British and former French colonies (the excluded category being former Span-
ish or Portuguese colonies), the latitude of the country, an index of ethno-
linguistic fractionalization, variables measuring the percentage of the pop-
ulation who profess the Catholic, Muslim and Protestant religions, dummy
variables for Latin America and Africa and of course, GDP per capita. The
sources for all variables used in the paper can be found in table A2 in the
Appendix.
3 Empirical analysis: cross-section
3.1 Baseline results
We start by analyzing the relationship between European descendants in
the population and democracy using cross-section analysis. The interest of
using a cross-section is that our endogenous variable is the average of democ-
racy scores over a reasonably long period, 1972-2006 in most regressions and
1960-2006 in a robustness check. This average will eliminate short-term �uc-
tuations, for which our theory is not relevant, and focus on the long run.
Table 1 reports the initial results of this analysis.
In the �rst column of table 1 we run a simple regression where the share
of European descendants in the population is included without any controls.
13
The coe¢ cient on European descendants takes the value of 0:629 and is
statistically signi�cant at the 1% level. This coe¢ cient represents the e¤ect
on the democracy score of passing from 0 to 100% of European descendants
in the population, roughly the di¤erence between a typical country in Sub-
Saharan Africa and a country like Canada or New Zealand. If we consider
that the average value of the Freedom House democracy index over the period
1972-2006 is 1 for Canada and 0:31 for Nigeria, 0:20 for Tunisia and 0:08
for the Democratic Republic of Congo it becomes clear that the magnitude
of the estimated e¤ect would account for most of the di¤erence between
these countries. Passing from 0 to 50% of European descendants in the
population (roughly the di¤erence between an African country and an average
Latin American country like Colombia or the Dominican Republic) would
increase the democracy index by 0:629�0:50 = 0:315 ; also a large part of the
observed di¤erence. Notably, this simple regression is able to explain half of
the variation in our measure of democracy.
The second column of table 1 incorporates what is perhaps the most pop-
ular explanatory factor of democracy: economic development, as measured
by the country�s GDP per capita. Since the "modernization hypothesis" pro-
poses that economic development will eventually lead to democratic changes,
we use GDP per capita in 1970, at the beginning of our period of analysis,
as an explanatory factor. This also addresses the potential reverse causality
that would arise if democracy is bene�cial for economic development.
14
It is worth noting that the degree of European settlement in a country may
well be one of the long-run determinants of GDP per capita, either because of
its e¤ect on institutional development (Acemoglu et al. 2001, 2002), because
of the Europeans�higher levels of human capital (Glaeser et al. 2004) or
through any other potential channel. If the degree of European descendants
is a¤ecting democracy only through its e¤ect on GDP per capita then the
inclusion of this variable would render the e¤ect of European descendants
insigni�cant. Such a result would not imply that the degree of European
settlement is irrelevant, but it would point to a mechanism that is not stressed
in the present paper but in other parts of the literature.
The results, however, are still supportive of our interpretation. When we
include GDP per capita the coe¢ cient on European descendants falls slightly,
to 0:420, but remains statistically signi�cant and of large magnitude. The
coe¢ cient on GDP per capita is statistically signi�cant in this regression
but, as we shall see, loses signi�cance once additional controls are added to
the equation. Thus, European descendants tend to have a positive e¤ect on
democracy scores for a given level of economic development
The next �ve columns of table 1 incorporate progressively additional con-
trol variables to the two regressors considered above. Column 7 presents our
full baseline regression with all control variables included simultaneously.
Each of the control variables that we include is of interest not only because
they are plausible determinants of democracy (and have �gured as such in
15
previous empirical analysis such as Barro 1999); but also because they may
be correlated with our measure of European descendants and could thus lead
to an omitted variable bias.
In column 3 we incorporate dummy variables identifying former British
colonies and former French colonies (the omitted category being former colonies
of Spain and Portugal). This tests for an important alternative explanation
linking colonialism to democracy, namely that colonies of more democratic
countries (such as Britain) became more democratic than colonies of more
authoritarian regimes such as France or Spain; arguably because of some
form of institutional transfer that does not depend on the degree of Euro-
pean settlement. An omitted variable bias would arise if the colonies of the
most democratic European power, say Britain, tend to receive more settlers
than the others.
Column 4 adds a measure of climate, latitude, which is simply the distance
from the equator scaled between 0 and 1. Places further away from the
equator are characterized by temperate climate while tropical countries �nd
themselves close to the equator. It can be argued that tropical climate can
somehow in�uence the political regime, for instance because the production of
tropical products such as cane sugar or cacao implies a highly unequal income
distribution and therefore concentrates power in a few hands. Moreover, it
was certainly the case that fewer Europeans settled in tropical regions, once
again raising the possibility of an omitted variable bias.
16
The next column considers the in�uence of ethnic diversity, as measured
by a country�s ethnolinguistic fractionalization. Ethnic diversity may make
democracy less workable, as each ethnic group pushes for its own interests
and blocs measures that are bene�cial for the country as a whole but not for
each particular group (Easterly and Levine 1997).
In column 6 we add the percentage of the population that follow the
Catholic, Muslim and Protestant religions. One may well argue that certain
religions impart a world view more akin to autocracy or to democracy in
their followers. It is also certainly the case that European settlement will
be positively correlated with the percentage of Christians, either Catholic or
Protestants, in the population. Thus, the inclusion of these controls covers
yet another potential bias.
Column 7, �nally, adds dummy variables for Latin America and for Sub-
Saharan Africa to account for any particular characteristic of these two re-
gions that may be driving the results. This is not necessarily a very ap-
propriate test, since the share of European descendants in the population
may be precisely the particular characteristic that we allude to. Our thesis
should survive the inclusion of these controls, however, since democracy and
European descendants should be correlated within these regions as well.
As table 1 makes clear, the share of European descendants in the pop-
ulation remains statistically signi�cant at the 1% level in all regression and
its coe¢ cient does not change much, stabilizing at around 0:500: This is
17
not much di¤erent from the initial coe¢ cient in column 1, and it implies an
important e¤ect on democracy scores.
On the other hand, GDP per capita becomes statistically not signi�cant
as we consider a larger set of control variables; its coe¢ cient falling in size
from 0:106 in the �rst column to 0:036 in the last one. This result joins those
of Acemoglu et al. (2008, 2009) on the lack of support for the modernization
hypothesis once historical factors are taken into account.
Most other control variables fail to achieve statistical signi�cance, al-
though the size of their coe¢ cients can be large in some cases. The two
control variables that appear to have a clear, statistically signi�cant, e¤ect
on democracy are the dummy for former British colonies and the dummy
for Latin American countries. The results in column 7 imply that a former
British colony would have a democracy score 0:151 higher than otherwise
expected, while the e¤ect for a Latin American country would be even larger
at 0:282: It is worth mentioning that since the early 1980s Latin America has
experienced a successful democratic period that was not a characteristic of
the region in earlier decades.
Overall, these initial results show strong support for our thesis. The share
of European descendants in the population appears to have a large e¤ect on
the prevalence of democracy that cannot be accounted by the potential e¤ect
of Europeans on GDP per capita or by the fact that European settlement
may be correlated with factors such as the identity of the colonial power,
18
climate or religion.
3.2 Robustness tests
We test the robustness of the above results by changing our measures of
democracy, changing our measure of European settlement, excluding parts
of the sample, controlling for institutional quality and considering the pos-
sibility of endogeneity bias. Our departure point is column 7 of table 1, our
baseline regression with all controls. Results are reported in table 2.
In the �rst column of table 2 we substitute the Freedom House measure
of democracy with the one from Polity IV, which we average over the period
1960-2006. This has no consequence on most control variables, since they
are time-invariant anyway, the exception being GDP per capita. In order
to remain with a measure of economic development at the beginning of the
period, we consider GDP per capita in 1960 for this regression alone.
Results are fully consistent with those of previous regressions. The coef-
�cient on European descendants is 0:489, very similar to the value obtained
with the democracy index from Freedom House, and is statistically signif-
icant. Control variables have similar e¤ects, with GDP per capita in 1960
showing a coe¢ cient that is small and not signi�cant.
In the second column the change is on our measure of European descen-
dants, by considering the original estimates from McEvedy and Jones (1975)
19
without the adjustments described in the previous section. Our results con-
tinue to hold, though we notice that the coe¢ cient on European settlers
-while still statistically signi�cant at the 5% level- is smaller than in other
columns. This result can be explained if we regard the measure of European
descendants used in this column as a noisier version of the more appropriate
one considered in the rest of the paper, since measurement errors produce a
bias towards zero in estimated coe¢ cients.
The third and fourth columns of table 2 see the exclusion of Latin Amer-
ican (column 3) and Sub-Saharan African (column 4) countries. Results
remain unchallenged, with the coe¢ cient on European descendants keeping
its value of about 0:500: The coe¢ cients on other control variables do not
su¤er major changes.
The regression reported in the �fth column of table 2 is thought as a test
of our thesis of the link between European descendants and democracy as
opposed to the thesis developed in Acemoglu et al. (2008, 2009). As dis-
cussed previously, Acemoglu et al. (2008, 2009) link the colonial past to the
democratic present through the institutional development of a country. This
is a di¤erent channel from the one we are stressing here, where the colonial
past matters because it can bring a signi�cant number of European settlers
to the country and European settlers make democracy more likely irrespec-
tive of other institutional settings. A simple way to control for the thesis of
Acemoglu et al. (2008,2009) is to include a measure of institutional qual-
20
ity in our regression. If European settlement matters only because it makes
a country�s (economic) institutions better, then controlling for institutional
quality should render the share of European descendants in the population
insigni�cant.
Column 5 uses as a control the preferred measure of institutional qual-
ity from Acemoglu et al. (2001), namely the risk of expropriation by the
government in 1985. The results are strongly supportive of our thesis: the
coe¢ cient on European descendants continues to be statistically signi�cant
with a coe¢ cient of about 0:500 whereas the measure of institutional quality
is not signi�cant and its coe¢ cient is relatively small6.
3.3 Robustness tests: endogeneity
The �nal robustness test that we consider deals with the potential problem
of reverse causality in our regression. One may argue that Europeans de-
cided to emigrate to countries that were already democratic or in the process
of becoming so. In this case our results would be capturing the e¤ects of
democracy on European settlement and not the opposite.
Our �rst argument against such eventuality is that for the large majority
of colonized countries European immigration took place essentially during
6Acemoglu et al. (2009) �nd support for their interpretation by considering plausibleindicators of early institutional quality: year of independence, population density in 1500and the polity scores in the �rst ten years of independence. By considering a measureof current institutional quality we are giving higher chances to this institutional channelsince we are ignoring the possibility of reverse causality.
21
the colonial period, well before the establishment of any democratic regime.
Of course, post-colonial European migration also took place, and it actually
concerned much larger numbers of people than in colonial times, but the rel-
evant point for our analysis is that these post-colonial �ows concerned only
a small number of countries: the United States, Canada, Australia and the
southern cone of South America (Argentina, Brazil, Uruguay and Chile)7.
Some of these are very big countries, but since every country has the same
weight in our cross-section we can say that for the majority of our observa-
tions reverse causality is not a likely problem.
Of course, even a small number of biased observations may be su¢ cient
to invalidate our results; so let us consider the matter further. The choice
of destination of European immigrants during the late 19th century and
early 20th century could be suspected to be in�uenced by the presence or
absence of democracy in the destination countries. This seems unlikely for
South American countries, which were not democratic until well into the 20th
century (Smith 2005), but is a more tenable position when we consider the
countries that attracted by far the most immigrants: the United States and
Canada.
As is well known, the United States and Canada were among the most
democratic countries in the world at the time (Engerman and Sokolo¤ 1997,
2005). There are, however, two important elements in this historical episode
7See Hatton and Williamson (2005) and Maddison (2007). For estimates of immigrationto Argentina, Brazil, Uruguay and Chile during this period see Sanchez-Albornoz (1986).
22
that lead us to think that causality runs from European settlement to democ-
racy and not the other way round. First is the fact that both the United
States and Canada were countries whose population was overwhelmingly of
European origin long before the late 19th century. Indeed, these countries
became mostly European �rst and democratic later on. The large numbers
of immigrants that they attracted once they had become democratic did not
change the ethnic composition of their population: they were already mostly
populated by European descendants.
The second element becomes apparent once we take a closer look at the
evolution of democratic rights in the United States during the late 19th
and early 20th centuries. As it turns out, the period from 1890 to 1926
saw the reintroduction of literacy requirements for voting in 18 states of
the Union (Engerman and Sokolo¤ 2005). These measures, largely directed
towards blacks and immigrants, were a typical method to disenfranchise poor
potential voters during this period. Thus, many of the immigrants coming
to the United States were not able to participate in the democratic process,
despite the fact that they were coming to a largely democratic country. It is
therefore di¢ cult to argue that it was the possibility of exercising democratic
rights that attracted them in the �rst place.
While we �nd the above arguments quite convincing, it is worth address-
ing the issue more formally with an instrumental variables estimation in
which the percentage of European descendants in the population is treated
23
as an endogenous variable. Our set of instruments consists of the country�s
mean temperature, the prevalence of malaria, the mortality rate for Euro-
pean settlers and the population density of the country in the year 1500 (see
appendix for data sources). One can make a plausible argument for each
of these variables�e¤ect on the degree of European settlement. Europeans
would be more reluctant to emigrate to countries with a high-risk disease en-
vironment, as measured by the mortality rate and the prevalence of malaria.
They would prefer cooler, temperate regions closer in climate to their native
countries over tropical, hot countries. Population density would be an at-
tractive feature for Europeans interested in exploiting the labour resources of
their colonies, as argued by Acemoglu et al. (2002). All this implies that the
�rst condition for the validity of our instrumental variables is likely to be sat-
is�ed. Indeed, a regression of European descendants on these four variables
explains 57% of the variation in the data.
The second condition for instrumental variable validity states that in-
struments should not be correlated with the error term in the second-stage
regression. To make sure that this is the case we are including both GDP
per capita and institutional quality as control variables of our second stage
regression. Our instruments are likely determinants of these variables and
could a¤ect democracy through them.
The results of this IV regression are reported in column 6 of table 2 and are
strongly supportive of our thesis. The coe¢ cient on European descendants
24
continues to be statistically signi�cant at the 1% level and its size is even
larger than in previous regressions. Other coe¢ cients take similar values
as previously, with institutional quality remaining statistically insigni�cant
and and small in size. Overall, we �nd that instrumenting for the degree of
European settlement does not invalidate our results, it actually tends to make
them even stronger (suggesting that if our measure of European descendants
is indeed endogenous then the correlation with the error term would actually
be negative).
4 Empirical analysis: panel
We complement our cross-sectional analysis with a panel study. Panel re-
gressions are not the �rst choice in the present paper for two reasons. First,
a panel will capture relatively short-term variations in democracy as com-
pared with a cross-section in which the endogenous variable is an average
over several decades. Second, due to the time-invariant nature of our regres-
sor of interest we cannot consider �xed e¤ects regressions, which would be
of interest by their capacity to remove unobservable country-speci�c factors.
Despite these shortcomings, there are still good reasons to test our thesis
in a panel setting. First of all, a panel allows for the inclusion of time dum-
mies. Time dummies are desirable in this context because of the existence
of "democratic waves" throughout large regions of the world (Huntington
1993). The 1970s, for instance, saw a large number of developing countries
25
falling into military dictatorships whereas the 1990s was characterized by a
return of democracy in most parts of the world. All our panel regressions
will include time dummies.
A second reason is that a panel allows us to estimate a dynamic model
that takes into account the persistence of democratic (or undemocratic)
structures. This is done by estimating a model in which the (5-year) lag
of democracy enters as an explanatory variable of current democracy. Panel
regressions also allow for interesting comparisons with other works in the
literature that also use this methodology (Barro 1999, Acemoglu et al. 2008,
2009). Our panel consists of 10 quinquennial observations for each country,
from 1960 to 2005 (see section 2).
Our results are reported in table 3. The �rst column of this table cor-
responds to our full baseline regression from previous section (last column
of table 1). The main di¤erence is that instead of using GDP per capita
at some initial period we use its 5-year lag. The results are very similar to
those obtained in the cross-section, with the coe¢ cient on European descen-
dants taking value of 0:498 and being statistically signi�cant at the 1% level.
GDP per capita has an even smaller e¤ect than before and is not statistically
signi�cant. The dummies on British colonies and Latin American countries
remain positive and signi�cant, and will be so in all panel regressions. An-
other variable that is now consistently signi�cant is the share of Catholics
in the population, with a large negative coe¢ cient. The coe¢ cients on time
26

dummies are not reported for conciseness, but they tend to be statistically
signi�cant.
The second column of table 3 incorporates the 5-year lag of democracy as
an additional explanatory factor. As expected, democracy has a signi�cant
degree of persistence: the coe¢ cient on lagged democracy takes the value of
0:528 and is clearly statistically signi�cant. The in�uence of European de-
scendants remains of similar magnitude as in previous speci�cations. To see
this, one must consider that in a model with a lagged dependent variable the
coe¢ cient �1 measures only the short-term e¤ect of European descendants on
democracy. The long term e¤ect, once the model reaches a new equilibrium,
would be given by �1=(1 � ), where represents the coe¢ cient on lagged
democracy. This would yield an overall e¤ect of 0:304=(1 � 0:528) = 0:644;
which is in line with our previous results. Results are consistent when we use
longer lags of democracy8.
Columns 3 to 8 in table 6 constitute a series of robustness checks on
our panel results that follow those performed in table 2. We run our base-
line regression using quinquennial measures of democracy from the Polity
IV dataset (column 3), using the measure of European descendants without
adjusting for mixed ethnic origin (column 4), excluding Latin America or
Sub-Saharan Africa (columns 5 and 6), controlling for institutional quality
8Using 10-year lags, for instance, produces a coe¢ cient on European descendants of0:464 and a coe¢ cient on lagged democracy of 0:265 , for a long-term e¤ect of Europeandescendants of 0:631:
27
(column 7) and instrumenting for European descendants while controlling for
institutional quality (column 8). Our central result of a large and statisti-
cally signi�cant e¤ect of the share of European descendants on democracy is
con�rmed in each of these regressions. As before, the coe¢ cient of this vari-
able is somewhat smaller when we don�t adjust for mixed ethnic origin and
is larger when we use instrumental variables; in most other regressions the
coe¢ cient is close to 0:500: GDP per capita has an even smaller e¤ect than
in our cross-section analysis, and most control variables are not statistically
signi�cant with the exceptions noted above.
To sum up, the empirical analysis carried out in this and the preceding
section is strongly supportive of the thesis developed in this paper. The share
of European descendants in the population is a major explanatory factor of
democracy over the last 4 or 5 decades. The e¤ect does not appear to work, as
one may be tempted to think, through the e¤ect of European descendants on
GDP per capita or on institutional quality; for we run regressions controlling
for these country characteristics. Overall, the e¤ect of European descendants
on democracy scores appears to be robust and of large magnitude: passing
from 0 to 100% of European descendants in the population would translate
into an average democracy score about 0:500 higher.
28
5 Concluding remarks
This paper discusses and tests the hypothesis that the share of European
descendants in the population is a major explanatory factor of democracy
in former colonized countries. We di¤er from other papers in the literature
since we do not advance that European settlement exercises its in�uence
on democracy through institutional development or through higher levels
of GDP per capita. Instead, we suggest a simpler mechanism according
to which a population with a large European component makes democracy
more likely because (i) European descendants are wealthier -and have thus
more bargaining power-, (ii) The elite in many colonized countries trust them
more than they trust the original population, and (iii) Europeans brought
with them knowledge of democracy itself. Regression analysis supports our
thesis, since our measure of European descendants in the population has a
high e¤ect on democracy scores while institutions and GDP per capita do
not.
The results obtained in this paper underline the importance of historical
factors in general, and colonial past in particular, in long run socioeconomic
outcomes. It seems natural to think that in democratic development, as in
economic development or in income distribution, there is a large degree of
path dependence whose origins may stretch back for not only decades but
centuries.
We would not like to convey the idea, however, that countries of low
29
European settlement are destined to remain undemocratic or that history is
destiny. We �nd it thus pertinent to conclude with two points that may not
have been evident in the preceding discussion. First, there is considerable un-
explained variation in the data. A good example is India, where a negligible
level of European settlement did not preclude this country from becoming a
well-functioning democracy (average Freedom House score of 0.80). Second,
our analysis has focused on the cross-sectional di¤erences in democracy, not
on its time dimension. This is of necessity in our cross-sectional analysis, but
our panel analysis has also removed much of the time variation by the inclu-
sion of time dummies. What is important to remember is that, although the
di¤erences in democracy across countries are large and have prevailed over
the last few decades, there is also a general tendency towards more democracy
in most parts of the world. In time, one would hope that the explanatory
factors that we considered in this paper will not account for di¤erences in
democracy, for all the world will be democratic, but for di¤erences in the
establishment of democratic regimes.
30
References
Acemoglu, D., Johnson, S. and Robinson, J. A. 2001, The colonial origins
of comparative development: an empirical investigation, American Economic
Review 91 (5), p. 1369-1401.
Acemoglu, D., Johnson, S. and Robinson, J. A. 2002, Reversal of Fortune:
Geography and Institutions in the Making of the Modern World Income
Distribution, Quarterly Journal of Economics 117 (4), p. 1231-1294.
Acemoglu, D., Johnson, S., Robinson, J. A. and Yared, P. 2008, Income
and Democracy, American Economic Review 98 (3), 808-842.
Acemoglu, D., Johnson, S., Robinson, J. A. and Yared, P. 2009, Reeval-
uating the modernization hypothesis, unpublished manuscript, MIT.
Angeles, L. 2007, Income Inequality and Colonialism, European Economic
Review 51 (July), p.1155-1176.
Barro, R. J. 1999, Determinants of Democracy, Journal of Political Econ-
omy 107 (6), S158-S183.
Bollen, K. A. 1990, Political Democracy: Conceptual and Measurement
Traps, Studies in Comparative International Development 25 (1), 7-24.
Central Inteligence Agency 2008, The CIA World Factbook 2008, avail-
able online: https://www.cia.gov/library/publications/the-world-factbook/
Easterly, W. and Levine, R. 1997, Africa�s growth tragedy: policies and
ethnic division, Quarterly Journal of Economics 112 (4), 1203-1250.
Engerman, S. L. and Sokolo¤, K. L. 1997, Factor Endowments, Insti-
tutions and Di¤erential paths of growth among New World Economies, in
31
Haber, S. H. (ed.), How Latin America Fell Behind, Stanford: Stanford Uni-
versity Press.
Engerman, S. L. and Sokolo¤, K. L. 2005, Colonialism, Inequality and
long-run paths of development, NBER working paper 11057.
Feyrer, J. and Sacerdote, B. forthcoming, Colonialism and Modern In-
come: Islands as Natural Experiments, Review of Economics and Statistics.
FreedomHouse, 2009, Freedom in theWorld, http://www.freedomhouse.org
, accesed on March 2009.
Glaeser, E. L., La Porta, R., Lopez de Silanes, F. and Shleifer, A., 2004,
Do Institutions cause growth?, Journal of Economic Growth 9, 271-303.
Hatton, T. J. and Williamson, J. G. 2005, Global Migration and the
World Economy, Cambridge: MIT Press.
Huntington, S. P. 1993, The third wave: Democratization in the late
twentieth century, University of Oklahoma Press .
La Porta, R., Lopez-de-Silanes, F., Schleifer, A. and Vishny, R. 1998, Law
and Finance, Journal of Political Economy 106 (6), 1113-1155.
La Porta, R., Lopez-de-Silanes, F., Schleifer, A. and Vishny, R. 1999, The
Quality of Government, The Journal of Law, Economics and Organization
15 (1), 222-279.
Lipset, S. M. 1959, Some social requisities of democracy: economic devel-
opment and political legitimacy, American Political Science Review 53 (1),
p. 69-105.
Londregan, J. B. and Poole, K. T. 1996, Does high income promote
32
democracy?, World Politics 49 (1), 1-30.
Maddison, A. 2007, Contours of theWorld Economy, 1 - 2030 AD, Oxford:
Oxford University Press.
Maddison, A. 2009, Statistics on World Population, GDP and per capita
GDP, 1 - 2006 AD, available at: http://www.ggdc.net/maddison/ .
Marshall, M. G. and Jaggers, K. 2007, Polity IV Project: Dataset Users�
Manual.
McEvedy, C. and Jones, R. 1978, Atlas of World Population History,
Harmondsworth, New York : Penguin books.
North, D. C. 1981, Structure and change in economic history, New York:
W. W. Norton & Co.
North, D. C. and Thomas, R. P. 1974, The rise of the western world: A
new economic history, Cambridge: Cambridge University Press.
Papaioannou, E. and Siourounis, G. 2008, Economic and social factors
driving the third wave of democratization, Journal of Comparative Eco-
nomics 36, 365-387.
Przeworski, A. and Limongi, F 1997, Modernization: Theory and Facts,
World Politics 49 (2), 155-183.
Przeworski, A., ALvarez, M., Cheibub, J. A. and Limongi, F. 2000,
Democracy and Development: Political Institutions and Material Well-being
in the World, 1950-1990. New York: Cambridge University Press.
Rodrik, D., Subramanian, A. and Trebbi, F. 2004, Institutions rule: the
primacy of institutions over geography and integration, Journal of Economic
33
Growth 9 (2), 131-165.
Sanchez-Albornoz, N. 1986, The population of Latin America, 1850-1930,
in Bethell, L. (ed.) The Cambridge History of Latin America, volume IV,
Cambridge: Cambridge University Press.
34
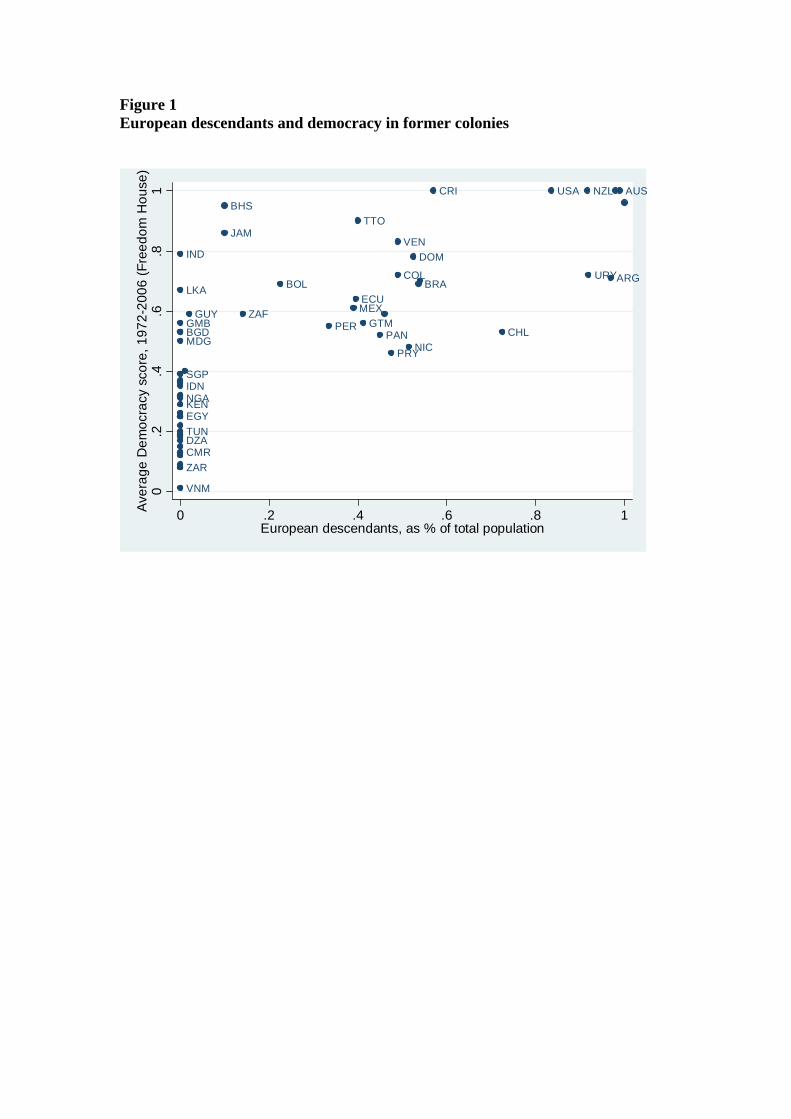
Figure 1 European descendants and democracy in former colonies
ARG
AUS
BGD
BHS
BOL BRA
CHL
CMR
COL
CRI
DOM
DZA
ECU
EGY
GMB GTMGUY
IDN
IND
JAM
KEN
LKA
MDG
MEX
NGA
NIC
NZL
PANPER
PRY
SGP
TTO
TUN
URY
USA
VEN
VNM
ZAF
ZAR
0.2
.4.6
.81
Ave
rage
Dem
ocra
cy s
core
, 197
2-20
06 (F
reed
om H
ouse
)
0 .2 .4 .6 .8 1European descendants, as % of total population
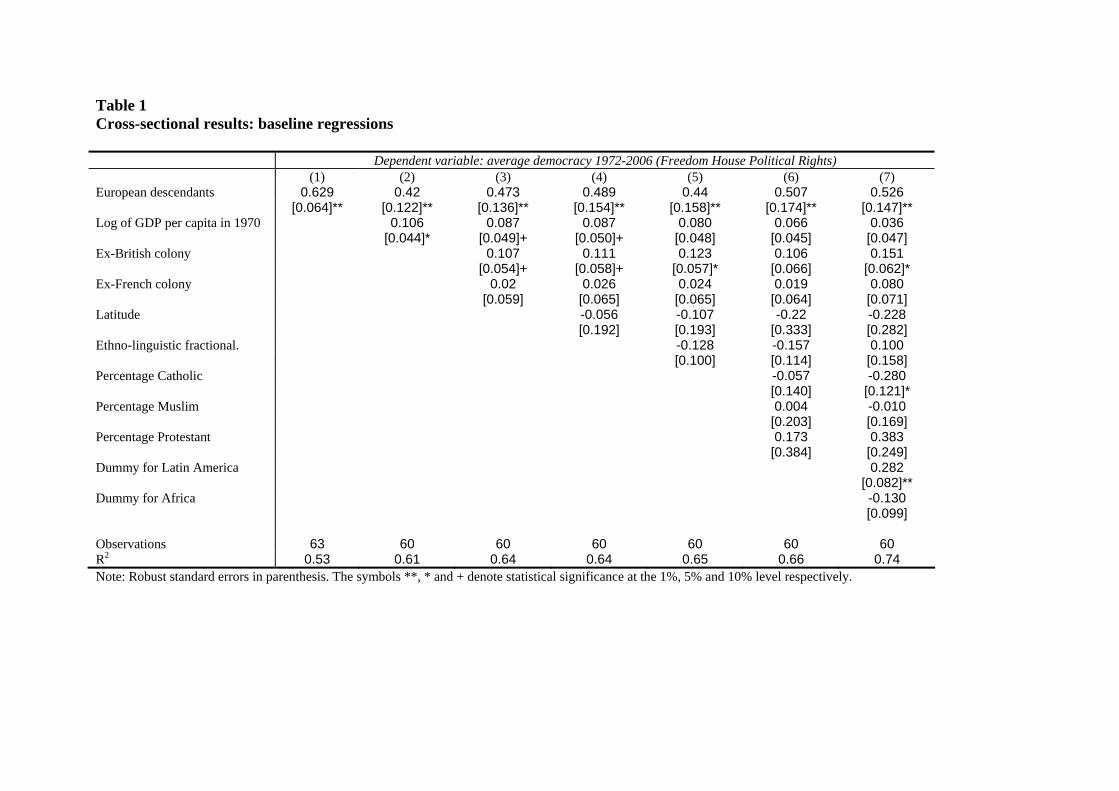
Table 1 Cross-sectional results: baseline regressions
Dependent variable: average democracy 1972-2006 (Freedom House Political Rights) (1) (2) (3) (4) (5) (6) (7)
European descendants 0.629 0.42 0.473 0.489 0.44 0.507 0.526 [0.064]** [0.122]** [0.136]** [0.154]** [0.158]** [0.174]** [0.147]** Log of GDP per capita in 1970 0.106 0.087 0.087 0.080 0.066 0.036 [0.044]* [0.049]+ [0.050]+ [0.048] [0.045] [0.047] Ex-British colony 0.107 0.111 0.123 0.106 0.151 [0.054]+ [0.058]+ [0.057]* [0.066] [0.062]* Ex-French colony 0.02 0.026 0.024 0.019 0.080 [0.059] [0.065] [0.065] [0.064] [0.071] Latitude -0.056 -0.107 -0.22 -0.228 [0.192] [0.193] [0.333] [0.282] Ethno-linguistic fractional. -0.128 -0.157 0.100 [0.100] [0.114] [0.158] Percentage Catholic -0.057 -0.280 [0.140] [0.121]* Percentage Muslim 0.004 -0.010 [0.203] [0.169] Percentage Protestant 0.173 0.383 [0.384] [0.249] Dummy for Latin America 0.282 [0.082]** Dummy for Africa -0.130 [0.099] Observations 63 60 60 60 60 60 60 R2 0.53 0.61 0.64 0.64 0.65 0.66 0.74 Note: Robust standard errors in parenthesis. The symbols **, * and + denote statistical significance at the 1%, 5% and 10% level respectively.
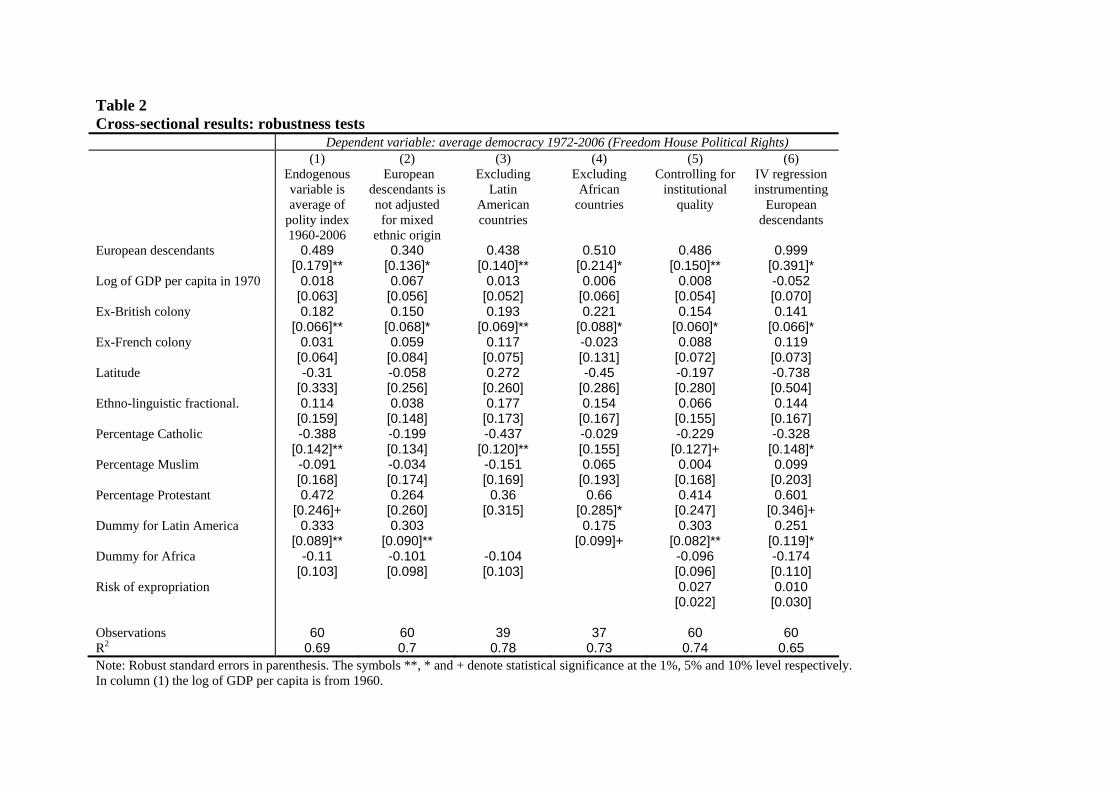
Table 2 Cross-sectional results: robustness tests
Dependent variable: average democracy 1972-2006 (Freedom House Political Rights) (1)
Endogenous variable is average of
polity index 1960-2006
(2) European
descendants is not adjusted for mixed
ethnic origin
(3) Excluding
Latin American countries
(4) Excluding
African countries
(5) Controlling for
institutional quality
(6) IV regression instrumenting
European descendants
European descendants 0.489 0.340 0.438 0.510 0.486 0.999 [0.179]** [0.136]* [0.140]** [0.214]* [0.150]** [0.391]* Log of GDP per capita in 1970 0.018 0.067 0.013 0.006 0.008 -0.052 [0.063] [0.056] [0.052] [0.066] [0.054] [0.070] Ex-British colony 0.182 0.150 0.193 0.221 0.154 0.141 [0.066]** [0.068]* [0.069]** [0.088]* [0.060]* [0.066]* Ex-French colony 0.031 0.059 0.117 -0.023 0.088 0.119 [0.064] [0.084] [0.075] [0.131] [0.072] [0.073] Latitude -0.31 -0.058 0.272 -0.45 -0.197 -0.738 [0.333] [0.256] [0.260] [0.286] [0.280] [0.504] Ethno-linguistic fractional. 0.114 0.038 0.177 0.154 0.066 0.144 [0.159] [0.148] [0.173] [0.167] [0.155] [0.167] Percentage Catholic -0.388 -0.199 -0.437 -0.029 -0.229 -0.328 [0.142]** [0.134] [0.120]** [0.155] [0.127]+ [0.148]* Percentage Muslim -0.091 -0.034 -0.151 0.065 0.004 0.099 [0.168] [0.174] [0.169] [0.193] [0.168] [0.203] Percentage Protestant 0.472 0.264 0.36 0.66 0.414 0.601 [0.246]+ [0.260] [0.315] [0.285]* [0.247] [0.346]+ Dummy for Latin America 0.333 0.303 0.175 0.303 0.251 [0.089]** [0.090]** [0.099]+ [0.082]** [0.119]* Dummy for Africa -0.11 -0.101 -0.104 -0.096 -0.174 [0.103] [0.098] [0.103] [0.096] [0.110] Risk of expropriation 0.027 0.010 [0.022] [0.030] Observations 60 60 39 37 60 60 R2 0.69 0.7 0.78 0.73 0.74 0.65 Note: Robust standard errors in parenthesis. The symbols **, * and + denote statistical significance at the 1%, 5% and 10% level respectively. In column (1) the log of GDP per capita is from 1960.
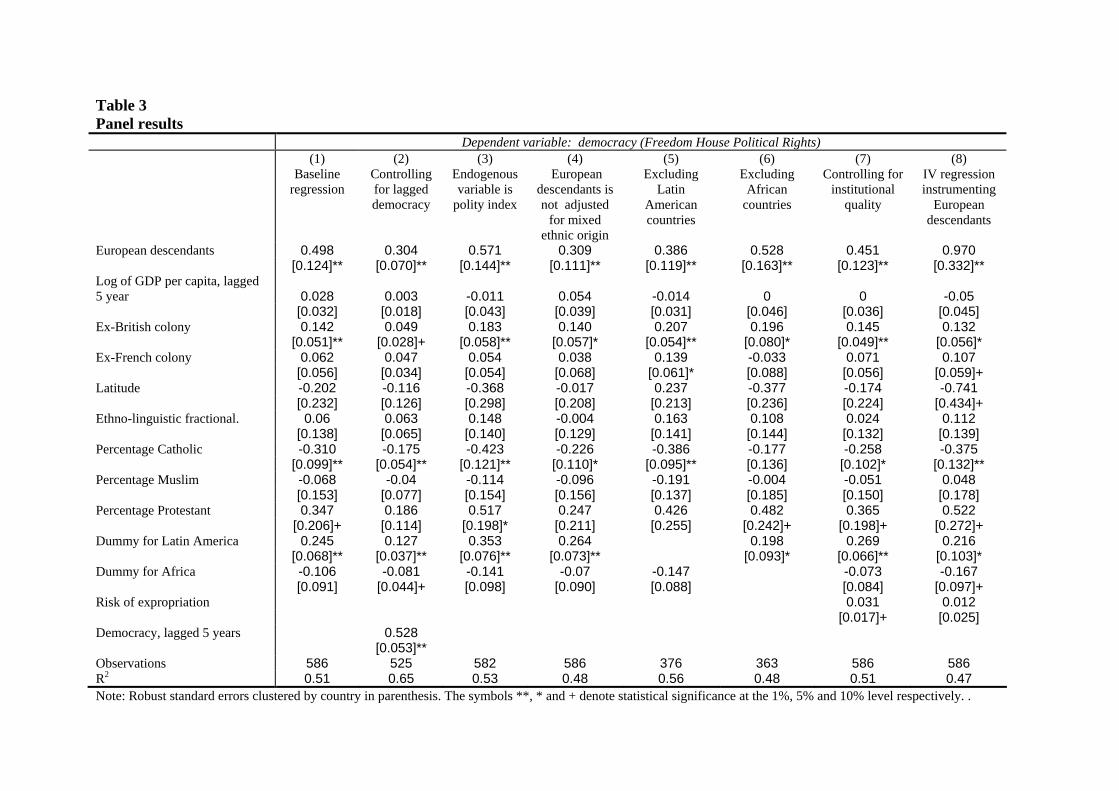
Table 3 Panel results
Dependent variable: democracy (Freedom House Political Rights) (1)
Baseline regression
(2) Controlling for lagged democracy
(3) Endogenous variable is
polity index
(4) European
descendants is not adjusted
for mixed ethnic origin
(5) Excluding
Latin American countries
(6) Excluding
African countries
(7) Controlling for
institutional quality
(8) IV regression instrumenting
European descendants
European descendants 0.498 0.304 0.571 0.309 0.386 0.528 0.451 0.970 [0.124]** [0.070]** [0.144]** [0.111]** [0.119]** [0.163]** [0.123]** [0.332]** Log of GDP per capita, lagged 5 year 0.028 0.003 -0.011 0.054 -0.014 0 0 -0.05 [0.032] [0.018] [0.043] [0.039] [0.031] [0.046] [0.036] [0.045] Ex-British colony 0.142 0.049 0.183 0.140 0.207 0.196 0.145 0.132 [0.051]** [0.028]+ [0.058]** [0.057]* [0.054]** [0.080]* [0.049]** [0.056]* Ex-French colony 0.062 0.047 0.054 0.038 0.139 -0.033 0.071 0.107 [0.056] [0.034] [0.054] [0.068] [0.061]* [0.088] [0.056] [0.059]+ Latitude -0.202 -0.116 -0.368 -0.017 0.237 -0.377 -0.174 -0.741 [0.232] [0.126] [0.298] [0.208] [0.213] [0.236] [0.224] [0.434]+ Ethno-linguistic fractional. 0.06 0.063 0.148 -0.004 0.163 0.108 0.024 0.112 [0.138] [0.065] [0.140] [0.129] [0.141] [0.144] [0.132] [0.139] Percentage Catholic -0.310 -0.175 -0.423 -0.226 -0.386 -0.177 -0.258 -0.375 [0.099]** [0.054]** [0.121]** [0.110]* [0.095]** [0.136] [0.102]* [0.132]** Percentage Muslim -0.068 -0.04 -0.114 -0.096 -0.191 -0.004 -0.051 0.048 [0.153] [0.077] [0.154] [0.156] [0.137] [0.185] [0.150] [0.178] Percentage Protestant 0.347 0.186 0.517 0.247 0.426 0.482 0.365 0.522 [0.206]+ [0.114] [0.198]* [0.211] [0.255] [0.242]+ [0.198]+ [0.272]+ Dummy for Latin America 0.245 0.127 0.353 0.264 0.198 0.269 0.216 [0.068]** [0.037]** [0.076]** [0.073]** [0.093]* [0.066]** [0.103]* Dummy for Africa -0.106 -0.081 -0.141 -0.07 -0.147 -0.073 -0.167 [0.091] [0.044]+ [0.098] [0.090] [0.088] [0.084] [0.097]+ Risk of expropriation 0.031 0.012 [0.017]+ [0.025] Democracy, lagged 5 years 0.528 [0.053]** Observations 586 525 582 586 376 363 586 586 R2 0.51 0.65 0.53 0.48 0.56 0.48 0.51 0.47 Note: Robust standard errors clustered by country in parenthesis. The symbols **, * and + denote statistical significance at the 1%, 5% and 10% level respectively. .
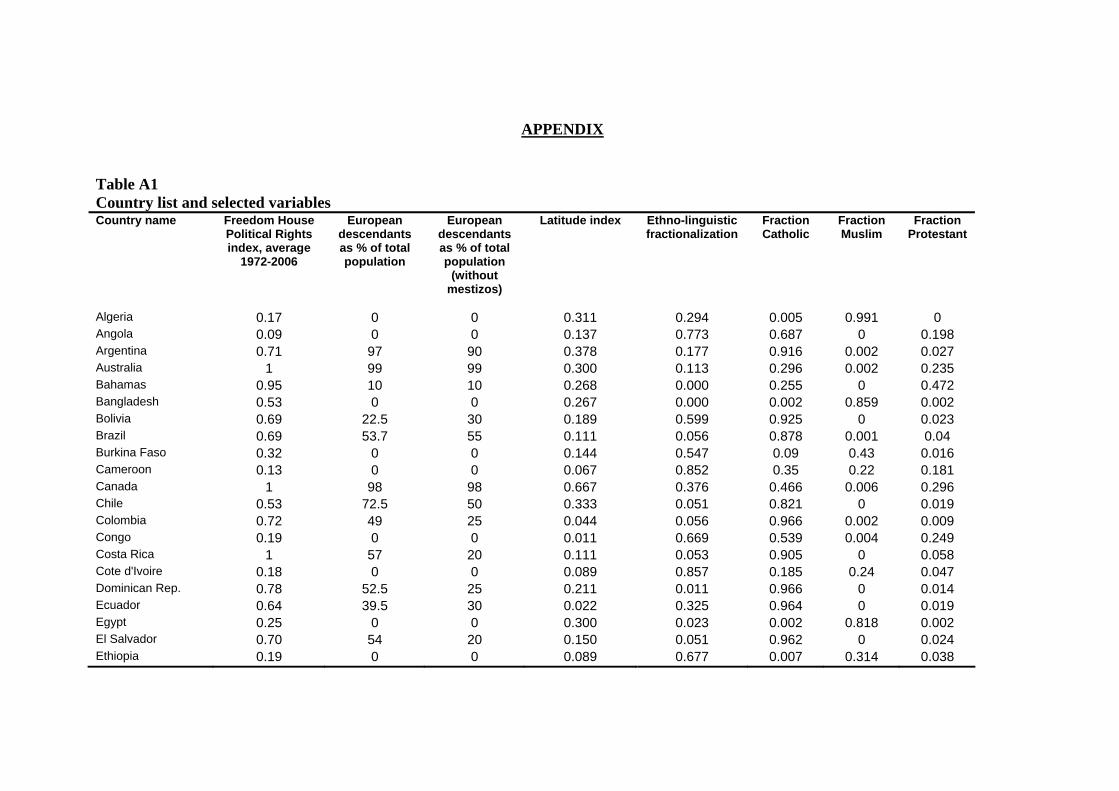
APPENDIX Table A1 Country list and selected variables Country name
Freedom House Political Rights index, average
1972-2006
European descendants as % of total population
European descendants as % of total population
(without mestizos)
Latitude index
Ethno-linguistic fractionalization
Fraction Catholic
Fraction Muslim
Fraction Protestant
Algeria 0.17 0 0 0.311 0.294 0.005 0.991 0 Angola 0.09 0 0 0.137 0.773 0.687 0 0.198 Argentina 0.71 97 90 0.378 0.177 0.916 0.002 0.027 Australia 1 99 99 0.300 0.113 0.296 0.002 0.235 Bahamas 0.95 10 10 0.268 0.000 0.255 0 0.472 Bangladesh 0.53 0 0 0.267 0.000 0.002 0.859 0.002 Bolivia 0.69 22.5 30 0.189 0.599 0.925 0 0.023 Brazil 0.69 53.7 55 0.111 0.056 0.878 0.001 0.04 Burkina Faso 0.32 0 0 0.144 0.547 0.09 0.43 0.016 Cameroon 0.13 0 0 0.067 0.852 0.35 0.22 0.181 Canada 1 98 98 0.667 0.376 0.466 0.006 0.296 Chile 0.53 72.5 50 0.333 0.051 0.821 0 0.019 Colombia 0.72 49 25 0.044 0.056 0.966 0.002 0.009 Congo 0.19 0 0 0.011 0.669 0.539 0.004 0.249 Costa Rica 1 57 20 0.111 0.053 0.905 0 0.058 Cote d'Ivoire 0.18 0 0 0.089 0.857 0.185 0.24 0.047 Dominican Rep. 0.78 52.5 25 0.211 0.011 0.966 0 0.014 Ecuador 0.64 39.5 30 0.022 0.325 0.964 0 0.019 Egypt 0.25 0 0 0.300 0.023 0.002 0.818 0.002 El Salvador 0.70 54 20 0.150 0.051 0.962 0 0.024 Ethiopia 0.19 0 0 0.089 0.677 0.007 0.314 0.038
Country name
Freedom House Political Rights index (average
1972-2006)
European descendants with mestizos
(% of total population)
European descendants
(% of total population)
Latitude index
Ethno-linguistic fractionalization
Fraction Catholic
Fraction Muslim
Fraction Protestant
Gabon 0.25 0 0 0.011 0.797 0.652 0.008 0.188 Gambia 0.56 0 0 0.148 0.780 0.019 0.848 0.004 Ghana 0.39 0 0 0.089 0.706 0.187 0.157 0.258 Guatemala 0.56 41.2 20 0.170 0.477 0.94 0 0.049 Guinea 0.08 0 0 0.122 0.760 0.011 0.69 0.001 Guyana 0.59 2 2 0.056 0.238 0.18 0.09 0.18 Haiti 0.15 0 0 0.211 0.064 0.826 0 0.128 Honduras 0.59 46 20 0.167 0.097 0.958 0.001 0.026 India 0.79 0 0 0.222 0.742 0.013 0.116 0.011 Indonesia 0.35 0 0 0.056 0.691 0.027 0.434 0.048 Jamaica 0.86 10 10 0.202 0.013 0.096 0.001 0.555 Kenya 0.29 0 0 0.011 0.827 0.264 0.06 0.193 Madagascar 0.50 0 0 0.222 0.063 0.26 0.017 0.22 Malaysia 0.53 0 0 0.026 0.610 0.028 0.494 0.014 Mali 0.37 0 0 0.189 0.809 0.007 0.8 0.002 Malta 0.96 100 100 0.394 0.103 0.973 0 0.005 Mexico 0.61 39 15 0.256 0.174 0.947 0 0.012 Morocco 0.4 1 1 0.356 0.348 0.002 0.994 0 New Zealand 1 91.7 91.7 0.456 0.148 0.187 0 0.379 Nicaragua 0.48 51.5 20 0.144 0.099 0.947 0 0.044 Niger 0.22 0 0 0.178 0.733 0.002 0.879 0 Nigeria 0.31 0 0 0.111 0.857 0.121 0.45 0.158 Pakistan 0.36 0 0 0.333 0.622 0.005 0.968 0.008 Panama 0.52 45 20 0.100 0.191 0.85 0.045 0.052 Paraguay 0.46 47.5 25 0.256 0.411 0.96 0 0.019 Peru 0.55 33.5 30 0.111 0.432 0.951 0 0.027 Senegal 0.53 0 0 0.156 0.779 0.056 0.91 0.001
Country name
Freedom House Political Rights index (average
1972-2006)
European descendants with mestizos
(% of total population)
European descendants
(% of total population)
Latitude index
Ethno-linguistic fractionalization
Fraction Catholic
Fraction Muslim
Fraction Protestant
Sierra Leone 0.32 0 0 0.092 0.813 0.022 0.394 0.048 Singapore 0.39 0 0 0.014 0.322 0.047 0.174 0.026 South Africa 0.59 14.05 16 0.322 0.831 0.104 0.013 0.39 Sri Lanka 0.67 0 0 0.078 0.326 0.068 0.072 0.004 Sudan 0.13 0 0 0.167 0.512 0.044 0.73 0.001 Tanzania 0.26 0 0 0.067 0.890 0.282 0.325 0.112 Togo 0.12 0 0 0.089 0.728 0.293 0.17 0.061 Trinidad and Tobago
0.90 40 40 0.122 0.231 0.358 0.065 0.132
Tunisia 0.20 0 0 0.378 0.070 0.001 0.994 0 United States 1 83.6 83.6 0.422 0.209 0.3 0.008 0.436 Uganda 0.25 0 0 0.011 0.836 0.496 0.066 0.019 Uruguay 0.72 92 90 0.367 0.067 0.595 0 0.019 Venezuela 0.83 49 20 0.089 0.053 0.948 0 0.01 Vietnam 0.01 0 0 0.178 0.118 0.039 0.01 0.002 Zaire (Democratic Republic of Congo)
0.08 0 0 0.000 0.872 0.484 0.014 0.29
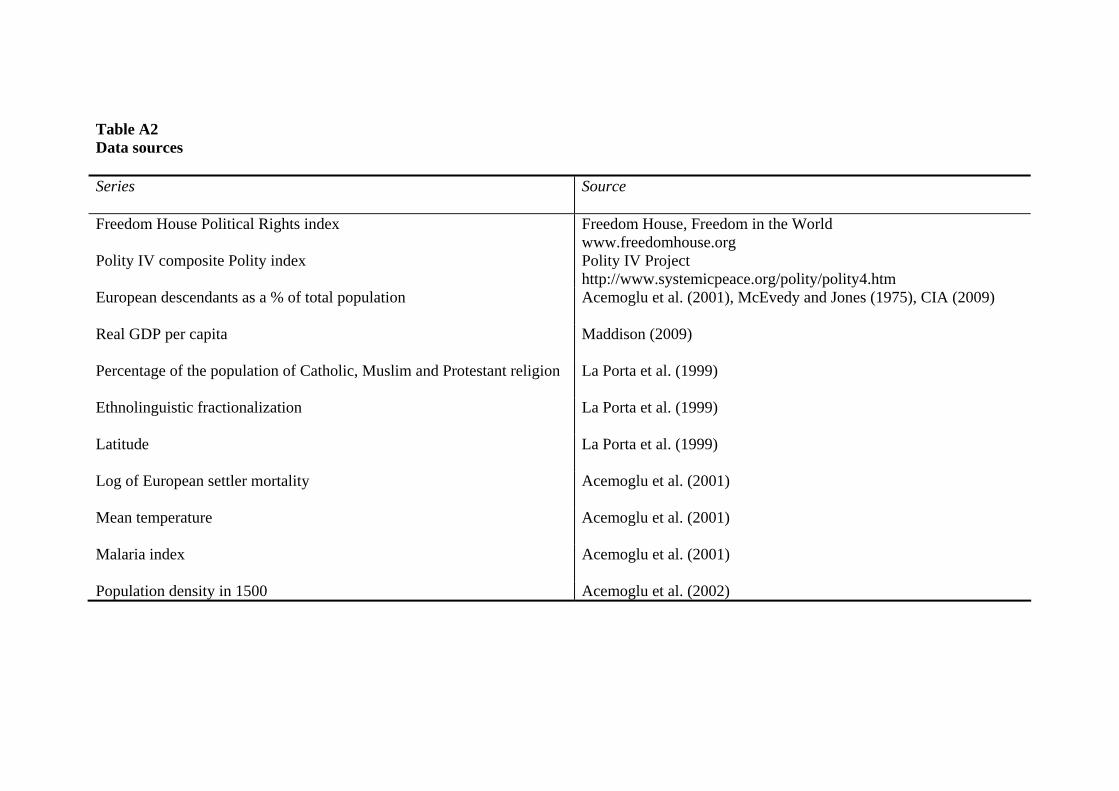
Table A2 Data sources Series
Source
Freedom House Political Rights index Freedom House, Freedom in the World www.freedomhouse.org
Polity IV composite Polity index Polity IV Project http://www.systemicpeace.org/polity/polity4.htm
European descendants as a % of total population Acemoglu et al. (2001), McEvedy and Jones (1975), CIA (2009)
Real GDP per capita Maddison (2009)
Percentage of the population of Catholic, Muslim and Protestant religion La Porta et al. (1999)
Ethnolinguistic fractionalization La Porta et al. (1999)
Latitude La Porta et al. (1999)
Log of European settler mortality Acemoglu et al. (2001)
Mean temperature Acemoglu et al. (2001)
Malaria index Acemoglu et al. (2001)
Population density in 1500 Acemoglu et al. (2002)


