Embed Size (px)
Citation preview
345Research Article
IntroductionIn response to a specific developmental or homeostatic signal, the
average transcriptional output from a cell population is typically
regulated in a reproducible manner, giving rise to deterministic
models of gene expression. Deterministic models predict that
increasing concentrations of activated nuclear transcription factor
complexes will uniformly interact with the target gene promoters
and cause homogenous transcription in all of the individual cells
within the population. By contrast, numerous studies reveal that
expression of a given gene is highly variable between individual
isogenic cells in the population. This heterogeneous gene expression
exists in systems ranging from bacteria and yeast to mammalian
cells derived from normal tissue, suggesting that cell-to-cell
variation is fundamental to the process of gene activation (Bahar
et al., 2006; Blake et al., 2003; Elowitz et al., 2002). These results
have led to the development of stochastic gene expression models
(reviewed by Kaern et al., 2005; Kaufmann and van Oudenaarden,
2007), where each allele is activated by multiple regulatory events
that occur with some controlled probability. However, the
mechanistic details of how the probabilistic transcription factor
interactions with chromatin give rise to the deterministic
transcriptional response observed in the averaged cell population
require further clarification.
Transcriptional heterogeneity can be caused by regulatory events
that occur independently at each allele. This variability, termed gene
intrinsic noise, is predicted to be caused by the inherently random
association of low concentrations of transcription factors with the
limiting number of regulatory elements in the target gene promoters
(Elowitz et al., 2002; Raser and O’Shea, 2004; Swain et al., 2002).
Additionally, random transitions in the surrounding chromatin
environment also affect the heterogeneous transcription of individual
homologous alleles. Studies in yeast reveal that the state of the
surrounding chromatin regulates all the promoters at a single genomic
locus in a coordinated manner, but individual homologous loci have
variable regulation (Becskei et al., 2005). Mammalian cells exhibit
similar behavior (Raj et al., 2006), suggesting a strong evolutionary
conservation of the mechanisms that link the local chromatin
environment to the probabilistic regulation of gene expression.
The mouse mammary tumor virus long terminal repeat (MMTV-
LTR) promoter provides a well-characterized system to define the
probabilistic transcriptional mechanisms that underlie the apparent
deterministic behavior of the averaged mammalian cell population.
When bound by the synthetic steroid dexamethasone (Dex),
glucocorticoid receptor (GR) protein associates with six DNA
response elements located in the MMTV-LTR to strongly activate
transcription (Huang et al., 1981; Payvar et al., 1983; Scheidereit
et al., 1983). When the GR binds to the response elements, there
is an extensive reorganization of the chromatin, which allows
additional DNA-binding transcription factors and coregulators to
access the site (Richard-Foy and Hager, 1987). This change in the
Gene regulation often appears deterministic in the average cell
population, but transcription is a probabilistic process at the
single-cell level. Although many mechanisms are invoked to
account for this behavior, it is difficult to determine how cell-
to-cell variation in the interactions of transcription factors with
target chromatin impact transcriptional output. Here, we use
cells that contain a 200-copy tandem array of promoter or
reporter gene units to simultaneously visualize transient
interaction, equilibrium or steady-state binding of fluorescent-
protein-labeled glucocorticoid receptor with its DNA response
elements, the recruitment of diverse coregulators, and
transcriptional output at the single-cell level. These regulatory
proteins associate with target chromatin via a probabilistic
mechanism that produces cell-to-cell variability in binding. The
multiple steps of this process are partially independent and
differ between individual regulators. The association level of
each regulator influences the transcriptional output in
individual cells, but this does not account for all transcriptional
heterogeneity. Additionally, specific combinatorial interactions
of the glucocorticoid receptor and coregulators with response
elements regulate transcription at the single-cell level. Like
many endogenous genes, the average array transcriptional
activity evolves over time. This apparently deterministic average
temporal promoter progression involves changes in the
probability that specific combinatorial glucocorticoid receptor
and coregulator interactions will occur on the response elements
in single cells. These data support the emerging ‘return-to-
template’ transcription model, which mechanistically unifies the
observed extremely transient interactions between the
transcription factor and response elements, cell-to-cell
variability in steady-state association of factors with chromatin,
and the resulting heterogeneous gene expression between
individual cells.
Supplementary material available online at
http://jcs.biologists.org/cgi/content/full/122/3/345/DC1
Key words: Chromatin, Steroid receptor, Stochastics, Transcription
Summary
Combinatorial probabilistic chromatin interactionsproduce transcriptional heterogeneityTy C. Voss, R. Louis Schiltz, Myong-Hee Sung, Thomas A. Johnson, Sam John and Gordon L. Hager*Laboratory of Receptor Biology and Gene Expression, Building 41, B602, Center for Cancer Research, National Cancer Institute, NIH, Bethesda,MD 20892, USA*Author for correspondence (e-mail: [email protected])
Accepted 21 October 2008Journal of Cell Science 122, 345-356 Published by The Company of Biologists 2009doi:10.1242/jcs.035865
Jour
nal o
f Cel
l Sci
ence
346
chromatin conformation involves the action of the Brg1 containing
ATP-dependent nucleosome-remodeling complex (Fryer and
Archer, 1998). GRs also recruit many other coregulator protein
complexes to activate the promoter, including complexes that
contain the p160 coactivator GRIP, additional histone
acetyltransferases (HATs), and histone deacetylases (HDACs) (Li
et al., 2003; Qiu et al., 2006). The GR-dependent activation of
MMTV transcription is temporally complex, reaching a maximal
level within 30 minutes then rapidly evolving to an attenuated state
within 2 hours (Archer et al., 1994; Becker et al., 2002). This
reproducible, time-dependent progression of the averaged cell
population appears to be strongly deterministic.
We have previously studied how GR association with response
elements and the surrounding chromatin environment interact to
control transcription using a cell line that contains a 200-copy
MMTV-LTR reporter gene tandem array integrated at a single
genomic locus (referred to as the MMTV array) (McNally et al.,
2000; Walker et al., 1999). Importantly, photobleaching experiments
on living cells demonstrate that the GR and coregulators
concentrated at the MMTV array are not stably bound, but are
dynamically exchanging with the surrounding nucleoplasm over a
time scale of seconds (Becker et al., 2002; McNally et al., 2000).
The ‘return-to-template’ model proposes that the transient
recruitment of multiple transcription factor-coregulator complexes
over time causes multiple stochastic regulatory events at each
promoter during transcriptional activation (Hager et al., 2004; Hager
et al., 2006). In the current report, we reveal how the probabilistic
formation of many different transcription-factor–chromatin states
at the MMTV promoter can give rise to both heterogeneous
transcriptional behavior within single cells, and also produce an
apparent deterministic response in the averaged cell population.
ResultsSteady-state binding of GR and associated coregulators withchromatin and resulting transcription in the averaged cellpopulationWe generated two stable inducible cell lines to explore the actions
of the GR and interacting coregulator proteins at the single-cell level.
The 3617 cell line, which contains the integrated MMTV promoter-
reporter gene array and expresses GFP-labeled GR (GFP-GR), was
the founder cell line for the two additional lines. The resulting 6643
cell line and 6790 cell line express exogenous Brg1 or GRIP,
respectively, as a fusion protein labeled with the monomeric Cherry
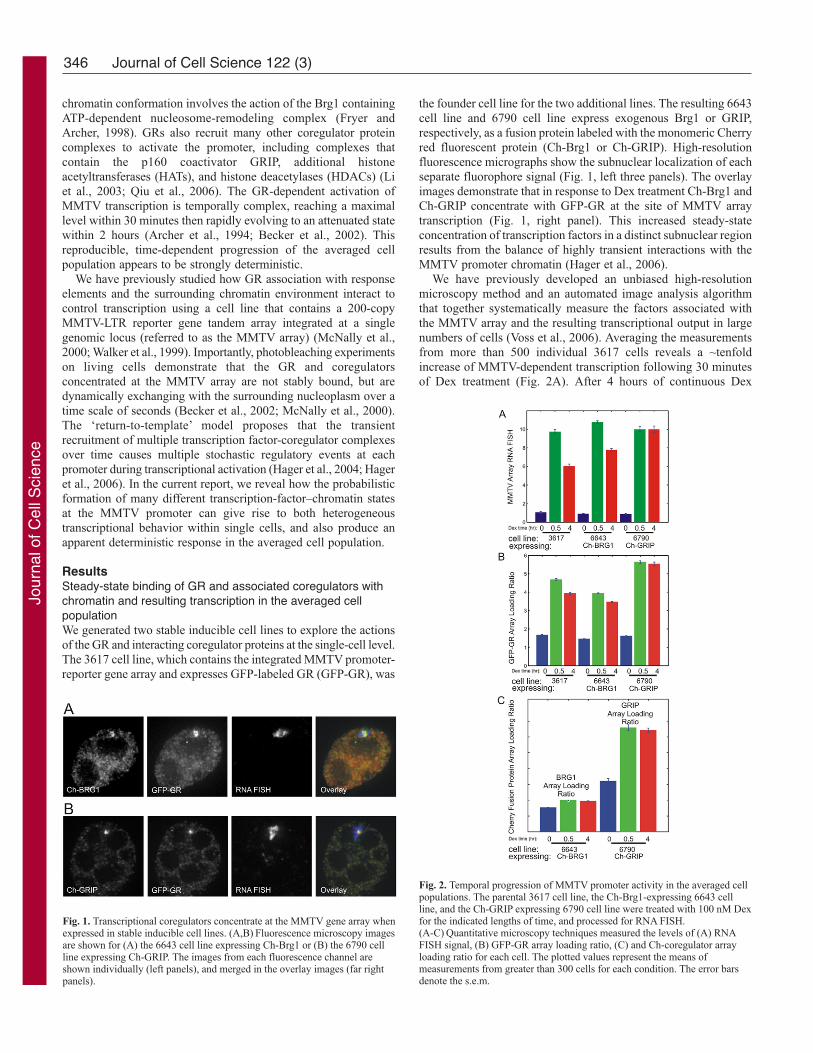
red fluorescent protein (Ch-Brg1 or Ch-GRIP). High-resolution
fluorescence micrographs show the subnuclear localization of each
separate fluorophore signal (Fig. 1, left three panels). The overlay
images demonstrate that in response to Dex treatment Ch-Brg1 and
Ch-GRIP concentrate with GFP-GR at the site of MMTV array
transcription (Fig. 1, right panel). This increased steady-state
concentration of transcription factors in a distinct subnuclear region
results from the balance of highly transient interactions with the
MMTV promoter chromatin (Hager et al., 2006).
We have previously developed an unbiased high-resolution
microscopy method and an automated image analysis algorithm
that together systematically measure the factors associated with
the MMTV array and the resulting transcriptional output in large
numbers of cells (Voss et al., 2006). Averaging the measurements
from more than 500 individual 3617 cells reveals a ~tenfold
increase of MMTV-dependent transcription following 30 minutes
of Dex treatment (Fig. 2A). After 4 hours of continuous Dex
Journal of Cell Science 122 (3)
Fig. 1. Transcriptional coregulators concentrate at the MMTV gene array whenexpressed in stable inducible cell lines. (A,B) Fluorescence microscopy imagesare shown for (A) the 6643 cell line expressing Ch-Brg1 or (B) the 6790 cellline expressing Ch-GRIP. The images from each fluorescence channel areshown individually (left panels), and merged in the overlay images (far rightpanels).
Fig. 2. Temporal progression of MMTV promoter activity in the averaged cellpopulations. The parental 3617 cell line, the Ch-Brg1-expressing 6643 cellline, and the Ch-GRIP expressing 6790 cell line were treated with 100 nM Dexfor the indicated lengths of time, and processed for RNA FISH.(A-C) Quantitative microscopy techniques measured the levels of (A) RNAFISH signal, (B) GFP-GR array loading ratio, (C) and Ch-coregulator arrayloading ratio for each cell. The plotted values represent the means ofmeasurements from greater than 300 cells for each condition. The error barsdenote the s.e.m.
Jour
nal o
f Cel
l Sci
ence
347Probabilistic chromatin interactions
treatment, the RNA FISH signal decreases ~40% compared with
maximal levels. The intensity of fluorescent protein at the MMTV
array relative to the surrounding nucleoplasm intensity, referred to
as the array loading ratio, approximates the amount of steady-state
association with the promoters in each cell (Voss et al., 2006). An
example of the automated image analysis algorithm measurement
of cell line 3617 with different levels of GFP-GR array loading is
shown in supplementary material Fig. S1. Although this assay of
GR-MMTV array interaction utilizes measurement of a single pixel,
the method is not dominated by random noise in the images
(supplementary material Fig. S2). In the averaged cell line 3617
populations, the average GFP-GR array loading ratio significantly
increases threefold after 30 minutes, then decreases slightly but
significantly from the maximal level after 4 hours of continuous
Dex treatment (Fig. 2B). The details of all statistical pairwise
comparisons of the mean values in Fig. 2 are shown in
supplementary material Table S1.
The ATP-dependent Brg1-containing chromatin-remodeling
complexes, have an important role in the regulation of GR-mediated
transcription. Exogenous expression of Ch-Brg1 in cell line 6643
causes a modest increase in the average MMTV transcriptional
activity compared with cell line 3617 (Fig. 2A). This slight
difference becomes statistically significant when comparing the
6643 cell line with the 3617 cell line after 4 hours of Dex treatment
(Fig. 2A; supplementary material Table S1). Ch-Brg1 expression
also leads to a modest but significant decrease in the mean steady-
state association of GR with the MMTV array (Fig. 2B;
supplementary material Table S1). In response to hormone, there
is a slight but significant increase in the average steady-state
association of Ch-Brg1 with the MMTV array (Fig. 2C;
supplementary material Table S1). Although it is clear that
exogenous Ch-Brg1 regulates MMTV promoter activity, the general
behavior observed in cell line 6643 is probably similar to that of
cells expressing only endogenous Brg1. Western blots reveal that
there is relatively little overexpression of Ch-Brg1 compared with
endogenous protein (supplementary material Fig. S3B), consistent
with the minor effects observed in the Ch-Brg1 cells.
The p160 coactivator GRIP directly interacts with GR (Hong et
al., 1996; Hong et al., 1999). In turn, GRIP facilitates the recruitment
of additional coregulator proteins, which possess enzymatic
functions required for gene activation (Li et al., 2003; Ma et al.,
2001). Unlike Ch-Brg1, exogenous Ch-GRIP has statistically
significant effects on transcription only after long-term hormone
treatment compared with short-term treatment, preventing the time-
dependent decrease seen in cell line 3617 (Fig. 2A; supplementary
material Table S1). Ch-GRIP expression also causes significantly
increased steady-state association of GR with the MMTV array
compared with cell line 3617 (Fig. 2B; supplementary material Table
S1), suggesting that additional GRIP modifies the balance of
dynamic GR association-dissociation rates with the MMTV-LTR.
In response to hormone, there is also a large increase in the amount
of Ch-GRIP associated with the MMTV array (Fig. 2C;
supplementary material Table S1). Unlike the response in cell line
3617, the steady-state levels of GR and GRIP at the array do not
decrease significantly at the later time point in cell line 6790
(supplementary material Table S1). Ch-GRIP is expressed
approximately twofold over endogenous protein levels in these cells
(supplementary material Fig. S3C). Although it is clear that this
Ch-GRIP expression level alters normal MMTV promoter
progression in the 6790 cell line, the cell line provides insight
into how this important coregulator influences probabilistic
transcriptional regulation.
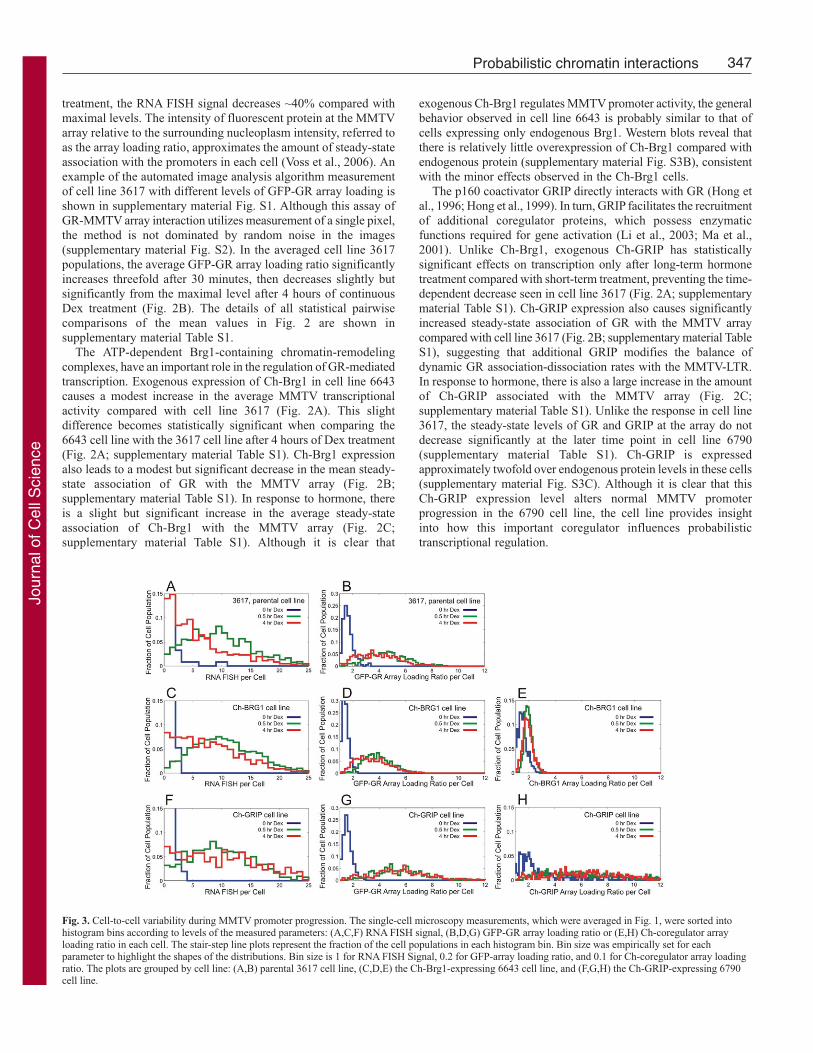
Fig. 3. Cell-to-cell variability during MMTV promoter progression. The single-cell microscopy measurements, which were averaged in Fig. 1, were sorted intohistogram bins according to levels of the measured parameters: (A,C,F) RNA FISH signal, (B,D,G) GFP-GR array loading ratio or (E,H) Ch-coregulator arrayloading ratio in each cell. The stair-step line plots represent the fraction of the cell populations in each histogram bin. Bin size was empirically set for eachparameter to highlight the shapes of the distributions. Bin size is 1 for RNA FISH Signal, 0.2 for GFP-array loading ratio, and 0.1 for Ch-coregulator array loadingratio. The plots are grouped by cell line: (A,B) parental 3617 cell line, (C,D,E) the Ch-Brg1-expressing 6643 cell line, and (F,G,H) the Ch-GRIP-expressing 6790cell line.
Jour
nal o
f Cel
l Sci
ence
348
Heterogeneity within the cell population of GR-coregulator-chromatin association and transcriptional outputAt the averaged cell population level, the time-dependent hormone
response is very reproducible and appears deterministic. However,
we questioned whether the system behaves probabilistically at the
single-cell level. Indeed, there is a large degree of heterogeneity
between individual cells within each population, suggesting
probabilistic mechanisms drive the process. This heterogeneity is
illustrated by histogram stair-step plots showing the fraction of the
cell population at each measured level of the response (Fig. 3). In
the absence of hormone, the majority of cells from the 3617 cell
line have low levels of RNA FISH signal (Fig. 3A). Treatment with
Dex for 30 minutes produces a broad shift in population where many
more cells have higher levels of RNA FISH signal. Strikingly, the
plot shows that the RNA FISH signal after 30 minutes of Dex
treatment varies by as much as 25-fold between individual cells.
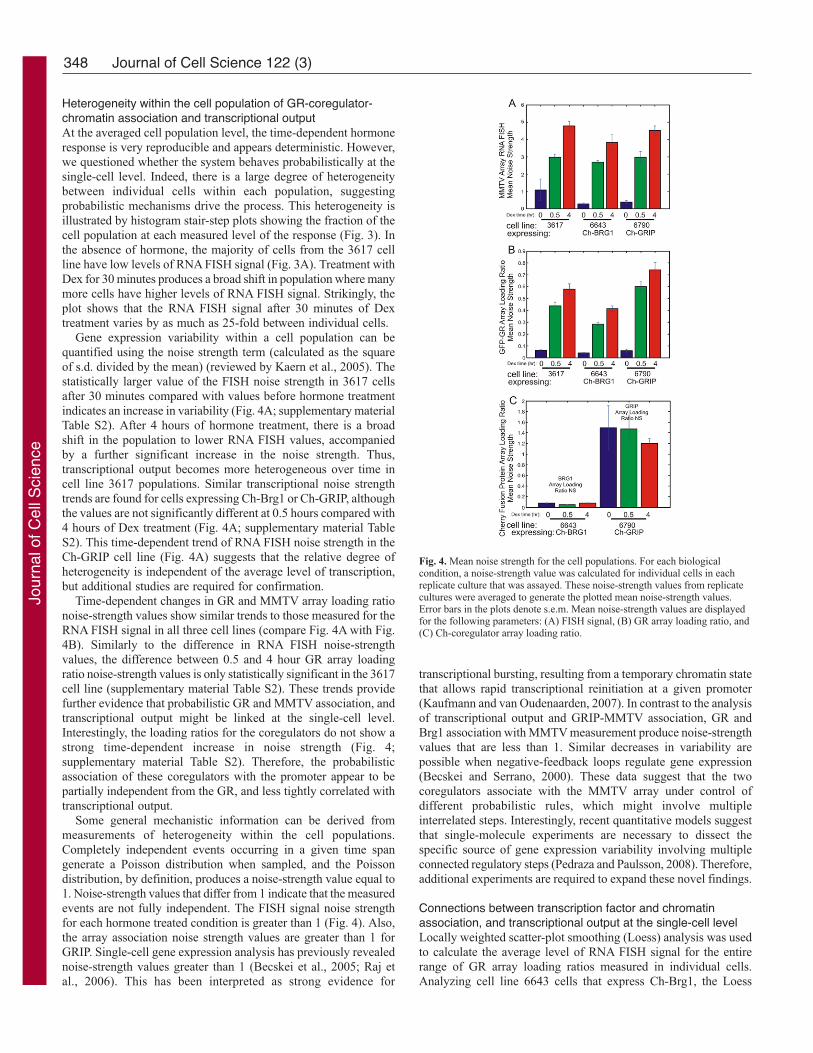
Gene expression variability within a cell population can be
quantified using the noise strength term (calculated as the square
of s.d. divided by the mean) (reviewed by Kaern et al., 2005). The
statistically larger value of the FISH noise strength in 3617 cells
after 30 minutes compared with values before hormone treatment
indicates an increase in variability (Fig. 4A; supplementary material
Table S2). After 4 hours of hormone treatment, there is a broad
shift in the population to lower RNA FISH values, accompanied
by a further significant increase in the noise strength. Thus,
transcriptional output becomes more heterogeneous over time in
cell line 3617 populations. Similar transcriptional noise strength
trends are found for cells expressing Ch-Brg1 or Ch-GRIP, although
the values are not significantly different at 0.5 hours compared with
4 hours of Dex treatment (Fig. 4A; supplementary material Table
S2). This time-dependent trend of RNA FISH noise strength in the
Ch-GRIP cell line (Fig. 4A) suggests that the relative degree of
heterogeneity is independent of the average level of transcription,
but additional studies are required for confirmation.
Time-dependent changes in GR and MMTV array loading ratio
noise-strength values show similar trends to those measured for the
RNA FISH signal in all three cell lines (compare Fig. 4A with Fig.
4B). Similarly to the difference in RNA FISH noise-strength
values, the difference between 0.5 and 4 hour GR array loading
ratio noise-strength values is only statistically significant in the 3617
cell line (supplementary material Table S2). These trends provide
further evidence that probabilistic GR and MMTV association, and
transcriptional output might be linked at the single-cell level.
Interestingly, the loading ratios for the coregulators do not show a
strong time-dependent increase in noise strength (Fig. 4;
supplementary material Table S2). Therefore, the probabilistic
association of these coregulators with the promoter appear to be
partially independent from the GR, and less tightly correlated with
transcriptional output.
Some general mechanistic information can be derived from
measurements of heterogeneity within the cell populations.
Completely independent events occurring in a given time span
generate a Poisson distribution when sampled, and the Poisson
distribution, by definition, produces a noise-strength value equal to
1. Noise-strength values that differ from 1 indicate that the measured
events are not fully independent. The FISH signal noise strength
for each hormone treated condition is greater than 1 (Fig. 4). Also,
the array association noise strength values are greater than 1 for
GRIP. Single-cell gene expression analysis has previously revealed
noise-strength values greater than 1 (Becskei et al., 2005; Raj et
al., 2006). This has been interpreted as strong evidence for
transcriptional bursting, resulting from a temporary chromatin state
that allows rapid transcriptional reinitiation at a given promoter
(Kaufmann and van Oudenaarden, 2007). In contrast to the analysis
of transcriptional output and GRIP-MMTV association, GR and
Brg1 association with MMTV measurement produce noise-strength
values that are less than 1. Similar decreases in variability are
possible when negative-feedback loops regulate gene expression
(Becskei and Serrano, 2000). These data suggest that the two
coregulators associate with the MMTV array under control of
different probabilistic rules, which might involve multiple
interrelated steps. Interestingly, recent quantitative models suggest
that single-molecule experiments are necessary to dissect the
specific source of gene expression variability involving multiple
connected regulatory steps (Pedraza and Paulsson, 2008). Therefore,
additional experiments are required to expand these novel findings.
Connections between transcription factor and chromatinassociation, and transcriptional output at the single-cell levelLocally weighted scatter-plot smoothing (Loess) analysis was used
to calculate the average level of RNA FISH signal for the entire
range of GR array loading ratios measured in individual cells.
Analyzing cell line 6643 cells that express Ch-Brg1, the Loess
Journal of Cell Science 122 (3)
Fig. 4. Mean noise strength for the cell populations. For each biologicalcondition, a noise-strength value was calculated for individual cells in eachreplicate culture that was assayed. These noise-strength values from replicatecultures were averaged to generate the plotted mean noise-strength values.Error bars in the plots denote s.e.m. Mean noise-strength values are displayedfor the following parameters: (A) FISH signal, (B) GR array loading ratio, and(C) Ch-coregulator array loading ratio.
Jour
nal o
f Cel
l Sci
ence
349Probabilistic chromatin interactions
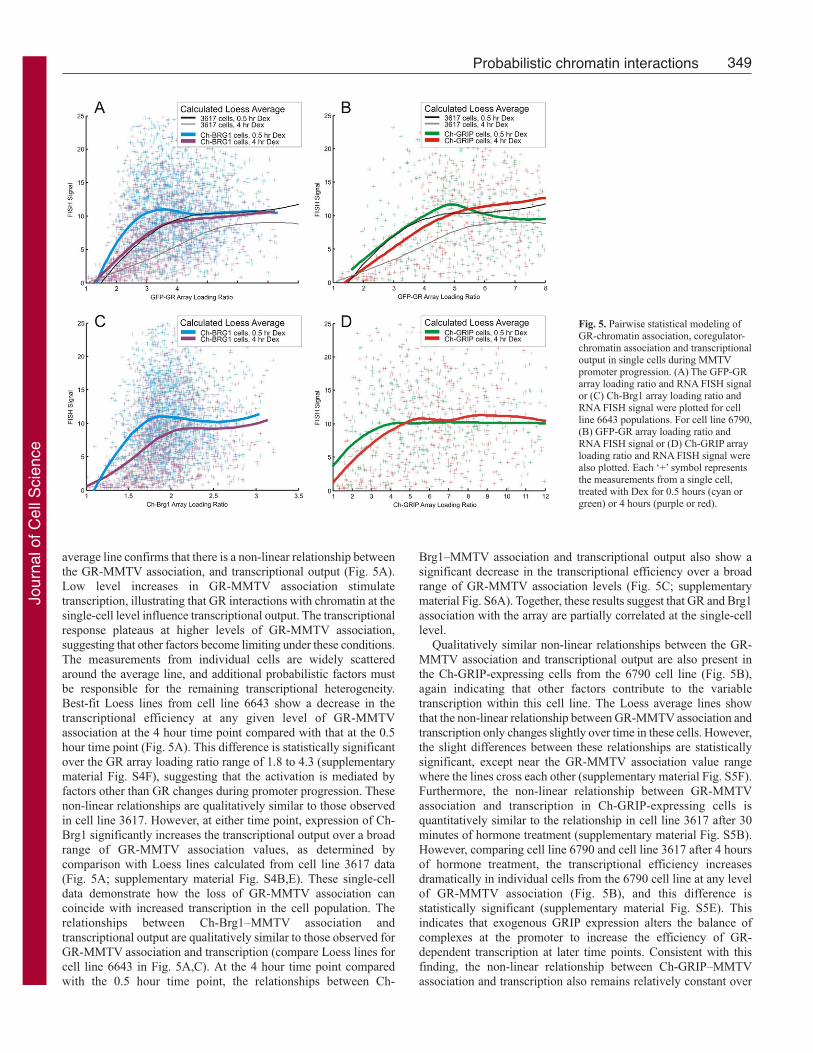
average line confirms that there is a non-linear relationship between
the GR-MMTV association, and transcriptional output (Fig. 5A).
Low level increases in GR-MMTV association stimulate
transcription, illustrating that GR interactions with chromatin at the
single-cell level influence transcriptional output. The transcriptional
response plateaus at higher levels of GR-MMTV association,
suggesting that other factors become limiting under these conditions.
The measurements from individual cells are widely scattered
around the average line, and additional probabilistic factors must
be responsible for the remaining transcriptional heterogeneity.
Best-fit Loess lines from cell line 6643 show a decrease in the
transcriptional efficiency at any given level of GR-MMTV
association at the 4 hour time point compared with that at the 0.5
hour time point (Fig. 5A). This difference is statistically significant
over the GR array loading ratio range of 1.8 to 4.3 (supplementary
material Fig. S4F), suggesting that the activation is mediated by
factors other than GR changes during promoter progression. These
non-linear relationships are qualitatively similar to those observed
in cell line 3617. However, at either time point, expression of Ch-
Brg1 significantly increases the transcriptional output over a broad
range of GR-MMTV association values, as determined by
comparison with Loess lines calculated from cell line 3617 data
(Fig. 5A; supplementary material Fig. S4B,E). These single-cell
data demonstrate how the loss of GR-MMTV association can
coincide with increased transcription in the cell population. The
relationships between Ch-Brg1–MMTV association and
transcriptional output are qualitatively similar to those observed for
GR-MMTV association and transcription (compare Loess lines for
cell line 6643 in Fig. 5A,C). At the 4 hour time point compared
with the 0.5 hour time point, the relationships between Ch-
Brg1–MMTV association and transcriptional output also show a
significant decrease in the transcriptional efficiency over a broad
range of GR-MMTV association levels (Fig. 5C; supplementary
material Fig. S6A). Together, these results suggest that GR and Brg1
association with the array are partially correlated at the single-cell
level.
Qualitatively similar non-linear relationships between the GR-
MMTV association and transcriptional output are also present in
the Ch-GRIP-expressing cells from the 6790 cell line (Fig. 5B),
again indicating that other factors contribute to the variable
transcription within this cell line. The Loess average lines show
that the non-linear relationship between GR-MMTV association and
transcription only changes slightly over time in these cells. However,
the slight differences between these relationships are statistically
significant, except near the GR-MMTV association value range
where the lines cross each other (supplementary material Fig. S5F).
Furthermore, the non-linear relationship between GR-MMTV
association and transcription in Ch-GRIP-expressing cells is
quantitatively similar to the relationship in cell line 3617 after 30
minutes of hormone treatment (supplementary material Fig. S5B).
However, comparing cell line 6790 and cell line 3617 after 4 hours
of hormone treatment, the transcriptional efficiency increases
dramatically in individual cells from the 6790 cell line at any level
of GR-MMTV association (Fig. 5B), and this difference is
statistically significant (supplementary material Fig. S5E). This
indicates that exogenous GRIP expression alters the balance of
complexes at the promoter to increase the efficiency of GR-
dependent transcription at later time points. Consistent with this
finding, the non-linear relationship between Ch-GRIP–MMTV
association and transcription also remains relatively constant over
Fig. 5. Pairwise statistical modeling ofGR-chromatin association, coregulator-chromatin association and transcriptionaloutput in single cells during MMTVpromoter progression. (A) The GFP-GRarray loading ratio and RNA FISH signalor (C) Ch-Brg1 array loading ratio andRNA FISH signal were plotted for cellline 6643 populations. For cell line 6790,(B) GFP-GR array loading ratio andRNA FISH signal or (D) Ch-GRIP arrayloading ratio and RNA FISH signal werealso plotted. Each ‘+’ symbol representsthe measurements from a single cell,treated with Dex for 0.5 hours (cyan orgreen) or 4 hours (purple or red).
Jour
nal o
f Cel
l Sci
ence
350
time (Fig. 5D; supplementary material Fig. S6B). These results
reveal how the Ch-GRIP-induced changes at the single-cell level
alter promoter progression in the averaged cell population.
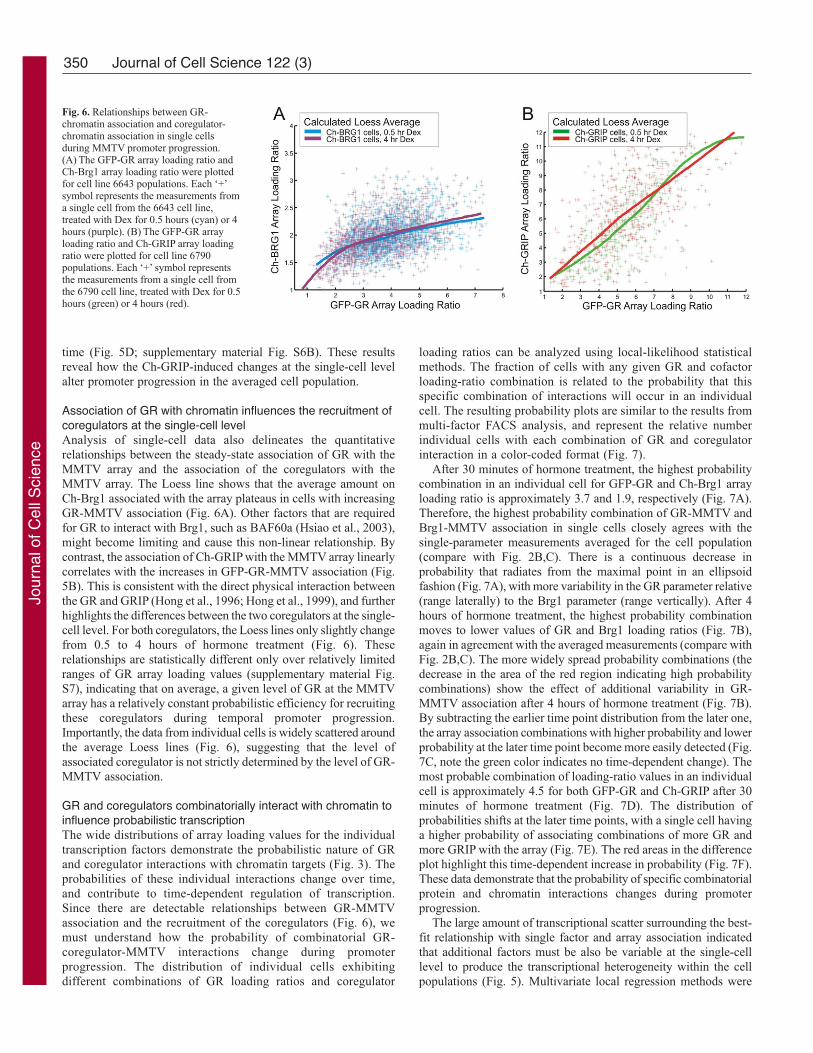
Association of GR with chromatin influences the recruitment ofcoregulators at the single-cell levelAnalysis of single-cell data also delineates the quantitative
relationships between the steady-state association of GR with the
MMTV array and the association of the coregulators with the
MMTV array. The Loess line shows that the average amount on
Ch-Brg1 associated with the array plateaus in cells with increasing
GR-MMTV association (Fig. 6A). Other factors that are required
for GR to interact with Brg1, such as BAF60a (Hsiao et al., 2003),
might become limiting and cause this non-linear relationship. By
contrast, the association of Ch-GRIP with the MMTV array linearly
correlates with the increases in GFP-GR-MMTV association (Fig.
5B). This is consistent with the direct physical interaction between
the GR and GRIP (Hong et al., 1996; Hong et al., 1999), and further
highlights the differences between the two coregulators at the single-
cell level. For both coregulators, the Loess lines only slightly change
from 0.5 to 4 hours of hormone treatment (Fig. 6). These
relationships are statistically different only over relatively limited
ranges of GR array loading values (supplementary material Fig.
S7), indicating that on average, a given level of GR at the MMTV
array has a relatively constant probabilistic efficiency for recruiting
these coregulators during temporal promoter progression.
Importantly, the data from individual cells is widely scattered around
the average Loess lines (Fig. 6), suggesting that the level of
associated coregulator is not strictly determined by the level of GR-
MMTV association.
GR and coregulators combinatorially interact with chromatin toinfluence probabilistic transcriptionThe wide distributions of array loading values for the individual
transcription factors demonstrate the probabilistic nature of GR
and coregulator interactions with chromatin targets (Fig. 3). The
probabilities of these individual interactions change over time,
and contribute to time-dependent regulation of transcription.
Since there are detectable relationships between GR-MMTV
association and the recruitment of the coregulators (Fig. 6), we
must understand how the probability of combinatorial GR-
coregulator-MMTV interactions change during promoter
progression. The distribution of individual cells exhibiting
different combinations of GR loading ratios and coregulator
loading ratios can be analyzed using local-likelihood statistical
methods. The fraction of cells with any given GR and cofactor
loading-ratio combination is related to the probability that this
specific combination of interactions will occur in an individual
cell. The resulting probability plots are similar to the results from
multi-factor FACS analysis, and represent the relative number
individual cells with each combination of GR and coregulator
interaction in a color-coded format (Fig. 7).
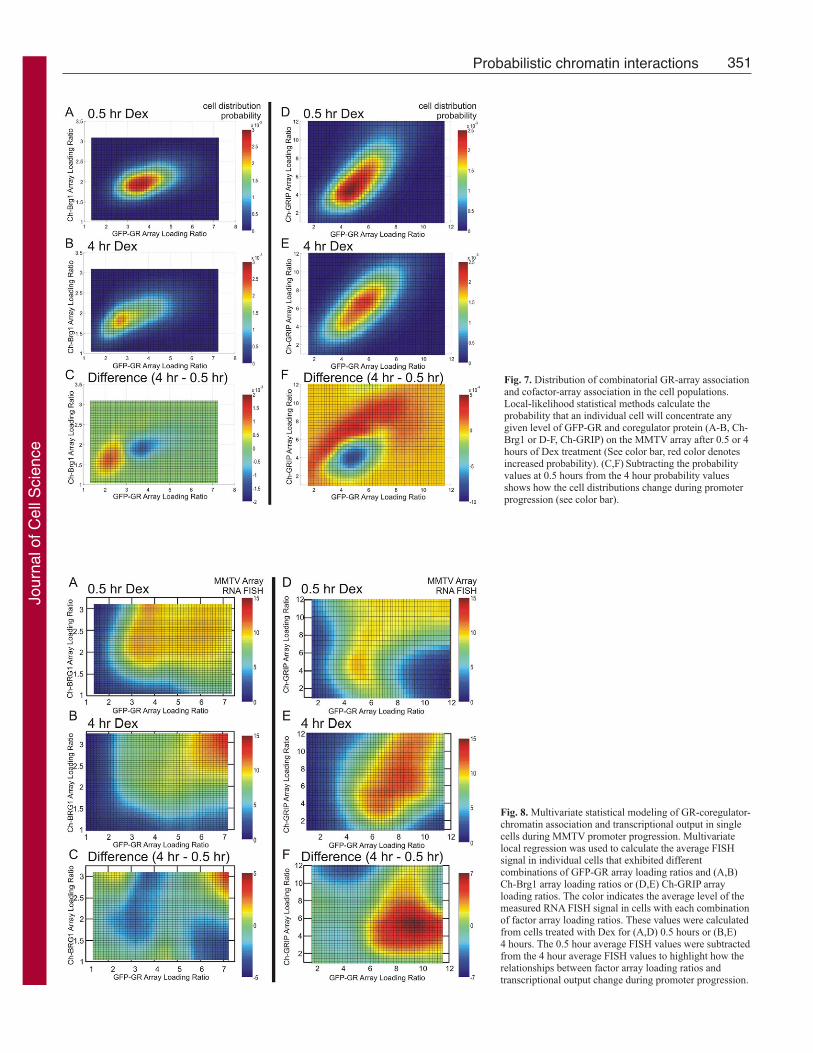
After 30 minutes of hormone treatment, the highest probability
combination in an individual cell for GFP-GR and Ch-Brg1 array
loading ratio is approximately 3.7 and 1.9, respectively (Fig. 7A).
Therefore, the highest probability combination of GR-MMTV and
Brg1-MMTV association in single cells closely agrees with the
single-parameter measurements averaged for the cell population
(compare with Fig. 2B,C). There is a continuous decrease in
probability that radiates from the maximal point in an ellipsoid
fashion (Fig. 7A), with more variability in the GR parameter relative
(range laterally) to the Brg1 parameter (range vertically). After 4
hours of hormone treatment, the highest probability combination
moves to lower values of GR and Brg1 loading ratios (Fig. 7B),
again in agreement with the averaged measurements (compare with
Fig. 2B,C). The more widely spread probability combinations (the
decrease in the area of the red region indicating high probability
combinations) show the effect of additional variability in GR-
MMTV association after 4 hours of hormone treatment (Fig. 7B).
By subtracting the earlier time point distribution from the later one,
the array association combinations with higher probability and lower
probability at the later time point become more easily detected (Fig.
7C, note the green color indicates no time-dependent change). The
most probable combination of loading-ratio values in an individual
cell is approximately 4.5 for both GFP-GR and Ch-GRIP after 30
minutes of hormone treatment (Fig. 7D). The distribution of
probabilities shifts at the later time points, with a single cell having
a higher probability of associating combinations of more GR and
more GRIP with the array (Fig. 7E). The red areas in the difference
plot highlight this time-dependent increase in probability (Fig. 7F).
These data demonstrate that the probability of specific combinatorial
protein and chromatin interactions changes during promoter
progression.
The large amount of transcriptional scatter surrounding the best-
fit relationship with single factor and array association indicated
that additional factors must be also be variable at the single-cell
level to produce the transcriptional heterogeneity within the cell
populations (Fig. 5). Multivariate local regression methods were
Journal of Cell Science 122 (3)
Fig. 6. Relationships between GR-chromatin association and coregulator-chromatin association in single cellsduring MMTV promoter progression.(A) The GFP-GR array loading ratio andCh-Brg1 array loading ratio were plottedfor cell line 6643 populations. Each ‘+’symbol represents the measurements froma single cell from the 6643 cell line,treated with Dex for 0.5 hours (cyan) or 4hours (purple). (B) The GFP-GR arrayloading ratio and Ch-GRIP array loadingratio were plotted for cell line 6790populations. Each ‘+’ symbol representsthe measurements from a single cell fromthe 6790 cell line, treated with Dex for 0.5hours (green) or 4 hours (red).
Jour
nal o
f Cel
l Sci
ence
351Probabilistic chromatin interactions
Fig. 7. Distribution of combinatorial GR-array associationand cofactor-array association in the cell populations.Local-likelihood statistical methods calculate theprobability that an individual cell will concentrate anygiven level of GFP-GR and coregulator protein (A-B, Ch-Brg1 or D-F, Ch-GRIP) on the MMTV array after 0.5 or 4hours of Dex treatment (See color bar, red color denotesincreased probability). (C,F) Subtracting the probabilityvalues at 0.5 hours from the 4 hour probability valuesshows how the cell distributions change during promoterprogression (see color bar).
Fig. 8. Multivariate statistical modeling of GR-coregulator-chromatin association and transcriptional output in singlecells during MMTV promoter progression. Multivariatelocal regression was used to calculate the average FISHsignal in individual cells that exhibited differentcombinations of GFP-GR array loading ratios and (A,B)Ch-Brg1 array loading ratios or (D,E) Ch-GRIP arrayloading ratios. The color indicates the average level of themeasured RNA FISH signal in cells with each combinationof factor array loading ratios. These values were calculatedfrom cells treated with Dex for (A,D) 0.5 hours or (B,E)4 hours. The 0.5 hour average FISH values were subtractedfrom the 4 hour average FISH values to highlight how therelationships between factor array loading ratios andtranscriptional output change during promoter progression.
Jour
nal o
f Cel
l Sci
ence
352
used to test this prediction further. Local regression calculated the
average transcriptional output for each measured combination of
GR and coregulator-array association. The calculated transcriptional
output relative to the mean transcription in cells without hormone
is presented for each level of GR array loading ratio and coregulator
array loading ratio (Fig. 8). After 30 minutes of hormone treatment,
the transcription levels from combinations of GFP-GR array loading
and Ch-GRIP array loading show a complex pattern. The pattern
demonstrates that for a given level of steady-state GR-MMTV
association (all the cells on a given vertical column on the graph,
Fig. 8B) a critical level of Brg1-MMTV association is also required
to efficiently activate transcription at the single-cell level (increase
in transcription along the same vertical column on the graph).
Although the transcriptional output pattern is different for
combinations of GR and GRIP-array association, again the amount
of both GR and coregulator associated with the array at the single-
cell level control the level of transcription (Fig. 8D). For both
coregulators, the transcriptional output from GR and array binding
combinations changes over time (Fig. 8B,E). There is a general
trend for lower levels of GR-coregulator-MMTV association to
become less transcriptionally active whereas higher-level factor
combinations become more transcriptionally active over time. This
trend is illustrated in the time difference plots, with red values
showing the combinations of array association that increase
transcriptional output at the later time points (Fig. 8C,F). Taken
together, these results strongly support a general mechanism in
which probabilistic combinatorial interactions of regulatory proteins
with target chromatin contribute to the heterogeneous transcriptional
output observed at the single-cell level.
DiscussionAlthough much progress has been made in understanding the
probabilistic nature of gene expression, very little was previously
known about the connections between steady-state binding of
transcription factors with integrated DNA response elements and
transcriptional output at the single-cell level. Our analysis indicates
that the GR and interacting transcriptional coregulators associate
with the MMTV array to widely different degrees in individual cells
within the population. The quantitative microscopy methods used
in this study accurately measure the steady-state binding of array-
associated proteins as previously shown by comparison to chromatin
immunoprecipitation assays (Voss et al., 2006). The imaging assay
is further validated by the biologically induced statistical differences
that we observe in parameters (mean values, noise-strength values,
non-linear Loess relationships) that are derived from measurements
of many single cells. If the imaging assay results were dominated
by random methodological variation, then statistically significant
differences could not be detected between different biological
conditions. Our statistically validated results indicate that the
probabilistic interactions of multiple factors with promoter
chromatin produce the deterministic temporal progression of
transcriptional activity, which is observed in the averaged cell
population.
Probabilistic transcription factor association with targetpromotersVariable transcription factor binding to target promoters between
individual cells might be caused by many possible mechanisms.
However, the potential mechanisms probably exhibit a small set of
general underlying properties. In some systems, cell-to-cell variation
is due to finite number effects, in which limited numbers of
molecules cause random and infrequent productive biochemical
interactions with target promoters (Elowitz et al., 2002; Raser and
O’Shea, 2004; Swain et al., 2002). These inherently random
biochemical interactions make each promoter’s activity independent
of another homologous promoter. However, this type of gene
intrinsic noise is unlikely to be a major cause of the MMTV array
heterogeneity because the averaging of random independent events
at the 200 constituent promoters in the array would cause a
homogenous response in each cell.
Probabilistic mechanisms can coordinately regulate multiple
promoters when they are integrated at a single site in the genome.
When multiple copies of a promoter-reporter construct are tandemly
inserted into a single yeast genomic locus and compared with an
integrated single-copy promoter-reporter, the expression level
increases to the expected level, but the relative cell-to-cell variability
does not decrease (Becskei et al., 2005). As explained above, a
decrease in cell-to-cell transcriptional variability is expected when
multiple independently regulated promoters are in the same cell.
However, when a single promoter-reporter construct is integrated
in each homologous allele (two copies per cell), the expression level
increases and the relative level of cell-to-cell variation decreases
as expected (Becskei et al., 2005). Global extrinsic cell-to-cell
differences would affect homologous alleles identically and cause
relative variation levels to remain constant. Therefore, the decease
in variation indicates that extrinsic variability is not the major
determinant of heterogeneity in this system.
Transitions in the surrounding chromatin state also appear to
coordinately regulate promoters that are tandemly integrated in
mammalian cell (Raj et al., 2006). Diverse experimental evidence
suggests this property regulates many different promoters, including
the MMTV-LTR. For example, there is direct biochemical evidence
that the MMTV-LTR in the averaged hormone-treated cell
population exists in multiple native chromatin states (Georgel et
al., 2003). In addition to the MMTV gene array, another tandemly
integrated promoter-gene array model system is also
heterogeneously bound by the estrogen receptor (Sharp et al., 2006),
again suggesting that probabilistic association mechanisms might
be widely utilized in transcriptional regulation. Similarly to the
MMTV array, other tandem gene array systems are transiently
associated with their activating transcription factor proteins (Bosisio
et al., 2006; Sharp et al., 2006). Recent studies also demonstrate
that transient protein interactions are involved in changing steady-
state transcription-factor-chromatin interaction levels (Karpova et
al., 2008). Considering these results, cell-to-cell variability in
steady-state chromatin interactions probably involves changes in
the balance of the dynamic association and disassociation rates for
the interacting proteins.
Additional mechanisms might also regulate promoters that are
integrated at a single genomic locus. The controlled movement of
multiple promoters into specific subnuclear regions, which facilitate
efficient transcription, is proposed to coordinately regulate
promoters in a probabilistic manner (Faro-Trindade and Cook, 2006;
Osborne et al., 2004). Other dynamic mechanisms such as the self-
reinforcing linear spread of regulatory proteins along the chromatin
fiber, also coordinately regulate adjacent genes (Grewal and Jia,
2007). Although further experiments are required to delineate which
of these additional mechanisms are functioning at specific
promoters, it is clear that cell-to-cell variability of transcription-
factor-chromatin steady-state association contributes to probabilistic
gene expression in the cell population. Importantly, the presented
data indicate that probabilistic interactions of multiple factors with
Journal of Cell Science 122 (3)
Jour
nal o
f Cel
l Sci
ence
353Probabilistic chromatin interactions
chromatin combine to produce transcriptional heterogeneity within
the cell population.
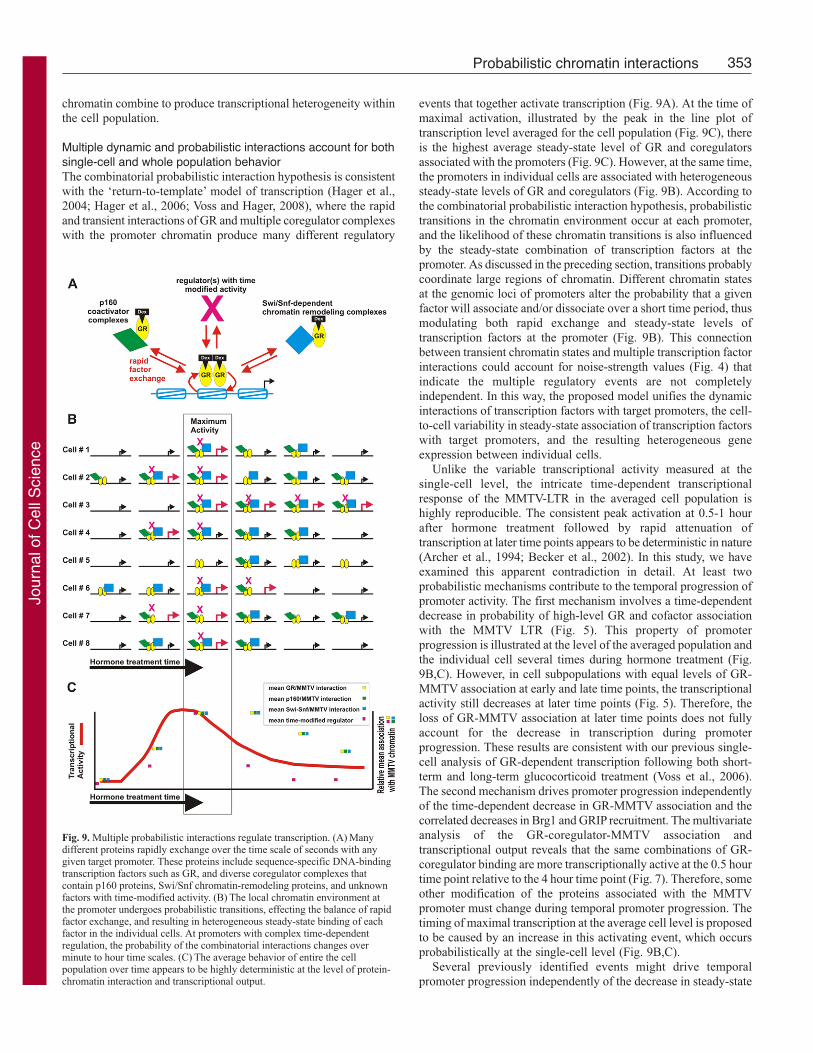
Multiple dynamic and probabilistic interactions account for bothsingle-cell and whole population behaviorThe combinatorial probabilistic interaction hypothesis is consistent
with the ‘return-to-template’ model of transcription (Hager et al.,
2004; Hager et al., 2006; Voss and Hager, 2008), where the rapid
and transient interactions of GR and multiple coregulator complexes
with the promoter chromatin produce many different regulatory
events that together activate transcription (Fig. 9A). At the time of
maximal activation, illustrated by the peak in the line plot of
transcription level averaged for the cell population (Fig. 9C), there
is the highest average steady-state level of GR and coregulators
associated with the promoters (Fig. 9C). However, at the same time,
the promoters in individual cells are associated with heterogeneous
steady-state levels of GR and coregulators (Fig. 9B). According to
the combinatorial probabilistic interaction hypothesis, probabilistic
transitions in the chromatin environment occur at each promoter,
and the likelihood of these chromatin transitions is also influenced
by the steady-state combination of transcription factors at the
promoter. As discussed in the preceding section, transitions probably
coordinate large regions of chromatin. Different chromatin states
at the genomic loci of promoters alter the probability that a given
factor will associate and/or dissociate over a short time period, thus
modulating both rapid exchange and steady-state levels of
transcription factors at the promoter (Fig. 9B). This connection
between transient chromatin states and multiple transcription factor
interactions could account for noise-strength values (Fig. 4) that
indicate the multiple regulatory events are not completely
independent. In this way, the proposed model unifies the dynamic
interactions of transcription factors with target promoters, the cell-
to-cell variability in steady-state association of transcription factors
with target promoters, and the resulting heterogeneous gene
expression between individual cells.
Unlike the variable transcriptional activity measured at the
single-cell level, the intricate time-dependent transcriptional
response of the MMTV-LTR in the averaged cell population is
highly reproducible. The consistent peak activation at 0.5-1 hour
after hormone treatment followed by rapid attenuation of
transcription at later time points appears to be deterministic in nature
(Archer et al., 1994; Becker et al., 2002). In this study, we have
examined this apparent contradiction in detail. At least two
probabilistic mechanisms contribute to the temporal progression of
promoter activity. The first mechanism involves a time-dependent
decrease in probability of high-level GR and cofactor association
with the MMTV LTR (Fig. 5). This property of promoter
progression is illustrated at the level of the averaged population and
the individual cell several times during hormone treatment (Fig.
9B,C). However, in cell subpopulations with equal levels of GR-
MMTV association at early and late time points, the transcriptional
activity still decreases at later time points (Fig. 5). Therefore, the
loss of GR-MMTV association at later time points does not fully
account for the decrease in transcription during promoter
progression. These results are consistent with our previous single-
cell analysis of GR-dependent transcription following both short-
term and long-term glucocorticoid treatment (Voss et al., 2006).
The second mechanism drives promoter progression independently
of the time-dependent decrease in GR-MMTV association and the
correlated decreases in Brg1 and GRIP recruitment. The multivariate
analysis of the GR-coregulator-MMTV association and
transcriptional output reveals that the same combinations of GR-
coregulator binding are more transcriptionally active at the 0.5 hour
time point relative to the 4 hour time point (Fig. 7). Therefore, some
other modification of the proteins associated with the MMTV
promoter must change during temporal promoter progression. The
timing of maximal transcription at the average cell level is proposed
to be caused by an increase in this activating event, which occurs
probabilistically at the single-cell level (Fig. 9B,C).
Several previously identified events might drive temporal
promoter progression independently of the decrease in steady-state
Fig. 9. Multiple probabilistic interactions regulate transcription. (A) Manydifferent proteins rapidly exchange over the time scale of seconds with anygiven target promoter. These proteins include sequence-specific DNA-bindingtranscription factors such as GR, and diverse coregulator complexes thatcontain p160 proteins, Swi/Snf chromatin-remodeling proteins, and unknownfactors with time-modified activity. (B) The local chromatin environment atthe promoter undergoes probabilistic transitions, effecting the balance of rapidfactor exchange, and resulting in heterogeneous steady-state binding of eachfactor in the individual cells. At promoters with complex time-dependentregulation, the probability of the combinatorial interactions changes overminute to hour time scales. (C) The average behavior of entire the cellpopulation over time appears to be highly deterministic at the level of protein-chromatin interaction and transcriptional output.
Jour
nal o
f Cel
l Sci
ence
354
GR-MMTV association. One likely candidate is the time-dependent
control of HDAC1 deacetylase activity, which is required for high-
level MMTV transcription (Qiu et al., 2006). Before hormone
treatment, HDAC1 is unacetylated and enzymatically active, but
between 15 minutes and 1 hour of hormone treatment there is a
significant acetylation of HDAC1 and a dramatic loss of its
deacetylase activity (Qiu et al., 2006). The acetylation of MMTV
core histones is also transiently modified during promoter
progression (Aoyagi and Archer, 2007), indicating that this might
be a downstream effect of the changes in acetylase and deacetylase
activities. The enzymatic activity of HDAC1 is regulated over time
even when the steady-state association with the GR does not change.
Although this independence from the GR is a predicted property
of the hypothetical second mechanism, additional experiments are
required to define how HDAC1 regulates MMTV transcription at
the single-cell level. The dephosphorylation and loss of H1 linker
histone from MMTV has also been proposed to have a role in the
time-dependent suppression of transcription. However, significant
decreases in H1 phosphorylation are first detected after 7 hours of
hormone treatment (Lee and Archer, 1998), suggesting that this
mechanism does not significantly attenuate earlier MMTV
transcription. Additional experimental approaches are required to
confirm how the covalent modification of protein complexes
contributes to probabilistic behavior of promoters at the single-cell
level.
Along with previous studies, the presented data reveal how
multiple dynamic and probabilistic protein-chromatin interactions
act in combination to generate a controlled transcriptional response
in a eukaryotic cell population. Many endogenous genes exhibit a
high degree of transcriptional variability between individual
mammalian cells (Levsky et al., 2002), and it is likely that similar
probabilistic mechanisms regulate endogenous promoters. Several
lines of evidence suggest that probabilistic gene expression has
many crucial roles in higher eukaryotes. Increases in cell-to-cell
transcriptional heterogeneity correlate with aging in normal tissue
and are hypothesized to be involved in oncogenesis (Bahar et al.,
2006; Capp, 2005). These examples support the concept that
probabilistic gene expression decreases viability in higher
eukaryotes, but there are also cases where these mechanisms are
essential for normal physiology. For instance, stochastic gene
expression is thought to be critical for functional photoreactive cells
in the retina and for functional odorant-receptor-expressing cells in
the olfactory bulb (Shykind, 2005; Wernet et al., 2006). Considering
these important aspects of single-cell behavior, we propose that
probabilistic and dynamic interactions of multiple regulatory
proteins with chromatin control the physiological expression of
many genes.
Materials and MethodsPlasmids and generation of inducible cell linesThe coding sequence (CDS) for the monomeric Cherry red fluorescent protein (Ch)was amplified from the pRSET bacterial expression vector (Shaner et al., 2004) usingprimers with unique restriction enzyme sites. The Ch CDS was then cloned in-frameupstream of Brg1 or GRIP (Baumann et al., 2001) using standard recombinantmethods. The fusion protein coding sequences were then subcloned into pRev-TREretroviral Tet-inducible expression vector (Clontech).
Retroviral particles were produced in Phoenix cells (Swift et al., 2001) by standardmethods. Mouse mammary carcinoma 3617 cells, which contain the integrated MMTVreporter gene array and a Tet-inducible GFP-GR expression vector (Walker et al.,1999) were infected with retroviral particles encoding Tet-regulated Ch-Brg1 or Ch-GRIP to produce the 6643 cell line or 6790 cell line, respectively. Cells with integratedretrovirus were selected with Hygromycin for at least 14 days prior to the start cellline characterization. For maintenance, cell line 3617, cell line 6643 and cell line6790 cells were cultured with DMEM supplemented with 10% fetal calf serum and
5 μg/ml tetracycline to repress expression of the Tet-regulated fusion proteins (Walkeret al., 1999).
RNA FISH, microscopy and automated image analysis18 hours before RNA FISH experiments, cell lines 3617, 6643 and 6790 were platedon number 1 German 22�22 mm square coverslips in DMEM supplemented with10% charcoal-stripped calf serum. Tetracycline was omitted from the medium toinduce expression of the fluorescent fusion proteins. Cells on coverslips were treatedwith 100 nM dexamethasone for 0, 0.5 or 4 hours then immediately processed forRNA FISH to detect the MMTV-controlled reporter gene, as previously described(Voss et al., 2006).
Following the RNA FISH detection, images of several randomly selected fieldsof cells were digitally captured using a computer-controlled epifluorescencemicroscope fitted with a �60/1.4 numerical aperture, oil-immersion objective(DeltaVision RT, Applied Precision, Issaquah, WA). Movement of a high-precisionstage in the optical axis (9.3 μm range at 0.3 μm spacing between images) alloweddigital imaging of the full volume of each nucleus. Automated filter wheels and apolychroic light splitter were used to capture images of each fluorophore. Imageswere batch processed with a commercially available constrained iterative digitaldeconvolution algorithm (Softworx Explorer Suite; Applied Precision) toquantitatively reassign out-of-focus light and restore signal contrast in theepifluorescence images.
The deconvolved images were processed and analyzed using a custom automatedalgorithm that was implemented in the Matlab scientific computing software, aspreviously described (Voss et al., 2006). Briefly, the nucleus of each cell isautomatically identified. The algorithm then defines the discreet region in each nucleuscontaining the RNA FISH signal. The fluorescence intensity and size of the FISHsignal are measured as an indicator of MMTV promoter activity in each cell. Thepositional information defining the FISH signal is then used to measure the degreeof FP-fusion protein enrichment at the MMTV array. For each fluorescent proteinimage, the algorithm calculates the relative transcription factor concentration on thearray as the maximal fluorescent protein pixel intensity value in the defined FISHsignal region divided by the mean intensity of the fluorescent protein in the nucleus.Measurement from the individual nuclei were exported to spreadsheet software (Excel,Microsoft) for further analysis.
The images of three cells from the 3617 cell line illustrate the biologicalheterogeneity that exists between the individual clonal cells (supplementary materialFig. S1). The size and fluorescence intensity of the RNA fish signal varies betweenthe cells, but because this area is much brighter than the surrounding nucleoplasm,the automated analysis algorithm uses this local intensity difference to reliably identifythe region of interest (ROI) that contains the MMTV array (supplementary materialFig. S1B). In some cells the XFP-protein associated with the MMTV array is highlyconcentrated (supplementary material Fig. S1C,D, Cell 1), whereas in other cells,the local concentration increase is very low (supplementary material Fig. S1C,D, Cell3).
Because the boundaries of the protein associated with the array are not robust, itis difficult for an expert user or an automated algorithm to accurately identify thearea in the nucleus where the XFP-fusion proteins specifically associate with theMMTV array. To overcome this challenge, the algorithm uses the FISH ROI as aguide to find the maximal concentration of the XFP-fusion proteins at the array(supplementary material Fig. S1C). The single maximal pixel intensity value in theXFP image area that is identified using the FISH ROI is divided by mean nuclearXFP-fusion protein intensity to calculate the loading ratio, which approximates therelative degree of binding (supplementary material Fig. S1C).
The 3D fluorescence-intensity projections demonstrate that the GFP-GR forms‘peaks’ of intensity with a central maximal point (supplementary material Fig. S1E).We observe similar behavior for the other XFP-fusion proteins (data not shown).This suggests that the maximal single pixel intensity represents the intensity valuesof the immediately surrounding pixels. We tested this by calculating the loading ratiobased on the mean of a 3�3 pixel area (9 pixels total) centered on the maximalintensity pixel. The 3�3 pixel loading ratios calculated for the example images showthe same trend as the single maximal pixel loading ratios (supplementary materialFig. S1C). To systematically quantify this trend, the single pixel loading ratio andthe 3�3 pixel loading ratio were calculated for many individual cells, and this analysiswas performed for XFP-fusion proteins in all cell lines. Linear regression revealedthat results from the two measurement methods were correlated with an R2 value ofapproximately 0.9 (supplementary material Fig. S2). Therefore, the loading ratio basedon the maximal single pixel value is not dominated by methodological pixel-to-pixelvariation and represents the relative local concentration of the immediately surroundingprotein. Since the minimum size of the region where XFP-fusion proteins interactwith the array is unknown, the single maximal pixel is used by the algorithm tocalculate the loading ratio in the remaining analysis presented in this report.
Statistical analysisData were acquired from a minimum of three independent cultures with assaysperformed on multiple days. The combined morphometric data were imported fromthe spreadsheet into Matlab for statistical analysis and generation of all graphs. Thefunctions in the Matlab statistics toolbox were used to calculate the mean value and
Journal of Cell Science 122 (3)
Jour
nal o
f Cel
l Sci
ence
355Probabilistic chromatin interactions
s.e. for each experimental group. Noise strength was calculated as the s.d. squared
divided by the mean value for each group (Kaern et al., 2005).
Multiple statistical comparisons are made between the mean parameter data in Fig.
2. When making comparisons between multiple conditions in a given data set using
parametric statistical methods, ANOVA was used to first used to determine whether
any significant differences existed between all conditions. If significant differences
were identified by ANOVA, then a post-hoc test (also known as multiple comparison
test) was used to detect differences between specific pairs of values. These parametric
statistical methods assume that the measurements in each condition follow a normal
distribution. Because the number of measurements for each condition in Fig. 2 is
very large, it is possible to determine whether they are normally distributed using a
Lilliefors statistical test. Documentation for Lillifors test and other statistical methods
used is available at http://www.mathworks.com/access/helpdesk/help/toolbox/stats/.
The results of Lilliefors test (data not shown) indicate that these data do not meet
the criteria for a normal distribution (P>0.05). Because of this, we used the Kruskal-
Wallis and Dunn’s test, which are non-parametric equivalents of ANOVA and post-
hoc test, to confirm the statistical differences. These non-parametric tests produce
only slight changes in the statistical differences identified by the ANOVA and Tukey’s
HSD post hoc comparisons (Tukey’s HSD is based on Student’s t-test,
http://www.mathworks.com/access/helpdesk/help/toolbox/stats/). We highlight the
slight differences between the non-parametric and parametric statistical methods in
supplementary material Table S1. Importantly, the two methods yield very similar
biological conclusions, which are discussed in the Results section.
We also calculated the noise strength values in replicate cultures, allowing the
statistical comparison of the resulting mean noise strength values (Fig. 4). Because
there are relatively few calculated values from the individual cultures, parametric
tests are more appropriate than non-parametric tests for identifying differences between
the means. Therefore, we use ANOVA and Tukey’s HSD post-hoc test to detect
significant differences in mean noise-strength values between conditions. As detailed
in the Results section, this analysis clearly demonstrates that specific biological
conditions cause significant reproducible changes in mean noise strength values
(supplementary material Table S2).
The best-fit lines for the two-factor analysis were calculated by locally weighted
scatter-plot smoothing (Loess) technique implemented in the Matlab statistical toolbox
software. A Loess curve from a locally weighted regression is a type of moving average
representing the (linear or non-linear) relationship between two parameters (for
example, FISH signal versus XFP-array loading ratio). We wished to determine
whether two Loess curves are statistically different and also understand where along
the x range the two Loess curves are different. We tested these differences between
pairs of Loess curves by implementing a permutation test. This is a robust non-
parametric statistical test that is valid even when data distributions are unknown.
The permutation test was implemented using the Matlab statistics toolbox software.
For each pair of Loess curves, the distance between the curves was defined by the
sum of absolute differences between y, using a (dx=0.1) grid over a fixed interval on
the x axis. Randomized data sets were generated by combining all data from both
groups and randomly reassigning the group labels. Each of the two randomized data
sets was used to compute a new Loess curve and the distance between the two
randomized Loess curves was calculated the same way as for the original data set.
The randomization was repeated 1000 times and we obtained the number of cases
where the distance between the two Loess curves was greater than that of the two
original Loess curves. This number divided by 1000 is our permutation P value,
which approximates the probability of obtaining the observed difference by random
chance. We plotted these P values in parallel with the Loess lines for each pairwise
comparison, setting the significance difference cut off at P<0.05 (supplementary
material Figs S4-7).
The best-fit surfaces for the three-factor analysis (Figs 7 and 8) were calculated
using locally weighted regression and local-likelihood techniques implemented in
the Locfit function package, which was written for Matlab by Catherine Loader
(University of Aukland, Aukland, New Zealand). Full documentation for Locfit
functions, including source code, is publicly available (http://locfit.herine.net/), and
Locfit functions and documentation are also included in the widely used R statistical
software package (http://www.r-project.org/).
Western blot analysisCell lysates were compared before and after 18 hours of induction of XFP-fusion
protein expression, which was initiated by removal of tetracycline from the growth
medium. Cells were lysed in RIPA buffer and protein concentration was measured
using Bradford assay (Bio-Rad, Hercules CA). Lysates were loaded at 40 μg per well
on 3-8% gradient acrylamide Tris-acetate gel (Invitrogen, Carlsbad, CA). Commercial
antibodies were used in western blots as follows: anti-GR (PA1-511A, Affinity
BioReagents, Golden, CO); anti-Brg1 (07-478 Millipore, Billerica, MA); anti-GRIP
(610984, BD Biosciences, San Jose, CA).
The authors thank Richard N. Day, Catherine L. Smith, and TomMisteli for helpful discussion during preparation of the manuscript. ThemCherry FP cDNA was a generous gift from Roger Tsien. AnindyaHendarwanto provided expert technical support. Tatiana Karpova
assisted with experiments performed in the NCI Core Fluorescence
Imaging Facility. This research was supported (in part) by the Intramural
Research Program of the NIH, National Cancer Institute, Center for
Cancer Research. Deposited in PMC for release after 12 months.
ReferencesAoyagi, S. and Archer, T. K. (2007). Dynamic histone acetylation/deacetylation with
progesterone receptor-mediated transcription. Mol. Endocrinol. 21, 843-856.
Archer, T. K., Lee, H. L., Cordingley, M. G., Mymryk, J. S., Fragoso, G., Berard, D.
S. and Hager, G. L. (1994). Differential steroid hormone induction of transcription
from the mouse mammary tumor virus promoter. Mol. Endocrinol. 8, 568-576.
Bahar, R., Hartmann, C. H., Rodriguez, K. A., Denny, A. D., Busuttil, R. A., Dolle,
M. E., Calder, R. B., Chisholm, G. B., Pollock, B. H., Klein, C. A. et al. (2006).
Increased cell-to-cell variation in gene expression in ageing mouse heart. Nature 441,
1011-1014.
Baumann, C. T., Ma, H., Wolford, R., Reyes, J. C., Maruvada, P., Lim, C., Yen, P.
M., Stallcup, M. R. and Hager, G. L. (2001). The glucocorticoid receptor interacting
protein 1 (GRIP1) localizes in discrete nuclear foci that associate with ND10 bodies and
are enriched in components of the 26S proteasome. Mol. Endocrinol. 15, 485-500.
Becker, M., Baumann, C., John, S., Walker, D. A., Vigneron, M., McNally, J. G. and
Hager, G. L. (2002). Dynamic behavior of transcription factors on a natural promoter
in living cells. EMBO Rep. 3, 1188-1194.
Becskei, A. and Serrano, L. (2000). Engineering stability in gene networks by
autoregulation. Nature 405, 590-593.
Becskei, A., Kaufmann, B. B. and van Oudenaarden, A. (2005). Contributions of low
molecule number and chromosomal positioning to stochastic gene expression. Nat. Genet.37, 937-944.
Blake, W. J., Kaern, M., Cantor, C. R. and Collins, J. J. (2003). Noise in eukaryotic
gene expression. Nature 422, 633-637.
Bosisio, D., Marazzi, I., Agresti, A., Shimizu, N., Bianchi, M. E. and Natoli, G. (2006).
A hyper-dynamic equilibrium between promoter-bound and nucleoplasmic dimers
controls NF-kappaB-dependent gene activity. EMBO J. 25, 798-810.
Capp, J. P. (2005). Stochastic gene expression, disruption of tissue averaging effects and
cancer as a disease of development. BioEssays 27, 1277-1285.
Elowitz, M. B., Levine, A. J., Siggia, E. D. and Swain, P. S. (2002). Stochastic gene
expression in a single cell. Science 297, 1183-1186.
Faro-Trindade, I. and Cook, P. R. (2006). Transcription factories: structures conserved
during differentiation and evolution. Biochem. Soc. Trans. 34, 1133-1137.
Fryer, C. J. and Archer, T. K. (1998). Chromatin remodelling by the glucocorticoid receptor
requires the BRG1 complex. Nature 393, 88-91.
Georgel, P. T., Fletcher, T. M., Hager, G. L. and Hansen, J. C. (2003). Formation of
higher-order secondary and tertiary chromatin structures by genomic mouse mammary
tumor virus promoters. Genes Dev. 17, 1617-1629.
Grewal, S. I. and Jia, S. (2007). Heterochromatin revisited. Nat. Rev. Genet. 8, 35-46.
Hager, G. L., Nagaich, A. K., Johnson, T. A., Walker, D. A. and John, S. (2004). Dynamics
of nuclear receptor movement and transcription. Biochim. Biophys. Acta 1677, 46-51.
Hager, G. L., Elbi, C., Johnson, T. A., Voss, T., Nagaich, A. K., Schiltz, R. L., Qiu, Y.
and John, S. (2006). Chromatin dynamics and the evolution of alternate promoter states.
Chromosome. Res. 14, 107-116.
Hong, H., Kohli, K., Trivedi, A., Johnson, D. L. and Stallcup, M. R. (1996). GRIP1, a
novel mouse protein that serves as a transcriptional coactivator in yeast for the hormone
binding domains of steroid receptors. Proc. Natl. Acad. Sci. USA 93, 4948-4952.
Hong, H., Darimont, B. D., Ma, H., Yang, L., Yamamoto, K. R. and Stallcup, M. R.
(1999). An additional region of coactivator GRIP1 required for interaction with the
hormone-binding domains of a subset of nuclear receptors. J. Biol. Chem. 274, 3496-
3502.
Hsiao, P. W., Fryer, C. J., Trotter, K. W., Wang, W. and Archer, T. K. (2003). BAF60a
mediates critical interactions between nuclear receptors and the BRG1 chromatin-
remodeling complex for transactivation. Mol. Cell. Biol. 23, 6210-6220.
Huang, A. L., Ostrowski, M. C., Berard, D. and Hager, G. L. (1981). Glucocorticoid
regulation of the Ha-MuSV p21 gene conferred by sequences from mouse mammary
tumor virus. Cell 27, 245-255.
Kaern, M., Elston, T. C., Blake, W. J. and Collins, J. J. (2005a). Stochasticity in gene
expression: from theories to phenotypes. Nat. Rev. Genet. 6, 451-464.
Karpova, T. S., Kim, M. J., Spriet, C., Nalley, K., Stasevich, T. J., Kherrouche, Z.,
Heliot, L. and McNally, J. G. (2008). Concurrent fast and slow cycling of a
transcriptional activator at an endogenous promoter. Science 319, 466-469.
Kaufmann, B. B. and van Oudenaarden, A. (2007). Stochastic gene expression: from
single molecules to the proteome. Curr. Opin. Genet. Dev. 17, 107-112.
Lee, H. L. and Archer, T. K. (1998). Prolonged glucocorticoid exposure dephosphorylates
histone H1 and inactivates the MMTV promoter. EMBO J. 17, 1454-1466.
Levsky, J. M., Shenoy, S. M., Pezo, R. C. and Singer, R. H. (2002). Single-cell gene
expression profiling. Science 297, 836-840.
Li, X., Wong, J., Tsai, S. Y., Tsai, M. J. and O’Malley, B. W. (2003). Progesterone and
glucocorticoid receptors recruit distinct coactivator complexes and promote distinct
patterns of local chromatin modification. Mol. Cell. Biol. 23, 3763-3773.
Ma, H., Baumann, C. T., Li, H., Strahl, B. D., Rice, R., Jelinek, M. A., Aswad, D. W.,
Allis, C. D., Hager, G. L. and Stallcup, M. R. (2001). Hormone-dependent, CARM1-
directed, arginine-specific methylation of histone H3 on a steroid-regulated promoter.
Curr. Biol. 11, 1981-1985.
Jour
nal o
f Cel
l Sci
ence
356
McNally, J. G., Muller, W. G., Walker, D., Wolford, R. and Hager, G. L. (2000a). The
glucocorticoid receptor: rapid exchange with regulatory sites in living cells. Science 287,
1262-1265.
Osborne, C. S., Chakalova, L., Brown, K. E., Carter, D., Horton, A., Debrand, E.,
Goyenechea, B., Mitchell, J. A., Lopes, S., Reik, W. et al. (2004). Active genes
dynamically colocalize to shared sites of ongoing transcription. Nat. Genet. 36, 1065-
1071.
Payvar, F., DeFranco, D., Firestone, G. L., Edgar, B., Wrange, O., Okret, S.,
Gustafsson, J. A. and Yamamoto, K. R. (1983). Sequence-specific binding of
glucocorticoid receptor to MTV DNA at sites within and upstream of the transcribed
region. Cell 35, 381-392.
Pedraza, J. M. and Paulsson, J. (2008). Effects of molecular memory and bursting on
fluctuations in gene expression. Science 319, 339-343.
Qiu, Y., Zhao, Y., Becker, M., John, S., Parekh, B. S., Huang, S., Hendarwanto, A.,
Martinez, E. D., Chen, Y., Lu, H. et al. (2006). HDAC1 acetylation is linked to
progressive modulation of steroid receptor-induced gene transcription. Mol. Cell 22,
669-679.
Raj, A., Peskin, C. S., Tranchina, D., Vargas, D. Y. and Tyagi, S. (2006). Stochastic
mRNA synthesis in mammalian cells. PLoS. Biol. 4, e309.
Raser, J. M. and O’Shea, E. K. (2004). Control of stochasticity in eukaryotic gene
expression. Science 304, 1811-1814.
Richard-Foy, H. and Hager, G. L. (1987). Sequence-specific positioning of nucleosomes
over the steroid-inducible MMTV promoter. EMBO J. 6, 2321-2328.
Scheidereit, C., Geisse, S., Westphal, H. M. and Beato, M. (1983). The glucocorticoid
receptor binds to defined nucleotide sequences near the promoter of mouse mammary
tumour virus. Nature 304, 749-752.
Shaner, N. C., Campbell, R. E., Steinbach, P. A., Giepmans, B. N., Palmer, A. E.
and Tsien, R. Y. (2004). Improved monomeric red, orange and yellow fluorescent
proteins derived from Discosoma sp. red fluorescent protein. Nat. Biotechnol. 22, 1567-
1572.
Sharp, Z. D., Mancini, M. G., Hinojos, C. A., Dai, F., Berno, V., Szafran, A. T., Smith,
K. P., Lele, T. P., Ingber, D. E. and Mancini, M. A. (2006). Estrogen-receptor-alpha
exchange and chromatin dynamics are ligand- and domain-dependent. J. Cell Sci. 119,
4101-4116.
Shykind, B. M. (2005). Regulation of odorant receptors: one allele at a time. Hum. Mol.Genet. 14 Spec No. 1, R33-R39.
Swain, P. S., Elowitz, M. B. and Siggia, E. D. (2002). Intrinsic and extrinsic contributions
to stochasticity in gene expression. Proc. Natl. Acad. Sci. USA 99, 12795-12800.
Swift, S., Lorens, J., Achacoso, P. and Nolan, G. P. (2001). Rapid production of
retroviruses for efficient gene delivery to mammalian cells using 293T cell-based systems.
Curr. Protoc. Immunol. Chapter 10, Unit 10.17C.
Voss, T. C. and Hager, G. L. (2008). Visualizing chromatin dynamics in intact cells.
Biochim. Biophys. Acta. 1783, 2044-2051.
Voss, T. C., John, S. and Hager, G. L. (2006a). Single-cell analysis of glucocorticoid
receptor action reveals that stochastic post-chromatin association mechanisms regulate
ligand-specific transcription. Mol. Endocrinol. 20, 2641-2655.
Walker, D., Htun, H. and Hager, G. L. (1999). Using inducible vectors to study intracellular
trafficking of GFP-tagged steroid/nuclear receptors in living cells. Methods 19, 386-
393.
Wernet, M. F., Mazzoni, E. O., Celik, A., Duncan, D. M., Duncan, I. and Desplan, C.
(2006). Stochastic spineless expression creates the retinal mosaic for colour vision. Nature440, 174-180.
Journal of Cell Science 122 (3)
Jour
nal o
f Cel
l Sci
ence


