Embed Size (px)
Citation preview

Industrial and Corporate Change, Volume 20, Number 5, pp. 1403–1437
doi:10.1093/icc/dtr034
Advance Access published July 12, 2011
Commercializing academic research:
the quality of faculty patenting
Dirk Czarnitzki*,z, Katrin Hussinger** and Cedric Schneidery
The knowledge produced by academic scientists has been identified as a potential
key driver of technological progress. Recent policies in Europe aim at increasing
commercially orientated activities in academe. Based on a sample of German sci-
entists across all fields of science, we investigate the importance of academic
patenting. Our findings suggest that academic involvement in patenting results
in a citation premium, as academic patents appear to generate more forward
citations. We also find that in the European context of changing research object-
ives and funding sources since the mid-1990s, the “importance” of academic
patents declines over time. We show that academic entrants have patents of
lower “quality” than academic incumbents but they did not cause the decline,
since the relative importance of patents involving academics with an existing
patenting history declined over time as well. Moreover, a preliminary evaluation
of the effects of the abolishment of the “professor privilege” (the German coun-
terpart of the US Bayh-Dole Act) reveals that this legal disposition led to an accel-
eration of this apparent decline.
JEL classification: O31, O32, O34.
*Dirk Czarnitzki, Centre for R&D Monitoring (ECOOM), K.U. Leuven, Belgium; Department of
Managerial Economics, Strategy and Innovation, K.U. Leuven, Belgium; Centre for European
Economic Research (ZEW), Mannheim, Germany. e-mail: [email protected]
**Katrin Hussinger, University of Maastricht, Department of Organization and Strategy, The
Netherlands; K.U. Leuven, Department of Managerial Economics, Strategy and Innovation,
Belgium; Centre for European Economic Research (ZEW), Mannheim, Germany. e-mail:
yCedric Schneider, Copenhagen Business School, Department of Economics (Denmark). e-mail:
zMain author for correspondence.
� The Author 2011. Published by Oxford University Press on behalf of Associazione ICC. All rights reserved.
at CB
S Library on A
ugust 28, 2013http://icc.oxfordjournals.org/
Dow
nloaded from

1. Introduction
Assessing the economic impact of public science has been discussed among economic
scholars, professionals and policy makers since decades. The most obvious contri-
bution of public science toward economic growth is the education of the future
high-skilled labor force. Possibly equally important, however, is the fact that
public science provides research results for the public domain, and their insights
can be picked up by the business sector so that research results from public institu-
tions can be translated into new production processes and products. Third, more
active ways to promote the knowledge and technology transfer from academe to
industry are, among other channels, collaborations in R&D projects, faculty consult-
ing, spin-off creation by universities, university patenting and licensing of technol-
ogies. Those activities are typically summarized as industry–science interactions.
Several scholars have shown positive economic benefits of research results pro-
duced in public science. For instance, Jaffe (1989) has shown that university research
contributes to state-level corporate patenting. Adams (1990) found that cumulative
stocks of academic research stimulate productivity growth in industry. Lichtenberg
(1996, 2001, 2003) links pharmaceutical innovation to lower hospital costs and
increased life expectancy, and Toole (2007) concludes that university research
makes significant contribution to drug innovation in pharmaceutical industry.
Mansfield (1991) concludes from a survey of 76 US firms that 11% of product
inventions and 9% of process inventions would not have been made in the absence
of recent academic research. This picture is supported by the Yale survey and the
Carnegy Mellon survey. Both surveys have shown that universities deliver a signifi-
cant impact for new product and process development in firms (Cohen et al., 2002).
Further studies have shown that academic scientists significantly contributed to the
birth of the US biotechnology industry (Zucker and Darby, 1996; Zucker et al.,
1998), and that academic scientists significantly contribute to firm performance
when they venture from academe to industry (Zucker et al., 2002; Toole and
Czarnitzki, 2007, 2009).1
On the background of the ongoing transformation of economies towards
“modern knowledge societies,” many governments increased their attention
toward industry–science interactions, and, hence, those have been the subject of
innovation policy in most industrialized countries recently. Such policies aim at
increasing industry–science interactions in the future as it is assumed that an
increased attitude toward commercialization in public science will result in even
higher economic benefits. Despite the presumably positive effect of increased com-
mercialization of academic inventions on technological progress, there are some
serious threats. Most important is the peril of the “culture of open science” at
1We refer the reader to Foray and Lissoni (2010) for a recent survey on the benefits of academic
research.
1404 D. Czarnitzki et al.
at CB
S Library on A
ugust 28, 2013http://icc.oxfordjournals.org/
Dow
nloaded from

universities through a shift in content of academic research from basic to applied
research that focuses on subsequent commercialization (Verspagen, 2006). Many
scholars see the relatively open nature of science progress at universities, which is
characterized by sharing of knowledge, data and research results as opposed to cor-
porate research and development, as a key determinant of the success of university
research (Dasgupta and David, 1994).
These controversial arguments gave rise to several studies on the commercializa-
tion of academic research in response to policy changes. Among other policies, the
most prominent or most studied example is the US Bayh-Dole Act from 1980. The
Bayh-Dole Act strengthened the patenting rights of US universities (and small busi-
nesses) by granting them the right to patent and to retain the ownership of inven-
tions even if these were financed through public resources. Examples of studies on
the potential effects of the Bayh-Dole Act are Henderson et al. (1998), Mowery and
Ziedonis (2002), Mowery et al. (2002), and Sampat et al. (2003).
While most of the literature on the quality of academic commercialization is
based on the Bayh-Dole Act in the United States, little attention has been paid to
the commercial value of science more generally. We exploit institutional differences
between the United States and Europe, and suggest that even without a Bayh-Dole
Act, the increasing orientation toward commercialization results in diminishing
quality of academic commercialization.
In this article, we build on the literature that has analyzed the consequence of the
Bayh-Dole Act in the United States (Henderson et al., 1998; Mowery and Ziedonis,
2002; Mowery et al., 2002; Sampat et al., 2003). However, there are several differences
between the aforementioned studies and ours. First and foremost, we focus on aca-
demic patents rather than university patents. That is, our unit of analysis will be
patents that involve at least one academic inventor, even if the patent in question is
owned by a corporation. The reason is that until recently academic inventions in
most European countries were owned by the faculty inventors themselves or by their
industrial sponsor, even if the invention was partly funded by public resources. This
is in contrast to the United States where universities may claim the property rights of
their patented inventions since the Bayh-Dole Act of 1980.2 An immediate implica-
tion of the high share of academic inventions being assigned to the business sector is
that the contribution of academe to business innovation development would be
largely underestimated if such science–industry collaborations were not taken into
account (Geuna and Nesta, 2006; Verspagen, 2006; van Pottelsberghe de la Potterie,
2007). As may already be apparent from the preceding discussion, the second dif-
ference between previous literature on US data and our study is that the institutional
framework is different in Europe. Until recently, most European countries allowed
2For a discussion of the payoffs of private–public research activities under different ownership
regimes we refer the reader to Aghion and Tirole (1994).
The quality of faculty patenting 1405
at CB
S Library on A
ugust 28, 2013http://icc.oxfordjournals.org/
Dow
nloaded from
faculty members to retain ownership of any patented invention. It is only recently
that countries like Germany implemented Bayh-Dole Act type of legislations.
We use patent data on German professors as we are able to identify individual
academic inventors. Our results show that “academic patents” are, on average, more
“important” than a corporate patent without faculty involvement. However, we
observe a stark decline of quality over time. First, the quality of corporate and
academic patents converges, but in the most recent period in our data, academic
quality even falls behind corporate quality. Interestingly, this last period corresponds
to the introduction of a Bayh-Dole-type policy in Germany. In further steps, we show
that academic entrants that enter commercialization channels possibly due to budget
constraints in the public sector account for a larger share of the decline than do
experienced inventors.
The remainder of the article is organized as follows: first we outline the literature and
our hypotheses to be tested. The third section presents the construction of the database,
and some descriptive evidence. Section 4 presents econometric evidence from count
data models. The final section concludes and suggests further research on the topic.
2. Commercializing academic research
2.1 The difference between public and private research
Public sector science in form of discoveries and inventions produced at universities
or other public research institutions has some features that distinguish it from re-
search financed and produced in the business sector. Typically, public knowledge
production happens in an open regime that facilitates disclosure and diffusion of
inventions and discoveries (Dasgupta and David, 1994). Science has priority over
commercialization of inventions and the incentives for inventors are significantly
determined by peer recognition and career rewards such as tenure, and not only by
monetary rewards (Merton, 1973).3 This incentive structure strongly supports the
openness of public science and leverages effective cumulative innovation through a
sharing of knowledge, data and research results. In contrast, science produced in the
private sector aims at commercialization and the profit from an invention largely
depends on the degree to which others can be excluded (Arrow, 1962).
As the focus of private science is often on short and medium-term profits from
inventions, the private sector is likely to systematically “underfund” inventions that
are rather basic in nature (Agrawal and Henderson, 2002). As opposed to applied
inventions that are strongly linked to their commercial success basic inventions and
the results of fundamental research are more difficult to appropriate, especially in the
short run. This is one of the main arguments for publicly sponsored science.
3This is strongly supported by a recent survey among European inventors (Giuri et al., 2007).
1406 D. Czarnitzki et al.
at CB
S Library on A
ugust 28, 2013http://icc.oxfordjournals.org/
Dow
nloaded from

A systematic difference in the nature of public and private science has been empir-
ically approved (Trajtenberg et al., 1997). A related argument for public science is
that fundamental research might have much broader applications, i.e. their social
value should be higher than that of private science. Hence, the “shoulders” of in-
ventions and discoveries produced at universities are supposed to be much broader
than those of private inventions. Beyond break-through inventions and industry–
science collaborations, publicly sponsored science at universities provides codified
ways of solving problems that can be useful beyond a specific content and univer-
sities borders (Dasgupta and David, 1994). Furthermore, public science provides a
structured picture of interdependencies in science, which can help uncovering the
relevant technology areas of a particular problem. This can save research efforts as it
can help avoiding unnecessary (costly and time consuming) experiments and maxi-
mize the probability of discovery (Fleming and Sorensen, 2004).
These distinctive features of public science suggest a significant contribution to
technological progress and growth: the basicness of university science increases the
potential for its use and the open culture at universities positively affects the diffu-
sion of research results. Griliches (1984) and Adams (1990) document a significant
contribution of university research and science produced at public research centers
to economic growth in their seminal studies.
In addition, there are arguments that support that the knowledge produced in the
public science sector should even exceed private sector knowledge. For instance, in
order to justify publicly financed science, we should see that discoveries made in the
public sector have a higher social value than inventions produced by the private
sector (Agrawal and Henderson, 2002).
However, what happens if academic scientists engage in commercialization? In the
case of spin-off creation or patenting, for example, we can follow the logic of a
theoretical model of Lacetera (2009). Suppose an industrial research and an academic
scientist face the same time constraint for their activity (e.g. 12 working hours per
day), and suppose both have certain ideas for research projects. The (risk neutral)
industrial researcher would start a project if the expected profits are larger than zero.
The academic scientist, however, has to decide to which extent he or she splits the
time between academic tasks, e.g. publications, and commercial tasks. Thus, the
academic has opportunity cost of foregone academic merits if he or she decides to
engage in commercialization. The academic scientist would only self-select into com-
mercialization if the expected utility gain, that is, monetary profits, is larger than the
lost utility of non-published papers due to time constraints. Hence, we can still
conclude that academic patents, for instance, should be more valuable than private
sector patents due to the incurred positive opportunity cost for the academic scientist
which induces a self-selection into commercialization.4
4Lacetera (2009) originally built his model to argue that studies comparing academic spin-off
performance with other newly founded firms are suffering from such self-selection bias.
The quality of faculty patenting 1407
at CB
S Library on A
ugust 28, 2013http://icc.oxfordjournals.org/
Dow
nloaded from

An alternative view on the scientist’s decision to patent is that patents emerge in
response to scientific opportunities (Azoulay et al., 2007) and as by-products of
scientific research (Murray, 2002; Murray and Stern, 2007). If a researcher discovers
a productive research domain this will become visible in a high flow of later publi-
cations and patenting will occur as a by-product of such a surge in scientific prod-
uctivity. From this point of view, academic patenting is an opportunistic response to
the discovery of a promising research area (Azoulay et al., 2007).
Taking these different arguments together, we arrive at a first hypothesis which
will be tested with patent data:
Hypothesis 1: Faculty involvement in the commercialization of inventions should, on
average, lead to higher quality than inventions produced by non-academics.
Furthermore, we will also test if academic inventors are more likely to produce
break-through inventions. While one expects that the average quality is higher, it can
also be expected that block-buster patents are produced in academe, as they may
require highly complex processes and approaches. Academics who are usually
assumed to be at the forefront of research in their field may have a comparative
advantage over industrial researchers, as they, for instance, shape their human capital
within a small group of initial discoverers of new technology field. See Zucker et al.
(1998) for the example of academic discoveries in the biotechnology sector and how
their commercialization activities linked to a few star scientists led to a diffusion of
knowledge that is nowadays commonly used in the United States or to a large extent
even in the global biotechnology industry.
Hypothesis 2: Faculty involvement in the commercialization of inventions does not only
lead to higher quality, on average, but faculty patents are especially more cited in the
upper tail of the quality distribution of inventions.
2.2 Public budgets and implications for public research
The recent past has seen significant changes in the European public science sector.
First of all, public budgets spent on science and technology decreased significantly all
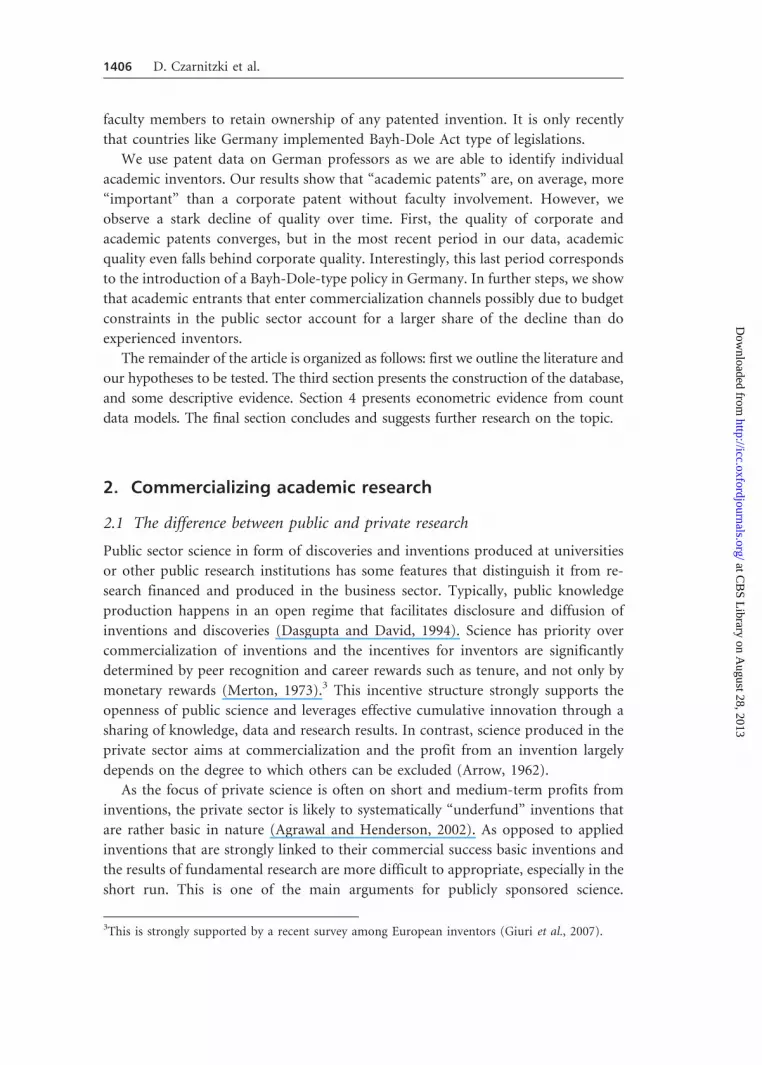
over Europe (Geuna and Nesta, 2006). Figure 1 shows the development of higher
education R&D expenditures (HERD) in Germany and the United States over the
past decades. The solid line shows that the investment in higher education is almost
constant over time in terms of GDP in Germany at �0.4%. In the United States,
HERD/GDP grew over time, but is still 50.4% in the mid-2000s. In contrast, the
share of HERD financed by the business sector increased significantly in Germany.
It rose from a share of �2% in 1981 to 14% in 2005. Thus the contribution of private
Researchers typically found that academic spin-offs perform better, but Lacetera argues that this is
a self-selection effect than rather superior average performance in the population of academics.
1408 D. Czarnitzki et al.
at CB
S Library on A
ugust 28, 2013http://icc.oxfordjournals.org/
Dow
nloaded from
funding sources gradually substituted public funding sources. Interestingly, we do
not see such a trend in the United States. The share of HERD financed by the
business sector peaks at �8% at the end of the 1990s, but declines to �4% by 2005.
Furthermore, in the presence of public budget constraints the structure of public
financing of research changed toward competitive funds (Geuna, 2001). Examples
are the “elite university” in Germany, where universities compete against each other
for “elite” funding by the government.
The decreasing public funding forced universities to more and more reach out for
different sources of financing (Geuna and Nesta, 2006). Besides an increased finan-
cing by nonprofit organizations, most of the funding gap was bridged through
increased collaborations with the private sector (Geuna, 2001). The increased
dependence on industry funds might have significant consequences for academic
B
A
0.2
0.3
0.4
0.5
0.6
0
2
4
6
8
10
12
14
16
1981 1984 1987 1990 1993 1996 1999 2002 2005
HE
RD
/GD
P
HE
RD
by
busi
ness
sec
tor
HERD by business sector (in %)HERD/GDP (in %)
0.2
0.3
0.4
0.5
0.6
0
2
4
6
8
10
12
14
16
1981 1984 1987 1990 1993 1996 1999 2002 2005
HE
RD
/GD
P
HE
RD
by
busi
ness
sec
tor
HERD by industry (in %)HERD/GDP (in %)
Figure 1 Higher education R&D expenditure over time. (A) Germany and (B) United States.
Source: OECD—Main Science and Technology Indicators: own calculations.
The quality of faculty patenting 1409
at CB
S Library on A
ugust 28, 2013http://icc.oxfordjournals.org/
Dow
nloaded from

research. On the one hand, close links between academia and industry have many
positive aspects not only for the business partner (e.g. Zucker and Darby, 2000; Hall
et al., 2001) but also for the academic sector, as for instance, the realization of
complementarities between applied and basic research (Azoulay et al., 2006) and
the generation of new research ideas (Rosenberg, 1998). However, there are also
some potential negative implications. Most serious, the content of academic research
might shift from rather basic to applied inventions that aim at immediate commer-
cialization (Azoulay et al., 2006), which would have negative implications for
long-term fundamental research. A shift in content toward commercialization
would partly explain the increased engagement of academics in patenting that was
documented by a number of scholars for different European countries (Meyer et al.,
2003; Lissoni et al., 2006; Czarnitzki et al., 2007, 2009).5
However, scientists face an increasing pressure to patent from changing rules in
the public science sector [Sampat (2003) for the United States, Geuna and Nesta
(2006) and Franzoni and Lissoni (2009) for Europe]. The competition for funding
from the government is not based on scientific publications only but also evaluates
the scientists or the university department in terms of their patent outcome.
Furthermore, career rewards as tenure are increasingly dependent on patents
and industry–science collaboration rather than on scientific publications only.
These developments gradually changed the incentive structure for scientists and
put them under increased pressure to transfer their knowledge into marketable
products.
Extending Lacetera’s (2009) argument, suppose that an academic scientist has the
opportunity to complete either an economically valuable project or to do basic
science in each of two periods. The scientist can do pre-commercial research in
the first period and use this new knowledge to engage in commercial activity in
the second period. Alternatively, the scientist can engage in commercial activity right
away, building on his current stock of knowledge solely. In the first scenario, the
scientist applies his new research results to innovate. In the second scenario, the
scientist will innovate based on the current state of knowledge. Therefore, the quality
of these innovations will differ substantially, as the innovation based on novel sci-
entific achievements will have a higher value than the innovation based on existing
knowledge. Due to the increased pressure to patent they face, scientists will therefore
5Another important threat concerns the number and the quality of scientific publications. Geuna
and Nesta (2006) survey the existing literature for Europe on the effect of increased patenting on
publication outcome. Most of the studies for Europe find no empirical evidence for university
patenting to reduce the number of scientific publications or their quality (e.g. Czarnitzki et al.
2007, for Germany, Breschi et al., 2006, for Italy). For the United States, the results are similar (e.g.
Stephan et al., 2006, Azoulay et al., 2006, Fabrizio and DiMinin, 2005). Distinguishing between
university and corporate patents of professors in Germany, Czarnitzki et al. (2007b) conclude that
corporate patenting by academics has a negative impact on their scientific performance, while
patents in collaboration with not-profit organizations spur their publication outcome and quality.
1410 D. Czarnitzki et al.
at CB
S Library on A
ugust 28, 2013http://icc.oxfordjournals.org/
Dow
nloaded from

be more likely to shift toward immediate commercialization without performing
pre-commercial research, which will result in innovations of lower quality.
In addition, incentives for the corporate sector to collaborate with academia have
also evolved. Many European governments, as well as the European Commission,
have launched several public programs to promote and strengthen industry–science
links, by financially supporting collaboration between academia and the private
sector (Veugelers and Cassiman, 2005). There is ample evidence that these financial
incentives increase the propensity of firms of engaging in cooperative agreements
with academia in order to benefit from government-sponsored cost sharing of in-
novation (Capron and Cincera, 2003; Mohnen and Hoareau, 2003; Veugelers and
Cassiman, 2005).
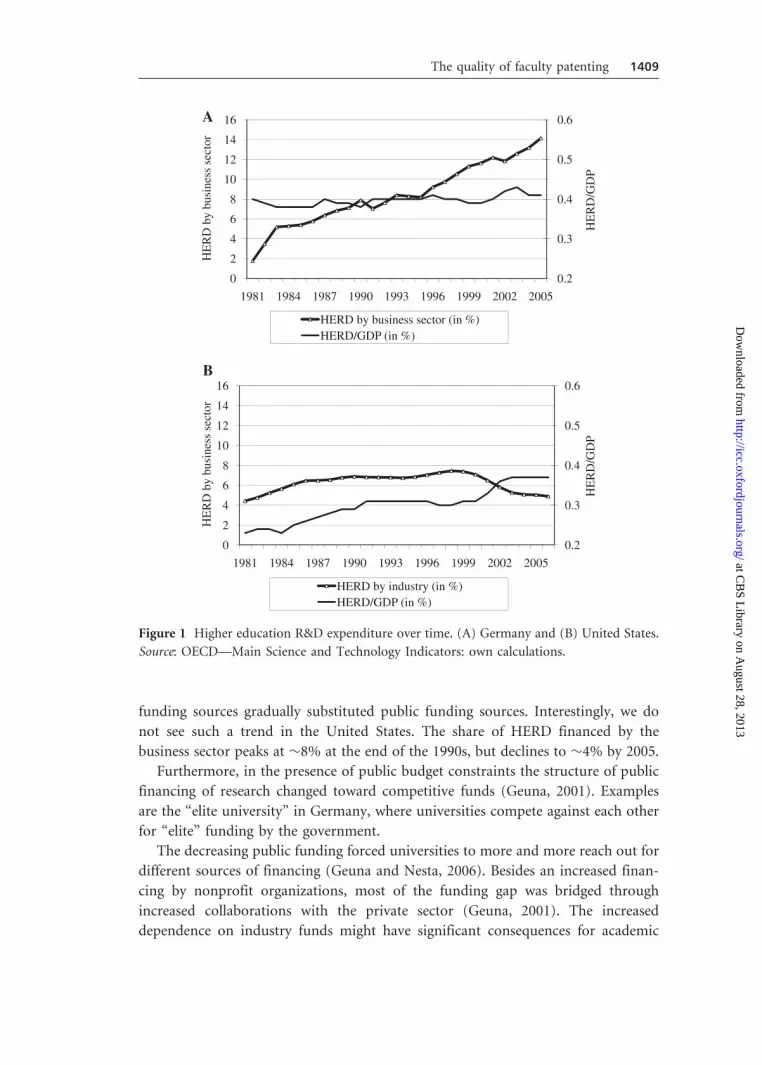
Figure 2 shows some evidence from German subsidy data taken from the PROFI
database. The graph shows annual statistics of civilian “direct project funding” of the
German Federal Government. The “direct project funding” is the most important
project-orientated policy instrument for funding R&D projects in Germany.
Applicants for public R&D money can submit proposals that are evaluated according
to technological feasibility and expected economic returns. An application may either
be filed by a single firm or research institution, or by a research consortium of firms
and/or research institutions. The upper chart shows that grants given out to con-
sortia rather than single firms or institutions oscillates �40% of total grants in the
2000s. The lower graph clearly shows the change of policy in Germany. Within
several sub-programs of the “direct project funding” the German Government pro-
moted industry–science interactions. This becomes evident when we separate the
collaborative research grants by type of consortium. Since the mid-1980s, we find
a clear trend toward promoting industry–science consortia, while there is a lower
growth of grants given to pure firm research consortia or pure science consortia.
However, cooperation with academia requires a critical level of prior knowledge
or “absorptive capacity” (Cohen and Levinthal, 1989) to effectively recognize, as-
similate, and utilize external information flows stemming from academia, which are
by nature more basic. This suggests that the growing public support of cooperative
agreements between the private sector and academia led many firms that do not have
this critical level of internal knowledge to engage in partnerships with academia.
Thus, we arrive at our third hypothesis on a possible decline of patent quality.
Hypothesis 3: The quality of faculty patents declines with the increasing shift toward
commercialization in academe (compared to a control group of corporate patents).
Mowery et al. (2006) find that in the United States, inexperienced universities
initially adopted an indiscriminate policy toward patenting as they entered into this
activity after passage of the Bayh-Dole Act and patented inventions with little evalu-
ation of the market within their industry. Furthermore, they find that the decline
quality of university patents in the United States is largely due to these academic
The quality of faculty patenting 1411
at CB
S Library on A
ugust 28, 2013http://icc.oxfordjournals.org/
Dow
nloaded from

entrants. Provided Hypothesis 3 is fulfilled, the decline in quality of faculty patents
might as well be driven by academic entrants. Therefore, we will test whether the
decrease in quality of faculty patents should be attributed to academics with no
historical experience in patenting, or if there is a more secular decline.
We argue that even if academic entrants patent inventions of lower importance
than academic incumbents, they are not causing the decline, since the new “research
culture” induced by the changing objectives and funding sources affect all potential
academic inventor.
0
10
20
30
40
50
1985 1988 1991 1994 1997 2000 2003 2006
Shar
e of
col
labo
rativ
e fu
ndin
g (i
n %
).
0
50
100
150
200
250
300
350
400
450
1985 1987 1989 1991 1993 1995 1997 1999 2001 2003 2005
Gra
nted
am
ount
in m
illio
n E
UR
(no
min
al).
only firms
only science
firms+science
A
B
Figure 2 Civilian mission-orientated research funding by German Federal Government.
(A) Share of collaborative research grants in terms of total amount granted within
mission-orientated research funding in Germany and (B) division of collaborative research
grants by type of research consortia.
Source: PROFI database from Germany’s Federal Ministry of Education and Research: own
calculations.
1412 D. Czarnitzki et al.
at CB
S Library on A
ugust 28, 2013http://icc.oxfordjournals.org/
Dow
nloaded from

Hypothesis 4: Academic entrants have patents of lower quality than academic incum-
bents, but they do not drive the decline in quality.
2.3 The abolishment of the professor’s privilege in Germany
As outlined above, the shift to entrepreneurial universities (Etzkowitz et al., 2000)
may reduce the difference between academic and industrial research due to an orien-
tation toward commercialization in public science. Studies for the United States that
have investigated the consequences of the Bayh-Dole Act find mixed evidence on this
hypothesis (among others, Henderson et al., 1998; Mowery and Ziedonis, 2002;
Mowery et al., 2002; Sampat et al., 2003). Researchers have studied patent quality
before and after the Act in 1980. However, the after-Bayh-Dole Act phase was also
characterized by a general trend toward the entrepreneurial university in the United
States that cannot be purely attributed to strengthening universities’ patent rights.
For instance, it can also be observed that the number of spin-off companies is con-
stantly growing in the United States, from about 200 in the mid-1990s per year to
about 400 in the early 2000s (Source: AUTM US Licensing Survey: FY 2004).
We make use of institutional differences between the United States and Germany
to uncover differences of the generally increasing commercialization trend and the
impact of a Bayh-Dole Act-type policy change in February 2002. Until then, German
universities had a weak position in terms of their rights to use the inventions of their
employees. The “professors’ privilege” determined that professors were the only
occupational group in Germany that had the right to use their scientific results for
private commercialization even if the underlying research was financed by the uni-
versity. This explains why the majority of inventions (that were taken out as patents)
made in German universities were not assigned to universities but to the professors
themselves or to corporations (Geuna and Nesta, 2006; Verspagen, 2006; Czarnitzki
et al., 2007, 2009).
Once derived from Article 5 of the German constitution, which pertains to the
freedom of science and research, the German Federal Ministry of Education and
Research (BMBF) decided to abandon the professor’s privilege in 2002 because it was
suspected to inhibit science and technology transfer (Kilger and Bartenbach, 2002).
Under the old law, the professor bore all the financial risk of filing a patent appli-
cation (including patent application fees and potential infringement costs). As the
distribution of the value of patents is known to be very skew university professors
faced the risk that the costs of patenting would increase the profits thereof by far,
which significantly decreased their incentives to patent. Under the new law, the
university takes over the financial risk and the patent application procedure and
the professor receives 30% of the revenues from exploiting his invention. Hence,
the threshold for professors to patent is even reduced as the opportunity cost
of patenting were decreased through the abolishment of the “professor’s privilege”
in 2002.
The quality of faculty patenting 1413
at CB
S Library on A
ugust 28, 2013http://icc.oxfordjournals.org/
Dow
nloaded from
We expect that the abolishment of the “professor’s privilege” will have two effects:
for one, the number of patents assigned to universities is expected to increase.
Second, we suspect a decline in quality of patents taken out by professors. As a
result of the change in law the self selection effect into commercial activities that
resulted in higher quality of academic patents is supposed to be significantly reduced.
Hence, a potential decline of patent quality due to an increasing commercial orien-
tation in academe is expected to be accelerated trough the change in law, i.e. after
2002. The investigation of the effect of the abolishment of the professors’ privilege
should, however, be taken cautiously, since we only observe academic patents for a
short period after the law change (2 years). Our results should be taken as indicative
of the effect that the abolishment of the professors’ privilege had in the short run, but
should not be taken as a definitive evaluation.
3. Data and methodology
3.1 Data and sample selection
Our analysis is based on a data set issued by the European Patent Office (EPO) and
the OECD. The “EPO/OECD patent citations database” covers all patents applied for
at the EPO since its foundation in 1978 and up to October 2006 as well as all patents
applied for under the Patent Cooperation Treaty (PCT) in which the EPO is desig-
nated, so-called “Euro-PCT applications.” In addition to detailed information on all
cited patents, the dataset contains other information for each patent (technology
classes, date of application and title) and each applicant and inventor (name and
place of residence). An earlier version of this database is fully described and analyzed
in Webb et al. (2005).
From this database, we extracted all applications involving at least one inventor
residing in Germany, resulting in a total of 346,892 patent applications. We identified
all patents invented by German Professors by using the persons’ title “Prof. Dr.” and
variations of that.6 The professor title is protected by the German criminal code
(article 132a) against misuse by unauthorized persons. Although not compulsory, it
is common practice in Germany to use academic titles in official communications.
Czarnitzki et al. (2007) did a test on the accuracy of this identification strategy for a
sample of patents of German scientists at the German Patent and Trade Mark Office
and the European Patent Office. They checked whether the names of professors
appeared in the patent database without the title but with the same address in
order to verify that the title field is always filled in the data. The verification of a
sample of persons had shown that university professors (or professors at other higher
education facilities such as polytechnical colleges) can be identified by their title with
6Variations include, for instance, “Professor Dr.”, “Prof.” or “Professor”.
1414 D. Czarnitzki et al.
at CB
S Library on A
ugust 28, 2013http://icc.oxfordjournals.org/
Dow
nloaded from

high precision. Czarnitzki et al. (2007) conclude that it basically never happens that
inventor names appear sometimes with “Prof. Dr.” (or similar title) and sometimes
without on other patents. Thus, we can safely argue that with focus on Germany this
procedure delivers a listing of patents where professors are recorded as inventors. In
total, we found 4973 (granted) patents that list at least one faculty member between
1980 and 2003. Our data turned out to contain “only” 22 university patents (i.e.
patents owned by universities), �0.45% of the total of academic patents.
To further check the completeness of our sample of academic patents, we com-
pared the outcome with a similar search in the data from the German Patent and
Trademark Office (GPTO). More precisely, we searched all patents that have an EPO
equivalent at the GPTO and that list professors as inventors. We found only 112 cases
in which the GPTO patent listed a professor, but not the equivalent EPO patent over
the period 1990–2001. We interpret the small number of patents not found in EPO
data, as some confirmation of our statement that German professors use their title in
correspondence and official documents regularly.
We are aware that this way of identifying professors is not perfect. Our sample
might include a few professors that work part of their time in industry so that their
patents may not be generated in a purely academic environment. Furthermore, we
might miss professors that do not mention their title on their patents applications.
Thus, note that we by no means claim to identify the population of professor patents,
but a sample where we ensure that the included patents are definitely “academic”
patents.7
In order to evaluate the “importance” of our “academic patents,” we constructed
a control group that include one nonacademic patent for each academic patent. The
non-academic patents were randomly drawn based on the date of applications and
on 30 patent technology classes as defined in the OST-INPI/FhG-ISI classification
also often referred to as the Fraunhofer classification, which is based on a concord-
ance with IPC assignments. For a detailed description see OECD (1994: 77–78 for the
definition).
In order to ensure that no patent owned by others than corporations would end
up in our control group, we applied a two-step sampling approach. In the first step,
we randomly drew five potential control patents for each academic patent from the
same technology class and application year. In the second step, we checked manually
the assignee type of each potential control patent and deleted noncorporate patents.
7There is some evidence that our sample actually covers the major part of the population of aca-
demic patents. For instance, Lissoni et al. (2008) find that the percentage of professor patents in
Sweden, Italy and France is �4%. Schmiemann and Duvry (2003) also found a share of 4% for
patents with German priority at the EPO. Verspagen (2006) reports also a share of academic
inventors of 4% within corporate patents covered by the PATVAL survey. With our strategy we
find that our sample leads to a share of 2.8% of academic patents in the total number of patents with
German applicants at the EPO.
The quality of faculty patenting 1415
at CB
S Library on A
ugust 28, 2013http://icc.oxfordjournals.org/
Dow
nloaded from

Noncorporate patents were for instance owned by not-for-profit nongovernmental
organizations, governments, individuals, and foreign applicants. In total, 6758 pa-
tents were taken out of the pool from which the control group was drawn. From the
remaining pool of potential controls, we subsequently sampled one control patent
for each academic patent randomly from the same year and technology class.8
3.2 Variables
We use the number of citations received by a focal patent from any subsequent
patent application in order to establish potential differences between academic pa-
tents and the control group. Our purpose in this article is to evaluate the involve-
ment of academics in terms of the quality of patents. In particular, we want to know
whether applications involving academic inventors have a stronger technological
impact, and are therefore more frequently cited. Patent forward citations are a
well established measure for the “importance,” the “quality,” or the “significance”
of a patented invention and have been used in different contexts in the literature on
technological change (Trajtenberg, 1990; Henderson et al., 1998; Harhoff et al., 1999;
Hall et al., 2001; Trajtenberg, 2001). Previous studies have shown that forward cit-
ations are highly correlated with the social value of the patented invention
(Trajtenberg, 1990, for the computer tomography industry) as well as with its private
value (Harhoff et al., 1999; Hall et al., 2005). Furthermore, forward citations reflect
the economic and technological “importance” as perceived by the inventors them-
selves (Jaffe et al., 2000) and knowledgeable peers in the technology field (Albert
et al., 1991). In this article, we use citation data from the EPO that has been made
recently available in machine readable format by the EPO and the OECD. The high
correlation between the number of forward citations to EPO patents with patent
value has been documented by Gambardella et al. (2008).
Although the literature interprets forward citations as a measure of an invention’s
“impact” or “importance,” citations to academic patents may arise for several rea-
sons, beyond their economic value. Academic patents may be cited more often be-
cause the underlying inventions are well documented and disseminated through
alternative channels such as journal publications. Differences in citation patterns
may also be explain by within-technology differences. Academic patents might
garner more citations than a corporate patent in the same technology class be-
cause their (presumed) basic nature makes them more relevant in a larger number
of fields.
8An alternative approach to construct a control group would be to apply a propensity score
matching to select the most similar patents from the control group. This is problematic in our
context, since we cannot easily identify the whole population of corporate patents.
1416 D. Czarnitzki et al.
at CB
S Library on A
ugust 28, 2013http://icc.oxfordjournals.org/
Dow
nloaded from

Therefore, we follow Rysman and Simcoe (2008) and maintain two simultaneous
interpretations of patent citations. The agnostic interpretation views patent citations
as a measure of how “interesting” a patent is, where interest can arise from any
source, beyond their economic impact. The alternative interpretation views citations
as an indication of a patent’s economic value. Giving a definitive interpretation of a
patent citation is beyond the scope of this article and we will therefore interpret our
conclusions with this caveat in mind.
Previous US studies on patent citations paid particular attention to
“self-citations,” i.e. cited and citing patents are owned by the same entity (e.g.
Jaffe et al., 1993; Jaffe and Trajtenberg, 2002). Self-citations differ from external
citations in that they cannot be regarded as representing spillovers to another pa-
tentee, they might be affected by the patentee’s differential knowledge and they might
provide different signals than other citations regarding the value to the patentee with
respect to future cumulative inventions (Hall et al., 2005). Contrary to the
well-known “NBER Patent Database,” the “EPO/OECD patent citations database”
does not indicate self-citations. Hence, we cannot control for them. However, we do
not expect any significant impact on the results from self-citations for two reasons.
First, previous studies have found little effects from the exclusion of self-citation on
forward citations in different contexts. Hall et al. (2005), for instance, found a real
but limited effect of the exclusion of self-citation on the relationship between for-
ward citations and the market value of firms for US patents (see also Hall et al.,
2007).
For Europe, Sapsalis and Van Pottelsberghe de la Potterie (2007) found that
removing self-citations does not affect the relationship between forward
citations and the explanatory variables for EPO patents of Belgian universities.
Second, unlike at the USPTO, patent applicants at the EPO do not have the
“duty of candor,” which means that there is no legal requirement to disclose prior
art. In order to check whether an EPO patent application fulfils the necessary
criteria to be granted, a patent examiner researches prior. The results of this inves-
tigation are summarized in the so-called “search report.” Descriptive statistics
show that 495% of the citations in EPO patents are added by the examiner.
In contrast, USPTO applicants have to provide a full list of prior art, including
their own work. This suggests that the “self-bias” in EPO patents is presum-
ably very low and would carry a weak informational content. The fact that the
allocation of citations follows a standardized procedure at the EPO is likely to
reduce the noise contained in the forward citations as a measure of the “importance”
of patents.
Turning to the explanatory variables of our analysis, our main variable is a binary
indicator that takes the value 1 if the inventor is an academic (see description in
Section 3.1). We will test whether patents that involve academic inventors are more
“important” than those of the controls.
The quality of faculty patenting 1417
at CB
S Library on A
ugust 28, 2013http://icc.oxfordjournals.org/
Dow
nloaded from

Following the literature on patent quality, intrinsic attributes of the patent that
may lead to a higher expected count of forward citations need to be controlled for.
Consequently, we include the following control variables.
Number of references to the patent literature (backward citations): the search
report published by the EPO yields information on the state of the art relevant for
a given patent application. Backward citations determine the legal boundaries of an
invention by citing a related body of work. Thus, one could hypothesize that appli-
cations containing references to a large number of related inventions are of more
incremental nature (Lanjouw and Schankerman, 2001). However, empirical evidence
tends to uncover a positive effect of backward citations on the value of a patent
(Harhoff et al., 2003), which suggests that the number of cited patent is more likely
to refer to the crowdedness of the technological area (Lanjouw and Schankerman,
2001). Everything else equal, patents in more crowded areas should generate more
forward citations. An alternative interpretation is that backward citations are a meas-
ure of the scope of the patents. Since patent citations always refer to a claim (or a set
of claims), patents with more backward citations should be more cited, everything
else equal (Harhoff et al., 2003).
Patent scope: following Lerner (1994), we use the number of international patent
classes (IPC), at the four-digit level, assigned to the patent as a measure of patent
scope. The number of IPC assignments is a proxy for the extent of monopoly power a
patent grants. Thus the broader the scope of a patent, the higher is the probability to
be cited by other patents.
References to the non-patent literature: we include a binary variable that takes the
value 1 if the patent application cites at least one non-patent reference (NPR). We
hypothesize that NPRs capture the invention’s science linkage. This measure should
be taken cautiously, since NPRs do not necessarily represent a linkage to prior sci-
entific work (Harhoff et al., 2003).9 However, Callaert et al. (2004) show that �65%
of NPRs in EPO patents refer to scientific publications and there is some recognition
of their use as an indicator of science-technology linkages (Schmoch, 1997; Meyer,
2000).
Number of applicants and number of inventors: we follow Reitzig (2004) and
hypothesize that the more inventors and applicants participate in the research and
development process underlying the focal patent, the higher the resulting techno-
logical quality.
Share of foreign applicants and foreign inventors: we measure the degree of inter-
nationalization of the patent by including the share of non-German applicants and
inventors, since cross-border patents might have a higher visibility and might there-
fore be cited more often.
9Non-patent references can also be made to trade journals, firm publications or standard classifi-
cations in a technology field as classifications of chemical substances or mechanical designs.
1418 D. Czarnitzki et al.
at CB
S Library on A
ugust 28, 2013http://icc.oxfordjournals.org/
Dow
nloaded from

Finally, we control for systematic year and technology effects by including dum-
mies for application years and technology fields (see below).
3.3 Descriptive analysis
3.3.1 Summary statistics
Table 1 displays descriptive statistics of the variables used in the analysis. These
figures show that academic patents receive, on average, more citations than the
control group and have more NPRs. In addition, academic patents appear to be
broader, as measured by the number of IPC assignments and to be in less crowded
technology fields as indicated by the number of backward citations. They list more
applicants and inventors. The share of both foreign applicants and foreign inventors
is higher in the group of corporate patents. All these mean differences are signifi-
cantly different from zero at the one per cent level.
Table 2 tabulates the number of academic patents in each of the technology areas
from the OST classification. The Table shows that most academic patents are granted
in chemicals and pharmaceuticals, which contains 440% of all academic patents,
notably in the field of organic fine chemicals.
3.3.2 Citation lags
Forward citations are by nature truncated, since earlier patents have more time to
garner citations than later ones (Hall et al., 2001). Sampat et al. (2003) compare
university and corporate patents in the United States and find that the resulting
difference in citation counts is sensitive to the length of the time period taken
Table 1 Descriptive statistics
Academic patents Control group t-test on
mean
differenceMean (SD) Min. Max. Mean (SD) Min. Max.
No. of forward citations 2.702 (3.792) 0 58 2.242 (3.122) 0 48 �0.460***
No. of backward citations 3.700 (2.370) 0 19 3.909 (2.230) 0 18 0.208***
No. of backward citation 0.047 (0.213) 0 1 0.024 (0.153) 0 1 0.024***
No. of NPRs/No. of backward citations 0.475 (1.422) 0 48 0.226 (0.911) 0 40 0.250***
Share of foreign applicants 0.056 (0.222) 0 1 0.098 (0.289) 0 1 �0.042***
Share of foreign inventors 0.027 (0.109) 0 0.833 0.043 (0.152) 0 0.9 �0.016***
No. of inventors 3.434 (2.096) 1 21 2.609 (1.674) 1 12 0.824***
No. of applicants 1.131 (0.563) 1 14 1.076 (0.363) 1 9 0.054***
No. of IPC assignments 1.663 (0.861) 1 11 1.556 (0.770) 1 8 �0.106***
No. of observations 4973 4973
*** (**, *) indicate a significance level of 1% (5%, 10%).
The quality of faculty patenting 1419
at CB
S Library on A
ugust 28, 2013http://icc.oxfordjournals.org/
Dow
nloaded from
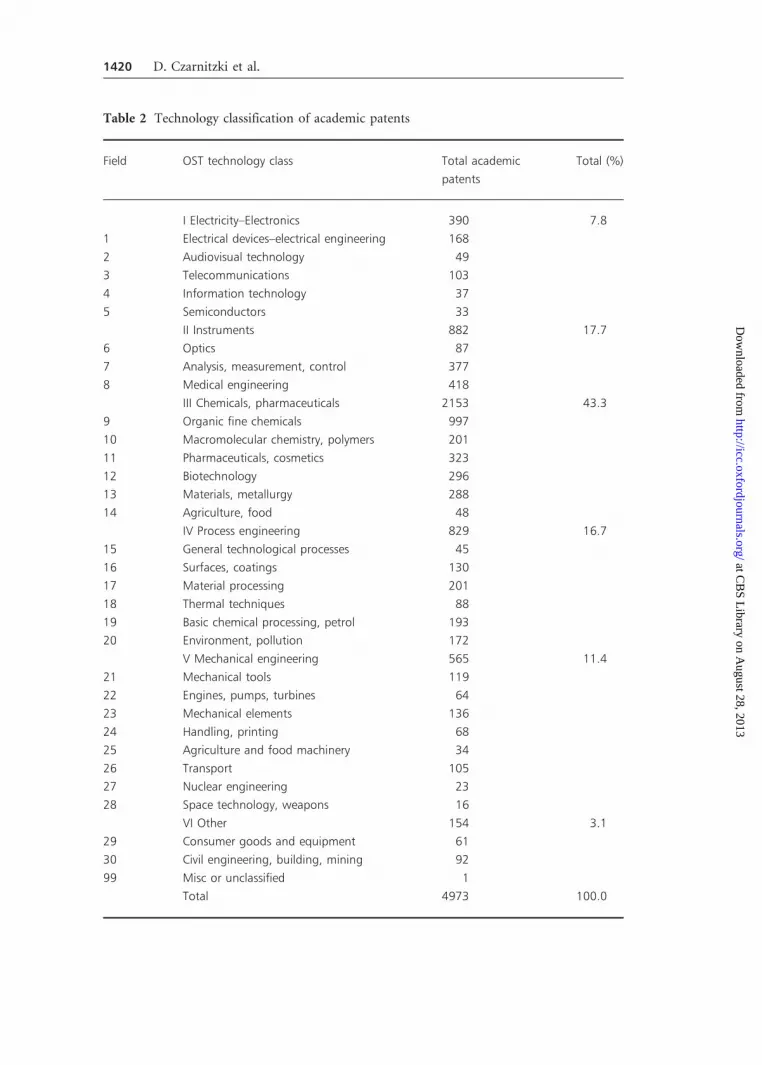
Table 2 Technology classification of academic patents
Field OST technology class Total academic
patents
Total (%)
I Electricity–Electronics 390 7.8
1 Electrical devices–electrical engineering 168
2 Audiovisual technology 49
3 Telecommunications 103
4 Information technology 37
5 Semiconductors 33
II Instruments 882 17.7
6 Optics 87
7 Analysis, measurement, control 377
8 Medical engineering 418
III Chemicals, pharmaceuticals 2153 43.3
9 Organic fine chemicals 997
10 Macromolecular chemistry, polymers 201
11 Pharmaceuticals, cosmetics 323
12 Biotechnology 296
13 Materials, metallurgy 288
14 Agriculture, food 48
IV Process engineering 829 16.7
15 General technological processes 45
16 Surfaces, coatings 130
17 Material processing 201
18 Thermal techniques 88
19 Basic chemical processing, petrol 193
20 Environment, pollution 172
V Mechanical engineering 565 11.4
21 Mechanical tools 119
22 Engines, pumps, turbines 64
23 Mechanical elements 136
24 Handling, printing 68
25 Agriculture and food machinery 34
26 Transport 105
27 Nuclear engineering 23
28 Space technology, weapons 16
VI Other 154 3.1
29 Consumer goods and equipment 61
30 Civil engineering, building, mining 92
99 Misc or unclassified 1
Total 4973 100.0
1420 D. Czarnitzki et al.
at CB
S Library on A
ugust 28, 2013http://icc.oxfordjournals.org/
Dow
nloaded from

into account. They argue that citations to universities occur on average later
than citations to the controls. We test the hypothesis of different citation lags be-
tween academic patents and the control group by plotting the kernel density of
the citation lag distribution for both groups. Figure 3 reveals that there are no
systematic differences between academic patents and the controls. Moreover,
the Kolmogorov–Smirnov test does not reject equality of the citation lag
distributions (P-value: 0.678). Hence, we can safely argue that our empirical
findings are not driven by systematic differences in citation lags for academic and
control patents.
The finding that there is no significant difference in citation lags for European
patents might be due to different procedures at the EPO and USPTO. As pointed out
in Section 3.2 already, contrary to practices at the USPTO, inventors applying for an
EPO patent do not have the “duty of candor” and are not required to provide a list of
prior art. The patent application is examined by the patent office and even references
made by the applicant have to be approved by the patent examiner. Bacchiocchi and
Montobbio (2004) find that these institutional differences imply that USPTO patents
contain on average more citations than EPO patents and that the median citation lag
is twice as large at the USPTO than at the EPO.
3.4 Methodology
Since our variable of interest, the number of forward citations contains only positive
integers, we use count models. The specification of our baseline regression follows a
well established literature in the area (see for example Henderson et al., 1998 or
0.0
05.0
1
Ker
nel d
ensi
ty
0 100 200 300
Lag (in months)
AcademicControl group
Figure 3 Citation lags of academic patents and controls.
The quality of faculty patenting 1421
at CB
S Library on A
ugust 28, 2013http://icc.oxfordjournals.org/
Dow
nloaded from

Mowery et al., 2002). More specifically, we estimate negative binomial and Poisson
models with conditional mean:
E CjX½ �T ¼ exp �ACADþX
t
�t APYt þX
c
�c TECHc þX
i
�iZiþlogðT Þþ"
" #,
ð1Þ
where C is the number of forward citations to the focal patent and X is the vector of
explanatory variables containing: ACAD, a dummy that equals 1 for all academic
patents in our sample; APY, a set of dummy variables for different patent application
years t, and TECH, a set of dummy variables for the different technology classes c a
patent application is attributed to. In addition, the vector Z contains the control
variables outlined in Section 3.2. The dependent variable, the number of forward
citations, is truncated since later patents have less time to garner citations than earlier
ones, which is why we estimate the model with “exposure” (Cameron and Trivedi,
1998). The variable T is the age of the patent in 2006 (the last year recorded in our
data) since its publication, or exposure during which citations occur. Thus, the
natural log of T enters as an offset in the conditional mean. One assumption in
the “traditional” maximum-likelihood estimation of the Poisson model is equidis-
persion, that is, the conditional mean is equal to the variance. Typically this assump-
tion is violated, and scholars tended to estimate Negative Binomial models that allow
for overdispersion, but require parametric assumptions about the form of
overdispersion.
While the Negative Binomial model would be efficient if the functional form
assumption for the overdispersion is correct, it would lead to inconsistent estimates
otherwise. Therefore, it is usually preferred to estimate less restrictive models.
Gourieroux et al. (1984) have shown that the parameter estimates of the Poisson
model are consistent as long as the conditional mean is correctly specified, even if the
true distribution is not Poisson. Although the standard errors obtained from the
Poisson model will be too small in case of overdispersion, they can easily be adjusted
and made robust against arbitrary forms of heteroscedasticity (see e.g. Wooldridge,
2002). We estimate both Poisson models with quasi-maximum-likelihood (QML),
i.e. Poisson with fully robust standard errors, and Negative Binomial models.
Two robustness tests are reported in the Appendix Tables A1 and A2. First, we
repeat the baseline regression using both zero-inflated Poisson and zero-inflated
negative binomial models to account for the large share of zeros in the dependent
variable (�30%). Second, Sampat et al. (2003) show that US University patents are
on average granted later than corporate patents. To correct for the potential right
censoring of patent citations, we follow the approach suggested by Marco (2007) and
estimate the hazard of patent citations to separate out the effect of patent quality and
citation inflation. Both approaches are consistent with the results of our baseline
regression analysis that is presented subsequently.
1422 D. Czarnitzki et al.
at CB
S Library on A
ugust 28, 2013http://icc.oxfordjournals.org/
Dow
nloaded from

4. Results
4.1 Are academic patents more “important” than corporate patents?
Table 3 displays the results of the Negative Binomial and Poisson regressions for
equation (1). Confirming our findings on the comparison of means, patents invol-
ving an academic inventor have a higher technological impact. According to the
Negative Binomial regression results, academic patents receive on average �13%
[¼exp(0.120)� 1] more citations than their counterparts in the control group.
This confirms our first hypothesis that academics are involved in more “important”
inventions. This suggests that university patenting per se is not the only channel
through which academics can generate knowledge externalities. Overall, the results
support our assumption that academic patents are, on average, more “important”
than purely corporate patents.
With respect to the control variables, our results show that, everything else equal,
applications with more backward citations receive, on average, more citations. In the
Table 3 QMLE Poisson and Negative Binomial regressions for patent forward citations: aca-
demics patents versus controls
Variables QMLE Poisson Negative Binomial
Coef. SE Coef. SE
ACAD 0.124*** 0.028 0.120*** 0.025
No. of backward citations 0.044*** 0.006 0.047*** 0.006
No. of backward citation �0.038 0.075 �0.018 0.069
No. of NPRs/No. of backward citations 0.011 0.007 0.015 0.011
Share of foreign applicants 0.188*** 0.058 0.190*** 0.054
Share of foreign inventors 0.014 0.107 0.050 0.106
No. of inventors 0.064*** 0.009 0.067*** 0.007
No. of applicants 0.001 0.023 �0.006 0.027
No. of IPC assignments 0.114*** 0.019 0.122*** 0.016
log(T) 1 1
Constant �3.645*** 0.307 �3.673*** 0.347
App. years – test of joint significance �2(23) ¼ 173.43*** �2(23)¼ 206.67***
Tech. classes – test of joint significance �2(30) ¼ 343.86*** �2(30)¼ 355.34***
Overdispersion parameter 0.9467 0.022
Hausman test (P-value) 0.694
LR test of equidispersion (P-value) 0.000
Log-likelihood �25,186.659 �19,896.378
*** (**, *) indicate a significance level of 1% (5%, 10%).
The quality of faculty patenting 1423
at CB
S Library on A
ugust 28, 2013http://icc.oxfordjournals.org/
Dow
nloaded from

same way, broader applications, as measured by the number of IPC assignments (at
the four-digit level), show a higher expected citations count. Finally, NPRs do not
exhibit a higher citation impact.
Diagnostic tests are reported at the bottom of the table. A likelihood-ratio (LR)
test rejects equidispersion (i.e. equality of the mean and the variance) and a general-
ized Hausman test does not reject consistency of the negative binomial model.
4.2 Are academic patents more “important” in the upper tail of the qualitydistribution of inventions?
In order to test our second hypothesis, we estimate quantile regressions. For simpli-
city we use a log-linear specification instead of count models, where the dependent
variable is the log of (one plus) the number of forward citations. Figure 4 displays the
results. The solid curve represents the coefficient of the quantile regression, the
shaded area indicates the confidence interval of this regression and the dotted
lines the OLS coefficient and the corresponding confidence interval. The results
are only shown from the 50th percentile since there are 430% of patents with no
citation, so that the coefficient for the academic dummy would always be zero at
lower quantiles.
As Figure 4 shows, the results suggest that academics are not more likely to be
found in the upper tail of the quality distribution of patented inventions. Neither do
we find a monotonic relationship between the estimated coefficient and the percent-
ile. Therefore, we do not confirm our second hypothesis.
-0.1
00.
000.
100.
200.
30C
oeffi
cien
t for
'AC
AD
'
.5 .6 .7 .8 .9Quantile
Figure 4 Quantile regression results.
1424 D. Czarnitzki et al.
at CB
S Library on A
ugust 28, 2013http://icc.oxfordjournals.org/
Dow
nloaded from

4.3 Did the “quality” of academic patents decline over time?
Given the changing conditions for academics in terms of research agendas, funding
sources, as well as legal structures, we test whether the “quality” of academic patents
has evolved over time. To do so, we repeat the baseline regression by interacting
the application years with the “academic patent” dummy. The estimated model
becomes:
E CjX½ �T ¼ expX
t
�t ACAD � APYtð Þ þX
t
�t APYt þX
c
�c TECHc
"
þX
i
�iZiþlogðT Þþ"
#,
ð2Þ
Note that we include the ACAD***APY interaction term for each time period,
such that the coefficients �t measure the difference in forward citations relative to the
control group of corporate patents for each time period.
The results are reported in Table 4. The signs and magnitude of the interaction
terms suggest that the quality of academic and corporate patents tends to converge
over time, which supports our hypothesis 3 of greater pressure put on faculty mem-
bers to patent, leading to academic patents of lower “importance”. The results reveal
a decreasing trend in academic patent quality, even without a Bayh-Dole act type of
legislation.
Interestingly, the interaction terms of application years and the academic inventor
dummy becomes negative and significant after 2001, which corresponds to the
period of the abolishment of the “professor privilege.” These preliminary estimations
suggest that the law change has accelerated the decline in “importance” of academic
patents, confirming hypothesis 4; however, we are not able to assess the long-term
impact of this policy change for two reasons. First, in order to effectively assess the
effect of this new measure, we would need to perform the analysis using a longer time
window of the citations. The current result only includes data for 2 years after the
policy change entered into play and we only have 3 years of citations data for
the latest period in our sample. Second, it is not clear whether universities already
started to enforce this policy since we only observe four patents granted to univer-
sities in the post 2002 period. The present results are therefore only indicative of a
negative relationship in the short run. Moreover, as demonstrated by Mowery et al.
(2003), universities (and academics) can learn to patent, through experience in pa-
tenting and therefore our results might well be different in the long run, once
universities start to enforce the new policy by claiming ownership of the patents
and establishing efficient technology transfer offices, which does not seem to be the
case so far.
The quality of faculty patenting 1425
at CB
S Library on A
ugust 28, 2013http://icc.oxfordjournals.org/
Dow
nloaded from

4.4 Is the decline driven by academic entry?
Mowery et al. (2006) find that in the United States, inexperienced universities ini-
tially adopted an indiscriminate policy toward patenting as they entered into this
activity after passage of the Bayh-Dole Act and patented inventions with little evalu-
ation of the market within their industry. Furthermore, they find that the decline
quality of university patents in the United States is largely due to these academic
entrants. In order to complement our previous findings we test whether the decline
in the quality of faculty patents can be attributed to academics with no historical
experience in patenting.
Table 4 QMLE Poisson and Negative Binomial regressions for patent forward citations: the
“importance” of academic patents over time
Variables QMLE Poisson Negative Binomial
Coef. SE Coef. SE
1980–1983*ACAD 0.188*** 0.066 0.213*** 0.061
1984–1987*ACAD 0.103* 0.056 0.108** 0.050
1988–1991*ACAD 0.107** 0.052 0.124** 0.049
1992–1995*ACAD 0.238*** 0.059 0.234*** 0.057
1996–1998*ACAD 0.014 0.080 0.025 0.072
1999–2001*ACAD �0.154 0.149 �0.136 0.097
2002–2003*ACAD �0.995*** 0.339 �0.954*** 0.285
No. of backward citations 0.044*** 0.006 0.047*** 0.006
No. of backward citation �0.038 0.075 �0.021 0.069
No. of NPRs/No. of backward citations 0.011* 0.007 0.015 0.011
Share of foreign applicants 0.189*** 0.058 0.182*** 0.054
Share of foreign inventors 0.003 0.107 0.042 0.106
No. of inventors 0.065*** 0.009 0.067*** 0.007
No. of applicants �0.001 0.023 �0.006 0.028
No. of IPC assignments 0.113*** 0.019 0.121*** 0.015
log(T) 1 1
Constant �2.844*** 0.094 �2.889*** 0.090
App. Years – test of joint significance �2(6)¼ 86.06*** �2(6)¼ 106.03***
Tech. Classes – test of joint significance �2(30)¼ 351.66*** �2(30)¼ 360.52***
Overdispersion parameter 0.948 0.022
Hausman test (P-value) 0.507
LR test of equidispersion (P-value) 0.000
Log-likelihood �25,199.897 �19,898.628
*** (**,*) indicate a significance level of 1% (5%, 10%).
1426 D. Czarnitzki et al.
at CB
S Library on A
ugust 28, 2013http://icc.oxfordjournals.org/
Dow
nloaded from

The estimated model becomes:
E CjX½ �T ¼ expX
t
�t APYt � ACAD INCUMð Þ þX
t
!t APYt � ACAD ENTð Þ
"
þX
t
�t APYt þX
c
�c TECHc þX
i
�iZi þ logðT Þ þ "
#,
ð3Þ
where ACAD_ENT equals 1 for all entrant faculty members and 0 for all incumbent
Faculty inventors and the control group. Entrants are defined as academic inventors
who have never patented before the focal patent. Similarly, ACAD_INCUM stands
for academic incumbents, who are faculty members that have at least patented once
before the focal patent. For a given time period t, exp(!) will be indicative of the
quality of patents issued to academic entrants relative to those granted to the control
group. Similarly, the comparison of ! and � will measure the difference in quality
between academic entrants and academic incumbents.
In the previous section, we identified three periods: the period 1980–1995, in
which the academic patents were more important than those of the controls; the
period 1996–2001, where this relationship became insignificant, and the period
2002–2003, after the abolishment of the professor privilege, where the relationship
became negative. We are going to use these three time windows in order to identify
whether entry of new academic inventors played a role in this apparent decline in
quality of academic patents.
The results in Table 5 suggest that academic entrants performed better than the
controls until 1995. The relationship becomes negative in the 1996–2001 period. The
negative effect is even stronger in the post 2001 period (after the abolishment of the
professors’ privilege). The same pattern is identified for incumbents, but somewhat
less pronounced. Therefore, we test whether the coefficients between incumbents and
entrants differ significantly. The results of these formal tests on the relative perform-
ance of academic entrants versus incumbents are presented in Table 6. One-sided
�2-tests for the null hypothesis ! � � reveal that we cannot reject the Null that the
coefficients of entrants and incumbents differ at the 5% significance level. Hence, our
previous finding on the decline in quality holds for both incumbents and entrants.
This suggests that academic entrants are not causing the decline.
5. Conclusion
As a major source of knowledge creation the public science sector and universities in
particular have attracted considerable attention by policy makers and economic
scholars in the recent past. Their main interest is to access the full potential of science
and knowledge produces at universities (and other public science institutions) and to
The quality of faculty patenting 1427
at CB
S Library on A
ugust 28, 2013http://icc.oxfordjournals.org/
Dow
nloaded from

Table 5 Estimation results (3)
Variables QMLE Poisson Negative Binomial
Coef. SE Coef. SE
1980–1995*ACAD_ENT 0.129*** 0.039 0.145*** 0.035
1996–2001*ACAD_ENT �0.114 0.093 �0.114 0.077
2001–2003*ACAD_ENT �1.407*** 0.419 �1.358*** 0.415
1980–1995*ACAD_INCUM 0.154*** 0.035 0.168*** 0.033
1996–2001*ACAD_INCUM 0.010 0.082 0.022 0.067
2001–2003*ACAD_INCUM �0.671* 0.385 �0.632* 0.339
No. of backward citations 0.042*** 0.006 0.046*** 0.006
No. of backward citation �0.049 0.075 �0.034 0.070
No. of NPRs/ No. of backward citations 0.012* 0.007 0.017 0.011
Share of foreign applicants 0.192*** 0.058 0.191*** 0.054
Share of foreign inventors 0.077 0.108 0.097 0.106
No. of inventors 0.071*** 0.009 0.075*** 0.007
No. of applicants �0.012 0.023 �0.015 0.028
No. of IPC assignments 0.105*** 0.019 0.118*** 0.016
log(T) 1 1
Constant �2.556*** 0.085 �2.569*** 0.082
App. years – test of joint significance �2(2)¼ 31.07*** �2(6)¼ 38.37***
Tech. classes – test of joint significance �2(30)¼ 360.65*** �2(30)¼ 361.22***
Overdispersion parameter 0.972 0.022
Hausman test (P-value) 0.458
LR test of equidispersion (P-value) 0.000
Log-likelihood �25,454.155 �19,898.628
*** (**, *) indicate a significance level of 1% (5%, 10%).
Table 6 Test of ! � �
P-value of one-sided �2-test
Poisson QMLE Negative Binomial
1980–1995 0.284 0.563
1996–2001 0.108 0.103
2002–2003 0.057 0.065
1428 D. Czarnitzki et al.
at CB
S Library on A
ugust 28, 2013http://icc.oxfordjournals.org/
Dow
nloaded from

identify and facilitate effective ways to improve exploitation of these inventions for
the benefit of the economy. In consequence, recent policy endeavors aimed at enhan-
cing knowledge transfer from science to industry. Most prominent and also most
significant actions taken by governments of industrialized countries were Bayh-Dole
act type of legislation changes to strengthen universities’ patenting rights.
Addressing the importance of university inventions as opposed to business inven-
tions previous studies focused on patents as a way to make inventions and their
importance (in terms of citations they receive) visible. It is found that university
patents outperform patents in the business sector in terms of citations they receive
(e.g. Henderson et al., 1998). Not all inventions by university professors are, how-
ever, patented through the university (Thursby et al., 2009). The present article takes
an initial step in focusing on the whole landscape of inventions taken out by aca-
demic scientists independent of assigneeship on patent documents. By comparing
patents with at least one academic on the inventor list to a control group of pure
business patents we find that academic involvement in patenting results in greater
knowledge externalities as measured by forward citations. Hence, our results confirm
the findings by previous studies that focus on university patents only. However, our
analysis also suggests that the contribution of academics is underestimated if only
patents assigned to universities are taken into account. Indeed, a major channel of
knowledge transfer from science to business takes place through consulting and other
forms of collaborative research in between academics and firms that become visible
in co-invented patents assigned to the private sector. Taking these patents into ac-
count is especially important for Europe where Bayh-Dole act type of legislations
took place only recently in many countries, which implies that universities claim the
right on academics’ inventions only in recent years.
Furthermore, we find that in the European context of changing public sector
research environments and increasingly competitive funding sources, the “import-
ance” of academic patents declines over time since the mid-1990s. This is partly due
to inexperienced academics that engage in patenting without any thorough evalu-
ation of the relevant market as is suggested by the low number of citations their
patents receive. However, also the relative importance of patents involving experi-
enced academics declined over time. Hence, the quality of corporate and academic
patents converge and in the most recent period in our data, academic quality even
falls behind corporate quality. This last period corresponds to the introduction of a
Bayh-Dole-type policy in Germany, which suggests that this legal disposition led to
an acceleration of the patent quality decline. However, the latter result has to be
taken cautiously, as it only maps the effects in the immediate years after the abol-
ishment of the professors’ privilege and might be a transitory effect.10
10See the discussion on the effects of the Bayh-Dole Act on the quality of academic patents and the
importance of using a long enough citation window to measure patent quality by Sampat et al.
(2003).
The quality of faculty patenting 1429
at CB
S Library on A
ugust 28, 2013http://icc.oxfordjournals.org/
Dow
nloaded from

These results have some interesting implications. In showing that academic and
business patents converge over the past decades in terms of importance we find a
similar pattern as has been found for the United States (e.g. Henderson et al., 1998).
However, the relative quality decline of university patents in the United States is
typically attributed at least in part to the Bayh-Dole act that led university to
increased patenting. The fact that we observe the same development for Germany,
where the “German Bayh-Dole act” took only place recently, suggests, however, that
the convergence between academic and business patents is rather attributable to a
reorientation of the public science sector toward marketable research projects, fund-
ing sources in the private sector and through industry–science collaborations.
Acknowledgements
The authors thank conference/seminar participants at the Georgia Institute of
Technology, the Haas Business School at UC Berkeley, the University of
Notre-Dame, the University of Helsinki (HECER), Maastricht University, and at
the Patent and Innovation conference of the Applied Econometric Association
(Tokyo) for useful comments. Czarnitzki gratefully acknowledges financial support
from K.U. Leuven’s research fund (grant: OT 07/012).
References
Adams, J. D. (1998), The Industrial Scientific Labor Force since World War II. Proceedings of the
Business and Economics Section of the American Statistical Association. American Statis.
Assoc. Alexandria, Va.
Adams, J. D. (1990), ‘Fundamental stocks of knowledge and productivity growth,’ Journal of
Political Economy, 98, 673–702.
Aghion, P. and J. Tirole (1994), ‘The management of innovation,’ Quarterly Journal of
Economics, 109, 1185–1209.
Agrawal, A. and R. Henderson (2002), ‘Putting patents in context: exploring knowledge trans-
fer from MIT,’ Management Science, 48(1), 44–60.
Albert, M. B., D. Avery, F. Narin and P. McAllister (1991), ‘Direct validation of citation counts
as indicators of industrially important patents,’ Research Policy, 20, 251–259.
Arrow, K. (1962), ‘Economic welfare and the allocation of resources for invention,’
in R. R. Nelson (ed.), The Rate and Direction of Inventive Activity. Princeton University
Press: Princeton, NJ, pp. 609–625.
Azoulay, P., W. Ding and T. Stuart (2006), The Impact of Academic Patenting on the Rate,
Quality and Direction of (Public) Research. NBER working paper 11917, Cambridge, MA.
Azoulay, P., W. Ding and T. Stuart (2007), ‘The determinants of faculty patenting behavior:
demographics or opportunities?’ Journal of Economic Behavior and Organization, 63,
599–623.
1430 D. Czarnitzki et al.
at CB
S Library on A
ugust 28, 2013http://icc.oxfordjournals.org/
Dow
nloaded from

Bacchiocchi, E. and F. Montobbio (2004), EPO vs. USPTO Citation Lags. CESPRI working
paper 161.
Breschi, S., F. Lissoni and F. Montobbio (2006), University Patenting and Scientific
Productivity. A quantitative study of Italian academic inventors. CESPRI Working paper
no.189, Milan.
Callaert, J., B. Van Looy, A. Verbeek, K. Debackere and B. Thijs (2004), ‘Traces of prior art:
an analysis of non-patent references found in patent documents,’ Scientometrics, 69(18),
3–20.
Cameron, A.C. and P. K. Trivedi (1998), Regression Analysis of Count Data. Cambridge
University Press: New York.
Capron, H. and M. Cincera (2003), ‘Industry–University S&T Transfers, Belgian Evidence on
CIS data,’ Brussels Economic Review, 46(3), 58–85.
Cohen, W. and D. Levinthal (1989), ‘Innovation and learning: the two faces of R&D,’
Economic Journal, 99, 569–596.
Cohen, W., A. Goto, A. Nagata, R. Nelson and J. Walsh (2002), ‘R&D spillovers, patents and
the incentives to innovate in Japan and the United States,’ Research Policy, 31, 8–41.
Czarnitzki, D., W. Glanzel and K. Hussinger (2007), ‘Patent and publication activities of
German professors: an empirical assessment of their co-activity,’ Research Evaluation,
16(4), 311–319.
Czarnitzki, D., W. Glanzel and K. Hussinger (2009), ‘Heterogeneity of patenting activity and
implications for scientific research,’ Research Policy, 38, 26–34.
Dasgupta, P. and P. David (1994), ‘Towards a new economics of science,’ Research Policy, 23,
487–521.
Etzkowitz, H., A. Webster, C. Gebhardt and B. R. Cantisano Terra (2000), ‘The future of the
university and the university of the future: evolution of ivory tower to entrepreneurial
paradigm,’ Research Policy, 29, 313–330.
Fabrizio, K.R. and A. DiMinin (2005), Commercializing the Laboratory: Faculty Patenting and
the Open Science Environment. Working Paper, University of California.
Fleming, L. and O. Sorenson (2004), ‘Science as a map in technological search,’ Strategic
Management Journal, 25, 909–928.
Foray, D. and F. Lissoni (2010), ‘University Research and Public-Private Interaction,’
in B. H. Hall and N. Rosenberg (eds), Handbook of Economics of Technical Change.
Elsevier: North-Holland.
Franzoni, C. and F. Lissoni (2009), ‘Academic Entrepreneurship: Critical Issues and Lessons
for Europe,’ in A. Varga (ed.), Academic Entrepreneurship and Regional Development.
Edward Elgar: Cheltenham, UK, pp. 163–190.
Gambardella, A., D. Harhoff and B. Verspagen (2008), ‘The value of European patents,’
European Management Review, 5, 69–84.
Geuna, A. (2001), ‘The changing rationale for European university research funding: are there
negative unintended consequences,’ Journal of Economic Issues, 35, 607–632.
The quality of faculty patenting 1431
at CB
S Library on A
ugust 28, 2013http://icc.oxfordjournals.org/
Dow
nloaded from

Geuna, A. and L. J. J. Nesta (2006), ‘University patenting and its effects on academic research:
the emerging European evidence,’ Research Policy, 35, 790–807.
Giuri, P., M. Mariani, S. Brusoni, G. Crespi, D. Francoz, A. Gambardella, W. Garcia-Fontes, A.
Geuna, R. Gonzales, D. Harhoff, K. Hoisl, C. Lebas, A. Luzzi, L. Magazzini, L. Nesta, O.
Nomaler, N. Palomeras, P. Patel, M. Romanelli and B. Verspagen (2006), ‘Inventors and
invention processes in Europe results from the PatVal-EU survey,’ Research Policy, 36(8),
1107–1127.
Gourieroux, C., A. Monfort and A. Trognon (1984), ‘Pseudo maximum likelihood methods:
applications to poisson models,’ Econometrica, 52(3), 701–720.
Griliches, Z. (1984), R&D, Patents, and Productivity. University of Chicago Press: Chicago.
Hall, B. H., A. Jaffe and M. Trajtenberg (2001), The NBER Patent Citations Data File: Lessons,
Insights, and Methodological Tools. NBER Working Paper No. 8498.
Hall, B. H., A. Jaffe and M. Trajtenberg (2005), ‘Market value and patent citations,’ RAND
Journal of Economics, 36, 16–38.
Hall, B. H., A. N. Link and J. T. Scott (2001), ‘Barriers inhibiting industry from partnering
with universities: evidence from the advanced technology program,’ Journal of Technology
Transfer, 26, 87–98.
Hall, B. H., G. Thoma and S. Torrisi (2007), The Market Value of Patents and R&D: Evidence
from European Firms. NBER Working Paper No. 13426.
Harhoff, D., F. Narin, F. M. Scherer and K. Vopel (1999), ‘Citation frequency and the value of
patented innovation,’ Review of Economics and Statistics, 81(3), 511–515.
Harhoff, D., F. M. Scherer and K. Vopel (2003), ‘Citations, family size, opposition and the
value of patent rights - evidence from Germany,’ Research Policy, 32, 1343–1363.
Henderson, R., A. Jaffe and M. Trajtenberg (1998), ‘Universities as a source of commercial
technology,’ Review of Economics and Statistics, 80(1), 119–127.
Jaffe, A. (1989), ‘The real effects of academic research,’ American Economic Review, 97(5),
957–907.
Jaffe, A., M. S. Fogarty and M. Trajtenberg (2000), ‘Knowledge spillovers and
patent citations: evidence from a survey of inventors,’ American Economic Review, 90,
215–218.
Jaffe, A. and M. Trajtenberg (2002), Patents, Citations and Innovation: A Window on the
Knowledge Economy. MIT Press: Cambridge.
Jaffe, A., M. Trajtenberg and R. Henderson (1993), ‘Geographical localization of know-
ledge spilloevers as evidenced by patent citations,’ Quarterly Journal of Economics, 108,
577–598.
Kilger, C. and K. Bartenbach (2002), ‘New rules for German professors,’ Science, 298(8),
1173–1175.
Lacetera, N. (2009), ‘Academic Entrepreneurship,’ Managerial and Decision Economics, 30(7),
443–464.
1432 D. Czarnitzki et al.
at CB
S Library on A
ugust 28, 2013http://icc.oxfordjournals.org/
Dow
nloaded from

Lanjouw, J. O. and M. Schankerman (2001), ‘Characteristics of patent litigation: a window on
competition,’ RAND Journal of Economics, 32(1), 129–151.
Lerner, J. (1994), ‘The importance of patent scope: an empirical analysis,’ RAND Journal of
Economics, 25(2), 319–333.
Lichtenberg, F. (1996), ‘Do (more and better) drugs keep people out of hospitals?’ American
Economic Review, 86(2), 384–388.
Lichtenberg, F. (2001), ‘Are the benefits of newer drugs worth their cost? Evidence from the
1996 MEPS,’ Health Affairs, 20(5), 241–252.
Lichtenberg, F. (2003), ‘Pharmaceutical innovation, mortality reduction, and economic
growth,’ in K. M. Murphy and R. H. Topel (eds), Measuring the Gains from Medical
Research: An Economic Approach. University of Chicago Press: Chicago.
Lissoni, F., B. Sanditov and G. Tarasconi (2006), The KEINS Database on Academic Inventors:
Methodology and Contents. CESPRI Working paper no.181, Milan.
Lissoni, F., P. Llerena, M. McKelvey and B. Sanditov (2008), ‘Academic patenting in Europe:
new evidence from the KEINS database,’ Research Evaluation, 16, 87–102.
Mansfield, E. (1991), ‘Academic research and industrial innovation,’ Research Policy, 20(1),
1–12.
Marco, A. C. (2007), ‘The dynamics of patent citations,’ Economics Letters, 94(2), 290–296.
Merton, R. K. (1973), ‘The normative structure of science,’ in R. K. Merton (ed.), The
Sociology of Science: Theoretical and Empirical Investigations. The University of Chicago
Press: Chicago, IL.
Meyer, M. (2000), ‘Does science push technology? Patents citing scientific literature,’ Research
Policy, 29, 409–434.
Meyer, M., T. Sinilainen and J. T. Utecht (2003), ‘Towards hybrid triple helix indicators: a
study of university-related patents and a survey of academic inventors,’ Scientometrics,
58(2), 321–350.
Mohnen, P. and C. Hoareau (2003), ‘What type of enterprises forges close links with uni-
versities and government labs? Evidence from CIS2,’ Managerial and Decision Economics, 24,
133–146.
Mowery, D., R. Nelson, B. Sampat and A. Ziedonis (2002), ‘The growth of patenting and
licensing by U.S. Universities: an assessment of the effects of the Bayh-Dole Act of 1980,’
Research Policy, 30, 99–119.
Mowery, D., B. Sampat and A. Ziedonis (2002), ‘Learning to patent: institutional experience,
learning abd the characteristics of U.S. University patents after the Bayh-Dole Act,
1981-1992,’ Management Science, 48(1), 73–89.
Mowery, D. and A. Ziedonis (2002), ‘Academic patenting quality and quantity before and after
the Bayh-Dole Act in the United States,,’ Research Policy, 31, 399–418.
Murray, F. (2002), ‘Innovation as co-evolution of scientific and technological networks:
exploring tissue engineering,’ Research Policy, 31(8–9), 1389–1403.
The quality of faculty patenting 1433
at CB
S Library on A
ugust 28, 2013http://icc.oxfordjournals.org/
Dow
nloaded from

Murray, F. and S. Stern (2007), ‘Do formal intellectual property rights hinder the free flow of
scientific knowledge? An empirical test of the anti-commons hypothesis,’ Journal of
Economic Behavior and Organization, 63(4), 648–687.
OECD (1994), The Measurement of Scientific and Technological Activities: Using Patent Data as
Science and Technology Indicators, Patent Manual. OECD/GD(94)114: Paris.
Reitzig, M. (2004), ‘Improving patent valuations for management purposes - validating new
indicators by analyzing application rationales,’ Research policy, 33(6–7), 939–957.
Rosenberg, N. (1998), ‘Chemical engineering as a general purpose technology,’ in E. Helpman
(ed.), General Purpose Technologies and Economic Growth. MIT Press: Cambridge,
pp. 167–192.
Rysman, M. and T. Simcoe (2008), ‘Patents and the performance of voluntary standard-setting
organizations,’ Management Science, 54(11), 1920–1934.
Sampat, B. (2006), ‘Patenting and US academic research in the 20th century: the world before
and after Bayh- Dole,’ Research Policy, 35, 772–789.
Sampat, B., D. Mowery and A. Ziedonis (2003), ‘Changes in university patent quality after the
Bauh-Dole act: a re-examination,’ International Journal of Industrial Organization, 21(3),
1371–1390.
Sapsalis, E. and B. van Pottelsberghe de la Potterie (2007), ‘The institutional sources of know-
ledge and the value of academic patents,’ Economics of Innovation and New Technology,
16(2), 139–157.
Schmiemann, M. and J.-N. Duvry (2003), ‘New approaches to technology transfer from pub-
licly funded research,’ Journal of Technology Transfer, 28, 9–15.
Schmoch, U. (1997), ‘Indicators and the relation between science and technology,’
Scientometrics, 38(1), 103–116.
Stephan, P., S. Gurmu, A. J. Sumell and G. Black (2006), ‘Who’s patenting in the University?’
Economics of Innovation and New Technology, 16(2), 71–99.
Thursby, J. G, A. Fuller and M. C. Thursby (2009), ‘US Faculty Patenting: inside and outside
the university,’ Research Policy, 38, 14–25.
Thursby, J. G. and M. C. Thursby (2002), ‘Who is selling the ivory tower? Sources of growth in
university licensing,’ Management Science, 48(1), 90–104.
Toole, A. A. (2007), The Impact of Public Basic Research on Industrial Innovation: Evidence
from the Pharmaceutical Industry, Mimeo, Rutgers University, earlier version available as
Stanford University (SIEPR) Discussion Paper 00-07.
Toole, A. A. and D. Czarnitzki (2007), ‘Biomedical academic entrepreneurship through the
SBIR Program,’ Journal of Economic Behavior and Organization, 63, 716–738.
Toole, A. A. and D. Czarnitzki (2009), ‘Exploring the relationship between scientist human
capital and firm performance: the case of biomedical academic entrepreneurs in the SBIR
program,’ Management Science, 55(1), 101–114.
1434 D. Czarnitzki et al.
at CB
S Library on A
ugust 28, 2013http://icc.oxfordjournals.org/
Dow
nloaded from

Trajtenberg, M. (1990), ‘A penny for your quotes: patent citations and the value of innov-
ations,’ RAND Journal of Economics, 21(1), 172–187.
Trajtenberg, M. (2001), ‘Innovation in Israel 1968-97: a comparative analysis using patent
data,’ Research Policy, 30, 363–389.
Trajtenberg, M., R. Henderson and A. B. Jaffe (1997), ‘University versus corporate patents: a
window on the basicness of invention,’ Economics of Innovation and New Technologies,
5(19), 19–50.
Verspagen, B. (2006), ‘University research, intellectual property rights and European innov-
ation systems,’ Journal of Economic Survey, 20(4), 607–632.
Veugelers, R. and B. Cassiman (2005), ‘R&D cooperation between firms and universities. some
empirical evidence from Belgian manufacturing,’ International Journal of Industrial
Organization, 23, 355–379.
Webb, C., H. Dernis, D. Harhoff and K. Hoisl (2005), Analyzing European and
International Patent Citations: A Set of EPO Database Building Blocks. STI Working Paper
2005/9, OECD.
Wooldridge, J. M. (2002), Econometric Analysis of Cross-Section and Panel Data. MIT Press:
Cambridge.
Zucker, L. G. and M. R. Darby (1996), ‘Star scientists and institutional transformation: pat-
terns of invention and innovation in the formation of the biotechnology industry,’
Proceedings of the National Academies of Science, 93, 12709–12716.
Zucker, L. G. and M. R. Darby (2000), ‘Capturing technological opportunities via Japan’s star
scientists,’ Journal of Technology Transfer, 26, 37–58.
Zucker, L.G., M. R. Darby and M. B. Brewer (1998), ‘Intellectual human capital and the birth
of US biotechnology enterprises,’ American Economic Review, 88(1), 290–306.
Zucker, L. G., M. R. Darby and J. S. Armstrong (2002), ‘Commercializing knowledge: uni-
versity science, knowledge capture, and firm performance in biotechnology,’ Management
Science, 48(1), 138–153.
The quality of faculty patenting 1435
at CB
S Library on A
ugust 28, 2013http://icc.oxfordjournals.org/
Dow
nloaded from
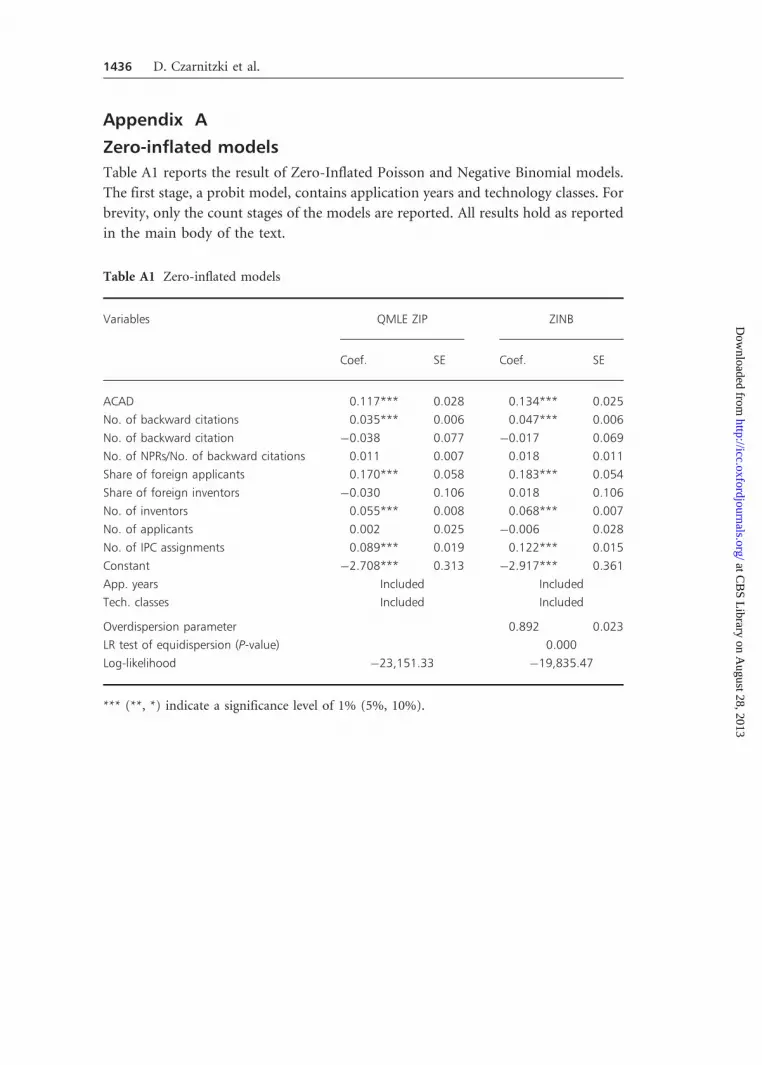
Appendix A
Zero-inflated models
Table A1 reports the result of Zero-Inflated Poisson and Negative Binomial models.
The first stage, a probit model, contains application years and technology classes. For
brevity, only the count stages of the models are reported. All results hold as reported
in the main body of the text.
Table A1 Zero-inflated models
Variables QMLE ZIP ZINB
Coef. SE Coef. SE
ACAD 0.117*** 0.028 0.134*** 0.025
No. of backward citations 0.035*** 0.006 0.047*** 0.006
No. of backward citation �0.038 0.077 �0.017 0.069
No. of NPRs/No. of backward citations 0.011 0.007 0.018 0.011
Share of foreign applicants 0.170*** 0.058 0.183*** 0.054
Share of foreign inventors �0.030 0.106 0.018 0.106
No. of inventors 0.055*** 0.008 0.068*** 0.007
No. of applicants 0.002 0.025 �0.006 0.028
No. of IPC assignments 0.089*** 0.019 0.122*** 0.015
Constant �2.708*** 0.313 �2.917*** 0.361
App. years Included Included
Tech. classes Included Included
Overdispersion parameter 0.892 0.023
LR test of equidispersion (P-value) 0.000
Log-likelihood �23,151.33 �19,835.47
*** (**, *) indicate a significance level of 1% (5%, 10%).
1436 D. Czarnitzki et al.
at CB
S Library on A
ugust 28, 2013http://icc.oxfordjournals.org/
Dow
nloaded from

Hazard models
Table A2 displays the results of a Weibull model and a model with frailty where the
frailty follows a Gamma distribution, following the approach proposed by Marco
(2007). The hazard function is the probability that a patent will receive a citation
given that it has survived for t years since its last citation. The results reveal that
academic patents have a higher hazard of receiving a forward citation. Thus, the
results using the approach proposed by Marco (2007) are in line with our finding
obtained with count data models as reported in the main body of the text.
Table A2 Hazard models
Variables Weibull Frailty
Haz. ratio SE Haz. Ratio SE
ACAD 1.136*** 0.025 1.228*** 0.058
No. of backward citations 1.045*** 0.005 1.067*** 0.012
No. of backward citation 0.917 0.059 0.966 0.130
No. of NPRs/No. of backward citations 1.015* 0.008 1.012 0.020
Share of foreign applicants 1.164*** 0.053 1.212** 0.120
Share of foreign inventors 1.123 0.105 1.266 0.251
No. of inventors 1.050*** 0.007 1.097*** 0.015
No. of applicants 0.983 0.020 0.920* 0.045
No. of IPC assignments 1.116*** 0.015 1.171*** 0.034
App. years—test of joint significance �2(23)¼ 346.60*** �2(23)¼ 297.68***
Tech. classes—test of joint significance �2(30)¼ 194.32*** �2(30)¼ 341.37***
Weibull parameter 1.006 0.010 1.927 0.045
Heterogeneity parameter 1.835 0.087
Log-likelihood �15,222.577 �14,690.386
*** (**, *) indicate a significance level of 1% (5%, 10%).
The quality of faculty patenting 1437
at CB
S Library on A
ugust 28, 2013http://icc.oxfordjournals.org/
Dow
nloaded from


