Embed Size (px)
Citation preview
Commodity MarketsFelim O’Rourke, Bahrain Polytechnic, [email protected]
Introduction This paper is based on teaching notes for an Economics Course forMoney and Banking students in Bahrain Polytechnic. The paper is based on trying to understand real world markets using insights from a variety of business disciplines. The note covers the variety of Market Types, Commodity Markets, Market Balance, PriceInstability, Elasticity, Market Stability, Minimum Prices, Price Cycles, the Price of Oil, the impact of technology improvements on market prices and long term trends in food prices.
Variety of Market Types There is an enormous variety of Market Types. Some Markets are local and others are world-wide, some are products and others areservices, some are individual products and others are entire systems, some are brands and others are commodities, some are high technology and others are low technology, some have very fewbuyers or sellers and others have many buyers or sellers.
Markets can be viewed from a variety of perspectives. All businesses are particularly interested in the market in which they are selling their products. When sellers looks at the marketin which they are selling they are interested in the market price
1
and understanding their ability to control their selling price. The ability to control the market price is called Market Power. This analysis looks at markets from the perspective of the sellerand focuses on the seller’s Market Power.
There are three key factors that appear to influence the market power of a Seller in every market. These are the number of competitors, the degree of product variation/differentiation and the relationship with the customer.
The seller has massive market power if s/he is the only seller. The seller has increased market power if her product meets the needs of the customer and her product is significantly different from alternatives. The relationship with the final customer is also a key determinant of market power. If a seller has a close relationship with the final customer based on understanding the customer’s needs in depth and trust from previous interactions this gives a high degree of market power.
When markets are seen from the perspective of the seller and classified in terms of Market Power three market types appear to dominate. These key market types are Monopoly Markets, Brand Markets and Commodity Markets.
Monopoly Markets exist where there is only one seller and in thissituation the Monopolist has great market power. Companies which have developed Strong Brands have a degree of Market Power similar to the Monopolist. These strong brands are based on product differentiation and building a close relationship with the customer. The vast majority of businesses however sell commodity type products in Commodity Type Markets and the dominant form of trading, particularly in financial instruments, is in commodity type markets.
2
Commodity Markets Commodity Markets are markets where no individual buyer or sellerhas any significant ability to control the market price. A Commodity Market exists where:
There are a large number of both Buyers and Sellers The product is Standardized. Middlemen control the Relationship with Customers
For a market to be a commodity market there must be a large number of buyers and sellers. If this is not the case then eitherthe buyers or the sellers can organize to dominate the market. For example if there are only 2 or 3 sellers it is relatively easy for them to share the market and eliminate competition.
For a market to be a commodity market the product must be standardized or at least the products of individual firms must besimilar. This applies to both technical features of the product and product image. For a product to be a commodity the purchaser must not be concerned about the identity of the producer. If a company is selling a technically differentiated product with a particular image then it is likely that the purchaser will be interested in the identity of the producer and the output of thatproducer will be identified as a brand.
All commodity markets have middlemen who link producers and customers and control the relationship with customers. Such middlemen include traders, wholesalers, dealers, agents and brokers. Standardization makes it easier for middlemen to operatein a market and the existence of middlemen encourages standardization.
These middlemen encourage product standardization as it makes it much easier for them to trade if the products from different producers are standardized. For example in 1848 the Chicago Commodity Exchange standardized the farm products that it traded
3
in. This made it easier for the traders, for example, to use the newly invented telegraph system to sell farm products from a Mid-West US farmer to a London food importer. Before the emergence of“marketing” and branding in the US from 1900 to 1930 most marketswere dominated by chains of middlemen and the producers did not control the relationship with customers. One of the key challenges for the early companies in branding, such as P&G, was to eliminate the middlemen and gain control of the customer relationship. It was only in this way that the producer, eg P&G, could effectively guarantee the quality of its product to the customer and build the relationship of trust that is fundamental to any brand.
Physical Commodity Markets include products traded on the world’scommodity exchanges such as crude oil, lead and zinc and unprocessed agricultural products such as hogs, wheat and soya-beans. The World Bank Commodity Price Database covers 70 commodities and gives prices for many years, with some price series dating back to 1960.
Financial Commodity Markets include a wide variety of financial products including Bonds, FX, Equities and Derivatives. There hasbeen a massive growth in trading in complex financial products such as Swaps and Asset Backed Securities over the last 40 years.The growth of trading in these complex financial commodities led the US to set up the US Commodity Futures Trading Commission in 1975 to regulate the market.
Futures Trading in farm products was developed by the Chicago Board of Trade in the 1850s. This allowed farmers to sell their products in advance and reduce risk. Futures Trading was gradually extended to a whole range of physical products such as metals and energy. CME , the successor to the Chicago Commodity Exchange, which describes itself as the “world's leading and most diversederivatives marketplace” launched its first Financial Futures product in 1971. This involved futures contracts based on 7 currencies
4
priced in $s. In 1981 CME started offering futures contracts based on the S&P 500 Index and US Treasury Bonds. CME now offers futures and options based on interest rates, equity indexes, foreign exchange, energy and agricultural products.
Bloomberg's site classifies markets under Indexes, Futures, Currencies and Bonds. Three of these are financial products and all of these are sold in commodity-type markets. The Financial Times e/edition gives market data under a variety of heading including Equities, Currencies Capital and Commodities. Three of these also are financial products and all are sold in commodity-type markets.
Generic Drugs, which are drugs which have lost their patent protection, are also commodities whereas Patent Drugs which are protected by Patent Laws, are monopolies. Companies manufacturingproducts for large retail chains, who put the retailer’s brands on the products, are also effectively in a commodity market.
Market Balance in Commodity Markets In Commodity Markets the bargaining between Buyers and Sellers determines the price. An example of a very simple situation will illustrate how price is determined.
The following 5 Buyers and 5 Sellers go into a market to trade a standardized item (the number of Buyers and Sellers is too low for a Commodity Market but this is to make your calculations easier).
A is willing to buy 2 units at a Price up to €13 per unit B is willing to sell 3 units at a Price of €12 or more per unit C
is willing to buy 2 units at a Price up to €16 per unit D is willing to buy 3 units at a Price up to €12
5
per unit E is willing to sell 2 units at a Price of €15 or more per unit F
is willing to sell 2 units at a Price of €16 or more per unit G
is willing to buy 5 units at a Price up to €15 per unit H is willing to sell 4 units at a Price of €13 or more per unit I
is willing to buy 2 units at a Price up to €14 per unit J is willing to sell 2 units at a Price of €14 or more per unit
The market will balance at a price at which the amount that sellers want to sell (Supply) will be equal to the amount that buyers want to buy (Demand). The way to calculate the price at which supply and demand balances is to calculate the amount for sale at all different price and the amount demanded at all different prices. These calculations are easier if you start calculating supply from a low price and calculating demand from ahigh price. The number of units that are for sale (supply) at allthe different prices is shown below,
Market Price €11 Sellers - Units for sale 0 Market Price €12 Sellers B Units for sale 3 Market Price €13 Sellers B,H Units for sale 7 Market Price €14 Sellers B,H,J Units for sale 9 Market Price €15 Sellers B,H,J,E Units for sale 11 Market Price £16 Sellers B,H,J,E,F Units for sale 13
The number of units that buyers wish to buy (demand) at all the 6
different prices is shown below, Market Price €17Buyers - Units demanded 0
Market Price €16 Buyers C Units demanded 2Market Price €15 Buyers C,G
Units demanded 7 Market Price €14 Buyers C,G,I Units demanded 9
Market Price €13 Buyers C,G,I,AUnits demanded 11 Market Price €12Buyers C,G,I,A,D Units demanded 14Market Price €11 Buyers C,G,I,A,D Units demanded 14
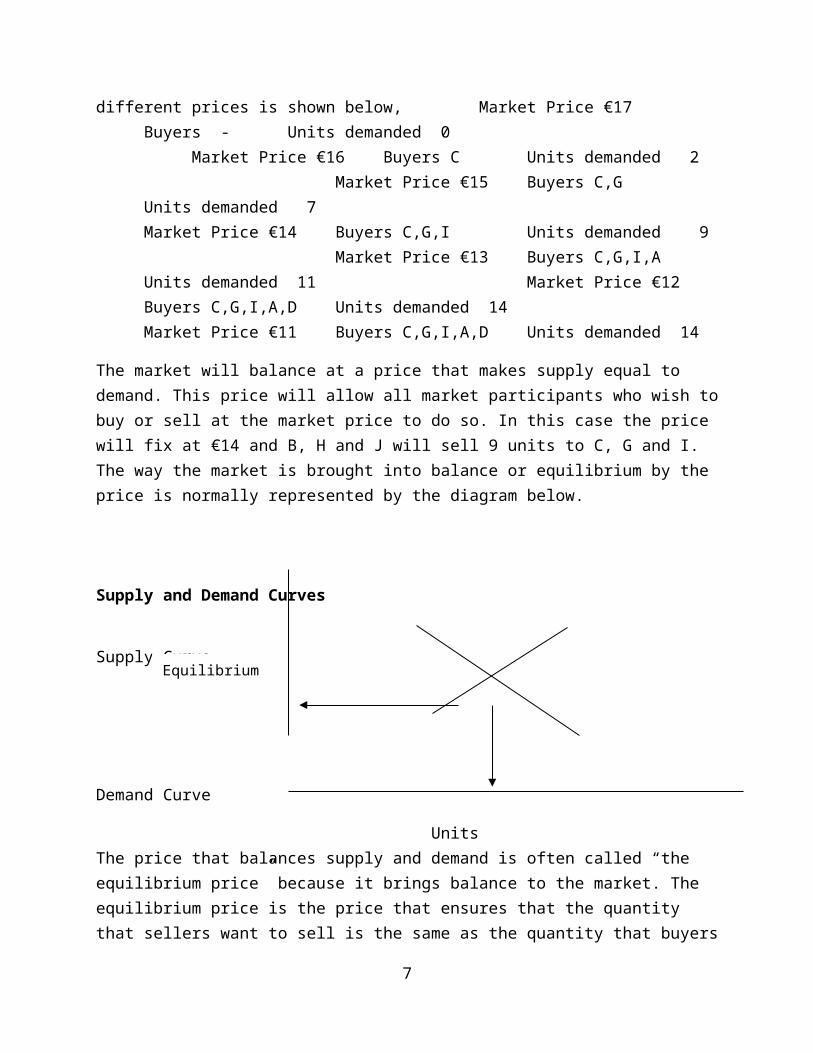
The market will balance at a price that makes supply equal to demand. This price will allow all market participants who wish tobuy or sell at the market price to do so. In this case the price will fix at €14 and B, H and J will sell 9 units to C, G and I. The way the market is brought into balance or equilibrium by the price is normally represented by the diagram below.
Supply and Demand Curves
Supply Curve
Demand Curve
Units The price that balances supply and demand is often called “the equilibrium price” because it brings balance to the market. The equilibrium price is the price that ensures that the quantity that sellers want to sell is the same as the quantity that buyers
7
Equilibrium Price
want to buy (supply = demand).
The sensitivity of a market to changes in supply or demand can beillustrated by working out the impact of a new trader entering the above market. If this new trader wishes to sell 4 units at a price at or above €11 the market price will fall from €14 to €13 but if he wishes to buy 4 units at a price at or below €16 the market price will rise to €15.
Price Instability The nature of commodity markets means that prices are unstable. In brands markets and commodity markets the firm that is selling sets the market price and brings stability to the market.
In commodity markets the price is determined by the interaction of Supply and Demand and prices constantly fluctuate, even minuteby minute as in financial markets, as Supply and Demand conditions change. Commodity markets are also influenced by speculation as buyers buy in anticipation of price increases and sellers sell in anticipation of price falls.
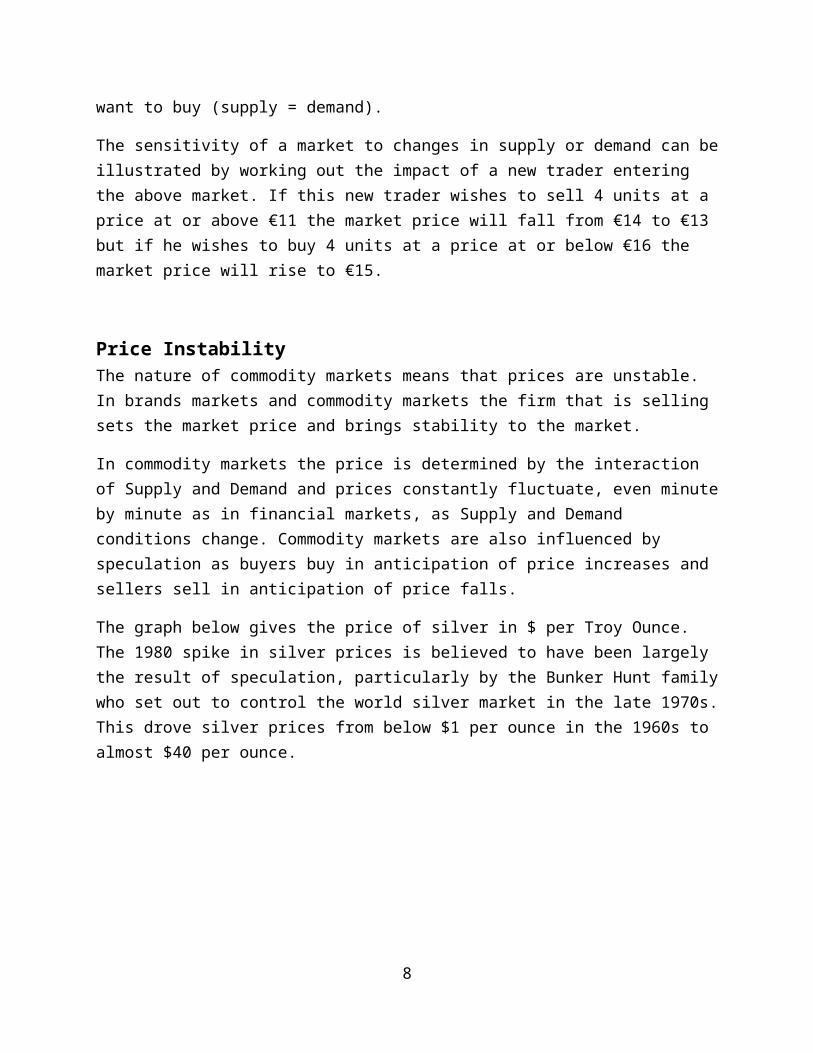
The graph below gives the price of silver in $ per Troy Ounce. The 1980 spike in silver prices is believed to have been largely the result of speculation, particularly by the Bunker Hunt familywho set out to control the world silver market in the late 1970s.This drove silver prices from below $1 per ounce in the 1960s to almost $40 per ounce.
8
Price of Silver in Current $s per Troy Ounce
60 65 70 75 80 85 90 95 0 5 100.005.0010.0015.0020.0025.0030.0035.0040.0045.00
SilverSilver
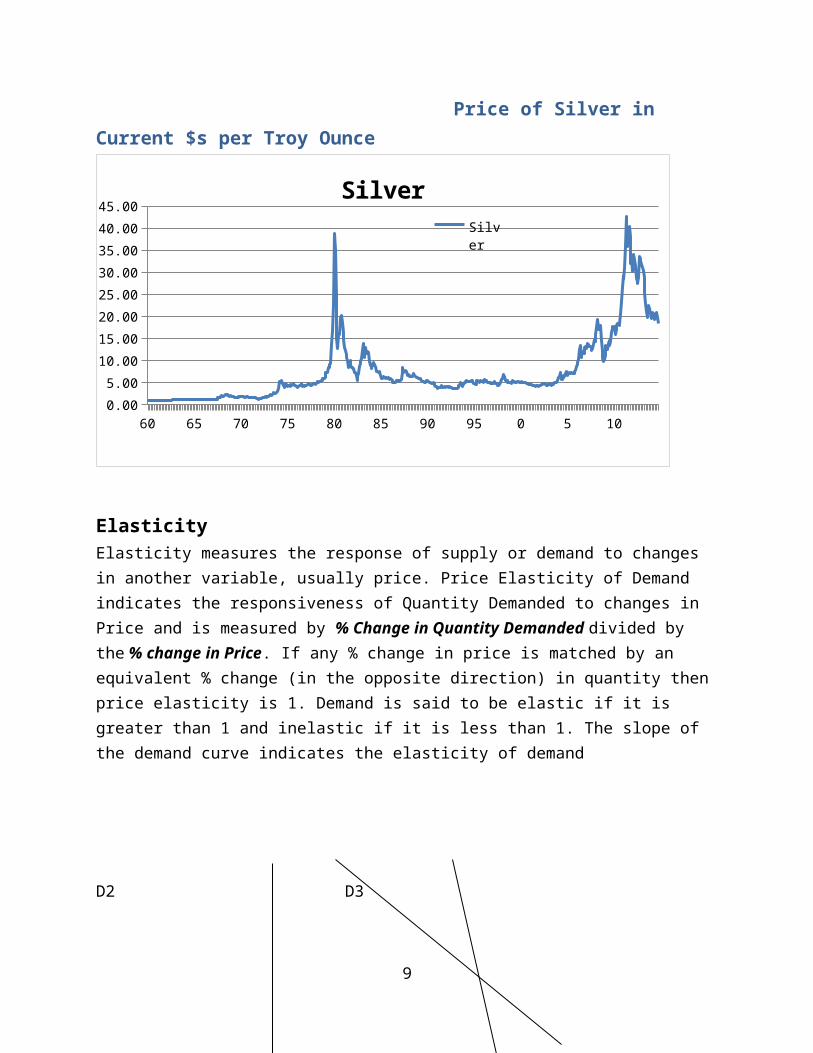
ElasticityElasticity measures the response of supply or demand to changes in another variable, usually price. Price Elasticity of Demand indicates the responsiveness of Quantity Demanded to changes in Price and is measured by % Change in Quantity Demanded divided by the % change in Price. If any % change in price is matched by an equivalent % change (in the opposite direction) in quantity then price elasticity is 1. Demand is said to be elastic if it is greater than 1 and inelastic if it is less than 1. The slope of the demand curve indicates the elasticity of demand
D2 D3
9
Price B ………….. D1 ……………………..
Price A ……………………….……………………….
Quantity Q1 Q2 Q3
In the diagram above D1 represent a very elastic demand as any % change in price will lead to a much greater % change in quantity.D2 represent a price elasticity of around 1 and D3 represents an inelastic demand.
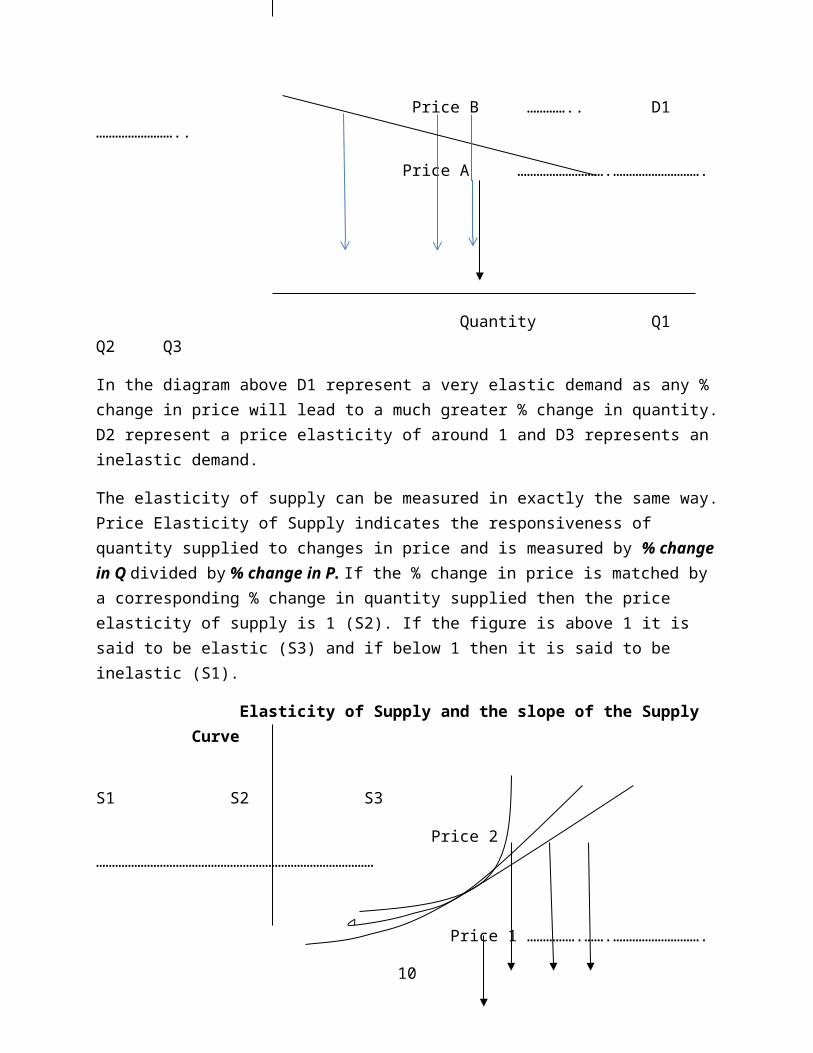
The elasticity of supply can be measured in exactly the same way.Price Elasticity of Supply indicates the responsiveness of quantity supplied to changes in price and is measured by % changein Q divided by % change in P. If the % change in price is matched by a corresponding % change in quantity supplied then the price elasticity of supply is 1 (S2). If the figure is above 1 it is said to be elastic (S3) and if below 1 then it is said to be inelastic (S1).
Elasticity of Supply and the slope of the Supply Curve
S1 S2 S3
Price 2 ……………………………………………………………………………
Price 1 …………….…….……………………….
10
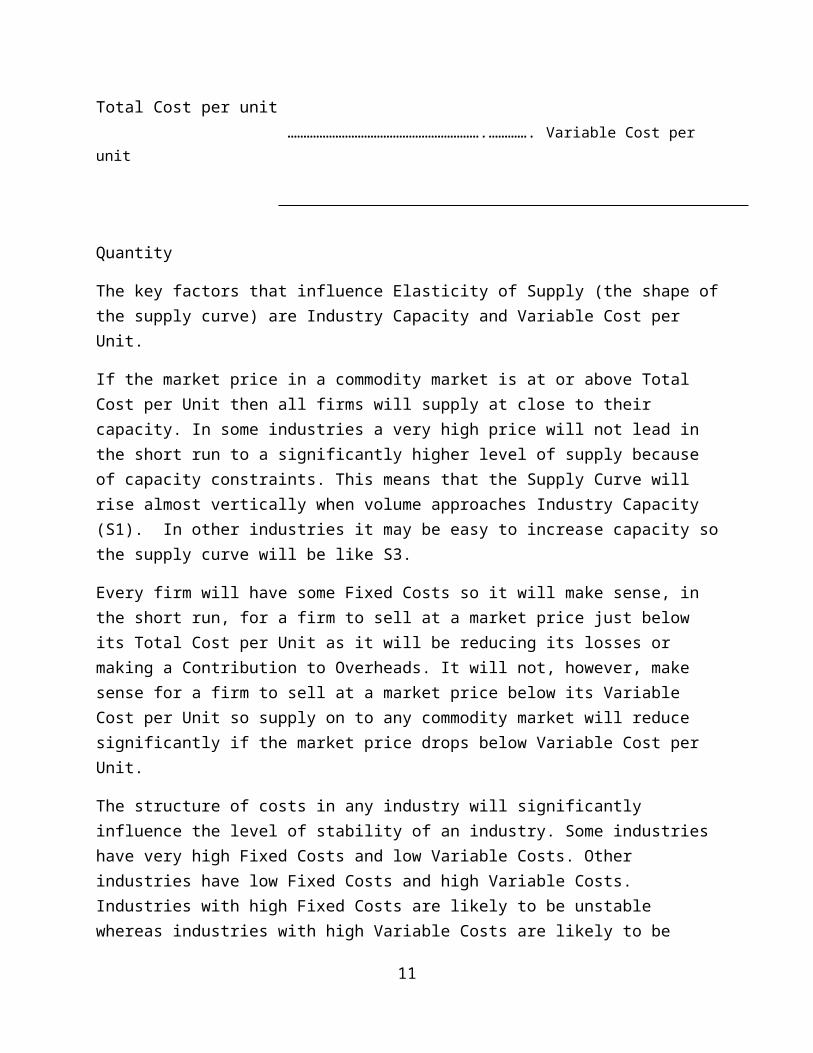
Total Cost per unit …………………………………………………….…………. Variable Cost per
unit
Quantity
The key factors that influence Elasticity of Supply (the shape ofthe supply curve) are Industry Capacity and Variable Cost per Unit.
If the market price in a commodity market is at or above Total Cost per Unit then all firms will supply at close to their capacity. In some industries a very high price will not lead in the short run to a significantly higher level of supply because of capacity constraints. This means that the Supply Curve will rise almost vertically when volume approaches Industry Capacity (S1). In other industries it may be easy to increase capacity sothe supply curve will be like S3.
Every firm will have some Fixed Costs so it will make sense, in the short run, for a firm to sell at a market price just below its Total Cost per Unit as it will be reducing its losses or making a Contribution to Overheads. It will not, however, make sense for a firm to sell at a market price below its Variable Cost per Unit so supply on to any commodity market will reduce significantly if the market price drops below Variable Cost per Unit.
The structure of costs in any industry will significantly influence the level of stability of an industry. Some industries have very high Fixed Costs and low Variable Costs. Other industries have low Fixed Costs and high Variable Costs. Industries with high Fixed Costs are likely to be unstable whereas industries with high Variable Costs are likely to be
11
stable. The oil industry is an example of an industry with high Fixed Costs and low Variable Costs. The capital costs (Fixed) to open up a new oil well are very high but then the operating (Variable) costs are low. This is part of the reason for the instability of the oil market.
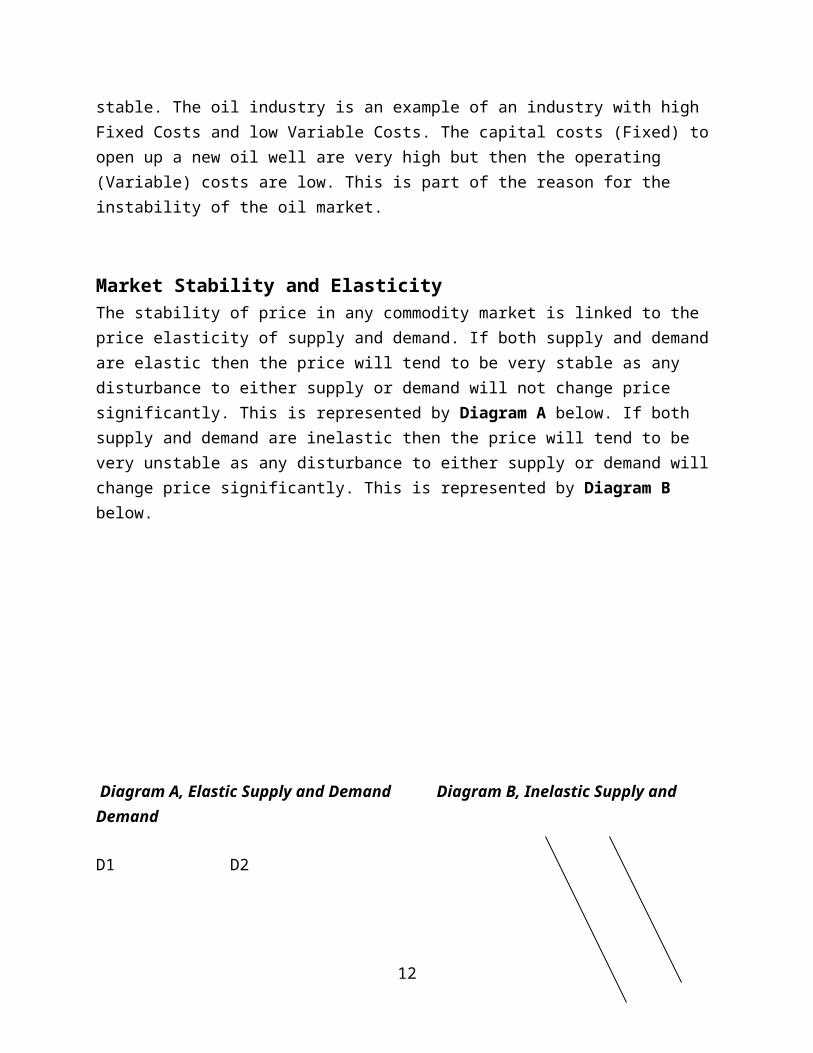
Market Stability and ElasticityThe stability of price in any commodity market is linked to the price elasticity of supply and demand. If both supply and demand are elastic then the price will tend to be very stable as any disturbance to either supply or demand will not change price significantly. This is represented by Diagram A below. If both supply and demand are inelastic then the price will tend to be very unstable as any disturbance to either supply or demand will change price significantly. This is represented by Diagram B below.
Diagram A, Elastic Supply and Demand Diagram B, Inelastic Supply and Demand D1 D2
12
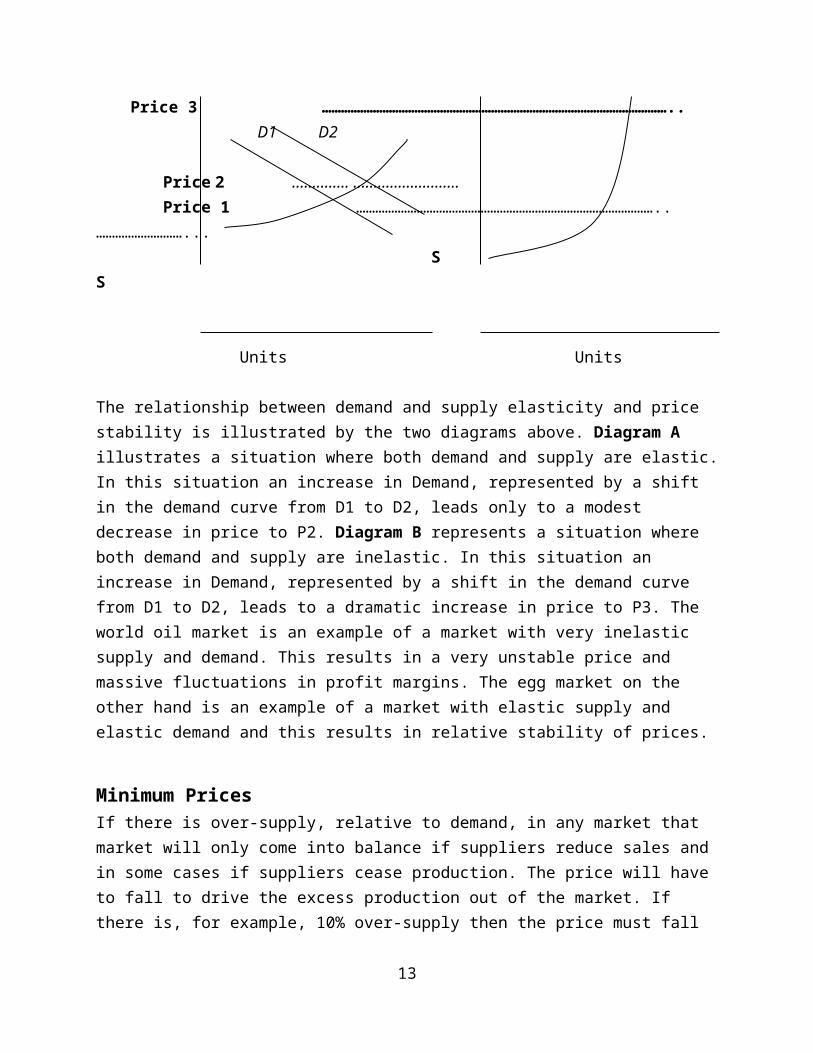
Price 3 ……………………………………………………………………………………………….. D1 D2 Price 2 ……..…… ………………..…… Price 1 …………………………………………………………………………………..………………………... S S
Units Units
The relationship between demand and supply elasticity and price stability is illustrated by the two diagrams above. Diagram A illustrates a situation where both demand and supply are elastic.In this situation an increase in Demand, represented by a shift in the demand curve from D1 to D2, leads only to a modest decrease in price to P2. Diagram B represents a situation where both demand and supply are inelastic. In this situation an increase in Demand, represented by a shift in the demand curve from D1 to D2, leads to a dramatic increase in price to P3. The world oil market is an example of a market with very inelastic supply and demand. This results in a very unstable price and massive fluctuations in profit margins. The egg market on the other hand is an example of a market with elastic supply and elastic demand and this results in relative stability of prices.
Minimum Prices If there is over-supply, relative to demand, in any market that market will only come into balance if suppliers reduce sales and in some cases if suppliers cease production. The price will have to fall to drive the excess production out of the market. If there is, for example, 10% over-supply then the price must fall
13
sufficiently to drive 10% of production out of the market (assuming no increase in demand).
All businesses will have Fixed Costs or Overheads and Variable Costs. Fixed Costs or Overheads are costs that the business mustmeet irrespective of its level of production or sales as long as it continues to operate. Examples of Fixed Costs are Rates, Bank Repayments, Depreciation of Plant and Machinery. Variable Costs are costs that vary with the level of production and sales. Examples of Variable Costs are Raw Materials, Energy and Direct Labour Costs. The Variable Cost per unit is the extra cost of producing one more unit and will obviously reflect the amount of extra raw materials, energy and other inputs needed to produce one extra unit.
If there is over-supply in a commodity market the price will haveto fall to reduce supply. Companies supplying to a Commodity Market will usually continue to supply while they are covering their Variable Cost per Unit. In an over-supply situation therefore the price will fall to just below the Variable Cost perUnit of the most inefficient producers. This should drive sufficient production capacity out of the industry to bring aboutbalance between supply and demand.
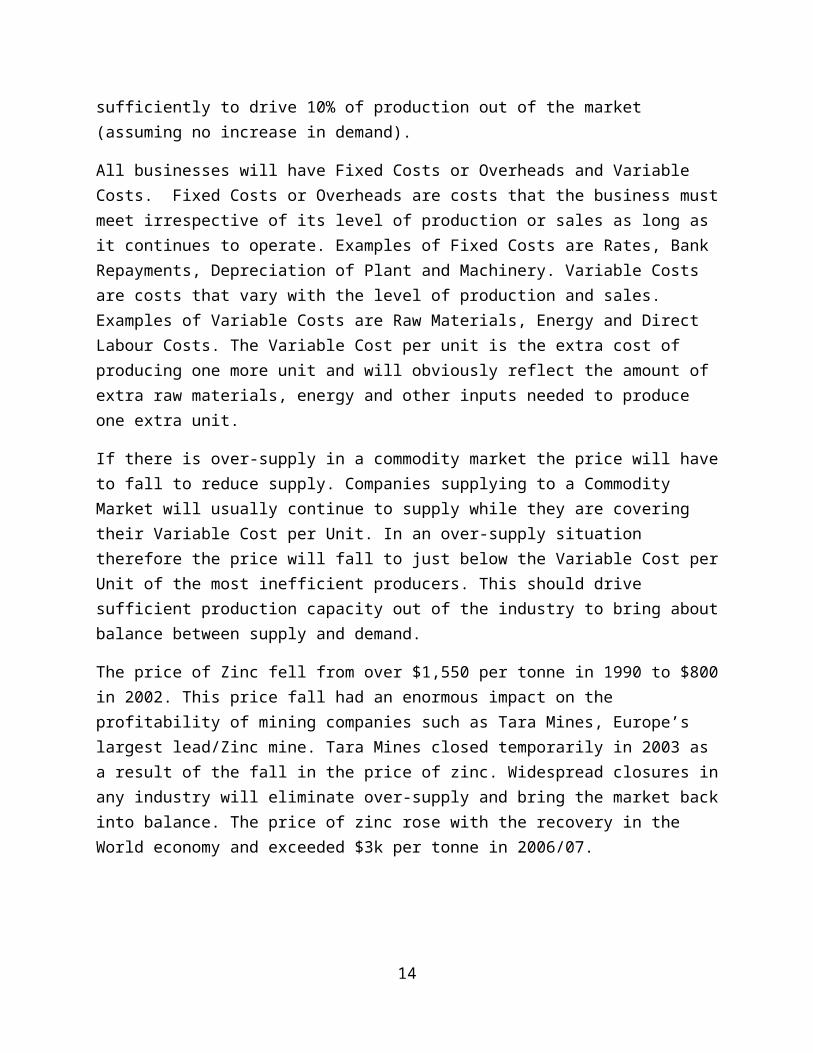
The price of Zinc fell from over $1,550 per tonne in 1990 to $800in 2002. This price fall had an enormous impact on the profitability of mining companies such as Tara Mines, Europe’s largest lead/Zinc mine. Tara Mines closed temporarily in 2003 as a result of the fall in the price of zinc. Widespread closures inany industry will eliminate over-supply and bring the market backinto balance. The price of zinc rose with the recovery in the World economy and exceeded $3k per tonne in 2006/07.
14
60 65 70 75 80 85 90 95 0 5 100.00
500.001000.001500.002000.002500.003000.003500.004000.004500.005000.00
Zinc Prices in Currrent $ per Metric Tonne
Zinc
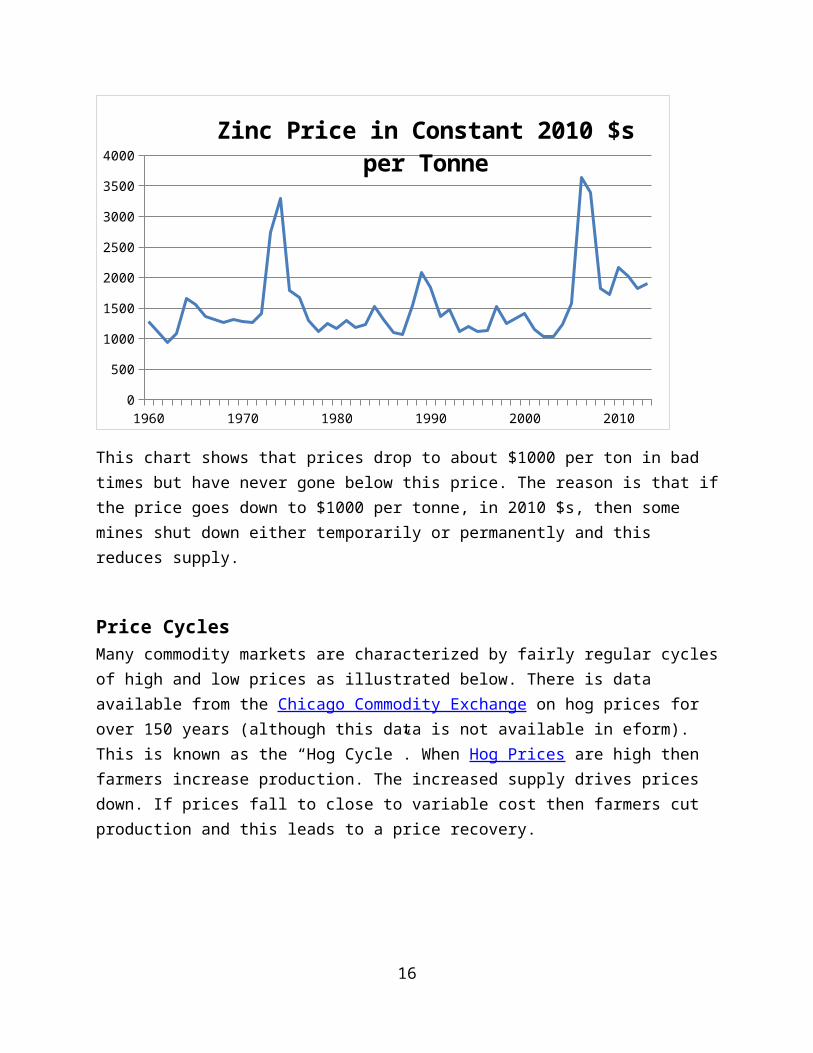
The above chart is based on current prices for zinc but a better insight into the market can be got by looking at zinc prices in constant prices. This data is also available from the World Bank GEM series. The chart below gives zinc prices per tonne in constant 2010 $ but is based on Annual Average Prices whereas theChart above is based on Monthly Average Prices.
15
1960 1970 1980 1990 2000 20100
500
1000
1500
2000
2500
3000
3500
4000Zinc Price in Constant 2010 $s
per Tonne
This chart shows that prices drop to about $1000 per ton in bad times but have never gone below this price. The reason is that ifthe price goes down to $1000 per tonne, in 2010 $s, then some mines shut down either temporarily or permanently and this reduces supply.
Price CyclesMany commodity markets are characterized by fairly regular cyclesof high and low prices as illustrated below. There is data available from the Chicago Commodity Exchange on hog prices for over 150 years (although this data is not available in eform). This is known as the “Hog Cycle”. When Hog Prices are high then farmers increase production. The increased supply drives prices down. If prices fall to close to variable cost then farmers cut production and this leads to a price recovery.
16
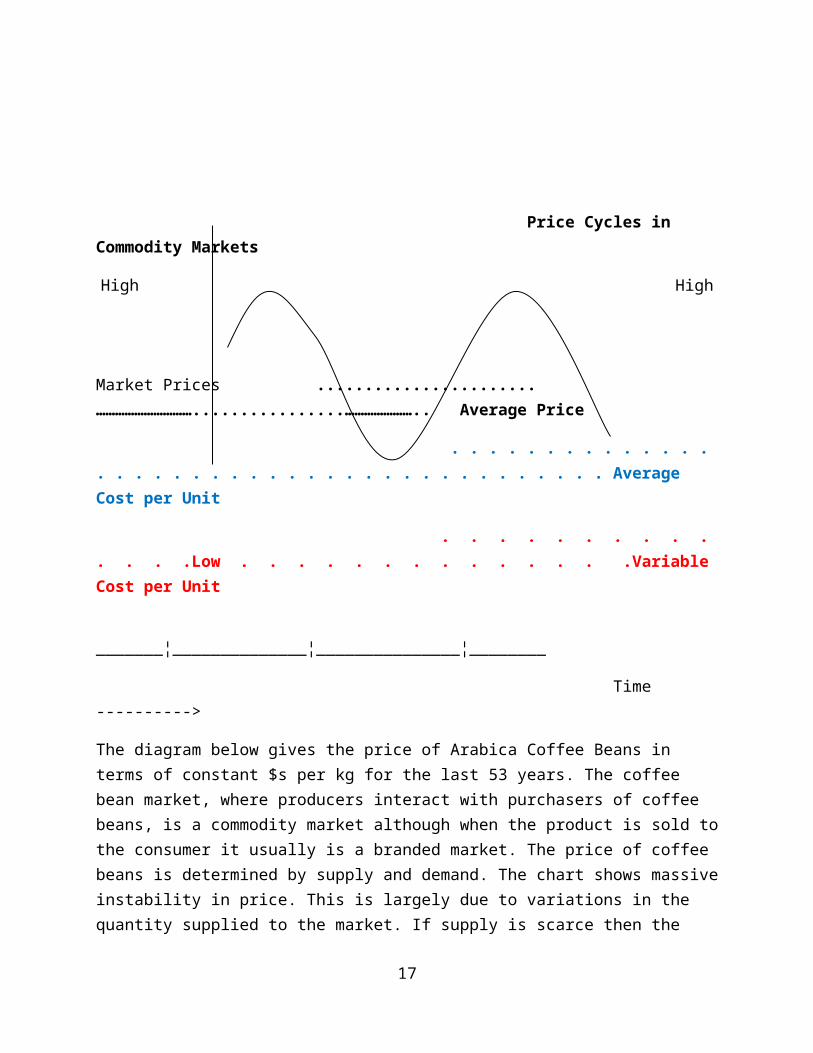
Price Cycles in Commodity Markets
High High
Market Prices .......................…………………………................………………….. Average Price
. . . . . . . . . . . . . . . . . . . . . . . . . . . . . . . . . . . . . . . . . Average Cost per Unit
. . . . . . . . . . . . . .Low . . . . . . . . . . . . . .Variable Cost per Unit
_______¦______________¦_______________¦________
Time ---------->
The diagram below gives the price of Arabica Coffee Beans in terms of constant $s per kg for the last 53 years. The coffee bean market, where producers interact with purchasers of coffee beans, is a commodity market although when the product is sold tothe consumer it usually is a branded market. The price of coffee beans is determined by supply and demand. The chart shows massiveinstability in price. This is largely due to variations in the quantity supplied to the market. If supply is scarce then the
17
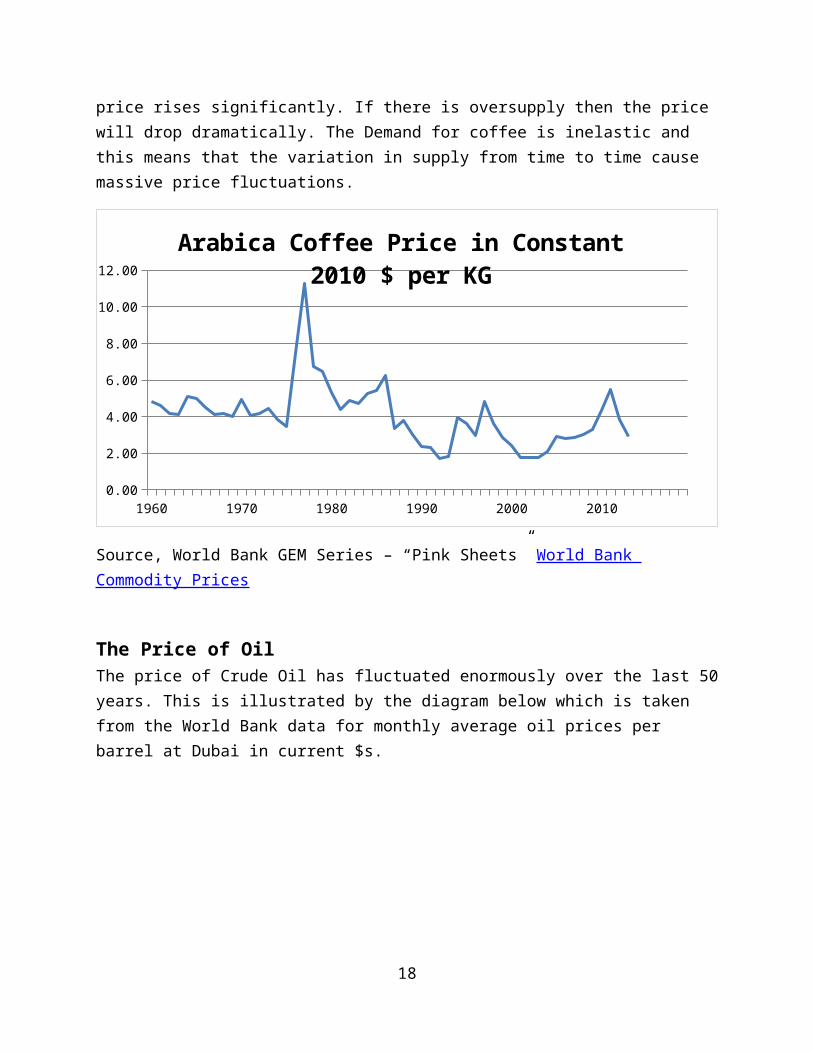
price rises significantly. If there is oversupply then the price will drop dramatically. The Demand for coffee is inelastic and this means that the variation in supply from time to time cause massive price fluctuations.
1960 1970 1980 1990 2000 20100.00
2.00
4.00
6.00
8.00
10.00
12.00Arabica Coffee Price in Constant
2010 $ per KG
Source, World Bank GEM Series – “Pink Sheets” World Bank Commodity Prices
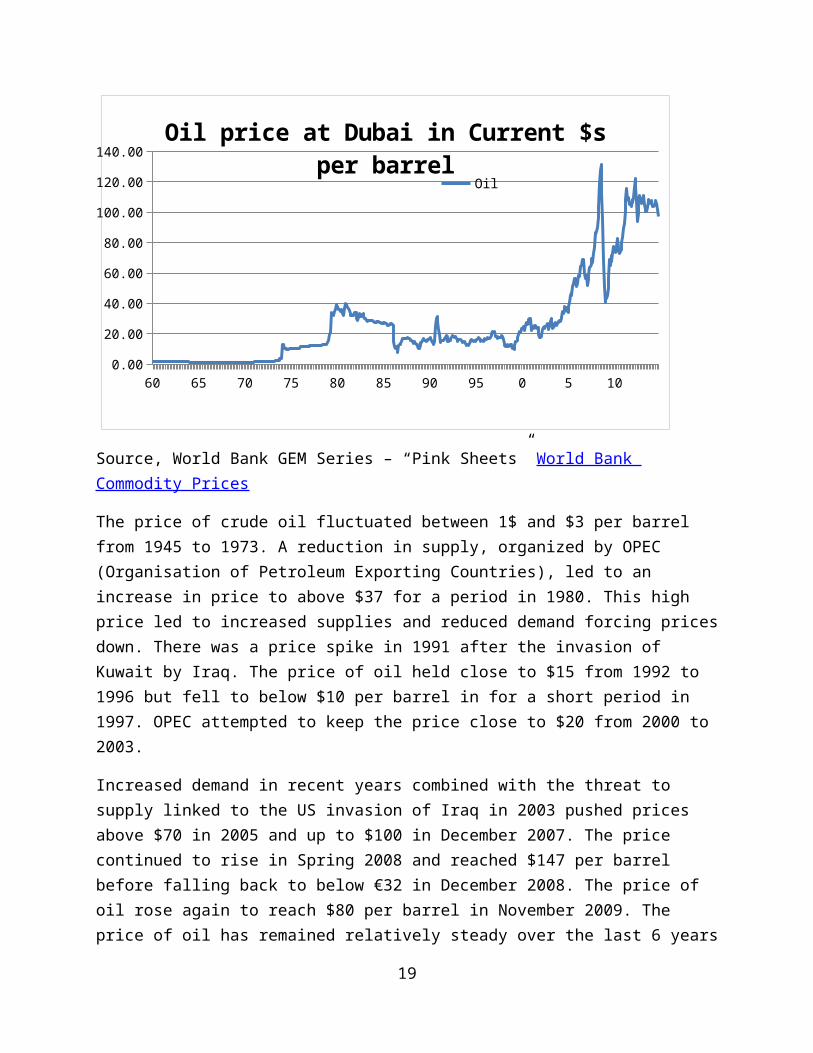
The Price of Oil The price of Crude Oil has fluctuated enormously over the last 50years. This is illustrated by the diagram below which is taken from the World Bank data for monthly average oil prices per barrel at Dubai in current $s.
18
60 65 70 75 80 85 90 95 0 5 100.00
20.00
40.00
60.00
80.00
100.00
120.00
140.00Oil price at Dubai in Current $s
per barrelOil
Source, World Bank GEM Series – “Pink Sheets” World Bank Commodity Prices
The price of crude oil fluctuated between 1$ and $3 per barrel from 1945 to 1973. A reduction in supply, organized by OPEC (Organisation of Petroleum Exporting Countries), led to an increase in price to above $37 for a period in 1980. This high price led to increased supplies and reduced demand forcing pricesdown. There was a price spike in 1991 after the invasion of Kuwait by Iraq. The price of oil held close to $15 from 1992 to 1996 but fell to below $10 per barrel in for a short period in 1997. OPEC attempted to keep the price close to $20 from 2000 to 2003.
Increased demand in recent years combined with the threat to supply linked to the US invasion of Iraq in 2003 pushed prices above $70 in 2005 and up to $100 in December 2007. The price continued to rise in Spring 2008 and reached $147 per barrel before falling back to below €32 in December 2008. The price of oil rose again to reach $80 per barrel in November 2009. The price of oil has remained relatively steady over the last 6 years
19
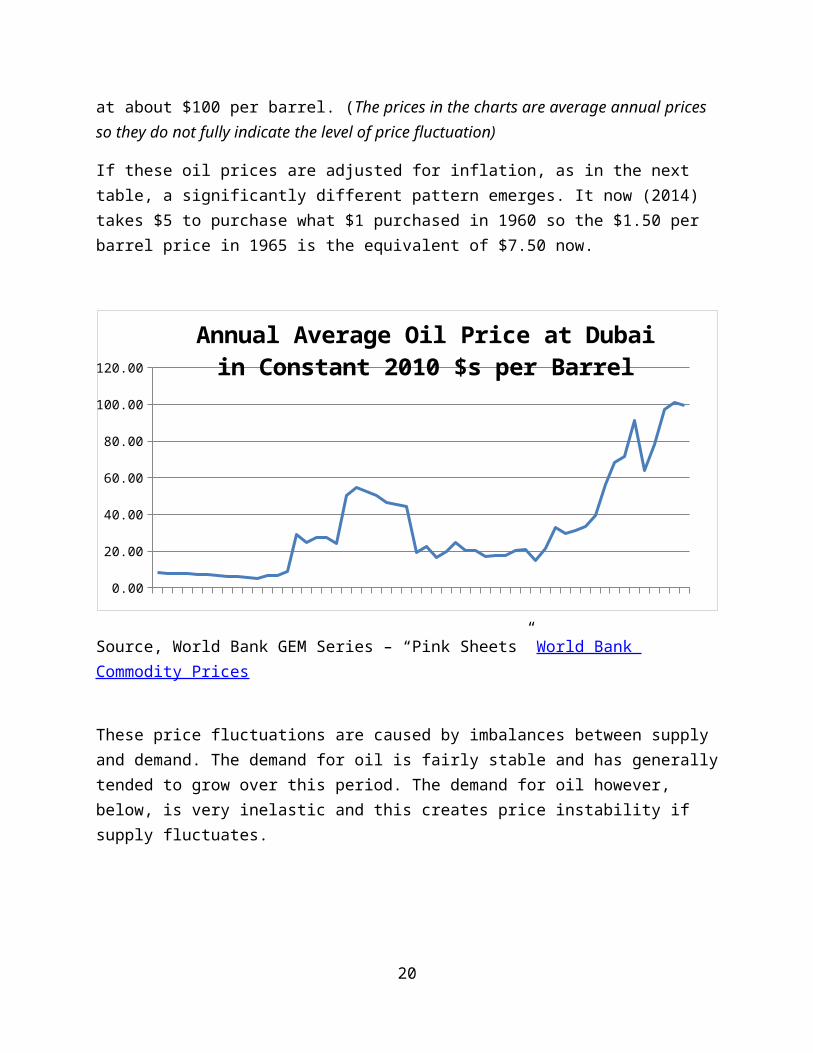
at about $100 per barrel. (The prices in the charts are average annual prices so they do not fully indicate the level of price fluctuation)
If these oil prices are adjusted for inflation, as in the next table, a significantly different pattern emerges. It now (2014) takes $5 to purchase what $1 purchased in 1960 so the $1.50 per barrel price in 1965 is the equivalent of $7.50 now.
0.00
20.00
40.00
60.00
80.00
100.00
120.00
Annual Average Oil Price at Dubai in Constant 2010 $s per Barrel
Source, World Bank GEM Series – “Pink Sheets” World Bank Commodity Prices
These price fluctuations are caused by imbalances between supply and demand. The demand for oil is fairly stable and has generallytended to grow over this period. The demand for oil however, below, is very inelastic and this creates price instability if supply fluctuates.
20
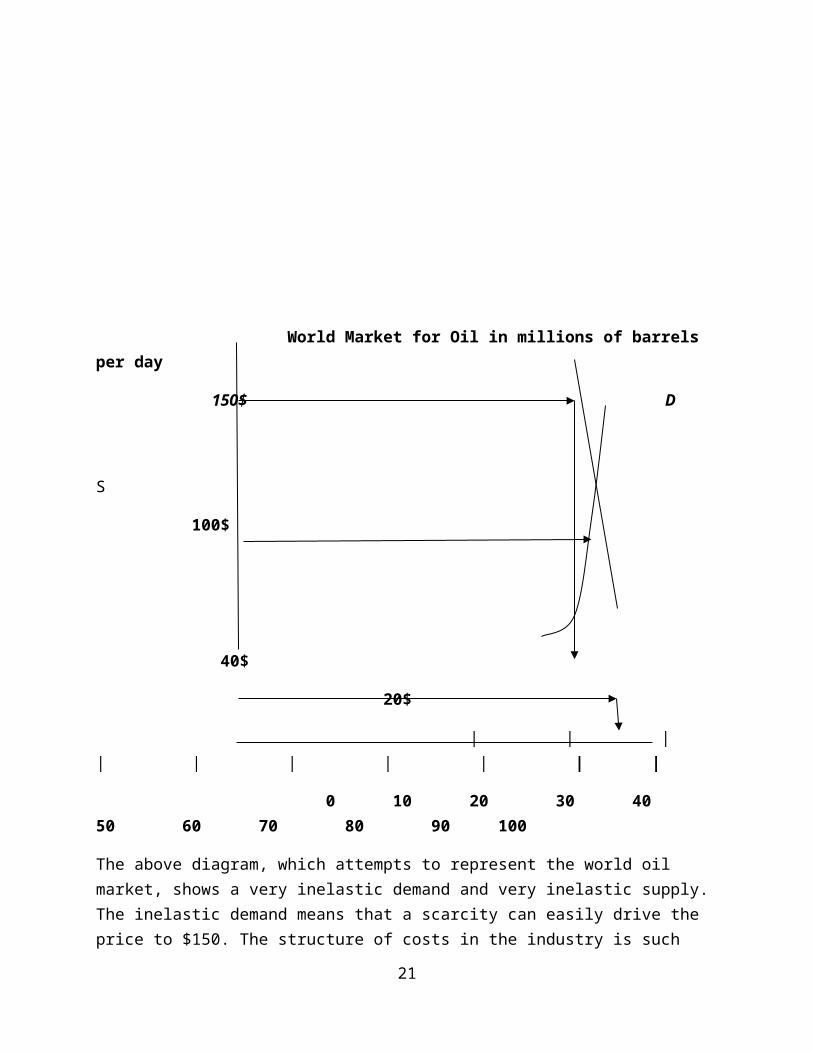
World Market for Oil in millions of barrels per day
150$ D
S
100$
40$
20$
| | | | | | | | | |
0 10 20 30 40 50 60 70 80 90 100
The above diagram, which attempts to represent the world oil market, shows a very inelastic demand and very inelastic supply. The inelastic demand means that a scarcity can easily drive the price to $150. The structure of costs in the industry is such
21
that even if the price fell to $30 that many suppliers would continue to supply.
Over the past 30 years there have been massive variations in the price of crude oil but these price variations have not, in the short term, led to major changes in demand because energy usage is built into the pattern of living of people in the developed world. The US EIA estimates that Total crude oil production is now running at about 91 million barrels per day and this is giving a market balance at just baround $90 per barrel.
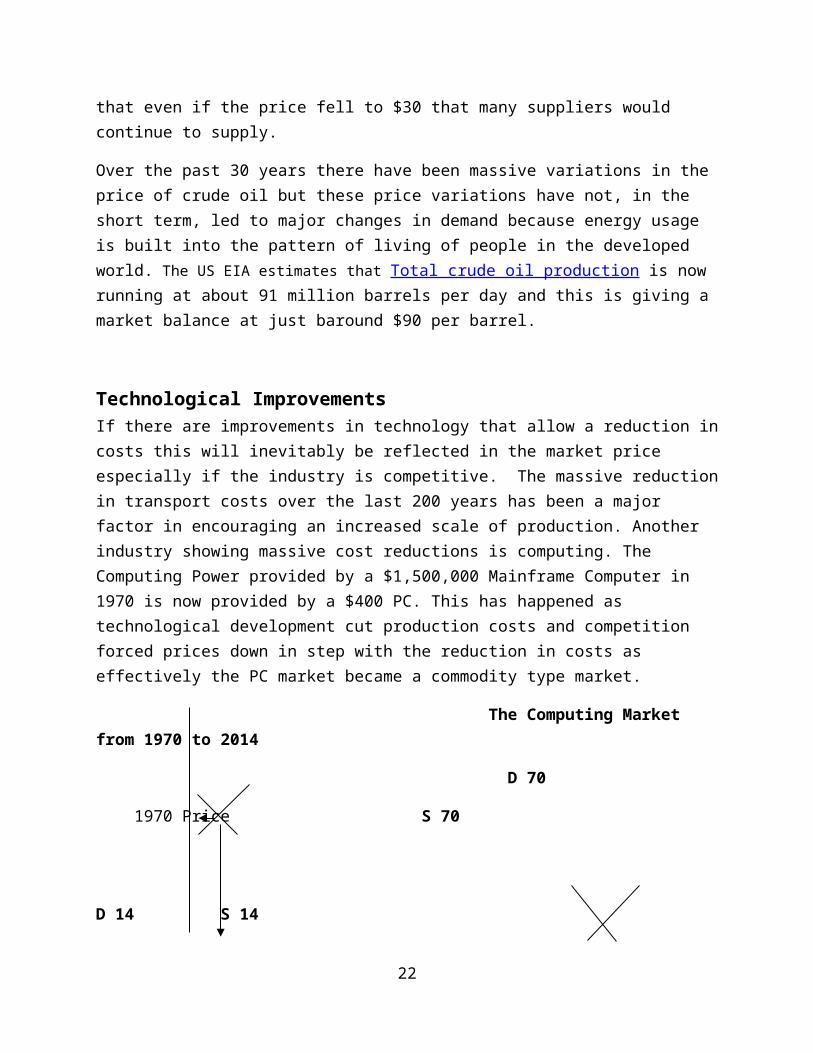
Technological ImprovementsIf there are improvements in technology that allow a reduction incosts this will inevitably be reflected in the market price especially if the industry is competitive. The massive reductionin transport costs over the last 200 years has been a major factor in encouraging an increased scale of production. Another industry showing massive cost reductions is computing. The Computing Power provided by a $1,500,000 Mainframe Computer in 1970 is now provided by a $400 PC. This has happened as technological development cut production costs and competition forced prices down in step with the reduction in costs as effectively the PC market became a commodity type market.
The Computing Market from 1970 to 2014
D 70
1970 Price S 70
D 14 S 14
22
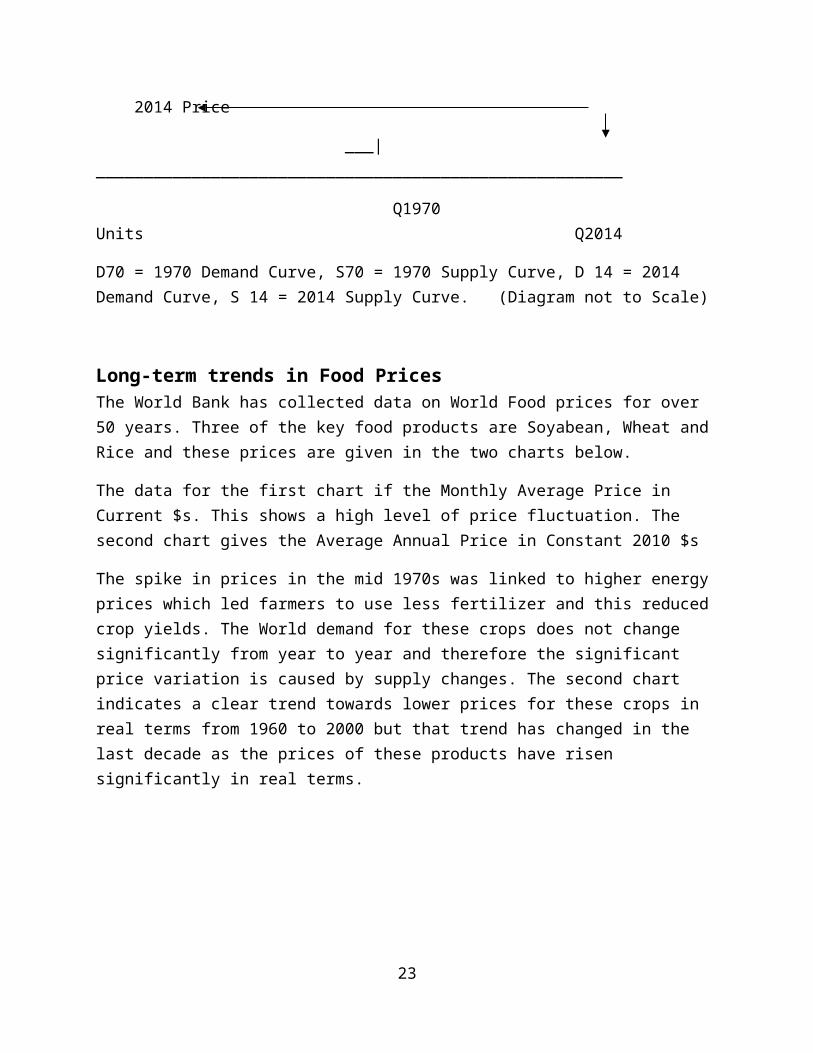
2014 Price
___|_______________________________________________________
Q1970 Units Q2014
D70 = 1970 Demand Curve, S70 = 1970 Supply Curve, D 14 = 2014 Demand Curve, S 14 = 2014 Supply Curve. (Diagram not to Scale)
Long-term trends in Food Prices The World Bank has collected data on World Food prices for over 50 years. Three of the key food products are Soyabean, Wheat and Rice and these prices are given in the two charts below.
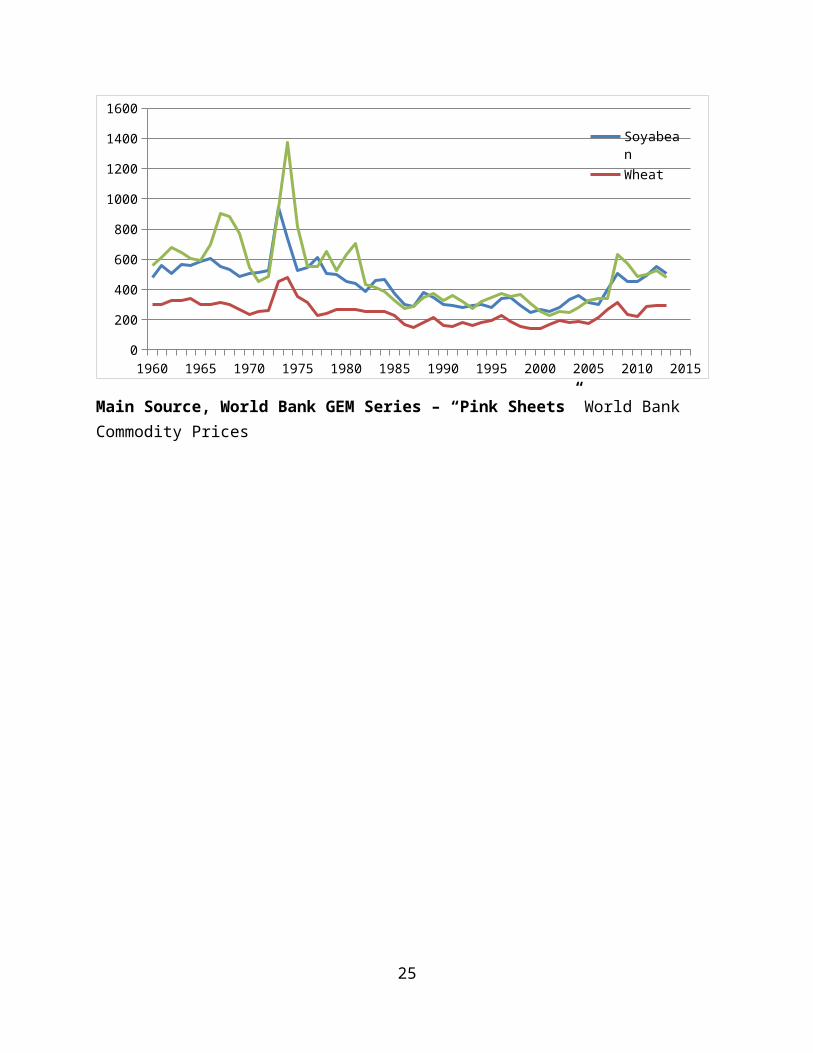
The data for the first chart if the Monthly Average Price in Current $s. This shows a high level of price fluctuation. The second chart gives the Average Annual Price in Constant 2010 $s
The spike in prices in the mid 1970s was linked to higher energy prices which led farmers to use less fertilizer and this reduced crop yields. The World demand for these crops does not change significantly from year to year and therefore the significant price variation is caused by supply changes. The second chart indicates a clear trend towards lower prices for these crops in real terms from 1960 to 2000 but that trend has changed in the last decade as the prices of these products have risen significantly in real terms.
23
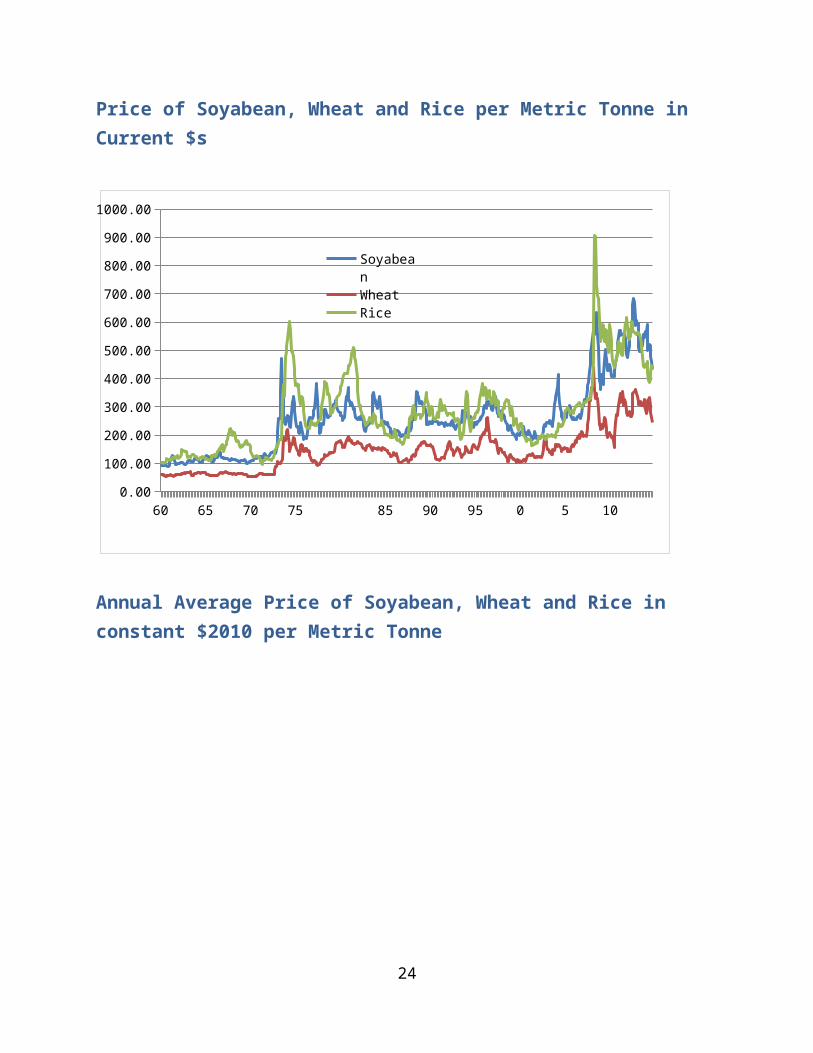
Price of Soyabean, Wheat and Rice per Metric Tonne in Current $s
60 65 70 75 85 90 95 0 5 100.00
100.00
200.00
300.00
400.00
500.00
600.00
700.00
800.00
900.00
1000.00
SoyabeanWheatRice
Annual Average Price of Soyabean, Wheat and Rice in constant $2010 per Metric Tonne
24
1960 1965 1970 1975 1980 1985 1990 1995 2000 2005 2010 20150
200
400
600
800
1000
1200
1400
1600
SoyabeanWheat
Main Source, World Bank GEM Series – “Pink Sheets” World Bank Commodity Prices
25