Embed Size (px)
Citation preview
Common Data Set 2012-2013
A. General InformationB. Enrollment and PersistenceC. First-Time, First-Year (Freshman) AdmissionD. Transfer AdmissionE. Academic Offerings and PoliciesF. Student LifeG. Annual ExpensesH. Financial AidI. Instructional Faculty and Class SizeJ. Disciplinary areas of Degrees Conferred
A. GENERAL INFORMATION
A1. Address Information
Name of College or University: Massachusetts Institute of TechnologyMailing Address: 77 Massachusetts AvenueCity, State, Zip, Country: Cambridge, MA 02139 USA
Street Address (if different): ___City, State, Zip, Country: ___
Main Phone Number: 617.253.1000WWW Home Page Address: http://web.mit.edu/
Admissions Phone Number: 617.253.3400Admissions Toll-free Number: ___Admissions Office Mailing Address: 77 Massachusetts Avenue, Room 3-108City, State, Zip, Country: Cambridge, MA 02139 USAAdmissions Fax Number: 617.258.8304Admissions E-mail Address: [email protected] there is a separate URL for your school’s online application, please specify:http://mitadmissions.orgIf you have a mailing address other than the above to which applications should be sent, pleaseprovide: ___
A2. Source of institutional control (check one only)
___ Public_X_ Private (nonprofit)
___ Proprietary
A3. Classify your undergraduate institution:
_X_ Coeducational college___ Men's college___ Women's college
A4. Academic year calendar
___ Semester _X_ 4-1-4___ Quarter ___ Continuous___ Trimester ___ Differs by program (describe): ___ Other (describe):
A5. Degrees offered by your institution
___ Certificate ___ Postbachelor's certificate___ Diploma _X_ Master's___ Associate ___ Post-master's certificate___ Transfer _X_ Doctoral degree–research/scholarship___ Terminal ___ Doctoral degree– professional practice_X_ Bachelor's ___ Doctoral degree– other
B. ENROLLMENT AND PERSISTENCE
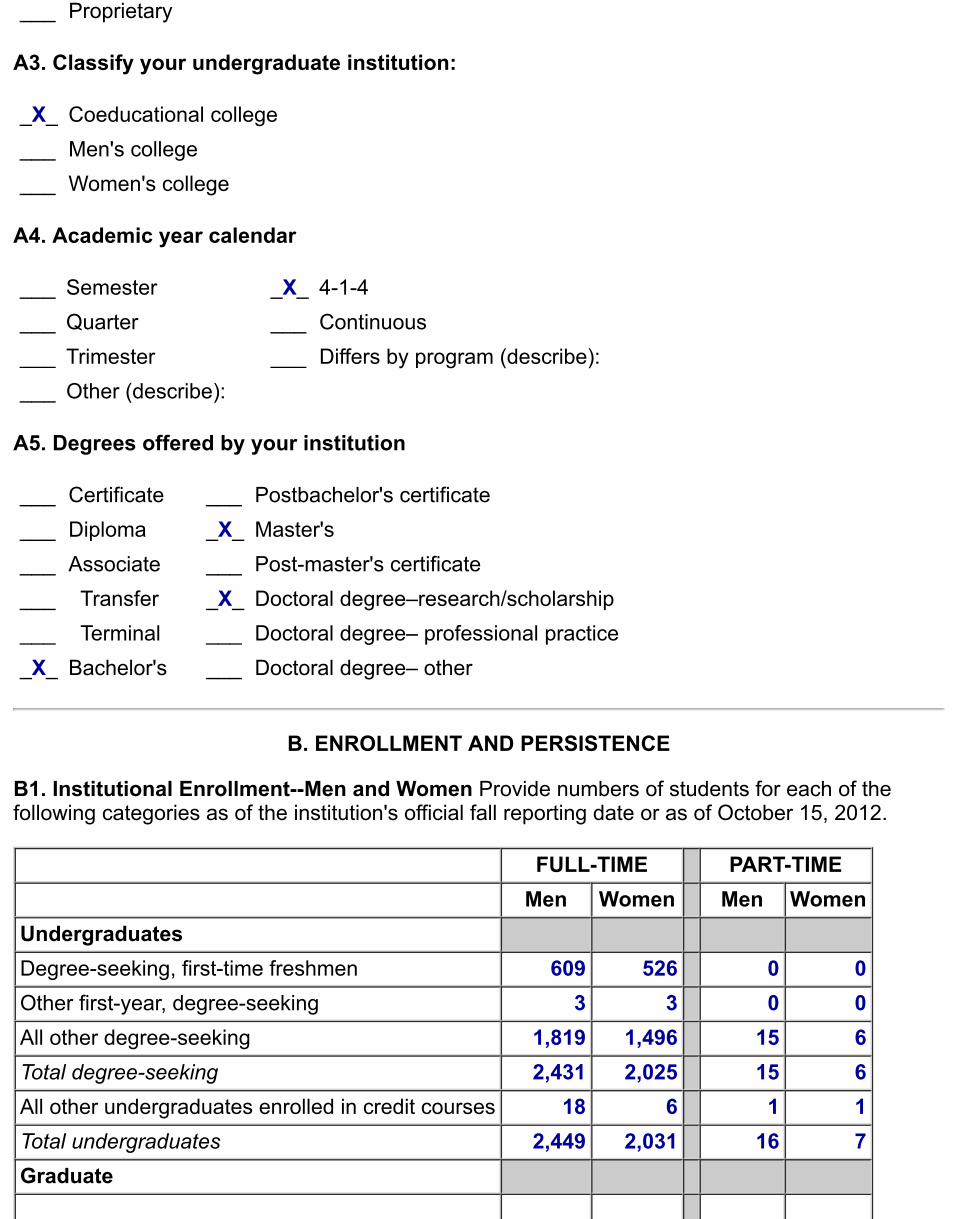
B1. Institutional Enrollment--Men and Women Provide numbers of students for each of thefollowing categories as of the institution's official fall reporting date or as of October 15, 2012.
FULL-TIME PART-TIME Men Women Men WomenUndergraduates Degree-seeking, first-time freshmen 609 526 0 0Other first-year, degree-seeking 3 3 0 0All other degree-seeking 1,819 1,496 15 6Total degree-seeking 2,431 2,025 15 6All other undergraduates enrolled in credit courses 18 6 1 1Total undergraduates 2,449 2,031 16 7Graduate
Degree-seeking, first-time 1,420 677 0 0All other degree-seeking 3,040 1,362 15 9All other graduates enrolled in credit courses 28 10 99 26Total graduate 4,488 2,049 114 35
Total all undergraduates: 4,503
Total all graduate and professional students: 6,686
GRAND TOTAL ALL STUDENTS: 11,189
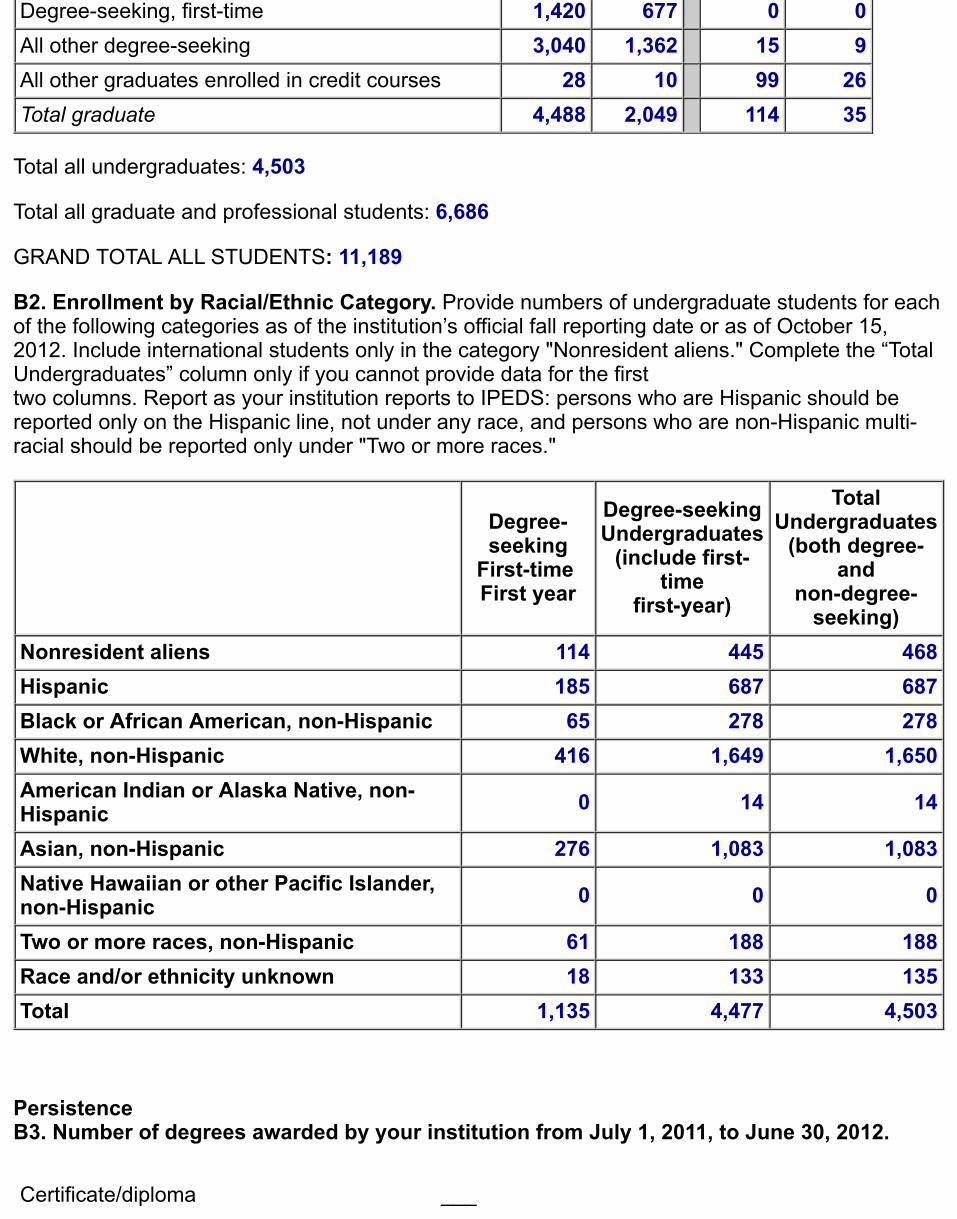
B2. Enrollment by Racial/Ethnic Category. Provide numbers of undergraduate students for eachof the following categories as of the institution’s official fall reporting date or as of October 15,2012. Include international students only in the category "Nonresident aliens." Complete the “TotalUndergraduates” column only if you cannot provide data for the firsttwo columns. Report as your institution reports to IPEDS: persons who are Hispanic should bereported only on the Hispanic line, not under any race, and persons who are non-Hispanic multi-racial should be reported only under "Two or more races."
Degree-seeking
First-time First year
Degree-seekingUndergraduates
(include first-time
first-year)
TotalUndergraduates
(both degree-and
non-degree-seeking)
Nonresident aliens 114 445 468Hispanic 185 687 687Black or African American, non-Hispanic 65 278 278White, non-Hispanic 416 1,649 1,650American Indian or Alaska Native, non-Hispanic 0 14 14
Asian, non-Hispanic 276 1,083 1,083Native Hawaiian or other Pacific Islander,non-Hispanic 0 0 0
Two or more races, non-Hispanic 61 188 188Race and/or ethnicity unknown 18 133 135Total 1,135 4,477 4,503
PersistenceB3. Number of degrees awarded by your institution from July 1, 2011, to June 30, 2012.
Certificate/diploma ___
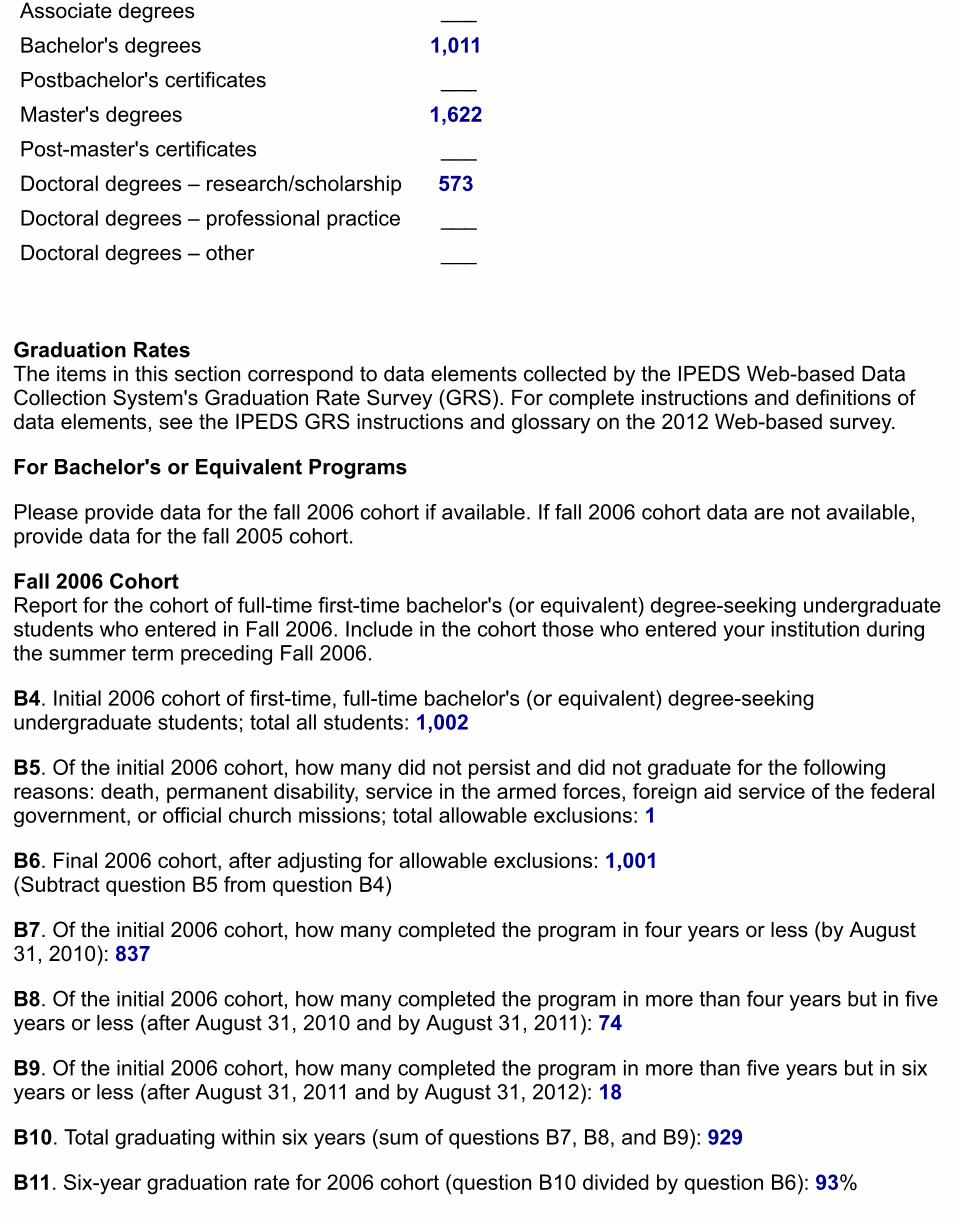
Associate degrees ___Bachelor's degrees 1,011Postbachelor's certificates ___Master's degrees 1,622Post-master's certificates ___Doctoral degrees – research/scholarship 573Doctoral degrees – professional practice ___Doctoral degrees – other ___
Graduation Rates The items in this section correspond to data elements collected by the IPEDS Web-based DataCollection System's Graduation Rate Survey (GRS). For complete instructions and definitions ofdata elements, see the IPEDS GRS instructions and glossary on the 2012 Web-based survey.
For Bachelor's or Equivalent Programs
Please provide data for the fall 2006 cohort if available. If fall 2006 cohort data are not available,provide data for the fall 2005 cohort.
Fall 2006 CohortReport for the cohort of full-time first-time bachelor's (or equivalent) degree-seeking undergraduatestudents who entered in Fall 2006. Include in the cohort those who entered your institution duringthe summer term preceding Fall 2006.
B4. Initial 2006 cohort of first-time, full-time bachelor's (or equivalent) degree-seekingundergraduate students; total all students: 1,002
B5. Of the initial 2006 cohort, how many did not persist and did not graduate for the followingreasons: death, permanent disability, service in the armed forces, foreign aid service of the federalgovernment, or official church missions; total allowable exclusions: 1
B6. Final 2006 cohort, after adjusting for allowable exclusions: 1,001(Subtract question B5 from question B4)
B7. Of the initial 2006 cohort, how many completed the program in four years or less (by August31, 2010): 837
B8. Of the initial 2006 cohort, how many completed the program in more than four years but in fiveyears or less (after August 31, 2010 and by August 31, 2011): 74
B9. Of the initial 2006 cohort, how many completed the program in more than five years but in sixyears or less (after August 31, 2011 and by August 31, 2012): 18
B10. Total graduating within six years (sum of questions B7, B8, and B9): 929
B11. Six-year graduation rate for 2006 cohort (question B10 divided by question B6): 93%
Fall 2005 CohortReport for the cohort of full-time first-time bachelor's (or equivalent) degree-seeking undergraduatestudents who entered in Fall 2005. Include in the cohort those who entered your institution duringthe summer term preceding Fall 2005.
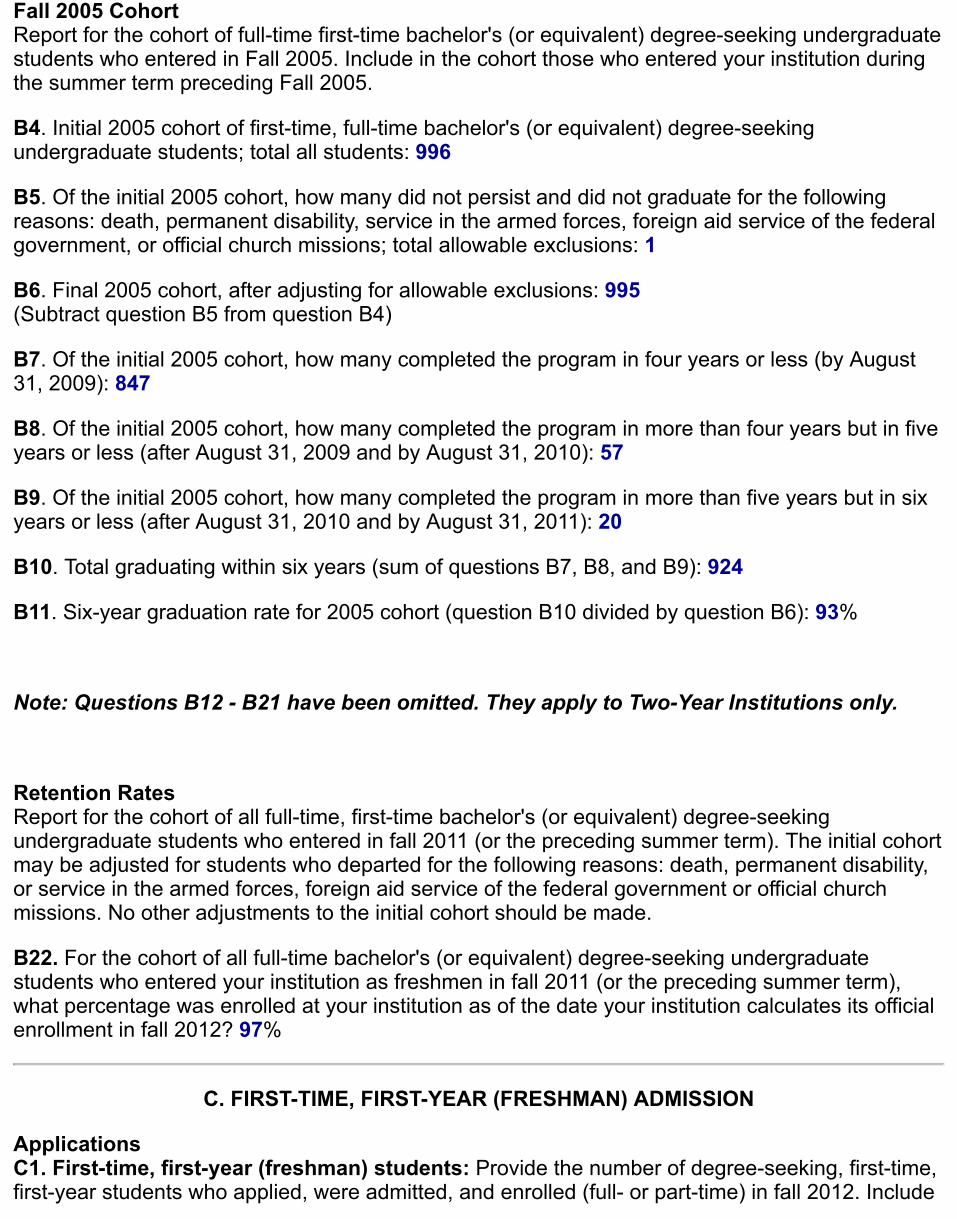
B4. Initial 2005 cohort of first-time, full-time bachelor's (or equivalent) degree-seekingundergraduate students; total all students: 996
B5. Of the initial 2005 cohort, how many did not persist and did not graduate for the followingreasons: death, permanent disability, service in the armed forces, foreign aid service of the federalgovernment, or official church missions; total allowable exclusions: 1
B6. Final 2005 cohort, after adjusting for allowable exclusions: 995(Subtract question B5 from question B4)
B7. Of the initial 2005 cohort, how many completed the program in four years or less (by August31, 2009): 847
B8. Of the initial 2005 cohort, how many completed the program in more than four years but in fiveyears or less (after August 31, 2009 and by August 31, 2010): 57
B9. Of the initial 2005 cohort, how many completed the program in more than five years but in sixyears or less (after August 31, 2010 and by August 31, 2011): 20
B10. Total graduating within six years (sum of questions B7, B8, and B9): 924
B11. Six-year graduation rate for 2005 cohort (question B10 divided by question B6): 93%
Note: Questions B12 - B21 have been omitted. They apply to Two-Year Institutions only.
Retention Rates Report for the cohort of all full-time, first-time bachelor's (or equivalent) degree-seekingundergraduate students who entered in fall 2011 (or the preceding summer term). The initial cohortmay be adjusted for students who departed for the following reasons: death, permanent disability,or service in the armed forces, foreign aid service of the federal government or official churchmissions. No other adjustments to the initial cohort should be made.
B22. For the cohort of all full-time bachelor's (or equivalent) degree-seeking undergraduatestudents who entered your institution as freshmen in fall 2011 (or the preceding summer term),what percentage was enrolled at your institution as of the date your institution calculates its officialenrollment in fall 2012? 97%
C. FIRST-TIME, FIRST-YEAR (FRESHMAN) ADMISSION
Applications C1. First-time, first-year (freshman) students: Provide the number of degree-seeking, first-time,first-year students who applied, were admitted, and enrolled (full- or part-time) in fall 2012. Include
early decision, early action, and students who began studies during summer in this cohort.Applicants should include only those students who fulfilled the requirements for consideration foradmission (i.e., who completed actionable applications) and who have been notified of one of thefollowing actions: admission, non-admission, placement on waiting list, or application withdrawn(by applicant or institution). Admitted applicants should include wait-listed students who weresubsequently offered admission.
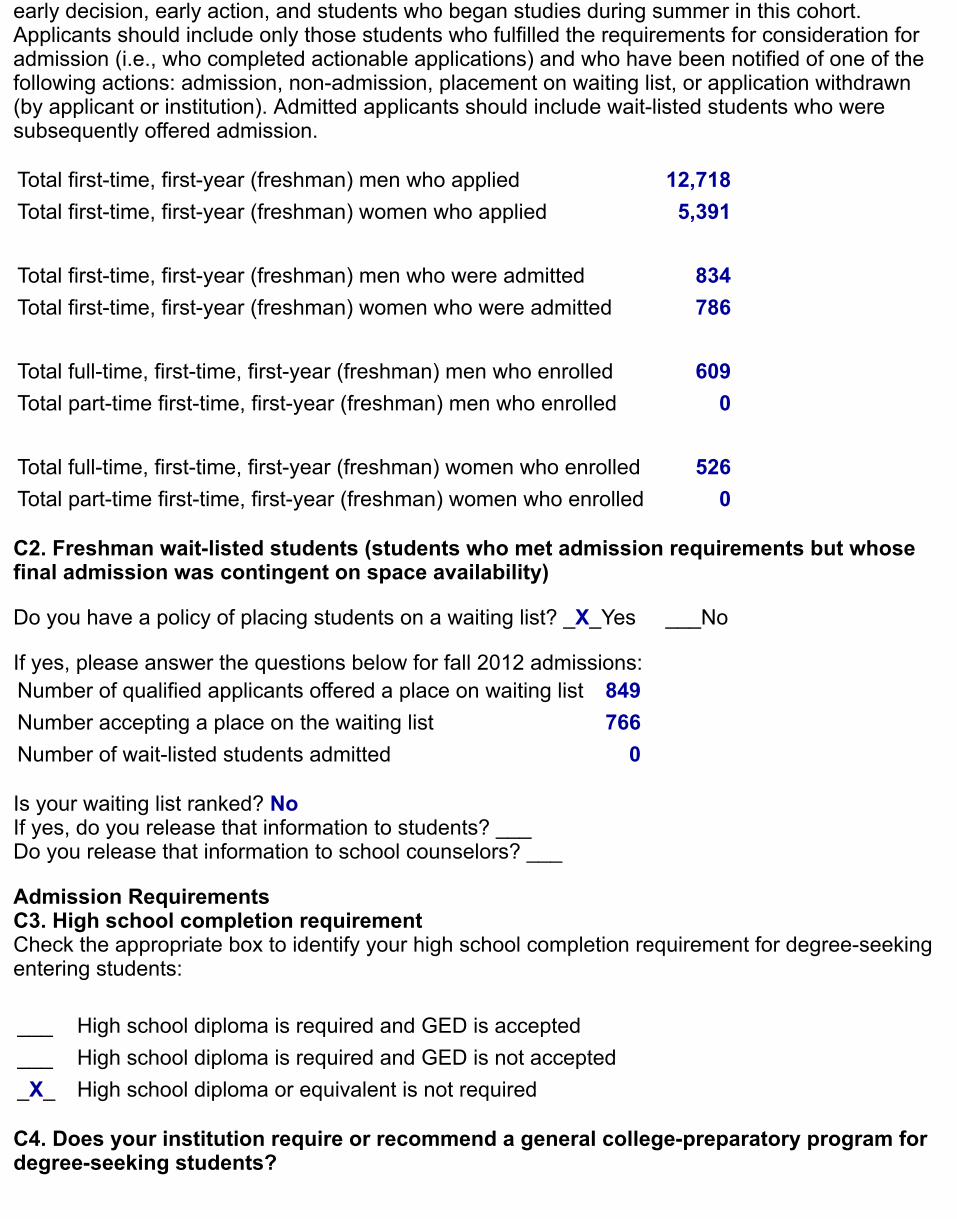
Total first-time, first-year (freshman) men who applied 12,718Total first-time, first-year (freshman) women who applied 5,391 Total first-time, first-year (freshman) men who were admitted 834Total first-time, first-year (freshman) women who were admitted 786 Total full-time, first-time, first-year (freshman) men who enrolled 609Total part-time first-time, first-year (freshman) men who enrolled 0 Total full-time, first-time, first-year (freshman) women who enrolled 526Total part-time first-time, first-year (freshman) women who enrolled 0
C2. Freshman wait-listed students (students who met admission requirements but whosefinal admission was contingent on space availability)
Do you have a policy of placing students on a waiting list? _X_Yes ___No
If yes, please answer the questions below for fall 2012 admissions:Number of qualified applicants offered a place on waiting list 849Number accepting a place on the waiting list 766Number of wait-listed students admitted 0
Is your waiting list ranked? NoIf yes, do you release that information to students? ___Do you release that information to school counselors? ___
Admission RequirementsC3. High school completion requirement Check the appropriate box to identify your high school completion requirement for degree-seekingentering students:
___ High school diploma is required and GED is accepted___ High school diploma is required and GED is not accepted_X_ High school diploma or equivalent is not required
C4. Does your institution require or recommend a general college-preparatory program fordegree-seeking students?
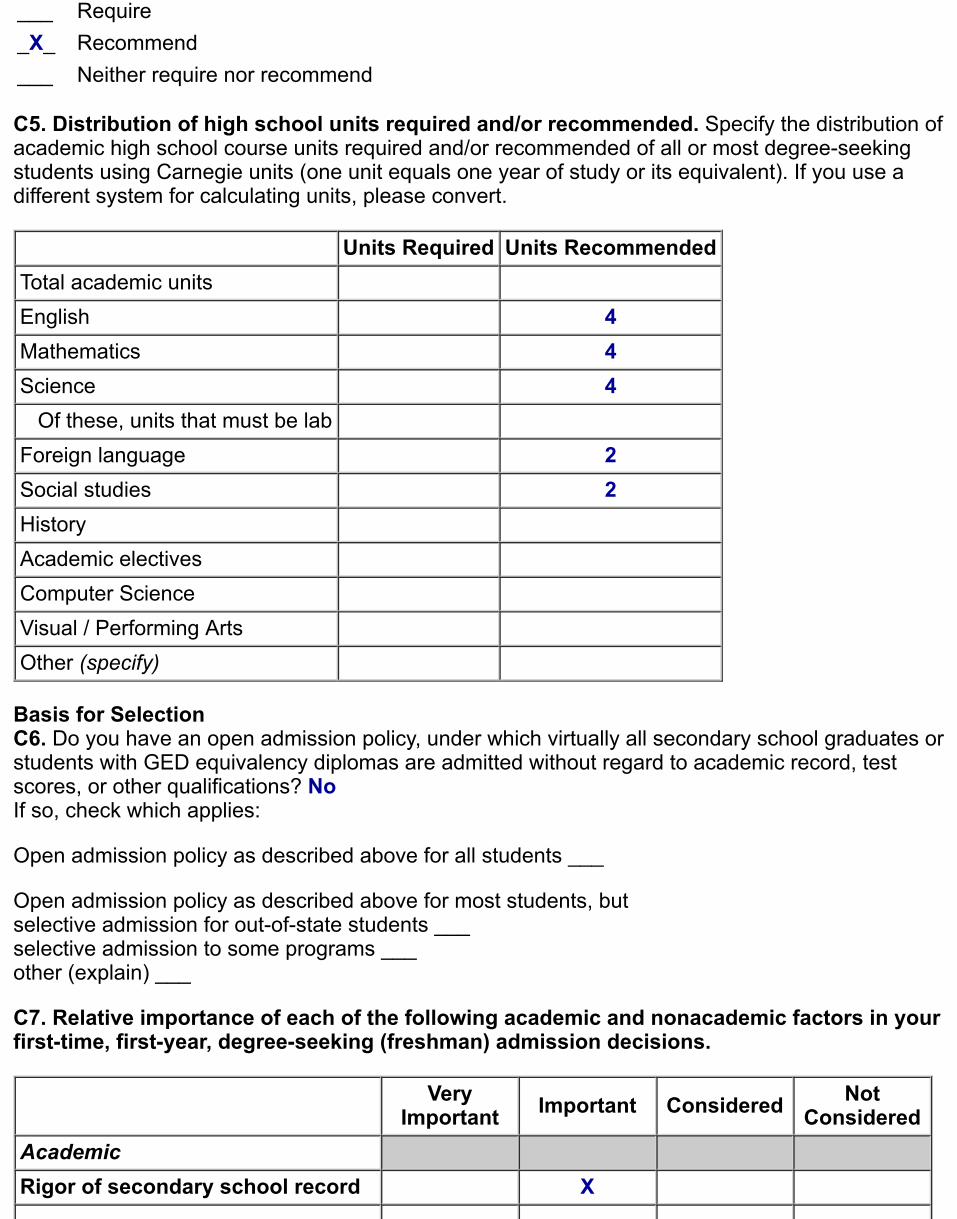
___ Require_X_ Recommend___ Neither require nor recommend
C5. Distribution of high school units required and/or recommended. Specify the distribution ofacademic high school course units required and/or recommended of all or most degree-seekingstudents using Carnegie units (one unit equals one year of study or its equivalent). If you use adifferent system for calculating units, please convert.
Units Required Units RecommendedTotal academic units English 4Mathematics 4Science 4 Of these, units that must be lab Foreign language 2Social studies 2History Academic electives Computer Science Visual / Performing Arts Other (specify)
Basis for Selection C6. Do you have an open admission policy, under which virtually all secondary school graduates orstudents with GED equivalency diplomas are admitted without regard to academic record, testscores, or other qualifications? No If so, check which applies:
Open admission policy as described above for all students ___
Open admission policy as described above for most students, but selective admission for out-of-state students ___ selective admission to some programs ___ other (explain) ___
C7. Relative importance of each of the following academic and nonacademic factors in yourfirst-time, first-year, degree-seeking (freshman) admission decisions.
VeryImportant Important Considered Not
ConsideredAcademic Rigor of secondary school record X
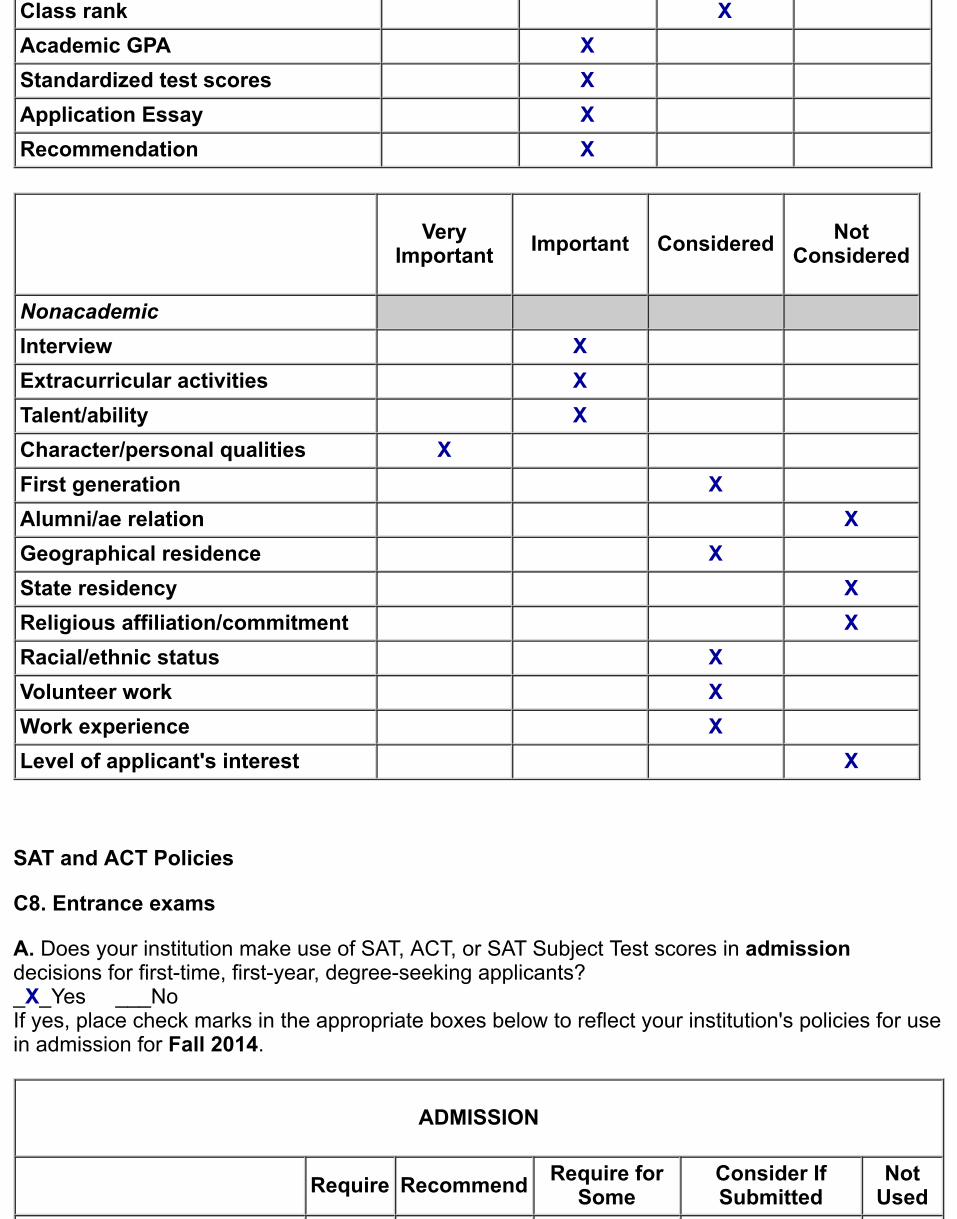
Class rank X Academic GPA X Standardized test scores X Application Essay X Recommendation X
VeryImportant Important Considered Not
Considered
Nonacademic Interview X Extracurricular activities X Talent/ability X Character/personal qualities X First generation X Alumni/ae relation XGeographical residence X State residency XReligious affiliation/commitment XRacial/ethnic status X Volunteer work X Work experience X Level of applicant's interest X
SAT and ACT Policies
C8. Entrance exams
A. Does your institution make use of SAT, ACT, or SAT Subject Test scores in admissiondecisions for first-time, first-year, degree-seeking applicants? _X_Yes ___No If yes, place check marks in the appropriate boxes below to reflect your institution's policies for usein admission for Fall 2014.
ADMISSION
Require Recommend Require forSome
Consider IfSubmitted
NotUsed
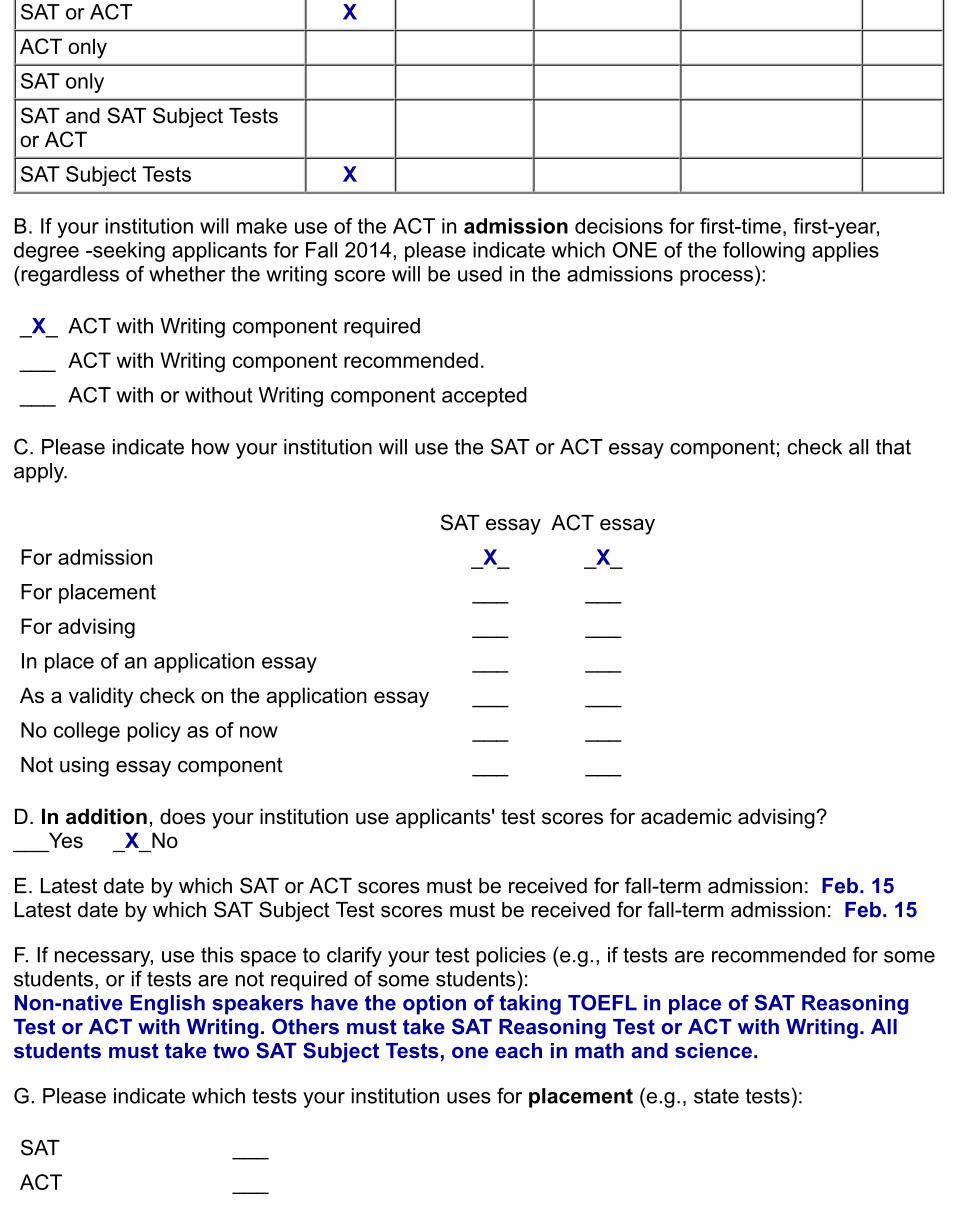
SAT or ACT X ACT only SAT only SAT and SAT Subject Testsor ACT
SAT Subject Tests X
B. If your institution will make use of the ACT in admission decisions for first-time, first-year,degree -seeking applicants for Fall 2014, please indicate which ONE of the following applies(regardless of whether the writing score will be used in the admissions process):
_X_ ACT with Writing component required___ ACT with Writing component recommended.___ ACT with or without Writing component accepted
C. Please indicate how your institution will use the SAT or ACT essay component; check all thatapply.
SAT essay ACT essayFor admission _X_ _X_For placement ___ ___For advising ___ ___In place of an application essay ___ ___As a validity check on the application essay ___ ___No college policy as of now ___ ___Not using essay component ___ ___
D. In addition, does your institution use applicants' test scores for academic advising? ___Yes _X_No
E. Latest date by which SAT or ACT scores must be received for fall-term admission: Feb. 15Latest date by which SAT Subject Test scores must be received for fall-term admission: Feb. 15
F. If necessary, use this space to clarify your test policies (e.g., if tests are recommended for somestudents, or if tests are not required of some students): Non-native English speakers have the option of taking TOEFL in place of SAT ReasoningTest or ACT with Writing. Others must take SAT Reasoning Test or ACT with Writing. Allstudents must take two SAT Subject Tests, one each in math and science.
G. Please indicate which tests your institution uses for placement (e.g., state tests):
SAT ___ACT ___
SAT Subject Tests ___AP _X_CLEP ___Institutional Exam _X_State Exam (specify): _________
Freshman Profile
Provide percentages for ALL enrolled, degree-seeking, full-time and part-time, first-time, first-year (freshman) students enrolled in fall 2012, including students who began studies duringsummer, international students/nonresident aliens, and students admitted under specialarrangements.
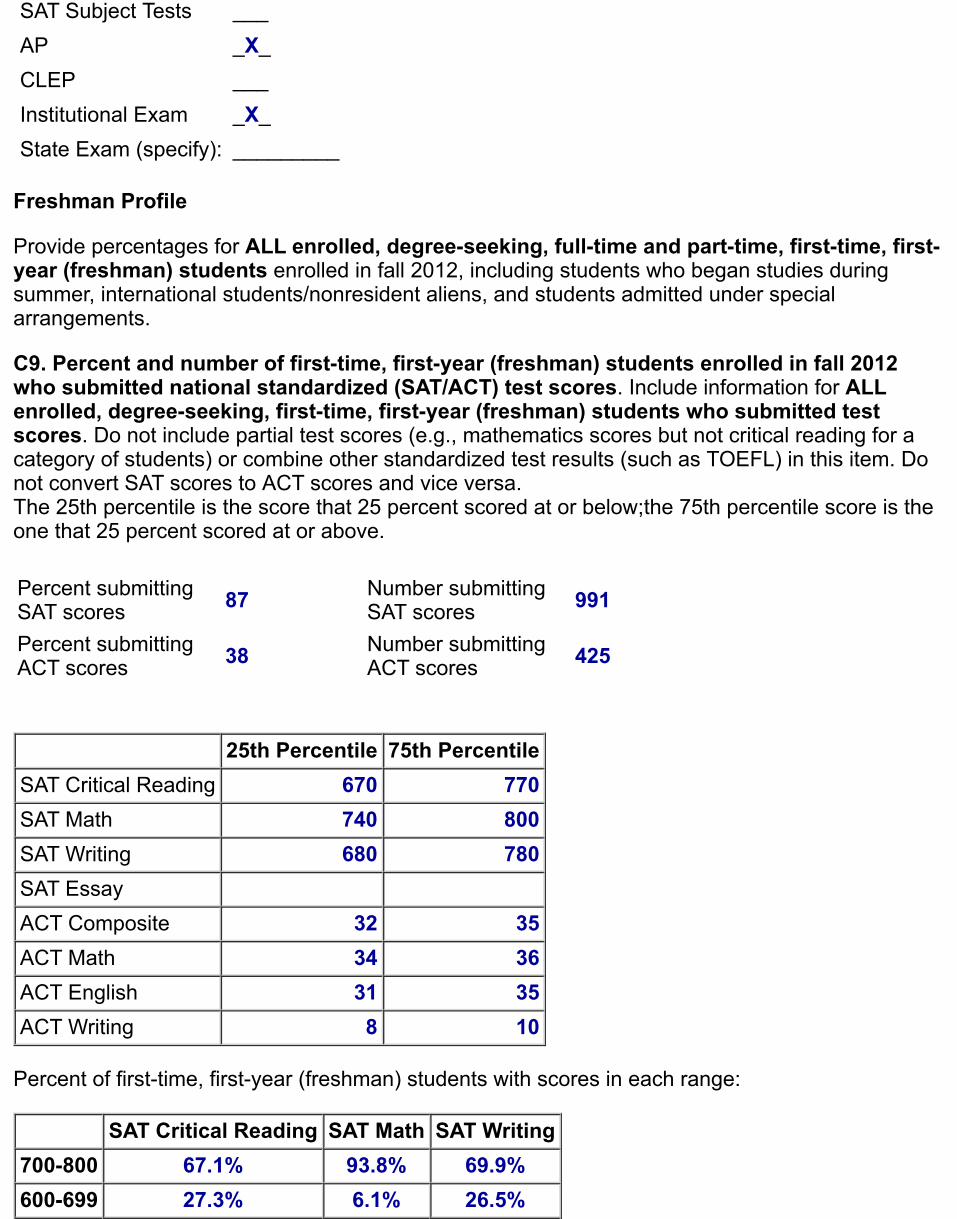
C9. Percent and number of first-time, first-year (freshman) students enrolled in fall 2012who submitted national standardized (SAT/ACT) test scores. Include information for ALLenrolled, degree-seeking, first-time, first-year (freshman) students who submitted testscores. Do not include partial test scores (e.g., mathematics scores but not critical reading for acategory of students) or combine other standardized test results (such as TOEFL) in this item. Donot convert SAT scores to ACT scores and vice versa. The 25th percentile is the score that 25 percent scored at or below;the 75th percentile score is theone that 25 percent scored at or above.
Percent submittingSAT scores 87 Number submitting
SAT scores 991
Percent submittingACT scores 38 Number submitting
ACT scores 425
25th Percentile 75th PercentileSAT Critical Reading 670 770SAT Math 740 800SAT Writing 680 780SAT Essay ACT Composite 32 35ACT Math 34 36ACT English 31 35ACT Writing 8 10
Percent of first-time, first-year (freshman) students with scores in each range:
SAT Critical Reading SAT Math SAT Writing700-800 67.1% 93.8% 69.9%600-699 27.3% 6.1% 26.5%
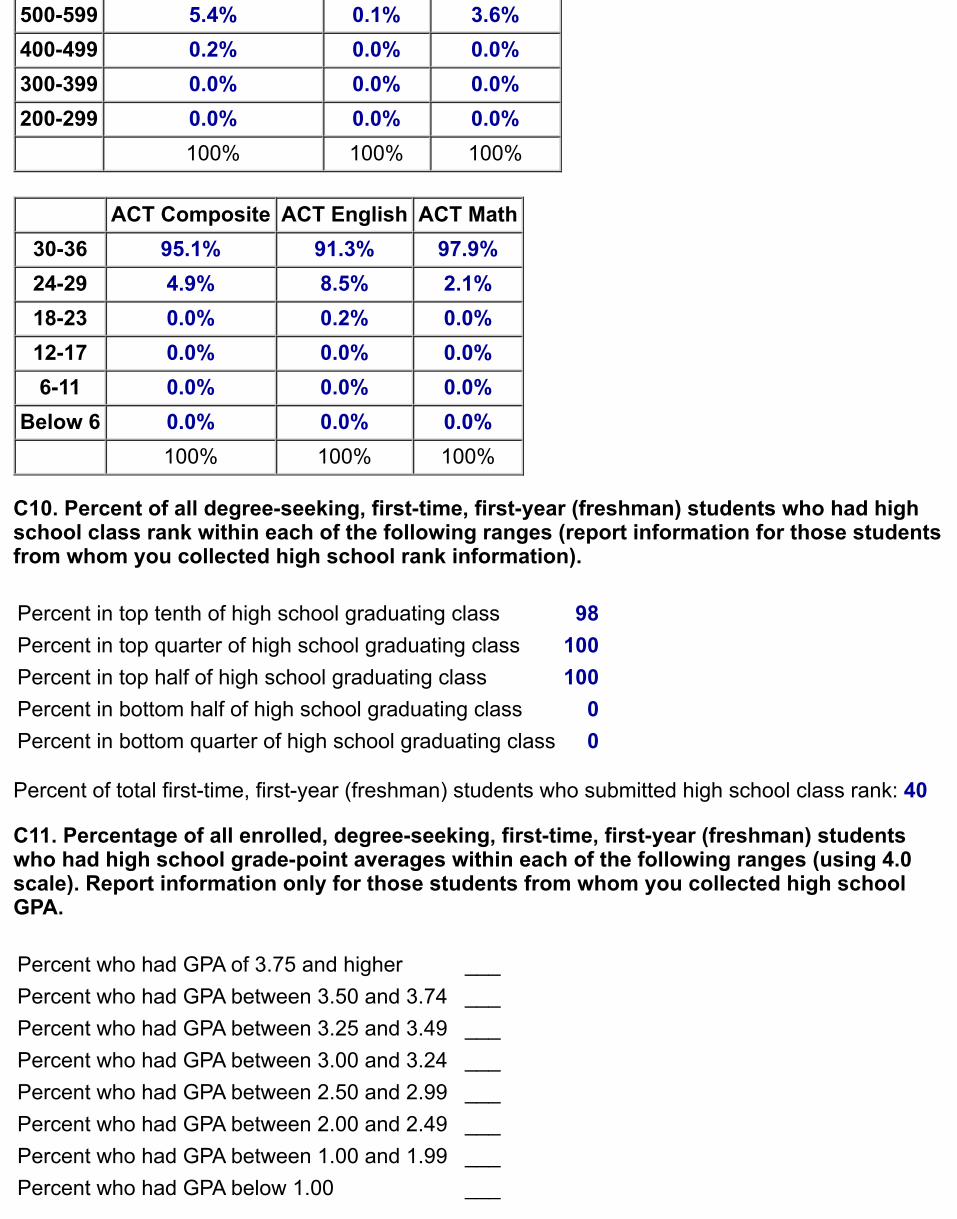
500-599 5.4% 0.1% 3.6%400-499 0.2% 0.0% 0.0%300-399 0.0% 0.0% 0.0%200-299 0.0% 0.0% 0.0% 100% 100% 100%
ACT Composite ACT English ACT Math30-36 95.1% 91.3% 97.9%24-29 4.9% 8.5% 2.1%18-23 0.0% 0.2% 0.0%12-17 0.0% 0.0% 0.0%6-11 0.0% 0.0% 0.0%
Below 6 0.0% 0.0% 0.0% 100% 100% 100%
C10. Percent of all degree-seeking, first-time, first-year (freshman) students who had highschool class rank within each of the following ranges (report information for those studentsfrom whom you collected high school rank information).
Percent in top tenth of high school graduating class 98Percent in top quarter of high school graduating class 100Percent in top half of high school graduating class 100Percent in bottom half of high school graduating class 0Percent in bottom quarter of high school graduating class 0
Percent of total first-time, first-year (freshman) students who submitted high school class rank: 40
C11. Percentage of all enrolled, degree-seeking, first-time, first-year (freshman) studentswho had high school grade-point averages within each of the following ranges (using 4.0scale). Report information only for those students from whom you collected high schoolGPA.
Percent who had GPA of 3.75 and higher ___Percent who had GPA between 3.50 and 3.74 ___Percent who had GPA between 3.25 and 3.49 ___Percent who had GPA between 3.00 and 3.24 ___Percent who had GPA between 2.50 and 2.99 ___Percent who had GPA between 2.00 and 2.49 ___Percent who had GPA between 1.00 and 1.99 ___Percent who had GPA below 1.00 ___
100%
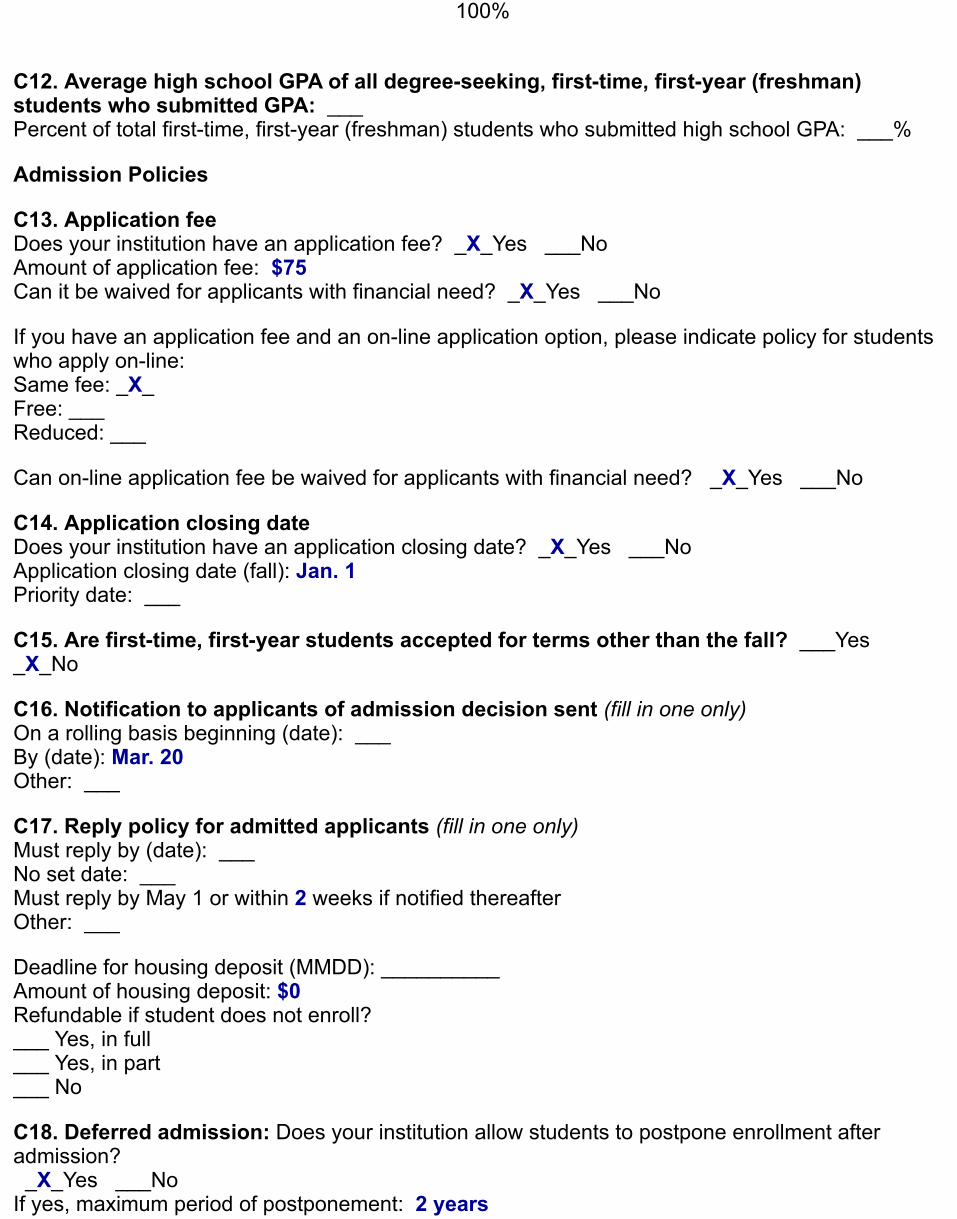
C12. Average high school GPA of all degree-seeking, first-time, first-year (freshman)students who submitted GPA: ___Percent of total first-time, first-year (freshman) students who submitted high school GPA: ___%
Admission Policies
C13. Application fee Does your institution have an application fee? _X_Yes ___NoAmount of application fee: $75 Can it be waived for applicants with financial need? _X_Yes ___No
If you have an application fee and an on-line application option, please indicate policy for studentswho apply on-line:Same fee: _X_Free: ___Reduced: ___
Can on-line application fee be waived for applicants with financial need? _X_Yes ___No
C14. Application closing date Does your institution have an application closing date? _X_Yes ___NoApplication closing date (fall): Jan. 1Priority date: ___
C15. Are first-time, first-year students accepted for terms other than the fall? ___Yes _X_No
C16. Notification to applicants of admission decision sent (fill in one only) On a rolling basis beginning (date): ___By (date): Mar. 20Other: ___
C17. Reply policy for admitted applicants (fill in one only)Must reply by (date): ___No set date: ___Must reply by May 1 or within 2 weeks if notified thereafterOther: ___
Deadline for housing deposit (MMDD): __________Amount of housing deposit: $0Refundable if student does not enroll?___ Yes, in full___ Yes, in part___ No
C18. Deferred admission: Does your institution allow students to postpone enrollment afteradmission? _X_Yes ___NoIf yes, maximum period of postponement: 2 years
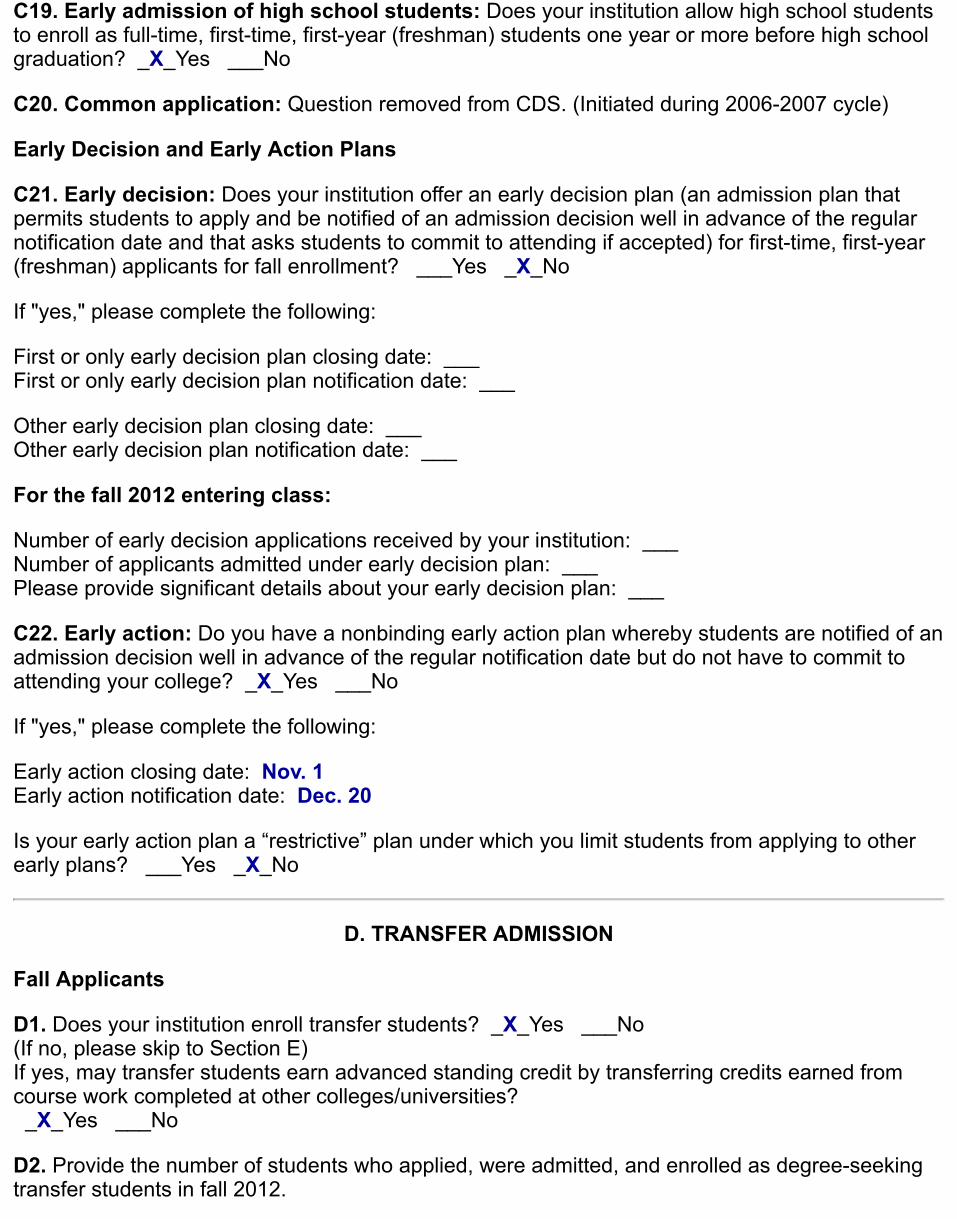
C19. Early admission of high school students: Does your institution allow high school studentsto enroll as full-time, first-time, first-year (freshman) students one year or more before high schoolgraduation? _X_Yes ___No
C20. Common application: Question removed from CDS. (Initiated during 2006-2007 cycle)
Early Decision and Early Action Plans
C21. Early decision: Does your institution offer an early decision plan (an admission plan thatpermits students to apply and be notified of an admission decision well in advance of the regularnotification date and that asks students to commit to attending if accepted) for first-time, first-year(freshman) applicants for fall enrollment? ___Yes _X_No
If "yes," please complete the following:
First or only early decision plan closing date: ___First or only early decision plan notification date: ___
Other early decision plan closing date: ___Other early decision plan notification date: ___
For the fall 2012 entering class:
Number of early decision applications received by your institution: ___Number of applicants admitted under early decision plan: ___Please provide significant details about your early decision plan: ___
C22. Early action: Do you have a nonbinding early action plan whereby students are notified of anadmission decision well in advance of the regular notification date but do not have to commit toattending your college? _X_Yes ___No
If "yes," please complete the following:
Early action closing date: Nov. 1Early action notification date: Dec. 20
Is your early action plan a “restrictive” plan under which you limit students from applying to otherearly plans? ___Yes _X_No
D. TRANSFER ADMISSION
Fall Applicants
D1. Does your institution enroll transfer students? _X_Yes ___No(If no, please skip to Section E)If yes, may transfer students earn advanced standing credit by transferring credits earned fromcourse work completed at other colleges/universities? _X_Yes ___No
D2. Provide the number of students who applied, were admitted, and enrolled as degree-seekingtransfer students in fall 2012.
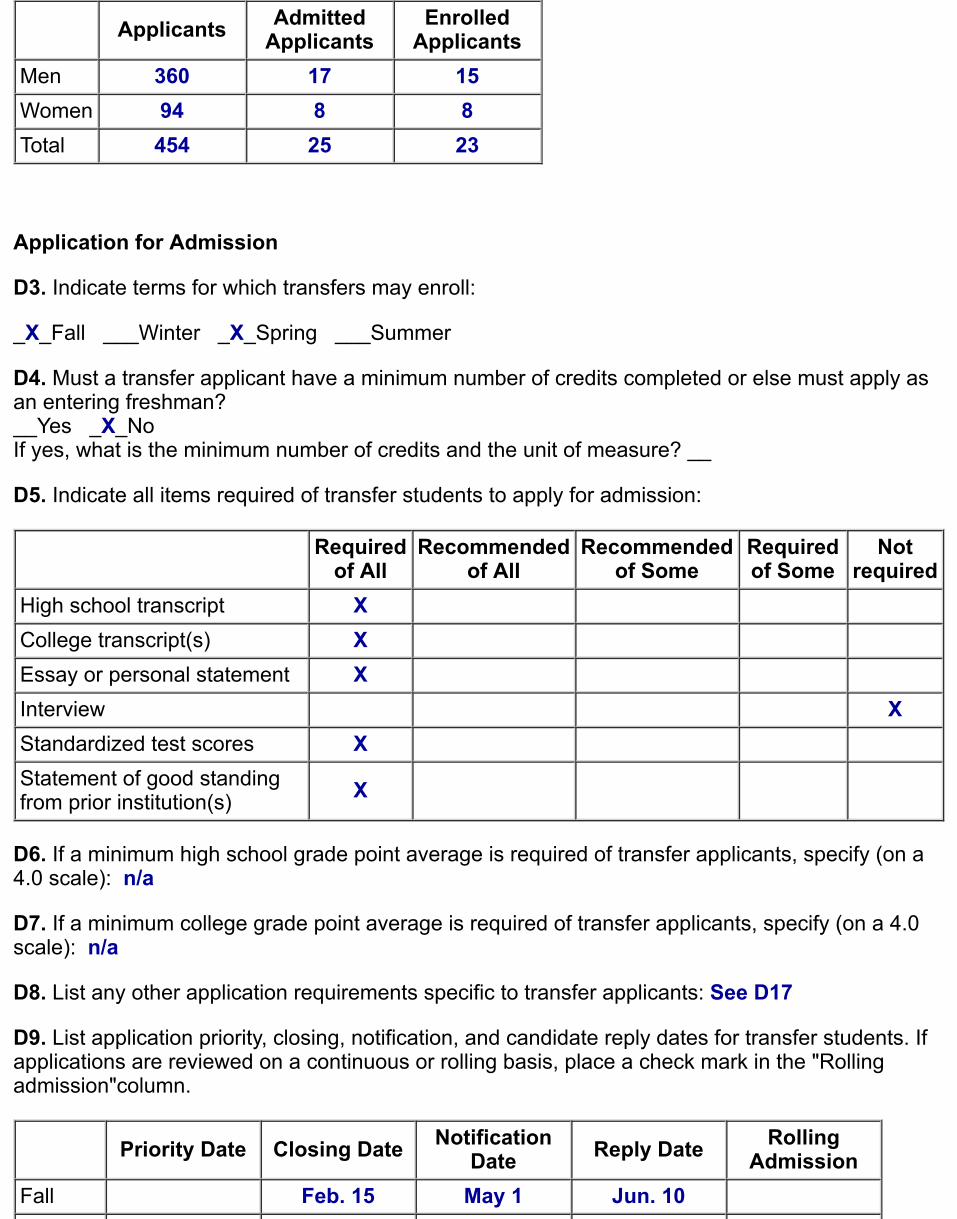
Applicants AdmittedApplicants
EnrolledApplicants
Men 360 17 15Women 94 8 8Total 454 25 23
Application for Admission
D3. Indicate terms for which transfers may enroll:
_X_Fall ___Winter _X_Spring ___Summer
D4. Must a transfer applicant have a minimum number of credits completed or else must apply asan entering freshman?__Yes _X_NoIf yes, what is the minimum number of credits and the unit of measure? __
D5. Indicate all items required of transfer students to apply for admission:
Requiredof All
Recommendedof All
Recommendedof Some
Requiredof Some
Notrequired
High school transcript X College transcript(s) X Essay or personal statement X Interview XStandardized test scores X Statement of good standingfrom prior institution(s) X
D6. If a minimum high school grade point average is required of transfer applicants, specify (on a4.0 scale): n/a
D7. If a minimum college grade point average is required of transfer applicants, specify (on a 4.0scale): n/a
D8. List any other application requirements specific to transfer applicants: See D17
D9. List application priority, closing, notification, and candidate reply dates for transfer students. Ifapplications are reviewed on a continuous or rolling basis, place a check mark in the "Rollingadmission"column.
Priority Date Closing Date NotificationDate Reply Date Rolling
AdmissionFall Feb. 15 May 1 Jun. 10
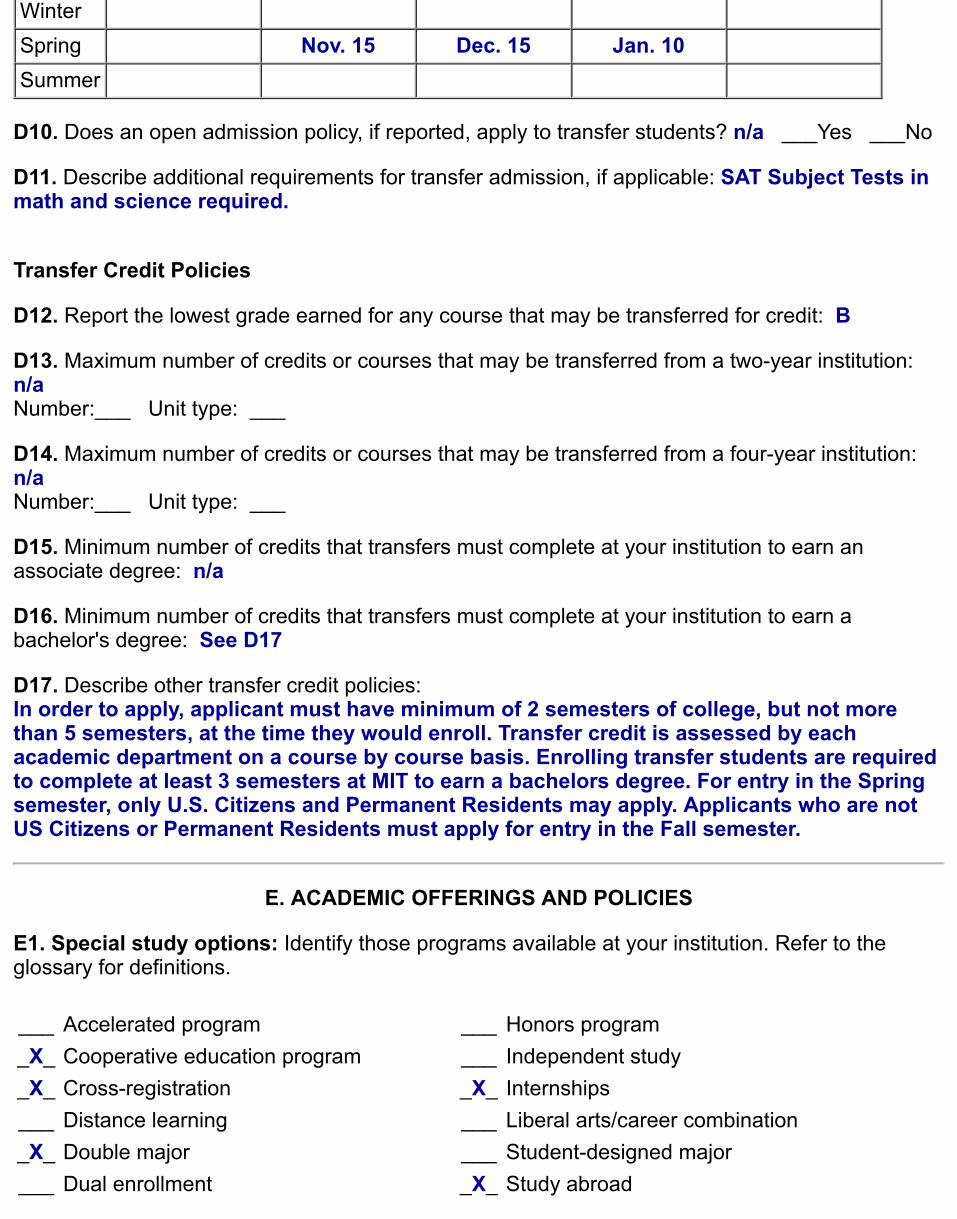
Winter Spring Nov. 15 Dec. 15 Jan. 10 Summer
D10. Does an open admission policy, if reported, apply to transfer students? n/a ___Yes ___No
D11. Describe additional requirements for transfer admission, if applicable: SAT Subject Tests inmath and science required.
Transfer Credit Policies
D12. Report the lowest grade earned for any course that may be transferred for credit: B
D13. Maximum number of credits or courses that may be transferred from a two-year institution:n/a Number:___ Unit type: ___
D14. Maximum number of credits or courses that may be transferred from a four-year institution:n/a Number:___ Unit type: ___
D15. Minimum number of credits that transfers must complete at your institution to earn anassociate degree: n/a
D16. Minimum number of credits that transfers must complete at your institution to earn abachelor's degree: See D17
D17. Describe other transfer credit policies: In order to apply, applicant must have minimum of 2 semesters of college, but not morethan 5 semesters, at the time they would enroll. Transfer credit is assessed by eachacademic department on a course by course basis. Enrolling transfer students are requiredto complete at least 3 semesters at MIT to earn a bachelors degree. For entry in the Springsemester, only U.S. Citizens and Permanent Residents may apply. Applicants who are notUS Citizens or Permanent Residents must apply for entry in the Fall semester.
E. ACADEMIC OFFERINGS AND POLICIES
E1. Special study options: Identify those programs available at your institution. Refer to theglossary for definitions.
___ Accelerated program ___ Honors program_X_ Cooperative education program ___ Independent study_X_ Cross-registration _X_ Internships___ Distance learning ___ Liberal arts/career combination_X_ Double major ___ Student-designed major___ Dual enrollment _X_ Study abroad
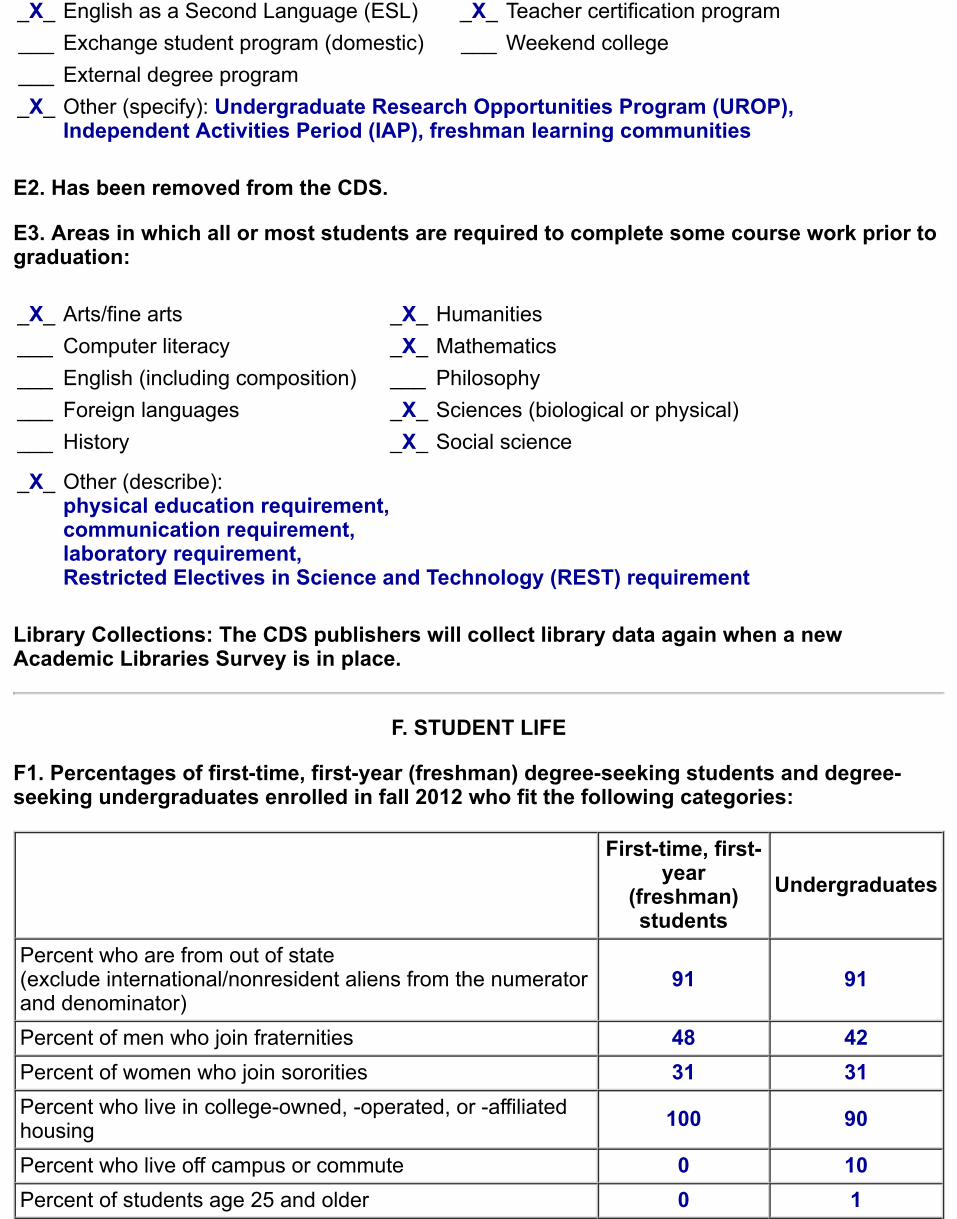
_X_ English as a Second Language (ESL) _X_ Teacher certification program___ Exchange student program (domestic) ___ Weekend college___ External degree program_X_ Other (specify): Undergraduate Research Opportunities Program (UROP),
Independent Activities Period (IAP), freshman learning communities
E2. Has been removed from the CDS.
E3. Areas in which all or most students are required to complete some course work prior tograduation:
_X_ Arts/fine arts _X_ Humanities___ Computer literacy _X_ Mathematics___ English (including composition) ___ Philosophy___ Foreign languages _X_ Sciences (biological or physical)___ History _X_ Social science
_X_ Other (describe): physical education requirement, communication requirement, laboratory requirement, Restricted Electives in Science and Technology (REST) requirement
Library Collections: The CDS publishers will collect library data again when a newAcademic Libraries Survey is in place.
F. STUDENT LIFE
F1. Percentages of first-time, first-year (freshman) degree-seeking students and degree-seeking undergraduates enrolled in fall 2012 who fit the following categories:
First-time, first-year
(freshman)students
Undergraduates
Percent who are from out of state (exclude international/nonresident aliens from the numeratorand denominator)
91 91
Percent of men who join fraternities 48 42Percent of women who join sororities 31 31Percent who live in college-owned, -operated, or -affiliatedhousing 100 90
Percent who live off campus or commute 0 10Percent of students age 25 and older 0 1
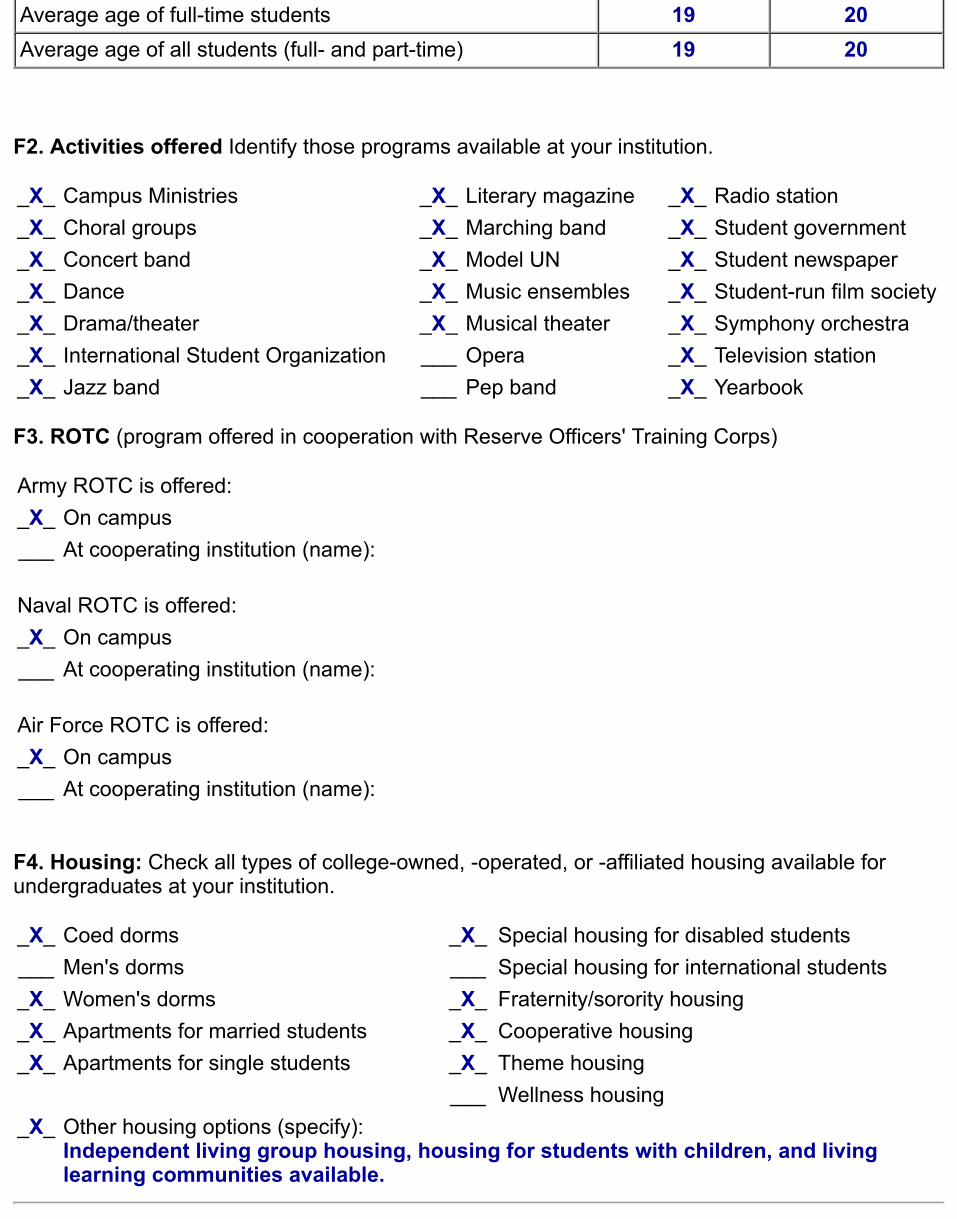
Average age of full-time students 19 20Average age of all students (full- and part-time) 19 20
F2. Activities offered Identify those programs available at your institution.
_X_ Campus Ministries _X_ Literary magazine _X_ Radio station_X_ Choral groups _X_ Marching band _X_ Student government_X_ Concert band _X_ Model UN _X_ Student newspaper_X_ Dance _X_ Music ensembles _X_ Student-run film society_X_ Drama/theater _X_ Musical theater _X_ Symphony orchestra_X_ International Student Organization ___ Opera _X_ Television station_X_ Jazz band ___ Pep band _X_ Yearbook
F3. ROTC (program offered in cooperation with Reserve Officers' Training Corps)
Army ROTC is offered:_X_ On campus___ At cooperating institution (name):
Naval ROTC is offered:_X_ On campus___ At cooperating institution (name):
Air Force ROTC is offered:_X_ On campus___ At cooperating institution (name):
F4. Housing: Check all types of college-owned, -operated, or -affiliated housing available forundergraduates at your institution.
_X_ Coed dorms _X_ Special housing for disabled students___ Men's dorms ___ Special housing for international students_X_ Women's dorms _X_ Fraternity/sorority housing_X_ Apartments for married students _X_ Cooperative housing_X_ Apartments for single students _X_ Theme housing
___ Wellness housing_X_ Other housing options (specify):
Independent living group housing, housing for students with children, and livinglearning communities available.
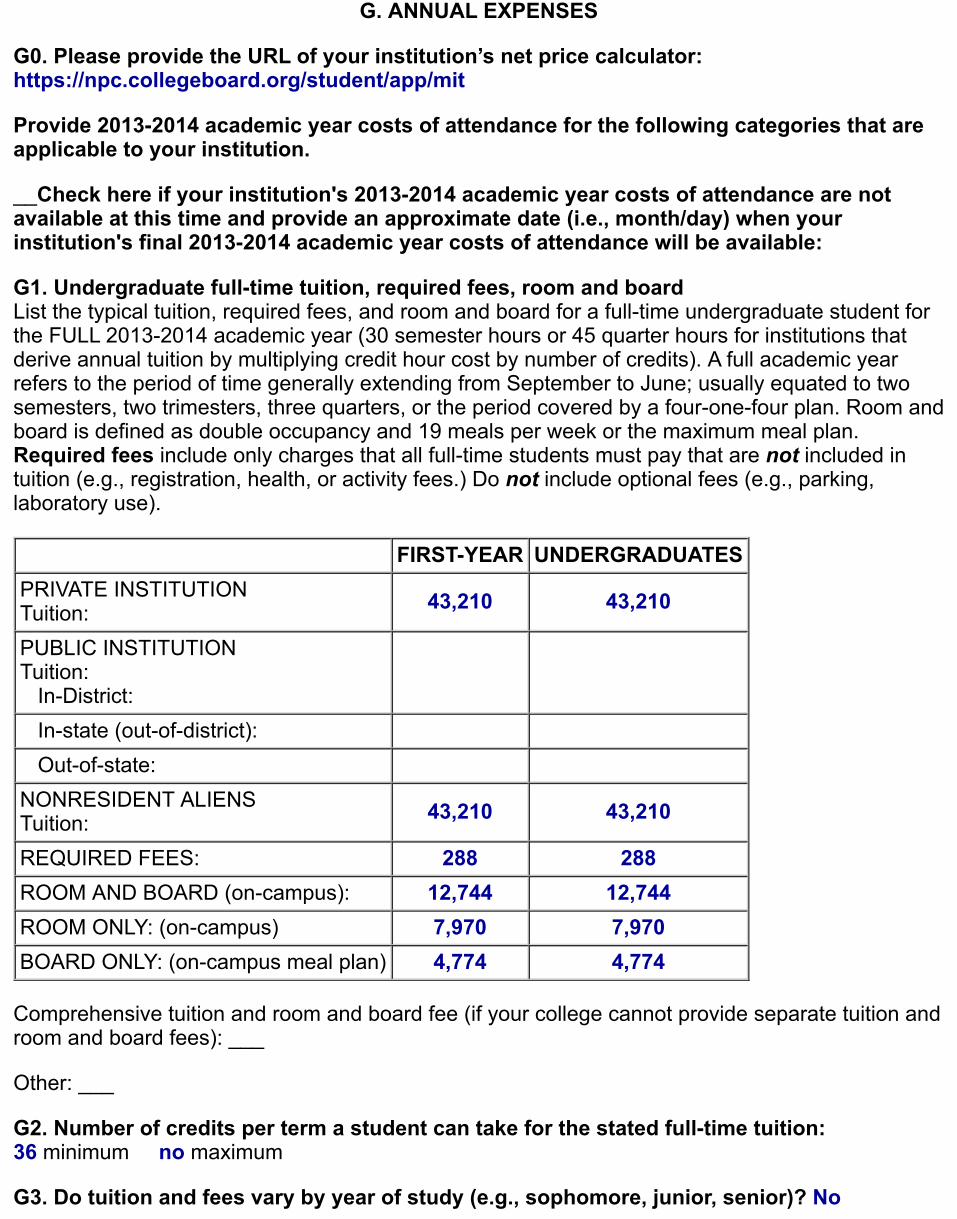
G. ANNUAL EXPENSES
G0. Please provide the URL of your institution’s net price calculator:https://npc.collegeboard.org/student/app/mit
Provide 2013-2014 academic year costs of attendance for the following categories that areapplicable to your institution.
__Check here if your institution's 2013-2014 academic year costs of attendance are notavailable at this time and provide an approximate date (i.e., month/day) when yourinstitution's final 2013-2014 academic year costs of attendance will be available:
G1. Undergraduate full-time tuition, required fees, room and board List the typical tuition, required fees, and room and board for a full-time undergraduate student forthe FULL 2013-2014 academic year (30 semester hours or 45 quarter hours for institutions thatderive annual tuition by multiplying credit hour cost by number of credits). A full academic yearrefers to the period of time generally extending from September to June; usually equated to twosemesters, two trimesters, three quarters, or the period covered by a four-one-four plan. Room andboard is defined as double occupancy and 19 meals per week or the maximum meal plan.Required fees include only charges that all full-time students must pay that are not included intuition (e.g., registration, health, or activity fees.) Do not include optional fees (e.g., parking,laboratory use).
FIRST-YEAR UNDERGRADUATESPRIVATE INSTITUTION Tuition: 43,210 43,210
PUBLIC INSTITUTIONTuition: In-District:
In-state (out-of-district): Out-of-state: NONRESIDENT ALIENS Tuition: 43,210 43,210
REQUIRED FEES: 288 288ROOM AND BOARD (on-campus): 12,744 12,744ROOM ONLY: (on-campus) 7,970 7,970BOARD ONLY: (on-campus meal plan) 4,774 4,774
Comprehensive tuition and room and board fee (if your college cannot provide separate tuition androom and board fees): ___
Other: ___
G2. Number of credits per term a student can take for the stated full-time tuition: 36 minimum no maximum
G3. Do tuition and fees vary by year of study (e.g., sophomore, junior, senior)? No
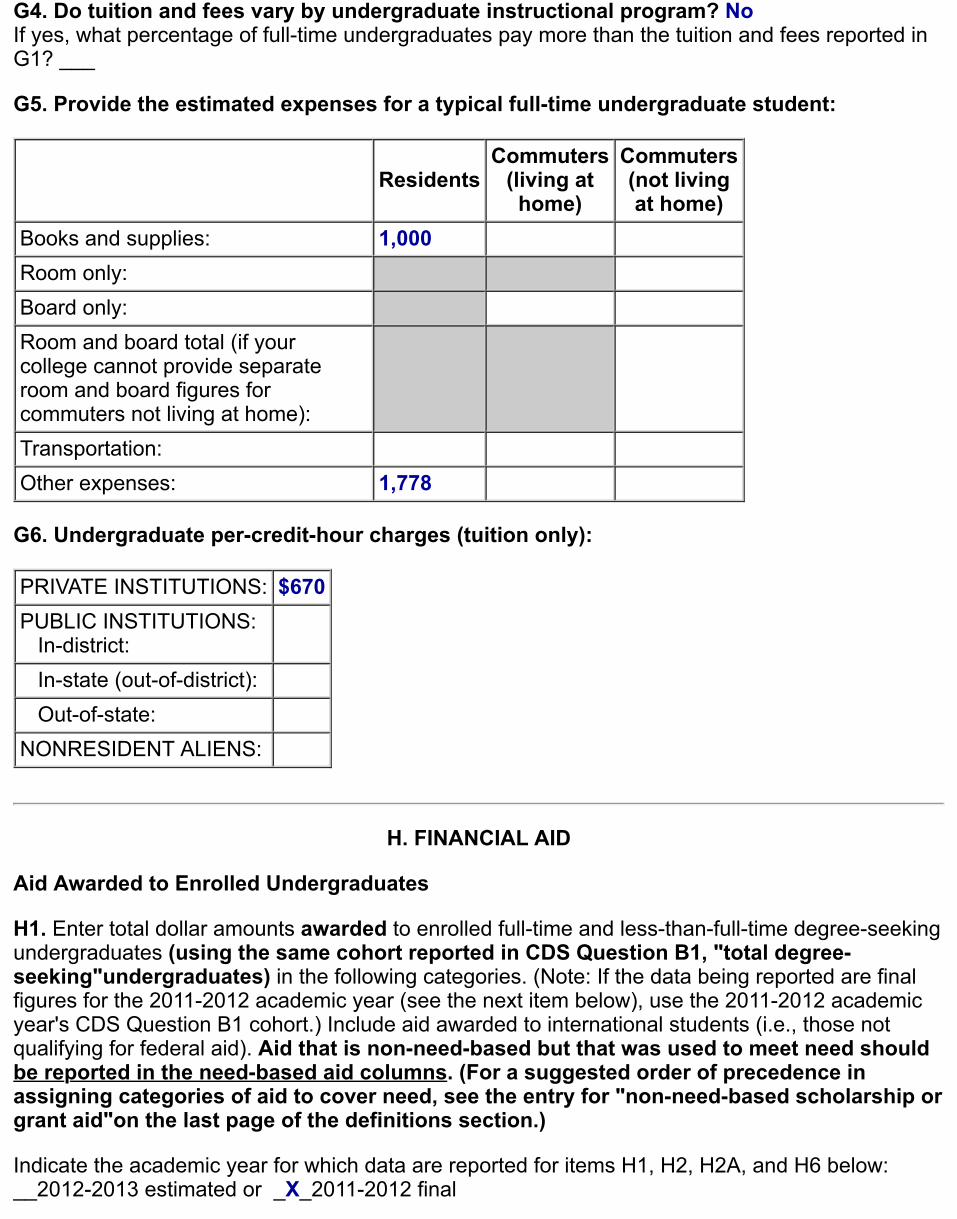
G4. Do tuition and fees vary by undergraduate instructional program? NoIf yes, what percentage of full-time undergraduates pay more than the tuition and fees reported inG1? ___
G5. Provide the estimated expenses for a typical full-time undergraduate student:
ResidentsCommuters
(living athome)
Commuters(not livingat home)
Books and supplies: 1,000 Room only: Board only: Room and board total (if yourcollege cannot provide separateroom and board figures forcommuters not living at home):
Transportation: Other expenses: 1,778
G6. Undergraduate per-credit-hour charges (tuition only):
PRIVATE INSTITUTIONS: $670PUBLIC INSTITUTIONS: In-district:
In-state (out-of-district): Out-of-state: NONRESIDENT ALIENS:
H. FINANCIAL AID
Aid Awarded to Enrolled Undergraduates
H1. Enter total dollar amounts awarded to enrolled full-time and less-than-full-time degree-seekingundergraduates (using the same cohort reported in CDS Question B1, "total degree-seeking"undergraduates) in the following categories. (Note: If the data being reported are finalfigures for the 2011-2012 academic year (see the next item below), use the 2011-2012 academicyear's CDS Question B1 cohort.) Include aid awarded to international students (i.e., those notqualifying for federal aid). Aid that is non-need-based but that was used to meet need shouldbe reported in the need-based aid columns. (For a suggested order of precedence inassigning categories of aid to cover need, see the entry for "non-need-based scholarship orgrant aid"on the last page of the definitions section.)
Indicate the academic year for which data are reported for items H1, H2, H2A, and H6 below: __2012-2013 estimated or _X_2011-2012 final
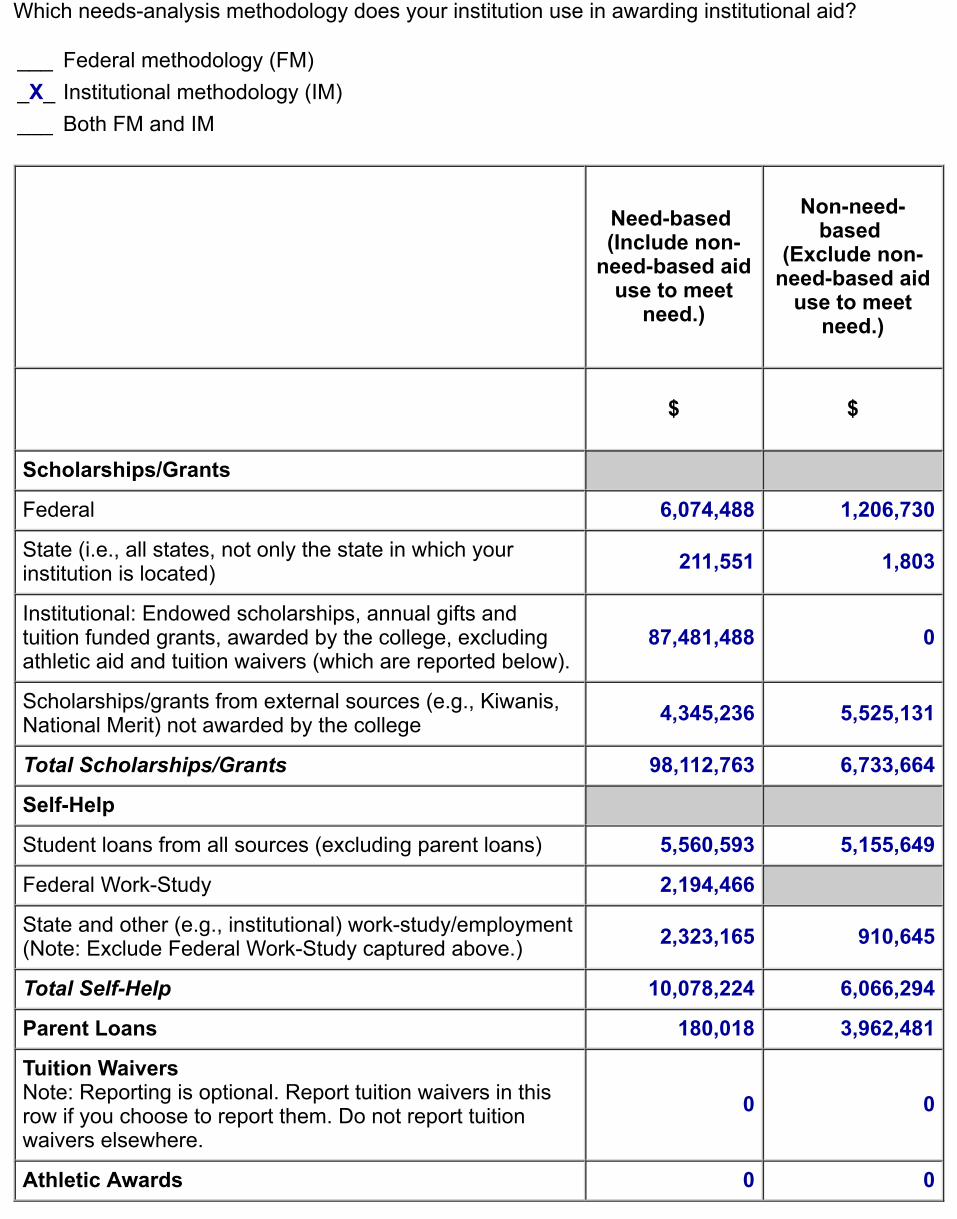
Which needs-analysis methodology does your institution use in awarding institutional aid?
___ Federal methodology (FM)_X_ Institutional methodology (IM)___ Both FM and IM
Need-based (Include non-
need-based aiduse to meet
need.)
Non-need-based
(Exclude non-need-based aid
use to meetneed.)
$ $
Scholarships/Grants
Federal 6,074,488 1,206,730
State (i.e., all states, not only the state in which yourinstitution is located) 211,551 1,803
Institutional: Endowed scholarships, annual gifts andtuition funded grants, awarded by the college, excludingathletic aid and tuition waivers (which are reported below).
87,481,488 0
Scholarships/grants from external sources (e.g., Kiwanis,National Merit) not awarded by the college 4,345,236 5,525,131
Total Scholarships/Grants 98,112,763 6,733,664
Self-Help
Student loans from all sources (excluding parent loans) 5,560,593 5,155,649
Federal Work-Study 2,194,466
State and other (e.g., institutional) work-study/employment(Note: Exclude Federal Work-Study captured above.) 2,323,165 910,645
Total Self-Help 10,078,224 6,066,294
Parent Loans 180,018 3,962,481
Tuition WaiversNote: Reporting is optional. Report tuition waivers in thisrow if you choose to report them. Do not report tuitionwaivers elsewhere.
0 0
Athletic Awards 0 0
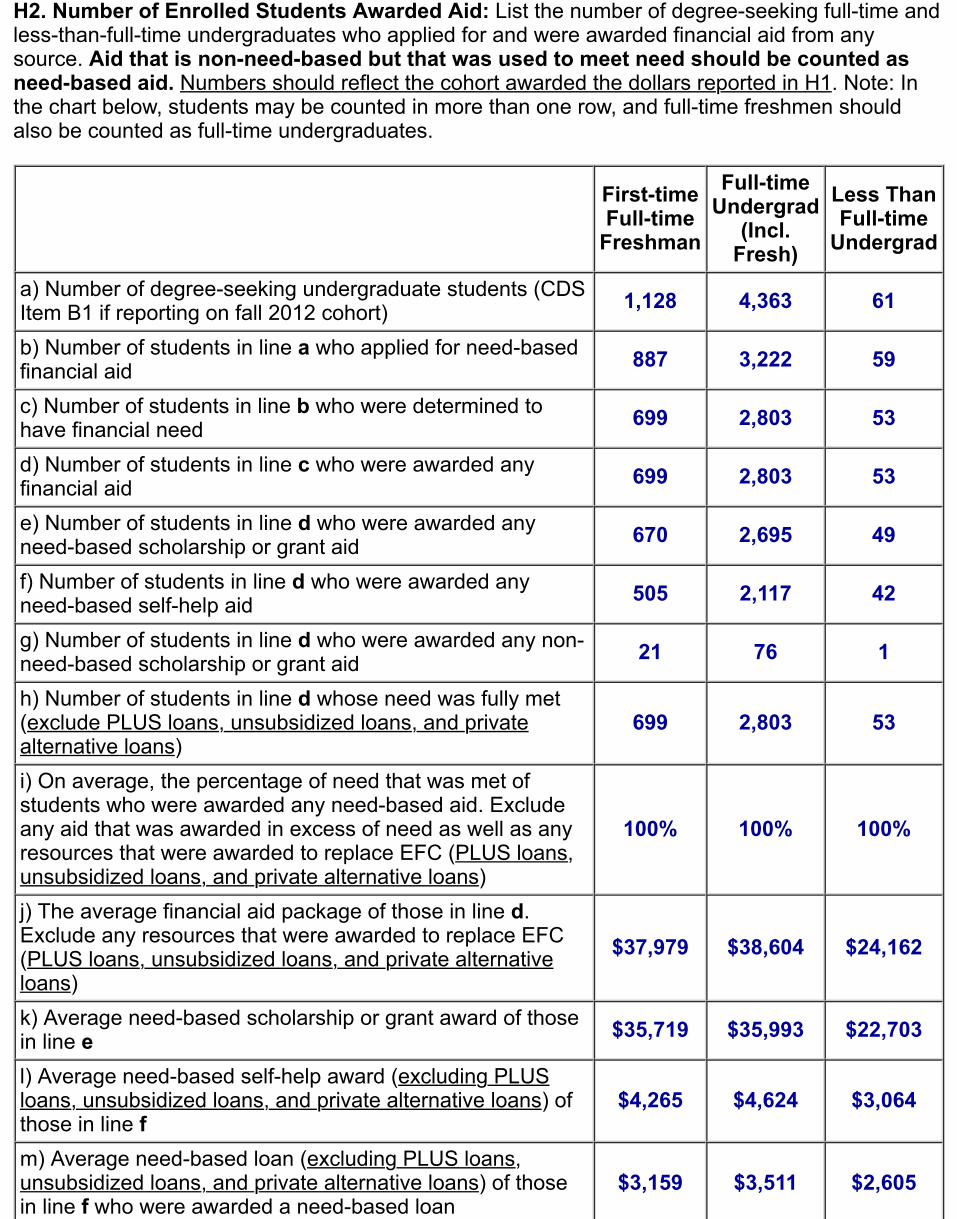
H2. Number of Enrolled Students Awarded Aid: List the number of degree-seeking full-time andless-than-full-time undergraduates who applied for and were awarded financial aid from anysource. Aid that is non-need-based but that was used to meet need should be counted asneed-based aid. Numbers should reflect the cohort awarded the dollars reported in H1. Note: Inthe chart below, students may be counted in more than one row, and full-time freshmen shouldalso be counted as full-time undergraduates.
First-timeFull-time
Freshman
Full-timeUndergrad
(Incl.Fresh)
Less ThanFull-time
Undergrad
a) Number of degree-seeking undergraduate students (CDSItem B1 if reporting on fall 2012 cohort) 1,128 4,363 61
b) Number of students in line a who applied for need-basedfinancial aid 887 3,222 59
c) Number of students in line b who were determined tohave financial need 699 2,803 53
d) Number of students in line c who were awarded anyfinancial aid 699 2,803 53
e) Number of students in line d who were awarded anyneed-based scholarship or grant aid 670 2,695 49
f) Number of students in line d who were awarded anyneed-based self-help aid 505 2,117 42
g) Number of students in line d who were awarded any non-need-based scholarship or grant aid 21 76 1
h) Number of students in line d whose need was fully met(exclude PLUS loans, unsubsidized loans, and privatealternative loans)
699 2,803 53
i) On average, the percentage of need that was met ofstudents who were awarded any need-based aid. Excludeany aid that was awarded in excess of need as well as anyresources that were awarded to replace EFC (PLUS loans,unsubsidized loans, and private alternative loans)
100% 100% 100%
j) The average financial aid package of those in line d.Exclude any resources that were awarded to replace EFC(PLUS loans, unsubsidized loans, and private alternativeloans)
$37,979 $38,604 $24,162
k) Average need-based scholarship or grant award of thosein line e $35,719 $35,993 $22,703
l) Average need-based self-help award (excluding PLUSloans, unsubsidized loans, and private alternative loans) ofthose in line f
$4,265 $4,624 $3,064
m) Average need-based loan (excluding PLUS loans,unsubsidized loans, and private alternative loans) of thosein line f who were awarded a need-based loan
$3,159 $3,511 $2,605
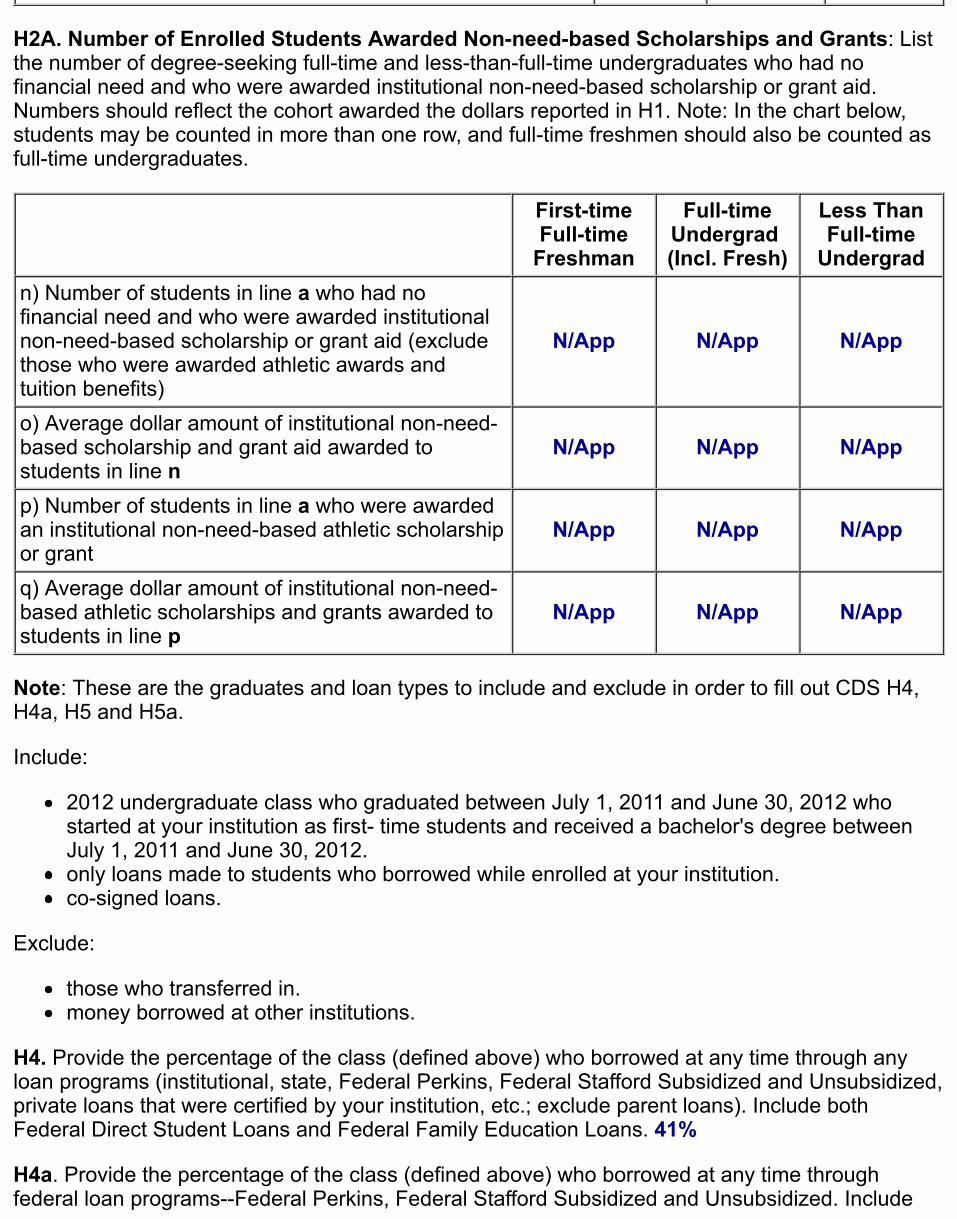
H2A. Number of Enrolled Students Awarded Non-need-based Scholarships and Grants: Listthe number of degree-seeking full-time and less-than-full-time undergraduates who had nofinancial need and who were awarded institutional non-need-based scholarship or grant aid.Numbers should reflect the cohort awarded the dollars reported in H1. Note: In the chart below,students may be counted in more than one row, and full-time freshmen should also be counted asfull-time undergraduates.
First-timeFull-time
Freshman
Full-timeUndergrad (Incl. Fresh)
Less ThanFull-time
Undergradn) Number of students in line a who had nofinancial need and who were awarded institutionalnon-need-based scholarship or grant aid (excludethose who were awarded athletic awards andtuition benefits)
N/App N/App N/App
o) Average dollar amount of institutional non-need-based scholarship and grant aid awarded tostudents in line n
N/App N/App N/App
p) Number of students in line a who were awardedan institutional non-need-based athletic scholarshipor grant
N/App N/App N/App
q) Average dollar amount of institutional non-need-based athletic scholarships and grants awarded tostudents in line p
N/App N/App N/App
Note: These are the graduates and loan types to include and exclude in order to fill out CDS H4,H4a, H5 and H5a.
Include:
2012 undergraduate class who graduated between July 1, 2011 and June 30, 2012 whostarted at your institution as first- time students and received a bachelor's degree betweenJuly 1, 2011 and June 30, 2012.only loans made to students who borrowed while enrolled at your institution.co-signed loans.
Exclude:
those who transferred in.money borrowed at other institutions.
H4. Provide the percentage of the class (defined above) who borrowed at any time through anyloan programs (institutional, state, Federal Perkins, Federal Stafford Subsidized and Unsubsidized,private loans that were certified by your institution, etc.; exclude parent loans). Include bothFederal Direct Student Loans and Federal Family Education Loans. 41%
H4a. Provide the percentage of the class (defined above) who borrowed at any time throughfederal loan programs--Federal Perkins, Federal Stafford Subsidized and Unsubsidized. Include
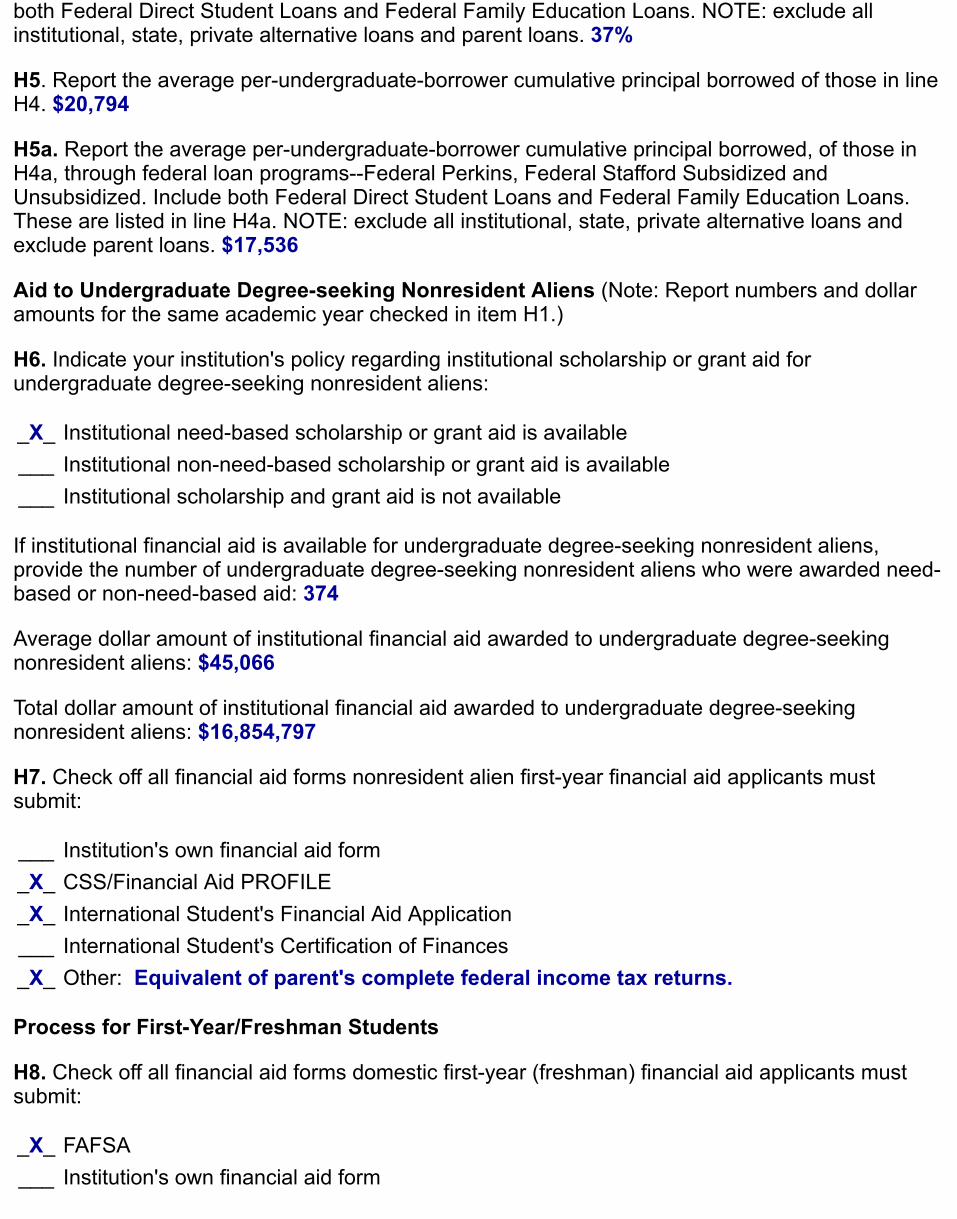
both Federal Direct Student Loans and Federal Family Education Loans. NOTE: exclude allinstitutional, state, private alternative loans and parent loans. 37%
H5. Report the average per-undergraduate-borrower cumulative principal borrowed of those in lineH4. $20,794
H5a. Report the average per-undergraduate-borrower cumulative principal borrowed, of those inH4a, through federal loan programs--Federal Perkins, Federal Stafford Subsidized andUnsubsidized. Include both Federal Direct Student Loans and Federal Family Education Loans.These are listed in line H4a. NOTE: exclude all institutional, state, private alternative loans andexclude parent loans. $17,536
Aid to Undergraduate Degree-seeking Nonresident Aliens (Note: Report numbers and dollaramounts for the same academic year checked in item H1.)
H6. Indicate your institution's policy regarding institutional scholarship or grant aid forundergraduate degree-seeking nonresident aliens:
_X_ Institutional need-based scholarship or grant aid is available___ Institutional non-need-based scholarship or grant aid is available___ Institutional scholarship and grant aid is not available
If institutional financial aid is available for undergraduate degree-seeking nonresident aliens,provide the number of undergraduate degree-seeking nonresident aliens who were awarded need-based or non-need-based aid: 374
Average dollar amount of institutional financial aid awarded to undergraduate degree-seekingnonresident aliens: $45,066
Total dollar amount of institutional financial aid awarded to undergraduate degree-seekingnonresident aliens: $16,854,797
H7. Check off all financial aid forms nonresident alien first-year financial aid applicants mustsubmit:
___ Institution's own financial aid form_X_ CSS/Financial Aid PROFILE_X_ International Student's Financial Aid Application___ International Student's Certification of Finances_X_ Other: Equivalent of parent's complete federal income tax returns.
Process for First-Year/Freshman Students
H8. Check off all financial aid forms domestic first-year (freshman) financial aid applicants mustsubmit:
_X_ FAFSA___ Institution's own financial aid form
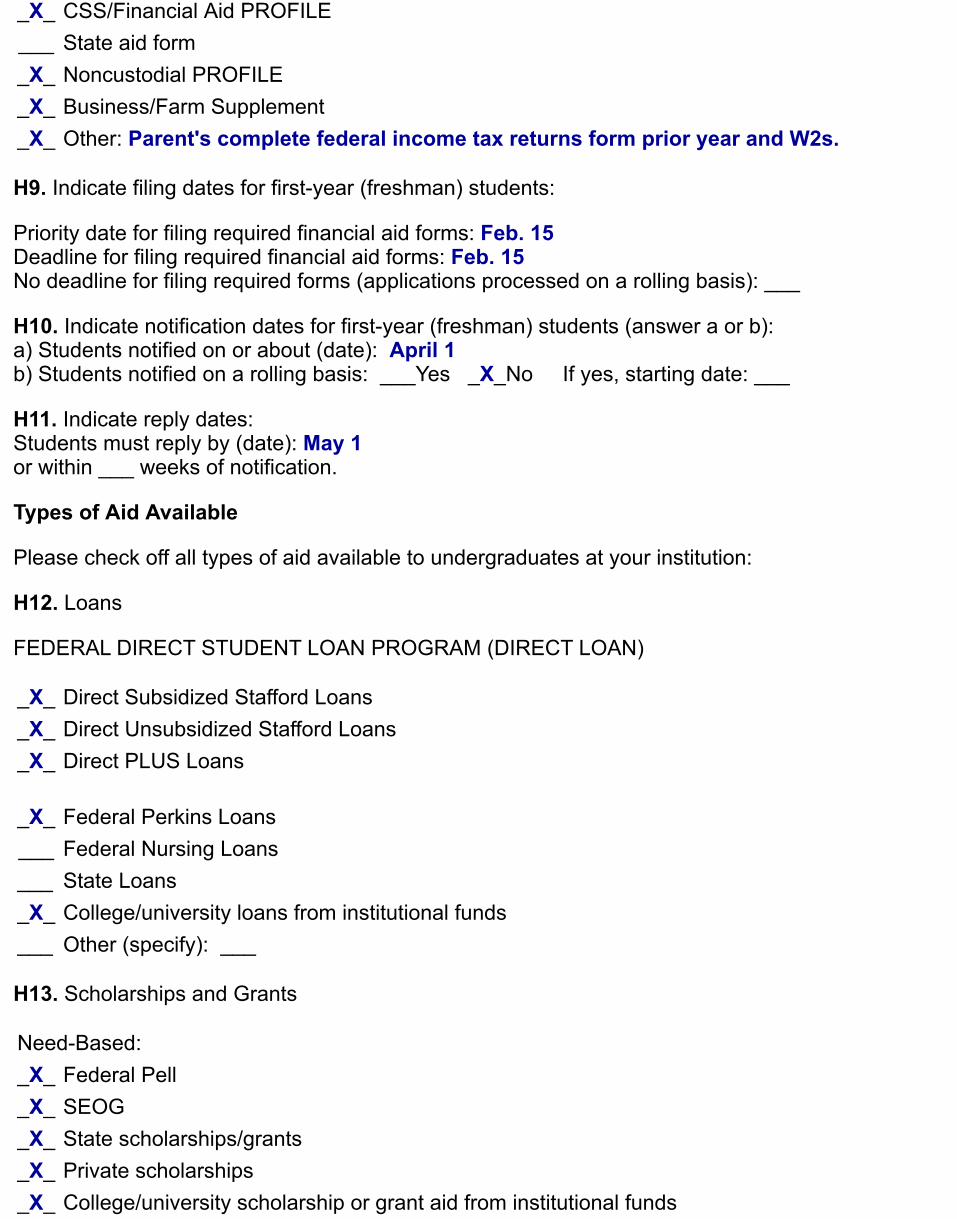
_X_ CSS/Financial Aid PROFILE___ State aid form_X_ Noncustodial PROFILE_X_ Business/Farm Supplement_X_ Other: Parent's complete federal income tax returns form prior year and W2s.
H9. Indicate filing dates for first-year (freshman) students:
Priority date for filing required financial aid forms: Feb. 15Deadline for filing required financial aid forms: Feb. 15No deadline for filing required forms (applications processed on a rolling basis): ___
H10. Indicate notification dates for first-year (freshman) students (answer a or b):a) Students notified on or about (date): April 1b) Students notified on a rolling basis: ___Yes _X_No If yes, starting date: ___
H11. Indicate reply dates: Students must reply by (date): May 1or within ___ weeks of notification.
Types of Aid Available
Please check off all types of aid available to undergraduates at your institution:
H12. Loans
FEDERAL DIRECT STUDENT LOAN PROGRAM (DIRECT LOAN)
_X_ Direct Subsidized Stafford Loans_X_ Direct Unsubsidized Stafford Loans_X_ Direct PLUS Loans
_X_ Federal Perkins Loans___ Federal Nursing Loans___ State Loans_X_ College/university loans from institutional funds___ Other (specify): ___
H13. Scholarships and Grants
Need-Based:_X_ Federal Pell_X_ SEOG_X_ State scholarships/grants_X_ Private scholarships_X_ College/university scholarship or grant aid from institutional funds
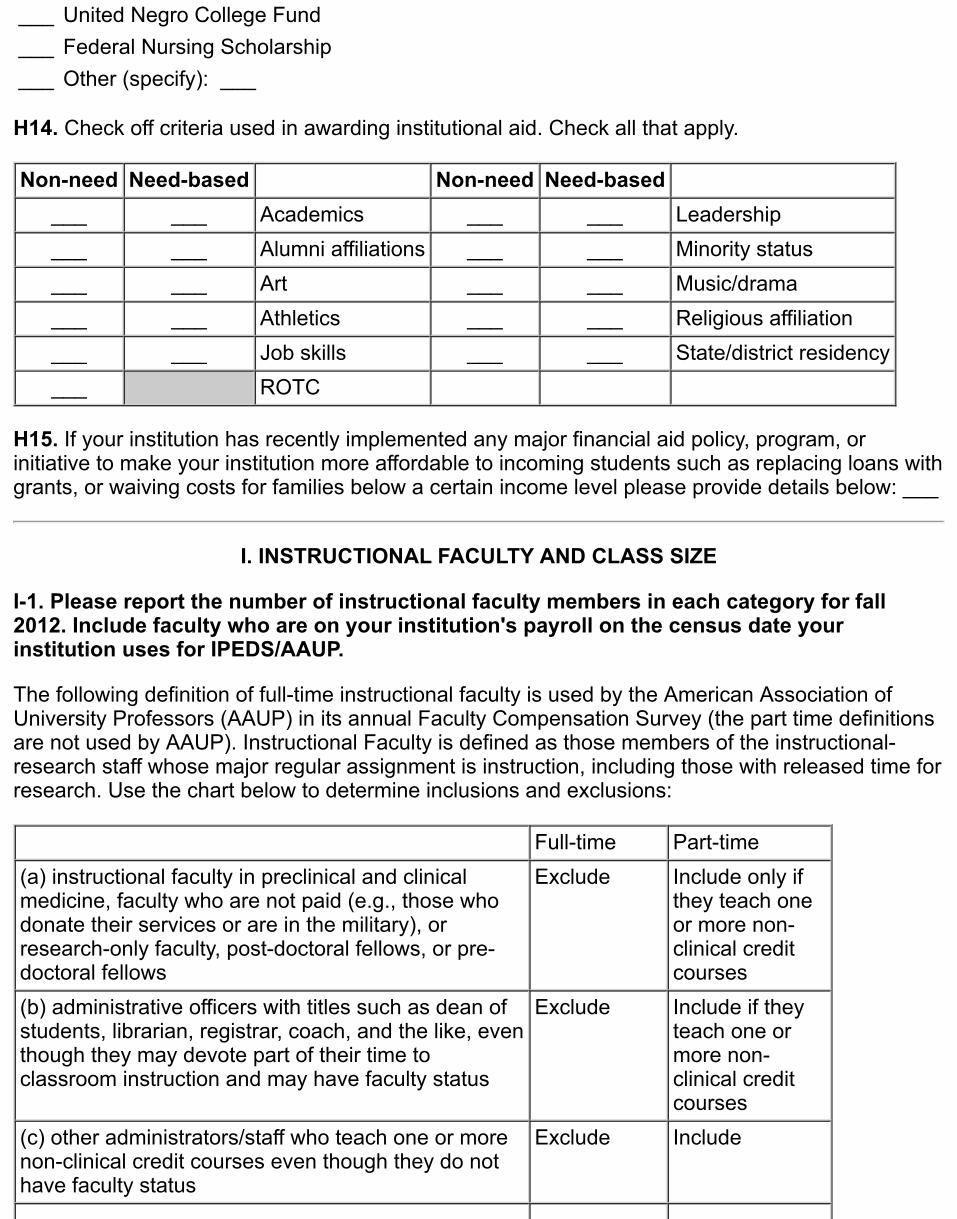
___ United Negro College Fund___ Federal Nursing Scholarship___ Other (specify): ___
H14. Check off criteria used in awarding institutional aid. Check all that apply.
Non-need Need-based Non-need Need-based ___ ___ Academics ___ ___ Leadership___ ___ Alumni affiliations ___ ___ Minority status___ ___ Art ___ ___ Music/drama___ ___ Athletics ___ ___ Religious affiliation___ ___ Job skills ___ ___ State/district residency___ ROTC
H15. If your institution has recently implemented any major financial aid policy, program, orinitiative to make your institution more affordable to incoming students such as replacing loans withgrants, or waiving costs for families below a certain income level please provide details below: ___
I. INSTRUCTIONAL FACULTY AND CLASS SIZE
I-1. Please report the number of instructional faculty members in each category for fall2012. Include faculty who are on your institution's payroll on the census date yourinstitution uses for IPEDS/AAUP.
The following definition of full-time instructional faculty is used by the American Association ofUniversity Professors (AAUP) in its annual Faculty Compensation Survey (the part time definitionsare not used by AAUP). Instructional Faculty is defined as those members of the instructional-research staff whose major regular assignment is instruction, including those with released time forresearch. Use the chart below to determine inclusions and exclusions:
Full-time Part-time(a) instructional faculty in preclinical and clinicalmedicine, faculty who are not paid (e.g., those whodonate their services or are in the military), orresearch-only faculty, post-doctoral fellows, or pre-doctoral fellows
Exclude Include only ifthey teach oneor more non-clinical creditcourses
(b) administrative officers with titles such as dean ofstudents, librarian, registrar, coach, and the like, eventhough they may devote part of their time toclassroom instruction and may have faculty status
Exclude Include if theyteach one ormore non-clinical creditcourses
(c) other administrators/staff who teach one or morenon-clinical credit courses even though they do nothave faculty status
Exclude Include
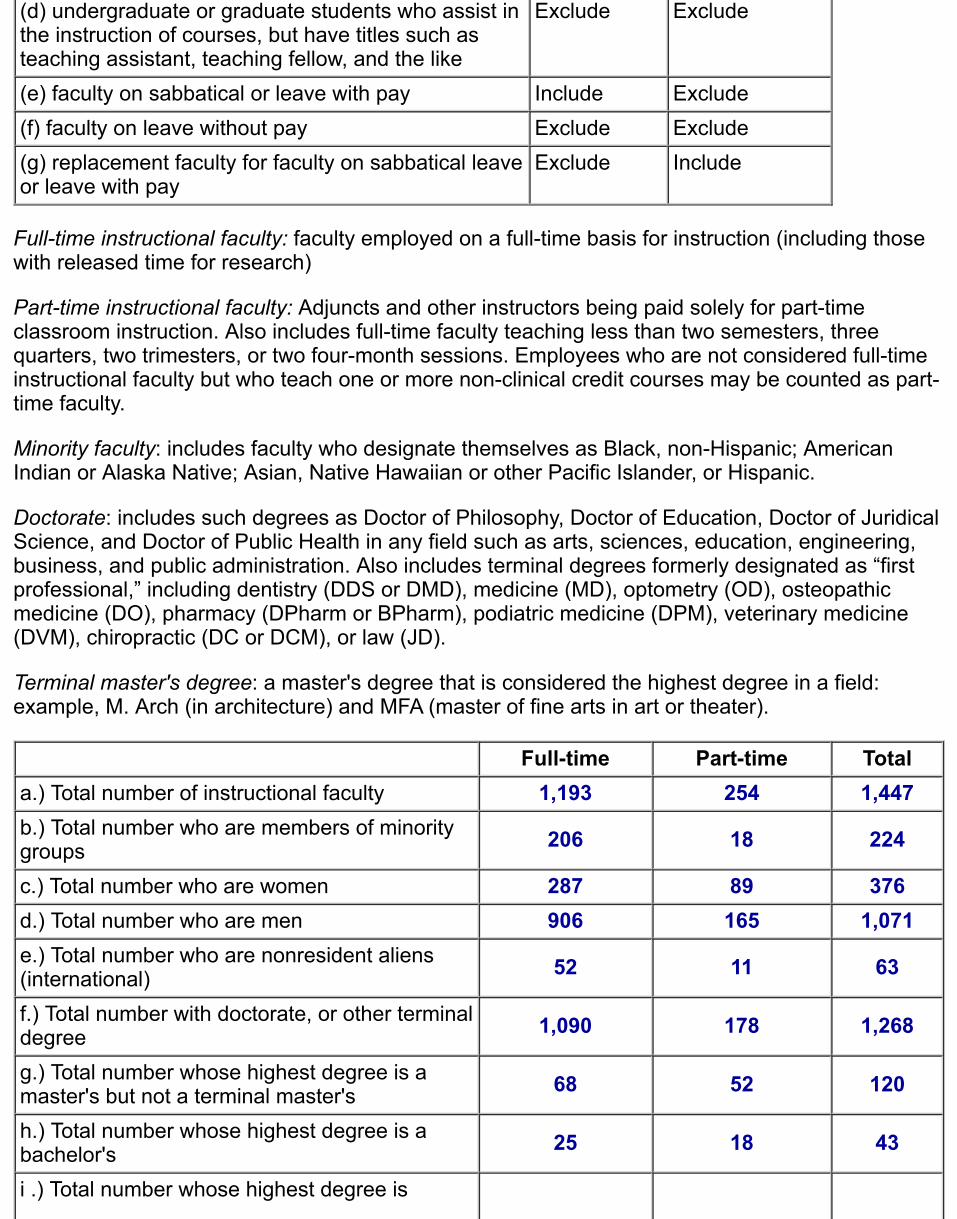
(d) undergraduate or graduate students who assist inthe instruction of courses, but have titles such asteaching assistant, teaching fellow, and the like
Exclude Exclude
(e) faculty on sabbatical or leave with pay Include Exclude(f) faculty on leave without pay Exclude Exclude(g) replacement faculty for faculty on sabbatical leaveor leave with pay
Exclude Include
Full-time instructional faculty: faculty employed on a full-time basis for instruction (including thosewith released time for research)
Part-time instructional faculty: Adjuncts and other instructors being paid solely for part-timeclassroom instruction. Also includes full-time faculty teaching less than two semesters, threequarters, two trimesters, or two four-month sessions. Employees who are not considered full-timeinstructional faculty but who teach one or more non-clinical credit courses may be counted as part-time faculty.
Minority faculty: includes faculty who designate themselves as Black, non-Hispanic; AmericanIndian or Alaska Native; Asian, Native Hawaiian or other Pacific Islander, or Hispanic.
Doctorate: includes such degrees as Doctor of Philosophy, Doctor of Education, Doctor of JuridicalScience, and Doctor of Public Health in any field such as arts, sciences, education, engineering,business, and public administration. Also includes terminal degrees formerly designated as “firstprofessional,” including dentistry (DDS or DMD), medicine (MD), optometry (OD), osteopathicmedicine (DO), pharmacy (DPharm or BPharm), podiatric medicine (DPM), veterinary medicine(DVM), chiropractic (DC or DCM), or law (JD).
Terminal master's degree: a master's degree that is considered the highest degree in a field:example, M. Arch (in architecture) and MFA (master of fine arts in art or theater).
Full-time Part-time Totala.) Total number of instructional faculty 1,193 254 1,447b.) Total number who are members of minoritygroups 206 18 224
c.) Total number who are women 287 89 376d.) Total number who are men 906 165 1,071e.) Total number who are nonresident aliens(international) 52 11 63
f.) Total number with doctorate, or other terminaldegree 1,090 178 1,268
g.) Total number whose highest degree is amaster's but not a terminal master's 68 52 120
h.) Total number whose highest degree is abachelor's 25 18 43
i .) Total number whose highest degree is
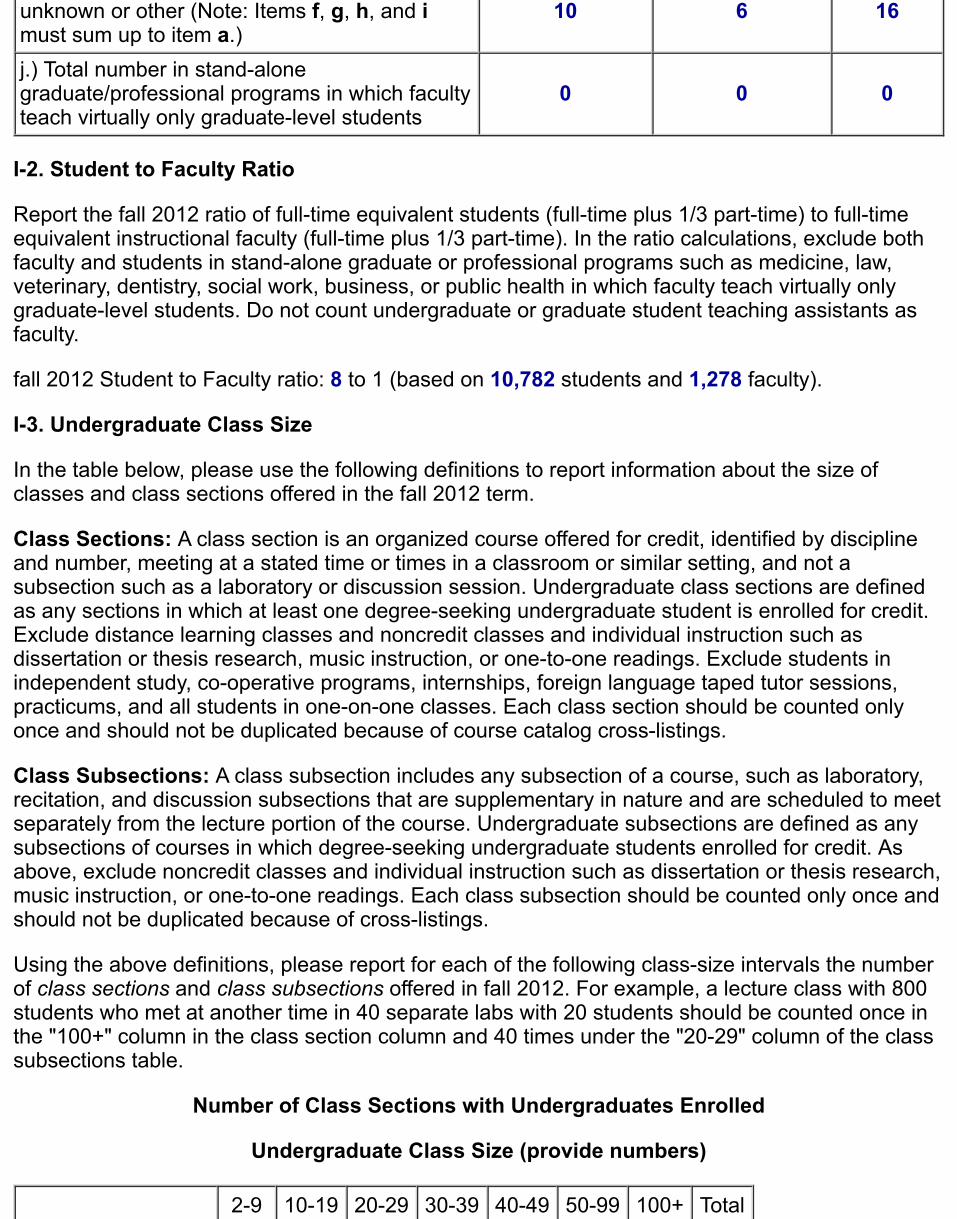
unknown or other (Note: Items f, g, h, and imust sum up to item a.)
10 6 16
j.) Total number in stand-alonegraduate/professional programs in which facultyteach virtually only graduate-level students
0 0 0
I-2. Student to Faculty Ratio
Report the fall 2012 ratio of full-time equivalent students (full-time plus 1/3 part-time) to full-timeequivalent instructional faculty (full-time plus 1/3 part-time). In the ratio calculations, exclude bothfaculty and students in stand-alone graduate or professional programs such as medicine, law,veterinary, dentistry, social work, business, or public health in which faculty teach virtually onlygraduate-level students. Do not count undergraduate or graduate student teaching assistants asfaculty.
fall 2012 Student to Faculty ratio: 8 to 1 (based on 10,782 students and 1,278 faculty).
I-3. Undergraduate Class Size
In the table below, please use the following definitions to report information about the size ofclasses and class sections offered in the fall 2012 term.
Class Sections: A class section is an organized course offered for credit, identified by disciplineand number, meeting at a stated time or times in a classroom or similar setting, and not asubsection such as a laboratory or discussion session. Undergraduate class sections are definedas any sections in which at least one degree-seeking undergraduate student is enrolled for credit.Exclude distance learning classes and noncredit classes and individual instruction such asdissertation or thesis research, music instruction, or one-to-one readings. Exclude students inindependent study, co-operative programs, internships, foreign language taped tutor sessions,practicums, and all students in one-on-one classes. Each class section should be counted onlyonce and should not be duplicated because of course catalog cross-listings.
Class Subsections: A class subsection includes any subsection of a course, such as laboratory,recitation, and discussion subsections that are supplementary in nature and are scheduled to meetseparately from the lecture portion of the course. Undergraduate subsections are defined as anysubsections of courses in which degree-seeking undergraduate students enrolled for credit. Asabove, exclude noncredit classes and individual instruction such as dissertation or thesis research,music instruction, or one-to-one readings. Each class subsection should be counted only once andshould not be duplicated because of cross-listings.
Using the above definitions, please report for each of the following class-size intervals the numberof class sections and class subsections offered in fall 2012. For example, a lecture class with 800students who met at another time in 40 separate labs with 20 students should be counted once inthe "100+" column in the class section column and 40 times under the "20-29" column of the classsubsections table.
Number of Class Sections with Undergraduates Enrolled
Undergraduate Class Size (provide numbers)
2-9 10-19 20-29 30-39 40-49 50-99 100+ Total
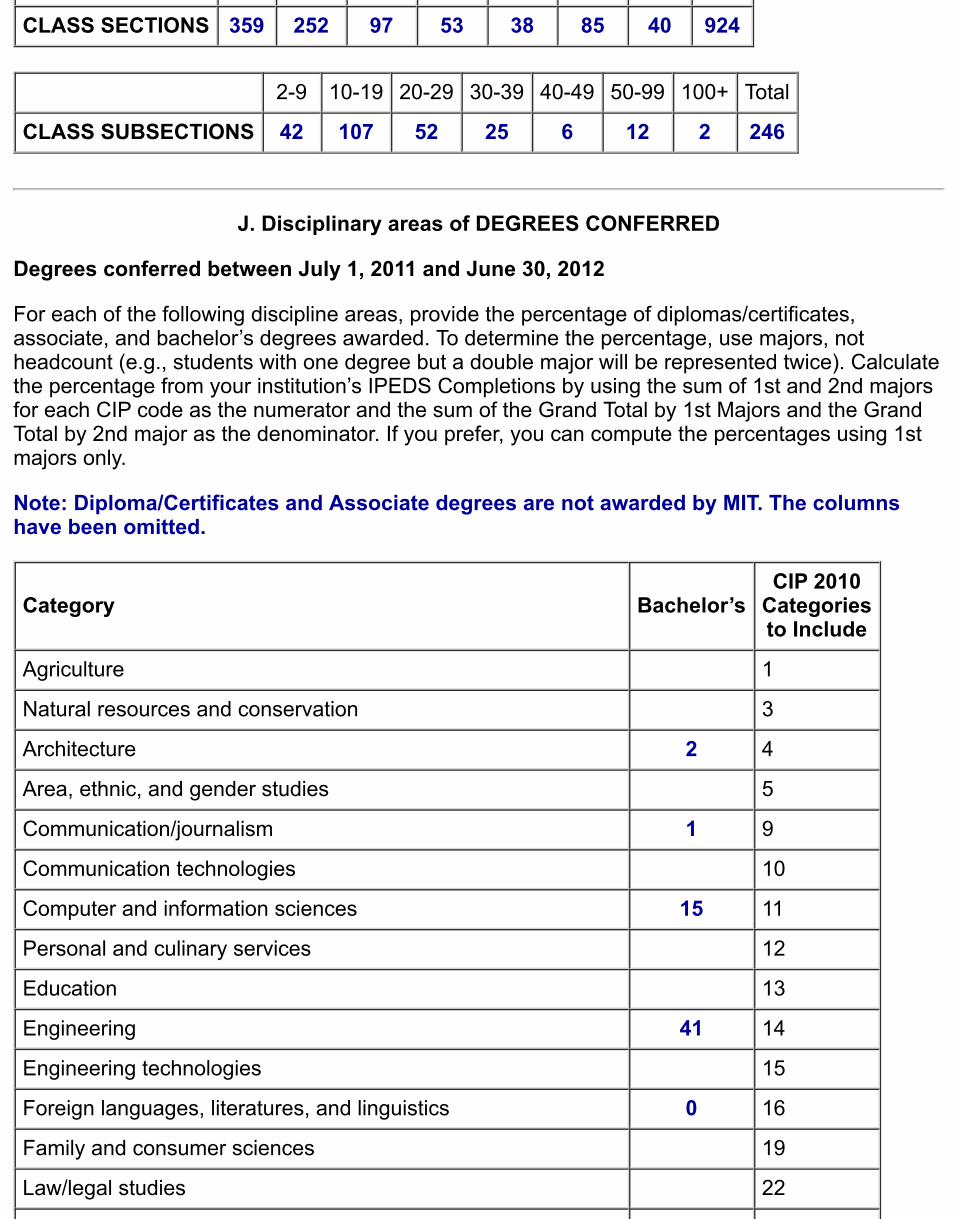
CLASS SECTIONS 359 252 97 53 38 85 40 924
2-9 10-19 20-29 30-39 40-49 50-99 100+ Total
CLASS SUBSECTIONS 42 107 52 25 6 12 2 246
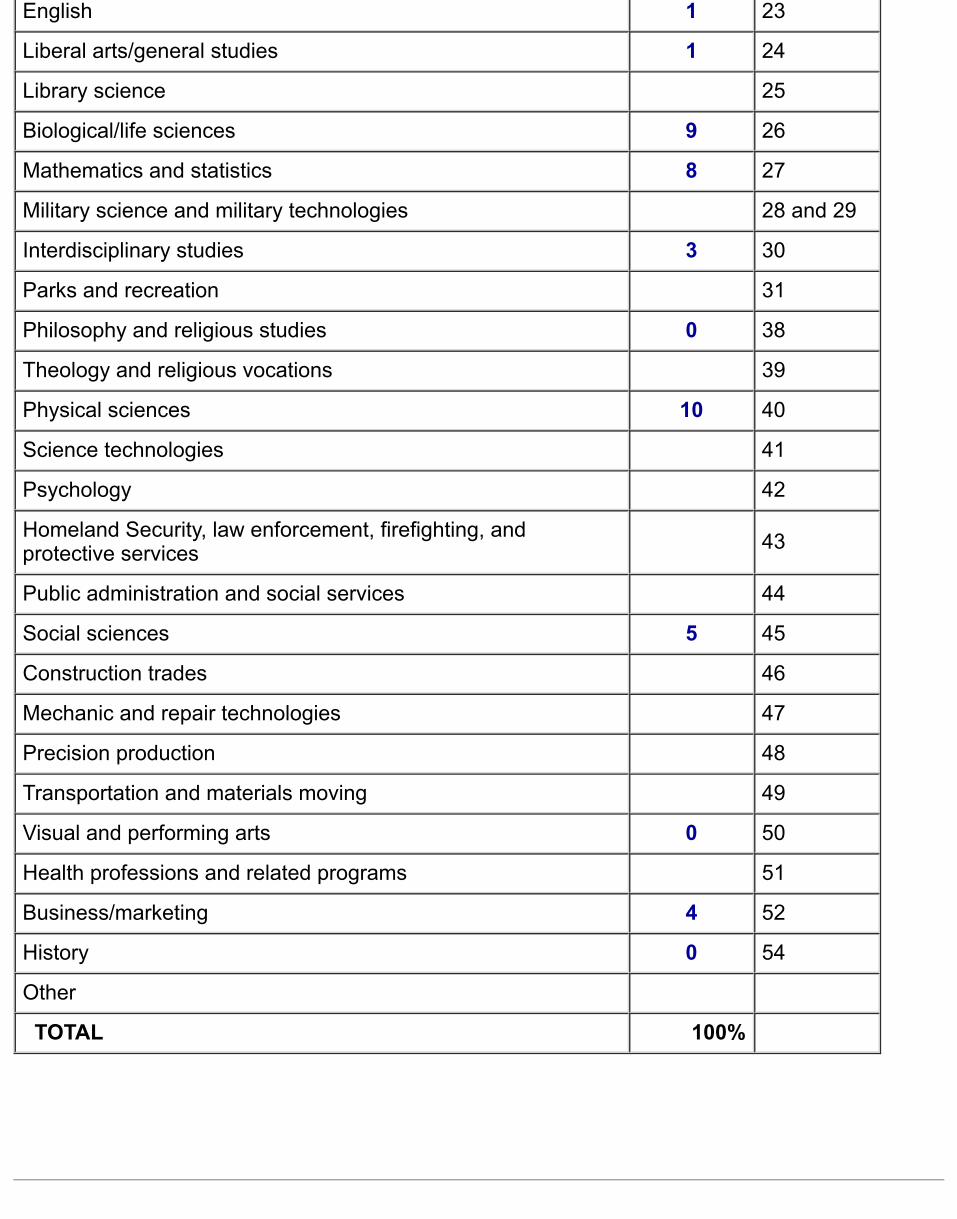
J. Disciplinary areas of DEGREES CONFERRED
Degrees conferred between July 1, 2011 and June 30, 2012
For each of the following discipline areas, provide the percentage of diplomas/certificates,associate, and bachelor’s degrees awarded. To determine the percentage, use majors, notheadcount (e.g., students with one degree but a double major will be represented twice). Calculatethe percentage from your institution’s IPEDS Completions by using the sum of 1st and 2nd majorsfor each CIP code as the numerator and the sum of the Grand Total by 1st Majors and the GrandTotal by 2nd major as the denominator. If you prefer, you can compute the percentages using 1stmajors only.
Note: Diploma/Certificates and Associate degrees are not awarded by MIT. The columnshave been omitted.
Category Bachelor’sCIP 2010
Categoriesto Include
Agriculture 1
Natural resources and conservation 3
Architecture 2 4
Area, ethnic, and gender studies 5
Communication/journalism 1 9
Communication technologies 10
Computer and information sciences 15 11
Personal and culinary services 12
Education 13
Engineering 41 14
Engineering technologies 15
Foreign languages, literatures, and linguistics 0 16
Family and consumer sciences 19
Law/legal studies 22
English 1 23
Liberal arts/general studies 1 24
Library science 25
Biological/life sciences 9 26
Mathematics and statistics 8 27
Military science and military technologies 28 and 29
Interdisciplinary studies 3 30
Parks and recreation 31
Philosophy and religious studies 0 38
Theology and religious vocations 39
Physical sciences 10 40
Science technologies 41
Psychology 42
Homeland Security, law enforcement, firefighting, andprotective services 43
Public administration and social services 44
Social sciences 5 45
Construction trades 46
Mechanic and repair technologies 47
Precision production 48
Transportation and materials moving 49
Visual and performing arts 0 50
Health professions and related programs 51
Business/marketing 4 52
History 0 54
Other
TOTAL 100%

Institutional ResearchOffice of the Provost
Massachusetts Institute of Technology77 Massachusetts Avenue, Room 11-268Cambridge, MA 02139-4307
617.258.5876 phone 617.252.1003 fax