Embed Size (px)
Citation preview

ELSEVIER European Economic Review 41 (1997) 1781-1816
EUROPEAN ECONOMIC REVIEW
Common trends and hysteresis in Scandinavian unemployment
Tor Jacobson a, Anders Vredin b, Anders Warne ‘, *
a Department of Statistics, Stockholm School of Economics, Box 6501. 11383 Stockholm, Sweden
b Department of Economics, Stockholm School of Economics, Box 6501, II383 Stockholm, Sweden
’ Institute for International Economic Studies, Stockholm Uniuersity, 10691 Stockholm, Sweden
Received 15 November 1994; revised 15 April 1996
Abstract
We examine the sources of labor market fluctuations in the Scandinavian countries using structural VAR models with common trends. Our primary concerns are the sources of hysteresis in unemployment and possible differences between the economies. A simple economic model is presented to motivate our identifying assumptions. We show how estimates of the theoretical parameters may be obtained from the estimated common trends coefficients. The empirical results suggest that (i) the only common source of hysteresis in the Scandinavian labor markets is shocks to wage setting (or, equivalently, equilibrium unemployment); (ii) transitory labor demand shocks, which are emphasized in the theoreti- cal literature on hysteresis, do not seem to be empirically important. 0 1997 Elsevier Science B.V.
JEL classification: E24
Keywords: Common trends: Hysteresis; Identification; Structural parameters; Supply and demand
shocks: Unemployment
* Corresponding author. E-mail: [email protected]. E-mail Jacobson: [email protected]. E-mail
Vredin: [email protected].
0014-2921/97/$17.00 0 1997 Elsevier Science B.V. All rights reserved.
PII SOO14-2921(96)00027-X
1782 T. Jacobson et al./European Economic Reuietis 41 (1997) 1781-1816
1. Introduction
Since the 1970s many European economies have suffered from persistent high unemployment rates. The persistence has led many economists to conclude that the
unemployment problem is not purely a cyclical phenomenon (‘Keynesian unem-
ployment’), and that European labor markets have serious structural problems. Whether European unemployment indeed reflects structural rather than cyclical
factors is an important policy question. According to Wyplosz (1994) however, the apparent signs of hysteresis in unemployment make it hard to distinguish between cyclical and structural unemployment. Hysteresis here means that tempo-
rary shocks give rise to permanent changes in the level of unemployment. In this paper we try to shed new light on the sources of labor market
fluctuations by formulating and estimating a so called common trends model. The basis is a structural vector autoregressive (VAR) model with cointegrated vari-
ables. Other labor market studies using structural VAR’s have been presented by Bean (1992) Blakemore and Hoffman (1993) Gamber and Joutz (1993) Hansen
and Warne (199.5) and Jacobson et al. (1993). Earlier empirical evidence on the sources of European unemployment mostly
comes from small (one or two equation) econometric labor market models (see e.g. Bean (1994) and Elmeskov (1994) for surveys). Many studies have involved estimation of so called error correction models of wage setting and labor demand.
Our motives for suggesting the VAR/common trends approach are, first, that variables which are commonly treated as exogenous in smaller models (labor supply and productivity in particular) should be taken as endogenous. Second, a time series model which allows for common stochastic trends (and, hence, unit roots) is well suited to study the hysteresis phenomenon. Temporary shocks to the stochastic trends have permanent effects, while short-run fluctuations are driven both by the trend shocks and purely transitory shocks. In this sense, the structural and cyclical components of unemployment are correlated, but still distinguishable.
In Jacobson et al. (1993) we applied the common trends approach to Swedish labor market data. Sweden and other Nordic countries have been the focus of much research in the field of labor economics. partly because of their (historically) low unemployment rates. It has often been argued that real wages in these countries have shown strong sensitivity to changes in unemployment, possibly because of high degrees of centralization in wage negotiations (see Calmfors and Driffill (1988) for a discussion on these issues). Results in Jacobson et al. (1993) suggest that the high alleged elasticity of real wages with respect to unemployment reported by earlier studies is a reflection of unemployment responding (much) less to various shocks than real wages do. Furthermore, the long-run behavior of real wages is explained by aggregate supply shocks (labor supply and technology), while transitory demand shocks give rise to short-run comovements of real wages and unemployment.
In this paper we extend our earlier analysis in two ways. First, we present a

T. Jacobson et al./European Economic Review 41(1997) 1781-1816 1783
simple theoretical model which is used to motivate the identifying restrictions on
the common trends model as well as to interpret the results. The simple model is consistent with more elaborate standard labor market models, as reviewed by e.g. Lindbeck (1993), Bean (1994), and Wyplosz (1994). Second, we apply the
common trends approach to labor market data from the other Scandinavian countries, Denmark and Norway. Our analyses enable comparisons of the Scandi- navian countries with respect to the sources of labor market fluctuations and how the economies respond to various shocks. The conventional view that the labor markets in these ‘corporatist’ countries have much in common, and that they differ from the other European countries, is challenged in the survey by Elmeskov
(1994). Our results suggest, for instance, that the only common source of hysteresis in the Scandinavian countries is shocks to wage setting (or equilibrium unemployment).
The paper is structured as follows: In Section 2 we present a simple theoretical labor market model which we will use to motivate the identifying assumptions and to interpret our findings. This exercise also serves as an illustration of how time
series models may be connected to economic theory. In Section 3 the results from testing for cointegration and hypotheses about the cointegration space are given. Asymptotic inference is here augmented by parametric bootstrap tests based on Monte Carlo simulation. The bootstrap testing serves two purposes. First, we may evaluate how well the asymptotic distributions work in our small sample setting. Second, since the asymptotic approximations turn out to be poor, our empirical
results can be secured by use of sound inference. The evidence from the empirical common trends models is presented in Section 4. Finally, our main findings are summarized in Section 5.
2. A labor market model
In this section we shall present a simple discrete time labor market model for the determination of real output, wages, employment, and unemployment. The model contains a minimum of dynamics to simplify the discussion about the long-run properties of the model. In the empirical analysis we will allow for more
general dynamic patterns. Following what has now become standard practice in macro-oriented labor
economics, the model consists of a labor demand relation, a labor supply relation, and a wage setting relation. The production possibilities are described by the
function
yt= 0,+pe,, t= 1,2 ,.... (1)
Here, y, is output, e, is employment, the parameter p measures returns to scale, while o1 is a stochastic technology variable. Notice that all variables are expressed

1784 T. Jacobson et al. /European Economic Review 41 (1997) 1781-1816
in natural logarithms. It is assumed that technology is exogenous according to
e,=e,_,+E,,,. r=1,2 ,...,
and evolves
(2)
where l y f is a pure technology innovation. The labor demand function is assumed
to be given by
e, = AY, - VW, + l d,t9 t= 1.2,.... (3)
The variable cd,, is a pure labor demand shock while w, is the real product wage. The parameters h and 77 measure the output and wage elasticities, respectively. Below, we shall sometimes refer to 77 as the labor demand elasticity. It is worth
pointing out that if firms maximize current profits, have perfect information and take prices as given, then both parameters will be equal to unity (and E~,~ = 0). In
that case, the model exhibits a constant wage share. Next, we assume the labor force, I,, to be related to the real product wage
according to
Ir=7?-wWt+&, t= I,2 ).... (4)
Here, 5, is an exogenous labor supply variable which follows the process
&=5t-,+E,Y,tr t= 1,2 . . . . . (5)
where E, , , is a pure labor supply shock. The parameter rr measures the slope of
the labor supply curve, i.e. the labor supply elasticity. ’ In the special case with r equal to zero, we will have an exogenous labor force. Furthermore, we assume that the wage setting relation is
w,= -Y(!,--e,)+S(y,-e,)+o,, r=1,2 ,..., (6)
where w, is an exogenous wage shock which is given by the stochastic process
Wt = +w,_ , + E,.,, t= 1,2..... (7)
All parameters (except rr ) are assumed nonnegative, 4 I 1, and the initial values of the exogenous variables ( ,$a, r3,, w,,) are, for simplicity, equal to zero. To close
the model we assume that the four pure shocks are Lid. Gaussian with zero mean, variances ui2 > 0, for i = s, y, w, d, and zero covariances.
The wage setting relation is (according to common practice) assumed to reflect
that the labor market is not perfectly competitive. Changes in w, may be interpreted as reflecting changes in the equilibrium level of unemployment. Defining this level as o,* = o/-y, Eq. (6) can be rewritten as
w,= -r[@,-e,) -w,*] +qY,-e,), (8)
’ Taxes may create a wedge between the real product wage and the consumption wage. in which
case it is the latter that should influence labor supply. In the empirical anaiysis we will include a
measure of the tax wedge as an exogenous variable.

T. Jacobson et al. / European Economic Review 41 11997) 1781-1816 1785
which shows that real wages are affected by the deviation between actual and equilibrium unemployment. The shock E~,~ can thus be interpreted as a shock to the equilibrium level of unemployment, and the parameter 4 may be interpreted as representing some rigidities in the labor market. ’ Note, however, that the model is also consistent with a purely competitive labor market. With p = A = n = 6 = 1, C$ = 0 and y > 0, we have that unemployment is white noise and that the real wage
is equal to the marginal product of labor (plus white noise). Suppose the weight on unemployment in the wage setting relation (6) becomes very large, i.e. let y + cc),
then (I, - e,> + 0 for Eq. (6) to hold. In this case Eq. (6) takes the form of a standard labor market equilibrium relation.
The model in Eqs. (l)-(7) has a unique solution, provided [(l - phX1 + -yr ) + 7-y + ( p - 11776 ] # 0, which can be expressed (in terms of the variables we will consider in the empirical analyses) as
(1 - A)(1 + YT) + 77Y
The parameter I,!J is here given by
1
*= (l-pA)(l+yrr)fr)y+(p-l)$’
5,
(9)
and it will typically be positive. For example, take p = A = 7 = 1 and y > 0 then $ = l/ y is positive.
It can be seen from Eq. (9) that the four variables productivity, employment,
unemployment and real wages are driven by four unobserved components: the two random walks in labor supply (5,) and technology Co,>, a stationary component due to labor demand shocks (E~,~), and one component due to shocks to the wage setting relation ( w,). The wage setting component can be stationary, C$ < 1, or nonstationary, C#J = 1. In the latter case, there are thus three common trends: a labor supply trend, a technology trend, and an equilibrium unemployment (or wage setting) trend.
’ For theories about the sources of equilibrium unemployment and its persistence. see e.g. the
seminal work by Phelps (1972) or the reviews by Bean (1994) and Wyplosz (1994).

1786 T. Jacobson et al./Europearz Economic Review 41 (1997) 1781-1816
The important property of our labor market model is that the endogenous variables are driven by unit root processes. The assumption that e.g. technology
follows a random walk rather than a more general I(1) process is a simplification with no loss of generality about the long-run properties of the variables. In the empirical analyses we will study a VAR model which allows for more complex
dynamics. This implies, among other things, that unemployment can have a permanent (random walk) component and a serially correlated transitory compo-
nent. These components may be interpreted as ‘structural’ and ‘cyclical’ unem- ployment, respectively, but it should be noted that the two will in general be correlated.
With four variables and three common trends, we know from Stock and Watson (1988) that there is one cointegration relation. The labor demand function (3)
provides this relation and in terms of the four left-hand side variables in lZq. (91 it can be written as
A (l-h) 1 U’,--(y,-e,)+pe =--E
rl 77 ’ rl d.‘.
Notice that 7 = A = 1 implies a stationary wage share. If 4 < 1. it follows that the four variables are driven by two common trends. A
second cointegration relation is given by the wage setting relation (6), which can
be written
w,+y(l,-e,)-6(y,-e,)=w,. (11) Suppose 6 = 1 and y > 0, then Eq. (11) is a stationary relation between the wage share and unemployment. Hence, if n = A = 1 in Eq. (101, so that the wage share itself is stationary, it follows that unemployment must be stationary as well.
If 77 = A = 1, then the coefficient on the technology trend in the unemployment equation is #(S - 1) while the coefficient on the labor supply trend is @Cl - p)(l - 6). Hence, if either p. the returns to scale parameter, or 6, the parameter on productivity in the wage setting relation, is equal to unity, then the labor supply trend has no long-run effect on unemployment. Furthermore, in the latter case (S = 11, there will be no long-run effect from the technology trend either. 3 In this case the only possible source of hysteresis in unemployment is shocks to wage setting (equilibrium unemployment), provided 4 = 1. In theoretical models of the labor market it is commonly assumed that the unemployment rate is independent, in the long run, of shocks to both technology and labor supply. 4 Our model has this property if, for example, n = A = 6 = I. We will refer to the case when
3 The fact that hysteresis critically depends on the link between wage aspirations and the steady
sta$z wage. which here is reflected in S, has been emphasized by Alogoskoufis and Manning (1988).
According to Lindbeck (1993), a realistic macroeconomic theory of unemployment should have
this property.

T. Jacobson et al./European Economic Review 41 (1997) 1781-1816 1787
unemployment (in the long run) is not influenced by the technology and labor
supply trends as satisfying the ‘Layard-Nickel1 condition’ (cf. Layard and Nickell, 1986).
More generally, our model suggests that hysteresis in unemployment is caused by the stochastic trends in technology, labor supply and (if 4 = 1) the equilibrium level of unemployment. Although the mechanisms which generate hysteresis in this model are quite simple, the model is consistent with more elaborate theories about unemployment persistence. Since our empirical implementation will allow for richer short-run dynamics, our analysis is compatible with theories which explain unemployment by wage setting in combination with transitory labor
demand shocks, e.g. Lindbeck and Snower (19871, Gottfries and Horn (1987), and Ellis and Holden (1991). In these models labor demand shocks have persistent but not permanent effects, which is true also in our model. Our framework is
consistent with the analysis by Blanchard and Summers (1986), where labor demand shocks have permanent effects, but only insofar as these changes in labor demand stem from shocks to technology. Our model allows the long-run effects on unemployment from technological improvements to be either negative, as in Pissarides (19901, or positive, as in Aghion and Howitt (1994). The model is however not at all consistent with theories where hysteresis is a result of nonlinearities as in Pissarides (1992) and Bentolila and Bertola (1990).
An important insight from the common trends model is that a unit root in unemployment only means that there are some shocks which have permanent effects on unemployment. In other words, the existence of hysteresis does not imply that all shocks affect unemployment permanently. In our view, permanent changes in unemployment are the result of ‘supply shocks’ or ‘structural’ factors (technology, labor supply, wage setting); ‘cyclical’ factors (labor demand shocks) have only temporary effects. Transitory fluctuations in unemployment around its stochastic trend are caused both by ‘structural’ shocks to technology, labor supply and wage setting, and by ‘cyclical’ shocks to labor demand. ’
As emphasized by Bean (1994), the inter-country differences in unemployment development may be due to differences in shocks, or different propagations mechanisms. The number of shocks that give rise to permanent effects, as well as
the nature of the propagation mechanisms, are of course empirical questions. Using our framework, hypotheses about the number of stochastic trends may be tested with, for instance, the Johansen (1991) maximum likelihood procedure. Given that we are willing to impose some identifying restrictions on our model, we may go on to examine the sources of hysteresis in more detail. These are the subjects of the analyses in the remainder of the paper.
’ Our approach may be contrasted with that of Jaeger and Parkinson (1994). who allow cyclical
unemployment to affect structural unemployment, but not vice versa.

1788 T. Jacobson et al./European Economic Review 41 11997) 1781-1816
3. Steady state relations
Cointegration, or steady state, properties of the Scandinavian labor market data is the concern of this section. Specifically, we will establish whether it is appropriate to model two or three common stochastic trends, and if the theoretical model in Section 2 is consistent with the data. In other words, we will determine the number of cointegration vectors, or steady states, for Denmark, Norway, and
Sweden. Moreover, we will examine if the cointegration vectors in Eqs. (10) and (111, suggested by the economic model, are reasonable representations in the
empirical model. Let Y, be a four-dimensional endogenous time series, Z, a two-dimensional
exogenous time series, and D, a vector of centered quarterly dummies. The vector autoregressive representation for Y, based on the exogenous stochastic and deterministic variables (VARX) is given by
P I’
Y,=p+ ?PD,+ cn,Y,_,+ zP,AZ,_j+~,, t= 1,2 ,..., T. (12) j= I j= 1
It is assumed that q and Z, are stationary in first differences ( AY, = Y, - Y,_ , and analogously for AZ,), but possibly nonstationary in levels. 6 Finally, the initial conditions (Y,, . . . ,Y, _) are taken as fixed and the innovation E, is assumed to be i.i.d. Gaussian with zero mean and positive definite covariance matrix s.
A reparameterization of Eq. (12) yields a vector error correction (VEC) representation for Y,. This transformation is particularly useful for the estimation and statistical analysis of cointegration relations (see Johansen (1991, 1992) and Johansen and Juselius (1990, 1992) for details). Letting c = -X,?= ;+, IIj and (YP’ = II= I, - X,“=, n,, we obtain
P- 1
AY,=p+ TD,+ C cAY,_,-c~p'~'_l + iPjAZt-j+ E,.
i= I j= 1
( 13)
Writing l7= (Y@’ reflects an assumption of reduced rank r < 4 for II, implying
that (Y and p are 4 X r matrices. Johansen (1991) states conditions on the parameters which imply that P’Y, and AY, are stationary although Y, is nonsta- tionary. When r > 0 we say that Y, is cointegrated, the cointegration vectors are found in the r columns of p, while the elements of CY determine how the r cointegration relations, /3’ I’_ ,, enter the four equations in (13).
The three data sets consist of quarterly observations from the Scandinavian labor markets; Denmark (1971-901, Norway (1967-90), and Sweden (1965-90). ’
’ Specifically, conditional on Z, we assume that Y, is integrated at most of order 1 and that AZ, is
stationary and ergodic (cf. Jacobson et al. (1993) for more details about the VAR model with stochastic
exogenous variables).
’ We are indebted to Niels Haldrup, Ragnar Nymoen. Bertil Holmlund, and Lena Svensson for
generously providing the Danish. Norwegian, and Swedish data sets.
T. Jacobson et al. /European Economic Review 41 (1997) 1781-1816 1789
The four endogenous variables for Sweden are (the log of) real GDP for the
private sector ( y), total employment in hours for the private sector (e>, unemploy- ment (1- e), and the hourly real product wage for the private sector (w). For Norway we use data from manufacturing industries on output, employment, and real wages, while the Danish employment and real wage series are also taken from manufacturing industries data but the output series is the industrial production index. 8 Hence, Y, = [( y, - e,) e, (1, - e,) wty. The two stochastic exogenous
variables are a tax wedge measure (7) and a nominal exchange rate variable (s). ’ Hence, the vector of exogenous stochastic variables is given by Z, = [r2 ~~1.
In Fig. 1 the four endogenous variables are plotted for each country. In the
upper left box the productivity series are shown for Denmark, Norway, and Sweden. To facilitate comparisons we have normalized the productivity, employ- ment, and real wage series such that the final observation is zero.
For our purposes, the behavior of the unemployment series is particularly interesting. From Fig. 1 we see that between 1974 and 1975 the Danish unemploy-
ment rate jumped from roughly 2 percent to 6.5 percent and has not returned to the low levels experienced by Norway and Sweden. lo Moreover, the Danish series seems to be more volatile than the Norwegian and Swedish series. These casual observations lead to the impression that possibly only the Danish unemployment series shows signs of hysteresis.
Prior to the cointegration analysis we need to establish appropriate lag orders for the underlying VARX models. Lag orders ranging from 1 to 8 are evaluated
with respect to serial correlation and normality of the estimated residuals in Eq. (12). The results for the Scandinavian countries are presented in Table 1. The
’ The mixing of series for the whole economy (unemployment) with series from a sector of the
economy (e.g. manufacturing employment) is by no means ideal. Our intention has been to examine
labor market data similar to those used in previous studies of the Scandinavian countries. The implicit
definition of the labor supply series that follows may be unfortunate, but we think that the alternative -
to include production, employment, and real wages from the other sectors - would give rise to other
problems.
9 The unemployment series is given by ln[l/(l - u, / lOO)], where U, is the unemployment rate for
the whole, respective, economy. The real product wage is computed from the average nominal wage
per hour, the payroll tax, and the producer price index for manufacturing industries. The tax wedge, 7,
is calculated as ln[( 1 - T,~ ),/( 1 + ~)‘xl + T,“~~)], where r i is the average income tax rate. TP is the
payroll tax rate, and r ya’ is the value added tax rate. For the exchange rate variables (s) we have
computed (the logs of) currency basket indexes for Sweden and Norway. The Swedish weights are
taken from March 1979 while the base of the index is 1965:1, and the Norwegian weights are taken
from August 1982. For Denmark we used the exchange rate between Danish kroner and (West)
German marks. The reason for including the tax wedge has been given above. The nominal exchange
rate captures the fact that an important part of real wage adjustment in the Scandinavian countries have
taken the form of devaluations. Neither the nominal exchange rate nor the tax wedge is possible to
model endogenously within a linear VAR model with Gaussian innovations.
lo This may be interpreted as a sign of a structural break for Denmark. It is. however, not manifested
in the estimated residuals of the VEC model for Denmark.

T. Jacobson et al./ European Econonric Reuiew 4If1997) 1781-1816
ProduCtlVlty ““employment m -. 0 I
Fig. I. Quarterly observations of the Scandinavian labor market variables.
multivariate Portmanteau statistic (suggested by Hosking (1980)) examines the null of no serial correlation. We find that in the Swedish model we cannot reject the null for lag orders 4 and 5, whereas for the Danish and Norwegian models
acceptable lag orders range from 2 to 6. The two multivariate normality tests (due
to Mardia (1970)) are based on estimated skewness and kurtosis. The Norwegian residuals seem multinormal throughout, while the Swedish model requires at least 2 lags and the Danish 3 lags for multinormality. Moreover, applying multivariate
order determination criteria can provide rough upper and lower bounds for the lag order. We consider the Akaike (1969) information criterion (AIC), the Hannan and Quinn (1979) iterated log-criterion (LIL), and the Bayesian information criterion
(BIG; Schwarz (197811. Unfortunately, for these particular applications, the three criteria do not convey much information. LIL is minimized for p = 5 in the
Swedish model but does not converge for the other two models. AIC does not converge in any model, and the conservative Bayesian criterion picks small lag orders in all three models. Synthesizing the information in Table 1 it seems straightforward to choose order 4 for Sweden and 2 for Norway. The choice of 3 lags for Denmark is problematic since univariate normality (not reported) does not hold in all four equations. The preferred lag order for Denmark is hence 4.
It is also useful to calculate the roots, ?, of the estimated polynomial equation det[ 1, - Xffijzj] = 0. For the Scandinavian data all roots were found to have modulus greater than 1 for the chosen lag orders. However, some roots are close to unity which can be interpreted as informal support for the unit root approach.

T. Jacobson et al. /European Economic Review 41 (1997) 1781-1816 1791
Table 1
Multivariate determination of lag order for the VARX models”
Statistic 1 2 3 4 5 6 7 8
Denmark
AIC - 32.980 - 33.226 - 33.555 - 33.907 - 33.932 - 34.327 - 34.925 - 35.817 * BIC - 32.497 * -32.252 -32.082 -31.929 -31.441 -31.315 -31.383 -31.737 LIL - 32.786 -32.836 -32.966 -33.117 -32.938 -33.127 -33.515 -34.194* Port. 335.248 256.300 229.015 230.345 223.043 216.456 222.286 244.240
[0.0053] [0.4830] [0.6839] [0.3713] [0.2257] [0.1089] [0.0103] [O.OOOO] Q skew 84.56 52.20 7.94 10.72 10.99 19.74 32.44 31.19
[O.OOOO] [O.OOOl] [0.9922] [0.9532] [0.9466] [0.4741] [0.0388] [0.0527] Q kuri 41.59 19.07 0.31 0.59 0.002 0.14 1.20 1.39
[O.OOOO] [O.OOOO] [0.5791] [0.4410] [0.9619] [0.7093] [0.2735] [0.2378]
Norway AK - 32.651
BIC - 32.212
LIL - 32.474
Port. 45 1.43
[0.000]
Q akeu 20.27 [0.4411
Q k”rl 1.64
[0.2011
- 33.390
- 32.507 *
- 33.034
245.89
[0.664]
22.87
[0.295]
0.00
IO.9461
- 33.571
- 32.238
- 33.034
232.91
LO.6161
25.65
[0.178]
1.81
LO.1791
- 33.942
-32.152
- 33.220
222.66
LO.5131
21.19
[0.386]
1.33
[0.248]
- 34.544
- 32.292
- 33.637
228.72
10.1551
23.73
to.2541
5.67
[0.0171
- 34.854
-32.133
- 33.758
217.93
[0.096]
20.62
[0.420]
0.28
IO.5941
- 35.094
-31.897
- 33.807
234.12
[0.0021
16.54
LO.6831
0.25
[0.620]
- 35.455 *
-31.777
- 33.975 *
233.89
[0.0001
16.56
[0.6811
0.01
[0.9041
Sweden AIC - 34.428 - 34.907 - 35.269 - 35.631 - 35.940 - 35.874 - 36.004 - 36.309 * BIC - 34.016 - 34.079 * - 34.019 - 33.954 - 33.830 - 33.326 - 33.012 - 32.868 LIL - 34.261 - 34.572 -34.763 - 34.952 - 35.087 * - 34.844 - 34.795 - 34.919 Port. 419.527 338.882 280.886 246.348 237.403 236.312 246.471 244.161
[O.OOOO] [0.0004] [0.0360] [0.1460] [0.0791] [0.0161] [0.0004] [O.OOOO] Q skew 56.46 27.32 23.52 19.99 23.40 23.37 20.80 19.79
[O.OOOO] [0.1266] [0.2640] [0.4587] [0.2698] [0.271 l] [0.4090] [0.4714] Q k”F, 18.35 0.49 1.03 0.11 0.02 0.10 0.02 0.002
[O.OOOO] IO.48461 [0.3112] [0.7422] [0.8996] [0.7532] iO.87741 LO.96331
a The Portmanteau statistic has an asymptotic x’ distribution with 16(18 - p) degrees of freedom. The
skewness and kurtosis statistics. Qskew and Qkur,, are asymptotically distributed as x2 with 20 and I degrees of freedom, respectively. p-values are reported within brackets.
Inference for the cointegration rank r in Eq. (13) is carried out by use of a likelihood ratio test, the so called trace test. This statistic has a nonstandard asymptotic distribution and simulated critical values are used in practise (see e.g. the tables in Osterwald-Lenum (1992)). The results for the Scandinavian labor market data are shown in Table 2. The Swedish outcome serves as an excellent illustration of how difficult the choice of rank can be.
The sequential testing strategy (see Johansen, 1992) is to first consider the null no cointegration ( r = 0) against the alternative of at least one cointegration vector

1792 T. Jacobson et d/European Economic Reoiew 41 (1997) 1781-1816
Table 2 Cointegration analysis of VARX( p) models with two exogenous stochastic regressorsa
Ho Denmark Norway Sweden Critical values
e^ m,, E LR,, 2 LR,, 0.90 0.95
r=O 0.382 68.53 0.258 50.41 0.386 78.66 43.95 47.21
i-51 0.294 32.46 0.138 22.69 0.146 30.29 26.79 29.68
i-52 0.133 10.98 0.090 8.93 0.134 14.66 13.33 15.41
i-53 0.004 0.28 0.001 0.12 0.005 0.46 2.64 3.76
& = [ -0.295 3.838 7.990 l.OOO]
& =[-1.617 -3.009 -11.470 l.OOO]
& = [ - 1.422 0.083 18.788 1 .OOO]
0.99
54.46
35.65
20.04
6.65
a Critical values from the 0.90, 0.95, and 0.99 percentiles of the simulated asymptotic distribution are
taken from Osterwald-Lenum (1992, Table 1).
(1 I r 5 4). The observed value of 78.66 clearly exceeds the one percent critical value from the asymptotic distribution (54.461, and we may thus reject the null hypothesis. The next step is to consider the null of no more than one cointegration vector (r 5 1) against the alternative of at least two cointegration vectors (2 _< r I 4); the observed value, 30.29, suggests rejection if a test size of five percent is adopted. If we decide to reject the null of r < 1, the consecutive null of no more
than two cointegration vectors is rejected if a test size of ten percent is used. However, the last null, r 4 3, cannot be rejected at standard marginal levels of
significance. Hence, reduced rank of n is at hand for the Swedish data, but the dimensionality of the cointegration space, r, is less clear. Similarly, for the Danish data the choice between one and two cointegration vectors is not obvious, while the results for Norway seem more straightforward to evaluate. For a test size of five percent, the sequential testing strategy suggests that there is one cointegration vector (and, hence, three stochastic trends) in Norway.
In order to gain insights in how well the asymptotic distributions approximate the unknown small-sample distributions we have undertaken a simulation study of the empirical error correction models using parametric bootstrapping. Moreover, the bootstrap inference can be used for resolving the rank determination problem. Ii
In panels A-D of Table 3 the 50, 80, 90, and 95 percent empirical quantiles are compared with the asymptotic quantiles from Osterwald-Lenum. The focus is here on the cases when the null hypothesis is true. We find that the empirical
II The experimental design for each of the Scandinavian countries is as follows. Five data generating
processes (DGP’s) are constructed by taking the coefficients ( fi. 4, f,, B, 8, 6, 2) and setting the
cointegration rank, r. to (0, 1. 2. 3, 4). For each DGP we generate 10,000 samples by adding
pseudo-normal variates, suitably transformed according to the estimated covariance matrix 2, in place
of E,. In each generated sample we calculate trace statistics under the four possible null hypotheses. For each null. the statistics are ordered into empirical distributions that can be compared with the
asymptotic distributions such as those in Osterwald-Lenum (1992).

T. Jacobson et al. /European Economic Reuiew 41 (1997) 1781-1816 1793
Table 3
Simulated percentiles for the trace test for cointegration rank in comparison with critical values from
Osterwald-Lenum”
Panel A Panel B
Testing Ha: r = 0 against H,: r 2 1 Testing H,: r 5 1 against H,: r 2 2
Percentiles: 0.50 0.80 0.90 0.95 Percentiles: 0.50 0.80 0.90 0.95 Crit. values: 33.60 40.15 43.95 47.21 Crit. values: 18.70 23.64 26.79 29.68
Denmark 45.10 55.07 60.69 65.62 Denmark 25.09 32.61 37.04 41.19
Norway 35.72 43.20 47.45 51.42 Norway 19.78 25.39 28.56 31.34
Sweden 39.12 4764 52.67 57.07 Sweden 22.97 30.04 33.92 37.53
Panel C
Testing Ha: r I 2 against H,: r 2 3
Panel D
TestingH,:r<3againstH,:r=4 - ” I.
Percentiles: 0.50 0.80 0.90 0.95 Percentiles: 0.50 0.80 0.90 0.95
Crit. values: 7.55 11.07 13.33 15.41 Crit. values: 0.44 1.66 2.69 3.76
Denmark 10.73 16.00 18.99 21.69 Denmark 0.87 2.89 4.54 6.20
Norway 9.00 12.70 14.90 16.99 Norway 0.85 2.87 4.49 5.85
Sweden 11.02 15.43 18.04 20.52 Sweden 1.53 4.39 6.29 7.89
a The number of cointegration vectors for each DGP is equal to the maximum number of cointegration
vectors under the null hypothesis. Critical values from the simulated asymptotic distribution are taken
from Osterwald-Lenum ( 1992, Table 1 J.
distributions are skewed to the right of the asymptotic, i.e. the trace test is oversized so that we may reject a true null at some higher level than the desired, say, five percent level.
A consequence of the oversized trace test in the Monte Carlo simulation is to
consider a conservative approach when evaluating the formal test results of Table 2, i.e. to reject hypotheses for small p-values only. I2 This leads to a cointegration
rank of one for all Scandinavian labor market models. Hence, in what follows we condition the analysis on r = 1. This is consistent with the theoretical model with
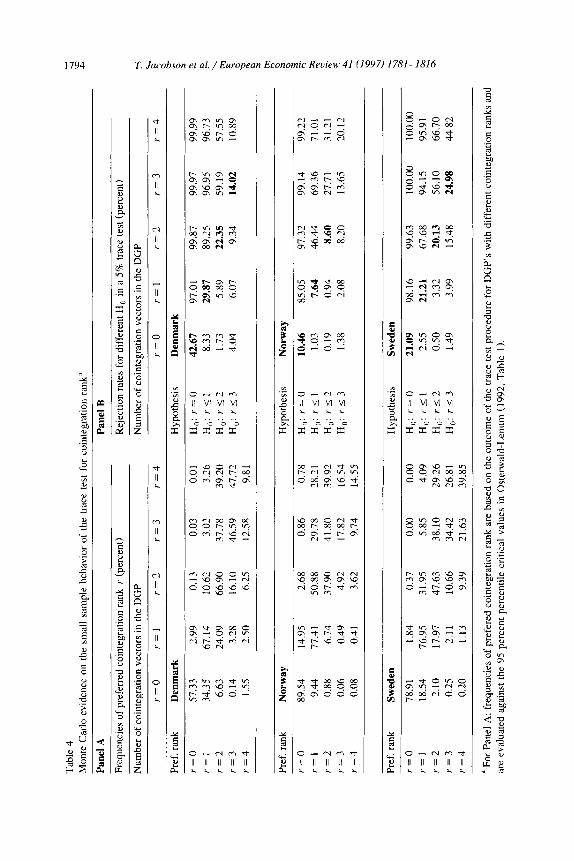
three stochastic trends. For completeness we also present simulation evidence on how well the testing
procedure selects the true cointegration rank (panel A of Table 4) and size and power estimates (panel B); see Jacobson et al. (1993) for further discussion on
these issues. The estimated cointegration vectors, ( p,, &, p,>, are given in Table 2. Note
that the maximum likelihood estimates have been normalized by setting the
coefficient on the real product wage equal to unity. The remainder of this section
I’ One could very well argue for r = 2 in the Swedish model by considering the likeliness of the
trace test results in light of the simulated empirical distributions when the null hypotheses are false: cf.
Jacobson et al. (1993). For comparison purposes, however, it is attractive to maintain the same rank
across the three models.
Tab
le
4
Mon
te
Car
lo
evid
ence
on
th
e sm
all
sam
ple
beha
vior
of
the
tr
ace
test
fo
r co
inte
grat
ion
rank
” 5 P
Pan
el
A
Pan
el
B
Freq
uenc
ies
of p
refe
rred
co
inte
grat
ion
rank
r
(per
cent
) R
ejec
tion
rate
s fo
r di
ffer
ent
H,
in a
5%
tra
ce
test
(pe
rcen
t)
Num
ber
of c
oint
egra
tion
vect
ors
in t
he D
GP
Num
ber
of c
oint
egra
tion
vect
ors
in t
he D
GP
r=O
i-
=1
r=2
r=3
r=4
r=O
r=l
r=2
r=3
r=4
Pref
. ra
nk
Den
mar
k H
ypot
hesi
s D
enm
ark
r=O
51
.33
2.99
0.
13
0.03
0.
01
H,:
r=O
42
.67
97.0
1 99
.87
99.9
7 99
.99
r=l
34.3
5 67
.14
10.6
2 3.
02
3.26
H
,,:
r I
I 8.
33
29.8
7 89
.25
96.9
5 96
.73
r=2
6.63
24
.09
66.9
0 37
.78
39.2
0 H
a: r<?
1.73
5.
89
22.3
5 59
.19
57.5
5
r=3
0.14
3.
28
16.1
0 46
.59
47.1
2 H
a:
rs3
4.04
6.
07
9.34
14
.02
10.8
9
r=4
1.55
2.
50
6.25
12
.58
9.81
Pref
. ra
nk
Nor
way
H
ypot
hesi
s N
orw
ay
r=O
89.5
4 14
.95
2.68
0.
86
0.78
H
,,:
r =
0 10
.46
85.0
5 91
.32
99.1
4 99
.22
r=l
9.44
77
.41
50.8
8 29
.78
?&.‘
I H
,,:
r<l
1.03
7.
64
46.4
4 69
.36
71.0
1
r=2
0.88
6.
74
37.9
0 41
.80
39.9
2 H
,: r<2
0.19
0.
94
8.60
27
.71
31.2
1
r=3
0.06
0.
49
4.92
17
.82
16.5
4 H
a: r<3
1.38
2.
08
8.20
13
.65
20.1
2
r=4
0.08
0.
41
3.62
9.
74
14.5
5
Pref
. ra
nk
r=O
r=l
r=2
r=3
r=4
Swed
en
Hyp
othe
sis
Swed
en
78.9
1 1.
84
0.37
0.
00
0.00
H
,: r=O
21.0
9 98
.16
99.6
3 10
0.00
10
0.00
18.5
4 76
.95
31.9
5 5.
85
4.09
H
,: r<
l 2.
55
21.2
1 67
.68
94.1
5 95
.91
2.10
17
.97
47.6
3 38
.10
29.2
6 H
,: rS2
0.50
3.
32
20.1
3 56
.10
66.7
0
0.25
2.
11
10.6
6 34
.42
26.8
1 H
,: r<
3 1.
49
3.99
15
.48
24.9
8 44
.82
0.20
1.13
9.
39
21.6
3 39
.85
’ Fo
r Pa
nel
A;
freq
uenc
ies
of p
refe
red
coin
tegr
atio
n ra
nk
are
base
d on
the
out
com
e of
the
tra
ce
test
pro
cedu
re
for
DG
P’s
with
di
ffer
ent
coin
tegr
atio
n ra
nks
and
are
eval
uate
d ag
ains
t th
e 95
per
cent
pe
rcen
tile
criti
cal
valu
es
in O
ster
wal
d-L
enum
f 1
992,
T
able
I 1
.

T. Jacobson et al/European Economic Reuiew 41 (1997) 1781-1816
will be dedicated to the links between the estimated cointegration
steady states of the form:
A (1-A) p'Yr=W,--(yt-et)+-e
77 rl I’
1795
vectors and
(14)
In other words, we shall examine how the estimated cointegration vectors relate to
the labor demand relation in Eq. (lo), i.e. the theory predicted cointegration relation. This is achieved by considering, in turn, the following: (i) likelihood ratio tests of linear restrictions imposed on p, (ii) estimation of confidence intervals for
the parameters involved, n and A, and finally (iii) ocular inspection of the steady state relations given by the cointegration vectors.
A likelihood ratio test of linear restrictions on the cointegration vectors, for
given cointegration rank, involves an asymptotic X2-distribution with degrees of freedom equal to the number of restrictions involved. As in the case of the trace test above we augment the formal testing by simulations in order to evaluate how valid the asymptotic approximations are in these small sample applications.
In the upper panel of Table 5 we find the results for Denmark, in the middle for Norway, and in the bottom panel for Sweden. We consider, in turn, one, two and three restrictions on the cointegration vector, /I. First, a zero restriction on unemployment, i.e. /3, as specified in Table 5. Next, we require equal coefficients with opposite signs on the real wage and productivity, as well as a zero coefficient
on unemployment ( &). Third, zero restrictions on both unemployment and employment (&). Finally, the fourth case ( p4) imposes zero coefficients on employment and unemployment, and equal coefficients with opposite signs for real wages and productivity. In terms of the theoretical labor market model, p, is
the general labor demand relation in Eq. (101, & is the labor demand relation with the restriction that A = n (equal elasticities on output and real wages), & is the
labor demand relation with A (the output elasticity) equal to unity, and p4 sets r] and A equal to unity. As mentioned in Section 2, this last case implies a stationary wage share.
For each country the observed LR tests of these four null hypotheses are large enough to suggest rejection of the nulls if we base our inference on the asymptotic distributions. However, this picture is modified by the simulation results. The nominal test size, five percent, is grossly surpassed by the simulated empirical
sizes. For Sweden the latter are found to be around 30, 75, 30, and 42 percent. As in the trace test case we may conclude that asymptotic inference introduces an uncontrolled risk of incorrectly rejecting a true null. Comparing the observed values of the LR statistic with empirical distributions, we can compute empirical p-values for the tests. From Table 5 it can be seen that these are substantially larger than the asymptotic and that some of the null hypotheses are weakly consistent with the data. It is nonetheless a delicate matter to try and discriminate between these borderline significant results and we will next turn to estimated confidence intervals for further guidance.

1796 T. Jacobson et al./ European Economic Review 41 (1997) 1781-1816
Table 5
Simulations of likelihood ratio tests of linear restrictions on the cointegration vector’
Hypothesis LR Distribution Percentiles Size p-value
0.50 0.80 0.90 0.95
8.942 Xf 0.455 I.642 2.706 3.841 5.00% 0.003
Emp. 1.333 4.841 1.691 10.687 25.54% 0.076
21.363 X; I.386 3.219 4.605 5.991 5.00% 0.000
Emp. 5.418 11.246 15.208 18.874 45.66% 0.029
22.376 Xz’ 1.386 3.219 4.605 5.991 5.00% 0.000
Emp. 5.98 1 12.196 16.420 20.200 49.91% 0.032
22.378 XZ 2.366 4.642 6.25 1 7.815 5.00% 0.000
Emp. 8.741 15.268 19.773 23.483 55.58% 0.061
10.694 Xf 0.455 I.642 2.106
Emp. 1.136 3.784 5.998
13.692 Xz? 1.386 3.219 4.605
Emp. 3.600 1.762 10.592
15.213 Xz? 1.386 3.219 4.605
Emp. 4.409 9.038 12.019
25.766 X? 2.366 4.642 6.25 1
Emp. 10.879 16.329 19.494
19.495 Xf 0.455 I.642 7.706
Emp. I .692 5.606 8.586
30.209 X22 1.386 3.219 4.605
Emp. 12.946 24.560 31.1 14
2 1.291 Xi 1.386 3.319 3.605
Emp. 3.486 7.786 10.992
31.820 X_f 2.366 4.642 6.25 1
Emp. 6.65’) 12.189 15.672
3.841 5.00% 0.001
7.987 19.58% 0.020
5.991 5.00% 0.001
13.256 30.29% 0.045
5.991 5.00% 0.000
14.820 37.28% 0.045
7.815 5.00% 0.000
71 ‘39 __._ 70.25% 0.020
3.841 5.00% 0.000
11.588 29.98% 0.008
5.991 5.00% 0.000
36.756 75.56% 0.109
5.991 5.00% 0.000
13.905 30.03% 0.006
7.815 5.00% 0.000
18.494 41.93% 0.002
p;=1p,., PI.2 0 Il. Pi=[-1 P?.? 0 11% /3;=1p,, 0 0 11, p;=[-l 0 0 II. “To obtain empirical distributions, LR statistics have been calculated, under the null, for 10,000
samples and have been ordered from the smallest to the largest.
From Eq. (14) above we find that the estimated cointegration vectors provide
estimates of A and 77 since pi,, = -h/v and pi,? = (1 - M/q, where pi,, is the first element of the cointegration vector with the ith restriction, according to the notation in Table 5, imposed. Johansen (1991) provides asymptotic conditional standard errors for the individual /3 coefficients of restricted cointegration vectors. Using the Delta method we can construct asymptotic conditional standard errors for A and 77. In Table 6 we present estimates of pi.,, and of the corresponding A and 7. as well as two sets of confidence intervals to supplement the point

Tab
le
6
Est
imat
ed
coin
tegr
atio
n an
d la
bor
dem
and
para
met
ers
with
95
per
cent
co
nfid
ence
in
terv
al?
Mod
el
Den
mar
k N
orw
ay
Swed
en
P I.1
P
I.2
4,
0.21
2 2.
608
. (
- 0.
289.
0.71
4)
[-0.
284,
I.
0211
P?
- 1.
000
(-) L-1
P3
-
0.99
4
( - 2
.095
.0.1
08)
[-
1.66
1.
-0.6
181
C-0
.718
.5.9
34)
[1.4
33,1
0.03
1
- 0.
356
( -0
.940
,0.2
29)
[-
1.55
6.0.
1771
0.00
0
(-)
[-I
P,.,
-
1.59
6
C-3
.523
,0.3
31)
[-
12.1
0,0.
1.41
3]
- 1.
000
(-)
1-l
- 0.
609
( -
1.45
7.0.
240)
[ -0.
869,
-
0.41
81
P 1.2
- 1.
970
C-4
.130
,0.1
89)
[ - 1
0.24
, -
1.76
31
- 0.
777
( -
1.62
2,0.
068)
[ - 1
.268
, -
0.52
21
0.00
0
C-1
l-1
Pi.1
P
i.2
-2.1
57
- 1.
503
( -
4.98
5.0.
670)
[ - 1
4.56
, -
1.68
71
- 1.
000
(-) 1-l
-2.1
17
(-5.
810.
1.57
6)
[-6.
814,
-
1.39
11
(-
3.93
2,0.
927)
I-7.
447,
-0
.312
1
2.25
8
C-0
.384
,4.8
99)
[1.1
03,2
4.08
]
0.00
0
C-1
i-1
Mod
el
A
17
A
17
h 71
PI
- 0.
085
(-0.
389,
0.21
8)
[ - 1
.070
.0.2
29]
Pz
1.55
2
(0.1
44.2
.959
)
[1.1
25,7
.977
]
Pj
1 .O
OO
(-) L-1
0.41
7
( -
0.20
6.1.
041)
[0.1
39,1
.075
1
1.55
2
(0.1
44,2
.959
)
[1.1
25.7
.977
]
1.00
6
C--
0.10
9,2.
122)
[0.6
20,1
.676
]
- 4.
263
(-
10.1
6,1.
637)
[ - 5
.806
.10.
931
4.48
1
C-1
2.48
,21.
44)
[3.2
47.2
9.91
]
1.00
0
(-)
L-1
- 2.
671
C-6
.114
.0.7
72)
[-3.
291,
6.61
3]
4.48
1
(-
12.4
8.21
.44)
[3.2
47,2
9.91
]
1.64
4
(-
0.64
6.3.
932)
[1.1
84.2
.363
]
3.29
5
(-4.
189,
10.7
8)
[4.3
13.2
78.2
]
0.30
7
(0.0
58,0
.863
)
[ -0.
412,
0.84
9]
1.00
0
(-)
[-I
1.52
7
( -
2.53
3,5.
587)
[ 1.5
20,4
6.58
]
0.30
7
(0.0
58,0
.863
)
[-0.
412,
0.84
9]
0.47
2
- 0.
352,
1.29
7)
[0.0
86,1
.128
]
‘The
re
latio
nshi
p be
twee
n th
e in
divi
dual
p
coef
fici
ents
an
d A
and
t)
are
gi
ven
by:
p,,
= -
h/r)
an
d /3
,,? =
(1
- h)
/v.
Her
e,
the
inde
x i
is d
eter
min
ed
p,.
whi
ch
is d
efin
ed
in T
able
5.
In
pare
nthe
ses
we
repo
rt
conf
iden
ce
inte
rval
s ba
sed
on a
sym
ptot
ic
cond
ition
al
dist
ribu
tion
(see
Jo
hans
en,
1991
),
and
in b
rack
ets
boot
stra
pped
in
terv
als
base
d on
the
eq
ual
tails
pe
rcen
tile-
t m
etho
d (s
ee
Hal
l, 19
88).

1798 T. Jacobson et al./European Economic Review 41 (1997) 1781-1816
estimates. On the one hand 95 percent intervals based on the conditional asymp- totic variances, and on the other hand 95 percent parametric bootstrap equal tails percentile-f intervals, due to Hall (1988). I3 The reason for considering bootstrap
intervals is, of course, the possibility that the asymptotic conditional standard errors are poor approximation in our small sample applications. The results in the lower section of Table 6 suggest that the & vector (with the output elasticity of labor demand A = 1) provides a plausible cointegration vector for all three countries. The point estimates of the wage elasticity are roughly unity for Denmark, 1.65 for Norway, and 0.47 for Sweden. These estimates are not
unreasonable, neither from a theoretical perspective nor in comparison with findings in other studies; cf. Bean (1994). The percentile-t intervals for & are very short in comparison with the intervals for p, and &.
Reevaluating the LR tests of the p3 vector in light of the interval estimates. we find some support for the Danish and Norwegian cases, but little for the Swedish (a p-value of 0.6 percent). What is more troublesome, the depicted cointegration relations in Figs. 2-4 suggest that the stationary appearances of the unrestricted
relations are, to varying degrees, distorted when linear restrictions are imposed. However, cases p2 for Denmark and Norway, and /3d for Sweden (see Fig. 5) can be thought of as mean reverting and, hence, acceptably stationary relations.
In conclusion. we have found support for the idea that there is one cointegration
relation between productivity, employment, unemployment, and the real wage. These variables thus seem to be driven by three common trends, which in our
interpretation reflect stochastic trends in technology, labor supply, and wage setting (equilibrium unemployment). According to the theoretical model, the
cointegration relation should be the labor demand relation. This idea does however receive only mild support. at best, from the empirical tests. The overall picture of the validity of the theoretical model is therefore somewhat mixed.
For reasons given above, the following analyses will be based on a cointegra- tion vector for the Swedish data which is equal to p,, i.e. that A = 77 = 1. We thus assume that the wage share is stationary in the case of Sweden. For the Danish and Norwegian data we have chosen to base the subsequent analyses on the cointegra- tion vector &, i.e. on the weaker restriction that A = 7. Since the evidence from the common trends analyses may be sensitive to the choice of cointegration vector,
we will discuss the robustness of our results in the concluding section.
I3 The equal tails percentile-r interval is based on bootstrapping the pivotal statistic fi(ib - e^)/(i,‘.
where e^ is the maximum likelihood estimate in the original sample, Jb is the maximum likelihood
estimate in the bth bootstrap sample. b = 1.. ,B, and 4’ is the estimated asymptotic (conditional) standard error of % in the bth bootstrap sample. We have set B = 10,000 for the intervals in Table 6.
Hall (1988) gives a theoretical covering error of O(T- ’ ) for the equal tails interval which can be
compared with O(T- I/‘) for the more common and less sophisticated percentile interval. cf. Efron
(1981).

-03
-0
I 01
0.
2 33
04
-0
.8
-3.6
-0
4
-0.2
-0
0
3.2
I I
._ -
-5- -
> -
.
>
-
-
0.0
0 2
0.‘
0 6
0 8
i.0
1.2
1 4
c

1800 T. Jacobson et d/European Economic Review 41 (1997) 1781-1816
Fig. 4. Estimated cointegration relations for Sweden.
Fig. 5. The wage shares in Denmark. Norway, and Sweden

T. Jacobson et al/European Economic Reuiew 41 (1997) 1781-1816 1801
4. Common trends
In this section we shall analyse the empirical evidence from estimates of common trends models for the Scandinavian countries. In Section 4.1 we first
present the common trends model, discussing the exactly identifying assumptions
in some detail and relating the common trends coefficients to the parameters of the theoretical model. We then examine how hypotheses about the theoretical parame- ters can be translated into overidentifying restrictions on the common trends
coefficients. The empirical results are given in Section 4.2.
4. I. Identification
The common trends model for the four endogenous variables productivity,
employment (hours), unemployment and the real product wage based on three
trends (one cointegration vector) is given by:
In comparison with Eq. (9), this model allows for richer short-run dynamics, as captured by the matrices Gi, which are 4 X 4 and satisfy conditions which ensure that ztGiet _ i is stationary. The four-dimensional vector X, comprises initial conditions and the influence from the exogenous Z and D variables (we shall return to this part below). For the three common trends we include drift terms, e.g.
0, = t-%9 + et- I + E,,,, thereby allowing the growth rates of the endogenous vari-
ables as well as the trends to have means different from zero. Moreover, we let the innovations to the trends have unit variances.
In order to exactly identify the empirical trends and the aij coefficients in Eq. (15) it is necessary to impose three restrictions on the common trends coefficients; information about estimation, identification and inference in common trends models can be found in e.g. King et al. (1987, 1991) Mellander et al. (1992),
Quah (1994) and Warne (1993). l4 A number of studies have proposed identifica-
tion schemes for labor market trends. Here we shall discuss three of them.
(I) Jacobson et al. (1993) assume that the labor force is exogenous in the long run (r = 0). From Eq. (9) we see that this restriction implies that the labor force is
I4 Specifically, let k be the number of common trends. Exact identification of these trends requires
that we impose k(k - 1)/Z? restrictions on the common trends coefficients. With k = 3 we thus find
that three identifying restrictions are necessary. while for k = 2 only one identifying restriction is
needed.

1802 T. Jacobson et al./European Economic Rwiew 41 (1997) 1781-1816
only driven by the labor supply trend. The assumption is exactly identifying in the
case of two trends. If there are three trends, however, long-run exogeneity of the labor force only provides two out of the three necessary restrictions on the long-run coefficients.
(II) Bean (1992) proposed letting p = 1 (constant returns to scale). From Eq. (9) we find that this restriction implies that productivity is only determined by the technology trend in the long run and, thus, is exactly identifying when there are two trends. On the other hand, when there are three stochastic trends an additional assumption is required to achieve identification.
(III) As mentioned above, the restrictions 77 = A = 8 = 1 imply that the unemploy- ment rate is not influenced by the labor supply and technology trends in the long
run, the Layard-Nickel1 condition. ” Technically, when there are three trends, then the Layard-Nickel1 condition only imposes two restrictions on the trend coefficients. In fact, the condition implies that the equilibrium unemployment trend is identified since it is the only trend which has a long-run effect on unemployment. The technology and labor supply trends, however, remain uniden- tified and an additional restriction is needed.
In this paper we choose to work with the condition ph = 1. This restriction is implied by (but does not imply) the combined restrictions of cases (II) and (III). Furthermore, ph = 1 is exactly identifying irrespective of whether there are two or three trends (cf. Eq. (9)). With two trends, the restriction implies that real wages, in the long run, are only driven by the technology trend. In the case of three trends, it also implies that the real wage and the labor force are not influenced by
the equilibrium unemployment trend. Given this identifying assumption it is possible to test whether the labor market data are consistent with the hypotheses: (a) labor supply is exogenous (n = O), and (b) unemployment is not influenced by labor supply and technology in the long run (the Layard-Nickel1 condition).
In terms of Eq. (15) the identifying assumption means that ad2 = ad3 = 0 and
az3 = - u33. The remaining aij coefficients are uniquely determined from the long run (conditional on X) covariance matrix of Y and the condition that P’Y, is stationary.
Since the parameters (A, 7) are identified from the cointegration relation, it follows that p is identified from ph = 1. Given the aij coefficients it is possible
to identify additional ‘deep’ parameters, (A, 6. 7~, fly, qr, Us,). We now find that the labor supply parameters are given by:
rr = (a,, + a31 /% ’ >
a, = a,, + a3?.
(16)
I5 Note. however, that these restrictions are only sufficient for the Layxd-Nickel1 condition to be
satisfied. A more general, but still only sufficient set of restrictions is A = 1 and ~6 = 1.

T. Jacobson et al. /European Economic Review 41 (1997) 1781-1816 1803
For A # 1 it is possible to determine the parameters of the wage setting relation,
(y, 6, uW,),), from (77, A) and the ajj coefficients (unless a3, = uj2 = 0, the Layard-Nickel1 condition, happens to be true). Some algebra gives us:
6= 42 a41
~a,,a,,+(l -A)(a2,u32-a22a31)'
(1 - Y)%*a4, Y=
~a32a4, + c1 - A)(a2,a32 -a22a31) ’
(17)
(18)
while
an= [Y+ (P- wa33. (19)
On the other hand, if A = 1 it can be shown that these three parameters are
unidentified. I6 However, gi ven values for 9, we can compute ( y, 6). In
particular,
Y = uW/a3s >
6 = l/77 + a3l Gv33a41. (20)
Finally, the parameter a~, the standard deviation of the technology trend innovation, is identified for all values of A. The general expression is given by
It may be noted that if 17 = A, then with ph = 1 we find that a~ = u4,. Also, if A = 1 we have that p = 1 and 9” = ~a,,.
From the expressions in Eqs. (16)-(21) we see how overidentifying restrictions
about the theoretical parameters can be expressed in terms of constraints on the common trends coefficients. The hypothesis of a vertical supply curve, n = 0, is
algebraically equivalent to the hypothesis a2, + a3, = 0; cf. Eq. (16). The properties of the wage setting relation are crucial for the persistence of
unemployment. It is thus of interest to study how sharply wage setting responds to changes in productivity (an issue explained by Alogoskoufis and Manning (1988)). Under A # 1, it can be seen from Eq. (17) that S = 1 if a2, = u3, = 0 when 77 = A.” Also, from Eq. (17) it can be seen that S = 0 is equivalent to a32 = 0, while from Eq. (18) we find the same relation between y and u22. Notice, however, that jointly the restrictions 6 = y = 0 are not consistent with three
l6 From Eqs. (9) and (15) we find that, for ph = 1, the theoretical model implies that a3? = ( p - I )$&ps. Hence, if A = 1 it follows that p = 1 and thus in theory ax2 should be equal to zero. In that
case, there are five relations left between the aij coefficients and the six theoretical parameters
encountered in the theoretical trend coefficients.
” In fact, 6 = 1 if and only if aj2 az2. Clearly, a *, = a3, = 0 is only a sufficient condition for this to
hold.

1804 T. Jacobson et al. /European Economic Re&w 41 (1997) 1781-1816
common trends since the imply that yY = a,. = 0. It is therefore not meaningful to
test the joint hypothesis. ‘* Finally, under 77 = A = 1 it can be seen from Eq. (20) that the hypothesis of a
unit elasticity on productivity in the wage setting relation, S = 1, is true if and
only if u3, = 0. This means that the coefficient on the technology trend in the unemployment equation is zero.
4.2. Empirical evidence
The aji coefficients obtained from the estimated error correction models are
given in Table 7. I9 Recall that these estimates are based on the condition that all
the shocks have unit variances. The interpretation of an u,~ coefficient is thus that it measures the long-run effect on the ith endogenous variables from a unit shock to the jth trend innovation. For example, we find that a unit shock to technology raises Swedish productivity by roughly one percent in the long run.
Examining the results in Table 7, we find that they are reasonable in view of
the theoretical model. For example, a positive technology shock leads to higher productivity and higher real wages in the long run; and a positive labor supply shock increases employment. Unemployment is significantly affected in the long run by shocks to wage setting (equilibrium unemployment) in all countries. In Denmark significant long-run unemployment effects are also recorded for labor supply shocks, while the same is true for technology shocks in Norway.
In the lower panel of Table 7 we report Wald statistics from tests of hypotheses about the a,, coefficients. For Denmark and Norway we cannot reject that the labor supply elasticity, rr, is equal to zero, while for Sweden we can at the 5
percent level. Next, for Sweden we find that we cannot reject the hypothesis that
8 = 1 (a3, = O), while the joint hypothesis (71. = 0. 6 = 1) can be rejected at the 10
percent level. In contrast, for Denmark we cannot reject either that (QT = 0, S = 1) or that u 3, = 0, while both hypotheses are rejected in the case of Norway.
Another interesting issue concerns the sensitivity of wage setting to unemploy- ment (7). As noted above, y is not identified for the Swedish data set since A = 1. For Denmark and Norway we can reject the hypothesis that y = 0 at standard significance levels.
Let us now turn to the Layard-Nickel1 condition. In terms of the empirical
‘* From the expression for y in Eq. (18) it can be seen that a 3z = 0 implies that y = - aJ, /a3,. Hence, the value of a?: does not affect y in this case.
” In the case of Denmark we impose two restrictions on the a coefficients (cf. Eq. (13)).
Specifically, the coefficients in the employment and unemployment equations are restricted to zero.
Testing these two restrictions with the LR statistic yields 1.425. From e.g. Johansen (1991) we know
that this statistic has an asymptotic x * distribution and, hence, these restrictions seem to be consistent
with the data. Note also that the point estimate of r) (and A) drops from 1.55 (no restrictions on a) to
I .36.

Tab
le
I
Est
imat
ed
com
mon
tr
ends
co
effi
cien
ts
and
Wal
d st
atis
tics
for
Den
mar
k,
Nor
way
, an
d Sw
eden
”
Var
iabl
e D
enm
ark
Nor
way
Sw
eden
0 5
w
0 5
0 e
5 w
?‘-e
0.
0135
-
0.00
55
0.00
12
0.01
24
-0.0
137
0.00
19
0.01
02
0.00
00
0.00
00
(0.0
031)
(0
.001
2)
(0.0
002)
(0
.003
4)
(0.0
013)
to
.000
3)
(0.0
030)
(-
) C
-J
e 0.
0027
0.
0206
-
0.00
46
0.00
60
0.01
76
- 0.
0025
-0
.012
1 0.
0080
-0
.001
7
(0.0
068)
~0
.004
4)
(0.0
008)
(0
.003
5)
(0.0
017)
(0
.000
3)
(0.0
055)
(0
.001
8)
(0.0
003)
l-
e -0
.001
9 -
0.00
39
0.00
46
- 0.
0017
-
0.00
00
0.00
25
0.00
12
-0.0
012
0.00
17
(0.0
020)
(0
.001
6)
(0.0
008)
(0
.000
6)
(0.0
004)
(0
.000
3)
~0.0
009)
(0
.000
6)
(0.0
003)
M
0.
0142
0.
0000
0.
0000
0.
0171
0.
0000
0.
0000
0.
0102
0.
0000
0.
0000
(0.0
032)
(-
) C
--j
(0.0
030)
(-
) (-
) (0
.003
0)
(-)
(-)
“0
Wal
d st
atis
tics
for
rest
rict
ions
on
A
a?,
+ a
3, =
0
0.02
70
1.58
45
5.17
78
(Tr=
O)
[0.8
696]
[0
.208
1]
[0.0
229]
02
, =
a3,
= 0
1.64
18
8.60
84
5.51
24
(7r=
O,
S=l)
[0
.440
01
[0.0
1351
L
O.0
6351
0
- -0
31
0.92
30
7.68
64
1.87
78
[0.3
367]
[0
.005
6]
[O. 1
7061
;;:
0, -0
2
1.46
09
110.
9790
[0.0
0001
~0
.ooo
o1
;I;=
=o”
, 6.
0641
0.
0028
[0.0
138]
[0
.957
8]
_
a3,
= qI
- -0
6.
2312
7.
6991
5.
0681
[0.0
4441
[0
.021
3]
[0.0
7931
a E
stim
ated
st
anda
rd
erro
rs
are
repo
rted
w
ithin
pa
rent
hesi
s an
d p-
valu
es
with
in
brac
kets
. T
he
asym
ptot
ic
dist
ribu
tion
of
the
estim
ated
co
mm
on
tren
ds
coef
fici
ents
is
nor
mal
an
d is
giv
en
in W
ame
(199
3).
The
as
ympt
otic
di
stri
butio
n of
th
e W
ald
stat
istic
is
,y
’(q).

1806 T. Jacobson et al. /European Economic Reciew 41 C 1997) I781 -1816
common trends model, this condition amounts to the restrictions u3, = uj2 = 0.
Within the theoretical model we noted that the labor supply and technology trends exert a zero long-run influence on unemployment if, for example, A = 7 = 6 = 1. Furthermore, with 77 = A the Layard-Nickel1 condition is satisfied by the theoreti- cal model if and only if v= 6 = 1. Given our results related to 6 we thus expect
the Layard-Nickel1 condition to be inconsistent with the Norwegian data. For Sweden, on the other hand, the opposite result is expected.
The empirical evidence on the Layard-Nickel1 condition is quite unequivocal across the Scandinavian countries. At the ten percent level, the null hypothesis (ax, = u3? = 0) is rejected for all countries, although at the one percent level it is not rejected for any country. For Norway we already noted that the technology trend affects the long-run behavior of unemployment. For Denmark and Sweden the labor supply trend has a similar influence on unemployment. With the point
estimate of p, the returns to scale parameter, being less than unity and 6 being nonzero in Denmark (given our identifying assumption), this result is consistent with the theoretical model (cf. Eq. (91). For Sweden (with p = v = I>, however, the theoretical model states that the coefficient on 5 is zero. The point estimate of uj2 for Sweden is significantly different from zero, but it is small (minus 0.12 percent) relative to the Danish point estimate (minus 0.39 percent).
In Table 8 estimates of the theoretical parameters are given (remember that for Sweden (y, 6, a,.) are not identified since h = 1). For example, the estimated 7r parameters are positive for Denmark and Norway, but since the standard errors are large they are not significantly different from zero at standard significance levels. Furthermore, the estimated supply elasticity for Sweden is very close to minus 1.
Another interesting difference is the estimated standard deviation of the labor supply innovation (r?,). While Denmark and Norway appear to be very similar in this respect, the standard deviation is less than half for Sweden. Labor supply shocks thus seem to be less volatile in Sweden than in Denmark and Norway.
Turning to the parameters from the wage setting relation (y, S, a,) we find that the results for Denmark and Norway are very different. For Denmark, the estimated 6 is relatively close to 1 and, if we perform a standard t-test, not significantly different from 1 at the ten percent level. Moreover, the point estimate of y is 1.24 for Denmark and 9.68 for Norway. That wages are strongly sensitive to unemployment in Norway is consistent with what has previously been recorded (cf. Bean et al., 1986; Alogoskoufis and Manning, 1988). Note, however, that the standard errors are large (especially for Norway) and a 95 percent confidence interval for y in Norway states that it lies between 2.59 and 16.76. Similarly, for Denmark the 95 percent confidence interval is given by 0.19 to 2.30. Moreover, the point estimates of qV are very different for Denmark and Norway. Again, the Norwegian point estimate is larger than the Danish and this may lead us to conclude that the equilibrium unemployment trend is more volatile in Norway than in Denmark. However, in terms of the equilibrium unemployment variable
w, * = w/-y (cf. Eq. (811, it is the ratio between Us and y that is interesting. Here,

T. Jacobson et al./ European Economic Reuiew JI 11997) 1781-1816 1807
Table 8
Estimates of the theoretical parameters for Denmark, Norway and Swedena
Parameter Denmark Norway Sweden
x 0.0597
(0.3592)
fl, 0.0142
(0.0032)
? 0.0168
tO.0032)
Y 1.2446
(0.5281)
6 0.8790
(0.0804)
% 0.0046
(0.0024)
rr,. * 0.0037
(0.0007)
0.2516
(0.1959)
0.0171
(0.0030)
0.0176
(0.0016)
9.6760
(3.5454)
0.0149
(0.2788)
0.0241
(0.0097)
0.0025
(0.0003)
- 1.0690
(0.2374)
0.0102
(0.0030)
0.0068
(0.0014) _
0.0017
(0.0003 )
Sweden
0.0100 5.7723
(0.9979)
0.0075 4.3292
(0.7484)
0.0046 2.6669
(0.46 10)
0.0025 1.4431
(0.2495)
0.0010 0.5772
(0.0998)
1.6969
(0.4211)
1.5227
(0.3158)
1.3220
(0.1945)
1.1742
(0.1053)
1.0697
(0.0421)
a Estimated standard errors are reported in parentheses. The asymptotic distribution of the estimated
coefficients is normal and the standard errors are based on Wame (1993). The parameter o, *,
measuring the volatility of the innovation to equilibrium unemployment. is given by ok /y. For n = 1
(Sweden) this ratio is equal to a3s.
we find from Table 8 that the point estimate of a, * = CT,,,/ y is 0.37 percent for Denmark and only 0.25 percent per quarter for Norway. *’ Furthermore, for the case of Sweden a,,, = aj3 and is thus identified. The point estimate for Sweden is
0.17 percent per quarter. In other words, our results suggest that the change in the equilibrium unemployment rate appears to be the most volatile in Denmark and the least volatile in Sweden.
In the bottom panel of Table 8 we report estimates of (y, 6) for Sweden when we condition on u,,. Here we have chosen values for a,,, the standard deviation of
” From Eqs. (17)-(19) it can be shown that o%, * = 11 + as? /az21as3 when P # 1.

1808 T. Jacobson ef al./European Economic Reriew41 ~199711781-1816
Fig. 6. Impulse response functions for unemployment (I-e) with 95 percent confidence intervals from a
unit shock to the technology innovation.
the equilibrium unemployment innovation, in the range between 1 percent per quarter and 0.1 percent. For example, if we let uW take the same value as the Danish point estimate (0.46 percent per quarter), both y and S seem larger for
Sweden than for Denmark. Note, however, that the estimates of y are decreasing in u,,,, and since the latter is unknown we cannot determine whether y is larger in Sweden than in Denmark or not. Furthermore, the estimate of 6 for Sweden is not significantly different from 1 at the 5 percent level (the t-test has a p-value of roughly ten percent). Again, this is consistent with our finding that u3, is not significantly different from zero (see Table 7).
In Figs. 6-9 we provide some estimated impulse response functions for the four different shocks along with 95 percent confidence bands. In terms of Eq. (15), impulse response functions are given by
resp( Y,+ ;(e, = e,) = [ A O]e, + Qjej. (22)
Here, the four-dimensional vector e,, is unity at element j and zero otherwise (the jth column of the identity matrix). Moreover, the limit of Gi as i increases is zero and, hence, the long-run response in the vector Y from the shock ej is given by the jth column of the 4 X 4 matrix [A 01. In Figs. 6-9 we focus on responses over the first 10 years (40 quarters) in unemployment. ”
” The remaining impulse response functions are available from the authors on request.

T. Jacobson et al./European Economic Reoiew 4ICI997) 1781-1816 1809
$I---=-- -_______~----- e
::
9 r ---~-------- \ ” ’ __--
7
Fig. 7. Impulse response functions for unemployment (l-e) with 95 percent confidence intervals from a
unit shock to the labor supply innovation.
0 4 B 12 16 20 24 28 32 36
Fig. 8. Impulse response functions for unemployment (Z-e) with 95 percent confidence intervals from a
unit shock to the equilibrium unemployment innovation.

Fig. 9. Impulse response functions for unemployment (I-e) with 95 percent confidence intervals from a
unit shock to the labor demand innovation.
A noteworthy feature of these graphs is that the short-run adjustment towards the long-run levels is generally quite fast in Norway and somewhat slower in Denmark. The short-run effects from the technology and labor supply shocks are
of about the same magnitude as the estimated long-run parameters. Adjustment to equilibrium unemployment shocks occurs within l-2 years in Norway and Sweden and within approximately 4 years in Denmark. For the transitory labor demand shocks we find no significant short-run effects in Norway and Sweden,
and some in Denmark. Although the shapes of the impulse responses in Fig. 9 suggest some persistence in unemployment (in Denmark and Sweden), the lack of significant effects (at the 5 percent level) casts doubt on the empirical importance
of those theoretical arguments that view transitory labor demand shocks as an important source of persistence.
So far we have not discussed the importance of the exogenous variables. Let Y,,
be the initial conditions for the endogenous variables, D, is a vector with centered seasonal dummies, and Z, = [7, stY. Here, 7, is the tax wedge and s, the exchange rate. We can now express the vector X, from Eq. (15) as
m f cc x,= Y”+BZ,_, + CB,AZ,_,_i + Cc D; + cC;D,_,. (23)
i=ll j=l " i=O
We assume that the growth rates of the exogenous variables, AZ, are stationary, while the levels need not be. For example, exchange rates have often been found

T. Jacobson et al/European Economic Review 41 (1997) 1781-1816 1811
Table 9
Estimated long-run coefficients on the exogenous variables and likelihood ratio statistics for Denmark,
Norway, and Swedena
Variable Denmark Norway Sweden
7 s 7 s 7 s
y-e 0.4903
(0.2953)
e - 0.0202
(0.4295)
1-e - 0.0359
(0.1267)
,I’ 0.4850
(0.3070)
0.0540
(0.1885)
- 0.2343
(0.2849)
0.0777
(0.0836)
- 0.0082
(0.1901)
0.3518
(0.2087)
- 0.0367
(0.2116)
0.0698
(0.0359)
0.3233
(0.2005)
0.0358
(0.1446) - 0.2738
(0.1466)
0.0089
(0.0248) -0.1770
(0.1389)
- 0.3240
(0.1820)
0.3849
(0.2555)
- 0.0395
(0.0396)
- 0.3240
(0.1820)
-0.1188
(0.0817)
0.0098
(0.1148)
0.0235
(0.0178)
-0.1188
(0.0817)
HO LR statistics for restrictions on B
B, = 0 2.9505 10.4151 4.1125
IO.39931 [0.01531 [0.2496]
B, =0 0.9982 4.0892 5.5588
[0.80171 [0.2520] io.13521
B=O 4.1370 14.8540 10.0079
to.65811 [0.0214] [0.13431
a Estimated standard errors are reported in parentheses and p-values in brackets. The asymptotic
distribution of the estimated coefficients is normal and the standard errors are based on Warne (1993).
The asymptotic distribution of the likelihood ratio statistic is x’(q), with q = (II - r)m, n being the
number of endogenous variables, r the number of cointegration vectors, and m the number of columns
of B that are equal to zero under Ha.
to be well described as random walks (with drift). In that case, the level of the exchange rate series is nonstationary while the growth rate is stationary. If Z is nonstationary, then the trending behavior of the endogenous variables depends on
the exogenous variables unless the matrix B in Eq. (23) is equal to zero. Before we examine the estimates, note that the interpretation of an individual coefficient is unclear unless it is equal to zero. The reason for this is that changes in the
exogenous variables have not been modelled. ‘* In Table 9 we report estimates of the individual coefficients for the Scandina-
vian countries as well as tests of hypotheses about the columns of the B matrix. ”
” If we assume that r and s are independent random walks (with drift) the coefficients in the B matrix have an analogous interpretation to those in the A matrix. On the other hand, if the growth rate
of the tax wedge follows a moving average process, then a one standard deviation shock to the tax
wedge innovation will lead to additional changes in the forthcoming periods, and the long-run change
in the tax wedge itself is typically different from the initial shock. To set up a meaningful experiment
about changes in the exogenous variables, we should first construct a model for these. and then base
the experiment on the model design. However, if the columns of the B matrix are equal to zero, the
long-run outcome of any such model consistent experiment will be the same.
‘3 For more details about the B matrix, see Jacobson et al. (1993).

1812 T. Jacobson et al./European Economic Review 41 (1997) 1781-1816
Since our theoretical labor market model only involves real variables and macroe- conomic theory generally predicts that nominal shocks have no long-run influence
on real variables, we are primarily concerned with the coefficients in B that are related to the nominal exchange rate. Generally, the point estimates are close to zero. In the lower panel of Table 9 we report likelihood ratio statistics from tests
of hypotheses that certain columns of the B matrix are equal to zero. For example, the hypothesis B,? = 0 denotes the hypothesis that all the coefficients on s in the B matrix are equal to zero, i.e. that the nominal exchange rate has no long-run effect on the real variables. For all Scandinavian countries we find that this hypothesis cannot be rejected at the ten percent level and, hence, nominal shocks do not seem to matter in the long run. For the tax wedge variable, 7, the evidence is mixed. For Denmark and Sweden we find that the coefficients on the tax wedge are not
significantly different from zero even at the 20 percent level, while for Norway the hypothesis B, = 0 can be rejected at the 5 percent level. One interpretation of the
results for Denmark and Sweden is that tax incidence falls entirely on labor. The outcomes of the joint test, i.e. B = 0, agree with the individual column tests.
5. Conclusions
This paper is concerned with the questions whether there is persistence in the Scandinavian unemployment rates, the sources of such persistence, and possible similarities and differences across these countries. We suggest that there is hysteresis, not only in the Danish labor market, which has shown ‘European’ tendencies, but also in Norway and Sweden, where unemployment rates have been low and stable historically. The hysteresis phenomenon, documented by Blanchard
and Summers (1986) and many others, thus seems to be relevant also for the Scandinavian countries.
We argue that there are three sources of hysteresis: shocks to technology, labor supply, and equilibrium unemployment (wage setting). Equilibrium unemployment shocks is found to be the only common source of hysteresis in the three countries. In addition, technological shocks have permanent effects on unemployment in Norway, while this is true for labor supply shocks in Denmark. In contrast with arguments made by e.g. Layard and Nickel1 (1986) and Lindbeck (1993), unem- ployment does not seem to be independent, even in the long run, from changes in technology and labor supply. Transitory labor demand shocks, which are given an important role in the theoretical literature on unemployment persistence, do not seem to be empirically important. The labor markets in all three Scandinavian countries also seem to be characterized by nominal neutrality, in the sense that exogenous changes in the exchange rate exert no long-run influence on real variables.
These conclusions critically depend on the assumptions that unemployment does not enter the cointegration relation and that ph = 1. The first assumption is

T. Jacobson et al/European Economic Reuiew 41 (1997) 1781-1816 1813
based on our finding of just one cointegration relation and our theoretical
argument that the cointegration relation, if there is only one such relation, should reflect labor demand. The second assumption, which provides us with our identifying restrictions, is consistent with but does not imply restrictions which are common in earlier work. We regard these assumptions as reasonable, and the conclusions just drawn as warranted. The estimates of particular parameters of the theoretical model are more obviously open to question; some provide rather weak
empirical support for the specification of our theoretical model. Runkle (1987) discusses the apparent uncertainty in unrestricted VAR models. Sims (1987), in his comment on Runkle’s paper, argues that due to the many parameters estimated in
a VAR the five percent significance level of conventional model building may be an inappropriately harsh criterion since data “do indeed speak more softly than
they appear to in standard models”. Although it is widely recognized that
restrictions on the VAR parameters (such as the cointegration rank restrictions)
reduces the uncertainty, we cannot expect the seemingly high precision of a fully specified structural model.
The findings that there is hysteresis also in the Scandinavian countries, and that various supply shocks are more important for hysteresis than transitory demand shocks, appear to be robust since they have been corroborated by other studies using somewhat different data and/or methods. Hansen and Wame (19951, using annual data for Denmark (1905-92), find that unemployment is primarily deter- mined by the labor supply trend. Assarsson and Jansson (1995) apply the Jaeger
and Parkinson (1994) approach to Danish and Swedish data and find strong hysteresis effects in both countries. In contrast with conventional wisdom (but not with the view of Elmeskov (1994), we believe), these analyses suggest that the Scandinavian labor markets are not fundamentally different from those in other developed economies. What, then, explains that unemployment has been lower and more stable, at least in Norway and Sweden? A comparison between the Scandinavian countries suggests that the volatility of both labor supply shocks and equilibrium unemployment shocks has been relatively low in Sweden. In Norway wage setting seems to react relatively stronger to unemployment.
Given our findings, can we expect Norway and Sweden to make similar unemployment experiences as Denmark and other European countries have made? In the case of Norway there is some reason for optimism, considering the
relatively high responsiveness of real wages to unemployment. The recent devel- opment in Norway (out of sample) has been more favorable than in Denmark and Sweden, which is consistent with this result. On the other hand, there is a general
reason for pessimism in the fact that hysteresis to an important extent seems to be associated with shocks to equilibrium unemployment, i.e. there is no stable natural level of unemployment. An important task for future research is to uncover the sources of changes in equilibrium unemployment by putting the theoretical hysteresis models to test, which requires that the identification problems encoun- tered by earlier studies (cf. Manning, 1993; Bean, 1994) can be solved. It is

1814 T. Jacobson et al. / European Economic Ret&w 41 119971 1781-1816
probably fair to say that the question about the sources of unemployment
hysteresis cannot be fully answered by macroeconomic time series analyses, but that microeconomic analyses are warranted.
Acknowledgements
We have received valuable comments from two anonymous referees, Nils Gottfries, Steinar Holden, Kenneth Wallis and participants at the conference on
Unemployment and Labor Market Policy, Sigtuna, Sweden, as well as seminars at the IIES, Norwegian School of Economics in Bergen, Stockholm School of Economics, and the University of Umei. Financial support from Bankforskn- ingsinstitutet, Humanistik-Samhiillsuetenskapliga Forsknings&det, Riksbankens Jubileumsfond and Tore Browalds Forskningsstifelse is gratefully acknowledged.
References
Aghion, P. and 0. Howitt, 1994, Growth and unemployment, Review of Economic Studies 61,
477-494.
Akaike, H., 1969, Fitting autoregressive models for prediction, Annals of the Institute for Statistical
Mathematics 21, 243-247.
Alogoskoufis, G.S. and A. Manning. 1988, On the persistence of unemployment, Economic Policy 7.
428-469.
Assarsson, B. and P. Jansson, 1995, Some further evidence on hysteresis in unemployment rates: The
cases of Denmark and Sweden. Working paper 199512 (Department of Economics, University of
Uppsala, Uppsala).
Bean. C.R., 1992, Identifying the causes of British unemployment. Working paper no. 276 (London
School of Economics, London).
Bean, C.R., 1994, European unemployment: A survey. Journal of Economic Literature 32. 573-619.
Bean, C.R., P.R.G. Layard and S.J. Nickell, 1986, The rise in unemployment: A multi-country study,
Economica. Supplement, 53. l-22.
Bentolila, S. and G. Bertola, 1990, Firing costs and labour demand: How bad is eurosclerosis?, Review
of Economic Studies 57, 381-402.
Blakemore. A.E. and D.L. Hoffman, 1993, Nonstationary behavior in the labor market and the
intertemporal substitution effect, Unpublished manuscript (Arizona State University, Tempe, AZ).
Blanchard. O.J. and L.H. Summers. 1986, Hysteresis and the European unemployment problem, In: S.
Fischer, ed., NBER macroeconomics annual (MIT Press, Cambridge, MA) 15-78.
Calmfors, L. and J. Driffill. 1988, Bargaining structure. corporatism and macroeconomic performance, Economic Policy 6, 13-61.
Efron, B., 1981, Non-parametric standard errors and confidence intervals, Canadian Journal of
Statistics 9. 139-172.
Ellis, C.J. and S. Holden, 1991. Hysteresis and the seniority-wage relationship, Memorandum no. 9 (Department of Economics, University of Oslo, Oslo).
Elmeskov. J., 1994, Nordic unemployment in a European perspective, Swedish Economic Policy Review 1. 21-70.
Gamber. E.N. and F.L. Joutz, 1993, The dynamic effects of aggregate demand and supply disturbances: Comment, American Economic Review 83, 1387- 1393.

T. Jacobson et al/European Economic Reuiew 41 (1997) 1781-1816 1815
Gottfries, N. and H. Horn, 1987. Wage formation and the persistence of unemployment, Economic
Journal 97, 877-884.
Hall, P., 1988. Theoretical comparisons of bootstrap confidence intervals, Annals of Statistics 16. 927-953.
Hannan, E.J. and B.G. Quinn, 1979, The determination of the order of an autoregression, Journal of the
Royal Statistical Society. Series B, 41, 190-195.
Hansen, H. and A. Wame, 1995, Common trends analysis of Danish unemployment, Discussion paper
no. 95-03 (Institute of Economics, University of Copenhagen. Copenhagen).
Hosking, J.R.M., 1980, The multivariate portmanteau statistic. Journal of the American Statistical
Association 75, 602-608.
Jacobson, T., A. Vredin and A. Wame, 1993, Are real wages and unemployment related?, Seminar
paper no. 558 (Institute for International Economic Studies, Stockholm University, Stockholm).
Jaeger, A. and M. Parkinson, 1994, Some evidence on hysteresis in unemployment rates, European
Economic Review 38, 329-342.
Johansen, S., 1991. Estimation and hypothesis testing of cointegration vectors in Gaussian vector
autoregressive models. Econometrica 59, 1551-1580.
Johansen, S.. 1992. Determination of cointegration rank in the presence of a linear trend. Oxford
Bulletin of Economics and Statistics 54, 383-397.
Johansen, S. and K. Juselius, 1990, Maximum likelihood estimation and inference on cointegration:
With applications to the demand for money, Oxford Bulletin of Economics and Statistics 52.
169-210.
Johansen, S. and K. Juselius, 1992, Testing structural hypotheses in a multivariate cointegration
analysis of the PPP and the UIP for U.K., Journal of Econometrics 53, 21 l-244.
King, R.G., C.I. Plosser. J.H. Stock and M.W. Watson, 1987, Stochastic trends and economic
fluctuations, Working paper no. 2229 (NBER, Cambridge, MA).
King. R.G., C.I. Plosser, J.H. Stock and M.W. Watson, 1991. Stochastic trends and economic
fluctuations, American Economic Review 81, 819-840.
Layard, P.R.G. and S.J. Nickell. 1986, Unemployment in Britain, Economica, Supplement. 53.
121-169.
Lindbeck, A., 1993. Unemployment and macroeconomics (MIT Press, Cambridge, MA).
Lindbeck, A. and D.J. Snower, 1987, Union activity, unemployment persistence and wage-employ-
ment ratchets, European Economic Review 31. 157-167.
Manning, A., 1993. Wage bargaining and the Phillips curve: The identification and specification of
aggregate wage equations, Economic Journal 103. 98- 118.
Mardia. K.V., 1970, Measures of multivariate skewness and kurtosis with applications. Biometrika 57.
5 19-530.
Mellander, E., A. Vredin and A. Warne, 1992, Stochastic trends and economic fluctuations in a small
open economy, Journal of Applied Econometrics 7, 369-394.
Osterwald-Lenum, M.. 1992, A note with quantiles of the asymptotic distribution of the maximum
likelihood cointegration rank test statistics: Four cases. Oxford Bulletin of Economics and Statistics
54, 46 l-472.
Phelps, E.S.. 1972, Inflation policy and unemployment theory (Macmillan, London).
Pissarides, C.A.. 1990. Equilibrium unemployment theory (Basil Blackwell, Oxford).
Pissarides. C.A., 1992, Loss of skill during unemployment and the persistence of employment shocks.
Quarterly Journal of Economics 107. 1371-1391.
Quah. D., 1994. Identifying vector autoregressions, In: V. Bergstrom and A. Vredin, eds., Measuring
and interpreting business cycles, FIEF studies in labor markets and economic policy, Vol. 5,
195-213 (Clarendon Press, Oxford).
Runkle, D.E., 1987, Vector autoregressions and reality, Journal of Business and Economic Statistics 5.
437-442.
Schwarz, G., 1978, Estimating the dimension of a model, Annals of Statistics 6, 461-464.

1816 T. Jacobson et al./European Economic Review 41 (1997) 1781-1816
Sims. CA.. 1987, Comment on vector autoregressions and reality, Journal of Business and Economic
Statistics 5. 443-449.
Stock, J.H. and M.W. Watson, 1988, Testing for common trends, Journal of the American Statistical
Association 83. 1097-l 107.
Wame, A., 1993, A common trends model identification, estimation and inference. Seminar paper no.
555 (Institute for International Economic Studies, Stockholm University, Stockholm).
Wyplosz. C., 1994, Demand and structural views of Europe’s high unemployment trap. Swedish
Economic Policy Review 1, 75-107.