Embed Size (px)
Citation preview
Compact Reconnaissance Imaging Spectrometer for Mars
investigation and data set from the Mars Reconnaissance
Orbiter’s primary science phase
Scott L. Murchie,1 Frank P. Seelos,1 Christopher D. Hash,2 David C. Humm,1
Erick Malaret,2 J. Andrew McGovern,1 Teck H. Choo,1 Kimberly D. Seelos,1
Debra L. Buczkowski,1 M. Frank Morgan,1 Olivier S. Barnouin-Jha,1 Hari Nair,1
Howard W. Taylor,1 Gerald W. Patterson,1 Christopher A. Harvel,1 John F. Mustard,3
Raymond E. Arvidson,4 Patrick McGuire,4,5 Michael D. Smith,6 Michael J. Wolff,7
Timothy N. Titus,8 Jean-Pierre Bibring,9 and Francois Poulet9
Received 24 January 2009; revised 22 May 2009; accepted 22 June 2009; published 1 October 2009.
[1] The part of the Compact Reconnaissance Imaging Spectrometer (CRISM) for Marsinvestigation conducted during the Mars Reconnaissance Orbiter’s (MRO’s) primaryscience phase was a comprehensive investigation of past aqueous environments, structureof the planet’s crust, past climate, and current meteorology. The measurements toimplement this investigation include over 9500 targeted observations of surface featurestaken at spatial resolutions of better than 40 m/pixel, monitoring of seasonal variations inatmospheric aerosols and trace gases, and acquisition of a 200 m/pixel map coveringover 55% of Mars in 72 selected wavelengths under conditions of relatively lowatmospheric opacity. Key results from these data include recognition of a diversity ofaqueous mineral-containing deposits, discovery of a widespread distribution ofphyllosilicates in early to middle Noachian units, the first definitive detection ofcarbonates in bedrock, new constraints on the sequence of events that formedHesperian-aged, sulfate-rich layered deposits, characterization of seasonal polar processes,and monitoring of the 2007 global dust event. Here we describe CRISM’s scienceinvestigations during the Primary Science Phase, the data sets that were collected and theircalibration and uncertainties, and how they have been processed and made available tothe scientific community. We also describe the ongoing investigation during MRO’sextended science phase.
Citation: Murchie, S. L., et al. (2009), Compact Reconnaissance Imaging Spectrometer for Mars investigation and data set from the
Mars Reconnaissance Orbiter’s primary science phase, J. Geophys. Res., 114, E00D07, doi:10.1029/2009JE003344.
1. Introduction
[2] The Compact Reconnaissance Imaging Spectrometerfor Mars (CRISM) [Murchie et al., 2007a] is one of sixmajor science instruments on the Mars ReconnaissanceOrbiter (MRO), along with the High Resolution ImagingScience Experiment (HiRISE) [McEwen et al., 2007], the
Mars Color Imager (MARCI), Context Imager (CTX)[Malin et al., 2007], the Mars Climate Sounder (MCS)[McCleese et al., 2007], and the Shallow Radar (SHARAD)[Seu et al., 2007]. The three primary science objectives ofthe MRO mission are (1) to search for evidence of aqueousand/or hydrothermal activity; (2) to map and characterizethe composition, geology, and stratigraphy of surface depos-its; and (3) to characterize seasonal variations in dust andice aerosols and water content of surface materials, recov-ering science lost with the failure of the Mars ClimateOrbiter. MRO’s two secondary objectives are (1) to provideinformation on the atmosphere complementary to thereflown MCO investigations, and (2) to identify new siteswith high science potential for future investigation. MROhas completed its primary science phase (PSP), which lastedfrom November 2006 to November 2008. During that timethe spacecraft operated in a sun-synchronous, near-circular(255 � 320 km altitude), near-polar orbit with a mean localsolar time of 1510. The observations acquired include avariety of regional to global mapping and atmospheric
JOURNAL OF GEOPHYSICAL RESEARCH, VOL. 114, E00D07, doi:10.1029/2009JE003344, 2009ClickHere
for
FullArticle
1Johns Hopkins University Applied Physics Laboratory, Laurel,Maryland, USA.
2Applied Coherent Technology, Herndon, Virginia, USA.3Department of Geological Sciences, Brown University, Providence,
Rhode Island, USA.4Department of Earth and Planetary Sciences, Washington University,
Saint Louis, Missouri, USA.5Freie Universitaet, Berlin, Germany.6NASA Goddard Space Flight Center, Greenbelt, Maryland, USA.7Space Science Institute, Boulder, Colorado, USA.8U.S. Geological Survey, Flagstaff, Arizona, USA.9Institut d’Astrophysique Spatiale, Universite Paris Sud, Orsay, France.
Copyright 2009 by the American Geophysical Union.0148-0227/09/2009JE003344$09.00
E00D07 1 of 15
monitoring campaigns, plus a series of targeted observationsin which the spacecraft actively pointed the coboresightedHiRISE, CRISM, and CTX instruments to measure a seriesof geologic targets at high spatial resolution. The mission’sobjectives, design, and implementation were summarizedby Zurek and Smrekar [2007].[3] In this paper we briefly review the specific objectives
of the CRISM investigation during the PSP, the measure-ment strategies used to address them, and the key results.We summarize the data sets acquired during the PSP, andhow they have been calibrated, processed, and made avail-able to the scientific community. We also summarizeobservational and data product generation plans forMRO’s second Mars year of operations, the extendedscience phase (ESP).
2. Instrument Operation Overview
[4] The CRISM instrument and its operating modes usedduring data acquisition were described in detail by Murchieet al. [2007a, 2007b]. The following summary providesbackground for how the instrument hardware capabilitieswere used in PSP measurement campaigns to addressMRO’s primary and secondary science objectives, and forthe creation of data products from those measurements.[5] The CRISM instrument consists of three assemblies.
The largest, the Optical Sensor Unit (OSU), contains optics,detectors, radiators, and a cryogenic system, all of whichcan be gimbaled, or pivoted, to track Mars’ surface. A DataProcessing Unit (DPU) provides power, command andcontrol, and data editing and compression, and the GimbalMotor Electronics (GME) runs the gimbal.[6] The OSU contains telescope optics that focus light on
a slit to form an image one line high and approximately600 columns wide. After the light passes through the slit, abeam splitter directs it to two independent grating spec-trometers with separate detectors. In each spectrometer, theone-line spatial image is dispersed into its componentwavelengths that are reimaged onto different rows of thatspectrometer’s detector. One spectrometer, denoted as vis-ible near infrared (VNIR), uses an array of silicon photo-diodes to capture spatial/spectral images covering thewavelengths 362–1053 nm. The other spectrometer,denoted as infrared (IR), uses an array of HgCdTe diodesto take spatial/spectral images at 1002–3920 nm. Bothspectrometers sample the spectrum at 6.55 nm per detectorrow. Both detectors have fixed-mounted filters with two orthree wavelength zones, to block higher orders from thegrating and, in the case of the IR detector, to attenuatethermal emissions from the spectrometer cavity. Eachdetector is also wider than the image of the scene; sparecolumns at the sides of the detectors do not contain sceneinformation, but do detect wavelength-dependent, diffusescattering of light from the grating that has to be removedduring calibration. A cryogenic cooling system maintainsthe IR detector at �148�C to �163�C to limit noise, and thespectrometer housing is cooled by a passive radiator to�70�C to �78�C to limit thermal background. The temper-ature of the VNIR detector drifts with that of the spectrom-eter housing, and typically is �55�C to �65�C.[7] The DPU provides power and command-and-control,
and also data editing capabilities to manage data volume
and to establish operating modes for the instrument. Toremove smear, an along-track gimbaling capability can beused to track a point on the surface and scan across itslowly. Frame rates of 1, 3.75, 15, and 30 Hz can also beused to manage pixel smear. Data editing capabilitiesinclude selection of which wavelength channels are down-linked, and binning of pixels in the spatial direction. Thetwo major choices for the number of wavelengths is the544 detector rows with useful amounts of scene radiance,or 72 rows selected for their coverage of key wavelengthsthat separate major mineral phases [Pelkey et al., 2007]. (Ineach case, one extra detector row is included for calibrationpurposes.) Spatial binning of pixels can be done usinggroups of 1, 2, 5, or 10 pixels in the cross-track spectraldirection. Pixels are ‘‘squared’’ in the along-track directionby adjusting frame rate and/or the rate of gimbal motion.[8] CRISM’s two basic operating modes are targeted, in
which the gimbal is used for image motion compensation,and fixed pointing at spacecraft nadir. In targeted observa-tions the gimbal is scanned to track a point on the surfaceand prevent smear from motion of the spacecraft. A super-imposed scan slowly sweeps the field of view across aregion approximately 10 km � 10 km over 2–3 min toacquire an unsmeared image of a target area. For geologictargets, surrounding the time of closest approach, 350 to540 image lines are acquired at a frame rate of 3.75 Hz.Spatial sampling is 18 m/pixel using no spatial pixelbinning, or 36 m/pixel for 2� binning. Ten to twelveadditional abbreviated, 10� spatially binned images aretaken before and after the main image, providing measure-ments of the same scene with different path lengths throughthe atmosphere. This sequence of multiple measurements atdifferent geometries is called an emission phase function, orEPF. When analyzed using a radiative transfer model thatincorporates a model of surface scattering and wavelength-dependent attenuation by atmospheric gases and aerosols,an EPF allows separation of atmospheric and surfaceradiances. For investigation of the atmosphere, the centralimage can also be 10� binned to minimize data volume. Alltargeted measurements are taken in 544 wavelength channelscovering 0.36–3.92 microns with 6.55 nm spectral sampling.The 11 to 13 spatial images taken during the gimbal’s trackingof a target constitute a single, multiimage observation.[9] CRISM can also build up images using passive, fixed
pointing, and this is done in either of two ways. First,images are acquired at 15 Hz with 10� spatial pixelbinning, or 30 Hz with 5� spatial pixel binning, yieldingpixel footprints of 200 or 100 m, respectively. When itoperates in this mode, CRISM returns data from only72 wavelengths. The 200 m/pixel mode is used almostexclusively to map Mars globally, or to ‘‘ride-along’’ withMRO’s other cameras when the available data volume or acrowded observing schedule limits the number of targetedobservations. Second, data can be taken at a lower framerate of 3.75 Hz using 10� spatial pixel binning and all544 wavelengths. The mode of operation measures a 10 �10 km spot hyperspectrally with minimal data volume and isused to monitor atmospheric gases.[10] Internal instrument calibrations are taken interleaved
with and as part of all observations. An internal shutter isclosed to take dark measurements (of IR background due toemission inside the instrument) every 3 min. One or more
E00D07 MURCHIE ET AL.: CRISM INVESTIGATION AND DATA SET
2 of 15
E00D07
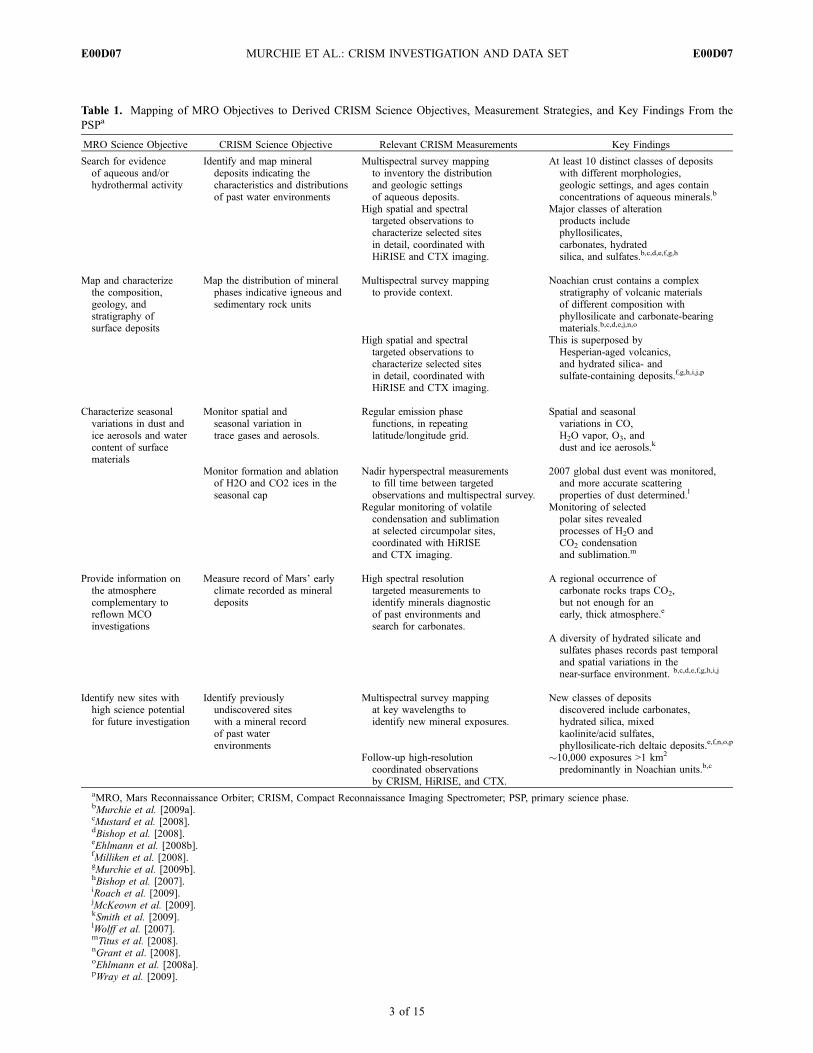
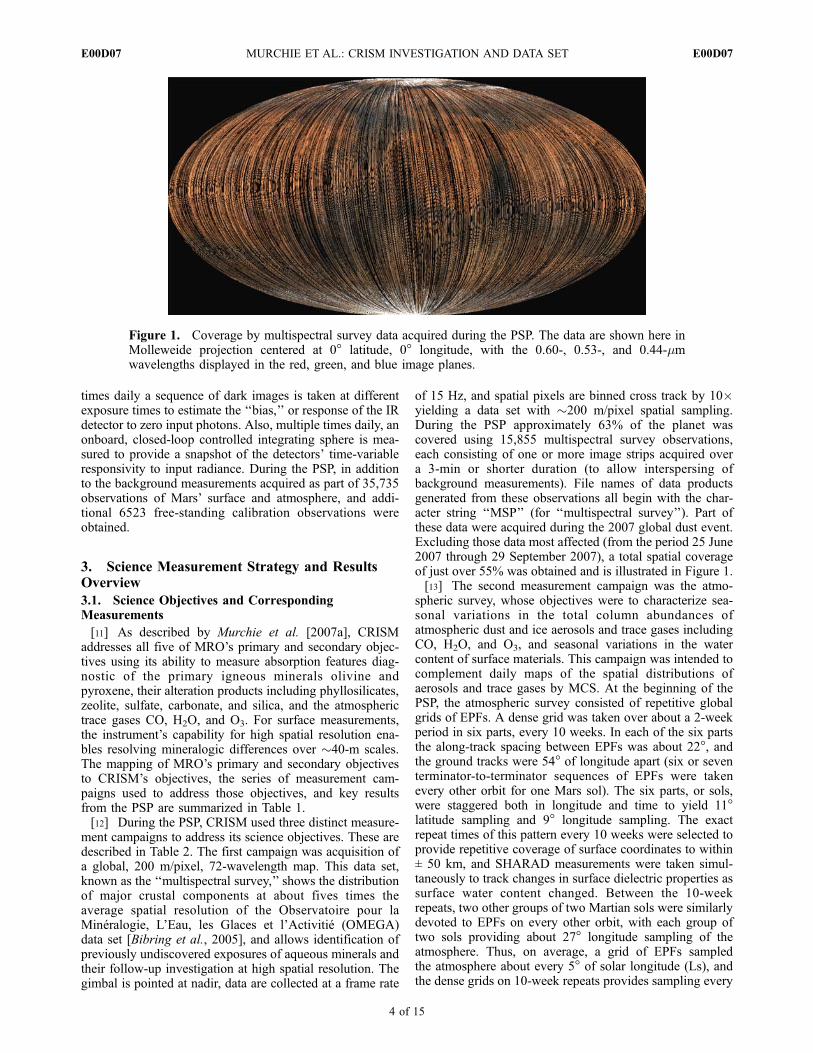
Table 1. Mapping of MRO Objectives to Derived CRISM Science Objectives, Measurement Strategies, and Key Findings From the
PSPa
MRO Science Objective CRISM Science Objective Relevant CRISM Measurements Key Findings
Search for evidenceof aqueous and/orhydrothermal activity
Identify and map mineraldeposits indicating thecharacteristics and distributionsof past water environments
Multispectral survey mappingto inventory the distributionand geologic settingsof aqueous deposits.
At least 10 distinct classes of depositswith different morphologies,geologic settings, and ages containconcentrations of aqueous minerals.b
High spatial and spectraltargeted observations tocharacterize selected sitesin detail, coordinated withHiRISE and CTX imaging.
Major classes of alterationproducts includephyllosilicates,carbonates, hydratedsilica, and sulfates.b,c,d,e,f,g,h
Map and characterizethe composition,geology, andstratigraphy ofsurface deposits
Map the distribution of mineralphases indicative igneous andsedimentary rock units
Multispectral survey mappingto provide context.
Noachian crust contains a complexstratigraphy of volcanic materialsof different composition withphyllosilicate and carbonate-bearingmaterials.b,c,d,e,j,n,o
High spatial and spectraltargeted observations tocharacterize selected sitesin detail, coordinated withHiRISE and CTX imaging.
This is superposed byHesperian-aged volcanics,and hydrated silica- andsulfate-containing deposits.f,g,h,i,j,p
Characterize seasonalvariations in dust andice aerosols and watercontent of surfacematerials
Monitor spatial andseasonal variation intrace gases and aerosols.
Regular emission phasefunctions, in repeatinglatitude/longitude grid.
Spatial and seasonalvariations in CO,H2O vapor, O3, anddust and ice aerosols.k
Monitor formation and ablationof H2O and CO2 ices in theseasonal cap
Nadir hyperspectral measurementsto fill time between targetedobservations and multispectral survey.
2007 global dust event was monitored,and more accurate scatteringproperties of dust determined.l
Regular monitoring of volatilecondensation and sublimationat selected circumpolar sites,coordinated with HiRISEand CTX imaging.
Monitoring of selectedpolar sites revealedprocesses of H2O andCO2 condensationand sublimation.m
Provide information onthe atmospherecomplementary toreflown MCOinvestigations
Measure record of Mars’ earlyclimate recorded as mineraldeposits
High spectral resolutiontargeted measurements toidentify minerals diagnosticof past environments andsearch for carbonates.
A regional occurrence ofcarbonate rocks traps CO2,but not enough for anearly, thick atmosphere.e
A diversity of hydrated silicate andsulfates phases records past temporaland spatial variations in thenear-surface environment. b,c,d,e,f,g,h,i,j
Identify new sites withhigh science potentialfor future investigation
Identify previouslyundiscovered siteswith a mineral recordof past waterenvironments
Multispectral survey mappingat key wavelengths toidentify new mineral exposures.
New classes of depositsdiscovered include carbonates,hydrated silica, mixedkaolinite/acid sulfates,phyllosilicate-rich deltaic deposits.e,f,n,o,p
Follow-up high-resolutioncoordinated observationsby CRISM, HiRISE, and CTX.
�10,000 exposures >1 km2
predominantly in Noachian units.b,c
aMRO, Mars Reconnaissance Orbiter; CRISM, Compact Reconnaissance Imaging Spectrometer; PSP, primary science phase.bMurchie et al. [2009a].cMustard et al. [2008].dBishop et al. [2008].eEhlmann et al. [2008b].fMilliken et al. [2008].gMurchie et al. [2009b].hBishop et al. [2007].iRoach et al. [2009].jMcKeown et al. [2009].kSmith et al. [2009].lWolff et al. [2007].mTitus et al. [2008].nGrant et al. [2008].oEhlmann et al. [2008a].pWray et al. [2009].
E00D07 MURCHIE ET AL.: CRISM INVESTIGATION AND DATA SET
3 of 15
E00D07
times daily a sequence of dark images is taken at differentexposure times to estimate the ‘‘bias,’’ or response of the IRdetector to zero input photons. Also, multiple times daily, anonboard, closed-loop controlled integrating sphere is mea-sured to provide a snapshot of the detectors’ time-variableresponsivity to input radiance. During the PSP, in additionto the background measurements acquired as part of 35,735observations of Mars’ surface and atmosphere, and addi-tional 6523 free-standing calibration observations wereobtained.
3. Science Measurement Strategy and ResultsOverview
3.1. Science Objectives and CorrespondingMeasurements
[11] As described by Murchie et al. [2007a], CRISMaddresses all five of MRO’s primary and secondary objec-tives using its ability to measure absorption features diag-nostic of the primary igneous minerals olivine andpyroxene, their alteration products including phyllosilicates,zeolite, sulfate, carbonate, and silica, and the atmospherictrace gases CO, H2O, and O3. For surface measurements,the instrument’s capability for high spatial resolution ena-bles resolving mineralogic differences over �40-m scales.The mapping of MRO’s primary and secondary objectivesto CRISM’s objectives, the series of measurement cam-paigns used to address those objectives, and key resultsfrom the PSP are summarized in Table 1.[12] During the PSP, CRISM used three distinct measure-
ment campaigns to address its science objectives. These aredescribed in Table 2. The first campaign was acquisition ofa global, 200 m/pixel, 72-wavelength map. This data set,known as the ‘‘multispectral survey,’’ shows the distributionof major crustal components at about fives times theaverage spatial resolution of the Observatoire pour laMineralogie, L’Eau, les Glaces et l’Activitie (OMEGA)data set [Bibring et al., 2005], and allows identification ofpreviously undiscovered exposures of aqueous minerals andtheir follow-up investigation at high spatial resolution. Thegimbal is pointed at nadir, data are collected at a frame rate
of 15 Hz, and spatial pixels are binned cross track by 10�yielding a data set with �200 m/pixel spatial sampling.During the PSP approximately 63% of the planet wascovered using 15,855 multispectral survey observations,each consisting of one or more image strips acquired overa 3-min or shorter duration (to allow interspersing ofbackground measurements). File names of data productsgenerated from these observations all begin with the char-acter string ‘‘MSP’’ (for ‘‘multispectral survey’’). Part ofthese data were acquired during the 2007 global dust event.Excluding those data most affected (from the period 25 June2007 through 29 September 2007), a total spatial coverageof just over 55% was obtained and is illustrated in Figure 1.[13] The second measurement campaign was the atmo-
spheric survey, whose objectives were to characterize sea-sonal variations in the total column abundances ofatmospheric dust and ice aerosols and trace gases includingCO, H2O, and O3, and seasonal variations in the watercontent of surface materials. This campaign was intended tocomplement daily maps of the spatial distributions ofaerosols and trace gases by MCS. At the beginning of thePSP, the atmospheric survey consisted of repetitive globalgrids of EPFs. A dense grid was taken over about a 2-weekperiod in six parts, every 10 weeks. In each of the six partsthe along-track spacing between EPFs was about 22�, andthe ground tracks were 54� of longitude apart (six or seventerminator-to-terminator sequences of EPFs were takenevery other orbit for one Mars sol). The six parts, or sols,were staggered both in longitude and time to yield 11�latitude sampling and 9� longitude sampling. The exactrepeat times of this pattern every 10 weeks were selected toprovide repetitive coverage of surface coordinates to within± 50 km, and SHARAD measurements were taken simul-taneously to track changes in surface dielectric properties assurface water content changed. Between the 10-weekrepeats, two other groups of two Martian sols were similarlydevoted to EPFs on every other orbit, with each group oftwo sols providing about 27� longitude sampling of theatmosphere. Thus, on average, a grid of EPFs sampledthe atmosphere about every 5� of solar longitude (Ls), andthe dense grids on 10-week repeats provides sampling every
Figure 1. Coverage by multispectral survey data acquired during the PSP. The data are shown here inMolleweide projection centered at 0� latitude, 0� longitude, with the 0.60-, 0.53-, and 0.44-mmwavelengths displayed in the red, green, and blue image planes.
E00D07 MURCHIE ET AL.: CRISM INVESTIGATION AND DATA SET
4 of 15
E00D07
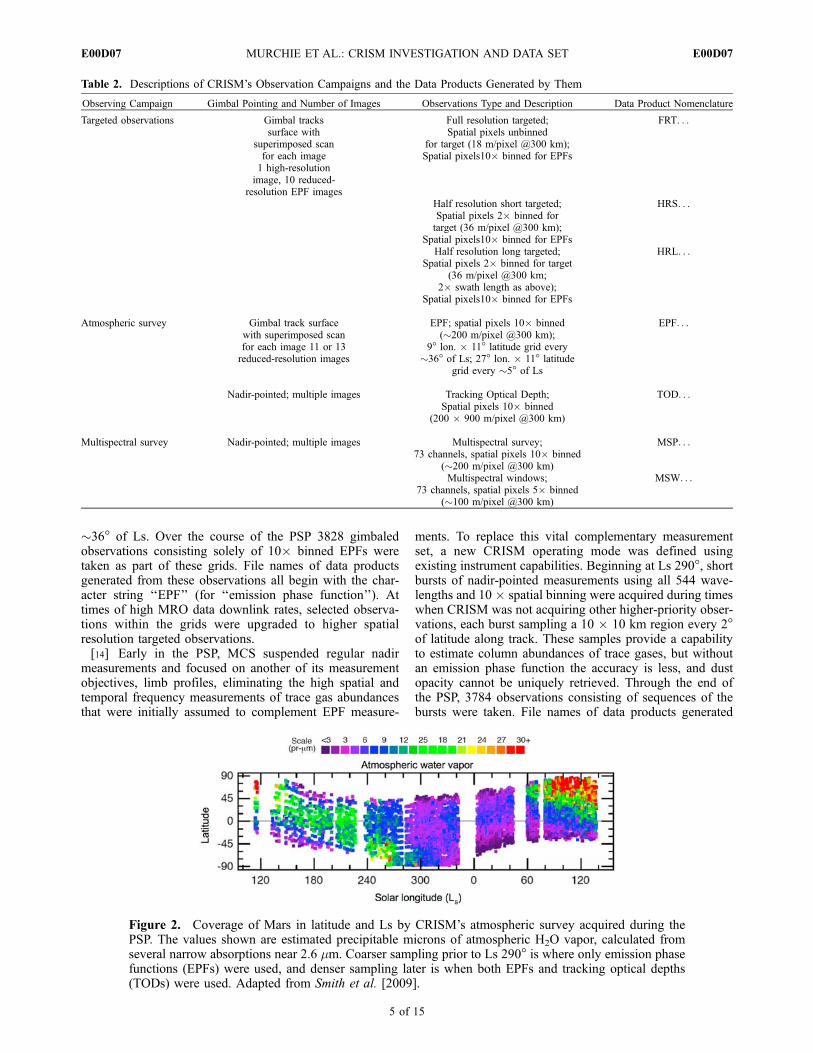
�36� of Ls. Over the course of the PSP 3828 gimbaledobservations consisting solely of 10� binned EPFs weretaken as part of these grids. File names of data productsgenerated from these observations all begin with the char-acter string ‘‘EPF’’ (for ‘‘emission phase function’’). Attimes of high MRO data downlink rates, selected observa-tions within the grids were upgraded to higher spatialresolution targeted observations.[14] Early in the PSP, MCS suspended regular nadir
measurements and focused on another of its measurementobjectives, limb profiles, eliminating the high spatial andtemporal frequency measurements of trace gas abundancesthat were initially assumed to complement EPF measure-
ments. To replace this vital complementary measurementset, a new CRISM operating mode was defined usingexisting instrument capabilities. Beginning at Ls 290�, shortbursts of nadir-pointed measurements using all 544 wave-lengths and 10 � spatial binning were acquired during timeswhen CRISM was not acquiring other higher-priority obser-vations, each burst sampling a 10 � 10 km region every 2�of latitude along track. These samples provide a capabilityto estimate column abundances of trace gases, but withoutan emission phase function the accuracy is less, and dustopacity cannot be uniquely retrieved. Through the end ofthe PSP, 3784 observations consisting of sequences of thebursts were taken. File names of data products generated
Figure 2. Coverage of Mars in latitude and Ls by CRISM’s atmospheric survey acquired during thePSP. The values shown are estimated precipitable microns of atmospheric H2O vapor, calculated fromseveral narrow absorptions near 2.6 mm. Coarser sampling prior to Ls 290� is where only emission phasefunctions (EPFs) were used, and denser sampling later is when both EPFs and tracking optical depths(TODs) were used. Adapted from Smith et al. [2009].
Table 2. Descriptions of CRISM’s Observation Campaigns and the Data Products Generated by Them
Observing Campaign Gimbal Pointing and Number of Images Observations Type and Description Data Product Nomenclature
Targeted observations Gimbal trackssurface with
superimposed scanfor each image1 high-resolutionimage, 10 reduced-
resolution EPF images
Full resolution targeted;Spatial pixels unbinned
for target (18 m/pixel @300 km);Spatial pixels10� binned for EPFs
FRT. . .
Half resolution short targeted;Spatial pixels 2� binned fortarget (36 m/pixel @300 km);
Spatial pixels10� binned for EPFs
HRS. . .
Half resolution long targeted;Spatial pixels 2� binned for target
(36 m/pixel @300 km;2� swath length as above);
Spatial pixels10� binned for EPFs
HRL. . .
Atmospheric survey Gimbal track surfacewith superimposed scanfor each image 11 or 13reduced-resolution images
EPF; spatial pixels 10� binned(�200 m/pixel @300 km);
9� lon. � 11� latitude grid every�36� of Ls; 27� lon. � 11� latitude
grid every �5� of Ls
EPF. . .
Nadir-pointed; multiple images Tracking Optical Depth;Spatial pixels 10� binned
(200 � 900 m/pixel @300 km)
TOD. . .
Multispectral survey Nadir-pointed; multiple images Multispectral survey;73 channels, spatial pixels 10� binned
(�200 m/pixel @300 km)
MSP. . .
Multispectral windows;73 channels, spatial pixels 5� binned
(�100 m/pixel @300 km)
MSW. . .
E00D07 MURCHIE ET AL.: CRISM INVESTIGATION AND DATA SET
5 of 15
E00D07
from these observations all begin with the characterstring for ‘‘tracking optical depth’’ (TOD). Figure 2 showsthe latitude and Ls distribution of atmospheric surveymeasurements during the PSP; the addition of TODs dra-matically improved spatial and temporal sampling of tracegas variations.[15] CRISM’s third (and its primary) measurement cam-
paign was to identify and map the distribution of keyminerals at high spatial resolution, at thousands of high-priority targets including candidate sedimentary deposits,volcanic regions, crustal sections exposed in steep escarp-ments, and sites which exhibit evidence for concentrationsof aqueously formed minerals. This was accomplishedusing targeted observations with unbinned or 2� binnedcentral images. Binning was used in some cases to conservedata volume, and in other cases to allow acquisition of alonger central image (10 � 20 km) in the same amount oftime, when areal coverage was deemed more important thanspatial resolution. Typically, the observations were coordi-nated with HiRISE and CTX to provide simultaneous,overlapping coverage. The regions of interest selected fortargeting were initially compiled from mineralogicalexposures identified by OMEGA, the Thermal EmissionSpectrometer (TES) on Mars Global Surveyor [Christensenet al., 2001b], and the Thermal Emission Imaging System(THEMIS) on Mars Odyssey [Christensen et al., 2004],formations with light-toned layering identified in imagesfrom the Mars Orbiter Camera (MOC) on Mars GlobalSurveyor [Malin et al., 1992] and from THEMIS, and sitesfor polar monitoring identified from OMEGA, THEMIS,and MOC data. Later, regions of interest identified inHiRISE or CTX images and in CRISM’s multispectralsurvey were also targeted. File names of data productsgenerated from targeted observations begin with the char-acter string for ‘‘full resolution target’’ (FRT) if the centralimage is unbinned, for ‘‘half resolution short’’ (HRS) if it is2� binned but comparable in size, or ‘‘half resolution long’’(HRL) if 2� binned and extended in length along track.
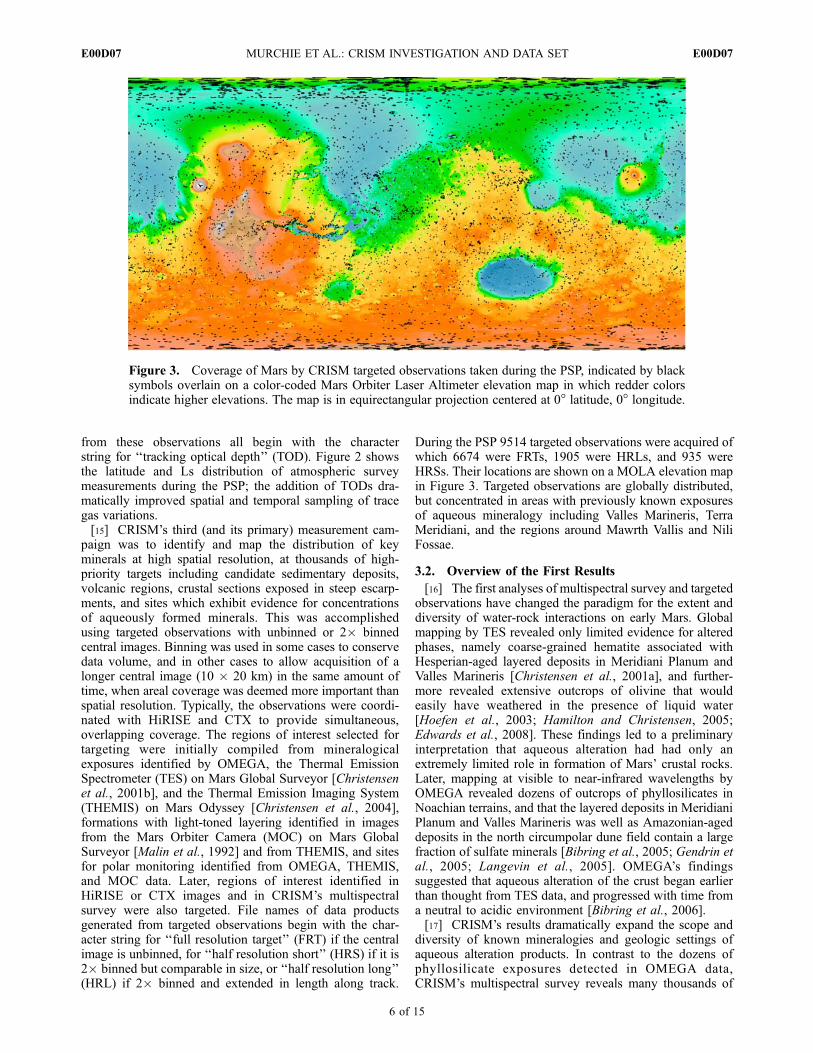
During the PSP 9514 targeted observations were acquired ofwhich 6674 were FRTs, 1905 were HRLs, and 935 wereHRSs. Their locations are shown on a MOLA elevation mapin Figure 3. Targeted observations are globally distributed,but concentrated in areas with previously known exposuresof aqueous mineralogy including Valles Marineris, TerraMeridiani, and the regions around Mawrth Vallis and NiliFossae.
3.2. Overview of the First Results
[16] The first analyses of multispectral survey and targetedobservations have changed the paradigm for the extent anddiversity of water-rock interactions on early Mars. Globalmapping by TES revealed only limited evidence for alteredphases, namely coarse-grained hematite associated withHesperian-aged layered deposits in Meridiani Planum andValles Marineris [Christensen et al., 2001a], and further-more revealed extensive outcrops of olivine that wouldeasily have weathered in the presence of liquid water[Hoefen et al., 2003; Hamilton and Christensen, 2005;Edwards et al., 2008]. These findings led to a preliminaryinterpretation that aqueous alteration had had only anextremely limited role in formation of Mars’ crustal rocks.Later, mapping at visible to near-infrared wavelengths byOMEGA revealed dozens of outcrops of phyllosilicates inNoachian terrains, and that the layered deposits in MeridianiPlanum and Valles Marineris was well as Amazonian-ageddeposits in the north circumpolar dune field contain a largefraction of sulfate minerals [Bibring et al., 2005; Gendrin etal., 2005; Langevin et al., 2005]. OMEGA’s findingssuggested that aqueous alteration of the crust began earlierthan thought from TES data, and progressed with time froma neutral to acidic environment [Bibring et al., 2006].[17] CRISM’s results dramatically expand the scope and
diversity of known mineralogies and geologic settings ofaqueous alteration products. In contrast to the dozens ofphyllosilicate exposures detected in OMEGA data,CRISM’s multispectral survey reveals many thousands of
Figure 3. Coverage of Mars by CRISM targeted observations taken during the PSP, indicated by blacksymbols overlain on a color-coded Mars Orbiter Laser Altimeter elevation map in which redder colorsindicate higher elevations. The map is in equirectangular projection centered at 0� latitude, 0� longitude.
E00D07 MURCHIE ET AL.: CRISM INVESTIGATION AND DATA SET
6 of 15
E00D07
resolvable exposures in Noachian units [Mustard et al.,2008]. In the Mawrth Valles region, coordinated targetedobservations reveal vertical layering of phyllosilicate com-position consistent over hundreds of thousands of squarekilometers [Bishop et al., 2008; McKeown et al., 2009]. Anumber of highland craters exhibit concentrations of phyllo-silicate in the lower beds of fans interpreted as deltaicdeposits formed in former intracrater lakes; these depositsare exobiologically important, because they may be capableof preserving organic chemistry formed in a habitable envi-ronment [Ehlmann et al., 2008a]. In other topographicallylow areas in the highland plateau plains, phyllosilicates havebeen found to underlie previously recognized deposits inter-preted to contain a large fraction of chloride minerals[Osterloo et al., 2008]. Active investigation now centers onthe depth, lateral extent, and continuity of phyllosilicates inthe highlands [Murchie et al., 2009a]. Two new classes ofaqueous minerals have been detected from orbit in bedrockexposures, Noachian-aged carbonates [Ehlmann et al.,2008b] and Hesperian-aged or younger hydrated silica[Milliken et al., 2008]. The presence of carbonates demon-strates that at least parts of the Noachian crust escapedsubsequent acidic conditions, and the carbonates’ restrictedextent places limits the amount of CO2 from an ancient denseatmosphere that is trapped in crustal rocks. The presence ofhydrated silica indicates that liquid water persisted later intoMartian history than previous evidence had suggested.[18] CRISM’s higher spatial resolution coverage of sul-
fate-containing layered deposits also provides new con-straints on the emplacement and distribution of thosedeposits. At various locations in and surrounding VallesMarineris, including Juventae Chasma [Bishop et al., 2009],Candor Chasma [Murchie et al., 2009b; Roach et al., 2009],and Aram Chaos (K. Lichtenberg et al., Stratigraphy ofhydrated sulfates in the sedimentary deposits of AramChaos, Mars, submitted to Journal of Geophysical Research,2009), layers containing monohydrated and polyhydratedsulfates form sharp contacts, and monohydrated sulfateusually underlies polyhydrated sulfate; in eastern CandorChasma, they form a complex interbedded sequence. InAram Chaos, the hydrated sulfates are in turn superposedon a thin layer of material containing a hydroxylatedsulfate. The layering of sulfate mineralogies suggestseither changes in the depositional environment or diagen-esis [Murchie et al., 2009b; Roach et al., 2009]. Outlyingoccurrences of sulfate-containing layered material resem-bling the deposits in Meridiani Planum have been foundto the east in Schiaparelli Crater [Wiseman et al., 2009].Sulfates have also been detected in layered, intracraterdeposits in Terra Sirenum, where alunite and othersulfates occur together with the phyllosilicate mineralkaolinite [Swayze et al., 2008; Wray et al., 2008, 2009];these deposits are interpreted as having formed in lacus-trine environments. Overall, the spatial distribution ofsulfate-bearing deposits is consistent with models of evap-orite deposition by Hesperian-aged groundwater discharge,providing a unifying mechanism for emplacing thesewidely separated materials [Andrews-Hanna et al., 2007;Murchie et al., 2009b; Lichtenberg et al., submittedmanuscript, 2009].[19] Finally, CRISM has also provided new evidence for
geologically recent climate and present-day seasonal and
atmospheric phenomena. Late summer residuals of theseasonal polar cap correlate with high concentrations ofhydrogen interpreted as ground ice, measured by the MarsOdyssey gamma-ray spectrometer [Calvin et al., 2009].This finding suggests a relationship between surficial occur-rences of ice and either the present-day deposition of groundice or the preservation of relict ground ice. During subli-mation of CO2 ice in the seasonal polar caps, the formationof fan- and spider-like features can be modeled by adiabaticcooling of CO2 gas formed by solar heating under the icethat is released and freezes to form downwind frost streaks[Titus et al., 2008]. Analysis of EPF measurements acquiredduring the ‘‘2007 global dust event’’ reveals that atmo-spheric dust has a higher single scattering albedo thanpreviously assumed, providing up to 10�K less atmosphericheating (depending on altitude) than current global circula-tion models assume [Wolff et al., 2009]. Spatial and seasonalvariations in atmospheric gases, determined using thecollection of EPF and TOD measurements, show thatfollowing the global dust event atmospheric H2O vaporwas unusually low compared with previous Mars years. Forthe first time, mapping of CO revealed spatial seasonalvariations in column abundance where this gas was con-centrated by autumn condensation of CO2 in the seasonalpolar caps, and diluted by its springtime sublimation [Smithet al., 2009].
4. Data Product Generation
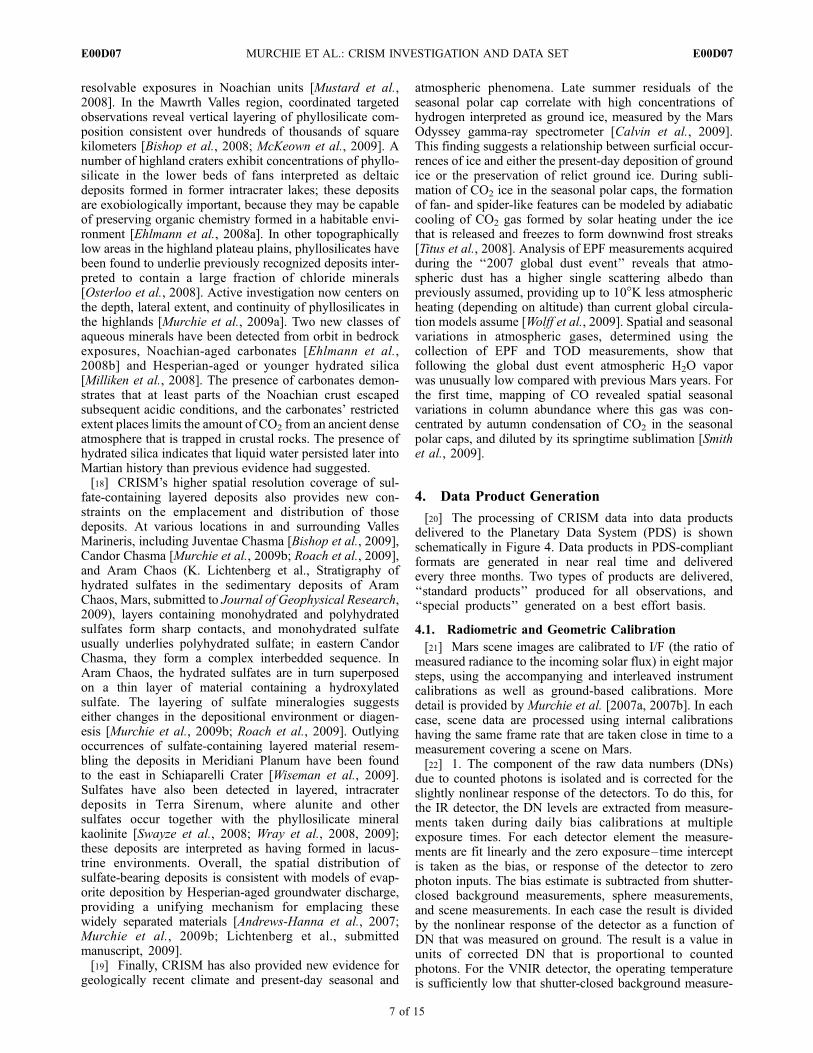
[20] The processing of CRISM data into data productsdelivered to the Planetary Data System (PDS) is shownschematically in Figure 4. Data products in PDS-compliantformats are generated in near real time and deliveredevery three months. Two types of products are delivered,‘‘standard products’’ produced for all observations, and‘‘special products’’ generated on a best effort basis.
4.1. Radiometric and Geometric Calibration
[21] Mars scene images are calibrated to I/F (the ratio ofmeasured radiance to the incoming solar flux) in eight majorsteps, using the accompanying and interleaved instrumentcalibrations as well as ground-based calibrations. Moredetail is provided by Murchie et al. [2007a, 2007b]. In eachcase, scene data are processed using internal calibrationshaving the same frame rate that are taken close in time to ameasurement covering a scene on Mars.[22] 1. The component of the raw data numbers (DNs)
due to counted photons is isolated and is corrected for theslightly nonlinear response of the detectors. To do this, forthe IR detector, the DN levels are extracted from measure-ments taken during daily bias calibrations at multipleexposure times. For each detector element the measure-ments are fit linearly and the zero exposure–time interceptis taken as the bias, or response of the detector to zerophoton inputs. The bias estimate is subtracted from shutter-closed background measurements, sphere measurements,and scene measurements. In each case the result is dividedby the nonlinear response of the detector as a function ofDN that was measured on ground. The result is a value inunits of corrected DN that is proportional to countedphotons. For the VNIR detector, the operating temperatureis sufficiently low that shutter-closed background measure-
E00D07 MURCHIE ET AL.: CRISM INVESTIGATION AND DATA SET
7 of 15
E00D07
ments sample only bias without measurable dark current, sothe background measurements are used instead of dedicatedbias calibrations to estimate bias.[23] 2. For the IR detector only, bias-corrected and
linearized DNs from interleaved background measurementsare subtracted from similarly corrected scene and integrat-ing sphere measurements. This step removes internal emis-sions of the spectrometer cavity that illuminate the IRdetector.[24] 3. For both detectors, bias-, linearity-, and back-
ground-corrected scene and sphere data are divided byexposure time, yielding a result that is proportional tomeasured radiance.[25] 4. For both detectors, at each row, the scattered light
from the grating that is measured in dedicated columns atthe edge of the scene and sphere images is subtracted fromthe data.[26] 5. For both detectors, sphere measurements are
divided by a ground-based model of the sphere’s spectralradiance, yielding a measure of responsivity of each detec-tor element. That responsivity is time-variable, and affectedby detector temperature and temperature-dependent trans-missivities of the beam splitter and of the detector-mountedfilters. However, at VNIR wavelengths <560 nm the trans-missive optics are spectrally featureless and the integrating
sphere has low spectral radiance, so a ground-based mea-surement of responsivity is used instead.[27] 6. The processed scene data are divided by the
responsivity model, yielding estimated scene spectral radi-ance.[28] 7. Residual calibration nonuniformity is removed
using a ‘‘flat field’’ correction. Scene measurements are inprinciple flat fielded using the radiometric model of theonboard integrating sphere, but there are artifacts in thatmodel at the scale of one to several detector elements. Toremove these, a flat field image was constructed frommultiple measurements of bland, dusty regions of Mars,whose radiances were normalized to unity at each wave-length. The radiances of other scenes are divided by the flatfield to correct the propagated artifacts.[29] 8. Flat field–corrected scene radiances are divided
by a solar spectrum convolved through CRISM’s bandpasses measured on ground, scaled to Mars’ solar distance,yielding I/F.[30] Pointing calculations and geolocation are done on a
pixel-by-pixel basis. Latitude and longitude are calculatedfor each pixel using the line of sight intercept of the field ofview with the MOLA shape model of Mars. Photometricangles are evaluated relative both to the shape model andrelative to the MOLA areoid. Ancillary data useful forfurther processing steps, including MOLA slope and slope
Figure 4. Schematic representation of pipeline processing of CRISM data products delivered to thePlanetary Data System.
E00D07 MURCHIE ET AL.: CRISM INVESTIGATION AND DATA SET
8 of 15
E00D07
azimuth and TES bolometric albedo and thermal inertia, areresampled from publicly released data sets into the nonmap-projected sensor space of each detector element in theradiance and I/F data.[31] The results of these steps are four complementary
data sets containing raw data and the calibration filesneeded to process them, as well as data calibrated usingthe best algorithms available at the time of processing:[32] 1. Experiment data records (EDRs) contain raw
images taken either as scene measurements or duringinternal calibrations.[33] 2. Targeted reduced data records (TRDRs) contain
image data for all types of scene observations, calibrated tounits of radiance and I/F.[34] 3. Derived data records (DDRs) contain image planes
with the latitude, longitude, photometric angles, and otherinformation for each image pixel in the TRDRs. Thelatitude and longitude support map projection of theTRDRs, whereas the photometric angles and ancillaryinformation support correction of the TRDRs for illumina-tion and atmospheric effects.[35] 4. Calibration data records (CDRs) contain the vec-
tors and matrices used to process data from raw form,including those derived from in-flight calibrations as wellas ground-derived values. The calibration process is obvi-ously complicated and users are not recommended toattempt to redo processing to the TRDR level themselves;rather, this is for archival purposes to assist in diagnosingartifacts in the calibrated data.
4.2. Additional Radiometric Corrections
[36] The most basic step in further processing of datacalibrated to I/F is a correction for illumination effects andfor attenuation by atmospheric gases. Three methods havebeen developed for this purpose. The first method, the‘‘volcano scan correction,’’ is the correction typically appliedto single targeted observations. The data are divided by thecosine of the solar incidence angle and by a scaled atmo-spheric transmission spectrum obtained during an observa-tion crossing Olympus Mons [Bibring et al., 2005; Mustardet al., 2008]. This corrects for atmospheric gases but notaerosols. All of the information required for this operation isincluded with the data set delivered to the PDS. I/F comesdirectly from TRDRs, and solar incidence angles from theDDRs. The scaled atmospheric transmission spectrum andan explanation of its application are included as filesformatted as CDRs, whose nomenclature begins with thestring ‘‘CDR4_AT.’’ There are separate versions for eachinstrument configuration, as explained in documentationaccompanying the delivered data. (A similar set of filescontaining the wavelengths for each detector element, usedin spectral data analysis, has a nomenclature that beginswith the string ‘‘CDR4_WA.’’)[37] The second atmospheric/photometric correction
method, the ‘‘Lambert albedo correction,’’ is applied duringstandard processing to mosaics of multispectral dataacquired over a range of atmospheric and illuminationconditions. That method is discussed in more detail insection 4.4. The third method is applied to selected targetedobservations. Using atmospheric gas and aerosol abundancefrom similar Ls as discussed in section 4.4 as a startingguess, the program Discrete Ordinates Radiative Transfer
(DISORT) [Stamnes et al., 1988] is run iteratively to modelboth surface and atmospheric radiances to minimize atmo-spheric gas bands, and Lambert albedo is retrieved.
4.3. Data Accuracy and Precision
4.3.1. Radiometric Calibration Accuracy, VersionHistory, and Caveats[38] The goals for radiometric calibration accuracy
developed for CRISM prior to MRO launch were (1) 10%absolute accuracy at 630 nm (to support mixture modelingusing laboratory spectra); (2) 1% relative accuracy, com-paring 0.45 and 0.75 mm (to measure the decrease inreflectance below 0.8 mm due to ferric iron); (3) 0.5%relative accuracy, for adjacent channels near 1 mm (tomeasure the 1-mm absorption due to ferrous and ferricminerals); (4) 0.25% relative accuracy, for adjacent channelsnear 2.3 mm (to measure absorptions due to phyllosilicates,hydrated silica and sulfates, and carbonates); and (5) 1%relative accuracy, comparing 1.6 mm versus 2.5 mm and2.5 versus 3.1 mm (to measure spectral continuum, pyroxeneabsorption bands, and depth of the 3-mm H2O absorption).[39] Attainment of these goals was evaluated over the
VNIR wavelength range by comparing CRISM data withsimultaneously acquired PANCAM measurements of large,uniform areas at the MER landing sites (e.g., ‘‘Cliff Hanger’’in Figure 19 of Arvidson et al. [2008]). Over the IRwavelength range it was evaluated by comparison of CRISMdata with OMEGA measurements of the same sites. In bothcases, corrections for photometric and atmospheric effectswere made to simulate OMEGA or PANCAM data atCRISM geometry. The results of these comparisons andother results led to updates in the calibration; the valuesreported below pertain to the current version, version 2. Inthe comparison of CRISM’s VNIR wavelength range withPANCAM data, goal 1 (absolute calibration) is met, andgoal 2 (spectral slope at 0.45–0.75 mm) is close to beingmet. The comparison of CRISM’s VNIR wavelength rangeat 440–1000 nm with PANCAM data suggests that absolutecalibration at those wavelengths may be good typically to±5%. Independent comparison of CRISM’s VNIR wave-length range with MARCI data yields similar agreement towithin ±2–3% [Wolff et al., 2009]. The relative accuracy ofwavelengths near 1 mm does not meet goal 3 and is closer to1%, but is expected to meet this goal after the upgrade tocalibration version 3 described below. Systematic channel-to-channel variations appear in multiple scenes and may beattributable to errors in the radiometric model of theintegrating sphere; reduction of these artifacts is plannedfor version 3. The relative accuracy channel-to-channel near2.3 mm either meets or is close to goal 4, 0.25%. Goal 5 wasnot initially met owing to errors in continuum slope asdescribed below, that were addressed using CRISM obser-vations of Deimos, but this goal may now be met.[40] As is typical of other imaging investigations on
planetary missions, as data were acquired in-flight, previ-ously recognized calibration issues have become betterquantified and some new issues have emerged. In response,the calibration algorithm goes through periodic upgrades.Which calibration version was used to process a particularobservation is coded as the last character of the root filename. In addition, the full list of calibration files applied tothe data is given in the detached PDS label. The initial
E00D07 MURCHIE ET AL.: CRISM INVESTIGATION AND DATA SET
9 of 15
E00D07
version of the calibration, version 0, was based on strictapplication of ground-derived performance (most notablythe radiometric model of the integrating sphere), and using arelative simple estimate of scattered light from the grating(interpolating between values from the scattered lightcolumns of the detector). Once Mars observations wereacquired, several problems became apparent, especially (1) afield angle–dependent shape to VNIR spectra that wastraced to the overly simplistic treatment of scattered lightfrom the grating; (2) systematic, column-to-column differ-ences in spectral shape, traced to uncorrected artifacts ofnoise in ground calibration data; (3) inaccurate spectral shapeat VNIR wavelengths <0.5 mm, traced to random noise andsystematic processing errors using the low internal integrat-ing sphere radiance at those wavelengths; (4) spurious, sharppeaks or troughs at boundaries of detector zones, traced tolight leakage at the boundaries of the order-sorting filters;(5) shallow, systematic bumps at wavelengths where effectsof atmospheric H2O vapor were inaccurately removed fromground calibration data; (6) intermittently elevated values ofI/F at particular detector columns and wavelengths, traced touncorrected, transient elevated bias in particular detectorelements, discussed below; and (7) a broad, shallow rise inI/F centered near 3.4 mm, resulting from incomplete imple-mentation of a correction for leaked second-order light inzone 3 of the IR detector.[41] The next version of the calibration, IR version 1 and
VNIR version 2 (VNIR version 1 having been abandoned),addressed the first six of the above issues. Changes made tothe processing included improved noise correction andinterpolation across detector-zone boundaries in ground-based calibration data, modeling scattered light as a poly-nomial function of field angle, adoption of fixed values ofresponsivity at <0.56 mm, and introduction of a rudimentaryfilter to interpolate over detector elements when they exhibittransient high bias levels.[42] VNIR version 2 and IR version 1 were used in the
comparison with OMEGA measurements of bland, dustyareas of Mars, and a comparison of CRISM measurementsof Deimos with ground-based measurements [Lynch et al.,2007]. Discrepancies drove an update in IR calibration toversion 2. The comparison with OMEGA indicated system-atic differences between the two data sets in continuumslope at >1.5 mm as well as a recurring, systematic ‘‘bump’’near 2.55 mm. The same features appeared in the spectrumof Deimos, which is an ideal calibration target because itsspectrum is believed to be smooth and it exhibits noatmospheric gas absorptions. The 2.55-mm bump was tracedto incomplete removal of atmospheric water vapor from thespectra of the ground calibration standard used for theintegrating sphere; the error in the continuum slope at>1.5 mm was modeled as a small pointing error at theground calibration standard, which slightly vignetted thestandard (incoming rays from the standard did not reach partof the aperture, affecting how the multizoned gratings weresampled). Corrections for both effects were derived fromfirst principles of instrument performance. Additionalchanges in IR version 2 included (1) refinements to thecorrections for noise and light leakage in detector-zoneboundaries in ground-based calibration data; (2) increasingthe threshold for filtering pixels with elevated bias, toremediate aliasing that the initial filter introduced into the
data; and (3) implementation of the correction for leakedsecond-order light in zone 3 of the IR detector. After allthese changes, a shallow ‘‘ramp’’ remained near 1.9 mm andit was corrected empirically.[43] Six known issues remaining in VNIR and IR version
2 are being investigated, and will be addressed in anupgrade to ‘‘version 3’’ or later versions. The first issue issystematic channel-to-channel variations, discussed above,with will be addressed by removing the correspondingsystematic error in the integrating sphere model. The secondissue is the temporal drift in wavelength calibration, thatis, the mapping of detector rows to wavelengths. Sea-sonal variations in optics temperatures introduced a time-dependent variation in CRISM’s wavelength calibrationabout 1 nm in magnitude (0.15 detector rows) [Smith etal., 2009]. The inaccuracy in wavelength calibration resultsin errors in removal of CO2 gas absorptions and elevation-dependent errors in the 2-mm wavelength region in atmo-spherically corrected data. The resulting artifact introduceserror into 1.9- to 2.1-mm absorptions owing to ices andbound water. A time-dependent wavelength calibration hassubsequently been developed that has with an accuracy ofabout 0.13 nm, as has a time-segmented volcano-scanatmospheric correction. Either the usage of the time-segmented volcano-scan correction or the incorporation ofa time-dependent wavelength calibration into the Lambertalbedo correction largely removes this effect. The third issueis high time-frequency variations in detector bias, or ‘‘noisypixels,’’ which affect up to a couple percent of the IRdetector elements. In spatial images at some wavelength,this appears as streaks, and the effect is worse and affectsmore detector elements at higher detector temperatures. Theeffects of these bias variations are being addressed using akernel filter that identifies outlying values from variousdetector elements statistically, and then interpolates overthem from the surrounding data. The fourth issue is aspurious peak or trough near 3.18 mm that appears in partsof the field of view, intermittently. It has been traced to anartifact of the zone 1-zone 2 boundary in the correction forleaked second-order light in zone 3 of the IR detector, and iscorrected in version 3. The fifth issue is time variations inspectral shape at <1.5 mm which result from slight irrepro-ducibility in shutter position viewing the internal integratingsphere, that change the way integrating sphere radiance issampled by the two zones of the IR grating. This is beingcorrected using the known effect of the phenomenon, whichcan be scaled from observation to observation by itssignature at the boundary of the two VNIR detector zones.This may be remedied by shifting the wavelength of thecorrection. The final issue is high spectral frequency oscil-lations at >3300. These are due to a Fabry-Perot effect in thezone of the detector-mounted filter that blocks out-of-orderlight at >2.7 mm. Small variations in that filter’s temperature(thickness) between observations of Mars and of the internalintegrating sphere cause�5% oscillations in system responseas a function of wavelength not to cancel out. This will beaddressed by using weighted averages of temporally adja-cent integrating sphere measurements, instead of using theclosest one in time as is the current practice.[44] Two other radiometric calibration issues are so inte-
gral to the data that further corrections are not likely. Thefirst of these latter issues is incomplete removal of grating
E00D07 MURCHIE ET AL.: CRISM INVESTIGATION AND DATA SET
10 of 15
E00D07
scatter at <0.44 mm. At these wavelengths, for mostMars scenes, radiance is low and strongly affected byresiduals from the correction for grating scatter. The secondissue is leakage of light though boundaries of differentzones of the detector-mounted filters. This leakage is scene-dependent and presently cannot be accurately estimatedand removed.[45] Given the various issues outlined above, some guide-
lines can be prescribed for reliability of the radiometriccalibration at different wavelengths. The following channelsat the ends of detector zones can be routinely excluded:(1) VNIR wavelengths less than 410 nm, between 644 and684 nm, and greater than 1023 nm. (2) IR wavelengthsless than 1021 nm, 2694 and 2701 nm, and greater than3924 nm.[46] The following channels may be degraded in their
accuracy in some observations, but intrascene variationsappear to be valid. In other words, information from thefollowing channels can be recovered by ratioing to somespectrally bland part of the same scene, preferably in thesame column(s) of an image: (1) VNIR wavelengths 410–442 nm (due to artifacts from the correction for gratingscatter, in very contrasty scenes). (2) VNIR wavelengths970–1023 nm and IR wavelengths 1021–1047 nm (theradiances can misalign between detectors; the reason isspeculated to be uncorrected effects of beam splitter tem-perature). (3) IR wavelengths near 1650 nm surroundingthe zone 1-zone 2 boundary. (4) IR wavelengths 2660–2800 nm (the reason is uncertain but may be due toproblems with correction of water vapor in measurementsof the ground calibration standard). (5) IR wavelengthsgreater than 3700 nm (there is a scene-dependent turn-down in radiances beyond 3700 nm due to unknowncauses).[47] In terms of scientific interpretation of the data, the
implications of calibration artifacts depend on preprocessingand the scene. Where it is possible to ratio a region ofinterest to a spectrally bland region in or near the samedetector column, narrow absorptions due to phyllosilicates,carbonates, silica, or sulfates can be measured in the relativespectra to an accuracy typically of much better than 1%.The information lost in the ratioing process is the visiblewavelength red slope and the exact shape of the 1-mmabsorption due to ferrous minerals. In unratioed spectra, theprimary cautions on interpretations are that (1) uncorrectedtemporal variations in shape of IR spectra at <1.5 mm canlead to errors in models of the relative abundances of olivineand pyroxene; (2) the 3.18-mm artifact can obscure the3.4-mm carbonate absorption, where carbonate is present;and (3) errors in correction for atmospheric CO2 at timesof extreme instrument temperatures lead to a superimposed‘‘ripple’’ near 2 mm that can partially obscure the 1.9-mmabsorption owing to molecular H2O-bearing phases.4.3.2. Geometric Calibration[48] The goal for accuracy in projection of CRISM data
onto the MOLA shape model was 600 m. That goal wasderived from an error estimate including expected knowl-edge of gimbal pointing, spacecraft position and attitude,and Mars cartographic control. In practice overlappingimages have typically mosaicked with errors of 200 m orless indicating superior performance of all aspects of MROand CRISM pointing.
4.4. Assembly of Map-Projected Multispectral Data
[49] Data taken as part of the multispectral survey aredelivered to the PDS processed beyond the TRDR level, byapplying an estimated correction for atmospheric and pho-tometric effects, mosaicking the image strips, and calculat-ing spectral parameters that give an overview of the datacontent. The assembled map is divided into 1964 separatetiles, each covering 5� in latitude with an approximatelysquare outline.4.4.1. Correction for Atmospheric and PhotometricEffects[50] The procedure for correcting multispectral survey
measurements is described in detail by McGuire et al.[2008]. The correction is done using three external, pregen-erated, hyperdimensional lookup tables. Using the latitude,longitude, elevation, Ls, and local solar time for a pixelextracted from the appropriate DDR, the column abundan-ces of atmospheric gases and aerosols are retrieved from a‘‘climatology’’ lookup table (‘‘ADR_CL’’) that representsaverage conditions from previous Mars years measured byTES. Next for the latitude, Ls, surface slope azimuth andmagnitude, and TES bolometric albedo and thermal inertiaretrieved from the DDR and the dust and ice aerosolopacities retrieved from the ADR_CL, surface-temperaturefor the pixel is retrieved from another lookup table(‘‘ADR_TE’’). Finally, for an I/F at some wavelength fromthe scene data, and values retrieved from the correspondingpixel location in the DDR and from the ADRs, a multipli-cative correction that was precomputed using DISORT[Stamnes et al., 1988] is retrieved from a third lookup table(‘‘ADR_AC’’) and applied. The output, ‘‘Lambert albedo,’’is an estimate of the surface I/F for hypothetical normalillumination and viewing geometry in the absence of anatmosphere and thermal emission.[51] Both the Lambert albedo and volcano-scan correc-
tions have limitations that affect interpretability of the dataespecially at <0.8 mm and near 2 mm. Both methods areaffected by a time-dependent drift of approximately ± 1 nmin wavelength calibration, as was described in section 4.3.1.This shift introduces artifacts from inaccurate modeling andremoval of the 2-mm CO2 absorption. In addition, thevolcano scan correction does not explicitly correct forscattering effects of atmospheric aerosols, leading tohigher-than-actual values of corrected I/F at most wav-lengths. In contrast, the Lambert albedo correction doesexplicitly correct for aerosols, using a model for dustscattering and climatological predictions of aerosol opticaldepth. The effects of this approach are concentrated atshorter wavelengths, but extend to all wavelengths inspecific seasons as discussed at greater length in section4.4.3. Finally, both corrections assume Lambertian scatter-ing from the surface, instead of using more accurate Hapkescattering functions [e.g., Johnson et al., 2006], introducingsystematic errors to corrected I/F that depend on thephotometric geometry of the observation.4.4.2. Calculation of Summary Products[52] Summary products are described by Pelkey et al.
[2007] and represent spectral indices indicative of theoccurrence of different mineral phases and atmosphericconstituents. Summary products may also be affected bydependencies on solar incidence angle, surface slopes,atmospheric conditions, detector artifacts, and response to
E00D07 MURCHIE ET AL.: CRISM INVESTIGATION AND DATA SET
11 of 15
E00D07
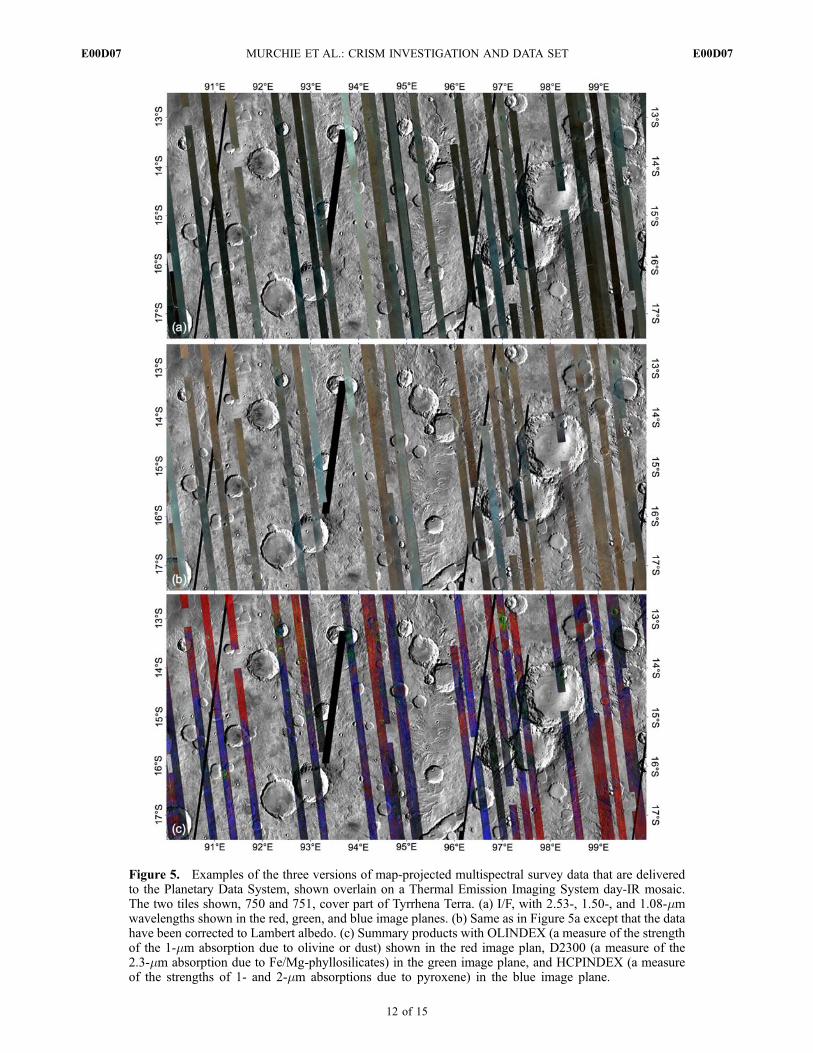
Figure 5. Examples of the three versions of map-projected multispectral survey data that are deliveredto the Planetary Data System, shown overlain on a Thermal Emission Imaging System day-IR mosaic.The two tiles shown, 750 and 751, cover part of Tyrrhena Terra. (a) I/F, with 2.53-, 1.50-, and 1.08-mmwavelengths shown in the red, green, and blue image planes. (b) Same as in Figure 5a except that the datahave been corrected to Lambert albedo. (c) Summary products with OLINDEX (a measure of the strengthof the 1-mm absorption due to olivine or dust) shown in the red image plan, D2300 (a measure of the2.3-mm absorption due to Fe/Mg-phyllosilicates) in the green image plane, and HCPINDEX (a measureof the strengths of 1- and 2-mm absorptions due to pyroxene) in the blue image plane.
E00D07 MURCHIE ET AL.: CRISM INVESTIGATION AND DATA SET
12 of 15
E00D07
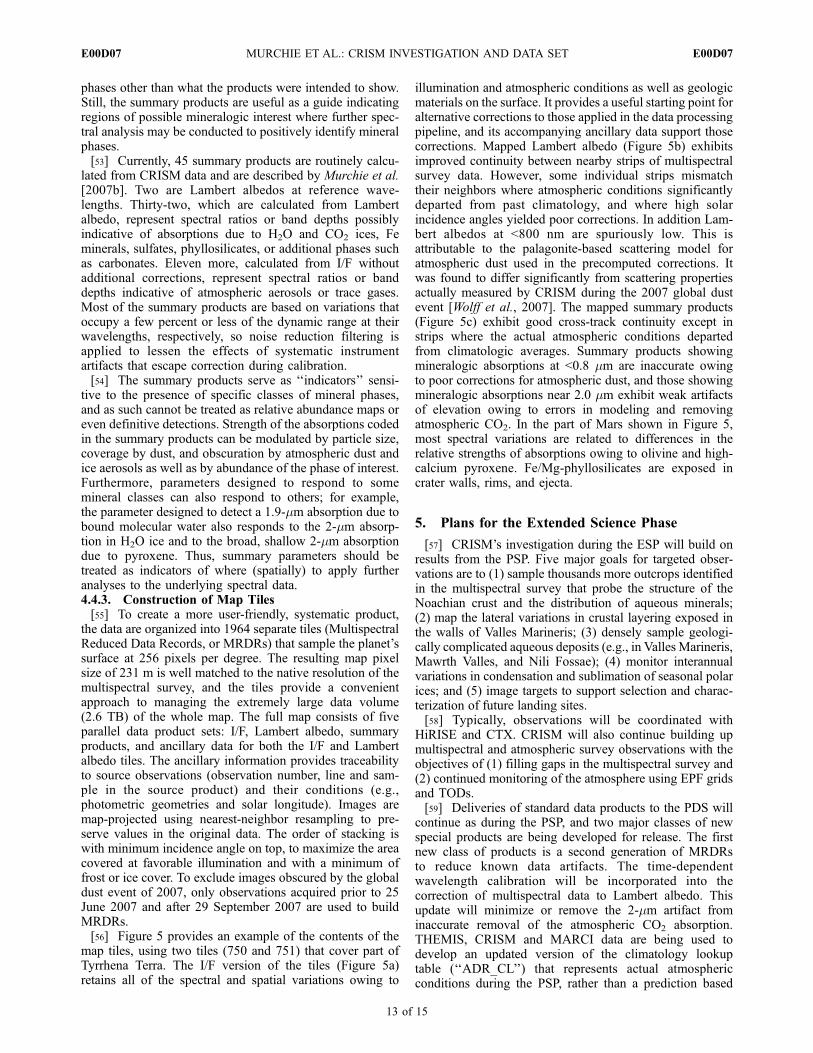
phases other than what the products were intended to show.Still, the summary products are useful as a guide indicatingregions of possible mineralogic interest where further spec-tral analysis may be conducted to positively identify mineralphases.[53] Currently, 45 summary products are routinely calcu-
lated from CRISM data and are described by Murchie et al.[2007b]. Two are Lambert albedos at reference wave-lengths. Thirty-two, which are calculated from Lambertalbedo, represent spectral ratios or band depths possiblyindicative of absorptions due to H2O and CO2 ices, Feminerals, sulfates, phyllosilicates, or additional phases suchas carbonates. Eleven more, calculated from I/F withoutadditional corrections, represent spectral ratios or banddepths indicative of atmospheric aerosols or trace gases.Most of the summary products are based on variations thatoccupy a few percent or less of the dynamic range at theirwavelengths, respectively, so noise reduction filtering isapplied to lessen the effects of systematic instrumentartifacts that escape correction during calibration.[54] The summary products serve as ‘‘indicators’’ sensi-
tive to the presence of specific classes of mineral phases,and as such cannot be treated as relative abundance maps oreven definitive detections. Strength of the absorptions codedin the summary products can be modulated by particle size,coverage by dust, and obscuration by atmospheric dust andice aerosols as well as by abundance of the phase of interest.Furthermore, parameters designed to respond to somemineral classes can also respond to others; for example,the parameter designed to detect a 1.9-mm absorption due tobound molecular water also responds to the 2-mm absorp-tion in H2O ice and to the broad, shallow 2-mm absorptiondue to pyroxene. Thus, summary parameters should betreated as indicators of where (spatially) to apply furtheranalyses to the underlying spectral data.4.4.3. Construction of Map Tiles[55] To create a more user-friendly, systematic product,
the data are organized into 1964 separate tiles (MultispectralReduced Data Records, or MRDRs) that sample the planet’ssurface at 256 pixels per degree. The resulting map pixelsize of 231 m is well matched to the native resolution of themultispectral survey, and the tiles provide a convenientapproach to managing the extremely large data volume(2.6 TB) of the whole map. The full map consists of fiveparallel data product sets: I/F, Lambert albedo, summaryproducts, and ancillary data for both the I/F and Lambertalbedo tiles. The ancillary information provides traceabilityto source observations (observation number, line and sam-ple in the source product) and their conditions (e.g.,photometric geometries and solar longitude). Images aremap-projected using nearest-neighbor resampling to pre-serve values in the original data. The order of stacking iswith minimum incidence angle on top, to maximize the areacovered at favorable illumination and with a minimum offrost or ice cover. To exclude images obscured by the globaldust event of 2007, only observations acquired prior to 25June 2007 and after 29 September 2007 are used to buildMRDRs.[56] Figure 5 provides an example of the contents of the
map tiles, using two tiles (750 and 751) that cover part ofTyrrhena Terra. The I/F version of the tiles (Figure 5a)retains all of the spectral and spatial variations owing to
illumination and atmospheric conditions as well as geologicmaterials on the surface. It provides a useful starting point foralternative corrections to those applied in the data processingpipeline, and its accompanying ancillary data support thosecorrections. Mapped Lambert albedo (Figure 5b) exhibitsimproved continuity between nearby strips of multispectralsurvey data. However, some individual strips mismatchtheir neighbors where atmospheric conditions significantlydeparted from past climatology, and where high solarincidence angles yielded poor corrections. In addition Lam-bert albedos at <800 nm are spuriously low. This isattributable to the palagonite-based scattering model foratmospheric dust used in the precomputed corrections. Itwas found to differ significantly from scattering propertiesactually measured by CRISM during the 2007 global dustevent [Wolff et al., 2007]. The mapped summary products(Figure 5c) exhibit good cross-track continuity except instrips where the actual atmospheric conditions departedfrom climatologic averages. Summary products showingmineralogic absorptions at <0.8 mm are inaccurate owingto poor corrections for atmospheric dust, and those showingmineralogic absorptions near 2.0 mm exhibit weak artifactsof elevation owing to errors in modeling and removingatmospheric CO2. In the part of Mars shown in Figure 5,most spectral variations are related to differences in therelative strengths of absorptions owing to olivine and high-calcium pyroxene. Fe/Mg-phyllosilicates are exposed incrater walls, rims, and ejecta.
5. Plans for the Extended Science Phase
[57] CRISM’s investigation during the ESP will build onresults from the PSP. Five major goals for targeted obser-vations are to (1) sample thousands more outcrops identifiedin the multispectral survey that probe the structure of theNoachian crust and the distribution of aqueous minerals;(2) map the lateral variations in crustal layering exposed inthe walls of Valles Marineris; (3) densely sample geologi-cally complicated aqueous deposits (e.g., in Valles Marineris,Mawrth Valles, and Nili Fossae); (4) monitor interannualvariations in condensation and sublimation of seasonal polarices; and (5) image targets to support selection and charac-terization of future landing sites.[58] Typically, observations will be coordinated with
HiRISE and CTX. CRISM will also continue building upmultispectral and atmospheric survey observations with theobjectives of (1) filling gaps in the multispectral survey and(2) continued monitoring of the atmosphere using EPF gridsand TODs.[59] Deliveries of standard data products to the PDS will
continue as during the PSP, and two major classes of newspecial products are being developed for release. The firstnew class of products is a second generation of MRDRsto reduce known data artifacts. The time-dependentwavelength calibration will be incorporated into thecorrection of multispectral data to Lambert albedo. Thisupdate will minimize or remove the 2-mm artifact frominaccurate removal of the atmospheric CO2 absorption.THEMIS, CRISM and MARCI data are being used todevelop an updated version of the climatology lookuptable (‘‘ADR_CL’’) that represents actual atmosphericconditions during the PSP, rather than a prediction based
E00D07 MURCHIE ET AL.: CRISM INVESTIGATION AND DATA SET
13 of 15
E00D07
on climatology. This update will minimize the mismatch ofoverlapping MSP strips acquired at different times. Finally,scattering properties of atmospheric dust are being updatedusing results from CRISM EPF measurements, and a secondversion of the lookup table to correct from I/F toLambert albedo (‘‘ADR_AC’’) will yield improved accuracyat <0.8 mm.[60] Second, an atmospherically corrected and map pro-
jected version of targeted observations is being developedfor release. These new products will be generated usingapproaches similar to those used to create MRDRs, withthree exceptions:[61] 1. Each map product will show only a single image.[62] 2. The map scale will be 3072 pixels per degree,
yielding a map pixel 19.3 m in scale, which is well matchedto the native resolution of targeted observation.[63] 3. A simplified atmospheric and photometric correc-
tion will be employed. Values of I/F are divided by cosineof the solar incidence angle, and corrected for atmosphericeffects using the volcano scan correction. This approachcorrects for atmospheric gases but not aerosols.
[64] Acknowledgments. The authors wish to thank all of the mem-bers of the CRISM and OMEGA teams who have contributed to planningand validation of CRISM observations and to testing of updates to theinstrument calibration.
ReferencesAndrews-Hanna, J., R. Phillips, and M. Zuber (2007), Meridiani Planumand the global hydrology of Mars, Nature, 446, 163–168, doi:10.1038/nature05594.
Arvidson, R. E., et al. (2008), Spirit Mars Rover mission to the ColumbiaHills, Gusev Crater: Mission overview and selected results from theCumberland Ridge to Home Plate, J. Geophys. Res., 113, E12S33,doi:10.1029/2008JE003183.
Bibring, J.-P., et al. (2005), Mars surface diversity as revealed by theOMEGA/Mars Express observations, Science, 307, 1576 – 1581,doi:10.1126/science.1108806.
Bibring, J.-P., et al. (2006), Global mineralogical and aqueous Mars historyderived from OMEGA/Mars Express data, Science, 312, 400–404,doi:10.1126/science.1122659.
Bishop, J., E. Noe Dobrea, S. Murchie, C. Weitz, W. Calvin, L. Roach,S. Pelkey, A. Brown, J. Mustard, and J.-P. Bibring (2007), Sulfates andmafic minerals in Juventae Chasma as seen by CRISM in coordinationwith OMEGA, HIRISE and context images, in Seventh InternationalConference on Mars, July 9–13, 2007, Pasadena CA [CD-ROM], LPIContrib., 1353, Abstract 3350.
Bishop, J. L., et al. (2008), Phyllosilicate diversity and past aqueous activityrevealed at Mawrth Vallis, Mars, Science, 321, 830–833, doi:10.1126/science.1159699.
Bishop, J. L., et al. (2009), Mineralogy of Juventae Chasma: Sulfates in thelight-toned mounds, mafics in the sand, and opal in the plains, J. Geo-phys. Res., doi:10.1029/2009JE003352, in press.
Calvin, W., L. Roach, F. Seelos, K. Seelos, R. Green, S. Murchie, andJ. Mustard (2009), CRISM observations of northern Martian latitudes insummer, J. Geophys. Res., doi:10.1029/2009JE003348, in press.
Christensen, P. R., R. V. Morris, M. D. Lane, J. L. Bandfield, and M. C.Malin (2001a), Global mapping of Martian hematite mineral deposits:Remnants of water-driven processes on early Mars, J. Geophys. Res.,106, 23,873–23,885, doi:10.1029/2000JE001415.
Christensen, P. R., et al. (2001b), Mars Global Surveyor Thermal EmissionSpectrometer experiment: Investigation description and surface scienceresults, J. Geophys. Res., 106, 23,823 – 23,871, doi:10.1029/2000JE001370.
Christensen, P. R., et al. (2004), The Thermal Emission Imaging System(THEMIS) for the Mars 2001 Odyssey Mission, Space Sci. Rev., 110,85–130.
Edwards, C. S., P. R. Christensen, and V. E. Hamilton (2008), Evidence forextensive olivine-rich basalt bedrock outcrops in Ganges and Eos chas-mas, Mars, J. Geophys. Res., 113, E11003, doi:10.1029/2008JE003091.
Ehlmann, B. L., J. F. Mustard, C. I. Fassett, S. C. Schon, J. W. Head III,D. J. DesMarais, J. A. Grant, and S. L. Murchie (2008a), Clay-bearing
minerals and organic preservation potential in sediments from a Martiandelta environment, Jezero crater, Nili Fossae, Mars, Nat. Geosci., 1, 355–358, doi:10.1038/ngeo207.
Ehlmann, B., et al. (2008b), Orbital identification of carbonate-bearingrocks on Mars, Science, 322, 1828–1832, doi:10.1126/science.1164759.
Gendrin, A., et al. (2005), Sulfates in Martian layered terrains: The OMEGA/Mars Express view, Science, 307, 1587–1591, doi:10.1126/science.1109087.
Hamilton, V. E., and P. R. Christensen (2005), Evidence for extensive,olivine-rich bedrock on Mars, Geology, 33, 433–436, doi:10.1130/G21258.1.
Hoefen, T. M., R. N. Clark, J. L. Bandfield, M. D. Smith, J. C. Pearl, andP. R. Christensen (2003), Discovery of olivine in the Nili Fossae region ofMars, Science, 302, 627–630, doi:10.1126/science.1089647.
Johnson, J. R., et al. (2006), Spectrophotometric properties of materialsobserved by Pancam on the Mars Exploration Rovers: 2. Opportunity,J. Geophys. Res., 111, E12S16, doi:10.1029/2006JE002762.
Langevin, Y., F. Poulet, J.-P. Bibring, and B. Gondet (2005), Sulfates in thenorth polar region of Mars detected by OMEGA/Mars Express, Science,307, 1584–1587, doi:10.1126/science.1109091.
Lynch, D. K., R. W. Russel, R. J. Rudy, S. Mazuk, C. Venturini, H. B.Hammel, M. V. Sykes, R. C. Puetter, and R. B. Perry (2007), Infraredspectra of Deimos (1–13 mm) and Phobos (3–13 mm), Astron. J.,134, 1459–1463, doi:10.1086/519975.
Malin, M. C., G. E. Danielson, A. P. Ingersoll, H. Masursky, J. Veverka,M. A. Ravine, and T. A. Soulanille (1992), The Mars Observer Camera,J. Geophys. Res., 97, 7699–7718, doi:10.1029/92JE00340.
Malin, M. C., et al. (2007), Context Camera investigation on board the MarsReconnaissance Orbiter, J. Geophys. Res., 112, E05S04, doi:10.1029/2006JE002808.
McCleese, D. J., J. T. Schofield, F. W. Taylor, S. B. Calcutt, M. C. Foote,D. M. Kass, C. B. Leovy, D. A. Paige, P. L. Read, and R. W. Zurek(2007), Mars climate sounder: An investigation of thermal and watervapor structure, dust and condensate distributions in the atmosphere,and energy balance of the polar regions, J. Geophys. Res., 112,E05S06, doi:10.1029/2006JE002790.
McEwen, A. S., et al. (2007), Mars Reconnaissance Orbiter’s High Resolu-tion Imaging Science Experiment (HiRISE), J. Geophys. Res., 112,E05S02, doi:10.1029/2005JE002605.
McGuire, P. C., et al. (2008), CRISM retrieval of surface Lambert albedosfor multispectral mapping of Mars with DISORT-based radiative transfermodeling, IEEE Trans. Geosci. Remote Sens., 46, 4020 – 4040,doi:10.1109/TGRS.2008.2000631.
McKeown, N. K., J. L. Bishop, E. Z. Noe Dobrea, M. Parente, B. L.Ehlmann, J. F. Mustard, S. L. Murchie, J.-P. Bibring, and E. Silver(2009), Characterization of phyllosilicates observed in the central MawrthVallis region, Mars, their potential formational processes, and implica-tions for past climate, J. Geophys. Res., doi:10.1029/2008JE003301, inpress.
Milliken, R., et al. (2008), Opaline silica in young deposits on Mars, Geol-ogy, 36, 847–850, doi:10.1130/G24967A.1.
Murchie, S., et al. (2007a), Compact Reconnaissance Imaging Spectrometerfor Mars (CRISM) on Mars Reconnaissance Orbiter (MRO), J. Geophys.Res., 112, E05S03, doi:10.1029/2006JE002682.
Murchie, S., E. Guinness, and S. Slavney (2007b), CRISM data productsoftware interface specification, ftp://pds-geosciences.wustl.edu/mro-crism/mro-m-crism-2-edr-v1/mrocr_0001/document/crism_dpsis.pdf,NASA Planet. Data Syst., Greenbelt, Md., 17 Aug.
Murchie, S. L., et al. (2009a), A synthesis of Martian aqueous mineralogyafter 1 Mars year of observations from the Mars Reconnaissance Orbiter,J. Geophys. Res., doi:10.1029/2009JE003342, in press.
Murchie, S., et al. (2009b), Evidence for the origin of layered deposits inCandor Chasma, Mars, J. Geophys. Res., doi:10.1029/2009JE003343, inpress.
Mustard, J., et al. (2008), Hydrated silicate minerals on Mars observed bythe CRISM instrument on MRO, Nature, 454, 305–309, doi:10.1038/nature07097.
Osterloo, M. M., V. E. Hamilton, J. L. Bandfield, T. D. Glotch, A. M.Baldridge, P. R. Christensen, L. L. Tornabene, and F. S. Anderson(2008), Chloride-bearing materials in the southern highlands of Mars,Science, 319, 1651–1654, doi:10.1126/science.1150690.
Pelkey, S. M., et al. (2007), CRISM multispectral summary products: Para-meterizing mineral diversity on Mars from reflectance, J. Geophys. Res.,112, E08S14, doi:10.1029/2006JE002831.
Roach, L. H., J. F. Mustard, S. L. Murchie, J.-P. Bibring, F. Forget, K. W.Lewis, O. Aharonson, M. Vincendon, and J. L. Bishop (2009), Testingevidence of recent hydration state change in sulfates on Mars, J. Geo-phys. Res., 114, E00D02, doi:10.1029/2008JE003245.
Seu, R., et al. (2007), SHARAD sounding radar on the Mars ReconnaissanceOrbiter, J. Geophys. Res., 112, E05S05, doi:10.1029/2006JE002745.
E00D07 MURCHIE ET AL.: CRISM INVESTIGATION AND DATA SET
14 of 15
E00D07
Smith, M. D., M. J. Wolff, R. T. Clancy, and S. L. Murchie (2009), Com-pact Reconnaissance Imaging Spectrometer observations of water vaporand carbon monoxide, J. Geophys. Res., 114, E00D03, doi:10.1029/2008JE003288.
Stamnes, K., S.-C. Tsay, K. Jayaweera, and W. Wiscombe (1988), Numeri-cally stable algorithm for discrete-ordinate-method radiative transfer inmultiple scattering and emitting layered media, Appl. Opt., 27, 2502–2509, doi:10.1364/AO.27.002502.
Swayze, G. A., et al. (2008), Discovery of the acid-sulfate mineral alunite inTerra Sirenum, Mars, using MRO CRISM: Possible evidence for acid-saline lacustrine deposits?, Eos Trans. AGU, 89(53), Fall Meet. Suppl.,Abstract P44A–04.
Titus, T. N., T. I. Michaels, A. Colaprete, H. H. Kieffer, Y. Langevin, S. L.Murchie, and M. Vincendon (2008), Exotic processes within the crypticregion of Mars: A new method for near real-time estimates of winddirection, in Third International Workshop on the Mars Atmosphere:Modeling and Observations, November 10–13, 2008, Williamsburg,VA, LPI. Contrib., 1447, Abstract 9043.
Wiseman, S. M., R. E. Arvidson, R. V. Morris, S. L. Murchie, F. P. Seelos,J. C. Andrews-Hanna, and CRISM Team (2009), Hydrated sulfate depos-its detected within Schiaparelli Crater, Mars, Lunar Planet. Sci., XL,Abstract 1798.
Wolff, M., R. T. Clancy, M. D. Smith, R. E. Arvidson, B. Cantor, M. Kahre,R. Morris, and F. Seelos (2007), Investigating the wavelength depen-dence of the single scattering albedo of Martian dust aerosols withCRISM and MARCI observations of the very dusty atmosphere in2007, Eos Trans. AGU, 88(52), Fall Meet. Suppl., Abstract P31D–03.
Wolff, M., M. Smith, R. T. Clancy, R. Arvidson, M. Kahre, F. Seelos IV,S. Murchie, and H. Savijarvi (2009), Wavelength dependence of dustaerosol single scattering albedo as observed by the Compact Reconnais-sance Imaging Spectrometer, J. Geophys. Res., 114, E00D04, doi:10.1029/2009JE003350.
Wray, J. J., et al. (2008), Clays and sulfates in a potential lacustrine eva-porite sequence at Columbus Crater, Mars, Eos Trans. AGU, 89(53), FallMeet. Suppl., Abstract P53B–1446.
Wray, J. J., S. L. Murchie, S. W. Squyres, F. P. Seelos, and L. L. Tornabene(2009), Diverse aqueous environments on ancient Mars revealed in thesouthern highlands, Geology, doi:10.1130/G30331A.1, in press.
Zurek, R. W., and S. E. Smrekar (2007), An overview of the Mars Recon-naissance Orbiter (MRO) science mission, J. Geophys. Res., 112,E05S01, doi:10.1029/2006JE002701.
�����������������������R. E. Arvidson and P. McGuire, Department of Earth and Planetary
Sciences, Washington University, Saint Louis, MO 63130, USA.O. S. Barnouin-Jha, D. L. Buczkowski, T. H. Choo, C. A. Harvel, D. C.
Humm, J. A. McGovern, M. F. Morgan, S. L. Murchie, H. Nair, G. W.Patterson, F. P. Seelos, K. D. Seelos, and H. W. Taylor, Johns HopkinsUniversity Applied Physics Laboratory, Laurel, MD 20723, USA.J.-P. Bibring and F. Poulet, Institut d’Astrophysique Spatiale, Universite
Paris Sud, F-91405 Orsay, France.C. D. Hash and E. Malaret, Applied Coherent Technology, 112 Elden
Street, Herndon, VA 20170, USA.J. F. Mustard, Department of Geological Sciences, Brown University,
Providence, RI 02912, USA.M. D. Smith, NASA Goddard Space Flight Center, 8800 Greenbelt Road,
Greenbelt, MD 20771, USA.T. N. Titus, U.S. Geological Survey, 2255 North Gemini Drive, Flagstaff,
AZ 86001, USA.M. J. Wolff, Space Science Institute, 4750 Walnut Street, Boulder, CO
80301, USA.
E00D07 MURCHIE ET AL.: CRISM INVESTIGATION AND DATA SET
15 of 15
E00D07


