Embed Size (px)
Citation preview

journal of MEMBRANE
SCIENCE
E L S E V I E R Journal of Membrane Science 101 (1995) 99-108
Compaction of microporous membranes used in membrane distillation. I. Effect on gas permeability
Kevin W. Lawson, Matthew S. Hall, Douglas R. Lloyd * Department of Chemical Engineering, Separations Research Program, The University of Texas at Austin, Austin, TX 78712-1062, USA
Received 17 August 1994; accepted 7 November 1994
Abstract
Membrane compaction effects are well documented in RO, UF, and gas separation, but little attention is paid to compaction effects in microporous membrane processes. This paper examines the effects of compaction on the gas permeability of micro- porous membranes to be used in MD. Contrary to what is observed in RO and UF systems where membrane permeability is reduced by compaction, limited compaction of microporous membranes can result in enhanced permeability. This enhancement is the result of decreased membrane thickness, which increases the pressure gradient across the membrane. An experimental method is devised to determine the effects of membrane compaction on permeability, and a theory for modifying flux equations to include a parameter for membrane compaction is introduced.
Keywords: Gas and vapor permeation; Membrane distillation; Microporous and porous membranes
1. Introduction
Membrane compaction can have significant effects on membrane performance under normal operating conditions. These effects are well documented in the literature for pressure driven applications such as reverse osmosis (RO), ultrafiltration (UF) [ 1-4], and gas separation [ 5 ]. The high pressures required in these applications tend to cause compaction of the membrane, which in turn reduces membrane permea- bility. Compaction densities the membrane's selective layer, and it effectively thickens the selective layer by densifying the membrane's support layer. Despite the attention membrane compaction has received in high pressure applications, little has been done to determine its effects in low pressure applications such as micro- filtration and, specifically, membrane distillation. This
* Corresponding author.
0376-7388/95/$09.50 © 1995 Elsevier Science B.V. All rights reserved S S D I 0 3 7 6 - 7 3 8 8 ( 9 4 ) 0 0 2 8 9 - 4
paper examines how membrane compaction affects the gas permeability measurements of microporous mem- branes used in membrane distillation.
While the gas permeability of a microporous membrane is of little importance to gas separation proc- esses, it is often measured as a preliminary step to predicting the membrane's performance in membrane distillation [6-8] and gas filtration [9] systems. The effects of membrane compaction on gas permeability of microporous membranes have been neglected pri- marily because the effects are incorporated into per- meability coefficients. The procedure for determining a permeability coefficient generally entails measuring the gas flux through a membrane at various feed pres- sures and fitting the results with the equation:
Ap N = Xp~v~--r- ~ 1 )
o

100 K.W. Lawson et aL /Journal of Membrane Science 101 (1995) 99-108
where N is flux, K is the permeability coefficient, Pavg
is the average pressure within the membrane, AP is the pressure drop across the membrane, and 8 is the membrane thickness (S is often incorporated into K giving N = KAP). The exponent/3 is equal to zero for Knudsen diffusion limited processes [ 6,7 ] or is used as an additional fitting parameter when viscous flux becomes significant [ 8]. This procedure is adequate if the membrane is subsequently used in an application such as gas filtration which is similar to the gas per- meation experiments from which K was obtained; how- ever, a problem may arise when the application is significantly different. Such is the case with membrane distillation.
Membrane distillation (MD) can take on a variety of forms depending on the specific application, includ- ing vacuum MD [6,7], sweep gas MD [ 10], air gap MD [11], and direct contact MD (DCMD) [8,12], which will be discussed here for illustration purposes. In DCMD two aqueous solutions are brought into con- tact with a microporous (pore sizes range from 0.01 to 1/zm, porosities range from 40 to 80%) hydrophobic membrane. Due to surface tension forces, the liquids are unable to penetrate the membrane pores, and a vapor liquid equilibrium is established on both sides of the membrane. A simplified schematic of the resulting con- figuration is shown in Fig. 1. If the temperature- and composition-dependent vapor pressures of the two aqueous solutions are not equal, a vapor pressure gra- dient, AP °, is established within the membrane pores, resulting in a net flux of vapor. Since gas flux is being driven by a vapor pressure gradient within the pores,
Fig. 1. The MD process.
and the membrane is being compacted independently by the hydrostatic pressures exerted by the facing liq- uids, Eq. ( 1 ) may not be valid for MD. Therefore, it is necessary to obtain some measure of how membrane compaction independently affects membrane permea- bility.
In the present work a theoretical basis and experi- mental method are devised to determine the effects of membrane compaction on gas flow through micropo- rous membranes. The results from this treatment are given by three parameters: Knudsen, viscous, and com- paction coefficients (K0, Bo, and 3'). Further, it will be shown that low levels of compaction can actually enhance the permeabilities the highly porous mem- branes used in MD. Specific implications of this phe- nomenon in terms of the MD process will be discussed.
2. Theory
The parameters that are normally used to character- ize a microporous membrane are the porosity or void fraction, e, average pore size, (r) , tortuosity, ~-, and thickness, 3. Each of these parameters influences membrane permeability, and each parameter is affected by membrane compaction. One cannot determine by experiment how the membrane parameters are inde- pendently affected by compaction, because membrane porosity, tortuosity, and thickness always appear in flux equations as [ E/8~-], and pore radius appears with [ E/ St] as either ( r ) or ( r 2) depending on the mode of flux (Knudsen or viscous, respectively). Therefore, before detailing the theory necessary to separate the effects of membrane compaction from the permeability coeffi- cient, it is necessary to introduce a few basic assump- tions about how compaction affects membrane parameters and permeability.
As the membrane is compacted, the porosity decreases while the polymer volume remains nearly constant. How compaction affects ( r ) is highly dependent on the membrane structure; however, it can be assumed that ( r ) decreases with decreasing e as the membrane is compacted. In terms of e and ( r ) effects, membrane compaction reduces permeability as reported in the RO and UF literature.
While compaction decreases membrane thickness, its effect on tortuosity may vary. Fig. 2 shows an exag- gerated example of how tortuosity and membrane

K. W. Lawson et aL / Journal of Membrane Science 101 (1995) 99-108 101
~ A - Compaction ~ • 0.67
' l l y ~' Ill T
F 8 = 6 , ~ - = 2 8 = 4,~-= 2.5
Fig. 2. Effect of compaction on membrane thickness and tortuosity.
i o9
0.8
,0 i 0,9 0.7
0 .8
I
0 . ? '
0 .6 1.0 0.8 0.6 0.4 0.2 0.0
~/6 o
Fig. 3. Effect of compaction on permeability of membranes with various initial porosities, E o. Calculations assume N/zl P cc ~/8 . See Appendix for details.
E o
E, <r> effect i ~ . . . . . . ~ - - - . . / ~ ' ~ effect
I / , ! I' / ,.,
i / / ; \ / / ~ ' ~ \ \ III.
I. / / ' eIiect \ \
, / / .. \',, //// il. ~\i\ 1
Ap
Fig. 4. Effect of compaction on permeability of a high porosity membrane.
thickness may be influenced by membrane compaction. For example, if the membrane is compacted 33% result- ing in a thickness decrease from 6 to 4, then total path length through the membrane, ~-8, decreases only 17% from 12 to 10 because the steps perpendicular to corn-
paction are not affected by the compaction. For real membranes the tortuosity can increase, but it cannot decrease unless the membrane is damaged by the com- paction. The magnitude of the tortuosity increase depends on the structure of the membrane. In terms of r6 effects, membrane compaction increases flux, because the pressure gradient increases. That is, the vapor pressure driving force acts over a shorter distance as the membrane is compacted.
Fig. 3 illustrates how the combined membrane parameter effects influence the overall permeabilities of membranes with various initial porosities, Eo. A com- plete explanation of the assumptions and details of the model used to generate Fig. 3 are presented in the Appendix. The graph shows how permeability (which is proportional to e2/6 for this case) changes relative to the uncompacted permeability as the membrane is compacted. For membranes with high initial porosities, the permeability actually increases with low levels of compaction; therefore, compaction may be beneficial to processes such as MD, which employ highly porous membranes. The simplifying assumptions result in a conservative estimate of the possible benefits of membrane compaction. Real membrane morphologies could result in an even more enhanced flux. For denser membranes, the permeability decreases for all levels of compaction. This would explain why increased per- meabilities caused by compaction have not been reported in the RO, UF, or gas separation literature.
Fig. 4 details how the competing effects of E and ( r ) (decreasing flux) and ~-6 (increasing flux) affect over- all permeability for high porosity membranes. In sec- tion I (low ziP), ~'8 effects are dominant and the permeability increases with compaction. In section II neither of the effects is dominant. In section III (high ziP), e and (r) effects are dominant and the permea- bility decreases with compaction. The theory presented herein can be used independently in section I (using 6 as an adjustable parameter) and III (using e or ( r ) as an adjustable parameter) of the graph, but it cannot be extended through section II (i.e., the theory is linear). The theory identifies the dominant compaction effect and incorporates only one of the corresponding membrane parameters to fit experimental data, but the effects are not necessarily limited to that parameter. For example, 8 is used to characterize section I effects, but e and (r) effects also influence the slope of the permeability versus Ap curve in section I.

102 K.W. Lawson et al. /Journal of Membrane Science 101 (1995) 99-108
Preliminary gas permeation (GP) experiments reveal that the membranes used herein exhibit Section I behavior over the entire range of AP tested (A P range was limited to typical AP ° values found in MD); there- fore, membrane compaction is modelled by varying membrane thickness while holding the other membrane parameters constant. For low levels of compaction it is assumed that membrane thickness decreases linearly as AP increases; hence, thickness is given by:
(5=(5o-(5'AP (2)
where 3o is the uncompacted membrane thickness, (5' is the compaction coefficient, and AP is the pressure drop across the membrane. If flux increases with com- paction (section I), then (5' will be positive.
So far, the theoretical development has been focused on ideal membranes, providing only a qualitative meas- ure of how the permeability of a real membrane is affected by compaction. For a real membrane which has a complex geometry, the permeability versus com- paction relationship is highly dependent upon the membrane structure, and it must be determined exper- imentally.
In determining the permeation characteristics of a membrane, it is usually adequate to examine the flux versus pressure drop curve (N vs. AP) as described in the introduction. If the resulting curve is fit with a linear equation such as Eq. (1), then all information about membrane compaction is lost. Membrane compaction information is contained in the higher order terms, which are given by the curvature of the N vs. Ap curve (f~=o):
AP AP ,[AP'~ 2 N= K(5o_ (5, A p= K--~--oo + K (s t-~-'o ) +... (3)
where, since (5'AP << 60 for low levels of compaction, higher order terms become negligible. The N vs. AP curvature is usually small and is often attributed to experimental error. The experimental data reported herein are plotted following the method of Carman [13] to make the effects of membrane compaction more apparent and distinguishable from experimental errors.
A more general equation for gas flux through porous media is given by the dusty-gas model [ 14-16]. Only the terms applicable to single gas flux are needed here:
1 [ PBo] N= I~T K°v + VP (4)
/ z 3
where K o is the Knudsen flux coefficient, B o is the viscous flux coefficient, v is the gas's mean molecular speed, P is pressure, and/z is gas viscosity. For appli- cations such as MD in which low pressure drops are employed, Eq. (4) may be written in finite form with negligible error:
I [Kov+P~Bo] AP N = - - ~ (5) RTL l ~ d 6
where Pavg is the average of feed and permeate pres- sures. Rearrangement and substitution of Eq. (2) into (5) gives a form that is not only convenient for deter- mining the flux coefficients, but is explicit in the membrane permeability, N~ A p:
N Rr(~o - ~ 'aP) Ap v
= Ko + Bo p"v~ =- Y= Ko + BoX (6) tzv
Eq. (6) relates membrane permeability, N/AP, to the membrane parameters, operating conditions, and, for the purpose of this work, the variable membrane thickness. As shown by Carman [ 13 ], a plot of Y vs. X should be a straight line with a slope of Bo and intercept of Ko (for porous media). However, if exper- imental GP data from a compactable material (such as the membranes used herein) are plotted assuming per- meability is not affected by compaction ((5'= 0), the data scatter about the 'best fit' line in a way that cannot be attributed to experimental error. If the experimental data are recorded at randomly selected feed and per- meate pressures the data scatter randomly about the best fit line, apparently the result of gross experimental error. On the other hand, an experimental procedure can be adopted that separates the effects of compaction from the true experimental error. As with the procedure described herein, experimental data can be obtained so that the effects of compaction appear as distinguishable trends in the data scatter (see Fig. 8 in the results sec- tion).
When the effects of membrane compaction are con- sidered, the value of Y calculated from experimental data can be adjusted with iS' so that the data do yield a straight line (see Fig. 9 in the results section). Values

K. W. Lawson et al. / Journal of Membrane Science 101 (1995) 99-108 103
Fig. 5. Cross-sectional SEM of 3MPPD.
for 6', Ko, and Bo can be obtained with the aid of a non- linear regression program by minimizing the deviation:
n
t7 2= ~ [Y(8') - (Ko+BoX) ] 2 (7) i = 1
[ unlike the parameters in Eq. (1)] ; however, 8' is a function of temperature. The magnitude of B' is directly related to the temperature dependent mechanical prop- erties of the membrane material. A study of these tem- perature effects will be carried out in future work.
where n is the number of data points, and Y and X are calculated from experimental data. The values of Ko and Bo represent the uncompacted permeability coef- ficients, while 8' accounts for changes in permeability due to compaction.
Eq. (6) is convenient in the sense that the fitting parameters are independent of the type of gas used, and Ko and Bo are independent of temperature and pressure
Table 1 Membrane parameters
Reference Pore size (/zm) Void (%) 80 (/~m)
3MPPA 0.29 66.3 101 3MPPB 0.40 75.9 81 3MPPC 0.51 79.2 81 3MPPD 0.58 79.6 91 3MPPE 0.73 84.7 91
3. Experimental materials and procedures
The membranes used in this work are bi-axially ori- ented, skinless, microporous polypropylene mem- branes provided by the 3M Corporation. Fig. 5 shows an SEM of the cross-sectional structure of one of these membranes (3MPPD). The remaining membranes have similar structures and vary only in the degree of bi-axial orientation. The structure of these membranes differs significantly from that of the ideal membrane described in the theoretical development; therefore, the permeability versus compaction relationship must be determined experimentally. Characteristic parameters provided by the manufacturer (8o was verified by the authors) are listed in Table 1.
Each of the membranes was loaded into the gas per- meation apparatus shown in Fig. 6. Experiments were

104 K. W. Lawson et al. / Journal of Membrane Science 101 (1995) 99-108
V a c ~ @ ~ N2andH z Source
(1) membrane cel l \ " \ ~ (2) manometers (3) pressure regulators (4) gas rotameter (5) sintered metal support ~ (6) j (6) PP membrane
Fig. 6. Gas permeation apparatus.
Fzz q Mitutoyo
weights I
micrometer
sample holder
Fig. 7. Compactability test apparatus.
immediately upstream of the membrane module and permeate pressure was allowed to come to steady state. Permeate pressure was not directly adjusted but was allowed to vary proportionally with feed pressure. A bleed valve on the vacuum pump was used to change the proportionality between feed and permeate pres- sures, but this adjustment was made only once or twice for each membrane as will be discussed in the results section. Gas flow rate was measured with a calibrated gas rotameter (Linde: 0 to 50 ml/s at 80 psig). Feed and permeate pressures were measured with mercury manometers. Membrane thicknesses were determined before and after testing with a Mitutoyo micrometer to determine the degree of irreversible compaction (not detectable).
A relative measure of membrane compactability was obtained with the apparatus shown in Fig. 7. Membrane thicknesses were measured with 0, 1, 2, and 5 pound loading on a square inch of the membrane material.
To verify that the results obtained in these experi- ments were indeed caused by membrane compaction and not by a flaw in the apparatus or measuring devices, several samples of sintered carbon frit (GSP-Fletcher: no. GSP- 10, 80 = 1400/zm, E = 0.13) were tested in the gas permeation apparatus.
carried out with 1 to 6 layers of membrane. Both N2 and H2 were permeated through the membranes at 25°C over a range of feed and permeate pressures (0 to 200 kPa). Prior to recording any data, feed and permeate pressures were adjusted to give Ap = 200 kPa for a period of 5 min. This step was included so that any irreversible compaction would not affect the results. Feed pressure was then adjusted with the regulator
4. Results
A brief set of experiments was carried out with sev- eral of the membrane samples to determine the effects of using more than one layer of the membrane in the experimental apparatus. By using more than one layer, lower flow rates and higher AP can be achieved. For
Table 2 Results for membranes and carbon frit a
Membrane Ko Bo (10 -14 m z) ~'/8o (10 -3 kPa -1) 8/8oatAPma x (kPa) (10 -7 m)
3MPPA (1 layer) 1.71 0.61 0.99 3MPPA 1.71 0.59 0.96 0.93 at 70 3MPPB 2.58 0.91 1.1 0.95 at 45 3MPPC 3.88 1.82 3.3 0.91 at 28 3MPPD 6.00 3.16 5.1 0.90 at 19 3MPPE 6.77 5.61 6.3 0.92 at 12 Carbon Frit 0.27 0.71 0.27 0.95 at 181
a The combined experimental and sampling errors are: Ko + 2%, Bo + 4%, 8'/80 + 2%.
3.0
2.8
2.6
2.4 >-
~- 2.2 t~
2.0
1.8 2 0
. . . . . .
/ /
I I I I I I I
4 6 8 10 12 14 16 18
Pavg / i "t vi [10 e m -~]
2 . 8
Fig. 8. Results from 3M93A with 8' = 0.
the particular apparatus used in this work less experi- mental error results under these conditions. Experi- ments carried out with 1 and 6 layers of membrane revealed negligible (within sampling and experimental error: see Table 2) difference in the results. All remain- ing data and analysis presented herein were carried out with 6 layers of membrane.
The first step in analyzing the experimental flux results is to determine which aspect of membrane com- paction (changes in E and ( r ) or 78) is dominant. To do this, experimental data were plotted according to Eq. (6) with 8' = 0. A sample (6 layers of 3MPPA) of a resulting plot is shown in Fig. 8. The least-squares fit with 8' = 0 is shown as a solid line, and trends in the data are shown by dashed lines. The data plotted in Fig. 8 were obtained as follows: as the feed pressure, Pf, was increased, the permeate pressure increased pro- portionally to a new steady-state value; therefore, as Pf increased so did both Pavg and Ap. As discussed in the theory section, this procedure yields distinguishable trends in the data scatter as opposed to random scatter. As Pavg increases along each trend so does the degree of compaction and the enhancement of flux. Each trend in the data results from a different bleed valve setting on the vacuum pump.
The trends in the data, which have slopes greater than the 8' = 0 least-squares fit, indicate that as Ap is increased, so is the membrane permeability (relative to what is predicted with 8 ' = 0); thus, it may be con- cluded for 3MPPA operated at A P < 2 0 0 kPa that
changes in ~-8, which increase permeability, have more influence on membrane permeability than changes in e and (r) , which decrease permeability. Results from the other membranes (which are as conclusive as the 3MPPA results) lead to the same conclusion; hence, 8 should be used as the variable parameter as outlined in the theory section.
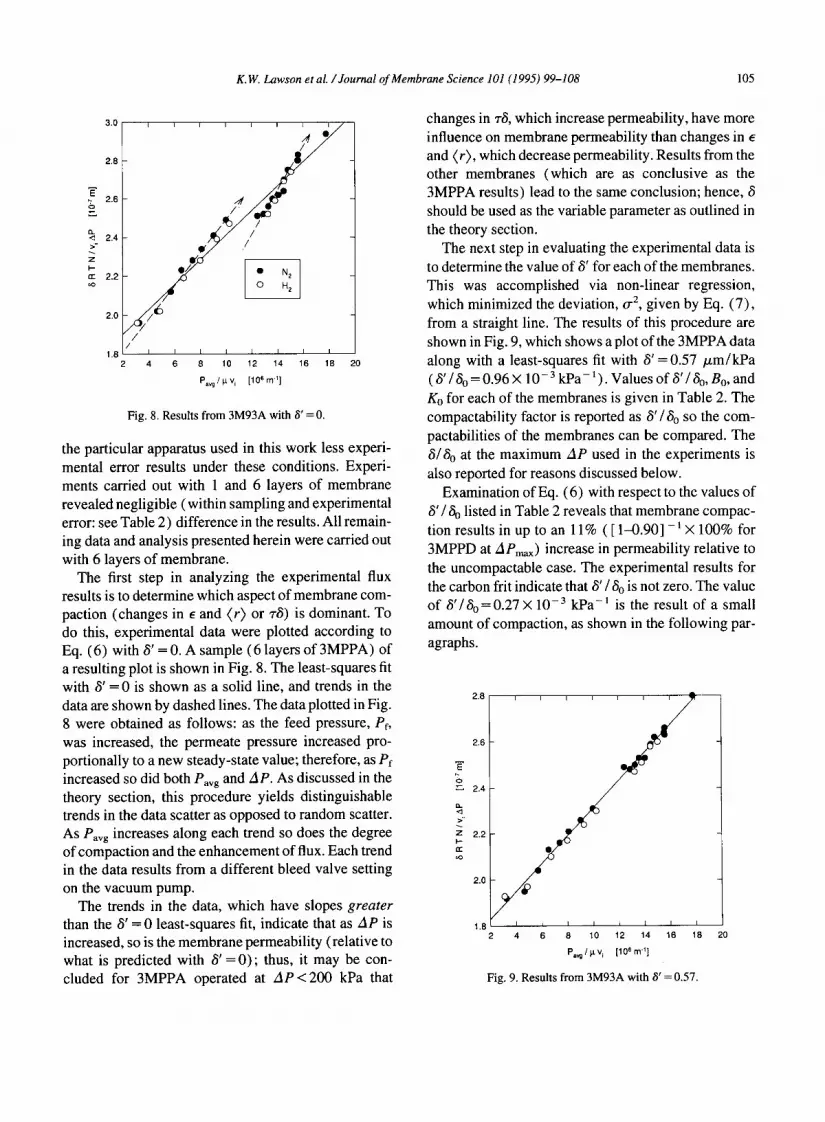
The next step in evaluating the experimental data is to determine the value of 8' for each of the membranes. This was accomplished via non-linear regression, which minimized the deviation, 0 -2, given by Eq. (7), from a straight line. The results of this procedure are shown in Fig. 9, which shows a plot of the 3MPPA data along with a least-squares fit with 8'= 0.57 /~m/kPa ( 3' / 8o = 0.96 × 10 - 3 kPa- 1 ) . Values of 8' / 6O, Bo, and Ko for each of the membranes is given in Table 2. The compactability factor is reported as 8'/8o so the com- pactabilities of the membranes can be compared. The 3/8o at the maximum Ap used in the experiments is also reported for reasons discussed below.
Examination of Eq. (6) with respect to the values of 8'/6 o listed in Table 2 reveals that membrane compac- tion results in up to an 11% ( [1--0.90] -1X 100% for 3MPPD at APmax) increase in permeability relative to the uncompactable case. The experimental results for the carbon frit indicate that 8' / 8o is not zero. The value of 8'/6o=0.27× 10 -3 kPa -1 is the result of a small amount of compaction, as shown in the following par- agraphs.
2.6
0 2.4
z 2 . 2 F-
2.0
1.8 2
I I I I I I I I
4 6 8 10 12 14 16 18
Palg/}.tvi [106m 1]
Fig. 9. Results from 3M93A with a' = 0.57.
K.W. Lawson et al. /Journal of Membrane Science 101 (1995) 99-108 105
2 0

106 K. W. Lawson et aL / Journal of Membrane Science 101 (1995) 99-108
1.00 (
0.97
0.94
0.91 o
0.88
0.85
0.82
0.79 0
Carbon Frit
I ~ 3MPPD I ~ "~
7 14 21 28 35
Mechanical Pressure [kPa]
Fig. 10. Mechanical compaction results.
To determine whether the results from the gas per- meation experiments were realistic, mechanical com- pressibility tests were performed on each of the membranes, and the results were compared to the val- ues of 8 ' / ~ . The results of the mechanical compress- ibility tests are shown in Fig. 10, where each curve has a combined sampling and experimental error of about +2%. Fig. 10 reveals no direct relationship between the mechanical compressibility and the 8'/80 value obtained from flux experiments (Table 2). This would seem to confirm that even though 78 effects were dom- inant in these experiments, the results are also affected by ~ and ( r ) effects.
Fig. 10 does, however, provide a means for deter- mining whether the 8'/80 values obtained from gas permeation experiments are realistic. Values of 8'/8o required to fit permeation data should not exceed the mechanical compressibility values. Table 2 lists the membrane thicknesses, 8/~o, at the maximum Ap used in the GP experiments. A quick comparison of these values with the results shown in Fig. 10 reveals that the 8'/80 values found herein are acceptable. Also shown in Fig. 10 is the compressibility of the carbon frit. The slight compressibility of the frit accounts for the com- paction effects seen in the experimental flux results listed above.
5. Conclusions
Membrane compaction plays an important role in gas flux through microporous membranes, but is often
overlooked because its effects are easily absorbed into permeability coefficients. The effects of membrane compaction may become important in applications such as membrane distillation in which the Ap causing membrane compaction is independent of the flux driv- ing force AP °. In such a case it is necessary to under- stand how compaction independently affects membrane permeability. For the specific membranes and experimental conditions carried out herein, membrane permeability is enhanced by up to 11% as a result of compaction effects. This result contradicts compaction results from related fields such as reverse osmosis and ultrafiltration; however, microporous membranes operate at much lower Ap and are more porous than those used in RO and UF. Under these conditions, the effects of reducing the path length through the membrane (which tends to increase per- meability) outweigh the effects of decreasing the membrane porosity and pore size (which tend to decrease permeability). A theory that explains these results and a method for modifying existing flux equa- tions to incorporate a compaction coefficient were introduced.
Since, in membrane distillation, Ap acting on the membrane is independent of the flux driving force A p°, the results of this work have some important implica- tions in MD. Membrane distillation utilizes the same type of membranes examined in this work, so theoret- ically compaction can be used to enhance the produc- tion of MD systems. By increasing the liquid feed pressure, the membrane can be compacted without affecting the driving force AP °, and the permeability will increase while the thermal energy requirements will decrease. Since membrane permeability can be increased significantly (up to 11% in this work) with relatively small pressure drops (up to 70 kPa in this work); no equipment changes, other than a means for varying the hydrostatic pressure of the feed, will be required. The operating costs associated with increas- ing the liquid pressure will be insignificant compared to the savings realized from the decreased thermal energy requirements.
Before the compaction results from this work can be applied to the MD process more information about the compaction phenomenon must be obtained. Future work will examine the effects of membrane compaction on liquid permeability and the effects of temperature on membrane compactability. With the higher temper-

K. W. Lawson et al. / Journal of Membrane Science 101 (1995) 99-108 107
atures used in MD (up to 100°C), the membranes will compact more easily as the membrane mechanical properties change with increasing temperature. Further, at some level of compaction porosity and pore size effects begin to reduce flux; therefore, the limits of beneficial compaction must be determined.
6. List of Symbols
Bo viscous permeability coefficient K permeability coefficient Ko Knudsen permeability coefficient N molar flux P, P° pressure, vapor pressure R gas constant r pore radius T temperature v mean molecular speed X defined in Eq. (6) Y defined in Eq. (6)
Greek symbols A AP, pressure drop 6 membrane thickness 60 uncompacted membrane thickness 8' compaction coefficient
membrane porosity /x gas viscosity 0 -2 deviation ~- membrane tortuosity
7. Appendix
Membrane compaction calculations were carried out with the following assumptions: ( I ) compaction occurs only in the direction parallel
to AP; (2) Knudsen diffusion is negligible, use (r2); (3) membrane consists of straight through, round
pores ( z = 1 = constant) ; (4) polymer volume remains constant; (5) throughout compaction e2_ o = e3 - o; (6) as a consequence of 3, 4, and 5: @2) <x e.
7.1. Calculations:
Initial thickness: 60 Initial volume: Vo = areao 60 Initial porosity: ¢-o Polymer volume: Vp = ( 1 - ~ ) Vo = constant Initial permeability: (N/AP)o[eo(r2)o] / [ 6O~'] ot ~o/6o Thickness: 8 Volume: V= areao 8 Porosity: ~= 1 - V p / V = 1 - [ ( 1 - ~ ) V o ] / V = 1 - [ ( 1 - Co) 80]/8 Permeability: N/ A P cz [ e( P) ] / [ 8r] J~ 8 Resulting equation:
N/AP [ ( 1 - Co) 6o] 2 60
(N/AP)o = L1 3 J 706
The assumptions not only simplify the calculations, but also provide a conservative estimate of the benefi- cial effects of membrane compaction. In the permea- bility relationship, N / A P o c J / & the effects of decreasing • tend to decrease permeability while effects of decreasing 3 tend to increase permeability. Use of more realistic membrane models and/or the inclusion of viscous flux into the current model reduce the expo- nent of permeability to less than two. Thus, the simpli- fying assumptions lead to an underprediction of permeability enhancement.
Acknowledgements
The authors would like to thank Bert Exsted of 3M for providing the membranes used in this work, and the Texas Advanced Technology Program for their finan- cial support and the National Science Foundation for their fellowship support.
References
[ 1 ] J.L. Bert, Membrane compaction: a theoretical and experimental explanation, J. Polym. Sci., Part B, Polym. Lett., 7 (1969) 685.
[21 W. Pusch and G. Mossa, Influence of pressure and/or pressure differential on membrane permeability, Desalination, 24 (1978) 39.
[3] P.F. Fuls, M.P. Dell and I.A. Pearson, Non-linear flow through compressible membranes and its relation to osmotic pressure, J. Membrane Sci., 66 (1992) 37.

08 K. W. Lawson et al. / Journal of Membrane Science 101 (1995) 99-108
[4] B.J. Rudie, T.A. Torgrimson and D.D. Spatz, Reverse-osmosis and ultrafiltration membrane compaction and fouling studies using ultrafiltration pretreatment, ACS Symp. Ser., 281 (1985) 403.
[5] R.E. Kesting and A.K. Fritzsche, Polymeric Gas Separation Membranes, Wiley, New York, 1993.
[6] S. Bandini, C. Gostoli and G.C. Sarti, Separation efficiency in vacuum membrane distillation, J. Membrane Sci., 73 (1992) 217.
[7] G.C. Sarti, C. Gostoli and S. Bandini, Extraction of organic components from aqueous streams by vacuum membrane distillation, J. Membrane Sci., 80 (1993) 21.
[8] R.W. Schofield, Membrane Distillation, Ph.D. Thesis. The University of New South Wales, 1989.
[9] J.F.C. Brown, Membrane filtration applied to gas processing, Process Biochem., 12 (1977) 10.
[ 10] L. Basini, G. D'Angelo, M. Gobbi, G.C. Sarti and C. Gostoli, A desalination process through sweeping gas membrane distillation, Desalination, 64 (1987) 245.
[ 11 ] C. Gostoli and G.C. Sarti, Separation of liquid mixtures by membrane distillation, J. Membrane Sci., 33 (1989) 211.
[ 12] M.E. Findley, Vaporization through porous membranes, Ind. Eng. Chem., Process Design Develop., 6 (1967) 226.
[ 13 ] P.C. Carman, Flow of Gases Through Porous Media, Academic Press, New York, 1956.
[ 14] R. Datta, S. Dechapanichkul, J.S. Kim, L.Y. Fang and H. Uehara, A generalized model for the transport of gases in porous, non-porous, and leaky membranes. I. Application to single gases, J. Membrane Sci., 75 (1992) 245.
[ 15] R. Jackson, Transport in Porous Catalysts, in S.W. Churchill (Ed.), Chemical Engineering Monographs, Elsevier, New York, 1977.
[ 16] E.A. Mason and A.P. Malinauskas, Gas Transport in Porous Media: The Dusty-Gas Model, in S.W. Churchill (Ed.), Chemical Engineering Monographs, Elsevier, New York, 1983.