Embed Size (px)
Citation preview
Document code: FOTL_150320181_3 Copyright © 2016 Firstobject Technologies Ltd. All rights reserved
EVEREADY INDUSTRIES INDIA LTDResult Update (PARENT BASIS): Q3 FY18
CMP: 379.00 MAR 15th, 2018
Overweight ISIN:INE128A01029
Index Details SYNOPSISEveready Industries India Ltd is the country’smarket leader of batteries and flashlights - sellingmore than 1.2 billion batteries and nearly 25 millionflashlights.
Revenue for the quarter stood at Rs. 3695.70 mnfrom Rs. 3447.80 mn, when compared with the prioryear period, grew by 7.19%.
During Q3 FY18, EBIDTA is Rs. 384.34 mn asagainst Rs. 374.28 mn in the corresponding periodof the previous year, increased by 2.69%.
During Q3 FY18, company’s net profit stood at Rs.209.44 mn from Rs. 351.95 mn in the correspondingquarter ending of previous year.
EPS of the company stood at Rs. 2.88 during thequarter, as against Rs. 4.84 per share over previousyear period.
Eveready has agreed to enter into a Joint Venturewith Universal Wellbeing Pte. Ltd. to engage in thebusiness of manufacturing/importing and marketingof fast moving consumer goods (FMCG) in India.
For the nine months ended 31 Dec, 2017, thecompany posted revenues of Rs. 11254.83 mn asagainst Rs. 11012.25 mn in the previous year sameperiod.
During 9M FY18, Net Profit stood at Rs. 708.59 mnfrom Rs. 831.75 mn in the previous year sameperiod.
Net Sales and PAT of the company are expected togrow at a CAGR of 6% and 19% over 2016 to2019E, respectively.
Stock DataSector Non-Durable Household Prod.BSE Code 531508Face Value 5.0052wk. High / Low (Rs.) 465.00/228.65Volume (2wk. Avg.) 7669Market Cap (Rs. in mn.) 27548.45
Annual Estimated Results(A*: Actual / E*: Estimated)(Rs. in mn) FY17A FY18E FY19E
Net Sales 14186.90 14728.78 15966.00EBITDA 1428.69 1623.93 1793.49Net Profit 936.44 883.52 987.01EPS 12.88 12.16 13.58P/E 29.42 31.18 27.91
Shareholding Pattern (%)
As on Dec 2017 As on Sep 2017
Promoter 44.05 44.05
Public 55.95 55.95
Others -- --
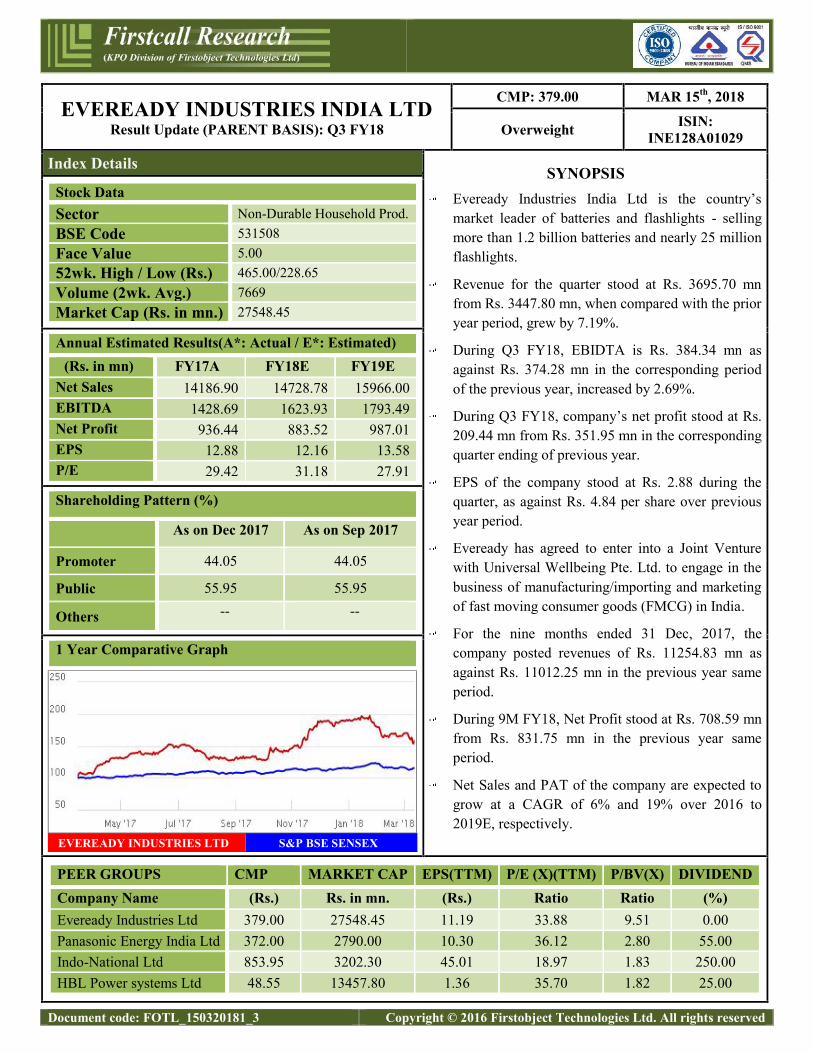
1 Year Comparative Graph
EVEREADY INDUSTRIES LTD S&P BSE SENSEX
PEER GROUPS CMP MARKET CAP EPS(TTM) P/E (X)(TTM) P/BV(X) DIVIDENDCompany Name (Rs.) Rs. in mn. (Rs.) Ratio Ratio (%)Eveready Industries Ltd 379.00 27548.45 11.19 33.88 9.51 0.00Panasonic Energy India Ltd 372.00 2790.00 10.30 36.12 2.80 55.00Indo-National Ltd 853.95 3202.30 45.01 18.97 1.83 250.00HBL Power systems Ltd 48.55 13457.80 1.36 35.70 1.82 25.00
Document code: FOTL_150320181_3 Copyright © 2016 Firstobject Technologies Ltd. All rights reserved
QUARTERLY HIGHLIGHTS (PARENT BASIS)
Results updates- Q3 FY18,
(Rs. in millions) Dec-17 Dec-16 % Change
Revenue 3695.70 3447.80 7.19%
Net Profit 209.44 351.95 -40.49%
EPS 2.88 4.84 -40.49%
EBIDTA 384.34 374.28 2.69%
Revenue for the quarter stood at Rs. 3695.70 million from Rs. 3447.80 million, when compared with the prior year period,
grew by 7.19%. EBIDTA is Rs. 384.34 million as against Rs. 374.28 million in the corresponding period of the previous
year, increased by 2.69%. The company’s net profit stood at Rs. 209.44 million from Rs. 351.95 million in the
corresponding quarter ending of previous year. Reported earnings per share of the company stood at Rs. 2.88 during the
quarter, as against Rs. 4.84 per share over previous year period.
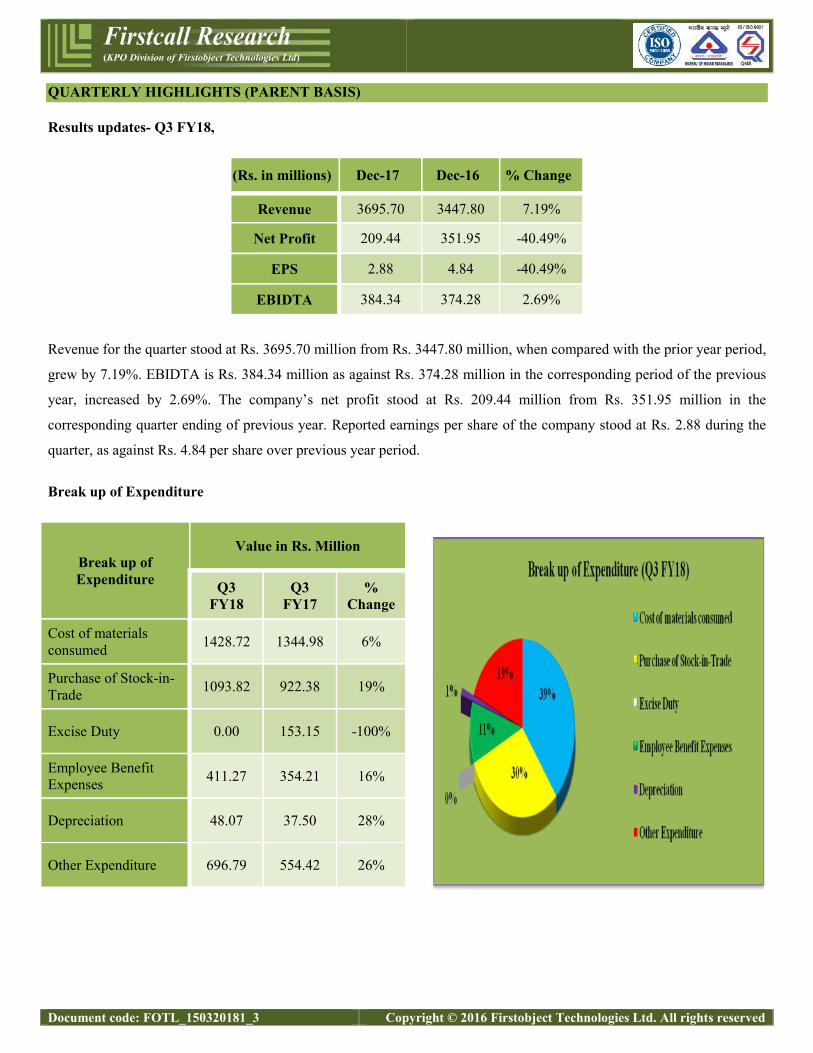
Break up of Expenditure
Break up ofExpenditure
Value in Rs. Million
Q3FY18
Q3FY17
%Change
Cost of materialsconsumed 1428.72 1344.98 6%
Purchase of Stock-in-Trade 1093.82 922.38 19%
Excise Duty 0.00 153.15 -100%
Employee BenefitExpenses 411.27 354.21 16%
Depreciation 48.07 37.50 28%
Other Expenditure 696.79 554.42 26%
Document code: FOTL_150320181_3 Copyright © 2016 Firstobject Technologies Ltd. All rights reserved
Updates
Eveready Industries India Ltd. (Eveready), a leading player in the consumer goods market has agreed to enter into a
Joint Venture with Universal Wellbeing Pte. Ltd. to engage in the business of manufacturing/importing and marketing
of fast moving consumer goods (FMCG) in India.
EIIL shall acquire 30% shares of the Joint Venture Company to be newly incorporated for the same. Balance 70%
shall be acquired by Universal Wellbeing Pte. Ltd.
On 10 Nov, 2017, The company entered into a Share Purchase cum Shareholders Agreement with MCLeod Russel
India Ltd (MCLeod) to operate and manage Greendale India Ltd, as a joint venture, with both the company and
MCLeod holding a 50% shares each of Greendal, to carry out the packet tea business.
COMPANY PROFILE
Eveready Industries India Limited (EIIL) is the industry frontrunner in the portable energy (dry battery and flashlight)
segment, with sales of over 1.2 billion batteries and 25 million flashlights every year. Eveready continues to be one of the
most trusted brands to millions of people across India for generations. The company also markets LED, CFL, GLS and
other lighting products, rechargeable lanterns and devices, packet tea and small home appliances. Eveready has an
extensive distribution network of over 4000 distributors and reaches towns with a o ulation of 5000 or more.
Eveready Industries India Limited (EIIL) is one of India’s leading FMCG companies, with its products and brands being
household names over the past century. Over the decades, it has been the leader in the dry cell batteries and flashlights
markets in the second most populous country in the world.
The Company’s contemporary product portfolio in the domestic market comprises the following:
Dry cell and rechargeable batteries under the brand names ‘Eveready’, ‘Powercell’ and ‘Uniross’.
Flashlights and lanterns under the brand names ‘Eveready’ and ‘Powercell’.
Packet tea under the brand names ‘Tez’, ‘Jaago’ and ‘Premium Gold’.
Lamps and luminaires under the brand names ‘Eveready’ and ‘Powercell’
Devices like mobile power banks, rechargeable fans and radio under the ‘Eveready’ brand
The Company is the largest player in India with regard to dry batteries and flashlights having a market share exceeding
50% in both categories. Its competencies in these product categories are equal to the best in the world. The Company
continues to leverage its wide distribution network with a range of product offerings in branded tea, lighting and electrical
segments.
Document code: FOTL_150320181_3 Copyright © 2016 Firstobject Technologies Ltd. All rights reserved
FINANCIAL HIGHLIGHT (PARENT BASIS) (A*- Actual, E* -Estimations & Rs. In Millions)
Balance Sheet as of March 31, 2016 -2019E
FY16A FY17A FY18E FY19EAPPLICATION OF FUNDSNon-Current Assets
a) Property, plant and equipment 2190.54 3312.11 3358.48 3660.74b) Capital work in progress 210.00 31.83 290.35 325.19c) Investment property 0.56 0.56 0.56 0.56d) Other intangible assets 29.86 28.91 29.83 31.02e) Intangible assets under development 10.74 32.17 47.93 57.99f) Financial assets
i) Investments 26.57 26.57 27.63 28.73ii) Loans 18.30 15.38 17.07 19.12iii) Other Financial assets 64.41 52.19 67.85 81.42
g) Non current tax assets 13.18 16.16 14.22 15.93h) Other noncurrent assets 322.91 344.55 332.83 362.79i) Deferred tax assets 0.96 0.00 0.00 0.00
1. Sub Total - Non-Current Assets 2888.04 3860.42 4186.75 4583.50Current assets
a) Inventories 2374.11 2842.95 2700.81 2862.85b) Financial assets
i) Trade receivable 705.40 838.67 1258.00 1572.50ii) Cash and cash equivalents 20.67 24.86 104.20 129.21iii) Other balances with banks 6.26 6.16 6.28 6.60iv) Loans 362.74 74.13 970.40 1242.11v) Other financial assets 45.90 51.15 49.62 55.57
c) Other current assets 267.75 358.20 945.46 1162.922. Sub Total - Current Assets 3782.82 4196.13 6034.77 7031.76Total Assets (1+2) 6670.85 8056.55 10221.51 11615.25SOURCES OF FUNDSShareholder's Funds
Equity share capital 363.44 363.44 363.44 363.44Other equity 1700.17 2531.85 3415.37 4402.38
1.Total Net worth 2063.60 2895.28 3778.81 4765.82Non Current Liabilities
a) Financial liabilitiesi) Long term borrowing 665.19 945.32 947.21 890.38ii) Other financial liabilities 39.47 39.47 40.66 42.28
b) Provisions 54.52 65.34 73.18 80.50c) Deferred tax liabilities 0.00 12.15 31.30 36.93
2. Sub Total - Non - Current Liabilities 759.18 1062.28 1092.35 1050.10Current Liabilities
a) Financial liabilitiesi) Borrowings 718.38 727.17 930.78 1005.24ii) Trades payable 2114.40 2399.06 2543.89 2635.07iii) Other financial liabilities 561.49 436.94 607.35 710.60
b) Other current liabilities 112.87 135.02 137.72 143.22c) Provisions 112.64 135.10 166.18 196.09d) Current tax liabilities 228.29 265.70 964.45 1109.12
3. Sub Total - Current Liabilities 3848.07 4098.98 5350.36 5799.34Total Liabilities (1+2+3) 6670.85 8056.55 10221.51 11615.25
Document code: FOTL_150320181_3 Copyright © 2016 Firstobject Technologies Ltd. All rights reserved
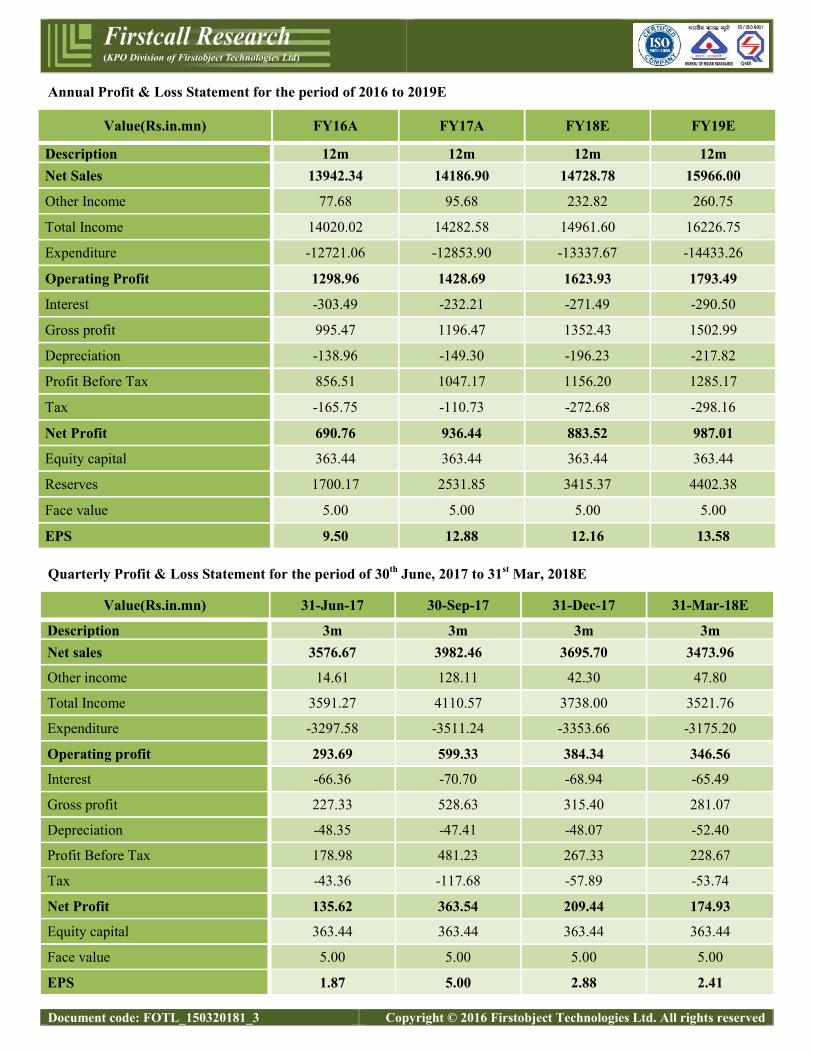
Annual Profit & Loss Statement for the period of 2016 to 2019E
Value(Rs.in.mn) FY16A FY17A FY18E FY19E
Description 12m 12m 12m 12mNet Sales 13942.34 14186.90 14728.78 15966.00
Other Income 77.68 95.68 232.82 260.75
Total Income 14020.02 14282.58 14961.60 16226.75
Expenditure -12721.06 -12853.90 -13337.67 -14433.26
Operating Profit 1298.96 1428.69 1623.93 1793.49
Interest -303.49 -232.21 -271.49 -290.50
Gross profit 995.47 1196.47 1352.43 1502.99
Depreciation -138.96 -149.30 -196.23 -217.82
Profit Before Tax 856.51 1047.17 1156.20 1285.17
Tax -165.75 -110.73 -272.68 -298.16
Net Profit 690.76 936.44 883.52 987.01
Equity capital 363.44 363.44 363.44 363.44
Reserves 1700.17 2531.85 3415.37 4402.38
Face value 5.00 5.00 5.00 5.00
EPS 9.50 12.88 12.16 13.58
Quarterly Profit & Loss Statement for the period of 30th June, 2017 to 31st Mar, 2018E
Value(Rs.in.mn) 31-Jun-17 30-Sep-17 31-Dec-17 31-Mar-18E
Description 3m 3m 3m 3mNet sales 3576.67 3982.46 3695.70 3473.96
Other income 14.61 128.11 42.30 47.80
Total Income 3591.27 4110.57 3738.00 3521.76
Expenditure -3297.58 -3511.24 -3353.66 -3175.20
Operating profit 293.69 599.33 384.34 346.56
Interest -66.36 -70.70 -68.94 -65.49
Gross profit 227.33 528.63 315.40 281.07
Depreciation -48.35 -47.41 -48.07 -52.40
Profit Before Tax 178.98 481.23 267.33 228.67
Tax -43.36 -117.68 -57.89 -53.74
Net Profit 135.62 363.54 209.44 174.93
Equity capital 363.44 363.44 363.44 363.44
Face value 5.00 5.00 5.00 5.00
EPS 1.87 5.00 2.88 2.41
Document code: FOTL_150320181_3 Copyright © 2016 Firstobject Technologies Ltd. All rights reserved
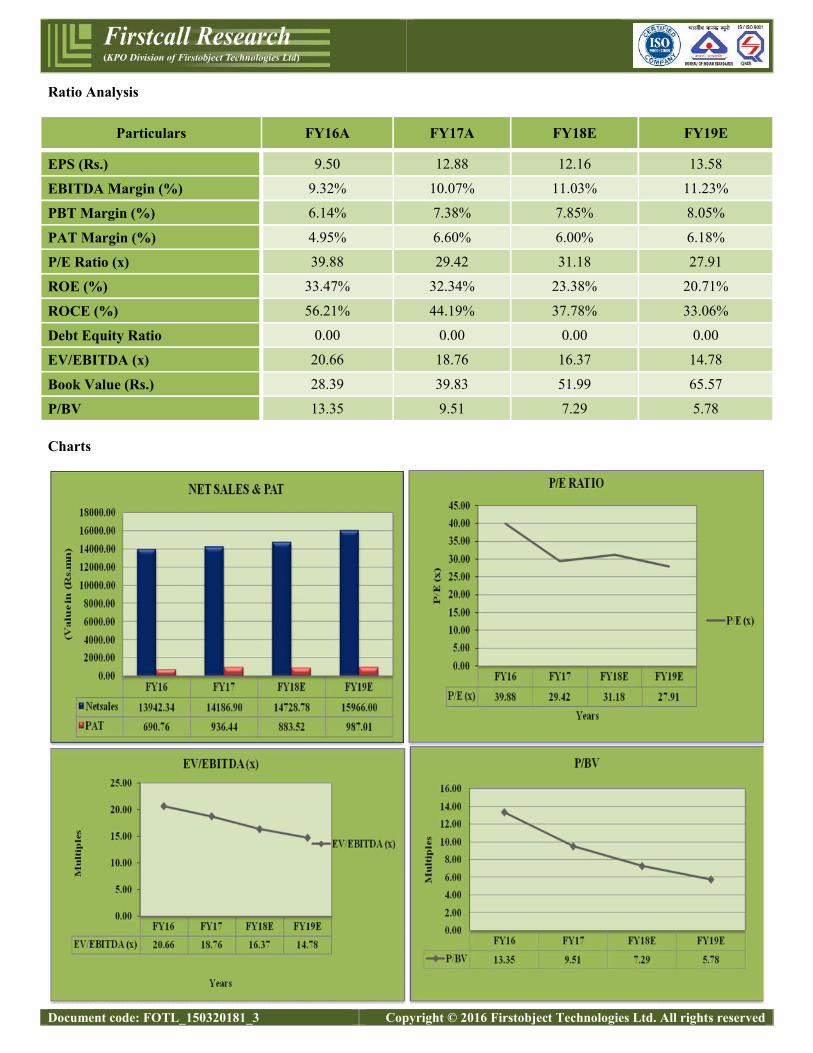
Ratio Analysis
Particulars FY16A FY17A FY18E FY19E
EPS (Rs.) 9.50 12.88 12.16 13.58
EBITDA Margin (%) 9.32% 10.07% 11.03% 11.23%
PBT Margin (%) 6.14% 7.38% 7.85% 8.05%
PAT Margin (%) 4.95% 6.60% 6.00% 6.18%
P/E Ratio (x) 39.88 29.42 31.18 27.91
ROE (%) 33.47% 32.34% 23.38% 20.71%
ROCE (%) 56.21% 44.19% 37.78% 33.06%
Debt Equity Ratio 0.00 0.00 0.00 0.00
EV/EBITDA (x) 20.66 18.76 16.37 14.78
Book Value (Rs.) 28.39 39.83 51.99 65.57
P/BV 13.35 9.51 7.29 5.78
Charts
Document code: FOTL_150320181_3 Copyright © 2016 Firstobject Technologies Ltd. All rights reserved
OUTLOOK AND CONCLUSION
At the current market price of Rs.379.00, the stock P/E ratio is at 31.18 x FY18E and 27.91 x FY19E respectively.
Earning per share (EPS) of the company for the earnings for FY18E and FY19E is seen at Rs. 12.16 and Rs. 13.58
respectively.
Net Sales and PAT of the company are expected to grow at a CAGR of 6% and 19% over 2016 to 2019E,
respectively.
On the basis of EV/EBITDA, the stock trades at 16.37 x for FY18E and 14.78 x for FY19E.
Price to Book Value of the stock is expected to be at 7.29 x and 5.78 x for FY18E and FY19E respectively.
Hence, we say that, we are Overweight in this particular scrip for Medium to Long term investment.
INDUSTRY OVERVIEW
Consumer Goods Industry in India
India has been traditionally a consumption-driven economy. Broadly categorized into urban and rural markets, the Indian
consumer segment is attracting increasing attention from marketeers across the globe.
The growing purchasing power and the rising influence of the social media have made the Indian consumer to adopt a
more aspirational lifestyle. India could become the world’s largest middle class consumer market with total consumer
spends of nearly US $13 trillion by the year 2030. This sector has grown at an annual average of 11% over the last decade
and is anticipated to expand at a CAGR of around 15%. Online retailing is expected to be a Rs 1150 billion (US$ 17.5
billion) industry by end of 2018 and is growing at an impressive rate of 15%.
The introduction of the path-breaking tax reform, the Goods and Services Tax (GST) is expected to bring down cascading
effect of taxes, thereby reducing prices of various essential commodities. The economy will finally turn around -may be
sooner than what is indicated by the current data. All these factors, coupled with the fundamental strength of the economy
will accelerate consumption to its potential in both rural and urban markets. Hence the outlook for this sector appears
quite robust over the coming years.
BATTERIES
The Indian market for dry cell batteries is now estimated to be worth over Rs 1,600 crores by value and 2.7 billion pieces
by volume. The battery market has few players, out of which EIIL has a market share of 50% between its Eveready and
PowerCell brands.
Document code: FOTL_150320181_3 Copyright © 2016 Firstobject Technologies Ltd. All rights reserved
The battery category was adversely impacted due to lower consumer off-take and de-stocking in trade channels, post
demonetization, announced by the Government during the latter part of the year. The market also continued to be
disturbed by poor quality products imported from China at dumped prices. As a result, the category volume and value
both remained flat during the year.
The split of technology within the dry batteries market remained constant with the zinc carbon battery segment virtually
dominating the entire market with 97% share. The alkaline battery segment has minimal share of the market at less than
2%. The rechargeable battery segment, which accounts for the balance 1% market share, has remained stagnant, despite
having a loyal customer base.
The consumption of batteries is driven by growth in the off-take of its applications. A growing need for portable power
and the advent of a number of battery-operated gadgets like remotes, toys, clocks and torches have catalyzed
consumption. Since these gadgets are used on an everyday basis, batteries have enjoyed a non-cyclical demand.
Opportunities
India has a low per capita consumption across a number of product groups, batteries included, indicating an inherent
potential for growth. Since dry cell batteries represent the cheapest source of portable power, consumption is expected to
increase over time. Besides, growing income levels, changing lifestyles and an increased need for convenience have
resulted in proliferation of gadgets run by batteries. These include remote controls, torches, toys, cameras, FM radio sets
and portable music systems, among others.
Alkaline batteries, although popular in the West, do not as yet comprise a serious alternative to carbon zinc batteries. This
is due to the price-sensitive nature of the Indian consumer. That has led to a mere 2% market share for such batteries,
despite they being present for over 15 years. In any case, EIIL does have a presence in this segment and will be able to
participate if the market provides any indication of an opportunity.
FLASHLIGHTS
The flashlight market is shaped by EIIL because of its dominant market share position at about 75% of the organised
segment. At the same time, there is also a vast unorganized segment that is estimated to be almost equivalent to the size of
the organized one. Taking that into account, EIIL has a market share of around 35%.
Opportunities and threats
A vast dormant population (almost 45 million households) of non-users represents a large opportunity for the flashlights
market. This will continue to be tapped by EIIL in the years to come.
The urban areas, where flashlights are seldom owned, comprise another specific area of opportunity. Vast sections of
urban areas now face periodic power cuts and flashlights provide a viable alternative solution during those times.
Document code: FOTL_150320181_3 Copyright © 2016 Firstobject Technologies Ltd. All rights reserved
The category however, faces a continued threat in the form of gray market operations launching lookalike models, usually
without payment of taxes and duties. The only way to sidestep this problem is to continue launching new and innovative
models.
LIGHTING AND ELECTRICAL PRODUCTS
The brand Eveready is a natural fit to the lighting and electrical category. The Company’s distribution network in general
trade and modern retail has also provided a good platform to enter this category. However, further expansion is underway
to tap the exclusive electrical trade. In order to make a meaningful range offering to the market, more electrical products
have been added in the last few months. These include LED panels, battens, tube lights apart from the existing portfolio of
LED bulbs, luminaries and electrical appliances.
Opportunities and threats
In an emerging economy like India, the volume of lighting products will continue to have high growth, due to increased
housing and commercial development. Newer lighting technologies mainly LED bulbs will become more popular as these
will be more environmentally-friendly and also provide higher value to consumers over time. The Government of India’s
countrywide campaign of providing LED bulbs at affordable prices will add fillip to the category. EIIL will have to be a
part of all such technology changes. This provides a good opportunity for the Company to entrench itself in the category
given its brand fit and distribution network. EIIL will however continue to be present in all other ranges in the category to
cater to all kinds of consumer needs.
The category however faces the threat of fragmented competition, dynamic market prices and low entry barriers. The
Company will have to continue its focus on maintaining its brand salience alongwith enhanced distribution to reach the
desired scale.
OUTLOOK:
The effect of demonetization impacted consumer demand especially in rural segment. However, various counter measures
adopted by the govt. to ease the money flow situations and steps taken to encourage non cash transactions restored
normalcy to markets by the year end. Thus any impact on the company’s turnover on this count during 2016-2017 was a
onetime occurrence.
Introduction of GST in the near future is expected to have a positive impact on the economy, thereby augmenting demand,
which will be beneficial to the company. Additionally, it is anticipated that the GST regime will bring in higher degree of
tax compliance in the country. Two of the product categories marketed by the company via batteries and flashlights, bear
the impact of non compliance with tax laws by unorganized part of the market- either through undervalued dumped
imports from china for batteries or grey market local operations in the flashlights market. It is expected that GST regime
Document code: FOTL_150320181_3 Copyright © 2016 Firstobject Technologies Ltd. All rights reserved
will bring such elements into its net thereby eliminating the unfair gap in the pricing structure with tax compliant
organizations. As a consequence both batteries and flashlights should show reasonable growth in 2017-2018.
Adequate pricing actions have been taken in respect of batteries to protect margins against higher input costs on account
of costlier commodities.
The lower margin CFL products are now a small percentage of the lighting business, in line with the market decline of
this category. Led products with higher margins are now more than 70% of the lighting business and this will be the
growth driver of the category and for the overall business of the company.
Overall outlook appears to be stable. Barring any unanticipated macroeconomic factor, the company should remain on
course to deliver performance as per trends.
Document code: FOTL_150320181_3 Copyright © 2016 Firstobject Technologies Ltd. All rights reserved
Disclosure Section
The information and opinions in Firstcall Research was prepared by our analysts and it does not constitute an offer orsolicitation for the purchase or sale of any financial instrument including any companies scrips or this is not an officialconfirmation of any transaction. The information contained herein is from publicly available secondary sources and dataor other secondary sources believed to be reliable but we do not represent that it is accurate or complete and it should notbe relied on as such. Firstcall Research or any of its affiliates shall not be in any way responsible for any loss or damagethat may arise to any person from any inadvertent error in the information contained in this report. Firstcall Research and/or its affiliates and/or employees will not be liable for the recipients’ investment decision based on this document.
Analyst Certification
The following analysts hereby state that their views about the companies and sectors are on best effort basis to the best oftheir knowledge. Unless otherwise stated, the individuals listed on the cover page of this report are research analysts. Theanalyst qualifications, sectors covered and their exposure if any are tabulated hereunder:
Name of the Analyst Qualifications SectorsCovered
Exposure/Interest tocompany/sector UnderCoverage in the CurrentReport
Dr.C.V.S.L. Kameswari M.Sc, PGDCA,M.B.A,Ph.D (Finance)
Pharma &Diversified
No Interest/ Exposure
U. Janaki Rao M.B.A CapitalGoods
No Interest/ Exposure
B. Anil Kumar M.B.A Auto, IT &FMCG
No Interest/ Exposure
M. Vijay M.B.A Diversified No Interest/ ExposureV. Harini Priya M.B.A Diversified No Interest/ ExposureMD. Naveed M.B.A Diversified No Interest/ ExposureA. Bhikshapathi M.B.A Diversified No Interest/ Exposure
Important Disclosures on Subject Companies
In the next 3 months, neither Firstcall Research nor the Entity expects to receive or intends to seek compensation for anyservices from the company under the current analytical research coverage. Within the last 12 months, Firstcall Researchhas not received any compensation for its products and services from the company under the current coverage. Within thelast 12 months, Firstcall Research has not provided or is providing any services to, or has any client relationship with, thecompany under current research coverage.
Within the last 12 months, Firstcall Research has neither provided or is providing any services to and/or in the past has notentered into an agreement to provide services or does not have a client relationship with the company under the researchcoverage.
Certain disclosures listed above are also for compliance with applicable regulations in various jurisdictions. FirstcallResearch does not assign ratings of Buy, Hold or Sell to the stocks we cover. Overweight, Equal-weight, No-Weight andUnderweight are not the equivalent of buy, hold and sell. Investors should carefully read the definitions of all weightsused in Firstcall Research. In addition, since Firstcall Research contains more complete information concerning theanalyst's views, investors should carefully read Firstcall Research, in its entirety, and not infer the contents from theweightages assigned alone. In any case, weightages (or research) should not be used or relied upon as investment advice.
Document code: FOTL_150320181_3 Copyright © 2016 Firstobject Technologies Ltd. All rights reserved
An investor's decision to buy or sell should depend on individual circumstances (such as the investor's own discretion, hisability of understanding the dynamics, existing holdings) and other considerations.
Analyst Stock Weights
Overweight (O): The stock's total return is expected to exceed the average total return of the analyst's industry (orindustry team's) coverage universe, on a risk-adjusted basis, over the next 12-18 months.
Equal-weight (E): The stock's total return is expected to be in line with the average total return of the analyst's industry(or industry team's) coverage universe, on a risk-adjusted basis, over the next 12-18 months.
No-weight (NR): Currently the analyst does not have adequate conviction about the stock's total return relative to theaverage total return of the analyst's industry (or industry team's) coverage universe, on a risk-adjusted basis, over the next12-18 months.
Underweight (U): The stock's total return is expected to be below the average total return of the analyst's industry (orindustry team's) coverage universe, on a risk-adjusted basis, over the next 12-18 months.
Unless otherwise specified, the weights included in Firstcall Research does not indicate any price targets. The statisticalsummaries of Firstcall Research will only indicate the direction of the industry perception of the analyst and theinterpretations of analysts should be seen as statistical summaries of financial data of the companies with perceivedindustry direction in terms of weights.
Firstcall Research may not be distributed to the public media or quoted or used by the public media without the expresswritten consent of Firstcall Research. The reports of Firstcall Research are for Information purposes only and is not to beconstrued as a recommendation or a solicitation to trade in any securities/instruments. Firstcall Research is not abrokerage and does not execute transactions for clients in the securities/instruments.
Firstcall Research - Overall StatementS.No Particulars Remarks1 Comments on general trends in the securities market Full Compliance in Place2 Discussion is broad based and also broad based indices Full Compliance in Place3 Commentaries on economic, political or market conditions Full Compliance in Place4
Periodic reports or other communications not for public appearanceFull Compliance in Place
5 The reports are statistical summaries of financial data of the companies as and whereapplicable
Full Compliance in Place
6 Analysis relating to the sector concerned Full Compliance in Place7 No material is for public appearance Full Compliance in Place8 We are no intermediaries for anyone and neither our entity nor our analysts have any
interests in the reportsFull Compliance in Place
9 Our reports are password protected and contain all the required applicable disclosures Full Compliance in Place
10 Analysts as per the policy of the company are not entitled to take positions either fortrading or long term in the analytical view that they form as a part of their work
Full Compliance in Place
11 No conflict of interest and analysts are expected to maintain strict adherence to thecompany rules and regulations.
Full Compliance in Place
12As a matter of policy no analyst will be allowed to do personal trading or deal andeven if they do so they have to disclose the same to the company and take priorapproval of the company
Full Compliance in Place

Document code: FOTL_150320181_3 Copyright © 2016 Firstobject Technologies Ltd. All rights reserved
13Our entity or any analyst shall not provide any promise or assurance of any favorableoutcome based on their reports on industry, company or sector or group
Full Compliance in Place
14 Researchers maintain arms length/ Chinese wall distance from other employees of theentity
Full Compliance in Place
15No analyst will be allowed to cover or do any research where he has financial interest
Full Compliance in Place
16 Our entity does not do any reports upon receiving any compensation from anycompany
Full Compliance in Place
Firstcall Research Provides
Industry Research on all the Sectors and Equity Research on Major Companiesforming part of Listed and Unlisted Segments
For Further Details Contact:Mobile No: 09959010555
E-mail: [email protected]@firstcallresearch.comwww.firstcallresearch.com


