Embed Size (px)
Citation preview

C o c a C o l a | 1
Company Overview : Coca Cola
Coca-Cola Company (KO) (obtained from yahoo) Coke is it -- it being the #1
nonalcoholic beverage company in the world. The Coca-Cola Company is home to 15 billion
dollar brands, including four of the top five soft drinks: Coca-Cola, Diet Coke, Fanta, and
Sprite. Other top brands include Minute Maid, Powerade, and vitaminwater. All told, it owns
or licenses and markets more than 500 beverage brands, mainly sparkling drinks but also
waters, juice drinks, energy and sports drinks, and ready-to-drink teas and coffees. With the
world's largest beverage distribution system, The Coca-Cola Company reaches consumers in
more than 200 countries. About 40% of its revenue is generated in the US.
Coca-Cola has sold trademarked products in the United States since 1886 and is now
selling trademarked products in over 200 countries. The company has the most valuable
brand in the world and owns four of the world’s top 5 non-alcoholic “sparkling” brands.
Their mission is to refresh the world, to inspire moments of optimism and happiness, and to
create value and make a difference.1 They believe that their success depends on their ability
to provide consumers with a wide variety of options to meet desires, needs, and lifestyle
choices. Coca-Cola has four strategic priorities to create long-term growth: to drive beverage
leadership, to accelerate innovation, to leverage their balanced geographic portfolio, and to
lead the Coca-Cola system for growth.
Vision Statement:
Coca Cola’s vision serves as the framework for our Roadmap and guides every aspect
of our business by describing what we need to accomplish in order to continue achieving
sustainable, quality growth.
People: Be a great place to work where people are inspired to be the best they can be.
Portfolio: Bring to the world a portfolio of quality beverage brands that anticipate
and satisfy people's desires and needs.
Partners: Nurture a winning network of customers and suppliers, together we create
mutual, enduring value.
Planet: Be a responsible citizen that makes a difference by helping build and support
sustainable communities.
Profit: Maximize long-term return to shareowners while being mindful of our overall
responsibilities.

C o c a C o l a | 2
Productivity: Be a highly effective, lean and fast-moving organization.
Mission:
Coca Cola’s Roadmap starts with our mission, which is enduring. It declares our
purpose as a company and serves as the standard against which we weigh our actions and
decisions.
To refresh the world...
To inspire moments of optimism and happiness...
To create value and make a difference.
Part I : External Analysis
Global Beverages Industry
The global beverages industry consists of four different categories according to Datamonitor:
Beer (along with Cider & FABs), Soft Drinks, Wine, and Spirits. Beer, Cider & FABs
account for 33.5% of the industry’s total value, and it is closely followed by Soft Drinks at
32.0%. Coca-Cola products fall under the Soft Drinks category, and despite this category
being only 32.0% of the industry, The Coca-Cola Company is the market leader in the global
beverages industry with a market share of 16.3%.
Datamonitor predicts that the global beverages industry will experience revenue and volumes
growth decline during 2010-2015. However, European and Asia-Pacific industries will grow
with CAGRs of 0.2% and 4.3%.
Competitors
The non-alcoholic beverages segment of the commercial beverages industry is highly
competitive. Commercial beverages companies compete with each other in multiple
geographicareas. Competitive products include numerous non-alcoholic sparkling beverages,
various water products, juices and nectars, fruit drinks, coffees and teas, energy and
performance-enhancing drinks, dairy-based drinks, functional beverages and other ready-to-
drink form. PepsiCo, Inc. is the primary competitors of The Coca-Cola Company in many
countries, including the United States. Other significant competitors include Nestle, Dr.
Pepper Snapple Group, Inc., Group Danone, Kraft Foods Inc. and Unilever
C o c a C o l a | 3
Five Forces Analysis
Threats of New Entrants
The level of new entrants is measured by multiple factors including: brand loyalty,
advertising ability, access of distribution channels, and supplier availability. These factors
create a low to moderate threat of new entrants.
Customer and brand loyalty make it very problematic for new competitors to enter
into the beverage industry. Coca-Cola is the most known beverage brand throughout
the world, which has been made possible through advertising and marketing.
Advertising and marketing are a key component for a new company to gain
recognition from consumers. However, both these components require large amounts
of funding to produce broad scale marketing campaigns that will gain the recognition
needed to compete with industry leaders, such as Coca-Cola.
Access to distributing channels is an important factor when entering into a new
market. It can be tiresome for new entrants to find retailers that will carry their
product before they are established. Shelf space will rarely be made for products that
cannot prove they have consumers to regularly buy their product.
Coca-Cola and other industry leaders have strict bottling contracts in all of their sales
areas. These contracts block the bottling company from doing business with
companies producing a similar product. One of the only alternatives for the new
company is to do the bottling themselves, which requires high amounts of capital.
Threats of Substitute Products
In the beverage industry there are many substitutes for each category of beverage. This
allows the consumer to help shape what the retailers put on the shelves. Examples of these
substitute products compared to Coca-Cola are: Pepsi products, beer, wine, tea, coffee,
energy drinks, etc. The substitute products create a moderate threat in the industry.

C o c a C o l a | 4
Marketing and advertising, again, have a major impact on the substitute products. If
the consumers do not know about a particular product, then retailers do not want to
stock that product.
The switching cost for retailers is fairly low, so retailers can easily switch to more
popular products. This can create an advantage for the retailer from a cost standpoint
and for the producers of the substitute product.
Throughout the beverage industry, product lines are very similar in price between
competing companies. Differentiation techniques are taken so consumers will choose
their product. This can give substitute products the opportunity to use promotional
influences to gain consumers’ favor.
Bargaining Power of Buyers
Buyers make up an important aspect of the beverage industry. Some of these buyers
include: fast food fountain, vending, convenience stores, and super markets. The bargaining
power of the buyer is low to moderate.
Fast food chains have the highest bargaining power out of the other buyers, simply
because they buy in bulk. This method of purchasing provides the least profit for
Coca-Cola due to small margins. It is more for the customer to sample the product
and grow a loyalty toward the brand name.
Vending machines provide a straight line approach from getting the product directly
into the hands of the consumer. There is literally no bargaining power for the buyer.
Convenience stores, like vending machines, have no bargaining power. The reason
for this low bargaining power is because convenience stores pay inflated prices for
the products since they are buying smaller quantities.
Super markets have low bargaining power. The power they possess is best shelf
space, but consumers usually make the final decision of the most popular products.

C o c a C o l a | 5
Bargaining Power of Suppliers
The bargaining power of the suppliers, in the beverage industry, is very low because the
ingredients used to create these beverages are readily available.
The basic materials used to make Coca-Cola products are easily found with many
suppliers. This ease of access gives a huge advantage to Coca-Cola because the
company can set their own prices with the suppliers.
Switching costs are also very low, so the ability for manufacturers to change suppliers
is easily done.
There is great emphasis put on the buyer industry to suppliers. The industry utilizes
large quantities of raw materials the suppliers must remain in good standing with the
buyers.
Competitor Rivalry
The intensity of rivalry among competitors differs by the industry. In the beverage industry
the level of rivalry is relatively moderate. The main reason for this is the number of major
players controlling the market share. These players are Coca-Cola and PepsiCo.
Brand loyalty is a determinant of the rivalry between competitors. In the end the
consumers chooses the product, so the rivalry comes in the form of advertising and
marketing strategies to gain market value.
Products in the industry are easily differentiated. This differentiation lowers the level
of rivalry because each company is trying to create the next product that will have
high consumer reviews.
The ability for consumers to control the market greatly boosts competitor rivalry.
Because stores stock their shelves with the most popular products, competitors are
always fighting for their product to be the most popular and easiest to recognize.
Expansion opportunities are one of the major factors affecting rivalry. The best way
to gain market share is to enter into a market that is not already occupied by strong
competitors.

C o c a C o l a | 6
Part II : Internal Analysis
Revenue Breakdown by Product :
FY 2011
31/12/2011 %
Revenue
Non-Alcoholic
Beverages 37,882 81.67
Bottling Investments 8,501 18.33
Corporate 159
46,542 100
Non-Alcoholic
Beverages82%
Bottling Investments
18%

C o c a C o l a | 7
Revenue Breakdown by Geography:
FY 2011
31/12/2011 %
Revenue
North America 20,559 44.32
Bottling Investments 8,501 18.33
Pacific 5,454 11.76
Europe 4,777 10.3
Latin America 4,403 9.49
Eurasia & Africa 2,689 5.8
Corporate 159
46,542 100
North America
44%
Bottling Investments
18%
Pacific12%
Europe10%
Latin America
10%
Eurasia & Africa
6%

C o c a C o l a | 8
Common Size Balance Sheet 2011
31/12/2011
Assets (%)
Cash & Near Cash Items 16.01
Short-Term Investments 1.54
Accounts & Notes Receivable 6.15
Inventories 3.87
Other Current Assets 4.31
Total Current Assets 31.88
LT Investments & LT Receivables 1.43
Net Fixed Assets 18.68
Gross Fixed Assets 28.95
Accumulated Depreciation 10.27
Other Long-Term Assets 48.01
Total Long-Term Assets 68.12
Total Assets 100
Liabilities & Shareholders' Equity
Accounts Payable 11.26
Short-Term Borrowings 18.65
Other Short-Term Liabilities 0.45
Total Current Liabilities 30.36

C o c a C o l a | 9
Long-Term Borrowings 17.08
Other Long-Term Liabilities 12.65
Total Long-Term Liabilities 29.72
Total Liabilities 60.09
Total Preferred Equity 0
Minority Interest 0.36
Share Capital & APIC 15.12
Retained Earnings & Other Equity 24.44
Total Equity 39.91
Total Liabilities & Equity 100
In year 2011, the current assets is 31.88% of total assets and long-termed assets is
68.12%. The main current assets is Cash which is 16.01% and the main long-termed
assets is other long-termed assets which is 48.01%. The current liabilities is 30.36%
of total liabilities & equity. And the long-term liabilities is 29.72% of total liabilities
& equities. The total equity is 39.91%. The main current liabilities is short-term
borrowings. The main long-term liabilities is long-term borrowings. And the main
total equity is retained earning & other equity which is around 24.44%.
Common Size Income Statement
31/12/2013 (%)
Revenue 100
Cost of Revenue 39.4
Gross Profit 60.6
Operating Expenses 36.72

C o c a C o l a | 10
Operating Income 23.88
Financing Cost & Net Non-operating Losses (Gains) (1.66)
Pretax Income 25.54
Income Tax Expense 6.21
Income Before XO Items 19.33
Extraordinary Loss Net of Tax 0
Minority Interests 0.06
Net Income 19.27
Gross profit of the company in year 2011 is 60.6 % of sales and operation income is
23.88 % of sales. The cost of goods sold is 39.4 % of sales and operating cost is
36.72%. Lastly, the net income in year 2011 is 19.27% of sales in year 2011.
Ratio Analysis
Trend Analysis
Efficiency Ratio
2009 2010 2011
Average
Accounts Receivable
Turnover 9.05 8.58 9.96 9.19
Inventory Turnover 4.88 5.07 6.34 5.43
Accounts Payable Turnover 1.72 1.64 2.04 1.80
Total Asset Turnover 0.69 0.58 0.61 0.63
Fixed Asset Tuenover 3.47 2.89 3.14 3.16

C o c a C o l a | 11
Liquidity Ratio
Current Ratio 1.28 1.17 1.05 1.17
Quick Ratio 1.11 1.02 0.92 1.02
Leverage Ratio
Debt Ratio 0.92 1.33 1.51 1.25
Interest Coverage 26.67 13.50 29.04 23.07
Profitability Ratio
Gross Profit Margin 64.22% 63.86% 60.86% 62.98%
Operating Profit Margin 26.56% 24.06% 21.82% 24.15%
Net Profit Margin 22.02% 33.63% 18.42% 24.69%
Return on Assets 15.30% 19.42% 11.21% 15.31%
Return on Equity 29.54% 41.68% 27.11% 32.78%
In the efficiency ratio, the Coca Cola company has higher efficiency in the past year
because all of the indicators has been increasing during the past 3 years.
In the Liquidity ratio, the Coca Cola company has lower liquidity during the past 3
years because they has lower current and quick ratio.
In the Leverage ratio, the Coca Cola company use higher debt during the past 3 years
but they have high ability to back the interest.
In the profitability ratio, the Coca Cola company has lower profitability because all of
the indicators has been decreasing during the past 3 years. The return from assets and
equity also decrease.

C o c a C o l a | 12
Cross Sectional Analysis
P/E
P/E ratio of Coca Cola is the second best in the market, it lower than the MNST.
P/S
P/S ratio of Coca Cola is the second best in the market, it lower than the MNST too.
P/BV
P/BV ratio of Coca Cola is the third in the market, it is lower than MNST and PEP
company.
In conclusion, MNST company has the highest P/E, P/S, and P/BV in the market, and
the KO is the second best compare to the other company.

C o c a C o l a | 13
SWOT Analysis
Strengths
Coca-Cola has been accepted as a part of American culture for over a century. One of
the biggest strengths of Coca-Cola is the company’s brand recognition. The Coca-
Cola brand image is displayed on items ranging from clothing to souvenirs, and this
recognizable branding helps distinguish Coca-Cola from competitors. Their brand is a
symbol of enjoyment and quality, and it has allowed Coca-Cola to retain current
customers and penetrate new markets.
Coca-Cola owns four of the top five non-alcoholic beverage brands: Coca-Cola, Diet
Coke, Sprite, and Fanta.4 The wide variety in their product line and product
popularity gives the Coca-Cola a competitive advantage because of their huge market
presence.
The company has 500 brands and 3,500 beverages that are sold to consumers in over
200 countries around the world. Coca-Cola is considered one of the largest beverage
manufacturers in the world, and of the 55 billion beverage servings consumed
worldwide each day, 1.7 billion of those servings are trademarks owned or licensed
by Coca-Cola. The company’s global presence not only diversifies Coca-Cola’s
revenue streams, but it makes the company less reliant on a single economy and
reduces business risk.

C o c a C o l a | 14
Datamonitor reports that Coca-Cola has “the world’s largest beverage distribution
system,” and these distribution capabilities have allowed them to produce beverages
on a global level. Their distribution network is difficult to copy and “has acted as a
sturdy barrier to entry in the industry.”
The company has the highest market share in the global beverage market (and
carbonated soft drinks market) and differentiates itself and through heavy advertising
and promotion activities. According to a recent report published in Beverage-Digest,
Coca-Cola’s market share for 2010 U.S. carbonated soft drinks (CSD) was 42.0%
compared to PepsiCo’s CSD market share of 29.3%.5 In the global beverages
industry, which includes both alcoholic and non-alcoholic beverages worldwide,
Coca-Cola holds a market share of 16.3%, which is almost double PepsiCo’s market
share of 9.2%.
Weaknesses
Coca-Cola South Pacific’s marketing director Lucie Austin says “launching new
flavors will always be a gamble for Coca-Cola. Never mind the extent of research that
goes in to the planning phase, if the product doesn’t connect with consumers, the
whole brand is in trouble.” Although Coca-Cola has been successful with new
product launches, like Coke Zero, launches of products like New Coke have been
disasters. The fact that some Coca-Cola products “die off rapidly and disappear as if
they never existed” can be considered a weakness of Coca-Cola because the company
does not always consider the impact of these new products entering the market.
Product recalls have negatively impacted Coca-Cola’s brand image, which have
decreased some consumer’s confidence in Coca-Cola products. In 2010, SmartWater
PET Bottles were recalled in North America because the beverages did not meet the
FDA’s quality standards for bottled water. In 2009 at Coca-Cola Israel, traces of
benzene and sulfur were found in 1.5 liter bottles of Coke and Diet Coke, which also
resulted in a product recall.
As a result of product recalls and consumer perception, destocking of Coca-Cola
products is another weakness for the company. During product recalls, stores are
forced to destock contaminated products. Businesses may choose to destock these
products in response to actions the company may take, such as closing local bottling

C o c a C o l a | 15
plants. In either case, destocking hurts the image of Coca-Cola, and consumers who
wish to purchase Coca-Cola products cannot from these particular stores.
Opportunities
Bottled water consumption has been increasing rapidly around the globe, and this
consumption increase is promising for Coca-Cola products like Dasani and
SmartWater. According to recent bottled water statistics provided by the International
Bottled Water Association, the overall consumption of bottled water in the U.S. has
increased by 3.5% in 2010. The entire U.S. refreshment beverage category also grew
by 1.2%, and bottled water’s market share grew to 15% as consumer interest in
healthy, calorie-free beverages increased.
Coca-Cola’s acquisition of its major bottler in North America, Coca-Cola Enterprises
(CCE), is an opportunity for Coca-Cola to take control of more company business
functions and to become more flexible by integrating 90% of its regional volume.4
Acquisitions, like CCE, extend Coca-Cola’s control over manufacturing and
distribution all over the world and give the company opportunity for growth through
new product launch or greater penetration of existing markets.
According to Datamonitor, emerging countries in Asia and Africa account for 76% of
the world’s population. The soft-drink market in Asia-Pacific has increased by 4.1%
in 2010, and that percentage is expected to increase to 29.3% in 2015. Growth in these
markets gives Coca-Cola an opportunity to establish new market bases and strengthen
current ones to increase revenue and volume growth.
Complementary food products will increase the drink consumption. When two
complementary products used together, the value of each product increases; therefore
people will more likely to buy Coca-Cola products with complementary food products
that the company owns. The company will be able to enhance its brand awareness
through complementary food products because the channels that beverage distributed
will increase.
Coca-Cola has had great success in the past with innovative products like Coke Zero,
and if the company can continue developing new, popular beverages, there is an
opportunity for company growth and increased profits.
The nonalcoholic ready-to-drink (NARTD) beverage market is expected to grow at
6% per year over the next 12 years, which will increase retail sales in this industry to
more than $1 trillion by 2020. This expansion is “fueled by increase in middle-class

C o c a C o l a | 16
consumers” and “indicates that there will be more people with more disposable
income who potentially will tap into refreshment and convenience.” If Coca-Cola
can take advantage of this growth through innovative, new products, the company can
increase profits and market presence.
Threats
The increasing competition and ability to expand in emerging markets are two factors
that might hurt the company. The major competitors are PepsiCo, Nestle, Dr. Pepper,
Group Danone, Kraft Foods, and Unilever. Coca-Cola’s primary competitor, PepsiCo
Inc., has been increasing advertising and promotion costs. In 2010, PepsiCo reported
$824 million for marketing commitments for the next five year period.9 However, as
of the 2011 3rd quarter, the marketing commitments for the same time period
increased to $2,501 million.10 The expected cost of marketing activities for the next
five year period is $4,557 million for Coca-Cola.
Evolving customer preferences are a threat for most businesses, and public health
concerns are a challenge to Coca-Cola and the beverage industry. Health advocates
are also advising people to decrease their intakes of high fructose corn syrup (HFCS),
a form of sugar which many Coca-Cola products contain. The United States
government has increased the number of regulations associated with carbonated
drinks, and some state public school systems have even banned soft drink sales on
school campuses. Because consumer preference may be shifting to healthier drinks,
growth rates for carbonated drink sales will likely decline, creating a threat for the
company because carbonated drinks constitute 77% of Coca-Cola’s sales. Even
though Coca-Cola offers healthy alternatives, these changing consumer preferences
will decrease the sales of Coca-Cola carbonated drinks, which will decrease the
company’s overall profitability.
Reduced consumer purchasing power has shifted customer preference to value
products. In 2009, Coca-Cola refused to cut prices at Costco, which resulted in
Costco destocking Coca-Cola products. As a result, Coca-Cola lost market share to
PepsiCo. If Coca-Cola gives in to stores like Costco and Wal-Mart by lowering their
prices, the pricing power of Coca-Cola and other beverage manufacturers also would
decline.

C o c a C o l a | 17
Water scarcity and poor water quality impact Coca-Cola production costs, because
water is the main ingredient for most Coca-Cola products. Datamonitor predicts that
by 2025, the demand for freshwater will rise by 56% of what people are currently
demanding, which will result in increased production costs for Coca-Cola and
possibly capacity constraints in production.
The increasing price of raw materials, such as sugar and metals used in
manufacturing, might have negative impacts on the company’s operations. Especially,
the fluctuations in the prices of those ingredients and packaging materials might cause
harm for Coca-Cola. These factors will increase the operating costs which will
increase the prices of final products. Consequently, high prices will result in a
decrease in sales, and therefore in profitability.
Coca-Cola’s worldwide operations are impacted by foreign exchange fluctuation,
which means that increases or decreases in the value of the U.S. dollar against other
currencies will impact financial statements denominated in foreign currencies.
Devaluation of currencies can also negatively impact company earnings and assets in
those markets.

C o c a C o l a | 18
Part III : Company Strategies
The Coca Cola company uses focus strategy to attract their customers because their
have focus in many types of customers. The Coca Cola company can’t use Cost-Leadership
strategy and Differentiate Strategy because the company can use the same cost as they use
and their product isn’t different from the competitors. By trying to serve each segment, the
company can increase its sales and revenues. Basically the Coca-Cola Company made 7 types
of drink for the world:
1. In First Energy drinks—for those with a high-intensity approach to life, there brands
of energy drinks contain ingredients such as ginseng extract, guarana extract, and
caffeine and B vitamins
2. In Juices/juice drinks—they bring innovation to the goodness of juice in their more
than 100 juices and juice drink brands, offering both adults and children nutritious,
refreshing and flavorful beverages.
3. In Soft drinks—their dozens of soft drink brands provide flavor and refreshment in a
variety of choices. From the original Coca-Cola to most recent introductions, soft
drinks from The Coca-Cola Company are both icons and innovators in the beverage
industry.
4. In Sports drinks—Carbohydrates, fluids, and electrolytes team together in our sports
drinks, providing rapid hydration and terrific taste for fitness-seekers at any level.
5. In Tea and coffee—bottled and canned teas and coffees provide consumers' favorite
drinks in convenient take-anywhere packaging, satisfying both traditional tea drinkers
and today's growing coffee culture.
6. In Water—Smooth and essential, their waters and water beverages offer hydration in
its purest form.
7. Other products—So much more than soft drinks, their brands also include milk
products, soup, and more. So you can choose a Coca-Cola Company product anytime,
anywhere, for nutrition, refreshment or other needs.
The Coca Cola company produce many different type of products to serve each type
of customers. For example, they produce coke-zero to serve the fat people who want to
drink soft drink. As you can see from many types of products of Coca Cola company,
they think the new products to serve in each type of customers. They focus the customers
in each type more than differentiate their products from their customers.

C o c a C o l a | 19
Part IV : Valuation
Valuation (KO):
- Method: Dividend Discount Model because the growth of dividend per share is
relatively stable.
- Holding Period: Coca Cola is the defensive stock because of its low beta (0.721) and
doing business in the consumer product. Furthermore, Coca Cola is the large market-
capitalization stock and have a lot of liquidity and stable leverage. Investors can hold
this stock for a long term (10 years or more) with low market risk, therefore we use 10
years for holding period of Coca Cola and expect to sell this stock in 2021.
- Growth: We use the 10-year compound annual growth rate of DPS (13.74%) and
EPS (11.87%) to be the growth rate of DPS and EPS respectively because the growth
rate of DPS and EPS is relatively stable.
Growth of Dividend: CAGR of DPS (10-year average) 8.92%
Growth of EPS: CAGR of EPS (10-year average) 11.87%
- Terminal Value: We use the average of past 10-year P/E and forecast the EPS to
convert P/E into stock price. We are confident that the P/E is suitable due to stability
of KO’s P/E and being the defensive stock with stable growth of EPS.
Average of 10-year PE 19.59
EPS Growth Rate 11.87%
EPS
2011 1.89
2012 2.12
2013 2.37
2014 2.65
2015 2.97

C o c a C o l a | 20
2016 3.32
2017 3.71
2018 4.15
2019 4.64
2020 5.20
2021 5.81
Terminal Value 113.87
We forecast the EPS at the end of 2021 to be 5.81 and multiply with the 10-year average of
PE to get the price of Coca Cola of $113.87 in the next 10 years. We expect to sell Coca Cola
at the end of 2021 to get the cash of $113.87.
- Cash Flow Received from Dividend and Stock:
DPS Growth Rate 8.92%
DPS in 2011 0.94
(1) (2) (1) + (2)
DPS Terminal Value Cash Flow
2012 1.02
1.02
2013 1.12
1.12
2014 1.21
1.21
2015 1.32
1.32
2016 1.44
1.44
2017 1.57
1.57
2018 1.71
1.71
2019 1.86
1.86

C o c a C o l a | 21
2020 2.03
2.03
2021 2.21 113.87 116.08
- WACC: We use the market return from Bloomberg and risk free rate from10-year
government bond rate as inputs in CAPM(Capital Asset Pricing Model) to get cost of
equity (Ke) of 8.13%. The cost of debt of 2.49% is derived from synthetic rating. The
interest coverage ratio of Coca Cola is 24.35 in 2011 and 25.98 in the third quarter of
2012 which is higher than 8.5 and Coca Cola is large manufacturing firm, therefore
the default spread should be 0.65%. We get the cost of debt of 2.49%. The weight of
debt (Wd) and equity (We) are 86.72% and 13.28% respectively which derived from
market value of KO and the total long-term liability. Overall we get the WACC of
7.30%.
WACC
Rm 10.56%
Rf 1.84%
Rm - Rf 8.72%
Beta 0.721
Ke 8.13%
2011 9M 2012
Interest Coverage Ratio 24.35 25.98
Default Spread 0.65%
Kd 2.49%
Market Value of KO 170,153.98 We 86.72%
Total Long-Term Liabilities 26,056.00 Wd 13.28%
196,209.98

C o c a C o l a | 22
WACC 7.30%
- Fair Value:
WACC 7.30%
Cash Flow Discounted Cash Flow
1 2012 1.02 0.95
2 2013 1.12 0.97
3 2014 1.21 0.98
4 2015 1.32 1.00
5 2016 1.44 1.01
6 2017 1.57 1.03
7 2018 1.71 1.04
8 2019 1.86 1.06
9 2020 2.03 1.08
10 2021 116.08 57.37
Intrinsic Value 66.49
Intrinsic Value 66.49
Market Value 37.54
Undervalues 77.12%
We discount the cash flow by WACC of 7.30% to get the intrinsic value of 66.49 which is
77.12% higher than the market value. Therefore we recommend you to buy Coca Cola stock.

C o c a C o l a | 23
There are some reasons that I am confident that my valuation is correct. Firstly, Asia or other
developing countries have a high potential to grow. As shown in the table above, Indian and
Chinese people drink Coke just only 11 and 34 bottles per year respectively whereas
people drink it 394 bottles per year. Secondly, KO has a great marketing and distribution
channel that can create strong brand value for Coke. Coke also uses high leverage and
repurchase its stocks back every year which magnify the EPS and DPS for
Coke. But you should aware of the failure of the Coke products and people concern more on
their health which can slow down the growth rate of KO.

C o c a C o l a | 24
Part V : Recommendation
In the recommendation, we think that now Coca Cola stock price is undervalue stock
because now the market price is $ 33. But the intrinsic value of the Coca Cola stock that we
have compute is $ 66.49 which has been doubled from the current stock price in the market.
So, the investors who want to buy the Coca Cola stock should buy and hold it.
In the business strategies, they should differentiate their products which the
competitors can’t copy them because it will help them get higher profit than competitors and
they will come to dominate the market. Also, they should distribute some of the products that
they serve only in some countries to serve to the worldwide. To make their products become
more recognize for the other countries. Moreover, they should try to find the new technology
and innovation to reduce their cost of goods sold and operation cost. Lastly, the company
should reduce their debt financing as the company has higher debt in this time, from this it
will help the financial risk of the company become lower.

C o c a C o l a | 25
References
http://www.coca-colacompany.com/our-company/mission-vision-values
http://assets.coca-
colacompany.com/b6/f3/ecad445f4fc1819dd37e04e057ad/form_10K_2011.pdf
http://www.stock-analysis-on.net/NYSE/Company/Coca-Cola-Co/DCF/DDM
http://www.stock-analysis-on.net/NYSE/Company/Coca-Cola-Co/Valuation/Ratios
Bloomberg Terminal

C o c a C o l a | 26
Appendixes
Balance Sheet:
FY 2007 FY 2008 FY 2009 FY 2010 FY 2011
Assets
Cash & Near Cash Items 4,093.00 4,701.00 7,021.00 8,517.00 12,803.00
Short-Term Investments 215.00 278.00 2,192.00 2,820.00 1,232.00
Accounts & Notes Receivable 3,317.00 3,090.00 3,758.00 4,430.00 4,920.00
Inventories 2,220.00 2,187.00 2,354.00 2,650.00 3,092.00
Other Current Assets 2,260.00 1,920.00 2,226.00 3,162.00 3,450.00
Total Current Assets 12,105.00 12,176.00 17,551.00 21,579.00 25,497.00
LT Investments & LT
Receivables 488.00 463.00 538.00 631.00 1,141.00
Net Fixed Assets 8,493.00 8,326.00 9,561.00 14,727.00 14,939.00
Gross Fixed Assets 14,444.00 14,400.00 16,467.00 21,706.00 23,151.00
Accumulated Depreciation 5,951.00 6,074.00 6,906.00 6,979.00 8,212.00
Other Long-Term Assets 22,183.00 19,554.00 21,021.00 35,984.00 38,397.00
Total Long-Term Assets 31,164.00 28,343.00 31,120.00 51,342.00 54,477.00
Total Assets 43,269.00 40,519.00 48,671.00 72,921.00 79,974.00
Liabilities & Shareholders'
Equity
Accounts Payable 6,915.00 6,205.00 6,657.00 8,859.00 9,009.00
Short-Term Borrowings 6,052.00 6,531.00 6,800.00 9,376.00 14,912.00
C o c a C o l a | 27
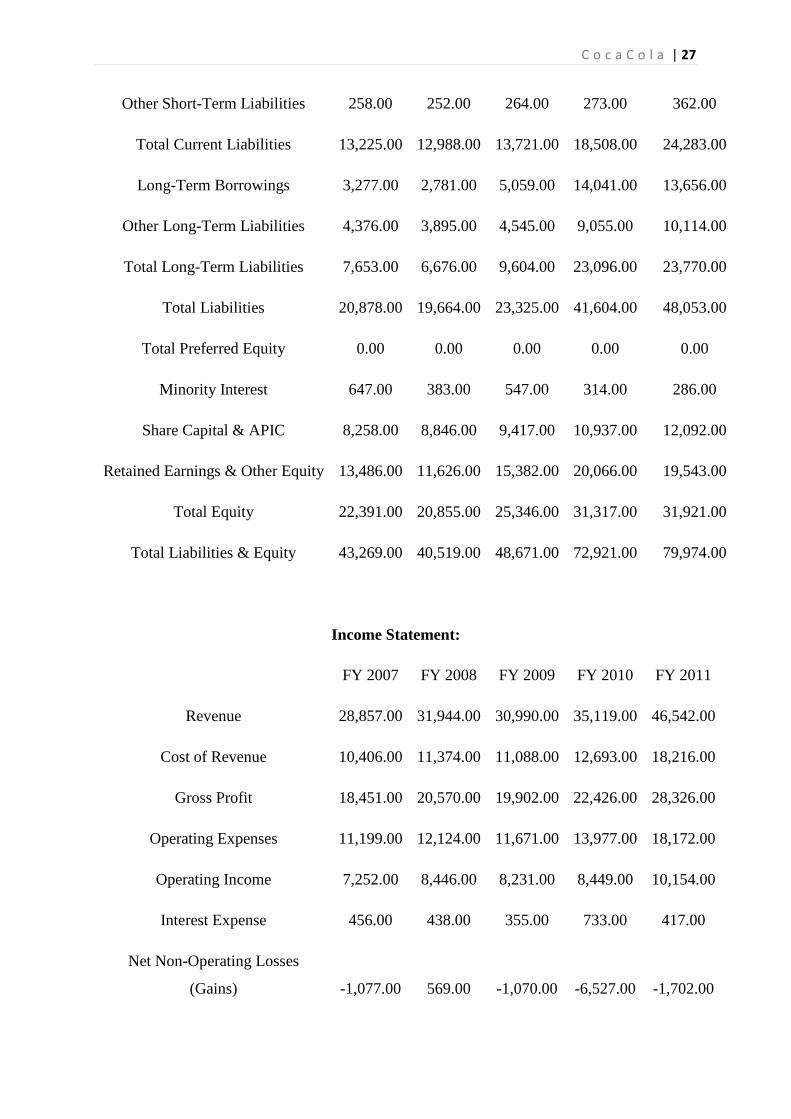
Other Short-Term Liabilities 258.00 252.00 264.00 273.00 362.00
Total Current Liabilities 13,225.00 12,988.00 13,721.00 18,508.00 24,283.00
Long-Term Borrowings 3,277.00 2,781.00 5,059.00 14,041.00 13,656.00
Other Long-Term Liabilities 4,376.00 3,895.00 4,545.00 9,055.00 10,114.00
Total Long-Term Liabilities 7,653.00 6,676.00 9,604.00 23,096.00 23,770.00
Total Liabilities 20,878.00 19,664.00 23,325.00 41,604.00 48,053.00
Total Preferred Equity 0.00 0.00 0.00 0.00 0.00
Minority Interest 647.00 383.00 547.00 314.00 286.00
Share Capital & APIC 8,258.00 8,846.00 9,417.00 10,937.00 12,092.00
Retained Earnings & Other Equity 13,486.00 11,626.00 15,382.00 20,066.00 19,543.00
Total Equity 22,391.00 20,855.00 25,346.00 31,317.00 31,921.00
Total Liabilities & Equity 43,269.00 40,519.00 48,671.00 72,921.00 79,974.00
Income Statement:
FY 2007 FY 2008 FY 2009 FY 2010 FY 2011
Revenue 28,857.00 31,944.00 30,990.00 35,119.00 46,542.00
Cost of Revenue 10,406.00 11,374.00 11,088.00 12,693.00 18,216.00
Gross Profit 18,451.00 20,570.00 19,902.00 22,426.00 28,326.00
Operating Expenses 11,199.00 12,124.00 11,671.00 13,977.00 18,172.00
Operating Income 7,252.00 8,446.00 8,231.00 8,449.00 10,154.00
Interest Expense 456.00 438.00 355.00 733.00 417.00
Net Non-Operating Losses
(Gains) -1,077.00 569.00 -1,070.00 -6,527.00 -1,702.00

C o c a C o l a | 28
Pretax Income 7,873.00 7,439.00 8,946.00 14,243.00 11,439.00
Income Tax Expense 1,892.00 1,632.00 2,040.00 2,384.00 2,805.00
Income Before XO Items 5,981.00 5,807.00 6,906.00 11,859.00 8,634.00
Minority Interests 0.00 0.00 82.00 50.00 62.00
Net Income 5,981.00 5,807.00 6,824.00 11,809.00 8,572.00
Total Cash Preferred Dividends 0.00 0.00 0.00 0.00 0.00
Other Adjustments 0.00 0.00 0.00 25.00 39.00
Net Income Available to Common
Shareholders 5,981.00 5,807.00 6,824.00 11,784.00 8,533.00
Statement of Cash Flow:
FY 2007 FY 2008 FY 2009 FY 2010 FY 2011
Cash From Operating
Activities
Net Income 5,981.00 5,807.00 6,824.00 11,809.00 8,572.00
Depreciation & Amortization 1,163.00 1,228.00 1,236.00 1,443.00 1,954.00
Other Non-Cash Adjustments 0.00 1,224.00 690.00 -4,090.00 841.00
Changes in Non-Cash Capital 6.00 -688.00 -564.00 370.00 -1,893.00
Cash From Operations 7,150.00 7,571.00 8,186.00 9,532.00 9,474.00
Cash From Investing
Activities
Disposal of Fixed Assets 239.00 129.00 104.00 134.00 101.00
Capital Expenditures -1,648.00 -1,968.00 -1,993.00 -2,215.00 -2,920.00

C o c a C o l a | 29
Increase in Investments 0.00 0.00 -2,152.00 0.00 0.00
Decrease in Investments 0.00 0.00 0.00 0.00 0.00
Other Investing Activities -5,310.00 -524.00 -108.00 -2,324.00 295.00
Cash From Investing Activities -6,719.00 -2,363.00 -4,149.00 -4,405.00 -2,524.00
Cash from Financing
Activities
Dividends Paid -3,149.00 -3,521.00 -3,800.00 -4,068.00 -4,300.00
Change in Short-Term
Borrowings 0.00 0.00 0.00 0.00 0.00
Increase in Long-Term
Borrowings 9,979.00 4,337.00 14,689.00 15,251.00 27,495.00
Decrease in Long-term
Borrowings -5,638.00 -4,308.00 -12,326.00
-
13,403.00
-
22,530.00
Increase in Capital Stocks 1,619.00 586.00 662.00 1,666.00 1,569.00
Decrease in Capital Stocks -1,838.00 -1,079.00 -1,518.00 -2,961.00 -4,513.00
Other Financing Activities 249.00 -615.00 576.00 -116.00 -385.00
Cash from Financing Activities 1,222.00 -4,600.00 -1,717.00 -3,631.00 -2,664.00
Net Changes in Cash 1,653.00 608.00 2,320.00 1,496.00 4,286.00


