Embed Size (px)
Citation preview

Experimental Hematology 2013;41:28–38
Comparative clonal analysis of reconstitution kinetics after transplantationof hematopoietic stem cells gene marked with a lentiviral SIN
or a g-retroviral LTR vector
Kerstin Cornilsa, Cynthia C. Bartholomaeb, Lars Thieleckec, Claudia Langea, Anne Arensb,Ingmar Glauchec, Ulrike Mocka, Kristoffer Rieckena, Sebastian Gerdesc, Christof von Kalleb,
Manfred Schmidtb, Ingo Roederc, and Boris Fehsea
aResearch Department Cell and Gene Therapy, Clinic for Stem Cell Transplantation, University Medical Centre Hamburg-Eppendorf, Hamburg,
Germany; bDepartment of Translational Oncology, National Centre for Tumour Diseases and German Cancer Research Centre, Heidelberg,
Germany; cInstitute for Medical Informatics and Biometry, Faculty of Medicine Carl Gustav Carus, Dresden University of Technology,
Dresden, Germany
(Received 17 January 2012; revised 28 August 2012; accepted 10 September 2012)
Offprint requests to
Gene Therapy, Clinic
Centre Hamburg-Epp
E-mail: [email protected]
Supplementary data
dx.doi.org/10.1016/j.
0301-472X/$ - see fro
http://dx.doi.org/10
Retroviral gene marking has been used successfully in preclinical and clinical transplantationsettings. Highly sensitive techniques for vector insertion-site determination, such as linearamplification–mediated polymerase chain reaction (LAM-PCR) in conjunction with next-generation sequencing, have been introduced to assess the composition of gene-marked hema-topoiesis at a single-cell level. Here we used these novel techniques for directly comparingclonal reconstitution kinetics in mice transplanted with bone-marrow–derived stem cellsgenetically marked with either a standard, spleen focus–forming virus long terminal repeat(LTR)–driven g-retroviral, or a lentiviral self-inactivating vector containing an identicalbut internal spleen focus–forming virus–derived enhancer/promoter. We observed that theuse of the lentiviral self-inactivating vector for gene marking was associated with a broaderrepertoire of differently marked hematopoietic clones. More importantly, we found a signifi-cantly higher probability of insertions in growth-promoting, clonal-dominance–associatedgenes in the spleen focus–forming virus LTR–driven g-retroviral vector at later time pointsof analysis. Based on our data, we suggest that the combined use of LAM-PCR and next-generation sequencing represents a potent tool for the analysis of clonal reconstitution kineticsin the context of gene marking with integrated vectors. At the same time, our findings provethat the use of multiple restriction enzymes for LAM-PCR is indispensable to detect most orideally all individual stem cell clones contributing to hematopoiesis. We have also found thattechniques such as quantitative PCR can be helpful to retrospectively analyze reconstitutionkinetics for individual hematopoietic stem cell clones. Finally, our results confirm the notionthat marking with lentiviral self-inactivating vectors is associated with a lower risk of geno-toxicity as compared with g-retroviral LTR vectors. � 2013 ISEH - Society for Hematologyand Stem Cells. Published by Elsevier Inc.
Gene marking with integrating, retroviral vectors has beenvery useful to follow-up the in vivo fate of cells. In fact,important insights in stem cell biology, but also thepotential impact of the gene-marking vectors, have been
: Boris Fehse, Ph.D., Research Department Cell and
for Stem Cell Transplantation, University Medical
endorf, Martinistr. 52, 20246 Hamburg, Germany;
related to this article can be found online at http://
exphem.2012.09.003.
nt matter. Copyright � 2013 ISEH - Society for Hematol
.1016/j.exphem.2012.09.003
obtained in various animal models [1–5]. Gene-markingapproaches in clinical cell therapy settings contributesignificantly to our understanding of highly relevantphenomena, such as relapse induction after stem cell trans-plantation or homing potential of ex vivo expanded immunecells toward tumors [6,7]. In clinical gene therapy, cure ofthe disease was accompanied or followed by severe adverseevents in some patients [8–12]. Remarkably, malignanttransformation was related to the up-regulation of cellularproto-oncogenes by proviral regulatory elements. Thesefindings emphasize the need for uncovering the transduced
ogy and Stem Cells. Published by Elsevier Inc.

29K. Cornils et al./ Experimental Hematology 2013;41:28–38
cell pool and dissecting the contribution of individualclones to hematopoietic repopulation.
Recently, large-scale clonal analyses of gene-markedcells have been revolutionized based on novel techniquecombinations, specifically ligation-mediated or linear-amplification-mediated (LM/LAM-) polymerase chain reac-tion (PCR) and next-generation sequencing (NGS) [13–17].Using LM-PCR followed by pyrosequencing, the Baumlaboratory investigated the impact of target cells (hematopoi-etic stem vs progenitor cells), vector types (g-retroviral vslentiviral vectors) and ex vivo culture conditions on the prob-ability of clonal dominance [18,19]. However, LM-PCR hasbeen shown to preferentially retrieve insertion sites present indominant clones [3,20,21]. In contrast, LAM-PCR facilitatesretrieval of insertion sites present at low frequencies in thecell pool, although constraints exist due to the use of restric-tion enzymes and the PCR steps favoring shorter fragments[22–25].
We have previously introduced murine stem cell trans-plantation and marking models for in vivo analysis of retro-viral gene transfer vectors [26,27]. These models have beenshown to be predictive for unwanted side effects of retro-viral gene transfer, such as vector-induced clonal domi-nance or leukemia [2,3,20]. Here we combined theestablished model with techniques mentioned for high-resolution insertion site analysis to directly compare recon-stitution after transplantation of hematopoietic stem (HSC)
, CD45.2
Lenti-SF SIN-LTR S
SFFV-LTRSF91
A
B
Figure 1. Vector design and experimental set-up. (A) The SF91-eGFP vector wa
cloning the SFFV-promoter element from the SF91 into the LeGO-G2 vector [28
depleted bone marrow cells from male CD45.2 mice. Transduced cells were trans
were observed for 7 months. During that observation time blood samples were t
and progenitor cells (HPC) transduced by either a standardg-retroviral spleen focus–forming virus (SFFV) vector(SF91) or a lentiviral self-inactivating (SIN) vector withan internal SF91 U3 promoter/enhancer (termed LentiSF).In order to analyze engraftment kinetics, we obtained bloodsamples from transplanted animals at regular intervals(approximately every 4 weeks). On these samples, we per-formed LAM-PCR, followed by 454 sequencing to uncoverand quantify clonal contribution of gene-marked cells. Weshow that by using these techniques, clone-specific recon-stitution kinetics by gene-marked stem and progenitor cellscan be analyzed in detail. At the same time, our data indi-cate that application of additional techniques, such as quan-titative PCR, might be necessary for more detailed analysesof individual clonal contributions. Finally, comparativeanalysis of the two vector types in our sensitive mousemodel corroborates an improved safety profile of lentiviralSIN vectors.
Materials and methods
Vector design and productionThe SF91 vector was described earlier [2]. The Lenti-SF–enhanced green fluorescent protein (eGFP)-vector is an SIN lenti-viral vector that contains an eGFP gene under the control of aninternal spleen focus–forming virus (SFFV) promoter (Fig. 1A).It essentially resembles the structure of LeGO-G2 [28] with two
7 months
, CD45.1
Blood-Samples
eGFP wPREFFV SIN-LTR
eGFP wPRE SFFV-LTR
s described previously [26]. The Lenti-SF-eGFP vector was constructed by
]. (B) Viral supernatants of the two vectors were used to transduce lineage-
planted into lethally irradiated female CD45.1 recipients (n 5 10). Animals
aken every 4 to 5 weeks.

30 K. Cornils et al./ Experimental Hematology 2013;41:28–38
additional modifications: the SIN-long terminal repeat (LTR)contains the large deletion described by Zufferey et al. [29], andthe wPRE element was safety optimized [30]. Cell-free superna-tants containing viral particles pseudotyped with mouse Moloneyecotropic envelope protein (env) were obtained by transient trans-fection of 293T cells [27,31]. Vector titers were determined onSC-1 cells as described previously [28].
Bone marrow preparation, stimulation, and transductionBone marrow cells were harvested from femora and tibiae of 8- to10-week-old male C57Bl/6 mice (CD45.2). Lineage depletion wasperformed according to manufacturer’s instructions (Miltenyi Bio-tec, Bergisch-Gladbach, Germany). The lineage-negative fractionof cells was prestimulated in StemSpan Medium (StemCell Tech-nologies, Grenoble, France) containing 100 ng/mL of thefollowing cytokines: murine stem cell factor, human thrombopoie-tin, human fms-like tyrosine kinase receptor-3 ligand, and humaninterleukin-11 (Immunotools, Friesoythe, Germany). After 2 daysof stimulation, cells were transduced with either the SF91 or theLenti-SF vector (both ecotropic pseudotypes) on Retronectin- (Ta-KaRa, Otsu, Shiga, Japan) coated plates at a multiplicity of infec-tion (MOI) of 3 (Fig. 1B). Transduction efficiencies wereestimated via fluorescence-activated cell sorting (FACS) analysis.
Transplantation and blood samplingLethally irradiated (10 Gy) C57Bl/6 female mice (CD45.1) weretransplanted with 5 � 105 cells via tail vein injection (n 5 10per group). After transplantation and during follow-up, threemice per group died due to unknown reasons, most probablyengraftment failures. During the observation time of 7 months,serial peripheral blood samples were taken via retro-orbitalbleeding approximately every 4 weeks starting 6 weeks after trans-plantation (Fig. 1B). A small amount of blood was used to monitorthe reconstitution by analyzing the eGFP-expression via FACS.The remaining blood cells were used for DNA extraction (Qiagen,Hilden, Germany). Four animals per group were randomly chosenfor LAM-PCR and 454 sequencing. After 7 months, all animalswere sacrificed and bone marrow, blood, spleen, and thymuswere collected for further analysis.
LAM-PCR and 454 sequencingOne hundred nanograms DNA were used for LAM-PCR asdescribed by Schmidt et al. [22]. Two restriction enzymes(SF91: Tsp509I and HinPI; Lenti-SF: Tsp509I and HpyCH4IV;all NEB, Ipswich, MA, USA) were used for each vector toincrease the recovery of integration sites in independent LAMreactions [14]. According to Gabriel et al. [24], both restriction-enzyme combinations facilitate very similar genome accessibility(Lenti-SF: 56%, SF91: 54%). LAM-PCR products were used for454 pyrosequencing after introduction of barcoded primers, puri-fication of the evolved product, and quantification [32]. LAMproducts independently generated for each blood sample (usingthe two different restriction enzymes) were sequenced.Sequencing was performed in the German Cancer ResearchCentre core facilities. To obtain a representative picture of theclonal composition of the blood at each time point, we aimed atassessing approximately 1000 sequences per sample. The actualrange of processed sequences eligible for clonal analyses was 53to 2203 reads at different time points.
Sequence analysis and clonal distributionSorting of the sequences according to their sample-specific bar-code and trimming to remove LTR and linker-sequences wasdone using a proprietarily developed in-house Perl script by theDepartment of Translational Oncology, National Centre forTumour Diseases and German Cancer Research Centre (Heidel-berg, German) [32]. Quality control included checking the ob-tained sequences for the presence of the last PCR primer (LTR3for LentiSF and A3 for the SF91 [22]) and at least 5 bp of the viralLTR sequence.
For automatic analysis of the presorted sequences, a specific R-Script was developed using sophisticated clustering and mappingsoftware. In the first step, the single reads were mapped to themouse genome (July 2007, NCBI37, mm9) via Segemehl Vers.0093 [33]. Sequences with !85% of similarity to the mousegenome were excluded from further analysis. Those sequenceswere mostly showing the internal control of the LAM-PCR, othervector-derived sequences and some other sequences, which can beattributed to an inherent technical issue of NGS termed collisions[34]. Also, single reads were excluded from analysis. The remain-ing sequences were clustered with UClust (Version 1.1.579, [35])to identify clusters of identical sequences. Assignment of the cor-responding genomic integration sites to the specific clusters wasdone by calculating the cluster-specific consensus sequence usingclustal 2.0.12 [36] and submitting these sequences to a virusintegration-site analysis tool developed at the Medical SchoolHannover (http://eh.mh-hannover.de/isa). A window of 6250 kbaround the identified integration site was analyzed for the closestgene. Identified genes were checked for their presence in the retro-viral tagged cancer gene database (RTCGD) [37].
LM-PCR and quantitative real-time PCRLM-PCR using 200 ng DNA as a template was described previ-ously [38]. The same restriction enzymes were used as forLAM-PCR (two per vector, see LAM-PCR and 454 sequencing).Two potentially important integration sites identified by LM-PCR on spleen DNA were chosen to assess clonal contributionof the corresponding clones in all respective blood samples viaquantitative real-time PCR (qPCR)done identified in animalI.4.5 (Mcts1), the other one in animal I.4.7 (Trim32). The LTR-genome junction of the corresponding clone was PCR amplified(Taq-Polymerase, Fermentas, St. Leon-Rot, Germany) usingintegration-specific primers (LTR-specific forward-primer: 50-CCCGTCTGTTGTGTGACTCT and the integration-specificreverse-primer; Mcts1-RV: 50-CTCTGTGTAGCCCTGGCTGTand Trim32-RV: 50-GCAGATCTCTTTAGCTCCTTGG). The ob-tained fragments (169 bp for Mcts1, 113 bp for Trim32) werecloned into the pCR 2.1-TOPO vector (TOPO cloning kit; Invitro-gen, Carlsbad, CA, USA) to generate plasmid standard curves (108
to 103 copies/mL) as described by Bozorgmehr et al. [39].In order to determine the relative contribution of the specific
clone at a given time point, we performed a control PCR detectinga 109-bp fragment derived from an intron of the Erythropoietinreceptor (EpoR) gene in parallel. We used the following primers:EpoR-FW: 50-GCAGGCGGGGTCGCTACTC and EpoR-RV: 50-CGC CTGTGCAGATCCGATAA.
Before SYBR-Green-based qPCR (QuantiTect SYBR Green;Qiagen), the DNA of the blood samples was amplified via WholeGenome Amplification (Repli-g; Qiagen). The total amount ofcopies of the clone was assessed by absolute quantification from

31K. Cornils et al./ Experimental Hematology 2013;41:28–38
the respective plasmid standard curve. Contributions of the Mcts1-clone in animal I.4.5 and the Trim32-clone in animal I.4.7 werecalculated by division of the absolute copy numbers of the cloneby the absolute copy numbers of the EpoR gene.
Results
Efficient transduction of murine HSC/HPC with bothvectorsIn order to ensure low vector copy numbers per transducedcell (i.e., 1–2), we aimed at an intermediate gene transferefficiency of approximately 30% to 50% [40]. To thisaim, we used equal MOIs of 3 for both vectors. MOIswere calculated based on vector titers determined onmurine SC-1 cells.
c-kit
GF
P
A
B
0
20
40
60
80
100
6 10 15
weeks
% eG
FP
Lenti-SF
0 1 2 3 4
12 6
2557
100 101 102 103 104100
101
102
103
104
Figure 2. FACS analysis of freshly transduced and peripheral blood cells to dete
expression of eGFP and the stem cell marker c-kit (phycoerythrin-coupled antibo
SF91-transduced cells was approximately 4 times higher in comparison to Lent
blood samples taken at indicated time points post-transplantation. Relative num
in both experimental groups (n54 randomly chosen animals per group).
Despite applying equalized MOIs, transduction rateswere quite different for the two vectors. While approxi-mately 74% of the lineage-depleted bone marrow cellswere transduced with the SF91 vector, the correspondingrate was 18% for Lenti-SF (Fig. 2A). In both cultures, theproportion of earlier, c-kit–positive cells was almost equal(34% vs 31%). Accordingly, the percentage of eGFP-positive c-kit cells was also more than four times higherin the SF91 group (26% vs 6%; Fig. 2A). Remarkably,copy numbers of proviral vector DNA estimated by qPCR24 hours after transduction, i.e., before integration, wereessentially equal for both vector types (SF91: 2.34; Lenti-SF: 2.45). These data indicate that the applied MOIs werewell adjusted, and facilitated entry of identical amountsof viral particles. However, mean numbers of integrated
0 1 2 3 4
SF91
100 101 102 103 104100
101
102
103
104
48 26
818
23 28
SF91Lenti-SF
ct eGFP expression. (A) Analysis of transduced cells by flow cytometry for
dy) 48 hours after transduction. As evident, transduction efficiency in the
i-SF–transduced cells. (B) Percentage of eGFP-expressing cells in whole-
bers of eGFP-expressing cells remained stable over the observation time

32 K. Cornils et al./ Experimental Hematology 2013;41:28–38
vector copies detected at final analysis in vivo in spleencells were, in full agreement with the FACS data fourfoldhigher for SF91: 1.06 (n 5 4) than for Lenti-SF: 0.23(n 5 4). Also, similar donor chimerism as assessed byflow cytometry was observed for the two vector groups(LentiSF: 65.5%; SF91: 55.3%).
While the reason for the relatively big difference intransduction rates could not be resolved unambiguously,sufficient numbers of cells were transduced for both vectorsto allow for later follow-up of vector-positive cells in vivo.This was confirmed by determining numbers of eGFP-positive cells using FACS of whole-blood samples at eachdata point during the entire observation time (Fig. 2B), aswell as by a detailed analysis of eGFP contents in differentblood cell lineages at final analysis (Supplementary TableE1; online only, available at www.exphem.org).
Numbers of clones contributing to hematopoiesis overtime are relative constant for both vectorsIn the next step, we used LAM-PCR followed by NGS todetermine relative clone sizes at each given time point ofanalysis. To do so, all obtained sequences underwent pro-cessing and quality control. Only those sequences that ful-filled initial quality criteria and could be mapped witha similarity of at least 85% to the mouse genome wereincluded in further analysis. Together w40,000 sequenceswere obtained and O30,000 sequences passed all qualitycriteria (Table 1). Unfortunately, no blood samples couldbe obtained for LAM-PCR at week 28 for mouse I.4.5,
Table 1. Numbers of obtained sequence reads by 454 sequencing after
trimming and additional quality control
After trimming
Mouse W6 W10 W15 W19 W23 W28 Total
I.1.2 103 126 125 170 1126 1413 3063
I.1.4 1092 1405 2086 150 1155 1212 7100
I.1.5 1334 886 965 530 1223 1394 6332
I.1.6 504 1062 928 1321 956 435 5206
I.4.2 2549 131 158 131 2704 38 5711
I.4.4 590 772 754 150 258 37 2561
I.4.5 755 1092 1236 754 994 0a 4831
I.4.7 973 1040 823 628 1355 824 5643
Total 40,447
After additional quality control
I.1.2 53 67 84 59 897 1271 2431
I.1.4 675 845 1977 116 958 1127 5698
I.1.5 1171 823 835 521 1158 1354 5862
I.1.6 452 833 632 1306 902 428 4553
I.4.2 2203 66 78 66 2015 29 4457
I.4.4 408 544 528 62 232 0 1774
I.4.5 635 757 983 528 325 0a 3228
I.4.7 455 867 448 353 681 126 2930
Total 30,933
aNo blood sample available.
and LAM-PCR was not efficient for mice I.4.2 and 1.4.4.Therefore, cluster data could not be compared at thattime point between the two groups.
Using the clustering algorithm described in Material andMethods, identical and highly similar sequences were clus-tered. Based on this, numbers of individual clusters at eachtime point were assessed for both vectors for each indi-vidual animal. Based on the assumption that a given clusterrepresents a single clone with a defined insertion site, thisdata was used to assess the kinetics of clone numberscontributing to hematopoiesis (Fig. 3). To allow for directcomparison between the two vector groups, numbers ofclusters were related to the absolute number of gene-marked cells. Results shown in Figure 3 reflect the calcu-lated mean numbers of different clones per 100,000transplanted, gene-modified cells in the peripheral bloodof each of four mice per vector group at the indicatedtime points after transplantation. The obtained data indicatethat, despite large inter-animal variation in both vectorgroups, the numbers of clones contributing to hematopoi-esis were relatively stable.
Patterns of clone size changes during hematopoieticrecovery with different marking vectorsIn the next step, the relative contribution of each clone to(the gene-marked proportion of) hematopoiesis was deter-mined based on the sequence numbers (read counts) fora given cluster in relation to the whole number of relevantsequences obtained for that time point. These data wereused to create kinetic plots reflecting hematopoietic recon-stitution of each individual animal by gene-marked cells.For plainness, relative data obtained for all animals(n 5 4) of each of the two vector groups were mergedinto one graph (Fig. 4). As illustrated, contribution of indi-vidual clones to hematopoiesis followed wave-like kineticsfor essentially all clones marked with Lenti-SF (Fig. 4B).On the contrary, single clones in the SF91 group apparentlyshowed a tendency for continuous expansion and remaineddominant over time (Fig. 4A, upper clone).
Long-term reconstituting clones marked with SF91 showa tendency toward over-representation of insertions inthe vicinity of proto-oncogenesNext we used the sequence data obtained by NGS to iden-tify and compare the distribution of vector-insertion sites inlong-term reconstituting clones marked with either SF91 orLenti-SF. We focused on insertions into genes previouslyincluded in the RTCGD (Supplementary Table E2; onlineonly, available at www.exphem.org) [36]. Four mice wereavailable for analysis per group. For comparison of thetwo vector groups, we determined for each time point thenumber of clusters representing insertions in the proximityof RTCGD genes relative to the absolute number of clusters(Fig. 5A). A relatively large window of6250 kb around theintegration site were used for gene analysis. Notably,

0.0
5.0
10.0
15.0
20.0
25.0
6 10 15 19 23
weeks
clu
sters
/ 1
00.000 c
ells
Lenti-SF SF91
Figure 3. Mean numbers of clusters per 100,000 transplanted, transduced cells in the peripheral blood of individual mice at different time points. Numbers of
clusters were determined after processing the obtained sequences with a cluster algorithm (compare Materials and Methods). Numbers of clusters were calcu-
lated for individual animals per 100,000 transplanted, eGFP-positive transduced cells based on the initial transduction rate of 0.74 for SF91 and 0.18 for
Lenti-SF. Data represents mean values for four animals per group.
33K. Cornils et al./ Experimental Hematology 2013;41:28–38
already at early time points after transplantation (weeks 6and 10), the relative contribution of RTCGD clusters tothe total number of clusters was lower for Lenti-SF (e.g.,at week 6 by a factor of 2.4), although differences werenot significant (p 5 0.28; Fisher’s exact test). These datamost probably reflect the different integration preferencesof the two vector types. Strikingly, the relative contributionof RTCGD clusters remained at high levels of about 20%over the whole observation period in the SF91 group, whileit decreased to approximately 2% in the Lenti-SF group at
Figure 4. Clonal composition of hematopoiesis over time. Kinetics of relative
hematopoietic reconstitution after transplantation are shown for the two vector gro
per group. Relative clone sizes were adjusted to the total sequences obtained fo
the final data point. At final analysis, the difference betweenthe two groups was highly significant (p 5 0.003; Fisher’sexact test). Also, the overall relative representation ofRTCGD hits was significantly higher in the SF91 ascompared with the Lentis-SF group (p ! 0.05; Fisher’sexact test). Finally, we analyzed the relative proportion ofsequence counts for RTCGD insertions in comparison tothe total read counts at any given time point (Fig. 5B).Again, the relative contribution of clones representingRTCGD hits was significantly larger in the SF91 group as
contribution of individual sequence clusters (also referred to as clones) to
ups. Data shown reflect a summarized analysis for each of the four animals
r each individual mouse at each data point.

A
0.0
5.0
10.0
15.0
20.0
25.0
30.0
6 10 15 19 23
weeks
Rela
tive P
ro
po
rtio
n o
f R
TC
GD
-clu
ster
(%
) p=0.011
p=0.003
Lenti-SF
n.s.n.s.
n.s.
B
Me
an
Fractio
no
f R
TC
GD
-rea
ds
(%
)
0
5
10
15
20
25
30
35
40
6 10 15 19 23
weeks
Lenti-SF
n.s.
n.s.
n.s.
n.s.p=0.043
SF91
SF91
Figure 5. Mean numbers of clones/clusters containing insertion sites in the proximity of retrovirally tagged cancer genes and their abundance in the blood of
mice over time. Cluster sequences were blasted against the mouse genome; genes in a window of6250 kb were identified and analyzed for their presence in the
RTCGD [37]. (A) Mean numbers of RTCGD clusters in relation to total cluster numbers are depicted for the four animals per vector group and the different time
points. (B) Read counts for the RTCGD-clusters [as in (A)] were set in relation to the total reads for the four individual mice at all time point; depicted are the
means for both groups; whiskers indicate the standard error; p values indicate significant differences between the two groups, n.s. 5 not significant.
34 K. Cornils et al./ Experimental Hematology 2013;41:28–38
compared with the Lenti-SF group at the final point of anal-ysis (Welch two-sample t test). Remarkably, at later timepoints, RTCGD hits apparently capture a higher share of
hematopoiesis per cluster (based on the relation of readcounts to cluster numbers) in the SF91, but not the Lenti-SF group. For example, the relative quota of RTCGD

35K. Cornils et al./ Experimental Hematology 2013;41:28–38
clusters for SF91 at week 23 is approximately 18%, and therespective reads for these clusters total up to 28%. Incontrast, for Lenti-SF group, the relative proportions ofRTCGD hits and counts are essentially identicaldbothapproximately 2% (Fig. 5). In line with this, at week 23RTCGD hits were present in all four animals of the SF91group (representing up to 42% of total read counts in singleindividuals), but only in one of four Lenti-SF mice (3% ofread counts). These data again support the notion thatclonal dominance due to insertional mutagenesis is morelikely to develop after transduction with SF91 than withLenti-SF.
LAM-PCR þ NGS provide a representative clonalanalysisAt final analysis, we performed LM-PCR [38] on spleenDNA samples. This enabled us to reveal single insertionsites (e.g., insertion I.4.5, Fig. 6B) that had escaped detec-tion in peripheral blood (not shown). As reported previ-ously, a restriction fragment length bias becomes relevantwhen using LM- and/or LAM-PCR [23,24,38]. Most prob-ably due to the latter, only the 276-bp Tsp509I- but not the748-bp HpyCH4IV fragment of the respective insertion inmouse I.4.7 (Fig. 6A) was detectable by LAM-PCR atdifferent time points. Accordingly, insertion in mouseI.4.5 was detected by LAM-PCR/NGS at only one timepoint due to the large fragment sizes generated by bothHpyCH4IV and Tsp509I (Fig. 6B).
mouse I.4.7
0
0.2
0.4
0.6
0.8
1
1.2
6 10 15 19 23 28
weeks
co
py
ra
tio
in
se
rtio
n/h
k
0
0.2
0.4
0.6
0.8
1
1.2
re
ad
co
un
ts
mean qPCR454-reads
3‘ LTR
Tsp509I276, 314 bp
HpyCH4IV748 bp
A
Figure 6. Comparative quantitative analysis of LAM-PCR amplicon sequence co
of clonal contribution as determined by LAM-PCR and NGS (relative read counts
examples of outcomes are shown. (A) Integration-specific quantitative real-time P
qPCR data with quantitative cluster analysis revealed a very good correlation. In
locus showed a good accessibility at least for Tsp509I. (B) On the contrary, only
ysis based on 454 sequencing was found for an integration site from mouse I.4.5
relatively distant from the insertion, which strongly impairs detection by LAM-P
In line, quantification of LAM products does not alwayscorrelate with results from qPCR using insertion-specificprimers. In fact, we observed a nice correlation for theTrim32-clone, which is obviously based on the efficientamplification of the short Tsp509I-fragment (Fig. 6A).However, insertion into the Mcts1-locus remained almostunnoticed by LAM-PCR at each time point analyzed, whichstrongly contrasted qPCR results. Together these in vivodata confirm the prediction that even the use of twodifferent restriction enzymes for LAM-PCR may notstrictly ensure a complete figure of gene-marked clones[23,24]. Alternative techniques, such as nonrestrictiveLAM-PCR, have been developed to solve this problem. Inaddition, insertion-site–specific qPCR techniques can behelpful for validating quantification data.
DiscussionIn this work, we used an established bone marrow trans-plantation assay to directly compare clonal reconstitutionkinetics after transplantation of hematopoietic stem andprogenitor cells marked with either a g-retroviral LTRvector or a lentiviral SIN vector with an internal promoter.Hematopoietic reconstitution was assessed over time basedon blood samples taken every 4 weeks (starting 6 weeksafter transplantation). Sensitive detection methods, namelyLAM-PCR followed by 454 NGS were applied in order toensure the highest possible sensitivity of clone detection.
0.00
0.05
0.10
0.15
0.20
6 10 15 19 23
weeks
co
py
ra
tio
in
se
rtio
n/h
k
0.00
0.05
0.10
0.15
0.20
re
ad
co
un
ts
mean qPCR454-reads
3‘ LTR
Tsp509I514, 870 bp
HpyCH4IV2636 bp
mouse I.4.5B
unts and clone-specific qPCRs. We directly compared quantitative analysis
/cluster numbers) and integration-specific qPCR (copy ratio). Two different
CR for an integration found in mouse I.4.7 was established. Comparison of
line, analyses of the restriction sites of the used enzymes near the insertion
weak correlation of integration-specific qPCR and quantitative cluster anal-
. As indicated, restriction sites for both enzymes used for LAM-PCR were
CR [24].

36 K. Cornils et al./ Experimental Hematology 2013;41:28–38
These methods were previously shown to facilitate efficientdetection of vector insertion sites, particularly in clinicalsamples from gene-therapy studies [14,15,41]. Importantly,the following conditions have to be met in order to obtaina representative picture of clonal blood composition usingthe approach described here: the amount of sampled bloodneeds to be sufficient for analysis but low enough to avoida significant impact on hematopoiesis; the LAM-PCRproduct should reflect clonal composition, which requiressufficient DNA amounts and quality; sequencing shouldbe deep enough to catch low-abundant clones. As alsonoted in this work, due to technical limitations it is some-times difficult to meet all criteria, e.g., obtain sufficientblood. Therefore, single data points had to be excludedfrom analyses or have to be interpreted with caution.
Analyzing hematopoietic reconstitution on a single-clone level provides important insights into the regenera-tive potential of blood stem and progenitor cells. Inaddition, assessing growth kinetics of single clones overlong periods of time can facilitate our understanding ofmalignant transformation and progression [42]. Our dataconfirm earlier studies indicating gradual and differentialinvolvement of single HSC/HPC during hematopoieticreconstitution [43]. Indeed, different kinetics could beseen for individual hematopoietic clones: while somecould be detected at all time points analyzed, other cloneswere present only early or only late after transplantation.Also, several clones presented an oscillating behavior.Finally, for some clones we observed a steady expansionover time. Notably, clonalexpansion was much morepronounced in the SF91 group.
With regard to the question of clonal composition ofhematopoiesis, it also needs to be taken into account thata large proportion of transplanted HSC/HPC were notgene marked. Obviously, to assess the actual number ofclones contributing to hematopoiesis at any time point thenumbers as defined in our work need to be extrapolated.Also, in the given experimental setting, we had no possi-bility of discriminating between short-living cells, such asgranulocytes, and long-living cells, such as memorylymphocytes, during the follow-up study [44]. Conse-quently, in the given study the clonal repertoire measuredat each time point represents a mixture of different celltypes, not all of which mirror active HSC/HPC. In fact,contribution of marked cells to all blood lineages wasconfirmed at final analysis, admittedly with great variancesamong individual animals (e.g., from 1.4% to 73.6% for Gr-1–positive cells; Supplementary Table E1; online only,available at www.exphem.org). At the same time, ourmarking data suggest that a significant proportion ofgene-marked cells analyzed at any given time point repre-sented short-lived cells that reflected the activity of HSC/HPC. This is in good agreement with previous work inthe given model indicating particularly efficient retroviralgene marking for the myeloid compartment [3,20,26,27].
Our study also has provided important insights into theimpact of vector design on clonal contribution and evolu-tion during reconstitution. Two types of vectors wereused for HSC/HPC marking in a parallel experimentdastandard g-retroviral LTR vector and a lentiviral SINvector. For direct comparability, we used identical SFFV-derived promoter sequences in both vectors. In a previousstudy, Kustikova et al. [18] also compared the impact ofthese two vector types on clonal blood composition,although not in a parallel experimental setting and basedon LM-PCR. LAM-PCR followed by NGS as used in ourstudy has been shown to have a much higher resolutionpower for clones represented at low frequencies [22].
Using an identical transduction protocol for both vectors,we were able to ensure sufficient gene-transfer rates intoHSC and HPC. However, despite application of identicalMOIs (as based on titration on SC-1 fibroblasts), initialtransduction rates were significantly different. Our data indi-cate that a restriction for the HIV-based vectors occurred atthe postentry/integration level in the murine bone marrowcells, which had not been observed in murine SC-1 cellsused for titration. Notably, three- to fourfold variations inintegration efficiencies were previously found for VSV-pseudotyped lentiviral constructs in different mouse celllines [45]. Those differences can most probably be ascribedto some cell-type–specific postentry/preintegration blocks.Indeed, specific blocks for HIV integration were found inmurine T cells, for example [46]. We could also not excludethat lentiviral vectors pseudotyped with the mouse env-protein are less infectious than g-retroviral vectors withthe same env protein, and that this difference becomes rele-vant only on difficult targets, such as primary HSC/HPC. Inany case, our observation supports the notion that infectioustiters (or MOIs) ideally need to be determined on actualtarget cells because distinct vectors can differ in their trans-duction capability of defined targets [47,48].
Importantly, independent of the used vector, gene-marked cells contributed significantly to the reconstitutionof hematopoiesis at all time points, i.e., there was noevidence for clonal outgrowth of transduced cells. Genemarking, as measured based on eGFP expression, wasstable over time for both vector types (compare Fig. 2B).This indicates that neither of the vectors underwentsilencing and that none of the gene-marked cells weremalignantly transformed. However, detection of both unde-sired effects can require longer observation periods and/orserial transplantation [2,3,12].
Despite the relatively limited number of animals ineach experimental group, we made some interesting obser-vations. First, in both vector groups, mean numbers ofclones detectable in the peripheral blood remained essen-tially constant during the whole follow-up time. Thisobservation was in line with FACS data indicating constantmarking levels in the peripheral blood. Together theseresults suggest that long-term reconstituting HSC were

37K. Cornils et al./ Experimental Hematology 2013;41:28–38
successfully transduced with both vectors. Second, at alltime points, mean numbers of clones contributing to hema-topoiesis per 100,000 transplanted gene-marked cells wereapproximately two times higher in the Lenti-SF group.Based on such normalization, it might be supposed thatthe lentiviral vectors were relatively more efficient in trans-ducing HSC/HPC. Notably, transduction conditions wereidentical for both vector types; the observed disparityapparently reflected an intrinsic vector feature of the lenti-viral vector. One potential explanation would refer to thepostentry restriction noted for the lentiviral vector in thisstudy, which might be relatively less pronounced in long-term reconstituting HSC. Finally, at later time points ofour study, clones harboring insertions nearby RTCGDgenes were significantly over-represented for the g-retro-viral as compared with the lentiviral vector group. Thisfinding is in good agreement with previous observations[3,5,20].
ConclusionsAltogether we have shown here that the used transplanta-tion model in conjunction with highly sensitive detectionmethods, namely LAM-PCR followed by 454 NGS, allowsestablishment of a representative picture of hematopoieticreconstitution and assessment of the impact of the usedmarking vector on the clonal repertoire. Obviously, thismodel system can, in principle, also be used to investigatefurther parameters of gene transfer, such as target cell pop-ulation or transduction conditions [18,19]. At the sametime, our qPCR data has clearly indicated that the reconsti-tution picture obtained with this approach is not complete.Despite the fact that we performed two independent LAM-PCRs using two different restriction sites for each sample,some clones contributing to hematopoiesis were notadequately quantified based on 454 sequencing. This is inline with previous data [24] and underlines the need touse improved protocols, such as multi-arm LAM-PCR[23]. Alternatively, novel techniques such as nonrestrictivePCR [32] or barcoded vectors for pure clonality analyseswithout the information of the vector location [34,46,49–51] can help to overcome these restrictions.
Funding disclosureThis work was supported by the Deutsche Forschungsge-meinschaft (DFG; FE568/11-1 to BF, DFG-SPP1230:RO3500/2-1 to IR & SCHM2134/1-2 to MS) and theGerman Ministry for Research and Education (BMBF;iGene to MS & BF, BMBF-FKZ 0315452 to IR).
AcknowledgmentsThe authors thank G€okhan Arman-Kalcek, Melanie Lachmann,Regine Thiele und Ina Kutschera for excellent technical assistance
and Ute Modlich for critical reading of the manuscript. We aregrateful to Martijn H. Brugman and Stefan Bartels for kindlyproviding the ISA tool. Flow cytometry work was performed inthe FACS Sorting Core Unit of the UMC Hamburg-Eppendorf.
Conflict of interest disclosureNo financial interest/relationships with financial interest relatingto the topic of this article have been declared.
References1. Jordan CT, Lemischka IR. Clonal and systemic analysis of long-term
hematopoiesis in the mouse. Genes Dev. 1990;4:220–232.
2. Li Z, D€ullmann J, Schiedlmeier B, et al. Murine leukemia induced by
retroviral gene marking. Science. 2002;296:497.
3. Kustikova O, Fehse B, Modlich U, et al. Clonal dominance of hema-
topoietic stem cells triggered by retroviral gene marking. Science.
2005;308:1171–1174.
4. Enssle J, Trobridge GD, Keyser KA, et al. Stable marking and trans-
gene expression without progression to monoclonality in canine long-
term hematopoietic repopulating cells transduced with lentiviral
vectors. Hum Gene Ther. 2010;21:397–403.
5. Calmels B, Ferguson C, Laukkanen MO, et al. Recurrent retroviral
vector integration at the Mds1/Evi1 locus in nonhuman primate hema-
topoietic cells. Blood. 2005;106:2530–2533.
6. Tey SK, Brenner MK. The continuing contribution of gene marking to
cell and gene therapy. Mol Ther. 2007;15:666–676.
7. Barese CN, Dunbar CE. Contributions of gene marking to cell and
gene therapies. Hum Gene Ther. 2011;22:659–668.
8. Hacein-Bey-Abina S, Von Kalle C, Schmidt M, et al. LMO2-associ-
ated clonal T cell proliferation in two patients after gene therapy for
SCID-X1. Science. 2003;302:415–419.
9. Hacein-Bey-Abina S, von Kalle C, Schmidt M, et al. A serious adverse
event after successful gene therapy for X-linked severe combined
immunodeficiency. N Engl J Med. 2003;348:255–256.
10. Hacein-Bey-Abina S, Garrigue A, Wang GP, et al. Insertional onco-
genesis in 4 patients after retrovirus-mediated gene therapy of
SCID-X1. J Clin Invest. 2008;118:3132–3142.
11. Howe SJ, Mansour MR, Schwarzwaelder K, et al. Insertional muta-
genesis combined with acquired somatic mutations causes leukemo-
genesis following gene therapy of SCID-X1 patients. J Clin Invest.
2008;118:3143–3150.
12. Stein S,OttMG,Schultze-Strasser S, et al. Genomic instability andmye-
lodysplasia with monosomy 7 consequent to EVI1activation after gene
therapy for chronic granulomatous disease. NatMed. 2010;16:198–204.
13. Wang GP, Garrigue A, Ciuffi A, et al. DNA bar coding and pyrose-
quencing to analyze adverse events in therapeutic gene transfer. Nu-
cleic Acids Res. 2008;36:e49.
14. Cartier N, Hacein-Bey-Abina S, Bartholomae CC, et al. Hematopoi-
etic stem cell gene therapy with a lentiviral vector in X-linked adreno-
leukodystrophy. Science. 2009;326:818–823.
15. Cavazzana-Calvo M, Payen E, Negre O, et al. Transfusion indepen-
dence and HMGA2 activation after gene therapy of human b-thalas-
saemia. Nature. 2010;467:318–322.
16. Boztug K, Schmidt M, Schwarzer A, et al. Stem-cell gene therapy for
the Wiskott-Aldrich syndrome. N Engl J Med. 2010;363:1918–1927.
17. Biffi A, Bartolomae CC, Cesana D, et al. Lentiviral vector common
integration sites in preclinical models and a clinical trial reflect
a benign integration bias and not oncogenic selection. Blood. 2011;
117:5332–5339.
18. Kustikova OS, Schiedlmeier B, Brugman MH, et al. Cell-intrinsic and
vector-relatedproperties cooperate to determine the incidence and conse-
quences of insertional mutagenesis. Mol Ther. 2009;17:1537–1547.

38 K. Cornils et al./ Experimental Hematology 2013;41:28–38
19. Maetzig T, Brugman MH, Bartels S, et al. Polyclonal fluctuation of
lentiviral vector-transduced and expanded murine hematopoietic
stem cells. Blood. 2011;117:3053–3064.
20. Kustikova OS, Geiger H, Li Z, et al. Retroviral vector insertion sites
associated with dominant hematopoietic clones mark ‘‘stemness’’
pathways. Blood. 2007;109:1897–1907.
21. Kustikova OS, Modlich U, Fehse B. Retroviral insertion site analysis
in dominant haematopoietic clones. Methods Mol Biol. 2009;506:
373–390.
22. Schmidt M, Schwarzwaelder K, Bartholomae C, et al. High-resolution
insertion-site analysis by linear amplification-mediated PCR (LAM-
PCR). Nat Methods. 2007;4:1051–1057.
23. Harkey MA, Kaul R, Jacobs MA, et al. Multiarm high-throughput
integration site detection: limitations of LAM-PCR technology and
optimization for clonal analysis. Stem Cells Dev. 2007;16:381–392.
24. Gabriel R, Eckenberg R, Paruzynski A, et al. Comprehensive genomic
access to vector integration in clinical gene therapy. Nat Med. 2009;
15:1431–1436.
25. Brady T, Roth SL, Malani N, et al. A method to sequence and quantify
DNA integration for monitoring outcome in gene therapy. Nucleic
Acids Res. 2011;39:e72.
26. Li Z, Schwieger M, Lange C, et al. Predictable and efficient retroviral
gene transfer into murine bone marrow repopulating cells using
a defined vector dose. Exp Hematol. 2003;31:1206–1214.
27. Cornils K, Lange C, Schambach A, et al. Stem cell marking with
promotor-deprived self-inactivating retroviral vectors does not lead
to induced clonal imbalance. Mol Ther. 2009;17:131–143.
28. Weber K, Bartsch U, Stocking C, Fehse B. A multicolor panel of novel
lentiviral ‘‘gene ontology’’ (LeGO) vectors for functional gene anal-
ysis. Mol Ther. 2008;16:698–706.
29. Zufferey R, Dull T, Mandel RJ, et al. Self-inactivating lentivirus vector
for safe and efficient in vivo gene delivery. J Virol. 1998;72:9873–9880.
30. Schambach A, Bohne J, Baum C, et al. Woodchuck hepatitis virus
post-transcriptional regulatory element deleted from X protein and
promoter sequences enhances retroviral vector titer and expression.
Gene Ther. 2006;13:641–645.
31. Schambach A, Galla M, Modlich U, et al. Lentiviral vectors pseudo-
typed with murine ecotropic envelope: increased biosafety and conve-
nience in preclinical research. Exp Hematol. 2006;34:588–592.
32. Paruzynski A, Arens A, Gabriel R, et al. Genome-wide high-
throughput integrome analyses by nrLAM-PCR and next-generation
sequencing. Nat Protoc. 2010;5:1379–1395.
33. Hoffmann S, Otto C, Kurtz S, et al. Fast mapping of short sequences
with mismatches, insertions and deletions using index structures.
PLoS Comput Biol. 2009;5:e1000502.
34. Bystrykh LV, Verovskaya E, Zwart E, Broekhuis M, de Haan G.
Counting stem cells: methodological constraints. Nat Methods.
2012;96:567–574.
35. Edgar RC. Search and clustering orders of magnitude faster than
BLAST. Bioinformatics. 2010;26:2460–2461.
36. Thompson JD, Higgins DG, Gibson TJ. CLUSTALW: improving the
sensitivity of progressive multiple sequence alignment through
sequence weighting, position-specific gap penalties and weight matrix
choice. Nucleic Acids Res. 1994;22:4673–4680.
37. Akagi K, Suzuki T, Stephens RM, Jenkins NA, Copeland NG.
RTCGD: retroviral tagged cancer gene database. Nucleic Acids Res.
2004;32(Database issue):D523–527.
38. Kustikova OS, Baum C, Fehse B. Retroviral integration site analysis in
hematopoietic stem cells. Methods Mol Biol. 2008;430:255–267.
39. Bozorgmehr F, Laufs S, Sellers SE, et al. No evidence of clonal domi-
nance in primates up to 4 years following transplantation of multidrug
resistance 1 retrovirally transduced long-term repopulating cells. Stem
Cells. 2007;25:2610–2618.
40. Kustikova OS, Wahlers A, Kuhlcke K, et al. Dose finding with retro-
viral vectors: correlation of retroviral vector copy numbers in single
cells with gene transfer efficiency in a cell population. Blood. 2003;
102:3934–3937.
41. Cattoglio C, Maruggi G, Bartholomae C, et al. High-definition
mapping of retroviral integration sites defines the fate of allogeneic
T cells after donor lymphocyte infusion. PLoS One. 2010;5:e15688.
42. Roeder I, Horn K, Sieburg HB, Cho R, Muller-Sieburg C, Loeffler M.
Characterization and quantification of clonal heterogeneity among
hematopoietic stem cells: a model-based approach. Blood. 2008;112:
4874–4883.
43. Drize N, Chertkov J, Sadovnikova E, Tiessen S, Zander A. Long-term
maintenance of hematopoiesis in irradiated mice by retrovirally trans-
duced peripheral blood stem cells. Blood. 1997;89:1811–1817.
44. Gerrits A, Dykstra B, Kalmykowa OJ, et al. Cellular barcoding tool for
clonal analysis in the hematopoietic system. Blood. 2010;115:2610–
2618.
45. Bieniasz PD, Cullen BR. Multiple blocks to human immunodeficiency
virus type 1 replication in rodent cells. J Virol. 2000;74:9868–9877.
46. Tervo HM, Goffinet C, Keppler OT. Mouse T-cells restrict replication
of human immunodeficiency virus at the level of integration. Retrovir-
ology. 2008;5:58.
47. Shabram P, Aguilar-Cordova E. Multiplicity of infection/multiplicity
of confusion. Mol Ther. 2000;2:420–421.
48. Fehse B, Kustikova OS, Bubenheim M, Baum C. Pois(s)ondit’s
a question of dose. Gene Ther. 2004;11:879–881.
49. Schepers K, Swart E, van Heijst JW, et al. Dissecting T cell lineage
relationships by cellular barcoding. J Exp Med. 2008;205:2309–2318.
50. Lu R, Neff NF, Quake SR, Weissman IL. Tracking single hematopoi-
etic stem cells in vivo using high-throughput sequencing in conjunc-
tion with viral genetic barcoding. Nat Biotechnol. 2011;29:928–933.
51. Glimm H, Ball CR, von Kalle C. You can count on this: barcoded
hematopoietic stem cells. Cell Stem Cell. 2011;9:390–392.

Supplementary Table E1. GFP-positive cells of different blood
lineages at final analysis
Lenti-SF SF91
Meana SD Mean SD
Gr-1b 28.0 31.62 61.4 31.53
CD11bc 33.5 41.20 60.0 43.82
B220d 11.6 10.50 60.4 42.91
CD3e 13.5 15.90 63.9 27.71
SD 5 standard deviation.aMean of all 4 animals.bMarker for granulocytes.cmarker for monocytes.dB-cell marker.eT-cell marker.
38.e1K. Cornils et al./ Experimental Hematology 2013;41:28–38
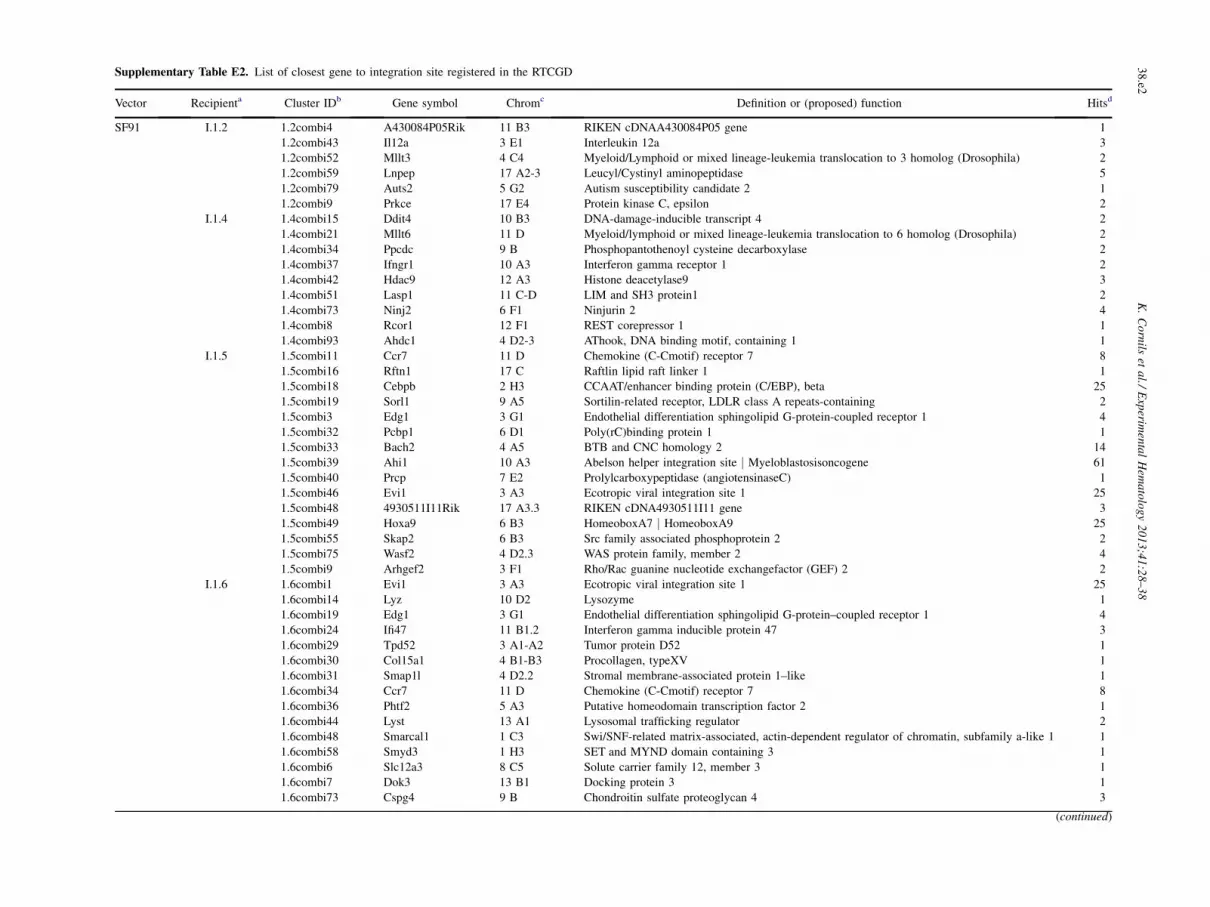
Supplementary Table E2. List of closest gene to integration site registered in the RTCGD
Vector Recipienta Cluster IDb Gene symbol Chromc Definition or (proposed) function Hitsd
SF91 I.1.2 1.2combi4 A430084P05Rik 11 B3 RIKEN cDNAA430084P05 gene 1
1.2combi43 Il12a 3 E1 Interleukin 12a 3
1.2combi52 Mllt3 4 C4 Myeloid/Lymphoid or mixed lineage-leukemia translocation to 3 homolog (Drosophila) 2
1.2combi59 Lnpep 17 A2-3 Leucyl/Cystinyl aminopeptidase 5
1.2combi79 Auts2 5 G2 Autism susceptibility candidate 2 1
1.2combi9 Prkce 17 E4 Protein kinase C, epsilon 2
I.1.4 1.4combi15 Ddit4 10 B3 DNA-damage-inducible transcript 4 2
1.4combi21 Mllt6 11 D Myeloid/lymphoid or mixed lineage-leukemia translocation to 6 homolog (Drosophila) 2
1.4combi34 Ppcdc 9 B Phosphopantothenoyl cysteine decarboxylase 2
1.4combi37 Ifngr1 10 A3 Interferon gamma receptor 1 2
1.4combi42 Hdac9 12 A3 Histone deacetylase9 3
1.4combi51 Lasp1 11 C-D LIM and SH3 protein1 2
1.4combi73 Ninj2 6 F1 Ninjurin 2 4
1.4combi8 Rcor1 12 F1 REST corepressor 1 1
1.4combi93 Ahdc1 4 D2-3 AThook, DNA binding motif, containing 1 1
I.1.5 1.5combi11 Ccr7 11 D Chemokine (C-Cmotif) receptor 7 8
1.5combi16 Rftn1 17 C Raftlin lipid raft linker 1 1
1.5combi18 Cebpb 2 H3 CCAAT/enhancer binding protein (C/EBP), beta 25
1.5combi19 Sorl1 9 A5 Sortilin-related receptor, LDLR class A repeats-containing 2
1.5combi3 Edg1 3 G1 Endothelial differentiation sphingolipid G-protein-coupled receptor 1 4
1.5combi32 Pcbp1 6 D1 Poly(rC)binding protein 1 1
1.5combi33 Bach2 4 A5 BTB and CNC homology 2 14
1.5combi39 Ahi1 10 A3 Abelson helper integration site j Myeloblastosisoncogene 61
1.5combi40 Prcp 7 E2 Prolylcarboxypeptidase (angiotensinaseC) 1
1.5combi46 Evi1 3 A3 Ecotropic viral integration site 1 25
1.5combi48 4930511I11Rik 17 A3.3 RIKEN cDNA4930511I11 gene 3
1.5combi49 Hoxa9 6 B3 HomeoboxA7 j HomeoboxA9 25
1.5combi55 Skap2 6 B3 Src family associated phosphoprotein 2 2
1.5combi75 Wasf2 4 D2.3 WAS protein family, member 2 4
1.5combi9 Arhgef2 3 F1 Rho/Rac guanine nucleotide exchangefactor (GEF) 2 2
I.1.6 1.6combi1 Evi1 3 A3 Ecotropic viral integration site 1 25
1.6combi14 Lyz 10 D2 Lysozyme 1
1.6combi19 Edg1 3 G1 Endothelial differentiation sphingolipid G-protein–coupled receptor 1 4
1.6combi24 Ifi47 11 B1.2 Interferon gamma inducible protein 47 3
1.6combi29 Tpd52 3 A1-A2 Tumor protein D52 1
1.6combi30 Col15a1 4 B1-B3 Procollagen, typeXV 1
1.6combi31 Smap1l 4 D2.2 Stromal membrane-associated protein 1–like 1
1.6combi34 Ccr7 11 D Chemokine (C-Cmotif) receptor 7 8
1.6combi36 Phtf2 5 A3 Putative homeodomain transcription factor 2 1
1.6combi44 Lyst 13 A1 Lysosomal trafficking regulator 2
1.6combi48 Smarcal1 1 C3 Swi/SNF-related matrix-associated, actin-dependent regulator of chromatin, subfamily a-like 1 1
1.6combi58 Smyd3 1 H3 SET and MYND domain containing 3 1
1.6combi6 Slc12a3 8 C5 Solute carrier family 12, member 3 1
1.6combi7 Dok3 13 B1 Docking protein 3 1
1.6combi73 Cspg4 9 B Chondroitin sulfate proteoglycan 4 3
(continued)
38.e2
K.Cornils
etal./
Experim
entalHem
atology2013;41:28–38

Supplementary Table E2. (continued )
Vector Recipienta Cluster IDb Gene symbol Chromc Definition or (proposed) function Hitsd
1.6combi8 Hectd2 19 C2 HECT domain containing 2 1
1.6combi80 Rgag4 X D Retrotransposon gag domain containing 4 2
1.6combi81 Sp2 11 D Sp2 transcription factor 1
Lenti-SF I.4.2 4.2combi_10 Zcchc6 13 B2 zincfinger, CCHC domain containing 6 1
4.2combi_20 Elovl5 9 E1 ELOVL family member 5, elongation of long chain fatty acids (yeast) 3
4.2combi_33 Pdcd6ip 9 F2 Programmed cell death 6 interacting protein 1
I.4.4 4.4combi_41 Ctsc 7 D3-E1.1 Cathepsin C 2
4.4combi_7 Mlstd2 7 F2 Male sterility domain containing 2 1
I.4.5 4.5combi_20 Zscan22 7 A1 Zincfinger and SCAN domain containing 22 1
4.5combi_22 Parp11 6 F3 Poly(ADP-ribose)polymerase family, member 11 2
4.5combi_33 2310022M17Rik 11 A4 RIKEN cDNA2310022M17 gene 1
4.5combi_34 Pscd1 11 E2 Pleckstrin homology, Sec7 and coiled-coil domains 1 1
4.5combi_9 Mlstd2 7 F2 Male sterility domain containing 2 1
I.4.7 4.7combi_25 Atf3 1 H6 Activating transcription factor 3 1
aRecipient: Transplanted mice are numbered: I represents cohort, 1 represents the group (1 5 SF91, 4 5 Lenti-SF) and the last number resembles the individual mouse.bThe consensus sequence after processing the 454-sequencing data was blasted against the mouse genome via the ISA tool. Genes in a window of 6250 kb around the insertion site were analyzed. The
closest gene to the insertion site was checked against the RTCGD database [37].cIntegration site of vector on chromosome.dNumber of hits in the RTCGD.
38.e3
K.Cornils
etal./
Experim
entalHem
atolog
y2013;41:28–38


