Embed Size (px)
Citation preview

Comparative study of Gamow-Teller strength distributions on odd-odd nucleus 50
V
and its impact on electron capture rates in astrophysical environments
Jameel-Un Nabi*, Muhammad Sajjad
Faculty of Engineering Sciences, Ghulam Ishaq Khan Institute of Engineering
Sciences and Technology, Topi 23640, Swabi, NWFP, Pakistan Gamow-Teller (GT) strength transitions are an ideal probe for testing nuclear structure models. In
addition to nuclear structure, GT transitions in nuclei directly affect the early phases of Type Ia and Type-
II supernovae core collapse since the electron capture rates are partly determined by these GT transitions.
In astrophysics, GT transitions provide an important input for model calculations and element formation
during the explosive phase of a massive star at the end of its life-time. Recent nucleosynthesis
calculations show that odd-odd and odd-A nuclei cause the largest contribution in the rate of change of
lepton-to-baryon ratio. In the present manuscript, we have calculated the GT strength distributions and
electron capture rates for odd-odd nucleus 50
V by using the pn-QRPA theory. At present 50
V is the first
experimentally available odd-odd nucleus in fp-shell nuclei. We also compare our GT strength
distribution with the recently measured results of a 50
V(d,2He)
50Ti experiment, with the earlier work of
Fuller, Fowler, and Newman (referred to as FFN) and subsequently with the large-scale shell model
calculations. SNe Ia model calculations performed using FFN rates result in overproduction of 50
Ti, and
were brought to a much acceptable value by employing shell model results. It might be interesting to
study how the composition of the ejecta using presently reported QRPA rates compare with the observed
abundances.
PACS number(s): 26.20.+f, 21.60.Jz, 23.40.-s, 26.50.+x
I. INTRODUCTION
The Gamow-Teller (GT) response is astrophysically important for a number of nuclides, particularly
around iron. One of the factors controlling the late phases of stellar evolution and initiation of stellar
collapse of massive stars leading to Type-I and Type-II supernovae is the lepton fraction [1,2]. This
lepton fraction in turn is controlled by weak interaction rates (primarily beta-decay and electron
Corresponding author.
E-mail address: [email protected]
Fax: +92-938-271890

capture rates). An important and non-trivial contribution to the weak rates is the distribution of GT
strength. In recent years, new developments in nuclear-structure physics have led to renewed interest
in the role of the GT strength distribution in fp-shell nuclei. If the mass of the iron core exceeds the
Chandrasekhar limit, the pressure of the relativistic degenerate electron gas can no longer resist the
force of gravity, and the core starts to collapse marking the beginning of Type-II supernova. SNe Ia
are thought to be the explosions of white dwarfs that accrete matter from binary companions. The
relatively high Fermi energy of the degenerate electron gas in white dwarfs can lead to substantial
electron capture thereby significantly reducing the lepton fraction. This then controls the isotopic
composition ejected from such explosions. GT strengths have important implications in this scenario
as well, such as explosive nucleosynthesis in O-Ne-Mg white dwarfs [e.g. 3, 4].
The first extensive effort to tabulate the weak interaction rates at high temperatures and densities,
where decays from excited states of the parent nuclei become relevant, was done by Fuller, Fowler,
and Newman (FFN) [2]. FFN calculated the weak interaction rates over a wide range of temperatures
and densities (10≤ ρYe (g cm-3
) ≤1011
, 107
≤ T (K) ≤1011
). The GT strength and excitation energies
were calculated using a zero-order shell model. They also incorporated the experimental data available
at that time. The matrix elements of Brown et al. [5] were used for unmeasured GT strengths. When
these were also not available, FFN assumed an average log ft value of 5.0 for their calculation of weak
rates. Later Aufderheide et al. [6] extended the FFN work for neutron rich nuclei in pf-shell. They
tabulated the top 90 electron capture nuclei averaged throughout the stellar trajectory (see Table 25
therein) for core collapse densities ρ = (107 − 10
10) g/cm
3. They found that for densities ρ7 > 10 (ρ7
measures the density in 107 g/cm
3) electrons are most effectively captured by odd-odd nuclei. These
were the nuclei which, according to the calculations of the authors, affected eY (where eY is the lepton-
to-baryon ratio) the most in the presupernova evolution. With the advent of high computing machines

and efficient algorithms, large-scale shell-model calculations have also been performed for pf-shell
nuclei in the mass range A= 45-65 [7] and employed in many simulation codes with relative success
[8].
Recent nucleosynthesis calculations [e.g. 8] show that the rate of change of lepton fraction (product of
rates and nuclear abundances) is significantly affected by odd-odd and odd-A nuclei, while the
contribution of even-even nuclei is negligible. This also implies that the largest contribution to the
neutronization of the ejecta comes from odd-odd and odd-A nuclei. The list of most important electron
capture nuclei (those which make the largest contribution to eY ) compiled by Aufderheide and
collaborators [6] contained the isotope of vanadium, 50
V. The 50
V nucleus is one of the very few
stable odd-odd nuclei in the pf shell and is the only odd-odd nucleus experimentally accessible at
present.
The GT strength distribution can be determined using the (d,2He) reaction [9, 10]. High-resolution
spectra for this reaction are now available for light nuclei [11] and this program is being extended to
medium-weight nuclei. The available experimental data obtained for the GT strength distribution have
until recently been hampered by a rather poor energy resolution, making a detailed comparison
between theory and experiment difficult [12]. It is, however, important to note that the GT strength is
fragmented over many discrete states in the fp-shell nuclei, and the details of the strength distributions
are important in presupernova models. Therefore, knowledge of the experimental GT distributions
should be elaborated and theoretical efforts should be made to reproduce them.
We present our formalism for the calculation of GT strength distribution and electron capture rates
briefly in Section II. The GT strength distribution is presented and compared with measurements and
other calculations in Section III. In this section we also present, for the first time, the microscopic
calculation of GT strength distribution from the first two excited states of 50
V. The pn-QRPA electron
capture rates for 50
V are presented in Section IV. Here we also compare our rate calculations with
those of FFN and large-scale shell model calculations. Section V finally summarizes this work.
II. METHOD OF CALCULATION
The QRPA theory is an efficient way to generate GT strength distributions. These strength
distributions constitute a primary and non-trivial contribution to the electron capture rates among iron-
regime nuclides. We used the pn-QRPA theory to calculate the strength functions and the associated
electron capture rates for 50
V. The reliability of the pn-QRPA calculations was discussed in detail by
Nabi and Klapdor [13]. There the authors compared the measured data (half lives and B(GT) strength)
of thousands of nuclides with the pn-QRPA calculations and got fairly good comparison. We
incorporated experimental data wherever available to further strengthen the reliability of our
calculated rates. The calculated excitation energies (along with their log ft values) were replaced with
an experimental one when they were within 0.5 MeV of each other. Missing measured states were
inserted and inverse and mirror transitions were also taken into account. We did not replace the
theoretical levels with the experimental ones beyond the excitation energy for which experimental
compilations have no definite spin and/or parity.
The pn-QRPA theory was used with a separable interaction which granted us the liberty of performing
the calculations in a much larger single-particle basis than a general interaction. We performed the pn-
QRPA calculations using seven major harmonic oscillator shells. The Hamiltonian for our calculations
was of the form
,QRPA sp pair ph pp
GT GTH H V V V

where spH is the single-particle Hamiltonian, pairV is the pairing force, ph
GTV is the particle-hole (ph)
Gamow-Teller force, and pp
GTV is the particle-particle (pp) Gamow-Teller force. Single-particle
energies and wave functions were calculated in the Nilsson model [14], which takes into account
nuclear deformations. The proton-neutron residual interactions occur in particle-hole and particle-
particle interaction forms. These interactions were characterized by two interaction constants χ and к,
respectively. In this calculation, we took the values of χ = 0.1000 MeV and к =0.1000 MeV for 50
V
(for further details of choice of these parameters we refer the reader to [15]). The electron capture rates
from the thi state of the parent to the thj state of the daughter nucleus is given by
2ln 2
( , , ) ( ) ( )ec
Aij ij f ij ij
V
gf T E B F B GT
gD
We took the value of D=6295s [16] and the ratio of the axial vector to the vector coupling constant as -
1.254 [17]. Since then these values have changed a little bit but did not lead to any appreciable change
in our capture rate calculations. ijB ’s are the sum of reduced transition probabilities of the Fermi B(F)
and GT transitions B(GT). Details of the reduced transition probabilities can be found in [13, 18, and
19]. For details regarding the QRPA wave functions we refer to [20]. The phase space integral ( )ijf is
an integral over total energy and for electron capture rates it is given by
2 21( ) ( , ) ,
l
ij m
w
f w w w w F Z w G dw
In the above equation, w is the total energy of the electron including its rest mass, lw is the total
capture threshold energy (rest + kinetic) for electron capture. G is the Fermi-Dirac distribution

function for electrons. In the above equation, ( , )F z w are the so-called Fermi functions and are
calculated according to the procedure adopted by Gove and Martin [21]. The total electron capture
rate per unit time per nucleus is then calculated using
ec eciji
ij
P .
The summation over all initial and final states is carried out until satisfactory convergence in the rate
calculations is achieved. Here iP is the probability of occupation of parent excited states and follows
the normal Boltzmann distribution.
III. COMPARISONS OF GT STRENGTH DISTRIBUTIONS
Gamow-Teller (GT) transitions are the dominant excitation mode for electron captures during the
presupernova evolution. The GT+ strength distributions for the electron capture rates on 50
V have been
calculated using the pn-QRPA theory. Quenching of the GT strength is taken into account and a
standard quenching factor of 0.77 ([22], and references therein) is used. We calculated microscopically
the GT strength for 114 excited states of 50
V up to excitation energies in the vicinity of 9 MeV. For
each excited state of parent 50
V we considered 100 states in the daughter 50
Ti up to energies around 30
MeV. We employed a luxurious model space of 7ħω in our calculations as mentioned in previous
section.
Our calculated GT strength distribution for the ground state of odd-odd nucleus 50
V is shown in Fig. 1,
while the (d,2He) experiment and shell model results are shown in Fig.2 and Fig.3, respectively (both
Figures 2 & 3 are adapted from Ref.[23]). The peak at energy 9.1 MeV (Fig. 1) towers up to a value of
1.5 on the B(GT+) axis. Because of the high level density and the size of the statistical error, a

comparison of the individual peaks can not be made. Bäumer and collaborators [23] restricted the
extraction of GT strength to Ex ≤ 12.2MeV due to the statistical error present in their spectra. Taking
into account the transition up to 12.2 MeV, our calculation shows that the centroid of the GT strength
resides at energy 8.8 MeV, which is in total agreement with the experimental value [23]. The GT
centroid of the shell model calculation was calculated to be 8.5 MeV [23]. We placed our centroid at a
slightly higher energy as compared to the shell model results. Table I presents the measured and
calculated (QRPA and shell model) values of the centroid and total GT strength for the ground state of
50V up to 12.2 MeV in daughter
50Ti. The total GT strength calculated by the QRPA model lies very
close within the upper limit of the measured value. This is to be contrasted with the shell model
strength which coincides with the lower limit of the experimental value.
Large-scale shell model calculations usually apply the so-called Brink’s hypothesis as an
approximation to calculate GT strength distributions from excited states. Brink’s hypothesis states that
GT strength distribution on excited states is identical to that from the ground state, shifted only by the
excitation energy of the state. We on the other hand, present for the first time, the microscopic
calculations of these strength distributions for the excited states of 50
V. Fig. 4 shows the GT strength
distribution for the ground and first two excited states (at 0.23 and 0.32 MeV, respectively) of 50
V. At
high temperatures and densities pertinent to supernova conditions these excited states have a finite
probability of occupation and a microscopic calculation of strength function from these states is
desirable. The GT centroids for the first and second excited states are around 8.8 MeV and 9.0 MeV,
respectively, in daughter 50
Ti (up to 12.2 MeV). The corresponding total GT strengths for 1st and 2
nd
excited states are 7.9 and 11.2, respectively. The extracted total GT strengths from excited states also
suggest that the Brink’s hypothesis may not be a good approximation to use.

IV. ELECTRON CAPTURE RATES
The electron capture rates were calculated as per the formalism presented in Section II. In this section
we present these calculations and compare them with the FFN and large-scale shell model results.
We present our electron capture rates at an abbreviated temperature-density scale in Table II. A
complete set of calculated rates may be requested as ASCII files from the corresponding author.
Fig.5 depicts the comparison of our calculated rates with the FFN rates and that calculated using shell
model. The comparison is shown for three values of densities (logρYe= 3,7,11 g/cm3). Densities are
measured in units of g/cm3 while T9 measures the temperature in 10
9 K. The scales are appropriate for
both types of supernovae (Type-Ia and Type-II). The first two panels show the electron capture rates
calculated by pn-QRPA (this work) and shell model [7], respectively. At low temperatures (T9 ~ 1) and
densities (logρYe < 7 g/cm3) the QRPA rates are smaller than the shell model rates. At (logρYe= 3
g/cm3), our rates are suppressed by roughly three orders of magnitude. Whereas at higher densities
(logρYe ~ 7 g/cm3) our rates are suppressed by one order of magnitude compared to shell model
results. Simulators should take note of our suppressed electron capture rates during the presupernova
stage. We recall that we placed the centroid of our strength at slightly higher value of energy in the
daughter. As the temperature of the stellar core increases (T9 ~ 3) we are in good comparison with the
shell model rates. At high temperatures (T9 ~ 10) and densities (logρYe ~ 11g/cm3) our rates are
slightly enhanced compared to shell model (roughly by a factor of five). In the domain of high density
region the Fermi energies of electrons are high enough and the electron capture rates are sensitive to
the total GT strength rather than its distribution details [24]. Our calculated total GT strength is larger
as compared to shell model strength (see Table I) and results in the enhancement of our rates in the

high density region. We also note here that we did not employ the so-called Brink’s hypothesis in our
calculations as usually employed by large-scale shell model calculation.
The FFN electron capture rates are depicted in the right panel of Fig.5. Comparing the QRPA rates
with FFN calculations we found a similar trend at presupernova densities and temperatures (as was the
case with the shell model rates). At high densities (logρYe~ 11 g/cm3) our rates are in reasonable
agreement with the FFN rates.
V. SUMMARY AND CONCLUSIONS
The Gamow-Teller strength distribution in 50
V has been calculated using the pn-QRPA theory. Our
results are consistent with 50
V(d,2He)
50Ti experiment [23]. Our total GT strength of 2.51 is higher than
the shell model result of 1.42. The differences in the GT strength distributions using various model
calculations were highlighted. GT strength distributions from excited states were also calculated using
the pn-QRPA model and presented. The associated electron capture rates in stellar environment
calculated using various models were also compared.
Type-Ia SNe contribute to about half of the abundance of the Fe-group nuclides in the galactic
evolution [25]. It is desired that the simulation calculations do not overproduce these nuclides
compared to their relative solar abundances. Recently Brachwitz et al. [8] did the model calculations
for Type-Ia supernova by employing separately FFN and shell model rates set. The calculations
resulted in the overproduction of 50
Ti by using the electron capture rates of FFN. The outcome of the
simulation calculations, however was much improved when (the relatively suppressed) rates of shell
model were employed. It might be interesting to study how the composition of the ejecta using
presently reported QRPA rates compare with the observed abundances by performing similar

calculations. We are currently working on calculations of weak rates of other iron regime nuclides in
large model space (up to 7ħω) which are believed to play pivotal role in the neutronization of the
nucleosynthesis ejecta and hope to report soon on our results.
ACKNOWLEDGEMENT
This work is partially supported by the ICTP (Italy) through the OEA-project-Prj-16.
[1] H.A. Bethe, G.E. Brown, J. Applegate, and J.M. Lattimer, Nucl. Phys. A324, 487
(1979).
[2] G.M. Fuller, W. A. Fowler, M. J.Newman, Ap.J. Suppl. 42, 447 (1980); 48, 279
(1982); Astrophys J. 252, 715 (1982); 293, 1 (1985).
[3] T. Oda, M. Hino, K. Muto, M. Takahara, and K. Sato, At. Data Nucl. Data Tables 56,
231 (1994).
[4] J.-U. Nabi, M.-U. Rahman, Phys.Rev. C 75,035803 (2007).
[5] B.A.Brown, W.Chung, and B. H. Wildenthal, Phys. Rev. Lett. 40, 1631 (1978).
[6] M.B. Aufderheide, I. Fushiki, S. E Woosley, and D. H. Hartmann, Astrophys.
J. Suppl. 91, 389 (1994).
[7] K. Langanke, G. Martinez-Pinedo, At. Data and Nucl. Data Tables 79, 1 (2001).
[8] F. Brachwitz, D. J. Dean, W. R. Hix, K. Iwamoto, G. Martinez-Pinedo, K. Nomoto,
M. R. Strayer, F.-K.Thielemann and H. Umeda, Astrophys. J. 536, 934 (2000).
[9] H. Ohnuma, K. Hatanaka, S. I. Hayakawa, M. Hosaka, T. Ichihara, S. Ishida, S. Kato, T. Niizeki,
M. Ohura, H. Okamura, H. Orihara, H. Sakai, H. Shimizu, Y. Tajima, H. Toyokawa, H. Y. Yoshida,
and M. Yosoi, Phys. Rev. C 47, 648 (1993).
[10] H. M. Xu, G. K. Ajupova, A. C. Betker, C. A. Gagliardi, B. Kokenge, Y.-W. Lui, and A. F.
Zaruba, Phys. Rev. C 52, 1161 (1995).
[11] S. Rakers, C. Bäumer, D. Frekers, and R. Schmidt, A. M. van den Berg, V. M. Hannen , M. N.
Harakeh, M. A. de Huu, H. J. Wörtche, D. De Frenne, M. Hagemann, J. Heyse, E. Jacobs and
Y. Fujita, Phys. Rev. C 65, 044323 (2002).
[12] M.Hagemann, A.M. Van den Berg, D.De Frenne, V.M. Hannen, M.N. Harakeh, J. Heyse, M.A.
de Huu, E. Jacobs, K.Langanke, G.Martinez-Pinedo, H.J. Wortche, Phys.lett. B 579, 251 (2004).
[13] J.-U. Nabi and H. V. Klapdor-Kleingrothaus, At. Data Nucl.Data Tables 88, 237 (2004).

[14] S. G. Nilsson, Mat. Fys. Medd. Dan. Vid. Selsk 29, 16 (1955).
[15] M. Hirsch, A. Staudt, K. Muto, and H. V. Klapdor-Kleingrothaus, At.Data Nucl.Data
Tables 53, 165 (1993).
[16] A. Staudt, E.Bender, K. Muto, and H.V. Klapdor-Kleingrothaus, At.Data Nucl.
Data Tables 44, 79 (1990).
[17] V. Rodin, A. Faessler, F. Simkovic, and P. Vogel, Czech. J. Phys. 56, 495 (2006); E.Kolbe,
K.Langanke, and P.Vogel, Phys. Rev. C 62, 055502 (2000).
[18] J.-U. Nabi and H. V. Klapdor-Kleingrothaus, At.Data Nucl.Data Tables 71, 149 (1999).
[19] J.-U. Nabi and M.-U. Rahman, Phys. Lett. B612, 190 (2005).
[20] J.-U. Nabi, M. Sajjad, M.-U. Rahman, accepted for publication in Acta Phys. Polon. B (2007).
[21] N. B. Gove, M. J. Martin, Nuclear Data Tables 10, 205 (1971).
[22] G. Martinez-Pinedo, A. Poves, E.Caurier, and A.P. Zuker, Phys.Rev. C 53, R2602
(1996).
[23] C.Bäumer, A.M. van den Berg, B. Davids, D. Frekers, D. De Frenne, E.-W. Grewe,
P. Haefner, M. N. Harakeh, F.Hofmann, S.Hollstein, M. Hunyadi, M. A. de Huu, E.
Jacobs, B. C. Junk, A. Korff, K. Langanke, G. Mart´ınez-Pinedo, A. Negret, P.von
Neumann-Cosel, L.Popescu, S.Rakers, A. Richter, and H.J.Wörtche, Phys. Rev. C
71, 024603 (2005).
[24] V. G. Soloviev, Prog. Part. Nucl. Phys. 19, 107 (1987).
[25] K. Langanke and G. Martinez-Pinedo, Phys.Lett. B453, 187 (1999).

FIG.2. Experimental GT+ strength
distribution for 50
V →50Ti measured
through 50
V(d,2He)
50Ti. The hatched
area marks the contribution from non-
∆L = 0 transition strength. (The figure
is reproduced from Ref [23]).
FIG.1. Gamow-Teller strength distribution
for the ground state of 50
V. The energy scales
refers to the excitation energy in the daughter 50
Ti.
Ej (MeV)
B(G
T+
)
50V
50Ti
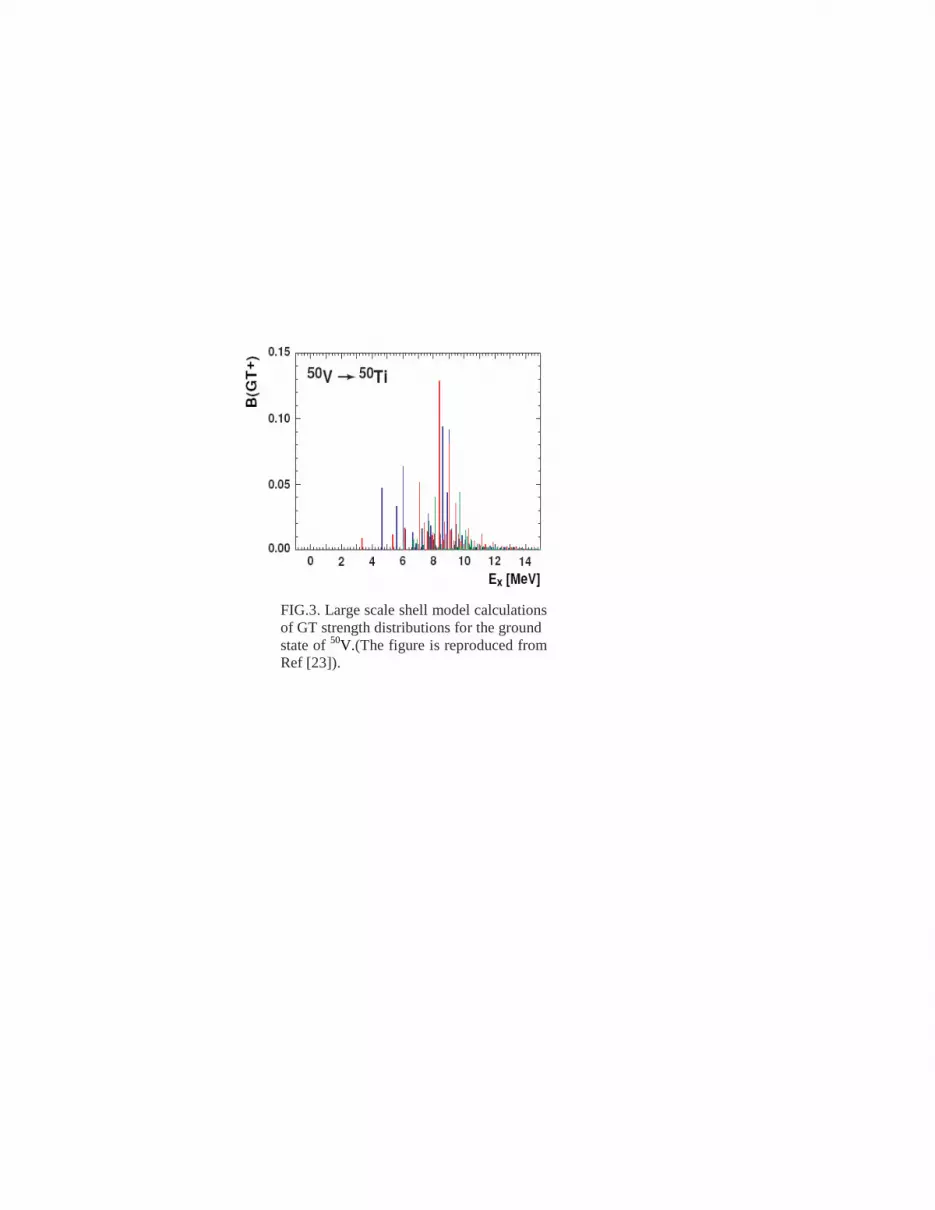
FIG.3. Large scale shell model calculations
of GT strength distributions for the ground
state of 50
V.(The figure is reproduced from
Ref [23]).

0.0
0.2
0.4
0.6
0.8
1.0
1.2
1.4
1.6
ground state Ei=0 MeV
0 2 4 6 8 10 12 14 16 18 200
1
2
3
4
5
6E
i=0.32 MeV
2nd
excited state
Ej(MeV)
0
1
2
3
4
Ei=0.23 MeV
B(G
T+
) s
tre
ng
th
1st excited state
FIG. 4. Gamow-Teller (GT) strength distributions for 50
V.
The top, middle and bottom panels show our calculated GT
strength distributions for the ground state, 1st and 2
nd
excited states, respectively. Ei (Ej) represents the parent
(daughter) states (in MeV).

0 2 4 6 8 10
FFN
logYe=3
logYe=7
logYe=11
0 2 4 6 8 10
T9
shell model
logYe=3
logYe=7
logYe=11
0 2 4 6 8 10-14
-12
-10
-8
-6
-4
-2
0
2
4
6
QRPA
logYe=3
logYe=7
logYe=11
log
(ec)
FIG. 5. QRPA electron capture rates for 50
V as a function of temperature for different
selected densities (left panel). The middle and the right panels show corresponding rates
using the large-scale shell model [7] and FFN [2] calculations, respectively. For units see
text.
TABLE I: Comparison of GT centroids
and total GT strengths (up to 12.2 MeV)
Models GT centroid ∑S(GT+)
QRPA 8.8 MeV 2.51
Experiment 8.8±0.4 MeV 1.9±0.5 Shell model 8.5 MeV 1.42

TABLE II: Calculated electron capture rates for 50
V
(50
V 50
Ti) for different selected densities and
temperatures in stellar matter. ρYe has units of g/cm3,
where ρ is the baryon density and Ye is the ratio of the
electron number to the baryon number. Temperatures (T9)
are measured in 109 K. The densities and calculated
electron capture rates (λec) are tabulated in log scales.
log ρYe T9 log λec
1.0 1.00 -13.257
1.0 3.00 -5.651
1.0 10.00 -1.289
1.0 30.00 2.472
3.0 1.00 -13.029
3.0 3.00 -5.650
3.0 10.00 -1.288
3.0 30.00 2.473
5.0 1.00 -11.176
5.0 3.00 -5.591
5.0 10.00 -1.287
5.0 30.00 2.473
8.0 1.00 -3.428
8.0 3.00 -2.111
8.0 10.00 -0.559
8.0 30.00 2.508
11.0 1.00 4.409
11.0 3.00 4.631
11.0 10.00 4.871
11.0 30.00 5.539


