Embed Size (px)
Citation preview
1
Comparing Willingness to Pay for Improved Drinking Water
Quality using Stated Preference Methods in Rural and Urban
Kenya
Roy Brouwer1, Fumbi Crescent Job
2, Richard Johnston
2, Bianca van der Kroon
1
1 Vrije Universiteit Amsterdam, Institute for Environmental Studies, the Netherlands
2 Eawag - Swiss Federal Institute of Aquatic Science and Technology, Switzerland
Abstract
A combination of stated preference methods is applied to assess rural and urban household demand for
improved in-house drinking water technology in Kenya. Important filter characteristics are identified
based on expert and focus group interviews and used to design a choice experiment targeting 150 rural
and 150 urban residents. The choice experiment is followed by a contingent valuation question using a
payment card. Differences are tested between applied methods as well as urban and rural household
demand. We find substantial demand and positive WTP for improved drinking water technology in rural
and urban households in Kenya. Demand is significantly higher in the rural sample in terms of absolute
average WTP based on the choice experiment and in relative average WTP measured as the share of
household income respondents are willing to sacrifice for the new drinking water technology based on the
CV method. Contrary to expectations, the latter approach produces higher WTP values than the choice
experiment, possibly due to payment card range bias.
Key words: Safe drinking water, Public perception, Gravity Driven Membrane Disinfection,
Choice experiment, Contingent Valuation, Willingness to pay
2
1. Introduction
Access to safe drinking water has been on the global agenda for decades. According to the joint
monitoring program of the World Health Organization (WHO) and the United Nation’s
Children’s Fund (UNICEF) little progress has been made with respect to reaching target 10 of
the Millennium Development Goals (MDG), that by 2015 the proportion of people without
access to safe drinking water should be halved (WHO/UNICEF, 2012). Kenya is among the Sub-
Saharan Countries where access to safe drinking water is limited. Official government statistics
estimate that 74 percent of the total population has access to safe drinking water (GoK, 2009).
However, a study conducted by the US Agency for International Development (USAID) together
with the Kenya National Bureau of Statistics (KNBS) in 2009 shows that this share is lower,
namely 63 percent (USAID and KNBS, 2009).
Poor sanitation is one of the major causes of feacal contamination of drinking water in urban
areas (Murage and Ndingu, 2007). This results in turn in infectious diseases such as cholera,
diarrhea and typhoid (Peter-Varbanets, 2010). Diarrhea is estimated to be responsible for 22
percent of all pediatric deaths worldwide (Tornheim et al., 2010). Especially in developing
countries, and Africa in particular, diarrheal diseases are among the leading causes of morbidity
and mortality. In Kenya, for children below the age of 5, diarrhea prevalence is about 3.5 cases
per child per year, which is 10 percent higher than the world average of 3.2 cases per child per
year (Mirza et al., 1997).
The key to safe drinking water is thought to be found in household water treatment and safe
storage systems. Several systems have been introduced and promoted in Kenya to alleviate the
3
problem of poor drinking water quality with varying degrees of success. The most popular
treatment systems in Kenya include boiling of water and chlorination, very few households use
filters, ceramic, bio-sand or life straw filters. Sixty percent of the rural and 42 percent of the
urban population does not treat its water before drinking (USAID and KNBS, 2009). Sobsey
(2002) attributes the low degree of adoption and diffusion of filters to factors such as high
investment and maintenance costs and limited effectiveness in improving water quality.
Chlorinated drinking water often results toan unpleasant taste or smell of drinking water (Luoto
et al., 2011).
In this study, we assess rural and urban household demand for a new gravity driven membrane
filter. The new technology is based on ultra-low pressure filtration and flux stabilization and has
extensively been tested and described in literature (Peter-Varbanets et al., 2009; 2010 and 2011).
The ultra-low pressure for disinfection is generated by gravity, hence no pumping mechanism or
peripheral equipment is needed. Flux stabilization occurs because of bio-fouling and the system
therefore does not require back flushing, cross flow or chemical cleaning of the filters (Peter -
Varbanets et al., 2011). The filter is able to generate a water flux of 10 Lh-1
m-2
(24Lday-1
m-2
),
which meets the WHO recommendation of 10-40 Lday-1
(Sobsey, 2002). The filter has the
potential to reliably treat surface water even with turbidity values of up to 600 NTU
(nephelometric turbidity units) (Boulestreau et al., 2010). Much less is known about household
perception of the new technology’s characteristics, hence the reason for this study with the main
objective to estimate urban and rural household demand for the new filter. Demand is estimated
using a choice experiment, where households were offered different specifications of the filter
based on their key characteristics.
Deleted: 8
Deleted: in
Deleted:
Deleted: the
Deleted: .
Deleted: H
4
2. Methodology
Choice experiments are part of the family of stated preference methods (e.g. Hanley et al. 1998;
Birol and Koundouri 2008; Carson and Louviere 2011). Preferences for existing or new products
or policy programs are elicited using a social survey format, such as in-person interviews. In the
choice experiment, the relevant characteristics of these products or policy programs are varied
and make up alternatives between which consumers, users or the general public are asked to
choose. Based on their choices for different compositions of these characteristics in a product or
policy program, we learn about their underlying preferences and willingness to pay. This is
generally considered a more reliable value elicitation approach than the one-shot contingent
valuation method (e.g. Bennett and Blamey, 2001; Hensher et al., 2005).
Although choice experiments were originally developed in marketing research and applied to a
wide variety of consumer products, almost no applications exist pertaining to drinking water
supply and drinking water quality. The limited number of choice experiments conducted in this
area in the developed world focus either on WTP to avoid water restrictions, for instance due to
droughts in Australia (Hensher et al., 2006), on drinking water free from pollutants like
pesticides and nitrates in Denmark (Hasler et al., 2005) or residual chlorine and trihalomethane
in Japan (Yoshida and Kanai year? also, its not in the list of references!). The only other choice
experiment carried out in a developing country context was as far as we know the one by Tarfasa
and Brouwer (2013), who employed a choice experiment to assess demand for more reliable and
safe piped drinking water supply in urban Ethiopia. The safety of drinking water supply was
linked to the occurrence of diarrhea and the need to boil water before drinking.
Deleted: or
5
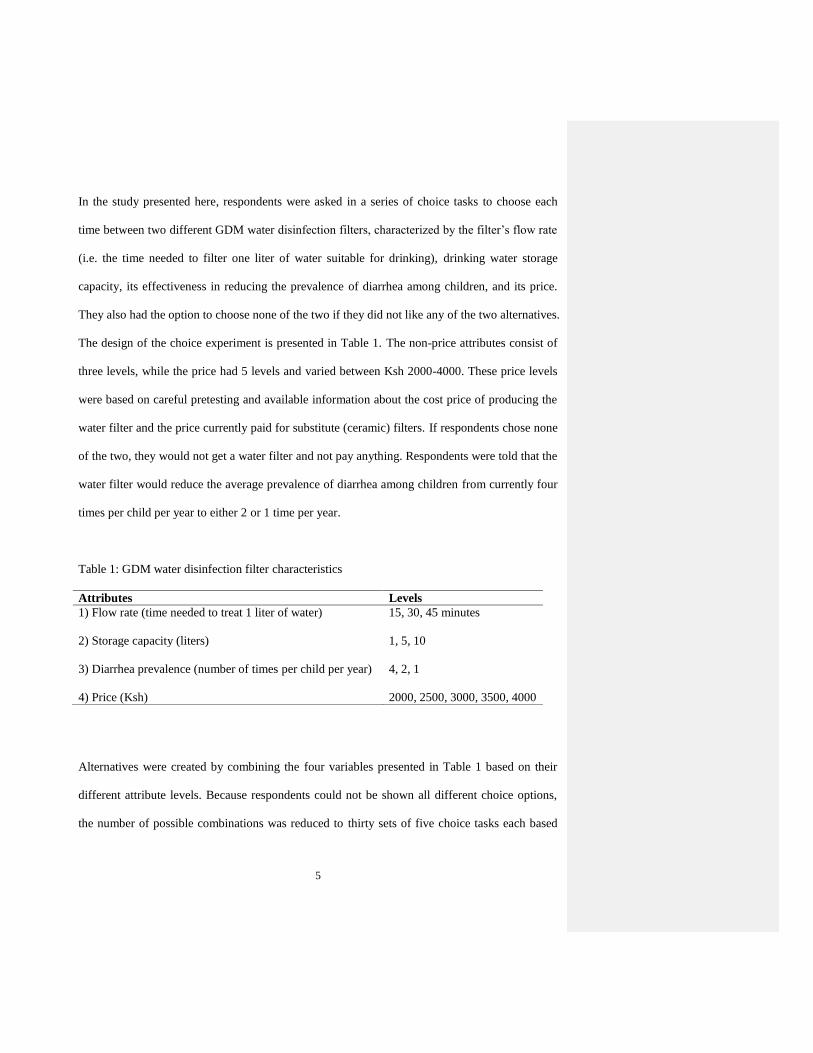
In the study presented here, respondents were asked in a series of choice tasks to choose each
time between two different GDM water disinfection filters, characterized by the filter’s flow rate
(i.e. the time needed to filter one liter of water suitable for drinking), drinking water storage
capacity, its effectiveness in reducing the prevalence of diarrhea among children, and its price.
They also had the option to choose none of the two if they did not like any of the two alternatives.
The design of the choice experiment is presented in Table 1. The non-price attributes consist of
three levels, while the price had 5 levels and varied between Ksh 2000-4000. These price levels
were based on careful pretesting and available information about the cost price of producing the
water filter and the price currently paid for substitute (ceramic) filters. If respondents chose none
of the two, they would not get a water filter and not pay anything. Respondents were told that the
water filter would reduce the average prevalence of diarrhea among children from currently four
times per child per year to either 2 or 1 time per year.
Table 1: GDM water disinfection filter characteristics
Attributes Levels
1) Flow rate (time needed to treat 1 liter of water) 15, 30, 45 minutes
2) Storage capacity (liters) 1, 5, 10
3) Diarrhea prevalence (number of times per child per year) 4, 2, 1
4) Price (Ksh) 2000, 2500, 3000, 3500, 4000
Alternatives were created by combining the four variables presented in Table 1 based on their
different attribute levels. Because respondents could not be shown all different choice options,
the number of possible combinations was reduced to thirty sets of five choice tasks each based
6
on a D-efficient fractional factorial design using the software Sawtooth (hence the total number
of choice cards was 150 divided over 30 sets of 5 cards). Each respondent was randomly shown
one of these thirty sets of five different choice cards. An example card is presented in Figure 1.
INSERT FIGURE 1 HERE
3. Econometric model
Preferences are modeled in terms of McFadden’s (1974) Random Utility Model (RUM),
allowing for a separation of utility (c
ijtU ) into a deterministic part (c
ijtV ) and a stochastic part ( c
ijt ).
Choice experiments fall in the class of attribute-based methods in which the deterministic part of
utility for individual i for good j in choice task t is described in (1) as a linear function of its
attributes ijtX and other explanatory variables ijtZ (Train, 2003):
ijtijtijtijtijtijt ZXVU itDj (1)
In each choice task the respondent is presented with a limited set of product proposals itD , each
proposing an improvement in domestic water supply and quality. The stochastic term is assumed
to follow an IID extreme value distribution of type 1.
To account for preference heterogeneity, the preference parameters for the non-price attributes
are allowed to vary across respondents, applying different mixing distributions. Equation (2)
describes the mixed logit (ML) probability of individual i selecting alternative j in choice task t
over other choice alternatives k. The utility coefficients vary according to individual (hence i)
7
with density | i b for the non-price attributes. This density can be a function of any set of
parameters and represents in this case the mean and covariance of in the sample population.
ii
Dj
iktikti
ijtijti
ijt dbZX
ZXP
)|(
)(exp
)(exp
itDj (2)
ML-models assume heterogeneity to be continuous over the interval spanned by the assumed
distribution for the preference parameters (Scarpa et al., 2005). Treating preference parameters
as random variables requires estimation through simulated maximum likelihood. Procedurally,
the maximum likelihood algorithm searches for a solution by simulating draws from distributions
with given means and standard deviations. Probabilities are calculated by integrating the joint
simulated distribution. Recent applications of ML-models have shown that this model is superior
to the standard multinomial logit model in terms of overall fit and accuracy of welfare estimates
(e.g., Breffle and Morey, 2000; Layton and Brown, 2000; Morey and Rossmann, 2003;
Provencher and Bishop, 2004; Brouwer et al., 2010).
Mixed logit models account for respondent differences (preference heterogeneity) and repeated
choices (Train, 2003). Even if unobserved heterogeneity is accounted for in a ML-model, the
model may fail to explain the sources of heterogeneity (Hynes et al., 2008). To this end,
interactions of respondent specific household characteristics can be included with choice specific
attributes in the utility function to improve the model fit (Revelt and Train, 1998). We test to
what extent data from repeated individual choices and between different geographical locations
can be combined into an aggregate choice model using the Swait and Louviere (1993) test
procedure. As part of this procedure, equality of scale parameters is tested. Scale parameters, and
8
as a result choice variance, may differ across repeated choice sequences, for instance due to
preference learning (Brouwer et al., 2010).
Error component (EC) models furthermore accommodate correlation between the utilities of
alternatives (Brownstone and Train, 1999). Correlation between alternatives is accounted for by
including an error component with zero mean in the utility function specification to allow for
heteroscedasticity between those alternatives that are likely to be correlated. Scarpa et al. (2005)
recommend applying EC models when comparing less familiar (hypothetical) alternatives with
better known (existing) ones (the opt-out in this case).
Finally, if a price attribute is included in the choice experiment, welfare estimates can be derived
(e.g., Hensher et al., 2005). The welfare measure represents the monetary value arising from a
change in the bundle of water supply services, also referred to as the consumer surplus (CS). In
the study presented here, the economic welfare implications are estimated of different product
characteristics and corresponding water supply and quality improvements.
4. Survey design
The questionnaire used for the survey was based on previous household surveys in Africa, most
importantly an existing drinking water supply survey in Ethiopia and a similar survey conducted
in the same study area at around the same time focusing on the use of energy efficient cooking
stoves in Kenyan households. The questionnaire and choice experiment were tested over a period
of 4 weeks in three test rounds based on 180 face-to-face interviews.
9
The final version of the questionnaire consisted of four main parts. The first part started off by
asking respondents relatively easy questions about their household socio-demographic
characteristics (e.g. age of the household head, household composition, education level etc.). The
second part collected information about the household’s sanitation facilities, their drinking water
sources, whether they treat their water before drinking, and if so how often and which treatment
methods they use. Furthermore, questions were included related to their knowledge, experience
and perception of the risks related to drinking untreated water. Part three introduced the newly
developed GDM water disinfection filter, using a picture of the newly designed filter, and a short
description of its characteristics. It was explained to respondents that the new filter would be
introduced on the market in a standard format, but that the filters would vary in terms of storage
capacity, flow rate and effectiveness in reducing the occurrence of diarrhea in children, and
consequently the price of the filter.
The survey targeted both urban and rural residents with limited education. Therefore, the
attributes and their levels were conveyed on choice cards to respondents with pictographs and as
little text as possible. Each choice card was printed on a separate sheet of paper, laminated and
bound together with other choice cards into a spiral binder for multiple use. In order to make sure
respondents had a clear understanding of the choice task, they were first asked to make their
choice using an instruction card. Here, they were allowed to ask questions about the choice task
before the experiment started. Respondents who chose the opt-out were asked in a follow-up
question for the reasons underlying their choices.
Deleted: with
10
Following the choice experiment, respondents were asked the question how much they would be
willing to pay maximum for a GDM water disinfection filter with a storage capacity of 10 liters,
a flow rate of 30 minutes to purify one liter of water, and maximum effectiveness in reducing
diarrhea occurrence among children to at most once a year per child. This question was included
to be able to compare the choice experiment results with those if the contingent valuation (CV)
approach would have been used. Respondents were asked the CV question after the choice
experiment because they were expected to be familiar by then with the different filter
characteristics. The WTP question was elicited using a payment card containing 32 bid levels,
including zero and a “I don’t know’ option, and the possibility to state a different amount of
money.
The fourth and final part of the questionnaire consisted of a series of questions related to the
household’s income situation and assets. The pre-tests showed that respondents felt ill at ease if
these latter questions were asked at the start of the interview, hence the reason that they were
included at the end of the questionnaire.
5. Survey implementation
The survey was implemented in Nakuru County by 5 trained interviewers in 12 days at the end
of January 2012. Nakuru County is located in Kenya’s Rift Valley, 160 km North-West of
Nairobi. Two locations were selected based on household water use characteristics. The first area
is Nessuit, inhabited by around 7,000 people (Nakuru district offices, 2012) who predominantly
depend on agriculture for their livelihood. Nessuit is located in the river Njoro watershed. Njoro
river (60 km) drains a small predominantly rural catchment (280 km2) and is seriously polluted
Deleted: .
Deleted: H
11
(Yillia et al., 2008). This is causing a series of health problems for the surrounding communities
as the river remains the main source of water for domestic purposes (drinking, washing, cooking
and bathing) (Yillia et al., 2008). Public health institutions in the area reported cases of water
related diseases, such as typhoid, diarrhoea and dysentery, which accounted for over 50 percent
of all illnesses (Silas et al 2011). Due to the lack of prior information about household
characteristics, the sampling procedure applied in this first location was random.
Nakuru municipality is the second location used in this study. Nakuru has roughly 300,000
inhabitants (Nakuru district office, 2012) and is the fourth largest urban centre in Kenya. The
city has developed into a busy regional service centre and is one of the most rapidly growing
urban areas. A majority of the households in this location have access to piped water. The major
source of water for Nakuru Municipality comes from 2 local treatment plants and a number of
bore holes (Kiruki et al, 2011) The present system of water treatment using chlorine appears
functioning well. In their study, Kiruki et al (2011) fond low levels of contamination of Nakuru
Municipal water and in some Nakuru estates like Nakuru town centre, Kiti and Milimani.
However, no pathogens were found. In order to account for the income diversity of the
municipality, the sample is drawn from three estates representing poor, middle income and
wealthy households. Within each block of estates, households were subsequently selected
randomly.
The central hypothesis underlying the sampling strategy is that demand and WTP is highest in
the rural area of Njoro where people have no access to piped (tap) water, which is expected to be
safer than the use of unprotected streams and bore holes. An important confounding factor for
Deleted: (Silas et al, 2011).
Formatted: Font color: Red
Deleted: Silas
Deleted: i
12
which control will have to be included in this case study is the difference in income levels
between the two areas. Household income is expected to be significantly higher in the urban area
than in the rural area. Since income and ability to pay is one of the most important determinants
of WTP, this is expected to have a major impact on demand too.
5. Results
5.1. Sample characteristics
Household socio-demographic characteristics in the rural (Njoro) and urban (Nakuru) samples
are presented in Table 2. The share of women in the Njoro sample is slightly higher. The average
age of the respondent is 33.7 years, no significant difference can be detected between the two
samples. All the respondents in Nakuru are literate, the share of respondents who cannot read
and write in Njoro is less than 10 percent. This is less than the national average of 13 percent
(UNICEF, 2012 not in the references). Approximately the same share of respondents of around
30 percent in both districts finished secondary school. The differences in monthly household
income between the two districts are big and statistically significant. Mean monthly income is 5
times higher in the urban sample than in the rural one. The high value in Nakuru is partly caused
by a few outliers, i.e. three respondents claiming their households earn more than 300 thousand
Kenyan Shillings per month1. The median values are much lower, especially in Nakuru, namely
47,500 Ksh or USD 541 (and the median value is 12,000 Ksh or USD 137 in Njoro). Comparing
the trimmed mean annual per capita income levels in the rural and urban household sample (Ksh
35,865 and 209,027 respectively) to the national average provided by the Kenya National Bureau
1 The average exchange rate (Ksh to US dollar) in the month of January in 2012 was 0.0114.
13
of Statistics (KNBS, 2012) of 76,252, rural households reported to earn less than half of this,
while the urban sample in Nakuru earned on average almost three times as much.
Turning to drinking water supply and sanitation conditions, contrary to urban households none of
the rural households have access to either private or public piped water. Three quarters of the
interviewed urban households have their own tap water, one in every fifth respondent uses public
tap water. Almost 40 percent of the rural households collect their drinking water from streams,
followed by unprotected (32%) and protected (27%) springs and wells. On average, a household
spends 22 minutes every day to collect drinking water in rural areas, whereas households who
depend on public tap water have to walk less than 5 minutes to collect their water.
No significant difference can bet detected between rural and urban households when we look at
their average water consumption (almost 4 liters per day). However, almost twice as many
households in urban areas (almost 80%) treat their water before drinking compared to rural
households. Boiling water is the most common treatment method, followed by chlorination. In
rural areas nobody filters their water, in urban areas this is less than 15 percent. Almost one
quarter of the respondents has children in their household who face diarrhea, while this share is
almost 7 percent in Nakuru. Remarkably, there is not that much difference between the share of
respondents in the rural and urban sample who believe that their drinking water is safe to drink:
just over 50 percent is of this opinion in the urban area Nakuru against 47 percent in the rural
area Njoro. Almost none of the rural households has a covered pit latrine. Although still almost a
quarter of the urban households has no pit latrine either, a majority of 65 percent is connected to
the sewer system and has a flushing toilet.
14
Table 2: Summary of household characteristics across the two districts
Sample characteristics
Nakuru
(urban)
Njoro
(rural)
M-W test1
Gender (% female) 53.3 59.3
Average age 33.1 34.4 -0.077
Average number of household members 4.3 5.7 -5.035***
Share illiterate (%) 0.0 7.5
Share completed secondary school (%) 32.9 28.8
Average monthly household income (Ksh) 76,017 15,219 8.086***
Share no or uncovered pit latrine (%) 24.0 94.0
Share covered/ventilated pit latrine (%) 11.3 6.0
Share flushing toilet (%) 64.7 0.0
Share piped water (%) 66.7 0.0
Share public tap (%) 20.7 0.0
Share bottled water (%) 6.7 0.7
Share collecting water from protected wells/springs (%) 0.0 27.3
Share collecting water from unprotected wells/springs (%) 0.0 32.0
Share collecting water from streams (%) 0.0 39.3
Average time to collect water (minutes/day) 4.49 21.94 -12.311***
Average household water use (liters/day) 3.95 3.96 0.164
Share treating drinking water (%) 78.7 43.3
Share boiling drinking water (%) 34.0 27.3
Share filtering water (%) 12.7 0.0
Share chlorinating water (%) 22.7 13.3
Share children with diarrhea (%) 6.9 23.4
Share who believes the water they drink is safe (%) 52.7 46.9
1 Standardized Mann-Whitney test statistic.
Significance level: ***
1%
15
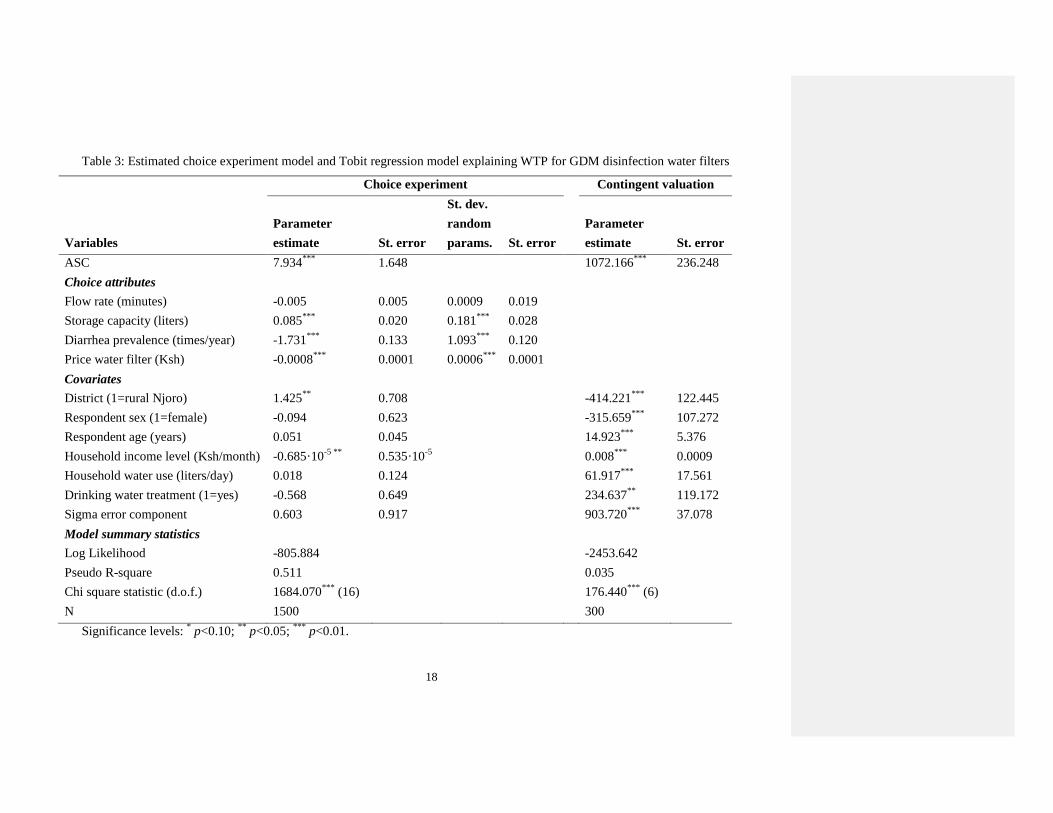
5.2. Estimated choice models
Two different models were estimated, one based on the choice experiment, and one based on the
follow-up WTP question (see Table 3). The statistical model underlying the choice experiment
was detailed already in Section 3. Respondent choices were regressed on the choice attributes
and other covariates using a combined random parameters and error component logit model,
which was estimated in NLOGIT version 4.0, accounting for the panel data structure of the
choice experiment. For efficiency purposes, the model was estimated using a Halton sequence of
100 replications in a quasi-Monte Carlo maximum likelihood simulation (Bhat, 2001).
Preference heterogeneity is accounted for by randomizing the choice attributes across
respondents (presented in Table 3 in the column under the heading ‘St. dev. Random params’) .
Different distributional assumptions were tested. A normal distribution produced the statistically
best fit for the continuous choice attributes. Once control is included for these random effects, no
additional significant effects can be detected for any of the other socio-demographic, water use,
water treatment or risk perception characteristics discussed in the previous section. The only
variable that is statistically significant is the dummy variable for the urban and rural district. This
is as expected, since also the Swait and Louviere (1993) test convincingly rejects the null
hypothesis of model equality when estimating and comparing the two separate choice models for
the urban and rural sample2. As expected, all else being constant, respondents in the rural district
Njoro are more likely to choose one of the two presented filter specifications than respondents in
2 The outcome of the Likelihood Ratio (LR) test when comparing the preference parameters between the two models
for Njoro and Nakuru whilst keeping the scale parameter contact is 27.4 (p<0.002). Equality of scale parameters is
rejected at the one percent significance level by the same test (LR=11.39, 1 degree of freedom).
16
urban Nakuru, indicating that demand for the GDM filter is higher in the rural district. Tests
were also carried out to see if any systematic pattern could be detected based on respondent
choices throughout the choice sequence, but this did not yield anything. Comparing the stability
of preferences throughout the choice sequence, hardly any differences can be detected between
choices at the 5 percent significance level (test results are available from the authors), suggesting
that respondents had more or less well-defined preferences when they started the choice
experiment even though the presented new GDM filter is not sold on the market yet.
The estimated choice model is highly significant (see the outcome of the chi-square test) with a
relatively high pseudo R2 for this type of research of more than 50 percent. The outcome for the
error component is not statistically significant. The significant positive outcome of the
alternative specific constant (ASC) implies that respondents value the GDM filter positively
compared to their current situation. All attribute parameters are statistically significant and have
the expected signs, except for the filter’s flow rate. Respondents prefer higher storage capacity,
lower diarrhea prevalence rates and, as expected, a lower price for the filter. The higher the price,
the lower the likelihood that households will choose one of the GDM filters. The standard
deviation of the distribution of these three random parameters is also highly significant,
indicating preference heterogeneity in the choice attributes.
The non-significance of the flow rate is attributed to the relatively low opportunity costs of time
often encountered in a developing country context and the relatively small differences between
the three attribute levels (15, 30 and 45 minutes). These levels furthermore do not differ very
much from the average amount of time needed especially in rural areas to collect water (see
17
Table 2). In the rural district Njoro, 51 percent of the sample collected its water within 15
minutes (this share is 89% in urban Nakuru), while 12 percent of the respondents needed more
than 45 minutes (this share is only 2% in Nakuru). Despite thorough pretesting, these differences
were not picked up sufficiently in the pre-test phase of the survey.
Turning to the CV model, a remarkable finding is first of all that here all the covariates are
significant at the one or five percent level, and secondly that the coefficient for the district
dummy is negative, indicating that respondents in rural Njoro are willing to pay significantly less
than respondents in urban Nakuru. Women are also willing to pay significantly less than men,
while older and higher income earning respondents, whose households use more water and also
treat their drinking water already, are willing to pay more (all other things being equal). The CV
model was estimated using Tobit regression to account for the censored nature of the dependent
variable (e.g. Greene, 2003). The pseudo R-square is very low, but lacks the conventional
explanatory power interpretation. Estimating the same model using ordinary least squares
regression, the results remain the same, suggesting that the estimated CV model is robust, and
the ordinary R-square is much higher, namely 45 percent.
The CV model is based on respondent WTP for a GDM water disinfection filter with a storage
capacity of 10 liters, a flow rate of 30 minutes to purify one liter of water, and maximum
effectiveness in reducing diarrhea occurrence among children to at most once a year per child.
Using the estimated coefficients of the choice experiment model presented in Table 3, WTP for
the same filter specification can be calculated (this calculation procedure is explained, for
example, in Hensher et al., 2005). This is presented in Table 4.
Deleted: his
Deleted: urban
18
Table 3: Estimated choice experiment model and Tobit regression model explaining WTP for GDM disinfection water filters
Choice experiment Contingent valuation
Variables
Parameter
estimate
St. error
St. dev.
random
params.
St. error
Parameter
estimate
St. error
ASC 7.934***
1.648
1072.166***
236.248
Choice attributes
Flow rate (minutes) -0.005 0.005 0.0009 0.019
Storage capacity (liters) 0.085***
0.020 0.181***
0.028
Diarrhea prevalence (times/year) -1.731***
0.133 1.093***
0.120
Price water filter (Ksh) -0.0008***
0.0001 0.0006***
0.0001
Covariates
District (1=rural Njoro) 1.425**
0.708 -414.221***
122.445
Respondent sex (1=female) -0.094 0.623 -315.659***
107.272
Respondent age (years) 0.051 0.045 14.923***
5.376
Household income level (Ksh/month) -0.685·10-5 **
0.535·10-5
0.008***
0.0009
Household water use (liters/day) 0.018 0.124 61.917***
17.561
Drinking water treatment (1=yes) -0.568 0.649 234.637**
119.172
Sigma error component 0.603 0.917 903.720***
37.078
Model summary statistics
Log Likelihood -805.884 -2453.642
Pseudo R-square 0.511 0.035
Chi square statistic (d.o.f.) 1684.070***
(16) 176.440***
(6)
N 1500 300
Significance levels: * p<0.10;
** p<0.05;
*** p<0.01.
19
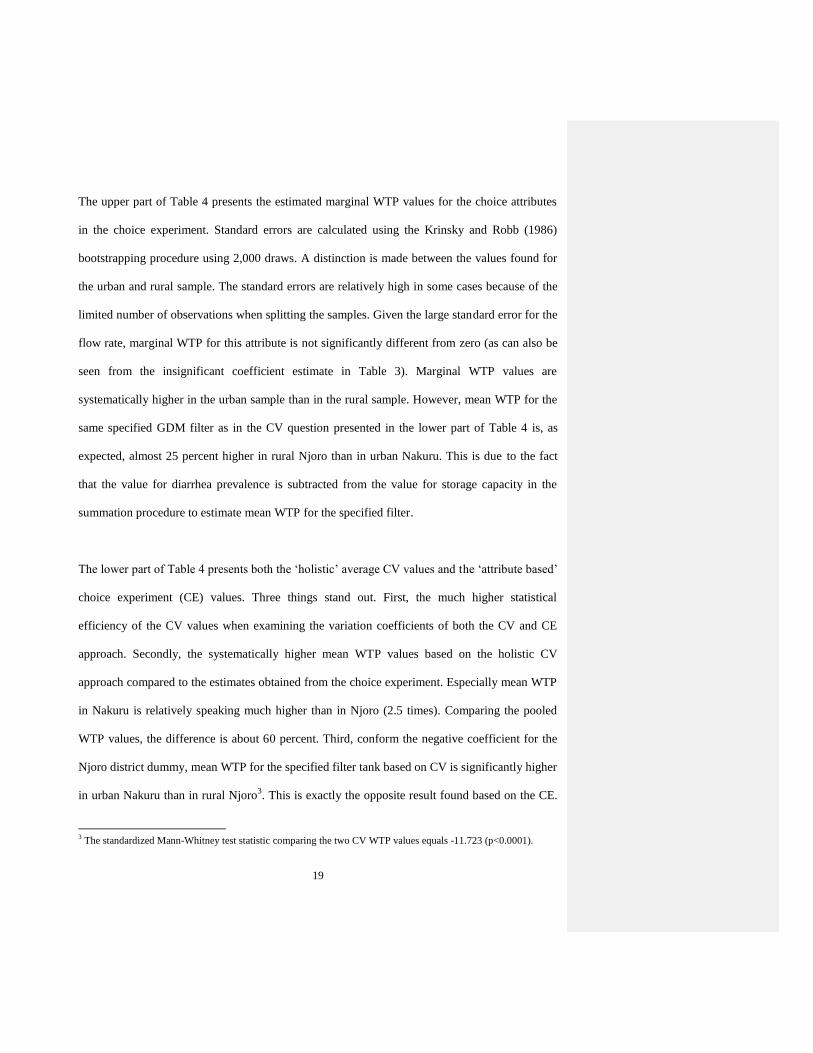
The upper part of Table 4 presents the estimated marginal WTP values for the choice attributes
in the choice experiment. Standard errors are calculated using the Krinsky and Robb (1986)
bootstrapping procedure using 2,000 draws. A distinction is made between the values found for
the urban and rural sample. The standard errors are relatively high in some cases because of the
limited number of observations when splitting the samples. Given the large standard error for the
flow rate, marginal WTP for this attribute is not significantly different from zero (as can also be
seen from the insignificant coefficient estimate in Table 3). Marginal WTP values are
systematically higher in the urban sample than in the rural sample. However, mean WTP for the
same specified GDM filter as in the CV question presented in the lower part of Table 4 is, as
expected, almost 25 percent higher in rural Njoro than in urban Nakuru. This is due to the fact
that the value for diarrhea prevalence is subtracted from the value for storage capacity in the
summation procedure to estimate mean WTP for the specified filter.
The lower part of Table 4 presents both the ‘holistic’ average CV values and the ‘attribute based’
choice experiment (CE) values. Three things stand out. First, the much higher statistical
efficiency of the CV values when examining the variation coefficients of both the CV and CE
approach. Secondly, the systematically higher mean WTP values based on the holistic CV
approach compared to the estimates obtained from the choice experiment. Especially mean WTP
in Nakuru is relatively speaking much higher than in Njoro (2.5 times). Comparing the pooled
WTP values, the difference is about 60 percent. Third, conform the negative coefficient for the
Njoro district dummy, mean WTP for the specified filter tank based on CV is significantly higher
in urban Nakuru than in rural Njoro3. This is exactly the opposite result found based on the CE.
3 The standardized Mann-Whitney test statistic comparing the two CV WTP values equals -11.723 (p<0.0001).
20
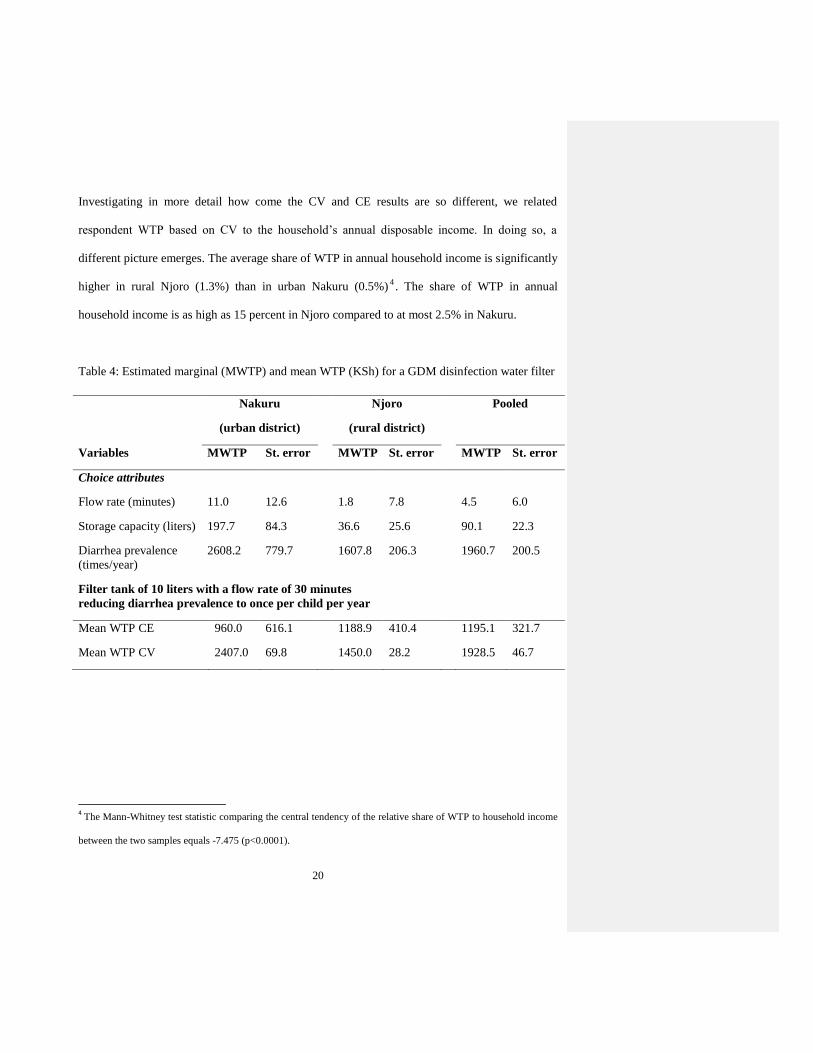
Investigating in more detail how come the CV and CE results are so different, we related
respondent WTP based on CV to the household’s annual disposable income. In doing so, a
different picture emerges. The average share of WTP in annual household income is significantly
higher in rural Njoro (1.3%) than in urban Nakuru (0.5%)4. The share of WTP in annual
household income is as high as 15 percent in Njoro compared to at most 2.5% in Nakuru.
Table 4: Estimated marginal (MWTP) and mean WTP (KSh) for a GDM disinfection water filter
Nakuru
(urban district)
Njoro
(rural district)
Pooled
Variables MWTP St. error MWTP St. error MWTP St. error
Choice attributes
Flow rate (minutes) 11.0 12.6 1.8 7.8 4.5 6.0
Storage capacity (liters) 197.7 84.3 36.6 25.6 90.1 22.3
Diarrhea prevalence
(times/year)
2608.2 779.7 1607.8 206.3 1960.7 200.5
Filter tank of 10 liters with a flow rate of 30 minutes
reducing diarrhea prevalence to once per child per year
Mean WTP CE 960.0 616.1 1188.9 410.4 1195.1 321.7
Mean WTP CV 2407.0 69.8 1450.0 28.2 1928.5 46.7
4 The Mann-Whitney test statistic comparing the central tendency of the relative share of WTP to household income
between the two samples equals -7.475 (p<0.0001).
21
6. Discussion and conclusions
In this study, we assessed rural and urban household demand for a new gravity driven membrane
filter. The new technology is not yet available on the market and the study presented here
explored the marketing potential of the new filter. Important filter characteristics were identified
based on expert and focus group interviews, and used to design a choice experiment targeting
150 rural and 150 urban residents. In addition, all respondents were asked a CV question
afterwards to elicit their WTP for a specific 10 liter in-house filter tank with a flow rate of 2
liters per hour that was able to provide maximum health protection and reduce current high
frequency levels of child diarrhea prevalence in both urban and rural areas to at most once a year
per child.
In general, we observed that respondents felt at ease and comfortable answering the choice
questions, because the survey was well pre-tested. There was no indication of preference
learning when respondents went through the choice sequence, and the study did not suffer from
any protest responses. These observations provide confidence in the reliability of the results
presented here. A caveat in the study was, however, that we failed to properly pick up the value
attached to the time it takes to filter the water with the new filter technology, despite proper pre-
testing. This choice attribute did not show up statistically significant in the estimated choice
model based on the data collected in the main survey. On the one hand, the differences between
the levels used in the choice experiment were perhaps too small. On the other hand, the levels in
the design of the choice experiment largely overlapped with how much time people currently
spend to collect drinking water, and we were unable to find a significant effect of the amount of
time it actually costs people to collect drinking water on choice behavior and stated WTP in the
Deleted: hence
22
CV approach, neither in rural or urban Kenya. One possible explanation might be that exactly
because of this overlap, respondents did not see any value added in the flow rate attribute and the
amount of time they could save in water collection when buying the new filter.
Given the limited access to clean drinking water in rural Kenya, our prior expectation was that
demand for the new filter would be highest in the rural sample. In the study we found that the
number of households in which children suffer from diarrhea is, however, even higher in urban
Nakuru (81%) than in rural Njoro (70%), which may have influenced our findings. Unfortunately
no information was available from the household survey that would have allowed us to use
actual diarrhea prevalence levels in each household in the choice analysis to represent baseline
conditions, and differences therein across households. The estimated choice model based on the
choice experiment confirms that rural demand for the new drinking water filter is higher than
urban demand, but to our surprise we found the opposite result for the CV approach, even if we
control for other influencing factors such as respondent sex, age, disposable household income,
current water use and drinking water treatment. Nevertheless, when relating stated WTP in the
CV to household income, we again found that the share of their income respondents are willing
to sacrifice to purchase the new filter technology is significantly higher in the rural sample than
in the urban one, confirming the first hypothesis.
A second important hypothesis in this study was that we expected WTP values derived from the
attribute-based choice experiment to be significantly higher than those from a comparable
holistic CV survey. This hypothesis is based on results found in previous studies (e.g. Foster and
Mourato Not in the list of references!, 2003; Brouwer et al., 2010). Surprisingly, the second
23
hypothesis is rejected in this particular study when comparing the estimated WTP values from
both stated preference approaches. Overall, mean WTP from the CV question is more than 60
percent higher than WTP derived from the estimated choice model. We have two possible
explanations for this finding. First, the upper range of bid amounts used in the payment card to
support the CV WTP question following the choice experiment is higher than the range of price
levels used in the choice experiment. This was done in view of the fact that the CV WTP
question aimed to elicit the maximum amount of money respondents were willing to sacrifice to
get the new filter in their homes. Fifty-five percent of the values on the payment card are in the
same range as the bid levels used in the choice experiment, the rest of the values is higher.
Secondly, the standard linear summation procedure used in the literature to calculate a total
economic value may not adequately reflect how respondents form a total value judgment when
they are asked to value the whole instead of trading off the different parts making up the whole.
More research should go into the appropriate summation of marginal WTP values into an overall
economic value for a good or product.
24
Acknowledgements
Financial support provided by the Netherlands Organisation for International Cooperation in
Higher Education Nuffic for Fumbi Crescent’s stay at EAWAG is gratefully acknowledged. Roy
Brouwer and Bianca Kroon were co-funded by EAWAG.
25
References
Bennett J, Blamey R (2001) The choice modelling approach to environmental valuation. Edward
Elgar, Cheltenham, UK.
Birol, E., Koundouri, P.(Eds.), 2008. Choice experiments informing environmental policy. A
European perspective. Cheltenham, UK: Edward Elgar Publishing.
Boulestreau, Hoa, Peter, Pronk, Rajagopaul, Lesjean (2010) operation of a 5m3/d Gravity-driven
Ultrafiltration Unit for Decentralised Water Supply. Presented at the Conference Membrane in
Drinking and Industrial Water Treatment - MDIW 2010 June 27-30, NTNU,Trondheim,
Norway
Brouwer, R., Dekker, T., Rolfe, J. and Windle, J. (2010). Choice certainty and consistency in
repeated choice experiments. Environmental and Resource Economics, 46(1): 93-109.
Brownstone, D. and K. Train (1999). Forecasting new product penetration with flexible
substitution patterns. Journal of Economics, 89: 109–129.
Bhat, C.R., 2001. Quasi-random maximum simulated likelihood estimation of the mixed
multinomial logit model. Transportation research Part B. 35, 677-693.
26
Breffle, W. and Morey, E., 2000. Investigating Preference Heterogeneity in a Repeated Discrete-
Choice Recreation Demand Model of Atlantic Salmon fishing. Marine Resource Economics. 15,
1-20.
Carson and Louviere 2011......
GoK. (2009) population and housing census results. Ministry of planning and vision 2030.
Hensher, D.A., Rose, J.M. and Greene, W.H. (2005). Applied choice analysis. A primer.
Cambridge: Cambridge University Press.
Hensher, D.A., Shore, N. and Train, K., 2006. Water Supply Security and Willingness to Pay to
Avoid Drought Restrictions. The Economic Record. 82(256), 56–66.
Hynes, S., Hanley, N. and Scarpa, R. (2008). Effects on welfare measures of alternative means of
accounting for preference heterogeneity in recreational demand models. American Journal of
Agricultural Economics 90(4), 1011-1027.
Kiruki S, Limo M, Njagi E, Paul O (2011) Bacteriological quality and diarrhoeagenic pathogens
on River Njoro and Nakuru Municipal water, Kenya. International Journal for Biotechnology
and Molecular Biology Research 2: 150-162
Krinsky, I., and Robb, A.L. (1986). On approximating the statistical properties of elasticities.
Review of Economics and Statistics, 68: 715–719.
Formatted: Justified
27
Layton, D. and Brown, G., 2000. Heterogeneous preferences regarding global climate change.
Review of Economics and Statistics. 82, 616–624.
Louviere, J.J., Hensher, D.A. and Swait, J.D., 2003. Stated choice methods: analysis and
applications. Cambridge University Press, Cambridge.
Luoto J, Najnin N, Mahmud M, Albert J, Islam M, Luby S, Unicomb L, Levine D (2011b) What
Point-of-Use Water Treatment Products Do Consumers Use? Evidence from a Randomized
Controlled Trial among the Urban Poor in Bangladesh. PLoS ONE 6: e26132 DOI
10.1371/journal.pone.0026132
Mirza MN, Caulfield LE, Black RE, Macharia WM (1997) Risk Factors for Diarrheal Duration.
American Journal of Epidemiology 146: 776-785
McFadden, D. (1974). Conditional Logit Analysis of Qualitative Choice Behaviour. In:
Zarembka, P. (ed.). Frontiers in Econometrics. New York: Academic Press.
Morey, E.R. and Rossmann, K.G., 2003. Using Stated-Preference Questions to Investigate
Variations in Willingness to Pay for Preserving Marble Monuments: Classic Heterogeneity,
Random Parameters, and Mixture Models. Journal of Cultural Economics. 27(4), 229.
28
Murage. E W, Ndingu. A M (2007) Quality of water the slum dwelers use, the case of a kenyan
slum. Journal of urban health vol 84
Peter-Varbanets M, Zurbrügg C, Swartz C, Pronk W (2009) Decentralized systems for potable
water and the potential of membrane technology. Journal of Water Research 43: 245-265
Peter-Varbanets M, Hammes F, Vital M, Pronk W (2010) Stabilization of flux during dead-end
ultra-low pressure ultrafiltration. Journal of Water Research 44: 3607-3616
Peter-Varbanets M, Margot J, Traber J, Pronk W (2011) Mechanisms of membrane fouling
during ultra-low pressure ultrafiltration. Journal of Membrane Science 377: 42-53
Provencher, B. and Bishop, R.C. (2004). Does accounting for preference heterogeneity improve
the forecasting of a random utility model? Journal of Environmental Economics and
Management 48(1),793-810.
Revelt, D. and Train, K., 1998. Mixed logit with repeated choices: households’ choice of
appliance efficiency level. Review of Economics and Statistics. 53, 647–657.
Rose, J.M., Hensher, D.A., Caussade, S., de Dios Ortuzar, J. and Jou, R-C., 2009. Identifying
differences in willingness to pay due to dimensionality in stated choice experiments: a cross-
country analysis. Journal of Transport Geography. 17, 21-29.
Scarpa, R., Willis, K.G., and Acutt, M. (2005). Individual-specific welfare measures for public
goods: a latent class approach to residential customers of Yorkshire Water. In: Koundouri. P.
Deleted: 
29
(ed.). Econometrics informing natural resource management. Edward Elgar Publishers,
Cheltenham, UK.
Swait, J. and Louviere, J. (1993). The role of the scale parameter in the estimation and
comparison of multinomial logit models. Journal of Marketing Research, 30 (3), 305-314.
Sobsey MD (2002) Managing Water in the Home: Accelerated Health Gains from Improved
Water Supply WHO, Water, Sanitation and Health Department of Protection of the Human
Environment World Health Organization Geneva.
Tarfasa, S. & Brouwer, R. (2013). Estimation of the public benefits of urban water supply
improvements in Ethiopia: a choice experiment. Applied Economics, 45(9): 1099-1108.
Tornheim JA, Manya AS, Oyando N, Kabaka S, O’Reilly CE, Breiman RF, Feikin DR (2010)
The epidemiology of hospitalization with diarrhea in rural Kenya: the utility of existing health
facility data in developing countries. International Journal of Infectious Diseases 14: e499-e505
DOI 10.1016/j.ijid.2009.07.021
Train, K. (2003). Discrete Choice Methods with Simulation Cambridge: Cambridge University
Press.
USAID, KNBS (2009) Demographic and health survey KEBS. Nairobi. Kenya.
Deleted: Geneva.
30
WHO/UNICEF (2012) progress in drinking water and sanitation: 2012 update. WHO and
UNICEF New York-USA.
Yillia PT, Kreuzinger N, Mathooko JM (2008) The effect of in-stream activities on the Njoro
River , Kenya . Part II : Microbial water quality. Physics and Chemistry of the Earth, Parts
A/B/C 33: 729-737


