Embed Size (px)
Citation preview
Biotechnol. Appl. Biochem. (2007) 48, 149–158 (Printed in Great Britain) doi:10.1042/BA20060233 149
Comparison of articular cartilage with costal cartilage in initialcell yield, degree of dedifferentiation during expansion andredifferentiation capacity
Jungsun Lee*, Eunkyung Lee†, Hwi-yool Kim‡ and Youngsook Son†1
*R&D Institute, Modern Cell and Tissue Technologies Inc., Seoul, Korea, †Laboratory of Tissue Engineering andMusculoskeletal Bioorgan Center, College of Life Science, Kyung Hee University, Yongin, Korea, and ‡College ofVeterinary Medicine, Konkuk University, Seoul, Korea
Costal cartilage has been proposed as an alternativedonor of chondrocytes for articular-cartilage repair.In the present study we compared the initial cell yieldof chondrocytes from rabbit costal cartilage and theircell expansion rates in monolayer culture with thoseof articular cartilage. Costal cartilage gave an approx.2.6-fold higher cell yield than did articular cartilage.During in vitro culture, CCs (costal chondrocytes) grewfaster and displayed approx. 3-fold more cell expan-sion up to P4 (passage 4) than did ACs (articular chon-drocytes). In order to match the degree of dedifferent-iation during serial cultivation with the cells’ expansionrate, type II collagen expression and the emergence offibroblastic morphology were monitored at each cellpassage. Both ACs and CCs gradually lost their chon-drocytic phenotype, changed to fibroblast-like cells anddisplayed a reduced expression of type II collagen. Wethen also evaluated the redifferentiation capacity ofthe expanded ACs and CCs by culturing them at highdensity in collagen gel. Almost fully dedifferentiatedCCs at P4 were successfully redifferentiated into hy-aline cartilage, which showed the expression of glycos-aminoglycan and type II collagen as well as the form-ation of lacunae and a territorial matrix. In conclusion,costal cartilage may have advantages over articularcartilage as an alternative donor tissue for autologouschondrocytes on the basis of its higher cell yield,higher cell expansion and successful reversion intohyaline cartilage without ossification in vitro. However,although this experiment with a rabbit model gave abetter insight into the problem than other experimentshave done, it does not answer definitively the questionas to which cells are most appropriate for articularcartilage repair in humans.
Introduction
ACT (autologous articular-chondrocyte transplantation) hasbeen clinically applied in small defects of articular cartilage,
but only limited success has been reported after using thismethod [1,2]. Even though ACs (articular chondrocytes) canbe easily isolated from mature articular cartilage by enzymedigestion, the two-step procedures that are required forharvesting and grafting are invasive to the joint and ratherexpensive to perform. Thus ACT cannot be applied to morethan two small lesions, to a lesion size larger than 10 cm2, topatients with rheumatoid or immune-related arthritis, andto older patients because of the degeneration of articularcartilage that occurs with age [1,3–5]. Furthermore, only 1–2% (v/v) of articular cartilage is composed of chondrocytes,and from these, only approx. 2000 cells/mg of human artic-ular cartilage can be isolated for culture [1,5]. An average3 cm2 defect requires 9 × 10⁶ cells for the ACT procedure ifimplanted at cell densities similar to that found in the normalhuman knee joint [1,6–9]. In reality, more cells may berequired for ACT, since 26% of patients under the age of 40with grade IV chondromalacia lesions had multiple lesions.Therefore a large number of chondrocytes is required to filladequately a volume of defect with a cell density similar tothat seen in normal human articular cartilage.
Costal cartilage is the biggest permanent manifestationof hyaline cartilage in the mammalian body and it seems tohave several advantages over articular cartilage as a potentialdonor tissue for autologous chondrocytes. Although retro-gressive change in calcification is often reported, even inpatients 80 years of age or older, actively proliferating chon-drocytes were also detected [10], and a significant amount ofcostal cartilage is available in patients younger than 60 years[11]. In addition, its easy surgical accessibility makes costal
Key words: articular chondrocyte, cartilage repair, costal chondrocyte,dedifferentiation, high-density culture, redifferentiation.
Abbreviations used: AC, articular chondrocyte; ACT, autologous articular-chondrocyte transplantation; CC, costal chondrocyte; 3D, three-dimensional; D-PBS, Dulbecco’s PBS; DAB, 3,3′-diaminobenzidinetetrahydrochloride; DAPI, 4′ ,6-diamidino-2-phenylindole; DMEM,Dulbecco’s modified Eagle’s medium; GAG, glycosaminoglycan; H&E,haematoxylin and eosin; MTT, 3-(4,5-dimethylthiazol-2-yl)-2,5-diphenyl-2H-tetrazolium bromide; P, passage; PDT, population doubling time.
1 To whom correspondence should be addressed (email [email protected]).
C© 2007 Portland Press Ltd
150 J. Lee, E. Lee, H.-Y. Kim and Y. Son
cartilage the most useful source of ACT to treat a varietyof articular-cartilage disorders such as rheumatoid arthritis,osteoarthritis and cartilage defects of the joints [12,13].Several reports regarding costal cartilage as a possiblealternative donor source for autologous grafts in thereconstruction of articular cartilage [11,14–19], the externalear [20] and the trachea [21] are available, but direct andcomprehensive evaluation of costal cartilage in comparisonwith articular cartilage in terms of their initial cell yieldsand expansion rates, the relationship between their de-differentiation degree and in vitro cell expansion rate, theirredifferentiation capacity at different degrees of dedifferenti-ation and, finally, possible contraction problems in the finallyregenerated cartilage, have not yet been explored.
Gradual loss of chondrocytic phenotypes, such asround morphology and expression of the cartilage-speci-fic proteoglycans and type II collagen [22–26], allowedonly restricted expansion of chondrocytes in vitro. Severalattempts have been made to redifferentiate those fibroblas-tically dedifferentiated ACs into hyaline cartilage by high-density 3D (three-dimensional) cell culture in type I collagengels, agarose gels or alginate beads [27–29], but their redif-ferentiation capacity was not explored extensively with re-gard to the degree of dedifferentiation. In the present studywe evaluated whether costal cartilage can be selected as adonor chondrocyte source for tissue-engineered articularcartilage or ACT on the basis of initial cell yield and thedegree of cell expansion and dedifferentiation duringthe in vitro cultivation by directly comparing these propertieswith those of articular cartilage. We also estimated the redif-ferentiation capacity of the in-vitro-expanded chondrocyteswith different degrees of dedifferentiation.
Materials and methods
Isolation of chondrocytesArticular and costal cartilages were obtained from 3–4-month-old New Zealand White rabbits. The synovial joints,such as the the stifle (≡knee), the hip and the shoulder,were opened. The cartilage was dissected from theunderlying bone and was weighed. The costal cartilage, afterthe soft adhering tissues, including perichondrium, had beenremoved, was then weighed. This cartilage was minced into1–2 mm3 pieces and rinsed three times in D-PBS (Dulbecco’sPBS; Jeil Biotech Services, Taegu, Korea). After it had beenrinsed, the minced cartilage was digested with an enzymecocktail solution that included collagenase D (2 mg/ml;Roche, Mannheim, Germany), hyaluronidase (1 mg/ml;Roche) and DNase (0.75 mg/ml; Roche) under 5 % CO2
at 37 ◦C overnight. The solution was then filtered througha 53-µm-pore-size nylon mesh, at which point isolatedcells were washed twice with DMEM (Dulbecco’s modified
Eagle’s medium; Gibco Life Technologies, Grand Island,NY, U.S.A.) supplemented with 10 % (v/v) FBS (fetal bovineserum; Hyclone Technologies, Logan, UT, U.S.A.) and1% penicillin/streptomycin/fungizone cocktail (Gibco),and viable cells were counted on a haemocytometer onthe basis of Trypan Blue exclusion. The cells were platedat a cell density of 5 × 10⁵ cells/100-mm-diameter Petridish, the culture medium was changed every other day, andfresh 50 µg/ml L-ascorbic acid (Sigma, St. Louis, MO, U.S.A.)was added at each medium change. The primary cells atconfluence were subcultured up to P4 (passage 4).
MTT [3-(4,5-dimethylthiazol-2-yl)-2,5-diphenyl-2H-tetrazolium bromide] assayACs and CCs (costal chondrocytes) at each passage wereseeded at a cell density of 1 × 10⁵ cells/well of a six-well cul-ture plate and cultured for 5 days. Cell growth was deter-mined on the basis of the MTT assay, as reported previously[29]. For the calibration of cell number from attenuance(D600), a standard curve was constructed using a range ofcell numbers from 1 × 10⁵ to 8 × 10⁵.
Immunofluorescence staining of type II collagenThe chondrocytes from each passage were plated on to acoverslip, cultured for 2 days, fixed with 3.7% (v/v) formalinin PBS for 10 min and permeabilized with 0.2% TritonX-100 in PBS. The permeabilized cells were incubated with20% normal goat serum to block non-specific reactions, anda monoclonal anti-(type II collagen) antibody (monoclonalanti-mouse antibody; Chemicon International, Temecula,CA, U.S.A.) was used as a primary antibody. FITC-labelledgoat anti-mouse IgG conjugate (Vector Laboratories,Burlingame, CA, U.S.A.) was used as a secondary antibody,and the coverslip was incubated for 5 min with DAPI(4′,6-diamidino-2-phenylindole; 1 g/ml) to stain the nuclei.Cells were observed under a fluorescence microscope(Olympus Corp., Tokyo, Japan).
High-density 3D cultures in collagen gel and theirimmunohistochemical stainingChondrocytes (2 × 10⁶ at P2 or P4) were mixed with a400 µl premixture of Type I collagen solution (Vitrogen100®; Celtrix Laboratories, Palo Alto, CA, U.S.A.), 10 ×DMEM/F12 medium and the reconstitution buffer (0.1 MNaOH/200 mM Hepes, pH 7.4) in the proportions of 8:1:1respectively, and the collagen/cell mixture was plated on to12-mm-diameter Millicells (Millipore, Bedford, MA, U.S.A.)in a 37 ◦C incubator for gelation. Millicells were then trans-ferred to six-well plates with 6 ml of culture medium per welland cultured for the indicated times. Media were changedevery week. At 2, 7, 14 and 28 days, the 3D constructs werefixed with phosphate-buffered 10% (w/v) formalin. Paraffinsections (4 µm thickness) were deparaffinized and stained
C© 2007 Portland Press Ltd
Reversion of dedifferentiated costal chondrocytes 151
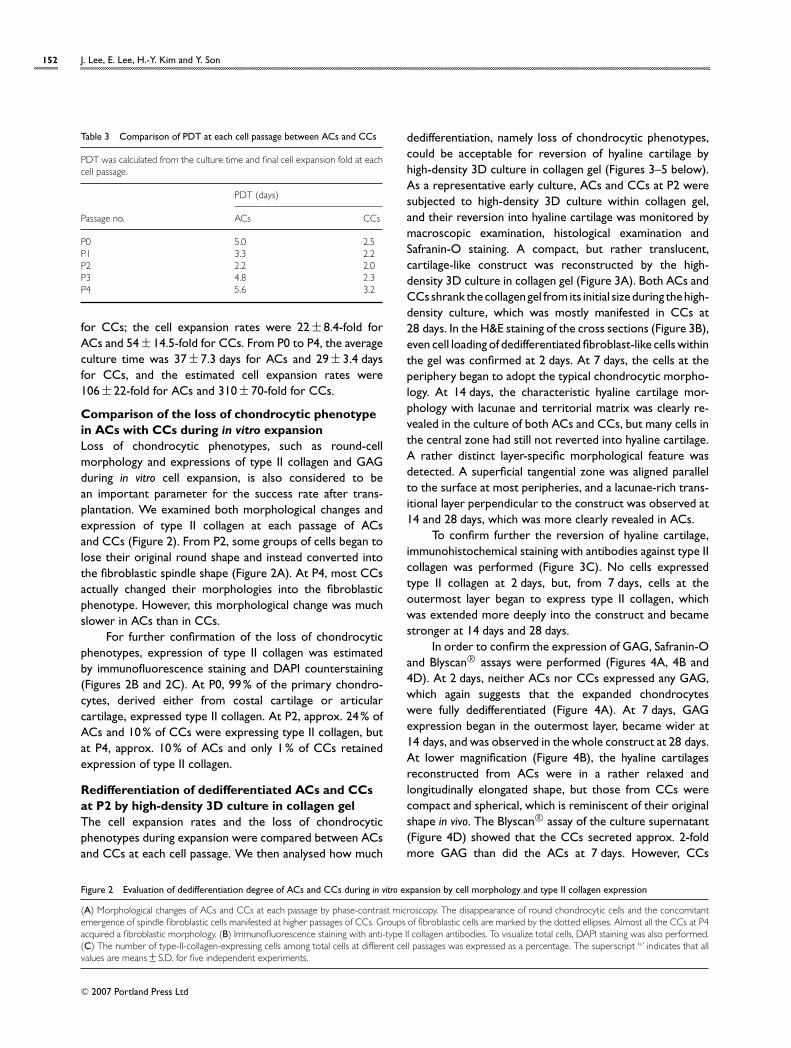
Table 1 Comparison of initial cell yield of chondrocytes isolated fromarticular cartilage and costal cartilage
Values for three independent cell isolations, and the mean +− S.D., are given.Statistical analysis was carried out using the student t test (P < 0.05).
Yield (cells/mg)
Cells Isolation no. . . . 1 2 3 Mean +− S.D.
ACs 6000 7000 13400 8800 +− 3278CCs 20000 26600 22100 22900 +− 2753
with H&E (haematoxylin and eosin) for their histologicalfeatures, such as lacunae and territorial matrix formation,Safranin-O for GAG (glycosaminoglycan) expression, andvon Kossa stain for calcium deposits. For immunohistochem-ical staining, sections were permeabilized with 0.2% TritonX-100 in PBS and incubated with 0.2% hyaluronidase at37 ◦C for 1 h. Anti-(type II collagen) antibody was applied tothe specimens overnight at 4 ◦C, then incubated with strept-avidin/peroxidase for 1 h and developed with 0.1% DAB(3,3′-diaminobenzidine tetrahydrochloride; Chromogen,DAKO Corp., CA, U.S.A.) in PBS for 5 min. Fast Red dye(Vector) was used for counterstaining.
Blyscan® GAG assayThe GAG content was determined quantitatively using theBlyscan® (Bicolor, Belfast, Northern Ireland, U.K.) 1,9-Dimethylmethylene Blue assay [30]. A 300 µl aliquot ofthe culture supernatant was analysed according to themanufacturer’s recommendations and calibrated using astandard curve constructed by using 0.1, 0.2, 0.3, 0.5, 1 and2 µg of shark chondroitin sulfate (Sigma).
StatisticsStatistical analysis was performed using Student’s unpairedt test to determine whether variables were significantlydifferent (P < 0.05) in each experiment.
Results
Comparison of initial cell yields and expansionrates of chondrocytes isolated from articularcartilage with costal cartilageIn order to estimate the possibility of using costal cartilageas an alternative donor tissue for articular-cartilage repair,we first compared initial cell yields of articular cartilage withthose of costal cartilage (Table 1). The articular cartilage andthe costal cartilage gave initial cell yields of 8800 +− 3278and 22 900 +− 2753 cells/mg respectively, which correspondsto an approx. 2.6-fold higher cell yield for the costal cartil-age compared with articular cartilage. Thus costal cartilageseems to be the better donor site for the isolation of auto-logous chondrocytes than articular cartilage with respect
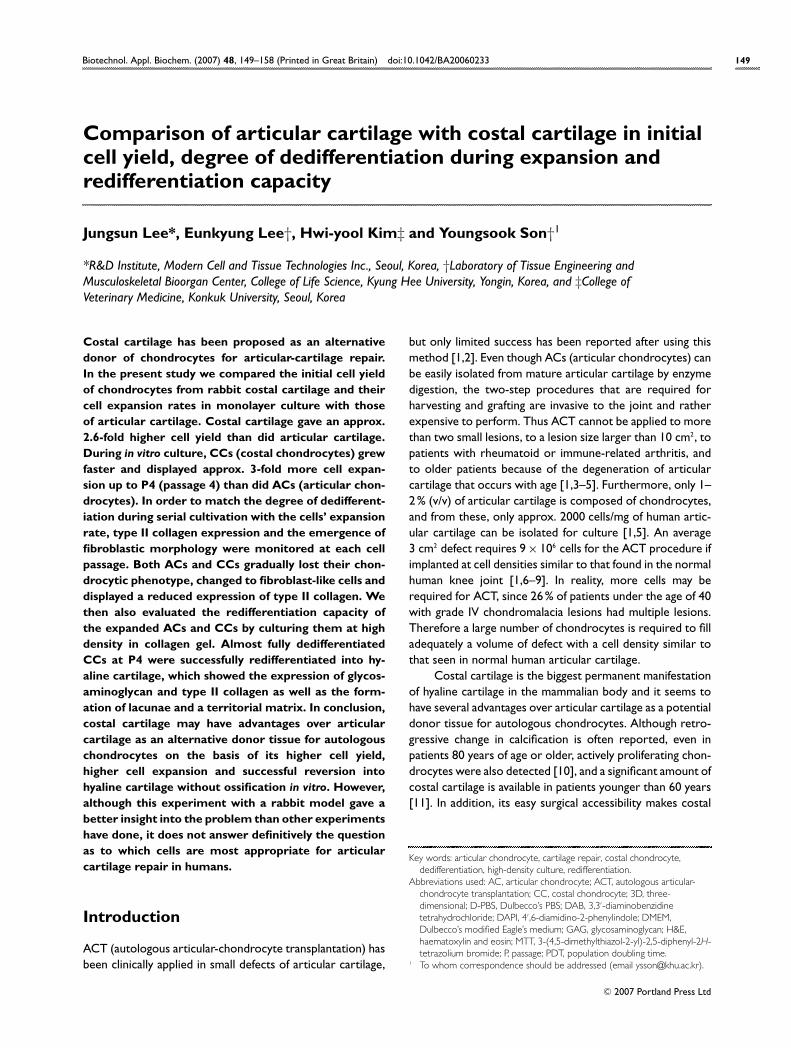
Figure 1 Comparison of cell growth between ACs and CCs at each passageby MTT assay
ACs and CCs at each passage were plated at a density of 1 × 10⁵ cells/wellin six-well plates and cultured for 5 days. The MTT assay was performed atday 5 and the A540 values was converted into cell number using the standardcurve constructed as described in the Materials and methods section. Resultsare means +− S.D. for three independent experiments. The cell growth of CCswas significantly faster than that of ACs (P < 0.05).
Table 2 Comparison of total cell expansion and time to reach confluencebetween ACs and CCs
Values are means +− S.D. for three independent experiments. ER, expansionrate.
P0−P2 P0−P4
Cells Time (days) ER (fold) Time (days) ER (fold)
ACs 20 +− 7 22 +− 8.4 37 +− 7.3 106 +− 22CCs 13 +− 3 54 +− 14.5 29 +− 3.4 310 +− 70
to initial cell yield. The in vitro expandabilities of chon-drocytes from articular cartilage and costal cartilage werethen compared. The cells from each passage were platedseparately, at a density of 1 × 10⁵ cells/well, on a six-wellplate, and the MTT assay was performed on day 5 afterseeding (Figure 1). Throughout the cell passages the overallgrowth rates of CCs were higher than those of ACs. AtP0, the growth rate of CCs was approximately twice thatof ACs. From P0 to P2, the growth rates of ACs and CCsincreased along the cell passage, but from P3 their growthrates became lower than in P2.
For the estimation of PDT (population doubling time)and final cell expansion of ACs and CCs, the time to reachconfluence and the total cell number at each cell passagewere compared after seeding the same cell numbers(Tables 2 and 3). The PDT of ACs at P0 was approx.5 days, but the PDT of CCs was 2.5 days. Thus ACs tooktwice the time to reach confluence at P0 than did CCs.From P1, the PDT of ACs became shorter, but again wasextended from P3. In contrast, CCs gave a fairly even PDTfrom P0 up to P4. Then, in order to simulate current ACTtechnologies, the average culture times from P0 to P2 andfrom P0 to P4 of ACs and CCs and their cumulative cellexpansions were compared. From P0 to P2, the averageculture time was 20 +− 7.0 days for ACs and 13 +− 3.0 days
C© 2007 Portland Press Ltd
152 J. Lee, E. Lee, H.-Y. Kim and Y. Son
Table 3 Comparison of PDT at each cell passage between ACs and CCs
PDT was calculated from the culture time and final cell expansion fold at eachcell passage.
PDT (days)
Passage no. ACs CCs
P0 5.0 2.5P1 3.3 2.2P2 2.2 2.0P3 4.8 2.3P4 5.6 3.2
for CCs; the cell expansion rates were 22 +− 8.4-fold forACs and 54 +− 14.5-fold for CCs. From P0 to P4, the averageculture time was 37 +− 7.3 days for ACs and 29 +− 3.4 daysfor CCs, and the estimated cell expansion rates were106 +− 22-fold for ACs and 310 +− 70-fold for CCs.
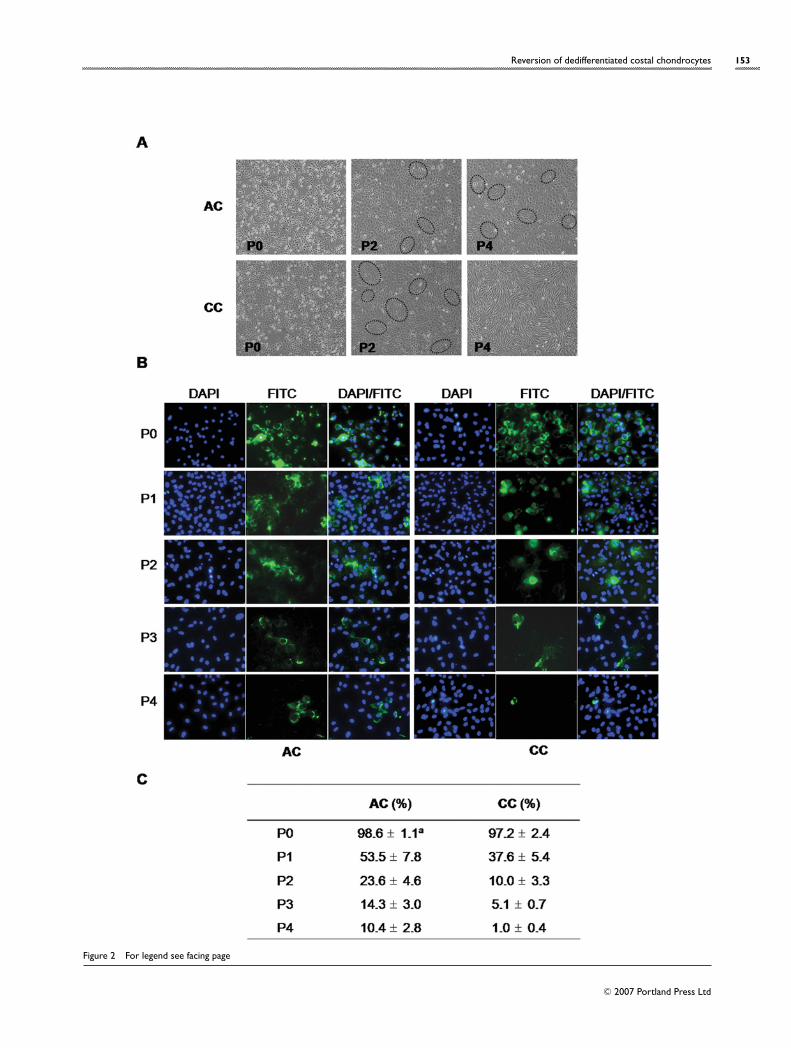
Comparison of the loss of chondrocytic phenotypein ACs with CCs during in vitro expansionLoss of chondrocytic phenotypes, such as round-cellmorphology and expressions of type II collagen and GAGduring in vitro cell expansion, is also considered to bean important parameter for the success rate after trans-plantation. We examined both morphological changes andexpression of type II collagen at each passage of ACsand CCs (Figure 2). From P2, some groups of cells began tolose their original round shape and instead converted intothe fibroblastic spindle shape (Figure 2A). At P4, most CCsactually changed their morphologies into the fibroblasticphenotype. However, this morphological change was muchslower in ACs than in CCs.
For further confirmation of the loss of chondrocyticphenotypes, expression of type II collagen was estimatedby immunofluorescence staining and DAPI counterstaining(Figures 2B and 2C). At P0, 99 % of the primary chondro-cytes, derived either from costal cartilage or articularcartilage, expressed type II collagen. At P2, approx. 24% ofACs and 10 % of CCs were expressing type II collagen, butat P4, approx. 10% of ACs and only 1% of CCs retainedexpression of type II collagen.
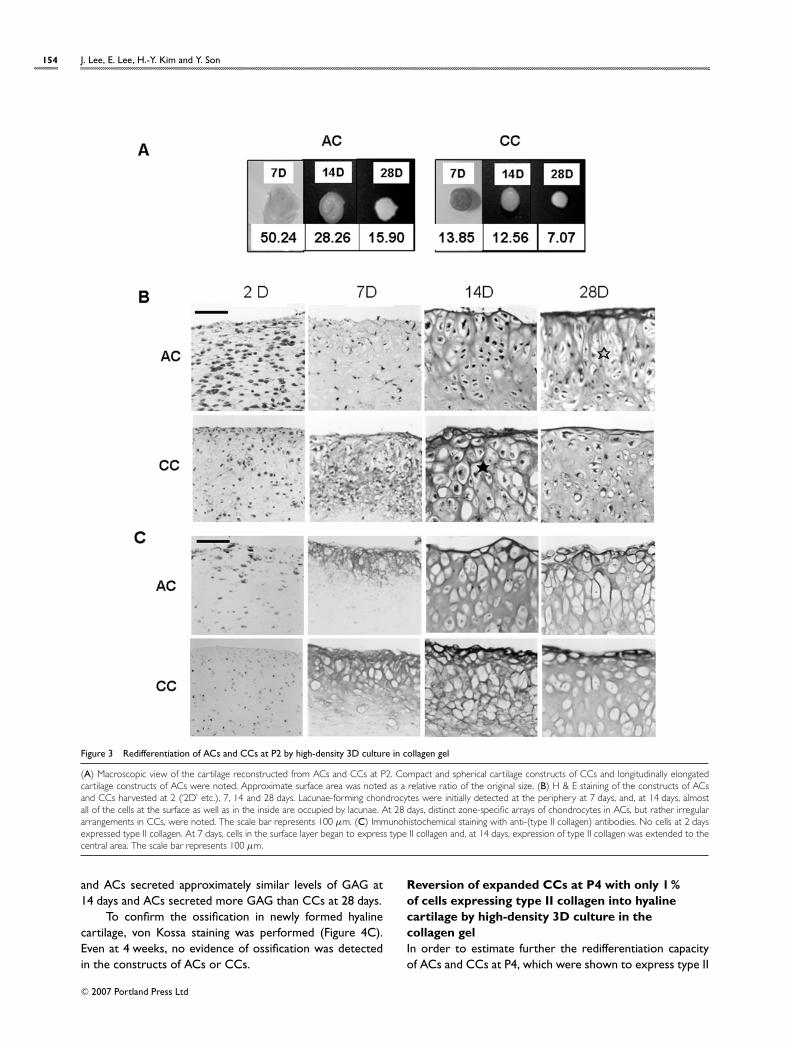
Redifferentiation of dedifferentiated ACs and CCsat P2 by high-density 3D culture in collagen gelThe cell expansion rates and the loss of chondrocyticphenotypes during expansion were compared between ACsand CCs at each cell passage. We then analysed how much
dedifferentiation, namely loss of chondrocytic phenotypes,could be acceptable for reversion of hyaline cartilage byhigh-density 3D culture in collagen gel (Figures 3–5 below).As a representative early culture, ACs and CCs at P2 weresubjected to high-density 3D culture within collagen gel,and their reversion into hyaline cartilage was monitored bymacroscopic examination, histological examination andSafranin-O staining. A compact, but rather translucent,cartilage-like construct was reconstructed by the high-density 3D culture in collagen gel (Figure 3A). Both ACs andCCsshrank thecollagengel from its initial sizeduring thehigh-density culture, which was mostly manifested in CCs at28 days. In the H&E staining of the cross sections (Figure 3B),even cell loading of dedifferentiated fibroblast-like cells withinthe gel was confirmed at 2 days. At 7 days, the cells at theperiphery began to adopt the typical chondrocytic morpho-logy. At 14 days, the characteristic hyaline cartilage mor-phology with lacunae and territorial matrix was clearly re-vealed in the culture of both ACs and CCs, but many cells inthe central zone had still not reverted into hyaline cartilage.A rather distinct layer-specific morphological feature wasdetected. A superficial tangential zone was aligned parallelto the surface at most peripheries, and a lacunae-rich trans-itional layer perpendicular to the construct was observed at14 and 28 days, which was more clearly revealed in ACs.
To confirm further the reversion of hyaline cartilage,immunohistochemical staining with antibodies against type IIcollagen was performed (Figure 3C). No cells expressedtype II collagen at 2 days, but, from 7 days, cells at theoutermost layer began to express type II collagen, whichwas extended more deeply into the construct and becamestronger at 14 days and 28 days.
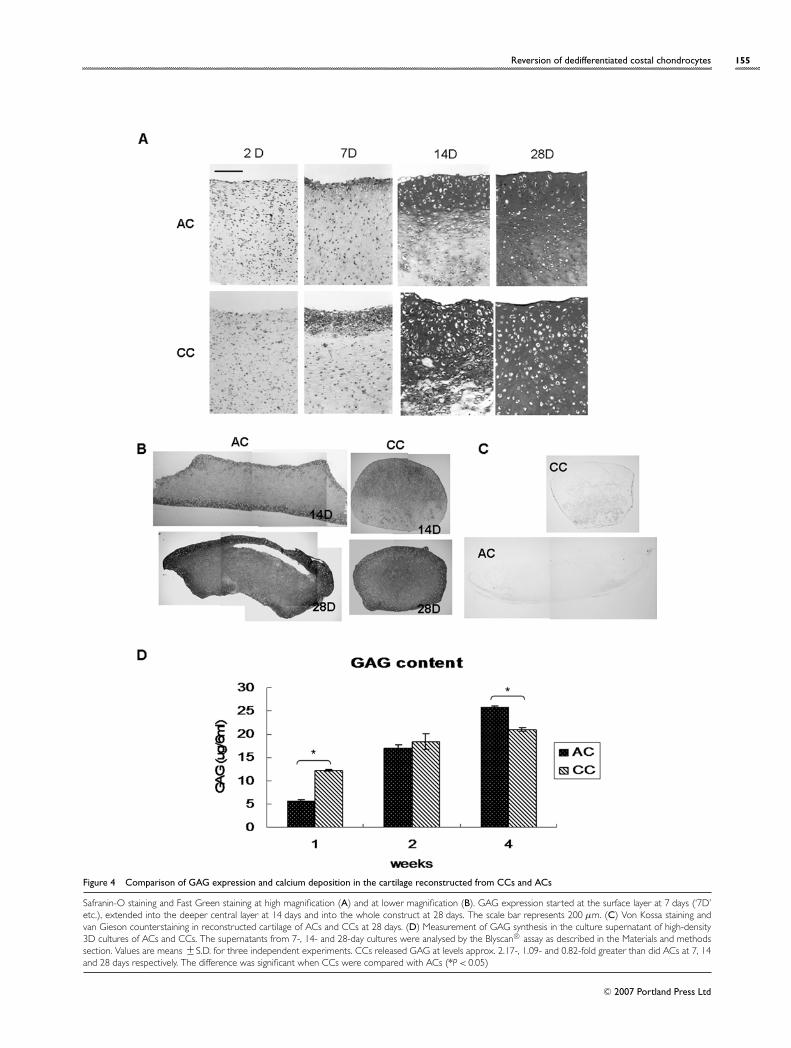
In order to confirm the expression of GAG, Safranin-Oand Blyscan® assays were performed (Figures 4A, 4B and4D). At 2 days, neither ACs nor CCs expressed any GAG,which again suggests that the expanded chondrocyteswere fully dedifferentiated (Figure 4A). At 7 days, GAGexpression began in the outermost layer, became wider at14 days, and was observed in the whole construct at 28 days.At lower magnification (Figure 4B), the hyaline cartilagesreconstructed from ACs were in a rather relaxed andlongitudinally elongated shape, but those from CCs werecompact and spherical, which is reminiscent of their originalshape in vivo. The Blyscan® assay of the culture supernatant(Figure 4D) showed that the CCs secreted approx. 2-foldmore GAG than did the ACs at 7 days. However, CCs
Figure 2 Evaluation of dedifferentiation degree of ACs and CCs during in vitro expansion by cell morphology and type II collagen expression
(A) Morphological changes of ACs and CCs at each passage by phase-contrast microscopy. The disappearance of round chondrocytic cells and the concomitantemergence of spindle fibroblastic cells manifested at higher passages of CCs. Groups of fibroblastic cells are marked by the dotted ellipses. Almost all the CCs at P4acquired a fibroblastic morphology. (B) Immunofluorescence staining with anti-type II collagen antibodies. To visualize total cells, DAPI staining was also performed.(C) The number of type-II-collagen-expressing cells among total cells at different cell passages was expressed as a percentage. The superscript ‘a ’ indicates that allvalues are means +− S.D. for five independent experiments.
C© 2007 Portland Press Ltd
Reversion of dedifferentiated costal chondrocytes 153
Figure 2 For legend see facing page
C© 2007 Portland Press Ltd
154 J. Lee, E. Lee, H.-Y. Kim and Y. Son
Figure 3 Redifferentiation of ACs and CCs at P2 by high-density 3D culture in collagen gel
(A) Macroscopic view of the cartilage reconstructed from ACs and CCs at P2. Compact and spherical cartilage constructs of CCs and longitudinally elongatedcartilage constructs of ACs were noted. Approximate surface area was noted as a relative ratio of the original size. (B) H & E staining of the constructs of ACsand CCs harvested at 2 (‘2D’ etc.), 7, 14 and 28 days. Lacunae-forming chondrocytes were initially detected at the periphery at 7 days, and, at 14 days, almostall of the cells at the surface as well as in the inside are occupied by lacunae. At 28 days, distinct zone-specific arrays of chondrocytes in ACs, but rather irregulararrangements in CCs, were noted. The scale bar represents 100 µm. (C) Immunohistochemical staining with anti-(type II collagen) antibodies. No cells at 2 daysexpressed type II collagen. At 7 days, cells in the surface layer began to express type II collagen and, at 14 days, expression of type II collagen was extended to thecentral area. The scale bar represents 100 µm.
and ACs secreted approximately similar levels of GAG at14 days and ACs secreted more GAG than CCs at 28 days.
To confirm the ossification in newly formed hyalinecartilage, von Kossa staining was performed (Figure 4C).Even at 4 weeks, no evidence of ossification was detectedin the constructs of ACs or CCs.
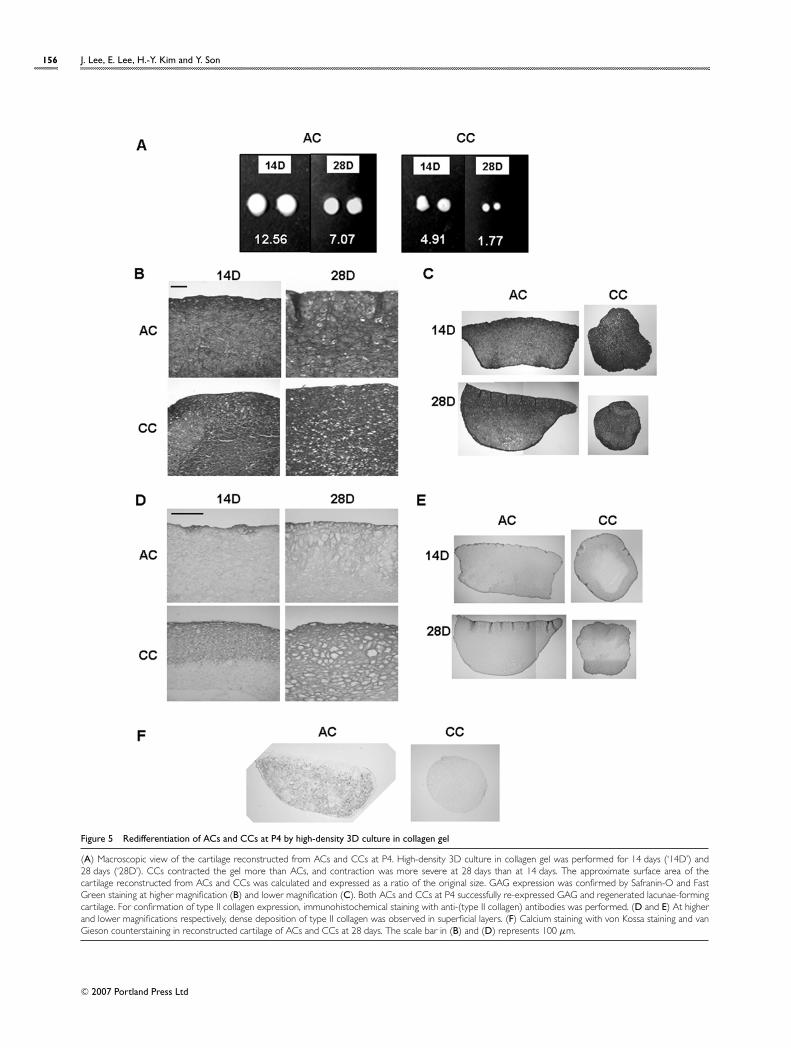
Reversion of expanded CCs at P4 with only 1%of cells expressing type II collagen into hyalinecartilage by high-density 3D culture in thecollagen gelIn order to estimate further the redifferentiation capacityof ACs and CCs at P4, which were shown to express type II
C© 2007 Portland Press Ltd
Reversion of dedifferentiated costal chondrocytes 155
Figure 4 Comparison of GAG expression and calcium deposition in the cartilage reconstructed from CCs and ACs
Safranin-O staining and Fast Green staining at high magnification (A) and at lower magnification (B). GAG expression started at the surface layer at 7 days (‘7D’etc.), extended into the deeper central layer at 14 days and into the whole construct at 28 days. The scale bar represents 200 µm. (C) Von Kossa staining andvan Gieson counterstaining in reconstructed cartilage of ACs and CCs at 28 days. (D) Measurement of GAG synthesis in the culture supernatant of high-density3D cultures of ACs and CCs. The supernatants from 7-, 14- and 28-day cultures were analysed by the Blyscan® assay as described in the Materials and methodssection. Values are means +− S.D. for three independent experiments. CCs released GAG at levels approx. 2.17-, 1.09- and 0.82-fold greater than did ACs at 7, 14and 28 days respectively. The difference was significant when CCs were compared with ACs (*P < 0.05)
C© 2007 Portland Press Ltd
156 J. Lee, E. Lee, H.-Y. Kim and Y. Son
Figure 5 Redifferentiation of ACs and CCs at P4 by high-density 3D culture in collagen gel
(A) Macroscopic view of the cartilage reconstructed from ACs and CCs at P4. High-density 3D culture in collagen gel was performed for 14 days (‘14D’) and28 days (‘28D’). CCs contracted the gel more than ACs, and contraction was more severe at 28 days than at 14 days. The approximate surface area of thecartilage reconstructed from ACs and CCs was calculated and expressed as a ratio of the original size. GAG expression was confirmed by Safranin-O and FastGreen staining at higher magnification (B) and lower magnification (C). Both ACs and CCs at P4 successfully re-expressed GAG and regenerated lacunae-formingcartilage. For confirmation of type II collagen expression, immunohistochemical staining with anti-(type II collagen) antibodies was performed. (D and E) At higherand lower magnifications respectively, dense deposition of type II collagen was observed in superficial layers. (F) Calcium staining with von Kossa staining and vanGieson counterstaining in reconstructed cartilage of ACs and CCs at 28 days. The scale bar in (B) and (D) represents 100 µm.
C© 2007 Portland Press Ltd
Reversion of dedifferentiated costal chondrocytes 157
collagen at 10.0 +− 2.8% and 0.9 +− 0.4% respectively, high-density 3D culture was also applied (Figure 5). On macro-scopic examination the surface area of the reconstructedcartilage was reduced to approx. 11.11 % (for ACs) and4.34 % (for CCs) of their initial sizes at 14 days, and approx.6.25% for ACs and 1.57% for CCs of their initial sizes at28 days (Figure 5A). Since CCs contracted the collagengel more than the ACs, which was mostly manifested atP4, this contraction may reflect the degree of fibroblasticdedifferentiation during cell expansion. However, by subject-ing them to high-density 3D culture, CCs from P4 couldregain the hyaline cartilage phenotypes, such as GAG ex-pression and lacunae formation, by high-density 3D cellculture (Figures 5B and 5C) and type II collagen expression(Figures 5D and 5E), similarly to those of P2 chondrocytes.Again, no evidence of ossification was detected in the con-structs of ACs or CCs (Figure 5F).
Discussion
In the present study we evaluated whether chondrocytesisolated from costal cartilage (CCs) can be applied as a po-tential cell source for tissue-engineered cartilage in compar-ison with ACs. On the basis of its initial cell yield fromthe same amount of tissue, cell expansion rate, capacityto reconstruct hyaline cartilage by high-density 3D cultureand surgical accessibility, costal cartilage may be stronglyproposed as a donor cartilage candidate for ACT. However,even after extensive expansion, differences in inherent pro-perties of ACs and CCs were still recognized in thecollagen contraction and specified layer formation of the re-constructed hyaline cartilage.
Even though several reports are available of the applic-ability of human and rabbit costal cartilage as donor tissuesfor ACT or tissue-engineered cartilage, the degree of dedif-ferentiation during in vitro expansion and its relationship withredifferentiation capacity were not extensively evaluated. Inmost cases, ACs or CCs at early passage, just after cell isola-tion or in growth-factor-supplemented culture, were testedfor redifferentiation or transplantation. Thus the potentialvalue of CCs as substitutes for ACs for cartilage repair wasnot comprehensively explored and rather underestimated.
Our data comparing CCs with ACs suggest that costalcartilage may be a useful donor tissue for current ACTin cases where success is restricted by patient age andlimited choice of donor site. Costal cartilage gave 2.6-foldhigher initial cell yields and 3.0-fold higher cell expansionat P4 than did articular cartilage. Taken together, CCscould provide approx. 9-fold more cells from the samedonor weight during a similar culture period. Furthermore,retention of redifferentiation capacity in the fully dedif-ferentiated CCs at P4 (approx. 300-fold expansion) is also a
favourable attribute of costal cartilage as a potential donortissue. However, the contractile property observed in themacroscopic view of the hyaline cartilage reconstructedwith CCs must be controlled for successful application inACT. Non-collagenous and non-contractile rigid scaffoldsmay be alternative ways to resist the contractile property ofCCs, or certain factors to repress α-smooth-muscle actinmay be considered as well.
Costal cartilage in vivo has a reverse direction of chon-drogenic layers compared with articular cartilage. Costal car-tilage is occupied by the undifferentiated progenitor cells atthe peripheral surface and more differentiated chondrocytesin the centre. According to our histological data obtainedfrom CC hyaline cartilage, the fully differentiated layer wassuperficially apposed and lacunae-rich chondrocytes werepositioned internally, which is a similar orientation to that ofarticular cartilage. However, the better acquisition of zone-specific histological characteristics in the hyaline cartilagereconstructed from ACs is in contrast with the randomarray of lacunae in CCs. Thus, for completion of zone-specific four-layer apposition in the reconstructed cartilage,bioreactors providing a mechanical load similar to that inin vivo articular cartilage should be applied in the future.
As shown in the final macroscopic view of the recon-structed cartilage from ACs and CCs, some inherent prop-erties seem to be fairly well retained, even after extensivecell expansion. Interestingly, CCs were reconstructedin round-shaped cartilage, but ACs were reconstructed inmore elongated cartilage, even though the same size of coll-agen gel was initially molded for the high-density 3D culture.This deformation may be partially due to the contractileproperty of CCs, but the underlying mechanisms remain tobe explored further.
Acknowledgments
This work was supported by a grant given by the Musculo-skeletal Bioorgan Center Project of the Korean Ministry ofHealth and Welfare, and the BK21 Center for FunctionalBiomaterials from Natural Resources given to Y. S., and byResearch Funds from the R&D Institute, Modern Cell andTissue Technologies given to J. L.
References
1 Brittberg, M., Lindahl, A., Nilsson, A., Ohlsson, C., Isaksson, O.and Peterson, L. (1994) N. Engl. J. Med. 331, 889–895
2 Grande, A. G., Pitman, M. I., Peterson, L., Menche, D. and Klein,M. (1989) J. Orthop. Res. 7, 208–218
3 Brittberg, M., Nilsson, A., Lindahl, A., Ohlsson, C. and Peterson,L. (1996) Clin. Orthop. 326, 279–283
C© 2007 Portland Press Ltd
158 J. Lee, E. Lee, H.-Y. Kim and Y. Son
4 Morelli, M., Nagamori, J. and Miniaci, A. (2002) Curr. Opin.Orthop. 13, 155–161
5 Lindberg, J., Anderssen, M. and Bengtssen, C. (2000) Cartilageand Cartilage Repair in the New Millenium: Proceedings of the3rd Symposium of the International Cartilage Repair Society,27–29 April 2000, Gothenburg, Sweden, p. 14
6 Chaipinyo, K., Oakes, B. W. and Van Damme, M. P. (2002)J. Orthop. Res. 20, 1070–1078
7 Hunziker, E. B. (2002) Osteoarthr. Cartilage 10, 432–4638 Minas, T. (1998) Am. J. Orthop. 27, 739–7449 Stockwell, R. A. (1971) J. Anat. 109, 411–421
10 Quintarelli, G. and Dellovo, M. C. (1966) Histochemie 7,141–167
11 Mori, R., Kataoka, H., Kuriwaka, M. and Ochi, M. (2003)Clin. Orthop. 406, 262–274
12 Saadeh, P. B., Brent, B., Mehrara, B. J., Steinbrech, D. S., Ting, V.,Gittes, G. K. and Longaker, M. T. (1999) Ann. Plast. Surg. 42,509–513
13 Kitaoka, E., Satomura, K., Hayashi, E., Yamanouchi, K., Tobiume,S., Kume, K., Obinata, M. and Nagayama, M. (2001)J. Cell Biochem. 81, 571–582
14 Figueroa, A. A., Gans, B. J. and Pruzansky, S. (1984) Oral Surg.Oral Med. Oral Pathol. 58, 257–268
15 Hasegawa, T. and Yamano, Y. (1992) J. Hand Surg. 17,583–585
16 Raustia, A., Pernu, H., Pyhtinen, J. and Oikarinen, K. (1996)J. Oral Maxillofac. Surg. 54, 1393–4000
17 Pietila, K., Kantomaa, T., Pirttiniemi, P. and Poikela, A. (1999)Cells Tissues Organs 164, 30–36
18 Tay, A. G., Farhadi, J., Suetterlin, R., Pierer, G., Heberer, M. andMartin, I. (2004) Tissue Eng. 10, 763–770
19 Isogai, N., Kusuhara, H., Ikada, Y., Ohtani, H., Jacquet, R., Hillyer,J., Lowder, E. and Landis, W. J. (2006) Tissue Eng. 12, 691–703
20 Laurie, S. W., Kaban, L. B., Mulliken, J. B. and Murray, J. E. (1984)Plast. Reconstr. Surg. 73, 933–938
21 Heatley, D. G., Clary, R. A., Garner, F. T. and Lusk, R. P. (1995)Laryngoscope 105, 983–987
22 Mayne, R., Vail, M. S., Mayne, P. M. and Miller, E. J. (1976)Proc. Natl. Acad. Sci. U.S.A. 73, 1674–1678
23 von der Mark, K., Gauss, V., von der Mark, H. and Muller, P.(1977) Nature 267, 531–532
24 von der Mark, K. (1980) Curr. Top. Dev. Bio. 14, 199–22525 Oegema, T. R. and Thompson, R. C. (1981) J. Biol. Chem. 256,
1015–102226 Lefebvre, V., Peeters-Joris, C. and Vaes, G. (1990)
Biochim. Biophys. Acta 1051, 266–27527 Benya, P. D. and Shaffer, J. D. (1982) Cell 30, 215–22428 Kimura, T., Yasui, N., Ohsawa, S. and Ono, K. (1984)
Clin. Orthop. 187, 231–23929 Bonaventure, J., Kadhom, N., Cohen-Solal, L., Ng, K. H.,
Bourguignon, J., Lasselin, C. and Freisinger, P. (1994) Exp. CellRes. 212, 97–104
30 Goldberg, R. L. and Kolibas, L. M. (1990) Connective TissueRes. 24, 265–275
Received 23 November 2006/17 April 2007; accepted 11 May 2007Published as Immediate Publication 11 May 2007, doi:10.1042/BA20060233
C© 2007 Portland Press Ltd


