Embed Size (px)
Citation preview
JOURNAL OF LIGHTWAVE TECHNOLOGY, VOL. 28, NO. 12, JUNE 15, 2010 1811
Comparison of Orthogonal Frequency-DivisionMultiplexing and On-Off Keying in AmplifiedDirect-Detection Single-Mode Fiber Systems
Daniel J. F. Barros and Joseph M. Kahn, Fellow, IEEE
Abstract—We discuss the use of orthogonal frequency-divisionmultiplexing (OFDM) for combating group-velocity dispersion(GVD) effects in amplified direct-detection (DD) systems usingsingle-mode fiber. We review known OFDM techniques, in-cluding asymmetrically clipped optical OFDM (ACO-OFDM),DC-clipped OFDM (DC-OFDM) and single-sideband OFDM(SSB-OFDM), and derive a linearized channel model for eachtechnique. We present an iterative procedure to achieve optimumpower allocation for each OFDM technique, since there is noclosed-form solution for amplified DD systems. For each tech-nique, we minimize the optical power required to transmit at agiven bit rate and normalized GVD by iteratively adjusting thebias and optimizing the power allocation among the subcarriers.We verify that SSB-OFDM has the best optical power efficiencyamong the different OFDM techniques. We compare these OFDMtechniques to on-off keying (OOK) with maximum-likelihood se-quence detection (MLSD) and show that SSB-OFDM can achievethe same optical power efficiency as OOK with MLSD, but atthe cost of requiring twice the electrical bandwidth and also acomplex quadrature modulator. We compare the computationalcomplexity of the different techniques and show that SSB-OFDMrequires fewer operations per bit than OOK with MLSD.
Index Terms—Communications system performance, di-rect-detection, group-velocity dispersion, intensity modulation,maximum-likelihood sequence detection, maximum-likelihoodsequence estimation, multi-carrier optical systems, orthogonalfrequency-division multiplexing.
I. INTRODUCTION
R ECEIVER-BASED electronic signal processing in op-tical communication systems has been the subject of
many recent studies. In coherent systems, linear equalizershave been shown to fully compensate linear fiber impairmentsin single-mode fiber (SMF), such as group-velocity dispersion(GVD) and polarization-mode dispersion (PMD) [1]. On theother hand, in systems using direct-detection (DD), linearequalizers offer little performance improvement, because thenonlinear photodetection process destroys information on the
Manuscript received January 29, 2010; revised April 15, 2010; acceptedApril 18, 2010. Date of publication April 29, 2010; date of current versionJune 02, 2010. This work was supported by the Portuguese Foundation forScience and Technology scholarship SFRH/BD/22547/2005 and by a StanfordGraduate Fellowship.
The authors are with the Department of Electrical Engineering, StanfordUniversity, Stanford, CA 94305-9515 USA (e-mail: [email protected];[email protected]).
Digital Object Identifier 10.1109/JLT.2010.2048999
phase of the received electric field. Recently, maximum-likeli-hood sequence detection (MLSD) was shown to be effective inmitigating GVD and PMD impairments in DD links [2], [3].Although the computational complexity of MLSD increasesexponentially with the channel memory, using low-complexitybranch metrics, near-optimal performance can be achieved withmanageable computational complexity, provided the effectivechannel memory does not exceed a few symbol intervals [4].
An alternate approach to combating fiber impairments in am-plified DD systems is to use multicarrier modulation, such as or-thogonal frequency-division multiplexing (OFDM). There arethree major approaches for combining OFDM with DD. Thefirst two techniques are based on intensity modulation (IM), andso require some means to make the OFDM signal nonnegative.The first technique adds a DC bias to reduce the negative signalexcursions and then clips the remainder of the negative excur-sions. This method is called DC-OFDM. The second techniqueclips the entire negative excursion of the waveform, avoidingthe need for a DC bias [5], [6]. Clipping noise is avoided byappropriate choice of the subcarrier frequencies. This techniqueis called asymmetrically clipped optical OFDM (ACO-OFDM).The third technique is based on single-sideband modulation ofthe complex-valued optical electric field by an OFDM signal.A DC bias (carrier component) is added, leaving a guard bandbetween the carrier and the OFDM signal in order to avoid in-termodulation products caused by photodetection [7], [8]. Thismethod is called single-sideband OFDM (SSB-OFDM).
There have been several studies of the different OFDM tech-niques (e.g., [6]), but there has been no comparison of powerefficiencies among the various direct-detection OFDM methodsin SMF, and to conventional baseband methods, such as on-offkeying (OOK). Furthermore, in previous work, the DC biasand the powers of the subcarriers were not jointly optimizedbased on the channel response and the nonlinear beat noises,since there is no closed-form solution for this optimization.We present an iterative procedure based on known bit-loadingalgorithms with a new modification, the bias ratio (BR), inorder to obtain the optimum power allocation. We compare theperformance of the three OFDM techniques using optimizedpower allocations to the performance of OOK with MLSD.
This paper is organized as follows. In Section II, we reviewmethods for power and bit allocation for multicarrier systemsand describe the optimal water-filling solution. We presentour system model in Section III. In Section IV, we review thedifferent OFDM formats and derive equivalent linear channelmodels for each one, assuming only GVD is present in the
0733-8724/$26.00 © 2010 IEEE
Authorized licensed use limited to: Stanford University. Downloaded on June 29,2010 at 22:14:27 UTC from IEEE Xplore. Restrictions apply.
1812 JOURNAL OF LIGHTWAVE TECHNOLOGY, VOL. 28, NO. 12, JUNE 15, 2010
SMF. Furthermore, we discuss the effects of amplifier noisein direct-detection systems and compute an expression forthe autocorrelation function of the photodetected noise. InSection V, we compare the optical power required to transmitat a given bit rate for the different optimized OFDM formatsand for OOK with MLSD, making use of previously publishedresults for the latter format. In that section, we also compare thecomputational complexities of the various formats. We presentconclusions in Section VI.
II. POWER AND BIT ALLOCATION
A. Gap Approximation
On an AWGN channel, the maximum achievable bit rate isgiven by the Shannon capacity
(1)
where is the capacity, is the channel bandwidth and SNRis the signal-to-noise ratio. Any real system must transmit at abit rate less than capacity. For QAM modulation, the achievablebit rate can be expressed approximately as
(2)
where is the bit rate and is called the gap constant. The gapconstant, introduced by Cioffi et al. [9] and Forney et al. [10],represents a loss with respect to the Shannon capacity.
The gap analysis is widely used in the bit loading of OFDMsystems, since it separates coding gain from power-allocationgain [11]. For uncoded QAM, the gap constant is given by
(3)
where is the symbol-error probability andis the inverse function. As an example, the gap is 8.8 dB
at and is 9.5 dB at for uncoded QAM.The use of forward error-correction (FEC) codes reduces thegap. A well-coded system may have a gap as low as 0.5 dB at
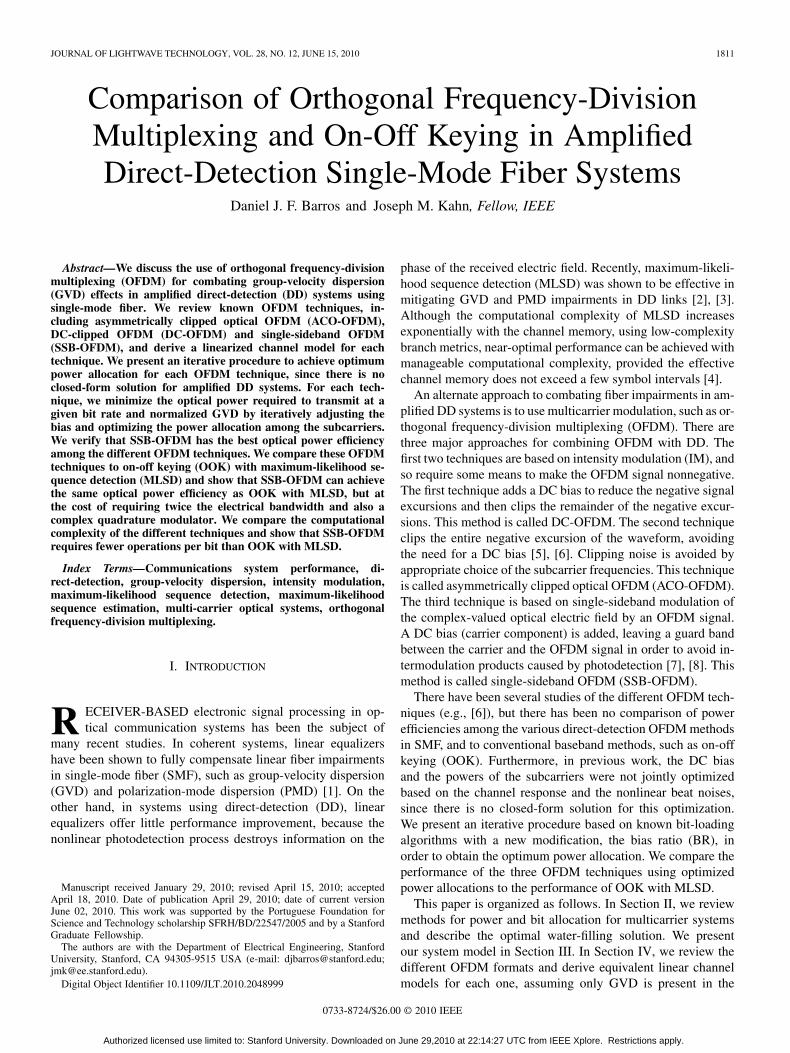
. A gap of 0 dB means the maximum bit rate hasbeen achieved and therefore . Fig. 1 shows the attainablebit rates for various gap values.
For the remainder of the paper, we define the normalized bitrate , which has units of bits/s/Hz.
B. Optimum Power Allocation
The OFDM signal splits the transmission channel into par-allel channels. When the total average transmitted power is con-strained, the maximum obtainable bit rate can be written as
(4)
where and are the channel gain, noise varianceand transmitted power at subcarrier , respectively, and is
Fig. 1. Achievable bit rates as a function of SNR for various values of the gap�.
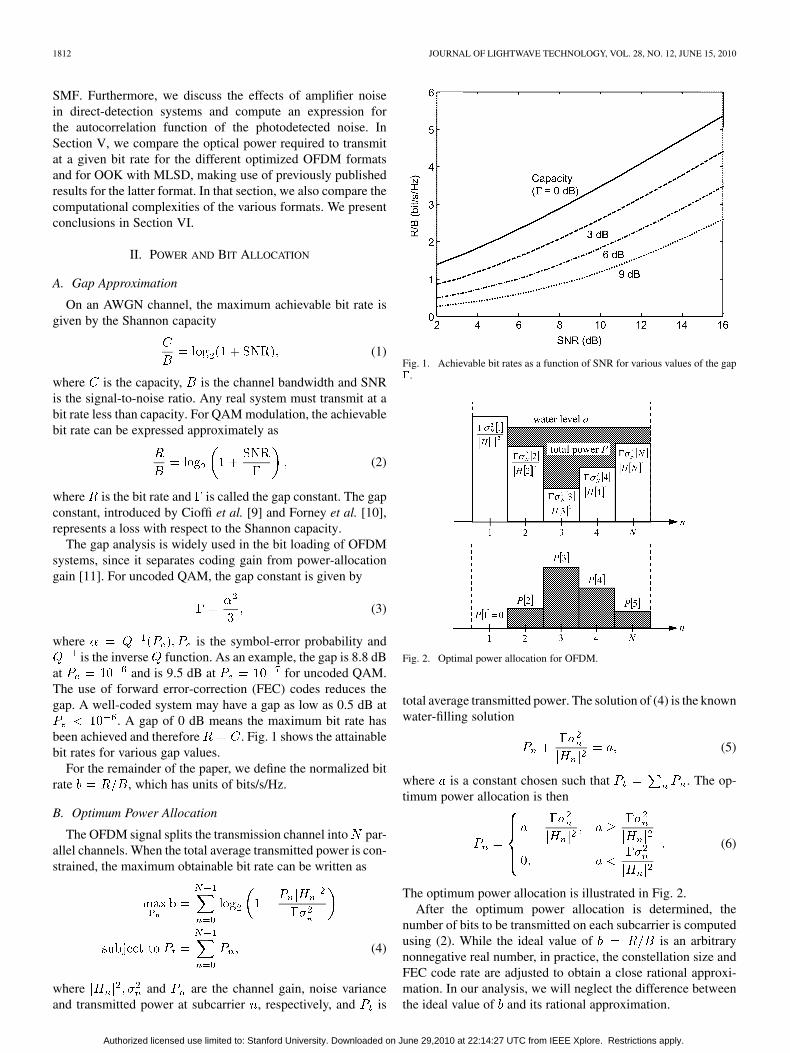
Fig. 2. Optimal power allocation for OFDM.
total average transmitted power. The solution of (4) is the knownwater-filling solution
(5)
where is a constant chosen such that . The op-timum power allocation is then
(6)
The optimum power allocation is illustrated in Fig. 2.After the optimum power allocation is determined, the
number of bits to be transmitted on each subcarrier is computedusing (2). While the ideal value of is an arbitrarynonnegative real number, in practice, the constellation size andFEC code rate are adjusted to obtain a close rational approxi-mation. In our analysis, we will neglect the difference betweenthe ideal value of and its rational approximation.
Authorized licensed use limited to: Stanford University. Downloaded on June 29,2010 at 22:14:27 UTC from IEEE Xplore. Restrictions apply.
BARROS AND KAHN: COMPARISON OF ORTHOGONAL FREQUENCY-DIVISION MULTIPLEXING 1813
Fig. 3. System model.
We note that when the total average transmitted power is con-strained, the optimal power allocation yields a variable data rate.For some applications, a fixed data rate is required. In this case,the optimal design minimizes the average power required totransmit at a given fixed bit rate. The power minimization canbe written as
(7)
The solution of (7) is also the water-filling solution given by (5).However, in this case the constant is chosen such that bit rateis equal to the desired value. We can interpret this solution as thewater/power being poured until the required bit rate is achieved.
III. OFDM SYSTEM MODEL
The OFDM system model is shown in Fig. 3.An optical OFDM modulator encodes transmitted symbols
onto an electrical OFDM waveform and modulates this onto theintensity (instantaneous power) of an optical carrier. The mod-ulator can generate one of DC-OFDM, SSB-OFDM or ACO-OFDM. Details of modulators for particular OFDM schemes aredescribed in Section IV. After propagating through the SMF, theoptical signal is optically amplified and bandpass-filtered. Weassume that the optical amplifier has a high gain so that its am-plified spontaneous emission (ASE) is dominant over thermaland shot noises. The ASE noise is modeled as complex additivewhite Gaussian noise (AWGN) with zero mean. The ASE canbe expressed as , where and
are uncorrelated Gaussian random processes, each havinghalf the variance of .
In our analysis, PMD and fiber nonlinearity are neglected,and GVD is the only fiber impairment considered. In the opticalelectric field domain, the fiber is modeled as a linear system withtransfer function given by
(8)
where is the fiber GVD parameter and is the fiber length.The overall optical transfer function is given by
(9)
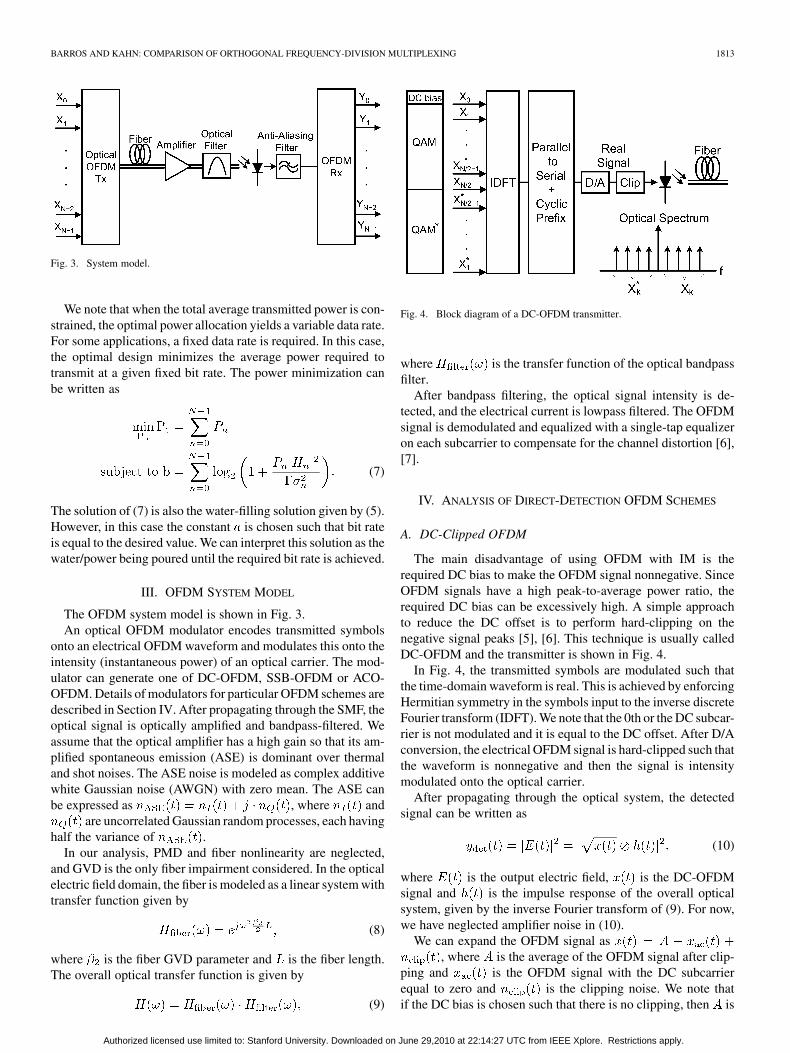
Fig. 4. Block diagram of a DC-OFDM transmitter.
where is the transfer function of the optical bandpassfilter.
After bandpass filtering, the optical signal intensity is de-tected, and the electrical current is lowpass filtered. The OFDMsignal is demodulated and equalized with a single-tap equalizeron each subcarrier to compensate for the channel distortion [6],[7].
IV. ANALYSIS OF DIRECT-DETECTION OFDM SCHEMES
A. DC-Clipped OFDM
The main disadvantage of using OFDM with IM is therequired DC bias to make the OFDM signal nonnegative. SinceOFDM signals have a high peak-to-average power ratio, therequired DC bias can be excessively high. A simple approachto reduce the DC offset is to perform hard-clipping on thenegative signal peaks [5], [6]. This technique is usually calledDC-OFDM and the transmitter is shown in Fig. 4.
In Fig. 4, the transmitted symbols are modulated such thatthe time-domain waveform is real. This is achieved by enforcingHermitian symmetry in the symbols input to the inverse discreteFourier transform (IDFT). We note that the 0th or the DC subcar-rier is not modulated and it is equal to the DC offset. After D/Aconversion, the electrical OFDM signal is hard-clipped such thatthe waveform is nonnegative and then the signal is intensitymodulated onto the optical carrier.
After propagating through the optical system, the detectedsignal can be written as
(10)
where is the output electric field, is the DC-OFDMsignal and is the impulse response of the overall opticalsystem, given by the inverse Fourier transform of (9). For now,we have neglected amplifier noise in (10).
We can expand the OFDM signal as, where is the average of the OFDM signal after clip-
ping and is the OFDM signal with the DC subcarrierequal to zero and is the clipping noise. We note thatif the DC bias is chosen such that there is no clipping, then is
Authorized licensed use limited to: Stanford University. Downloaded on June 29,2010 at 22:14:27 UTC from IEEE Xplore. Restrictions apply.
1814 JOURNAL OF LIGHTWAVE TECHNOLOGY, VOL. 28, NO. 12, JUNE 15, 2010
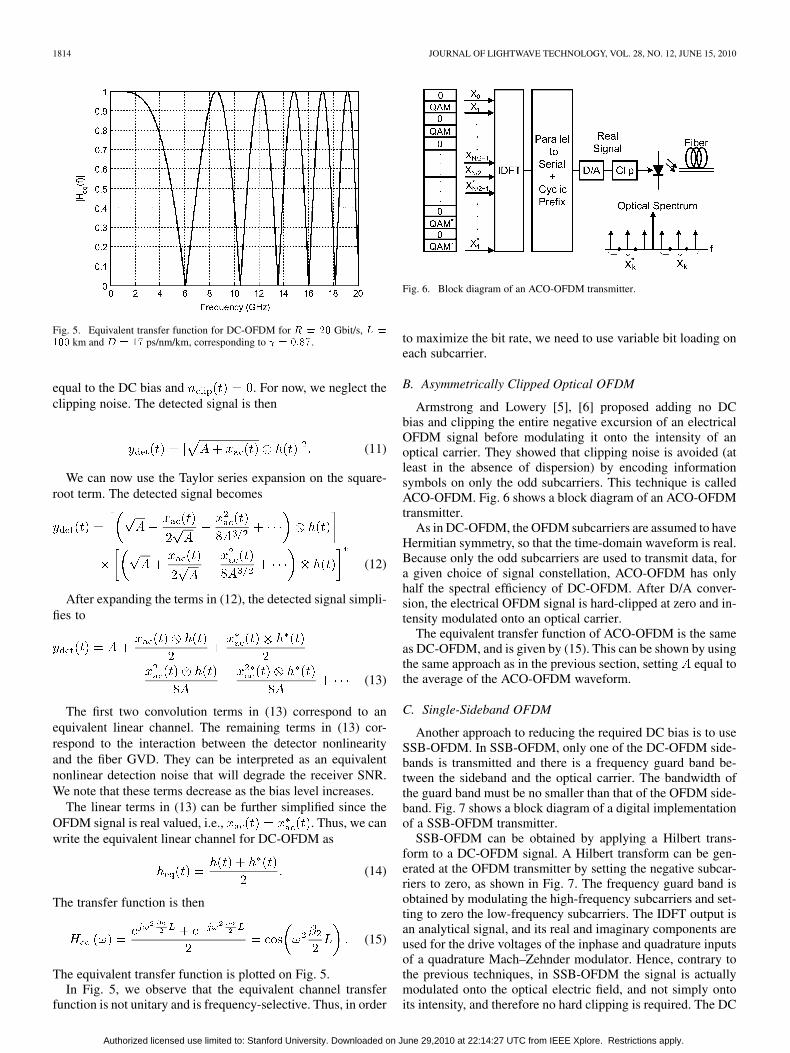
Fig. 5. Equivalent transfer function for DC-OFDM for � � �� Gbit/s, � �
��� km and � � �� ps/nm/km, corresponding to � � ����.
equal to the DC bias and . For now, we neglect theclipping noise. The detected signal is then
(11)
We can now use the Taylor series expansion on the square-root term. The detected signal becomes
(12)
After expanding the terms in (12), the detected signal simpli-fies to
(13)
The first two convolution terms in (13) correspond to anequivalent linear channel. The remaining terms in (13) cor-respond to the interaction between the detector nonlinearityand the fiber GVD. They can be interpreted as an equivalentnonlinear detection noise that will degrade the receiver SNR.We note that these terms decrease as the bias level increases.
The linear terms in (13) can be further simplified since theOFDM signal is real valued, i.e., . Thus, we canwrite the equivalent linear channel for DC-OFDM as
(14)
The transfer function is then
(15)
The equivalent transfer function is plotted on Fig. 5.In Fig. 5, we observe that the equivalent channel transfer
function is not unitary and is frequency-selective. Thus, in order
Fig. 6. Block diagram of an ACO-OFDM transmitter.
to maximize the bit rate, we need to use variable bit loading oneach subcarrier.
B. Asymmetrically Clipped Optical OFDM
Armstrong and Lowery [5], [6] proposed adding no DCbias and clipping the entire negative excursion of an electricalOFDM signal before modulating it onto the intensity of anoptical carrier. They showed that clipping noise is avoided (atleast in the absence of dispersion) by encoding informationsymbols on only the odd subcarriers. This technique is calledACO-OFDM. Fig. 6 shows a block diagram of an ACO-OFDMtransmitter.
As in DC-OFDM, the OFDM subcarriers are assumed to haveHermitian symmetry, so that the time-domain waveform is real.Because only the odd subcarriers are used to transmit data, fora given choice of signal constellation, ACO-OFDM has onlyhalf the spectral efficiency of DC-OFDM. After D/A conver-sion, the electrical OFDM signal is hard-clipped at zero and in-tensity modulated onto an optical carrier.
The equivalent transfer function of ACO-OFDM is the sameas DC-OFDM, and is given by (15). This can be shown by usingthe same approach as in the previous section, setting equal tothe average of the ACO-OFDM waveform.
C. Single-Sideband OFDM
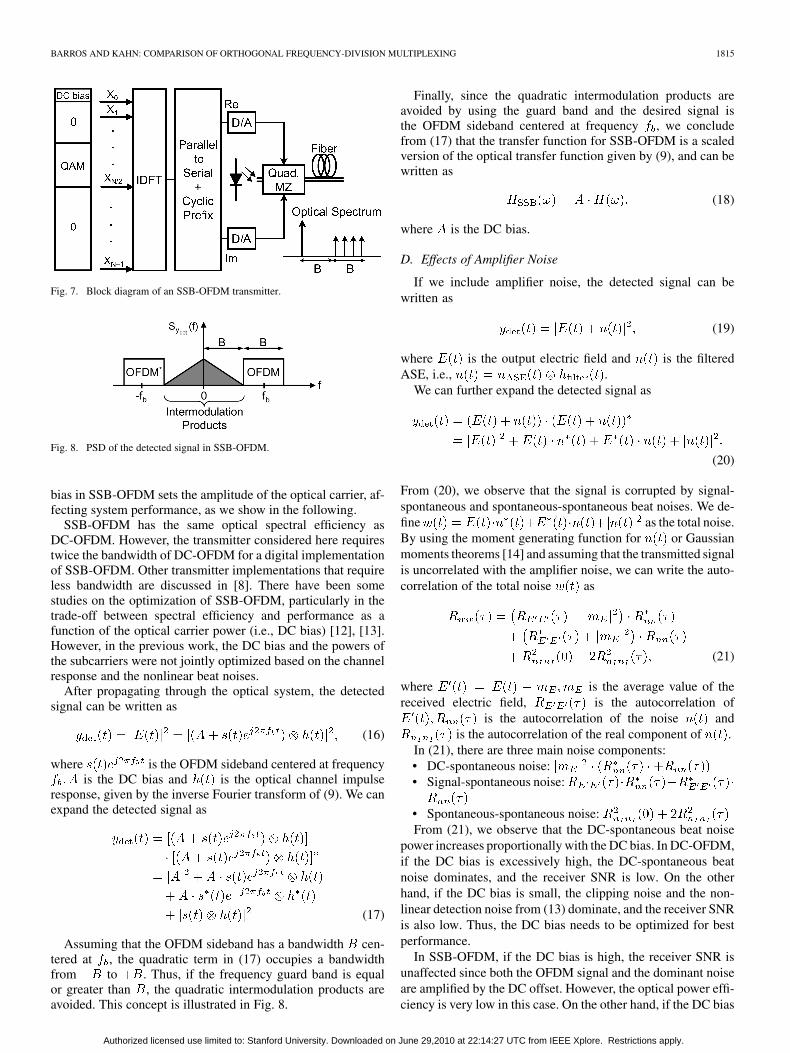
Another approach to reducing the required DC bias is to useSSB-OFDM. In SSB-OFDM, only one of the DC-OFDM side-bands is transmitted and there is a frequency guard band be-tween the sideband and the optical carrier. The bandwidth ofthe guard band must be no smaller than that of the OFDM side-band. Fig. 7 shows a block diagram of a digital implementationof a SSB-OFDM transmitter.
SSB-OFDM can be obtained by applying a Hilbert trans-form to a DC-OFDM signal. A Hilbert transform can be gen-erated at the OFDM transmitter by setting the negative subcar-riers to zero, as shown in Fig. 7. The frequency guard band isobtained by modulating the high-frequency subcarriers and set-ting to zero the low-frequency subcarriers. The IDFT output isan analytical signal, and its real and imaginary components areused for the drive voltages of the inphase and quadrature inputsof a quadrature Mach–Zehnder modulator. Hence, contrary tothe previous techniques, in SSB-OFDM the signal is actuallymodulated onto the optical electric field, and not simply ontoits intensity, and therefore no hard clipping is required. The DC
Authorized licensed use limited to: Stanford University. Downloaded on June 29,2010 at 22:14:27 UTC from IEEE Xplore. Restrictions apply.
BARROS AND KAHN: COMPARISON OF ORTHOGONAL FREQUENCY-DIVISION MULTIPLEXING 1815
Fig. 7. Block diagram of an SSB-OFDM transmitter.
Fig. 8. PSD of the detected signal in SSB-OFDM.
bias in SSB-OFDM sets the amplitude of the optical carrier, af-fecting system performance, as we show in the following.
SSB-OFDM has the same optical spectral efficiency asDC-OFDM. However, the transmitter considered here requirestwice the bandwidth of DC-OFDM for a digital implementationof SSB-OFDM. Other transmitter implementations that requireless bandwidth are discussed in [8]. There have been somestudies on the optimization of SSB-OFDM, particularly in thetrade-off between spectral efficiency and performance as afunction of the optical carrier power (i.e., DC bias) [12], [13].However, in the previous work, the DC bias and the powers ofthe subcarriers were not jointly optimized based on the channelresponse and the nonlinear beat noises.
After propagating through the optical system, the detectedsignal can be written as
(16)
where is the OFDM sideband centered at frequencyis the DC bias and is the optical channel impulse
response, given by the inverse Fourier transform of (9). We canexpand the detected signal as
(17)
Assuming that the OFDM sideband has a bandwidth cen-tered at , the quadratic term in (17) occupies a bandwidthfrom to . Thus, if the frequency guard band is equalor greater than , the quadratic intermodulation products areavoided. This concept is illustrated in Fig. 8.
Finally, since the quadratic intermodulation products areavoided by using the guard band and the desired signal isthe OFDM sideband centered at frequency , we concludefrom (17) that the transfer function for SSB-OFDM is a scaledversion of the optical transfer function given by (9), and can bewritten as
(18)
where is the DC bias.
D. Effects of Amplifier Noise
If we include amplifier noise, the detected signal can bewritten as
(19)
where is the output electric field and is the filteredASE, i.e., .
We can further expand the detected signal as
(20)
From (20), we observe that the signal is corrupted by signal-spontaneous and spontaneous-spontaneous beat noises. We de-fine as the total noise.By using the moment generating function for or Gaussianmoments theorems [14] and assuming that the transmitted signalis uncorrelated with the amplifier noise, we can write the auto-correlation of the total noise as
(21)
where is the average value of thereceived electric field, is the autocorrelation of
is the autocorrelation of the noise andis the autocorrelation of the real component of .
In (21), there are three main noise components:• DC-spontaneous noise:• Signal-spontaneous noise:
• Spontaneous-spontaneous noise:From (21), we observe that the DC-spontaneous beat noise
power increases proportionally with the DC bias. In DC-OFDM,if the DC bias is excessively high, the DC-spontaneous beatnoise dominates, and the receiver SNR is low. On the otherhand, if the DC bias is small, the clipping noise and the non-linear detection noise from (13) dominate, and the receiver SNRis also low. Thus, the DC bias needs to be optimized for bestperformance.
In SSB-OFDM, if the DC bias is high, the receiver SNR isunaffected since both the OFDM signal and the dominant noiseare amplified by the DC offset. However, the optical power effi-ciency is very low in this case. On the other hand, if the DC bias
Authorized licensed use limited to: Stanford University. Downloaded on June 29,2010 at 22:14:27 UTC from IEEE Xplore. Restrictions apply.
1816 JOURNAL OF LIGHTWAVE TECHNOLOGY, VOL. 28, NO. 12, JUNE 15, 2010
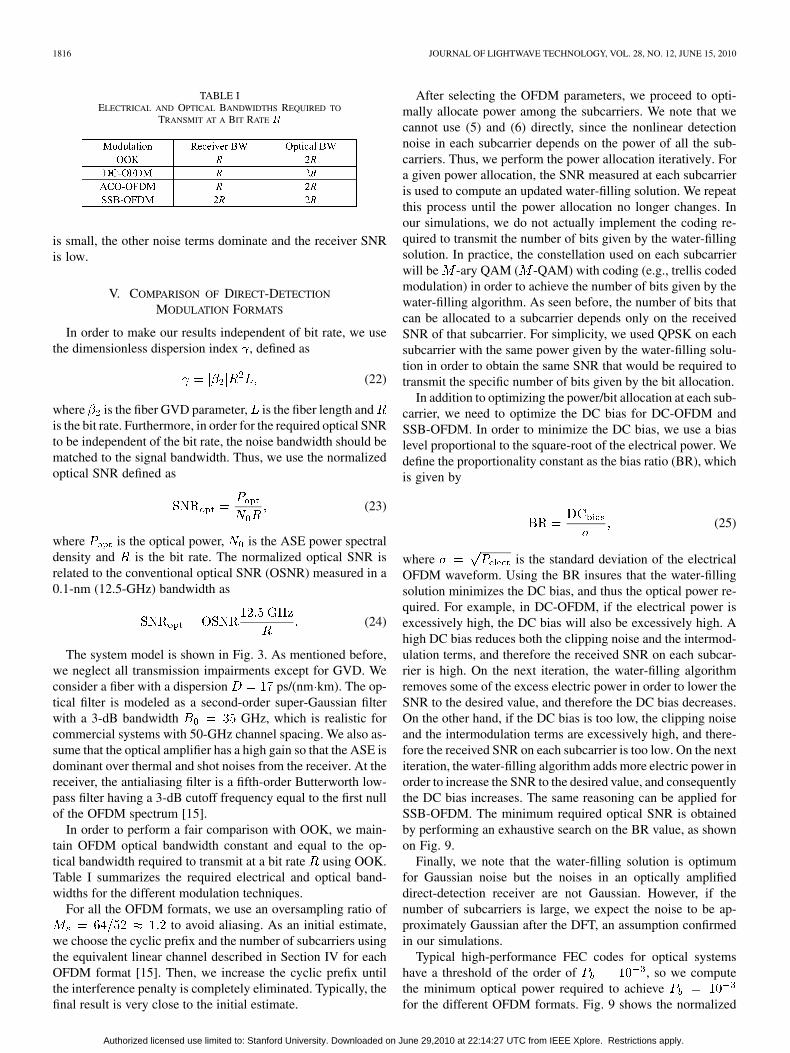
TABLE IELECTRICAL AND OPTICAL BANDWIDTHS REQUIRED TO
TRANSMIT AT A BIT RATE �
is small, the other noise terms dominate and the receiver SNRis low.
V. COMPARISON OF DIRECT-DETECTION
MODULATION FORMATS
In order to make our results independent of bit rate, we usethe dimensionless dispersion index , defined as
(22)
where is the fiber GVD parameter, is the fiber length andis the bit rate. Furthermore, in order for the required optical SNRto be independent of the bit rate, the noise bandwidth should bematched to the signal bandwidth. Thus, we use the normalizedoptical SNR defined as
(23)
where is the optical power, is the ASE power spectraldensity and is the bit rate. The normalized optical SNR isrelated to the conventional optical SNR (OSNR) measured in a0.1-nm (12.5-GHz) bandwidth as
(24)
The system model is shown in Fig. 3. As mentioned before,we neglect all transmission impairments except for GVD. Weconsider a fiber with a dispersion ps/(nm km). The op-tical filter is modeled as a second-order super-Gaussian filterwith a 3-dB bandwidth GHz, which is realistic forcommercial systems with 50-GHz channel spacing. We also as-sume that the optical amplifier has a high gain so that the ASE isdominant over thermal and shot noises from the receiver. At thereceiver, the antialiasing filter is a fifth-order Butterworth low-pass filter having a 3-dB cutoff frequency equal to the first nullof the OFDM spectrum [15].
In order to perform a fair comparison with OOK, we main-tain OFDM optical bandwidth constant and equal to the op-tical bandwidth required to transmit at a bit rate using OOK.Table I summarizes the required electrical and optical band-widths for the different modulation techniques.
For all the OFDM formats, we use an oversampling ratio ofto avoid aliasing. As an initial estimate,
we choose the cyclic prefix and the number of subcarriers usingthe equivalent linear channel described in Section IV for eachOFDM format [15]. Then, we increase the cyclic prefix untilthe interference penalty is completely eliminated. Typically, thefinal result is very close to the initial estimate.
After selecting the OFDM parameters, we proceed to opti-mally allocate power among the subcarriers. We note that wecannot use (5) and (6) directly, since the nonlinear detectionnoise in each subcarrier depends on the power of all the sub-carriers. Thus, we perform the power allocation iteratively. Fora given power allocation, the SNR measured at each subcarrieris used to compute an updated water-filling solution. We repeatthis process until the power allocation no longer changes. Inour simulations, we do not actually implement the coding re-quired to transmit the number of bits given by the water-fillingsolution. In practice, the constellation used on each subcarrierwill be -ary QAM ( -QAM) with coding (e.g., trellis codedmodulation) in order to achieve the number of bits given by thewater-filling algorithm. As seen before, the number of bits thatcan be allocated to a subcarrier depends only on the receivedSNR of that subcarrier. For simplicity, we used QPSK on eachsubcarrier with the same power given by the water-filling solu-tion in order to obtain the same SNR that would be required totransmit the specific number of bits given by the bit allocation.
In addition to optimizing the power/bit allocation at each sub-carrier, we need to optimize the DC bias for DC-OFDM andSSB-OFDM. In order to minimize the DC bias, we use a biaslevel proportional to the square-root of the electrical power. Wedefine the proportionality constant as the bias ratio (BR), whichis given by
(25)
where is the standard deviation of the electricalOFDM waveform. Using the BR insures that the water-fillingsolution minimizes the DC bias, and thus the optical power re-quired. For example, in DC-OFDM, if the electrical power isexcessively high, the DC bias will also be excessively high. Ahigh DC bias reduces both the clipping noise and the intermod-ulation terms, and therefore the received SNR on each subcar-rier is high. On the next iteration, the water-filling algorithmremoves some of the excess electric power in order to lower theSNR to the desired value, and therefore the DC bias decreases.On the other hand, if the DC bias is too low, the clipping noiseand the intermodulation terms are excessively high, and there-fore the received SNR on each subcarrier is too low. On the nextiteration, the water-filling algorithm adds more electric power inorder to increase the SNR to the desired value, and consequentlythe DC bias increases. The same reasoning can be applied forSSB-OFDM. The minimum required optical SNR is obtainedby performing an exhaustive search on the BR value, as shownon Fig. 9.
Finally, we note that the water-filling solution is optimumfor Gaussian noise but the noises in an optically amplifieddirect-detection receiver are not Gaussian. However, if thenumber of subcarriers is large, we expect the noise to be ap-proximately Gaussian after the DFT, an assumption confirmedin our simulations.
Typical high-performance FEC codes for optical systemshave a threshold of the order of , so we computethe minimum optical power required to achievefor the different OFDM formats. Fig. 9 shows the normalized
Authorized licensed use limited to: Stanford University. Downloaded on June 29,2010 at 22:14:27 UTC from IEEE Xplore. Restrictions apply.
BARROS AND KAHN: COMPARISON OF ORTHOGONAL FREQUENCY-DIVISION MULTIPLEXING 1817
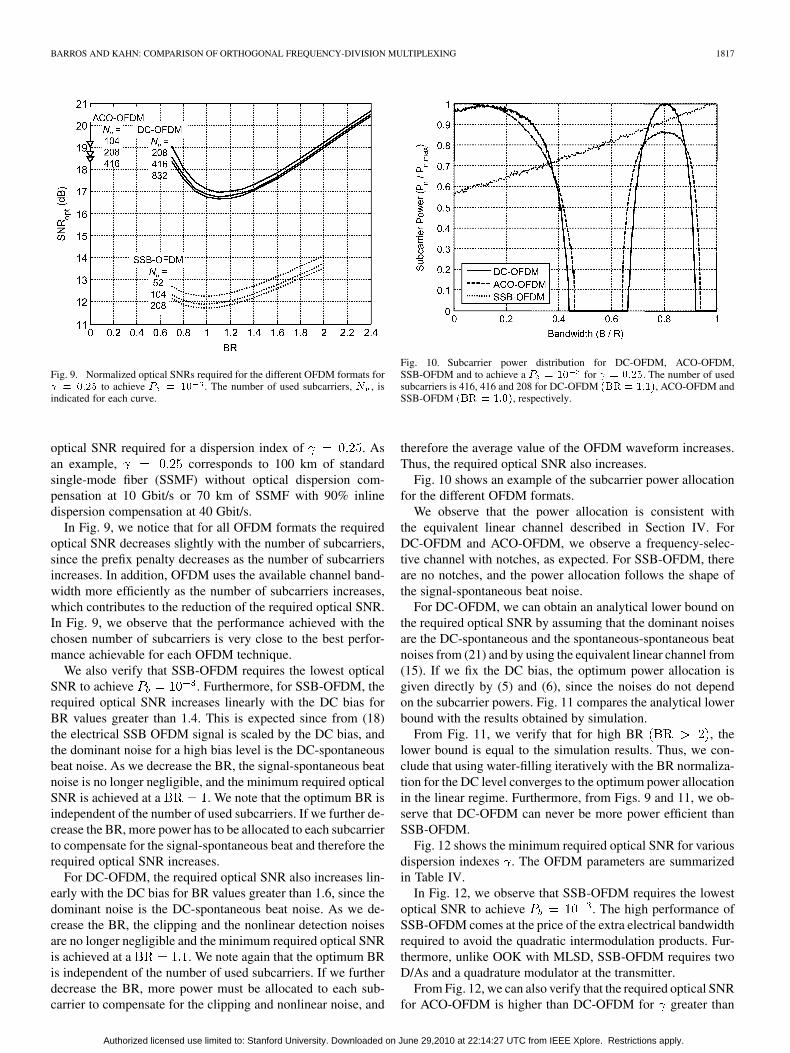
Fig. 9. Normalized optical SNRs required for the different OFDM formats for� � ���� to achieve � � �� . The number of used subcarriers, � , isindicated for each curve.
optical SNR required for a dispersion index of . Asan example, corresponds to 100 km of standardsingle-mode fiber (SSMF) without optical dispersion com-pensation at 10 Gbit/s or 70 km of SSMF with 90% inlinedispersion compensation at 40 Gbit/s.
In Fig. 9, we notice that for all OFDM formats the requiredoptical SNR decreases slightly with the number of subcarriers,since the prefix penalty decreases as the number of subcarriersincreases. In addition, OFDM uses the available channel band-width more efficiently as the number of subcarriers increases,which contributes to the reduction of the required optical SNR.In Fig. 9, we observe that the performance achieved with thechosen number of subcarriers is very close to the best perfor-mance achievable for each OFDM technique.
We also verify that SSB-OFDM requires the lowest opticalSNR to achieve . Furthermore, for SSB-OFDM, therequired optical SNR increases linearly with the DC bias forBR values greater than 1.4. This is expected since from (18)the electrical SSB OFDM signal is scaled by the DC bias, andthe dominant noise for a high bias level is the DC-spontaneousbeat noise. As we decrease the BR, the signal-spontaneous beatnoise is no longer negligible, and the minimum required opticalSNR is achieved at a . We note that the optimum BR isindependent of the number of used subcarriers. If we further de-crease the BR, more power has to be allocated to each subcarrierto compensate for the signal-spontaneous beat and therefore therequired optical SNR increases.
For DC-OFDM, the required optical SNR also increases lin-early with the DC bias for BR values greater than 1.6, since thedominant noise is the DC-spontaneous beat noise. As we de-crease the BR, the clipping and the nonlinear detection noisesare no longer negligible and the minimum required optical SNRis achieved at a . We note again that the optimum BRis independent of the number of used subcarriers. If we furtherdecrease the BR, more power must be allocated to each sub-carrier to compensate for the clipping and nonlinear noise, and
Fig. 10. Subcarrier power distribution for DC-OFDM, ACO-OFDM,SSB-OFDM and to achieve a � � �� for � � ����. The number of usedsubcarriers is 416, 416 and 208 for DC-OFDM ��� � ���, ACO-OFDM andSSB-OFDM ��� � ���, respectively.
therefore the average value of the OFDM waveform increases.Thus, the required optical SNR also increases.
Fig. 10 shows an example of the subcarrier power allocationfor the different OFDM formats.
We observe that the power allocation is consistent withthe equivalent linear channel described in Section IV. ForDC-OFDM and ACO-OFDM, we observe a frequency-selec-tive channel with notches, as expected. For SSB-OFDM, thereare no notches, and the power allocation follows the shape ofthe signal-spontaneous beat noise.
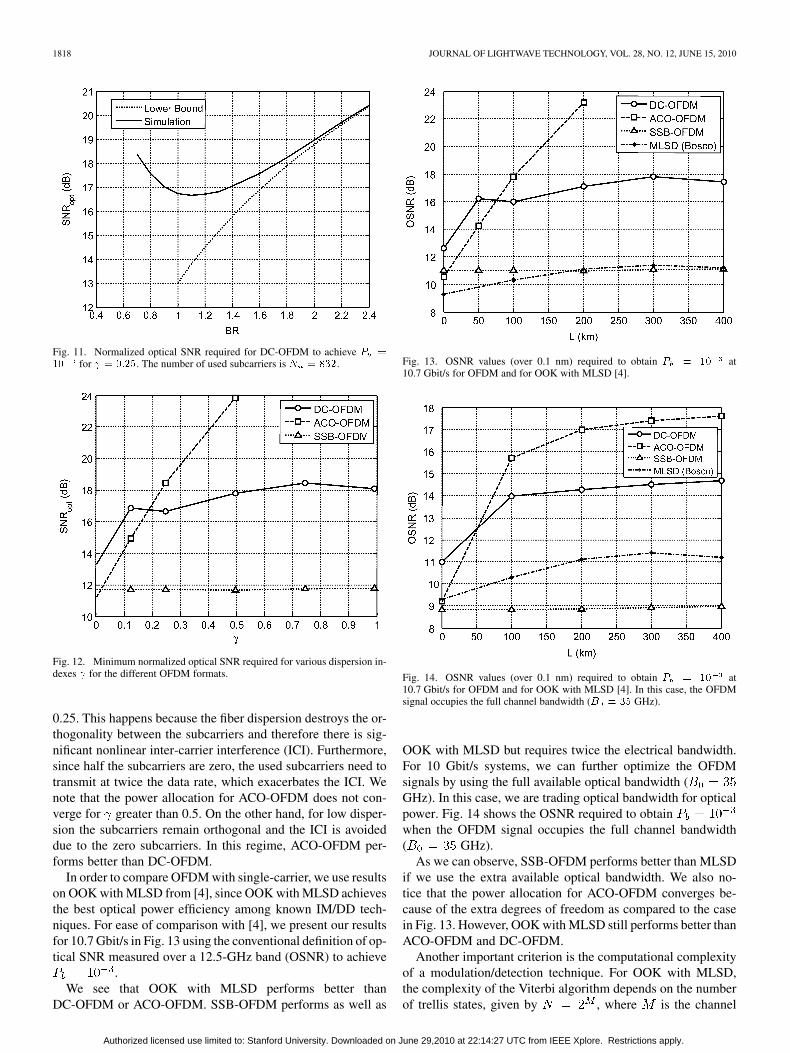
For DC-OFDM, we can obtain an analytical lower bound onthe required optical SNR by assuming that the dominant noisesare the DC-spontaneous and the spontaneous-spontaneous beatnoises from (21) and by using the equivalent linear channel from(15). If we fix the DC bias, the optimum power allocation isgiven directly by (5) and (6), since the noises do not dependon the subcarrier powers. Fig. 11 compares the analytical lowerbound with the results obtained by simulation.
From Fig. 11, we verify that for high BR , thelower bound is equal to the simulation results. Thus, we con-clude that using water-filling iteratively with the BR normaliza-tion for the DC level converges to the optimum power allocationin the linear regime. Furthermore, from Figs. 9 and 11, we ob-serve that DC-OFDM can never be more power efficient thanSSB-OFDM.
Fig. 12 shows the minimum required optical SNR for variousdispersion indexes . The OFDM parameters are summarizedin Table IV.
In Fig. 12, we observe that SSB-OFDM requires the lowestoptical SNR to achieve . The high performance ofSSB-OFDM comes at the price of the extra electrical bandwidthrequired to avoid the quadratic intermodulation products. Fur-thermore, unlike OOK with MLSD, SSB-OFDM requires twoD/As and a quadrature modulator at the transmitter.
From Fig. 12, we can also verify that the required optical SNRfor ACO-OFDM is higher than DC-OFDM for greater than
Authorized licensed use limited to: Stanford University. Downloaded on June 29,2010 at 22:14:27 UTC from IEEE Xplore. Restrictions apply.
1818 JOURNAL OF LIGHTWAVE TECHNOLOGY, VOL. 28, NO. 12, JUNE 15, 2010
Fig. 11. Normalized optical SNR required for DC-OFDM to achieve � �
�� for � � ����. The number of used subcarriers is � � ���.
Fig. 12. Minimum normalized optical SNR required for various dispersion in-dexes � for the different OFDM formats.
0.25. This happens because the fiber dispersion destroys the or-thogonality between the subcarriers and therefore there is sig-nificant nonlinear inter-carrier interference (ICI). Furthermore,since half the subcarriers are zero, the used subcarriers need totransmit at twice the data rate, which exacerbates the ICI. Wenote that the power allocation for ACO-OFDM does not con-verge for greater than 0.5. On the other hand, for low disper-sion the subcarriers remain orthogonal and the ICI is avoideddue to the zero subcarriers. In this regime, ACO-OFDM per-forms better than DC-OFDM.
In order to compare OFDM with single-carrier, we use resultson OOK with MLSD from [4], since OOK with MLSD achievesthe best optical power efficiency among known IM/DD tech-niques. For ease of comparison with [4], we present our resultsfor 10.7 Gbit/s in Fig. 13 using the conventional definition of op-tical SNR measured over a 12.5-GHz band (OSNR) to achieve
.We see that OOK with MLSD performs better than
DC-OFDM or ACO-OFDM. SSB-OFDM performs as well as
Fig. 13. OSNR values (over 0.1 nm) required to obtain � � �� at10.7 Gbit/s for OFDM and for OOK with MLSD [4].
Fig. 14. OSNR values (over 0.1 nm) required to obtain � � �� at10.7 Gbit/s for OFDM and for OOK with MLSD [4]. In this case, the OFDMsignal occupies the full channel bandwidth (� � �� GHz).
OOK with MLSD but requires twice the electrical bandwidth.For 10 Gbit/s systems, we can further optimize the OFDMsignals by using the full available optical bandwidth (GHz). In this case, we are trading optical bandwidth for opticalpower. Fig. 14 shows the OSNR required to obtainwhen the OFDM signal occupies the full channel bandwidth( GHz).
As we can observe, SSB-OFDM performs better than MLSDif we use the extra available optical bandwidth. We also no-tice that the power allocation for ACO-OFDM converges be-cause of the extra degrees of freedom as compared to the casein Fig. 13. However, OOK with MLSD still performs better thanACO-OFDM and DC-OFDM.
Another important criterion is the computational complexityof a modulation/detection technique. For OOK with MLSD,the complexity of the Viterbi algorithm depends on the numberof trellis states, given by , where is the channel
Authorized licensed use limited to: Stanford University. Downloaded on June 29,2010 at 22:14:27 UTC from IEEE Xplore. Restrictions apply.
BARROS AND KAHN: COMPARISON OF ORTHOGONAL FREQUENCY-DIVISION MULTIPLEXING 1819
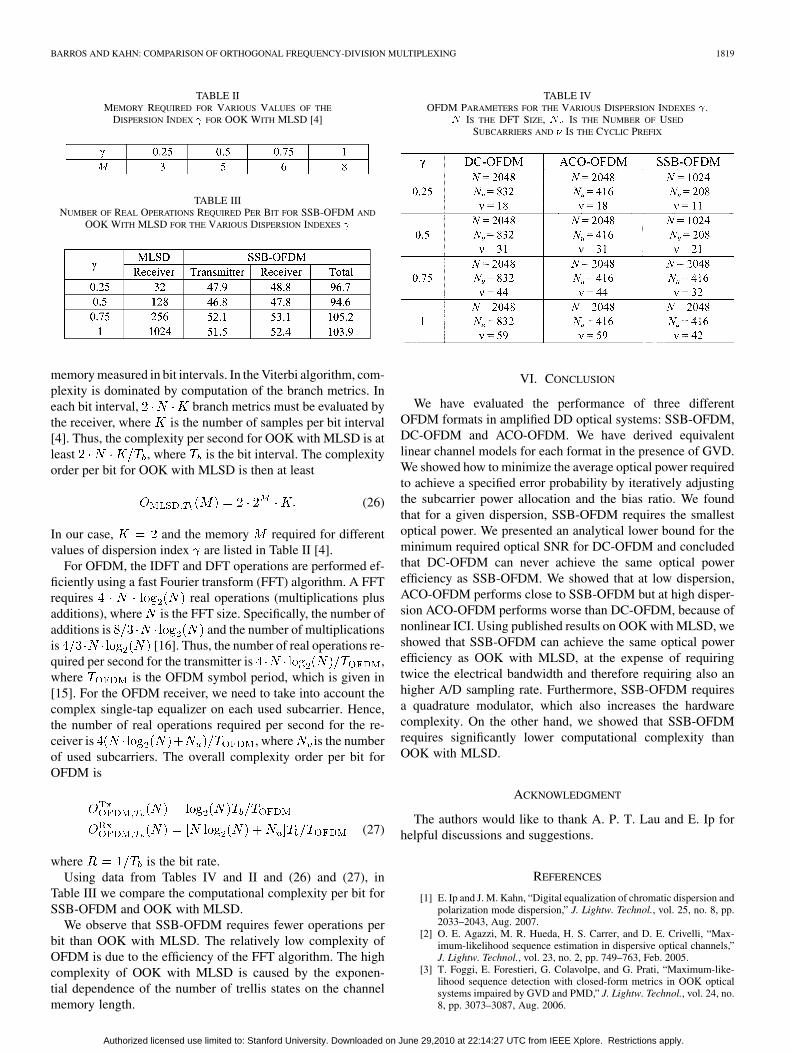
TABLE IIMEMORY REQUIRED FOR VARIOUS VALUES OF THE
DISPERSION INDEX � FOR OOK WITH MLSD [4]
TABLE IIINUMBER OF REAL OPERATIONS REQUIRED PER BIT FOR SSB-OFDM AND
OOK WITH MLSD FOR THE VARIOUS DISPERSION INDEXES �
memory measured in bit intervals. In the Viterbi algorithm, com-plexity is dominated by computation of the branch metrics. Ineach bit interval, branch metrics must be evaluated bythe receiver, where is the number of samples per bit interval[4]. Thus, the complexity per second for OOK with MLSD is atleast , where is the bit interval. The complexityorder per bit for OOK with MLSD is then at least
(26)
In our case, and the memory required for differentvalues of dispersion index are listed in Table II [4].
For OFDM, the IDFT and DFT operations are performed ef-ficiently using a fast Fourier transform (FFT) algorithm. A FFTrequires real operations (multiplications plusadditions), where is the FFT size. Specifically, the number ofadditions is and the number of multiplicationsis [16]. Thus, the number of real operations re-quired per second for the transmitter is ,where is the OFDM symbol period, which is given in[15]. For the OFDM receiver, we need to take into account thecomplex single-tap equalizer on each used subcarrier. Hence,the number of real operations required per second for the re-ceiver is , where is the numberof used subcarriers. The overall complexity order per bit forOFDM is
(27)
where is the bit rate.Using data from Tables IV and II and (26) and (27), in
Table III we compare the computational complexity per bit forSSB-OFDM and OOK with MLSD.
We observe that SSB-OFDM requires fewer operations perbit than OOK with MLSD. The relatively low complexity ofOFDM is due to the efficiency of the FFT algorithm. The highcomplexity of OOK with MLSD is caused by the exponen-tial dependence of the number of trellis states on the channelmemory length.
TABLE IVOFDM PARAMETERS FOR THE VARIOUS DISPERSION INDEXES � .
� IS THE DFT SIZE, � IS THE NUMBER OF USED
SUBCARRIERS AND � IS THE CYCLIC PREFIX
VI. CONCLUSION
We have evaluated the performance of three differentOFDM formats in amplified DD optical systems: SSB-OFDM,DC-OFDM and ACO-OFDM. We have derived equivalentlinear channel models for each format in the presence of GVD.We showed how to minimize the average optical power requiredto achieve a specified error probability by iteratively adjustingthe subcarrier power allocation and the bias ratio. We foundthat for a given dispersion, SSB-OFDM requires the smallestoptical power. We presented an analytical lower bound for theminimum required optical SNR for DC-OFDM and concludedthat DC-OFDM can never achieve the same optical powerefficiency as SSB-OFDM. We showed that at low dispersion,ACO-OFDM performs close to SSB-OFDM but at high disper-sion ACO-OFDM performs worse than DC-OFDM, because ofnonlinear ICI. Using published results on OOK with MLSD, weshowed that SSB-OFDM can achieve the same optical powerefficiency as OOK with MLSD, at the expense of requiringtwice the electrical bandwidth and therefore requiring also anhigher A/D sampling rate. Furthermore, SSB-OFDM requiresa quadrature modulator, which also increases the hardwarecomplexity. On the other hand, we showed that SSB-OFDMrequires significantly lower computational complexity thanOOK with MLSD.
ACKNOWLEDGMENT
The authors would like to thank A. P. T. Lau and E. Ip forhelpful discussions and suggestions.
REFERENCES
[1] E. Ip and J. M. Kahn, “Digital equalization of chromatic dispersion andpolarization mode dispersion,” J. Lightw. Technol., vol. 25, no. 8, pp.2033–2043, Aug. 2007.
[2] O. E. Agazzi, M. R. Hueda, H. S. Carrer, and D. E. Crivelli, “Max-imum-likelihood sequence estimation in dispersive optical channels,”J. Lightw. Technol., vol. 23, no. 2, pp. 749–763, Feb. 2005.
[3] T. Foggi, E. Forestieri, G. Colavolpe, and G. Prati, “Maximum-like-lihood sequence detection with closed-form metrics in OOK opticalsystems impaired by GVD and PMD,” J. Lightw. Technol., vol. 24, no.8, pp. 3073–3087, Aug. 2006.
Authorized licensed use limited to: Stanford University. Downloaded on June 29,2010 at 22:14:27 UTC from IEEE Xplore. Restrictions apply.
1820 JOURNAL OF LIGHTWAVE TECHNOLOGY, VOL. 28, NO. 12, JUNE 15, 2010
[4] G. Bosco, P. Poggiolini, and M. Visintin, “Performance analysis ofMLSE receivers based on the square-root metric,” J. Lightw. Technol.,vol. 26, no. 14, pp. 2098–2109, Jul. 2008.
[5] J. Armstrong, B. J. C. Schmidt, D. Kalra, H. A. Suraweera, and A.J. Lowery, “Performance of asymmetrically clipped optical OFDM inAWGN for an intensity modulated direct detection system,” Proc. IEEEGLOBECOM, 2006.
[6] J. Armstrong and B. J. C. Schmidt, “Comparison of asymmetricallyclipped optical OFDM and DC-biased optical OFDM in AWGN,” IEEECommun. Lett., vol. 12, no. 5, pp. 343–345, 2008.
[7] A. J. Lowery, “Improving sensitivity and spectral efficiency in direct-detection optical OFDM systems,” in Proc. OFC/NFOEC 2008, 2008,Paper OMM4.
[8] B. J. C. Schmidt, A. J. Lowery, and J. Armstrong, “Experimentaldemonstrations of electronic dispersion compensation for long-haultransmission using direct-detection optical OFDM,” J. Lightw.Technol., vol. 26, no. 1, pp. 196–203, Jan. 2008.
[9] J. M. Cioffi, G. P. Dudevoir, M. V. Eyuboglu, and G. D. Forney, Jr., “MMSE decision-feedback equalizers and coding—Part II: Codingresults,” IEEE Trans. Commun., vol. 43, no. 10, pp. 2595–2604, Oct.1995.
[10] G. D. Forney and G. Ungerboeck, “Modulation and coding for linearGaussian channels,” IEEE Trans. Inf. Theory, vol. 44, no. 6, pp.2384–2415, Jun. 1998.
[11] W. Yu, G. Ginis, and J. M. Cioffi, “An adaptive multiuser power controlalgorithm for VDSL,” Proc. IEEE GLOBECOM, 2001.
[12] A. Ali, J. Leibrich, and W. Rosenkranz, “Spectral efficiencyand receiver sensitivity in direct detection optical-OFDM,” Proc.OFC/NFOEC 2009, 2009, Paper OMT7.
[13] A. Ali, H. Paul, J. Leibrich, W. Rosenkranz, and K. D. Kammeyer,“Optical biasing in direct detection optical-OFDM for improving re-ceiver sensitivity,” in Proc. OFC/NFOEC 2010, 2010, Paper JThA12.
[14] J. W. Goodman, Statistical Optics. Hoboken, NJ: Wiley-Interscience,1985.
[15] D. J. F. Barros and J. M. Kahn, “Optimized dispersion compensa-tion using orthogonal frequency-division multiplexing,” J. Lightw.Technol., vol. 26, no. 16, pp. 2889–2898, Aug. 2008.
[16] S. G. Johnson and M. Frigo, “A modified split-radix FFT with fewerarithmetic operations,” IEEE Trans. Signal Process., vol. 55, no. 1, pp.111–119, Jan. 2007.
Daniel J. F. Barros received the Licenciatura degree (hons) in electrical andelectronics engineering from the University of Porto, Portugal, in 2004 and theM.S. degree in electrical engineering from Stanford University, Stanford, CA,in 2007, where he is currently working towards the Ph.D. degree in electricalengineering.
His research interests include single-mode optical-fiber communication, dig-ital signal processing and RF circuits.
Joseph M. Kahn (M’90-SM’98-F’00) received the A.B., M.A. and Ph.D. de-grees in physics from the University of California at Berkeley in 1981, 1983,and 1986, respectively.
From 1987–1990, he was at AT&T Bell Laboratories, Crawford Hill Lab-oratory, in Holmdel, NJ. He demonstrated multi-Gb/s coherent optical fibertransmission systems, setting world records for receiver sensitivity. From1990–2003, he was on the faculty of the Department of Electrical Engineeringand Computer Sciences at U.C. Berkeley, performing research on optical andwireless communications. Since 2003, he has been a Professor of ElectricalEngineering at Stanford University, where he heads the Optical Communica-tions Group. His current research interests include: rate-adaptive and spectrallyefficient modulation and coding methods, coherent detection and associateddigital signal processing algorithms, digital compensation of fiber nonlinearity,high-speed transmission in multimode fiber, and free-space systems. In 2000,he helped found StrataLight Communications (now Opnext Subsystems),where he served as Chief Scientist from 2000–2003.
Professor Kahn received the National Science Foundation Presidential YoungInvestigator Award in 1991. From 1993–2000, he served as a Technical Ed-itor of IEEE Personal Communications Magazine. Since 2009, he has been anAssociate Editor of IEEE/OSA JOURNAL OF OPTICAL COMMUNICATIONS AND
NETWORKING.
Authorized licensed use limited to: Stanford University. Downloaded on June 29,2010 at 22:14:27 UTC from IEEE Xplore. Restrictions apply.


