Embed Size (px)
Citation preview
Comparison of Sewage and Coal-Mine Wastes on StreamMacroinvertebrates Within an Otherwise Clean UplandCatchment Southeastern Australia
Ian A Wright amp Shelley Burgin
Received 11 December 2008 Accepted 2 March 2009 Published online 21 March 2009 Springer Science + Business Media BV 2009
Abstract Macroinvertebrates have been widely usedin freshwater ecosystems as surrogates to assess theimpacts of waste discharges and water pollutionHowever often interpretations have been made onthe impact of one pollutant in the presence of othersthat may provide an unidentified additive effective orotherwise confound the results There have been fewopportunities to study the impact of pollutants withoutsuch potentially confounding effects We studiedmacroinvertebrates using a replicated kick samplingtechnique and identified to the family level to assessand compare the effects of zinc-rich coal-mine wasteand organic pollution from treated sewage on anotherwise clean upland stream network within a worldheritage area We used multivariate analysis ofmacroinvertebrate assemblages from polluted andclean sites to measure and compare the effect of eachwaste impact to community structure We alsocalculated three widely used biotic indices (Ephem-eroptera Plecoptera and Trichoptera (EPT) familyrichness family richness and abundance) and foundthat the EPT index was the only one to respond toboth pollution types Macroinvertebrate abundancewas an important attribute of the study with each
source of pollution having a contrasting effect on totalabundance It also helped us to measure the relativeresponse of families to each pollutant There was aninitial significant modification of macroinvertebrateassemblages below the outflow of each of thepollutants followed by different degrees of recoverydownstream
Keywords Organic Heavy metal Zinc Pollution
Water quality NMDS Abundance EPT richness
1 Introduction
Macroinvertebrates are widely regarded as one of thebest indicators of the ecological condition of riversand streams (Hynes 1960 Hellawell 1986 Rosenbergand Resh 1993 Metzeling et al 2006) They havebeen used to assess impacts of different types of waterpollution including sewage wastes (Jolly andChapman 1966 Pinder and Far 1987 Cosser 1988Whitehurst and Lindsey 1990 Growns et al 1995Wright et al 1995) mine drainage (Winner et al1975 Norris et al 1982 Mackey 1988 Malmqvistand Hoffsten 1999 Sloane and Norris 2003) urbanlanduses (Chessman and Williams 1999 Walsh et al2001 Gresens et al 2007) and forestry activities(McCord et al 2007) However detailed investigationsof freshwater macroinvertebrates have demonstratedthe difficulty of isolating the effects of the targetimpact (eg sewage waste mine drainage pollution)
Water Air Soil Pollut (2009) 204227ndash241DOI 101007s11270-009-0040-x
I A Wright () S BurginCollege of Health and ScienceUniversity of Western SydneyLocked Bag 1797 South Penrith Distribution Centre1797 Sydney NSW Australiae-mail iwrightuwseduau
from other disturbances generated by human activitiesin often highly modified hydrological catchments
There have been a large number of biotic indicesdeveloped to help interpret stream macroinvertebrateresults from biological assessment of waterways Two ofthe most popular and simply calculated indices are taxarichness and total abundance (see Resh and Jackson1993) Abundance is often ignored due to the prolifer-ation of qualitative rapid assessment methodologies(eg Lenat 1988) The Ephemeroptera Plecoptera andTrichoptera (EPT) richness index is one of the mostwidely used biotic indices based on the taxonomicrichness of three common and sensitive macroinverte-brate orders (Lenat 1988 Lenat and Penrose 1996)The EPT index has been widely reported to be a robustand effective index for measuring impairment to streammacroinvertebrates (eg Sheehan 1984 Plafkin et al1989 Barbour et al 1992 Hickey and Clements 1998Camargo et al 2004 Kitchin 2005 Metzeling et al2006) Other biotic indices have been developed suchas the Australian SIGNAL and SIGNAL2 pollutiontolerance indices (Chessman 1995 2003) and the SouthAfrican Chutter index (Chutter 1972) based on therelative tolerance of macroinvertebrate taxonomicgroups to water pollution within a geographical area
Studies on the response of macroinvertebrates toorganic and heavy-metal pollution impacts within asingle catchment are very rare Such situations areideal for testing the response of the whole communitybiotic indices and individual taxonomic groups todifferent pollution types One of the only previousexamples was the Nent River (Northern England)where macroinvertebrates (Armitage 1980 Armitageand Blackburn 1985) and algae (Say and Whitton1981) were used to assess the dual impacts ofcontamination from several centuries of mining andorganic pollution wastes within an agricultural catch-ment While strong impairment of the target biota wasobserved there may have been additional effects onmacroinvertebrate communities other than the targetpollutants due to background contamination togetherwith the potential for synergistic andor overlappingeffects (eg Connell and Miller 1984) of the pollutantsthat were the focus of the study It is desirabletherefore to conduct studies on macroinvertebratecommunities that focus on the contribution of theeffects of a single pollutant within a lsquocleanrsquo background
We used quantitative surveys to compare theeffects of contamination from two separate dis-
charges of heavy-metal contamination and treatedsewage on stream macroinvertebrates within a smallotherwise clean stream network to investigate theimpact of each of these pollution types on residentmacroinvertebrate communities The use of a smallcatchment for the study increased the likelihood ofwaterways sharing similar fauna (Corkum 1989)and minimised biogeographic variation of animalsacross sampling sites (Cranston 1995) Although ourpreference would have been to conduct a beforeversus after control versus impact (BACI) design(see Underwood 1991) both waste discharges in theGrose River catchment were constructed manydecades previously (Wright 2006) To compensatewe sought to compare macroinvertebrate and waterquality results from waste affected sites with resultsfrom multiple reference sites (Fairweather 1990)across the catchment away from the influence ofany known disturbance or waste discharges torepresent the spectrum of undisturbed catchmentphysio-chemical and biological conditions
The questions we addressed in this study are (1) domacroinvertebrates respond differently to differenttypes of pollutants (2) what is the relative effective-ness of commonly used biotic indices and (3) ismeasurement of macroinvertebrate abundance impor-tant for pollution assessment
2 Materials and Methods
21 Study Area and Sampling Sites
Field work was carried out on waterways (Table 1) inthe upper Grose River catchment in the BlueMountains (33deg35prime S 150deg15prime E) which forms partof the Great Dividing Range in southeastern Australia(Fig 1) Most of the study area is protected as part ofBlue Mountains National Park estate nested withinthe Greater Blue Mountains World Heritage Area(NPWS 2001 BMCC 2002) Whilst most of the studyarea is undisturbed wilderness roads run along theouter rim of the catchment to service urban centresincluding Mount Victoria and Blackheath (NPWS1999) Only a very small proportion of the twotownships lie within the hydrological catchment ofthe study area and urban lands cover less than 2 ofthe study area Further details of the study area aregiven in Wright (2006)
228 Water Air Soil Pollut (2009) 204227ndash241
Two waste sources discharge into tributaries of theupper Grose River One is coal-mine drainage from adisused underground coal mine lsquoCanyon Collieryrsquowhich operated under various owners from the1920s (Macqueen 2007) until 1997 (EPA 2001) Ahorizontal mine drainage shaft (Macqueen 2007)discharges from the abandoned mine into DalpuraCreek which shortly thereafter flows into the GroseRiver (Fig 1) The second point source is theBlackheath sewage treatment plant (STP) It wasconstructed in the 1930s and at the time of samplingdischarged approximately 092 MLday of secondarytreated effluent to Hat Hill Creek (Sydney Water2004) Previous monitoring results reported ammonialevels in the STP effluent discharged to Hat HillCreek at mean levels of 4 mgL (Sydney Water 2004)
Ten sampling sites were selected in the study area(Table 1 Fig 1) Four sites were clean reference sitesunaffected by waste discharges to represent naturalconditions (GEN GDK VIC HHU) The remainingsix sites were downstream from waste discharges Threereceived mine-drainage (DAL GDD GBK) and twosewage effluent (HHD HHG) DAL was not sampledfor macroinvertebrates but was sampled only for waterquality as it was considered to be a point-source impactof mine drainage into the Grose River The site GHUwas the furthest downstream in the study and wassubject to a mixture of the two waste sources (Fig 1)
22 Macroinvertebrate Sampling
Macroinvertebrates were collected from nine sites in theupper Grose River catchment on three occasions (Fig 1Table 1) between April and June 2003 On eachsampling occasion and at each of the nine macro-invertebrate sites five quantitative benthic samples werecollected from cobble riffle zones (cf Resh and Jackson1993 Wright et al 1995) The location of each replicatewas randomly selected within a 15-m stream reach
Samples were collected by lsquokick samplingrsquo Alsquokickrsquo net with a frame of 30times30 cm and 250 μmmesh was used (Rosenberg and Resh 1993 Wright1994) Sampling was achieved by disturbing thestream bottom for a period of 1 min over a 900-cm2
area immediately upstream of the net The netcontents including stream detritus and macroinverte-brates were immediately placed into a labelledstorage container and preserved in 70 ethanol
In the laboratory the sediment below 250 μm waswashed from the sample The remaining material wasthen sorted under a dissecting microscope (times40) to extractthe macroinvertebrates from stream detritus (eg leavessticks rocks gravel) Macroinvertebrate identificationwas determined using the identification keys recommen-ded by Hawking (1994) All insect groups wereidentified to family as these data have been demonstratedto provide adequate taxonomic resolution for impact
Table 1 Summary information for each of the sampling sites used in this study
Site name Site code Co-ordinates Width Vegetation (Keithand Benson 1988)
Streamorder
Altitude(m ASL)
Grose River aboveEngineers track
GEN 33deg 328prime S 150deg 165prime E 1ndash2 m Tall open forest form 2nd 750
Grose River belowKoombanda Brook
GDK 33deg 329prime S 150deg 181prime E 2ndash4 m Tall open forest form 2nd 670
Grose River belowDalpura Creek
GDD 33deg 329prime S 150deg 181prime E 2ndash4 m Tall open forest form 2nd 585
Grose River at BurraKorrain
GBK 33deg 34prime S 150deg 182prime E 2ndash4 m Open forest form 2nd 485
Grose River atHungerfords Track
GHU 33deg 347prime S 150deg 202prime E 2ndash4 m Open forest form 2nd 375
Victoria Creek VIC 33deg 34prime S 150deg 182prime E 2ndash3 m Closed forest form 2nd 485
Dalpura Creek DAL 33deg 329prime S 150deg 181prime E 1ndash2 m Tall open forest form 1st 590
Hat Hill Creek aboveSTP discharge
HHU 33deg 371prime S 150deg 18prime E 1 m Blue Mountains SedgeSwamp
1st 965
Hat Hill Creek belowSTP
HHD 33deg 369prime S 150deg 181prime E 1 m Blue Mountains SedgeSwamp and clearedgrassland
1st 950
Hat Hill Creek aboveGrose River
HHG 33deg 347prime S 150deg 195prime E 1ndash2 m Closed forest form 1st 440
Water Air Soil Pollut (2009) 204227ndash241 229
assessment (Wright 1994 Wright et al 1995) Somenon-insect groups (Oligochaeta TemnocephalidaeHydracarina non-Ancylidae Gastropoda) were not iden-tified to the family level due to identification difficulties
23 Water Quality Sampling
Water quality data were collected from ten sites onthree occasions including samples from DalpuraCreek downstream of the mine drainage outflow(Fig 1) They were collected immediately prior tothe macroinvertebrates to minimise disturbance due tokick-sampling At each site on each occasion waterquality was monitored in situ at the centre of the
waterway using a portable field chemistry meter(WTW Multiline P4 Universal Meter WeilheimGermany) to measure stream electrical conductivity pHand water temperature Water samples were also collect-ed in 200 mL plastic bottles for later laboratory analysisWater samples were cooled and analysis was conductedwithin 72 hours of collection Replicated measurementof water quality samples was conducted with multiplefield meter readings taken on each sampling occasionand duplicate bottles collected for later laboratoryanalysis on three different sampling occasions
These samples were analysed using standardchemical analysis methods (APHA 1998) Chemicalanalysis comprised total zinc (TZn) hardness alka-
Coal mine
d iN
drainage
Bell
KoombandahO
Koombandah
Brook
DALDAL
GENGDDGBK
GEN
GBK
VIC
GHU
S
HHG
33ordm 35rsquo S
Hat HillVictoriaMount Victoria
a
CreekVictoria
Creek
Mount Victoria
Blackheath STP
HHD discharge
HHUMount Boyce
1088 m ASL
2 k
1088 m ASL
2 km150ordm 20rsquo E
BlackheathBlackheath
Fig 1 Map of survey sites(square symbols) water-ways and waste dischargepoints in the upper GroseRiver Site DAL was sam-pled only for water chemis-try Approximate catchmentboundary is dashed lineInset shows location ofstudy area in southeasternAustralia Details on sam-pling sites given in Table 1
230 Water Air Soil Pollut (2009) 204227ndash241
linity total nitrogen (TN) and total phosphorus (TP)On the first sampling occasion samples were alsoassessed for the metals aluminium arsenic boronbarium cadmium chromium cobalt copper iron leadmanganese mercury molybdenum nickel seleniumsilver tin uranium and zinc When only zinc was foundto exceed ANZECC (2000) guidelines for ecosystemprotection subsequent metal analyses were restrictedto zinc and it is the only metal data presented
24 Data Analysis
Multivariate analyses of macroinvertebrate communi-ty studies have been demonstrated to be a soundtechnique to evaluate the ecology of macroinverte-brates (Corkum 1989) of freshwater (Norris et al1982 Marchant et al 1994 Wright et al 1995) andmarine pollution (Clarke 1993 Warwick 1993) Non-metric multidimensional scaling (NMDS) was per-formed on the similarity matrix computed withsquare-root transformed macroinvertebrate taxonabundance data using the Bray-Curtis dissimilaritymeasure (Clarke 1993 Warwick 1993) Two-dimensional ordination plots represented the dissim-ilarity among samples All reference sites weregrouped to test differences by two-way analysis ofsimilarity (ANOSIM Clarke 1993) between referencesites and sites downstream of the waste discharges Inthe ordinations the influence of particular taxa ondissimilarities between communities was quantifiedusing the similarity percentage procedure (SIMPER)These multivariate analyses were achieved using thesoftware package PRIMER version 5 (Clarke 1993)
Macroinvertebrate and chemical data were alsoanalysed using a mixed model analysis of variance(SPSS V14) with lsquositesrsquo treated as a fixed factor andsampling lsquotimersquo as a random factor Data were checkedfor normality using PP plots and for homogeneity ofvariance using Levenersquos test Linear contrasts were usedto test for differences between clean reference sites andthose polluted with either waste discharge
3 Results
31 Macroinvertebrates
A total of 48069 (54 taxa) macroinvertebrates werecollected with a majority being insects (Table 2)
Family (F8108=1895 plt0001) and EPT familyrichness (F8108=2746 plt0001) differed significant-ly among sites Linear contrasts showed that familyand EPT family richness were significantly lowerimmediately downstream of both waste sourcescompared to reference sites (Table 3 Fig 2) Totalabundance also differed significantly between sites(F8108=525 p=0002) and was significantly higherimmediately downstream of the STP organic outflowcompared to the reference sites and was significantlylower downstream of the zinc-rich coal-mine effluentcompared to the reference sites (Table 3 Fig 2)When biotic indices were compared between the mostdownstream site sampled (ie where both wastesources were mixed GHU) and the reference sitesusing linear contrasts only total abundance wassignificantly different (Table 3 Fig 2)
Based on community structure multivariate anal-ysis showed that the site immediately downstream ofthe STP (HHD) and the two sites downstream of themine outflow (GDD GBK) were well separated fromall other sites which tended to cluster (ie sampleswere grouped in the NMDS ordination Fig 3) Stressvalues (range=020ndash017) indicated that in twodimensions the MDS was a fair representation ofthe original data (cf Clarke 1993) The ANOSIMresults (Table 4) showed that the differences betweensampling sites were more influential than time(Global R 0772 vs 0126) Pairwise comparison ofsites (Table 4) confirmed that there were differencesin community structure in the presence of the wastedischarges (GDD HHD) compared to reference sites(R-statistic values 0930 and 0927) Comparison ofassemblages at the two sites downstream of the zincpollution point source (GBK GDD) and the organicpollution outflow (HHG HHD) showed that the coal-mine waste sites were more similar (R-statistic 0297)than the sewage discharge sites (R-statistic 0980)Different degrees of recovery were detected beloweach waste source Community structure at the lowersite downstream of the zinc pollution (GBK) was lesssimilar to reference sites (R-statistic 0770) than at thelower sewage site (HHG) compared to the referencesites (R-statistic 0323)
Using SIMPER data from the reference sites werecompared with the sites immediately downstream ofthe STP (HHD) and mine drainage (GDD) site(Table 5) Of the ten taxa that contributed most tothe separation between the mine drainage and
Water Air Soil Pollut (2009) 204227ndash241 231
reference sites all except Hydropsychidae had lowerabundance at the mine drainage site than at referencesites In contrast of the ten taxa that contributed mostto the separation between the site immediately
downstream of the sewage inflow (HHD) and thereference sites six (Ancylidae Nemertea non-Ancylidae gastropods Simuliidae HydroptilidaeCorbiculidae) had higher abundance in the presence
Table 2 Summary list of most abundant macroinvertebrate groups (comprising gt01 of total abundance) collected from all sites inthe Grose River catchment between April and June 2003
Phylum Class (Order) Family VIC GEN GDK GDD GBK GHU HHU HHD HHG
Plathelminthese Turbellaria (Tricladida) Dugessidae 4 ndash 1 ndash 2 83 ndash 46 38
Nemertea Tetrastemmatidae ndash ndash ndash ndash ndash ndash ndash 737 ndash
Annelida Oligochaeta 229 698 1023 6 15 171 82 148 197
Mollusca Gastropoda Ancylidae 8 ndash 139 ndash ndash 1 ndash 2476 349
Gastropoda (Non-Ancylidae) ndash ndash 2 ndash ndash ndash ndash 271 ndash
Bivalvia Corbiculidae ndash ndash ndash ndash ndash 5 ndash 106 ndash
Arhtropoda Arachnida (Acariformes) 27 19 21 3 15 104 89 4 10
Orobatidae 3 1 6 ndash 1 36 11 45 4
Insecta (Ephemeroptera) Baetidae 786 101 714 3 40 6202 213 6 392
Caenidae 376 ndash 392 ndash ndash ndash ndash ndash 118
Leptophlebiidae 682 413 378 ndash 4 85 536 ndash 811
Insecta (Odonata) Aeshnidae 8 8 19 3 12 37 28 1 14
Gomphidae 84 1 10 3 19 35 ndash ndash ndash
Insecta (Plecoptera) Gripopterygidae 292 705 489 94 274 78 1011 94 43
Insecta (Megaloptera) Corydalidae 19 3 8 ndash 4 29 ndash ndash ndash
Insecta (Coleoptera) Elmidae larvae 433 474 449 4 14 118 323 75 987
Elmidae adults 131 227 408 22 59 136 72 30 108
Psphenidae 18 329 92 ndash ndash 32 8 6 9
Hydrophilidae 17 1 12 ndash 18 31 1 8 ndash
Scirtidae 146 31 83 6 144 200 40 ndash 2
Insecta (Diptera) Ceratopogindae 16 68 183 10 8 22 2 34 12
Chironomidae 490 800 1043 147 369 1153 1425 2187 688
Simuliidae 100 5 97 11 77 1931 305 746 67
Empididae 57 7 24 46 93 36 44 1 6
Tipulidae 49 43 39 2 6 140 48 2 12
Insecta (Trichoptera) Hydrobiosidae 20 9 11 ndash 2 114 35 13 48
Philopotamidae 9 19 80 ndash 169 27 15 3 30
Hydroptilidae 115 77 302 84 217 41 ndash 1070 4
Hydropyschidae 223 1 48 288 246 156 83 7 321
Ecnomidae 48 35 44 1 12 50 1 ndash 20
Leptoceridae 14 ndash 1 30 74 231 ndash ndash 35
Helicopsychidae 141 1 30 ndash ndash 23 ndash ndash 34
Glossomatidae 30 11 14 ndash ndash 71 54 ndash 3
Calamoceratidae 39 ndash ndash ndash ndash 73 ndash ndash 1
Conoescucidae 82 ndash 64 1 22 291 ndash ndash 27
Tasimiidae 2 ndash 1 ndash ndash 24 ndash ndash 62
CalocidHelicophidae ndash 2 ndash ndash ndash 308 26 ndash 25
Insecta Unidentified 203 23 60 57 11 483 21 27 169
232 Water Air Soil Pollut (2009) 204227ndash241
of sewage than at the reference sites while the otherfour common taxa (Leptophlebiidae Baetidae Elmi-dae Scirtidae) were in higher abundance at thereference sites than in the presence of the highestinfluence of organic pollution (Table 5)
The affinity of each common taxon to eachpollution type was compared based on the SIMPERresults (Table 6) Leptophlebiidae was the only familythat had a highly negative response to both types ofpollution Elmidae (larvae) Baetidae and Psephenidaehad highly negative responses to zinc pollution andmoderately negative responses to organic pollution(Table 6) In contrast the response of Ancylidae washighly positive to organic pollution and highlynegative in the presence of zinc pollution Other taxathat demonstrated a negative response to zinc pollu-tion and a positive response to organic pollution werethe Chironomidae and Simuliidae Hydropsychidaewas the only common taxon that showed a negativeresponse to organic pollution and a positive responseto zinc pollution (Table 6)
32 Physical and Chemical Indicators
The effects of the two waste discharges on the waterchemistry of local streams (Table 7 Fig 4) were clearlyapparent although distinctly different TP (F950=805plt0001 Table 8) and TN (F950=910 plt0001Table 8) both varied highly significantly among sitesLinear contrasts revealed that both were higherimmediately below the STP (HHD) (TP 5068 μgLand TN 143167 μgL) compared to the referencesites (TP 38ndash50 μgL and TN 550ndash1017 μgL)
Five kilometres below the STP (HHG) there was somereduction (TP 1892 μgL TN 75333 μgL Fig 4)
Mean total zinc levels also varied significantly amongsites (F944=7472 plt0001 Table 8) and linearcontrasts revealed that total zinc was significantly higher(5947 μgL) in Dalpura Ck the tributary containing thecoal-mine outflow compared to reference sites (42ndash62 μgL) With further distance downstream of DalpuraCk the level gradually dropped although at the mostdownstream site sampled (GHU) levels remainedelevated (707 μgL Fig 4)
Given that water hardness was classified as lsquosoftrsquo(ANZECC 2000) the recommended lsquotrigger levelrsquo forprotecting aquatic ecosystems for New South Walesupland streams for total zinc levels (5 μgL) wereviolated at all sites sampled downstream of the coalmine (see Tables 7 and 8)
4 Discussion
Treated sewage from Blackheath STP and minedrainage from the disused Canyon Colliery resultedin different and distinct pollution-related changes tomacroinvertebrate communities and water chemistryof surface waters in the upper reaches of the GroseRiver system Comparison of the water quality andecological effects of the two pollution gradients inthis study was enhanced by the lack of other humanimpacts apart from the waste discharges in anotherwise predominantly naturally vegetated (c 95)upland catchment within a largely protected NationalPark reserve (NPWS 2001)
Table 3 Results for linear comparisons of biotic indices for total family richness EPT family richness and total abundance
Total family richness EPT family richness Total abundance
Comparison (linear contrast) Mean highest at F p Mean highest at F p Mean highest at F p
Reference sites vs HHD Reference sites 193 Reference sites 9582 HHD 480
Reference sites vs GDD Reference sites 752 Reference sites 7360 Reference sites 722
Reference sites vs GHU ndash 43 ns ndash 17 ns GHU 172
GDD vs GBK GBK 146 GBK 144 GBK 04 ns
HHD vs HHG HHG 49 HHG 289 HHD 39 ns
Comparisons are between unpolluted sites with selected polluted sites and comparison of recovery downstream of each of the pointsource outflows See Fig 1 for catchment map with sites
EPT Ephemeroptera Plecoptera and Trichoptera combined
plt005 plt0001 plt00001 ns = not significant
Water Air Soil Pollut (2009) 204227ndash241 233
0
200
400
600
800
1000
1200
T1
T2
T3
T1
T2
T3
T1
T2
T3
T1
T2
T3
T1
T2
T3
T1
T2
T3
T1
T2
T3
T1
T2
T3
T1
T2
T3
GEN G DK GDD GBK GHU VIC HHU HHD HHG
To
tal A
bu
nd
ance
Grose River sites Tributary sites
Mine drainage
enters
Hat Hill Ck
entersSTP waste
enters
Hat Hill Creek
0
5
10
15
20
25
30
T1
T2
T3
T1
T2
T3
T1
T2
T3
T1
T2
T3
T1
T2
T3
T1
T2
T3
T1
T2
T3
T1
T2
T3
T1
T2
T3
GEN GDK GDD GBK GHU VIC HHU HHD HHG
Fam
ily R
ich
nes
s
Grose River sites Tributary sites
Mine drainage
enters
Hat Hill Ck
enters
STP waste
enters
Hat Hill Creek
0
5
10
15
20
25
30
T1
T2
T3
T1
T2
T3
T1
T2
T3
T1
T2
T3
T1
T2
T3
T1
T2
T3
T1
T2
T3
T1
T2
T3
T1
T2
T3
GEN GDK GDD GBK GHU VIC HHU HHD HHG
EP
T R
ich
nes
s
Grose River sites Tributary sites
Mine drainage
entersHat Hill Ck
entersSTP waste
enters
Hat Hill Creek
Fig 2 Back-transformedmean macroinvertebrate(top) total abundance (mid-dle) taxon richness and(lowest) EPT richness col-lected from sites in theupper Grose River and itstributaries on each of thethree sampling occasions(T1 T2 and T3) plusmnstandarderror from five replicates ateach site
234 Water Air Soil Pollut (2009) 204227ndash241
Fig 3 NMDS ordination of macroinvertebrate data Stress =02 Each symbol represents a centroid of five macroinverte-brate samples from the Grose River and its tributaries fromeach of three sampling occasions (four from GBK on secondoccasion) Reference sites are squares black VIC light grey
GEN white GDK dark grey HHU Sites immediately belowwaste discharges are diamonds black GDD (coal-mine drain-age) white HHD (sewage) Sites further downstream of wastedischarges are triangles white HHG dark grey GBK blackGHU (site abbreviations given in Table 1)
Table 4 Summary results for two-way ANOSIM
Source of variation Comparison R-statistic p ()
Site Global R 0772 01
Reference sites vs point source of zinc pollution (GDD) 0930 01
Reference sites vs second site below point source zinc pollution site (GBK) 0770 01
Reference sites vs site of combined pollution (GHU) 0611 01
Reference sites vs point source of organic pollution (HHD) 0927 01
Reference sites vs second site below organic pollution inflow (HHG) 0323 01
Comparison of within stream recovery from zinc pollution (GDD vs GBK) 0297 09
Point source of zinc pollution (GDD) vs site of combined pollution (GHU) 0927 01
Comparison of two pollution types at outflows (GDD vs HHD) 0988 01
Point source of zinc (GDD) vs downstream organic pollution (HHG) 0984 01
Downstream zinc (GBK) vs site of combined pollution (GHU) 0800 01
Downstream zinc (GBK) vs point source organic pollution (HHD) 0960 01
Downstream zinc (GBK) vs downstream organic pollution (HHG) 0923 01
Combined pollution site (GHU) vs point source organic pollution (HHD) 0944 01
Site of combined pollution (GHU) vs downstream organic pollution (HHG) 0887 01
Point source organic (HHD) vs downstream organic pollution (HHG) 0980 01
Time Global R 0126 01
Sampling time 1 vs 2 0192 01
Sampling time 1 vs 3 0162 02
Sampling time 2 vs 3 0014 272
Values of ANOSIM statistic (R) and significance (p) for pairwise differences between reference sites (GEN GDK VIC HHUgrouped) and pairwise differences between time of sampling and sample site (see Fig 1 for catchment map with sites)
Water Air Soil Pollut (2009) 204227ndash241 235
We found that biological indices (macroinvertebrateabundance family richness and EPT family richness)responded differently to the two waste discharges in thisstudy Family richness declined to a greater degreedownstream from the coal-mine drainage compared toonly a modest reduction below the STP (Fig 2) Asimilar difference in taxonomic richness to dualdisturbance gradients was observed by Metzeling etal (2006) who reported that family richness performedpoorly against a salinity gradient but better against ahabitat simplification gradient EPT richness was theonly one of the indices that responded with a reductionof similar magnitude below both the mine and STPdischarge In comparison macroinvertebrate abun-dance declined below the mine but increased immedi-ately below the STP Measuring abundance is often notincluded in many pollution studies perhaps partly dueto the popularity of rapid assessment methodologiesthat use non-quantitative techniques (eg Chessman1995) Our findings illustrate how abundance data canbe a very important ecological attribute in pollutionstudies Abundance of individual families in this studyhelped reveal differences in community structure at
Taxon Reference sites HHD Contribution () Cumulative ()
Reference sites compared to site of organic pollution outflow (HHD)
Ancylidae 245 16507 810 810
Nemertea 0 4913 622 1432
Leptophlebiidae 3348 0 583 2015
(non-Ancylidae) Gastropoda 003 1807 511 2527
Simuliidae 845 4973 438 2965
Baetidae 3023 040 435 3400
Elmidae (larvae) 2798 500 382 3782
Hydroptilidae 823 7133 375 4157
Corbiculidae 000 707 341 4497
Scirtidae 500 000 317 4814
Reference sites compared to site of mine drainage (GDD)
Leptophlebiidae 3348 0 770 770
Elmidae (larvae) 2798 027 685 1455
Baetidae 3023 020 597 2051
Oligochaeta 3387 040 589 2640
Gripopteryigidae 4162 627 423 3063
Psephenidae 745 0 409 3472
Hydropsychidae 592 1920 390 3862
Chironomidae 6263 980 360 4221
Scirtidae 500 040 337 4558
Hydroptilidae 823 560 331 4889
Table 5 Results of SIM-PER breakdown the mostinfluential macroinverte-brates contributing to thedifferent communities at thereference sites compared tothose at the site sampledbelow each pollution source
Table 6 Change in abundancea due to pollution (zinc ororganic) in the upland streams of the Grose River catchmentGreater Blue Mountains World Heritage Area
Family Coal-mine (zinc)pollution
Sewagepollution
Leptophlebiidae timestimestimes timestimestimes
Elmidae (larvae) timestimestimes timestimes
Baetidae timestimestimes timestimes
Ancylidae timestimestimes radicradicradic(Class) Oligochaeta timestimes times
Chironomidae timestimes radicGripopteryigidae timestimes timestimes
Hydropsychidae radic timestimes
Psephenidae timestimestimes timestimes
Simuliidae timestimes radicradic
radic 200 to 500 abundance radicradic 500 to 1000 radicradicradicgt1000 times 20 to 50 timestimes 1 to 20 timestimestimes lt1 or ND(not detected)a Abundance relates to comparison of abundance below eachpollution point source to average from reference sites
236 Water Air Soil Pollut (2009) 204227ndash241
polluted and unpolluted sites further details of whichare discussed further below
A group of six taxa were particularly abundant andstrongly influenced the organically polluted macro-invertebrate community below Blackheath STPAncylidae non-Ancylidae gastropods NemerteaSimuliidae Hydroptilidae and Corbiculidae Thisgroup of biota collectively increased their abundancein the presence of sewage effluent more than three
times that found at unpolluted reference sites How-ever in contrast the macroinvertebrate communitybelow the coal mine was depauperate with only oneinfluential taxa Hydropsychidae being more abun-dant here than at unpolluted sites Hydropsychidaewas much less abundant below the STP
Our finding that Hydropsychidae was tolerant ofmine drainage contrasts with findings from someAustralian metal pollution studies For example
Table 7 Summary of physicochemical data indicating mean and range (in brackets) for each water physical and chemical variableaccording to site
Site Watertemperature (degC)
pH Electricalconductivity(μScm)
Total nitrogen(μgL)
Totalphosphorus(μgL)
Total zinc(μgL)
Hardness(mgLCaCO3)
Reference sites
GEN 114 (89ndash137) 61 (600ndash633) 393 (38ndash41) 55 (25ndash100) 38 (3ndash6) 42 (25ndash50) 52 (5ndash55)
GDK 116 (87ndash147) 74 (728ndash745) 827 (70ndash92) 683 (50ndash90) 42 (3ndash6) 42 (25ndash50) 231 (20ndash26)
VIC 114 (95ndash130) 70 (692ndash723) 47 709 (25ndash130) 47 (3ndash8) 42 (25ndash50) 85 (8ndash9)
HHU 101 (95ndash112) 60 (584ndash620) 313 (29ndash33) 1017 (90ndash110) 50 (3ndash8) 62 (5ndash100) 32 (3ndash35)
Mine drainage (zinc) polluted sites
DAL 128 (113ndash153) 706 (694ndash718) 1339 (131ndash139) 25 45 (3ndash8) 5947 (545ndash650) 492 (475ndash51)
GDD 124 (102ndash151) 72 (701ndash735) 1511 (140ndash160) 25 43 (3ndash7) 388 (297ndash440) 538 (505ndash57)
GBK 125 (114ndash136) 73 (715ndash753) 1433 (130ndash150) 333 (25ndash50) 45 (3ndash7) 2613 (212ndash300) 498 (445ndash55)
STP (organic) polluted sites
HHD 112 (110ndash138) 72 (676ndash744) 3270 (132ndash462) 143167 (4400ndash21200)
5068 (204ndash820) 125 (5ndash200) 384 (37ndash395)
HHG 124 (105ndash121) 724 (718ndash727) 2308 (201ndash265) 75333 (6700ndash9000) 1892 (180ndash198) 5 232 (20ndash265)
Combined pollution site
GHU 123 (100ndash149) 76 (743ndash780) 1415 (123ndash157) 1680 (1540ndash1950) 405 (34ndash45) 707 (60ndash80) 322 (29ndash355)
See Fig 1 for map of sites
1
10
100
1000
10000
100000
GEN GDK GDD GBK GHU VIC HHU HHD HHG DAL
Mine drainage enters
Grose River
Hat Hill Ck enters
Grose River
Grose River sites Tributary sites
STP enters
Hat Hill Ck
Hat Hill Creek
Fig 4 Mean total phospho-rus (grey bar) mean totalzinc (black bar) and meantotal nitrogen (white bar) inμgL collected from dupli-cate samples at each siteon three sampling occasionsApril to June 2003 (plus onestandard error) Grose Riversites are grouped to the leftand tributary sites to theright Arrows and text indi-cate the location that minedrainage and Hat Hill Ckenters the Grose River andwhere STP effluent flowsinto Hat Hill Creek
Water Air Soil Pollut (2009) 204227ndash241 237
Norris (1986) reported that Hydropsychidae respondednegatively to metal-pollution in the MolongoloRiver and Mackey (1988) also made the sameobservation in the River Dee Metal-pollution toler-ance of Hydropsychidae was also observed inDaylight Creek (NSW) where they were the secondmost abundant taxa at a highly copper- and zinc-polluted site (Napier 1992) and in the South EskRiver (Tasmania) they were abundant at all but onemetal-polluted site (Norris et al 1982) Tolerance ofHydropsychidae to mine pollution has been docu-mented in other parts of the world for example theywere recorded in New Zealand metal-polluted water-ways (Hickey and Clements 1998) an English zinccontaminated river (Armitage 1980) and in acid minedrainage (AMD)-affected waters in Kentucky (Shortet al 1990)
The mayfly family Leptophlebiidae emerged asthe most sensitive family in this study with equaland absolute intolerance of both the mine drainageand sewage No individual specimen was collectedat either the mine-polluted site or the STP-pollutedsite Our results reinforce the reputation of Lepto-phlebiidae as one of the most pollution-sensitivemacroinvertebrate families worldwide They havebeen reported as being completely missing fromother heavily acid mine drainage-affected reachesof rivers and streams such as the River Dee inQueensland (Mackey 1988) Bobrsquos Creek in Ken-
tucky (Short et al 1990) and the River Vascatildeo inPortugal (Gerhadt et al 2004) Some pollutiontolerance has been reported with AMD-affectedstreams in New Zealand (Winterbourn 1998) con-taining Leptophlebiidae tolerant of highly acidicwaters (pH 35) Leptophlebiidae are also frequentlyreported to be very sensitive to organic pollutionwith several researchers reporting their completeabsence at the most affected sites (Cosser 1988Whitehurst and Lindsey 1990 Wright et al 1995)
Four animals that strongly contributed to com-munity structure at the polluted sites exhibitedopposite affinities towards each of the two waste-types Hydropsychidae was discussed above Theother three taxa were highly abundant in theorganic pollution below the STP (AncylidaeChironomidae and Simuliidae) and were absent orat very low abundances below the mine drainageThe gastropod Ancylidae had the most stronglydiverging relationship to the waste sources It wasmore than 1000 more abundant in the presenceof sewage effluent than at the unpolluted referencesites yet it displayed intolerance of mine pollutionThis differential tolerance is supported by themetal (SIGNAL-MET 810) and organic pollution(SIGNAL-SEW 210) grades in Chessman andMcEvoy (1998) Ancylidae have also been foundto be intolerant of mine drainage in Spain (Marqueacuteset al 2003) and were reported as being tolerant of
Table 8 Results for linear comparisons of chemical data (zinc total phosphorus and total nitrogen) compared to differences betweenreference sites and both zinc and organic pollution
Comparison (linear contrast) Zinc Total phosphorus Total nitrogen
Mean higher at F p Mean higher at F p Mean higher at F p
Reference sites vs HHD ndash 01 NS HHD 566 HHD 587
Reference sites vs GDD GDD 4456 ndash 00 NS ndash 01 NS
Reference sites vs GHU GHU 139 ndash 03 NS ndash 07 NS
GDD vs GBK GDD 310 ndash 00 NS ndash 01 NS
HHD vs HHG ndash 01 NS HHD 141 HHD 83
Comparisons are between unpolluted sites with selected polluted sites and comparison of recovery downstream of each of the pointsource outflows Specifically comparisons are between 1 unpolluted sites and site immediately downstream of organic pollutionoutflow (HHD) 2 unpolluted reference sites and zinc pollution point source (GDD) 3 unpolluted sites with most downstream sitesampled within the catchment were residues of both zinc and organic pollution combined (GHU) 4 zinc pollution point source(GDD) and downstream (GBK) and 5 organic pollution outflow site (HHD) and further downstream of organic pollution (HHG) SeeFig 1 for catchment map with sites
ns not significant
plt005 plt0001 plt00001
238 Water Air Soil Pollut (2009) 204227ndash241
sewage pollution in NSW (Wright 1994 Wright et al1995) and nutrient enrichment in the Eresma River inCentral Spain (Camargo et al 2004) although theywere absent from the most sewage-polluted sites onthe River Adur (Whitehurst and Lindsey 1990)possibly due to other human influences in thedisturbed Adur catchment
The biological and chemical changes resultingfrom pollution has been illustrated by the classicmodel developed by Hynes (1960) with a steadyincrease of lsquopollution faunarsquo below the waste dis-charge then a gradual and progressive reduction withfurther distance below the point-source and acorresponding inverse relationship with pollutionsensitive animals We found some evidence ofrecovery below each waste source compared to siteslocated in the zone of highest contamination Consid-erable recovery was evident further downstreambelow the STP discharge in Hat Hill Creek yet alower degree of recovery was observed in the GroseRiver below the coal mine until the sewage-enrichedwaters combined with the Grose River
This study constitutes some of the first Australianevidence that coal mining can result in freshwaterecosystem damage due to heavy-metal contaminationSuch cases may appear to be unusual in Australia butthis is not the case internationally where coal mininghas been more frequently associated with AMD andelevated heavy metal levels in the USA (eg Herlihyet al 1990) Europe (eg Armitage 1980 Malmqvistand Hoffsten 1999 Johnson 2003) and New Zealand(Winterbourn 1998)
This study builds upon previous northern hemi-sphere studies that also used macroinvertebrates tomeasure sewage and mine drainage impacts Theywere carried out on the Nent River system in Englandwhere they contended with contaminated runoff fromurban and agricultural landuses as well as mine andsewage impacts (Armitage 1980 Armitage andBlackburn 1985) Although strong changes in macro-invertebrate community structure were detected in theNent River there were difficulties clearly differenti-ating the specific sewage and mining impacts due tooverlapping contamination from multiple sources ofmine pollution Our current study was able to limit theconfounding effects of multiple overlapping sourcesof pollution and disturbance due to it being situated ina small catchment that was predominantly naturallyvegetated
5 Conclusions
Comparison of ecological effects of two differenttypes of pollution (organic and inorganic) in a smallcatchment with otherwise unpolluted waterwaysflowing upstream of the two waste dischargesprovided an unusual opportunity to observe therelationship of macroinvertebrates to the differentwaste sources The ecological effects of each of thetwo waste sources (STP and mine drainage) wereclearly apparent from observed changes to thetaxonomic assemblages of stream macroinvertebratesWe found that multivariate analysis of quantitativefamily level data allowed detailed assessment of thepollution impacts Three biotic indices family rich-ness total abundance and EPT richness were alsovaluable for comparing effects of the two wastes EPTrichness was particularly sensitive at detecting bio-logical impairment from both pollution sources
Acknowledgements This study formed part of the seniorauthorrsquos PhD research at the University of Western SydneySydney Water made laboratory facilities and sampling appara-tus available for use for this study Susan Alexandra Wright andother volunteers generously assisted with field work and OlegNicetic conducted univariate data analysis We are grateful forthe comments by Dr Debbie Rae Dr Helen Nice andanonymous referees on this manuscript
References
ANZECC (Australian and New Zealand Environment andConservation Council) (2000) Australian and NewZealand guidelines for fresh and marine waters CanberraAustralian and New Zealand Environment and Conserva-tion Council
APHA (American Public Health Association) (1998) StandardMethods for the Examination of Water and Wastewater(20th ed) Washington DC American Public HealthAssociation
Armitage P D (1980) The effects of mine drainage andorganic enrichment on benthos in the River Nent systemNorthern Pennines Hydrobiologia 74 119ndash128doi101007BF00014563
Armitage P D amp Blackburn J H (1985) Chironomidae in aPennine stream system receiving mine drainage andorganic enrichment Hydrobiologia 121 165ndash172doi101007BF00008720
Barbour M T Plafkin J L Bradley B P Graves C G ampWisseman R W (1992) Evaluation of EPArsquos rapidbioassessment benthic metrics Metric redundancy andvariability among reference stream sites EnvironmentalToxicology and Chemistry 11 437ndash449 doi1018971552-8618(1992)11[437EOERBB]20CO2
Water Air Soil Pollut (2009) 204227ndash241 239
BMCC (Blue Mountains City Council) (2002) State of theEnvironment Report 20012002 Katoomba NSW BlueMountains City Council
Camargo J A Alonso A amp De La Puente M (2004)Multimetric assessment of nutrient enrichment inimpounded rivers based on benthic macroinvertebratesEnvironmental Monitoring and Assessment 96 233ndash249doi101023BEMAS00000317307863075
Chessman B C (1995) Rapid assessment of rivers usingmacroinvertebrates A procedure based on habitat-specificsampling family level identification and a biotic indexAustralian Journal of Ecology 20 122ndash129 doi101111j1442-99931995tb00526x
Chessman B C (2003) New sensitivity grades for Australianriver macroinvertebrates Marine amp Freshwater Research54 95ndash103 doi101071MF02114
Chessman B C amp McEvoy P K (1998) Towards diagnosticbiotic indices for river macroinvertebrates Hydrobiologia364 169ndash182 doi101023A1003142819625
Chessman B C amp Williams S A (1999) Biodiversity andconservation of river macroinvertebrates Pacific Conser-vation Biology 5 36ndash55
Chutter F M (1972) An empirical biotic index of the qualityof water in South African streams and rivers WaterResearch 6 19ndash30 doi1010160043-1354(72)90170-4
Clarke K R (1993) Non-parametric multivariate analyses ofchanges in community structure Australian Journal ofEcology 18 117ndash143 doi101111j1442-99931993tb00438x
Connell D W amp Miller G J (1984) Chemistry andEcotoxicology of Pollution New York Brisbane JohnWiley amp Sons
Corkum L D (1989) Patterns of benthic invertebrate assemb-lages in rivers of northwestern North America FreshwaterBiology 21 191ndash205 doi101111j1365-24271989tb01358x
Cosser P R (1988) Macroinvertebrate community structure andchemistry of an organically polluted creek in south-eastQueensland Australian Journal of Marine and FreshwaterResearch 39 671ndash683 doi101071MF9880671
Cranston P S (1995) Biogeography In P Armitage et al (Ed)The Chironomidae The biology and ecology of non-bitingmidges (pp 180ndash197) Melbourne Chapman amp Hall
EPA (NSW Environment Protection Authority) (2001) CanyonColliery Environment Protection Licence Licence 558httpwwwepanswgovauprpoeolicencesL558pdfAccessed 19 February 2009
Fairweather P G (1990) Sewage and the biota on seashoresAssessment of impact in relation to natural variabilityEnvironmental Monitoring and Assessment 14 197ndash210doi101007BF00677916
Gerhadt A Janssens de Bisthoven L amp Soares A M V M(2004) Macroinvertebrate response to acid mine drainageCommunity metrics and on-line behavioural toxicitybioassay Environmental Pollution 130 263ndash274doi101016jenvpol200311016
Gresens S E Belt K T Tang J A Gwinn D C amp BanksP A (2007) Temporal and spatial responses of Chirono-midae (Diptera) and other benthic invertebrates to urbanstormwater runoff Hydrobiologia 575 173ndash190doi101007s10750-006-0366-y
Growns J E Chessman B C McEvoy P K amp Wright I A(1995) Rapid assessment of rivers using macroinverte-brates Case studies in the Nepean River and BlueMountains NSW Australian Journal of Ecology 20130ndash141 doi101111j1442-99931995tb00527x
Hawking J H (1994) A preliminary guide to keys andzoological information to identify invertebrates from Aus-tralian freshwaters Cooperative Research Centre for Fresh-water Ecology Identification Guide No 2Albury NSWCooperative Research Centre for Freshwater Ecology
Hellawell J M (1986) Biological Indicators of FreshwaterPollution and Environmental Management London Elesvier
Herlihy A T Kaufman P R Mitch M E amp Brown D D(1990) Regional estimates of acid mine drainage impacton streams in the mid-Atlantic and southeastern UnitedStates Water Air and Soil Pollution 50 91ndash107doi101007BF00284786
Hickey C W amp Clements W H (1998) Effects of heavymetals on benthic macroinvertebrate communities in NewZealand streams Environmental Toxicology and Chemis-try 17 2338ndash2346 doi1018971551-5028(1998)017lt2338EOHMOBgt23CO2
Hynes H B N (1960) The Biology of Polluted WatersLiverpool Liverpool University Press
Johnson D B (2003) Chemical and microbiological charac-teristics of mineral spoils and drainage waters at aban-doned coal and metal mines Water Air and SoilPollution 3 47ndash66
Jolly V H amp Chapman M A (1966) A preliminarybiological study of the effects of pollution on FarmersrsquosCreek and Coxrsquos River New South Wales Hydrobiologia27 160ndash192 doi101007BF00161494
Keith D A amp Benson D H (1988) Natural vegetation of theKatoomba area Cunninghamia 2 107ndash144
Kitchin P L (2005) Measuring the amount of statisticalinformation in the EPT index Environmetrics 16 51ndash59doi101002env670
Lenat D R (1988) Water quality assessment of streams usinga qualitative collection method for benthic macroinverte-brates Bulletin of the North American BenthologicalSociety 7 222ndash233 doi1023071467422
Lenat D R amp Penrose D L (1996) History of the EPT taxarichness metric Bulletin of the North American Bentho-logical Society 13 305ndash307
Mackey A P (1988) The biota of the River Dee (centralQueensland Australia) in relation to the effects of acidmine drainage Proceedings of the Royal Society ofQueensland 99 9ndash19
Macqueen A (2007) Back from the Brink Blue Gum Forestand the Grose Wilderness Second Edition 8 Angel StWentworth Falls NSW self-published
Malmqvist B amp Hoffsten P (1999) Influence of drainagefrom old mine deposits on benthic macroinvertebratecommunities in central Swedish streams Water Research33 2415ndash2423 doi101016S0043-1354(98)00462-X
Marchant R Barmutta L A amp Chessman B C (1994)Preliminary study of the ordination and classification ofmacroinvertebrate communities from running waters inVictoria Australia Australian Journal of Marine andFreshwater Research 45 945ndash962 doi101071MF9940945
240 Water Air Soil Pollut (2009) 204227ndash241
Marqueacutes M J Martiacutenez-Conde E amp Rovira J V (2003)Effects of zinc and lead mining on the benthic macro-invertebrates of a fluvial ecosystem Water Air and SoilPollution 148 363ndash388 doi101023A1025411932330
McCord S B Grippo R S amp Eagle D M (2007) Effects ofsilviculture using best management practices on streammacroinvertebrate communities in three ecoregions ofArkansas USA Water Air and Soil Pollution 184 299ndash311 doi101007s11270-007-9417-x
Metzeling L Perriss S amp Robinson D (2006) Can thedetection of salinity and habitat simplification gradientsusing rapid bioassessment of benthic invertebrates beimproved through finer taxonomic resolution or alterna-tives indices Hydrobiologia 572 235ndash252 doi101007s10750-005-9004-3
Napier G M (1992) Application of laboratory-derived data tonatural aquatic ecosystems PhD thesis Graduate Schoolof the Environment Macquarie University
Norris R H (1986) Mine waste pollution of the MolongloRiver New South Wales and the Australian CapitalTerritory Effectiveness of remedial works at Captains Flatmining area Australian Journal of Marine and FreshwaterResearch 37 147ndash157 doi101071MF9860147
Norris R H Lake P S amp Swain R (1982) Ecologicaleffects of mine effluents on the South Esk River north-eastern Tasmania (III) Benthic macroinvertebrates Aus-tralian Journal of Marine and Freshwater Research 33789ndash809 doi101071MF9820789
NPWS (National Parks and Wildlife Service) (1999) BlueMountains National Park Walking Track Guide WalkingTracks in the Grose Valley Blue Mountains HeritageCentre Blackheath NSW self-published
NPWS (National Parks and Wildlife Service) (2001) BlueMountains National Park Plan of Management BlueMountains Heritage Centre Blackheath NSW self-published
Pinder L C V amp Far I S (1987) Biological surveillance ofwater quality 3 The influence of organic enrichment onthe macroinvertebrate fauna of small chalk streams Archivfuer Hydrobiologie 109 619ndash637
Plafkin J L Barbour M T Porter K D Grosse S K ampHughes R M (1989) Rapid bioassessment protocols foruse in streams and rivers Benthic macroinvertebrates andfish Washington DC United States EnvironmentalProtection Agency
Resh V H amp Jackson J K (1993) Rapid assessmentapproaches to biomonitoring using benthic macroinverte-brates In D M Rosenberg amp V H Resh (Eds)Freshwater Biomonitoring and Benthic Macroinverte-brates (pp 195ndash223) New York London Chapman ampHall
Rosenberg D M amp Resh V H (1993) Freshwaterbiomonitoring and benthic macroinvertebrates New YorkLondon Chapman amp Hall
Say P J amp Whitton B A (1981) Changes in flora down astream showing a zinc gradient Hydrobiologia 76 255ndash262 doi101007BF00006217
Sheehan P J (1984) Effects on community and ecosystemstructure and dynamics In P J Sheehan et al (Ed)Effects of Pollutants at the Ecosystem Level (pp 51ndash100)Chichester New York John Wiley amp Sons
Short T Black J A amp Birge W J (1990) Effects of acid-mine drainage on the chemical and biological character ofan alkaline headwater stream Archives of EnvironmentalContamination and Toxicology 19 241ndash248 doi101007BF01056093
Sloane P I W amp Norris R H (2003) Relationship ofAUSRIVAS-based macroinvertebrate predictive model out-puts to a metal pollution gradient Journal of the NorthAmerican Benthological Society 22 457ndash471 doi1023071468274
Sydney Water Corporation (2004) Annual EnvironmentalIndicators Compliance Report 20032004 Sydney NSWSydney Water Corporation
Underwood A J (1991) Beyond BACI Experimental designsfor detecting human environmental impacts on temporalvariations in natural populations Australian Journal ofMarine and Freshwater Research 42 569ndash587doi101071MF9910569
Walsh C J Sharpe A K Breen P F amp Sonneman J A(2001) Effects of urbanisation on streams of the Mel-bourne region Victoria Australia I Benthic macroinver-tebrate communities Freshwater Biology 46 535ndash551doi101046j1365-2427200100690x
Warwick R M (1993) Environmental impact studies onmarine communities Pragmatical considerations Austra-lian Journal of Ecology 18 63ndash80 doi101111j1442-99931993tb00435x
Whitehurst I T amp Lindsey B I (1990) The impact oforganic enrichment on the benthic macroinvertebratecommunities of a lowland river Water Research 24625ndash630 doi1010160043-1354(90)90195-C
Winner R W Van Dyke J S Caris N amp Farrell M P (1975)Response of the macroinvertebrate fauna to a copper gradientin an experimental polluted stream Vereiningung fuumlrtheoretische und angewandte Limnologie 19 2121ndash2127
Winterbourn M J (1998) Insect faunas of acidic coal minedrainages in Westland New Zealand New ZealandJournal of Entomology 21 65ndash72
Wright I A (1994) The ecological impacts of Wentworth Fallssewage treatment plant on Blue Mountains Creek MScthesis Graduate School of the Environment MacquarieUniversity
Wright I A (2006) Australian Chironomidae (Diptera) inupland streams and freshwater lakes PhD thesis Univer-sity of Western Sydney
Wright I A Chessman B C Fairweather P G ampBenson L J (1995) Measuring the impact of sewageeffluent on the macroinvertebrate community of anupland stream The effect of different levels oftaxonomic resolution and quantification AustralianJournal of Ecology 20 142ndash149 doi101111j1442-99931995tb00528x
Water Air Soil Pollut (2009) 204227ndash241 241
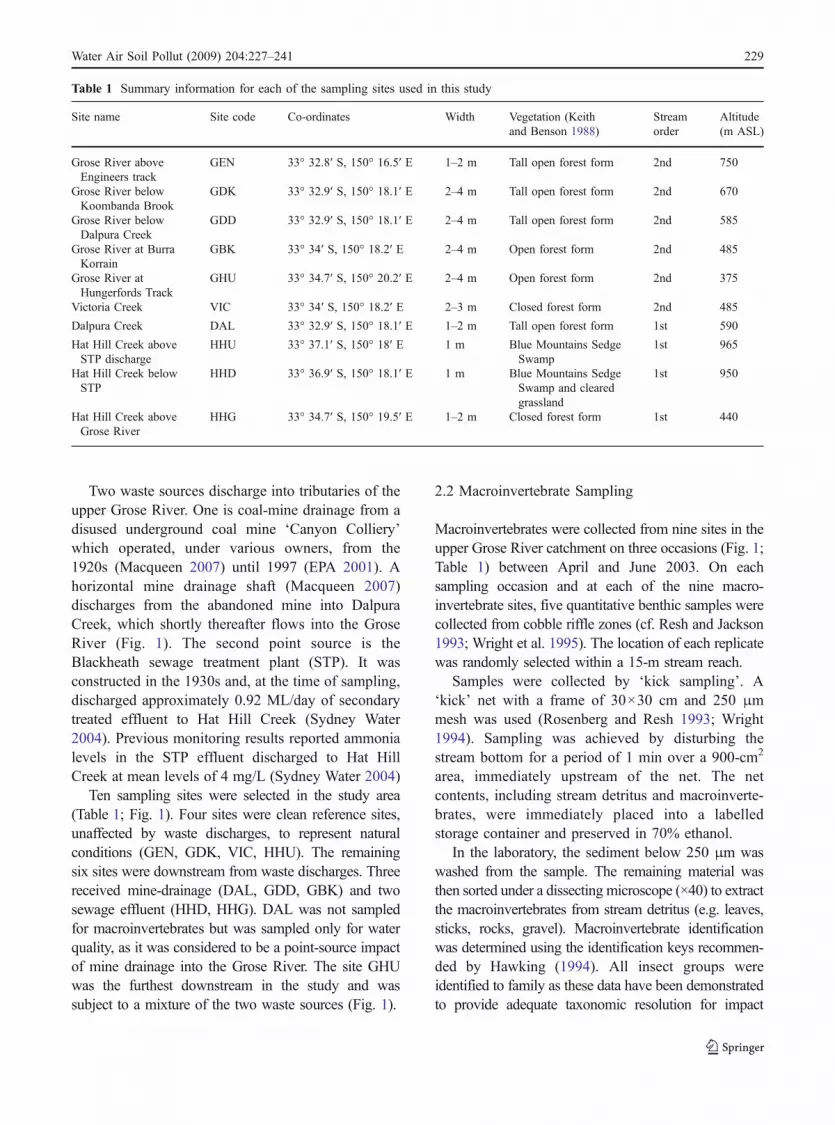

0
200
400
600
800
1000
1200
T1
T2
T3
T1
T2
T3
T1
T2
T3
T1
T2
T3
T1
T2
T3
T1
T2
T3
T1
T2
T3
T1
T2
T3
T1
T2
T3
GEN G DK GDD GBK GHU VIC HHU HHD HHG
To
tal A
bu
nd
ance
Grose River sites Tributary sites
Mine drainage
enters
Hat Hill Ck
entersSTP waste
enters
Hat Hill Creek
0
5
10
15
20
25
30
T1
T2
T3
T1
T2
T3
T1
T2
T3
T1
T2
T3
T1
T2
T3
T1
T2
T3
T1
T2
T3
T1
T2
T3
T1
T2
T3
GEN GDK GDD GBK GHU VIC HHU HHD HHG
Fam
ily R
ich
nes
s
Grose River sites Tributary sites
Mine drainage
enters
Hat Hill Ck
enters
STP waste
enters
Hat Hill Creek
0
5
10
15
20
25
30
T1
T2
T3
T1
T2
T3
T1
T2
T3
T1
T2
T3
T1
T2
T3
T1
T2
T3
T1
T2
T3
T1
T2
T3
T1
T2
T3
GEN GDK GDD GBK GHU VIC HHU HHD HHG
EP
T R
ich
nes
s
Grose River sites Tributary sites
Mine drainage
entersHat Hill Ck
entersSTP waste
enters
Hat Hill Creek
Fig 2 Back-transformedmean macroinvertebrate(top) total abundance (mid-dle) taxon richness and(lowest) EPT richness col-lected from sites in theupper Grose River and itstributaries on each of thethree sampling occasions(T1 T2 and T3) plusmnstandarderror from five replicates ateach site
234 Water Air Soil Pollut (2009) 204227ndash241
Fig 3 NMDS ordination of macroinvertebrate data Stress =02 Each symbol represents a centroid of five macroinverte-brate samples from the Grose River and its tributaries fromeach of three sampling occasions (four from GBK on secondoccasion) Reference sites are squares black VIC light grey
GEN white GDK dark grey HHU Sites immediately belowwaste discharges are diamonds black GDD (coal-mine drain-age) white HHD (sewage) Sites further downstream of wastedischarges are triangles white HHG dark grey GBK blackGHU (site abbreviations given in Table 1)
Table 4 Summary results for two-way ANOSIM
Source of variation Comparison R-statistic p ()
Site Global R 0772 01
Reference sites vs point source of zinc pollution (GDD) 0930 01
Reference sites vs second site below point source zinc pollution site (GBK) 0770 01
Reference sites vs site of combined pollution (GHU) 0611 01
Reference sites vs point source of organic pollution (HHD) 0927 01
Reference sites vs second site below organic pollution inflow (HHG) 0323 01
Comparison of within stream recovery from zinc pollution (GDD vs GBK) 0297 09
Point source of zinc pollution (GDD) vs site of combined pollution (GHU) 0927 01
Comparison of two pollution types at outflows (GDD vs HHD) 0988 01
Point source of zinc (GDD) vs downstream organic pollution (HHG) 0984 01
Downstream zinc (GBK) vs site of combined pollution (GHU) 0800 01
Downstream zinc (GBK) vs point source organic pollution (HHD) 0960 01
Downstream zinc (GBK) vs downstream organic pollution (HHG) 0923 01
Combined pollution site (GHU) vs point source organic pollution (HHD) 0944 01
Site of combined pollution (GHU) vs downstream organic pollution (HHG) 0887 01
Point source organic (HHD) vs downstream organic pollution (HHG) 0980 01
Time Global R 0126 01
Sampling time 1 vs 2 0192 01
Sampling time 1 vs 3 0162 02
Sampling time 2 vs 3 0014 272
Values of ANOSIM statistic (R) and significance (p) for pairwise differences between reference sites (GEN GDK VIC HHUgrouped) and pairwise differences between time of sampling and sample site (see Fig 1 for catchment map with sites)
Water Air Soil Pollut (2009) 204227ndash241 235
We found that biological indices (macroinvertebrateabundance family richness and EPT family richness)responded differently to the two waste discharges in thisstudy Family richness declined to a greater degreedownstream from the coal-mine drainage compared toonly a modest reduction below the STP (Fig 2) Asimilar difference in taxonomic richness to dualdisturbance gradients was observed by Metzeling etal (2006) who reported that family richness performedpoorly against a salinity gradient but better against ahabitat simplification gradient EPT richness was theonly one of the indices that responded with a reductionof similar magnitude below both the mine and STPdischarge In comparison macroinvertebrate abun-dance declined below the mine but increased immedi-ately below the STP Measuring abundance is often notincluded in many pollution studies perhaps partly dueto the popularity of rapid assessment methodologiesthat use non-quantitative techniques (eg Chessman1995) Our findings illustrate how abundance data canbe a very important ecological attribute in pollutionstudies Abundance of individual families in this studyhelped reveal differences in community structure at
Taxon Reference sites HHD Contribution () Cumulative ()
Reference sites compared to site of organic pollution outflow (HHD)
Ancylidae 245 16507 810 810
Nemertea 0 4913 622 1432
Leptophlebiidae 3348 0 583 2015
(non-Ancylidae) Gastropoda 003 1807 511 2527
Simuliidae 845 4973 438 2965
Baetidae 3023 040 435 3400
Elmidae (larvae) 2798 500 382 3782
Hydroptilidae 823 7133 375 4157
Corbiculidae 000 707 341 4497
Scirtidae 500 000 317 4814
Reference sites compared to site of mine drainage (GDD)
Leptophlebiidae 3348 0 770 770
Elmidae (larvae) 2798 027 685 1455
Baetidae 3023 020 597 2051
Oligochaeta 3387 040 589 2640
Gripopteryigidae 4162 627 423 3063
Psephenidae 745 0 409 3472
Hydropsychidae 592 1920 390 3862
Chironomidae 6263 980 360 4221
Scirtidae 500 040 337 4558
Hydroptilidae 823 560 331 4889
Table 5 Results of SIM-PER breakdown the mostinfluential macroinverte-brates contributing to thedifferent communities at thereference sites compared tothose at the site sampledbelow each pollution source
Table 6 Change in abundancea due to pollution (zinc ororganic) in the upland streams of the Grose River catchmentGreater Blue Mountains World Heritage Area
Family Coal-mine (zinc)pollution
Sewagepollution
Leptophlebiidae timestimestimes timestimestimes
Elmidae (larvae) timestimestimes timestimes
Baetidae timestimestimes timestimes
Ancylidae timestimestimes radicradicradic(Class) Oligochaeta timestimes times
Chironomidae timestimes radicGripopteryigidae timestimes timestimes
Hydropsychidae radic timestimes
Psephenidae timestimestimes timestimes
Simuliidae timestimes radicradic
radic 200 to 500 abundance radicradic 500 to 1000 radicradicradicgt1000 times 20 to 50 timestimes 1 to 20 timestimestimes lt1 or ND(not detected)a Abundance relates to comparison of abundance below eachpollution point source to average from reference sites
236 Water Air Soil Pollut (2009) 204227ndash241
polluted and unpolluted sites further details of whichare discussed further below
A group of six taxa were particularly abundant andstrongly influenced the organically polluted macro-invertebrate community below Blackheath STPAncylidae non-Ancylidae gastropods NemerteaSimuliidae Hydroptilidae and Corbiculidae Thisgroup of biota collectively increased their abundancein the presence of sewage effluent more than three
times that found at unpolluted reference sites How-ever in contrast the macroinvertebrate communitybelow the coal mine was depauperate with only oneinfluential taxa Hydropsychidae being more abun-dant here than at unpolluted sites Hydropsychidaewas much less abundant below the STP
Our finding that Hydropsychidae was tolerant ofmine drainage contrasts with findings from someAustralian metal pollution studies For example
Table 7 Summary of physicochemical data indicating mean and range (in brackets) for each water physical and chemical variableaccording to site
Site Watertemperature (degC)
pH Electricalconductivity(μScm)
Total nitrogen(μgL)
Totalphosphorus(μgL)
Total zinc(μgL)
Hardness(mgLCaCO3)
Reference sites
GEN 114 (89ndash137) 61 (600ndash633) 393 (38ndash41) 55 (25ndash100) 38 (3ndash6) 42 (25ndash50) 52 (5ndash55)
GDK 116 (87ndash147) 74 (728ndash745) 827 (70ndash92) 683 (50ndash90) 42 (3ndash6) 42 (25ndash50) 231 (20ndash26)
VIC 114 (95ndash130) 70 (692ndash723) 47 709 (25ndash130) 47 (3ndash8) 42 (25ndash50) 85 (8ndash9)
HHU 101 (95ndash112) 60 (584ndash620) 313 (29ndash33) 1017 (90ndash110) 50 (3ndash8) 62 (5ndash100) 32 (3ndash35)
Mine drainage (zinc) polluted sites
DAL 128 (113ndash153) 706 (694ndash718) 1339 (131ndash139) 25 45 (3ndash8) 5947 (545ndash650) 492 (475ndash51)
GDD 124 (102ndash151) 72 (701ndash735) 1511 (140ndash160) 25 43 (3ndash7) 388 (297ndash440) 538 (505ndash57)
GBK 125 (114ndash136) 73 (715ndash753) 1433 (130ndash150) 333 (25ndash50) 45 (3ndash7) 2613 (212ndash300) 498 (445ndash55)
STP (organic) polluted sites
HHD 112 (110ndash138) 72 (676ndash744) 3270 (132ndash462) 143167 (4400ndash21200)
5068 (204ndash820) 125 (5ndash200) 384 (37ndash395)
HHG 124 (105ndash121) 724 (718ndash727) 2308 (201ndash265) 75333 (6700ndash9000) 1892 (180ndash198) 5 232 (20ndash265)
Combined pollution site
GHU 123 (100ndash149) 76 (743ndash780) 1415 (123ndash157) 1680 (1540ndash1950) 405 (34ndash45) 707 (60ndash80) 322 (29ndash355)
See Fig 1 for map of sites
1
10
100
1000
10000
100000
GEN GDK GDD GBK GHU VIC HHU HHD HHG DAL
Mine drainage enters
Grose River
Hat Hill Ck enters
Grose River
Grose River sites Tributary sites
STP enters
Hat Hill Ck
Hat Hill Creek
Fig 4 Mean total phospho-rus (grey bar) mean totalzinc (black bar) and meantotal nitrogen (white bar) inμgL collected from dupli-cate samples at each siteon three sampling occasionsApril to June 2003 (plus onestandard error) Grose Riversites are grouped to the leftand tributary sites to theright Arrows and text indi-cate the location that minedrainage and Hat Hill Ckenters the Grose River andwhere STP effluent flowsinto Hat Hill Creek
Water Air Soil Pollut (2009) 204227ndash241 237
Norris (1986) reported that Hydropsychidae respondednegatively to metal-pollution in the MolongoloRiver and Mackey (1988) also made the sameobservation in the River Dee Metal-pollution toler-ance of Hydropsychidae was also observed inDaylight Creek (NSW) where they were the secondmost abundant taxa at a highly copper- and zinc-polluted site (Napier 1992) and in the South EskRiver (Tasmania) they were abundant at all but onemetal-polluted site (Norris et al 1982) Tolerance ofHydropsychidae to mine pollution has been docu-mented in other parts of the world for example theywere recorded in New Zealand metal-polluted water-ways (Hickey and Clements 1998) an English zinccontaminated river (Armitage 1980) and in acid minedrainage (AMD)-affected waters in Kentucky (Shortet al 1990)
The mayfly family Leptophlebiidae emerged asthe most sensitive family in this study with equaland absolute intolerance of both the mine drainageand sewage No individual specimen was collectedat either the mine-polluted site or the STP-pollutedsite Our results reinforce the reputation of Lepto-phlebiidae as one of the most pollution-sensitivemacroinvertebrate families worldwide They havebeen reported as being completely missing fromother heavily acid mine drainage-affected reachesof rivers and streams such as the River Dee inQueensland (Mackey 1988) Bobrsquos Creek in Ken-
tucky (Short et al 1990) and the River Vascatildeo inPortugal (Gerhadt et al 2004) Some pollutiontolerance has been reported with AMD-affectedstreams in New Zealand (Winterbourn 1998) con-taining Leptophlebiidae tolerant of highly acidicwaters (pH 35) Leptophlebiidae are also frequentlyreported to be very sensitive to organic pollutionwith several researchers reporting their completeabsence at the most affected sites (Cosser 1988Whitehurst and Lindsey 1990 Wright et al 1995)
Four animals that strongly contributed to com-munity structure at the polluted sites exhibitedopposite affinities towards each of the two waste-types Hydropsychidae was discussed above Theother three taxa were highly abundant in theorganic pollution below the STP (AncylidaeChironomidae and Simuliidae) and were absent orat very low abundances below the mine drainageThe gastropod Ancylidae had the most stronglydiverging relationship to the waste sources It wasmore than 1000 more abundant in the presenceof sewage effluent than at the unpolluted referencesites yet it displayed intolerance of mine pollutionThis differential tolerance is supported by themetal (SIGNAL-MET 810) and organic pollution(SIGNAL-SEW 210) grades in Chessman andMcEvoy (1998) Ancylidae have also been foundto be intolerant of mine drainage in Spain (Marqueacuteset al 2003) and were reported as being tolerant of
Table 8 Results for linear comparisons of chemical data (zinc total phosphorus and total nitrogen) compared to differences betweenreference sites and both zinc and organic pollution
Comparison (linear contrast) Zinc Total phosphorus Total nitrogen
Mean higher at F p Mean higher at F p Mean higher at F p
Reference sites vs HHD ndash 01 NS HHD 566 HHD 587
Reference sites vs GDD GDD 4456 ndash 00 NS ndash 01 NS
Reference sites vs GHU GHU 139 ndash 03 NS ndash 07 NS
GDD vs GBK GDD 310 ndash 00 NS ndash 01 NS
HHD vs HHG ndash 01 NS HHD 141 HHD 83
Comparisons are between unpolluted sites with selected polluted sites and comparison of recovery downstream of each of the pointsource outflows Specifically comparisons are between 1 unpolluted sites and site immediately downstream of organic pollutionoutflow (HHD) 2 unpolluted reference sites and zinc pollution point source (GDD) 3 unpolluted sites with most downstream sitesampled within the catchment were residues of both zinc and organic pollution combined (GHU) 4 zinc pollution point source(GDD) and downstream (GBK) and 5 organic pollution outflow site (HHD) and further downstream of organic pollution (HHG) SeeFig 1 for catchment map with sites
ns not significant
plt005 plt0001 plt00001
238 Water Air Soil Pollut (2009) 204227ndash241
sewage pollution in NSW (Wright 1994 Wright et al1995) and nutrient enrichment in the Eresma River inCentral Spain (Camargo et al 2004) although theywere absent from the most sewage-polluted sites onthe River Adur (Whitehurst and Lindsey 1990)possibly due to other human influences in thedisturbed Adur catchment
The biological and chemical changes resultingfrom pollution has been illustrated by the classicmodel developed by Hynes (1960) with a steadyincrease of lsquopollution faunarsquo below the waste dis-charge then a gradual and progressive reduction withfurther distance below the point-source and acorresponding inverse relationship with pollutionsensitive animals We found some evidence ofrecovery below each waste source compared to siteslocated in the zone of highest contamination Consid-erable recovery was evident further downstreambelow the STP discharge in Hat Hill Creek yet alower degree of recovery was observed in the GroseRiver below the coal mine until the sewage-enrichedwaters combined with the Grose River
This study constitutes some of the first Australianevidence that coal mining can result in freshwaterecosystem damage due to heavy-metal contaminationSuch cases may appear to be unusual in Australia butthis is not the case internationally where coal mininghas been more frequently associated with AMD andelevated heavy metal levels in the USA (eg Herlihyet al 1990) Europe (eg Armitage 1980 Malmqvistand Hoffsten 1999 Johnson 2003) and New Zealand(Winterbourn 1998)
This study builds upon previous northern hemi-sphere studies that also used macroinvertebrates tomeasure sewage and mine drainage impacts Theywere carried out on the Nent River system in Englandwhere they contended with contaminated runoff fromurban and agricultural landuses as well as mine andsewage impacts (Armitage 1980 Armitage andBlackburn 1985) Although strong changes in macro-invertebrate community structure were detected in theNent River there were difficulties clearly differenti-ating the specific sewage and mining impacts due tooverlapping contamination from multiple sources ofmine pollution Our current study was able to limit theconfounding effects of multiple overlapping sourcesof pollution and disturbance due to it being situated ina small catchment that was predominantly naturallyvegetated
5 Conclusions
Comparison of ecological effects of two differenttypes of pollution (organic and inorganic) in a smallcatchment with otherwise unpolluted waterwaysflowing upstream of the two waste dischargesprovided an unusual opportunity to observe therelationship of macroinvertebrates to the differentwaste sources The ecological effects of each of thetwo waste sources (STP and mine drainage) wereclearly apparent from observed changes to thetaxonomic assemblages of stream macroinvertebratesWe found that multivariate analysis of quantitativefamily level data allowed detailed assessment of thepollution impacts Three biotic indices family rich-ness total abundance and EPT richness were alsovaluable for comparing effects of the two wastes EPTrichness was particularly sensitive at detecting bio-logical impairment from both pollution sources
Acknowledgements This study formed part of the seniorauthorrsquos PhD research at the University of Western SydneySydney Water made laboratory facilities and sampling appara-tus available for use for this study Susan Alexandra Wright andother volunteers generously assisted with field work and OlegNicetic conducted univariate data analysis We are grateful forthe comments by Dr Debbie Rae Dr Helen Nice andanonymous referees on this manuscript
References
ANZECC (Australian and New Zealand Environment andConservation Council) (2000) Australian and NewZealand guidelines for fresh and marine waters CanberraAustralian and New Zealand Environment and Conserva-tion Council
APHA (American Public Health Association) (1998) StandardMethods for the Examination of Water and Wastewater(20th ed) Washington DC American Public HealthAssociation
Armitage P D (1980) The effects of mine drainage andorganic enrichment on benthos in the River Nent systemNorthern Pennines Hydrobiologia 74 119ndash128doi101007BF00014563
Armitage P D amp Blackburn J H (1985) Chironomidae in aPennine stream system receiving mine drainage andorganic enrichment Hydrobiologia 121 165ndash172doi101007BF00008720
Barbour M T Plafkin J L Bradley B P Graves C G ampWisseman R W (1992) Evaluation of EPArsquos rapidbioassessment benthic metrics Metric redundancy andvariability among reference stream sites EnvironmentalToxicology and Chemistry 11 437ndash449 doi1018971552-8618(1992)11[437EOERBB]20CO2
Water Air Soil Pollut (2009) 204227ndash241 239
BMCC (Blue Mountains City Council) (2002) State of theEnvironment Report 20012002 Katoomba NSW BlueMountains City Council
Camargo J A Alonso A amp De La Puente M (2004)Multimetric assessment of nutrient enrichment inimpounded rivers based on benthic macroinvertebratesEnvironmental Monitoring and Assessment 96 233ndash249doi101023BEMAS00000317307863075
Chessman B C (1995) Rapid assessment of rivers usingmacroinvertebrates A procedure based on habitat-specificsampling family level identification and a biotic indexAustralian Journal of Ecology 20 122ndash129 doi101111j1442-99931995tb00526x
Chessman B C (2003) New sensitivity grades for Australianriver macroinvertebrates Marine amp Freshwater Research54 95ndash103 doi101071MF02114
Chessman B C amp McEvoy P K (1998) Towards diagnosticbiotic indices for river macroinvertebrates Hydrobiologia364 169ndash182 doi101023A1003142819625
Chessman B C amp Williams S A (1999) Biodiversity andconservation of river macroinvertebrates Pacific Conser-vation Biology 5 36ndash55
Chutter F M (1972) An empirical biotic index of the qualityof water in South African streams and rivers WaterResearch 6 19ndash30 doi1010160043-1354(72)90170-4
Clarke K R (1993) Non-parametric multivariate analyses ofchanges in community structure Australian Journal ofEcology 18 117ndash143 doi101111j1442-99931993tb00438x
Connell D W amp Miller G J (1984) Chemistry andEcotoxicology of Pollution New York Brisbane JohnWiley amp Sons
Corkum L D (1989) Patterns of benthic invertebrate assemb-lages in rivers of northwestern North America FreshwaterBiology 21 191ndash205 doi101111j1365-24271989tb01358x
Cosser P R (1988) Macroinvertebrate community structure andchemistry of an organically polluted creek in south-eastQueensland Australian Journal of Marine and FreshwaterResearch 39 671ndash683 doi101071MF9880671
Cranston P S (1995) Biogeography In P Armitage et al (Ed)The Chironomidae The biology and ecology of non-bitingmidges (pp 180ndash197) Melbourne Chapman amp Hall
EPA (NSW Environment Protection Authority) (2001) CanyonColliery Environment Protection Licence Licence 558httpwwwepanswgovauprpoeolicencesL558pdfAccessed 19 February 2009
Fairweather P G (1990) Sewage and the biota on seashoresAssessment of impact in relation to natural variabilityEnvironmental Monitoring and Assessment 14 197ndash210doi101007BF00677916
Gerhadt A Janssens de Bisthoven L amp Soares A M V M(2004) Macroinvertebrate response to acid mine drainageCommunity metrics and on-line behavioural toxicitybioassay Environmental Pollution 130 263ndash274doi101016jenvpol200311016
Gresens S E Belt K T Tang J A Gwinn D C amp BanksP A (2007) Temporal and spatial responses of Chirono-midae (Diptera) and other benthic invertebrates to urbanstormwater runoff Hydrobiologia 575 173ndash190doi101007s10750-006-0366-y
Growns J E Chessman B C McEvoy P K amp Wright I A(1995) Rapid assessment of rivers using macroinverte-brates Case studies in the Nepean River and BlueMountains NSW Australian Journal of Ecology 20130ndash141 doi101111j1442-99931995tb00527x
Hawking J H (1994) A preliminary guide to keys andzoological information to identify invertebrates from Aus-tralian freshwaters Cooperative Research Centre for Fresh-water Ecology Identification Guide No 2Albury NSWCooperative Research Centre for Freshwater Ecology
Hellawell J M (1986) Biological Indicators of FreshwaterPollution and Environmental Management London Elesvier
Herlihy A T Kaufman P R Mitch M E amp Brown D D(1990) Regional estimates of acid mine drainage impacton streams in the mid-Atlantic and southeastern UnitedStates Water Air and Soil Pollution 50 91ndash107doi101007BF00284786
Hickey C W amp Clements W H (1998) Effects of heavymetals on benthic macroinvertebrate communities in NewZealand streams Environmental Toxicology and Chemis-try 17 2338ndash2346 doi1018971551-5028(1998)017lt2338EOHMOBgt23CO2
Hynes H B N (1960) The Biology of Polluted WatersLiverpool Liverpool University Press
Johnson D B (2003) Chemical and microbiological charac-teristics of mineral spoils and drainage waters at aban-doned coal and metal mines Water Air and SoilPollution 3 47ndash66
Jolly V H amp Chapman M A (1966) A preliminarybiological study of the effects of pollution on FarmersrsquosCreek and Coxrsquos River New South Wales Hydrobiologia27 160ndash192 doi101007BF00161494
Keith D A amp Benson D H (1988) Natural vegetation of theKatoomba area Cunninghamia 2 107ndash144
Kitchin P L (2005) Measuring the amount of statisticalinformation in the EPT index Environmetrics 16 51ndash59doi101002env670
Lenat D R (1988) Water quality assessment of streams usinga qualitative collection method for benthic macroinverte-brates Bulletin of the North American BenthologicalSociety 7 222ndash233 doi1023071467422
Lenat D R amp Penrose D L (1996) History of the EPT taxarichness metric Bulletin of the North American Bentho-logical Society 13 305ndash307
Mackey A P (1988) The biota of the River Dee (centralQueensland Australia) in relation to the effects of acidmine drainage Proceedings of the Royal Society ofQueensland 99 9ndash19
Macqueen A (2007) Back from the Brink Blue Gum Forestand the Grose Wilderness Second Edition 8 Angel StWentworth Falls NSW self-published
Malmqvist B amp Hoffsten P (1999) Influence of drainagefrom old mine deposits on benthic macroinvertebratecommunities in central Swedish streams Water Research33 2415ndash2423 doi101016S0043-1354(98)00462-X
Marchant R Barmutta L A amp Chessman B C (1994)Preliminary study of the ordination and classification ofmacroinvertebrate communities from running waters inVictoria Australia Australian Journal of Marine andFreshwater Research 45 945ndash962 doi101071MF9940945
240 Water Air Soil Pollut (2009) 204227ndash241
Marqueacutes M J Martiacutenez-Conde E amp Rovira J V (2003)Effects of zinc and lead mining on the benthic macro-invertebrates of a fluvial ecosystem Water Air and SoilPollution 148 363ndash388 doi101023A1025411932330
McCord S B Grippo R S amp Eagle D M (2007) Effects ofsilviculture using best management practices on streammacroinvertebrate communities in three ecoregions ofArkansas USA Water Air and Soil Pollution 184 299ndash311 doi101007s11270-007-9417-x
Metzeling L Perriss S amp Robinson D (2006) Can thedetection of salinity and habitat simplification gradientsusing rapid bioassessment of benthic invertebrates beimproved through finer taxonomic resolution or alterna-tives indices Hydrobiologia 572 235ndash252 doi101007s10750-005-9004-3
Napier G M (1992) Application of laboratory-derived data tonatural aquatic ecosystems PhD thesis Graduate Schoolof the Environment Macquarie University
Norris R H (1986) Mine waste pollution of the MolongloRiver New South Wales and the Australian CapitalTerritory Effectiveness of remedial works at Captains Flatmining area Australian Journal of Marine and FreshwaterResearch 37 147ndash157 doi101071MF9860147
Norris R H Lake P S amp Swain R (1982) Ecologicaleffects of mine effluents on the South Esk River north-eastern Tasmania (III) Benthic macroinvertebrates Aus-tralian Journal of Marine and Freshwater Research 33789ndash809 doi101071MF9820789
NPWS (National Parks and Wildlife Service) (1999) BlueMountains National Park Walking Track Guide WalkingTracks in the Grose Valley Blue Mountains HeritageCentre Blackheath NSW self-published
NPWS (National Parks and Wildlife Service) (2001) BlueMountains National Park Plan of Management BlueMountains Heritage Centre Blackheath NSW self-published
Pinder L C V amp Far I S (1987) Biological surveillance ofwater quality 3 The influence of organic enrichment onthe macroinvertebrate fauna of small chalk streams Archivfuer Hydrobiologie 109 619ndash637
Plafkin J L Barbour M T Porter K D Grosse S K ampHughes R M (1989) Rapid bioassessment protocols foruse in streams and rivers Benthic macroinvertebrates andfish Washington DC United States EnvironmentalProtection Agency
Resh V H amp Jackson J K (1993) Rapid assessmentapproaches to biomonitoring using benthic macroinverte-brates In D M Rosenberg amp V H Resh (Eds)Freshwater Biomonitoring and Benthic Macroinverte-brates (pp 195ndash223) New York London Chapman ampHall
Rosenberg D M amp Resh V H (1993) Freshwaterbiomonitoring and benthic macroinvertebrates New YorkLondon Chapman amp Hall
Say P J amp Whitton B A (1981) Changes in flora down astream showing a zinc gradient Hydrobiologia 76 255ndash262 doi101007BF00006217
Sheehan P J (1984) Effects on community and ecosystemstructure and dynamics In P J Sheehan et al (Ed)Effects of Pollutants at the Ecosystem Level (pp 51ndash100)Chichester New York John Wiley amp Sons
Short T Black J A amp Birge W J (1990) Effects of acid-mine drainage on the chemical and biological character ofan alkaline headwater stream Archives of EnvironmentalContamination and Toxicology 19 241ndash248 doi101007BF01056093
Sloane P I W amp Norris R H (2003) Relationship ofAUSRIVAS-based macroinvertebrate predictive model out-puts to a metal pollution gradient Journal of the NorthAmerican Benthological Society 22 457ndash471 doi1023071468274
Sydney Water Corporation (2004) Annual EnvironmentalIndicators Compliance Report 20032004 Sydney NSWSydney Water Corporation
Underwood A J (1991) Beyond BACI Experimental designsfor detecting human environmental impacts on temporalvariations in natural populations Australian Journal ofMarine and Freshwater Research 42 569ndash587doi101071MF9910569
Walsh C J Sharpe A K Breen P F amp Sonneman J A(2001) Effects of urbanisation on streams of the Mel-bourne region Victoria Australia I Benthic macroinver-tebrate communities Freshwater Biology 46 535ndash551doi101046j1365-2427200100690x
Warwick R M (1993) Environmental impact studies onmarine communities Pragmatical considerations Austra-lian Journal of Ecology 18 63ndash80 doi101111j1442-99931993tb00435x
Whitehurst I T amp Lindsey B I (1990) The impact oforganic enrichment on the benthic macroinvertebratecommunities of a lowland river Water Research 24625ndash630 doi1010160043-1354(90)90195-C
Winner R W Van Dyke J S Caris N amp Farrell M P (1975)Response of the macroinvertebrate fauna to a copper gradientin an experimental polluted stream Vereiningung fuumlrtheoretische und angewandte Limnologie 19 2121ndash2127
Winterbourn M J (1998) Insect faunas of acidic coal minedrainages in Westland New Zealand New ZealandJournal of Entomology 21 65ndash72
Wright I A (1994) The ecological impacts of Wentworth Fallssewage treatment plant on Blue Mountains Creek MScthesis Graduate School of the Environment MacquarieUniversity
Wright I A (2006) Australian Chironomidae (Diptera) inupland streams and freshwater lakes PhD thesis Univer-sity of Western Sydney
Wright I A Chessman B C Fairweather P G ampBenson L J (1995) Measuring the impact of sewageeffluent on the macroinvertebrate community of anupland stream The effect of different levels oftaxonomic resolution and quantification AustralianJournal of Ecology 20 142ndash149 doi101111j1442-99931995tb00528x
Water Air Soil Pollut (2009) 204227ndash241 241
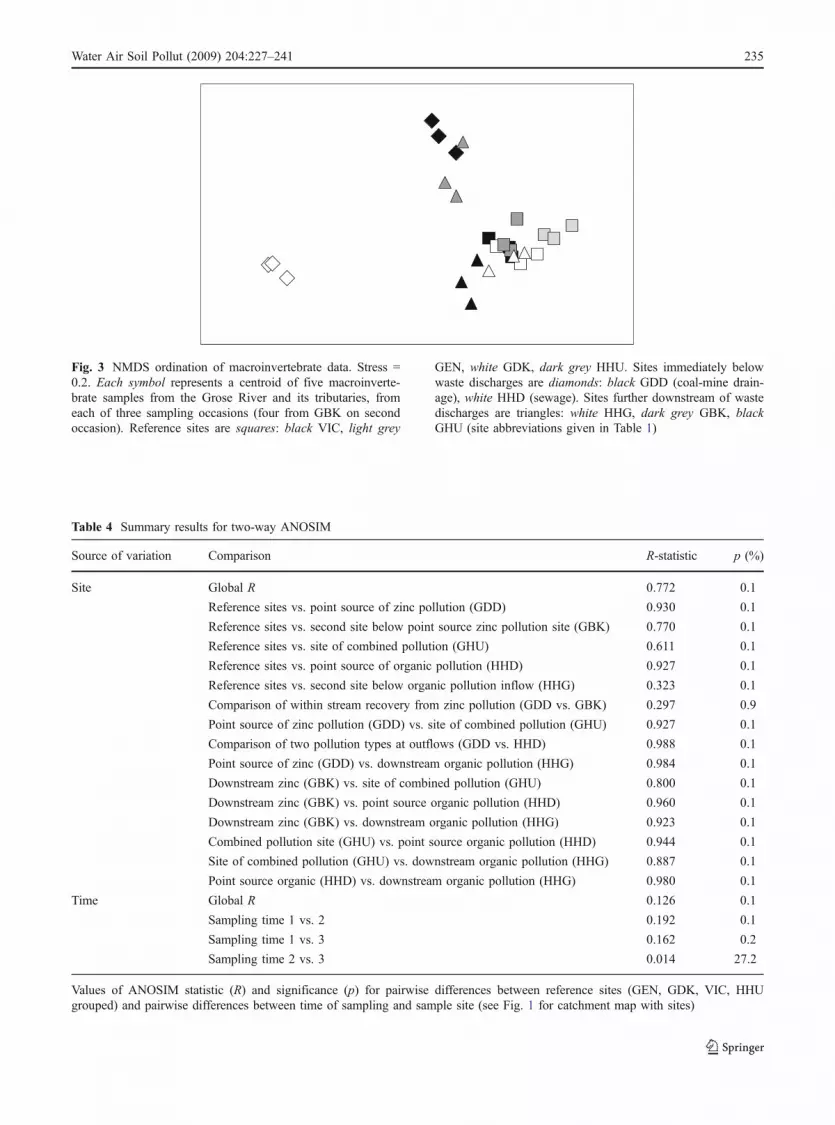


