Embed Size (px)
Citation preview

RADIOCARBON, Vol 42, Nr 3, 2000, p 403–414 © 2000 by the Arizona Board of Regents on behalf of the University of Arizona
403
COMPARISON OF U-SERIES AND RADIOCARBON DATES OF SPELEOTHEMS
Tomasz Goslar1 • Helena Hercman2 • Anna Pazdur1
ABSTRACT. The paper presents a comparison of U-series and radiocarbon dates of speleothems collected in several cavesin central and southern Europe and southeast Africa. Despite a large spread of dates, mainly due to contamination withyounger carbon, the group of corresponding 14C and 230Th/U ages of speleothem samples seems to be coherent with the pre-vious suggestion of large deviation between the 14C and the absolute time scale between 35 and 45 ka BP. This agrees withthe result of frequency analysis of published 14C and 230Th/U ages of speleothem.
INTRODUCTION
Calibration of the radiocarbon time scale has been a subject of research for more than 40 years.Recently, the 14C calibration has been extended far beyond the beginning of Holocene, due to thedata from corals (Bard et al. 1998), and from annually laminated oceanic and lacustrine sediments(Hughen et al. 1998; Goslar et al. 1995; Kitagawa and van der Plicht 1998). These data indicate devi-ation between the 14C and the absolute time scale increasing from 1000 to >3000 years between 11and 24 ka BP.
The 14C calibration is important not only to geochronologists, but it is also related to reconstructionof past geomagnetic fields (e.g. Mazaud et al. 1991; Laj et al. 1996; Bard 1998), solar activity (e.g.Stuiver and Braziunas 1993; Bard 1998), and water circulation in the ocean (e.g. Goslar et al. 1995,1999; Hughen et al. 1998; Bard 1998). The latter factor appeared best reflected in the Younger Dryasperiod, and with much lower confidence at the beginning of Bølling interstadial slightly after 15,000cal BP (Stuiver et al. 1998). For the earlier time, large variations of atmospheric 14C concentrationare expected because of the changes of the geomagnetic field (Laj et al. 1996; Tric et al. 1992), con-nected even with disappearance of deviation between 14C and absolute time scales before 40 ka BP(Mazaud et al. 1991). For the period before 23 ka BP, however, only two 14C dates of corals are avail-able (Bard et al. 1998). They are supplemented by some dates from laminated sediments of LakeSuigetsu, Japan, but the relevant part of the Suigetsu varve chronology is based on only a single core,and therefore, needs to be confirmed (Kitagawa and van der Plicht 1998).
Another material enabling comparison of 14C and calendar time scales is speleothem. Using 14C and230Th/U ages of stalagmite from the Cango Cave in South Africa, Vogel (1983) found large devia-tions between both time scales in the late Pleistocene, well before the coral dates became available.In recent years, the set of the Cango dates has been enlarged and completed with dates from Lynd’sCave, Tasmania (Vogel and Kronfeld 1997). A similar study was published by Holmgren et al.(1994), who dated stalagmites from the Lobatse II Cave, Botswana. Our goal was to enlarge signif-icantly the set of speleothem dates, by 14C and 230Th/U dating of stalagmites from many sites inEurope and Africa.
MATERIAL AND METHODS
In our research, we used speleothem samples collected in several caves (Table 1, Figure 1) in centraland southern Europe, and in southeast Africa. For dating, we selected the largest stalagmites accessi-ble. From each specimen, a slice about 1 cm thick was cut out along the stalagmite axis, and for datingwe used sections with large and clear carbonate crystals, transparent on the slices. These 0.3–3 cm
1Radiocarbon Laboratory, Institute of Physics, Silesian University of Technology, ul. Krzywoustego 2, 44-100 Gliwice,Poland. Email: [email protected].
2Institute of Geological Sciences, Polish Academy of Sciences, ul. Twarda 51/55, 00-818 Warsaw, Poland
404 T Goslar et al.
Sam
ple
Dis
tanc
e fr
om b
ase
(mm
)
14C
age
(BP
)C
orre
cted
14C
age
(B
P)
U(p
pm)
230 T
h/U
age
(cal
BP
)
Cor
rect
ed
230 T
h/U
age
(cal
BP
)
Sude
ty M
ount
ains
(Po
land
)N
ied
wie
dzia
1A
0–18
10,5
40 ±
800
088
40 ±
100
00.
144
± 0.
004
1.20
± 0
.03
18.5
0.11
2 ±
0.00
312
,810
± 3
7011
,830
± 7
0000
Nie
dw
iedz
ia 1
B18
–60
10,4
10 ±
700
087
10 ±
100
0N
ied
wie
dzia
1C
86–1
2290
90 ±
800
073
90 ±
100
00.
064
± 0.
002
1.53
± 0
.07
6.5
0.10
3 ±
0.00
211
,750
± 2
809,
9160
± 1
5000
Nie
dw
iedz
ia 1
D18
2–21
753
80 ±
800
036
80 ±
100
00.
060
± 0.
002
1.89
± 0
.09
4.6
0.10
3 ±
0.00
211
,660
± 2
409,
7970
± 1
5000
Nie
dw
iedz
ia 5
/244
80 ±
600
027
80 ±
100
00.
016
± 0.
002
4.75
± 0
.52
70.
171
± 0.
035
19,9
30 ±
445
016
,000
± 5
5000
Mor
avia
n K
arst
(C
zech
Rep
ubli
c)H
olst
ynsk
a 2/
10.
34 ±
0.0
101.
89 ±
0.0
352
0.13
0 ±
0.00
715
,000
± 8
00H
olst
ynsk
a 2/
213
,350
± 1
700
11,6
50 ±
105
00.
604
± 0.
010
1.68
± 0
.03
205
0.11
4 ±
0.00
513
,100
± 6
00H
olst
ynsk
a 2/
488
10 ±
700
071
10 ±
100
00.
519
± 0.
011.
35 ±
0.0
212
0.09
3 ±
0.00
610
,500
± 7
009,
9230
± 1
1000
Kad
lec
108
590
± 1
500
6890
± 1
000
0.14
4 ±
0.00
81.
38 ±
0.1
01.
60.
11
± 0.
010
13,4
00 ±
900
9,8
90 ±
550
00K
adle
c 2
8140
± 6
000
6440
± 1
000
0.11
5 ±
0.00
51.
42 ±
0.0
72
0.17
1 ±
0.00
420
,160
± 5
109,
5280
± 5
700
Cra
cow
-Wie
lu
ñ
Upl
and
(Pol
and)
Dzi
ewic
za 1
/547
,800
± 1
500
46,1
00 ±
180
00.
047
± 0.
003
2.41
± 0
.17
8.8
0.53
± 0
.050
76,1
00 ±
10,
200
66,9
00 ±
13,
400
Bez
Naz
wy
1/1
30–4
030
,400
± 1
900
28,7
00 ±
220
00.
070
± 0.
003
1.75
± 0
.10
4.8
0.36
± 0
.010
47,0
40 ±
142
034
,800
± 1
5000
Bez
Naz
wy
1/2
20–3
044
,500
± 2
200
42,8
00 ±
250
00.
054
± 0.
002
2.09
± 0
.11
4.6
0.51
± 0
.010
72,9
20 ±
258
055
,100
± 2
8000
W T
omas
zów
kach
235
,200
± 6
000
33,5
00 ±
120
00.
050
± 0.
002
1.99
± 0
.11
30.
34 ±
0.0
3044
,130
± 4
270
24,2
00 ±
620
00W
iern
a A
+B
+C
70–1
8047
,200
+ 4
300
−280
045
,500
+ 4
400
−300
0W
iern
a B
+C
100–
180
0.11
7 ±
0.00
31.
09 ±
0.0
384
1.01
± 0
.020
>35
0,00
0W
iern
a D
+E
+F
182–
282
>46
,000
>44
,000
Wie
rna
D+
E18
0–25
00.
110
± 0.
004
0.97
6 ±
0.05
291.
04 ±
0.0
5>
350,
000
Wie
rna
G28
0–30
040
,200
+ 2
600
−200
038
,500
+ 2
800
−230
0W
iern
a H
300–
320
>46
,300
>46
,700
>44
,500
>45
,000
U23
4 U23
8----
-------
Th
230 T
h23
2----
--------
--T
h23
0
U23
4----
--------
--
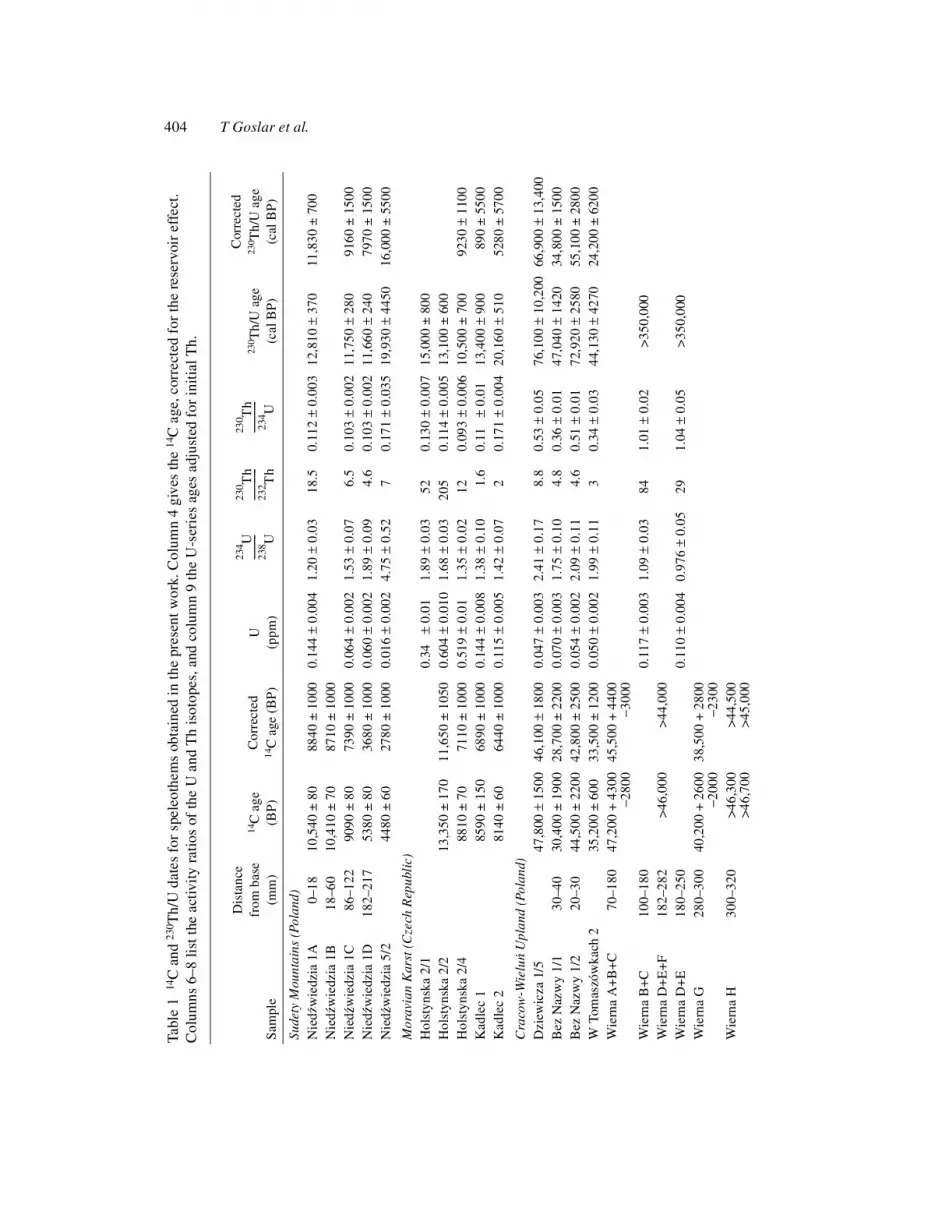
Tabl
e1
14C
and
230 T
h/U
dat
es f
or s
pele
othe
ms
obta
ined
in th
e pr
esen
t wor
k. C
olum
n 4
give
s th
e 14
C a
ge, c
orre
cted
for
the
rese
rvoi
r ef
fect
. C
olum
ns 6
–8 li
st th
e ac
tivit
y ra
tios
of
the
U a
nd T
h is
otop
es, a
nd c
olum
n 9
the
U-s
erie
s ag
es a
djus
ted
for
init
ial T
h.
U-Series and 14C Dates of Speleothems 405
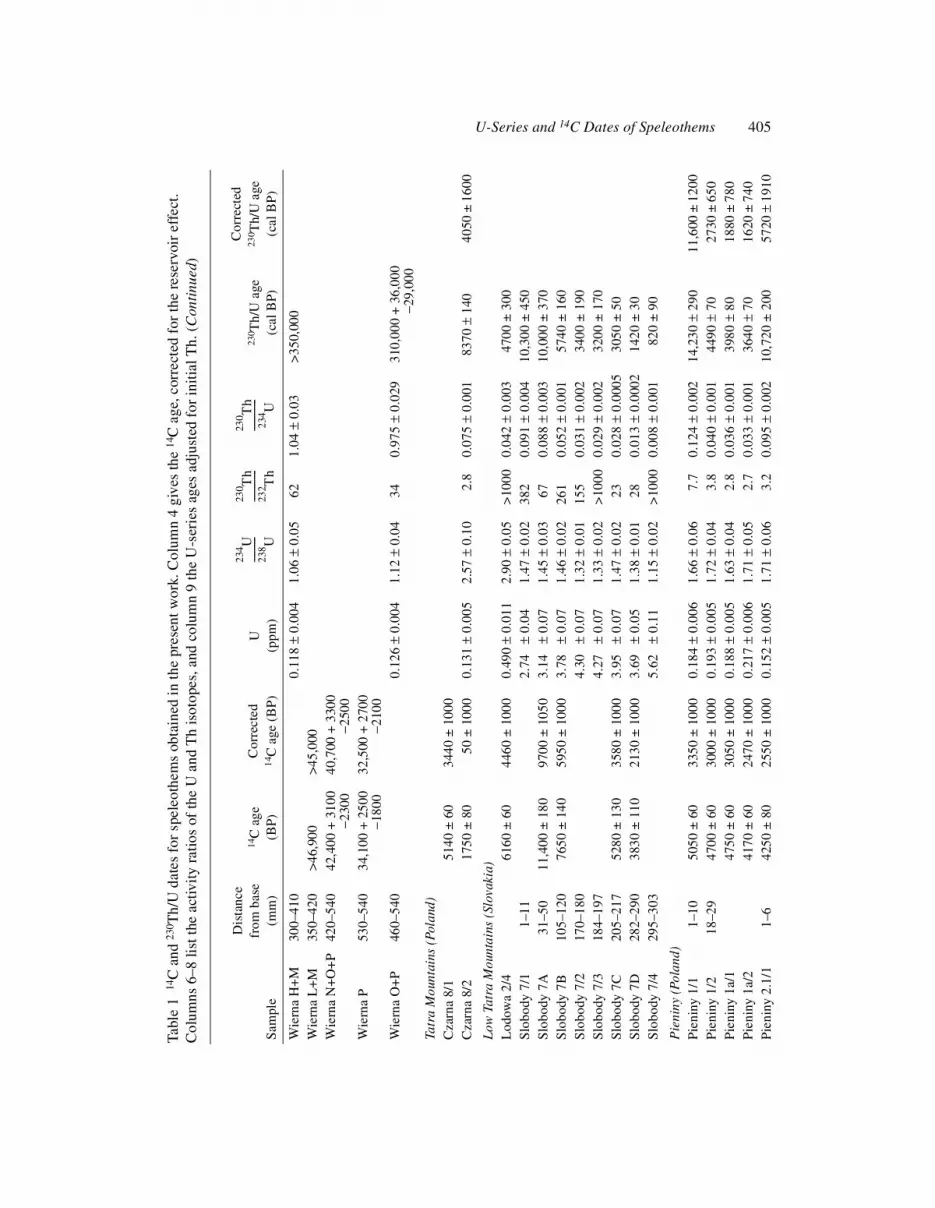
Tabl
e1
14C
and
230 T
h/U
dat
es f
or s
pele
othe
ms
obta
ined
in th
e pr
esen
t wor
k. C
olum
n 4
give
s th
e 14
C a
ge, c
orre
cted
for
the
rese
rvoi
r ef
fect
. C
olum
ns 6
–8 li
st th
e ac
tivit
y ra
tios
of
the
U a
nd T
h is
otop
es, a
nd c
olum
n 9
the
U-s
erie
s ag
es a
djus
ted
for
init
ial T
h. (
Con
tinu
ed)
Sam
ple
Dis
tanc
e fr
om b
ase
(mm
)
14C
age
(BP)
Cor
rect
ed14
C a
ge (
BP
)U
(ppm
)
230 T
h/U
age
(cal
BP)
Cor
rect
ed
230 T
h/U
age
(cal
BP
)
Wie
rna
H+
M30
0–41
00.
118
± 0.
004
1.06
± 0
.05
621.
04 ±
0.0
3>
350,
000
Wie
rna
L+
M35
0–42
0>
46,9
00>
45,0
00W
iern
a N
+O
+P
420–
540
42,4
00 +
310
0−2
300
40,7
00 +
330
00−2
500
Wie
rna
P53
0–54
034
,100
+ 2
500
−180
032
,500
+ 2
7000
−210
0W
iern
a O
+P
460–
540
0.12
6 ±
0.00
41.
12 ±
0.0
434
0.97
5 ±
0.02
931
0,00
0 +
36,
000
−29,
000
Tatr
a M
ount
ains
(Po
land
)C
zarn
a 8/
1,2
5140
± 6
000
3440
± 1
000
Cza
rna
8/2
,217
50 ±
800
00
050
± 1
000
0.13
1 ±
0.00
52.
57 ±
0.1
02.
80.
075
± 0.
001
0837
0 ±
140
,040
50 ±
160
0
Low
Tat
ra M
ount
ains
(Sl
ovak
ia)
Lod
owa
2/4
,261
60 ±
600
0044
60 ±
100
00.
490
± 0.
011
2.90
± 0
.05
>10
000.
042
± 0.
003
,047
00 ±
300
0S
lobo
dy 7
/11–
112.
74
± 0.
041.
47 ±
0.0
238
20.
091
± 0.
004
10,3
00 ±
450
0S
lobo
dy 7
A31
–50
11,4
00 ±
180
097
00 ±
105
03.
14
± 0.
071.
45 ±
0.0
367
0.08
8 ±
0.00
310
,000
± 3
700
Slo
body
7B
105–
120
,276
50 ±
140
0059
50 ±
100
03.
78
± 0.
071.
46 ±
0.0
226
10.
052
± 0.
001
,057
40 ±
160
Slo
body
7/2
170–
180
4.30
± 0
.07
1.32
± 0
.01
155
0.03
1 ±
0.00
2,0
3400
± 1
90S
lobo
dy 7
/318
4–19
74.
27 ±
0.0
71.
33 ±
0.0
2>
1000
0.02
9 ±
0.00
2,0
3200
± 1
70S
lobo
dy 7
C20
5–21
7,2
5280
± 1
3000
3580
± 1
000
3.95
± 0
.07
1.47
± 0
.02
230.
028
± 0.
0005
,030
50 ±
500
Slo
body
7D
282–
290
,238
30 ±
110
0213
0 ±
100
03.
69 ±
0.0
51.
38 ±
0.0
128
0.01
3 ±
0.00
02,0
1420
± 3
000
Slo
body
7/4
295–
303
5.62
± 0
.11
1.15
± 0
.02
>10
000.
008
± 0.
001
,082
0 ±
900
0
Pie
niny
(Po
land
)P
ieni
ny 1
/11–
10,2
5050
± 6
0003
350
± 1
000
0.18
4 ±
0.00
61.
66 ±
0.0
67.
70.
124
± 0.
002
14,2
30 ±
290
011
,600
± 1
200
Pie
niny
1/2
18–2
9,2
4700
± 6
0003
000
± 1
000
0.19
3 ±
0.00
51.
72 ±
0.0
43.
80.
040
± 0.
001
,044
90 ±
700
0,0
2730
± 6
500
Pie
niny
1a/
1,2
4750
± 6
0003
050
± 1
000
0.18
8 ±
0.00
51.
63 ±
0.0
42.
80.
036
± 0.
001
,039
80 ±
800
0,0
1880
± 7
800
Pie
niny
1a/
2,2
4170
± 6
0002
470
± 1
000
0.21
7 ±
0.00
61.
71 ±
0.0
52.
70.
033
± 0.
001
,036
40 ±
700
0,0
1620
± 7
400
Pie
niny
2.1
/11–
6,2
4250
± 8
0002
550
± 1
000
0.15
2 ±
0.00
51.
71 ±
0.0
63.
20.
095
± 0.
002
10,7
20 ±
200
0,0
5720
± 1
910
U23
4 U23
8----
-------
Th
230 T
h23
2----
--------
--T
h23
0
U23
4----
--------
--

406 T Goslar et al.
Sam
ple
Dis
tanc
e fr
om b
ase
(mm
)
14C
age
(BP)
Cor
rect
ed14
C a
ge (
BP)
U(p
pm)
230 T
h/U
age
(cal
BP
)
Cor
rect
ed
230 T
h/U
age
(cal
BP
)
Pie
niny
2.1
/26 −
13,4
440
± 8
0002
740
± 1
000
Pie
niny
2.1
/313
−20
,412
0 ±
600
0242
0 ±
100
00.
147
± 0.
005
1.84
± 0
.07
3.2
0.06
1 ±
0.00
2,6
870
± 18
00,3
660
± 1
270
Slov
ak K
arst
(Sl
ovak
ia)
Kra
snoh
orsk
a 1A
35,5
00 ±
170
033
,800
± 2
000
0.03
5 ±
0.00
22.
17 ±
0.1
65.
90.
44
± 0.
0158
,880
± 1
900
47,2
00 ±
620
0K
rasn
ohor
ska
KZ
SA
36,6
00 ±
500
034
,900
± 5
100
0.18
5 ±
0.01
13.
80 ±
0.2
522
0.42
± 0
.03
52,0
00 ±
450
0
Rus
e re
gion
(B
ulga
ria)
Bul
gari
a O
Cz
137
,000
± 1
400
35,3
00 ±
170
00.
092
± 0.
004
1.46
± 0
.07
>10
000.
33
± 0.
0242
,700
± 3
600
Bul
gari
a O
Cz
212
,900
± 1
5011
,200
± 1
000
0.16
7 ±
0.00
51.
67 ±
0.0
6>
1000
0.19
± 0
.02
22,4
00 ±
260
0B
ulga
ria
Bul
g 1
38,3
00 ±
700
36,6
00 ±
125
00.
096
± 0.
007
1.08
± 0
.11
310.
38
± 0.
0352
,000
± 5
000
Bul
gari
a B
ulg
221
,650
± 2
8019
,950
± 1
100
Bul
gari
a B
ulg
315
,650
± 1
0013
,950
± 1
000
0.13
2 ±
0.00
51.
14 ±
0.0
610
0.18
±
0.05
21,4
50 ±
700
018
,500
± 8
000
Bul
gari
a B
ulg
411
,250
± 1
400,
9550
± 1
000
0.10
5 ±
0.00
31.
17 ±
0.0
422
0.01
9 ±
0.06
0,2
000
± 7
000
Tanz
ania
Tanz
ania
MA
F1A
0 −26
33,7
00 ±
110
032
,000
± 1
500
0.50
9 ±
0.01
31.
10 ±
0.0
324
0.31
±
0.01
40,1
90 ±
850
Tanz
ania
MA
F1B
90−1
0436
,700
+37
00−2
600
35,0
00 ±
380
00.
231
± 0.
005
1.12
± 0
.03
180.
31
± 0.
0139
,600
± 7
2037
,000
± 1
000
Tanz
ania
MA
F1C
151−
165
32,0
00 ±
160
030
,300
± 1
900
0.22
6 ±
0.00
81.
31 ±
0.0
533
0.34
± 0
.01
44,4
00 ±
200
0Ta
nzan
ia M
AF
1D24
4−25
833
,800
± 1
700
32,1
00 ±
200
00.
26
± 0.
011.
02 ±
0.0
528
0.28
8 ±
0.00
737
,000
± 1
000
Tanz
ania
MA
F1E
282−
296
31,6
00 ±
160
029
,900
± 1
900
Tanz
ania
MA
F1F
334 −
346
29,8
00 ±
130
028
,100
± 1
700
0.18
3 ±
0.00
61.
17 ±
0.0
58.
80.
36
± 0.
0147
,160
± 1
130
40,0
00 ±
200
0
U23
4 U23
8----
-------
Th
230 T
h23
2----
--------
--T
h23
0
U23
4----
--------
--
Tabl
e1
14C
and
230 T
h/U
dat
es f
or s
pele
othe
ms
obta
ined
in th
e pr
esen
t wor
k. C
olum
n 4
give
s th
e 14
C a
ge, c
orre
cted
for
the
rese
rvoi
r ef
fect
.C
olum
ns 6
–8 li
st th
e ac
tivit
y ra
tios
of
the
U a
nd T
h is
otop
es, a
nd c
olum
n 9
the
U-s
erie
s ag
es a
djus
ted
for
init
ial T
h. (
Con
tinu
ed)

U-Series and 14C Dates of Speleothems 407
(most frequently 0.5–1.5 cm) wide sections were cut out along growth layers, and divided in two por-tions. The edges of some stalagmites had fine-grained structure, and these sections were avoided.Also, we did not use sections containing depositional discontinuities.
One portion was dated by the 14C method in the Gliwice Radiocarbon Laboratory, using the CO2-filled proportional counters. Prior to separation of CO2 for dating the outer part of the sample (about20% of sample mass) was leached out with 4% HCl. Table 1 lists the 14C dating results.
The twin sample was dated by the 230Th/U method at the Institute of Geological Sciences, PolishAcademy of Sciences, Warsaw. Standard radiometric dating procedure of the 230Th/234U methodwas used (Ivanovich and Harmon 1992). Samples of 10–40 g were dissolved in about 6 mol nitricacid. Uranium and thorium fractions were separated by chromatography. 234U, 238U, 230Th, and232Th activities were measured by using isotope dilution with a 228Th/232U spike. All measurementswere done with alpha spectrometry using OCTET PC (EG&G ORTEC). The ages were calculatedby standard algorithm (Ivanovich and Harmon 1992). Reported errors are 1 sigma. For the sampleswith 230Th/232Th <20, correction for detrital thorium was performed using an assumed initial 230Th/232Th of 1.5 ± 0.5. Results of the measurements are listed in Table 1.
DISCUSSION
14C dates of speleothem samples are obviously affected by the “reservoir effect” because the 14C inprecipitating speleothem is diluted with the 14C-free carbon from leached carbonate rocks. There-fore, the 14C age of speleothem is greater than that of organisms deriving carbon from the atmo-sphere. So-called “apparent ages” are obtained. In the range of the 14C calibration curve, the dilution
Figure 1 Map showing regions in Europe, where the samples listed in Table 1have been collected. 1. Sudety Mountains (Poland), 2. Moravian Karst (CzechRepublic), 3. Cracow-Wieluñ Upland (Poland), 4. Tatra Mountains (Poland),5. Low Tatra Mountains (Slovakia), 6. Pieniny (Poland), 7. Slovak Karst (Slo-vakia), 8. Ruse region (Bulgaria), 9. One speleothem comes from Tanzania,Africa (collected by K Holmgren).
112
3
45
67
8
9
South Africa

408 T Goslar et al.
factor can be assessed when the absolute age of the speleothem is known. Recent compilation of bib-liographic data (Genty and Massault 1997) suggests that the dilution factors usually range between0.7 and 0.9 (corresponding to apparent ages between 2750 and 750 yr), with the mean value of about0.8 (apparent age of 1700 yr). In our studies the reservoir corrections of the speleothem samplesfrom the Slobody Cave (Figure 2) are fairly constant over the whole Holocene and range from 2300to 2700 yr. However, for most of our samples the reservoir correction is not exactly known, and (cf.Table 1) we used a value of 1700 ± 1000 yr.
The precision of the 230Th/U ages strongly depends on the concentrations of uranium and detritalthorium. In our collection, the lowest U concentration (usually <0.1 ppm) was revealed by the sam-ples from the Cracow-Wieluñ Upland. Activity of detrital 230Th, which is not produced from thedecay of 234U in the speleothem, is routinely subtracted from the measured total 230Th activity (if230Th/232Th activity ratio is less than 20). It is determined through the measurement of 232Th activity,and an assumed initial activity ratio of 232Th and 230Th in the detrital minerals. This ratio is, however,usually not exactly known, but ranges between 1 and 2 according to bibliographic data.
The uncertainty of the 230Th/232Th activity ratio affects the accuracy of the 230Th/U age, especiallywhen the activity of 232Th is high. For a few samples, the error in 230Th/U age reached as much asseveral thousand years (Table 1).
In Figure 3 we compare the 14C and 230Th/U ages of our samples, together with the earlier publisheddatings of speleothem and lignite (Goede and Vogel 1991; Holmgren et al. 1994; Vogel and Kron-feld 1997; Geyh and Schlüchter 1998), and with the coral 14C calibration data (Bard et al. 1998). Thespread of our data points (Figure 3) is large. Comparison with the calibration dates suggests thatmany 14C ages are too low, or 230Th/U ages too high. The former case appears more probable, asyoung (or modern) carbonate might be deposited in the original structure of porous speleothem or infractures. Such contamination distinctly affects 14C ages of old samples, while its influence on the
Figure 2 Profiles of 230Th/U (solid symbols) and 14C (open symbols) age of selectedstalagmites. Squares = Slobody Cave; circles = MAF, Tanzania (this work); triangles =Lobatse II, Botswana (Holmgren et al. 1994). Open squares connected with dashed linerepresent 14C ages of samples in equilibrium with atmospheric carbon, obtained from230Th/U ages using the 14C calibration curve.
0 5 10
0
10
20
30
20 30 40 50
Dis
tanc
e ab
ove
the
base
(cm
)
230 14Th/U, C age (kyr BP)

U-Series and 14C Dates of Speleothems 409
230Th/U ages is much smaller. For example, 5% contamination of 40 ka old speleothem wouldchange the 230Th/U age by less than 2000, and the 14C age by almost 15,000 years. Such an effectwas observed for the stalagmite from the Lobatse II Cave (Holmgren et al. 1994) through the non-monotonous profile of 14C age between 10 and 20 cm (Figure 2). Contamination with younger car-bon is also evident in the speleothem from the Wierna Cave. This speleothem, dated with a 230Th/Uage to >300 ka BP, gave four finite 14C ages, one of them even less than 40,000 BP (Figure 3). Withthis explanation in mind, one could expect the “true” relationship between 14C and calendar timescales represented by the upper edge of the range covered by our dates. Such an edge can be tracedbetween 35 and 45 ka BP, and indeed, it well agrees with the other dates.
On the other hand, profiles of 14C and 230Th/U ages in the stalagmite from Tanzania (MAF, Figure 2)suggest some problems with the 230Th/U dates rather than 14C dates. This could be due to open-sys-tem conditions, which affected 234U/238U as well as 230Th/234U activity ratios (cf. Figure 4). It isworth noting, that the two MAF dates, outlying from the monotonous 230Th/U profile (Figure 2), arejust those producing the large spread of dates between 35 and 50 ka BP (Figure 3).
Figure 3 Comparison of 14C and 230Th/U ages of speleothem samples used in thiswork (l) with other relevant dates. The circles beyond the right edge of the plot rep-resent samples from the Wierna stalagmite, dated with 230Th/U to >300 ka BP. ∆ = cor-als from Barbados, Tahiti and Mururoa Atoll (Bard et al. 1998); ◊ = stalagmites fromCango Cave, South Africa and Lynd’s Cave, Tasmania (Vogel and Kronfeld 1998); × =stalagmite from Lobatse II Cave (Holmgren et al. 1994); � = lignite from Kärnten andGossau, Switzerland (Geyh and Schlüchter 1998); + = annually laminated sediments ofLake Suigetsu, Japan (Kitagawa and van der Plicht 1998). 14C ages of our sampleshave been corrected for the apparent age 1700 ± 1000 yr. Dashed line shows relation-ship between 14C and absolute time scales, obtained by analysis of frequency distribu-tions of not-paired 14C and 230Th/U ages of speleothem samples (discussed in the text).
0 20 40 60
Calendar age (kyr BP)
0
20
40
60
14C
age
(ky
r B
P)

410 T Goslar et al.
The large spread of our dates precludes detailed conclusions concerning 14C calibration. Neverthe-less, a lack of dates with 14C ages older than the 230Th/U one between 35 and 45 ka BP is coherentwith the suggestion from earlier 230Th/U and 14C dates (Vogel and Kronfeld 1997; Geyh andSchlüchter 1998; Bard et al. 1998) that the deviation between both time scales was large in thatperiod. The cluster of 230Th/U-14C dates (Figure 3) clearly disagrees with the comparison of 14C andvarve ages from Lake Suigetsu (Kitagawa and van der Plicht 1998), perhaps an effect of non-contin-uous varve chronology in the oldest part of the Suigetsu sediments.
Comparison of Frequency Distribution of 14C and 230Th/U Ages of Speleothems
Though few speleothem samples have been dated by both the 14C and 230Th/U methods, there aremany speleothem samples dated by only one of these methods. Looking through our bibliography,we found 133 “single” 14C dates and 252 230Th/U dates of speleothem samples (younger than 60 ka)from Europe (Table 2). These dates are not uniformly distributed in time, reflecting some periodsmore favoring speleothem growth than the other ones.
The maxima of distributions of 14C and 230Th/U ages (Figure 5a) are not synchronous, most dis-tinctly for period before 30 ka BP, an effect presumably reflecting deviation between both timescales. We tried thus to find such dependence between 14C and calendar time scales (the so-called“transfer function”, Figure 5b) which explains most of the time lags between both distributions. Thisfunction transfers the horizontal scale of distribution of 14C dates (Figure 5c). The clue is to findsuch a function, which gives a minimum sum of squares of differences between the 230Th/U andtransferred 14C distribution curves.
Figure 4 Plot of 234U/238U vs. 230Th/234U activity ratios for the samples from WiernaCave and MAF, Tanzania
0.0 0.4 0.8 1.2230 234Th/ U
0.8
1.2
1.6
Wierna
MAF
234
238
U/
U

U-Series and 14C Dates of Speleothems 411
The optimal transfer function has been found with the computer algorithm VARFIT (Goslar 1993).This algorithm searches the optimum in the large class of allowed transfer functions, using thedynamic programming method (Bellman and Dreyfus 1962). In our case, the class of allowed trans-fer functions was limited by two conditions. First, we allowed that for any age the 14C time scalecould be stretched or stressed by no more than 50%. This limitation obviously reflects the fact thatthe concentration of 14C in the atmosphere never changed too abruptly. Second, we fixed the age of34,000 BP transferred at 38 ka BP, to synchronize distinct maximum in both distributions. Withoutsuch a fixation, the VARFIT synchronized 34,000 BP with another maximum of the 230Th/U distri-bution, at 44 ka BP, the result being completely unlikely, in view of other calibration data.
The obtained transfer function agrees well (Figure 3) with the coral data in the period 0–20 ka BP,and between 35 and 45 ka BP it fits very well with the line traced by the pairs of 14C and 230Th/Uages of speleothems. Some offset between 20 and 35 ka BP is insignificant as only few 14C and230Th/U-dated speleothem samples from this period are available. This result seems to confirm thatlarge deviation between 14C and calendar time scales did not disappear before 35,000 BP. However,as the uncertainty of the transfer function is not known, the transfer function approach yields onlytentative conclusions.
Table 2 Sources of dates used in comparison of frequency distribution of 14C and 230Th/U agesof speleothem
LocationNr of dates References
Radiocarbon methodCroatia, Slovenia, Bosnia 73 Srdoè et al. (1973, 1975, 1977, 1979, 1981, 1982, 1984,
1989, 1992)Germany 10 Geyh and Hennig (1986)Tatra Mountains, Poland 13 Duliñski M. (1988); Hercman (1991)Slovakia 5 Hercman et al. (1994)Cracow-Wieluñ Upland, Poland 32 Pazdur et al. (1994)Total 133
Uranium-Thorium methodCrakow-Wieluñ Upland, Poland 10 G³azek (1986); H Hercman, unpublishedTatra Mountains, Poland; 31 Duliñski M. (1988); Hercman et al. (1998);
H Hercman, unpublishedSudety Mountains, Holy Cross Mountains, Poland
18 Hercman et al. (1995); H Hercman, unpublished
Great Britain 116 Hennig et al. (1983); Atkinson et al. (1986); Rowe et al. (1989); Gascoyne et al. (1983); Ford et al. (1983); Sutcliffe et al. (1985)
Moravian Karst, Czech Republic 11 Hercman et al. (1997); H Hercman, unpublishedFrance 18 Bakalowicz et al. (1984); Maire and Quinif (1987)Germany 33 Hennig et al. (1983Low Tatra Mountains, Slovakia 15 Duliñski M. (1988); Hercman et al. (1997);
H Hercman, unpublished
Total 252

412 T Goslar et al.
CONCLUSION
14C dates of speleothem are commonly treated with caution because of the reservoir effect, produc-ing an apparent age that is usually not accurately known. However, in light of our data and some pre-vious research (Holmgren et al. 1994), the reservoir effect may be of minor importance when com-pared to contamination with younger carbon. The latter effect can alter 14C ages of old (>30 ka)samples by several thousand years. Despite the large spread, our pairs of 14C and 230Th/U ages ofspeleothem samples seem coherent with the previously published data on corals, speleothem andlignite, which suggested a large deviation between 14C and absolute time scales between 35 and 45ka BP. The around 4000-year deviation seems also supported through the analysis of frequency dis-tributions of 14C and 230Th/U ages of speleothem. In this analysis, a much larger set of ages, obtainedwith one of these methods only, was used.
Figure 5 a: Comparison of frequency distributions of14C (solid line) and 230Th/U (dashed line) ages of spe-leothem, selected from literature. b: relationshipbetween 14C and 230Th/U time scales (transfer func-tion) which best explains the time lags between distri-butions from section a. c: as in section a, with thetime scale of 14C distribution modified according tothe transfer function shown in section b.
0 10 20 30 40 50
0
2
0 10 20 30 40 50230 14Th/U age, C transf. age (kyr)
0
2
0 10 20 30 40 50
0
10
20
30
40
50
a
b
c
14C transf. age (kyr)
230 14Th/U age, C age (kyr)
14C
age
(ky
r)F
(a.
u.)
F (
a.u.
)

U-Series and 14C Dates of Speleothems 413
ACKNOWLEDGMENTS
This study was sponsored by the State Committee for Scientific Research through grant nr 283/PO4/96/11 to Helena Hercman. The authors wish to thank K Holmgren, Stockholm University, Sweden,for sharing the speleothem from Tanzania.
REFERENCES
Atkinson TC, Lawson TJ, Smart PL, Harmon RS, HessJW. 1986. New data on speleothem deposition andpalaeoclimate in Britain over the last forty thousandyears. Journal of Quaternary Science 1:67–72.
Bakalowicz M, Sorriaux P, Ford DC. 1984. Quaternaryglacial events in the Pyrenees from U-series dating ofspeleothems in the Niaux-Lombrives-Sabart caves,Ariege, France. Norsk Geografisk Tidsskrift 38:193–7.
Bard E. 1998. Geochemical and geophysical implica-tions of the radiocarbon calibration. Geochimica etCosmochimica Acta 62:2025–38.
Bard E, Arnold M, Hamelin B, Tisnerat-Laborde N, Ca-bioch G. 1998. Radiocarbon calibration by means ofmass spectrometric 230Th/234U and 14C ages of corals:an updated database including samples from Barba-dos, Mururoa and Tahiti. Radiocarbon 40(3):1085–92.
Bellman RE, Dreyfus SE. 1962. Applied dynamic pro-gramming. Princeton University Press, Princeton,New Jersey.
Duliñski M. 1988. Sk³ad izotopowy tlenu i wodoru w na-ciekach jaskiniowych datowanych metod¹ 230Th/234Ujako obraz zmian paleoklimatycznych na obszarachkontynentalnych (in Polish). Thesis, MIFiTJ AGH,Kraków.
Ford DC, Gascoyne M, Beck JS. 1983. Speleothem datesand Pleistocene Chronology in the Peak District ofDerbyshire. Transactions of the British Cave ResearchAssociation 10(2):103–15.
Gascoyne M, Schwarcz HP, Ford DC. 1983. Uranium-Series ages of Speleothem from Northwest England:Correlation with Quaternary Climate. PhilosophicalTransactions of the Royal Society, London B 301:143–64.
Genty D, Massault M. 1997. Bomb 14C recorded in lam-inated speleothems: calculation of dead carbon pro-portion. Radiocarbon 39(1): 33–48.
Geyh MA, Hennig GJ. 1986. Multiple Dating of a LongFlowstone Profile. Radiocarbon 28(2A):503–9.
Geyh MA, Schlüchter C. 1998. Calibration of the 14Ctime scale beyond 22,000 BP. Radiocarbon 40(1):475–82.
G³azek J. 1986. Wyniki datowañ nacieków jaskiniowychz terenu Polski metod¹230Th/234U. Zeszyty NaukowePolitechniki l¹skiej, Geochronometria 2:55–65.
Goede A, Vogel JC. 1991. Trace element variations anddating of a Late Pleistocene Tasmanian Speleothem.Palaeogeography, Palaeoclimatology, Palaeoecology88:121–31.
Goslar T. 1993. Seasonal component changes found inthe youngest part of the Lake Go ci¹¿ laminated sed-iment. Polish Botanical Studies, Guidebook Series 8:189–202 (in Polish with English summary).
Goslar T, Arnold M, Bard E, Kuc T, Pazdur MF, Ralska-Jasiewiczowa M, Ró¿añski K, Tisnerat N, Walanus A,Wicik B, Wiêckowski, K. 1995. High concentration ofatmospheric 14C during the Younger Dryas cold epi-sode. Nature 377:414–7.
Goslar T, Wohlfarth B, Björck S, Possnert G, Björck J.1999. Variations of atmospheric 14C concentrationsover the Alleröd-Younger Dryas transition. ClimateDynamics 15:29–42.
Hennig GJ, Grün R, Brunnacker K. 1983. Speleothems,travertines and paleoclimates. Quaternary Research20:1–29.
Hercman H. 1991. Rekonstrukcja elementów rodowiskageologicznego Tatr Zachodnich na podstawie datowa-nia izotopowego nacieków jaskiniowych. ZeszytyNaukowe Politechniki l¹skiej, Geochronometria 8:1–139.
Hercman H, Pazdur A, Pazdur MF, Mitter P. 1994. Da-towanie izotopowe nacieków z wybranych jaskiñS³owackiego Krasu. Zeszyty Naukowe Politechnikil¹skiej, Geochronometria 10:81–96.
Hercman H, Lauritzen SE, G³azek J. 1995. Uranium-Se-ries Dating of Speleothems from Niedzwiedzia andRadochowska Caves, Sudetes (Poland). Theoreticaland Applied Karstology 8:37–48.
Hercman H, Bella P, G³azek J, Gradziñski M, LauritzenSE, Lovlie R. 1997. Uranium-Series dating of Spele-othems from Demanova Ice Cave: a Step to Age Esti-mation of the Demanova Cave System (the Nizke Ta-try Mts., Slovakia). Annales Societalis GeologorumPoloniae 67:439–50.
Hercman H, Lauritzen SE, G³azek J, Vit J. 1997. Ura-nium-Series dating of Speleothems from Amaterskaand Holstejnska Caves, Moravian Karst, Czech Re-public. Proceedings of the 12th International Con-gress of Speleology 1:45–7.
Hercman H, Nowicki T, Lauritzen SE. 1998. Rozwój sys-temu jaskiniowego Szczeliny Chocho³owskiej (TatryZachodnie) w wietle datowañ nacieków metod¹ ura-nowo-torow¹. Studia Geologica Polonica 113:85–103.
Holmgren K, Lauritzen SE, Possnert G. 1994. 230Th/234Udating of a Late Pleistocene stalagmite in Lobatse IICave, Botswana. Quaternary Science Reviews 13:111–9.

414 T Goslar et al.
Hughen KA, Overpeck JT, Lehman SJ, Kashgarian M,Southon J, Peterson LC, Alley R, Sigman DM. 1998.Deglacial changes in ocean circulation from an ex-tended radiocarbon calibration. Nature 391:65–8.
Ivanovich M, Harmon RS. 1992. Uranium Series Dise-quilibrium: Application to Environmental Problems.Oxford: 571.
Kitagawa H, van der Plicht J. 1998. Atmospheric radio-carbon calibration to 45,000 yr B.P.: late glacial fluc-tuations and cosmogenic isotope production. Science279:1187–90.
Laj C, Mazaud A, Duplessy JC. 1996. Geomagnetic in-tensity and 14C abundance in the atmosphere andocean during the past 50 kyr. Geophysical ResearchLetters 23:2045–8.
Maire R, Quinif Y. 1987. Chronostratigraphie et evolu-tion sedimentaire en milieu Alpin dans la GalerieAranzadi (Gouffre de la Pierre Saint Martin, Pyrenees,France). Annales Societe Geolique de Belgique, 110.
Mazaud A, Laj C, Bard E, Arnold M, Tric E. 1991. Geo-magnetic field control of 14C production over the last80 ky: implications for the radiocarbon time-scale.Geophysical Research Letters 18:1885–8.
Pazdur A, Hercman H, Górny A, Olszewski M. 1994.Wstêpne wyniki badañ nad chronologi¹ powstawanianacieków w jaskiniach Wy¿yny Krakowsko-Wie-luñskiej. Zeszyty Naukowe Politechniki l¹skiej, Geo-chronometria 10:61–79.
Rowe PJ, Atkinson TC, Jenkinson RDS. 1989. Uranium-Series Dating of Cave Deposits at Creswell CragsGorge, England. Cave Science 16:3–17.
Srdoè D, Slipcevic A, Paninic J, Obeliæ B, Breyer B.1973. Rudjer Boskovic Institute radiocarbon measure-ments II. Radiocarbon 15(2):435–41.
Srdoè D, Slipcevic A, Planinic J. 1975. Rudjer BoskovicInstitute radiocarbon measurements III. Radiocarbon17(1):149-–55.
Srdoè D, Slipcevic A, Obeliæ B, Horvatinèiæ N. 1977.Rudjer Boskovic Institute radiocarbon measurementsIV. Radiocarbon 19(3):465–75.
Srdoè D, Slipcevic A, Obeliæ B, Horvatinèiæ N. 1979.Rudjer Boskovic Institute radiocarbon measurementsV. Radiocarbon 21(1):131–7.
Srdoè D, Slipcevic A, Obeliæ B, Horvatinèiæ N. 1981.Rudjer Boskovic Institute radiocarbon measurementsVI. Radiocarbon 23(3):410–21.
Srdoè D, Horvatinèiæ N, Obeliæ B. 1982. Rudjer Bosk-ovic Institute radiocarbon measurements VII. Radio-carbon 24(3):352–71.
Srdoè D, Obeliæ B, Horvatinèiæ N, Krajcar I. 1984. Rud-jer Boskovic Institute radiocarbon measurementsVIII. Radiocarbon 26(3):449–60.
Srdoè D, Obeliæ B, Horvatinèiæ N, Broniè IK. 1989. Rud-jer Boskovic Institute radiocarbon measurements XI.Radiocarbon 31(1):85–98.
Srdoè D, Horvatinèiæ N, Broniæ IK, Obeliæ B. 1992. Rud-jer Boskovic Institute radiocarbon measurements XII.Radiocarbon 34(1):155–75.
Stuiver M, Braziunas T. 1993. Sun, ocean, climate and at-mospheric 14CO2: an evaluation of causal and spectralrelationships. The Holocene 3:289–305.
Stuiver M, Reimer PJ, Bard E, Warren Beck J, Burr GS,Hughen KA, Kromer B, McCormac G, van der PlichtJ, Spurk M. 1998. INTCAL98 Radiocarbon age cali-bration, 24,000-0 cal BP. Radiocarbon 40(3):1041–83.
Sutcliffe AJ, Harmon RS, Ivanovich M, Rae A, Hess JW.1985. Wolverine in Northern England at About 83,000yr B.P.: Faunal Evidence for Climatic Change duringIsotope Stage 5. Quaternary Research 24:73–86.
Tric E, Valet JP, Tucholka P, Paterne M, Labeyrie L, Gui-chard F, Tauxe L, Fontugne M. 1992. Paleointensity ofthe Geomagnetic field during the last 80,000 years.Journal of Geophysical Research B97:9337–51.
Vogel J. 1983. 14C variations during the Upper Pleisto-cene. Radiocarbon 25(2):213–8.
Vogel JC, Kronfeld J. 1997. Calibration of radiocarbondates for the Late Pleistocene using U-Th dates on sta-lagmites. Radiocarbon 39(1):27–32.


