Embed Size (px)
Citation preview
1
2
COMPENDIUM OF LECTURE NOTES
“Impact of Climate Change in Rainfed
(Sponsored by D.O.E., Ministry of Agriculture, Govt. of India, New Delhi)
September 26
Dr. M.S.Prasad, Principal Scientist(Agril.Extn
Dr.K.Nagasree, Senior Scientist (Agril. Extn
Dr. G. Nirmala, Senior Scientist (Agril.Extn.)
Dr. K. Ravi Shankar, Senior
Dr. Manoranjan Kumar, Senior Scientist (S&WCE)
Dr. B.M.K. Raju,
Dr. N. Ravi Kumar, Senior Scientist
Dr.A.V.M. Subba Rao, Scientist (
Transfer of Technology Section
CENTRAL RESEARCH
SANTOSHNAGAR
COMPENDIUM OF LECTURE NOTES
Model Training Course on
“Impact of Climate Change in Rainfed Agriculture and Adaptation Strategies”
(Sponsored by D.O.E., Ministry of Agriculture, Govt. of India, New Delhi)
September 26-October 03,2013
COURSE DIRECTOR(S)
Dr. M.S.Prasad, Principal Scientist(Agril.Extn.) & Head, TOT
&
Dr.K.Nagasree, Senior Scientist (Agril. Extn.)
COURSE CO-DIRECTOR(S)
Dr. G. Nirmala, Senior Scientist (Agril.Extn.)
Dr. K. Ravi Shankar, Senior Scientist (Agril.Extn.)
Dr. Manoranjan Kumar, Senior Scientist (S&WCE)
Dr. B.M.K. Raju, Senior Scientist ( Agril. Statistics)
Dr. N. Ravi Kumar, Senior Scientist (Computer applications)
Dr.A.V.M. Subba Rao, Scientist (Sr. Sc.)(Agrometeorology
Transfer of Technology Section
RESEARCH INSTITUTE FOR DRYLAND AGRICULTURE
ANTOSHNAGAR, HYDERABAD – 500 059
Agriculture and Adaptation Strategies”
(Sponsored by D.O.E., Ministry of Agriculture, Govt. of India, New Delhi)
) & Head, TOT
applications)
Sr. Sc.)(Agrometeorology)
AGRICULTURE
CENTRAL RESEARCHSANTOSHNAGAR
Transfer of Technology Section
“Impact of Climate Change in Rainfed Agriculture and Adaptation Strategies”
(Sponsored by D.O.E., Ministry of Agriculture, Govt. of India, New Delhi)
Venue
Period
Participants
Course Director(s)
Co-Directors
Objectives:
i. To introduce the concept of climate change and its potential impact in rainfed agriculture to the
participants including adaptation strategies
ii. To give exposure to the participants about the GHG emissions from agriculture and allied
sectors, various types of mitigation measures for reducing GHG emissions
iii. To provide insights of carbon trading, clean development mechanism and the issues of global
warming 2
RESEARCH INSTITUTE FOR DRYLAND AGRICULTUREANTOSHNAGAR, HYDERABAD – 500 059
Transfer of Technology Section
Model Training Course on
“Impact of Climate Change in Rainfed Agriculture and Adaptation Strategies”
(Sponsored by D.O.E., Ministry of Agriculture, Govt. of India, New Delhi)
COURSE OUTLINE
: CRIDA, Hyderabad.
: September 26-October 03, 2013
pants : Subject Matter Specialists
& Extension Functionaries
from line departments like
Dept. of Agri/Horti/AH.
: Dr. M.S. Prasad
Principal Scientist (Agril.Extn.) & Head, TOT
& Dr.K. Nagasree, Senior Scientist (Agril. Extn.
: Dr. G. Nirmala, Senior Scientist (Agril.Extn.)
Dr. K. Ravi Shankar, Senior Scientist (Agril.Extn.)
Dr. Manoranjan Kumar, Senior Scientist (S&
Dr. B.M.K. Raju, Senior Scientist ( Agril. Statistics
Dr. N. Ravi Kumar, Senior Scientist (Computer applications)
Dr.A.V.M. Subba Rao, Scientist (Sr. Sc.)(Agrometeorology)
CONTENTS To introduce the concept of climate change and its potential impact in rainfed agriculture to the
participants including adaptation strategies
To give exposure to the participants about the GHG emissions from agriculture and allied
sectors, various types of mitigation measures for reducing GHG emissions
To provide insights of carbon trading, clean development mechanism and the issues of global
AGRICULTURE
“Impact of Climate Change in Rainfed Agriculture and Adaptation Strategies”
(Sponsored by D.O.E., Ministry of Agriculture, Govt. of India, New Delhi)
Head, TOT
(Agril. Extn.)
Dr. G. Nirmala, Senior Scientist (Agril.Extn.)
(Agril.Extn.)
Dr. Manoranjan Kumar, Senior Scientist (S&WCE)
Agril. Statistics)
(Computer applications)
Dr.A.V.M. Subba Rao, Scientist (Sr. Sc.)(Agrometeorology)
To introduce the concept of climate change and its potential impact in rainfed agriculture to the
To give exposure to the participants about the GHG emissions from agriculture and allied
To provide insights of carbon trading, clean development mechanism and the issues of global
3
CONTENTS
Title of the Topic Resource Faculty Prof /Dr/Shri/Smt
Page No’s
Govt. & ICAR initiatives on climate change and adaptation & mitigation strategies
B. Venkateswarlu 1-19
Climate change and its impact on agriculture V.U.M. Rao 20-35
Rain water management as an adaptation strategy to climate change
K.S. Reddy 36-55
Drought management measures for climate resilience in
field crops
Md. Osman 56-64
CDM concept : theory and practice J.V.N.S. Prasad 65-73
Managing sustainable horticultural production in a
changing climate scenario
N.N. Reddy 74-84
Conservation agriculture for productivity enhancement and mitigating GHG emissions
G. Prathiba 85-90
Role of conservation agricultural practices to mitigate adverse effects of climate change
K.L. Sharma 91-110
Impact of climate change on crops M. Vanaja 111-116
Energy efficiency in agriculture to minimize GHG emissions
I. Srinivas 117-128
Impacts of climate change on plant pathogens and adaptation strategies
S. Desai 129-133
Environmental impacts of nutrient recycling and adaptation strategies for INM
K. Jeevan Rao ANGRAU
134-145
Trends in climate based pest forecasting systems &
contingency planning
Y.G. Prasad 146-154
Impact of climate change on crop – pest interactions M. Srinivasa Rao
155-165
Farmers knowledge, perception and adaptation measures towards climate variability
K. Ravi Shankar 166-176
CDM opportunities in livestock sector Prabhat Kumar Pankaj
177-187
Assessment of vulnerability to climate change C.A.Rama Rao 188-193
Weather insurance based climatic risk management in rainfed crops
V.U.M.Rao 194-201
1
GOVT. & ICAR INITIATIVES ON CLIMATE CHANGE AND ADAPTATION & MITIGATION STRATEGIES
B. Venkateswarlu, Director, Central Research Institute for Dryland Agriculture,
Santoshnagar, Hyderabad – 500 059
Evidence over the past few decades has conclusively established that significant
changes in climate are taking place worldwide as a result of enhanced
anthropogenic activities. The fast pace of development and industrialization and
indiscriminate destruction of natural environment, more so in the last century, have
altered the concentration of atmospheric gases that lead to global warming. The
major cause for climate change and global warming has been ascribed to the
increased levels of greenhouse gases (GHGs) like carbon dioxide (CO2), methane
(CH4), nitrous oxide (N2O), chlorofluorocarbons (CFCs) etc. beyond their natural
levels due to the uncontrolled activities such as burning of fossil fuels, increased use
of refrigerants, and enhanced agricultural related practices.
The IPCC (2007) report has projected that by 2100 earth’s mean temperature will
rise by 1.4 to 5.8 0C, precipitation will decrease in the sub-tropical areas, and
frequency of extreme events will increase significantly. As of now, in reality, in the
past 100 years, the global mean temperature has increased by 0.74 0C. IPCC
reported that eleven of the last twelve years (between 1995 to 2009) rank among
the twelve warmest years in the instrumental record of global surface temperature
(since 1850). The temperature increase is widespread over the globe and is greater
at higher northern latitudes. Land regions have warmed faster than the oceans
which has already started affecting the climatic phenomenon in different parts of
world. Melting of glaciers, rising sea level are some of the most important
manifestations of it. IPCC (2007) have further reported change in their frequency
and /or intensity of extreme events over the last 50 years. The report has made the
following significant observations:
• It is very likely that cold days, cold nights and frosts have become less
frequent over most land areas, while hot days and hot nights have become
more frequent
• It is likely that heat waves have become more frequent over most land areas.
• It is likely that the frequency of heavy precipitation events has increased over
most areas.
• It is likely that the incidence of extreme high sea level has increased at a
broad range of sites worldwide since 1975.
Since climate is central to many critical agricultural decisions ranging from farm to
policy level (Venkateswarlu and Shanker, 2009), it is also imperative to realize that
most of these decisions have to be made well in advance to counter the impacts of
climate change at the earliest. Therefore, the Indian Government has taken a stance
to address climate issues by fully participating in international conventions such as
the United Nation Framework Convention on Climate Change (UNFCCC) and,
secondly, developing National Climate Change Response Policies. At the domestic
level, it is essential to develop Programs and Policies that increase farm productivity
and incomes; make agriculture climate resilient and promote stability and security
for the farmers; ensure that the agriculture sector becomes a part of the solution to
2
the climate change problems rather than the cause and there is a need to make
climate change adaptation and mitigation measures as an integral part of overall
planning and development strategy of the country on long term.
A National Action Plan on Climate Change (NAPCC) was unveiled by the Hon’ble
Prime Minister of India in June 2008. It outlined a national strategy which would
enable the country to adapt to climate change and ensure that development and
ecological sustainability go hand in hand. This National Action Plan consists of eight
missions viz. National Solar Mission; National Energy Efficiency Mission; National
Sustainable Habitat Mission; National Water Mission; National Sustaining Himalayas
Mission; A Green India Mission; National Sustainable Agriculture Mission; and
National Strategic Knowledge Mission. At least three of them have a bearing on
Indian Agriculture viz., National Water Mission, National Mission on Green India,
National Mission for Sustaining the Himalayan Ecosystem, in addition to the
National Mission for Sustainable Agriculture.
Building state of the art infrastructure for research and training of scientists in
frontier areas and tools, increasing climate change literacy to different levels of
stakeholders, mainly farmers; enhancement of national capacity on decision support
systems developing best weather insurance products for vulnerable areas and
farmers and carbon trading in agriculture; and international collaboration are some
other key areas through which challenges of climate change and global warming can
be tackled. The Indian Council of Agricultural Research (ICAR) has recently launched
a mega project entitled “National Initiative on Climate Resilient Agriculture” which
includes all these components of strategic research, strengthening R&D
infrastructure, capacity building and technology demonstration on farmer’s fields.
Since the beginning of 21st Century, India has experienced droughts in quick
succession, of which the 2009 one was the most recent one that significantly
affected kharif crop production. It was the 2nd largest all India monsoon rainfall
deficit since 1972 (23% below normal). Incidentally, 2009 also achieved the
distinction of being the warmest year in past several centuries across the world.
However, after 2009, 2010 proved to the warmest year on record since 1850. 2011
is now the 11th warmest year on record since 1850 (Fig. 1). Apart from that, 1998
was one of the warmest years; 2003 experienced unprecedented heat and cold
waves across the globe; occurrence of high temperature in March 2004 adversely
affected crops like wheat, apple, potato etc. across northern India; 2005 witnessed
destructive hurricanes/cyclones across the globe and again, 2007 was as warm as
1998 in the entire northern hemisphere and unusual summer rains and floods were
experienced in many parts of India. Besides that, the amount and distribution of
rainfall is becoming more and more erratic which is causing greater incidences of
droughts and floods globally. The increase in frequency of heavy rainfall events in
last 50 years over Central India points towards a significant change in climate
pattern in India (Goswami, 2006).The data clears indicates increase in heavy (>10
cm) and very heavy (>15cm) rainfall events and decrease in light to moderate
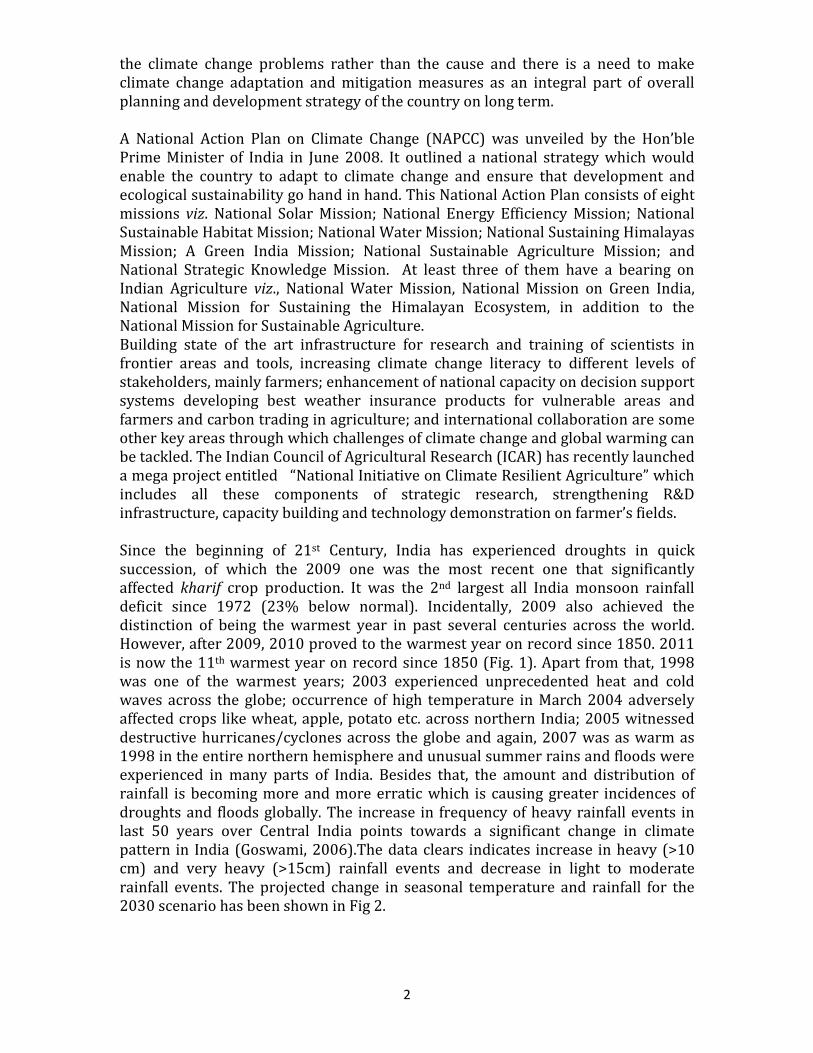
rainfall events. The projected change in seasonal temperature and rainfall for the
2030 scenario has been shown in Fig 2.
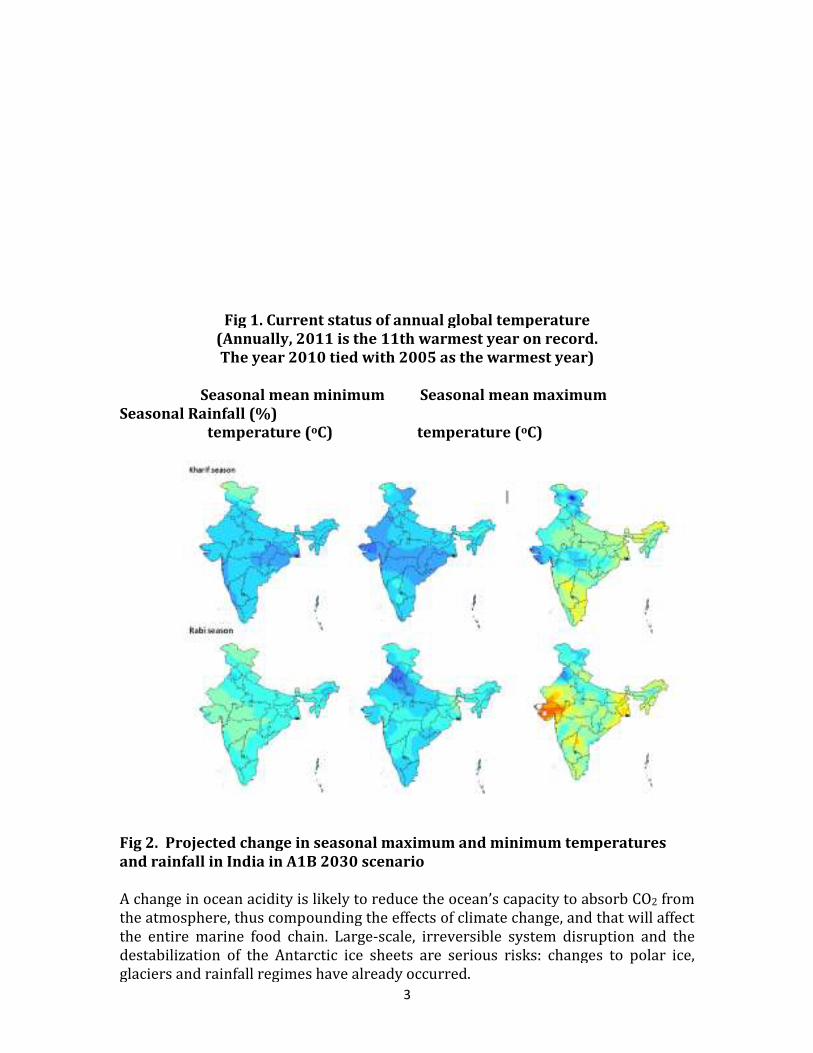
Fig 1. Current status of annual global temperature(Annually, 2011 is the 11th warmest year on record.The year 2010 tied with 2005 as the warmest year)
Seasonal mean minimum Seasonal mean maximum Seasonal Rainfall (%) temperature (
Fig 2. Projected change in seasonal maximum and minimum temperatures
and rainfall in India in A1B 2030 scenario
A change in ocean acidity is likely to reduce the ocean’s capacity to
the atmosphere, thus compounding the effects of climate change, and that will affect
the entire marine food chain. Large
destabilization of the Antarctic ice sheets are serious risks: changes to
glaciers and rainfall regimes have already occurred.
3
Fig 1. Current status of annual global temperature
(Annually, 2011 is the 11th warmest year on record. 2010 tied with 2005 as the warmest year)
Seasonal mean minimum Seasonal mean maximum
temperature (oC) temperature (oC)
Projected change in seasonal maximum and minimum temperatures
and rainfall in India in A1B 2030 scenario
A change in ocean acidity is likely to reduce the ocean’s capacity to absorb CO
the atmosphere, thus compounding the effects of climate change, and that will affect
the entire marine food chain. Large-scale, irreversible system disruption and the
destabilization of the Antarctic ice sheets are serious risks: changes to
glaciers and rainfall regimes have already occurred.
Seasonal mean minimum Seasonal mean maximum
Projected change in seasonal maximum and minimum temperatures
absorb CO2 from
the atmosphere, thus compounding the effects of climate change, and that will affect
scale, irreversible system disruption and the
destabilization of the Antarctic ice sheets are serious risks: changes to polar ice,
4
The rainfall analysis of India (Rao et al., 2008) showed that significant negative
trends of rainfall were observed in the eastern parts of Madhya Pradesh,
Chhattisgarh and parts of Jharkhand, U.P., and northeast India. Lal (2001) reported
that annual mean area-averaged surface warming over the Indian sub-continent is
to likely to range between 3.5 and 5.5 0C by 2080s. These projections showed more
warming in winter season over summer. The spatial distribution of surface warming
suggests a mean annual rise in surface temperatures in North India by 3 0C or more
by 2050. The study also indicated that during winter, the surface mean air
temperature could rise by 3 0C in Northern and Central parts, while it would rise by
2 0C in Southern parts by the same period. In case of rainfall, a marginal increase of
7-10% in annual rainfall is projected over the sub-continent by 2080. Nevertheless,
the study suggests a fall in rainfall by 5-25% in winter, while it would increase by
10-15% in summer, Marked variability is seen even in the onset and withdrawal of
monsoon over the period. The glaciers and the snowfields in the Himalayas are on
the decline as a result of climate variability. The rate of retreat of the snow of
Gangotri glacier demonstrated a sharp rise in the first half of the 20th century.
Glacial melt would lead to increased summer river flow and floods over the next few
decades, followed by a serious reduction in flows thereafter.
Role of green house gases
The increasing levels of green house gases (GHG’s) in the atmosphere have been
attributed as one of the major driving force behind the rapid climate change
phenomenon. The main GHGs contributing to this phenomenon are CO2, CH4 and
N2O. Apart from fossil fuel burning, the frequent volcanic eruptions are also
contributing to this increase in concentration, in the atmosphere. Though the
increase in the level of CO2 is expected to produce some beneficial effects on crop
dry matter production, it may soon be nullified by associated water and thermal
stresses leading to overall deterioration of agro-climatic conditions for food
production systems. At the global scale, the historical temperature-yield
relationships indicate that warming from 1981 to 2002 is very likely to offset some
of the yield gains from technological advance, rising CO2 and other non-climatic
factors (Lobell and Field, 2007). The recent release of Greenhouse gas inventory by
Indian government revealed that the Net Greenhouse Gas (GHG) emissions from
India in 2007, including LULUCF, were 1727.71 million tons of CO2 equivalent (eq)
of which CO2 emissions were 1221.76 million tons, CH4 emissions were 20.56
million tons; and N2O emissions were 0.24 million tons. GHG emissions from
Energy, Industry, Agriculture and Waste sectors constituted 58%, 22%, 17% and
3% of the net CO2 eq emissions, respectively. The energy sector emitted 1100.06
million tons of CO2 eq, of which 719.31 million tons of CO2 eq were emitted from
electricity generation and 142.04 million tons of CO2 eq from the transport
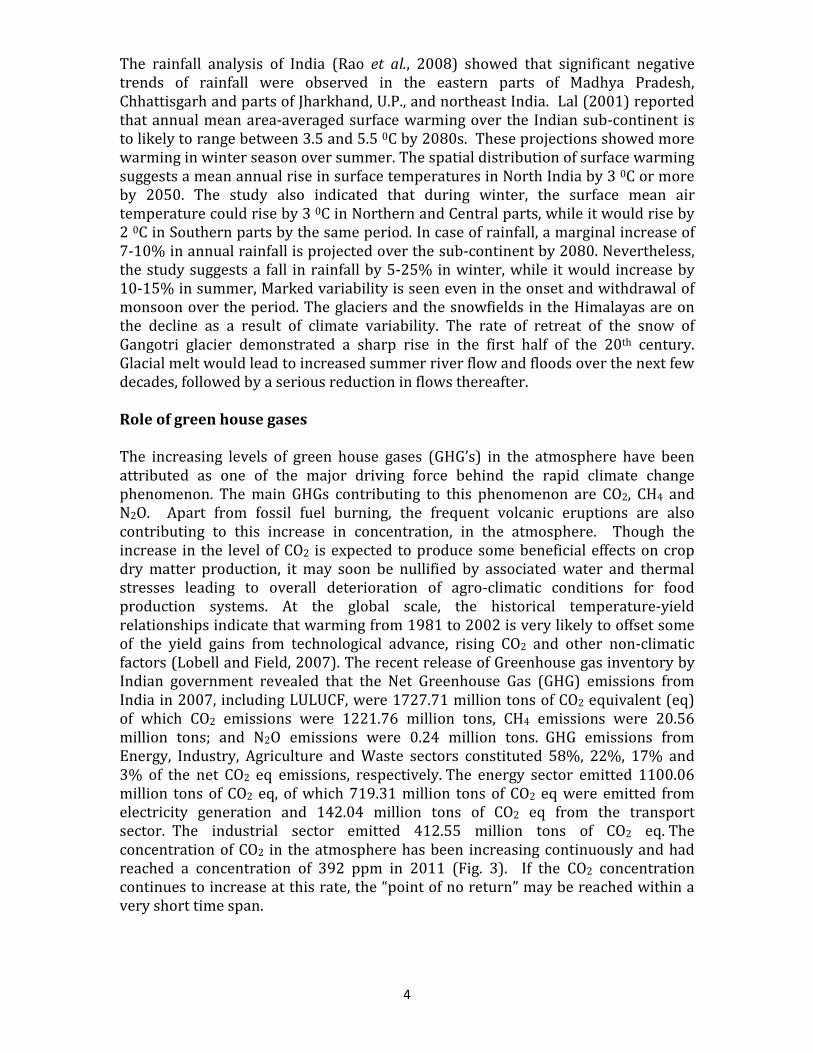
sector. The industrial sector emitted 412.55 million tons of CO2 eq. The
concentration of CO2 in the atmosphere has been increasing continuously and had
reached a concentration of 392 ppm in 2011 (Fig. 3). If the CO2 concentration
continues to increase at this rate, the “point of no return” may be reached within a
very short time span.
Fig 3. Current global Role of carbon dioxide
A growing body of research suggests that atmospheric carbon dioxide levels may
affect water availability through its influence on vegetation. Controlled experiments
indicate that elevated CO2
that is stomata, to water vapor transport. Experiments suggest that a doubling of
CO2 would increase stomatal resistance and reduce the rate of transpiration
passage of water vapor from plant
decrease in transpiration would tend to increase runoff. On the other hand, CO
has been demonstrated to increase plant growth, leading to a larger area of
transpiring tissue and a corresponding increase
might offset increases in plant water
atmosphere are a potential increase in leaf temperatures caused by reduced
transpiration rates and species changes in vegetation comm
opposing influences on water supplies would depend on the type of vegetation and
other interacting factors, such as soil type and climate.
The management and labour costs of farm production will rise to a great level owing
to increased incidences of pests and diseases as well as weeds. Additionally, extreme
events like hails and frosts will also negatively impact crop production. As of now,
most of the developing countries, including India, are not fully prepared to deal with
the adverse impacts expected as a consequence of climate change and are therefore
relatively vulnerable.
Impact on water resources
A warmer climate will modify the hydrologic cycle, altering rainfall, magnitude and
timing of run-off. Warm air holds more m
surface moisture. With more moisture in the atmosphere, rainfall and snowfall
events tend to be more intense, increasing the potential for floods. However, if there
is little or no moisture in the soil to evaporate, the
5
Fig 3. Current global CO2 concentration levels
A growing body of research suggests that atmospheric carbon dioxide levels may
affect water availability through its influence on vegetation. Controlled experiments
concentrations increase the resistance of plant “pores,”
that is stomata, to water vapor transport. Experiments suggest that a doubling of
would increase stomatal resistance and reduce the rate of transpiration
passage of water vapor from plants by about 50 percent on average. The resulting
decrease in transpiration would tend to increase runoff. On the other hand, CO
has been demonstrated to increase plant growth, leading to a larger area of
transpiring tissue and a corresponding increase in transpiration. Other factors that
might offset increases in plant water-use efficiency associated with a CO
atmosphere are a potential increase in leaf temperatures caused by reduced
transpiration rates and species changes in vegetation communities. The net effect of
opposing influences on water supplies would depend on the type of vegetation and
other interacting factors, such as soil type and climate.
The management and labour costs of farm production will rise to a great level owing
ncreased incidences of pests and diseases as well as weeds. Additionally, extreme
events like hails and frosts will also negatively impact crop production. As of now,
most of the developing countries, including India, are not fully prepared to deal with
he adverse impacts expected as a consequence of climate change and are therefore
Impact on water resources
A warmer climate will modify the hydrologic cycle, altering rainfall, magnitude and
off. Warm air holds more moisture and increases evaporation of
surface moisture. With more moisture in the atmosphere, rainfall and snowfall
events tend to be more intense, increasing the potential for floods. However, if there
is little or no moisture in the soil to evaporate, the incident solar radiation will lead
A growing body of research suggests that atmospheric carbon dioxide levels may
affect water availability through its influence on vegetation. Controlled experiments
concentrations increase the resistance of plant “pores,”
that is stomata, to water vapor transport. Experiments suggest that a doubling of
would increase stomatal resistance and reduce the rate of transpiration -- the
s by about 50 percent on average. The resulting
decrease in transpiration would tend to increase runoff. On the other hand, CO2 also
has been demonstrated to increase plant growth, leading to a larger area of
in transpiration. Other factors that
use efficiency associated with a CO2 -enriched
atmosphere are a potential increase in leaf temperatures caused by reduced
unities. The net effect of
opposing influences on water supplies would depend on the type of vegetation and
The management and labour costs of farm production will rise to a great level owing
ncreased incidences of pests and diseases as well as weeds. Additionally, extreme
events like hails and frosts will also negatively impact crop production. As of now,
most of the developing countries, including India, are not fully prepared to deal with
he adverse impacts expected as a consequence of climate change and are therefore
A warmer climate will modify the hydrologic cycle, altering rainfall, magnitude and
oisture and increases evaporation of
surface moisture. With more moisture in the atmosphere, rainfall and snowfall
events tend to be more intense, increasing the potential for floods. However, if there
incident solar radiation will lead
6
to increase in the temperature, contributing to longer and more severe droughts
(Trenberth, 1999). Therefore, change in climate will affect the soil moisture,
groundwater recharge and frequency of flood or drought episodes and finally
groundwater level in different areas.
At present, available statistics on water demand show that the agriculture sector is
the largest consumer of water in India using more than 80% of the available water.
The quantity of water used for agriculture has increased progressively through the
years as more and more areas were brought under irrigation. Since 1950-51, the net
irrigated area in India rose from 28.85 to 62.29 million ha up to 2007-08.
Contribution of surface water and groundwater resources for irrigation has played a
significant role in India attaining self-sufficiency in food production during the past
three decades, but water is likely to become more scarce and critical input in future.
By judicious utilization, the demand for water from farm sector can be pegged at
68% by the year 2050, but agriculture will still remain the largest consumer. In
order to meet this demand, augmentation of the existing water resources by
development of additional sources of water or conservation of the existing
resources through impounding more water in the existing water bodies and their
conjunctive use will be needed (Mall et al., 2006). Table 1 (adopted from Mall et al.,
2006) summarizes the possible impacts of climate change on water resources
during the next century over India. The enhanced surface warming over the Indian
subcontinent by the end of the next century would result in an increase in pre-
monsoonal and monsoonal rainfall and no substantial change in winter rainfall over
the central plains. This would result in an increase in the monsoonal and annual
run-off in the central plains, with no substantial change in winter run-off and
increase in evaporation and soil wetness during the monsoon on an annual basis.
Table 1. Impact of climate change on water resources during the next century over India (adopted from Mall et al., 2006)
Region/location Impact
Indian subcontinent • Increase in monsoonal and annual run-off in the
central plains
• No substantial change in winter run-off
• Increase in evaporation and soil wetness during
monsoon and on an annual basis
Orissa and West Bengal One metre sea-level rise would inundate 1700 km2 of
prime agricultural land
Indian coastline One metre sea-level rise on the Indian coastline is likely
to affect a total area of 5763 km2 and put 7.1 million
people at risk
All-India Increases in potential evaporation across India
Central India Basin located in a comparatively drier region is more
sensitive to climatic changes
Kosi Basin Decrease in discharge on the Kosi River Decrease in
run-off by 2–8%
Southern and Central
India
Soil moisture increases marginally by 15–20% during
monsoon months
7
Chenab River Increase in discharge in the Chenab River
River basins of India General reduction in the quantity of the available run-
off, increase in Mahanadi and Brahmini basins
Damodar Basin Decreased river flow
Rajasthan Increase in evapotranspiration
In another study made by IITM, Pune in collaboration with DEFRA, UK reported that
there will be an increase in annual rainfall and annual flow in Godavari and Ganga
basins by 2071-2100 period.
Impact on agriculture, livestock and fisheries
Agriculture Sector The impact of climate change on agriculture will be one of the major deciding factors
influencing future food security of the world including India. A major part of the
agriculture in India is rainfed (~80 million ha out of 142 million ha net cultivated
area) and will remain so for at least for a foreseeable future. Rainfed agriculture in
India contributes to 44% of total foodgrain production. Around 66% of livestock
population is also dependent on rainfed areas. The crop losses due to climate
variability will vary from region to region depending on regional climate, crop and
cropping systems, soils and management practices. Rainfed crops are likely to be
worst hit by climate change because of the limited options for coping with
variability of rainfall and temperature. The major crops like wheat and rice are
expected to undergo all the weather aberrations and their sustainability will be
determined by crop’s capacity of natural adaptability as well as appropriate
mitigation measures adopted.
The impact of climate change on agriculture may accentuate at regional level
creating more vulnerability in food security rather than the global level as a whole.
The potential impact will be felt in shifts of sowing time and length of growing
seasons, which may necessitate effective adjustment in sowing and harvesting dates,
change in genetic traits of cultivars and sometimes total adjustment of cropping
system itself. With warmer environment associated with erratic rainfall distribution,
the rate of evapotranspiration will increase and quick depletion of soil nutrient
reservoir would call for much greater efficiency in use of water and nutrients to
sustain crop productivity. Apart from these, tackling frequent and more intense
extreme events like heat and cold waves, droughts and floods may become a “norm”
for the common farming community (IPCC, 2001). Such phenomena will impact
agriculture considerably through their direct and indirect effects on crops, livestock,
and incidences of pest-disease-weeds, increasing deterioration of soil health in
totality, and, thereby, threatening the food security like never before.
The Indian Council of Agricultural Research indicated an All India Network Project
on Climate Change in 2004 to study the impact of climate change on major crops,
livestock, fisheries, soils and other biotic factors as well as to understand different
natural adaptation capabilities of both flora and fauna. The possible interventions to
increase the adaptability of crop-livestock systems and mitigation measures to
minimize the adverse impacts were studied across length and breadth of different
agro-ecosystems of India (Naresh Kumar et al., 2012).
Assessment of climate change impact over Indian agriculture (
far has indicated that a marg
with increase in CO2 concentration would cause very minimal reduction in wheat
production of India if simple adaptation strategies like adjustment of planting date,
increased fertilizer use, irrigation wa
uniformly. But in absence of any adaptive mechanism, the yield loss in wheat may
cross 4-5 million tons.
The availability of viable pollen, sufficient numbers of germinating pollen grains and
successful growth of pollen tube to the ovule are of fundamental importance in grain
formation. The Network study on wheat and rice suggested that high temperature
around flowering reduced fertility of pollen grains as well as pollen germination on
stigma. These effects were more pronounced in
cultivars. A positive finding of the study was that the
more or less tolerant to such adverse affects. But differential impact of increasing
temperatures were observed wit
found that Aestivum wheat cultivars are more prone to reduced grain quality due to
increasing temperature during the fruit setting stage than
experiments, using advanced ‘Temperature g
sowing to study the impact of rising temperature on growth and development of
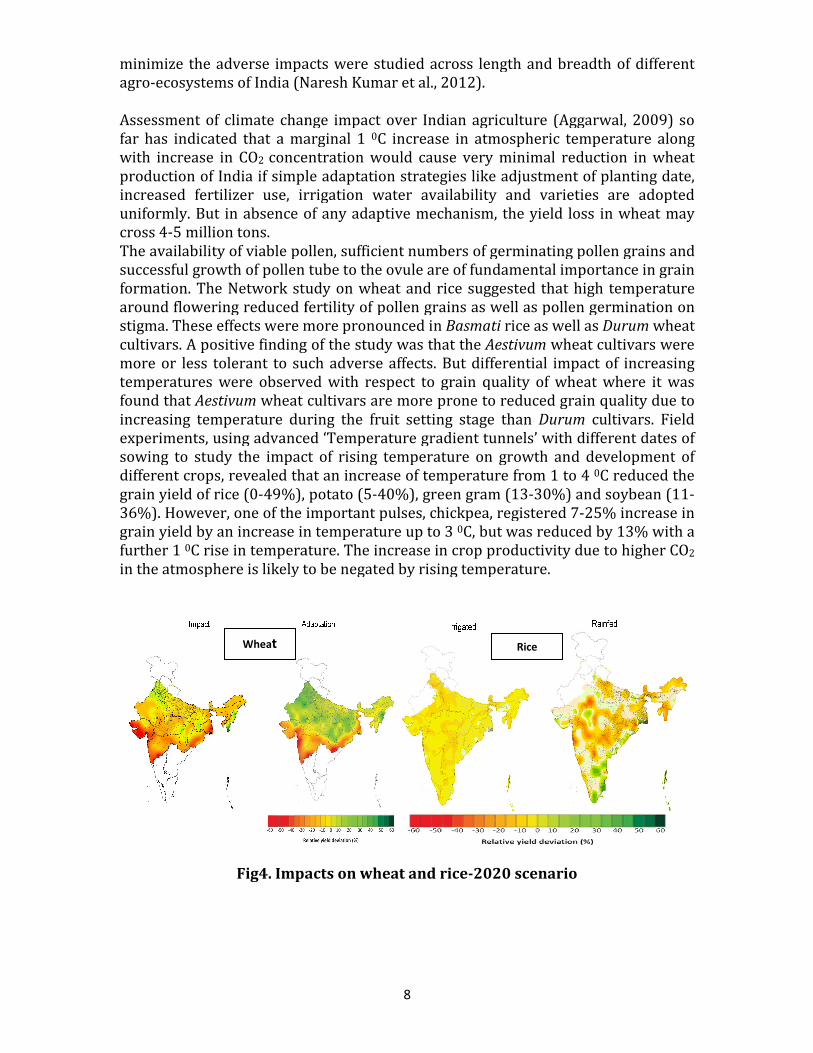
different crops, revealed that an increase of temperature from 1 to 4
grain yield of rice (0-49%), potato (5
36%). However, one of the important pulses, chickpea, registered 7
grain yield by an increase in temperature up to 3
further 1 0C rise in temperature. The increase in crop productivity due to higher CO
in the atmosphere is likely to be negated by rising temperature.
Fig4. Impacts on wheat and rice
Wheat
8
minimize the adverse impacts were studied across length and breadth of different
ecosystems of India (Naresh Kumar et al., 2012).
Assessment of climate change impact over Indian agriculture (Aggarwal, 2009
far has indicated that a marginal 1 0C increase in atmospheric temperature along
concentration would cause very minimal reduction in wheat
production of India if simple adaptation strategies like adjustment of planting date,
increased fertilizer use, irrigation water availability and varieties are adopted
uniformly. But in absence of any adaptive mechanism, the yield loss in wheat may
The availability of viable pollen, sufficient numbers of germinating pollen grains and
pollen tube to the ovule are of fundamental importance in grain
formation. The Network study on wheat and rice suggested that high temperature
around flowering reduced fertility of pollen grains as well as pollen germination on
more pronounced in Basmati rice as well as Durum
cultivars. A positive finding of the study was that the Aestivum wheat cultivars were
more or less tolerant to such adverse affects. But differential impact of increasing
temperatures were observed with respect to grain quality of wheat where it was
wheat cultivars are more prone to reduced grain quality due to
increasing temperature during the fruit setting stage than Durum cultivars. Field
experiments, using advanced ‘Temperature gradient tunnels’ with different dates of
sowing to study the impact of rising temperature on growth and development of
different crops, revealed that an increase of temperature from 1 to 4 0C reduced the
49%), potato (5-40%), green gram (13-30%) and soybean (11
36%). However, one of the important pulses, chickpea, registered 7-25% increase in
grain yield by an increase in temperature up to 3 0C, but was reduced by 13% w
C rise in temperature. The increase in crop productivity due to higher CO
in the atmosphere is likely to be negated by rising temperature.
Fig4. Impacts on wheat and rice-2020 scenario
Rice
minimize the adverse impacts were studied across length and breadth of different
Aggarwal, 2009) so
C increase in atmospheric temperature along
concentration would cause very minimal reduction in wheat
production of India if simple adaptation strategies like adjustment of planting date,
ter availability and varieties are adopted
uniformly. But in absence of any adaptive mechanism, the yield loss in wheat may
The availability of viable pollen, sufficient numbers of germinating pollen grains and
pollen tube to the ovule are of fundamental importance in grain
formation. The Network study on wheat and rice suggested that high temperature
around flowering reduced fertility of pollen grains as well as pollen germination on
Durum wheat
wheat cultivars were
more or less tolerant to such adverse affects. But differential impact of increasing
h respect to grain quality of wheat where it was
wheat cultivars are more prone to reduced grain quality due to
cultivars. Field
radient tunnels’ with different dates of
sowing to study the impact of rising temperature on growth and development of
C reduced the
30%) and soybean (11-
25% increase in
C, but was reduced by 13% with a
C rise in temperature. The increase in crop productivity due to higher CO2
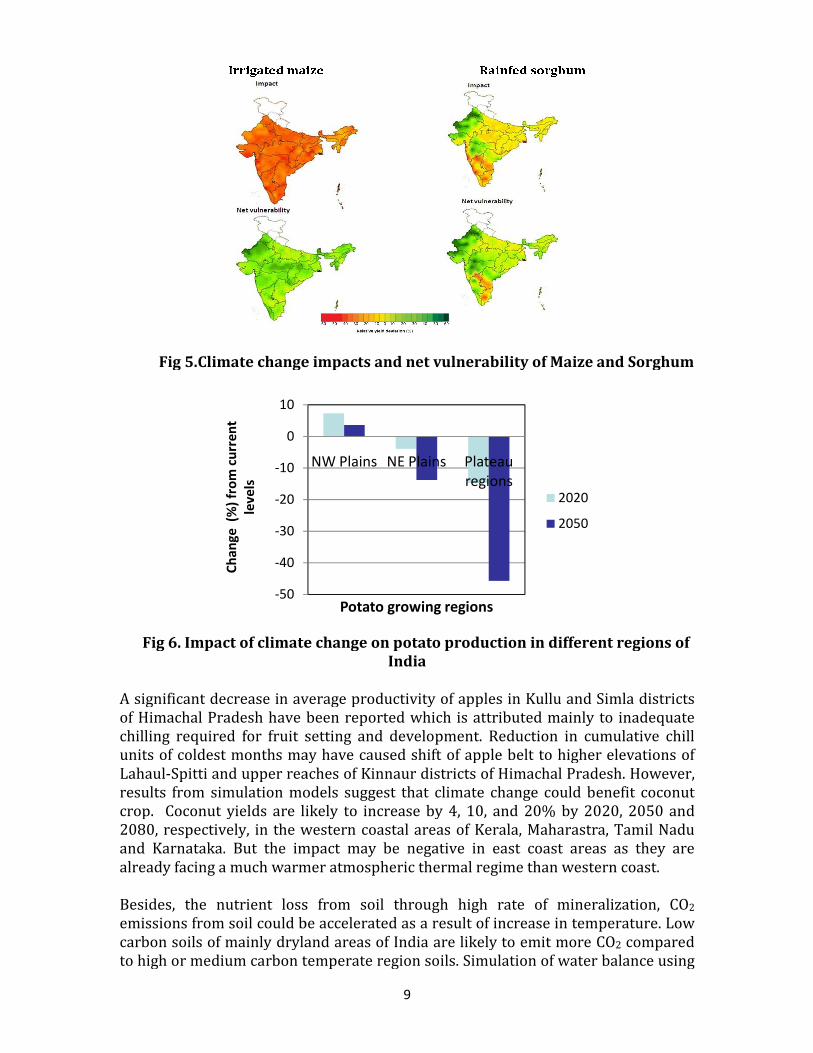
Fig 5.Climate change impacts and net vulnerability of Maize and Sorghum
Fig 6. Impact of climate change on potato production in different regions of
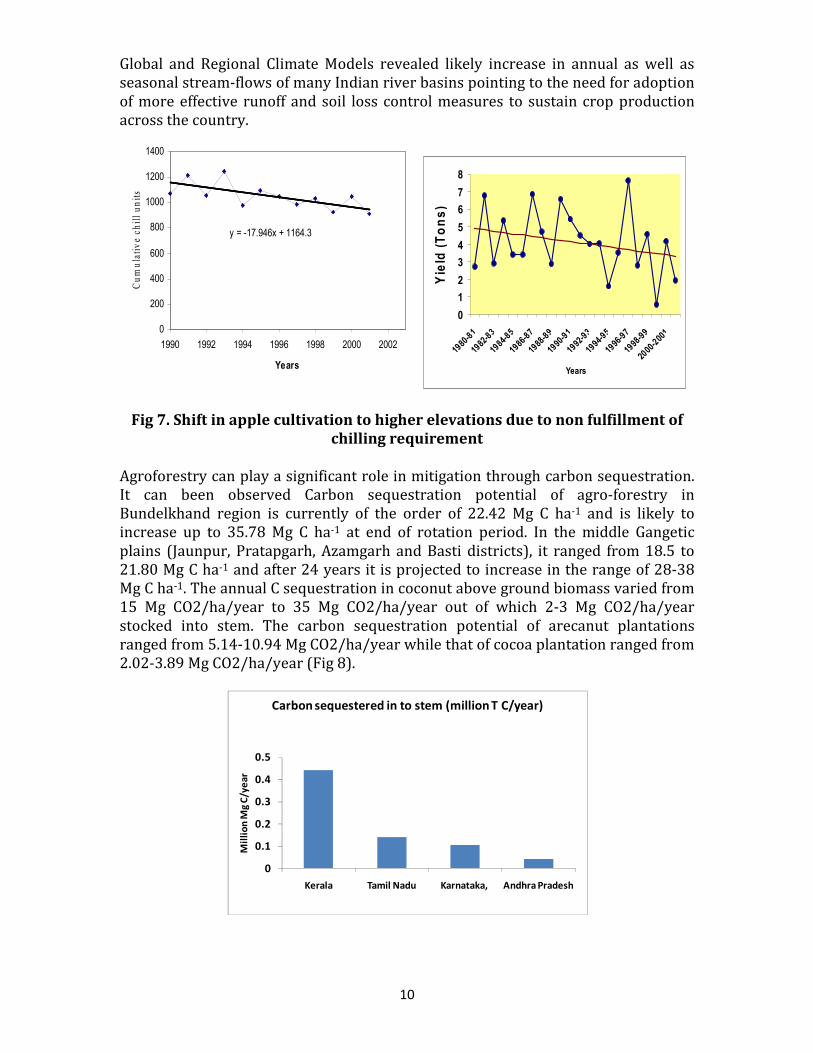
A significant decrease in average productivity of apples in Kullu and Simla dis
of Himachal Pradesh have been reported which is attributed mainly to inadequate
chilling required for fruit setting and development. Reduction in cumulative chill
units of coldest months may have caused shift of apple belt to higher elevations of
Lahaul-Spitti and upper reaches of Kinnaur districts of Himachal Pradesh. However,
results from simulation models suggest that climate change could benefit coconut
crop. Coconut yields are likely to increase by 4, 10, and 20% by 2020, 2050 and
2080, respectively, in the western coastal areas of Kerala, Maharastra, Tamil Nadu
and Karnataka. But the impact may be negative in east coast areas as they are
already facing a much warmer atmospheric thermal regime than western coast.
Besides, the nutrient loss from
emissions from soil could be accelerated as a result of increase in temperature. Low
carbon soils of mainly dryland areas of India are likely to emit more CO
to high or medium carbon temperate region
-50
-40
-30
-20
-10
0
10
Ch
an
ge
(%
) fr
om
cu
rre
nt
lev
els
9
Fig 5.Climate change impacts and net vulnerability of Maize and Sorghum
Fig 6. Impact of climate change on potato production in different regions of
India
A significant decrease in average productivity of apples in Kullu and Simla dis
of Himachal Pradesh have been reported which is attributed mainly to inadequate
chilling required for fruit setting and development. Reduction in cumulative chill
units of coldest months may have caused shift of apple belt to higher elevations of
Spitti and upper reaches of Kinnaur districts of Himachal Pradesh. However,
results from simulation models suggest that climate change could benefit coconut
crop. Coconut yields are likely to increase by 4, 10, and 20% by 2020, 2050 and
ively, in the western coastal areas of Kerala, Maharastra, Tamil Nadu
and Karnataka. But the impact may be negative in east coast areas as they are
already facing a much warmer atmospheric thermal regime than western coast.
Besides, the nutrient loss from soil through high rate of mineralization, CO
emissions from soil could be accelerated as a result of increase in temperature. Low
carbon soils of mainly dryland areas of India are likely to emit more CO
to high or medium carbon temperate region soils. Simulation of water balance using
NW Plains NE Plains Plateau
regions
Potato growing regions
2020
2050
Fig 5.Climate change impacts and net vulnerability of Maize and Sorghum
Fig 6. Impact of climate change on potato production in different regions of
A significant decrease in average productivity of apples in Kullu and Simla districts
of Himachal Pradesh have been reported which is attributed mainly to inadequate
chilling required for fruit setting and development. Reduction in cumulative chill
units of coldest months may have caused shift of apple belt to higher elevations of
Spitti and upper reaches of Kinnaur districts of Himachal Pradesh. However,
results from simulation models suggest that climate change could benefit coconut
crop. Coconut yields are likely to increase by 4, 10, and 20% by 2020, 2050 and
ively, in the western coastal areas of Kerala, Maharastra, Tamil Nadu
and Karnataka. But the impact may be negative in east coast areas as they are
already facing a much warmer atmospheric thermal regime than western coast.
soil through high rate of mineralization, CO2
emissions from soil could be accelerated as a result of increase in temperature. Low
carbon soils of mainly dryland areas of India are likely to emit more CO2 compared
soils. Simulation of water balance using
10
Global and Regional Climate Models revealed likely increase in annual as well as
seasonal stream-flows of many Indian river basins pointing to the need for adoption
of more effective runoff and soil loss control measures to sustain crop production
across the country.
Fig 7. Shift in apple cultivation to higher elevations due to non fulfillment of chilling requirement
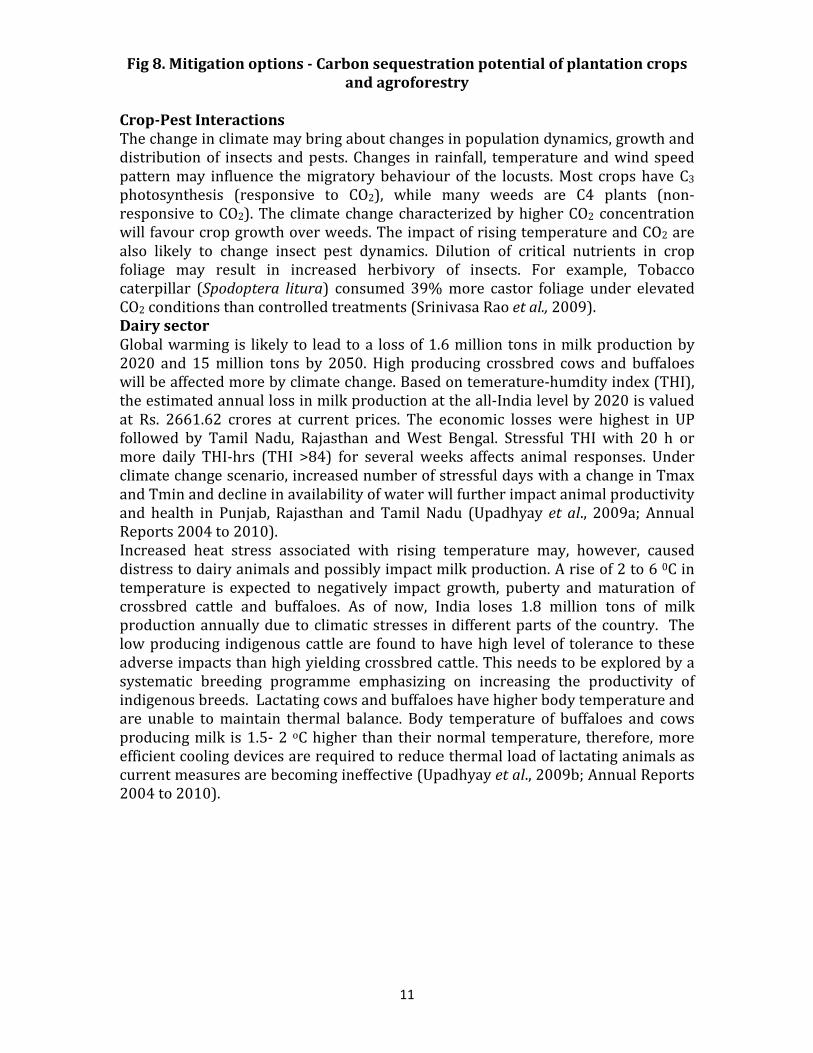
Agroforestry can play a significant role in mitigation through carbon sequestration.
It can been observed Carbon sequestration potential of agro-forestry in
Bundelkhand region is currently of the order of 22.42 Mg C ha-1 and is likely to
increase up to 35.78 Mg C ha-1 at end of rotation period. In the middle Gangetic
plains (Jaunpur, Pratapgarh, Azamgarh and Basti districts), it ranged from 18.5 to
21.80 Mg C ha-1 and after 24 years it is projected to increase in the range of 28-38
Mg C ha-1. The annual C sequestration in coconut above ground biomass varied from
15 Mg CO2/ha/year to 35 Mg CO2/ha/year out of which 2-3 Mg CO2/ha/year
stocked into stem. The carbon sequestration potential of arecanut plantations
ranged from 5.14-10.94 Mg CO2/ha/year while that of cocoa plantation ranged from
2.02-3.89 Mg CO2/ha/year (Fig 8).
y = -17.946x + 1164.3
0
200
400
600
800
1000
1200
1400
1990 1992 1994 1996 1998 2000 2002
Years
Cum
ulative chill units
0
1
2
3
4
5
6
7
8
1980-81
1982-83
1984-85
1986-87
1988-89
1990-91
1992-93
1994-95
1996-97
1998-99
2000-2001
Years
Yield (Tons)
0
0.1
0.2
0.3
0.4
0.5
Kerala Tamil Nadu Karnataka, Andhra Pradesh
Mil
lio
n M
g C
/ye
ar
Carbon sequestered in to stem (million T C/year)
11
Fig 8. Mitigation options - Carbon sequestration potential of plantation crops and agroforestry
Crop-Pest Interactions The change in climate may bring about changes in population dynamics, growth and
distribution of insects and pests. Changes in rainfall, temperature and wind speed
pattern may influence the migratory behaviour of the locusts. Most crops have C3
photosynthesis (responsive to CO2), while many weeds are C4 plants (non-
responsive to CO2). The climate change characterized by higher CO2 concentration
will favour crop growth over weeds. The impact of rising temperature and CO2 are
also likely to change insect pest dynamics. Dilution of critical nutrients in crop
foliage may result in increased herbivory of insects. For example, Tobacco
caterpillar (Spodoptera litura) consumed 39% more castor foliage under elevated
CO2 conditions than controlled treatments (Srinivasa Rao et al., 2009).
Dairy sector
Global warming is likely to lead to a loss of 1.6 million tons in milk production by
2020 and 15 million tons by 2050. High producing crossbred cows and buffaloes
will be affected more by climate change. Based on temerature-humdity index (THI),
the estimated annual loss in milk production at the all-India level by 2020 is valued
at Rs. 2661.62 crores at current prices. The economic losses were highest in UP
followed by Tamil Nadu, Rajasthan and West Bengal. Stressful THI with 20 h or
more daily THI-hrs (THI >84) for several weeks affects animal responses. Under
climate change scenario, increased number of stressful days with a change in Tmax
and Tmin and decline in availability of water will further impact animal productivity
and health in Punjab, Rajasthan and Tamil Nadu (Upadhyay et al., 2009a; Annual
Reports 2004 to 2010).
Increased heat stress associated with rising temperature may, however, caused
distress to dairy animals and possibly impact milk production. A rise of 2 to 6 0C in
temperature is expected to negatively impact growth, puberty and maturation of
crossbred cattle and buffaloes. As of now, India loses 1.8 million tons of milk
production annually due to climatic stresses in different parts of the country. The
low producing indigenous cattle are found to have high level of tolerance to these
adverse impacts than high yielding crossbred cattle. This needs to be explored by a
systematic breeding programme emphasizing on increasing the productivity of
indigenous breeds. Lactating cows and buffaloes have higher body temperature and
are unable to maintain thermal balance. Body temperature of buffaloes and cows
producing milk is 1.5- 2 oC higher than their normal temperature, therefore, more
efficient cooling devices are required to reduce thermal load of lactating animals as
current measures are becoming ineffective (Upadhyay et al., 2009b; Annual Reports
2004 to 2010).
LATITUDE(°N)
1961-1976
1987-1996
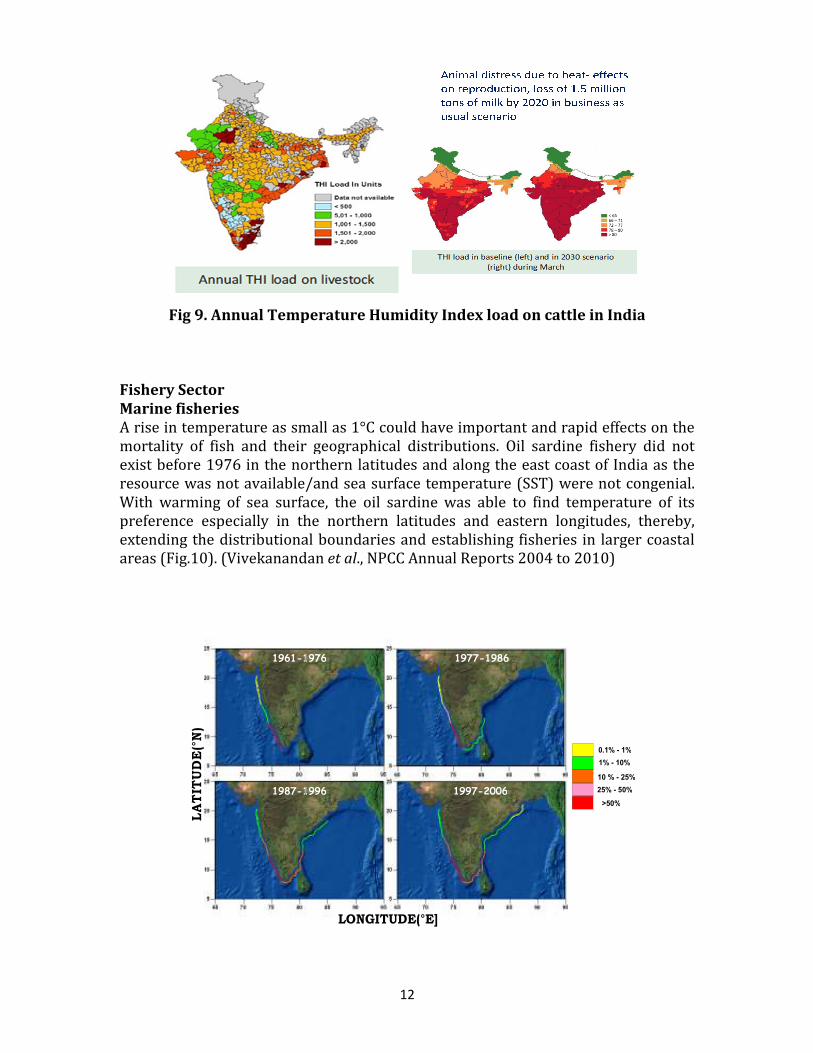
Fig 9. Annual Temperature Humidity Index load on cattle in India
Fishery Sector
Marine fisheries A rise in temperature as small as 1°C could have important and rapid effects on the
mortality of fish and their geographical distributions. Oil sardine fishery did not
exist before 1976 in the northern latitudes and along the east coast of India as the
resource was not available/and sea surface temperature (SST) were not congenial.
With warming of sea surface, the oil sardine was able to find temperature of its
preference especially in the northern latitudes and eastern longitudes, thereby,
extending the distributional boundaries and establishing fisheries in larger coastal
areas (Fig.10). (Vivekanandan
12
0.1% - 1%
1% - 10%
10 % - 25%
25% - 50%
>50%
LONGITUDE(°E]
1961-1976 1977-1986
1987-1996 1997-2006
Annual Temperature Humidity Index load on cattle in India
A rise in temperature as small as 1°C could have important and rapid effects on the
mortality of fish and their geographical distributions. Oil sardine fishery did not
exist before 1976 in the northern latitudes and along the east coast of India as the
ource was not available/and sea surface temperature (SST) were not congenial.
With warming of sea surface, the oil sardine was able to find temperature of its
preference especially in the northern latitudes and eastern longitudes, thereby,
stributional boundaries and establishing fisheries in larger coastal
areas (Fig.10). (Vivekanandan et al., NPCC Annual Reports 2004 to 2010)
0.1% - 1%
1% - 10%
10 % - 25%
25% - 50%
>50%
Annual Temperature Humidity Index load on cattle in India
A rise in temperature as small as 1°C could have important and rapid effects on the
mortality of fish and their geographical distributions. Oil sardine fishery did not
exist before 1976 in the northern latitudes and along the east coast of India as the
ource was not available/and sea surface temperature (SST) were not congenial.
With warming of sea surface, the oil sardine was able to find temperature of its
preference especially in the northern latitudes and eastern longitudes, thereby,
stributional boundaries and establishing fisheries in larger coastal
., NPCC Annual Reports 2004 to 2010)
13
Nemipterus japonicus: Change in spawning season off
Chennai
0
20
40
60
80
100
1980
1982
1984
1986
1993
1995
1997
1999
2001
2003
Year
Spawners (%)
October - March
April - September
N. mesoprion : Change in spawning season off Chennai
0
20
40
60
80
100
1983
1985
1987
1993
1995
1997
1999
2001
2003
Year
Spawners (%) October-March
April-September
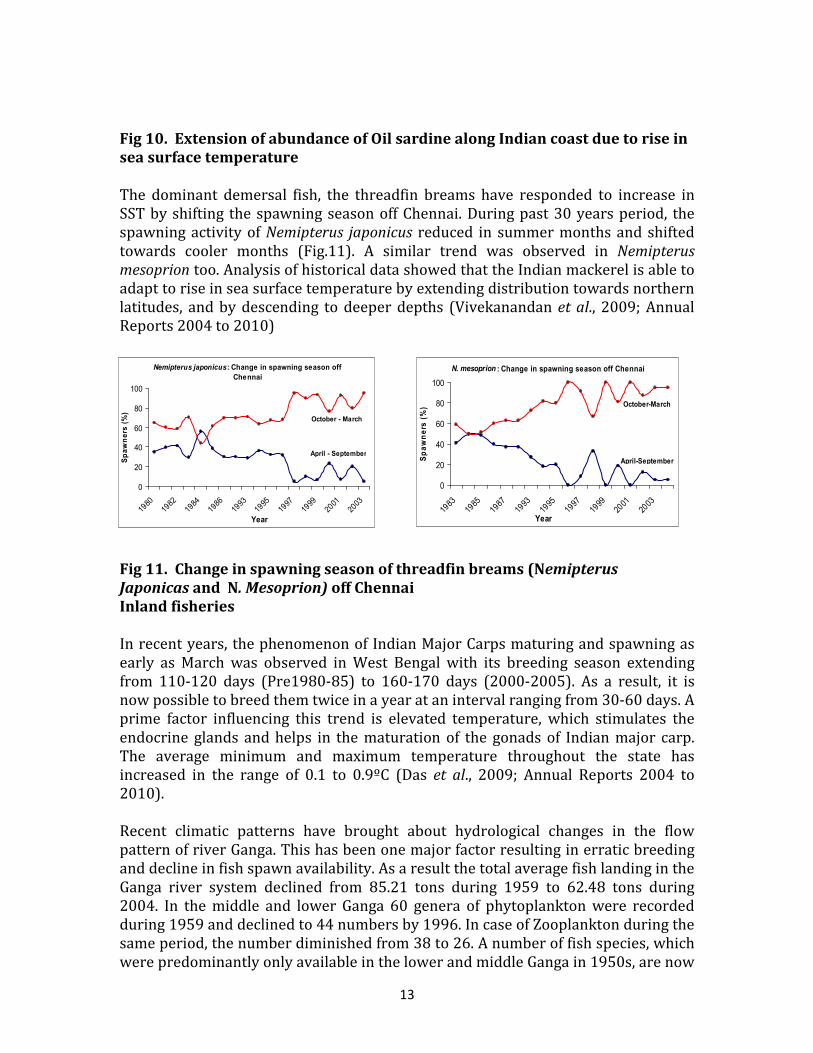
Fig 10. Extension of abundance of Oil sardine along Indian coast due to rise in sea surface temperature
The dominant demersal fish, the threadfin breams have responded to increase in
SST by shifting the spawning season off Chennai. During past 30 years period, the
spawning activity of Nemipterus japonicus reduced in summer months and shifted
towards cooler months (Fig.11). A similar trend was observed in Nemipterus
mesoprion too. Analysis of historical data showed that the Indian mackerel is able to
adapt to rise in sea surface temperature by extending distribution towards northern
latitudes, and by descending to deeper depths (Vivekanandan et al., 2009; Annual
Reports 2004 to 2010)
Fig 11. Change in spawning season of threadfin breams (Nemipterus
Japonicas and N. Mesoprion) off Chennai Inland fisheries
In recent years, the phenomenon of Indian Major Carps maturing and spawning as
early as March was observed in West Bengal with its breeding season extending
from 110-120 days (Pre1980-85) to 160-170 days (2000-2005). As a result, it is
now possible to breed them twice in a year at an interval ranging from 30-60 days. A
prime factor influencing this trend is elevated temperature, which stimulates the
endocrine glands and helps in the maturation of the gonads of Indian major carp.
The average minimum and maximum temperature throughout the state has
increased in the range of 0.1 to 0.9ºC (Das et al., 2009; Annual Reports 2004 to
2010).
Recent climatic patterns have brought about hydrological changes in the flow
pattern of river Ganga. This has been one major factor resulting in erratic breeding
and decline in fish spawn availability. As a result the total average fish landing in the
Ganga river system declined from 85.21 tons during 1959 to 62.48 tons during
2004. In the middle and lower Ganga 60 genera of phytoplankton were recorded
during 1959 and declined to 44 numbers by 1996. In case of Zooplankton during the
same period, the number diminished from 38 to 26. A number of fish species, which
were predominantly only available in the lower and middle Ganga in 1950s, are now
14
recorded from the upper cold-water stretch up to Tehri (Das et al., 2009; Annual
Reports 2004 to 2010)
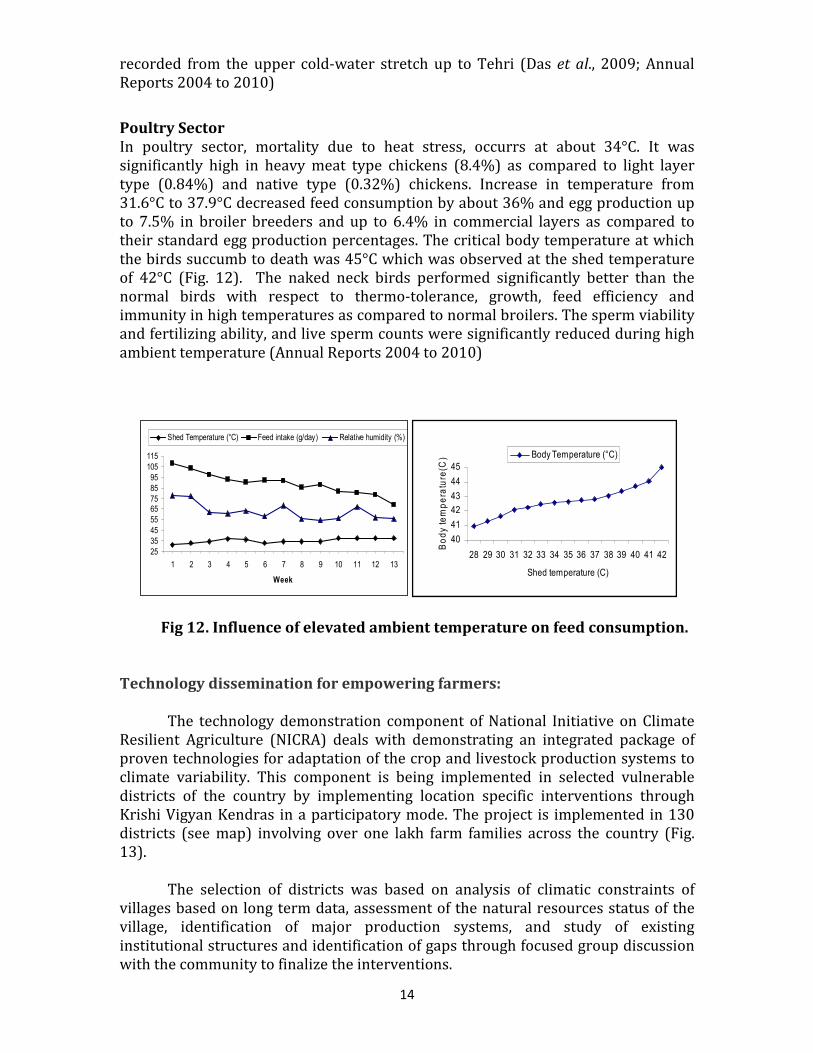
Poultry Sector In poultry sector, mortality due to heat stress, occurrs at about 34°C. It was
significantly high in heavy meat type chickens (8.4%) as compared to light layer
type (0.84%) and native type (0.32%) chickens. Increase in temperature from
31.6°C to 37.9°C decreased feed consumption by about 36% and egg production up
to 7.5% in broiler breeders and up to 6.4% in commercial layers as compared to
their standard egg production percentages. The critical body temperature at which
the birds succumb to death was 45°C which was observed at the shed temperature
of 42°C (Fig. 12). The naked neck birds performed significantly better than the
normal birds with respect to thermo-tolerance, growth, feed efficiency and
immunity in high temperatures as compared to normal broilers. The sperm viability
and fertilizing ability, and live sperm counts were significantly reduced during high
ambient temperature (Annual Reports 2004 to 2010)
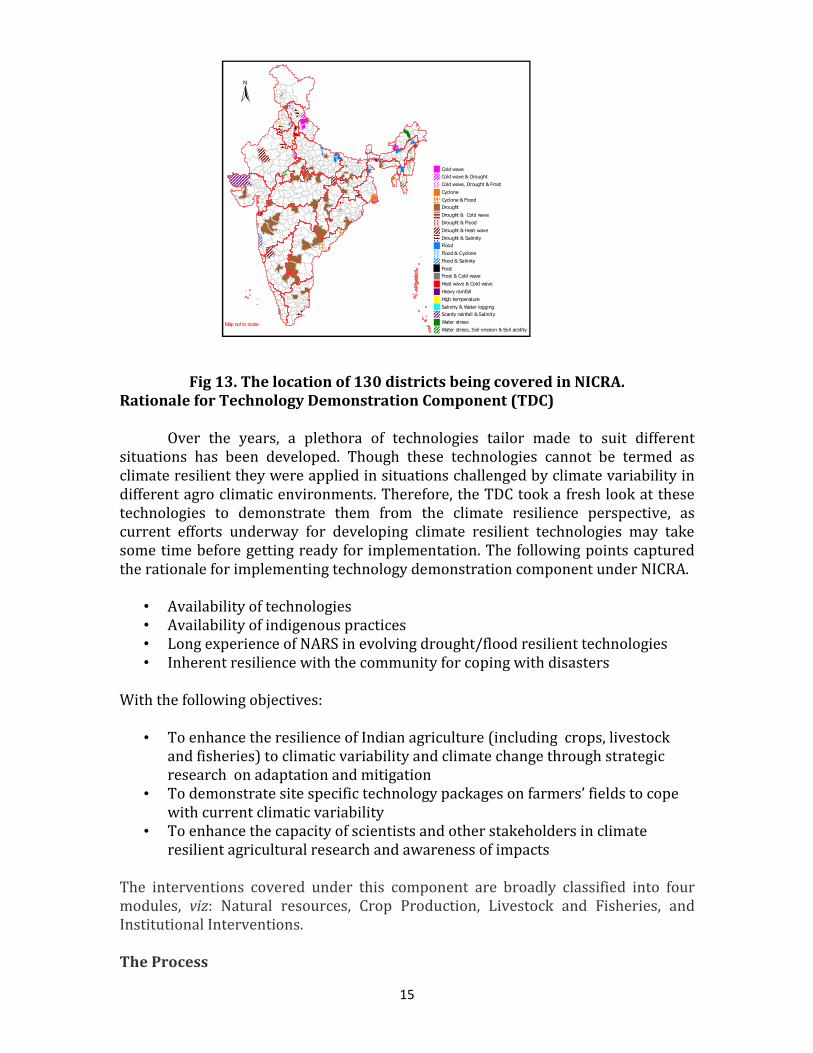
Fig 12. Influence of elevated ambient temperature on feed consumption. Technology dissemination for empowering farmers:
The technology demonstration component of National Initiative on Climate
Resilient Agriculture (NICRA) deals with demonstrating an integrated package of
proven technologies for adaptation of the crop and livestock production systems to
climate variability. This component is being implemented in selected vulnerable
districts of the country by implementing location specific interventions through
Krishi Vigyan Kendras in a participatory mode. The project is implemented in 130
districts (see map) involving over one lakh farm families across the country (Fig.
13).
The selection of districts was based on analysis of climatic constraints of
villages based on long term data, assessment of the natural resources status of the
village, identification of major production systems, and study of existing
institutional structures and identification of gaps through focused group discussion
with the community to finalize the interventions.
25
35
45
55
6575
85
95
105
115
1 2 3 4 5 6 7 8 9 10 11 12 13
Week
Shed Temperature (°C) Feed intake (g/day) Relative humidity (%)
40
41
42
43
44
45
28 29 30 31 32 33 34 35 36 37 38 39 40 41 42
Shed temperature (C)
Bo
dy te
mp
era
ture
(C) Body Temperature (°C)
15
N
Cold wave
Cold wave & Drought
Cold wave, Drought & Frost
Cyclone
Cyclone & Flood
Drought
Drought & Cold wave
Drought & Flood
Drought & Heat wave
Drought & Salinity
Flood
Flood & Cyclone
Flood & Salinity
Frost
Frost & Cold wave
Heat wave & Cold wave
Heavy rainfall
High temperature
Salinity & Water logging
Scanty rainfall & Salinity
Water stress
Water stress, Soil erosion & Soil acidityMap not to scale
Fig 13. The location of 130 districts being covered in NICRA. Rationale for Technology Demonstration Component (TDC)
Over the years, a plethora of technologies tailor made to suit different
situations has been developed. Though these technologies cannot be termed as
climate resilient they were applied in situations challenged by climate variability in
different agro climatic environments. Therefore, the TDC took a fresh look at these
technologies to demonstrate them from the climate resilience perspective, as
current efforts underway for developing climate resilient technologies may take
some time before getting ready for implementation. The following points captured
the rationale for implementing technology demonstration component under NICRA.
• Availability of technologies
• Availability of indigenous practices
• Long experience of NARS in evolving drought/flood resilient technologies
• Inherent resilience with the community for coping with disasters
With the following objectives:
• To enhance the resilience of Indian agriculture (including crops, livestock
and fisheries) to climatic variability and climate change through strategic
research on adaptation and mitigation
• To demonstrate site specific technology packages on farmers’ fields to cope
with current climatic variability
• To enhance the capacity of scientists and other stakeholders in climate
resilient agricultural research and awareness of impacts
The interventions covered under this component are broadly classified into four
modules, viz: Natural resources, Crop Production, Livestock and Fisheries, and
Institutional Interventions.
The Process
16
The KVK team for each district carried out a detailed exercise on the needs of
the village, the climatic vulnerability (drought/floods/heat wave/frost/cyclone) and
the available technology options from the concerned Zonal Agricultural Research
Station of the SAUs. After a careful study of the gaps, specific interventions from
each of the modules were selected and an integrated package from all modules was
formulated. The majority of the farmers were covered with one or more of the
interventions in order to demonstrate a discernable effect. The project was launched
in each village after giving wide publicity and by involving all the line departments
under the leadership of the district administration. The launch event was used to
generate wide spread awareness within the community and across line departments
so as to prepare a platform for exploiting synergy through convergence of other
government projects.
The unique features of the project are that a baseline for all the project sites were
established through a systematic benchmark survey, emphasis was on natural
resource management interventions to build the communities’ capacity to cope with
climate variability through need based investment and establishment of a network
of automatic weather stations across 100 KVKs as well as custom hiring centers in
each project village for promoting mechanization on small farms and friendly
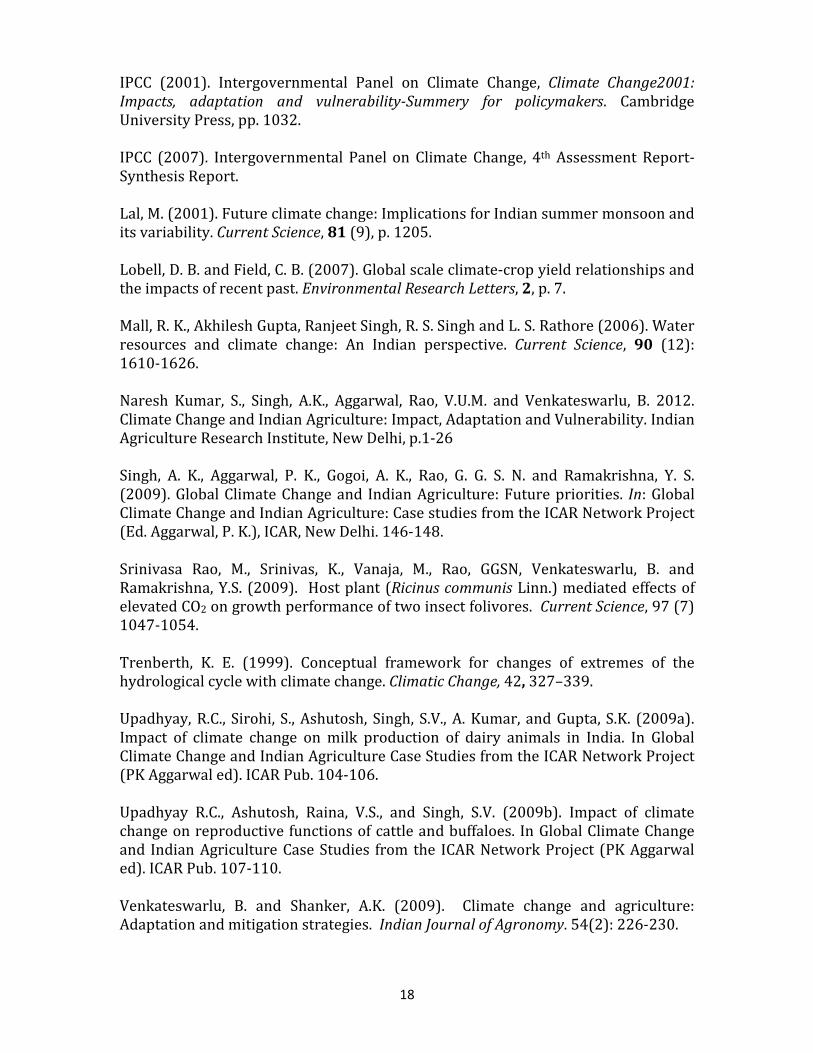
setting up of Village Climate Risk Management Committees (VCRMC) – grassroots
peoples’ institutions to take need based decisions at the village level.
The project has already made a visible impact in helping the farmers in the
vulnerable districts to cope up with the vagaries of weather.
Adaptation/mitigation strategies
A comprehensive strategy of utilization of existing knowledge, strengthening R&D in
key areas and evolving a policy frame work that builds on risk management and
providing incentives to sustainable use of natural resources will be required for
successful adaptation to climate by the farm sector. The goal of this strategy is to
minimize as risks associated with farming and enable farms to cope with these risks
(Singh et al., 2009).
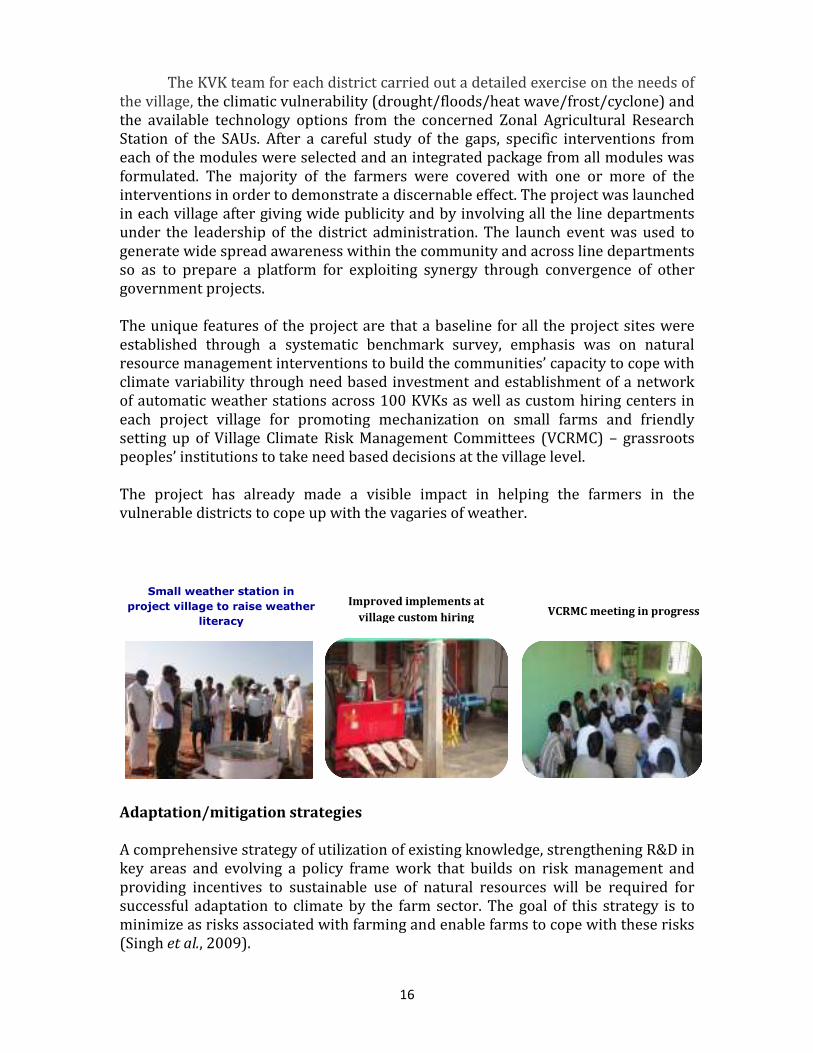
Small weather station in
project village to raise weather
literacy VCRMC meeting in progress
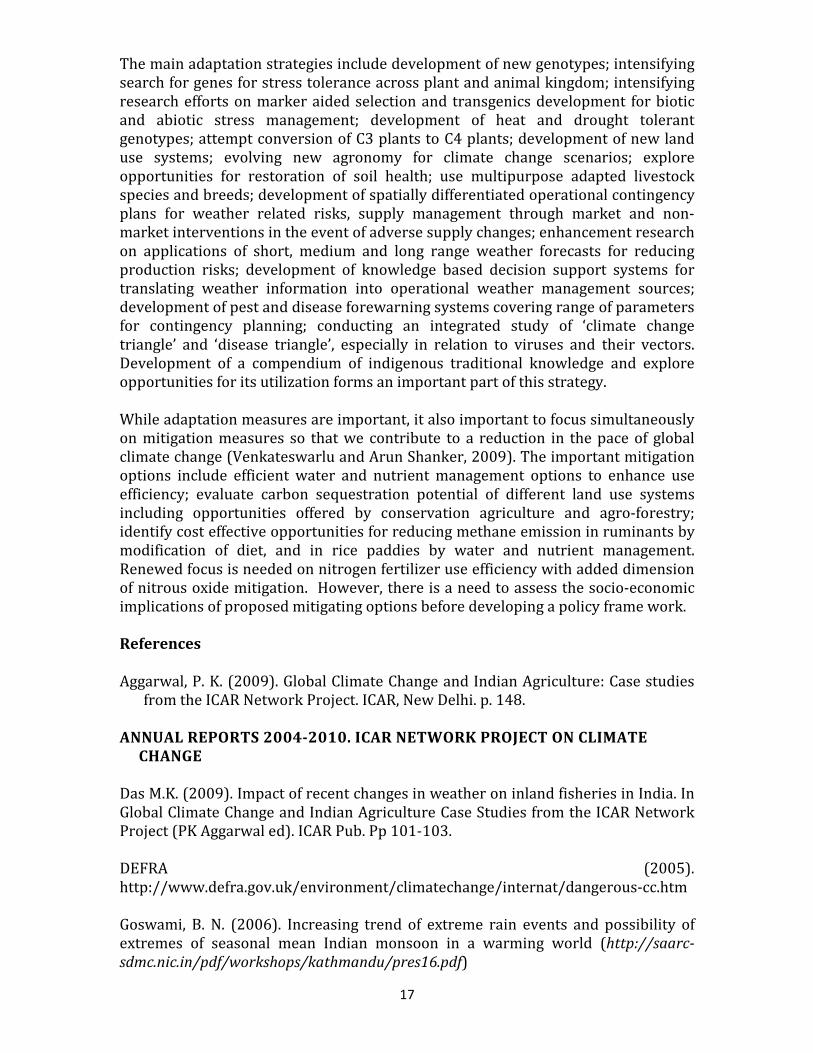
Improved implements at
village custom hiring
17
The main adaptation strategies include development of new genotypes; intensifying
search for genes for stress tolerance across plant and animal kingdom; intensifying
research efforts on marker aided selection and transgenics development for biotic
and abiotic stress management; development of heat and drought tolerant
genotypes; attempt conversion of C3 plants to C4 plants; development of new land
use systems; evolving new agronomy for climate change scenarios; explore
opportunities for restoration of soil health; use multipurpose adapted livestock
species and breeds; development of spatially differentiated operational contingency
plans for weather related risks, supply management through market and non-
market interventions in the event of adverse supply changes; enhancement research
on applications of short, medium and long range weather forecasts for reducing
production risks; development of knowledge based decision support systems for
translating weather information into operational weather management sources;
development of pest and disease forewarning systems covering range of parameters
for contingency planning; conducting an integrated study of ‘climate change
triangle’ and ‘disease triangle’, especially in relation to viruses and their vectors.
Development of a compendium of indigenous traditional knowledge and explore
opportunities for its utilization forms an important part of this strategy.
While adaptation measures are important, it also important to focus simultaneously
on mitigation measures so that we contribute to a reduction in the pace of global
climate change (Venkateswarlu and Arun Shanker, 2009). The important mitigation
options include efficient water and nutrient management options to enhance use
efficiency; evaluate carbon sequestration potential of different land use systems
including opportunities offered by conservation agriculture and agro-forestry;
identify cost effective opportunities for reducing methane emission in ruminants by
modification of diet, and in rice paddies by water and nutrient management.
Renewed focus is needed on nitrogen fertilizer use efficiency with added dimension
of nitrous oxide mitigation. However, there is a need to assess the socio-economic
implications of proposed mitigating options before developing a policy frame work.
References
Aggarwal, P. K. (2009). Global Climate Change and Indian Agriculture: Case studies
from the ICAR Network Project. ICAR, New Delhi. p. 148.
ANNUAL REPORTS 2004-2010. ICAR NETWORK PROJECT ON CLIMATE CHANGE
Das M.K. (2009). Impact of recent changes in weather on inland fisheries in India. In
Global Climate Change and Indian Agriculture Case Studies from the ICAR Network
Project (PK Aggarwal ed). ICAR Pub. Pp 101-103.
DEFRA (2005).
http://www.defra.gov.uk/environment/climatechange/internat/dangerous-cc.htm
Goswami, B. N. (2006). Increasing trend of extreme rain events and possibility of
extremes of seasonal mean Indian monsoon in a warming world (http://saarc-
sdmc.nic.in/pdf/workshops/kathmandu/pres16.pdf)
18
IPCC (2001). Intergovernmental Panel on Climate Change, Climate Change2001:
Impacts, adaptation and vulnerability-Summery for policymakers. Cambridge
University Press, pp. 1032.
IPCC (2007). Intergovernmental Panel on Climate Change, 4th Assessment Report-
Synthesis Report.
Lal, M. (2001). Future climate change: Implications for Indian summer monsoon and
its variability. Current Science, 81 (9), p. 1205.
Lobell, D. B. and Field, C. B. (2007). Global scale climate-crop yield relationships and
the impacts of recent past. Environmental Research Letters, 2, p. 7.
Mall, R. K., Akhilesh Gupta, Ranjeet Singh, R. S. Singh and L. S. Rathore (2006). Water
resources and climate change: An Indian perspective. Current Science, 90 (12):
1610-1626.
Naresh Kumar, S., Singh, A.K., Aggarwal, Rao, V.U.M. and Venkateswarlu, B. 2012.
Climate Change and Indian Agriculture: Impact, Adaptation and Vulnerability. Indian
Agriculture Research Institute, New Delhi, p.1-26
Singh, A. K., Aggarwal, P. K., Gogoi, A. K., Rao, G. G. S. N. and Ramakrishna, Y. S.
(2009). Global Climate Change and Indian Agriculture: Future priorities. In: Global
Climate Change and Indian Agriculture: Case studies from the ICAR Network Project
(Ed. Aggarwal, P. K.), ICAR, New Delhi. 146-148.
Srinivasa Rao, M., Srinivas, K., Vanaja, M., Rao, GGSN, Venkateswarlu, B. and
Ramakrishna, Y.S. (2009). Host plant (Ricinus communis Linn.) mediated effects of
elevated CO2 on growth performance of two insect folivores. Current Science, 97 (7)
1047-1054.
Trenberth, K. E. (1999). Conceptual framework for changes of extremes of the
hydrological cycle with climate change. Climatic Change, 42, 327–339.
Upadhyay, R.C., Sirohi, S., Ashutosh, Singh, S.V., A. Kumar, and Gupta, S.K. (2009a).
Impact of climate change on milk production of dairy animals in India. In Global
Climate Change and Indian Agriculture Case Studies from the ICAR Network Project
(PK Aggarwal ed). ICAR Pub. 104-106.
Upadhyay R.C., Ashutosh, Raina, V.S., and Singh, S.V. (2009b). Impact of climate
change on reproductive functions of cattle and buffaloes. In Global Climate Change
and Indian Agriculture Case Studies from the ICAR Network Project (PK Aggarwal
ed). ICAR Pub. 107-110.
Venkateswarlu, B. and Shanker, A.K. (2009). Climate change and agriculture:
Adaptation and mitigation strategies. Indian Journal of Agronomy. 54(2): 226-230.

19
Vivekanandan, E., Rajagopalan, M. and Pillai, N.G.K. (2009). Recent trends in sea
surface temperature and its impact on oil sardine In Global Climate Change and
Indian Agriculture Case Studies from the ICAR Network Project (PK Aggarwal ed).
ICAR Pub. 89-92.
Vivekanandan, E., Hussain Ali, M. and Rajagopalan, M. (2009). Impact of rise in
seawater temperature on the pawning of threadfin beams. In Global Climate Change
and Indian Agriculture Case Studies from the ICAR Network Project (PK Aggarwal
ed). ICAR Pub. 93-96.
20
CLIMATE CHANGE AND ITS IMPACT ON AGRICULTURE
V U M Rao, Principal Scientist, AICRPAM, Central Research Institute for Dryland
Agriculture, Santoshnagar, Hyderabad
Agriculture is the sector most vulnerable to climate change due to its high
dependence on climate and weather. Climate change is now a fact recognised
globally. India, still an agrarian country with 70 % of the working population
depends on agricultural activities for their livelihood. The ever increasing
population and the food security increasing the pressure on Indian agriculture
besides climate variability and change. Variability in onset of South west Monsoon
and the distribution of rainfall in the kharif season are the key factors for crop
production of the country. Temperature is the other factor effecting the rabi crops.
The major cause to climate change has been ascribed to the increased levels of
greenhouse gases like carbon dioxide (CO2), methane (CH4), nitrous oxides (NO2),
chlorofluorocarbons (CFCs) beyond their natural levels due to the uncontrolled
human activities such as burning of fossil fuels, increased use of refrigerants, and
enhanced agricultural activities. The Inter-Governmental Panel on Climate Change
has projected that the global mean surface temperature will rise by 1.4-5.8ºC by
2100 due to increase in carbon dioxide concentration in the atmosphere. Further,
the projection of increase in extreme event frequencies further creating a chaos to
the Indian agriculture. This paper mainly deals with the current level of climate
change and the Impacts on Indian agriculture, some adaptation and mitigation
strategies and vulnerability.
Introduction
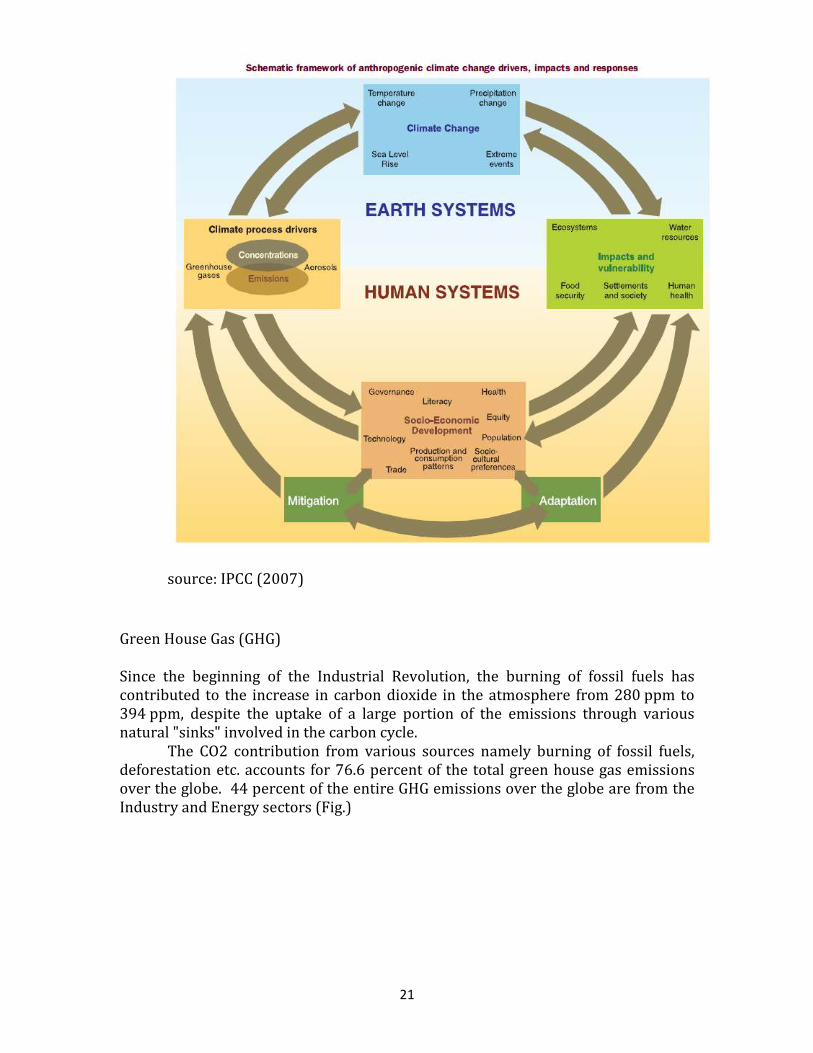
Climate change (CC) refers to a change in the state of the climate that can be
identified by changes in the mean and/or the variability of its properties, and that
persists for an extended period, typically decades or longer. It refers to any change
in climate over time, whether due to natural variability or as a result of human
activity (IPCC ,2007). The climate change is majorly ascribed to the increase in
anthropogenic gases in atmosphere. The following picture shows how the
anthropogenic gases drive the climate change in clockwise direction to derive
climatic changes and impacts from socio-economic information and emissions With
increased understanding of these linkages, it is now possible to assess the linkages
also counterclockwise, i.e. to evaluate possible development pathways and global
emissions constraints that would reduce the risk of future impacts that society may
wish to avoid.
21
source: IPCC (2007)
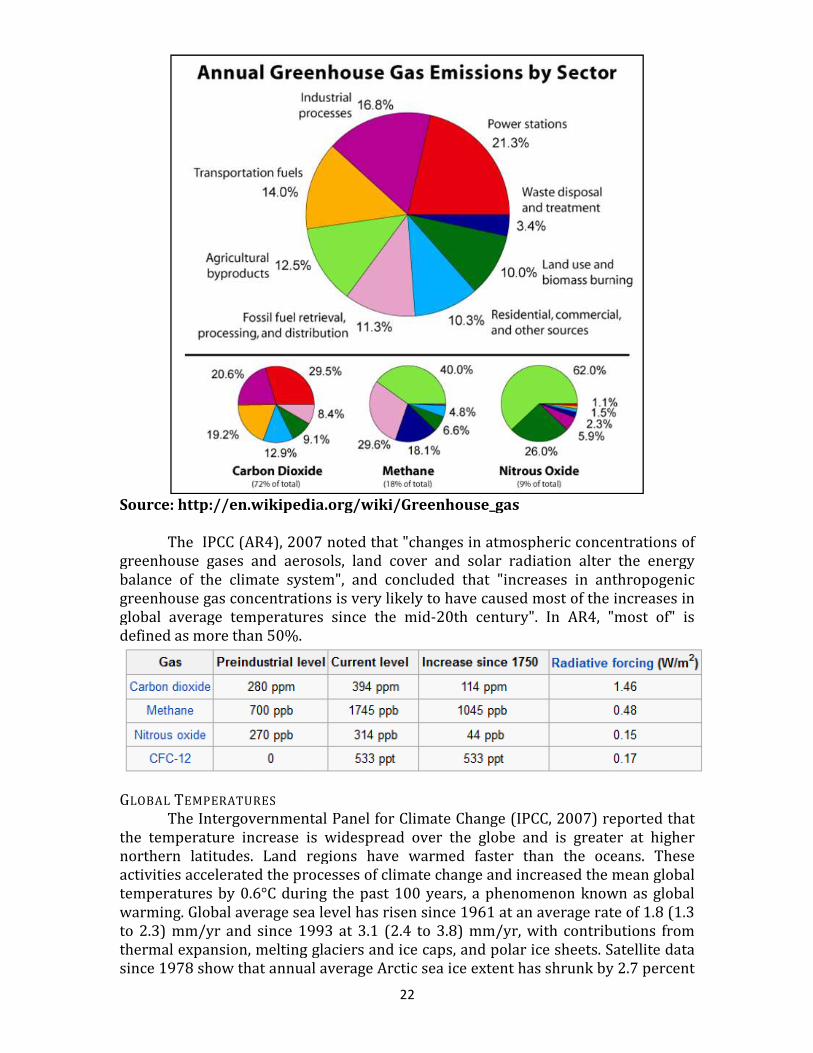
Green House Gas (GHG)
Since the beginning of the Industrial Revolution, the burning of fossil fuels has
contributed to the increase in carbon dioxide in the atmosphere from 280 ppm to
394 ppm, despite the uptake of a large portion of the emissions through various
natural "sinks" involved in the carbon cycle.
The CO2 contribution from various sources namely burning of fossil fuels,
deforestation etc. accounts for 76.6 percent of the total green house gas emissions
over the globe. 44 percent of the entire GHG emissions over the globe are from the
Industry and Energy sectors (Fig.)
Source: http://en.wikipedia.org/wiki/Greenhouse_gas The IPCC (AR4), 2007 noted that "changes in atmospheric conc
greenhouse gases and aerosols, land cover and solar radiation alter the energy
balance of the climate system", and concluded that "increases in anthropogenic
greenhouse gas concentrations is very likely to have caused most of the increases in
global average temperatures since the mid
defined as more than 50%.
GLOBAL TEMPERATURES
The Intergovernmental Panel for Climate Change (IPCC, 2007) reported that
the temperature increase is widespread over the globe and is greater at higher
northern latitudes. Land regions have warmed faster than the oceans. These
activities accelerated the processes of climate change and increased the mean global
temperatures by 0.6°C during the past 100 years, a phenomenon known as global
warming. Global average sea level has risen since 1961 at an average rate of 1.8 (1.3
to 2.3) mm/yr and since 1993 at 3.1
thermal expansion, melting glaciers and ice caps, and polar ice sheets. Satellite data
since 1978 show that annual average Arctic sea ice extent has shrunk by 2.7 percent
22
Source: http://en.wikipedia.org/wiki/Greenhouse_gas
The IPCC (AR4), 2007 noted that "changes in atmospheric concentrations of
greenhouse gases and aerosols, land cover and solar radiation alter the energy
balance of the climate system", and concluded that "increases in anthropogenic
greenhouse gas concentrations is very likely to have caused most of the increases in
global average temperatures since the mid-20th century". In AR4, "most of" is
The Intergovernmental Panel for Climate Change (IPCC, 2007) reported that
the temperature increase is widespread over the globe and is greater at higher
northern latitudes. Land regions have warmed faster than the oceans. These
rocesses of climate change and increased the mean global
temperatures by 0.6°C during the past 100 years, a phenomenon known as global
warming. Global average sea level has risen since 1961 at an average rate of 1.8 (1.3
to 2.3) mm/yr and since 1993 at 3.1 (2.4 to 3.8) mm/yr, with contributions from
thermal expansion, melting glaciers and ice caps, and polar ice sheets. Satellite data
since 1978 show that annual average Arctic sea ice extent has shrunk by 2.7 percent
entrations of
greenhouse gases and aerosols, land cover and solar radiation alter the energy
balance of the climate system", and concluded that "increases in anthropogenic
greenhouse gas concentrations is very likely to have caused most of the increases in
20th century". In AR4, "most of" is
The Intergovernmental Panel for Climate Change (IPCC, 2007) reported that
the temperature increase is widespread over the globe and is greater at higher
northern latitudes. Land regions have warmed faster than the oceans. These
rocesses of climate change and increased the mean global
temperatures by 0.6°C during the past 100 years, a phenomenon known as global
warming. Global average sea level has risen since 1961 at an average rate of 1.8 (1.3
(2.4 to 3.8) mm/yr, with contributions from
thermal expansion, melting glaciers and ice caps, and polar ice sheets. Satellite data
since 1978 show that annual average Arctic sea ice extent has shrunk by 2.7 percent
23
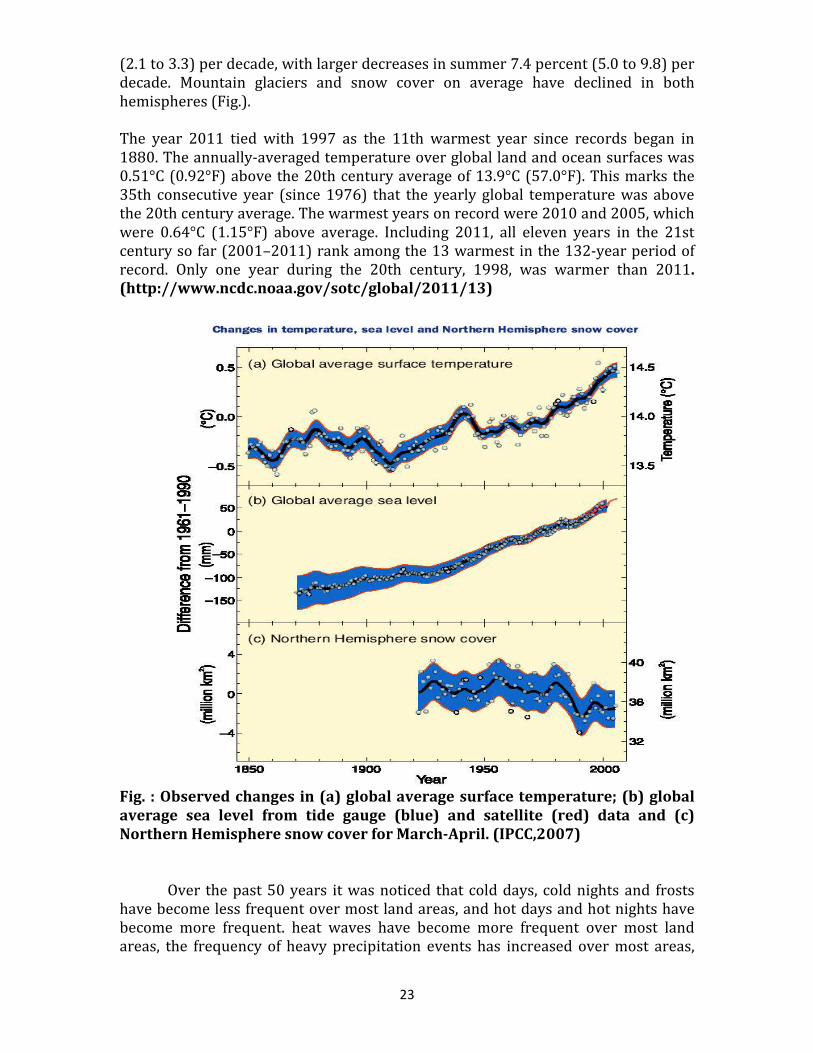
(2.1 to 3.3) per decade, with larger decreases in summer 7.4 percent (5.0 to 9.8) per
decade. Mountain glaciers and snow cover on average have declined in both
hemispheres (Fig.).
The year 2011 tied with 1997 as the 11th warmest year since records began in
1880. The annually-averaged temperature over global land and ocean surfaces was
0.51°C (0.92°F) above the 20th century average of 13.9°C (57.0°F). This marks the
35th consecutive year (since 1976) that the yearly global temperature was above
the 20th century average. The warmest years on record were 2010 and 2005, which
were 0.64°C (1.15°F) above average. Including 2011, all eleven years in the 21st
century so far (2001–2011) rank among the 13 warmest in the 132-year period of
record. Only one year during the 20th century, 1998, was warmer than 2011. (http://www.ncdc.noaa.gov/sotc/global/2011/13)
Fig. : Observed changes in (a) global average surface temperature; (b) global
average sea level from tide gauge (blue) and satellite (red) data and (c) Northern Hemisphere snow cover for March-April. (IPCC,2007)
Over the past 50 years it was noticed that cold days, cold nights and frosts
have become less frequent over most land areas, and hot days and hot nights have
become more frequent. heat waves have become more frequent over most land
areas, the frequency of heavy precipitation events has increased over most areas,
24
and since 1975 the incidence of extreme high sea level has increased worldwide
(IPCC, 2007).
Indian Scenario
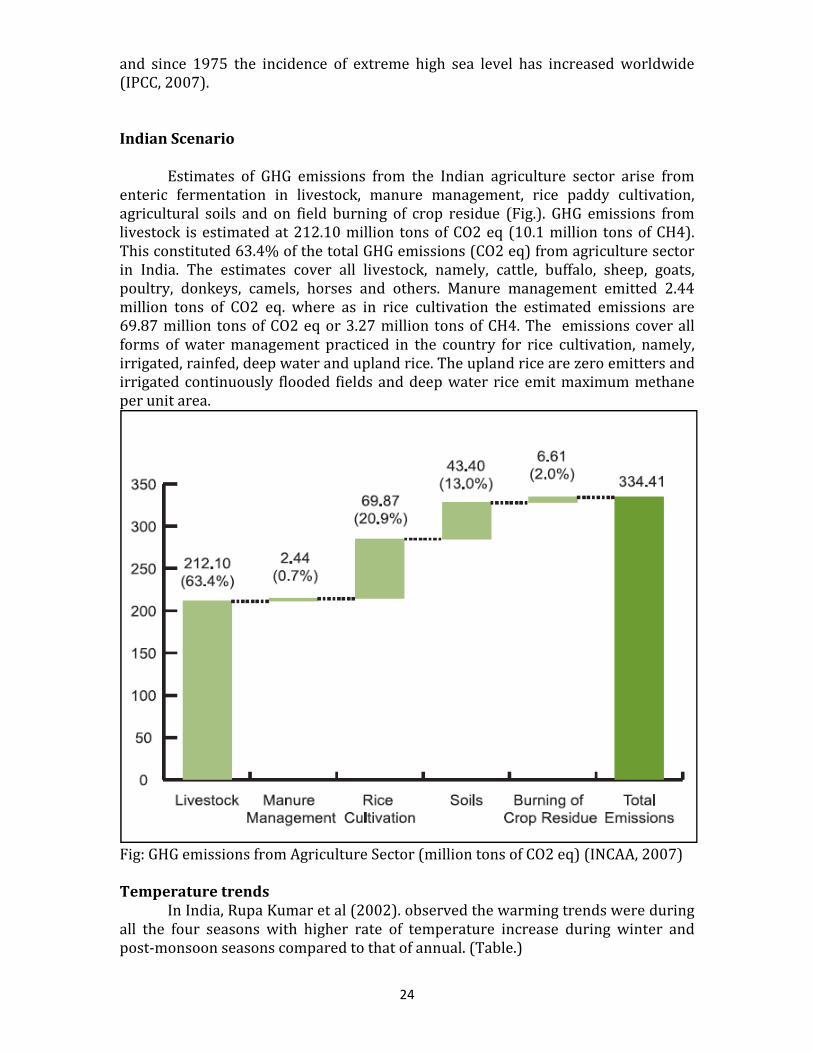
Estimates of GHG emissions from the Indian agriculture sector arise from
enteric fermentation in livestock, manure management, rice paddy cultivation,
agricultural soils and on field burning of crop residue (Fig.). GHG emissions from
livestock is estimated at 212.10 million tons of CO2 eq (10.1 million tons of CH4).
This constituted 63.4% of the total GHG emissions (CO2 eq) from agriculture sector
in India. The estimates cover all livestock, namely, cattle, buffalo, sheep, goats,
poultry, donkeys, camels, horses and others. Manure management emitted 2.44
million tons of CO2 eq. where as in rice cultivation the estimated emissions are
69.87 million tons of CO2 eq or 3.27 million tons of CH4. The emissions cover all
forms of water management practiced in the country for rice cultivation, namely,
irrigated, rainfed, deep water and upland rice. The upland rice are zero emitters and
irrigated continuously flooded fields and deep water rice emit maximum methane
per unit area.
Fig: GHG emissions from Agriculture Sector (million tons of CO2 eq) (INCAA, 2007)
Temperature trends
In India, Rupa Kumar et al (2002). observed the warming trends were during
all the four seasons with higher rate of temperature increase during winter and
post-monsoon seasons compared to that of annual. (Table.)
25
TABLE.: TRENDS IN MEAN SURFACE AIR TEMPERATURES OVER INDIA DURING 1901-2000
Season Trends (°C / Decade)
Annual 0.03*
Winter 0.04*
Pre-monsoon 0.02*
Monsoon 0.01
Post-Monsoon 0.05
* Significant at 95% and more (Source: Rupa Kumar et al., 2002)
Evaluation of trends in minimum and maximum temperatures for the entire
country and also for the six homogenous regions in the country showed a
decreasing minimum temperature trend during summer monsoon and an
increasing trend during the winter season where as an increasing trend in both
the seasons for maximum temperature was noticed which may have influence on
rainfed agricultural production system in kharif and wheat production in rabi.
Analysis of observed spatial patterns of maximum temperature indicate more than
45oC in central India, 35-40oC along west coast, about 25o C in Himachal
Pradesh in North India (NATCOM Report, 2004). Arora et al (2005) reported that
annual mean temperature, mean maximum and minimum temperature have
increased at the rate of 0.42, 0.92 and 0.09 o C/100yr respectively.
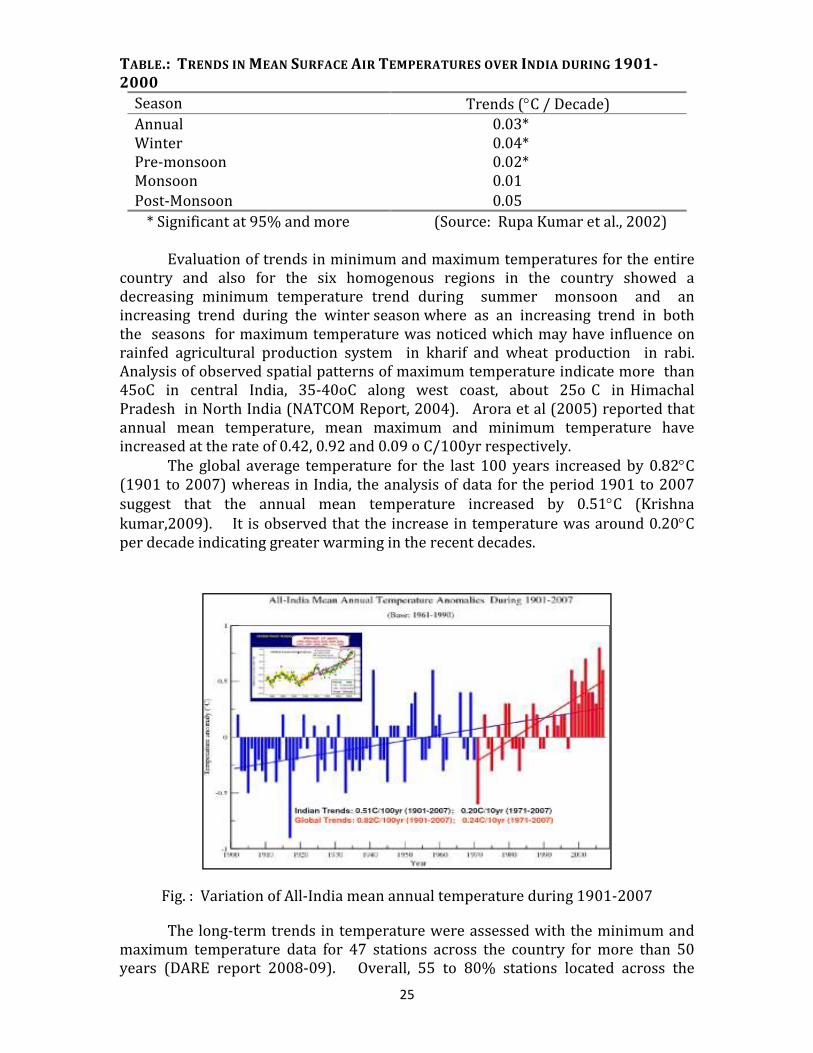
The global average temperature for the last 100 years increased by 0.82°C
(1901 to 2007) whereas in India, the analysis of data for the period 1901 to 2007
suggest that the annual mean temperature increased by 0.51°C (Krishna
kumar,2009). It is observed that the increase in temperature was around 0.20°C
per decade indicating greater warming in the recent decades.
Fig. : Variation of All-India mean annual temperature during 1901-2007
The long-term trends in temperature were assessed with the minimum and
maximum temperature data for 47 stations across the country for more than 50
years (DARE report 2008-09). Overall, 55 to 80% stations located across the
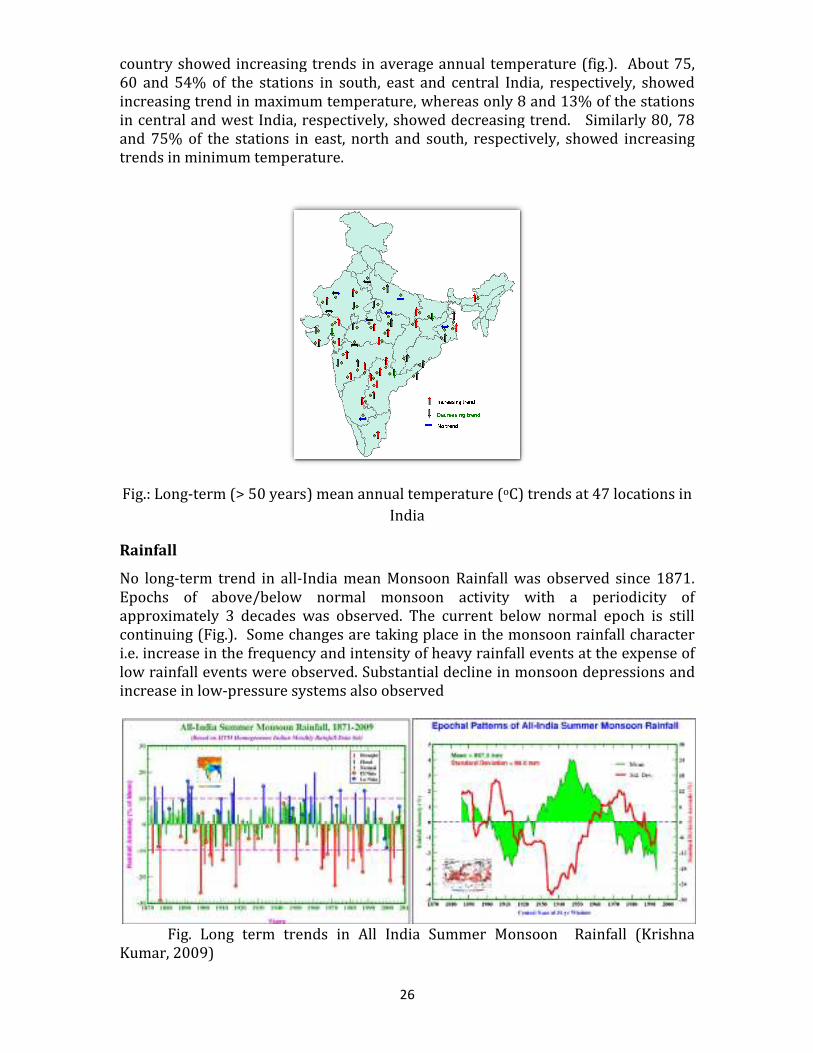
country showed increasing trends in average annual temperature (fig.). About 75,
60 and 54% of the stations in south, east and
increasing trend in maximum temperature, whereas only 8 and 13% of the stations
in central and west India, respectively, showed decreasing trend. Similarly 80, 78
and 75% of the stations in east, north and south, respe
trends in minimum temperature.
Fig.: Long-term (> 50 years) mean annual temperature (
Rainfall
No long-term trend in all-India mean Monsoon Rainfall was observed since 1871.
Epochs of above/below normal monsoon activity with a periodicity of
approximately 3 decades was observed. The current below normal epoch is still
continuing (Fig.). Some changes are taking place in the monsoon rainfall character
i.e. increase in the frequency and i
low rainfall events were observed. Substantial decline in monsoon depressions and
increase in low-pressure systems also observed
Fig. Long term trends in All India Summer Monsoon Rainfall (Krishna
Kumar, 2009)
26
country showed increasing trends in average annual temperature (fig.). About 75,
60 and 54% of the stations in south, east and central India, respectively, showed
increasing trend in maximum temperature, whereas only 8 and 13% of the stations
in central and west India, respectively, showed decreasing trend. Similarly 80, 78
and 75% of the stations in east, north and south, respectively, showed increasing
trends in minimum temperature.
term (> 50 years) mean annual temperature (oC) trends at 47 locations in
India
India mean Monsoon Rainfall was observed since 1871.
above/below normal monsoon activity with a periodicity of
approximately 3 decades was observed. The current below normal epoch is still
continuing (Fig.). Some changes are taking place in the monsoon rainfall character
i.e. increase in the frequency and intensity of heavy rainfall events at the expense of
low rainfall events were observed. Substantial decline in monsoon depressions and
pressure systems also observed
Fig. Long term trends in All India Summer Monsoon Rainfall (Krishna
country showed increasing trends in average annual temperature (fig.). About 75,
central India, respectively, showed
increasing trend in maximum temperature, whereas only 8 and 13% of the stations
in central and west India, respectively, showed decreasing trend. Similarly 80, 78
ctively, showed increasing
C) trends at 47 locations in
India mean Monsoon Rainfall was observed since 1871.
above/below normal monsoon activity with a periodicity of
approximately 3 decades was observed. The current below normal epoch is still
continuing (Fig.). Some changes are taking place in the monsoon rainfall character
ntensity of heavy rainfall events at the expense of
low rainfall events were observed. Substantial decline in monsoon depressions and
Fig. Long term trends in All India Summer Monsoon Rainfall (Krishna
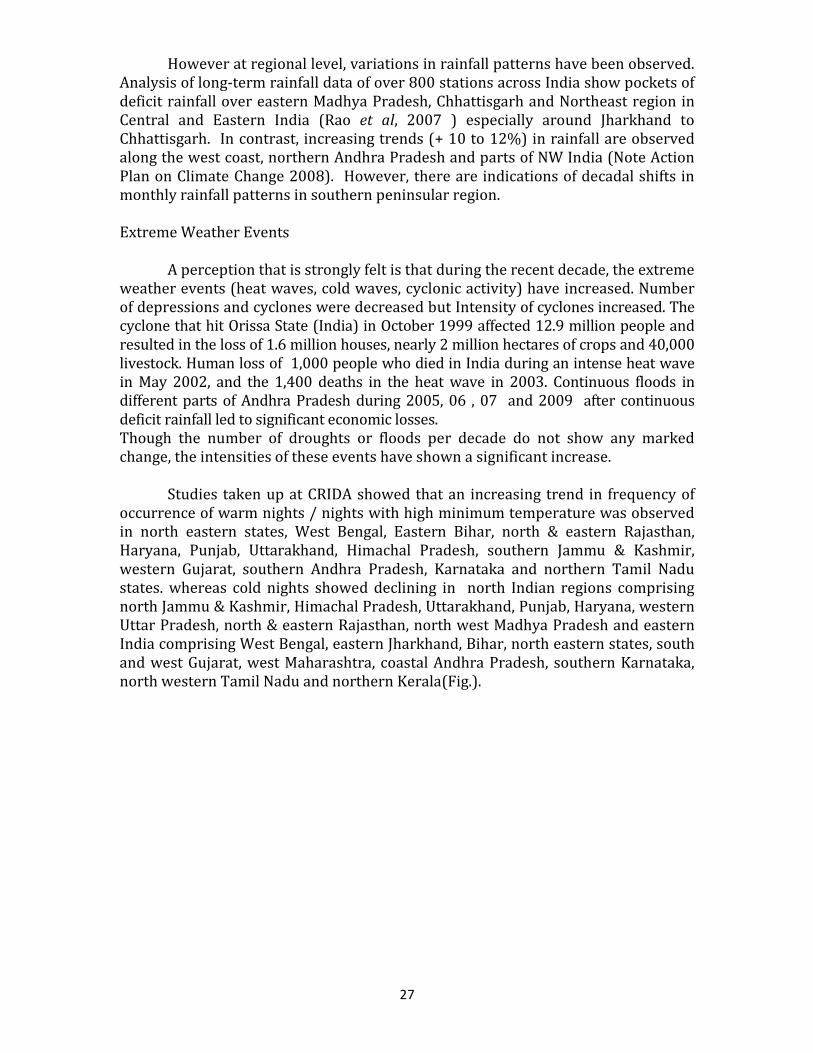
27
However at regional level, variations in rainfall patterns have been observed.
Analysis of long-term rainfall data of over 800 stations across India show pockets of
deficit rainfall over eastern Madhya Pradesh, Chhattisgarh and Northeast region in
Central and Eastern India (Rao et al, 2007 ) especially around Jharkhand to
Chhattisgarh. In contrast, increasing trends (+ 10 to 12%) in rainfall are observed
along the west coast, northern Andhra Pradesh and parts of NW India (Note Action
Plan on Climate Change 2008). However, there are indications of decadal shifts in
monthly rainfall patterns in southern peninsular region.
Extreme Weather Events
A perception that is strongly felt is that during the recent decade, the extreme
weather events (heat waves, cold waves, cyclonic activity) have increased. Number
of depressions and cyclones were decreased but Intensity of cyclones increased. The
cyclone that hit Orissa State (India) in October 1999 affected 12.9 million people and
resulted in the loss of 1.6 million houses, nearly 2 million hectares of crops and 40,000
livestock. Human loss of 1,000 people who died in India during an intense heat wave
in May 2002, and the 1,400 deaths in the heat wave in 2003. Continuous floods in
different parts of Andhra Pradesh during 2005, 06 , 07 and 2009 after continuous
deficit rainfall led to significant economic losses.
Though the number of droughts or floods per decade do not show any marked
change, the intensities of these events have shown a significant increase.
Studies taken up at CRIDA showed that an increasing trend in frequency of
occurrence of warm nights / nights with high minimum temperature was observed
in north eastern states, West Bengal, Eastern Bihar, north & eastern Rajasthan,
Haryana, Punjab, Uttarakhand, Himachal Pradesh, southern Jammu & Kashmir,
western Gujarat, southern Andhra Pradesh, Karnataka and northern Tamil Nadu
states. whereas cold nights showed declining in north Indian regions comprising
north Jammu & Kashmir, Himachal Pradesh, Uttarakhand, Punjab, Haryana, western
Uttar Pradesh, north & eastern Rajasthan, north west Madhya Pradesh and eastern
India comprising West Bengal, eastern Jharkhand, Bihar, north eastern states, south
and west Gujarat, west Maharashtra, coastal Andhra Pradesh, southern Karnataka,
north western Tamil Nadu and northern Kerala(Fig.).
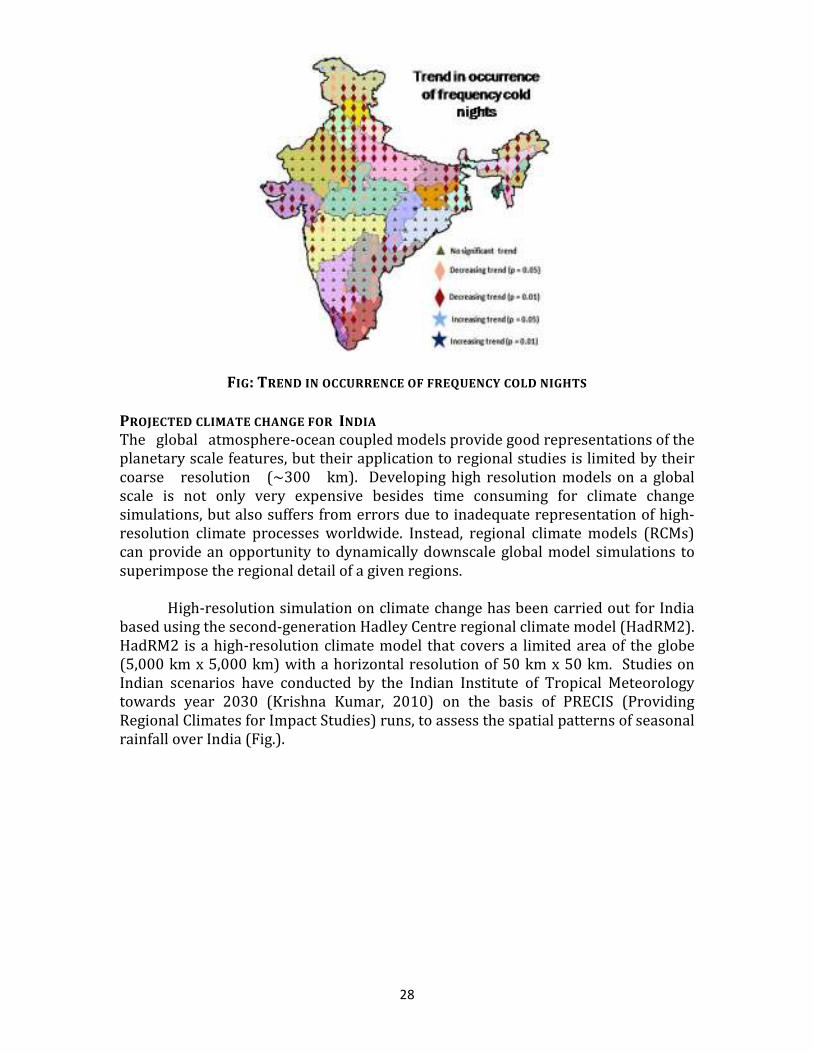
28
FIG: TREND IN OCCURRENCE OF FREQUENCY COLD NIGHTS
PROJECTED CLIMATE CHANGE FOR INDIA The global atmosphere-ocean coupled models provide good representations of the
planetary scale features, but their application to regional studies is limited by their
coarse resolution (~300 km). Developing high resolution models on a global
scale is not only very expensive besides time consuming for climate change
simulations, but also suffers from errors due to inadequate representation of high-
resolution climate processes worldwide. Instead, regional climate models (RCMs)
can provide an opportunity to dynamically downscale global model simulations to
superimpose the regional detail of a given regions.
High-resolution simulation on climate change has been carried out for India
based using the second-generation Hadley Centre regional climate model (HadRM2).
HadRM2 is a high-resolution climate model that covers a limited area of the globe
(5,000 km x 5,000 km) with a horizontal resolution of 50 km x 50 km. Studies on
Indian scenarios have conducted by the Indian Institute of Tropical Meteorology
towards year 2030 (Krishna Kumar, 2010) on the basis of PRECIS (Providing
Regional Climates for Impact Studies) runs, to assess the spatial patterns of seasonal
rainfall over India (Fig.).
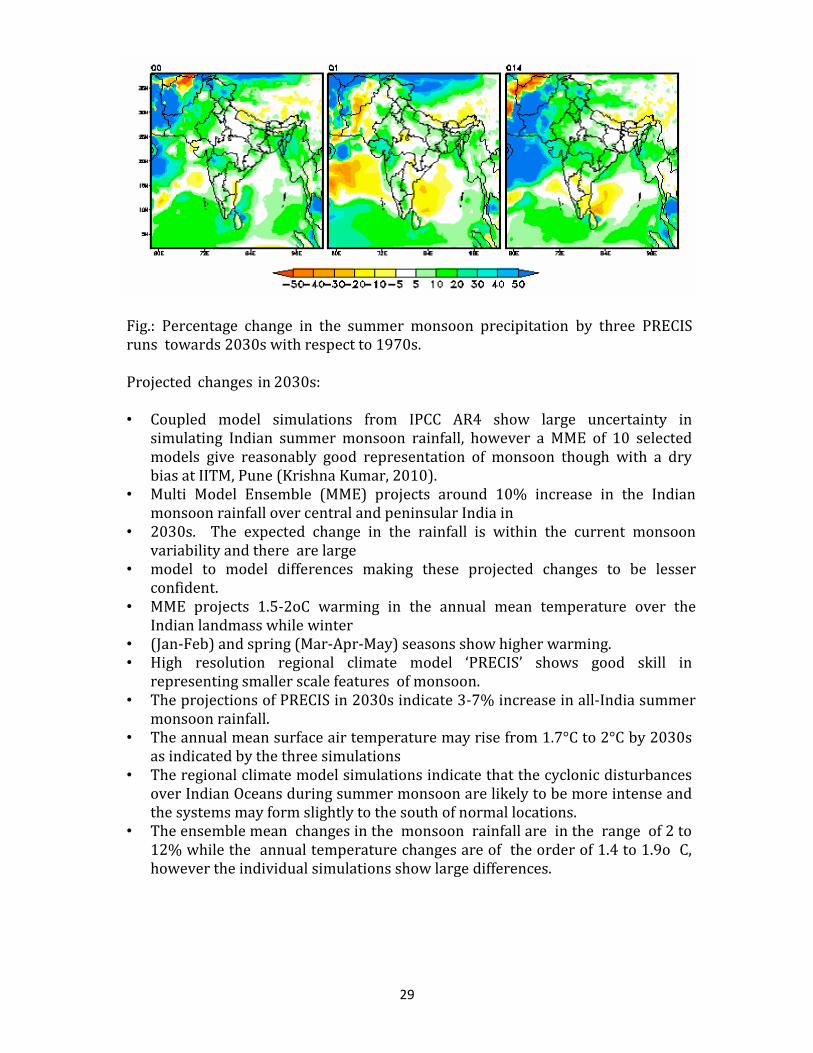
29
Fig.: Percentage change in the summer monsoon precipitation by three PRECIS
runs towards 2030s with respect to 1970s.
Projected changes in 2030s:
• Coupled model simulations from IPCC AR4 show large uncertainty in
simulating Indian summer monsoon rainfall, however a MME of 10 selected
models give reasonably good representation of monsoon though with a dry
bias at IITM, Pune (Krishna Kumar, 2010).
• Multi Model Ensemble (MME) projects around 10% increase in the Indian
monsoon rainfall over central and peninsular India in
• 2030s. The expected change in the rainfall is within the current monsoon
variability and there are large
• model to model differences making these projected changes to be lesser
confident.
• MME projects 1.5-2oC warming in the annual mean temperature over the
Indian landmass while winter
• (Jan-Feb) and spring (Mar-Apr-May) seasons show higher warming.
• High resolution regional climate model ‘PRECIS’ shows good skill in
representing smaller scale features of monsoon.
• The projections of PRECIS in 2030s indicate 3-7% increase in all-India summer
monsoon rainfall.
• The annual mean surface air temperature may rise from 1.7°C to 2°C by 2030s
as indicated by the three simulations
• The regional climate model simulations indicate that the cyclonic disturbances
over Indian Oceans during summer monsoon are likely to be more intense and
the systems may form slightly to the south of normal locations.
• The ensemble mean changes in the monsoon rainfall are in the range of 2 to
12% while the annual temperature changes are of the order of 1.4 to 1.9o C,
however the individual simulations show large differences.
30
Impacts of Climate Change on Agriculture
Climate Change associated with global warming would have profound
influence on regional climate conditions and would impact the future performance
on agriculture and allied sectors in many ways. The likely impacts on these systems
are briefly given below.
AGRICULTURE
With rapid increase in population and urbanization, the availability of arable
land dwindled considerably from 0.48 ha in 1950 to 0.15 ha in 2005 and is likely to
further reduce to 0.08 ha by 2020 (Mall et al, 2006). Under the climate change
scenario, the impacts on agricultural production in India are likely to be manifolds
and the magnitude may vary greatly by the region. Some of the expected impacts
are:
� The agricultural crops in eastern region in the country are predicted to be most
affected by increased air temperature.
� Major shifts in cropping pattern are expected to take place and the areas under
rabi crops are likely to be reduced and the cropping zones may move
northwards to suitable cooler climate regions.
� Reduction in crop yields is more likely in the rainfed areas due to changes in
rainfall pattern during monsoon season and increased crop water demands.
� There would be an increase in extreme weather events (heat and cold waves,
high rainfall events) adversely affecting agricultural productivity.
� Although, increased levels of Co2 may increase net primary productivity of
plants, the changes in temperature associated with the above phenomena may
nullify the benefit.
� Potential yields of major cereals crops especially wheat is likely to be reduced
due to likely increase in minimum temperatures during the reproductive period.
� The yield levels of some of the major pulses like pigeonpea in kharif and
chickpea in rabi sorghum are to be decreased.
Experimental studies under Network project on Climate change (NPCC) reveals that
• Reduction in yield of rice, mustard & chickpea @ 3-5 % per 0C increase as
compared to 5-8% reduction in yield of wheat, groundnut, green gram, soybean
and potato when the temperatures were raised gradually (1 to 3 0C). Among the
crops wheat showed highest degree of thermal sensitivity.
• The grain yield and biomass of wheat were reduced @ 10-12 and 8-10% per
degree Celsius increase in atm. temp.
31
• Gradual rise in atmospheric temp. caused marked depletion in pollen
germination of different rice cultivars, while lower temp. showed remarkable
reduction in pollen germination of wheat cultivars
• Wheat and rice showed greater thermal sensitivity during reproductive and
vegetative growth phase, while mustard and greengram registered greater
thermal sensitivity during ripening growth phase (seed filling period).
OTC Studies
• The OTCs studies revealed that pulse crops in general are more responsive to
elevated CO2 for both biomass and seed yield.
• The impact of elevated levels of CO2 in improving the harvest index in pulses
indicates that elevated CO2 influencing the partitioning of assimilates towards
economic yield
• Among the cereals Sorghum was found to be less responsive followed by Maize
and Bajra.
Fisheries and Aquaculture
With increase in sea surface temperature (SST) and rise in sea level, the
marine life would get affected considerably. Similarly, the inland aquaculture also
would be affected due to changes in water body temperatures.
� Impacts of increased temperature and tropical cyclonic activity would affect the
capture, production and marketing costs of the marine fish. Also the loss of
infrastructure, fishing tools and housing will be enormous.
� Migration of different marine and inland species to favourable climate regions.
� In general temperature changes are likely to impact cool water species
negatively, warm water species positively.
Mitigation Strategies
All the above projections indicate that the impacts of climate change would have
considerable physical and socio-economic consequences on the country’s linked
resources and would have a strategic influence on future livelihood prospects of
large percentage of the country’s population. There is already considerable
awareness on these issues and the country, at the highest level had initiated special
drive on adaptation and mitigation strategies to face the challenges posed by the
climate change. Briefly they are described below;
1. Improve inventories of emission of greenhouse gases using state-of-art
emission equipments coupled with simulation models, and GIS for upscaling
2. Evaluate carbon sequestration potential of different land use systems including
opportunities offered by conservation agriculture and agro-forestry
3. Critically evaluate the mitigation potential of biofuels; enhance this by their
genetic improvement and use of engineered microbes
32
4. Identify cost-effective opportunities for reducing methane generation and
emission in ruminants b y modification of diet, and in rice paddies by water
and nutrient management. Renew focus on nitrogen fertilizer use efficiency
with added dimension of nitrous oxides mitigation
5. Assess biophysical and socio-economic implications of mitigation of
proposed GHG mitigating interventions before developing policy for their
implementation
Policies 1. Mainstreaming adaptation in current policy considerations: Climate change
impacts and adaptations should be considered in all major development
planning activities.
2. Develop new infrastructure, policies and institutions to support the new
land use arrangements identified by science and technology.
3. Enhance investment in water harvesting and conservation options; and
promote small farm mechanization and efficient water use technologies.
4. Facilitate greater adoption of scientific and economic pricing policies,
especially for water, land, energy, and other resources.
5. Explore international partnerships for joint food security.
6. Consider financial incentives and package for improved land management
including resource conservation/ enhancement (water, carbon, energy), and
fertilizer use efficiency.
7. Establish an inter-ministerial institutional mechanism for strategic follow-up
action.
8. Consider incentives for industry and farming community for producing and
using slow release fertilizers and Green House Gas inhibitors.
9. Explore CDM benefits for mitigation strategies for farmers and agriculture-
based industry.
10. Explore international partnerships for collaborative research on adaptation
of climate change r research.
11. Establish ‘Green Research Fund’ for strengthening research on adaptation,
mitigation and impact assessment.
33
Epilogue
It has been noticed that climate change is a reality due to sharp increase in
the concentration of green house gases since the industrial era. This has altered the
climatic systems and has influenced the regional climate by way of increased
frequency of extreme weather events and change in moisture and thermal regimes.
The resultant impacts are expected to influence various sectors, viz., water
resources, agriculture, forestry, natural ecosystems, fisheries and aquaculture and
energy. The impact assessment studies due to projected climatic changes in the next
100 years provide directions and clues to develop adaptation and mitigation
strategies in coping up with the expected changes in future. Perhaps, this review
article may pave way in identifying suitable solutions for minimizing the risk and
stabilize the agricultural production in meeting the future food requirements. More
details on the impacts, adaptation and management strategies to meet the future
climate change situations are discussed in detail in the chapters that follow in this
publication.
34
References
Cocheme, J. and Franquin, P. (1967). An agro-climatological survey of a semi-arid
area in Africa, South of Sahara, Tech. Note 86, WMO, Geneva
Fertiliser Association of India, 1994. Fertiliser Statistics 1993-94. New Delhi, India
III-21 IV-86 pp
Ghosh, SP (ed.) (1990). Agro-climatic Zone Specific Research. Indian Perspective
under NARP. Indian Council of Agricultural Research, New Delhi, India, 539 pp
GOSWAMI, BN., VENUGOPAL, V., SENGUPTA, D., MADHUSOODANAN, MS., PRINCE K.
XAVIER (2006). INCREASING TREND OF EXTREME RAIN EVENTS OVER INDIA IN A
WARMING ENVIRONMENT. SCIENCE, 314. 5804, 1442 - 1445
Government of India (1987). Agro-climatic Regions Planning: An Overview.
Planning Commission, New Delhi, India.
Guhathkurta, P. and Rajeevan, M. (2006). Trends in the rainfall patter over India.
National Climate Centre, Report No.2, India Met Department, Pune
Hargreaves, GH (1971). Precipitation dependability and potential for agricultural
production in North-east Brazil. EMBRAPA and Utah State University Publication
No. 74-D159, pp 123
India’s Initial National Communication to the United Nations Framework
Convention on Climate Change (NATCOM) 2004
Mall RK, Ranjet Singh, Akhilesh Gupta, Srinivasan G and Rathore LS (2006). Impact
of Climate change on Indian Agriculture: A Review. Climate Change, 78: 445-478
Springer Science, Business Media B.V.
National Action Plan on Climate Change (2008). Prime Minister’s Council on Climate
Change, Government of India, p 49
Papadakis, J. (1975). Climates of the world and their potentials, Buenos Aires.
Rao, GGSN., Kesava Rao, AVR., Ramakrishna, YS and Victor, US (1999). Resource
Characterization of Drylands: Climate. In a book, Fifty Years of Dryland Agricultural
Research in India (Eds. HP Singh et al), CRIDA, Hyderabad.
Ramakrishna, YS (1994). Sustainable Development of the Indian Arid Zone (Eds. RP
Singh and S Singh), Sci. Pub. Jodhpur, Chapter 1, 135.
35
Ravi Sharma (2007). India: Status of National Communications to the UNFCCC
Web address http://www.whrc.org/policy/climate_change/alapdf/ala-08-india.pdf
Rupa Kumar, K., Pant, GB., Parthasarathy, B. and Sontakke, NA (1992). Spatial and
subseasonal patterns of the long-term trends of Indian summer monsoon rainfall.
Int. J. Climatol., 12, 257-268.
Sehgal, JL, Mandal, DK, Mandel, C and Vadivelu, S (1990). Agroecological regions in
India, Publication 24, 130 pp, NBSSLUP, Nagpur
Sehgal, J and Mandal, DK (1996). Agro-ecological Regions of India and Climate
Change. In: Climate Variability and Agriculture. (YP Abrol, S Gadgil and GB Pant,
eds.), Narosa Publishing House, New Delhi, India, pp 204-222.
National Action Plan on Climate Change 2008
Sikka, DR and Gadgil, S. (1980). On the maximum cloud zone and the ITCZ over
Indian longitudes during the southwest monsoon; Mon. Wea. Rev. 108 1840–1853.
Sikka, D.R. and Dixit, C.M., 1972: A study of satellite observed cloudiness over the
equatorial Indian Ocean and India during the southwest monsoon season, J. Mar.
Bio., Asia, India, 14, 805-818.
Singh, KK. (2008). Climate Change, book chapter in Climate change and Food
security edited by M. Dutta et al Published by New India publishing Agency, New
Delhi, PP 1-19.
Subba Rao, AVM., Santhi Bhushan Chowdary, Manikandan, N., Rao, VUM., Rao, GGSN
and Ramakrishna, YS (2007). “Rainfall trends, periodicities and vulnerable areas to
climate change over India” presented in The National Conference on "Impact of
Climate Change with particular reference to Agriculture" Held during August 22-24,
2007 at TNAU, Coimbatore.
Troll, C. (1965). Seasonal Climates of the Earth. In: World Maps of Climatology
(Rodenwaldt and H. Jusatz, eds.), Springer Verlag, Berlin, 28 pp
36
RAINWATER MANAGEMENT AS AN ADAPTATION STRATEGY TO
CLIMATE CHANGE
K. S. Reddy*, B Umesha and Vijayalakshmi
* Principal Scientist (SWCE)
Division of Resource Management
Central Research Institute for Dryland Agriculture, Hyderabad-500059.
E Mail: [email protected]
Rainfall is a basic resource for all the forms of water in semi arid tropics of India.
Though the annual average rainfall of the country is 1200 mm, it varies in both
space and time affecting the availability of water for different sectors. India uses
80% of the available water in agriculture keeping the remaining 20% for drinking,
industry and energy sectors. The growing population puts tremendous pressure on
the water resources. The annual per capita water availability has decreased from
5000 m3 in 1950 to 1300 m3 in 2010 and projected to decrease further to below
1000 m3 by 2025 (MOWR,2011). Added to this, the country may face climate change
in future predicting more frequent floods, droughts, extreme events of rainfall etc.
with increased temperature (IPCC, 2007). The food grain production in India is
calculated by irrigated and rainfed areas by 60% and 40% respectively. Most of the
pulse and oil seeds production (80%) comes from rainfed areas. Rainfed areas are
suffer from severe land degradation and poor socio economic base of farmers.
Several management options are available at the farm scale to increase
rainfall use
efficiency. Some of these are management of crop residues to improve infiltration
and reduce sediment levels, construction of farm ponds for collection of excess
rainfall flowing from the farm area, crop rotations and soil amendments (Freebairn
et al., 1986). Several researchers have shown that on-farm runoff collection into
dugout farm ponds and supplemental irrigation can increase and stabilize the crop
production (Krishna et al., 1987). There is abundant scope and opportunity for
harvesting excess runoff in the rainfed region in different states of the country
(Wani, et al., 2003, Sharma et al, 2009) Among several interventions, farm ponds is
the most important one in the integrated water management practices and other
natural resource management. Farm ponds would help the farmers for on farm
water management by using stored water for tackling the drought or dryspells
during the season.
Planning of Farm Pond
Farm pond Farm Pond is a dug out structure with definite shape and size having proper inlet
and outlet structures for collecting the surface runoff flowing from the farm area. It
is one of the most important rain water harvesting structure constructed at the
lowest portion of the farm area. The stored water must be used for irrigation only.
Inadvertently, some people use the farm ponds as ground water recharge structures
which is not correct as per the definition. For recharging the ground water, the
37
structures require high capacity and are generally located in the soils having high
infiltration rates and are called percolation tanks. Percolation tank is meant for only
recharge purpose and not for irrigation. Such structures conceptually differ in their
hydrology and physical location. A farm pond must be located within a farm drawing
the maximum runoff possible in a given rainfall event. A percolation pond can be
dug out in any area where the land is not utilized for agriculture.
Farm ponds have a significant role in rainfed regions where annual rainfall is more
than or equal to 500 mm. If average annual rainfall (AAR) varies between 500 to 750
mm, the farmponds with capacity of 250 to 500 m3 can be constructed. If AAR is
more than 750 mm, the farm ponds with capacity more than 500 m3 can be planned
particularly in black soil regions without lining. It was observed from the field
experience and if present rainfall pattern changes; atleast two to three rainfall
events producing considerable runoff are possible in a season making farm ponds
an attractive proposition. Farm ponds conserve the natural resources like soil and
nutrients apart from water and acts as flood control structure by reducing peak
flows in the watersheds or given area of catchment. Depending on the source of
water and their location; farm ponds are grouped into four
Types:
1) Excavated or Dug out ponds
2) Surface ponds
3) Spring or creek fed ponds and
4) Off stream storage ponds.
Soil type India has 30% alfisols, 35% vertisols and 35% of other soils including
alluvial, laterite, etc., in rainfed areas (Virmani, 1991). The distribution of different
soils of India is given in. For construction of farm pond, the soils must have low
hydraulic conductivity with minimum seepage and percolation so that water can be
retained for more time in a farm pond. Soils with a low infiltration rate are most
suitable for construction of pond. The black soils have good potential for rain water
harvesting without lining as the seepage losses are minimum. The seepage losses
are more in sandy soils and their mixed textures and they require lining for storing
water for more time. The soils having outcrops and stones must be avoided for
digging farm ponds. The soil profile depth must be investigated before digging of the
pond. The soils having good depth of >1 m, free of stones, low Ph, Ec and ground
water level may be choosen for site selection for farm pond. Peat soils have special
problems, since they are usually very acidic in nature and need sufficient liming.
Soils rich in limestone create special problems of precipitating phosphate and iron.
Soil depth The depth of soil is important where rain water harvesting systems are proposed.
Deep soils have the capacity to store harvested water for longer duration. Soils
having more than 1m are ideal for construction of farm ponds. More the depth of
soil, the depth of farm pond will be more and reduces the evaporation losses.
Topography
38
The topographic features of the farm catchment area may vary from place to place
and proposed land for pond construction must have minimum earth excavation so
that cost can be reduced with increased storage. Depending up on the capacity of the
farm pond, the contour survey is conducted to determine the slope, drainage pattern
within farm. However, for small catchments of 1-5 ha land, a reconnaissance is
sufficient to identify the location for farm pond. The contour survey can be done by
using dumpy level with staff or a total survey station which gives the digital map of
the farm with contours. The farm pond must be located within farm itself looking
into the slope and drainage flow pattern to the convenience of the farmer.
Drainage / Catchment area
The drainage/catchments area which produces surface runoff for storage in farm
ponds is very important from hydrology point of view. The structure must get filled
at least once in the season so that the farmers can use the water for critical
irrigation during dry spells. The characteristics of a catchment that directly affect
the runoff yield are the slope of the area, infiltration of the soil, vegetation, land use
and shape of the catchment. These interrelated factors are variable and site-specific.
If the drainage area is too small in relation to the pond size, the pond may not
adequately fill, or the water level may drop too low during extended periods of hot,
dry weather. The high intense rainfall events would cause soil erosion and the
runoff carries the silt load into the farm pond. These problems can be solved
through proper soil and water conservation treatments. In order to achieve the
desired depth and capacity of a pond to be proposed, the inflow must be reasonably
free of silt from an eroding catchment. The best protection is adequate erosion
control through in situ moisture conservation or land management practices (Ridge
and furrow, Broad bed furrow, Compartmental bunds, Contour bund and Graded
bund etc). On the drainage contributing area. Land under permanent cover of trees
or grasses are the most desirable drainage area. If such land is not available, treat
the watershed with proper conservation practices to control erosion before
constructing the pond. The catchments must be selected in such a way that, the
drainage from farmsteads, feedlots, sewage lines, dumps, industrial and urban sites
and other similar areas does not reach the pond.
Design of Farm Pond Rainfall analysis Rainfall is one of the most important and critical hydrological input parameter for
the design of farm ponds. Its distribution varies both spatially and temporally in
semi arid regions of the country. The quantity of surface runoff depends mainly on
the rainfall characteristics like intensity, frequency and duration of its occurrence.
The high intense rainfall exceeding infiltration capacity of soil can produce more
runoff than the event with low intensity for longer duration. Apart from the physical
characteristics of the catchment area contributing to produce surface runoff, the
rainfall analysis is very critical for optimal economic design of farm pond. But long
term data on rainfall intensity is seldom available in the country. A case of seasonal
rainfall analysis is presented in this bullettin for the design of farm ponds.
Design rainfall It is defined as the total amount of rain during the cropping season at or above
which the catchment area will provide sufficient runoff to satisfy the crop water
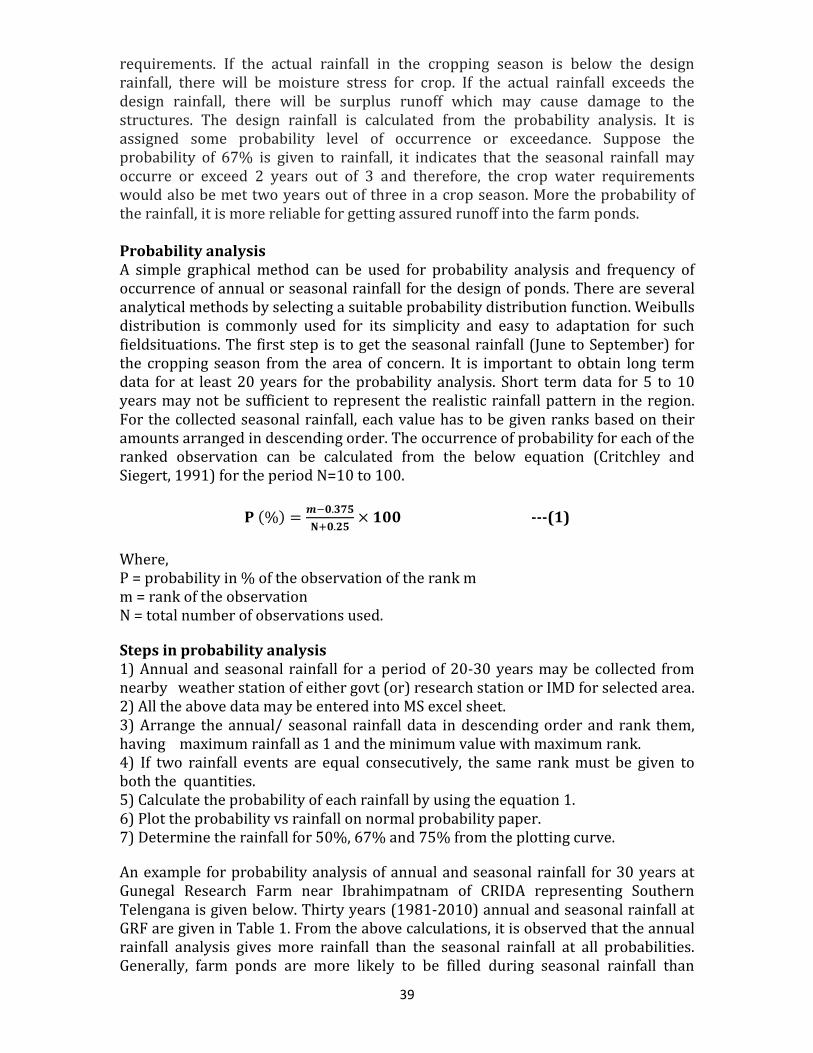
39
requirements. If the actual rainfall in the cropping season is below the design
rainfall, there will be moisture stress for crop. If the actual rainfall exceeds the
design rainfall, there will be surplus runoff which may cause damage to the
structures. The design rainfall is calculated from the probability analysis. It is
assigned some probability level of occurrence or exceedance. Suppose the
probability of 67% is given to rainfall, it indicates that the seasonal rainfall may
occurre or exceed 2 years out of 3 and therefore, the crop water requirements
would also be met two years out of three in a crop season. More the probability of
the rainfall, it is more reliable for getting assured runoff into the farm ponds.
Probability analysis A simple graphical method can be used for probability analysis and frequency of
occurrence of annual or seasonal rainfall for the design of ponds. There are several
analytical methods by selecting a suitable probability distribution function. Weibulls
distribution is commonly used for its simplicity and easy to adaptation for such
fieldsituations. The first step is to get the seasonal rainfall (June to September) for
the cropping season from the area of concern. It is important to obtain long term
data for at least 20 years for the probability analysis. Short term data for 5 to 10
years may not be sufficient to represent the realistic rainfall pattern in the region.
For the collected seasonal rainfall, each value has to be given ranks based on their
amounts arranged in descending order. The occurrence of probability for each of the
ranked observation can be calculated from the below equation (Critchley and
Siegert, 1991) for the period N=10 to 100.
����� �����
��� � ��������������������������������������---(1)
Where,
P = probability in % of the observation of the rank m
m = rank of the observation
N = total number of observations used.
Steps in probability analysis 1) Annual and seasonal rainfall for a period of 20-30 years may be collected from
nearby weather station of either govt (or) research station or IMD for selected area.
2) All the above data may be entered into MS excel sheet.
3) Arrange the annual/ seasonal rainfall data in descending order and rank them,
having maximum rainfall as 1 and the minimum value with maximum rank.
4) If two rainfall events are equal consecutively, the same rank must be given to
both the quantities.
5) Calculate the probability of each rainfall by using the equation 1.
6) Plot the probability vs rainfall on normal probability paper.
7) Determine the rainfall for 50%, 67% and 75% from the plotting curve.
An example for probability analysis of annual and seasonal rainfall for 30 years at
Gunegal Research Farm near Ibrahimpatnam of CRIDA representing Southern
Telengana is given below. Thirty years (1981-2010) annual and seasonal rainfall at
GRF are given in Table 1. From the above calculations, it is observed that the annual
rainfall analysis gives more rainfall than the seasonal rainfall at all probabilities.
Generally, farm ponds are more likely to be filled during seasonal rainfall than
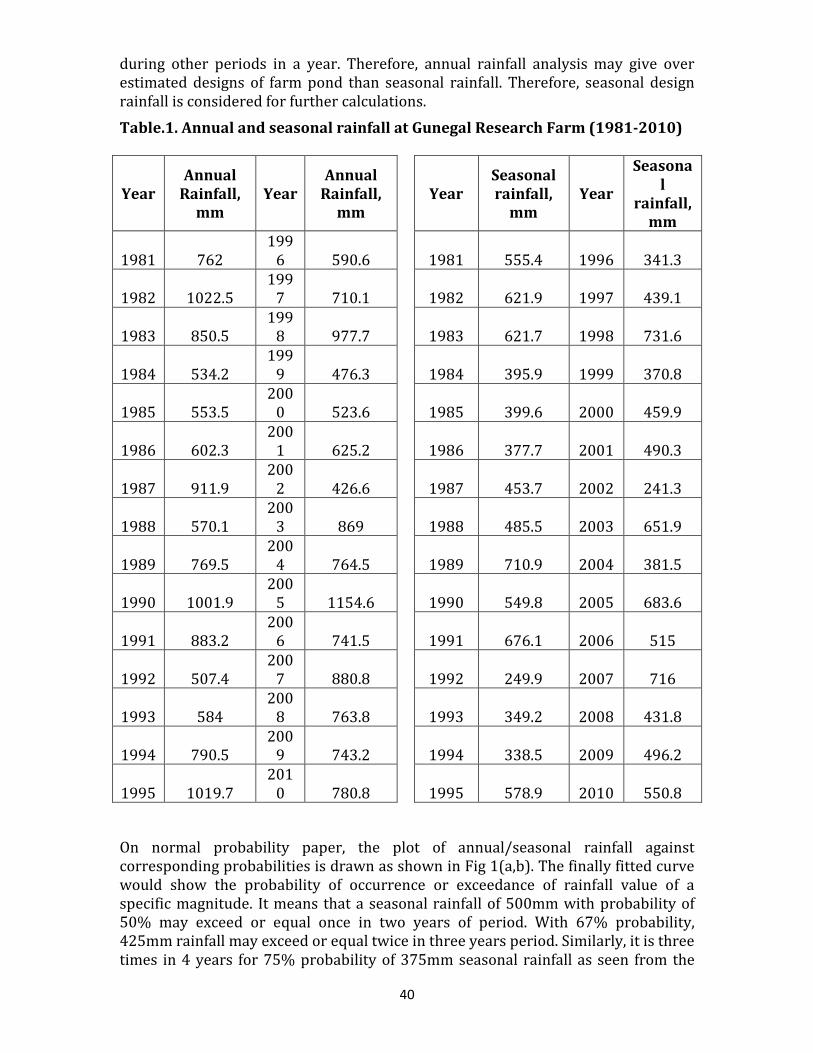
40
during other periods in a year. Therefore, annual rainfall analysis may give over
estimated designs of farm pond than seasonal rainfall. Therefore, seasonal design
rainfall is considered for further calculations.
Table.1. Annual and seasonal rainfall at Gunegal Research Farm (1981-2010)
Year Annual
Rainfall, mm
Year Annual
Rainfall, mm
Year
Seasonal rainfall,
mm Year
Seasona
l rainfall,
mm
1981 762
199
6 590.6 1981 555.4 1996 341.3
1982 1022.5
199
7 710.1 1982 621.9 1997 439.1
1983 850.5
199
8 977.7 1983 621.7 1998 731.6
1984 534.2
199
9 476.3 1984 395.9 1999 370.8
1985 553.5
200
0 523.6 1985 399.6 2000 459.9
1986 602.3
200
1 625.2 1986 377.7 2001 490.3
1987 911.9
200
2 426.6 1987 453.7 2002 241.3
1988 570.1
200
3 869 1988 485.5 2003 651.9
1989 769.5
200
4 764.5 1989 710.9 2004 381.5
1990 1001.9
200
5 1154.6 1990 549.8 2005 683.6
1991 883.2
200
6 741.5 1991 676.1 2006 515
1992 507.4
200
7 880.8 1992 249.9 2007 716
1993 584
200
8 763.8 1993 349.2 2008 431.8
1994 790.5
200
9 743.2 1994 338.5 2009 496.2
1995 1019.7
201
0 780.8 1995 578.9 2010 550.8
On normal probability paper, the plot of annual/seasonal rainfall against
corresponding probabilities is drawn as shown in Fig 1(a,b). The finally fitted curve
would show the probability of occurrence or exceedance of rainfall value of a
specific magnitude. It means that a seasonal rainfall of 500mm with probability of
50% may exceed or equal once in two years of period. With 67% probability,
425mm rainfall may exceed or equal twice in three years period. Similarly, it is three
times in 4 years for 75% probability of 375mm seasonal rainfall as seen from the
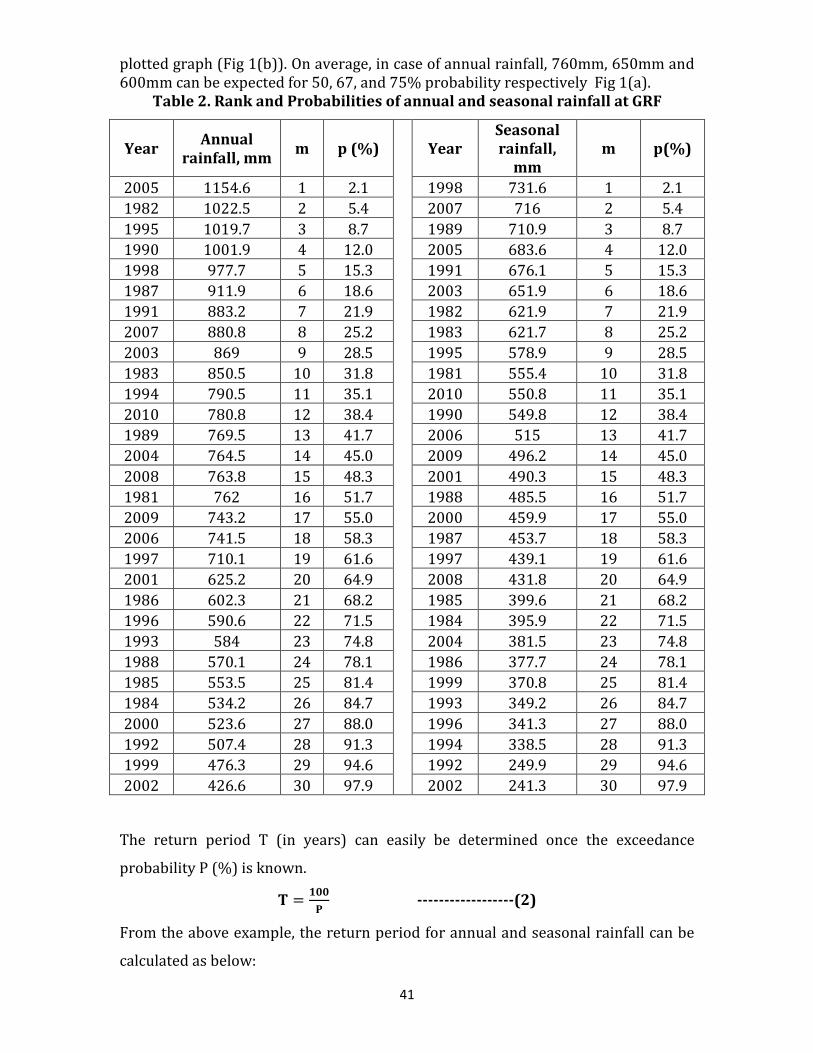
41
plotted graph (Fig 1(b)). On average, in case of annual rainfall, 760mm, 650mm and
600mm can be expected for 50, 67, and 75% probability respectively Fig 1(a).
Table 2. Rank and Probabilities of annual and seasonal rainfall at GRF
Year Annual
rainfall, mm m p (%)
Year Seasonal rainfall,
mm m p(%)
2005 1154.6 1 2.1 1998 731.6 1 2.1
1982 1022.5 2 5.4 2007 716 2 5.4
1995 1019.7 3 8.7 1989 710.9 3 8.7
1990 1001.9 4 12.0 2005 683.6 4 12.0
1998 977.7 5 15.3 1991 676.1 5 15.3
1987 911.9 6 18.6 2003 651.9 6 18.6
1991 883.2 7 21.9 1982 621.9 7 21.9
2007 880.8 8 25.2 1983 621.7 8 25.2
2003 869 9 28.5 1995 578.9 9 28.5
1983 850.5 10 31.8 1981 555.4 10 31.8
1994 790.5 11 35.1 2010 550.8 11 35.1
2010 780.8 12 38.4 1990 549.8 12 38.4
1989 769.5 13 41.7 2006 515 13 41.7
2004 764.5 14 45.0 2009 496.2 14 45.0
2008 763.8 15 48.3 2001 490.3 15 48.3
1981 762 16 51.7 1988 485.5 16 51.7
2009 743.2 17 55.0 2000 459.9 17 55.0
2006 741.5 18 58.3 1987 453.7 18 58.3
1997 710.1 19 61.6 1997 439.1 19 61.6
2001 625.2 20 64.9 2008 431.8 20 64.9
1986 602.3 21 68.2 1985 399.6 21 68.2
1996 590.6 22 71.5 1984 395.9 22 71.5
1993 584 23 74.8 2004 381.5 23 74.8
1988 570.1 24 78.1 1986 377.7 24 78.1
1985 553.5 25 81.4 1999 370.8 25 81.4
1984 534.2 26 84.7 1993 349.2 26 84.7
2000 523.6 27 88.0 1996 341.3 27 88.0
1992 507.4 28 91.3 1994 338.5 28 91.3
1999 476.3 29 94.6 1992 249.9 29 94.6
2002 426.6 30 97.9 2002 241.3 30 97.9
The return period T (in years) can easily be determined once the exceedance
probability P (%) is known.
� ��
� ------------------(2)
From the above example, the return period for annual and seasonal rainfall can be
calculated as below:
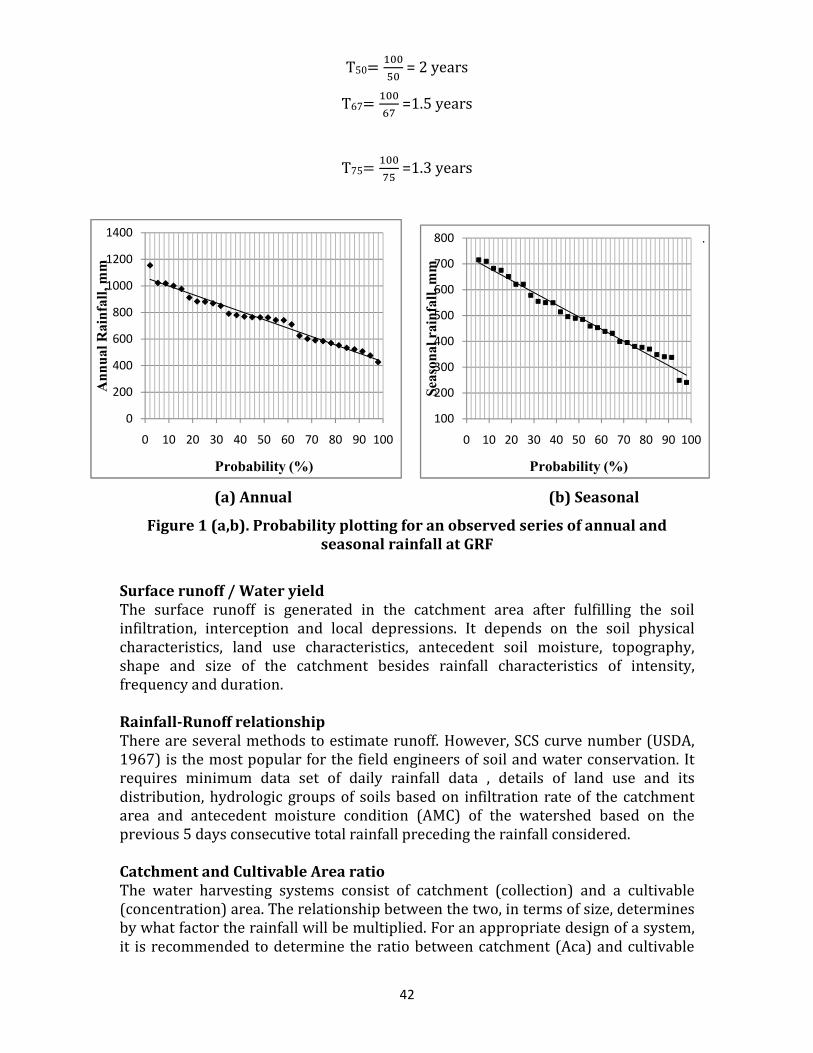
42
T50����
�� = 2 years
T67����
���=1.5 years
T75����
���=1.3 years
(a) Annual (b) Seasonal
Figure 1 (a,b). Probability plotting for an observed series of annual and seasonal rainfall at GRF
Surface runoff / Water yield The surface runoff is generated in the catchment area after fulfilling the soil
infiltration, interception and local depressions. It depends on the soil physical
characteristics, land use characteristics, antecedent soil moisture, topography,
shape and size of the catchment besides rainfall characteristics of intensity,
frequency and duration.
Rainfall-Runoff relationship There are several methods to estimate runoff. However, SCS curve number (USDA,
1967) is the most popular for the field engineers of soil and water conservation. It
requires minimum data set of daily rainfall data , details of land use and its
distribution, hydrologic groups of soils based on infiltration rate of the catchment
area and antecedent moisture condition (AMC) of the watershed based on the
previous 5 days consecutive total rainfall preceding the rainfall considered.
Catchment and Cultivable Area ratio The water harvesting systems consist of catchment (collection) and a cultivable
(concentration) area. The relationship between the two, in terms of size, determines
by what factor the rainfall will be multiplied. For an appropriate design of a system,
it is recommended to determine the ratio between catchment (Aca) and cultivable
0
200
400
600
800
1000
1200
1400
0 10 20 30 40 50 60 70 80 90 100
Annual R
ain
fall, m
m
Probability (%)
.
100
200
300
400
500
600
700
800
0 10 20 30 40 50 60 70 80 90 100Sea
sonal ra
infa
ll, m
m
Probability (%)
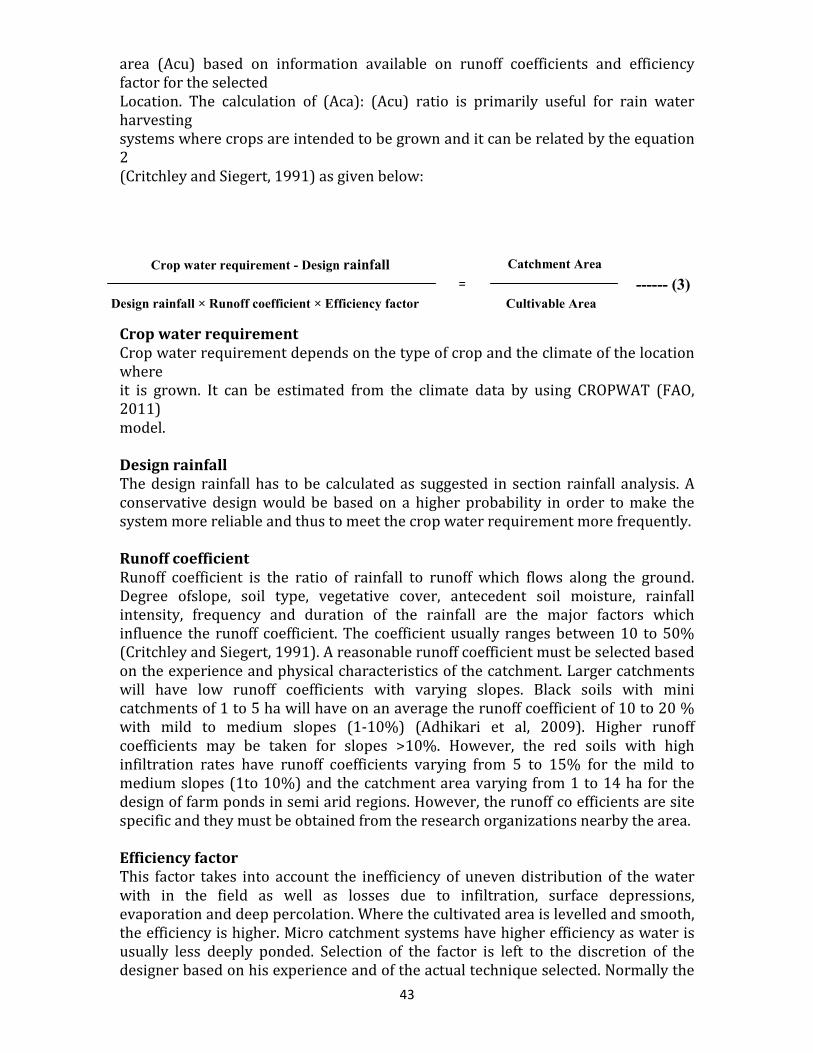
43
area (Acu) based on information available on runoff coefficients and efficiency
factor for the selected
Location. The calculation of (Aca): (Acu) ratio is primarily useful for rain water
harvesting
systems where crops are intended to be grown and it can be related by the equation
2
(Critchley and Siegert, 1991) as given below:
Crop water requirement
Crop water requirement depends on the type of crop and the climate of the location
where
it is grown. It can be estimated from the climate data by using CROPWAT (FAO,
2011)
model.
Design rainfall The design rainfall has to be calculated as suggested in section rainfall analysis. A
conservative design would be based on a higher probability in order to make the
system more reliable and thus to meet the crop water requirement more frequently.
Runoff coefficient
Runoff coefficient is the ratio of rainfall to runoff which flows along the ground.
Degree ofslope, soil type, vegetative cover, antecedent soil moisture, rainfall
intensity, frequency and duration of the rainfall are the major factors which
influence the runoff coefficient. The coefficient usually ranges between 10 to 50%
(Critchley and Siegert, 1991). A reasonable runoff coefficient must be selected based
on the experience and physical characteristics of the catchment. Larger catchments
will have low runoff coefficients with varying slopes. Black soils with mini
catchments of 1 to 5 ha will have on an average the runoff coefficient of 10 to 20 %
with mild to medium slopes (1-10%) (Adhikari et al, 2009). Higher runoff
coefficients may be taken for slopes >10%. However, the red soils with high
infiltration rates have runoff coefficients varying from 5 to 15% for the mild to
medium slopes (1to 10%) and the catchment area varying from 1 to 14 ha for the
design of farm ponds in semi arid regions. However, the runoff co efficients are site
specific and they must be obtained from the research organizations nearby the area.
Efficiency factor
This factor takes into account the inefficiency of uneven distribution of the water
with in the field as well as losses due to infiltration, surface depressions,
evaporation and deep percolation. Where the cultivated area is levelled and smooth,
the efficiency is higher. Micro catchment systems have higher efficiency as water is
usually less deeply ponded. Selection of the factor is left to the discretion of the
designer based on his experience and of the actual technique selected. Normally the
=
Crop water requirement - Design rainfall
Design rainfall × Runoff coefficient × Efficiency factor
Catchment Area
Cultivable Area
------ (3)
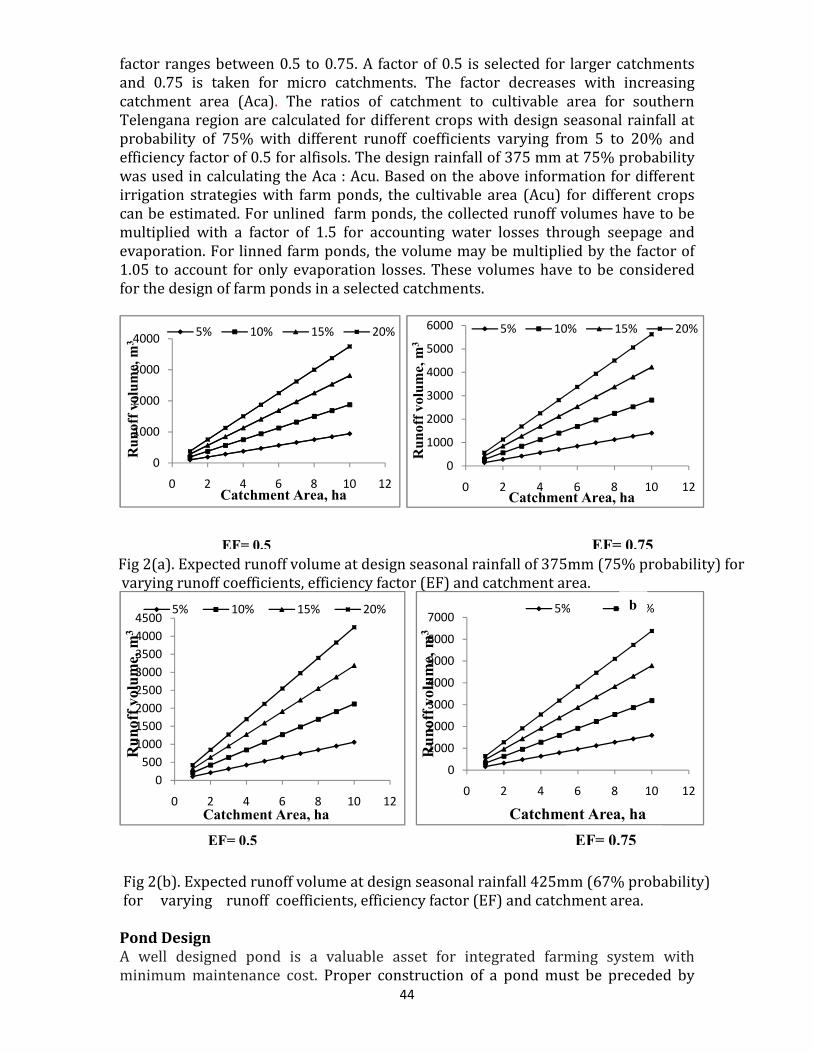
44
factor ranges between 0.5 to 0.75. A factor of 0.5 is selected for larger catchments
and 0.75 is taken for micro catchments. The factor decreases with increasing
catchment area (Aca). The ratios of catchment to cultivable area for southern
Telengana region are calculated for different crops with design seasonal rainfall at
probability of 75% with different runoff coefficients varying from 5 to 20% and
efficiency factor of 0.5 for alfisols. The design rainfall of 375 mm at 75% probability
was used in calculating the Aca : Acu. Based on the above information for different
irrigation strategies with farm ponds, the cultivable area (Acu) for different crops
can be estimated. For unlined farm ponds, the collected runoff volumes have to be
multiplied with a factor of 1.5 for accounting water losses through seepage and
evaporation. For linned farm ponds, the volume may be multiplied by the factor of
1.05 to account for only evaporation losses. These volumes have to be considered
for the design of farm ponds in a selected catchments.
Fig 2(a). Expected runoff volume at design seasonal rainfall of 375mm (75% probability) for
varying runoff coefficients, efficiency factor (EF) and catchment area.
Fig 2(b). Expected runoff volume at design seasonal rainfall 425mm (67% probability)
for varying runoff coefficients, efficiency factor (EF) and catchment area.
Pond Design A well designed pond is a valuable asset for integrated farming system with
minimum maintenance cost. Proper construction of a pond must be preceded by
0
1000
2000
3000
4000
0 2 4 6 8 10 12
Runoff
volu
me,
m3
Catchment Area, ha
5% 10% 15% 20%
0
1000
2000
3000
4000
5000
6000
0 2 4 6 8 10 12
Runoff
volu
me,
m3
Catchment Area, ha
5% 10% 15% 20%
0
500
1000
1500
2000
2500
3000
3500
4000
4500
0 2 4 6 8 10 12
Runoff
volu
me,
m3
Catchment Area, ha
5% 10% 15% 20%
0
1000
2000
3000
4000
5000
6000
7000
0 2 4 6 8 10 12
Runoff
volu
me,
m3
Catchment Area, ha
5% 10%b
EF= 0.5 EF= 0.75
EF= 0.5 EF= 0.75
45
proper planning and design. To design a pond, careful study is required with respect
to the hydrology of the catchment, rainfall–runoff relationship, and requirement of
water, expected seepage and evaporation losses. The main consideration in design is
to provide enough water for agricultural operations at minimum cost. The analysis
of these parameters will guide to decide the dimension of the ponds. Dimensions in
designing a pond are the size, shape of the pond, side slopes and the water control
structures (inlet, silt trap and outlet). The design of a excavated or dugout pond
include the determination of specifications for the following: (a) Pond capacity, (b)
Shape of pond, (c) Dimensions (depth, top & bottom widths and side slopes), (d)
Inlet channels and (e) Emergency spillway or Outlet.
Pond Capacity The capacity of the dugout pond depends on purpose for which water is needed and
by the amount of inflow that can be expected in a given period. The seasonal water
yield can be estimated using past historical weather data. The capacity of the pond
depends upon the catchment size and factors affecting its water yield. On a
conservative estimate, a dependable minimum value of 20% of the seasonal rainfall
can be expected to go as runoff in case of black soils and 10% in case of red soils
with mild to medium slopes. The pond should be of sufficient capacity to meet the
demand of the crops or integrated farming system for which it is constructed.
Generally, one or two supplemental irrigations with 50mm or less are planned for
irrigating crops from such ponds. Barring summer months, the evaporation rate is
fairly constant during the period of storage in the semi-arid regions. However, the
seepage rate varies widely due to the variations in the sub-soil strata. A suitable
provision should be made for the loss in storage capacity due to silting which is
generally kept as 5-10 per cent. In sandy or light texture soils having high
infiltration rate (>10cm/hr) will have a water loss of 50-60% in which seepage is
predominant (40-50%). In such soils, the pond capacity must be designed for actual
requirement of water for irrigation plus the seepage (40-50%) and evaporation
losses (5%).
Shape of Pond
Excavated farm ponds may normally be of three shapes, viz; (a) square, (b)
rectangular, and c) inverted cone. However, as curved shape offers difficulties in
construction, either square or rectangular ponds are normally adopted. Inverted
cone ponds with circular cross section are theoretically cheaper, but difficult to
construct and manage. Lining of such ponds would require more material for the
same capacity of square or rectangular farm ponds. Therefore, the lining of inverted
cone farm ponds is costlier.
Dimensions of farm pond The selection of dimensions for excavated pond depends on the required capacity,
soil type, purpose and type of machine available for pond construction. The size of a
pond should be relative to the size of the catchment area contributing surface runoff
to the site. Ponds with too little catchment will have difficulty in filling up and
remaining full during drought conditions. Ponds with too much watershed require
expensive water control structures and are difficult to manage. Therefore,
determination of optimum dimensions based on hydrological considerations is very
important to keep the area loss to an extent of 10 to 12% in a farm catchment.
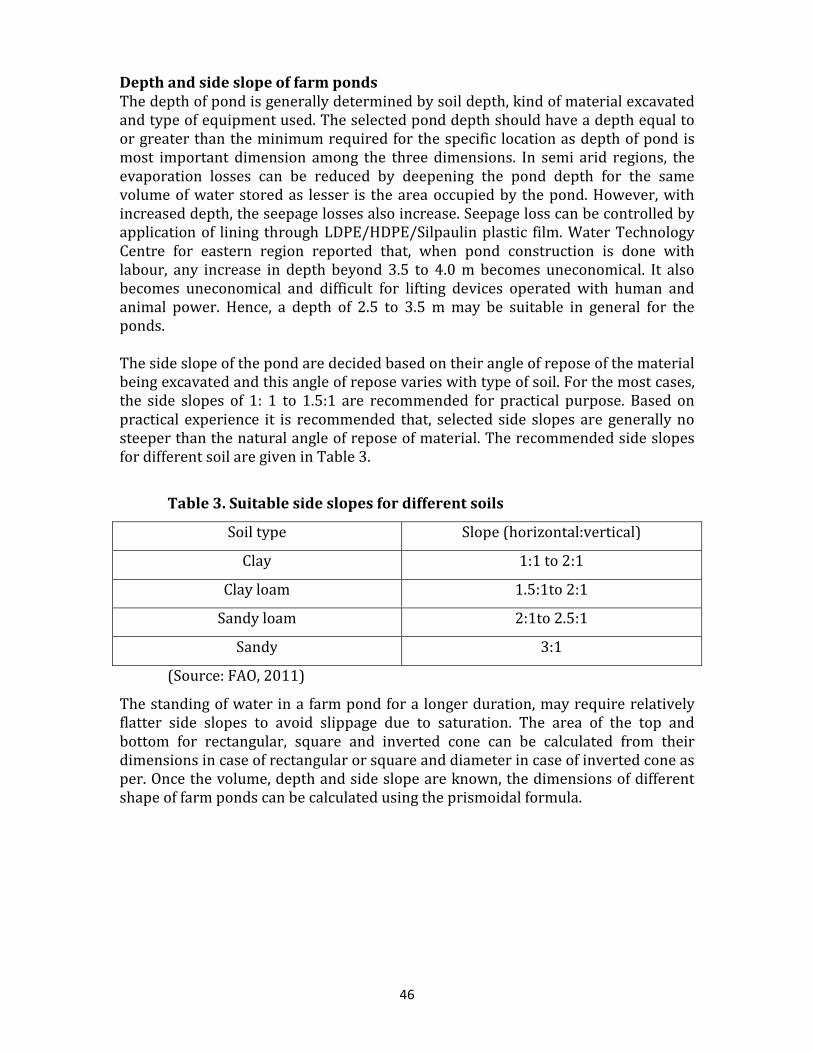
46
Depth and side slope of farm ponds
The depth of pond is generally determined by soil depth, kind of material excavated
and type of equipment used. The selected pond depth should have a depth equal to
or greater than the minimum required for the specific location as depth of pond is
most important dimension among the three dimensions. In semi arid regions, the
evaporation losses can be reduced by deepening the pond depth for the same
volume of water stored as lesser is the area occupied by the pond. However, with
increased depth, the seepage losses also increase. Seepage loss can be controlled by
application of lining through LDPE/HDPE/Silpaulin plastic film. Water Technology
Centre for eastern region reported that, when pond construction is done with
labour, any increase in depth beyond 3.5 to 4.0 m becomes uneconomical. It also
becomes uneconomical and difficult for lifting devices operated with human and
animal power. Hence, a depth of 2.5 to 3.5 m may be suitable in general for the
ponds.
The side slope of the pond are decided based on their angle of repose of the material
being excavated and this angle of repose varies with type of soil. For the most cases,
the side slopes of 1: 1 to 1.5:1 are recommended for practical purpose. Based on
practical experience it is recommended that, selected side slopes are generally no
steeper than the natural angle of repose of material. The recommended side slopes
for different soil are given in Table 3.
Table 3. Suitable side slopes for different soils
Soil type Slope (horizontal:vertical)
Clay 1:1 to 2:1
Clay loam 1.5:1to 2:1
Sandy loam 2:1to 2.5:1
Sandy 3:1
(Source: FAO, 2011)
The standing of water in a farm pond for a longer duration, may require relatively
flatter side slopes to avoid slippage due to saturation. The area of the top and
bottom for rectangular, square and inverted cone can be calculated from their
dimensions in case of rectangular or square and diameter in case of inverted cone as
per. Once the volume, depth and side slope are known, the dimensions of different
shape of farm ponds can be calculated using the prismoidal formula.
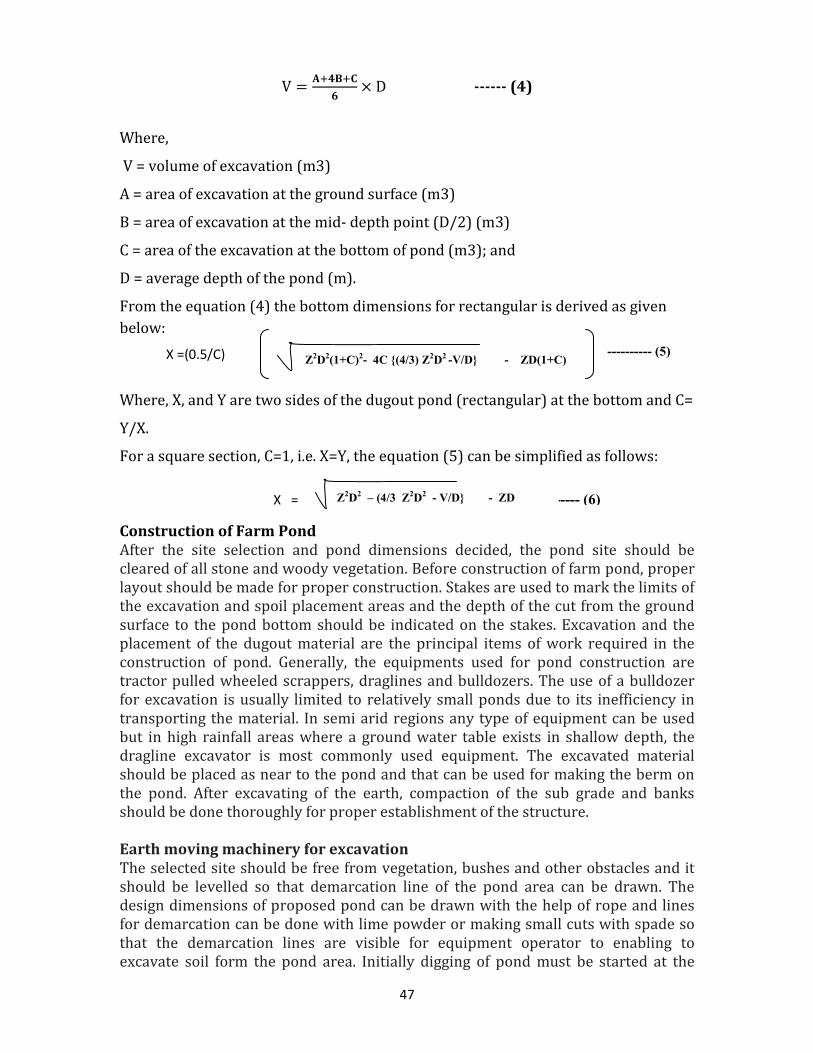
47
� �������
�� � ------ (4)
Where,
V = volume of excavation (m3)
A = area of excavation at the ground surface (m3)
B = area of excavation at the mid- depth point (D/2) (m3)
C = area of the excavation at the bottom of pond (m3); and
D = average depth of the pond (m).
From the equation (4) the bottom dimensions for rectangular is derived as given
below:
Where, X, and Y are two sides of the dugout pond (rectangular) at the bottom and C=
Y/X.
For a square section, C=1, i.e. X=Y, the equation (5) can be simplified as follows:
Construction of Farm Pond
After the site selection and pond dimensions decided, the pond site should be
cleared of all stone and woody vegetation. Before construction of farm pond, proper
layout should be made for proper construction. Stakes are used to mark the limits of
the excavation and spoil placement areas and the depth of the cut from the ground
surface to the pond bottom should be indicated on the stakes. Excavation and the
placement of the dugout material are the principal items of work required in the
construction of pond. Generally, the equipments used for pond construction are
tractor pulled wheeled scrappers, draglines and bulldozers. The use of a bulldozer
for excavation is usually limited to relatively small ponds due to its inefficiency in
transporting the material. In semi arid regions any type of equipment can be used
but in high rainfall areas where a ground water table exists in shallow depth, the
dragline excavator is most commonly used equipment. The excavated material
should be placed as near to the pond and that can be used for making the berm on
the pond. After excavating of the earth, compaction of the sub grade and banks
should be done thoroughly for proper establishment of the structure.
Earth moving machinery for excavation
The selected site should be free from vegetation, bushes and other obstacles and it
should be levelled so that demarcation line of the pond area can be drawn. The
design dimensions of proposed pond can be drawn with the help of rope and lines
for demarcation can be done with lime powder or making small cuts with spade so
that the demarcation lines are visible for equipment operator to enabling to
excavate soil form the pond area. Initially digging of pond must be started at the
Z2D2(1+C)2- 4C {(4/3) Z2D2 -V/D} - ZD(1+C) ---------- (5) X =(0.5/C)
------- (6) Z2D2 – (4/3 Z2D2 - V/D} - ZD X =
48
central portion of layout to a designed depth indicated on stakes. There are two
types of earth moving machinery like JCB with bucket volume of 0.1 m3 with short
boom and Tata-Hitachi Volvo 200 model with bucket capacity of 1m3 with long
boom of 4m. When the soil from the bottom of pond is completely removed, put the
rope connecting to the corner of bottom area and outer top corner; give the required
or desired slope at one corner of pond by cutting the soil. It is often suggested that
shaping the pond must be done with cutting rather than filling of soil and this will
facilitate better preparation of the sub grade, which is very important for stable
pond boundary. The excavation soil should be compacted for its regular shape of
trapezoidal bund with bottom width at least 1.5 to 2.5m and top width 0.5m and
height of bund as 0.5m. The side slopes may be kept as 1:1. The bunds after
compaction to the dimensions may be well grassed for its stability.
Operation and Maintenance of Pond Proper maintenance of the pond can ensure good life and service as it prevents
expensive repair costs. A pond, no matter how well planned and built, must be
adequately maintained if its intended purpose are to be realized throughout its
expected life. Lack of operation and maintenance has caused severe damage of
ponds, and inlet, outlet channels. The pond should be inspected periodically. Care
should be taken when heavy rains occur for the damages if any in farm pond.
Initially damage may be small, but if neglected it may increase until repair becomes
impractical. Any rills on the side slopes of the pond may be filled and any washes are
in the inlet spillway must be immediately filled with suitable material with
thorough compaction. Care should be taken to keep the water in the pond as clean
and unpolluted as possible. Trampling by livestock, particularly dogs and wild life
must be prevented.
Fencing Fencing must be erected around the farm pond to prevent the entry of wildlife, stray
dog etc. Fencing provides the protection from the damage and pollution by livestock.
In farm field, cost effective vegetative hedges by using Henna, shallow rooted fruit
trees, glyricidia etc., may be planned as protection to farm pond. Also, the barbed
wire fencing with stones can also be preferred so as to reduce the cost of fencing.
Lining of Farm Pond Lining of farm pond to control seepage and percolation losses would be helpful in
supplemental irrigation at crop critical stages, livestock rearing and domestic water
supply. Lining is required in farm pond to control seepage from the wetted surface
area. Seepage losses are predominant in case of light texture soils where sand
percentile is more as compared to clay and silt particles. Particularly, the farm
ponds constructed in red soils require lining for long storage of water in the
structures. Black cotton or vertislos or laterite soils do not require lining as the
seepage losses are minimum because of more clay content.
It is found that water losses through seepage varies from 1.21 to 10.54
cumecs/million sqm from heavy clay loam to porous gravelly soils in the earthen
ponds, are the major constraints to its failure. In other words we can say that the
49
drop in depth per day (cm) of ponded water via seepage and evaporation is 10.36 to
90.65 cm from heavy clay to porous gravelly soils. Several material options are
available for lining of farm ponds. The locally available material such as bricks and
stones are used for hard surface lining of farm ponds. Such linings are constructed
by using cement concrete and mortar. Asphaltic materials, paddy husk with cow
dung. cement with soil mixture, flay ash mixture, bentonile have been tried to
control seepage in farm ponds and their effectiveness are studied at different
locations of the country bricks, stones etc.
Advantages of pond lining with plastic film
• Reduction in water losses through percolation and seepage to the maximum
extent (95%).
• Availability of water for a longer period of time.
• Lining with plastic film has benefits in porous soils where water retention in
pond and water harvesting tanks is minimal (Red soils).
• Prevents the lower area from the problem of water logging and prevents
upward intrusion of salts in to stored water.
• Judicious utilization of stored water for the purpose of storage of drinking
water, for fish culture and to provide supplementary irrigation during crop
critical stages.
• Economical and effective method of storing water.
Method of laying Polyethylene films in farm ponds For Laying of Polyethylene films minimum of 500 micron film are best suited for
lasting of film and the following procedure are taken into consideration:
• Choose the film as per BIS/ISI mark
• Make the sides of the farm pond clean and smooth by removing vegetation and
rills if any on the surface. A herbicide or weedicide may be applied on surface in
advances so that there won’t be any vegetation or root mass
• Make the trench of dimension 15 x 15 cm at the bottom along the sides for holding
the plastic film firmly while laying
• Use minimum of 500 micron sheet or 300-350 gsm cross reinforced silpaulin
• Calculate the film requirement for dugout pond.
• Plastic films manufactured in to panels of standard widths. Therefore convert the
film into a single sheet as a desired either mechanically by heat-sealing machine
like Hot Air fusion welding machine or manually (by overlapping 15 cm of the edge
of two sheet and scrubbed lightly using emery paper or sand paper (120 grade)
using bitumen/ Synthetic Rubber adhesive No-998 made by fevicol so that it fit
exactly to fit in to the pond.
• Monitor the film in sun light for searching/puncture hole if any, and seal the hole
with bitumen/adhesive or by heat – sealing procedure.
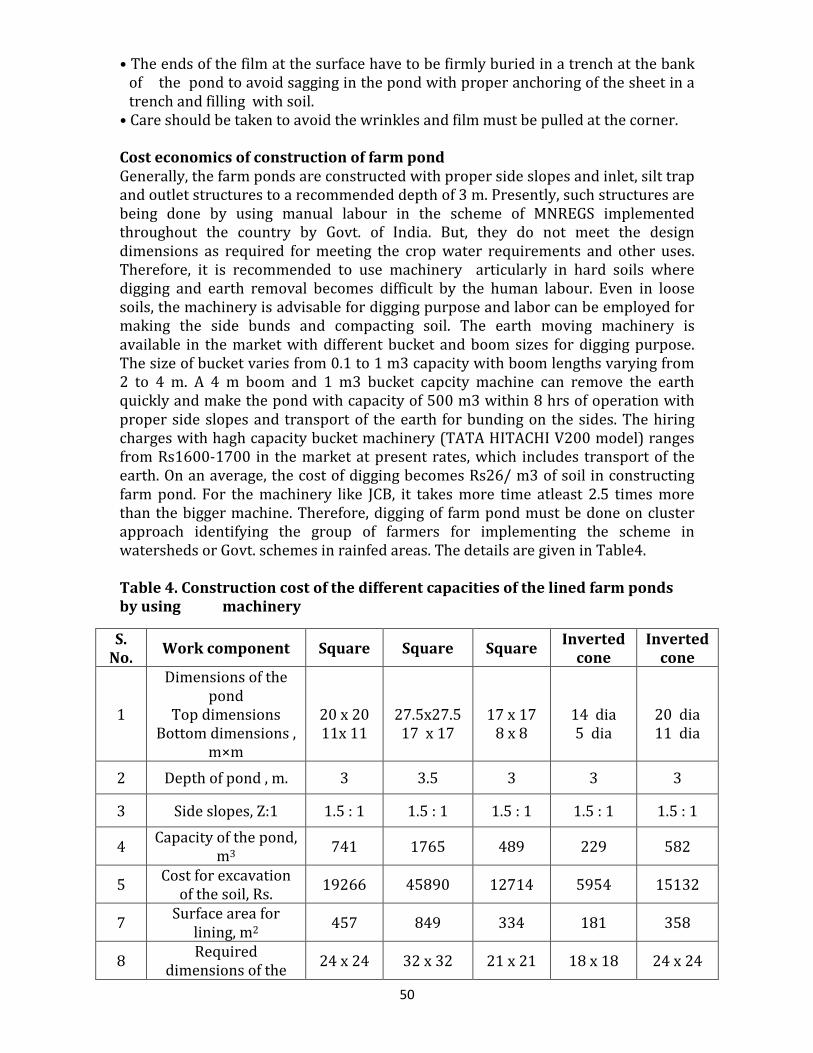
50
• The ends of the film at the surface have to be firmly buried in a trench at the bank
of the pond to avoid sagging in the pond with proper anchoring of the sheet in a
trench and filling with soil.
• Care should be taken to avoid the wrinkles and film must be pulled at the corner.
Cost economics of construction of farm pond
Generally, the farm ponds are constructed with proper side slopes and inlet, silt trap
and outlet structures to a recommended depth of 3 m. Presently, such structures are
being done by using manual labour in the scheme of MNREGS implemented
throughout the country by Govt. of India. But, they do not meet the design
dimensions as required for meeting the crop water requirements and other uses.
Therefore, it is recommended to use machinery articularly in hard soils where
digging and earth removal becomes difficult by the human labour. Even in loose
soils, the machinery is advisable for digging purpose and labor can be employed for
making the side bunds and compacting soil. The earth moving machinery is
available in the market with different bucket and boom sizes for digging purpose.
The size of bucket varies from 0.1 to 1 m3 capacity with boom lengths varying from
2 to 4 m. A 4 m boom and 1 m3 bucket capcity machine can remove the earth
quickly and make the pond with capacity of 500 m3 within 8 hrs of operation with
proper side slopes and transport of the earth for bunding on the sides. The hiring
charges with hagh capacity bucket machinery (TATA HITACHI V200 model) ranges
from Rs1600-1700 in the market at present rates, which includes transport of the
earth. On an average, the cost of digging becomes Rs26/ m3 of soil in constructing
farm pond. For the machinery like JCB, it takes more time atleast 2.5 times more
than the bigger machine. Therefore, digging of farm pond must be done on cluster
approach identifying the group of farmers for implementing the scheme in
watersheds or Govt. schemes in rainfed areas. The details are given in Table4.
Table 4. Construction cost of the different capacities of the lined farm ponds by using machinery
S. No.
Work component Square Square Square Inverted
cone Inverted
cone
1
Dimensions of the
pond
Top dimensions
Bottom dimensions ,
m×m
20 x 20
11x 11
27.5x27.5
17 x 17
17 x 17
8 x 8
14 dia
5 dia
20 dia
11 dia
2 Depth of pond , m. 3 3.5 3 3 3
3 Side slopes, Z:1 1.5 : 1 1.5 : 1 1.5 : 1 1.5 : 1 1.5 : 1
4 Capacity of the pond,
m3 741 1765 489 229 582
5 Cost for excavation
of the soil, Rs. 19266 45890 12714 5954 15132
7 Surface area for
lining, m2 457 849 334 181 358
8 Required
dimensions of the 24 x 24 32 x 32 21 x 21 18 x 18 24 x 24
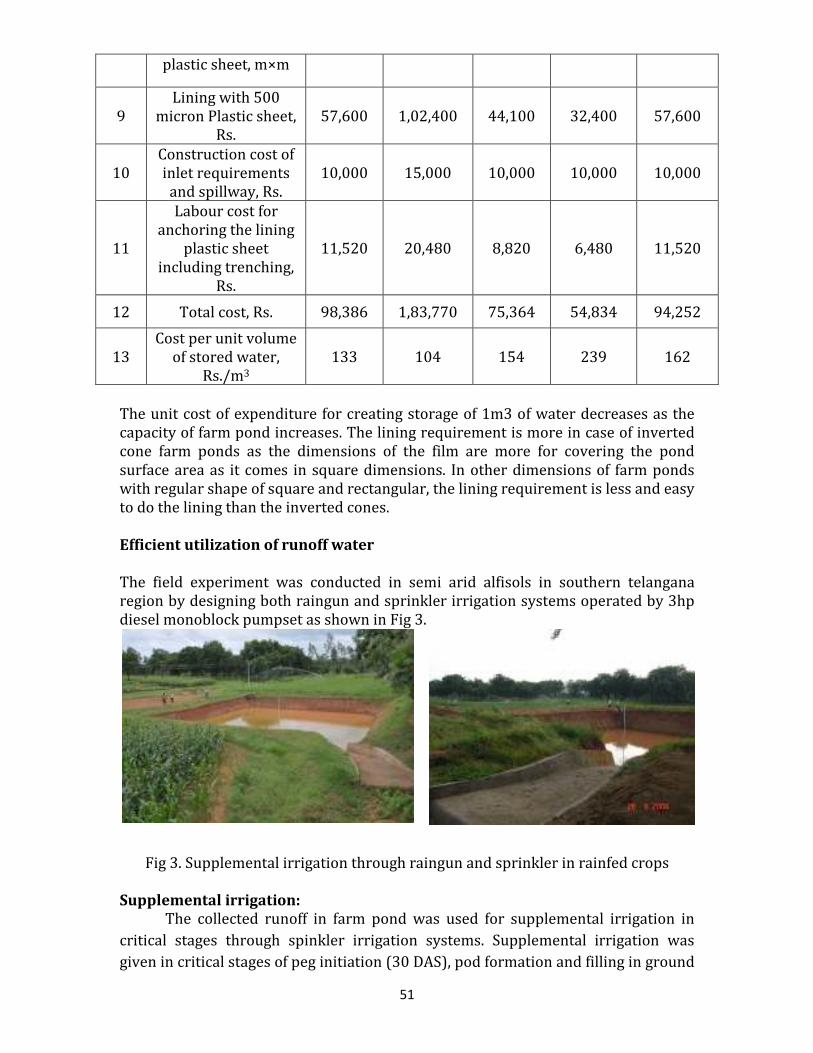
51
plastic sheet, m×m
9
Lining with 500
micron Plastic sheet,
Rs.
57,600 1,02,400 44,100 32,400 57,600
10
Construction cost of
inlet requirements
and spillway, Rs.
10,000 15,000 10,000 10,000 10,000
11
Labour cost for
anchoring the lining
plastic sheet
including trenching,
Rs.
11,520 20,480 8,820 6,480 11,520
12 Total cost, Rs. 98,386 1,83,770 75,364 54,834 94,252
13
Cost per unit volume
of stored water,
Rs./m3
133 104 154 239 162
The unit cost of expenditure for creating storage of 1m3 of water decreases as the
capacity of farm pond increases. The lining requirement is more in case of inverted
cone farm ponds as the dimensions of the film are more for covering the pond
surface area as it comes in square dimensions. In other dimensions of farm ponds
with regular shape of square and rectangular, the lining requirement is less and easy
to do the lining than the inverted cones.
Efficient utilization of runoff water The field experiment was conducted in semi arid alfisols in southern telangana
region by designing both raingun and sprinkler irrigation systems operated by 3hp
diesel monoblock pumpset as shown in Fig 3.
Fig 3. Supplemental irrigation through raingun and sprinkler in rainfed crops
Supplemental irrigation: The collected runoff in farm pond was used for supplemental irrigation in
critical stages through spinkler irrigation systems. Supplemental irrigation was
given in critical stages of peg initiation (30 DAS), pod formation and filling in ground
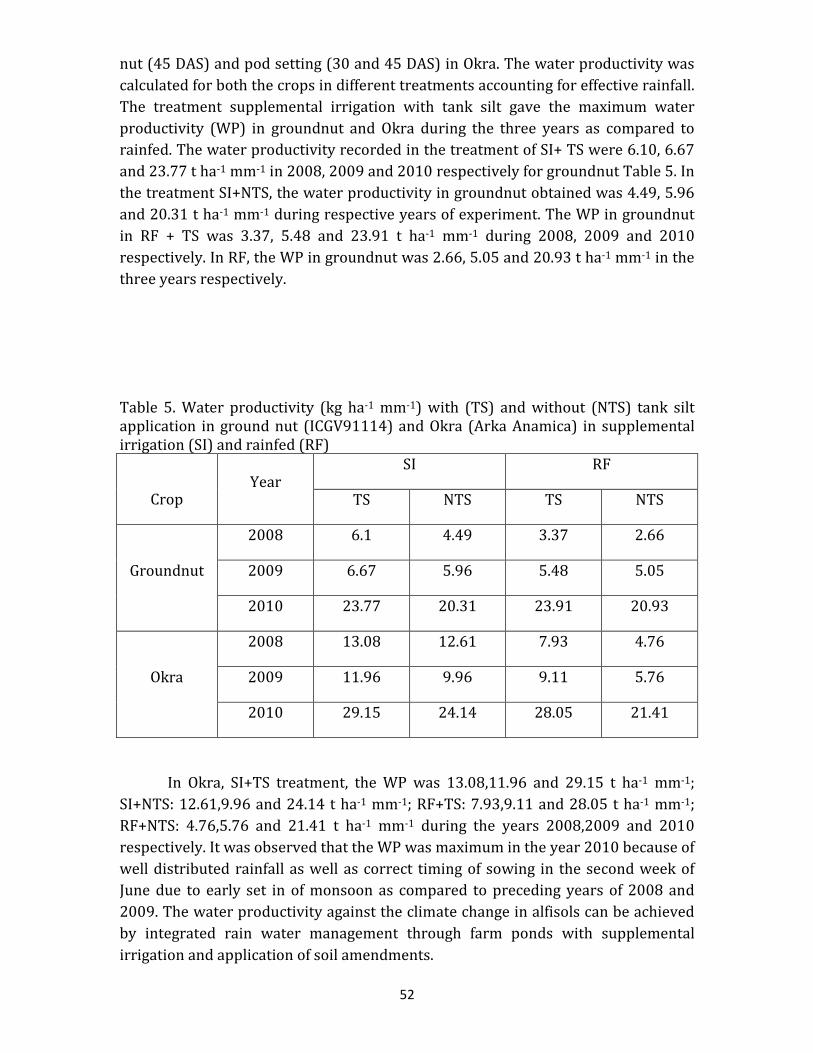
52
nut (45 DAS) and pod setting (30 and 45 DAS) in Okra. The water productivity was
calculated for both the crops in different treatments accounting for effective rainfall.
The treatment supplemental irrigation with tank silt gave the maximum water
productivity (WP) in groundnut and Okra during the three years as compared to
rainfed. The water productivity recorded in the treatment of SI+ TS were 6.10, 6.67
and 23.77 t ha-1 mm-1 in 2008, 2009 and 2010 respectively for groundnut Table 5. In
the treatment SI+NTS, the water productivity in groundnut obtained was 4.49, 5.96
and 20.31 t ha-1 mm-1 during respective years of experiment. The WP in groundnut
in RF + TS was 3.37, 5.48 and 23.91 t ha-1 mm-1 during 2008, 2009 and 2010
respectively. In RF, the WP in groundnut was 2.66, 5.05 and 20.93 t ha-1 mm-1 in the
three years respectively.
Table 5. Water productivity (kg ha-1 mm-1) with (TS) and without (NTS) tank silt
application in ground nut (ICGV91114) and Okra (Arka Anamica) in supplemental
irrigation (SI) and rainfed (RF)
Crop Year
SI RF
TS NTS TS NTS
Groundnut
2008 6.1 4.49 3.37 2.66
2009 6.67 5.96 5.48 5.05
2010 23.77 20.31 23.91 20.93
Okra
2008 13.08 12.61 7.93 4.76
2009 11.96 9.96 9.11 5.76
2010 29.15 24.14 28.05 21.41
In Okra, SI+TS treatment, the WP was 13.08,11.96 and 29.15 t ha-1 mm-1;
SI+NTS: 12.61,9.96 and 24.14 t ha-1 mm-1; RF+TS: 7.93,9.11 and 28.05 t ha-1 mm-1;
RF+NTS: 4.76,5.76 and 21.41 t ha-1 mm-1 during the years 2008,2009 and 2010
respectively. It was observed that the WP was maximum in the year 2010 because of
well distributed rainfall as well as correct timing of sowing in the second week of
June due to early set in of monsoon as compared to preceding years of 2008 and
2009. The water productivity against the climate change in alfisols can be achieved
by integrated rain water management through farm ponds with supplemental
irrigation and application of soil amendments.
53
There is considerable evidence that runoff water could be used to optimize the
production on semi arid Alfisols. On Alfisols, the potential for delivering excess rain
water to runoff storage structure is extremely good since even improved system of
farming results in the loss 15-35% of the seasonal rainfall as runoff. In rainfed
alfisols, the combined use of supplemental irrigation and application of soil
amendments such as tank silt can contribute significantly towards greater
productivity with less uncertainty.
Conclusion:
The impact of climate change on rainfed alfisols creates problems in local
and country level as alfisols are the predominant soil in India. The runoff producing
in rainfed alfisol from extreme events due to climate change can be effectively
collected and used as supplemental irrigation in critical stages of crop growth
period which would improve the water productivity in rainfed alfisols. The soil
water content in alfisols can be increased through application of soil amendments
such as tank silt and organic materials by atleast 2 to 3%.
54
References:
Adhikari, R.N., Mishra, P.K., and Muralidhar, W. 2009. Dugout farm pond- A potential
source of water harvesting in deep black soils in deccan plateau region. Rainwater
harvesting and reuse through farm ponds, Proceedings of national workshopcum
brain storming. CRIDA. Hyd.
Anonymous. 1972. Handbook of hydrology. Ministry of Agricultural and Co-
operation,
New Delhi.
Ben Asher, J. 1988. A review of water harvesting in Israel. (Draft) working paper for
World Bank’s Sub-Sahara Water Harvesting Study.
Bharat R. Sharma, K.V. Rao, K.P.R. Vittal, Y.S. Ramakrishna, and U. Amarasinghe.
2010.
Estimating the potential of rainfed agriculture in India: Prospects for water
productivity improvements. Agricultural Water Management 97:23–30.
Critchley W and Siegert K. 1991. FAO Manual on Water Harvesting.
Falkenmark, M., and J. Rockström. 2004. Balancing Water for Humans and Nature:
The New Approach in Ecohydrology. London: Earthscan.
Freebairn, D. M., Wockner, G. H., and Silburn, D. M. (1986). “ Effect of catchment
management on runoff, water quality, and yield potential from vertisols.”
Agricultural Water Management., 12(1), 1-19.
IPCC. 2007. Special Report on Managing the Risks of Extreme Events and Disasters
to
Advance Climate Change Adaptation. http://www.ipcc.in
Krishna, J. H., Arkin, G. F., and Martin, J. R. 1987. “ Runoff impoundment for
supplemental irrigation in Texas.” Water Resources. Bulletin., 23(6), 1057-1061.
Ministry of Water Resources, 2012.
http://www.deccanherald.com/content/109161/
water-efficiency-norms-cards.html.
NABARD, 2012. Model bankable scheme for sprinkler irrigation systems.
http://www.nabard.org.
National Atlas and Thematic Mapping Organization.
http://ww.advanceagriculturalpractice.in
Panigrahi, B. 2011. Irrigation systems engineering. New India publishing agency.
Ravi babu, R. 2011. Model design and cost estimate details of soil and water
55
conservation measures. IGWDP NABARD, Hyderabad.
Ravi babu, R. 2011. Quality issues in soil and water conservation techniques. Telugu
version, IGWDP NABARD, Hyderabad.
Soil Conservation Service, USDA. 1964. Hydrology, Section 4, National Engineering
Handbook, Washington, D.C., Revised Edition.
Wani, S. P., Pathak, P., Sreedevi, T.K., Singh, H.P and Singh, P. 2003. Efficient
management of rainwater for increased productivity and groundwater rechargein
Asia. Book chapter in Water Productivity in Agriculture: Limits and Opportunities
for Improvement edited by Kijne, et al., 2003. CABI publishing, Cambridge, USA.
http://agritech.tnau.ac.in/agricultural_engineering/farmpond_reservoir.pdf
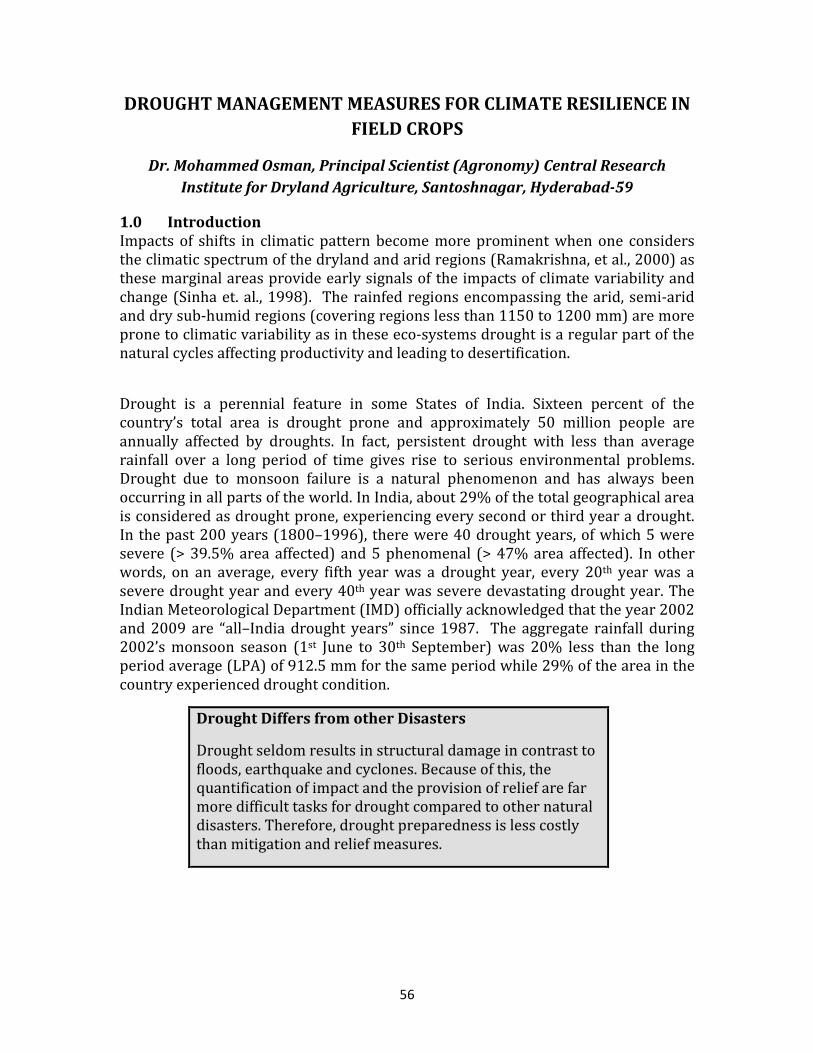
56
DROUGHT MANAGEMENT MEASURES FOR CLIMATE RESILIENCE IN
FIELD CROPS
Dr. Mohammed Osman, Principal Scientist (Agronomy) Central Research
Institute for Dryland Agriculture, Santoshnagar, Hyderabad-59
1.0 Introduction Impacts of shifts in climatic pattern become more prominent when one considers
the climatic spectrum of the dryland and arid regions (Ramakrishna, et al., 2000) as
these marginal areas provide early signals of the impacts of climate variability and
change (Sinha et. al., 1998). The rainfed regions encompassing the arid, semi-arid
and dry sub-humid regions (covering regions less than 1150 to 1200 mm) are more
prone to climatic variability as in these eco-systems drought is a regular part of the
natural cycles affecting productivity and leading to desertification.
Drought is a perennial feature in some States of India. Sixteen percent of the
country’s total area is drought prone and approximately 50 million people are
annually affected by droughts. In fact, persistent drought with less than average
rainfall over a long period of time gives rise to serious environmental problems.
Drought due to monsoon failure is a natural phenomenon and has always been
occurring in all parts of the world. In India, about 29% of the total geographical area
is considered as drought prone, experiencing every second or third year a drought.
In the past 200 years (1800–1996), there were 40 drought years, of which 5 were
severe (> 39.5% area affected) and 5 phenomenal (> 47% area affected). In other
words, on an average, every fifth year was a drought year, every 20th year was a
severe drought year and every 40th year was severe devastating drought year. The
Indian Meteorological Department (IMD) officially acknowledged that the year 2002
and 2009 are “all–India drought years” since 1987. The aggregate rainfall during
2002’s monsoon season (1st June to 30th September) was 20% less than the long
period average (LPA) of 912.5 mm for the same period while 29% of the area in the
country experienced drought condition.
Drought Differs from other Disasters
Drought seldom results in structural damage in contrast to
floods, earthquake and cyclones. Because of this, the
quantification of impact and the provision of relief are far
more difficult tasks for drought compared to other natural
disasters. Therefore, drought preparedness is less costly
than mitigation and relief measures.
57
1.1 Types of Drought
Many people consider drought to be largely a natural or physical event. But, in
reality drought has both natural and social components. Drought has been classified
into four types namely: meteorological, hydrological, agricultural and socio-
economic.
Meteorological drought is often defined by a period of substantially diminished
precipitation duration and / or amount. The commonly used definition of
meteorological drought is an interval of time, generally in the order of months or
years, during which the actual moisture supply at a given place consistently falls
below the climatically appropriate moisture supply.
Agricultural drought occurs when there is inadequate soil moisture to meet the
needs of a particular crop at a particular time. Agriculture is usually the first
economic sector to be affected by drought. Agricultural drought usually occurs after
or during meteorological drought, but before hydrological drought, can also affect
livestock and agricultural operations.
Hydrological drought refers to deficiencies in surface and subsurface water
supplies. It is measured in terms of stream flow, snow pack, surface and
groundwater levels. There is usually a delay between rains and measurable water in
streams, lakes and reservoirs. Therefore, hydrological measurements tend to lag
other drought indicators.
Socio-economic drought occurs when physical water shortages start to affect the
health, well- being, and quality of life of the people, or when the drought starts to
affect the supply and demand of economic goods and services.
1.2 Impact of Drought
Effect of drought is more severe than the other natural disasters and is often due to
improper management of available water. Though, the country receives substantial
/ normal amount of rainwater through monsoon rains, often, part of it is lost
creating scarcity of water leading to drought. Thus, each drought year is unique in
climatic characteristic and its impact can be felt only after it happened. Droughts
have multiple effects on agricultural production during the subsequent years too,
due to:
♦ Non-availability of quality seeds for sowing of crops
♦ Inadequate draft power for carrying out agricultural operations as a result of
either distress sale or loss of life of cattle
♦ Reduced use of precious inputs like fertilizers as the purchasing power of the
farmers decline
♦ Non-availability of raw materials to agro-based industries, and
♦ Deforestation to meet the energy needs in domestic sector as agricultural
wastes may not be available in required quantity
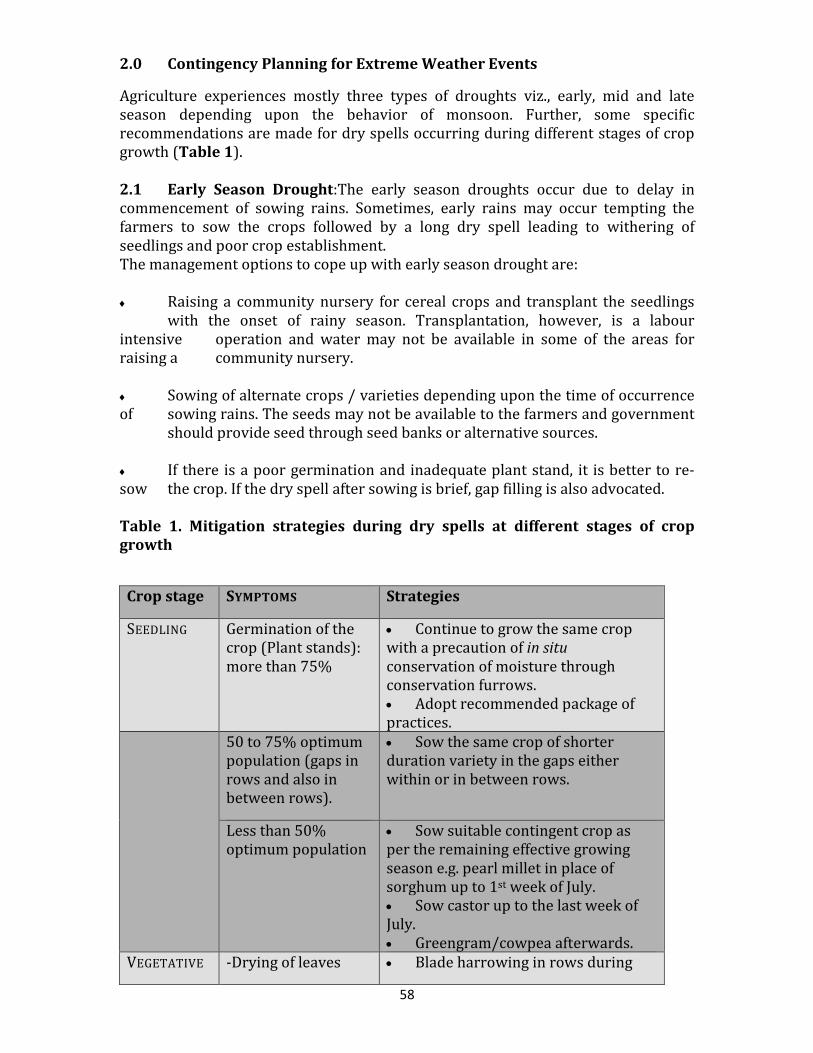
58
2.0 Contingency Planning for Extreme Weather Events
Agriculture experiences mostly three types of droughts viz., early, mid and late
season depending upon the behavior of monsoon. Further, some specific
recommendations are made for dry spells occurring during different stages of crop
growth (Table 1).
2.1 Early Season Drought:The early season droughts occur due to delay in
commencement of sowing rains. Sometimes, early rains may occur tempting the
farmers to sow the crops followed by a long dry spell leading to withering of
seedlings and poor crop establishment. The management options to cope up with early season drought are:
♦ Raising a community nursery for cereal crops and transplant the seedlings
with the onset of rainy season. Transplantation, however, is a labour
intensive operation and water may not be available in some of the areas for
raising a community nursery.
♦ Sowing of alternate crops / varieties depending upon the time of occurrence
of sowing rains. The seeds may not be available to the farmers and government
should provide seed through seed banks or alternative sources.
♦ If there is a poor germination and inadequate plant stand, it is better to re-
sow the crop. If the dry spell after sowing is brief, gap filling is also advocated. Table 1. Mitigation strategies during dry spells at different stages of crop growth
Crop stage SYMPTOMS Strategies
SEEDLING
Germination of the
crop (Plant stands):
more than 75%
• Continue to grow the same crop
with a precaution of in situ
conservation of moisture through
conservation furrows.
• Adopt recommended package of
practices.
50 to 75% optimum
population (gaps in
rows and also in
between rows).
• Sow the same crop of shorter
duration variety in the gaps either
within or in between rows.
Less than 50%
optimum population
• Sow suitable contingent crop as
per the remaining effective growing
season e.g. pearl millet in place of
sorghum up to 1st week of July.
• Sow castor up to the last week of
July.
• Greengram/cowpea afterwards.
VEGETATIVE -Drying of leaves • Blade harrowing in rows during
59
-Wilting of plant
-Soil cracking in
black soils
dry spell in coarse cereals, oilseed and
pulse crops to create dust mulch and
closing of cracks in black soils.
• Supplemental irrigation of 5 cm. of
rain water stored in farm pond during
dry spell.
AFTER RELIEF OF DRY SPELL
• Spraying of 2% urea especially to
pulses, castor and sunflower crop.
• 10 kg N/ha (additional) application
• Conservation furrows at 1.2 m
distance after relief of dry spell.
FLOWERING - Drying of flowers
- Dropping of
flowers
- Wilting of plants
• Blade harrowing to create dust
mulch in wide spaced crops like castor
and sunflower.
• 5 cm. of supplemental irrigation
(if stored water is available in drought
situation)
• Spray urea@ 2% in pulses, oilseed
and nutritive cereals during dry spell.
• Additional 10 kg N/ha as a part of
top dressing
Grain filling
- Wrinkled seeds
- Dried pods/ cobs
/spikes
- Wilting of the crop
- Excess leaf fall on
the ground
• Supplemental irrigation from
harvested rain water in the pond
Other options are: � Growing short duration drought tolerant millets and intercropping with pulses,
etc.
� Seed treatment: priming.
� Transplanting of seedlings of millets.
� Thinning.
� Mulching.
� Re-sowing, if drought occurs within 15 days after sowing.
� Growing crops for fodder alone.
2.2 Mid-Season Drought
Mid-season drought occurs in association with long gaps between two successive
rainy events if the moisture stored in the soil falls short of water requirement of the
crop during the dry period. At times, mid season drought may be associated with
low and inadequate rainfall in the growing season that will not meet the crop water
needs as per its phenological stage.
The management options to cope-up with the mid season drought are:
60
� Rain water harvesting for life saving irrigation and recycling when drought
occurs
� Reducing crop density by thinning
� Weed control and mulching
� In-situ moisture conservation practices like conservation furrow
� Dust mulching, repeated harrowing
� Intercropping to minimize crop loss
� Contingency crop planning
� Defoliation of leaves at the bottom of the plant
2.3 Late Season Drought
If the crop encounters moisture stress during the reproductive stage due to early
cessation of rainy season, there may be rise in temperature, hastening the process of
crop maturity. The grain yield of crops is highly correlated with the water
availability conditions during the reproductive stage of growth. Short duration high
yielding varieties may escape late season droughts. Another possibility is to provide
supplementary irrigation through rainwater harvesting and recycling. Organic
mulches are found to be useful in improving crop yields during post-rainy season.
When crops are grown late under rainfed conditions, terminal drought can be
anticipated with greater certainty. Therefore, varieties that respond better to
terminal droughts have to be preferred.
The management options to cope-up with the late season drought are:
o Rainwater harvesting and irrigating at critical stages like flowering/grain
filling.
o Replacing paddy with less water requiring crops
o Intercropping to minimize risks
o Mulching at critical stages of crop growth
o Use of early harvesting and processing strategies
o Use of anti-transparent
o Thinning
o Defoliation: removal of leaves at the bottom
o Contour farming
o Strip Farming
o Deep ploughing
2.4 Short and Long Term Preventive and Corrective Measures
2.4.1 Preventive Measures
Short term
� Ploughing across the slope.
� Sowing across the slope.
� Introduction of less water requiring crops.
� Introduction of drought tolerant crop varieties.
� Urea treatment for dry fodder.
� Preventing deforestation.
� Roof water harvesting.
61
� Recycling of runoff water in farms.
Long -Term � Tree based farming.
� Diversified farming.
� Change of cropping pattern.
� Revival of water harvesting structures.
� Construction of check dams/ farm ponds
� De-silting of tanks
� Watershed management Long Term
2.4.2 Corrective Measures
Short Term
� Soil and water conservation measures.
� Repair of existing water resources.
� Close monitoring of relief work.
� Taking up minor irrigation repair works.
� Loan and subsidy to needy people.
� Raising community nursery to supply seedlings.
� Production and supply of fodder.
� Efficient use of available irrigation water by drip and sprinkler irrigation
techniques.
Long-Term
� Agroforestry.
� Horticulture development.
� Pasture and fodder development.
� Creation of water harvesting structures.
� Construction of check dams and percolation tanks.
� Drainage line treatment.
� Establishment of fodder and seed banks.
� Implementation of land use policy strictly.
3.0 Farming in Relation to Annual Rainfall
Depending on the range of rainfall (low to high), some farming strategies
have been discussed for three types of rainfall situations.
Area Receiving Rainfall Less Than 500mm
♦ Linking arable farming with animal husbandry on high priority.
♦ Arable farming limited to millets and pulses and adoption of agroforestry,
silvipastoral and hortipastoral systems.
♦ Growing drought – tolerant perennial tree species that provide fuel, fodder
and food.
♦ Adopting arid – horticulture to augment farm income.
62
♦ Emphasizing efficient management of rangelands and common village
grazing lands, adopting improved strains of grasses, reseeding techniques,
and developing fodder banks.
Area Receiving Rainfall 500 To 750 Mm
♦ Emphasis on oilseed and legume based intercropping systems in not so
favourable tracts.
♦ High value (fruits, medicinal, aromatic bushes, dyes and bio-pesticides) and
high-tech agriculture (drip irrigation, processing, extraction and value added
products).
♦ Utilization of marginal and shallow lands through alternate land use system
with agriculture-forests-pasture system with a range of options.
♦ Afforestation of highly degraded undulating lands.
♦ Watershed approach in farming systems perspective.
Area Receiving Rainfall More Than 750 Mm
♦ Aquaculture in high-rainfall, double-cropped regions with rationalization of
area under rice.
♦ Intercropping systems and improved crop varieties of maize, soybean,
groundnut and double cropping in deeper soil zones.
♦ Dryland horticulture and tree farming
♦ Integrated watershed management
4.0 Drought in Andhra Pradesh: A Case Study
Andhra Pradesh is the third most drought prone State of India after Rajasthan and
Karnataka. Rayalseema and Southern parts of Telangana are considered as the
chronic drought prone regions compared to coastal Andhra. CRIDA was given the
task by the Planning Department, Government of Andhra Pradesh to develop
Disaster Management Plan in respect of Drought. The mandals prone to
Meteorological, Hydrological and Agricultural droughts were assessed and
prioritized using bio-physical and socio-economic parameters. Drought severity
index was worked out for all the mandals. Drought assessment focused on
meteorological, hydrological and agricultural drought scenario generation on real
time basis for all the mandals of Andhra Pradesh. Decision Support Software (DSS)
was developed with nine different modules dealing with drought assessment,
mitigation and risk transfer measures to reduce the time lag in collection,
processing and transfer of data/information. Using the art of information
technology, a unique attempt was made to bring the planners and implementers on
a single platform. In drought mitigation, stress has been laid on contingency crop
planning and alternate land uses for drought proofing. Groundwater, surface water
and livestock management received due attention as drought preparedness is much
cost-effective than relief measures. Risk transfer measures focused on developing a
response plan by assigning roles and responsibilities to various departments
including banks and insurance. Community-based participatory planning was
introduced to improve the effectiveness and transparency in various relief measures
related to livelihood, food, fodder and nutritional security.
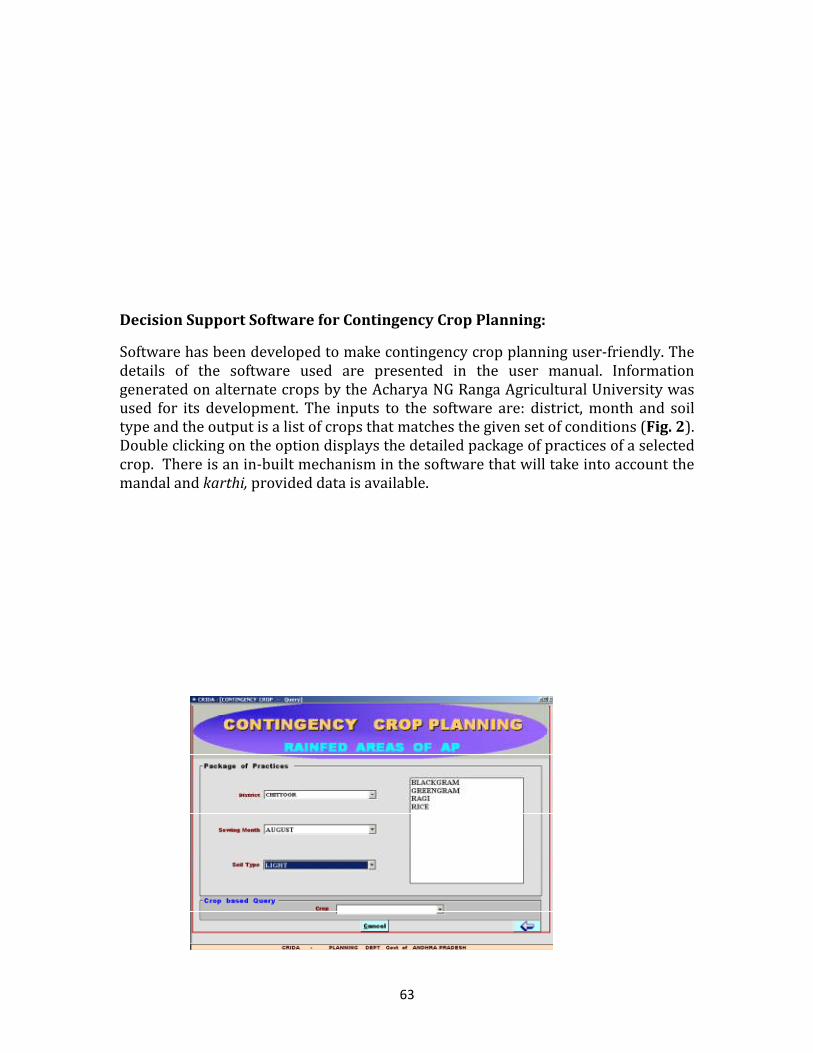
63
Decision Support Software for Contingency Crop Planning:
Software has been developed to make contingency crop planning user-friendly. The
details of the software used are presented in the user manual. Information
generated on alternate crops by the Acharya NG Ranga Agricultural University was
used for its development. The inputs to the software are: district, month and soil
type and the output is a list of crops that matches the given set of conditions (Fig. 2).
Double clicking on the option displays the detailed package of practices of a selected
crop. There is an in-built mechanism in the software that will take into account the
mandal and karthi, provided data is available.
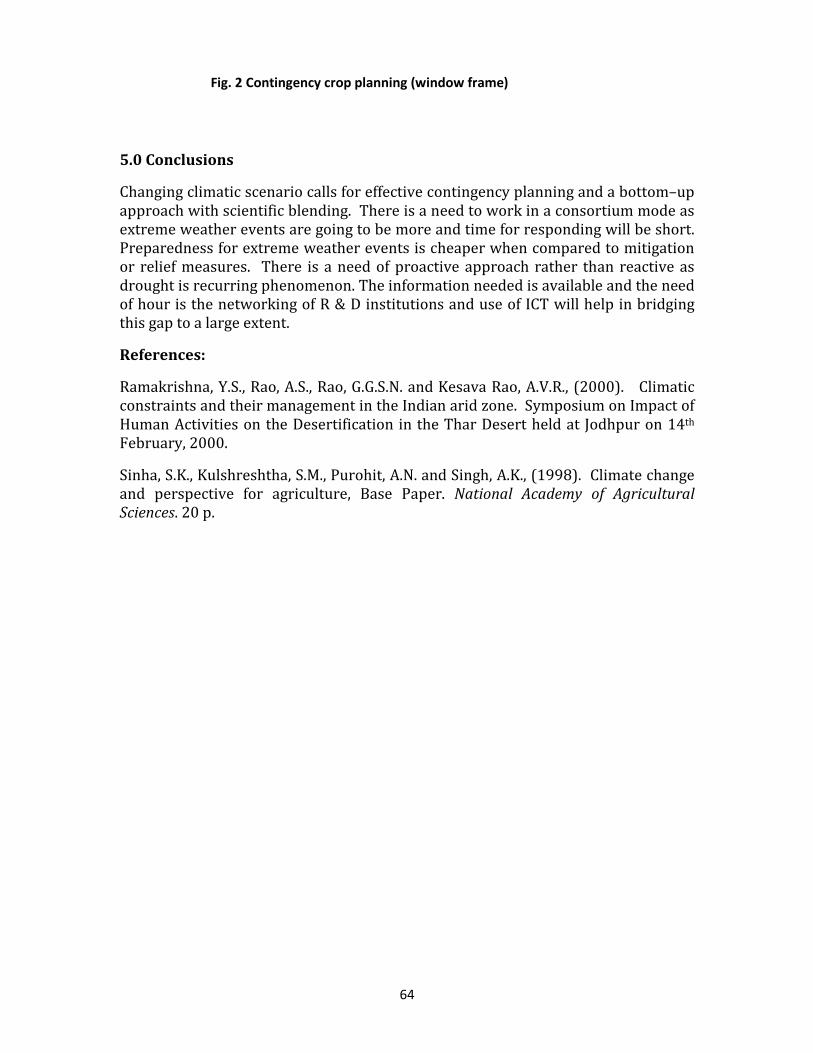
64
5.0 Conclusions
Changing climatic scenario calls for effective contingency planning and a bottom–up
approach with scientific blending. There is a need to work in a consortium mode as
extreme weather events are going to be more and time for responding will be short.
Preparedness for extreme weather events is cheaper when compared to mitigation
or relief measures. There is a need of proactive approach rather than reactive as
drought is recurring phenomenon. The information needed is available and the need
of hour is the networking of R & D institutions and use of ICT will help in bridging
this gap to a large extent.
References:
Ramakrishna, Y.S., Rao, A.S., Rao, G.G.S.N. and Kesava Rao, A.V.R., (2000). Climatic
constraints and their management in the Indian arid zone. Symposium on Impact of
Human Activities on the Desertification in the Thar Desert held at Jodhpur on 14th
February, 2000.
Sinha, S.K., Kulshreshtha, S.M., Purohit, A.N. and Singh, A.K., (1998). Climate change
and perspective for agriculture, Base Paper. National Academy of Agricultural
Sciences. 20 p.
Fig. 2 Contingency crop planning (window frame)
65
CDM CONCEPT:THEORY AND PRACTICE JVNS Prasad, Sr. Scientist (Agronomy), Central Research Institute for Dryland
Agriculture,
Hyderabad -500059, [email protected]
Introduction
Warming of the climate system is an established fact, which is evident from
the increase in global average air and ocean temperatures, widespread melting of
snow and ice and rising global average sea level. The warming trend in India over
the past 100 years (1901 to 2007) was observed to be 0.510C with accelerated
warming of 0.21oC per every 10 years since 1970. Global green house gas (GHG)
emissions due to human activities have grown since pre-industrial times, with an
increase of 70% between 1970 and 2004 where as the emissions of Carbon dioxide
(CO2) have grown by about 80% between 1970 and 2004, from 21 to 38 gigatonnes
(Gt), and represented 77% of total anthropogenic GHG emissions in 2004 (IPCC
2007). With the current climate change mitigation policies global GHG emissions
will continue to grow over the next few decades. A warming of about 0.2°C per
decade is projected for a range of emissions scenarios for the next two decades.
Even if the concentrations of all GHGs and aerosols had been kept constant at year
2000 levels, a further warming of about 0.1°C per decade would be expected (IPCC
2007). Climate change impacts on agriculture are being witnessed all over the
world, but countries like India are more vulnerable in view of the high population
depending on agriculture and excessive pressure on natural resources. The
projected impacts are likely to further aggravate yield fluctuations of many crops
with impact on food security and prices. Cereal productivity is projected to
decrease by 10-40% by 2100 and greater loss is expected in rabi. There are already
evidences of negative impacts on yield of wheat and paddy in parts of India due to
increased temperature, increasing water stress and reduction in number of rainy
days. Water requirement of crops is also likely to go up with projected warming and
extreme events are likely to increase. In view of the widespread influence of climate
change, there is a need to reduce the emissions of green house gases which are the
main drivers of climate change.
Climate change, Kyoto protocol and Clean Development Mechanism In response to the concerns of increasing concentrations of GHGs, as early as
1992, more than 150 nations came together to sign the United Nations Framework
Convention on Climate Change (UNFCCC) at The Earth Summit in Rio. A part of the
agreement is that the developed nations would reduce the GHG emissions to 1990
levels by the year 2000. This led to the establishment of a protocol in 1997 at Kyoto,
Japan that would be binding for the developed nations, which is popularly called as
the Kyoto Protocol. The Kyoto Protocol was adopted in December 1997. The
Protocol creates legally binding obligations for 38 industrialized countries, including
11 countries in Central and Eastern Europe, to reduce their emissions of GHGs to an
average of approximately 5.2 percent below their 1990 levels as an average over the
period 2008-2012. The targets cover the six main greenhouse gases: carbon dioxide,
methane, nitrous oxide, hydrofluorocarbons (HFCs), perfluorocarbons (PFCs), and
sulphur hexafluoride. The Protocol also allows these countries the option of
66
deciding which of the six gases will form a part of their national emissions reduction
strategy. After more than four years of debate, governments finally in 2001 agreed
to a comprehensive rulebook—the Marrakech Accords—on how to implement the
Kyoto Protocol.
The Protocol established three mechanisms designed to help industrialized
countries (Annex I Parties) to reduce the costs of meeting their emissions targets by
achieving emission reductions at lower costs in other countries than they could
domestically.
• International Emission Trading permits countries to transfer parts of their
‘allowed emissions’ (“assigned amount units”).
• Joint Implementation (JI) allows countries to claim credit for emission reductions
that arise from investment in other industrialized countries, which result in a
transfer of equivalent “emission reduction units” between the countries.
• The Clean Development Mechanism (CDM) allows emission reduction projects that
assist in creating sustainable development in developing countries to generate
“certified emission reductions” for use by the investor.
The mechanisms give countries and private sector companies the opportunity to
reduce emissions anywhere in the world—wherever the cost is lowest—and they
can then count these reductions towards their own targets. It is envisaged that
through emission reduction projects, these mechanisms could stimulate
international investment and provide the essential resources for cleaner economic
growth in all parts of the world. The CDM, in particular, aims to assist developing
countries in achieving sustainable development by promoting environmentally
friendly investment from industrialized country governments and businesses. The
funding channeled through the CDM should assist developing countries in reaching
some of their economic, social, environmental, and sustainable development
objectives, such as cleaner air and water, improved land use, accompanied by social
benefits such as rural development, employment, and poverty alleviation and
reduced dependence on imported fossil fuels.
Emissions of GHGs from agriculture in India
Agriculture sector is one of the main sources of GHG emissions throughout
the world and in India as well. In India, agriculture contributed about 17% of the
CO2 equivalent emissions for the base year 2007 (INCCA 2010). Details of GHG
emissions from agriculture are given below:
a) CH4: The agriculture sector dominates the total national CH4 emissions, within
which emissions due to enteric fermentation (63%) and rice cultivation (21%) were
the largest. Methane emissions from various categories of animals range from 28 to
43 g CH4 / animal. The methane emission coefficient for continuously flooded rice
fields is about 17 g/ m2. Burning of crop residue is a significant net source of CH4 in
addition to other trace gases.
b) N2O: Agriculture sector accounted for 71 percent of total N2O emission from India
in 2007. Emissions from soils are the largest source of N2O emissions in India
followed by manure management. Emissions of N2O results from anthropogenic
nitrogen input through direct and indirect pathways, including the volatilization
67
losses from synthetic fertilizer and animal manure application, leaching and run-off
from applied nitrogen to aquatic systems.
c) CO2: CO2 emissions from agriculture are due to the consumption of diesel for
various farm operations and due to the use of electricity for pumping of
groundwater. Land use conversion from forests to agriculture due to shifting
cultivation and on-site burning results in CO2 emissions.
Mitigation options in agriculture
Agriculture can help mitigate climate change by reducing GHG emissions and
also by sequestering CO2 from the atmosphere.
• In irrigated rice cultivation, management practices such as water
management, nutrient management, selection of suitable variety, spacing,
stand establishment, crop sequence were found to reduce methane emissions
by 7 to 68%. Mid season drainage also found to reduce the emissions of
methane substantially in lowland paddy. Application of nitrification
inhibitors, matching nitrogen supply with crop demand, tighten N flow
cycles, use advanced fertilization techniques, optimum tillage, irrigation and
drainage, etc. found to reduce the N2O losses up to 80% (Adhya, 2008).
• Conservation agriculture practices such as reduced tillage, retention of crop
residues on the surface, application of optimum quantum of nutrients and
suitable crop rotation contributes to reduction of CO2 emissions and
contributes towards carbon sequestration. Application of organic manures,
fertilizers and integrated nutrient management practices improves the crop
growth and also sequesters substantial quantities of soil carbon. The
potential of carbon sequestration due to adoption of recommended package
of practices on agricultural soils is about 6 to 7 Tg C/y. In addition, the
potential of soil inorganic carbon sequestration estimated at 21.8 to 25.6 Tg
C/y (Lal, 2004).
• Restoration of degraded lands by establishing suitable vegetative cover not
only arrest further erosion from these soils but also increases carbon
sequestration through enhanced biomass recycling. Trees should be
integrated with arable cropping where ever possible and emphasis needs to
be given to horticulture and short rotation forestry to meet the demands of
the economy. Large scale tree planting can be integrated in to the
employment guarantee program by which it can be made as a community led
development initiative. Degraded forest lands which are under joint forest
management (JFM) and community forest management (CFM) can also be
brought under this kind of community initiative and this can be linked to the
CDM of UNFCCC where the community will get the benefit of the afforestation
activity and also the benefits of the tree produce.
• Organic agriculture reduces soil erosion, restores organic carbon content,
reduces nitrogen fertilizer use and energy requirement. Organic agriculture
reduces the usage of nitrogen fertilizers substantially and thus emissions and
contributes to carbon sequestration.
• There is significant scope to reduce the emissions by using energy efficient
pumps for irrigation, reducing the number of tillage operations and adoption
of energy efficient devices in agricultural operations.
68
• Improved management of livestock feed, and research on dietary
supplements, balanced nutrition, feed mixtures needs to be further
investigated.
Agriculture and CDM Large number of CDM projects developed so far relates to energy sector and
industrial processes with high global warming potential. Landfill gas and HFCs
(Hydro Chloro Flouro Carbon) together account for much of the CERs (Certified
Emission Reductions) in the CDM pipeline. In agriculture sector, the number of
projects registered was 87 (6.08 %). However, majority of these projects are related
to manure management in large-scale livestock/ animal production units and not
related to core agriculture activities of small sized holdings. Similarly the number of
projects in Afforestation/Refforestation (A/R) sector is only five out of 1430,
representing less than 1% percent. Projects related to agriculture and afforestation
and reforestation will ensure greater participation of farmers/ communities in the
emission reduction activities resulting in sustainable development benefits.
Properly designed CDM projects in these two sectors can provide useful additional
revenue to rural communities, which will be independent of existing streams of
revenue from the forestry plantations besides contributing to the emission
reduction or carbon sequestration.
Potential CDM projects related to agriculture
The prerequisites for a CDM project is that they should be project based and the
proposed activity should have an approved methodology. Two kinds of activities are
possible in agriculture in the first commitment period. They are energy efficiency
projects and carbon sequestration projects. Activities which reduce the green house
gas emissions through improving energy efficiency can be taken up in CDM. In sink
projects, only afforestation and reforestation related activities are allowed, and the
maximum use of CERs from A&R projects should be less than 1% of the 1990
emissions of the Annex 1 party during the first commitment period of the Kyoto
protocol. Soil carbon sequestration is eligible only as a part of land use change and
afforestation and reforestation activities, during the first commitment period of
Kyoto Protocol. Other sinks related activities like revegetation, forest management,
cropland management and grazing land management are not allowed under the
CDM but only as joint implementation projects in Annex-I countries. Hence clean
development projects exclusively on soil carbon sequestration in arable lands are
not forthcoming during the first commitment period. However few CDM projects are
under implementation in afforestation and reforestation sector which considers soil
carbon pool.
a) Energy efficiency (Emission reductions).
Substantial quantities of energy are being consumed in various agricultural
operations and also at the household level. Activities which can reduce emissions by
introducing energy efficiency measures are eligible in CDM. Some of the possible
activities could be, reducing the number of tillage operations in agriculture,
installing capacitors to agricultural pump sets, using pump sets operated by solar
energy for water lifting, replacing the incandescent lights with the compact
fluorescent lights in the houses, farms, streets, installing energy efficient equipment,
etc. All these interventions have supporting methodologies which can be used for
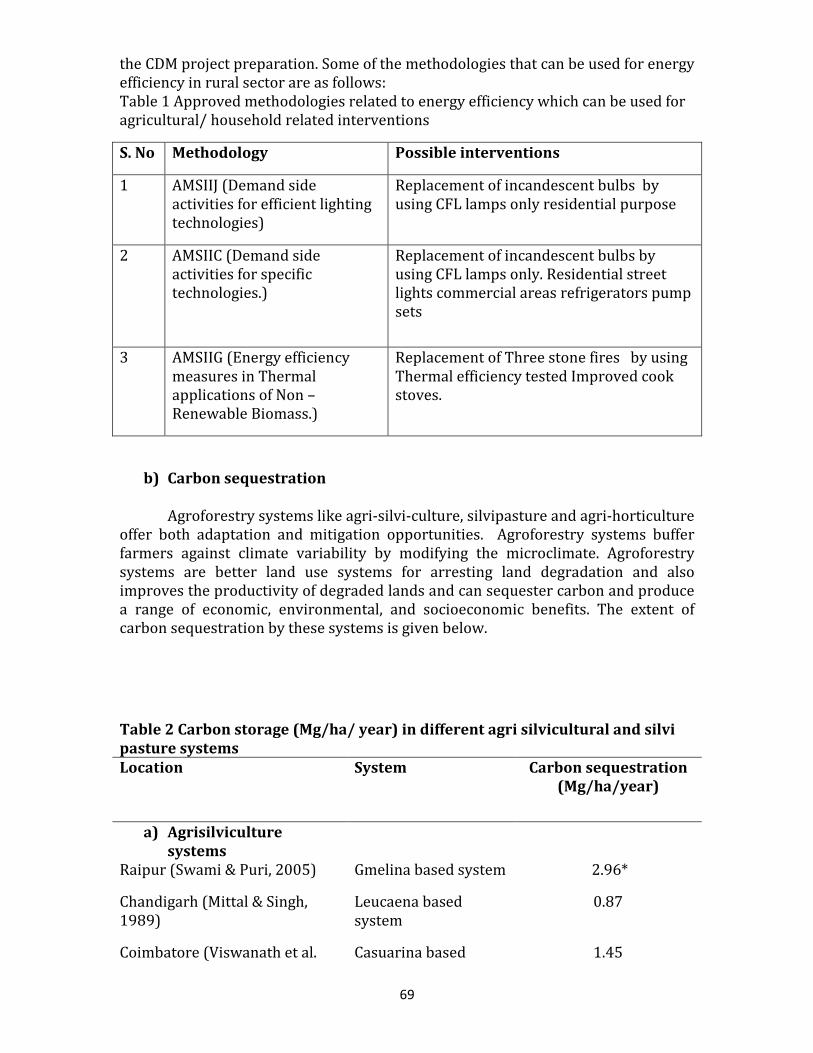
69
the CDM project preparation. Some of the methodologies that can be used for energy
efficiency in rural sector are as follows:
Table 1 Approved methodologies related to energy efficiency which can be used for
agricultural/ household related interventions
S. No Methodology Possible interventions
1 AMSIIJ (Demand side
activities for efficient lighting
technologies)
Replacement of incandescent bulbs by
using CFL lamps only residential purpose
2 AMSIIC (Demand side
activities for specific
technologies.)
Replacement of incandescent bulbs by
using CFL lamps only. Residential street
lights commercial areas refrigerators pump
sets
3 AMSIIG (Energy efficiency
measures in Thermal
applications of Non –
Renewable Biomass.)
Replacement of Three stone fires by using
Thermal efficiency tested Improved cook
stoves.
b) Carbon sequestration
Agroforestry systems like agri-silvi-culture, silvipasture and agri-horticulture
offer both adaptation and mitigation opportunities. Agroforestry systems buffer
farmers against climate variability by modifying the microclimate. Agroforestry
systems are better land use systems for arresting land degradation and also
improves the productivity of degraded lands and can sequester carbon and produce
a range of economic, environmental, and socioeconomic benefits. The extent of
carbon sequestration by these systems is given below.
Table 2 Carbon storage (Mg/ha/ year) in different agri silvicultural and silvi
pasture systems
Location
System
Carbon sequestration (Mg/ha/year)
a) Agrisilviculture
systems
Raipur (Swami & Puri, 2005) Gmelina based system 2.96*
Chandigarh (Mittal & Singh,
1989)
Leucaena based
system
0.87
Coimbatore (Viswanath et al. Casuarina based 1.45
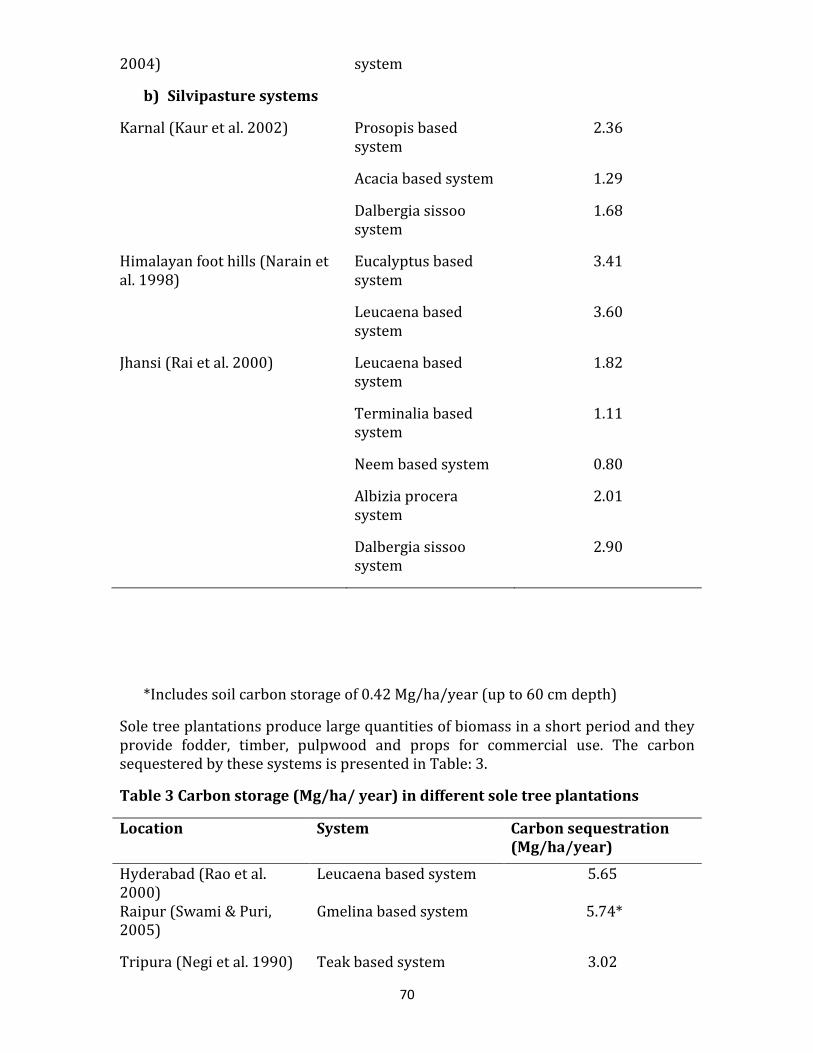
70
2004) system
b) Silvipasture systems
Karnal (Kaur et al. 2002) Prosopis based
system
2.36
Acacia based system 1.29
Dalbergia sissoo
system
1.68
Himalayan foot hills (Narain et
al. 1998)
Eucalyptus based
system
3.41
Leucaena based
system
3.60
Jhansi (Rai et al. 2000) Leucaena based
system
1.82
Terminalia based
system
1.11
Neem based system 0.80
Albizia procera
system
2.01
Dalbergia sissoo
system
2.90
*Includes soil carbon storage of 0.42 Mg/ha/year (up to 60 cm depth)
Sole tree plantations produce large quantities of biomass in a short period and they
provide fodder, timber, pulpwood and props for commercial use. The carbon
sequestered by these systems is presented in Table: 3.
Table 3 Carbon storage (Mg/ha/ year) in different sole tree plantations
Location System
Carbon sequestration (Mg/ha/year)
Hyderabad (Rao et al.
2000)
Leucaena based system 5.65
Raipur (Swami & Puri,
2005)
Gmelina based system 5.74*
Tripura (Negi et al. 1990) Teak based system 3.02
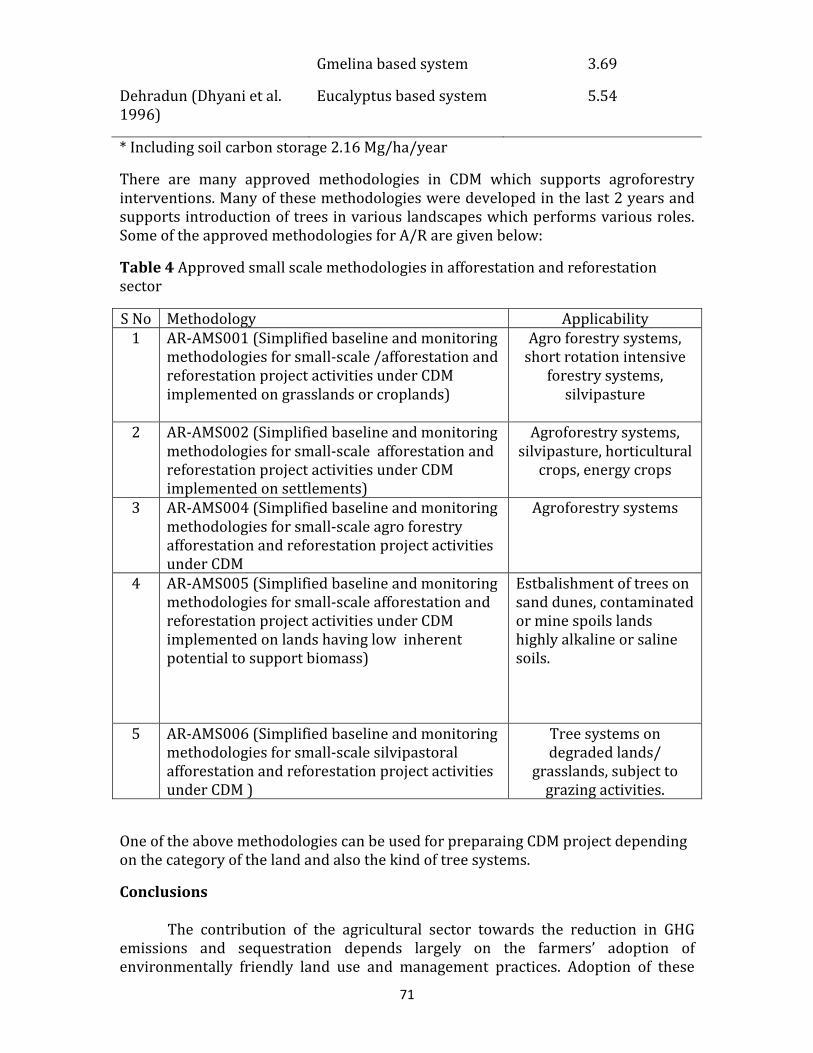
71
Gmelina based system 3.69
Dehradun (Dhyani et al.
1996)
Eucalyptus based system 5.54
* Including soil carbon storage 2.16 Mg/ha/year
There are many approved methodologies in CDM which supports agroforestry
interventions. Many of these methodologies were developed in the last 2 years and
supports introduction of trees in various landscapes which performs various roles.
Some of the approved methodologies for A/R are given below:
Table 4 Approved small scale methodologies in afforestation and reforestation
sector
S No Methodology Applicability
1 AR-AMS001 (Simplified baseline and monitoring
methodologies for small-scale /afforestation and
reforestation project activities under CDM
implemented on grasslands or croplands)
Agro forestry systems,
short rotation intensive
forestry systems,
silvipasture
2 AR-AMS002 (Simplified baseline and monitoring
methodologies for small-scale afforestation and
reforestation project activities under CDM
implemented on settlements)
Agroforestry systems,
silvipasture, horticultural
crops, energy crops
3 AR-AMS004 (Simplified baseline and monitoring
methodologies for small-scale agro forestry
afforestation and reforestation project activities
under CDM
Agroforestry systems
4 AR-AMS005 (Simplified baseline and monitoring
methodologies for small-scale afforestation and
reforestation project activities under CDM
implemented on lands having low inherent
potential to support biomass)
Estbalishment of trees on
sand dunes, contaminated
or mine spoils lands
highly alkaline or saline
soils.
5 AR-AMS006 (Simplified baseline and monitoring
methodologies for small-scale silvipastoral
afforestation and reforestation project activities
under CDM )
Tree systems on
degraded lands/
grasslands, subject to
grazing activities.
One of the above methodologies can be used for preparaing CDM project depending
on the category of the land and also the kind of tree systems.
Conclusions
The contribution of the agricultural sector towards the reduction in GHG
emissions and sequestration depends largely on the farmers’ adoption of
environmentally friendly land use and management practices. Adoption of these
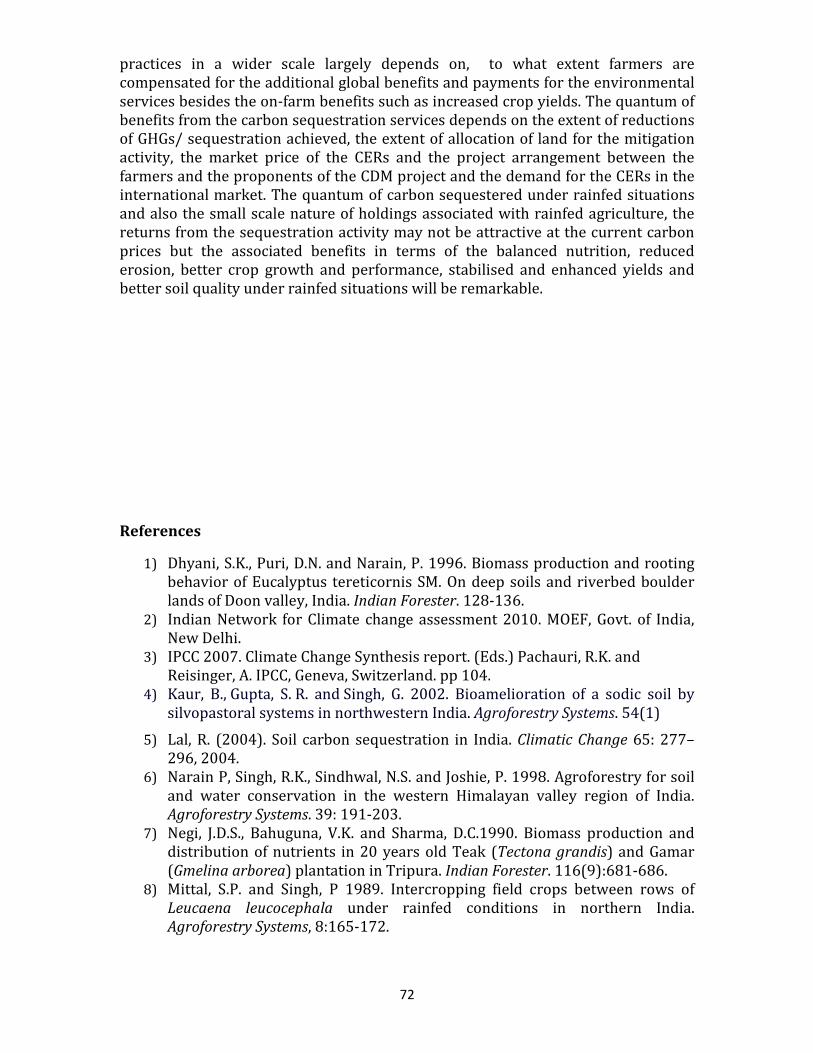
72
practices in a wider scale largely depends on, to what extent farmers are
compensated for the additional global benefits and payments for the environmental
services besides the on-farm benefits such as increased crop yields. The quantum of
benefits from the carbon sequestration services depends on the extent of reductions
of GHGs/ sequestration achieved, the extent of allocation of land for the mitigation
activity, the market price of the CERs and the project arrangement between the
farmers and the proponents of the CDM project and the demand for the CERs in the
international market. The quantum of carbon sequestered under rainfed situations
and also the small scale nature of holdings associated with rainfed agriculture, the
returns from the sequestration activity may not be attractive at the current carbon
prices but the associated benefits in terms of the balanced nutrition, reduced
erosion, better crop growth and performance, stabilised and enhanced yields and
better soil quality under rainfed situations will be remarkable.
References
1) Dhyani, S.K., Puri, D.N. and Narain, P. 1996. Biomass production and rooting
behavior of Eucalyptus tereticornis SM. On deep soils and riverbed boulder
lands of Doon valley, India. Indian Forester. 128-136.
2) Indian Network for Climate change assessment 2010. MOEF, Govt. of India,
New Delhi.
3) IPCC 2007. Climate Change Synthesis report. (Eds.) Pachauri, R.K. and
Reisinger, A. IPCC, Geneva, Switzerland. pp 104.
4) Kaur, B., Gupta, S. R. and Singh, G. 2002. Bioamelioration of a sodic soil by
silvopastoral systems in northwestern India. Agroforestry Systems. 54(1)
5) Lal, R. (2004). Soil carbon sequestration in India. Climatic Change 65: 277–
296, 2004.
6) Narain P, Singh, R.K., Sindhwal, N.S. and Joshie, P. 1998. Agroforestry for soil
and water conservation in the western Himalayan valley region of India.
Agroforestry Systems. 39: 191-203.
7) Negi, J.D.S., Bahuguna, V.K. and Sharma, D.C.1990. Biomass production and
distribution of nutrients in 20 years old Teak (Tectona grandis) and Gamar
(Gmelina arborea) plantation in Tripura. Indian Forester. 116(9):681-686.
8) Mittal, S.P. and Singh, P 1989. Intercropping field crops between rows of
Leucaena leucocephala under rainfed conditions in northern India.
Agroforestry Systems, 8:165-172.
73
9) Rai, P., Rao, G.R. and Solanki, K.R. 2000. Effect of multipurpose tree species on
composition, dominance, yield and crude protein content in forage in natural
grassland. Indian Journal of Forestry 23(4): 380-385.
10) Rao, L.G.G, Joseph, B. and Sreemannarayana, B. 2000. Growth and biomass
production of some important multipurpose tree species on rainfed sandy
loam soils. Indian Forester 126(7): 772-781.
11) Swamy, S. L. and Puri S. (2005). Biomass production and C-sequestration of
Gmelina arborea in plantation and agroforestry system in India. Agroforestry
systems 64(3):181-195.
12) Viswanath, S., Peddappaiah, R.S., Subramoniam, V., Manivachakam, P. and
George, M. (2004). Management of Casuarina equisetifolia in wide-row
intercropping systems for enhanced productivity. Indian Journal of
Agroforestry 6(2): 19-25.
74
MANAGING SUSTAINABLE HORTICULTURAL PRODUCTION IN A
CHANGING CLIMATE SCENARIO Dr. N.N. Reddy, Principal Scientist (hort.) Central Research Institute for Dryland
Agriculture Hyderabad
Abstract:
Climate change cause Abiotic stress in the living system which otherwise referred to
as the negative impact of non-living factors on the living organisms in a specific
environment. The non-living variable must influence the environment beyond its
normal range of variation to adversely affect the population performance or
individual physiology of the organism. Abiotic stress factors, or stressors, are
naturally occurring factors such as low or high rainfall, extremes in temperature,
intense sunlight or wind that may cause harm to the plants and animals in the area
affected. Abiotic stress is essentially unavoidable. Abiotic stress affects organisms
dependent on environmental factors. Abiotic stress is the most harmful factor
concerning the growth and productivity of horticultural crops. Drought or flood is
unpredictable condition or event for unspecified period or duration. Drought is a
frequent occurrence in Semi Arid Tropical (SAT) regions of India. Suitable fruit and
vegetable species and varieties for SAT regions, benefits of farm pond water
harvesting system, nutrient management, intercropping of annuals with in the
perennial fruit tree rows, suitable grass and legume species for horti-pastural
systems and root stocks are discussed. Integrated horticultural management
practices to combat climate change related events and more so drought and possible
remedial measures are discussed in the present paper.
From areas which have experienced drought, it is evident that drought is not a
constant or totally predictable condition in occurrence or duration. Rather, there are
levels of drought and levels of drought impact.
Long-term indicators of available water include climate and weather conditions, soil
moisture, water tables, water quality, stream flow, mountain snow pack, and
watershed runoff. Indicators of such changes in the hydrologic cycle are termed first
order impacts. Second order impacts would affect food production, transportation,
and industries that are particularly dependent on water resources, and sensitive to
supply disruption. A third order impact would be one that requires significant
reductions in high water-use activities, requires serious adjustment in lifestyle, and
impinges on the social welfare, behavior, economy, and health of the community. A
supply insufficiency may have an immediate second or third order impact, but
generally for a shorter period of time.
For semi-arid climatic environment having negative moisture index, poor soil
quality and traditional agricultural practices, the food security, nutritional security,
sustainability and profitability of a horticultural production system especially to
those below poverty line, is still a distant dream. The total precipitation received in
these areas seems to be adequate for crop production; however, its erratic
distribution often causes drought conditions and seriously affects the agri-
horticultural production. Therefore, effective utilization of every drop of water
75
through adoption of appropriate technology is imperative for improving
productivity to augment agri-horticultural production and to achieve sustainable
improvements in the living standards of resource poor small & marginal farmers.
Efficient utilization of every drop of water in crop production also assumes
significance because utilizable water resource for agriculture sector is becoming
increasingly scarce owing to unpredictable monsoons, depleting groundwater
reserves, rising alternative demands viz., domestic & industrial uses. It is a matter of
concern that it is happening at a time when there is an increased demand for various
agricultural commodities due to phenomenal growth in the population. The need of
the hour is, therefore, to maximize the agricultural production per unit of water
used.
Suitable Fruit Varieties for Semi Arid Tropical Regions
CROPS CULTIVARS
FRUITS:
Ber Gola, Umran, Banarasi Karaka, Kaitli.
Pomegranate Ganesh, Jyothi, P-26, Jalore seedless. Mango Banganapalli, Alampur Baneshan, Nelum, Mallika, Bombay
Green, Amrapali, Kesar.
Sapota Cricket Ball, Kalipatti.
Sweet orange Mosambi, Kodur Sathgudi, Valencia, Blood Red ,Malta.
Lime Tenali, Promalini, Vikram.
Custard apple Bala Nagar, Arka Sahan.
Guava Allahabad Safeda, Sardar, Arka Mridula.
Papaya Coorg Honey Dew, Pusa Delicious, Pusa Majsty, Pusa
Dwarf,Taiwan 786
Aonla Kanchan, Krishna, Narendra –7.
Fig Poona, Black Ischia.
Tamarind PKM-1, Pratisthan, Yogeshwari.
Bael Narendra Bael-5, Narendra Bael-9.
Passion fruit Kaveri.
Source : Reddy & Singh, 2002.
Suitable Vegetables Varieties for Semi Arid Tropical Regions
Onion Arka Niketan, Arka Kalyan, Pusa Red, Nasik Red, Pusa Ratnar, Pusa
White Round, Pusa White Flat, Patna Red, Arka Pitambar (for
export). Tomato Pusa Ruby, Pusa Early Dwarf, Swarna Mani,Vaishali,Naveen,
Rupali, Rashmi
Brinjal Arka Navneet, Pusa Purple Long, Pusa Purple Round, Pusa Kranthi,
Arka Sheel, Arka Kusumakar, Arka Shirish, Swarna Shree, Swarna
Manjari.
Chillies G-5, G-3, Pusa Jwala, NP-46A, Arka Gaurav, Arka Lohit, Bharat,
Sindhur.
76
Drumstick PKM-1
Cowpea Pusa Barsati, Pusa Rituraj, Pusa Dofasali
Cluster bean Pusa Navbahar, Pusa Sadabahar
Amarnath Chhoti Chaulai, Badi Chauli.
Okra Arka Anamika, Arka Abhay, Parbhani Kranti, Pusa Makhmali.
Water melon Arka Manik, Arka Jyothi, Sugar Baby.
Musk melon Pusa Sharbati, Hara Madhu, Punjab Sunheri, Pusa Maduras.
Bitter gourd Arka Harit, Priya, Kalyanpur Sona.
Ridge gourd Swarna Manjari, Pusa Nasdar.
Round melon Arka Tinda.
Cabbage Pusa Mukta, Pride of India, Golden Acre, Pusa Synthetic, Pusa
Drumhead, Shree Ganesh Gol.
Cauliflower Pusa Deepali, Improved Japanese, Pusa Snowball.
Pumpkin Arka Chandan, Arka Suryamukhi
Radish Arka Nishant
Source: Reddy & Singh, 2002. Microcatchment or farm pond water harvesting system: Heavy rains resulting in the heavy down pours is a common event resulting in runoff
even in dry land regions. About 15-30% runoff water could be capitalized for water
harvesting and runoff recycling (Reddy et al.,2002). Efficient utilization of harvested
water requires an elaborate consideration in selection of site, runoff inducement,
storage, seepage, evaporation losses, water lifting and conveyance devices and their
efficiencies. A farm pond of 150m3 capacity with side slopes of 1.5:1 is considered
sufficient for each hectare of catchments area in the black soils with a provision of
emptying it to accommodate subsequent events of runoff.
Microsite Improvement:
It is preferable to plant the fruit trees with the onset of monsoon in well prepared
and well filled pits at suitable distances. Most of the above fruit species respond well
in closed spacing except tamarind, aonla, jamun and mango which prefer wider
spacing. The pits should be of one cubic metre dimension, filled with equal
quantities of tank silt, well decomposed compost or Farm yard Manure and the good
soil from the site, two kg single super phosphate, two kg neem cake or castor cake
and 50 g of BHC dust. Before filling the pit, dried leaves may be burnt in the pit to
kill any inoculum inside. Application of 10 kg bentonite at the bottom of pit enhance
availability of moisture to the root system.
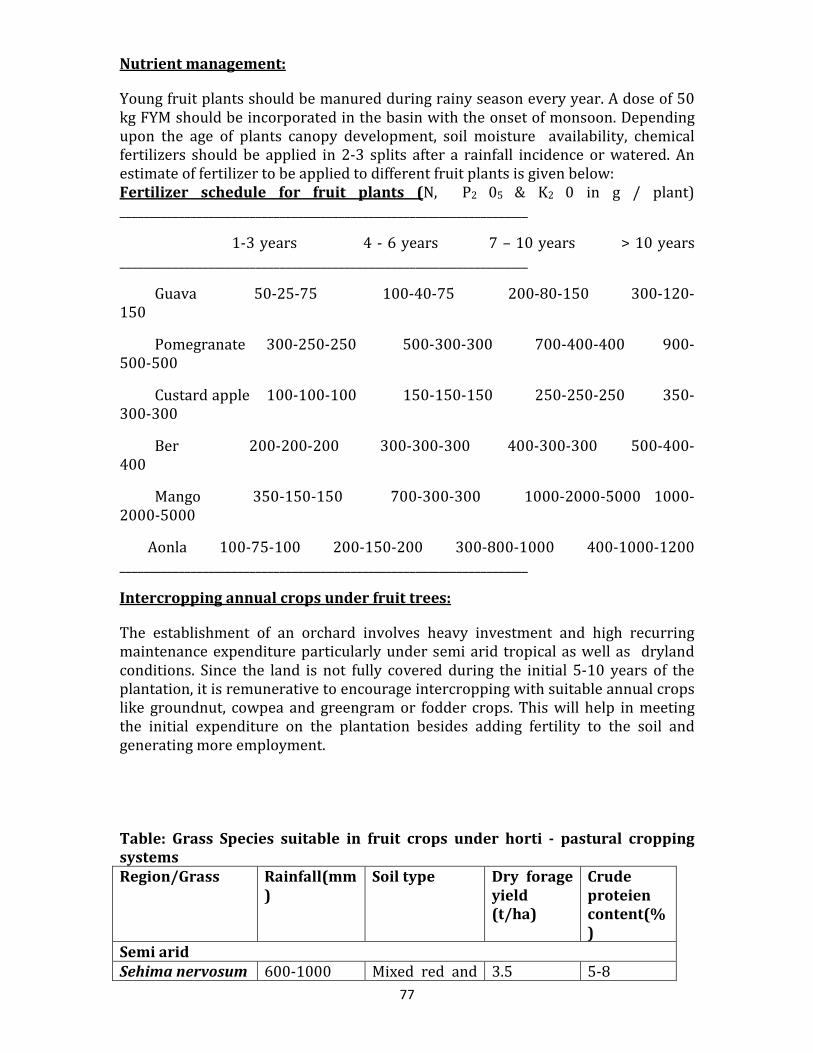
77
Nutrient management:
Young fruit plants should be manured during rainy season every year. A dose of 50
kg FYM should be incorporated in the basin with the onset of monsoon. Depending
upon the age of plants canopy development, soil moisture availability, chemical
fertilizers should be applied in 2-3 splits after a rainfall incidence or watered. An
estimate of fertilizer to be applied to different fruit plants is given below:
Fertilizer schedule for fruit plants (N, P2 05 & K2 0 in g / plant)
_____________________________________________________________________
1-3 years 4 - 6 years 7 – 10 years > 10 years
_____________________________________________________________________
Guava 50-25-75 100-40-75 200-80-150 300-120-
150
Pomegranate 300-250-250 500-300-300 700-400-400 900-
500-500
Custard apple 100-100-100 150-150-150 250-250-250 350-
300-300
Ber 200-200-200 300-300-300 400-300-300 500-400-
400
Mango 350-150-150 700-300-300 1000-2000-5000 1000-
2000-5000
Aonla 100-75-100 200-150-200 300-800-1000 400-1000-1200
_____________________________________________________________________
Intercropping annual crops under fruit trees:
The establishment of an orchard involves heavy investment and high recurring
maintenance expenditure particularly under semi arid tropical as well as dryland
conditions. Since the land is not fully covered during the initial 5-10 years of the
plantation, it is remunerative to encourage intercropping with suitable annual crops
like groundnut, cowpea and greengram or fodder crops. This will help in meeting
the initial expenditure on the plantation besides adding fertility to the soil and
generating more employment.
Table: Grass Species suitable in fruit crops under horti - pastural cropping systems
Region/Grass Rainfall(mm
)
Soil type Dry forage
yield (t/ha)
Crude
proteien content(%)
Semi arid
Sehima nervosum 600-1000 Mixed red and 3.5 5-8
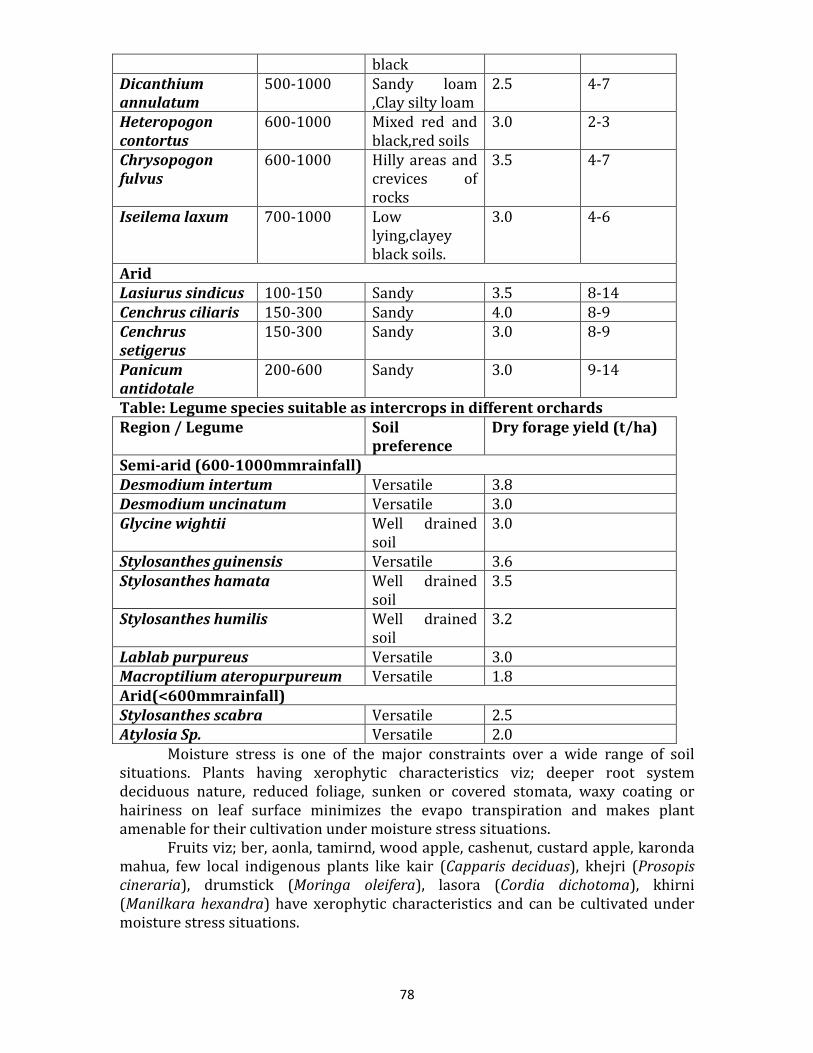
78
black
Dicanthium
annulatum
500-1000 Sandy loam
,Clay silty loam
2.5 4-7
Heteropogon
contortus
600-1000 Mixed red and
black,red soils
3.0 2-3
Chrysopogon
fulvus
600-1000 Hilly areas and
crevices of
rocks
3.5 4-7
Iseilema laxum 700-1000 Low
lying,clayey
black soils.
3.0 4-6
Arid
Lasiurus sindicus 100-150 Sandy 3.5 8-14
Cenchrus ciliaris 150-300 Sandy 4.0 8-9
Cenchrus
setigerus
150-300 Sandy 3.0 8-9
Panicum
antidotale
200-600 Sandy 3.0 9-14
Table: Legume species suitable as intercrops in different orchards
Region / Legume Soil preference
Dry forage yield (t/ha)
Semi-arid (600-1000mmrainfall)
Desmodium intertum Versatile 3.8
Desmodium uncinatum Versatile 3.0
Glycine wightii Well drained
soil
3.0
Stylosanthes guinensis Versatile 3.6
Stylosanthes hamata Well drained
soil
3.5
Stylosanthes humilis Well drained
soil
3.2
Lablab purpureus Versatile 3.0
Macroptilium ateropurpureum Versatile 1.8
Arid(<600mmrainfall)
Stylosanthes scabra Versatile 2.5
Atylosia Sp. Versatile 2.0
Moisture stress is one of the major constraints over a wide range of soil
situations. Plants having xerophytic characteristics viz; deeper root system
deciduous nature, reduced foliage, sunken or covered stomata, waxy coating or
hairiness on leaf surface minimizes the evapo transpiration and makes plant
amenable for their cultivation under moisture stress situations.
Fruits viz; ber, aonla, tamirnd, wood apple, cashenut, custard apple, karonda
mahua, few local indigenous plants like kair (Capparis deciduas), khejri (Prosopis
cineraria), drumstick (Moringa oleifera), lasora (Cordia dichotoma), khirni
(Manilkara hexandra) have xerophytic characteristics and can be cultivated under
moisture stress situations.
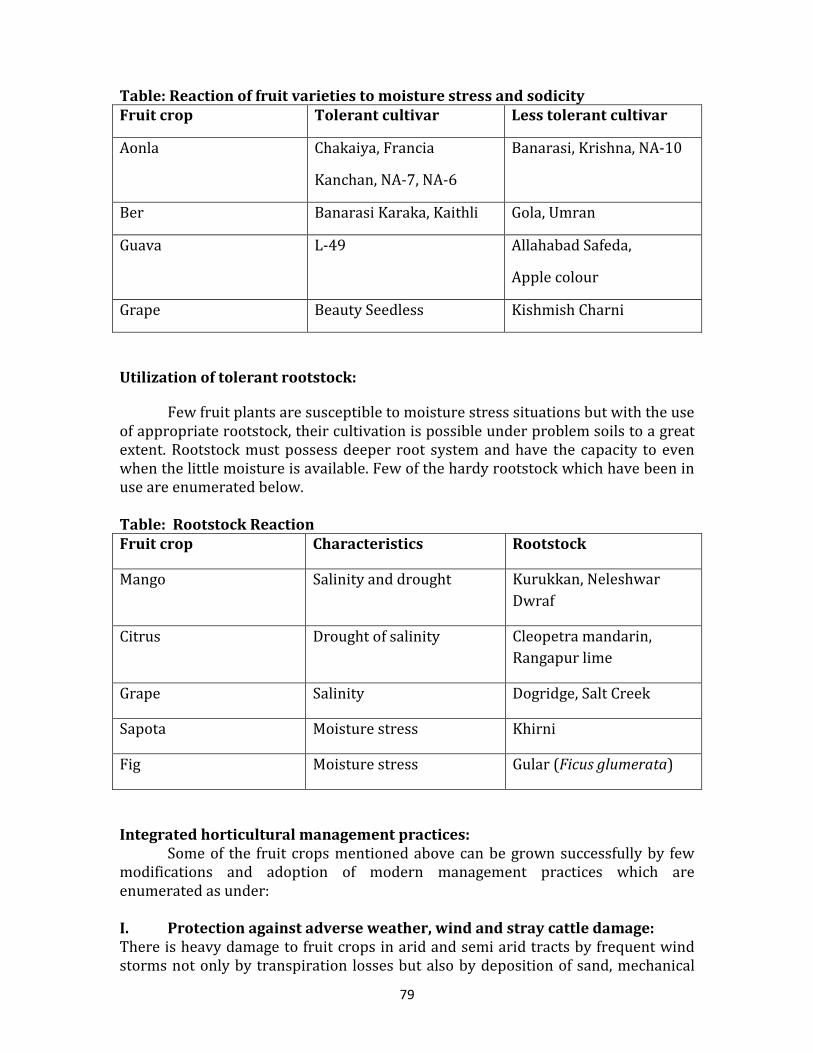
79
Table: Reaction of fruit varieties to moisture stress and sodicity
Fruit crop Tolerant cultivar Less tolerant cultivar
Aonla Chakaiya, Francia
Kanchan, NA-7, NA-6
Banarasi, Krishna, NA-10
Ber Banarasi Karaka, Kaithli Gola, Umran
Guava L-49 Allahabad Safeda,
Apple colour
Grape Beauty Seedless Kishmish Charni
Utilization of tolerant rootstock:
Few fruit plants are susceptible to moisture stress situations but with the use
of appropriate rootstock, their cultivation is possible under problem soils to a great
extent. Rootstock must possess deeper root system and have the capacity to even
when the little moisture is available. Few of the hardy rootstock which have been in
use are enumerated below.
Table: Rootstock Reaction
Fruit crop Characteristics Rootstock
Mango Salinity and drought Kurukkan, Neleshwar
Dwraf
Citrus Drought of salinity Cleopetra mandarin,
Rangapur lime
Grape Salinity Dogridge, Salt Creek
Sapota Moisture stress Khirni
Fig Moisture stress Gular (Ficus glumerata)
Integrated horticultural management practices: Some of the fruit crops mentioned above can be grown successfully by few
modifications and adoption of modern management practices which are
enumerated as under:
I. Protection against adverse weather, wind and stray cattle damage: There is heavy damage to fruit crops in arid and semi arid tracts by frequent wind
storms not only by transpiration losses but also by deposition of sand, mechanical
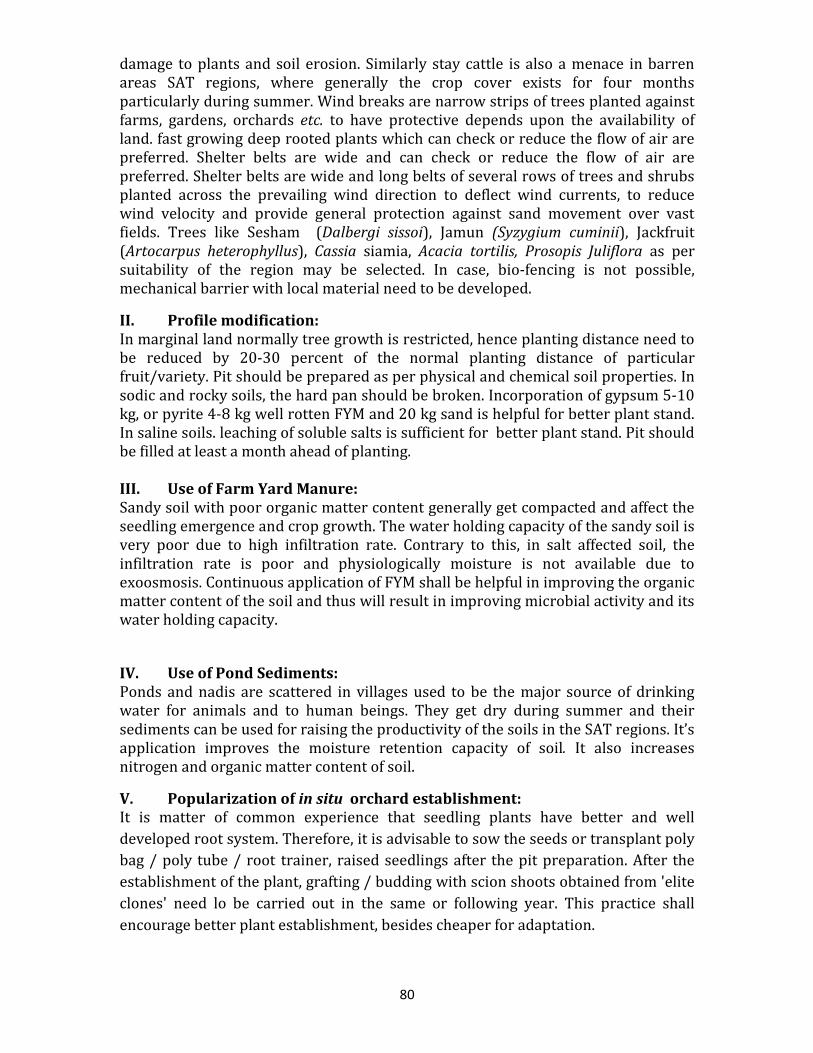
80
damage to plants and soil erosion. Similarly stay cattle is also a menace in barren
areas SAT regions, where generally the crop cover exists for four months
particularly during summer. Wind breaks are narrow strips of trees planted against
farms, gardens, orchards etc. to have protective depends upon the availability of
land. fast growing deep rooted plants which can check or reduce the flow of air are
preferred. Shelter belts are wide and can check or reduce the flow of air are
preferred. Shelter belts are wide and long belts of several rows of trees and shrubs
planted across the prevailing wind direction to deflect wind currents, to reduce
wind velocity and provide general protection against sand movement over vast
fields. Trees like Sesham (Dalbergi sissoi), Jamun (Syzygium cuminii), Jackfruit
(Artocarpus heterophyllus), Cassia siamia, Acacia tortilis, Prosopis Juliflora as per
suitability of the region may be selected. In case, bio-fencing is not possible,
mechanical barrier with local material need to be developed.
II. Profile modification: In marginal land normally tree growth is restricted, hence planting distance need to
be reduced by 20-30 percent of the normal planting distance of particular
fruit/variety. Pit should be prepared as per physical and chemical soil properties. In
sodic and rocky soils, the hard pan should be broken. Incorporation of gypsum 5-10
kg, or pyrite 4-8 kg well rotten FYM and 20 kg sand is helpful for better plant stand.
In saline soils. leaching of soluble salts is sufficient for better plant stand. Pit should
be filled at least a month ahead of planting.
III. Use of Farm Yard Manure: Sandy soil with poor organic matter content generally get compacted and affect the
seedling emergence and crop growth. The water holding capacity of the sandy soil is
very poor due to high infiltration rate. Contrary to this, in salt affected soil, the
infiltration rate is poor and physiologically moisture is not available due to
exoosmosis. Continuous application of FYM shall be helpful in improving the organic
matter content of the soil and thus will result in improving microbial activity and its
water holding capacity.
IV. Use of Pond Sediments: Ponds and nadis are scattered in villages used to be the major source of drinking
water for animals and to human beings. They get dry during summer and their
sediments can be used for raising the productivity of the soils in the SAT regions. It’s
application improves the moisture retention capacity of soil. It also increases
nitrogen and organic matter content of soil.
V. Popularization of in situ orchard establishment: It is matter of common experience that seedling plants have better and well
developed root system. Therefore, it is advisable to sow the seeds or transplant poly
bag / poly tube / root trainer, raised seedlings after the pit preparation. After the
establishment of the plant, grafting / budding with scion shoots obtained from 'elite
clones' need lo be carried out in the same or following year. This practice shall
encourage better plant establishment, besides cheaper for adaptation.
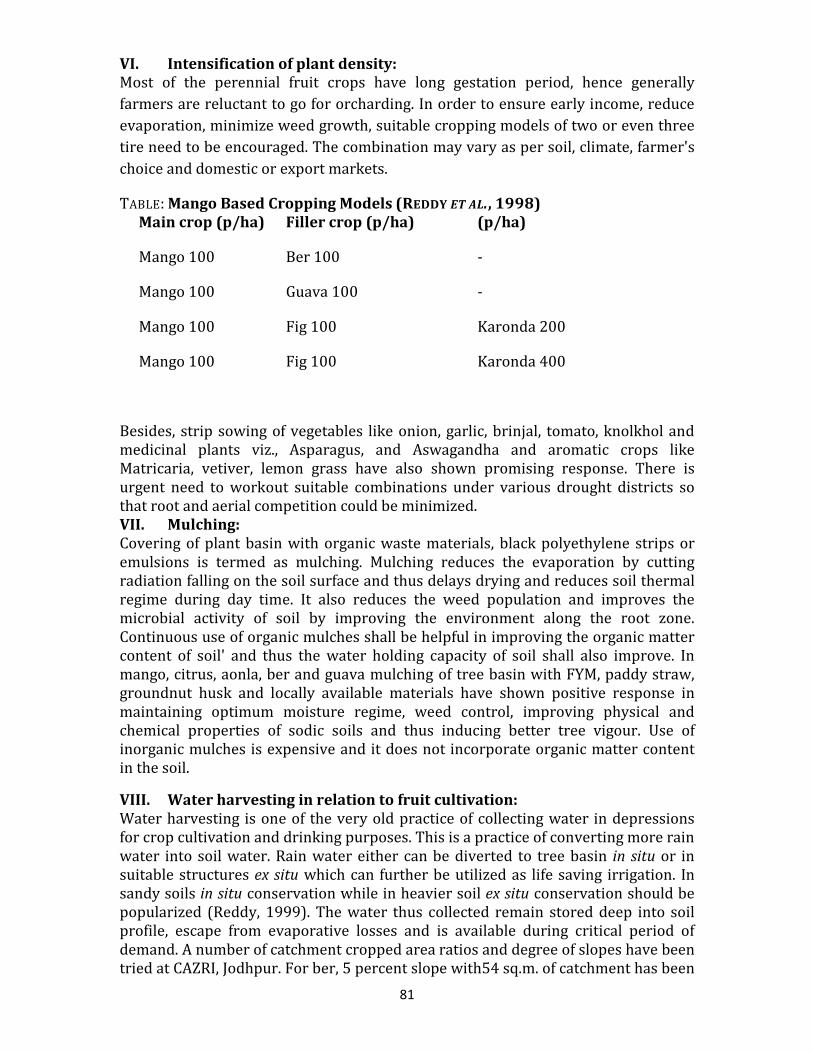
81
VI. Intensification of plant density: Most of the perennial fruit crops have long gestation period, hence generally
farmers are reluctant to go for orcharding. In order to ensure early income, reduce
evaporation, minimize weed growth, suitable cropping models of two or even three
tire need to be encouraged. The combination may vary as per soil, climate, farmer's
choice and domestic or export markets.
TABLE: Mango Based Cropping Models (REDDY ET AL., 1998) Main crop (p/ha) Filler crop (p/ha) (p/ha)
Mango 100 Ber 100 -
Mango 100 Guava 100 -
Mango 100 Fig 100 Karonda 200
Mango 100 Fig 100 Karonda 400
Besides, strip sowing of vegetables like onion, garlic, brinjal, tomato, knolkhol and
medicinal plants viz., Asparagus, and Aswagandha and aromatic crops like
Matricaria, vetiver, lemon grass have also shown promising response. There is
urgent need to workout suitable combinations under various drought districts so
that root and aerial competition could be minimized.
VII. Mulching: Covering of plant basin with organic waste materials, black polyethylene strips or
emulsions is termed as mulching. Mulching reduces the evaporation by cutting
radiation falling on the soil surface and thus delays drying and reduces soil thermal
regime during day time. It also reduces the weed population and improves the
microbial activity of soil by improving the environment along the root zone.
Continuous use of organic mulches shall be helpful in improving the organic matter
content of soil' and thus the water holding capacity of soil shall also improve. In
mango, citrus, aonla, ber and guava mulching of tree basin with FYM, paddy straw,
groundnut husk and locally available materials have shown positive response in
maintaining optimum moisture regime, weed control, improving physical and
chemical properties of sodic soils and thus inducing better tree vigour. Use of
inorganic mulches is expensive and it does not incorporate organic matter content
in the soil.
VIII. Water harvesting in relation to fruit cultivation: Water harvesting is one of the very old practice of collecting water in depressions
for crop cultivation and drinking purposes. This is a practice of converting more rain
water into soil water. Rain water either can be diverted to tree basin in situ or in
suitable structures ex situ which can further be utilized as life saving irrigation. In
sandy soils in situ conservation while in heavier soil ex situ conservation should be
popularized (Reddy, 1999). The water thus collected remain stored deep into soil
profile, escape from evaporative losses and is available during critical period of
demand. A number of catchment cropped area ratios and degree of slopes have been
tried at CAZRI, Jodhpur. For ber, 5 percent slope with54 sq.m. of catchment has been
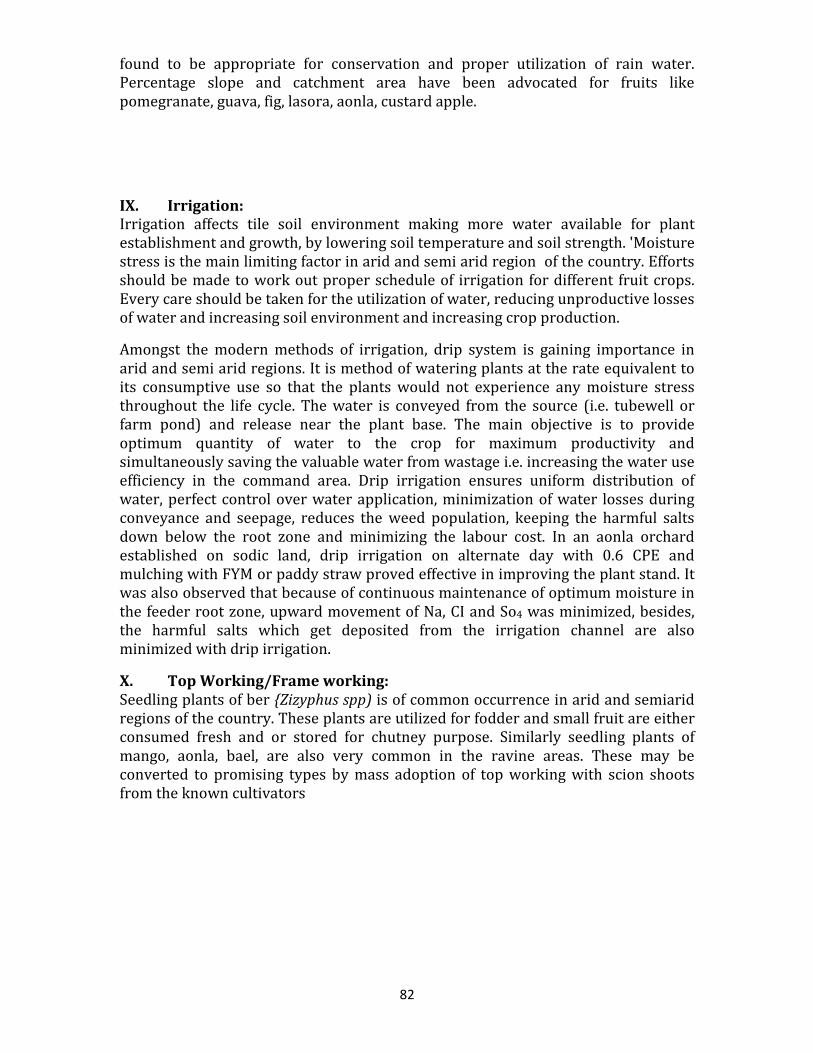
82
found to be appropriate for conservation and proper utilization of rain water.
Percentage slope and catchment area have been advocated for fruits like
pomegranate, guava, fig, lasora, aonla, custard apple.
IX. Irrigation: Irrigation affects tile soil environment making more water available for plant
establishment and growth, by lowering soil temperature and soil strength. 'Moisture
stress is the main limiting factor in arid and semi arid region of the country. Efforts
should be made to work out proper schedule of irrigation for different fruit crops.
Every care should be taken for the utilization of water, reducing unproductive losses
of water and increasing soil environment and increasing crop production.
Amongst the modern methods of irrigation, drip system is gaining importance in
arid and semi arid regions. It is method of watering plants at the rate equivalent to
its consumptive use so that the plants would not experience any moisture stress
throughout the life cycle. The water is conveyed from the source (i.e. tubewell or
farm pond) and release near the plant base. The main objective is to provide
optimum quantity of water to the crop for maximum productivity and
simultaneously saving the valuable water from wastage i.e. increasing the water use
efficiency in the command area. Drip irrigation ensures uniform distribution of
water, perfect control over water application, minimization of water losses during
conveyance and seepage, reduces the weed population, keeping the harmful salts
down below the root zone and minimizing the labour cost. In an aonla orchard
established on sodic land, drip irrigation on alternate day with 0.6 CPE and
mulching with FYM or paddy straw proved effective in improving the plant stand. It
was also observed that because of continuous maintenance of optimum moisture in
the feeder root zone, upward movement of Na, CI and So4 was minimized, besides,
the harmful salts which get deposited from the irrigation channel are also
minimized with drip irrigation.
X. Top Working/Frame working: Seedling plants of ber {Zizyphus spp) is of common occurrence in arid and semiarid
regions of the country. These plants are utilized for fodder and small fruit are either
consumed fresh and or stored for chutney purpose. Similarly seedling plants of
mango, aonla, bael, are also very common in the ravine areas. These may be
converted to promising types by mass adoption of top working with scion shoots
from the known cultivators
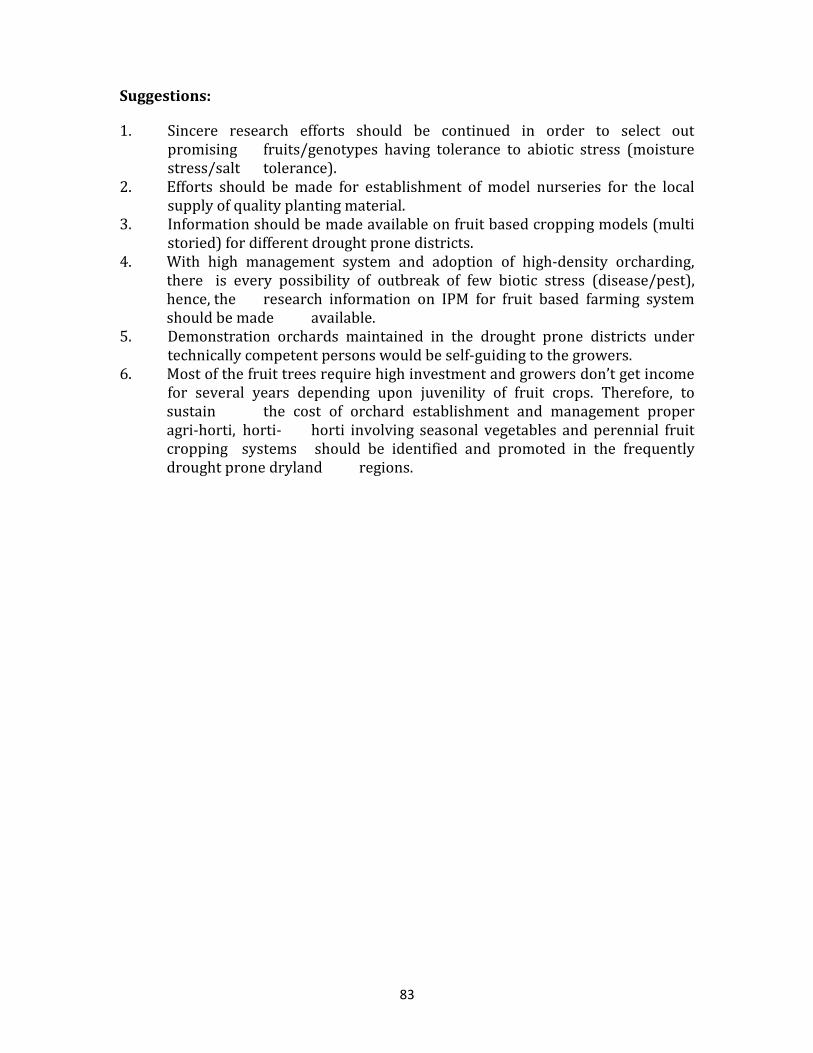
83
Suggestions:
1. Sincere research efforts should be continued in order to select out
promising fruits/genotypes having tolerance to abiotic stress (moisture
stress/salt tolerance).
2. Efforts should be made for establishment of model nurseries for the local
supply of quality planting material.
3. Information should be made available on fruit based cropping models (multi
storied) for different drought prone districts.
4. With high management system and adoption of high-density orcharding,
there is every possibility of outbreak of few biotic stress (disease/pest),
hence, the research information on IPM for fruit based farming system
should be made available.
5. Demonstration orchards maintained in the drought prone districts under
technically competent persons would be self-guiding to the growers.
6. Most of the fruit trees require high investment and growers don’t get income
for several years depending upon juvenility of fruit crops. Therefore, to
sustain the cost of orchard establishment and management proper
agri-horti, horti- horti involving seasonal vegetables and perennial fruit
cropping systems should be identified and promoted in the frequently
drought prone dryland regions.
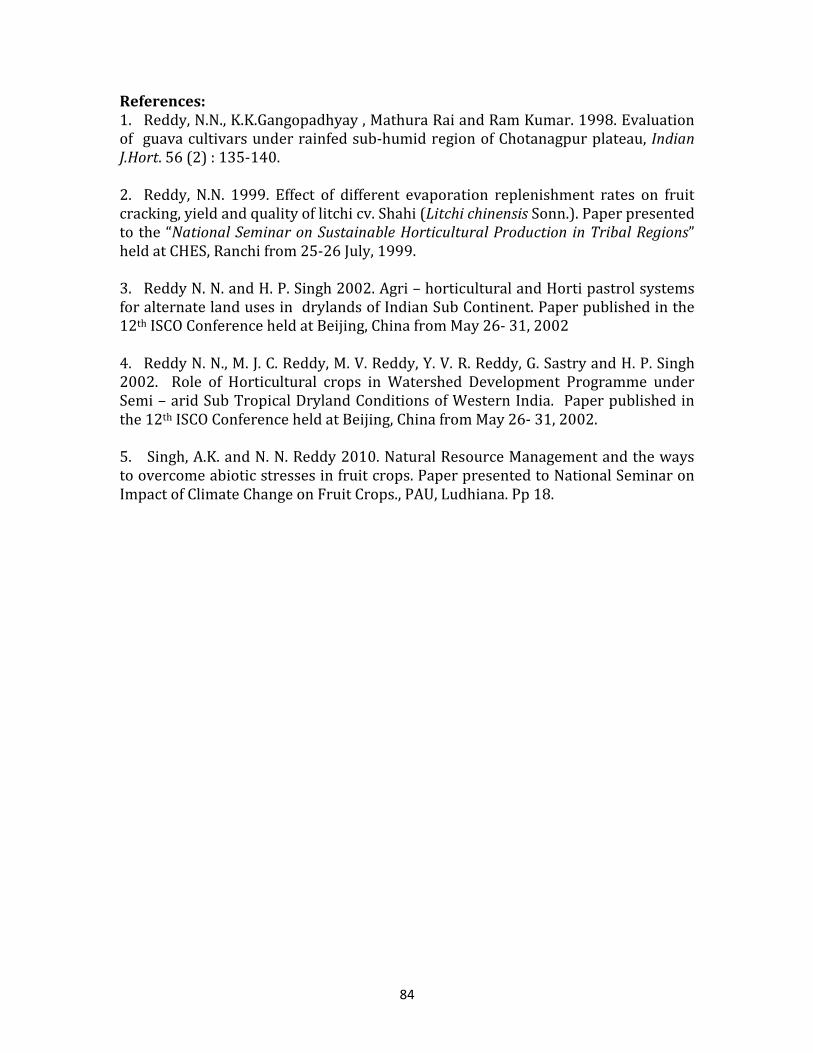
84
References: 1. Reddy, N.N., K.K.Gangopadhyay , Mathura Rai and Ram Kumar. 1998. Evaluation
of guava cultivars under rainfed sub-humid region of Chotanagpur plateau, Indian
J.Hort. 56 (2) : 135-140.
2. Reddy, N.N. 1999. Effect of different evaporation replenishment rates on fruit
cracking, yield and quality of litchi cv. Shahi (Litchi chinensis Sonn.). Paper presented
to the “National Seminar on Sustainable Horticultural Production in Tribal Regions”
held at CHES, Ranchi from 25-26 July, 1999.
3. Reddy N. N. and H. P. Singh 2002. Agri – horticultural and Horti pastrol systems
for alternate land uses in drylands of Indian Sub Continent. Paper published in the
12th ISCO Conference held at Beijing, China from May 26- 31, 2002
4. Reddy N. N., M. J. C. Reddy, M. V. Reddy, Y. V. R. Reddy, G. Sastry and H. P. Singh
2002. Role of Horticultural crops in Watershed Development Programme under
Semi – arid Sub Tropical Dryland Conditions of Western India. Paper published in
the 12th ISCO Conference held at Beijing, China from May 26- 31, 2002.
5. Singh, A.K. and N. N. Reddy 2010. Natural Resource Management and the ways
to overcome abiotic stresses in fruit crops. Paper presented to National Seminar on
Impact of Climate Change on Fruit Crops., PAU, Ludhiana. Pp 18.
85
CONSERVATION AGRICULTURE FOR PRODUCTIVITY
ENHANCEMENT AND MITIGATING GHG EMISSIONS
G.Pratibha, Senior Scientist
Central Research Institute for Dryland Agriculture-59.
India is endowed with a rich and vast diversity of natural resources, particularly
soil, water, weather, multipurpose trees and bio-diversity. To realize the potential of
production system on a sustained basis, efficient management of the natural
resources is very crucial. With the advent of high-yielding crop varieties and
intensive cultivation, the food grain production has increased from 51 million tones
(mt ) in 1950-51 to a record figure of 210 mt during 2007-2008. This impressive
achievement has pulled the country in to self-sufficiency for food demand. With
adoption of intensive agriculture to meet the varied growing demands for food, fuel,
fiver, feed, fertilizer and products in the recent year, the natural resources are
however, put under intense strain resulting in fast degradation and lowering of their
production efficiency.
Land degradation is a major threat to our food and environmental security. There is
150 m ha degrades land constituting 45.5% of total geographical area. The area
suffering due to water and wind erosion is 109.7 and 11.7 m ha respectively. The
area under waterlogging, salinization/alkalization and other problems are 9.0,9.2
and 10.3 m ha respectively. The widespread erosion tin the hilly catchments area is
resulting in excessive siltation of multipurpose reservoirs and other water-bodies to
the country at rates higher than their designed capacity.
A major factor responsible for the degradation of the natural resources is soil
erosion, The accelerated soil erosion has irreversible destroyed some 430 m ha of
land area covering 30% of the present cultivated area in different countries of
world. In general soil erosion is more severe in mountainous than undulating areas.
Their rate of natural erosion for the world is of the order of 1.5 to 7.0 t/ha/year for
the mountainous region and 0.1-7 t/ha/year for the undulation plains. If the global
warming trends (caused by increases in atmospheric, Co2,expected to reach 600
ppm by 2070,continues, global erosion rate may increase considerably., Erosion by
water is most serious degradation problem in the Indian context. It has been
estimated that soil erosion was taking place at an average rate of 16.35t/ha /year
totaling 5,334 mt/year,nearly 29% of the total eroded soil was parentally loss to the
sea and nearly 10% was deposited in reservoirs, resulting in the reduction of their
storage capacity by 1-2% annually. The remaining 61% of the eroded soil was
transferred from one place to another. The annual water erosion rate values ranged
from <5 t/ha/year to more than 80 t/ha/year.
Conservation agriculture (CA) is concept for resource saving agricultural crop
production that strives to achieve acceptable profits together with high and
sustainable production levels. While concurrently conserving the environment, CA is
based o enhancing natural biological processes above and below ground.
Intervention viz., mechanical soil tillage are reduced to an absolute minimum and
the use of external inputs such as agrochemicals and nutrients of mineral or organic
origin are applied at an optimum level and in a way and quantity that does not
interfere to disrupt the biological processes.
86
What is conservation Agriculture
Conservation Agriculture (CA) refers to the system of raising crops without tilling
the soil while retaining the crop residues on the soil surface. It has the potential to
emerge as an effective strategy to the increasing concerns of serious and
widespread natural resources degradation and environmental pollution, which
accompanied the adoption and promotion of green revolution technologies, since
the early seventies,
Over the past 2-3 decades globally, CA has emerged as a way of transition to the
sustainability of intensive production systems. It permits management of water and
soils for agricultural production without excessively disturbing the soil, while
protecting it from the processes that contribute to degradation like erosion,
compaction, aggregate breakdown etc,
The key features which characterize CA include:
a) Minimum soil disturbance by adopting no-tillage and minimum traffic for
agricultural operations,
b) Leave and manage the crop residues on the soil surface, and
c) Adopt spatial and temporal crop sequencing/crop rotation to derive maximum
benefits from inputs and minimize adverse environmental impacts.
Conservation agriculture permits management of soils for agricultural production
without excessively disturbing the soil, while protecting it from the processes that
contribute to degradation e.g. erosion, compaction, aggregate breakdown, loss in
organic matter, leaching of nutrients etc. Conservation agriculture is a way to
achieve goals of enhanced productivity and profitability while protecting natural
resources and environment, an example of a win win situation. In the conventional
systems, while soil tillage is a necessary requirement to produce a crop, tillage does
not form a part of this strategy in CA. In the conventional system involving intensive
tillage, there is a gradual decline in soil organic matter through accelerated
oxidation and burning of crop residues causing pollution, green house gases
emission and loss of valuable plant nutrients. When the crop residues are retained
on soil surface in combination with no tillage, it initiates processes that lead to
improved soil quality and overall resource enhancement.
Benefits of CA have been demonstrated through its large-scale adoption in many
socioeconomic and agro-ecological situations in different countries the world over.
Benefits to Farmers
These include:
• Reduced cultivation cost through savings in labour, time and farm power.
• Improved and stable yields with reduced use of inputs (fertilizers, pesticides).
• In case of mechanised farmers, longer life and minimum repair of tractors and less
87
• water, power and much lower fuel consumption.
• Benefits of CA come about over a period of time and in some cases, might appear
less
• profitable in the initial years.
Benefits to Natural Resources
These include:
• Reduced soil degradation through reduced impact of rainfall causing structural
• breakdown, reduced erosion and runoff.
• Gradual decomposition of surface residues leading to increased organic matter and
• biological activity resulting in improved capacity of soils to retain and regulate
water
and nutrient availability and supply.
• Improved biological activity and diversity in the soil including natural predators and
competitors.
• Reduced pollution of surface and ground water from chemicals and pesticides,
resulting from improved inputs use efficiency.
• Savings in non-renewable energy use and increased carbon sequestration.
Conservation Agriculture Global Scenario
According to current estimates globally, CA systems are being adopted in some 96
million ha, largely in the rainfed areas and that the area under CA is increasing
rapidly. USA has been the pioneer country in adopting CA systems and currently
more than 18 million ha land is under such system. The spread of CA in US has been
the result of a combination of public pressure to fight erosion, a strong tillage and
conservation related research and education backup and public incentives to adopt
reduced tillage systems. Other countries where CA practices have now been widely
adopted for many years include Australia, Argentina, Brazil and Canada. In many
countries of Latin America CA systems are fast catching up. Some states of Brazil
have adopted an official policy to promote CA. In Costa Rica a separate Department
of Conservation Agriculture has been set up. A redeeming features about CA systems
in many of these countries is that these have come more as farmers' or community
led initiatives rather than a result of the usual research extension system efforts.
Farmers practising CA in many countries in South America are highly organized into
local, regional and national farmers' organizations, which are supported by
institutions from both south and north America. Spread of CA systems is relatively
less in Europe as compared to countries mentioned above. While extensive research
over the past two decades in Europe has demonstrated the potential benefits of CA
yet the evolution of practice its has been slower in EU countries vis-a-vis. other
parts of the world possibly due to inadequate institutional support. France and
Spain are the two countries where CA was being followed in about one million ha of
area under annual crops. In Europe a European Conservation Agriculture
Federation, ECAF, a regional lobby group has been founded. This body unites
national associations in UK, France, Germany, Italy, Portugal and Spain.
Conservation agriculture is being adopted to varying degrees in countries of south-
88
east Asia viz. Japan, Malaysia, Indonesia, Korea, the Philippines, Taiwan, Sri Lanka
and Thailand. Central Asia is another area prospective of CA. In South Asia CA
systems would need to reflect the unique elements of intensively cultivated
irrigated cropping systems with contrasting edaphic needs, rainfed systems with
monsoonic climate features, etc. Concerted efforts of Rice-Wheat Consortium for the
Indo-Gangetic Plains (IGP) a CG initiative and the national research system of the
countries of the region (Bangladesh, India, Nepal and Pakistan) over the past decade
or so are now leading to increasing adoption of CA technologies chiefly for sowing
wheat crop. According to recent assessments in more than one million ha area
wheat was planted using a no-till seed drill in the region. Experiences from Pakistan
(Punjab, Sindh and Baluchistan provinces) showed that with zero-tillage technology
farmers were able to save on land preparation costs by about Rs. 2500 per ha and
reduce diesel consumption by 50 to 60 litres per ha. Zero tillage allows timely
sowing of wheat, enables uniform drilling of seed, improves fertilizers use efficiency,
saves water and increases yield up to 20 percent. The number of zero tillage drills in
Pakistan increased from just 13 in 1998-99 to more than 5000 in 2003-2004.
Farmers have also adopted bed planting of wheat, cotton and rice. Wheat straw
chopper has also been adapted to overcome planting problems in wheat crop
residue. Bed and furrow planting of cotton is finding favour with the farmers due to
savings in irrigation water and related benefits of improved use-efficiency of applied
fertilizers, reduced soil crusting, etc. There is widespread use of laser land leveller
which helps in curtailing irrigation, reduces labour requirement, enhances
cultivated area and improves overall productivity. In 2003-04 around 225 laser land
levellers were being used.
Conservation Agriculture in Rainfed Semi-arid and Arid Regions Rainfed semi-arid and arid regions are characterized by variable and unpredictable
rainfall, structurally unstable soils and low overall productivity. Results of most
research station studies show that zero/ reduced tillage system without crop
residues left on the soil surface have no particular advantage because much of the
rainfall is lost as runoff due to rapid surface sealing nature of soils. It would
therefore appear that no tillage alone in the absence of soil cover is unlikely to
become a favored practice. However, overall productivity and residue availability
being low and demand of limited residues for livestock feed being high also poses a
major limitation for residue use as soil cover in the arid and semi-arid regions. In
the semi-arid regions there is wide variability in rainfall and its distribution and
nature of soils. It would appear that there is need to identify situations where
availability of even moderate amount of residues can be combined with reduced
tillage to enhance soil quality and efficient use of rainwater. There appears no doubt
that managing zero-tillage system requires a higher level of management vis-a-vis
conventional crop production systems. Also there exists sufficient knowledge to
show that benefits of CA mainly consist of reversing the process of degradation and
that its advantage in terms of crop productivity may accrue only gradually.
CA or no-till farming has spread mostly in the rainfed agriculture allover the world.
However, in India its success is more in irrigated belt of the Indo-Gangetic plains.
Considering the severe problems of land degradation due to runoff induced soil
erosion, rainfed areas particularly in arid and semi-arid regions requires the
practice of CA more than the irrigated areas to ensure a sustainable production.
89
Unlike the homogenous growing environment of the IGP, the production systems in
arid and semi-arid regions are quite heterogeneous and diverse in terms of land and
ware management and cropping systems. These include the core rainfed areas
which cover up to 60-70% of the net sown area and the irrigated production
systems in the remaining 30-40% area. The rainfed cropping systems are mostly
single cropped in the red soil areas while in the black soil regions; a second crop is
taken on the residual moisture. In rabi black soils farmers keep lands fallow during
kharif and grow rabi crop on conserved moisture. The rainfall ranges from >500
mm in arid to 1000 mm in dry sub-humid zones. Alfisols, vertisols, inceptisols and
entisols are the major soil orders. Soils are slopy and highly degraded due to
continued erosion by water and wind. Sealing, crusting, subsurface hard pans and
cracking are the key constraints which cause high erosion and impede infiltration of
rainfall. The choice and type of tillage largely depend on the soil type and rainfall.
Leaving crop residue on the surface is another important component of CA, but in
rainfed areas due to its competing uses as fodder, little or no residues are available
for surface application.
Experience from several experiments in the country showed that minimum or
reduced tillage does not offer any advantage over conventional tillage in terms of
grain yield without retention of surface residue. Leaving surface residue is key to
control runoff, soil erosion and hard setting in rainfed areas which are the key
problems. In view of the shortage of residues in rainfed areas, several alternatives
strategies have emerged for generation of residues either through in situ cultivation
and incorporation as a cover crop or harvesting from perennial plants grown on
bunds and adding the green leaves as manure cum mulching. Agro forestry and alley
cropping systems are other options where biomass generation can be integrated
along with crop production. This indicates that the concept of CA has to be
understood in a broader perspective in arid and semi-arid agriculture which include
an array of practices like reduced tillage, land treatments for water conservation,
on-farm and off-farm biomass generation and agro forestry. Here, conservation
tillage with reduced retention on surface is more appropriate than zero tillage
which is emphasized in irrigated agriculture.
Constraints in Adopting Conservation Agriculture Systems
Conservation agriculture poses a challenge both for the scientific community and
the farmers to overcome the past mindset and explore the opportunities that CA
offers for natural resources improvement. CA is now considered a route to
sustainable agriculture. Spread of CA, therefore, will call for a greatly strengthened
research and linked development efforts.
• Although significant successful efforts have been made in developing and promoting
machinery for seeding wheat in no till system, successful adoption of CA systems
will call for greatly accelerated effort in developing, standardizing and promoting
quality machinery aimed at a range of crop and cropping sequences, permanent bed
and furrow planting systems, harvesting operations to manage crop residues, etc.
• Conservation agriculture systems represent a major departure from the past ways
of doing things. This implies that the whole range of practices including planting and
90
harvesting, water and nutrient management, diseases and pest control etc. need to
be evolved, evaluated and matched in the context of new systems.
• Managing CA systems will be highly demanding in terms of knowledge base. This
will call for greatly enhanced capacity of scientists to address problems from a
systems perspective, be able to work in close partnerships with farmers and other
stakeholders and strengthened knowledge and information sharing mechanisms.
How Long Does It Take to See Benefits
Usually the full benefits of CA take time and, in f act, the initial transition years may
present problems that influence farmers to disadopt the technology. Weeds are
often a major initial problem that required integrated weed management over time
to get them under control. Soil physical and biological health also takes time to
develop. Three to seven years may be needed for all the benefits to take hold. But in
the meantime, farmer save on costs of production and time and usually get similar
or better yields than with conventional systems. Farmers should be encouraged to
continue this sustainable pract ice and correct problems as they arise.
Conclusions
Crop production in the next decade will have to produce more food from less land
by making more efficient use of natural resources—and with minimal impact on the
environment. Only by doing so can food production keep pace with demand, while
land’s productivity is preserved for future generations. This is a tall order for
agricultural scientists, extension personnel, and farmers. Use of productive but more
sustainable management practices described in this paper can help solve this
problem. Crop and soil management systems that improve soil health parameters
(physical, biological, and chemical) and reduce farmer costs are essential.
Development of appropriate equipment to allow these systems to be successfully
adopted by farmers is a prerequisite for success. Overcoming traditional mindsets
about tillage by promoting farmer experimentation with this technology in a
participatory way will help accelerate adoption. Encouraging donors to support this
long-term, applied research with sustainable funding is also an urgent need.
91
ROLE OF CONSERVATION AGRICULTURAL PRACTICES TO
MITIGATE ADVERSE EFFECTS OF CLIMATE CHANGE
K.L. Sharma, Principal Scientist and National Fellow (ICAR), Central Research
Institute for Dryland Agriculture, Santoshnagar, Hyderabad
1. Introduction India has predominantly agrarian economy. Of the total geographical area of 329
million ha, 142 million ha is devoted to agriculture (FAI, 1990). Out of an estimated
net cultivated area of about 142.2 m ha, only about 55 m ha is under irrigation,
while 87 m ha is unirrigated. The irrigated area produces about 56% of total food
requirement of India. The remaining 44% of the total food production is supported
by rainfed agriculture. Most of the essential commodities such as coarse cereals
(90%), pulses (87%), and oil seeds (74%) are produced from the rainfed
agriculture. These statistics emphasise the role that rainfed regions play in ensuring
food for the ever-rising population. Owing to diversity in rainfall pattern,
temperature, parent material, vegetation and relief or topography, this country is
bestowed with different soil types predominantly alluvial soils, black soil, red soils,
laterites, desert soils, mountainous soils etc. Taxonomically, soils in India fall under
Entisols (80.1 m ha), Inceptisols (95.8 m ha), Vertisols (26.3 m ha), Aridisols (14.6),
Mollisols (8.0 m ha), Ultisols (0.8 m ha), Alfisols (79.7 m ha), Oxisols (0.3 m ha) and
non-classified soil (23.1 m ha). Rainfall wise, 15 m ha area falls in a rainfall zone of
<500mm, 15 m ha under 500 to 750 mm, 42 m ha under 750 to 1150 mm and 25 m
ha under > 1150 mm rainfall. Predominant soil orders which represent semi-arid
tropical region are Alfisols, Entisols, Vertisols and associated soils. Other soil orders
such as Oxisols, Inceptisols and Aridisols also form a considerable part of rainfed
agriculture. Most of the soils in rainfed regions are at the verge of degradation with
low cropping intensity, relatively low organic matter status, poor soil physical
health, low fertility, etc.
Out of the 328.7 m ha of land, it has been estimated that about 187.7 m ha (57.1%)
of total geographical area is degraded. Of the total degraded area, water erosion has
affected 148.9 m ha (45.3%), wind erosion 13.5 m ha (4.1%), chemical deterioration
13.8 m ha (4.2%), physical deterioration 11.6 m ha (3.5%). Another 18.2 m ha
(5.5%) land which is constrained by ice caps, salt flats, arid mountains, and rock out
crops is not fit for agriculture at all (Sehgal and Abrol, 1994). Moisture stress
accompanied by other soil related constraints result in low productivity of majority
of the crops (Sharma et al 1999). Besides natural causes, agricultural use of land is
causing serious soil losses in many places across the world including in Indian
subcontinent. It is probable that human race will not be able to feed the growing
population, if this loss of fertile soils continues at the existing rate. In many
developing countries, hunger is compelling the community to cultivate land that is
unsuitable for agriculture and which can only be converted to agricultural use
through enormous efforts and costs, such as those involved in the construction of
terraces and other surface treatments.
Indian sub-continent predominantly represents wide spectrum of climate ranging
from arid to semi arid, sub humid and humid with wider variation in rainfall amount
92
and pattern. Seasonal temperature fluctuations are also vast. Soils representing
rainfed regions are marginally low in organic matter status. The first predominant
cause of soil degradation in rainfed regions undoubtedly is water erosion. The
process of erosion sweeps away the topsoil along with organic matter and exposes
the subsurface horizons. The second major indirect cause of degradation is loss of
organic matter by virtue of temperature mediated fast decomposition of organic
matter and robbing away of its fertility. Above all, the several other farming
practices such as reckless tillage methods, harvest of every small component of
biological produce and virtually no return of any plant residue back to the soil,
burning of the existing residue in the field itself for preparation of clean seed bed,
open grazing etc aggravate the process of soil degradation.
2. Soil degradation - major causes
The predominant reasons which degrade soil quality and deteriorate its productive
capacity could be enumerated as: i) washing away of topsoil and organic matter
associated with clay size fractions due to water erosion resulting in a ‘big robbery in
soil fertility’, ii) intensive deep tillage and inversion tillage with moldboard and disc
plough resulting in a) fast decomposition of remnants of crop residues which is
catalyzed by high temperature, b) breaking of stable soil aggregates and aggravating
the process of oxidation of entrapped organic C and c) disturbance to the habitat of
soil micro flora and fauna and loss in microbial diversity, iii) dismally low levels of
fertilizer application and widening of removal-use gap in plant nutrients, iv) mining
and other commercial activities such as use of top soil for other than agricultural
purpose, v) mono cropping without following any suitable rotation, vi) nutrient
imbalance caused due to disproportionate use of primary, secondary and
micronutrients, vii) no or low use of organic manures such as FYM, compost, vermi-
compost and poor recycling of farm based crop residues because of competing
demand for animal fodder and domestic fuel, viii) no or low green manuring as it
competes with the regular crop for date of sowing and other resources, ix) poor
nutrient use efficiency attributing to nutrient losses due to leaching, volatilization
and denitrification, x) indiscriminate use of other agricultural inputs such as
herbicides, pesticides, fungicides, etc., resulting in poor soil and water quality, xi)
water logging, salinity and alkalinity and acid soils. As a result of several above-
mentioned reasons, soils encounter diversity of constraints broadly on account of
physical, chemical and biological soil health and ultimately end up with poor
functional capacity (Sharma et al., 2007). In order to restore the quality of degraded
soils and to prevent them from some further degradation, it is of paramount
importance to focus on conservation agriculture practices on long-term basis.
There is no doubt that, agricultural management practices such as crop rotations,
inclusion of legumes in cropping systems, addition of animal based manures,
adoption of soil water conservation practices, various permutations and
combinations of deep and shallow tillage, mulching of soils with in-situ grown and
93
externally brought plant and leafy materials always remained the part and parcel of
agriculture in India. Despite all these efforts, the concept of conservation farming
could not be followed in an integrated manner to expect greater impact in terms of
protecting the soil resource from degradative processes.
3. Effect of Climate on Agriculture in India – likely risk
According to Rao et al (2010), the major weather related risks in Agriculture could
be as follows: Monsoons in India exhibits substantial inter-seasonal variations,
associated with a variety of phenomena such as passage of monsoon disturbances
associated with active phase and break monsoon periods whose periodicities vary
from 3-5 and 10-15 days respectively. It is well noticed that summer monsoon
rainfall in India varied from 604 to 1020 mm. The inter-seasonal variations in
rainfall cause floods and droughts, which are the major climate risk factors in Indian
Agriculture. The main unprecedented floods in India are mainly due to movement of
cyclonic disturbances from Bay of Bengal and Arabian Sea on to the land masses
during monsoon and post-monsoon seasons – and during break monsoon conditions
in some parts of Uttar Pradesh and Bihar. The thunderstorms due to local weather
conditions also damages agricultural crops in the form of flash floods. Beside floods,
drought is a normal, repetitive feature of climate associated with deficiency of
rainfall over extended period of time to different dryness levels describing its
severity. During the period 1871 to 2009, there were 24 major drought years,
defined as years with less than one standard deviation below the mean. Another
important adverse effect of climate change could be unprecedented heat waves.
Heat waves generally occur during summer season where the cropped land is
mostly fallow, and therefore, their impact on agricultural crops is limited. However,
these heat waves adversely affect orchards, livestock, poultry and rice nursery beds.
The heat wave conditions during 2003 May in Andhra Pradesh and 2006 in Orissa
are recent examples that have affected the economy to a greater extent. Also
occurrence of heat waves in the northern parts during summer is common every
year resulting in quite a good number of human deaths. Further, the water
requirements of summer crops grown under irrigated conditions increase to a
greater extent. Another adverse effect of climate change is cold waves which mostly
occur in northern states. The Northern states of Punjab, Haryana, U.P., Bihar and
Rajasthan experience cold wave and ground frost like conditions during winter
months of December and January almost every year. The occurrence of these waves
has significantly increased in the recent past due to reported climatic changes at
local, regional and global scales. Site-specific short-term fluctuations in lower
temperatures and the associated phenomena of chilling, frost, fogginess and
impaired sunshine may sometimes play havoc in an otherwise fairly stable
cropping/farming system of a region.
3.1 Influence of climate change on soil quality
Climate change is likely to have a variety of impacts on soil quality. Soils vary
depending on the climate and show a strong geographical correlation with climate.
The key components of climate in soil formation are moisture and temperature.
Temperature and moisture amounts cause different patterns of weathering and
94
leaching. Wind redistributes sand and other particles especially in arid regions. The
amount, intensity, timing, and kind of precipitation influence soil formation.
Seasonal and daily changes in temperature affect moisture effectiveness, biological
activity, rates of chemical reactions, and kinds of vegetation. Soils and climate are
intimately linked. Climate change scenarios indicate increased rainfall intensity in
winter and hotter, drier summers. Changing climate with prolonged periods of dry
weather followed by intense rainfall could be a severe threat to soil resource.
Climate has a direct influence on soil formation and cool, wet conditions and acidic
parent material have resulted in the accumulation of organic matter. A changing
climate could also impact the workability of mineral soils and susceptibility to
poaching, erosion, compaction and water holding capacity. In areas where winter
rainfall becomes heavier, some soils may become more susceptible to erosion. Other
changes include the washing away of organic matter and leaching of nutrients and in
some areas, particularly those facing an increase in drought conditions, saltier soils,
etc.
Not only does climate influence soil properties, but also regulates climate via the
uptake and release of greenhouse gases such as carbon dioxide, methane and
nitrous oxide. Soil can act as a source and sink for carbon, depending on land use
and climatic conditions. Land use change can trigger organic matter decomposition,
primarily via land drainage and cultivation. Restoration and recreation of peatlands
can result in increased methane emissions initially as soils become anaerobic,
whereas in the longer term they become a sink for carbon as organic mater
accumulates. Climatic factors have an important role in peat formation and it is thus
highly likely that a changing climate will have significant impacts on this resource.
3.2 Carbon build up and rising temperatures
In India, over two-thirds of the increase in atmospheric CO2 during the past 20 years
is due to fossil fuel burning. The rest is due to land-use change, especially
deforestation, and to a lesser extent, cement production. Global average surface
temperature increased 0.6 (0.2) oC in the 20th century and will increase by 1.4 to 5.8 oC by 2100. Estimates indicate that India's climate could become warmer under
conditions of increased atmospheric carbon dioxide. The average temperature
change is predicted to be in the range of 2.33oC to 4.78oC with a doubling in CO2
concentrations. Over the past 100 years, mean surface temperatures have increased
by 0.3-0.8oC across the region. The 1990s have been the hottest decade for a
thousand years. The time taken for CO2 to pass through the atmosphere varies
widely, with a significant impact. It can take from 5 to 200 years to pass through the
atmosphere, with an average of 100 years. This means that CO2 emission produced
50 years ago still linger in atmosphere today. It also means that current emissions
won’t lose their deleterious effect until year 2104. Even though drastic measures to
reduce climate emissions have been taken in recent years, climate change is
impossible to prevent. As a result of increasing pressure from climate change on
95
current key areas of food production, there might be a rising need for increased food
production. The production of food more locally is also being promoted in an
attempt to reduce food miles. To meet food production and security objectives,
there might be the need to afford prime agricultural land more protection. The rise
in temperatures will influence crop yields by shifting optimal crop growing seasons,
changing patterns of precipitation and potential evapotranspiration, reducing
winter storage of moisture in snow and glacier areas, shifting the habitat's of crops
pests and diseases, affecting crop yields through the effects of carbon dioxide and
temperature and reducing cropland through sea-level rise and vulnerability to
flooding
3.3 Climatic change effect on soil fertility and erosion
No comprehensive study has yet been made of the impact of possible climatic
changes on soils. Higher temperatures could increase the rate of microbial
decomposition of organic matter, adversely affecting soil fertility in the long run. But
increases in root biomass resulting from higher rates of photosynthesis could offset
these effects. Higher temperatures could accelerate the cycling of nutrients in the
soil, and more rapid root formation could promote more nitrogen fixation. But these
benefits could be minor compared to the deleterious effects of changes in rainfall.
For example, increased rainfall in regions that are already moist could lead to
increased leaching of minerals, especially nitrates. In the Leningrad region of the
USSR a one-third increase in rainfall (which is consistent with the GISS 2 x CO2
scenario) is estimated to lead to falls in soil productivity of more than 20 per cent.
Large increases in fertilizer applications would be necessary to restore productivity
levels. Decreases in rainfall, particularly during summer, could have a more
dramatic effect, through the increased frequency of dry spells leading to increased
proneness to wind erosion. Susceptibility to wind erosion depends in part on
cohesiveness of the soil (which is affected by precipitation effectiveness) and wind
velocity.
Nitrogen availability is important to soil fertility and N cycling is altered by human
activity. Increasing atmospheric CO2 concentrations, global warming and changes in
precipitation patterns are likely to affect N processes and N pools in forest
ecosystems. Temperature, precipitation, and inherent soil properties such as parent
material may have caused differences in n pool size through interaction with biota.
Keller et al., 2004 reported that climate change will directly affect carbon and
nitrogen mineralization through changes in temperature and soil moisture, but it
may also indirectly affect mineralization rates through changes in soil quality.
3.4 Impact on biodiversity
Climate change is having a major impact on biodiversity and in turn biodiversity loss
(in the form of carbon sequestration trees and plants) is a major driver of climate
change. Land degradation such as soil erosion, deteriorating soil quality and
desertification are driven by climate variability such as changes in rainfall, drought
96
and floods. Degraded land releases more carbon and greenhouse gases back into the
atmosphere and slowly kills off forests and other biodiversity that can sequester
carbon, creating a feed back loop that intensifies climate change.
4. Conservation agriculture and its components
Conservation agriculture is a practice that reduces soil erosion, sustains soil fertility,
improves water management and reduces production costs, making inputs and
services affordable to small-scale farmers. Conservation agriculture is defined as a
set of practices aimed at achieving the following three principles simultaneously: i)
maintaining adequate soil cover, ii) disturbing the soil minimally, and iii) ensuring
crop rotation and Organizations (FAO) of the United Nations is a concept for
resource-saving agricultural crop production that strives to achieve acceptable
profits together with high and sustained production levels while concurrently
conserving the environment. It is based on enhancing natural biological processes
above and below the ground. Interventions such as mechanical soil tillage are
reduced to an absolute minimum, and the use of external inputs such as
agrochemicals and nutrients of mineral or organic origin are applied at an optimum
level and in a way and quantity that does not interfere with, or disrupt the biological
processes (Philip et al., 2007). Conservation agriculture, in broader sense includes
all those practices of agriculture, which help in conserving the land and
environment while achieving desirably sustainable yield levels. Tillage is one of the
important pillars of conservation agriculture which disrupts inter dependent
natural cycles of water, carbon and nitrogen. Conservation tillage is a generic term
encompassing many different soil management practices. It is generally defined as
‘any tillage system that reduces loss of soil or water relative to conventional tillage;
mostly a form of non-inversion tillage allows protective amount of residue mulch on
the surface (Mannering and Fenster, 1983).
Lal (1989) reported that the tillage system can be labeled as conservation tillage if it
i) allows crop residues as surface mulch, ii) is effective in conserving soil and water,
iii) maintains good soil structure and organic matter contents, iv) maintains
desirably high and economic level of productivity, v) cut short the need for chemical
amendments and pesticides, vi) preserves ecological stability and vii) minimizes the
pollution of natural waters and environments. In order to ensure the above criteria
in agriculture, there is a need to follow a range of cultural practices such as i) using
crop residue as mulch, ii) adoption of non-inversions or no-tillage systems, iii)
promotion of crop rotations by including cover crops, buffer strips, agroforestry,
etc., iv) enhancement of infiltration capacity of soil through rotation with deep
rooted perennials and modification of the root zone; v) enhancement in surface
roughness of soil without jumping into fine tilth, vi) improvement in biological
activity of soil fauna through soil surface management and vii) reducing cropping
intensity to conserve soil and water resources and building up of soil fertility. The
effects of conservation tillage on various soil properties, organic matter status, soil
nutrient status and environmental quality have comprehensively reviewed by
Blevins and Frye (1993), Lal (1989), Unger and McCalla (1980) and Unger (1990).
From the various reviews, it is understood that no single tillage system is suitable
for all soils and climatic conditions. The predominant advantages of the
conservation tillage have been found in terms of soil erosion control, water
97
conservation, less use of fossil fuels specifically for preparation of seed bed, reduced
labour requirements, more timeliness of operations or greater flexibility in planting
and harvesting operations that may facilitate double cropping, more intensive use of
slopping lands and minimized risk of environmental pollution. Some of the
discouraging and undesirable effects of conservation tillage has been reported as:
(1) Increase in use of herbicides and consequently increased cost, (2) problems and
difficulties in controlling of some of the infested weeds, (3) difficulty in managing
poorly drained soils, (3) slower warming of temperate soils due to surface residue
layer during winter and springs which delays germination and early growth.
However, in tropics this negative aspect can become an asset in helping in
maintaining relatively lower temperature and thereby enhancing germination. It
also helps in preserving soil and water resources.
5. Importance and scope of conservation agricultural practices in rainfed areas
As discussed in the foregoing section, soil quality degradation is more prominent in
rainfed agro-ecoregions because of natural and human induced crop husbandry
practices, which call for the adherence to the conservation agriculture management
as top priority. Conservation agriculture has the main aim of protecting the soil from
erosion and maintaining, restoring and improving soil organic carbon status in the
various production systems, hence more suited and required in rainfed agriculture.
Predominantly, this goal can be achieved through minimizing the soil tillage,
inclusion of crop rotation or cover crops (mostly legumes) and maintaining
continuous residue cover on soil surface. The former is governed by the amount of
draft, a farmer is using and the latter by the produce amount, harvesting index and
fodder requirements including open grazing. The crop rotations are induced by crop
diversification, which has wider scopes in the rainfed agriculture than in irrigated
agriculture. Diversification will help not only in minimizing the risk occurred due
to failure of crops, improving total farm income but also in carbon sequestration.
Tillage, which is one of the predominant pillars of conservation agriculture, disrupts
the inter-dependent natural cycles of water carbon and nitrogen. Tillage unlocks the
potential microbial activity by creating more reactive surface area for gas exchange
on soil aggregates that are exposed to higher ambient oxygen concentration (21%).
Tillage also breaks the aggregate to expose fresh surfaces for enhanced gas
exchange and perhaps, may lead to more carbon loss from the interior that may
have higher carbon-dioxide concentration. Thus, an intensive tillage creates
negative conditions for carbon sequestration and microbial activity. However, the
main question is whether the intensity of tillage or length of cultivation of land
which is an environment enemy in production agriculture in terms of loss of carbon-
dioxide, soil moisture through evaporation and biota dwindling is a major
production constraint to agriculture or not. The developed countries suffer from
heavy-duty mechanization, while India is suffering from long use of plough without
caring much about the maintenance of land cover. The major toll of organic C in
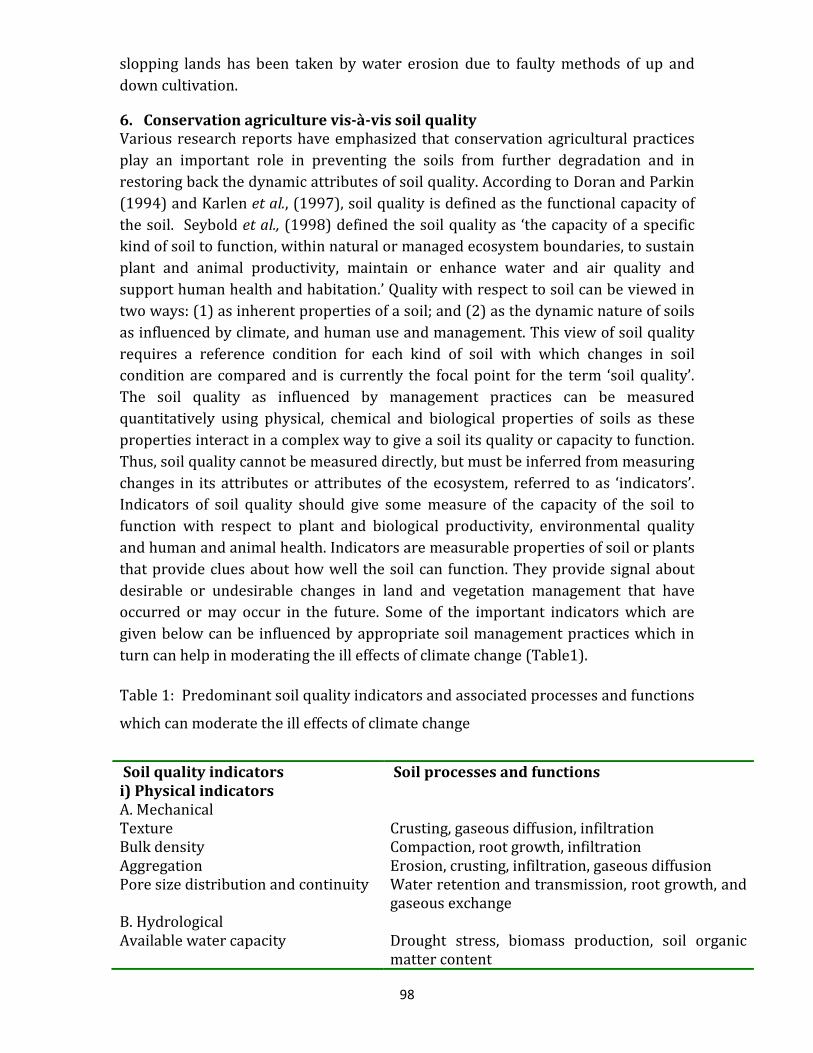
98
slopping lands has been taken by water erosion due to faulty methods of up and
down cultivation.
6. Conservation agriculture vis-à-vis soil quality Various research reports have emphasized that conservation agricultural practices
play an important role in preventing the soils from further degradation and in
restoring back the dynamic attributes of soil quality. According to Doran and Parkin
(1994) and Karlen et al., (1997), soil quality is defined as the functional capacity of
the soil. Seybold et al., (1998) defined the soil quality as ‘the capacity of a specific
kind of soil to function, within natural or managed ecosystem boundaries, to sustain
plant and animal productivity, maintain or enhance water and air quality and
support human health and habitation.’ Quality with respect to soil can be viewed in
two ways: (1) as inherent properties of a soil; and (2) as the dynamic nature of soils
as influenced by climate, and human use and management. This view of soil quality
requires a reference condition for each kind of soil with which changes in soil
condition are compared and is currently the focal point for the term ‘soil quality’.
The soil quality as influenced by management practices can be measured
quantitatively using physical, chemical and biological properties of soils as these
properties interact in a complex way to give a soil its quality or capacity to function.
Thus, soil quality cannot be measured directly, but must be inferred from measuring
changes in its attributes or attributes of the ecosystem, referred to as ‘indicators’.
Indicators of soil quality should give some measure of the capacity of the soil to
function with respect to plant and biological productivity, environmental quality
and human and animal health. Indicators are measurable properties of soil or plants
that provide clues about how well the soil can function. They provide signal about
desirable or undesirable changes in land and vegetation management that have
occurred or may occur in the future. Some of the important indicators which are
given below can be influenced by appropriate soil management practices which in
turn can help in moderating the ill effects of climate change (Table1).
Table 1: Predominant soil quality indicators and associated processes and functions
which can moderate the ill effects of climate change
Soil quality indicators Soil processes and functions
i) Physical indicators
A. Mechanical
Texture Crusting, gaseous diffusion, infiltration
Bulk density Compaction, root growth, infiltration
Aggregation Erosion, crusting, infiltration, gaseous diffusion
Pore size distribution and continuity Water retention and transmission, root growth, and
gaseous exchange
B. Hydrological
Available water capacity Drought stress, biomass production, soil organic
matter content
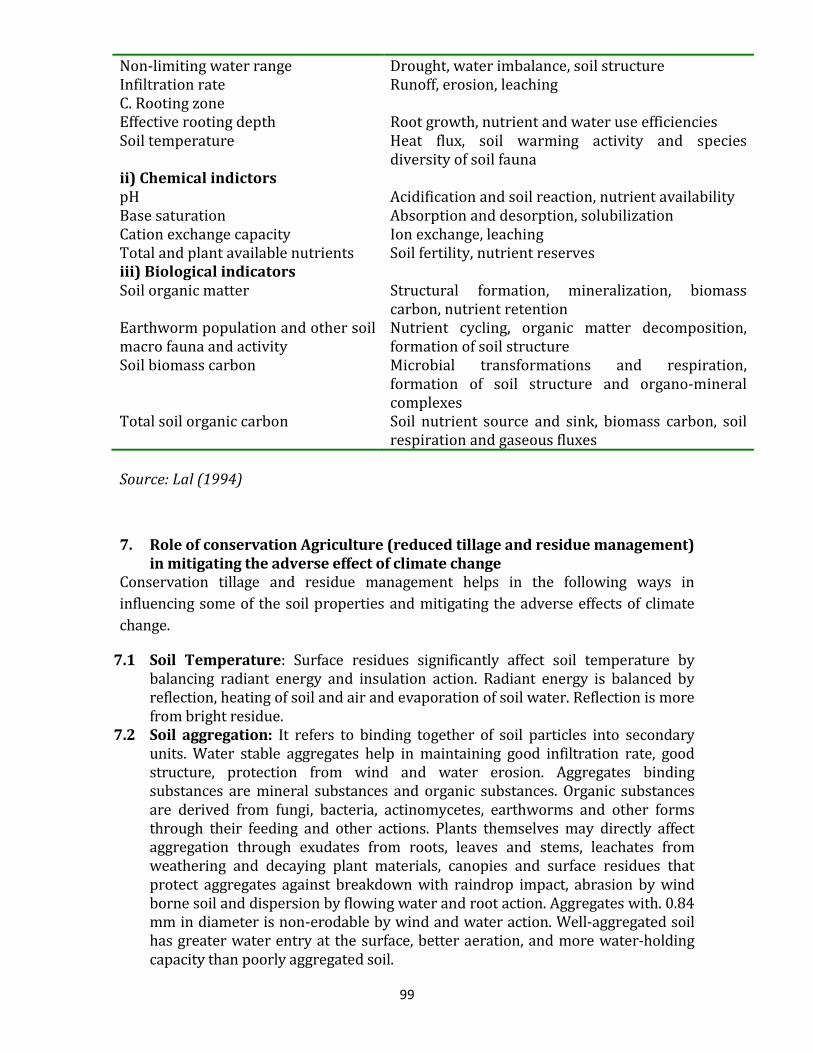
99
Non-limiting water range Drought, water imbalance, soil structure
Infiltration rate Runoff, erosion, leaching
C. Rooting zone
Effective rooting depth Root growth, nutrient and water use efficiencies
Soil temperature Heat flux, soil warming activity and species
diversity of soil fauna
ii) Chemical indictors
pH Acidification and soil reaction, nutrient availability
Base saturation Absorption and desorption, solubilization
Cation exchange capacity Ion exchange, leaching
Total and plant available nutrients Soil fertility, nutrient reserves
iii) Biological indicators
Soil organic matter Structural formation, mineralization, biomass
carbon, nutrient retention
Earthworm population and other soil
macro fauna and activity
Nutrient cycling, organic matter decomposition,
formation of soil structure
Soil biomass carbon Microbial transformations and respiration,
formation of soil structure and organo-mineral
complexes
Total soil organic carbon Soil nutrient source and sink, biomass carbon, soil
respiration and gaseous fluxes
Source: Lal (1994)
7. Role of conservation Agriculture (reduced tillage and residue management) in mitigating the adverse effect of climate change
Conservation tillage and residue management helps in the following ways in
influencing some of the soil properties and mitigating the adverse effects of climate
change.
7.1 Soil Temperature: Surface residues significantly affect soil temperature by
balancing radiant energy and insulation action. Radiant energy is balanced by
reflection, heating of soil and air and evaporation of soil water. Reflection is more
from bright residue.
7.2 Soil aggregation: It refers to binding together of soil particles into secondary
units. Water stable aggregates help in maintaining good infiltration rate, good
structure, protection from wind and water erosion. Aggregates binding
substances are mineral substances and organic substances. Organic substances
are derived from fungi, bacteria, actinomycetes, earthworms and other forms
through their feeding and other actions. Plants themselves may directly affect
aggregation through exudates from roots, leaves and stems, leachates from
weathering and decaying plant materials, canopies and surface residues that
protect aggregates against breakdown with raindrop impact, abrasion by wind
borne soil and dispersion by flowing water and root action. Aggregates with. 0.84
mm in diameter is non-erodable by wind and water action. Well-aggregated soil
has greater water entry at the surface, better aeration, and more water-holding
capacity than poorly aggregated soil.
100
7.3 Aggregation is closely associated with biological activity and the level of organic
matter in the soil. The gluey substances that bind components into aggregates are
created largely by the various living organisms present in healthy soil. Therefore,
aggregation is increased by practices that favor soil biota. Because the binding
substances are themselves susceptible to microbial degradation, organic matter
needs to be replenished to maintain aggregation. To conserve aggregates once
they are formed, minimize the factors that degrade and destroy them.
7.4 Well-aggregated soil also resists surface crusting. The impact of raindrops causes
crusting on poorly aggregated soil by disbursing clay particles on the soil surface,
clogging the pores immediately beneath, sealing them as the soil dries.
Subsequent rainfall is much more likely to run off than to flow into the soil. In
contrast, a well-aggregated soil resists crusting because the water-stable
aggregates are less likely to break apart when a raindrop hits them. Any
management practice that protects the soil from raindrop impact will decrease
crusting and increase water flow into the soil. Mulches and cover crops serve this
purpose well, as do no-till practices which allow the accumulation of surface
residue.
7.5 Soil density and porosity: Soil bulk density and porosity are inversely related.
Tillage layer density is lower in ploughed than unploughed (area in grass, low
tillage area etc). When residues are involved, tilled soils will reflect lower
density. Mechanization with heavy machinery results in soil compaction, which
is undesirable and is associated with increased bulk density and decreased
porosity. Natural compaction occurs in soils, which are low in organic matter
and requires loosening. But, practicing conservation tillage to offset the
compaction will be effective only when there is adequate residue, while
intensive tillage may adversely influence the soil fauna, which indirectly
influence the soil bulk density and porosity.
7.6 Effects on other physical properties: Tillage also influences crusting, hydraulic
conductivity and water storage capacity. It has been understood that the textural
influences and changes in proportion of sand, silt and clay occur due to inversion
and mixing caused by different tillage instruments, tillage depth, mode of
operation and effect of soil erosion. Soil crusting which severely affects
germination and emergence of seedling is caused due to aggregate dispersion and
soil particles resorting and rearrangement during rainstorm followed by drying.
Conservation tillage and surface residue help in protecting the dispersion of soil
aggregates and helps in increasing saturated hydraulic conductivity. Increased
HC in conjunction with increased infiltration resulting from conservation tillage
allows soil profile to be more readily filled with water. Further, less evaporation
is also supported by conservation tillage, and profile can retain more water.
7.7 Effect on soil organic matter and soil fertility: Conservation agricultural
practices help in improving soil organic matter by way of i) regular addition of
organic wastes and residues, use of green manures, legumes in the rotation,
reduced tillage, use of fertilizers, and supplemental irrigation ii) drilling the seed
without disturbance to soil and adding fertilizer through drill following chemical
weed control and iii) maintaining surface residue, practicing reduced tillage,
recycling of residues, inclusion of legumes in crop rotation. These practices
provide great opportunity in maintaining and restoring soil quality in terms of
101
SOM and N in SAT regions. It is absolutely necessary to spare some residue for
soil application, which will help in improving soil tilth, fertility and productivity.
8. Some research experiences showing the effect of conservation management practices on soil quality improvement
There are several reports on the influence of conservation agricultural management
practices comprising of tillage, residue recycling, application of organic manures,
green manuring and integrated use of organic and inorganic sources of nutrients,
soil water conservation treatments, integrated pest management, organic farming,
etc., on soil quality. Improved soil quality parameters create additional muscle
power to soil to combat the ill effects of climate change. Some of the results
pertaining to the effect of conservation agricultural practices on soil quality are
given below:
The studies conducted over a 9 year period in Alfisols at Bangalore with finger millet,
revealed that the yields were similar with optimum N, P, K application and with 50%
NPK applied through combined use of fertilizers + FYM applied @ 10 t ha-1.
Application of vermicompost in combination with inorganic fertilizer in 1:1 ratio in
terms of N equivalence was found very effective in case of sunflower grown in Alfisol
at Hyderabad (Neelaveni, 1998). Combined use of crop residues and inorganic
fertilizer showed better performance than sole application of residue. Use of crop
residue in soil poor in nitrogen (Bangalore) showed significant improvement in the
fertility status and soil physical properties. Continuous addition of crop residues for
five years enhanced maize grain yield by 25%. Organic matter status improved from
0.5% in the control plots to 0.9% in plots treated with maize residue at 4 t ha-1 year-1.
In Alfisols at Hyderabad, use of crop residues in pearl millet and cowpea not only
enhanced the yields but also made appreciable improvements in stability of soil
structure, soil aggregates and hydraulic conductivity.
Capitalisation of legume effect is one of the important strategies of tapping additional
nitrogen through biological N fixation. There are many reports on this aspect (Singh
and Das, 1984; Sharma and Das, 1992). The beneficial effect of preceding crops on the
succeeding non-legume crops has been studied at many locations. When maize was
grown after groundnut, a residual effect of equivalent to 15 kg N ha-1 was observed at
ICRISAT (Reddy et al. 1982). Sole cowpea has been reported to exhibit a residual
effect of the magnitude of 25-50 kg N ha-1 (Reddy et al. 1982). Based on a five year
rotation of castor with sorghum + pigeon pea and green gram + pigeon pea in an
Alfisol of Hyderabad, it was observed that green gram + pigeon pea intercrop (4:1)
can leave a net positive balance of 97 kg ha-1 total N in soil (Das et al. 1990).
Results of a long-term study conducted on soil quality improvement revealed that
the application of gliricidia loppings proved superior to sorghum stover and no
residue treatments in maintaining higher soil quality index (SQI) values. Further,
102
increasing N levels also helped in maintaining higher SQI. Among the 24 treatments,
the highest SQI was obtained in conventional tillage (CT) + gliricidia loppings (GL) +
90 kg N ha-1 (CTGLN90) (1.27) followed by CTGLN60 (1.19) and minimum tillage
(MT) + sorghum stover (SS) + 90 kg N ha-1 (MTSSN90) (1.18), while the lowest was
under minimum tillage + no residue (NR) + 30 kg N ha-1 (MTNRN30) (0.90) followed
by MTNRN0 (0.94), indicating relatively less aggradative effects. The application of
90 kg N ha-1 under minimum tillage even without applying any residue (MTNRN90)
proved quite effective in maintaining soil quality index as high as 1.10. The key
indicators, which contributed considerably towards SQI were, available N, K, S,
microbial biomass carbon (MBC) and hydraulic conductivity (HC). Among the
various treatments, CTGLN90 not only had the highest SQI, but was most promising
from the viewpoint of sustainability, maintaining higher average yield levels under
sorghum-castor rotation. From the view point of SYI, CT approach remained
superior to MT. To maintain yield as well as soil quality in Alfisols, primary tillage
along with organic residue and nitrogen application are needed (Sharma et al,
2005).
Another long-term experiment was conducted with two tillage (conventional (CT)
and reduced (RT)) and five INM treatments (control, 40 kg N through urea, 4 t
compost + 20 kg N, 2 t Gliricidia loppings + 20 kg N and 4 t compost + 2 t Gliricidia
loppings) using sorghum and green gram as test crops. Tillage did not influence the
soil quality index (SQI), while the conjunctive nutrient use treatments had a
significant effect. The conjunctive nutrient use treatments aggraded the soil quality
by 24.2 to 27.2 %, while the sole inorganic treatment could aggrade only to the
extent of 18.2 % over the control. Statistically, the overall superiority of the
treatments in aggrading the soil quality was: 4 Mg compost + 2 Mg gliricidia
loppings (T5) > 2 Mg Gliricidia loppings + 20 kg N through urea (T4) = 4 Mg
compost + 20 kg N through urea (T3) > 40 kg N through urea (T2). The extent of
percent contribution of the key indicators towards soil quality index (SQI) was:
microbial biomass carbon (MBC) (28.5%), available nitrogen (28.6%), DTPA- Zn
(25.3%), DTPA- Cu (8.6%), hydraulic conductivity (HC) (6.1%) and mean weight
diameter (MWD) (2.9%) (Sharma et al., 2008).
Based on the network tillage experiment being carried out since 1999 at various
centers of All India Coordinated Research Project on Dryland Agriculture
(AICRPDA), it was observed that in arid (< 500 mm rainfall) region, low tillage was
almost comparable to conventional tillage and the weed management was not so
difficult, whereas, in semi arid (500 – 1000 mm) region, conventional tillage was
found superior. It is a well-established fact that infiltration of rainfall depends on
soil loosening and its receptiveness and thus requires more surface disturbance.
Success of crops depends on rainfall infiltration and soil moisture holding in the
profile.
For improving the carbon content in soil, apart from crop residues, the agro-forestry
also becomes important. However, nothing comes free. The agro-forestry system
comprising of perennial components depends on the sub-soil components. It has
been observed that grasslands and tree system play an important role in improving
103
soil properties such as bulk density, mean weight diameter, water stable aggregates
and organic carbon. Apart from the above, other soil properties such as infiltration
rate and hydraulic conductivity were also influenced due to agro forestry systems
compared to agricultural systems.
8. Promotion of conservation farming- Steps
The following steps are needed to promote conservation farming in the future:
8.1 There is a need to create awareness among the communities about the
importance of soil resources, organic matter build up in soil. Traditional
practices such as burning of residues, clean cultivation, intensive tillage and
pulverization of soil upto finest tilth need to be discouraged.
8.2 Systems approach is essential for fitting conservation tillage in modern
agriculture. In order to follow the principle of “grain is to man and a residue
is to soil”, farming systems approach introducing alternative fodder crops is
essential. Agroforestry systems with special emphasis on silvipastures
systems need to be introduced. Unproductive livestock herds needs to be
discouraged
8.3 For the adoption of conservation tillage, it is essential that complete package
of practices may be identified based on intensive research for each agro
ecological region.
8.4 The increased use of herbicides has become inevitable for adopting
conservation tillage/conservation farming practices. The countries that use
relatively higher amount of herbicides are already facing problem of non-
point source pollution and environmental hazard. In order to reduce the
herbicidal demand, there are scopes to study the allelopathic effects of cover
crops and intercultural and biological method of weed control. In other
words, due concentration is needed to do research on regenerative cropping
systems to reduce dependence on inorganic chemicals.
8.5 Low tillage, crop rotation, cover crops, maintenance of residues on the
surface, control of weeds through herbicides, are the key components of
conservation farming. Therefore, it is essential that these themes must be
studied in depth under diverse soil and climatic conditions across the
country on long-term basis.
8.6 The other objective of conservation farming is to minimize the inputs
originating from non-renewable energy sources. Eg. Fertilizers and
pesticides. Hence, research focus is required on enhancing fertilizer use
104
efficiency and reduction in use of pesticides. This aspect can be
strengthened by following integrated nutrient management and integrated
pest management approach.
8.7 The past research experiences of conservation tillage reveal that the major
toll of yield is taken by poor germination and poor crop stand because of
poor microclimatic environment and hard setting tendencies of soil,
excessive weed growth and less infiltration of water to the crop root zone.
Therefore, the important aspects which need concentrated research focus
include appropriate time of sowing, suitable seed rate, depth of seed
placement and soil contact, row orientation, etc. Suitable cultivars having
responsiveness to inputs also become important component of conservation
farming.
8.8 The issues related to development of eco-friendly practices for tillage and
residue recycling – appropriately for specific combination of soil-agro
climatic cropping system – to alleviate physical constraints with higher
water and nutrient use efficiency need to be addressed.
8.9 Inter-disciplinary research efforts are required to develop appropriate
implements for seeding in zero tillage, residue incorporation and inter-
cultural operations.
Research focus is needed on modeling of tillage dynamics and root growth,
incorporation of soil-physical properties in crop-growth simulation models and
relating it to crop yields under major cropping sequences.
9. Research and management strategies to improve soil resilience towards climatic change
The following research, developmental and policy strategies are suggested to
restore and maintain soil quality on long-term basis.
9.1 Checking soil resource through effective soil and water conservation
(SWC) measures: It is well accepted connotation that ‘Prevention is better
than cure’. In order to protect the top soil, organic mater content contained
in it and associated essential nutrients, it is of prime importance that there
should be no migration of soil and water out of a given field. If this is
controlled, the biggest robbery of clay-organic matter -nutrients is checked.
This can be easily achieved, if the existing technology on soil and water
conservation is appropriately applied on an extensive scale. The cost for in-
situ and ex-situ practices of SWC has been the biggest concern in the past.
There is a need to launch ‘soil resource awareness program’ among the
farming community. Suitable incentives / support need to be given to the
farming community by way of employment / food for work program, etc.
105
9.2 Rejuvenation and reorientation of soil testing program in the country: About more than 600 Soil testing labs situated in the country need to be
reoriented, restructured and need to be given fresh mandate of assessing
the soil quality in its totality including chemical, physical, biological soil
quality indicators and water quality. The testing needs to be on intensive
scale and recommendations are required to be made on individual farm
history basis. Special focus is required on site specific nutrient management
(SSNM). Soil Health Card system needs to be introduced. Soil fertility maps
of intensive scale need to be prepared. District soil testing labs need to be
renamed as ‘District Soil Care Labs’ and required to be well equipped with
good equipments and qualified manpower for assessing important soil
quality indicators including micronutrients. Fertilizer application needs to
be based on soil tests and nutrient removal pattern of the cropping system
in a site specific manner. This will help in correcting the deficiency of
limiting nutrients. Keeping in mind the sluggish and inefficient activities of
regional soil testing labs of the states, private sector can also be
encouraged to take up Soil Care Programs with a reasonable costs using a
principle of ‘Soil Clinics, Diagnosis and Recommendation’.
9.3 Promotion of management practices which enhance soil organic matter: Management practices such as application of organic manures
(composts, FYM, vermi-composts), legume-crop based green manuring,
tree-leaf green manuring, residue recycling, sheep-goat penning, organic
farming, conservation tillage, inclusion of legumes in crop rotation need to
be encouraged (Sharma et al., 2002, 2004). Similar to inorganic fertilizer,
subsidy provisions for organic manures can also be made so that growers
should be motivated to take up these practices as components of integrated
nutrient management (INM). As is being done in some of the countries such
as USA, conservation tillage and land cover need to be promoted in India too
for better carbon sequestration.
9.4 Development and promotion of other bio-resources for enhancing microbial diversity and ensuring their availability: In addition to
organic manures, there is a huge potential to develop and promote bio-
fertilizers and bio-pesticides in large scale. These can play an important role
in enhancement of soil fertility and soil biological health. Use of toxic plant
protection chemical can also be reduced. In addition to this, there is a need
to focus on advance research for enhancing microbial diversity by
identifying suitable gene pools
9.5 Ensuring availability of balanced multi-nutrient fertilizers: Fertilizer
companies need to produce multi-nutrient fertilizers containing nutrients in
a balanced proportion so that illiterate farmers can use these fertilizers
without much hassle.
106
9.6 Enhancing the input use efficiency through precision farming: The
present level of use efficiency of fertilizer nutrients, chemicals, water and
other inputs is not very satisfactory. Hence, costly inputs go waste to a
greater extent and result in monetary loss and environmental (soil and
water) pollution. More focus is required to improve input use efficiency.
The components required to be focused could be suitable machinery and
other precision tools for placement of fertilizers, seeds and other chemical
in appropriate soil moisture zone so that losses could be minimized and
efficiency could be increased. This aspect has a great scope in rainfed
agriculture. This will also help in increasing water use efficiency (WUE) too.
9.7 Amelioration of problematic soils using suitable amendments and improving their quality to a desired level: History has a record that poor
soil quality or degraded soils have taken toll of even great civilizations. No
country can afford to let its soils be remaining degraded by virtue of water
logging, salinisation, alkalinity, erosion etc. Lots of efforts have already gone
into the research process. There is a need to ameliorate the soils at
extensive scale on regular basis. No matter, how much it costs.
9.8 Land cover management: Promotion of land cover management is must to
protect the soil and to enhance organic matter in soil.
9.9 Mass awareness about the importance of soil resource and its maintenance: There is need to introduce the importance of soil resource
and its care in the text books at school and college levels. The subject is dealt
at present apparently along with geography. Farming communities too need
to be made aware about soil, its erosion, degradation, benefits and losses
occurred due to poor soil quality. This can be done through various action
learning tools which explain the processes of soil degradation in a simple
and understandable manner.
9.10 Need to constitute a high power body such as National Authority on Land and Soil Resource Health or National Commission on Soil Resource Health: State Soil and Water conservation departments restrict
their activities only up to construction of small check dams, plugging of
gullies etc in common lands. State Soil testing labs are almost sluggish in
action, poorly equipped and are with under-qualified manpower. Mostly, no
tests are done except for Organic C, P and K. State agricultural universities
(SAU) only adopt few villages, and consequently, no extensive testing of soil
health is done. ICAR institutions also take up few watersheds. Then, there
will be no one to work for Soil Health Care program at extensive scale.
Hence, a Central High Power Authority / Commission on soil Resource
Health is needed to coordinate the program with States. It is beyond the
capacity of research organizations to take up such giant and extensive task
in addition to their regular research mandates.

107
Thus conservation agriculture can play an important role not only in improving the
physical, chemical and biological soil quality parameters but also in mitigating the
adverse impact of climate change. The principles of conservation agriculture need to
be followed in holistic manner and the practices must continue on long term bases
to see the explicit impact.
108
References:
Blevins, R.L., and Frye, W.W. 1993. Conservation tillage: An ecological approach
to soil management. Adv. Agron.51:33–78.
Das, S. K., Sharma, K. L. and Rao, K.P.C. (1990). Response of castor bean (Ricinus
communis) to fertilizer nitrogen under different crop rotation on dryland Alfisol.
Accepted for XIV International Soil Science Congress held at Tokyo, Japan, August
1990.
Doran. J.W., and Parkin, T. B.1994. Defining and assessing soil quality. In:
Defining Soil Quality for a Sustainable Environment. J. W. Doran, D. C. Coleman,
D. F. Bezdicek, and B. A. Stewart (Eds.). Soil Sci. Soc. Am. Special Publication
No.35, Madison, Wisconsin, USA, pp. 3-21.
FAI, 1990. Fertilizer Association of India.
Karlen, D.L., Mausbach, M.J., Doran, J. W., Cline, R. G., Harres, R. F., and Schuman.
G. E. 1997. Soil quality: A concept definition, and framework for evaluation. Soil
Sci. Soc. Am. J. 61: 4-10.
Lal, R. 1989. Conservation tillage for sustainable agriculture: tropics versus
temperate environments. Adv. Agro. 42: 86–197.
Lal, R. 1994. Date analysis and interpretation. In: Methods and Guidelines for
Assessing Sustainable Use of Soil and Water Resources in the Tropics, R. Lal
(Ed.). Soil Management Support Services Technical. Monograph. No. 21.
SMAA/SCS/USDA, Washington D. C, pp. 59-64.
Mannering, J.V., and Fenster, C.R. (1983). What is conservation tillage? J. Soil
Water Conserv. 38, 141-143.
Neeleveni, 1998. Efficient use of organic matter in semi-arid environment
through vermiculture composting and management. PhD Thesis submitted to
ANGRAU, Rajendranagar, Hyderabad.
Philip, B., Addo, D, B., Delali, D.G., Asare, B. E., Bernard, T., Soren, D.L., and John, A.
2007. Conservation agriculture as practiced in Ghana. Nairobi: African
Conservation Tillage Network; Paris, France:, Centre de cooperation
international de recherche agronomique, pour le development; Rome, Italy: Food
and Agriculture, Organization of the United Nations. p 45.
Rao, G.G.S.N., Rao, V.U.M., Vijaya Kumar, P., Rao, A.V.M.S., and Ravindra Chary, G.
2010. Climate risk management and contingency crop planning. Lead papers. In:
National Symposium on Climate Change and Rainfed Agriculture, 18-20
February, 2010, CRIDA, Hyderabad, India. Organized by Indian Society of
109
Dryland Agriculture and Central Research Institute for Dryland Agriculture. Pp.
37.
Reddy, M. S., Rego, T.J., Burford, J. R., and Willey, R. W. 1982. Paper presented at
the Expert Consultations on Fertilizer use under multiple cropping systems,
organized by the FAO at IARI, New Delhi, February, 3-6.
Sehgal, J., and Abrol. I.P. 1994. Soil Degradation in. India. Status and the Impact.
Oxford IBH Publishing Co. Pvt. Ltd., New Delhi, Bombay, Calcutta.
Seybold CA, Mausbach MJ, Karlen DL, Rogers HH. 1998. Quantification of soil
quality. In Lal R, Kimble JM, Follett RF, Stewart BA, eds. Soil Processes and the
Carbon Cycle. Boca Raton, FL: CRC Press LLC, pp. 387–404.
Sharma, K. L. and Das, S. K. (1992). Nitrogen and phosphorus management in
dryland crops and cropping systems. In Dryland Agriculture in India - State of
Art of Research in India (L.L. Somani., K.P.R. Vittal and B.Venkateswarlu
eds).Scientific Publishers, P.O. Box 91, Jodhpur -342001, India pp 305-350.
Sharma, K. L., Vittal, K. P. R., Ramakrishna, Y. S., Srinivas, K., Venkateswarlu, B.,
and Kusuma Grace, J. 2007. Fertilizer use constraints and management in rainfed
areas with special emphasis on nitrogen use efficiency. In: (Y. P. Abrol, N.
Raghuram and M. S. Sachdev (Eds)), Agricultural Nitrogen Use and Its
Environmental Implications. I. K. International Publishing House, Pvt., Ltd. New
Delhi. Pp 121-138.
Sharma, K.L. Kusuma Grace, J. Uttam Kumar Mandal, Pravin N. Gajbhiye, Srinivas,
K. Korwar, G. R. Ramesh, V., Kausalya Ramachandran, and S. K. Yadav ( 2008)
Evaluation of long-term soil management practices through key indicators and
soil quality indices using principal component analysis and linear scoring
technique in rainfed Alfisols. Australian Journal of Soil Research. 46: 368-377.
Sharma, K.L., Mandal, U.K., Srinivas, K., Vittal, K.P.R., Biswapati Mandal, Grace,
J.K., and Ramesh, V. 2005. Long-term soil management effects on crop yields and
soil quality in a dryland Alfisol. Soil-and-Tillage-Research. 83(2): 246-259.
Sharma, K.L., Srinivas, K., Mandal, U.K., Vittal, K.P.R., Kusuma Grace, J., and
Maruthi Sankar, G. (2004). Integrated Nutrient Management Strategies for
Sorghum and Green gram in Semi arid Tropical Alfisols. Indian Journal of
Dryland Agricultural Research and Development 19 (1): 13-23.
Sharma, K.L., Vittal, K.P.R., Srinivas, K., Venkateswarlu, B. and Neelaveni, K.
(1999) Prospects of organic farming in dryland agriculture. In Fifty Years of
110
Dryland Agricultural Research in India (Eds. H.P. Singh, Y.S. Ramakrishna, K.L.
Sharma and B. Venkateswarlu) Central Research Institute for Dryland
Agriculture, Santoshnagar, Hyderabad, pp 369-378.
Singh, R. P. and Das S. K. 1984. Nitrogen management in cropping systems with
particular reference to rainfed lands of India. In: Nutrient management in
drylands with special reference to cropping systems and semi-arid red soils. All
India Coordinated Research Project for Dryland Agriculture, Hyderabad, India.
pp. 1-56.
Unger, P.W. (1990). Conservation tillage systems. Adv. Soil Sci. 13, 27-68.
Unger, P.W., and McCalla, T.M. 1980. Conservation tillage systems. Adv. Agron.
33: 1–58.
111
IMPACT OF CLIMATE CHANGE ON CROPS
M. Vanaja, Principal Scientist, Central Research Institute for Dryland
Agriculture,
Santoshnagar, Hyderabad- 500 059
Impact of climate change on agriculture will be one of the major deciding
factors influencing the future food security of mankind on the earth. Agriculture is
not only sensitive to climate change but at the same time is one of the major drivers
for climate change. Understanding the weather changes over period of time and
adjusting the management practices towards achieving better harvest is a challenge
to the growth of agricultural sector as a whole.
Relatively small changes in climate can have significant impacts on
agricultural productivity. The climate sensitivity of agriculture is uncertain, as there
is regional variation of rainfall, temperature, crops and cropping system, soils and
management practices. The inter-annual variability of crop yields is particularly
sensitive to changes in climatic variability. The inter-annual variations in
temperature and precipitation were much higher than the predicted changes in
temperature and precipitation. The crop losses may increase if the predicted climate
change increases the climate variability. The tropics are more dependent on
agriculture as 75% of world population lives in tropics and two thirds of these
people main occupation is agriculture. With low levels of technology, wide range of
pests, diseases and weeds, land degradation, unequal land distribution and rapid
population growth, any impact on tropical agriculture will affect their livelihood.
India, being a large country, experiences wide fluctuations in climatic
conditions with cold winters in the north, tropical climate in south, arid region in
west, wet climate in the east, marine climate in coastline and dry continental climate
in interior. A likely impact of climate change on agricultural productivity in India is
causing a great concern to the scientists and planners as it can hinder their attempts
for achieving household food security. Food grain requirements in the country (both
human and cattle) would reach about 300 mt in 2020. The future agriculture sector is
under enormous pressure to address the increasing demand for food, fibre and fuel
as well as income, employment and other essential ecosystem services for the
growing population from less affable natural resources such as diminishing
availability of water and arable land and warmer atmosphere. Any measures to
maximize the production or productivity to address these multiple demands placed
on agriculture should have inbuilt mechanisms to reduce the greenhouse gas
emissions as well as required to possess more potential to sequester the carbon or
otherwise culminate into disastrous climatic conditions.
Temperature
The global warming depends upon the total stock of GHGs in the atmosphere
and continued emissions beyond the earth’s adsorptive capacity necessarily imply a
rise in temperature. Agriculture is expected to be affected by changes in
temperature, precipitation and atmospheric carbon dioxide concentrations. The
increasing concentration of greenhouse gases is predicted to increase average global
temperatures gradually. The gradually increasing concentrations of greenhouse
112
gases will lead to gradually increasing global temperatures and more precipitation.
The global temperature increases, however, are not likely to be uniform across the
planet. Most climate models agree that the temperature increases will be larger in
the higher latitudes and that they will be greater at night than during the day. That
is, global warming will increase average temperatures but it will also decrease the
range of temperatures both through the day (diurnal cycle) and across latitudes. The
mean atmospheric temperatures of the globe have been on the increase and the last
13 out of 15 years recorded the highest temperatures in the last 100 years. The
frequency of occurrence of heat and cold waves is on the increase. Significant
changes in daily maximum and minimum temperatures are observed.
The mean global temperature rose by 0.6°C over the past 100 years. The
projections suggest that the global surface temperature may increase by 1.4 to 5.8°
by the end of the Century if there is no let up in the release of GHG into the
atmosphere. Warmest summers were observed in the last decade of the past
Century and the warming phase continued in this decade also during 2002 and 2003
in Asian Sub-continent and Europe, which has witnessed heavy human causalities.
Exceeding crop-specific high temperature thresholds may result in a
significantly higher risk of crop failure. The inter-annual variability of crop yields is
particularly sensitive to changes in climatic variability. In regions where crop
production is affected by water shortages, increases in the year-to-year variability of
yields in addition to lower mean yields are predicted. It was estimated that a 0.5ºC
increase in winter temperature would reduce wheat crop duration by seven days
and reduce yield by 0.45 tonne per hectare. An increase in winter temperature by
0.5ºC would thereby translate into a 10 per cent reduction in wheat production in
the high-yield states of Punjab, Haryana and UP. An estimated 2ºC increase in mean
air temperature could decrease rice yield by about 0.75 tonne per hectare in high
yield areas and by about 0.60 tonne per hectare in low coastal regions. Even with
adaptation by farmers of their cropping patterns and inputs in response to climate
change, the losses would remain significant. The loss in farm level net revenue is
estimated to range between 9 and 25% for a temperature rise of 2.0ºC to 3.5ºC.
Precipitation
Climate model predictions of CO2-induced global warming typically suggest that
rising temperatures should be accompanied by increases in rainfall amounts and
intensities, as well as enhanced variability. Both the number and intensity of heavy
precipitation events are projected to increase in a warming world, according to the
IPCC. Monsoon rainfall is an important socio-economic feature of India, and that
climate models suggest that global averaged temperatures are projected to rise
under all scenarios of future energy use, leading to "increased variability and
strength of the Asian monsoon." Kripalani et al. report, "there is no clear evidence to
suggest that the strength and variability of neither the Indian Monsoon Rainfall
(IMR) nor the epochal changes are affected by the global warming." The analysis of
observed data for the 131-year period (1871-2001) suggests no clear role of global
warming in the variability of monsoon rainfall over India."
113
Earth's climate is determined by a conglomerate of cycles within cycles, all of
which are essentially independent of the air's CO2 concentration; and it
demonstrates that the multi-century warm and cold periods of the planet's
millennial-scale oscillation of temperature may have both wetter and drier periods
embedded within them. Consequently, it can be appreciated that warmth alone is
not a sufficient condition for the concomitant occurrence of the dryness associated
with drought.
Water availability
Of the 1.5 billion hectares (ha) of cropland worldwide, only 18% (277 million
hectare) is irrigated land; the remaining 82 percent is rainfed land. The importance
of rainfed agriculture varies regionally, and is most significant in country like India
where rainfed agriculture accounts for about 65% of the cropland and 70% of
population main occupation. Under current water use practices, increases in
population and changes in diet are projected to increase water consumption in food
and fiber production by 70-90%. If demands for biomass energy increase, this may
aggravate the problem. In addition, sectoral competition for water resources will
intensify, further exacerbating the stress on developing country producers.
Throughout the 20th century, global water use has increased in the agricultural,
domestic and industrial sectors. Evaporation from reservoirs has increased at a
slower rate. Projections indicate that both global water use and evaporation will
continue to increase.
Climate model predictions of CO2-induced global warming typically suggest
that rising temperatures should be accompanied by increases in rainfall amounts
and intensities, as well as enhanced variability. Both the number and intensity of
heavy precipitation events are projected to increase in a warming world, according
to the IPCC. More intense and longer droughts have been observed over wider areas
since 1970’s, particularly tropics and subtropics (IPCC, 2007). Increased drying
linked with higher temperatures and decreased precipitation has contributed to
changes in drought. Changes in sea surface temperatures (SST), wind pattern and
decreased snow pack and snow cover have also been linked to droughts. Many
regions across the world started witnessing increased occurrence of extreme
weather events. There have been events of increased number of intense cyclonic
events and increase in occurrence of high rainfall events, even though the quantum
of rainfall had not shown large changes.
Impacts of GHGs
Rice, wheat, maize, sorghum, soybean and barley are the six major crops in
the world and they are grown in 40% cropped area, 55% of non-meat calories and
over 70% of animal feed (FAO, 2006). Since 1961, there is substantial increase in the
yield of all the crops. The impact of warming was likely offset to some extent by
fertilization effects of increased CO2 levels. At the global scale, the historical
temperature- yield relationships indicate that warming from 1981 to 2002 very
likely offset some of the yield gains from technological advance, rising CO2 and other
non-climatic factors.
114
The carbon dioxide level in the atmosphere has been rising and that this rise
is due primarily to the burning of fossil fuels and to deforestation. Measured in
terms of volume, there were about 280 parts of CO2 in every million parts of air at
the beginning of the Industrial Revolution, and there are 370 parts per million
(ppm) today, a 30 percent rise. The annual increase is 1.9 ppm, and if present trends
continue, the concentration of CO2 in the atmosphere will double to about 700 ppm
in the latter half of the 21st century.
Carbon dioxide is the basic raw material that plants use in photosynthesis to
convert solar energy into food, fiber, and other forms of biomass. Voluminous
scientific evidence shows that if CO2 were to rise above its current ambient level of
370 parts per million, most plants would grow faster and larger because of more
efficient photosynthesis and a reduction in water loss. There are two important
reasons for this productivity boost at higher CO2 levels. One is superior efficiency of
photosynthesis and the other is a sharp reduction in water loss per unit of leaf area.
By partially closing stomatal pores, higher CO2 levels greatly reduce the plants'
water loss- a significant benefit in arid and semi arid climates where water is
limiting the productivity.
The mean response to a doubling of the CO2 concentration from its current
level of 360 ppm is a 32 percent improvement in plant productivity, with varied
manifestations in different species. Cereal grains with C3 metabolism, including rice,
wheat, barley, oats, and rye, show yield increases ranging from 25 to 64 percent,
resulting from a rise in carbon fixation and reduction in photo-respiration. Food
crops with C4 metabolism, including corn, sorghum, millet, and sugarcane, show
yield increases ranging from 10 to 55 percent, resulting primarily from superior
efficiency in water use. In crop plants, a distinction has to be made between the
increase in total biomass and increase in economic yield resulting from an elevated
CO2 supply. When the dry mass production and yield increase of the world's ten most
important crop species in response to elevated CO2 was analyzed from different
experiments, it was found that in some species the relative increase of total biomass
and in others that of economic yield is greater.
Field crops under drought often experience two quite different but related
and simultaneous stresses: soil water deficit and high temperature stresses.
Elevated CO2 increase growth, grain yield and canopy photosynthesis while
reducing evapotranspiration. During drought stress cycles, this water savings under
elevated CO2 allow photosynthesis to continue for few more days compared with the
ambient CO2 so that increase drought avoidance. Elevated atmospheric CO2
concentration ameliorates, to various degrees, the negative impacts of soil water
deficit and high temperature stresses.
Methane in the Earth's atmosphere is an important greenhouse gas with a
global warming potential of 25 over a 100-year period. This means that a methane
emission will have 25 times the impact on temperature of a carbon dioxide emission
of the same mass over the following 100 years. Methane has a large effect for a brief
period (a net lifetime of 8.4 years in the atmosphere), whereas carbon dioxide has a
small effect for a long period (over 100 years). Because of this difference in effect
and time period, the global warming potential of methane over a 20 year time
115
period is 72. The Earth's methane concentration has increased by about 150% since
1750, and it accounts for 20% of the total radiative forcing from all of the long-lived
and globally mixed greenhouse gases.
Methane is emitted from a variety of both human-related (anthropogenic)
and natural sources. Human-related activities include fossil fuel production, animal
husbandry (enteric fermentation in livestock and manure management), rice
cultivation, biomass burning, and waste management. These activities release
significant quantities of methane to the atmosphere. It is estimated that 60% of
global methane emissions are related to human-related activities. Natural sources of
methane include wetlands, gas hydrates, permafrost, termites, oceans, freshwater
bodies, non-wetland soils, and other sources such as wildfires.
Soils emit N2O through biological and non-biological pathways and the
agricultural lands are most significant sources of this GHG. The quantity of N2O
emitted from agricultural land dependent on fertilizer application and subsequent
microbial denitrification of the soil. Emissions of N2O from soils are estimated to be
as much as 16 percent of global budget of N2O. Various agricultural soil management
practices contribute to greenhouse gas emissions. Agricultural soil management
practices such as irrigation, tillage or the fallowing of land can affect the efflux of
these gases. Level of N2O emissions may be dependent on the type of fertilizer used,
amount and placement depth of fertilizer, soil moisture and temperature. Tilling
tends to decrease N2O emissions; no-till and herbicides may increase N2O emissions.
In order to estimate how greenhouse gases will impact farming, we must
examine the range of climate change predictions. We also must predict what farming
will look like in the distant future. Climate change will occur slowly. The impacts we
are concerned about will occur in the second half of the 21st century. It is
consequently important to project what agriculture will look like in 50 to 100 years
because it is this future system that will be affected. The answers to these basic
questions about future agriculture will help determine what global warming will
likely do to the agricultural sector.
Adaptation strategies
Agriculture is one sector, which is immediately affected by climate change,
and it is expected that the impact on global agricultural production may be small.
However, regional vulnerabilities to food deficits may increase. Short or long-term
fluctuations in weather patterns - climate variability and climate change- can
influence crop yields and can force farmers to adopt new agricultural practices in
response to altered climatic conditions. Climate variability / change, therefore, have
a direct impact on food security. Seasonal precipitation distribution patterns and
amounts could change due to climate change. With warmer temperatures, evapo-
transpiration rates would raise, which would call for much greater efficiency of
water use. Yields can be significantly enhanced by improved agricultural water
management, in particular by increasing water availability through on-farm water
management techniques such as water harvesting and supplemental irrigation, and
by increasing the water uptake capacity of crops through measures such as
116
conservation farming. In many circumstances, investments in improved water
management in rainfed agriculture are catalytic, reducing barriers to the adoption.
The potential effect of climate change on agriculture is the shifts in the
sowing time and length of growing seasons geographically, which would alter
planting and harvesting dates of crops and varieties currently used in a particular
area. The crop varieties with short duration and/or tolerance to high temperature,
flooding, drought are recommended to fit in future predicted conditions with more
frequent extreme events such as heat waves, droughts, and floods.
Increasing agricultural production in order to meet projected increases in
demands can be accomplished by bringing new land into agricultural production,
increasing the cropping intensity on existing agricultural lands and increasing yields
on existing agricultural lands. Adoption of any one of these strategies will depend
upon local availability of land and water resources, agro-ecological conditions and
technologies used for crop production, as well as infrastructural and institutional
development. Seventy-five percent of the projected growth in crop production in
developing countries comes from yield growth and 16 percent from increases in
cropping intensity.
Many under developed and developing countries are already vulnerable to
weather shocks, having already weak economies, without significant investments in
agriculture and limited institutional capacities to adapt, future climate changes will
increase this vulnerability. Thus, increasing the resilience of agricultural systems is
a key means of adapting to climate change as well as increasing food security. Food
security exists when all people, at all times, have physical and economic access to
sufficient, safe and nutritious food to meet their dietary needs and food preferences
for an active and healthy life.
117
ENERGY EFFICIENCY IN AGRICULTURE TO MINIMIZE GHG
EMISSIONS
I. Srinivas, Senior Scientist (Farm Machinery and Power) Central Research
Institute for Dryland Agriculture, Santoshnagar, Hyderabad
Introduction: The agriculture sector has at its core the production process for foodstuff (e.g.,
grains, fruits and vegetables, meat, fish, poultry, and milk), and non-food vegetable
products of economic value (e.g., tobacco, jute, hemp). However, the sector also
comprises or has close links with processes that take place before and after this core
production process, such as fertilizer production, post-harvest processing, and
transport of foodstuff. Defined broadly, the agriculture sector has as its primary goal
the delivery of food on the table for the population or for export. Despite the relative
importance of this sector to economic activity and employment in the Developing
countries, agricultural energy use tends to be small compared to that in industry or
transport.
Energy needs of Agriculture and its impact on emissions:
Agriculture requires energy at all stages of production. Energy is used by
agricultural machinery (e.g., tractors and harvesters), irrigation systems and pumps,
which may run on electricity, diesel, or other energy sources. Energy is also needed
for processing and conserving agricultural products, transportation, and storage. In
that respect, it is a critical factor in adding value in the agricultural sector. Indirect
energy use occurs mainly through the production and application of mineral
fertilizers and chemicals required to improve crop yields. In many cases, electricity
and fuel use tends to be inefficient because of price subsidies, and thus mitigation
options may offer a significant potential for improving efficiency and reducing GHG
emissions from this sector.
Mitigation options available for energy conservation in agriculture sector:
Potential mitigation options for agricultural energy use are described below. While
some of the options are not yet available for widespread implementation, or need
more scientific and economic analysis before their applicability can be assessed,
they are also presented since they might become feasible later on. The main near-
term option likely to be of interest for GHG mitigation is efficiency improvement in
irrigation. The use of various renewable sources of energy for agricultural
applications (e.g., wind-driven pumps, solar drying, diesel engines powered with
mostly gasified biomass) have been tested on a limited scale and may be of interest
in some cases. (Agricultural residues may also be used for meeting energy demands
outside the agriculture sector - e.g., for cogeneration in agro-processing industries.)
118
� Reduce energy use for irrigation.
Irrigating crops often requires considerable amounts of electricity or diesel fuel.
Reducing energy consumption for irrigation while providing the desired service
may be accomplished through use of more efficient pump sets and water-frugal
farming methods. To improve the efficiency of irrigation pump sets, a number of
technical measures are available. These include: use foot valves that have low-flow
resistance; replace undersized pipes and reduce number of elbows and other fittings
that cause frictional losses; use high-efficiency pumps; select pumps better matched
to the required lift characteristics; use rigid PVC pipes for suction and delivery;
operate pumps at the recommended RPM; select prime mover for the pump (i.e.,
electric motor or diesel engine) matched to the load; select an efficient diesel engine
or motor for the application; schedule and perform recommended maintenance of
the pump and the prime mover; and ensure efficient transmission of mechanical
power from the prime mover to the pump.
� Increase the efficiency of non-pumping farm machinery: Energy use for traction for cultivation, sowing, weeding, harvesting, and other
operations can be reduced through use of more efficient equipment or by
minimizing the need for traction through low-tillage agriculture.
� Switch to lower-carbon energy sources: Options in this category include wind- and photovoltaic-powered pumps, enhanced
solar drying, and use of biofuels instead of fossil fuels in various applications where
heat is required.
� Reduce input of chemical fertilizers:
The two basic ways of reducing the input of chemical fertilizers are to target
fertilizer application better and to substitute organic or microbial fertilizers for
chemical fertilizers. Reduced demand for chemical fertilizer lowers energy use in
the chemical industry. There have been limited studies in developing and transition
countries on reducing the intensity of chemical fertilizer inputs through improved
application or use of organic fertilizers so assessing the potential impact of this
option is difficult.
� Use conservation tillage systems:
Conservation tillage practices store carbon in the soil through retention of
vegetative matter (crop residue). Since most conservation tillage practices reduce
the number of trips across a field needed to grow and gather a crop, total energy
required to grow a crop is reduced.
� Improve efficiency of post-harvest drying and storage: Various agricultural products are subjected to drying or cold storage before they
are sent to market. The efficiency of these processes can generally be improved
through use of better equipment and proper maintenance.
� Reduce post-harvest food grain losses: Assuming that food needs are being met, use of storage methods impervious to
pests and rodents can reduce the need for crop production, thereby saving the
energy that would be used in that production.
119
Energy efficient Technologies presently using in agriculture: 1. Conservation Agriculture:
In the context of mitigation of GHG’s, conservation tillage, defined, in general terms,
as the reduction of soil tillage intensity in combination with the maintenance of crop
residues on the soil surface, can play a decisive role. Nothing is more important to
humanity than reliable food production, but the mechanization and intensification
of traditional tillage based systems has exacerbated major environmental problems,
because:
1. Conventional tillage is fossil-energy intensive process, which also accelerate s
oxidation of soil organic matter
2. Conventional tillage buries residue, which is the surface soil’s natural
protection against erosion by wind and water
3. Tillage and traffic cause subsurface degradation, reducing soil biological
activity and promoting root zone water logging, which converts crop
nutrients into nitrous oxide and methane-both damaging the greenhouse gases.
Conservation tillage was originally developed to halt the soil erosion caused by
traditional tillage based agriculture. The first conservation agriculture system
identified soil tillage as a major problem, and replaces this with herbicide and other
weed control measures. It is a concept for resource-saving agricultural crop
production that strives to achieve acceptable profits together with high and
sustained production levels while concurrently conserving the environment. It is
based on enhancing natural biological processes above and below the ground.
Interventions such as mechanical soil tillage are reduced to an absolute minimum,
and the use of external inputs such as agrochemicals and nutrients of mineral or
organic origin are applied at an optimum level and in a way and quantity that does
not interfere with, or disrupt, the biological processes. Conservation Agriculture is
characterized by three principles which are linked to each other, namely:
• Continuous minimum mechanical soil disturbance.
• Permanent organic soil cover.
• Diversified crop rotations in the case of annual crops or plant associations in
case of perennial crops.
Advantages of Conservation Agriculture:
Conservation Agriculture, understood in this way, provides a number of advantages
on global, regional, local and farm level:
• It provides a truly sustainable production system, not only conserving but
also enhancing the natural resources and increasing the variety of soil biota, fauna
and flora (including wild life) in agricultural production systems without sacrificing
yields on high production levels. As CA depends on biological processes to work, it
enhances the biodiversity in an agricultural production system on a micro- as well
as macro level.
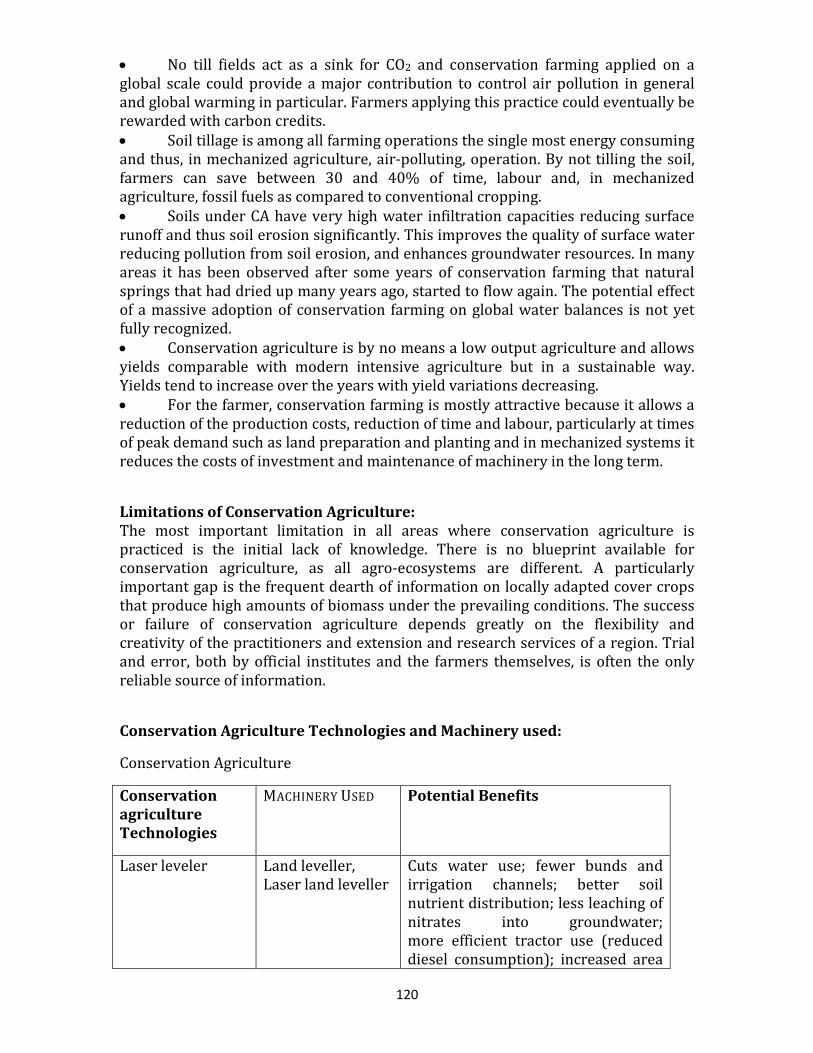
120
• No till fields act as a sink for CO2 and conservation farming applied on a
global scale could provide a major contribution to control air pollution in general
and global warming in particular. Farmers applying this practice could eventually be
rewarded with carbon credits.
• Soil tillage is among all farming operations the single most energy consuming
and thus, in mechanized agriculture, air-polluting, operation. By not tilling the soil,
farmers can save between 30 and 40% of time, labour and, in mechanized
agriculture, fossil fuels as compared to conventional cropping.
• Soils under CA have very high water infiltration capacities reducing surface
runoff and thus soil erosion significantly. This improves the quality of surface water
reducing pollution from soil erosion, and enhances groundwater resources. In many
areas it has been observed after some years of conservation farming that natural
springs that had dried up many years ago, started to flow again. The potential effect
of a massive adoption of conservation farming on global water balances is not yet
fully recognized.
• Conservation agriculture is by no means a low output agriculture and allows
yields comparable with modern intensive agriculture but in a sustainable way.
Yields tend to increase over the years with yield variations decreasing.
• For the farmer, conservation farming is mostly attractive because it allows a
reduction of the production costs, reduction of time and labour, particularly at times
of peak demand such as land preparation and planting and in mechanized systems it
reduces the costs of investment and maintenance of machinery in the long term.
Limitations of Conservation Agriculture: The most important limitation in all areas where conservation agriculture is
practiced is the initial lack of knowledge. There is no blueprint available for
conservation agriculture, as all agro-ecosystems are different. A particularly
important gap is the frequent dearth of information on locally adapted cover crops
that produce high amounts of biomass under the prevailing conditions. The success
or failure of conservation agriculture depends greatly on the flexibility and
creativity of the practitioners and extension and research services of a region. Trial
and error, both by official institutes and the farmers themselves, is often the only
reliable source of information.
Conservation Agriculture Technologies and Machinery used:
Conservation Agriculture
Conservation agriculture Technologies
MACHINERY USED Potential Benefits
Laser leveler Land leveller,
Laser land leveller
Cuts water use; fewer bunds and
irrigation channels; better soil
nutrient distribution; less leaching of
nitrates into groundwater;
more efficient tractor use (reduced
diesel consumption); increased area
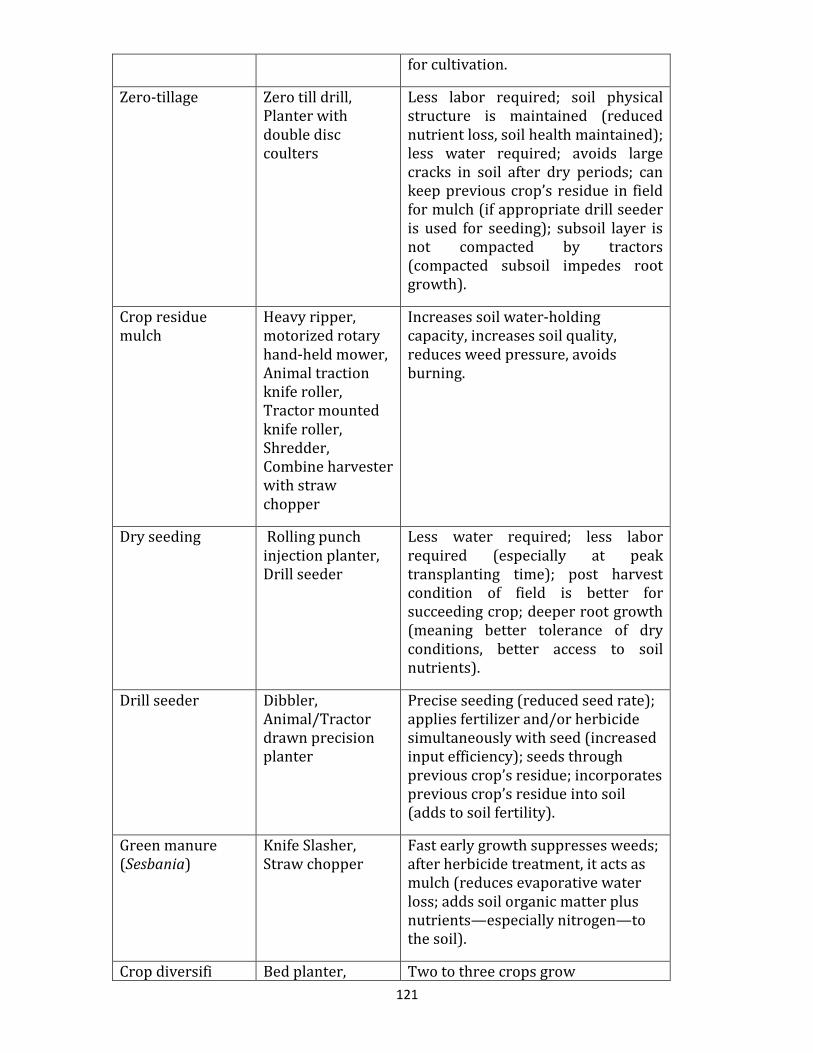
121
for cultivation.
Zero-tillage Zero till drill,
Planter with
double disc
coulters
Less labor required; soil physical
structure is maintained (reduced
nutrient loss, soil health maintained);
less water required; avoids large
cracks in soil after dry periods; can
keep previous crop’s residue in field
for mulch (if appropriate drill seeder
is used for seeding); subsoil layer is
not compacted by tractors
(compacted subsoil impedes root
growth).
Crop residue
mulch
Heavy ripper,
motorized rotary
hand-held mower,
Animal traction
knife roller,
Tractor mounted
knife roller,
Shredder,
Combine harvester
with straw
chopper
Increases soil water-holding
capacity, increases soil quality,
reduces weed pressure, avoids
burning.
Dry seeding Rolling punch
injection planter,
Drill seeder
Less water required; less labor
required (especially at peak
transplanting time); post harvest
condition of field is better for
succeeding crop; deeper root growth
(meaning better tolerance of dry
conditions, better access to soil
nutrients).
Drill seeder Dibbler,
Animal/Tractor
drawn precision
planter
Precise seeding (reduced seed rate);
applies fertilizer and/or herbicide
simultaneously with seed (increased
input efficiency); seeds through
previous crop’s residue; incorporates
previous crop’s residue into soil
(adds to soil fertility).
Green manure
(Sesbania)
Knife Slasher,
Straw chopper
Fast early growth suppresses weeds;
after herbicide treatment, it acts as
mulch (reduces evaporative water
loss; adds soil organic matter plus
nutrients—especially nitrogen—to
the soil).
Crop diversifi Bed planter, Two to three crops grow
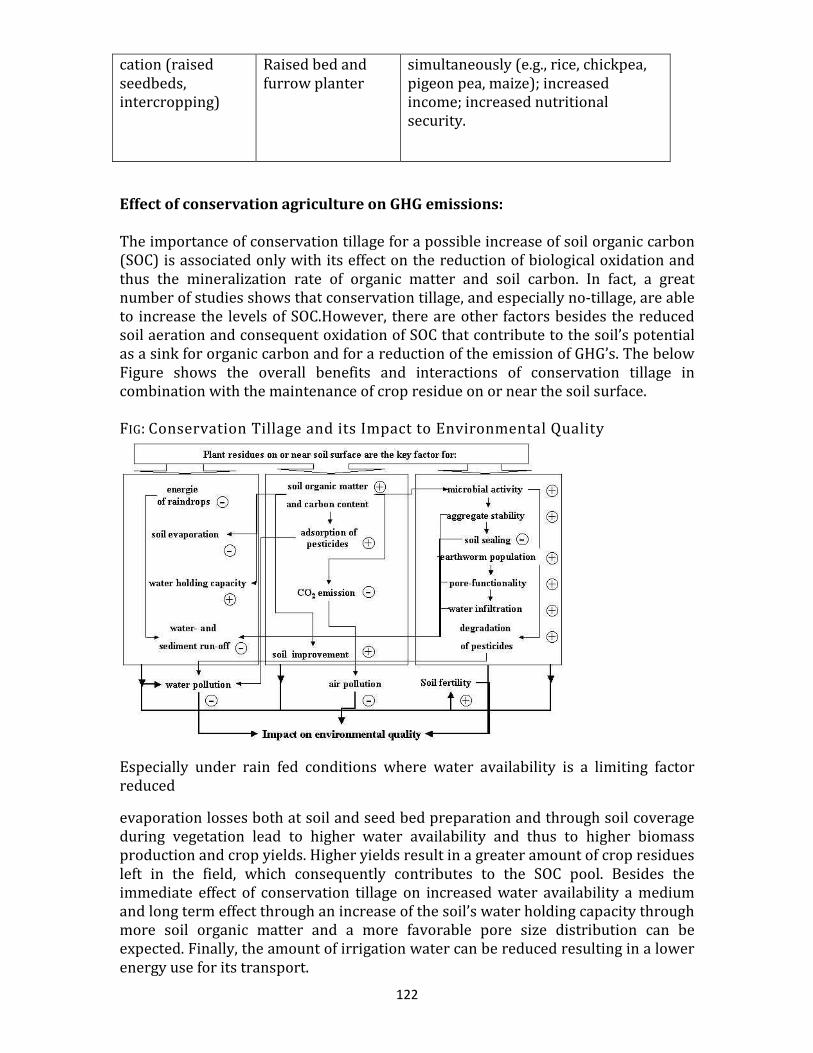
122
cation (raised
seedbeds,
intercropping)
Raised bed and
furrow planter
simultaneously (e.g., rice, chickpea,
pigeon pea, maize); increased
income; increased nutritional
security.
Effect of conservation agriculture on GHG emissions: The importance of conservation tillage for a possible increase of soil organic carbon
(SOC) is associated only with its effect on the reduction of biological oxidation and
thus the mineralization rate of organic matter and soil carbon. In fact, a great
number of studies shows that conservation tillage, and especially no-tillage, are able
to increase the levels of SOC.However, there are other factors besides the reduced
soil aeration and consequent oxidation of SOC that contribute to the soil’s potential
as a sink for organic carbon and for a reduction of the emission of GHG’s. The below
Figure shows the overall benefits and interactions of conservation tillage in
combination with the maintenance of crop residue on or near the soil surface.
FIG: Conservation Tillage and its Impact to Environmental Quality
Especially under rain fed conditions where water availability is a limiting factor
reduced
evaporation losses both at soil and seed bed preparation and through soil coverage
during vegetation lead to higher water availability and thus to higher biomass
production and crop yields. Higher yields result in a greater amount of crop residues
left in the field, which consequently contributes to the SOC pool. Besides the
immediate effect of conservation tillage on increased water availability a medium
and long term effect through an increase of the soil’s water holding capacity through
more soil organic matter and a more favorable pore size distribution can be
expected. Finally, the amount of irrigation water can be reduced resulting in a lower
energy use for its transport.
123
Again, with regard to soil fertility soil organic matter acts as a key factor for
improvement of biomass production and crop yields, especially on the SOC depleted
intensively cultivated cropland with low stocking rates. Furthermore, improved soil
fertility will allow to reduce mineral fertilizer input contributing thus to reduced
energy use for its manufacturing and a reduced potential for the emission of nitrous
oxides. In this context the inclusion of winter cover crops in crop rotations as a
recommended management practice within the concept of Conservation Agriculture
(Derpsch, 2001) can also be regarded as a strategy to not only prevent nutrient
leaching and reduce fertilizer input but also to enhance SOC accumulation and to
improve soil fertility and biomass production.
Potential of Conservation Agriculture to reduce CO2 emissions and increase in
Carbon Sequestration
The estimation of the potential for carbon sequestration through conservation
tillage requires at least information on the potential land area, which could be
submitted to this change in soil management, and the rate with which carbon is
accumulated per unit of time and area as a consequence of this change. One of these
few attempts has been made by Smith et al. (1998), indicating a carbon
sequestration through no-tillage of around 0.4 t ha-1a-1. According to the same
authors the maintenance of 2 or 10 t of straw may have an additional effect on
carbon sequestration of around 0.2 or 0.7 t C ha-1a-1, respectively. Based on this
information carbon sequestration and savings in fuel consumption per hectare by
using conservation agriculture are given below:
- Carbon sequestration (reduced C emission) under no-tillage (NT): 0.77 t C ha-
1a-1
- Carbon sequestration under reduced tillage (RT): 0.50 t C ha-1a-1
- Reduced fuel consumption under NT: 44.2 l ha-1a-1
- Reduced fuel consumption under RT: 20.0 l ha-1a-1
2. Biogas technology:
Biogas is a proven and widely used source of energy in Asia. There is now yet
another wave of renewed interest in biogas due to the increasing concerns of
climate change, indoor air pollution and increasing oil prices. Such concerns,
particularly for climate change, open opportunities for the use of the Clean
Development Mechanism (CDM) in the promotion of biogas. Biogas originates from
bacteria during the process of bio-degradation of organic materials under anaerobic
(without air) conditions.biogas is produced from different types of biogas plants like
Ballon plants, Fixed dome type , Floating dome type depending up on raw material.
Biogas is a mixture of gases mainly composed of:
Methane (CH4): 40-70 % by volume
Carbon dioxide (CO2): 30-60 % by volume
Hydrogen (H2): 0-1 % by volume
Hydrogen sulfide (H2S): 0-3 % by volume
124
The burning of dung and plant residue is a considerable waste of plant nutrients.
Farmers in developing countries are in dire need of fertilizer for maintaining
cropland productivity. Nonetheless, many small farmers continue to burn
potentially valuable natural fertilizers, despite being unable to afford chemical
fertilizers. The amount of technically available nitrogen, potassium and
phosphorous in the form of organic materials is around eight times as high as the
quantity of chemical fertilizers actually consumed in developing countries. Biogas
technology is a suitable tool, especially for small farmers, for maximizing the use of
scarce resources. After extraction of the energy content of dung and other organic
waste material, the resulting sludge is still a good fertilizer, supporting soil quality
as well as higher crop yields.
Benefits of Biogas Technology:
Well-functioning biogas systems can yield a range of benefits for users, the society
and the environment in general:
� Production of energy (heat, light, electricity);
� Transformation of organic wastes into high-quality fertilizer;
� Improvement of hygienic conditions through reduction of pathogens, worm
eggs and flies;
� Reduction of workload, mainly for women, in firewood collection and
cooking;
� Positive environmental externalities through protection of soil, water, air and
woody vegetation;
� Economic benefits through energy and fertilizer substitution, additional
income sources and increasing yields of animal husbandry and agriculture;
� Other economic and eco-benefit through decentralized energy generation,
import substitution and environmental protection.
Applications of Biogas technology:
Cooking: Biogas can be used for cooking in a specially designed burner. A biogas
plant of 2 m3 capacity is sufficient for providing cooking fuel to a family of four to
five.
Lighting: Gas lamps can be fuelled by biogas. To power a 100-candle lamp (60 W),
the biogas required is 0.13 m3 per hour.
Power generation: Biogas can be used to operate a dual-fuel engine and can
replace up to 75% of the diesel. At presently biogas power based irrigation pumps
and sludge from biogas digester are using as power souces in agriculture. Still
biogas based IC engines are not extensively using in Indian agriculture. However,
the required high level of investment in capital and other limitations of biogas
technology should also be thoroughly considered. But there is a lot of scope for
deployment of these technologies in Indian agriculture.
125
Biogas Effect on GHG Emissions
Last but not least, biogas technology takes part in the global struggle against the
greenhouse effect by reducing the release of CO2 from burning fossil fuels in two
ways. First, biogas is a direct substitute for gas or coal for cooking, heating,
electricity generation and lighting. Second, the reduction in the consumption of
artificial fertiliser avoids carbon dioxide emissions that would otherwise come from
the fertiliser-producing industries. By helping to counter deforestation and
degradation caused by overusing ecosystems as sources of firewood and by
melioration of soil conditions, biogas technology reduces CO2 releases from these
processes and sustains the capability of forests and woodlands to act as a carbon
sink.
Methane, the main component of biogas is itself a greenhouse gas with a much
higher "greenhouse potential" than CO2. Converting methane to carbon dioxide
through combustion is another contribution of biogas technology in the mitigation
of global warming. However, this holds true only for the case that the material used
for biogas generation would otherwise undergo anaerobic decomposition, thereby
releasing methane into the atmosphere. Methane leaking from biogas plants without
being burned does contribute to the greenhouse effect. Burning biogas also releases
CO2. Similar to the sustainable use of firewood, this returns carbon dioxide which
has been assimilated from the atmosphere by growing plants. There is no net intake
of carbon dioxide in the atmosphere from biogas burning, as is the case when
burning fossil fuels.
3. Biofuels:
Adequate energy and power availability on Indian farms and in rural sector is
essential to enhance agricultural productivity and agro-processing facilities. The
availability of energy is closely linked to agricultural productivity and profitability.
Indian farms had only 0.3 kW/ha power in 1971 with 45% of it available from
animal power. Today it is close to 1.5 kW/ha with a diminished supply of animate
power and increased dependence on fuels and electricity. The contribution of
different power sources to the total power has changed with time. This change is
mainly due to increased use of tractors, whose contribution increased from 7.5 % in
1971 to 47 % in 2005-06.
Presently about 3 million (2004-05) tractors and power tillers in India farms
contribute about 65,000 MW of power. The share of stationary power in the overall
agricultural power availability has increased from 32 % in 1971-72 to 41 Percent in
2003-04. Average level of farm mechanization as on now is about 25 percent and
this level needs to be gradually increased to about 50 % in the next decade. Farm
operations in India presently consume 37-62 % of total energy used in cultivation of
different crops. The tractors and engines in the agricultural sector today consume
about 10 % of the total diesel consumption in the country. A serious effort is
required to quantify the energy and power requirements of agricultural sector with
growth targets of 4 % annually, the emerging scenario points for doubling the
energy availability during the next decade. Certain estimates indicate 1.4 MT
increase in diesel consumption by the agricultural sector every five years. There is a
requirement to make available different sources of alternate power for agricultural
126
needs. In this connection transport fuels of biological origin have drawn a great deal
of attention during the last two decades.
Biofuels are renewable liquid fuels coming from biological raw material and have
been proved to be good substitutes for oil. As such biofuels –ethanol and Biodiesel-
are aining worldwide acceptance as a solution for problems of environmental
degradation, energy security, restricting imports, rural employment and agricultural
economy.
Biodiesel is made from virgin or used vegetable oils (both edible & non-edible) and
animal fats through trans-esterification and is a diesel substitute and requires very
little or no engine modifications up to 20% blend and minor modification for higher
percentage blends. Since India cannot afford the use of edible vegetable oils as
power source because of its increased human population, planners suggested the
use of non-edible vegetable oils like Pongamia, Jatropha, etc for use as alternate
fuels. As India comprises of 40 % wasteland, it may be appropriate to grow non-
edible oil plants, which not only gives the oil but also enriches the environment by
adding green forest cover for ecological balance. Small-scale biodiesel production
units and oil expeller are available in the market for on farm application. The
petroleum companies also buy jatropha and pongamia oils at predetermined cost
from farmers.
Advantages of Biofuels: � Ethanol and biodiesel being superior fuels from the environmental point of
view
� Use of biofuels becomes compelling in view of the tightening of automotive
vehicle emission standards and court interventions,
� The need to provide energy security, specially for the rural areas,
� The need to create employment, specially for the rural poor living in areas
having high
incidence of land degradation,
� Providing nutrients to soil, checking soil erosion and thus preventing land
degradation,
� Addressing global concern relating to containing Carbon emissions,
� Reducing dependence on oil imports.
� Usability of biofuels in the present engines without requiring any major
modification
� The production of biofuels utilizing presently under-utilized resources of
land and of molasses and, in the process, generating massive employment for the
poor.
Effect of Biofuels on GHG emissions:
In agriculture sector there is no role to play for ethanol because it is produced from
industrial byproducts. So biodiesel is mainly used for blending with diesel in
agriculture diesel engines. For mitigating climate change by reducing emission of
green house gases, meeting rural energy needs, protecting the environment and
generating gainful employment Jatropha and Pongamia have multiple roles to play.
127
The use of biodiesel in conventional diesel/petrol engine results in substantial
reduction of GHG emissions like unburned hydrocarbons, carbon monoxide and
particulate matter. However, Emissions of nitrogen dioxides are either slightly
reduced or slightly increased depending on the duty cycle and testing methods. The
use of biodiesel decreases the solid carbon fraction of particulate matter (since the
oxygen in biodiesel enables more complete combustion to CO2), eliminates the
sulphur fraction (as there is no sulphur in the fuel), while the soluble or hydrogen
fraction stays the same or is increased. Biodiesel can blend with diesel up to 40% in
agriculture diesel engines with out any modifications and achieve up to 50%
reduction in emissions.
CDM opportunities in energy efficiency areas:
Energy efficiency and fuel switching measures for agricultural facilities and activities: 1. This category comprises any energy efficiency and/or fuel switching measure
implemented in agricultural activities of facilities or processes. This category covers
project activities that encourage energy efficiency or involves fuel switching.
Examples of energy-efficient practices include efficiency measures for specific
agricultural processes (such as less irrigation, etc.), and measures leading to a
reduced requirement of farm power per unit area of land, reflected in less and
smaller tractors, longer lifetime of tractors and less farm equipment. Further energy
efficient measures would be reducing fuel use in agriculture, such as reduced
machinery use through, e.g. the elimination of tillage operations, reduction of
irrigation, use of lighter machinery, etc. y comprises any energy efficiency and/or
fuel switching measure implemented in agricultural activities of facilities or
processes. This category covers project activities that encourage energy efficiency or
involves fuel switching. Examples of energy-efficient practices include efficiency
measures for specific agricultural processes (such as less irrigation, etc.), and
measures leading to a reduced requirement of farm power per unit area of land,
reflected in less and smaller tractors, longer lifetime of tractors and less farm
equipment. Further energy efficient measures would be reducing fuel use in
agriculture, such as reduced machinery use through, e.g. the elimination of tillage
operations, reduction of irrigation, use of lighter machinery, etc.
2. The measures may be replacement on existing equipment or equipment
being installed in a new facility.
3. The aggregate energy savings of a single project may not exceed the
equivalent of 60 GWh per year.
4. Grid-connected and biomass residue fired electricity generation project
activities, including cogeneration.

128
5. Grid connected Mini hydals integrated in water conservation structures.
This category covers project activities that encourage energy efficiency or involves
fuel switching. Examples of energy-efficient practices include efficiency measures
for specific agricultural processes (such as less irrigation, etc.), and measures
leading to a reduced requirement of farm power per unit area of land, reflected in
less and smaller tractors, longer lifetime of tractors and less farm equipment.
Further energy efficient measures would be reducing fuel use in agriculture, such as
reduced machinery us through, e.g. the elimination of tillage operations, reduction of
irrigation, use of lighter machinery, etc.
129
IMPACTS OF CLIMATE CHANGE ON PLANT PATHOGENS AND
ADAPTATION STRATEGIES
Suseelendra Desai, Principal Scientist (Plant Pathology), Central
Research Institute for Dryland Agriculture, Santoshnagar, Hyderabad
Abstract
Climate –variability and -change are exerting additional pressure on
developing countries of tropics and subtropics which are already at the
threshold to cope with the increasing demand for food for increasing
population pressure. Even a small increase in temperature in these areas
will cause significant yield declines in major food grain crops. The changing
climate not only influences the crop growth and development but also
expected to alter stages and rates of development of the pathogen, modify
host resistance, and result in changes in the physiology of host-pathogen
interactions. It is expected that the range of many insects, diseases and
weeds will expand or change, and new combinations of pests and diseases
may emerge when current natural ecosystems respond to altered
temperature and precipitation profiles. Although, the research in
establishing the impacts of pathogens and their natural enemies is at its
infancy, independent studies conducted across the laboratories could be
used to draw inferences. Elevated CO2 levels are known to increase foliar
density which in turn will influence the microclimate of the pathogen,
altered host morphology which in turn may influence host-pathogen
interaction, enhanced sporulation of anthracnose pathogen, and increased
dry-root rot under moisture stress conditions. For instance, an increase in
temperature may lead to increased host susceptibility, a new/rapid
development of the pathogen, more rapid vector development leading to
faster spread of the insect-borne viruses, a variable
overwintering/oversummering of the pathogen/vector; shift in spread
pattern of the pathogens. Initial studies show an increased sporulation and
altered biocontrol traits in Trichoderma, a known biocontrol agent. Efforts
are underway at CRIDA to assess climate change impacts on important
pathogens and their natural enemies. The present paper reviews the
interaction of different weather variables with different insects, diseases
and weeds and the probable threats for food grain production, availability
and quality.
Introduction Modern commercial agricultural systems are constantly under threat of
outbreak of disease epidemics. In conventional agricultural systems, crops
and their pathogens established a harmony and hence, equilibrium was
established through a natural evolution process over decades. This
equilibrium also included biocontrol systems wherein other living
organisms were parasitizing the plant pathogens. This equilibrium helped in
minimal crop losses due to diseases. However, increasing pressure on food
security demanded increased agricultural output and there by disturbing
130
the equilibrium. Hence, the global agriculture started experiencing the
outbreak of epidemics of crop diseases leading to severe losses. While this
development took place on one side, the environmental pollution has
become additional variable to be reckoned with which had impacts on all
biological systems. The elevated CO2 levels coupled with increasing
temperatures do affect host-pathogen interactions.
Elevated CO2 and host-pathogen interactions
Under elevated CO2 levels, the morpho-physiology of the crop plants is
significantly influenced. The bulk of the available data clearly suggests that
atmospheric CO2 enrichment asserts its greatest positive influence on
infected as opposed to healthy plants. This influence in turn will modulate
the balance of co-evolution between the host and the pathogen as well as
pathogen and biocontrol agent. Elevated carbon dioxide [ECO2] and
associated climate change have the potential to accelerate plant pathogen
evolution, which may, in turn, affect virulence. Plant–pathogen interactions
under increasing CO2 concentrations have the potential to disrupt both
agricultural and natural systems severely, yet the lack of experimental data
and the subsequent ability to predict future outcomes constitutes a
fundamental knowledge gap. Furthermore, nothing is known about the
mechanistic bases of increasing pathogen aggressiveness. Under elevated
CO2 conditions, mobilization of resources into host resistance through
various mechanisms such as reduced stomatal density and conductance,
(Hibberd et al., 1996a, 1996b); greater accumulation of carbohydrates in
leaves; more waxes, extra layers of epidermal cells and increased fibre
content (Owensby, 1994); production of papillae and accumulation of
silicon at penetration sites (Hibberd et al., 1996a); greater number of
mesophyll cells (Bowes, 1993); and increased biosynthesis of phenolics
(Hartley et al., 2000), increased tannin content (Parsons et al. 2003) have
been reported. Malmstrom and Field (1997) reported that CO2 enrichment
in oats may reduce losses of infected plants to drought and may enable
yellow dwarf diseased plants to compete better with healthy neighbors. On
the contrary, in tomato, the yields were at par (Jwa and Walling, 2001).
Similarly, Tiedemann and Firsching (2000) reported yield enhancement in
spring wheat infected with rust incubated under elevated CO2 and ozone
conditions. Chakraborty and Datta (2003) reported loss of aggressiveness of
Colletotrichum gloeosporioides on Stylosanthes scabra over 25 infection
cycles under elevated CO2 conditions. On the contrary, pathogen fecundity
increased due to altered canopy environment. McElrone et al. (2005) found
that exponential growth rates of Phyllosticta minima were 17% greater
under elevated CO2. Simultaneously, in the host Acer rubrum, the infection
process was hampered due to stomatal conductance was reduced by 21-
36% and thereby leading to smaller openings for infecting germ tubes and
altered leaf chemistry. Reduced incidence of Potato virus Y on tobacco
(Matros et al., 2006), enhanced glyocellins (phytoalexins) after elicitation
with ß-glucan in soybeans against stem canker (Braga et al., 2006) and
reduced leafspot in stiff goldenrod due to reduced leaf nitrogen content that
131
imparted resistance (Strengbom and Reich, 2006). Lake and Wade (2009)
have shown that Erysiphe cichoracearum aggressiveness increased
under elevated CO2, together with changes in the leaf epidermal
characteristics of the model plant Arabidopsis thaliana. Stomatal density,
guard cell length, and trichome numbers on leaves developing post-
infection are increased under ECO2 in direct contrast to non-infected
responses. As many plant pathogens utilize epidermal features for
successful infection, these responses provide a positive feedback
mechanism facilitating an enhanced susceptibility of newly developed
leaves to further pathogen attack. Furthermore, screening of resistant and
susceptible ecotypes suggests inherent differences in epidermal responses
to elevated CO2. Gamper et al. (2004) noted that colonization levels of
arbuscular mycorrhizae tended to be high and on Lolium perenne and
Trifolium repens which may help in increased protection against stresses.
Impacts of elevated temperature and high intensity rainfall
Hannukkala et al (2007) have reported increased and early occurrence of
epidemics of late blight of potato in Finland due to climate change and lack
of crop rotation. Jones et al (2003) have reported differential response of
host resistance in wheat against Puccinia recondita at differential
temperatures. Under drought stress, the disease symptoms may be reduced
but at the same time the resistance of the host can also be modified thus
leading to higher disease incidence. Drought impacted disease resistant
plant types showed loss of resistance. Some pathogens could also enhance
their ability to exhibit variability with which their fitness to the changed
environment is enabled. Such kind of variability has also been suggested as
an early indicator of environmental change because of their short
generation times.
Research needs
Impact of climate change on plant diseases is poorly understood due to the
paucity of studies in this area. Research has started only recently to
understand the impacts of climate change on agricultural systems. A
process-based approach is required to quantify the impact on
pathogen/disease cycle is potentially the most useful in defining the impact
of elevated CO2 on plant diseases. The projections for the future depict that
appropriate adaptation and mitigation strategies should be developed to
meet worst possible scenarios.
In view of these opposing changes in pathogen behavior at elevated levels of
atmospheric CO2, it is difficult to know the ultimate outcome of atmospheric
CO2 enrichment for this specific pathogen-host relationship. More research,
especially under realistic field conditions, will be needed to clarify the
situation; and, of course, different results are likely to be observed for
different pathogen-host associations. Similarly, the relationships between
biocontrol agents and the pathogens need to be studied in relation to
enhanced CO2 to assimilate the ultimate effects on a systems basis for
different climatic conditions.
132
Conclusion
In summation, the vast bulk of the available data clearly suggests that
atmospheric CO2 enrichment asserts its greatest positive influence on
infected as opposed to healthy plants. Moreover, it would appear that
elevated CO2 has the ability to significantly ameliorate the deleterious
effects of various stresses imposed upon plants by numerous pathogenic
invaders. Consequently, as the atmosphere's CO2 concentration continues its
upward climb, earth's vegetation should be increasingly better equipped to
successfully deal with pathogenic organisms and the damage they have
traditionally done to mankind's crops, as well as to the plants that sustain
the rest of the planet's animal life.
Selected References
Bowes, G. (1993). Facing the inevitable: Plants and increasing atmospheric
CO2. Annual Review of Plant Physiology and Plant Molecular Biology 44: 309-
332.
Braga, M.R., Aidar, M.P.M., Marabesi, M.A. and de Godoy, J.R.L. (2006). Effects
of elevated CO2 on the phytoalexin production of two soybean cultivars
differing in the resistance to stem canker disease. Environmental and
Experimental Botany 58: 85-92.
Chakraborty, S. and Datta, S. (2003). How will plant pathogens adapt to host
plant resistance at elevated CO2 under a changing climate? New Phytologist
159: 733-742.
Chakraborty, S., Pangga, I.B., Lupton, J., Hart, L., Room, P.M. and Yates, D.
(2000). Production and dispersal of Colletotrichum gloeosporioides spores
on Stylosanthes scabra under elevated CO2. Environmental Pollution 108:
381-387.
Gamper, H., Peter, M., Jansa, J., Luscher, A., Hartwig, U.A. and Leuchtmann, A.
(2004). Arbuscular mycorrhizal fungi benefit from 7 years of free air CO2
enrichment in well-fertilized grass and legume monocultures. Global Change
Biology 10: 189-199.
Garrett, K.A., Dendy, S.P., Frank, E.E., Rouse, M.N. and Travers, S.E. (2006).
Climate change effects on plant disease:Genomes to ecosystems. Annual
Review of Phytopathology 44:489-509.
Hartley, S.E., Jones, C.G. and Couper, G.C. (2000). Biosynthesis of plant
phenolic compounds in elevated atmospheric CO2. Global Change Biology 6:
497-506.
Hibberd, J.M., Whitbread, R. and Farrar, J.F. (1996b). Effect of 700 µmol per
mol CO2 and infection of powdery mildew on the growth and partitioning of
barley. New Phytologist 134: 309-345.
133
Hibberd, J.M., Whitbread, R. and Farrar, J.F. (1996a). Effect of elevated
concentrations of CO2 on infection of barley by Erysiphe graminis.
Physiological and Molecular Plant Pathology 48: 37-53.
Huber, D.M. and Watson, R.D. (1974). Nitrogen form and plant disease.
Annual Reviews of Phytopathology 12: 139-155.
Jwa, N.-S. and Walling, L.L. (2001). Influence of elevated CO2 concentration
on disease development in tomato. New Phytologist 149: 509-518.
Lake, J.A. and Wade, R.N. (2009). Plant–pathogen interactions and elevated
CO2: morphological changes in favour of pathogens. J. Exp. Bot. 60(11):
3123–3131.
Malmstrom, C.M. and Field, C.B. (1997). Virus-induced differences in the
response of oat plants to elevated carbon dioxide. Plant, Cell and
Environment 20: 178-188.
Matros, A., Amme, S., Kettig, B., Buck-Sorlin, G.H., Sonnewald, U. and Mock,
H.-P. (2006). Growth at elevated CO2 concentrations leads to modified
profiles of secondary metabolites in tobacco cv. SamsunNN and to increased
resistance against infection with potato virus Y. Plant, Cell and Environment
29: 126-137.
McElrone, A.J., Reid, C.D., Hoye, K.A., Hart, E. and Jackson, R.B. (2005).
Elevated CO2 reduces disease incidence and severity of a red maple fungal
pathogen via changes in host physiology and leaf chemistry. Global Change
Biology 11: 1828-1836.
Owensby, C.E. (1994). Climate change and grasslands: ecosystem-level
responses to elevated carbon dioxide. Proceedings of the XVII International
Grassland Congress. Palmerston North, New Zealand: New Zealand
Grassland Association, pp. 1119-1124.
Pangga, I.B., Chakraborty, S. and Yates, D. (2004). Canopy size and induced
resistance in Stylosanthes scabra determine anthracnose severity at high
CO2. Phytopathology 94: 221-227.
Parsons, W.F.J., Kopper, B.J. and Lindroth, R.L. (2003). Altered growth and
fine root chemistry of Betula papyrifera and Acer saccharum under elevated
CO2. Canadian Journal of Forest Research 33: 842-846.
Tiedemann, A.V. and Firsching, K.H. (2000). Interactive effects of elevated
ozone and carbon dioxide on growth and yield of leaf rust-infected versus
non-infected wheat. Environmental Pollution 108: 357-363.
134
ENVIRONMENTAL IMPACTS OF NUTRIENT RECYCLING AND ADAPTATION STRATEGIES FOR INTEGRATED NUTRIENT
MANAGEMENT
Dr.K.Jeevan Rao, Professor Department of Soil Science & Agricultural Chemistry,
College of Agriculture, Acharya N G Ranga Agricultural University, Rajendranagar, Hyderabad-30,
Email: [email protected]
Food grain production in India has made a quantum jump from a mere 50.8 million tonnes in1950-51 to above 255.4 million tonnes by 2012-13(4th estimate). This was made possible by the introduction of dwarf wheats in 1968, which set in the “Green Revolution”. A parallel increase in the consumption of fertilizers from 69.8 thousand tonnes in 1950 to 27.7 million tonnes (N + P2O5 + K2O) was witnessed by 2011-12. In spite of serious efforts made in recent years to produce more, sustainability in agricultural production is remaining still as a goal to be achieved. Agriculture is the mainstay of the Indian economy, contributing about 14.0 % of the gross domestic product and providing livelihood to two-thirds of the population. In India livestock rearing is complementary to agriculture, with an expected livestock population of over 480 million.
Nutrients in an ecosystem recycle through soil organisms, plants, and
grazing livestock. Appropriate management can enhance the nutrient cycle, increase productivity, and reduce costs. Rising levels of gases in the Earth’s atmosphere have the potential to cause changes in our climate. Some of these emission increases can be traced directly to organic wastes. The disposal and treatment of waste can produce emissions of several greenhouse gases (GHGs), which contribute to global climate change. The most significant GHG gas produced from waste is methane. It is released during the breakdown of organic matter in landfills. Other forms of waste disposal also produce GHGs but these are mainly in the form of carbon dioxide. The annual contribution to global methane budget from Indian rice paddies is less than 4 Tg and not 37 Tg as was propagated by the western agencies. CO2 equivalent emissions from agriculture have also been quantified. These estimates helped Indian policy makers greatly in their negotiations on global climate change. The possible strategies for mitigating methane and nitrous oxide emissions from agriculture have also been identified.
Forms of N (NO–3 and NH+4 ) which are taken up by plants can be made available for crop production through chemical fertilizers, natural and anthropogenic biological N fixation and through recycling of plant and animal wastes. These can be then converted into several other forms (NH3, NOx, N2O), which can move readily among terrestrial, aquatic and atmospheric realms. Galloway et al. labelled this diverse pool of N forms as ‘reactive N’ and defined the term to include all biologically, radiatively and/or photochemically active forms of N. The fate of reactive N in agroecosystems in India assumes great importance since reactive N fixed
135
biologically or applied as fertilizer not only leads to increased crop production, but can also leak from agroecosystems in the form of N2O, NH3 and NOx gases, depending on how efficiently plants use it. Industrial fixation of N for use as fertilizer represents by far the largest human contribution of new reactive N to the N-cycle, with fertilizer use in India during the 11 years (1995–2005) equalling the total quantity used up to 1994.
Food and Agricultural Organization, Rome , is concerned with the effect of agriculture on climate change, the impact of climate change on agriculture and with the role that agriculture can play in mitigating climate change. Historically, land-use conversion and soil cultivation have been an important source of greenhouse gases (GHGs) to the atmosphere. It is estimated that they are responsible for about one-third of GHG emissions. However, improved agricultural practices can help mitigate climate change by reducing emissions from agriculture and other sources and by storing carbon in plant biomass and soils. The National Agricultural Policy envisages annual growth of 4 per cent in agricultural production. Government of India has already initiated concerted action to double the agricultural production by 2025, which means increasing production from agricultural crops, horticultural crops, animal husbandry and fishery sectors. The country will need 301 million tonnes of food grains by 2025 to feed its 1.4 billion population. This will raise demand for supply of nutrients through chemical fertilizers to the extent of 35 million tonnes in addition to around 10 million tonnes coming from organic manures and use of bio fertilizers. It will be a gigantic task to supply such a huge quantity of nutrients through chemical fertilizers and also organic manures. Though the total potential for organic sources in the country is estimated as about 442 million tonnes with the nutrient content of 10.75 million tonnes, the present utilization is only about 1/3 indicating meager supplies of nutrients through this source. Since either of the sources cannot be totally depended upon to produce the targeted level of food, and as fertilizers are becoming costly and availability of organic manures is becoming difficult due to mechanization and decline in domestic animal populations, it is becoming imperative to find out options to blend both these inorganic and organic sources for crop production purposes.
Integrated Plant Nutrient Supply System (IPNSS) or Integrated Nutrient Management (INM):
Crops remove nutrients from soil. However, the soil is not an eternal supplier of nutrients required for crops growing on it. There is always a need to supplement the nutrient supply to crops through external sources like fertilizers and manures. Continuous use of inorganic fertilizers might harm the soil though the nutrients are supplied in adequate amounts. Though several types of organic manures are available, they are not having considerable amounts of N, P and K in their composition to facilitate their application alone to meet the crop needs. Application of organic manures has long term beneficial effects leading to improvement in soil conditions and making them favorable for sustainable agriculture. Excess usage of fertilizers also leads to loss of energy spent on their manufacture besides leading to increase chemical loads in soil and water.
136
Integrated plant nutrient management is the combined application of
chemical fertilizers along with organic manures, green manures, bio
fertilizers and other organic recyclable materials for crop production. The
INM encourages the use of in house organic wastes, which also helps in
keeping environment clean and safe. The INM or IPNSS as a concept is much
more complex and does not end at combined use of chemical fertilizers,
organic manures and bio fertilizers and when fully put into practice, holds
key for sustainable agricultural production. Plant nutrients are involved in
cycles and INM must monitor the pathways of flow of plant nutrients in an
agricultural production system to maximize the profit on a farm so that
farming as a profession is continued. Most Indian farmers practice a farming system involving crop
husbandry and raising livestock for dairying and draught. If all the pathways of nutrient flow are well controlled, a large part of plant nutrient cycling can be assured. This is very well practiced in China, where all animal (as well as human) excreta is returned to the farm. However, due to social system and traditions in India, human excreta is never returned to the farm except in a small way in peri urban agriculture where some sewage sludge and urban solid wastes are used for crop production. Cattle dung is mostly wasted as dung cakes for fuel purpose.
A number of researchers in India have reported the advantages of INM on crop yields and soil fertility. Results from a long term fertility experiment clearly show the advantage of addition of FYM along with chemical fertilizers on crop yield . Data on the effect of addition of 50% N through FYM, wheat straw or green manures to rice on soil properties after 12 cycles of rice-wheat cropping system showed the advantage in increasing organic carbon and available N, P and K in soil over application of chemical fertilizers alone.
Most studies, thus, indicate a definite improvement in the soil organic matter content due to INM. This is beneficial as it supports the life of organisms and acts as a source and sink for plant nutrients in soils. It is also involved in maintaining soil tilth, free movement of air, and infiltration of water, promoting water retention and reducing soil erosion thus, improving in general, the soil health. Application of organic manures and residues also increases the efficiency of nutrients added through chemical fertilizers by temporary immobilization, which even protects the nutrients by reducing leaching losses.
Integrated nutrient management includes the utilization of bio
fertilizers such as Rhizobium, Azotobacter and Azosprillum to meet part of nitrogen needs of crops. Use of phosphate solubilizing micro organisms (PSM) helps in more efficient utilization of native P and also absorption of P from difficultly available source like rock phosphate. Time, source and method of application of fertilizers besides use of materials like nitrification inhibitors, slow releasing N fertilizers also come in the fold of INM. Thus,
137
focussed attention is needed on these three principal areas i.e. improving fertilizer use efficiency, efficient use of organic sources and efficient use of biological nitrogen fixation (BNF) for practicing INM in any crop or cropping system.
Integrated nutrient management involves preparing a complete balance sheet of plant nutrients added to an agricultural production system and those taken out of it and, thus, also calls for monitoring the plant nutrients added to the system by rainfall and irrigation and those taken out by surface runoff and soil erosion.
In the integrated nutrient management in cropping systems, the residual
effects of applied materials are to be taken into account so that the last crop
in the sequence can be applied sufficiently less quantities of inorganic
fertilizers to supply, N, P2O5 and K2O to bring down the cost of cultivation
besides improving the soil physical conditions for sustainable crop
production. While doing this exercise, the fertilizer equivalence of the
components involved in the INM package must be taken into account to
bring economy in usage of inorganic fertilizers. Further. the options may be
made available to suit the economic conditions of farmers.
Nitrogen in Indian agriculture: Inputs, use efficiency and leakages: In the last three decades, use of reactive N in the form of chemical
fertilizers has kept pace with the production of food grains, although the consumption is concentrated in certain areas with intensive farming. As for cereal-based agriculture, recovery of N by rice and wheat at on-farm locations in India rarely exceeds the 50% mark. Agricultural activities in India account for more than 80% of the total N2O emissions, including 60% from the use of N fertilizers and 12% from burning of agricultural residues. In Asia, reactive N transfers to the atmosphere by NH3 volatilization are expected to reach 19 Tg N yr–1 in the next three decades; 29% being India’s contribution. Of the total anthropogenic emissions of NOx and N2O from Asian agriculture, about 68% is due to the combined contributions of India and China. Additionally, riverine discharge of dissolved inorganic N derived from N in river basins and leaching of nitrate-N to the surface and ground water bodies also contributes to the application of reactive N in agriculture. Integrated management of organic amendments and fertilizer N can improve efficiency of reactive N use by crop plants, while achieving targets of productivity and quality. The greatest challenge in improving N use efficiency lies in developing precision management of reactive N in time and space. Approaches to maximize synchrony between crop-N demand and the supply of mineral N from soil resources along with reactive N inputs in high-yielding agricultural systems are critical towards this end. Among a host of upcoming technologies aimed at improving N management strategies, leaf colour charts, chlorophyll meters and optical sensors, which allow in-season estimation of N requirement of crops, are the most promising.
138
From 1960 to 1990, genetic improvements led to the development of highly fertilizer-responsive rice and wheat varieties with improved management strategies, resulting in a dramatic rise in productivity and production of rice and wheat in India. This has witnessed a linear increase since then and at present contributes to more than 75% of the total food grains produced in the country, with nitrogen fertilizers contributing largely to this remarkable increase . In the years to come, Indian agriculture will have to strike a delicate balance between inputs and outputs of reactive N. Substantial reactive N inputs will have to be linked to minimal leakage of reactive N. Extent of losses of reactive N forms from agro-ecosystems and possibility of reducing leakage of N by enhancing N use efficiency through the adoption of precision technologies is needed.
Nitrogen Use Efficiency Of Agricultural Crops: During the last half-decade while fertilizer N consumption in India has
been touching new heights, production of both rice and wheat is plateauing..
In fact,
fertilizer N efficiency in foodgrain production expressed as partial factor
productivity of N (PFPN) has been decreasing exponentially since 1965.
PFPN is an aggregate efficiency index that includes contributions to crop
yield derived from uptake of indigenous soil N, fertilizer N-uptake efficiency,
and the efficiency with which N acquired by the plant is converted to grain
yield. An initial decline in PFPN is an expected consequence of the adoption
of N fertilizers by farmers and not necessarily bad within a systems context.
While fertilizer use increased exponentially during the course of the green
revolution, resulting in a steep decrease in PFPN due to low fertilizer N-
uptake efficiency. This is of particular concern for the reactive N budget as
fertilizer N use in India is continuously increasing .
Nitrogen needs of crop plants are met with by applying fertilizer N and net
N mineralization from soil organic matter and organic manure. Fertilizer N
is applied in forms readily available to plants, but mineralization of N is
controlled by soil, water, temperature and aeration. Once these factors
become optimum, the amount of N that is mineralized depends upon the
quality and quantity of organic matter in the soil. High rates of net N
mineralization can result in dilution of fertilizer N. But if crop demand for N
and the amount of fertilizer N remain constant, an increase in net N
mineralization will lead to a decrease in observed N use efficiency. Loss of N
via denitrification, ammonia volatilization and leaching may lead to low N
use efficiency, particularly when conditions for plant growth are favourable
and plant-N demand cannot be met because of large N losses. Relative
magnitude of different N loss mechanisms will depend upon soil type,
weather, fertilizer-use and crop management, with climate exerting the
strongest influence on the amount and pathways of N losses.
Current status of INM Keeping the importance of organic resources in view, a lot of research has been done on integrated nutrient management during last two decades in
139
natural resource management (NRM) institutions and state agricultural universities. This research has led to:
• Development of INM practices for major crops; • Understanding the enhanced role of organic manures in increasing
input use efficiency due to their favourable effect on physical, chemical and biological condition of the soil;
• Establishing the beneficial role of integrated use of organic manures in improving nutrient cycling in different production systems in various types of soils;
• Beneficial role of INM in improving soil chemical, physical and biological quality for sustainable crop production; and
• The work on INM has been compiled and published in the form of books/bulletins by several institutions.
Research gaps in INM: The research gaps include:
• Mismatching of INM practices developed at research stations with the farmers’ resources and their practices;
• INM recommendations for different crops are not based on soil testing and nutrient release behaviour of the manures;
• Nutrient balance/flow analysis vis-à-vis soil fertility management practices with special reference to INM at farm level needs to be worked out;
• Nutrient release characteristics of farm residues in relation to their quality to develop decision support systems;
• Biofertilizers were not included as component of INM in many cases; and Integrated Farming Systems (IFS) approach needs to be encouraged for sustaining livelihood in rural areas particularly for small and marginal farmers.
Organic Agriculture: According to International Federation of Organic Agriculture
Movements (IFOAM), organic Agriculture could contribute significantly to
reduce GHG releases and to sequester carbon in soils and biomass. There is
sufficient evidence that Organic Agriculture is superior to mainstream
agriculture. This is even more important as the capacity of Organic
Agriculture to contribute to the mitigation of climate change can be
considered as an ancillary benefit to its primary goal of sustainable land use.
This primary goal is achieved by gains in soil productivity, consecutive food
security, biodiversity conservation and many other benefits. As opposed to
the focus of conservation agriculture on a single technology, Organic
Agriculture follows a site-specific and systematic approach that includes a
comprehensive set of integrated technologies. Because of the inspection and
certification systems required in Organic Agriculture, monitoring and
evaluation of carbon sequestration is simplified and cost-effective in
comparison to conventional agricultural practices. Policymakers should
recognize the potential of organic farming for GHG reduction and develop
appropriate programs for using this potential. Such programs may look into
the emission reduction potential, in the sequestration potential, in the
140
possibility for organically grown biomass, or in combinations of all the
aspects. This is as relevant in developed countries as in developing
countries(IFOAM,2004).
Recommendations(Peter et al ,2000)
A. Promote effective and environmentally sound management of plant
nutrients: A1. The balanced and efficient use of plant nutrients from both organic and inorganic sources, at the farm and community levels, should be emphasized; the use of local sources of organic matter and other soil amendments should be promoted; and successful cases of integrated plant nutrient management should be analyzed, documented, and disseminated. A2. Innovative approaches to support and promote integrated plant nutrient management should be pursued. A3. Encouragement should be given to develop further, in cooperation with all relevant organizations, a Code-of-Conduct on the effective and environmentally sound management of plant nutrients, for dissemination at both international and national levels.
B. Improve Database, Research, Monitoring, and Extension of Effective Plant Nutrient Management: B1. Participatory forms of design, testing, and extension of improved plant nutrient management strategies that build upon local institutions and social organizations, including trained farmer groups, should be promoted. B2. A network of benchmark sites on representative farmers’ fields in major farming systems should be developed to monitor the stocks and especially the flows of plant nutrients. B3. A comprehensive data base needs to be developed for all mineral and organic sources of nutrients, including their amount, composition, processing techniques, their economic value, and their availability. B4. The impact of micro- and macro-economic policies on plant nutrient management should be evaluated. C. Support Complementary Measures to Lower Costs, Recycle Urban Waste, Secure Land Tenure, and Increase Production Capacity: C1.Ways and means should be sought to lower the price of fertilizers at farm gate and to reduce the farmers’ perception of the risk in the use of fertilizers by: (i) investing in distribution infrastructure; (ii) researching innovative ways to share risks and to provide finance; (iii)encouraging subregional cooperation for country-level fertilizer production facilitiesand/or procurement; and (iv) improving dialogue between different sectors and agencies to arrive at a common approach to improved plant nutrition. C2. Improvement of security of access to land is essential for the intensification of fertilizer use and the successful promotion of integrated plant nutrient management systems. C3. The recycling of pollutant-free organic urban waste into the wider peri-urban agricultural sector should be promoted, considering that such waste
141
constitutes an increasingly significant and so far largely untapped source of plant nutrients. C4.Investment in production capacity for mineral and organic fertilizers should be increased and facilitating the procurement of raw materials and energy for their processing enhanced.
Conclusions: Integrated nutrient management has a great potential to offset the
growing heavy nutrient demands to achieve the maximum yields and to
sustain the crop productivity on long term basis. A widening gap of 8 to 10
million tonnes exists between annual nutrient removal and addition.
Despite the existing constraints in availability and usage of different organic
and biological sources, efforts should be made to synthesis the available
data for developing agro-ecological specific and practically feasible and
economically viable INM packages for different crops and cropping systems.
A recent survey on awareness of farmers about bio fertilizers, soil testing,
INM and balanced use of fertilizers indicates, lot of extension work is
needed to educate farmers on organic waste recycling and use of different
components of INM in better ways for crop production purposes. Surveys
also show that in certain areas imbalanced use of fertilizers is being
practiced. Such areas have to be monitored regularly and the farmers be
advocated to resort to INM to overcome the bad effects of excess use of
fertilizers. Materials such as bio fertilizers, green manure seeds etc. may be
made available to farmers at the place where soil testing service is done to
encourage them adopt INM package. Provision of alternate energy source is
also important to make rural poor not to burn crop residues and dung for
fuel purposes. Research efforts on improving the fertilizer and water use
efficiencies specifically in dry land and rain fed areas must be made more
seriously and options be made available to farmers for adopting INM as a
routine in future years to come.
Use of increasing amounts of reactive N in the form of fertilizers in
Indian agriculture and proper management of fertilizer N will remain at the
forefront of issues to improve the global reactive N balance over both the
short and long term. To achieve the tripartite goal of food security,
agricultural profitability and environmental quality in a country like India,
improving N use efficiency in agriculture will have to be the top priority.
Efficiency with which reactive N is utilized by crop plants is governed by N
requirement of crops, N supply from soil, and fertilizer and N losses from
the soil–water–plant system. While optimum moisture,temperature, supply
of adequate amount of nutrients other than N, and pest and weed
management define crop N requirement, large field-to-field variability of
soil N supply restricts efficient use of N fertilizers when broad-based
blanket recommendations are used in rice and wheat. Integrated
management of organic and inorganic N sources can help achieve high N use
efficiency. Innovative fertilizer management has to integrate both
preventive and field-specific corrective N-management strategies to
increase profitability in irrigated rice and wheat systems, and to ensure that
142
there exists synchrony between crop N demand and supply of mineral N
from soil reserves and fertilizer inputs. This will lead to maintenance of
plant-available N pool at the minimum size required to meet crop N
requirements at each growth stage, with little vulnerability to loss of N to
the environment. Dryland farming has led to historically large emissions of CO2 from stored soil carbon and high rates of soil erosion and water-borne sediment. With the development and adoption of reduced tillage systems over the past 20 years, significant strides have been made in reducing soil erosion and water quality degradation. However, the potential for dryland farms to sequester carbon by returning soil organic matter levels to near native condition has not been reached. These systems also rely on inputs of nitrogen fertilizer made from fossil fuel. Several strategies are being explored to improve specific aspects of the environmental performance of these systems, but few attempts have been made to analyze and optimize dryland systems for greenhouse gas mitigation, soil and water conservation, energy efficiency, and economic performance.
There is significant potential to increase N use efficiency at the farm level, because concepts and tools needed to achieve it are already available. However, new technologies need to be cost-effective and user-friendly, so that these become attractive to farmers. Collaborative effort of agronomists, soil scientists, agricultural economists, sociologists, ecologists and politicians can help agriculture make substantial contribution to reduce the global GHG load.
143
References: Commission of the European Communities (1986) Council directive C86/278/EEC on the protection of the Environment and in particular of the soil , when sewage sludge is used in agriculture. European Community.L 181(Annex1A):6-12.Down to Earth (2006).Ecological Foot Print. Gobar Times. November 30 pp66. ICAR(2007).Recommendations of National Conference on Climate Change and Indian Agriculture. New Delhi.
IOCI, 2002: Climate Variability and Change in SouthWest Western Australia. Indian Ocean Climate Initiative. Perth, Australia, 36 pp. http://www.ioci.org.au/publications/pdf/IOCI_CVCSW02.pdf. IPCC (Intergovernmental Panel on Climate Change), 2000: Land Use, Land-Use Change and Forestry, R. T. Watson, I. R. Noble, B. Bolin, N. H. Ravindranath, D. J. Verardo and D. J. Dokken, Eds., Cambridge University Press, Cambridge, 375 pp.
IPCC (Intergovernmental Panel on Climate Change), 2001a: Climate Change
2001: The Scientific Basis. Contribution of Working Group I to the Third
Assessment Report of the Intergovernmental Panel on Climate Change, J.T.
Houghton, Y. Ding, D.J. Griggs, M. Noguer, P.J. van der Linden, X. Dai, K.
Maskell and C.A. Johnson, Eds., Cambridge University Press, Cambridge, 881
pp.
IPCC (Intergovernmental Panel on Climate Change), 2001b: Climate Change 2001: Impacts, Adaptation, and Vulnerability. Contribution of Working Group II to the Third Assessment Report of the Intergovernmental Panel on Climate Change, J.J. McCarthy, O.F. Canziani, N.A. Leary, D.J. Dokken and K.S. White, Eds., Cambridge University Press, Cambridge, 1032 pp. IPCC (Intergovernmental Panel on Climate Change), 2001c: Climate Change 2001: Mitigation. Contribution of Working Group III to the Third Assessment Report of the Intergovernmental Panel on Climate Change, B. Metz, O. Davidson, R. Swart and J. Pan, Eds., Cambridge University Press, Cambridge, 760 pp. IPCC (Intergovernmental Panel on Climate Change), 2007a: Climate Change 2007: The Physical Science Basis. Contribution of Working Group I to the Fourth Assessment Report of the Intergovernmental Panel on Climate Change, S. Solomon, D. Qin, M. Manning, Z. Chen, M. Marquis, K. B. Averyt, M. Tignor and H. L. Miller, Eds., Cambridge University Press, Cambridge, 996 pp.
144
IPCC (Intergovernmental Panel on Climate Change), 2007b: Climate Change 2007: Impacts, Adaptation and Vulnerability. Contribution of Working Group II to the Fourth Assessment Report of the Intergovernmental Panel on Climate Change, M.L. Parry, O.F. Canziani, J.P. Palutikof, P.J. van der Linden and C.E. Hanson, Eds., Cambridge University Press, Cambridge, 976 pp. IPCC (Intergovernmental Panel on Climate Change), 2007c: Climate Change 2007: Mitigation. Contribution of Working Group III to the Fourth Assessment Report of the Intergovernmental Panel on Climate Change, B. Metz, O. Davidson, P.Bosch, R. Dave and L. Meyer, Eds., Cambridge University Press, Cambridge, 851 pp.IPCC (Intergovernmental Panel on Climate Change), 2007d: Climate Change 2007: Synthesis Report. Contribution of Working Groups I, II and III to the Fourth Assessment Report of the Intergovernmental Panel on Climate Change, Core Writing Team, R.K Pachauri and A. Reisinger, Eds., IPCC, Geneva, 102 pp. Jeevan Rao K and Shantaram M V (1997) Relationship between heavy metals and soil properties in municipal solid waste treated soils. 4th International Conference on the Bio-geochemistry of trachea elements, (June 23-26). University of Californ, Berkely, USA. Jeevan Rao K and Shantaram M V (1998) Correlation matrix between heavy metals in soils treated with municipal solid waste. Proceedings, 16th World Congress of Soil Science, Symposium, 28, Mount Petlier, France, pp: 529. Jeevan Rao, K(2007). Composting of municipal and agricultural wastes- In proceedings of International Conference on sustainable solid waste management, Anna University , Chennai Jeevan Rao, K(2007).Environmental Impacts of nutrient cycling through organic wastes in agriculture and natural ecosystem , 94th Indian science congress-Agricultural science section - Invited lecture, Annamalai University , Chidambaram. Jeevan Rao, K (2008). Need for National Soil Policies for Developing Countries - some facts, Bulletin of the International Union of Soil Sciences (IUSS)-112 , The Netherlands. pp 19. National Environmental Engineering Research Institute (1983) Solid Waste Management - A Course Manual, Nehru Marg, Nagpur. Peter Gruhn, Francesco Goletti, and Montague Yudelman (2000).Integrated Nutrient Management, Soil Fertility,and Sustainable Agriculture: Current Issues and Future Challenges- Food, Agriculture, and the Environment Discussion Paper 32-International Food Policy Research Institute-2033 K Street, N.W.Washington, D.C. 20006 U.S.A. Ramohan Reddy.G and K.Jeevan rao .(2000). Impact of sewage Irrigation on macro nutrient status of soil. The Andhra Agricultural Journal .47(3&4)218-223 .
145
Subba Rao, A. and K. Sammi Reddy(2005). Integrated nutrient management vis-à-vis crop production/productivity, nutrient balance, farmer livelihood and environment: India. For Better Farmer Livelihoods, Food Security and Environmental Sustainability-FAO- Paper Number 2. Tandon.H.L.S.(1997).Organic Resources : An Assessment of potential supplies , their contribution to Agricultural productivity and Policy Issues for Indian agriculture from 2000 to 2025. In Plant Nutrient Needs ,Supply, Efficiency and policy issues:2000-2025.(eds) J.S.Kanwar and J.C.Katyal.NAAS.New Delhi.15-28. U.S. Environmental Protection Agency.(1993) . Standards for the use or disposal of sewage sludge .Fed.feigst.58,32,40.part:503. U.S. Environmental Protection Agency Climate Change and Waste website
U.S. Environmental Protection Agency(1998) .Greenhouse Gas Emissions From Management of Selected Materials in Municipal Solid Waste, September [EPA530-R-98-013] U.S. Environmental Protection Agency, Inventory of U.S. Greenhouse Gas Emissions and Sinks: 1990 – 1997, April 1999 [EPA 236-R-99-003]. Velmurugan1, A. V. K. Dadhwal1 and Y. P. Abrol (2008). Regional nitrogen cycle: An Indian perspective, Indian Agriculyure, Environment and health, Current science, VOL. 94, NO. 11, Venkata Sridhar. T.K., Jeevan Rao,K. and G.Bhopal Raj.(2006).Risk Assessment of Metals in sewage sludge of Hyderabad. Journal of research,ANGRAU.34(2)
Model Training Course on “Impact of Climate Change in Rainfed Agriculture and Adaptation Strategies”
September 26-October 03, 2013, CRIDA , Hyderabad
146
TRENDS IN CLIMATE BASED PEST FORECASTING SYSTEMS & CONTINGENCY PLANNING
Y.G. Prasad, Principal Scientist (Entomology) Central Research Institute for
Dryland Agriculture, Hyderabad
Introduction Integrated pest management (IPM) has been a response to the need for improving
pest management and reducing the environmental impacts of synthetic pesticides.
IPM is an ecosystem-based strategy that focuses on short- and long-term prevention
of pests or their damage through a combination of techniques. Integrated crop
management (ICM) adds to IPM other components of the system such as soil,
fertility, and water management. Climatic descriptions aid management of some
aspects of the cropping system, such as long-term choices of location for planting,
and between-season sanitation measures. For in-season pest management, forecasts
or warning systems that use past and future weather data for predicting the
likelihood of pest outbreaks are useful. Large-scale regulatory control programs use
both weather and climate information to plan and take preventive and emergency
action to solve particularly damaging pest problems.
Weather is the short run of the physical factors experienced by an insect population,
and climate is the long-term pattern of expected weather. Assessing the impacts of
weather and climate on insects is more than the matter of taking the temperature
and determining the state of the system, because different species are affected in
different ways and to different degrees, and weather can thereby modify the
outcome of biotic interactions. The outcomes of interactions on short time scales
add up to trends and consequently climate modifies the qualities of the whole
ecosystem in the long run.
One of the earliest works on forecasting was the formulation of the Dutch rules for
forecasting of potato late blight. Uvarov published his monumental work, Insects and
Climate, in 1931 in which he reviewed more than 1150 articles written in 11
languages on every conceivable aspect of the subject. There have been a number of
discussions of the effect of weather on insect abundance that examine this complex
topic from specialized points of view. Since 1931, numerous reviews and thousands
of papers have appeared that describe the effects of single variables, such as
temperature, on one or the other biological processes thought to be important to
insects.
In India, the earliest reviews on entomological and plant pathological research
(Pant, 1964 and Singh, 1968) pointed that awareness of the role of weather on pests
and diseases existed in the early forties. Mehta (1940) pioneered the work on the
role of environmental factors in the epidemiology of wheat rust. Pradhan (1946) did
pioneering work on effect of temperature on insect development rates and
durations and also devised biometer and biograph for simplified practical
application of these relationships. Cataloguing of pests and diseases that are known
Model Training Course on “Impact of Climate Change in Rainfed Agriculture and Adaptation Strategies”
September 26-October 03, 2013, CRIDA , Hyderabad
147
to be weather sensitive in their proliferation and determining weather conditions
conducive for their growth and spread can help in locating the likely regions and
periods of occurrence and initiation of control measures on the basis of weather
warnings. Venkataraman (1992) summarized approaches that have been used to
anticipate the occurrence of a pest or disease through several approaches like
geographical, phenological, biological and bioclimatic analysis.
Weather warnings against pests and diseases Short- and medium-range forecasts of required variables make models useful
planning tools. Improved forecasts with longer lead times could reduce dependence
on pesticides in the control of some insects and diseases. While short- and medium-
range forecasts can assist with in-season decision making, quantification of climatic
variability and long-lead forecasting are needed to help farmers make strategic
choices such as the crops to grow, variety to plant, or planting date. One example on
the utility of long-range forecasting would be to predict weather conditions favoring
outbreaks of a pest at a susceptible crop growth stage, based on risk assessment of
long-term weather patterns such as El Nino events. In the United States and the
Netherlands, commercial firms are applying mesoscale modeling techniques to
forecasting disease and insect development, and producing gridded products for
regional and on-farm planning and pest management (Strand, 2000).
Monitoring one or more important weather parameters for initiation of a pest and
disease, the occurrence of an incubation period is identified. This stage would merit
the issue of a warning. A forecast of the outbreak could be issued based on a forecast
of the anticipated weather. However, since this forecast covers only a short period,
one is obliged to assume that normal weather follows incubation and an amended
forecast is issued on the basis of deviation of the weather conditions actually
occurring. This type of forecast is of primary use to alert survey teams regarding the
likely areas and times of appearance of a pest or disease in a particular stage of
development. Real time surveys to actually locate the foci of infestation are crucial
for this type of alerts. Once the pest and disease has been monitored, an advisory
regarding the general weather conditions and conduciveness favoring a rapid
spread can be issued to facilitate timely control operations.
Data requirements
Models require access to weather and climate data, in addition to pest and plant
data. The models usually require as inputs measurements of temperature, rainfall
and humidity, although other variables may be required either as direct inputs or in
computing values for variables not measured. Weather variables need to be
measured at the field level, at regional stations, or on a broader scale depending on
the need. For many farm management actions, data representative of the field
conditions are expected.
Model Training Course on “Impact of Climate Change in Rainfed Agriculture and Adaptation Strategies”
September 26-October 03, 2013, CRIDA , Hyderabad
148
Various types of pest/disease incidence data (trap catches, population counts and
crop damage assessments) could be made use of. Many research articles published
on pest-weather relationships used pest monitoring data from light traps (for
example yellow stem borer in rice), pheromone traps (for American bollworm) and
sticky traps (for whitefly) apart from population counts and damage assessment
data. Long-term data is preferable as it better captures the patterns in relationships.
However, historical data collected from several sources suffer from several
inadequacies: lack of ancillary data such as sowing times, crop damage assessments,
lack of time-series data, missing and non-uniform pest/disease data.
Pest forecasting: Approaches to modeling
In model development important points for consideration are: the level of detail at
which a given model is to be developed as the level of detail is linked to the objective
and data availability to develop and run the model. Models can range from strictly
empirical to most complex and sophisticated descriptive models. A model may be
discrete or continuous, static or dynamic, and deterministic or stochastic.
The rates at which insects complete their life cycles depend mainly on temperature,
so that the times of activity of a given pest insect can vary greatly both from region
to region and from year to year. Many models have been developed using
temperature data to forecast insect activity. Relatively crude methods of computing
day-degrees are sufficient for many applications. Most forecasting models on
diurnal variation rely on approximations using sine waves. However, day-degree
forecasts in general cannot readily predict insect populations that have polymodal
patterns of activity.
Empirical approaches involve estimating pest and disease incidence and intensity
through experimentation and surveys on crops not subjected to control
interventions and establishing relationships with concurrent, prevailing weather
and/or past weather factors. The studies could be conducted at single stations in
which the emphasis is on delineation of differences in meteorological conditions in
epidemic and non-epidemic years or multi-station studies in which the emphasis is
on delineation of meteorological conditions leading to changes in periods and
intensity of infestations. A multi-station study is preferred as it facilitates
corroboration of the general surmises and leads to maximization of data in a short
period if observations are recorded on crop stands sown at periodic intervals at a
number of stations. It should be noted that findings from empirical field studies can
straight away be applied in climatologically analogous areas but can give misleading
results when applied to other areas.
Development of an empirical forecast model is not an end in itself. Even the simplest
model (even simple prediction rules) must be tested to be proven, but validation
over a wide range of conditions will be most important for models based on
empirical rather than biological and physical processes, or where there is
insufficient understanding and quantification of how interactions change under
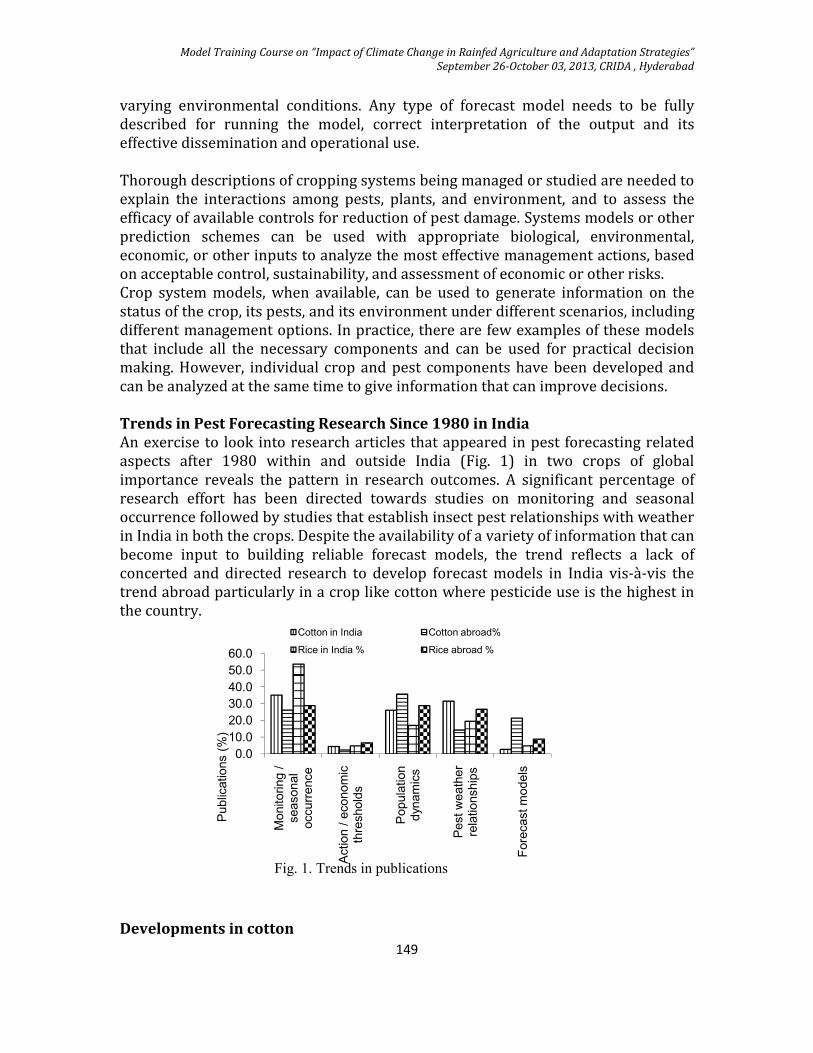
Model Training Course on “Impact of Climate Change in Rainfed Agriculture and Adaptation Strategies”
September 26-October 03, 2013, CRIDA , Hyderabad
149
varying environmental conditions. Any type of forecast model needs to be fully
described for running the model, correct interpretation of the output and its
effective dissemination and operational use.
Thorough descriptions of cropping systems being managed or studied are needed to
explain the interactions among pests, plants, and environment, and to assess the
efficacy of available controls for reduction of pest damage. Systems models or other
prediction schemes can be used with appropriate biological, environmental,
economic, or other inputs to analyze the most effective management actions, based
on acceptable control, sustainability, and assessment of economic or other risks.
Crop system models, when available, can be used to generate information on the
status of the crop, its pests, and its environment under different scenarios, including
different management options. In practice, there are few examples of these models
that include all the necessary components and can be used for practical decision
making. However, individual crop and pest components have been developed and
can be analyzed at the same time to give information that can improve decisions.
Trends in Pest Forecasting Research Since 1980 in India An exercise to look into research articles that appeared in pest forecasting related
aspects after 1980 within and outside India (Fig. 1) in two crops of global
importance reveals the pattern in research outcomes. A significant percentage of
research effort has been directed towards studies on monitoring and seasonal
occurrence followed by studies that establish insect pest relationships with weather
in India in both the crops. Despite the availability of a variety of information that can
become input to building reliable forecast models, the trend reflects a lack of
concerted and directed research to develop forecast models in India vis-à-vis the
trend abroad particularly in a crop like cotton where pesticide use is the highest in
the country.
Developments in cotton
0.0
10.0
20.0
30.0
40.0
50.0
60.0
Monitoring /
seasonal
occurr
ence
Action / e
conom
ic
thre
shold
s
Popula
tion
dynam
ics
Pest w
eath
er
rela
tionship
s
Fore
cast m
odels
Public
ations (%
)
Fig. 1. Trends in publications
Cotton in India Cotton abroad%
Rice in India % Rice abroad %
Model Training Course on “Impact of Climate Change in Rainfed Agriculture and Adaptation Strategies”
September 26-October 03, 2013, CRIDA , Hyderabad
150
It appears that the amount and distribution of rainfall plays a significant role in the
population dynamics of Helicoverpa armigera Hubner on several crops across
regions in India. Several studies indicate that rainfall at critical times during the
crop growth and growing season is crucial for the build up of H. armigera. Chari and
Rao (1988) attributed prevalence of continuous drizzle and cloudy weather
condition as one of the factors responsible for the severe outbreak of H.armigera on
tobacco in Andhra Pradesh. An agroecosystem analysis led to the observation that
all other factors remaining constant, excessive and heavy rainfall concentrated for
about 8-10 days at a stretch at the time of flowering and square formation stage is
one single important factor that triggers the build up of H. armigera on cotton
(Diwakar, 1998). An analysis of the rainfall data and outbreak years of H. armigera
both in Punjab, Haryana and Rajasthan in the North zone (1990, ‘91, ‘96 and ‘97)
and Andhra Pradesh, Tamil Nadu and Karnataka in the South zone (1987, ‘88, ‘89
and ‘97) also led to the same conclusion. Rainfall in the last fortnight of September
in the outbreak years was twice the rainfall received in normal and non-outbreak
years in the North Zone. Similarly in the southern states, heavy cyclonic rainfall in
the last fortnight of October or November was double the amount received in non-
outbreak years.
Das et al. (2000) developed prediction models for H. armigera based on monthly
pheromone trap catch data (1983-90) from PAU, Ludhiana. The first multiple
regression model (R2 0.75) for predicting population density in October (PM-A) on
cotton used previous population of October to February (PO-F), relative humidity and
minimum temperature of February (RHEF and TminF) as independent explanatory
variables. The second model predicts the population density (R2 0.87) during
October (PO) using pest population density of June (PJ) and total amount of rainfall
during June and July (RJ-J).
Another approach was to develop a simple rule to predict the attack of H. armigera
on crops grown in Andhra Pradesh using the pheromone trap moth catch data and
rainfall - amount and distribution pattern. Deficit rainfall during monsoon (June-
September) combined with surplus rainfall during November indicated a severe
pest attack. The deviations in rainfall taking into account the actual rainfall received
in a given year and long-term averages for that location could be used to forecast the
level of attack of H. armigera in several crops in Andhra Pradesh (Das et al. 2001).
The thumb rule was extended to chickpea-pigeon pea based cropping system at
Gulbarga, Karnataka using both historical as well as current season data. After
studying the historical data on monthly rainfall and percent pod damage in
pigeonpea at Gulbarga, the thumb rule was modified to take account surplus rainfall
in the month of October instead of November to suit this ecosystem. By using the
prediction rule it was possible to predict the level of attack (low = <30% pod
damage; moderate = 30-60%; severe = >60%) by end of October.
Recent attempts to develop models for H. armigera in cotton suggested that
forewarnings based on comparison of current seasonal pattern in pheromone trap catch and weather (relative humidity and rainfall) with normal pattern and pattern in epidemic years of occurrence could be useful for this pest (Fig.
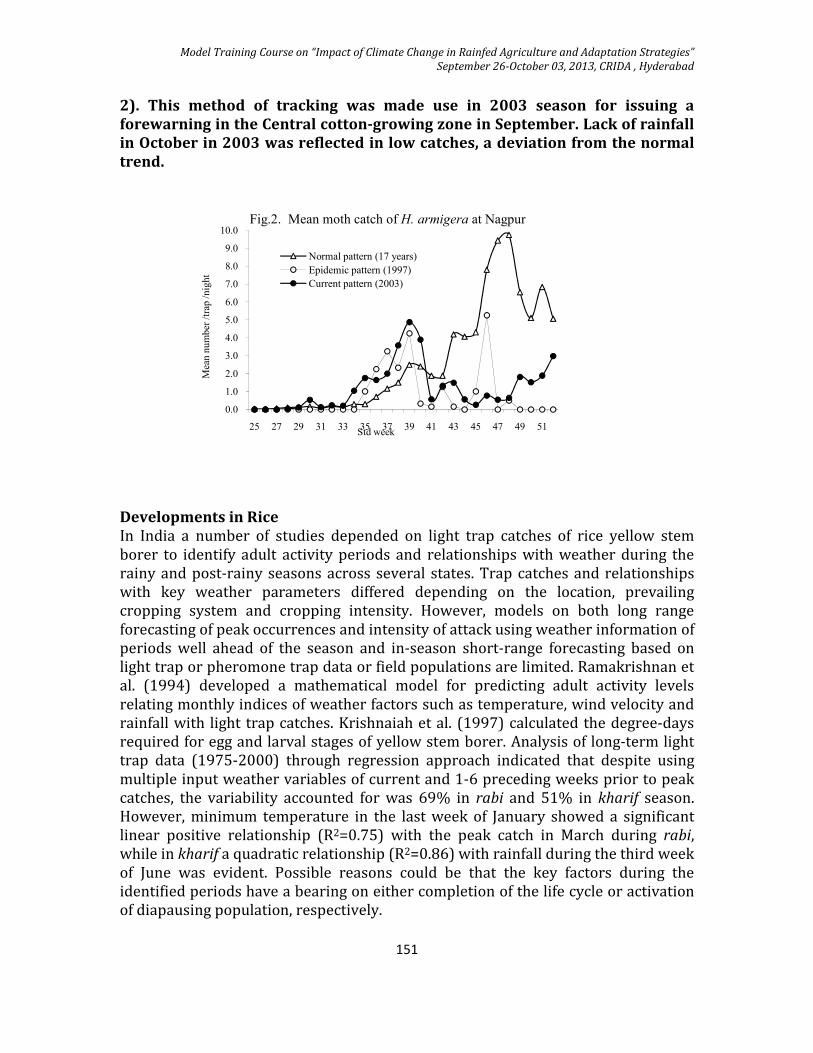
Model Training Course on “Impact of Climate Change in Rainfed Agriculture and Adaptation Strategies”
September 26-October 03, 2013, CRIDA , Hyderabad
151
2). This method of tracking was made use in 2003 season for issuing a forewarning in the Central cotton-growing zone in September. Lack of rainfall in October in 2003 was reflected in low catches, a deviation from the normal
trend.
Developments in Rice In India a number of studies depended on light trap catches of rice yellow stem
borer to identify adult activity periods and relationships with weather during the
rainy and post-rainy seasons across several states. Trap catches and relationships
with key weather parameters differed depending on the location, prevailing
cropping system and cropping intensity. However, models on both long range
forecasting of peak occurrences and intensity of attack using weather information of
periods well ahead of the season and in-season short-range forecasting based on
light trap or pheromone trap data or field populations are limited. Ramakrishnan et
al. (1994) developed a mathematical model for predicting adult activity levels
relating monthly indices of weather factors such as temperature, wind velocity and
rainfall with light trap catches. Krishnaiah et al. (1997) calculated the degree-days
required for egg and larval stages of yellow stem borer. Analysis of long-term light
trap data (1975-2000) through regression approach indicated that despite using
multiple input weather variables of current and 1-6 preceding weeks prior to peak
catches, the variability accounted for was 69% in rabi and 51% in kharif season.
However, minimum temperature in the last week of January showed a significant
linear positive relationship (R2=0.75) with the peak catch in March during rabi,
while in kharif a quadratic relationship (R2=0.86) with rainfall during the third week
of June was evident. Possible reasons could be that the key factors during the
identified periods have a bearing on either completion of the life cycle or activation
of diapausing population, respectively.
0.0
1.0
2.0
3.0
4.0
5.0
6.0
7.0
8.0
9.0
10.0
25 27 29 31 33 35 37 39 41 43 45 47 49 51
Mean number /trap /night
Std week
Fig.2. Mean moth catch of H. armigera at Nagpur
Normal pattern (17 years)
Epidemic pattern (1997)
Current pattern (2003)
Model Training Course on “Impact of Climate Change in Rainfed Agriculture and Adaptation Strategies”
September 26-October 03, 2013, CRIDA , Hyderabad
152
Developments in Groundnut The groundnut leaf miner, Aproaerema modicella (Deventer), is a major insect pest
of groundnut and soybean in many south Asian and Southeast Asian countries.
Several articles deal with weather relationships of this pest. At Anantapur, the
largest groundnut growing district in India, a simple rule was developed for short-
term prediction of leafminer severity based on maximum temperature variations A
sharp increase in maximum temperature by >20C followed by persistent heat wave
and dry conditions for a few days lead to outbreak of leafminer 3-4 days after such a
rise (AICRPAM, 1993).
A soil-moisture model was adopted for estimation of leaf miner severity in
Karnataka (Gadgil et al. 1999). In the model it is assumed that leaf miner
populations are always present at a low level. Whenever favorable weather
conditions occur in the appropriate growth stage of the crop, population builds up
rapidly. However, if a drenching shower (> 2 cm/day) occurs in the first 14 leaf
miner days (starting 35 days after sowing), it is assumed that the leaf miner is
eliminated. A leaf miner day has been defined as a non-rainy day with dry soil (<
half of the available soil moisture). In this model the loss in crop yield due to leaf
miner incidence is taken to depend upon the number of leaf miner days. The soil
moisture model attempts to estimate the sowing dates in a given region based on
rainfall and soil data and then estimates the leafminer days 35 days after sowing
based on model assumptions.
Emergence of red hairy caterpillar was closely associated with the amount and
distribution of rainfall in the months of July and August at Anantapur. A rain event of
10 mm or above in these two months resulted in emergence of red hairy caterpillar
moths in large numbers after 3 to 4 days. This information is being successfully used
for early warning of red hairy caterpillar in Andhra Pradesh (AICRPAM, 1998).
Developments in Mustard Among the insect pests, mustard aphid, Lipaphis erysimi (Kaltenbach) is the most
important. A number of statistical models have been reported in literature to
explain the relationships among aphid infestation, weather parameters, crop age
and yield. Prasad et al. (1984) suggested using initial population level in preceding
week as an explanatory variable in prediction equations. Thermal time calculations
for phenological stages in mustard and aphid have been the subject of research in
recent years. Accumulation of 250 or more degree-days during the month of January
at New Delhi indicated low aphid attack, whereas 200 or less during the month
indicated high aphid incidence on mustard in the ensuing month. Slower
accumulation of heat units in a given year is likely to promote aphid infestation
(Chakravarthy and Gautam, 2002).
Using weekly data on weather parameters starting from the week of sowing up to
50th meteorological weeks (second week of December) for several years, models for
forecasting time of first appearance of aphid, time of peak aphid infestation and
Model Training Course on “Impact of Climate Change in Rainfed Agriculture and Adaptation Strategies”
September 26-October 03, 2013, CRIDA , Hyderabad
153
intensity of attack were developed for several locations such as Behrampur,
Pantnagar, Hissar, Ludhiana, Morena, Bharatpur and Kanpur (Agrawal et al. 2004).
Institutional Endeavor in Pest Forewarning Related Work In India, crop pest surveillance and monitoring activities are being undertaken by
various agencies such as Department of Plant Protection and Quarantine, State
Departments of Agriculture, ICAR and State Agricultural Universities (SAUs). The All
India Coordinated Research Project on Agrometeorology with its 25 centres spread
across the country is vested with the mandate of issuing agro-advisories based on
medium range weather forecasts on crop and pest status. A sizable database has
been fed into the centralized agromet data bank at the Central Research Institute for
Dryland Agriculture (CRIDA). The National Agricultural Technology Project on
“Weather based forewarning systems for crop pests and diseases” also contributed
to the development of relational database management system (RDBMS) on climate,
crop pests and diseases covering 6 crops and 75 locations. A dynamic website
(http://www.cropweatheroutlook.org) has been launched in July 2003 by CRIDA.
Similarly, 83 Agromet field units of NCMRWF issue agro-advisories. The National
Centre for Integrated Pest Management (NCIPM) is also vested with the mandate of
developing and validating pest-forecasting models. All India Coordinated Research
projects for several crops include monitoring and surveillance of pests and diseases
as one of the activities in their yearly technical programs. There is a need to aim and
put in place a system for integration of efforts by various agencies on the subject of
making pest forecasting operational.
References: AICRPAM, 1993. .All India Coordinated Research Project on Agrometeorology,
Annual Report. Sub centre, Anand, 30-39.
AICRPAM, 1998. .All India Coordinated Research Project on Agrometeorology, 1997,
Project Coordinator’s Report. 19 and 26.
Chakravarty, N.V.K. and Gautam, R.D. 2002. Forewarning mustard aphid. IARI /
NATP Publication . 49 p.
Chari, M.S. and Rao, R.S.N. 1988. Changing pest complex in relation to cropping
system- Tobacco. In: Proceedings of National Seminar on Changing pest situation in
the current agriculture scenario of India held at Krishi Anusandhan Bhavan, Pusa,
New Delhi, ICAR, New Delhi.
Das, D. K., Trivedi, T.P., Singh Joginder and Dhandapani, A. (2000). Weather based
prediction model of Helicoverpa armigera for Integrated Pest Management in cotton
–chickpea based agro-ecosystem of Punjab. Paper presented in International
Conference on Managing Natural Resources for Sustainable Agricultural Production
Model Training Course on “Impact of Climate Change in Rainfed Agriculture and Adaptation Strategies”
September 26-October 03, 2013, CRIDA , Hyderabad
154
in the 21st Century. Voluntary Papers – Natural resources, Vol.2, February 14-18,
2000, New Delhi, pp: 621-622.
Das, D.K., Trivedi, T.P. and Srivastava, C.P. 2001. Simple rule to predict attack of
Helicoverpa armigera on crops growing in Andhra Pradesh. Indian Journal of
Agricultural Sciences 71(6): 421-423.
Diwakar, M.C. 1998. Factors influencing outbreak of American bollworm
(Helicoverpa armigera) Hubner on cotton in India. Plant protection Bulletin 50(1-4):
13-14.
Gadgil Sulochana, P. R. Seshagiri Rao and S. Sridhar. 1999. Modelling impact of
climate variability on rainfed groundnut, Current Science, 76(4) : 557-569.
Krishnaiah, N.V., Pasalu, I.C., Padmavathi, L., Krishnaiah, K. and Ram Prasad, A.S.R.
1997. Day degree requirement of rice yellow stem borer, Scirpophaga incertulas
(Walker). Oryza 34:185-186
Pradhan, S. 1946. Idea of a biograph and biometer. Proc. Natn.Inst. Science India
12: 301-314.
Ramakrishna, A., Sundaram, A. and Uthamasamy S. 1994. Forecasting model for
seasonal indices of stem borer population in rice. Journal of Insect Science 7(1): 58-
60.
Mehta, K.C. 1940. Further Studies on the Control of Rusts in India. Monograph.
Indian Council of Agricultural Research. New Delhi.
Pant, N.C. (Ed.) 1964. Entomology in India 1938-63. Entomological Society, India,
pp.629.
Singh, R.S. 1968. Plant Diseases. Oxford and I.B.H. Publication Co., Inida.
Strand, J.F. 2000. Some agrometeorological aspects of pest and disease management
for the 21st century. Agricultural and Forest Meteorology 103: 73-82.
Venkataraman, S. and Krishnan, A. 1992. Weather in the incidence and control of
pests and diseases. In Crops and Weather (Ed. Venkataraman, S. and Krishnan, A.)
Publications and Information Division, Indian Council of Agricultural Research. pp:
259-302.
Model Training Course on “Impact of Climate Change in Rainfed Agriculture and Adaptation Strategies”
September 26-October 03, 2013, CRIDA , Hyderabad
155
IMPACT OF CLIMATE CHANGE ON CROP-PEST INTERACTIONS
M. Sreenivasa rao, senior scientist,
Central research institute for dryland agriculture, santoshangar, hyderabad –
500 059
Introduction
Global atmospheric CO2 concentration has increased by approximately 30%
since the industrial revolution and is believed to be responsible for an increase of
~0.6°C in mean annual global surface temperature. Elevated CO2 can directly
stimulate plant growth, affect plant resource allocation patterns and change plant
tissue quality and is consequently predicted to indirectly affect insect-herbivory.
Increased CO2 causes a decline in nutritional quality of host plant. This reduction in
nutritional quality of the host plant results in decline in performance of herbivorous
insects. Thus effects of elevated CO2 on the foliar chemistry of plants that prolong
the developmental time, increase the food consumption and reduce the growth of
insect herbivores lead to an increase in their susceptibility to natural enemies.
Survival of natural enemies will also be affected under high CO2. This review
summarizes the results from several years of research on the effects of elevated CO2
and temperature on plant chemistry and subsequent effects on the performance of
insect herbivores and also the direct effects of elevated CO2 and temperature on
insects and natural enemies.
Effect of elevated CO2 on phytochemistry of plants
Among the host plants, forest trees and grasses have been extensively
studied for insect-plant interactions under elevated CO2. Few studies are available
on cultivated crops. Among forest trees, birch followed by quaking aspen has been
studied the most. (Table1). From the table it is clear that plant species show great
variability in response to CO2. Increased CO2 causes a decline in nutritional quality
of the host. The elevated CO2 concentrations used in the studies mentioned ranged
from 530 ppm to 1050 ppm.
A decrease in nitrogen concentration was reported in birch, quaking aspen,
oak and pine. An increase in condensed tannin levels was reported in birch trees,
quaking aspen and oak. However, it was reported no effect on condensed tannins in
birch trees An increase in tremulacin levels was observed under elevated CO2 in
birch trees. Increase in starch was observed in birch oak and pine trees. The other
effects of elevated CO2 on forest trees are decrease in flavonyl glycosides and
increase in catechin and cinnamoylquinic acids in European white birch, increase in
drymatter production and root to shoot ratio of aspen, high carbohydrate: N ratio in
white oak, decrease in monoterpenes and Starch: N ratios in loblolly pine, Pinus
taeda
As in case of forest trees and grasses a decrease in nitrogen was observed in
cultivated plants like cotton, Gossypium hirsutum, soybean, Glycine max, mungbean,
Vigna radiata, spring wheat, Triticum aestivum, plantain, Plantago lanceolata and
Model Training Course on “Impact of Climate Change in Rainfed Agriculture and Adaptation Strategies”
September 26-October 03, 2013, CRIDA , Hyderabad
156
birdsfoot trefoil, Lotus corniculatus. Increase in C:N ratio in cotton and birdsfoot
trefoil was observed. Starch concentration increased in mungbean, wheat and
common beet, Beta vulgaris. There was an increase in sugars in mungbean wheat
and birdsfoot trefoil.
In elevated CO2 conditions across types of plants viz., forest trees, grasses
and cultivated plants the change in phytochemistry of plants was significant. In
majority of cases decrease in nitrogen, increase in condensed tannins, tremulacin
levels, starch, drymatter production and root shoot ratio was observed. These
changes in phytochemistry of plants lead to deterioration of nutritional quality of
plants.
Effect on insects
The impact of elevated carbon dioxide on host plants and insects is
comprehensively reviewed and presented in table 1. Insect performance and host
plant chemistry was influenced by elevated CO2. Among the orders of class insecta,
Lepidoptera was mainly studied with gypsy moth Lymantria dispar and forest tent
caterpillar, Malacosoma distrria being studied the most.
Lepidoptera
It can be inferred from the table 1 that elevated CO2 had negative effect on
performance of gypsy moth, which was studied extensively on an array of trees.
Relative growth rate declined by 30% on sessile oak, Quercus petraea and it
increased by 29% on hornbeem, Carpinus betulus. Decline in relative growth rate
was more on yellow birch, Betula allegheniens compared to gray birch, Betula
populifolia. The pupal mass declined by 38% under elevated CO2 on gray birch while
there was no effect on pupal mass on yellow birch. The differential response was
attributed to greater decline in nutritional quality of yellow birch than gray birch.
Thus the decline in larval performance was host-species-specific.. The larval
consumption increased on quaking aspen, Populus tremuloides as well as paper
birch, Betula papyrifera when exposed to 700 ppm of CO2. Though there was an
increase in consumption by the larvae, the final weight of the larvae was reduced on
quaking aspen while an increase was noticed on paper birch.. Prolonged larval
development time was observed on eastern white pine, Pinus strobus and quaking
aspen. The studies conducted with forest tent caterpillar, M.distria indicate that
larval feeding varies with host plant. Faster development time and 20% decrease in
growth rate was observed on quaking aspen. Larvae preferred aspen to paper birch
under elevated CO2 conditions. No effect on the performance of the larvae was
noticed on quaking aspen and white oak, Quercus alba.
Thus it can be summarized that lepidoterans were negatively affected. The
performance of the same insect varied from host to host indicating host species
specificity. The effect of elevated carbon dioxide is significant across various species
of lepidopterans. The response of insects varied differently and it was not
consistent across host plants (eg. The effects of elevated CO2 on gypsy moth (table
Model Training Course on “Impact of Climate Change in Rainfed Agriculture and Adaptation Strategies”
September 26-October 03, 2013, CRIDA , Hyderabad
157
1) varied on several host plants) while the response of different insects feeding on
same host was different (eg. Differential response of insects (table 1) feeding on
Birch tree)
Homoptera
The family aphididae in this order was widely studied, and mixed response of
aphids was reported under elevated CO2. It was reviewed the aphid response to
elevated ozone and CO2 and observed that among 26 aphid host plant combinations
under elevated CO2, six cases indicated increased aphid performance and five cases
indicated reduced aphid performance, while 12 aphid host plant combinations did
not differ from ambient CO2 level. The effect of different host plants on same aphid
was different and on the same host the effect was different on two different aphid
species
Cotton aphid, Aphis gossypii fecundity significantly increased on cotton. Local
populations of grain aphid, Sitobion avenae on spring wheat, Triticum avenae and
green peach aphid, Myzus persicae on annual blue grass, Poa annua increased under
elevated CO2. The aphid, Uroleucon nigrotuberculatum feeding on golden rod,
Solidago canadensis produced more winged offspring in response to search cues
from predators under elevated CO2. Myzus persicae population on bittersweet
(Solanum dulcamara) increased by 120%.
Direct effects on Insects
If the effect through the host plants is eliminated none of the studies had a
direct effect on insect growth, consumption and development. However, insects
have been shown to respond directly to carbon dioxide concentrations. Wireworm
larvae can locate a food source from distances of up to 20 cm and respond to a CO2
concentration increase as small as 0.002%. The ability to locate host plants of some
herbivores may be affected. Fluctuations in CO2 density as small as 0.14% or 0.5
ppm were detected by the labial palps of Helicoverpa armigera. Other insects are
able to locate their plant hosts following the plume of slightly higher CO2
concentrations, as does the moth Cactoblastis cactorum with its host plant Opuntia
stricta. Diabrotica virgifera virgifera (Le Conte) uses CO2 concentrations in soil to
locate corn roots.
In most of the studies on impact of elevated CO2 on insect-plant interactions
the insects in ambient conditions were fed with detached leaves of host plants
grown under elevated CO2. However, there are a few studies in which both insects
and host plants were exposed to elevated CO2 but these studies couldn’t pinpoint
the direct effects of elevated CO2 on insects. Hence there is a need to further
examine how insects get affected when exposed directly to elevated CO2
concentrations.
Model Training Course on “Impact of Climate Change in Rainfed Agriculture and Adaptation Strategies”
September 26-October 03, 2013, CRIDA , Hyderabad
158
Effect of elevated temperature on plants
The consequence of rising atmospheric carbon dioxide would be an increase
in ambient temperature. But they are usually treated separately because of
experimental difficulties of varying both independently. However, there are a small
number of studies in which both temperature and elevated carbon dioxide were
considered.
Elevated temperature is known to alter the phytochemistry of the host plants
and affect the insect growth and development directly or indirectly through effect
on host plants. The effect of temperature on different host plants is reviewed
hereunder.
A +3° C rise in temperature adversely affected the nutritional quality of
primay leaf growth of Quercus robur to a much greater extent than doubling of
atmospheric carbon dioxide. Differential response was noticed due to elevation of
temperature in different species. Temperature caused a decrease in foliar nitrogen
in Q.robur, increased in Cardamine hirsuta, Poa annua, Senecio vulgaris and Spergula
arvensis and had no effect on red maple, A. rubrum and sugar maple, A. saccharum.
Stem biomass of dark-leaved willow (Salix myrsinifolia) increased, branching and
leaf material decreased in relation to stems. The concentrations of phenolic
compounds decreased in S. myrsinifolia. The concentrations of Cinnamoylquinic
acids decreased and Salidroside decreased in white birch, Betula pendula leaves
under elevated temperature conditions. Leaf water content of sugar maple leaves
declined and condensed tannin content increased in Q.robur .
Effect of temperature on herbivorous insects Temperature is identified as dominant abiotic factor directly affecting
herbivorous insects. Temperature directly affects the development, survival and
abundance of insects. The influence of elevated temperature on various insect
species is presented below.
There was no effect of elevated temperature except early pupation on larvae
of winter moth, Operophtera brumata feeding on oak leaves, Q.robur. Larval
development and adult fecundity of O.brumata was adversely affected by increased
temperatures on Q. robur. Temperature had no effect on the growth or consumption
of gypsy moth larvae, however the long-term exposure to a 3.5°C increase in
temperature shortened insect development but had no effect on pupal weight. The
larvae reared on elevated CO2 grown leaves had reduced growth. Hence it was
concluded that alterations in leaf chemistry due to elevated CO2 atmosphere are
more important in the plant-insect interactions than either the direct short time
effects of temperature on insect performance or its indirect effects on leaf
chemistry. In some tree-herbivorous insect systems the direct effects of an
increased global mean temperature may have greater consequences for altering
plant-insect interactions than the indirect effects of an increased temperature.
Model Training Course on “Impact of Climate Change in Rainfed Agriculture and Adaptation Strategies”
September 26-October 03, 2013, CRIDA , Hyderabad
159
References:
Whittaker, J.B. 1999. Impacts and responses at population level of herbivores
insects to elevated CO2. European Journal Entomology 96: 149-156.
Williams, R.S., Norby, R.J. and Lincoln, D.E. 2000. Effects of elevated CO2 and
temperature-grown red and sugar maple on gypsy moth performance. Global
Change Biology 6: 685-695.
Srinivasa Rao, M., MasoodKhan MA,Srinivas K,Vanaja M,Rao GGSN and Ramakrishna
YS 2006 Effects of elevated CO2 and temperature on insect plant interactions –a
review .Agricultural Reviews.200-207. pp
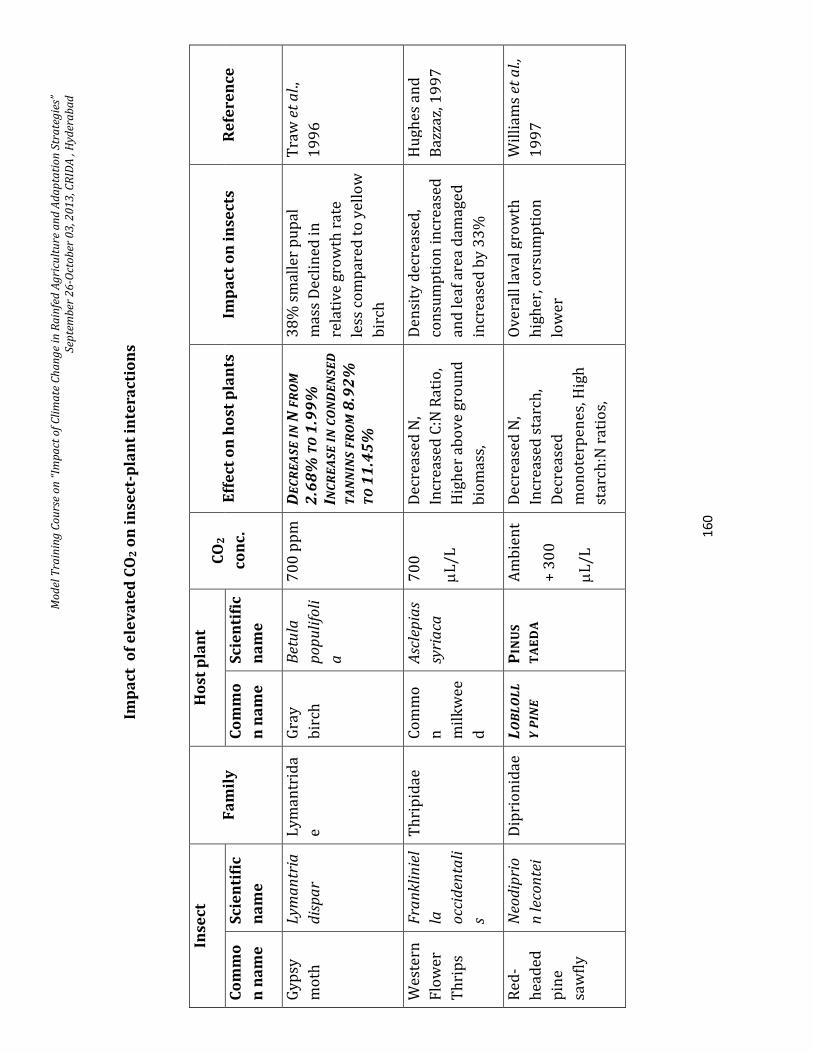
Mo
del
Tra
inin
g C
ou
rse
on
“Im
pa
ct o
f C
lim
ate
Ch
an
ge
in R
ain
fed
Ag
ricu
ltu
re a
nd
Ad
ap
tati
on
Str
ate
gie
s”
Sep
tem
ber
26
-Oct
ob
er 0
3, 2
01
3, C
RID
A ,
Hyd
era
ba
d
16
0
Imp
ac
t o
f e
lev
ate
d C
O2 o
n i
nse
ct-
pla
nt
inte
rac
tio
ns
Inse
ct
Fa
mil
y
Ho
st p
lan
t
CO
2
co
nc
. E
ffe
ct o
n h
ost
pla
nts
Im
pa
ct
on
in
sec
ts
Re
fere
nc
e
Co
mm
o
n n
am
e
Sc
ien
tifi
c
na
me
Co
mm
o
n n
am
e
Sc
ien
tifi
c
na
me
Gy
psy
mo
th
Lym
an
tria
dis
pa
r
Ly
ma
ntr
ida
e
Gra
y
bir
ch
Bet
ula
po
pu
lifo
li
a
70
0 p
pm
D
EC
RE
AS
E I
N N
FR
OM
2.6
8%
TO
1.9
9%
INC
RE
AS
E I
N C
ON
DE
NS
ED
TA
NN
INS
FR
OM
8.9
2%
TO
11
.45
%
38
% s
ma
lle
r p
up
al
ma
ss D
ecl
ine
d i
n
rela
tiv
e g
row
th r
ate
less
co
mp
are
d t
o y
ell
ow
bir
ch
Tra
w e
t a
l.,
19
96
We
ste
rn
Flo
we
r
Th
rip
s
Fra
nk
lin
iel
la
occ
iden
tali
s
Th
rip
ida
e
Co
mm
o
n
mil
kw
ee
d
Asc
lep
ias
syri
aca
70
0
µL
/L
De
cre
ase
d N
,
Incr
ea
sed
C:N
Ra
tio
,
Hig
he
r a
bo
ve
gro
un
d
bio
ma
ss,
De
nsi
ty d
ecr
ea
sed
,
con
sum
pti
on
in
cre
ase
d
an
d l
ea
f a
rea
da
ma
ge
d
incr
ea
sed
by
33
%
Hu
gh
es
an
d
Ba
zza
z, 1
99
7
Re
d-
he
ad
ed
pin
e
saw
fly
Neo
dip
rio
n l
eco
nte
i
Dip
rio
nid
ae
L
OB
LO
LL
Y P
INE
PIN
US
TA
ED
A
Am
bie
nt
+ 3
00
µL
/L
De
cre
ase
d N
,
Incr
ea
sed
sta
rch
,
De
cre
ase
d
mo
no
terp
en
es,
Hig
h
sta
rch
:N r
ati
os,
Ov
era
ll l
av
al
gro
wth
hig
he
r, c
ors
um
pti
on
low
er
Wil
lia
ms
et a
l.,
19
97
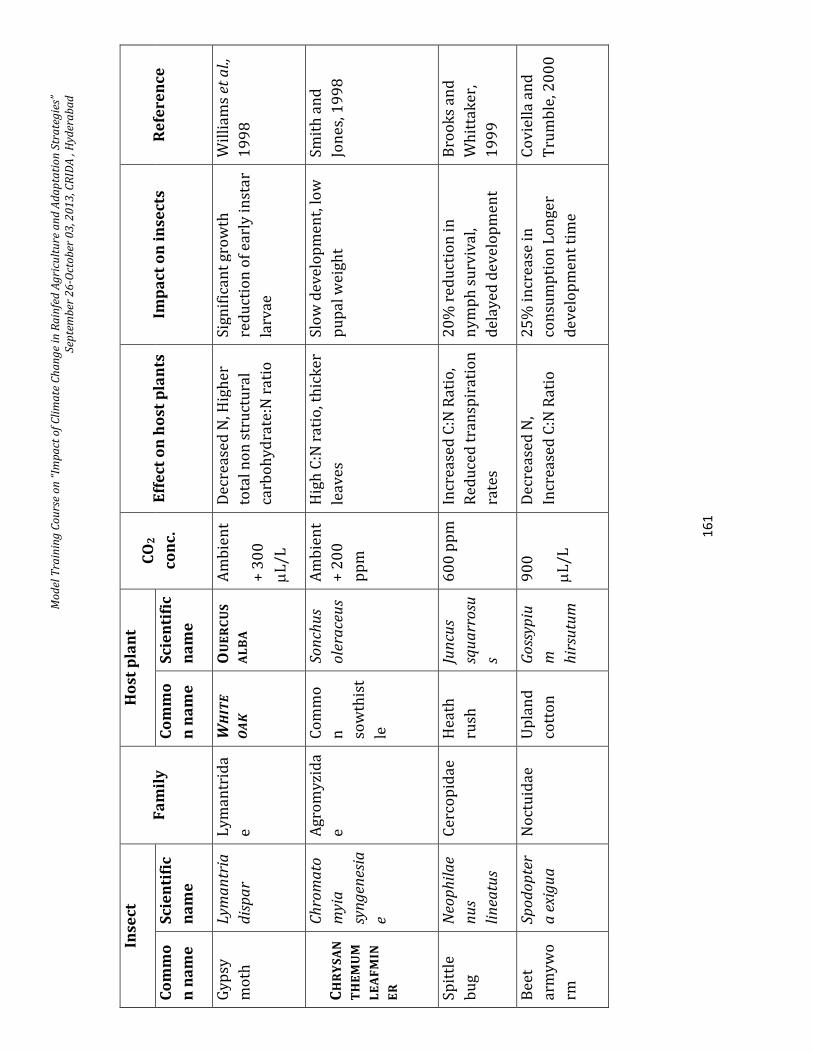
Mo
del
Tra
inin
g C
ou
rse
on
“Im
pa
ct o
f C
lim
ate
Ch
an
ge
in R
ain
fed
Ag
ricu
ltu
re a
nd
Ad
ap
tati
on
Str
ate
gie
s”
Sep
tem
ber
26
-Oct
ob
er 0
3, 2
01
3, C
RID
A ,
Hyd
era
ba
d
16
1
Inse
ct
Fa
mil
y
Ho
st p
lan
t
CO
2
co
nc
. E
ffe
ct o
n h
ost
pla
nts
Im
pa
ct
on
in
sec
ts
Re
fere
nc
e
Co
mm
o
n n
am
e
Sc
ien
tifi
c
na
me
Co
mm
o
n n
am
e
Sc
ien
tifi
c
na
me
Gy
psy
mo
th
Lym
an
tria
dis
pa
r
Ly
ma
ntr
ida
e
WH
ITE
OA
K
OU
ER
CU
S
AL
BA
A
mb
ien
t
+ 3
00
µL
/L
De
cre
ase
d N
, Hig
he
r
tota
l n
on
str
uct
ura
l
carb
oh
yd
rate
:N r
ati
o
Sig
nif
ica
nt
gro
wth
red
uct
ion
of
ea
rly
in
sta
r
larv
ae
Wil
lia
ms
et a
l.,
19
98
CH
RY
SA
N
TH
EM
UM
LE
AF
MIN
ER
Ch
rom
ato
myi
a
syn
gen
esia
e
Ag
rom
yzi
da
e
Co
mm
o
n
sow
this
t
le
So
nch
us
ole
race
us
Am
bie
nt
+ 2
00
pp
m
Hig
h C
:N r
ati
o, t
hic
ke
r
lea
ve
s
Slo
w d
ev
elo
pm
en
t, l
ow
pu
pa
l w
eig
ht
Sm
ith
an
d
Jon
es,
19
98
Sp
ittl
e
bu
g
Neo
ph
ila
e
nu
s
lin
eatu
s
Ce
rco
pid
ae
H
ea
th
rush
Jun
cus
squ
arr
osu
s
60
0 p
pm
In
cre
ase
d C
:N R
ati
o,
Re
du
ced
tra
nsp
ira
tio
n
rate
s
20
% r
ed
uct
ion
in
ny
mp
h s
urv
iva
l,
de
lay
ed
de
ve
lop
me
nt
Bro
ok
s a
nd
Wh
itta
ke
r,
19
99
Be
et
arm
yw
o
rm
Sp
od
op
ter
a e
xig
ua
No
ctu
ida
e
Up
lan
d
cott
on
Go
ssyp
iu
m
hir
sutu
m
90
0
µL
/L
De
cre
ase
d N
,
Incr
ea
sed
C:N
Ra
tio
25
% i
ncr
ea
se i
n
con
sum
pti
on
Lo
ng
er
de
ve
lop
me
nt
tim
e
Co
vie
lla
an
d
Tru
mb
le, 2
00
0
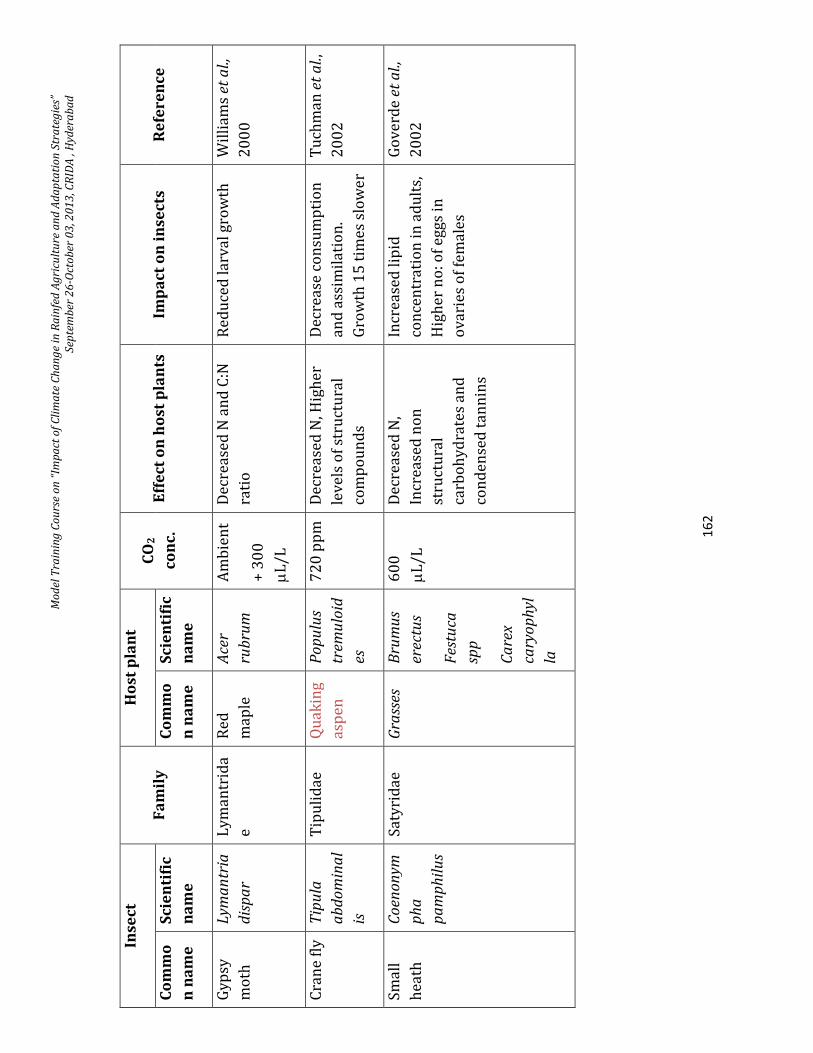
Mo
del
Tra
inin
g C
ou
rse
on
“Im
pa
ct o
f C
lim
ate
Ch
an
ge
in R
ain
fed
Ag
ricu
ltu
re a
nd
Ad
ap
tati
on
Str
ate
gie
s”
Sep
tem
ber
26
-Oct
ob
er 0
3, 2
01
3, C
RID
A ,
Hyd
era
ba
d
16
2
Inse
ct
Fa
mil
y
Ho
st p
lan
t
CO
2
co
nc
. E
ffe
ct o
n h
ost
pla
nts
Im
pa
ct
on
in
sec
ts
Re
fere
nc
e
Co
mm
o
n n
am
e
Sc
ien
tifi
c
na
me
Co
mm
o
n n
am
e
Sc
ien
tifi
c
na
me
Gy
psy
mo
th
Lym
an
tria
dis
pa
r
Ly
ma
ntr
ida
e
Re
d
ma
ple
Ace
r
rub
rum
Am
bie
nt
+ 3
00
µL
/L
De
cre
ase
d N
an
d C
:N
rati
o
Re
du
ced
la
rva
l g
row
th
Wil
lia
ms
et a
l.,
20
00
Cra
ne
fly
T
ipu
la
ab
do
min
al
is
Tip
uli
da
e
Qu
ak
ing
asp
en
Po
pu
lus
trem
ulo
id
es
72
0 p
pm
D
ecr
ea
sed
N, H
igh
er
lev
els
of
stru
ctu
ral
com
po
un
ds
De
cre
ase
co
nsu
mp
tio
n
an
d a
ssim
ila
tio
n.
Gro
wth
15
tim
es
slo
we
r
Tu
chm
an
et
al.
,
20
02
Sm
all
he
ath
Co
eno
nym
ph
a
pa
mp
hil
us
Sa
tyri
da
e
Gra
sses
B
rum
us
erec
tus
Fes
tuca
spp
Ca
rex
cary
op
hyl
la
60
0
µL
/L
De
cre
ase
d N
,
Incr
ea
sed
no
n
stru
ctu
ral
carb
oh
yd
rate
s a
nd
con
de
nse
d t
an
nin
s
Incr
ea
sed
lip
id
con
cen
tra
tio
n i
n a
du
lts,
Hig
he
r n
o:
of
eg
gs
in
ov
ari
es
of
fem
ale
s
Go
ve
rde
et
al.
,
20
02
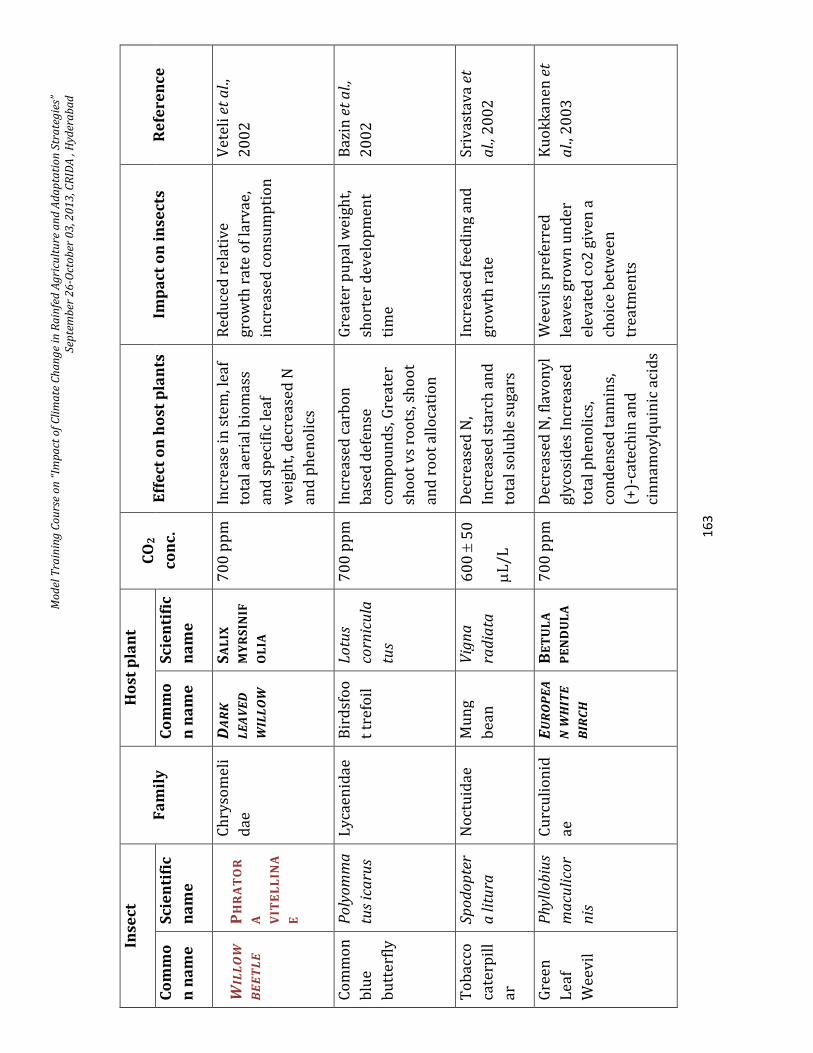
Mo
del
Tra
inin
g C
ou
rse
on
“Im
pa
ct o
f C
lim
ate
Ch
an
ge
in R
ain
fed
Ag
ricu
ltu
re a
nd
Ad
ap
tati
on
Str
ate
gie
s”
Sep
tem
ber
26
-Oct
ob
er 0
3, 2
01
3, C
RID
A ,
Hyd
era
ba
d
16
3
Inse
ct
Fa
mil
y
Ho
st p
lan
t
CO
2
co
nc
. E
ffe
ct o
n h
ost
pla
nts
Im
pa
ct
on
in
sec
ts
Re
fere
nc
e
Co
mm
o
n n
am
e
Sc
ien
tifi
c
na
me
Co
mm
o
n n
am
e
Sc
ien
tifi
c
na
me
WIL
LO
W
BE
ET
LE
PH
RA
TO
R
A
VIT
EL
LIN
A
E
Ch
ryso
me
li
da
e
DA
RK
LE
AV
ED
WIL
LO
W
SA
LIX
MY
RS
INIF
OL
IA
70
0 p
pm
In
cre
ase
in
ste
m, l
ea
f
tota
l a
eri
al
bio
ma
ss
an
d s
pe
cifi
c le
af
we
igh
t, d
ecr
ea
sed
N
an
d p
he
no
lics
Re
du
ced
re
lati
ve
gro
wth
ra
te o
f la
rva
e,
incr
ea
sed
co
nsu
mp
tio
n
Ve
teli
et
al.
,
20
02
Co
mm
on
blu
e
bu
tte
rfly
Po
lyo
mm
a
tus
ica
rus
Ly
cae
nid
ae
B
ird
sfo
o
t tr
efo
il
Lo
tus
corn
icu
la
tus
70
0 p
pm
In
cre
ase
d c
arb
on
ba
sed
de
fen
se
com
po
un
ds,
Gre
ate
r
sho
ot
vs
roo
ts, s
ho
ot
an
d r
oo
t a
llo
cati
on
Gre
ate
r p
up
al
we
igh
t,
sho
rte
r d
ev
elo
pm
en
t
tim
e
Ba
zin
et
al.,
20
02
To
ba
cco
cate
rpil
l
ar
Sp
od
op
ter
a l
itu
ra
No
ctu
ida
e
Mu
ng
be
an
Vig
na
rad
iata
60
0 ±
50
µL
/L
De
cre
ase
d N
,
Incr
ea
sed
sta
rch
an
d
tota
l so
lub
le s
ug
ars
Incr
ea
sed
fe
ed
ing
an
d
gro
wth
ra
te
Sri
va
sta
va
et
al.
, 20
02
Gre
en
Le
af
We
ev
il
Ph
yllo
biu
s
ma
culi
cor
nis
Cu
rcu
lio
nid
ae
EU
RO
PE
A
N W
HIT
E
BIR
CH
BE
TU
LA
PE
ND
UL
A
70
0 p
pm
D
ecr
ea
sed
N, f
lav
on
yl
gly
cosi
de
s In
cre
ase
d
tota
l p
he
no
lics
,
con
de
nse
d t
an
nin
s,
(+)-
cate
chin
an
d
cin
na
mo
ylq
uin
ic a
cid
s
We
ev
ils
pre
ferr
ed
lea
ve
s g
row
n u
nd
er
ele
va
ted
co
2 g
ive
n a
cho
ice
be
twe
en
tre
atm
en
ts
Ku
ok
ka
ne
n e
t
al.
, 20
03
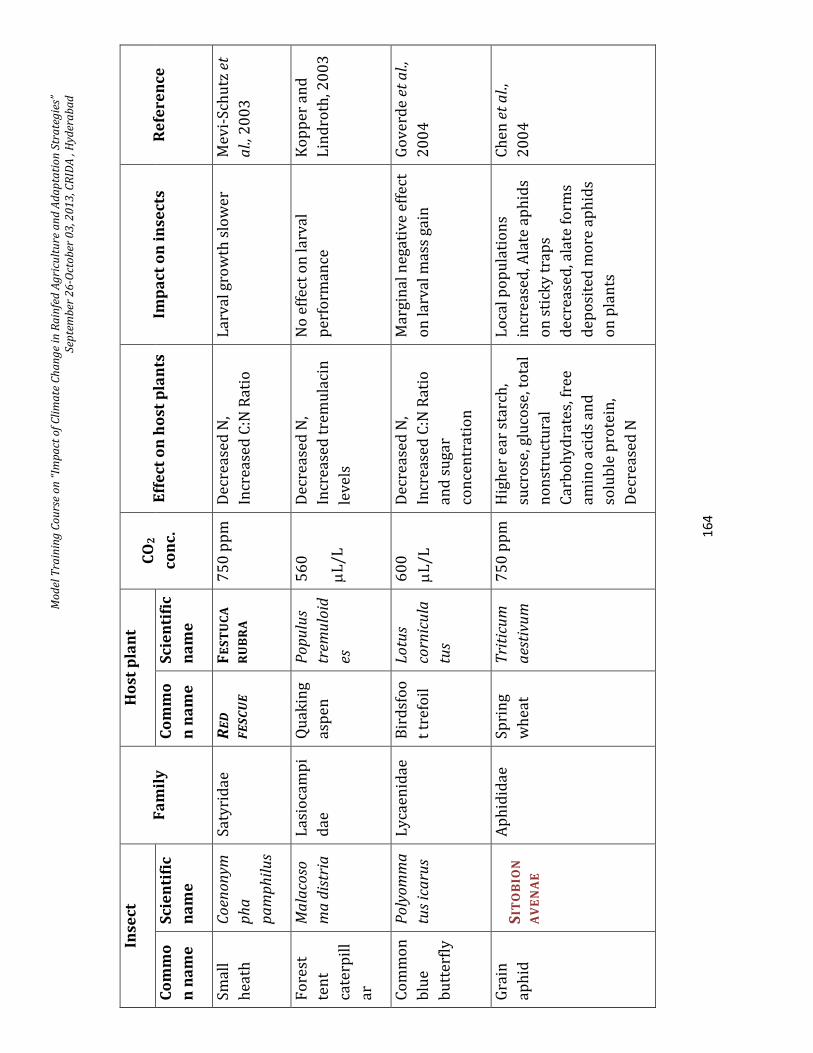
Mo
del
Tra
inin
g C
ou
rse
on
“Im
pa
ct o
f C
lim
ate
Ch
an
ge
in R
ain
fed
Ag
ricu
ltu
re a
nd
Ad
ap
tati
on
Str
ate
gie
s”
Sep
tem
ber
26
-Oct
ob
er 0
3, 2
01
3, C
RID
A ,
Hyd
era
ba
d
16
4
Inse
ct
Fa
mil
y
Ho
st p
lan
t
CO
2
co
nc
. E
ffe
ct o
n h
ost
pla
nts
Im
pa
ct
on
in
sec
ts
Re
fere
nc
e
Co
mm
o
n n
am
e
Sc
ien
tifi
c
na
me
Co
mm
o
n n
am
e
Sc
ien
tifi
c
na
me
Sm
all
he
ath
Co
eno
nym
ph
a
pa
mp
hil
us
Sa
tyri
da
e
RE
D
FE
SC
UE
FE
ST
UC
A
RU
BR
A
75
0 p
pm
D
ecr
ea
sed
N,
Incr
ea
sed
C:N
Ra
tio
La
rva
l g
row
th s
low
er
Me
vi-
Sch
utz
et
al.
, 20
03
Fo
rest
ten
t
cate
rpil
l
ar
Ma
laco
so
ma
dis
tria
La
sio
cam
pi
da
e
Qu
ak
ing
asp
en
Po
pu
lus
trem
ulo
id
es
56
0
µL
/L
De
cre
ase
d N
,
Incr
ea
sed
tre
mu
laci
n
lev
els
No
eff
ect
on
la
rva
l
pe
rfo
rma
nce
Ko
pp
er
an
d
Lin
dro
th, 2
00
3
Co
mm
on
blu
e
bu
tte
rfly
Po
lyo
mm
a
tus
ica
rus
Ly
cae
nid
ae
B
ird
sfo
o
t tr
efo
il
Lo
tus
corn
icu
la
tus
60
0
µL
/L
De
cre
ase
d N
,
Incr
ea
sed
C:N
Ra
tio
an
d s
ug
ar
con
cen
tra
tio
n
Ma
rgin
al
ne
ga
tiv
e e
ffe
ct
on
la
rva
l m
ass
ga
in
Go
ve
rde
et
al.
,
20
04
Gra
in
ap
hid
S
ITO
BIO
N
AV
EN
AE
Ap
hid
ida
e
Sp
rin
g
wh
ea
t
Tri
ticu
m
aes
tivu
m
75
0 p
pm
H
igh
er
ea
r st
arc
h,
sucr
ose
, glu
cose
, to
tal
no
nst
ruct
ura
l
Ca
rbo
hy
dra
tes,
fre
e
am
ino
aci
ds
an
d
solu
ble
pro
tein
,
De
cre
ase
d N
Lo
cal
po
pu
lati
on
s
incr
ea
sed
, Ala
te a
ph
ids
on
sti
cky
tra
ps
de
cre
ase
d, a
late
fo
rms
de
po
site
d m
ore
ap
hid
s
on
pla
nts
Ch
en
et
al.
,
20
04
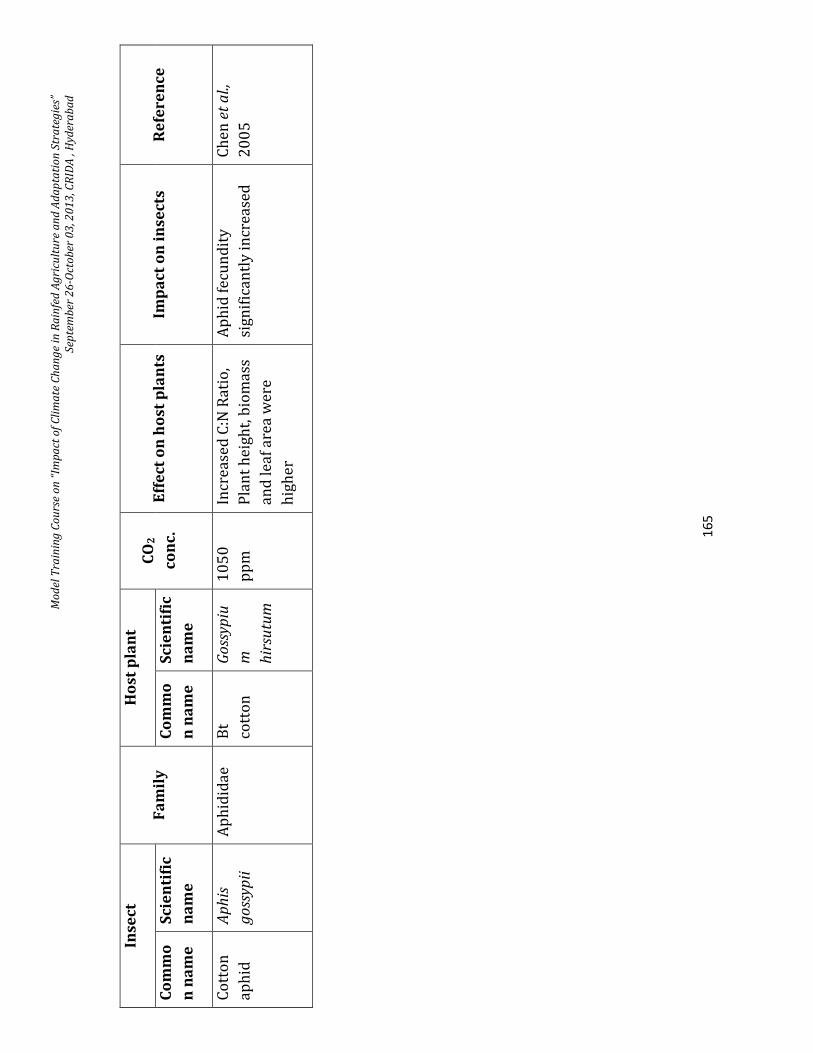
Mo
del
Tra
inin
g C
ou
rse
on
“Im
pa
ct o
f C
lim
ate
Ch
an
ge
in R
ain
fed
Ag
ricu
ltu
re a
nd
Ad
ap
tati
on
Str
ate
gie
s”
Sep
tem
ber
26
-Oct
ob
er 0
3, 2
01
3, C
RID
A ,
Hyd
era
ba
d
16
5
Inse
ct
Fa
mil
y
Ho
st p
lan
t
CO
2
co
nc
. E
ffe
ct o
n h
ost
pla
nts
Im
pa
ct
on
in
sec
ts
Re
fere
nc
e
Co
mm
o
n n
am
e
Sc
ien
tifi
c
na
me
Co
mm
o
n n
am
e
Sc
ien
tifi
c
na
me
Co
tto
n
ap
hid
Ap
his
go
ssyp
ii
Ap
hid
ida
e
Bt
cott
on
Go
ssyp
iu
m
hir
sutu
m
10
50
pp
m
Incr
ea
sed
C:N
Ra
tio
,
Pla
nt
he
igh
t, b
iom
ass
an
d l
ea
f a
rea
we
re
hig
he
r
Ap
hid
fe
cun
dit
y
sig
nif
ica
ntl
y i
ncr
ea
sed
Ch
en
et
al.,
20
05
Model Training Course on “Impact of Climate Change in Rainfed Agriculture and Adaptation Strategies”
September 26-October 03, 2013, CRIDA , Hyderabad
166
FARMERS’ KNOWLEDGE, PERCEPTION AND ADAPTATION MEASURES TOWARDS CLIMATE VARIABILITY
K. Ravi Shankar, Senior Scientist (Agril. Extension), Transfer of Technology
Section, Central Research Institute for Dryland Agriculture
Introduction
Indigenous knowledge is generally defined as the “Knowledge of a people of a
particular area based on their interactions and experiences within that area, their
traditions, and their incorporation of knowledge emanating from elsewhere into
their production and economic systems”. It is culturally appropriate, holistic and
integrative. Incorporating indigenous knowledge is less expensive than bringing in
aid for populations unprepared for catastrophes and disasters, or than importing
adaptive measures, which are usually introduced in a top- down manner and
difficult to implement, particularly because of financial and institutional constraints.
Indigenous people that live close to natural resources often observe the activities
around them and are the first to identify and adapt to any changes. The appearance
of certain birds, mating of certain animals and flowering of certain plants are all
important signals of changes in time and seasons that are well understood in
traditional knowledge systems. Farmers have been confronted with changing
environments for millennia and have developed a wide array of coping strategies,
and their traditional knowledge and practices provide an important basis for facing
the even greater challenges of climate change. Participatory research and farmer-
back-to-farmer models of technology transfer are examples of attempts towards
establishing a bridge between traditional knowledge and scientific knowledge. The
increasing attention to adaptation to climate change has not come with sufficient
emphasis on the local nature of climate adaptation and on the role of local
institutions and local governance in shaping adaptation practices (Agrawal et al.,
2009). Local knowledge is therefore a major priority in the planning of adaptation
(Allen, 2006). Indigenous knowledge systems can facilitate understanding and
effective communication and increase the rate of dissemination and utilization of
climate change mitigation and adaptation options. While the importance of
indigenous knowledge has been realized in the design and implementation of
sustainable development projects, little attention has been drawn to their
incorporation into formal changing climate mitigation and adaptation strategies
(Nyong et al., 2007).
Climate change is becoming a major driver of disasters, with increasingly
frequent and intense floods and storms affecting more people globally. Increased
forced displacement is an extremely likely consequence of such events. Heightened
drought risk, desertification, sea level rise and changes in the availability of water
and fertile land, coupled with reduced access to basic resources, will also fuel longer
term migration and forced displacement.
Model Training Course on “Impact of Climate Change in Rainfed Agriculture and Adaptation Strategies”
September 26-October 03, 2013, CRIDA , Hyderabad
167
Climate change: Impacts on Agriculture in India
Agriculture is one of the largest contributors to India’s Gross Domestic Product
(GDP), approximately 20%. It is the main source of livelihood for almost 60% of the
country’s total population. The impacts of changing climate on agriculture will
therefore be severely felt in India. It has been projected that under the scenario of a
2.50C to 4.90C temperature rise in India, rice yields will drop by 32%-40% and
wheat yields by 41-52%. This would cause GDP to fall by 1.8%-3.4% (GOI, 2011;
Guiteras, 2007; OECD, 2002). Despite the gloomy predictions about the negative
impacts for India’s agricultural sector, climate change is expected to bring
opportunities as well e.g.: production gains through the CO2 fertilization effect or the
expansion of cultivated land to higher altitudes and northern latitudes. However, it
must be noted that to date all climate change projections have been accompanied by
uncertainty-not primarily concerning trends but extent (IFPRI, 2009; UNFCC, 2009).
Adaptation to Climate change
Agriculture in developing countries is one of the most vulnerable sectors of the
global economy to changing climate (Kurukulasuriya et al., 2006; Seo and
Mendelsohn 2008c). Farmers whose livelihoods depend on the use of natural
resources are likely to bear the brunt of adverse changing climate impacts. Farmers
will be hard hit if they do not adjust at all to new climates (Mendelsohn et al., 1994,
Rosenzweig and Hillel 1998; Reilly et al., 1996). Adaptation to climate change
requires that farmers first notice that climate has changed, and then identify useful
adaptations and implement them (Maddison, 2006). Adaptation is widely
recognized as a vital component of any policy response to climate change. Studies
show that without adaptation, climate change is generally detrimental to the
agriculture sector; but with adaptation, vulnerability can largely be reduced
(Easterling et al., 1993; Rosenzweig and Parry 1994; Smith 1996; Mendelsohn 1998;
Reilly and Schimmelpfennig 1999; Smit and Skinner, 2002). The degree to which an
agricultural system is affected by climate change depends on its adaptive capacity.
The adaptive capacity of a system describes its ability to modify its characteristics
or behavior so as to cope better with changes in external conditions. Adaptive
capacity is determined by various factors including recognition of the need to adapt,
willingness to undertake adaptation, and the availability of, and ability to deploy,
resources (Brown, 2010). Recent empirical studies indicate that farmers have
already adapted to the existing climates that they face by choosing crops or
livestock or irrigation (Kurukulasuriya and Mendelsohn 2007, 2008; Nhemachena
and Hassan 2007; Seo and Mendelsohn 2008a, 2008b) ideal for their current
climate. The adaptation strategies must not be used in isolation. For instance, the
use of early maturing crop varieties must be accompanied by other crop
management practices such as crop rotation or the use of cover crops. This,
however, requires additional institutional support, such as credit, access to input
and output markets and information.
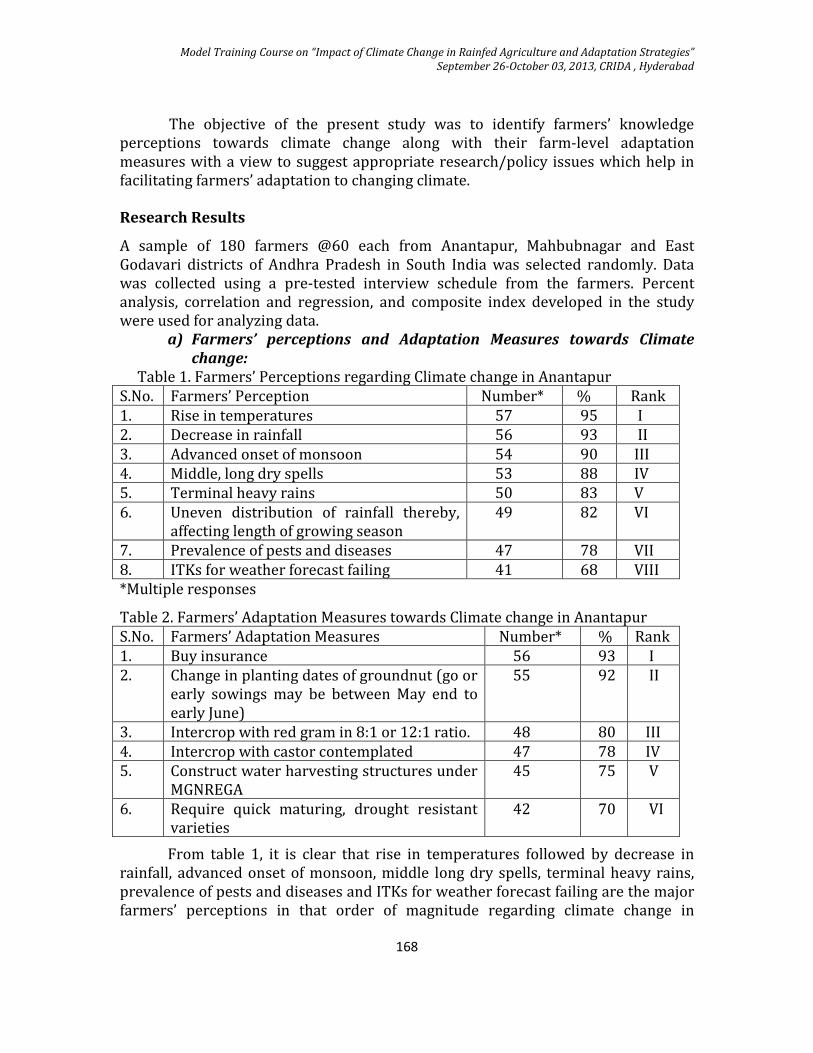
Model Training Course on “Impact of Climate Change in Rainfed Agriculture and Adaptation Strategies”
September 26-October 03, 2013, CRIDA , Hyderabad
168
The objective of the present study was to identify farmers’ knowledge
perceptions towards climate change along with their farm-level adaptation
measures with a view to suggest appropriate research/policy issues which help in
facilitating farmers’ adaptation to changing climate.
Research Results
A sample of 180 farmers @60 each from Anantapur, Mahbubnagar and East
Godavari districts of Andhra Pradesh in South India was selected randomly. Data
was collected using a pre-tested interview schedule from the farmers. Percent
analysis, correlation and regression, and composite index developed in the study
were used for analyzing data.
a) Farmers’ perceptions and Adaptation Measures towards Climate
change:
Table 1. Farmers’ Perceptions regarding Climate change in Anantapur
S.No. Farmers’ Perception Number* % Rank
1. Rise in temperatures 57 95 I
2. Decrease in rainfall 56 93 II
3. Advanced onset of monsoon 54 90 III
4. Middle, long dry spells 53 88 IV
5. Terminal heavy rains 50 83 V
6. Uneven distribution of rainfall thereby,
affecting length of growing season 49 82 VI
7. Prevalence of pests and diseases 47 78 VII
8. ITKs for weather forecast failing 41 68 VIII
*Multiple responses
Table 2. Farmers’ Adaptation Measures towards Climate change in Anantapur
S.No. Farmers’ Adaptation Measures Number* % Rank
1. Buy insurance 56 93 I
2. Change in planting dates of groundnut (go or
early sowings may be between May end to
early June)
55 92 II
3. Intercrop with red gram in 8:1 or 12:1 ratio. 48 80 III
4. Intercrop with castor contemplated 47 78 IV
5. Construct water harvesting structures under
MGNREGA 45 75 V
6. Require quick maturing, drought resistant
varieties 42 70 VI
From table 1, it is clear that rise in temperatures followed by decrease in
rainfall, advanced onset of monsoon, middle long dry spells, terminal heavy rains,
prevalence of pests and diseases and ITKs for weather forecast failing are the major
farmers’ perceptions in that order of magnitude regarding climate change in
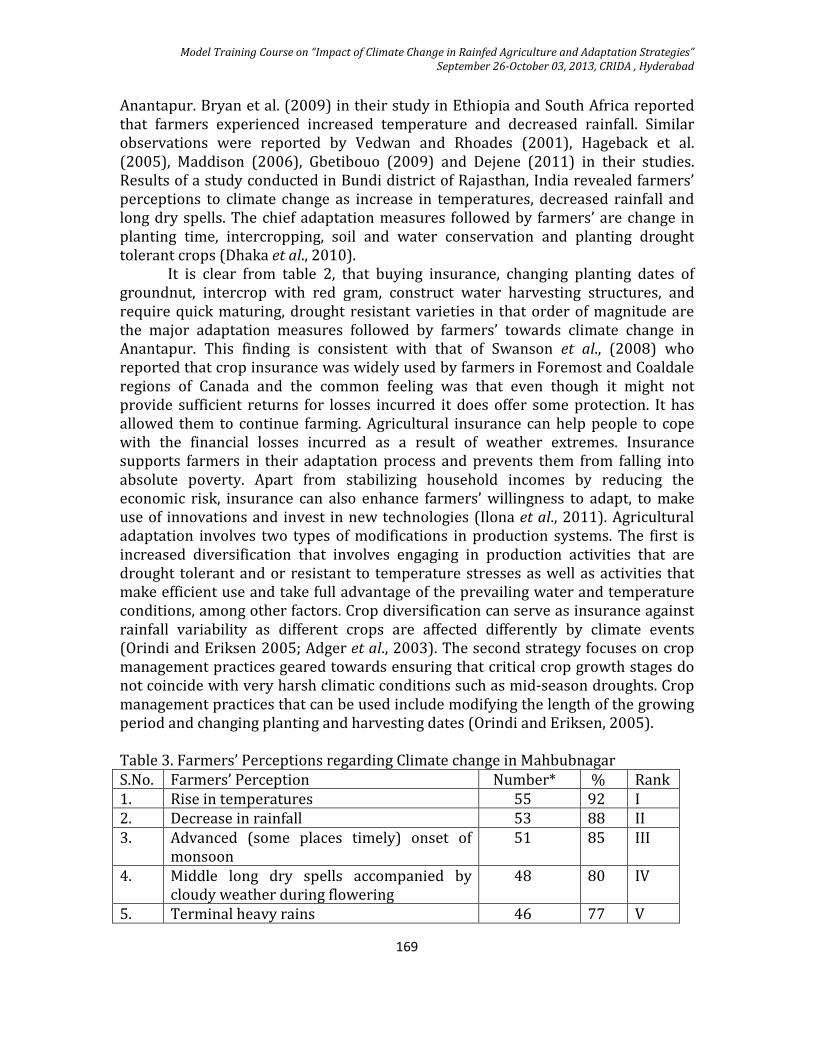
Model Training Course on “Impact of Climate Change in Rainfed Agriculture and Adaptation Strategies”
September 26-October 03, 2013, CRIDA , Hyderabad
169
Anantapur. Bryan et al. (2009) in their study in Ethiopia and South Africa reported
that farmers experienced increased temperature and decreased rainfall. Similar
observations were reported by Vedwan and Rhoades (2001), Hageback et al.
(2005), Maddison (2006), Gbetibouo (2009) and Dejene (2011) in their studies.
Results of a study conducted in Bundi district of Rajasthan, India revealed farmers’
perceptions to climate change as increase in temperatures, decreased rainfall and
long dry spells. The chief adaptation measures followed by farmers’ are change in
planting time, intercropping, soil and water conservation and planting drought
tolerant crops (Dhaka et al., 2010). It is clear from table 2, that buying insurance, changing planting dates of
groundnut, intercrop with red gram, construct water harvesting structures, and
require quick maturing, drought resistant varieties in that order of magnitude are
the major adaptation measures followed by farmers’ towards climate change in
Anantapur. This finding is consistent with that of Swanson et al., (2008) who
reported that crop insurance was widely used by farmers in Foremost and Coaldale
regions of Canada and the common feeling was that even though it might not
provide sufficient returns for losses incurred it does offer some protection. It has
allowed them to continue farming. Agricultural insurance can help people to cope
with the financial losses incurred as a result of weather extremes. Insurance
supports farmers in their adaptation process and prevents them from falling into
absolute poverty. Apart from stabilizing household incomes by reducing the
economic risk, insurance can also enhance farmers’ willingness to adapt, to make
use of innovations and invest in new technologies (Ilona et al., 2011). Agricultural
adaptation involves two types of modifications in production systems. The first is
increased diversification that involves engaging in production activities that are
drought tolerant and or resistant to temperature stresses as well as activities that
make efficient use and take full advantage of the prevailing water and temperature
conditions, among other factors. Crop diversification can serve as insurance against
rainfall variability as different crops are affected differently by climate events
(Orindi and Eriksen 2005; Adger et al., 2003). The second strategy focuses on crop
management practices geared towards ensuring that critical crop growth stages do
not coincide with very harsh climatic conditions such as mid-season droughts. Crop
management practices that can be used include modifying the length of the growing
period and changing planting and harvesting dates (Orindi and Eriksen, 2005).
Table 3. Farmers’ Perceptions regarding Climate change in Mahbubnagar
S.No. Farmers’ Perception Number* % Rank
1. Rise in temperatures 55 92 I
2. Decrease in rainfall 53 88 II
3. Advanced (some places timely) onset of
monsoon 51 85 III
4. Middle long dry spells accompanied by
cloudy weather during flowering 48 80 IV
5. Terminal heavy rains 46 77 V
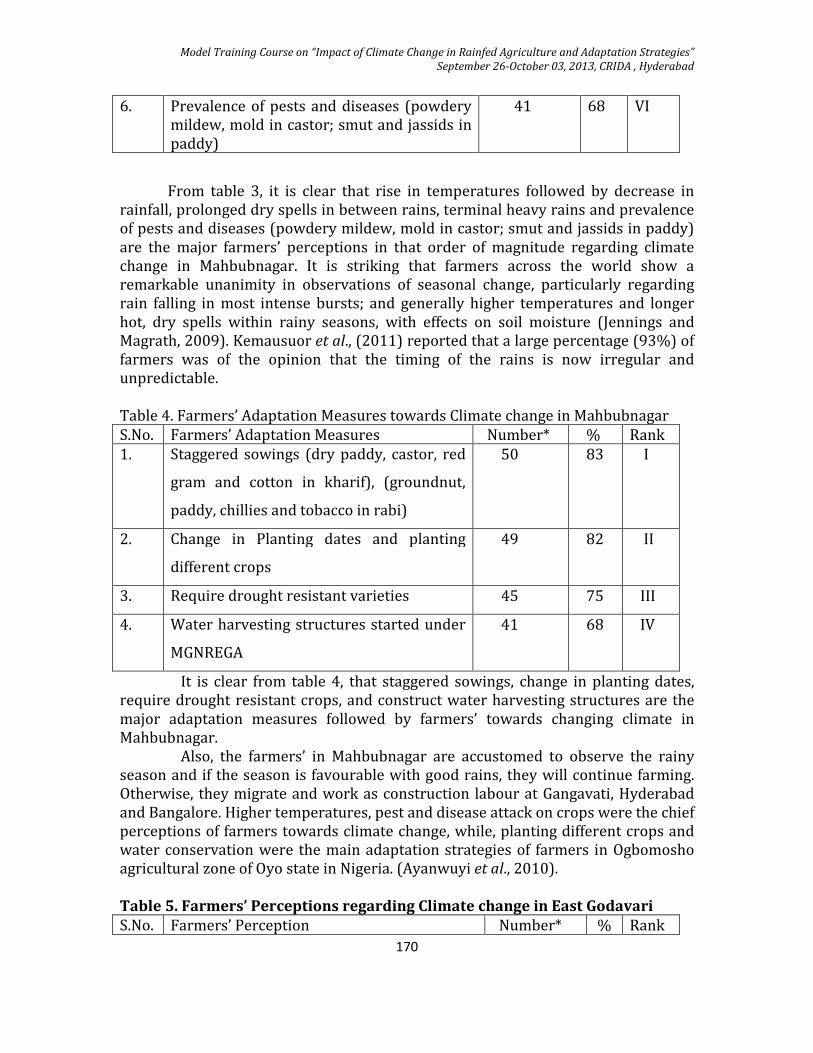
Model Training Course on “Impact of Climate Change in Rainfed Agriculture and Adaptation Strategies”
September 26-October 03, 2013, CRIDA , Hyderabad
170
6. Prevalence of pests and diseases (powdery
mildew, mold in castor; smut and jassids in
paddy)
41 68 VI
From table 3, it is clear that rise in temperatures followed by decrease in
rainfall, prolonged dry spells in between rains, terminal heavy rains and prevalence
of pests and diseases (powdery mildew, mold in castor; smut and jassids in paddy)
are the major farmers’ perceptions in that order of magnitude regarding climate
change in Mahbubnagar. It is striking that farmers across the world show a
remarkable unanimity in observations of seasonal change, particularly regarding
rain falling in most intense bursts; and generally higher temperatures and longer
hot, dry spells within rainy seasons, with effects on soil moisture (Jennings and
Magrath, 2009). Kemausuor et al., (2011) reported that a large percentage (93%) of
farmers was of the opinion that the timing of the rains is now irregular and
unpredictable.
Table 4. Farmers’ Adaptation Measures towards Climate change in Mahbubnagar
S.No. Farmers’ Adaptation Measures Number* % Rank
1. Staggered sowings (dry paddy, castor, red
gram and cotton in kharif), (groundnut,
paddy, chillies and tobacco in rabi)
50 83 I
2. Change in Planting dates and planting
different crops
49 82 II
3. Require drought resistant varieties 45 75 III
4. Water harvesting structures started under
MGNREGA
41 68 IV
It is clear from table 4, that staggered sowings, change in planting dates,
require drought resistant crops, and construct water harvesting structures are the
major adaptation measures followed by farmers’ towards changing climate in
Mahbubnagar.
Also, the farmers’ in Mahbubnagar are accustomed to observe the rainy
season and if the season is favourable with good rains, they will continue farming.
Otherwise, they migrate and work as construction labour at Gangavati, Hyderabad
and Bangalore. Higher temperatures, pest and disease attack on crops were the chief
perceptions of farmers towards climate change, while, planting different crops and
water conservation were the main adaptation strategies of farmers in Ogbomosho
agricultural zone of Oyo state in Nigeria. (Ayanwuyi et al., 2010).
Table 5. Farmers’ Perceptions regarding Climate change in East Godavari
S.No. Farmers’ Perception Number* % Rank
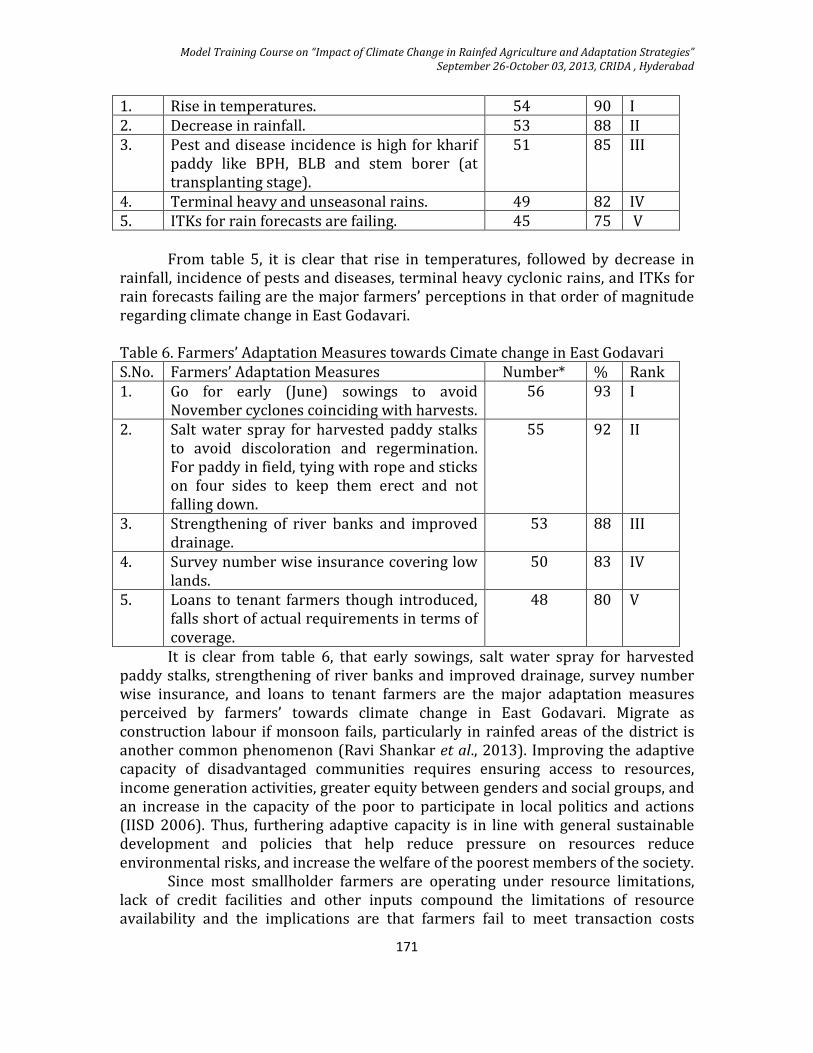
Model Training Course on “Impact of Climate Change in Rainfed Agriculture and Adaptation Strategies”
September 26-October 03, 2013, CRIDA , Hyderabad
171
1. Rise in temperatures. 54 90 I
2. Decrease in rainfall. 53 88 II
3. Pest and disease incidence is high for kharif
paddy like BPH, BLB and stem borer (at
transplanting stage).
51 85 III
4. Terminal heavy and unseasonal rains. 49 82 IV
5. ITKs for rain forecasts are failing. 45 75 V
From table 5, it is clear that rise in temperatures, followed by decrease in
rainfall, incidence of pests and diseases, terminal heavy cyclonic rains, and ITKs for
rain forecasts failing are the major farmers’ perceptions in that order of magnitude
regarding climate change in East Godavari.
Table 6. Farmers’ Adaptation Measures towards Cimate change in East Godavari
S.No. Farmers’ Adaptation Measures Number* % Rank
1. Go for early (June) sowings to avoid
November cyclones coinciding with harvests.
56 93 I
2. Salt water spray for harvested paddy stalks
to avoid discoloration and regermination.
For paddy in field, tying with rope and sticks
on four sides to keep them erect and not
falling down.
55 92 II
3. Strengthening of river banks and improved
drainage.
53 88 III
4. Survey number wise insurance covering low
lands.
50 83 IV
5. Loans to tenant farmers though introduced,
falls short of actual requirements in terms of
coverage.
48 80 V
It is clear from table 6, that early sowings, salt water spray for harvested
paddy stalks, strengthening of river banks and improved drainage, survey number
wise insurance, and loans to tenant farmers are the major adaptation measures
perceived by farmers’ towards climate change in East Godavari. Migrate as
construction labour if monsoon fails, particularly in rainfed areas of the district is
another common phenomenon (Ravi Shankar et al., 2013). Improving the adaptive
capacity of disadvantaged communities requires ensuring access to resources,
income generation activities, greater equity between genders and social groups, and
an increase in the capacity of the poor to participate in local politics and actions
(IISD 2006). Thus, furthering adaptive capacity is in line with general sustainable
development and policies that help reduce pressure on resources reduce
environmental risks, and increase the welfare of the poorest members of the society. Since most smallholder farmers are operating under resource limitations,
lack of credit facilities and other inputs compound the limitations of resource
availability and the implications are that farmers fail to meet transaction costs
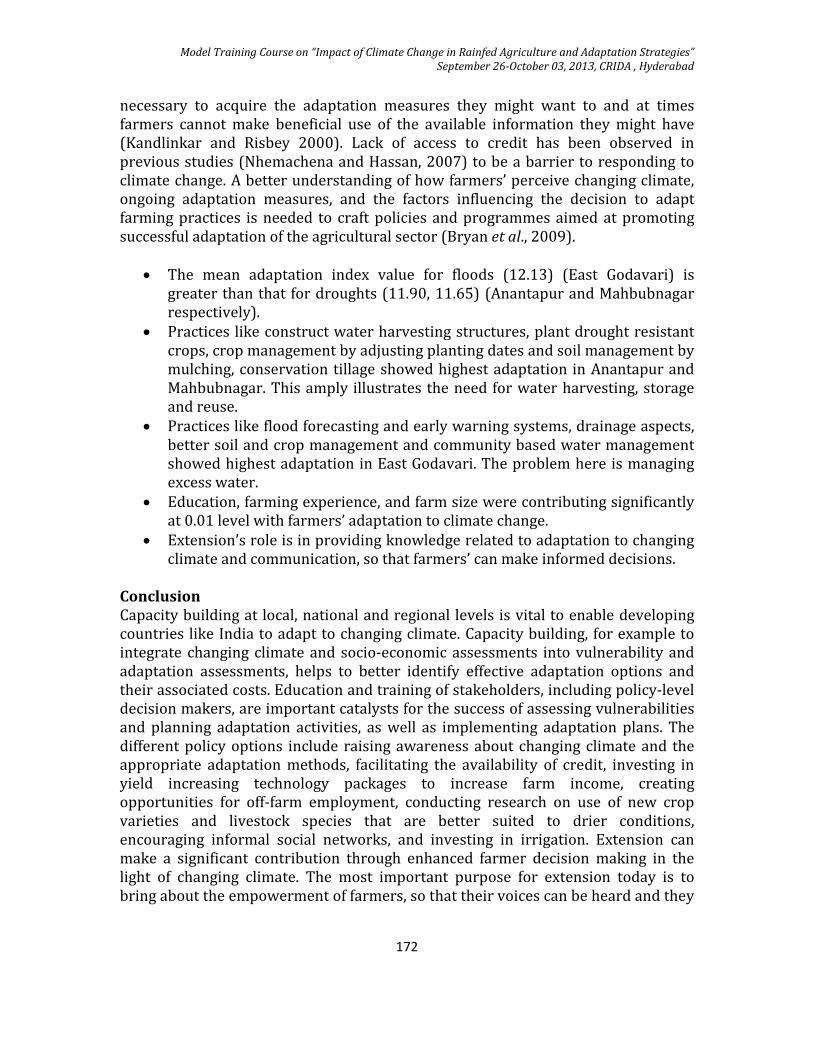
Model Training Course on “Impact of Climate Change in Rainfed Agriculture and Adaptation Strategies”
September 26-October 03, 2013, CRIDA , Hyderabad
172
necessary to acquire the adaptation measures they might want to and at times
farmers cannot make beneficial use of the available information they might have
(Kandlinkar and Risbey 2000). Lack of access to credit has been observed in
previous studies (Nhemachena and Hassan, 2007) to be a barrier to responding to
climate change. A better understanding of how farmers’ perceive changing climate,
ongoing adaptation measures, and the factors influencing the decision to adapt
farming practices is needed to craft policies and programmes aimed at promoting
successful adaptation of the agricultural sector (Bryan et al., 2009).
• The mean adaptation index value for floods (12.13) (East Godavari) is
greater than that for droughts (11.90, 11.65) (Anantapur and Mahbubnagar
respectively).
• Practices like construct water harvesting structures, plant drought resistant
crops, crop management by adjusting planting dates and soil management by
mulching, conservation tillage showed highest adaptation in Anantapur and
Mahbubnagar. This amply illustrates the need for water harvesting, storage
and reuse.
• Practices like flood forecasting and early warning systems, drainage aspects,
better soil and crop management and community based water management
showed highest adaptation in East Godavari. The problem here is managing
excess water.
• Education, farming experience, and farm size were contributing significantly
at 0.01 level with farmers’ adaptation to climate change.
• Extension’s role is in providing knowledge related to adaptation to changing
climate and communication, so that farmers’ can make informed decisions.
Conclusion
Capacity building at local, national and regional levels is vital to enable developing
countries like India to adapt to changing climate. Capacity building, for example to
integrate changing climate and socio-economic assessments into vulnerability and
adaptation assessments, helps to better identify effective adaptation options and
their associated costs. Education and training of stakeholders, including policy-level
decision makers, are important catalysts for the success of assessing vulnerabilities
and planning adaptation activities, as well as implementing adaptation plans. The
different policy options include raising awareness about changing climate and the
appropriate adaptation methods, facilitating the availability of credit, investing in
yield increasing technology packages to increase farm income, creating
opportunities for off-farm employment, conducting research on use of new crop
varieties and livestock species that are better suited to drier conditions,
encouraging informal social networks, and investing in irrigation. Extension can
make a significant contribution through enhanced farmer decision making in the
light of changing climate. The most important purpose for extension today is to
bring about the empowerment of farmers, so that their voices can be heard and they
Model Training Course on “Impact of Climate Change in Rainfed Agriculture and Adaptation Strategies”
September 26-October 03, 2013, CRIDA , Hyderabad
173
can play a major role in deciding how they will mitigate and adapt to changing
climate.
As national and international policy makers turn their attention to changing
climate adaptation, they should keep in mind that constructing an enabling
environment that minimizes these vulnerabilities will be central to any meaningful
and lasting increase in the adaptive capacity of the rural poor. Govt. policies
designed to promote adaptation at the farm level will lead to greater food and
livelihood security in the face of changing climate.
References
Adger W.N., S. Huq, K. Brown, D. Conway and M. Hulme. 2003. Adaptation to climate
change in the developing world. Progress in Development Studies 3: 179-195.
Agrawal, A., Kononen, M. and Perrin N. 2009. The Role of Local Institutions in
Adaptation to Climate Change. Social Development working papers, Paper No. 118.
Allen, K.M. 2006. Community based disaster preparedness and climate adaptation:
local capacity building in the Philippines. Disasters 30(1):81-101.
Ayanwuyi, E. Kuponiyi, F.A. Ogunlade and Oyetoro J.O. 2010. Farmers Perception of
Impact of Climate Changes on Food Crop Production in Ogbomosho Agricultural
Zone of Oyo State, Nigeria. Global Journal of Human Social Science, Vol.10, Issue 7:33-
39.
Brown, K. 2010. Climate change and development short course: Resilience and
Adaptive Capacity (Power Point presentation). Norwich, UK: International
Development, University of East Anglia.
Bryan, E., Deressa, T.T, Gbetibouo, G.A. and Ringler, C. 2009. Adaptation to Climate
Change in Ethiopia and South Africa: Options and Constraints. Environmental
Science and Policy, 12(4): 413-426.
Dejene K. Mengistu 2011. Farmers’ perception and knowledge of climate change and
their coping strategies to the related hazards: Case study from Adiha, Central Tigray,
Ethiopia. Agricultural Sciences 2(2011):138-145.
Dhaka, B.L., Chayal, K. and Poonia, M.K. 2010. Analysis of Farmers’ Perception and
Adaptation Strategies to Climate Change, Libyan Agricultural Research Center
Journal International, 1 (6): 388-390.
Easterling, W.E., P.R. Crosson, N.J. Rosenberg, M.S. McKenney, L.A. Katz, and K.M.
Lemon 1993. Agricultural Impacts of and Responses to Climate Change in the
Missouri-Iowa-Nebraska Region. Climatic Change, 24 (1-2): 23-62.
Model Training Course on “Impact of Climate Change in Rainfed Agriculture and Adaptation Strategies”
September 26-October 03, 2013, CRIDA , Hyderabad
174
Gbetibouo, G.A.2009. Understanding farmers’ perceptions and adaptations to
climate change and variability: The case of the Limpopo Basin, South Africa.
Discussion Paper No. 00849, South Africa Environment and Production Technology
Division, IFPRI.
GOI-Government of India 2011: Agriculture.
http://india.gov.in/sectors/agriculture/index.php
Guiteras, R. 2007. The impact of Climate Change on Indian Agriculture.
http://www.colgate.edu/portaldata/imagegallerywww/2050/ImageGallery/Guiter
asPaper.pdf
Hageback, J.M. Sundbery, D. Ostroald, X. Chen, and P.Knutsson. 2005. Climate
variability and land use change in Danagou watershed, China-examples of small
scale farmers adaptation. Climate Change 72:189-212
IFPRI – International Food Policy Research Institute, 2009: Climate Change Impact
on Agriculture and Costs of Adaptation. http://www.undp-
adaptation.org/undpcc/files/docs/publications/pr21.pdf
IISD (International Institute for Sustainable Development) 2006. Understanding
adaptation to climate change in developing countries. http://www.iisd.org. Accessed
November 20, 2006.
Ilona Porsche, Anna Kalisch, and Rosie Fuglien. 2011. Adaptation in Agriculture :40-
83 In: Adaptation to climate change with a focus on rural areas and India:230 p, New
Delhi.
Jennings, S. and Magrath, J., 2009: What happened to the seasons?
Oxfam research report Available online at:
http://www.oxfam.org.uk/resources/policy/climate_change/research-where-are-
the-seasons.html
Kandlinkar, M. and J. Risbey. 2000. Agricultural impacts of climate change: if
adaptation is the answer, what is the question? Climatic Change 45: 529-539. Kemausuor, F., Dwamena, E., Ato Bart-Plange and Nicholas Kyei Baffour. 2011.
Farmers’ Perception of Climate Change in the Ejura-Sekyedumase District of Ghana,
ARPN Journal of Agricultural and Biological Science, Vol.6, No.10:26-37.
Kurukulasuriya, P. and R. Mendelsohn. 2007. "Modeling Endogenous Irrigation: The
Impact Of Climate Change On Farmers In Africa". World Bank Policy Research
Working Paper 4278.
Kurukulasuriya, P. and R. Mendelsohn. 2008. "Crop Switching as an Adaptation
Strategy to Climate Change" African Journal Agriculture and Resource Economics
(forthcoming).
Kurukulasuriya, P., R. Mendelsohn, R. Hassan, J. Benhin, M. Diop, H. M. Eid, K.Y. Fosu,
G.Gbetibouo, S. Jain, A. Mahamadou, S. El-Marsafawy, S. Ouda, M. Ouedraogo, I. S, D.
Model Training Course on “Impact of Climate Change in Rainfed Agriculture and Adaptation Strategies”
September 26-October 03, 2013, CRIDA , Hyderabad
175
Maddision, N. Seo and A. Dinar. 2006. "Will African Agriculture Survive Climate
Change?" World Bank Economic Review 20(3), pp. 367-388.
Maddison, D. 2006. The perception of and adaptation to climate change in Africa.
CEEPA. Discussion Paper No. 10. Centre for Environmental Economics and Policy in
Africa. Pretoria, South Africa: University of Pretoria.
Mendelsohn, R. 1998. Climate-change damages. In Economics and Policy Issues in
Climate Change, ed. W.D. Nordhaus. Resources for the Future: Washington, D.C.
Mendelsohn, R., W. Nordhaus and D. Shaw. 1994. "The Impact of Global Warming on
Agriculture: A Ricardian Analysis", American Economic Review 84, pp.753-771.
Nhemachena, C. and R Hassan. 2007. "Determinants of climate adaptation strategies
of African farmers: Multinomial choice analysis, Draft Report, CEEPA, University of
Pretoria.
Nyong, A., Adesina, F. and Elasha, B.O. 2007. The value of indigenous knowledge in
climate change mitigation and adaptation strategies in the African Sahel. Mitigation
and Adaptation Strategies in Global Change 12:787-797.
OECD, 2002. Organisation for Economic Cooperation and Development 2002:
Climate Change: India’s perceptions, positions, policies and possibilities.
http://www.oecd.org/dataoecd/22/16/1934784.pdf
Orindi, V.A., and S. Eriksen. 2005. Mainstreaming adaptation to climate change in the
development process in Uganda. Ecopolicy Series 15. Nairobi, Kenya: African Centre
for Technology Studies (ACTS).
Ravi Shankar, K., Nagasree, K., Prasad, M.S., and Venkateswarlu, B. 2013. Farmers’
Knowledge Perceptions and Adaptation Measures towards Climate Change in South
India and Role of Extension in Climate Change Adaptation and Mitigation. In:
Compendium of National Seminar on Futuristic Agricultural Extension for
Livelihood Improvement and Sustainable Development, January 19-21, 2013 at
ANGRAU, Rajendranagar, Hyderabad: 295-303.
Reilly, J., and D. Schimmelpfennig. 1999. Agricultural impact assessment,
vulnerability and scope for adaptation. Climatic Change 43: 745-788.
Reilly, J., W. Baethgen, F.E. Chege, S.C. van de Greijn, L. Ferda, A. Iglesia, C. Kenny, D.
Patterson, J. Rogasik, R. Rotter, C. Rosenzweig, W. Sombroek, and J. Westbrook 1996.
‘Agriculture in a changing climate: impacts and adaptations’, in IPCC
(Intergovernmental Panel on Climate Change), R.Watson, M. Zinyowera, R. Moss,
and D. Dokken (eds), Climate Change 1995: Impacts, Adaptations, and Mitigation of
Climate Change: Scientific-Technical Analyses, Cambridge: Cambridge University
Press, Cambridge pp. 427- 468.
Model Training Course on “Impact of Climate Change in Rainfed Agriculture and Adaptation Strategies”
September 26-October 03, 2013, CRIDA , Hyderabad
176
Rosenzweig, C., and D. Hillel 1998. Climate change and the global harvest: potential
impacts of the greenhouse effect on agriculture. Oxford University Press, New York,
USA.
Rosenzweig, C, and M.L. Parry. 1994. Potential impact of climate-change on world
food supply. Nature 367:133-138.
Seo, S. N. and R. Mendelsohn. 2008a. "Measuring Impacts and Adaptations to Climate
Change: A Structural Ricardian Model of African Livestock Management",
Agricultural Economics, 38, pp.1-15.
Seo, S. N. and R. Mendelsohn. 2008b. "An Analysis of Crop Choice: Adapting to
Climate Change in South American Farms", Ecological Economics (forthcoming).
Seo, S. N. and R. Mendelsohn. 2008c. "A Ricardian Analysis of the Impact of Climate
Change on South American Farms", Agricultura Technica (forthcoming).
Smit B., and M.W. Skinner. 2002. Adaptation Options in agriculture to climate
change: A typology. Mitigation and Adaptation strategies for Global Change 7:85-114.
Smith, J.B. 1996. Using a decision matrix to assess climate change adaptation. In
Adapting to climate change: An international Perspective, ed. J.B. Smith, N. Bhatti, G.
Menzhulin, R. Benioff, M.I. Budyko, M. Campos, B.Jallow, and F.Rijsberman. New
York: Springer.
Swanson, D., Henry David, V., Christa Rust, and Jennifer Medlock 2008.
Understanding Adaptive Policy Mechanisms through Farm-Level Studies of
Adaptation to Weather Events in Alberta, Canada. Published by the International
Institute for Sustainable Development, Canada: pp.72. UNFCC – United Nations Framework Convention on Climate Change 2009: Climate
Change Impacts, vulnerabilities and adaptation in developing countries.
http://unfcc.int/resource/docs/publications/impacts.pdf
Vedwan, N. and R.E. Rhoades. 2001. Climate change in the western Himalayas of
India: A study of local perception and response. Climate Research 19:109-117.
Model Training Course on “Impact of Climate Change in Rainfed Agriculture and Adaptation Strategies”
September 26-October 03, 2013, CRIDA , Hyderabad
177
CDM OPPORTUNITIES IN LIVESTOCK SECTOR
Dr. Prabhat Kumar Pankaj, Senior Scientist (LPM), Central Research Institute for
Dryland Agriculture, Hyderabad-500 059
The performance, health and well-being of the livestock are strongly affected by
climate both, directly and indirectly. The direct effects involve heat exchanges
between the animal and its environment that are linked to air temperature,
humidity, wind-speed and thermal radiation. These linkages have bearing on the
physiology of the animal and influence animal performance (e.g., growth, milk and
wool production, reproduction) and health. Hot and humid environmental
conditions stress the lactating dairy cow and reduce intake of the nutrients
necessary to support milk yield and body maintenance. The primary factors that
cause heat stress in dairy cows are high environmental temperatures and high
relative humidity. In addition, radiant energy from the sun contributes to stress if
cows are not properly shaded. The tremendous amount of body heat that the high
yielding dairy cow produces is helpful in cold climates but is a severe liability during
hot weather. Short-term extreme events (e.g., summer heat waves, winter storms)
can result in the death of vulnerable animals, which can have substantial financial
impacts on livestock producers. Although the level of vulnerability of the farm
animals to environmental stresses varies with the genetic potential, life stage and
nutritional status of the animals, the studies unambiguously indicate that the
performance of farm animals is directly sensitive to climate factors. Summer
weather reduces production of high-producing dairy cows and also the conception
rates of dairy cows as much as 36%. With predicted global warming, an additional
decline in milk production beyond expected summer reductions may occur
particularly in the hot/hot-humid regions.
Besides the direct effects of climate change on animal production, there are
profound indirect effects as well, which include climatic influences on Quantity and
quality of feed and fodder resources such as pastures, forages, grain and crop by-
residues and The severity and distribution of livestock diseases and parasites.
Lowland sites in relatively low rainfall areas expected reduction of herbage yield a
lot in dry seasons. Climate driven models of the temporal and spatial distribution of
pests, diseases and weeds have been developed for some key species e.g. the
temperate livestock tick Haemaphysalis longicornis and the tropical cattle tick
Boophilus microplus. Potential climate change impacts on buffalo fly and sheep
blowfly have also been inferred (Sutherst et al. 1996). Climate scenarios in New
Zealand and Australia have indicated increased incidence of epidemics of animal
diseases as vectors spread and extension of cattle tick which is directly related to
changes in both temperature and rainfall (Sutherst, 1995). Thus, in general, climate
change-related temperature increase will have adverse impacts on the animal
production system.
Model Training Course on “Impact of Climate Change in Rainfed Agriculture and Adaptation Strategies”
September 26-October 03, 2013, CRIDA , Hyderabad
178
Indian context:
The mean summer (April to June) temperature of India ranges from 25 to 450C in
most parts of the country. Higher temperature during summer months would
increase the heat stress in animals, particularly in crossbred cows. The crossbred
cows, which are high yielders and more economic to farmers, are more susceptible
to heat stress compared to local cows and buffaloes. The proactive management
counter measures during heat waves (e.g. providing sprinklers or changing the
housing pattern etc.) or animal nutrition strategies to reduce excessive heat loads
are often expensive and beyond the means of small and marginal farmers who own
most of the livestock in India. Where high temperatures are associated with decline
in rainfall or increased evapotranspiration, the possibility of economically rearing
animals would be further limited as decline in rainfall shall aggravate the feed and
fodder shortage in the area. The greatest impact would perhaps be on the pastoral
families, who would migrate to arable areas to secure their livelihood. This would
entail significant dislocation costs for these livestock keepers. However, at the same
time positive impacts can also be or in the in high altitudes would decrease
maintenance requirement of animals and increase the productivity of winter
pastures. Possible benefits of climate change during cooler seasons though not well
documented, are likely to be less than the consequential negative hot weather
impacts (Hahn et al., 1992), especially if the cold season is much shorter than the
hot one.
Contribution of Livestock to Climate Change
The animal production system which is vulnerable to climate change is itself a large
contributor to global warming through emission of methane and nitrous oxide.
About half of the annual global emission of 75.8 Tg from enteric fermentation came
from only five countries; viz. India (10.27 Tg), the erstwhile USSR (8.05 Tg), Brazil
(7.46 Tg), the USA (6.99 Tg) and China (4.37 Tg). Species-wise cattle contributed
75%, buffaloes 8%, sheep 9% and goats 3% to the total emission. The annual
methane production per animal was estimated to be 95 kg for the German dairy
cows, nearly three fold higher than 35 kg for the Indian cattle (Crutzen et al., 1986).
Estimates of enteric emissions from Indian livestock vary widely from 6.17 Tg/year
to 10.3 Tg/year of which 60% from cattle, 30% from buffaloes and 3% from sheep
and 6% from goat and 1% from other livestock.
Methane’s radiative activity refers to properties that cause it to trap infrared
radiation (IR), or heat, enhancing the greenhouse effect. Its chemically active
properties have indirect impacts on global warming as the gas enters into chemical
reactions in the atmosphere that not only affect the period of time methane stays in
the atmosphere (i.e. its lifetime), but that also play a role in determining the
atmospheric concentrations of tropospheric ozone and stratospheric water vapour,
both of which are also greenhouse gases. These indirect and direct effects make
Model Training Course on “Impact of Climate Change in Rainfed Agriculture and Adaptation Strategies”
September 26-October 03, 2013, CRIDA , Hyderabad
179
methane a large contributor, second only to carbon dioxide, to potential future
warming of the earth. Methane concentration in the atmosphere is largely
correlated with anthropogenic activities and these sources currently represent
about 70% of total annual emissions, The global warming potential (GWP) of
methane is 21 times more than carbon dioxide. Additionally, methane’s chemical
lifetime is relatively short, about 12 years compared to 120 years for carbon
dioxide.
Nitrous oxide (N2O) is another potent greenhouse gas, the primary anthropogenic
emissions of which are thought to come from agricultural fertilizers, and to a lesser
degree, fossil fuel combustion and biomass burning. The GWP of nitrous oxide is
321.
There are two sources of GHG emissions from livestock:
1) From the digestive process
2) From animal wastes
Emissions from digestive process:
Methane is produced in herbivores as a by-product of ‘enteric fermentation: a
digestive process by which carbohydrates (polysaccharides) are broken down by
micro-organisms into simple molecules for absorption into the bloodstream. The
level of methane production by animals depends on the type of digestive system the
animal has. Methane is produced by the methanogenic archaebacteria located
mainly in the rumen, and is released as gas into the atmosphere.
Factors affecting enteric emissions: The average daily feed intake and the
percentage of this feed energy which is converted to methane are the two important
determinants of methane emissions from livestock.
Average daily feed intake: All dairy cows and young cattle are recommended to have
a conversion rate of 6.0 percent (± 0.5%) of feed energy intake and all non-dairy
cattle, other than young stall-fed animals, are recommended to have a conversion
rate of 7.0% (± 0.5%). Conversion rate for grazing cattle is 6.0% (± 0.5%). The
feeding situations (grazing or stall-fed) also have a bearing on the energy
requirement as additional energy is required by grazing animals to obtain their
food.
Methane conversion efficiency: The other important determinant of methane
emission in livestock, depends on rumen microflora6 and the quality (digestibility,
nutrient composition and energy value) of the feed. In fact, the diversity, size and
activity of the microbial population in the rumen which determines the efficiency of
fermentation in the rumen (and hence methane emissions) is itself largely
influenced by diet. Therefore, type of feed and fodder intake by the livestock has a
dominant influence on the production of methane in the rumen.
Model Training Course on “Impact of Climate Change in Rainfed Agriculture and Adaptation Strategies”
September 26-October 03, 2013, CRIDA , Hyderabad
180
Emissions from animal wastes:
Methane and Nitrous oxide are the two important GHG emitted from animal wastes.
Methane emissions from manure: Animal wastes contain organic compounds such
as carbohydrates and proteins. These relatively complex compounds are broken
down naturally by bacteria. In the presence of oxygen, the action of aerobic bacteria
results in the carbon being converted to carbon dioxide. The emission of carbon
dioxide is part of the natural cycling of carbon in the environment and results in no
overall increase in atmospheric carbon dioxide. The carbon dioxide, originally
absorbed from the atmosphere through photosynthesis by the plants which formed
the livestock feed, is simply being released. However, in the absence of oxygen,
anaerobic bacteria transform the carbon to methane and so the decomposition of
livestock wastes under moist, oxygen free (anaerobic) environments results in an
increase in the concentration of greenhouse through production of methane.
The amount of methane released from animal manure depends on many variables
such as:
Methane producing potential of manure: Each type of animal waste has its
characteristic content of degradable organic matter (material that can be readily
decomposed), moisture, nitrogen and other compounds. As a consequence, the
maximum methane producing potential of the different manures varies both across
species and, in instances where feeding practices vary, within a single species.
Quantity of manure produced: which depends on feed intake and digestibility
Waste management system used: The most important factor affecting the methane
emissions from animal wastes is how the manure is managed (e.g. whether it is
stored as a liquid or spread as a solid). Metabolic processes of methanogenes leads
to methane production at all stages of manure handling. In the modern intensive
livestock practices, where animals are often housed or kept in confines spaces,
manure is often stores in tanks or lagoons. Liquid systems tend to encourage
anaerobic conditions and to produce significant quantities of CH4. On the other
hand, when livestock are in fields and their manure ends up being spread thinly on
the ground, aerobic decomposition usually predominates and these aerobic solid
waste management approaches may produce little or no methane at all, which is
true under grazing.
Climate: The warmer the climate the more biological activity takes place and the
greater is the potential for methane evolution. Also, where precipitation causes high
soil moisture contents, air is excluded from soil pores and the soils become
anaerobic again increasing the potential for methane release even for wastes which
have been spread. Hence, higher temperatures and moist conditions also promote
CH4 production.
Model Training Course on “Impact of Climate Change in Rainfed Agriculture and Adaptation Strategies”
September 26-October 03, 2013, CRIDA , Hyderabad
181
Nitrous oxide emissions from animal wastes: Animal wastes contain nitrogen in
the form of various complex compounds. Nitrous oxide forms and is emitted to the
atmosphere via the microbial processes of nitrification and denitrification. The
majority of nitrogen in wastes is in ammonia form. Nitrification occurs aerobically
and converts this ammonia into nitrate, while de-nitrification occurs anaerobically
and converts the nitrate to nitrous oxide.
The generation of nitrous oxide is influenced by
Nitrogen concentration: The rate of nitrification will be higher for animal wastes
which contain more nitrogen. The nitrogen excreted by the animals in turn depends
upon the quantity and quality of feed intake. For example, the dairy cows consuming
more protein supplements excrete more nitrogen.
Animal waste management system: The method of managing the animal wastes
determine the oxygen concentration and microbial community which have bearing
on the emission rate of nitrous oxide. For nitrification, the optimal conditions imply
that oxygen is available and pH is low. Increasing aeration initiates the nitrification-
denitrification reactions, and hence makes release of N2O possible. Nitrous oxide is a
side-product which is produced in larger quantities Therefore, as fresh dung and
slurry is highly anoxic and well-buffered with near neutral pH, it is expected that
higher nitrification will occur. After the initial aerobic reaction, when conditions are
suboptimal for nitrification, for example when oxygen is deficient, as in situations
with high biological activity consuming oxygen, large amounts of N2O is produced. A
dry aerobic system of waste management may therefore provide a more conducive
environment for N2O emission than the waste managed in anaerobic lagoon and
liquid system.
Relevance of CDM for the Indian Livestock sector:
United Nations Framework Convention on Climate Change (UNFCCC) divides
countries into two groups: Annex I parties, the industrialized countries who have
historically contributed the most to climate change, and non- Annex I Parties, which
include primarily the developing countries, like India. In order to grasp reduction
opportunities in the non- Annex B countries, the Kyoto Protocol instituted a
mechanism called Clean Development Mechanism (CDM), defined in Article 12 of
the Protocol. The CDM allows countries with emission targets to buy emission
credits from projects in countries without targets and hence is of relevance for
India, unlike the first two mechanisms mentioned above which are applicable to
only Annex I countries. Under the CDM, an Annex I party is to implement a project
that reduces greenhouse gas emissions (or subject to constraints, removes green
house gases by carbon sequestration) in the territory of a non-Annex I party. The
resulting certified emission reduction (CERs), can then be used by the Annex I party
to help meet its emission reduction target. CERs are tradable under Article 3.12 of
the Kyoto Protocol.
Model Training Course on “Impact of Climate Change in Rainfed Agriculture and Adaptation Strategies”
September 26-October 03, 2013, CRIDA , Hyderabad
182
The developing countries like India can benefit from this mechanism as the CDM
can:
* attract capital for projects that assist a more prosperous but less green house gas-
intensive economy;
* encourage and permit the active participation of both private and public sectors;
* provide a tool for technology transfer, if investment is channelled into projects
that replace technologies which lead to high emissions and
* help define investment priorities in projects that meet sustainable development
goals.
The two broad criteria stipulated under the Kyoto Protocol that CDM projects must
satisfy are broadly classified as additionality and sustainable development. The
real, measurable, and long-term benefits related to the mitigation of climate change,
the additional greenhouse gas reductions are calculated with reference to a defined
“baseline”.
Sustainable development: Under this the CDM should have
Social well-being: The CDM project activity should lead to alleviation of poverty by
generating additional employment, removal of social disparities and contributing to
provision of basic amenities to people leading to improvement in their quality of life.
Economic well-being: The CDM project activity should bring in additional
investment consistent with the needs of the people.
Environmental well-being: This should include a discussion of the impact of the
project activity on resource sustainability and resource degradation, if any, due to
the proposed activity; bio-diversity-friendliness; impact on human health; reduction
of levels of pollution in general;
Technological well-being: The CDM project activity should lead to transfer of
environmentally safe and sound technologies with a priority to the renewable sector
or energy efficiency projects that are comparable to best practices in order to assist
in upgradation of the technological base.
Options for reducing Enteric emissions:
The strategies for reducing methane emissions from enteric fermentation can be
broadly focused in two main areas: 1) reducing livestock numbers and 2) improving
the rumen fermentation efficiency.
Increase in Productivity of the animals: The rising demand for food from animal
origin needs to be met by increasing the productivity levels rather than increasing
the numbers. Unless the emission reduction strategies are accompanied by increase
Model Training Course on “Impact of Climate Change in Rainfed Agriculture and Adaptation Strategies”
September 26-October 03, 2013, CRIDA , Hyderabad
183
in productivity they will not be in consonance with the sustainable development of
livestock sector.
Improving rumen fermentation efficiency: The growth of rumen microbes is
influenced by chemical, physiological and nutritional components. The major
chemical and physiological modifiers of rumen fermentation are rumen pH and
turnover rate and both of these are affected by diet and other nutritionally related
characteristics such as level of intake, feeding strategies, quality of fodder and
fodder: concentrate ratios. The options for increasing rumen efficiency can meet the
sustainable development criteria only if they do not lead to any adverse affect on the
health of the animal. For instance, feeding ruminants on diets containing high levels
of readily fermented non-structural carbohydrate has been shown to minimize
methane production by reducing the protozoal population and lowering rumen pH.
However, this can give rise to an overall depressed ruminal fermentation, which
may lower the conversion of feed energy into animal product and may be
detrimental to the animal's health. The options identified to increase rumen
efficiency without threatening the animal health can be classified as: improved
nutrition through
o year round supply of green fodder
o feed additives,
o strategic supplementation, and
o dietary manipulation,
changing rumen microflora by
o adding specific inhibitors or antibiotics,
o biotechnological manipulation and
o genetic engineering.
Year round supply of green fodder: A number of options like Alley cropping (is a
system in which food/fodder crops are grown in alleys formed by hedgerows of
trees or shrubs), Ley farming (A rotation is a cropping system in which two or more
crops are grown in a fixed sequence. If the rotation includes a period of pasture, a
ley, which is used for grazing and conservation, the system is sometimes called
“alternate husbandry” or mixed farming), cultivation of short duration fodder and
contingency crops like African tall, Horse gram etc on tank beds and unlined ponds
with left over moisture in the middle of winter season, back yard cultivation of Para
grass and production of Azolla, storing excess greens as silage and hay as haylage
would ably augment the year nutritious fodder demand and enhance the
productivity in livestock by better digestibility of feed and fodder. Seeding common
property resources (CPR) with improved high yielding fodder varieties and legume
fodders along with social regularization of rotational grazing substantially
strengthen the local fodder resource base and indirectly reduce enteric methane
emissions. Further, practice of chopping and soaking of hay will enhance
digestibility and reduce GHG emissions from livestock.
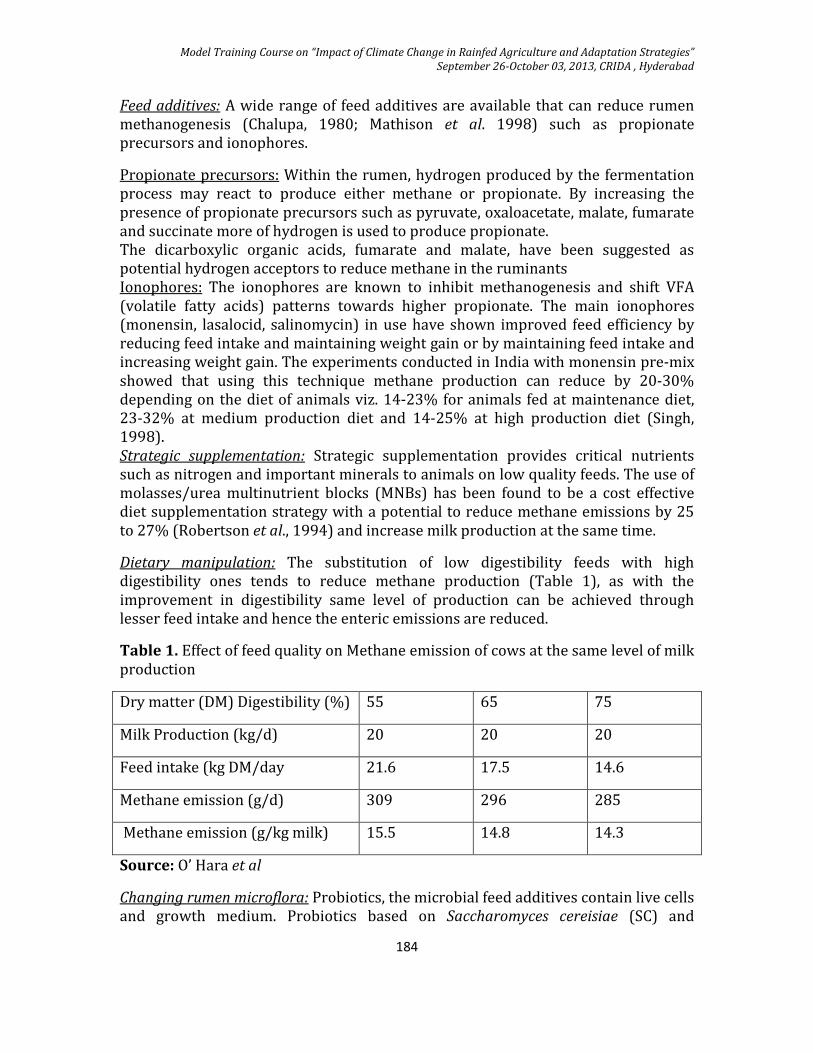
Model Training Course on “Impact of Climate Change in Rainfed Agriculture and Adaptation Strategies”
September 26-October 03, 2013, CRIDA , Hyderabad
184
Feed additives: A wide range of feed additives are available that can reduce rumen
methanogenesis (Chalupa, 1980; Mathison et al. 1998) such as propionate
precursors and ionophores.
Propionate precursors: Within the rumen, hydrogen produced by the fermentation
process may react to produce either methane or propionate. By increasing the
presence of propionate precursors such as pyruvate, oxaloacetate, malate, fumarate
and succinate more of hydrogen is used to produce propionate.
The dicarboxylic organic acids, fumarate and malate, have been suggested as
potential hydrogen acceptors to reduce methane in the ruminants
Ionophores: The ionophores are known to inhibit methanogenesis and shift VFA
(volatile fatty acids) patterns towards higher propionate. The main ionophores
(monensin, lasalocid, salinomycin) in use have shown improved feed efficiency by
reducing feed intake and maintaining weight gain or by maintaining feed intake and
increasing weight gain. The experiments conducted in India with monensin pre-mix
showed that using this technique methane production can reduce by 20-30%
depending on the diet of animals viz. 14-23% for animals fed at maintenance diet,
23-32% at medium production diet and 14-25% at high production diet (Singh,
1998).
Strategic supplementation: Strategic supplementation provides critical nutrients
such as nitrogen and important minerals to animals on low quality feeds. The use of
molasses/urea multinutrient blocks (MNBs) has been found to be a cost effective
diet supplementation strategy with a potential to reduce methane emissions by 25
to 27% (Robertson et al., 1994) and increase milk production at the same time.
Dietary manipulation: The substitution of low digestibility feeds with high
digestibility ones tends to reduce methane production (Table 1), as with the
improvement in digestibility same level of production can be achieved through
lesser feed intake and hence the enteric emissions are reduced.
Table 1. Effect of feed quality on Methane emission of cows at the same level of milk
production
Dry matter (DM) Digestibility (%) 55 65 75
Milk Production (kg/d) 20 20 20
Feed intake (kg DM/day 21.6 17.5 14.6
Methane emission (g/d) 309 296 285
Methane emission (g/kg milk) 15.5 14.8 14.3
Source: O’ Hara et al
Changing rumen microflora: Probiotics, the microbial feed additives contain live cells
and growth medium. Probiotics based on Saccharomyces cereisiae (SC) and
Model Training Course on “Impact of Climate Change in Rainfed Agriculture and Adaptation Strategies”
September 26-October 03, 2013, CRIDA , Hyderabad
185
Aspergillus oryzae (AO) are widely used for increasing animal productivity. There
are mixed reports as to whether these probiotic additives can reduce methane
emissions. AO has been seen to reduce methane by 50% which was directly related
to a reduction in the protozoal population (Frumholtz et al., 1989).
Strategic supplementation using molasses-urea products (MUP) like urea molasses
mineral blocks: It has beneficial effect both on enhancing production and reducing
methane emissions from livestock
Dietary manipulation through increasing concentrate feeding: on an average less
than 500 grammes of concentrate was fed to dairy animals per day. For the non-
dairy animals the quantity was even lower. Over the years an increase in the
proportion of the concentrate in the livestock feed has been observed. But even the
existing proportion of 7.5% concentrate is not sufficient to cater to the
recommended nutritional requirement of 40% concentrate and 60% roughage on
dry mater basis for the Indian cattle. For high milk producing dairy animals the
concentrate to roughage ratio is still higher at 50:50.
Hexose partitioning: In hexose partitioning, by varying diet, it may be possible to
manipulate the amount of the feed carbohydrate going directly into microbial
growth as opposed to fermentation.
Immunogenic approach: The removal of one species of protozoan from the rumen
will invoke the improvements in productivity associated with defaunation
(improved protein:energy ratio of the nutrients available for absorption). It is also
believed that by modifying the activity of the rumen protozoan, there will be an
indirect effect on the activity of methanogens, due to their commensal relationship
with rumen protozoa. Therefore, by reducing the protozoal population, there may
be a corresponding effect on the production of methane.
Genetic engineering: Suggestions have also been made about the potential use of
genetic engineering viz. recombinant deoxyribonucleic acid (DNA) technology to
modify the fermentation characteristics of rumen micro-organisms ruminal
methane production.
Bacteriocins: Bacteriocins are antibiotics, generally protein or peptide in nature,
produced by bacteria. Callaway et al (1997) used the bacteriocinnisin which is
produced by Lactococcus lactis, to produce a 36% reduction of methane production
in vitro. Further research is on to evaluate the efficacy of bacteriocins.
Other techniques: Other techniques to inhibit methanogen growth and methane are
the use of inhibitors, mevastatin and lovastatin (Miller and Wolin 2001). Also
certain microbes in the rumen are known to promote reactions that minimise
methane production and it may be possible to introduce such microbes directly as
Model Training Course on “Impact of Climate Change in Rainfed Agriculture and Adaptation Strategies”
September 26-October 03, 2013, CRIDA , Hyderabad
186
feed supplements. Such microbes include acetogens and methane oxidisers.
Acetogens are bacteria that produce acetic acid by the reduction of carbon dioxide
with hydrogen, thus reducing the hydrogen available for reaction to produce
methane (methanogenesis)
Transfer of safe technologies: Bovine somatotropin (bST) is an example of one such
controversial biotechnology. It is imperative to ensure that there is no ‘technological
dumping’ in the developing nations under the CDM projects.
Key constraints for potential CDM projects:
There are a number of constraints in implementing the enteric methane mitigation
strategies at the field level. These barriers which include,
Technical issues:
- Access to farmers for implementation and monitoring
- Inadequate field testing of technologies
Financial issues:
- Lack of capital with farmers
- Direct economic incentives lacking for non-dairy animals
Socio-cultural issues
- Cultural taboos on rearing animals for meat
- Poor extension outreach to women
Institutional issues
- No Capacity Building in the Agriculture sector
- Research and Policy Imperatives
Possible remedial measures to the constraints: • Assessment of baseline using disaggregated level data: An appropriate baseline
being the first step in design and formulation of CDM project, research needs to be
carried to work out the total enteric emissions at the district level and the regional
emission factors for the purpose of identifying the ‘hot spots’ for CDM projects in the
dairy sector.
• Assessment of cost-effective regional animal nutrition strategies for methane
reduction
•Assessment of transactions cost for potential CDM project
• Initiation of Capacity Building Efforts in the Indian Livestock Sector
References:
Callaway TR, Martin SA, Wampler JL, Hill NS & Hill GM (1997). Malate content of
forage varieties commonly fed to cattle. Journal of Dairy Science, 80: 1651- 1665.
Model Training Course on “Impact of Climate Change in Rainfed Agriculture and Adaptation Strategies”
September 26-October 03, 2013, CRIDA , Hyderabad
187
Chalupa W (1980). Chemical control of rumen microbial activity. In Digestive
Physiology and Metabolism in Ruminants: 325-347. (Eds) Ruckebusch Y & Thivend
P. MTP Press, Lancaster, England. Clifford, B.C., Davies, A. and Griffith G. (1996)
Crutzen, P.J., Aselmann, I., & Seiler, W. (1986). Methane Production by Domestic
Animals, Wild Ruminants, Other Herbivorous Fauna and Humans. Tellus, 38B: 271-
284.
Frumholtz P P, Newbold C J and Wallace R J (1989). Influence of Aspergillus oryzae
fermentation extract on the fermentation of a basal ration in the rumen simulation
technique (Rusitec). Journal of Agricultural Science, Cambridge, 113,
Hahn, G.L., P.L. Klinedinst, and D.A. Wilhite (1992). Climate Change Impacts on
Livestock Production and Management. American Society of Agricultural Engineers,
St. Joseph, MI, USA, 16 pp.
Mathison GW, Okine EK, McAllister TA, Dong Y, Galbraith J, & Dmytruk OIN(1998).
Reducing methane emission from ruminant animals. Journal of Applied Animal
Research, 14: 1-28.
Miller TL & Wolin MJ (2001). Inhibition of growth of methane-producing bacteria of
the ruminant forestomach by hydroxymethylglutaryl~SCoA reductase inhibitors.
Journal of Dairy Science, 84: 1445-1448.
O’Har ,P, John Freney and Marc Ulyatt (2003). Abatement of Agricultural Non-Carbon
Dioxide Greenhouse Gas Emissions: A Study of Research Requirements Report
prepared for the Ministry of Agriculture and Forestry on behalf of the Convenor,
Ministerial Group on Climate Change, the Minister of Agriculture and the Primary
Industries Council ISBN No. 0-478-07754-8
Robertson, et. al. (1994). Assessment of Strategic Livestock Feed Supplementation as
an Opportunity for Generating Income for Small-Scale Dairy Producers and
Reducing Methane Emissions in Bangladesh, Appropriate Technology International,
USA.
Singh, G.P. (1998). Methanogenesis and production of green House gases under
animal Husbandry system. Final report of A.P.Cess funded project, N.D.R.I., Karnal.
Sutherst, R.W. (1995). The potential advance of pest in natural ecosystems under
climate change: implications for planning and management. In 'Impacts of climate
change on ecosystems and species: terrestrial ecosystems'. (Eds. J. Pernetta, C.
Leemans, D. Elder, S. Humphrey) IUCN, Gland, Switzerland, pp83-98.
Sutherst, R.W., Yonow, T., Chakraborty, S., O’Donnell, C. and White, N. (1996). A
generic approach to defining impacts of climate change on pests, weeds and
diseases in Australia. In ‘Greenhouse: Coping with climate change’. (Eds. W.J. Bouma,
G.I. Pearman and M.R. Manning.) pp. 281-307. (CSIRO: Melbourne.) 169-172.
Model Training Course on “Impact of Climate Change in Rainfed Agriculture and Adaptation Strategies”
September 26-October 03, 2013, CRIDA , Hyderabad
188
ASSESSMENT OF VULNERABILITY TO CLIMATE CHANGE
C A Rama Rao, Senior Scientist (Agril. Economics) Central Research Institute for
Dryland Agriculture, Hyderabad 500059
The Intergovernmental Panel on Climate Change (IPCC) has projected that the
global mean temperatures will increase by 1.4 – 5.80 C by 2100. Climate change, in
general terms, is referred to as a permanent shift in the rainfall (amount and
distribution), temperature and other climate related variables. Though the
variability in climate is natural, there is some marked change in this variability since
the beginning of the industrial revolution and much of this change is attributed to
the anthropogenic factors. Unabated increase in the emission of what are called
Green House Gasses (GHGs) is the single most important reason for the observed
climate change. All the sectors of the economy are exposed to climate change
directly and indirectly. However, agriculture is the most vulnerable sector for
obvious reasons.
Nature of climate change: Climate change is global in its causes and consequences
and the effects are unevenly distributed across the globe. Ironically, the nations and
communities which contributed most to the climate change are least affected and
the nations which contributed least are most affected. It is the poor and developing
countries that are more vulnerable to climate change. The impact is also more on
the countries nearer to the equator than on those which are far from the equator.
The impact is also likely to be long-term and persistent, and if not acted up on now,
may as well be irrevocable and irreversible. In economics, it is viewed as a case of
failure of markets in getting the polluters pay for the negative externalities that are
both spatial and temporal.
Sinha and Swaminathan (1991) – showed that an increase of 2oC in temperature
could decrease the rice yield by about 0.75 ton/ha in the high yield areas; and a
0.5oC increase in winter temperature would reduce wheat yield by 0.45 ton/ha.
Impacts on Indian Agriculture –Literature
Rao and Sinha (1994) – showed that wheat yields could decrease between 28 to
68% without considering the CO2 fertilization effects; and would range between +4
to -34% after considering CO2 fertilization effects. Aggarwal and Sinha (1993) –
using WTGROWS model showed that a 2oC temperature rise would decrease wheat
yields in most places. Lat et al. (1996) – concluded that carbon fertilization effects
would not be able to offset the negative impacts of high temperature on rice yields.
Saseendran et al. (2000) – showed that for every one degree rise in temperature the
decline in rice yield would be about 6%. Aggarwal et al. (2002) – using WTGROWS
and recent climate change scenarios estimated impacts on wheat and other cereal
crops. All these studies focused only on agronomic impacts of climate change.
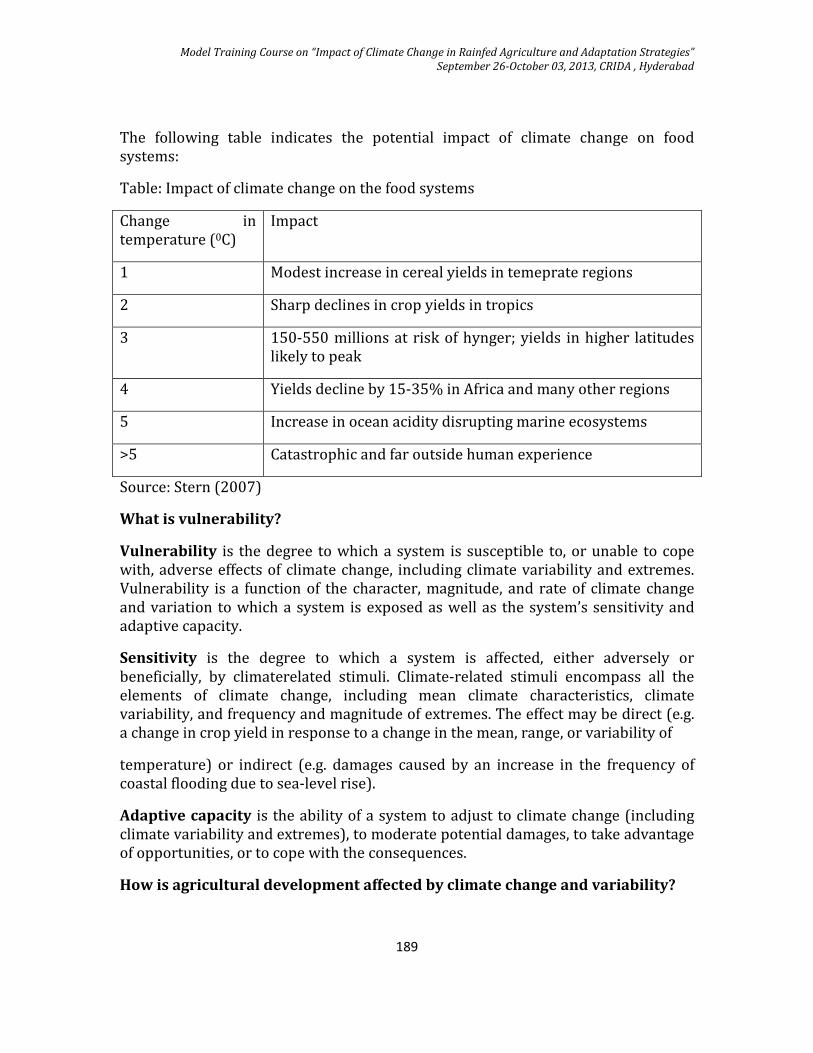
Model Training Course on “Impact of Climate Change in Rainfed Agriculture and Adaptation Strategies”
September 26-October 03, 2013, CRIDA , Hyderabad
189
The following table indicates the potential impact of climate change on food
systems:
Table: Impact of climate change on the food systems
Change in
temperature (0C)
Impact
1 Modest increase in cereal yields in temeprate regions
2 Sharp declines in crop yields in tropics
3 150-550 millions at risk of hynger; yields in higher latitudes
likely to peak
4 Yields decline by 15-35% in Africa and many other regions
5 Increase in ocean acidity disrupting marine ecosystems
>5 Catastrophic and far outside human experience
Source: Stern (2007)
What is vulnerability?
Vulnerability is the degree to which a system is susceptible to, or unable to cope
with, adverse effects of climate change, including climate variability and extremes.
Vulnerability is a function of the character, magnitude, and rate of climate change
and variation to which a system is exposed as well as the system’s sensitivity and
adaptive capacity.
Sensitivity is the degree to which a system is affected, either adversely or
beneficially, by climaterelated stimuli. Climate-related stimuli encompass all the
elements of climate change, including mean climate characteristics, climate
variability, and frequency and magnitude of extremes. The effect may be direct (e.g.
a change in crop yield in response to a change in the mean, range, or variability of
temperature) or indirect (e.g. damages caused by an increase in the frequency of
coastal flooding due to sea-level rise).
Adaptive capacity is the ability of a system to adjust to climate change (including
climate variability and extremes), to moderate potential damages, to take advantage
of opportunities, or to cope with the consequences.
How is agricultural development affected by climate change and variability?
Model Training Course on “Impact of Climate Change in Rainfed Agriculture and Adaptation Strategies”
September 26-October 03, 2013, CRIDA , Hyderabad
190
Exposure to a high degree of climate risk is a characteristic feature of rainfed
agriculture in the drylands of sub-Saharan Africa and South Asia (Brown and Jansen,
2008).
Climate variability directly affects crop production, primarily by driving supply
of soil moisture in rainfed agriculture, and surface water runoff and shallow
groundwater recharge in irrigated agriculture. Because biological response is
nonlinear and generally concave over some range of environmental variability,
climate variability tends to reduce average yields.
Climate-driven fluctuations in production contribute substantially to volatility
of food prices, particularly where remoteness, the nature of the commodity,
transportation infrastructure, stage of market development or policy limit
integration with global markets. Because market forces tend to move prices in the
opposite direction to production fluctuations, variability in food crop prices tends to
buffer farm incomes, but exacerbates food insecurity for poor net consumers.
The uncertainty associated with climate variability creates a moving target for management that reduces efficiency of input use and hence profitability, as
management that is optimal for average climatic conditions can be far from optimal
for growing season weather in most years. Crop responsiveness to fertilizer and
planting density, and hence optimal rates and profitability of production inputs,
varies considerably from year to year as a function of water supply.
Climate variability and risk aversion on the part of decision makers cause substantial loss of opportunity in climatically-favorable seasons as a result of
the precautionary strategies that vulnerable farmers employ ex ante to protect
against the possibility of catastrophic loss in the event of a climatic shock. Farmers’
precautionary strategies – selection of less risky but less profitable crops, under-use
of fertilizers, shifting household labor to less profitable off-farm activities, and
avoiding investment in production assets, and improved technology – come at a
substantial cost when climatic conditions are favorable.
Many of the coping responses that vulnerable households employ ex-post to survive an uninsured climate shock can have adverse, long-term livelihood
consequences. Coping strategies that include liquidating productive assets,
defaulting on loans, migration, withdrawing children from school to work on farm
or tend livestock, severely reducing nutrient intake and over-exploiting natural
resources, even permanent abandonment of farms and migration to urban centers
or refugee camps, sacrifice capacity to build a better life in the future (Brown and
Jansen, 2008).
It is imperative to understand the impact of climate change on agriculture to devise
policies and measure needed to adapt to climate change. There are basically three
approaches to do this. They are agro-economic approach, agro-ecological approach
and Ricardian approach. Agro-economic approach incorporates crop yield changes
Model Training Course on “Impact of Climate Change in Rainfed Agriculture and Adaptation Strategies”
September 26-October 03, 2013, CRIDA , Hyderabad
191
associated with various equilibrium climate change scenarios into an applied
general equilibrium model. Agro-ecological approach assigns crops to
agroecological zones and estimates potential crop yields. As climate changes, the
extent of agroecological zones and the potential yields of crops assigned to those
zones changes. These acreage and yield changes are then included in economic
models to assess socio-economic impacts. Ricardian approach is based on the
argument that, ‘by examining two agricultural areas that are similar in all respects
except that one has a climate on average (say) 3oC warmer than the other, one
would be able to infer the willingness to pay in agriculture to avoid a 3oC
temperature rise’.
Assessing vulnerability
Vulnerability is a function of exposure and sensitivity to climate change and the
adaptive capacity of the region or the individual exposed to climate change. One of
the methodologies to assess vulnerability is to construct indices of sensitivity,
adaptive capacity and finally vulnerability as was done by TERI. A number of
biophysical and socio-economic variables go into the construction of these indices.
Using the district-level database for India, TERI constructed a map showing the
vulnerability to climate change. They constructed a climate sensitivity matrix as
defined by dryness and monsoon dependency and based on a 0.5° × 0.5° gridded
dataset for 1961–90 developed by the Climatic Research Unit of the University of
East Anglia in UK, and then recaluculated the index using the output from the
HadRM2 downscaled general circulation model to show the potential shifts
sensitivity to climate change. The resulting climate vulnerability map (Figure 1)
illustrates the spatial distribution of vulnerability within India. It is notable that the
districts with the highest climate sensitivity under exposure to climate change are
not necessarily the most vulnerable, and vice versa. For example, most districts in
southern Bihar have only medium sensitivity to climate change, yet are still highly
vulnerable to climate change as the result of low adaptive capacity. By contrast,
most districts in northern Punjab have very high sensitivity to climate change, yet
are foundto be only moderately vulnerable as the result of high adaptive capacity.
Assessment of both adaptive capacity in combination with climate change
sensitivity andexp osure is thus crucial for differentiating relative vulnerability to
climate change.
Vulnerability assessment – case studies
To supplement the district level vulnerability mapping as described above, some
case studies were also conducted to understand the ground level issues in climate
change. These were conducted in Jhalawar district of Rajasthan, Anantapur district
of Andhra Pradesh and Chitradurga district of Karnataka. “What the case studies
show, which was not visible through the national profiles, is the effect that
institutional barriers or support systems have on local-level vulnerability. In the
cases of Jhalawar and Anantapur, institutional barriers leave farmers who are
‘‘double exposed’’ poorly equipped to adapt to either of the stressors, let alone both
Model Training Course on “Impact of Climate Change in Rainfed Agriculture and Adaptation Strategies”
September 26-October 03, 2013, CRIDA , Hyderabad
192
simultaneously. In Chitradurga, on the other hand, institutional support appears to
facilitate adaptation to both climatic change and globalization. However, these
supports tendto disproportionately benefit the district’s larger farmers” (OBrien et
al., 2004).
Rainfed agriculture is more vulnerable to climate change because of the projected
changes in rainfall behaviour: Incidence of droughts and floods is likely to be more
frequent, rainfall delivered in a smaller number of high intensity rainy days
necessitating the high storage needs. On the other hand, the increased temperatures
will enhance to evapo-transpiration needs of the plants. One immediate implication
is that huge investments are needed to create large scale water storage structures to
take care of the longer dry periods. In-situ and small scale water conservation
methods are best useful when the rainfall is normal or little sub-normal.
A multi-pronged approach that includes technological, institutional and policy-
related measures is needed to cope with the potential adverse effects of climate
change. Technological advances must include breeding of crop varieties that do well
in altered climate, water conserving technologies such as micro-irrigation, and
methods that reduce water evaporation from surface water bodies. In terms of
institutional interventions, better pricing of water and power, more efficient
allocation of water resources between regions and sectors are needed. At a more
general level, it is important to strengthen those features such as education,
markets, connectivity, etc. which will contribute to enhancing the adaptive capacity
of communities vulnerable to climate change.
Efforts for Mitigation of Climate Change in India
India has for quite some time pursued GHG friendly policies in her own interest.
India’s obligation to minimize energy consumption - particularly oil consumption -
and to deal with its environmental problems prompt it to follow many such policies.
Directly or indirectly these efforts are made by Government as well as by people to
reduce energy consumption. These include:
a) Emphasis on energy conservation.
b) Promotion of renewable energy sources.
c) Abatement of air pollution.
d) Afforestation and wasteland development.
e) Economic reforms, subsidy removal and joint ventures in capital goods.
f) Fuel substitution policies.
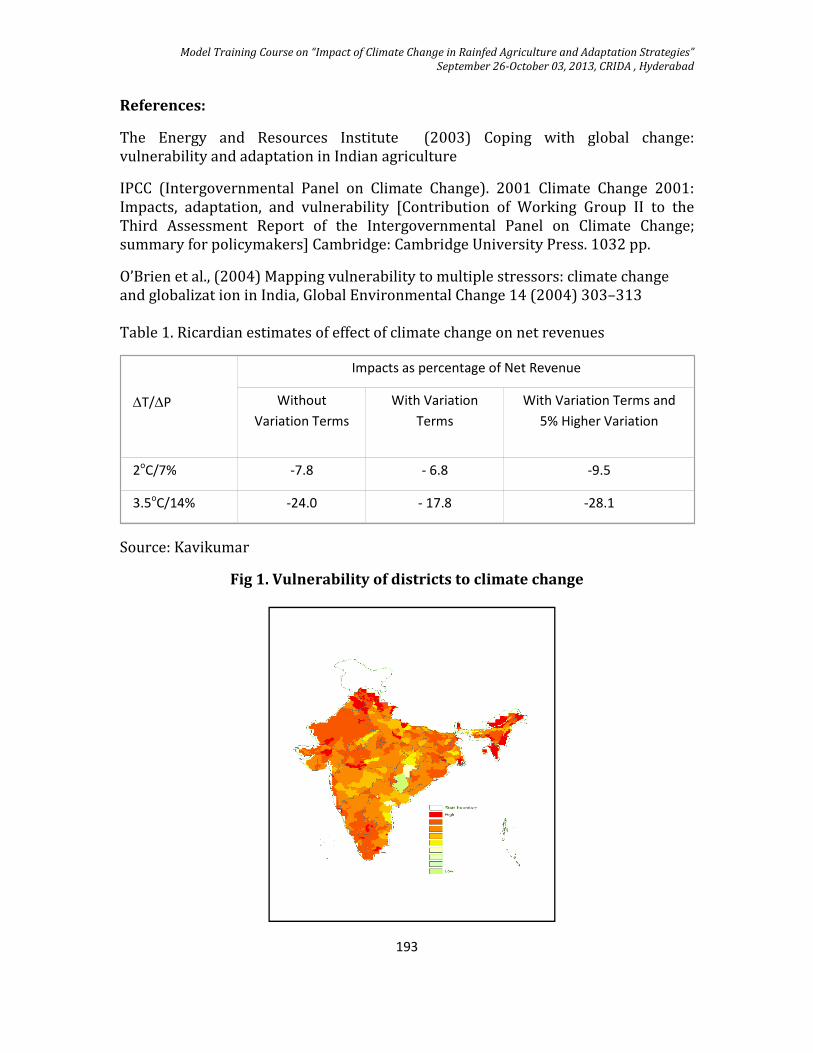
Model Training Course on “Impact of Climate Change in Rainfed Agriculture and Adaptation Strategies”
September 26-October 03, 2013, CRIDA , Hyderabad
193
References:
The Energy and Resources Institute (2003) Coping with global change:
vulnerability and adaptation in Indian agriculture
IPCC (Intergovernmental Panel on Climate Change). 2001 Climate Change 2001:
Impacts, adaptation, and vulnerability [Contribution of Working Group II to the
Third Assessment Report of the Intergovernmental Panel on Climate Change;
summary for policymakers] Cambridge: Cambridge University Press. 1032 pp.
O’Brien et al., (2004) Mapping vulnerability to multiple stressors: climate change
and globalizat ion in India, Global Environmental Change 14 (2004) 303–313
Table 1. Ricardian estimates of effect of climate change on net revenues
Source: Kavikumar
Fig 1. Vulnerability of districts to climate change
∆T/∆P
Impacts as percentage of Net Revenue
Without
Variation Terms
With Variation
Terms
With Variation Terms and
5% Higher Variation
2
oC/7% -7.8 - 6.8 -9.5
3.5oC/14% -24.0 - 17.8 -28.1
Model Training Course on “Impact of Climate Change in Rainfed Agriculture and Adaptation Strategies”
September 26-October 03, 2013, CRIDA , Hyderabad
194
WEATHER INSURANCE BASED CLIMATE RISK MANAGEMENT IN
RAINFED CROPS V U M Rao, Principal Scientist, AICRPAM, Central Research Institute for Dryland
Agriculture, Santoshnagar, Hyderabad
Introduction Climate has always presented a challenge to those whose livelihoods depend on the
weather. Even though a drought (or flood, or a hurricane or cold wave or heat wave)
may happen infrequently, the threat of the disaster is enough to block economic
vitality, growth and wealth generation during all-years-good or bad. The risk of
drought and flooding can keep people in poverty traps, as risk-adverse behavior
limits productivity and willingness of creditors to lend to farmers, for example. Lack
of access to financial services, especially in rural areas, in turn restricts access to
agricultural inputs and technologies, such as improved seeds and fertilizers. At the
national level, when disaster strikes, many developing countries rely on
humanitarian aid, whose delay can led to higher human and economic costs.
Climate change is one of the most important global environmental challenges facing
by human beings, which affects food production, property, natural ecosystems,
freshwater supply and health sector. The Intergovernmental Panel on Climate
Change (IPCC) projects that the global mean temperature may increase between 1.4
and 5.8 °C by 2100 (IPCC, 2007). At the same time, the Intergovernmental Panel on
Climate Change’s fourth assessment report has warned us that climate change is
likely to reduce food production potential, especially in some already food-short
areas. It further states that there is now higher confidence in the projected increases
in droughts, heat waves and floods, as well as their adverse impacts which will be
hardest felt by the most vulnerable, who are often in the weakest economic position.
Climate change will greatly exacerbate this situation; and developing countries,
which are least responsible for climate change, face its greatest impacts. New tools
are urgently needed to help vulnerable people deal with climate change, and the
uncertainty that accompanies this. It is not only the poor who need such tools. After
a climate-related disaster, governments struggle to finance relief and recovery
efforts and maintain essential government services. Disaster response can be
delayed for several months as humanitarian aid trickles. One innovative response to
enable poverty reduction through better climate risk management is weather
insurance.
Climate Risk Management and Agriculture Climate risk is a particular challenge for the hundreds of millions whose livelihoods
depend on rainfed agriculture in marginal, high-risk environments. Climate risk is
not a new phenomenon, and climate risk management in the broad sense has long
been practiced. Farmers anticipate the rains, using indicators,and time their
Model Training Course on “Impact of Climate Change in Rainfed Agriculture and Adaptation Strategies”
September 26-October 03, 2013, CRIDA , Hyderabad
195
planting and inputs based on their best estimates; they install irrigation system if
they can; and they reduce risk exposure by diversifying their livelihoods as far as
possible (Decron,1996; Ellis,2000). Scientists have also sought ways to help manage
the risk that climate presents. Agriculture research has developed crop varieties
that are drought tolerant, for example, and soil management practices that increase
soil moisture-holding capacity. Weather forecasts have been a major advance in
helping people plan appropriately. Rainfed agriculture is often characterized by high
variability of production outcomes, that is, by production risk. Unlike most other
entrepreneurs, agricultural producers cannot predict with certainty the amount of
output their production process will yield, due to external factors such as weather,
pests, and diseases. Agricultural producers can also be hindered by adverse events
during harvesting or collecting that may result in production losses. In discussing
how to design appropriate risk management policies, it is useful to understand
strategies and mechanisms employed by producers to deal with risk, including the
distinction between informal and formal risk management mechanisms and
between ex-ante and ex-post strategies. The-ex ante or ex-post classification
identifies the time in which the response to risk takes place: ex-ante responses take
place before the potential harming event; ex post responses take thereafter. Ex-ante
informal strategies are characterized by diversification of income sources and
choice of agricultural production strategy. One strategy producers employ is risk
avoidance. Extreme poverty, in many cases, makes producers very risk-averse,
pushing them to avoid high-risk activities, even though the income gains to be
generated might be far greater than those gotten through less risky choices. This
inability to accept and manage risk respectively reflected in the inability to
accumulate and retain wealth is sometimes referred to as the "the poverty trap"
(World Bank 2001).
According to Clarkson et al., (2001), there are six requirements that must be met if
rainfed farmers are to manage risks related to climate extremes, variability and
change. These include:
•Awareness that weather and climate extremes, variability and change will impact
on farm operations
•Understanding of weather and climate processes, including the causes of climate
variability and change
•Historical knowledge of weather extremes and climate variability for the location
of the farm operations
•Analytical tools to describe the weather extremes and climate variability
•Forecasting tools or access to early warning and forecast conditions, to give ad-
vance notice of likely extreme events and seasonal anomalies
•Ability to apply the warnings and forecasts in decision-making
Model Training Course on “Impact of Climate Change in Rainfed Agriculture and Adaptation Strategies”
September 26-October 03, 2013, CRIDA , Hyderabad
196
Agriculture Insurance Company of India Ltd. (AIC)
Agriculture Insurance, including livestock insurance has been practiced in the
country for over 25 years. Prior to 2002-03 General Insurance Corporation of India
(GIC) was implementing National Agricultural Insurance Scheme (NAIS).
Recognizing the necessity for a focused development of crop insurance program in
the country and an exclusive organization to carry it forward, Government created
an exclusive organization - Agriculture Insurance Company of India Limited (AIC)
on 20th December 2002 (www.aicofindia.org). AIC commenced business from 1st
April 2003. AIC introduced rainfall insurance known as ‘Varsha Bima’ during the
2004 South-West Monsoon period. Varsha Bima (Varsha Bima covers anticipated
shortfall in crop yield on account of deficit rainfall. Varsha Bima is voluntary for all
classes of cultivators who stand to lose financially upon adverse incidence of rainfall
can take insurance under the scheme. Initially Varsha Bima is meant for cultivators
for whom National Agricultural Insurance Scheme (NAIS) is voluntary) provided for
five different options suiting varied requirements of farming community. These are
– (i) seasonal rainfall insurance based on aggregate rainfall from June to September,
(ii) sowing failure insurance based on rainfall between 15th June and 15th August,
(iii) rainfall distribution insurance with weights assigned to different weeks
between June and September, (iv) agronomic index constructed on the basis of
water requirement of crops at different pheno-phases and (v) catastrophe option,
covering extremely adverse deviations of 50 percent & above in rainfall during the
season. Varsha Bima has been piloted in 20 rain gauge areas spread over Andhra
Pradesh, Karnataka, Rajasthan and Uttar Pradesh. During 2005, Varsha Bima was
fine-tuned and extended to 120 locations in 10 States during kharif 2005, and
further to 150 locations in 15 States during kharif 2006 AIC also introduced weather
insurance pilots on wheat insurance, mango insurance, and coffee insurance during
2005-06, and is looking ahead for expansion. Thanks to the sustained efforts and
launch of innovative insurance products in the past 6 to 7 years, the number of
farmers and the cropped area covered under crop insurance has seen spectacular
growth. For the year 2009-10 as many as 27 million farmers growing crops on over
38 million hectares were insured under various crop insurance programs of AIC.
The numbers seem very impressive, yet a great majority of farmers who actually
need insurance protection are still outside its purview.
Crop Insurance
The idea of crop insurance emerged in India during the early part of the twentieth
century. Yet it was not operated in a big way till recent years. J.S. Chakravarti
proposed a rain insurance scheme for the Mysore State and for India as a whole with
view to insuring farmers against drought during 1920s. Crop insurance received
more attention after India’s independence in 1947. The subject as discussed in 1947
by the Central Legislature and the then Minister of Food and Agriculture, Dr.
Rajendra Prasad gave an assurance that the government would examine the
possibility of crop and cattle insurance. In October 1965 the Government of India
Model Training Course on “Impact of Climate Change in Rainfed Agriculture and Adaptation Strategies”
September 26-October 03, 2013, CRIDA , Hyderabad
197
decided to introduce a Crop Insurance Bill and a Model Scheme of Crop Insurance in
order to enable the States to introduce, if they so desire, crop insurance. In 1970 the
draft Bill and the Model Scheme were referred to an Expert Committee headed by
Dr. Dharm Narain. Different experiments on crop insurance on a limited, ad-hoc and
scattered scale started from 1972-73. The first crop insurance program was on H-4
cotton in Gujarat. All such programs, however, resulted in considerable financial
losses. The program(s) covered 3110 farmers for a premium of Rs. 4, 54,000 and
paid claims of Rs. 3.79 millions. It was realized that programs based on the
individual farm approach would not be viable in the country. Obviously, “individual
farm approach” would reflect crop losses on realistic basis and hence, most
desirable, but, in Indian conditions, implementing a crop insurance scheme at
“individual farm unit level” is beset with problems, such as:
(i) Non availability of past record of land surveys, ownership, tenancy and yields at
individual farm level (ii) Large number of farm holdings (nearly 116 millions) with
small farm holding size (country average of 1.41 hectares) (iii) Remoteness of
villages and inaccessibility of farm-holdings (iv) Large variety of crops, varied agro-
climatic conditions and package of practices (v) Simultaneous harvesting of crops all
over the country (vi) Effort required in collection of small amount of premium from
large no. of farmers (vii) Prohibitive cost of manpower and infrastructure
Weather Insurance
As the name suggest, weather insurance is an insurance coverage against the
vagaries of weather. Many agrarian economies owe their strength to favourable
weather parameters, such as rainfall, temperature, relative humidity etc. Around
sixty five percent of Indian agriculture is heavily dependent on rainfall, and,
therefore, is extremely weather sensitive. Many agricultural inputs such as soil,
seeds, fertilizer, management practices etc. contribute to productivity. However,
weather, particularly rainfall has overriding importance over all other inputs. The
reason is simple - without proper rainfall, the contributory value of all the other
inputs diminishes substantially. An analysis of Indian Crop Insurance Program
between 1985 and 2003 reveals that rainfall accounted for nearly 95 percent claims
– 85 percent because of deficit rainfall and 10 percent because of excess rainfall
(AIC, 2006). Reducing vulnerability to weather in developing countries may very
well be the most critical challenge facing development in the new millennium. One
of the most obvious applications of weather risk management products, weather
insurance or weather derivatives. Weather impacts on many aspects of the
agricultural supply and demand chain. From the supply side, weather risk
management can help to control both production risk and quality risk. Weather
events like warmer than normal winter or a cooler than normal summer can impact
all sorts of companies like utilities, food and agricultural groups and even
retailers.The basic idea of weather insurance is to estimate the percentage deviation
in crop output due to adverse deviations in weather conditions. There are statistical
techniques to workout the relationships between crop output and weather
parameters.
Model Training Course on “Impact of Climate Change in Rainfed Agriculture and Adaptation Strategies”
September 26-October 03, 2013, CRIDA , Hyderabad
198
Advantages of Weather Insurance over Traditional Crop Insurance
There are many shortcomings in the traditional crop insurance. The important ones
are: (a) adverse selection (b) multiple agencies and their huge administrative cost
(c) lack of reliable methodology for estimating and reporting crop yields (d) delays
in settlement of claims (f) program limited to growers (farmers). Majority of these
shortcomings could be overcome in the weather insurance, as follows:
(i) Trigger events (like rainfall) can be independently verified & measured.
(ii) Compared to yield based insurance, weather insurance is inexpensive to operate.
Since very few agencies would be involved in implementation, the aggregate
administrative cost would be far lower.
(iii) Unlike traditional crop insurance where claim settlement can take up to a year,
quick payouts in private weather insurance contracts can improve recovery
times and thus enhance coping capacity.
(iv) Scientific way of designing product and transparency.
(v) Individual farmers are generally unable to influence the weather index value.
Weather-Index
Index-based weather risk insurance contracts in agriculture have emerged as an
alternative to traditional crop insurance. These are linked to the underlying weather
risk defined as an index based on historical data (for example, for rainfall,
temperature, snow, etc.) rather than the extent of loss (for example, crop yield loss).
Weather insurance is a creative product that can be used for situations ranging from
sales promotions to income stabilization, unlike regular insurance, which would
only cover physical damage, weather insurance protects against additional expenses
or loss of profit from a specific weather event. Insurance generally pays based on
actual damages, while weather insurance pay based on the difference between a
negotiated "strike price" and the actual weather (or the total of weather related
index). As the weather index is objectively measured and is the same for all farmers,
the problem of adverse selection is minimized. Weather-indexed insurance can help
farmers protect their overall income rather than the yield of a specific crop, improve
their risk profile enhancing access to bank credit, and hence reduce overall
vulnerability. Some of pilot schemes and delivery models operated in India are:
1. ICICI Lombard pilot scheme for groundnut in Andhra Pradesh
2. KBS pilot scheme for soya farmers in Ujjain
3. Rajasthan government insurance for orange crop
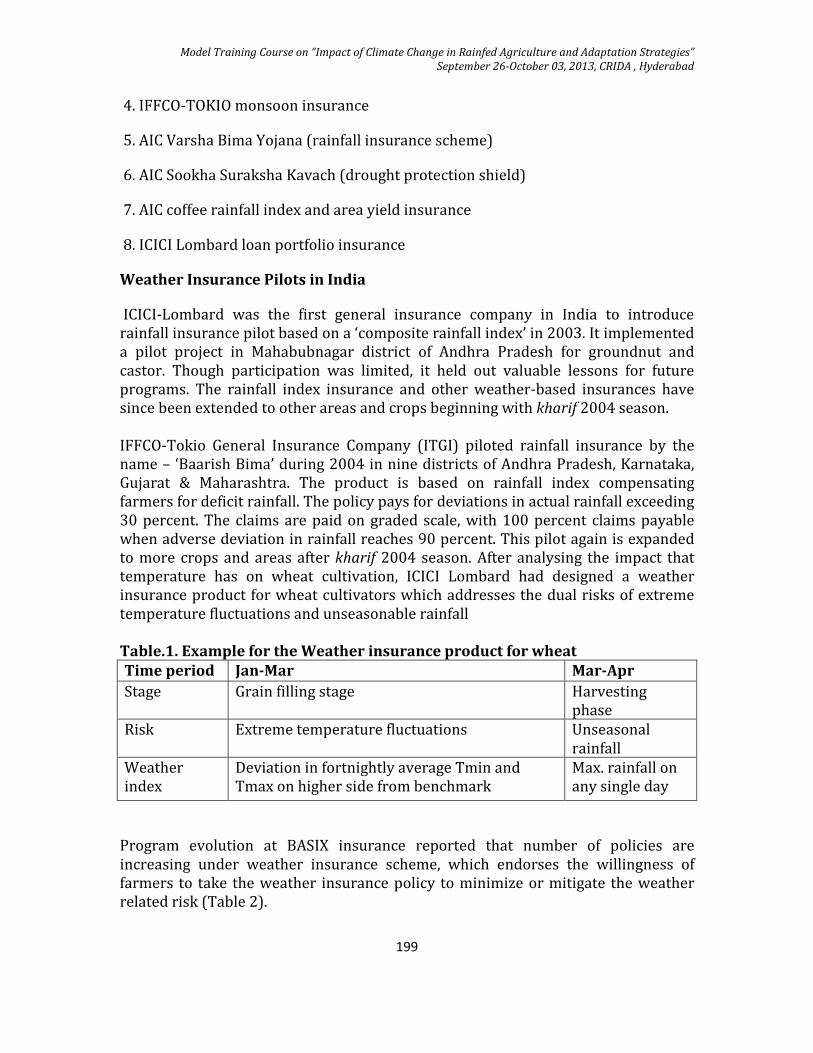
Model Training Course on “Impact of Climate Change in Rainfed Agriculture and Adaptation Strategies”
September 26-October 03, 2013, CRIDA , Hyderabad
199
4. IFFCO-TOKIO monsoon insurance
5. AIC Varsha Bima Yojana (rainfall insurance scheme)
6. AIC Sookha Suraksha Kavach (drought protection shield)
7. AIC coffee rainfall index and area yield insurance
8. ICICI Lombard loan portfolio insurance
Weather Insurance Pilots in India
ICICI-Lombard was the first general insurance company in India to introduce
rainfall insurance pilot based on a ‘composite rainfall index’ in 2003. It implemented
a pilot project in Mahabubnagar district of Andhra Pradesh for groundnut and
castor. Though participation was limited, it held out valuable lessons for future
programs. The rainfall index insurance and other weather-based insurances have
since been extended to other areas and crops beginning with kharif 2004 season.
IFFCO-Tokio General Insurance Company (ITGI) piloted rainfall insurance by the
name – ‘Baarish Bima’ during 2004 in nine districts of Andhra Pradesh, Karnataka,
Gujarat & Maharashtra. The product is based on rainfall index compensating
farmers for deficit rainfall. The policy pays for deviations in actual rainfall exceeding
30 percent. The claims are paid on graded scale, with 100 percent claims payable
when adverse deviation in rainfall reaches 90 percent. This pilot again is expanded
to more crops and areas after kharif 2004 season. After analysing the impact that
temperature has on wheat cultivation, ICICI Lombard had designed a weather
insurance product for wheat cultivators which addresses the dual risks of extreme
temperature fluctuations and unseasonable rainfall
Table.1. Example for the Weather insurance product for wheat
Time period Jan-Mar Mar-Apr
Stage Grain filling stage Harvesting
phase
Risk Extreme temperature fluctuations Unseasonal
rainfall
Weather
index
Deviation in fortnightly average Tmin and
Tmax on higher side from benchmark
Max. rainfall on
any single day
Program evolution at BASIX insurance reported that number of policies are
increasing under weather insurance scheme, which endorses the willingness of
farmers to take the weather insurance policy to minimize or mitigate the weather
related risk (Table 2).
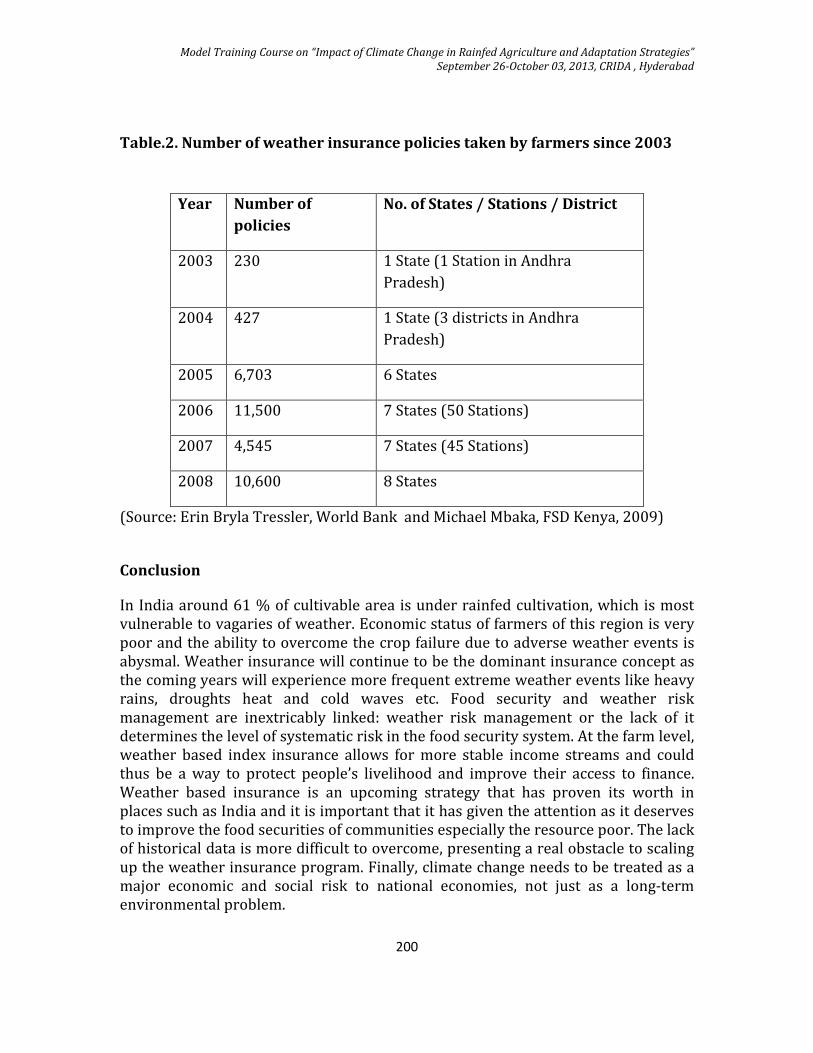
Model Training Course on “Impact of Climate Change in Rainfed Agriculture and Adaptation Strategies”
September 26-October 03, 2013, CRIDA , Hyderabad
200
Table.2. Number of weather insurance policies taken by farmers since 2003
Year Number of
policies
No. of States / Stations / District
2003 230 1 State (1 Station in Andhra
Pradesh)
2004 427 1 State (3 districts in Andhra
Pradesh)
2005 6,703 6 States
2006 11,500 7 States (50 Stations)
2007 4,545 7 States (45 Stations)
2008 10,600 8 States
(Source: Erin Bryla Tressler, World Bank and Michael Mbaka, FSD Kenya, 2009)
Conclusion
In India around 61 % of cultivable area is under rainfed cultivation, which is most
vulnerable to vagaries of weather. Economic status of farmers of this region is very
poor and the ability to overcome the crop failure due to adverse weather events is
abysmal. Weather insurance will continue to be the dominant insurance concept as
the coming years will experience more frequent extreme weather events like heavy
rains, droughts heat and cold waves etc. Food security and weather risk
management are inextricably linked: weather risk management or the lack of it
determines the level of systematic risk in the food security system. At the farm level,
weather based index insurance allows for more stable income streams and could
thus be a way to protect people’s livelihood and improve their access to finance.
Weather based insurance is an upcoming strategy that has proven its worth in
places such as India and it is important that it has given the attention as it deserves
to improve the food securities of communities especially the resource poor. The lack
of historical data is more difficult to overcome, presenting a real obstacle to scaling
up the weather insurance program. Finally, climate change needs to be treated as a
major economic and social risk to national economies, not just as a long-term
environmental problem.
Model Training Course on “Impact of Climate Change in Rainfed Agriculture and Adaptation Strategies”
September 26-October 03, 2013, CRIDA , Hyderabad
201
References Dercon S. (1996) Risk, crop choice,and savings: Evidence from Tanzania. Economic
Development and Cultural Change 44: 485-513
Ellis F. (2000) Rural livelihoods and Diversity in Developing Countries. Oxford
University Press,Oxford.
IPCC.2007. Intergovernmental Panel on Climate Change 2007:Synthesis Report.p.23
World Bank. 2001. World Development Report 2000/2001: Attacking Poverty.
Washington
Clarkson, N.M., Abawi, G.Y., Graham, L.B., Chiew, F.H.S., James, R.A., Clewett, J.F.,
George, D.A. and Berry, D. 2000. Seasonal stream flow forecasts to improve
management of water resources: Major issues and future directions in Australia.
Proceedings of the 26th National and third International Hydrology and Water
Resource Symposium. The Institution of Engineers. Perth. pp. 653-658
AIC, 2006. Crop Insurance in India. Agriculture Insurance Company of India Limited
(AIC), New Delhi, p.10
www.aicofindia.org
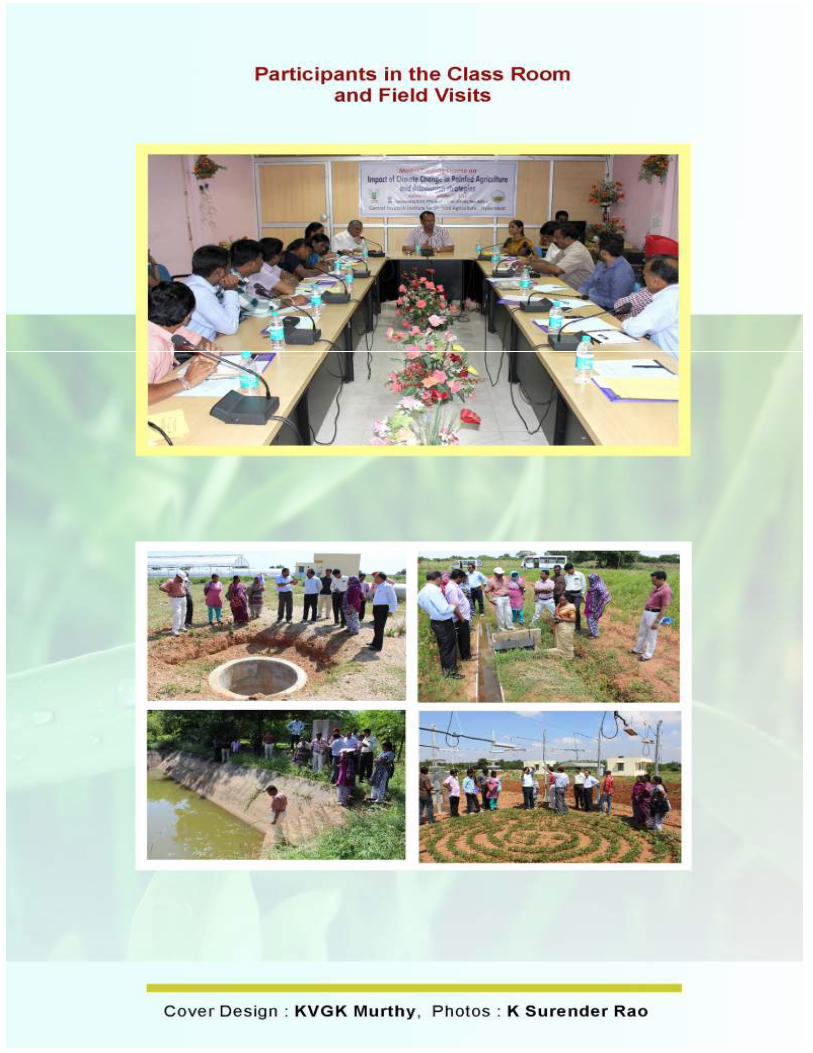
Model Training Course on “Impact of Climate Change in Rainfed Agriculture and Adaptation Strategies”
September 26-October 03, 2013, CRIDA , Hyderabad
202
Model Training Course on “Impact of Climate Change in Rainfed Agriculture and Adaptation Strategies”
September 26-October 03, 2013, CRIDA , Hyderabad
203


