Embed Size (px)
Citation preview
ORIGINAL RESEARCH ARTICLEpublished: 17 June 2014
doi: 10.3389/fncom.2014.00065
Compensating for thalamocortical synaptic loss inAlzheimer’s diseaseKamal Abuhassan1*, Damien Coyle2 and Liam Maguire2
1 Department of Biology, University of Leicester, Leicester, UK2 Intelligent Systems Research Centre, School of Computing and Intelligent Systems, University of Ulster, Derry, UK
Edited by:
Terrence J. Sejnowski, The SalkInstitute for Biological Studies, USA
Reviewed by:
Da-Hui Wang, Beijing NormalUniversity, ChinaJoaquín J. Torres, University ofGranada, SpainXin Tian, Tianjin Medical University,China
*Correspondence:
Kamal Abuhassan, Department ofBiology, University of Leicester,Adrian Building, University Road,Leicester LE1 7RH, UKe-mail: [email protected]
The study presents a thalamocortical network model which oscillates within the alphafrequency band (8–13 Hz) as recorded in the wakeful relaxed state with closed eyesto study the neural causes of abnormal oscillatory activity in Alzheimer’s disease (AD).Incorporated within the model are various types of cortical excitatory and inhibitoryneurons, recurrently connected to thalamic and reticular thalamic regions with the ratiosand distances derived from the mammalian thalamocortical system. The model is utilizedto study the impacts of four types of connectivity loss on the model’s spectral dynamics.The study focuses on investigating degeneration of corticocortical, thalamocortical,corticothalamic, and corticoreticular couplings, with an emphasis on the influence ofeach modeled case on the spectral output of the model. Synaptic compensation hasbeen included in each model to examine the interplay between synaptic deletion andcompensation mechanisms, and the oscillatory activity of the network. The results ofpower spectra and event related desynchronization/synchronization (ERD/S) analysesshow that the dynamics of the thalamic and cortical oscillations are significantly influencedby corticocortical synaptic loss. Interestingly, the patterns of changes in thalamic spectralactivity are correlated with those in the cortical model. Similarly, the thalamic oscillatoryactivity is diminished after partial corticothalamic denervation. The results suggest thatthalamic atrophy is a secondary pathology to cortical shrinkage in Alzheimer’s disease. Inaddition, this study finds that the inhibition from neurons in the thalamic reticular nucleus(RTN) to thalamic relay (TCR) neurons plays a key role in regulating thalamic oscillations;disinhibition disrupts thalamic oscillatory activity even though TCR neurons are moredepolarized after being released from RTN inhibition. This study provides information thatcan be explored experimentally to further our understanding on the neurodegenerationassociated with AD pathology.
Keywords: Alzheimer’s disease, thalamocortical oscillations, synaptic compensation mechanisms, connectivity
loss, thalamic atrophy, Electroencephalography, thalamocortical network model
INTRODUCTIONThe thalamocortical network is a substantial structure and iscentral to brain function (Jones, 2002), consisting of the thala-mus and the cortex, recurrently connected to each other withneural pathways. The collective firing activity of the reciprocallyconnected neuronal populations in the thalamocortical system,referred to as thalamocortical oscillations, plays a significantrole in controlling our functional and cognitive behaviors andhas substantial influence on the oscillations of non-invasivelyrecorded brain activity via electroencephalography (EEG).
The recording of brain oscillations via clinical EEG has beenused in the clinical diagnosis of Alzheimer’s disease (AD). EEGand computational modeling studies have observed a decreasein the mean frequency, alpha (8–13 Hz) and beta (14–30 Hz)band powers with a parallel increase in delta (1–3 Hz) and theta(4–7 Hz) band powers in AD and Mild Cognitive Impairment(MCI) groups compared with those in healthy elderly groups(Jelic, 2000; Jeong, 2004; Koenig et al., 2005; Jelles et al., 2008;
Park et al., 2008; Bhattacharya et al., 2011). The underlying neuralcauses of abnormal brain oscillations are still not clearly under-stood. Based on a magnetic resonance imaging (MRI) study of139 memory complainers (MC) and probable AD subjects, DeJong et al. (2008) have observed reduced volumes of thalamusin AD. The overall brain size and the volume of gray matterin neocortical areas were shown to be significantly reduced inprobable AD subjects and the volumes of the left side of hip-pocampus, putamen, and thalamus in probable AD subjects aretightly associated with some cognitive test scores. The anteriorand lateral parts of the thalamus are surrounded by a thin sheet ofinhibitory neurons known as reticular thalamic neurons (RTN)that are essential for the oscillatory activity of thalamic neu-rons (Sherman, 2001; Bhattacharya et al., 2011). Computationalmodels of the thalamocortical system have shown that the thala-mic reticular fibers contributes to the thalamocortical oscillations(Moretti et al., 2004; Bhattacharya et al., 2011). This circuitry isspeculated to be impaired in AD (Bhattacharya et al., 2011). The
Frontiers in Computational Neuroscience www.frontiersin.org June 2014 | Volume 8 | Article 65 | 1
COMPUTATIONAL NEUROSCIENCE
Abuhassan et al. Compensating for thalamocortical synaptic loss
neuropathology in the RTN can result in abnormal oscillatoryactivity in the thalamic nuclei.
With the limitations of current imaging modalities it is diffi-cult to make the link between abnormal oscillations, structuralatrophy, neuronal and synaptic loss and how the brain com-pensates for, or degenerates under, such loss over an extendedduration. The aim of this study is to, for the first time, shed lighton the interplay between these brain associated phenomena usinga novel computational modeling framework.
This paper presents a neuronal network model of 100,000cortical neurons, 3340 thalamocortical neurons, 3340 reticularthalamic neurons and more than 10 million synapses withAmino-3-Hydroxyl-5-Methyl-4-Isoxazole-Propionate (AMPA),γ-Aminobutyric Acid (GABA), N-Methyl-D-aspartate (NMDA)and gap junction (GJ) kinetics, short-term plasticity and adistribution of axonal conduction delays. The model developedin C with Message Passing Interface (MPI) and simulated ona High Performance Computing (HPC) facility. The modelincludes different types of cortical excitatory and inhibitoryneurons recurrently connected to thalamic and reticular thalamicregions with the ratios and distances found in the mammalianthalamocortical system. The network model oscillates in alphafrequency band as recorded in the wakeful relaxed state withclosed eyes. The model has been utilized to study the impacts offour types of connectivity loss on abnormal oscillatory activityin AD. The study is targeted at investigating the degenera-tion of corticocortical, thalamocortical, corticothalamic, andcorticoreticular couplings, with an emphasis on the influenceof each modeled case on the spectral output of the model.It is believed that the cognitive decline in AD is caused bythe impaired connectivity between cortical regions (Li et al.,2011).
Synaptic compensation has been considered and includedin each model to examine the interplay between synaptic lossand compensation mechanisms, and the oscillatory activity ofthe network. Several experimental studies have found that theneurodegenerative process in AD is accompanied by synapticcompensation mechanisms, “a homeostatic mechanism whichmaintains the excitatory response of individual neurons andprevents the catastrophic amnesia associated with synapse loss”(Small, 2004; Turrigiano, 2012, 2011). From a neurobiologicalperspective, compensation might result from neuritic outgrowth(Uylings and De Brabander, 2002), an increase in neurogenesisprocesses (Jin et al., 2004) or increased expressions of the post-synaptic protein PSD-95 and Apolipoprotein D (Leuba et al.,2008). PSD-95 protein determines the size and strength of thesynapse (Holtmaat and Svoboda, 2009). On an activity level,synaptic compensation senses and regulates the firing rate ofthe network at the neuron or network level (Fröhlich et al.,2008). An in vitro study observed that the release of the pro-inflammatory cytokine tumor-necrosis factor-alpha (TNF-α)increases or decreases based on network-wide activity changesand then, AMPA receptors were regulated by a global home-ostatic mechanism (Stellwagen and Malenka, 2006). Individualneurons can also sense changes in their spiking activity throughcalcium-dependent sensors which in turn adjust the abundanceof glutamate receptors at the synapse (Turrigiano, 2012). Synaptic
scaling protocols adjust both the AMPA and the NMDA currents(Turrigiano, 2012).
In a previous study (Abuhassan et al., 2013), we describedan investigation into three types of compensation mechanismsin a cortical network, namely global (network-based), local(neuronal-based) and combined (local and global) compensationmechanisms. In contrast, this study investigates compensationmechanism from another point of view. Here, the models incor-porate the following compensation mechanisms: (1) corticocor-tical synaptic compensation in response to thalamocortical andcorticocortical synaptic loss, (2) decreased RTN inhibition to tha-lamocortical relay (TCR) neurons in response to corticothalamicdenervation and (3) decreased RTN self-inhibition after corti-coreticular connectivity loss. The biological basis for such choicesis discussed in section Synaptic Degeneration and Compensationbelow. The current study presents the following novel findings:(1) synaptic compensation plays a significant role in preservingthe dynamics of the network (after degeneration), (2) the activityof the network is significantly affected by corticocortical synapticloss, (3) thalamic atrophy can be a secondary pathology to corticalshrinkage and (4) a deficit in the activity of the RTN population(disinhibition) causes a disruption in the oscillatory activity ofthe TCR population. The remainder of the paper is structured asfollows: Materials and methods are described in section Materialsand Methods. Results and in-depth analysis are provided in sec-tion Results. Finally, discussions and conclusions are presented insections Discussion and Conclusion, respectively.
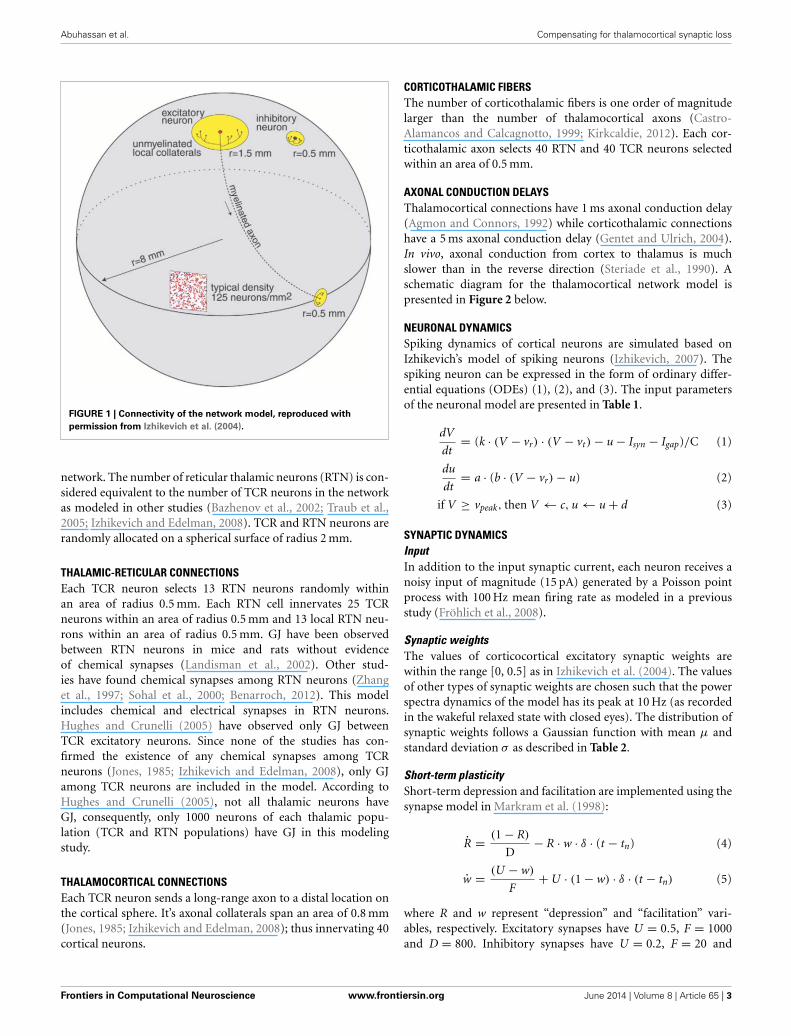
MATERIALS AND METHODSCORTICAL NETWORKThe cortical part of the model is inspired by the anatomy ofthe cerebral cortex with an anatomy and dynamics following thestudy in Izhikevich et al. (2004). The model preserves impor-tant ratios and relative distances found in the mammalian cor-tex (Braitenberg and Schüz, 1998). The ratio of excitatory toinhibitory neurons is 4 to 1. The radius of local non-myelinatedaxonal arborizations of an excitatory neuron is 1.5 mm, and thelength of the myelinated axon is 12 mm as shown in Figure 1. Thelong axon is sent to a distant region on the sphere and its collater-als span an area of radius 0.5. Each excitatory neuron innervates75 randomly chosen local targets and 25 distant targets. The spanof local non-myelinated axonal collaterals of an inhibitory neu-ron is 0.5 mm. Each inhibitory neuron innervates 25 randomlychosen neurons within a circle of radius 0.5 mm. As presentedin (Izhikevich et al., 2004), the axonal conduction velocity is1 m/s for myelinated axons (Swadlow, 1994) and 0.15 m/s fornon-myelinated collaterals (Waxman and Bennett, 1972).
THALAMIC AND RETICULAR THALAMIC NETWORKThe relative distribution of thalamic neurons is unknown(Izhikevich and Edelman, 2008). It has been observed that thereis 350,000 thalamocortical connections per 11,000,000 neuronsin layer 4 of the primary visual cortex (Binzegger et al., 2004)leading to a ratio of 1/30 (Izhikevich and Edelman, 2008). If weassume that each TCR neuron is associated with one fiber, thenthe distribution of TCR neurons is concluded as a proportion ofcortical neurons resulting in 3340 TCR neurons in the thalamic
Frontiers in Computational Neuroscience www.frontiersin.org June 2014 | Volume 8 | Article 65 | 2
Abuhassan et al. Compensating for thalamocortical synaptic loss
FIGURE 1 | Connectivity of the network model, reproduced with
permission from Izhikevich et al. (2004).
network. The number of reticular thalamic neurons (RTN) is con-sidered equivalent to the number of TCR neurons in the networkas modeled in other studies (Bazhenov et al., 2002; Traub et al.,2005; Izhikevich and Edelman, 2008). TCR and RTN neurons arerandomly allocated on a spherical surface of radius 2 mm.
THALAMIC-RETICULAR CONNECTIONSEach TCR neuron selects 13 RTN neurons randomly withinan area of radius 0.5 mm. Each RTN cell innervates 25 TCRneurons within an area of radius 0.5 mm and 13 local RTN neu-rons within an area of radius 0.5 mm. GJ have been observedbetween RTN neurons in mice and rats without evidenceof chemical synapses (Landisman et al., 2002). Other stud-ies have found chemical synapses among RTN neurons (Zhanget al., 1997; Sohal et al., 2000; Benarroch, 2012). This modelincludes chemical and electrical synapses in RTN neurons.Hughes and Crunelli (2005) have observed only GJ betweenTCR excitatory neurons. Since none of the studies has con-firmed the existence of any chemical synapses among TCRneurons (Jones, 1985; Izhikevich and Edelman, 2008), only GJamong TCR neurons are included in the model. According toHughes and Crunelli (2005), not all thalamic neurons haveGJ, consequently, only 1000 neurons of each thalamic popu-lation (TCR and RTN populations) have GJ in this modelingstudy.
THALAMOCORTICAL CONNECTIONSEach TCR neuron sends a long-range axon to a distal location onthe cortical sphere. It’s axonal collaterals span an area of 0.8 mm(Jones, 1985; Izhikevich and Edelman, 2008); thus innervating 40cortical neurons.
CORTICOTHALAMIC FIBERSThe number of corticothalamic fibers is one order of magnitudelarger than the number of thalamocortical axons (Castro-Alamancos and Calcagnotto, 1999; Kirkcaldie, 2012). Each cor-ticothalamic axon selects 40 RTN and 40 TCR neurons selectedwithin an area of 0.5 mm.
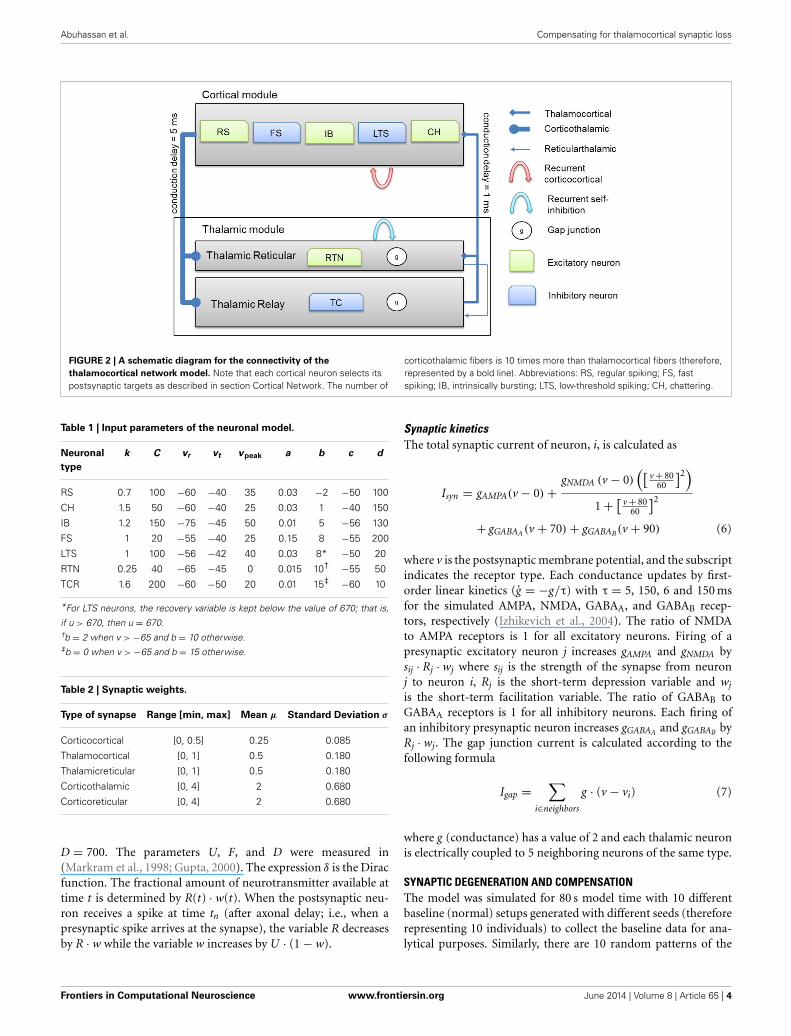
AXONAL CONDUCTION DELAYSThalamocortical connections have 1 ms axonal conduction delay(Agmon and Connors, 1992) while corticothalamic connectionshave a 5 ms axonal conduction delay (Gentet and Ulrich, 2004).In vivo, axonal conduction from cortex to thalamus is muchslower than in the reverse direction (Steriade et al., 1990). Aschematic diagram for the thalamocortical network model ispresented in Figure 2 below.
NEURONAL DYNAMICSSpiking dynamics of cortical neurons are simulated based onIzhikevich’s model of spiking neurons (Izhikevich, 2007). Thespiking neuron can be expressed in the form of ordinary differ-ential equations (ODEs) (1), (2), and (3). The input parametersof the neuronal model are presented in Table 1.
dV
dt= (k · (V − vr) · (V − vt)− u− Isyn − Igap)/C (1)
du
dt= a · (b · (V − vr)− u) (2)
if V ≥ vpeak, then V ← c, u← u+ d (3)
SYNAPTIC DYNAMICSInputIn addition to the input synaptic current, each neuron receives anoisy input of magnitude (15 pA) generated by a Poisson pointprocess with 100 Hz mean firing rate as modeled in a previousstudy (Fröhlich et al., 2008).
Synaptic weightsThe values of corticocortical excitatory synaptic weights arewithin the range [0, 0.5] as in Izhikevich et al. (2004). The valuesof other types of synaptic weights are chosen such that the powerspectra dynamics of the model has its peak at 10 Hz (as recordedin the wakeful relaxed state with closed eyes). The distribution ofsynaptic weights follows a Gaussian function with mean μ andstandard deviation σ as described in Table 2.
Short-term plasticityShort-term depression and facilitation are implemented using thesynapse model in Markram et al. (1998):
R = (1− R)
D− R · w · δ · (t − tn) (4)
w = (U − w)
F+ U · (1− w) · δ · (t − tn) (5)
where R and w represent “depression” and “facilitation” vari-ables, respectively. Excitatory synapses have U = 0.5, F = 1000and D = 800. Inhibitory synapses have U = 0.2, F = 20 and
Frontiers in Computational Neuroscience www.frontiersin.org June 2014 | Volume 8 | Article 65 | 3
Abuhassan et al. Compensating for thalamocortical synaptic loss
FIGURE 2 | A schematic diagram for the connectivity of the
thalamocortical network model. Note that each cortical neuron selects itspostsynaptic targets as described in section Cortical Network. The number of
corticothalamic fibers is 10 times more than thalamocortical fibers (therefore,represented by a bold line). Abbreviations: RS, regular spiking; FS, fastspiking; IB, intrinsically bursting; LTS, low-threshold spiking; CH, chattering.
Table 1 | Input parameters of the neuronal model.
Neuronal
type
k C vr vt vpeak a b c d
RS 0.7 100 −60 −40 35 0.03 −2 −50 100
CH 1.5 50 −60 −40 25 0.03 1 −40 150
IB 1.2 150 −75 −45 50 0.01 5 −56 130
FS 1 20 −55 −40 25 0.15 8 −55 200
LTS 1 100 −56 −42 40 0.03 8* −50 20
RTN 0.25 40 −65 −45 0 0.015 10† −55 50
TCR 1.6 200 −60 −50 20 0.01 15‡ −60 10
*For LTS neurons, the recovery variable is kept below the value of 670; that is,
if u > 670, then u = 670.†b = 2 when v > −65 and b = 10 otherwise.‡b = 0 when v > −65 and b = 15 otherwise.
Table 2 | Synaptic weights.
Type of synapse Range [min, max] Mean μ Standard Deviation σ
Corticocortical [0, 0.5] 0.25 0.085
Thalamocortical [0, 1] 0.5 0.180
Thalamicreticular [0, 1] 0.5 0.180
Corticothalamic [0, 4] 2 0.680
Corticoreticular [0, 4] 2 0.680
D = 700. The parameters U, F, and D were measured in(Markram et al., 1998; Gupta, 2000). The expression δ is the Diracfunction. The fractional amount of neurotransmitter available attime t is determined by R(t) · w(t). When the postsynaptic neu-ron receives a spike at time tn (after axonal delay; i.e., when apresynaptic spike arrives at the synapse), the variable R decreasesby R · w while the variable w increases by U · (1− w).
Synaptic kineticsThe total synaptic current of neuron, i, is calculated as
Isyn = gAMPA(v − 0)+gNMDA (v − 0)
([ v+ 8060
]2)
1+ [ v+ 8060
]2
+ gGABAA(v + 70)+ gGABAB(v + 90) (6)
where v is the postsynaptic membrane potential, and the subscriptindicates the receptor type. Each conductance updates by first-order linear kinetics (g = −g/τ) with τ = 5, 150, 6 and 150 msfor the simulated AMPA, NMDA, GABAA, and GABAB recep-tors, respectively (Izhikevich et al., 2004). The ratio of NMDAto AMPA receptors is 1 for all excitatory neurons. Firing of apresynaptic excitatory neuron j increases gAMPA and gNMDA bysij · Rj · wj where sij is the strength of the synapse from neuronj to neuron i, Rj is the short-term depression variable and wj
is the short-term facilitation variable. The ratio of GABAB toGABAA receptors is 1 for all inhibitory neurons. Each firing ofan inhibitory presynaptic neuron increases gGABAA and gGABAB byRj · wj. The gap junction current is calculated according to thefollowing formula
Igap =∑
i∈neighbors
g · (v − vi) (7)
where g (conductance) has a value of 2 and each thalamic neuronis electrically coupled to 5 neighboring neurons of the same type.
SYNAPTIC DEGENERATION AND COMPENSATIONThe model was simulated for 80 s model time with 10 differentbaseline (normal) setups generated with different seeds (thereforerepresenting 10 individuals) to collect the baseline data for ana-lytical purposes. Similarly, there are 10 random patterns of the
Frontiers in Computational Neuroscience www.frontiersin.org June 2014 | Volume 8 | Article 65 | 4
Abuhassan et al. Compensating for thalamocortical synaptic loss
model for each type of connectivity loss. For each network pat-tern, different degrees of synaptic loss (SL) were simulated withvalues between 10 and 60% (representing different stages of AD).The spectral analysis is based on the average of these simulations.
Each network is simulated for 10 s model time with physio-logical values of all parameters. Then, synaptic loss is performedby a random deletion of a fraction (SL) of connections fol-lowed by the synaptic compensation mechanism as describedbelow.
Corticocortical connectivity lossSynaptic loss is implemented in this case by deleting excita-tory synapses among cortical neurons on the cortical surface.The compensation rule is applied from 80 s until 200 s (modeltime). The firing rate of excitatory neurons is calculated every5 s by averaging over all excitatory spikes in the preceding 5 sinterval. The remaining synaptic weights between excitatory neu-rons are then increased in these time-points by the followingformula
�p = ε · (e∗ − e) · s (8)
where ε is a rate parameter (ε = 0.1), e∗ is the target firing rate(the firing rate of the network during the steady-state beforesynaptic loss), e is the current average firing rate and parameters denotes the synaptic strength. The total model time is 300 s.
Thalamocortical connectivity lossCortical neurons receive input from thalamic neurons asdescribed in section Corticothalamic Fibers above. This caseexamines the effect of losing such input (synapses) on the spec-tral output of the network. This case incorporates the presentedcompensation mechanism in case 1 (above) where corticocorti-cal synaptic weights are scaled up to compensate for the loss ofthalamic input signals that is induced by thalamocortical synapticloss.
Corticothalamic connectivity lossThis case explores the dynamics of the network after abnormalreduction of the distribution of cortical efferents (input) to theTCR neurons in the thalamic network. It is mentioned earlier(in section Corticothalamic Fibers above) that TCR afferents arereceived from cortical and RTN neurons. To compensate for theloss of cortical input, the study has scaled down the inhibitoryinput from RTN neurons according to equation (8) with ε hasan initial value of 0.05 and evolves autonomously such that it isincreased by 0.00125 if e is less than e∗ and decreased by 0.00125otherwise. The computation is allowed to run for a long period(500 s) to allow the model to stabilize. When using a constantparameter value (as in the above two cases), a significant depolar-ized phase followed by highly hyperpolarized intervals is observed(similar to sleep oscillations) (Bazhenov et al., 2002). The aim isto maintain the asynchronous firing pattern of the system (as inthe wakeful state).
Corticoreticular connectivity lossThis case models the effects of reduced RTN afferents on abnor-mal oscillatory activity in AD. This case includes a synapticreaction mechanism that scales down the inhibition among RTN
neurons to recover their output activity. The model employs theabove mentioned technique in estimating ε with an increase (ordecrease) in magnitude of 0.0025.
DATA ANALYSIS AND COMPUTER SIMULATIONSEEG and modeling studies have quantified frequency alterationsin the ongoing oscillatory signal in response to a stimulus (event)based on the event related desynchronization/synchronization(ERD/S) measure (Pfurtscheller and Lopes da Silva, 1999; Durkaet al., 2004b; Bhattacharya et al., 2012). ERD refers to diminishedpower density in certain EEG waves after the internal or exter-nal stimulation, whereas ERS is observed if the event causes anenhancement in the power amplitude of an EEG frequency band.The measure first appeared in Pfurtscheller and Aranibar (1977)and has been extensively utilized in BCI studies such as (Coyleet al., 2005; Herman et al., 2008; Prasad et al., 2010).
This modeling study employs an ERD/ERS tool1 to analysethe impact of synaptic loss (the event) and compensation on thenetwork oscillatory activity. ERD/ERS estimation is based on aprevious study (Durka et al., 2004b) that is accompanied with anonline freely available MATLAB® routine (Durka et al., 2004a).The approach uses a Short time Fourier transform (STFT or spec-trogram) to compute the time-frequency power of different wavesand bootstrapping with pseudo-t statistics to mark the significantincrease (ERS) or decrease (ERD) of the frequency band power ina particular band.
The simulated LFP are estimated by averaging spike trainssmoothed with a Gaussian kernel (SD of 20 ms) (Fröhlich et al.,2008). Time-frequency spectrogram is a common EEG (and sig-nal processing) analytical method used to visualize changes onthe spectral power of frequency bands as a function of time. Thestudy presented in this paper has determined the spectograms ofthe simulated LFP signals based on the MATLAB® (MathWorks)function spectrogram() provided with a LFP signal of length 6 sand a Hamming window of size 2 s. For presentation purposes,the spectrogram plots have been filtered with the MATLAB®(MathWorks) function filter2().
Dynamics of neurons are simulated using the first-order Eulermethod with 0.5 ms time step to avoid numerical instabilities. Thesynaptic dynamics are simulated with 1 ms time step (Izhikevichet al., 2004). Data Analysis is performed with custom-writtenMATLAB® programs using the MATLAB parallel toolbox to speedup computations. The anatomy of the network is implemented inMATLAB and saved to ASCII files. A C implementation with MPIis used to load the network (ASCII files) and simulate the modeldynamics. The model runs on a HPC facility that consists of 31
1The event in real EEG experiments corresponds to a motor task that lastsfor a short time (few seconds). Such events stimulate certain populations ofneurons and results in an attenuation or potentiation in the power of cer-tain frequency bands. In this study, the event corresponds to a massive lossof synapses. By utilizing the ERD/ERS measure, the study aims to examinethe effects of synaptic loss and compensation on the oscillatory activity of thenetwork. Synaptic compensation is implemented by increasing the weights ofthe remaining synapses. Synaptic weights and the intrinsic membrane prop-erties of the neurons are responsible for the dynamics of the EEG signal(Pfurtscheller and Lopes da Silva, 1999). This justifies the choice of utilizingan ERD/ERS analysis in this study.
Frontiers in Computational Neuroscience www.frontiersin.org June 2014 | Volume 8 | Article 65 | 5
Abuhassan et al. Compensating for thalamocortical synaptic loss
Dell R401 computing servers, each with 2 physical Intel XeonCPUs with 6 Cores running at 2.66 GHz.
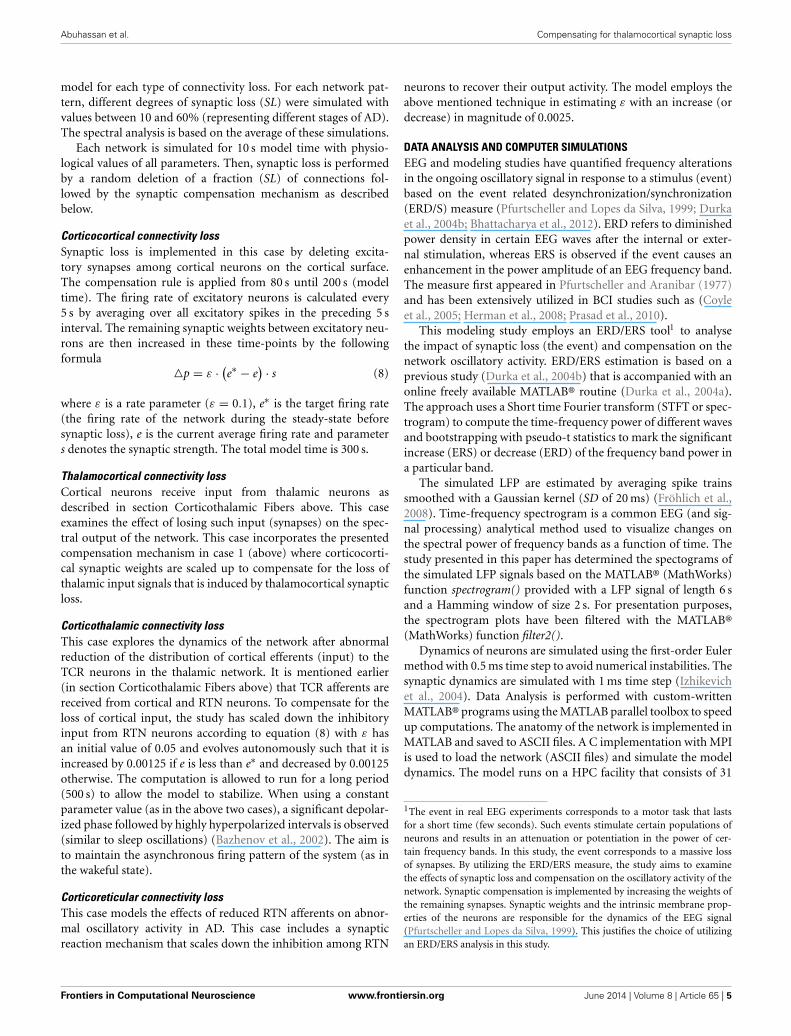
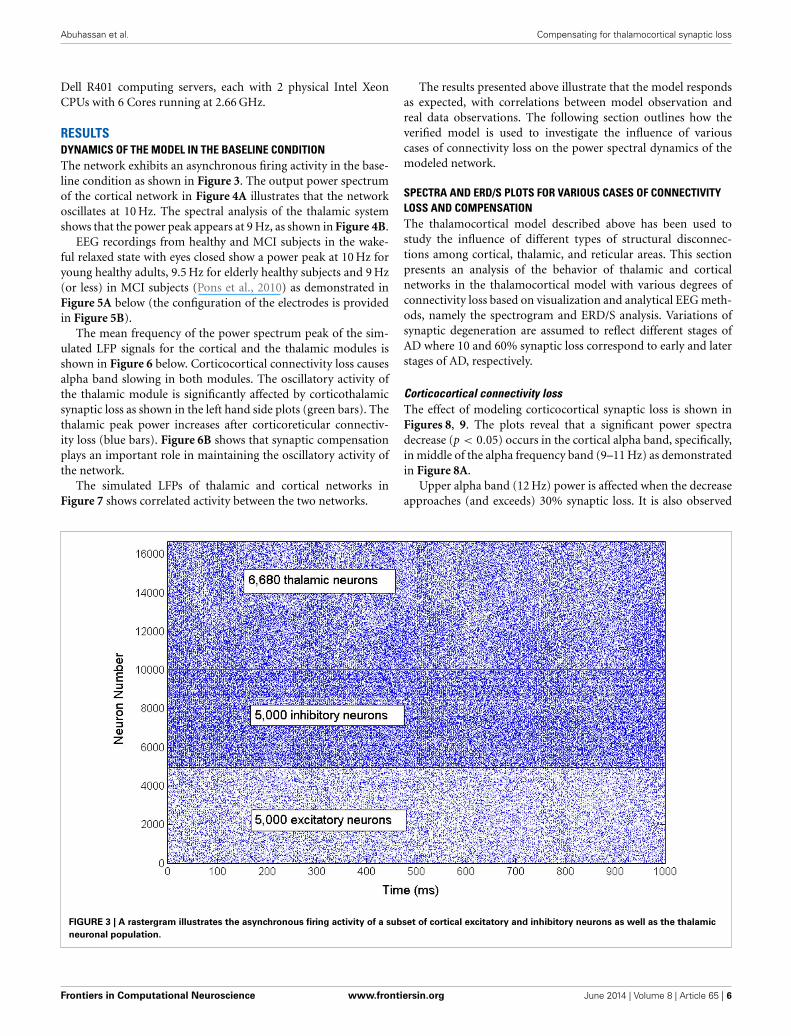
RESULTSDYNAMICS OF THE MODEL IN THE BASELINE CONDITIONThe network exhibits an asynchronous firing activity in the base-line condition as shown in Figure 3. The output power spectrumof the cortical network in Figure 4A illustrates that the networkoscillates at 10 Hz. The spectral analysis of the thalamic systemshows that the power peak appears at 9 Hz, as shown in Figure 4B.
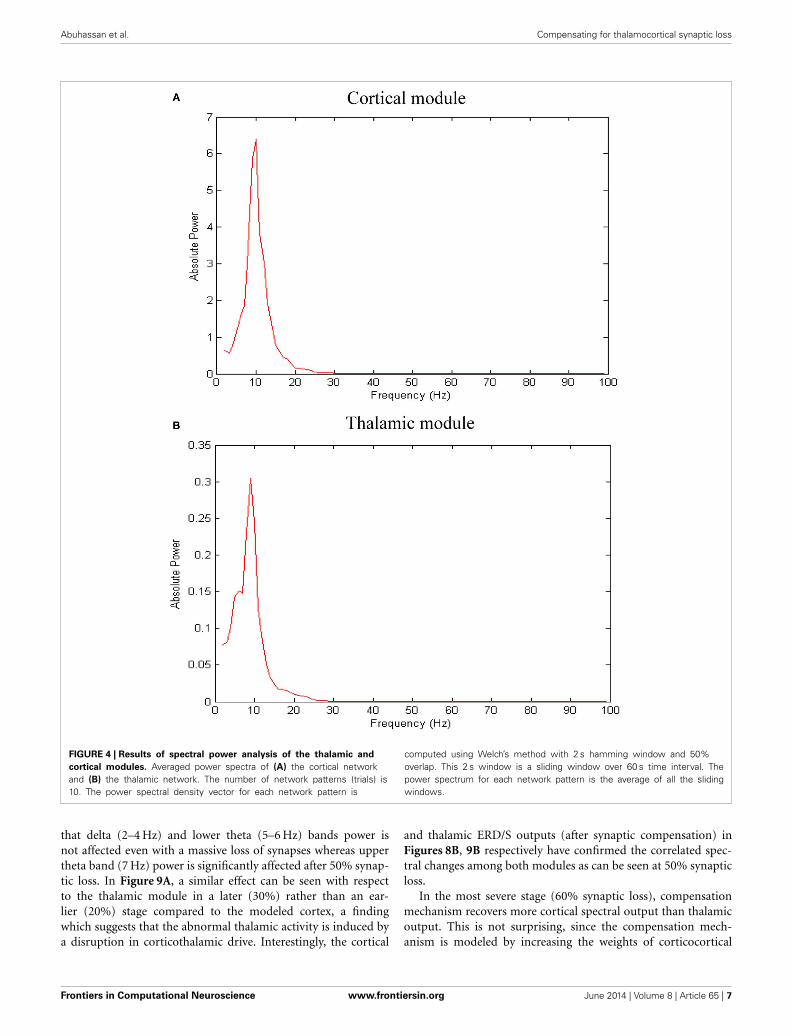
EEG recordings from healthy and MCI subjects in the wake-ful relaxed state with eyes closed show a power peak at 10 Hz foryoung healthy adults, 9.5 Hz for elderly healthy subjects and 9 Hz(or less) in MCI subjects (Pons et al., 2010) as demonstrated inFigure 5A below (the configuration of the electrodes is providedin Figure 5B).
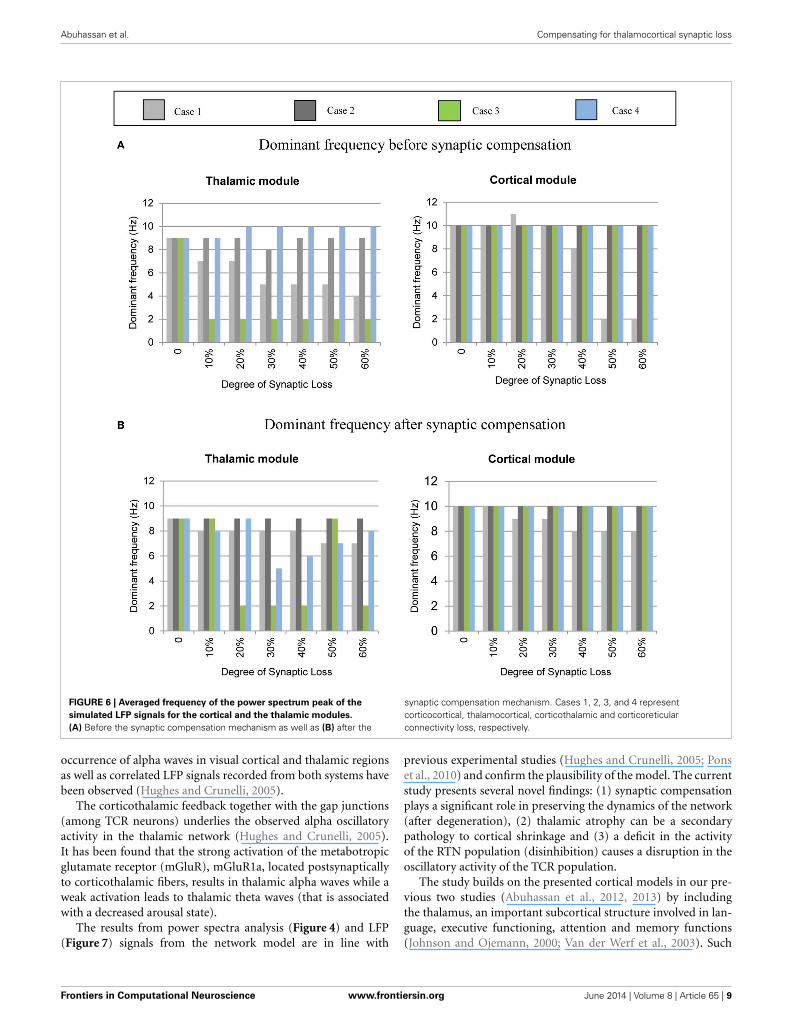
The mean frequency of the power spectrum peak of the sim-ulated LFP signals for the cortical and the thalamic modules isshown in Figure 6 below. Corticocortical connectivity loss causesalpha band slowing in both modules. The oscillatory activity ofthe thalamic module is significantly affected by corticothalamicsynaptic loss as shown in the left hand side plots (green bars). Thethalamic peak power increases after corticoreticular connectiv-ity loss (blue bars). Figure 6B shows that synaptic compensationplays an important role in maintaining the oscillatory activity ofthe network.
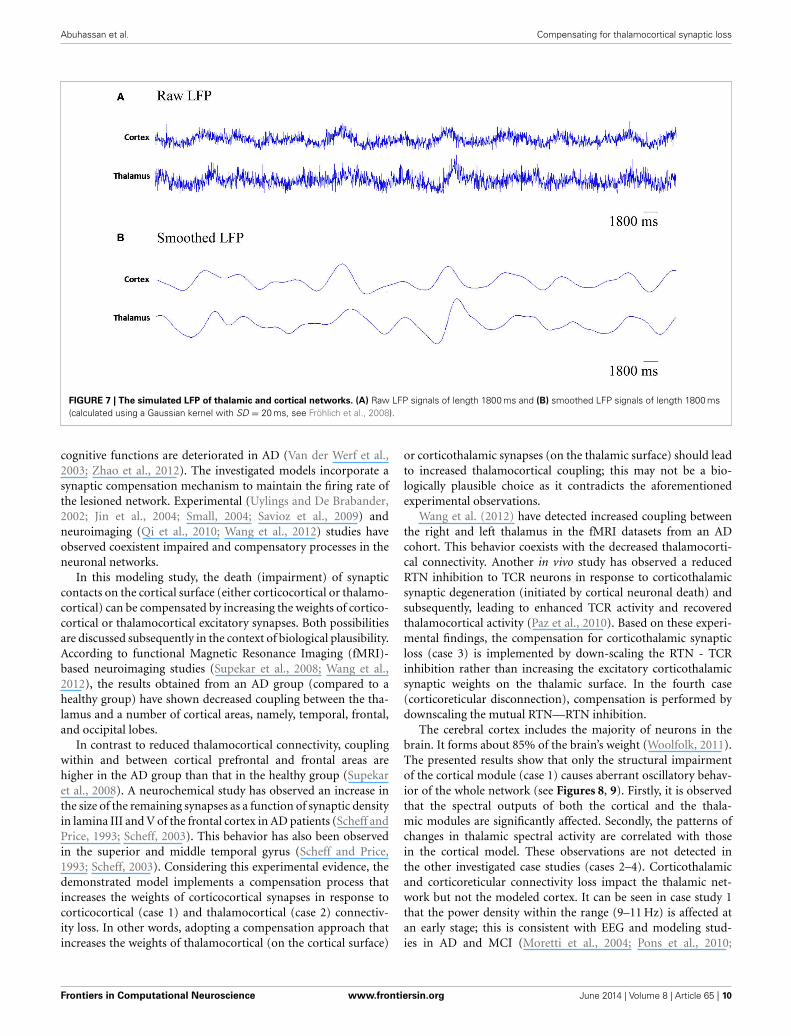
The simulated LFPs of thalamic and cortical networks inFigure 7 shows correlated activity between the two networks.
The results presented above illustrate that the model respondsas expected, with correlations between model observation andreal data observations. The following section outlines how theverified model is used to investigate the influence of variouscases of connectivity loss on the power spectral dynamics of themodeled network.
SPECTRA AND ERD/S PLOTS FOR VARIOUS CASES OF CONNECTIVITYLOSS AND COMPENSATIONThe thalamocortical model described above has been used tostudy the influence of different types of structural disconnec-tions among cortical, thalamic, and reticular areas. This sectionpresents an analysis of the behavior of thalamic and corticalnetworks in the thalamocortical model with various degrees ofconnectivity loss based on visualization and analytical EEG meth-ods, namely the spectrogram and ERD/S analysis. Variations ofsynaptic degeneration are assumed to reflect different stages ofAD where 10 and 60% synaptic loss correspond to early and laterstages of AD, respectively.
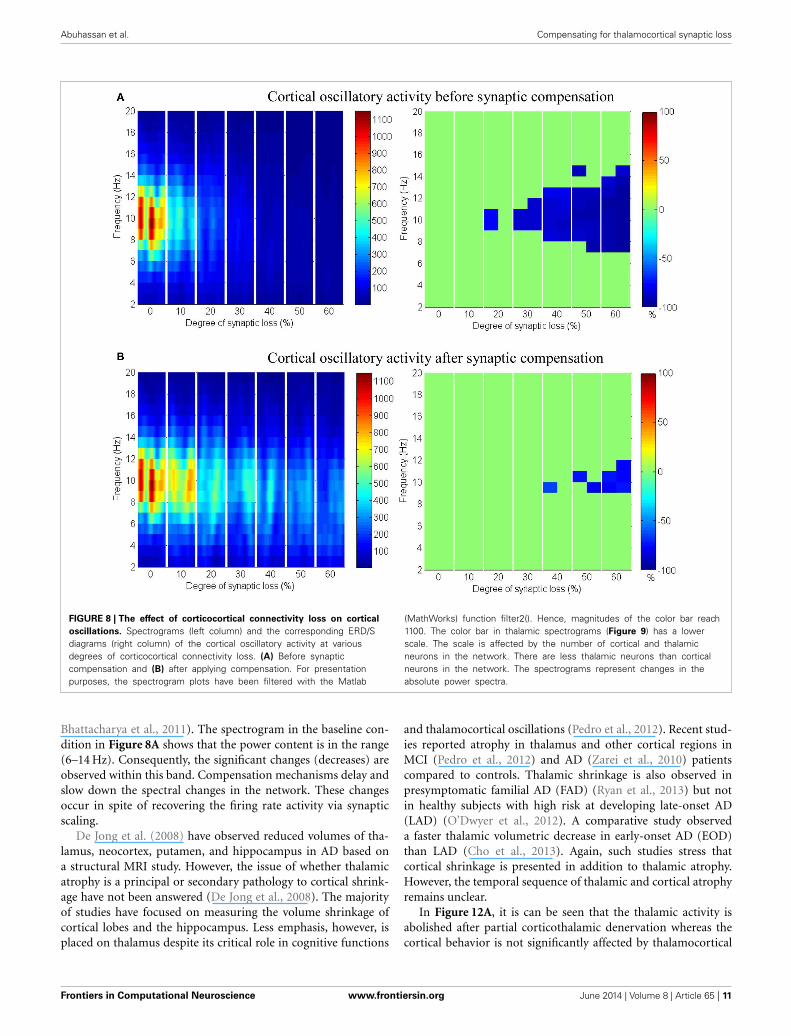
Corticocortical connectivity lossThe effect of modeling corticocortical synaptic loss is shown inFigures 8, 9. The plots reveal that a significant power spectradecrease (p < 0.05) occurs in the cortical alpha band, specifically,in middle of the alpha frequency band (9–11 Hz) as demonstratedin Figure 8A.
Upper alpha band (12 Hz) power is affected when the decreaseapproaches (and exceeds) 30% synaptic loss. It is also observed
FIGURE 3 | A rastergram illustrates the asynchronous firing activity of a subset of cortical excitatory and inhibitory neurons as well as the thalamic
neuronal population.
Frontiers in Computational Neuroscience www.frontiersin.org June 2014 | Volume 8 | Article 65 | 6
Abuhassan et al. Compensating for thalamocortical synaptic loss
FIGURE 4 | Results of spectral power analysis of the thalamic and
cortical modules. Averaged power spectra of (A) the cortical networkand (B) the thalamic network. The number of network patterns (trials) is10. The power spectral density vector for each network pattern is
computed using Welch’s method with 2 s hamming window and 50%overlap. This 2 s window is a sliding window over 60 s time interval. Thepower spectrum for each network pattern is the average of all the slidingwindows.
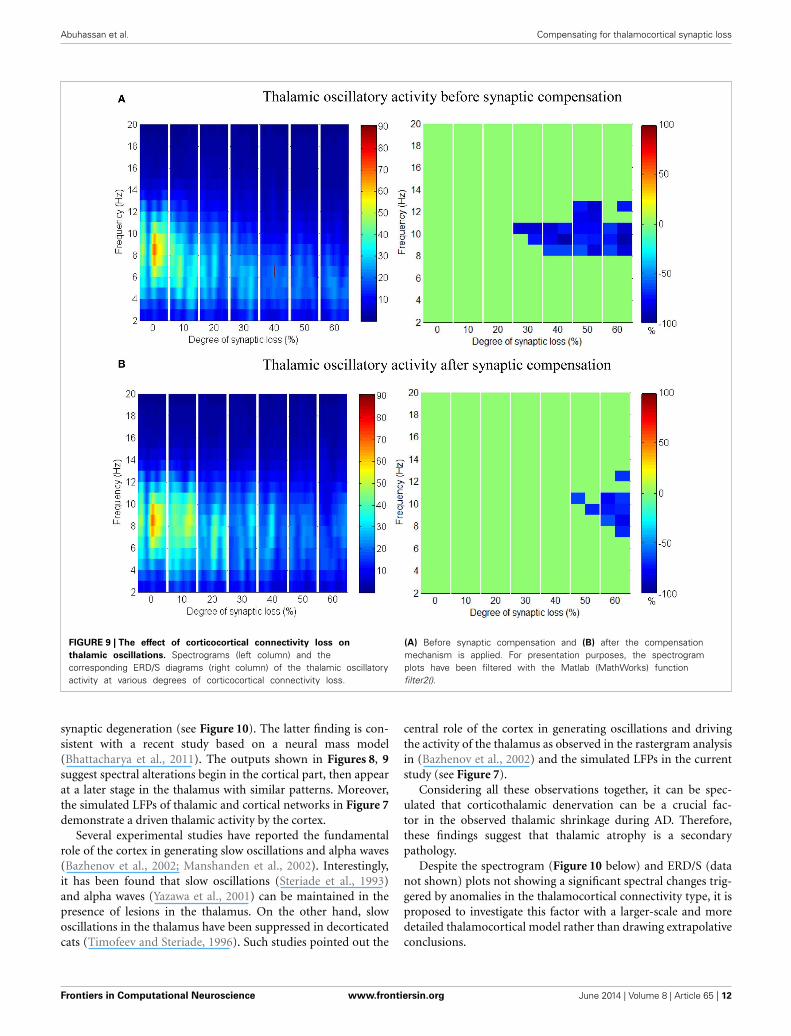
that delta (2–4 Hz) and lower theta (5–6 Hz) bands power isnot affected even with a massive loss of synapses whereas uppertheta band (7 Hz) power is significantly affected after 50% synap-tic loss. In Figure 9A, a similar effect can be seen with respectto the thalamic module in a later (30%) rather than an ear-lier (20%) stage compared to the modeled cortex, a findingwhich suggests that the abnormal thalamic activity is induced bya disruption in corticothalamic drive. Interestingly, the cortical
and thalamic ERD/S outputs (after synaptic compensation) inFigures 8B, 9B respectively have confirmed the correlated spec-tral changes among both modules as can be seen at 50% synapticloss.
In the most severe stage (60% synaptic loss), compensationmechanism recovers more cortical spectral output than thalamicoutput. This is not surprising, since the compensation mech-anism is modeled by increasing the weights of corticocortical
Frontiers in Computational Neuroscience www.frontiersin.org June 2014 | Volume 8 | Article 65 | 7
Abuhassan et al. Compensating for thalamocortical synaptic loss
FIGURE 5 | (A) Averaged frequency of the power spectrum peak of the EEGsignals recorded from 12 electrodes. The graph includes three categories:young (Y), healthy old (HO) subjects, and MCI patients. Reprinted from Pons
et al. (2010) with kind permission from Elsevier. Copyright©2010, Elsevier. (B)
Configuration of the electrodes’ positions. Adapted and modified from Nuweret al. (1999). F, frontal; C, central; P, parietal; O, occipital; T, temporal.
synapses, thus it has a direct influence on the cortex and indirectinfluence on the thalamus.
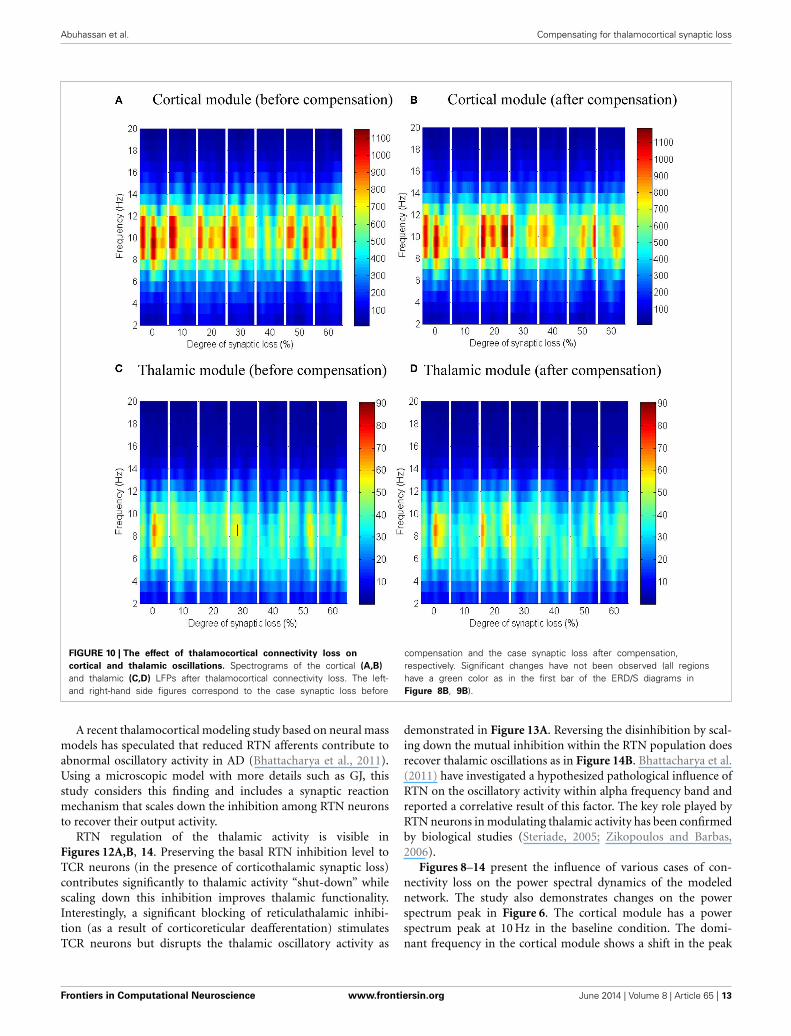
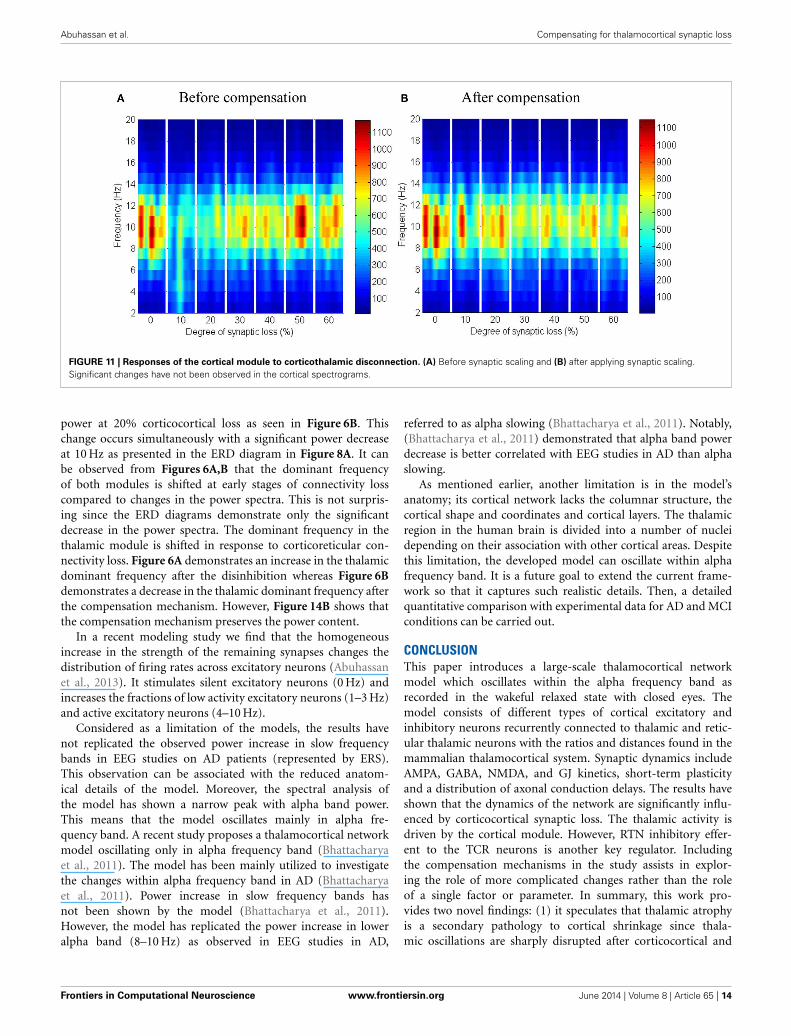
Thalamocortical connectivity lossNext, the effect of abnormal dismantling of thalamocortical con-tacts on the cortical surface is examined. From Figures 10A,B, itcan be seen that the cortical spectral activity is not affected by thisdeafferentation. The same behavior is observed in the thalamicmodule in Figures 10C,D.
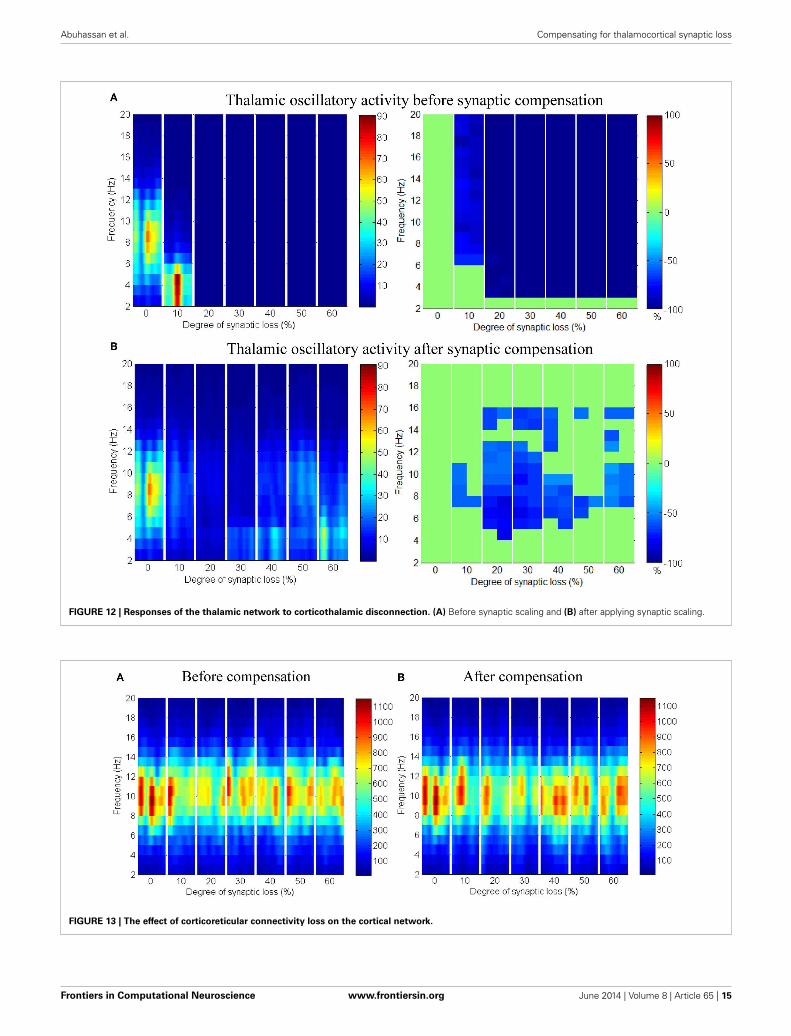
Corticothalamic connectivity lossThe synaptic connectivity of the cortical afferents pathways tothe thalamic neurons controls oscillatory activity in the tha-lamic module as confirmed by experimental (Contreras et al.,1996; Destexhe, 2000) and theoretical studies (Mayer et al., 2007).Decortication (i.e., removal of the cortical slice) results in syn-chrony loss in the thalamus (Contreras et al., 1996; Destexhe,2000; Mayer et al., 2007). The findings of this modeling studyshow that thalamic activity is diminished at an early stage start-ing with a clear shift to low frequency waves at 10% connectivityloss followed by a marked loss of activity in the next stages as pre-sented in Figure 12A. On the contrary, cortical oscillations are notsignificantly affected by this loss, as demonstrated in Figure 11A.
Applying compensation mechanism for the thalamic networkassists in (partial) recovery of the network activity as displayedin the ERD plot in Figure 12B. The compensation mechanism inthis case is modeled by scaling down the inhibition from RTNneurons.
Taking corticothalamic connectivity loss before compensation(Figure 12A) together with the case after reducing RTN to TCRinhibition (Figure 12B), the data indicates that the spiking activ-ity of the inhibitory RTN neurons is another important factorcontributing significantly to the breakdown of thalamic activity.Scaling down this factor helps excitatory TCR neurons to recover(partially) it’s spiking activity. The reader can also see that thedecrease ratio (darkness of the blue color) in Figure 12B is lessthan that in Figure 12A.
Corticoreticular connectivity lossAs mentioned earlier, RTN neurons play a crucial role in regulat-ing thalamic oscillatory activity. Any impairment in this circuit(due to neuronal death or loss of afferent input from other areas)is expected to have a direct influence on the thalamus. This sec-tion presents the results of partial deafferentation of RTN neuronsmodeled by a loss of cortical contacts on the RTN surface.
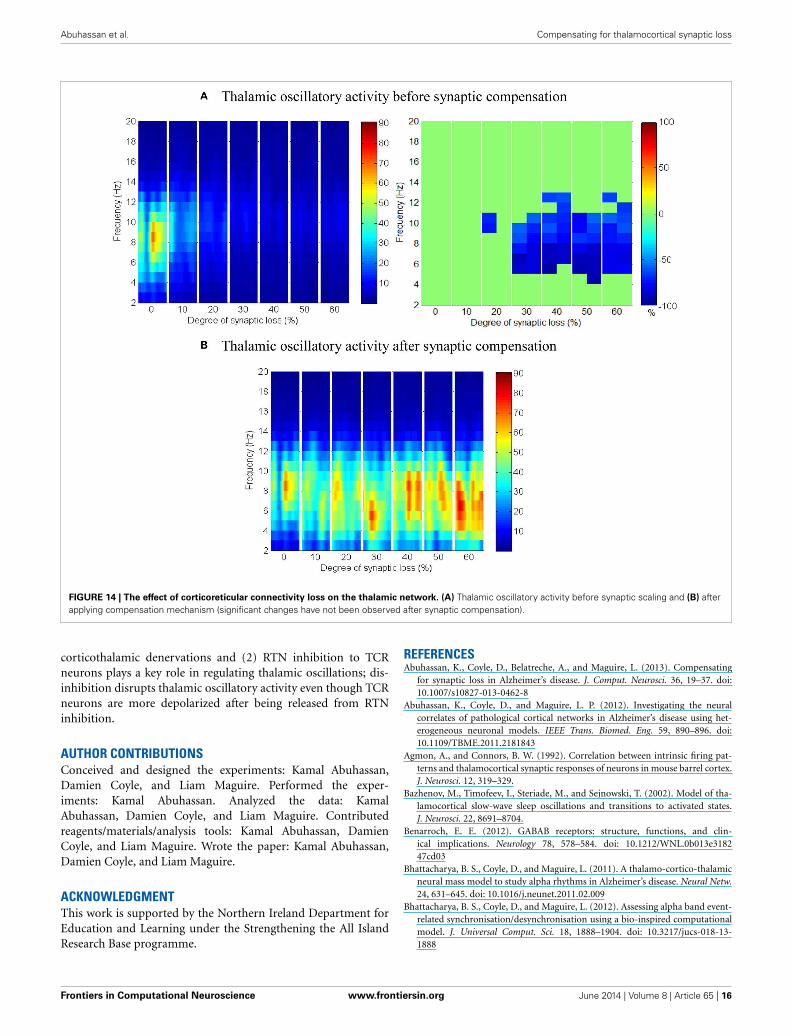
The results in Figures 13A,B show that cortical oscillationsare not significantly affected by this loss. On the other hand, thethalamic oscillatory activity is disturbed as seen in Figure 14Adespite the significant decrease in RTN—TCR inhibition and theincrease in TCR firing rate. Interestingly, the spectral dynam-ics of the thalamic network is fully recovered when decreasingthe mutual inhibition in the RTN population. This helps RTNneurons depolarize recovering their firing rate and regulates thethalamic oscillatory activity as shown in Figure 14B.
DISCUSSIONThis study discusses the results of modeling structural synapticimpairment of fundamental connectivity types based on a novelthalamocortical network model consisting of different types ofcortical excitatory and inhibitory neurons recurrently connectedto thalamic and reticular thalamic regions with the ratios anddistances found in the mammalian thalamocortical system. Themodel includes short- and long-range corticocortical couplings,synaptic transmission with AMPA, GABA, NMDA, and GJ kinet-ics, short-term plasticity and a distribution of axonal conductiondelays. The model was implemented using C programming lan-guage with MPI and was run on HPC facility.
Figure 7 presents the rhythmic activity in both, the thalamicand the cortical modules in the baseline condition. Thalamicalpha activity appears simultaneously with cortical alpha activ-ity as seen in Figure 4. The thalamus is situated in the middleof the human brain. Therefore, the definitive contribution ofhuman thalamus to the recorded EEG signals at the scalp surface(non-invasively) cannot be identified. Using the invasive intracra-nial EEG (iEEG) recording from brains of dogs, a synchronized
Frontiers in Computational Neuroscience www.frontiersin.org June 2014 | Volume 8 | Article 65 | 8
Abuhassan et al. Compensating for thalamocortical synaptic loss
FIGURE 6 | Averaged frequency of the power spectrum peak of the
simulated LFP signals for the cortical and the thalamic modules.
(A) Before the synaptic compensation mechanism as well as (B) after the
synaptic compensation mechanism. Cases 1, 2, 3, and 4 representcorticocortical, thalamocortical, corticothalamic and corticoreticularconnectivity loss, respectively.
occurrence of alpha waves in visual cortical and thalamic regionsas well as correlated LFP signals recorded from both systems havebeen observed (Hughes and Crunelli, 2005).
The corticothalamic feedback together with the gap junctions(among TCR neurons) underlies the observed alpha oscillatoryactivity in the thalamic network (Hughes and Crunelli, 2005).It has been found that the strong activation of the metabotropicglutamate receptor (mGluR), mGluR1a, located postsynapticallyto corticothalamic fibers, results in thalamic alpha waves while aweak activation leads to thalamic theta waves (that is associatedwith a decreased arousal state).
The results from power spectra analysis (Figure 4) and LFP(Figure 7) signals from the network model are in line with
previous experimental studies (Hughes and Crunelli, 2005; Ponset al., 2010) and confirm the plausibility of the model. The currentstudy presents several novel findings: (1) synaptic compensationplays a significant role in preserving the dynamics of the network(after degeneration), (2) thalamic atrophy can be a secondarypathology to cortical shrinkage and (3) a deficit in the activityof the RTN population (disinhibition) causes a disruption in theoscillatory activity of the TCR population.
The study builds on the presented cortical models in our pre-vious two studies (Abuhassan et al., 2012, 2013) by includingthe thalamus, an important subcortical structure involved in lan-guage, executive functioning, attention and memory functions(Johnson and Ojemann, 2000; Van der Werf et al., 2003). Such
Frontiers in Computational Neuroscience www.frontiersin.org June 2014 | Volume 8 | Article 65 | 9
Abuhassan et al. Compensating for thalamocortical synaptic loss
FIGURE 7 | The simulated LFP of thalamic and cortical networks. (A) Raw LFP signals of length 1800 ms and (B) smoothed LFP signals of length 1800 ms(calculated using a Gaussian kernel with SD = 20 ms, see Fröhlich et al., 2008).
cognitive functions are deteriorated in AD (Van der Werf et al.,2003; Zhao et al., 2012). The investigated models incorporate asynaptic compensation mechanism to maintain the firing rate ofthe lesioned network. Experimental (Uylings and De Brabander,2002; Jin et al., 2004; Small, 2004; Savioz et al., 2009) andneuroimaging (Qi et al., 2010; Wang et al., 2012) studies haveobserved coexistent impaired and compensatory processes in theneuronal networks.
In this modeling study, the death (impairment) of synapticcontacts on the cortical surface (either corticocortical or thalamo-cortical) can be compensated by increasing the weights of cortico-cortical or thalamocortical excitatory synapses. Both possibilitiesare discussed subsequently in the context of biological plausibility.According to functional Magnetic Resonance Imaging (fMRI)-based neuroimaging studies (Supekar et al., 2008; Wang et al.,2012), the results obtained from an AD group (compared to ahealthy group) have shown decreased coupling between the tha-lamus and a number of cortical areas, namely, temporal, frontal,and occipital lobes.
In contrast to reduced thalamocortical connectivity, couplingwithin and between cortical prefrontal and frontal areas arehigher in the AD group than that in the healthy group (Supekaret al., 2008). A neurochemical study has observed an increase inthe size of the remaining synapses as a function of synaptic densityin lamina III and V of the frontal cortex in AD patients (Scheff andPrice, 1993; Scheff, 2003). This behavior has also been observedin the superior and middle temporal gyrus (Scheff and Price,1993; Scheff, 2003). Considering this experimental evidence, thedemonstrated model implements a compensation process thatincreases the weights of corticocortical synapses in response tocorticocortical (case 1) and thalamocortical (case 2) connectiv-ity loss. In other words, adopting a compensation approach thatincreases the weights of thalamocortical (on the cortical surface)
or corticothalamic synapses (on the thalamic surface) should leadto increased thalamocortical coupling; this may not be a bio-logically plausible choice as it contradicts the aforementionedexperimental observations.
Wang et al. (2012) have detected increased coupling betweenthe right and left thalamus in the fMRI datasets from an ADcohort. This behavior coexists with the decreased thalamocorti-cal connectivity. Another in vivo study has observed a reducedRTN inhibition to TCR neurons in response to corticothalamicsynaptic degeneration (initiated by cortical neuronal death) andsubsequently, leading to enhanced TCR activity and recoveredthalamocortical activity (Paz et al., 2010). Based on these experi-mental findings, the compensation for corticothalamic synapticloss (case 3) is implemented by down-scaling the RTN - TCRinhibition rather than increasing the excitatory corticothalamicsynaptic weights on the thalamic surface. In the fourth case(corticoreticular disconnection), compensation is performed bydownscaling the mutual RTN—RTN inhibition.
The cerebral cortex includes the majority of neurons in thebrain. It forms about 85% of the brain’s weight (Woolfolk, 2011).The presented results show that only the structural impairmentof the cortical module (case 1) causes aberrant oscillatory behav-ior of the whole network (see Figures 8, 9). Firstly, it is observedthat the spectral outputs of both the cortical and the thala-mic modules are significantly affected. Secondly, the patterns ofchanges in thalamic spectral activity are correlated with thosein the cortical model. These observations are not detected inthe other investigated case studies (cases 2–4). Corticothalamicand corticoreticular connectivity loss impact the thalamic net-work but not the modeled cortex. It can be seen in case study 1that the power density within the range (9–11 Hz) is affected atan early stage; this is consistent with EEG and modeling stud-ies in AD and MCI (Moretti et al., 2004; Pons et al., 2010;
Frontiers in Computational Neuroscience www.frontiersin.org June 2014 | Volume 8 | Article 65 | 10
Abuhassan et al. Compensating for thalamocortical synaptic loss
FIGURE 8 | The effect of corticocortical connectivity loss on cortical
oscillations. Spectrograms (left column) and the corresponding ERD/Sdiagrams (right column) of the cortical oscillatory activity at variousdegrees of corticocortical connectivity loss. (A) Before synapticcompensation and (B) after applying compensation. For presentationpurposes, the spectrogram plots have been filtered with the Matlab
(MathWorks) function filter2(). Hence, magnitudes of the color bar reach1100. The color bar in thalamic spectrograms (Figure 9) has a lowerscale. The scale is affected by the number of cortical and thalamicneurons in the network. There are less thalamic neurons than corticalneurons in the network. The spectrograms represent changes in theabsolute power spectra.
Bhattacharya et al., 2011). The spectrogram in the baseline con-dition in Figure 8A shows that the power content is in the range(6–14 Hz). Consequently, the significant changes (decreases) areobserved within this band. Compensation mechanisms delay andslow down the spectral changes in the network. These changesoccur in spite of recovering the firing rate activity via synapticscaling.
De Jong et al. (2008) have observed reduced volumes of tha-lamus, neocortex, putamen, and hippocampus in AD based ona structural MRI study. However, the issue of whether thalamicatrophy is a principal or secondary pathology to cortical shrink-age have not been answered (De Jong et al., 2008). The majorityof studies have focused on measuring the volume shrinkage ofcortical lobes and the hippocampus. Less emphasis, however, isplaced on thalamus despite its critical role in cognitive functions
and thalamocortical oscillations (Pedro et al., 2012). Recent stud-ies reported atrophy in thalamus and other cortical regions inMCI (Pedro et al., 2012) and AD (Zarei et al., 2010) patientscompared to controls. Thalamic shrinkage is also observed inpresymptomatic familial AD (FAD) (Ryan et al., 2013) but notin healthy subjects with high risk at developing late-onset AD(LAD) (O’Dwyer et al., 2012). A comparative study observeda faster thalamic volumetric decrease in early-onset AD (EOD)than LAD (Cho et al., 2013). Again, such studies stress thatcortical shrinkage is presented in addition to thalamic atrophy.However, the temporal sequence of thalamic and cortical atrophyremains unclear.
In Figure 12A, it is can be seen that the thalamic activity isabolished after partial corticothalamic denervation whereas thecortical behavior is not significantly affected by thalamocortical
Frontiers in Computational Neuroscience www.frontiersin.org June 2014 | Volume 8 | Article 65 | 11
Abuhassan et al. Compensating for thalamocortical synaptic loss
FIGURE 9 | The effect of corticocortical connectivity loss on
thalamic oscillations. Spectrograms (left column) and thecorresponding ERD/S diagrams (right column) of the thalamic oscillatoryactivity at various degrees of corticocortical connectivity loss.
(A) Before synaptic compensation and (B) after the compensationmechanism is applied. For presentation purposes, the spectrogramplots have been filtered with the Matlab (MathWorks) functionfilter2().
synaptic degeneration (see Figure 10). The latter finding is con-sistent with a recent study based on a neural mass model(Bhattacharya et al., 2011). The outputs shown in Figures 8, 9suggest spectral alterations begin in the cortical part, then appearat a later stage in the thalamus with similar patterns. Moreover,the simulated LFPs of thalamic and cortical networks in Figure 7demonstrate a driven thalamic activity by the cortex.
Several experimental studies have reported the fundamentalrole of the cortex in generating slow oscillations and alpha waves(Bazhenov et al., 2002; Manshanden et al., 2002). Interestingly,it has been found that slow oscillations (Steriade et al., 1993)and alpha waves (Yazawa et al., 2001) can be maintained in thepresence of lesions in the thalamus. On the other hand, slowoscillations in the thalamus have been suppressed in decorticatedcats (Timofeev and Steriade, 1996). Such studies pointed out the
central role of the cortex in generating oscillations and drivingthe activity of the thalamus as observed in the rastergram analysisin (Bazhenov et al., 2002) and the simulated LFPs in the currentstudy (see Figure 7).
Considering all these observations together, it can be spec-ulated that corticothalamic denervation can be a crucial fac-tor in the observed thalamic shrinkage during AD. Therefore,these findings suggest that thalamic atrophy is a secondarypathology.
Despite the spectrogram (Figure 10 below) and ERD/S (datanot shown) plots not showing a significant spectral changes trig-gered by anomalies in the thalamocortical connectivity type, it isproposed to investigate this factor with a larger-scale and moredetailed thalamocortical model rather than drawing extrapolativeconclusions.
Frontiers in Computational Neuroscience www.frontiersin.org June 2014 | Volume 8 | Article 65 | 12
Abuhassan et al. Compensating for thalamocortical synaptic loss
FIGURE 10 | The effect of thalamocortical connectivity loss on
cortical and thalamic oscillations. Spectrograms of the cortical (A,B)
and thalamic (C,D) LFPs after thalamocortical connectivity loss. The left-and right-hand side figures correspond to the case synaptic loss before
compensation and the case synaptic loss after compensation,respectively. Significant changes have not been observed (all regionshave a green color as in the first bar of the ERD/S diagrams inFigure 8B, 9B).
A recent thalamocortical modeling study based on neural massmodels has speculated that reduced RTN afferents contribute toabnormal oscillatory activity in AD (Bhattacharya et al., 2011).Using a microscopic model with more details such as GJ, thisstudy considers this finding and includes a synaptic reactionmechanism that scales down the inhibition among RTN neuronsto recover their output activity.
RTN regulation of the thalamic activity is visible inFigures 12A,B, 14. Preserving the basal RTN inhibition level toTCR neurons (in the presence of corticothalamic synaptic loss)contributes significantly to thalamic activity “shut-down” whilescaling down this inhibition improves thalamic functionality.Interestingly, a significant blocking of reticulathalamic inhibi-tion (as a result of corticoreticular deafferentation) stimulatesTCR neurons but disrupts the thalamic oscillatory activity as
demonstrated in Figure 13A. Reversing the disinhibition by scal-ing down the mutual inhibition within the RTN population doesrecover thalamic oscillations as in Figure 14B. Bhattacharya et al.(2011) have investigated a hypothesized pathological influence ofRTN on the oscillatory activity within alpha frequency band andreported a correlative result of this factor. The key role played byRTN neurons in modulating thalamic activity has been confirmedby biological studies (Steriade, 2005; Zikopoulos and Barbas,2006).
Figures 8–14 present the influence of various cases of con-nectivity loss on the power spectral dynamics of the modelednetwork. The study also demonstrates changes on the powerspectrum peak in Figure 6. The cortical module has a powerspectrum peak at 10 Hz in the baseline condition. The domi-nant frequency in the cortical module shows a shift in the peak
Frontiers in Computational Neuroscience www.frontiersin.org June 2014 | Volume 8 | Article 65 | 13
Abuhassan et al. Compensating for thalamocortical synaptic loss
FIGURE 11 | Responses of the cortical module to corticothalamic disconnection. (A) Before synaptic scaling and (B) after applying synaptic scaling.Significant changes have not been observed in the cortical spectrograms.
power at 20% corticocortical loss as seen in Figure 6B. Thischange occurs simultaneously with a significant power decreaseat 10 Hz as presented in the ERD diagram in Figure 8A. It canbe observed from Figures 6A,B that the dominant frequencyof both modules is shifted at early stages of connectivity losscompared to changes in the power spectra. This is not surpris-ing since the ERD diagrams demonstrate only the significantdecrease in the power spectra. The dominant frequency in thethalamic module is shifted in response to corticoreticular con-nectivity loss. Figure 6A demonstrates an increase in the thalamicdominant frequency after the disinhibition whereas Figure 6Bdemonstrates a decrease in the thalamic dominant frequency afterthe compensation mechanism. However, Figure 14B shows thatthe compensation mechanism preserves the power content.
In a recent modeling study we find that the homogeneousincrease in the strength of the remaining synapses changes thedistribution of firing rates across excitatory neurons (Abuhassanet al., 2013). It stimulates silent excitatory neurons (0 Hz) andincreases the fractions of low activity excitatory neurons (1–3 Hz)and active excitatory neurons (4–10 Hz).
Considered as a limitation of the models, the results havenot replicated the observed power increase in slow frequencybands in EEG studies on AD patients (represented by ERS).This observation can be associated with the reduced anatom-ical details of the model. Moreover, the spectral analysis ofthe model has shown a narrow peak with alpha band power.This means that the model oscillates mainly in alpha fre-quency band. A recent study proposes a thalamocortical networkmodel oscillating only in alpha frequency band (Bhattacharyaet al., 2011). The model has been mainly utilized to investigatethe changes within alpha frequency band in AD (Bhattacharyaet al., 2011). Power increase in slow frequency bands hasnot been shown by the model (Bhattacharya et al., 2011).However, the model has replicated the power increase in loweralpha band (8–10 Hz) as observed in EEG studies in AD,
referred to as alpha slowing (Bhattacharya et al., 2011). Notably,(Bhattacharya et al., 2011) demonstrated that alpha band powerdecrease is better correlated with EEG studies in AD than alphaslowing.
As mentioned earlier, another limitation is in the model’sanatomy; its cortical network lacks the columnar structure, thecortical shape and coordinates and cortical layers. The thalamicregion in the human brain is divided into a number of nucleidepending on their association with other cortical areas. Despitethis limitation, the developed model can oscillate within alphafrequency band. It is a future goal to extend the current frame-work so that it captures such realistic details. Then, a detailedquantitative comparison with experimental data for AD and MCIconditions can be carried out.
CONCLUSIONThis paper introduces a large-scale thalamocortical networkmodel which oscillates within the alpha frequency band asrecorded in the wakeful relaxed state with closed eyes. Themodel consists of different types of cortical excitatory andinhibitory neurons recurrently connected to thalamic and retic-ular thalamic neurons with the ratios and distances found in themammalian thalamocortical system. Synaptic dynamics includeAMPA, GABA, NMDA, and GJ kinetics, short-term plasticityand a distribution of axonal conduction delays. The results haveshown that the dynamics of the network are significantly influ-enced by corticocortical synaptic loss. The thalamic activity isdriven by the cortical module. However, RTN inhibitory effer-ent to the TCR neurons is another key regulator. Includingthe compensation mechanisms in the study assists in explor-ing the role of more complicated changes rather than the roleof a single factor or parameter. In summary, this work pro-vides two novel findings: (1) it speculates that thalamic atrophyis a secondary pathology to cortical shrinkage since thala-mic oscillations are sharply disrupted after corticocortical and
Frontiers in Computational Neuroscience www.frontiersin.org June 2014 | Volume 8 | Article 65 | 14
Abuhassan et al. Compensating for thalamocortical synaptic loss
FIGURE 12 | Responses of the thalamic network to corticothalamic disconnection. (A) Before synaptic scaling and (B) after applying synaptic scaling.
FIGURE 13 | The effect of corticoreticular connectivity loss on the cortical network.
Frontiers in Computational Neuroscience www.frontiersin.org June 2014 | Volume 8 | Article 65 | 15
Abuhassan et al. Compensating for thalamocortical synaptic loss
FIGURE 14 | The effect of corticoreticular connectivity loss on the thalamic network. (A) Thalamic oscillatory activity before synaptic scaling and (B) afterapplying compensation mechanism (significant changes have not been observed after synaptic compensation).
corticothalamic denervations and (2) RTN inhibition to TCRneurons plays a key role in regulating thalamic oscillations; dis-inhibition disrupts thalamic oscillatory activity even though TCRneurons are more depolarized after being released from RTNinhibition.
AUTHOR CONTRIBUTIONSConceived and designed the experiments: Kamal Abuhassan,Damien Coyle, and Liam Maguire. Performed the exper-iments: Kamal Abuhassan. Analyzed the data: KamalAbuhassan, Damien Coyle, and Liam Maguire. Contributedreagents/materials/analysis tools: Kamal Abuhassan, DamienCoyle, and Liam Maguire. Wrote the paper: Kamal Abuhassan,Damien Coyle, and Liam Maguire.
ACKNOWLEDGMENTThis work is supported by the Northern Ireland Department forEducation and Learning under the Strengthening the All IslandResearch Base programme.
REFERENCESAbuhassan, K., Coyle, D., Belatreche, A., and Maguire, L. (2013). Compensating
for synaptic loss in Alzheimer’s disease. J. Comput. Neurosci. 36, 19–37. doi:10.1007/s10827-013-0462-8
Abuhassan, K., Coyle, D., and Maguire, L. P. (2012). Investigating the neuralcorrelates of pathological cortical networks in Alzheimer’s disease using het-erogeneous neuronal models. IEEE Trans. Biomed. Eng. 59, 890–896. doi:10.1109/TBME.2011.2181843
Agmon, A., and Connors, B. W. (1992). Correlation between intrinsic firing pat-terns and thalamocortical synaptic responses of neurons in mouse barrel cortex.J. Neurosci. 12, 319–329.
Bazhenov, M., Timofeev, I., Steriade, M., and Sejnowski, T. (2002). Model of tha-lamocortical slow-wave sleep oscillations and transitions to activated states.J. Neurosci. 22, 8691–8704.
Benarroch, E. E. (2012). GABAB receptors: structure, functions, and clin-ical implications. Neurology 78, 578–584. doi: 10.1212/WNL.0b013e318247cd03
Bhattacharya, B. S., Coyle, D., and Maguire, L. (2011). A thalamo-cortico-thalamicneural mass model to study alpha rhythms in Alzheimer’s disease. Neural Netw.24, 631–645. doi: 10.1016/j.neunet.2011.02.009
Bhattacharya, B. S., Coyle, D., and Maguire, L. (2012). Assessing alpha band event-related synchronisation/desynchronisation using a bio-inspired computationalmodel. J. Universal Comput. Sci. 18, 1888–1904. doi: 10.3217/jucs-018-13-1888
Frontiers in Computational Neuroscience www.frontiersin.org June 2014 | Volume 8 | Article 65 | 16
Abuhassan et al. Compensating for thalamocortical synaptic loss
Binzegger, T., Douglas, R. J., and Martin, K. A. C. (2004). A quantitative mapof the circuit of cat primary visual cortex. J. Neurosci. 24, 8441–8453. doi:10.1523/JNEUROSCI.1400-04.2004
Braitenberg, V., and Schüz, A. (1998). Cortex: Statistics and Geometry of NeuronalConnectivity. Berlin: Springer. doi: 10.1007/978-3-662-03733-1
Castro-Alamancos, M. A., and Calcagnotto, M. E. (1999). Presynaptic long-termpotentiation in corticothalamic synapses. J. Neurosci. 19, 9090–9097.
Cho, H., Seo, S. W., Kim, J.-H., Kim, C., Ye, B. S., Kim, G. H., et al. (2013).Changes in subcortical structures in early- versus late-onset Alzheimer’s dis-ease. Neurobiol. Aging 34, 1740–1747. doi: 10.1016/j.neurobiolaging.2013.01.001
Contreras, D., Destexhe, A., Sejnowski, T. J., and Steriade, M. (1996). Control ofspatiotemporal coherence of a thalamic oscillation by corticothalamic feedback.Science (New York, NY) 274, 771–774. doi: 10.1126/science.274.5288.771
Coyle, D., Prasad, G., and McGinnity, T. M. (2005). A time-frequency approach tofeature extraction for a brain-computer interface with a comparative analysis ofperformance measures. EURASIP J. Adv. Signal Process. 2005, 3141–3151. doi:10.1155/ASP.2005.3141
De Jong, L. W., Van der Hiele, K., Veer, I. M., Houwing, J. J., Westendorp, R. G. J.,Bollen, E. L. E. M., et al. (2008). Strongly reduced volumes of putamen and tha-lamus in Alzheimer’s disease: an MRI study. Brain 131, 3277–3285. doi: 10.1093/brain/awn278
Destexhe, A. (2000). Modelling corticothalamic feedback and the gating of the tha-lamus by the cerebral cortex. J. Physiol. Paris 94, 391–410. doi: 10.1016/S0928-4257(00)01093-7
Durka, P. J., Zygierewicz, J., Klekowicz, H., Ginter, J., and Blinowska, K. J.(2004a). ERD/ERS Software Tool. Available online at: http://eeg.pl/Members/durka/dataset.2008-02-12.5871220409
Durka, P. J., Zygierewicz, J., Klekowicz, H., Ginter, J., and Blinowska, K. J. (2004b).On the statistical significance of event-related EEG desynchronization andsynchronization in the time-frequency plane. IEEE Trans. Biomed. Eng. 51,1167–1175. doi: 10.1109/TBME.2004.827341
Fröhlich, F., Bazhenov, M., and Sejnowski, T. J. (2008). Pathological effect ofhomeostatic synaptic scaling on network dynamics in diseases of the cortex.J. Neurosci. 28, 1709–1720. doi: 10.1523/JNEUROSCI.4263-07.2008
Gentet, L. J., and Ulrich, D. (2004). Electrophysiological characterization ofsynaptic connections between layer VI cortical cells and neurons of thenucleus reticularis thalami in juvenile rats. Eur. J. Neurosci. 19, 625–633. doi:10.1111/j.1460-9568.2004.03168.x
Gupta, A. (2000). Organizing principles for a diversity of GABAergic interneu-rons and synapses in the neocortex. Science 287, 273–278. doi: 10.1126/sci-ence.287.5451.273
Herman, P., Prasad, G., McGinnity, T. M., and Coyle, D. (2008). Comparativeanalysis of spectral approaches to feature extraction for EEG-based motorimagery classification. IEEE Trans. Neural Syst. Rehabil. Eng. 16, 317–326. doi:10.1109/TNSRE.2008.926694
Holtmaat, A., and Svoboda, K. (2009). Experience-dependent structural synap-tic plasticity in the mammalian brain. Nat. Rev. Neurosci. 10, 647–658. doi:10.1038/nrn2699
Hughes, S. W., and Crunelli, V. (2005). Thalamic mechanisms of EEG alpharhythms and their pathological implications. Neuroscientist 11, 357–372. doi:10.1177/1073858405277450
Izhikevich, E. M. (2007). Dynamical systems in neuroscience: the geometry ofexcitability and bursting. Dyn. Syst. 25, 441.
Izhikevich, E. M., and Edelman, G. M. (2008). Large-scale model of mammalianthalamocortical systems. Proc. Natl. Acad. Sci. U.S.A. 105, 3593–3598. doi:10.1073/pnas.0712231105
Izhikevich, E. M., Gally, J. A., and Edelman, G. M. (2004). Spike-timing dynam-ics of neuronal groups. Cereb. Cortex 14, 933–944. doi: 10.1093/cercor/bhh053
Jelic, V. (2000). Quantitative electroencephalography in mild cognitive impairment:longitudinal changes and possible prediction of Alzheimer’s disease. Neurobiol.Aging. 21, 533–540. doi: 10.1016/S0197-4580(00)00153-6
Jelles, B., Scheltens, P., Van der Flier, W. M., Jonkman, E. J., Da Silva, F. H. L., andStam, C. J. (2008). Global dynamical analysis of the EEG in Alzheimer’s disease:frequency-specific changes of functional interactions. Clin. Neurophysiol. 119,837–841. doi: 10.1016/j.clinph.2007.12.002
Jeong, J. (2004). EEG dynamics in patients with Alzheimer’s disease. Clin.Neurophysiol. 115, 1490–1505. doi: 10.1016/j.clinph.2004.01.001
Jin, K., Peel, A. L., Mao, X. O., Xie, L., Cottrell, B. A., Henshall, D. C., et al. (2004).Increased hippocampal neurogenesis in Alzheimer’s disease. Proc. Natl. Acad.Sci. U.S.A. 101, 343–347. doi: 10.1073/pnas.2634794100
Johnson, M. D., and Ojemann, G. A. (2000). The role of the human thalamus inlanguage and memory: evidence from electrophysiological studies. Brain Cogn.42, 218–230. doi: 10.1006/brcg.1999.1101
Jones, E. G. (1985). The Thalamus. 1st Edn. New York, NY: Plenum Press. doi:10.1007/978-1-4615-1749-8
Jones, E. G. (2002). Thalamic circuitry and thalamocortical synchrony. Philos.Trans. R. Soc. Lond. B. Biol. Sci. 357, 1659–1673. doi: 10.1098/rstb.2002.1168
Kirkcaldie, M. (2012). “Neocortex,” in The Mouse Nervous System, eds C. Watson,G. Paxinos, and L. Puelles (London: Academic Press), 52–94. doi: 10.1016/B978-0-12-369497-3.10004-4
Koenig, T., Prichep, L., Dierks, T., Hubl, D., Wahlund, L. O., John, E.R., et al. (2005). Decreased EEG synchronization in Alzheimer’s dis-ease and mild cognitive impairment. Neurobiol. Aging 26, 165–171. doi:10.1016/j.neurobiolaging.2004.03.008
Landisman, C. E., Long, M. A., Beierlein, M., Deans, M. R., Paul, D. L., andConnors, B. W. (2002). Electrical synapses in the thalamic reticular nucleus.J. Neurosci. 22, 1002–1009.
Leuba, G., Savioz, A., Vernay, A., Carnal, B., Kraftsik, R., Tardif, E., et al.(2008). Differential changes in synaptic proteins in the Alzheimer frontal cor-tex with marked increase in PSD-95 postsynaptic protein. J. Alzheimers Dis. 15,139–151.
Li, X., Coyle, D., Maguire, L., Watson, D. R., and McGinnity, T. M. (2011). Graymatter concentration and effective connectivity changes in Alzheimer’s dis-ease: a longitudinal structural MRI study. Neuroradiology 53, 733–748. doi:10.1007/s00234-010-0795-1
Manshanden, I., De Munck, J. C., Simon, N. R., and Lopes da Silva, F. H. (2002).Source localization of MEG sleep spindles and the relation to sources ofalpha band rhythms. Clin. Neurophysiol. 113, 1937–1947. doi: 10.1016/S1388-2457(02)00304-8
Markram, H., Wang, Y., and Tsodyks, M. (1998). Differential signaling via thesame axon of neocortical pyramidal neurons. Proc. Natl. Acad. Sci. U.S.A. 95,5323–5328. doi: 10.1073/pnas.95.9.5323
Mayer, J., Schuster, H. G., Claussen, J. C., and Mölle, M. (2007). Corticothalamicprojections control synchronization in locally coupled bistable thalamic oscilla-tors. Phys. Rev. Lett. 99, 068102. doi: 10.1103/PhysRevLett.99.068102
Moretti, D. V., Babiloni, C., Binetti, G., Cassetta, E., Dal Forno, G., Ferreric,F., et al. (2004). Individual analysis of EEG frequency and band power inmild Alzheimer’s disease. Clin. Neurophysiol. 115, 299–308. doi: 10.1016/S1388-2457(03)00345-6
Nuwer, M. R., Comi, G., Emerson, R., Fuglsang-Frederiksen, A., Guérit, J. M.,Hinrichs, H., et al. (1999). IFCN standards for digital recording of clinical EEG.International Federation of Clinical Neurophysiology. Electroencephalogr. Clin.Neurophysiol. 52, 11–14.
O’Dwyer, L., Lamberton, F., Matura, S., Tanner, C., Scheibe, M., Miller, J., et al.(2012). Reduced hippocampal volume in healthy young ApoE4 carriers: an MRIstudy. PLoS ONE 7:e48895. doi: 10.1371/journal.pone.0048895.
Park, Y.-M., Che, H.-J., Im, C.-H., Jung, H.-T., Bae, S.-M., and Lee, S.-H. (2008). Decreased EEG synchronization and its correlation with symp-tom severity in Alzheimer’s disease. Neurosci. Res. 62, 112–117. doi:10.1016/j.neures.2008.06.009
Paz, J. T., Christian, C. A., Parada, I., Prince, D. A., and Huguenard, J. R.(2010). Focal cortical infarcts alter intrinsic excitability and synaptic exci-tation in the reticular thalamic nucleus. J. Neurosci. 30, 5465–5479. doi:10.1523/JNEUROSCI.5083-09.2010
Pedro, T., Weiler, M., Yasuda, C. L., D’Abreu, A., Damasceno, B. P., Cendes, F., et al.(2012). Volumetric brain changes in thalamus, corpus callosum and medialtemporal structures: mild Alzheimer’s disease compared with amnestic mildcognitive impairment. Dement. Geriatr. Cogn. Disord. 34, 149–155. doi: 10.1159/000342118
Pfurtscheller, G., and Aranibar, A. (1977). Event-related cortical desyn-chronization detected by power measurements of scalp EEG.Electroencephalogr. Clin. Neurophysiol. 42, 817–826. doi: 10.1016/0013-4694(77)90235-8
Pfurtscheller, G., and Lopes da Silva, F. H. (1999). Event-related EEG/MEG syn-chronization and desynchronization: basic principles. Clin. Neurophysiol. 110,1842–1857. doi: 10.1016/S1388-2457(99)00141-8
Frontiers in Computational Neuroscience www.frontiersin.org June 2014 | Volume 8 | Article 65 | 17
Abuhassan et al. Compensating for thalamocortical synaptic loss
Pons, A. J., Cantero, J. L., Atienza, M., and Garcia-Ojalvo, J. (2010). Relating struc-tural and functional anomalous connectivity in the aging brain via neural massmodeling. Neuroimage 52, 848–861. doi: 10.1016/j.neuroimage.2009.12.105
Prasad, G., Herman, P., Coyle, D., McDonough, S., and Crosbie, J. (2010). Applyinga brain-computer interface to support motor imagery practice in people withstroke for upper limb recovery: a feasibility study. J. Neuroeng. Rehabil. 7, 60.doi: 10.1186/1743-0003-7-60
Qi, Z., Wu, X., Wang, Z., Zhang, N., Dong, H., Yao, L., et al. (2010). Impairmentand compensation coexist in amnestic MCI default mode network. Neuroimage50, 48–55. doi: 10.1016/j.neuroimage.2009.12.025
Ryan, N. S., Keihaninejad, S., Shakespeare, T. J., Lehmann, M., Crutch, S. J., Malone,I. B., et al. (2013). Magnetic resonance imaging evidence for presymptomaticchange in thalamus and caudate in familial Alzheimer’s disease. Brain 136,1399–1414. doi: 10.1093/brain/awt065
Savioz, A., Leuba, G., Vallet, P. G., and Walzer, C. (2009). Contribution of neuralnetworks to Alzheimer disease’s progression. Brain Res. Bull. 80, 309–314. doi:10.1016/j.brainresbull.2009.06.006
Scheff, S. W. (2003). Reactive synaptogenesis in aging and Alzheimer’s disease:lessons learned in the Cotman laboratory. Neurochem. Res. 28, 1625–1630. doi:10.1023/A:1026048619220
Scheff, S. W., and Price, D. A. (1993). Synapse loss in the temporal lobe inAlzheimer’s disease. Ann. Neurol. 33, 190–199. doi: 10.1002/ana.410330209
Sherman, S. M. (2001). A wake-up call from the thalamus. Nat. Neurosci. 4,344–346. doi: 10.1038/85973
Small, D. H. (2004). Mechanisms of synaptic homeostasis in Alzheimer’s disease.Curr. Alzheimer Res. 1, 27–32. doi: 10.2174/1567205043480573
Sohal, V. S., Huntsman, M. M., and Huguenard, J. R. (2000). Reciprocal inhibitoryconnections regulate the spatiotemporal properties of intrathalamic oscilla-tions. J. Neurosci. 20, 1735–1745.
Stellwagen, D., and Malenka, R. C. (2006). Synaptic scaling mediated by glial TNF-alpha. Nature 440, 1054–1059. doi: 10.1038/nature04671
Steriade, M. (2005). Sleep, epilepsy and thalamic reticular inhibitory neurons.Trends Neurosci. 28, 317–324. doi: 10.1016/j.tins.2005.03.007
Steriade, M., Jones, E. G., and Llinás, R. R. (1990). Thalamic oscillations andsignaling. New York, NY, US: Wiley.
Steriade, M., Nuñez, A., and Amzica, F. (1993). Intracellular analysis of relationsbetween the slow (< 1 Hz) neocortical oscillation and other sleep rhythms ofthe electroencephalogram. J. Neurosci. 13, 3266–3283.
Supekar, K., Menon, V., Rubin, D., Musen, M., and Greicius, M. D. (2008). Networkanalysis of intrinsic functional brain connectivity in Alzheimer’s disease. PLoSComput. Biol. 4:e1000100. doi: 10.1371/journal.pcbi.1000100
Swadlow, H. A. (1994). Efferent neurons and suspected interneurons in motorcortex of the awake rabbit: axonal properties, sensory receptive fields, andsubthreshold synaptic inputs. J. Neurophysiol. 71, 437–453.
Timofeev, I., and Steriade, M. (1996). Low-frequency rhythms in the thalamus ofintact-cortex and decorticated cats. J. Neurophysiol. 76, 4152–4168.
Traub, R. D., Contreras, D., Cunningham, M. O., Murray, H., LeBeau, F.E. N., Roopun, A., et al. (2005). Single-column thalamocortical networkmodel exhibiting gamma oscillations, sleep spindles, and epileptogenic bursts.J. Neurophysiol. 93, 2194–2232. doi: 10.1152/jn.00983.2004
Turrigiano, G. (2011). Too many cooks? Intrinsic and synaptic homeostatic mech-anisms in cortical circuit refinement. Annu. Rev. Neurosci. 34, 89–103. doi:10.1146/annurev-neuro-060909-153238
Turrigiano, G. (2012). Homeostatic synaptic plasticity: local and global mech-anisms for stabilizing neuronal function. Cold Spring Harb. Perspect. Biol.4:a005736. doi: 10.1101/cshperspect.a005736
Uylings, H. B. M., and De Brabander, J. M. (2002). Neuronal changes in nor-mal human aging and Alzheimer’s disease. Brain Cogn. 49, 268–276. doi:10.1006/brcg.2001.1500
Van der Werf, Y. D., Scheltens, P., Lindeboom, J., Witter, M. P., Uylings, H.B. M., and Jolles, J. (2003). Deficits of memory, executive functioning andattention following infarction in the thalamus; a study of 22 cases withlocalised lesions. Neuropsychologia 41, 1330–1344. doi: 10.1016/S0028-3932(03)00059-9
Wang, Z., Jia, X., Liang, P., Qi, Z., Yang, Y., Zhou, W., et al. (2012). Changes inthalamus connectivity in mild cognitive impairment: evidence from resting statefMRI. Eur. J. Radiol. 81, 277–285. doi: 10.1016/j.ejrad.2010.12.044
Waxman, S. G., and Bennett, M., V (1972). Relative conduction velocities of smallmyelinated and non-myelinated fibres in the central nervous system. Nat. NewBiol. 238, 217–219. doi: 10.1038/newbio238217a0
Woolfolk, A. (2011). Educational Psychology. 11th Edn. Columbus, OH:Pearson/Allyn & Bacon.
Yazawa, S., Kawasaki, S., Kanemaru, A., Kuratsuwa, Y., Yabuoshi, R., and Ohi, T.(2001). Bilateral paramedian thalamo-midbrain infarction showing electroen-cephalographic alpha activity. Intern. Med. 40, 443–448. doi: 10.2169/inter-nalmedicine.40.443
Zarei, M., Patenaude, B., Damoiseaux, J., Morgese, C., Smith, S., Matthews, P.M., et al. (2010). Combining shape and connectivity analysis: an MRI studyof thalamic degeneration in Alzheimer’s disease. Neuroimage 49, 1–8. doi:10.1016/j.neuroimage.2009.09.001
Zhang, S. J., Huguenard, J. R., and Prince, D. A. (1997). GABAA receptor-mediatedCl- currents in rat thalamic reticular and relay neurons. J. Neurophysiol. 78,2280–2286.
Zhao, X., Liu, Y., Wang, X., Liu, B., Xi, Q., Guo, Q., et al. (2012).Disrupted small-world brain networks in moderate Alzheimer’s disease: aresting-state FMRI study. PLoS ONE 7:e33540. doi: 10.1371/journal.pone.0033540
Zikopoulos, B., and Barbas, H. (2006). Prefrontal projections to the thalamicreticular nucleus form a unique circuit for attentional mechanisms. J. Neurosci.26, 7348–7361. doi: 10.1523/JNEUROSCI.5511-05.2006
Conflict of Interest Statement: The authors declare that the research was con-ducted in the absence of any commercial or financial relationships that could beconstrued as a potential conflict of interest.
Received: 23 August 2013; accepted: 26 May 2014; published online: 17 June 2014.Citation: Abuhassan K, Coyle D and Maguire L (2014) Compensating for thalamocor-tical synaptic loss in Alzheimer’s disease. Front. Comput. Neurosci. 8:65. doi: 10.3389/fncom.2014.00065This article was submitted to the journal Frontiers in Computational Neuroscience.Copyright © 2014 Abuhassan, Coyle and Maguire. This is an open-access articledistributed under the terms of the Creative Commons Attribution License (CC BY).The use, distribution or reproduction in other forums is permitted, provided theoriginal author(s) or licensor are credited and that the original publication in thisjournal is cited, in accordance with accepted academic practice. No use, distribution orreproduction is permitted which does not comply with these terms.
Frontiers in Computational Neuroscience www.frontiersin.org June 2014 | Volume 8 | Article 65 | 18


