Embed Size (px)
Citation preview

J O U R N A L O F P R O T E O M I C S 1 2 3 ( 2 0 1 5 ) 1 1 4 – 1 2 7
Ava i l ab l e on l i ne a t www.sc i enced i r ec t . com
ScienceDirect
www.e l sev i e r . com/ loca te / j p ro t
Complementing DIGE proteomics and DNA subarray
analyses to shed light on Oenococcus oeni adaptationto ethanol in wine-simulated conditionsAntonella Costantinia,b,c, Kalliopi Rantsioub, Avishek Majumderc, Susanne Jacobsena,1,Enrica Pessioned, Birte Svenssonc, Emilia Garcia-Morunoa, Luca Cocolinb,⁎aConsiglio per la ricerca e la sperimentazione in agricoltura, Centro di ricerca per l'enologia, Via P. Micca 35, 14100 Asti, ItalybUniversità di Torino, Department of Agricultural, Forest and Food Sciences, Largo Paolo Braccini 2, Grugliasco, 10095 Torino, ItalycEnzyme and Protein Chemistry, Department of Systems Biology, Technical University of Denmark, Søltofts Plads, Building 224, DK-2800 Kgs.Lyngby, DenmarkdUniversità di Torino, Department of Life Sciences and Systems Biology, Via Accademia Albertina 13, 10123 Torino, Italy
A R T I C L E I N F O
⁎ Corresponding author. Tel.: +39 011 670 855E-mail address: lucasimone.cocolin@unit
1 Deceased May 27, 2014. This paper is ded
http://dx.doi.org/10.1016/j.jprot.2015.04.0191874-3919/© 2015 Elsevier B.V. All rights rese
A B S T R A C T
Article history:Received 20 January 2015Accepted 9 April 2015Available online 25 April 2015
Direct addition of Oenococcus oeni starters into wine can cause viability problems. In the presentstudy, the influence of ethanol in wine-simulated conditions on O. oeni has been evaluated bycomplementing microarray techniques and DIGE proteomics. Two different ethanol concen-trations were studied. In 12% ethanol, pyrimidine anabolismwas stimulated, but in 8% ethanolsome energy-consuming biosynthetic pathways were limited. The most significant result wasthe stress response induced by alcohol that concerned both the cell-envelope andspecific stressproteins. Interestingly, 8% and 12% ethanol triggered different stress responses: inmild ethanolstress (8%), chaperones with prevalent refolding activity (like HSP20) were over-expressed,whereas at higher alcohol concentration (12%), together with HSP20 and the refolding DNAJ/K,also chaperones having proteolytic activity (like ClpP) were induced. Furthermore the stressresponse repressor HrcA was downregulated only at 12% ethanol, suggesting that it controlsstress pathways, which are different from those active at 8% alcohol. This result confirms thatthe HrcA system is operative in O. oeni where the CtrS system is prevalent.
Biological significanceThe use of malolactic starter cultures has become widespread to control the MLF processand to prevent off-flavors. There is significant interest in understanding the molecularmechanisms that O. oeni uses to adapt to harsh wine conditions. The overall resultshighlight that the alcohol-induced stress response involves not only biosynthesis of stressproteins but also envelope-linked mechanisms. From a practical point of view this researchunderlines the importance of starters acclimation to induce responses that would allowbetter adaptation to the wine. As a consequence, a well adapted starter can completemalolactic fermentation and improve the final wine quality.
© 2015 Elsevier B.V. All rights reserved.
Keywords:O. oeniStress responseCell envelopeEnergy metabolismEPSChaperones
3; fax: +39 011 670 8549.o.it (L. Cocolin).icated to her memory.
rved.

115J O U R N A L O F P R O T E O M I C S 1 2 3 ( 2 0 1 5 ) 1 1 4 – 1 2 7
1. Introduction
The most important role of Oenococcus oeni in winemakinginvolves flavor development and de-acidification through thedecarboxylation of malate to lactate with the production ofcarbon dioxide, the so-called malolactic fermentation (MLF) [1].BesidesMLF,O. oeni possesses genes for citratemetabolism, oneof the pathways associated with the wine sensory profile.Therefore, the use of this species in oenology represents anadded value for the quality of a wine. Winery practices arefacilitated by commercial freeze-dried starter cultures of O. oeniavailable for direct inoculation into wines [2].
O. oeni is the lactic acid bacterium best adapted to survive inthe harsh wine environment characterized by the presence ofethanol, low pH, nutritional limitation and the presence ofsulfites [3,4]. However, direct inoculation of O. oeni starters intowine leads to significant cell mortality and, consequently,failure of MLF. Alcohol stress is for sure the biggest challenge.To improve survival, adaptation of O. oeni cells to the wineenvironment before inoculum has been proposed [5]. However,it is important to understand themechanisms involved inO. oenistress response and alcohol tolerance. It should also beconsidered that a starter can have a different behavior ascompared to a spontaneous/autochthonous malolactic strains,because it undergoes industrial processes, among which lyoph-ilization, which are stressing “per se”. The role of adaptation todifferent wine stressors has been discussed in several works.Guzzo et al. [6] demonstrated that pre-incubating O. oeni cells inthe presence of a sub-lethal concentration of sulfite (15 mg/L)enhanced tolerance to a highly inhibitory sulfite concentration,suggesting the involvement of adaptation mechanisms.Beltramo et al. [7] demonstrated that to increase survival andgrowth of O. oeni in wine, cells had to be adapted by growingthem in wine-like medium at low pH (3.5) before inoculationintowine. Conversely, theydidnot observe anyeffect in termsofbetter survival in wine by adapting the cells in 10% ethanol.
Several genes involved in stress tolerance of O. oeni havebeen identified [7,8]. However, the link between a behaviorobserved under particular conditions and the genetic back-ground of O. oeni is essential to disclose the molecularregulatory mechanisms in order to pave the way to newpractical applications [9].
Functional analysis of gene expression using comparativetranscriptomics and proteomics may provide insight into stressresponses and regulation mechanisms in lactic acid bacteria(LAB). This approach is useful also to study the behavior ofbacteria in a real food system. As far as transcriptomics isconcerned, the microarray technique has proven to be awell-established method. In O. oeni the only application ofmicroarrays has been by Borneman et al. [10] who studiedthe genomic content of ten strains in order to understandthe basis of phenotypic differences among them. For whatconcerns proteomics, several approaches are possible. The two-dimensional (2D)-DIGE technique was first described in 1997[11]. It relies on a pre-electrophoretic labeling, allowingmultiplexing of samples into the same gel. This technique wasapplied in the study of acidic stress response of Lactobacillusrhamnosus GG [12], of the exoproteome of trehalose-adaptedLactococcus lactis [13], and recently of the production by Penicilliumexpansum of geosmin, an earth-smelling sesquiterpine that
spoils wine [14], but as far as we know, it has never been appliedto O. oeni.
Silveira et al. [5] used 2D gel electrophoresis (without theDIGE application) and showed that both ethanol stress andadaptation changed the protein profiles of O. oeni cells, inparticular that of membrane associated proteins. Cecconi et al.[15] observed that the different physiological behavior betweenacclimated and non-acclimated O. oeni cells was mainlyascribable to differential modulation of specific proteins in-volved in stress response, and in sugar and amino acidmetabolism. Very recently [16] a partial proteome referencemap of O. oeni has been produced, which underlined theimportance of malate and citrate metabolism in this species.
Since commercialized LAB starters for MLF differ in theirphenotypic traits and especially in the time required to adaptthem to wine conditions, and the new type of starters are forthe direct inoculation (MBR®) in wine [17], we sought toinvestigate if an adaptation phase and, in particular, thecomposition of the adaptation medium can influence theO. oeni starter behaviour. To this purpose a rich medium wascompared to wine-like media having different ethanol con-tent (8% and 12% respectively). In the first part of the study wedeveloped a subgenomic-array, which takes into account themain genes involved in different metabolic pathways ofinterest for growth and MLF under wine conditions. In thesecond part of the work, we applied the differential gelelectrophoresis (DIGE) technique, which allowed a moreaccurate and sensitive quantitative proteomic analysis. Toour knowledge, a part from some data concerning spoilagefungi, this is the first application of DIGE in the area of stressinvestigation in enology. The experimental approach used, bycomplementing transcriptomic and proteomic data, aimed atdescribing the physiological behavior of O. oeni when adaptedto different media prior to inoculation in wine.
2. Materials and methods
2.1. Bacterial strain and growth conditions.
Acommercial starter ofO. oeniwas used in this study (Elios,MBRprocess, Lallemand, Verona, Italy). Samples of 0.5 g of lyophi-lized culture were rehydrated in 50 ml of three different media:MRS (indicated as M) (DeMan Rogosa and Sharpe, Biogenetics,Milan, Italy) supplemented with 3 g/L malic acid; a wine-likemedium composed of glucose 2 g/L, yeast extract 0.5 g/L,peptone 1 g/L, potassium phosphate 0.2 g/L, sodium acetate0.5 g/L, ammonium citrate 0.2 g/L, magnesium sulfate 0.02 g/L,manganese sulfate 0.005 g/L, Tween-80 0.1 g/L, 20% apple juice(containing about 5 g/L fructose), 3 g/L malic acid and supple-mented with 8% ethanol (indicated as et.8%); and the samewine-like medium supplemented with 12% ethanol (indicatedas et.12%). All the media used were buffered to reach pH 3.5.Samples were mixed for a few seconds, incubated at 25 °C for20 min and then inoculated into 150 ml of the same medium.Cultureswere kept for 1 day at 25 °C to acclimate the cells. Afterthis acclimation period, samples were taken and used for theexpression and protein profile analyses. Three and fourbiological replicates were analyzed for microarray and proteo-mic studies, respectively.

116 J O U R N A L O F P R O T E O M I C S 1 2 3 ( 2 0 1 5 ) 1 1 4 – 1 2 7
2.2. Microarray
2.2.1. Probes and design of subgenomic-arrayThe first step ofmicroarray fabrication required the selection ofprobes to be used. The genes of interest were chosen in order tohave representative enzymes of the main metabolisms. To thispurpose, O. oeni pathways and gene function found on KEGG(Kyoto Encyclopedia of Genes and Genomes; http://www.genome.ad.jp/kegg) [18] were analyzed and gene sequenceswere retrieved from GenBank. Probes, 35 nucleotide long, weredesigned by using Array designer software (Premier Biosoft,http://www.premierbiosoft.com) and Primer3 [19], and theyare deposited on NCBI with the accession numbers fromPr031952747 to Pr031952891. BLAST analysis was automaticallyperformed by the software Array Designer. Moreover everyobtained probe was further analyzed by BLAST against thegenome draft of AWRI553 [20].
The microarray format used in this study was based onstandardmicroscopic glass slides. Probeswere spotted onto theactivated slide surface by Centro di Ricerca Interdipartimentaleper le Biotecnologie Innovative (CRIBI University of Padova,Italy). The chip was arranged in 16 blocks and genes wererepeated three times.
2.2.2. RNA extraction and cDNA synthesisRNAextractionwasperformedusing “MasterPureTM®CompleteDNA and RNA purification kit”, after 1 day of adaptation for allsamples. DNAse treatment was performed in all extractionsusing TURBO DNase (Ambion, Milan, Italy) at 37 °C for 3 h. Afterthe DNAse treatment, RNA was analyzed with Experion (Biorad,Milan, Italy)microcapillary automated electrophoresis system inorder to determine its quality, integrity and suitability formicroarrays analysis.
Reverse transcriptase reaction was performed using 2 μg ofRNA in a 25 μl mix containing reverse transcriptase M-MLV(Promega, Milan, Italy) according to themanufacturer's instruc-tions. cDNA synthesis and precipitation wasmade according toRantsiou et al. [21]; finally the cDNA pellet was air dried. Threebiological replicates were made.
2.2.3. Hybridization conditionsSlides were pre-treated in the following steps: one wash with0.1% Triton X100 for 5 min; KCl 100 mM for 10 min; one washfor 1 min with sterile water; 1 h with a blocking buffer (1× QIprocess Schott Nexterion® supplemented with 0.02% v/v HCl37%, Jena, Germany) using an oven PersonalHyb® (Stratagene,Milan, Italy) at 50 °C; one wash with sterile water. Lastly,slides were covered with SecureSeal™ hybridization chamber22 mm (Invitrogen, Milan, Italy).
For hybridization experiment it was necessary to find theoptimal conditions for the analysis. To this purpose twodifferent temperatures of hybridization were tested, 30 and50 °C. A greater number of probes hybridized at 30 °C (data notshown), therefore in the subsequent analysis the temperatureof 30 °C was used.
cDNA samples were resuspended in 350 μl of hybridizationbuffer composed of 1× SSC and SDS 0.1%, denatured at 95 °C for5 min and loaded in the hybridization chamber. Slides wereincubated overnight at 30 °C, using the Eppendorf Thermomixerat a constant velocity of 300 rpm.The detection of the slideswas
performed using the SilverQuant Detection Kit (Gentel Biosci-ence, Madison, USA), following themanufacturer's instructions.
2.2.4. Microarray data analysisAir-dried slides were scanned at a resolution of 10 μm with aSilverquant microarray scanner (Eppendorf, Milan, Italy); thescanned images were further analyzed with the softwareSilverquant microarray analysis (Eppendorf) in order to quan-tify the spots.
Background corrections, test for outliers, mean of genereplicates, normalization and data plotting were performedusing the “Micro Array Data Analyzer” MADA (www.mpi-bremen.de). Data obtained from this analysis were furtherprocessed with Genesis software [22]. Differentially expressedgenes were evaluated with ANOVA analysis using SPSS (SPSS15.0 for Windows 2004; SPSS, Chicago, IL, USA).
2.3. Proteomic
2.3.1. Protein sample preparationSamples, taken after 1 day of adaptation in the three differentmedia described, were pelleted and proteins were extracted.Cells were disrupted using a Bio 101 Savant FastPrep FP 120bead beater (Savant, Farmingdale, USA) in the presence ofphenol, Tris 10 mM pH 8.5 and acid washed glass beads(Sigma). The interphase was collected and proteins wereprecipitated with three volumes of ice cold 96% ethanol at−20 °C overnight. Proteins were resuspended in 500 μl ofrehydration buffer (Tris 10 mM, 7 M urea, 2 M thiourea, 3%CHAPS). Four biological replicates were analyzed.
Protein concentration was estimated using the 2-D Quantkit (GE Healthcare, Copenhagen, Denmark) following themanufacturer's instructions.
2.3.2. SDS-PAGEMonodimensional electrophoresis was performed onprecasted gel NuPAGE Novex 4-12% Bis–Tris Gel (Invitrogen,Copenhagen, Denmark). The molecular weight marker MARK12TM unstained standard (Invitrogen) was used. The run wasperformed using the XCell SureLock® Mini-Cell apparatus(Invitrogen). The gel was fixed and stained with ColloidalCoomassie Blue [23].
2.3.3. Sample preparation for DIGEProteins (50 μg) were labeled with 200 pmol of Cy2, Cy3 andCy5 CyDye DIGE Fluors for Ettan DIGE (GE Healthcare)according to the manufacturer's instructions. An internalstandard was prepared with a pool of the tested samplesrepresenting all the different biological replicates of all thestudied conditions.
2.3.4. 2D gel electrophoresisSamples labeled with the different dyes were mixed, andadded to the rehydration buffer (7 M Urea, 2 M thiourea, 3%CHAPS, Tris 10 mM pH 8.5, 10% glycerol, 5% isopropanol,100 mM DTT). Each strip for the first dimension contained amixture composed of 50 μg of internal standard labeled withCy2, 50 μg of the sample labeled with Cy3 and 50 μg of thesample labeled with Cy5. Isoelectrofocusing (IEF) was done byin-gel rehydration on IPG strips pH 4–7, 18 cm. The IEF was

117J O U R N A L O F P R O T E O M I C S 1 2 3 ( 2 0 1 5 ) 1 1 4 – 1 2 7
carried out in IPG-Phor (GE Healthcare) at 20 °C, 50 μA/stripuntil 60 kVh.
Gels (24 cm width) for the second dimension were castusing Gel caster for Ettan DALTsix system (GE Healthcare).After the first dimension, the IPG strips were placed in 5 mlequilibration buffer (6 M urea, 30% glycerol, 50 mM Tris–HCl,pH 8.8, 2% SDS, 0.01% bromophenol blue) supplemented with1% DTT for 15 min and then placed in the equilibration buffercontaining 2.5% iodoacetamide for 15 min. The strips werethereafter, placed on 12.5% SDS-PAGE gels and overlaid with0.5% agarose sealing solution. Electrophoresis was performedwith the Ettan DALTsix electrophoresis unit (GE Healthcare)with the following program: 2 W per gel for 1 h, then 12 W pergel until the bromophenol blue reached the bottom of the gel.
2.3.5. Image analysisDIGE gels were scanned using the Typhoon 9410 VariableMode Imager (GE Healthcare). Imaging of DIGE gels was doneimmediately after the second dimension at excitation/emission wavelengths of 488/520 nm (Cy2), 532/580 nm (Cy3)and 633/670 nm (Cy5), respectively.
After image acquisition, the gels were fixed in the fixingsolution (30% ethanol and 2% phosphoric acid) and stainedovernight by colloidal CBB as described by Candiano et al. [23].
Progenesis SameSpot (version 3.3, nonlinear DynamicsLtd., Newcastle upon Tyne, UK) was used for spot detection.DIGE gel images were then aligned by automated calculationof 20 manually assigned alignment landmark vectors. A1.5-fold threshold (spot volume ratio change) and ANOVA(p < 0.05) was chosen as criterion in the identification ofdifferentially abundant protein candidates.
The choice of the fold-change threshold used in thecurrent study was based on the statistical analysis and it isof significance. The 1.5-fold threshold value used was basedon the Power analysis, which has a recommended value of80%. Power analysis can be used to calculate the minimumsample size required to accept the outcome of a statistical testwith a particular level of confidence. The experimental setuphad enough statistical power with the four replicate gels.False discovery rate estimates the number of false positiveswithin statistically significant changes in the experiment. Thep value was set to <0.05 giving a false discovery rate of 5%.
2.3.6. Trypsin digestion and mass spectrometry analysisThe selected spots were excised from the gel and treated asdescribed by Majumder et al. [24]. One microliter of trypsindigested sample was loaded on the AnchorChip target andallowed to dry, then 1 μl of matrix α-cyano-hydroxycinnamicacid (CHCA 0.5 μg/μl in 90/10 ACN/TFA) was added to the driedsample and left to dry completely. Spots were washed with2 μl of 0.5% trifluoroacetic acid. β-lactoglobulin (5 pmol/ml)was used as standard. Mass spectrometry peptide fingerprintand MS/MS were performed with the Ultraflex II MALDI-TOFMS mass spectrometer (Bruker-Daltonics, Bremen, Germany)using Flex Control v3.0 (Bruker-Daltonics) and processed byFlex Analysis v3.0 (Bruker-Daltonics). The MS together withMS/MS spectra were searched against the NCBI nr (NBCInr20111105) database for bacteria using the MASCOT 2.0software integrated with BioTools v3.1 (Bruker-Daltonics).Peptide mass maps were acquired in re-flectron mode with
500 laser shots per spectrum. Spectra were calibrated exter-nally and internally using a tryptic digest of β-lactoglobulin(5 pmol/L) and porcine trypsin autolysis products, respective-ly. MS/MS data were acquired with stop conditions so that1000–1600 laser shots were accumulated for each spectrum.
Search parameters were monoisotopic peptide mass accu-racy of 80 ppm, fragment mass accuracy to ±0.7 Da; maxi-mum of one missed cleavage; carbamidomethylation ofcysteine and partial oxidation of methionine; Mascot cutoffscore was 40. Filtering of peaks was carried out for knownkeratin and autocatalytic trypsin peaks. The protein functionwas described using Microbial Genome Database (www.mbgd.genome.ad.jp).
3. Results and discussion
MLF is a desirable transformation in winemaking processesboth for reducing acidity and for adding flavors to wine.Inoculation with a commercial starter strains into wineincreases the control of MLF with respect to endogenousbacteria performing spontaneous MLF [2]. Although someauthors [25] disagree about the real contribution of addedstarter LAB, it is generally accepted that improvements in thequality and the performance of MLF are ascribed to exogenousstarter cultures [26–29]. However, the limit of using exogenousbacteria lies in their difficulty to adapt to the harsh wineconditions (low pH and, especially, very high alcohol content).In this context, acclimation procedures can improve adapta-tion. In this study, as shown by two different approaches(transcriptomics and proteomics), acclimation media stronglyinfluence gene expression and protein profiles in the malo-lactic bacterium O. oeni, through the involvement of adaptiveresponses that could lead to improved survival and MLF whenthe microorganism is inoculated into wine.
The developed subgenomic array was successfully appliedand the reliability of the technique was confirmed by thecomparison of the response of some genes studied in a previousinvestigation using reverse transcription quantitative PCR(RT-qPCR) [30]. For instance oeoe 1651 gene, coding for anABC-type sugar transporter, has been previously shown to betranscribed in thewine-likemedium (which contains a very lowsugar concentration) and not transcribed in MRS, and this wasconfirmed here with the subgenomic microarray approach.
Overall, several genes became up-regulated by wine-likemedium acclimation. In Fig. 1 the differentially expressedgenes after the adaptation phase are shown. These genescould be ascribed to nine classes referred in Table 1; the maindifferences in gene expression concerned the physiology ofcell wall and membrane, sugar, acid, nitrogen metabolismsand stress.
In order to check which genes were significantly differen-tially expressed, ANOVA analysis was performed on the dataafter normalization. The results obtained are shown in Fig. 2.It was observed that in the presence of ethanol (both 8% and12%) two genes encoding alcohol dehydrogenase (oeoe 0242and oeoe 0527) were less expressed. In et.8%, the glucosidasegene (oeoe 0040), genes involved in exopolysaccharide synthe-sis (oeoe 0071), glnQ (oeoe 1634) encoding a polar amino acidtransporter, lysylaminopeptidase (oeoe 1058), and hrcA were

Fig. 1 – Heatmap of changes in gene expression of O. oeni after 24 h of adaptation in ethanol 8% and ethanol 12%. Datapresented were obtained by normalization using the strain adapted in MRS (M) as reference condition: green color representsdown-regulated genes in comparison with normalizing condition; red color indicates up-regulated genes.
118 J O U R N A L O F P R O T E O M I C S 1 2 3 ( 2 0 1 5 ) 1 1 4 – 1 2 7
on the contrary more expressed. Finally in et.12% thetranscription was higher for genes related to glycan biosyn-thesis (oeoe 0144 and oeoe 1444), genes related to nitrogenmetabolism (oeoe 0258) and the gene oeoe 0455, which wasrelated to the signal recognition particle.
In the second part of the study, comparative proteomeanalysis was performed by DIGE. The pH region 4–7 waschosen since the pI values of most proteins from lactic acidbacteria lie in this pH range. Only statistically significantchanges (p value < 0.05) in spot intensities were considered(Suppl. Table 1).
Statistically significant differentially abundant proteinswere found comparing the samples adapted in MRS withthose adapted in et.8% (Fig. 3). The selected protein spots wereexcised from the gels and analyzed byMS andMS/MS, becauseMS data alone were not sufficient for the identification.Results are shown in Table 2A.
The comparative analysis of the gels derived from cellsgrown in MRS and with ethanol 12% respectively, revealedthat the differentially abundant proteins were the same asfound in the previous analyses of et.8%, with some differencesin the fold changes (Suppl. Fig. 1). Additional proteins werealso found to be differentially abundant. Thus as shown in
Table 2B, four proteins (not significantly induced in the 8%ethanol cultures), identified as clpL2 protein (spot 428), heatshock protein HSP20 (spot 994), 50S ribosomal protein L13(spot 905) and ATP-binding subunit of Clp protease and DnaK/DnaJ chaperones (spot 432) were found to be more abundantin samples adapted in et.12% (Fig. 4).
Taking into account the results obtained from the twodifferent analyses, it is possible to classify the differentiallyabundant genes/proteins into six main functional and meta-bolic families: 1) stress response, 2) surface modifications,3) MLF and citratemetabolism, 4) sugarmetabolism, 5) nitrogenmetabolism (amino acids, purines and pyrimidines), 6) diacetylbiosynthetic route.
The overall, most significant response of O. oeni in mediacontaining ethanol, was an increased transcription of stressrelated genes and an enhanced production of stress relatedproteins. In the literature data concerning O. oeni proteomics arescarce, nevertheless, all agree about the capability of this speciesto biosynthesize a variety of stress proteins [5,15]. Similarly,expression of genes encoding stress response proteins havebeen reported by several authors [31–34].
Interestingly, some stress proteins/genes (trxA, HSP20,ribosomal-associated HSP) were more induced in mild (et.8%)

Table 1 – Up- and down-regulated genes, grouped into functional categories, in media containing 8% (indicated as et.8%)and 12% ethanol (indicated as et.12%) tested with respect to medium MRS (M).
Functional group Gene Protein encoded Expressionin et.8%
Expressionin et.12%
Envelope oeoe1444 Peptidoglycal interpeptide bridge formation protein – ↑oeoe0144 N-acetylmuramoyl-L-alanine amidase – ↑oeoe0719 D-alanyl D-alanine carboxypeptidase ↑ ↑oeoe0040 Glucosidase ↑ –oeoe1779 Glycosidase – ↓oeoe0071 Exopolysaccharide biosynthesis protein ↑ ↑oeoe1737 UDP glucose 6-dehydrogenase ↑ –
Cell membrane oeoe0455 Signal recognition particle ↑ ↑oeoe0457 Signal recognition particle ↓ –oeoe1333 Signal peptidase ↓ –
Stress response trxA Thioredoxin ↑ ↓oeoe0289 Heat shock protein HSP20 ↑ ↓oeoe0184 Heat shock protein, ribosome associated ↑ ↓hrcA Heat inducible transcription repressor HrcA ↑ ↓clpP ATPase protein as HSP100 – ↑oeoe1191 Glutathione reductase ↑ ↑
Sugar metabolism oeoe1044 lacZ (galactosidase/glycosyl hydrolase) – ↑oeoe1651 ABC-type sugar transport system, ATPase ↑ ↑oeoe0249 Phosphomannose isomerase ↑ ↑oeoe0367 pgm (Phosphoglycerate mutase) – ↑oeoe1650 Enolase ↓ ↓oeoe0243 Aryl alcohol dehydrogenase ↑ ↑oeoe0527 Alcohol dehydrogenase ↓ ↓butA Acetoin dehydrogenase/reductase – ↓oeoe0135 Glucose-6 phosphate 1-dehydrogenase ↑ ↑oeoe0892 6-Phosphogluconate dehydrogenase ↑ ↑oeoe1480 Transketolase ↓ ↓oeoe1183 Putative phosphoketolase ↓ ↓
Nitrogen metabolism oeoe1634 glnQ polar amino acid transport ↑ –oeoe0952 Glutamine synthase ↑ ↓oeoe0630-oeoe0631 ABC-type spermidine/putrescine transport system ↓ ↓oeoe0632-oeoe0634 Spermidine-putrescine ABC transporter permease protein ↓ ↓oeoe0153 Shikimate kinase ↓ –oeoe1058 lysylaminopeptidase ↑ –oeoe1857 Aromatic compounds catabolism protein ↑ ↑purK Purine biosynthesis phosphoribosylaminoimidazole carboxylase – –oeoe0258 Aspartate carbamoyltransferase – ↑oeoe0766 Cystathione β-lyase ↑ ↓
MLF/citrate metabolism oeoe1565 MLF system transcription activator – ↑mleP Malate permease ↑ ↑mleR Malolactic regulator ↑ ↑mleA Malolactic enzyme gene ↑ ↑oeoe0419 Putative citrate transporter ↓ ↓oeoe0423 Citrate lyase, α-subunit ↓ –
Secondary metabolism oeoe0242 Short chain alcohol dehydrogenase ↓ ↓Energy metabolism oeoe1435 Phosphotransacetylase – ↑
oeoe1629 Polyphosphate kinase ↓ ↓oeoe0659 ATP synthase, subunit α ↑ ↑
Metals oeoe0623 Cobalt transport ↓ ↓oeoe1054 Metal ion transport ↑ –
Transcription/Translation/Protein synthesis/regulation
oeoe0005 DNA gyrase β subunit – –oeoe0673 DNA polymerase I ↑ –rpoB RNA polymerase β subunit ↑ –oeoe0976 Elongation factor – –oeoe0105 vicR DNA-binding response regulator ↑ ↑
119J O U R N A L O F P R O T E O M I C S 1 2 3 ( 2 0 1 5 ) 1 1 4 – 1 2 7
than in strong (et.12%) ethanol stress. On the other hand, thestress response repressor HrcA is down-regulated only athigher alcohol content (12%) where a strong stress response isneeded (Fig. 2). These data suggest that different stressresponses are operative at different stress degrees and alsounderline the importance of a gradual and progressive
acclimation to alcohol for better inducing concerted pheno-typic responses useful for wine adaptation. No differenceswere found for other stress related genes included in the arraysuch as hsp33, ftsH, clpX, cspE, oeoe 0513 (Transcriptionalrepressor of class III stress) and oeoe 0807 (stress responsemembrane GTPase).

0
10
20
30
40
50
60
70
Fig. 2 – Differentially expressed genes in the media used in this study (p < 0.05) after microarray analysis, showing the mRNAvalues (M indicates cell adapted in MRS; et.8% indicated cells adapted in a medium containing ethanol 8%; et.12% indicatedcells adapted in a medium containing ethanol 12%).
120 J O U R N A L O F P R O T E O M I C S 1 2 3 ( 2 0 1 5 ) 1 1 4 – 1 2 7
TrxA (thioredoxin-encoding gene) is induced by both oxida-tive stress [35] and by heat [36]. This is the first time that thisgene is associatedwith alcohol stress response. The heat-shockresponse is a ubiquitous phenomenon that enables cells tosurvive to a variety of environmental stresses [37] and heatshock proteins (HSP) are referred to contribute to the ethanol-stress response in bacteria [38,39]. In particular, HSP20 familyprotein is strongly induced by several kinds of stresses(temperature, ethanol, sulfites and acidic pH) and duringstationary growth phase in O. oeni cells [6,39]. In the presentinvestigationweobservedan increased level of proteinHSP20 incells adapted in media containing 8% (spot 995, Fig. 3) and 12%ethanol (spot 994, Fig. 4). This is an additional evidence thatHSP20 has a role in the ethanol stress response, probablyrefoldingmoderately damaged proteins, and that this responsein O. oeni occurs after 1 day of acclimation.
Many important hsp genes are controlled by a negativemodulation mediated by specific repressor proteins such asCtsR andHrcA. Grandvalet et al. [8] demonstrated that the CtsRrepressor is the major regulator of chaperone gene expressionin O. oeni. These authors showed that under optimal growthconditions, CtsR would prevent the synthesis of unnecessarystress proteins until environmental changes (ethanol, acid,nutritional and oxidative stresses) occur. In this condition CtsRcoordinates the synthesis of HSPs strongly inducing transcrip-tion of stress genes, thus enhancing the adaptability of thisLAB under adverse conditions. A second negative heat shockcontrol mechanism is the CIRCE/HrcA system; it was found inseveral bacilli and it has been best characterized in Bacillussubtilis [40]. The increased transcription of hrcA gene due toethanol 8% proves that this regulative system is operative alsoinO. oeni. Furthermore, the evidence that a negativemodulatoris active at 8%, but less expressed at 12% ethanol, is consistentwith the cell's need of triggering different stress responses athigher alcohol concentration, as discussed above. Actually,12% ethanol enhanced the expression of stress proteins suchas ClpL2 (spot 428) Hsp20 (spot 994) and ClpP and DNAJ/DNAKchaperones (spot 432). Beltramo et al. [7] observed, byRT-qPCR, that the expression level of the genes clpL1 andclpL2, also increased inO. oeni cells adapted at low pH, and they
concluded that these genes confer to the cell ability to adapt toacidic stress. The present finding of enhanced transcription ofClpP in 12% ethanol medium by O. oeni suggests that thissystem is involved in the alcohol stress response. Althoughthe refolding/proteolytic cycle set-up by chaperones andproteases is far from being fully elucidated (especially inprokaryotes) and new paradigms are continuously reported inthe literature [41] it is generally accepted that ClpP displayschiefly protease activity, suggesting that it cannot restoreprotein functionality, but only eliminate irreversibly damagedproteins in order to recover and recycle its amino acids.Actually, ClpP is a serine protease: alone it is able to degradeshort peptides; when associated with ClpA, it can degradelarger peptides, whereas the degradation of larger proteinsrequires the ClpA–ClpP complex plus energy supplied by ATPhydrolysis. Conversely, other stress proteins, such as DnaJ/Kare induced for both refolding moderately denatured proteinsor irreversibly degrading protein aggregates [43]. The presentfindings, highlighting over-expression of proteolytic chaper-ones in 12%, but not in 8% ethanol, are consistent with thehigher degree of protein damage in the former condition.Moreover, the expression of clp genes seems to be regulated byHrcA, as observed in several Lactobacillus species, where directinteraction between HrcA and the promoter of a clp gene hasbeen reported [44]. It is generally recognized that clp genes aremainly regulated by the CtsR repressor in low G + C contentGram-positive bacteria: hence the present result suggests thatHrcA plays an important role in such negative modulation notonly in lactobacilli, but also in oenococci.
Additionally, it is worth noticing that some stress chaper-ones (e.g. GroEL, spot 1043) were less abundant in ethanol,probably due to a possible more stressing event than alcoholbeing present in the control medium. We speculate that thehigh MRS sugar content could represent a stressor, generatinga high osmotic stress.
A second interesting modification induced by ethanolconcerns the bacterial envelope structures such as membrane,cell-wall and surface layer. Genes for exopolysaccharides (EPS)andglycanbiosynthesis, aswell as formembranestability,wereup-regulated by alcohol exposure. The gene oeoe 0071, described

a)
b)
14
4 7pI
kDa
94
14
Fig. 3 – a) Representative 2D DIGE image of whole-cell extract soluble proteins of Oenococcus oeni. b) 2DEmap. Numbers indicatethe spots differentially abundant comparing O. oeni adapted in MRS (M) with cells adapted in medium with 8% (et.8%) and 12%ethanol (et.12%). Asterisks indicate the spots differentially abundant protein in medium with 12% ethanol (et.12%) comparedwith MRS medium (M).
121J O U R N A L O F P R O T E O M I C S 1 2 3 ( 2 0 1 5 ) 1 1 4 – 1 2 7
as gene related to EPS production, was significantly induced inboth 8% and 12% ethanol. According to Ciezack et al. [45], mostO. oeni strains produce significant amounts of EPS. Thisproduction is independent from their genotype and not directlyconnected with growth. Conversely, it could be stimulated bychanging the growth medium composition. Very recentlyproduction of EPS by O. oeni ATCC BAA-1163 was hypothesized
based on detection of enzyme-encoding genes. Nonetheless, noproteins directly involved in their biosynthesis were found inthe partial proteomic referencemap determined by 2DEMS-MS[16]. Hence our finding can provide further suggestive evidencethat in O. oeni EPS production is not constitutive but stress-related. Generally LAB produce EPS by diverting a certainamount of glucose from catabolic routes, to protect the cell

Table 2 – Differentially abundant proteins obtained comparing cells adapted in MRS (M) towards cells adapted in 8% (et.8%)(A) and 12% (et.12%) (B) ethanol, and the identification by MS/MS analysis.
Spotno.
ANOVAp value
Foldchange
Average normalizedvolumes
Mw pI Mascotscore
Protein ID NCBI AcNo.
A)546 <0.001 1.6 MRS: et.8%: 55434 5.81 113 citrate lyase, alpha subunit gi|116490503
1.223 ± 0.08 0.788 ± 0.09 [O. oeni PSU-1]993 <0.001 1.7 MRS: et.8%: 33293 4.8 670 citrate lyase beta subunit gi|116490502
1.325 ± 0.21 0.797 ± 0.07 [O. oeni PSU-1]946 <0.001 3.4 MRS: et.8%: 15459 5.3 154 metylmalonil coA epimerase gi|116491672
2.208 ± 0.94 0.657 ± 0.2 [O. oeni PSU-1]629 <0.001 1.8 MRS: et.8%: 40943 5.1 262 malate oxidoreductase gi|116490498
1.444 ± 0.35 0.793 ± 0.15 [O. oeni PSU-1]736 <0.001 4.7 MRS: et.8%: 32898 4.83 60 6-phosphogluconate gi|116491501
2.173 ± 1 0.459 ± 0.23 dehydrogenase-like protein[O. oeni PSU-1]
763 0.001 1.5 MRS: et.8%: 28154 5.65 170 Short-chain alcohol dehydrogenase gi|1164903471.289 ± 0.24 0.873 ± 0.1 [O. oeni PSU-1]
985 0.009 1.5 et.8%: MRS: 14000 4.7 hypotetical protein1.390 ± 0.29 0.935 ± 0.19
995 0.013 1.7 et.8%: MRS: 16927 5.1 80 heat shock protein Hsp20 gi|1164903891.105 ± 0.3 0.634 ± 0.14 [O.oeni PSU-1]
1043 0.007 1.7 MRS: et.8%: 57253 4.84 337 chaperonin GROEL gi|1164913791.363 ± 0.24 0.809 ± 0.29 [O.oeni PSU-1]
B)905 0.003 1.7 et.12%: MRS: 16256 9 111 50S ribosomal protein L13 gi|116490691
1.171 ± 0.5 0.672 ± 0.3 [O. oeni PSU-1]994 <0.001 4 et.12%: MRS: 16927 5.1 75 heat shock protein Hsp20 gi|116490389
1.843 ± 0.6 0.465 ± 0.32 [O. oeni PSU-1]428 <0.001 1.7 et.12%: MRS: 79275 5.4 112 clpL2 protein gi|71466871
1.276 ± 0.25 0.740 ± 0.13 [O. oeni]432 <0.001 1.8 et12%: MRS: 81243 5.37 204 ATP-binding subunit of Clp protease
and DnaK/DnaJ chaperonesgi|116490703
1.314 ± 0.35 0.737 ± 0.09 [O. oeni PSU-1]
122 J O U R N A L O F P R O T E O M I C S 1 2 3 ( 2 0 1 5 ) 1 1 4 – 1 2 7
internal environment from several stressors (toxic metal ions,ethanol, and sulfur dioxide). However, although a role inprotecting the bacterial cell from phage attack was initiallysuggested [46], but more recent experiments failed to reveal asignificant phage resistant phenotype in EPS producing strains[47]. Nevertheless, due to their high water-binding properties,EPS constitute a protection factor against dehydration andosmotic stress [48]. It is thus possible that the EPSmay enhancebacterial survival in wine resulting in an advantage formalolactic starters. Recently Dimopoulou et al. [49] showedthat in O. oeni many genes are involved in EPS production.Among them there is also oeoe 1737, which, in our subarray,proved to be upregulated in ethanol 8%. This result stronglysupports the hypothesis that EPS production can be a responseto stressing environmental conditions.
The genes encoding enzymes involved in cell-wall biosyn-thesis and degradation were strongly induced by ethanol:some of them (oeoe 1444 and oeoe 0144) only at 12% ethanol,other (oeoe 0719) also at 8%. This finding is consistent with theneed of cell-wall renewal after contact with stressing alcoholconcentrations: probably some damage occurs and henceboth degradation and ex novo synthesis are required. Repaircan be achieved by enhancing the amount of cell wallprocessing enzymes. Increased transcription of the gene oeoe0455, coding for a signal recognition particle protein (SRP), wasalso observed in both ethanol conditions. The SRP pathway is
considered crucial for the viability of all organisms andconserved in all life domains [50,51]. In the literature, nostudies focusing on O. oeni are available to this regard.Gutierrez et al. [52] studied the Ffh protein, homologue ofthe eukaryotic SRP, in the lactic acid bacterium Streptococcusmutans. This protein is a chaperone, also found in Escherichiacoli, involved in protein translocation and membrane biogen-esis [53]. These authors suggested that Ffh may participate inthe maintenance of a functional membrane protein composi-tion during adaptation of S. mutans to changing environmen-tal conditions. Tourdot-Maréchal et al. [54] suggest that thecapacity of O. oeni to regulate its membrane fluidity representsa stress tolerance mechanism, related with its ability toregulate membrane composition with respect to both lipidsand proteins. Silveira et al. [5,55] observed that membranes ofO. oeni cells exposed to 12% ethanol showed a decreasedpermeability and increased disordering. At molecular level,they demonstrated that O. oeni was able to respond to thefluidizing effect of ethanol by increasing the degree ofunsaturation of the membrane's fatty acids. In our experi-ments, genes related with membrane stability and glycanbiosynthesis, were up-regulated in the presence of ethanol12% in agreement with what described by these authors.Moreover, Hasona et al. [56] observed that SRP were involvedin many cellular mechanisms including ATPase activity,protein synthesis machinery and biofilm formation. These
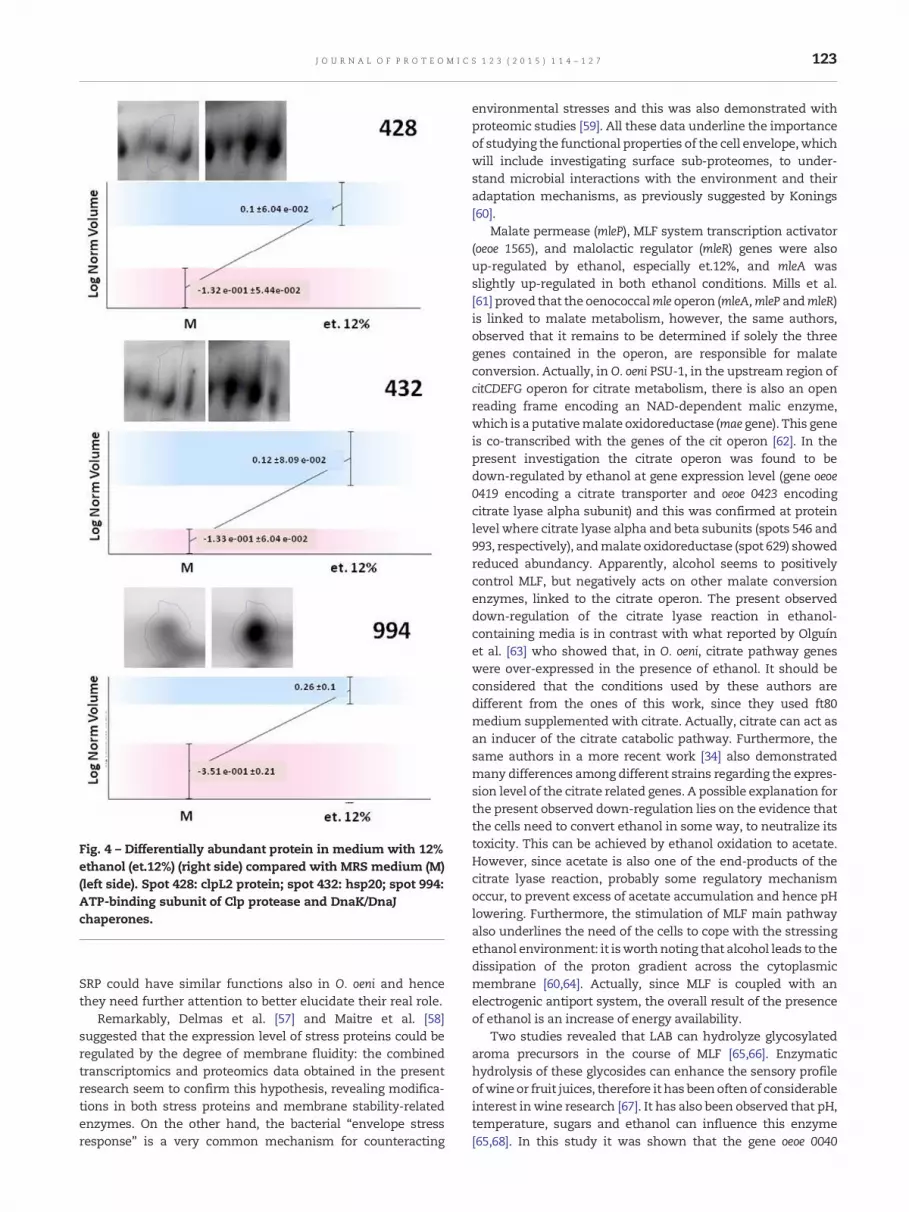
Fig. 4 – Differentially abundant protein in medium with 12%ethanol (et.12%) (right side) compared with MRS medium (M)(left side). Spot 428: clpL2 protein; spot 432: hsp20; spot 994:ATP-binding subunit of Clp protease and DnaK/DnaJchaperones.
123J O U R N A L O F P R O T E O M I C S 1 2 3 ( 2 0 1 5 ) 1 1 4 – 1 2 7
SRP could have similar functions also in O. oeni and hencethey need further attention to better elucidate their real role.
Remarkably, Delmas et al. [57] and Maitre et al. [58]suggested that the expression level of stress proteins could beregulated by the degree of membrane fluidity: the combinedtranscriptomics and proteomics data obtained in the presentresearch seem to confirm this hypothesis, revealing modifica-tions in both stress proteins and membrane stability-relatedenzymes. On the other hand, the bacterial “envelope stressresponse” is a very common mechanism for counteracting
environmental stresses and this was also demonstrated withproteomic studies [59]. All these data underline the importanceof studying the functional properties of the cell envelope,whichwill include investigating surface sub-proteomes, to under-stand microbial interactions with the environment and theiradaptation mechanisms, as previously suggested by Konings[60].
Malate permease (mleP), MLF system transcription activator(oeoe 1565), and malolactic regulator (mleR) genes were alsoup-regulated by ethanol, especially et.12%, and mleA wasslightly up-regulated in both ethanol conditions. Mills et al.[61] proved that the oenococcalmle operon (mleA,mleP andmleR)is linked to malate metabolism, however, the same authors,observed that it remains to be determined if solely the threegenes contained in the operon, are responsible for malateconversion. Actually, in O. oeni PSU-1, in the upstream region ofcitCDEFG operon for citrate metabolism, there is also an openreading frame encoding an NAD-dependent malic enzyme,which is a putativemalate oxidoreductase (mae gene). This geneis co-transcribed with the genes of the cit operon [62]. In thepresent investigation the citrate operon was found to bedown-regulated by ethanol at gene expression level (gene oeoe0419 encoding a citrate transporter and oeoe 0423 encodingcitrate lyase alpha subunit) and this was confirmed at proteinlevel where citrate lyase alpha and beta subunits (spots 546 and993, respectively), andmalate oxidoreductase (spot 629) showedreduced abundancy. Apparently, alcohol seems to positivelycontrol MLF, but negatively acts on other malate conversionenzymes, linked to the citrate operon. The present observeddown-regulation of the citrate lyase reaction in ethanol-containing media is in contrast with what reported by Olguínet al. [63] who showed that, in O. oeni, citrate pathway geneswere over-expressed in the presence of ethanol. It should beconsidered that the conditions used by these authors aredifferent from the ones of this work, since they used ft80medium supplemented with citrate. Actually, citrate can act asan inducer of the citrate catabolic pathway. Furthermore, thesame authors in a more recent work [34] also demonstratedmany differences among different strains regarding the expres-sion level of the citrate related genes. A possible explanation forthe present observed down-regulation lies on the evidence thatthe cells need to convert ethanol in some way, to neutralize itstoxicity. This can be achieved by ethanol oxidation to acetate.However, since acetate is also one of the end-products of thecitrate lyase reaction, probably some regulatory mechanismoccur, to prevent excess of acetate accumulation and hence pHlowering. Furthermore, the stimulation of MLF main pathwayalso underlines the need of the cells to cope with the stressingethanol environment: it isworthnoting that alcohol leads to thedissipation of the proton gradient across the cytoplasmicmembrane [60,64]. Actually, since MLF is coupled with anelectrogenic antiport system, the overall result of the presenceof ethanol is an increase of energy availability.
Two studies revealed that LAB can hydrolyze glycosylatedaroma precursors in the course of MLF [65,66]. Enzymatichydrolysis of these glycosides can enhance the sensory profileofwineor fruit juices, therefore it has beenoften of considerableinterest inwine research [67]. It has also been observed that pH,temperature, sugars and ethanol can influence this enzyme[65,68]. In this study it was shown that the gene oeoe 0040

124 J O U R N A L O F P R O T E O M I C S 1 2 3 ( 2 0 1 5 ) 1 1 4 – 1 2 7
encoding for a glucosidase, was more expressed in et.8%.This gene is involved in sugar metabolism and organismspecific pathways for flavor production. These data agreewith Li et al. [69] who showed higher glycosidaseenzyme activity at low ethanol concentrations. Hence theacclimation procedure in 8% ethanol seems to induce apathway of interest for wine quality. This was opposed by asecond glycosidase enzyme (gene oeoe 1779) that wasdown-regulated by et.12%.
ButA is a gene encoding acetoin reductase, enzyme involvedindiacetyl/acetoinbiosynthetic pathway. This protein catalyzesthe formationof 2,3-butanediol frompyruvatewith acetolactateand diacetyl as intermediates. This last compound acts on thesensory properties of wine, since it confers “butter” aroma. Thesensory perception of diacetyl depends onmany factors such asorigin of wine, fermentation temperature, SO2, duration of MLF[70]. In this study it was shown that butA gene was down-regulated in presence of ethanol 12%. García-Quintáns et al. [71]demonstrated that in L. lactis, this biosynthetic pathway isinduced at the transcriptional level by acidic growth conditions.Olguín et al. [63] observed that in presence of ethanoltranscription of the gene aslD (acetolactate decarboxylase),also involved in diacetyl production, was significantly reduced;it seems from the present results that also butA gene follows thesame behavior of aslD gene.
For what concerns protein metabolism, shikimate kinase(oeoe 0153) was down-regulated. It is well known that theshikimate pathway is essential for the synthesis of all aromaticamino acids, as well as other metabolites, such as folic acid andubiquinone [72]. This pathway is essential for parasites, bacteria,and fungi [73–75]. Shikimate kinase is the fifth enzyme in theshikimate pathway that catalyzes the phosphate transfer fromATP to shikimate to generate shikimate 3-phosphate and ADP[76]. Therefore in this anabolic route, ATP is consumed. Thefinding that in media containing 8% ethanol shikimate kinasegene was less expressed, can be due to the fact that in theseconditions bacteria try to limit ATP consumption (and, ingeneral, ATP-consuming anabolic routes) to better cope withalcohol-induced stress, as suggested by Henick-Kling et al. [77].On the other hand, it is well known that O. oeni, as most LAB,displays limited amino acidbiosynthetic pathways. Remize et al.[78] found that amino acid requirement was strain-dependentand some strains appeared to be particularly demanding.Since LAB cannot synthesize glutamic acid [79], it was foundto be essential for all strains. The results presented hereunderline that 8% ethanol stimulated the biosynthesis of aglutamate transporter (gene oeoe 1634). It has to be consid-ered that glutamate can also be used as source of energy bydecarboxylation to γ-amine butyrate (GABA) coupled toextrusion of GABA in the environment by a glutamate-GABAantiport system [80]. This system both maintains pH homeo-stasis and allows proton motive force generation. Takentogether, these results suggest that the cells react to theethanol stress by both conserving ATP and enhancingpotential energy availability.
As far as purine metabolism is concerned no significantdifferences in the ethanol-stimulated and the control condi-tion were observed. On the contrary aspartate carbamoyltransferase, the first enzyme of the anabolic pathway forpyrimidine biosynthesis is up-regulated (gene oeoe 0258). This
enzyme is negatively affected, at catalytic level, by bothfeed-back mechanisms generated by end-products of thepathway and by allosteric systems acting on protein subunitsdifferent from those bearing the active sites [81]. This findingsuggests that also biosynthetic regulation plays a role be-sides catalytic mechanisms. Furthermore, this stress-linkedup-regulation is in agreement with what observed in Pseudo-monas putida under saline stress conditions using 2-DE andMALDI TOF MS [82].
With respect to sugar metabolism the transcriptomic andproteomic results seem contradictory. In particular, thephosphogluconate dehydrogenase-encoding gene proved tobe up-regulated whereas the corresponding enzyme wasshown to be less abundant in ethanol (both in et.8% andet.12%). Furthermore, genes encoding the heterofermentativeenzymes, trans- and phospho-ketolase, as well as alcoholdehydrogenase isoforms were down-regulated. On the otherhand a flow direction of glucose towards biosynthesis of EPSand cell-wall sugars is supported as it has already beendiscussed above.
4. Conclusions
The present combined transcriptomic/proteomic approach wasuseful to obtain integrated information regarding the physio-logical response of O. oeni adapted in different media prior toinoculation into wine. The results obtained demonstrated thatcomposition of the medium strongly affects starter responses,as expected. Following ethanol acclimation a significant expres-sion increase of genes related toMLF andstress response occurs.The stress response ismainly focused on the control of envelopecomposition (membrane, cell wall and EPS), but also concernsgeneral stress proteins such as chaperones and proteases. Inparticular, we found that 8% or 12% ethanol differentiallymodulate bacterial responses. For instance adaptation to thelower ethanol content induces surface modifications such asEPS layer production, whereas adaptation to the higher ethanolconcentrations induce structural changes such as mem-brane composition modification. Furthermore, the 8%and 12% ethanol conditions can control different stressresponse pathways by activating refolding or degradingchaperones, respectively. Further investigations, in-cludes analysis of a higher number of O. oeni strains, arenecessary to clarify the role of the rehydration mediumon the survival and performance of O. oeni during winemalolactic fermentation. Nevertheless, based on theresults obtained in this study, we suggest that even witha commercial strain for a direct inoculation in wine,an acclimation step can improve performance of theselected starter through induction of different defencemechanisms and MLF stimulation prior to transfer intowine.
Supplementary data to this article can be found online athttp://dx.doi.org/10.1016/j.jprot.2015.04.019.
Conflict of interest
None.

125J O U R N A L O F P R O T E O M I C S 1 2 3 ( 2 0 1 5 ) 1 1 4 – 1 2 7
Acknowledgments
This work was supported, in part, by a grant from RegionePiemonte Det. Dir. no. 4 of October 3, 2007 and was financed,in part, by COLMIA project DM 16101/7301/08. A. C. is arecipient of a PhD fellowship from the Consiglio per la Ricercae la Sperimentazione in Agricoltura: Decreto Dirigenziale no.862 on 10 February 2009.
The authors want to thank Center for Advanced FoodStudies (LMC) for the Ultraflex 2 Bruker Mass Spectrometerand the Council for Independent Research Natural Sciences forthe Typhoon. Finally the authors are very grateful to LindaBianco, Anne Blicher, Louise Maria Helsted and Birgit Andersenfor their precious help and technical assistance.
R E F E R E N C E S
[1] Malherbe S, Tredoux AGJ, Nieuwoudt HH, du Toit M.Comparative metabolic profiling to investigate thecontribution of O. oeni MLF starter cultures to red winecomposition. J Ind Microbiol Biotechnol 2012;39:477–94.
[2] Nielsen JC, Prahl C, Lonvaud-Funel A. Malolacticfermentation in wine by direct inoculation with freeze-driedLeuconostoc oenos cultures. Am J Enol Vitic 1996;47:42–8.
[3] Pfeiler EA, Klaenhammer TR. The genomics of lactic acidbacteria. Trends Microbiol 2007;15:546–53.
[4] G-Alegrìa E, Lopez I, Ruiz JI, Sa¡enz J, Fernandez E, ZarazagaM, et al. High tolerance of wild Lactobacillus plantarum andOenococcus oeni strains to lyophilisation and stressenvironmental conditions of acid pH and ethanol. FEMSMicrobiol Lett 2004;230:53–61.
[5] Silveira MG, Baumgartner M, Rombouts FM, Abee T. Effect ofadaptation to ethanol on cytoplasmic and membrane proteinprofiles of Oenococcus oeni. Appl Environ Microbiol 2004;70:2748–55. http://dx.doi.org/10.1128/AEM.70.5.2748-2755.2004.
[6] Guzzo J, Jobin M-P, Diviès C. Increase of sulfite tolerance inOenococcus oeni by means of acidic adaptation. FEMS MicrobiolLett 1998;160:43–7.
[7] Beltramo C, Desroche N, Tourdot-Maréchal R, Grandvalet C,Guzzo J. Real-time PCR for characterizing the stress responseof Oenococcus oeni in a wine-like medium. Res Microbiol 2006;157:267–74.
[8] Grandvalet C, Coucheney F, Beltramo C, Guzzo J. CtsR is themaster regulator of stress response gene expression inOenococcus oeni. J Bacteriol 2005;187:5614–23. http://dx.doi.org/10.1128/JB.187.16.5614-5623.2005.
[9] Torriani S, Felis G, Fracchetti F. Selection criteria and tools formalolactic starters development: an update. Ann Microbiol2011;61:33–9.
[10] Borneman AR, Bartowsky EJ, McCarthy J, Chambers PJ.Genotypic diversity in Oenococcus oeni by high-densitymicroarray comparative genome hybridization and wholegenome sequencing. Appl Microbiol Biotechnol 2010;86:681–91.
[11] Unlü M, Morgan ME, Minden JS. Difference gelelectrophoresis: a single gel method for detecting changes inprotein extracts. Electrophoresis 1997;18:2071–7.
[12] Koponen J, Laakso K, Koskenniemi K, Kankainen M, Savijoki K,Nyman TA, et al. Effect of acid stress on protein expression andphosphorylation in Lactobacillus rhamnosus GG. J Proteomics2012;75:1357–74.
[13] Genovese F, Coïsson JD, Majumder A, Pessione A, Svensson B,Jacobsen S, et al. An exoproteome approach tomonitor safety ofa cheese-isolated Lactococcus lactis. Food Res Int 2013;54:1072–9.
[14] Behr M, Serchi T, Cocco E, Guignard C, Sergeant K, Renaut J,et al. Description of the mechanisms underlying geosminproduction in Penicillium expansum using proteomics.J Proteomics 2014;96:13–28.
[15] Cecconi D, Milli A, Rinalducci S, Zolla L, Zapparoli G.Proteomic analysis of Oenococcus oeni freeze-dried culture toassess the importance of cell acclimation to conductmalolactic fermentation in wine. Electrophoresis 2009;30:2988–95.
[16] Mohedano M de la L, Russo P, de Los Ríos V, Capozzi V,Fernández de Palencia P, Spano G, et al. A partial proteomereference map of the wine lactic acid bacterium Oenococcusoeni ATCC BAA-1163. Open Biol 2014;4:130154.
[17] Lerm E, Engelbrecht L, Du Toit M. Malolactic fermentation:the ABC's of MLF. S Afr J Enol Vitic 2010;31:186–212.
[18] Kanehisa M, Araki M, Goto S, Hattori M, Hirakawa M, Itoh M,et al. KEGG for linking genomes to life and the environment.Nucleic Acids Res 2008;36:D480–4.
[19] Rozen S, Skaletsky H. Primer3 on the WWW for general usersand for biologist programmers. Methods Mol Biol 2000;132:365–86.
[20] Borneman AR, McCarthy JM, Chambers PJ, Bartowsky EJ.Comparative analysis of the Oenococcus oeni pan genomereveals genetic diversity in industrially-relevant pathways.BMC Genomics 2012;13:373.
[21] Rantsiou K, Greppi A, Garosi M, Acquadro A, Mataragas M,Cocolin L. Strain dependent expression of stress responseand virulence genes of Listeria monocytogenes in meat juices asdetermined by microarray. Int J Food Microbiol 2012;152:116–22.
[22] Sturn A, Quackenbush J, Trajanoski Z. Genesis: clusteranalysis of microarray data. Bioinformatics 2002;18:207–8.
[23] Candiano G, Bruschi M, Musante L, Santucci L, Ghiggeri GM,Carnemolla B, et al. Blue silver: a very sensitive colloidalCoomassie G-250 staining for proteome analysis.Electrophoresis 2004;25:1327–33.
[24] Majumder A, Sultan A, Jersie-Christensen RR, Ejby M,Schmidt BG, Lahtinen SJ, et al. Proteome reference map ofLactobacillus acidophilus NCFM and quantitative proteomicstowards understanding the prebiotic action of lactitol.Proteomics 2011;11:3470–81.
[25] Lopez I, Lòpez R, Santamaría P, Torres C, Ruiz-Larrea F.Performance of malolactic fermentation by inoculation ofselectedLactobacillus plantarum and Oenococcus oeni strains isolatedfrom Rioja red wines. Vitis 2008;47:123–9.
[26] Pilatte E, Prahl C. Biological deacidification of acid grapevarieties by inoculation on must with a freeze-dried cultureof Lactobacillus plantarum. 48th Annu. Meet. ASEV, San Diego,USA; 1997.
[27] Carbó R, Soler B, Gordón E, De Castro J, Sancho J. Adaptaciónde las bacterias lácticas para la fermentación maloláctica delvino. Riv Vitic Enol 1998;4:39–45.
[28] Nielsen JC, Richelieu M. Control of flavor development inwine during and after malolactic fermentation by Oenococcusoeni. Appl Environ Microbiol 1999;65:740–5.
[29] Delaquis P, Cliff M, King M, Girard B, Hall J, Reynolds A. Effect oftwo commercial malolactic cultures on the chemical and sensoryproperties of chancellor wines vinified with different yeasts andfermentation temperatures. Am J Enol Vitic 2000;51:42–8.
[30] Costantini A, Vaudano E, Rantsiou K, Cocolin L, Garcia-MorunoE. Quantitative expression analysis ofmleP gene and two genesinvolved in the ABC transport system in Oenococcus oeni duringrehydration. Appl Microbiol Biotechnol 2011;91:1601–9.
[31] Coucheney F, Gal L, Beney L, Lherminier J, Gervais P, Guzzo J.A small HSP, Lo18, interacts with the cell membrane andmodulates lipid physical state under heat shock conditionsin a lactic acid bacterium. Biochim Biophys Acta 1720;2005:92–8.

126 J O U R N A L O F P R O T E O M I C S 1 2 3 ( 2 0 1 5 ) 1 1 4 – 1 2 7
[32] Desroche N, Beltramo C, Guzzo J. Determination of aninternal control to apply reverse transcription quantitativePCR to study stress response in the lactic acid bacteriumOenococcus oeni. J Microbiol Methods 2005;60:325–33.
[33] Capozzi V, Russo P, Beneduce L, Weidmann S, Grieco F, GuzzoJ, et al. Technological properties of Oenococcus oeni strainsisolated from typical southern Italian wines. Lett ApplMicrobiol 2010;50:327–34.
[34] Olguín N, Bordons A, Reguant C. Multigenic expressionanalysis as an approach to understanding the behaviour ofOenococcus oeni in wine-like conditions. Int J Food Microbiol2010;144:88–95.
[35] Reott MA, Parker AC, Rocha ER, Smith CJ. Thioredoxins inredox maintenance and survival during oxidative stress ofBacteroides fragilis. J Bacteriol 2009;191:3384–91.
[36] Jobin M-P, Garmyn D, Diviès C, Guzzo J. Expression of theOenococcus oeni trxA gene is induced by hydrogen peroxideand heat shock. Microbiology 1999;145:1245–51.
[37] Moritomo RI, Tissières A, Georgopoulos C. Stress proteins inbiology and medicine. New York: Cold Spring Harbor Labo-ratory Press; 1990.
[38] Guzzo J, Cavin JF, Divies C. Induction of stress proteins inLeuconostoc oenos to perform direct inoculation of wine.Biotechnol Lett 1994;16:1189–94.
[39] Guzzo J, Delmas F, Pierre F, Jobin M-P, Samyn B, Van BeeumenJ, et al. A small heat shock protein from Leuconostoc oenosinduced by multiple stresses and during stationary growthphase. Lett Appl Microbiol 1997;24:393–6.
[40] Schumann W, Hecker M, Msadek T. Regulation and functionof heat-inducible genes in Bacillus subtilis. In: Sonenshein AL,Hoch JA, Losick R, editors. Bacillus subtilis its closest relat.from genes to cells. Washington: American Society forMicrobiology; 2002. p. 359–68.
[41] Frees D, Gerth U, Ingmer H. Clp chaperones and proteases arecentral in stress survival, virulence and antibiotic resistanceof Staphylococcus aureus. Int J Med Microbiol 2014;304:142–9.
[43] Herman C, D'Ari R. Proteolysis and chaperones: thedestruction/reconstruction dilemma. Curr Opin Microbiol1998;1:204–9.
[44] Suokko A, Savijoki K, Malinen E, Palva A, Varmanen P.Characterization of a mobile clpL gene from Lactobacillusrhamnosus. Appl Environ Microbiol 2005;71:2061–9.
[45] Ciezack G, Hazo L, Chambat G, Heyraud A, Lonvaud-Funel A,Dols-Lafargue M. Evidence for exopolysaccharide productionby Oenococcus oeni strains isolated from non-ropy wines.J Appl Microbiol 2010;108:499–509.
[46] Moineau S, Borkaev M, Holler BJ, Walker SA, Kondo JK,Vedamuthu ER, et al. Isolation and characterization ofLactococcal bacteriophages from cultured buttermilk plants inthe United States. J Dairy Sci 1996;79:2104–11.
[47] Deveau H, Van Calsteren M-R, Moineau S. Effect ofexopolysaccharides on phage-host interactions in Lactococcuslactis. Appl Environ Microbiol 2002;68:4364–9.
[48] Kumar AS, Mody K, Jha B. Bacterial exopolysaccharides—aperception. J Basic Microbiol 2007;47:103–17.
[49] Dimopoulou M, Hazo L, Dols-Lafargue M. Exploration ofphenomena contributing to the diversity of Oenococcus oeniexopolysaccharides. Int J Food Microbiol 2012;153:114–22.
[50] Herskovits AA, Bochkareva ES, Bibi E. New prospects instudying the bacterial signal recognition particle pathway.Mol Microbiol 2000;38:927–39.
[51] Cao TB, Saier MH. The general protein secretory pathway:phylogenetic analyses leading to evolutionary conclusions.Biochim Biophys Acta 2003;1609:115–25.
[52] Gutierrez JA, Crowley PJ, Cvitkovitch DG, Brady LJ, HamiltonIR, Hillman JD, et al. Streptococcus mutans ffh, a gene encodinga homologue of the 54 kDa subunit of the signal recognitionparticle, is involved in resistance to acid stress. Microbiology1999;145:357–66.
[53] Luirink J, Dobberstein B. Mammalian and Escherichia colisignal recognition particles. Mol Microbiol 1994;11:9–13.
[54] Tourdot-Maréchal R, Gaboriau D, Beney L, Diviès C.Membrane fluidity of stressed cells of Oenococcus oeni. Int JFood Microbiol 2000;55:269–73.
[55] da Silveira MG, Romão MVS, Loureiro-Dias MC, Rombouts FM,Abee T. Flow cytometric assessment of membrane integrityof ethanol-stressed Oenococcus oeni cells. Appl EnvironMicrobiol 2002;68:6087–93.
[56] Hasona A, Zuobi-Hasona K, Crowley PJ, Abranches J, RuelfMA, Bleiweis AS, et al. Membrane composition changes andphysiological adaptation by Streptococcus mutans signalecognition particle pathway mutants. J Bacteriol 2007;189:1219–30.
[57] Delmas F, Pierre F, Coucheney F, Divies C, Guzzo J.Biochemical and physiological studies of the small heatshock protein Lo18 from the lactic acid bacterium Oenococcusoeni. J Mol Microbiol Biotechnol 2001;3:601–10.
[58] Maitre M, Weidmann S, Rieu A, Fenel D, Schoehn G, Ebel C,et al. The oligomer plasticity of the small heat-shock proteinLo18 from Oenococcus oeni influences its role in bothmembrane stabilization and protein protection. Biochem J2012;444:97–104.
[59] Mazzoli R, Fattori P, Lamberti C, GiuffridaMG, ZapponiM,GiuntaC, et al. High isoelectric point sub-proteome analysis ofAcinetobacter radioresistens S13 reveals envelope stress responsesinduced by aromatic compounds. Mol Biosyst 2011;7:598–607.
[60] Konings WN. Microbial transport: adaptations to naturalenvironments. Antonie Van Leeuwenhoek 2006;90:325–42.
[61] Mills DA, Rawsthorne H, Parker C, Tamir D, Makarova K.Genomic analysis of Oenococcus oeni PSU-1 and its relevanceto winemaking. FEMS Microbiol Rev 2005;29:465–75.
[62] Bekal-Si Ali S, Diviès C, Prévost H. Genetic organization of thecitCDEF locus and identification of mae and clyR genes fromLeuconostoc mesenteroides. J Bacteriol 1999;181:4411–6.
[63] Olguín N, Bordons A, Reguant C. Influence of ethanol and pHon the gene expression of the citrate pathway in Oenococcusoeni. Food Microbiol 2009;26:197–203.
[64] Chu-Ky S, Tourdot-Marechal R, Marechal P-A, Guzzo J.Combined cold, acid, ethanol shocks in Oenococcus oeni:effects on membrane fluidity and cell viability. BiochimBiophys Acta 1717;2005:118–24.
[65] Grimaldi A, Bartowsky E, Jiranek V. A survey of glycosidaseactivities of commercial wine strains of Oenococcus oeni. Int JFood Microbiol 2005;105:233–44.
[66] Ugliano M, Genovese A, Moio L. Hydrolysis of wine aromaprecursors during malolactic fermentation with fourcommercial starter cultures of Oenococcus oeni. J Agric FoodChem 2003;51:5073–8.
[67] Mateo J, Jiménez M. Monoterpenes in grape juice and wines.J Chromatogr A 2000;881:557–67.
[68] Spagna G, Barbagallo RN, Palmeri R, Restuccia C, Giudici P.Properties of endogenous β-glucosidase of a Saccharomycescerevisiae strain isolated from Sicilian musts and wines.Enzyme Microb Technol 2002;31:1030–5.
[69] Li YH, Fan MT, Zhang GQ, Liu YL. Assessment ofB-D-glucosidase activity from two typical strains of the lacticacid bacteria Oenococus oeni in China. S Afr J Enol Vitic 2012;33:144–9.
[70] Bartowsky EJ, Henschke PA. The “buttery” attribute ofwine–diacetyl–desirability, spoilage and beyond. Int J FoodMicrobiol 2004;96:235–52.
[71] García-Quintáns N, Repizo G, Martín M, Magni C, López P.Activation of the diacetyl/acetoin pathway in Lactococcus lactissubsp. lactis bv. diacetylactis CRL264 by acidic growth. ApplEnviron Microbiol 2008;74:1988–96.
[72] Parish T, Stoker NG. The common aromatic amino acidbiosynthesis pathway is essential in Mycobacteriumtuberculosis. Microbiology 2002;148:3069–77.

127J O U R N A L O F P R O T E O M I C S 1 2 3 ( 2 0 1 5 ) 1 1 4 – 1 2 7
[73] Kishore GM, Shah DM. Amino acid biosynthesis inhibitors asherbicides. Annu Rev Biochem 1988;57:627–63.
[74] Roberts F, Roberts CW, Johnson JJ, Kyle DE, Krell T, Coggins JR,et al. Evidence for the shikimate pathway in apicomplexanparasites. Nature 1998;393:801–5.
[75] Herrmann KM, Weaver LM. The shikimate pathway. AnnuRev Plant Physiol Plant Mol Biol 1999;50:473–503.
[76] Berlyn MB, Giles NH. Organization of enzymes in thepolyaromatic synthetic pathway: separability in bacteria.J Bacteriol 1969;99:222–30.
[77] Henick-Kling T, Cox DJ, Olsen E. Prodution de l'énergie durantla fermentation malolactique. Rev Enol 1991;132:63–6.
[78] Remize F, Gaudin A, Kong Y, Guzzo J, Alexandre H, Krieger S,et al. Oenococcus oeni preference for peptides: qualitative andquantitative analysis of nitrogen assimilation. Arch Microbiol2006;185:459–69.
[79] Hebert EM, Raya RR, De Giori GS. Nutritional requirementsand nitrogen-dependent regulation of proteinase activity ofLactobacillus helveticus CRL 1062. Appl Environ Microbiol 2000;66:5316–21.
[80] Mazzoli R, Pessione E, Dufour M, Laroute V, Giuffrida MG,Giunta C, et al. Glutamate-induced metabolic changes inLactococcus lactis NCDO 2118 during GABA production:combined transcriptomic and proteomic analysis. AminoAcids 2010;39:727–37.
[81] Gerhart J. From feedback inhibition to allostery: the enduringexample of aspartate transcarbamoylase. FEBS J 2014;281:612–20.
[82] Rangeshwaran R, Ashwitha K, Sivakumar G, Jalali SK.Analysis of proteins expressed by an abiotic stress tolerantPseudomonas putida (NBAII-RPF9) isolate under saline and hightemperature conditions. Curr Microbiol 2013;67:659–67.


