Embed Size (px)
Citation preview

Components of quantitative resistance to powdery mildew(Erysiphe pisi) in pea (Pisum sativum)
S. L. H. Viljanen-Rollinsona*†, R. E. Gaunta, C. M. A. Framptonb, R. E. Falloonc andD. L. McNeilaaDepartment of Plant Science and bCentre for Computing and Biometrics, PO Box 84, Lincoln University, Canterbury; and cNewZealand Institute for Crop & Food Research Ltd, Private Bag 4704, Christchurch, New Zealand
Components of quantitative resistance in pea (Pisum sativum) to Erysiphe pisi, the pathogen causing powdery mildew,were investigated. Conidium germination, infection efficiency, latent period and conidium production dynamics on cv.Quantum (quantitatively resistant) were compared with those on Pania and Bolero (susceptible). There was anadditional comparison in conidium germination experiments with the resistant cv. Resal. Quantitative resistance inQuantum did not affect conidium germination, but infection efficiency of conidia on this cultivar was 34% less thanon the susceptible Pania. More conidia germinated on 5-day-old leaflets than on 15-day-old leaflets but the age of theplant did not affect percentage germination or infection efficiency. The length of the latent period did not differbetween cultivars. Total conidium production (AUC) per unit leaflet area on Quantum was 25% less than on Pania.The maximum conidium production per day (CMAX) per unit leaflet area on Quantum was 33% less than on Pania.The time to maximum conidium production per day (TMAX) was 10% longer on Quantum than on Pania. The cv.Bolero, reported to be susceptible, also showed some degree of quantitative resistance, but this differed from that ofQuantum. Total conidium production was less on Bolero than on Quantum, but the conidia on Bolero were producedsooner, and for a shorter period, than on Quantum. The stability of these responses was tested by analysingcomponents in three different temperature regimes and testing for interactions with temperature, and with leaflet age.Temperature affected all conidium production variables. AUC per leaflet area was nearly seven times as great andCMAX nearly 15 times greater at 238C than at 138C. TMAX increased by 1·5 times when temperature increased from138C to 188C or 238C. Several interactions occurred and these are described.
Introduction
Powdery mildew of pea (Pisum sativum), caused byErysiphe pisi, is an important disease in pea cropsthroughout the world (Dixon, 1978) including NewZealand (Falloon et al., 1989). Utilizing disease resis-tance is an important strategy for controlling plantpathogens, because it may be relatively easy to use, cost-effective, and environmentally more acceptable thanreliance on pesticides (Hogenboom, 1993). Pea cultivarswith qualitative resistance to E. pisi have been bred andgrown commercially in New Zealand (Goulden & Scott,1993) and elsewhere (Dixon, 1978), but these probablypossess single, major gene resistance (Timmerman et al.,1994) which therefore may not be durable. Quantitativeresistance of agricultural crops to fungal pathogens ischaracterized by a continuous variation ranging from
very low to moderate levels of resistance (Parlevliet,1992). Quantitative resistance reduces the rate ofepidemic development in crops and therefore theseverity of disease (Geiger & Heun, 1989), and is oftenmore durable (Johnson, 1984) than qualitative diseaseresistance. Quantitative resistance has, until recently,been used less in breeding programmes than qualitativeresistance, mainly because the latter has been easier toincorporate into agronomically desirable genotypes.
Quantitative resistance can be selected in breedingprogrammes either on the basis of overall symptomexpression, or by prior identification of resistancemechanisms or correlated variables followed by selec-tion for these mechanisms. In the latter, the first steptowards efficient selection for quantitative resistance isdetermination of the resistance components. No singlemeasure is suitable, and each host–pathogen interactionis likely to be different (Johnson, 1992). The threesummary components include reduced infection fre-quency or density, reduced lesion size or concentration,and reduced propagule production per unit of host tissueover a period of time (Parlevliet, 1992). In most host–pathogen interactions involving biotrophic pathogens,
Plant Pathology (1998) 47, 137–147
Q 1998 BSPP 137
* Present address: New Zealand Institute for Crop & FoodResearch Ltd, Private Bag 4704, Christchurch, New Zealand.
†E-mail: [email protected]
Accepted 6 October 1997.

the major epidemiological components of quantitativeresistance are infection efficiency, latent period, and rateand duration of sporulation (Parlevliet, 1989). Somecomponents are more important than others in char-acterizing quantitative resistance, and it is possible, forsome host–pathogen interactions, to recognize onecomponent of quantitative resistance, or a set ofsubcomponents, that adequately represent the quantita-tive resistance in the field. For example, in barley leafrust (caused by Puccinia hordei) latent period was themost suitable component to assess for field quantitativeresistance (Parlevliet & van Ommeren, 1975; Neervort& Parlevliet, 1978). The identification of single compo-nents may be especially useful in material that has beenselected for quantitative resistance over a long period,but less so on recently accessed material (Simmonds,1991). In populations that have not been stronglyselected for quantitative resistance no, or negative,correlation of components is expected.
The factors regulating quantitative resistance to E. pisiin pea have not been investigated in relation to selectionand breeding. The objectives of the present study were todefine epidemiological components of quantitativeresistance in this host–pathogen interaction by examin-ing differences in disease development in Pania andBolero (both susceptible), Quantum (quantitativelyresistant), and Resal (qualitatively resistant). Thesecultivars were chosen based on local experience andclassification of resistance response by breeders (R. E.Scott, 1992, personal communication). The componentsconsidered were: conidium germination, infection effi-ciency, latent period and conidium production dynamics(area under the curve of total conidium production(AUC), daily maximum conidium production (CMAX)and time to maximum conidium production (TMAX)).Effects of plant and leaf age on conidium germinationand infection efficiency were also measured.
Materials and methods
General methods
Isolates of E. pisi were obtained from several field-grownsusceptible pea cultivars around Lincoln, New Zealand(latitude 438 380S, altitude 11 m) during 1992–93 toensure adequate pathogenicity on the cultivars tested.The population was inoculated and maintained on peacultivar Pania in a glasshouse at 228C (18–268C)illuminated with fluorescent light to extend daylight to16 h during winter. Seeds of Pania, Bolero (similar ingrowth habit to, and a parent of, Quantum), Quantumand Resal (germination experiments only) were germi-nated in Petri dishes lined with a moistened filter paper,placed inside plastic bags to prevent moisture loss andleft in a dark incubator at 208C for 7 days. Seedlings atgrowth stage (GS) 004 (germination: emergence; Knott,1987) with plumules about 1 cm long and radicles 5–8 cm long with secondary rootlets, were planted in 13-cm pots filled with a mixture of sterilized washed bark
and sand (55 : 45) plus 1·6 kg of lime, 1·0 kg of slowrelease fertilizer (Osmocote), 0·35 kg of superphosphate,0·45 kg of zeolites, and 0·13 kg calcium nitrate per m3 ofthe mixture. The plants were placed in an isolation plantpropagator (Burkard Manufacturing Co. Ltd, Rick-mansworth, Herts, UK), in a glasshouse at 22·38C (range18·2–26·88C), to prevent infection before inoculation.Relative humidity in the plant enclosure of the propa-gator pots varied between 40 and 100%.
Conidium inoculum was collected from heavilyinfected leaves 24 h after old, possibly nonviable conidiahad been dislodged with compressed air. Inoculum wascollected in glass vials with a vacuum pump-operatedcyclone spore collector. Horizontally supported leafletson intact plants were inoculated in an earthed metalsettling tower (height 1·72 m, diameter 0·53 m) withE. pisi conidia dispersed upwards for 5 s by compressedair (380 kPa). Conidia were settled onto the intact plantsfor 5 min. The number of conidia deposited per cm2 leafarea was assessed by placing two microscope slidescovered with a 2-mm film of 0·1% water agar on thebottom of the settling tower and counting the number ofconidia on 10 cross-sections on a slide (1·6 ×26·0 mm).Throughout this paper, ‘leaf’ refers to the whole pea leaf,including all pairs of leaflets, and ‘leaflet’ is used whenonly the first pair of leaflets was assessed. Leaf age wasdetermined on the basis of one new pair of leavesemerging every 4·5 days. Nodes were numbered as theyemerged, node 1 being the oldest.
Effects of cultivar, plant and leaflet age ongermination of conidia
Six experiments were carried out to assess the effect ofplant and leaf ages on conidium germination on the fourpea cultivars. For all experiments, whole plants atdifferent growth stages and leaf ages (Table 1) wereinoculated in the settling tower with 6 mg of conidia,giving 120 6 33 conidia per cm2 of leaflets. Plants werethen transferred into high humidity (above 97%) in aconstant temperature room (mean 22·38C, range 21·1–23·38C) for 24 h. Germination of conidia was assessedby removing four leaflet discs (area 78·5 mm2, diameter10·0 mm) from each pair of leaflets with a cork borer.Leaflet discs were cleared and stained for 7–10 days inthe solution of Keane et al. (1988), drawn across filterpaper supporting the leaflet discs by gravity feed.Germinated and nongerminated conidia on each leafletdisc were counted using a compound microscope. In allexperiments each replicate was a single plant, and thesample size was four leaflet discs per plant. Experiment 1had one, experiments 2–5 had two, and experiment 6had four replicates. The effects of cultivar, leaflet age andplant age on germination were analysed by analysis ofvariance within each set of data A–E as illustrated inFig. 1. Differences between cultivars were also tested onnode 4 (leaf age 5 days) at GS 105 (vegetative, fivenodes). Different sets of data were used as appropriatefor different comparisons.
S. L. H. Viljanen-Rollinson et al.138
Q 1998 BSPP Plant Pathology (1998) 47, 137–147

Effects of cultivar and plant age on infectionefficiency
Seven experiments measuring infection efficiency werecarried out (Table 1). Single plants were replicates andtwo leaflets per node were the sample size. There weretwo replicates in experiments 7–12 and four replicates inexperiment 13. Leaf and plant age comparisons weresimilar to those in the germination experiments. Resalwas not used beyond germination experiments as nolesions, or very few, developed on this cultivar. Whenplants were at the required growth stage, they wereinoculated in the settling tower with 0·5 mg of conidia todeposit 10 (range 7·2–13·9) conidia per cm2. Plantswere incubated in a high humidity room as describedpreviously and then transferred to a glasshouse at 21·28C(range 18·2–24·88C). The numbers of colonies per leafletwere counted 10 days after inoculation (dai). Leafletarea was measured with a portable leaf area meter (LI-3000, Li-Cor, Lincoln, Nebraska, USA) or by imageanalysis. Infection efficiency was calculated as the ratioof total number of colonies per cm2 leaflet area to thetotal number of conidia deposited per cm2 leaflet area.Nodes 4 and 5, 7 and 8, and 10 and 11 were grouped foranalysis and data were normalized by logarithmic
transformation. Geometric means are presented. Theeffect of cultivar and plant age on infection efficiencywas analysed by analysis of variance within each dataset, but all data were combined to determine overallcultivar effects.
Effects of cultivar on latent period and conidiumproduction
Three experiments were conducted on leaflets at nodes6, 7 and 8 to determine cultivar effects on latent periodand conidium production (experiment 14) or onconidium production only (experiments 15 and 16) indifferent environments. The experimental design ofexperiment 14 was a three-temperature × three-culti-var × three-node position factorial with a sample size ofthree plants per replicate, and with three replicates pertreatment. The experimental design of experiments 15and 16 was a two-temperature × three-cultivar × three-node position factorial with a sample size of three plantsper replicate and with four replicates per treatment.
Before inoculation, plants at GS 107–108 (vegetative,seven to eight nodes) were transferred to controlledenvironment cabinets for acclimatization at 148C
Components of resistance to E. pisi 139
Q 1998 BSPP Plant Pathology (1998) 47, 137–147
Table 1 Details of experiments on Erysiphe pisi conidium germination and infection efficiency on pea cultivars. Leaflet age (days) at the time ofinoculation at each node is given in parenthesis
Germination Infection efficiency
Plant growth Nodes inoculated Nodes inoculatedExperiment stage (leaflet age) Experiment Plant growth stage (leaflet age)
1, 2, 3 105 4 (5) 7, 8 105 4, 5 (1–5)4, 5 108 4 (15) and 7 (5) 9 109 4, 5 (15–20); 7, 8 (1–5)6 105 4 (5) 10, 11, 12 105 4, 5 (1–5)
108 4 (15) and 7 (5) 109 4, 5 (15–20); 7, 8 (1–5)111 7 (15)
13 105 4, 5 (1–5)111 4, 5 (25–30); 10, 11 (1–5)114 10, 11 (15–20)
Figure 1 Plant age and leaf age comparisonsin germination experiments. The effect ofplant age was tested by: A, comparison ofnode 4 (leaf age 5 days) of plants at GS 105with node 7 of plants at GS 108 (leaf age 5days); B, comparison of node 4 (leaf age 15days) of plants at GS 108 with node 7 (leafage 15 days) at GS 111. The effect of leafage was tested by: C, comparison of node 4(leaf age 5 days) of plants at GS 105 withnode 4 (leaf age 15 days) of plants at GS108; D, comparison of node 7 (leaf age 5days) of plants at GS 108 with node 7 (leafage 15 days) of plants at GS 111; E, compari-son of node 4 (leaf age 15 days) with node 7(leaf age 5 days) of plants at GS 108.
(6 28C) day, 68C (6 1·58C) night. To avoid plant damagefrom high temperature in the low light (220–260 mmol m¹2 s¹1) supplied by daylight-incandescentand fluorescent lights, the daytime temperature wasgradually increased to 208C (6 28C). Whole plants werethen inoculated in the settling tower with 0·35 mg ofconidia to give 7 (6 2) conidia, and approximately oneinfection, per cm2 leaflet area. Plants were incubated inhigh humidity as before for 24 h and then transferred tothe controlled environment cabinets. The effect of thecultivars on conidium production and latent period weretested in the following three environmental conditions ina 16-h day/8-h night cycle.1 Day temperature 138C (mean 13·1, range 10·9–14·58C) and night 68C (mean 5·8; 4·5–6·98C).2 Day temperature 198C (mean 18·8; 16·5–21·58C) andnight 118C (mean 10·9; 9·2–13·58C).3 Day temperature 238C (mean 23·0; 20·2–26·28C) andnight 158C (mean 15·2; 14·2–16·28C).
The effect of cultivars on conidium production at thelowest temperature regime was not tested in experiments15 and 16 as powdery mildew developed very slowlyunder these conditions in experiment 14. Conidiumcollection started 5 days after inoculation (dai) in allexperiments. Conidia from each of the three nodepositions of the three plants for each cultivar werecollected daily (between 07·00 and 09·00 hours) intosmall glass vials with a cyclone spore collector attachedto a vacuum pump. This was continued until leaflets ateach node senesced, which occurred 60 dai at 138C andup to 42 dai at the higher temperatures. Care was takennot to damage leaflet surfaces with the spore collectorand not to disturb the leaflets and dislodge conidia.Conidia in each vial were suspended in 0·5 mL of 0·1%Tween-80 solution and counted with a haemocytometer(six samples per vial). The latent periods in experiment14 were determined as the number of days frominoculation until the first day when conidia were seenvisually, less 12 h to account for conidia that wereformed between the sampling times.
Disease severity (%) was measured with the aid of adisease assessment key (Falloon et al., 1995) every dayafter colonies became visible to the naked eye on nodes
6, 7 and 8. Possible bias in visual assessment wasminimized by practising scoring with image analysisprior to the experiment. The number of colonies on thesenodes was counted 10 days (20 days in the lowesttemperature) after inoculation. At the same time, the size(cm2) of the leaflets was estimated with the aid of paperleaflet models of known area. The colony area (cm2) wascalculated from the percentage leaflet area occupied bythe colonies. Conidium production was expressed on acolony area and leaflet area basis. Three variables,derived from curves fitted to the data, were used tocharacterize conidium production over time. These weretotal conidium production expressed as the area underthe curve for conidium production (AUC), the maximumnumber of conidia produced per day (CMAX) andthe number of days to CMAX (TMAX). The datafor both AUC and CMAX were normalized bylogarithmic transformations before statistical analysis.Geometric means for these variables are presentedin tables. Analysis of variance was used to compareAUC, CMAX and TMAX values between cultivars,temperatures and node positions.
Results
Germination of conidia
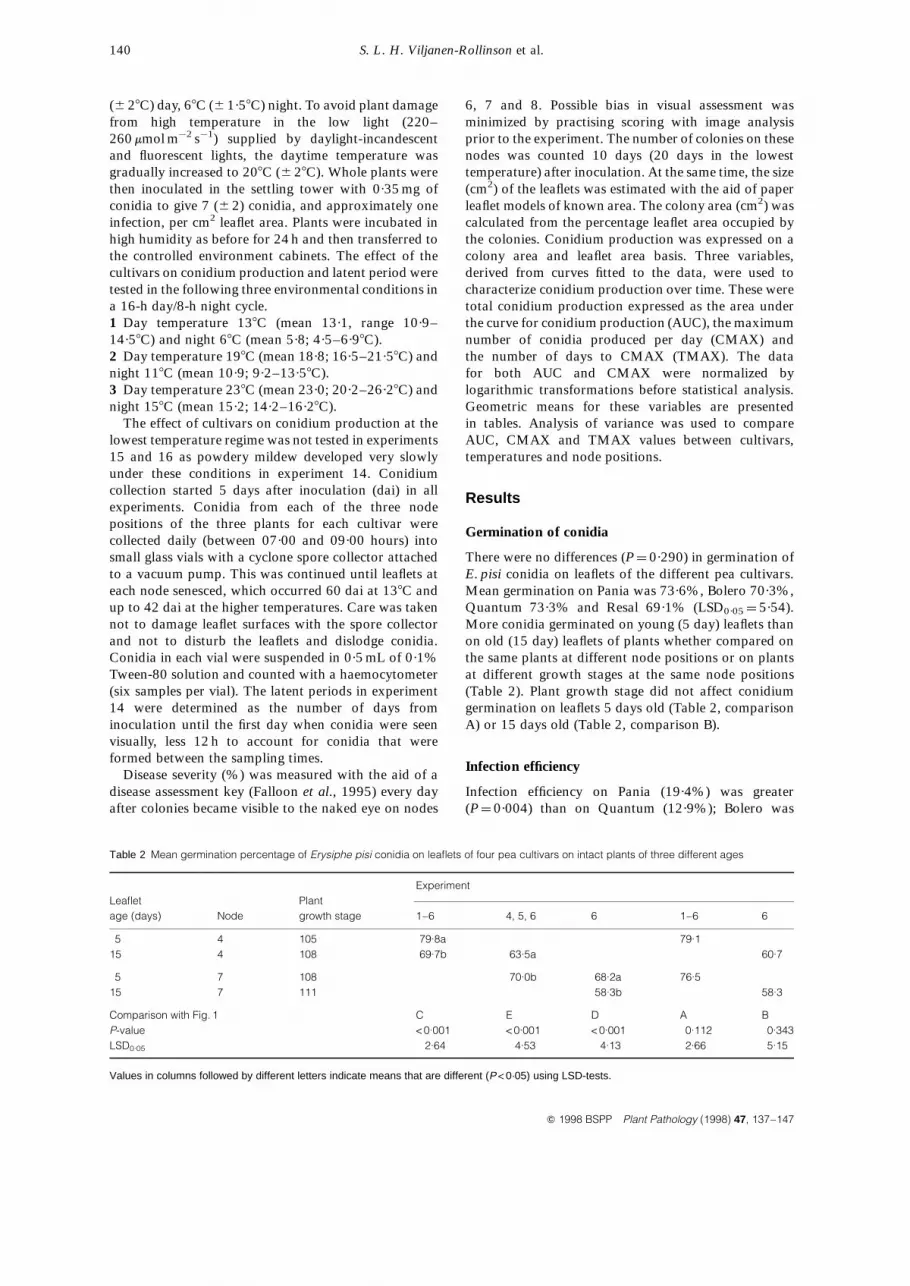
There were no differences (P ¼ 0·290) in germination ofE. pisi conidia on leaflets of the different pea cultivars.Mean germination on Pania was 73·6%, Bolero 70·3%,Quantum 73·3% and Resal 69·1% (LSD0·05 ¼ 5·54).More conidia germinated on young (5 day) leaflets thanon old (15 day) leaflets of plants whether compared onthe same plants at different node positions or on plantsat different growth stages at the same node positions(Table 2). Plant growth stage did not affect conidiumgermination on leaflets 5 days old (Table 2, comparisonA) or 15 days old (Table 2, comparison B).
Infection efficiency
Infection efficiency on Pania (19·4%) was greater(P ¼ 0·004) than on Quantum (12·9%); Bolero was
S. L. H. Viljanen-Rollinson et al.140
Q 1998 BSPP Plant Pathology (1998) 47, 137–147
Table 2 Mean germination percentage of Erysiphe pisi conidia on leaflets of four pea cultivars on intact plants of three different ages
ExperimentLeaflet Plantage (days) Node growth stage 1–6 4, 5, 6 6 1–6 6
5 4 105 79·8a 79·115 4 108 69·7b 63·5a 60·7
5 7 108 70·0b 68·2a 76·515 7 111 58·3b 58·3
Comparison with Fig. 1 C E D A BP-value < 0·001 < 0·001 < 0·001 0·112 0·343LSD0·05 2·64 4·53 4·13 2·66 5·15
Values in columns followed by different letters indicate means that are different (P < 0·05) using LSD-tests.
intermediate (15·6%) and not significantly differentfrom either Pania or Quantum. Plant age (P ¼ 0·313)and leaflet age (P ¼ 0·162 at growth stage 109 andP ¼ 0·929 at growth stage 111) had no effect oninfection efficiency.
Latent period and conidium production
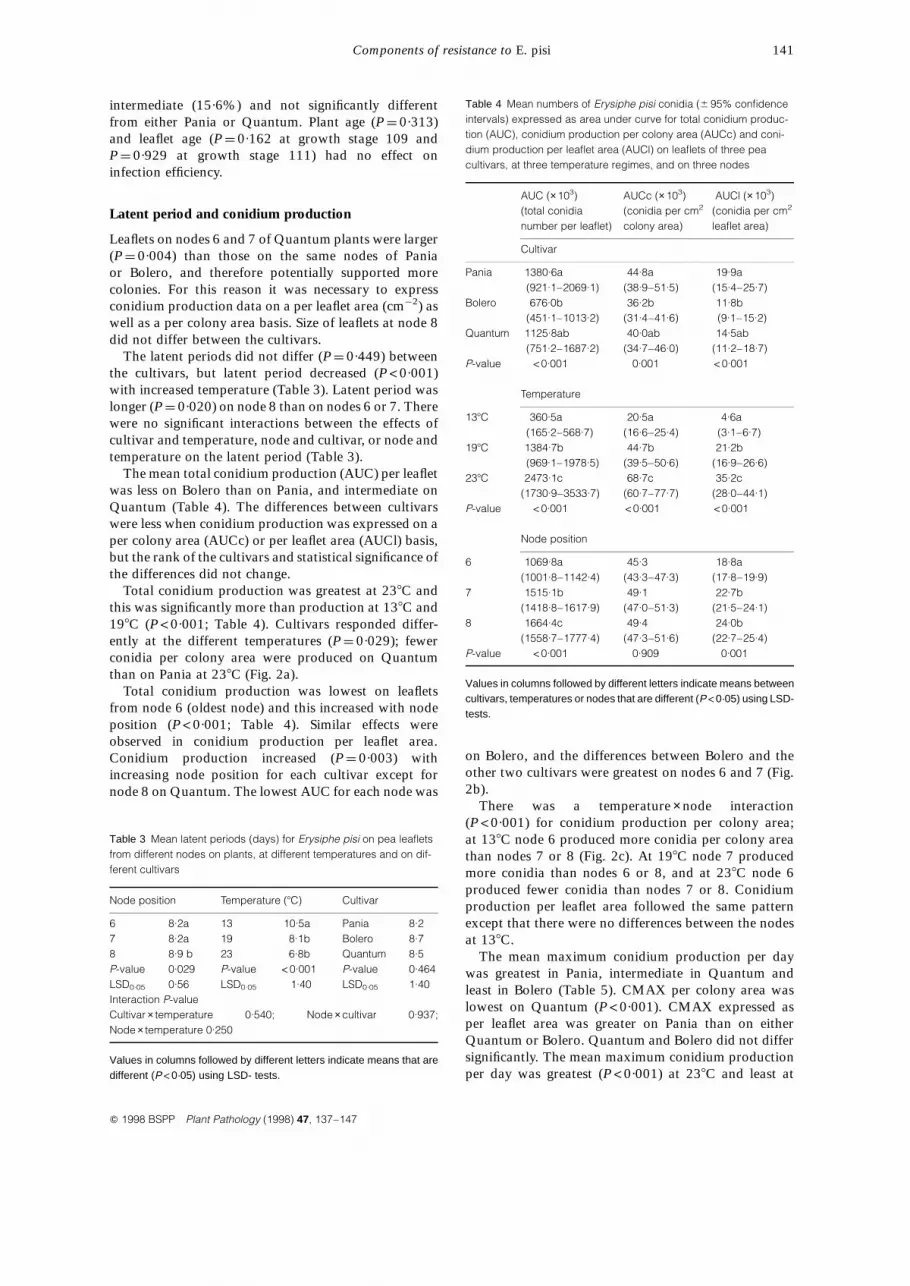
Leaflets on nodes 6 and 7 of Quantum plants were larger(P ¼ 0·004) than those on the same nodes of Paniaor Bolero, and therefore potentially supported morecolonies. For this reason it was necessary to expressconidium production data on a per leaflet area (cm¹2) aswell as a per colony area basis. Size of leaflets at node 8did not differ between the cultivars.
The latent periods did not differ (P ¼ 0·449) betweenthe cultivars, but latent period decreased (P< 0·001)with increased temperature (Table 3). Latent period waslonger (P ¼ 0·020) on node 8 than on nodes 6 or 7. Therewere no significant interactions between the effects ofcultivar and temperature, node and cultivar, or node andtemperature on the latent period (Table 3).
The mean total conidium production (AUC) per leafletwas less on Bolero than on Pania, and intermediate onQuantum (Table 4). The differences between cultivarswere less when conidium production was expressed on aper colony area (AUCc) or per leaflet area (AUCl) basis,but the rank of the cultivars and statistical significance ofthe differences did not change.
Total conidium production was greatest at 238C andthis was significantly more than production at 138C and198C (P< 0·001; Table 4). Cultivars responded differ-ently at the different temperatures (P ¼ 0·029); fewerconidia per colony area were produced on Quantumthan on Pania at 238C (Fig. 2a).
Total conidium production was lowest on leafletsfrom node 6 (oldest node) and this increased with nodeposition (P< 0·001; Table 4). Similar effects wereobserved in conidium production per leaflet area.Conidium production increased (P ¼ 0·003) withincreasing node position for each cultivar except fornode 8 on Quantum. The lowest AUC for each node was
on Bolero, and the differences between Bolero and theother two cultivars were greatest on nodes 6 and 7 (Fig.2b).
There was a temperature ×node interaction(P <0·001) for conidium production per colony area;at 138C node 6 produced more conidia per colony areathan nodes 7 or 8 (Fig. 2c). At 198C node 7 producedmore conidia than nodes 6 or 8, and at 238C node 6produced fewer conidia than nodes 7 or 8. Conidiumproduction per leaflet area followed the same patternexcept that there were no differences between the nodesat 138C.
The mean maximum conidium production per daywas greatest in Pania, intermediate in Quantum andleast in Bolero (Table 5). CMAX per colony area waslowest on Quantum (P <0·001). CMAX expressed asper leaflet area was greater on Pania than on eitherQuantum or Bolero. Quantum and Bolero did not differsignificantly. The mean maximum conidium productionper day was greatest (P <0·001) at 238C and least at
Components of resistance to E. pisi 141
Q 1998 BSPP Plant Pathology (1998) 47, 137–147
Table 3 Mean latent periods (days) for Erysiphe pisi on pea leafletsfrom different nodes on plants, at different temperatures and on dif-ferent cultivars
Node position Temperature (8C) Cultivar
6 8·2a 13 10·5a Pania 8·27 8·2a 19 8·1b Bolero 8·78 8·9 b 23 6·8b Quantum 8·5P-value 0·029 P-value < 0·001 P-value 0·464LSD0·05 0·56 LSD0·05 1·40 LSD0·05 1·40Interaction P-valueCultivar × temperature 0·540; Node × cultivar 0·937;Node × temperature 0·250
Values in columns followed by different letters indicate means that aredifferent (P < 0·05) using LSD- tests.
Table 4 Mean numbers of Erysiphe pisi conidia (6 95% confidenceintervals) expressed as area under curve for total conidium produc-tion (AUC), conidium production per colony area (AUCc) and coni-dium production per leaflet area (AUCl) on leaflets of three peacultivars, at three temperature regimes, and on three nodes
AUC (×103) AUCc (×103) AUCl (× 103)(total conidia (conidia per cm2 (conidia per cm2
number per leaflet) colony area) leaflet area)
Cultivar
Pania 1380·6a 44·8a 19·9a(921·1–2069·1) (38·9–51·5) (15·4–25·7)
Bolero 676·0b 36·2b 11·8b(451·1–1013·2) (31·4–41·6) (9·1–15·2)
Quantum 1125·8ab 40·0ab 14·5ab(751·2–1687·2) (34·7–46·0) (11·2–18·7)
P-value < 0·001 0·001 < 0·001
Temperature
138C 360·5a 20·5a 4·6a(165·2–568·7) (16·6–25·4) (3·1–6·7)
198C 1384·7b 44·7b 21·2b(969·1–1978·5) (39·5–50·6) (16·9–26·6)
238C 2473·1c 68·7c 35·2c(1730·9–3533·7) (60·7–77·7) (28·0–44·1)
P-value < 0·001 < 0·001 < 0·001
Node position
6 1069·8a 45·3 18·8a(1001·8–1142·4) (43·3–47·3) (17·8–19·9)
7 1515·1b 49·1 22·7b(1418·8–1617·9) (47·0–51·3) (21·5–24·1)
8 1664·4c 49·4 24·0b(1558·7–1777·4) (47·3–51·6) (22·7–25·4)
P-value < 0·001 0·909 0·001
Values in columns followed by different letters indicate means betweencultivars, temperatures or nodes that are different (P <0·05) using LSD-tests.

138C. Adjusting CMAX for colony area or leaflet areadid not change the order or significance of thetemperature effect. Maximum conidium productionwas lowest (P< 0·001) on node 6 but when CMAXwas expressed per colony and leaflet areas, the nodes didnot differ. Figure 3(a) illustrates cultivar node interac-tion. CMAX on node 8 on Quantum was lower(P ¼ 0·007) than that on node 7, and CMAX per leafletarea on node 8 on Quantum was lower (P ¼ 0·003) thanfor Bolero. Figure 3(b) illustrates the observednode × temperature interaction (P ¼ 0·026) for CMAXper colony area.
Mean time to maximum conidium production did notdiffer (P ¼ 0·073) between the cultivars, but whenTMAX was adjusted for colony area or leaflet area,Quantum had the longest (P <0·001) TMAXc andlongest (P ¼ 0·005) TMAXl (Table 6). TMAX waslongest (P <0·001) at 138C, but did not differ between198C and 238C. Expressing TMAX per colony area didnot change the order or the significance of this result, butadjusting for leaflet area increased the differencesbetween the temperatures. TMAX was shortest(P ¼ 0·003) on node 7 and longest on node 8 (Table 6).There were no differences (P ¼ 0·091) between nodes forTMAX per colony area. Some interactions wereobserved in the rate of conidium production as outlinedin Fig. 4.
In summary, total conidium production was greateston Pania, intermediate on Quantum and least on Bolero.Peak conidium production and the rate of conidiumproduction were greatest on Pania, intermediate onBolero and least on Quantum. Several isolates of E. pisi
S. L. H. Viljanen-Rollinson et al.142
Q 1998 BSPP Plant Pathology (1998) 47, 137–147
Figure 2 Total conidium production. (a) Mean AUC per colony areafor numbers of Erysiphe pisi conidia produced at three temperatureson leaflets of three pea cultivars (B, Pania; X, Bolero; V, Quantum).Bars in this and Figs 3 and 4 represent 95% confidence intervals.(b) Mean AUC for numbers of Erysiphe pisi conidia produced onleaflets at three nodes of three pea cultivars (B, Pania; X, Bolero; V,Quantum).(c) Mean AUC per colony area for numbers of Erysiphepisi conidia produced on leaflets at three nodes of pea plants atthree temperatures (B,138C; X,198C; V, 238C).
Table 5 Mean daily maximum numbers (6 95% confidence inter-vals) of Erysiphe pisi conidia (CMAX), maximum numbers per colonyarea (CMAXc) and maximum numbers per leaflet area (CMAXl), onleaflets of three pea cultivars at three temperature regimes and onthree nodes
CMAX (× 103) CMAXc (× 103) CMAXl (× 103)(total number of (conidia per cm2 (conidia per cm2
conidia per leaflet) colony area) leaflet area)
Cultivar
Pania 197·01a 4·9a 2·1a(131·0–269·2) (4·2–5·7) (1·6–2·7)
Bolero 108·7b 4·1ab 1·4b(72·3–163·4) (3·5–4·8) (1·1–1·8)
Quantum 152·1ab 3·3b 1·4b(101·1–228·7) (2·9–3·9) (1·1–1·8)
P-value 0·002 < 0·001 < 0·001
Temperature
138C 29·9a 1·5a 0·3a(16·0–55·7) (1·2–1·9) (0·2–0·4)
198C 250·4b 5·0b 2·4b(174·8–358·9) (4·3–5·7) (1·9–2·9)
238C 435·4c 8·9c 5·4c(303·8–623·9) (7·7–10·2) (4·3–6·7)
P-value < 0·001 < 0·001 < 0·001
Node position
6 181·1a 5·4 2·4(168·7–194·5) (5·1–5·7) (2·2–2·6)
7 242·6b 5·8 2·8(225·9–260·4) (5·4–6·1) (2·6–3·0)
8 256·3b 5·4 2·8(238·7–275·21) (5·1–5·7) (2·6–3·0)
P-value < 0·001 0·095 0·100
Values in columns followed by different letters indicate means betweencultivars, temperatures or nodes that are different (P <0·05) using LSD-tests.

were used as a bulk inoculum but there was no evidenceof change in the pathogenicity of the population duringthese investigations.
Discussion
A number of epidemiological components were ident-ified that may be useful for characterization of quanti-tative resistance to E. pisi in the pea cultivar Quantum,by making comparisons with two cultivars (Bolero andPania) that are susceptible to the pathogen in the field(Viljanen-Rollinson et al., 1998). The collective effectsof each or some of the components are particularlyimportant. The differences between Quantum and Paniaand between Bolero and Pania were ¹ 34% and ¹ 20%in infection efficiency, ¹ 33% and ¹ 16% in maximumnumber of conidia produced per day (CMAX) percolony area, and ¹ 16% and þ 9% in time to CMAX(TMAX) per colony area, respectively. Collectively thesedifferences between Quantum and Pania amount to asubstantial effect. The total conidium production percolony area was less on Bolero than on Quantum, butthe conidia on Bolero were produced faster and in ashorter time period than on Quantum, so that underfield conditions (Viljanen-Rollinson, 1996) Bolero hadsimilar susceptibility to Pania.
Conidium germination
The proportion of conidial germination was not animportant factor of quantitative resistance in Quantum.Host genotype affects germination in some host–pathogeninteractions, but most studies on Erysiphe spp. haveconcluded that it is not important (Singh & Singh, 1983;Douglas et al., 1984; Wright & Heale, 1984; Carver &Adaigbe, 1990). However, Mukhopadhyaya & Russell(1979) found significant differences in germination ofErysiphe betae conidia on sugar beets with variablelevels of resistance. Other studies have indicated thatgermination of Erysiphe conidia is rarely influenced byexternal factors other than environmental conditions.Conidia can germinate on nonhost plants (Johnson et al.,1982), in or on water (Sivapalan, 1993), on cellulosemembranes laid on agar (De Waard, 1971), and evenwhen in contact with toxic chemicals (Gay et al., 1985).Therefore it is not surprising that cultivar did not havean effect on germination in these experiments.
In the present study, leaflet age affected germination,with more conidia germinating on young leaflets than on
Components of resistance to E. pisi 143
Q 1998 BSPP Plant Pathology (1998) 47, 137–147
Figure 3 Peak conidium production: (a) Mean maximum numbers ofErysiphe pisi conidia produced per day (CMAX) per leaflet area onleaflets at three nodes of three pea cultivars (B, Pania; X, Bolero; V,Quantum). (b) Mean maximum numbers of Erysiphe pisi conidia pro-duced per day (CMAX) per colony area on leaflets at three nodes ofpea plants at three temperatures (B, 138C; X, 198C; V, 238C).
Table 6 Mean time (days; 6 95% confidence intervals) to CMAX(TMAX), to CMAXc (TMAXc) and to CMAXl (TMAXl), on leaflets ofthree pea cultivars at three temperature regimes and on three nodes
TMAX TMAXc TMAXl(days) (days) (days)
Cultivar
Pania 20·9 18·0a 21·4a(19·0–22·8) (16·5–19·6) (19·3–23·4)
Bolero 22·3 16·4a 24·0ab(20·4–24·2) (14·9–18·0) (21·9–26·1)
Quantum 23·2 21·5b 25·0b(21·3–25·1) (20·0–23·0) (22·9–27·0)
P-value 0·073 < 0·001 0·005
Temperature
138C 28·6a 23·6a 30·8a(25·7–31·5) (21·3–26·0) (27·6–33·9)
198C 20·0b 16·7b 21·2b(18·3–21·6) (15·3–18·1) (19·4–23·0)
238C 17·8b 15·6b 18·3c(16·2–19·5) (14·3–17·0) (16·5–20·1)
P-value < 0·001 < 0·001 < 0·001
Node position
6 19·1ab 16·6 20·9(18·3–19·8) (15·9–17·4) (20·1–21·8)
7 19·0a 16·4 20·3(18·3–19·7) (15·6–17·1) (19·4–21·1)
8 20·0b 17·3 21·0(19·2–20·7) (16·6–18·1) (20·1–21·8)
P-value 0·003 0·091 0·023
Values in columns followed by different letters indicate means betweencultivars, temperatures or nodes that are different (P <0·05) using LSD-tests.

old leaflets. Carver & Adaigbe (1990) found that moreE. graminis f.sp. avenae conidia germinated on youngthan on old leaves of oats, and on adult plant than onseedling leaves, although these effects were small inabsolute terms. Others have found the reverse applyingwhere more conidia germinated on adult plant than onseedling leaves of barley (Russell et al., 1975; Ayres &Woolacott, 1980) and oats (Douglas et al., 1984).
Infection efficiency
Infection efficiency of E. pisi was 34% less on Quantumthan on Pania. Other studies indicated that infectionefficiency is an important component of quantitativeresistance. In oats, reduced infection efficiency ofE. graminis f.sp. avenae conidia was found to contributeto quantitative resistance (Jones, 1978). Reduction incolony number per leaf area was also shown to be acomponent of quantitative resistance in the barley–E. graminis f.sp. hordei interaction (Asher & Thomas,1983; Heun, 1986; Newton, 1990). Nørgaard Knudsen(1984) found that infection efficiency of E. graminis f.sp.hordei varied by a factor of 2·8 for the most susceptiblecultivar of barley compared with the most resistantcultivar. In contrast, Raju & Anilkumar (1990) found oncowpea that E. polygoni colony numbers per leaflet wasnot a good indicator of resistance.
The effect of leaflet age on germination of conidia wasnot reflected in these infection efficiency experiments, aresult that contrasts with those from some otherinfection efficiency studies. Asher & Thomas (1983)showed that a reduction in E. graminis f.sp. hordeicolony number contributed to quantitative resistance inbarley. In spring wheat, a large growth stage effect oninfection efficiency of Puccinia. f.sp. tritici was demon-strated by Broers (1989). Roumen (1992) reported adecline in the number of sporulating Pyricularia oryzaelesions per cm2 rice leaf area with increase of leaf age inall genotypes.
Latent period
Effects on latent period did not appear to be animportant characteristic of quantitative resistance topowdery mildew in Quantum. The differences betweencultivars may have been too small to be detected in thistype of experiment, where the start of conidiumproduction was examined only once per day perplant and not as the proportion of colonies producingconidia. Latent period measured as the number of dayswhen 50% of colonies are producing conidia may providea more accurate measurement. However, the biologicalsignificance of such small differences may be questionable,but could be tested in suitable epidemic models.
Latent period has been found to be an important
S. L. H. Viljanen-Rollinson et al.144
Q 1998 BSPP Plant Pathology (1998) 47, 137–147
Figure 4 Rate of conidium production: (a) Mean time to maximumErysiphe pisi conidium production per day (TMAX) per colony areaat three temperatures on leaflets of three pea cultivars (B, Pania; X,Bolero; V, Quantum). (b) Mean time to maximum Erysiphe pisi coni-dium production per day (TMAX) per colony area on leaflets at threenodes of three pea cultivars (B, Pania; X, Bolero; V, Quantum). (c)Mean time to maximum Erysiphe pisi conidium production per day(TMAX) per leaflet area on leaflets at three nodes of three pea culti-vars (B, Pania; X, Bolero; V, Quantum). (d) Mean time to maximumErysiphe pisi conidium production per day (TMAX) per leaflet areaon leaflets at three nodes of pea plants at three temperatures (B,138C;X, 198C;V, 238C).

factor of quantitative resistance in most host–pathogeninteractions. Latent period contributed to quantitativeresistance in oats to E. graminis f.sp. avenae (Jones,1978), in barley to P. hordei (Parlevliet & vanOmmeren, 1975; Neervoort & Parlevliet, 1978), andin wheat to P. recondita f.sp. tritici (Lee & Shaner, 1985;Broers, 1989; Denissen, 1993). However, Roumen & deBoef (1993) reported that in rice infected by Pyriculariaoryzae, latent period was not an important componentof quantitative resistance, as this variable varied onlyslightly between treatments, with a maximum differenceof 8 h between cultivars. Asher & Thomas (1984)reported that in barley, E. graminis f.sp. hordei colonygrowth rate appeared to be retarded in the early stages ofdevelopment, and this persisted to give an extendedlatent period. Variation of latent period was of onlyminor importance and the authors concluded that thiswas unlikely to contribute to resistance (Asher &Thomas, 1984). However, latent periods are likely tobe longer in the field compared with controlledenvironment conditions because of lower and morevariable temperatures in the field (Nørgaard Knudsen,1984). Therefore, even small differences in latent periodfrequently found under controlled environment condi-tions could be an important component of quantitativeresistance in the field and should not be disregardedtotally. If pea seed lines with reduced latent periods wereidentified, this could provide useful parental material.
Conidium production
Total conidium production on Quantum and on Bolerowas reduced by almost 20% and by 50%, respectively,compared with that on Pania. Reduced conidiumproduction as a result of quantitative resistance hasalso been found in E. graminis-infected barley (Asher,1982; Asher & Thomas, 1984; Nørgaard Knudsen,1984), wheat (Shaner, 1973; Rouse et al., 1980; Nass etal., 1981) and oats (Jones, 1978), and in the cowpea-E. polygoni interaction (Raju & Anilkumar, 1990). Thereduction was about 10% and 20%, respectively, whenadjusted for colony area, and 25% and 40%, respect-ively, when adjusted for leaflet area. The differencesbetween conidium production per leaf, per colony areaand per leaflet area are attributable to reduced infectionefficiency on Quantum compared with Pania, differencesin colony expansion rates and differences in leaflet sizesbetween Quantum and the other two cultivars. Thesmaller differences between cultivars per colony areathan per leaflet area indicated that the spread of colonieson Bolero was less than on Quantum, although nodifferences between these cultivars were found whenspecifically tested for colony size (Viljanen-Rollinson,1996). Younger leaflets (node 8) on Quantum showedconsistently lower conidium production than those onPania or Bolero, indicating that fewer colonies formedinitially, but the colonies grew more rapidly onQuantum than on Pania or Bolero.
The difference in total conidium production between
Quantum and Bolero may have been caused by thedifferences in leaflet size, as Quantum leaflets werelarger than those of Pania or Bolero at nodes 6 and 7.However, no differences between the nodes were foundwhen the components of conidium production werecorrected for colony area. Therefore, all differences intotal conidium production that were found between thedifferent nodes were the result of different leaflet sizes.
The maximum conidium production per day onQuantum and Bolero was reduced by over 20% andby 40%, respectively, when compared with Pania. Thedifference in time to maximum conidium productionbetween Quantum and Pania was approximately 10%.Time to maximum conidium production per dayprovided an epidemiologically similar method of asses-sing delayed conidium production to latent period. Thisstudy indicated that Quantum had a narrower range ofconidium production per colony area at the differenttemperatures than the other cultivars.
All measures of conidium production were signifi-cantly affected by temperature. Total conidium produc-tion per colony area increased 2·15 times and CMAXper colony area increased three-fold for every 58Cincrease in temperature (Table 5). Ward & Manners(1974) found sporulation was greatest at 208C forE. graminis f.sp. hordei; optimum relative humidity forsporulation was 100%, but light intensity and photo-period had little effect on sporulation. Overall quanti-tative resistance in Quantum was stable.
Implications for breeding for quantitative resistance
Reductions in infection efficiency, leading to lowerpercentage of leaf area covered, maximum conidiumproduction per colony area, and increases in time tomaximum conidium production were importantepidemiological factors that characterized quantitativeresistance in the pea cultivar Quantum compared withthe susceptible cultivar Pania. Percentage germination ofconidia and latent period did not differ between thesecultivars. Bolero is one of the parent lines of Quantum,and although it was evident that Bolero also had somequantitative resistance to powdery mildew, this differedfrom the quantitative resistance observed in Quantum.This is consistent with the report (D. Webster, AsgrowSeed Company, 1994, personal communication) thatquantitative resistance in Quantum is inherited fromPlus and not from Bolero. Combination of the resistancein Quantum with that in Bolero may lead to greaterexpression of resistance overall.
It is unlikely that conidium production could be usedas a criterion to select progeny for quantitative resistancebecause of costs associated with the time required forsuch analyses. The costs may be worthwhile, however, inthe selection and identification of parental material inbreeding programmes. Before this is possible, suitablescreening procedures for the components must beavailable, and providing information for developingthese has been the purpose of this study. Other factors,
Components of resistance to E. pisi 145
Q 1998 BSPP Plant Pathology (1998) 47, 137–147
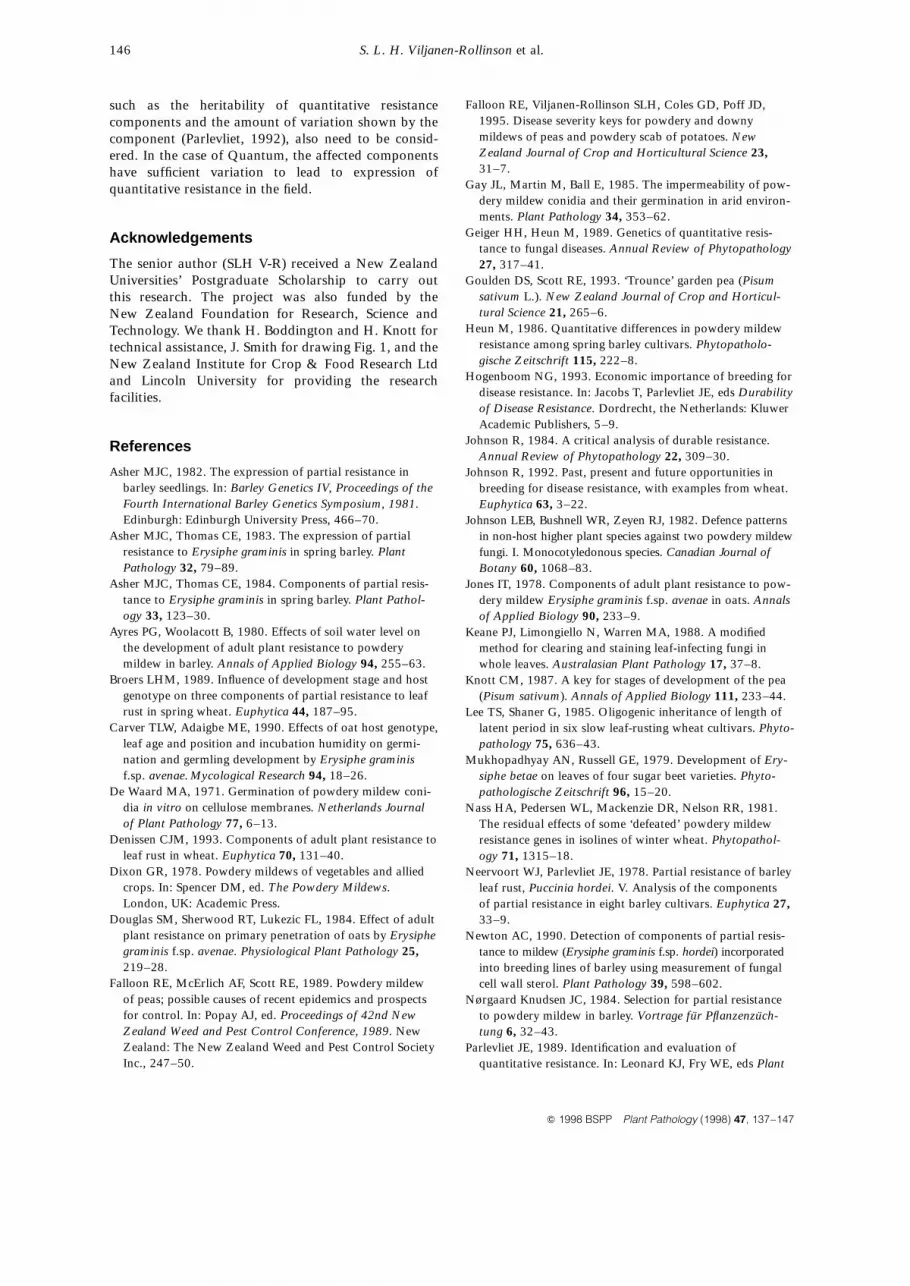
such as the heritability of quantitative resistancecomponents and the amount of variation shown by thecomponent (Parlevliet, 1992), also need to be consid-ered. In the case of Quantum, the affected componentshave sufficient variation to lead to expression ofquantitative resistance in the field.
Acknowledgements
The senior author (SLH V-R) received a New ZealandUniversities’ Postgraduate Scholarship to carry outthis research. The project was also funded by theNew Zealand Foundation for Research, Science andTechnology. We thank H. Boddington and H. Knott fortechnical assistance, J. Smith for drawing Fig. 1, and theNew Zealand Institute for Crop & Food Research Ltdand Lincoln University for providing the researchfacilities.
References
Asher MJC, 1982. The expression of partial resistance inbarley seedlings. In: Barley Genetics IV, Proceedings of theFourth International Barley Genetics Symposium, 1981.Edinburgh: Edinburgh University Press, 466–70.
Asher MJC, Thomas CE, 1983. The expression of partialresistance to Erysiphe graminis in spring barley. PlantPathology 32, 79–89.
Asher MJC, Thomas CE, 1984. Components of partial resis-tance to Erysiphe graminis in spring barley. Plant Pathol-ogy 33, 123–30.
Ayres PG, Woolacott B, 1980. Effects of soil water level onthe development of adult plant resistance to powderymildew in barley. Annals of Applied Biology 94, 255–63.
Broers LHM, 1989. Influence of development stage and hostgenotype on three components of partial resistance to leafrust in spring wheat. Euphytica 44, 187–95.
Carver TLW, Adaigbe ME, 1990. Effects of oat host genotype,leaf age and position and incubation humidity on germi-nation and germling development by Erysiphe graminisf.sp. avenae. Mycological Research 94, 18–26.
De Waard MA, 1971. Germination of powdery mildew coni-dia in vitro on cellulose membranes. Netherlands Journalof Plant Pathology 77, 6–13.
Denissen CJM, 1993. Components of adult plant resistance toleaf rust in wheat. Euphytica 70, 131–40.
Dixon GR, 1978. Powdery mildews of vegetables and alliedcrops. In: Spencer DM, ed. The Powdery Mildews.London, UK: Academic Press.
Douglas SM, Sherwood RT, Lukezic FL, 1984. Effect of adultplant resistance on primary penetration of oats by Erysiphegraminis f.sp. avenae. Physiological Plant Pathology 25,219–28.
Falloon RE, McErlich AF, Scott RE, 1989. Powdery mildewof peas; possible causes of recent epidemics and prospectsfor control. In: Popay AJ, ed. Proceedings of 42nd NewZealand Weed and Pest Control Conference, 1989. NewZealand: The New Zealand Weed and Pest Control SocietyInc., 247–50.
Falloon RE, Viljanen-Rollinson SLH, Coles GD, Poff JD,1995. Disease severity keys for powdery and downymildews of peas and powdery scab of potatoes. NewZealand Journal of Crop and Horticultural Science 23,31–7.
Gay JL, Martin M, Ball E, 1985. The impermeability of pow-dery mildew conidia and their germination in arid environ-ments. Plant Pathology 34, 353–62.
Geiger HH, Heun M, 1989. Genetics of quantitative resis-tance to fungal diseases. Annual Review of Phytopathology27, 317–41.
Goulden DS, Scott RE, 1993. ‘Trounce’ garden pea (Pisumsativum L.). New Zealand Journal of Crop and Horticul-tural Science 21, 265–6.
Heun M, 1986. Quantitative differences in powdery mildewresistance among spring barley cultivars. Phytopatholo-gische Zeitschrift 115, 222–8.
Hogenboom NG, 1993. Economic importance of breeding fordisease resistance. In: Jacobs T, Parlevliet JE, eds Durabilityof Disease Resistance. Dordrecht, the Netherlands: KluwerAcademic Publishers, 5–9.
Johnson R, 1984. A critical analysis of durable resistance.Annual Review of Phytopathology 22, 309–30.
Johnson R, 1992. Past, present and future opportunities inbreeding for disease resistance, with examples from wheat.Euphytica 63, 3–22.
Johnson LEB, Bushnell WR, Zeyen RJ, 1982. Defence patternsin non-host higher plant species against two powdery mildewfungi. I. Monocotyledonous species. Canadian Journal ofBotany 60, 1068–83.
Jones IT, 1978. Components of adult plant resistance to pow-dery mildew Erysiphe graminis f.sp. avenae in oats. Annalsof Applied Biology 90, 233–9.
Keane PJ, Limongiello N, Warren MA, 1988. A modifiedmethod for clearing and staining leaf-infecting fungi inwhole leaves. Australasian Plant Pathology 17, 37–8.
Knott CM, 1987. A key for stages of development of the pea(Pisum sativum). Annals of Applied Biology 111, 233–44.
Lee TS, Shaner G, 1985. Oligogenic inheritance of length oflatent period in six slow leaf-rusting wheat cultivars. Phyto-pathology 75, 636–43.
Mukhopadhyay AN, Russell GE, 1979. Development of Ery-siphe betae on leaves of four sugar beet varieties. Phyto-pathologische Zeitschrift 96, 15–20.
Nass HA, Pedersen WL, Mackenzie DR, Nelson RR, 1981.The residual effects of some ‘defeated’ powdery mildewresistance genes in isolines of winter wheat. Phytopathol-ogy 71, 1315–18.
Neervoort WJ, Parlevliet JE, 1978. Partial resistance of barleyleaf rust, Puccinia hordei. V. Analysis of the componentsof partial resistance in eight barley cultivars. Euphytica 27,33–9.
Newton AC, 1990. Detection of components of partial resis-tance to mildew (Erysiphe graminis f.sp. hordei) incorporatedinto breeding lines of barley using measurement of fungalcell wall sterol. Plant Pathology 39, 598–602.
Nørgaard Knudsen JC, 1984. Selection for partial resistanceto powdery mildew in barley. Vortrage fur Pflanzenzuch-tung 6, 32–43.
Parlevliet JE, 1989. Identification and evaluation ofquantitative resistance. In: Leonard KJ, Fry WE, eds Plant
S. L. H. Viljanen-Rollinson et al.146
Q 1998 BSPP Plant Pathology (1998) 47, 137–147

Disease Epidemiology, Vol. 2: Genetics, Resistance andManagement. London, UK: McGraw–Hill Publishing Com-pany, 215–48.
Parlevliet JE, 1992. Selecting components of partial resistance.In: Stalker HT, Murphy JP, eds Plant Breeding in the1990s. Wallingford, UK: CAB International, 281–302.
Parlevliet JE, van Ommeren A, 1975. Partial resistance ofbarley to leaf rust Puccinia hordei. II. Relationship betweenfield trials, micro plot tests and latent period. Euphytica24, 293–303.
Raju SG, Anilkumar TB, 1990. Evaluation of cowpea geno-types for partial resistance to powdery mildew. Euphytica50, 191–5.
Roumen EC, 1992. Effect of leaf age on components of par-tial resistance in rice to leaf blast. Euphytica 63, 271–9.
Roumen EC, de Boef WS, 1993. Latent period to leaf blast inrice and its importance as a component of partial resis-tance. Euphytica 69, 185–90.
Rouse DI, Nelson RR, Mackenzie DR, Armitage CR, 1980.Components of rate-reducing resistance in seedlings offour wheat cultivars and parasitic fitness in six isolates ofErysiphe graminis f.sp. tritici. Phytopathology 70, 1097–100.
Russell GE, Andrews CR, Bishop CD, 1975. Germination ofErysiphe graminis f.sp. hordei conidia on barley leaves.Annals of Applied Biology 81, 161–9.
Shaner G, 1973. Estimation of conidia production by indivi-dual pustules of Erysiphe graminis f.sp. tritici. Phytopathol-ogy 63, 847–50.
Simmonds NW, 1991. Genetics of horizontal resistance todiseases of crops. Biological Reviews of the CambridgePhilosophical Society 66, 189–241.
Singh UP, Singh HB, 1983. Development of Erysiphe pisi onsusceptible and resistant cultivars of pea. Transactions ofthe British Mycological Society 81, 275–8.
Sivapalan A, 1993. Effects of water on germination of pow-dery mildew conidia. Mycological Research 97, 71–6.
Timmerman GM, Frew TJ, Weeden NF, Miller AL, GouldenDS, 1994. Linkage analysis of er-1, a recessive Pisumsativum gene for resistance to powdery mildew fungus(Erysiphe pisi DC). Theoretical and Applied Genetics 88,1050–5.
Viljanen-Rollinson SLH, 1996. Expression and Detectionof Quantitative Resistance to Erysiphe pisi in Pea (Pisumsativum). Lincoln, New Zealand: Lincoln University, PhDthesis.
Viljanen-Rollinson SLH, Frampton CMA, Gaunt RE, FalloonRE, McNeil DL, 1998. Spatial and temporal spread ofpowdery mildew (Erysiphe pisi) in peas (Pisum satiuum)varying in quantitative resistance. Plant Pathology 47,148–156 (this issue).
Ward SV, Manners JG, 1974. Environmental effects on thequantity and viability of conidia produced by Erysiphegraminis. Transactions of the British Mycological Society62, 119–28.
Wright AJ, Heale JB, 1984. Adult plant resistance to powderymildew (Erysiphe graminis) in three barley cultivars. PlantPathology 33, 493–502.
Components of resistance to E. pisi 147
Q 1998 BSPP Plant Pathology (1998) 47, 137–147


