Embed Size (px)
Citation preview

Compounds with Polar Metallic Bonding
Constantin Hoch
www.mdpi.com/journal/crystals
Edited by
Printed Edition of the Special Issue Published in Crystals

Compounds with Polar Metallic Bonding

Compounds with Polar Metallic Bonding
Special Issue Editor
Constantin Hoch
MDPI • Basel • Beijing • Wuhan • Barcelona • Belgrade
Special Issue Editor
Constantin Hoch
LMU Munich, Department for Chemistry,
Germany
Editorial Office
MDPI
St. Alban-Anlage 66
4052 Basel, Switzerland
This is a reprint of articles from the Special Issue published online in the open access journal Crystals
(ISSN 2073-4352) from 2018 to 2019 (available at: https://www.mdpi.com/journal/crystals/special
issues/Polar Metallic Bonding)
For citation purposes, cite each article independently as indicated on the article page online and as
indicated below:
LastName, A.A.; LastName, B.B.; LastName, C.C. Article Title. Journal Name Year, Article Number,
Page Range.
ISBN 978-3-03921-070-1 (Pbk)
ISBN 978-3-03921-071-8 (PDF)
c© 2019 by the authors. Articles in this book are Open Access and distributed under the Creative
Commons Attribution (CC BY) license, which allows users to download, copy and build upon
published articles, as long as the author and publisher are properly credited, which ensures maximum
dissemination and a wider impact of our publications.
The book as a whole is distributed by MDPI under the terms and conditions of the Creative Commons
license CC BY-NC-ND.
Contents
About the Special Issue Editor . . . . . . . . . . . . . . . . . . . . . . . . . . . . . . . . . . . . . . vii
Constantin HochCompounds with Polar Metallic BondingReprinted from: Crystals 2019, 9, 267, doi:10.3390/cryst9050267 . . . . . . . . . . . . . . . . . . . . 1
Corinna Lorenz, Stefanie Gartner and Nikolaus KorberAmmoniates of Zintl Phases: Similarities and Differences of Binary Phases A4E4 and TheirCorresponding SolvatesReprinted from: Crystals 2018, 8, 276, doi:10.3390/cryst8070276 . . . . . . . . . . . . . . . . . . . . 5
Alexander Ovchinnikov, Matej Bobnar, Yurii Prots, Walter Schnelle, Peter Hohn and Yuri GrinBa4[Mn3N6], a Quasi-One-Dimensional Mixed-Valent Nitridomanganate (II, IV)Reprinted from: Crystals 2018, 8, 235, doi:10.3390/cryst8060235 . . . . . . . . . . . . . . . . . . . . 22
Yufei Hu, Kathleen Lee and Susan M. KauzlarichOptimization of Ca14MgSb11 through Chemical Substitutions on Sb Sites: Optimizing SeebeckCoefficient and Resistivity SimultaneouslyReprinted from: Crystals 2018, 8, 211, doi:10.3390/cryst8050211 . . . . . . . . . . . . . . . . . . . . 36
Riccardo Freccero, Pavlo Solokha, Davide Maria Proserpio, Adriana Saccone and Serena De NegriLu5Pd4Ge8 and Lu3Pd4Ge4: Two More Germanides among Polar IntermetallicsReprinted from: Crystals 2018, 8, 205, doi:10.3390/cryst8050205 . . . . . . . . . . . . . . . . . . . . 46
Michael Langenmaier, Michael Jehle and Caroline RohrMixed Sr and Ba Tri-Stannides/Plumbides AII(Sn1−xPbx)3Reprinted from: Crystals 2018, 8, 204, doi:10.3390/cryst8050204 . . . . . . . . . . . . . . . . . . . . 64
Asa Toombs and Gordon J. MillerRhombohedral Distortion of the Cubic MgCu2-Type Structure in Ca2Pt3Ga and Ca2Pd3GaReprinted from: Crystals 2018, 8, 186, doi:10.3390/cryst8050186 . . . . . . . . . . . . . . . . . . . . 85
Fabian Eustermann, Simon Gausebeck, Carsten Dosche, Mareike Haensch, Gunther Wittstock and Oliver JankaCrystal Structure, Spectroscopic Investigations, and Physical Properties of the Ternary Intermetallic REPt2Al3 (RE = Y, Dy–Tm) and RE2Pt3Al4 Representatives (RE = Tm, Lu)Reprinted from: Crystals 2018, 8, 169, doi:/10.3390/cryst8040169 . . . . . . . . . . . . . . . . . . . 98
Simon Steinberg and Richard DronskowskiThe Crystal Orbital Hamilton Population (COHP) Method as a Tool to Visualize and AnalyzeChemical Bonding in Intermetallic CompoundsReprinted from: Crystals 2018, 8, 225, doi:10.3390/cryst8050225 . . . . . . . . . . . . . . . . . . . . 118
v

About the Special Issue Editor
Constantin Hoch studied Chemistry at the University of Freiburg im Breisgau (Germany), where
he also received his PhD degree in 2003. First as a postdoc, then as scientific coworker, he stayed for
several years at the Max Planck Institute for Solid State Research in Stuttgart (Germany). After a short
stay at Stuttgart University, he moved to Munich University, where he earned his Habilitation in 2018.
His research interests include transition forms of metallic and ionic bonding and compound classes
such as subvalent alkaline and earth alkaline metal compounds, amalgams of less noble metals and
metal-rich metalates. These chemical systems require development of modern preparation methods,
X-ray crystallography on highly absorbing materials, and DFT calculations of the electronic structures
of solids with polar metal-metal bonding. His results have been published in internationally
renowned peer-reviewed journals (105 publications to date, with 677 citations and h = 13).
vii

crystals
Editorial
Compounds with Polar Metallic Bonding
Constantin Hoch
Department Chemie, LMU München, Butenandtstraße 5-13(D), D-81377 München, Germany;[email protected]; Tel.: +49-89-2180-77421
Received: 14 May 2019; Accepted: 16 May 2019; Published: 22 May 2019
Recently, I witnessed a discussion amongst solid state chemists whether the term polar intermetallic
bonding was necessary or dispensable, whether a conceptual discernation of this special class ofintermetallic compounds was indicated or spurious. It quickly outcropped that the reason for thisdiscussion is the ambiguity of the term polar. Most chemists associate polarity immediately with bondpolarity in a classical van Arkel-Ketelaar triangle picture [1,2]. And as introduction of ionic polarizationinto a covalent bond is a very common case also in intermetallic systems, the term polar intermetallic
phases indeed may seem dispensable. However, the term has existed in the literature for many decades,and there is a good reason for this. Polarity in intermetallic phases causes a number of effects, and theunderlying structure-property relationships justify summarizing this class of intermetallic compoundswith one common epithet. The conceptual difficulty with it is due to multiple meanings of the term.There are several instances of polar metal or polar metal-metal bonding in the literature, and as they originatefrom different scientific backgrounds it is not always clear to the public in which sense polarity is beingreferred to by the author.
Not only Coulombic, but all kinds of dipoles are appropriate to create polarity in an intermetallic phase.The different aspects of macroscopic polarity have one common condition, and it is a crystallographic one.Dipole interaction in a long-range ordering is only observed when inversion symmetry or mirror planesperpendicular to the dipole axis are absent. Therefore the crystallographic meaning of polar is the absenceof special symmetry operations [3,4]. The perhaps largest number of scientific publications on polar metals
concentrates on electron conducting materials showing some kind of ordering of electric dipoles in thestructures. The coexistence of ordered electric dipoles, as e.g., in ferroelectrics, and metallic behaviorcomes as a surprise as it would normally be forbidden by Gauss’ law: Due to charge screening the effectivefield within an electron conductor has to be zero, ruling out any kind of cooperative long-range dipoleordering. This rule can be broken in cases of weak electron-phonon coupling, and it is observed in a largeand growing number of perovskite-type materials [5–8]. These materials show great potential in futuredata storage systems with high density and long lifetimes [9,10]. Also the presence of magnetic dipolesand their long-range ordering leads to a form of polarity within an intermetallic phase, and ferromagneticbehavior is a common case. The interface created by contacting a semiconductor with a metal resultsin a Schottky barrier, and its height depends on electron concentrations, doping and other parameters.The height of the Schottky barrier creates polarity at the metallic interface often referred to in literatureas polar bonding [11,12]. And finally, in coordination chemistry, a covalent bonding between the metalcenters of a heterodimetallic coordination compound is described as a polar metal-metal bond when theelectronegativity differences between the metal atoms is pronounced [13]. This shows how different themeaning of polar metallic bonding can be understood, depending on the context.
The Special Issue of Crystals entitled Compounds with Polar Metallic Bonding presented here isa compilation of eight original articles based on the most recent research projects. It may therefore be seenas a snapshot view on the subject, and it is my great pleasure to see so many different interpretations of
Crystals 2019, 9, 267; doi:10.3390/cryst9050267 www.mdpi.com/journal/crystals
1
Crystals 2019, 9, 267
the term polar metallic bonding assembled here. The broad spectrum of the different meanings of polarity inintermetallic compounds is brought forward by a plethora of modern synthetic approaches, structuralstudies, interpretations of chemical bonding and application-driven materials science. We are extremelyhappy to have attracted prominent and outstanding members of the intermetallic community to contributewith articles of highest quality to this compilation and we owe them the deepest gratitude:
• Corinna Lorenz, Stefanie Gärtner and Nikolaus Korber report in their article ‘Amoniates of ZintlPhases: Similarities and Differences of Binary Phases A4E4 and Their Corresponding Solvates’ [14]about Zintl chemistry, presenting chemical examples for highest polarity, the complete electrontransfer from less noble metal to an electronegative metal. Intermetallic phases of this kind can bedissolved in and recrystallized from polar solvents. Crystalline solvates of Zintl phases may be seenas ‘expanded metals’ and cross the border from intermetallic phases to coordination compounds inan impressive way.
• Alexander Ovchinnikov, Matej Bobnar, Yurii Prots, Walter Schnelle, Peter Höhn and Yuri Grinpresent a communication with he title ‘Ba4[Mn3N6], a Quasi-One-Dimensional Mixed-ValentNitridomanganate(II,IV)’ [15] and give a beautiful example of both sophisticated modern solidstate synthesis and of modern interpretation of the chemical bond in a semiconducting material withlong-range ordering of magnetic dipoles. The interplay of magnetic and electronic properties is mostinteresting in this chain compound.
• Yufei Hu, Kathleen Lee and Susan M. Kauzlarich report on ‘Optimization of Ca14MgSb11
through Chemical Substitutions on Sb Sites: Optimizing Seebeck Coefficient and ResistivitySimultaneously’ [16]. Their reseach on thermoelectric materials within the class of Zintl compoundshas gained great atention over the years. Getting control over thermal end electric conductivity viastructural modification is a highly difficult task, and the article present in this Special Issue givesan excellent example.
• Riccardo Freccero, Pavlo Solokha, Davide Maria Proserpio, Adriana Saccone and Serena De Negrireport on ’Lu5Pd4Ge8 and Lu3Pd4Ge4: Two More Germanides among Polar Intermetallics’ [17].Their structural and theoretical study shows the compounds to consist of a network of negativelypolarized Ge and Pd atoms whereas Lu acts as a counter-cation, being positively polarized.
• Michael Langenmaier, Michael Jehle and Caroline Röhr present an article entitled ‘Mixed Sr andBa Tri-Stannides/Plumbides AI I(Sn1−x
Pbx)3’ [18], dealing with a mixed-crystal series in which thecontinuous chemical exchange causes the transition from ionic to metallic bonding. This is a mostinstructive example how chemical bonding can be directly manipulated by chemical means. Modernways of conceptualizing electron distributions in the sense of counting rules are presented next tohigh-level DFT calculations of the electronic structures and also geometric analyses.
• Asa Toombs and Gordon J. Miller show a detailed structural study on ‘Rhombohedral Distortion ofthe Cubic MgCu2-Type Structure in Ca2Pt3Ga and Ca2Pd3Ga’ [19]. They give an excellent exampleon how electronic structure and crystallographic distortion mutually interact.
• Fabian Eustermann, Simon Gausebeck, Carsten Dosche, Mareike Haensch, Gunther Wittstock andOliver Janka present an article entitled ’Crystal Structure, Spectroscopic Investigations, and PhysicalProperties of the Ternary Intermetallic REPt2Al3 (RE = Y, Dy–Tm) and RE2Pt3Al4 Representatives(RE = Tm, Lu)’ [20]. Here, structural and chemical modifications go hand in hand with symmetryreduction, magnetic interactions and with gradual polarity changes.
• Simon Steinberg and Richard Dronskowski present a review on ‘The Crystal Orbital HamiltonPopulation (COHP) Method as a Tool to Visualize and Analyze Chemical Bonding in IntermetallicCompounds’ [21]. This comprehensive study gives a summary and overview on fundamentalconcepts of recognizing the chemical bonding in intermetallic compounds. They give a coherent
2
Crystals 2019, 9, 267
introduction into the well-established COHP method, the 25th anniversary of which gave rise for thisreview. With the examples of cluster-based rare-earth transition metal halides and of gold-containingintermetallic series they illustrate polarity and its expression in terms of bond analyses. The relevanceof such considerations on material chemistry is emphasized with respect to phase-change materialsand to magnetic materials.
The world of intermetallic compounds with polar metallic bonding is a rapidly growing one.It is a fertile ground on which novel materials emerge, due to the unique ability of polar intermetallics toprovide new and unexpected combinations of properties. This Special Issue may be taken as an excellentexample on how much further work is needed in order to purposefully direct material research in thisfield, and, indeed, how valuable basic research on chemical systems and development of concepts forelucidation of electronic bonding situations is with this respect.
References
1. Van Arkel, A.E. Moleculen en Kristallen; van Stockum: Den Haag, The Netherlands, 1941.2. Ketelaar, J.A.A. De Chemische Binding: Inleiding in de Theoretische Chemie; Elsevier: New York, NY, USA;
Amsterdam, The Netherlands, 1947.3. Anderson, P.W.; Blount, E.I. Symmetry considerations on martensitic transformations: ‘ferroelectric’ metals?
Phys. Rev. Lett. 1965, 14, 217. [CrossRef]4. Lawson, A.C.; Zachariasen, W.H. Low temperature lattice transformation of HfV2. Phys. Lett. 1972, 38, 1.
[CrossRef]5. Kim, T.H.; Puggioni, D.; Yuan, Y.; Xie, L.; Zhou, H.; Campbell, N.; Ryan, P.J.; Hoi, Y.C.; Kim, J.-W.;
Patzner, J.R.; et al. Polar metals by geometric design. Nature 2016, 533, 68–72. [CrossRef] [PubMed]6. Puggioni, D.; Rondinelli, J.M. Designing a robustly metallic noncentrosymmetric ruthenate oxide with large
thermopower anisotropy. Nat. Commun. 2014, 5, 3432. [CrossRef] [PubMed]7. Puggioni, D.; Giovanetti, G.; Capone, M.; Rondinelli, J.M. Design of a Mott multiferroic from a nonmagentic
polar metal. Phys. Rev. Lett. 2015, 115, 087202. [CrossRef] [PubMed]8. Shi, Y.; Guo, Y.; Wang, X.; Princep, A.J.; Khalyavin, S.; Manuel, P.; Michiue, Y.; Sato, A.; Tsuda, K.; Yu, S.; et al.
A ferroelectric-like structural transition in a metal. Nat. Mater. 2013, 12, 1024–1027. [CrossRef]9. Scott, J.F. Data storage: Multiferroic memories. Nat. Mater. 2007, 6, 256–257. [CrossRef]10. Morin, M.; Canévet, E.; Raynaud, A.; Bartkowiak, M.; Sheptyakov, D.; Ban, V.; Kenzelmann, M.; Pomjakushina,
E.; Conder, K.; Medarde, M. Tuning magnetic spirals beyond room temperature with chemical disorder.Nat. Commun. 2016, 7, 13758. [CrossRef]
11. Mönch, W. (Ed.) Electronic Structure of Metal-Semiconductor Contacts; Jaca Book: Milano, Italy, 1990;ISBN 978-94-009-0657-0.
12. Berthold, C.; Binggeli, N.; Baldereschi, A. Schottky barrier heights at polar metal/semiconductor interfaces.Phys. Rev. B 2003, 68, 085323. [CrossRef]
13. Muetterties, E.L.; Rhodin, T.N.; Band, E.; Brucker, C.F.; Pretzer, W.R. Clusters and Surfaces. Chem. Rev. 1979, 79,91–137. [CrossRef]
14. Lorenz, C.; Gärtner, S.; Korber, N. Ammoniates of Zintl phases. similarities and differences of binary phasesA4E4 and their corresponding solvates. Crystals 2018, 8, 276. [CrossRef]
15. Ovchinnikov, A.; Bobnar, M.; Prots, Y.; Schnelle, W.; Höhn, P.; Grin, Y. Ba4[Mn3N6], a quasi-one-dimensionalmixed-valent nitridomanganate(II,IV). Crystals 2018, 8, 235. [CrossRef]
16. Hu, Y.; Lee, K.; Kauzlarich, S.M. Optimization of Ca14MgSb11 through chemical substitutions on Sb sites:optimizing Seebeck coefficient and resistivity simultaneously. Crystals 2018, 8, 211. [CrossRef]
17. Freccero, R.; Solokha, P.; Proserpio, D.M.; Saccone, A.; De Negri, S. Lu5Pd4Ge8 and Lu3Pd4Ge4: Two moregermanides among polar intermetallics. Crystals 2018, 8, 205. [CrossRef]
3
Crystals 2019, 9, 267
18. Langenmaier, M.; Jehle, M.; Röhr, C. Mixed Sr and Ba tri-stannides/plumbides AI I(Sn1−xPbx)3. Crystals 2018, 8, 204.[CrossRef]
19. Toombs, A.; Miller, G.J. Rhombohedral distortion of the cubic MgCu2-type structure in Ca2Pt3Ga and Ca2Pd3Ga.Crystals 2018, 8, 186. [CrossRef]
20. Eustermann, F.; Gausebeck, S.; Dosche, C.; Haensch, M.; Wittstock, G.; Janka, O. Crystal structure, spectroscopicinvestigations, and physical properties of the ternary intermetallic REPt2Al3 (RE = Y, Dy-Tm) and RE2Pt3Al4representatives (RE = Tm, Lu). Crystals 2018, 8, 169. [CrossRef]
21. Steinberg, S.; Dronskowski, R. The crystal orbital Hamilton population (COHP) method as a tool to visualize andanalyze chemical bonding in intermetallic compounds. Crystals 2018, 8, 225. [CrossRef]
c© 2019 by the authors. Licensee MDPI, Basel, Switzerland. This article is an open accessarticle distributed under the terms and conditions of the Creative Commons Attribution (CCBY) license (http://creativecommons.org/licenses/by/4.0/).
4
crystals
Article
Ammoniates of Zintl Phases: Similarities andDifferences of Binary Phases A4E4 and TheirCorresponding Solvates
Corinna Lorenz, Stefanie Gärtner and Nikolaus Korber *
Institute of Inorganic Chemistry, University of Regensburg, 93055 Regensburg, Germany;[email protected] (C.L.); [email protected] (S.G.)* Correspondence: [email protected]; Tel: +49-941-943-4448; Fax: +49-941-943-1812
Received: 20 April 2018; Accepted: 23 June 2018; Published: 29 June 2018
Abstract: The combination of electropositive alkali metals A (A = Na-Cs) and group 14 elements E(E = Si-Pb) in a stoichiometric ratio of 1:1 in solid state reactions results in the formation of polyanionicsalts, which belong to a class of intermetallics for which the term Zintl compounds is used. Crystalstructure analysis of these intermetallic phases proved the presence of tetrahedral tetrelide tetraanions[E4]4− precast in solid state, and coulombic interactions account for the formation of a dense,three-dimensional cation-anion network. In addition, it has been shown that [E4]4− polyanions arealso present in solutions of liquid ammonia prepared via different synthetic routes. From thesesolutions crystallize ammoniates of the alkali metal tetrahedranides, which contain ammoniamolecules of crystallization, and which can be characterized by X-ray crystallography despitetheir low thermal stability. The question to be answered is about the structural relations betweenthe analogous compounds in solid state vs. solvate structures, which all include the tetrahedral[E4]4− anions. We here investigate the similarities and differences regarding the coordination spheresof these anions and the resulting cation-anion network. The reported solvates Na4Sn4·13NH3,Rb4Sn4·2NH3, Cs4Sn4·2NH3, Rb4Pb4·2NH3 as well as the up to now unpublished crystal structuresof the new compounds Cs4Si4·7NH3, Cs4Ge4·9NH3, [Li(NH3)4]4Sn4·4NH3, Na4Sn4·11.5NH3 andCs4Pb4·5NH3 are considered for comparisons. Additionally, the influence of the presence of anotheranion on the overall crystal structure is discussed by using the example of a hydroxide co-crystalwhich was observed in the new compound K4.5Sn4(OH)0.5·1.75 NH3.
Keywords: Zintl compounds; liquid ammonia; crystal structure
1. Introduction
The term “polar intermetallics” applies to a large field of intermetallic compounds, theproperties of which range from metallic and superconducting to semiconducting with a real bandgap [1–5]. For the compounds showing a real band gap, the Zintl–Klemm concept is applicableby formally transferring the valence electrons of the electropositive element to the electronegativepartner, and the resulting salt-like structure allows for the discussion of anionic substructures [1–9].The combination of electropositive alkali metals A (A = Na-Cs) and group 14 elements E (E = Si-Pb) ina stoichiometric ratio of 1:1 in solid state reactions results in the formation of salt-like, semiconductingintermetallic compounds which show the presence of the tetrahedral [E4]4− anions precast in solidstate. These anions are valence isoelectronic to white phosphorus and can be seen as molecular units.They have been known since the work of Marsh and Shoemaker in 1953 who first reported on thecrystal structure of NaPb [10]. Subsequently, the list of the related binary phases of alkali metaland group 14 elements was completed (Table 1, Figure 1). Due to coulombic interactions a dense,three-dimensional cation-anion network in either the KGe structure type (A = K-Cs; E = Si, Ge) [11–17]
Crystals 2018, 8, 276; doi:10.3390/cryst8070276 www.mdpi.com/journal/crystals5
Crystals 2018, 8, 276
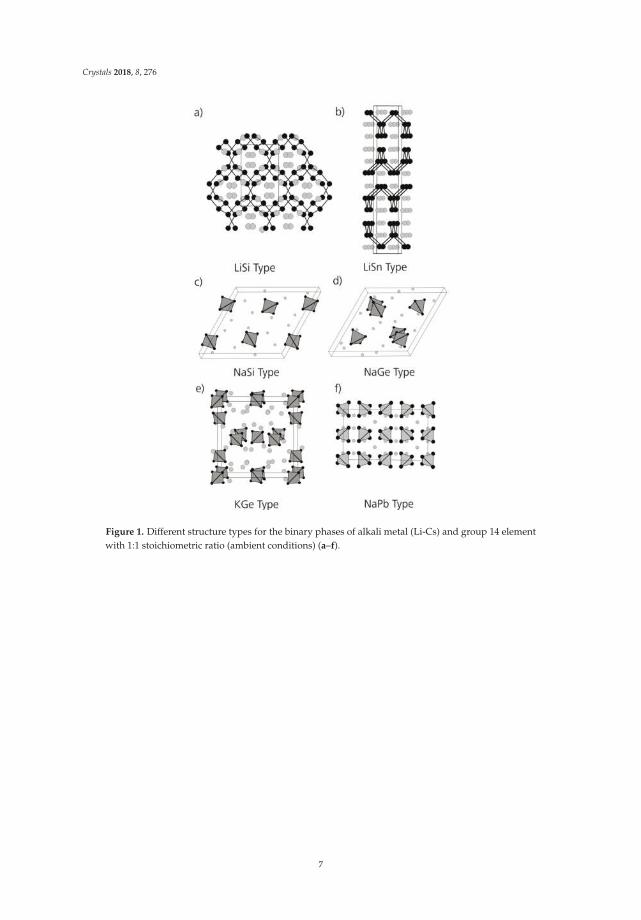
or NaPb structure type (A = Na-Cs; E = Sn, Pb) (Figure 1e,f) [18–21] is observed. For sodium andthe lighter group 14 elements silicon and germanium, binary compounds lower in symmetry (NaSi:C2/c [14,16,17,22], NaGe: P21/c [14,16]) are formed, which also contain the tetrahedral shaped [E4]4−
anions (Figure 1c,d). In the case of lithium, no binary compound with isolated [E4]4− polyanions isreported at ambient conditions: In LiSi [23] and LiGe [24] (LiSi structure type, Figure 1a), threefoldbound silicon atoms are observed in a three-dimensionally extended network, which for tetrel atomswith a charge of −1 is an expected topological alternative to tetrahedral molecular units, and whichconforms to the Zintl–Klemm concept. If the [E4]4− cages are viewed as approximately spherical,the calculated radius r would be 3.58 Å for silicide, 3.67 Å for germanide, 3.96 Å for stannide and 3.90Å for plumbide clusters (r = averaged distances of the center of the cages to the vertex atoms + van derWaals radii of the elements, each [25]). The dimensions for silicon and germanium are very similar,as are those for tin and lead. It is worth noticing that there is a significant increase in the size of thetetrahedra, which are considered as spherical, for the transition from germanium to tin, which couldexplain the change of the structure type KGe to NaPb.
For binary compounds of lithium and tin or lead, the case is different. The Zintl rule is notapplicable as LiSn (Figure 1b) [26] includes one-dimensional chains of tin atoms, whereas NaSn [19,27]forms two-dimensional layers as the tin substructure. For LiPb [28] the CsCl structure has beenreported, which is up to now unreproduced.
Table 1. Binary phases of alkali metal (Li-Cs) and group 14 element with 1:1 stoichiometric ratio(ambient conditions).
Si Ge Sn Pb
Li I41/a LiSi [23] I41/a LiSi [24] I41/amd [26] CsCl (?) [28]Na C2/c [14,16,17,22] P21/c [14,16] I41/acd NaPb [19,27] I41/acd NaPb [10]K P-43n KGe [11,12,14] P-43n KGe [11,13] I41/acd NaPb [19,21] I41/acd NaPb [21]
Rb P-43n KGe [11,12,14] P-43n KGe [11,13,14] I41/acd NaPb [18,21] I41/acd NaPb [20,21]Cs P-43n KGe [11,12,14] P-43n KGe [11,13,14] I41/acd NaPb [18,21] I41/acd NaPb [24]
Additionally, it has been shown that the tetrelide tetraanions are also present in solutions of liquidammonia [29], and from these solutions alkali metal cation-[E4]4− compounds that additionally containammonia molecules of crystallization can be precipitated. We earlier reported on the crystal structuresof Rb4Sn4·2NH3, Cs4Sn4·2NH3 and Rb4Pb4·2NH3, which showed strong relations to the correspondingbinaries [30]. In Na4Sn4·13 NH3 [31,32] no such relation is observed. In general, ammonia in solidammoniates is not only an innocent and largely unconnected solvent molecule but may also act asa ligand towards the alkali metal cations. This leads to a variety of crystal structures, which allowsfor the investigation of the competing effects of cation-anion-interaction vs. alkali-metal-amminecomplex formation in the solid state. We here report on the single crystal X-ray investigationsof the new compounds Cs4Si4·7NH3, Cs4Ge4·9NH3, [Li(NH3)4]4Sn4·4NH3, Na4Sn4·11.5NH3 andCs4Pb4·5NH3 and compare the previously reported solvates as well as the new ammoniate compoundsof tetratetrelide tetranions to the known binary compounds. It has to be noted that the numberof ammoniate structures of tetrelide tetraanions is very limited [30–34] as they are easily oxidizedin solution by forming less reduced species like [E9]4− [35–40] and [E5]2− [36,41–43]. In Table 2,all hitherto known ammoniates which contain the highly charged [E4]4− (E = Si-Pb) cluster are listed.For [Sn9]4− we could recently show that co-crystallization of hydroxide anions is possible in thecompound Cs5Sn9(OH)·4NH3 [44]. We here present the first crystal structure of the co-crystal of[Sn4]4− and the hydroxide anion in the compound K4.5Sn4(OH)0.5·1.75 NH3 which allows for thediscussion of the influence of another anion on the overall crystal structure.
6
Crystals 2018, 8, 276
Figure 1. Different structure types for the binary phases of alkali metal (Li-Cs) and group 14 elementwith 1:1 stoichiometric ratio (ambient conditions) (a–f).
7
Crystals 2018, 8, 276
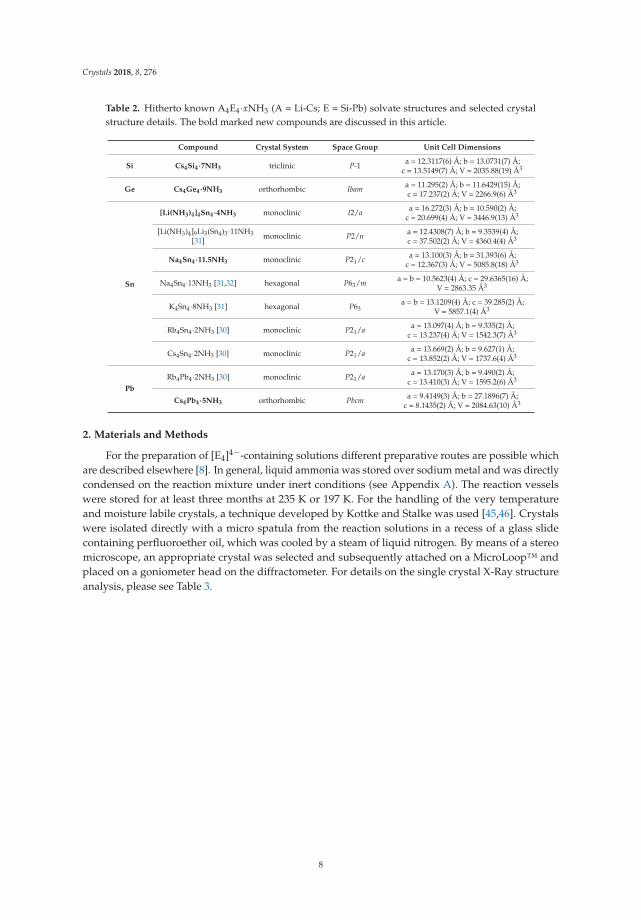
Table 2. Hitherto known A4E4·xNH3 (A = Li-Cs; E = Si-Pb) solvate structures and selected crystalstructure details. The bold marked new compounds are discussed in this article.
Compound Crystal System Space Group Unit Cell Dimensions
Si Cs4Si4·7NH3 triclinic P-1 a = 12.3117(6) Å; b = 13.0731(7) Å;c = 13.5149(7) Å; V = 2035.88(19) Å3
Ge Cs4Ge4·9NH3 orthorhombic Ibama = 11.295(2) Å; b = 11.6429(15) Å;c = 17.237(2) Å; V = 2266.9(6) Å3
Sn
[Li(NH3)4]4Sn4·4NH3 monoclinic I2/aa = 16.272(3) Å; b = 10.590(2) Å;
c = 20.699(4) Å; V = 3446.9(13) Å3
[Li(NH3)4]9Li3(Sn4)3·11NH3[31] monoclinic P2/n
a = 12.4308(7) Å; b = 9.3539(4) Å;c = 37.502(2) Å; V = 4360.4(4) Å3
Na4Sn4·11.5NH3 monoclinic P21/ca = 13.100(3) Å; b = 31.393(6) Å;
c = 12.367(3) Å; V = 5085.8(18) Å3
Na4Sn4·13NH3 [31,32] hexagonal P63/ma = b = 10.5623(4) Å; c = 29.6365(16) Å;
V = 2863.35 Å3
K4Sn4·8NH3 [31] hexagonal P63a = b = 13.1209(4) Å; c = 39.285(2) Å;
V = 5857.1(4) Å3
Rb4Sn4·2NH3 [30] monoclinic P21/aa = 13.097(4) Å; b = 9.335(2) Å;
c = 13.237(4) Å; V = 1542.3(7) Å3
Cs4Sn4·2NH3 [30] monoclinic P21/aa = 13.669(2) Å; b = 9.627(1) Å;
c = 13.852(2) Å; V = 1737.6(4) Å3
PbRb4Pb4·2NH3 [30] monoclinic P21/a
a = 13.170(3) Å; b = 9.490(2) Å;c = 13.410(3) Å; V = 1595.2(6) Å3
Cs4Pb4·5NH3 orthorhombic Pbcma = 9.4149(3) Å; b = 27.1896(7) Å;
c = 8.1435(2) Å; V = 2084.63(10) Å3
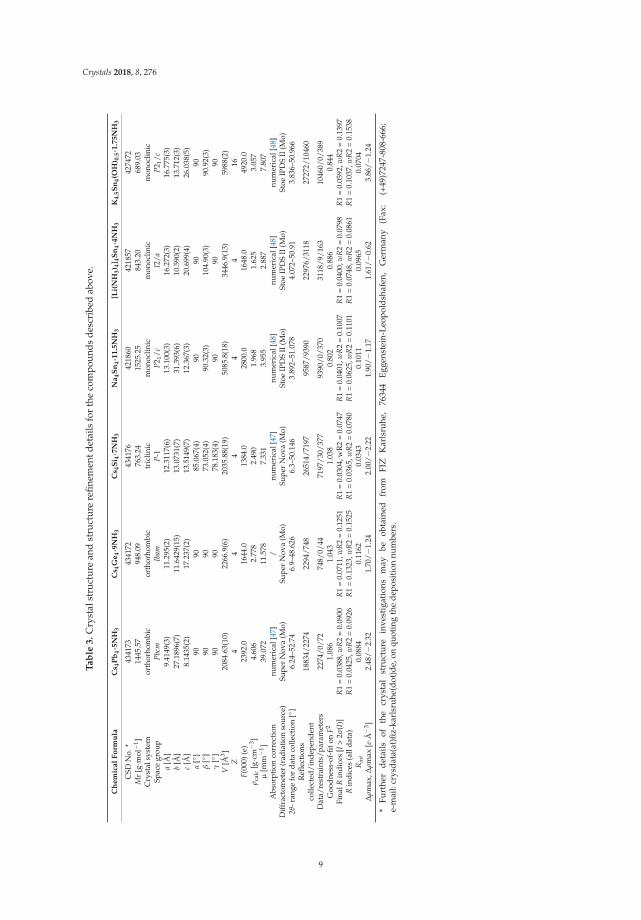
2. Materials and Methods
For the preparation of [E4]4−-containing solutions different preparative routes are possible whichare described elsewhere [8]. In general, liquid ammonia was stored over sodium metal and was directlycondensed on the reaction mixture under inert conditions (see Appendix A). The reaction vesselswere stored for at least three months at 235 K or 197 K. For the handling of the very temperatureand moisture labile crystals, a technique developed by Kottke and Stalke was used [45,46]. Crystalswere isolated directly with a micro spatula from the reaction solutions in a recess of a glass slidecontaining perfluoroether oil, which was cooled by a steam of liquid nitrogen. By means of a stereomicroscope, an appropriate crystal was selected and subsequently attached on a MicroLoop™ andplaced on a goniometer head on the diffractometer. For details on the single crystal X-Ray structureanalysis, please see Table 3.
8
Crystals 2018, 8, 276
Tab
le3.
Cry
stal
stru
ctur
ean
dst
ruct
ure
refin
emen
tdet
ails
for
the
com
poun
dsde
scri
bed
abov
e.
Ch
emic
alFo
rmu
laC
s 4P
b4·
5NH
3C
s 4G
e 4·9
NH
3C
s 4S
i 4·7
NH
3N
a 4S
n4·
11.5
NH
3[L
i(N
H3)
4]4S
n4·
4NH
3K
4.5S
n4(
OH
) 0.5·1
.75N
H3
CSD
No.
*43
4173
4341
7243
4176
4218
6042
1857
4274
72M
r[g·m
ol−
1 ]14
45.5
794
8.09
763.
2415
25.2
584
3.20
689.
03C
ryst
alsy
stem
orth
orho
mbi
cor
thor
hom
bic
tric
linic
mon
oclin
icm
onoc
linic
mon
oclin
icSp
ace
grou
pP
bcm
Ibam
P-1
P2 1
/cI2
/aP
2 1/c
a[Å
]9.
4149
(3)
11.2
95(2
)12
.311
7(6)
13.1
00(3
)16
.272
(3)
16.7
75(3
)b
[Å]
27.1
896(
7)11
.642
9(15
)13
.073
1(7)
31.3
93(6
)10
.590
(2)
13.7
12(3
)c
[Å]
8.14
35(2
)17
.237
(2)
13.5
149(
7)12
.367
(3)
20.6
99(4
)26
.038
(5)
α[
]90
9085
.067
(4)
9090
90β
[]
9090
73.0
52(4
)90
.32(
3)10
4.90
(3)
90.9
2(3)
γ[
]90
9078
.183
(4)
9090
90V
[Å3 ]
2084
.63(
10)
2266
.9(6
)20
35.8
8(19
)50
85.8
(18)
3446
.9(1
3)59
88(2
)Z
44
44
416
F(0
00)(
e)23
92.0
1644
.013
84.0
2800
.016
48.0
4920
.0ρ
calc
[g·c
m−
3 ]4.
606
2.77
82.
490
1.96
81.
625
3.05
7µ
[mm
−1 ]
39.0
7211
.578
7.33
13.
955
2.88
77.
807
Abs
orpt
ion
corr
ecti
onnu
mer
ical
[47]
/nu
mer
ical
[47]
num
eric
al[4
8]nu
mer
ical
[48]
num
eric
al[4
8]D
iffra
ctom
eter
(rad
iati
onso
urce
)Su
per
Nov
a(M
o)Su
per
Nov
a(M
o)Su
per
Nov
a(M
o)St
oeIP
DS
II(M
o)St
oeIP
DS
II(M
o)St
oeIP
DS
II(M
o)2
θ-ra
nge
for
data
colle
ctio
n[
]6.
24–5
2.74
6.9–
48.6
266.
3–50
.146
3.89
2–51
.078
4.07
2–50
.91
3.83
6–50
.966
Refl
ecti
ons
colle
cted
/ind
epen
dent
1883
4/22
7422
94/7
4826
514/
7197
9587
/939
022
976/
3118
2727
2/10
460
Dat
a/re
stra
ints
/par
amet
ers
2274
/0/7
274
8/0/
4471
97/3
0/37
793
90/0
/370
3118
/9/1
6310
460/
0/38
9G
oodn
ess-
of-fi
ton
F2
1.08
61.
043
1.03
80.
802
0.88
60.
844
Fina
lRin
dice
s[I
>2σ
(I)]
R1
=0.
0388
,wR
2=
0.09
00R
1=
0.07
11,w
R2
=0.
1251
R1
=0.
0304
,wR
2=
0.07
47R
1=
0.04
01,w
R2
=0.
1007
R1
=0.
0400
,wR
2=
0.07
98R
1=
0.05
92,w
R2
=0.
1397
Rin
dice
s(a
llda
ta)
R1
=0.
0425
,wR
2=
0.09
26R
1=
0.13
23,w
R2
=0.
1525
R1
=0.
0365
,wR
2=
0.07
80R
1=
0.06
25,w
R2
=0.
1101
R1
=0.
0748
,wR
2=
0.08
61R
1=
0.10
37,w
R2
=0.
1538
Rin
t0.
0884
0.11
620.
0343
0.10
110.
0965
0.07
04∆
ρm
ax,∆
ρm
ax[e·Å
−3 ]
2.48
/−
2.32
1.70
/−
1.24
2.00
/−
2.22
1.90
/−
1.17
1.61
/−
0.62
3.86
/−
1.24
*Fu
rthe
rd
etai
lsof
the
crys
tal
stru
ctu
rein
vest
igat
ions
may
beob
tain
edfr
omFI
ZK
arls
ruhe
,76
344
Egg
enst
ein-
Leo
pol
dsh
afen
,G
erm
any
(Fax
:(+
49)7
247-
808-
666;
e-m
ail:
crys
data
(at)
fiz-k
arls
ruhe
(dot
)de,
onqu
otin
gth
ede
posi
tion
num
bers
.
9
Crystals 2018, 8, 276
3. Results
In the following, the crystal structures of the new compounds Cs4Pb4·5NH3, Cs4Ge4·9NH3,Cs4Si4·7NH3, Na4Sn4·11.5NH3, [Li(NH3)4]4Sn4·4NH3 and K4.5Sn4(OH)0.5·1.75NH3 are describedindependently, their similarities and differences towards the binary materials are discussedsubsequently in Section 4 (Discussions).
3.1. Cs4Pb4·5NH3
The reaction of elemental lead with stoichiometric amounts of cesium in liquid ammonia yieldsshiny metallic, reddish needles of Cs4Pb4·5NH3. The asymmetric unit of the crystal structure ofCs4Pb4·5NH3 consists of three crystallographically independent lead atoms, four cesium cations andfour ammonia molecules of crystallization. One of the lead atoms and one of the nitrogen atoms arelocated on the general Wyckoff position 8e of the orthorhombic space group Pbcm (No. 57). The othertwo lead atoms, four Cs+ cations and three nitrogen atoms occupy the special Wyckoff positions 4d
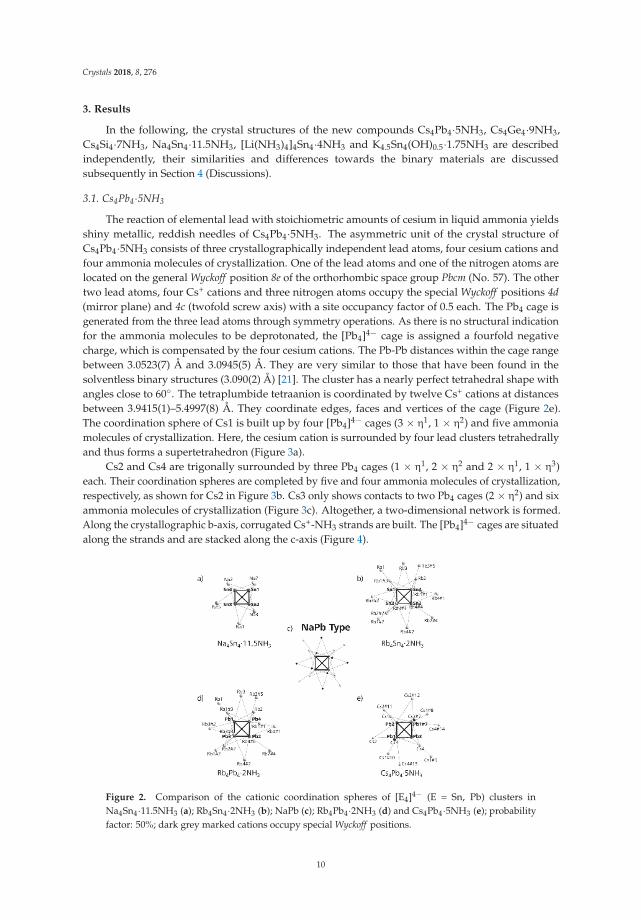
(mirror plane) and 4c (twofold screw axis) with a site occupancy factor of 0.5 each. The Pb4 cage isgenerated from the three lead atoms through symmetry operations. As there is no structural indicationfor the ammonia molecules to be deprotonated, the [Pb4]4− cage is assigned a fourfold negativecharge, which is compensated by the four cesium cations. The Pb-Pb distances within the cage rangebetween 3.0523(7) Å and 3.0945(5) Å. They are very similar to those that have been found in thesolventless binary structures (3.090(2) Å) [21]. The cluster has a nearly perfect tetrahedral shape withangles close to 60. The tetraplumbide tetraanion is coordinated by twelve Cs+ cations at distancesbetween 3.9415(1)–5.4997(8) Å. They coordinate edges, faces and vertices of the cage (Figure 2e).The coordination sphere of Cs1 is built up by four [Pb4]4− cages (3 × η1, 1 × η2) and five ammoniamolecules of crystallization. Here, the cesium cation is surrounded by four lead clusters tetrahedrallyand thus forms a supertetrahedron (Figure 3a).
Cs2 and Cs4 are trigonally surrounded by three Pb4 cages (1 × η1, 2 × η2 and 2 × η1, 1 × η3)each. Their coordination spheres are completed by five and four ammonia molecules of crystallization,respectively, as shown for Cs2 in Figure 3b. Cs3 only shows contacts to two Pb4 cages (2 × η2) and sixammonia molecules of crystallization (Figure 3c). Altogether, a two-dimensional network is formed.Along the crystallographic b-axis, corrugated Cs+-NH3 strands are built. The [Pb4]4− cages are situatedalong the strands and are stacked along the c-axis (Figure 4).
Figure 2. Comparison of the cationic coordination spheres of [E4]4− (E = Sn, Pb) clusters inNa4Sn4·11.5NH3 (a); Rb4Sn4·2NH3 (b); NaPb (c); Rb4Pb4·2NH3 (d) and Cs4Pb4·5NH3 (e); probabilityfactor: 50%; dark grey marked cations occupy special Wyckoff positions.
10
Crystals 2018, 8, 276
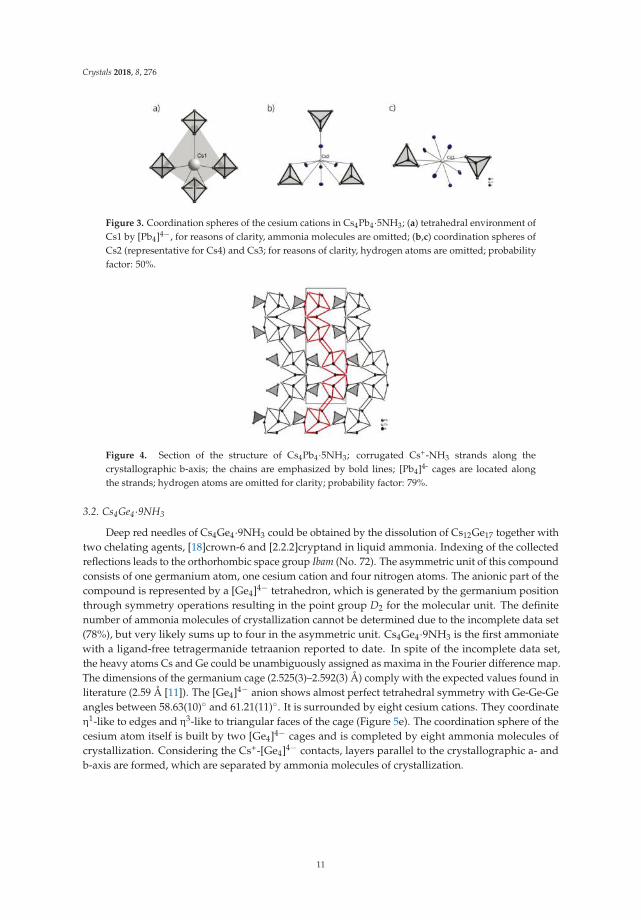
Figure 3. Coordination spheres of the cesium cations in Cs4Pb4·5NH3; (a) tetrahedral environment ofCs1 by [Pb4]4−, for reasons of clarity, ammonia molecules are omitted; (b,c) coordination spheres ofCs2 (representative for Cs4) and Cs3; for reasons of clarity, hydrogen atoms are omitted; probabilityfactor: 50%.
Figure 4. Section of the structure of Cs4Pb4·5NH3; corrugated Cs+-NH3 strands along thecrystallographic b-axis; the chains are emphasized by bold lines; [Pb4]4- cages are located alongthe strands; hydrogen atoms are omitted for clarity; probability factor: 79%.
3.2. Cs4Ge4·9NH3
Deep red needles of Cs4Ge4·9NH3 could be obtained by the dissolution of Cs12Ge17 together withtwo chelating agents, [18]crown-6 and [2.2.2]cryptand in liquid ammonia. Indexing of the collectedreflections leads to the orthorhombic space group Ibam (No. 72). The asymmetric unit of this compoundconsists of one germanium atom, one cesium cation and four nitrogen atoms. The anionic part of thecompound is represented by a [Ge4]4− tetrahedron, which is generated by the germanium positionthrough symmetry operations resulting in the point group D2 for the molecular unit. The definitenumber of ammonia molecules of crystallization cannot be determined due to the incomplete data set(78%), but very likely sums up to four in the asymmetric unit. Cs4Ge4·9NH3 is the first ammoniatewith a ligand-free tetragermanide tetraanion reported to date. In spite of the incomplete data set,the heavy atoms Cs and Ge could be unambiguously assigned as maxima in the Fourier difference map.The dimensions of the germanium cage (2.525(3)–2.592(3) Å) comply with the expected values found inliterature (2.59 Å [11]). The [Ge4]4− anion shows almost perfect tetrahedral symmetry with Ge-Ge-Geangles between 58.63(10) and 61.21(11). It is surrounded by eight cesium cations. They coordinateη1-like to edges and η3-like to triangular faces of the cage (Figure 5e). The coordination sphere of thecesium atom itself is built by two [Ge4]4− cages and is completed by eight ammonia molecules ofcrystallization. Considering the Cs+-[Ge4]4− contacts, layers parallel to the crystallographic a- andb-axis are formed, which are separated by ammonia molecules of crystallization.
11
Crystals 2018, 8, 276
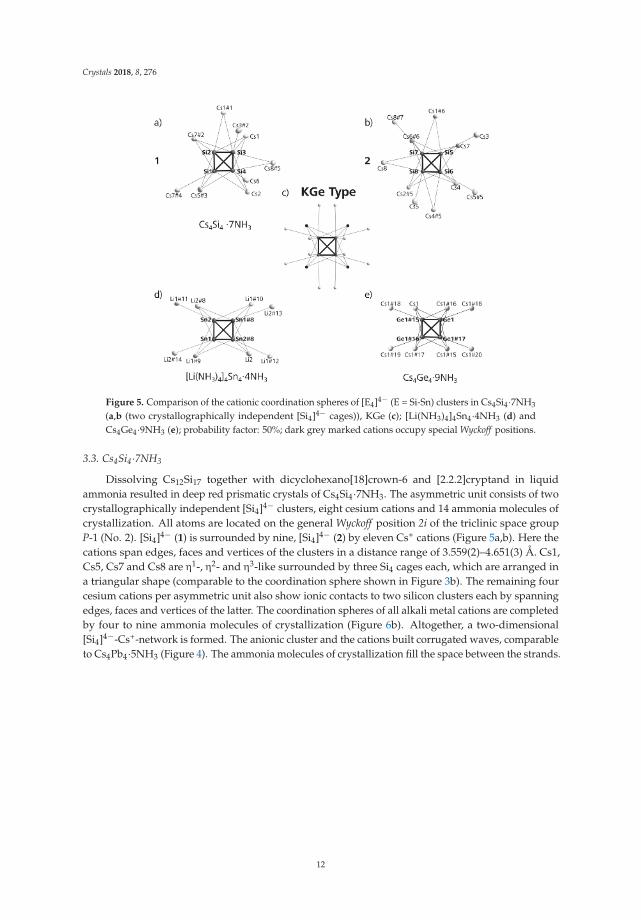
Figure 5. Comparison of the cationic coordination spheres of [E4]4− (E = Si-Sn) clusters in Cs4Si4·7NH3
(a,b (two crystallographically independent [Si4]4− cages)), KGe (c); [Li(NH3)4]4Sn4·4NH3 (d) andCs4Ge4·9NH3 (e); probability factor: 50%; dark grey marked cations occupy special Wyckoff positions.
3.3. Cs4Si4·7NH3
Dissolving Cs12Si17 together with dicyclohexano[18]crown-6 and [2.2.2]cryptand in liquidammonia resulted in deep red prismatic crystals of Cs4Si4·7NH3. The asymmetric unit consists of twocrystallographically independent [Si4]4− clusters, eight cesium cations and 14 ammonia molecules ofcrystallization. All atoms are located on the general Wyckoff position 2i of the triclinic space groupP-1 (No. 2). [Si4]4− (1) is surrounded by nine, [Si4]4− (2) by eleven Cs+ cations (Figure 5a,b). Here thecations span edges, faces and vertices of the clusters in a distance range of 3.559(2)–4.651(3) Å. Cs1,Cs5, Cs7 and Cs8 are η1-, η2- and η3-like surrounded by three Si4 cages each, which are arranged ina triangular shape (comparable to the coordination sphere shown in Figure 3b). The remaining fourcesium cations per asymmetric unit also show ionic contacts to two silicon clusters each by spanningedges, faces and vertices of the latter. The coordination spheres of all alkali metal cations are completedby four to nine ammonia molecules of crystallization (Figure 6b). Altogether, a two-dimensional[Si4]4−-Cs+-network is formed. The anionic cluster and the cations built corrugated waves, comparableto Cs4Pb4·5NH3 (Figure 4). The ammonia molecules of crystallization fill the space between the strands.
12
Crystals 2018, 8, 276
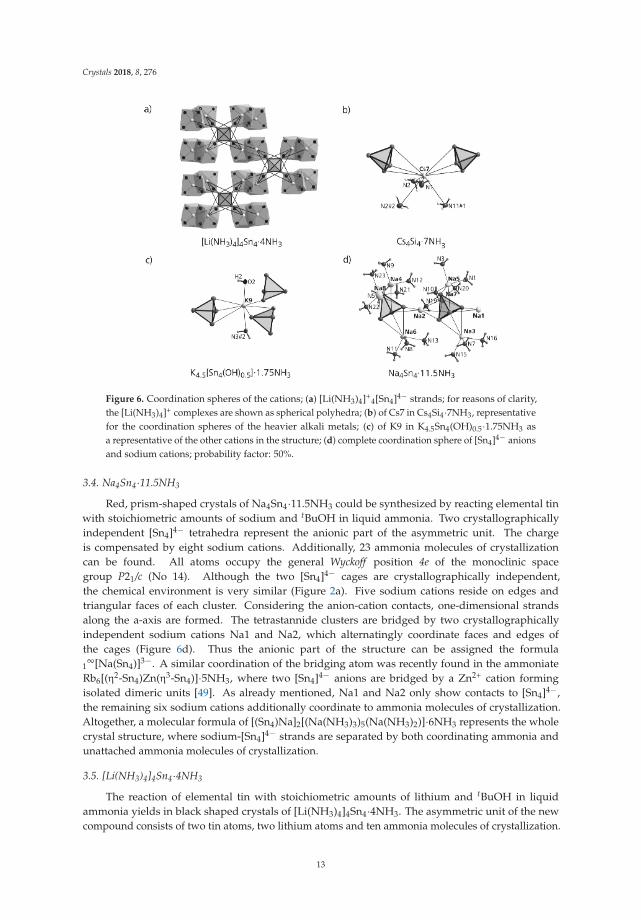
Figure 6. Coordination spheres of the cations; (a) [Li(NH3)4]+4[Sn4]4− strands; for reasons of clarity,
the [Li(NH3)4]+ complexes are shown as spherical polyhedra; (b) of Cs7 in Cs4Si4·7NH3, representativefor the coordination spheres of the heavier alkali metals; (c) of K9 in K4.5Sn4(OH)0.5·1.75NH3 asa representative of the other cations in the structure; (d) complete coordination sphere of [Sn4]4− anionsand sodium cations; probability factor: 50%.
3.4. Na4Sn4·11.5NH3
Red, prism-shaped crystals of Na4Sn4·11.5NH3 could be synthesized by reacting elemental tinwith stoichiometric amounts of sodium and tBuOH in liquid ammonia. Two crystallographicallyindependent [Sn4]4− tetrahedra represent the anionic part of the asymmetric unit. The chargeis compensated by eight sodium cations. Additionally, 23 ammonia molecules of crystallizationcan be found. All atoms occupy the general Wyckoff position 4e of the monoclinic spacegroup P21/c (No 14). Although the two [Sn4]4− cages are crystallographically independent,the chemical environment is very similar (Figure 2a). Five sodium cations reside on edges andtriangular faces of each cluster. Considering the anion-cation contacts, one-dimensional strandsalong the a-axis are formed. The tetrastannide clusters are bridged by two crystallographicallyindependent sodium cations Na1 and Na2, which alternatingly coordinate faces and edges ofthe cages (Figure 6d). Thus the anionic part of the structure can be assigned the formula
1∞[Na(Sn4)]3−. A similar coordination of the bridging atom was recently found in the ammoniate
Rb6[(η2-Sn4)Zn(η3-Sn4)]·5NH3, where two [Sn4]4− anions are bridged by a Zn2+ cation formingisolated dimeric units [49]. As already mentioned, Na1 and Na2 only show contacts to [Sn4]4−,the remaining six sodium cations additionally coordinate to ammonia molecules of crystallization.Altogether, a molecular formula of [(Sn4)Na]2[(Na(NH3)3)5(Na(NH3)2)]·6NH3 represents the wholecrystal structure, where sodium-[Sn4]4− strands are separated by both coordinating ammonia andunattached ammonia molecules of crystallization.
3.5. [Li(NH3)4]4Sn4·4NH3
The reaction of elemental tin with stoichiometric amounts of lithium and tBuOH in liquidammonia yields in black shaped crystals of [Li(NH3)4]4Sn4·4NH3. The asymmetric unit of the newcompound consists of two tin atoms, two lithium atoms and ten ammonia molecules of crystallization.
13
Crystals 2018, 8, 276
All atoms are located on the general Wyckoff position 8f of the monoclinic space group I2/a (No. 15).As there is no indication for the presence of deprotonated ammonia molecules, the charge of the Sn4
cluster sums up to −4. The tin cluster does not show direct contacts to lithium cations as all of these arecoordinated by four ammonia molecules which results in tetrahedrally shaped [Li(NH3)4]+ complexesthat can be considered as large and approximately spherical cationic units (Figure 6). For details,see Section 4.2. The ammonia lithium distances of 2.064(1)–2.116(1) Å in the tetrahedral cationiccomplex [Li(NH3)4]+ are in good agreement with literature-known lithiumtetraammine complexes [38].The [Sn4]4− cage is coordinated by eight [Li(NH3)4]+ complexes, which span vertices and faces of thecluster (Figure 6a). The distances within the tetrahedron vary between 2.9277(8)–2.9417(8) Å and liewithin the expected values for [Sn4]4− anions in ammoniate crystal structures. The Sn-Sn-Sn anglesrange between 59.882(20) and 60.276(20).
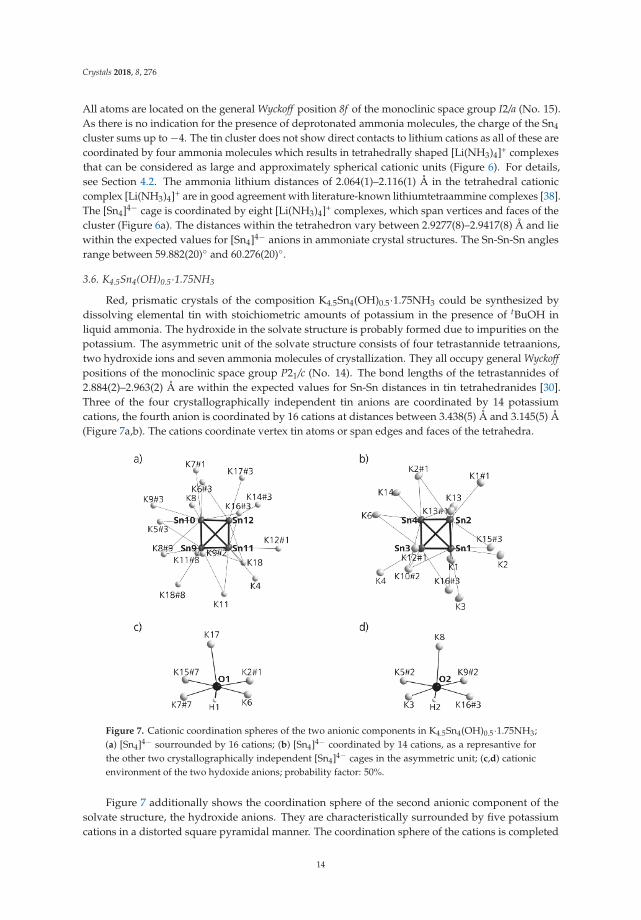
3.6. K4.5Sn4(OH)0.5·1.75NH3
Red, prismatic crystals of the composition K4.5Sn4(OH)0.5·1.75NH3 could be synthesized bydissolving elemental tin with stoichiometric amounts of potassium in the presence of tBuOH inliquid ammonia. The hydroxide in the solvate structure is probably formed due to impurities on thepotassium. The asymmetric unit of the solvate structure consists of four tetrastannide tetraanions,two hydroxide ions and seven ammonia molecules of crystallization. They all occupy general Wyckoff
positions of the monoclinic space group P21/c (No. 14). The bond lengths of the tetrastannides of2.884(2)–2.963(2) Å are within the expected values for Sn-Sn distances in tin tetrahedranides [30].Three of the four crystallographically independent tin anions are coordinated by 14 potassiumcations, the fourth anion is coordinated by 16 cations at distances between 3.438(5) Å and 3.145(5) Å(Figure 7a,b). The cations coordinate vertex tin atoms or span edges and faces of the tetrahedra.
Figure 7. Cationic coordination spheres of the two anionic components in K4.5Sn4(OH)0.5·1.75NH3;(a) [Sn4]4− sourrounded by 16 cations; (b) [Sn4]4− coordinated by 14 cations, as a represantive forthe other two crystallographically independent [Sn4]4− cages in the asymmetric unit; (c,d) cationicenvironment of the two hydoxide anions; probability factor: 50%.
Figure 7 additionally shows the coordination sphere of the second anionic component of thesolvate structure, the hydroxide anions. They are characteristically surrounded by five potassiumcations in a distorted square pyramidal manner. The coordination sphere of the cations is completed
14
Crystals 2018, 8, 276
by tin clusters, hydroxide ions or/and ammonia molecules of crystallization (Figure 7c,d). Altogether,the structure of K4.5Sn4(OH)0.5·1.75NH3 consists of strands of ammonia molecules, hydroxide anionsand potassium cations, which are connected via tetrastannide anions.
4. Discussion
In this section we discuss similarities and differences of the binary compounds towards the solvatestructures with respect to the coordination spheres of the cations and the cluster anions.
4.1. NaPb Type Analogies
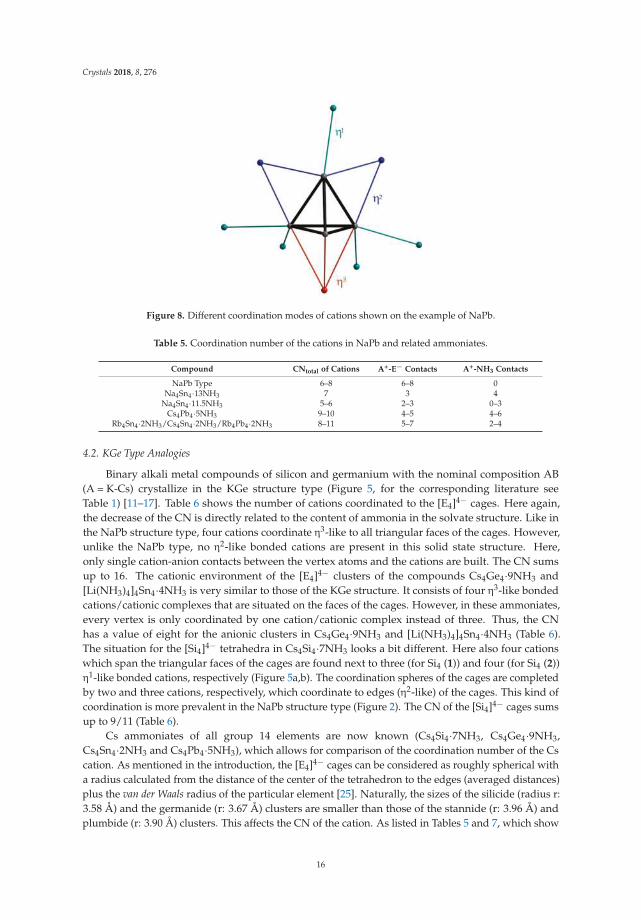
As already mentioned in the introduction, all alkali metal stannides and plumbides with thenominal composition AE, except the compounds containing lithium, crystallize in the tetragonal spacegroup I41/acd (No. 142) and belong to the NaPb structure type [10,18–21]. Considering the directcationic environment of the tetrelide cluster in the binary phase (Figure 2c), the coordination number(CN) sums up to 16. With increasing content of ammonia molecules of crystallization, the coordinationnumber of the cages decrease (Table 4). Figure 2 shows which cation-anion contacts are broken withinthe solvate structures. Generally, there are three different modes of the coordination of the cationtowards the anion (Figure 8).
In the binary phases and Na4Sn4·13NH3 [31,32] all triangular faces of the anions are capped η3-likeby cations. In contrast, in A4E4·2NH3 (A = K, Rb; E = Sn, Pb) [30] three faces and in Cs4Pb4·5NH3 onlyone face of the [E4]4− anions are coordinated η3-like by the cations. In addition to the coordinationof the faces, the edges of the [E4]4− tetrahedra are coordinated η2-like. For NaPb, Rb4Sn4·2NH3,Cs4Sn4·2NH3 and Rb4Pb4·2NH3, four η2-like coordinated cations are present. In Cs4Pb4·5NH3 fivecations coordinate to the cage in a η2-like fashion, in Na4Sn4·11.5NH3 only two. Finally, the cationicenvironment of the [E4]4− anions in the binary phase is completed by a total of eight cations which arebonded η1-like to each vertex. In Rb4Sn4·2NH3, Cs4Sn4·2NH3, Rb4Pb4·2NH3 and Cs4Pb4·5NH3 threeand two vertices are coordinated by two cations, respectively. The other vertices each only show onetetrelide-alkali metal contact. Table 4 summarizes the anion coordinations and it becomes evident thatthe solvate structures with a small content of ammonia molecules of crystallization are more similarto the solid state structure, thus the three-dimensional cation-anion interactions are considerablyless disturbed. Additionally, more anion-cation contacts appear in the solvate structures with theheavier alkali metals. Rubidium and cesium, as well as tin and lead are considered as soft acids andbases according to the HSAB theory [50]. The solvate structures containing sodium show much lessanion-cation contacts due to the favored interaction of the hard base ammonia to the hard acid sodiumcation (Table 5). Table 5 additionally shows the total coordination numbers of the cations, whichis classified into cation-anion (A+-E−) and cation-nitrogen (A+-NH3) contacts. In Na4Sn4·13NH3,Na4Sn4·11.5NH3 and Cs4Pb4·5NH3 the numbers of anion-cation contacts and the cation-nitrogencontacts are similar. In contrast, Rb4Sn4·2NH3, Cs4Sn4·2NH3 and Rb4Pb4·2NH3 show more A+-E−
contacts than ion-dipole interactions between the cation and the ammonia molecules of crystallization.
Table 4. Coordination number of the [E4]4− cages in NaPb and related compounds.
CompoundCoordination
Number (CN) E−-A+η
1-likeCoordination
η2-like
Coordinationη
3-likeCoordination
NaPb Type 16 8 4 4Na4Sn4·13NH3 4 / / 4
Na4Sn4·11.5NH3 5 / 2 3Cs4Pb4·5NH3 12 6 5 1
Rb4Sn4·2NH3/Cs4Sn4·2NH3/Rb4Pb4·2NH3 14 7 4 3
15
Crystals 2018, 8, 276
Figure 8. Different coordination modes of cations shown on the example of NaPb.
Table 5. Coordination number of the cations in NaPb and related ammoniates.
Compound CNtotal of Cations A+-E− Contacts A+-NH3 Contacts
NaPb Type 6–8 6–8 0Na4Sn4·13NH3 7 3 4
Na4Sn4·11.5NH3 5–6 2–3 0–3Cs4Pb4·5NH3 9–10 4–5 4–6
Rb4Sn4·2NH3/Cs4Sn4·2NH3/Rb4Pb4·2NH3 8–11 5–7 2–4
4.2. KGe Type Analogies
Binary alkali metal compounds of silicon and germanium with the nominal composition AB(A = K-Cs) crystallize in the KGe structure type (Figure 5, for the corresponding literature seeTable 1) [11–17]. Table 6 shows the number of cations coordinated to the [E4]4− cages. Here again,the decrease of the CN is directly related to the content of ammonia in the solvate structure. Like inthe NaPb structure type, four cations coordinate η3-like to all triangular faces of the cages. However,unlike the NaPb type, no η2-like bonded cations are present in this solid state structure. Here,only single cation-anion contacts between the vertex atoms and the cations are built. The CN sumsup to 16. The cationic environment of the [E4]4− clusters of the compounds Cs4Ge4·9NH3 and[Li(NH3)4]4Sn4·4NH3 is very similar to those of the KGe structure. It consists of four η3-like bondedcations/cationic complexes that are situated on the faces of the cages. However, in these ammoniates,every vertex is only coordinated by one cation/cationic complex instead of three. Thus, the CNhas a value of eight for the anionic clusters in Cs4Ge4·9NH3 and [Li(NH3)4]4Sn4·4NH3 (Table 6).The situation for the [Si4]4− tetrahedra in Cs4Si4·7NH3 looks a bit different. Here also four cationswhich span the triangular faces of the cages are found next to three (for Si4 (1)) and four (for Si4 (2))η1-like bonded cations, respectively (Figure 5a,b). The coordination spheres of the cages are completedby two and three cations, respectively, which coordinate to edges (η2-like) of the cages. This kind ofcoordination is more prevalent in the NaPb structure type (Figure 2). The CN of the [Si4]4− cages sumsup to 9/11 (Table 6).
Cs ammoniates of all group 14 elements are now known (Cs4Si4·7NH3, Cs4Ge4·9NH3,Cs4Sn4·2NH3 and Cs4Pb4·5NH3), which allows for comparison of the coordination number of the Cscation. As mentioned in the introduction, the [E4]4− cages can be considered as roughly spherical witha radius calculated from the distance of the center of the tetrahedron to the edges (averaged distances)plus the van der Waals radius of the particular element [25]. Naturally, the sizes of the silicide (radius r:3.58 Å) and the germanide (r: 3.67 Å) clusters are smaller than those of the stannide (r: 3.96 Å) andplumbide (r: 3.90 Å) clusters. This affects the CN of the cation. As listed in Tables 5 and 7, which show
16
Crystals 2018, 8, 276
the coordination number of the cations in NaPb/KGe and the related ammoniates, the CN of Cs+
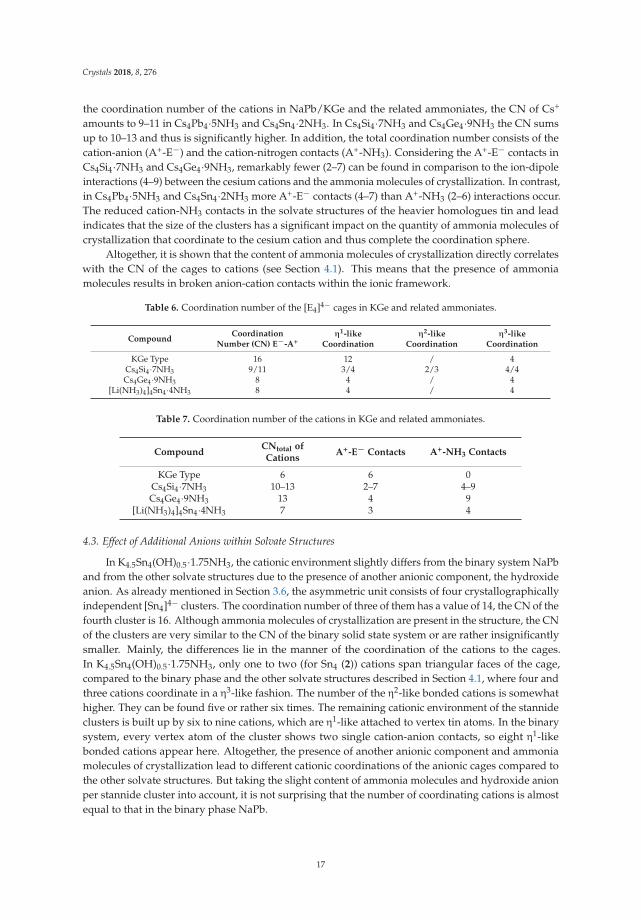
amounts to 9–11 in Cs4Pb4·5NH3 and Cs4Sn4·2NH3. In Cs4Si4·7NH3 and Cs4Ge4·9NH3 the CN sumsup to 10–13 and thus is significantly higher. In addition, the total coordination number consists of thecation-anion (A+-E−) and the cation-nitrogen contacts (A+-NH3). Considering the A+-E− contacts inCs4Si4·7NH3 and Cs4Ge4·9NH3, remarkably fewer (2–7) can be found in comparison to the ion-dipoleinteractions (4–9) between the cesium cations and the ammonia molecules of crystallization. In contrast,in Cs4Pb4·5NH3 and Cs4Sn4·2NH3 more A+-E− contacts (4–7) than A+-NH3 (2–6) interactions occur.The reduced cation-NH3 contacts in the solvate structures of the heavier homologues tin and leadindicates that the size of the clusters has a significant impact on the quantity of ammonia molecules ofcrystallization that coordinate to the cesium cation and thus complete the coordination sphere.
Altogether, it is shown that the content of ammonia molecules of crystallization directly correlateswith the CN of the cages to cations (see Section 4.1). This means that the presence of ammoniamolecules results in broken anion-cation contacts within the ionic framework.
Table 6. Coordination number of the [E4]4− cages in KGe and related ammoniates.
CompoundCoordination
Number (CN) E−-A+η
1-likeCoordination
η2-like
Coordinationη
3-likeCoordination
KGe Type 16 12 / 4Cs4Si4·7NH3 9/11 3/4 2/3 4/4Cs4Ge4·9NH3 8 4 / 4
[Li(NH3)4]4Sn4·4NH3 8 4 / 4
Table 7. Coordination number of the cations in KGe and related ammoniates.
CompoundCNtotal ofCations
A+-E− Contacts A+-NH3 Contacts
KGe Type 6 6 0Cs4Si4·7NH3 10–13 2–7 4–9Cs4Ge4·9NH3 13 4 9
[Li(NH3)4]4Sn4·4NH3 7 3 4
4.3. Effect of Additional Anions within Solvate Structures
In K4.5Sn4(OH)0.5·1.75NH3, the cationic environment slightly differs from the binary system NaPband from the other solvate structures due to the presence of another anionic component, the hydroxideanion. As already mentioned in Section 3.6, the asymmetric unit consists of four crystallographicallyindependent [Sn4]4− clusters. The coordination number of three of them has a value of 14, the CN of thefourth cluster is 16. Although ammonia molecules of crystallization are present in the structure, the CNof the clusters are very similar to the CN of the binary solid state system or are rather insignificantlysmaller. Mainly, the differences lie in the manner of the coordination of the cations to the cages.In K4.5Sn4(OH)0.5·1.75NH3, only one to two (for Sn4 (2)) cations span triangular faces of the cage,compared to the binary phase and the other solvate structures described in Section 4.1, where four andthree cations coordinate in a η3-like fashion. The number of the η2-like bonded cations is somewhathigher. They can be found five or rather six times. The remaining cationic environment of the stannideclusters is built up by six to nine cations, which are η1-like attached to vertex tin atoms. In the binarysystem, every vertex atom of the cluster shows two single cation-anion contacts, so eight η1-likebonded cations appear here. Altogether, the presence of another anionic component and ammoniamolecules of crystallization lead to different cationic coordinations of the anionic cages compared tothe other solvate structures. But taking the slight content of ammonia molecules and hydroxide anionper stannide cluster into account, it is not surprising that the number of coordinating cations is almostequal to that in the binary phase NaPb.
17
Crystals 2018, 8, 276
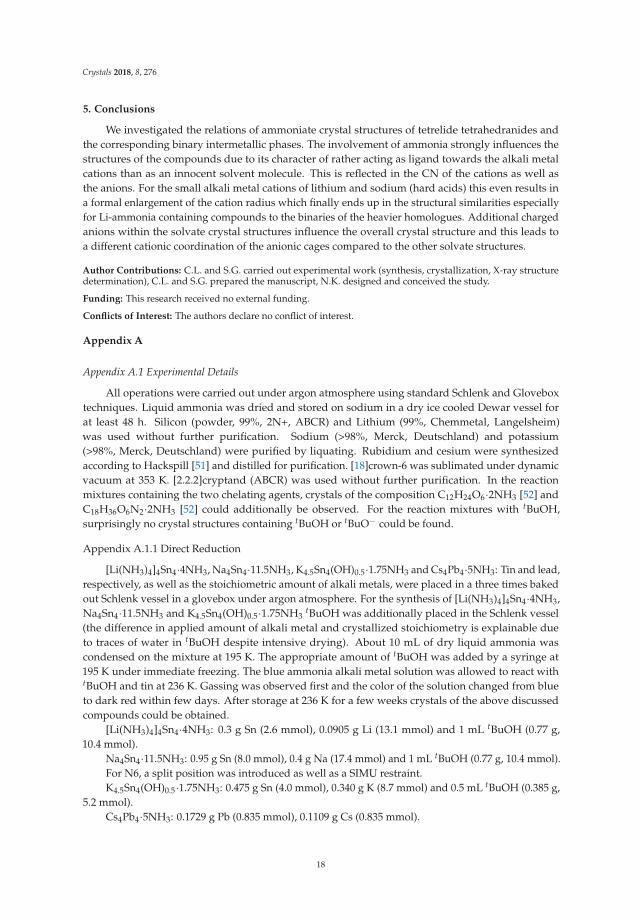
5. Conclusions
We investigated the relations of ammoniate crystal structures of tetrelide tetrahedranides andthe corresponding binary intermetallic phases. The involvement of ammonia strongly influences thestructures of the compounds due to its character of rather acting as ligand towards the alkali metalcations than as an innocent solvent molecule. This is reflected in the CN of the cations as well asthe anions. For the small alkali metal cations of lithium and sodium (hard acids) this even results ina formal enlargement of the cation radius which finally ends up in the structural similarities especiallyfor Li-ammonia containing compounds to the binaries of the heavier homologues. Additional chargedanions within the solvate crystal structures influence the overall crystal structure and this leads toa different cationic coordination of the anionic cages compared to the other solvate structures.
Author Contributions: C.L. and S.G. carried out experimental work (synthesis, crystallization, X-ray structuredetermination), C.L. and S.G. prepared the manuscript, N.K. designed and conceived the study.
Funding: This research received no external funding.
Conflicts of Interest: The authors declare no conflict of interest.
Appendix A
Appendix A.1 Experimental Details
All operations were carried out under argon atmosphere using standard Schlenk and Gloveboxtechniques. Liquid ammonia was dried and stored on sodium in a dry ice cooled Dewar vessel forat least 48 h. Silicon (powder, 99%, 2N+, ABCR) and Lithium (99%, Chemmetal, Langelsheim)was used without further purification. Sodium (>98%, Merck, Deutschland) and potassium(>98%, Merck, Deutschland) were purified by liquating. Rubidium and cesium were synthesizedaccording to Hackspill [51] and distilled for purification. [18]crown-6 was sublimated under dynamicvacuum at 353 K. [2.2.2]cryptand (ABCR) was used without further purification. In the reactionmixtures containing the two chelating agents, crystals of the composition C12H24O6·2NH3 [52] andC18H36O6N2·2NH3 [52] could additionally be observed. For the reaction mixtures with tBuOH,surprisingly no crystal structures containing tBuOH or tBuO− could be found.
Appendix A.1.1 Direct Reduction
[Li(NH3)4]4Sn4·4NH3, Na4Sn4·11.5NH3, K4.5Sn4(OH)0.5·1.75NH3 and Cs4Pb4·5NH3: Tin and lead,respectively, as well as the stoichiometric amount of alkali metals, were placed in a three times bakedout Schlenk vessel in a glovebox under argon atmosphere. For the synthesis of [Li(NH3)4]4Sn4·4NH3,Na4Sn4·11.5NH3 and K4.5Sn4(OH)0.5·1.75NH3
tBuOH was additionally placed in the Schlenk vessel(the difference in applied amount of alkali metal and crystallized stoichiometry is explainable dueto traces of water in tBuOH despite intensive drying). About 10 mL of dry liquid ammonia wascondensed on the mixture at 195 K. The appropriate amount of tBuOH was added by a syringe at195 K under immediate freezing. The blue ammonia alkali metal solution was allowed to react withtBuOH and tin at 236 K. Gassing was observed first and the color of the solution changed from blueto dark red within few days. After storage at 236 K for a few weeks crystals of the above discussedcompounds could be obtained.
[Li(NH3)4]4Sn4·4NH3: 0.3 g Sn (2.6 mmol), 0.0905 g Li (13.1 mmol) and 1 mL tBuOH (0.77 g,10.4 mmol).
Na4Sn4·11.5NH3: 0.95 g Sn (8.0 mmol), 0.4 g Na (17.4 mmol) and 1 mL tBuOH (0.77 g, 10.4 mmol).For N6, a split position was introduced as well as a SIMU restraint.K4.5Sn4(OH)0.5·1.75NH3: 0.475 g Sn (4.0 mmol), 0.340 g K (8.7 mmol) and 0.5 mL tBuOH (0.385 g,
5.2 mmol).Cs4Pb4·5NH3: 0.1729 g Pb (0.835 mmol), 0.1109 g Cs (0.835 mmol).
18
Crystals 2018, 8, 276
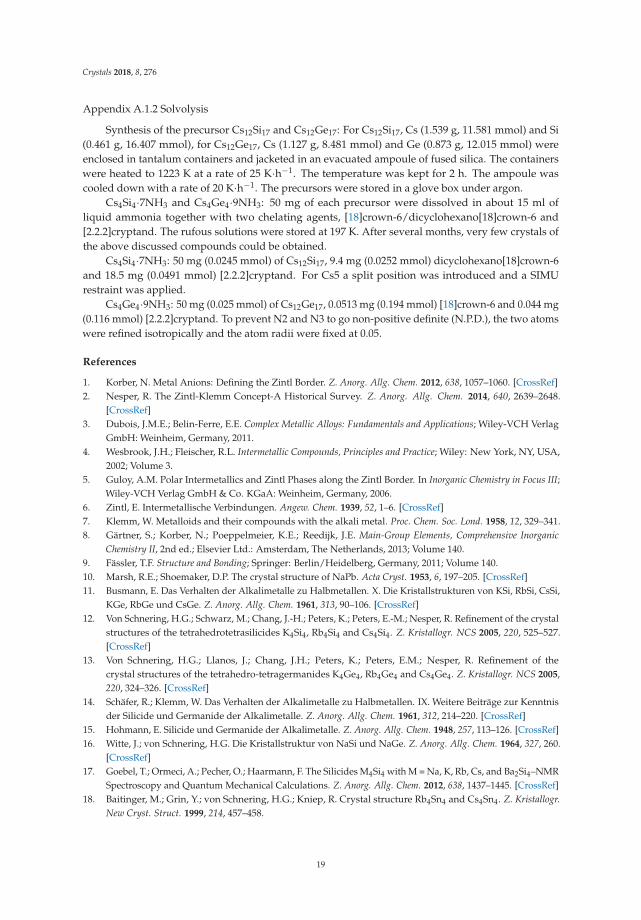
Appendix A.1.2 Solvolysis
Synthesis of the precursor Cs12Si17 and Cs12Ge17: For Cs12Si17, Cs (1.539 g, 11.581 mmol) and Si(0.461 g, 16.407 mmol), for Cs12Ge17, Cs (1.127 g, 8.481 mmol) and Ge (0.873 g, 12.015 mmol) wereenclosed in tantalum containers and jacketed in an evacuated ampoule of fused silica. The containerswere heated to 1223 K at a rate of 25 K·h−1. The temperature was kept for 2 h. The ampoule wascooled down with a rate of 20 K·h−1. The precursors were stored in a glove box under argon.
Cs4Si4·7NH3 and Cs4Ge4·9NH3: 50 mg of each precursor were dissolved in about 15 ml ofliquid ammonia together with two chelating agents, [18]crown-6/dicyclohexano[18]crown-6 and[2.2.2]cryptand. The rufous solutions were stored at 197 K. After several months, very few crystals ofthe above discussed compounds could be obtained.
Cs4Si4·7NH3: 50 mg (0.0245 mmol) of Cs12Si17, 9.4 mg (0.0252 mmol) dicyclohexano[18]crown-6and 18.5 mg (0.0491 mmol) [2.2.2]cryptand. For Cs5 a split position was introduced and a SIMUrestraint was applied.
Cs4Ge4·9NH3: 50 mg (0.025 mmol) of Cs12Ge17, 0.0513 mg (0.194 mmol) [18]crown-6 and 0.044 mg(0.116 mmol) [2.2.2]cryptand. To prevent N2 and N3 to go non-positive definite (N.P.D.), the two atomswere refined isotropically and the atom radii were fixed at 0.05.
References
1. Korber, N. Metal Anions: Defining the Zintl Border. Z. Anorg. Allg. Chem. 2012, 638, 1057–1060. [CrossRef]2. Nesper, R. The Zintl-Klemm Concept-A Historical Survey. Z. Anorg. Allg. Chem. 2014, 640, 2639–2648.
[CrossRef]3. Dubois, J.M.E.; Belin-Ferre, E.E. Complex Metallic Alloys: Fundamentals and Applications; Wiley-VCH Verlag
GmbH: Weinheim, Germany, 2011.4. Wesbrook, J.H.; Fleischer, R.L. Intermetallic Compounds, Principles and Practice; Wiley: New York, NY, USA,
2002; Volume 3.5. Guloy, A.M. Polar Intermetallics and Zintl Phases along the Zintl Border. In Inorganic Chemistry in Focus III;
Wiley-VCH Verlag GmbH & Co. KGaA: Weinheim, Germany, 2006.6. Zintl, E. Intermetallische Verbindungen. Angew. Chem. 1939, 52, 1–6. [CrossRef]7. Klemm, W. Metalloids and their compounds with the alkali metal. Proc. Chem. Soc. Lond. 1958, 12, 329–341.8. Gärtner, S.; Korber, N.; Poeppelmeier, K.E.; Reedijk, J.E. Main-Group Elements, Comprehensive Inorganic
Chemistry II, 2nd ed.; Elsevier Ltd.: Amsterdam, The Netherlands, 2013; Volume 140.9. Fässler, T.F. Structure and Bonding; Springer: Berlin/Heidelberg, Germany, 2011; Volume 140.10. Marsh, R.E.; Shoemaker, D.P. The crystal structure of NaPb. Acta Cryst. 1953, 6, 197–205. [CrossRef]11. Busmann, E. Das Verhalten der Alkalimetalle zu Halbmetallen. X. Die Kristallstrukturen von KSi, RbSi, CsSi,
KGe, RbGe und CsGe. Z. Anorg. Allg. Chem. 1961, 313, 90–106. [CrossRef]12. Von Schnering, H.G.; Schwarz, M.; Chang, J.-H.; Peters, K.; Peters, E.-M.; Nesper, R. Refinement of the crystal
structures of the tetrahedrotetrasilicides K4Si4, Rb4Si4 and Cs4Si4. Z. Kristallogr. NCS 2005, 220, 525–527.[CrossRef]
13. Von Schnering, H.G.; Llanos, J.; Chang, J.H.; Peters, K.; Peters, E.M.; Nesper, R. Refinement of thecrystal structures of the tetrahedro-tetragermanides K4Ge4, Rb4Ge4 and Cs4Ge4. Z. Kristallogr. NCS 2005,220, 324–326. [CrossRef]
14. Schäfer, R.; Klemm, W. Das Verhalten der Alkalimetalle zu Halbmetallen. IX. Weitere Beiträge zur Kenntnisder Silicide und Germanide der Alkalimetalle. Z. Anorg. Allg. Chem. 1961, 312, 214–220. [CrossRef]
15. Hohmann, E. Silicide und Germanide der Alkalimetalle. Z. Anorg. Allg. Chem. 1948, 257, 113–126. [CrossRef]16. Witte, J.; von Schnering, H.G. Die Kristallstruktur von NaSi und NaGe. Z. Anorg. Allg. Chem. 1964, 327, 260.
[CrossRef]17. Goebel, T.; Ormeci, A.; Pecher, O.; Haarmann, F. The Silicides M4Si4 with M = Na, K, Rb, Cs, and Ba2Si4–NMR
Spectroscopy and Quantum Mechanical Calculations. Z. Anorg. Allg. Chem. 2012, 638, 1437–1445. [CrossRef]18. Baitinger, M.; Grin, Y.; von Schnering, H.G.; Kniep, R. Crystal structure Rb4Sn4 and Cs4Sn4. Z. Kristallogr.
New Cryst. Struct. 1999, 214, 457–458.
19
Crystals 2018, 8, 276
19. Grin, Y.; Baitinger, M.; Kniep, R.; von Schnering, H.G. Redetermination of the crystal structure of tetrasodiumtetrahedrotetrastannide, Na4Sn4 and tetrapotassium tetrahedro-tetrastannide, K4Sn4. Z. Kristallogr New
Cryst. Struct. 1999, 214, 453–454. [CrossRef]20. Baitinger, M.; Peters, K.; Somer, M.; Carrillo-Cabrera, W.; Grin, Y.; Kniep, R.; von Schnering, H.G. Crystal
structure of tetrarubidium tetrahedro-tetraplumbide, Rb4Pb4 and of tetracaesium tetrahedro-telraplumbide,Cs4Pb4. Z. Kristallogr. NCS 1999, 214, 455–456.
21. Hewaidy, I.F.; Busmann, E.; Klemm, W. Die Struktur der AB-Verbindungen der schweren Alkalimetalle mitZinn und Blei. Z. Anorg. Allg. Chem. 1964, 328, 283–293. [CrossRef]
22. Goebel, T.; Prots, Y.; Haarmann, F. Refinement of the crystal structure of tetrasodium tetrasilicide, Na4Si4.Z. Kristallogr. NCS 2008, 223, 187–188. [CrossRef]
23. Evers, J.; Oehlinger, G.; Sextl, G. LiSi, a Unique Zintl Phase—Although Stable, It Long Evaded Synthesis.Eur. J. Solid State Inorg. Chem. 1997, 34, 773–784.
24. Menges, E.; Hopf, V.; Schaefer, H.; Weiss, A. Die Kristallstruktur von LiGe—ein neuartiger, dreidimensionalerVerband von Element (IV)-atomen. Z. Naturf. B. 1969, 24, 1351–1352. [CrossRef]
25. Holleman, A.F.; Wiberg, E.; Wiberg, N. Anorganische Chemie, 103rd ed.; Walter de Gruyter GmbH: Berlin,Germany, 2017.
26. Müller, W.; Schäfer, H. Crystal-structure of LiSn. Z. Naturforsch. B 1973, B 28, 246–248.27. Müller, W.; Volk, K. Die Struktur des beta-NaSn. Z. Naturforsch. 1977, B 32, 709–710.28. Nowotny, H. The structure of LiPb. Z. Metallkunde 1941, 33, 388.29. Neumeier, M.; Fendt, F.; Gaertner, S.; Koch, C.; Gaertner, T.; Korber, N.; Gschwind, R.M. Detection of
the Elusive Highly Charged Zintl Ions [Si4]4− and [Sn4]4− in Liquid Ammonia by NMR Spectroscopy.Angew. Chem. Int. Ed. 2013, 52, 4483–4486. [CrossRef] [PubMed]
30. Wiesler, K.; Brandl, K.; Fleischmann, A.; Korber, N. Tetrahedral [Tt4]4− Zintl Anions throughSolution Chemistry: Syntheses and Crystal Structures of the Ammoniates Rb4Sn4·2NH3, Cs4Sn4·2NH3,and Rb4Pb4·2NH3. Z. Anorg. Allg. Chem. 2009, 635, 508–512. [CrossRef]
31. Fleischmann, A. Synthese und Strukturelle Charakterisierung homoatomarer Polyanionen der vierten undfünften Hauptgruppe durch Reduktion in flüssigem Ammoniak. Ph.D. Thesis, University of Regensburg,Regensburg, Germany, 2002.
32. Waibel, M.; Fässler, T.F. First Incorporation of the Tetrahedral [Sn4]4- Cluster into a Discrete SolvateNa4[Sn4](NH3)13 from Solutions of Na4Sn4 in Liquid Ammonia. Z. Naturforsch. B 2013, 68, 732–734.[CrossRef]
33. Lorenz, C.; Gärtner, S.; Korber, N. [Si4]4−in Solution–First Solvate Crystal Structure of the Ligand-freeTetrasilicide Tetraanion in Rb1. 2K2. 8Si4·7NH3. Z. Anorg. Allg. Chem. 2017, 643, 141–145. [CrossRef]
34. Fendt, F. Untersuchungen zum Lösungs-und Reaktionsverhalten von Polystanniden und-siliciden inflüssigem Ammoniak. Ph.D. Thesis, University of Regensburg, Regensburg, Germany, 2016.
35. Joseph, S.; Suchentrunk, C.; Kraus, F.; Korber, N. [Si9]4−Anions in Solution–Structures of the SolvatesRb4Si9·4.75 NH3 and [Rb (18-crown-6)] Rb3Si9·4NH3, and Chemical Bonding in [Si9]4−. Eur. J. Inorg. Chem.
2009, 2009, 4641–4647. [CrossRef]36. Joseph, S.; Suchentrunk, C.; Korber, N. Dissolving Silicides: Syntheses and Crystal Structures of New
Ammoniates Containing Si52− and Si94− Polyanions and the Role of Ammonia of Crystallisation. Z.
Naturforsch. 2010, B65, 1059–1065. [CrossRef]37. Suchentrunk, C.; Daniels, J.; Somer, M.; Carrillo-Cabrera, W.; Korber, N. Synthesis and Crystal Structures of
the Polygermanide Ammoniates K4Ge9·9 NH3, Rb4Ge9·5 NH3 And Cs6Ge18·4 NH3. Z. Naturforsch. 2005,B60, 277–283.
38. Korber, N.; Fleischmann, A. Synthesis and crystal structure of [Li(NH3)4]4[Sn9]·NH3 and[Li(NH3)4]4[Pb9]·NH3. Dalton Trans. 2001, 4, 383–385. [CrossRef]
39. Carrillo-Cabrera, W.; Aydemir, U.; Somer, M.; Kircali, A.; Fassler, T.F.; Hoffmann, S.D. Cs4Ge9·en: A NovelCompound with [Ge9]4− Clusters–Synthesis, Crystal Structure and Vibrational Spectra. Z. Anorg. Allg. Chem.
2007, 633, 1575–1580. [CrossRef]40. Somer, M.; Carrillo-Cabrera, W.; Peters, E.M.; Peters, K.; von Schnering, H.G. Tetrarubidium Nonagermanide
(4–) Ethylenediamine, Rb4[Ge9][en]. Z. Anorg. Allg. Chem. 1998, 624, 1915–1921. [CrossRef]41. Edwards, P.A.; Corbett, J.D. Stable homopolyatomic anions. Synthesis and crystal structures of salts
containing the pentaplumbide (2-) and pentastannide (2-) anions. Inorg. Chem. 1977, 16, 903–907. [CrossRef]
20
Crystals 2018, 8, 276
42. Goicoechea, J.M.; Sevov, S.C. Naked Deltahedral Silicon Clusters in Solution: Synthesis and Characterizationof Si93− and Si52−. J. Am. Chem. Soc. 2004, 126, 6860–6861. [CrossRef] [PubMed]
43. Suchentrunk, C.; Korber, N. Ge52− Zintl anions: synthesis and crystal structures of [K([2.2.2]-crypt)]2
Ge5·4NH3 and [Rb([2.2.2]-crypt)]2Ge5·4NH3. New J. Chem. 2006, 30, 1737–1739. [CrossRef]44. Friedrich, U.; Korber, N. Cs5Sn9(OH)·4NH3. Acta Crystallogr. E 2014, 70, i29. [CrossRef] [PubMed]45. Kottke, T.; Stalke, D. Crystal handling at low temperatures. J. Appl. Crystallogr. 1993, 26, 615–619. [CrossRef]46. Stalke, D. Cryo crystal structure determination and application to intermediates. Chem. Soc. Rev. 1998,
27, 171–178. [CrossRef]47. Rigaku. Crysalis pro, Version 1.171.38.46; Agilent Technologies: Santa Clara, CA, USA, 2017.48. X-RED. STOE & Cie GmbH Darmstadt 1998; X-RED Data Reduction for STADI4 and IPDS: Darmstadt,
Germany, 1998.49. Fendt, F.; Koch, C.; Gartner, S.; Korber, N. Reaction of Sn4
4− in liquid ammonia: the formation of Rb6[(η2-Sn4)Zn (η3-Sn4)]·5NH3. Dalton Trans. 2013, 42, 15548–15550. [CrossRef] [PubMed]
50. Pearson, R.G. Hard and Soft Acids and Bases. J. Am. Chem. Soc. 1963, 85, 3533–3539. [CrossRef]51. Hackspill, L. Some properties of the alkali metals. Helv. Chim. Acta 1928, 11, 1.52. Suchentrunk, C.; Rossmier, T.; Korber, N. Crystal structures of the [18]-crown-6 ammoniate C12H24O6·2NH3
and the cryptand [2.2.2] ammoniate C18H36O6N2·2NH3. Z. Kristallogr. 2006, 221, 162–165.
© 2018 by the authors. Licensee MDPI, Basel, Switzerland. This article is an open accessarticle distributed under the terms and conditions of the Creative Commons Attribution(CC BY) license (http://creativecommons.org/licenses/by/4.0/).
21
crystals
Communication
Ba4[Mn3N6], a Quasi-One-Dimensional Mixed-ValentNitridomanganate (II, IV)
Alexander Ovchinnikov 1,2, Matej Bobnar 1, Yurii Prots 1, Walter Schnelle 1, Peter Höhn 1,* andYuri Grin 1
1 Max-Planck-Institut für Chemische Physik fester Stoffe, Nöthnitzer Straße 40, 01187 Dresden, Germany;[email protected] (A.O.); [email protected] (M.B.); [email protected] (Y.P.);[email protected] (W.S.); [email protected] (Y.G.)
2 Department of Chemistry and Biochemistry, University of Delaware, Newark, DE 19716, USA* Correspondence: [email protected]; Tel.: +49-351-4646-2229
Received: 25 April 2018; Accepted: 18 May 2018; Published: 25 May 2018
Abstract: The mixed-valent nitridomanganate Ba4[Mn3N6] was prepared using a gas–solid hightemperature route. The crystal structure was determined employing high resolution synchrotronpowder diffraction data: space group Pbcn, a = 9.9930(1) Å, b = 6.17126(8) Å, c = 14.4692(2) Å,V = 892.31(2) Å3, Z = 4. The manganese atoms in the structure of Ba4[Mn3N6] are four-fold coordinatedby nitrogen forming infinite corrugated chains of edge-sharing [MnN4] tetrahedra. The chainsdemonstrate a complete charge order of Mn species. Magnetization measurements and first principlecalculations indicate quasi-one dimensional magnetic behavior. In addition, chemical bondinganalysis revealed pronounced Mn–Mn interactions along the chains.
Keywords: nitridometalate; crystal structure; powder diffraction; magnetism
1. Introduction
Low-dimensional magnetic systems, such as spin chains, ladders, or planes, attract much attentionas perspective materials for a wide range of applications, e.g., in spintronics, quantum computing,and information storage technologies [1,2]. Such quantum magnets may display exotic physicalphenomena including spin liquid behavior [3], spin-orbital Mott insulating state [4], and topologicalexcitations [5]. Since the decrease of dimensionality implies a spatial spin confinement, the role offluctuations becomes significant in these systems. Such fluctuations are spin-dependent and mostimportant for S = 1
2 and S = 1 systems. Therefore, the electronic state of the constituting magneticatoms, along with the magnetic topology, determines the behavior of a particular system.
Low-dimensional quantum magnets have been mainly explored in the families of halides [6],oxides [7], and higher chalcogenides [8], but little is known about the realization of such systemsin nitrides. Since multicomponent nitrides often demonstrate low-dimensional crystallographicarrangements of transition-metal atoms along with low coordination numbers and oxidation states ofthe latter [9–11], they represent a natural platform to probe low-dimensional magnetism. However,the preparation of single-phase nitrides and their inherent instability make the study of this class ofmaterials highly challenging.
In this contribution, we report on the synthesis and characterization of the first chain alkaline-earthnitridomanganate with a quasi-one-dimensional magnetic behavior.
2. Materials and Methods
Synthesis of Ba2N. All manipulations except the high-temperature treatment were done insidean Ar-filled glovebox due to the high air- and moisture-sensitivity of most of the materials. Barium
Crystals 2018, 8, 235; doi:10.3390/cryst8060235 www.mdpi.com/journal/crystals22
Crystals 2018, 8, 235
nitride, Ba2N, was prepared by annealing Ba lumps (99.9%, Alfa Aesar, Thermo Fisher (Kandel) GmbH,Karlsruhe, Germany) under N2 stream (Praxair Deutschland GmbH, Dresden, Germany, 99.9999%,additionally purified by molecular sieves and a BTS-catalyst) at 973 K for 12 h, followed by coolingdown to room temperature under Ar. The resulting black soft powder was single-phase according topowder X-ray diffraction (PXRD).
Synthesis of Ba4[Mn3N6]. Ba2N (Figure S1) and Mn powder (Alfa, 99.9998%) were mixed in theratio Ba:Mn = 4.04:3 in an agate mortar and thoroughly ground. The excess of Ba2N was employedto compensate for evaporation at high temperatures. The mixture was pelletized and annealed in aTa crucible under a constant N2 flow (7 mL/min) at T = 1023–1123 K for 108 h in total, with severalintermediate re-grindings. The resulting sample was almost single-phase. The intensity of the strongestimpurity peak was lower than 3% of the most intense peak of the main phase. The impurity reflectionscould be easily distinguished from those of the main phase by tracking the evolution of the PXRDpatterns upon annealing, however, they could not be assigned to any known phases. Annealing timeslonger than that in the above-given protocol led to gradual decomposition of the main phase andto partial amorphisation of the sample. The composition of the sample and the absence of potentialimpurity elements were confirmed by chemical analysis (Table S1).
Powder X-ray diffraction (PXRD). Laboratory PXRD patterns were collected on a Huber G670imaging plate Guinier camera (CuKα1 radiation, Huber Diffraktionstechnik GmbH & Co. KG, Rimsting,Germany). Powder samples were enclosed between two Kapton foils sealed with vacuum grease toreduce contact with air. Synchrotron PXRD data were collected at the ID22 beamline of the EuropeanSynchrotron Radiation Facility (ESRF, Grenoble, France). Samples were sieved to a particle sizeof less than 50 µm and enclosed in glass capillaries (d = 0.3 mm) sealed with Picein. Preliminarydata processing was performed in the WinXPow program suite [12]. Crystal structure solution wasaccomplished using direct methods as implemented in EXPO2009 [13]. Rietveld refinement wasperformed with the Jana2006 program [14]. Further details on the crystal structure investigations canbe obtained from the Fachinformationszentrum Karlsruhe, 76344 Eggenstein–Leopoldshafen, Germany(fax: (+49)7247-808-666; email: [email protected], http:///www.fiz-karlsruhe.de/request_for_deposited_data.html) on quoting the depository number CSD-434473.
Chemical analysis. Chemical analysis was performed for the constituting elements (Ba, Mn, N),as well as for expected impurities (C, H, O, Ta from the crucible). Non-metals were analyzed by acarrier-gas hot-extraction technique on LECO TCH 600 (N, H, O, LECO Corporation, Saint Joseph, MI,USA) and LECO C200 (C, LECO Corporation, Saint Joseph, MI, USA) analyzers. The metal contentwas determined by inductively coupled plasma optical emission spectroscopy (ICP-OES) on an AgilentTechnologies 5100 spectrometer (Agilent technologies, Santa Clara, CA, USA).
Differential thermal analysis and thermogravimetry (DTA-TG). Thermal behavior was studiedby means of DTA/TG measurements on a Netzsch STA 449C calorimetric setup (NETZSCH-GerätebauGmbH, Selb, Germany) in loosely closed Ta crucibles under dynamic Ar atmosphere. To preventsample degradation, the measurements were done inside an Ar-filled glovebox.
Electrical resistivity measurements. Electrical resistivity was measured on a cold-pressed pelletin a sapphire die cell within a cryostat using a four-contact Van-der-Pauw method. The setup wasmounted inside an Ar-filled glovebox. The sample was thoroughly ground and sieved before themeasurements. Only the fraction with the particle size between 20 µm and 50 µm was used in order toachieve a higher packing density and reduce the grain boundary effects.
Magnetization measurements. Temperature dependence of magnetic susceptibility wasmeasured on a powder sample enclosed in a sealed pre-calibrated quartz tube under 400 mbar of Heon a SQUID magnetometer (MPMS-XL7, Quantum Design Inc., San Diego, CA, USA) in external fieldsbetween 10 mT and 7 T within the temperature range 1.8–400 K. High-temperature magnetizationmeasurements were performed in the temperature range 320–575 K. All data were corrected for thecontainer diamagnetism. The Honda–Owen correction (“extrapolation to a large field”) was applied totake the possible contributions of ferro- or ferrimagnetic impurities into account [15].
23
Crystals 2018, 8, 235
Computational details. Spin-polarized electronic structure calculations were performedat the scalar relativistic level within the L(S)DA approach employing the FPLO-9 [16] or theTB-LMTO-ASA [17] code. The PW92 parametrization [18] of the LSDA functional was used inFPLO and the von Barth-Hedin parametrization [19] was employed in LMTO. Blöchl correctedlinear tetrahedron method with a 8 × 12 × 6 k-mesh was employed after checking for convergencewith respect to the number of k-points. For the LMTO calculations, experimentally obtained latticeparameters and atomic coordinates were used. The radial scalar-relativistic Dirac equation was solvedto get the partial waves. The calculation within the atomic sphere approximation (ASA) includescorrections for the neglect of interstitial regions and partial waves of higher order [20], hence anaddition of empty spheres in the case of Ba4[Mn3N6] was not necessary. The following radii of atomicspheres were applied for the calculations on: r(Ba1) = 2.116 Å; r(Ba21) = 2.187 Å, r(Mn1) = 1.415 Å,r(Mn2) = 1.217 Å, r(N1) = 1.094 Å, r(N2) = 1.003 Å and r(N3) = 1.044 Å. A basis set containing Ba(6s,5d),Mn(4s, 4p, 3d) and N(2s,2p) states was employed for the self-consistent calculations with the Ba(6p,4f )and N(3d) functions being downfolded. The electronic structures calculated with the two codeswere found to be consistent. For the analysis of the Mn–Mn interactions, Crystal Orbital HamiltonPopulation (COHP) [21] analysis was performed using the built-in procedure in the TB-LMTO-ASAprogram. The topology of electron density was analyzed with the program Dgrid [22]. The calculatedelectron density was integrated in basins, bounded by zero-flux surfaces in the density gradientfield [23]. This technique provides electron counts for each atomic basin revealing the effective chargesof the QTAIM atoms.
3. Results and Discussion
Crystal structure determination. Ba4[Mn3N6] was obtained as an almost phase-puremicrocrystalline product. Attempts to grow single crystals were not successful. Therefore, crystalstructure determination was accomplished based on high resolution synchrotron PXRD data (Figure 1).The reflections of the major phase were indexed in the orthorhombic crystal system with the latticeparameters a = 9.9930(1) Å, b = 6.17126(8) Å, c = 14.4692(2) Å. Extinction conditions were consistent onlywith the space group Pbcn (#60). Crystal structure solution using direct methods provided the positionsof all metal atoms and a part of the nitrogen atoms. The remaining nitrogen positions were locatedin a subsequent difference Fourier synthesis (Figure 2). For Ba atoms, an anisotropic refinement waspossible. Mn and N atoms were refined isotropically. In addition, atomic displacement parameters forall N atoms were constrained to be the same in the final cycles of the refinement. The crystallographicdata are listed in Table 1, atomic positions in Table 2, atomic displacement parameters in Table 3, andselected bond lengths/angles in Figure 3 and Table S2, respectively.
Crystal structure description. The crystal structure of Ba4[Mn3N6] represents a new structuretype and can be viewed as consisting of corrugated chains of edge-sharing [MnN4] tetrahedra runningalong [001], and Ba atoms embedded in-between the chains (Figure 2a,b). A similar structural motif isobserved for the nitridometalates AE3[M2N4] (AE = Sr, Ba, M = Al, Ga, Ge/Mg) [24–29] (Figure 2c),though the degree of the chain corrugation is weaker in these compounds. Perfectly linear chainsof edge-sharing [Fe3+N4] tetrahedra are present in the crystal structure of the lithium nitridoferrateLi3[FeN2] [30] (Figure 2d).
24
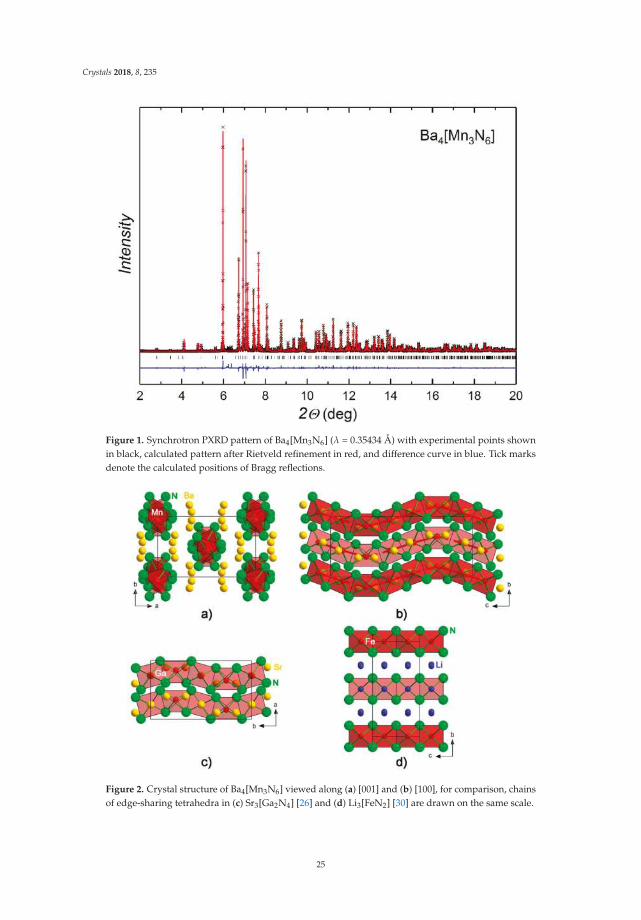
Crystals 2018, 8, 235
Figure 1. Synchrotron PXRD pattern of Ba4[Mn3N6] (λ = 0.35434 Å) with experimental points shownin black, calculated pattern after Rietveld refinement in red, and difference curve in blue. Tick marksdenote the calculated positions of Bragg reflections.
Figure 2. Crystal structure of Ba4[Mn3N6] viewed along (a) [001] and (b) [100], for comparison, chainsof edge-sharing tetrahedra in (c) Sr3[Ga2N4] [26] and (d) Li3[FeN2] [30] are drawn on the same scale.
25
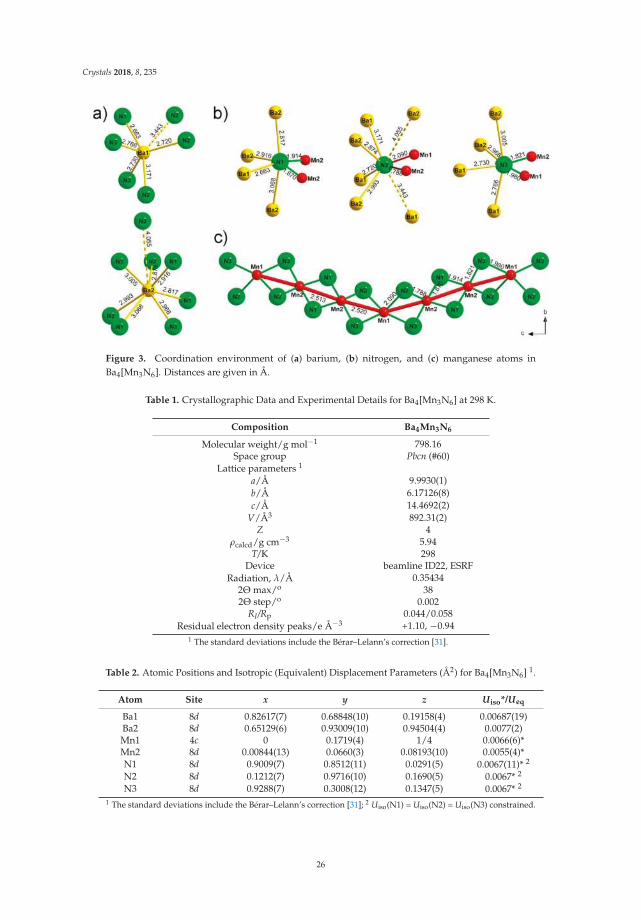
Crystals 2018, 8, 235
Figure 3. Coordination environment of (a) barium, (b) nitrogen, and (c) manganese atoms inBa4[Mn3N6]. Distances are given in Å.
Table 1. Crystallographic Data and Experimental Details for Ba4[Mn3N6] at 298 K.
Composition Ba4Mn3N6
Molecular weight/g mol−1 798.16Space group Pbcn (#60)
Lattice parameters 1
a/Å 9.9930(1)b/Å 6.17126(8)c/Å 14.4692(2)
V/Å3 892.31(2)Z 4
ρcalcd/g cm−3 5.94T/K 298
Device beamline ID22, ESRFRadiation, λ/Å 0.35434
2Θ max/o 382Θ step/o 0.002
RI/Rp 0.044/0.058Residual electron density peaks/e Å−3 +1.10, −0.94
1 The standard deviations include the Bérar–Lelann’s correction [31].
Table 2. Atomic Positions and Isotropic (Equivalent) Displacement Parameters (Å2) for Ba4[Mn3N6] 1.
Atom Site x y z Uiso*/Ueq
Ba1 8d 0.82617(7) 0.68848(10) 0.19158(4) 0.00687(19)Ba2 8d 0.65129(6) 0.93009(10) 0.94504(4) 0.0077(2)Mn1 4c 0 0.1719(4) 1/4 0.0066(6)*Mn2 8d 0.00844(13) 0.0660(3) 0.08193(10) 0.0055(4)*N1 8d 0.9009(7) 0.8512(11) 0.0291(5) 0.0067(11)* 2
N2 8d 0.1212(7) 0.9716(10) 0.1690(5) 0.0067* 2
N3 8d 0.9288(7) 0.3008(12) 0.1347(5) 0.0067* 2
1 The standard deviations include the Bérar–Lelann’s correction [31]; 2 Uiso(N1) = Uiso(N2) = Uiso(N3) constrained.
26
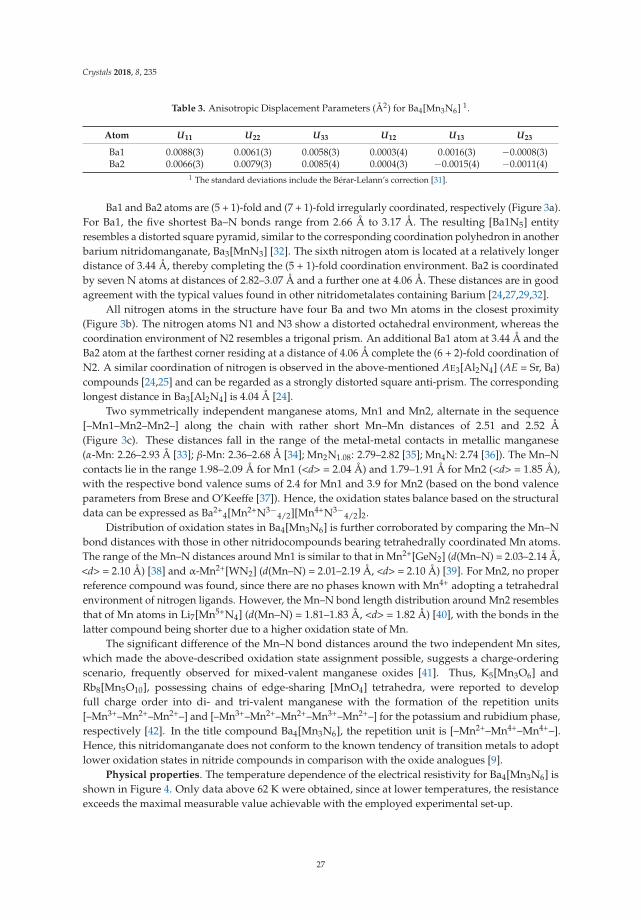
Crystals 2018, 8, 235
Table 3. Anisotropic Displacement Parameters (Å2) for Ba4[Mn3N6] 1.
Atom U11 U22 U33 U12 U13 U23
Ba1 0.0088(3) 0.0061(3) 0.0058(3) 0.0003(4) 0.0016(3) −0.0008(3)Ba2 0.0066(3) 0.0079(3) 0.0085(4) 0.0004(3) −0.0015(4) −0.0011(4)
1 The standard deviations include the Bérar-Lelann’s correction [31].
Ba1 and Ba2 atoms are (5 + 1)-fold and (7 + 1)-fold irregularly coordinated, respectively (Figure 3a).For Ba1, the five shortest Ba–N bonds range from 2.66 Å to 3.17 Å. The resulting [Ba1N5] entityresembles a distorted square pyramid, similar to the corresponding coordination polyhedron in anotherbarium nitridomanganate, Ba3[MnN3] [32]. The sixth nitrogen atom is located at a relatively longerdistance of 3.44 Å, thereby completing the (5 + 1)-fold coordination environment. Ba2 is coordinatedby seven N atoms at distances of 2.82–3.07 Å and a further one at 4.06 Å. These distances are in goodagreement with the typical values found in other nitridometalates containing Barium [24,27,29,32].
All nitrogen atoms in the structure have four Ba and two Mn atoms in the closest proximity(Figure 3b). The nitrogen atoms N1 and N3 show a distorted octahedral environment, whereas thecoordination environment of N2 resembles a trigonal prism. An additional Ba1 atom at 3.44 Å and theBa2 atom at the farthest corner residing at a distance of 4.06 Å complete the (6 + 2)-fold coordination ofN2. A similar coordination of nitrogen is observed in the above-mentioned AE3[Al2N4] (AE = Sr, Ba)compounds [24,25] and can be regarded as a strongly distorted square anti-prism. The correspondinglongest distance in Ba3[Al2N4] is 4.04 Å [24].
Two symmetrically independent manganese atoms, Mn1 and Mn2, alternate in the sequence[–Mn1–Mn2–Mn2–] along the chain with rather short Mn–Mn distances of 2.51 and 2.52 Å(Figure 3c). These distances fall in the range of the metal-metal contacts in metallic manganese(α-Mn: 2.26–2.93 Å [33]; β-Mn: 2.36–2.68 Å [34]; Mn2N1.08: 2.79–2.82 [35]; Mn4N: 2.74 [36]). The Mn–Ncontacts lie in the range 1.98–2.09 Å for Mn1 (<d> = 2.04 Å) and 1.79–1.91 Å for Mn2 (<d> = 1.85 Å),with the respective bond valence sums of 2.4 for Mn1 and 3.9 for Mn2 (based on the bond valenceparameters from Brese and O’Keeffe [37]). Hence, the oxidation states balance based on the structuraldata can be expressed as Ba2+
4[Mn2+N3−4/2][Mn4+N3−
4/2]2.Distribution of oxidation states in Ba4[Mn3N6] is further corroborated by comparing the Mn–N
bond distances with those in other nitridocompounds bearing tetrahedrally coordinated Mn atoms.The range of the Mn–N distances around Mn1 is similar to that in Mn2+[GeN2] (d(Mn–N) = 2.03–2.14 Å,<d> = 2.10 Å) [38] and α-Mn2+[WN2] (d(Mn–N) = 2.01–2.19 Å, <d> = 2.10 Å) [39]. For Mn2, no properreference compound was found, since there are no phases known with Mn4+ adopting a tetrahedralenvironment of nitrogen ligands. However, the Mn–N bond length distribution around Mn2 resemblesthat of Mn atoms in Li7[Mn5+N4] (d(Mn–N) = 1.81–1.83 Å, <d> = 1.82 Å) [40], with the bonds in thelatter compound being shorter due to a higher oxidation state of Mn.
The significant difference of the Mn–N bond distances around the two independent Mn sites,which made the above-described oxidation state assignment possible, suggests a charge-orderingscenario, frequently observed for mixed-valent manganese oxides [41]. Thus, K5[Mn3O6] andRb8[Mn5O10], possessing chains of edge-sharing [MnO4] tetrahedra, were reported to developfull charge order into di- and tri-valent manganese with the formation of the repetition units[–Mn3+–Mn2+–Mn2+–] and [–Mn3+–Mn2+–Mn2+–Mn3+–Mn2+–] for the potassium and rubidium phase,respectively [42]. In the title compound Ba4[Mn3N6], the repetition unit is [–Mn2+–Mn4+–Mn4+–].Hence, this nitridomanganate does not conform to the known tendency of transition metals to adoptlower oxidation states in nitride compounds in comparison with the oxide analogues [9].
Physical properties. The temperature dependence of the electrical resistivity for Ba4[Mn3N6] isshown in Figure 4. Only data above 62 K were obtained, since at lower temperatures, the resistanceexceeds the maximal measurable value achievable with the employed experimental set-up.
27
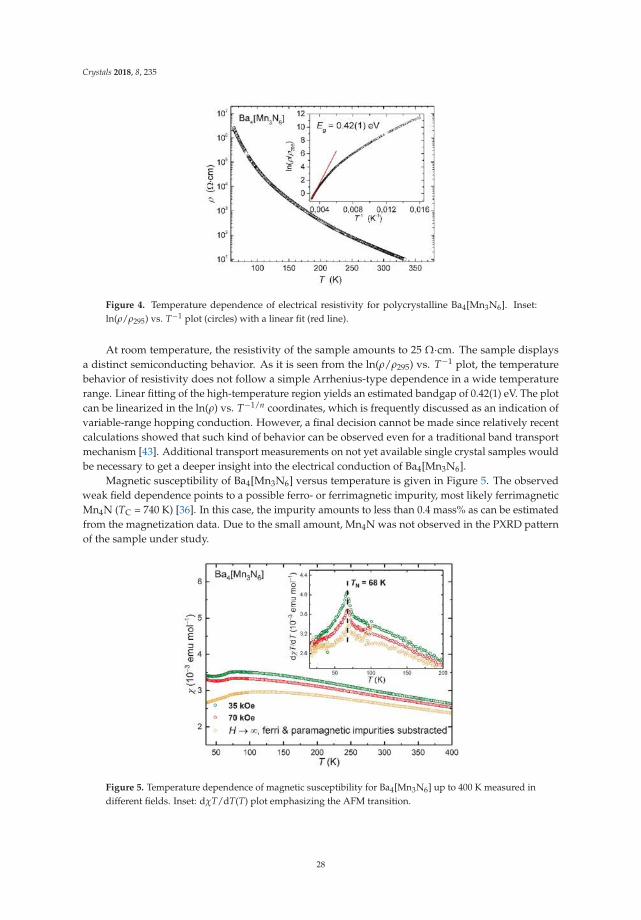
Crystals 2018, 8, 235
Figure 4. Temperature dependence of electrical resistivity for polycrystalline Ba4[Mn3N6]. Inset:ln(ρ/ρ295) vs. T−1 plot (circles) with a linear fit (red line).
At room temperature, the resistivity of the sample amounts to 25 Ω·cm. The sample displaysa distinct semiconducting behavior. As it is seen from the ln(ρ/ρ295) vs. T−1 plot, the temperaturebehavior of resistivity does not follow a simple Arrhenius-type dependence in a wide temperaturerange. Linear fitting of the high-temperature region yields an estimated bandgap of 0.42(1) eV. The plotcan be linearized in the ln(ρ) vs. T−1/n coordinates, which is frequently discussed as an indication ofvariable-range hopping conduction. However, a final decision cannot be made since relatively recentcalculations showed that such kind of behavior can be observed even for a traditional band transportmechanism [43]. Additional transport measurements on not yet available single crystal samples wouldbe necessary to get a deeper insight into the electrical conduction of Ba4[Mn3N6].
Magnetic susceptibility of Ba4[Mn3N6] versus temperature is given in Figure 5. The observedweak field dependence points to a possible ferro- or ferrimagnetic impurity, most likely ferrimagneticMn4N (TC = 740 K) [36]. In this case, the impurity amounts to less than 0.4 mass% as can be estimatedfrom the magnetization data. Due to the small amount, Mn4N was not observed in the PXRD patternof the sample under study.
Figure 5. Temperature dependence of magnetic susceptibility for Ba4[Mn3N6] up to 400 K measured indifferent fields. Inset: dχT/dT(T) plot emphasizing the AFM transition.
28
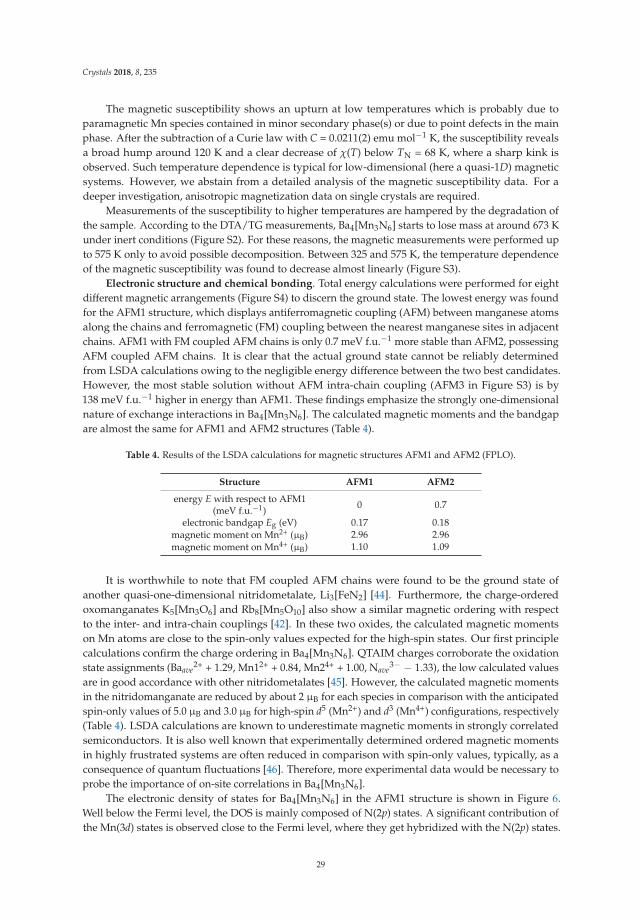
Crystals 2018, 8, 235
The magnetic susceptibility shows an upturn at low temperatures which is probably due toparamagnetic Mn species contained in minor secondary phase(s) or due to point defects in the mainphase. After the subtraction of a Curie law with C = 0.0211(2) emu mol−1 K, the susceptibility revealsa broad hump around 120 K and a clear decrease of χ(T) below TN = 68 K, where a sharp kink isobserved. Such temperature dependence is typical for low-dimensional (here a quasi-1D) magneticsystems. However, we abstain from a detailed analysis of the magnetic susceptibility data. For adeeper investigation, anisotropic magnetization data on single crystals are required.
Measurements of the susceptibility to higher temperatures are hampered by the degradation ofthe sample. According to the DTA/TG measurements, Ba4[Mn3N6] starts to lose mass at around 673 Kunder inert conditions (Figure S2). For these reasons, the magnetic measurements were performed upto 575 K only to avoid possible decomposition. Between 325 and 575 K, the temperature dependenceof the magnetic susceptibility was found to decrease almost linearly (Figure S3).
Electronic structure and chemical bonding. Total energy calculations were performed for eightdifferent magnetic arrangements (Figure S4) to discern the ground state. The lowest energy was foundfor the AFM1 structure, which displays antiferromagnetic coupling (AFM) between manganese atomsalong the chains and ferromagnetic (FM) coupling between the nearest manganese sites in adjacentchains. AFM1 with FM coupled AFM chains is only 0.7 meV f.u.−1 more stable than AFM2, possessingAFM coupled AFM chains. It is clear that the actual ground state cannot be reliably determinedfrom LSDA calculations owing to the negligible energy difference between the two best candidates.However, the most stable solution without AFM intra-chain coupling (AFM3 in Figure S3) is by138 meV f.u.−1 higher in energy than AFM1. These findings emphasize the strongly one-dimensionalnature of exchange interactions in Ba4[Mn3N6]. The calculated magnetic moments and the bandgapare almost the same for AFM1 and AFM2 structures (Table 4).
Table 4. Results of the LSDA calculations for magnetic structures AFM1 and AFM2 (FPLO).
Structure AFM1 AFM2
energy E with respect to AFM1(meV f.u.−1) 0 0.7
electronic bandgap Eg (eV) 0.17 0.18magnetic moment on Mn2+ (µB) 2.96 2.96magnetic moment on Mn4+ (µB) 1.10 1.09
It is worthwhile to note that FM coupled AFM chains were found to be the ground state ofanother quasi-one-dimensional nitridometalate, Li3[FeN2] [44]. Furthermore, the charge-orderedoxomanganates K5[Mn3O6] and Rb8[Mn5O10] also show a similar magnetic ordering with respectto the inter- and intra-chain couplings [42]. In these two oxides, the calculated magnetic momentson Mn atoms are close to the spin-only values expected for the high-spin states. Our first principlecalculations confirm the charge ordering in Ba4[Mn3N6]. QTAIM charges corroborate the oxidationstate assignments (Baave
2+ + 1.29, Mn12+ + 0.84, Mn24+ + 1.00, Nave3− − 1.33), the low calculated values
are in good accordance with other nitridometalates [45]. However, the calculated magnetic momentsin the nitridomanganate are reduced by about 2 µB for each species in comparison with the anticipatedspin-only values of 5.0 µB and 3.0 µB for high-spin d5 (Mn2+) and d3 (Mn4+) configurations, respectively(Table 4). LSDA calculations are known to underestimate magnetic moments in strongly correlatedsemiconductors. It is also well known that experimentally determined ordered magnetic momentsin highly frustrated systems are often reduced in comparison with spin-only values, typically, as aconsequence of quantum fluctuations [46]. Therefore, more experimental data would be necessary toprobe the importance of on-site correlations in Ba4[Mn3N6].
The electronic density of states for Ba4[Mn3N6] in the AFM1 structure is shown in Figure 6.Well below the Fermi level, the DOS is mainly composed of N(2p) states. A significant contribution ofthe Mn(3d) states is observed close to the Fermi level, where they get hybridized with the N(2p) states.
29
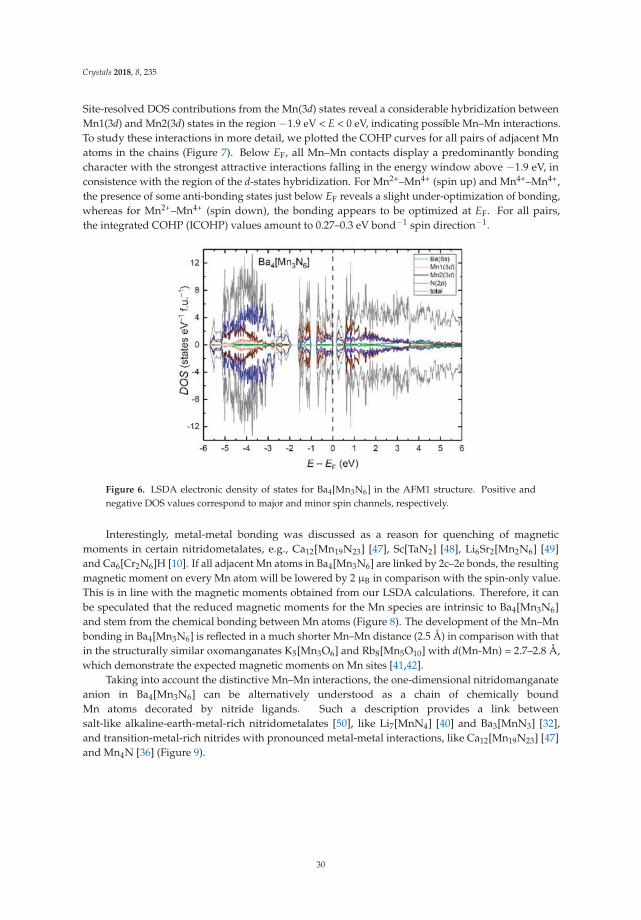
Crystals 2018, 8, 235
Site-resolved DOS contributions from the Mn(3d) states reveal a considerable hybridization betweenMn1(3d) and Mn2(3d) states in the region −1.9 eV < E < 0 eV, indicating possible Mn–Mn interactions.To study these interactions in more detail, we plotted the COHP curves for all pairs of adjacent Mnatoms in the chains (Figure 7). Below EF, all Mn–Mn contacts display a predominantly bondingcharacter with the strongest attractive interactions falling in the energy window above −1.9 eV, inconsistence with the region of the d-states hybridization. For Mn2+–Mn4+ (spin up) and Mn4+–Mn4+,the presence of some anti-bonding states just below EF reveals a slight under-optimization of bonding,whereas for Mn2+–Mn4+ (spin down), the bonding appears to be optimized at EF. For all pairs,the integrated COHP (ICOHP) values amount to 0.27–0.3 eV bond−1 spin direction−1.
Figure 6. LSDA electronic density of states for Ba4[Mn3N6] in the AFM1 structure. Positive andnegative DOS values correspond to major and minor spin channels, respectively.
Interestingly, metal-metal bonding was discussed as a reason for quenching of magneticmoments in certain nitridometalates, e.g., Ca12[Mn19N23] [47], Sc[TaN2] [48], Li6Sr2[Mn2N6] [49]and Ca6[Cr2N6]H [10]. If all adjacent Mn atoms in Ba4[Mn3N6] are linked by 2c–2e bonds, the resultingmagnetic moment on every Mn atom will be lowered by 2 µB in comparison with the spin-only value.This is in line with the magnetic moments obtained from our LSDA calculations. Therefore, it canbe speculated that the reduced magnetic moments for the Mn species are intrinsic to Ba4[Mn3N6]and stem from the chemical bonding between Mn atoms (Figure 8). The development of the Mn–Mnbonding in Ba4[Mn3N6] is reflected in a much shorter Mn–Mn distance (2.5 Å) in comparison with thatin the structurally similar oxomanganates K5[Mn3O6] and Rb8[Mn5O10] with d(Mn-Mn) = 2.7–2.8 Å,which demonstrate the expected magnetic moments on Mn sites [41,42].
Taking into account the distinctive Mn–Mn interactions, the one-dimensional nitridomanganateanion in Ba4[Mn3N6] can be alternatively understood as a chain of chemically boundMn atoms decorated by nitride ligands. Such a description provides a link betweensalt-like alkaline-earth-metal-rich nitridometalates [50], like Li7[MnN4] [40] and Ba3[MnN3] [32],and transition-metal-rich nitrides with pronounced metal-metal interactions, like Ca12[Mn19N23] [47]and Mn4N [36] (Figure 9).
30
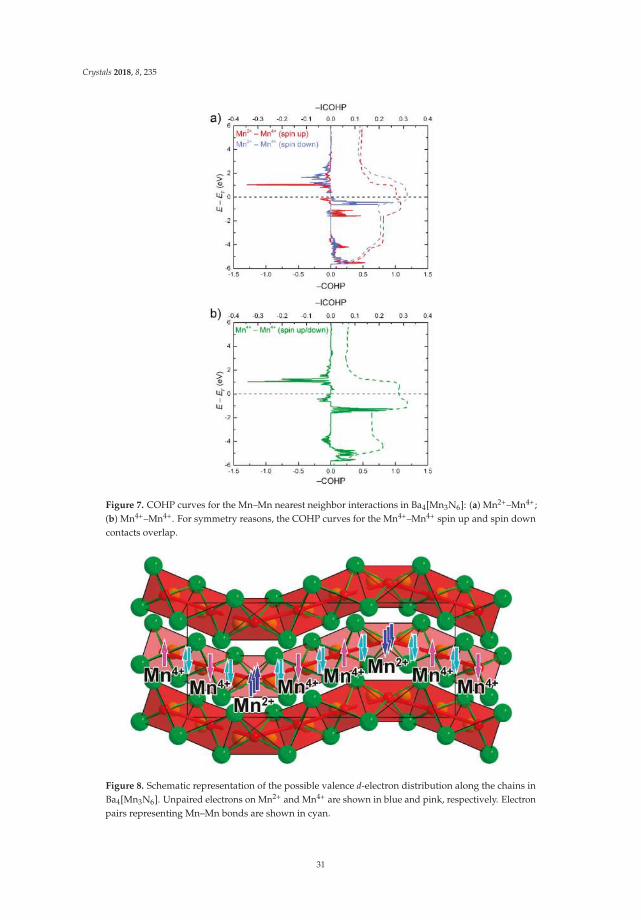
Crystals 2018, 8, 235
Figure 7. COHP curves for the Mn–Mn nearest neighbor interactions in Ba4[Mn3N6]: (a) Mn2+–Mn4+;(b) Mn4+–Mn4+. For symmetry reasons, the COHP curves for the Mn4+–Mn4+ spin up and spin downcontacts overlap.
Figure 8. Schematic representation of the possible valence d-electron distribution along the chains inBa4[Mn3N6]. Unpaired electrons on Mn2+ and Mn4+ are shown in blue and pink, respectively. Electronpairs representing Mn–Mn bonds are shown in cyan.
31
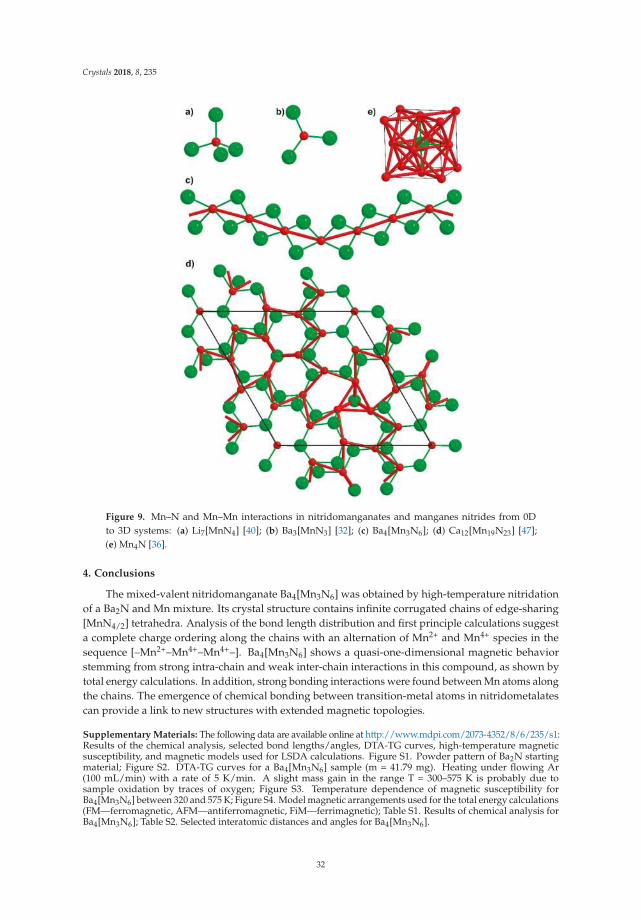
Crystals 2018, 8, 235
Figure 9. Mn–N and Mn–Mn interactions in nitridomanganates and manganes nitrides from 0Dto 3D systems: (a) Li7[MnN4] [40]; (b) Ba3[MnN3] [32]; (c) Ba4[Mn3N6]; (d) Ca12[Mn19N23] [47];(e) Mn4N [36].
4. Conclusions
The mixed-valent nitridomanganate Ba4[Mn3N6] was obtained by high-temperature nitridationof a Ba2N and Mn mixture. Its crystal structure contains infinite corrugated chains of edge-sharing[MnN4/2] tetrahedra. Analysis of the bond length distribution and first principle calculations suggesta complete charge ordering along the chains with an alternation of Mn2+ and Mn4+ species in thesequence [–Mn2+–Mn4+–Mn4+–]. Ba4[Mn3N6] shows a quasi-one-dimensional magnetic behaviorstemming from strong intra-chain and weak inter-chain interactions in this compound, as shown bytotal energy calculations. In addition, strong bonding interactions were found between Mn atoms alongthe chains. The emergence of chemical bonding between transition-metal atoms in nitridometalatescan provide a link to new structures with extended magnetic topologies.
Supplementary Materials: The following data are available online at http://www.mdpi.com/2073-4352/8/6/235/s1:Results of the chemical analysis, selected bond lengths/angles, DTA-TG curves, high-temperature magneticsusceptibility, and magnetic models used for LSDA calculations. Figure S1. Powder pattern of Ba2N startingmaterial; Figure S2. DTA-TG curves for a Ba4[Mn3N6] sample (m = 41.79 mg). Heating under flowing Ar(100 mL/min) with a rate of 5 K/min. A slight mass gain in the range T = 300–575 K is probably due tosample oxidation by traces of oxygen; Figure S3. Temperature dependence of magnetic susceptibility forBa4[Mn3N6] between 320 and 575 K; Figure S4. Model magnetic arrangements used for the total energy calculations(FM—ferromagnetic, AFM—antiferromagnetic, FiM—ferrimagnetic); Table S1. Results of chemical analysis forBa4[Mn3N6]; Table S2. Selected interatomic distances and angles for Ba4[Mn3N6].
32
Crystals 2018, 8, 235
Author Contributions: A.O. and P.H. planned and carried out the material synthesis. A.O. and Y.P. plannedand carried out the X-ray analysis. A.O., M.B., and W.S. planned and carried out resisitivity and magnetizationexperiments. A.O. and Y.G. performed quantum chemical calculations. All authors contributed in writingthe manuscript. P.H. and Y.G. supervised the project. All authors have given approval to the final version ofthe manuscript.
Acknowledgments: The authors acknowledge Horst Borrmann and Steffen Hückmann for collecting laboratoryPXRD data, Gudrun Auffermann, Anja Völzke, and Ulrike Schmidt for performing chemical analysis, MarcusSchmidt and Susanne Scharsach for conducting DTA/TG measurements, and Ralf Koban for carrying out electricalresistivity measurements. European Synchrotron Radiation Facility (ESRF, Grenoble, France) is acknowledged forproviding beamtime at the ID22 beamline managed by Andrew N. Fitch.
Conflicts of Interest: The authors declare no conflict of interest.
References
1. Zhang, W.X.; Ishikawa, R.; Breedlove, B.; Yamashita, M. Single-chain magnets: Beyond the Glauber model.RSC Adv. 2013, 3, 3772–3798. [CrossRef]
2. Ma, X.S.; Dakic, B.; Naylor, W.; Zeilinger, A.; Walther, P. Quantum simulation of the wavefunction to probefrustrated Heisenberg spin systems. Nat. Phys. 2011, 7, 399–405. [CrossRef]
3. Bauer, B.; Cincio, L.; Keller, B.P.; Dolfi, M.; Vidal, G.; Trebst, S.; Ludwig, A.W.W. Chiral spin liquid andemergent anyons in a Kagome lattice Mott insulator. Nat. Commun. 2014, 5, 5137. [CrossRef] [PubMed]
4. Modic, K.A.; Smidt, T.E.; Kimchi, I.; Breznay, N.P.; Biffin, A.; Choi, S.; Johnson, R.D.; Coldea, R.;Watkins-Curry, P.; McCandless, G.T.; et al. Realization of a three-dimensional spin-anisotropic harmonichoneycomb iridate. Nat. Commun. 2014, 5, 4203. [CrossRef] [PubMed]
5. Pereiro, M.; Yudin, D.; Chico, J.; Etz, C.; Eriksson, O.; Bergman, A. Topological excitations in a Kagomemagnet. Nat. Commun. 2014, 5, 4815. [CrossRef] [PubMed]
6. Van Well, N.; Foyevtsova, K.; Gottlieb-Schönmeyer, S.; Ritter, F.; Manna, R.S.; Wolf, B.; Meven, M.;Pfleiderer, C.; Lang, M.; Assmus, W.; et al. Low-temperature structural investigations of the frustratedquantum antiferromagnets Cs2Cu(Cl4-xBrx). Phys. Rev. B 2015, 91, 035124. [CrossRef]
7. Bisogni, V.; Kourtis, S.; Monney, C.; Zhou, K.J.; Kraus, R.; Sekar, C.; Strocov, V.; Büchner, B.; van den Brink, J.;Braicovich, L.; et al. Femtosecond Dynamics of Momentum-Dependent Magnetic Excitations from ResonantInelastic X-Ray Scattering in CaCu2O3. Phys. Rev. Lett. 2014, 112, 147401. [CrossRef] [PubMed]
8. Pak, C.; Kamali, S.; Pham, J.; Lee, K.; Greenfield, J.T.; Kovnir, K. Chemical Excision of Tetrahedral FeSe2
Chains from the Superconductor FeSe: Synthesis, Crystal Structure, and Magnetism of Fe3Se4(en)2. J. Am.
Chem. Soc. 2013, 135, 19111–19114. [CrossRef] [PubMed]9. Kniep, R.; Höhn, P. 2.06—Low-Valency Nitridometalates. In Comprehensive Inorganic Chemistry II, 2nd ed.;
Reedijk, J., Poeppelmeier, K., Eds.; Elsevier: Amsterdam, The Netherlands, 2013; pp. 137–160.10. Bailey, M.S.; Obrovac, M.N.; Baillet, E.; Reynolds, T.K.; Zax, D.B.; DiSalvo, F.J. Ca6(Cr2N6)H, the first
quaternary nitride–Hydride. Inorg. Chem. 2003, 42, 5572–5578. [CrossRef] [PubMed]11. Höhn, P.; Ballé, J.T.; Fix, M.; Prots, Y.; Jesche, A. Single Crystal Growth and Anisotropic Magnetic Properties
of Li2Sr[Li1-xFexN]2. Inorganics 2016, 4, 4040042. [CrossRef]12. STOE & Cie GmbH. WinXPow; STOE & Cie GmbH: Darmstadt, Germany, 2003.13. Altomare, A.; Camalli, M.; Cuocci, C.; Giacovazzo, C.; Moliterni, A.; Rizzi, R. EXPO2009: Structure solution
by powder data in direct and reciprocal space. J. Appl. Crystallogr. 2009, 42, 1197–1202. [CrossRef]14. Petricek, V.; Dušek, M.; Palatinus, L. Crystallographic Computing System JANA2006: General features.
Z. Kristallogr. 2014, 229, 345–352. [CrossRef]15. Honda, K. Die thermomagnetischen Eigenschaften der Elemente. Ann. Phys. 1910, 337, 1027–1063. [CrossRef]16. Koepernik, K.; Eschrig, H. Full-potential nonorthogonal local-orbital minimum-basis band-structure scheme.
Phys. Rev. B 1999, 59, 1743–1757. [CrossRef]17. Jepsen, O.; Burkhardt, A.; Andersen, O.K. The Stuttgart Tight-Binding LMTO-ASA Program; Version 4.7;
Max-Planck-Institut für Festkörperforschung: Stuttgart, Germany, 1998.18. Perdew, J.P.; Wang, Y. Accurate and simple analytic representation of the electron-gas correlation energy.
Phys. Rev. B 1992, 45, 13244–13249. [CrossRef]19. Von Barth, U.; Hedin, L. Local exchange-correlation potential for spin polarized case: 1. J. Phys. C Solid State
1972, 5, 1629–1642. [CrossRef]
33
Crystals 2018, 8, 235
20. Andersen, O.K. Linear Methods in Band Theory. Phys. Rev. B 1975, 12, 3060–3083. [CrossRef]21. Dronskowski, R.; Blöchl, P.E. Crystal orbital Hamilton populations (COHP): Energy-resolved visualization
of chemical bonding in solids based on density-functional calculations. J. Phys. Chem. 1993, 97, 8617–8624.[CrossRef]
22. Kohout, M. DGRID 4.6; Springer: Radebeul, Germany, 2011.23. Bader, R.F.W. Atoms in Molecules—A Quantum Theory, 2003 ed.; Clarendon Press: Oxford, UK, 1994; Volume 22,
pp. 1–456.24. Ludwig, M.; Niewa, R.; Kniep, R. Dimers [Al2N6]12− and chains 1
∞[AlN4/23−] in the crystal structures of
Ca6[Al2N6] and Ba3[Al2N4]. Z. Naturforsch. B 1999, 54, 461–465. [CrossRef]25. Blase, W.; Cordier, G.; Ludwig, M.; Kniep, R. Sr3[Al2N4]: Ein Nitridoaluminat mit gewellten Tetraederketten
1∞[AlN4/2
3−]. Z. Naturforsch. B 1994, 49, 501–505. [CrossRef]26. Clarke, S.J.; DiSalvo, F.J. Synthesis and structure of one-, two-, and three-dimensional alkaline earth metal
gallium nitrides: Sr3Ga2N4, Ca3Ga2Ne4, and Sr3Ga3N5. Inorg. Chem. 1997, 36, 1143–1148. [CrossRef][PubMed]
27. Yamane, H.; DiSalvo, F.J. Ba3Ga2N4. Acta Crystallogr. C 1996, 52, 760–761. [CrossRef]28. Park, D.G.; Gál, Z.A.; DiSalvo, F.J. Sr3GeMgN4: New quaternary nitride containing Mg. J. Alloy. Compd.
2003, 360, 85–89. [CrossRef]29. Park, D.G.; DiSalvo, F.J. A Structural Comparison between a New Quaternary Nitride, Ba3GeMgN4, and Its
Isostructural Sr analogue. Bull. Korean Chem. Soc. 2011, 32, 353–355. [CrossRef]30. Gudat, A.; Kniep, R.; Rabenau, A.; Bronger, W.; Ruschewitz, U. Li3FeN2, a ternary nitride with 1
∞[FeN3−4/2]
chains: Crystal structure and magnetic properties. J. Less Common Met. 1990, 161, 31–36. [CrossRef]31. Bérar, J.F.; Lelann, P. E.s.d.s and estimated probable-error obtained in Rietveld refinements with local
correlations. J. Appl. Crystallogr. 1991, 24, 1–5. [CrossRef]32. Tennstedt, A.; Röhr, C.; Kniep, R. Sr3[MnN3] and Ba3[MnN3], the First Nitridomanganates(III):
Trigonal-Planar Anions [MnIIIN3]6−. Z. Naturforsch. B 1993, 48, 794–796. [CrossRef]33. Yamada, T.; Fujii, Y. The Crystal Structure of α-Mn Reexamined on Single Crystal Specimens. J. Phys. Soc. Jpn.
1970, 28, 1503–1507. [CrossRef]34. Shoemaker, C.B.; Shoemaker, D.P.; Hopkins, T.E.; Yindepit, S. Refinement of the structure of b-manganese
and of a related phase in the Mn-Ni-Si system. Acta Crystallogr. B 1978, 34, 3573–3576. [CrossRef]35. Aoki, M.; Yamane, H.; Shimada, M.; Kajiwara, T. Single crystal growth of Mn2N using an In-Na flux.
Mater. Res. Bull. 2004, 39, 827–832. [CrossRef]36. Juza, R.; Deneke, K.; Puff, H. Ferrimagnetismus der Mischkristalle von Mn4N mit Chrom, Eisen und
Nickel—41. Mitteilung über Metallnitride und -amide. Z. Elektrochem. 1959, 63, 551–557.37. Brese, N.E.; O’Keeffe, M. Bond-valence parameters for solids. Acta Crystallogr. B 1991, 47, 192–197. [CrossRef]38. Wintenberger, M.; Guyader, J.; Maunaye, M. Étude cristallographique et magnétique de MnGeN2 par
diffraction neutronique. Solid State Commun. 1972, 11, 1485–1488. [CrossRef]39. Grins, J.; Käll, P.O.; Svensson, G. Synthesis and structural characterisation of MnWN2 prepared by
ammonolysis of MnWO4. J. Mater. Chem. 1995, 5, 571–575. [CrossRef]40. Niewa, R.; Wagner, F.R.; Schnelle, W.; Hochrein, O.; Kniep, R. Li24[MnN3]3N2 and Li5[(Li1-xMnx)N]3,
Two Intermediates in the Decomposition Path of Li7[MnN4] to Li2[(Li1-xMnx)N]: An Experimental andTheoretical Study. Inorg. Chem. 2001, 40, 5215–5222. [CrossRef] [PubMed]
41. Coey, J.M.D.; Viret, M.; von Molnar, S. Mixed-valence manganites. Adv. Phys. 1999, 48, 167–293. [CrossRef]42. Nuss, J.; Dasari, P.L.V.K.; Jansen, M. K5Mn3O6 and Rb8Mn5O10, New Charge Ordered Quasi
One-Dimensional Oxomanganates (II, III). Z. Anorg. Allg. Chem. 2015, 641, 316–321. [CrossRef]43. Michel, C.; Baranovskii, S.D.; Klar, P.J.; Thomas, P.; Goldlucke, B. Strong non-Arrhenius temperature
dependence of the resistivity in the regime of traditional band transport. Appl. Phys. Lett. 2006, 89, 112116.[CrossRef]
44. Ming, X.; Wang, X.L.; Du, F.; Han, B.; Wang, C.Z.; Chen, G. Unusual intermediate spin Fe3+ ion inantiferromagnetic Li3FeN2. J. Appl. Phys. 2012, 111, 063704. [CrossRef]
45. Bronger, W.; Baranov, A.; Wagner, F.R.; Kniep, R. Atom Volumina and Charge Distributions inNitridometalates. Z. Anorg. Allg. Chem. 2007, 633, 2553–2557. [CrossRef]
46. Jiang, H.C.; Kruger, F.; Moore, J.E.; Sheng, D.N.; Zaanen, J.; Weng, Z.Y. Phase diagram of the frustratedspatially-anisotropic S = 1 antiferromagnet on a square lattice. Phys. Rev. B 2009, 79, 174409. [CrossRef]
34
Crystals 2018, 8, 235
47. Ovchinnikov, A.; Bobnar, M.; Prots, Y.; Borrmann, H.; Sichelschmidt, J.; Grin, Y.; Höhn, P. Ca12[Mn19N23]and Ca133[Mn216N260]: Structural complexity by 2D intergrowth. Angew. Chem. 2018. [CrossRef]
48. Niewa, R.; Zherebtsov, D.A.; Schnelle, W.; Wagner, F.R. Metal-metal bonding in ScTaN2. A new compoundin the system ScN-TaN. Inorg. Chem. 2004, 43, 6188–6194. [CrossRef] [PubMed]
49. Bolvin, H.; Wagner, F.R. Case of a Strong Antiferromagnetic Exchange Coupling Induced by Spin Polarizationof a Mn-Mn Partial Single Bond. Inorg. Chem. 2012, 51, 7112–7118. [CrossRef] [PubMed]
50. Höhn, P.; Niewa, R. Nitrides of Non-Main Group Elements. In Handbook of Solid State Chemistry, Part 1.
Materials and Structure of Solids; Wiley-VCH Verlag GmbH & Co. KGaA: Weinheim, Germany, 2017;pp. 251–359.
© 2018 by the authors. Licensee MDPI, Basel, Switzerland. This article is an open accessarticle distributed under the terms and conditions of the Creative Commons Attribution(CC BY) license (http://creativecommons.org/licenses/by/4.0/).
35
crystals
Article
Optimization of Ca14MgSb11 through ChemicalSubstitutions on Sb Sites: Optimizing SeebeckCoefficient and Resistivity Simultaneously
Yufei Hu, Kathleen Lee and Susan M. Kauzlarich *
Department of Chemistry, University of California, One Shields Avenue, Davis, CA 95616, USA;[email protected] (Y.H.); [email protected] (K.L.)* Correspondence: [email protected]
Received: 17 April 2018; Accepted: 8 May 2018; Published: 13 May 2018
Abstract: In thermoelectric materials, chemical substitutions are widely used to optimizethermoelectric properties. The Zintl phase compound, Yb14MgSb11, has been demonstrated asa promising thermoelectric material at high temperatures. It is iso-structural with Ca14AlSb11 withspace group I41/acd. Its iso-structural analog, Ca14MgSb11, was discovered to be a semiconductor andhave vacancies on the Sb(3) sites, although in its nominal composition it can be described as consistingof fourteen Ca2+ cations with one [MgSb4]9− tetrahedron, one Sb3
7− linear anion and four isolatedSb3− anions (Sb(3) site) in one formula unit. When Sn substitutes Sb in Ca14MgSb11, optimizedSeebeck coefficient and resistivity were achieved simultaneously although the Sn amount is small(<2%). This is difficult to achieve in thermoelectric materials as the Seebeck coefficient and resistivityare inversely related with respect to carrier concentration. Thermal conductivity of Ca14MgSb11-xSnx
remains almost the same as Ca14MgSb11. The calculated zT value of Ca14MgSb10.80Sn0.20 reaches0.49 at 1075 K, which is 53% higher than that of Ca14MgSb11 at the same temperature. The bandstructure of Ca14MgSb7Sn4 is calculated to simulate the effect of Sn substitutions. Compared to theband structure of Ca14MgSb11, the band gap of Ca14MgSb7Sn4 is smaller (0.2 eV) and the Fermi-levelshifts into the valence band. The absolute values for density of states (DOS) of Ca14MgSb7Sn4 aresmaller near the Fermi-level at the top of valence band and 5p-orbitals of Sn contribute most to thevalence bands near the Fermi-level.
Keywords: Zintl; Ca14AlSb11; polar intermetallic; thermoelectric
1. Introduction
Thermoelectric materials have attracted significant attention as they can improve the efficiency ofenergy through converting wasted heat into electricity. The efficiency of thermoelectric materials canbe evaluated through the figure of merit (zT) by Equation (1).
zT =α2
ρκT (1)
In the equation, α is the Seebeck coefficient, ρ is electrical resistivity, T is the absolute temperatureand κ is thermal conductivity. Defects or tiny amounts of chemical substitutions are important tothe optimizations of thermoelectric properties in some typical thermoelectric materials as defectscan tune carrier concentrations effectively and adjust the Seebeck coefficient and electrical resistivity.Cationic defects, tuned carrier concentrations and optimized thermoelectric properties were observedin Zintl phase compounds [1–3]. Defects can also scatter phonons, make the systems phonon-glass-likeand decrease lattice thermal conductivity. The Zn defects in Zn-Sb compounds and Cu defectsin Cu-chalcogenides are essential for decreasing lattice thermal conductivity and tuning of carrier
Crystals 2018, 8, 211; doi:10.3390/cryst8050211 www.mdpi.com/journal/crystals36
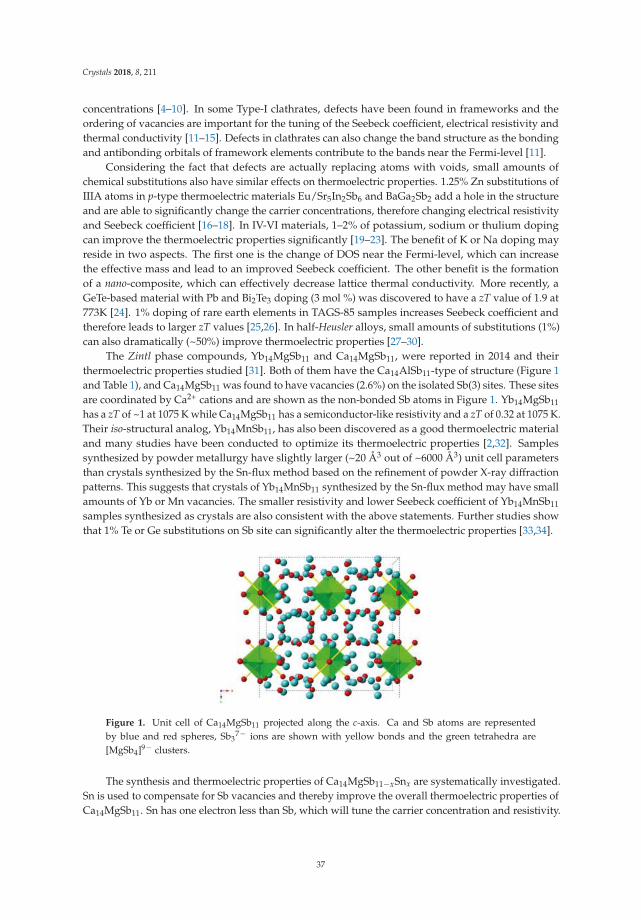
Crystals 2018, 8, 211
concentrations [4–10]. In some Type-I clathrates, defects have been found in frameworks and theordering of vacancies are important for the tuning of the Seebeck coefficient, electrical resistivity andthermal conductivity [11–15]. Defects in clathrates can also change the band structure as the bondingand antibonding orbitals of framework elements contribute to the bands near the Fermi-level [11].
Considering the fact that defects are actually replacing atoms with voids, small amounts ofchemical substitutions also have similar effects on thermoelectric properties. 1.25% Zn substitutions ofIIIA atoms in p-type thermoelectric materials Eu/Sr5In2Sb6 and BaGa2Sb2 add a hole in the structureand are able to significantly change the carrier concentrations, therefore changing electrical resistivityand Seebeck coefficient [16–18]. In IV-VI materials, 1–2% of potassium, sodium or thulium dopingcan improve the thermoelectric properties significantly [19–23]. The benefit of K or Na doping mayreside in two aspects. The first one is the change of DOS near the Fermi-level, which can increasethe effective mass and lead to an improved Seebeck coefficient. The other benefit is the formationof a nano-composite, which can effectively decrease lattice thermal conductivity. More recently, aGeTe-based material with Pb and Bi2Te3 doping (3 mol %) was discovered to have a zT value of 1.9 at773K [24]. 1% doping of rare earth elements in TAGS-85 samples increases Seebeck coefficient andtherefore leads to larger zT values [25,26]. In half-Heusler alloys, small amounts of substitutions (1%)can also dramatically (~50%) improve thermoelectric properties [27–30].
The Zintl phase compounds, Yb14MgSb11 and Ca14MgSb11, were reported in 2014 and theirthermoelectric properties studied [31]. Both of them have the Ca14AlSb11-type of structure (Figure 1and Table 1), and Ca14MgSb11 was found to have vacancies (2.6%) on the isolated Sb(3) sites. These sitesare coordinated by Ca2+ cations and are shown as the non-bonded Sb atoms in Figure 1. Yb14MgSb11
has a zT of ~1 at 1075 K while Ca14MgSb11 has a semiconductor-like resistivity and a zT of 0.32 at 1075 K.Their iso-structural analog, Yb14MnSb11, has also been discovered as a good thermoelectric materialand many studies have been conducted to optimize its thermoelectric properties [2,32]. Samplessynthesized by powder metallurgy have slightly larger (~20 Å3 out of ~6000 Å3) unit cell parametersthan crystals synthesized by the Sn-flux method based on the refinement of powder X-ray diffractionpatterns. This suggests that crystals of Yb14MnSb11 synthesized by the Sn-flux method may have smallamounts of Yb or Mn vacancies. The smaller resistivity and lower Seebeck coefficient of Yb14MnSb11
samples synthesized as crystals are also consistent with the above statements. Further studies showthat 1% Te or Ge substitutions on Sb site can significantly alter the thermoelectric properties [33,34].
Figure 1. Unit cell of Ca14MgSb11 projected along the c-axis. Ca and Sb atoms are representedby blue and red spheres, Sb3
7− ions are shown with yellow bonds and the green tetrahedra are[MgSb4]9− clusters.
The synthesis and thermoelectric properties of Ca14MgSb11−xSnx are systematically investigated.Sn is used to compensate for Sb vacancies and thereby improve the overall thermoelectric properties ofCa14MgSb11. Sn has one electron less than Sb, which will tune the carrier concentration and resistivity.
37
Crystals 2018, 8, 211
Calculations of the electronic band structures show that Sb(3) sites contribute most near the Fermi-leveland therefore substitution of this site may dramatically change the thermoelectric properties [31].
Table 1. Wyckoff positions and atomic coordinates [×104] of atoms for Ca14MgSb11.
Atom Wyckoff Positions x y z
Ca1 32g 9580(2) 9274(2) 8281(1)Ca2 32g 9771(2) 1264(2) 79(1)Ca3 16e 3553(2) 0 2500Ca4 32g 1781(2) 4030(2) 8439(1)Mg1 8a 0 2500 8750Sb1 16f 1364(1) 3864(1) 1250Sb2 32g 37(1) 1100(1) 8059(1)
Sb3 * 32g 8705(1) 9751(1) 9516(1)Sb4 8b 0 2500 1250
* Sb3 site has 2.6% vacancy.
2. Experimental Section
Reagents. Elemental Ca pieces (99.5%, Alfa Aesar, Tewksbury, MA, USA), Mg turnings (99.98%,Sigma-Aldrich, St. Louis, MO, USA), Sb (99.999%, Alfa Aesar, Tewksbury, MA, USA) and Sn (99.3%,Alfa Aesar, Tewksbury, MA, USA) were used for the synthesis. Ca was cut into small pieces whileMg and Sn were used as received. All elements were handled using inert atmosphere techniques,including an argon filled glovebox with water levels <0.5 ppm.
Synthesis of Powder. Quantitative yield, high purity samples were synthesized through a powdermetallurgy method [2]. Melting Sn and Mg together at 600 C with the ratio 1:2.2 to produce Mg2Sn asprecursor. Samples with the ratio Ca:Mg:Sb:Mg2Sn = 14:1.1 × (1−2x):11−x:x (x is the Sn amount) wereloaded into a 50 cm3 tungsten carbide ball mill vial with one large WC ball (diameter = 11 mm) andtwo small WC balls (diameter = 8 mm). The mixtures of elements were ball milled on a SPEX 8000 M(SPEX SamplePrep, Metuchen, NJ, USA) for one hour and another 30 min after a 30 min break (the 30min break prevents the reaction mixture from becoming too hot). The fine powder was transferred to aglovebox and then into a niobium tube, which was sealed by arc welding under argon and furtherjacketed under vacuum in fused silica. Ca14MgSb11−xSnx is annealed at 800 C for 4 days with aheating rate of 30 C/h [31].
Powder X-ray Diffraction. Samples were examined using a Bruker zero background holder ona Bruker D8 Advance Diffractometer operated at 40 kV and 40 mA utilizing Cu Kα radiation. Kβ
radiation is removed by a Ni filter. WinPLOTR (version Jan 2012, part of the FullProf suite of programs,https://www.ill.eu/sites/fullprof/ University of Rennes 1, Rennes, France) software was used forbackground subtraction and pattern analysis, and EDPCR 2.00 software (part of the FullProf suite ofprograms, https://www.ill.eu/sites/fullprof/ University of Rennes 1, Rennes, France) was used toperform Le Bail refinement [35].
Consolidation of Powder. The bulk powder samples were consolidated into dense pellets viaa Dr. Sinter Lab Jr. SPS-211Lx or SPS-2050 spark plasma sintering (SPS) system (Sumitomo, Tokyo,Japan) in a 12.7 mm high-density graphite die (POCO) under vacuum (<10 Pa). The temperature wasincreased from room temperature to 1000–1025 K in 15 min, and remained stable for 5–15 min. Whenthe temperature reached the maximum, the force loaded increased from 3 kN to 5–8 kN. The sampleswere cooled to room temperature afterwards. The geometrical sample density was larger than 95% ofthe theoretical density.
Thermal Conductivity. Thermal diffusivity (D) measurement was conducted on the pelletobtained from SPS from 300 K to 1075 K on a Netzsch LFA-457 laser flash unit (Netzsch, Burlington,MA, USA). The pellet surfaces were well polished and coated with graphite. The measurement wasconducted under dynamic argon atmosphere with a flow rate of 50 mL/min. Thermal conductivitywas calculated using the equation κ = D × ρ × Cp. Room-temperature density was measured from a
38
Crystals 2018, 8, 211
volume method and the high-temperature density was derived using thermal expansion data from aprevious paper on Yb14MnSb11 [36]. The Cp was taken from previous papers, which was measured bydifferential scanning calorimetry (DSC) [2].
Electrical Transport Properties. A Linseis LSR-3 unit (Linseis, Robinsville, NJ, USA) wasemployed to measure Seebeck coefficient and electrical resistivity via a four-probe method from325 K to 1075 K under a helium atmosphere on a bar-shaped sample [37]. The sample which had beenpreviously measured on the LFA instrument was cut into a 2 × 2 × 11 mm bar using a Buehler diamondsaw and polished before measurement. The probe distance was 8 mm. For convenience and clarity,Seebeck coefficient, electrical resistivity and thermal conductivity were fit to six-order polynomialfunctions to calculate zT values. Room-temperature Hall coefficient was measured with a QuantumDesign physical property measurement system (PPMS) from 7 T to −7 T by 5-point ac technique.Platinum leads were connected to the pressed pellet through silver paste. Carrier concentration wascalculated using equation RH = −1/ne using the average of RH from different magnetic fields.
Quantum-chemical calculations. Density functional band structure calculations for Ca14MgSb11
and Ca14MgSb7Sn4 were performed using the linear-muffin tin orbital method (TB-LMTO, Stuttgart,Germany, version 47.1b) within the tight binding approximation [38–42]. The density of states (DOS)and band structures were calculated after convergence of the total energy on a dense k-mesh with12 × 12 × 12 points, with 163 irreducible k-points. A basis set containing Ca(4s,3d), Mg(3s,3p), andSb(5s,5p) orbitals was employed for a self-consistent calculation, with Ca(4p), Mg(3d) and Sb(5d,4f )functions being downfolded.
3. Results and Discussion
Synthesis and Structure. Mg2Sn used in the reaction as a precursor was verified by powder X-raydiffraction. There may be very small peaks indicating the existence of unreacted Mg since extra Mg isused in the precursor synthesis. As mentioned in a previous paper, Ca14MgSb11 synthesized by powdermetallurgy may contain a minor amount of impurity Ca11Sb10 and its existence has a limited effecton the thermoelectric properties [31,43]. Ca14MgSb11−xSnx (x = 0.05 and 0.10) also contained minoramounts of impurities Ca11Sb10 while the Le Bail refinement of the powder X-ray diffraction patternfor Ca14MgSb10.80Sn0.20 indicates a phase pure sample (Figure 2). These samples are air-sensitive andoxidized rapidly upon exposure, leading to poor quality of powder X-ray diffraction patterns, notsuitable for Rietveld refinement. The refined unit cell parameters are listed in Table 2. Generally, theunit cell parameters show a slight increase with the increasing Sn amounts.
Table 2. Unit cell parameters from refinement of powder X-ray diffraction patterns.
Sn Amount Used in Synthesis a (Å) c (Å) V (Å3)
0.00 16.73(1) 22.54(1) 6309(1)0.05 16.72(1) 22.60(1) 6318(3)0.10 16.73(1) 22.59(1) 6323(3)0.20 16.73(1) 22.62(1) 6331(3)
Thermoelectric Properties. Figure 3 shows the results of thermoelectric properties measurementof Ca14MgSb10.95Snx (x = 0.05, 0.1 and 0.2). The Seebeck coefficient and resistivity of thesesamples change dramatically with the small changes of Sn compositions. The Seebeck coefficientof Ca14MgSb10.95Sn0.05 has a similar trend to that of Ca14MgSb11, but the values are much lower.Ca14MgSb10.90Sn0.10 and Ca14MgSb10.80Sn0.20 have almost the same Seebeck coefficient values, whichare slightly higher than the Seebeck coefficient of Ca14MgSb11. The linear increase of Seebeckcoefficients of Ca14MgSb10.90Sn0.10 and Ca14MgSb10.80Sn0.20 within the measured temperature regionis the most significant change caused by Sn substitutions. The Seebeck coefficient of Ca14MgSb11,
39
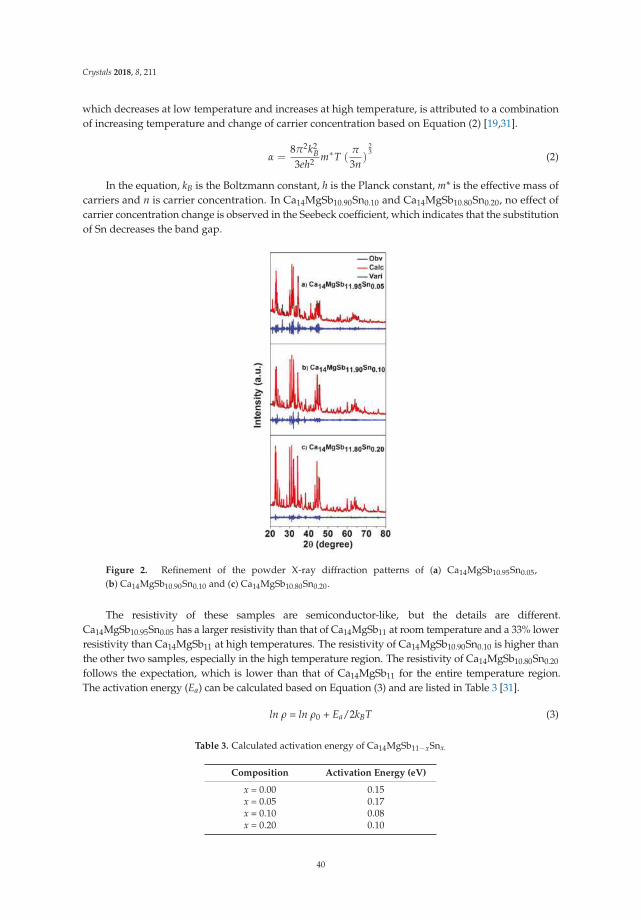
Crystals 2018, 8, 211
which decreases at low temperature and increases at high temperature, is attributed to a combinationof increasing temperature and change of carrier concentration based on Equation (2) [19,31].
α =8π2k2
B
3eh2 m∗T (π
3n)
23 (2)
In the equation, kB is the Boltzmann constant, h is the Planck constant, m* is the effective mass ofcarriers and n is carrier concentration. In Ca14MgSb10.90Sn0.10 and Ca14MgSb10.80Sn0.20, no effect ofcarrier concentration change is observed in the Seebeck coefficient, which indicates that the substitutionof Sn decreases the band gap.
Figure 2. Refinement of the powder X-ray diffraction patterns of (a) Ca14MgSb10.95Sn0.05,(b) Ca14MgSb10.90Sn0.10 and (c) Ca14MgSb10.80Sn0.20.
The resistivity of these samples are semiconductor-like, but the details are different.Ca14MgSb10.95Sn0.05 has a larger resistivity than that of Ca14MgSb11 at room temperature and a 33% lowerresistivity than Ca14MgSb11 at high temperatures. The resistivity of Ca14MgSb10.90Sn0.10 is higher thanthe other two samples, especially in the high temperature region. The resistivity of Ca14MgSb10.80Sn0.20
follows the expectation, which is lower than that of Ca14MgSb11 for the entire temperature region.The activation energy (Ea) can be calculated based on Equation (3) and are listed in Table 3 [31].
ln ρ = ln ρ0 + Ea/2kBT (3)
Table 3. Calculated activation energy of Ca14MgSb11−xSnx.
Composition Activation Energy (eV)
x = 0.00 0.15x = 0.05 0.17x = 0.10 0.08x = 0.20 0.10
40
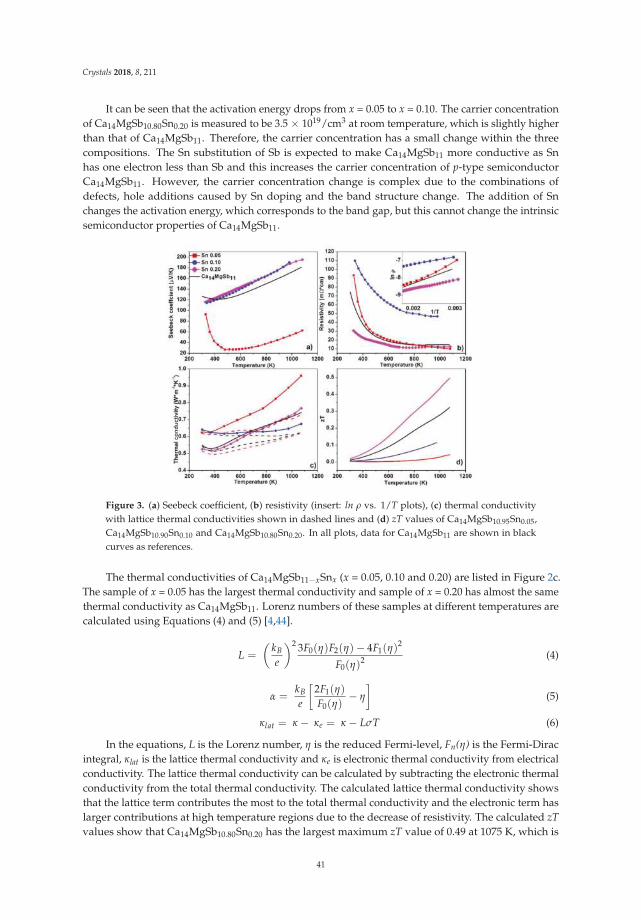
Crystals 2018, 8, 211
It can be seen that the activation energy drops from x = 0.05 to x = 0.10. The carrier concentrationof Ca14MgSb10.80Sn0.20 is measured to be 3.5 × 10¹⁹/cm3 at room temperature, which is slightly higherthan that of Ca14MgSb11. Therefore, the carrier concentration has a small change within the threecompositions. The Sn substitution of Sb is expected to make Ca14MgSb11 more conductive as Snhas one electron less than Sb and this increases the carrier concentration of p-type semiconductorCa14MgSb11. However, the carrier concentration change is complex due to the combinations ofdefects, hole additions caused by Sn doping and the band structure change. The addition of Snchanges the activation energy, which corresponds to the band gap, but this cannot change the intrinsicsemiconductor properties of Ca14MgSb11.
Figure 3. (a) Seebeck coefficient, (b) resistivity (insert: ln ρ vs. 1/T plots), (c) thermal conductivitywith lattice thermal conductivities shown in dashed lines and (d) zT values of Ca14MgSb10.95Sn0.05,Ca14MgSb10.90Sn0.10 and Ca14MgSb10.80Sn0.20. In all plots, data for Ca14MgSb11 are shown in blackcurves as references.
The thermal conductivities of Ca14MgSb11−xSnx (x = 0.05, 0.10 and 0.20) are listed in Figure 2c.The sample of x = 0.05 has the largest thermal conductivity and sample of x = 0.20 has almost the samethermal conductivity as Ca14MgSb11. Lorenz numbers of these samples at different temperatures arecalculated using Equations (4) and (5) [4,44].
L =
(kB
e
)2 3F0(η)F2(η)− 4F1(η)2
F0(η)2 (4)
α =kB
e
[2F1(η)
F0(η)− η
]
(5)
κlat = κ − κe = κ − LσT (6)
In the equations, L is the Lorenz number, η is the reduced Fermi-level, Fn(η) is the Fermi-Diracintegral, κlat is the lattice thermal conductivity and κe is electronic thermal conductivity from electricalconductivity. The lattice thermal conductivity can be calculated by subtracting the electronic thermalconductivity from the total thermal conductivity. The calculated lattice thermal conductivity showsthat the lattice term contributes the most to the total thermal conductivity and the electronic term haslarger contributions at high temperature regions due to the decrease of resistivity. The calculated zT
values show that Ca14MgSb10.80Sn0.20 has the largest maximum zT value of 0.49 at 1075 K, which is
41
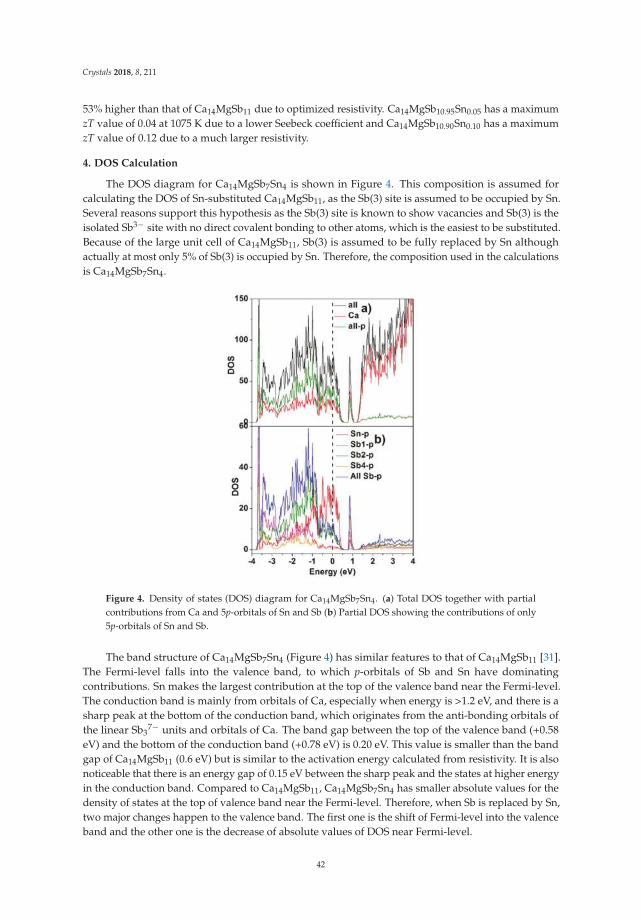
Crystals 2018, 8, 211
53% higher than that of Ca14MgSb11 due to optimized resistivity. Ca14MgSb10.95Sn0.05 has a maximumzT value of 0.04 at 1075 K due to a lower Seebeck coefficient and Ca14MgSb10.90Sn0.10 has a maximumzT value of 0.12 due to a much larger resistivity.
4. DOS Calculation
The DOS diagram for Ca14MgSb7Sn4 is shown in Figure 4. This composition is assumed forcalculating the DOS of Sn-substituted Ca14MgSb11, as the Sb(3) site is assumed to be occupied by Sn.Several reasons support this hypothesis as the Sb(3) site is known to show vacancies and Sb(3) is theisolated Sb3− site with no direct covalent bonding to other atoms, which is the easiest to be substituted.Because of the large unit cell of Ca14MgSb11, Sb(3) is assumed to be fully replaced by Sn althoughactually at most only 5% of Sb(3) is occupied by Sn. Therefore, the composition used in the calculationsis Ca14MgSb7Sn4.
Figure 4. Density of states (DOS) diagram for Ca14MgSb7Sn4. (a) Total DOS together with partialcontributions from Ca and 5p-orbitals of Sn and Sb (b) Partial DOS showing the contributions of only5p-orbitals of Sn and Sb.
The band structure of Ca14MgSb7Sn4 (Figure 4) has similar features to that of Ca14MgSb11 [31].The Fermi-level falls into the valence band, to which p-orbitals of Sb and Sn have dominatingcontributions. Sn makes the largest contribution at the top of the valence band near the Fermi-level.The conduction band is mainly from orbitals of Ca, especially when energy is >1.2 eV, and there is asharp peak at the bottom of the conduction band, which originates from the anti-bonding orbitals ofthe linear Sb3
7− units and orbitals of Ca. The band gap between the top of the valence band (+0.58eV) and the bottom of the conduction band (+0.78 eV) is 0.20 eV. This value is smaller than the bandgap of Ca14MgSb11 (0.6 eV) but is similar to the activation energy calculated from resistivity. It is alsonoticeable that there is an energy gap of 0.15 eV between the sharp peak and the states at higher energyin the conduction band. Compared to Ca14MgSb11, Ca14MgSb7Sn4 has smaller absolute values for thedensity of states at the top of valence band near the Fermi-level. Therefore, when Sb is replaced by Sn,two major changes happen to the valence band. The first one is the shift of Fermi-level into the valenceband and the other one is the decrease of absolute values of DOS near Fermi-level.
42
Crystals 2018, 8, 211
In the experimental samples Ca14MgSb11−xSnx (x = 0.05, 0.10 and 0.20), the Sn amount is muchlower than that used in the calculations for the DOS. Comparing the electronic calculations forCa14MgSb11 and Ca14MgSb7Sn4, a small decrease of band gap is expected. This is supported bythe experimental results. The Seebeck coefficient strongly depends on the density of states at theFermi-level [19,45,46].
S =π2
3kB
qkBT
[1n
dn(E)
dE+
1µ
dµ(E)
dE
]
E=EF
(7)
S =π2
3kB
qkBT
1n
d[g(E) ∗ f (E)]
dE+
1µ
dµ(E)
dE
E=EF
(8)
In Equations (7) and (8), µ is the mobility, n is the carrier density, g(E) is density of states and f (E) isFermi function [19]. In Ca14MgSb11−xSnx (x = 0.05, 0.10 and 0.20), as mentioned above, the Fermi levelshifts into valence band and the change of DOS at the Fermi level is difficult to determine. Based on themeasured Seebeck coefficient, it can be concluded that Fermi-level of Ca14MgSb10.95Sn0.05 falls into avalley of DOS and leads to a small Seebeck coefficient, while Ca14MgSb10.9Sn0.1 and Ca14MgSb10.8Sn0.2
have Fermi-levels with a large DOS and a large Seebeck coefficient. Mobility is inversely related toresistivity by the equation, 1/ρ = σ = neµ (n is carrier density, e is the charge carrier, u is mobility).Mobility depends on the band structure and affects resistivity significantly as the carrier densities forthese samples are approximately the same.
5. Summary
Ca14MgSb11−xSnx (x = 0.05, 0.1 and 0.2) solid solutions were synthesized by powder metallurgywith Mg2Sn as precursor. Although the Sn amount in the samples is small (<2%), optimizedSeebeck coefficient and resistivity were achieved simultaneously with similar thermal conductivity.This is very rare, as the Seebeck coefficient and resistivity are inversely related with respected tocarrier concentration. The Seebeck coefficient of Ca14MgSb10.95Sn0.05 has a similar temperaturedependence compared with Ca14MgSb11, while the Seebeck coefficients of Ca14MgSb10.90Sn0.10 andCa14MgSb10.80Sn0.20 linearly increase from room temperature to high temperature, different fromthe trend of Ca14MgSb11. Their resistivity shows semiconductor behavior and the activation energydecreases with Sn amount. The zT value of Ca14MgSb10.80Sn0.20 reaches 0.49 at 1075 K, which is 53%higher than that of Ca14MgSb11 at the same temperature. The band structure of Ca14MgSb7Sn4 iscalculated to better understand the effect of Sn substitution. The band gap of Ca14MgSb7Sn4 is 0.2 eVand the Fermi-level shifts into the valence band. 5p-orbitals of Sn contribute most to the valence bandsnear Fermi-level at the top of valence band and the overall DOS of Ca14MgSb7Sn4 are smaller in thevalence band compared to Ca14MgSb11. The substitution of Sn increases the carrier concentration anddecreases both the Seebeck coefficient and resistivity as expected.
Author Contributions: Y.H. and S.M.K conceived and designed the experiments. Y.H. performed the experimentsand analyzed the data. K.A.L. contributed to the DOS calculations. Y.H. wrote the first draft of the manuscript;all co-authors contributed to the final version of the manuscript.
Acknowledgments: The authors thank Julia Zaikina for her help in TB-LMTO calculations. This work wassupported by the NASA Science Mission Directorate’s Radioisotope Power Systems. Financial support fromNEUP is gratefully acknowledged.
Conflicts of Interest: The authors declare no conflict of interest.
References
1. Pomrehn, G.S.; Zevalkink, A.; Zeier, W.G.; van de Walle, A.; Snyder, G.J. Defect-Controlled ElectronicProperties in AZn2Sb2 Zintl Phases. Angew. Chem. In. Ed. 2014, 53, 3422–3426. [CrossRef] [PubMed]
2. Grebenkemper, J.H.; Hu, Y.; Barrett, D.; Gogna, P.; Huang, C.-K.; Bux, S.K.; Kauzlarich, S.M. HighTemperature Thermoelectric Properties of Yb14MnSb11 Prepared from Reaction of MnSb with the Elements.Chem. Mater. 2015, 27, 5791. [CrossRef]
43
Crystals 2018, 8, 211
3. Zevalkink, A.; Zeier, W.G.; Cheng, E.; Snyder, J.; Fleurial, J.-P.; Bux, S. Nonstoichiometry in the Zintl PhaseYb1−δZn2Sb2 as a Route to Thermoelectric Optimization. Chem. Mater. 2014, 26, 5710. [CrossRef]
4. Toberer, E.S.; Cox, C.A.; Brown, S.R.; Ikeda, T.; May, A.F.; Kauzlarich, S.M.; Snyder, G.J. Traversingthe Metal-Insulator Transition in a Zintl Phase: Rational Enhancement of Thermoelectric Efficiency inYb14Mn1−xAlxSb11. Adv. Funct. Mater. 2008, 18, 2795. [CrossRef]
5. Toberer, E.S.; Rauwel, P.; Gariel, S.; Taftø, J.; Jeffrey Snyder, G. Composition and the ThermoelectricPerformance of β-Zn4Sb3. J. Mater. Chem. 2010, 20, 9877. [CrossRef]
6. Snyder, G.J.; Christensen, M.; Nishibori, E.; Caillat, T.; Iversen, B.B. Disordered Zinc in Zn4Sb3 withPhonon-glass and Electron-crystal Thermoelectric Properties. Nat. Mater. 2004, 3, 458. [CrossRef] [PubMed]
7. He, Y.; Zhang, T.; Shi, X.; Wei, S.H.; Chen, L. High Thermoelectric Performance in Copper Telluride. NPG
Asia Mater. 2015, 7, e210. [CrossRef]8. He, Y.; Day, T.; Zhang, T.; Liu, H.; Shi, X.; Chen, L.; Snyder, G.J. High Thermoelectric Performance in
Non-Toxic Earth-abundant Copper Sulfide. Adv. Mater. 2014, 26, 3974. [CrossRef] [PubMed]9. Ge, Z.H.; Zhang, B.P.; Chen, Y.X.; Yu, Z.X.; Liu, Y.; Li, J.F. Synthesis and Transport Property of Cu1.8S as a
Promising Thermoelectric Compound. Chem. Commun. 2011, 47, 12697. [CrossRef] [PubMed]10. Liu, H.; Shi, X.; Xu, F.; Zhang, L.; Zhang, W.; Chen, L.; Li, Q.; Uher, C.; Day, T.; Snyder, G.J. Copper Ion
Liquid-like Thermoelectrics. Nat. Mater. 2012, 11, 422. [CrossRef] [PubMed]11. Kaltzoglou, A.; Fässler, T.; Christensen, M.; Johnsen, S.; Iversen, B.; Presniakov, I.; Sobolev, A.; Shevelkov, A.
Effects of the Order–disorder Phase Transition on the Physical Properties of A8Sn442 (A = Rb, Cs).J. Mater. Chem. 2008, 18, 5630. [CrossRef]
12. Kaltzoglou, A.; Fässler, T.F.; Gold, C.; Scheidt, E.W.; Scherer, W.; Kume, T.; Shimizu, H. Investigation ofSubstitution Effects and the Phase Transition in Type-I clathrates RbxCs8–xSn442 (1.3 ≤ x ≤ 2.1) UsingSingle-crystal X-ray Diffraction, Raman Spectroscopy, Heat Capacity and Electrical Resistivity Measurements.J. Solid State Chem. 2009, 182, 2924. [CrossRef]
13. Chung, D.; Hogan, T.; Brazis, P.; Roccilane, M.; Kannewurf, C.; Bastea, M.; Uher, C.; Kanatzidis, M.G.CsBi4Te6: A High-Performance Thermoelectric Material for Low-Temperature Applications. Science 2000,287, 1024. [CrossRef] [PubMed]
14. Dolyniuk, J.A.; Owens-Baird, B.; Wang, J.; Zaikina, J.V.; Kovnir, K. Clathrate Thermoelectrics. Mater. Sci. Eng. R
2016, 108, 1. [CrossRef]15. Zaikina, J.V.; Kovnir, K.A.; Sobolev, A.V.; Presniakov, I.A.; Prots, Y.; Baitinger, M.; Schnelle, W.; Olenev, A.V.;
Lebedev, O.I.; Van Tendeloo, G.; et al. Sn20.53.5As22I8: A Largely Disordered Cationic Clathrate with a New Typeof Superstructure and Abnormally Low Thermal Conductivity. Chem. Eur. J. 2007, 13, 5090. [CrossRef] [PubMed]
16. Aydemir, U.; Zevalkink, A.; Ormeci, A.; Gibbs, Z.M.; Bux, S.; Snyder, G.J. Thermoelectric Enhancement inBaGa2Sb2 by Zn Doping. Chem. Mater. 2015, 27, 1622. [CrossRef]
17. Chanakian, S.; Aydemir, U.; Zevalkink, A.; Gibbs, Z.M.; Fleurial, J.-P.; Bux, S.; Snyder, G.J. High TemperatureThermoelectric Properties of Zn-doped Eu5In2Sb6. J. Mater. Chem. C 2015, 3, 10518. [CrossRef]
18. Chanakian, S.; Zevalkink, A.; Aydemir, U.; Gibbs, Z.M.; Pomrehn, G.; Fleurial, J.-P.; Bux, S.; Snyder, G.J.Enhanced Thermoelectric Properties of Sr5In2Sb6 via Zn-doping. J. Mater. Chem. A 2015, 3, 10289. [CrossRef]
19. Heremans, J.P.; Jovovic, V.; Toberer, E.S.; Saramat, A.; Kurosaki, K.; Charoenphakdee, A.; Yamanaka, S.;Snyder, G.J. Enhancement of Thermoelectric Efficiency in PbTe by Distortion of the Electronic Density ofStates. Science 2008, 321, 554. [CrossRef] [PubMed]
20. Zhang, Q.; Cao, F.; Liu, W.; Lukas, K.; Yu, B.; Chen, S.; Opeil, C.; Broido, D.; Chen, G.; Ren, Z. Heavy Dopingand Band Engineering by Potassium to Improve the Thermoelectric Figure of Merit in p-Type PbTe, PbSe,and PbTe1-ySey. J. Am. Chem. Soc. 2012, 134, 10031. [CrossRef] [PubMed]
21. Pei, Y.; LaLonde, A.; Iwanaga, S.; Snyder, G.J. High Thermoelectric Figure of Merit in Heavy Hole DominatedPbTe. Energy Environ. Sci. 2011, 4, 2085. [CrossRef]
22. Girard, S.N.; He, J.; Zhou, X.; Shoemaker, D.; Jaworski, C.M.; Uher, C.; Dravid, V.P.; Heremans, J.P.;Kanatzidis, M.G. High Performance Na-doped PbTe-PbS Thermoelectric Materials: Electronic Densityof States Modification and Shape-controlled Nanostructures. J. Am. Chem. Soc. 2011, 133, 16588. [CrossRef][PubMed]
23. Zhao, L.D.; Tan, G.; Hao, S.; He, J.; Pei, Y.; Chi, H.; Wang, H.; Gong, S.; Xu, H.; Dravid, V.P.; et al. UltrahighPower Factor and Thermoelectric Performance in Hole-doped Single-Crystal SnSe. Science 2016, 351, 141.[CrossRef] [PubMed]
44
Crystals 2018, 8, 211
24. Wu, D.; Zhao, L.D.; Hao, S.; Jiang, Q.; Zheng, F.; Doak, J.W.; Wu, H.; Chi, H.; Gelbstein, Y.; Uher, C.; et al. Originof the High Performance in GeTe-Based Thermoelectric Materials upon Bi2Te3 Doping. J. Ame. Chem. Soc. 2014,136, 11412. [CrossRef] [PubMed]
25. Levin, E.M.; Cook, B.A.; Harringa, J.L.; Bud’ko, S.L.; Venkatasubramanian, R.; Schmidt-Rohr, K. Analysis ofCe- and Yb-Doped TAGS-85 Materials with Enhanced Thermoelectric Figure of Merit. Adv. Funct. Mater.
2011, 21, 441. [CrossRef]26. Levin, E.M.; Bud’ko, S.L.; Schmidt-Rohr, K. Enhancement of Thermopower of TAGS-85 High-Performance
Thermoelectric Material by Doping with the Rare Earth Dy. Adv. Funct. Mater. 2012, 22, 2766. [CrossRef]27. Bhattacharya, S.; Pope, A.L.; Littleton, R.T.; Tritt, T.M.; Ponnambalam, V.; Xia, Y.; Poon, S.J. Effect of Sb Doping
on the Thermoelectric Properties of Ti-based half-Heusler Compounds, TiNiSn1−xSbx. Appl. Phys. Lett. 2000, 77,2476. [CrossRef]
28. Shen, Q.; Chen, L.; Goto, T.; Hirai, T.; Yang, J.; Meisner, G.P.; Uher, C. Effects of Partial Substitution of Ni byPd on the Thermoelectric Properties of ZrNiSn-based half-Heusler Compounds. Appl. Phys. Lett. 2001, 79,4165. [CrossRef]
29. Appel, O.; Zilber, T.; Kalabukhov, S.; Beeri, O.; Gelbstein, Y. Morphological Effects on the Thermoelectric Propertiesof Ti0.3Zr0.35Hf0.35Ni1+δSn Alloys Following Phase Separation. J. Mater. Chem. C 2015, 3, 11653. [CrossRef]
30. Casper, F.; Graf, T.; Chadov, S.; Balke, B.; Felser, C. Half-Heusler Compounds: Novel Materials for Energyand Spintronic Applications. Semicond. Sci. Technol. 2012, 27, 063001. [CrossRef]
31. Hu, Y.; Wang, J.; Kawamura, A.; Kovnir, K.; Kauzlarich, S.M. Yb14MgSb11 and Ca14MgSb11—NewMg-Containing Zintl Compounds and Their Structures, Bonding, and Thermoelectric Properties. Chem. Mater.
2015, 27, 343. [CrossRef]32. Toberer, E.S.; Brown, S.R.; Ikeda, T.; Kauzlarich, S.M.; Jeffrey Snyder, G. High Thermoelectric Efficiency in
Lanthanum Doped Yb14MnSb11. Appl. Phys. Lett. 2008, 93, 062110. [CrossRef]33. Yi, T.; Abdusalyamova, M.N.; Makhmudov, F.; Kauzlarich, S.M. Magnetic and Transport Properties of Te
Doped Yb14MnSb11. J. Mater. Chem. 2012, 22, 14378. [CrossRef]34. Rauscher, J.F.; Cox, C.A.; Yi, T.; Beavers, C.M.; Klavins, P.; Toberer, E.S.; Snyder, G.J.; Kauzlarich, S.M.
Synthesis, Structure, Magnetism, and High Temperature Thermoelectric Properties of Ge Doped Yb14MnSb11.Dalton Trans. 2010, 39, 1055. [CrossRef] [PubMed]
35. Rodríquez-Carvajal, J. Recent Advances in Magnetic Structure Determination by Neutron Powder Diffraction.Physica B 1993, 192, 55. [CrossRef]
36. Ravi, V.; Firdosy, S.; Caillat, T.; Brandon, E.; Van Der Walde, K.; Maricic, L.; Sayir, A. Thermal ExpansionStudies of Selected High-Temperature Thermoelectric Materials. J. Electron. Mater. 2009, 38, 1433. [CrossRef]
37. Mackey, J.; Dynys, F.; Sehirlioglu, A. Uncertainty Analysis for Common Seebeck and Electrical ResistivityMeasurement Systems. Rev. Sci. Instrum. 2014, 85, 085119. [CrossRef] [PubMed]
38. Andersen, O.K. Linear Methods in Band Theory. Phys. Rev. B 1975, 12, 3060. [CrossRef]39. Andersen, O.K.; Jepsen, O. Explicit, First-Principles Tight-Binding Theory. Phys. Rev. Lett. 1984, 53, 2571. [CrossRef]40. Andersen, O.K.; Pawlowska, Z.; Jepsen, O. Illustration of the Linear-muffin-tin-orbital Tight-binding
Representation: Compact Orbitals and Charge Density in Si. Phys. Rev. B 1986, 34, 5253. [CrossRef]41. Nowak, H.J.; Andersen, O.K.; Fujiwara, T.; Jepsen, O.; Vargas, P. Electronic-structure Calculations for Amorphous
Solids Using the Recursion Method and Linear Muffin-tin Orbitals: Application to Fe80B20. Phys. Rev. B 1991,44, 3577. [CrossRef]
42. Lambrecht, W.R.L.; Andersen, O.K. Minimal Basis Sets in the Linear Muffin-tin Orbital Method: Applicationto the Diamond-structure Crystals C, Si, and Ge. Phys. Rev. B 1986, 34, 2439. [CrossRef]
43. Brown, S.R.; Kauzlarich, S.M.; Gascoin, F.; Jeffrey Snyder, G. High-temperature Thermoelectric Studies ofA11Sb10 (A=Yb, Ca). J. Solid State Chem. 2007, 180, 1414. [CrossRef]
44. Fistul, V.I. Heavily Doped Semiconductor; Plenum Press: New York, NY, USA, 1969.45. Cutler, M.; Mott, N.F. Observation of Anderson Localization in an Electron Gas. Phys. Rev. 1969, 181, 1336.
[CrossRef]46. Mahan, G.D.; Sofo, J.O. The Best Thermoelectric. Proc. Natl. Acad. Sci. USA 1996, 93, 7436. [CrossRef] [PubMed]
© 2018 by the authors. Licensee MDPI, Basel, Switzerland. This article is an open accessarticle distributed under the terms and conditions of the Creative Commons Attribution(CC BY) license (http://creativecommons.org/licenses/by/4.0/).
45
crystals
Article
Lu5Pd4Ge8 and Lu3Pd4Ge4: Two More Germanidesamong Polar Intermetallics
Riccardo Freccero 1, Pavlo Solokha 1,*, Davide Maria Proserpio 2,3, Adriana Saccone 1
and Serena De Negri 1
1 Dipartimento di Chimica e Chimica Industriale, Università degli Studi di Genova, Via Dodecaneso 31,16146 Genova, Italy; [email protected] (R.F.); [email protected] (A.S.);[email protected] (S.D.N.)
2 Dipartimento di Chimica, Università degli Studi di Milano, Via Golgi 19, 20133 Milano, Italy;[email protected]
3 Samara Center for Theoretical Materials Science (SCTMS), Samara State Technical University,Molodogvardeyskaya St. 244, Samara 443100, Russia
* Correspondence: [email protected]; Tel.: +39-010-3536-159
Received: 20 April 2018; Accepted: 3 May 2018; Published: 5 May 2018
Abstract: In this study, two novel Lu5Pd4Ge8 and Lu3Pd4Ge4 polar intermetallics were prepared bydirect synthesis of pure constituents. Their crystal structures were determined by single crystal X-raydiffraction analysis: Lu5Pd4Ge8 is monoclinic, P21/m, mP34, a = 5.7406(3), b = 13.7087(7), c = 8.3423(4)Å, β = 107.8(1), Z = 2; Lu3Pd4Ge4 is orthorhombic, Immm, oI22, a = 4.1368(3), b = 6.9192(5), c = 13.8229(9)Å, Z = 2. The Lu5Pd4Ge8 analysed crystal is one more example of non-merohedral twinning amongthe rare earth containing germanides. Chemical bonding DFT studies were conducted for thesepolar intermetallics with a metallic-like behavior. Gathered results for Lu5Pd4Ge8 and Lu3Pd4Ge4
permit to described both of them as composed by [Pd–Ge]δ– three dimensional networks bondedto positively charged lutetium species. From the structural chemical point of view, the studiedcompounds manifest some similarities to the Zintl phases, containing well-known covalent fragmentsi.e., Ge dumbbells as well as unique cis-Ge4 units. A comparative analysis of molecular orbitaldiagrams for Ge2
6– and cis-Ge10– anions with COHP results supports the idea of the existence ofcomplex Pd–Ge polyanions hosting covalently bonded partially polarised Ge units. The palladiumatoms have an anion like behaviour and being the most electronegative cause the noticeable variationof Ge species charges from site to site. Lutetium charges oscillate around +1.5 for all crystallographicpositions. Obtained results explained why the classical Zintl-Klemm concept can’t be applied for thestudied polar intermetallics.
Keywords: polar intermetallics; symmetry reduction; chemical bond
1. Introduction
In RE–Pd–Ge systems (RE = rare earth metal) more than one hundred ternary compounds havealready been discovered [1], which have been extensively studied with respect to crystal structure,chemical bonding and physical properties [2–6].
The structures of Ge-rich compounds are characterized by a variety of Ge covalent fragments,with topologies depending both on global stoichiometry and on the nature of the RE component.These units are often joined together through Pd atoms, meanwhile the RE species are located inbigger channels inside the structure [2,3,7]. The frameworks formed by Pd and Ge atoms have beeninterpreted as polyanions of general formula [PdxGey]δ– counterbalanced by the rare earth cations,coherently with the definition of these compounds as polar intermetallics [4].
Crystals 2018, 8, 205; doi:10.3390/cryst8050205 www.mdpi.com/journal/crystals46
Crystals 2018, 8, 205
It is interesting to remark that the ternary RE–Pd–Ge compounds manifest a tendency to bestoichiometric with ordered distributions of constituents through distinct Wyckoff sites. Moreover,within Pd–Ge fragments, both species have small coordination numbers (usually four or five) withvery similar topological distributions of neighbours (tetrahedral coordination or its derivatives).These features may be considered as geometrical traces of a similar chemical role of Pd and Ge. That iswhy symmetry reduction from certain aristotypes can conveniently depict the distortions relatedwith an ordered distribution of atom sorts. Such analysis has been conducted in the literature forAlB2 derivative polymorphs of REPdGe [8] and BaAl4 derivatives of the RE2Pd3Ge5 [7,9] family ofcompounds. In systems where such types of relationships exist, the geometric factor is surely of greatimportance. Thus, varying RE, different polymorphs [8] or even novel compounds may form. As anexample, heavy rare earth containing RE5Pd4Ge8 (RE = Er, Tm) [4] and RE3Pd4Ge4 (RE = Ho, Tm,Yb) [3] series of compounds may be cited.
During exploratory syntheses conducted in the Lu–Pd–Ge system in the framework of ourongoing studies on Ge-rich ternary compounds, the Lu representatives of the abovementioned 5:4:8and 3:4:4 stoichiometries were detected for the first time. In this paper, results on the synthesis andstructural characterization/analysis of these new germanides are reported, together with an extensivestudy of their chemical bonding, including Bader charges, Density of States (DOS) and Crystal OrbitalHamilton Population (COHP) curves as well as Molecular Orbitals (MO) diagrams for Zintl anionscomposed by Ge.
2. Experimental
2.1. Synthesis and SEM-EDXS Characterization
The Lu–Pd–Ge alloys were synthesized from elements with nominal purities >99.9% mass.Lutetium was supplied by Newmet Koch, Waltham Abbey, England, and palladium and germaniumby MaTecK, Jülich, Germany.
Different synthetic routes were followed, including arc melting and direct synthesis in resistancefurnace. In the latter case, proper amounts of components were placed in an alumina crucible, whichwas closed in an evacuated quartz ampoule to prevent oxidation at high temperatures, and submittedto one of the following thermal cycles in a resistance furnace:
(1) 25 C → (10 C/min) → 950 C (1 h) → (−0.2 C/min) → 600 C (168 h) → (−0.5 C/min) →300 C → furnace switched off
(2) 25 C → (10 C/min) → 1150 C (1 h) → (−0.2 C/min) → 300 C → furnace switched off
A continuous rotation of the quartz ampoule during the thermal cycle was applied. In somecases, the thermal treatment followed arc melting. A scanning electron microscope (SEM) Zeiss Evo 40(Carl Zeiss SMT Ltd., Cambridge, UK) coupled with a Pentafet Link Energy Dispersive X-raySpectroscopy (EDXS) system managed by INCA Energy software (Oxford Instruments, AnalyticalLtd., Bucks, UK) was used for microstructure observation and phase analysis. For this last purpose,calibration was performed with a cobalt standard. Samples to be analyzed were embedded in a phenolicresin with carbon filler, by using the automatic hot compression mounting press, Opal 410 (ATM GmbH,Mammelzen, Germany), and smooth surfaces for microscopic examinations were obtained with the aidof the automatic grinding and polishing machine, Saphir 520 (ATM GmbH, Mammelzen, Germany).SiC papers with grain sizes decreasing from 600 to 1200 mesh and diamond pastes with particle sizesdecreasing from 6 to 1 µm were employed for grinding and polishing, respectively.
2.2. X-ray Diffraction (XRD) Measurements on Single Crystals and Powder Samples
Single crystals of Lu5Pd4Ge8 and Lu3Pd4Ge4 were selected from suitable samples with the aid ofa light optical microscope operated in dark field mode. A full-sphere dataset was obtained in a routinefashion at ambient conditions on a four-circle Bruker Kappa APEXII CCD area-detector diffractometer
47
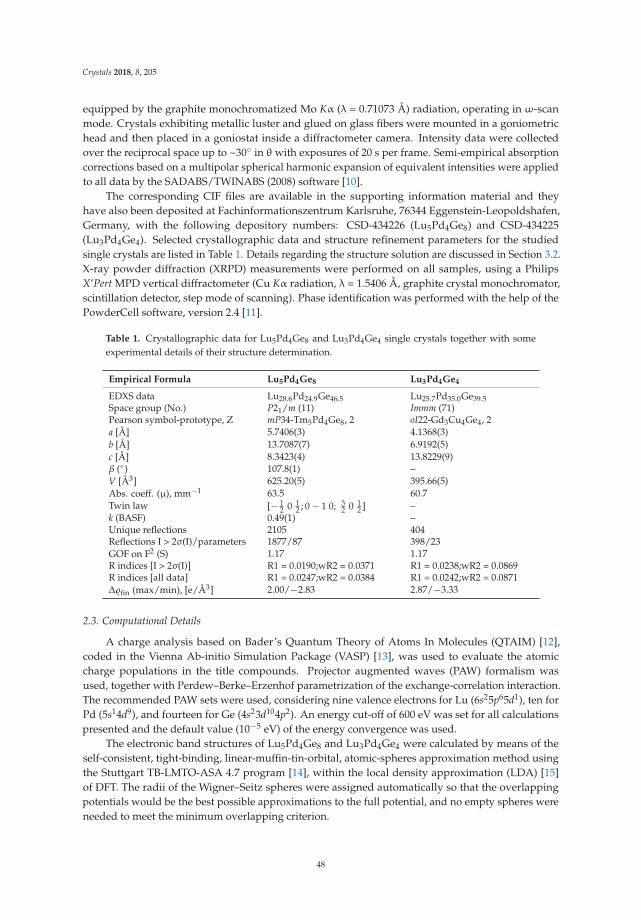
Crystals 2018, 8, 205
equipped by the graphite monochromatized Mo Kα (λ = 0.71073 Å) radiation, operating in ω-scanmode. Crystals exhibiting metallic luster and glued on glass fibers were mounted in a goniometrichead and then placed in a goniostat inside a diffractometer camera. Intensity data were collectedover the reciprocal space up to ~30 in θ with exposures of 20 s per frame. Semi-empirical absorptioncorrections based on a multipolar spherical harmonic expansion of equivalent intensities were appliedto all data by the SADABS/TWINABS (2008) software [10].
The corresponding CIF files are available in the supporting information material and theyhave also been deposited at Fachinformationszentrum Karlsruhe, 76344 Eggenstein-Leopoldshafen,Germany, with the following depository numbers: CSD-434226 (Lu5Pd4Ge8) and CSD-434225(Lu3Pd4Ge4). Selected crystallographic data and structure refinement parameters for the studiedsingle crystals are listed in Table 1. Details regarding the structure solution are discussed in Section 3.2.X-ray powder diffraction (XRPD) measurements were performed on all samples, using a PhilipsX’Pert MPD vertical diffractometer (Cu Kα radiation, λ = 1.5406 Å, graphite crystal monochromator,scintillation detector, step mode of scanning). Phase identification was performed with the help of thePowderCell software, version 2.4 [11].
Table 1. Crystallographic data for Lu5Pd4Ge8 and Lu3Pd4Ge4 single crystals together with someexperimental details of their structure determination.
Empirical Formula Lu5Pd4Ge8 Lu3Pd4Ge4
EDXS data Lu28.6Pd24.9Ge46.5 Lu25.7Pd35.0Ge39.5Space group (No.) P21/m (11) Immm (71)Pearson symbol-prototype, Z mP34-Tm5Pd4Ge8, 2 oI22-Gd3Cu4Ge4, 2a [Å] 5.7406(3) 4.1368(3)b [Å] 13.7087(7) 6.9192(5)c [Å] 8.3423(4) 13.8229(9)β () 107.8(1) –V [Å3] 625.20(5) 395.66(5)Abs. coeff. (µ), mm−1 63.5 60.7Twin law [− 1
2 0 12 ; 0 − 1 0; 3
2 0 12 ] –
k (BASF) 0.49(1) –Unique reflections 2105 404Reflections I > 2σ(I)/parameters 1877/87 398/23GOF on F2 (S) 1.17 1.17R indices [I > 2σ(I)] R1 = 0.0190;wR2 = 0.0371 R1 = 0.0238;wR2 = 0.0869R indices [all data] R1 = 0.0247;wR2 = 0.0384 R1 = 0.0242;wR2 = 0.0871∆fin (max/min), [e/Å3] 2.00/−2.83 2.87/−3.33
2.3. Computational Details
A charge analysis based on Bader’s Quantum Theory of Atoms In Molecules (QTAIM) [12],coded in the Vienna Ab-initio Simulation Package (VASP) [13], was used to evaluate the atomiccharge populations in the title compounds. Projector augmented waves (PAW) formalism wasused, together with Perdew–Berke–Erzenhof parametrization of the exchange-correlation interaction.The recommended PAW sets were used, considering nine valence electrons for Lu (6s25p65d1), ten forPd (5s14d9), and fourteen for Ge (4s23d104p2). An energy cut-off of 600 eV was set for all calculationspresented and the default value (10−5 eV) of the energy convergence was used.
The electronic band structures of Lu5Pd4Ge8 and Lu3Pd4Ge4 were calculated by means of theself-consistent, tight-binding, linear-muffin-tin-orbital, atomic-spheres approximation method usingthe Stuttgart TB-LMTO-ASA 4.7 program [14], within the local density approximation (LDA) [15]of DFT. The radii of the Wigner–Seitz spheres were assigned automatically so that the overlappingpotentials would be the best possible approximations to the full potential, and no empty spheres wereneeded to meet the minimum overlapping criterion.
48
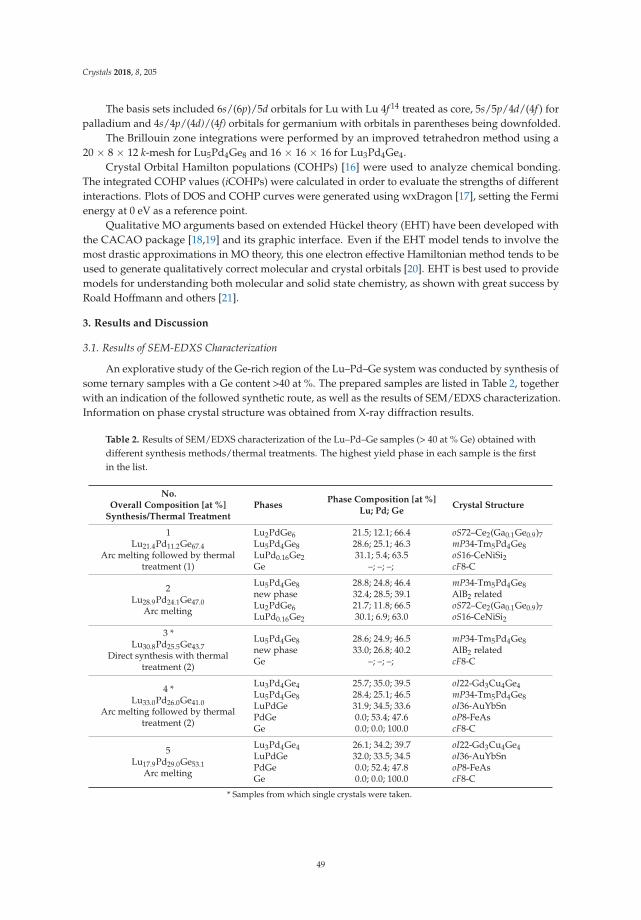
Crystals 2018, 8, 205
The basis sets included 6s/(6p)/5d orbitals for Lu with Lu 4f 14 treated as core, 5s/5p/4d/(4f ) forpalladium and 4s/4p/(4d)/(4f) orbitals for germanium with orbitals in parentheses being downfolded.
The Brillouin zone integrations were performed by an improved tetrahedron method using a20 × 8 × 12 k-mesh for Lu5Pd4Ge8 and 16 × 16 × 16 for Lu3Pd4Ge4.
Crystal Orbital Hamilton populations (COHPs) [16] were used to analyze chemical bonding.The integrated COHP values (iCOHPs) were calculated in order to evaluate the strengths of differentinteractions. Plots of DOS and COHP curves were generated using wxDragon [17], setting the Fermienergy at 0 eV as a reference point.
Qualitative MO arguments based on extended Hückel theory (EHT) have been developed withthe CACAO package [18,19] and its graphic interface. Even if the EHT model tends to involve themost drastic approximations in MO theory, this one electron effective Hamiltonian method tends to beused to generate qualitatively correct molecular and crystal orbitals [20]. EHT is best used to providemodels for understanding both molecular and solid state chemistry, as shown with great success byRoald Hoffmann and others [21].
3. Results and Discussion
3.1. Results of SEM-EDXS Characterization
An explorative study of the Ge-rich region of the Lu–Pd–Ge system was conducted by synthesis ofsome ternary samples with a Ge content >40 at %. The prepared samples are listed in Table 2, togetherwith an indication of the followed synthetic route, as well as the results of SEM/EDXS characterization.Information on phase crystal structure was obtained from X-ray diffraction results.
Table 2. Results of SEM/EDXS characterization of the Lu–Pd–Ge samples (> 40 at % Ge) obtained withdifferent synthesis methods/thermal treatments. The highest yield phase in each sample is the firstin the list.
No.Overall Composition [at %]
Synthesis/Thermal TreatmentPhases
Phase Composition [at %]Lu; Pd; Ge
Crystal Structure
1Lu21.4Pd11.2Ge67.4
Arc melting followed by thermaltreatment (1)
Lu2PdGe6Lu5Pd4Ge8LuPd0.16Ge2Ge
21.5; 12.1; 66.428.6; 25.1; 46.331.1; 5.4; 63.5
–; –; –;
oS72–Ce2(Ga0.1Ge0.9)7mP34-Tm5Pd4Ge8oS16-CeNiSi2cF8-C
2Lu28.9Pd24.1Ge47.0
Arc melting
Lu5Pd4Ge8new phaseLu2PdGe6LuPd0.16Ge2
28.8; 24.8; 46.432.4; 28.5; 39.121.7; 11.8; 66.530.1; 6.9; 63.0
mP34-Tm5Pd4Ge8AlB2 relatedoS72–Ce2(Ga0.1Ge0.9)7oS16-CeNiSi2
3 *Lu30.8Pd25.5Ge43.7
Direct synthesis with thermaltreatment (2)
Lu5Pd4Ge8new phaseGe
28.6; 24.9; 46.533.0; 26.8; 40.2
–; –; –;
mP34-Tm5Pd4Ge8AlB2 relatedcF8-C
4 *Lu33.0Pd26.0Ge41.0
Arc melting followed by thermaltreatment (2)
Lu3Pd4Ge4Lu5Pd4Ge8LuPdGePdGeGe
25.7; 35.0; 39.528.4; 25.1; 46.531.9; 34.5; 33.60.0; 53.4; 47.60.0; 0.0; 100.0
oI22-Gd3Cu4Ge4mP34-Tm5Pd4Ge8oI36-AuYbSnoP8-FeAscF8-C
5Lu17.9Pd29.0Ge53.1
Arc melting
Lu3Pd4Ge4LuPdGePdGeGe
26.1; 34.2; 39.732.0; 33.5; 34.50.0; 52.4; 47.80.0; 0.0; 100.0
oI22-Gd3Cu4Ge4oI36-AuYbSnoP8-FeAscF8-C
* Samples from which single crystals were taken.
49
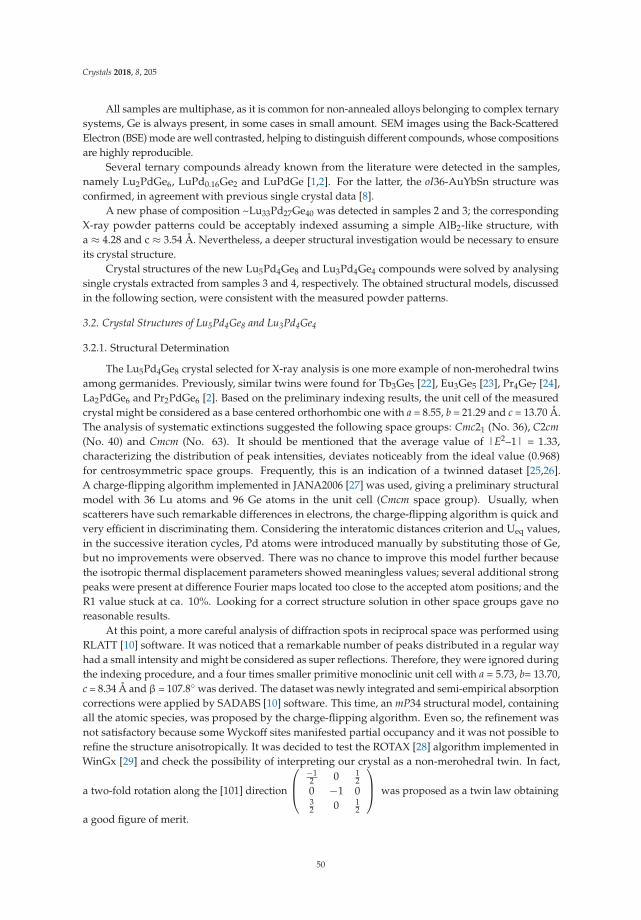
Crystals 2018, 8, 205
All samples are multiphase, as it is common for non-annealed alloys belonging to complex ternarysystems, Ge is always present, in some cases in small amount. SEM images using the Back-ScatteredElectron (BSE) mode are well contrasted, helping to distinguish different compounds, whose compositionsare highly reproducible.
Several ternary compounds already known from the literature were detected in the samples,namely Lu2PdGe6, LuPd0.16Ge2 and LuPdGe [1,2]. For the latter, the oI36-AuYbSn structure wasconfirmed, in agreement with previous single crystal data [8].
A new phase of composition ~Lu33Pd27Ge40 was detected in samples 2 and 3; the correspondingX-ray powder patterns could be acceptably indexed assuming a simple AlB2-like structure, witha ≈ 4.28 and c ≈ 3.54 Å. Nevertheless, a deeper structural investigation would be necessary to ensureits crystal structure.
Crystal structures of the new Lu5Pd4Ge8 and Lu3Pd4Ge4 compounds were solved by analysingsingle crystals extracted from samples 3 and 4, respectively. The obtained structural models, discussedin the following section, were consistent with the measured powder patterns.
3.2. Crystal Structures of Lu5Pd4Ge8 and Lu3Pd4Ge4
3.2.1. Structural Determination
The Lu5Pd4Ge8 crystal selected for X-ray analysis is one more example of non-merohedral twinsamong germanides. Previously, similar twins were found for Tb3Ge5 [22], Eu3Ge5 [23], Pr4Ge7 [24],La2PdGe6 and Pr2PdGe6 [2]. Based on the preliminary indexing results, the unit cell of the measuredcrystal might be considered as a base centered orthorhombic one with a = 8.55, b = 21.29 and c = 13.70 Å.The analysis of systematic extinctions suggested the following space groups: Cmc21 (No. 36), C2cm
(No. 40) and Cmcm (No. 63). It should be mentioned that the average value of |E2–1| = 1.33,characterizing the distribution of peak intensities, deviates noticeably from the ideal value (0.968)for centrosymmetric space groups. Frequently, this is an indication of a twinned dataset [25,26].A charge-flipping algorithm implemented in JANA2006 [27] was used, giving a preliminary structuralmodel with 36 Lu atoms and 96 Ge atoms in the unit cell (Cmcm space group). Usually, whenscatterers have such remarkable differences in electrons, the charge-flipping algorithm is quick andvery efficient in discriminating them. Considering the interatomic distances criterion and Ueq values,in the successive iteration cycles, Pd atoms were introduced manually by substituting those of Ge,but no improvements were observed. There was no chance to improve this model further becausethe isotropic thermal displacement parameters showed meaningless values; several additional strongpeaks were present at difference Fourier maps located too close to the accepted atom positions; and theR1 value stuck at ca. 10%. Looking for a correct structure solution in other space groups gave noreasonable results.
At this point, a more careful analysis of diffraction spots in reciprocal space was performed usingRLATT [10] software. It was noticed that a remarkable number of peaks distributed in a regular wayhad a small intensity and might be considered as super reflections. Therefore, they were ignored duringthe indexing procedure, and a four times smaller primitive monoclinic unit cell with a = 5.73, b= 13.70,c = 8.34 Å and β = 107.8 was derived. The dataset was newly integrated and semi-empirical absorptioncorrections were applied by SADABS [10] software. This time, an mP34 structural model, containingall the atomic species, was proposed by the charge-flipping algorithm. Even so, the refinement wasnot satisfactory because some Wyckoff sites manifested partial occupancy and it was not possible torefine the structure anisotropically. It was decided to test the ROTAX [28] algorithm implemented inWinGx [29] and check the possibility of interpreting our crystal as a non-merohedral twin. In fact,
a two-fold rotation along the [101] direction
⎛
⎜⎝
−12 0 1
20 −1 032 0 1
2
⎞
⎟⎠ was proposed as a twin law obtaining
a good figure of merit.
50
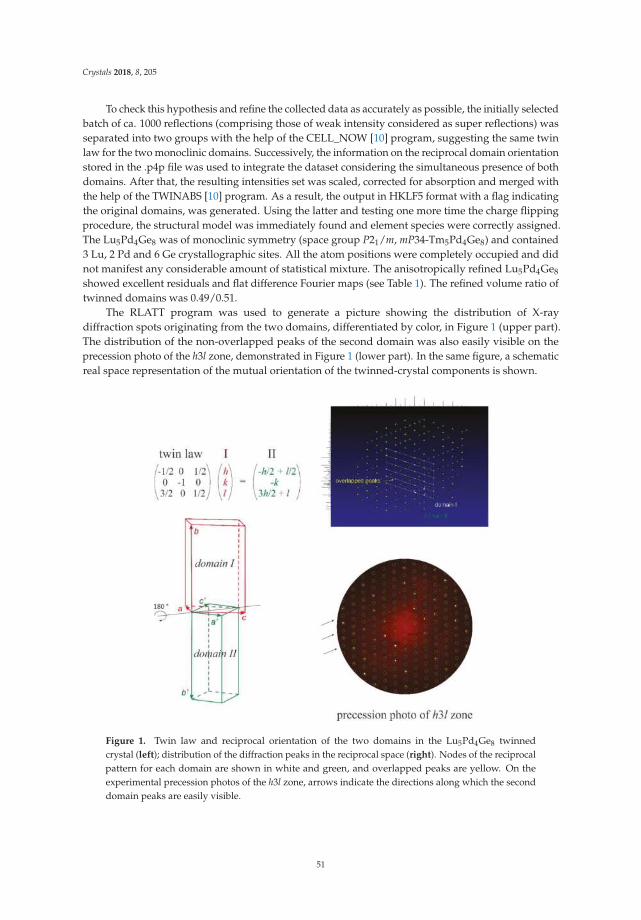
Crystals 2018, 8, 205
To check this hypothesis and refine the collected data as accurately as possible, the initially selectedbatch of ca. 1000 reflections (comprising those of weak intensity considered as super reflections) wasseparated into two groups with the help of the CELL_NOW [10] program, suggesting the same twinlaw for the two monoclinic domains. Successively, the information on the reciprocal domain orientationstored in the .p4p file was used to integrate the dataset considering the simultaneous presence of bothdomains. After that, the resulting intensities set was scaled, corrected for absorption and merged withthe help of the TWINABS [10] program. As a result, the output in HKLF5 format with a flag indicatingthe original domains, was generated. Using the latter and testing one more time the charge flippingprocedure, the structural model was immediately found and element species were correctly assigned.The Lu5Pd4Ge8 was of monoclinic symmetry (space group P21/m, mP34-Tm5Pd4Ge8) and contained3 Lu, 2 Pd and 6 Ge crystallographic sites. All the atom positions were completely occupied and didnot manifest any considerable amount of statistical mixture. The anisotropically refined Lu5Pd4Ge8
showed excellent residuals and flat difference Fourier maps (see Table 1). The refined volume ratio oftwinned domains was 0.49/0.51.
The RLATT program was used to generate a picture showing the distribution of X-raydiffraction spots originating from the two domains, differentiated by color, in Figure 1 (upper part).The distribution of the non-overlapped peaks of the second domain was also easily visible on theprecession photo of the h3l zone, demonstrated in Figure 1 (lower part). In the same figure, a schematicreal space representation of the mutual orientation of the twinned-crystal components is shown.
Figure 1. Twin law and reciprocal orientation of the two domains in the Lu5Pd4Ge8 twinnedcrystal (left); distribution of the diffraction peaks in the reciprocal space (right). Nodes of the reciprocalpattern for each domain are shown in white and green, and overlapped peaks are yellow. On theexperimental precession photos of the h3l zone, arrows indicate the directions along which the seconddomain peaks are easily visible.
51
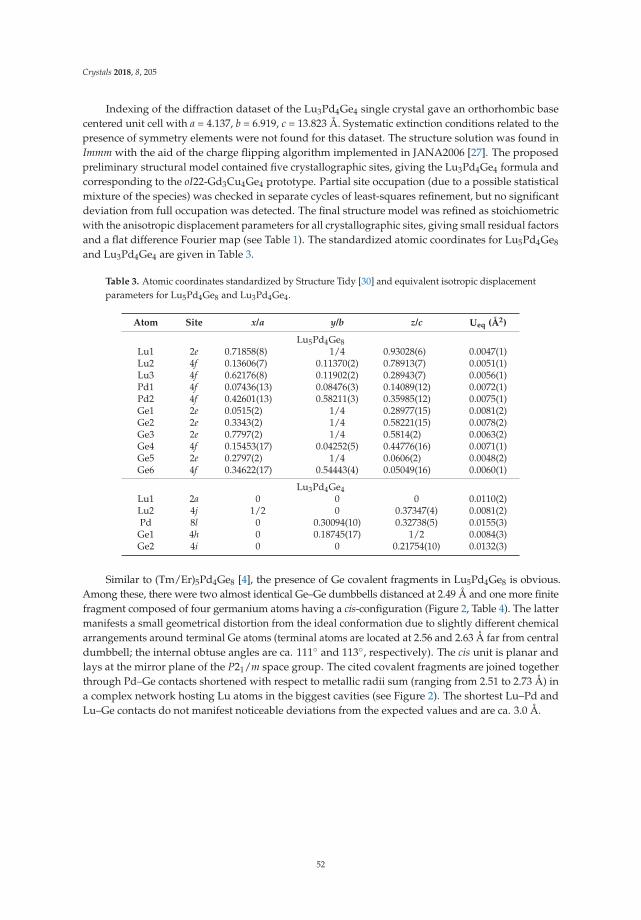
Crystals 2018, 8, 205
Indexing of the diffraction dataset of the Lu3Pd4Ge4 single crystal gave an orthorhombic basecentered unit cell with a = 4.137, b = 6.919, c = 13.823 Å. Systematic extinction conditions related to thepresence of symmetry elements were not found for this dataset. The structure solution was found inImmm with the aid of the charge flipping algorithm implemented in JANA2006 [27]. The proposedpreliminary structural model contained five crystallographic sites, giving the Lu3Pd4Ge4 formula andcorresponding to the oI22-Gd3Cu4Ge4 prototype. Partial site occupation (due to a possible statisticalmixture of the species) was checked in separate cycles of least-squares refinement, but no significantdeviation from full occupation was detected. The final structure model was refined as stoichiometricwith the anisotropic displacement parameters for all crystallographic sites, giving small residual factorsand a flat difference Fourier map (see Table 1). The standardized atomic coordinates for Lu5Pd4Ge8
and Lu3Pd4Ge4 are given in Table 3.
Table 3. Atomic coordinates standardized by Structure Tidy [30] and equivalent isotropic displacementparameters for Lu5Pd4Ge8 and Lu3Pd4Ge4.
Atom Site x/a y/b z/c Ueq (Å2)
Lu5Pd4Ge8Lu1 2e 0.71858(8) 1/4 0.93028(6) 0.0047(1)Lu2 4f 0.13606(7) 0.11370(2) 0.78913(7) 0.0051(1)Lu3 4f 0.62176(8) 0.11902(2) 0.28943(7) 0.0056(1)Pd1 4f 0.07436(13) 0.08476(3) 0.14089(12) 0.0072(1)Pd2 4f 0.42601(13) 0.58211(3) 0.35985(12) 0.0075(1)Ge1 2e 0.0515(2) 1/4 0.28977(15) 0.0081(2)Ge2 2e 0.3343(2) 1/4 0.58221(15) 0.0078(2)Ge3 2e 0.7797(2) 1/4 0.5814(2) 0.0063(2)Ge4 4f 0.15453(17) 0.04252(5) 0.44776(16) 0.0071(1)Ge5 2e 0.2797(2) 1/4 0.0606(2) 0.0048(2)Ge6 4f 0.34622(17) 0.54443(4) 0.05049(16) 0.0060(1)
Lu3Pd4Ge4Lu1 2a 0 0 0 0.0110(2)Lu2 4j 1/2 0 0.37347(4) 0.0081(2)Pd 8l 0 0.30094(10) 0.32738(5) 0.0155(3)
Ge1 4h 0 0.18745(17) 1/2 0.0084(3)Ge2 4i 0 0 0.21754(10) 0.0132(3)
Similar to (Tm/Er)5Pd4Ge8 [4], the presence of Ge covalent fragments in Lu5Pd4Ge8 is obvious.Among these, there were two almost identical Ge–Ge dumbbells distanced at 2.49 Å and one more finitefragment composed of four germanium atoms having a cis-configuration (Figure 2, Table 4). The lattermanifests a small geometrical distortion from the ideal conformation due to slightly different chemicalarrangements around terminal Ge atoms (terminal atoms are located at 2.56 and 2.63 Å far from centraldumbbell; the internal obtuse angles are ca. 111 and 113, respectively). The cis unit is planar andlays at the mirror plane of the P21/m space group. The cited covalent fragments are joined togetherthrough Pd–Ge contacts shortened with respect to metallic radii sum (ranging from 2.51 to 2.73 Å) ina complex network hosting Lu atoms in the biggest cavities (see Figure 2). The shortest Lu–Pd andLu–Ge contacts do not manifest noticeable deviations from the expected values and are ca. 3.0 Å.
52
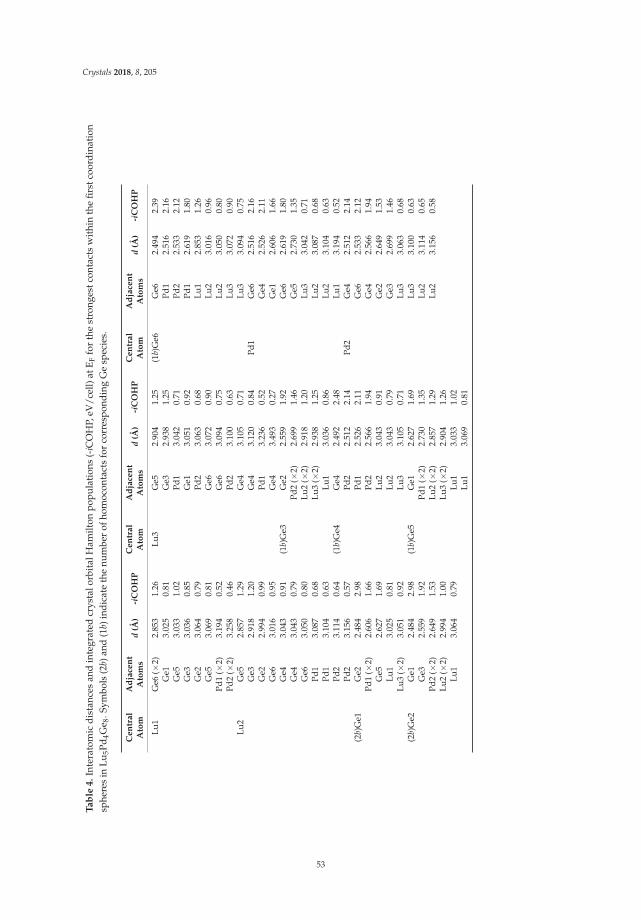
Crystals 2018, 8, 205
Tab
le4.
Inte
rato
mic
dis
tanc
esan
din
tegr
ated
crys
talo
rbit
alH
amilt
onpo
pula
tion
s(-
iCO
HP,
eV/c
ell)
atE
Ffo
rth
est
rong
estc
onta
cts
wit
hin
the
first
coor
din
atio
nsp
here
sin
Lu5P
d 4G
e 8.S
ymbo
ls(2
b)an
d(1
b)in
dica
teth
enu
mbe
rof
hom
ocon
tact
sfo
rco
rres
pond
ing
Ge
spec
ies.
Cen
tral
Ato
mA
dja
cen
tA
tom
sd
(Å)
-iC
OH
PC
entr
alA
tom
Ad
jace
nt
Ato
ms
d(Å
)-i
CO
HP
Cen
tral
Ato
mA
dja
cen
tA
tom
sd
(Å)
-iC
OH
P
Lu1
Ge6
(×2)
2.85
31.
26Lu
3G
e52.
904
1.25
(1b)
Ge6
Ge6
2.49
42.
39G
e13.
025
0.81
Ge3
2.93
81.
25Pd
12.
516
2.16
Ge5
3.03
31.
02Pd
13.
042
0.71
Pd2
2.53
32.
12G
e33.
036
0.85
Ge1
3.05
10.
92Pd
12.
619
1.80
Ge2
3.06
40.
79Pd
23.
063
0.68
Lu1
2.85
31.
26G
e53.
069
0.81
Ge6
3.07
20.
90Lu
23.
016
0.96
Pd1
( ×2)
3.19
40.
52G
e63.
094
0.75
Lu2
3.05
00.
80Pd
2(×
2)3.
258
0.46
Pd2
3.10
00.
63Lu
33.
072
0.90
Lu2
Ge5
2.85
71.
29G
e43.
105
0.71
Lu3
3.09
40.
75G
e32.
918
1.20
Ge4
3.12
00.
84Pd
1G
e62.
516
2.16
Ge2
2.99
40.
99Pd
13.
236
0.52
Ge4
2.52
62.
11G
e63.
016
0.95
Ge4
3.49
30.
27G
e12.
606
1.66
Ge4
3.04
30.
91(1
b)G
e3G
e22.
559
1.92
Ge6
2.61
91.
80G
e43.
043
0.79
Pd2
( ×2)
2.69
91.
46G
e52.
730
1.35
Ge6
3.05
00.
80Lu
2(×
2)2.
918
1.20
Lu3
3.04
20.
71Pd
13.
087
0.68
Lu3
(×2)
2.93
81.
25Lu
23.
087
0.68
Pd1
3.10
40.
63Lu
13.
036
0.86
Lu2
3.10
40.
63Pd
23.
114
0.64
(1b)
Ge4
Ge4
2.49
22.
48Lu
13.
194
0.52
Pd2
3.15
60.
57Pd
22.
512
2.14
Pd2
Ge4
2.51
22.
14(2
b)G
e1G
e22.
484
2.98
Pd1
2.52
62.
11G
e62.
533
2.12
Pd1
( ×2)
2.60
61.
66Pd
22.
566
1.94
Ge4
2.56
61.
94G
e52.
627
1.69
Lu2
3.04
30.
91G
e22.
649
1.53
Lu1
3.02
50.
81Lu
23.
043
0.79
Ge3
2.69
91.
46Lu
3(×
2)3.
051
0.92
Lu3
3.10
50.
71Lu
33.
063
0.68
(2b)
Ge2
Ge1
2.48
42.
98(1
b)G
e5G
e12.
627
1.69
Lu3
3.10
00.
63G
e32.
559
1.92
Pd1
(×2)
2.73
01.
35Lu
23.
114
0.65
Pd2
( ×2)
2.64
91.
53Lu
2(×
2)2.
857
1.29
Lu2
3.15
60.
58Lu
2(×
2)2.
994
1.00
Lu3
(×2)
2.90
41.
26Lu
13.
064
0.79
Lu1
3.03
31.
02Lu
13.
069
0.81
53
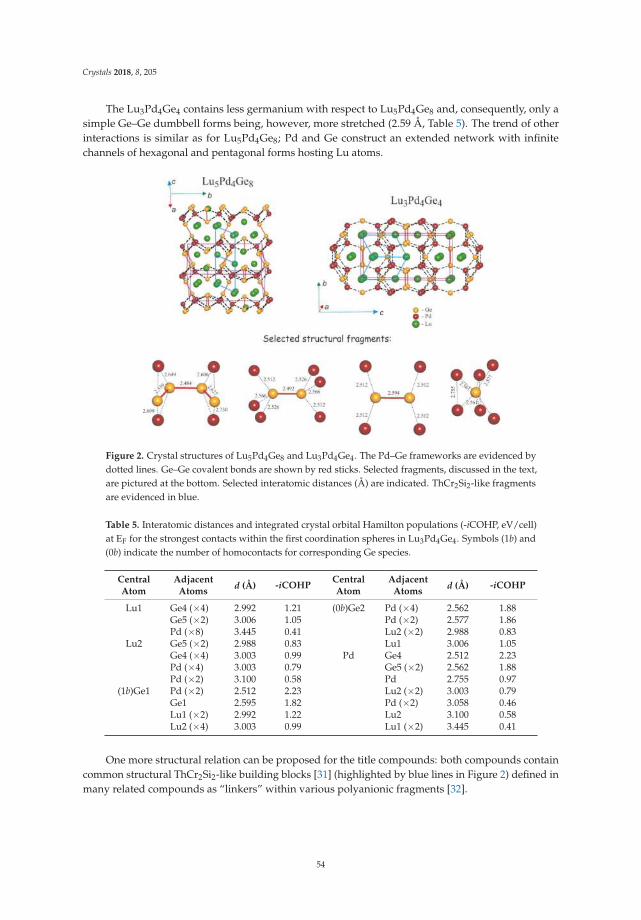
Crystals 2018, 8, 205
The Lu3Pd4Ge4 contains less germanium with respect to Lu5Pd4Ge8 and, consequently, only asimple Ge–Ge dumbbell forms being, however, more stretched (2.59 Å, Table 5). The trend of otherinteractions is similar as for Lu5Pd4Ge8; Pd and Ge construct an extended network with infinitechannels of hexagonal and pentagonal forms hosting Lu atoms.
Figure 2. Crystal structures of Lu5Pd4Ge8 and Lu3Pd4Ge4. The Pd–Ge frameworks are evidenced bydotted lines. Ge–Ge covalent bonds are shown by red sticks. Selected fragments, discussed in the text,are pictured at the bottom. Selected interatomic distances (Å) are indicated. ThCr2Si2-like fragmentsare evidenced in blue.
Table 5. Interatomic distances and integrated crystal orbital Hamilton populations (-iCOHP, eV/cell)at EF for the strongest contacts within the first coordination spheres in Lu3Pd4Ge4. Symbols (1b) and(0b) indicate the number of homocontacts for corresponding Ge species.
CentralAtom
AdjacentAtoms d (Å) -iCOHP
CentralAtom
AdjacentAtoms d (Å) -iCOHP
Lu1 Ge4 (×4) 2.992 1.21 (0b)Ge2 Pd (×4) 2.562 1.88Ge5 (×2) 3.006 1.05 Pd (×2) 2.577 1.86Pd (×8) 3.445 0.41 Lu2 (×2) 2.988 0.83
Lu2 Ge5 (×2) 2.988 0.83 Lu1 3.006 1.05Ge4 (×4) 3.003 0.99 Pd Ge4 2.512 2.23Pd (×4) 3.003 0.79 Ge5 (×2) 2.562 1.88Pd (×2) 3.100 0.58 Pd 2.755 0.97
(1b)Ge1 Pd (×2) 2.512 2.23 Lu2 (×2) 3.003 0.79Ge1 2.595 1.82 Pd (×2) 3.058 0.46Lu1 (×2) 2.992 1.22 Lu2 3.100 0.58Lu2 (×4) 3.003 0.99 Lu1 (×2) 3.445 0.41
One more structural relation can be proposed for the title compounds: both compounds containcommon structural ThCr2Si2-like building blocks [31] (highlighted by blue lines in Figure 2) defined inmany related compounds as “linkers” within various polyanionic fragments [32].
54
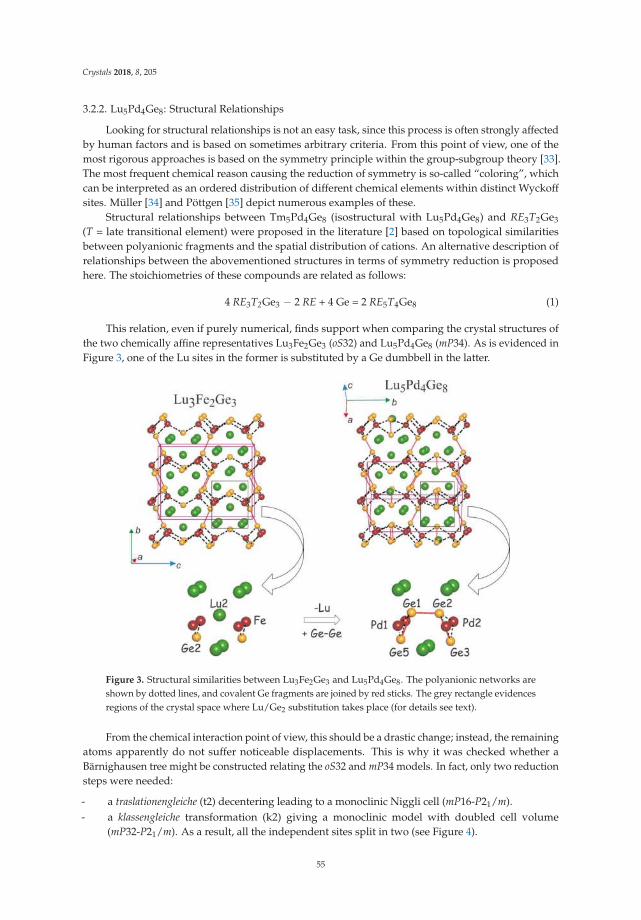
Crystals 2018, 8, 205
3.2.2. Lu5Pd4Ge8: Structural Relationships
Looking for structural relationships is not an easy task, since this process is often strongly affectedby human factors and is based on sometimes arbitrary criteria. From this point of view, one of themost rigorous approaches is based on the symmetry principle within the group-subgroup theory [33].The most frequent chemical reason causing the reduction of symmetry is so-called “coloring”, whichcan be interpreted as an ordered distribution of different chemical elements within distinct Wyckoffsites. Müller [34] and Pöttgen [35] depict numerous examples of these.
Structural relationships between Tm5Pd4Ge8 (isostructural with Lu5Pd4Ge8) and RE3T2Ge3
(T = late transitional element) were proposed in the literature [2] based on topological similaritiesbetween polyanionic fragments and the spatial distribution of cations. An alternative description ofrelationships between the abovementioned structures in terms of symmetry reduction is proposedhere. The stoichiometries of these compounds are related as follows:
4 RE3T2Ge3 − 2 RE + 4 Ge = 2 RE5T4Ge8 (1)
This relation, even if purely numerical, finds support when comparing the crystal structures ofthe two chemically affine representatives Lu3Fe2Ge3 (oS32) and Lu5Pd4Ge8 (mP34). As is evidenced inFigure 3, one of the Lu sites in the former is substituted by a Ge dumbbell in the latter.
Figure 3. Structural similarities between Lu3Fe2Ge3 and Lu5Pd4Ge8. The polyanionic networks areshown by dotted lines, and covalent Ge fragments are joined by red sticks. The grey rectangle evidencesregions of the crystal space where Lu/Ge2 substitution takes place (for details see text).
From the chemical interaction point of view, this should be a drastic change; instead, the remainingatoms apparently do not suffer noticeable displacements. This is why it was checked whether aBärnighausen tree might be constructed relating the oS32 and mP34 models. In fact, only two reductionsteps were needed:
- a traslationengleiche (t2) decentering leading to a monoclinic Niggli cell (mP16-P21/m).- a klassengleiche transformation (k2) giving a monoclinic model with doubled cell volume
(mP32-P21/m). As a result, all the independent sites split in two (see Figure 4).
55
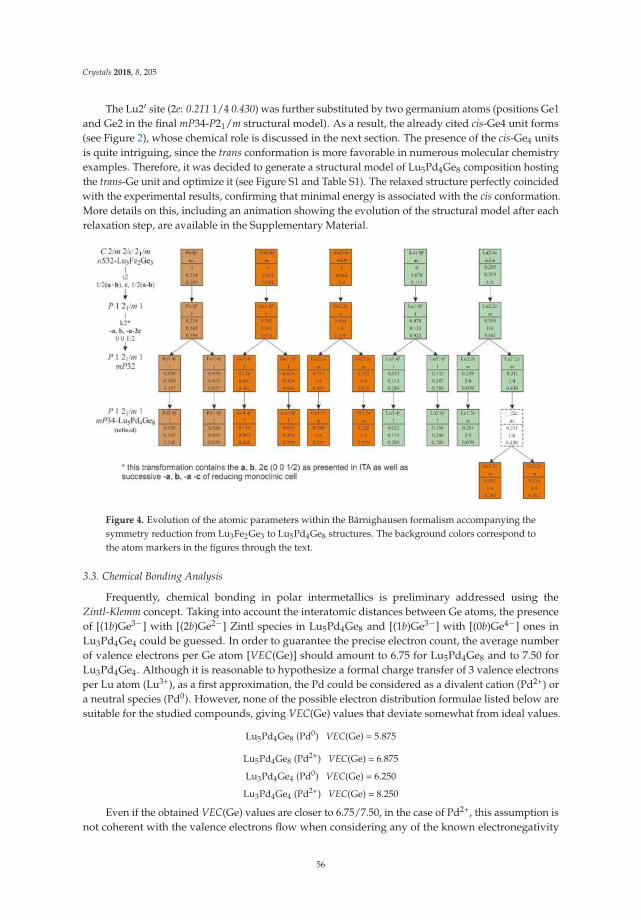
Crystals 2018, 8, 205
The Lu2′ site (2e: 0.211 1/4 0.430) was further substituted by two germanium atoms (positions Ge1and Ge2 in the final mP34-P21/m structural model). As a result, the already cited cis-Ge4 unit forms(see Figure 2), whose chemical role is discussed in the next section. The presence of the cis-Ge4 unitsis quite intriguing, since the trans conformation is more favorable in numerous molecular chemistryexamples. Therefore, it was decided to generate a structural model of Lu5Pd4Ge8 composition hostingthe trans-Ge unit and optimize it (see Figure S1 and Table S1). The relaxed structure perfectly coincidedwith the experimental results, confirming that minimal energy is associated with the cis conformation.More details on this, including an animation showing the evolution of the structural model after eachrelaxation step, are available in the Supplementary Material.
Figure 4. Evolution of the atomic parameters within the Bärnighausen formalism accompanying thesymmetry reduction from Lu3Fe2Ge3 to Lu5Pd4Ge8 structures. The background colors correspond tothe atom markers in the figures through the text.
3.3. Chemical Bonding Analysis
Frequently, chemical bonding in polar intermetallics is preliminary addressed using theZintl-Klemm concept. Taking into account the interatomic distances between Ge atoms, the presenceof [(1b)Ge3−] with [(2b)Ge2−] Zintl species in Lu5Pd4Ge8 and [(1b)Ge3−] with [(0b)Ge4−] ones inLu3Pd4Ge4 could be guessed. In order to guarantee the precise electron count, the average numberof valence electrons per Ge atom [VEC(Ge)] should amount to 6.75 for Lu5Pd4Ge8 and to 7.50 forLu3Pd4Ge4. Although it is reasonable to hypothesize a formal charge transfer of 3 valence electronsper Lu atom (Lu3+), as a first approximation, the Pd could be considered as a divalent cation (Pd2+) ora neutral species (Pd0). However, none of the possible electron distribution formulae listed below aresuitable for the studied compounds, giving VEC(Ge) values that deviate somewhat from ideal values.
Lu5Pd4Ge8 (Pd0) VEC(Ge) = 5.875
Lu5Pd4Ge8 (Pd2+) VEC(Ge) = 6.875
Lu3Pd4Ge4 (Pd0) VEC(Ge) = 6.250
Lu3Pd4Ge4 (Pd2+) VEC(Ge) = 8.250
Even if the obtained VEC(Ge) values are closer to 6.75/7.50, in the case of Pd2+, this assumption isnot coherent with the valence electrons flow when considering any of the known electronegativity
56
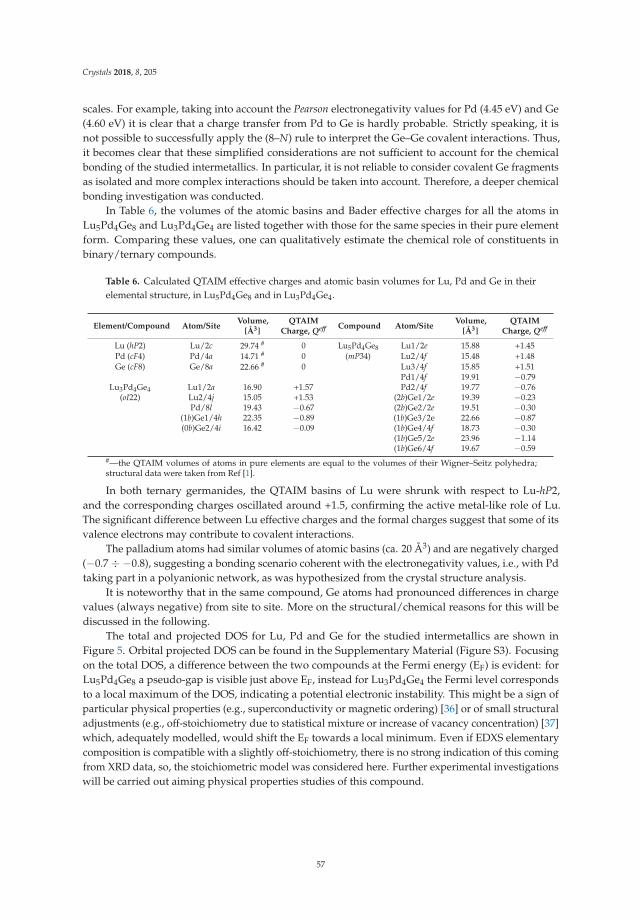
Crystals 2018, 8, 205
scales. For example, taking into account the Pearson electronegativity values for Pd (4.45 eV) and Ge(4.60 eV) it is clear that a charge transfer from Pd to Ge is hardly probable. Strictly speaking, it isnot possible to successfully apply the (8–N) rule to interpret the Ge–Ge covalent interactions. Thus,it becomes clear that these simplified considerations are not sufficient to account for the chemicalbonding of the studied intermetallics. In particular, it is not reliable to consider covalent Ge fragmentsas isolated and more complex interactions should be taken into account. Therefore, a deeper chemicalbonding investigation was conducted.
In Table 6, the volumes of the atomic basins and Bader effective charges for all the atoms inLu5Pd4Ge8 and Lu3Pd4Ge4 are listed together with those for the same species in their pure elementform. Comparing these values, one can qualitatively estimate the chemical role of constituents inbinary/ternary compounds.
Table 6. Calculated QTAIM effective charges and atomic basin volumes for Lu, Pd and Ge in theirelemental structure, in Lu5Pd4Ge8 and in Lu3Pd4Ge4.
Element/Compound Atom/SiteVolume,
[Å3]QTAIM
Charge, Qeff Compound Atom/SiteVolume,
[Å3]QTAIM
Charge, Qeff
Lu (hP2) Lu/2c 29.74 # 0 Lu5Pd4Ge8 Lu1/2e 15.88 +1.45Pd (cF4) Pd/4a 14.71 # 0 (mP34) Lu2/4f 15.48 +1.48Ge (cF8) Ge/8a 22.66 # 0 Lu3/4f 15.85 +1.51
Pd1/4f 19.91 −0.79Lu3Pd4Ge4 Lu1/2a 16.90 +1.57 Pd2/4f 19.77 −0.76
(oI22) Lu2/4j 15.05 +1.53 (2b)Ge1/2e 19.39 −0.23Pd/8l 19.43 −0.67 (2b)Ge2/2e 19.51 −0.30
(1b)Ge1/4h 22.35 −0.89 (1b)Ge3/2e 22.66 −0.87(0b)Ge2/4i 16.42 −0.09 (1b)Ge4/4f 18.73 −0.30
(1b)Ge5/2e 23.96 −1.14(1b)Ge6/4f 19.67 −0.59
#—the QTAIM volumes of atoms in pure elements are equal to the volumes of their Wigner–Seitz polyhedra;structural data were taken from Ref [1].
In both ternary germanides, the QTAIM basins of Lu were shrunk with respect to Lu-hP2,and the corresponding charges oscillated around +1.5, confirming the active metal-like role of Lu.The significant difference between Lu effective charges and the formal charges suggest that some of itsvalence electrons may contribute to covalent interactions.
The palladium atoms had similar volumes of atomic basins (ca. 20 Å3) and are negatively charged(−0.7 ÷ −0.8), suggesting a bonding scenario coherent with the electronegativity values, i.e., with Pdtaking part in a polyanionic network, as was hypothesized from the crystal structure analysis.
It is noteworthy that in the same compound, Ge atoms had pronounced differences in chargevalues (always negative) from site to site. More on the structural/chemical reasons for this will bediscussed in the following.
The total and projected DOS for Lu, Pd and Ge for the studied intermetallics are shown inFigure 5. Orbital projected DOS can be found in the Supplementary Material (Figure S3). Focusingon the total DOS, a difference between the two compounds at the Fermi energy (EF) is evident: forLu5Pd4Ge8 a pseudo-gap is visible just above EF, instead for Lu3Pd4Ge4 the Fermi level correspondsto a local maximum of the DOS, indicating a potential electronic instability. This might be a sign ofparticular physical properties (e.g., superconductivity or magnetic ordering) [36] or of small structuraladjustments (e.g., off-stoichiometry due to statistical mixture or increase of vacancy concentration) [37]which, adequately modelled, would shift the EF towards a local minimum. Even if EDXS elementarycomposition is compatible with a slightly off-stoichiometry, there is no strong indication of this comingfrom XRD data, so, the stoichiometric model was considered here. Further experimental investigationswill be carried out aiming physical properties studies of this compound.
57
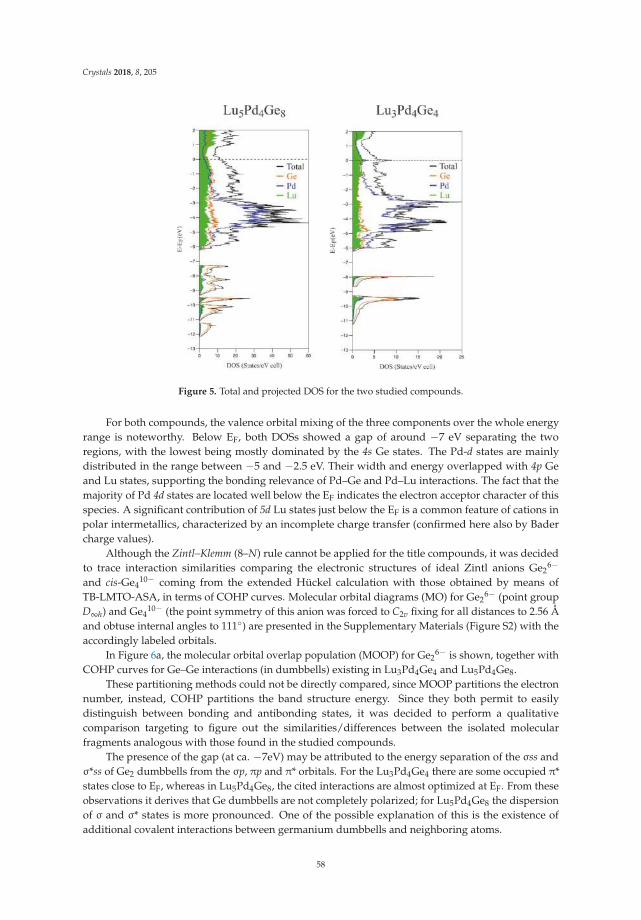
Crystals 2018, 8, 205
Figure 5. Total and projected DOS for the two studied compounds.
For both compounds, the valence orbital mixing of the three components over the whole energyrange is noteworthy. Below EF, both DOSs showed a gap of around −7 eV separating the tworegions, with the lowest being mostly dominated by the 4s Ge states. The Pd-d states are mainlydistributed in the range between −5 and −2.5 eV. Their width and energy overlapped with 4p Geand Lu states, supporting the bonding relevance of Pd–Ge and Pd–Lu interactions. The fact that themajority of Pd 4d states are located well below the EF indicates the electron acceptor character of thisspecies. A significant contribution of 5d Lu states just below the EF is a common feature of cations inpolar intermetallics, characterized by an incomplete charge transfer (confirmed here also by Badercharge values).
Although the Zintl–Klemm (8–N) rule cannot be applied for the title compounds, it was decidedto trace interaction similarities comparing the electronic structures of ideal Zintl anions Ge2
6−
and cis-Ge410− coming from the extended Hückel calculation with those obtained by means of
TB-LMTO-ASA, in terms of COHP curves. Molecular orbital diagrams (MO) for Ge26− (point group
D∞h) and Ge410− (the point symmetry of this anion was forced to C2v fixing for all distances to 2.56 Å
and obtuse internal angles to 111) are presented in the Supplementary Materials (Figure S2) with theaccordingly labeled orbitals.
In Figure 6a, the molecular orbital overlap population (MOOP) for Ge26− is shown, together with
COHP curves for Ge–Ge interactions (in dumbbells) existing in Lu3Pd4Ge4 and Lu5Pd4Ge8.These partitioning methods could not be directly compared, since MOOP partitions the electron
number, instead, COHP partitions the band structure energy. Since they both permit to easilydistinguish between bonding and antibonding states, it was decided to perform a qualitativecomparison targeting to figure out the similarities/differences between the isolated molecularfragments analogous with those found in the studied compounds.
The presence of the gap (at ca. −7eV) may be attributed to the energy separation of the σss andσ*ss of Ge2 dumbbells from the σp, πp and π* orbitals. For the Lu3Pd4Ge4 there are some occupied π*states close to EF, whereas in Lu5Pd4Ge8, the cited interactions are almost optimized at EF. From theseobservations it derives that Ge dumbbells are not completely polarized; for Lu5Pd4Ge8 the dispersionof σ and σ* states is more pronounced. One of the possible explanation of this is the existence ofadditional covalent interactions between germanium dumbbells and neighboring atoms.
58
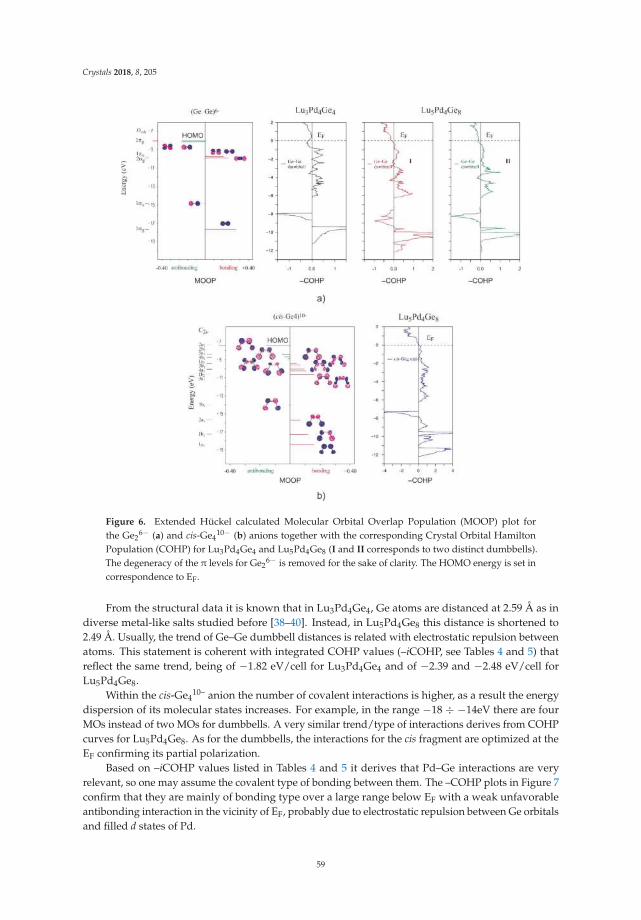
Crystals 2018, 8, 205
Figure 6. Extended Hückel calculated Molecular Orbital Overlap Population (MOOP) plot forthe Ge2
6− (a) and cis-Ge410− (b) anions together with the corresponding Crystal Orbital Hamilton
Population (COHP) for Lu3Pd4Ge4 and Lu5Pd4Ge8 (I and II corresponds to two distinct dumbbells).The degeneracy of the π levels for Ge2
6− is removed for the sake of clarity. The HOMO energy is set incorrespondence to EF.
From the structural data it is known that in Lu3Pd4Ge4, Ge atoms are distanced at 2.59 Å as indiverse metal-like salts studied before [38–40]. Instead, in Lu5Pd4Ge8 this distance is shortened to2.49 Å. Usually, the trend of Ge–Ge dumbbell distances is related with electrostatic repulsion betweenatoms. This statement is coherent with integrated COHP values (–iCOHP, see Tables 4 and 5) thatreflect the same trend, being of −1.82 eV/cell for Lu3Pd4Ge4 and of −2.39 and −2.48 eV/cell forLu5Pd4Ge8.
Within the cis-Ge410– anion the number of covalent interactions is higher, as a result the energy
dispersion of its molecular states increases. For example, in the range −18 ÷ −14eV there are fourMOs instead of two MOs for dumbbells. A very similar trend/type of interactions derives from COHPcurves for Lu5Pd4Ge8. As for the dumbbells, the interactions for the cis fragment are optimized at theEF confirming its partial polarization.
Based on –iCOHP values listed in Tables 4 and 5 it derives that Pd–Ge interactions are veryrelevant, so one may assume the covalent type of bonding between them. The –COHP plots in Figure 7confirm that they are mainly of bonding type over a large range below EF with a weak unfavorableantibonding interaction in the vicinity of EF, probably due to electrostatic repulsion between Ge orbitalsand filled d states of Pd.
59
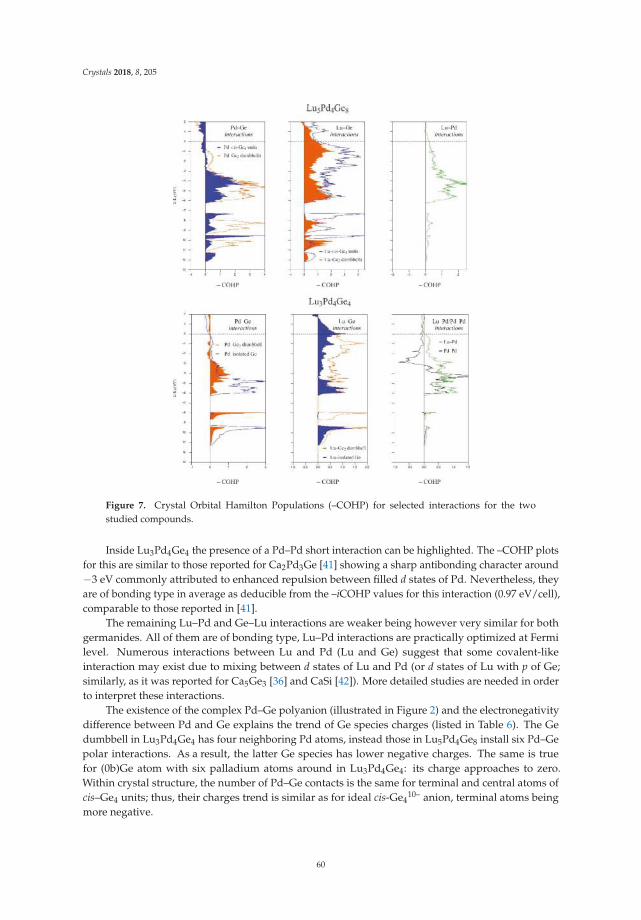
Crystals 2018, 8, 205
Figure 7. Crystal Orbital Hamilton Populations (–COHP) for selected interactions for the twostudied compounds.
Inside Lu3Pd4Ge4 the presence of a Pd–Pd short interaction can be highlighted. The –COHP plotsfor this are similar to those reported for Ca2Pd3Ge [41] showing a sharp antibonding character around−3 eV commonly attributed to enhanced repulsion between filled d states of Pd. Nevertheless, theyare of bonding type in average as deducible from the –iCOHP values for this interaction (0.97 eV/cell),comparable to those reported in [41].
The remaining Lu–Pd and Ge–Lu interactions are weaker being however very similar for bothgermanides. All of them are of bonding type, Lu–Pd interactions are practically optimized at Fermilevel. Numerous interactions between Lu and Pd (Lu and Ge) suggest that some covalent-likeinteraction may exist due to mixing between d states of Lu and Pd (or d states of Lu with p of Ge;similarly, as it was reported for Ca5Ge3 [36] and CaSi [42]). More detailed studies are needed in orderto interpret these interactions.
The existence of the complex Pd–Ge polyanion (illustrated in Figure 2) and the electronegativitydifference between Pd and Ge explains the trend of Ge species charges (listed in Table 6). The Gedumbbell in Lu3Pd4Ge4 has four neighboring Pd atoms, instead those in Lu5Pd4Ge8 install six Pd–Gepolar interactions. As a result, the latter Ge species has lower negative charges. The same is truefor (0b)Ge atom with six palladium atoms around in Lu3Pd4Ge4: its charge approaches to zero.Within crystal structure, the number of Pd–Ge contacts is the same for terminal and central atoms ofcis–Ge4 units; thus, their charges trend is similar as for ideal cis-Ge4
10– anion, terminal atoms beingmore negative.
60
Crystals 2018, 8, 205
4. Conclusions
The two new Lu5Pd4Ge8 and Lu3Pd4Ge4 polar intermetallics were synthesized and characterizedin this work. They were found to crystallize in the mP34–Tm5Pd4Ge8 and oI22–Gd3Cu4Ge4 structuresrespectively. A detailed description of crystal structure solution in the case of the non-merohedraltwinned crystal of Lu5Pd4Ge8 was proposed, highlighting the difficulties/problems encountered herealong with practical suggestions to manage them.
Joined crystal chemical analysis and combined DFT studies suggest the presence of [Pd4Ge8]7.4–
and [Pd4Ge4]4.6– polyanions. The interactions of Lu with these frameworks cannot be viewed as purelyionic as derives from its states distribution, COHP analysis and Bader charges. The Lu–Pd and Lu–Gebonding interactions are one of the most interesting aspects arisen from our study and their naturedeserves further investigations.
Supplementary Materials: The following are available online at http://www.mdpi.com/2073-4352/8/5/205/s1,Figure S1: Schematic representation of the structural relationships between “cis” and “trans” Ge4 fragmentsin Lu5Pd4Ge8 models; Figure S2: Molecular orbitals diagram for Ge2
6− (a) and cis-Ge410− (b) as generated by
CACAO; Figure S3: Total DOS for Lu5Pd4Ge8 and Lu3Pd4Ge4 together with the orbital projected DOS for eachspecies; Table S1: Atomic parameters for “trans”-Lu5Pd4Ge8 model. Video S1: Lu5Pd4Ge8_trans-cis_optimization,Lu5Pd4Ge8 CIF file, Lu3Pd4Ge4 CIF file.
Author Contributions: Riccardo Freccero, Pavlo Solokha and Serena De Negri conceived and designed theexperiments; Riccardo Freccero performed the syntheses; Pavlo Solokha and Davide Maria Proserpio performedthe XRD single crystal experiments; Serena De Negri performed SEM analyses; Riccardo Freccero, Pavlo Solokhaand Davide Maria Proserpio conducted different calculations; Riccardo Freccero, Pavlo Solokha, Serena De Negriand Adriana Saccone analyzed the data and wrote the paper.
Acknowledgments: The authors thank Roman Eremin from SCTMS (Samara State University, Russia) for hiscontribution in the Bader charge analysis.
Conflicts of Interest: The authors declare no conflict of interest.
References
1. Villars, P.; Cenzual, K. Pearson’s Crystal Data; ASM International: Metals Park, OH, USA, 2018.2. Freccero, R.; Solokha, P.; Proserpio, D.M.; Saccone, A.; De Negri, S. A new glance on R2MGe6 (R = rare earth
metal, M = another metal) compounds. An experimental and theoretical study of R2PdGe6 germanides.Dalton Trans. 2017, 46, 14021–14033. [CrossRef] [PubMed]
3. Niepman, D.; Prots, Y.M.; Pöttgen, R.; Jeitschko, W. The order of the palladium and germanium atoms in thegermanides LnPdGe (Ln = La–Nd, Sm, Gd, Tb) and the new compound Yb3Pd4Ge4. J. Solid State Chem. 2000,154, 329–337. [CrossRef]
4. Heying, B.; Rodewald, U.C.; Pöttgen, R. The germanides Er5Pd4Ge8 and Tm5Pd4Ge8—3D [Pd4Ge8]polyanions with Ge2 dumb-bells and Ge4 chains in cis-conformation. Z. Kristallogr. 2017, 232, 435–440.[CrossRef]
5. Feyerherm, R.; Becker, B.; Collins, M.F.; Mydosh, J.; Nieuwenhuys, G.J.; Ramakrishnan, S. The magneticstructure of CePd2Ge2 and Ce2Pd3Ge5. Phys. B 1998, 241–243, 643–645. [CrossRef]
6. Anand, V.K.; Thamizhavel, A.; Ramakrishnan, S.; Hossain, Z. Complex magnetic order in Pr2Pd3Ge5:A single crystal study. J. Phys. 2012, 24. [CrossRef] [PubMed]
7. Solokha, P.; Freccero, R.; De Negri, S.; Proserpio, D.M.; Saccone, A. The R2Pd3Ge5 (R = La–Nd, Sm) germanides:Synthesis, crystal structure and symmetry reduction. Struct. Chem. 2016, 27, 1693–1701. [CrossRef]
8. Rodewald, U.C.; Heying, B.; Hoffmann, R.-D.; Niepmann, D. Polymorphism in the germanides REPdGewith the heavy rare earth elements. Z. Naturforsch. 2009, 64b, 595–602. [CrossRef]
9. Chabot, B.; Parthé, E. Dy2Co3Si5, Lu2Co3Si5, Y2Co3Si5 and Sc2Co3Si5 with a monoclinic structuraldeformation variant of the orthorhombic U2Co3Si5 structure type. J. Less-Common Met. 1985, 106, 53–59.[CrossRef]
10. Bruker. APEX2, SAINT-Plus, XPREP, SADABS, CELL_NOW and TWINABS. Bruker AXS Inc.: Madison, WI,USA, 2014.
11. Kraus, W.; Nolze, G. POWDER CELL-A program for the representation and manipulation of crystal structureand calculation of the resulting X-ray powder pattern. J. Appl. Crystallogr. 1996, 29. [CrossRef]
61
Crystals 2018, 8, 205
12. Bader, R.F. Atoms in Molecules: A Quantum Theory; Clarendon Press and Oxford University Press: New York,NY, USA, 1994.
13. Kresse, G.; Furthmüller, J. Efficient iterative schemes for ab initio total-energy calculations using a plane-wavebasis set. J. Phys. Rev. B 1996, 54, 11169–11186. [CrossRef]
14. Krier, G.; Jepsen, O.; Burkhardt, A.; Andersen, O.K. The TB-LMTO-ASA Program; Version 4.7; Max-Planck-InstitutFür Festkörperforschung: Stuttgart, Germany, 2000.
15. Barth, U.; Hedin, L.A. Local exchange-correlation potential for the spin polarized case: I. J. Phys. Chem. 1972,C5, 1629–1642. [CrossRef]
16. Dronskowski, R.; Blöchl, P.E. Crystal orbital Hamilton populations (COHP): Energy-resolved visualizationof chemical bonding in solids based on density-functional calculations. J. Phys. Chem. 1993, 97, 8617–8624.[CrossRef]
17. Eck, B. Wxdragon, Aachen, Germany, 1994–2018. Available online: http://wxdragon.de/ (accessed on2 May 2018).
18. Mealli, C.; Proserpio, D.M. MO Theory made visible. J. Chem. Educ. 1990, 67, 399–403. [CrossRef]19. Mealli, C.; Ienco, A.; Proserpio, D.M. Book of Abstracts of the XXXIII. ICCC; ICCC: Florence, Italy, 1998.20. Lowe, J.; Peterson, K. Quantum Chemistry, 3rd ed.; Academic Press: Cambridge, MA, USA, 2005.21. Hoffmann, R. Solids and Surfaces: A Chemist’s View of Bonding in Extended Structures; VCH: New York, NY,
USA, 1988.22. Solokha, P.; De Negri, S.; Saccone, A.; Proserpio, D.M. On a non-merohedrally twinned Tb3Ge5 crystal.
In Proceedings of the XII International Conference on Crystal Chemistry of Intermetallic Compounds, Lviv,Ukraine, 22–26 September 2012.
23. Budnyk, S.L.; Weitzer, F.; Kubata, C.; Prots, Y.; Akselrud, L.G.; Schnelle, W.; Hiebl, K.; Nesper, R.; Wagner, F.R.;Grin, Yu. Barrelane-like germanium clusters in Eu3Ge5: Crystal structure, chemical bonding and physicalproperties. J. Solid State Chem. 2006, 179, 2329–2338. [CrossRef]
24. Shcherban, O.; Savysyuk, I.; Semuso, N.; Gladyshevskii, R.; Cenzual, K. Crystal structure of the compoundPr4Ge7. Chem. Met. Alloys 2009, 2, 115–122.
25. Müller, P. Crystal Structure Refinement: A Crystallographer’s Guide to SHELXL; Oxford University Press: Oxford,UK, 2006.
26. Clegg, W. Crystal Structure Analysis: Principle and Practice, 2nd ed.; Oxford University Press: Oxford, UK, 2009.27. Petricek, V.; Dusek, M.; Palatinus, L. Crystallographic computing system JANA2006: General features.
Z. Kristallogr. 2014, 229, 345–352.28. Cooper, R.I.; Gould, R.O.; Parsons, S.; Watkin, D.J. The derivation of non-merohedral twin laws during
refinement by analysis of poorly fitting intensity data and the refinement of non-merohedrally twinnedcrystal structures in the program crystals. J. Appl. Crystallogr. 2002, 35, 168–174. [CrossRef]
29. Farrugia, L.J. WinGX and ORTEP for windows: An update. J. Appl. Cryst. 2012, 45, 849–854. [CrossRef]30. Gelato, L.; Parthé, E. Structure tidy—A computer program to standardize crystal structure data.
J. Appl. Crystallogr. 1987, 20, 139–143. [CrossRef]31. Parthé, E.; Gelato, L.; Chabot, B.; Penzo, M.; Cenzual, K.; Gladyshevskii, R. TYPIX Standardized Data and
Crystal Chemical Characterization of Inorganic Structure Types; Springer-Verlag: Heidelberg, Germany, 1993.32. Prots, Y.; Demchyna, R.; Burkhardt, U.; Schwarz, U. Crystal structure and twinning of HfPdGe. Z. Kristallogr.
2007, 222, 513–520. [CrossRef]33. Wondratschek, H.; Müller, U. International Tables for Crystallography, Symmetry Relations between Space Groups;
Vol. A1; Kluwer Academic Publishers: Dordrecht, The Netherlands, 2004.34. Müller, U. Symmetry Relationships between Crystal Structures. Applications of Crystallographic Group Theory in
Crystal Chemistry; Oxford University Press: Oxford, UK, 2013.35. Pöttgen, R. Coloring, distortions, and puckering in selected intermetallic structures from the perspective of
group—Subgroup relations. Z. Anorg. Allg. Chem. 2014, 640, 869–891. [CrossRef]36. Landrum, G.A.; Dronskowski, R. The orbital origins of magnetism: from atoms to molecules to ferromagnetic
alloys. Angew. Chem. Int. Ed. 2000, 39, 1560–1585. [CrossRef]37. Lin, Q.; Corbett, J.D. Centric and non-centric Ca3Au~7.5Ge~3.5: Electron-poor derivatives of La3Al11.
syntheses, structures, and bonding analyses. Inorg. Chem. 2009, 48, 5403–5411. [CrossRef] [PubMed]38. Mudring, A.-V.; Corbett, J.D. Unusual electronic and bonding properties of the zintl phase Ca5Ge3 and
related compounds. A theoretical analysis. J. Am. Chem. Soc. 2004, 126, 5277–5281. [CrossRef] [PubMed]
62
Crystals 2018, 8, 205
39. Siggelkow, L.; Hlukhyy, V.; Fässler, T.F. Sr7Ge6, Ba7Ge6 and Ba3Sn2—Three new binary compoundscontaining dumbbells and four-membered chains of tetrel atoms with considerable Ge-Ge π-bondingcharacter. J. Solid State Chem. 2012, 191, 76–89. [CrossRef]
40. Eisenmann, B.; Schäfer, H. Zur Strukturchemie der Verbindungsreihe BaMg2X2 (X = Si, Ge, Sn, Pb). Z. Anorg.
Allg. Chem. 1974, 403, 163–172. [CrossRef]41. Doverbratt, I.; Ponou, S.; Lidin, S. Ca2Pd3Ge, a new fully ordered ternary Laves phase structure. J. Solid
State Chem. 2013, 197, 312–316. [CrossRef]42. Kurylyshyn, I.M.; Fässler, T.F.; Fischer, A.; Hauf, C.; Eickerling, G.; Presnitz, M.; Scherer, W. Probing the
Zintl-Klemm concept: A combined experimental and theoretical charge density study of the Zintl phaseCaSi. Angew. Chem. Int. Ed. 2014, 53, 3029–3032. [CrossRef] [PubMed]
© 2018 by the authors. Licensee MDPI, Basel, Switzerland. This article is an open accessarticle distributed under the terms and conditions of the Creative Commons Attribution(CC BY) license (http://creativecommons.org/licenses/by/4.0/).
63
crystals
Article
Mixed Sr and Ba Tri-Stannides/PlumbidesAII(Sn1−xPbx)3
Michael Langenmaier †,‡, Michael Jehle †,‡ and Caroline Röhr *
Institut für Anorganische und Analytische Chemie, Albert-Ludwigs-Universität Freiburg, 79104 Freiburg,Germany; [email protected] (M.L.); [email protected] (M.J.)* Correspondence: [email protected]; Tel.: +49-0761-203-6143† These authors contributed equally to this work.‡ Institut für Anorganische und Analytische Chemie, Albert-Ludwigs-Universität Freiburg, Albertstr. 21,
D-79104 Freiburg, Germany.
Received: 2 April 2018 ; Accepted: 26 April 2018; Published: 4 May 2018
Abstract: The continuous substitution of tin by lead (MIV) allows for the exploration geometric criteriafor the stability of the different stacking variants of alkaline-earth tri-tetrelides AIIMIV
3 . A seriesof ternary Sr and Ba mixed tri-stannides/plumbides AII(Sn1−xPbx)3 (AII = Sr, Ba) was synthesizedfrom stoichiometric mixtures of the elements. Their structures were determined by means of singlecrystal X-ray data. All structures exhibit close packed ordered AM3 layers containing M kagomé nets.Depending on the stacking sequence, the resulting M polyanion resembles the oxygen substructureof the hexagonal (face-sharing octahedra, h stacking, Ni3Sn-type, border compound BaSn3) or thecubic (corner-sharing octahedra, c stacking, Cu3Au-type, border compound SrPb3) perovskite. In thebinary compound BaSn3 (Ni3Sn-type) up to 28% of Sn can be substituted against Pb (hP8, P63/mmc,x = 0.28(4): a = 726.12(6), c = 556.51(6) pm, R1 = 0.0264). A further increased lead content of 47 to66% causes the formation of the BaSn2.57Bi0.43-type structure with a (hhhc)2 stacking [hP32, P63/mmc,x = 0.47(3): a = 726.80(3), c = 2235.78(14) pm, R1 = 0.0437]. The stability range of the BaPb3-typesequence (hhc)3 starts at a lead proportion of 78% (hR36, R3m, a = 728.77(3), c = 2540.59(15) pm,R1= 0.0660) and reaches up to the pure plumbide BaPb3. A second new polymorph of BaPb3
forms the Mg3In-type structure with a further increased amount of cubic sequences [(hhcc)3; hR48,a = 728.7(2), c = 3420.3(10) pm, R1 = 0.0669] and is thus isotypic with the border phase SrSn3 ofthe respective strontium series. For the latter, a Pb content of 32% causes a small existence regionof the PuAl3-type structure [hP24, P63/mmc, a = 696.97(6), c = 1675.5(2) pm, R1 = 0.1182] with a(hcc)2 stacking. The series is terminated by the pure c stacking of SrPb3, the stability range of thisstructure type starts at 75% Pb (cP4, Pm3m; a = 495.46(9) pm, R1 = 0.0498). The stacking of theclose packed layers is evidently determined by the ratio of the atomic radii of the contributingelements. The Sn/Pb distribution inside the polyanion (’coloring’) is likewise determined by sizecriteria. The electronic stability ranges, which are discussed on the basis of the results of FP-LAPWband structure calculations are compared with the Zintl concept and Wade’s/mno electron countingrules. Still, due to the presence of only partially occupied steep M-p bands the compounds are metalsexhibiting pseudo band gaps close to the Fermi level. Thus, this structure family represents aninstructive case for the transition from polar ionic/covalent towards (inter)metallic chemistry.
Keywords: stannides; plumbides; alkaline-earth
1. Introduction
In view of the complex bonding situation between ionic, covalent and metallic, the synthetic,crystallographic and bond theoretical studies on geometric and electronic parameters determiningthe structure chemistry (and therewith also the properties) of polar intermetallics of the alkali and
Crystals 2018, 8, 204; doi:10.3390/cryst8050204 www.mdpi.com/journal/crystals64
Crystals 2018, 8, 204
alkaline-earth compounds of the p-block elements are still a fascinating field of research. Compared tothe vast number of alkali/alkaline-earth stannides and plumbides [1], which are simple electron-preciseZintl phases, the tri-stannides and -plumbides ASn3 and APb3 of the alkaline-earth elements(A = Ca, Sr, Ba) are ordered derivatives of simple dense packings of the two elements [2–9]. Similar tothe variation of the alkaline-earth elements (A) in the pure tri-stannides [10] and tri-plumbides [11],a continuous substitution of tin by lead allows for the exploration of geometric and electronic (Sn/Pbdistribution) criteria for the stability of different stacking variants of the hexagonal close packed layers[AM3] in these tri-tetrelides AIIMIV
3.The tri-plumbides APb3 of calcium and strontium, which both form the cubic Cu3Au-type
structure (|:ABC:| or c stacking after Jagodzinski), have been structurally characterized using X-raypowder data in the past and some physical properties as well as the electronic band structure werereported in the 1960s and 1970s by Havinga et al. [6,12,13]. More recent works on their electronic andmagnetic properties were published by Baranovskiy et al. [14,15]. The structure of the binary bariumplumbide BaPb3 [(hhc)3 stacking] was derived and refined from 78 reflections by Sands, Wood andRamsey as early as 1964 [9]. Only two years later, van Vucht published an elaborate work [7], in whichhe, based on powder diffraction data, already suggested the existence of further stacking variantsfor the mixed alkaline-earth plumbides AxBa1 − xPb3 (A = Ca, Sr). These two series have been fullyexplored by our group 10 years ago [11]: Both the Ca and the Sr series start with the pure c stacking of(Ca/Sr)Pb3. At an approximate 1:1 ratio of strontium and barium (e.g., 35 to 53% Sr) the PuAl3-type[(hcc)2 stacking] has a distinct homogeneity range. Reversely, the (hhc)3 stacking of the binarycompound BaPb3 changes at an already very small partial substitution of barium against calcium(Ca0.03Ba0.97Pb3) or strontium (Sr0.11Ba0.89Pb3) towards the (hhcc)3 sequence of the Mg3In-type.
For the tri-stannides ASn3, the continuous substitution of the different alkaline-earth cationsagainst each other has been likewise investigated in a systematic study [10]: Starting from CaSn3 (purec stacking [2]) up to 46% of Ca can be substituted against Sr without a structural change. The binaryphase SrSn3 forms the Mg3In-type structure with a (hhcc)3 stacking sequence [3]. A small partialsubstitution of Sr against Ba (9 to 19%) causes the packing to switch to the (hhc)3 sequence of theBaPb3-type. At a Ba proportion of 26% a further structure change to the BaSn2.57Bi0.43-type structure[(hhhc)2 stacking] takes place. The tin series terminates with the pure h stacking of BaSn3; the stabilityrange of this Ni3Sn-type structure starts at the composition Sr0.22Ba0.78Sn3.
Beyond these pure geometric/size effects, van Vucht and Havinga [8,16] also demonstrated theelectronic influence on the h/c stacking of the layers in several Tl-substituted plumbides A(Tl/Pb)3.An indium content in Ba(In/Pb)3 of 15% also changes the stacking from the simple cubic to the mixed(hcc)2 sequence of the PuAl3-type [17]. For the electron-richer system BaSn3–BaBi3 a similar influenceof the valence electron (v.e.) number on the stacking was shown more recently by Fässler et al. [18].
In the present work, we report on the results of a systematic experimental, crystallographic andbond-theoretical DFT investigation of mixed Sn/Pb tri-tetrelides of Sr and Ba. Here, the substitutionof tin by lead does not only change the geometric relations, but in addition the occupation of thecrystallographically different M positions of the more complex stacked sequences with tin and/orlead, i.e., the ’coloring’ of the polyanion [19] can be studied.
2. Experimental
2.1. Synthesis and Phase Widths
The synthesis of the mixed Sn/Pb tri-tetrelides was generally performed starting fromthe elements strontium or barium, tin and lead as obtained from commercial sources (Sr, Ba:Metallhandelsgesellschaft Maassen, Bonn, 99%; Sn: shots, 99.9%, Riedel de Häen; Pb: powder,99.9%, Merck KGaA). The elements were filled into tantalum crucibles in a glovebox under anargon atmosphere and the sealed containers were heated up with a rate of 200 C/h to maximumtemperatures (Tmax) of 700 to 800 C. For all samples, the crystallization was performed by a slow
65
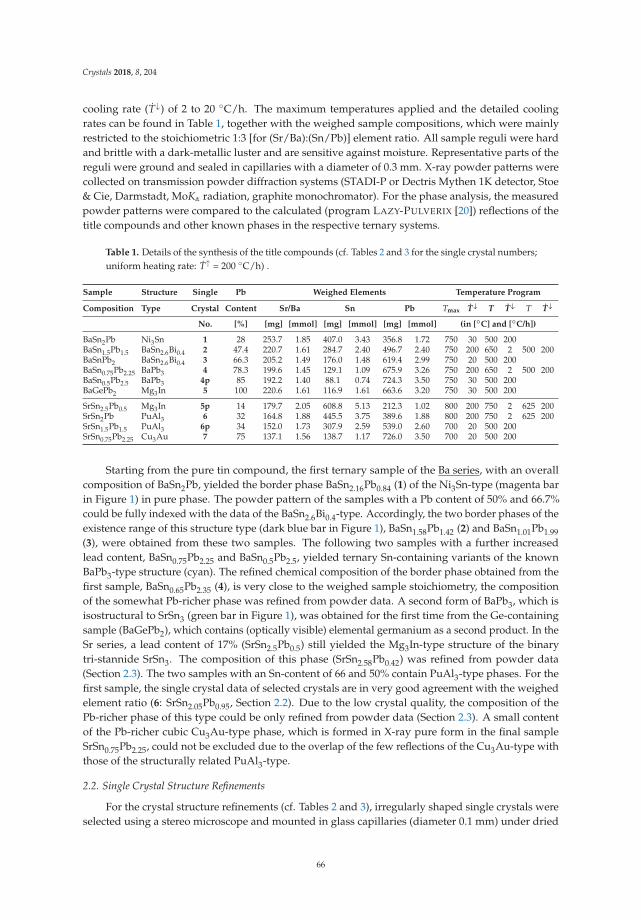
Crystals 2018, 8, 204
cooling rate (T↓) of 2 to 20 C/h. The maximum temperatures applied and the detailed coolingrates can be found in Table 1, together with the weighed sample compositions, which were mainlyrestricted to the stoichiometric 1:3 [for (Sr/Ba):(Sn/Pb)] element ratio. All sample reguli were hardand brittle with a dark-metallic luster and are sensitive against moisture. Representative parts of thereguli were ground and sealed in capillaries with a diameter of 0.3 mm. X-ray powder patterns werecollected on transmission powder diffraction systems (STADI-P or Dectris Mythen 1K detector, Stoe& Cie, Darmstadt, MoKα radiation, graphite monochromator). For the phase analysis, the measuredpowder patterns were compared to the calculated (program LAZY-PULVERIX [20]) reflections of thetitle compounds and other known phases in the respective ternary systems.
Table 1. Details of the synthesis of the title compounds (cf. Tables 2 and 3 for the single crystal numbers;uniform heating rate: T↑ = 200 C/h) .
Sample Structure Single Pb Weighed Elements Temperature Program
Composition Type Crystal Content Sr/Ba Sn Pb Tmax T↓ T T↓ T T↓
No. [%] [mg] [mmol] [mg] [mmol] [mg] [mmol] (in [C] and [C/h])
BaSn2Pb Ni3Sn 1 28 253.7 1.85 407.0 3.43 356.8 1.72 750 30 500 200BaSn1.5Pb1.5 BaSn2.6Bi0.4 2 47.4 220.7 1.61 284.7 2.40 496.7 2.40 750 200 650 2 500 200BaSnPb2 BaSn2.6Bi0.4 3 66.3 205.2 1.49 176.0 1.48 619.4 2.99 750 20 500 200BaSn0.75Pb2.25 BaPb3 4 78.3 199.6 1.45 129.1 1.09 675.9 3.26 750 200 650 2 500 200BaSn0.5Pb2.5 BaPb3 4p 85 192.2 1.40 88.1 0.74 724.3 3.50 750 30 500 200BaGePb2 Mg3In 5 100 220.6 1.61 116.9 1.61 663.6 3.20 750 30 500 200
SrSn2.5Pb0.5 Mg3In 5p 14 179.7 2.05 608.8 5.13 212.3 1.02 800 200 750 2 625 200SrSn2Pb PuAl3 6 32 164.8 1.88 445.5 3.75 389.6 1.88 800 200 750 2 625 200SrSn1.5Pb1.5 PuAl3 6p 34 152.0 1.73 307.9 2.59 539.0 2.60 700 20 500 200SrSn0.75Pb2.25 Cu3Au 7 75 137.1 1.56 138.7 1.17 726.0 3.50 700 20 500 200
Starting from the pure tin compound, the first ternary sample of the Ba series, with an overallcomposition of BaSn2Pb, yielded the border phase BaSn2.16Pb0.84 (1) of the Ni3Sn-type (magenta barin Figure 1) in pure phase. The powder pattern of the samples with a Pb content of 50% and 66.7%could be fully indexed with the data of the BaSn2.6Bi0.4-type. Accordingly, the two border phases of theexistence range of this structure type (dark blue bar in Figure 1), BaSn1.58Pb1.42 (2) and BaSn1.01Pb1.99(3), were obtained from these two samples. The following two samples with a further increasedlead content, BaSn0.75Pb2.25 and BaSn0.5Pb2.5, yielded ternary Sn-containing variants of the knownBaPb3-type structure (cyan). The refined chemical composition of the border phase obtained from thefirst sample, BaSn0.65Pb2.35 (4), is very close to the weighed sample stoichiometry, the compositionof the somewhat Pb-richer phase was refined from powder data. A second form of BaPb3, which isisostructural to SrSn3 (green bar in Figure 1), was obtained for the first time from the Ge-containingsample (BaGePb2), which contains (optically visible) elemental germanium as a second product. In theSr series, a lead content of 17% (SrSn2.5Pb0.5) still yielded the Mg3In-type structure of the binarytri-stannide SrSn3. The composition of this phase (SrSn2.58Pb0.42) was refined from powder data(Section 2.3). The two samples with an Sn-content of 66 and 50% contain PuAl3-type phases. For thefirst sample, the single crystal data of selected crystals are in very good agreement with the weighedelement ratio (6: SrSn2.05Pb0.95, Section 2.2). Due to the low crystal quality, the composition of thePb-richer phase of this type could be only refined from powder data (Section 2.3). A small contentof the Pb-richer cubic Cu3Au-type phase, which is formed in X-ray pure form in the final sampleSrSn0.75Pb2.25, could not be excluded due to the overlap of the few reflections of the Cu3Au-type withthose of the structurally related PuAl3-type.
2.2. Single Crystal Structure Refinements
For the crystal structure refinements (cf. Tables 2 and 3), irregularly shaped single crystals wereselected using a stereo microscope and mounted in glass capillaries (diameter 0.1 mm) under dried
66
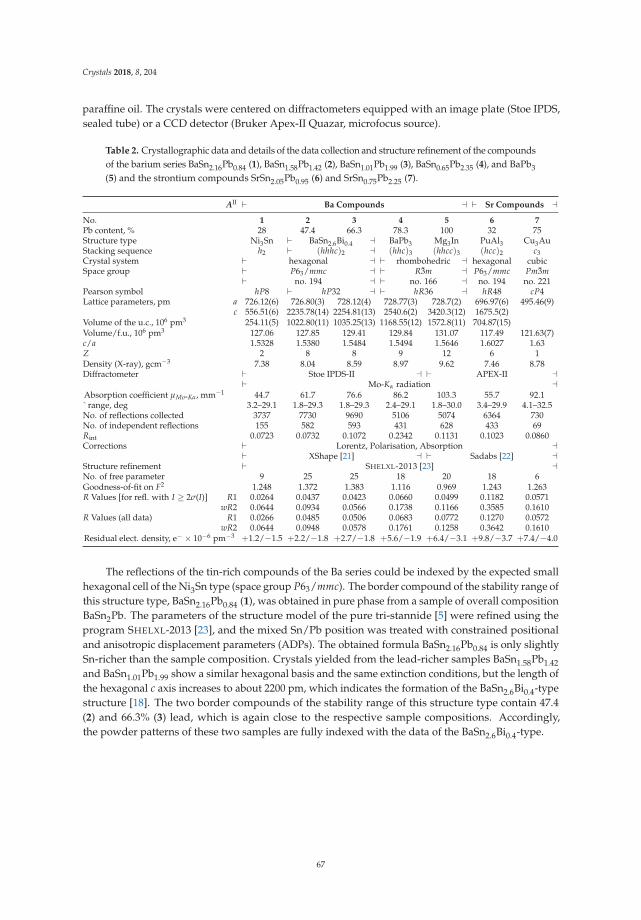
Crystals 2018, 8, 204
paraffine oil. The crystals were centered on diffractometers equipped with an image plate (Stoe IPDS,sealed tube) or a CCD detector (Bruker Apex-II Quazar, microfocus source).
Table 2. Crystallographic data and details of the data collection and structure refinement of the compoundsof the barium series BaSn2.16Pb0.84 (1), BaSn1.58Pb1.42 (2), BaSn1.01Pb1.99 (3), BaSn0.65Pb2.35 (4), and BaPb3(5) and the strontium compounds SrSn2.05Pb0.95 (6) and SrSn0.75Pb2.25 (7).
AII ⊢ Ba Compounds ⊣ ⊢ Sr Compounds ⊣
No. 1 2 3 4 5 6 7Pb content, % 28 47.4 66.3 78.3 100 32 75Structure type Ni3Sn ⊢ BaSn2.6Bi0.4 ⊣ BaPb3 Mg3In PuAl3 Cu3AuStacking sequence h2 ⊢ (hhhc)2 ⊣ (hhc)3 (hhcc)3 (hcc)2 c3Crystal system ⊢ hexagonal ⊣ ⊢ rhombohedric ⊣ hexagonal cubicSpace group ⊢ P63/mmc ⊣ ⊢ R3m ⊣ P63/mmc Pm3m
⊢ no. 194 ⊣ ⊢ no. 166 ⊣ no. 194 no. 221Pearson symbol hP8 ⊢ hP32 ⊣ ⊢ hR36 ⊣ hR48 cP4Lattice parameters, pm a 726.12(6) 726.80(3) 728.12(4) 728.77(3) 728.7(2) 696.97(6) 495.46(9)
c 556.51(6) 2235.78(14) 2254.81(13) 2540.6(2) 3420.3(12) 1675.5(2)Volume of the u.c., 106 pm3 254.11(5) 1022.80(11) 1035.25(13) 1168.55(12) 1572.8(11) 704.87(15)Volume/f.u., 106 pm3 127.06 127.85 129.41 129.84 131.07 117.49 121.63(7)c/a 1.5328 1.5380 1.5484 1.5494 1.5646 1.6027 1.63Z 2 8 8 9 12 6 1Density (X-ray), gcm−3 7.38 8.04 8.59 8.97 9.62 7.46 8.78Diffractometer ⊢ Stoe IPDS-II ⊣ ⊢ APEX-II ⊣
⊢ Mo-Kα radiation ⊣Absorption coefficient µMo-Kα, mm−1 44.7 61.7 76.6 86.2 103.3 55.7 92.1` range, deg 3.2–29.1 1.8–29.3 1.8–29.3 2.4–29.1 1.8–30.0 3.4–29.9 4.1–32.5No. of reflections collected 3737 7730 9690 5106 5074 6364 730No. of independent reflections 155 582 593 431 628 433 69Rint 0.0723 0.0732 0.1072 0.2342 0.1131 0.1023 0.0860Corrections ⊢ Lorentz, Polarisation, Absorption ⊣
⊢ XShape [21] ⊣ ⊢ Sadabs [22] ⊣Structure refinement ⊢ SHELXL-2013 [23] ⊣No. of free parameter 9 25 25 18 20 18 6Goodness-of-fit on F2 1.248 1.372 1.383 1.116 0.969 1.243 1.263R Values [for refl. with I ≥ 2σ(I)] R1 0.0264 0.0437 0.0423 0.0660 0.0499 0.1182 0.0571
wR2 0.0644 0.0934 0.0566 0.1738 0.1166 0.3585 0.1610R Values (all data) R1 0.0266 0.0485 0.0506 0.0683 0.0772 0.1270 0.0572
wR2 0.0644 0.0948 0.0578 0.1761 0.1258 0.3642 0.1610Residual elect. density, e− × 10−6 pm−3 +1.2/−1.5 +2.2/−1.8 +2.7/−1.8 +5.6/−1.9 +6.4/−3.1 +9.8/−3.7 +7.4/−4.0
The reflections of the tin-rich compounds of the Ba series could be indexed by the expected smallhexagonal cell of the Ni3Sn type (space group P63/mmc). The border compound of the stability range ofthis structure type, BaSn2.16Pb0.84 (1), was obtained in pure phase from a sample of overall compositionBaSn2Pb. The parameters of the structure model of the pure tri-stannide [5] were refined using theprogram SHELXL-2013 [23], and the mixed Sn/Pb position was treated with constrained positionaland anisotropic displacement parameters (ADPs). The obtained formula BaSn2.16Pb0.84 is only slightlySn-richer than the sample composition. Crystals yielded from the lead-richer samples BaSn1.58Pb1.42and BaSn1.01Pb1.99 show a similar hexagonal basis and the same extinction conditions, but the length ofthe hexagonal c axis increases to about 2200 pm, which indicates the formation of the BaSn2.6Bi0.4-typestructure [18]. The two border compounds of the stability range of this structure type contain 47.4(2) and 66.3% (3) lead, which is again close to the respective sample compositions. Accordingly,the powder patterns of these two samples are fully indexed with the data of the BaSn2.6Bi0.4-type.
67
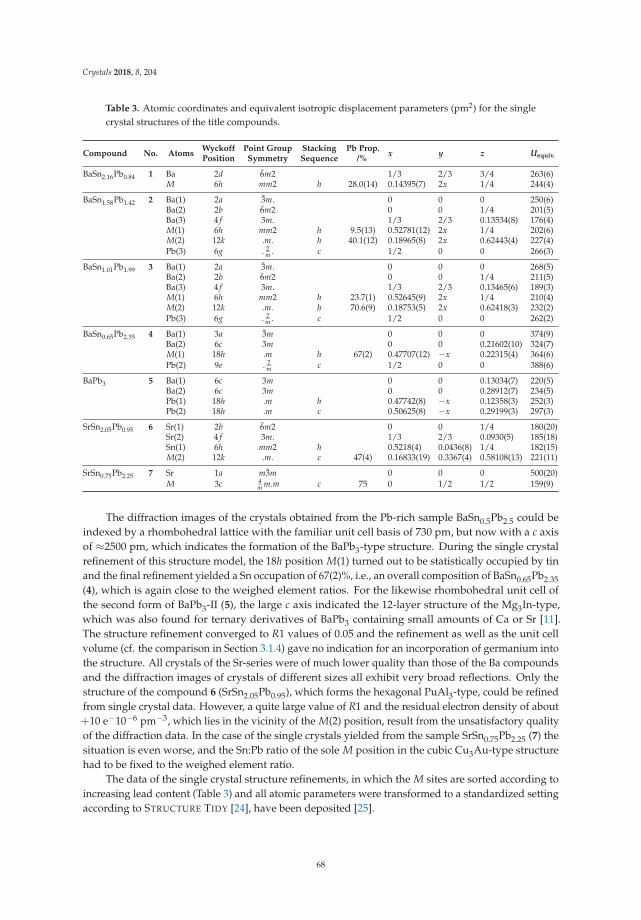
Crystals 2018, 8, 204
Table 3. Atomic coordinates and equivalent isotropic displacement parameters (pm2) for the singlecrystal structures of the title compounds.
Compound No. Atoms Wyckoff Point Group Stacking Pb Prop.x y z Uequiv.Position Symmetry Sequence /%
BaSn2.16Pb0.84 1 Ba 2d 6m2 1/3 2/3 3/4 263(6)M 6h mm2 h 28.0(14) 0.14395(7) 2x 1/4 244(4)
BaSn1.58Pb1.42 2 Ba(1) 2a 3m. 0 0 0 250(6)Ba(2) 2b 6m2 0 0 1/4 201(5)Ba(3) 4 f 3m. 1/3 2/3 0.13534(8) 176(4)M(1) 6h mm2 h 9.5(13) 0.52781(12) 2x 1/4 202(6)M(2) 12k .m. h 40.1(12) 0.18965(8) 2x 0.62443(4) 227(4)Pb(3) 6g . 2
m . c 1/2 0 0 266(3)
BaSn1.01Pb1.99 3 Ba(1) 2a 3m. 0 0 0 268(5)Ba(2) 2b 6m2 0 0 1/4 211(5)Ba(3) 4 f 3m. 1/3 2/3 0.13465(6) 189(3)M(1) 6h mm2 h 23.7(1) 0.52645(9) 2x 1/4 210(4)M(2) 12k .m. h 70.6(9) 0.18753(5) 2x 0.62418(3) 232(2)Pb(3) 6g . 2
m . c 1/2 0 0 262(2)
BaSn0.65Pb2.35 4 Ba(1) 3a 3m 0 0 0 374(9)Ba(2) 6c 3m 0 0 0.21602(10) 324(7)M(1) 18h .m h 67(2) 0.47707(12) −x 0.22315(4) 364(6)Pb(2) 9e . 2
m c 1/2 0 0 388(6)
BaPb3 5 Ba(1) 6c 3m 0 0 0.13034(7) 220(5)Ba(2) 6c 3m 0 0 0.28912(7) 234(5)Pb(1) 18h .m h 0.47742(8) −x 0.12358(3) 252(3)Pb(2) 18h .m c 0.50625(8) −x 0.29199(3) 297(3)
SrSn2.05Pb0.95 6 Sr(1) 2b 6m2 0 0 1/4 180(20)Sr(2) 4 f 3m. 1/3 2/3 0.0930(5) 185(18)Sn(1) 6h mm2 h 0.5218(4) 0.0436(8) 1/4 182(15)M(2) 12k .m. c 47(4) 0.16833(19) 0.3367(4) 0.58108(13) 221(11)
SrSn0.75Pb2.25 7 Sr 1a m3m 0 0 0 500(20)M 3c 4
m m.m c 75 0 1/2 1/2 159(9)
The diffraction images of the crystals obtained from the Pb-rich sample BaSn0.5Pb2.5 could beindexed by a rhombohedral lattice with the familiar unit cell basis of 730 pm, but now with a c axisof ≈2500 pm, which indicates the formation of the BaPb3-type structure. During the single crystalrefinement of this structure model, the 18h position M(1) turned out to be statistically occupied by tinand the final refinement yielded a Sn occupation of 67(2)%, i.e., an overall composition of BaSn0.65Pb2.35(4), which is again close to the weighed element ratios. For the likewise rhombohedral unit cell ofthe second form of BaPb3-II (5), the large c axis indicated the 12-layer structure of the Mg3In-type,which was also found for ternary derivatives of BaPb3 containing small amounts of Ca or Sr [11].The structure refinement converged to R1 values of 0.05 and the refinement as well as the unit cellvolume (cf. the comparison in Section 3.1.4) gave no indication for an incorporation of germanium intothe structure. All crystals of the Sr-series were of much lower quality than those of the Ba compoundsand the diffraction images of crystals of different sizes all exhibit very broad reflections. Only thestructure of the compound 6 (SrSn2.05Pb0.95), which forms the hexagonal PuAl3-type, could be refinedfrom single crystal data. However, a quite large value of R1 and the residual electron density of about+10 e−10−6 pm−3, which lies in the vicinity of the M(2) position, result from the unsatisfactory qualityof the diffraction data. In the case of the single crystals yielded from the sample SrSn0.75Pb2.25 (7) thesituation is even worse, and the Sn:Pb ratio of the sole M position in the cubic Cu3Au-type structurehad to be fixed to the weighed element ratio.
The data of the single crystal structure refinements, in which the M sites are sorted according toincreasing lead content (Table 3) and all atomic parameters were transformed to a standardized settingaccording to STRUCTURE TIDY [24], have been deposited [25].
68
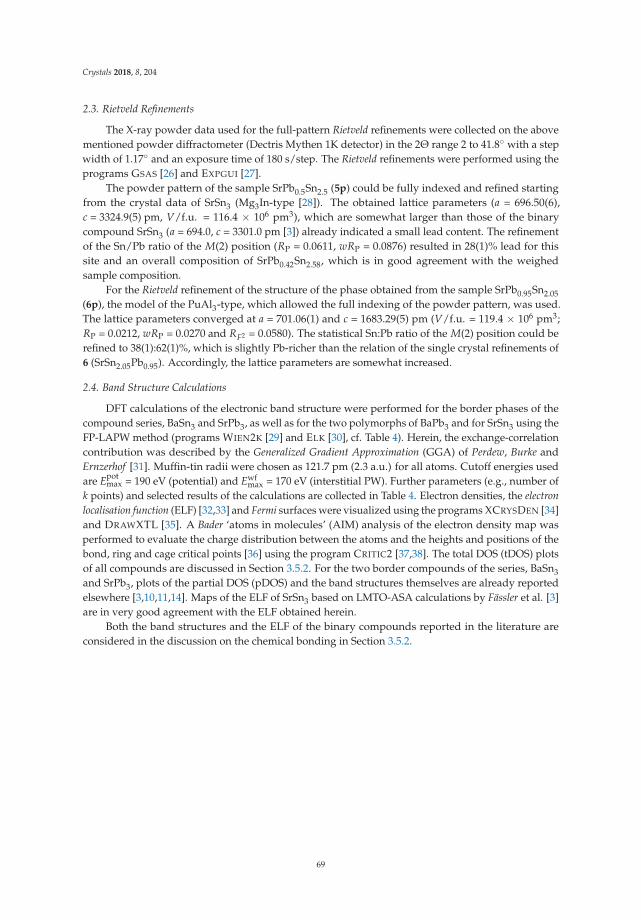
Crystals 2018, 8, 204
2.3. Rietveld Refinements
The X-ray powder data used for the full-pattern Rietveld refinements were collected on the abovementioned powder diffractometer (Dectris Mythen 1K detector) in the 2Θ range 2 to 41.8 with a stepwidth of 1.17 and an exposure time of 180 s/step. The Rietveld refinements were performed using theprograms GSAS [26] and EXPGUI [27].
The powder pattern of the sample SrPb0.5Sn2.5 (5p) could be fully indexed and refined startingfrom the crystal data of SrSn3 (Mg3In-type [28]). The obtained lattice parameters (a = 696.50(6),c = 3324.9(5) pm, V/f.u. = 116.4 × 10⁶ pm3), which are somewhat larger than those of the binarycompound SrSn3 (a = 694.0, c = 3301.0 pm [3]) already indicated a small lead content. The refinementof the Sn/Pb ratio of the M(2) position (RP = 0.0611, wRP = 0.0876) resulted in 28(1)% lead for thissite and an overall composition of SrPb0.42Sn2.58, which is in good agreement with the weighedsample composition.
For the Rietveld refinement of the structure of the phase obtained from the sample SrPb0.95Sn2.05(6p), the model of the PuAl3-type, which allowed the full indexing of the powder pattern, was used.The lattice parameters converged at a = 701.06(1) and c = 1683.29(5) pm (V/f.u. = 119.4 × 10⁶ pm3;RP = 0.0212, wRP = 0.0270 and RF2 = 0.0580). The statistical Sn:Pb ratio of the M(2) position could berefined to 38(1):62(1)%, which is slightly Pb-richer than the relation of the single crystal refinements of6 (SrSn2.05Pb0.95). Accordingly, the lattice parameters are somewhat increased.
2.4. Band Structure Calculations
DFT calculations of the electronic band structure were performed for the border phases of thecompound series, BaSn3 and SrPb3, as well as for the two polymorphs of BaPb3 and for SrSn3 using theFP-LAPW method (programs WIEN2K [29] and ELK [30], cf. Table 4). Herein, the exchange-correlationcontribution was described by the Generalized Gradient Approximation (GGA) of Perdew, Burke andErnzerhof [31]. Muffin-tin radii were chosen as 121.7 pm (2.3 a.u.) for all atoms. Cutoff energies usedare E
potmax = 190 eV (potential) and Ewf
max = 170 eV (interstitial PW). Further parameters (e.g., number ofk points) and selected results of the calculations are collected in Table 4. Electron densities, the electron
localisation function (ELF) [32,33] and Fermi surfaces were visualized using the programs XCRYSDEN [34]and DRAWXTL [35]. A Bader ‘atoms in molecules’ (AIM) analysis of the electron density map wasperformed to evaluate the charge distribution between the atoms and the heights and positions of thebond, ring and cage critical points [36] using the program CRITIC2 [37,38]. The total DOS (tDOS) plotsof all compounds are discussed in Section 3.5.2. For the two border compounds of the series, BaSn3and SrPb3, plots of the partial DOS (pDOS) and the band structures themselves are already reportedelsewhere [3,10,11,14]. Maps of the ELF of SrSn3 based on LMTO-ASA calculations by Fässler et al. [3]are in very good agreement with the ELF obtained herein.
Both the band structures and the ELF of the binary compounds reported in the literature areconsidered in the discussion on the chemical bonding in Section 3.5.2.
69
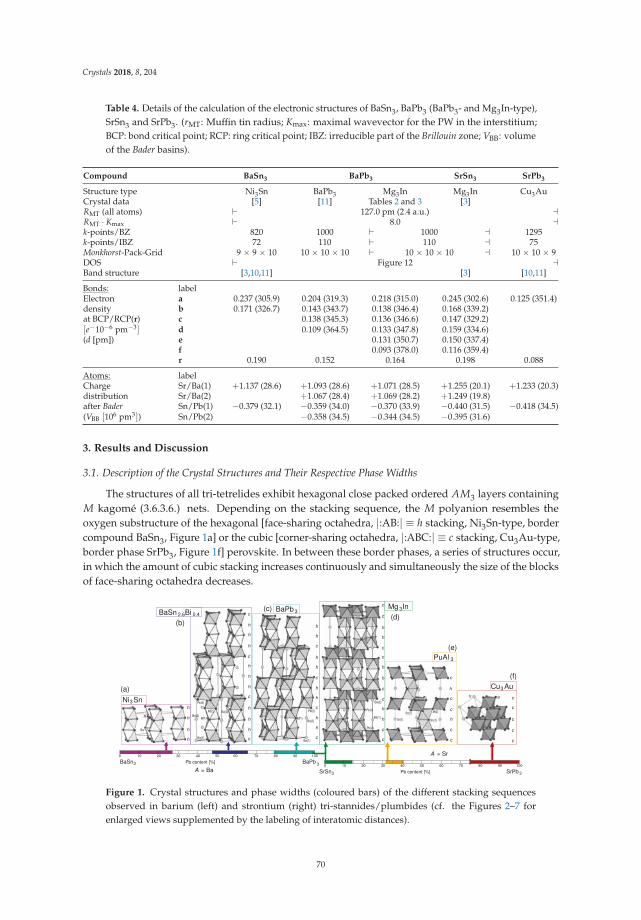
Crystals 2018, 8, 204
Table 4. Details of the calculation of the electronic structures of BaSn3, BaPb3 (BaPb3- and Mg3In-type),SrSn3 and SrPb3. (rMT: Muffin tin radius; Kmax: maximal wavevector for the PW in the interstitium;BCP: bond critical point; RCP: ring critical point; IBZ: irreducible part of the Brillouin zone; VBB: volumeof the Bader basins).
Compound BaSn3 BaPb3 SrSn3 SrPb3
Structure type Ni3Sn BaPb3 Mg3In Mg3In Cu3AuCrystal data [5] [11] Tables 2 and 3 [3]RMT (all atoms) ⊢ 127.0 pm (2.4 a.u.) ⊣RMT · Kmax ⊢ 8.0 ⊣k-points/BZ 820 1000 ⊢ 1000 ⊣ 1295k-points/IBZ 72 110 ⊢ 110 ⊣ 75Monkhorst-Pack-Grid 9 × 9 × 10 10 × 10 × 10 ⊢ 10 × 10 × 10 ⊣ 10 × 10 × 9DOS ⊢ Figure 12 ⊣Band structure [3,10,11] [3] [10,11]
Bonds: labelElectron a 0.237 (305.9) 0.204 (319.3) 0.218 (315.0) 0.245 (302.6) 0.125 (351.4)density b 0.171 (326.7) 0.143 (343.7) 0.138 (346.4) 0.168 (339.2)at BCP/RCP(r) c 0.138 (345.3) 0.136 (346.6) 0.147 (329.2)[e−10−6 pm−3] d 0.109 (364.5) 0.133 (347.8) 0.159 (334.6)(d [pm]) e 0.131 (350.7) 0.150 (337.4)
f 0.093 (378.0) 0.116 (359.4)r 0.190 0.152 0.164 0.198 0.088
Atoms: labelCharge Sr/Ba(1) +1.137 (28.6) +1.093 (28.6) +1.071 (28.5) +1.255 (20.1) +1.233 (20.3)distribution Sr/Ba(2) +1.067 (28.4) +1.069 (28.2) +1.249 (19.8)after Bader Sn/Pb(1) −0.379 (32.1) −0.359 (34.0) −0.370 (33.9) −0.440 (31.5) −0.418 (34.5)(VBB [106 pm3]) Sn/Pb(2) −0.358 (34.5) −0.344 (34.5) −0.395 (31.6)
3. Results and Discussion
3.1. Description of the Crystal Structures and Their Respective Phase Widths
The structures of all tri-tetrelides exhibit hexagonal close packed ordered AM3 layers containingM kagomé (3.6.3.6.) nets. Depending on the stacking sequence, the M polyanion resembles theoxygen substructure of the hexagonal [face-sharing octahedra, |:AB:| ≡ h stacking, Ni3Sn-type, bordercompound BaSn3, Figure 1a] or the cubic [corner-sharing octahedra, |:ABC:| ≡ c stacking, Cu3Au-type,border phase SrPb3, Figure 1f] perovskite. In between these border phases, a series of structures occur,in which the amount of cubic stacking increases continuously and simultaneously the size of the blocksof face-sharing octahedra decreases.
A = Ba
Pb content [%]3BaSn
A = Sr
M(2)
Sn(1)Sr(1)
(2)Sr
Ba(1)
Ba(2)
Pb(2)
M(1) Ba(1)
Pb(2)
Ba(2)
Pb(1)
6050403020100 70 80 90
3BaPb
Ba
M
Ba(1)
Ba(2)M(1)
Pb(3)
M(2) Ba(3)
60 70 80 90 10010 20 30 40 50
SrSn0
3 SrPb 3Pb content [%]
SrM
h
h
c
h
h
c
h
h
c
h
c
h
c
h
h
h
c
h
h
h
c
h
h
h
c
c
c
h
c
c
h
c
c
c
c
h
h
c
c
h
h
c
c
h
h
c
c
h
h
h
h
c
c
c
c
c
BaPb 3(c)
Ni Sn3
(a)
(b)
2.6BaSn Bi 0.4 (d)
Mg In3
PuAl 3
(e)
(f)
Cu Au3
100
Figure 1. Crystal structures and phase widths (coloured bars) of the different stacking sequencesobserved in barium (left) and strontium (right) tri-stannides/plumbides (cf. the Figures 2–7 forenlarged views supplemented by the labeling of interatomic distances).
70
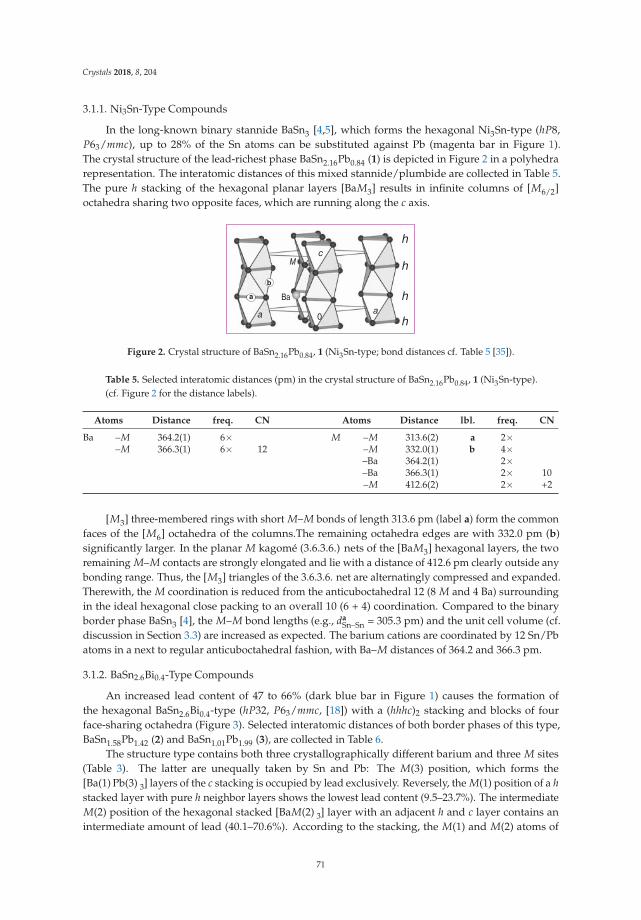
Crystals 2018, 8, 204
3.1.1. Ni3Sn-Type Compounds
In the long-known binary stannide BaSn3 [4,5], which forms the hexagonal Ni3Sn-type (hP8,P63/mmc), up to 28% of the Sn atoms can be substituted against Pb (magenta bar in Figure 1).The crystal structure of the lead-richest phase BaSn2.16Pb0.84 (1) is depicted in Figure 2 in a polyhedrarepresentation. The interatomic distances of this mixed stannide/plumbide are collected in Table 5.The pure h stacking of the hexagonal planar layers [BaM3] results in infinite columns of [M6/2]octahedra sharing two opposite faces, which are running along the c axis.
Ba
M
a
b
a 0a
c
h
h
h
h
Figure 2. Crystal structure of BaSn2.16Pb0.84, 1 (Ni3Sn-type; bond distances cf. Table 5 [35]).
Table 5. Selected interatomic distances (pm) in the crystal structure of BaSn2.16Pb0.84, 1 (Ni3Sn-type).(cf. Figure 2 for the distance labels).
Atoms Distance freq. CN Atoms Distance lbl. freq. CN
Ba –M 364.2(1) 6× M –M 313.6(2) a 2×–M 366.3(1) 6× 12 –M 332.0(1) b 4×
–Ba 364.2(1) 2×–Ba 366.3(1) 2× 10–M 412.6(2) 2× +2
[M3] three-membered rings with short M–M bonds of length 313.6 pm (label a) form the commonfaces of the [M6] octahedra of the columns.The remaining octahedra edges are with 332.0 pm (b)significantly larger. In the planar M kagomé (3.6.3.6.) nets of the [BaM3] hexagonal layers, the tworemaining M–M contacts are strongly elongated and lie with a distance of 412.6 pm clearly outside anybonding range. Thus, the [M3] triangles of the 3.6.3.6. net are alternatingly compressed and expanded.Therewith, the M coordination is reduced from the anticuboctahedral 12 (8 M and 4 Ba) surroundingin the ideal hexagonal close packing to an overall 10 (6 + 4) coordination. Compared to the binaryborder phase BaSn3 [4], the M–M bond lengths (e.g., da
Sn–Sn = 305.3 pm) and the unit cell volume (cf.discussion in Section 3.3) are increased as expected. The barium cations are coordinated by 12 Sn/Pbatoms in a next to regular anticuboctahedral fashion, with Ba–M distances of 364.2 and 366.3 pm.
3.1.2. BaSn2.6Bi0.4-Type Compounds
An increased lead content of 47 to 66% (dark blue bar in Figure 1) causes the formation ofthe hexagonal BaSn2.6Bi0.4-type (hP32, P63/mmc, [18]) with a (hhhc)2 stacking and blocks of fourface-sharing octahedra (Figure 3). Selected interatomic distances of both border phases of this type,BaSn1.58Pb1.42 (2) and BaSn1.01Pb1.99 (3), are collected in Table 6.
The structure type contains both three crystallographically different barium and three M sites(Table 3). The latter are unequally taken by Sn and Pb: The M(3) position, which forms the[Ba(1) Pb(3) 3] layers of the c stacking is occupied by lead exclusively. Reversely, the M(1) position of a h
stacked layer with pure h neighbor layers shows the lowest lead content (9.5–23.7%). The intermediateM(2) position of the hexagonal stacked [BaM(2) 3] layer with an adjacent h and c layer contains anintermediate amount of lead (40.1–70.6%). According to the stacking, the M(1) and M(2) atoms of
71
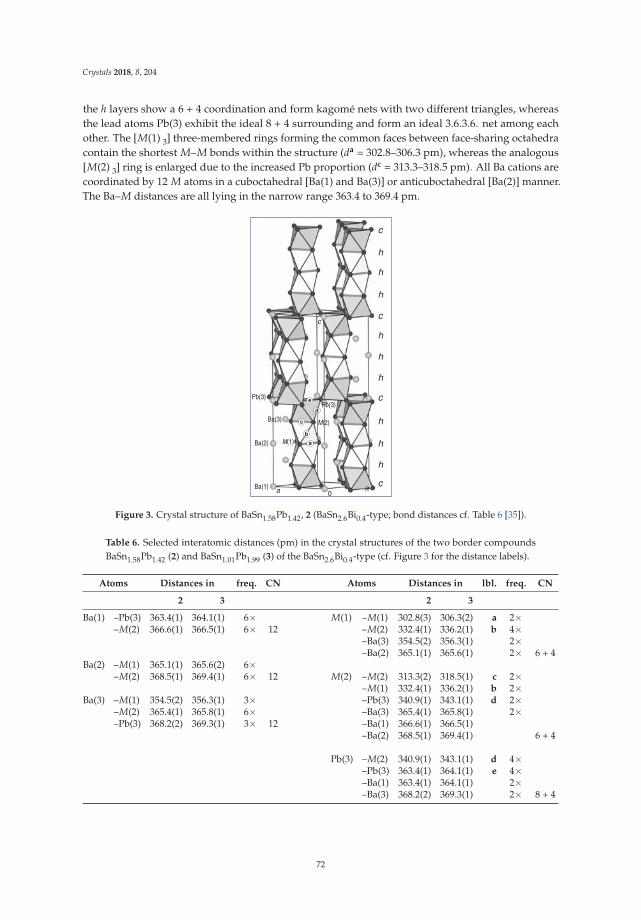
Crystals 2018, 8, 204
the h layers show a 6 + 4 coordination and form kagomé nets with two different triangles, whereasthe lead atoms Pb(3) exhibit the ideal 8 + 4 surrounding and form an ideal 3.6.3.6. net among eachother. The [M(1) 3] three-membered rings forming the common faces between face-sharing octahedracontain the shortest M–M bonds within the structure (da = 302.8–306.3 pm), whereas the analogous[M(2) 3] ring is enlarged due to the increased Pb proportion (dc = 313.3–318.5 pm). All Ba cations arecoordinated by 12 M atoms in a cuboctahedral [Ba(1) and Ba(3)] or anticuboctahedral [Ba(2)] manner.The Ba–M distances are all lying in the narrow range 363.4 to 369.4 pm.
M(2)
M(1)
Ba(1)
Ba(2)
Ba(3)
Pb(3)Pb(3)
c
h
h
h
c
h
h
h
c
h
h
h
c
a
b
c
d
e
c
a a0
Figure 3. Crystal structure of BaSn1.58Pb1.42, 2 (BaSn2.6Bi0.4-type; bond distances cf. Table 6 [35]).
Table 6. Selected interatomic distances (pm) in the crystal structures of the two border compoundsBaSn1.58Pb1.42 (2) and BaSn1.01Pb1.99 (3) of the BaSn2.6Bi0.4-type (cf. Figure 3 for the distance labels).
Atoms Distances in freq. CN Atoms Distances in lbl. freq. CN
2 3 2 3
Ba(1) –Pb(3) 363.4(1) 364.1(1) 6× M(1) –M(1) 302.8(3) 306.3(2) a 2×–M(2) 366.6(1) 366.5(1) 6× 12 –M(2) 332.4(1) 336.2(1) b 4×
–Ba(3) 354.5(2) 356.3(1) 2×–Ba(2) 365.1(1) 365.6(1) 2× 6 + 4
Ba(2) –M(1) 365.1(1) 365.6(2) 6×–M(2) 368.5(1) 369.4(1) 6× 12 M(2) –M(2) 313.3(2) 318.5(1) c 2×
–M(1) 332.4(1) 336.2(1) b 2×Ba(3) –M(1) 354.5(2) 356.3(1) 3× –Pb(3) 340.9(1) 343.1(1) d 2×
–M(2) 365.4(1) 365.8(1) 6× –Ba(3) 365.4(1) 365.8(1) 2×–Pb(3) 368.2(2) 369.3(1) 3× 12 –Ba(1) 366.6(1) 366.5(1)
–Ba(2) 368.5(1) 369.4(1) 6 + 4
Pb(3) –M(2) 340.9(1) 343.1(1) d 4×–Pb(3) 363.4(1) 364.1(1) e 4×–Ba(1) 363.4(1) 364.1(1) 2×–Ba(3) 368.2(2) 369.3(1) 2× 8 + 4
72
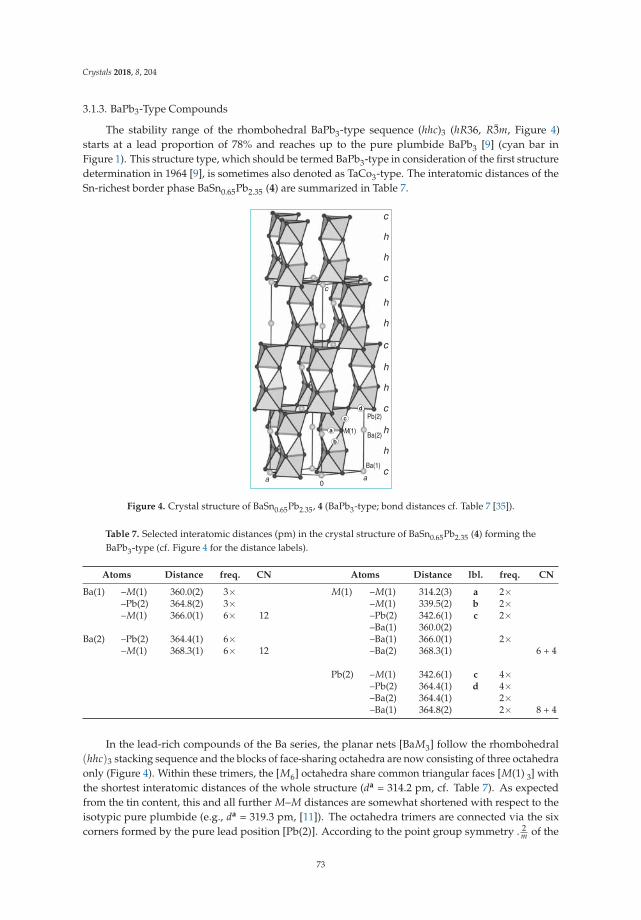
Crystals 2018, 8, 204
3.1.3. BaPb3-Type Compounds
The stability range of the rhombohedral BaPb3-type sequence (hhc)3 (hR36, R3m, Figure 4)starts at a lead proportion of 78% and reaches up to the pure plumbide BaPb3 [9] (cyan bar inFigure 1). This structure type, which should be termed BaPb3-type in consideration of the first structuredetermination in 1964 [9], is sometimes also denoted as TaCo3-type. The interatomic distances of theSn-richest border phase BaSn0.65Pb2.35 (4) are summarized in Table 7.
M(1)
Ba(1)
Ba(2)
Pb(2)
h
h
c
h
h
c
h
h
c
h
c
h
c
b
a
c
d
c
0a a
Figure 4. Crystal structure of BaSn0.65Pb2.35, 4 (BaPb3-type; bond distances cf. Table 7 [35]).
Table 7. Selected interatomic distances (pm) in the crystal structure of BaSn0.65Pb2.35 (4) forming theBaPb3-type (cf. Figure 4 for the distance labels).
Atoms Distance freq. CN Atoms Distance lbl. freq. CN
Ba(1) –M(1) 360.0(2) 3× M(1) –M(1) 314.2(3) a 2×–Pb(2) 364.8(2) 3× –M(1) 339.5(2) b 2×–M(1) 366.0(1) 6× 12 –Pb(2) 342.6(1) c 2×
–Ba(1) 360.0(2)Ba(2) –Pb(2) 364.4(1) 6× –Ba(1) 366.0(1) 2×
–M(1) 368.3(1) 6× 12 –Ba(2) 368.3(1) 6 + 4
Pb(2) –M(1) 342.6(1) c 4×–Pb(2) 364.4(1) d 4×–Ba(2) 364.4(1) 2×–Ba(1) 364.8(2) 2× 8 + 4
In the lead-rich compounds of the Ba series, the planar nets [BaM3] follow the rhombohedral(hhc)3 stacking sequence and the blocks of face-sharing octahedra are now consisting of three octahedraonly (Figure 4). Within these trimers, the [M6] octahedra share common triangular faces [M(1) 3] withthe shortest interatomic distances of the whole structure (da = 314.2 pm, cf. Table 7). As expectedfrom the tin content, this and all further M–M distances are somewhat shortened with respect to theisotypic pure plumbide (e.g., da = 319.3 pm, [11]). The octahedra trimers are connected via the sixcorners formed by the pure lead position [Pb(2)]. According to the point group symmetry . 2
m of the
73
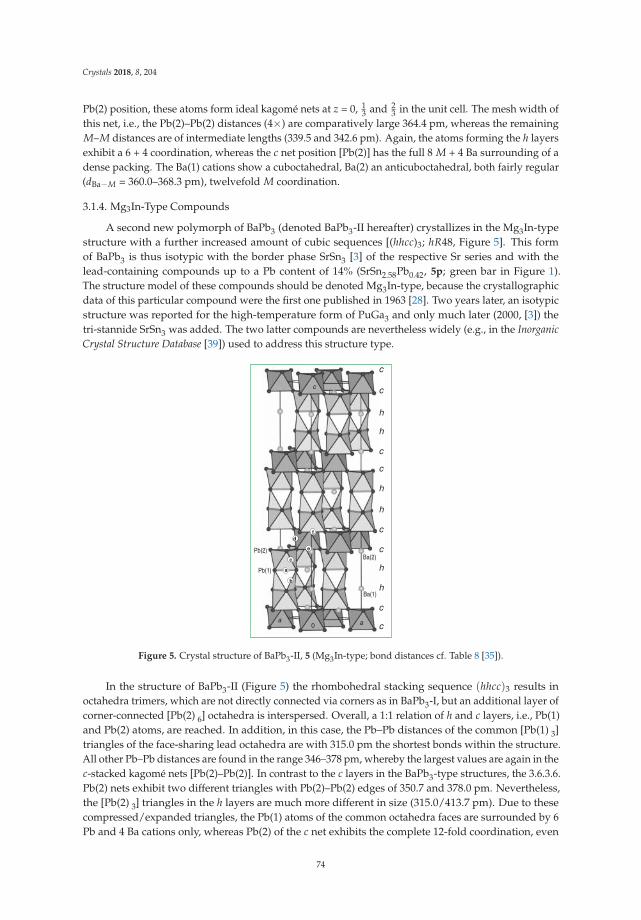
Crystals 2018, 8, 204
Pb(2) position, these atoms form ideal kagomé nets at z = 0, 13 and 2
3 in the unit cell. The mesh width ofthis net, i.e., the Pb(2)–Pb(2) distances (4×) are comparatively large 364.4 pm, whereas the remainingM–M distances are of intermediate lengths (339.5 and 342.6 pm). Again, the atoms forming the h layersexhibit a 6 + 4 coordination, whereas the c net position [Pb(2)] has the full 8 M + 4 Ba surrounding of adense packing. The Ba(1) cations show a cuboctahedral, Ba(2) an anticuboctahedral, both fairly regular(dBa−M = 360.0–368.3 pm), twelvefold M coordination.
3.1.4. Mg3In-Type Compounds
A second new polymorph of BaPb3 (denoted BaPb3-II hereafter) crystallizes in the Mg3In-typestructure with a further increased amount of cubic sequences [(hhcc)3; hR48, Figure 5]. This formof BaPb3 is thus isotypic with the border phase SrSn3 [3] of the respective Sr series and with thelead-containing compounds up to a Pb content of 14% (SrSn2.58Pb0.42, 5p; green bar in Figure 1).The structure model of these compounds should be denoted Mg3In-type, because the crystallographicdata of this particular compound were the first one published in 1963 [28]. Two years later, an isotypicstructure was reported for the high-temperature form of PuGa3 and only much later (2000, [3]) thetri-stannide SrSn3 was added. The two latter compounds are nevertheless widely (e.g., in the Inorganic
Crystal Structure Database [39]) used to address this structure type.
Pb(2)
Pb(1)
Ba(1)
Ba(2)
c
c
h
h
c
c
h
h
c
c
h
h
c
c
b
a
c
d
f
e
aa
c
0
Figure 5. Crystal structure of BaPb3-II, 5 (Mg3In-type; bond distances cf. Table 8 [35]).
In the structure of BaPb3-II (Figure 5) the rhombohedral stacking sequence (hhcc)3 results inoctahedra trimers, which are not directly connected via corners as in BaPb3-I, but an additional layer ofcorner-connected [Pb(2) 6] octahedra is interspersed. Overall, a 1:1 relation of h and c layers, i.e., Pb(1)and Pb(2) atoms, are reached. In addition, in this case, the Pb–Pb distances of the common [Pb(1) 3]triangles of the face-sharing lead octahedra are with 315.0 pm the shortest bonds within the structure.All other Pb–Pb distances are found in the range 346–378 pm, whereby the largest values are again in thec-stacked kagomé nets [Pb(2)–Pb(2)]. In contrast to the c layers in the BaPb3-type structures, the 3.6.3.6.Pb(2) nets exhibit two different triangles with Pb(2)–Pb(2) edges of 350.7 and 378.0 pm. Nevertheless,the [Pb(2) 3] triangles in the h layers are much more different in size (315.0/413.7 pm). Due to thesecompressed/expanded triangles, the Pb(1) atoms of the common octahedra faces are surrounded by 6Pb and 4 Ba cations only, whereas Pb(2) of the c net exhibits the complete 12-fold coordination, even
74
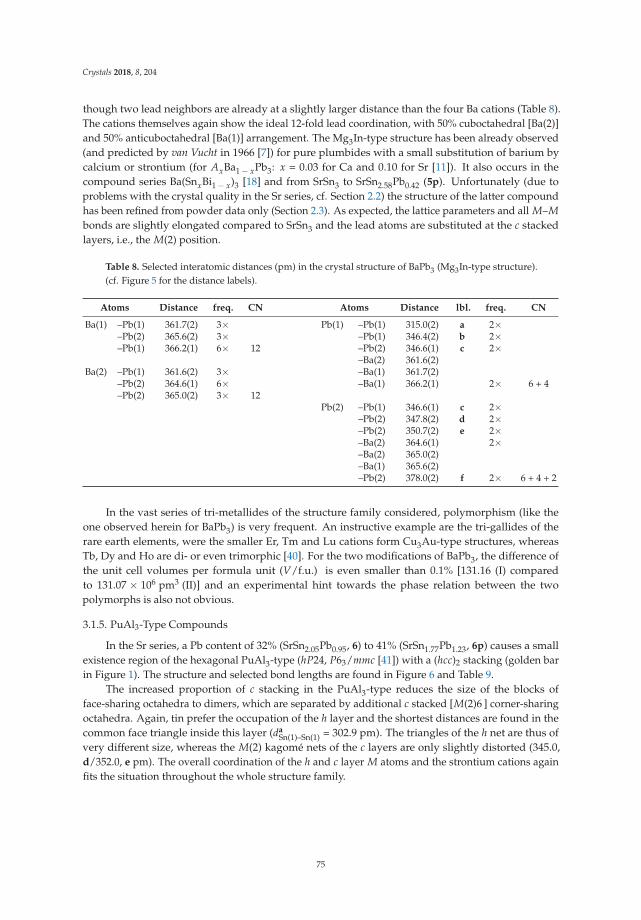
Crystals 2018, 8, 204
though two lead neighbors are already at a slightly larger distance than the four Ba cations (Table 8).The cations themselves again show the ideal 12-fold lead coordination, with 50% cuboctahedral [Ba(2)]and 50% anticuboctahedral [Ba(1)] arrangement. The Mg3In-type structure has been already observed(and predicted by van Vucht in 1966 [7]) for pure plumbides with a small substitution of barium bycalcium or strontium (for AxBa1 − xPb3: x = 0.03 for Ca and 0.10 for Sr [11]). It also occurs in thecompound series Ba(SnxBi1 − x)3 [18] and from SrSn3 to SrSn2.58Pb0.42 (5p). Unfortunately (due toproblems with the crystal quality in the Sr series, cf. Section 2.2) the structure of the latter compoundhas been refined from powder data only (Section 2.3). As expected, the lattice parameters and all M–M
bonds are slightly elongated compared to SrSn3 and the lead atoms are substituted at the c stackedlayers, i.e., the M(2) position.
Table 8. Selected interatomic distances (pm) in the crystal structure of BaPb3 (Mg3In-type structure).(cf. Figure 5 for the distance labels).
Atoms Distance freq. CN Atoms Distance lbl. freq. CN
Ba(1) –Pb(1) 361.7(2) 3× Pb(1) –Pb(1) 315.0(2) a 2×–Pb(2) 365.6(2) 3× –Pb(1) 346.4(2) b 2×–Pb(1) 366.2(1) 6× 12 –Pb(2) 346.6(1) c 2×
–Ba(2) 361.6(2)Ba(2) –Pb(1) 361.6(2) 3× –Ba(1) 361.7(2)
–Pb(2) 364.6(1) 6× –Ba(1) 366.2(1) 2× 6 + 4–Pb(2) 365.0(2) 3× 12
Pb(2) –Pb(1) 346.6(1) c 2×–Pb(2) 347.8(2) d 2×–Pb(2) 350.7(2) e 2×–Ba(2) 364.6(1) 2×–Ba(2) 365.0(2)–Ba(1) 365.6(2)–Pb(2) 378.0(2) f 2× 6 + 4 + 2
In the vast series of tri-metallides of the structure family considered, polymorphism (like theone observed herein for BaPb3) is very frequent. An instructive example are the tri-gallides of therare earth elements, were the smaller Er, Tm and Lu cations form Cu3Au-type structures, whereasTb, Dy and Ho are di- or even trimorphic [40]. For the two modifications of BaPb3, the difference ofthe unit cell volumes per formula unit (V/f.u.) is even smaller than 0.1% [131.16 (I) comparedto 131.07 × 10⁶ pm3 (II)] and an experimental hint towards the phase relation between the twopolymorphs is also not obvious.
3.1.5. PuAl3-Type Compounds
In the Sr series, a Pb content of 32% (SrSn2.05Pb0.95, 6) to 41% (SrSn1.77Pb1.23, 6p) causes a smallexistence region of the hexagonal PuAl3-type (hP24, P63/mmc [41]) with a (hcc)2 stacking (golden barin Figure 1). The structure and selected bond lengths are found in Figure 6 and Table 9.
The increased proportion of c stacking in the PuAl3-type reduces the size of the blocks offace-sharing octahedra to dimers, which are separated by additional c stacked [M(2)6 ] corner-sharingoctahedra. Again, tin prefer the occupation of the h layer and the shortest distances are found in thecommon face triangle inside this layer (da
Sn(1)–Sn(1) = 302.9 pm). The triangles of the h net are thus ofvery different size, whereas the M(2) kagomé nets of the c layers are only slightly distorted (345.0,d/352.0, e pm). The overall coordination of the h and c layer M atoms and the strontium cations againfits the situation throughout the whole structure family.
75
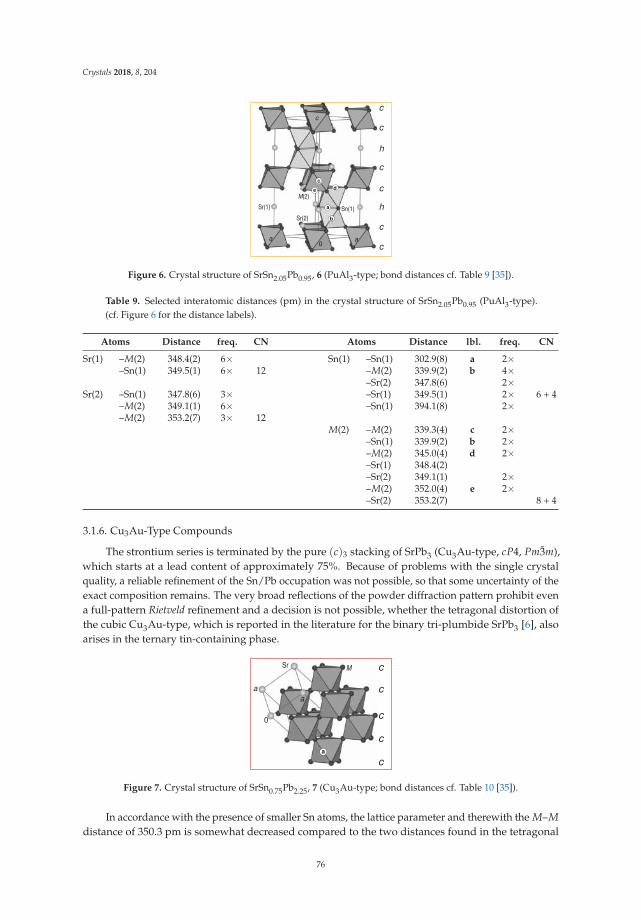
Crystals 2018, 8, 204
Sn(1)
(2)M
Sr(1)
Sr(2)
c
c
h
c
c
c
c
h
b
d
aa
c
0
c
e
a
Figure 6. Crystal structure of SrSn2.05Pb0.95, 6 (PuAl3-type; bond distances cf. Table 9 [35]).
Table 9. Selected interatomic distances (pm) in the crystal structure of SrSn2.05Pb0.95 (PuAl3-type).(cf. Figure 6 for the distance labels).
Atoms Distance freq. CN Atoms Distance lbl. freq. CN
Sr(1) –M(2) 348.4(2) 6× Sn(1) –Sn(1) 302.9(8) a 2×–Sn(1) 349.5(1) 6× 12 –M(2) 339.9(2) b 4×
–Sr(2) 347.8(6) 2×Sr(2) –Sn(1) 347.8(6) 3× –Sr(1) 349.5(1) 2× 6 + 4
–M(2) 349.1(1) 6× –Sn(1) 394.1(8) 2×–M(2) 353.2(7) 3× 12
M(2) –M(2) 339.3(4) c 2×–Sn(1) 339.9(2) b 2×–M(2) 345.0(4) d 2×–Sr(1) 348.4(2)–Sr(2) 349.1(1) 2×–M(2) 352.0(4) e 2×–Sr(2) 353.2(7) 8 + 4
3.1.6. Cu3Au-Type Compounds
The strontium series is terminated by the pure (c)3 stacking of SrPb3 (Cu3Au-type, cP4, Pm3m),which starts at a lead content of approximately 75%. Because of problems with the single crystalquality, a reliable refinement of the Sn/Pb occupation was not possible, so that some uncertainty of theexact composition remains. The very broad reflections of the powder diffraction pattern prohibit evena full-pattern Rietveld refinement and a decision is not possible, whether the tetragonal distortion ofthe cubic Cu3Au-type, which is reported in the literature for the binary tri-plumbide SrPb3 [6], alsoarises in the ternary tin-containing phase.
SrM
a
0
a
c
c
c
c
c
a
Figure 7. Crystal structure of SrSn0.75Pb2.25, 7 (Cu3Au-type; bond distances cf. Table 10 [35]).
In accordance with the presence of smaller Sn atoms, the lattice parameter and therewith the M–M
distance of 350.3 pm is somewhat decreased compared to the two distances found in the tetragonal
76
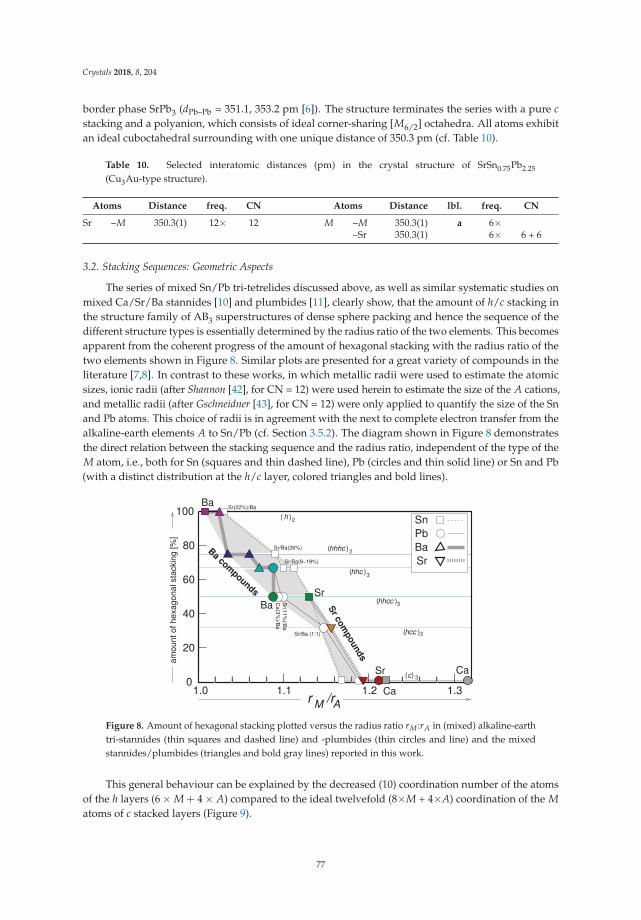
Crystals 2018, 8, 204
border phase SrPb3 (dPb–Pb = 351.1, 353.2 pm [6]). The structure terminates the series with a pure c
stacking and a polyanion, which consists of ideal corner-sharing [M6/2] octahedra. All atoms exhibitan ideal cuboctahedral surrounding with one unique distance of 350.3 pm (cf. Table 10).
Table 10. Selected interatomic distances (pm) in the crystal structure of SrSn0.75Pb2.25(Cu3Au-type structure).
Atoms Distance freq. CN Atoms Distance lbl. freq. CN
Sr –M 350.3(1) 12× 12 M –M 350.3(1) a 6×–Sr 350.3(1) 6× 6 + 6
3.2. Stacking Sequences: Geometric Aspects
The series of mixed Sn/Pb tri-tetrelides discussed above, as well as similar systematic studies onmixed Ca/Sr/Ba stannides [10] and plumbides [11], clearly show, that the amount of h/c stacking inthe structure family of AB3 superstructures of dense sphere packing and hence the sequence of thedifferent structure types is essentially determined by the radius ratio of the two elements. This becomesapparent from the coherent progress of the amount of hexagonal stacking with the radius ratio of thetwo elements shown in Figure 8. Similar plots are presented for a great variety of compounds in theliterature [7,8]. In contrast to these works, in which metallic radii were used to estimate the atomicsizes, ionic radii (after Shannon [42], for CN = 12) were used herein to estimate the size of the A cations,and metallic radii (after Gschneidner [43], for CN = 12) were only applied to quantify the size of the Snand Pb atoms. This choice of radii is in agreement with the next to complete electron transfer from thealkaline-earth elements A to Sn/Pb (cf. Section 3.5.2). The diagram shown in Figure 8 demonstratesthe direct relation between the stacking sequence and the radius ratio, independent of the type of theM atom, i.e., both for Sn (squares and thin dashed line), Pb (circles and thin solid line) or Sn and Pb(with a distinct distribution at the h/c layer, colored triangles and bold lines).
( )h 2
( )hhhc 2
hhc( )3
( )hhcc 3
hcc( )2
c( ) 3
Ba com
pounds
Sr co
mpounds
1.11.0 1.20
100
80
60
40
20
Ba
r /rM A
am
ount of hexagonal sta
ckin
g [%
]
1.3
Ca(3
%)/B
a
Sr(1
1%
)/Ba
Sr(22%)/Ba
Ca
Sr Ca
Sr/Ba (1:1)
Sr/Ba(9−19%)
Sr/Ba(26%) Ba
Pb
Sn
Sr
Sr
Ba
Figure 8. Amount of hexagonal stacking plotted versus the radius ratio rM:rA in (mixed) alkaline-earthtri-stannides (thin squares and dashed line) and -plumbides (thin circles and line) and the mixedstannides/plumbides (triangles and bold gray lines) reported in this work.
This general behaviour can be explained by the decreased (10) coordination number of the atomsof the h layers (6 × M + 4 × A) compared to the ideal twelvefold (8×M + 4×A) coordination of the M
atoms of c stacked layers (Figure 9).
77
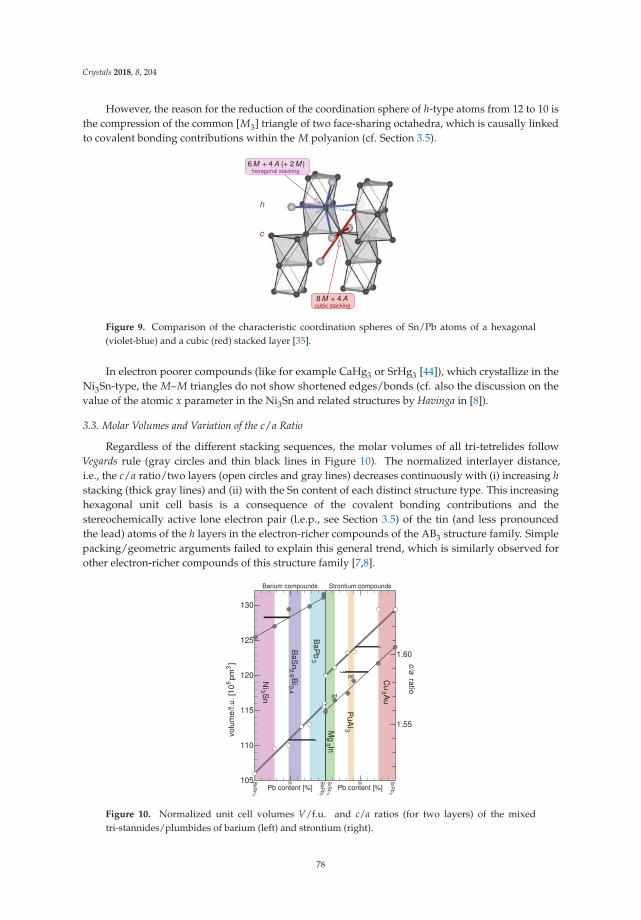
Crystals 2018, 8, 204
However, the reason for the reduction of the coordination sphere of h-type atoms from 12 to 10 isthe compression of the common [M3] triangle of two face-sharing octahedra, which is causally linkedto covalent bonding contributions within the M polyanion (cf. Section 3.5).
M
cubic stacking8 + 4 M
hexagonal stacking
h
c
6 + 4 (+ 2 )A M
A
Figure 9. Comparison of the characteristic coordination spheres of Sn/Pb atoms of a hexagonal(violet-blue) and a cubic (red) stacked layer [35].
In electron poorer compounds (like for example CaHg3 or SrHg3 [44]), which crystallize in theNi3Sn-type, the M–M triangles do not show shortened edges/bonds (cf. also the discussion on thevalue of the atomic x parameter in the Ni3Sn and related structures by Havinga in [8]).
3.3. Molar Volumes and Variation of the c/a Ratio
Regardless of the different stacking sequences, the molar volumes of all tri-tetrelides followVegards rule (gray circles and thin black lines in Figure 10). The normalized interlayer distance,i.e., the c/a ratio/two layers (open circles and gray lines) decreases continuously with (i) increasing h
stacking (thick gray lines) and (ii) with the Sn content of each distinct structure type. This increasinghexagonal unit cell basis is a consequence of the covalent bonding contributions and thestereochemically active lone electron pair (l.e.p., see Section 3.5) of the tin (and less pronouncedthe lead) atoms of the h layers in the electron-richer compounds of the AB3 structure family. Simplepacking/geometric arguments failed to explain this general trend, which is similarly observed forother electron-richer compounds of this structure family [7,8].
BaS
n3
SrS
n33
BaP
b
3S
rPb
1.55
1.60
pd
50
110
115
120
105
125
130
50
pd
Pb content [%] Pb content [%]
Strontium compoundsBarium compounds
Ni S
n3
BaS
n B
i2
.60
.4
Cu A
u3
Mg In3
PuA
l3
BaP
b3
c/a
ratio
volu
me/f.u
. [1
0 pm
]
63
Figure 10. Normalized unit cell volumes V/f.u. and c/a ratios (for two layers) of the mixedtri-stannides/plumbides of barium (left) and strontium (right).
78
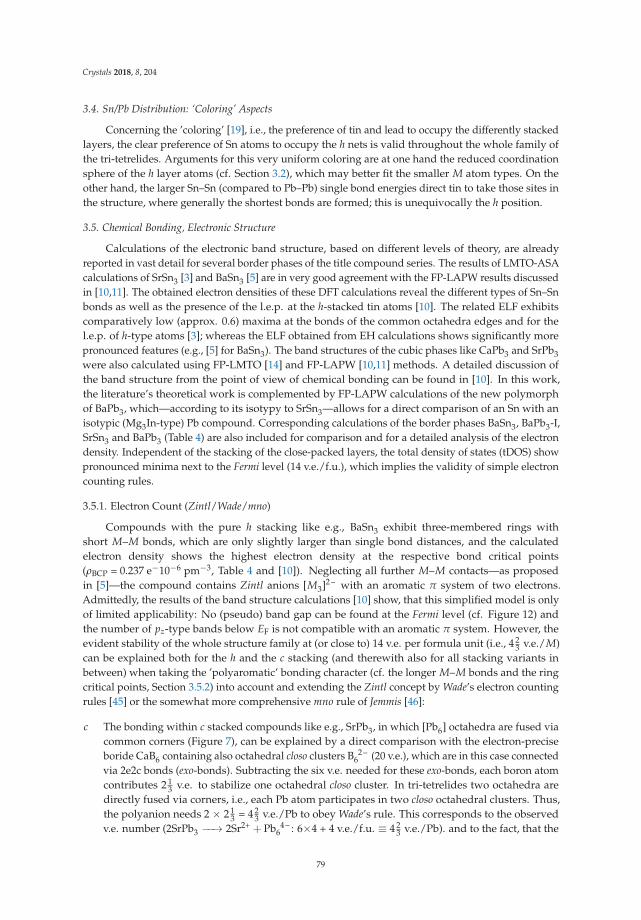
Crystals 2018, 8, 204
3.4. Sn/Pb Distribution: ‘Coloring’ Aspects
Concerning the ’coloring’ [19], i.e., the preference of tin and lead to occupy the differently stackedlayers, the clear preference of Sn atoms to occupy the h nets is valid throughout the whole family ofthe tri-tetrelides. Arguments for this very uniform coloring are at one hand the reduced coordinationsphere of the h layer atoms (cf. Section 3.2), which may better fit the smaller M atom types. On theother hand, the larger Sn–Sn (compared to Pb–Pb) single bond energies direct tin to take those sites inthe structure, where generally the shortest bonds are formed; this is unequivocally the h position.
3.5. Chemical Bonding, Electronic Structure
Calculations of the electronic band structure, based on different levels of theory, are alreadyreported in vast detail for several border phases of the title compound series. The results of LMTO-ASAcalculations of SrSn3 [3] and BaSn3 [5] are in very good agreement with the FP-LAPW results discussedin [10,11]. The obtained electron densities of these DFT calculations reveal the different types of Sn–Snbonds as well as the presence of the l.e.p. at the h-stacked tin atoms [10]. The related ELF exhibitscomparatively low (approx. 0.6) maxima at the bonds of the common octahedra edges and for thel.e.p. of h-type atoms [3]; whereas the ELF obtained from EH calculations shows significantly morepronounced features (e.g., [5] for BaSn3). The band structures of the cubic phases like CaPb3 and SrPb3were also calculated using FP-LMTO [14] and FP-LAPW [10,11] methods. A detailed discussion ofthe band structure from the point of view of chemical bonding can be found in [10]. In this work,the literature’s theoretical work is complemented by FP-LAPW calculations of the new polymorphof BaPb3, which—according to its isotypy to SrSn3—allows for a direct comparison of an Sn with anisotypic (Mg3In-type) Pb compound. Corresponding calculations of the border phases BaSn3, BaPb3-I,SrSn3 and BaPb3 (Table 4) are also included for comparison and for a detailed analysis of the electrondensity. Independent of the stacking of the close-packed layers, the total density of states (tDOS) showpronounced minima next to the Fermi level (14 v.e./f.u.), which implies the validity of simple electroncounting rules.
3.5.1. Electron Count (Zintl/Wade/mno)
Compounds with the pure h stacking like e.g., BaSn3 exhibit three-membered rings withshort M–M bonds, which are only slightly larger than single bond distances, and the calculatedelectron density shows the highest electron density at the respective bond critical points(ρBCP = 0.237 e−10−6 pm−3, Table 4 and [10]). Neglecting all further M–M contacts—as proposedin [5]—the compound contains Zintl anions [M3]2 – with an aromatic π system of two electrons.Admittedly, the results of the band structure calculations [10] show, that this simplified model is onlyof limited applicability: No (pseudo) band gap can be found at the Fermi level (cf. Figure 12) andthe number of pz-type bands below EF is not compatible with an aromatic π system. However, theevident stability of the whole structure family at (or close to) 14 v.e. per formula unit (i.e., 4 2
3 v.e./M)can be explained both for the h and the c stacking (and therewith also for all stacking variants inbetween) when taking the ’polyaromatic’ bonding character (cf. the longer M–M bonds and the ringcritical points, Section 3.5.2) into account and extending the Zintl concept by Wade’s electron countingrules [45] or the somewhat more comprehensive mno rule of Jemmis [46]:
c The bonding within c stacked compounds like e.g., SrPb3, in which [Pb6] octahedra are fused viacommon corners (Figure 7), can be explained by a direct comparison with the electron-preciseboride CaB6 containing also octahedral closo clusters B 2 –
6 (20 v.e.), which are in this case connectedvia 2e2c bonds (exo-bonds). Subtracting the six v.e. needed for these exo-bonds, each boron atomcontributes 2 1
3 v.e. to stabilize one octahedral closo cluster. In tri-tetrelides two octahedra aredirectly fused via corners, i.e., each Pb atom participates in two closo octahedral clusters. Thus,the polyanion needs 2 × 2 1
3 = 4 23 v.e./Pb to obey Wade’s rule. This corresponds to the observed
v.e. number (2SrPb3 −−→ 2Sr2+ + Pb 4 –6 : 6×4 + 4 v.e./f.u. ≡ 4 2
3 v.e./Pb). and to the fact, that the
79
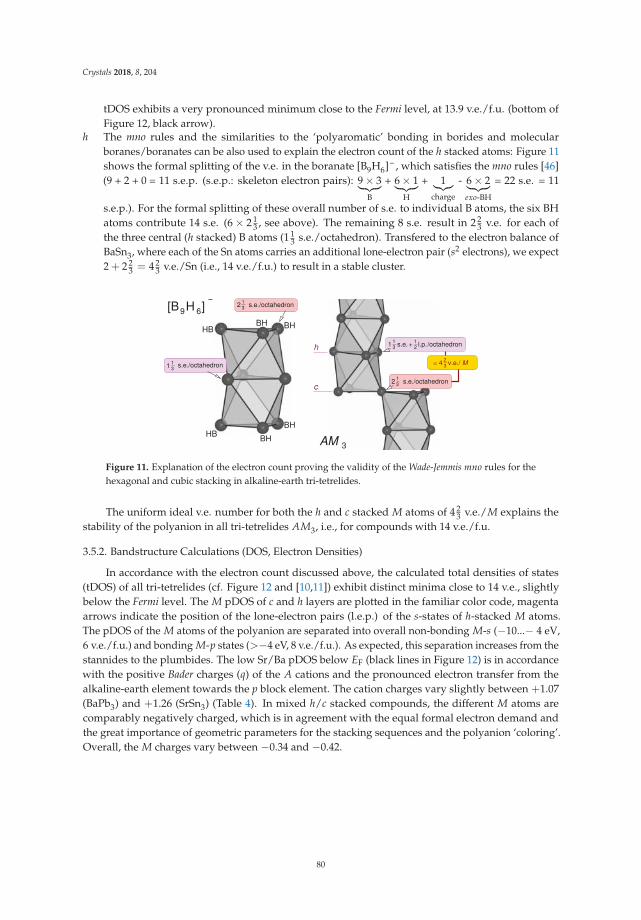
Crystals 2018, 8, 204
tDOS exhibits a very pronounced minimum close to the Fermi level, at 13.9 v.e./f.u. (bottom ofFigure 12, black arrow).
h The mno rules and the similarities to the ‘polyaromatic’ bonding in borides and molecularboranes/boranates can be also used to explain the electron count of the h stacked atoms: Figure 11shows the formal splitting of the v.e. in the boranate [B9H6]– , which satisfies the mno rules [46](9 + 2 + 0 = 11 s.e.p. (s.e.p.: skeleton electron pairs): 9 × 3
︸ ︷︷ ︸
B
+ 6 × 1︸ ︷︷ ︸
H
+ 1︸︷︷︸
charge
- 6 × 2︸ ︷︷ ︸
exo-BH
= 22 s.e. = 11
s.e.p.). For the formal splitting of these overall number of s.e. to individual B atoms, the six BHatoms contribute 14 s.e. (6 × 2 1
3 , see above). The remaining 8 s.e. result in 2 23 v.e. for each of
the three central (h stacked) B atoms (1 13 s.e./octahedron). Transfered to the electron balance of
BaSn3, where each of the Sn atoms carries an additional lone-electron pair (s2 electrons), we expect2 + 2 2
3 = 4 23 v.e./Sn (i.e., 14 v.e./f.u.) to result in a stable cluster.
132 s.e./octahedron
13
13
+ l.p.12
[B H ]9 6
−
AM 3
BH
BHHB
BHBHHB
131 s.e./octahedron
1
2 s.e./octahedron
32
M
/octahedrons.e.
= 4 v.e./
c
h
Figure 11. Explanation of the electron count proving the validity of the Wade-Jemmis mno rules for thehexagonal and cubic stacking in alkaline-earth tri-tetrelides.
The uniform ideal v.e. number for both the h and c stacked M atoms of 4 23 v.e./M explains the
stability of the polyanion in all tri-tetrelides AM3, i.e., for compounds with 14 v.e./f.u.
3.5.2. Bandstructure Calculations (DOS, Electron Densities)
In accordance with the electron count discussed above, the calculated total densities of states(tDOS) of all tri-tetrelides (cf. Figure 12 and [10,11]) exhibit distinct minima close to 14 v.e., slightlybelow the Fermi level. The M pDOS of c and h layers are plotted in the familiar color code, magentaarrows indicate the position of the lone-electron pairs (l.e.p.) of the s-states of h-stacked M atoms.The pDOS of the M atoms of the polyanion are separated into overall non-bonding M-s (−10...− 4 eV,6 v.e./f.u.) and bonding M-p states (>−4 eV, 8 v.e./f.u.). As expected, this separation increases from thestannides to the plumbides. The low Sr/Ba pDOS below EF (black lines in Figure 12) is in accordancewith the positive Bader charges (q) of the A cations and the pronounced electron transfer from thealkaline-earth element towards the p block element. The cation charges vary slightly between +1.07(BaPb3) and +1.26 (SrSn3) (Table 4). In mixed h/c stacked compounds, the different M atoms arecomparably negatively charged, which is in agreement with the equal formal electron demand andthe great importance of geometric parameters for the stacking sequences and the polyanion ‘coloring’.Overall, the M charges vary between −0.34 and −0.42.
80
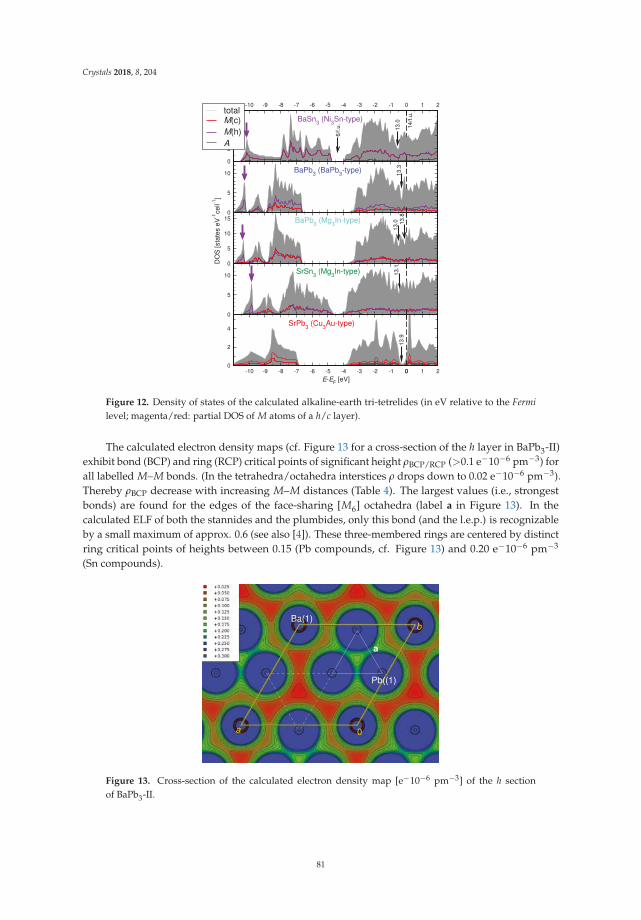
Crystals 2018, 8, 204
-10 -9 -8 -7 -6 -5 -4 -3 -2 -1 0 1 2
E-EF [eV]
0
2
4
DO
S [
sta
tes e
V-1
ce
ll-1]
0
0
5
10
0
5
10
150
5
10
-10 -9 -8 -7 -6 -5 -4 -3 -2 -1 0 1 2
0
2
4
6
8totalM(c)
M(h)
A
BaSn3 (Ni
3Sn-type)
13.3
13.8
13.1
13.9
13.0
BaPb3 (BaPb
3-type)
BaPb3 (Mg
3In-type)
SrSn3 (Mg
3In-type)
SrPb3 (Cu
3Au-type)
13.0
6/f
.u.
14/f
.u.
Figure 12. Density of states of the calculated alkaline-earth tri-tetrelides (in eV relative to the Fermi
level; magenta/red: partial DOS of M atoms of a h/c layer).
The calculated electron density maps (cf. Figure 13 for a cross-section of the h layer in BaPb3-II)exhibit bond (BCP) and ring (RCP) critical points of significant height ρBCP/RCP (>0.1 e−10−6 pm−3) forall labelled M–M bonds. (In the tetrahedra/octahedra interstices ρ drops down to 0.02 e−10−6 pm−3).Thereby ρBCP decrease with increasing M–M distances (Table 4). The largest values (i.e., strongestbonds) are found for the edges of the face-sharing [M6] octahedra (label a in Figure 13). In thecalculated ELF of both the stannides and the plumbides, only this bond (and the l.e.p.) is recognizableby a small maximum of approx. 0.6 (see also [4]). These three-membered rings are centered by distinctring critical points of heights between 0.15 (Pb compounds, cf. Figure 13) and 0.20 e−10−6 pm−3
(Sn compounds).
Ba(1)
Pb((1)
a
a 0
b
Figure 13. Cross-section of the calculated electron density map [e−10−6 pm−3] of the h sectionof BaPb3-II.
81
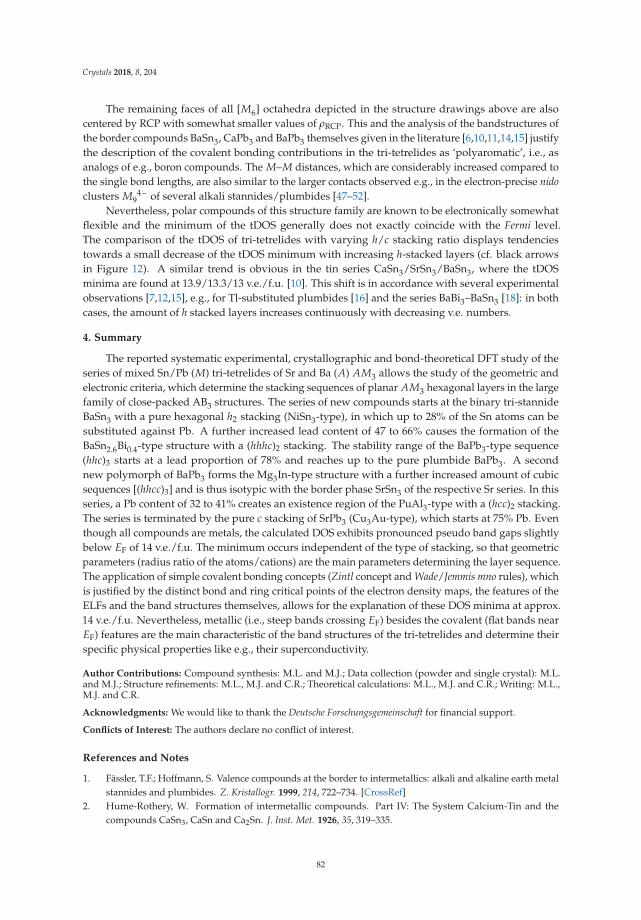
Crystals 2018, 8, 204
The remaining faces of all [M6] octahedra depicted in the structure drawings above are alsocentered by RCP with somewhat smaller values of ρRCP. This and the analysis of the bandstructures ofthe border compounds BaSn3, CaPb3 and BaPb3 themselves given in the literature [6,10,11,14,15] justifythe description of the covalent bonding contributions in the tri-tetrelides as ‘polyaromatic’, i.e., asanalogs of e.g., boron compounds. The M–M distances, which are considerably increased compared tothe single bond lengths, are also similar to the larger contacts observed e.g., in the electron-precise nido
clusters M 4 –9 of several alkali stannides/plumbides [47–52].
Nevertheless, polar compounds of this structure family are known to be electronically somewhatflexible and the minimum of the tDOS generally does not exactly coincide with the Fermi level.The comparison of the tDOS of tri-tetrelides with varying h/c stacking ratio displays tendenciestowards a small decrease of the tDOS minimum with increasing h-stacked layers (cf. black arrowsin Figure 12). A similar trend is obvious in the tin series CaSn3/SrSn3/BaSn3, where the tDOSminima are found at 13.9/13.3/13 v.e./f.u. [10]. This shift is in accordance with several experimentalobservations [7,12,15], e.g., for Tl-substituted plumbides [16] and the series BaBi3–BaSn3 [18]: in bothcases, the amount of h stacked layers increases continuously with decreasing v.e. numbers.
4. Summary
The reported systematic experimental, crystallographic and bond-theoretical DFT study of theseries of mixed Sn/Pb (M) tri-tetrelides of Sr and Ba (A) AM3 allows the study of the geometric andelectronic criteria, which determine the stacking sequences of planar AM3 hexagonal layers in the largefamily of close-packed AB3 structures. The series of new compounds starts at the binary tri-stannideBaSn3 with a pure hexagonal h2 stacking (NiSn3-type), in which up to 28% of the Sn atoms can besubstituted against Pb. A further increased lead content of 47 to 66% causes the formation of theBaSn2.6Bi0.4-type structure with a (hhhc)2 stacking. The stability range of the BaPb3-type sequence(hhc)3 starts at a lead proportion of 78% and reaches up to the pure plumbide BaPb3. A secondnew polymorph of BaPb3 forms the Mg3In-type structure with a further increased amount of cubicsequences [(hhcc)3] and is thus isotypic with the border phase SrSn3 of the respective Sr series. In thisseries, a Pb content of 32 to 41% creates an existence region of the PuAl3-type with a (hcc)2 stacking.The series is terminated by the pure c stacking of SrPb3 (Cu3Au-type), which starts at 75% Pb. Eventhough all compounds are metals, the calculated DOS exhibits pronounced pseudo band gaps slightlybelow EF of 14 v.e./f.u. The minimum occurs independent of the type of stacking, so that geometricparameters (radius ratio of the atoms/cations) are the main parameters determining the layer sequence.The application of simple covalent bonding concepts (Zintl concept and Wade/Jemmis mno rules), whichis justified by the distinct bond and ring critical points of the electron density maps, the features of theELFs and the band structures themselves, allows for the explanation of these DOS minima at approx.14 v.e./f.u. Nevertheless, metallic (i.e., steep bands crossing EF) besides the covalent (flat bands nearEF) features are the main characteristic of the band structures of the tri-tetrelides and determine theirspecific physical properties like e.g., their superconductivity.
Author Contributions: Compound synthesis: M.L. and M.J.; Data collection (powder and single crystal): M.L.and M.J.; Structure refinements: M.L., M.J. and C.R.; Theoretical calculations: M.L., M.J. and C.R.; Writing: M.L.,M.J. and C.R.
Acknowledgments: We would like to thank the Deutsche Forschungsgemeinschaft for financial support.
Conflicts of Interest: The authors declare no conflict of interest.
References and Notes
1. Fässler, T.F.; Hoffmann, S. Valence compounds at the border to intermetallics: alkali and alkaline earth metalstannides and plumbides. Z. Kristallogr. 1999, 214, 722–734. [CrossRef]
2. Hume-Rothery, W. Formation of intermetallic compounds. Part IV: The System Calcium-Tin and thecompounds CaSn3, CaSn and Ca2Sn. J. Inst. Met. 1926, 35, 319–335.
82

Crystals 2018, 8, 204
3. Fässler, T.F.; Hoffmann, S. SrSn3–eine supraleitende Legierung mit freien Elektronenpaaren. Z. Anorg.
Allg. Chem. 2000, 626, 106–112. [CrossRef]4. Ray, K.W.; Thompson, R.G. Study of barium-tin alloys. Met. Alloys 1930, 1, 314–316.5. Fässler, T.F.; Kronseder, C. BaSn3, ein Supraleiter im Grenzbereich zwischen Zintl-Phasen und
intermetallischen Verbindungen: Realraumanalyse von Bandstrukturen. Angew. Chem. 1997, 109, 2800–2803.[CrossRef]
6. Damsma, W.; Havinga, E.E. Influence of small lattice deformation on the superconductive criticaltemperature of alloys with the Cu3Au type structure. J. Phys. Chem. Solids 1972, 34, 813–816. [CrossRef]
7. Van Vucht, J.H.N. Influence of radius ratio on the structure of intermetallic compounds of the AB3 type.J. Less Common Met. 1966, 11, 308–322. [CrossRef]
8. Havinga, E.E. Influence of repulsive energy on structural parameters of the close-packed metal structures.J. Less Common Met. 1975, 41, 241–254. [CrossRef]
9. Sands, D.E.; Wood, D.H.; Ramsey, W.J. The structures of Ba5Pb3 , BaPb and BaPb3. Acta Crystallogr. 1964,17, 986–989. [CrossRef]
10. Wendorff, M.; Röhr, C. Gemischte Tristannide der Reihe CaSn3–SrSn3–BaSn3: Synthesen, Kristallstrukturen,Chemische Bindung. Z. Anorg. Allg. Chem. 2011, 637, 1013–1023. [CrossRef]
11. Wendorff, M.; Röhr, C. Gemischte Plumbide (Ca/Sr)xBa1−xPb3. Strukturchemie und chemische Bindung.Z. Naturforsch. 2008, 63b, 1383–1394.
12. Havinga, E.E. W-like dependence of critical temperature on number of valence electrons in non-transitionmetal Cu3Au-type alloys. Phys. Lett. A 1968, 28, 350–351. [CrossRef]
13. Havinga, E.E.; Damsma, W.; van Maaren, M.H. Oscillatory dependence of superconductive criticaltemperature on number of valency electrons in Cu3Au type alloys. J. Phys. Chem. Solids 1970, 31, 2653–2662.[CrossRef]
14. Baranovskiy, A.E.; Grechnev, G.E.; Svechkarev, I.V. Features of the electronic spectrum and anomalousmagnetism in the compounds YbPb3, YbSn3, CaPb3 and CaSn3. Low Temp. Phys. 2006, 32, 849–856.[CrossRef]
15. Baranovskiy, A.E.; Grechnev, G.E.; Mikitik, G.P.; Svechakarev, I.V. Anomalous diamagnetism in theintermetallic compounds CaPb3 and YbPb3. Low Temp. Phys. 2003, 29, 356–358. [CrossRef]
16. Havinga, E.E.; van Vucht, J.H.N. The crystal structure of Ba(Pb0.8Tl0.2)3. Acta Crystallogr. 1970, B26, 653–655.[CrossRef]
17. Single crystal structure refinement of the strucuture of BaIn0.15Pb2.85: Hexagonal, space group P63/mmc,a = 733(1), c = 3991(5) pm, Z = 14, R1 = 0.0494.
18. Ponou, S.; Fässler, T.F.; Kienle, L. Structural complexity in intermetallic alloys: Long-periodic order beyound10 nm in the system BaSn3/BaBi3. Angew. Chem. 2008, 47, 3999–4004. [CrossRef] [PubMed]
19. Miller, G.J. The “Coloring Problem” in solids: How it affects structure, composition and properties. Eur. J.
Inorg. Chem. 1998, 5, 523–536. [CrossRef]20. Yvon, K.; Jeitschko, W.; Parthé, E. Program LAZY-PULVERIX; University Geneve: Geneva, Switzerland, 1976.21. STOE & Cie GmbH. X-SHAPE (Version 1.03), Crystal Optimization for Numerical Absorption Correction;
STOE & Cie GmbH: Darmstadt, Germany, 2005.22. Sheldrick, G.M. SADABS: Program for Absorption Correction for Data from Area Detector Frames; Bruker
Analytical X-ray Systems, Inc.: Madison, WI, USA, 2008.23. Sheldrick, G.M. A short history of SHELX. Acta Crystallogr. 2008, A64, 112–122. [CrossRef] [PubMed]24. Gelato, L.M.; Parthé, E. STRUCTURE TIDY: A computer program to standardize structure data.
J. Appl. Crystallogr. 1990, A46, 467–473. [CrossRef]25. Further details on the crystal structure investigation are available from the Fachinformationszentrum Karlsruhe,
Gesellschaft für wissenschaftlich-technische Information mbH, D-76344 Eggenstein-Leopoldshafen 2 onquoting the depository numbers CSD 431093 (BaPb3-II), 431094 (BaSn0.65Pb2.35) 431095 (BaSn1.01Pb1.99) 431096(BaSn1.52Pb1.42) 431097 (BaSn2.20Pb0.80) and 431098 (SrSn2.05Pb0.95), the names of the authors, and citation ofthe paper (E-mail: [email protected]).
26. Larson, A.C.; Dreele, R.B.V. General Structure Analysis System (GSAS); Los Alamos National LaboratoryReport LAUR 86-748; Los Alamos National Laboratory: Los Alamos, NM, USA, 2000.
27. Toby, B.H. EXPGUI, a graphical user interface for GSAS. J. Appl. Crystallogr. 2001, 34, 210–221. [CrossRef]28. Schubert, K.; Gauzzi, F.; Frank, K. Kristallstruktur einiger Mg-B3-Phasen. Z. Metallk. 1963, 54, 422–429.
83
Crystals 2018, 8, 204
29. Blaha, P.; Schwarz, K.; Madsen, G.K.H.; Kvasnicka, D.; Luitz, J. WIEN2K, An Augmented Plane Wave and Local
Orbital Program for Calculating Crystal Properties; TU Wien: Vienna, Austria, 2006; ISBN3-9501031-1-2.30. Dewhurst, J.K.; Sharma, S.; Nordstrom, L.; Cricchio, F.; Bultmark, F.; Gross, E.K.U. ELK (Vers. 2.1.15),
The Elk–FP-LAPW Code. 2013. Available online: http://elk.sourceforge.net (accessed on 5 May 2018).31. Perdew, J.P.; Burke, S.; Ernzerhof, M. Generalized gradient approximation made simple. Phys. Rev. Lett.
1996, 77, 3865–3868. [CrossRef] [PubMed]32. Miller, G.J.; Zhang, Y.; Wagner, F.R. Chemical bonding in solids. In Handbook of Solid State Chemistry;
Dronskoski, R., Kikkawa, S., Stein, A., Eds.; Wiley-VCH: Weinheim, Germany, 2017; Volume 5, pp. 405–489.33. Savin, A.; Nesper, R.; Wengert, S.; Fässler, T.F. ELF: The electron localization function. Angew. Chem. Int. Ed.
1997, 36, 1808–1832. [CrossRef]34. Kokalj, A. Program XCRYSDEN. J. Mol. Graph. Model. 1999, 17, 176–178. [CrossRef]35. Finger, L.W.; Kroeker, M.; Toby, B.H. DRAWXTL: An open-source computer program to produce crystal
structure drawings. J. Appl. Crystallogr. 2007, 40, 188–192. [CrossRef]36. Bader, R.W.F. Atoms in Molecules. A Quantum Theory; International Series of Monographs on Chemistry;
Clarendon Press: Oxford, UK, 1994.37. De-la Roza, A.O.; Blanco, M.A.; Martá, A.; Pendás, A.M.; Luana, V. Program CRITIC2 (VERS. 1.0).
Comput. Phys. Commun. 2009, 180, 157–166.38. De-la Roza, A.O.; Luana, V. A fast and accurate algorithm for QTAIM integrations in solids. J. Comput. Chem.
2010, 32, 291–305. [CrossRef] [PubMed]39. FIZ Karlsruhe. Inorganic Crystal Structure Database; FIZ Karlsruhe: Karlsruhe, Germany, 2017.40. Cirafici, S.; Franceschi, E. Stacking of close-packed AB3 layers in RGa3 compounds (R = heavy rare earth).
J. Less Common Met. 1981, 77, 269–280. [CrossRef]41. Larson, A.C.; Cromer, D.T.; Stambaugh, C.K. The crystal structure of PuAl3. Acta Crystallogr. 1957,
10, 443–446. [CrossRef]42. Shannon, R.D. Revised effective ionic radii and systematic studies of interatomic distances in halides and
chalcogenides. Acta Crystallogr. 1976, A32, 751–767. [CrossRef]43. Pearson, W.B. The Crystal Chemistry and Physics of Metals and Alloys; Wiley Interscience: Hoboken, NJ,
USA, 1972.44. Wendorff, M.; Röhr, C. Alkaline-earth tri-mercurides AI IHg3 (AI I=Ca, Sr, Ba): Binary intermetallic
compounds with a common and a new structure type. Z. Kristallogr. 2018, in press.45. Wade, K. Structural and bonding patterns in cluster chemistry. Adv. Inorg. Chem. Radiochem. 1976, 18, 1.46. Jemmis, E.D.; Balakrishnarajan, M.M.; Pancharatna, P.D. Electronic requirements for macropolyhedral
boranes. Chem. Rev. 2002, 102, 93–144. [CrossRef] [PubMed]47. Todorov, E.; Sevov, S.C. Deltahedral clusters in neat solids: Synthesis and structure of the Zintl phase Cs4Pb9
with discrete Pb4−9 clusters. Inorg. Chem. 1998, 37, 3889–3891. [CrossRef] [PubMed]
48. Fässler, T.F. The renaissance of homoatomic nine-atom polyhedra of the heavier carbon-group element Si-Pb.Coord. Chem. Rev. 2001, 215, 347–377. [CrossRef]
49. Hoch, C.; Röhr, C.; Wendorff, M. Crystal structure of K4Sn9. Acta Crystallogr. 2002, C58, 45–46.50. Bobev, S.; Sevov, S.C. Isolated deltaheral clusters of leadin the solid state: synthesis and characterization of
Rb4Pb9 and Cs10K6Pb36 with Pb4−9 , and A′
3A′′Pb4 (A’ = Cs, Rb, K; A” = Na, Li) with Pb4−4 . Polyhedron 2002,
21, 641–649. [CrossRef]51. Fässler, T.F.; Hunziker, M. The nido-Pb4−
9 and the Jahn-Teller Distorted closo-Pb3−9 Zintl-Anions: Syntheses,
X-ray Structures and Theoretical Studies. Inorg. Chem. 1995, 33, 5798–5809.52. Hoch, C.; Wendorff, M.; Röhr, C. Synthesis and Crystal Structure of the Plumbides A4Pb9 and the Tetrelides
A12M17 (A=Na, K, Rb, Cs; M=Si, Ge, Sn). J. Alloys Compd. 2003, 361, 206–221. [CrossRef]
c© 2018 by the authors. Licensee MDPI, Basel, Switzerland. This article is an open accessarticle distributed under the terms and conditions of the Creative Commons Attribution(CC BY) license (http://creativecommons.org/licenses/by/4.0/).
84
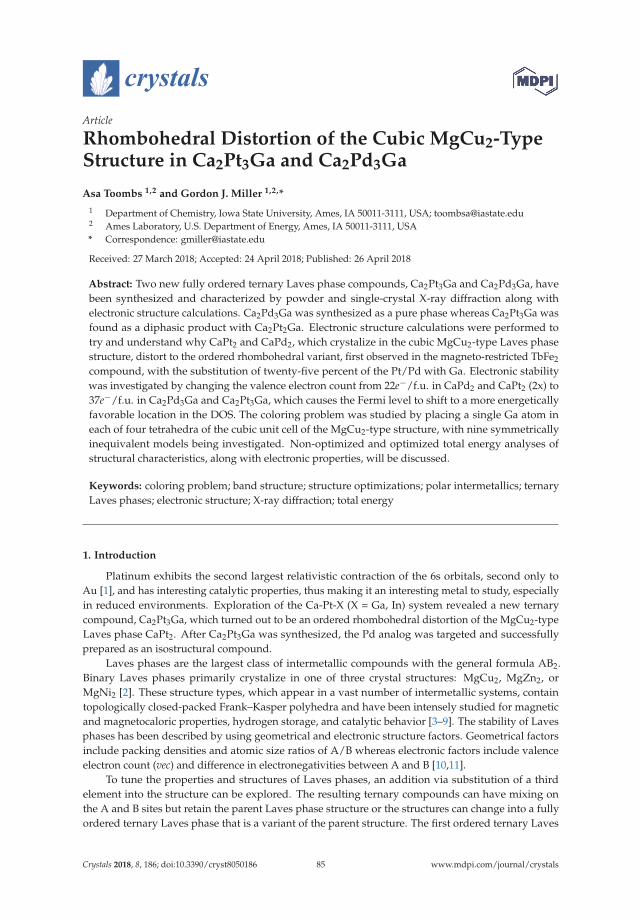
crystals
Article
Rhombohedral Distortion of the Cubic MgCu2-TypeStructure in Ca2Pt3Ga and Ca2Pd3Ga
Asa Toombs 1,2 and Gordon J. Miller 1,2,*1 Department of Chemistry, Iowa State University, Ames, IA 50011-3111, USA; [email protected] Ames Laboratory, U.S. Department of Energy, Ames, IA 50011-3111, USA* Correspondence: [email protected]
Received: 27 March 2018; Accepted: 24 April 2018; Published: 26 April 2018
Abstract: Two new fully ordered ternary Laves phase compounds, Ca2Pt3Ga and Ca2Pd3Ga, havebeen synthesized and characterized by powder and single-crystal X-ray diffraction along withelectronic structure calculations. Ca2Pd3Ga was synthesized as a pure phase whereas Ca2Pt3Ga wasfound as a diphasic product with Ca2Pt2Ga. Electronic structure calculations were performed totry and understand why CaPt2 and CaPd2, which crystalize in the cubic MgCu2-type Laves phasestructure, distort to the ordered rhombohedral variant, first observed in the magneto-restricted TbFe2
compound, with the substitution of twenty-five percent of the Pt/Pd with Ga. Electronic stabilitywas investigated by changing the valence electron count from 22e−/f.u. in CaPd2 and CaPt2 (2x) to37e−/f.u. in Ca2Pd3Ga and Ca2Pt3Ga, which causes the Fermi level to shift to a more energeticallyfavorable location in the DOS. The coloring problem was studied by placing a single Ga atom ineach of four tetrahedra of the cubic unit cell of the MgCu2-type structure, with nine symmetricallyinequivalent models being investigated. Non-optimized and optimized total energy analyses ofstructural characteristics, along with electronic properties, will be discussed.
Keywords: coloring problem; band structure; structure optimizations; polar intermetallics; ternaryLaves phases; electronic structure; X-ray diffraction; total energy
1. Introduction
Platinum exhibits the second largest relativistic contraction of the 6s orbitals, second only toAu [1], and has interesting catalytic properties, thus making it an interesting metal to study, especiallyin reduced environments. Exploration of the Ca-Pt-X (X = Ga, In) system revealed a new ternarycompound, Ca2Pt3Ga, which turned out to be an ordered rhombohedral distortion of the MgCu2-typeLaves phase CaPt2. After Ca2Pt3Ga was synthesized, the Pd analog was targeted and successfullyprepared as an isostructural compound.
Laves phases are the largest class of intermetallic compounds with the general formula AB2.Binary Laves phases primarily crystalize in one of three crystal structures: MgCu2, MgZn2, orMgNi2 [2]. These structure types, which appear in a vast number of intermetallic systems, containtopologically closed-packed Frank–Kasper polyhedra and have been intensely studied for magneticand magnetocaloric properties, hydrogen storage, and catalytic behavior [3–9]. The stability of Lavesphases has been described by using geometrical and electronic structure factors. Geometrical factorsinclude packing densities and atomic size ratios of A/B whereas electronic factors include valenceelectron count (vec) and difference in electronegativities between A and B [10,11].
To tune the properties and structures of Laves phases, an addition via substitution of a thirdelement into the structure can be explored. The resulting ternary compounds can have mixing onthe A and B sites but retain the parent Laves phase structure or the structures can change into a fullyordered ternary Laves phase that is a variant of the parent structure. The first ordered ternary Laves
Crystals 2018, 8, 186; doi:10.3390/cryst8050186 www.mdpi.com/journal/crystals85
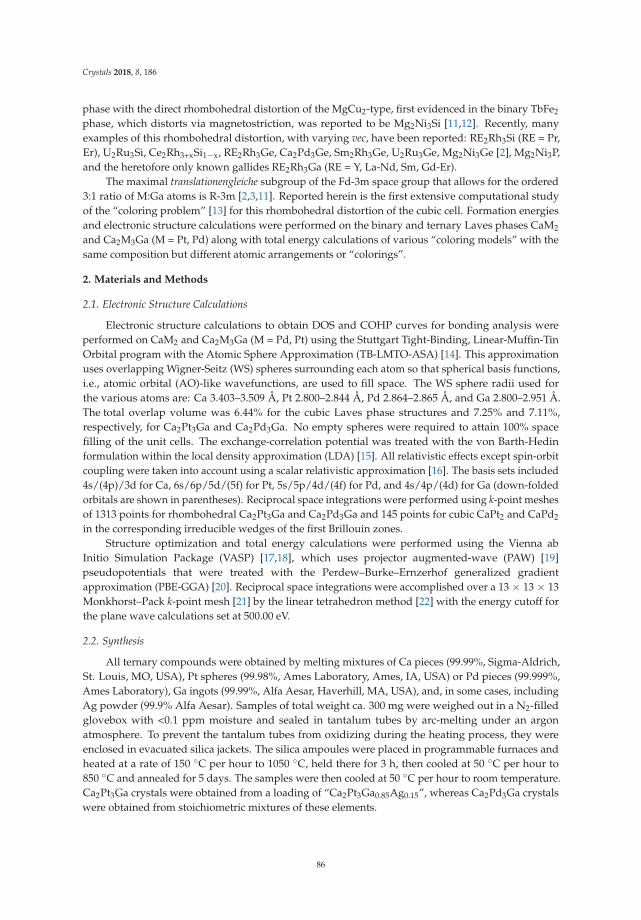
Crystals 2018, 8, 186
phase with the direct rhombohedral distortion of the MgCu2-type, first evidenced in the binary TbFe2
phase, which distorts via magnetostriction, was reported to be Mg2Ni3Si [11,12]. Recently, manyexamples of this rhombohedral distortion, with varying vec, have been reported: RE2Rh3Si (RE = Pr,Er), U2Ru3Si, Ce2Rh3+xSi1−x, RE2Rh3Ge, Ca2Pd3Ge, Sm2Rh3Ge, U2Ru3Ge, Mg2Ni3Ge [2], Mg2Ni3P,and the heretofore only known gallides RE2Rh3Ga (RE = Y, La-Nd, Sm, Gd-Er).
The maximal translationengleiche subgroup of the Fd-3m space group that allows for the ordered3:1 ratio of M:Ga atoms is R-3m [2,3,11]. Reported herein is the first extensive computational studyof the “coloring problem” [13] for this rhombohedral distortion of the cubic cell. Formation energiesand electronic structure calculations were performed on the binary and ternary Laves phases CaM2
and Ca2M3Ga (M = Pt, Pd) along with total energy calculations of various “coloring models” with thesame composition but different atomic arrangements or “colorings”.
2. Materials and Methods
2.1. Electronic Structure Calculations
Electronic structure calculations to obtain DOS and COHP curves for bonding analysis wereperformed on CaM2 and Ca2M3Ga (M = Pd, Pt) using the Stuttgart Tight-Binding, Linear-Muffin-TinOrbital program with the Atomic Sphere Approximation (TB-LMTO-ASA) [14]. This approximationuses overlapping Wigner-Seitz (WS) spheres surrounding each atom so that spherical basis functions,i.e., atomic orbital (AO)-like wavefunctions, are used to fill space. The WS sphere radii used forthe various atoms are: Ca 3.403–3.509 Å, Pt 2.800–2.844 Å, Pd 2.864–2.865 Å, and Ga 2.800–2.951 Å.The total overlap volume was 6.44% for the cubic Laves phase structures and 7.25% and 7.11%,respectively, for Ca2Pt3Ga and Ca2Pd3Ga. No empty spheres were required to attain 100% spacefilling of the unit cells. The exchange-correlation potential was treated with the von Barth-Hedinformulation within the local density approximation (LDA) [15]. All relativistic effects except spin-orbitcoupling were taken into account using a scalar relativistic approximation [16]. The basis sets included4s/(4p)/3d for Ca, 6s/6p/5d/(5f) for Pt, 5s/5p/4d/(4f) for Pd, and 4s/4p/(4d) for Ga (down-foldedorbitals are shown in parentheses). Reciprocal space integrations were performed using k-point meshesof 1313 points for rhombohedral Ca2Pt3Ga and Ca2Pd3Ga and 145 points for cubic CaPt2 and CaPd2
in the corresponding irreducible wedges of the first Brillouin zones.Structure optimization and total energy calculations were performed using the Vienna ab
Initio Simulation Package (VASP) [17,18], which uses projector augmented-wave (PAW) [19]pseudopotentials that were treated with the Perdew–Burke–Ernzerhof generalized gradientapproximation (PBE-GGA) [20]. Reciprocal space integrations were accomplished over a 13 × 13 × 13Monkhorst–Pack k-point mesh [21] by the linear tetrahedron method [22] with the energy cutoff forthe plane wave calculations set at 500.00 eV.
2.2. Synthesis
All ternary compounds were obtained by melting mixtures of Ca pieces (99.99%, Sigma-Aldrich,St. Louis, MO, USA), Pt spheres (99.98%, Ames Laboratory, Ames, IA, USA) or Pd pieces (99.999%,Ames Laboratory), Ga ingots (99.99%, Alfa Aesar, Haverhill, MA, USA), and, in some cases, includingAg powder (99.9% Alfa Aesar). Samples of total weight ca. 300 mg were weighed out in a N2-filledglovebox with <0.1 ppm moisture and sealed in tantalum tubes by arc-melting under an argonatmosphere. To prevent the tantalum tubes from oxidizing during the heating process, they wereenclosed in evacuated silica jackets. The silica ampoules were placed in programmable furnaces andheated at a rate of 150 C per hour to 1050 C, held there for 3 h, then cooled at 50 C per hour to850 C and annealed for 5 days. The samples were then cooled at 50 C per hour to room temperature.Ca2Pt3Ga crystals were obtained from a loading of “Ca2Pt3Ga0.85Ag0.15”, whereas Ca2Pd3Ga crystalswere obtained from stoichiometric mixtures of these elements.
86
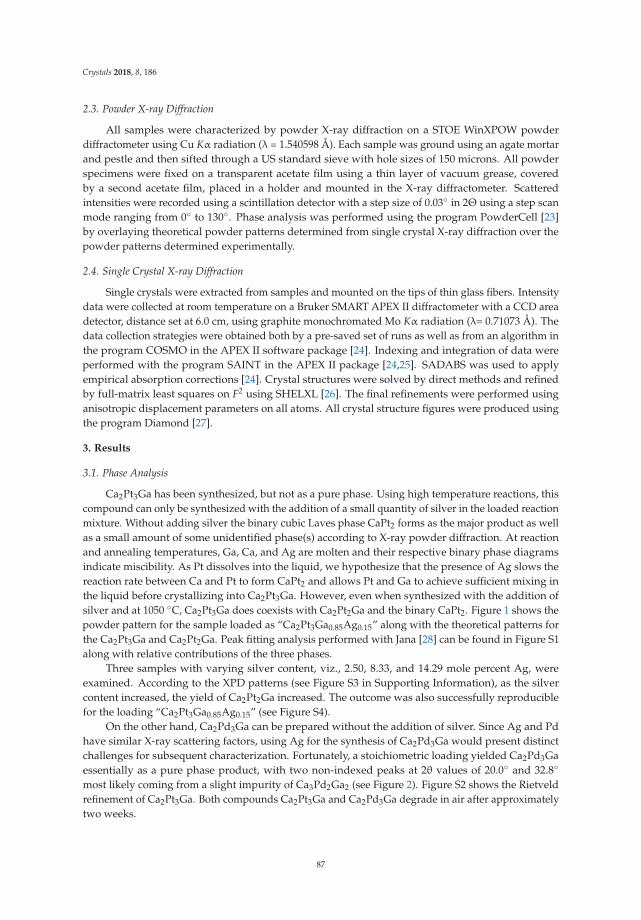
Crystals 2018, 8, 186
2.3. Powder X-ray Diffraction
All samples were characterized by powder X-ray diffraction on a STOE WinXPOW powderdiffractometer using Cu Kα radiation (λ = 1.540598 Å). Each sample was ground using an agate mortarand pestle and then sifted through a US standard sieve with hole sizes of 150 microns. All powderspecimens were fixed on a transparent acetate film using a thin layer of vacuum grease, coveredby a second acetate film, placed in a holder and mounted in the X-ray diffractometer. Scatteredintensities were recorded using a scintillation detector with a step size of 0.03 in 2Θ using a step scanmode ranging from 0 to 130. Phase analysis was performed using the program PowderCell [23]by overlaying theoretical powder patterns determined from single crystal X-ray diffraction over thepowder patterns determined experimentally.
2.4. Single Crystal X-ray Diffraction
Single crystals were extracted from samples and mounted on the tips of thin glass fibers. Intensitydata were collected at room temperature on a Bruker SMART APEX II diffractometer with a CCD areadetector, distance set at 6.0 cm, using graphite monochromated Mo Kα radiation (λ= 0.71073 Å). Thedata collection strategies were obtained both by a pre-saved set of runs as well as from an algorithm inthe program COSMO in the APEX II software package [24]. Indexing and integration of data wereperformed with the program SAINT in the APEX II package [24,25]. SADABS was used to applyempirical absorption corrections [24]. Crystal structures were solved by direct methods and refinedby full-matrix least squares on F2 using SHELXL [26]. The final refinements were performed usinganisotropic displacement parameters on all atoms. All crystal structure figures were produced usingthe program Diamond [27].
3. Results
3.1. Phase Analysis
Ca2Pt3Ga has been synthesized, but not as a pure phase. Using high temperature reactions, thiscompound can only be synthesized with the addition of a small quantity of silver in the loaded reactionmixture. Without adding silver the binary cubic Laves phase CaPt2 forms as the major product as wellas a small amount of some unidentified phase(s) according to X-ray powder diffraction. At reactionand annealing temperatures, Ga, Ca, and Ag are molten and their respective binary phase diagramsindicate miscibility. As Pt dissolves into the liquid, we hypothesize that the presence of Ag slows thereaction rate between Ca and Pt to form CaPt2 and allows Pt and Ga to achieve sufficient mixing inthe liquid before crystallizing into Ca2Pt3Ga. However, even when synthesized with the addition ofsilver and at 1050 C, Ca2Pt3Ga does coexists with Ca2Pt2Ga and the binary CaPt2. Figure 1 shows thepowder pattern for the sample loaded as “Ca2Pt3Ga0.85Ag0.15” along with the theoretical patterns forthe Ca2Pt3Ga and Ca2Pt2Ga. Peak fitting analysis performed with Jana [28] can be found in Figure S1along with relative contributions of the three phases.
Three samples with varying silver content, viz., 2.50, 8.33, and 14.29 mole percent Ag, wereexamined. According to the XPD patterns (see Figure S3 in Supporting Information), as the silvercontent increased, the yield of Ca2Pt2Ga increased. The outcome was also successfully reproduciblefor the loading “Ca2Pt3Ga0.85Ag0.15” (see Figure S4).
On the other hand, Ca2Pd3Ga can be prepared without the addition of silver. Since Ag and Pdhave similar X-ray scattering factors, using Ag for the synthesis of Ca2Pd3Ga would present distinctchallenges for subsequent characterization. Fortunately, a stoichiometric loading yielded Ca2Pd3Gaessentially as a pure phase product, with two non-indexed peaks at 2θ values of 20.0 and 32.8
most likely coming from a slight impurity of Ca3Pd2Ga2 (see Figure 2). Figure S2 shows the Rietveldrefinement of Ca2Pt3Ga. Both compounds Ca2Pt3Ga and Ca2Pd3Ga degrade in air after approximatelytwo weeks.
87
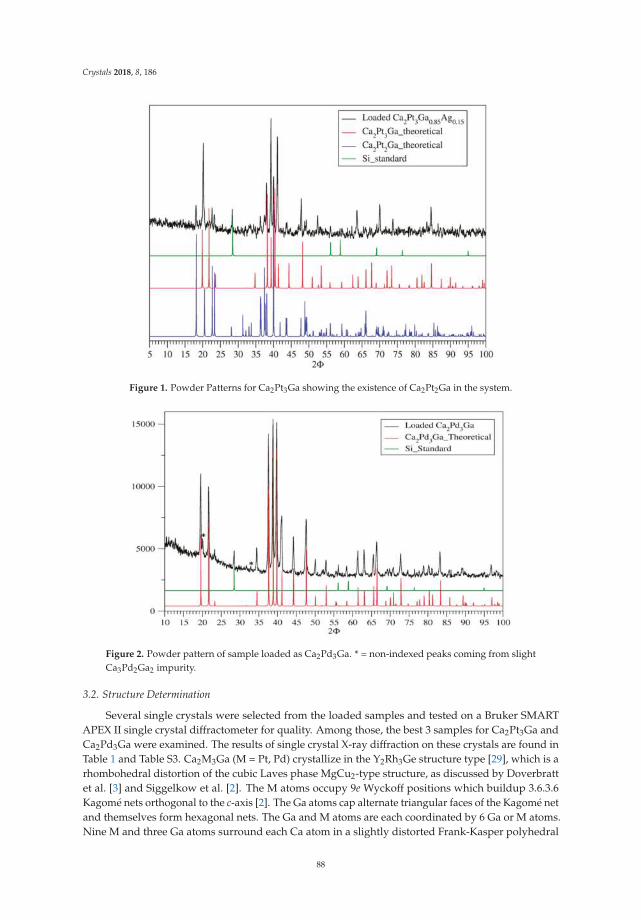
Crystals 2018, 8, 186
Figure 1. Powder Patterns for Ca2Pt3Ga showing the existence of Ca2Pt2Ga in the system.
Figure 2. Powder pattern of sample loaded as Ca2Pd3Ga. * = non-indexed peaks coming from slightCa3Pd2Ga2 impurity.
3.2. Structure Determination
Several single crystals were selected from the loaded samples and tested on a Bruker SMARTAPEX II single crystal diffractometer for quality. Among those, the best 3 samples for Ca2Pt3Ga andCa2Pd3Ga were examined. The results of single crystal X-ray diffraction on these crystals are found inTable 1 and Table S3. Ca2M3Ga (M = Pt, Pd) crystallize in the Y2Rh3Ge structure type [29], which is arhombohedral distortion of the cubic Laves phase MgCu2-type structure, as discussed by Doverbrattet al. [3] and Siggelkow et al. [2]. The M atoms occupy 9e Wyckoff positions which buildup 3.6.3.6Kagomé nets orthogonal to the c-axis [2]. The Ga atoms cap alternate triangular faces of the Kagomé netand themselves form hexagonal nets. The Ga and M atoms are each coordinated by 6 Ga or M atoms.Nine M and three Ga atoms surround each Ca atom in a slightly distorted Frank-Kasper polyhedral
88
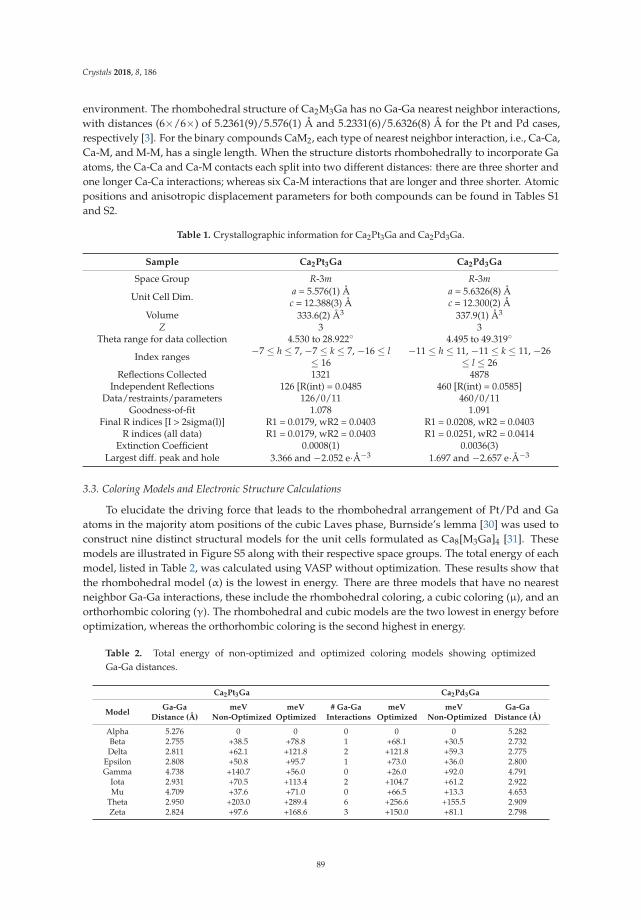
Crystals 2018, 8, 186
environment. The rhombohedral structure of Ca2M3Ga has no Ga-Ga nearest neighbor interactions,with distances (6×/6×) of 5.2361(9)/5.576(1) Å and 5.2331(6)/5.6326(8) Å for the Pt and Pd cases,respectively [3]. For the binary compounds CaM2, each type of nearest neighbor interaction, i.e., Ca-Ca,Ca-M, and M-M, has a single length. When the structure distorts rhombohedrally to incorporate Gaatoms, the Ca-Ca and Ca-M contacts each split into two different distances: there are three shorter andone longer Ca-Ca interactions; whereas six Ca-M interactions that are longer and three shorter. Atomicpositions and anisotropic displacement parameters for both compounds can be found in Tables S1and S2.
Table 1. Crystallographic information for Ca2Pt3Ga and Ca2Pd3Ga.
Sample Ca2Pt3Ga Ca2Pd3Ga
Space Group R-3m R-3m
Unit Cell Dim. a = 5.576(1) Åc = 12.388(3) Å
a = 5.6326(8) Åc = 12.300(2) Å
Volume 333.6(2) Å3 337.9(1) Å3
Z 3 3Theta range for data collection 4.530 to 28.922 4.495 to 49.319
Index ranges −7 ≤ h ≤ 7, −7 ≤ k ≤ 7, −16 ≤ l≤ 16
−11 ≤ h ≤ 11, −11 ≤ k ≤ 11, −26≤ l ≤ 26
Reflections Collected 1321 4878Independent Reflections 126 [R(int) = 0.0485 460 [R(int) = 0.0585]
Data/restraints/parameters 126/0/11 460/0/11Goodness-of-fit 1.078 1.091
Final R indices [I > 2sigma(l)] R1 = 0.0179, wR2 = 0.0403 R1 = 0.0208, wR2 = 0.0403R indices (all data) R1 = 0.0179, wR2 = 0.0403 R1 = 0.0251, wR2 = 0.0414
Extinction Coefficient 0.0008(1) 0.0036(3)Largest diff. peak and hole 3.366 and −2.052 e·Å−3 1.697 and −2.657 e·Å−3
3.3. Coloring Models and Electronic Structure Calculations
To elucidate the driving force that leads to the rhombohedral arrangement of Pt/Pd and Gaatoms in the majority atom positions of the cubic Laves phase, Burnside’s lemma [30] was used toconstruct nine distinct structural models for the unit cells formulated as Ca8[M3Ga]4 [31]. Thesemodels are illustrated in Figure S5 along with their respective space groups. The total energy of eachmodel, listed in Table 2, was calculated using VASP without optimization. These results show thatthe rhombohedral model (α) is the lowest in energy. There are three models that have no nearestneighbor Ga-Ga interactions, these include the rhombohedral coloring, a cubic coloring (µ), and anorthorhombic coloring (γ). The rhombohedral and cubic models are the two lowest in energy beforeoptimization, whereas the orthorhombic coloring is the second highest in energy.
Table 2. Total energy of non-optimized and optimized coloring models showing optimizedGa-Ga distances.
Ca2Pt3Ga Ca2Pd3Ga
ModelGa-Ga
Distance (Å)meV
Non-OptimizedmeV
Optimized# Ga-Ga
InteractionsmeV
OptimizedmeV
Non-OptimizedGa-Ga
Distance (Å)
Alpha 5.276 0 0 0 0 0 5.282Beta 2.755 +38.5 +78.8 1 +68.1 +30.5 2.732Delta 2.811 +62.1 +121.8 2 +121.8 +59.3 2.775
Epsilon 2.808 +50.8 +95.7 1 +73.0 +36.0 2.800Gamma 4.738 +140.7 +56.0 0 +26.0 +92.0 4.791
Iota 2.931 +70.5 +113.4 2 +104.7 +61.2 2.922Mu 4.709 +37.6 +71.0 0 +66.5 +13.3 4.653
Theta 2.950 +203.0 +289.4 6 +256.6 +155.5 2.909Zeta 2.824 +97.6 +168.6 3 +150.0 +81.1 2.798
89
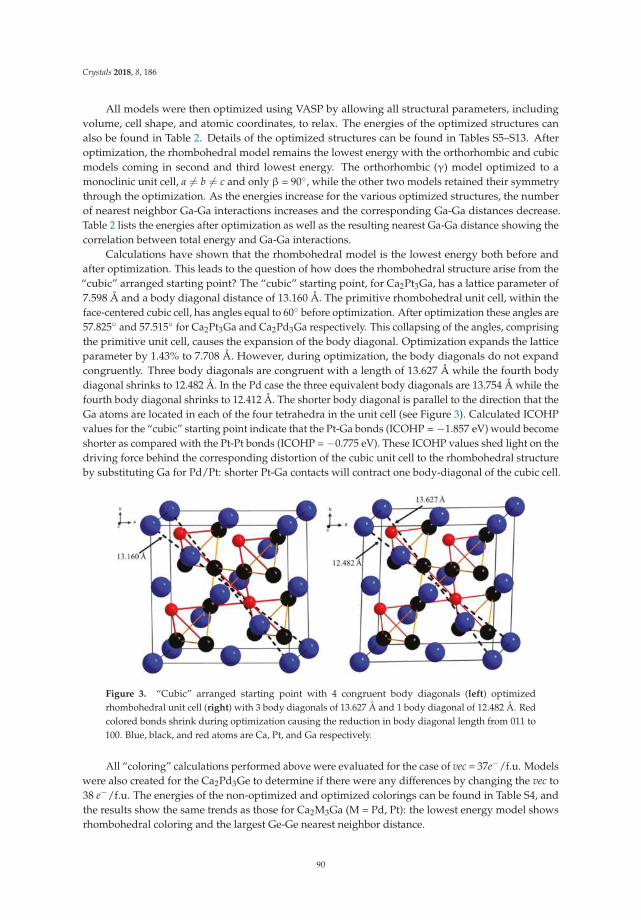
Crystals 2018, 8, 186
All models were then optimized using VASP by allowing all structural parameters, includingvolume, cell shape, and atomic coordinates, to relax. The energies of the optimized structures canalso be found in Table 2. Details of the optimized structures can be found in Tables S5–S13. Afteroptimization, the rhombohedral model remains the lowest energy with the orthorhombic and cubicmodels coming in second and third lowest energy. The orthorhombic (γ) model optimized to amonoclinic unit cell, a = b = c and only β = 90, while the other two models retained their symmetrythrough the optimization. As the energies increase for the various optimized structures, the numberof nearest neighbor Ga-Ga interactions increases and the corresponding Ga-Ga distances decrease.Table 2 lists the energies after optimization as well as the resulting nearest Ga-Ga distance showing thecorrelation between total energy and Ga-Ga interactions.
Calculations have shown that the rhombohedral model is the lowest energy both before andafter optimization. This leads to the question of how does the rhombohedral structure arise from the“cubic” arranged starting point? The “cubic” starting point, for Ca2Pt3Ga, has a lattice parameter of7.598 Å and a body diagonal distance of 13.160 Å. The primitive rhombohedral unit cell, within theface-centered cubic cell, has angles equal to 60 before optimization. After optimization these angles are57.825 and 57.515 for Ca2Pt3Ga and Ca2Pd3Ga respectively. This collapsing of the angles, comprisingthe primitive unit cell, causes the expansion of the body diagonal. Optimization expands the latticeparameter by 1.43% to 7.708 Å. However, during optimization, the body diagonals do not expandcongruently. Three body diagonals are congruent with a length of 13.627 Å while the fourth bodydiagonal shrinks to 12.482 Å. In the Pd case the three equivalent body diagonals are 13.754 Å while thefourth body diagonal shrinks to 12.412 Å. The shorter body diagonal is parallel to the direction that theGa atoms are located in each of the four tetrahedra in the unit cell (see Figure 3). Calculated ICOHPvalues for the “cubic” starting point indicate that the Pt-Ga bonds (ICOHP = −1.857 eV) would becomeshorter as compared with the Pt-Pt bonds (ICOHP = −0.775 eV). These ICOHP values shed light on thedriving force behind the corresponding distortion of the cubic unit cell to the rhombohedral structureby substituting Ga for Pd/Pt: shorter Pt-Ga contacts will contract one body-diagonal of the cubic cell.
Figure 3. “Cubic” arranged starting point with 4 congruent body diagonals (left) optimizedrhombohedral unit cell (right) with 3 body diagonals of 13.627 Å and 1 body diagonal of 12.482 Å. Redcolored bonds shrink during optimization causing the reduction in body diagonal length from 011 to100. Blue, black, and red atoms are Ca, Pt, and Ga respectively.
All “coloring” calculations performed above were evaluated for the case of vec = 37e−/f.u. Modelswere also created for the Ca2Pd3Ge to determine if there were any differences by changing the vec to38 e−/f.u. The energies of the non-optimized and optimized colorings can be found in Table S4, andthe results show the same trends as those for Ca2M3Ga (M = Pd, Pt): the lowest energy model showsrhombohedral coloring and the largest Ge-Ge nearest neighbor distance.
90
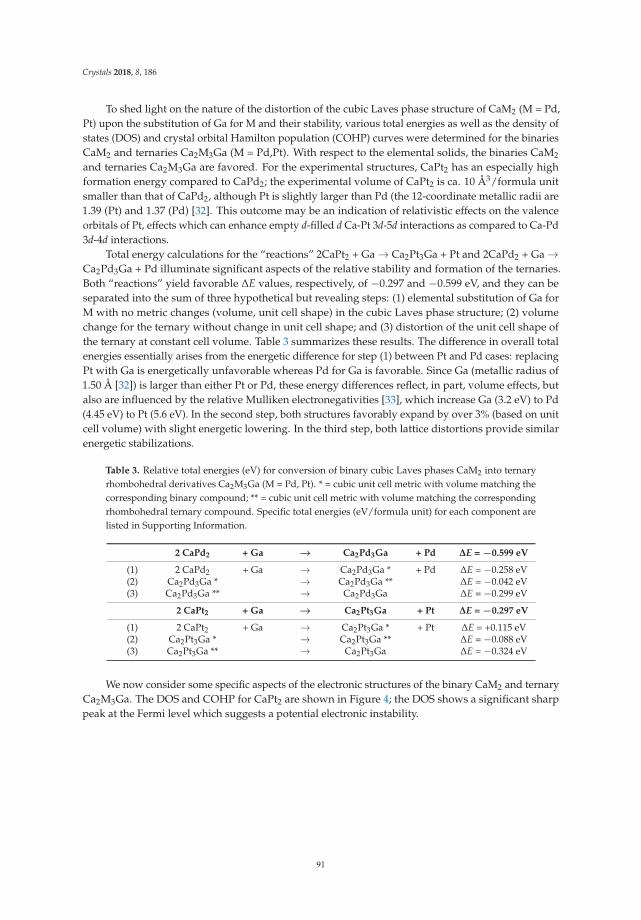
Crystals 2018, 8, 186
To shed light on the nature of the distortion of the cubic Laves phase structure of CaM2 (M = Pd,Pt) upon the substitution of Ga for M and their stability, various total energies as well as the density ofstates (DOS) and crystal orbital Hamilton population (COHP) curves were determined for the binariesCaM2 and ternaries Ca2M3Ga (M = Pd,Pt). With respect to the elemental solids, the binaries CaM2
and ternaries Ca2M3Ga are favored. For the experimental structures, CaPt2 has an especially highformation energy compared to CaPd2; the experimental volume of CaPt2 is ca. 10 Å3/formula unitsmaller than that of CaPd2, although Pt is slightly larger than Pd (the 12-coordinate metallic radii are1.39 (Pt) and 1.37 (Pd) [32]. This outcome may be an indication of relativistic effects on the valenceorbitals of Pt, effects which can enhance empty d-filled d Ca-Pt 3d-5d interactions as compared to Ca-Pd3d-4d interactions.
Total energy calculations for the “reactions” 2CaPt2 + Ga → Ca2Pt3Ga + Pt and 2CaPd2 + Ga →
Ca2Pd3Ga + Pd illuminate significant aspects of the relative stability and formation of the ternaries.Both “reactions” yield favorable ∆E values, respectively, of −0.297 and −0.599 eV, and they can beseparated into the sum of three hypothetical but revealing steps: (1) elemental substitution of Ga forM with no metric changes (volume, unit cell shape) in the cubic Laves phase structure; (2) volumechange for the ternary without change in unit cell shape; and (3) distortion of the unit cell shape ofthe ternary at constant cell volume. Table 3 summarizes these results. The difference in overall totalenergies essentially arises from the energetic difference for step (1) between Pt and Pd cases: replacingPt with Ga is energetically unfavorable whereas Pd for Ga is favorable. Since Ga (metallic radius of1.50 Å [32]) is larger than either Pt or Pd, these energy differences reflect, in part, volume effects, butalso are influenced by the relative Mulliken electronegativities [33], which increase Ga (3.2 eV) to Pd(4.45 eV) to Pt (5.6 eV). In the second step, both structures favorably expand by over 3% (based on unitcell volume) with slight energetic lowering. In the third step, both lattice distortions provide similarenergetic stabilizations.
Table 3. Relative total energies (eV) for conversion of binary cubic Laves phases CaM2 into ternaryrhombohedral derivatives Ca2M3Ga (M = Pd, Pt). * = cubic unit cell metric with volume matching thecorresponding binary compound; ** = cubic unit cell metric with volume matching the correspondingrhombohedral ternary compound. Specific total energies (eV/formula unit) for each component arelisted in Supporting Information.
2 CaPd2 + Ga → Ca2Pd3Ga + Pd ∆E = −0.599 eV
(1) 2 CaPd2 + Ga → Ca2Pd3Ga * + Pd ∆E = −0.258 eV(2) Ca2Pd3Ga * → Ca2Pd3Ga ** ∆E = −0.042 eV(3) Ca2Pd3Ga ** → Ca2Pd3Ga ∆E = −0.299 eV
2 CaPt2 + Ga → Ca2Pt3Ga + Pt ∆E = −0.297 eV
(1) 2 CaPt2 + Ga → Ca2Pt3Ga * + Pt ∆E = +0.115 eV(2) Ca2Pt3Ga * → Ca2Pt3Ga ** ∆E = −0.088 eV(3) Ca2Pt3Ga ** → Ca2Pt3Ga ∆E = −0.324 eV
We now consider some specific aspects of the electronic structures of the binary CaM2 and ternaryCa2M3Ga. The DOS and COHP for CaPt2 are shown in Figure 4; the DOS shows a significant sharppeak at the Fermi level which suggests a potential electronic instability.
91
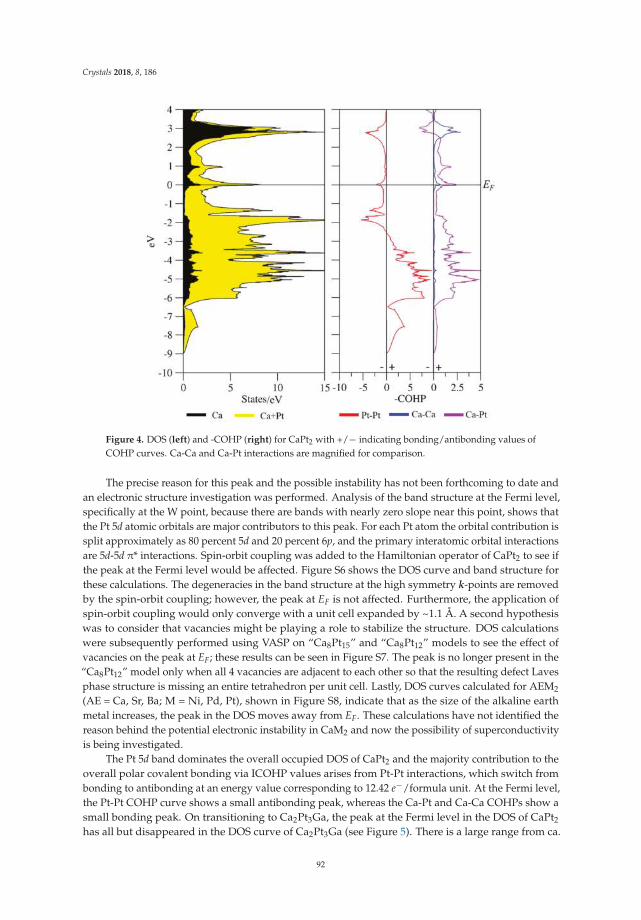
Crystals 2018, 8, 186
Figure 4. DOS (left) and -COHP (right) for CaPt2 with +/− indicating bonding/antibonding values ofCOHP curves. Ca-Ca and Ca-Pt interactions are magnified for comparison.
The precise reason for this peak and the possible instability has not been forthcoming to date andan electronic structure investigation was performed. Analysis of the band structure at the Fermi level,specifically at the W point, because there are bands with nearly zero slope near this point, shows thatthe Pt 5d atomic orbitals are major contributors to this peak. For each Pt atom the orbital contribution issplit approximately as 80 percent 5d and 20 percent 6p, and the primary interatomic orbital interactionsare 5d-5d π* interactions. Spin-orbit coupling was added to the Hamiltonian operator of CaPt2 to see ifthe peak at the Fermi level would be affected. Figure S6 shows the DOS curve and band structure forthese calculations. The degeneracies in the band structure at the high symmetry k-points are removedby the spin-orbit coupling; however, the peak at EF is not affected. Furthermore, the application ofspin-orbit coupling would only converge with a unit cell expanded by ~1.1 Å. A second hypothesiswas to consider that vacancies might be playing a role to stabilize the structure. DOS calculationswere subsequently performed using VASP on “Ca8Pt15” and “Ca8Pt12” models to see the effect ofvacancies on the peak at EF; these results can be seen in Figure S7. The peak is no longer present in the“Ca8Pt12” model only when all 4 vacancies are adjacent to each other so that the resulting defect Lavesphase structure is missing an entire tetrahedron per unit cell. Lastly, DOS curves calculated for AEM2
(AE = Ca, Sr, Ba; M = Ni, Pd, Pt), shown in Figure S8, indicate that as the size of the alkaline earthmetal increases, the peak in the DOS moves away from EF. These calculations have not identified thereason behind the potential electronic instability in CaM2 and now the possibility of superconductivityis being investigated.
The Pt 5d band dominates the overall occupied DOS of CaPt2 and the majority contribution to theoverall polar covalent bonding via ICOHP values arises from Pt-Pt interactions, which switch frombonding to antibonding at an energy value corresponding to 12.42 e−/formula unit. At the Fermi level,the Pt-Pt COHP curve shows a small antibonding peak, whereas the Ca-Pt and Ca-Ca COHPs show asmall bonding peak. On transitioning to Ca2Pt3Ga, the peak at the Fermi level in the DOS of CaPt2
has all but disappeared in the DOS curve of Ca2Pt3Ga (see Figure 5). There is a large range from ca.
92
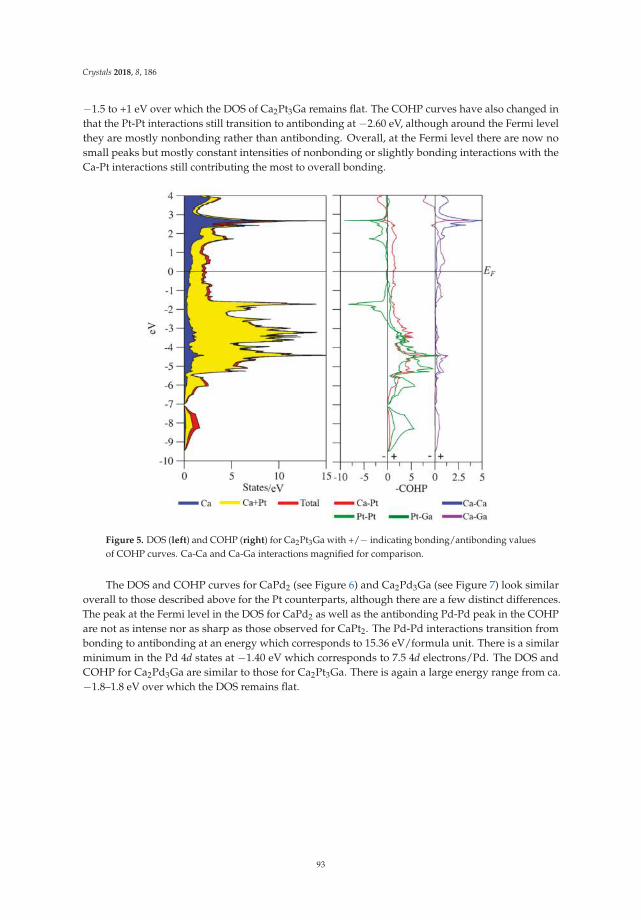
Crystals 2018, 8, 186
−1.5 to +1 eV over which the DOS of Ca2Pt3Ga remains flat. The COHP curves have also changed inthat the Pt-Pt interactions still transition to antibonding at −2.60 eV, although around the Fermi levelthey are mostly nonbonding rather than antibonding. Overall, at the Fermi level there are now nosmall peaks but mostly constant intensities of nonbonding or slightly bonding interactions with theCa-Pt interactions still contributing the most to overall bonding.
Figure 5. DOS (left) and COHP (right) for Ca2Pt3Ga with +/− indicating bonding/antibonding valuesof COHP curves. Ca-Ca and Ca-Ga interactions magnified for comparison.
The DOS and COHP curves for CaPd2 (see Figure 6) and Ca2Pd3Ga (see Figure 7) look similaroverall to those described above for the Pt counterparts, although there are a few distinct differences.The peak at the Fermi level in the DOS for CaPd2 as well as the antibonding Pd-Pd peak in the COHPare not as intense nor as sharp as those observed for CaPt2. The Pd-Pd interactions transition frombonding to antibonding at an energy which corresponds to 15.36 eV/formula unit. There is a similarminimum in the Pd 4d states at −1.40 eV which corresponds to 7.5 4d electrons/Pd. The DOS andCOHP for Ca2Pd3Ga are similar to those for Ca2Pt3Ga. There is again a large energy range from ca.−1.8–1.8 eV over which the DOS remains flat.
93
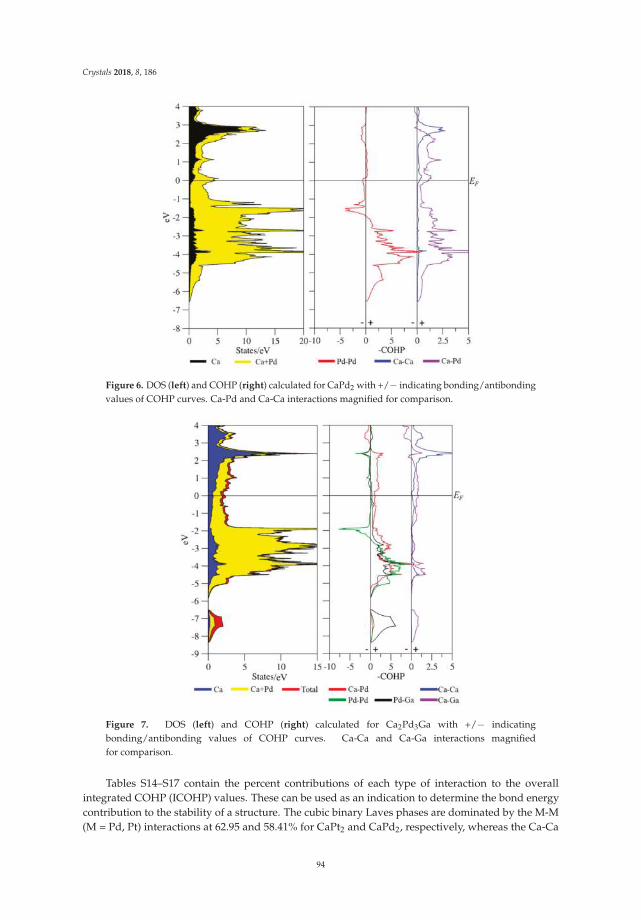
Crystals 2018, 8, 186
Figure 6. DOS (left) and COHP (right) calculated for CaPd2 with +/− indicating bonding/antibondingvalues of COHP curves. Ca-Pd and Ca-Ca interactions magnified for comparison.
Figure 7. DOS (left) and COHP (right) calculated for Ca2Pd3Ga with +/− indicatingbonding/antibonding values of COHP curves. Ca-Ca and Ca-Ga interactions magnifiedfor comparison.
Tables S14–S17 contain the percent contributions of each type of interaction to the overallintegrated COHP (ICOHP) values. These can be used as an indication to determine the bond energycontribution to the stability of a structure. The cubic binary Laves phases are dominated by the M-M(M = Pd, Pt) interactions at 62.95 and 58.41% for CaPt2 and CaPd2, respectively, whereas the Ca-Ca
94
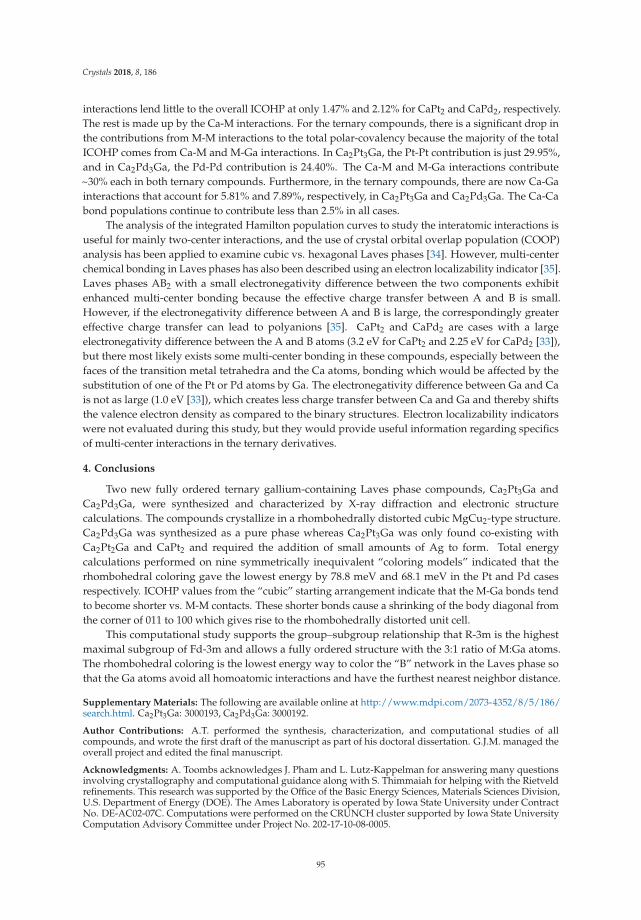
Crystals 2018, 8, 186
interactions lend little to the overall ICOHP at only 1.47% and 2.12% for CaPt2 and CaPd2, respectively.The rest is made up by the Ca-M interactions. For the ternary compounds, there is a significant drop inthe contributions from M-M interactions to the total polar-covalency because the majority of the totalICOHP comes from Ca-M and M-Ga interactions. In Ca2Pt3Ga, the Pt-Pt contribution is just 29.95%,and in Ca2Pd3Ga, the Pd-Pd contribution is 24.40%. The Ca-M and M-Ga interactions contribute~30% each in both ternary compounds. Furthermore, in the ternary compounds, there are now Ca-Gainteractions that account for 5.81% and 7.89%, respectively, in Ca2Pt3Ga and Ca2Pd3Ga. The Ca-Cabond populations continue to contribute less than 2.5% in all cases.
The analysis of the integrated Hamilton population curves to study the interatomic interactions isuseful for mainly two-center interactions, and the use of crystal orbital overlap population (COOP)analysis has been applied to examine cubic vs. hexagonal Laves phases [34]. However, multi-centerchemical bonding in Laves phases has also been described using an electron localizability indicator [35].Laves phases AB2 with a small electronegativity difference between the two components exhibitenhanced multi-center bonding because the effective charge transfer between A and B is small.However, if the electronegativity difference between A and B is large, the correspondingly greatereffective charge transfer can lead to polyanions [35]. CaPt2 and CaPd2 are cases with a largeelectronegativity difference between the A and B atoms (3.2 eV for CaPt2 and 2.25 eV for CaPd2 [33]),but there most likely exists some multi-center bonding in these compounds, especially between thefaces of the transition metal tetrahedra and the Ca atoms, bonding which would be affected by thesubstitution of one of the Pt or Pd atoms by Ga. The electronegativity difference between Ga and Cais not as large (1.0 eV [33]), which creates less charge transfer between Ca and Ga and thereby shiftsthe valence electron density as compared to the binary structures. Electron localizability indicatorswere not evaluated during this study, but they would provide useful information regarding specificsof multi-center interactions in the ternary derivatives.
4. Conclusions
Two new fully ordered ternary gallium-containing Laves phase compounds, Ca2Pt3Ga andCa2Pd3Ga, were synthesized and characterized by X-ray diffraction and electronic structurecalculations. The compounds crystallize in a rhombohedrally distorted cubic MgCu2-type structure.Ca2Pd3Ga was synthesized as a pure phase whereas Ca2Pt3Ga was only found co-existing withCa2Pt2Ga and CaPt2 and required the addition of small amounts of Ag to form. Total energycalculations performed on nine symmetrically inequivalent “coloring models” indicated that therhombohedral coloring gave the lowest energy by 78.8 meV and 68.1 meV in the Pt and Pd casesrespectively. ICOHP values from the “cubic” starting arrangement indicate that the M-Ga bonds tendto become shorter vs. M-M contacts. These shorter bonds cause a shrinking of the body diagonal fromthe corner of 011 to 100 which gives rise to the rhombohedrally distorted unit cell.
This computational study supports the group–subgroup relationship that R-3m is the highestmaximal subgroup of Fd-3m and allows a fully ordered structure with the 3:1 ratio of M:Ga atoms.The rhombohedral coloring is the lowest energy way to color the “B” network in the Laves phase sothat the Ga atoms avoid all homoatomic interactions and have the furthest nearest neighbor distance.
Supplementary Materials: The following are available online at http://www.mdpi.com/2073-4352/8/5/186/search.html. Ca2Pt3Ga: 3000193, Ca2Pd3Ga: 3000192.
Author Contributions: A.T. performed the synthesis, characterization, and computational studies of allcompounds, and wrote the first draft of the manuscript as part of his doctoral dissertation. G.J.M. managed theoverall project and edited the final manuscript.
Acknowledgments: A. Toombs acknowledges J. Pham and L. Lutz-Kappelman for answering many questionsinvolving crystallography and computational guidance along with S. Thimmaiah for helping with the Rietveldrefinements. This research was supported by the Office of the Basic Energy Sciences, Materials Sciences Division,U.S. Department of Energy (DOE). The Ames Laboratory is operated by Iowa State University under ContractNo. DE-AC02-07C. Computations were performed on the CRUNCH cluster supported by Iowa State UniversityComputation Advisory Committee under Project No. 202-17-10-08-0005.
95
Crystals 2018, 8, 186
Conflicts of Interest: The authors declare no conflict of interest.
References
1. Jansen, M. Effects of relativistic motion of electrons on the chemistry of gold and platinum. Solid State Sci.
2005, 7, 1464–1474. [CrossRef]2. Siggelkow, L.; Hlukhyy, V.; Faessler, T.F. The Influence of the Valence Electron Concentration on the Structural
Variation of the Laves Phases MgNi2−xGex. Z. Anorg. Allg. Chem. 2017, 643, 1424–1430. [CrossRef]3. Doverbratt, I.; Ponou, S.; Lidin, S. Ca2Pd3Ge, a new fully ordered ternary Laves phases structure. J. Solid
State Chem. 2013, 197, 312–316. [CrossRef]4. Stein, F.; Palm, M.; Sauthoff, G. Structure and stability of Laves phases. Part I—Critcal assessment of factors
controlling Laves phase stability. Intermetallics 2004, 12, 713–720. [CrossRef]5. Osters, O.; Nilges, T.; Schöneich, M.; Schmidt, P.; Rothballer, J.; Pielnhofer, F.; Weihrich, R. Cd4Cu7As, The
First Representative of a Fully Ordered, Orthorhombically Distorted MgCu2 Laves Phases. Inorg. Chem.
2012, 51, 8119–8127. [CrossRef] [PubMed]6. Murtaza, A.; Yang, S.; Zhou, C.; Song, X. Influence of Tb on easy magnetization direction and
magnetostriction of ferromagnetic Laves phase GdFe compounds. Chin. Phys. B 2016, 25, 096107. [CrossRef]7. Manickam, K.; Grant, D.M.; Walker, G.S. Optimization of AB2 type alloy composition with superior hydrogen
storage properties for stationary applications. Int. J. Hydrogen Energy 2015, 40, 16288–16293. [CrossRef]8. Nash, C.P.; Boyden, F.M.; Whittig, L.D. Intermetallic compounds of alkali metals with platinum. A novel
preparation of a colloidal platinum hydrogenation catalyst. J. Am. Chem. Soc. 1960, 82, 6203–6204. [CrossRef]9. Xiao, C.; Wang, L.; Maligal-Ganesh, R.V.; Smetana, V.; Walen, H.; Thiel, P.A.; Miller, G.J.; Johnson, D.D.;
Huang, W. Intermetallic NaAu2 as a Heterogeneous Catalyst for Low-Temperature CO Oxidation. J. Am.
Chem. Soc. 2013, 135, 9592–9595. [CrossRef] [PubMed]10. Thimmaiah, S.; Miller, G.J. Influence of Valence Electron Concentration on Laves Phases: Structures and
Phase Stability of Pseudo-Binary MgZn2−xPdx. Z. Anorg. Allg. Chem. 2015, 641, 1486–1494. [CrossRef]11. Seidel, S.; Janka, O.; Benndorf, C.; Mausolf, B.; Haarmann, F.; Eckert, H.; Heletta, L.; Pöttgen, R. Ternary
rhombohedral Laves phases RE2Rh3Ga (RE = Y, La-Nd, Sm, Gd-Er). Z. Naturforsch. 2017, 72, 289–303.[CrossRef]
12. Dwight, A.E.; Kimball, C.W. A rhombohedral Laves phase. Terbium-ron (TbFe2). Acta Cryst. Sect. B 1974, 30,2791–2793. [CrossRef]
13. Burdett, J.K.; Canadell, E.; Hughbanks, T. Symmetry control of the coloring problem: The electronic structureof MB2C2 (M = calcium, lanthanum, . . . ). J. Am. Chem. Soc. 1986, 108, 3971–3976. [CrossRef]
14. Jepsen, O.; Andersen, O.K. TB-LMTO, version 47; Max-Planck-Institut für Festkörperforshcung: Stuttgart,Germany, 2000.
15. Von Barth, U.; Hedin, L. Local exchange-correlation potential for the spin-polarized case. J. Phys. C 1972, 5,1629. [CrossRef]
16. Koelling, D.D.; Harmon, B.N. A technique for relative spin-polarized calculations. J. Phys. C 1977, 10,3107–3114. [CrossRef]
17. Kresse, G.; Hafner, J. Ab initio molecular dynamics for liquid metals. Phys. Rev. B 1993, 47, 558. [CrossRef]18. Kreese, G.; Furthmüller, J. Efficient iterative schemes for ab initio total-energy calculations using a plane-wave
basis set. Phys. Rev. B 1996, 54, 11169–11186. [CrossRef]19. Blöchl, P.E. Projector augmented-wave method. Phys. Rev. B 1994, 50, 17953–17979. [CrossRef]20. Perdew, J.P.; Burke, K.; Wang, Y. Gerneralized gradient approximation for the exchange-correlation hole of a
many-electron system. Phys. Rev. B 1996, 54, 16533–16539. [CrossRef]21. Monkhorst, H.J.; Pack, J.D. Special points for Brillouin-zone integrations. Phys. Rev. B 1976, 13, 5188.
[CrossRef]22. Blöchl, P.E.; Jepsen, O.; Andersen, O.K. Improved tetrahedron method for Brillouin-zone integrations.
Phys. Rev. B 1994, 49, 16223–16233. [CrossRef]23. PowderCell, version 2.3; Federal Institute for Materials Research and Testing: Berlin, Germany, 2000.24. APEX-II; Bruker AXS Inc.: Madison, WI, USA, 2013.25. SAINT-V8.27; Bruker AXS Inc.: Madison, WI, USA, 2013.26. SHELXTL-v2008/4; Bruker AXS Inc.: Madison, WI, USA, 2013.
96
Crystals 2018, 8, 186
27. Brandenburg, K. Diamond, version 3.2; Crystal Impact GbR: Bonn, Germany, 2011.28. Petricek, V.; Dusek, M.; Palatinus, L. Structure Determination Software Programs; Institute of Physics: Praha,
Czech Republic, 2006.29. Cenzual, K.; Chabot, B.; Parthe, E. Yttrium rhodium germanide (Y2Rh3Ge), a rhombohedral substitution
variant of the MgCu2 type. J. Solid State Chem. 1987, 70, 229–234. [CrossRef]30. Burdett, J.K.; McLarnan, T.J. Geometrical and electronic links among the structures of MX2 solids: Structural
enumeration and electronic stability of pyritelike systems. Inorg. Chem. 1982, 21, 1119–1128. [CrossRef]31. Xie, W.; Miller, G.J. β-Mn-Type Co8+xZn12−x as a Defect Cubic Laves Phase: Site Preferences, Magnetism,
and Electronic Structure. Inorg. Chem. 2013, 52, 9399–9408. [CrossRef] [PubMed]32. Wells, A.F. Structural Inorganic Chemistry, 5th ed.; Clarendon Press: Oxford, UK, 1984.33. Pearson, R.G. Absolute Electronegativity and Hardness: Application to Inorganic Chemistry. Inorg. Chem.
1988, 27, 734–740. [CrossRef]34. Johnston, R.; Hoffmann, R. Structure-Bonding Relationships in the Laves Phases. Z. Anorg. Allg. Chem. 1992,
616, 105–120. [CrossRef]35. Ormeci, A.; Simon, A.; Grin, Y. Structural Topology and Chemical Bonding in Laves Phases. Angew. Chem.
2010, 49, 8997–9001. [CrossRef] [PubMed]
© 2018 by the authors. Licensee MDPI, Basel, Switzerland. This article is an open accessarticle distributed under the terms and conditions of the Creative Commons Attribution(CC BY) license (http://creativecommons.org/licenses/by/4.0/).
97
crystals
Article
Crystal Structure, Spectroscopic Investigations,and Physical Properties of the Ternary IntermetallicREPt2Al3 (RE = Y, Dy–Tm) and RE2Pt3Al4Representatives (RE = Tm, Lu)
Fabian Eustermann 1, Simon Gausebeck 1, Carsten Dosche 2, Mareike Haensch 2,Gunther Wittstock 2 and Oliver Janka 1,2,*
1 Institut für Anorganische und Analytische Chemie, Universität Münster, Corrensstrasse 30, 48149 Münster,Germany; [email protected] (F.E.); [email protected] (S.G.)
2 Institut für Chemie, Carl von Ossietzky Universität Oldenburg, 26111 Oldenburg, Germany;[email protected] (C.D.); [email protected] (M.H.);[email protected] (G.W.)
* Correspondence: [email protected]; Tel.: +49-251-83-36074
Received: 1 March 2018; Accepted: 10 April 2018; Published: 16 April 2018
Abstract: The REPt2Al3 compounds of the late rare-earth metals (RE = Y, Dy–Tm) were found tocrystallize isostructural. Single-crystal X-ray investigations of YPt2Al3 revealed an orthorhombicunit cell (a = 1080.73(6), b = 1871.96(9), c = 413.04(2) pm, wR2 = 0.0780, 942 F2 values, 46 variables)with space group Cmmm (oC48; q2pji2hedb). A comparison with the Pearson database indicated thatYPt2Al3 forms a new structure type, in which the Pt and Al atoms form a [Pt2Al3]δ− polyanionand the Y atoms reside in the cavities within the framework. Via a group-subgroup scheme,the relationship between the PrNi2Al3-type structure and the new YPt2Al3-type structure wasillustrated. The compounds with RE = Dy–Tm were characterized by powder X-ray diffractionexperiments. While YPt2Al3 is a Pauli-paramagnet, the other REPt2Al3 (RE = Dy–Tm) compoundsexhibit paramagnetic behavior, which is in line with the rare-earth atoms being in the trivalentoxidation state. DyPt2Al3 and TmPt2Al3 exhibit ferromagnetic ordering at TC = 10.8(1) and 4.7(1) Kand HoPt2Al3 antiferromagnetic ordering at TN = 5.5(1) K, respectively. Attempts to synthesizethe isostructural lutetium compound resulted in the formation of Lu2Pt3Al4 (Ce2Ir3Sb4-type, Pnma,a = 1343.4(2), b = 416.41(8), c = 1141.1(2) pm), which could also be realized with thulium. The structurewas refined from single-crystal data (wR2 = 0.0940, 1605 F2 values, 56 variables). Again, a polyanionwith bonding Pt–Al interactions was found, and the two distinct Lu atoms were residing in thecavities of the [Pt3Al4]δ– framework. X-ray photoelectron spectroscopy (XPS) measurements wereconducted to examine the electron transfer from the rare-earth atoms onto the polyanionic framework.
Keywords: intermetallics; crystal structure; group-subgroup; magnetic properties; XPS
1. Introduction
In the field of intermetallic compounds [1,2], some structure types are found with an impressivenumber of entries listed in the Pearson database [3]. Amongst them are the binary Laves phasesof the MgCu2-type (Fd3m) [4] and MgZn2-type (P63/mmc) [5] structures (together with more than5500 entries), the cubic Cu3Au-type (Pm3m, >1950 entries) structures [6], and the hexagonal CaCu5-type(P6/mmm, >1650 entries) structures [7]. For ternary intermetallic compounds, the tetragonalbody-centered ThCr2Si2-type (I4/mmm, >3250 entries) [8], the orthorhombic TiNiSi-type (Pnma,>1550 entries), and the hexagonal ZrNiAl-type (P62m, >1450 entries) [9] representatives show abroad variety of compounds with numerous, different elemental combinations. The structures and
Crystals 2018, 8, 169; doi:/10.3390/cryst8040169 www.mdpi.com/journal/crystals98
Crystals 2018, 8, 169
physical properties of the equiatomic RETX (RE = rare-earth element, T = transition metal, X = elementof group 12–15) representatives have been recently summarized in a series of review articles [10–13].
Derived from the binary CaCu5-type structure, two prototypic ternary representatives withdifferent chemical compositions have been reported: the CeCo3B2- [14] and the PrNi2Al3-type [15]structures. From a crystal chemical point of view, YNi2Al3 is also worth mentioning [16], becausethis compound can be considered to be an i3-superstructure of the PrNi2Al3-type structure. Recently,an i7-superstructure of PrNi2Al3 has also been reported, which was also found for ErPd2Al3 [17].Our interests in the compounds of the REPt2Al3 series originate from the fact that only CePt2Al3(PrNi2Al3-type) has been reported previously [18]. Therefore, we synthesized and characterized themissing members of the REPt2Al3 series with the late, small rare-earth elements. From a basic researchpoint of view, investigations of the magnetic ground state of the open f -shell rare-earth atoms are alsoof great interest.
2. Experimental
2.1. Synthesis
The starting materials for the synthesis of the REPt2Al3 and RE2Pt3Al4 samples were piecesof the sublimed rare-earth elements (Y, Dy–Tm, and Lu from Smart Elements), platinum sheets(Agosi), and aluminum turnings (Koch Chemicals), all with stated purities better than 99.9%. For theREPt2Al3 compounds (RE = Y, Dy–Tm), the elements were weighed in the ideal 1:2:3 atomic ratioand arc-melted [19] in a water-cooled copper hearth under 800 mbar of argon pressure. The argongas was purified with a titanium sponge (873 K), molecular sieves, and silica gel. Re-melting of theobtained buttons from each site several times enhanced the homogeneity. The as-cast buttons of theyttrium compound were crushed, and the fragments were sealed in quartz ampoules, placed in thewater-cooled sample chamber of a high-frequency furnace (Typ TIG 5/300, Hüttinger Elektronik,Freiburg, Germany) [20], and heated until a softening of the piece was observed. The power wassubsequently reduced by 10%, and the sample was kept at this temperature for 120 min before beingcooled to room temperature. The other samples were annealed in muffle furnaces. They were heatedto 1223 K and then kept at this temperature for 14 days, followed by slow cooling until they reached573 K. Afterwards, the furnace was switched off. These different annealing procedures led to X-raypure samples suitable for physical properties measurements. For the RE2Pt3Al4 compounds (RE = Tm,Lu), the elements were weighed in the ideal 2:3:4 atomic ratio and arc-melted as described above.Again, an annealing step in a high-frequency furnace was subsequently conducted. The specimens arestable in air over weeks and show metallic luster; the ground samples are grey.
2.2. X-ray Image Plate Data and Data Collections
The polycrystalline samples were characterized at room temperature by powder X-ray diffractionon a Guinier camera (equipped with an image plate system, Fujifilm, Nakanuma, Japan, BAS-1800,)using Cu Kα1 radiation and α-quartz (a = 491.30, c = 540.46 pm, Riedel-de-Haën, Seelze, Germany) asan internal standard. The lattice parameters (Table 1) were obtained from a least-squares fit. Properindexing of the diffraction lines was ensured by an intensity calculation [21].
Irregularly shaped crystal fragments of the YPt2Al3 and Lu2Pt3Al4 compounds were obtainedfrom the annealed crushed buttons. The crystals were glued to quartz fibers using beeswax,and their quality was checked by Laue photographs on a Buerger camera (white molybdenumradiation, image plate technique, Fujifilm, Nakanuma, Japan, BAS-1800) for intensity data collection.The datasets were collected on a Stoe StadiVari four-circle diffractometer (Mo-Kα radiation(λ = 71.073 pm); µ-source; oscillation mode; hybrid-pixel-sensor, Dectris Pilatus 100 K [22]) withan open Eulerian cradle setup. Numerical absorption correction along with scaling was applied tothe datasets. All relevant crystallographic data, deposition, and details of the data collection andevaluation are listed in Tables 2–8. Further details of the crystal structure investigation may be
99
Crystals 2018, 8, 169
obtained from the Fachinformationszentrum Karlsruhe, 76344 Eggenstein-Leopoldshafen, Germany(Fax: +49-7247-808-666; E-Mail: [email protected], http://www.fiz-karlsruhe.de/request_for_deposited_data.html) by quoting the depository numbers CSD-434174 (YPt2Al3) and CSD-434175(Lu2Pt3Al4).
2.3. Energy Dispersive X-ray Spectroscopy (EDX) Data
The crystals measured on the diffractometer were analyzed semi-quantitatively using a ZeissEVO MA10 scanning electron microscope with YF3, TmF3, LuF3, Pt, and Al2O3 as standards. Noimpurity elements heavier than sodium (the detection limit of the instrument) were observed.The experimentally determined element ratios (YPt2Al3: 18 ± 2 at.% Y: 29 ± 2 at.% Pt: 53 ± 2 at.%Al; and Lu2Pt3Al4: 20 ± 2 at.% Y: 36 ± 2 at.% Pt: 44 ± 2 at.% Al) were in close agreement withthe ideal compositions (16.7:33.3:50 and 22.2:33.3:44.5), respectively. The deviations resulted fromthe irregular shape of the crystal surfaces (conchoidal fracture). Additionally, polycrystalline piecesfrom the annealed arc-melted buttons were embedded in a methylmethacrylate matrix and polishedwith diamond and SiO2 emulsions of different particle sizes. During the first attempts to synthesizeTmPt2Al3 and LuPt2Al3, phase segregation was observed; the secondary phases had the compositionsTm2Pt3Al4 and Lu2Pt3Al4.
2.4. Magnetic Properties Measurements
Fragments of the annealed buttons of the X-ray pure REPt2Al3 phases were attached to thesample holder rod of a vibrating sample magnetometer (VSM) unit using Kapton foil for measuringthe magnetization M(T, H) in a Quantum Design physical property measurement system (PPMS).The samples were investigated in the temperature range of 2.5–300 K with external magnetic fields upto 80 kOe. The magnetic data are summarized in Table 9.
2.5. X-ray Photoelectron Spectroscopy (XPS)
XPS was performed using an ESCALAB 250 Xi instrument (Thermo Fisher, East Grinsted, UK)with mono-chromatized Al Kα (hν = 1486.6 eV) radiation. All samples were cleaned by Ar+ sputtering(MAGCIS ion gun, 36 keV) for 60 s to remove adventitious carbon. High-resolution spectra weremeasured with pass energies of 10 eV (Pt 4f, Al 2s, Al 2p, and C 1s) and 20 eV (Y 3d and Pr 3d). Peakdeconvolution was performed using a Gaussian-Lorentzian peak shape by the software Avantage(Thermo Fisher). All spectra were referenced to remaining adventitious carbon at 284.8 eV. Because ofthe overlap of the Pt 4f and Al 2p signals, Al 2s was used for Al quantification. The obtained data aresummarized in Table 10.
3. Results and Discussion
During attempts to synthesize aluminum intermetallics with the composition REPt2Al3,well-resolved X-ray powder patterns for the small rare-earth elements RE = Y, Dy–Tm were observed.For the thulium compound, additional reflections showed up in the unannealed sample, which wereinitially interpreted as impurities. Subsequently, single crystals from the yttrium sample were isolatedand structurally investigated (vide infra). The large and early rare-earth elements (RE = La–Nd, Sm,Gd, and Tb) do not form the same structure type. Investigations on the structures formed by theseelements are still ongoing. Attempts to synthesize LuPt2Al3 also yielded a diffraction pattern differentfrom the slightly larger rare-earth elements Dy–Tm. As cast specimen, TmPt2Al3 and LuPt2Al3 weresubsequently investigated by scanning electron microscopy coupled with energy dispersive X-rayspectroscopy (SEM/EDX). The impurity phase in TmPt2Al3 and the main phase in nominal LuPt2Al3were found to be Tm2Pt3Al4 and Lu2Pt3Al4, respectively. Finally, samples with these compositionswere prepared, and single crystals from Lu2Pt3Al4 were isolated and investigated.
100
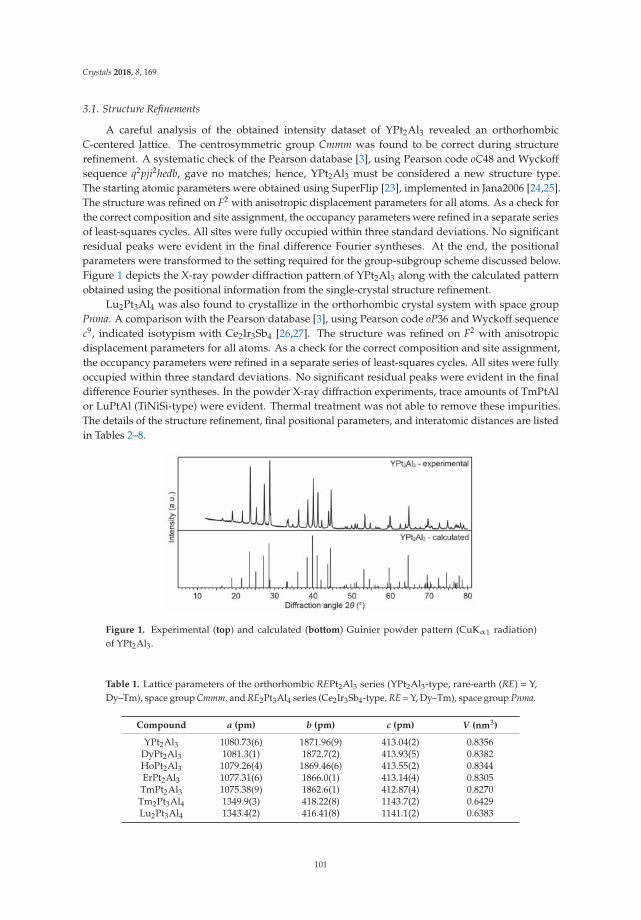
Crystals 2018, 8, 169
3.1. Structure Refinements
A careful analysis of the obtained intensity dataset of YPt2Al3 revealed an orthorhombicC-centered lattice. The centrosymmetric group Cmmm was found to be correct during structurerefinement. A systematic check of the Pearson database [3], using Pearson code oC48 and Wyckoffsequence q2pji2hedb, gave no matches; hence, YPt2Al3 must be considered a new structure type.The starting atomic parameters were obtained using SuperFlip [23], implemented in Jana2006 [24,25].The structure was refined on F2 with anisotropic displacement parameters for all atoms. As a check forthe correct composition and site assignment, the occupancy parameters were refined in a separate seriesof least-squares cycles. All sites were fully occupied within three standard deviations. No significantresidual peaks were evident in the final difference Fourier syntheses. At the end, the positionalparameters were transformed to the setting required for the group-subgroup scheme discussed below.Figure 1 depicts the X-ray powder diffraction pattern of YPt2Al3 along with the calculated patternobtained using the positional information from the single-crystal structure refinement.
Lu2Pt3Al4 was also found to crystallize in the orthorhombic crystal system with space groupPnma. A comparison with the Pearson database [3], using Pearson code oP36 and Wyckoff sequencec9, indicated isotypism with Ce2Ir3Sb4 [26,27]. The structure was refined on F2 with anisotropicdisplacement parameters for all atoms. As a check for the correct composition and site assignment,the occupancy parameters were refined in a separate series of least-squares cycles. All sites were fullyoccupied within three standard deviations. No significant residual peaks were evident in the finaldifference Fourier syntheses. In the powder X-ray diffraction experiments, trace amounts of TmPtAlor LuPtAl (TiNiSi-type) were evident. Thermal treatment was not able to remove these impurities.The details of the structure refinement, final positional parameters, and interatomic distances are listedin Tables 2–8.
Figure 1. Experimental (top) and calculated (bottom) Guinier powder pattern (CuKα1 radiation)of YPt2Al3.
Table 1. Lattice parameters of the orthorhombic REPt2Al3 series (YPt2Al3-type, rare-earth (RE) = Y,Dy–Tm), space group Cmmm, and RE2Pt3Al4 series (Ce2Ir3Sb4-type, RE = Y, Dy–Tm), space group Pnma.
Compound a (pm) b (pm) c (pm) V (nm3)
YPt2Al3 1080.73(6) 1871.96(9) 413.04(2) 0.8356DyPt2Al3 1081.3(1) 1872.7(2) 413.93(5) 0.8382HoPt2Al3 1079.26(4) 1869.46(6) 413.55(2) 0.8344ErPt2Al3 1077.31(6) 1866.0(1) 413.14(4) 0.8305TmPt2Al3 1075.38(9) 1862.6(1) 412.87(4) 0.8270Tm2Pt3Al4 1349.9(3) 418.22(8) 1143.7(2) 0.6429Lu2Pt3Al4 1343.4(2) 416.41(8) 1141.1(2) 0.6383
101
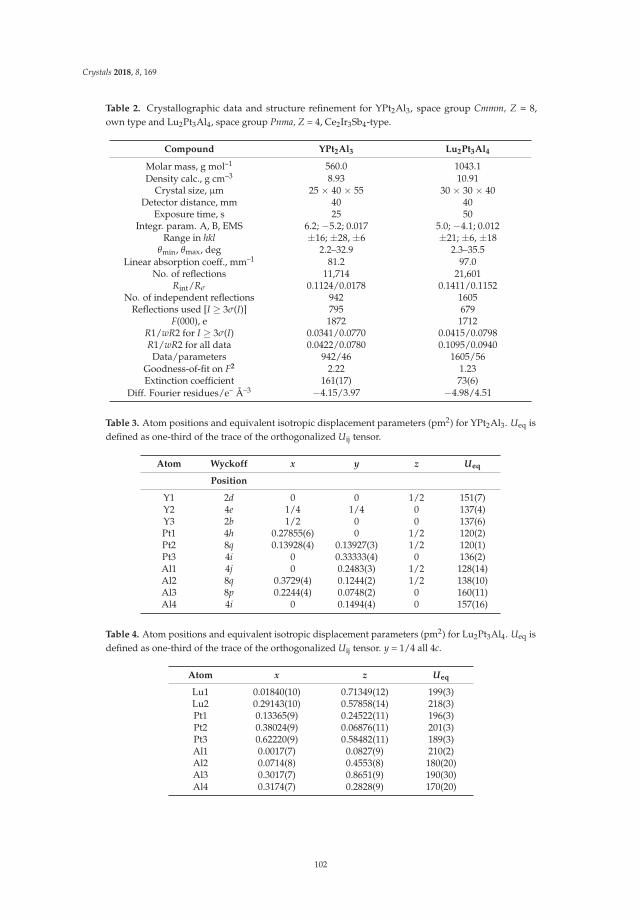
Crystals 2018, 8, 169
Table 2. Crystallographic data and structure refinement for YPt2Al3, space group Cmmm, Z = 8,own type and Lu2Pt3Al4, space group Pnma, Z = 4, Ce2Ir3Sb4-type.
Compound YPt2Al3 Lu2Pt3Al4
Molar mass, g mol–1 560.0 1043.1Density calc., g cm–3 8.93 10.91
Crystal size, µm 25 × 40 × 55 30 × 30 × 40Detector distance, mm 40 40
Exposure time, s 25 50Integr. param. A, B, EMS 6.2; −5.2; 0.017 5.0; −4.1; 0.012
Range in hkl ±16; ±28, ±6 ±21; ±6, ±18θmin, θmax, deg 2.2–32.9 2.3–35.5
Linear absorption coeff., mm–1 81.2 97.0No. of reflections 11,714 21,601
Rint/Rσ 0.1124/0.0178 0.1411/0.1152No. of independent reflections 942 1605
Reflections used [I ≥ 3σ(I)] 795 679F(000), e 1872 1712
R1/wR2 for I ≥ 3σ(I) 0.0341/0.0770 0.0415/0.0798R1/wR2 for all data 0.0422/0.0780 0.1095/0.0940
Data/parameters 942/46 1605/56Goodness-of-fit on F2 2.22 1.23Extinction coefficient 161(17) 73(6)
Diff. Fourier residues/e– Å–3 −4.15/3.97 −4.98/4.51
Table 3. Atom positions and equivalent isotropic displacement parameters (pm2) for YPt2Al3. Ueq isdefined as one-third of the trace of the orthogonalized Uij tensor.
Atom Wyckoff x y z Ueq
Position
Y1 2d 0 0 1/2 151(7)Y2 4e 1/4 1/4 0 137(4)Y3 2b 1/2 0 0 137(6)Pt1 4h 0.27855(6) 0 1/2 120(2)Pt2 8q 0.13928(4) 0.13927(3) 1/2 120(1)Pt3 4i 0 0.33333(4) 0 136(2)Al1 4j 0 0.2483(3) 1/2 128(14)Al2 8q 0.3729(4) 0.1244(2) 1/2 138(10)Al3 8p 0.2244(4) 0.0748(2) 0 160(11)Al4 4i 0 0.1494(4) 0 157(16)
Table 4. Atom positions and equivalent isotropic displacement parameters (pm2) for Lu2Pt3Al4. Ueq isdefined as one-third of the trace of the orthogonalized Uij tensor. y = 1/4 all 4c.
Atom x z Ueq
Lu1 0.01840(10) 0.71349(12) 199(3)Lu2 0.29143(10) 0.57858(14) 218(3)Pt1 0.13365(9) 0.24522(11) 196(3)Pt2 0.38024(9) 0.06876(11) 201(3)Pt3 0.62220(9) 0.58482(11) 189(3)Al1 0.0017(7) 0.0827(9) 210(2)Al2 0.0714(8) 0.4553(8) 180(20)Al3 0.3017(7) 0.8651(9) 190(30)Al4 0.3174(7) 0.2828(9) 170(20)
102
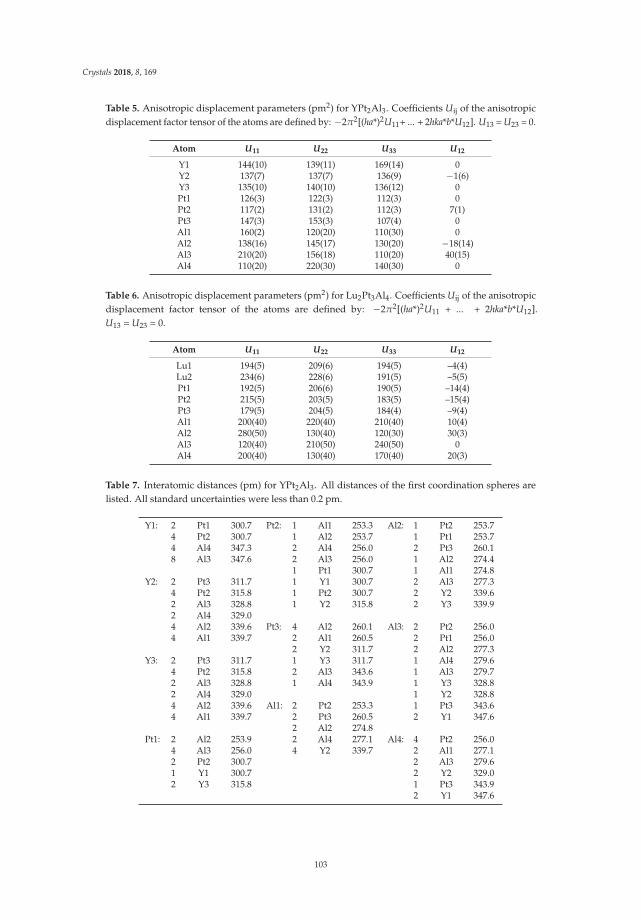
Crystals 2018, 8, 169
Table 5. Anisotropic displacement parameters (pm2) for YPt2Al3. Coefficients Uij of the anisotropicdisplacement factor tensor of the atoms are defined by: −2π2[(ha*)2U11+ ... + 2hka*b*U12]. U13 = U23 = 0.
Atom U11 U22 U33 U12
Y1 144(10) 139(11) 169(14) 0Y2 137(7) 137(7) 136(9) −1(6)Y3 135(10) 140(10) 136(12) 0Pt1 126(3) 122(3) 112(3) 0Pt2 117(2) 131(2) 112(3) 7(1)Pt3 147(3) 153(3) 107(4) 0Al1 160(2) 120(20) 110(30) 0Al2 138(16) 145(17) 130(20) −18(14)Al3 210(20) 156(18) 110(20) 40(15)Al4 110(20) 220(30) 140(30) 0
Table 6. Anisotropic displacement parameters (pm2) for Lu2Pt3Al4. Coefficients Uij of the anisotropicdisplacement factor tensor of the atoms are defined by: −2π2[(ha*)2U11 + ... + 2hka*b*U12].U13 = U23 = 0.
Atom U11 U22 U33 U12
Lu1 194(5) 209(6) 194(5) –4(4)Lu2 234(6) 228(6) 191(5) –5(5)Pt1 192(5) 206(6) 190(5) –14(4)Pt2 215(5) 203(5) 183(5) –15(4)Pt3 179(5) 204(5) 184(4) –9(4)Al1 200(40) 220(40) 210(40) 10(4)Al2 280(50) 130(40) 120(30) 30(3)Al3 120(40) 210(50) 240(50) 0Al4 200(40) 130(40) 170(40) 20(3)
Table 7. Interatomic distances (pm) for YPt2Al3. All distances of the first coordination spheres arelisted. All standard uncertainties were less than 0.2 pm.
Y1: 2 Pt1 300.7 Pt2: 1 Al1 253.3 Al2: 1 Pt2 253.74 Pt2 300.7 1 Al2 253.7 1 Pt1 253.74 Al4 347.3 2 Al4 256.0 2 Pt3 260.18 Al3 347.6 2 Al3 256.0 1 Al2 274.4
1 Pt1 300.7 1 Al1 274.8Y2: 2 Pt3 311.7 1 Y1 300.7 2 Al3 277.3
4 Pt2 315.8 1 Pt2 300.7 2 Y2 339.62 Al3 328.8 1 Y2 315.8 2 Y3 339.92 Al4 329.04 Al2 339.6 Pt3: 4 Al2 260.1 Al3: 2 Pt2 256.04 Al1 339.7 2 Al1 260.5 2 Pt1 256.0
2 Y2 311.7 2 Al2 277.3Y3: 2 Pt3 311.7 1 Y3 311.7 1 Al4 279.6
4 Pt2 315.8 2 Al3 343.6 1 Al3 279.72 Al3 328.8 1 Al4 343.9 1 Y3 328.82 Al4 329.0 1 Y2 328.84 Al2 339.6 Al1: 2 Pt2 253.3 1 Pt3 343.64 Al1 339.7 2 Pt3 260.5 2 Y1 347.6
2 Al2 274.8Pt1: 2 Al2 253.9 2 Al4 277.1 Al4: 4 Pt2 256.0
4 Al3 256.0 4 Y2 339.7 2 Al1 277.12 Pt2 300.7 2 Al3 279.61 Y1 300.7 2 Y2 329.02 Y3 315.8 1 Pt3 343.9
2 Y1 347.6
103
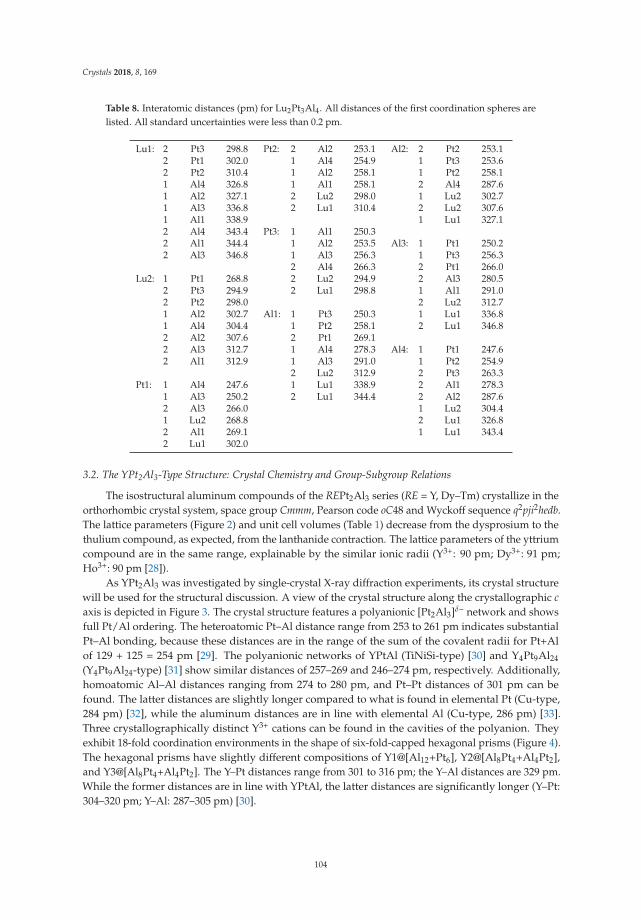
Crystals 2018, 8, 169
Table 8. Interatomic distances (pm) for Lu2Pt3Al4. All distances of the first coordination spheres arelisted. All standard uncertainties were less than 0.2 pm.
Lu1: 2 Pt3 298.8 Pt2: 2 Al2 253.1 Al2: 2 Pt2 253.12 Pt1 302.0 1 Al4 254.9 1 Pt3 253.62 Pt2 310.4 1 Al2 258.1 1 Pt2 258.11 Al4 326.8 1 Al1 258.1 2 Al4 287.61 Al2 327.1 2 Lu2 298.0 1 Lu2 302.71 Al3 336.8 2 Lu1 310.4 2 Lu2 307.61 Al1 338.9 1 Lu1 327.12 Al4 343.4 Pt3: 1 Al1 250.32 Al1 344.4 1 Al2 253.5 Al3: 1 Pt1 250.22 Al3 346.8 1 Al3 256.3 1 Pt3 256.3
2 Al4 266.3 2 Pt1 266.0Lu2: 1 Pt1 268.8 2 Lu2 294.9 2 Al3 280.5
2 Pt3 294.9 2 Lu1 298.8 1 Al1 291.02 Pt2 298.0 2 Lu2 312.71 Al2 302.7 Al1: 1 Pt3 250.3 1 Lu1 336.81 Al4 304.4 1 Pt2 258.1 2 Lu1 346.82 Al2 307.6 2 Pt1 269.12 Al3 312.7 1 Al4 278.3 Al4: 1 Pt1 247.62 Al1 312.9 1 Al3 291.0 1 Pt2 254.9
2 Lu2 312.9 2 Pt3 263.3Pt1: 1 Al4 247.6 1 Lu1 338.9 2 Al1 278.3
1 Al3 250.2 2 Lu1 344.4 2 Al2 287.62 Al3 266.0 1 Lu2 304.41 Lu2 268.8 2 Lu1 326.82 Al1 269.1 1 Lu1 343.42 Lu1 302.0
3.2. The YPt2Al3-Type Structure: Crystal Chemistry and Group-Subgroup Relations
The isostructural aluminum compounds of the REPt2Al3 series (RE = Y, Dy–Tm) crystallize in theorthorhombic crystal system, space group Cmmm, Pearson code oC48 and Wyckoff sequence q2pji2hedb.The lattice parameters (Figure 2) and unit cell volumes (Table 1) decrease from the dysprosium to thethulium compound, as expected, from the lanthanide contraction. The lattice parameters of the yttriumcompound are in the same range, explainable by the similar ionic radii (Y3+: 90 pm; Dy3+: 91 pm;Ho3+: 90 pm [28]).
As YPt2Al3 was investigated by single-crystal X-ray diffraction experiments, its crystal structurewill be used for the structural discussion. A view of the crystal structure along the crystallographic c
axis is depicted in Figure 3. The crystal structure features a polyanionic [Pt2Al3]δ– network and showsfull Pt/Al ordering. The heteroatomic Pt–Al distance range from 253 to 261 pm indicates substantialPt–Al bonding, because these distances are in the range of the sum of the covalent radii for Pt+Alof 129 + 125 = 254 pm [29]. The polyanionic networks of YPtAl (TiNiSi-type) [30] and Y4Pt9Al24
(Y4Pt9Al24-type) [31] show similar distances of 257–269 and 246–274 pm, respectively. Additionally,homoatomic Al–Al distances ranging from 274 to 280 pm, and Pt–Pt distances of 301 pm can befound. The latter distances are slightly longer compared to what is found in elemental Pt (Cu-type,284 pm) [32], while the aluminum distances are in line with elemental Al (Cu-type, 286 pm) [33].Three crystallographically distinct Y3+ cations can be found in the cavities of the polyanion. Theyexhibit 18-fold coordination environments in the shape of six-fold-capped hexagonal prisms (Figure 4).The hexagonal prisms have slightly different compositions of Y1@[Al12+Pt6], Y2@[Al8Pt4+Al4Pt2],and Y3@[Al8Pt4+Al4Pt2]. The Y–Pt distances range from 301 to 316 pm; the Y–Al distances are 329 pm.While the former distances are in line with YPtAl, the latter distances are significantly longer (Y–Pt:304–320 pm; Y–Al: 287–305 pm) [30].
104
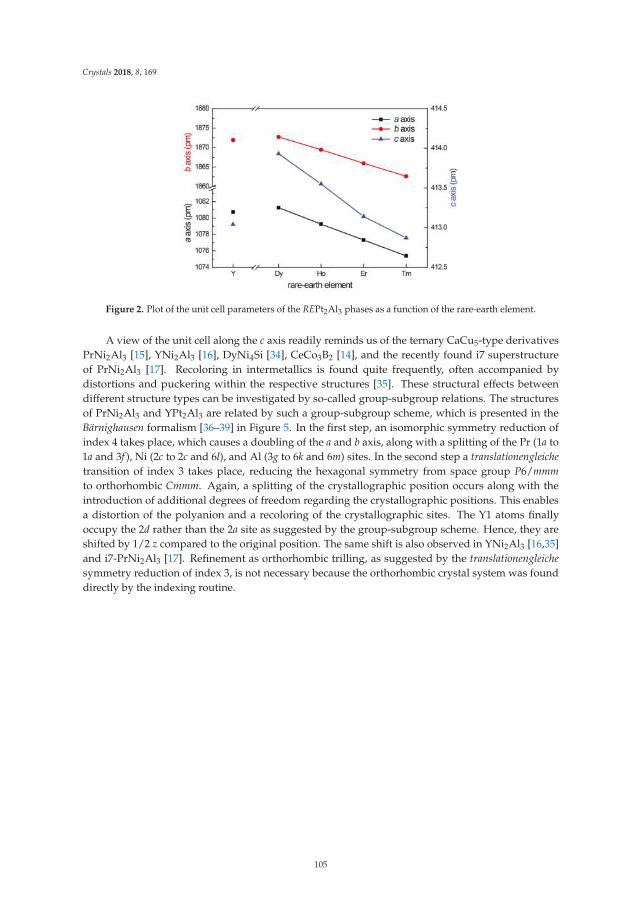
Crystals 2018, 8, 169
Figure 2. Plot of the unit cell parameters of the REPt2Al3 phases as a function of the rare-earth element.
A view of the unit cell along the c axis readily reminds us of the ternary CaCu5-type derivativesPrNi2Al3 [15], YNi2Al3 [16], DyNi4Si [34], CeCo3B2 [14], and the recently found i7 superstructureof PrNi2Al3 [17]. Recoloring in intermetallics is found quite frequently, often accompanied bydistortions and puckering within the respective structures [35]. These structural effects betweendifferent structure types can be investigated by so-called group-subgroup relations. The structuresof PrNi2Al3 and YPt2Al3 are related by such a group-subgroup scheme, which is presented in theBärnighausen formalism [36–39] in Figure 5. In the first step, an isomorphic symmetry reduction ofindex 4 takes place, which causes a doubling of the a and b axis, along with a splitting of the Pr (1a to1a and 3f ), Ni (2c to 2c and 6l), and Al (3g to 6k and 6m) sites. In the second step a translationengleiche
transition of index 3 takes place, reducing the hexagonal symmetry from space group P6/mmm
to orthorhombic Cmmm. Again, a splitting of the crystallographic position occurs along with theintroduction of additional degrees of freedom regarding the crystallographic positions. This enablesa distortion of the polyanion and a recoloring of the crystallographic sites. The Y1 atoms finallyoccupy the 2d rather than the 2a site as suggested by the group-subgroup scheme. Hence, they areshifted by 1/2 z compared to the original position. The same shift is also observed in YNi2Al3 [16,35]and i7-PrNi2Al3 [17]. Refinement as orthorhombic trilling, as suggested by the translationengleiche
symmetry reduction of index 3, is not necessary because the orthorhombic crystal system was founddirectly by the indexing routine.
105
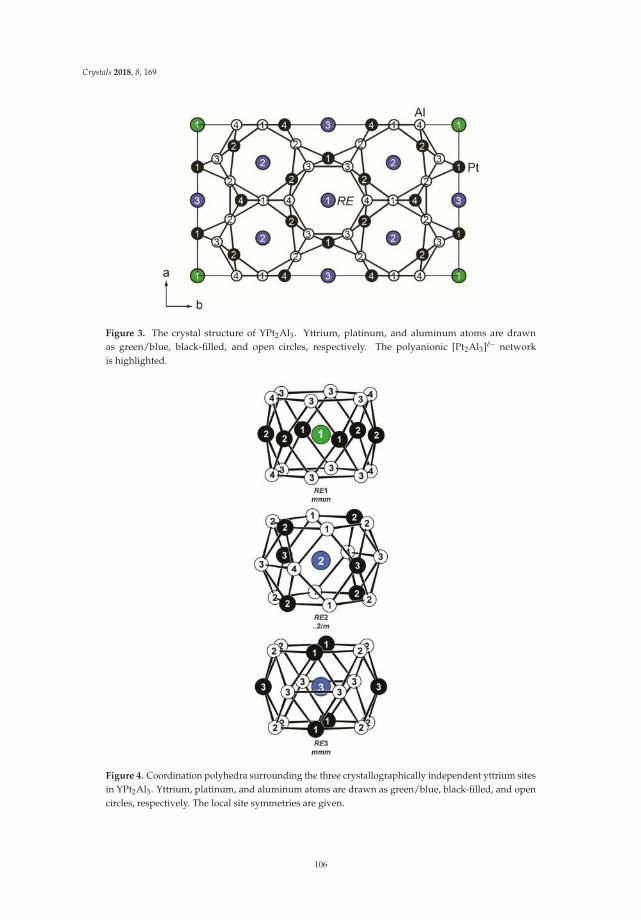
Crystals 2018, 8, 169
Figure 3. The crystal structure of YPt2Al3. Yttrium, platinum, and aluminum atoms are drawnas green/blue, black-filled, and open circles, respectively. The polyanionic [Pt2Al3]δ– networkis highlighted.
Figure 4. Coordination polyhedra surrounding the three crystallographically independent yttrium sitesin YPt2Al3. Yttrium, platinum, and aluminum atoms are drawn as green/blue, black-filled, and opencircles, respectively. The local site symmetries are given.
106
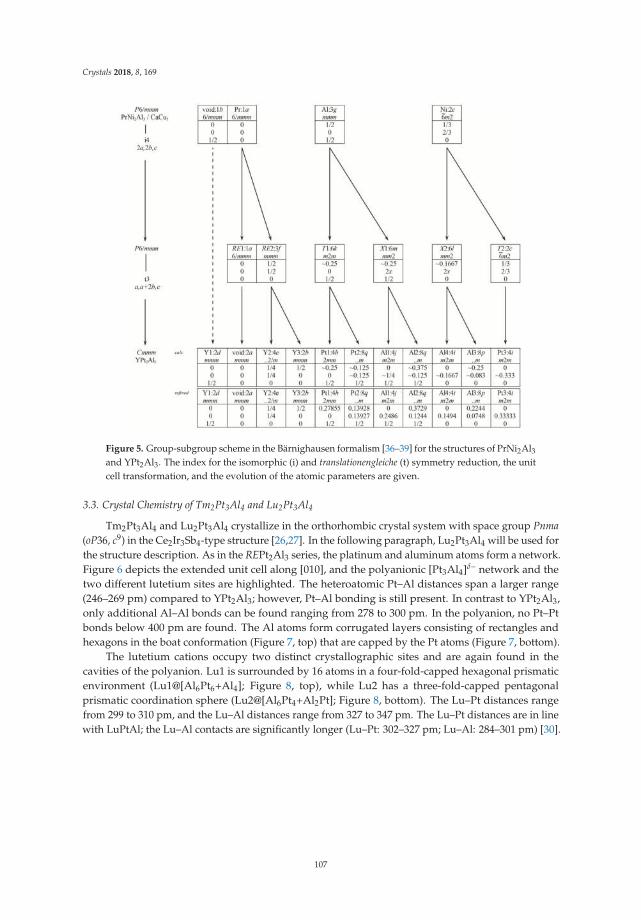
Crystals 2018, 8, 169
Figure 5. Group-subgroup scheme in the Bärnighausen formalism [36–39] for the structures of PrNi2Al3and YPt2Al3. The index for the isomorphic (i) and translationengleiche (t) symmetry reduction, the unitcell transformation, and the evolution of the atomic parameters are given.
3.3. Crystal Chemistry of Tm2Pt3Al4 and Lu2Pt3Al4
Tm2Pt3Al4 and Lu2Pt3Al4 crystallize in the orthorhombic crystal system with space group Pnma
(oP36, c9) in the Ce2Ir3Sb4-type structure [26,27]. In the following paragraph, Lu2Pt3Al4 will be used forthe structure description. As in the REPt2Al3 series, the platinum and aluminum atoms form a network.Figure 6 depicts the extended unit cell along [010], and the polyanionic [Pt3Al4]δ– network and thetwo different lutetium sites are highlighted. The heteroatomic Pt–Al distances span a larger range(246–269 pm) compared to YPt2Al3; however, Pt–Al bonding is still present. In contrast to YPt2Al3,only additional Al–Al bonds can be found ranging from 278 to 300 pm. In the polyanion, no Pt–Ptbonds below 400 pm are found. The Al atoms form corrugated layers consisting of rectangles andhexagons in the boat conformation (Figure 7, top) that are capped by the Pt atoms (Figure 7, bottom).
The lutetium cations occupy two distinct crystallographic sites and are again found in thecavities of the polyanion. Lu1 is surrounded by 16 atoms in a four-fold-capped hexagonal prismaticenvironment (Lu1@[Al6Pt6+Al4]; Figure 8, top), while Lu2 has a three-fold-capped pentagonalprismatic coordination sphere (Lu2@[Al6Pt4+Al2Pt]; Figure 8, bottom). The Lu–Pt distances rangefrom 299 to 310 pm, and the Lu–Al distances range from 327 to 347 pm. The Lu–Pt distances are in linewith LuPtAl; the Lu–Al contacts are significantly longer (Lu–Pt: 302–327 pm; Lu–Al: 284–301 pm) [30].
107
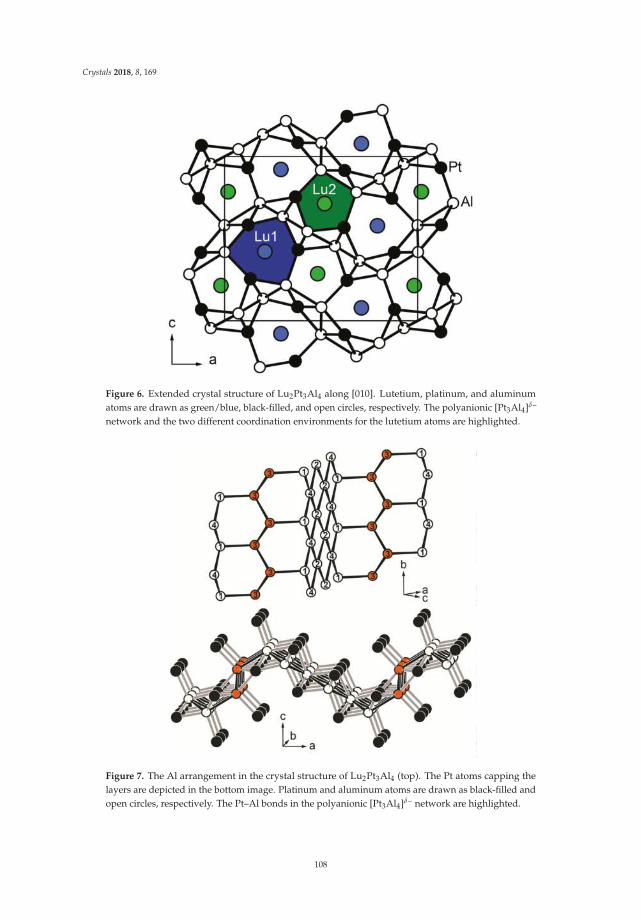
Crystals 2018, 8, 169
Figure 6. Extended crystal structure of Lu2Pt3Al4 along [010]. Lutetium, platinum, and aluminumatoms are drawn as green/blue, black-filled, and open circles, respectively. The polyanionic [Pt3Al4]δ–
network and the two different coordination environments for the lutetium atoms are highlighted.
Figure 7. The Al arrangement in the crystal structure of Lu2Pt3Al4 (top). The Pt atoms capping thelayers are depicted in the bottom image. Platinum and aluminum atoms are drawn as black-filled andopen circles, respectively. The Pt–Al bonds in the polyanionic [Pt3Al4]δ– network are highlighted.
108
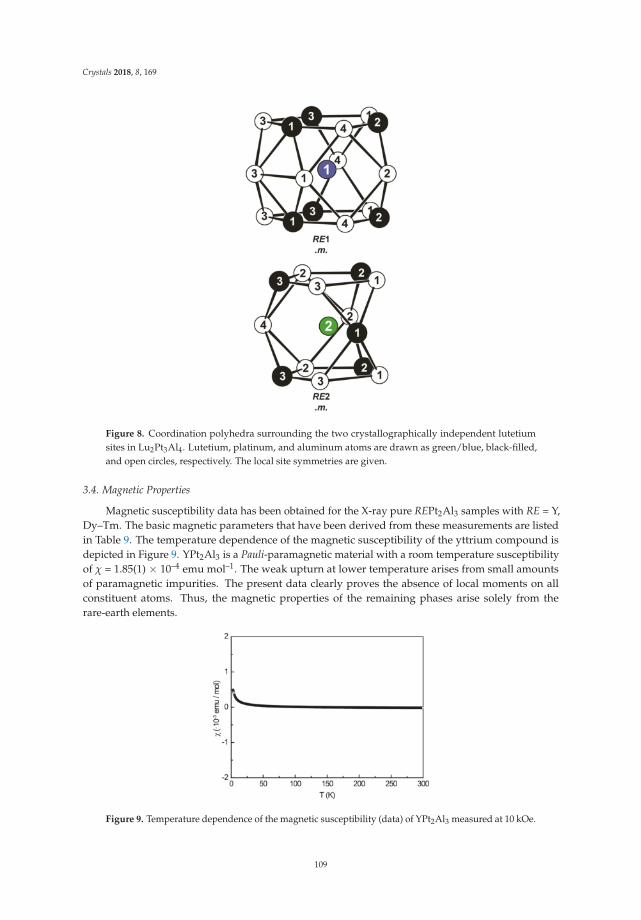
Crystals 2018, 8, 169
Figure 8. Coordination polyhedra surrounding the two crystallographically independent lutetiumsites in Lu2Pt3Al4. Lutetium, platinum, and aluminum atoms are drawn as green/blue, black-filled,and open circles, respectively. The local site symmetries are given.
3.4. Magnetic Properties
Magnetic susceptibility data has been obtained for the X-ray pure REPt2Al3 samples with RE = Y,Dy–Tm. The basic magnetic parameters that have been derived from these measurements are listedin Table 9. The temperature dependence of the magnetic susceptibility of the yttrium compound isdepicted in Figure 9. YPt2Al3 is a Pauli-paramagnetic material with a room temperature susceptibilityof χ = 1.85(1) × 10–4 emu mol–1. The weak upturn at lower temperature arises from small amountsof paramagnetic impurities. The present data clearly proves the absence of local moments on allconstituent atoms. Thus, the magnetic properties of the remaining phases arise solely from therare-earth elements.
Figure 9. Temperature dependence of the magnetic susceptibility (data) of YPt2Al3 measured at 10 kOe.
109
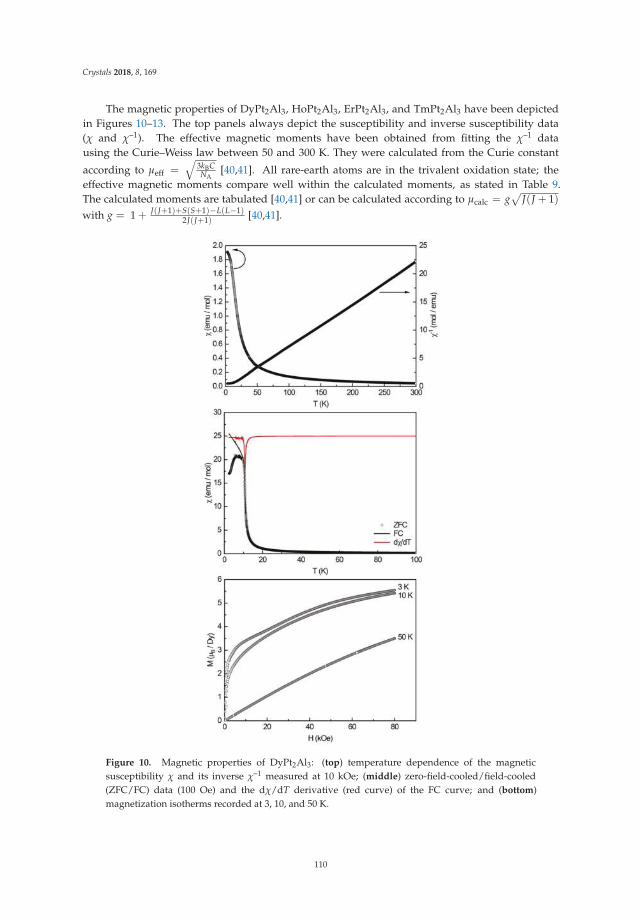
Crystals 2018, 8, 169
The magnetic properties of DyPt2Al3, HoPt2Al3, ErPt2Al3, and TmPt2Al3 have been depictedin Figures 10–13. The top panels always depict the susceptibility and inverse susceptibility data(χ and χ–1). The effective magnetic moments have been obtained from fitting the χ–1 datausing the Curie–Weiss law between 50 and 300 K. They were calculated from the Curie constant
according to µeff =√
3kBCNA
[40,41]. All rare-earth atoms are in the trivalent oxidation state; theeffective magnetic moments compare well within the calculated moments, as stated in Table 9.The calculated moments are tabulated [40,41] or can be calculated according to µcalc = g
√
J(J + 1)with g = 1 + J(J+1)+S(S+1)−L(L−1)
2J(J+1) [40,41].
Figure 10. Magnetic properties of DyPt2Al3: (top) temperature dependence of the magneticsusceptibility χ and its inverse χ–1 measured at 10 kOe; (middle) zero-field-cooled/field-cooled(ZFC/FC) data (100 Oe) and the dχ/dT derivative (red curve) of the FC curve; and (bottom)magnetization isotherms recorded at 3, 10, and 50 K.
110
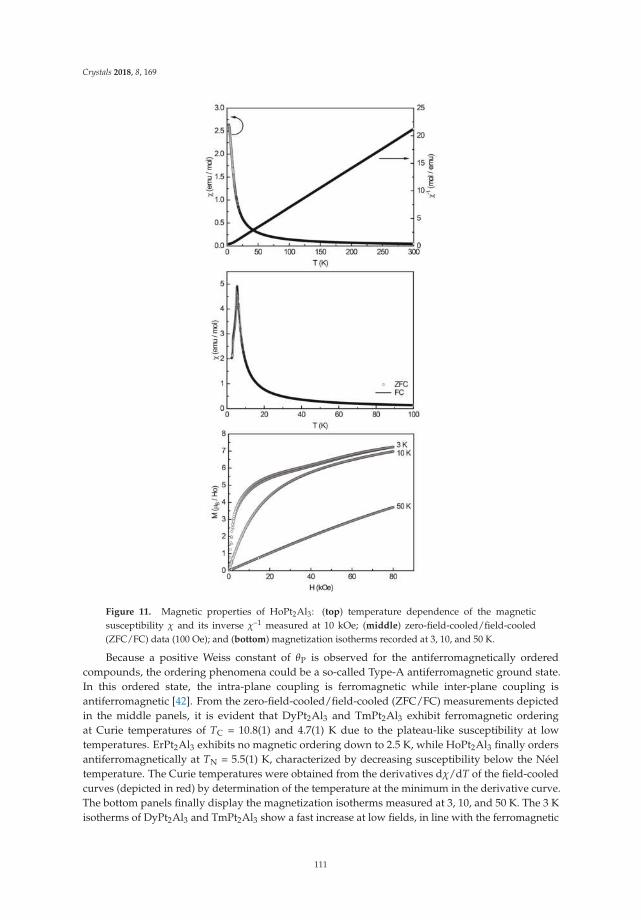
Crystals 2018, 8, 169
Figure 11. Magnetic properties of HoPt2Al3: (top) temperature dependence of the magneticsusceptibility χ and its inverse χ–1 measured at 10 kOe; (middle) zero-field-cooled/field-cooled(ZFC/FC) data (100 Oe); and (bottom) magnetization isotherms recorded at 3, 10, and 50 K.
Because a positive Weiss constant of θP is observed for the antiferromagnetically orderedcompounds, the ordering phenomena could be a so-called Type-A antiferromagnetic ground state.In this ordered state, the intra-plane coupling is ferromagnetic while inter-plane coupling isantiferromagnetic [42]. From the zero-field-cooled/field-cooled (ZFC/FC) measurements depictedin the middle panels, it is evident that DyPt2Al3 and TmPt2Al3 exhibit ferromagnetic orderingat Curie temperatures of TC = 10.8(1) and 4.7(1) K due to the plateau-like susceptibility at lowtemperatures. ErPt2Al3 exhibits no magnetic ordering down to 2.5 K, while HoPt2Al3 finally ordersantiferromagnetically at TN = 5.5(1) K, characterized by decreasing susceptibility below the Néeltemperature. The Curie temperatures were obtained from the derivatives dχ/dT of the field-cooledcurves (depicted in red) by determination of the temperature at the minimum in the derivative curve.The bottom panels finally display the magnetization isotherms measured at 3, 10, and 50 K. The 3 Kisotherms of DyPt2Al3 and TmPt2Al3 show a fast increase at low fields, in line with the ferromagnetic
111
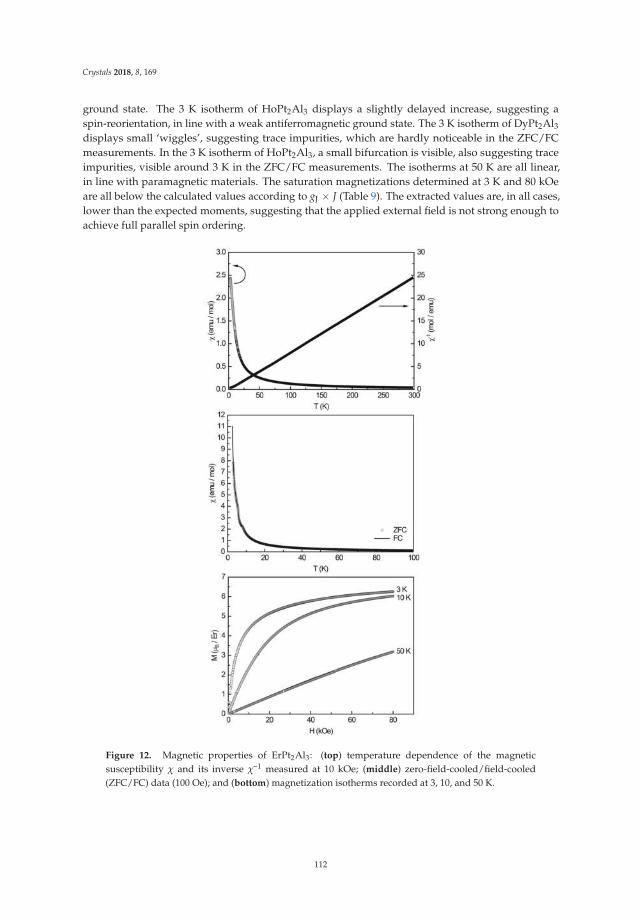
Crystals 2018, 8, 169
ground state. The 3 K isotherm of HoPt2Al3 displays a slightly delayed increase, suggesting aspin-reorientation, in line with a weak antiferromagnetic ground state. The 3 K isotherm of DyPt2Al3displays small ‘wiggles’, suggesting trace impurities, which are hardly noticeable in the ZFC/FCmeasurements. In the 3 K isotherm of HoPt2Al3, a small bifurcation is visible, also suggesting traceimpurities, visible around 3 K in the ZFC/FC measurements. The isotherms at 50 K are all linear,in line with paramagnetic materials. The saturation magnetizations determined at 3 K and 80 kOeare all below the calculated values according to gJ × J (Table 9). The extracted values are, in all cases,lower than the expected moments, suggesting that the applied external field is not strong enough toachieve full parallel spin ordering.
Figure 12. Magnetic properties of ErPt2Al3: (top) temperature dependence of the magneticsusceptibility χ and its inverse χ–1 measured at 10 kOe; (middle) zero-field-cooled/field-cooled(ZFC/FC) data (100 Oe); and (bottom) magnetization isotherms recorded at 3, 10, and 50 K.
112
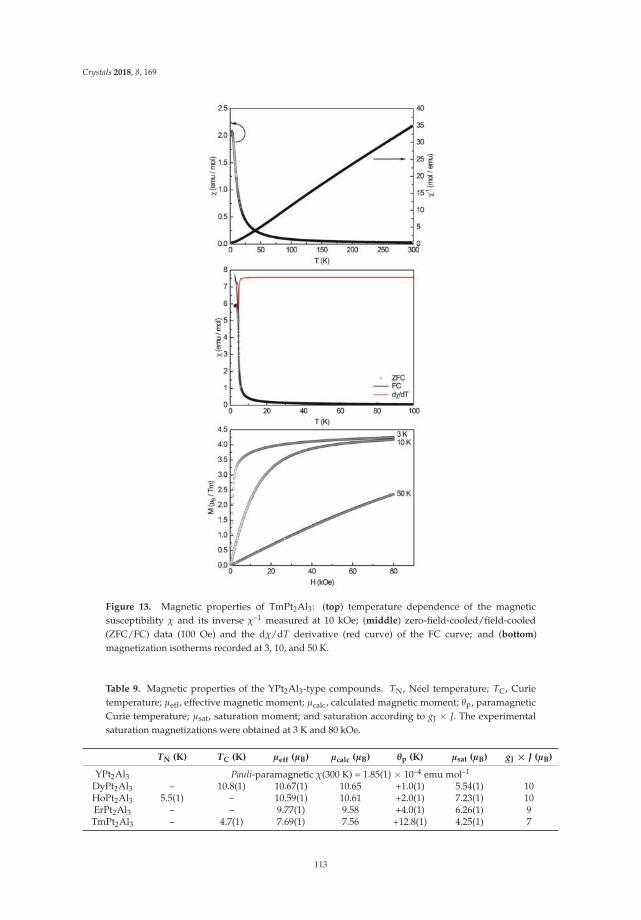
Crystals 2018, 8, 169
Figure 13. Magnetic properties of TmPt2Al3: (top) temperature dependence of the magneticsusceptibility χ and its inverse χ–1 measured at 10 kOe; (middle) zero-field-cooled/field-cooled(ZFC/FC) data (100 Oe) and the dχ/dT derivative (red curve) of the FC curve; and (bottom)magnetization isotherms recorded at 3, 10, and 50 K.
Table 9. Magnetic properties of the YPt2Al3-type compounds. TN, Néel temperature; TC, Curietemperature; µeff, effective magnetic moment; µcalc, calculated magnetic moment; θp, paramagneticCurie temperature; µsat, saturation moment; and saturation according to gJ × J. The experimentalsaturation magnetizations were obtained at 3 K and 80 kOe.
TN (K) TC (K) µeff (µB) µcalc (µB) θp (K) µsat (µB) gJ × J (µB)
YPt2Al3 Pauli-paramagnetic χ(300 K) = 1.85(1) × 10–4 emu mol–1
DyPt2Al3 – 10.8(1) 10.67(1) 10.65 +1.0(1) 5.54(1) 10HoPt2Al3 5.5(1) – 10.59(1) 10.61 +2.0(1) 7.23(1) 10ErPt2Al3 – – 9.77(1) 9.58 +4.0(1) 6.26(1) 9TmPt2Al3 – 4.7(1) 7.69(1) 7.56 +12.8(1) 4.25(1) 7
113
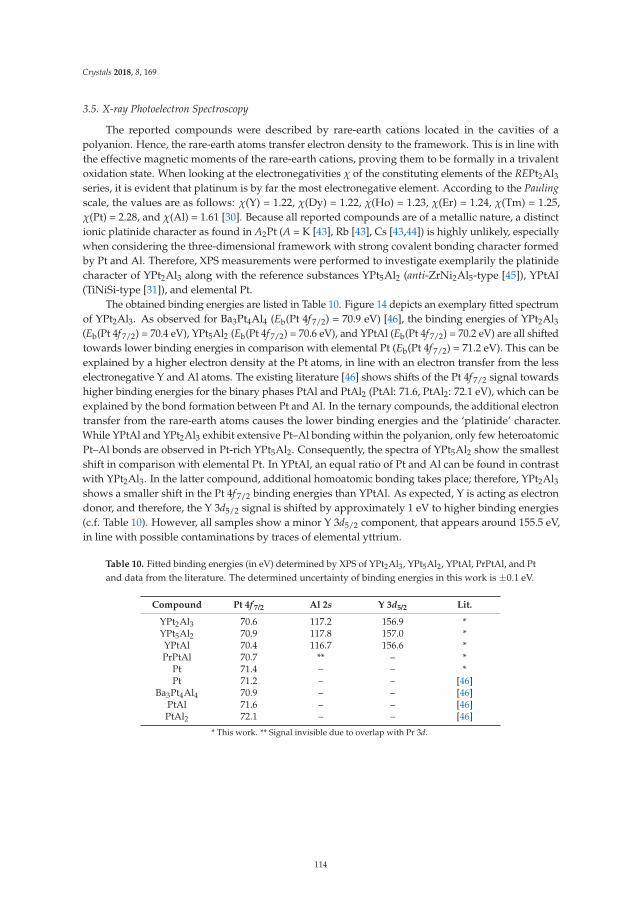
Crystals 2018, 8, 169
3.5. X-ray Photoelectron Spectroscopy
The reported compounds were described by rare-earth cations located in the cavities of apolyanion. Hence, the rare-earth atoms transfer electron density to the framework. This is in line withthe effective magnetic moments of the rare-earth cations, proving them to be formally in a trivalentoxidation state. When looking at the electronegativities χ of the constituting elements of the REPt2Al3series, it is evident that platinum is by far the most electronegative element. According to the Pauling
scale, the values are as follows: χ(Y) = 1.22, χ(Dy) = 1.22, χ(Ho) = 1.23, χ(Er) = 1.24, χ(Tm) = 1.25,χ(Pt) = 2.28, and χ(Al) = 1.61 [30]. Because all reported compounds are of a metallic nature, a distinctionic platinide character as found in A2Pt (A = K [43], Rb [43], Cs [43,44]) is highly unlikely, especiallywhen considering the three-dimensional framework with strong covalent bonding character formedby Pt and Al. Therefore, XPS measurements were performed to investigate exemplarily the platinidecharacter of YPt2Al3 along with the reference substances YPt5Al2 (anti-ZrNi2Al5-type [45]), YPtAl(TiNiSi-type [31]), and elemental Pt.
The obtained binding energies are listed in Table 10. Figure 14 depicts an exemplary fitted spectrumof YPt2Al3. As observed for Ba3Pt4Al4 (Eb(Pt 4f 7/2) = 70.9 eV) [46], the binding energies of YPt2Al3(Eb(Pt 4f 7/2) = 70.4 eV), YPt5Al2 (Eb(Pt 4f 7/2) = 70.6 eV), and YPtAl (Eb(Pt 4f 7/2) = 70.2 eV) are all shiftedtowards lower binding energies in comparison with elemental Pt (Eb(Pt 4f 7/2) = 71.2 eV). This can beexplained by a higher electron density at the Pt atoms, in line with an electron transfer from the lesselectronegative Y and Al atoms. The existing literature [46] shows shifts of the Pt 4f 7/2 signal towardshigher binding energies for the binary phases PtAl and PtAl2 (PtAl: 71.6, PtAl2: 72.1 eV), which can beexplained by the bond formation between Pt and Al. In the ternary compounds, the additional electrontransfer from the rare-earth atoms causes the lower binding energies and the ‘platinide’ character.While YPtAl and YPt2Al3 exhibit extensive Pt–Al bonding within the polyanion, only few heteroatomicPt–Al bonds are observed in Pt-rich YPt5Al2. Consequently, the spectra of YPt5Al2 show the smallestshift in comparison with elemental Pt. In YPtAl, an equal ratio of Pt and Al can be found in contrastwith YPt2Al3. In the latter compound, additional homoatomic bonding takes place; therefore, YPt2Al3shows a smaller shift in the Pt 4f 7/2 binding energies than YPtAl. As expected, Y is acting as electrondonor, and therefore, the Y 3d5/2 signal is shifted by approximately 1 eV to higher binding energies(c.f. Table 10). However, all samples show a minor Y 3d5/2 component, that appears around 155.5 eV,in line with possible contaminations by traces of elemental yttrium.
Table 10. Fitted binding energies (in eV) determined by XPS of YPt2Al3, YPt5Al2, YPtAl, PrPtAl, and Ptand data from the literature. The determined uncertainty of binding energies in this work is ±0.1 eV.
Compound Pt 4f 7/2 Al 2s Y 3d5/2 Lit.
YPt2Al3 70.6 117.2 156.9 *YPt5Al2 70.9 117.8 157.0 *YPtAl 70.4 116.7 156.6 *PrPtAl 70.7 ** – *
Pt 71.4 – – *Pt 71.2 – – [46]
Ba3Pt4Al4 70.9 – – [46]PtAl 71.6 – – [46]PtAl2 72.1 – – [46]
* This work. ** Signal invisible due to overlap with Pr 3d.
114
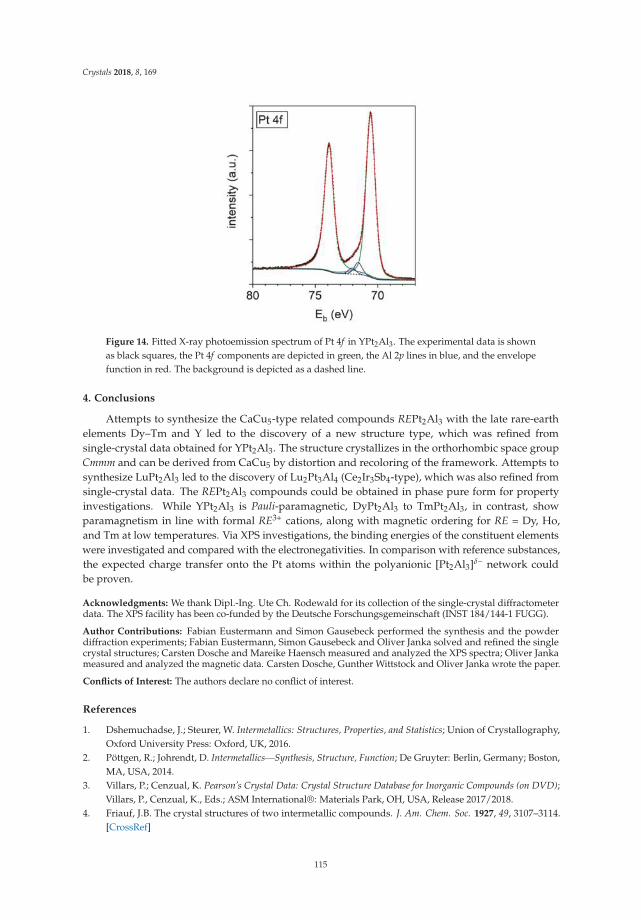
Crystals 2018, 8, 169
Figure 14. Fitted X-ray photoemission spectrum of Pt 4f in YPt2Al3. The experimental data is shownas black squares, the Pt 4f components are depicted in green, the Al 2p lines in blue, and the envelopefunction in red. The background is depicted as a dashed line.
4. Conclusions
Attempts to synthesize the CaCu5-type related compounds REPt2Al3 with the late rare-earthelements Dy–Tm and Y led to the discovery of a new structure type, which was refined fromsingle-crystal data obtained for YPt2Al3. The structure crystallizes in the orthorhombic space groupCmmm and can be derived from CaCu5 by distortion and recoloring of the framework. Attempts tosynthesize LuPt2Al3 led to the discovery of Lu2Pt3Al4 (Ce2Ir3Sb4-type), which was also refined fromsingle-crystal data. The REPt2Al3 compounds could be obtained in phase pure form for propertyinvestigations. While YPt2Al3 is Pauli-paramagnetic, DyPt2Al3 to TmPt2Al3, in contrast, showparamagnetism in line with formal RE3+ cations, along with magnetic ordering for RE = Dy, Ho,and Tm at low temperatures. Via XPS investigations, the binding energies of the constituent elementswere investigated and compared with the electronegativities. In comparison with reference substances,the expected charge transfer onto the Pt atoms within the polyanionic [Pt2Al3]δ– network couldbe proven.
Acknowledgments: We thank Dipl.-Ing. Ute Ch. Rodewald for its collection of the single-crystal diffractometerdata. The XPS facility has been co-funded by the Deutsche Forschungsgemeinschaft (INST 184/144-1 FUGG).
Author Contributions: Fabian Eustermann and Simon Gausebeck performed the synthesis and the powderdiffraction experiments; Fabian Eustermann, Simon Gausebeck and Oliver Janka solved and refined the singlecrystal structures; Carsten Dosche and Mareike Haensch measured and analyzed the XPS spectra; Oliver Jankameasured and analyzed the magnetic data. Carsten Dosche, Gunther Wittstock and Oliver Janka wrote the paper.
Conflicts of Interest: The authors declare no conflict of interest.
References
1. Dshemuchadse, J.; Steurer, W. Intermetallics: Structures, Properties, and Statistics; Union of Crystallography,Oxford University Press: Oxford, UK, 2016.
2. Pöttgen, R.; Johrendt, D. Intermetallics—Synthesis, Structure, Function; De Gruyter: Berlin, Germany; Boston,MA, USA, 2014.
3. Villars, P.; Cenzual, K. Pearson’s Crystal Data: Crystal Structure Database for Inorganic Compounds (on DVD);Villars, P., Cenzual, K., Eds.; ASM International®: Materials Park, OH, USA, Release 2017/2018.
4. Friauf, J.B. The crystal structures of two intermetallic compounds. J. Am. Chem. Soc. 1927, 49, 3107–3114.[CrossRef]
115
Crystals 2018, 8, 169
5. Lieser, K.H.; Witte, H. Untersuchungen in den ternären Systemen Magnesium-Kupfer-Zink,Magnesium-Nickel-Zink und Magnesium-Kupfer-Nickel. Z. Metallkd. 1952, 43, 396–401.
6. Johanssonm, C.H.; Linde, J.O. Röntgenographische Bestimmung der Atomanordnung in denMischkristallreihen Au-Cu und Pd-Cu. Annal. Physik 1925, 78, 439–460. [CrossRef]
7. Nowotny, H.N. Die Kristallstrukturen von Ni5Ce, Ni5La, Ni5Ca, Cu5La, Cu5Ca, Zn5La, Zn5Ca, Ni2Ce,MgCe, MgLa und MgSr. Z. Metallkd. 1942, 34, 247–253.
8. Ban, Z.; Sikirica, M. The crystal structure of ternary silicides ThM2Si2 (M = Cr, Mn, Fe, Co, Ni and Cu).Acta Crystallogr. 1965, 18, 594–599. [CrossRef]
9. Markiv, V.Y.; Matushevskaya, N.F.; Rozum, S.N.; Kuz’ma, Y.B. Investigation of aluminum-rich alloys of thesystem Zr-Ni-Al. Inorg. Mater. 1966, 2, 1356–1359.
10. Gupta, S.; Suresh, K.G. Review on magnetic and related properties of RTX compounds. J. Alloy Compd. 2015,618, 562–606. [CrossRef]
11. Pöttgen, R.; Chevalier, B. Cerium intermetallics with ZrNiAl-type structure—A review. Z. Naturforsch. B
2015, 70, 289–304. [CrossRef]12. Pöttgen, R.; Janka, O.; Chevalier, B. Cerium intermetallics CeTX—Review III. Z. Naturforsch. B 2016, 71,
165–191. [CrossRef]13. Janka, O.; Niehaus, O.; Pöttgen, R.; Chevalier, B. Cerium intermetallics with TiNiSi-type structure.
Z. Naturforsch. B 2016, 71, 737–764. [CrossRef]14. Kuz’ma, Y.B.; Krypyakevych, P.I.; Bilonizhko, N.S. Crystal structure of CeCo3B3 and analogous compounds.
Dopov. Akad. Nauk Ukr. RSR 1969, A31, 939–941.15. Rykhal, R.M.; Zarechnyuk, O.S.; Kuten, J.I. Isothermal section at 800 C for the
praseodymium-nickel-aluminium ternary system in the range of 0–33.3 at.% of praseodymium.Dopov. Akad. Nauk Ukr. RSR 1978, A10, 1136–1138.
16. Zarechnyuk, O.S.; Rykhal, R.M. Crystal Structure of the Compound YNi2Al3 and Related Phases. Visn. Lviv.
Derzh. Univ., Ser. Khim. 1981, 23, 45–47.17. Eustermann, F.; Hoffmann, R.-D.; Janka, O. Superstructure formation in PrNi2Al3 and ErPd2Al3. Z. Kristallogr.
2017, 232, 573–581. [CrossRef]18. Blazina, Z.; Westwood, S.M. On the structural and magnetic properties of the CePt5−xAlx system.
J. Alloy Compd. 1993, 201, 151–155. [CrossRef]19. Pöttgen, R.; Gulden, T.; Simon, A. Miniaturisierte Lichtbogenapperatur für den Laborbedarf. GIT Labor-Fachz.
1999, 43, 133–136.20. Pöttgen, R.; Lang, A.; Hoffmann, R.-D.; Künnen, B.; Kotzyba, G.; Müllmann, R.; Mosel, B.D.; Rosenhahn, C.
The stannides YbPtSn and Yb2Pt3Sn5. Z. Kristallogr. 1999, 214, 143–150. [CrossRef]21. Yvon, K.; Jeitschko, W.; Parthé, E. LAZY PULVERIX, a computer program, for calculating X-ray and neutron
diffraction powder patterns. J. Appl. Crystallogr. 1977, 10, 73–74. [CrossRef]22. Dectris. Technical Specification and Operating Procedure Pilatus 100K-S Detector System, Version 1.7; Dectris:
Baden-Daettwil, Switzerland, 2011.23. Palatinus, L.; Chapuis, G. SUPERFLIP—A computer program for the solution of crystal structures by charge
flipping in arbitrary dimensions. J. Appl. Crystallogr. 2007, 40, 786–790. [CrossRef]24. Petrícek, V.; Dušek, M.; Palatinus, L. Jana2006. The Crystallographic Computing System; Institute of Physics:
Praha, Czech Republic, 2006.25. Petrícek, V.; Dušek, M.; Palatinus, L. Crystallographic Computing System JANA2006: General features.
Z. Kristallogr. 2014, 229, 345–352. [CrossRef]26. Schäfer, K.; Hermes, W.; Rodewald, U.C.; Hoffmann, R.-D.; Pöttgen, R. Ternary Antimonides RE2Ir3Sb4
(RE = La, Ce, Pr, Nd). Z. Naturforsch. B 2011, 66, 777–783. [CrossRef]27. Cardoso-Gil, R.; Caroca-Canales, N.; Budnyk, S.; Schnelle, W. Crystal structure, chemical bonding and
magnetic properties of the new antimonides Ce2Ir3Sb4, La2Ir3Sb4, and Ce2Rh3Sb4. Z. Kristallogr. 2011, 226,657–666. [CrossRef]
28. Shannon, R.D. Revised effective ionic radii and systematic studies of interatomic distances in halides andchalcogenides. Acta Crystallogr. 1976, A32, 751. [CrossRef]
29. Emsley, J. The Elements; Clarendon Press-Oxford University Press: Oxford, UK; New York, NY, USA, 1998.30. Dwight, A.E. Crystal structure of equiatomic ternary compounds: Lanthanide-transition metal aluminides.
J. Less-Common Met. 1984, 102, L9–L13. [CrossRef]
116
Crystals 2018, 8, 169
31. Thiede, V.M.T.; Fehrmann, B.; Jeitschko, W. Ternary Rare Earth Metal Palladium and Platinum AluminidesR4Pd9Al24 and R4Pt9Al24. Z. Anorg. Allg. Chem. 1999, 625, 1417–1425. [CrossRef]
32. Hull, A.W. The positions of atoms in metals. Proc. Am. Inst. Electr. Eng. 1919, 38, 1445–1466. [CrossRef]33. Hull, A.W. A New Method of X-Ray Crystal Analysis. Phys. Rev. 1917, 10, 661–696. [CrossRef]34. Morozkin, A.V.; Knotko, A.V.; Yapaskurt, V.O.; Yuan, F.; Mozharivskyj, Y.; Nirmala, R. New orthorhombic
derivative of CaCu5-type structure: RNi4Si compounds (R = Y, La, Ce, Sm, Gd–Ho), crystal structure andsome magnetic properties. J. Solid State Chem. 2013, 208, 9–13. [CrossRef]
35. Pöttgen, R. Coloring, Distortions, and Puckering in Selected Intermetallic Structures from the Perspective ofGroup-Subgroup Relations. Z. Anorg. Allg. Chem. 2014, 640, 869–891. [CrossRef]
36. Bärnighausen, H. Group-Subgroup Relations between Space Groups: A Useful Tool in Crystal Chemistry.Commun. Math. Chem. 1980, 9, 139–175.
37. Bärnighausen, H.; Müller, U. Symmetriebeziehungen Zwischen den Raumgruppen als Hilfsmittel zur Straffen
Darstellung von Strukturzusammenhängen in der Kristallchemie; Universität Karlsruhe und Universität-Gh:Kassel, Germany, 1996.
38. Müller, U. Kristallographische Gruppe-Untergruppe-Beziehungen und ihre Anwendung in derKristallchemie. Z. Anorg. Allg. Chem. 2004, 630, 1519–1537. [CrossRef]
39. Müller, U. Symmetry Relationships between Crystal Structures; Oxford University Press: New York, NY,USA, 2013.
40. Lueken, H. Magnetochemie; B.G. Teubner: Stuttgart/Leipzig, Germany, 1999.41. Cheetham, A.K.; Day, P. Solid State Chemistry Techniques; Oxford University Press: New York, NY, USA, 1991.42. Wollan, E.O.; Koehler, W.C. Neutron Diffraction Study of the Magnetic Properties of the Series of
Perovskite-Type Compounds [(1−x)La,xCa]MnO3. Phys. Rev. 1955, 100, 545–563. [CrossRef]43. Karpov, A.; Jansen, M. A New Family of Binary Layered Compounds of Platinum with Alkali Metals (A = K,
Rb, Cs). Z. Anorg. Allg. Chem. 2006, 632, 84–90. [CrossRef]44. Karpov, A.; Nuss, J.; Wedig, U.; Jansen, M. Cs2Pt: A Platinide(-II) Exhibiting Complete Charge Separation.
Angew. Chem. Int. Ed. 2003, 42, 4818–4821. [CrossRef] [PubMed]45. Benndorf, C.; Stegemann, F.; Eckert, H.; Janka, O. New transition metal-rich rare-earth palladium/platinum
aluminides with RET5Al2 composition: Structure, magnetism and 27Al NMR spectroscopy. Z. Naturforsch. B
2015, 70, 101–110.46. Stegemann, F.; Benndorf, C.; Bartsch, T.; Touzani, R.S.; Bartsch, M.; Zacharias, H.; Fokwa, B.P.T.; Eckert, H.;
Janka, O. Ba3Pt4Al4—Structure, Properties, and Theoretical and NMR Spectroscopic Investigations of aComplex Platinide Featuring Heterocubane [Pt4Al4] Units. Inorg. Chem. 2015, 54, 10785–10793. [CrossRef][PubMed]
© 2018 by the authors. Licensee MDPI, Basel, Switzerland. This article is an open accessarticle distributed under the terms and conditions of the Creative Commons Attribution(CC BY) license (http://creativecommons.org/licenses/by/4.0/).
117
crystals
Review
The Crystal Orbital Hamilton Population (COHP)Method as a Tool to Visualize and Analyze ChemicalBonding in Intermetallic Compounds
Simon Steinberg 1 and Richard Dronskowski 1,2,*1 Institute of Inorganic Chemistry, RWTH Aachen University, D-52056 Aachen, Germany;
[email protected] Jülich-Aachen Research Alliance (JARA-FIT and -HPC), RWTH Aachen University,
D-52056 Aachen, Germany* Correspondence: [email protected]; Tel.: +49-241-80-93642
Received: 25 April 2018; Accepted: 14 May 2018; Published: 18 May 2018
Abstract: Recognizing the bonding situations in chemical compounds is of fundamental interestfor materials design because this very knowledge allows us to understand the sheer existence of amaterial and the structural arrangement of its constituting atoms. Since its definition 25 years ago,the Crystal Orbital Hamilton Population (COHP) method has been established as an efficient andreliable tool to extract the chemical-bonding information based on electronic-structure calculations ofvarious quantum-chemical types. In this review, we present a brief introduction into the theoreticalbackground of the COHP method and illustrate the latter by diverse applications, in particular bylooking at representatives of the class of (polar) intermetallic compounds, usually considered as“black sheep” in the light of valence-electron counting schemes.
Keywords: COHP method; bonding analyses; intermetallic compounds
1. Introduction
The search for the inmost force which binds the world [1] and its constituents has generatedenormous attention among scientists, and early theoretical research on the origin of this force identifieda chemical power making atoms combine by so-called “valence bonds” [2]. The introduction of thisvery idea of valence bonds which arise from the atoms’ valence electrons facilitated the developmentsof certain concepts, e.g., the octet rule [3], as fundamental relationships needed to rationalize thestructural arrangements and the electronic structures of diverse molecules. For the case of solid-statematerials, in particular ionic salts, first explorations to establish relationships between the structuralarrangements and the electron counts of such solids employed empirical data and resulted in varioussolid-state rules which, for instance, were based on the ratios of ionic radii, the “strengths” of theelectrostatic bonds, and the connectivities between diverse coordination polyhedra [4]. Further researchon the distributions of the valence electrons in intermetallic compounds revealed additional notions,e.g., those first proposed by Zintl [5–10] and Hume-Rothery [11–13], respectively, to somehow correlatestructural arrangements and the atoms’ electronic nature. Even today, however, the existence ofintermetallic compounds for which the electronic structures and, furthermore, the nature of bondingcannot be trivially categorized by applying one of the aforementioned concepts [14,15] underlines theneed for different means in order to reveal the bonding nature in such materials.
To determine an unbiased picture of the nature of bonding in a given solid-state material, it seemsnecessary to extract the chemical bonding information from the electronic band structure that iscomputed for the respective material by means of a quantum-mechanical technique. For this purpose,
Crystals 2018, 8, 225; doi:10.3390/cryst8050225 www.mdpi.com/journal/crystals118
Crystals 2018, 8, 225
the total energy of a many-particle system, i.e., the sum of the potential and kinetic energy, needs to becalculated solving the time-independent Schrödinger equation [16]
HΨ = EΨ (1)
with H as the Hamiltonian operator, at least in principle. The wave function Ψ itself is then given by aproperly symmetrized product of one-electron functions, so-called orbitals ψ. In the case of solid-statematerials, the one-electron functions ψ are then constructed following Bloch´s theorem to incorporatethe most important crystallographic symmetry: translation [17]. During the past nine decades, diversetechniques have been developed to approach the energies in order to construct the electronic bandstructure and densities-of-states of a given many-particle system [18]. The most successful trickto avoid calculating the many-electron wave function Ψ, however, is given by the framework ofdensity-functional theory [19–21], the workhorse of numerous of today´s quantum-chemical computerprograms. Here, the electron density, ρ(r), plays a major role in generating an effective potential Veff(r)for non-existent pseudo-electrons plus some exchange-correlation correction term. In the end, oneneeds to solve the single-particle Kohn–Sham equations
[
−12∇2 + Veff(r)
]
ψi(r) = Eiψi(r) (2)
and deals with one-electron ψi pseudo-functions to exactly cover the kinetic energy which is thelargest contributor. One approach to eventually obtain the bonding information from the resultsof the electronic band structure calculations (regardless of wave-function or density-based) is thecrystal orbital Hamilton population (COHP) method [22,23]. In the framework of the COHP technique,bonding, non-bonding, and antibonding interactions are identified for pairs of atoms (or orbitals) ina given solid-state material. In this review, we will present prototypical applications of the COHPprocedure to solid-state materials. The outcome of this survey will demonstrate the efficiency of themethod to reveal the actual nature of bonding and, furthermore, the causes for structural preferencesin solids.
2. The COHP Method—An Introduction
Before demonstrating the applications of the COHP method for intermetallic compounds, we willprovide a brief introduction into that technique. To obtain the energy of a many-particle system bysolving the aforementioned Schrödinger or Kohn–Sham equations, one first needs to establish properone-electron wave functions (orbitals). In the case of molecules consisting of a couple of atoms, thesemolecular orbitals are given by a linear combination of atomic orbitals (LCAO)
ψi(r) = ∑A
n
∑µ=1µ∈A
cµiφµ(r), (3)
composed of basis functions φµ(r), i.e., the atomic orbitals of the atoms A, and the mixing coefficientscµi. To obtain the energies of molecular systems, the Hamiltonian acts on the respective wavefunctions—but what is the best wave function among all possible functions? It is the one correspondingto the lowest total energy attainable by the variational principle [24]. Hence, the energy is differentiatedwith respect to the coefficients cµi (∂E/∂cµi) leading to the secular determinant
∑A ∑B ∑µ ∑νc∗µicνi Hµν − ∑A ∑B ∑µ ∑ν
c∗µicνiSµνEi = 0, (4)
with Hµν = 〈φµ
∣∣H
∣∣φν〉 and Sµν = 〈φµ
∣∣φν〉 representing the on-site and off-site entries of the
Hamiltonian and overlap matrices. In particular, Hµµ (µ = ν) contain the on-site or Coloumb integrals,
119
Crystals 2018, 8, 225
Hµν (µ = ν) are the off-site, hopping, interaction or resonance integrals, and Sµν represents the overlapintegrals. Note that we use the Dirac bracket notation, in which φµ represent the conjugate complexwave functions, because φ can (and will be) a complex function including an imaginary part.
While the aforementioned procedure allows determining the energies of a given molecular system,at this point, one may wonder how the assignments of electrons to particular orbitals thereby providinginformation about the electron distribution can be accomplished. The numbers of electrons residing inthe entire molecule and its molecular orbitals is given by
N = ∑A
∑µ
µ∈A
m
∑i
fic2µi + 2 ∑
A∑
B>A∑µ
µ∈A
∑ν
ν∈B
m
∑i
ficµicνiSµν (5)
= ∑A
∑µ
µ∈A
m
∑i
fi
⎛
⎜⎜⎜⎜⎜⎜⎝
c2µi + ∑
B =A∑ν
ν∈B
cµicνiSµν
⎞
⎟⎟⎟⎟⎟⎟⎠
(6)
with fi as the occupation numbers, which can be 0, 1, or 2. The first term of the Equation (5) representsthe net populations, while the second one contains the overlap populations. Furthermore, the sum ofboth terms shown in the Equation (6) comprises the gross populations, following an early suggestionof Mulliken.
While the LCAO ansatz is used to solve Schrödinger’s equation for molecules, the wave functionsemployed to solve Schrödinger’s or the Kohn–Sham equations for solid-state materials are constructedbased on Bloch´s theorem [17]
ψ(k, r + T) = eikTψ(k, r), (7)
with T as some lattice vector commutating with the Hamiltonian, ψ(k, r) as the crystal orbital ata specific site r, and k as a new quantum number from reciprocal space. Without doubt, thisis the most important theorem of theoretical solid-state science. The requirement of translationalsymmetry for constructing the wave functions fulfilling Bloch´s theorem also demands that the crystalstructure of a given material does not comprise any atomic sites showing positional of occupationaldisorders. Because the crystal structures of certain intermetallic compounds do comprise positionallyor occupationally disordered sites (see Sections 3.2 and 3.3), it is necessary to examine the electronicstructures of models approximating the actual crystal structures of such materials. To obtain numbers ofelectrons occupying the crystal orbitals in a given solid-state material, the k-dependence of mixingcoefficients cµi and cνi needs to be taken into consideration, leading to the k-dependent density matrix
Pµν(k) = ∑i
fic∗µi(k)cνi(k) (8)
Inserting Equation (8) in the Equations (5) and (6), respectively, and taking∫
Pµν(k)dk = Pµν
into account results in
N = ∑A
∑µ
µ∈A
Pµµ + 2 ∑A
∑B>A
∑µ
µ∈A
∑ν
ν∈B
Re[PµνSµν
](9)
120
Crystals 2018, 8, 225
= ∑A
∑µ
µ∈A
⎛
⎜⎜⎜⎜⎜⎜⎝
Pµµ + ∑B =A
∑ν
ν∈B
Re[PµνSµν
]
⎞
⎟⎟⎟⎟⎟⎟⎠
, (10)
with Re[PµνSµν] as the real parts of the (possibly) complex off-diagonal entries. To get hold of thenumbers of electrons N being dependent of the (band) energy, it is convenient to introduce thedensity-of-states matrix
Pµν(E) = ∑i
fic∗µicνiδ(ε − εi) (11)
which is obtained from a differentiation of Pµν with respect to E
Pµν =∫ εF
−∞Pµν(E)dE (12)
Combining the Equations (9) and (10) with Equation (11) yields
N =
εF∫
−∞
∑A
∑µ
µ∈A
Pµµ(E)dE +
εF∫
−∞
2 ∑A
∑B>A
∑µ
µ∈A
∑ν
ν∈B
Re[Pµν(E)Sµν
]dE (13)
=
εF∫
−∞
∑A
∑µ
µ∈A
⎛
⎜⎜⎜⎜⎜⎜⎝
Pµµ(E)dE + ∑B =A
∑ν
ν∈B
Re[Pµν(E)Sµν
]
⎞
⎟⎟⎟⎟⎟⎟⎠
dE (14)
The (second) off-diagonal contribution of the gross population in Equation (14), i.e.,Re[Pµν(E)Sµν], comprises the overlap-population-weighted densities-of-states and, hence, providesthe essential information regarding the distributions of the electrons between the atoms in anygiven solid-state material. This very technique to extract the bonding information based on theoverlap-population-weighted densities-of-states has been dubbed as the crystal orbital overlappopulation (COOP) method [25]. In the framework of the COOP method, bonding and antibondinginteractions are represented by positive and negative COOP values, respectively, while nonbondinginteractions are indicated by zero COOPs. The COOP method has been largely employed forelectronic-structure computations based on the semiempirical extended Hückel theory (EHT), which isprincipally equivalent to the empirical tight-binding approach including overlap [26]. In the EHT case,only the valence orbital are taken into account. In addition, certain entries of the secular determinantEquation (4), in particular, those of the interaction (Hµν) integrals, are parameterized; to do so, theinteraction matrix elements are determined solving the Wolfsberg–Helmholz formula [27] that employsCoulomb matrix elements (Hµµ) evolved from experimentally determined ionization potentials, whilethe overlap matrix elements are calculated utilizing Slater-type orbitals.
As denoted in the previous paragraph, theoretically determining the ground state of a givensolid-state system can be carried out by different approaches, and the computational challengesarising from the notorious electron–electron interactions can be so tremendous that they easilyovercome today´s (and also tomorrow’s) available computational resources [18]. To nonethelesscome to numerically powerful solutions of this problem, it has turned out extraordinarily convenientto concentrate on the electron density ρ(r) which arises from effective one-electron wave functions(orbitals) ψi(r) in the framework of density-functional-theory [19–21] (DFT), leading to
121
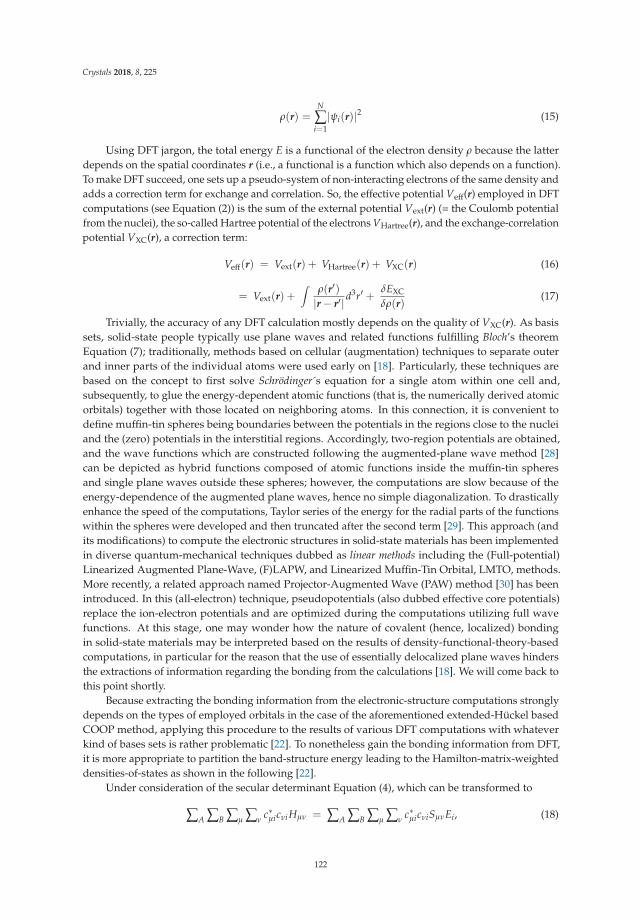
Crystals 2018, 8, 225
ρ(r) =N
∑i=1
|ψi(r)|2 (15)
Using DFT jargon, the total energy E is a functional of the electron density ρ because the latterdepends on the spatial coordinates r (i.e., a functional is a function which also depends on a function).To make DFT succeed, one sets up a pseudo-system of non-interacting electrons of the same density andadds a correction term for exchange and correlation. So, the effective potential Veff(r) employed in DFTcomputations (see Equation (2)) is the sum of the external potential Vext(r) (= the Coulomb potentialfrom the nuclei), the so-called Hartree potential of the electrons VHartree(r), and the exchange-correlationpotential VXC(r), a correction term:
Veff(r) = Vext(r) + VHartree(r) + VXC(r) (16)
= Vext(r) +∫
ρ(r′)
|r − r′|d3r′ +
δEXC
δρ(r)(17)
Trivially, the accuracy of any DFT calculation mostly depends on the quality of VXC(r). As basissets, solid-state people typically use plane waves and related functions fulfilling Bloch’s theoremEquation (7); traditionally, methods based on cellular (augmentation) techniques to separate outerand inner parts of the individual atoms were used early on [18]. Particularly, these techniques arebased on the concept to first solve Schrödinger´s equation for a single atom within one cell and,subsequently, to glue the energy-dependent atomic functions (that is, the numerically derived atomicorbitals) together with those located on neighboring atoms. In this connection, it is convenient todefine muffin-tin spheres being boundaries between the potentials in the regions close to the nucleiand the (zero) potentials in the interstitial regions. Accordingly, two-region potentials are obtained,and the wave functions which are constructed following the augmented-plane wave method [28]can be depicted as hybrid functions composed of atomic functions inside the muffin-tin spheresand single plane waves outside these spheres; however, the computations are slow because of theenergy-dependence of the augmented plane waves, hence no simple diagonalization. To drasticallyenhance the speed of the computations, Taylor series of the energy for the radial parts of the functionswithin the spheres were developed and then truncated after the second term [29]. This approach (andits modifications) to compute the electronic structures in solid-state materials has been implementedin diverse quantum-mechanical techniques dubbed as linear methods including the (Full-potential)Linearized Augmented Plane-Wave, (F)LAPW, and Linearized Muffin-Tin Orbital, LMTO, methods.More recently, a related approach named Projector-Augmented Wave (PAW) method [30] has beenintroduced. In this (all-electron) technique, pseudopotentials (also dubbed effective core potentials)replace the ion-electron potentials and are optimized during the computations utilizing full wavefunctions. At this stage, one may wonder how the nature of covalent (hence, localized) bondingin solid-state materials may be interpreted based on the results of density-functional-theory-basedcomputations, in particular for the reason that the use of essentially delocalized plane waves hindersthe extractions of information regarding the bonding from the calculations [18]. We will come back tothis point shortly.
Because extracting the bonding information from the electronic-structure computations stronglydepends on the types of employed orbitals in the case of the aforementioned extended-Hückel basedCOOP method, applying this procedure to the results of various DFT computations with whateverkind of bases sets is rather problematic [22]. To nonetheless gain the bonding information from DFT,it is more appropriate to partition the band-structure energy leading to the Hamilton-matrix-weighteddensities-of-states as shown in the following [22].
Under consideration of the secular determinant Equation (4), which can be transformed to
∑A ∑B ∑µ ∑νc∗µicνi Hµν = ∑A ∑B ∑µ ∑ν
c∗µicνiSµνEi, (18)
122
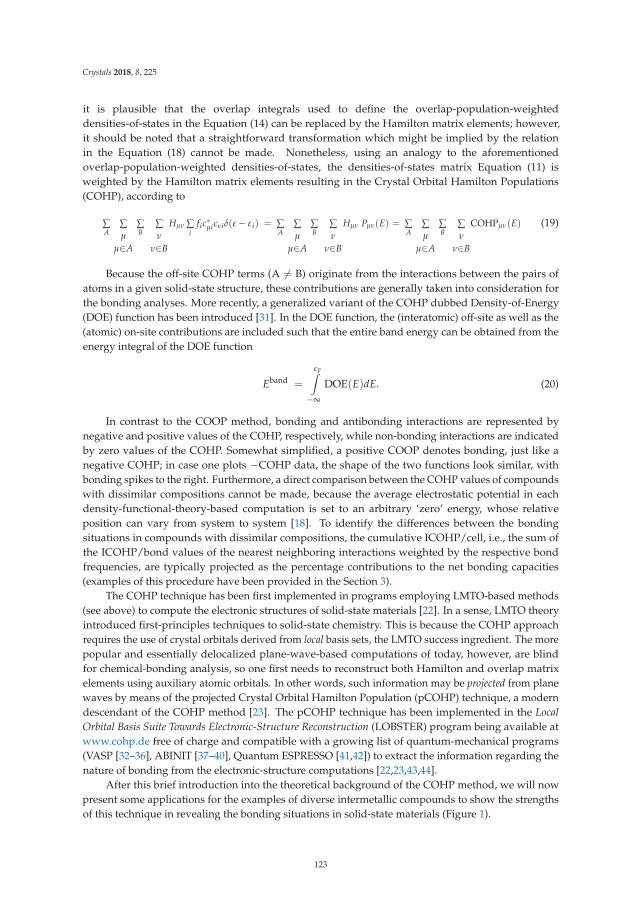
Crystals 2018, 8, 225
it is plausible that the overlap integrals used to define the overlap-population-weighteddensities-of-states in the Equation (14) can be replaced by the Hamilton matrix elements; however,it should be noted that a straightforward transformation which might be implied by the relationin the Equation (18) cannot be made. Nonetheless, using an analogy to the aforementionedoverlap-population-weighted densities-of-states, the densities-of-states matrix Equation (11) isweighted by the Hamilton matrix elements resulting in the Crystal Orbital Hamilton Populations(COHP), according to
∑A
∑
µ
µ∈A
∑B
∑
ν
ν∈B
Hµν ∑i
fic∗µicνiδ(ε − εi) = ∑
A∑
µ
µ∈A
∑B
∑
ν
ν∈B
Hµν Pµν(E) = ∑A
∑
µ
µ∈A
∑B
∑
ν
ν∈B
COHPµν(E) (19)
Because the off-site COHP terms (A = B) originate from the interactions between the pairs ofatoms in a given solid-state structure, these contributions are generally taken into consideration forthe bonding analyses. More recently, a generalized variant of the COHP dubbed Density-of-Energy(DOE) function has been introduced [31]. In the DOE function, the (interatomic) off-site as well as the(atomic) on-site contributions are included such that the entire band energy can be obtained from theenergy integral of the DOE function
Eband =
εF∫
−∞
DOE(E)dE. (20)
In contrast to the COOP method, bonding and antibonding interactions are represented bynegative and positive values of the COHP, respectively, while non-bonding interactions are indicatedby zero values of the COHP. Somewhat simplified, a positive COOP denotes bonding, just like anegative COHP; in case one plots −COHP data, the shape of the two functions look similar, withbonding spikes to the right. Furthermore, a direct comparison between the COHP values of compoundswith dissimilar compositions cannot be made, because the average electrostatic potential in eachdensity-functional-theory-based computation is set to an arbitrary ‘zero’ energy, whose relativeposition can vary from system to system [18]. To identify the differences between the bondingsituations in compounds with dissimilar compositions, the cumulative ICOHP/cell, i.e., the sum ofthe ICOHP/bond values of the nearest neighboring interactions weighted by the respective bondfrequencies, are typically projected as the percentage contributions to the net bonding capacities(examples of this procedure have been provided in the Section 3).
The COHP technique has been first implemented in programs employing LMTO-based methods(see above) to compute the electronic structures of solid-state materials [22]. In a sense, LMTO theoryintroduced first-principles techniques to solid-state chemistry. This is because the COHP approachrequires the use of crystal orbitals derived from local basis sets, the LMTO success ingredient. The morepopular and essentially delocalized plane-wave-based computations of today, however, are blindfor chemical-bonding analysis, so one first needs to reconstruct both Hamilton and overlap matrixelements using auxiliary atomic orbitals. In other words, such information may be projected from planewaves by means of the projected Crystal Orbital Hamilton Population (pCOHP) technique, a moderndescendant of the COHP method [23]. The pCOHP technique has been implemented in the Local
Orbital Basis Suite Towards Electronic-Structure Reconstruction (LOBSTER) program being available atwww.cohp.de free of charge and compatible with a growing list of quantum-mechanical programs(VASP [32–36], ABINIT [37–40], Quantum ESPRESSO [41,42]) to extract the information regarding thenature of bonding from the electronic-structure computations [22,23,43,44].
After this brief introduction into the theoretical background of the COHP method, we will nowpresent some applications for the examples of diverse intermetallic compounds to show the strengthsof this technique in revealing the bonding situations in solid-state materials (Figure 1).
123
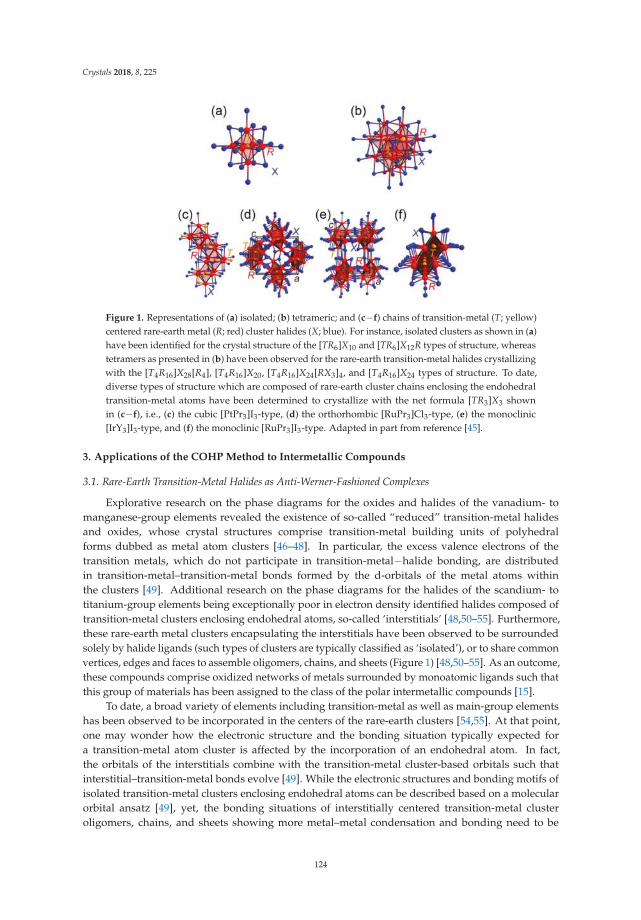
Crystals 2018, 8, 225
Figure 1. Representations of (a) isolated; (b) tetrameric; and (c−f) chains of transition-metal (T; yellow)centered rare-earth metal (R; red) cluster halides (X; blue). For instance, isolated clusters as shown in (a)have been identified for the crystal structure of the [TR6]X10 and [TR6]X12R types of structure, whereastetramers as presented in (b) have been observed for the rare-earth transition-metal halides crystallizingwith the [T4R16]X28[R4], [T4R16]X20, [T4R16]X24[RX3]4, and [T4R16]X24 types of structure. To date,diverse types of structure which are composed of rare-earth cluster chains enclosing the endohedraltransition-metal atoms have been determined to crystallize with the net formula [TR3]X3 shownin (c−f), i.e., (c) the cubic [PtPr3]I3-type, (d) the orthorhombic [RuPr3]Cl3-type, (e) the monoclinic[IrY3]I3-type, and (f) the monoclinic [RuPr3]I3-type. Adapted in part from reference [45].
3. Applications of the COHP Method to Intermetallic Compounds
3.1. Rare-Earth Transition-Metal Halides as Anti-Werner-Fashioned Complexes
Explorative research on the phase diagrams for the oxides and halides of the vanadium- tomanganese-group elements revealed the existence of so-called “reduced” transition-metal halidesand oxides, whose crystal structures comprise transition-metal building units of polyhedralforms dubbed as metal atom clusters [46–48]. In particular, the excess valence electrons of thetransition metals, which do not participate in transition-metal−halide bonding, are distributedin transition-metal–transition-metal bonds formed by the d-orbitals of the metal atoms withinthe clusters [49]. Additional research on the phase diagrams for the halides of the scandium- totitanium-group elements being exceptionally poor in electron density identified halides composed oftransition-metal clusters enclosing endohedral atoms, so-called ‘interstitials’ [48,50–55]. Furthermore,these rare-earth metal clusters encapsulating the interstitials have been observed to be surroundedsolely by halide ligands (such types of clusters are typically classified as ‘isolated’), or to share commonvertices, edges and faces to assemble oligomers, chains, and sheets (Figure 1) [48,50–55]. As an outcome,these compounds comprise oxidized networks of metals surrounded by monoatomic ligands such thatthis group of materials has been assigned to the class of the polar intermetallic compounds [15].
To date, a broad variety of elements including transition-metal as well as main-group elementshas been observed to be incorporated in the centers of the rare-earth clusters [54,55]. At that point,one may wonder how the electronic structure and the bonding situation typically expected fora transition-metal atom cluster is affected by the incorporation of an endohedral atom. In fact,the orbitals of the interstitials combine with the transition-metal cluster-based orbitals such thatinterstitial–transition-metal bonds evolve [49]. While the electronic structures and bonding motifs ofisolated transition-metal clusters enclosing endohedral atoms can be described based on a molecularorbital ansatz [49], yet, the bonding situations of interstitially centered transition-metal clusteroligomers, chains, and sheets showing more metal–metal condensation and bonding need to be
124
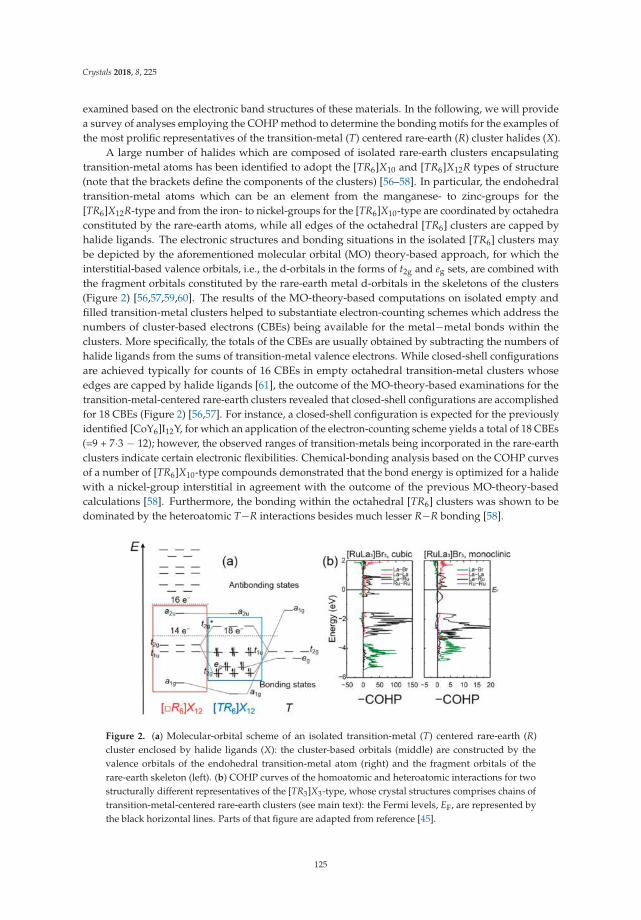
Crystals 2018, 8, 225
examined based on the electronic band structures of these materials. In the following, we will providea survey of analyses employing the COHP method to determine the bonding motifs for the examples ofthe most prolific representatives of the transition-metal (T) centered rare-earth (R) cluster halides (X).
A large number of halides which are composed of isolated rare-earth clusters encapsulatingtransition-metal atoms has been identified to adopt the [TR6]X10 and [TR6]X12R types of structure(note that the brackets define the components of the clusters) [56–58]. In particular, the endohedraltransition-metal atoms which can be an element from the manganese- to zinc-groups for the[TR6]X12R-type and from the iron- to nickel-groups for the [TR6]X10-type are coordinated by octahedraconstituted by the rare-earth atoms, while all edges of the octahedral [TR6] clusters are capped byhalide ligands. The electronic structures and bonding situations in the isolated [TR6] clusters maybe depicted by the aforementioned molecular orbital (MO) theory-based approach, for which theinterstitial-based valence orbitals, i.e., the d-orbitals in the forms of t2g and eg sets, are combined withthe fragment orbitals constituted by the rare-earth metal d-orbitals in the skeletons of the clusters(Figure 2) [56,57,59,60]. The results of the MO-theory-based computations on isolated empty andfilled transition-metal clusters helped to substantiate electron-counting schemes which address thenumbers of cluster-based electrons (CBEs) being available for the metal−metal bonds within theclusters. More specifically, the totals of the CBEs are usually obtained by subtracting the numbers ofhalide ligands from the sums of transition-metal valence electrons. While closed-shell configurationsare achieved typically for counts of 16 CBEs in empty octahedral transition-metal clusters whoseedges are capped by halide ligands [61], the outcome of the MO-theory-based examinations for thetransition-metal-centered rare-earth clusters revealed that closed-shell configurations are accomplishedfor 18 CBEs (Figure 2) [56,57]. For instance, a closed-shell configuration is expected for the previouslyidentified [CoY6]I12Y, for which an application of the electron-counting scheme yields a total of 18 CBEs(=9 + 7·3 − 12); however, the observed ranges of transition-metals being incorporated in the rare-earthclusters indicate certain electronic flexibilities. Chemical-bonding analysis based on the COHP curvesof a number of [TR6]X10-type compounds demonstrated that the bond energy is optimized for a halidewith a nickel-group interstitial in agreement with the outcome of the previous MO-theory-basedcalculations [58]. Furthermore, the bonding within the octahedral [TR6] clusters was shown to bedominated by the heteroatomic T−R interactions besides much lesser R−R bonding [58].
Figure 2. (a) Molecular-orbital scheme of an isolated transition-metal (T) centered rare-earth (R)cluster enclosed by halide ligands (X): the cluster-based orbitals (middle) are constructed by thevalence orbitals of the endohedral transition-metal atom (right) and the fragment orbitals of therare-earth skeleton (left). (b) COHP curves of the homoatomic and heteroatomic interactions for twostructurally different representatives of the [TR3]X3-type, whose crystal structures comprises chains oftransition-metal-centered rare-earth clusters (see main text): the Fermi levels, EF, are represented bythe black horizontal lines. Parts of that figure are adapted from reference [45].
125
Crystals 2018, 8, 225
Among the group of rare-earth transition-metal halides composed of cluster oligomers, the crystalstructures of a large number of compounds have been identified to contain one particular type oftetramer, [T4R16] (Figure 1). In particular, this sort of tetramer has been observed for the crystalstructures of four different types of rare-earth transition-metal halides, that are, the [T4R16]X28[R4] [62],[T4R16]X20 [63], [T4R16]X24[RX3]4 [64], and [T4R16]X24 [64] types of structure. The tetramers consistof pairs of dimers, i.e., two transition-metal centered octahedral rare-earth clusters sharing onecommon edge, which are positioned perpendicular to each other and condensed via four jointedges. The [T4R16] units are enclosed by 36 halide ligands, and their R16 fragments can also bedepicted as all-vertices-truncated supertetrahedra or Friauf -polyhedra. An examination [65] of thehitherto identified rare-earth transition-metal halides whose crystal structures comprise such tetramerssuggested that the maximum numbers of CBEs for intracluster bonding are attained for totals of15 electrons per transition-metal centered rare-earth octahedron. Examinations [66] of the electronicstructures for diverse halides composed of these tetramers bared that the Fermi levels fall into gapscorresponding to closed-shell configurations in halides for which CBE counts of 15 electrons per[TR6] cluster are achieved. An additional bonding analysis [66] based on the COHP curves and theirintegrated values (Table 1) indicates that the majority of the bonding interactions reside between theheteroatomic R−T as well as R−X separations, whereas the homoatomic R−R and T−T interactionsplay minor, but evident roles.
The group of rare-earth transition-metal halides with the net formula [TR3]X3 has emergedas a prolific class of compounds comprising cluster chains. To date, five different structure typeshave been identified for this group: the cubic [PtPr3]I3-type [67], the tetragonal [NiLa3]Br3-type [68],the orthorhombic [RuPr3]Cl3-type [69], and two independent monoclinic types of structure, i.e., the[RuPr3]I3 and [IrY3]I3 types of structure [70] (Figure 1). In particular, the monoclinic [RuPr3]I3-type hasbeen observed solely for bromides and iodides which comprise early lanthanide clusters (R = La−Pr)containing iron-group elements, while the cubic [PtPr3]I3-type has been identified for early lanthanide(R = La−Pr) cluster bromides and iodides containing elements from the iron- to copper-groups asendohedral atoms [71]. In the crystal structure of the monoclinic [RuPr3]I3-type, the octahedral [TR6]clusters share four common edges with neighboring clusters forming bioctahedral chains, whereasthe [TR6] octahedra in the cubic [PtPr3]I3-type structure condense via three common edges withother [TR6] clusters to helical chains. The existence of the cubic [PtPr3]I3 and monoclinic [RuPr3]I3
types of structures for systems with iron-group elements as endohedral atoms suggests that thereis a competition to adopt the respective type of structure. An examination [72] of the electronicband structures for two isocompositional bromides of both [TR3]X3-types reveals that the Fermilevel of the cubic compound falls in a maximum of the densities-of-states (DOS), while the Fermilevel in the monoclinic representative resides in a gap. Because the location of the Fermi level at apeak of the DOS curves typically indicates an electronically unfavorable situation, the monoclinic[RuPr3]I3-type structure should be preferred. Why, then, do we observe a competition between themonoclinic [RuPr3]I3-type and the cubic [PtPr3]I3-type for early lanthanide cluster bromides andiodides comprising iron-group elements as interstitials?
126
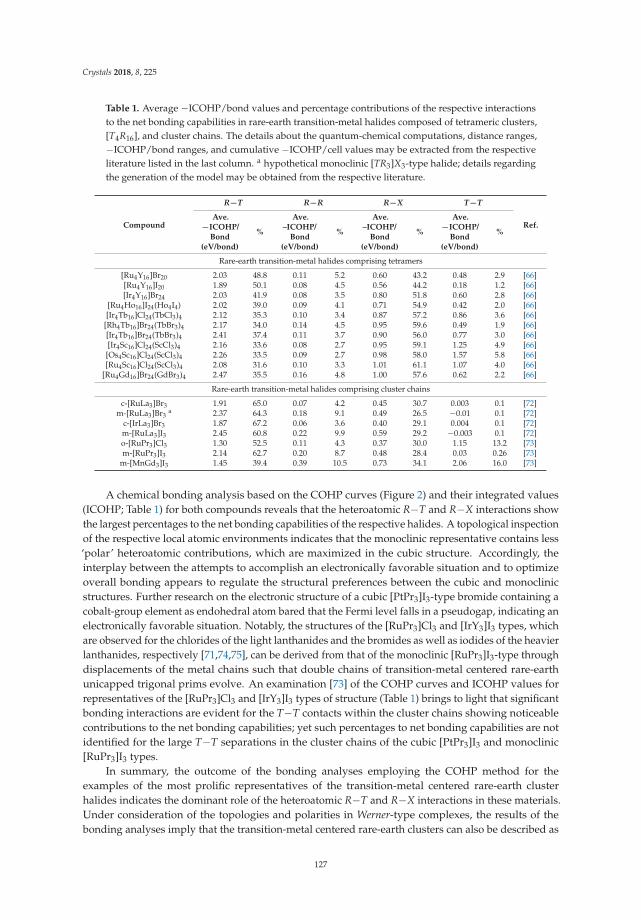
Crystals 2018, 8, 225
Table 1. Average −ICOHP/bond values and percentage contributions of the respective interactionsto the net bonding capabilities in rare-earth transition-metal halides composed of tetrameric clusters,[T4R16], and cluster chains. The details about the quantum-chemical computations, distance ranges,−ICOHP/bond ranges, and cumulative −ICOHP/cell values may be extracted from the respectiveliterature listed in the last column. a hypothetical monoclinic [TR3]X3-type halide; details regardingthe generation of the model may be obtained from the respective literature.
Compound
R−T R−R R−X T−T
Ref.Ave.
−ICOHP/Bond
(eV/bond)
%
Ave.–ICOHP/
Bond(eV/bond)
%
Ave.–ICOHP/
Bond(eV/bond)
%
Ave.−ICOHP/
Bond(eV/bond)
%
Rare-earth transition-metal halides comprising tetramers
[Ru4Y16]Br20 2.03 48.8 0.11 5.2 0.60 43.2 0.48 2.9 [66][Ru4Y16]I20 1.89 50.1 0.08 4.5 0.56 44.2 0.18 1.2 [66][Ir4Y16]Br24 2.03 41.9 0.08 3.5 0.80 51.8 0.60 2.8 [66]
[Ru4Ho16]I24(Ho4I4) 2.02 39.0 0.09 4.1 0.71 54.9 0.42 2.0 [66][Ir4Tb16]Cl24(TbCl3)4 2.12 35.3 0.10 3.4 0.87 57.2 0.86 3.6 [66]
[Rh4Tb16]Br24(TbBr3)4 2.17 34.0 0.14 4.5 0.95 59.6 0.49 1.9 [66][Ir4Tb16]Br24(TbBr3)4 2.41 37.4 0.11 3.7 0.90 56.0 0.77 3.0 [66][Ir4Sc16]Cl24(ScCl3)4 2.16 33.6 0.08 2.7 0.95 59.1 1.25 4.9 [66][Os4Sc16]Cl24(ScCl3)4 2.26 33.5 0.09 2.7 0.98 58.0 1.57 5.8 [66][Ru4Sc16]Cl24(ScCl3)4 2.08 31.6 0.10 3.3 1.01 61.1 1.07 4.0 [66]
[Ru4Gd16]Br24(GdBr3)4 2.47 35.5 0.16 4.8 1.00 57.6 0.62 2.2 [66]
Rare-earth transition-metal halides comprising cluster chains
c-[RuLa3]Br3 1.91 65.0 0.07 4.2 0.45 30.7 0.003 0.1 [72]m-[RuLa3]Br3
a 2.37 64.3 0.18 9.1 0.49 26.5 −0.01 0.1 [72]c-[IrLa3]Br3 1.87 67.2 0.06 3.6 0.40 29.1 0.004 0.1 [72]m-[RuLa3]I3 2.45 60.8 0.22 9.9 0.59 29.2 −0.003 0.1 [72]o-[RuPr3]Cl3 1.30 52.5 0.11 4.3 0.37 30.0 1.15 13.2 [73]m-[RuPr3]I3 2.14 62.7 0.20 8.7 0.48 28.4 0.03 0.26 [73]
m-[MnGd3]I3 1.45 39.4 0.39 10.5 0.73 34.1 2.06 16.0 [73]
A chemical bonding analysis based on the COHP curves (Figure 2) and their integrated values(ICOHP; Table 1) for both compounds reveals that the heteroatomic R−T and R−X interactions showthe largest percentages to the net bonding capabilities of the respective halides. A topological inspectionof the respective local atomic environments indicates that the monoclinic representative contains less‘polar’ heteroatomic contributions, which are maximized in the cubic structure. Accordingly, theinterplay between the attempts to accomplish an electronically favorable situation and to optimizeoverall bonding appears to regulate the structural preferences between the cubic and monoclinicstructures. Further research on the electronic structure of a cubic [PtPr3]I3-type bromide containing acobalt-group element as endohedral atom bared that the Fermi level falls in a pseudogap, indicating anelectronically favorable situation. Notably, the structures of the [RuPr3]Cl3 and [IrY3]I3 types, whichare observed for the chlorides of the light lanthanides and the bromides as well as iodides of the heavierlanthanides, respectively [71,74,75], can be derived from that of the monoclinic [RuPr3]I3-type throughdisplacements of the metal chains such that double chains of transition-metal centered rare-earthunicapped trigonal prims evolve. An examination [73] of the COHP curves and ICOHP values forrepresentatives of the [RuPr3]Cl3 and [IrY3]I3 types of structure (Table 1) brings to light that significantbonding interactions are evident for the T−T contacts within the cluster chains showing noticeablecontributions to the net bonding capabilities; yet such percentages to net bonding capabilities are notidentified for the large T−T separations in the cluster chains of the cubic [PtPr3]I3 and monoclinic[RuPr3]I3 types.
In summary, the outcome of the bonding analyses employing the COHP method for theexamples of the most prolific representatives of the transition-metal centered rare-earth clusterhalides indicates the dominant role of the heteroatomic R−T and R−X interactions in these materials.Under consideration of the topologies and polarities in Werner-type complexes, the results of thebonding analyses imply that the transition-metal centered rare-earth clusters can also be described as
127
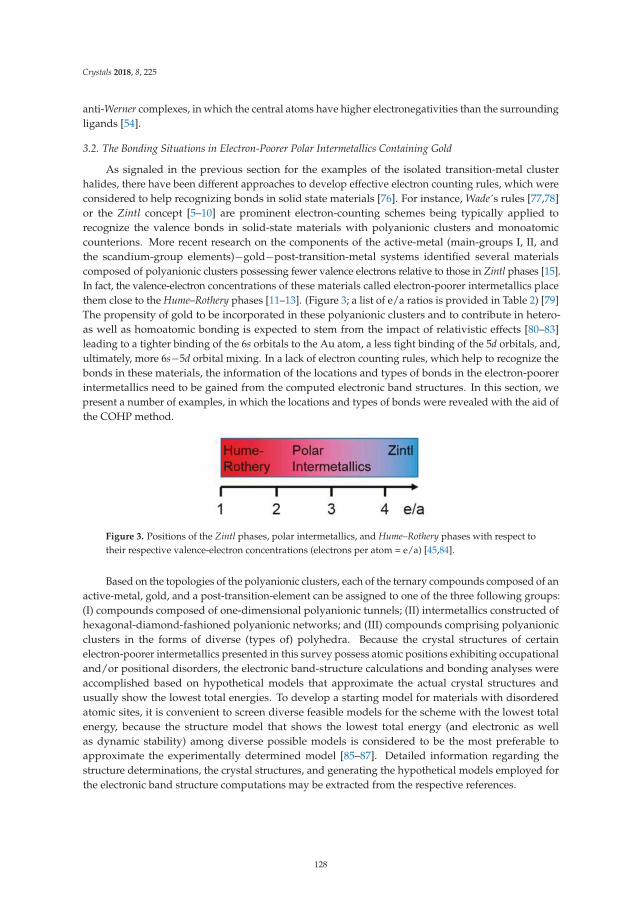
Crystals 2018, 8, 225
anti-Werner complexes, in which the central atoms have higher electronegativities than the surroundingligands [54].
3.2. The Bonding Situations in Electron-Poorer Polar Intermetallics Containing Gold
As signaled in the previous section for the examples of the isolated transition-metal clusterhalides, there have been different approaches to develop effective electron counting rules, which wereconsidered to help recognizing bonds in solid state materials [76]. For instance, Wade´s rules [77,78]or the Zintl concept [5–10] are prominent electron-counting schemes being typically applied torecognize the valence bonds in solid-state materials with polyanionic clusters and monoatomiccounterions. More recent research on the components of the active-metal (main-groups I, II, andthe scandium-group elements)−gold−post-transition-metal systems identified several materialscomposed of polyanionic clusters possessing fewer valence electrons relative to those in Zintl phases [15].In fact, the valence-electron concentrations of these materials called electron-poorer intermetallics placethem close to the Hume–Rothery phases [11–13]. (Figure 3; a list of e/a ratios is provided in Table 2) [79]The propensity of gold to be incorporated in these polyanionic clusters and to contribute in hetero-as well as homoatomic bonding is expected to stem from the impact of relativistic effects [80–83]leading to a tighter binding of the 6s orbitals to the Au atom, a less tight binding of the 5d orbitals, and,ultimately, more 6s−5d orbital mixing. In a lack of electron counting rules, which help to recognize thebonds in these materials, the information of the locations and types of bonds in the electron-poorerintermetallics need to be gained from the computed electronic band structures. In this section, wepresent a number of examples, in which the locations and types of bonds were revealed with the aid ofthe COHP method.
Figure 3. Positions of the Zintl phases, polar intermetallics, and Hume–Rothery phases with respect totheir respective valence-electron concentrations (electrons per atom = e/a) [45,84].
Based on the topologies of the polyanionic clusters, each of the ternary compounds composed of anactive-metal, gold, and a post-transition-element can be assigned to one of the three following groups:(I) compounds composed of one-dimensional polyanionic tunnels; (II) intermetallics constructed ofhexagonal-diamond-fashioned polyanionic networks; and (III) compounds comprising polyanionicclusters in the forms of diverse (types of) polyhedra. Because the crystal structures of certainelectron-poorer intermetallics presented in this survey possess atomic positions exhibiting occupationaland/or positional disorders, the electronic band-structure calculations and bonding analyses wereaccomplished based on hypothetical models that approximate the actual crystal structures andusually show the lowest total energies. To develop a starting model for materials with disorderedatomic sites, it is convenient to screen diverse feasible models for the scheme with the lowest totalenergy, because the structure model that shows the lowest total energy (and electronic as wellas dynamic stability) among diverse possible models is considered to be the most preferable toapproximate the experimentally determined model [85–87]. Detailed information regarding thestructure determinations, the crystal structures, and generating the hypothetical models employed forthe electronic band structure computations may be extracted from the respective references.
128
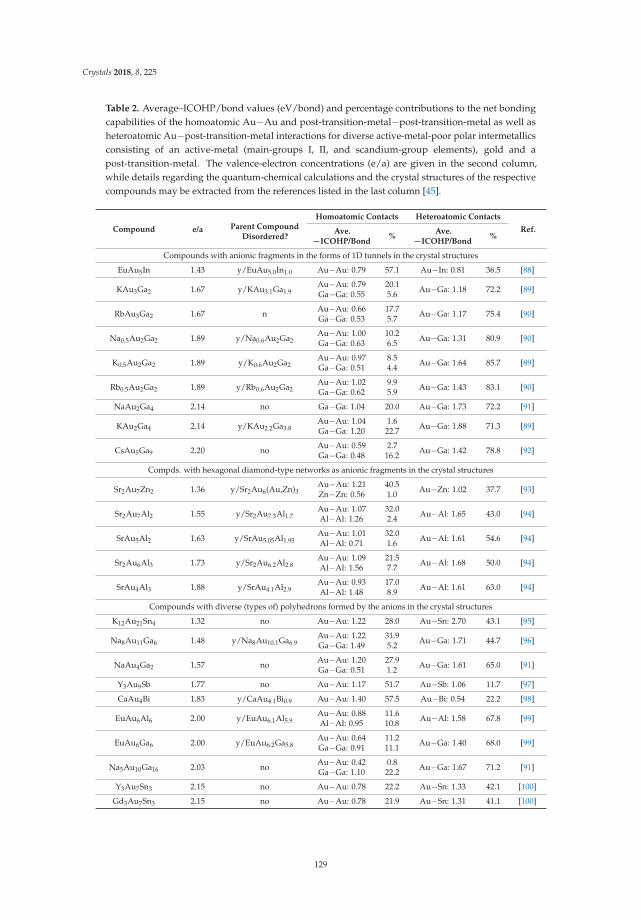
Crystals 2018, 8, 225
Table 2. Average–ICOHP/bond values (eV/bond) and percentage contributions to the net bondingcapabilities of the homoatomic Au−Au and post-transition-metal−post-transition-metal as well asheteroatomic Au−post-transition-metal interactions for diverse active-metal-poor polar intermetallicsconsisting of an active-metal (main-groups I, II, and scandium-group elements), gold and apost-transition-metal. The valence-electron concentrations (e/a) are given in the second column,while details regarding the quantum-chemical calculations and the crystal structures of the respectivecompounds may be extracted from the references listed in the last column [45].
Compound e/a Parent CompoundDisordered?
Homoatomic Contacts Heteroatomic Contacts
Ref.Ave.−ICOHP/Bond
%Ave.
−ICOHP/Bond%
Compounds with anionic fragments in the forms of 1D tunnels in the crystal structures
EuAu5In 1.43 y/EuAu5.0In1.0 Au−Au: 0.79 57.1 Au−In: 0.81 36.5 [88]
KAu3Ga2 1.67 y/KAu3.1Ga1.9Au−Au: 0.79Ga−Ga: 0.55
20.15.6 Au−Ga: 1.18 72.2 [89]
RbAu3Ga2 1.67 n Au−Au: 0.66Ga−Ga: 0.53
17.75.7 Au−Ga: 1.17 75.4 [90]
Na0.5Au2Ga2 1.89 y/Na0.6Au2Ga2Au−Au: 1.00Ga−Ga: 0.63
10.26.5 Au−Ga: 1.31 80.9 [90]
K0.5Au2Ga2 1.89 y/K0.6Au2Ga2Au−Au: 0.97Ga−Ga: 0.51
8.54.4 Au−Ga: 1.64 85.7 [89]
Rb0.5Au2Ga2 1.89 y/Rb0.6Au2Ga2Au−Au: 1.02Ga−Ga: 0.62
9.95.9 Au−Ga: 1.43 83.1 [90]
NaAu2Ga4 2.14 no Ga−Ga: 1.04 20.0 Au−Ga: 1.73 72.2 [91]
KAu2Ga4 2.14 y/KAu2.2Ga3.8Au−Au: 1.04Ga−Ga: 1.20
1.622.7 Au−Ga: 1.88 71.3 [89]
CsAu5Ga9 2.20 no Au−Au: 0.59Ga−Ga: 0.48
2.716.2 Au−Ga: 1.42 78.8 [92]
Compds. with hexagonal diamond-type networks as anionic fragments in the crystal structures
Sr2Au7Zn2 1.36 y/Sr2Au6(Au,Zn)3Au−Au: 1.21Zn−Zn: 0.56
40.51.0 Au−Zn: 1.02 37.7 [93]
Sr2Au7Al2 1.55 y/Sr2Au7.3Al1.7Au−Au: 1.07Al−Al: 1.26
32.02.4 Au−Al: 1.65 43.0 [94]
SrAu5Al2 1.63 y/SrAu5.05Al1.95Au−Au: 1.01Al−Al: 0.71
32.01.6 Au−Al: 1.61 54.6 [94]
Sr2Au6Al3 1.73 y/Sr2Au6.2Al2.8Au−Au: 1.09Al−Al: 1.56
21.57.7 Au−Al: 1.68 50.0 [94]
SrAu4Al3 1.88 y/SrAu4.1Al2.9Au−Au: 0.93Al−Al: 1.48
17.08.9 Au−Al: 1.61 63.0 [94]
Compounds with diverse (types of) polyhedrons formed by the anions in the crystal structures
K12Au21Sn4 1.32 no Au−Au: 1.22 28.0 Au−Sn: 2.70 43.1 [95]
Na8Au11Ga6 1.48 y/Na8Au10.1Ga6.9Au−Au: 1.22Ga−Ga: 1.49
31.95.2 Au−Ga: 1.71 44.7 [96]
NaAu4Ga2 1.57 no Au−Au: 1.20Ga−Ga: 0.51
27.91.2 Au−Ga: 1.61 65.0 [91]
Y3Au9Sb 1.77 no Au−Au: 1.17 51.7 Au−Sb: 1.06 11.7 [97]
CaAu4Bi 1.83 y/CaAu4.1Bi0.9 Au−Au: 1.40 57.5 Au−Bi: 0.54 22.2 [98]
EuAu6Al6 2.00 y/EuAu6.1Al5.9Au−Au: 0.88Al−Al: 0.95
11.610.8 Au−Al: 1.58 67.8 [99]
EuAu6Ga6 2.00 y/EuAu6.2Ga5.8Au−Au: 0.64Ga−Ga: 0.91
11.211.1 Au−Ga: 1.40 68.0 [99]
Na5Au10Ga16 2.03 no Au−Au: 0.42Ga−Ga: 1.10
0.822.2 Au−Ga: 1.67 71.2 [91]
Y3Au7Sn3 2.15 no Au−Au: 0.78 22.2 Au−Sn: 1.33 42.1 [100]
Gd3Au7Sn3 2.15 no Au−Au: 0.78 21.9 Au−Sn: 1.31 41.1 [100]
129
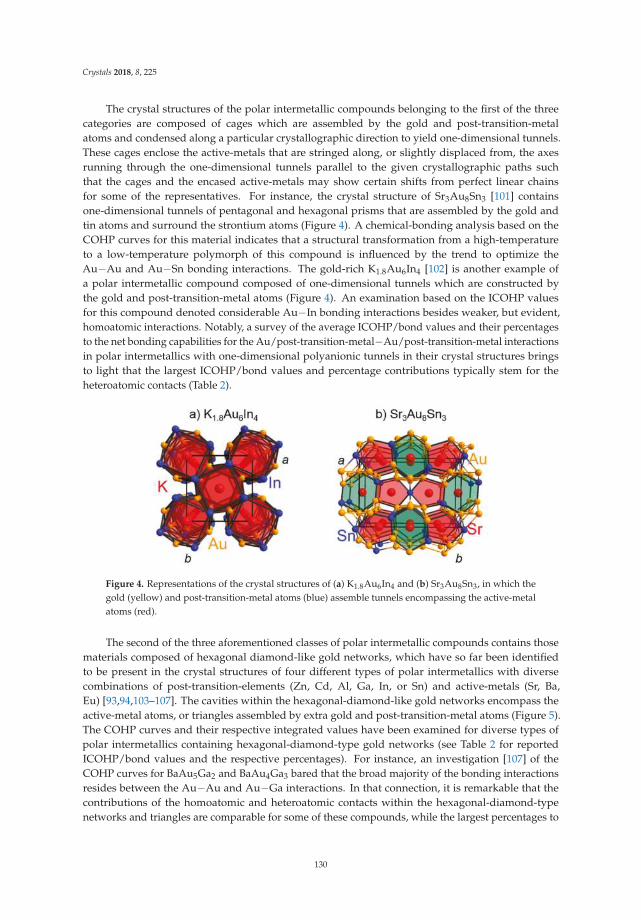
Crystals 2018, 8, 225
The crystal structures of the polar intermetallic compounds belonging to the first of the threecategories are composed of cages which are assembled by the gold and post-transition-metalatoms and condensed along a particular crystallographic direction to yield one-dimensional tunnels.These cages enclose the active-metals that are stringed along, or slightly displaced from, the axesrunning through the one-dimensional tunnels parallel to the given crystallographic paths suchthat the cages and the encased active-metals may show certain shifts from perfect linear chainsfor some of the representatives. For instance, the crystal structure of Sr3Au8Sn3 [101] containsone-dimensional tunnels of pentagonal and hexagonal prisms that are assembled by the gold andtin atoms and surround the strontium atoms (Figure 4). A chemical-bonding analysis based on theCOHP curves for this material indicates that a structural transformation from a high-temperatureto a low-temperature polymorph of this compound is influenced by the trend to optimize theAu−Au and Au−Sn bonding interactions. The gold-rich K1.8Au6In4 [102] is another example ofa polar intermetallic compound composed of one-dimensional tunnels which are constructed bythe gold and post-transition-metal atoms (Figure 4). An examination based on the ICOHP valuesfor this compound denoted considerable Au−In bonding interactions besides weaker, but evident,homoatomic interactions. Notably, a survey of the average ICOHP/bond values and their percentagesto the net bonding capabilities for the Au/post-transition-metal−Au/post-transition-metal interactionsin polar intermetallics with one-dimensional polyanionic tunnels in their crystal structures bringsto light that the largest ICOHP/bond values and percentage contributions typically stem for theheteroatomic contacts (Table 2).
Figure 4. Representations of the crystal structures of (a) K1.8Au6In4 and (b) Sr3Au8Sn3, in which thegold (yellow) and post-transition-metal atoms (blue) assemble tunnels encompassing the active-metalatoms (red).
The second of the three aforementioned classes of polar intermetallic compounds contains thosematerials composed of hexagonal diamond-like gold networks, which have so far been identifiedto be present in the crystal structures of four different types of polar intermetallics with diversecombinations of post-transition-elements (Zn, Cd, Al, Ga, In, or Sn) and active-metals (Sr, Ba,Eu) [93,94,103–107]. The cavities within the hexagonal-diamond-like gold networks encompass theactive-metal atoms, or triangles assembled by extra gold and post-transition-metal atoms (Figure 5).The COHP curves and their respective integrated values have been examined for diverse types ofpolar intermetallics containing hexagonal-diamond-type gold networks (see Table 2 for reportedICOHP/bond values and the respective percentages). For instance, an investigation [107] of theCOHP curves for BaAu5Ga2 and BaAu4Ga3 bared that the broad majority of the bonding interactionsresides between the Au−Au and Au−Ga interactions. In that connection, it is remarkable that thecontributions of the homoatomic and heteroatomic contacts within the hexagonal-diamond-typenetworks and triangles are comparable for some of these compounds, while the largest percentages to
130
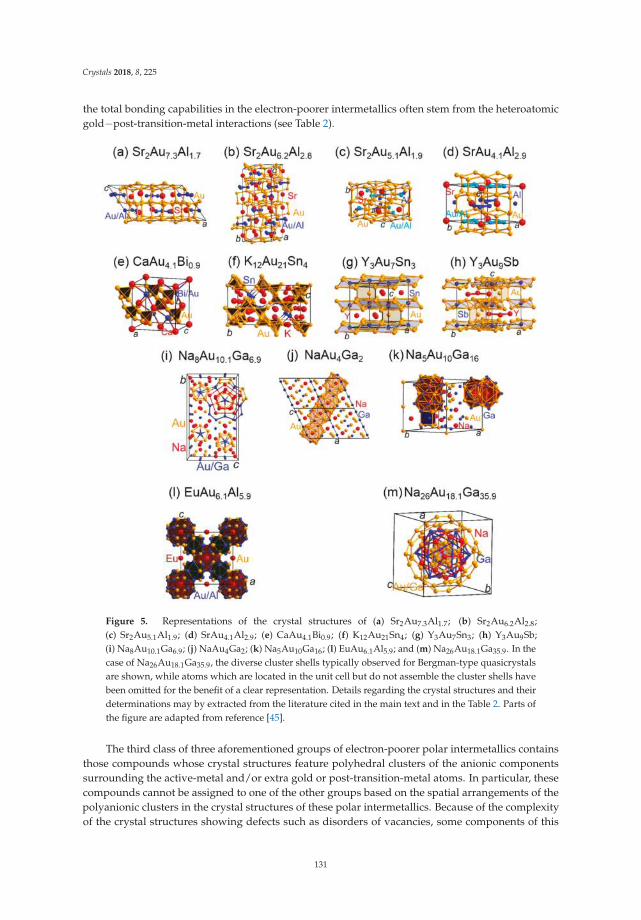
Crystals 2018, 8, 225
the total bonding capabilities in the electron-poorer intermetallics often stem from the heteroatomicgold−post-transition-metal interactions (see Table 2).
Figure 5. Representations of the crystal structures of (a) Sr2Au7.3Al1.7; (b) Sr2Au6.2Al2.8;(c) Sr2Au5.1Al1.9; (d) SrAu4.1Al2.9; (e) CaAu4.1Bi0.9; (f) K12Au21Sn4; (g) Y3Au7Sn3; (h) Y3Au9Sb;(i) Na8Au10.1Ga6.9; (j) NaAu4Ga2; (k) Na5Au10Ga16; (l) EuAu6.1Al5.9; and (m) Na26Au18.1Ga35.9. In thecase of Na26Au18.1Ga35.9, the diverse cluster shells typically observed for Bergman-type quasicrystalsare shown, while atoms which are located in the unit cell but do not assemble the cluster shells havebeen omitted for the benefit of a clear representation. Details regarding the crystal structures and theirdeterminations may by extracted from the literature cited in the main text and in the Table 2. Parts ofthe figure are adapted from reference [45].
The third class of three aforementioned groups of electron-poorer polar intermetallics containsthose compounds whose crystal structures feature polyhedral clusters of the anionic componentssurrounding the active-metal and/or extra gold or post-transition-metal atoms. In particular, thesecompounds cannot be assigned to one of the other groups based on the spatial arrangements of thepolyanionic clusters in the crystal structures of these polar intermetallics. Because of the complexityof the crystal structures showing defects such as disorders of vacancies, some components of this
131
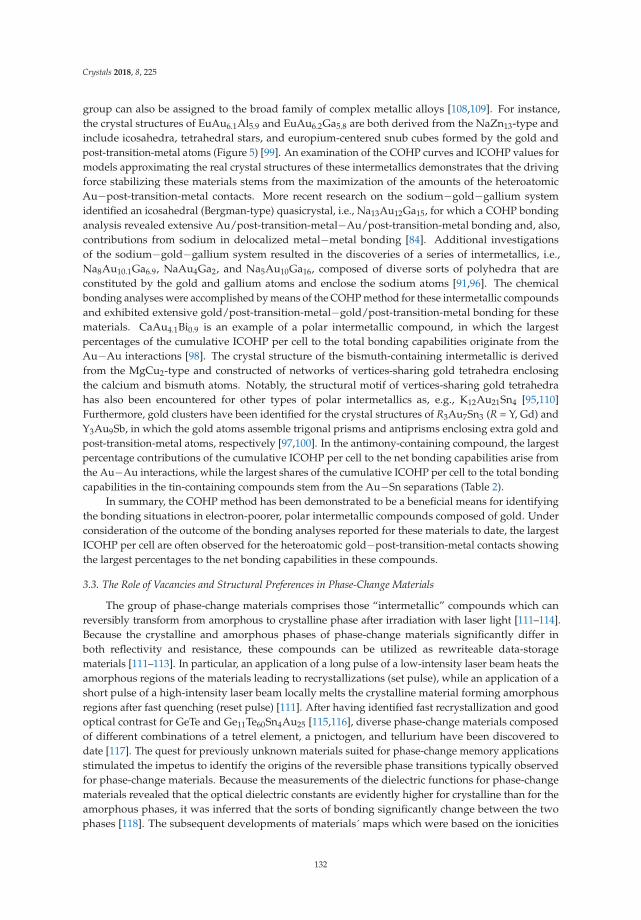
Crystals 2018, 8, 225
group can also be assigned to the broad family of complex metallic alloys [108,109]. For instance,the crystal structures of EuAu6.1Al5.9 and EuAu6.2Ga5.8 are both derived from the NaZn13-type andinclude icosahedra, tetrahedral stars, and europium-centered snub cubes formed by the gold andpost-transition-metal atoms (Figure 5) [99]. An examination of the COHP curves and ICOHP values formodels approximating the real crystal structures of these intermetallics demonstrates that the drivingforce stabilizing these materials stems from the maximization of the amounts of the heteroatomicAu−post-transition-metal contacts. More recent research on the sodium−gold−gallium systemidentified an icosahedral (Bergman-type) quasicrystal, i.e., Na13Au12Ga15, for which a COHP bondinganalysis revealed extensive Au/post-transition-metal−Au/post-transition-metal bonding and, also,contributions from sodium in delocalized metal−metal bonding [84]. Additional investigationsof the sodium−gold−gallium system resulted in the discoveries of a series of intermetallics, i.e.,Na8Au10.1Ga6.9, NaAu4Ga2, and Na5Au10Ga16, composed of diverse sorts of polyhedra that areconstituted by the gold and gallium atoms and enclose the sodium atoms [91,96]. The chemicalbonding analyses were accomplished by means of the COHP method for these intermetallic compoundsand exhibited extensive gold/post-transition-metal−gold/post-transition-metal bonding for thesematerials. CaAu4.1Bi0.9 is an example of a polar intermetallic compound, in which the largestpercentages of the cumulative ICOHP per cell to the total bonding capabilities originate from theAu−Au interactions [98]. The crystal structure of the bismuth-containing intermetallic is derivedfrom the MgCu2-type and constructed of networks of vertices-sharing gold tetrahedra enclosingthe calcium and bismuth atoms. Notably, the structural motif of vertices-sharing gold tetrahedrahas also been encountered for other types of polar intermetallics as, e.g., K12Au21Sn4 [95,110]Furthermore, gold clusters have been identified for the crystal structures of R3Au7Sn3 (R = Y, Gd) andY3Au9Sb, in which the gold atoms assemble trigonal prisms and antiprisms enclosing extra gold andpost-transition-metal atoms, respectively [97,100]. In the antimony-containing compound, the largestpercentage contributions of the cumulative ICOHP per cell to the net bonding capabilities arise fromthe Au−Au interactions, while the largest shares of the cumulative ICOHP per cell to the total bondingcapabilities in the tin-containing compounds stem from the Au−Sn separations (Table 2).
In summary, the COHP method has been demonstrated to be a beneficial means for identifyingthe bonding situations in electron-poorer, polar intermetallic compounds composed of gold. Underconsideration of the outcome of the bonding analyses reported for these materials to date, the largestICOHP per cell are often observed for the heteroatomic gold−post-transition-metal contacts showingthe largest percentages to the net bonding capabilities in these compounds.
3.3. The Role of Vacancies and Structural Preferences in Phase-Change Materials
The group of phase-change materials comprises those “intermetallic” compounds which canreversibly transform from amorphous to crystalline phase after irradiation with laser light [111–114].Because the crystalline and amorphous phases of phase-change materials significantly differ inboth reflectivity and resistance, these compounds can be utilized as rewriteable data-storagematerials [111–113]. In particular, an application of a long pulse of a low-intensity laser beam heats theamorphous regions of the materials leading to recrystallizations (set pulse), while an application of ashort pulse of a high-intensity laser beam locally melts the crystalline material forming amorphousregions after fast quenching (reset pulse) [111]. After having identified fast recrystallization and goodoptical contrast for GeTe and Ge11Te60Sn4Au25 [115,116], diverse phase-change materials composedof different combinations of a tetrel element, a pnictogen, and tellurium have been discovered todate [117]. The quest for previously unknown materials suited for phase-change memory applicationsstimulated the impetus to identify the origins of the reversible phase transitions typically observedfor phase-change materials. Because the measurements of the dielectric functions for phase-changematerials revealed that the optical dielectric constants are evidently higher for crystalline than for theamorphous phases, it was inferred that the sorts of bonding significantly change between the twophases [118]. The subsequent developments of materials´ maps which were based on the ionicities
132
Crystals 2018, 8, 225
and hybridizations determined for the bonds in diverse compounds indicated that the phase-changematerials are evident solely for small segments in these maps [117,119]. Additional examinations on thenature of bonding for the local structural arrangements in the amorphous phase of the phase-changematerial GeTe revealed that the tetrahedral fragments in the crystal structure are stabilized by thehomoatomic Ge−Ge bonds [120]. In this section, we will present two applications of the COHP methodto disclose the structural preferences for phase-change materials.
A prototypical representative of the group of phase-change materials is the ternary Ge2Sb2Te5,which crystallizes with a rocksalt-type of structure in its metastable state [121]. Notably, an exanimationof that crystal structure for Ge2Sb2Te5 revealed that vacancies of about 20 at.-% are evident for theoccupationally disordered Ge/Sb sites [122]. To understand the origin of the presence of vacanciesfor the mixed Ge/Sb sites in the rocksalt-like structure of Ge2Sb2Te5, the bonding situations wereexamined based on the COHP curves of three different compositions, i.e., Ge2Sb2Te4, Ge1.5Sb2Te4,and GeSb2Te4 [121] A comparison of the COHP curves for the three different compositions (Figure 6)reveals that significantly antibonding Ge−Te and Sb−Te interactions are evident at the Fermi level inthe germanium-richest telluride, while less and no antibonding Ge−Te and Sb−Te states are presentat the Fermi levels in the germanium-poorer Ge1.5Sb2Te4 and GeSb2Te4, respectively. Accordingly,it can be inferred that the presence of vacancies in the structure of the ternary phase-change materialscorresponds to a reduction of the valence-electron concentration in order to optimize the overallbonding. In other words, nature gets rid of the antibonding states by expelling some of theelectron-donating Ge atoms.
Figure 6. COHP curves of Ge2Sb2Te4 (left); Ge1.5Sb2Te4 (middle); and GeSb2Te4 (right) [121]:the Ge−Te and Sb−Te COHP curves are shown in blue and red, respectively, while the Fermi levels arerepresented by the black horizontal lines.
Recent research in the field of phase-change data storage materials has focused on thedevelopments of materials suited for applications in storage-class memories beyond the scope oftraditional phase-change materials. In that connection, chalcogenide superlattices (CSL) [123,124] andnanocrystals [125,126] were investigated for their capabilities to serve in such systems. In particular,interfacial phase-change materials (iPCMs) [127–129], in which the transformations do not occurbetween an amorphous and a crystalline phase, but between two crystalline phases, are of greatinterest as candidate systems. The more recent determinations of the crystal structure for the ternaryGe4Se3Te [31] (Figure 7) indicated that the type of structure observed for that chalcogenide mayserve as an archetype for future PCMs. In particular, the crystal structure of Ge4Se3Te is composedof layers of germanium and the chalcogenides (Ch = Se/Te; note that the chalcogenide sites areoccupationally disordered) with the stacking sequence of −Ch−Ge−Ge−Ch−. The stacking sequence
133
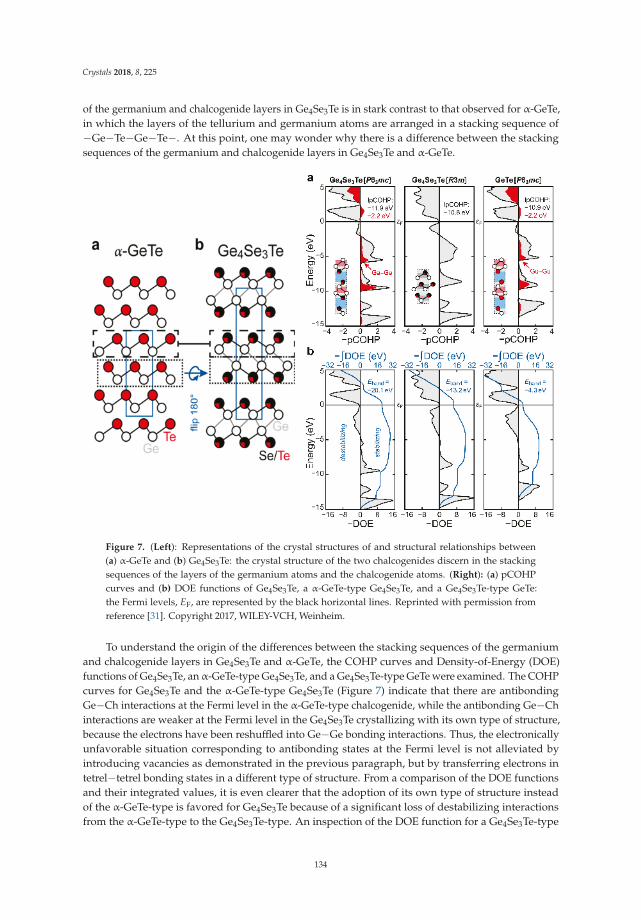
Crystals 2018, 8, 225
of the germanium and chalcogenide layers in Ge4Se3Te is in stark contrast to that observed for α-GeTe,in which the layers of the tellurium and germanium atoms are arranged in a stacking sequence of−Ge−Te−Ge−Te−. At this point, one may wonder why there is a difference between the stackingsequences of the germanium and chalcogenide layers in Ge4Se3Te and α-GeTe.
Figure 7. (Left): Representations of the crystal structures of and structural relationships between(a) α-GeTe and (b) Ge4Se3Te: the crystal structure of the two chalcogenides discern in the stackingsequences of the layers of the germanium atoms and the chalcogenide atoms. (Right): (a) pCOHPcurves and (b) DOE functions of Ge4Se3Te, a α-GeTe-type Ge4Se3Te, and a Ge4Se3Te-type GeTe:the Fermi levels, EF, are represented by the black horizontal lines. Reprinted with permission fromreference [31]. Copyright 2017, WILEY-VCH, Weinheim.
To understand the origin of the differences between the stacking sequences of the germaniumand chalcogenide layers in Ge4Se3Te and α-GeTe, the COHP curves and Density-of-Energy (DOE)functions of Ge4Se3Te, an α-GeTe-type Ge4Se3Te, and a Ge4Se3Te-type GeTe were examined. The COHPcurves for Ge4Se3Te and the α-GeTe-type Ge4Se3Te (Figure 7) indicate that there are antibondingGe−Ch interactions at the Fermi level in the α-GeTe-type chalcogenide, while the antibonding Ge−Chinteractions are weaker at the Fermi level in the Ge4Se3Te crystallizing with its own type of structure,because the electrons have been reshuffled into Ge−Ge bonding interactions. Thus, the electronicallyunfavorable situation corresponding to antibonding states at the Fermi level is not alleviated byintroducing vacancies as demonstrated in the previous paragraph, but by transferring electrons intetrel−tetrel bonding states in a different type of structure. From a comparison of the DOE functionsand their integrated values, it is even clearer that the adoption of its own type of structure insteadof the α-GeTe-type is favored for Ge4Se3Te because of a significant loss of destabilizing interactionsfrom the α-GeTe-type to the Ge4Se3Te-type. An inspection of the DOE function for a Ge4Se3Te-type
134
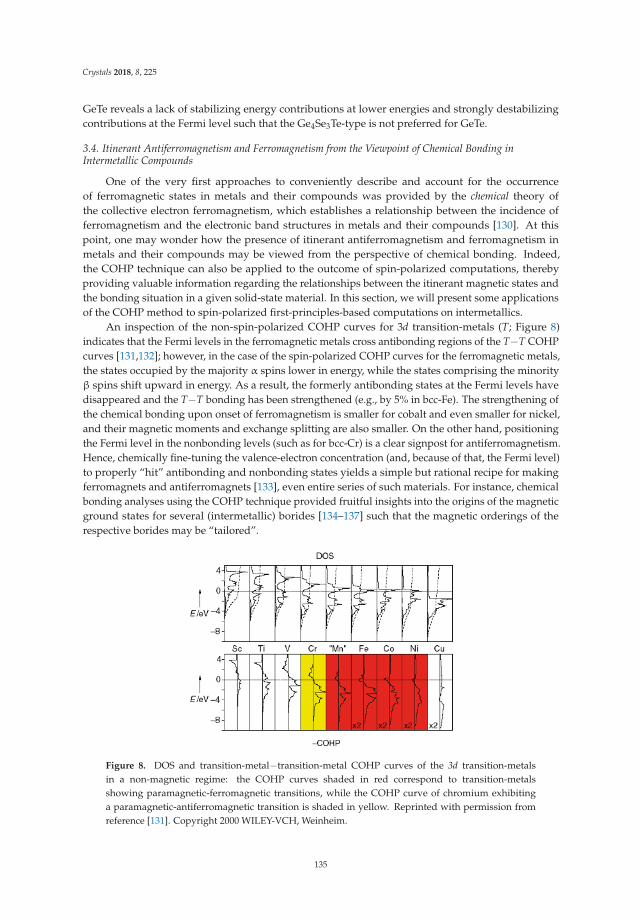
Crystals 2018, 8, 225
GeTe reveals a lack of stabilizing energy contributions at lower energies and strongly destabilizingcontributions at the Fermi level such that the Ge4Se3Te-type is not preferred for GeTe.
3.4. Itinerant Antiferromagnetism and Ferromagnetism from the Viewpoint of Chemical Bonding inIntermetallic Compounds
One of the very first approaches to conveniently describe and account for the occurrenceof ferromagnetic states in metals and their compounds was provided by the chemical theory ofthe collective electron ferromagnetism, which establishes a relationship between the incidence offerromagnetism and the electronic band structures in metals and their compounds [130]. At thispoint, one may wonder how the presence of itinerant antiferromagnetism and ferromagnetism inmetals and their compounds may be viewed from the perspective of chemical bonding. Indeed,the COHP technique can also be applied to the outcome of spin-polarized computations, therebyproviding valuable information regarding the relationships between the itinerant magnetic states andthe bonding situation in a given solid-state material. In this section, we will present some applicationsof the COHP method to spin-polarized first-principles-based computations on intermetallics.
An inspection of the non-spin-polarized COHP curves for 3d transition-metals (T; Figure 8)indicates that the Fermi levels in the ferromagnetic metals cross antibonding regions of the T−T COHPcurves [131,132]; however, in the case of the spin-polarized COHP curves for the ferromagnetic metals,the states occupied by the majority α spins lower in energy, while the states comprising the minorityβ spins shift upward in energy. As a result, the formerly antibonding states at the Fermi levels havedisappeared and the T−T bonding has been strengthened (e.g., by 5% in bcc-Fe). The strengthening ofthe chemical bonding upon onset of ferromagnetism is smaller for cobalt and even smaller for nickel,and their magnetic moments and exchange splitting are also smaller. On the other hand, positioningthe Fermi level in the nonbonding levels (such as for bcc-Cr) is a clear signpost for antiferromagnetism.Hence, chemically fine-tuning the valence-electron concentration (and, because of that, the Fermi level)to properly “hit” antibonding and nonbonding states yields a simple but rational recipe for makingferromagnets and antiferromagnets [133], even entire series of such materials. For instance, chemicalbonding analyses using the COHP technique provided fruitful insights into the origins of the magneticground states for several (intermetallic) borides [134–137] such that the magnetic orderings of therespective borides may be “tailored”.
Figure 8. DOS and transition-metal−transition-metal COHP curves of the 3d transition-metalsin a non-magnetic regime: the COHP curves shaded in red correspond to transition-metalsshowing paramagnetic-ferromagnetic transitions, while the COHP curve of chromium exhibitinga paramagnetic-antiferromagnetic transition is shaded in yellow. Reprinted with permission fromreference [131]. Copyright 2000 WILEY-VCH, Weinheim.
135
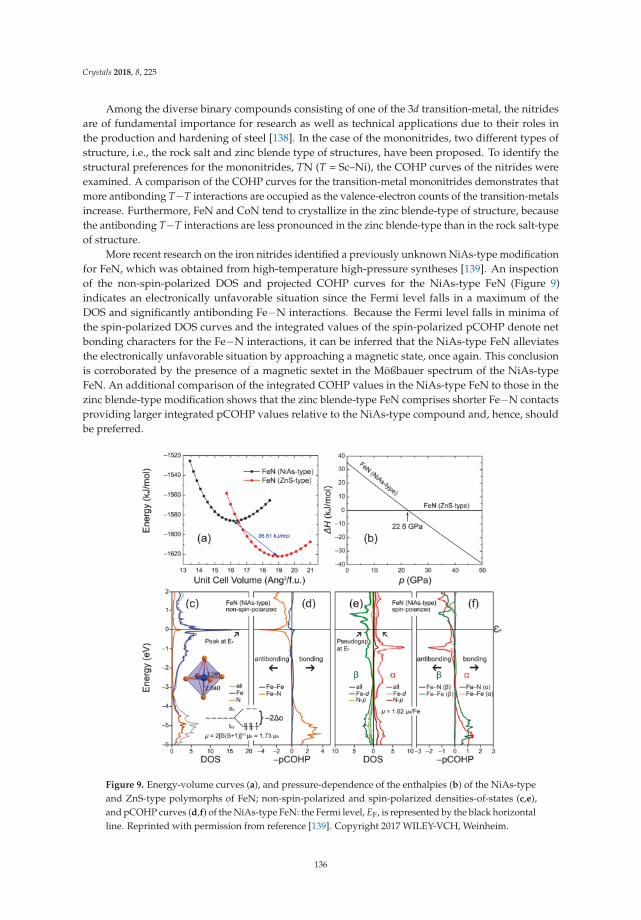
Crystals 2018, 8, 225
Among the diverse binary compounds consisting of one of the 3d transition-metal, the nitridesare of fundamental importance for research as well as technical applications due to their roles inthe production and hardening of steel [138]. In the case of the mononitrides, two different types ofstructure, i.e., the rock salt and zinc blende type of structures, have been proposed. To identify thestructural preferences for the mononitrides, TN (T = Sc–Ni), the COHP curves of the nitrides wereexamined. A comparison of the COHP curves for the transition-metal mononitrides demonstrates thatmore antibonding T−T interactions are occupied as the valence-electron counts of the transition-metalsincrease. Furthermore, FeN and CoN tend to crystallize in the zinc blende-type of structure, becausethe antibonding T−T interactions are less pronounced in the zinc blende-type than in the rock salt-typeof structure.
More recent research on the iron nitrides identified a previously unknown NiAs-type modificationfor FeN, which was obtained from high-temperature high-pressure syntheses [139]. An inspectionof the non-spin-polarized DOS and projected COHP curves for the NiAs-type FeN (Figure 9)indicates an electronically unfavorable situation since the Fermi level falls in a maximum of theDOS and significantly antibonding Fe−N interactions. Because the Fermi level falls in minima ofthe spin-polarized DOS curves and the integrated values of the spin-polarized pCOHP denote netbonding characters for the Fe−N interactions, it can be inferred that the NiAs-type FeN alleviatesthe electronically unfavorable situation by approaching a magnetic state, once again. This conclusionis corroborated by the presence of a magnetic sextet in the Mößbauer spectrum of the NiAs-typeFeN. An additional comparison of the integrated COHP values in the NiAs-type FeN to those in thezinc blende-type modification shows that the zinc blende-type FeN comprises shorter Fe−N contactsproviding larger integrated pCOHP values relative to the NiAs-type compound and, hence, shouldbe preferred.
Figure 9. Energy-volume curves (a), and pressure-dependence of the enthalpies (b) of the NiAs-typeand ZnS-type polymorphs of FeN; non-spin-polarized and spin-polarized densities-of-states (c,e),and pCOHP curves (d,f) of the NiAs-type FeN: the Fermi level, EF, is represented by the black horizontalline. Reprinted with permission from reference [139]. Copyright 2017 WILEY-VCH, Weinheim.
136
Crystals 2018, 8, 225
4. Conclusions
Because the information concerning the spatial arrangements of elements in a given material is offundamental interest for the materials design, there is critical need to recognize the bonding situationin a given material in order to understand the structural arrangements and preferences. The extractionof the information regarding the chemical bonding from electronic-structure computations requiresthe use of efficient and reliable procedures. Since its introduction 25 years ago, the COHP methodhas been employed to identify the bonding situations in numerous solid-state compounds (and alsomolecules). As shown in this contribution, the COHP technique does not depend on the employedbasis set and can be applied to the results of electronic-structure computations obtained using diversequantum-chemical means. Furthermore, we demonstrated the applications of this method to identifythe bonding situations in diverse (polar) intermetallic compounds, which are traditionally consideredas black sheep in the light of valence-electron counting rules [76]. The COHP analyses of the rare-earthtransition-metal halides enabled identification of these compounds as anti-Werner-fashioned complexes,whereas the applications of the COHP procedure to the electron-poorer polar intermetallic compoundsindicated that these materials tend to optimize the overall bonding by maximizing the amounts ofheteroatomic bonds providing the largest ICOHP per bond values. Furthermore, chemical-bondinganalyses based on the COHP technique have allowed identifying the structural preferences for nitridesand phase-change materials that are relevant for technical applications.
Author Contributions: This paper was completed trough contributions from both authors.
Acknowledgments: S.T. is grateful for a Liebig Stipend of the Verband der Chemischen Industrie e.V. (FCI),Frankfurt a. M.
Conflicts of Interest: The authors declare no conflict of interest.
References
1. Goethe, J.W. Faust—Der Tragödie Erster Teil; Reclam Publishers: Stuttgart, Germany, 1957.2. Pauling, L. The Modern Theory of Valency. J. Chem. Soc. 1948, 1461–1467. [CrossRef]3. Lewis, G.N. The atom and the molecule. J. Am. Chem. Soc. 1916, 38, 762–785. [CrossRef]4. Pauling, L. The principles determining the structure of complex ionic crystals. J. Am. Chem. Soc. 1929, 51,
1010–1026. [CrossRef]5. Zintl, E. Intermetallische Verbindungen. Angew. Chem. 1939, 52, 1–6. [CrossRef]6. Klemm, W.; Busmann, E. Volumeninkremente und Radien einiger einfach negativ geladener Ionen. Z. Anorg.
Allg. Chem. 1963, 319, 297–311. [CrossRef]7. Papoian, G.A.; Hoffmann, R. Hypervalent Bonding in One, Two, and Three Dimensions: Extending the
Zintl-Klemm Concept to Nonclassical Electron-Rich Networks. Angew. Chem. Int. Ed. 2000, 39, 2408–2448.[CrossRef]
8. Köhler, J.; Whangbo, M.-H. Late transition metal anions acting as p-metal elements. Solid State Sci. 2008, 10,444–449. [CrossRef]
9. Miller, G.J.; Schmidt, M.W.; Wang, F.; You, T.-S. Quantitative Advances in the Zintl-Klemm Formalism.In Structure and Bonding; Fässler, T., Ed.; Springer: Berlin/Heidelberg, Germany, 2011; Volume 139, pp. 1–55,ISBN 978-3-642-21150-8.
10. Nesper, R. The Zintl-Klemm Concept—A Historical Survey. Z. Anorg. Allg. Chem. 2014, 640, 2639–2648.[CrossRef]
11. Jones, H. The phase boundaries in binary alloys, Part 2: The theory of the α, β phase boundaries.Proc. Phys. Soc. 1937, 49, 250–257. [CrossRef]
12. Massalski, T.B.; Mizutani, U. Electronic Structure of Hume-Rothery Phases. Prog. Mater. Sci. 1978, 22,151–262. [CrossRef]
13. Mizutani, U.; Sato, H. The Physics of the Hume-Rothery Electron Concentration Rule. Crystals 2017, 7, 9.[CrossRef]
14. Corbett, J.D. Exploratory Synthesis in the Solid State. Endless Wonders. Inorg. Chem. 2000, 39, 5178–5191.[CrossRef] [PubMed]
137
Crystals 2018, 8, 225
15. Corbett, J.D. Exploratory Synthesis: The Fascinating and Diverse Chemistry of Polar Intermetallic Phases.Inorg. Chem. 2010, 49, 13–28. [CrossRef] [PubMed]
16. Schrödinger, E. Quantisierung als Eigenwertproblem. Ann. Phys. 1926, 384, 361–376. [CrossRef]17. Bloch, F. Über die Quantenmechanik der Elektronen in Kristallgittern. Z. Physik 1929, 52, 555–600. [CrossRef]18. Dronskowski, R. Computational Chemistry of Solid State Materials; WILEY-VCH Publishers: Weinheim,
Germany, 2005; ISBN 978–3-527-31410-2.19. Hohenberg, P.; Kohn, W. Inhomogeneous Electron Gas. Phys. Rev. 1964, 136, B864–B871. [CrossRef]20. Kohn, W.; Sham, L.J. Self-Consistent Equations Including Exchange and Correlation Effects. Phys. Rev. 1965,
140, A1133–A1138. [CrossRef]21. Jones, R.O.; Gunnarsson, O. The density functional formalism, its applications and prospects. Rev. Mod. Phys.
1989, 61, 689–746. [CrossRef]22. Dronskowski, R.; Blöchl, P.E. Crystal Orbital Hamilton Populations (COHP). Energy-Resolved Visualization
of Chemical Bonding in Solids Based on Density-Functional Calculations J. Phys. Chem. 1993, 97, 8617–8624.[CrossRef]
23. Deringer, V.L.; Tchougréeff, A.L.; Dronskowski, R. Crystal Orbital Hamilton Population (COHP) Analysis AsProjected from Plane-Wave Basis Sets. J. Phys. Chem. A 2011, 115, 5461–5466. [CrossRef] [PubMed]
24. Roothaan, C.C.J. New Developments in Molecular Orbital Theory. Rev. Mod. Phys. 1951, 23, 69–89. [CrossRef]25. Hughbanks, T.; Hoffmann, R. Chains of Trans-Edge-Sharing Molybdenum Octahedra: Metal-Metal Bonding
in Extended Systems. J. Am. Chem. Soc. 1983, 105, 3528–3537. [CrossRef]26. Hoffmann, R. How Chemistry and Physics Meet in the Solid State. Angew. Chem. Int. Ed. Engl. 1987, 26,
846–878. [CrossRef]27. Wolfsberg, M.; Helmholz, L. The Spectra and Electronic Structure of the Tetrahedral Ions MnO4
−, CrO4−,
and ClO4−. J. Chem. Phys. 1952, 20, 837–843. [CrossRef]
28. Slater, J.C. Wave Functions in a Periodic Potential. Phys. Rev. 1937, 51, 846–851. [CrossRef]29. Andersen, O.K. Linear methods in band theory. Phys. Rev. B Condens. Matter Mater. Phys. 1975, 12, 3060–3083.
[CrossRef]30. Blöchl, P.E. Projector augmented-wave method. Phys. Rev. B Condens. Matter Mater. Phys. 1994, 50,
17953–17979. [CrossRef]31. Küpers, M.; Konze, P.M.; Maintz, S.; Steinberg, S.; Mio, A.M.; Cojocaru-Mirédin, O.; Zhu, M.; Müller, M.;
Luysberg, M.; Mayer, J.; et al. Unexpected Ge–Ge Contacts in the Two-Dimensional Ge4Se3Te Phase andAnalysis of Their Chemical Cause with the Density of Energy (DOE) Function. Angew. Chem. Int. Ed. 2017,56, 10204–10208. [CrossRef] [PubMed]
32. Kresse, G.; Marsman, M.; Furthmüller, J. Vienna Ab Initio Simulation Package (VASP); The Guide ComputationalMaterials Physics, Faculty of Physics, Universität Wien: Vienna, Austria, 2014.
33. Kresse, G.; Furthmüller, J. Efficiency of ab-initio total energy calculations for metals and semiconductorsusing a plane-wave basis set. Comput. Mater. Sci. 1996, 6, 15–50. [CrossRef]
34. Kresse, G.; Furthmüller, J. Efficient iterative schemes for ab initio total-energy calculations using a plane-wavebasis set. Phys. Rev. B Condens. Matter Mater. Phys. 1996, 54, 11169–11186. [CrossRef]
35. Kresse, G.; Hafner, J. Ab initio molecular dynamics for liquid metals. Phys. Rev. B Condens. Matter Mater. Phys.
1993, 47, 558–561. [CrossRef]36. Kresse, G.; Joubert, D. From ultrasoft pseudopotentials to the projector augmented-wave method. Phys. Rev.
B Condens. Matter Mater. Phys. 1999, 59, 1758–1775. [CrossRef]37. Gonze, X.; Jollet, F.; Abreu Araujo, F.; Adams, D.; Amadon, B.; Applencourt, T.; Audouze, C.; Beuken, J.-M.;
Bieder, J.; Bokhanchuk, A.; et al. Recent developments in the ABINIT software package. Comput. Phys.
Commun. 2016, 205, 106–131. [CrossRef]38. Gonze, X.; Amadon, B.; Anglade, P.-M.; Beuken, J.-M.; Bottin, F.; Boulanger, P.; Bruneval, F.; Caliste, D.;
Caracas, R.; Côté, M.; et al. ABINIT: First-principles approach to material and nanosystem properties.Comput. Phys. Commun. 2009, 180, 2582–2615. [CrossRef]
39. Gonze, X.; Rignanese, G.-M.; Verstraete, M.; Beuken, J.-M.; Pouillon, Y.; Caracas, R.; Jollet, F.; Torrent, M.;Zerah, G.; Mikami, M.; et al. A brief introduction to the ABINIT software package. Z. Kristallog. Cryst. Mater.
2005, 220, 558–562. [CrossRef]
138
Crystals 2018, 8, 225
40. Gonze, X.; Beuken, J.-M.; Caracas, R.; Detraux, F.; Fuchs, M.; Rignanese, G.-M.; Sindic, L.; Verstraete, M.;Zerah, G.; Jollet, F.; et al. First-principles computation of material properties: The ABINIT software projec.Comput. Mater. Sci. 2002, 25, 478–492. [CrossRef]
41. Giannozzi, P.; Baroni, S.; Bonini, N.; Calandra, M.; Car, R.; Cavazzoni, C.; Ceresoli, D.; Chiarotti, G.L.;Cococcioni, M.; Dabo, I.; et al. QUANTUM ESPRESSO: A modular and open-source software project forquantum simulations of materials. J. Phys. Condens. Matter 2009, 21, 395502. [CrossRef] [PubMed]
42. Giannozzi, P.; Andreussi, O.; Brumme, T.; Bunau, O.; Nardelli, M.B.; Calandra, M.; Car, R.; Cavazzoni, C.;Ceresoli, D.; Cococcioni, M.; et al. Advanced capabilities for materials modelling with Quantum ESPRESSO.J. Phys. Condens. Matter 2017, 29, 465901. [CrossRef] [PubMed]
43. Maintz, S.; Deringer, V.L.; Tchougréeff, A.L.; Dronskowski, R. Analytic Projection From Plane-Wave andPAW Wavefunctions and Application to Chemical-Bonding Analysis in Solids. J. Comput. Chem. 2013, 34,2557–2567. [CrossRef] [PubMed]
44. Maintz, S.; Deringer, V.L.; Tchougréeff, A.L.; Dronskowski, R. LOBSTER: A Tool to Extract Chemical Bondingfrom Plane-Wave Based DFT. J. Comput. Chem. 2016, 37, 1030–1035. [CrossRef] [PubMed]
45. Gladisch, F.C.; Steinberg, S. Revealing Tendencies in the Electronic Structures of Polar IntermetallicCompounds. Crystals 2018, 8, 80. [CrossRef]
46. Schäfer, H.; Schnering, H.G. Metall-Metall-Bindungen bei niederen Halogeniden, Oxyden undOxydhalogeniden schwerer Übergangsmetalle. Angew. Chem. 1964, 76, 833–849. [CrossRef]
47. Cotton, F.A. Strong Homonuclear Metal-Metal Bonds. Acc. Chem. Res. 1969, 2, 240–247. [CrossRef]48. Simon, A. Cluster of Valence Electron Poor Metals—Structure, Bonding, and Properties. Angew. Chem. Int.
Ed. Engl. 1988, 27, 159–183. [CrossRef]49. Hughbanks, T. Bonding in clusters and condensed cluster compounds that extend in one, two and three
dimension. Prog. Solid St. Chem. 1989, 19, 329–372. [CrossRef]50. Corbett, J.D. Exploratory synthesis of reduced rare-earth-metal halides, chalcogenides, intermetallics:
New compounds, structures, and properties. J. Alloys Compds. 2006, 418, 1–20. [CrossRef]51. Corbett, J.D. Interstitially-stabilized cluster-based halides of the early transition metals. J. Alloys Compds.
1995, 229, 10–23. [CrossRef]52. Simon, A.; Mattausch, H.J.; Ryazanov, M.; Kremer, R.K. Lanthanides as d Metals. Z. Anorg. Allg. Chem. 2006,
632, 919–929. [CrossRef]53. Meyer, G. Reduced Halides of the Rare-Earth Elements. Chem. Rev. 1988, 88, 93–107. [CrossRef]54. Meyer, G. Cluster Complexes as anti-Werner Complexes. Z. Anorg. Allg. Chem. 2008, 634, 2729–2736.
[CrossRef]55. Meyer, G. Rare Earth Metal Cluster Complexes. In The Rare Earth Elements; Atwood, D.A., Ed.; John Wiley &
Sons, Ltd.: Chichester, UK, 2012; ISBN 978-1-119-95097-4.56. Hughbanks, T.; Corbett, J.D. Encapsulation of Heavy Transition Metals in Iodide Clusters. Synthesis,
Structure, and Bonding of the Unusual Cluster Phase Y6I10Ru. Inorg. Chem. 1989, 28, 631–635. [CrossRef]57. Hughbanks, T.; Corbett, J.D. Rare-Earth-Metal Iodide Clusters Centered by Transition Metals: Synthesis,
Structure, and Bonding of R7II2M Compounds (R = Sc, Y, Pr, Gd; M = Mn, Fe, Co, Ni). Inorg. Chem. 1988, 27,2022–2026. [CrossRef]
58. Rustige, C.; Brühmann, M.; Steinberg, S.; Meyer, E.; Daub, K.; Zimmermann, S.; Wolberg, M.; Mudring, A.-V.;Meyer, G. The Prolific ZR6X12R and ZR6X10 Structure Types with Isolated Endohedrally Stabilized (Z)Rare-Earth Metal (R) Cluster Halide (X) Complexes. Z. Anorg. Allg. Chem. 2012, 638, 1922–1931. [CrossRef]
59. Hughbanks, T.; Rosenthal, G.; Corbett, J.D. Alloy Clusters: The Encapsulation of Transition Metals (Mn,Fe, Co, Ni) within Cluster Halides of Zirconium and the Rare-Earth Metals. J. Am. Chem. Soc. 1986, 108,8289–8290. [CrossRef]
60. Sweet, L.E.; Roy, L.E.; Meng, F.; Hughbanks, T. Ferromagnetic Coupling in Hexanuclear Gadolinium Clusters.J. Am. Chem. Soc. 2006, 128, 10193–10201. [CrossRef] [PubMed]
61. Cotton, F.A.; Haas, T.E. A Molecular Orbital Treatment of the Bonding in Certain Metal Atom Clusters.Inorg. Chem. 1964, 3, 10–17. [CrossRef]
62. Ebihara, M.; Martin, J.D.; Corbett, J.D. Novel Chain and Oligomeric Condensed Cluster Phases forGadolinium Iodides with Manganese Interstitials. Inorg. Chem. 1994, 33, 2079–2084. [CrossRef]
63. Payne, M.W.; Ebihara, M.; Corbett, J.D. A Novel Oligomer of Condensed Metal Atom Clusters in [Y16Ru4I20].Angew. Chem. Int. Ed. Engl. 1991, 30, 856–858. [CrossRef]
139
Crystals 2018, 8, 225
64. Steinwand, S.J.; Corbett, J.D. Oligomeric Rare-Earth-Metal Halide Clusters. Three Structures Built of(Y16Z4)Br36 Units (Z = Ru, Ir). Inorg. Chem. 1996, 35, 7056–7067. [CrossRef] [PubMed]
65. Steinberg, S.; Zimmermann, S.; Brühmann, M.; Meyer, E.; Rustige, C.; Wolberg, M.; Daub, K.; Bell, T.;Meyer, G. Oligomeric rare-earth metal cluster complexes with endohedral transition metal atoms. J. Solid
State Chem. 2014, 219, 159–167. [CrossRef]66. Steinberg, S.; Bell, T.; Meyer, G. Electron Counting Rules and Electronic Structure in Tetrameric
Transition-Metal (T)-Centered Rare-Earth (R) Cluster Complex Halides (X). Inorg. Chem. 2015, 54, 1026–1037.[CrossRef] [PubMed]
67. Dorhout, P.K.; Payne, M.W.; Corbett, J.D. Condensed Metal Cluster Iodides Centered by Noble Metals. SixExamples of Cubic R3I3Z Phases (R = La, Pr; Z = Os, Ir, Pt). Inorg. Chem. 1991, 30, 4960–4962. [CrossRef]
68. Zheng, C.; Mattausch, H.J.; Hoch, C.; Simon, A. La3Br3Ni: Jahn–Teller Distortion in the Reduced Rare EarthMetal Halide. Z. Anorg. Allg. Chem. 2009, 635, 2429–2433. [CrossRef]
69. Herzmann, N.; Mudring, A.-V.; Meyer, G. Seven-Coordinate Ruthenium Atoms Sequestered inPraseodymium Clusters in the Chloride RuPr3Cl3. Inorg. Chem. 2008, 47, 7954–7956. [CrossRef] [PubMed]
70. Payne, M.W.; Dorhout, P.K.; Kim, S.-J.; Hughbanks, T.R.; Corbett, J.D. Chains of Centered Metal Clusterswith a Novel Range of Distortions: Pr3I3Ru, Y3I3Ru, and Y3I3Ir. Inorg. Chem. 1992, 31, 1389–1394. [CrossRef]
71. Steinberg, S.; Valldor, M.; Meyer, G. Change of magnetic and electronic features through subtle substitutionin cubic, non-centrosymmetric extended rare-earth metal cluster complexes TR3X3. J. Solid State Chem.
2013, 206, 176–181. [CrossRef]72. Steinberg, S.; Brgoch, J.; Miller, G.J.; Meyer, G. Identifying a Structural Preference in Reduced Rare-Earth
Metal Halides by Combining Experimental and Computational Techniques. Inorg. Chem. 2012, 51,11356–11364. [CrossRef] [PubMed]
73. Gupta, S.; Meyer, G.; Corbett, J.D. Contrasts in Structural and Bonding Representations among PolarIntermetallic Compounds. Strongly Differentiated Hamilton Populations for Three Related CondensedCluster Halides of the Rare-Earth Elements. Inorg. Chem. 2010, 49, 9949–9957. [CrossRef] [PubMed]
74. Köckerling, M.; Martin, J.D. Electronic Fine Tuning of the Structures of Reduced Rare-Earth Metal Halides.Inorg. Chem. 2001, 40, 389–395. [CrossRef] [PubMed]
75. Bell, T. Seltenerd-Clusterkomplexe mit endohedralen Übergangsmetallatomen und ihre strukturellen sowieelektronischen Beziehungen zu intermetallischen Phasen. Dr. rer. nat. Thesis, University of Cologne, Dr. HutPublishers, Munich, Germany, 2014.
76. Nesper, R. Bonding Patterns in Intermetallic Compounds. Angew. Chem. Int. Ed. Engl. 1991, 30, 789–817.[CrossRef]
77. Wade, K. The Structural Significance of the Number of Skeletal Bonding Electron-pairs in Carboranes, theHigher Boranes and Borane Anions, and Various Transition-metal Carbonyl Cluster Compounds. J. Chem.
Soc. D Chem. Commun. 1971, 792–793. [CrossRef]78. Wade, K. Skeletal electron counting in cluster species. some generalisations and predictions. Inorg. Nucl.
Chem. Lett. 1972, 8, 559–562. [CrossRef]79. Lin, Q.; Corbett, J.D. Exploratory Syntheses and Structures of SrAu4.3In1.7 and CaAg3.5In1.9: Electron-Poor
Intermetallics with Diversified Polyanionic Frameworks That Are Derived from the CaAu4In2 Approximant.Inorg. Chem. 2011, 50, 11091–11098. [CrossRef] [PubMed]
80. Pyykkö, P. Strong Closed-Shell Interactions in Inorganic Chemistry. Chem. Rev. 1997, 97, 597–636. [CrossRef][PubMed]
81. Pyykkö, P.; Desclaux, J.-P. Relativity and the Periodic System of the Elements. Acc. Chem. Res. 1979, 12,276–281. [CrossRef]
82. Pyykkö, P. Relativistic Effects in Structural Chemistry. Chem. Rev. 1988, 88, 563–594. [CrossRef]83. Pyykkö, P. Theoretical Chemistry of Gold. Angew. Chem. Int. Ed. 2004, 43, 4412–4456. [CrossRef] [PubMed]84. Smetana, V.; Lin, Q.; Pratt, D.K.; Kreyssig, A.; Ramazanoglu, M.; Corbett, J.D.; Goldman, A.I.; Miller, G.J.
A Sodium-Containing Quasicrystal: Using Gold To Enhance Sodium´s Covalency in IntermetallicCompounds. Angew. Chem. Int. Ed. 2012, 51, 12699–12702. [CrossRef] [PubMed]
85. Gautier, R.; Zhang, X.; Hu, L.; Yu, L.; Lin, Y.; Sunde, T.O.L.; Chon, D.; Poeppelmeier, K.R.; Zunger, A.Prediction and accelerated laboratory discovery of previously unknown 18-electron ABX compounds.Nat. Chem. 2015, 7, 308–316. [CrossRef] [PubMed]
140
Crystals 2018, 8, 225
86. Steinberg, S.; Stoffel, R.P.; Dronskowski, R. Search for the Mysterious SiTe—An Examination of the BinarySi-Te System Using First-Principles-Based Methods. Cryst. Growth Des. 2016, 16, 6152–6155. [CrossRef]
87. Wang, F.; Pearson, K.N.; Miller, G.J. EuAgxAl11-x with the BaCd11-Type Structure: Phase Width, Coloring,and Electronic Structure. Chem. Mater. 2009, 21, 230–236. [CrossRef]
88. Steinberg, S.; Card, N.; Mudring, A.-V. From the Ternary Eu(Au/In)2 and EuAu4(Au/In)2 with RemarkableAu/In Distributions to a New Structure Type: The Gold-Rich Eu5Au16(Au/In)6 Structure. Inorg. Chem. 2015,54, 8187–8196. [CrossRef] [PubMed]
89. Smetana, V.; Corbett, J.D.; Miller, G.J. Four Polyanionic Compounds in the K-Au-Ga System: A Case Studyin Exploratory Synthesis and of the Art of Structural Analysis. Inorg. Chem. 2012, 51, 1695–1702. [CrossRef][PubMed]
90. Smetana, V.; Miller, G.J.; Corbett, J.D. Three Alkali-Metal-Gold-Gallium Systems. Ternary Tunnel Structuresand Some Problems with Poorly Ordered Cations. Inorg. Chem. 2012, 51, 7711–7721. [CrossRef] [PubMed]
91. Smetana, V.; Miller, G.J.; Corbett, J.D. Polycluster and Substitution Effects in the Na-Au-Ga System:Remarkable Sodium Bonding Characteristics in Polar Intermetallics. Inorg. Chem. 2013, 52, 12502–12510.[CrossRef] [PubMed]
92. Smetana, V.; Corbett, J.D.; Miller, G.J. Complex Polyanionic Nets in RbAu4.01(2)Ga8.64(5) and CsAu5Ga9:The Role of Cations in the Formation of New Polar Intermetallics. Z. Anorg. Allg. Chem. 2014, 640, 790–796.[CrossRef]
93. Mishra, T.; Lin, Q.; Corbett, J.D. Gold Network Structures in Rhombohedral and Monoclinic Sr2Au6(Au,T)3
(T = Zn, Ga). A Transition via Relaxation. Inorg. Chem. 2013, 52, 13623–13630. [CrossRef] [PubMed]94. Palasyuk, A.; Grin, Y.; Miller, G.J. Turning Gold into “Diamond”: A Family of Hexagonal Diamond-Type
Au-Frameworks Interconnected by Triangular Clusters in the Sr-Al-Au System. J. Am. Chem. Soc. 2014, 136,3108–3117. [CrossRef] [PubMed]
95. Li, B.; Kim, S.-J.; Miller, G.J.; Corbett, J.D. Synthesis, Structure, and Bonding in K12Au21Sn4. A PolarIntermetallic Compound with Dense Au20 and open AuSn4 Layers. Inorg. Chem. 2009, 48, 11108–11113.[CrossRef] [PubMed]
96. Smetana, V.; Corbett, J.D.; Miller, G.J. Na8Au9.8(4)Ga7.2 and Na17Au5.87(2)Ga46.63: The diversity of pseudo5-fold symmetries in the Na–Au–Ga system. J. Solid State Chem. 2013, 207, 21–28. [CrossRef]
97. Celania, C.; Smetana, V.; Provino, A.; Pecharsky, V.; Manfrinetti, P.; Mudring, A.-V. R3Au9Pn (R = Y, Gd-Tm;Pn = Sb, Bi): A Link between Cu10Sn3 and Gd14Ag51. Inorg. Chem. 2017, 56, 7247–7256. [CrossRef] [PubMed]
98. Lin, Q.; Corbett, J.D. Multiple Nonstoichiometric Phases with Discrete Composition Ranges in theCaAu5-CaAu4Bi-BiAu2 System. A Case Study of the Chemistry of Spinodal Decomposition. J. Am. Chem. Soc.
2010, 132, 5662–5671. [CrossRef] [PubMed]99. Smetana, V.; Steinberg, S.; Mudryk, Y.; Pecharsky, V.; Miller, G.J.; Mudring, A.-V. Cation-Poor Complex
Metallic Alloys in Ba(Eu)-Au-Al(Ga) Systems: Identifying the Keys that Control Structural Arrangementsand Atom Distributions at the Atomic Level. Inorg. Chem. 2015, 54, 10296–10308. [CrossRef] [PubMed]
100. Provino, A.; Steinberg, S.; Smetana, V.; Kulkarni, R.; Dhar, S.K.; Manfrinetti, P.; Mudring, A.-V. Gold-richR3Au7Sn3: Establishing the interdependence between electronic features and physical properties. J. Mater.
Chem. C 2015, 3, 8311–8321. [CrossRef]101. Lin, Q.; Vetter, J.; Corbett, J.D. Disorder-Order Structural Transformation in Electron-Poor Sr3Au8Sn3 Driven
by Chemical Bonding Optimization. Inorg. Chem. 2013, 52, 6603–6609. [CrossRef] [PubMed]102. Lin, B.; Corbett, J.D. Different Cation Arrangements in Au-In Networks. Syntheses and Structures of Six
Intermetallic Compounds in Alkali-Metal-Au-In Systems. Inorg. Chem. 2007, 46, 6022–6028. [CrossRef]103. Lin, Q.; Mishra, T.; Corbett, J.D. Hexagonal-Diamond-like Gold Lattices, Ba and (Au,T)3 Interstitials and
Delocalized Bonding in a Family of Intermetallic Phases Ba2Au6(Au,T)3 (T = Zn, Cd, Ga, In, or Sr). J. Am.
Chem. Soc. 2013, 135, 11023–11031. [CrossRef] [PubMed]104. Gerke, B.; Hoffmann, R.-D.; Pöttgen, R. Zn3 and Ga3 Triangles as Building Units in Sr2Au6Zn3 and
Sr2Au6Ga3. Z. Anorg. Allg. Chem. 2013, 639, 2444–2449. [CrossRef]105. Gerke, B.; Korthaus, A.; Niehaus, O.; Haarmann, F.; Pöttgen, R. Triangular Zn3 and Ga3 units in Sr2Au6Zn3,
Eu2Au6Zn3, Sr2Au6Ga3, and Eu2Au6Ga3—Structure, magnetism, 151Eu Mössbauer and 69;71Ga solid stateNMR spectroscopy. Z. Naturforsch. B 2016, 71, 567–577. [CrossRef]
106. Gerke, B.; Pöttgen, R. Sr2Au6Al3 and Eu2Au6Al3—First Representatives of the Sr2Au6Zn3 Type withAluminium Triangles. Z. Naturforsch. B 2014, 69, 121–124. [CrossRef]
141
Crystals 2018, 8, 225
107. Smetana, V.; Steinberg, S.; Card, N.; Mudring, A.-V.; Miller, G.J. Crystal Structure and Bonding inBaAu5Ga2 and AeAu4+xGa3-x (Ae = Ba and Eu): Hexagonal Diamond-Type Au Frameworks and RemarkableCation/Anion Partitioning in the Ae-Au-Ga Systems. Inorg. Chem. 2015, 54, 1010–1018. [CrossRef] [PubMed]
108. Dubois, J.-M.; Belin-Ferré, E. Complex. Metallic Alloys: Fundamentals and Applications; WILEY-VCH PublishersGmbH & Co. KGaA: Weinheim, Germany, 2011; ISBN 978–3-527-32523-8.
109. Urban, K.; Feuerbach, M. Structurally complex alloy phases. J. Non. Cryst. Solids 2004, 334–335, 143–150.[CrossRef]
110. Li, B.; Kim, S.-J.; Miller, G.J.; Corbett, J.D. Gold Tetrahedra as Building Blocks in K3Au5Tr (Tr = In, Tl) andRb2Au3Tl and in Other Compounds: A Broad Group of Electron-Poor Intermetallic Phases. Inorg. Chem.
2009, 48, 6573–6583. [CrossRef] [PubMed]111. Wuttig, M.; Yamada, N. Phase-change materials for rewriteable data storage. Nat. Mater. 2007, 6, 824–832.
[CrossRef] [PubMed]112. Lencer, D.; Salinga, M.; Wuttig, M. Design Rules for Phase-Change Materials in Data Storage Applications.
Adv. Mater. 2011, 23, 2030–2058. [CrossRef] [PubMed]113. Wuttig, M.; Raoux, S. The Science and Technology of Phase Change Materials. Z. Anorg. Allg. Chem. 2012,
638, 2455–2465. [CrossRef]114. Bensch, W. Phasenwechselverbindungen auf Chalkogenidbasis für die optische und elektrische
Datenspeicherung. Z. Anorg. Allg. Chem. 2008, 634, 2009. [CrossRef]115. Chen, M.; Rubin, K.A.; Barton, R.W. Compound materials for reversible, phase-change optical data storage.
Appl. Phys. Lett. 1986, 49, 502–504. [CrossRef]116. Ohno, E.; Yamada, N.; Kurumizawa, T.; Kimura, K.; Takao, M. TeGeSnAu Alloys for Phase Change Type
Optical Disk Memories. Jpn. J. Appl. Phys. 1989, 28, 1235–1240. [CrossRef]117. Lencer, D.; Salinga, M.; Grabowski, B.; Hickel, T.; Neugebauer, J.; Wuttig, M. A map for phase-change
materials. Nat. Mater. 2008, 7, 972–977. [CrossRef] [PubMed]118. Shportko, K.; Kremers, S.; Woda, M.; Lencer, D.; Robertson, J.; Wuttig, M. Resonant bonding in crystalline
phase-change materials. Nat. Mater. 2008, 7, 653–658. [CrossRef] [PubMed]119. Esser, M.; Maintz, S.; Dronskowski, R. Automated first-principles mapping for phase-change materials. J.
Comput. Chem. 2017, 38, 620–628. [CrossRef] [PubMed]120. Deringer, V.L.; Zhang, W.; Lumeij, M.; Maintz, S.; Wuttig, M.; Mazzarello, R.; Dronskowski, R. Bonding
Nature of Local Structural Motifs in Amorphous GeTe. Angew. Chem. Int. Ed. 2014, 53, 10817–10820.[CrossRef] [PubMed]
121. Wuttig, M.; Lüsebrink, D.; Wamwangi, D.; Welnic, W.; Gilleßen, M.; Dronskowski, R. The role of vacanciesand local distortions in the desing of new phase-change materials. Nat. Mater. 2007, 6, 122–128. [CrossRef][PubMed]
122. Matsunaga, T.; Yamada, N.; Kubota, Y. Structure of stable and metastable Ge2Sb2Te5, an intermetalliccompound in GeTe-Sb2Te3 pseudo-binary systems. Acta Crystallogr. Sect. B 2004, 60, 685–691. [CrossRef][PubMed]
123. Chong, T.C.; Shi, L.P.; Zhao, R.; Tan, P.K.; Li, J.M.; Lee, H.K.; Miao, X.S.; Du, A.Y.; Tung, C.H. Phase changerandom access memory cell with superlattice-like structure. Appl. Phys. Lett. 2006, 88, 122114. [CrossRef]
124. Simpson, R.E.; Fons, P.; Kolobov, A.V.; Fukaya, T.; Krbal, M.; Yagi, T.; Tominaga, J. Interfacial phase-changememory. Nat. Nanotechnol. 2011, 6, 501–505. [CrossRef] [PubMed]
125. Buck, M.R.; Sines, I.T.; Schaak, R.E. Liquid-Phase Synthesis of Uniform Cube-Shaped GeTe Microcrystals.Chem. Mater. 2010, 22, 3236–3240. [CrossRef]
126. Konze, P.M.; Deringer, V.L.; Dronskowski, R. Understanding the Shape of GeTe Nanocrystals from FirstPrinciples. Chem. Mater. 2016, 28, 6682–6688. [CrossRef]
127. Tominaga, J.; Kolobov, A.V.; Fons, P.; Nakano, T.; Murakami, S. Ferroelectric Order Control of theDirac-Semimetal Phase in GeTe-Sb2Te3 Superlattices. Adv. Mater. Interfaces 2014, 1, 1300027. [CrossRef]
128. Ohyanagi, T.; Kitamura, M.; Araidai, M.; Kato, S.; Takaura, N.; Shiraishi, K. GeTe sequences in superlatticephase change memories and their electrical characteristics. Appl. Phys. Lett. 2014, 104, 252106. [CrossRef]
129. Momand, J.; Wang, R.; Boschker, J.E.; Verheijen, M.A.; Calarco, R.; Kooi, B.J. Interface formation of two-and three-dimensionally bonded materials in the case of GeTe-Sb2Te3 superlattices. Nanoscale 2015, 7,19136–19143. [CrossRef] [PubMed]
130. Stoner, E.C. Collective electron ferromagnetism. Proc. R. Soc. Lond. A 1938, 165, 372–414. [CrossRef]
142
Crystals 2018, 8, 225
131. Landrum, G.A.; Dronskowski, R. The Orbital Origins of Magnetism: From Atoms to Molecules toFerromagnetic Alloys. Angew. Chem. Int. Ed. 2000, 39, 1560–1585. [CrossRef]
132. Dronskowski, R. Itinerant Ferromagnetism and Antiferromagnetism from the Perspective of ChemicalBonding. J. Quantum. Chem. 2004, 96, 89–94. [CrossRef]
133. Dronskowski, R.; Korczak, K.; Lueken, H.; Jung, W. Chemically Tuning between Ferromagnetnism andAntiferromagnetism by Combining Theory and Synthesis in Iron/Manganese Rhodium Borides. Angew.
Chem. Int. Ed. 2002, 41, 2528–2532. [CrossRef]134. Fokwa, B.P.T.; Lueken, H.; Dronskowski, R. Rational Synthetic Tuning between Itinerant Antiferromagnetism
and Ferromagnetism in the Complex Boride Series Sc2FeRu5–nRhnB2 (0≤n≤5). Chem. Eur. J. 2007, 13,6040–6046. [CrossRef] [PubMed]
135. Brgoch, J.; Goerens, C.; Fokwa, B.P.T.; Miller, G.J. Scaffolding, Ladders, Chains, and Rare Ferrimagnetism inIntermetallic Borides: Electronic Structure Calculations and Magnetic Ordering. J. Am. Chem. Soc. 2011, 133,6832–6840. [CrossRef] [PubMed]
136. Zhang, Y.; Miller, G.J.; Fokwa, B.P.T. Computational Design of Rare-Earth-Free Magnets with theTi3Co5B2-Type Structure. Chem. Mater. 2017, 29, 2535–2541. [CrossRef]
137. Fokwa, B.P.T.; Samolyuk, G.D.; Miller, G.J.; Dronskowski, R. Ladders of a Magnetically Active Element inthe Structure of the Novel Complex Borid Ti9Fe2Ru18B8: Synthesis, Structure, Bonding, and Magnetism.Inorg. Chem. 2008, 47, 2113–2120. [CrossRef]
138. Eck, B.; Dronskowski, R.; Takahashi, M.; Kikkawa, S. Theoretical calculations on the structures, electronicand magnetic properties of binary 3d transition metal nitrides. J. Mater. Chem. 1999, 9, 1527–1537. [CrossRef]
139. Clark, W.P.; Steinberg, S.; Dronskowski, R.; McCammon, C.; Kupenko, I.; Bykov, M.; Dubronvinsky, L.;Akselrud, L.G.; Schwarz, U.; Niewa, R. High-Pressure NiAs-Type Modification of FeN. Angew. Chem. Int. Ed.
2017, 56, 7302–7306. [CrossRef] [PubMed]
© 2018 by the authors. Licensee MDPI, Basel, Switzerland. This article is an open accessarticle distributed under the terms and conditions of the Creative Commons Attribution(CC BY) license (http://creativecommons.org/licenses/by/4.0/).
143


MDPISt. Alban-Anlage 66
4052 BaselSwitzerland
Tel. +41 61 683 77 34Fax +41 61 302 89 18
www.mdpi.com
Crystals Editorial OfficeE-mail: [email protected]
www.mdpi.com/journal/crystals


MDPI
St. Alban-Anlage 66
4052 Basel
Switzerland
Tel: +41 61 683 77 34
Fax: +41 61 302 89 18
www.mdpi.com ISBN 978-3-03921-071-8


