Embed Size (px)
Citation preview
Comprehensive Annual Financial Report
The York County School DivisionCounty of York, Virginia
A Component Unit of the County of York, Virginia
For the Fiscal Year Ended June 30, 2019
Comprehensive Annual Financial Report
The York County School Division (Component Unit of the County of York, Virginia)
For the Fiscal Year Ended June 30, 2019
COMPREHENSIVE ANNUAL FINANCIAL REPORT
THE YORK COUNTY SCHOOL DIVISION (Component Unit of the County of York, Virginia)
For the Fiscal Year Ended June 30, 2019
Prepared by the Department of Finance
William Bowen Chief Financial Officer
Margaret Kirk, CPA Financial Supervisor

THIS PAGE LEFT BLANK INTENTIONALLY
i
THE YORK COUNTY SCHOOL DIVISION (A COMPONENT UNIT OF THE COUNTY OF YORK, VIRGINIA)
COMPREHENSIVE ANNUAL FINANCIAL REPORT June 30, 2019
TABLE OF CONTENTS PAGE INTRODUCTORY SECTION
Letter of Transmittal ....................................................................................................................... 1-8
Certificate of Achievement for Excellence in Financial Reporting –
Government Finance Officers Associations………………………………………………………… 9
Certificate of Excellence in Financial Reporting -
Association of School Business Officials International .............................................................. 10
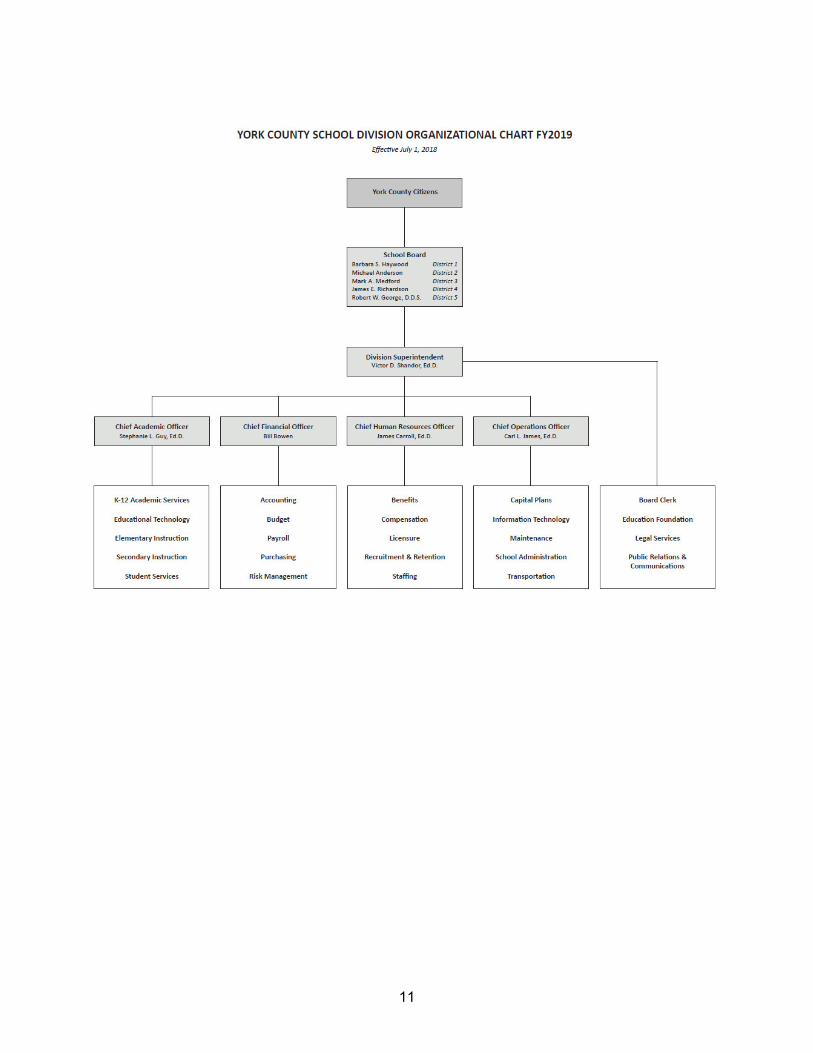
Organizational Chart ...................................................................................................................... 11
School Division Board Members and Officials ................................................................................ 12
FINANCIAL SECTION
Report of Independent Auditor ....................................................................................................... 13-14
Management’s Discussion and Analysis ........................................................................................ 15-25
Basic Financial Statements:
Government-Wide Financial Statements:
Statement of Net Position - Governmental Activities ............................................................. 26
Statement of Activities - Governmental Activities .................................................................. 27
Funds’ Financial Statements:
Governmental Fund Financial Statements:
Balance Sheet - Governmental Funds.............................................................................. 28
Reconciliation of the Balance Sheet of Governmental Funds to the
Statement of Net Position ............................................................................................ 29
Statement of Revenues, Expenditures, and Changes in Fund Balances -
Governmental Funds ................................................................................................... 30
Reconciliation of the Statement of Revenues, Expenditures, and Changes in
Fund Balances of Governmental Funds to the Statement of Activities ........................ 31
Proprietary Fund Financial Statements:
Statement of Net Position - Proprietary Fund ................................................................... 32
Statement of Revenues, Expenses, and Changes in Fund Net Position -
Proprietary Fund .......................................................................................................... 33
Statement of Cash Flows - Proprietary Fund .................................................................... 34
ii
PAGE
Basic Financial Statements (continued):
Funds’ Financial Statements (continued):
Fiduciary Funds’ Financial Statements:
Statement of Net Position - Fiduciary Funds .................................................................... 35
Statement of Changes in Net Position - Fiduciary Fund -
Pension Trust Fund - Optional Plan ............................................................................. 36
Notes to Basic Financial Statements (The notes to basic financial statements are an
integral part of the basic financial statements) ...................................................................... 37-94
Required Supplementary Information Other than Management’s Discussion and Analysis:
Schedule of Revenues - Budget and Actual - General Fund ..................................................... 96-97
Schedule of Expenditures - Budget and Actual - General Fund ................................................ 98-99
Schedule of Changes in Net Pension Liability (Asset) and Related Ratios -
Nonprofessional Employees ................................................................................................. 100
Schedule of Changes in Net Pension Liability (Asset) and Related Ratios -
Optional Plan ........................................................................................................................ 101
Schedule of Employer’s Share of Net Pension Liability ............................................................. 102
Schedule of Employer Contributions - Professional Employees ................................................ 103
Schedule of Employer Contributions - Nonprofessional Employees .......................................... 104
Schedule of Employer Contributions - Optional Plan ................................................................. 105
Schedule of Investments – Optional Plan .................................................................................. 106
Schedule of School Division’s Share of Net OPEB Liability - Group Life Insurance Program -
Nonprofessional Employees ................................................................................................. 107
Schedule of School Division’s Share of Net OPEB Liability - Group Life Insurance Program -
Professional Employees........................................................................................................ 108
Schedule of School Division’s Share of Net OPEB Liability - Health Insurance Credit Program -
Professional Employees........................................................................................................ 109
Schedule of School Division’s Share of Net OPEB Liability - Virginia Local Disability Program -
Nonprofessional Employees ................................................................................................. 110
Schedule of School Division’s Share of Net OPEB Liability - Virginia Local Disability Program -
Professional Employees........................................................................................................ 111
Schedule of Changes in Net OPEB Asset and Related Ratios - School Division Plan ................... 112
Schedule of Employer Contributions - Group Life Insurance Program -
Nonprofessional Employees ................................................................................................. 113
iii
PAGE
Schedule of Employer Contributions - Group Life Insurance Program -
Professional Employees........................................................................................................ 114
Schedule of Employer Contributions - Health Insurance Credit Program -
Professional Employees........................................................................................................ 115
Schedule of Employer Contributions - Virginia Local Disability Program -
Nonprofessional Employees ................................................................................................. 116
Schedule of Employer Contributions - Virginia Local Disability Program -
Professional Employees........................................................................................................ 117
Schedule of OPEB Contributions - School Division Plan ........................................................... 118
Notes to Required Supplementary Information .......................................................................... 119-120
Other Supplementary Information:
Schedule of Revenues and Expenditures - Budget and Actual -
Capital Projects Fund ............................................................................................................ 122
Schedule of Revenues and Expenditures - Budget and Actual -
Non-major Special Revenue Fund ........................................................................................ 123
Statement of Changes in Assets and Liabilities -
Agency Fund - School Activity Funds ................................................................................... 124
STATISTICAL SECTION
Statistical Section ........................................................................................................................... 125
Net Position by Component - Accrual Basis of Accounting - Last Ten Fiscal Years ...................... 126-127
Changes in Net Position - Accrual Basis of Accounting - Last Ten Fiscal Years ............................ 128-129
Fund Balances of Governmental Funds -
Modified Accrual Basis of Accounting - Last Ten Fiscal Years .................................................. 130-131
Changes in Fund Balances of Governmental Funds -
Modified Accrual Basis of Accounting - Last Ten Fiscal Years .................................................. 132-133
Food Services - Breakfast and Lunch Program Rates and Participation -
Last Ten Fiscal Years ................................................................................................................ 134
Assessed Value and Estimated Actual Value of Taxable Property
of the County of York, Virginia - Last Ten Calendar Years ........................................................ 135
Property Tax Rates for the County of York, Virginia - Last Ten Fiscal Years ................................. 136
Principal Property Taxpayers of the County of York, Virginia - Calendar Year -
Current Year and Nine Years Prior ............................................................................................ 137
iv
PAGE
Property Tax Levies and Collections of the County of York, Virginia -
Last Ten Fiscal Years ................................................................................................................ 138
Ratio of Outstanding Debt by Type of the County of York, Virginia -
Last Ten Fiscal Years ................................................................................................................ 139
Ratio of General Bonded Debt Outstanding for the County of York, Virginia -
Last Ten Fiscal Years ................................................................................................................ 140
Demographic and Economic Statistics - Last Ten Fiscal Years ..................................................... 141
Principal Employers - Current Year and Nine Years Prior .............................................................. 142
Full-time Equivalent Division Employees by Type - Last Ten Fiscal Years .................................... 143
Operating Statistics - Last Ten Fiscal Years .................................................................................. 144
Capital Assets Information by Governmental Activities - Last Ten Fiscal Years ............................ 145
School Building Information - Last Ten Fiscal Years ...................................................................... 146-147
COMPLIANCE SECTION
Report of Independent Auditor on Internal Control over Financial Reporting and on
Compliance and Other Matters Based on an Audit of Financial Statements
Performed in Accordance with Government Auditing Standards ............................................... 148-149
Schedule of Findings and Responses ............................................................................................ 150 - 152

INTRODUCTORY SECTION
November 27, 2019
Honorable Members of the School Board of the County of York, Virginia and Citizens of York County
We are pleased to submit to you the Comprehensive Annual Financial Report (CAFR) of the York County School Division (hereafter School Division), a component unit of the County of York, Virginia, for the fiscal year ended June 30, 2019 (FY 2019). State law requires that every general-purpose local government publish a complete set of audited financial statements within six months of the close of the fiscal year. This report has been prepared in accordance with the standards of the financial reporting as prescribed by the Governmental Accounting Standards Board (GASB) and the Auditor of Public Accounts of the Commonwealth of Virginia. Responsibility for the accuracy of the data and the completeness and fairness of presentation, including all disclosures, rests with management. All disclosures necessary to enable the reader to gain an understanding of the School Division’s financial activities have been included.
U.S. Generally Accepted Accounting Principles require that management provide a narrative introduction, overview and analysis to accompany the basic financial statements in the form of Management’s Discussion and Analysis (MD&A). This letter of transmittal is designed to complement MD&A and should be read in conjunction with it. The School Division’s MD&A can be found immediately following the report of the independent auditor.
The Comprehensive Annual Financial Report is presented in four sections: introductory, financial, statistical, and compliance. The introductory section includes this transmittal letter, an organizational chart and a list of principal officials. The financial section includes the MD&A, basic and fund financial statements, notes to the financial statements, required supplemental information (RSI) other than MD&A, as well as the independent auditor’s report on the MD&A, financial statements and schedules. The statistical section includes selected financial and demographic information, presented on a multi-year basis, where possible. The compliance section includes reports by the independent auditor on compliance and internal control.
The School Division is required to undergo an annual single audit in conformity with the provisions of the federal Single Audit Act Amendments of 1996. Information related to this single audit, including the Schedule of Expenditures of Federal Awards, findings and questioned costs, and auditor’s report, is included in the County of York’s Comprehensive Annual Financial Report.
Profile of the Reporting Entity and Organization.
York County, which was originally named Charles River County, was one of Virginia’s eight original “shires” formed in 1634. It was renamed nine years later in 1643 when the river that determines the County’s character was given the name of the then Duke of York. York County has played a major role in the development of the nation. Most importantly, it was the location of the culminating battle of the Revolutionary War and the subsequent surrender of Lord Cornwallis and his British army on October 19, 1781.
1
York County (County) is located in the Atlantic Coast’s “urban crescent” on the beautiful Virginia peninsula. Situated midway between Richmond and Virginia Beach, the County’s residents help comprise one of the nation’s largest metropolitan areas, commonly referred to as Hampton Roads. The School Division is the 22nd largest of 132 school divisions in the Commonwealth of Virginia. Total enrollment in FY 2019 was 12,756 and projected budgeted enrollment for fiscal year 2019 (FY 2019) is 12,985. Students are offered a broad range of services including regular education, special education, career and technical education, and gifted education. The oldest school building was built in the early 1950’s and the newest school building was built in the mid 1990’s. All school facilities undergo a complete renovation approximately every 20 years. The elected five-member School Board, vested with legislative powers, appoints the Superintendent, the executive and administrative head of the public school division. The School Division is fiscally dependent (i.e., it does not have taxing, levying, or borrowing authority) and is a component unit of the County of York. It derives most of its funding from allocations from the County and the Commonwealth of Virginia. The County Board of Supervisors approves the School Division’s operating budget, levies the necessary taxes to finance operations, and approves the borrowing of money and issuance of bonds when necessary. The Board of Supervisors is prohibited from exercising any control over specific appropriations within the operating budget of the School Division. However, the Board of Supervisors may exercise control in total by major categories (e.g., Instruction, Technology Pupil Transportation) as prescribed by the Code of Virginia, as amended. In accordance with the requirements of the Governmental Accounting Standards Board (GASB), the financial reporting entity consists of the primary government (County of York) and its component units, which are legally separate organizations for which the elected officials of the primary government are financially accountable (e.g., a component unit that is fiscally dependent on the primary government). The School Division is considered a component unit of the County of York. This report includes all funds of the School Division. The School Division has no component units for financial reporting purposes.
Economic Condition and Outlook
The Virginia economy continued to show signs of recovery in FY 2019. It was also the second year of the state fiscal biennium which meant that the local composite index (the “LCI” is a measure of the local government’s ability to pay) for each school division was not recalculated. In FY 2019, the first year of the biennium, the York County School Division’s LCI decreased from .3905 to .3822. The decrease resulted in over $300,000 more in state revenue than would have otherwise been received if the LCI had not changed. York County is fortunate to have affordable and plentiful housing and a moderate cost of living. As members of the dynamic Hampton Roads community, York County citizens have at their fingertips a wide variety of personal, professional and leisure opportunities, including numerous colleges and universities, theme parks, historical areas and much more. The significant tourism base continues to contribute to the County’s improving financial position. The combined effects of the Board’s fiscal stewardship, the reprieve in the decommissioning of two generating units at the Yorktown Power Station, the restoration of one-time revenue, and the prudent use of prior-year surpluses, puts York County in a better financial position than it has experienced since before the Great Recession. With the additional revenue from Senate Bill 942, the Amended Budget for FY 2019 reflects the priorities of investment in schools, public safety, employee compensation, and progress in cash funding
2
(pay-go funding) of capital projects. The FY 2020 Adopted Budget amended on May 20, 2019, continues to represent a carefully considered fiscal plan that invests in all of the Board’s strategic priorities (see Strategic Priorities) without a tax rate increase or fee increase. In addition, careful monitoring of revenues and expenditures ensured that the County ended the fiscal year in sound financial condition.
During Fiscal Year 2019, the Board of Supervisors re-affirmed its commitment to economic development by adopting the following as one of its six Strategic Priorities – Facilitate QUALITY ECONOMIC DEVELOPMENT that is sensitive to community character and the environment. In support of this objective, the Economic Development Authority (EDA), the Office of Economic Development (OED), and the entire County organization pursued and made significant strides on several initiatives, including:
Rt. 17 Revitalization Program. This program officially endorsed and authorized by the Board features a property acquisition element aimed at stimulating private investment in unique restaurant or retail offerings in the corridor. Targeted properties, once acquired, will be utilized to leverage parcel assemblage and development. The EDA acquired two parcels located at 7120 and 7124 George Washington Memorial Highway in April 2017. One year later, the EDA began negotiating a Letter of Intent (LOI) for a unique restaurant development on the combined properties. In June 2019, York County and Waukeshaw Development announced that a new Beale’s brewpub will open in spring 2021.
Home-Based Business Support. The Office of Economic Development, in partnership with the five other Peninsula localities and Gloucester, co-hosted the fourth annual Home-Based Business Conference in March 2019. This successful event boasted over 158 attendees, 20 speakers, and 22 exhibitors. The conference highlighted the County’s continuing focus on nurturing and growing its extensive home-based business sector. Another successful effort in the entrepreneurial arena was the 7th annual Peninsula-wide business plan competition, START Peninsula, which was held in FY2019 at the Applied Research Center Building in Newport News. A total of 33 people pitched their business ideas and three startups were awarded a combined total of $15,000 and free membership in the local chamber of commerce of their choice.
Regional Economic Development. The Greater Williamsburg Partnership (GWP), the regional economic development marketing organization for York, James City County and Williamsburg, along with the three localities, successfully worked to consolidate the GWP under the umbrella of the Greater Williamsburg Chamber and Tourism Alliance Business Council, to enhance the effectiveness of this important regional initiative. The merger was finalized in June 2019. Also in June, the partners were awarded a $600,000 grant under the EPA Brownfield Program for targeted environmental site assessments. These funds will be utilized to develop remediation/redevelopment plans, prepare brownfields inventory and database, prioritize sites for assessment, and support community engagement activities.
Development activity, which had slowed substantially in the post-recession years, remained strong in FY2019. Investment in new residential projects like Whittaker’s Mill and Arbordale led to an increase in residential building permit values, from $88.7 million in FY2018 to $113.5 million in FY2019. A total of 244 single family detached homes and townhouses were permitted. Apartment development also grew in the upper County.
3
Commercial building permit values did not eclipse those in FY2018, but remained strong; totaling $57.4 million compared to $63.3 million in FY2018. New commercial construction totaled $21.5 million significantly contributing to the growth of the County’s tax base. Two of the most significant commercial projects permitted in FY2019 were Tractor Supply on Route 17 and Big Top Entertainment’s new headquarters facility in York River Commerce Park South. In the same park, the EDA sold two parcels to Affordable Fasteners Supply Company and Marlowe We Care Company. These sales represent the growth of an existing York County company as well as the attraction of two new companies. The EDA also closed on a 6.4-acre sale in Busch Industrial Park to Leebcor Services LLC and has another 3.39-acre sale pending. Leebcor Services, a federal government contractor, plans to construct a 20,000 square feet headquarters building and two additional 20,000 square feet office buildings in the future.
In November 2018, the Peninsula localities and Gloucester officially established the Eastern Virginia Regional Industrial Facility Authority (EVRIFA). Earlier in 2018, the communities received a GO Virginia Grant to form the EVRIFA and develop plans for an unmanned systems testing/demonstration facility, with an adjacent light industrial park, on the former Cheatham Annex Fuel Depot site in York County. The EVRIFA is continuing to work on the unmanned systems facility and are currently working in concert with a solar farm development company for a co-location on the property. The EVRIFA plans to pursue additional GO Virginia funds for new regional economic development projects.
In addition to local economic growth, the current period’s financial statements were positively impacted by federal grants. In accordance with School Board policy, the School Division accepts all federal funds that are available, provided there is a specific need for such funds. In continuing to implement that policy, the School Division applied for and received funds from the federal government for programs such as Impact Aid, No Child Left Behind, Special Education Title VIB, and one-time funds from the Department of Defense due to the high percentage of students with parents or legal guardians connected to the military. Funds were also received from the federal government related to the Department of Defense Educational Activity grant program. The total DoDEA literacy grant is $1.5 million to be spent over a five-year period, ending in FY 2020. The grant funds efforts to improve student achievement in literacy in the School Division. In total, federal grant revenue comprised 10.4% of total General Fund Revenue. This percentage decreased in FY 2018 as compared to FY 2017 because of one-time prior year Impact Aid payments from the federal government.
Accounting System
In developing and evaluating the School Division’s accounting system, consideration is given to the adequacy of the internal control structure. The internal control structure is designed to provide reasonable, but not absolute, assurance regarding: (1) the safeguarding of assets against loss from unauthorized use or disposition; and (2) the reliability of financial records for preparing financial statements and maintaining accountability for assets. The concept of reasonable assurance recognizes that: (1) the cost of a control should not exceed the benefits likely to be derived; and (2) the evaluation of costs and benefits requires estimates and judgments by management.
All internal control evaluations occur within the above framework. We believe that the School Division’s internal control structure adequately safeguards assets and provides reasonable assurance of the proper recording of financial transactions. The accounting system is organized and operated on a function basis. Each function, relating to a specific area of operation, includes a report of appropriations, expenditures, encumbrances, and fund balances for each line item appropriate for that function.
4
Budgetary Controls. The School Division’s budgetary controls are an integral part of the School Division’s internal control system. The objective of these budgetary controls is to ensure compliance with legal provisions embodied in the annual appropriated budget approved by the School Board and County Board of Supervisors. Activities of the General Fund, Special Revenue Fund and Internal Service Fund are included in the annual appropriated budget. Project-length financial plans are adopted for the Capital Projects Fund.
Major Initiatives
In 2018-19, the York County School Division continued to focus on programs and services that support the School Board FY18-22 Strategic Plan which provides the framework for the school system’s instructional, operational and financial programs. Throughout fiscal year 2019, the School Board received progress reports on the strategies and benchmarks used to assess progress in meeting each of the Strategic Plan’s goal statements as summarized below: Goal 1 – Student Achievement York County students will consistently demonstrate growth and excellence in the skills and knowledge needed to be productive citizens. All 19 schools earned state accreditation based on performance on multiple school-quality indicators, with all but three schools (Dare Elementary - achievement gap in English, Magruder Elementary - achievement gap in English and math, Queen’s Lake Middle – achievement gap in English) earning Level One status in the new accountability system. The division also met or exceeded all federal targets for reading and mathematics, with the most notable gain in reading among students with disabilities. Since 2014, reading performance for that subgroup has improved by more than 17 percentage points. Goal 2 – Student Experiences The York County School Division will engage all students in rigorous educational experiences. Authentic learning experiences provide opportunities for students to engage in work that is meaningful to the discipline and connected to real world application. These experiences require students to problem solve, think critically and communicate what they have learned. Key focus areas of this goal are career awareness, exploration and preparedness. In FY19, the division created the EngagedIN YCSD program connects interested parents, community members, and businesses with schools and students to share their career experiences or expertise with students. The number of STEM-related clubs also increased at every level. Goal 3 – Staff Support The York County School Division will recruit, hire, retain and support a diverse staff that meets our highest standards. In FY19, the division developed numerous changes to the non-licensed compensation structure, raising the minimum and maximum salaries 14% and 25% respectively, placing the division in a more competitive market position. Additionally, the Human Resources office identified a new formula to evaluate the division’s workforce demographics along with indices that support to more accurately track retention statistics.
5

Goal 4 – School Culture The York County School Division will foster effective partnerships with families and our community and promote positive relationships between and among staff, students and families. The division recognizes that fostering effective, positive relationships with YCSD families is one of the most important responsibilities we have as educators. The division established a Family Engagement Committee that will meet quarterly each school year. As of FY19, all schools are using Virginia Tiered Systems of Support/Positive Behavior Intervention Systems as a framework for cultural responsiveness in the areas of academics, behavior and social-emotional wellness. Goal 5 – Operational Stewardship The York County School Division will maintain efficient, effective, service-oriented operations that support student achievement in safe, secure environments. For FY19, we compared the cost per pupil and standardized test scores between the York County School Division (YCSD) and eight (8) other school divisions. The results determined that YCSD had the lowest cost per pupil and the highest scores for English and math.
Policies and Significant Changes
Phase I of the County and school division’s new financial software system, Munis offered by Tyler Technologies went live in July 2019. Phase I included the chart of accounts, general ledger, projects and grants, procurement, accounts payable, cash management, capital assets, accounts receivable and general billing. The County and school division is currently working to implement the Human Resources and Payroll phase in early calendar year 2020.
Independent Audit
The Code of Virginia and the Commonwealth’s Auditor of Public Accounts require an annual audit of the books of account, financial records, and the transactions of all administrative departments, agencies, and activities of the County by an independent certified public accountant selected by the Board of Supervisors. This requirement has been complied with and the report of independent auditors has been included in the financial section of this report.
In addition to meeting the requirements set forth in State statutes and regulations, the audit was also designed to meet the requirements of the Single Audit Act Amendments of 1996 and Title 2 in the Code of Federal Regulations (CFR) Part 200, Uniform Administrative Requirements, Cost Principles and Audit Requirements for Federal Awards. The reports of the independent auditors that relate specifically to the single audit are also included in the compliance section of this report.
Instructional Leadership Awards
In FY18, Governor Ralph Northam and the Virginia Board of Education announced that 10 schools and the division earned a VIP award. Three elementary schools – Mt. Vernon, Tabb and Waller Mill – earned the Board of Education’s Excellence Award. This award recognizes schools that have met all state and federal accountability benchmarks and made significant progress toward goals for increased student achievement and expanded educational opportunities set by the board. Seven – Bethel Manor Elementary, Coventry Elementary, Seaford Elementary, Tabb Middle, Grafton High, Tabb High, and York High – earned the Board of Education Distinguished Achievement Award for meeting all state and federal benchmarks
6

and made progress toward the goals of the governor and the board. YCSD was also one of only 15 school systems in the state to earn the award as a division. Ten of York County Schools have received the Purple Star designation. The Purple Star award honors schools that demonstrate a commitment to meeting military families’ needs while also providing resources and programming related to transitions and academic planning. Virginia is home to several of the largest and most important military installations in the country and approximately 32% of all YCSD students have at least one parent serving in the military.
Financial Reporting Certificate Awards
The Government Finance Officers Association of the United States and Canada (GFOA) awarded a Certificate of Achievement for Excellence in Financial Reporting to the York County School Division for its comprehensive annual financial report for the fiscal year ended June 30, 2018 (FY 2018). In addition, the Association of School Business Officials of the United States and Canada (ASBO) awarded a Certificate of Excellence in Financial Reporting to the York County School Division for its comprehensive annual financial report for FY 2018. In order to be awarded a Certificate of Achievement from the GFOA or a Certificate of Excellence from ASBO, a governmental entity must publish an easily readable and efficiently organized comprehensive annual financial report. This report must satisfy both generally accepted accounting principles and applicable legal requirements. A certificate is the highest form of recognition awarded in the field of governmental financial reporting. A certificate is valid for a period of one year only. We believe that our current comprehensive annual financial report continues to meet the Certificate of Achievement program requirements and we are submitting it to the GFOA to determine its eligibility for another certificate. We also believe that our current comprehensive annual financial report continues to meet the Certificate of Excellence program requirements and we are submitting it to ASBO to determine its eligibility for another certificate.
Budget Presentation Awards
The Association of School Business Officials of the United States and Canada (ASBO) presented a Meritorious Budget Award to the York County School Division for its annual budget for the fiscal year beginning July 1, 2019. This program is designed to recognize school systems for achieving excellence in their school system budget presentation. The foundation of this program is a set of criteria developed by ASBO.
Acknowledgments The preparation of this report on a timely basis could not have been accomplished without the efficient and dedicated service of the entire finance staff of the School Division and without the coordination and collaborative efforts with the finance staff of York County. We would also like to thank the members of the School Board for their interest and support in planning and conducting the financial operations of the School Division in a responsible and progressive manner.
7
8
9
10
11
THE YORK COUNTY SCHOOL DIVISION (A COMPONENT UNIT OF THE COUNTY OF YORK, VIRGINIA)
June 30, 2019
12
School Division Board Members
James E. Richardson, Chair
Robert W. George, D.D.S., Vice Chair
Barbara S. Haywood
Brett Higginbotham
Mark A. Medford
School Officials Superintendent of Schools Dr. Victor D. Shandor
Chief Academic Officer Dr. Stephanie L. Guy
Chief Financial Officer William Bowen
Chief Human Resources Officer Dr. Anthony Vladu
Chief Operations Officer Dr. James Carroll
Director of Elementary Instruction Candi L. Skinner
Director of Information Technology Douglas E. Meade
Director of School Administration Dr. Aaron Butler
Director of Secondary Instruction Angela Seiders
Director of Student Services Dr. Elaine B. Gould

FINANCIAL SECTION
13
Report of Independent Auditor Members of the School Board York County School Division Report on the Financial Statements We have audited the accompanying financial statements of the governmental activities, each major fund, and the aggregate remaining fund information of the York County School Division (the “School Division”), a component unit of the County of York, Virginia, as of and for the year ended June 30, 2019, and the related notes to the financial statements, which collectively comprise the School Division’s basic financial statements as listed in the table of contents. Management’s Responsibility for the Financial Statements Management is responsible for the preparation and fair presentation of these financial statements in accordance with accounting principles generally accepted in the United States of America; this includes the design, implementation, and maintenance of internal control relevant to the preparation and fair presentation of financial statements that are free from material misstatement, whether due to fraud or error. Auditor’s Responsibility Our responsibility is to express opinions on these financial statements based on our audit. We conducted our audit in accordance with auditing standards generally accepted in the United States of America, the standards applicable to financial audits contained in Government Auditing Standards, issued by the Comptroller General of the United States, and the Specifications for Audits of Counties, Cities, and Towns, issued by the Auditor of Public Accounts of the Commonwealth of Virginia. Those standards and specifications require that we plan and perform the audit to obtain reasonable assurance about whether the financial statements are free from material misstatement. An audit involves performing procedures to obtain audit evidence about the amounts and disclosures in the financial statements. The procedures selected depend on the auditor’s judgment, including the assessment of the risks of material misstatement in the financial statements, whether due to fraud or error. In making those risk assessments, the auditor considers internal control relevant to the School Division’s preparation and fair presentation of the financial statements in order to design audit procedures that are appropriate in the circumstances, but not for the purpose of expressing an opinion on the effectiveness of the School Division’s internal control. Accordingly, we express no such opinion. An audit also includes evaluating the appropriateness of accounting policies used and the reasonableness of significant accounting estimates made by management, as well as evaluating the overall presentation of the financial statements. We believe that the audit evidence we have obtained is sufficient and appropriate to provide a basis for our audit opinions. Opinions In our opinion, the financial statements referred to above present fairly, in all material respects, the respective financial position of the governmental activities, each major fund, and aggregate remaining fund information of the School Division, as of June 30, 2019, and the respective changes in financial position and, where applicable, cash flows thereof for the year then ended in accordance with accounting principles generally accepted in the United States of America.
14
Other Matters Required Supplementary Information Accounting principles generally accepted in the United States of America require that the management’s discussion and analysis and the required supplementary information other than management discussion and analysis, as described in the table of contents, be presented to supplement the basic financial statements. Such information, although not a part of the basic financial statements, is required by the Governmental Accounting Standards Board, who considers it to be an essential part of financial reporting for placing the basic financial statements in an appropriate operational, economic, or historical context. We have applied certain limited procedures to the required supplementary information in accordance with auditing standards generally accepted in the United States of America, which consisted of inquiries of management about the methods of preparing the information and comparing the information for consistency with management’s responses to our inquiries, the basic financial statements, and other knowledge we obtained during our audit of the basic financial statements. We do not express an opinion or provide any assurance on the information because the limited procedures do not provide us with sufficient evidence to express an opinion or provide any assurance. Other Information Our audit was conducted for the purpose of forming opinions on the financial statements that collectively comprise the School Division’s basic financial statements. The Introductory Section, Other Supplementary Information, and Statistical Section, as listed in the table of contents, are presented for purposes of additional analysis and are not a required part of the basic financial statements. The Other Supplementary Information is the responsibility of management and was derived from and relates directly to the underlying accounting and other records used to prepare the basic financials statements. Such information has been subjected to the auditing procedures applied in the audit of the basic financial statements and certain additional procedures, including comparing and reconciling such information directly to the underlying accounting and other records used to prepare the basic financial statements or the basic financial statements themselves, and other additional procedures in accordance with auditing standards generally accepted in the United States of America. In our opinion, the Other Supplementary Information is fairly stated in all material respects in relation to the basic financial statements as a whole. The Introductory and Statistical Sections have not been subjected to the auditing procedures applied in the audit of the basic financial statements and, accordingly, we do not express an opinion or provide any assurance on them. Other Reporting Required by Government Auditing Standards In accordance with Government Auditing Standards, we have also issued our report dated November 27, 2019, on our consideration of the School Division’s internal control over financial reporting and on our tests of its compliance with certain provisions of laws, regulations, contracts, and grant agreements and other matters. The purpose of that report is solely to describe the scope of our testing of internal control over financial reporting and compliance and the results of that testing, and not to provide an opinion on the effectiveness of the School Division’s internal control over financial reporting or on compliance. That report is an integral part of an audit performed in accordance with Government Auditing Standards in considering the School Division’s internal control over financial reporting and compliance.
Virginia Beach, Virginia November 27, 2019
15
THE YORK COUNTY SCHOOL DIVISION (A COMPONENT UNIT OF THE COUNTY OF YORK, VIRGINIA)
Management’s Discussion and Analysis
For the Year Ended June 30, 2019 (Unaudited)
The discussion and analysis of the York County School Division’s (hereafter School Division) financial performance provides an overall review of the School Division’s financial activities for FY 2019. The intent of this discussion and analysis is to look at the School Division’s financial performance as a whole; readers should also review the transmittal letter at the front of this report and the School Division’s financial statements and notes to the basic financial statements which immediately follow this section, to enhance their understanding of the School Division’s financial performance. Financial Highlights
The School Division maintained a healthy net position of $54.5 million. The value of net position reflects the financial health of the School Division and includes certain assets procured with debt issued by the County of York. The School Division is a component unit of, and fiscally dependent on, the County of York. As such, all debt related to School Division assets are shown on the County’s statement of net position.
For the governmental funds, General Fund revenues accounted for $138.6 million or 90.2% of all revenues, and expenditures were $138.4 million or 91% of all expenditures, compared to $133.1 million (90.3%) in revenues and $134.4 million (91%) in expenditures in FY 2018.
Food Services ended the fiscal year with a fund balance of $1,185,624, an increase of $114,299 over the beginning of year fund balance. School Division operations staff and a food service management company closely monitored revenues and expenditures during the fiscal year. The increase in fund balance can be attributed to an increase in student enrollment and participation. It should also be noted that a new food service management company was contracted by the School Division for FY 2014. Since that time, the School Division has steadily increased the fund balance. The school division maintains three (3) months of food service reserves which largely comprises the fund balance. Funds held in excess of the required reserves are used to replace cafeteria equipment and supplies.
16
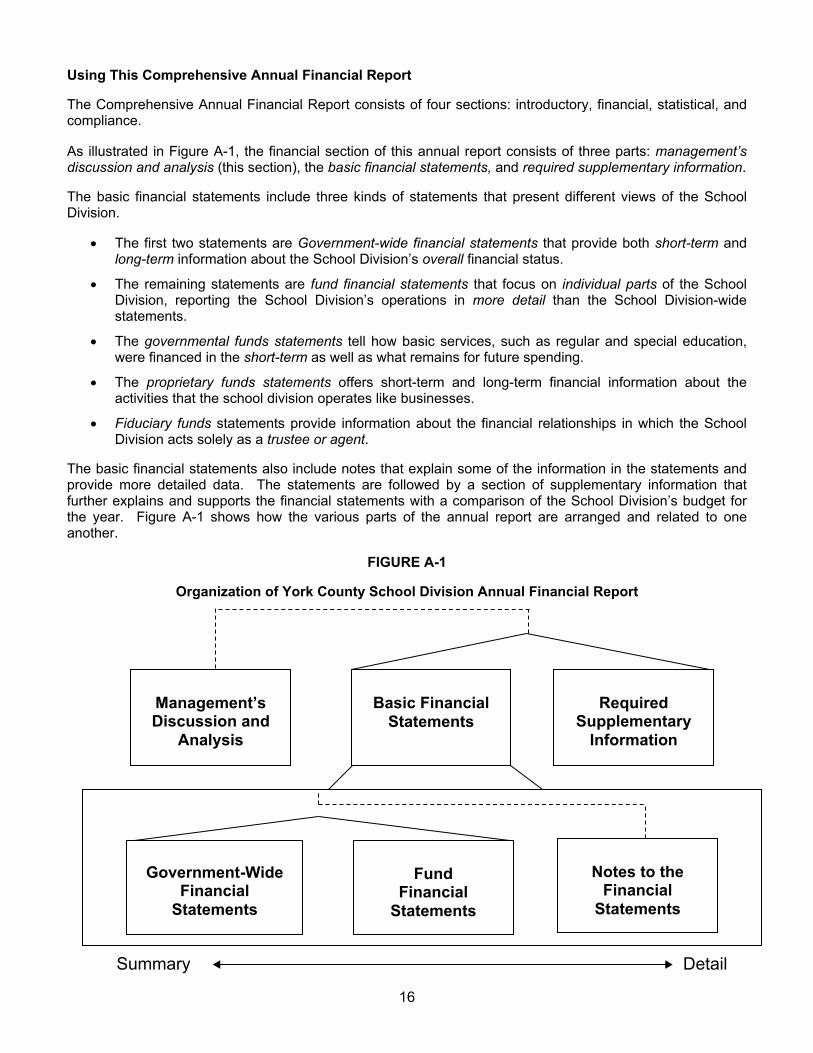
Using This Comprehensive Annual Financial Report The Comprehensive Annual Financial Report consists of four sections: introductory, financial, statistical, and compliance. As illustrated in Figure A-1, the financial section of this annual report consists of three parts: management’s discussion and analysis (this section), the basic financial statements, and required supplementary information. The basic financial statements include three kinds of statements that present different views of the School Division.
The first two statements are Government-wide financial statements that provide both short-term and long-term information about the School Division’s overall financial status.
The remaining statements are fund financial statements that focus on individual parts of the School Division, reporting the School Division’s operations in more detail than the School Division-wide statements.
The governmental funds statements tell how basic services, such as regular and special education, were financed in the short-term as well as what remains for future spending.
The proprietary funds statements offers short-term and long-term financial information about the activities that the school division operates like businesses.
Fiduciary funds statements provide information about the financial relationships in which the School Division acts solely as a trustee or agent.
The basic financial statements also include notes that explain some of the information in the statements and provide more detailed data. The statements are followed by a section of supplementary information that further explains and supports the financial statements with a comparison of the School Division’s budget for the year. Figure A-1 shows how the various parts of the annual report are arranged and related to one another.
FIGURE A-1
Organization of York County School Division Annual Financial Report
Summary Detail
Government-Wide
Financial Statements
Fund
Financial Statements
Notes to the
Financial Statements
Management’s Discussion and
Analysis
Basic Financial
Statements
Required
Supplementary Information
17
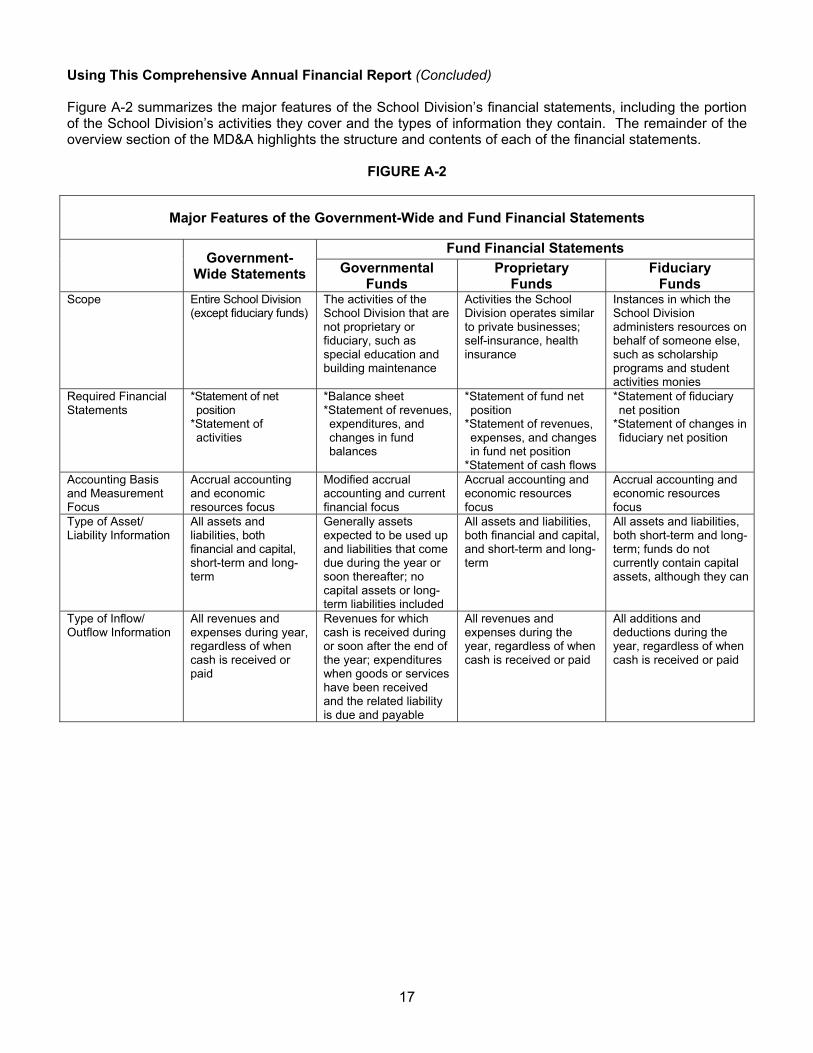
Using This Comprehensive Annual Financial Report (Concluded) Figure A-2 summarizes the major features of the School Division’s financial statements, including the portion of the School Division’s activities they cover and the types of information they contain. The remainder of the overview section of the MD&A highlights the structure and contents of each of the financial statements.
FIGURE A-2
Major Features of the Government-Wide and Fund Financial Statements
Government-
Wide Statements
Fund Financial Statements
Governmental Funds
Proprietary Funds
Fiduciary Funds
Scope
Entire School Division (except fiduciary funds)
The activities of the School Division that are not proprietary or fiduciary, such as special education and building maintenance
Activities the School Division operates similar to private businesses; self-insurance, health insurance
Instances in which the School Division administers resources on behalf of someone else, such as scholarship programs and student activities monies
Required Financial Statements
*Statement of net position
*Statement of activities
*Balance sheet *Statement of revenues, expenditures, and changes in fund balances
*Statement of fund net position
*Statement of revenues, expenses, and changes in fund net position
*Statement of cash flows
*Statement of fiduciary net position
*Statement of changes in fiduciary net position
Accounting Basis and Measurement Focus
Accrual accounting and economic resources focus
Modified accrual accounting and current financial focus
Accrual accounting and economic resources focus
Accrual accounting and economic resources focus
Type of Asset/ Liability Information
All assets and liabilities, both financial and capital, short-term and long-term
Generally assets expected to be used up and liabilities that come due during the year or soon thereafter; no capital assets or long-term liabilities included
All assets and liabilities, both financial and capital, and short-term and long-term
All assets and liabilities, both short-term and long-term; funds do not currently contain capital assets, although they can
Type of Inflow/ Outflow Information
All revenues and expenses during year, regardless of when cash is received or paid
Revenues for which cash is received during or soon after the end of the year; expenditures when goods or services have been received and the related liability is due and payable
All revenues and expenses during the year, regardless of when cash is received or paid
All additions and deductions during the year, regardless of when cash is received or paid
18
Government-Wide Statements The Government-wide statements report information about the York County School Division as a whole using accounting methods similar to those used in private-sector companies. While this document contains a number of funds used by the School Division to provide programs and activities, the view of the School Division, as a whole, looks at all financial transactions and asks the question, “How did we do financially during FY 2019?” The statement of net position and the statement of activities answer this question. These statements report all of the assets and liabilities using the accrual basis of accounting. This basis of accounting takes into account all of the current year’s revenues and expenses regardless of when cash is received or paid. The two Government-wide statements report the School Division’s net position and how they have changed. Net position - the difference between the School Division’s assets plus deferred outflows and liabilities plus deferred inflows - are only one way to measure the School Division’s financial health or position.
Over time, increases or decreases in the School Division’s net position are an indicator of whether its financial position is improving or deteriorating, respectively.
To assess the overall health of the School Division, additional non-financial factors may also be relevant, such as changes in the County tax base, the condition of school buildings and other facilities, required educational programs, and other factors.
In the statement of net position and the statement of activities, the School Division reports only activities related to governmental-type activities, since it has no business-type activities. The School Division’s governmental-type activities include: instruction, administration/attendance and health, transportation, operations and maintenance, food service, and interest on capital leases and capital projects. Fund Financial Statements The fund financial statements provide more detailed information about the School Division’s most significant or “major” funds. Funds are accounting devices that the School Division uses to help keep track of specific sources of funding and spending for particular purposes. The School Division has three types of funds:
Governmental Funds: Most of the School Division’s activities are reported in governmental funds, which focus on how much money flows into and out of those funds and the balances remaining at year-end available for spending in future periods. These funds are reported using an accounting method called modified accrual accounting, which measures cash and all other financial assets that can be readily converted to cash. The governmental fund statements provide a detailed short-term view of the School Division’s general government operations and the basic services it provides. Governmental fund information helps one determine whether there are more or fewer resources that can be spent in the near future to finance educational programs. Because the governmental funds information does not encompass the additional long-term focus of the School Division-wide statements, additional information has been added in the form of a reconciliation between the total fund balances of the governmental funds and the total net position of the School Division-wide activities.
Proprietary Funds: Proprietary funds are reported on a full accrual basis and economic resources focus. The School Division uses one internal service fund (a type of proprietary fund) to report activities that provide health and dental services for the School Division.
Fiduciary Funds: The School Division is trustee or fiduciary for the York County School Board Benefit
and Pension Trust Fund. All of the fiduciary activities are reported in a separate statement of fiduciary net position and a statement of changes in fiduciary net position. These activities are excluded from the School Division-wide statements because the School Division cannot use these assets to finance its operation. The student activity monies are also accounted for in this fund type, as an agency fund.
19
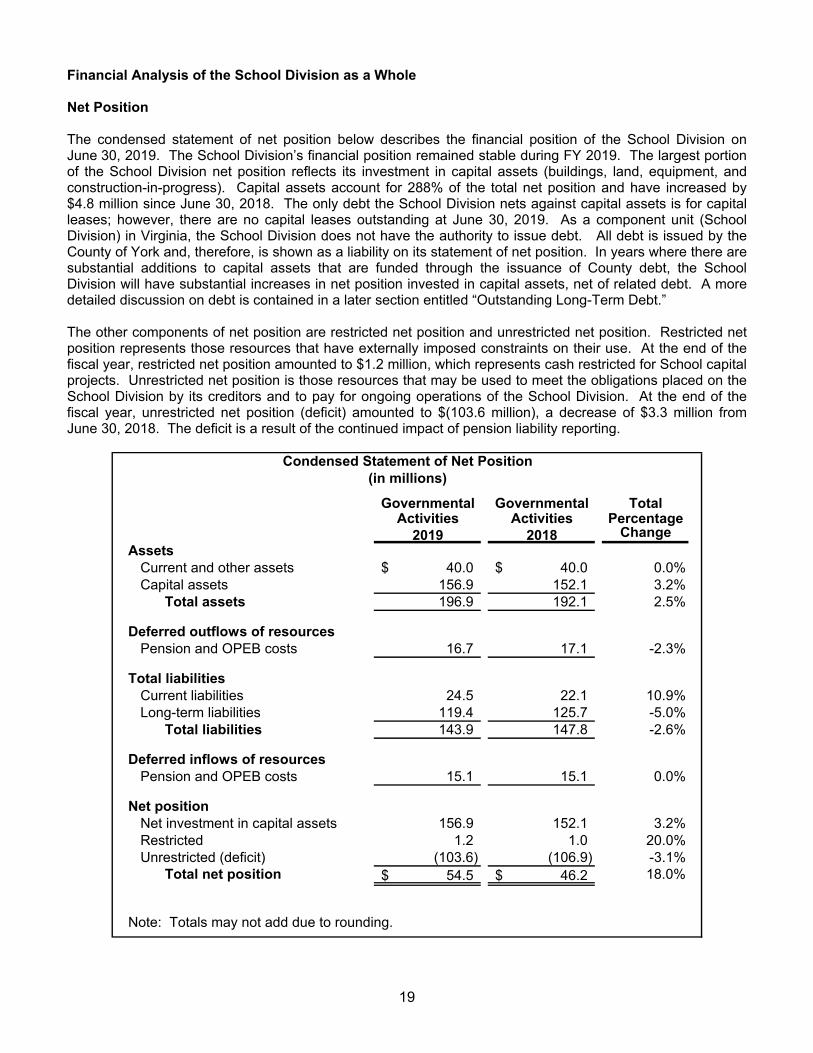
Financial Analysis of the School Division as a Whole Net Position The condensed statement of net position below describes the financial position of the School Division on June 30, 2019. The School Division’s financial position remained stable during FY 2019. The largest portion of the School Division net position reflects its investment in capital assets (buildings, land, equipment, and construction-in-progress). Capital assets account for 288% of the total net position and have increased by $4.8 million since June 30, 2018. The only debt the School Division nets against capital assets is for capital leases; however, there are no capital leases outstanding at June 30, 2019. As a component unit (School Division) in Virginia, the School Division does not have the authority to issue debt. All debt is issued by the County of York and, therefore, is shown as a liability on its statement of net position. In years where there are substantial additions to capital assets that are funded through the issuance of County debt, the School Division will have substantial increases in net position invested in capital assets, net of related debt. A more detailed discussion on debt is contained in a later section entitled “Outstanding Long-Term Debt.” The other components of net position are restricted net position and unrestricted net position. Restricted net position represents those resources that have externally imposed constraints on their use. At the end of the fiscal year, restricted net position amounted to $1.2 million, which represents cash restricted for School capital projects. Unrestricted net position is those resources that may be used to meet the obligations placed on the School Division by its creditors and to pay for ongoing operations of the School Division. At the end of the fiscal year, unrestricted net position (deficit) amounted to $(103.6 million), a decrease of $3.3 million from June 30, 2018. The deficit is a result of the continued impact of pension liability reporting.
Governmental Governmental TotalActivities Activities Percentage
2019 2018 ChangeAssets
Current and other assets 40.0$ 40.0$ 0.0%Capital assets 156.9 152.1 3.2%
Total assets 196.9 192.1 2.5%
Deferred outflows of resourcesPension and OPEB costs 16.7 17.1 -2.3%
Total liabilitiesCurrent liabilities 24.5 22.1 10.9%Long-term liabilities 119.4 125.7 -5.0%
Total liabilities 143.9 147.8 -2.6%
Deferred inflows of resourcesPension and OPEB costs 15.1 15.1 0.0%
Net positionNet investment in capital assets 156.9 152.1 3.2%Restricted 1.2 1.0 20.0%Unrestricted (deficit) (103.6) (106.9) -3.1%
Total net position 54.5$ 46.2$ 18.0%
Note: Totals may not add due to rounding.
Condensed Statement of Net Position(in millions)
20
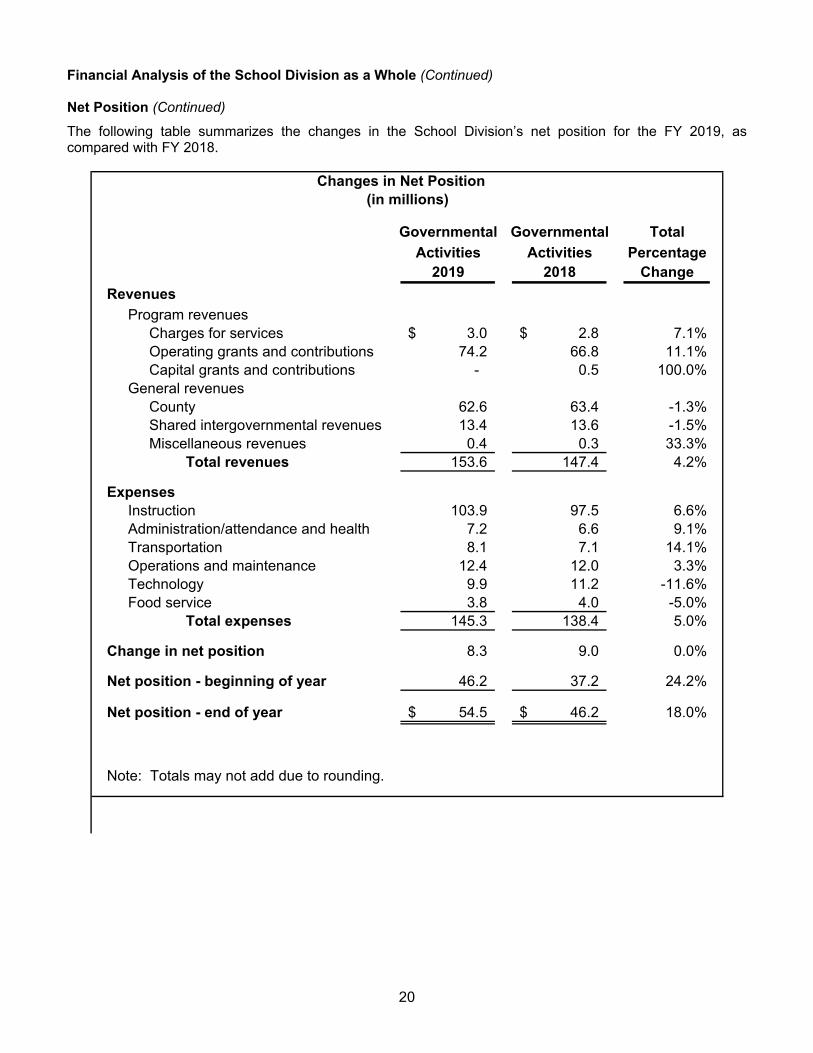
Financial Analysis of the School Division as a Whole (Continued) Net Position (Continued)
The following table summarizes the changes in the School Division’s net position for the FY 2019, as compared with FY 2018.
Governmental Governmental Total
Activities Activities Percentage2019 2018 Change
Revenues
Program revenuesCharges for services 3.0$ 2.8$ 7.1%Operating grants and contributions 74.2 66.8 11.1%Capital grants and contributions - 0.5 100.0%
General revenuesCounty 62.6 63.4 -1.3%Shared intergovernmental revenues 13.4 13.6 -1.5%Miscellaneous revenues 0.4 0.3 33.3%
Total revenues 153.6 147.4 4.2%
ExpensesInstruction 103.9 97.5 6.6%Administration/attendance and health 7.2 6.6 9.1%Transportation 8.1 7.1 14.1%Operations and maintenance 12.4 12.0 3.3%Technology 9.9 11.2 -11.6%Food service 3.8 4.0 -5.0%
Total expenses 145.3 138.4 5.0%
Change in net position 8.3 9.0 0.0%
Net position - beginning of year 46.2 37.2 24.2%
Net position - end of year 54.5$ 46.2$ 18.0%
Note: Totals may not add due to rounding.
Changes in Net Position(in millions)
21
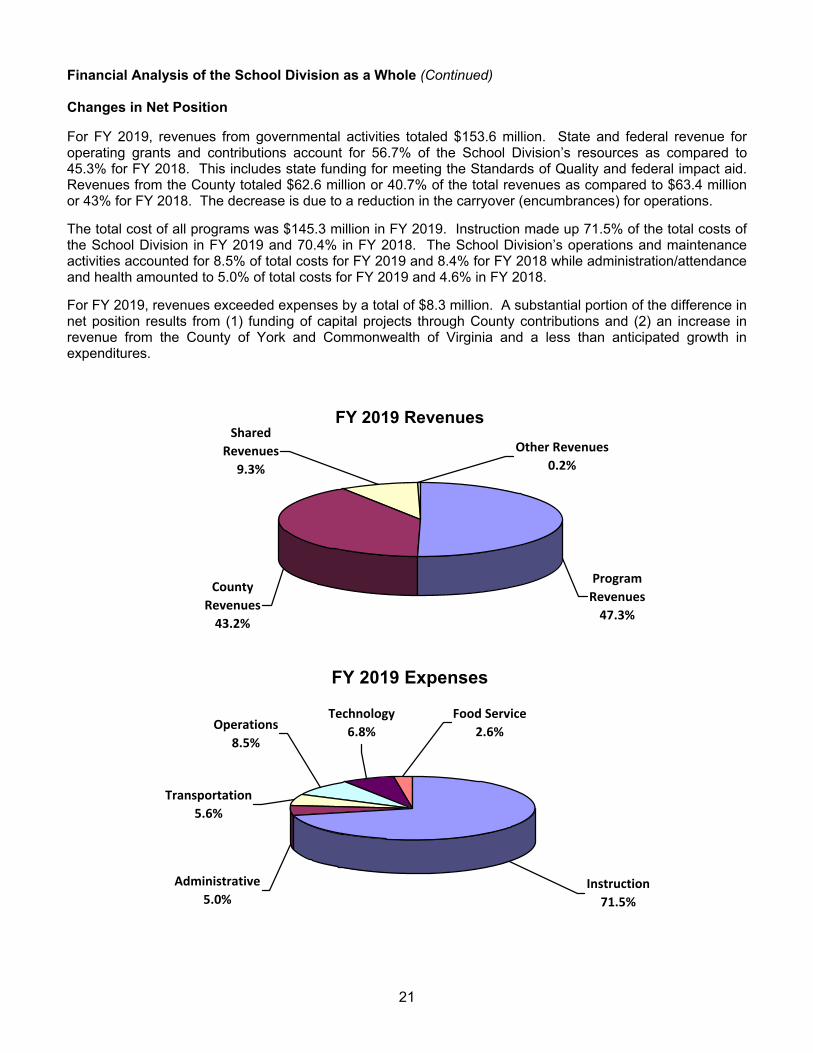
Financial Analysis of the School Division as a Whole (Continued) Changes in Net Position For FY 2019, revenues from governmental activities totaled $153.6 million. State and federal revenue for operating grants and contributions account for 56.7% of the School Division’s resources as compared to 45.3% for FY 2018. This includes state funding for meeting the Standards of Quality and federal impact aid. Revenues from the County totaled $62.6 million or 40.7% of the total revenues as compared to $63.4 million or 43% for FY 2018. The decrease is due to a reduction in the carryover (encumbrances) for operations.
The total cost of all programs was $145.3 million in FY 2019. Instruction made up 71.5% of the total costs of the School Division in FY 2019 and 70.4% in FY 2018. The School Division’s operations and maintenance activities accounted for 8.5% of total costs for FY 2019 and 8.4% for FY 2018 while administration/attendance and health amounted to 5.0% of total costs for FY 2019 and 4.6% in FY 2018.
For FY 2019, revenues exceeded expenses by a total of $8.3 million. A substantial portion of the difference in net position results from (1) funding of capital projects through County contributions and (2) an increase in revenue from the County of York and Commonwealth of Virginia and a less than anticipated growth in expenditures.
FY 2019 Revenues
County
Revenues
43.2%
Shared
Revenues
9.3%
Program
Revenues
47.3%
Other Revenues
0.2%
FY 2019 Expenses
Operations
8.5%
Instruction
71.5%
Transportation
5.6%
Administrative
5.0%
Food Service
2.6%
Technology
6.8%
22
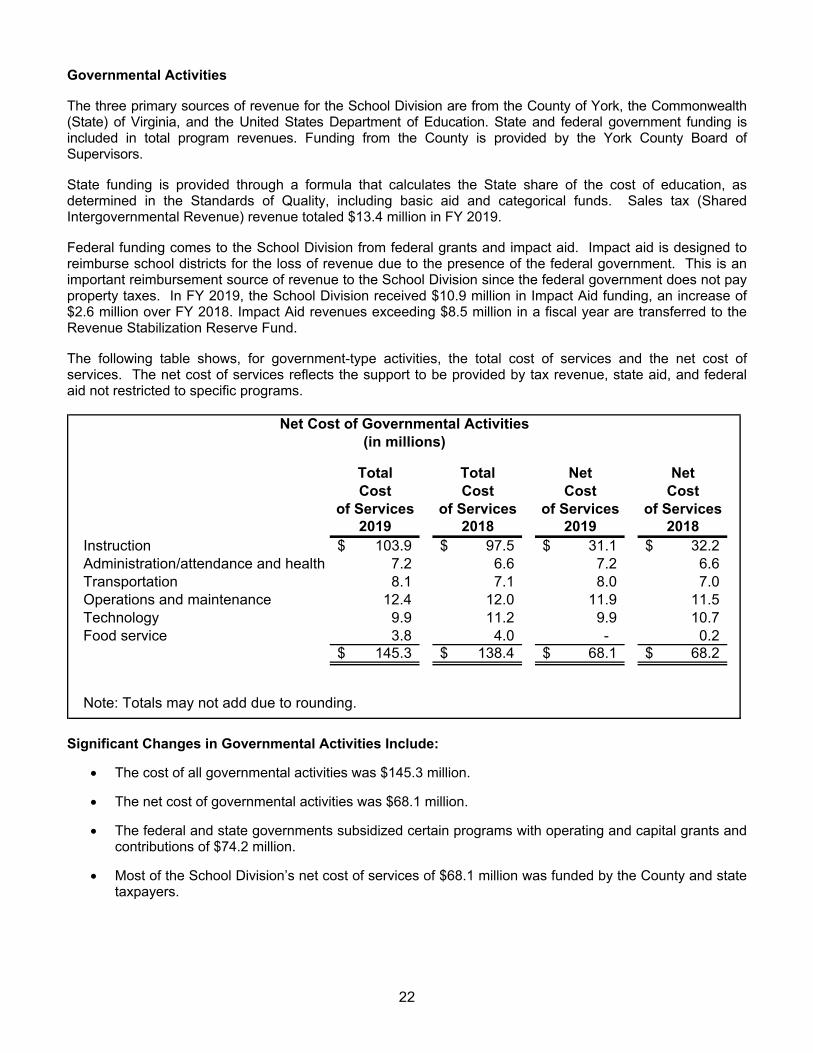
Governmental Activities The three primary sources of revenue for the School Division are from the County of York, the Commonwealth (State) of Virginia, and the United States Department of Education. State and federal government funding is included in total program revenues. Funding from the County is provided by the York County Board of Supervisors. State funding is provided through a formula that calculates the State share of the cost of education, as determined in the Standards of Quality, including basic aid and categorical funds. Sales tax (Shared Intergovernmental Revenue) revenue totaled $13.4 million in FY 2019. Federal funding comes to the School Division from federal grants and impact aid. Impact aid is designed to reimburse school districts for the loss of revenue due to the presence of the federal government. This is an important reimbursement source of revenue to the School Division since the federal government does not pay property taxes. In FY 2019, the School Division received $10.9 million in Impact Aid funding, an increase of $2.6 million over FY 2018. Impact Aid revenues exceeding $8.5 million in a fiscal year are transferred to the Revenue Stabilization Reserve Fund. The following table shows, for government-type activities, the total cost of services and the net cost of services. The net cost of services reflects the support to be provided by tax revenue, state aid, and federal aid not restricted to specific programs.
Total Total Net NetCost Cost Cost Cost
of Services of Services of Services of Services2019 2018 2019 2018
Instruction 103.9$ 97.5$ 31.1$ 32.2$ Administration/attendance and health 7.2 6.6 7.2 6.6 Transportation 8.1 7.1 8.0 7.0 Operations and maintenance 12.4 12.0 11.9 11.5 Technology 9.9 11.2 9.9 10.7 Food service 3.8 4.0 - 0.2
145.3$ 138.4$ 68.1$ 68.2$
Note: Totals may not add due to rounding.
Net Cost of Governmental Activities(in millions)
Significant Changes in Governmental Activities Include:
The cost of all governmental activities was $145.3 million.
The net cost of governmental activities was $68.1 million.
The federal and state governments subsidized certain programs with operating and capital grants and contributions of $74.2 million.
Most of the School Division’s net cost of services of $68.1 million was funded by the County and state
taxpayers.
23
Financial Analysis of the School Division’s Funds The strong financial performance of the School Division is also reflected in its major governmental funds, the General Fund and the Capital Projects Fund. As the School Division completed the year, the General Fund reported a fund balance of $5.2 million or a $0.2 million increase from the fund balance reported for FY 2018. The increase in fund balance for the General Fund stems from the inability to fill all vacant positions during the year. The Capital Projects Fund reported a fund balance at the end of FY 2019 of $4.8 million or a $0.5 million increase from the fund balance reported for FY 2018 due to the delay in the completion of several multi-year projects. The Food Service Fund, the non-major governmental fund, reported a fund balance of $1.2 million at the end of FY 2019, representing a $0.1 million increase from the FY 2018 reported fund balance. This increase was the result of an increased student enrollment and an increase in participation. General Fund Budgetary Highlights The School Division’s budget is prepared in accordance with Virginia School Laws. The most significant budgeted fund is the General Fund. During the course of FY 2019, the School Division amended its general fund budget as follows:
Amended and increased appropriations by $606,463 to account for changes in state funding due to higher than expected student enrollment, special education reimbursements and the addition of a new federal grant for STEM activities.
Amended appropriations throughout the major budget expenditure categories to accommodate changes in programs and services. This budget amendment did not change the total amount of the budget.
The actual results for the year show a net change in fund balance of $0.2 million. The increase, for the most part, was driven by an increase revenue and an increase in the year-end reversion. General Fund revenues were $138.6 million or 4.1% higher in FY 2019 as compared to FY 2018. Federal revenue increased $3 million or 2.3% in FY 2019 as compared to the previous fiscal year. This was due primarily to an increase in Impact Aid revenue and the addition of a new federal grant for STEM activities. General Fund actual expenditures were $4.8 million less than the final budgeted amount. Significant factors contributing to the variance include:
Outstanding encumbrances at June 30, 2019 are not reflected in the budget comparison schedule.
Personnel savings due to vacant positions, staff on leave without pay, and personnel attrition.
Portions of state and federal grants were carried forward to FY 2019.
Managed savings in numerous budget accounts. Proprietary Funds The School Division’s internal service fund, a proprietary fund type, is presented on the same basis as the government-wide financial statements but is presented in more detail in the fund financial statements. FY15 was the first year of operation for the fund. As of June 30, 2019, the ending net position of the fund was $3.8 million. The actual results for the year show a net change in fund balance of ($2.9) million. The decrease was driven by an increase in payments for contractual services. Charges for services totaled $17.2 million and payments for contractual services totaled $20.2 million.
24
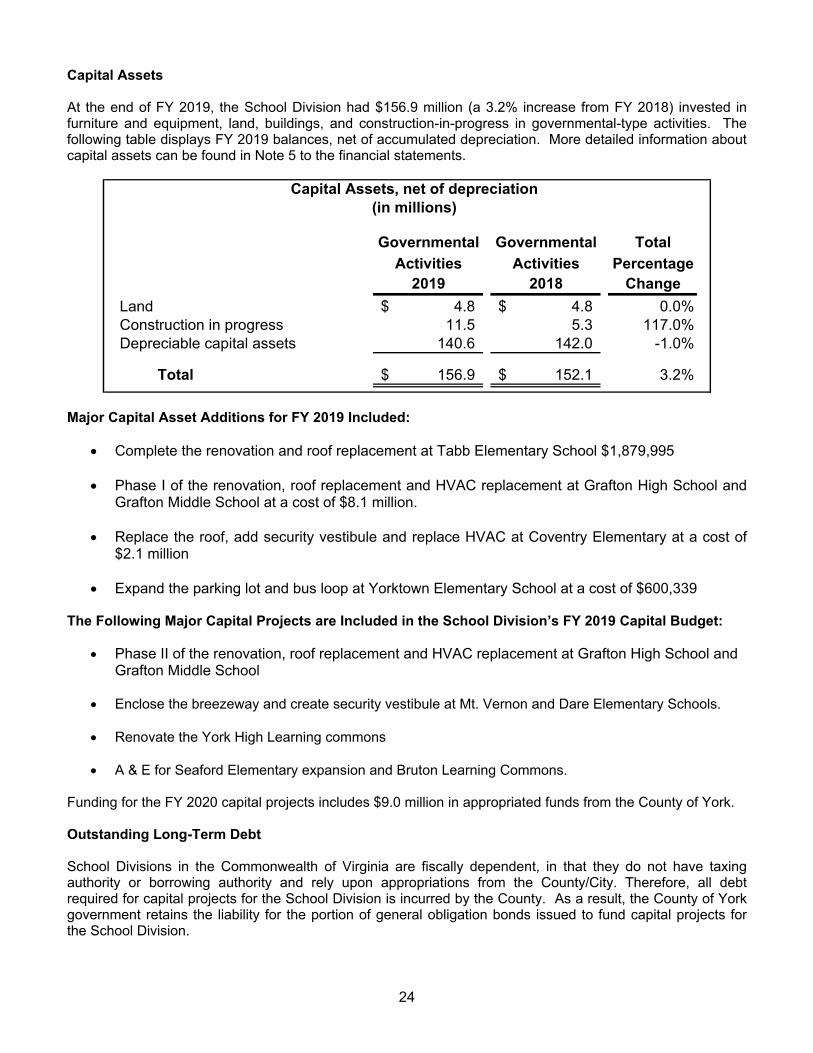
Capital Assets At the end of FY 2019, the School Division had $156.9 million (a 3.2% increase from FY 2018) invested in furniture and equipment, land, buildings, and construction-in-progress in governmental-type activities. The following table displays FY 2019 balances, net of accumulated depreciation. More detailed information about capital assets can be found in Note 5 to the financial statements.
Governmental Governmental Total
Activities Activities Percentage2019 2018 Change
Land 4.8$ 4.8$ 0.0%Construction in progress 11.5 5.3 117.0%Depreciable capital assets 140.6 142.0 -1.0%
Total 156.9$ 152.1$ 3.2%
Capital Assets, net of depreciation(in millions)
Major Capital Asset Additions for FY 2019 Included:
Complete the renovation and roof replacement at Tabb Elementary School $1,879,995
Phase I of the renovation, roof replacement and HVAC replacement at Grafton High School and Grafton Middle School at a cost of $8.1 million.
Replace the roof, add security vestibule and replace HVAC at Coventry Elementary at a cost of
$2.1 million
Expand the parking lot and bus loop at Yorktown Elementary School at a cost of $600,339 The Following Major Capital Projects are Included in the School Division’s FY 2019 Capital Budget:
Phase II of the renovation, roof replacement and HVAC replacement at Grafton High School and Grafton Middle School
Enclose the breezeway and create security vestibule at Mt. Vernon and Dare Elementary Schools.
Renovate the York High Learning commons
A & E for Seaford Elementary expansion and Bruton Learning Commons. Funding for the FY 2020 capital projects includes $9.0 million in appropriated funds from the County of York. Outstanding Long-Term Debt School Divisions in the Commonwealth of Virginia are fiscally dependent, in that they do not have taxing authority or borrowing authority and rely upon appropriations from the County/City. Therefore, all debt required for capital projects for the School Division is incurred by the County. As a result, the County of York government retains the liability for the portion of general obligation bonds issued to fund capital projects for the School Division.
25
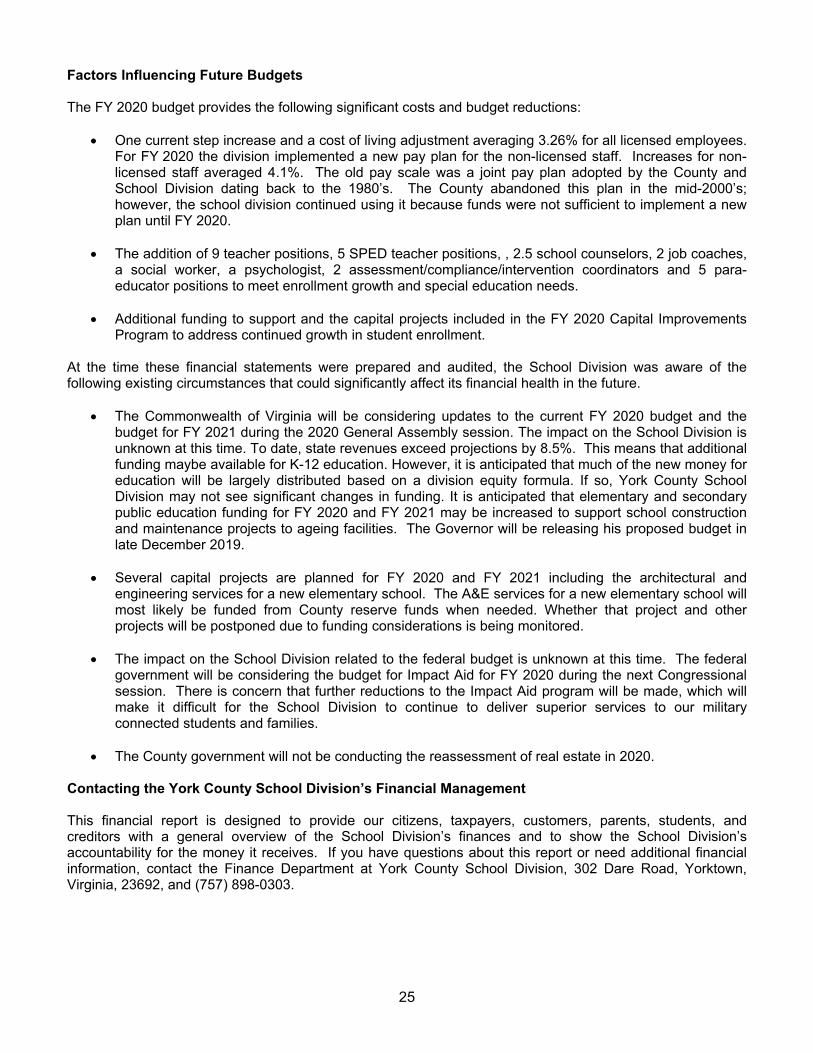
Factors Influencing Future Budgets The FY 2020 budget provides the following significant costs and budget reductions:
One current step increase and a cost of living adjustment averaging 3.26% for all licensed employees. For FY 2020 the division implemented a new pay plan for the non-licensed staff. Increases for non-licensed staff averaged 4.1%. The old pay scale was a joint pay plan adopted by the County and School Division dating back to the 1980’s. The County abandoned this plan in the mid-2000’s; however, the school division continued using it because funds were not sufficient to implement a new plan until FY 2020.
The addition of 9 teacher positions, 5 SPED teacher positions, , 2.5 school counselors, 2 job coaches, a social worker, a psychologist, 2 assessment/compliance/intervention coordinators and 5 para-educator positions to meet enrollment growth and special education needs.
Additional funding to support and the capital projects included in the FY 2020 Capital Improvements
Program to address continued growth in student enrollment. At the time these financial statements were prepared and audited, the School Division was aware of the following existing circumstances that could significantly affect its financial health in the future.
The Commonwealth of Virginia will be considering updates to the current FY 2020 budget and the budget for FY 2021 during the 2020 General Assembly session. The impact on the School Division is unknown at this time. To date, state revenues exceed projections by 8.5%. This means that additional funding maybe available for K-12 education. However, it is anticipated that much of the new money for education will be largely distributed based on a division equity formula. If so, York County School Division may not see significant changes in funding. It is anticipated that elementary and secondary public education funding for FY 2020 and FY 2021 may be increased to support school construction and maintenance projects to ageing facilities. The Governor will be releasing his proposed budget in late December 2019.
Several capital projects are planned for FY 2020 and FY 2021 including the architectural and engineering services for a new elementary school. The A&E services for a new elementary school will most likely be funded from County reserve funds when needed. Whether that project and other projects will be postponed due to funding considerations is being monitored.
The impact on the School Division related to the federal budget is unknown at this time. The federal
government will be considering the budget for Impact Aid for FY 2020 during the next Congressional session. There is concern that further reductions to the Impact Aid program will be made, which will make it difficult for the School Division to continue to deliver superior services to our military connected students and families.
The County government will not be conducting the reassessment of real estate in 2020.
Contacting the York County School Division’s Financial Management This financial report is designed to provide our citizens, taxpayers, customers, parents, students, and creditors with a general overview of the School Division’s finances and to show the School Division’s accountability for the money it receives. If you have questions about this report or need additional financial information, contact the Finance Department at York County School Division, 302 Dare Road, Yorktown, Virginia, 23692, and (757) 898-0303.

THIS PAGE LEFT BLANK INTENTIONALLY

BASIC FINANCIAL STATEMENTS
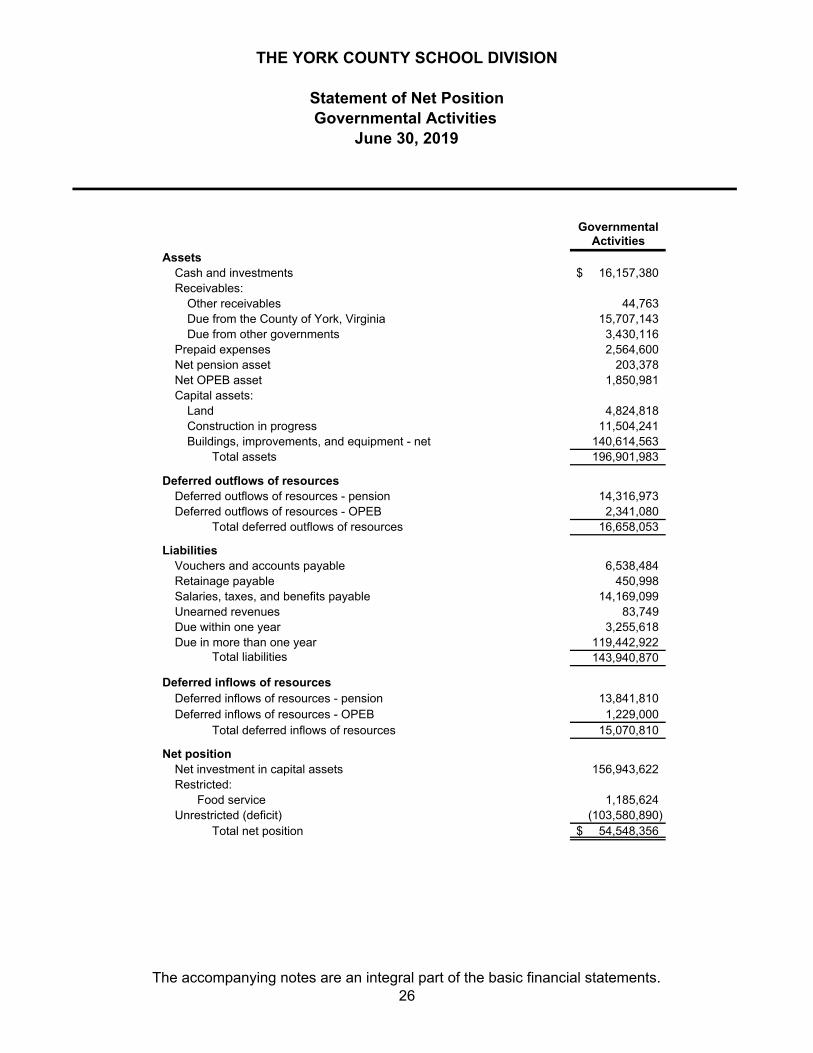
GovernmentalActivities
AssetsCash and investments 16,157,380$ Receivables:
Other receivables 44,763 Due from the County of York, Virginia 15,707,143 Due from other governments 3,430,116
Prepaid expenses 2,564,600 Net pension asset 203,378 Net OPEB asset 1,850,981 Capital assets:
Land 4,824,818 Construction in progress 11,504,241 Buildings, improvements, and equipment - net 140,614,563
Total assets 196,901,983
Deferred outflows of resourcesDeferred outflows of resources - pension 14,316,973 Deferred outflows of resources - OPEB 2,341,080
Total deferred outflows of resources 16,658,053
LiabilitiesVouchers and accounts payable 6,538,484 Retainage payable 450,998 Salaries, taxes, and benefits payable 14,169,099 Unearned revenues 83,749 Due within one year 3,255,618 Due in more than one year 119,442,922
Total liabilities 143,940,870
Deferred inflows of resourcesDeferred inflows of resources - pension 13,841,810 Deferred inflows of resources - OPEB 1,229,000
Total deferred inflows of resources 15,070,810
Net positionNet investment in capital assets 156,943,622 Restricted:
Food service 1,185,624 Unrestricted (deficit) (103,580,890)
Total net position 54,548,356$
June 30, 2019
Statement of Net Position
THE YORK COUNTY SCHOOL DIVISION
Governmental Activities
The accompanying notes are an integral part of the basic financial statements.26
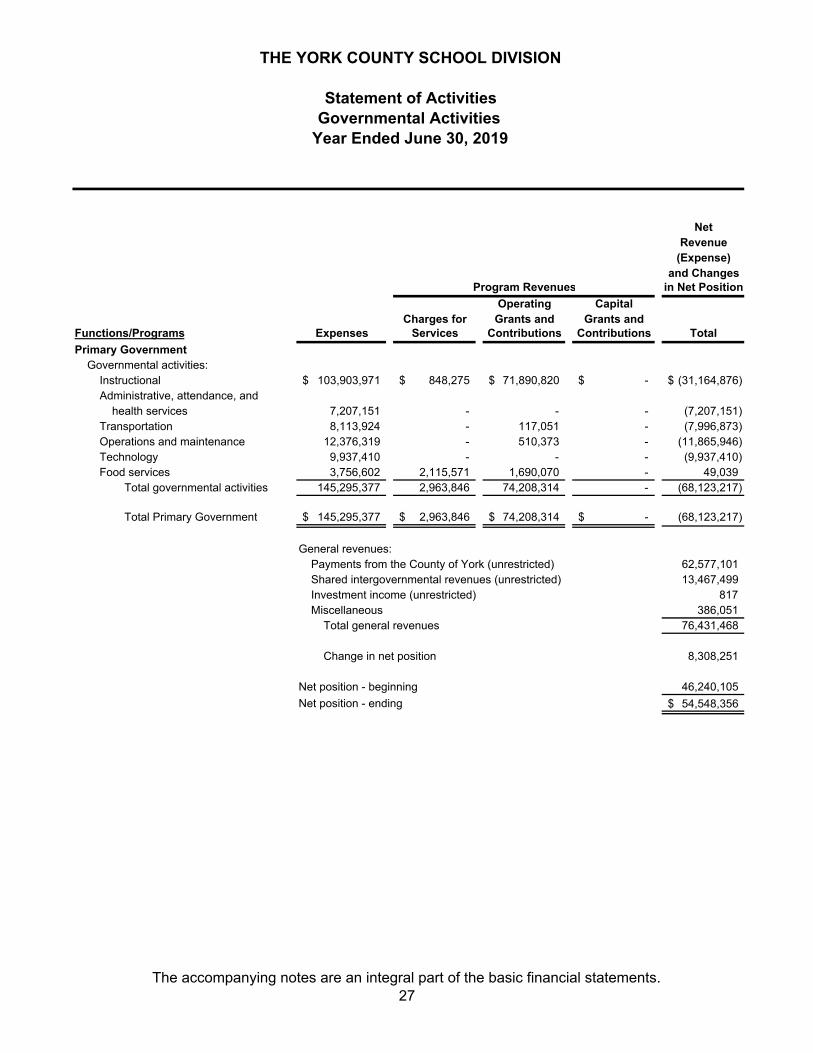
NetRevenue
(Expense)and Changes
Program Revenues in Net Position
Operating CapitalCharges for Grants and Grants and
Functions/Programs Expenses Services Contributions Contributions Total
Primary GovernmentGovernmental activities:
Instructional 103,903,971$ 848,275$ 71,890,820$ -$ (31,164,876)$ Administrative, attendance, and
health services 7,207,151 - - - (7,207,151) Transportation 8,113,924 - 117,051 - (7,996,873) Operations and maintenance 12,376,319 - 510,373 - (11,865,946) Technology 9,937,410 - - - (9,937,410) Food services 3,756,602 2,115,571 1,690,070 - 49,039
Total governmental activities 145,295,377 2,963,846 74,208,314 - (68,123,217)
Total Primary Government 145,295,377$ 2,963,846$ 74,208,314$ -$ (68,123,217)
General revenues:Payments from the County of York (unrestricted) 62,577,101 Shared intergovernmental revenues (unrestricted) 13,467,499 Investment income (unrestricted) 817 Miscellaneous 386,051
Total general revenues 76,431,468
Change in net position 8,308,251
Net position - beginning 46,240,105
Net position - ending 54,548,356$
Year Ended June 30, 2019
Statement of Activities
THE YORK COUNTY SCHOOL DIVISION
Governmental Activities
The accompanying notes are an integral part of the basic financial statements.27
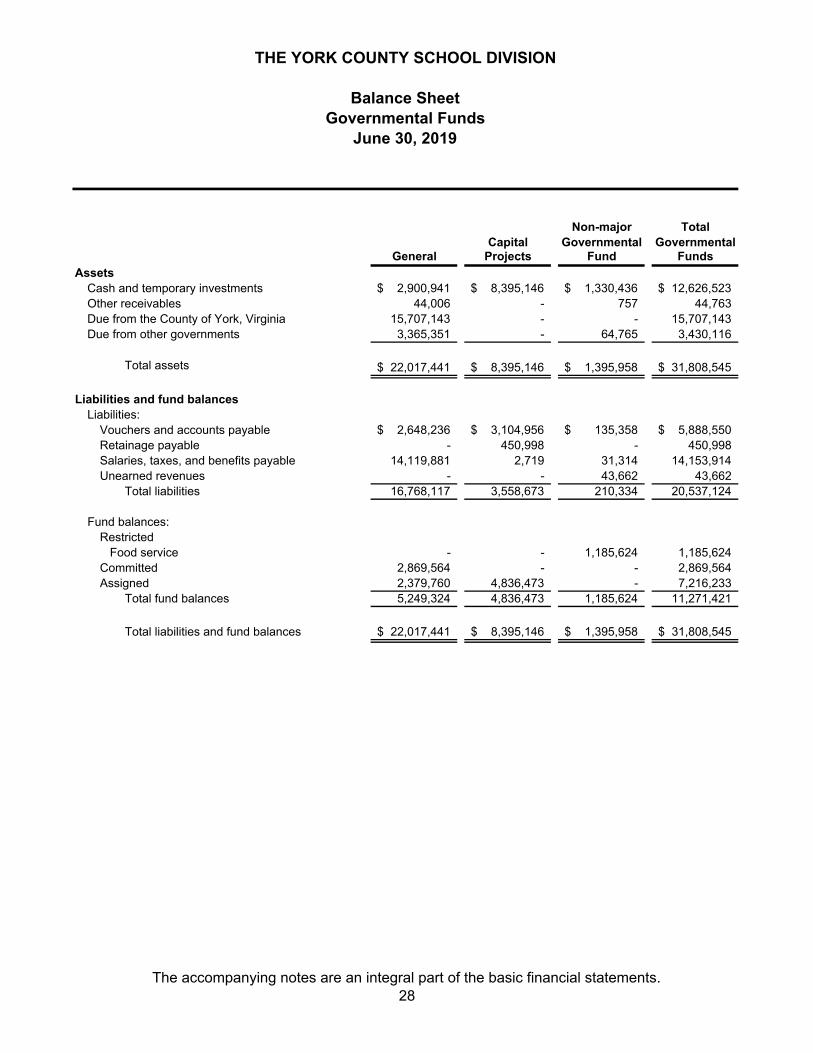
Non-major TotalCapital Governmental Governmental
General Projects Fund FundsAssets
Cash and temporary investments 2,900,941$ 8,395,146$ 1,330,436$ 12,626,523$ Other receivables 44,006 - 757 44,763 Due from the County of York, Virginia 15,707,143 - - 15,707,143 Due from other governments 3,365,351 - 64,765 3,430,116
Total assets 22,017,441$ 8,395,146$ 1,395,958$ 31,808,545$
Liabilities and fund balancesLiabilities:
Vouchers and accounts payable 2,648,236$ 3,104,956$ 135,358$ 5,888,550$ Retainage payable - 450,998 - 450,998 Salaries, taxes, and benefits payable 14,119,881 2,719 31,314 14,153,914 Unearned revenues - - 43,662 43,662
Total liabilities 16,768,117 3,558,673 210,334 20,537,124
Fund balances:Restricted Food service - - 1,185,624 1,185,624 Committed 2,869,564 - - 2,869,564 Assigned 2,379,760 4,836,473 - 7,216,233
Total fund balances 5,249,324 4,836,473 1,185,624 11,271,421
Total liabilities and fund balances 22,017,441$ 8,395,146$ 1,395,958$ 31,808,545$
June 30, 2019
THE YORK COUNTY SCHOOL DIVISION
Balance SheetGovernmental Funds
The accompanying notes are an integral part of the basic financial statements.28
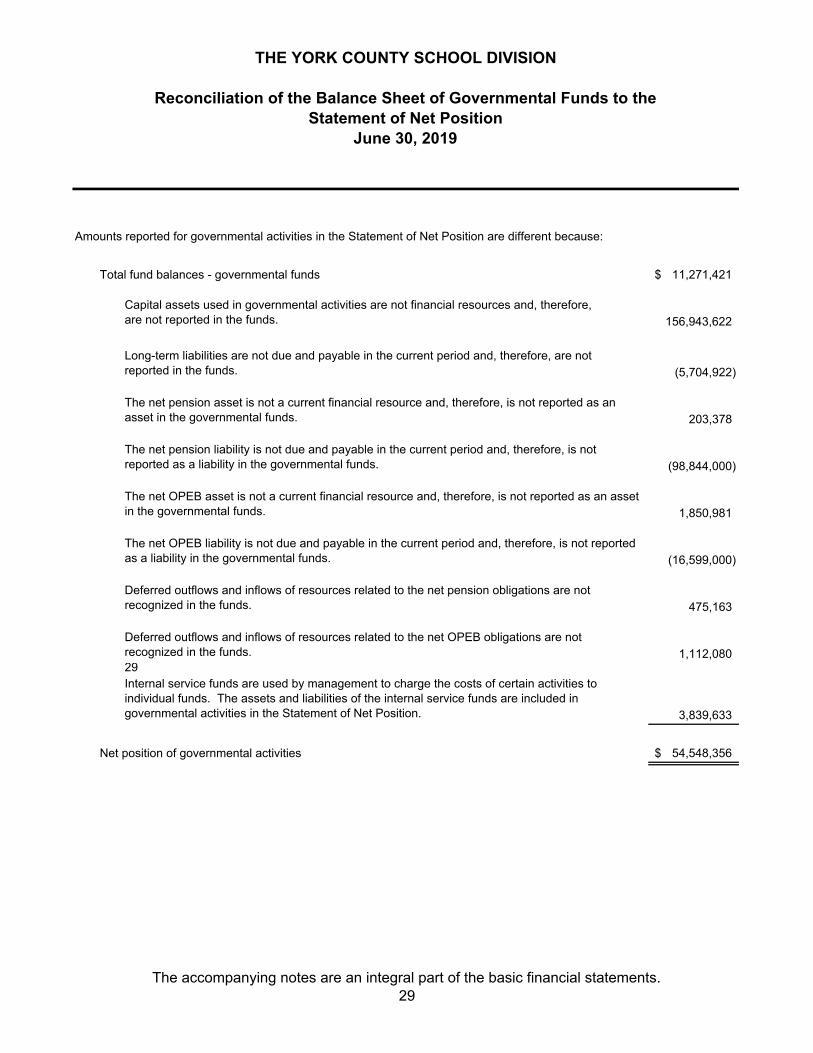
Amounts reported for governmental activities in the Statement of Net Position are different because:
Total fund balances - governmental funds 11,271,421$
Capital assets used in governmental activities are not financial resources and, therefore,are not reported in the funds. 156,943,622
Long-term liabilities are not due and payable in the current period and, therefore, are notreported in the funds. (5,704,922)
The net pension asset is not a current financial resource and, therefore, is not reported as an asset in the governmental funds. 203,378
The net pension liability is not due and payable in the current period and, therefore, is not reported as a liability in the governmental funds. (98,844,000)
The net OPEB asset is not a current financial resource and, therefore, is not reported as an asset in the governmental funds. 1,850,981
The net OPEB liability is not due and payable in the current period and, therefore, is not reported as a liability in the governmental funds. (16,599,000)
Deferred outflows and inflows of resources related to the net pension obligations are not recognized in the funds. 475,163
Deferred outflows and inflows of resources related to the net OPEB obligations are not recognized in the funds. 1,112,080 29Internal service funds are used by management to charge the costs of certain activities to individual funds. The assets and liabilities of the internal service funds are included in governmental activities in the Statement of Net Position. 3,839,633
Net position of governmental activities 54,548,356$
THE YORK COUNTY SCHOOL DIVISION
Reconciliation of the Balance Sheet of Governmental Funds to the Statement of Net Position
June 30, 2019
The accompanying notes are an integral part of the basic financial statements.29
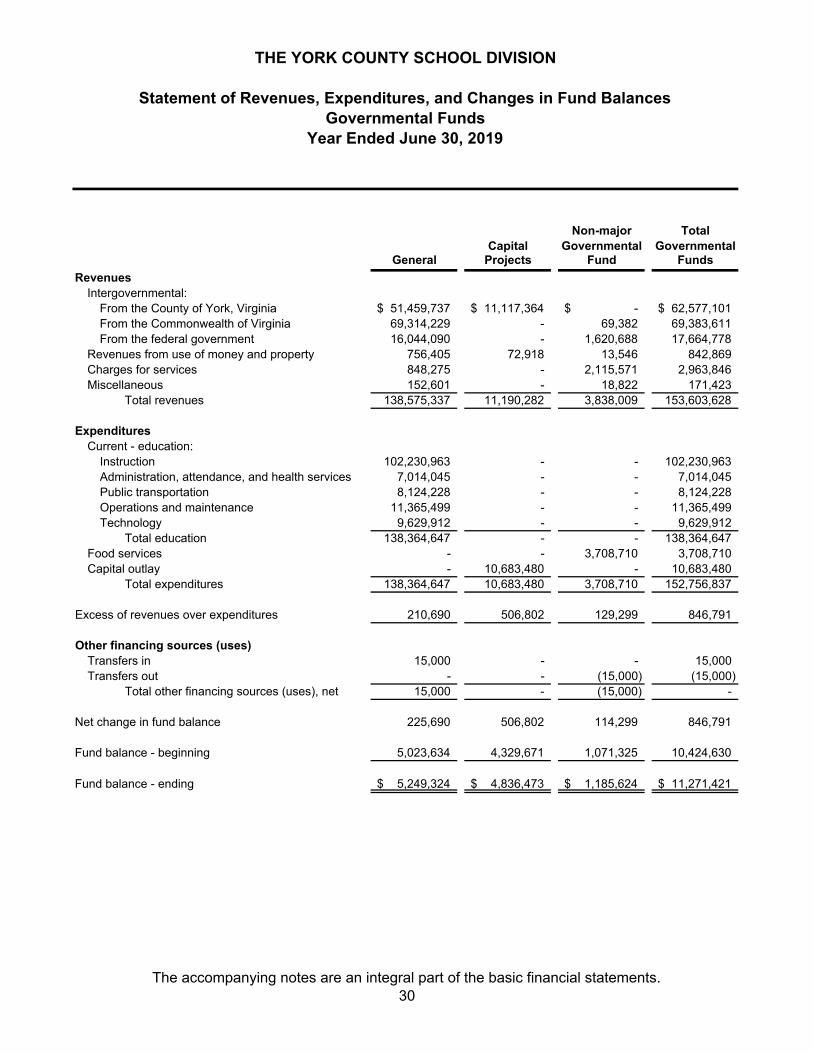
Non-major TotalCapital Governmental Governmental
General Projects Fund Funds
RevenuesIntergovernmental:
From the County of York, Virginia 51,459,737$ 11,117,364$ -$ 62,577,101$ From the Commonwealth of Virginia 69,314,229 - 69,382 69,383,611 From the federal government 16,044,090 - 1,620,688 17,664,778
Revenues from use of money and property 756,405 72,918 13,546 842,869 Charges for services 848,275 - 2,115,571 2,963,846 Miscellaneous 152,601 - 18,822 171,423
Total revenues 138,575,337 11,190,282 3,838,009 153,603,628
ExpendituresCurrent - education:
Instruction 102,230,963 - - 102,230,963 Administration, attendance, and health services 7,014,045 - - 7,014,045 Public transportation 8,124,228 - - 8,124,228 Operations and maintenance 11,365,499 - - 11,365,499 Technology 9,629,912 - - 9,629,912
Total education 138,364,647 - - 138,364,647 Food services - - 3,708,710 3,708,710 Capital outlay - 10,683,480 - 10,683,480
Total expenditures 138,364,647 10,683,480 3,708,710 152,756,837
Excess of revenues over expenditures 210,690 506,802 129,299 846,791
Other financing sources (uses)Transfers in 15,000 - - 15,000 Transfers out - - (15,000) (15,000)
Total other financing sources (uses), net 15,000 - (15,000) -
Net change in fund balance 225,690 506,802 114,299 846,791
Fund balance - beginning 5,023,634 4,329,671 1,071,325 10,424,630
Fund balance - ending 5,249,324$ 4,836,473$ 1,185,624$ 11,271,421$
Year Ended June 30, 2019Governmental Funds
Statement of Revenues, Expenditures, and Changes in Fund Balances
THE YORK COUNTY SCHOOL DIVISION
The accompanying notes are an integral part of the basic financial statements.30
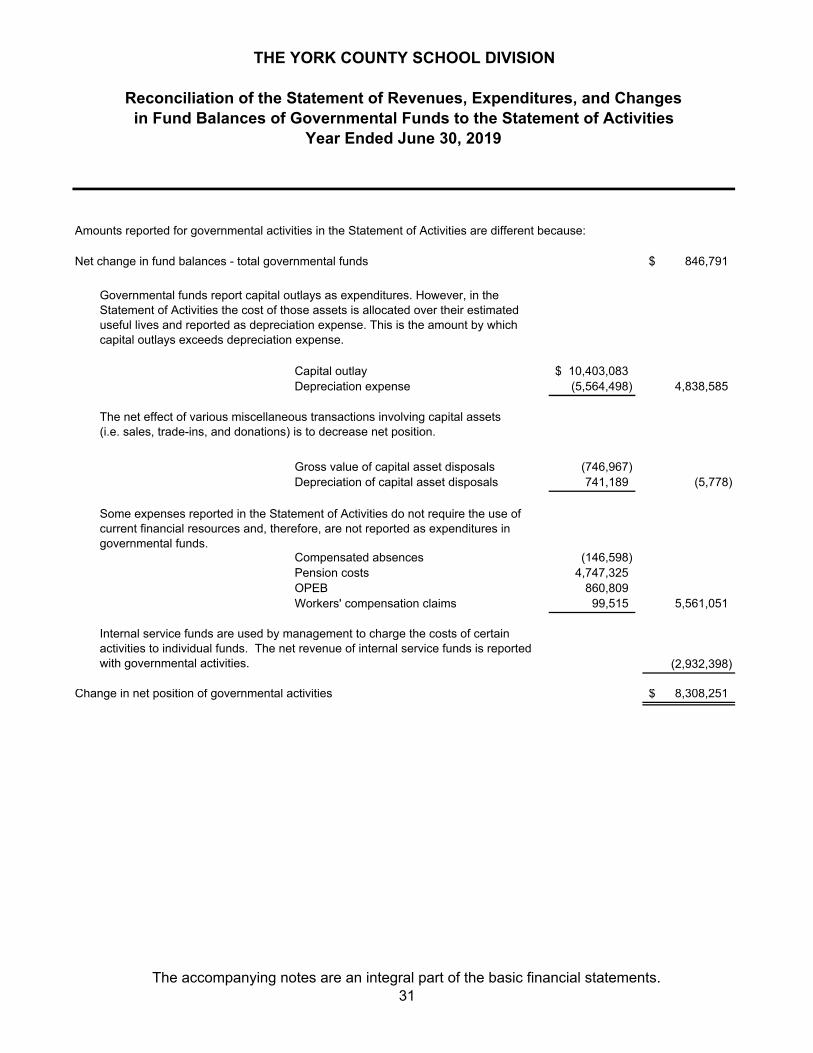
Amounts reported for governmental activities in the Statement of Activities are different because:
Net change in fund balances - total governmental funds 846,791$
Capital outlay 10,403,083$ Depreciation expense (5,564,498) 4,838,585
Gross value of capital asset disposals (746,967) Depreciation of capital asset disposals 741,189 (5,778)
Compensated absences (146,598) Pension costs 4,747,325 OPEB 860,809 Workers' compensation claims 99,515 5,561,051
(2,932,398)
Change in net position of governmental activities 8,308,251$
Internal service funds are used by management to charge the costs of certain activities to individual funds. The net revenue of internal service funds is reported with governmental activities.
THE YORK COUNTY SCHOOL DIVISION
Reconciliation of the Statement of Revenues, Expenditures, and Changesin Fund Balances of Governmental Funds to the Statement of Activities
Some expenses reported in the Statement of Activities do not require the use of current financial resources and, therefore, are not reported as expenditures in governmental funds.
Year Ended June 30, 2019
Governmental funds report capital outlays as expenditures. However, in the Statement of Activities the cost of those assets is allocated over their estimated useful lives and reported as depreciation expense. This is the amount by which capital outlays exceeds depreciation expense.
The net effect of various miscellaneous transactions involving capital assets (i.e. sales, trade-ins, and donations) is to decrease net position.
The accompanying notes are an integral part of the basic financial statements.31
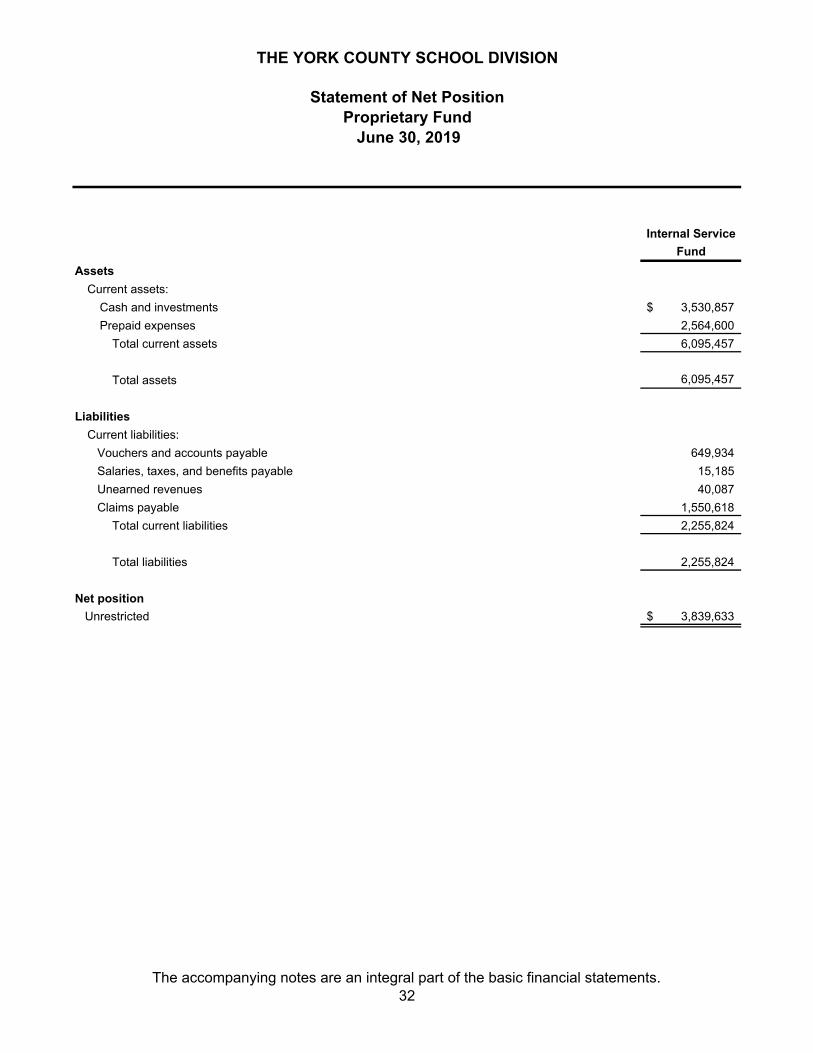
Internal Service
Fund
Assets
Current assets:
Cash and investments 3,530,857$
Prepaid expenses 2,564,600
Total current assets 6,095,457
Total assets 6,095,457
Liabilities
Current liabilities:
Vouchers and accounts payable 649,934
Salaries, taxes, and benefits payable 15,185
Unearned revenues 40,087
Claims payable 1,550,618
Total current liabilities 2,255,824
Total liabilities 2,255,824
Net position
Unrestricted 3,839,633$
THE YORK COUNTY SCHOOL DIVISION
Statement of Net Position
June 30, 2019 Proprietary Fund
The accompanying notes are an integral part of the basic financial statements.32
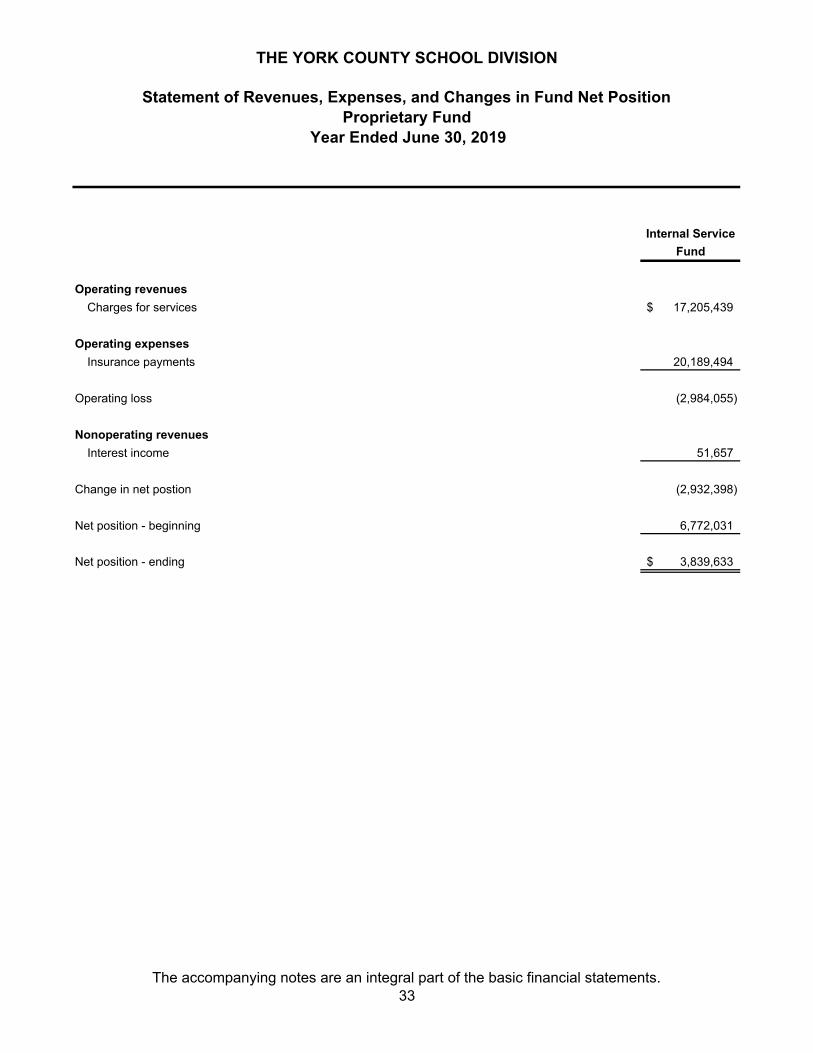
Internal Service
Fund
Operating revenues
Charges for services 17,205,439$
Operating expenses
Insurance payments 20,189,494
Operating loss (2,984,055)
Nonoperating revenues
Interest income 51,657
Change in net postion (2,932,398)
Net position - beginning 6,772,031
Net position - ending 3,839,633$
THE YORK COUNTY SCHOOL DIVISION
Statement of Revenues, Expenses, and Changes in Fund Net Position
Year Ended June 30, 2019 Proprietary Fund
The accompanying notes are an integral part of the basic financial statements.33
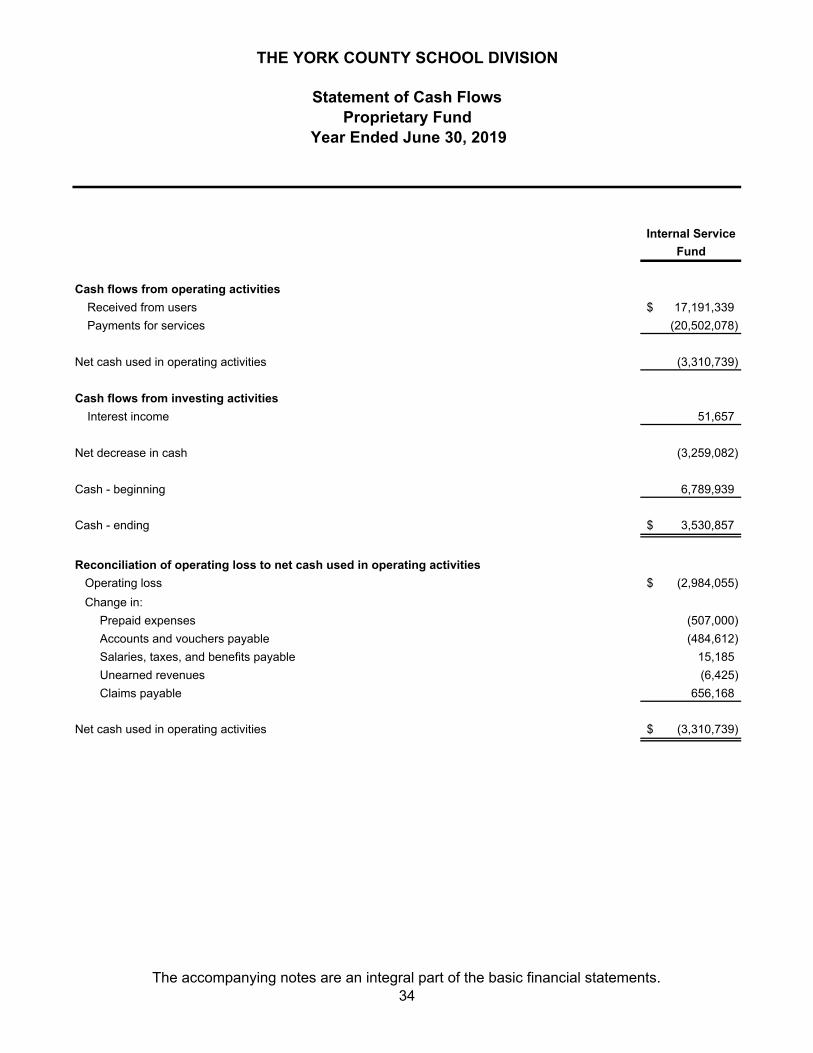
Internal Service
Fund
Cash flows from operating activities
Received from users 17,191,339$
Payments for services (20,502,078)
Net cash used in operating activities (3,310,739)
Cash flows from investing activities
Interest income 51,657
Net decrease in cash (3,259,082)
Cash - beginning 6,789,939
Cash - ending 3,530,857$
Reconciliation of operating loss to net cash used in operating activities
Operating loss (2,984,055)$
Change in:
Prepaid expenses (507,000)
Accounts and vouchers payable (484,612)
Salaries, taxes, and benefits payable 15,185
Unearned revenues (6,425)
Claims payable 656,168
Net cash used in operating activities (3,310,739)$
THE YORK COUNTY SCHOOL DIVISION
Statement of Cash Flows
Year Ended June 30, 2019 Proprietary Fund
The accompanying notes are an integral part of the basic financial statements.34
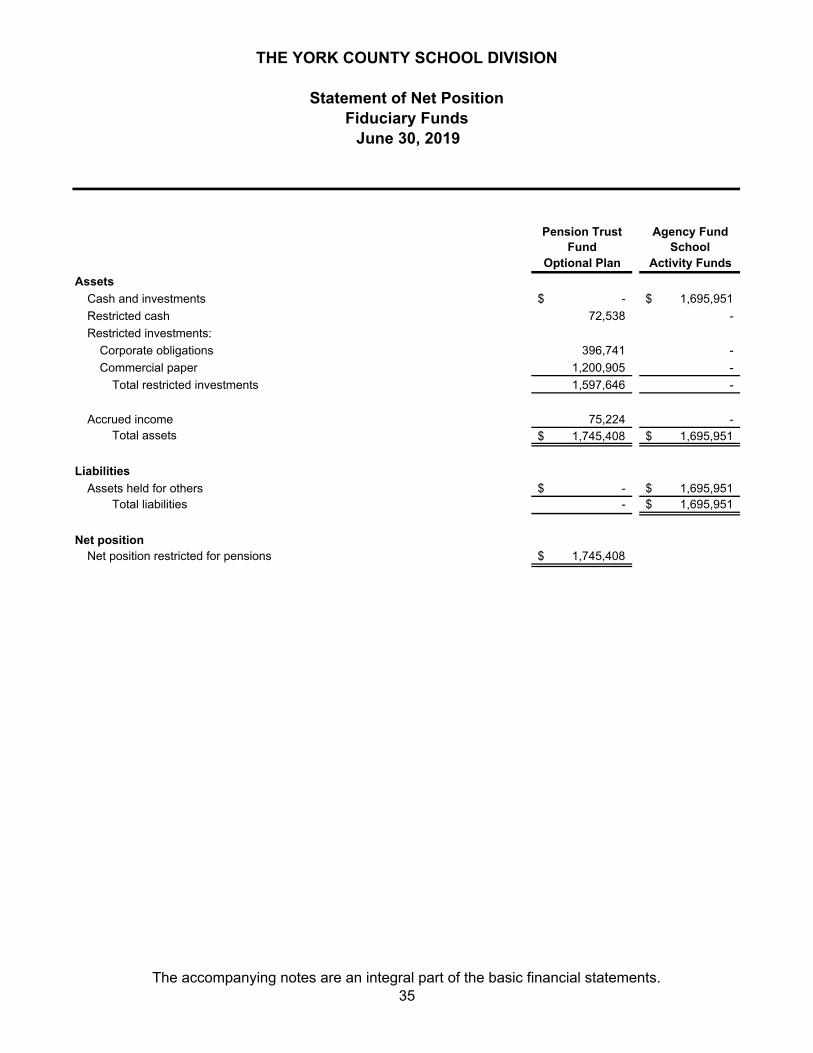
Pension Trust Agency FundFund School
Optional Plan Activity Funds
Assets
Cash and investments -$ 1,695,951$
Restricted cash 72,538 -
Restricted investments:
Corporate obligations 396,741 -
Commercial paper 1,200,905 -
Total restricted investments 1,597,646 -
Accrued income 75,224 - Total assets 1,745,408$ 1,695,951$
Liabilities
Assets held for others -$ 1,695,951$ Total liabilities - 1,695,951$
Net positionNet position restricted for pensions 1,745,408$
THE YORK COUNTY SCHOOL DIVISION
Statement of Net Position
June 30, 2019 Fiduciary Funds
The accompanying notes are an integral part of the basic financial statements.35
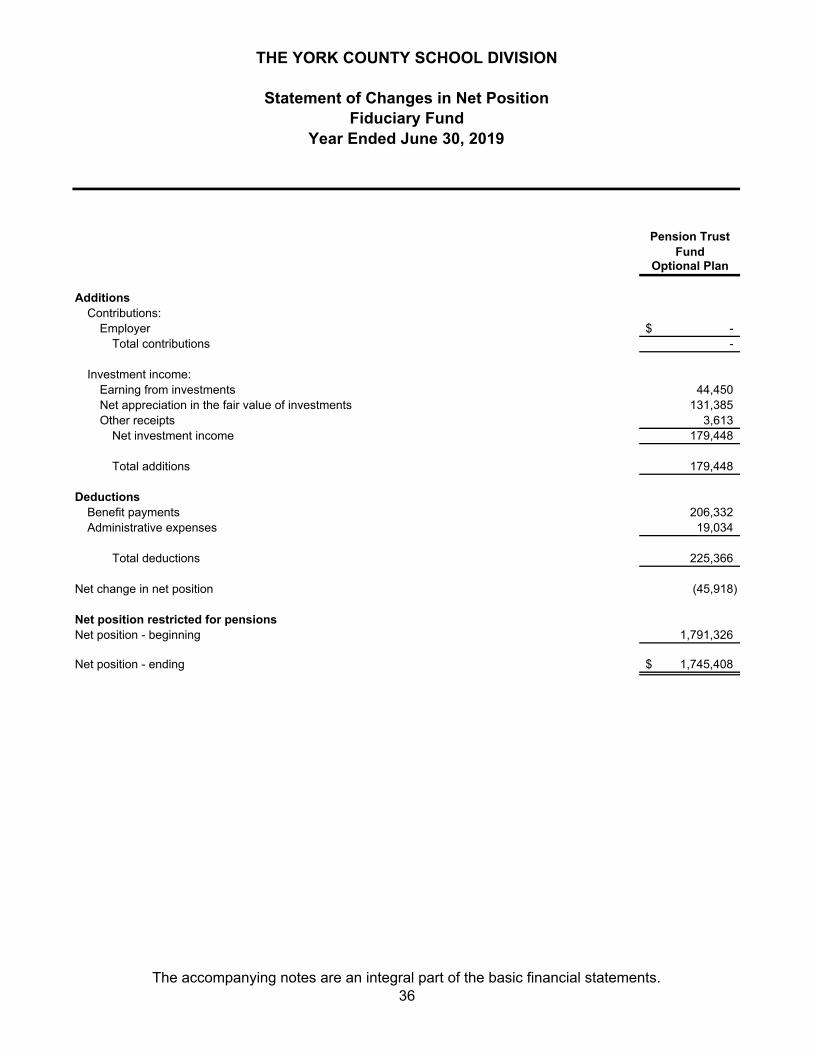
Pension TrustFund
Optional Plan
AdditionsContributions:
Employer -$ Total contributions -
Investment income:Earning from investments 44,450 Net appreciation in the fair value of investments 131,385 Other receipts 3,613
Net investment income 179,448
Total additions 179,448
DeductionsBenefit payments 206,332 Administrative expenses 19,034
Total deductions 225,366
Net change in net position (45,918)
Net position restricted for pensionsNet position - beginning 1,791,326
Net position - ending 1,745,408$
THE YORK COUNTY SCHOOL DIVISION
Statement of Changes in Net Position
Year Ended June 30, 2019Fiduciary Fund
The accompanying notes are an integral part of the basic financial statements.36
NOTES TO BASIC FINANCIAL STATEMENTS

THIS PAGE LEFT BLANK INTENTIONALLY
THE YORK COUNTY SCHOOL DIVISION
Notes to Basic Financial Statements June 30, 2019
37
1. SUMMARY OF SIGNIFICANT ACCOUNTING POLICIES
The basic financial statements presented for the York County School Division (School Division), are prepared in accordance with accounting principles generally accepted in the United States of America (U.S. GAAP) applicable to governmental units, as prescribed by the Governmental Accounting Standards Board (GASB). The School Division’s significant accounting and reporting policies are described below. Financial Reporting Entity The School Division is considered a component unit of the County of York, Virginia (County). The School Division has no component units. Component units are legally separate entities for which a primary government is financially accountable. Financial accountability ordinarily involves meeting both of the following criteria: (a) the primary government is accountable for the component unit, and (b) the primary government is able to impose its will upon the component unit (or there is a possibility that the component unit may provide specific financial benefits or impose specific financial burdens on the primary government). The information included in these basic financial statements will also be included in the County’s basic financial statements because of the significance of the School Division’s financial relationship with the County. The School Board determines educational policy and employs a Superintendent of Schools to administer the School Division’s policies. The members of the School Board are elected by the citizens of York County. The School Division is responsible for elementary and secondary education for the County. The accounting policies of the School Division conform with U.S. GAAP as applicable to governmental units. The following is a summary of the more significant accounting policies of the School Division: Basis of Presentation The School Division’s basic financial statements consist of government-wide financial statements, including a statement of net position and a statement of activities, and fund financial statements, which provide a more detailed level of financial information. Government-Wide Financial Statements: The Statement of Net Position and the Statement of Activities display information about the School Division as a whole, except for fiduciary funds. These statements are reflected on a full accrual basis of accounting and economic resources measurement focus, which incorporates long-term assets as well as long-term liabilities. Interfund transfers are eliminated to avoid “doubling up” revenues and expenditures. Governmental funds’ financial statements; therefore, include a reconciliation with brief explanations to better identify the relationship between the government-wide statements and the statements for governmental funds. The Statement of Net Position presents the financial condition of the governmental type activities of the School Division at year-end. The School Division does not have any business-type activities. The statement of activities presents a comparison between direct expenses and program revenues for each function of the School Division’s governmental activities. Direct expenses are those that are specifically associated with a service, program, or department and, therefore, identifiable to a particular function. Expenses are grouped in the following categories: instruction, administration, attendance and health services, transportation, operations and maintenance, capital projects (not capitalized), and food services.
THE YORK COUNTY SCHOOL DIVISION
Notes to Basic Financial Statements June 30, 2019
38
1. SUMMARY OF SIGNIFICANT ACCOUNTING POLICIES (Continued) Program revenues include charges paid by the recipient for the goods or services offered by the program or from grants and contributions that are restricted to meeting the operational or capital requirements of a particular program. Charges for services include pupil fees, summer school tuition, and cafeteria sales. Revenues not classified as program revenues are presented as general revenues of the School Division. The comparison of direct expenses with program revenues identifies the extent to which the governmental function is self-financing or draws from the general revenues of the School Division. The School Division does not allocate indirect expenses. As a general rule, the effect of interfund activity has been eliminated from the government-wide financial statements. Interfund services provided and used, however, are not eliminated in this process. Fund Financial Statements: During the year, the School Division segregates transactions related to certain functions or activities in separate funds in order to aid financial management and to demonstrate legal compliance. The fund financial statements present financial information of the School Division at this more detailed level. The focus of governmental fund financial statements is on major funds, each displayed in a separate column. The School Division has identified the General Fund and the Capital Projects Fund as major. The accounts of the School Division are organized on the basis of funds, each of which is considered a separate accounting entity. The operations of each fund are accounted for with a separate set of self-balancing accounts that comprise its assets, liabilities, fund balances, revenues, and expenditures. The fund statements are presented on a current financial resources measurement focus and the modified accrual basis of accounting. The acquisition, use, and balances of the School Division’s expendable financial resources and the related liabilities are accounted for through governmental funds. The measurement focus is based upon the determination of changes in financial position, rather than upon net income determination. The following fund types are used by the School Division:
Governmental Funds Governmental Funds are those funds through which most governmental functions of the School Division are financed. The acquisition, use, and balances of the School Division’s expendable financial resources and the related liabilities are accounted for through governmental funds. Governmental fund types use the flow of current financial resources measurement focus. This means that generally only current assets and current liabilities are reflected on their balance sheets. Their operating statements present increases (revenues and other financing sources) and decreases (expenditures and other financing uses) in net fund balance. The following are the School Division’s governmental fund types:
General Fund - The General Fund is the general operating fund of the School Division. It is used to account for all financial resources except those accounted for in another fund. Capital Projects Fund - The Capital Projects Fund is used to account for financial resources to be used for the acquisition or construction of major capital facilities or maintenance of school facilities (other than those financed by the operating fund). Non-major Governmental Fund - The non-major Governmental Fund (School Food Services Fund) is used to account for the proceeds of specific revenue sources that are legally restricted to expenditures for specific purposes. Accordingly, the School Food Services Fund is used to account for the school cafeteria operations. Revenues restricted for cafeteria operations include cafeteria sales and Federal grant reimbursements.
THE YORK COUNTY SCHOOL DIVISION
Notes to Basic Financial Statements June 30, 2019
39
1. SUMMARY OF SIGNIFICANT ACCOUNTING POLICIES (Continued)
Proprietary Fund - Internal Service Fund The Internal Service Fund accounts for the financing of services provided by one fund to other funds of the School Board. The Health and Dental Fund accounts for the payment of claims on liability claims arising from operations of the School Board. Operating revenues include charges for services. Operating expenses include cost of services. The Internal Service Fund is included in governmental activities for government-wide reporting purposes. As a general rule, the effect of interfund activity has been eliminated from the government-wide financial statements. The excess of revenue over expenses for the fund are allocated to the appropriate functional activity. Fiduciary Funds Fiduciary Funds are custodial in nature (assets equal liabilities) and do not involve measurement of the results of operations. Accordingly, the measurement focus is upon determination of changes in financial position rather than upon net income determination. The Trust and Agency funds consist of the Pension Trust Fund - Optional Plan and the School Activity Funds.
Trust Fund - The Pension Trust Fund - Optional Plan accounts for the revenues and expenses related to the School Division sponsored retirement plan, which is administered by a fiduciary agent of the School Division. The Pension Trust Fund - Optional Plan follows the accrual basis of accounting. The recognition of contributions, benefits, and refunds use the “flow of economic resources” measurement focus. The costs of plan administration are financed through employer and member contributions and earnings on investments. Agency Fund - The Agency Fund is custodial in nature and does not involve measurement of results of operations. The School Division’s Agency Fund are the School Activity Funds, which accounts for the student activity monies maintained on behalf of the students by the principal of each school.
Fiduciary funds are not included in the government-wide financial statements.
Basis of Accounting Basis of accounting determines when transactions are recorded in the financial records and reported in the financial statements. It relates to the timing of the measurements made regardless of the measurement focus applied. Governmental activities in the government-wide financial statements, proprietary fund financial statements, and the fiduciary funds financial statements are reported using the economic resources measurement focus and the accrual basis of accounting. Agency funds have no measurement focus. Revenues are recorded when earned and expenses are recorded when a liability is incurred, regardless of the timing of related cash flows. The primary revenues susceptible to accrual include intergovernmental revenues. In applying the subject to accrual concept to intergovernmental revenues, the legal and contractual requirements of the numerous individual programs are used as guidance. There are, however, essentially two types of these revenues. In one type, monies must be expended on the specific purpose or project before any amounts will be paid to the School Division, therefore, revenues are recognized based upon the expenditures recorded. In the other type, monies are virtually unrestricted as to the purpose of expenditure and are usually revocable only for failure to comply with prescribed compliance requirements. These resources are reflected as revenues at the time of receipt, or earlier, if the accrual criteria are met.
THE YORK COUNTY SCHOOL DIVISION
Notes to Basic Financial Statements June 30, 2019
40
1. SUMMARY OF SIGNIFICANT ACCOUNTING POLICIES (Continued) The governmental funds are reported using the current financial resources measurement focus and the modified accrual basis of accounting. Under the modified accrual basis of accounting, revenues are recorded as soon as they are both measurable and available. Revenues are considered available when they are collectible within the current period or soon enough thereafter to be used to pay liabilities of the current period. Generally, revenues collected within 45 days of year-end are recognized. For grants, revenue is recognized when all eligibility requirements have been met. The primary revenues susceptible to accrual include revenues from the County, the Commonwealth of Virginia, and the Federal government. Expenditures, other than interest and principal on long-term debt which is recorded when due, are recorded when the fund liability is incurred, if measurable.
Cash, Cash Equivalents, and Temporary Investments Cash and temporary investments are pooled with the cash and investments of the County. The School Division utilizes the pooled cash investment method wherein income from the investment of pooled cash is allocated to the various funds based on the percentage of cash and cash equivalents of each fund to the total pooled cash and cash equivalents. Investments in State Treasurer’s Local Government Investment Pool (LGIP) are recorded at amortized cost. All others are reported at fair value. The cash in the agency fund represents the student activity funds cash balances in the separate bank accounts maintained by the individual schools. Investments with original maturities of 90 days or less are considered cash equivalents. For purposes of the statement of cash flows, investments with original maturities of three months or less from the date of purchase are grouped into cash and temporary investments. Receivables and Due from Other Governments Amounts due from the Commonwealth of Virginia consist primarily of June sales tax, receivables from State entitlements, and reimbursement of grant expenditures. Amounts due from the Federal government are for reimbursement of grant expenditures. Other receivables consist primarily of amounts due from students and other customers of the School Division. All amounts should be collected within one year. Inventory Inventory is accounted for under the consumption method and is stated at cost on a first-in, first-out basis. The cost is recorded as an expenditure at the time inventory is purchased. The United States Department of Agriculture (USDA) donated food commodities are accounted for in the School Food Services Fund at the estimated value at the time of receipt. Revenues are recorded when donated goods are received and expenditures are recorded as these goods are used. Prepaids Certain payments to vendors reflect costs applicable to future accounting periods and are recorded as prepaid items in the basic financial statements. Prepaid items are expensed using the consumption method. Capital Assets General capital assets have been acquired for general school purposes. Capital outlays are recorded as expenditures in the governmental funds and as assets in the government-wide financial statements to the extent the School Division capitalization threshold is met. All capital assets are capitalized at cost (or estimated historical cost) and updated for additions and retirements during the year. Donated assets are recorded at acquisition value on the date received. The School Division maintains a capitalization threshold of $5,000 for equipment, improvements, and buildings. Land is capitalized regardless of value. The School Division has no infrastructure assets.
THE YORK COUNTY SCHOOL DIVISION
Notes to Basic Financial Statements June 30, 2019
41
1. SUMMARY OF SIGNIFICANT ACCOUNTING POLICIES (Continued)
Depreciation is recorded on general capital assets on a government-wide basis. All reported capital assets, except land and construction in progress, are depreciated. Depreciation is computed using the straight-line method over the estimated useful lives as follows:
Description Useful LivesBuildings 25-80 yearsImprovements other than buildings 30-80 yearsMachinery and equipment and vehicles 10-25 years
Compensated Absences Employees are granted vacation and sick pay in varying amounts as services are provided. They may accumulate, subject to certain limitations, unused vacation pay earned and, upon retirement, termination, or death may be compensated as salary-related payments for certain amounts at their then current rates of pay. The cost of accumulated compensated absences pay, including associated benefits, is accounted for as a liability in the government-wide financial statements. Compensated absences are reported in the governmental funds only if they have matured (i.e., unused reimbursable leave still outstanding following an employee’s resignation or retirement). Fund Balances/Net Position Fund balances have been classified to reflect the limitations and restrictions placed on the respective funds as follows:
Nonspendable - Includes amounts that cannot be spent because they are not in spendable form, or are legally or contractually required to be maintained intact.
Restricted - Includes amounts that can be spent only for the specific purposes stipulated by constitution, external resource providers, or through enabling legislation.
Committed - Includes amounts that can be used only for the specific purposes determined by the School Board via School Board Policy and cannot be used for any other purpose unless the School Division removes or changes the specified use by taking the same type of action it employed to previously commit those amounts. Only the School Board can modify or rescind a fund balance commitment via School Board Policy legislation.
Assigned - Includes amounts that are intended to be used by the School Division for specific purposes but do not meet the criteria to be classified as restricted or committed. In governmental funds other than the General Fund, assigned fund balance represents the remaining amount that is not restricted or committed. In the General Fund, the School Board has authorized the Superintendent of Schools to assign fund balance via School Board Policy legislation.
Unassigned - The residual classification for the School Division’s General Fund and includes all spendable amounts not contained in other classifications.
The School Division’s policy is to apply expenditures against restricted resources first when either restricted or unrestricted amounts are available. Within the unrestricted fund balance, it is the School Division’s policy to apply expenditures against committed amounts first, followed by assigned, and then unassigned amounts. It is possible for the non-general funds to have a negative unassigned fund balance when nonspendable and restricted amounts exceed the positive fund balance for that fund. Net position in government-wide financial statements is classified as net investment in capital assets, restricted, and unrestricted. Restricted net position represent constraints on resources that are either externally imposed by creditors, grantors, contributors, laws and regulations of other governments, or imposed by law through State Statute.
THE YORK COUNTY SCHOOL DIVISION
Notes to Basic Financial Statements June 30, 2019
42
1. SUMMARY OF SIGNIFICANT ACCOUNTING POLICIES (Continued)
Interfund Activity Interfund activity is reported as loans, services provided, reimbursements, or transfers. Loans are reported as due to and due from, as appropriate, and are subject to elimination in the government-wide statements. Services provided are treated as revenues and expenditures/expenses. Reimbursements are when one fund incurs a cost, charges the appropriate benefiting fund, and reduces its related cost as a reimbursement. All other Interfund transactions are treated as transfers. Transfers between governmental funds are netted as part of the reconciliation to the government-wide statements. Retirement Plan Retirement contributions are actuarially determined and consist of current service costs and amortization of prior service costs over a 30-year period. The School Division’s policy is to fund pension cost as it accrues. Deferred Outflows and Inflows of Resources Deferred outflows of resources represent a consumption of net position that applies to a future period, and so it will not be recognized as an expense or expenditure until then. The School Division’s deferred outflows of resources relate to pensions and other postemployment benefits (OPEB), and consist of the difference between expected and actual experience, changes of assumptions, changes in proportion and differences between employer contributions and proportionate share of contributions, and employer contributions subsequent to the measurement date. Deferred inflows of resources represent an acquisition of net position that applies to a future period and so it will not be recognized as revenue until then. The School Division’s deferred inflows of resources relate to pensions and OPEB, and consist of the difference between expected and actual experience, changes of assumptions, the net difference between projected and actual earnings on pension plan investments, the net difference between projected and actual earnings on plan investments, and changes in proportion and differences between employer contributions and proportionate share of contributions. Amounts reported as deferred outflows of resources related to pensions and OPEB resulting from the school division’s contributions subsequent to the measurement date will be recognized as a reduction of the liability in the following year. Other amounts reported as deferred inflows and deferred outflows of resources will be amortized according to the actuarial amortization calculation. See Note 9 and 10 for further details. Use of Estimates Management of the School Division has made a number of estimates and assumptions relating to the reporting of assets and liabilities and the disclosure of contingent assets and liabilities, to prepare these financial statements in conformity with U.S. GAAP. Management believes any differences between these estimates and actual results should not materially affect the School Division’s reporting of its financial position. Unearned Revenues The School Division reports unearned revenues on its government-wide financial statements, when revenues are received prior to the period in which all eligibility requirements have been met. Unearned revenue at the fund level arises when potential revenue does not meet both the “measurable” and “available” criteria for recognition in the current period. Unearned revenues also arise when resources are received by the government before it has legal claim to them, as when grant monies are received prior to incurring qualifying expenditures. In subsequent periods, when both revenue recognition criteria are met, or when the government has a legal claim to the resources, the liability for unearned revenue is removed from the balance sheet and revenue is recognized.
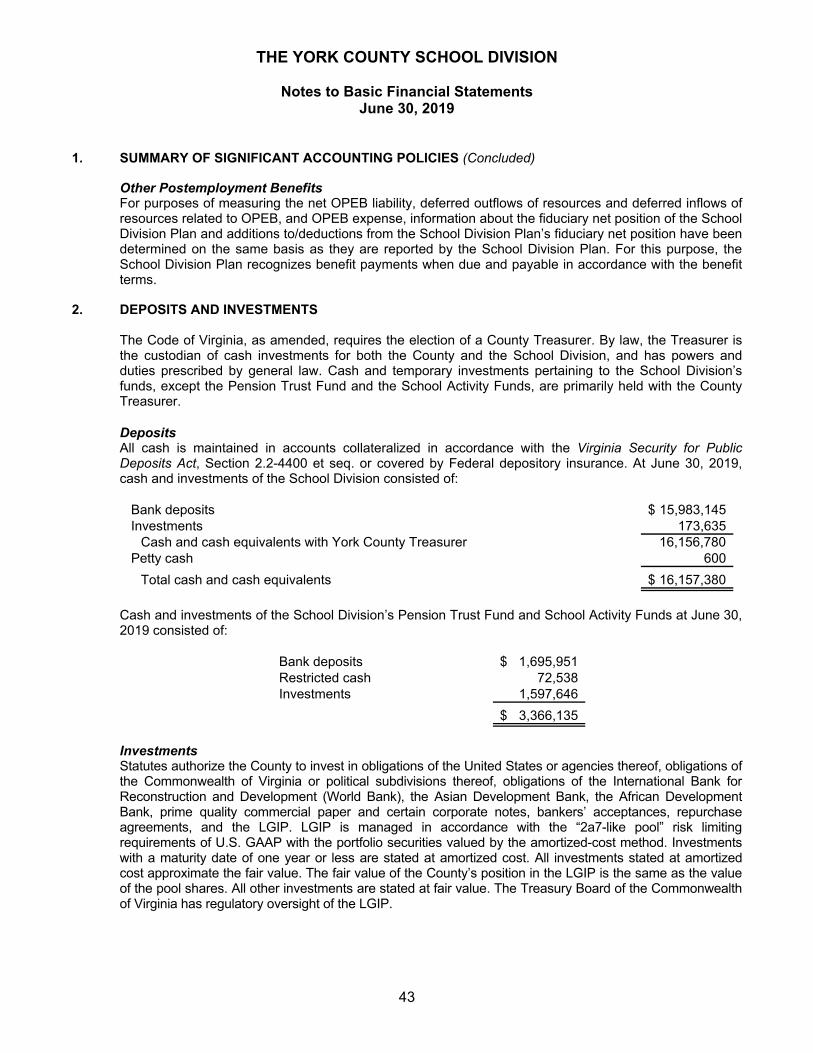
THE YORK COUNTY SCHOOL DIVISION
Notes to Basic Financial Statements June 30, 2019
43
1. SUMMARY OF SIGNIFICANT ACCOUNTING POLICIES (Concluded)
Other Postemployment Benefits For purposes of measuring the net OPEB liability, deferred outflows of resources and deferred inflows of resources related to OPEB, and OPEB expense, information about the fiduciary net position of the School Division Plan and additions to/deductions from the School Division Plan’s fiduciary net position have been determined on the same basis as they are reported by the School Division Plan. For this purpose, the School Division Plan recognizes benefit payments when due and payable in accordance with the benefit terms.
2. DEPOSITS AND INVESTMENTS
The Code of Virginia, as amended, requires the election of a County Treasurer. By law, the Treasurer is the custodian of cash investments for both the County and the School Division, and has powers and duties prescribed by general law. Cash and temporary investments pertaining to the School Division’s funds, except the Pension Trust Fund and the School Activity Funds, are primarily held with the County Treasurer. Deposits All cash is maintained in accounts collateralized in accordance with the Virginia Security for Public Deposits Act, Section 2.2-4400 et seq. or covered by Federal depository insurance. At June 30, 2019, cash and investments of the School Division consisted of:
Bank deposits 15,983,145$ Investments 173,635
Cash and cash equivalents with York County Treasurer 16,156,780 Petty cash 600
Total cash and cash equivalents 16,157,380$
Cash and investments of the School Division’s Pension Trust Fund and School Activity Funds at June 30, 2019 consisted of:
Bank deposits 1,695,951$ Restricted cash 72,538 Investments 1,597,646
3,366,135$
Investments Statutes authorize the County to invest in obligations of the United States or agencies thereof, obligations of the Commonwealth of Virginia or political subdivisions thereof, obligations of the International Bank for Reconstruction and Development (World Bank), the Asian Development Bank, the African Development Bank, prime quality commercial paper and certain corporate notes, bankers’ acceptances, repurchase agreements, and the LGIP. LGIP is managed in accordance with the “2a7-like pool” risk limiting requirements of U.S. GAAP with the portfolio securities valued by the amortized-cost method. Investments with a maturity date of one year or less are stated at amortized cost. All investments stated at amortized cost approximate the fair value. The fair value of the County’s position in the LGIP is the same as the value of the pool shares. All other investments are stated at fair value. The Treasury Board of the Commonwealth of Virginia has regulatory oversight of the LGIP.
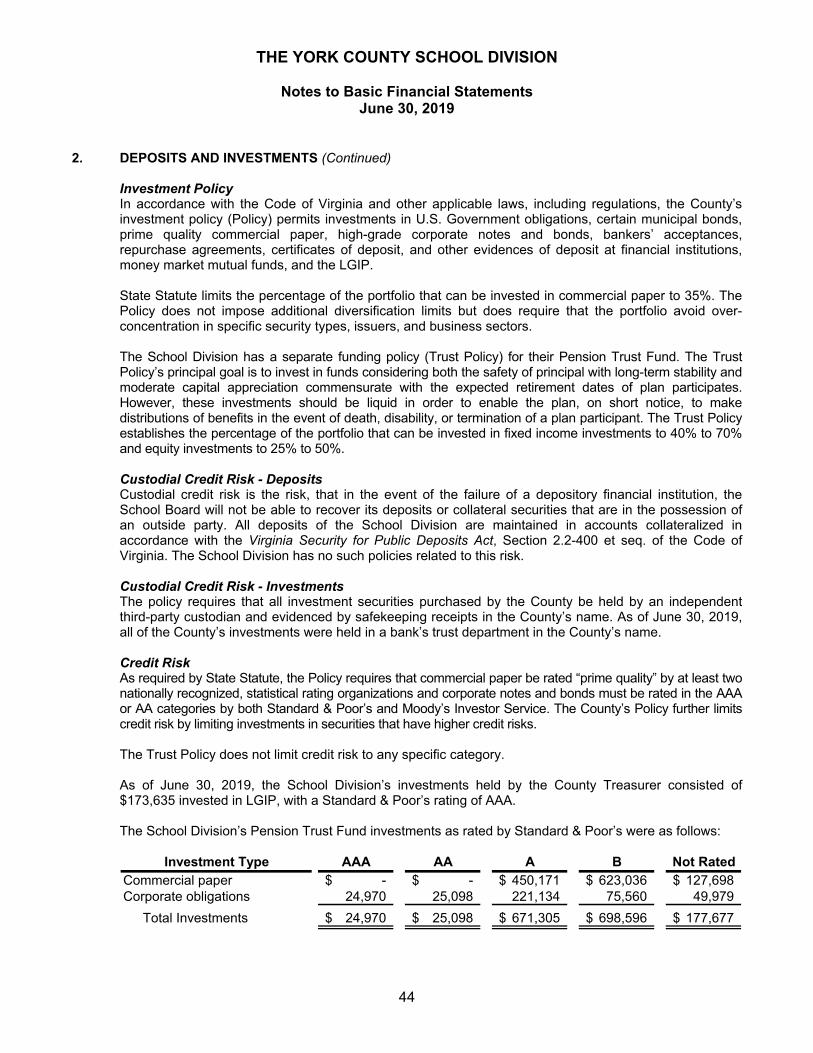
THE YORK COUNTY SCHOOL DIVISION
Notes to Basic Financial Statements June 30, 2019
44
2. DEPOSITS AND INVESTMENTS (Continued)
Investment Policy In accordance with the Code of Virginia and other applicable laws, including regulations, the County’s investment policy (Policy) permits investments in U.S. Government obligations, certain municipal bonds, prime quality commercial paper, high-grade corporate notes and bonds, bankers’ acceptances, repurchase agreements, certificates of deposit, and other evidences of deposit at financial institutions, money market mutual funds, and the LGIP. State Statute limits the percentage of the portfolio that can be invested in commercial paper to 35%. The Policy does not impose additional diversification limits but does require that the portfolio avoid over-concentration in specific security types, issuers, and business sectors. The School Division has a separate funding policy (Trust Policy) for their Pension Trust Fund. The Trust Policy’s principal goal is to invest in funds considering both the safety of principal with long-term stability and moderate capital appreciation commensurate with the expected retirement dates of plan participates. However, these investments should be liquid in order to enable the plan, on short notice, to make distributions of benefits in the event of death, disability, or termination of a plan participant. The Trust Policy establishes the percentage of the portfolio that can be invested in fixed income investments to 40% to 70% and equity investments to 25% to 50%. Custodial Credit Risk - Deposits Custodial credit risk is the risk, that in the event of the failure of a depository financial institution, the School Board will not be able to recover its deposits or collateral securities that are in the possession of an outside party. All deposits of the School Division are maintained in accounts collateralized in accordance with the Virginia Security for Public Deposits Act, Section 2.2-400 et seq. of the Code of Virginia. The School Division has no such policies related to this risk. Custodial Credit Risk - Investments The policy requires that all investment securities purchased by the County be held by an independent third-party custodian and evidenced by safekeeping receipts in the County’s name. As of June 30, 2019, all of the County’s investments were held in a bank’s trust department in the County’s name. Credit Risk As required by State Statute, the Policy requires that commercial paper be rated “prime quality” by at least two nationally recognized, statistical rating organizations and corporate notes and bonds must be rated in the AAA or AA categories by both Standard & Poor’s and Moody’s Investor Service. The County’s Policy further limits credit risk by limiting investments in securities that have higher credit risks. The Trust Policy does not limit credit risk to any specific category. As of June 30, 2019, the School Division’s investments held by the County Treasurer consisted of $173,635 invested in LGIP, with a Standard & Poor’s rating of AAA. The School Division’s Pension Trust Fund investments as rated by Standard & Poor’s were as follows:
AAA AA A B Not RatedCommercial paper -$ -$ 450,171$ 623,036$ 127,698$ Corporate obligations 24,970 25,098 221,134 75,560 49,979
Total Investments 24,970$ 25,098$ 671,305$ 698,596$ 177,677$
Investment Type
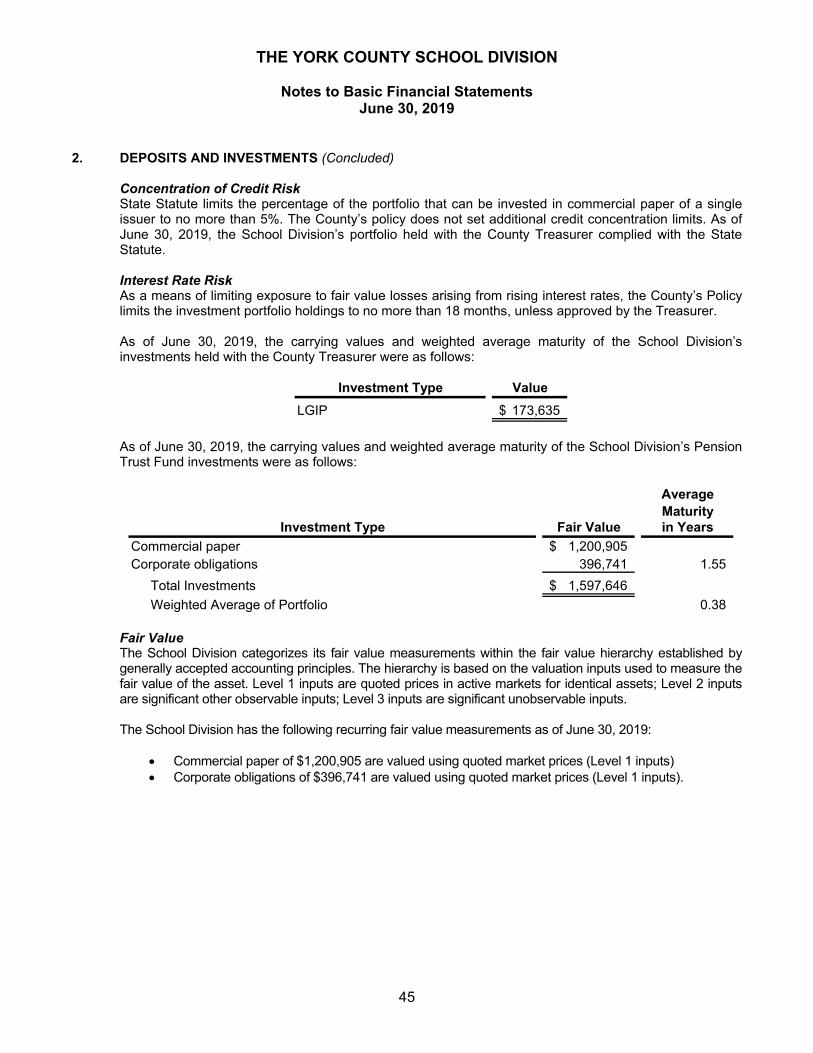
THE YORK COUNTY SCHOOL DIVISION
Notes to Basic Financial Statements June 30, 2019
45
2. DEPOSITS AND INVESTMENTS (Concluded)
Concentration of Credit Risk State Statute limits the percentage of the portfolio that can be invested in commercial paper of a single issuer to no more than 5%. The County’s policy does not set additional credit concentration limits. As of June 30, 2019, the School Division’s portfolio held with the County Treasurer complied with the State Statute. Interest Rate Risk As a means of limiting exposure to fair value losses arising from rising interest rates, the County’s Policy limits the investment portfolio holdings to no more than 18 months, unless approved by the Treasurer. As of June 30, 2019, the carrying values and weighted average maturity of the School Division’s investments held with the County Treasurer were as follows:
Value
173,635$
Investment Type
LGIP
As of June 30, 2019, the carrying values and weighted average maturity of the School Division’s Pension Trust Fund investments were as follows:
AverageMaturity
Fair Value in Years
1,200,905$ 396,741 1.55
1,597,646$
0.38 Weighted Average of Portfolio
Total Investments
Corporate obligationsCommercial paper
Investment Type
Fair Value The School Division categorizes its fair value measurements within the fair value hierarchy established by generally accepted accounting principles. The hierarchy is based on the valuation inputs used to measure the fair value of the asset. Level 1 inputs are quoted prices in active markets for identical assets; Level 2 inputs are significant other observable inputs; Level 3 inputs are significant unobservable inputs. The School Division has the following recurring fair value measurements as of June 30, 2019:
Commercial paper of $1,200,905 are valued using quoted market prices (Level 1 inputs) Corporate obligations of $396,741 are valued using quoted market prices (Level 1 inputs).
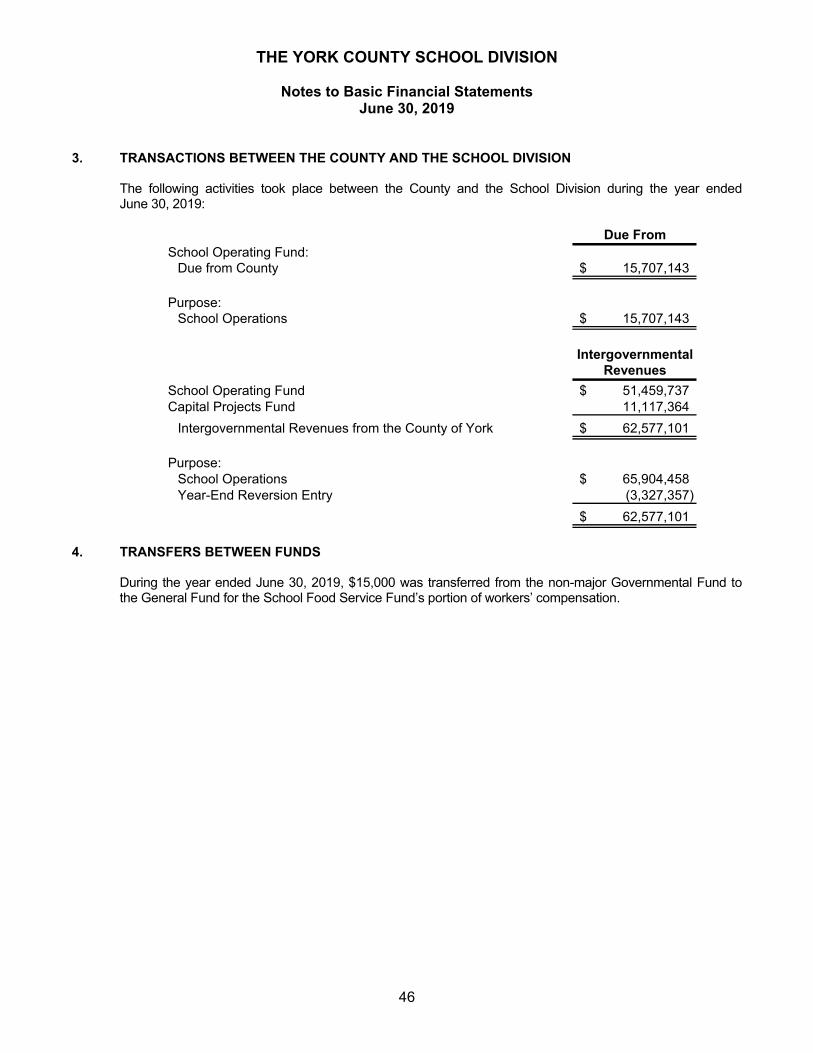
THE YORK COUNTY SCHOOL DIVISION
Notes to Basic Financial Statements June 30, 2019
46
3. TRANSACTIONS BETWEEN THE COUNTY AND THE SCHOOL DIVISION
The following activities took place between the County and the School Division during the year ended June 30, 2019:
Due From
School Operating Fund:Due from County 15,707,143$
Purpose:School Operations 15,707,143$
Intergovernmental
Revenues
School Operating Fund 51,459,737$ Capital Projects Fund 11,117,364
Intergovernmental Revenues from the County of York 62,577,101$
Purpose:School Operations 65,904,458$ Year-End Reversion Entry (3,327,357)
62,577,101$
4. TRANSFERS BETWEEN FUNDS
During the year ended June 30, 2019, $15,000 was transferred from the non-major Governmental Fund to the General Fund for the School Food Service Fund’s portion of workers’ compensation.
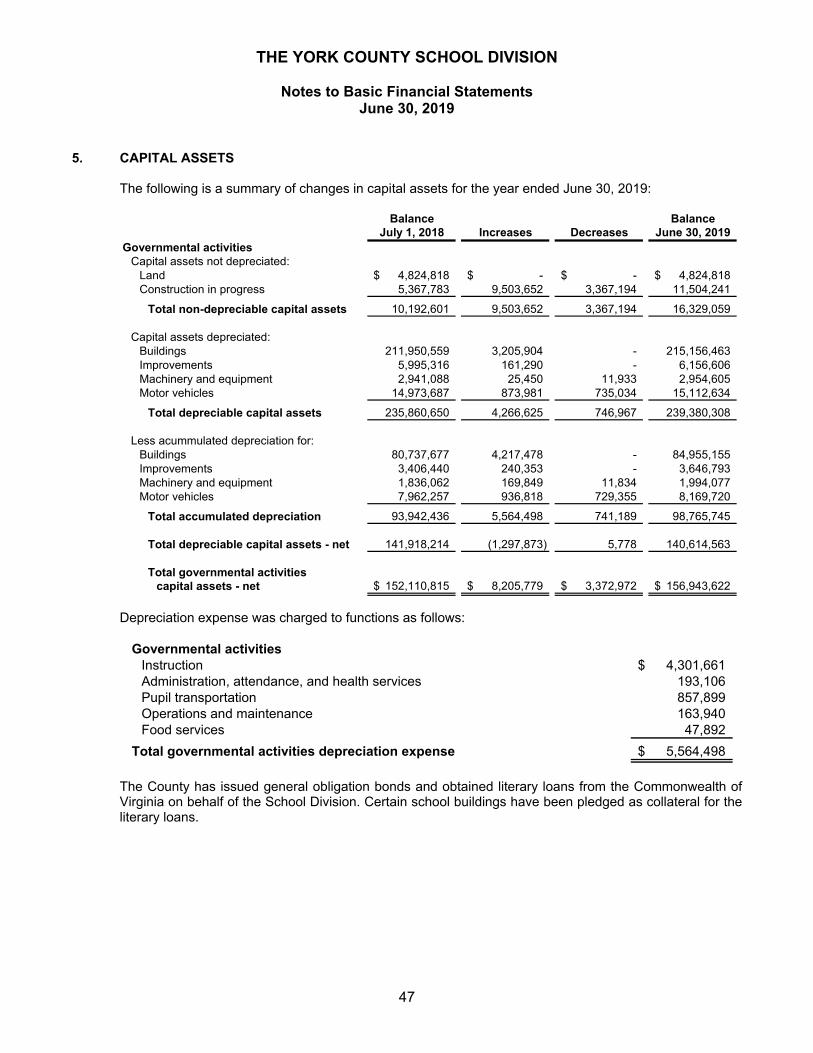
THE YORK COUNTY SCHOOL DIVISION
Notes to Basic Financial Statements June 30, 2019
47
5. CAPITAL ASSETS The following is a summary of changes in capital assets for the year ended June 30, 2019:
Balance BalanceJuly 1, 2018 Increases Decreases June 30, 2019
Governmental activitiesCapital assets not depreciated:
Land 4,824,818$ -$ -$ 4,824,818$ Construction in progress 5,367,783 9,503,652 3,367,194 11,504,241
Total non-depreciable capital assets 10,192,601 9,503,652 3,367,194 16,329,059
Capital assets depreciated:Buildings 211,950,559 3,205,904 - 215,156,463 Improvements 5,995,316 161,290 - 6,156,606 Machinery and equipment 2,941,088 25,450 11,933 2,954,605 Motor vehicles 14,973,687 873,981 735,034 15,112,634
Total depreciable capital assets 235,860,650 4,266,625 746,967 239,380,308
Less acummulated depreciation for:Buildings 80,737,677 4,217,478 - 84,955,155 Improvements 3,406,440 240,353 - 3,646,793 Machinery and equipment 1,836,062 169,849 11,834 1,994,077 Motor vehicles 7,962,257 936,818 729,355 8,169,720
Total accumulated depreciation 93,942,436 5,564,498 741,189 98,765,745
Total depreciable capital assets - net 141,918,214 (1,297,873) 5,778 140,614,563
Total governmental activitiescapital assets - net 152,110,815$ 8,205,779$ 3,372,972$ 156,943,622$
Depreciation expense was charged to functions as follows:
4,301,661$ 193,106 857,899 163,940
47,892
5,564,498$ Total governmental activities depreciation expense
Instruction
Food servicesOperations and maintenancePupil transportationAdministration, attendance, and health services
Governmental activities
The County has issued general obligation bonds and obtained literary loans from the Commonwealth of Virginia on behalf of the School Division. Certain school buildings have been pledged as collateral for the literary loans.
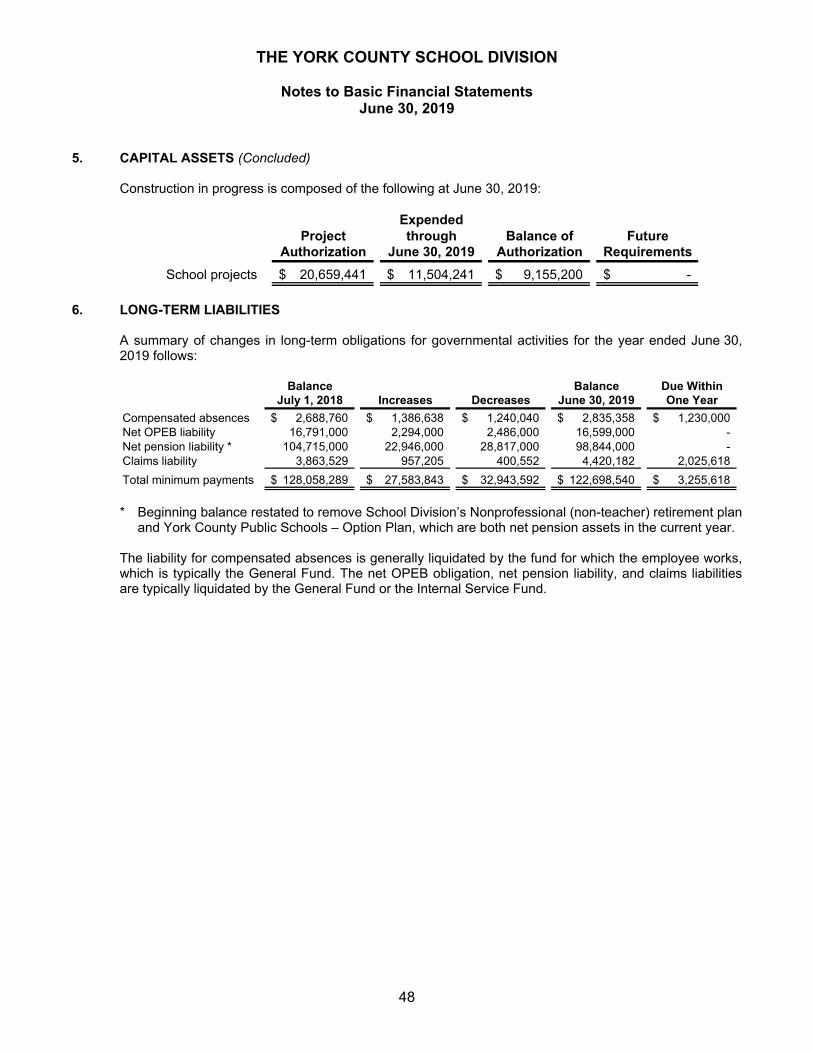
THE YORK COUNTY SCHOOL DIVISION
Notes to Basic Financial Statements June 30, 2019
48
5. CAPITAL ASSETS (Concluded) Construction in progress is composed of the following at June 30, 2019:
ExpendedProject through Balance of Future
Authorization June 30, 2019 Authorization Requirements
School projects 20,659,441$ 11,504,241$ 9,155,200$ -$
6. LONG-TERM LIABILITIES
A summary of changes in long-term obligations for governmental activities for the year ended June 30, 2019 follows:
Balance Balance Due WithinJuly 1, 2018 Increases Decreases June 30, 2019 One Year
Compensated absences 2,688,760$ 1,386,638$ 1,240,040$ 2,835,358$ 1,230,000$ Net OPEB liability 16,791,000 2,294,000 2,486,000 16,599,000 - Net pension liability * 104,715,000 22,946,000 28,817,000 98,844,000 - Claims liability 3,863,529 957,205 400,552 4,420,182 2,025,618
Total minimum payments 128,058,289$ 27,583,843$ 32,943,592$ 122,698,540$ 3,255,618$
* Beginning balance restated to remove School Division’s Nonprofessional (non-teacher) retirement plan
and York County Public Schools – Option Plan, which are both net pension assets in the current year. The liability for compensated absences is generally liquidated by the fund for which the employee works, which is typically the General Fund. The net OPEB obligation, net pension liability, and claims liabilities are typically liquidated by the General Fund or the Internal Service Fund.
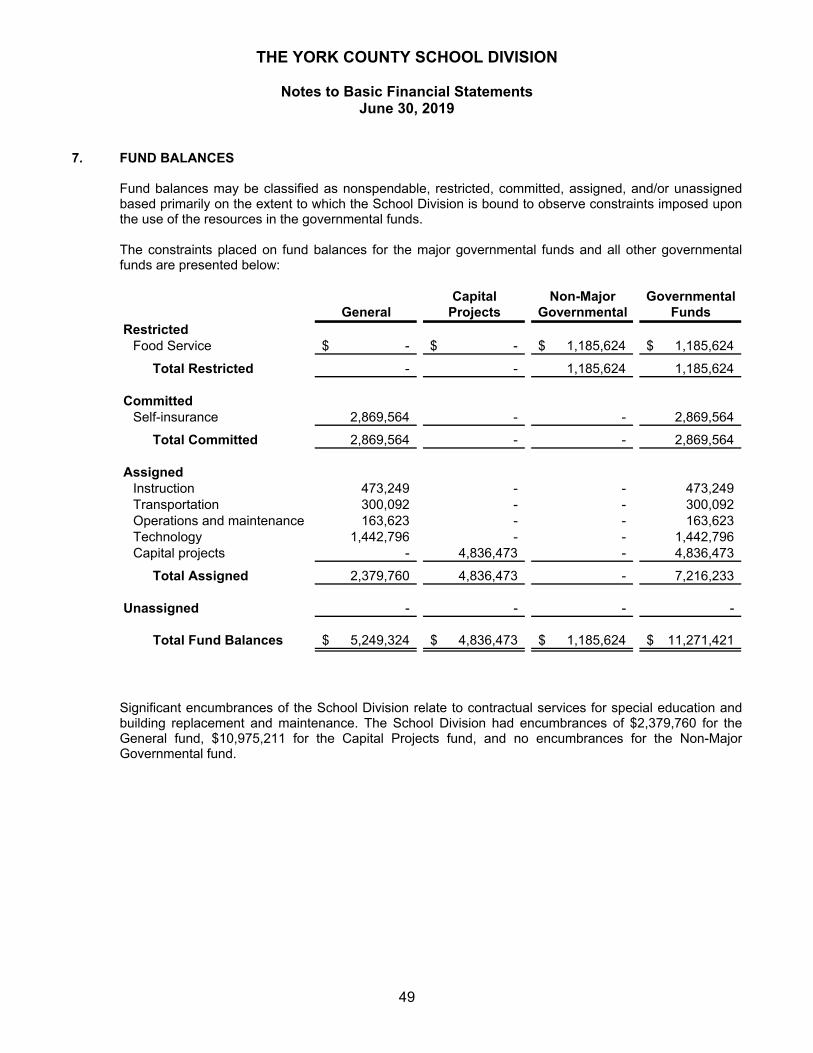
THE YORK COUNTY SCHOOL DIVISION
Notes to Basic Financial Statements June 30, 2019
49
7. FUND BALANCES
Fund balances may be classified as nonspendable, restricted, committed, assigned, and/or unassigned based primarily on the extent to which the School Division is bound to observe constraints imposed upon the use of the resources in the governmental funds. The constraints placed on fund balances for the major governmental funds and all other governmental funds are presented below:
Capital Non-Major GovernmentalGeneral Projects Governmental Funds
RestrictedFood Service -$ -$ 1,185,624$ 1,185,624$
Total Restricted - - 1,185,624 1,185,624
CommittedSelf-insurance 2,869,564 - - 2,869,564
Total Committed 2,869,564 - - 2,869,564
AssignedInstruction 473,249 - - 473,249 Transportation 300,092 - - 300,092 Operations and maintenance 163,623 - - 163,623 Technology 1,442,796 - - 1,442,796 Capital projects - 4,836,473 - 4,836,473
Total Assigned 2,379,760 4,836,473 - 7,216,233
Unassigned - - - -
Total Fund Balances 5,249,324$ 4,836,473$ 1,185,624$ 11,271,421$
Significant encumbrances of the School Division relate to contractual services for special education and building replacement and maintenance. The School Division had encumbrances of $2,379,760 for the General fund, $10,975,211 for the Capital Projects fund, and no encumbrances for the Non-Major Governmental fund.
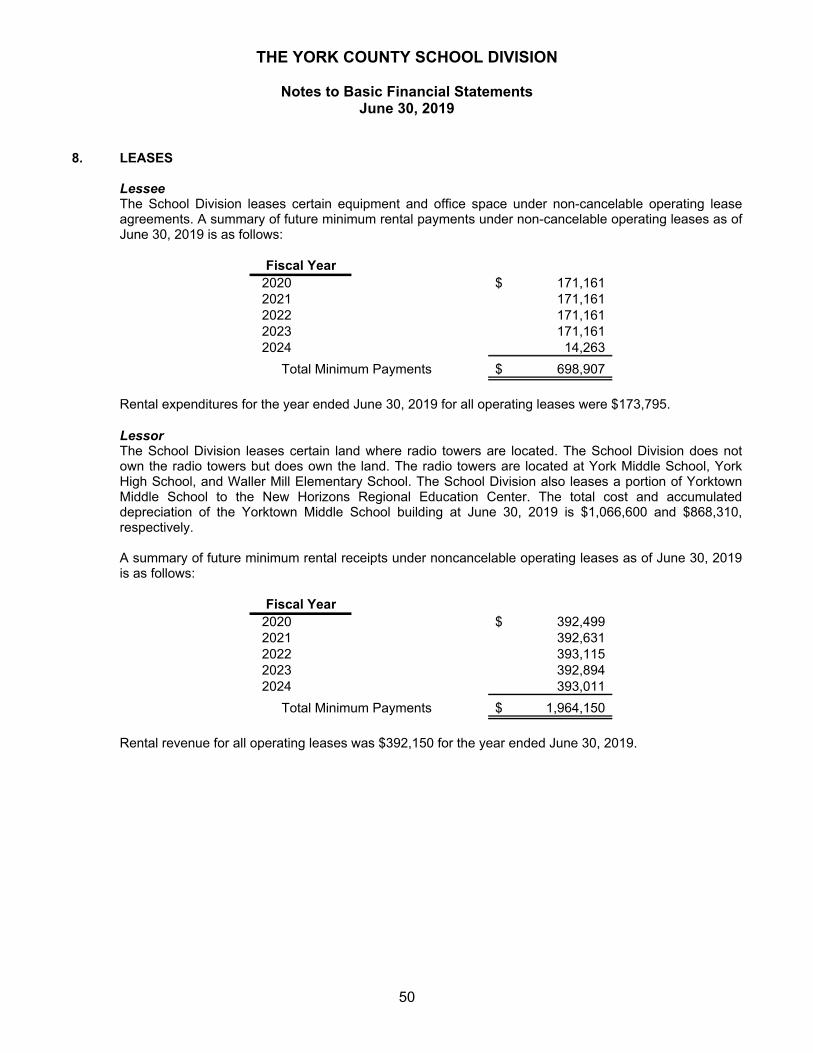
THE YORK COUNTY SCHOOL DIVISION
Notes to Basic Financial Statements June 30, 2019
50
8. LEASES
Lessee The School Division leases certain equipment and office space under non-cancelable operating lease agreements. A summary of future minimum rental payments under non-cancelable operating leases as of June 30, 2019 is as follows:
Fiscal Year2020 171,161$ 2021 171,161 2022 171,161 2023 171,161 2024 14,263
Total Minimum Payments 698,907$
Rental expenditures for the year ended June 30, 2019 for all operating leases were $173,795.
Lessor The School Division leases certain land where radio towers are located. The School Division does not own the radio towers but does own the land. The radio towers are located at York Middle School, York High School, and Waller Mill Elementary School. The School Division also leases a portion of Yorktown Middle School to the New Horizons Regional Education Center. The total cost and accumulated depreciation of the Yorktown Middle School building at June 30, 2019 is $1,066,600 and $868,310, respectively. A summary of future minimum rental receipts under noncancelable operating leases as of June 30, 2019 is as follows:
Fiscal Year
2020 392,499$ 2021 392,631 2022 393,115 2023 392,894 2024 393,011
Total Minimum Payments 1,964,150$
Rental revenue for all operating leases was $392,150 for the year ended June 30, 2019.
THE YORK COUNTY SCHOOL DIVISION
Notes to Basic Financial Statements June 30, 2019
51
9. DEFINED BENEFIT PENSION PLANS
Virginia Retirement System The School Division participates in the Virginia Retirement System (VRS or the System) Teacher Employee Plan (Professional Plan), which is a multiple employer, cost-sharing plan. The School Division also participates in the VRS Political Subdivision Retirement Plan (Nonprofessional Plan), which is a multi-employer, agent plan. For purposes of measuring the net pension liability, deferred outflows of resources and deferred inflows of resources related to pensions, and pension expense, information about the fiduciary net position of the York County Schools’ (Schools) Professional and Nonprofessional Retirement Plans and the additions to/deductions from the Schools’ Professional and Nonprofessional Retirement Plans’ net fiduciary position have been determined on the same basis as they were reported by VRS. In addition, benefit payments (including refunds of employee contributions) are recognized when due and payable in accordance with the benefit terms. Investments are reported at fair value. All full-time, salaried permanent (professional) employees of public school divisions are automatically covered by the VRS Teacher Retirement Plan upon employment. All full-time, salaried permanent (nonprofessional) employees of the Political Subdivision are automatically covered by the VRS Retirement Plan upon employment. These plans are administered by the Virginia Retirement System along with plans for other employer groups in the Commonwealth of Virginia. Members earn one month of service credit for each month they are employed and for which they and their employer pay contributions to VRS. Members are eligible to purchase prior service, based on specific criteria as defined in the Code of Virginia, as amended. Eligible prior service that may be purchased includes prior public service, active military service, certain periods of leave, and previously refunded service.
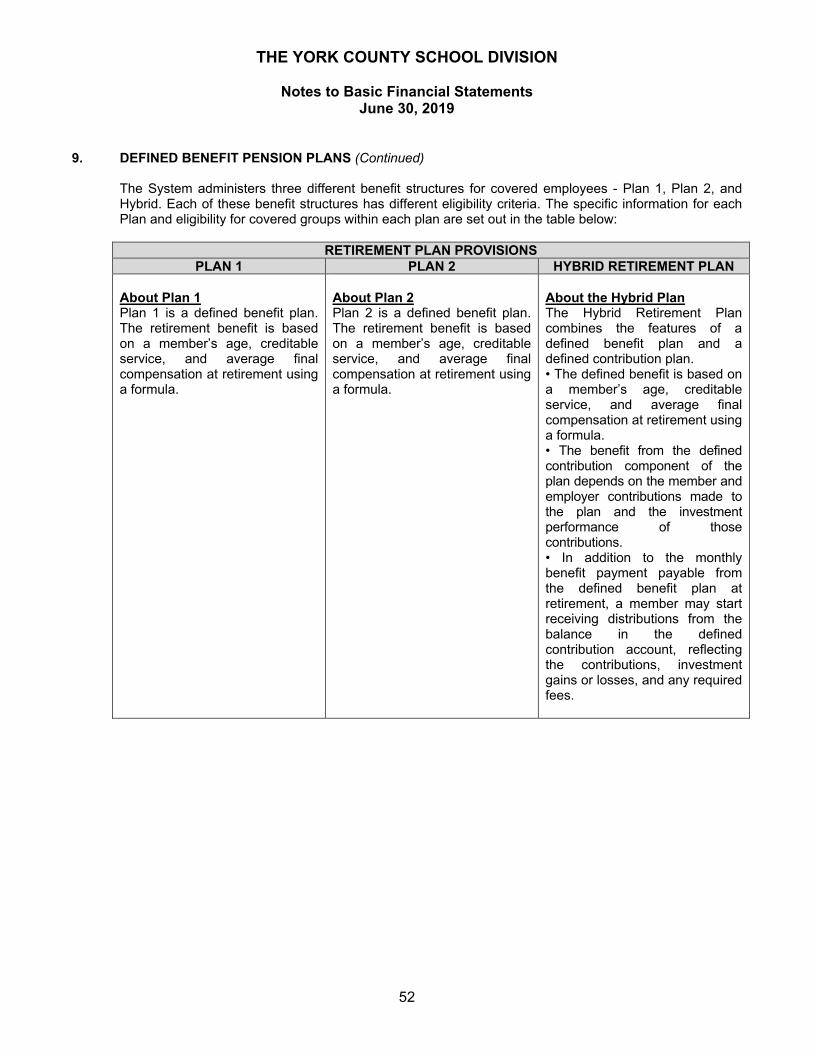
THE YORK COUNTY SCHOOL DIVISION
Notes to Basic Financial Statements June 30, 2019
52
9. DEFINED BENEFIT PENSION PLANS (Continued)
The System administers three different benefit structures for covered employees - Plan 1, Plan 2, and Hybrid. Each of these benefit structures has different eligibility criteria. The specific information for each Plan and eligibility for covered groups within each plan are set out in the table below:
RETIREMENT PLAN PROVISIONS
PLAN 1 PLAN 2 HYBRID RETIREMENT PLAN About Plan 1 Plan 1 is a defined benefit plan. The retirement benefit is based on a member’s age, creditable service, and average final compensation at retirement using a formula.
About Plan 2 Plan 2 is a defined benefit plan. The retirement benefit is based on a member’s age, creditable service, and average final compensation at retirement using a formula.
About the Hybrid Plan The Hybrid Retirement Plan combines the features of a defined benefit plan and a defined contribution plan. • The defined benefit is based on a member’s age, creditable service, and average final compensation at retirement using a formula. • The benefit from the defined contribution component of the plan depends on the member and employer contributions made to the plan and the investment performance of those contributions. • In addition to the monthly benefit payment payable from the defined benefit plan at retirement, a member may start receiving distributions from the balance in the defined contribution account, reflecting the contributions, investment gains or losses, and any required fees.
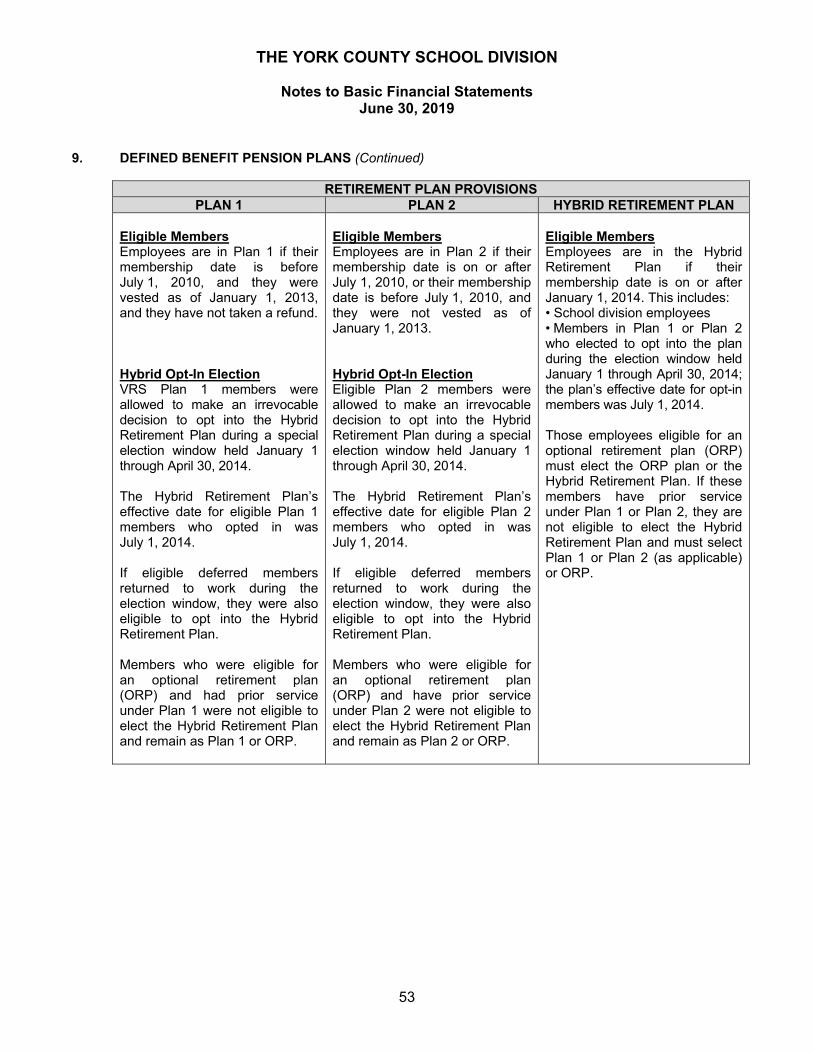
THE YORK COUNTY SCHOOL DIVISION
Notes to Basic Financial Statements June 30, 2019
53
9. DEFINED BENEFIT PENSION PLANS (Continued)
RETIREMENT PLAN PROVISIONS PLAN 1 PLAN 2 HYBRID RETIREMENT PLAN
Eligible Members Employees are in Plan 1 if their membership date is before July 1, 2010, and they were vested as of January 1, 2013, and they have not taken a refund. Hybrid Opt-In Election VRS Plan 1 members were allowed to make an irrevocable decision to opt into the Hybrid Retirement Plan during a special election window held January 1 through April 30, 2014. The Hybrid Retirement Plan’s effective date for eligible Plan 1 members who opted in was July 1, 2014. If eligible deferred members returned to work during the election window, they were also eligible to opt into the Hybrid Retirement Plan. Members who were eligible for an optional retirement plan (ORP) and had prior service under Plan 1 were not eligible to elect the Hybrid Retirement Plan and remain as Plan 1 or ORP.
Eligible Members Employees are in Plan 2 if their membership date is on or after July 1, 2010, or their membership date is before July 1, 2010, and they were not vested as of January 1, 2013. Hybrid Opt-In Election Eligible Plan 2 members were allowed to make an irrevocable decision to opt into the Hybrid Retirement Plan during a special election window held January 1 through April 30, 2014. The Hybrid Retirement Plan’s effective date for eligible Plan 2 members who opted in was July 1, 2014. If eligible deferred members returned to work during the election window, they were also eligible to opt into the Hybrid Retirement Plan. Members who were eligible for an optional retirement plan (ORP) and have prior service under Plan 2 were not eligible to elect the Hybrid Retirement Plan and remain as Plan 2 or ORP.
Eligible Members Employees are in the Hybrid Retirement Plan if their membership date is on or after January 1, 2014. This includes: • School division employees • Members in Plan 1 or Plan 2 who elected to opt into the plan during the election window held January 1 through April 30, 2014; the plan’s effective date for opt-in members was July 1, 2014. Those employees eligible for an optional retirement plan (ORP) must elect the ORP plan or the Hybrid Retirement Plan. If these members have prior service under Plan 1 or Plan 2, they are not eligible to elect the Hybrid Retirement Plan and must select Plan 1 or Plan 2 (as applicable) or ORP.
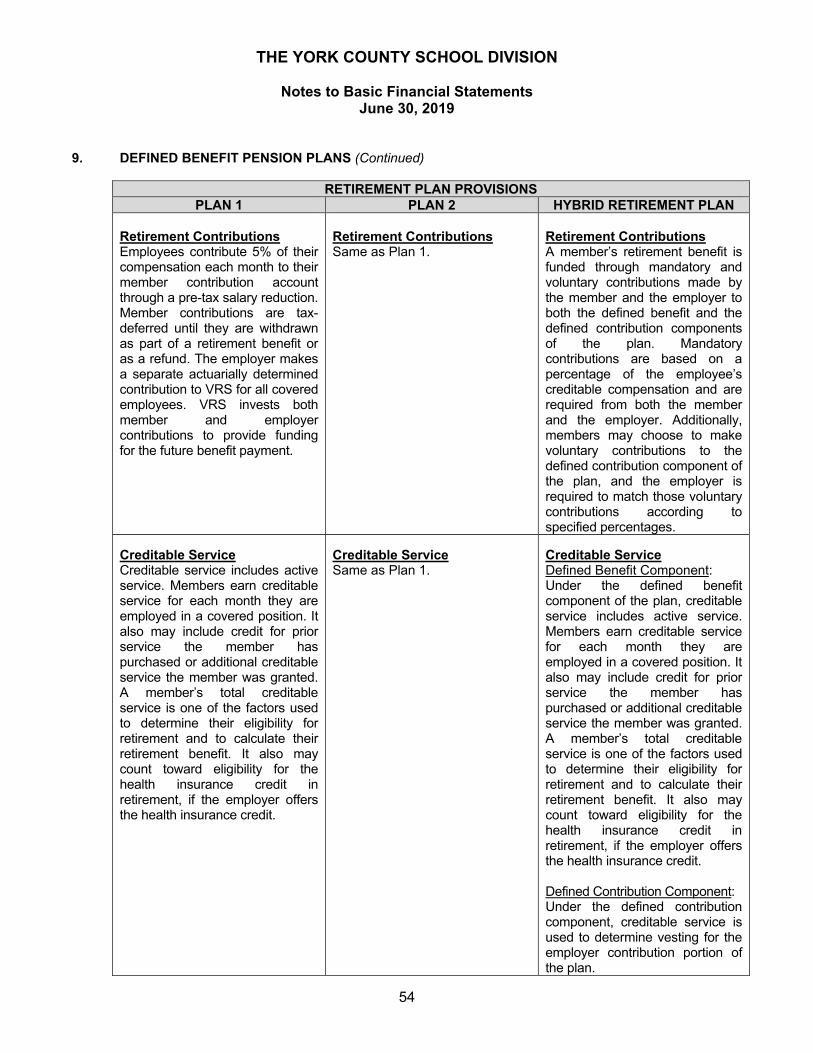
THE YORK COUNTY SCHOOL DIVISION
Notes to Basic Financial Statements June 30, 2019
54
9. DEFINED BENEFIT PENSION PLANS (Continued)
RETIREMENT PLAN PROVISIONS PLAN 1 PLAN 2 HYBRID RETIREMENT PLAN
Retirement Contributions Employees contribute 5% of their compensation each month to their member contribution account through a pre-tax salary reduction. Member contributions are tax-deferred until they are withdrawn as part of a retirement benefit or as a refund. The employer makes a separate actuarially determined contribution to VRS for all covered employees. VRS invests both member and employer contributions to provide funding for the future benefit payment.
Retirement Contributions Same as Plan 1.
Retirement Contributions A member’s retirement benefit is funded through mandatory and voluntary contributions made by the member and the employer to both the defined benefit and the defined contribution components of the plan. Mandatory contributions are based on a percentage of the employee’s creditable compensation and are required from both the member and the employer. Additionally, members may choose to make voluntary contributions to the defined contribution component of the plan, and the employer is required to match those voluntary contributions according to specified percentages.
Creditable Service Creditable service includes active service. Members earn creditable service for each month they are employed in a covered position. It also may include credit for prior service the member has purchased or additional creditable service the member was granted. A member’s total creditable service is one of the factors used to determine their eligibility for retirement and to calculate their retirement benefit. It also may count toward eligibility for the health insurance credit in retirement, if the employer offers the health insurance credit.
Creditable Service Same as Plan 1.
Creditable Service Defined Benefit Component: Under the defined benefit component of the plan, creditable service includes active service. Members earn creditable service for each month they are employed in a covered position. It also may include credit for prior service the member has purchased or additional creditable service the member was granted. A member’s total creditable service is one of the factors used to determine their eligibility for retirement and to calculate their retirement benefit. It also may count toward eligibility for the health insurance credit in retirement, if the employer offers the health insurance credit. Defined Contribution Component: Under the defined contribution component, creditable service is used to determine vesting for the employer contribution portion of the plan.
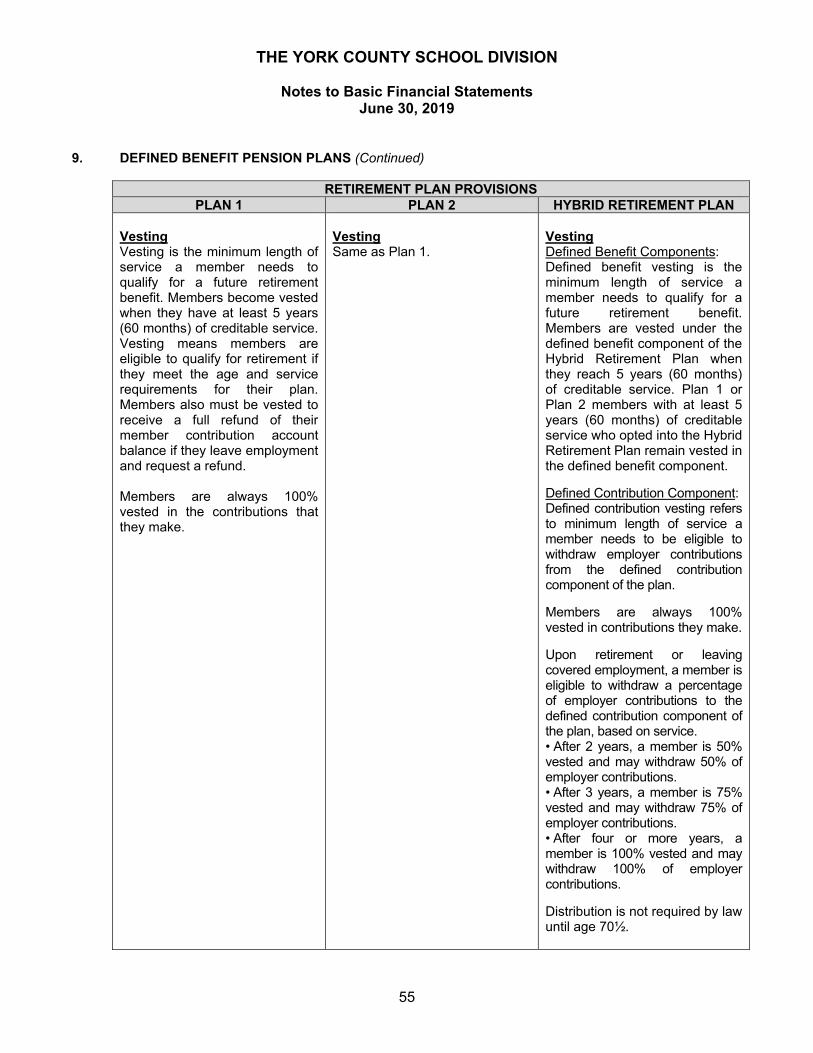
THE YORK COUNTY SCHOOL DIVISION
Notes to Basic Financial Statements June 30, 2019
55
9. DEFINED BENEFIT PENSION PLANS (Continued)
RETIREMENT PLAN PROVISIONS PLAN 1 PLAN 2 HYBRID RETIREMENT PLAN
Vesting Vesting is the minimum length of service a member needs to qualify for a future retirement benefit. Members become vested when they have at least 5 years (60 months) of creditable service. Vesting means members are eligible to qualify for retirement if they meet the age and service requirements for their plan. Members also must be vested to receive a full refund of their member contribution account balance if they leave employment and request a refund. Members are always 100% vested in the contributions that they make.
Vesting Same as Plan 1.
Vesting Defined Benefit Components: Defined benefit vesting is the minimum length of service a member needs to qualify for a future retirement benefit. Members are vested under the defined benefit component of the Hybrid Retirement Plan when they reach 5 years (60 months) of creditable service. Plan 1 or Plan 2 members with at least 5 years (60 months) of creditable service who opted into the Hybrid Retirement Plan remain vested in the defined benefit component. Defined Contribution Component: Defined contribution vesting refers to minimum length of service a member needs to be eligible to withdraw employer contributions from the defined contribution component of the plan. Members are always 100% vested in contributions they make. Upon retirement or leaving covered employment, a member is eligible to withdraw a percentage of employer contributions to the defined contribution component of the plan, based on service. • After 2 years, a member is 50% vested and may withdraw 50% of employer contributions. • After 3 years, a member is 75% vested and may withdraw 75% of employer contributions. • After four or more years, a member is 100% vested and may withdraw 100% of employer contributions. Distribution is not required by law until age 70½.
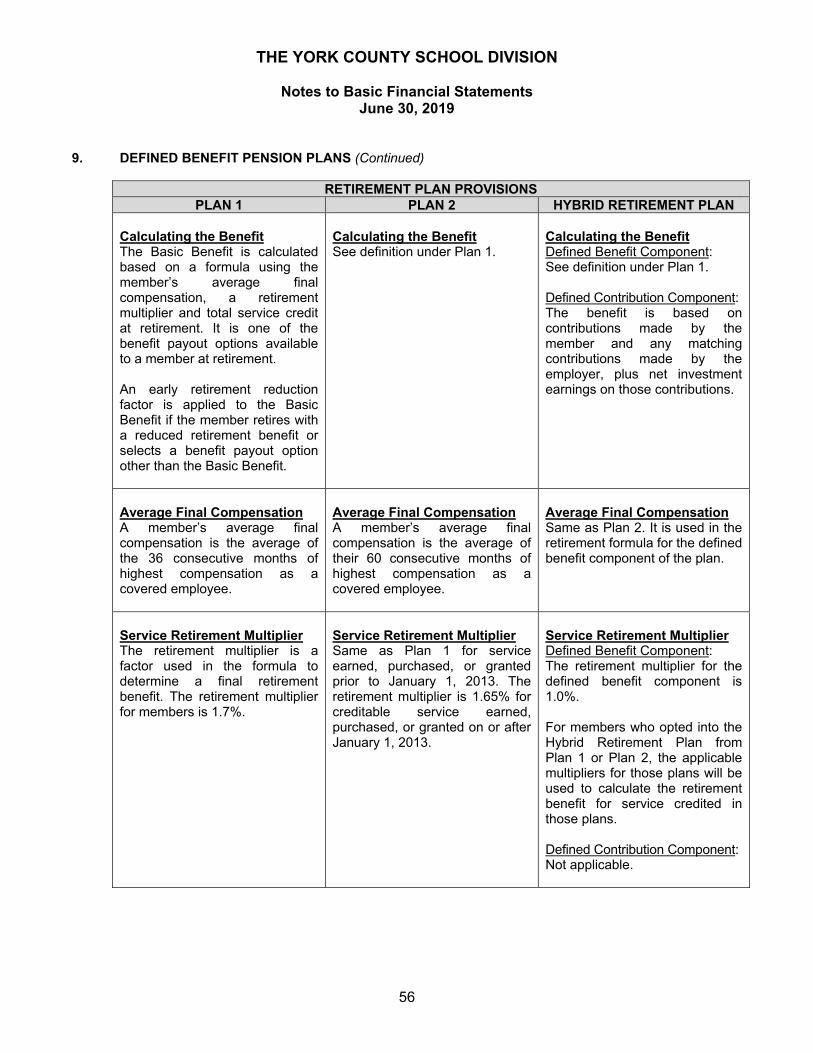
THE YORK COUNTY SCHOOL DIVISION
Notes to Basic Financial Statements June 30, 2019
56
9. DEFINED BENEFIT PENSION PLANS (Continued)
RETIREMENT PLAN PROVISIONS PLAN 1 PLAN 2 HYBRID RETIREMENT PLAN
Calculating the Benefit The Basic Benefit is calculated based on a formula using the member’s average final compensation, a retirement multiplier and total service credit at retirement. It is one of the benefit payout options available to a member at retirement. An early retirement reduction factor is applied to the Basic Benefit if the member retires with a reduced retirement benefit or selects a benefit payout option other than the Basic Benefit.
Calculating the Benefit See definition under Plan 1.
Calculating the Benefit Defined Benefit Component: See definition under Plan 1. Defined Contribution Component: The benefit is based on contributions made by the member and any matching contributions made by the employer, plus net investment earnings on those contributions.
Average Final Compensation A member’s average final compensation is the average of the 36 consecutive months of highest compensation as a covered employee.
Average Final Compensation A member’s average final compensation is the average of their 60 consecutive months of highest compensation as a covered employee.
Average Final Compensation Same as Plan 2. It is used in the retirement formula for the defined benefit component of the plan.
Service Retirement Multiplier The retirement multiplier is a factor used in the formula to determine a final retirement benefit. The retirement multiplier for members is 1.7%.
Service Retirement Multiplier Same as Plan 1 for service earned, purchased, or granted prior to January 1, 2013. The retirement multiplier is 1.65% for creditable service earned, purchased, or granted on or after January 1, 2013.
Service Retirement Multiplier Defined Benefit Component: The retirement multiplier for the defined benefit component is 1.0%. For members who opted into the Hybrid Retirement Plan from Plan 1 or Plan 2, the applicable multipliers for those plans will be used to calculate the retirement benefit for service credited in those plans. Defined Contribution Component: Not applicable.
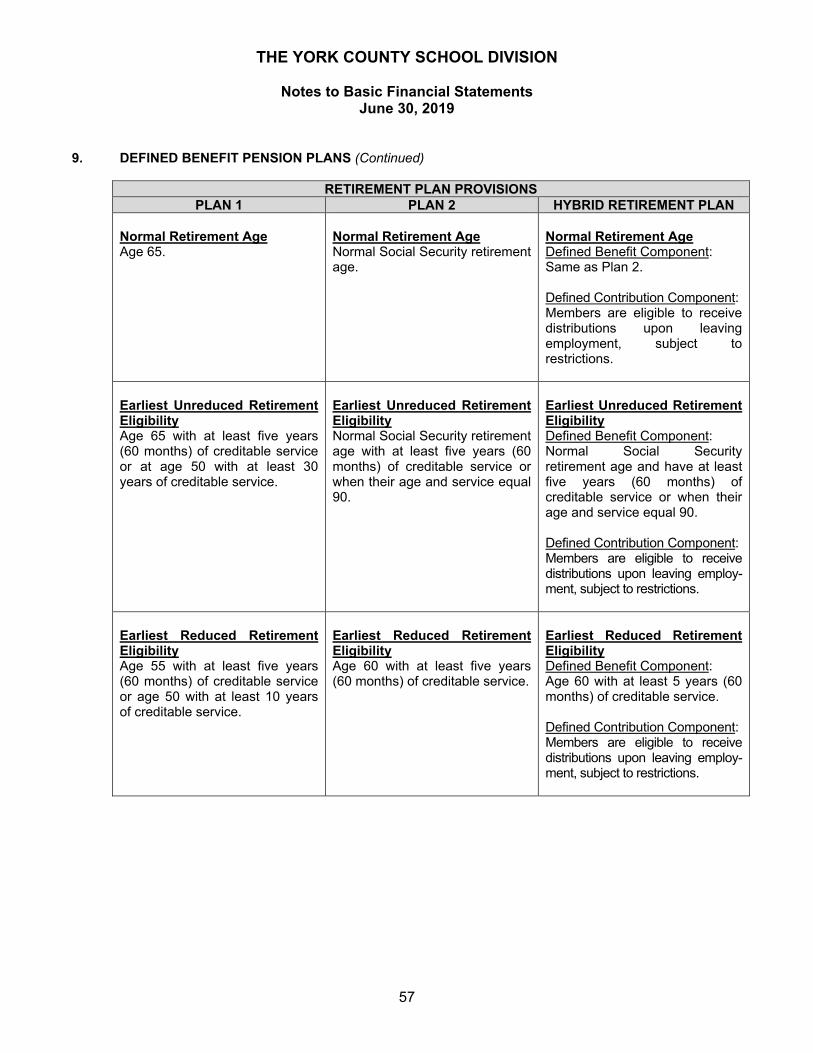
THE YORK COUNTY SCHOOL DIVISION
Notes to Basic Financial Statements June 30, 2019
57
9. DEFINED BENEFIT PENSION PLANS (Continued)
RETIREMENT PLAN PROVISIONS PLAN 1 PLAN 2 HYBRID RETIREMENT PLAN
Normal Retirement Age Age 65.
Normal Retirement Age Normal Social Security retirement age.
Normal Retirement Age Defined Benefit Component: Same as Plan 2. Defined Contribution Component: Members are eligible to receive distributions upon leaving employment, subject to restrictions.
Earliest Unreduced Retirement Eligibility Age 65 with at least five years (60 months) of creditable service or at age 50 with at least 30 years of creditable service.
Earliest Unreduced Retirement Eligibility Normal Social Security retirement age with at least five years (60 months) of creditable service or when their age and service equal 90.
Earliest Unreduced Retirement Eligibility Defined Benefit Component: Normal Social Security retirement age and have at least five years (60 months) of creditable service or when their age and service equal 90. Defined Contribution Component: Members are eligible to receive distributions upon leaving employ-ment, subject to restrictions.
Earliest Reduced Retirement Eligibility Age 55 with at least five years (60 months) of creditable service or age 50 with at least 10 years of creditable service.
Earliest Reduced Retirement Eligibility Age 60 with at least five years (60 months) of creditable service.
Earliest Reduced Retirement Eligibility Defined Benefit Component: Age 60 with at least 5 years (60 months) of creditable service. Defined Contribution Component: Members are eligible to receive distributions upon leaving employ-ment, subject to restrictions.
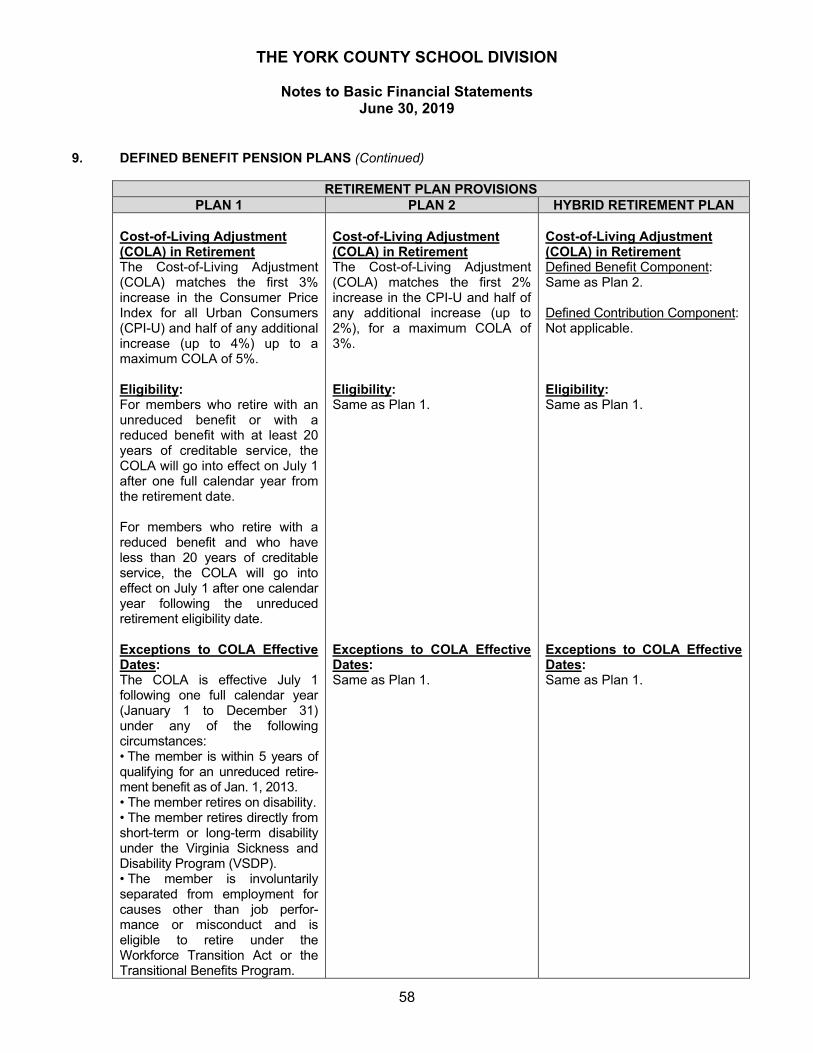
THE YORK COUNTY SCHOOL DIVISION
Notes to Basic Financial Statements June 30, 2019
58
9. DEFINED BENEFIT PENSION PLANS (Continued)
RETIREMENT PLAN PROVISIONS PLAN 1 PLAN 2 HYBRID RETIREMENT PLAN
Cost-of-Living Adjustment (COLA) in Retirement The Cost-of-Living Adjustment (COLA) matches the first 3% increase in the Consumer Price Index for all Urban Consumers (CPI-U) and half of any additional increase (up to 4%) up to a maximum COLA of 5%. Eligibility: For members who retire with an unreduced benefit or with a reduced benefit with at least 20 years of creditable service, the COLA will go into effect on July 1 after one full calendar year from the retirement date. For members who retire with a reduced benefit and who have less than 20 years of creditable service, the COLA will go into effect on July 1 after one calendar year following the unreduced retirement eligibility date. Exceptions to COLA Effective Dates: The COLA is effective July 1 following one full calendar year (January 1 to December 31) under any of the following circumstances: • The member is within 5 years of qualifying for an unreduced retire-ment benefit as of Jan. 1, 2013. • The member retires on disability. • The member retires directly from short-term or long-term disability under the Virginia Sickness and Disability Program (VSDP). • The member is involuntarily separated from employment for causes other than job perfor-mance or misconduct and is eligible to retire under the Workforce Transition Act or the Transitional Benefits Program.
Cost-of-Living Adjustment (COLA) in Retirement The Cost-of-Living Adjustment (COLA) matches the first 2% increase in the CPI-U and half of any additional increase (up to 2%), for a maximum COLA of 3%. Eligibility: Same as Plan 1. Exceptions to COLA Effective Dates: Same as Plan 1.
Cost-of-Living Adjustment (COLA) in Retirement Defined Benefit Component: Same as Plan 2. Defined Contribution Component: Not applicable. Eligibility: Same as Plan 1. Exceptions to COLA Effective Dates: Same as Plan 1.
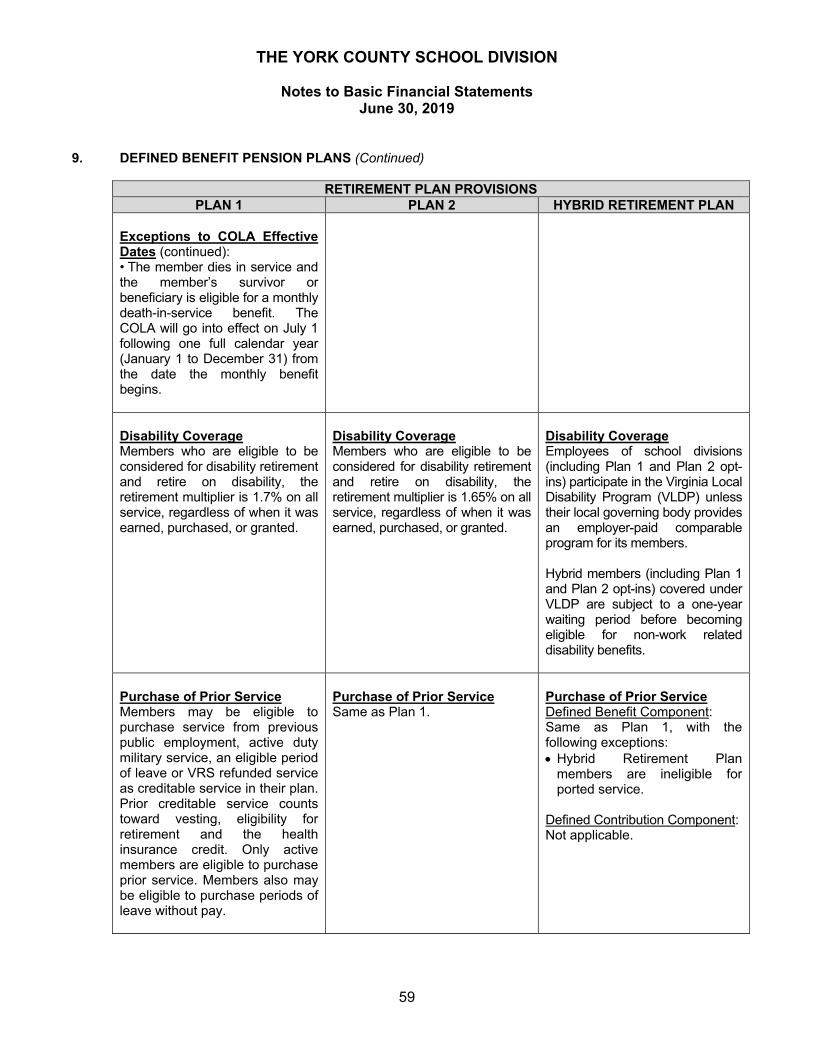
THE YORK COUNTY SCHOOL DIVISION
Notes to Basic Financial Statements June 30, 2019
59
9. DEFINED BENEFIT PENSION PLANS (Continued)
RETIREMENT PLAN PROVISIONS PLAN 1 PLAN 2 HYBRID RETIREMENT PLAN
Exceptions to COLA Effective Dates (continued): • The member dies in service and the member’s survivor or beneficiary is eligible for a monthly death-in-service benefit. The COLA will go into effect on July 1 following one full calendar year (January 1 to December 31) from the date the monthly benefit begins.
Disability Coverage Members who are eligible to be considered for disability retirement and retire on disability, the retirement multiplier is 1.7% on all service, regardless of when it was earned, purchased, or granted.
Disability Coverage Members who are eligible to be considered for disability retirement and retire on disability, the retirement multiplier is 1.65% on all service, regardless of when it was earned, purchased, or granted.
Disability Coverage Employees of school divisions (including Plan 1 and Plan 2 opt-ins) participate in the Virginia Local Disability Program (VLDP) unless their local governing body provides an employer-paid comparable program for its members. Hybrid members (including Plan 1 and Plan 2 opt-ins) covered under VLDP are subject to a one-year waiting period before becoming eligible for non-work related disability benefits.
Purchase of Prior Service Members may be eligible to purchase service from previous public employment, active duty military service, an eligible period of leave or VRS refunded service as creditable service in their plan. Prior creditable service counts toward vesting, eligibility for retirement and the health insurance credit. Only active members are eligible to purchase prior service. Members also may be eligible to purchase periods of leave without pay.
Purchase of Prior Service Same as Plan 1.
Purchase of Prior Service Defined Benefit Component: Same as Plan 1, with the following exceptions: Hybrid Retirement Plan
members are ineligible for ported service.
Defined Contribution Component: Not applicable.
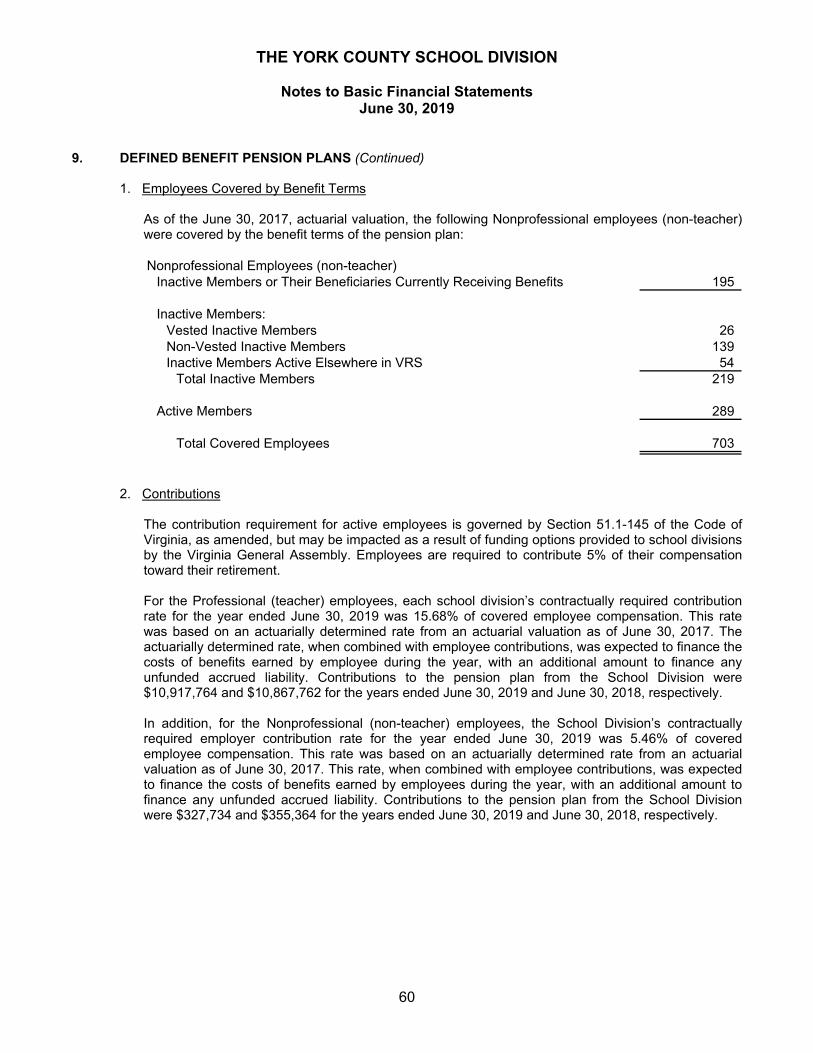
THE YORK COUNTY SCHOOL DIVISION
Notes to Basic Financial Statements June 30, 2019
60
9. DEFINED BENEFIT PENSION PLANS (Continued)
1. Employees Covered by Benefit Terms As of the June 30, 2017, actuarial valuation, the following Nonprofessional employees (non-teacher) were covered by the benefit terms of the pension plan: Nonprofessional Employees (non-teacher)
195
Inactive Members:Vested Inactive Members 26 Non-Vested Inactive Members 139 Inactive Members Active Elsewhere in VRS 54
Total Inactive Members 219
Active Members 289
Total Covered Employees 703
Inactive Members or Their Beneficiaries Currently Receiving Benefits
2. Contributions The contribution requirement for active employees is governed by Section 51.1-145 of the Code of Virginia, as amended, but may be impacted as a result of funding options provided to school divisions by the Virginia General Assembly. Employees are required to contribute 5% of their compensation toward their retirement. For the Professional (teacher) employees, each school division’s contractually required contribution rate for the year ended June 30, 2019 was 15.68% of covered employee compensation. This rate was based on an actuarially determined rate from an actuarial valuation as of June 30, 2017. The actuarially determined rate, when combined with employee contributions, was expected to finance the costs of benefits earned by employee during the year, with an additional amount to finance any unfunded accrued liability. Contributions to the pension plan from the School Division were $10,917,764 and $10,867,762 for the years ended June 30, 2019 and June 30, 2018, respectively. In addition, for the Nonprofessional (non-teacher) employees, the School Division’s contractually required employer contribution rate for the year ended June 30, 2019 was 5.46% of covered employee compensation. This rate was based on an actuarially determined rate from an actuarial valuation as of June 30, 2017. This rate, when combined with employee contributions, was expected to finance the costs of benefits earned by employees during the year, with an additional amount to finance any unfunded accrued liability. Contributions to the pension plan from the School Division were $327,734 and $355,364 for the years ended June 30, 2019 and June 30, 2018, respectively.
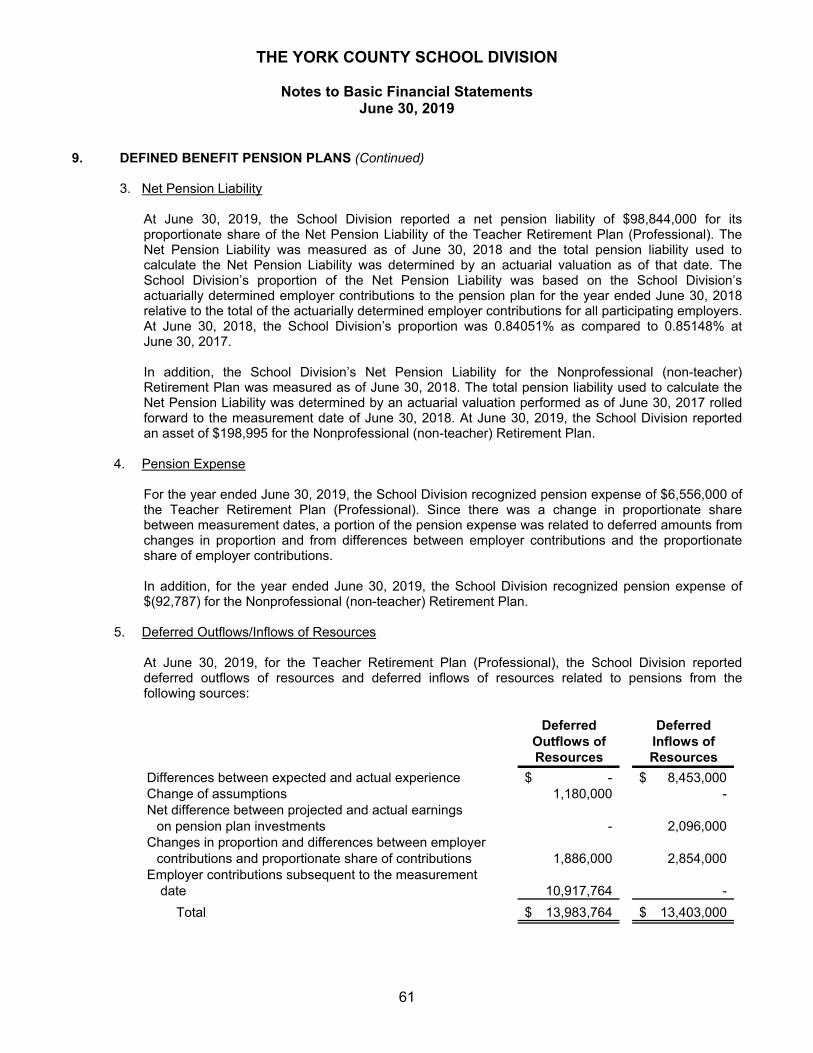
THE YORK COUNTY SCHOOL DIVISION
Notes to Basic Financial Statements June 30, 2019
61
9. DEFINED BENEFIT PENSION PLANS (Continued)
3. Net Pension Liability At June 30, 2019, the School Division reported a net pension liability of $98,844,000 for its proportionate share of the Net Pension Liability of the Teacher Retirement Plan (Professional). The Net Pension Liability was measured as of June 30, 2018 and the total pension liability used to calculate the Net Pension Liability was determined by an actuarial valuation as of that date. The School Division’s proportion of the Net Pension Liability was based on the School Division’s actuarially determined employer contributions to the pension plan for the year ended June 30, 2018 relative to the total of the actuarially determined employer contributions for all participating employers. At June 30, 2018, the School Division’s proportion was 0.84051% as compared to 0.85148% at June 30, 2017. In addition, the School Division’s Net Pension Liability for the Nonprofessional (non-teacher) Retirement Plan was measured as of June 30, 2018. The total pension liability used to calculate the Net Pension Liability was determined by an actuarial valuation performed as of June 30, 2017 rolled forward to the measurement date of June 30, 2018. At June 30, 2019, the School Division reported an asset of $198,995 for the Nonprofessional (non-teacher) Retirement Plan.
4. Pension Expense For the year ended June 30, 2019, the School Division recognized pension expense of $6,556,000 of the Teacher Retirement Plan (Professional). Since there was a change in proportionate share between measurement dates, a portion of the pension expense was related to deferred amounts from changes in proportion and from differences between employer contributions and the proportionate share of employer contributions. In addition, for the year ended June 30, 2019, the School Division recognized pension expense of $(92,787) for the Nonprofessional (non-teacher) Retirement Plan.
5. Deferred Outflows/Inflows of Resources At June 30, 2019, for the Teacher Retirement Plan (Professional), the School Division reported deferred outflows of resources and deferred inflows of resources related to pensions from the following sources:
Deferred DeferredOutflows of Inflows ofResources Resources
Differences between expected and actual experience -$ 8,453,000$ Change of assumptions 1,180,000 - Net difference between projected and actual earnings
on pension plan investments - 2,096,000 Changes in proportion and differences between employer
contributions and proportionate share of contributions 1,886,000 2,854,000 Employer contributions subsequent to the measurement
date 10,917,764 -
Total 13,983,764$ 13,403,000$
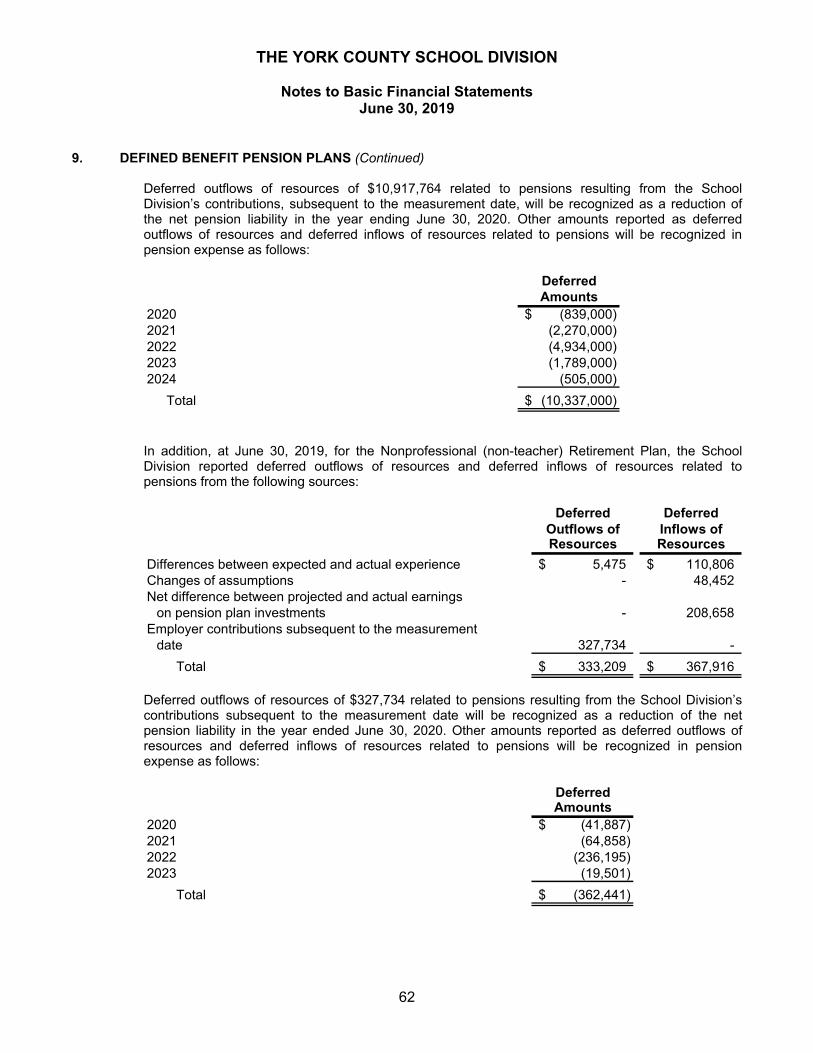
THE YORK COUNTY SCHOOL DIVISION
Notes to Basic Financial Statements June 30, 2019
62
9. DEFINED BENEFIT PENSION PLANS (Continued) Deferred outflows of resources of $10,917,764 related to pensions resulting from the School Division’s contributions, subsequent to the measurement date, will be recognized as a reduction of the net pension liability in the year ending June 30, 2020. Other amounts reported as deferred outflows of resources and deferred inflows of resources related to pensions will be recognized in pension expense as follows:
DeferredAmounts
2020 (839,000)$ 2021 (2,270,000) 2022 (4,934,000) 2023 (1,789,000) 2024 (505,000)
Total (10,337,000)$
In addition, at June 30, 2019, for the Nonprofessional (non-teacher) Retirement Plan, the School Division reported deferred outflows of resources and deferred inflows of resources related to pensions from the following sources:
Deferred DeferredOutflows of Inflows ofResources Resources
Differences between expected and actual experience 5,475$ 110,806$ Changes of assumptions - 48,452 Net difference between projected and actual earnings
on pension plan investments - 208,658 Employer contributions subsequent to the measurement
date 327,734 -
Total 333,209$ 367,916$
Deferred outflows of resources of $327,734 related to pensions resulting from the School Division’s contributions subsequent to the measurement date will be recognized as a reduction of the net pension liability in the year ended June 30, 2020. Other amounts reported as deferred outflows of resources and deferred inflows of resources related to pensions will be recognized in pension expense as follows:
DeferredAmounts
2020 (41,887)$ 2021 (64,858) 2022 (236,195) 2023 (19,501)
Total (362,441)$
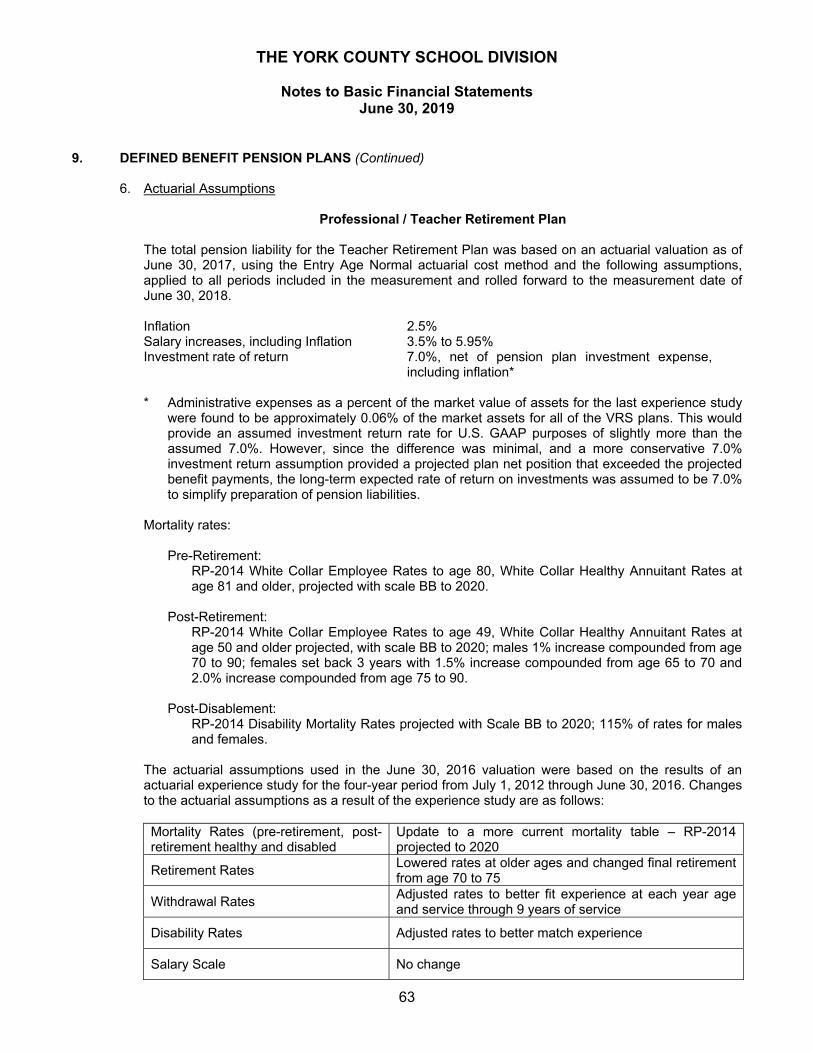
THE YORK COUNTY SCHOOL DIVISION
Notes to Basic Financial Statements June 30, 2019
63
9. DEFINED BENEFIT PENSION PLANS (Continued)
6. Actuarial Assumptions
Professional / Teacher Retirement Plan The total pension liability for the Teacher Retirement Plan was based on an actuarial valuation as of June 30, 2017, using the Entry Age Normal actuarial cost method and the following assumptions, applied to all periods included in the measurement and rolled forward to the measurement date of June 30, 2018. Inflation 2.5% Salary increases, including Inflation 3.5% to 5.95% Investment rate of return 7.0%, net of pension plan investment expense,
including inflation*
* Administrative expenses as a percent of the market value of assets for the last experience study were found to be approximately 0.06% of the market assets for all of the VRS plans. This would provide an assumed investment return rate for U.S. GAAP purposes of slightly more than the assumed 7.0%. However, since the difference was minimal, and a more conservative 7.0% investment return assumption provided a projected plan net position that exceeded the projected benefit payments, the long-term expected rate of return on investments was assumed to be 7.0% to simplify preparation of pension liabilities.
Mortality rates:
Pre-Retirement: RP-2014 White Collar Employee Rates to age 80, White Collar Healthy Annuitant Rates at age 81 and older, projected with scale BB to 2020.
Post-Retirement:
RP-2014 White Collar Employee Rates to age 49, White Collar Healthy Annuitant Rates at age 50 and older projected, with scale BB to 2020; males 1% increase compounded from age 70 to 90; females set back 3 years with 1.5% increase compounded from age 65 to 70 and 2.0% increase compounded from age 75 to 90.
Post-Disablement:
RP-2014 Disability Mortality Rates projected with Scale BB to 2020; 115% of rates for males and females.
The actuarial assumptions used in the June 30, 2016 valuation were based on the results of an actuarial experience study for the four-year period from July 1, 2012 through June 30, 2016. Changes to the actuarial assumptions as a result of the experience study are as follows: Mortality Rates (pre-retirement, post-retirement healthy and disabled
Update to a more current mortality table – RP-2014 projected to 2020
Retirement Rates Lowered rates at older ages and changed final retirement from age 70 to 75
Withdrawal Rates Adjusted rates to better fit experience at each year age and service through 9 years of service
Disability Rates Adjusted rates to better match experience
Salary Scale No change
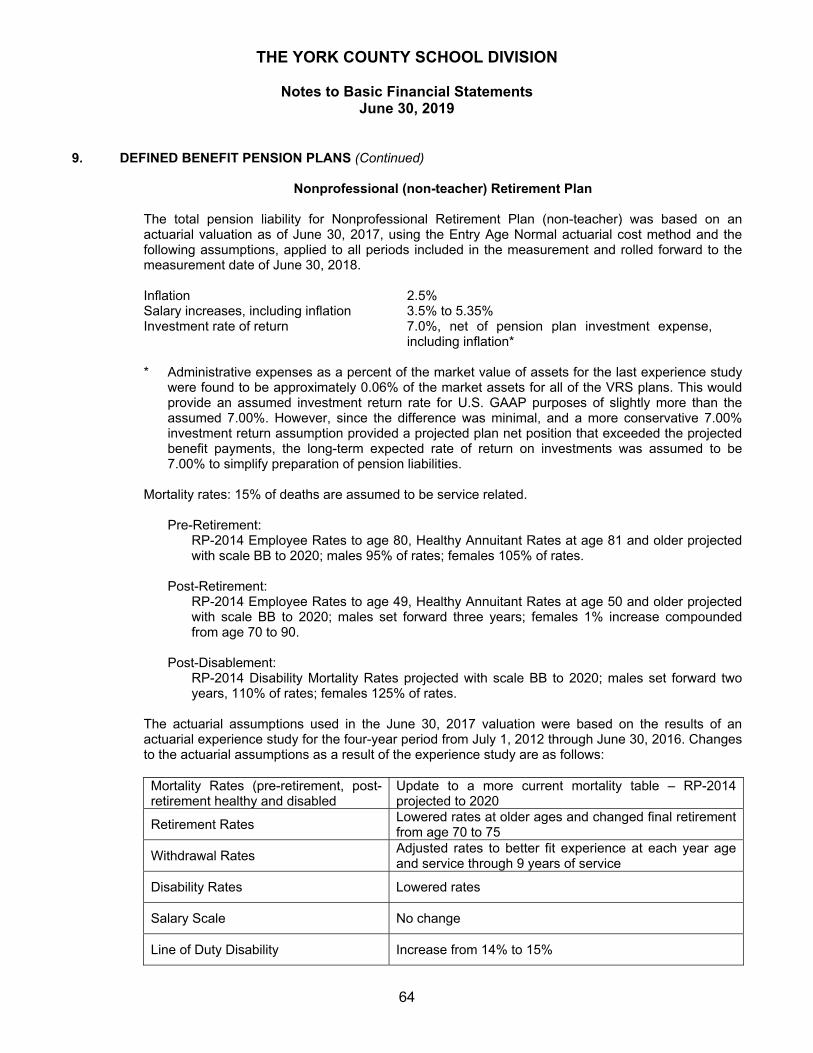
THE YORK COUNTY SCHOOL DIVISION
Notes to Basic Financial Statements June 30, 2019
64
9. DEFINED BENEFIT PENSION PLANS (Continued)
Nonprofessional (non-teacher) Retirement Plan The total pension liability for Nonprofessional Retirement Plan (non-teacher) was based on an actuarial valuation as of June 30, 2017, using the Entry Age Normal actuarial cost method and the following assumptions, applied to all periods included in the measurement and rolled forward to the measurement date of June 30, 2018. Inflation 2.5% Salary increases, including inflation 3.5% to 5.35% Investment rate of return 7.0%, net of pension plan investment expense,
including inflation* * Administrative expenses as a percent of the market value of assets for the last experience study
were found to be approximately 0.06% of the market assets for all of the VRS plans. This would provide an assumed investment return rate for U.S. GAAP purposes of slightly more than the assumed 7.00%. However, since the difference was minimal, and a more conservative 7.00% investment return assumption provided a projected plan net position that exceeded the projected benefit payments, the long-term expected rate of return on investments was assumed to be 7.00% to simplify preparation of pension liabilities.
Mortality rates: 15% of deaths are assumed to be service related.
Pre-Retirement: RP-2014 Employee Rates to age 80, Healthy Annuitant Rates at age 81 and older projected with scale BB to 2020; males 95% of rates; females 105% of rates.
Post-Retirement:
RP-2014 Employee Rates to age 49, Healthy Annuitant Rates at age 50 and older projected with scale BB to 2020; males set forward three years; females 1% increase compounded from age 70 to 90.
Post-Disablement:
RP-2014 Disability Mortality Rates projected with scale BB to 2020; males set forward two years, 110% of rates; females 125% of rates.
The actuarial assumptions used in the June 30, 2017 valuation were based on the results of an actuarial experience study for the four-year period from July 1, 2012 through June 30, 2016. Changes to the actuarial assumptions as a result of the experience study are as follows: Mortality Rates (pre-retirement, post-retirement healthy and disabled
Update to a more current mortality table – RP-2014 projected to 2020
Retirement Rates Lowered rates at older ages and changed final retirement from age 70 to 75
Withdrawal Rates Adjusted rates to better fit experience at each year age and service through 9 years of service
Disability Rates Lowered rates
Salary Scale No change
Line of Duty Disability Increase from 14% to 15%
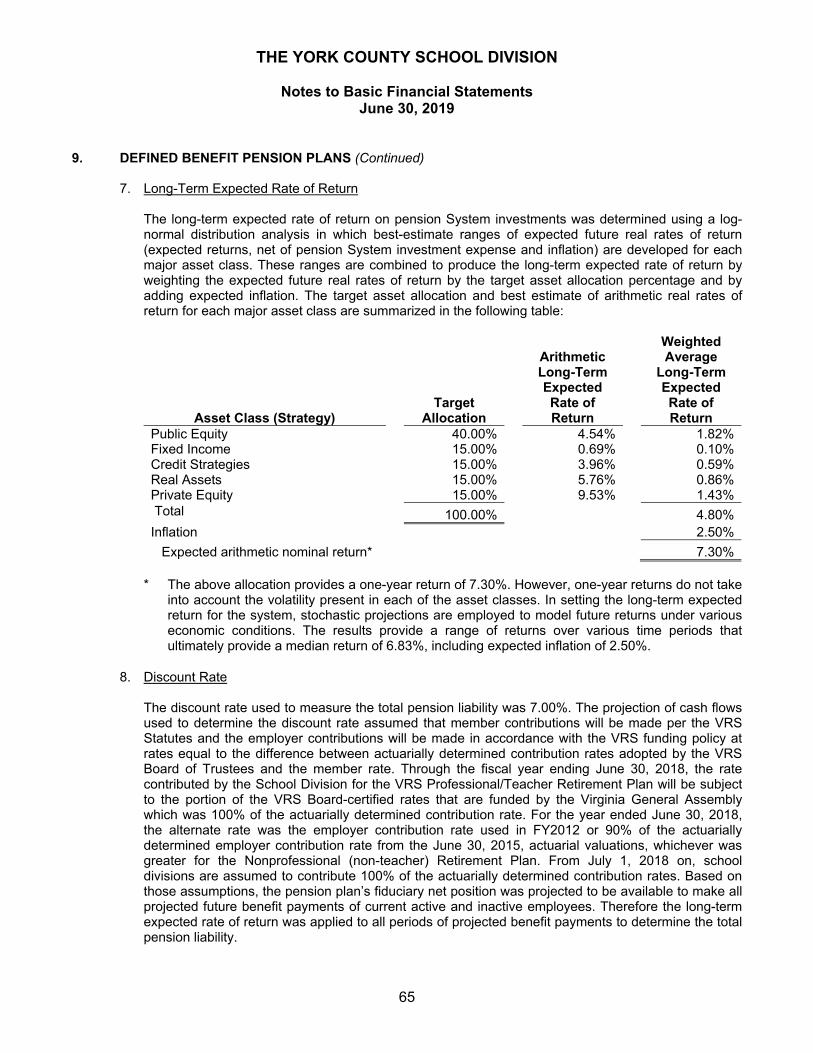
THE YORK COUNTY SCHOOL DIVISION
Notes to Basic Financial Statements June 30, 2019
65
9. DEFINED BENEFIT PENSION PLANS (Continued) 7. Long-Term Expected Rate of Return
The long-term expected rate of return on pension System investments was determined using a log-normal distribution analysis in which best-estimate ranges of expected future real rates of return (expected returns, net of pension System investment expense and inflation) are developed for each major asset class. These ranges are combined to produce the long-term expected rate of return by weighting the expected future real rates of return by the target asset allocation percentage and by adding expected inflation. The target asset allocation and best estimate of arithmetic real rates of return for each major asset class are summarized in the following table:
Asset Class (Strategy)
Target Allocation
Arithmetic Long-Term Expected Rate of Return
Weighted Average
Long-Term Expected Rate of Return
Public Equity 40.00% 4.54% 1.82% Fixed Income 15.00% 0.69% 0.10% Credit Strategies 15.00% 3.96% 0.59% Real Assets 15.00% 5.76% 0.86% Private Equity 15.00% 9.53% 1.43% Total 100.00% 4.80% Inflation 2.50%
Expected arithmetic nominal return* 7.30% * The above allocation provides a one-year return of 7.30%. However, one-year returns do not take
into account the volatility present in each of the asset classes. In setting the long-term expected return for the system, stochastic projections are employed to model future returns under various economic conditions. The results provide a range of returns over various time periods that ultimately provide a median return of 6.83%, including expected inflation of 2.50%.
8. Discount Rate
The discount rate used to measure the total pension liability was 7.00%. The projection of cash flows used to determine the discount rate assumed that member contributions will be made per the VRS Statutes and the employer contributions will be made in accordance with the VRS funding policy at rates equal to the difference between actuarially determined contribution rates adopted by the VRS Board of Trustees and the member rate. Through the fiscal year ending June 30, 2018, the rate contributed by the School Division for the VRS Professional/Teacher Retirement Plan will be subject to the portion of the VRS Board-certified rates that are funded by the Virginia General Assembly which was 100% of the actuarially determined contribution rate. For the year ended June 30, 2018, the alternate rate was the employer contribution rate used in FY2012 or 90% of the actuarially determined employer contribution rate from the June 30, 2015, actuarial valuations, whichever was greater for the Nonprofessional (non-teacher) Retirement Plan. From July 1, 2018 on, school divisions are assumed to contribute 100% of the actuarially determined contribution rates. Based on those assumptions, the pension plan’s fiduciary net position was projected to be available to make all projected future benefit payments of current active and inactive employees. Therefore the long-term expected rate of return was applied to all periods of projected benefit payments to determine the total pension liability.
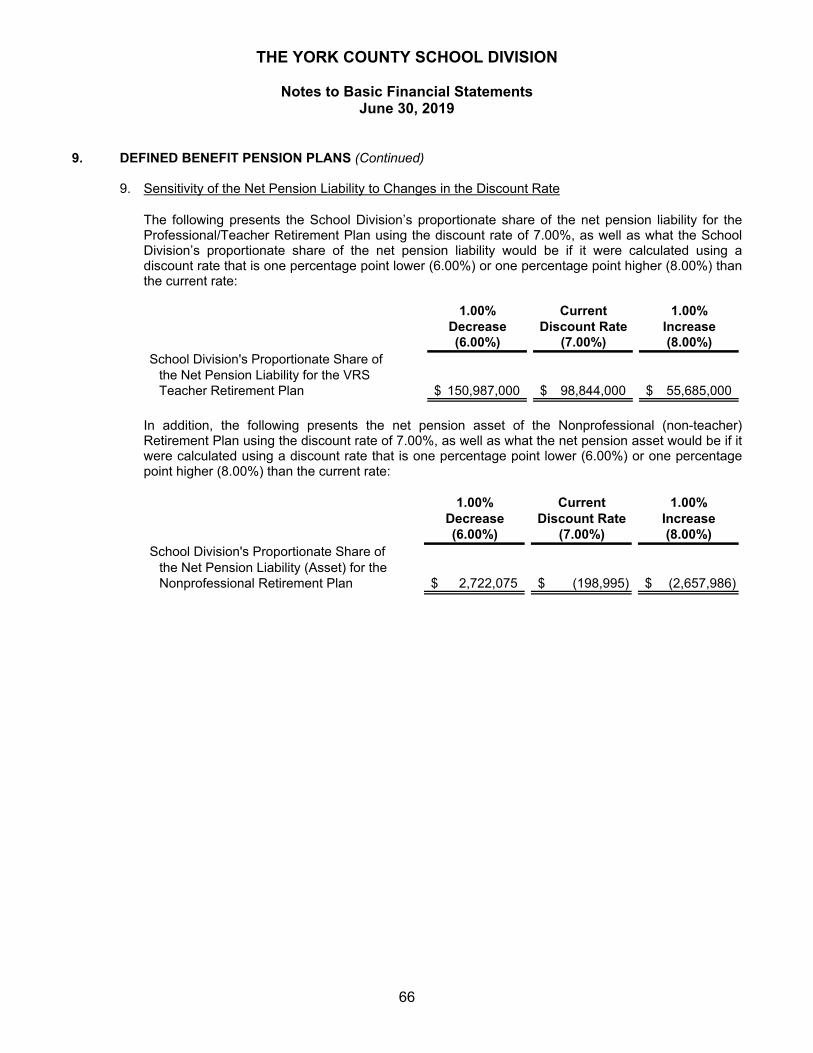
THE YORK COUNTY SCHOOL DIVISION
Notes to Basic Financial Statements June 30, 2019
66
9. DEFINED BENEFIT PENSION PLANS (Continued)
9. Sensitivity of the Net Pension Liability to Changes in the Discount Rate The following presents the School Division’s proportionate share of the net pension liability for the Professional/Teacher Retirement Plan using the discount rate of 7.00%, as well as what the School Division’s proportionate share of the net pension liability would be if it were calculated using a discount rate that is one percentage point lower (6.00%) or one percentage point higher (8.00%) than the current rate:
1.00% Current 1.00%Decrease Discount Rate Increase(6.00%) (7.00%) (8.00%)
School Division's Proportionate Share of the Net Pension Liability for the VRS Teacher Retirement Plan 150,987,000$ 98,844,000$ 55,685,000$
In addition, the following presents the net pension asset of the Nonprofessional (non-teacher) Retirement Plan using the discount rate of 7.00%, as well as what the net pension asset would be if it were calculated using a discount rate that is one percentage point lower (6.00%) or one percentage point higher (8.00%) than the current rate:
1.00% Current 1.00%Decrease Discount Rate Increase(6.00%) (7.00%) (8.00%)
School Division's Proportionate Share of the Net Pension Liability (Asset) for theNonprofessional Retirement Plan 2,722,075$ (198,995)$ (2,657,986)$
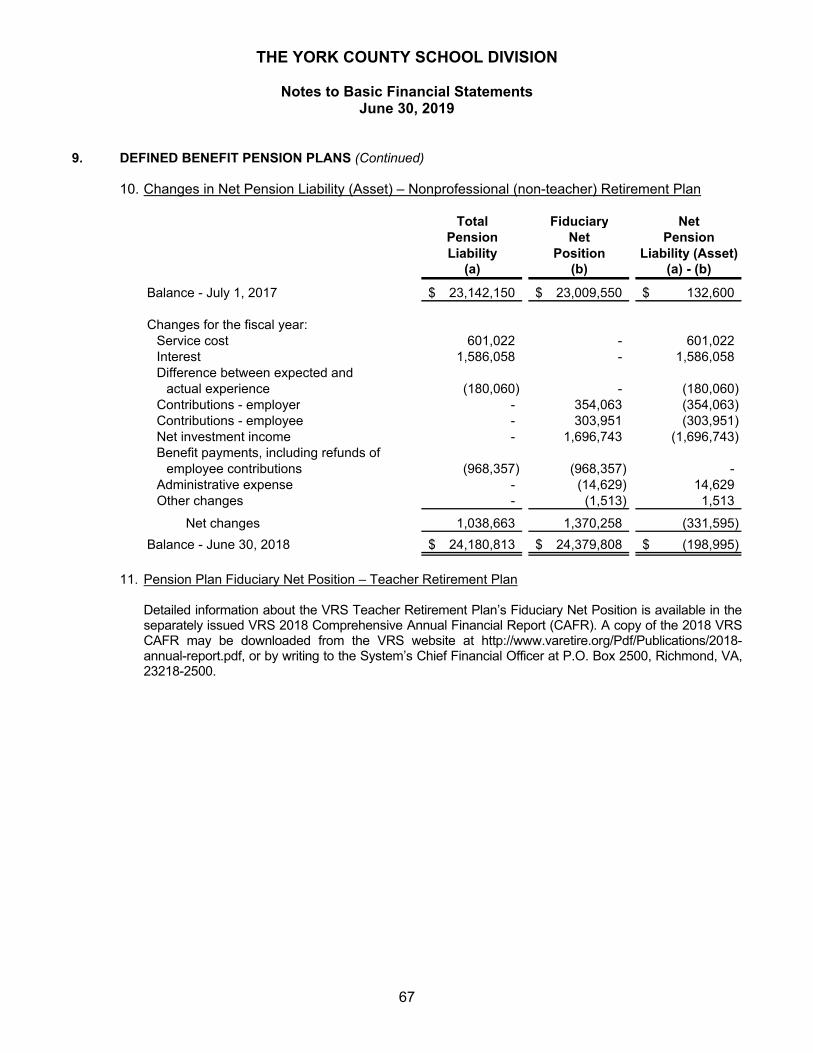
THE YORK COUNTY SCHOOL DIVISION
Notes to Basic Financial Statements June 30, 2019
67
9. DEFINED BENEFIT PENSION PLANS (Continued)
10. Changes in Net Pension Liability (Asset) – Nonprofessional (non-teacher) Retirement Plan
Total Fiduciary NetPension Net PensionLiability Position Liability (Asset)
(a) (b) (a) - (b)
Balance - July 1, 2017 23,142,150$ 23,009,550$ 132,600$
Changes for the fiscal year:Service cost 601,022 - 601,022 Interest 1,586,058 - 1,586,058 Difference between expected and
actual experience (180,060) - (180,060) Contributions - employer - 354,063 (354,063) Contributions - employee - 303,951 (303,951) Net investment income - 1,696,743 (1,696,743) Benefit payments, including refunds of
employee contributions (968,357) (968,357) - Administrative expense - (14,629) 14,629 Other changes - (1,513) 1,513
Net changes 1,038,663 1,370,258 (331,595)
Balance - June 30, 2018 24,180,813$ 24,379,808$ (198,995)$
11. Pension Plan Fiduciary Net Position – Teacher Retirement Plan
Detailed information about the VRS Teacher Retirement Plan’s Fiduciary Net Position is available in the separately issued VRS 2018 Comprehensive Annual Financial Report (CAFR). A copy of the 2018 VRS CAFR may be downloaded from the VRS website at http://www.varetire.org/Pdf/Publications/2018-annual-report.pdf, or by writing to the System’s Chief Financial Officer at P.O. Box 2500, Richmond, VA, 23218-2500.
THE YORK COUNTY SCHOOL DIVISION
Notes to Basic Financial Statements June 30, 2019
68
9. DEFINED BENEFIT PENSION PLANS (Continued)
York County Public Schools - Optional Plan
Plan Description Plan Administration – The York County School Division administers the Optional Plan, a single employer defined benefit pension plan. The plan provides pension benefits to nonprofessional employees of the School Division who were not previously covered by VRS. A fiduciary agent of the School Division administers the Optional Plan, which provides retirement benefits as well as death and disability benefits. As of June 30, 1992, the optional plan was frozen and the nonprofessional employees who participated in the plan became fully vested. The nonprofessional employees now participate in the VRS as noted above. Stand-alone financial reports are not issued for this plan. Plan Membership – At June 30, 2019, Optional Plan membership consisted of the following:
Active Plan Members 8 Retirees and Beneficiaries 68 Number of Vested Terminations 4
80
Benefits Provided – The School Division provides retirement benefits. Retirement benefits for plan members are calculated as 1.5% of final three-year average earnings times the member’s years of participation. Optional Plan members may retire at the age of 65 for normal retirement. Optional Plan members may retire at the age of 55 and with 5 years of participation for early retirement. Benefits are reduced actuarially for early commencement. Contributions – 2.50% of pay contribution was required as a condition of participation; however, no employee contributions were required after June 30, 1992. Employee contributions are accumulated with interest at 5.00%. For the year ended June 30, 2019, the average active member contribution rate was 0% of annual payroll and the School Division’s average contribution rate was 0% percent of annual payroll. Summary of Significant Accounting Policies Method Used to Value Investments – Investments are reported at fair value. Short-term investments are recorded at cost, which approximates fair value. Securities traded on a national securities exchange are valued at the last reported sales price on the last business day of the School Division’s fiscal year. Investments that do not have an established market are reported at estimated fair value. Investments Investment Policy – The Optional Plan’s policy in regard to the allocation of invested assets is established and may be amended by the School Division Board. It is the policy of the School Division Board to pursue an investment strategy that reduces the risk through the prudent diversification of the portfolio across a broad selection of distinct asset classes. The Optional Plan’s investment policy discourages the use of no-load mutual funds that invest in combinations of stocks and/or bonds.
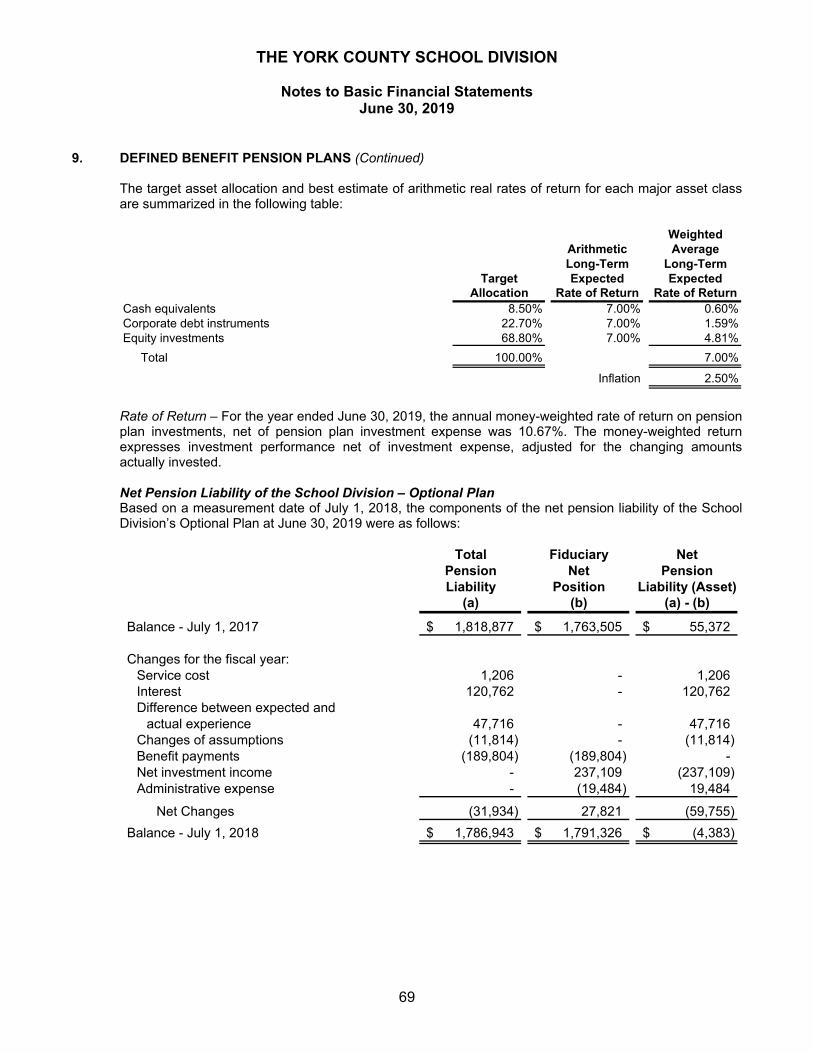
THE YORK COUNTY SCHOOL DIVISION
Notes to Basic Financial Statements June 30, 2019
69
9. DEFINED BENEFIT PENSION PLANS (Continued) The target asset allocation and best estimate of arithmetic real rates of return for each major asset class are summarized in the following table:
WeightedArithmetic AverageLong-Term Long-Term
Target Expected ExpectedAllocation Rate of Return Rate of Return
Cash equivalents 8.50% 7.00% 0.60%Corporate debt instruments 22.70% 7.00% 1.59%Equity investments 68.80% 7.00% 4.81%
Total 100.00% 7.00%
2.50%Inflation
Rate of Return – For the year ended June 30, 2019, the annual money-weighted rate of return on pension plan investments, net of pension plan investment expense was 10.67%. The money-weighted return expresses investment performance net of investment expense, adjusted for the changing amounts actually invested.
Net Pension Liability of the School Division – Optional Plan Based on a measurement date of July 1, 2018, the components of the net pension liability of the School Division’s Optional Plan at June 30, 2019 were as follows:
Total Fiduciary Net
Pension Net PensionLiability Position Liability (Asset)
(a) (b) (a) - (b)
Balance - July 1, 2017 1,818,877$ 1,763,505$ 55,372$
Changes for the fiscal year:Service cost 1,206 - 1,206 Interest 120,762 - 120,762 Difference between expected and
actual experience 47,716 - 47,716 Changes of assumptions (11,814) - (11,814) Benefit payments (189,804) (189,804) - Net investment income - 237,109 (237,109) Administrative expense - (19,484) 19,484
Net Changes (31,934) 27,821 (59,755)
Balance - July 1, 2018 1,786,943$ 1,791,326$ (4,383)$
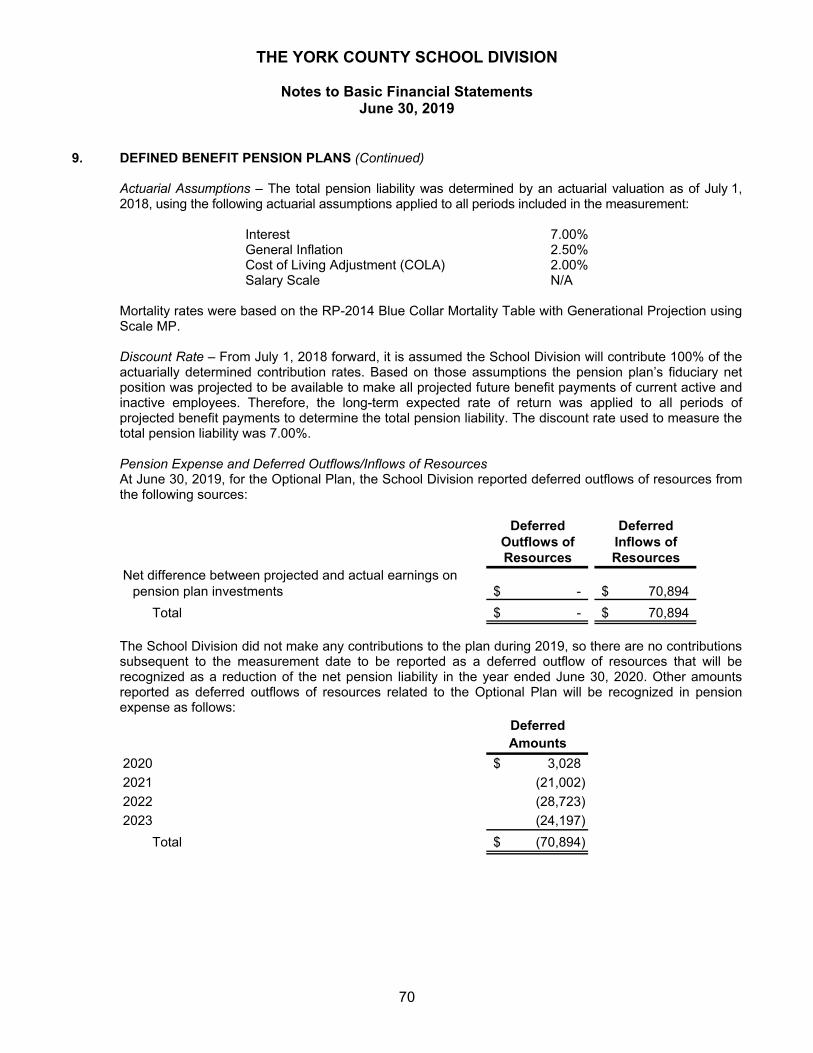
THE YORK COUNTY SCHOOL DIVISION
Notes to Basic Financial Statements June 30, 2019
70
9. DEFINED BENEFIT PENSION PLANS (Continued) Actuarial Assumptions – The total pension liability was determined by an actuarial valuation as of July 1, 2018, using the following actuarial assumptions applied to all periods included in the measurement:
Interest 7.00% General Inflation 2.50% Cost of Living Adjustment (COLA) 2.00% Salary Scale N/A
Mortality rates were based on the RP-2014 Blue Collar Mortality Table with Generational Projection using Scale MP. Discount Rate – From July 1, 2018 forward, it is assumed the School Division will contribute 100% of the actuarially determined contribution rates. Based on those assumptions the pension plan’s fiduciary net position was projected to be available to make all projected future benefit payments of current active and inactive employees. Therefore, the long-term expected rate of return was applied to all periods of projected benefit payments to determine the total pension liability. The discount rate used to measure the total pension liability was 7.00%.
Pension Expense and Deferred Outflows/Inflows of Resources At June 30, 2019, for the Optional Plan, the School Division reported deferred outflows of resources from the following sources:
Deferred DeferredOutflows of Inflows ofResources Resources
Net difference between projected and actual earnings on pension plan investments -$ 70,894$
Total -$ 70,894$
The School Division did not make any contributions to the plan during 2019, so there are no contributions subsequent to the measurement date to be reported as a deferred outflow of resources that will be recognized as a reduction of the net pension liability in the year ended June 30, 2020. Other amounts reported as deferred outflows of resources related to the Optional Plan will be recognized in pension expense as follows:
DeferredAmounts
2020 3,028$
2021 (21,002)
2022 (28,723)
2023 (24,197)
Total (70,894)$
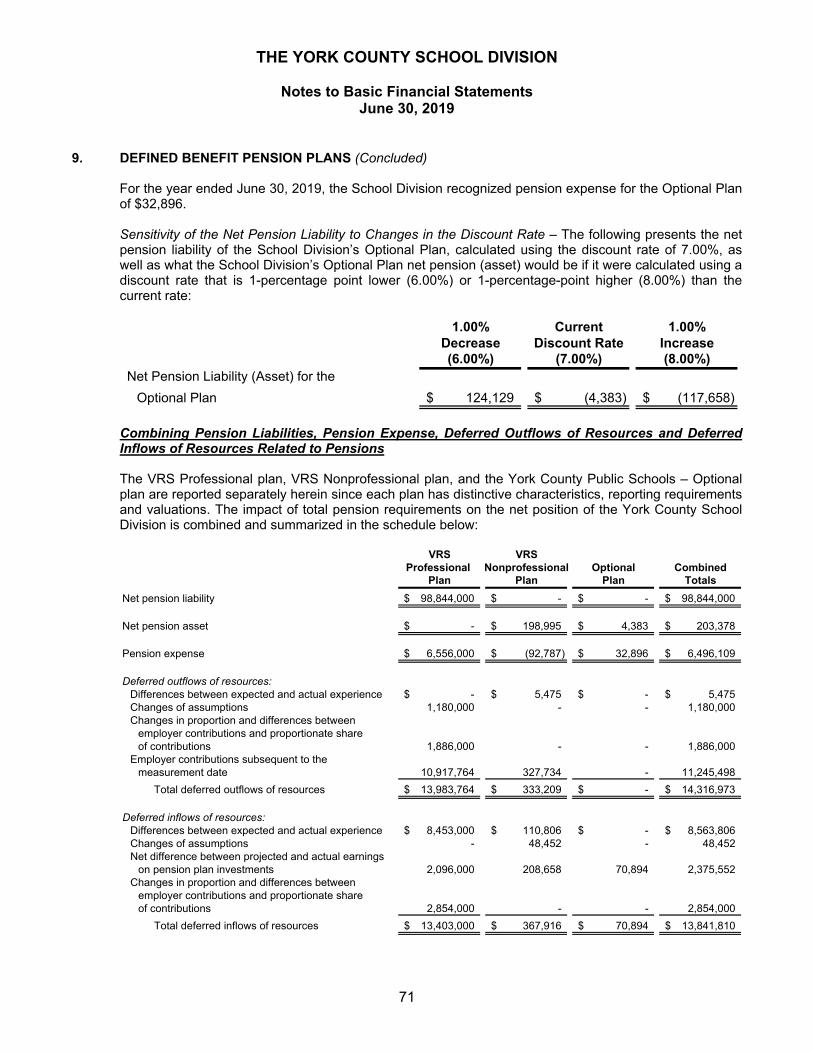
THE YORK COUNTY SCHOOL DIVISION
Notes to Basic Financial Statements June 30, 2019
71
9. DEFINED BENEFIT PENSION PLANS (Concluded) For the year ended June 30, 2019, the School Division recognized pension expense for the Optional Plan of $32,896. Sensitivity of the Net Pension Liability to Changes in the Discount Rate – The following presents the net pension liability of the School Division’s Optional Plan, calculated using the discount rate of 7.00%, as well as what the School Division’s Optional Plan net pension (asset) would be if it were calculated using a discount rate that is 1-percentage point lower (6.00%) or 1-percentage-point higher (8.00%) than the current rate:
1.00% Current 1.00%Decrease Discount Rate Increase(6.00%) (7.00%) (8.00%)
Net Pension Liability (Asset) for the
Optional Plan 124,129$ (4,383)$ (117,658)$
Combining Pension Liabilities, Pension Expense, Deferred Outflows of Resources and Deferred Inflows of Resources Related to Pensions The VRS Professional plan, VRS Nonprofessional plan, and the York County Public Schools – Optional plan are reported separately herein since each plan has distinctive characteristics, reporting requirements and valuations. The impact of total pension requirements on the net position of the York County School Division is combined and summarized in the schedule below:
VRS VRSProfessional Nonprofessional Optional Combined
Plan Plan Plan Totals
Net pension liability 98,844,000$ -$ -$ 98,844,000$
Net pension asset -$ 198,995$ 4,383$ 203,378$
Pension expense 6,556,000$ (92,787)$ 32,896$ 6,496,109$
Deferred outflows of resources:Differences between expected and actual experience -$ 5,475$ -$ 5,475$ Changes of assumptions 1,180,000 - - 1,180,000 Changes in proportion and differences between
employer contributions and proportionate shareof contributions 1,886,000 - - 1,886,000
Employer contributions subsequent to themeasurement date 10,917,764 327,734 - 11,245,498
Total deferred outflows of resources 13,983,764$ 333,209$ -$ 14,316,973$
Deferred inflows of resources:Differences between expected and actual experience 8,453,000$ 110,806$ -$ 8,563,806$ Changes of assumptions - 48,452 - 48,452 Net difference between projected and actual earnings
on pension plan investments 2,096,000 208,658 70,894 2,375,552 Changes in proportion and differences between
employer contributions and proportionate shareof contributions 2,854,000 - - 2,854,000
Total deferred inflows of resources 13,403,000$ 367,916$ 70,894$ 13,841,810$
THE YORK COUNTY SCHOOL DIVISION
Notes to Basic Financial Statements June 30, 2019
72
10. OTHER POSTEMPLOYMENT BENEFITS (OPEB) School Division VRS OPEB Plans The School Division participates in a cost-sharing multiple employer Group Life Insurance Program
(GLIP), a Teacher Employee Health Insurance Credit Program, a Political Subdivision Employee Virginia Disability Program, and a Teacher Employee Virginia Local Disability Program offered by the Virginia Retirement System (“VRS”).
VRS issues a publicly-available CAFR that includes financial statements and required supplementary
information for the plans administered by VRS. A copy of the most recent report may be obtained from the VRS website at http://www.varetire.org, or by writing to VRS’ Chief Financial Office at P.O. Box 2500, Richmond, Virginia 23218-2500.
The actuarial assumptions and long term expected rate of return are the same for the VRS OPEB
programs. As such, the presentation of the actuarial assumptions and long term expected rate of return are combined below. Specific information for the OPEB plans will be presented after this section.
Actuarial Assumptions
The total OPEB liabilities for all VRS plans were based on an actuarial valuation as of June 30, 2017, using the Entry Age Normal actuarial cost method and the following assumptions, applied to all periods included in the measurement and rolled forward to the measurement date of June 30, 2018.
Inflation 2.5% Salary increases, including inflation –
General state employees 3.5% – 5.35% Teachers 3.5% – 5.95% SPORS employees 3.5% – 4.75% VaLORS employees 3.5% – 4.75% JRS employees 4.5% Locality – General employees 3.5% – 5.35%
Locality – Hazardous Duty employees 3.5% – 4.75% Investment rate of return 7.0%, net of investment expenses, including inflation* * Administrative expenses as a percent of the market value of assets for the last experience study were
found to be approximately 0.06% of the market assets for all of the VRS plans. This would provide an assumed investment return rate for U.S. GAAP purposes of slightly more than the assumed 7.0%. However, since the difference was minimal, and a more conservative 7.0% investment return assumption provided a projected plan net position that exceeded the projected benefit payments, the long-term expected rate of return on investments was assumed to be 7.0% to simplify preparation of the OPEB liabilities.
THE YORK COUNTY SCHOOL DIVISION
Notes to Basic Financial Statements June 30, 2019
73
10. OTHER POSTEMPLOYMENT BENEFITS (Continued)
Mortality Rates – Teachers Pre-Retirement: RP-2014 White Collar Employee Rates to age 80, White Collar Healthy Annuitant Rates at age 81 and older projected with scale BB to 2020.
Post-Retirement: RP-2014 White Collar Employee Rates to age 49, White Collar Health Annuitant Rates at age 50 and older projected with scale BB to 2020; males 1% increase compounded from age 70 to 90; females set back 3 years with 1.5% increase compounded from age 65 to 70 and 2.0% increase compounded from age 75 to 90. Post-Disablement: RP-2014 Disability Mortality Rates projected with Scale BB to 2020; 115% of rates for males and females. The actuarial assumptions used in the June 30, 2017 valuation were based on the results of an actuarial experience study for the four-year period from July 1, 2012 through June 30, 2016. Changes to the actuarial assumptions as a result of the experience study are as follows: Mortality Rates (Pre-retirement, post-retirement healthy and disabled)
Updated to a more current mortality table – RP-2014 projected to 2020
Retirement Rates Lowered rates at older ages and changed final retirement from age 70 to 75
Withdrawal Rates Adjusted rates to better fit experience at each year age and service through 9 years of service
Disability Rates Adjusted rates to better match experience
Salary Scale No change
Mortality Rates – Non-Largest Ten Locality Employers - General Employees Pre-Retirement: RP-2014 Employee Rates to age 80, Healthy Annuitant Rates to 81 and older projected with Scale BB to 2020; males 95% of rates; females 105% of rates. Post-Retirement: RP-2014 Employee Rates to age 49, Healthy Annuitant Rates at age 50 and older projected with Scale BB to 2020; males set forward 3 years; females 1.0% increase compounded from age 70 to 90. Post-Disablement: RP-2014 Disability Life Mortality Table projected with scale BB to 2020; males set forward 2 years, 110% of rates; females 125% of rates. The actuarial assumptions used in the June 30, 2017 valuation were based on the results of an actuarial experience study for the period from July 1, 2012 through June 30, 2016.
THE YORK COUNTY SCHOOL DIVISION
Notes to Basic Financial Statements June 30, 2019
74
10. OTHER POSTEMPLOYMENT BENEFITS (Continued)
Changes to the actuarial assumptions as a result of the experience study are as follows: Mortality Rates (Pre-retirement, post-retirement healthy and disabled)
Updated to a more current mortality table – RP-2014 projected to 2020
Retirement Rates Lowered retirement rates at older ages and extended final retirement age from age 70 to 75.
Withdrawal Rates Adjusted termination rates to better fit experience at each age and service year
Disability Rates Lowered disability rates
Salary Scale No change
Line of Duty Disability Increased rate from 14% to 15%
Long-Term Expected Rate of Return The long-term expected rate of return on the System’s investments was determined using a log-normal distribution analysis in which best-estimate ranges of expected future real rates of return (expected returns, net of System’s investment expense and inflation) are developed for each major asset class. These ranges are combined to produce the long-term expected rate of return by weighting the expected future real rates of return by the target asset allocation percentage and by adding expected inflation. The target asset allocation and best estimate of arithmetic real rates of return for each major asset class are summarized in the following table:
Asset Class (Strategy)
Target Allocation
Arithmetic Long-Term Expected Rate of Return
Weighted Average
Long-Term Expected Rate of Return
Public Equity 40.00% 4.54% 1.82% Fixed Income 15.00% 0.69% 0.10% Credit Strategies 15.00% 3.96% 0.59% Real Assets 15.00% 5.76% 0.86% Private Equity 15.00% 9.53% 1.43%
Total 100.00% 4.80% Inflation 2.50%
Expected arithmetic nominal return* 7.30% * The above allocation provides a one-year return of 7.30%. However, one-year returns do not take into
account the volatility present in each of the asset classes. In setting the long-term expected return for the system, stochastic projections are employed to model future returns under various economic conditions. The results provide a range of returns over various time periods that ultimately provide a median return of 6.83%, including expected inflation of 2.50%.
THE YORK COUNTY SCHOOL DIVISION
Notes to Basic Financial Statements June 30, 2019
75
10. OTHER POSTEMPLOYMENT BENEFITS (Continued) Virginia Retirement System – GLIP Plan Description
All full-time, salaried permanent teachers and employees of participating political subdivisions are automatically covered by the VRS GLIP upon employment. This plan is administered by the VRS, along with pensions and other OPEB plans, for public employer groups in the Commonwealth of Virginia.
In addition to the Basic Group Life Insurance benefit, members are also eligible to elect additional coverage for themselves as well as a spouse or dependent children through the Optional Group Life Insurance Program. For members who elect the optional group life insurance coverage, the insurer bills employers directly for the premiums. Employers deduct these premiums from members’ paychecks and pay the premiums to the insurer. Since this is a separate and fully insured program, it is not included as part of the GLIP OPEB. The specific information for GLIP, including eligibility, coverage and benefits is set out in the table below:
GLIP PLAN PROVISIONS Eligible Employees
GLIP was established July 1, 1960, for state employees, teachers and employees of political subdivisions that elect the program.
Basic group life insurance coverage is automatic upon employment. Coverage end for employees who leave their position before retirement eligibility or who take a refund of their member contributions and accrued interest.
Benefit Amounts The benefits payable under GLIP have several components.
Natural Death Benefit – The natural death benefit is equal to the employee’s covered compensation rounded to the next highest thousand and then doubled.
Accidental Death Benefit – The accidental death benefit is double the natural death benefit. Other Benefit Provisions – In addition to the basic natural and accidental death benefits, the
program provides additional benefits provided under specific circumstances. These include: o Accidental dismemberment benefit o Safety belt benefit o Repatriation benefit o Felonious assault benefit o Accelerated death benefit option
Reduction in Benefit Amounts The benefit amounts provided to members covered under GLIP are subject to a reduction factor. The benefit amount reduces by 25% on January 1 following one calendar year of separation. The benefit amount reduces by an additional 25% on each subsequent January 1 until it reaches 25% of its original value. Minimum Benefit Amount and Cost-of-Living Adjustment (COLA) For covered members with at least 30 years of creditable service, there is a minimum benefit payable under GLIP. The minimum benefit was set at $8,000 by Statute. This amount is increased annually based on the VRS Plan 2 cost-of-living adjustment and was increased to $8,279 effective July 1, 2018.
THE YORK COUNTY SCHOOL DIVISION
Notes to Basic Financial Statements June 30, 2019
76
10. OTHER POSTEMPLOYMENT BENEFITS (Continued) Contributions
The contribution requirements for GLIP are governed by §51.1-506 and §51.1-508 of the Code of Virginia, as amended, but may be impacted as a result of funding provided to school divisions by the Virginia General Assembly. The total rate for GLIP was 1.31% of covered employee compensation. This was allocated into an employee and an employer component using a 60/40 split. The employee component was 0.79% (1.31% X 60%) and the employer component was 0.52% (1.31% X 40%). Employers may elect to pay all or part of the employee contribution, however the employer must pay all of the employer contribution. Each employer’s contractually required employer contribution rate for the year ended June 30, 2019 was 0.52% of covered employee compensation. This rate was based on an actuarially determined rate from an actuarial valuation as of June 30, 2017. The actuarially determined rate, when combined with employee contributions, was expected to finance the costs of benefits payable during the year, with an additional amount to finance any unfunded accrued liability. Contributions to GLIP from the School Division for nonprofessional employees were $33,927 and $33,613 for the years ended June 30, 2019 and June 30, 2019, respectively. Contribution to GLIP from the School Division for professional employees were $370,627 and $353,658 for the years ended June 30, 2019 and June 30, 2018, respectively.
OPEB Liabilities, OPEB Expense, and Deferred Outflows of Resources and Deferred Inflows of Resources Related to GLIP At June 30, 2019, the School Division reported a liability of $516,000 for its proportionate share of the Net GLIP OPEB Liability for nonprofessional employees. At June 30, 2019, the School Division reported a liability of $5,432,000 for its proportionate share of the Net GLIP OPEB Liability for professional employees. The Net GLIP OPEB Liability was measured as of June 30, 2018 and the total GLIP OPEB liability used to calculate the Net GLIP OPEB Liability was determined by an actuarial valuation as of that date. The covered employer’s proportion of the Net GLIP OPEB Liability was based on the covered employer’s actuarially determined employer contributions to GLIP for the year ended June 30, 2018 relative to the total of the actuarially determined employer contributions for all participating employers. At June 30, 2018, the participating employer’s proportion was 0.03399% as compared to 0.03505% at June 30, 2017 for nonprofessional employees. At June 30, 2018, the participating employer’s proportion was 0.35768% as compared to 0.36412% at June 30, 2017 for professional employees. For the year ended June 30, 2019, the School Division recognized GLIP OPEB expense of $(2,000) for nonprofessional employees. For the year ended June 30, 2019, the School Division recognized GLIP OPEB expense of $4,000 for professional employees. Since there was a change in proportionate share between measurement dates, a portion of the GLIP OPEB expense was related to deferred amounts from changes in proportion.
THE YORK COUNTY SCHOOL DIVISION
Notes to Basic Financial Statements June 30, 2019
77
10. OTHER POSTEMPLOYMENT BENEFITS (Continued)
At June 30, 2019, the School Division reported deferred outflows of resources and deferred inflows of resources related to the GLIP OPEB for nonprofessional employees from the following sources:
Deferred DeferredOutflows of Inflows ofResources Resources
Difference between expected and actual experience 25,000$ 9,000$ Net difference between projected and actual earnings
on OPEB plan investments - 17,000 Changes of assumptions - 22,000 Changes in proportionate share - 27,000 Employer contributions subsequent to the measurement date 33,927 -
Total 58,927$ 75,000$
$33,927 reported as deferred outflows of resources related to GLIP resulting from the employer’s contributions subsequent to the measurement date will be recognized as a reduction of the Net GLIP OPEB Liability in the Fiscal Year ending June 30, 2020 for nonprofessional employees. Other amounts reported as deferred outflows of resources and deferred inflows of resources related to the GLIP OPEB will be recognized in the GLIP OPEB expense in future reporting periods as follows:
DeferredAmounts
2020 (14,000)$ 2021 (14,000) 2022 (14,000) 2023 (9,000) 2024 (1,000) Thereafter 2,000
Total (50,000)$
At June 30, 2019, the School Division reported deferred outflows of resources and deferred inflows of resources related to the GLIP OPEB for professional employees from the following sources:
Deferred DeferredOutflows of Inflows ofResources Resources
Difference between expected and actual experience 266,000$ 97,000$ Net difference between projected and actual earnings
on OPEB plan investments - 177,000 Changes of assumptions - 226,000 Changes in proportionate share - 165,000 Employer costs subsequent to the measurement date 370,627 -
Total 636,627$ 665,000$
THE YORK COUNTY SCHOOL DIVISION
Notes to Basic Financial Statements June 30, 2019
78
10. OTHER POSTEMPLOYMENT BENEFITS (Continued)
$370,627 reported as deferred outflows of resources related to GLIP resulting from the employer’s contributions subsequent to the measurement date will be recognized as a reduction of the Net GLIP OPEB Liability in the Fiscal Year ending June 30, 2020 for professional employees. Other amounts reported as deferred outflows of resources and deferred inflows of resources related to the GLIP OPEB will be recognized in the GLIP OPEB expense in future reporting periods as follows:
DeferredAmounts
2020 (114,000)$ 2021 (114,000) 2022 (114,000) 2023 (64,000) 2024 (6,000) Thereafter 13,000
Total (399,000)$
Net GLIP OPEB Liability The net OPEB liability (NOL) for the Group Life Insurance Program represents the program’s total OPEB liability determined in accordance with U.S. GAAP, less the associated fiduciary net position. As of June 30, 2018, NOL amounts for the Group Life Insurance Program is as follows (amounts expressed in thousands):
Group LifeInsurance
OPEB ProgramTotal GLIP OPEB Liability 3,113,508$ Plan Fiduciary Net Position 1,594,773
Employer's Net GLIP OPEB Liability 1,518,735$
Plan Fiduciary Net Position as a Percentage of theTotal GLPI OPEB Liability 51.22%
The total GLIP OPEB liability is calculated by the System’s actuary, and each plan’s fiduciary net position is reported in the System’s financial statements. The net GLIP OPEB liability is disclosed in accordance with the requirements of U.S. GAAP in the System’s notes to the financial statements and required supplementary information.
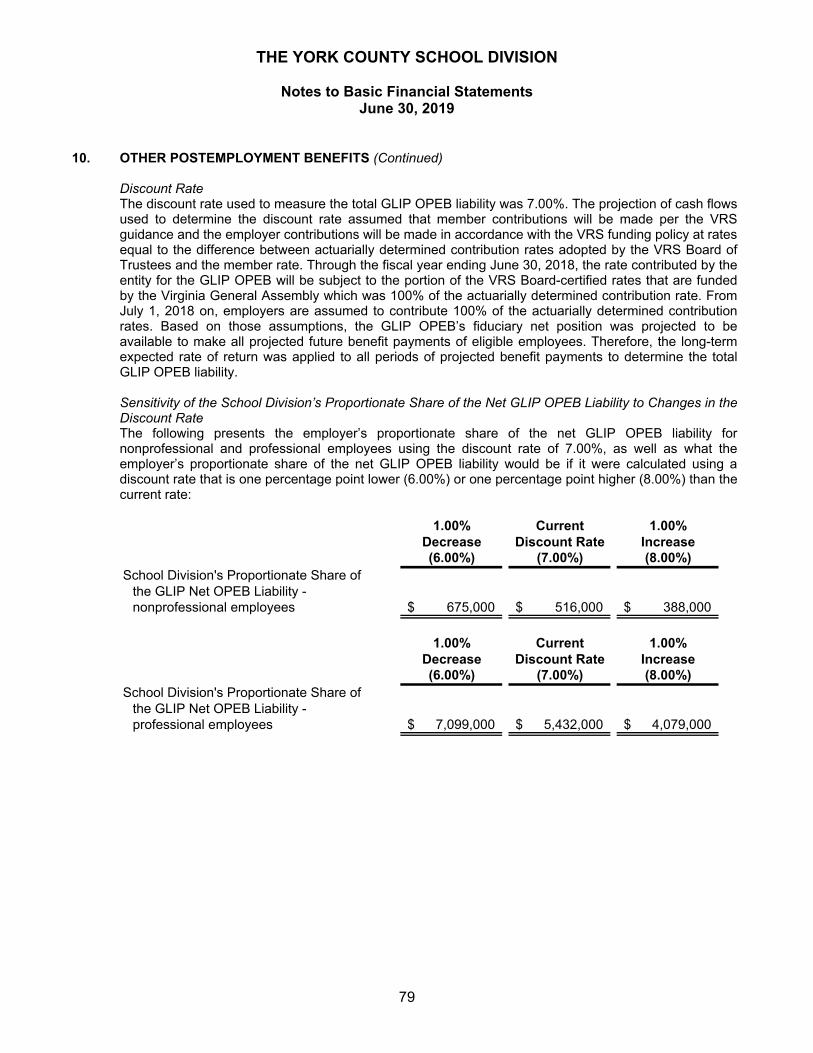
THE YORK COUNTY SCHOOL DIVISION
Notes to Basic Financial Statements June 30, 2019
79
10. OTHER POSTEMPLOYMENT BENEFITS (Continued)
Discount Rate The discount rate used to measure the total GLIP OPEB liability was 7.00%. The projection of cash flows used to determine the discount rate assumed that member contributions will be made per the VRS guidance and the employer contributions will be made in accordance with the VRS funding policy at rates equal to the difference between actuarially determined contribution rates adopted by the VRS Board of Trustees and the member rate. Through the fiscal year ending June 30, 2018, the rate contributed by the entity for the GLIP OPEB will be subject to the portion of the VRS Board-certified rates that are funded by the Virginia General Assembly which was 100% of the actuarially determined contribution rate. From July 1, 2018 on, employers are assumed to contribute 100% of the actuarially determined contribution rates. Based on those assumptions, the GLIP OPEB’s fiduciary net position was projected to be available to make all projected future benefit payments of eligible employees. Therefore, the long-term expected rate of return was applied to all periods of projected benefit payments to determine the total GLIP OPEB liability. Sensitivity of the School Division’s Proportionate Share of the Net GLIP OPEB Liability to Changes in the Discount Rate The following presents the employer’s proportionate share of the net GLIP OPEB liability for nonprofessional and professional employees using the discount rate of 7.00%, as well as what the employer’s proportionate share of the net GLIP OPEB liability would be if it were calculated using a discount rate that is one percentage point lower (6.00%) or one percentage point higher (8.00%) than the current rate:
1.00% Current 1.00%Decrease Discount Rate Increase(6.00%) (7.00%) (8.00%)
School Division's Proportionate Share of the GLIP Net OPEB Liability - nonprofessional employees 675,000$ 516,000$ 388,000$
1.00% Current 1.00%
Decrease Discount Rate Increase(6.00%) (7.00%) (8.00%)
School Division's Proportionate Share of the GLIP Net OPEB Liability - professional employees 7,099,000$ 5,432,000$ 4,079,000$
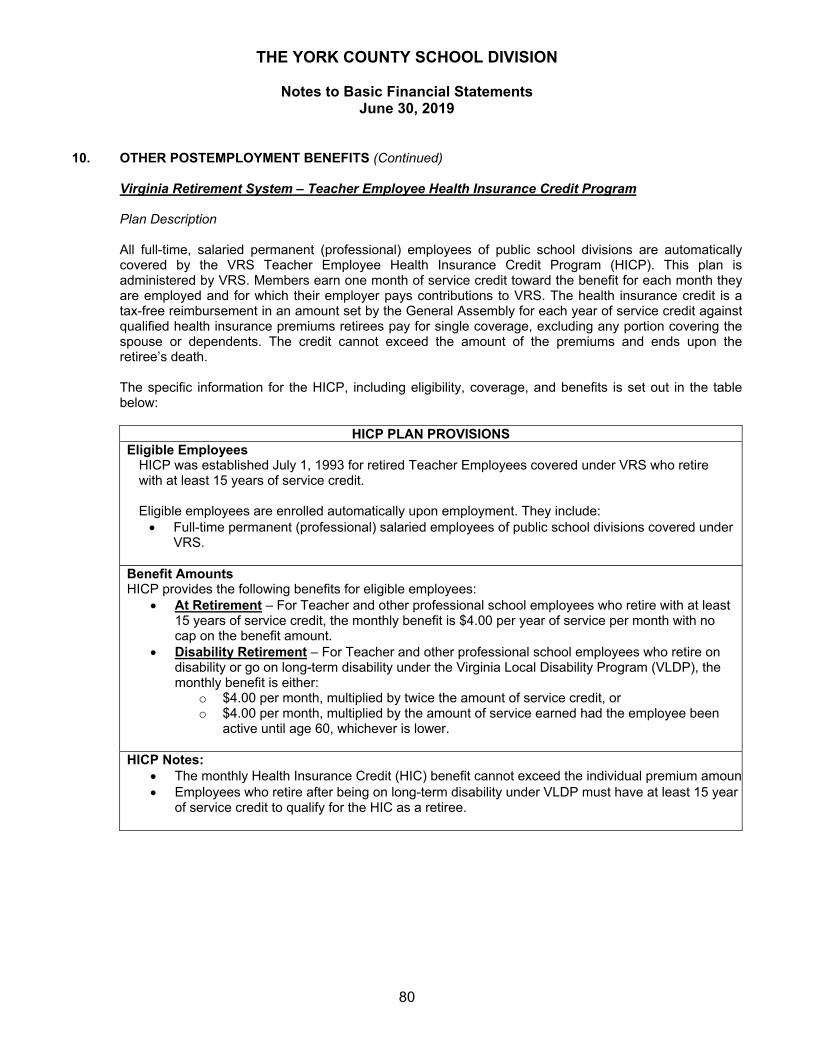
THE YORK COUNTY SCHOOL DIVISION
Notes to Basic Financial Statements June 30, 2019
80
10. OTHER POSTEMPLOYMENT BENEFITS (Continued)
Virginia Retirement System – Teacher Employee Health Insurance Credit Program Plan Description All full-time, salaried permanent (professional) employees of public school divisions are automatically covered by the VRS Teacher Employee Health Insurance Credit Program (HICP). This plan is administered by VRS. Members earn one month of service credit toward the benefit for each month they are employed and for which their employer pays contributions to VRS. The health insurance credit is a tax-free reimbursement in an amount set by the General Assembly for each year of service credit against qualified health insurance premiums retirees pay for single coverage, excluding any portion covering the spouse or dependents. The credit cannot exceed the amount of the premiums and ends upon the retiree’s death. The specific information for the HICP, including eligibility, coverage, and benefits is set out in the table below:
HICP PLAN PROVISIONS Eligible Employees
HICP was established July 1, 1993 for retired Teacher Employees covered under VRS who retire with at least 15 years of service credit. Eligible employees are enrolled automatically upon employment. They include: Full-time permanent (professional) salaried employees of public school divisions covered under
VRS.
Benefit Amounts HICP provides the following benefits for eligible employees:
At Retirement – For Teacher and other professional school employees who retire with at least 15 years of service credit, the monthly benefit is $4.00 per year of service per month with no cap on the benefit amount.
Disability Retirement – For Teacher and other professional school employees who retire on disability or go on long-term disability under the Virginia Local Disability Program (VLDP), the monthly benefit is either:
o $4.00 per month, multiplied by twice the amount of service credit, or o $4.00 per month, multiplied by the amount of service earned had the employee been
active until age 60, whichever is lower.
HICP Notes: The monthly Health Insurance Credit (HIC) benefit cannot exceed the individual premium amoun Employees who retire after being on long-term disability under VLDP must have at least 15 year
of service credit to qualify for the HIC as a retiree.
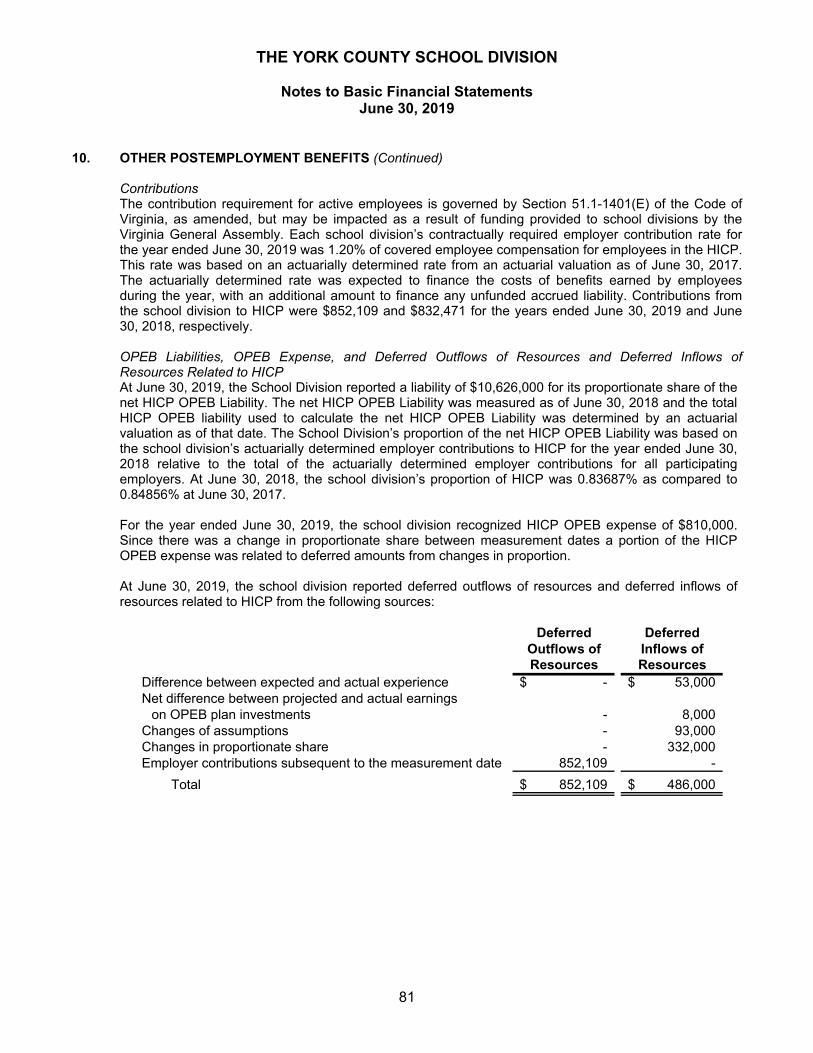
THE YORK COUNTY SCHOOL DIVISION
Notes to Basic Financial Statements June 30, 2019
81
10. OTHER POSTEMPLOYMENT BENEFITS (Continued) Contributions The contribution requirement for active employees is governed by Section 51.1-1401(E) of the Code of Virginia, as amended, but may be impacted as a result of funding provided to school divisions by the Virginia General Assembly. Each school division’s contractually required employer contribution rate for the year ended June 30, 2019 was 1.20% of covered employee compensation for employees in the HICP. This rate was based on an actuarially determined rate from an actuarial valuation as of June 30, 2017. The actuarially determined rate was expected to finance the costs of benefits earned by employees during the year, with an additional amount to finance any unfunded accrued liability. Contributions from the school division to HICP were $852,109 and $832,471 for the years ended June 30, 2019 and June 30, 2018, respectively.
OPEB Liabilities, OPEB Expense, and Deferred Outflows of Resources and Deferred Inflows of Resources Related to HICP At June 30, 2019, the School Division reported a liability of $10,626,000 for its proportionate share of the net HICP OPEB Liability. The net HICP OPEB Liability was measured as of June 30, 2018 and the total HICP OPEB liability used to calculate the net HICP OPEB Liability was determined by an actuarial valuation as of that date. The School Division’s proportion of the net HICP OPEB Liability was based on the school division’s actuarially determined employer contributions to HICP for the year ended June 30, 2018 relative to the total of the actuarially determined employer contributions for all participating employers. At June 30, 2018, the school division’s proportion of HICP was 0.83687% as compared to 0.84856% at June 30, 2017.
For the year ended June 30, 2019, the school division recognized HICP OPEB expense of $810,000. Since there was a change in proportionate share between measurement dates a portion of the HICP OPEB expense was related to deferred amounts from changes in proportion.
At June 30, 2019, the school division reported deferred outflows of resources and deferred inflows of resources related to HICP from the following sources:
Deferred DeferredOutflows of Inflows ofResources Resources
Difference between expected and actual experience -$ 53,000$ Net difference between projected and actual earnings
on OPEB plan investments - 8,000 Changes of assumptions - 93,000 Changes in proportionate share - 332,000 Employer contributions subsequent to the measurement date 852,109 -
Total 852,109$ 486,000$
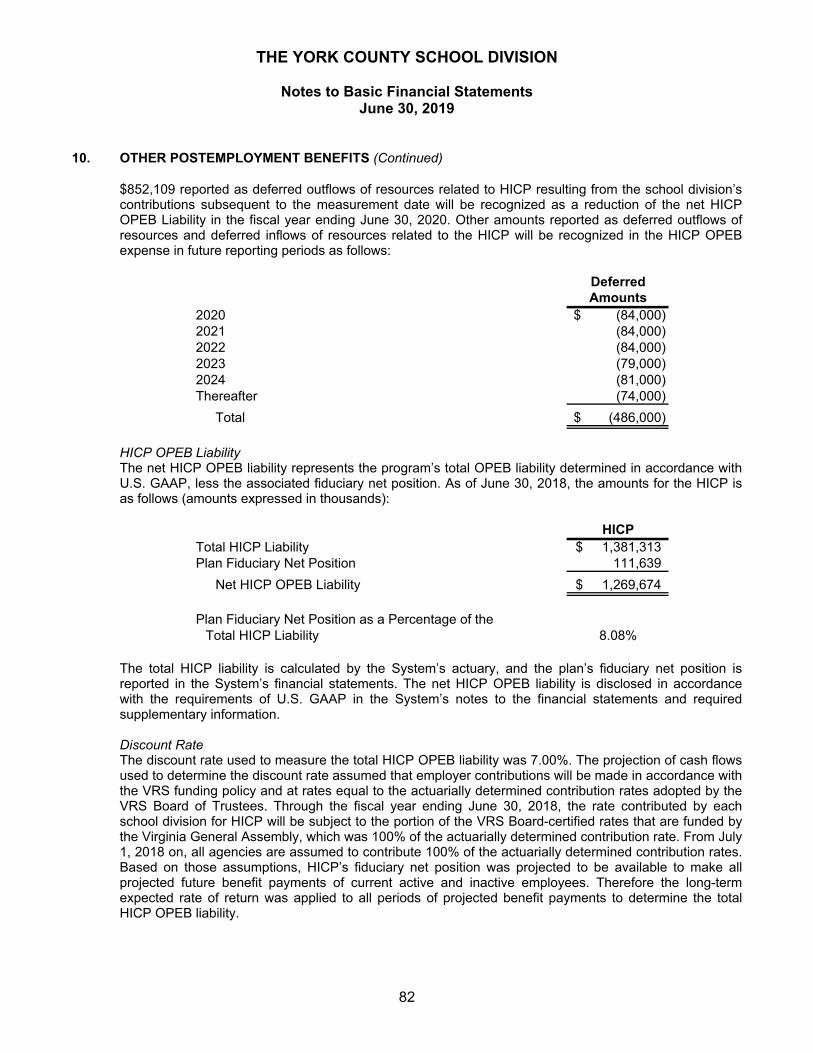
THE YORK COUNTY SCHOOL DIVISION
Notes to Basic Financial Statements June 30, 2019
82
10. OTHER POSTEMPLOYMENT BENEFITS (Continued)
$852,109 reported as deferred outflows of resources related to HICP resulting from the school division’s contributions subsequent to the measurement date will be recognized as a reduction of the net HICP OPEB Liability in the fiscal year ending June 30, 2020. Other amounts reported as deferred outflows of resources and deferred inflows of resources related to the HICP will be recognized in the HICP OPEB expense in future reporting periods as follows:
DeferredAmounts
2020 (84,000)$ 2021 (84,000) 2022 (84,000) 2023 (79,000) 2024 (81,000) Thereafter (74,000)
Total (486,000)$
HICP OPEB Liability The net HICP OPEB liability represents the program’s total OPEB liability determined in accordance with U.S. GAAP, less the associated fiduciary net position. As of June 30, 2018, the amounts for the HICP is as follows (amounts expressed in thousands):
HICPTotal HICP Liability 1,381,313$ Plan Fiduciary Net Position 111,639
Net HICP OPEB Liability 1,269,674$
Plan Fiduciary Net Position as a Percentage of theTotal HICP Liability 8.08%
The total HICP liability is calculated by the System’s actuary, and the plan’s fiduciary net position is reported in the System’s financial statements. The net HICP OPEB liability is disclosed in accordance with the requirements of U.S. GAAP in the System’s notes to the financial statements and required supplementary information.
Discount Rate The discount rate used to measure the total HICP OPEB liability was 7.00%. The projection of cash flows used to determine the discount rate assumed that employer contributions will be made in accordance with the VRS funding policy and at rates equal to the actuarially determined contribution rates adopted by the VRS Board of Trustees. Through the fiscal year ending June 30, 2018, the rate contributed by each school division for HICP will be subject to the portion of the VRS Board-certified rates that are funded by the Virginia General Assembly, which was 100% of the actuarially determined contribution rate. From July 1, 2018 on, all agencies are assumed to contribute 100% of the actuarially determined contribution rates. Based on those assumptions, HICP’s fiduciary net position was projected to be available to make all projected future benefit payments of current active and inactive employees. Therefore the long-term expected rate of return was applied to all periods of projected benefit payments to determine the total HICP OPEB liability.
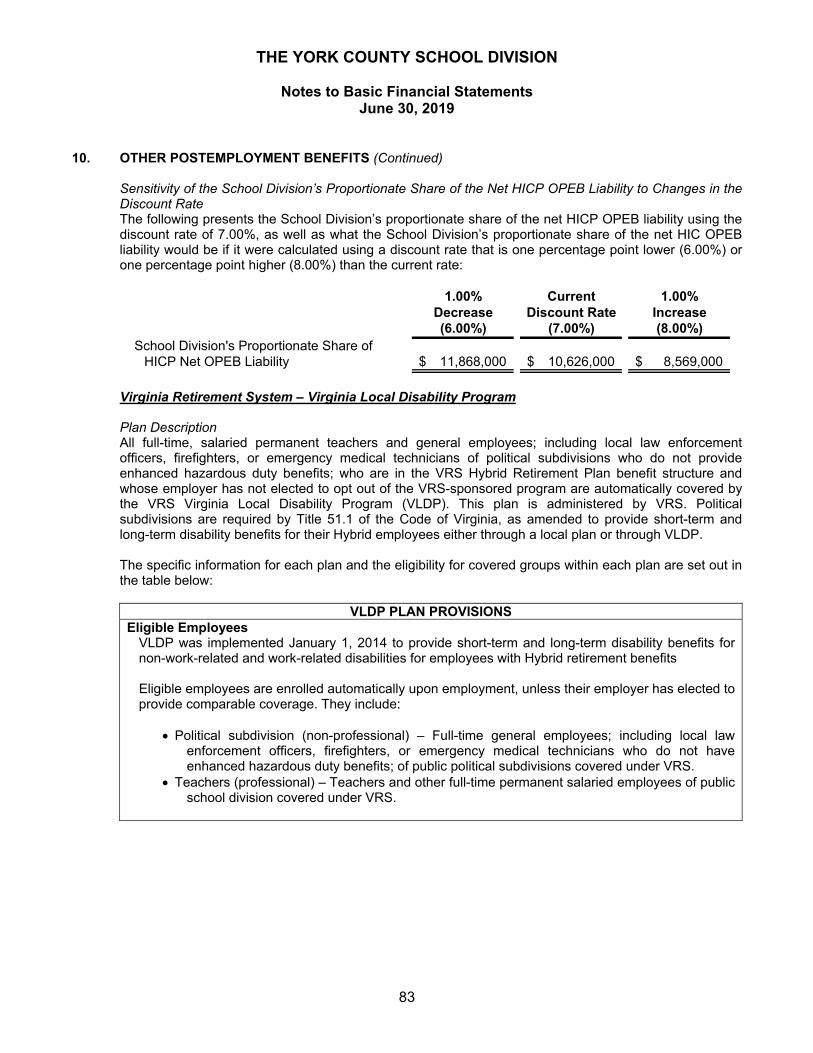
THE YORK COUNTY SCHOOL DIVISION
Notes to Basic Financial Statements June 30, 2019
83
10. OTHER POSTEMPLOYMENT BENEFITS (Continued)
Sensitivity of the School Division’s Proportionate Share of the Net HICP OPEB Liability to Changes in the Discount Rate The following presents the School Division’s proportionate share of the net HICP OPEB liability using the discount rate of 7.00%, as well as what the School Division’s proportionate share of the net HIC OPEB liability would be if it were calculated using a discount rate that is one percentage point lower (6.00%) or one percentage point higher (8.00%) than the current rate:
1.00% Current 1.00%Decrease Discount Rate Increase(6.00%) (7.00%) (8.00%)
School Division's Proportionate Share of HICP Net OPEB Liability 11,868,000$ 10,626,000$ 8,569,000$
Virginia Retirement System – Virginia Local Disability Program
Plan Description All full-time, salaried permanent teachers and general employees; including local law enforcement officers, firefighters, or emergency medical technicians of political subdivisions who do not provide enhanced hazardous duty benefits; who are in the VRS Hybrid Retirement Plan benefit structure and whose employer has not elected to opt out of the VRS-sponsored program are automatically covered by the VRS Virginia Local Disability Program (VLDP). This plan is administered by VRS. Political subdivisions are required by Title 51.1 of the Code of Virginia, as amended to provide short-term and long-term disability benefits for their Hybrid employees either through a local plan or through VLDP.
The specific information for each plan and the eligibility for covered groups within each plan are set out in the table below:
VLDP PLAN PROVISIONS Eligible Employees
VLDP was implemented January 1, 2014 to provide short-term and long-term disability benefits for non-work-related and work-related disabilities for employees with Hybrid retirement benefits Eligible employees are enrolled automatically upon employment, unless their employer has elected to provide comparable coverage. They include:
Political subdivision (non-professional) – Full-time general employees; including local law enforcement officers, firefighters, or emergency medical technicians who do not have enhanced hazardous duty benefits; of public political subdivisions covered under VRS.
Teachers (professional) – Teachers and other full-time permanent salaried employees of public school division covered under VRS.
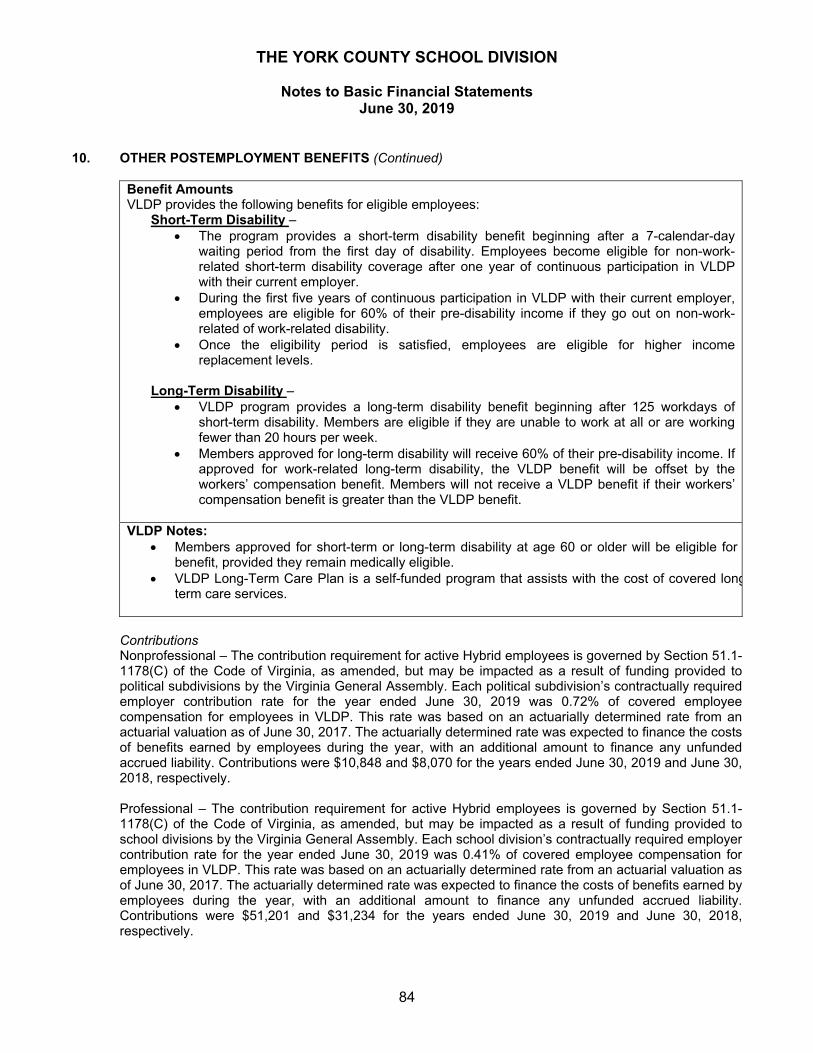
THE YORK COUNTY SCHOOL DIVISION
Notes to Basic Financial Statements June 30, 2019
84
10. OTHER POSTEMPLOYMENT BENEFITS (Continued)
Benefit Amounts VLDP provides the following benefits for eligible employees:
Short-Term Disability – The program provides a short-term disability benefit beginning after a 7-calendar-day
waiting period from the first day of disability. Employees become eligible for non-work-related short-term disability coverage after one year of continuous participation in VLDP with their current employer.
During the first five years of continuous participation in VLDP with their current employer, employees are eligible for 60% of their pre-disability income if they go out on non-work-related of work-related disability.
Once the eligibility period is satisfied, employees are eligible for higher income replacement levels.
Long-Term Disability –
VLDP program provides a long-term disability benefit beginning after 125 workdays of short-term disability. Members are eligible if they are unable to work at all or are working fewer than 20 hours per week.
Members approved for long-term disability will receive 60% of their pre-disability income. If approved for work-related long-term disability, the VLDP benefit will be offset by the workers’ compensation benefit. Members will not receive a VLDP benefit if their workers’ compensation benefit is greater than the VLDP benefit.
VLDP Notes:
Members approved for short-term or long-term disability at age 60 or older will be eligible for benefit, provided they remain medically eligible.
VLDP Long-Term Care Plan is a self-funded program that assists with the cost of covered longterm care services.
Contributions Nonprofessional – The contribution requirement for active Hybrid employees is governed by Section 51.1-1178(C) of the Code of Virginia, as amended, but may be impacted as a result of funding provided to political subdivisions by the Virginia General Assembly. Each political subdivision’s contractually required employer contribution rate for the year ended June 30, 2019 was 0.72% of covered employee compensation for employees in VLDP. This rate was based on an actuarially determined rate from an actuarial valuation as of June 30, 2017. The actuarially determined rate was expected to finance the costs of benefits earned by employees during the year, with an additional amount to finance any unfunded accrued liability. Contributions were $10,848 and $8,070 for the years ended June 30, 2019 and June 30, 2018, respectively. Professional – The contribution requirement for active Hybrid employees is governed by Section 51.1-1178(C) of the Code of Virginia, as amended, but may be impacted as a result of funding provided to school divisions by the Virginia General Assembly. Each school division’s contractually required employer contribution rate for the year ended June 30, 2019 was 0.41% of covered employee compensation for employees in VLDP. This rate was based on an actuarially determined rate from an actuarial valuation as of June 30, 2017. The actuarially determined rate was expected to finance the costs of benefits earned by employees during the year, with an additional amount to finance any unfunded accrued liability. Contributions were $51,201 and $31,234 for the years ended June 30, 2019 and June 30, 2018, respectively.
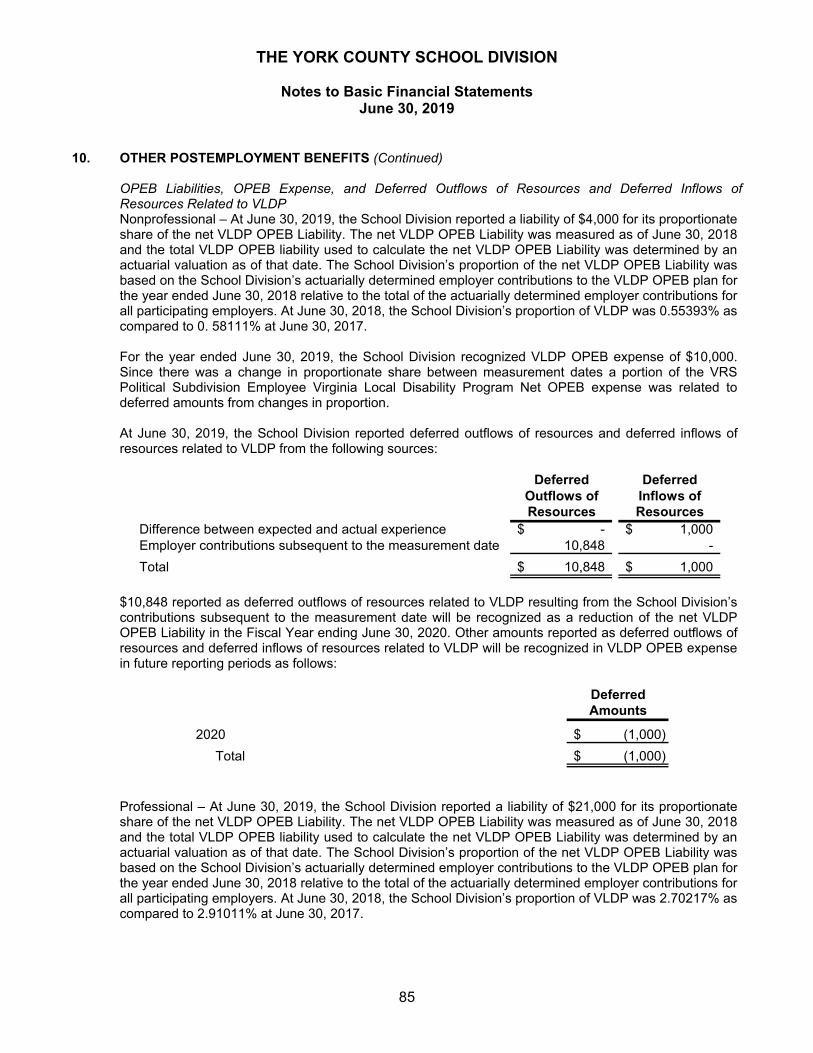
THE YORK COUNTY SCHOOL DIVISION
Notes to Basic Financial Statements June 30, 2019
85
10. OTHER POSTEMPLOYMENT BENEFITS (Continued)
OPEB Liabilities, OPEB Expense, and Deferred Outflows of Resources and Deferred Inflows of Resources Related to VLDP Nonprofessional – At June 30, 2019, the School Division reported a liability of $4,000 for its proportionate share of the net VLDP OPEB Liability. The net VLDP OPEB Liability was measured as of June 30, 2018 and the total VLDP OPEB liability used to calculate the net VLDP OPEB Liability was determined by an actuarial valuation as of that date. The School Division’s proportion of the net VLDP OPEB Liability was based on the School Division’s actuarially determined employer contributions to the VLDP OPEB plan for the year ended June 30, 2018 relative to the total of the actuarially determined employer contributions for all participating employers. At June 30, 2018, the School Division’s proportion of VLDP was 0.55393% as compared to 0. 58111% at June 30, 2017.
For the year ended June 30, 2019, the School Division recognized VLDP OPEB expense of $10,000. Since there was a change in proportionate share between measurement dates a portion of the VRS Political Subdivision Employee Virginia Local Disability Program Net OPEB expense was related to deferred amounts from changes in proportion.
At June 30, 2019, the School Division reported deferred outflows of resources and deferred inflows of resources related to VLDP from the following sources:
Deferred DeferredOutflows of Inflows ofResources Resources
Difference between expected and actual experience -$ 1,000$ Employer contributions subsequent to the measurement date 10,848 -
Total 10,848$ 1,000$
$10,848 reported as deferred outflows of resources related to VLDP resulting from the School Division’s contributions subsequent to the measurement date will be recognized as a reduction of the net VLDP OPEB Liability in the Fiscal Year ending June 30, 2020. Other amounts reported as deferred outflows of resources and deferred inflows of resources related to VLDP will be recognized in VLDP OPEB expense in future reporting periods as follows:
DeferredAmounts
2020 (1,000)$
Total (1,000)$
Professional – At June 30, 2019, the School Division reported a liability of $21,000 for its proportionate share of the net VLDP OPEB Liability. The net VLDP OPEB Liability was measured as of June 30, 2018 and the total VLDP OPEB liability used to calculate the net VLDP OPEB Liability was determined by an actuarial valuation as of that date. The School Division’s proportion of the net VLDP OPEB Liability was based on the School Division’s actuarially determined employer contributions to the VLDP OPEB plan for the year ended June 30, 2018 relative to the total of the actuarially determined employer contributions for all participating employers. At June 30, 2018, the School Division’s proportion of VLDP was 2.70217% as compared to 2.91011% at June 30, 2017.
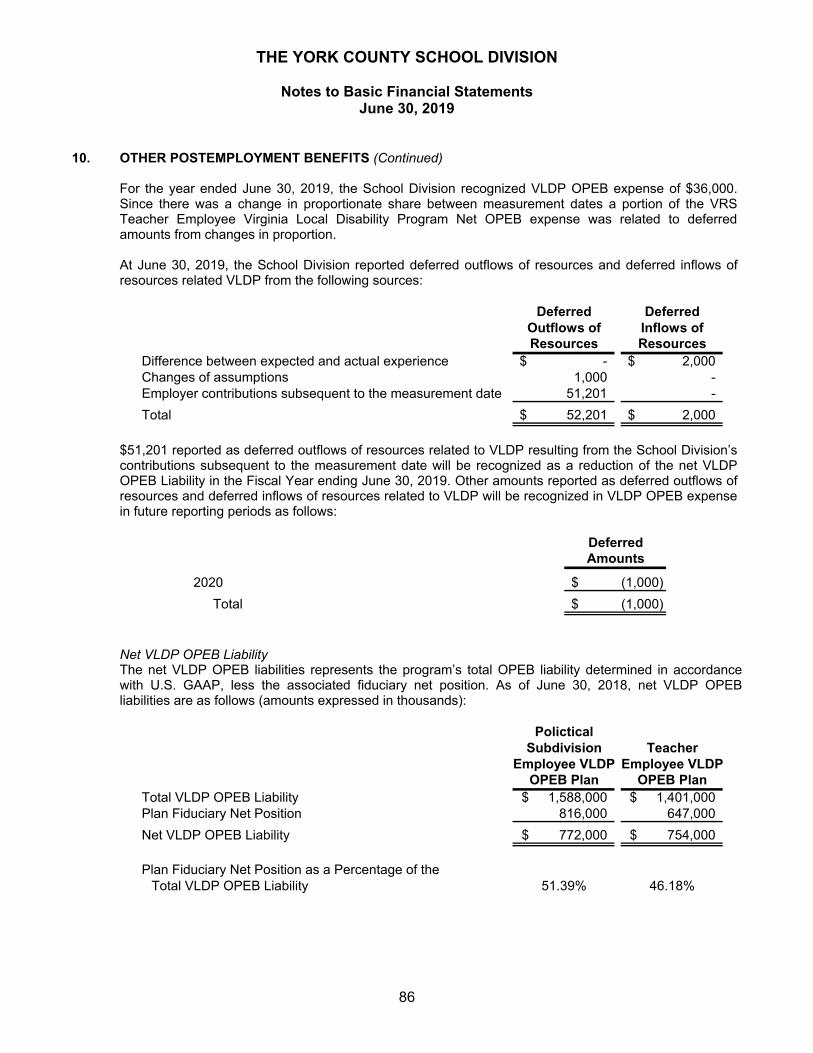
THE YORK COUNTY SCHOOL DIVISION
Notes to Basic Financial Statements June 30, 2019
86
10. OTHER POSTEMPLOYMENT BENEFITS (Continued)
For the year ended June 30, 2019, the School Division recognized VLDP OPEB expense of $36,000. Since there was a change in proportionate share between measurement dates a portion of the VRS Teacher Employee Virginia Local Disability Program Net OPEB expense was related to deferred amounts from changes in proportion.
At June 30, 2019, the School Division reported deferred outflows of resources and deferred inflows of resources related VLDP from the following sources:
Deferred DeferredOutflows of Inflows ofResources Resources
Difference between expected and actual experience -$ 2,000$ Changes of assumptions 1,000 - Employer contributions subsequent to the measurement date 51,201 -
Total 52,201$ 2,000$
$51,201 reported as deferred outflows of resources related to VLDP resulting from the School Division’s contributions subsequent to the measurement date will be recognized as a reduction of the net VLDP OPEB Liability in the Fiscal Year ending June 30, 2019. Other amounts reported as deferred outflows of resources and deferred inflows of resources related to VLDP will be recognized in VLDP OPEB expense in future reporting periods as follows:
DeferredAmounts
2020 (1,000)$
Total (1,000)$
Net VLDP OPEB Liability The net VLDP OPEB liabilities represents the program’s total OPEB liability determined in accordance with U.S. GAAP, less the associated fiduciary net position. As of June 30, 2018, net VLDP OPEB liabilities are as follows (amounts expressed in thousands):
PolicticalSubdivision Teacher
Employee VLDP Employee VLDPOPEB Plan OPEB Plan
Total VLDP OPEB Liability 1,588,000$ 1,401,000$ Plan Fiduciary Net Position 816,000 647,000
Net VLDP OPEB Liability 772,000$ 754,000$
Plan Fiduciary Net Position as a Percentage of theTotal VLDP OPEB Liability 51.39% 46.18%
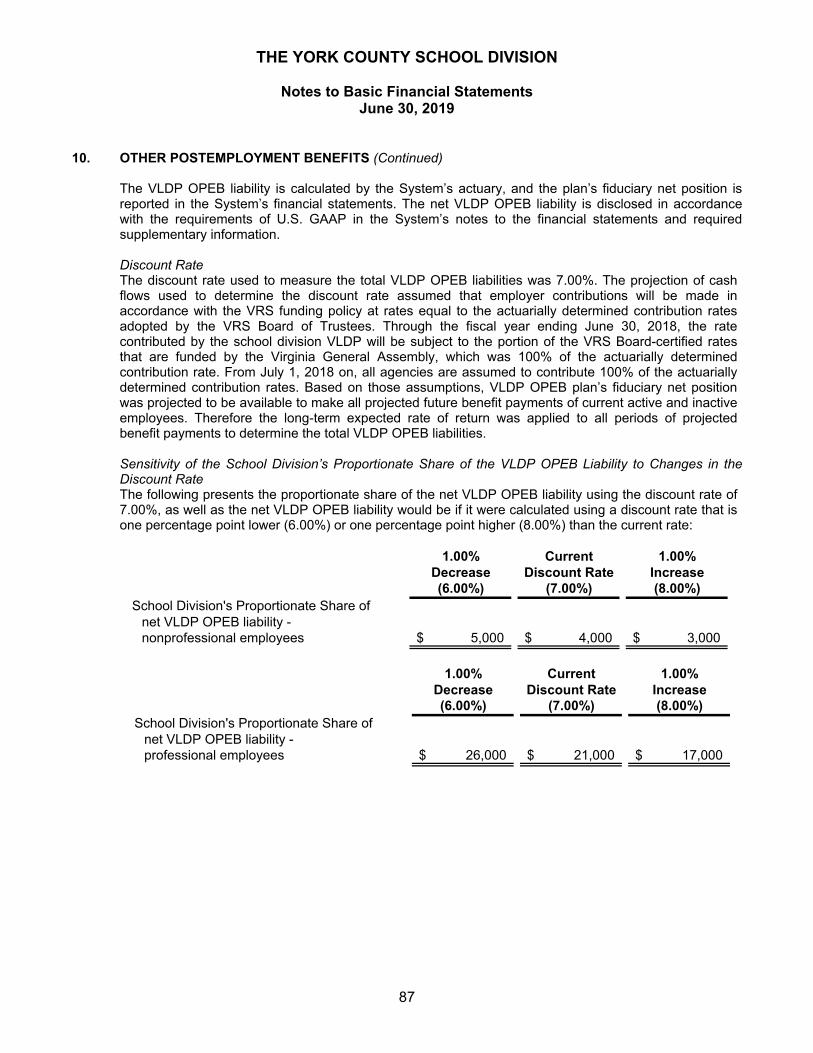
THE YORK COUNTY SCHOOL DIVISION
Notes to Basic Financial Statements June 30, 2019
87
10. OTHER POSTEMPLOYMENT BENEFITS (Continued) The VLDP OPEB liability is calculated by the System’s actuary, and the plan’s fiduciary net position is reported in the System’s financial statements. The net VLDP OPEB liability is disclosed in accordance with the requirements of U.S. GAAP in the System’s notes to the financial statements and required supplementary information.
Discount Rate The discount rate used to measure the total VLDP OPEB liabilities was 7.00%. The projection of cash flows used to determine the discount rate assumed that employer contributions will be made in accordance with the VRS funding policy at rates equal to the actuarially determined contribution rates adopted by the VRS Board of Trustees. Through the fiscal year ending June 30, 2018, the rate contributed by the school division VLDP will be subject to the portion of the VRS Board-certified rates that are funded by the Virginia General Assembly, which was 100% of the actuarially determined contribution rate. From July 1, 2018 on, all agencies are assumed to contribute 100% of the actuarially determined contribution rates. Based on those assumptions, VLDP OPEB plan’s fiduciary net position was projected to be available to make all projected future benefit payments of current active and inactive employees. Therefore the long-term expected rate of return was applied to all periods of projected benefit payments to determine the total VLDP OPEB liabilities.
Sensitivity of the School Division’s Proportionate Share of the VLDP OPEB Liability to Changes in the Discount Rate The following presents the proportionate share of the net VLDP OPEB liability using the discount rate of 7.00%, as well as the net VLDP OPEB liability would be if it were calculated using a discount rate that is one percentage point lower (6.00%) or one percentage point higher (8.00%) than the current rate:
1.00% Current 1.00%Decrease Discount Rate Increase(6.00%) (7.00%) (8.00%)
School Division's Proportionate Share of net VLDP OPEB liability - nonprofessional employees 5,000$ 4,000$ 3,000$
1.00% Current 1.00%
Decrease Discount Rate Increase(6.00%) (7.00%) (8.00%)
School Division's Proportionate Share of net VLDP OPEB liability - professional employees 26,000$ 21,000$ 17,000$
THE YORK COUNTY SCHOOL DIVISION
Notes to Basic Financial Statements June 30, 2019
88
10. OTHER POSTEMPLOYMENT BENEFITS (Continued) School Division OPEB Plan General Information about the OPEB Plan
Plan Description The County and School Division’s OPEB plans are each single-employer defined benefit plans administered by the County and School Division. In accordance with Article 8, Chapter 15, Title 15.2 of the Code of Virginia, the County and School Division have elected to establish a pooled trust for the purpose of accumulating and investing assets to fund Other Post-Employment Benefits. GASB 74 disclosures are reported in the County’s Comprehensive Annual Financial Report. The School Division in accordance with this election has joined the Virginia Pooled OPEB Trust Fund (Trust Fund), an irrevocable trust, with the purpose to fund other post-employment benefits. The Trust Fund issues separate financial statements, which can be obtained by requesting a copy from the plan administrator, VML/VACo Finance, 919 E. Main Street, Suite 1100, Richmond, Virginia 23219. Benefits Provided The School Division provides postemployment health care benefits, in accordance with School Division policy. Medical and dental coverage is provided to eligible retirees and their dependents. Medical benefits are provided until the retiree’s age 65. Medical benefits for dependent spouse are provided until the earlier of the spouse’s death, the retiree’s death, or the retiree’s age 65. Upon the earlier of the retiree’s death or the retiree’s age 65, the dependent spouse may elect to continue coverage through COBRA only. For participants who retire on or before age 65, dental benefits for both the retiree and their dependent spouse are provided until the retiree’s age 66 years, 6 months. For participants who retire after age 65, dental benefits for both the retiree and their dependent spouse are provided for 18 months from the date of retirement. Employees Covered by Benefit Terms Participants in the School Division’s OPEB plan must attain age 55 and have 5 or more years of service with the School Division to be eligible for health benefits upon retirement. Participants must also reitre directly from active employment and satisfy on of the VRS retirement eligibility requirements to be eligible for health benefits. VRS retirement eligibility requirements are shown in Note 9. At July 1, 2018, there were 1,638 active employees and 153 retirees participating in this program. Contributions Contribution requirements are established and may be amended by the School Board. Retirees having less than 20 years of service with the School Division upon retirement are responsible for 100% of their medical premium cost and dental premium cost, regardless of the plan or coverage tier elected. The School Divisions’ contribution for retirees having 20 or more years of service with the School Division is equal to 50% of the medical premium and 100% of the dental premium cost, regardless of the plan or coverage tier elected. The School Division’s contribution is reduced by the amount of any VRS Health Insurance Credit received by the retiree. The required contributions were actuarially determined and are based upon projected pay-as-you-go financing requirements. Contributions to the School Division Plan was $593,608 for the year ended June 30, 2019. Net OPEB Liability The School Division’s net OPEB liability was measured as of June 30, 2019, and the total OPEB liability used to calculate the net OPEB liability was determined by an actuarial valuation as of July 1, 2018.
THE YORK COUNTY SCHOOL DIVISION
Notes to Basic Financial Statements June 30, 2019
89
10. OTHER POSTEMPLOYMENT BENEFITS (Continued) Actuarial Methods and Assumptions The School Division pre-funds benefits through contributions to the trust. The current funding policy is to contribute the Actuarially Determined Contribution as calculated by the actuary. The Actuarially Determined Contribution is the sum of the current year’s normal cost plus and amount necessary to amortize the unfunded liability over a closed period. The following methods and assumptions were used to calculate the Actuarially Determined Contribution for the fiscal year ending June 30, 2018. Valuation Timing Actuarial valuations for OPEB funding purposes are
performed biennially as of July 1. The most recent valuation was performed as of July 1, 2018.
Actuarial Cost Method Projected Unit Credit Amortization Method Level Percent or Level Dollar Level Percentage of Payroll Closed, Open, or Layered Periods Layered Amortization Period as of June 30, 2018 Each New Base 30 years Amortization Growth Rate 3.00% Asset Valuation Method Market Value Inflation 2.50% Payroll Growth 3.00% Discount Rate 6.50 Age-Related Claims Costs Based on a blended premium rate for active employees
and retirees under age 65. Healthcare Cost Trend Rates Based on long term healthcare cost trend rates generated
by the Getzen Model. Retirement Rates Age 55 - 15.0%; Age 56-59 - 2.0%; Age 60 -15.0%; Age
61 - 2.0%; Age 62 - 4.0%; Age 63-64 - 10.0%; Age 65 - 100.0%
Mortality Rates Pre-Retirement RP-2014 Employee Rates to age 80, Healthy Annuitant
Rates at ages 81 and older projected with Scale BB to 2020; males setback 1 year, 85% of rates; females setback 1 year. 25% of deaths are assumed to be service-related.
Post-Retirement RP-2014 Employee Rates to age 49, Healthy Annuitant Rates at ages 50 and older projected with Scale BB to 2020; males set forward 1 year; females set back 1 year with 1.5% increase compounded from ages 70 to 85.
Post-Disablement RP-2014 Disabled Mortality Rates projected with Scale BB to 2020; males 115% of rates; females 130% of rates.
Disability Rates Male: Age 30 - 0.013%; Age 35 - 0.020%; Age 40 - 0.026%; Age 45 - 0.088%; Age 50 - 0.149%; Age 55 -0.286%; Age 60 - 0.422%. Female: Age 30 - 0.008%; Age 35 - 0.027%; Age 40 - 0.046%; Age 45 - 0.105%; Age 50 - 0.163%; Age 55 -0.293%; Age 60 - 0.422%.
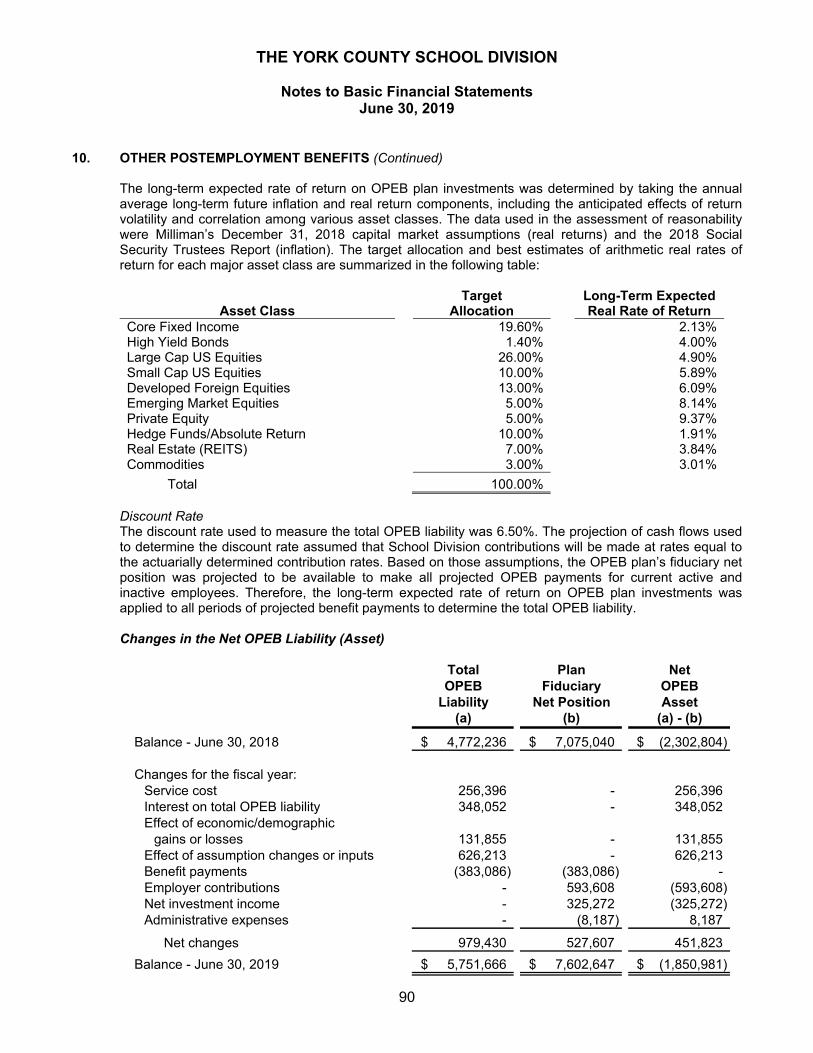
THE YORK COUNTY SCHOOL DIVISION
Notes to Basic Financial Statements June 30, 2019
90
10. OTHER POSTEMPLOYMENT BENEFITS (Continued)
The long-term expected rate of return on OPEB plan investments was determined by taking the annual average long-term future inflation and real return components, including the anticipated effects of return volatility and correlation among various asset classes. The data used in the assessment of reasonability were Milliman’s December 31, 2018 capital market assumptions (real returns) and the 2018 Social Security Trustees Report (inflation). The target allocation and best estimates of arithmetic real rates of return for each major asset class are summarized in the following table:
Asset Class Target
Allocation Long-Term Expected
Real Rate of Return Core Fixed Income 19.60% 2.13% High Yield Bonds 1.40% 4.00% Large Cap US Equities 26.00% 4.90% Small Cap US Equities 10.00% 5.89% Developed Foreign Equities 13.00% 6.09% Emerging Market Equities 5.00% 8.14% Private Equity 5.00% 9.37% Hedge Funds/Absolute Return 10.00% 1.91% Real Estate (REITS) 7.00% 3.84% Commodities 3.00% 3.01%
Total 100.00% Discount Rate The discount rate used to measure the total OPEB liability was 6.50%. The projection of cash flows used to determine the discount rate assumed that School Division contributions will be made at rates equal to the actuarially determined contribution rates. Based on those assumptions, the OPEB plan’s fiduciary net position was projected to be available to make all projected OPEB payments for current active and inactive employees. Therefore, the long-term expected rate of return on OPEB plan investments was applied to all periods of projected benefit payments to determine the total OPEB liability. Changes in the Net OPEB Liability (Asset)
Total Plan NetOPEB Fiduciary OPEB
Liability Net Position Asset(a) (b) (a) - (b)
Balance - June 30, 2018 4,772,236$ 7,075,040$ (2,302,804)$
Changes for the fiscal year:Service cost 256,396 - 256,396 Interest on total OPEB liability 348,052 - 348,052 Effect of economic/demographic
gains or losses 131,855 - 131,855 Effect of assumption changes or inputs 626,213 - 626,213 Benefit payments (383,086) (383,086) - Employer contributions - 593,608 (593,608) Net investment income - 325,272 (325,272) Administrative expenses - (8,187) 8,187
Net changes 979,430 527,607 451,823
Balance - June 30, 2019 5,751,666$ 7,602,647$ (1,850,981)$
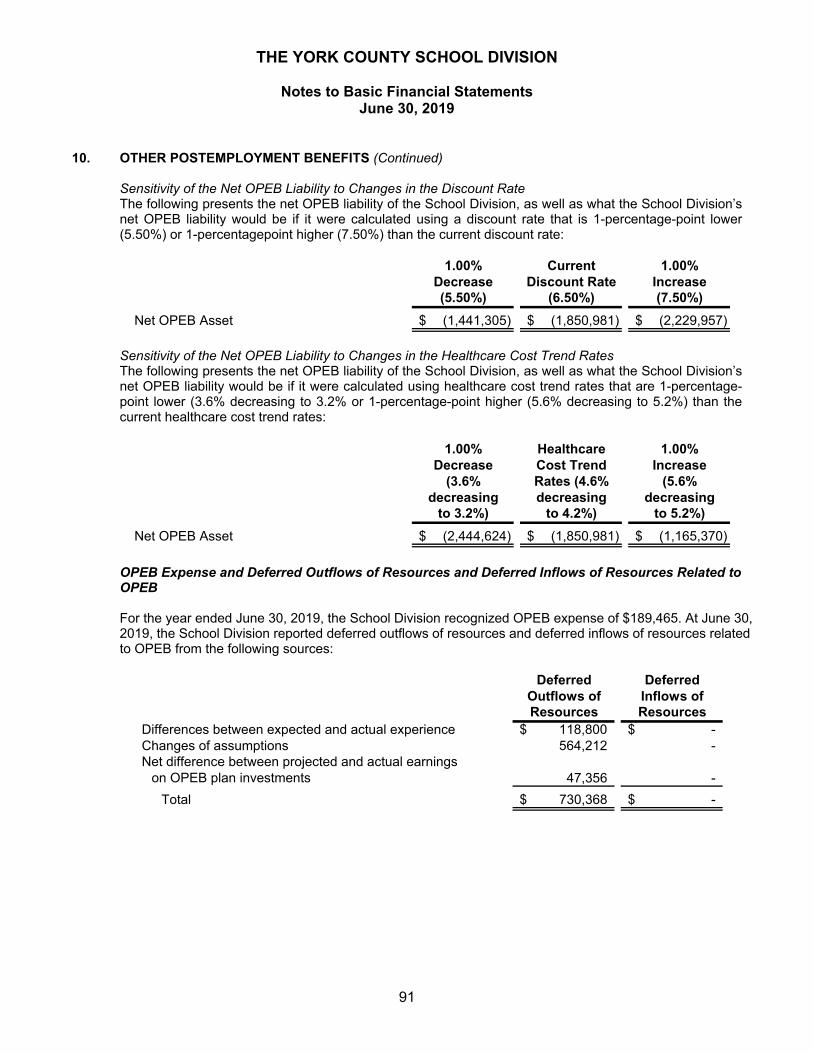
THE YORK COUNTY SCHOOL DIVISION
Notes to Basic Financial Statements June 30, 2019
91
10. OTHER POSTEMPLOYMENT BENEFITS (Continued)
Sensitivity of the Net OPEB Liability to Changes in the Discount Rate The following presents the net OPEB liability of the School Division, as well as what the School Division’s net OPEB liability would be if it were calculated using a discount rate that is 1-percentage-point lower (5.50%) or 1-percentagepoint higher (7.50%) than the current discount rate:
1.00% Current 1.00%Decrease Discount Rate Increase(5.50%) (6.50%) (7.50%)
Net OPEB Asset (1,441,305)$ (1,850,981)$ (2,229,957)$
Sensitivity of the Net OPEB Liability to Changes in the Healthcare Cost Trend Rates The following presents the net OPEB liability of the School Division, as well as what the School Division’s net OPEB liability would be if it were calculated using healthcare cost trend rates that are 1-percentage-point lower (3.6% decreasing to 3.2% or 1-percentage-point higher (5.6% decreasing to 5.2%) than the current healthcare cost trend rates:
1.00% Healthcare 1.00%Decrease Cost Trend Increase
(3.6% Rates (4.6% (5.6%decreasing decreasing decreasing
to 3.2%) to 4.2%) to 5.2%)
Net OPEB Asset (2,444,624)$ (1,850,981)$ (1,165,370)$
OPEB Expense and Deferred Outflows of Resources and Deferred Inflows of Resources Related to OPEB For the year ended June 30, 2019, the School Division recognized OPEB expense of $189,465. At June 30, 2019, the School Division reported deferred outflows of resources and deferred inflows of resources related to OPEB from the following sources:
Deferred DeferredOutflows of Inflows ofResources Resources
Differences between expected and actual experience 118,800$ -$ Changes of assumptions 564,212 - Net difference between projected and actual earnings
on OPEB plan investments 47,356 -
Total 730,368$ -$
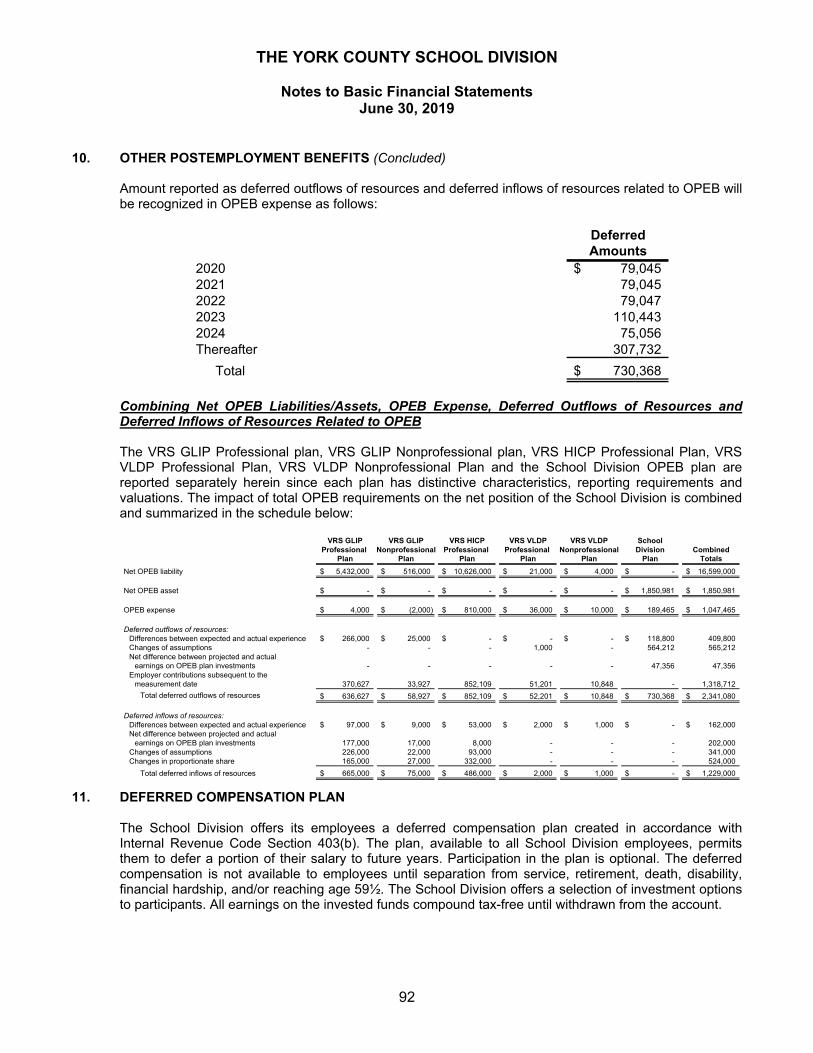
THE YORK COUNTY SCHOOL DIVISION
Notes to Basic Financial Statements June 30, 2019
92
10. OTHER POSTEMPLOYMENT BENEFITS (Concluded)
Amount reported as deferred outflows of resources and deferred inflows of resources related to OPEB will be recognized in OPEB expense as follows:
DeferredAmounts
2020 79,045$ 2021 79,045 2022 79,047 2023 110,443 2024 75,056 Thereafter 307,732
Total 730,368$
Combining Net OPEB Liabilities/Assets, OPEB Expense, Deferred Outflows of Resources and Deferred Inflows of Resources Related to OPEB The VRS GLIP Professional plan, VRS GLIP Nonprofessional plan, VRS HICP Professional Plan, VRS VLDP Professional Plan, VRS VLDP Nonprofessional Plan and the School Division OPEB plan are reported separately herein since each plan has distinctive characteristics, reporting requirements and valuations. The impact of total OPEB requirements on the net position of the School Division is combined and summarized in the schedule below:
VRS GLIP VRS GLIP VRS HICP VRS VLDP VRS VLDP SchoolProfessional Nonprofessional Professional Professional Nonprofessional Division Combined
Plan Plan Plan Plan Plan Plan Totals
Net OPEB liability 5,432,000$ 516,000$ 10,626,000$ 21,000$ 4,000$ -$ 16,599,000$
Net OPEB asset -$ -$ -$ -$ -$ 1,850,981$ 1,850,981$
OPEB expense 4,000$ (2,000)$ 810,000$ 36,000$ 10,000$ 189,465$ 1,047,465$
Deferred outflows of resources:Differences between expected and actual experience 266,000$ 25,000$ -$ -$ -$ 118,800$ 409,800 Changes of assumptions - - - 1,000 - 564,212 565,212 Net difference between projected and actual
earnings on OPEB plan investments - - - - - 47,356 47,356 Employer contributions subsequent to the
measurement date 370,627 33,927 852,109 51,201 10,848 - 1,318,712
Total deferred outflows of resources 636,627$ 58,927$ 852,109$ 52,201$ 10,848$ 730,368$ 2,341,080$
Deferred inflows of resources:Differences between expected and actual experience 97,000$ 9,000$ 53,000$ 2,000$ 1,000$ -$ 162,000$ Net difference between projected and actual
earnings on OPEB plan investments 177,000 17,000 8,000 - - - 202,000 Changes of assumptions 226,000 22,000 93,000 - - - 341,000 Changes in proportionate share 165,000 27,000 332,000 - - - 524,000
Total deferred inflows of resources 665,000$ 75,000$ 486,000$ 2,000$ 1,000$ -$ 1,229,000$
11. DEFERRED COMPENSATION PLAN
The School Division offers its employees a deferred compensation plan created in accordance with Internal Revenue Code Section 403(b). The plan, available to all School Division employees, permits them to defer a portion of their salary to future years. Participation in the plan is optional. The deferred compensation is not available to employees until separation from service, retirement, death, disability, financial hardship, and/or reaching age 59½. The School Division offers a selection of investment options to participants. All earnings on the invested funds compound tax-free until withdrawn from the account.
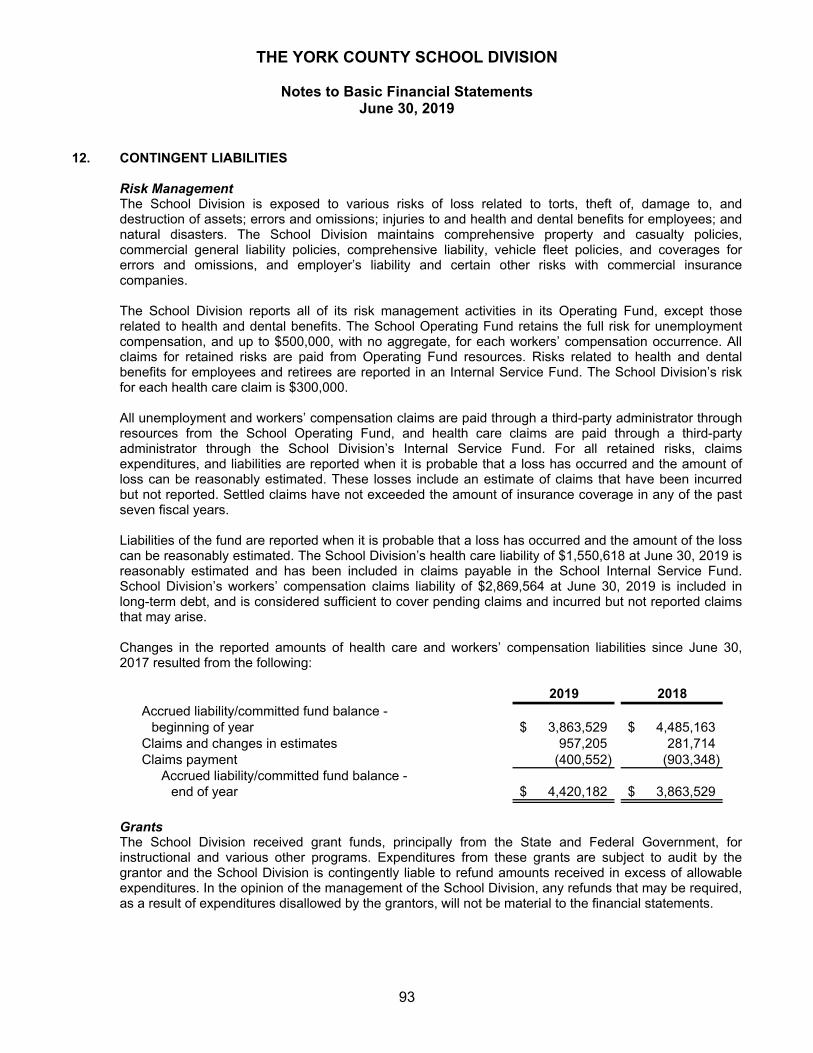
THE YORK COUNTY SCHOOL DIVISION
Notes to Basic Financial Statements June 30, 2019
93
12. CONTINGENT LIABILITIES Risk Management
The School Division is exposed to various risks of loss related to torts, theft of, damage to, and destruction of assets; errors and omissions; injuries to and health and dental benefits for employees; and natural disasters. The School Division maintains comprehensive property and casualty policies, commercial general liability policies, comprehensive liability, vehicle fleet policies, and coverages for errors and omissions, and employer’s liability and certain other risks with commercial insurance companies. The School Division reports all of its risk management activities in its Operating Fund, except those related to health and dental benefits. The School Operating Fund retains the full risk for unemployment compensation, and up to $500,000, with no aggregate, for each workers’ compensation occurrence. All claims for retained risks are paid from Operating Fund resources. Risks related to health and dental benefits for employees and retirees are reported in an Internal Service Fund. The School Division’s risk for each health care claim is $300,000.
All unemployment and workers’ compensation claims are paid through a third-party administrator through resources from the School Operating Fund, and health care claims are paid through a third-party administrator through the School Division’s Internal Service Fund. For all retained risks, claims expenditures, and liabilities are reported when it is probable that a loss has occurred and the amount of loss can be reasonably estimated. These losses include an estimate of claims that have been incurred but not reported. Settled claims have not exceeded the amount of insurance coverage in any of the past seven fiscal years. Liabilities of the fund are reported when it is probable that a loss has occurred and the amount of the loss can be reasonably estimated. The School Division’s health care liability of $1,550,618 at June 30, 2019 is reasonably estimated and has been included in claims payable in the School Internal Service Fund. School Division’s workers’ compensation claims liability of $2,869,564 at June 30, 2019 is included in long-term debt, and is considered sufficient to cover pending claims and incurred but not reported claims that may arise.
Changes in the reported amounts of health care and workers’ compensation liabilities since June 30, 2017 resulted from the following:
2019 2018Accrued liability/committed fund balance -
beginning of year 3,863,529$ 4,485,163$ Claims and changes in estimates 957,205 281,714 Claims payment (400,552) (903,348)
Accrued liability/committed fund balance -end of year 4,420,182$ 3,863,529$
Grants The School Division received grant funds, principally from the State and Federal Government, for instructional and various other programs. Expenditures from these grants are subject to audit by the grantor and the School Division is contingently liable to refund amounts received in excess of allowable expenditures. In the opinion of the management of the School Division, any refunds that may be required, as a result of expenditures disallowed by the grantors, will not be material to the financial statements.
THE YORK COUNTY SCHOOL DIVISION
Notes to Basic Financial Statements June 30, 2019
94
12. CONTINGENT LIABILITIES (Concluded)
Litigation The School Division is a defendant in various lawsuits and although the outcome of these lawsuits is not presently determinable, in the opinion of the School Division’s counsel, a possible claim or assertion does exist. Management estimates that the outcome will not have a material adverse effect on the financial condition of the School Division.
REQUIRED SUPPLEMENTARY INFORMATION
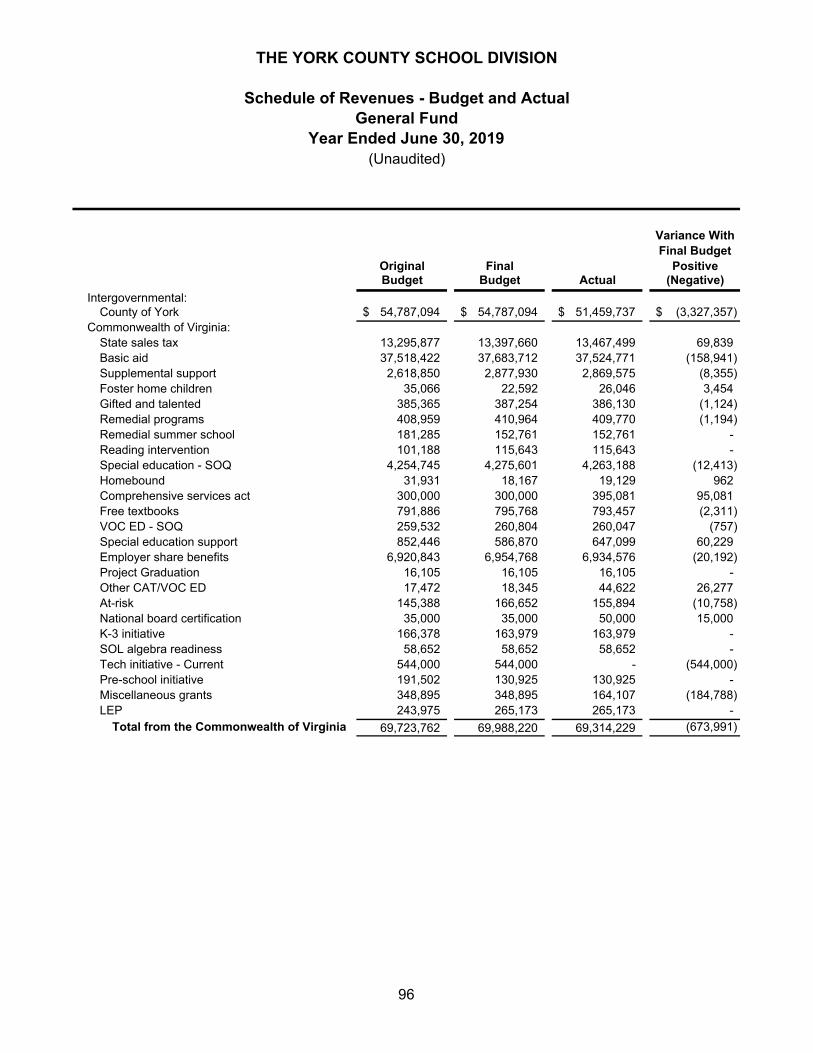
Variance WithFinal Budget
Original Final PositiveBudget Budget Actual (Negative)
Intergovernmental:County of York 54,787,094$ 54,787,094$ 51,459,737$ (3,327,357)$
Commonwealth of Virginia:State sales tax 13,295,877 13,397,660 13,467,499 69,839 Basic aid 37,518,422 37,683,712 37,524,771 (158,941) Supplemental support 2,618,850 2,877,930 2,869,575 (8,355) Foster home children 35,066 22,592 26,046 3,454 Gifted and talented 385,365 387,254 386,130 (1,124) Remedial programs 408,959 410,964 409,770 (1,194) Remedial summer school 181,285 152,761 152,761 - Reading intervention 101,188 115,643 115,643 - Special education - SOQ 4,254,745 4,275,601 4,263,188 (12,413) Homebound 31,931 18,167 19,129 962 Comprehensive services act 300,000 300,000 395,081 95,081 Free textbooks 791,886 795,768 793,457 (2,311) VOC ED - SOQ 259,532 260,804 260,047 (757) Special education support 852,446 586,870 647,099 60,229 Employer share benefits 6,920,843 6,954,768 6,934,576 (20,192) Project Graduation 16,105 16,105 16,105 - Other CAT/VOC ED 17,472 18,345 44,622 26,277 At-risk 145,388 166,652 155,894 (10,758) National board certification 35,000 35,000 50,000 15,000 K-3 initiative 166,378 163,979 163,979 - SOL algebra readiness 58,652 58,652 58,652 - Tech initiative - Current 544,000 544,000 - (544,000) Pre-school initiative 191,502 130,925 130,925 - Miscellaneous grants 348,895 348,895 164,107 (184,788) LEP 243,975 265,173 265,173 -
Total from the Commonwealth of Virginia 69,723,762 69,988,220 69,314,229 (673,991)
THE YORK COUNTY SCHOOL DIVISION
Year Ended June 30, 2019
Schedule of Revenues - Budget and ActualGeneral Fund
(Unaudited)
96
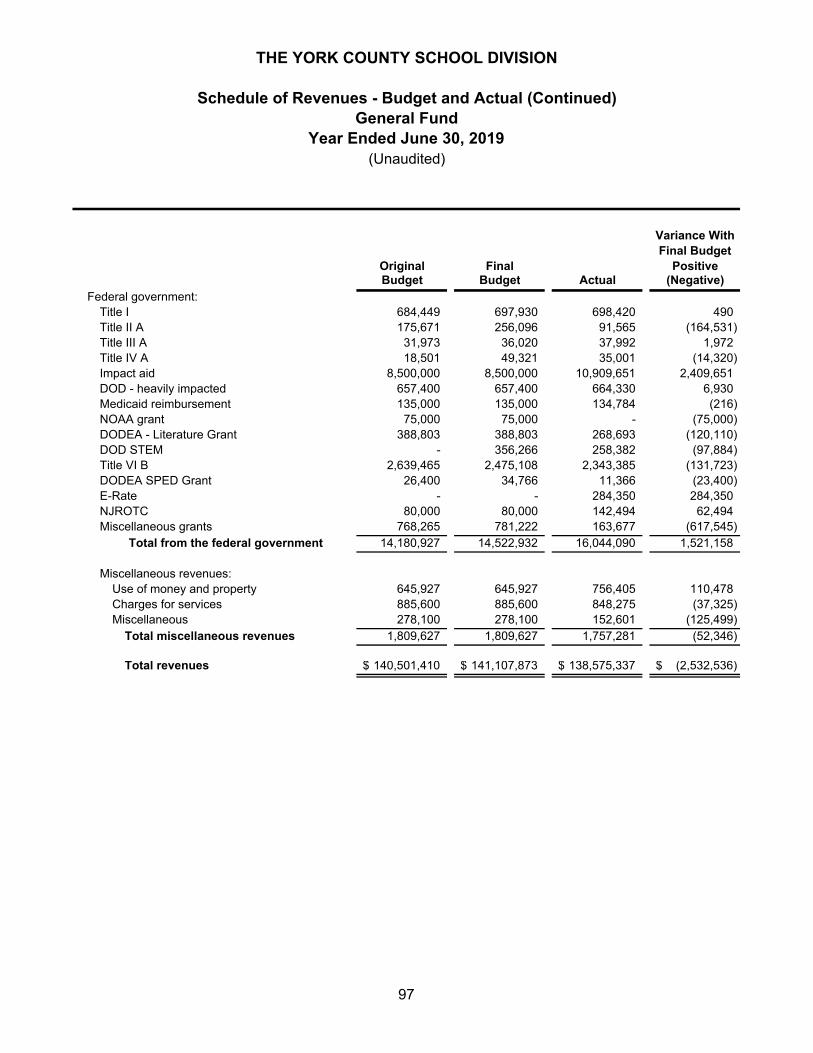
Variance WithFinal Budget
Original Final PositiveBudget Budget Actual (Negative)
Federal government:Title I 684,449 697,930 698,420 490 Title II A 175,671 256,096 91,565 (164,531) Title III A 31,973 36,020 37,992 1,972 Title IV A 18,501 49,321 35,001 (14,320) Impact aid 8,500,000 8,500,000 10,909,651 2,409,651 DOD - heavily impacted 657,400 657,400 664,330 6,930 Medicaid reimbursement 135,000 135,000 134,784 (216) NOAA grant 75,000 75,000 - (75,000) DODEA - Literature Grant 388,803 388,803 268,693 (120,110) DOD STEM - 356,266 258,382 (97,884) Title VI B 2,639,465 2,475,108 2,343,385 (131,723) DODEA SPED Grant 26,400 34,766 11,366 (23,400) E-Rate - - 284,350 284,350 NJROTC 80,000 80,000 142,494 62,494 Miscellaneous grants 768,265 781,222 163,677 (617,545)
Total from the federal government 14,180,927 14,522,932 16,044,090 1,521,158
Miscellaneous revenues:Use of money and property 645,927 645,927 756,405 110,478 Charges for services 885,600 885,600 848,275 (37,325) Miscellaneous 278,100 278,100 152,601 (125,499)
Total miscellaneous revenues 1,809,627 1,809,627 1,757,281 (52,346)
Total revenues 140,501,410$ 141,107,873$ 138,575,337$ (2,532,536)$
THE YORK COUNTY SCHOOL DIVISION
General FundSchedule of Revenues - Budget and Actual (Continued)
Year Ended June 30, 2019(Unaudited)
97
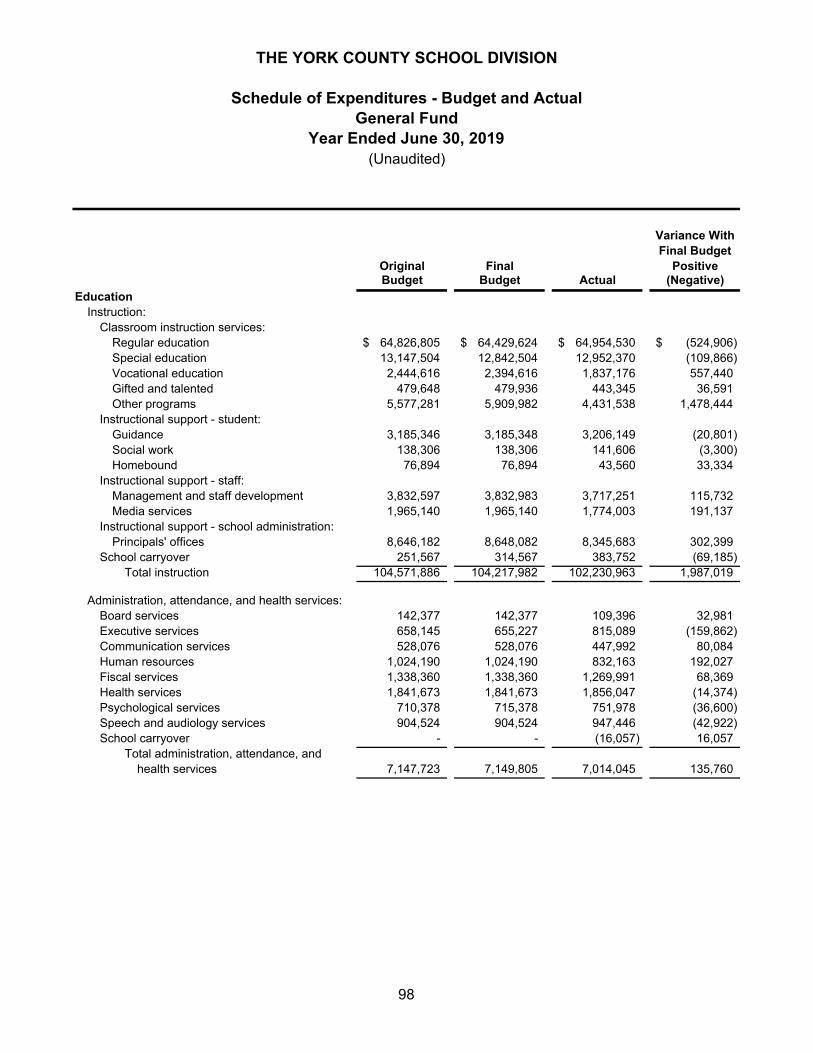
Variance WithFinal Budget
Original Final PositiveBudget Budget Actual (Negative)
EducationInstruction:
Classroom instruction services:Regular education 64,826,805$ 64,429,624$ 64,954,530$ (524,906)$ Special education 13,147,504 12,842,504 12,952,370 (109,866) Vocational education 2,444,616 2,394,616 1,837,176 557,440 Gifted and talented 479,648 479,936 443,345 36,591 Other programs 5,577,281 5,909,982 4,431,538 1,478,444
Instructional support - student:Guidance 3,185,346 3,185,348 3,206,149 (20,801) Social work 138,306 138,306 141,606 (3,300) Homebound 76,894 76,894 43,560 33,334
Instructional support - staff:Management and staff development 3,832,597 3,832,983 3,717,251 115,732 Media services 1,965,140 1,965,140 1,774,003 191,137
Instructional support - school administration:Principals' offices 8,646,182 8,648,082 8,345,683 302,399
School carryover 251,567 314,567 383,752 (69,185) Total instruction 104,571,886 104,217,982 102,230,963 1,987,019
Administration, attendance, and health services:Board services 142,377 142,377 109,396 32,981 Executive services 658,145 655,227 815,089 (159,862) Communication services 528,076 528,076 447,992 80,084 Human resources 1,024,190 1,024,190 832,163 192,027 Fiscal services 1,338,360 1,338,360 1,269,991 68,369 Health services 1,841,673 1,841,673 1,856,047 (14,374) Psychological services 710,378 715,378 751,978 (36,600) Speech and audiology services 904,524 904,524 947,446 (42,922) School carryover - - (16,057) 16,057
Total administration, attendance, andhealth services 7,147,723 7,149,805 7,014,045 135,760
THE YORK COUNTY SCHOOL DIVISION
Schedule of Expenditures - Budget and Actual
Year Ended June 30, 2019General Fund
(Unaudited)
98
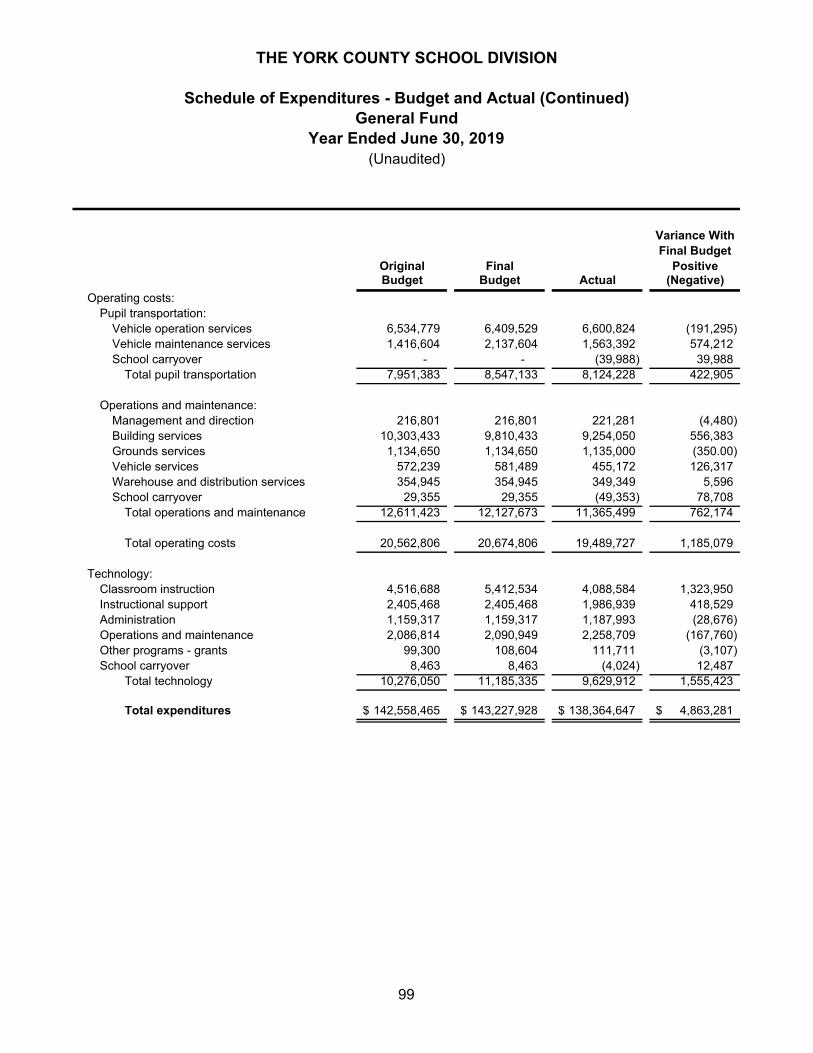
Variance WithFinal Budget
Original Final PositiveBudget Budget Actual (Negative)
THE YORK COUNTY SCHOOL DIVISION
Schedule of Expenditures - Budget and Actual (Continued)General Fund
Year Ended June 30, 2019(Unaudited)
Operating costs:Pupil transportation:
Vehicle operation services 6,534,779 6,409,529 6,600,824 (191,295) Vehicle maintenance services 1,416,604 2,137,604 1,563,392 574,212 School carryover - - (39,988) 39,988
Total pupil transportation 7,951,383 8,547,133 8,124,228 422,905
Operations and maintenance:Management and direction 216,801 216,801 221,281 (4,480) Building services 10,303,433 9,810,433 9,254,050 556,383 Grounds services 1,134,650 1,134,650 1,135,000 (350.00) Vehicle services 572,239 581,489 455,172 126,317 Warehouse and distribution services 354,945 354,945 349,349 5,596 School carryover 29,355 29,355 (49,353) 78,708
Total operations and maintenance 12,611,423 12,127,673 11,365,499 762,174
Total operating costs 20,562,806 20,674,806 19,489,727 1,185,079
Technology:Classroom instruction 4,516,688 5,412,534 4,088,584 1,323,950 Instructional support 2,405,468 2,405,468 1,986,939 418,529 Administration 1,159,317 1,159,317 1,187,993 (28,676) Operations and maintenance 2,086,814 2,090,949 2,258,709 (167,760) Other programs - grants 99,300 108,604 111,711 (3,107) School carryover 8,463 8,463 (4,024) 12,487
Total technology 10,276,050 11,185,335 9,629,912 1,555,423
Total expenditures 142,558,465$ 143,227,928$ 138,364,647$ 4,863,281$
99
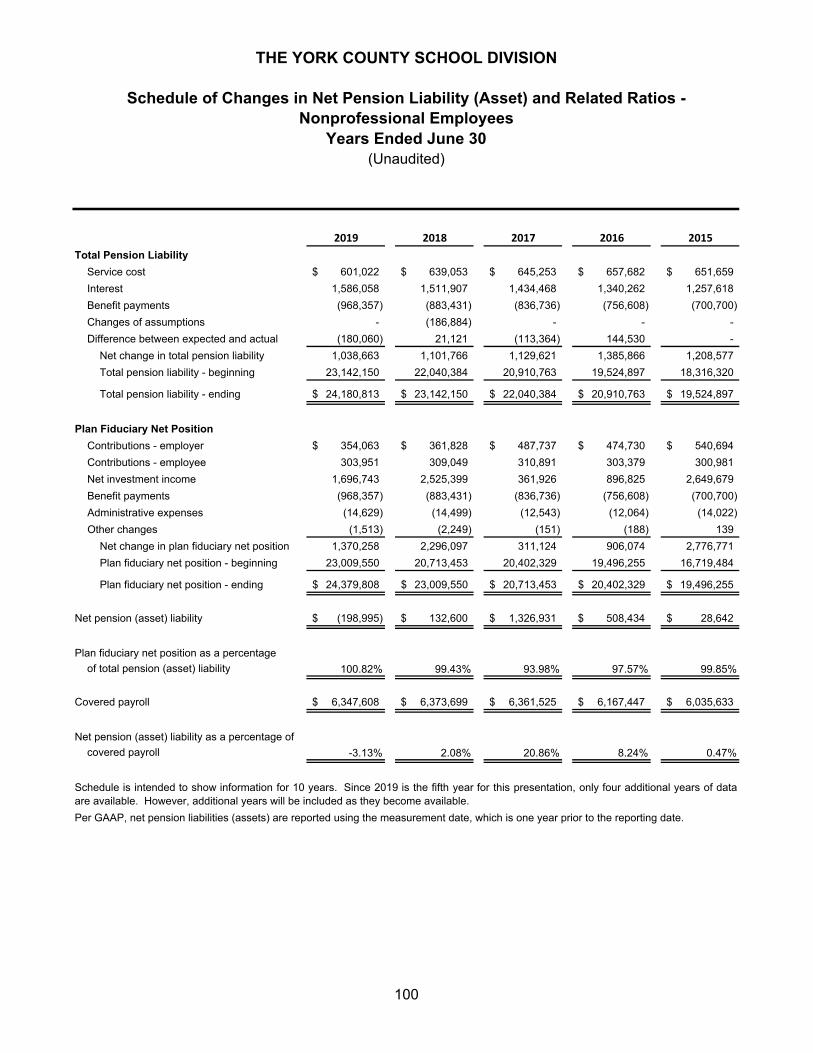
2019 2018 2017 2016 2015
Total Pension Liability
Service cost 601,022$ 639,053$ 645,253$ 657,682$ 651,659$
Interest 1,586,058 1,511,907 1,434,468 1,340,262 1,257,618
Benefit payments (968,357) (883,431) (836,736) (756,608) (700,700)
Changes of assumptions - (186,884) - - -
Difference between expected and actual (180,060) 21,121 (113,364) 144,530 -
Net change in total pension liability 1,038,663 1,101,766 1,129,621 1,385,866 1,208,577
Total pension liability - beginning 23,142,150 22,040,384 20,910,763 19,524,897 18,316,320
Total pension liability - ending 24,180,813$ 23,142,150$ 22,040,384$ 20,910,763$ 19,524,897$
Plan Fiduciary Net Position
Contributions - employer 354,063$ 361,828$ 487,737$ 474,730$ 540,694$
Contributions - employee 303,951 309,049 310,891 303,379 300,981
Net investment income 1,696,743 2,525,399 361,926 896,825 2,649,679
Benefit payments (968,357) (883,431) (836,736) (756,608) (700,700)
Administrative expenses (14,629) (14,499) (12,543) (12,064) (14,022)
Other changes (1,513) (2,249) (151) (188) 139
Net change in plan fiduciary net position 1,370,258 2,296,097 311,124 906,074 2,776,771
Plan fiduciary net position - beginning 23,009,550 20,713,453 20,402,329 19,496,255 16,719,484
Plan fiduciary net position - ending 24,379,808$ 23,009,550$ 20,713,453$ 20,402,329$ 19,496,255$
Net pension (asset) liability (198,995)$ 132,600$ 1,326,931$ 508,434$ 28,642$
Plan fiduciary net position as a percentage
of total pension (asset) liability 100.82% 99.43% 93.98% 97.57% 99.85%
Covered payroll 6,347,608$ 6,373,699$ 6,361,525$ 6,167,447$ 6,035,633$
Net pension (asset) liability as a percentage of
covered payroll -3.13% 2.08% 20.86% 8.24% 0.47%
Per GAAP, net pension liabilities (assets) are reported using the measurement date, which is one year prior to the reporting date.
Schedule is intended to show information for 10 years. Since 2019 is the fifth year for this presentation, only four additional years of dataare available. However, additional years will be included as they become available.
THE YORK COUNTY SCHOOL DIVISION
Schedule of Changes in Net Pension Liability (Asset) and Related Ratios -Nonprofessional Employees
Years Ended June 30(Unaudited)
100
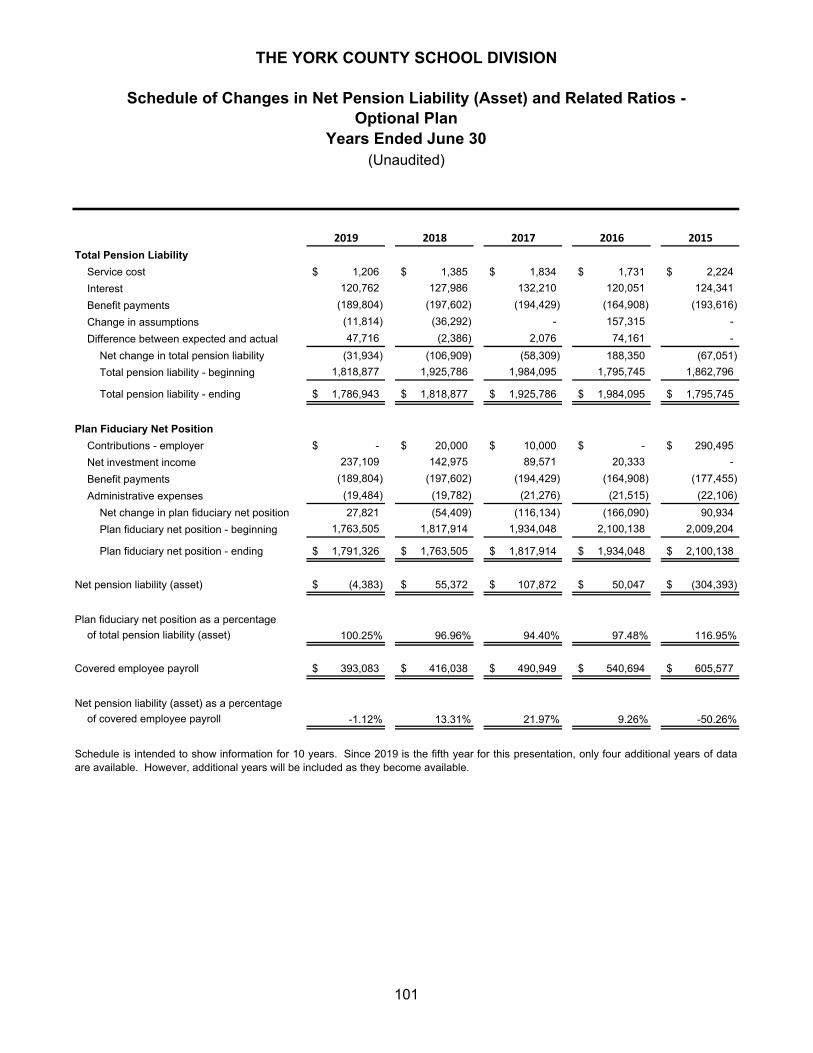
2019 2018 2017 2016 2015
Total Pension Liability
Service cost 1,206$ 1,385$ 1,834$ 1,731$ 2,224$
Interest 120,762 127,986 132,210 120,051 124,341
Benefit payments (189,804) (197,602) (194,429) (164,908) (193,616)
Change in assumptions (11,814) (36,292) - 157,315 -
Difference between expected and actual 47,716 (2,386) 2,076 74,161 -
Net change in total pension liability (31,934) (106,909) (58,309) 188,350 (67,051)
Total pension liability - beginning 1,818,877 1,925,786 1,984,095 1,795,745 1,862,796
Total pension liability - ending 1,786,943$ 1,818,877$ 1,925,786$ 1,984,095$ 1,795,745$
Plan Fiduciary Net Position
Contributions - employer -$ 20,000$ 10,000$ -$ 290,495$
Net investment income 237,109 142,975 89,571 20,333 -
Benefit payments (189,804) (197,602) (194,429) (164,908) (177,455)
Administrative expenses (19,484) (19,782) (21,276) (21,515) (22,106)
Net change in plan fiduciary net position 27,821 (54,409) (116,134) (166,090) 90,934
Plan fiduciary net position - beginning 1,763,505 1,817,914 1,934,048 2,100,138 2,009,204
Plan fiduciary net position - ending 1,791,326$ 1,763,505$ 1,817,914$ 1,934,048$ 2,100,138$
Net pension liability (asset) (4,383)$ 55,372$ 107,872$ 50,047$ (304,393)$
Plan fiduciary net position as a percentage
of total pension liability (asset) 100.25% 96.96% 94.40% 97.48% 116.95%
Covered employee payroll 393,083$ 416,038$ 490,949$ 540,694$ 605,577$
Net pension liability (asset) as a percentage
of covered employee payroll -1.12% 13.31% 21.97% 9.26% -50.26%
Schedule is intended to show information for 10 years. Since 2019 is the fifth year for this presentation, only four additional years of dataare available. However, additional years will be included as they become available.
THE YORK COUNTY SCHOOL DIVISION
Schedule of Changes in Net Pension Liability (Asset) and Related Ratios -
Years Ended June 30Optional Plan
(Unaudited)
101
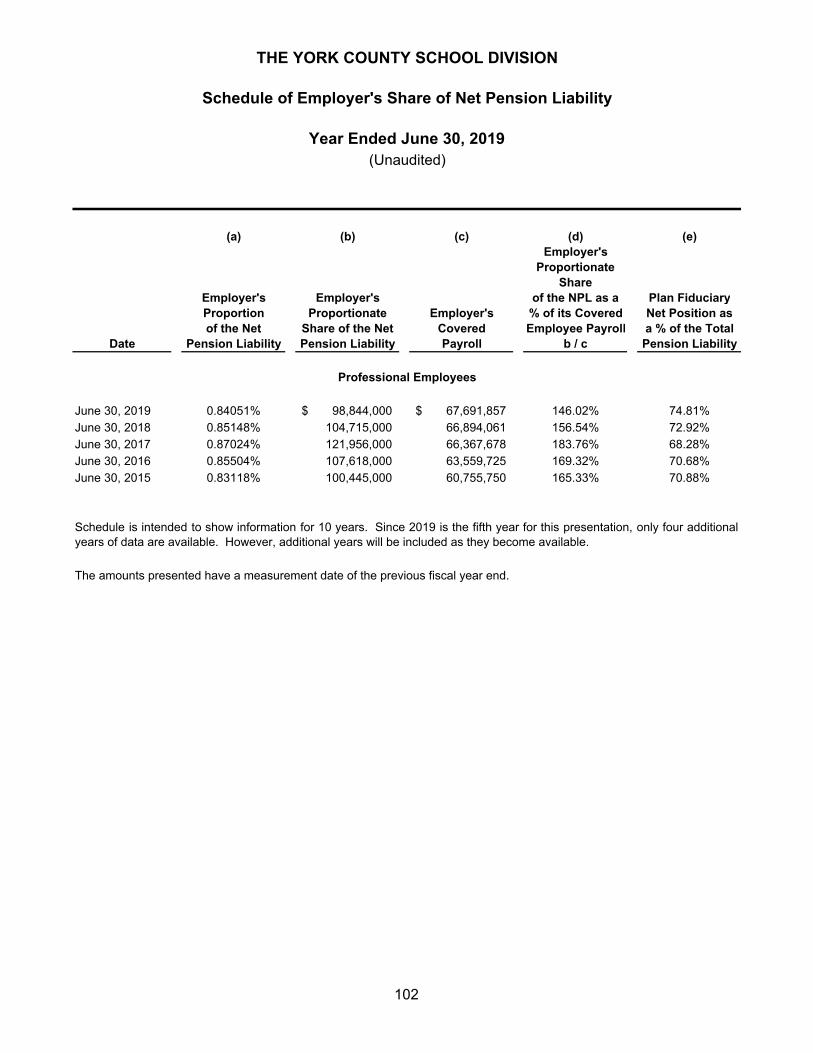
(a) (b) (c) (d) (e)Employer's
ProportionateShare
Employer's Employer's of the NPL as a Plan FiduciaryProportion Proportionate Employer's % of its Covered Net Position asof the Net Share of the Net Covered Employee Payroll a % of the Total
Date Pension Liability Pension Liability Payroll b / c Pension Liability
June 30, 2019 0.84051% 98,844,000$ 67,691,857$ 146.02% 74.81%
June 30, 2018 0.85148% 104,715,000 66,894,061 156.54% 72.92%
June 30, 2017 0.87024% 121,956,000 66,367,678 183.76% 68.28%
June 30, 2016 0.85504% 107,618,000 63,559,725 169.32% 70.68%
June 30, 2015 0.83118% 100,445,000 60,755,750 165.33% 70.88%
The amounts presented have a measurement date of the previous fiscal year end.
Schedule is intended to show information for 10 years. Since 2019 is the fifth year for this presentation, only four additionalyears of data are available. However, additional years will be included as they become available.
Professional Employees
THE YORK COUNTY SCHOOL DIVISION
Schedule of Employer's Share of Net Pension Liability
Year Ended June 30, 2019(Unaudited)
102
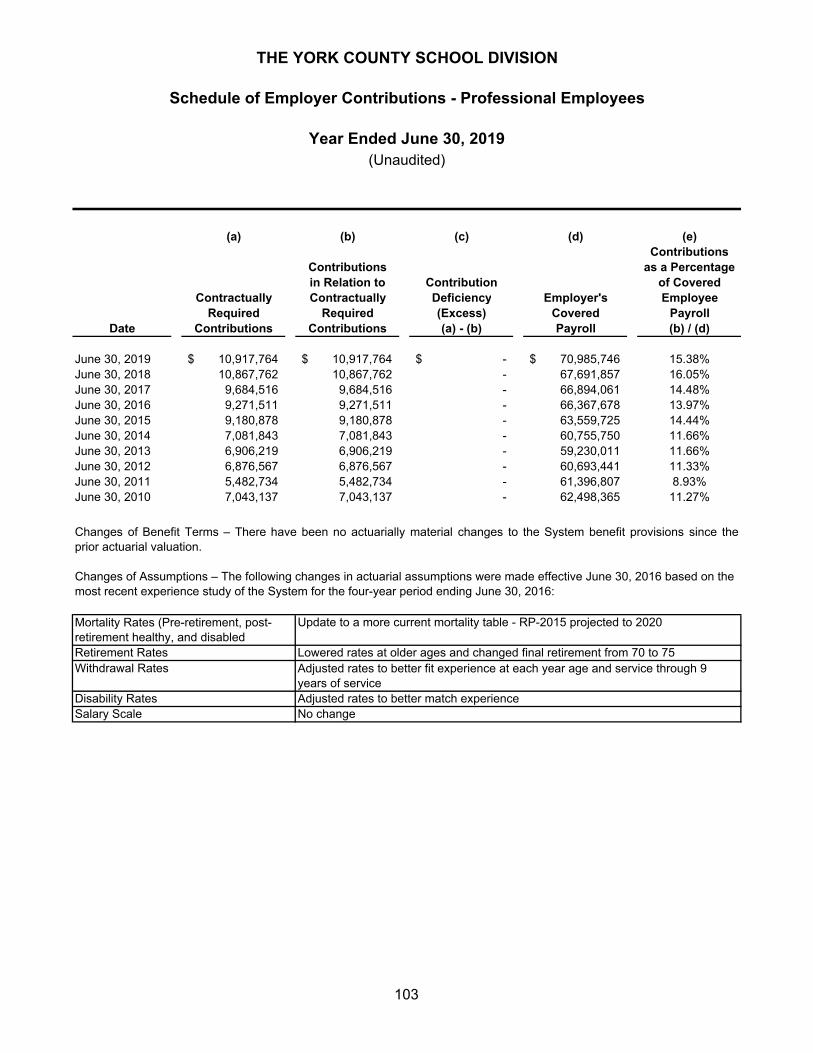
(a) (b) (c) (d) (e)Contributions
Contributions as a Percentagein Relation to Contribution of Covered
Contractually Contractually Deficiency Employer's EmployeeRequired Required (Excess) Covered Payroll
Date Contributions Contributions (a) - (b) Payroll (b) / (d)
June 30, 2019 10,917,764$ 10,917,764$ -$ 70,985,746$ 15.38%June 30, 2018 10,867,762 10,867,762 - 67,691,857 16.05%June 30, 2017 9,684,516 9,684,516 - 66,894,061 14.48%June 30, 2016 9,271,511 9,271,511 - 66,367,678 13.97%June 30, 2015 9,180,878 9,180,878 - 63,559,725 14.44%June 30, 2014 7,081,843 7,081,843 - 60,755,750 11.66%June 30, 2013 6,906,219 6,906,219 - 59,230,011 11.66%June 30, 2012 6,876,567 6,876,567 - 60,693,441 11.33%June 30, 2011 5,482,734 5,482,734 - 61,396,807 8.93%June 30, 2010 7,043,137 7,043,137 - 62,498,365 11.27%
Disability Rates Adjusted rates to better match experienceSalary Scale No change
Mortality Rates (Pre-retirement, post-retirement healthy, and disabled
Update to a more current mortality table - RP-2015 projected to 2020
Lowered rates at older ages and changed final retirement from 70 to 75Retirement RatesAdjusted rates to better fit experience at each year age and service through 9 years of service
Withdrawal Rates
Changes of Benefit Terms – There have been no actuarially material changes to the System benefit provisions since theprior actuarial valuation.
Changes of Assumptions – The following changes in actuarial assumptions were made effective June 30, 2016 based on the most recent experience study of the System for the four-year period ending June 30, 2016:
THE YORK COUNTY SCHOOL DIVISION
Schedule of Employer Contributions - Professional Employees
Year Ended June 30, 2019(Unaudited)
103
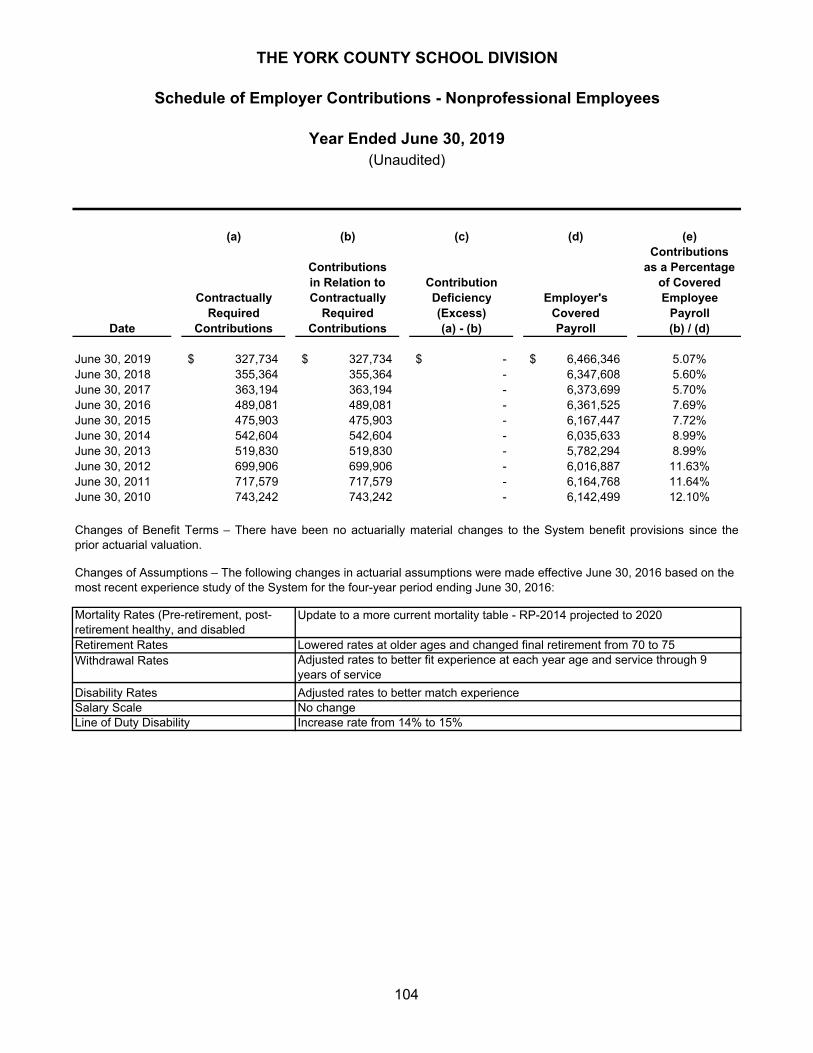
(a) (b) (c) (d) (e)Contributions
Contributions as a Percentagein Relation to Contribution of Covered
Contractually Contractually Deficiency Employer's EmployeeRequired Required (Excess) Covered Payroll
Date Contributions Contributions (a) - (b) Payroll (b) / (d)
June 30, 2019 327,734$ 327,734$ -$ 6,466,346$ 5.07%June 30, 2018 355,364 355,364 - 6,347,608 5.60%June 30, 2017 363,194 363,194 - 6,373,699 5.70%June 30, 2016 489,081 489,081 - 6,361,525 7.69%June 30, 2015 475,903 475,903 - 6,167,447 7.72%June 30, 2014 542,604 542,604 - 6,035,633 8.99%June 30, 2013 519,830 519,830 - 5,782,294 8.99%June 30, 2012 699,906 699,906 - 6,016,887 11.63%June 30, 2011 717,579 717,579 - 6,164,768 11.64%June 30, 2010 743,242 743,242 - 6,142,499 12.10%
Disability Rates Adjusted rates to better match experienceSalary Scale No changeLine of Duty Disability Increase rate from 14% to 15%
Mortality Rates (Pre-retirement, post-retirement healthy, and disabled
Update to a more current mortality table - RP-2014 projected to 2020
Retirement Rates Lowered rates at older ages and changed final retirement from 70 to 75Withdrawal Rates Adjusted rates to better fit experience at each year age and service through 9
years of service
Changes of Assumptions – The following changes in actuarial assumptions were made effective June 30, 2016 based on the most recent experience study of the System for the four-year period ending June 30, 2016:
THE YORK COUNTY SCHOOL DIVISION
Schedule of Employer Contributions - Nonprofessional Employees
Year Ended June 30, 2019
Changes of Benefit Terms – There have been no actuarially material changes to the System benefit provisions since theprior actuarial valuation.
(Unaudited)
104
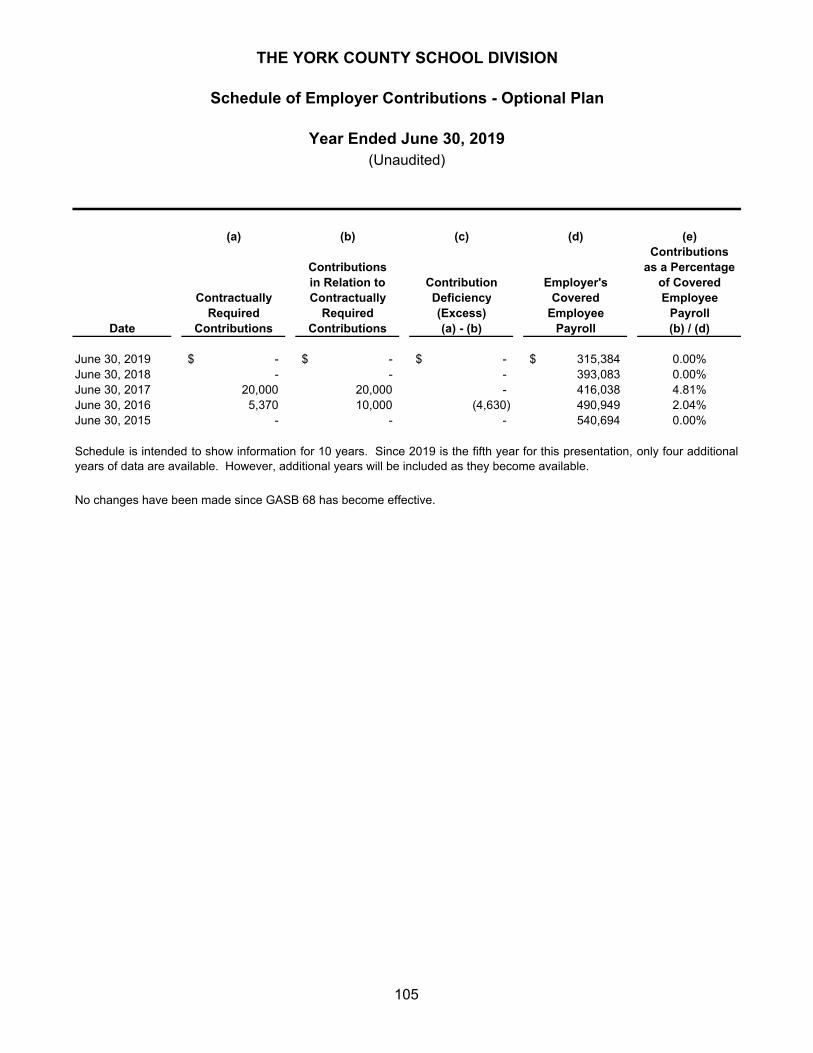
(a) (b) (c) (d) (e)Contributions
Contributions as a Percentagein Relation to Contribution Employer's of Covered
Contractually Contractually Deficiency Covered EmployeeRequired Required (Excess) Employee Payroll
Date Contributions Contributions (a) - (b) Payroll (b) / (d)
June 30, 2019 -$ -$ -$ 315,384$ 0.00%June 30, 2018 - - - 393,083 0.00%June 30, 2017 20,000 20,000 - 416,038 4.81%June 30, 2016 5,370 10,000 (4,630) 490,949 2.04%June 30, 2015 - - - 540,694 0.00%
THE YORK COUNTY SCHOOL DIVISION
Schedule of Employer Contributions - Optional Plan
Year Ended June 30, 2019
Schedule is intended to show information for 10 years. Since 2019 is the fifth year for this presentation, only four additionalyears of data are available. However, additional years will be included as they become available.
No changes have been made since GASB 68 has become effective.
(Unaudited)
105
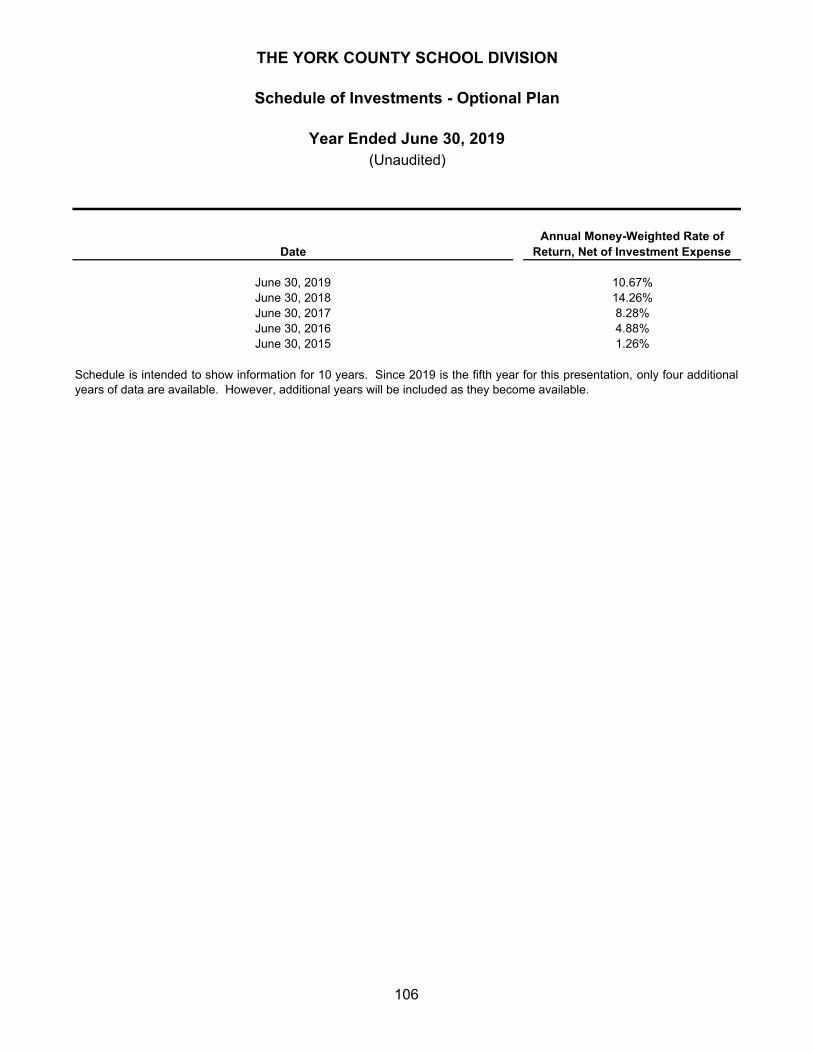
Schedule is intended to show information for 10 years. Since 2019 is the fifth year for this presentation, only four additionalyears of data are available. However, additional years will be included as they become available.
June 30, 2016 4.88%1.26%
THE YORK COUNTY SCHOOL DIVISION
Schedule of Investments - Optional Plan
Year Ended June 30, 2019(Unaudited)
Annual Money-Weighted Rate of Return, Net of Investment Expense
June 30, 2019 10.67%
Date
June 30, 2015
June 30, 2017 8.28%June 30, 2018 14.26%
106
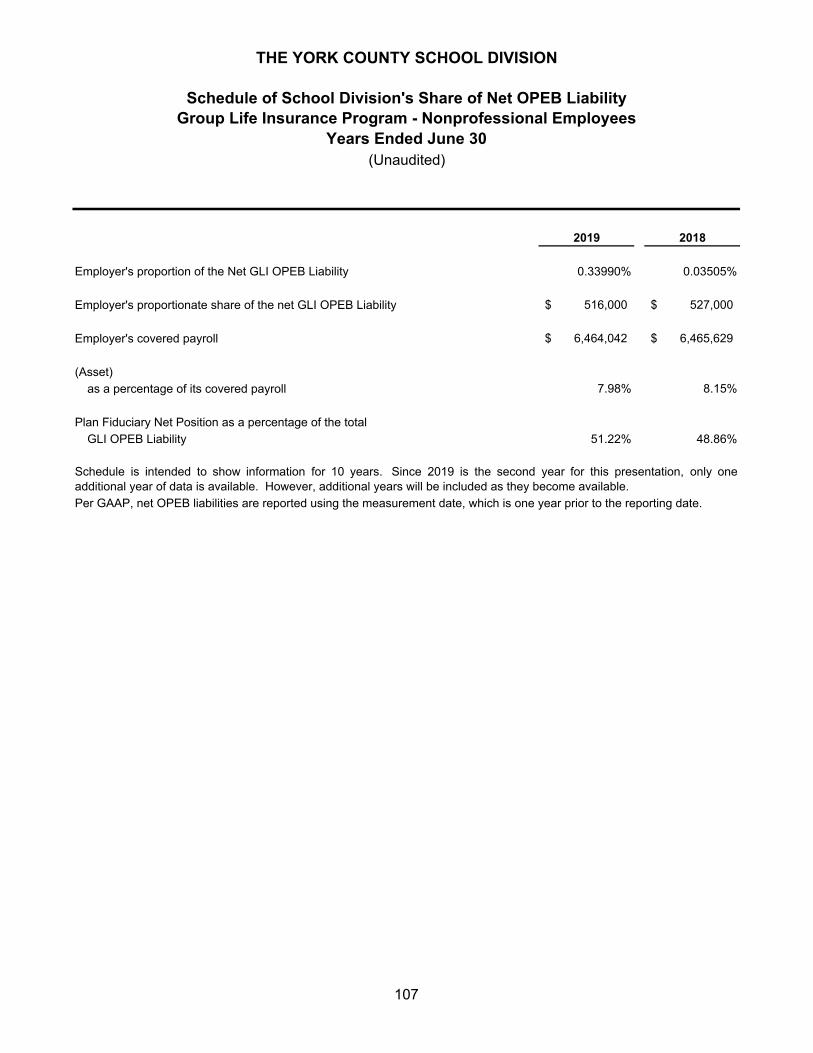
2019 2018
Employer's proportion of the Net GLI OPEB Liability 0.33990% 0.03505%
Employer's proportionate share of the net GLI OPEB Liability 516,000$ 527,000$
Employer's covered payroll 6,464,042$ 6,465,629$
(Asset)
as a percentage of its covered payroll 7.98% 8.15%
Plan Fiduciary Net Position as a percentage of the total
GLI OPEB Liability 51.22% 48.86%
Per GAAP, net OPEB liabilities are reported using the measurement date, which is one year prior to the reporting date.
THE YORK COUNTY SCHOOL DIVISION
Schedule of School Division's Share of Net OPEB Liability
Years Ended June 30(Unaudited)
Schedule is intended to show information for 10 years. Since 2019 is the second year for this presentation, only oneadditional year of data is available. However, additional years will be included as they become available.
Group Life Insurance Program - Nonprofessional Employees
107
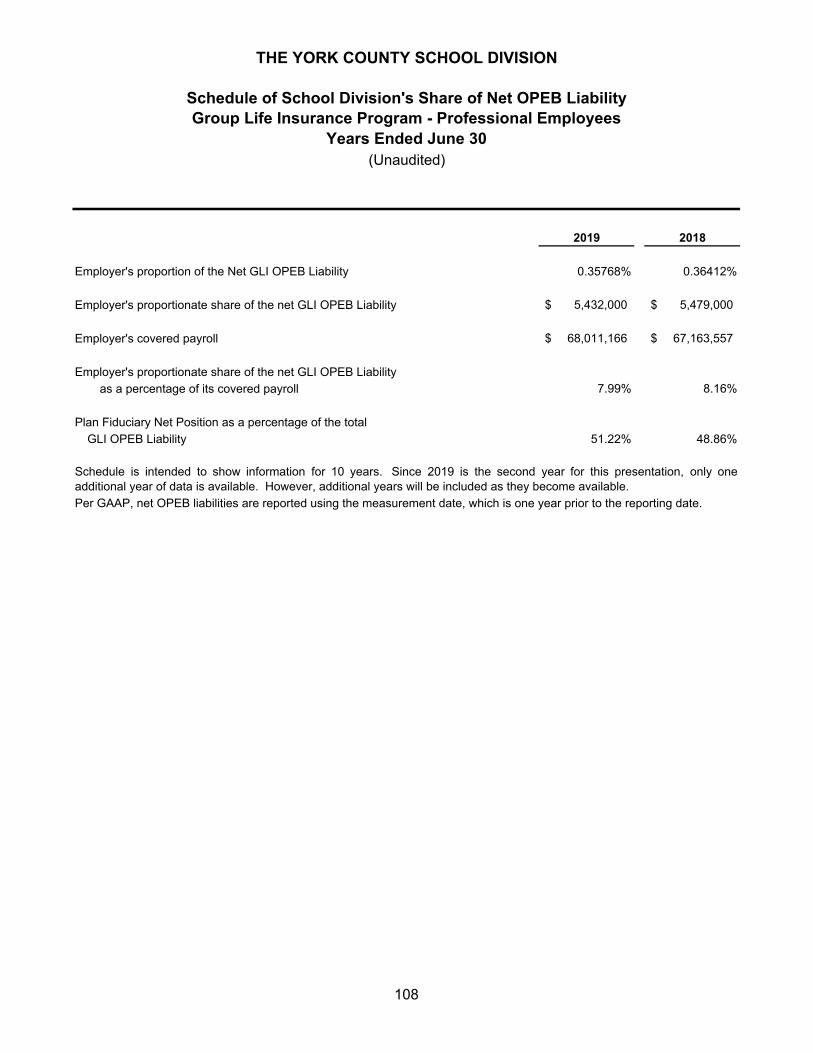
2019 2018
Employer's proportion of the Net GLI OPEB Liability 0.35768% 0.36412%
Employer's proportionate share of the net GLI OPEB Liability 5,432,000$ 5,479,000$
Employer's covered payroll 68,011,166$ 67,163,557$
Employer's proportionate share of the net GLI OPEB Liability
as a percentage of its covered payroll 7.99% 8.16%
Plan Fiduciary Net Position as a percentage of the total
GLI OPEB Liability 51.22% 48.86%
Per GAAP, net OPEB liabilities are reported using the measurement date, which is one year prior to the reporting date.
Schedule is intended to show information for 10 years. Since 2019 is the second year for this presentation, only oneadditional year of data is available. However, additional years will be included as they become available.
THE YORK COUNTY SCHOOL DIVISION
Schedule of School Division's Share of Net OPEB LiabilityGroup Life Insurance Program - Professional Employees
Years Ended June 30(Unaudited)
108

2019 2018
Employer's proportion of the Net HIC OPEB Liability 0.83687% 0.84856%
Employer's proportionate share of the net HIC OPEB Liability 10,626,000$ 10,765,000$
Employer's covered payroll 67,680,531$ 66,968,466$
Employer's proportionate share of the net HIC OPEB Liability
as a percentage of its covered payroll 15.70% 16.07%
Plan Fiduciary Net Position as a percentage of the total
HIC OPEB Liability 8.08% 7.04%
Per GAAP, net OPEB liabilities are reported using the measurement date, which is one year prior to the reporting date.
Schedule is intended to show information for 10 years. Since 2019 is the second year for this presentation, only oneadditional year of data is available. However, additional years will be included as they become available.
THE YORK COUNTY SCHOOL DIVISION
Schedule of School Division's Share of Net OPEB LiabilityHealth Insurance Credit Program - Professional Employees
Years Ended June 30(Unaudited)
109
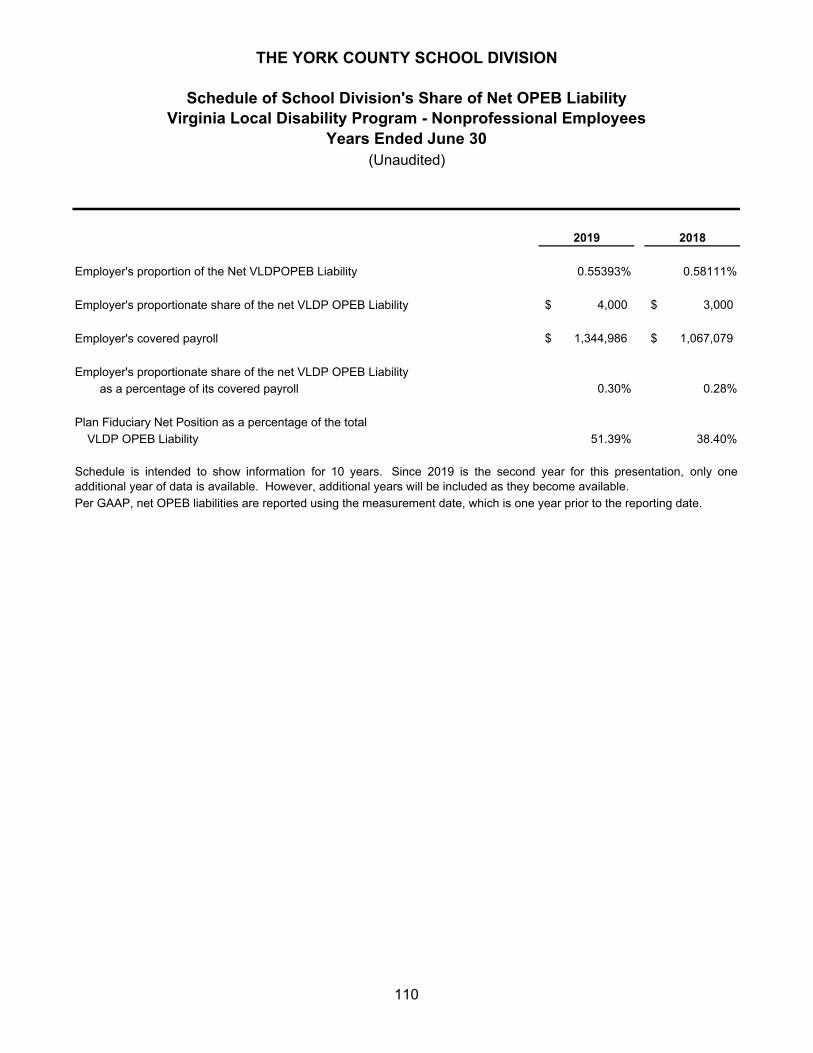
2019 2018
Employer's proportion of the Net VLDPOPEB Liability 0.55393% 0.58111%
Employer's proportionate share of the net VLDP OPEB Liability 4,000$ 3,000$
Employer's covered payroll 1,344,986$ 1,067,079$
Employer's proportionate share of the net VLDP OPEB Liability
as a percentage of its covered payroll 0.30% 0.28%
Plan Fiduciary Net Position as a percentage of the total
VLDP OPEB Liability 51.39% 38.40%
Per GAAP, net OPEB liabilities are reported using the measurement date, which is one year prior to the reporting date.
Schedule is intended to show information for 10 years. Since 2019 is the second year for this presentation, only oneadditional year of data is available. However, additional years will be included as they become available.
THE YORK COUNTY SCHOOL DIVISION
Schedule of School Division's Share of Net OPEB LiabilityVirginia Local Disability Program - Nonprofessional Employees
Years Ended June 30(Unaudited)
110

2019 2018
Employer's proportion of the Net VLDPOPEB Liability 2.70217% 2.91011%
Employer's proportionate share of the net VLDP OPEB Liability 21,000$ 17,000$
Employer's covered payroll 10,075,546$ 8,212,334$
Employer's proportionate share of the net VLDP OPEB Liability
as a percentage of its covered payroll 0.21% 0.21%
Plan Fiduciary Net Position as a percentage of the total
VLDP OPEB Liability 46.18% 31.96%
Per GAAP, net OPEB liabilities are reported using the measurement date, which is one year prior to the reporting date.
Schedule is intended to show information for 10 years. Since 2019 is the second year for this presentation, only oneadditional year of data is available. However, additional years will be included as they become available.
THE YORK COUNTY SCHOOL DIVISION
Schedule of School Division's Share of Net OPEB LiabilityVirginia Local Disability Program - Professional Employees
Years Ended June 30(Unaudited)
111
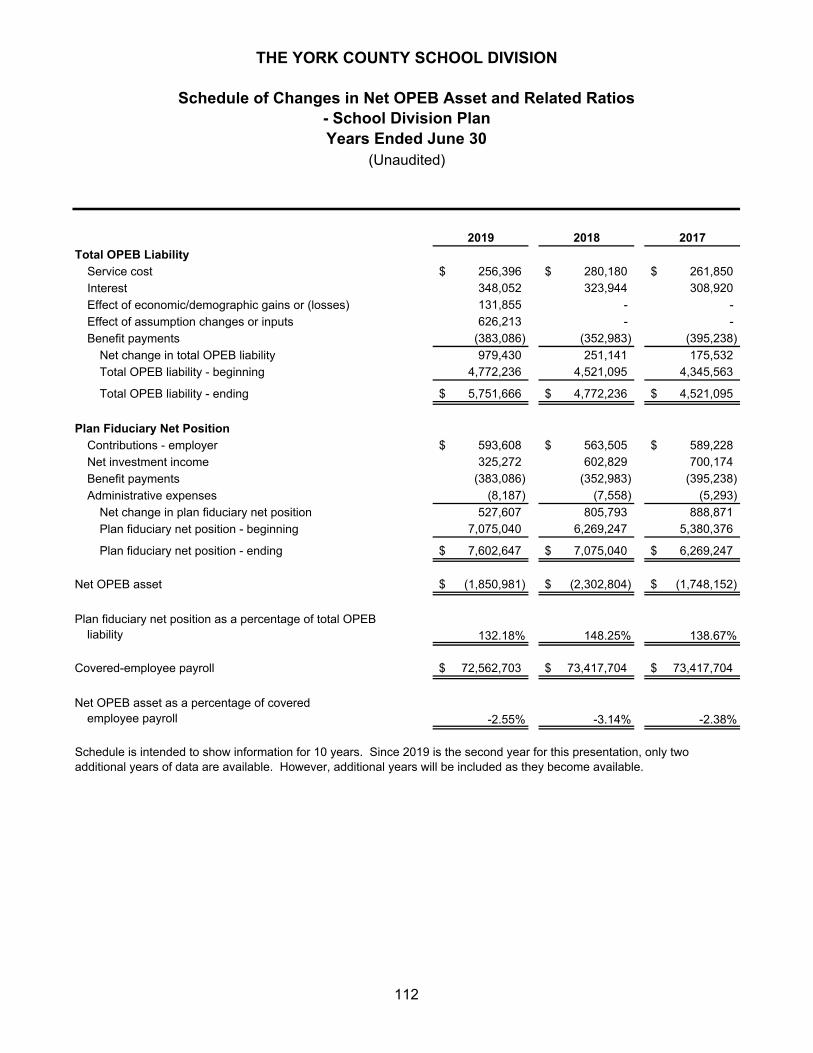
2019 2018 2017
Total OPEB Liability
Service cost 256,396$ 280,180$ 261,850$
Interest 348,052 323,944 308,920
Effect of economic/demographic gains or (losses) 131,855 - -
Effect of assumption changes or inputs 626,213 - -
Benefit payments (383,086) (352,983) (395,238)
Net change in total OPEB liability 979,430 251,141 175,532
Total OPEB liability - beginning 4,772,236 4,521,095 4,345,563
Total OPEB liability - ending 5,751,666$ 4,772,236$ 4,521,095$
Plan Fiduciary Net Position
Contributions - employer 593,608$ 563,505$ 589,228$
Net investment income 325,272 602,829 700,174
Benefit payments (383,086) (352,983) (395,238)
Administrative expenses (8,187) (7,558) (5,293)
Net change in plan fiduciary net position 527,607 805,793 888,871
Plan fiduciary net position - beginning 7,075,040 6,269,247 5,380,376
Plan fiduciary net position - ending 7,602,647$ 7,075,040$ 6,269,247$
Net OPEB asset (1,850,981)$ (2,302,804)$ (1,748,152)$
Plan fiduciary net position as a percentage of total OPEBliability 132.18% 148.25% 138.67%
Covered-employee payroll 72,562,703$ 73,417,704$ 73,417,704$
Net OPEB asset as a percentage of covered employee payroll -2.55% -3.14% -2.38%
(Unaudited)
THE YORK COUNTY SCHOOL DIVISION
Schedule of Changes in Net OPEB Asset and Related Ratios
Years Ended June 30
Schedule is intended to show information for 10 years. Since 2019 is the second year for this presentation, only two additional years of data are available. However, additional years will be included as they become available.
- School Division Plan
112
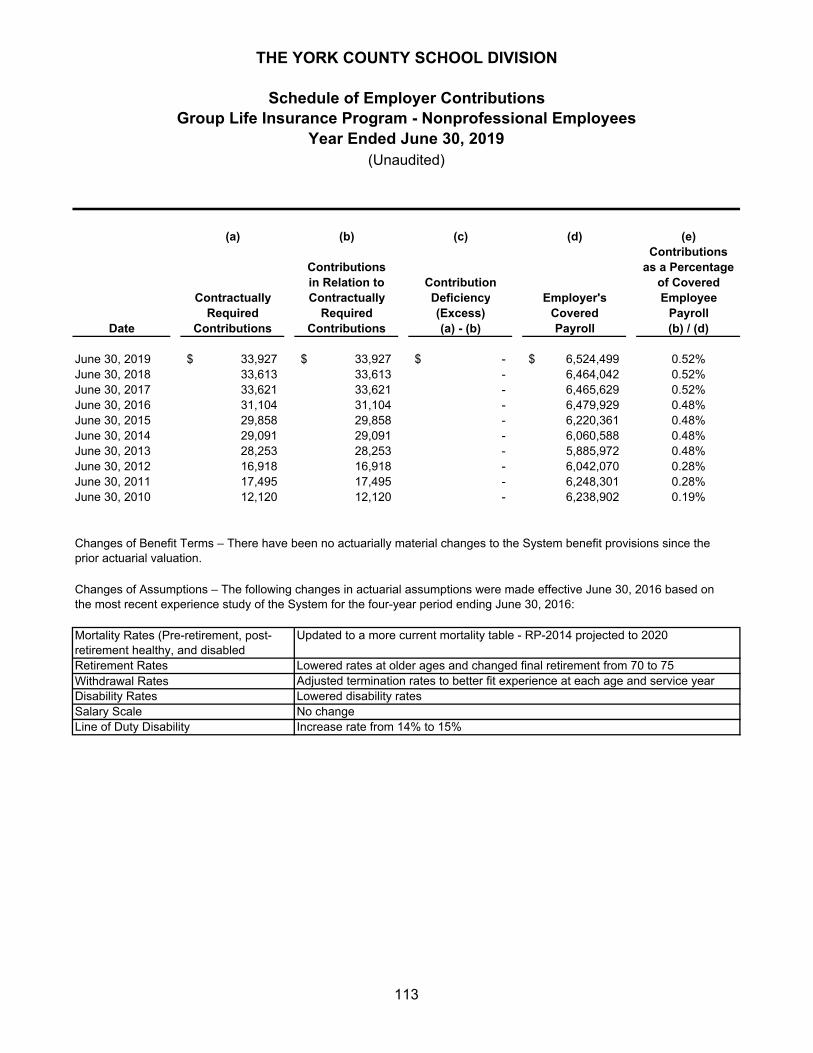
(a) (b) (c) (d) (e)Contributions
Contributions as a Percentagein Relation to Contribution of Covered
Contractually Contractually Deficiency Employer's EmployeeRequired Required (Excess) Covered Payroll
Date Contributions Contributions (a) - (b) Payroll (b) / (d)
June 30, 2019 33,927$ 33,927$ -$ 6,524,499$ 0.52%June 30, 2018 33,613 33,613 - 6,464,042 0.52%June 30, 2017 33,621 33,621 - 6,465,629 0.52%June 30, 2016 31,104 31,104 - 6,479,929 0.48%June 30, 2015 29,858 29,858 - 6,220,361 0.48%June 30, 2014 29,091 29,091 - 6,060,588 0.48%June 30, 2013 28,253 28,253 - 5,885,972 0.48%June 30, 2012 16,918 16,918 - 6,042,070 0.28%June 30, 2011 17,495 17,495 - 6,248,301 0.28%June 30, 2010 12,120 12,120 - 6,238,902 0.19%
Changes of Benefit Terms – There have been no actuarially material changes to the System benefit provisions since the prior actuarial valuation.
Changes of Assumptions – The following changes in actuarial assumptions were made effective June 30, 2016 based on the most recent experience study of the System for the four-year period ending June 30, 2016:
Withdrawal Rates Adjusted termination rates to better fit experience at each age and service yearDisability Rates Lowered disability rates
Mortality Rates (Pre-retirement, post-retirement healthy, and disabled
Updated to a more current mortality table - RP-2014 projected to 2020
Retirement Rates Lowered rates at older ages and changed final retirement from 70 to 75
Line of Duty Disability Increase rate from 14% to 15%Salary Scale No change
Group Life Insurance Program - Nonprofessional Employees
THE YORK COUNTY SCHOOL DIVISION
Schedule of Employer Contributions
Year Ended June 30, 2019(Unaudited)
113

(a) (b) (c) (d) (e)Contributions
Contributions as a Percentagein Relation to Contribution of Covered
Contractually Contractually Deficiency Employer's EmployeeRequired Required (Excess) Covered Payroll
Date Contributions Contributions (a) - (b) Payroll (b) / (d)
June 30, 2019 370,627$ 370,627$ -$ 71,274,389$ 0.52%June 30, 2018 353,658 353,658 - 68,011,166 0.52%June 30, 2017 349,251 349,251 - 67,163,557 0.52%June 30, 2016 319,402 319,402 - 66,542,088 0.48%June 30, 2015 306,106 306,106 - 63,772,157 0.48%June 30, 2014 292,259 292,259 - 60,887,315 0.48%June 30, 2013 284,574 284,574 - 59,286,277 0.48%June 30, 2012 170,304 170,304 - 60,822,776 0.28%June 30, 2011 172,205 172,205 - 61,501,849 0.28%June 30, 2010 120,348 120,348 - 62,630,962 0.19%
Retirement Rates Lowered rates at older ages and changed final retirement from 70 to 75Withdrawal Rates Adjusted rates to better fit experience at each year age and service through 9
years of serviceDisability Rates Adjusted rates to better match experienceSalary Scale No change
THE YORK COUNTY SCHOOL DIVISION
Schedule of Employer ContributionsGroup Life Insurance Program - Professional Employees
Year Ended June 30, 2019(Unaudited)
Changes of Benefit Terms – There have been no actuarially material changes to the System benefit provisions since the prior actuarial valuation.
Changes of Assumptions – The following changes in actuarial assumptions were made effective June 30, 2016 based on the most recent experience study of the System for the four-year period ending June 30, 2016:
Mortality Rates (Pre-retirement, post-retirement healthy, and disabled
Updated to a more current mortality table - RP-2014 projected to 2020
114
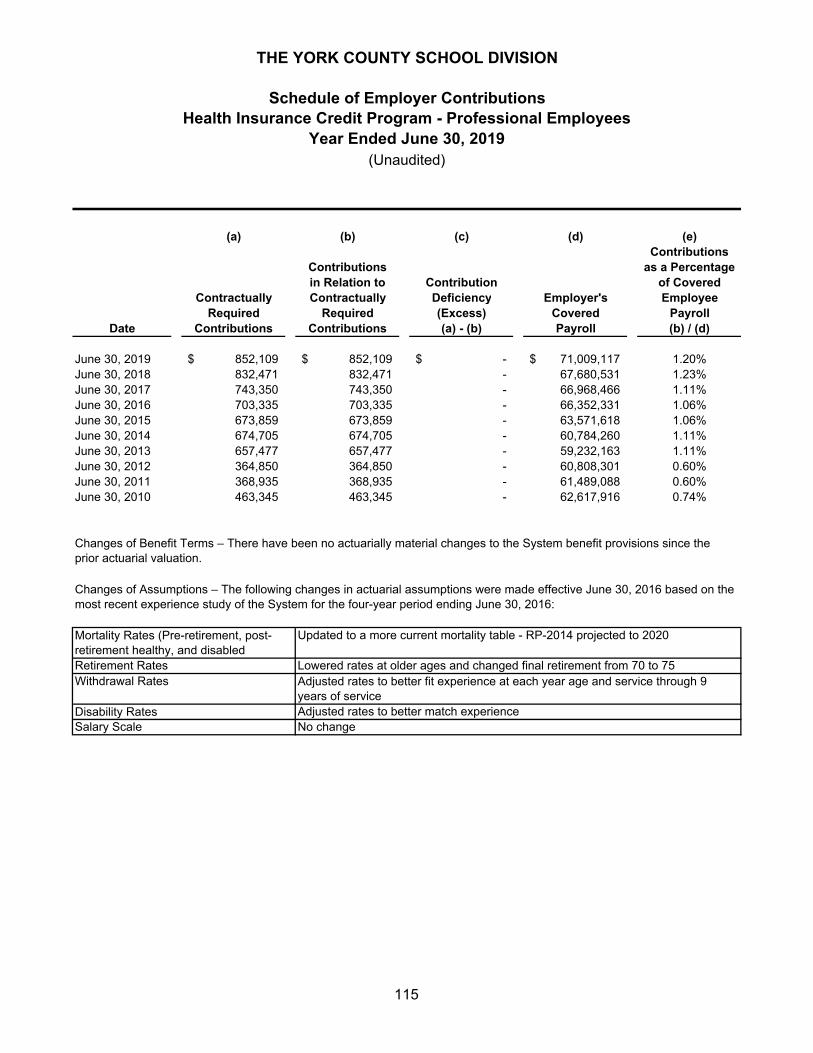
(a) (b) (c) (d) (e)Contributions
Contributions as a Percentagein Relation to Contribution of Covered
Contractually Contractually Deficiency Employer's EmployeeRequired Required (Excess) Covered Payroll
Date Contributions Contributions (a) - (b) Payroll (b) / (d)
June 30, 2019 852,109$ 852,109$ -$ 71,009,117$ 1.20%June 30, 2018 832,471 832,471 - 67,680,531 1.23%June 30, 2017 743,350 743,350 - 66,968,466 1.11%June 30, 2016 703,335 703,335 - 66,352,331 1.06%June 30, 2015 673,859 673,859 - 63,571,618 1.06%June 30, 2014 674,705 674,705 - 60,784,260 1.11%June 30, 2013 657,477 657,477 - 59,232,163 1.11%June 30, 2012 364,850 364,850 - 60,808,301 0.60%June 30, 2011 368,935 368,935 - 61,489,088 0.60%June 30, 2010 463,345 463,345 - 62,617,916 0.74%
Adjusted rates to better match experienceDisability Rates
Retirement Rates Lowered rates at older ages and changed final retirement from 70 to 75Withdrawal Rates Adjusted rates to better fit experience at each year age and service through 9
years of service
Salary Scale No change
THE YORK COUNTY SCHOOL DIVISION
Schedule of Employer ContributionsHealth Insurance Credit Program - Professional Employees
Year Ended June 30, 2019(Unaudited)
Changes of Benefit Terms – There have been no actuarially material changes to the System benefit provisions since the prior actuarial valuation.
Changes of Assumptions – The following changes in actuarial assumptions were made effective June 30, 2016 based on the most recent experience study of the System for the four-year period ending June 30, 2016:
Mortality Rates (Pre-retirement, post-retirement healthy, and disabled
Updated to a more current mortality table - RP-2014 projected to 2020
115
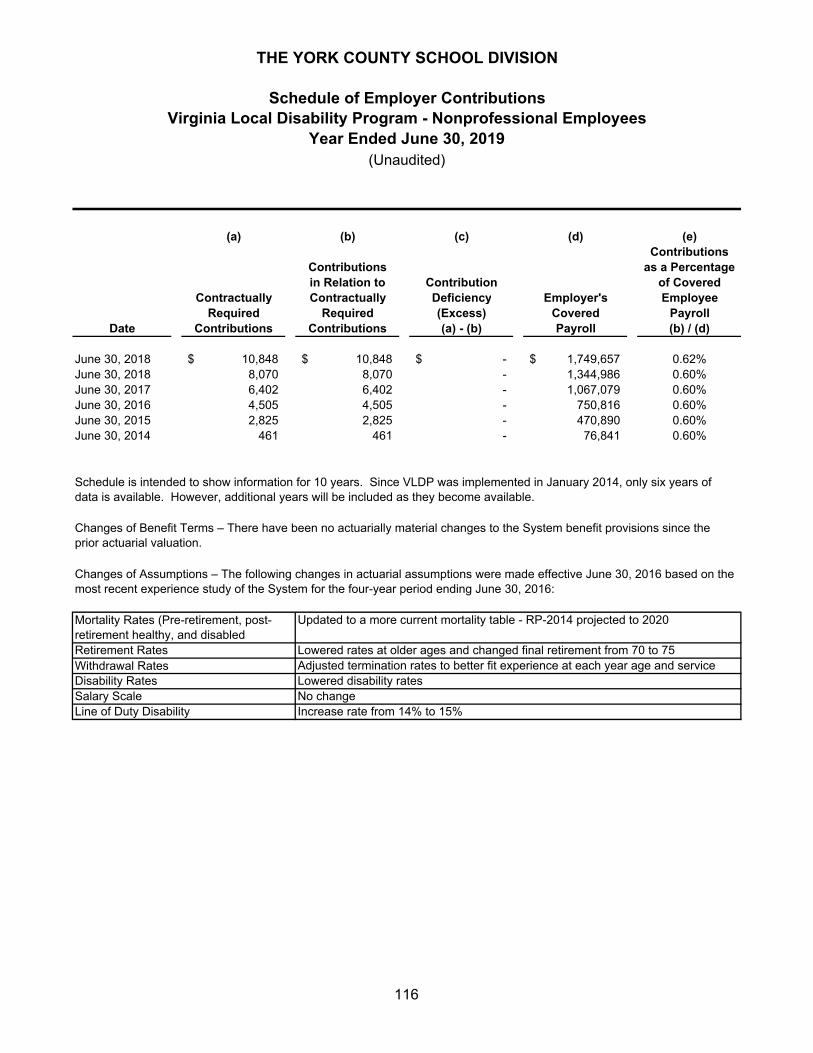
(a) (b) (c) (d) (e)Contributions
Contributions as a Percentagein Relation to Contribution of Covered
Contractually Contractually Deficiency Employer's EmployeeRequired Required (Excess) Covered Payroll
Date Contributions Contributions (a) - (b) Payroll (b) / (d)
June 30, 2018 10,848$ 10,848$ -$ 1,749,657$ 0.62%June 30, 2018 8,070 8,070 - 1,344,986 0.60%June 30, 2017 6,402 6,402 - 1,067,079 0.60%June 30, 2016 4,505 4,505 - 750,816 0.60%June 30, 2015 2,825 2,825 - 470,890 0.60%June 30, 2014 461 461 - 76,841 0.60%
Line of Duty Disability Increase rate from 14% to 15%
Disability Rates Lowered disability ratesSalary Scale No change
Retirement Rates Lowered rates at older ages and changed final retirement from 70 to 75Withdrawal Rates Adjusted termination rates to better fit experience at each year age and service
Changes of Benefit Terms – There have been no actuarially material changes to the System benefit provisions since the prior actuarial valuation.
Changes of Assumptions – The following changes in actuarial assumptions were made effective June 30, 2016 based on the most recent experience study of the System for the four-year period ending June 30, 2016:
Mortality Rates (Pre-retirement, post-retirement healthy, and disabled
Updated to a more current mortality table - RP-2014 projected to 2020
Schedule is intended to show information for 10 years. Since VLDP was implemented in January 2014, only six years of data is available. However, additional years will be included as they become available.
THE YORK COUNTY SCHOOL DIVISION
Schedule of Employer ContributionsVirginia Local Disability Program - Nonprofessional Employees
Year Ended June 30, 2019(Unaudited)
116
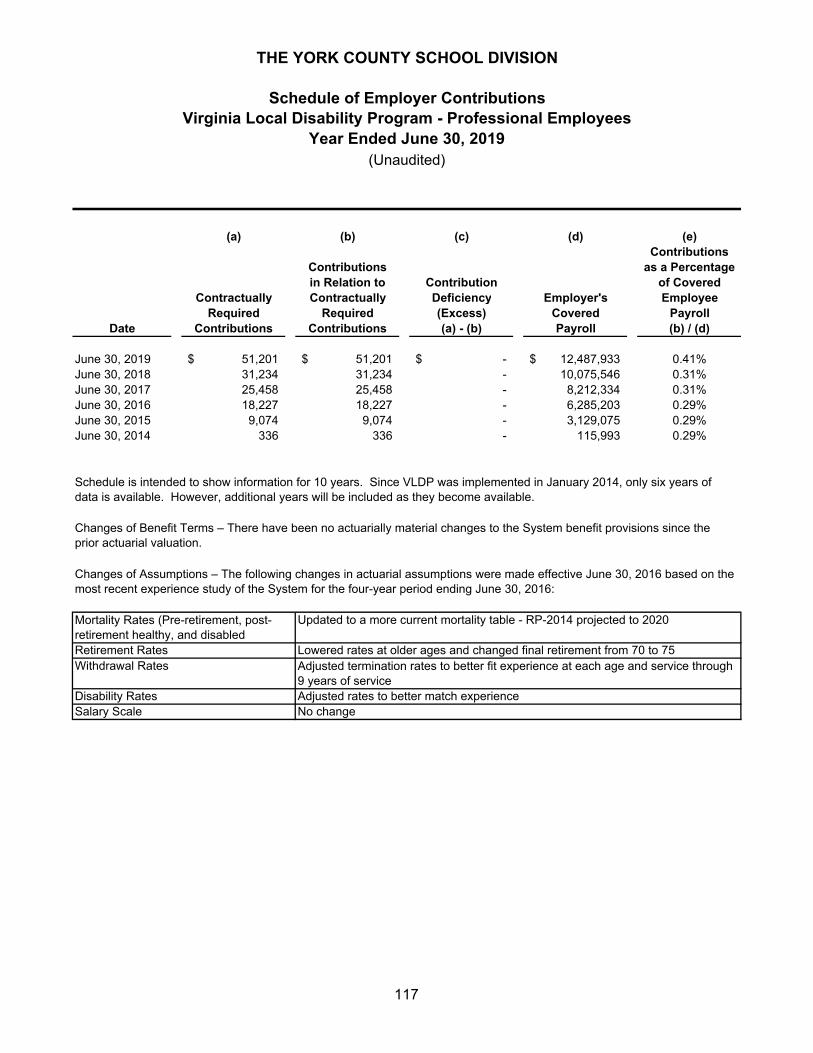
(a) (b) (c) (d) (e)Contributions
Contributions as a Percentagein Relation to Contribution of Covered
Contractually Contractually Deficiency Employer's EmployeeRequired Required (Excess) Covered Payroll
Date Contributions Contributions (a) - (b) Payroll (b) / (d)
June 30, 2019 51,201$ 51,201$ -$ 12,487,933$ 0.41%June 30, 2018 31,234 31,234 - 10,075,546 0.31%June 30, 2017 25,458 25,458 - 8,212,334 0.31%June 30, 2016 18,227 18,227 - 6,285,203 0.29%June 30, 2015 9,074 9,074 - 3,129,075 0.29%June 30, 2014 336 336 - 115,993 0.29%
Retirement Rates Lowered rates at older ages and changed final retirement from 70 to 75Withdrawal Rates Adjusted termination rates to better fit experience at each age and service through
9 years of serviceDisability Rates Adjusted rates to better match experience
Changes of Benefit Terms – There have been no actuarially material changes to the System benefit provisions since the prior actuarial valuation.
Changes of Assumptions – The following changes in actuarial assumptions were made effective June 30, 2016 based on the most recent experience study of the System for the four-year period ending June 30, 2016:
Mortality Rates (Pre-retirement, post-retirement healthy, and disabled
Updated to a more current mortality table - RP-2014 projected to 2020
Salary Scale No change
Schedule is intended to show information for 10 years. Since VLDP was implemented in January 2014, only six years of data is available. However, additional years will be included as they become available.
THE YORK COUNTY SCHOOL DIVISION
Schedule of Employer ContributionsVirginia Local Disability Program - Professional Employees
Year Ended June 30, 2019(Unaudited)
117
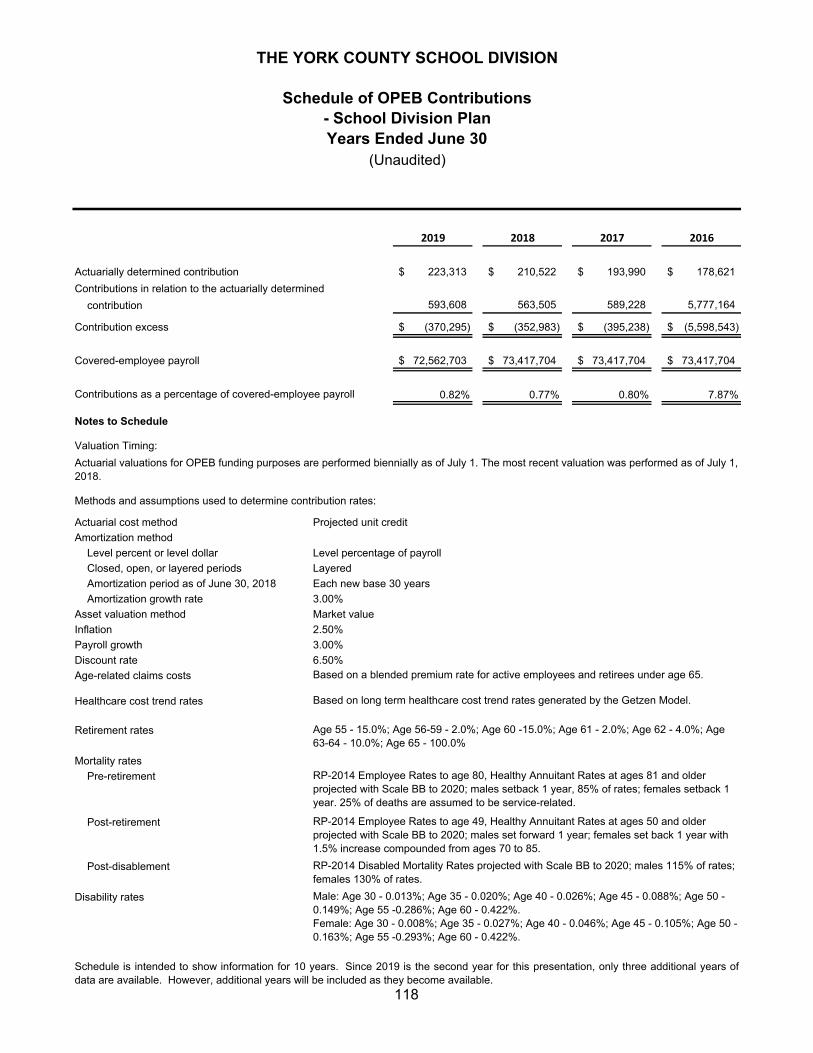
2019 2018 2017 2016
Actuarially determined contribution 223,313$ 210,522$ 193,990$ 178,621$
Contributions in relation to the actuarially determined
contribution 593,608 563,505 589,228 5,777,164
Contribution excess (370,295)$ (352,983)$ (395,238)$ (5,598,543)$
Covered-employee payroll 72,562,703$ 73,417,704$ 73,417,704$ 73,417,704$
Contributions as a percentage of covered-employee payroll 0.82% 0.77% 0.80% 7.87%
Notes to Schedule
Valuation Timing:
Actuarial cost method Projected unit credit
Amortization method
Level percent or level dollar Level percentage of payroll
Closed, open, or layered periods Layered
Amortization period as of June 30, 2018 Each new base 30 years
Amortization growth rate 3.00%
Asset valuation method Market value
Inflation 2.50%
Payroll growth 3.00%
Discount rate 6.50%
Age-related claims costs
Healthcare cost trend rates
Retirement rates
Mortality rates
Pre-retirement
Post-retirement
Post-disablement
Disability rates
Schedule is intended to show information for 10 years. Since 2019 is the second year for this presentation, only three additional years ofdata are available. However, additional years will be included as they become available.
Actuarial valuations for OPEB funding purposes are performed biennially as of July 1. The most recent valuation was performed as of July 1, 2018.
Methods and assumptions used to determine contribution rates:
- School Division Plan
THE YORK COUNTY SCHOOL DIVISION
Schedule of OPEB Contributions
Years Ended June 30(Unaudited)
Based on long term healthcare cost trend rates generated by the Getzen Model.
Based on a blended premium rate for active employees and retirees under age 65.
Age 55 - 15.0%; Age 56-59 - 2.0%; Age 60 -15.0%; Age 61 - 2.0%; Age 62 - 4.0%; Age 63-64 - 10.0%; Age 65 - 100.0%
RP-2014 Employee Rates to age 80, Healthy Annuitant Rates at ages 81 and older projected with Scale BB to 2020; males setback 1 year, 85% of rates; females setback 1 year. 25% of deaths are assumed to be service-related.
RP-2014 Employee Rates to age 49, Healthy Annuitant Rates at ages 50 and older projected with Scale BB to 2020; males set forward 1 year; females set back 1 year with 1.5% increase compounded from ages 70 to 85.
Male: Age 30 - 0.013%; Age 35 - 0.020%; Age 40 - 0.026%; Age 45 - 0.088%; Age 50 - 0.149%; Age 55 -0.286%; Age 60 - 0.422%.Female: Age 30 - 0.008%; Age 35 - 0.027%; Age 40 - 0.046%; Age 45 - 0.105%; Age 50 - 0.163%; Age 55 -0.293%; Age 60 - 0.422%.
RP-2014 Disabled Mortality Rates projected with Scale BB to 2020; males 115% of rates; females 130% of rates.
118
THE YORK COUNTY SCHOOL DIVISION
Notes to Required Supplementary Information June 30, 2018 (Unaudited)
119
1. BUDGETARY DATA The School Division follows these procedures in establishing the budgetary data reflected in the basic financial statements: As required under Section 22.1-92 of the Code of Virginia, the Division Superintendent prepares an estimate of the amount of money deemed to be needed in the General Fund, Special Revenue Fund, and Capital Projects Fund during the next fiscal year for the support of the public schools of the School Division. The estimate is required to be allocated for each major classification prescribed by the State Division of Education. Section 22.1-115 of the Code of Virginia states “the Division shall prescribe the following major classifications for expenditures of school funds: (i) instruction, (ii) administration, attendance, and health, (iii) pupil transportation, (iv) operation and maintenance, (v) school food services and other non-instructional operations, (vi) facilities, and (vii) debt and fund transfers.” The Superintendent’s proposed budget is based on budget requests prepared by administrative and supervisory staff. The Superintendent also receives input from the School Division, Employee Associations, Parent Teacher Associations, County Administrator, etc., in formulating the budget proposal. Citizen input is provided via a public forum early in the budget process. After the Superintendent’s budget is made public, the School Division conducts a public hearing on the proposed budget. The School Division is required by State law (Section 22.1-92 of the Code of Virginia) to conduct a public hearing on the proposed budget to receive the views of citizens. The School Division also holds several work sessions on the proposed budget and modifies the proposed budget if necessary. The School Division must approve the budget by April 1 and submit it to the Board of Supervisors for the County of York for its approval. The Board of Supervisors is required by State law to approve a School Division budget by May 1. If the Board of Supervisors approves a local appropriation that is less than the amount the School Division requested, the School Division must reduce the proposed budget accordingly. The School Division appropriates funds on a major classification level and may make supplemental appropriations based on the availability of financial resources. The Division Superintendent may only authorize the transfer of funds within the major classification, the legal level of budgetary control. Every appropriation lapses at the close of the fiscal year to the extent that it has not been expended. Funding for projects such as the capital improvement program is reappropriated annually until the project has been accomplished or abandoned. The budgets are prepared on a basis consistent with the modified accrual basis of accounting. Budgeted amounts reflected in the required supplementary information are as originally adopted or as amended by the School Division. The General Fund’s budget is adopted on a basis of accounting consistent with U.S. GAAP.
THE YORK COUNTY SCHOOL DIVISION
Notes to Required Supplementary Information June 30, 2018 (Unaudited)
120
2. LEGALLY ADOPTED BUDGETS The general, capital projects, and special revenue funds have legally adopted annual budgets.
3. PENSION DATA The supplemental information presented is intended to help users assess each system’s funding status on a going concern basis, assess progress made in accumulating assets to pay benefits when due, and make comparisons with other public employee retirement systems. Information pertaining to the retirement systems can be found in the notes to the financial statements.
4. OTHER POSTEMPLOYMENT BENEFITS DATA Actuarial valuations involve estimates of the value of reported amounts and assumptions about the probability of events far into the future. Actuarially determined amounts are subject to continual revision as actual results are compared to past expectations and new estimates are made about the future. Information pertaining to the OPEB plan can be found in the notes to the financial statements.

THIS PAGE LEFT BLANK INTENTIONALLY

OTHER SUPPLEMENTARY INFORMATION
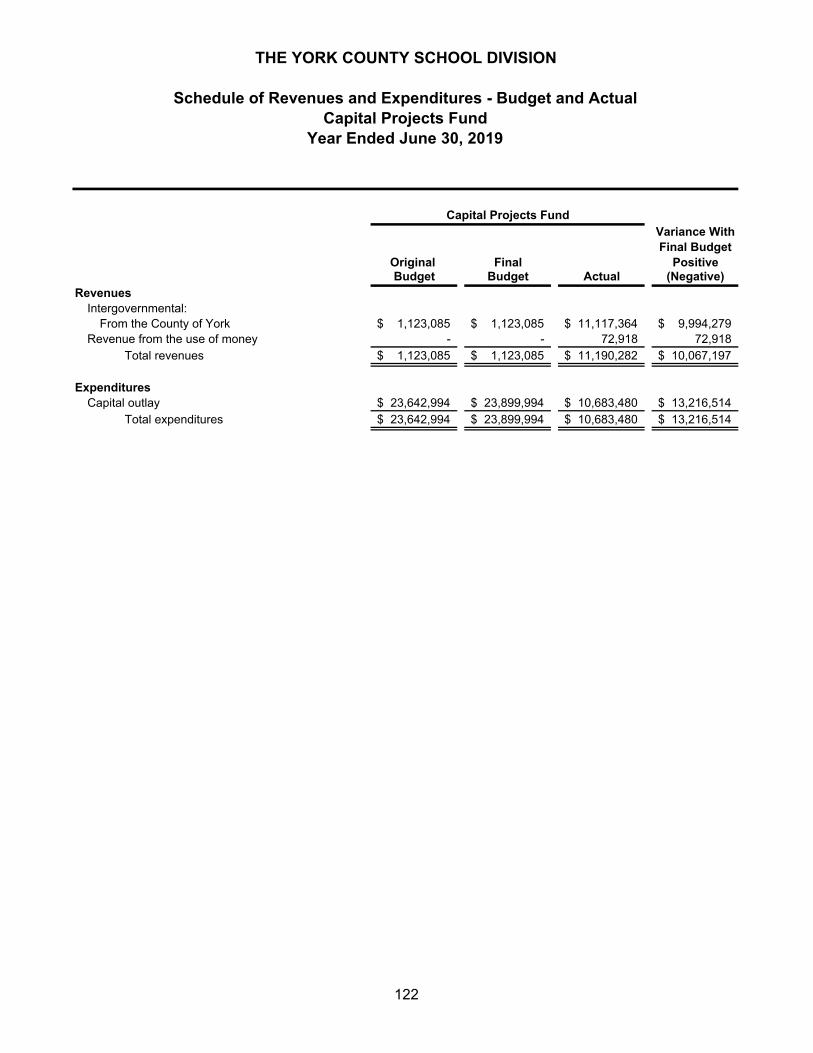
Variance WithFinal Budget
Original Final PositiveBudget Budget Actual (Negative)
RevenuesIntergovernmental:
From the County of York 1,123,085$ 1,123,085$ 11,117,364$ 9,994,279$ Revenue from the use of money - - 72,918 72,918
Total revenues 1,123,085$ 1,123,085$ 11,190,282$ 10,067,197$
ExpendituresCapital outlay 23,642,994$ 23,899,994$ 10,683,480$ 13,216,514$
Total expenditures 23,642,994$ 23,899,994$ 10,683,480$ 13,216,514$
THE YORK COUNTY SCHOOL DIVISION
Schedule of Revenues and Expenditures - Budget and ActualCapital Projects Fund
Year Ended June 30, 2019
Capital Projects Fund
122
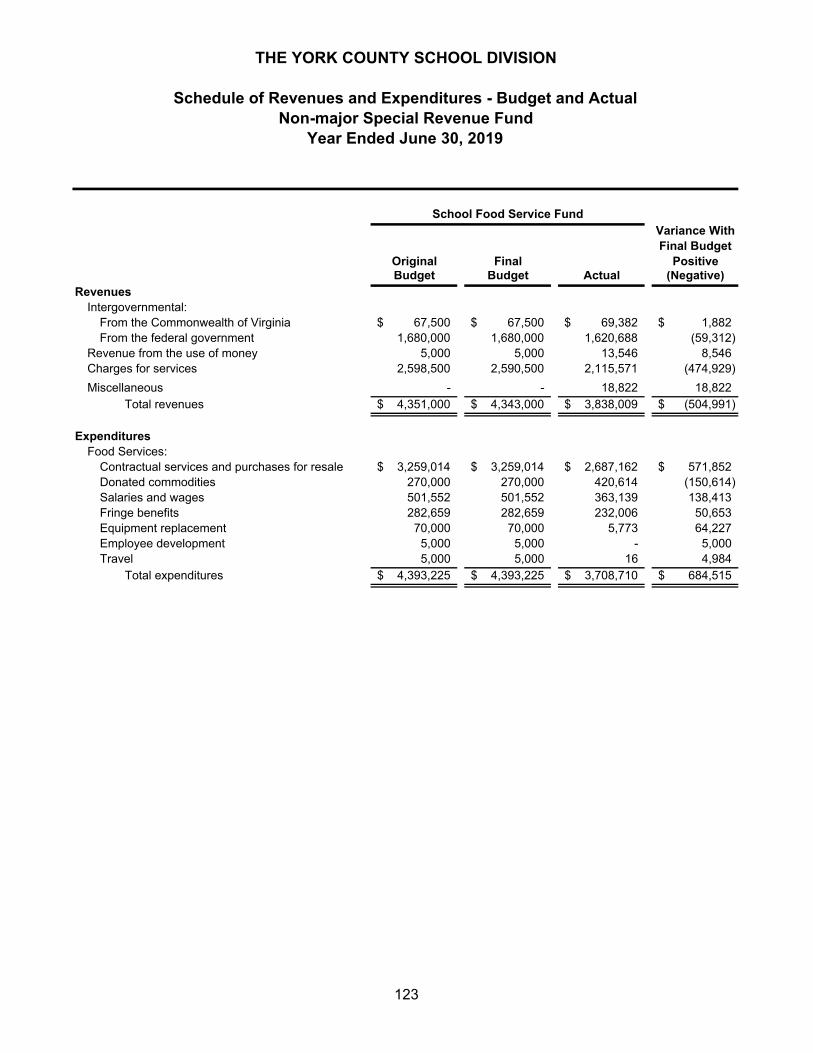
School Food Service FundVariance WithFinal Budget
Original Final PositiveBudget Budget Actual (Negative)
RevenuesIntergovernmental:
From the Commonwealth of Virginia 67,500$ 67,500$ 69,382$ 1,882$ From the federal government 1,680,000 1,680,000 1,620,688 (59,312)
Revenue from the use of money 5,000 5,000 13,546 8,546 Charges for services 2,598,500 2,590,500 2,115,571 (474,929)
Miscellaneous - - 18,822 18,822 Total revenues 4,351,000$ 4,343,000$ 3,838,009$ (504,991)$
ExpendituresFood Services:
Contractual services and purchases for resale 3,259,014$ 3,259,014$ 2,687,162$ 571,852$ Donated commodities 270,000 270,000 420,614 (150,614) Salaries and wages 501,552 501,552 363,139 138,413 Fringe benefits 282,659 282,659 232,006 50,653 Equipment replacement 70,000 70,000 5,773 64,227 Employee development 5,000 5,000 - 5,000 Travel 5,000 5,000 16 4,984
Total expenditures 4,393,225$ 4,393,225$ 3,708,710$ 684,515$
THE YORK COUNTY SCHOOL DIVISION
Schedule of Revenues and Expenditures - Budget and ActualNon-major Special Revenue Fund
Year Ended June 30, 2019
123
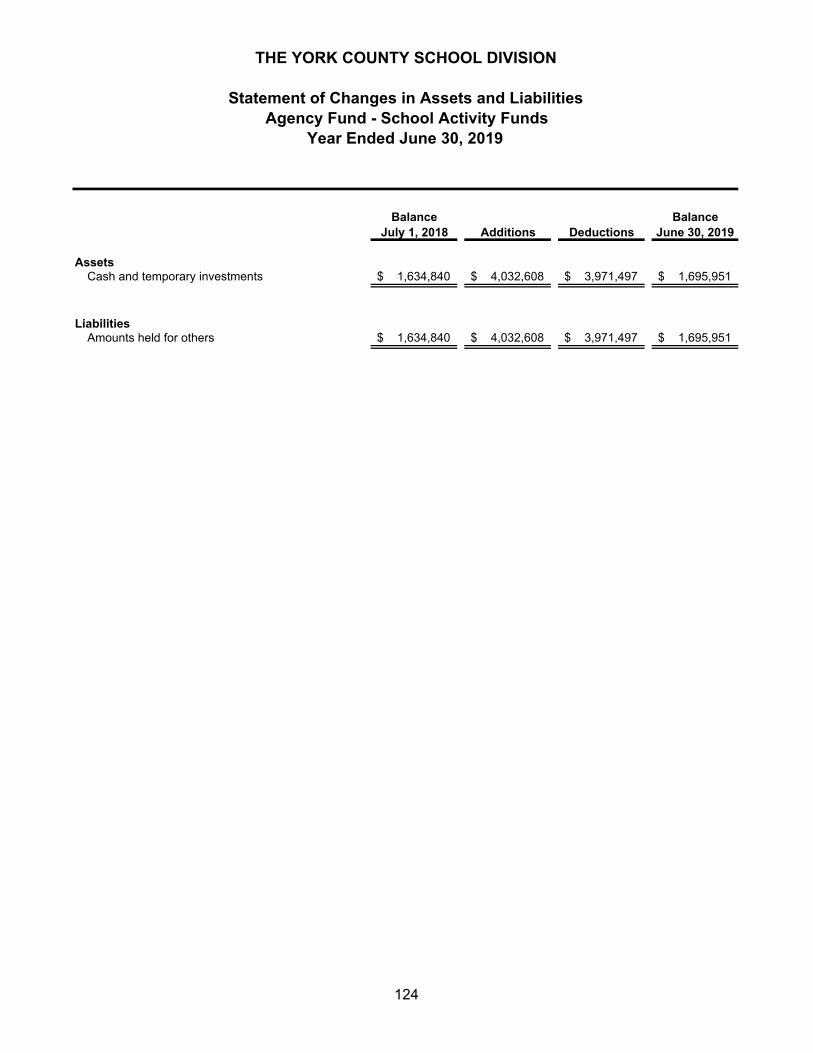
Balance BalanceJuly 1, 2018 Additions Deductions June 30, 2019
AssetsCash and temporary investments 1,634,840$ 4,032,608$ 3,971,497$ 1,695,951$
LiabilitiesAmounts held for others 1,634,840$ 4,032,608$ 3,971,497$ 1,695,951$
Year Ended June 30, 2019
THE YORK COUNTY SCHOOL DIVISION
Agency Fund - School Activity FundsStatement of Changes in Assets and Liabilities
124
STATISTICAL SECTION
(Unaudited)
Statistical Section
This part of the comprehensive annual financial report presents detailed information as a contextfor understanding what the information in the financial statements, note disclosures, and requiredsupplementary information says about the School Division's overall financial health.
Contents:
Financial Trends (pages 126 - 133)These schedules contain trend information to help the reader understand how the School Division'sfinancial performance and well-being have changed over time.
Revenue Capacity (pages 134 - 138)These schedules contain information to help the reader assess the School Division's mostsignificant local revenue source, Food Services charges for services. They also include theCounty's most significant local revenue source, property taxes, as the County provides significantrevenues to the School Division.
Debt Capacity (pages 139 - 140)These schedules present information to help the reader assess the affordability of the County'scurrent levels of outstanding debt and ability to issue additional debt in the future. Theseschedules are shown because the County incurs significant debt for the School Division's use.
Demographic and Economic Information (pages 141 - 144)These schedules offer demographic and economic indicators to help the reader understand howthe environment within which the School Division's financial activities take place and to help makecomparisons over time and with other governments.
Operating Information (pages 145 - 147)These schedules contain service and infrastructure data to help the reader understand how theinformation in the School Division's financial report relates to the services the School provides andthe activities it performs.
125
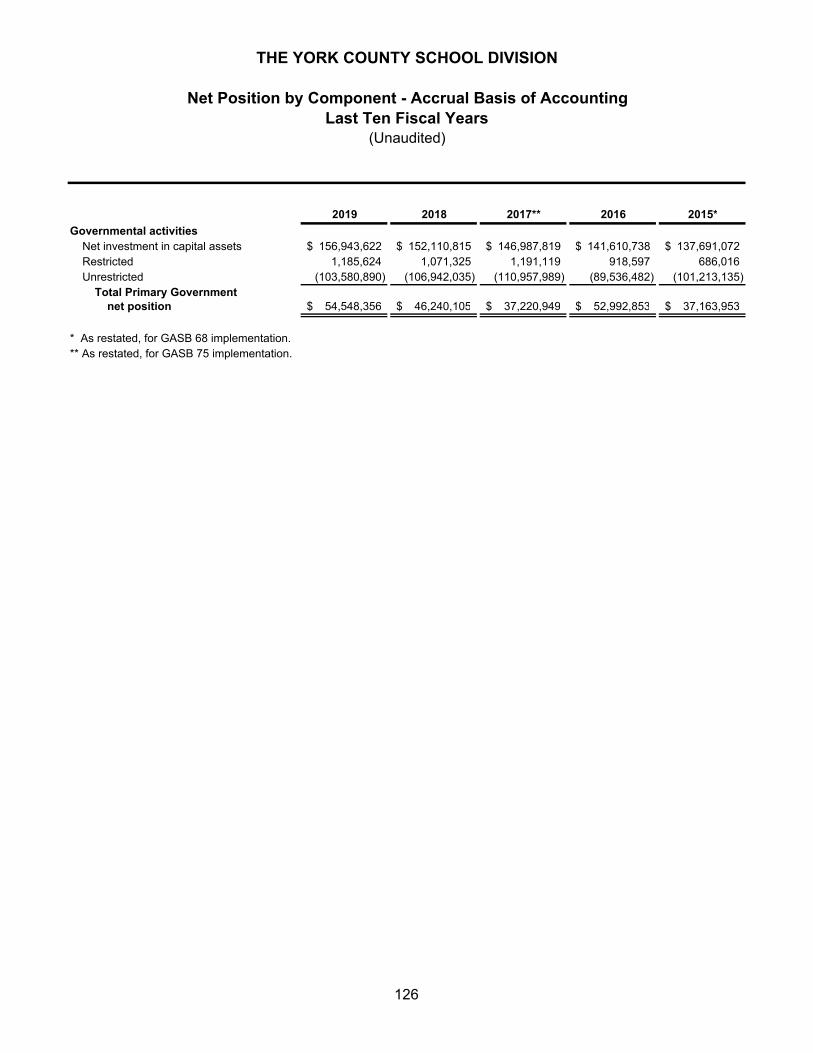
2019 2018 2017** 2016 2015*
Governmental activitiesNet investment in capital assets 156,943,622$ 152,110,815$ 146,987,819$ 141,610,738$ 137,691,072$ Restricted 1,185,624 1,071,325 1,191,119 918,597 686,016 Unrestricted (103,580,890) (106,942,035) (110,957,989) (89,536,482) (101,213,135)
Total Primary Governmentnet position 54,548,356$ 46,240,105$ 37,220,949$ 52,992,853$ 37,163,953$
* As restated, for GASB 68 implementation.** As restated, for GASB 75 implementation.
Last Ten Fiscal YearsNet Position by Component - Accrual Basis of Accounting
THE YORK COUNTY SCHOOL DIVISION
(Unaudited)
126
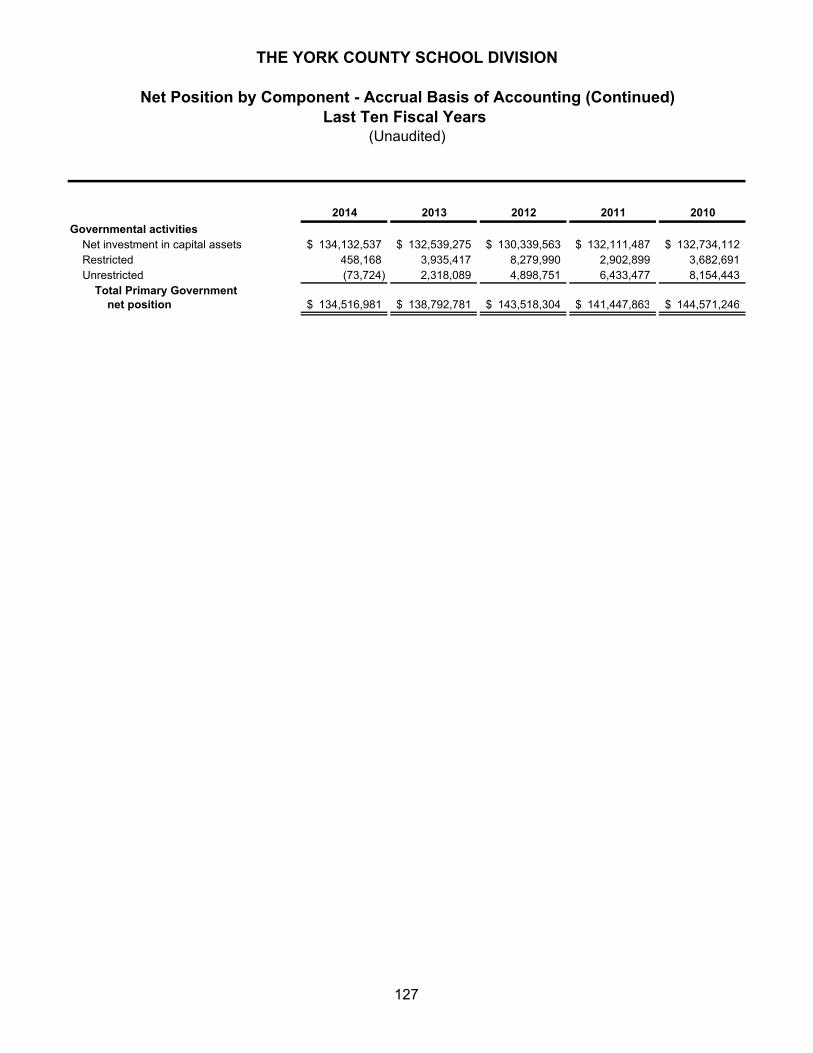
2014 2013 2012 2011 2010
Governmental activitiesNet investment in capital assets 134,132,537$ 132,539,275$ 130,339,563$ 132,111,487$ 132,734,112$ Restricted 458,168 3,935,417 8,279,990 2,902,899 3,682,691 Unrestricted (73,724) 2,318,089 4,898,751 6,433,477 8,154,443
Total Primary Governmentnet position 134,516,981$ 138,792,781$ 143,518,304$ 141,447,863$ 144,571,246$
THE YORK COUNTY SCHOOL DIVISION
Net Position by Component - Accrual Basis of Accounting (Continued)Last Ten Fiscal Years
(Unaudited)
127
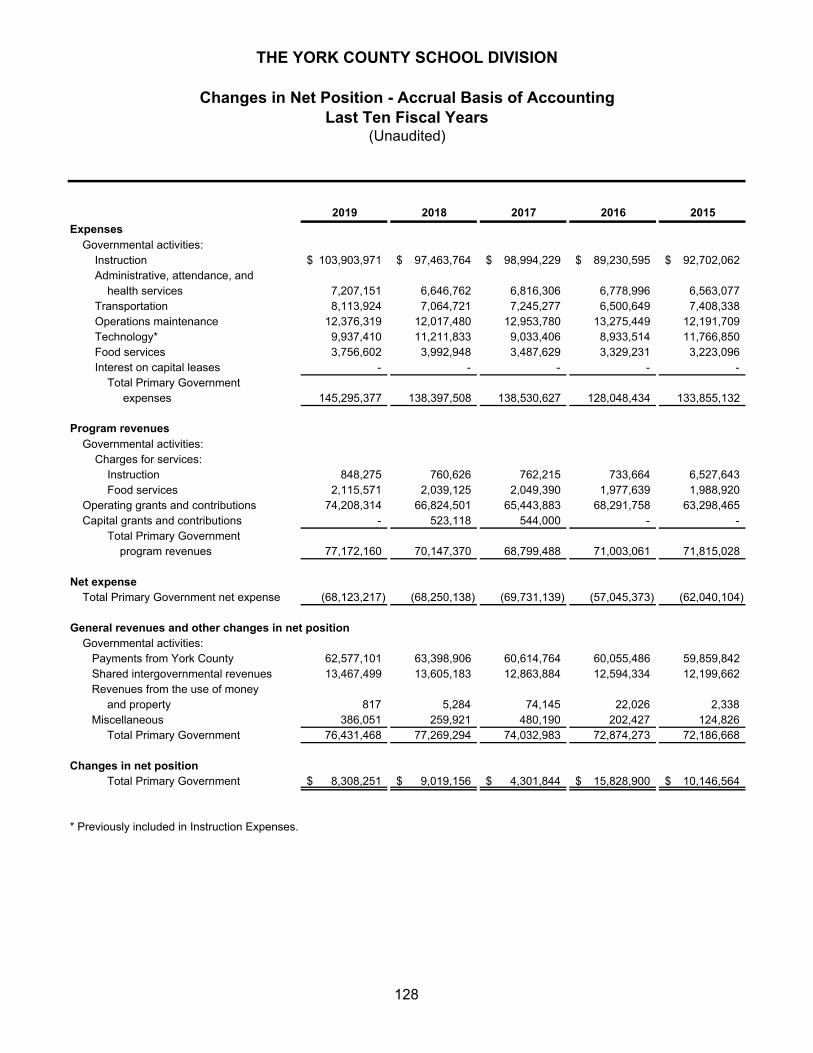
2019 2018 2017 2016 2015
ExpensesGovernmental activities:
Instruction 103,903,971$ 97,463,764$ 98,994,229$ 89,230,595$ 92,702,062$ Administrative, attendance, and
health services 7,207,151 6,646,762 6,816,306 6,778,996 6,563,077 Transportation 8,113,924 7,064,721 7,245,277 6,500,649 7,408,338 Operations maintenance 12,376,319 12,017,480 12,953,780 13,275,449 12,191,709 Technology* 9,937,410 11,211,833 9,033,406 8,933,514 11,766,850 Food services 3,756,602 3,992,948 3,487,629 3,329,231 3,223,096 Interest on capital leases - - - - -
Total Primary Government expenses 145,295,377 138,397,508 138,530,627 128,048,434 133,855,132
Program revenuesGovernmental activities:
Charges for services:Instruction 848,275 760,626 762,215 733,664 6,527,643 Food services 2,115,571 2,039,125 2,049,390 1,977,639 1,988,920
Operating grants and contributions 74,208,314 66,824,501 65,443,883 68,291,758 63,298,465 Capital grants and contributions - 523,118 544,000 - -
Total Primary Governmentprogram revenues 77,172,160 70,147,370 68,799,488 71,003,061 71,815,028
Net expense Total Primary Government net expense (68,123,217) (68,250,138) (69,731,139) (57,045,373) (62,040,104)
General revenues and other changes in net positionGovernmental activities: Payments from York County 62,577,101 63,398,906 60,614,764 60,055,486 59,859,842 Shared intergovernmental revenues 13,467,499 13,605,183 12,863,884 12,594,334 12,199,662 Revenues from the use of money
and property 817 5,284 74,145 22,026 2,338 Miscellaneous 386,051 259,921 480,190 202,427 124,826
Total Primary Government 76,431,468 77,269,294 74,032,983 72,874,273 72,186,668
Changes in net positionTotal Primary Government 8,308,251$ 9,019,156$ 4,301,844$ 15,828,900$ 10,146,564$
* Previously included in Instruction Expenses.
(Unaudited)Last Ten Fiscal Years
Changes in Net Position - Accrual Basis of Accounting
THE YORK COUNTY SCHOOL DIVISION
128
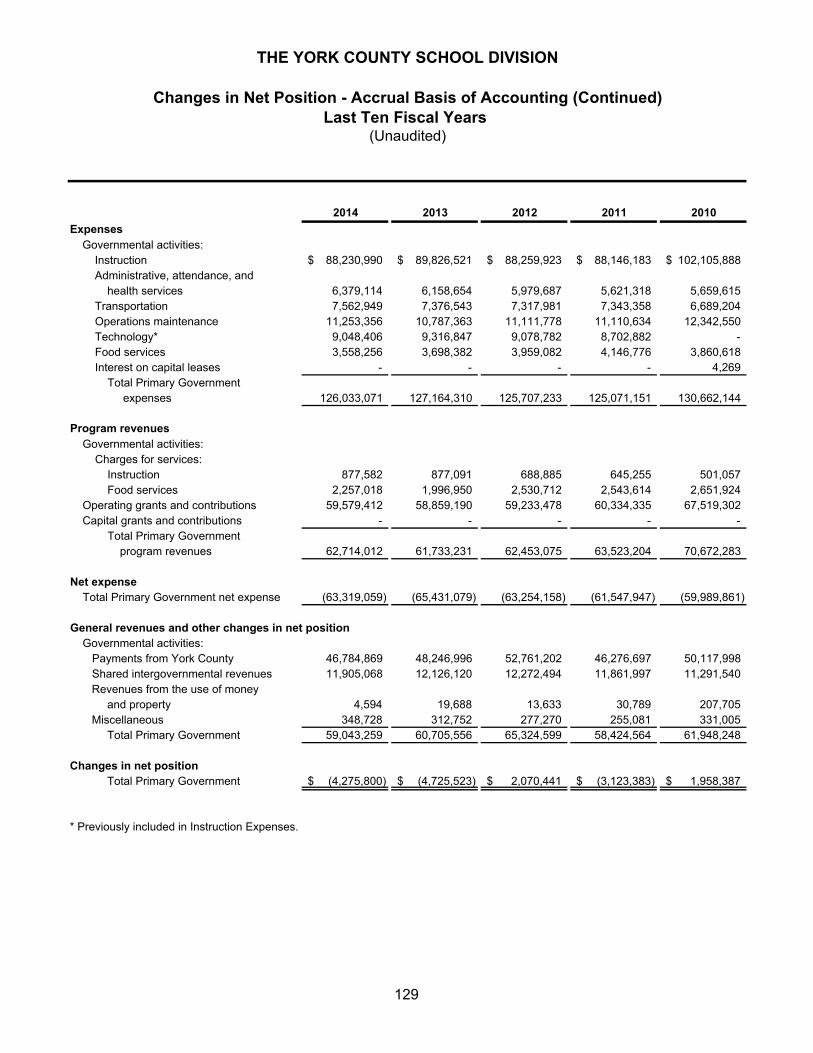
2014 2013 2012 2011 2010
ExpensesGovernmental activities:
Instruction 88,230,990$ 89,826,521$ 88,259,923$ 88,146,183$ 102,105,888$ Administrative, attendance, and
health services 6,379,114 6,158,654 5,979,687 5,621,318 5,659,615 Transportation 7,562,949 7,376,543 7,317,981 7,343,358 6,689,204 Operations maintenance 11,253,356 10,787,363 11,111,778 11,110,634 12,342,550 Technology* 9,048,406 9,316,847 9,078,782 8,702,882 - Food services 3,558,256 3,698,382 3,959,082 4,146,776 3,860,618 Interest on capital leases - - - - 4,269
Total Primary Government expenses 126,033,071 127,164,310 125,707,233 125,071,151 130,662,144
Program revenuesGovernmental activities:
Charges for services:Instruction 877,582 877,091 688,885 645,255 501,057 Food services 2,257,018 1,996,950 2,530,712 2,543,614 2,651,924
Operating grants and contributions 59,579,412 58,859,190 59,233,478 60,334,335 67,519,302 Capital grants and contributions - - - - -
Total Primary Governmentprogram revenues 62,714,012 61,733,231 62,453,075 63,523,204 70,672,283
Net expense Total Primary Government net expense (63,319,059) (65,431,079) (63,254,158) (61,547,947) (59,989,861)
General revenues and other changes in net positionGovernmental activities: Payments from York County 46,784,869 48,246,996 52,761,202 46,276,697 50,117,998 Shared intergovernmental revenues 11,905,068 12,126,120 12,272,494 11,861,997 11,291,540 Revenues from the use of money
and property 4,594 19,688 13,633 30,789 207,705 Miscellaneous 348,728 312,752 277,270 255,081 331,005
Total Primary Government 59,043,259 60,705,556 65,324,599 58,424,564 61,948,248
Changes in net positionTotal Primary Government (4,275,800)$ (4,725,523)$ 2,070,441$ (3,123,383)$ 1,958,387$
* Previously included in Instruction Expenses.
THE YORK COUNTY SCHOOL DIVISION
Changes in Net Position - Accrual Basis of Accounting (Continued)Last Ten Fiscal Years
(Unaudited)
129
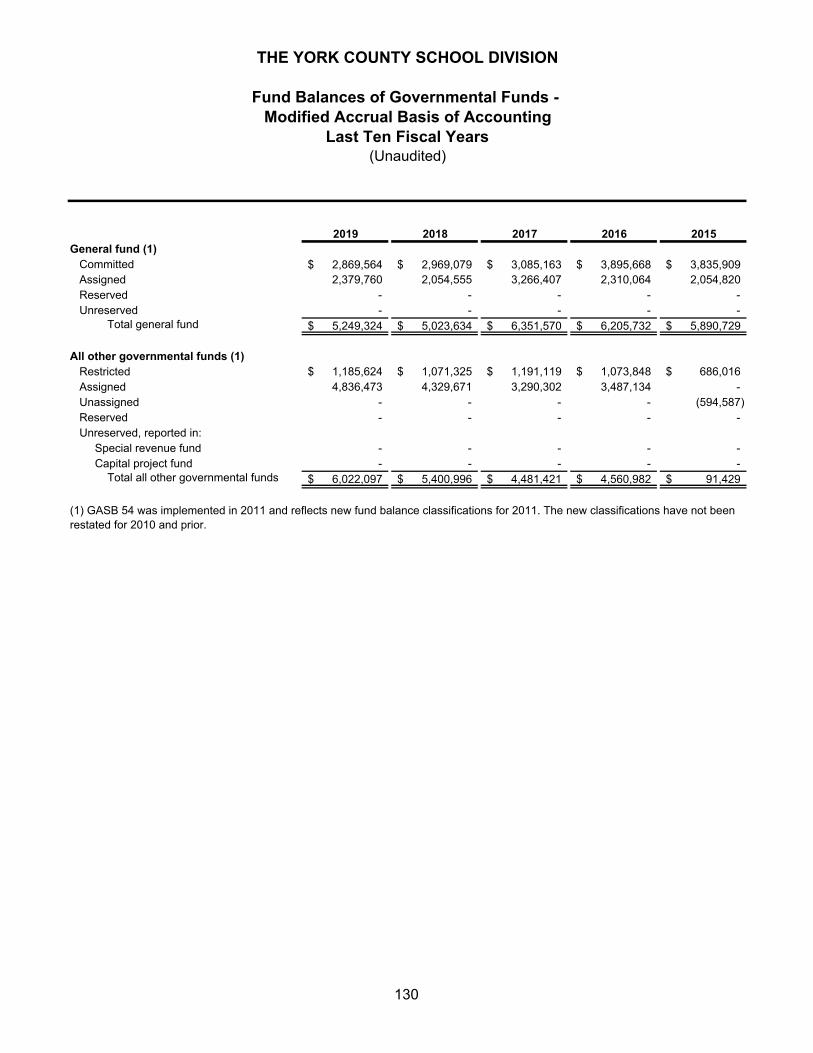
2019 2018 2017 2016 2015General fund (1) Committed 2,869,564$ 2,969,079$ 3,085,163$ 3,895,668$ 3,835,909$ Assigned 2,379,760 2,054,555 3,266,407 2,310,064 2,054,820 Reserved - - - - - Unreserved - - - - -
Total general fund 5,249,324$ 5,023,634$ 6,351,570$ 6,205,732$ 5,890,729$
All other governmental funds (1) Restricted 1,185,624$ 1,071,325$ 1,191,119$ 1,073,848$ 686,016$ Assigned 4,836,473 4,329,671 3,290,302 3,487,134 - Unassigned - - - - (594,587) Reserved - - - - - Unreserved, reported in:
Special revenue fund - - - - - Capital project fund - - - - -
Total all other governmental funds 6,022,097$ 5,400,996$ 4,481,421$ 4,560,982$ 91,429$
THE YORK COUNTY SCHOOL DIVISION
Fund Balances of Governmental Funds -
Last Ten Fiscal Years(Unaudited)
(1) GASB 54 was implemented in 2011 and reflects new fund balance classifications for 2011. The new classifications have not been restated for 2010 and prior.
Modified Accrual Basis of Accounting
130
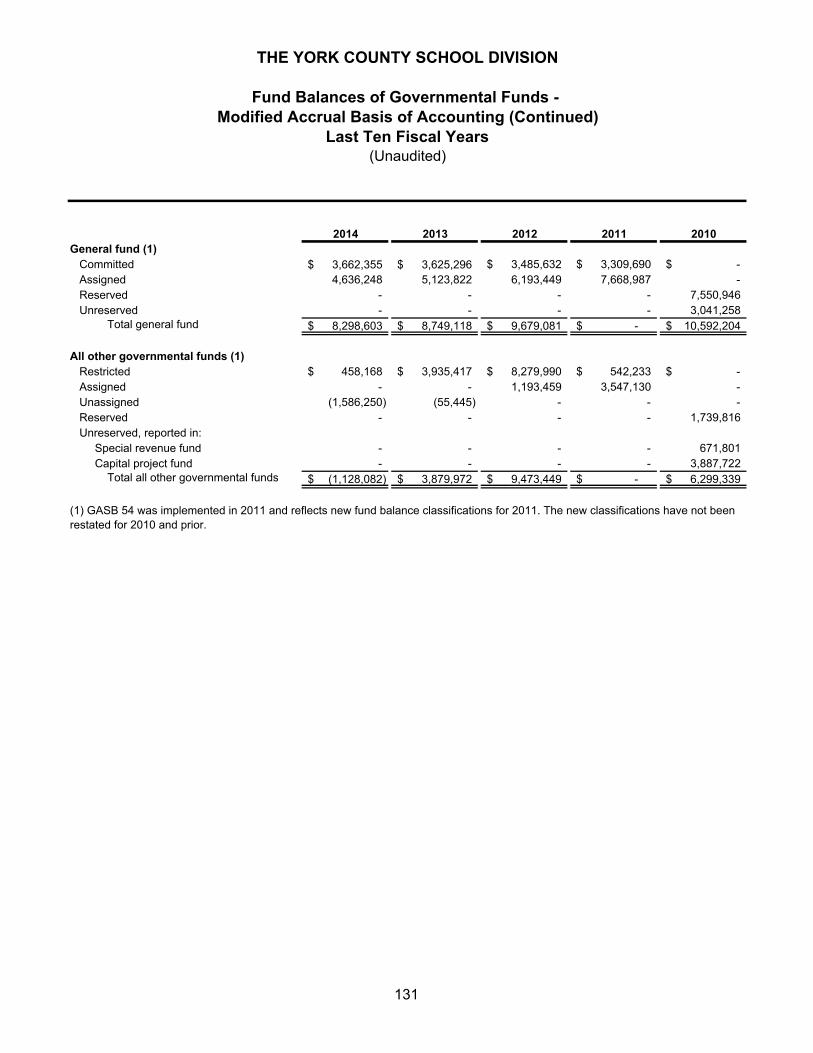
2014 2013 2012 2011 2010General fund (1) Committed 3,662,355$ 3,625,296$ 3,485,632$ 3,309,690$ -$ Assigned 4,636,248 5,123,822 6,193,449 7,668,987 - Reserved - - - - 7,550,946 Unreserved - - - - 3,041,258
Total general fund 8,298,603$ 8,749,118$ 9,679,081$ -$ 10,592,204$
All other governmental funds (1) Restricted 458,168$ 3,935,417$ 8,279,990$ 542,233$ -$ Assigned - - 1,193,459 3,547,130 - Unassigned (1,586,250) (55,445) - - - Reserved - - - - 1,739,816 Unreserved, reported in:
Special revenue fund - - - - 671,801 Capital project fund - - - - 3,887,722
Total all other governmental funds (1,128,082)$ 3,879,972$ 9,473,449$ -$ 6,299,339$
THE YORK COUNTY SCHOOL DIVISION
Fund Balances of Governmental Funds -
Last Ten Fiscal Years(Unaudited)
(1) GASB 54 was implemented in 2011 and reflects new fund balance classifications for 2011. The new classifications have not been restated for 2010 and prior.
Modified Accrual Basis of Accounting (Continued)
131
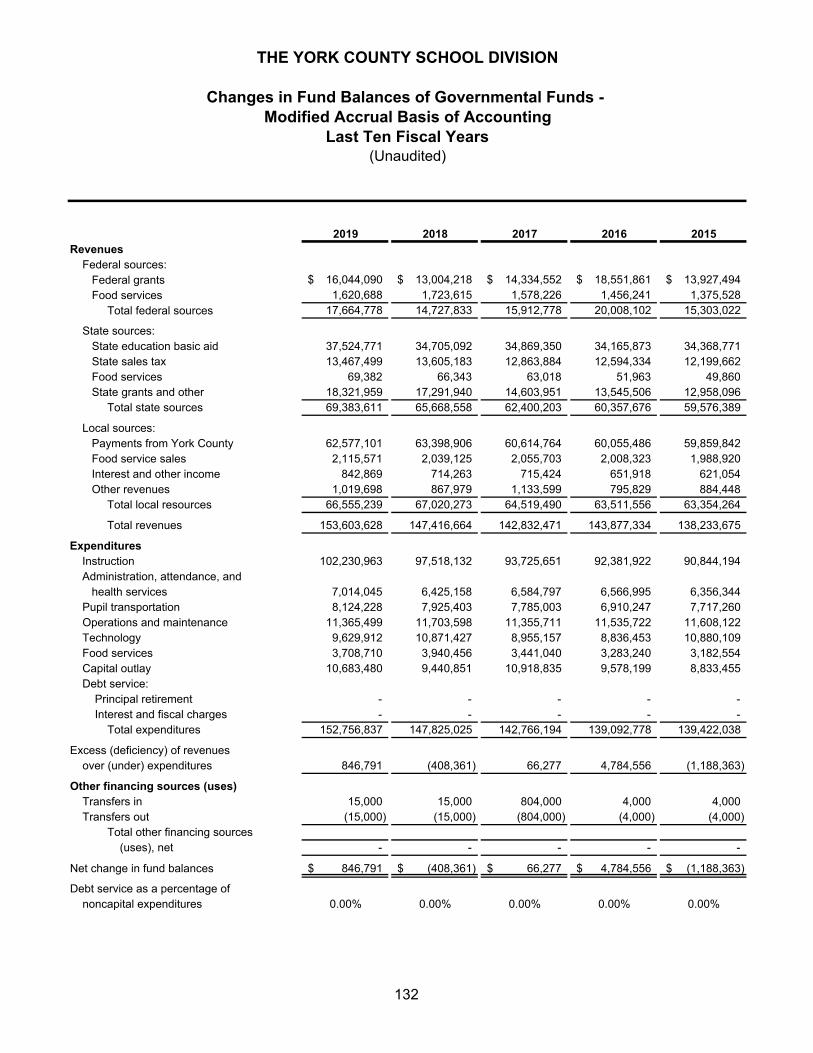
2019 2018 2017 2016 2015Revenues
Federal sources: Federal grants 16,044,090$ 13,004,218$ 14,334,552$ 18,551,861$ 13,927,494$ Food services 1,620,688 1,723,615 1,578,226 1,456,241 1,375,528
Total federal sources 17,664,778 14,727,833 15,912,778 20,008,102 15,303,022
State sources: State education basic aid 37,524,771 34,705,092 34,869,350 34,165,873 34,368,771 State sales tax 13,467,499 13,605,183 12,863,884 12,594,334 12,199,662 Food services 69,382 66,343 63,018 51,963 49,860 State grants and other 18,321,959 17,291,940 14,603,951 13,545,506 12,958,096
Total state sources 69,383,611 65,668,558 62,400,203 60,357,676 59,576,389
Local sources: Payments from York County 62,577,101 63,398,906 60,614,764 60,055,486 59,859,842 Food service sales 2,115,571 2,039,125 2,055,703 2,008,323 1,988,920 Interest and other income 842,869 714,263 715,424 651,918 621,054 Other revenues 1,019,698 867,979 1,133,599 795,829 884,448
Total local resources 66,555,239 67,020,273 64,519,490 63,511,556 63,354,264
Total revenues 153,603,628 147,416,664 142,832,471 143,877,334 138,233,675
ExpendituresInstruction 102,230,963 97,518,132 93,725,651 92,381,922 90,844,194 Administration, attendance, and health services 7,014,045 6,425,158 6,584,797 6,566,995 6,356,344 Pupil transportation 8,124,228 7,925,403 7,785,003 6,910,247 7,717,260 Operations and maintenance 11,365,499 11,703,598 11,355,711 11,535,722 11,608,122 Technology 9,629,912 10,871,427 8,955,157 8,836,453 10,880,109 Food services 3,708,710 3,940,456 3,441,040 3,283,240 3,182,554 Capital outlay 10,683,480 9,440,851 10,918,835 9,578,199 8,833,455 Debt service:
Principal retirement - - - - - Interest and fiscal charges - - - - -
Total expenditures 152,756,837 147,825,025 142,766,194 139,092,778 139,422,038
Excess (deficiency) of revenues over (under) expenditures 846,791 (408,361) 66,277 4,784,556 (1,188,363)
Other financing sources (uses)Transfers in 15,000 15,000 804,000 4,000 4,000 Transfers out (15,000) (15,000) (804,000) (4,000) (4,000)
Total other financing sources(uses), net - - - - -
Net change in fund balances 846,791$ (408,361)$ 66,277$ 4,784,556$ (1,188,363)$
Debt service as a percentage ofnoncapital expenditures 0.00% 0.00% 0.00% 0.00% 0.00%
Last Ten Fiscal Years(Unaudited)
THE YORK COUNTY SCHOOL DIVISION
Changes in Fund Balances of Governmental Funds - Modified Accrual Basis of Accounting
132
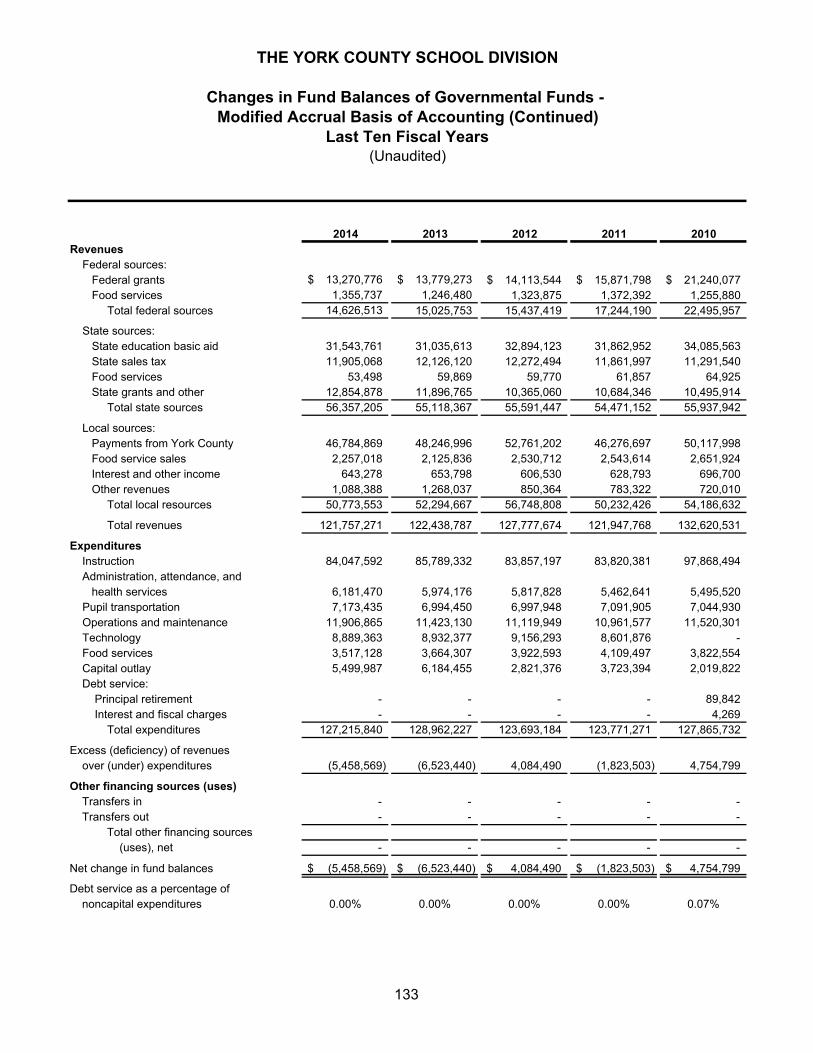
2014 2013 2012 2011 2010Revenues
Federal sources: Federal grants 13,270,776$ 13,779,273$ 14,113,544$ 15,871,798$ 21,240,077$ Food services 1,355,737 1,246,480 1,323,875 1,372,392 1,255,880
Total federal sources 14,626,513 15,025,753 15,437,419 17,244,190 22,495,957
State sources: State education basic aid 31,543,761 31,035,613 32,894,123 31,862,952 34,085,563 State sales tax 11,905,068 12,126,120 12,272,494 11,861,997 11,291,540 Food services 53,498 59,869 59,770 61,857 64,925 State grants and other 12,854,878 11,896,765 10,365,060 10,684,346 10,495,914
Total state sources 56,357,205 55,118,367 55,591,447 54,471,152 55,937,942
Local sources: Payments from York County 46,784,869 48,246,996 52,761,202 46,276,697 50,117,998 Food service sales 2,257,018 2,125,836 2,530,712 2,543,614 2,651,924 Interest and other income 643,278 653,798 606,530 628,793 696,700 Other revenues 1,088,388 1,268,037 850,364 783,322 720,010
Total local resources 50,773,553 52,294,667 56,748,808 50,232,426 54,186,632
Total revenues 121,757,271 122,438,787 127,777,674 121,947,768 132,620,531
ExpendituresInstruction 84,047,592 85,789,332 83,857,197 83,820,381 97,868,494 Administration, attendance, and health services 6,181,470 5,974,176 5,817,828 5,462,641 5,495,520 Pupil transportation 7,173,435 6,994,450 6,997,948 7,091,905 7,044,930 Operations and maintenance 11,906,865 11,423,130 11,119,949 10,961,577 11,520,301 Technology 8,889,363 8,932,377 9,156,293 8,601,876 - Food services 3,517,128 3,664,307 3,922,593 4,109,497 3,822,554 Capital outlay 5,499,987 6,184,455 2,821,376 3,723,394 2,019,822 Debt service:
Principal retirement - - - - 89,842 Interest and fiscal charges - - - - 4,269
Total expenditures 127,215,840 128,962,227 123,693,184 123,771,271 127,865,732
Excess (deficiency) of revenues over (under) expenditures (5,458,569) (6,523,440) 4,084,490 (1,823,503) 4,754,799
Other financing sources (uses)Transfers in - - - - - Transfers out - - - - -
Total other financing sources(uses), net - - - - -
Net change in fund balances (5,458,569)$ (6,523,440)$ 4,084,490$ (1,823,503)$ 4,754,799$
Debt service as a percentage ofnoncapital expenditures 0.00% 0.00% 0.00% 0.00% 0.07%
Modified Accrual Basis of Accounting (Continued)Last Ten Fiscal Years
(Unaudited)
THE YORK COUNTY SCHOOL DIVISION
Changes in Fund Balances of Governmental Funds -
133
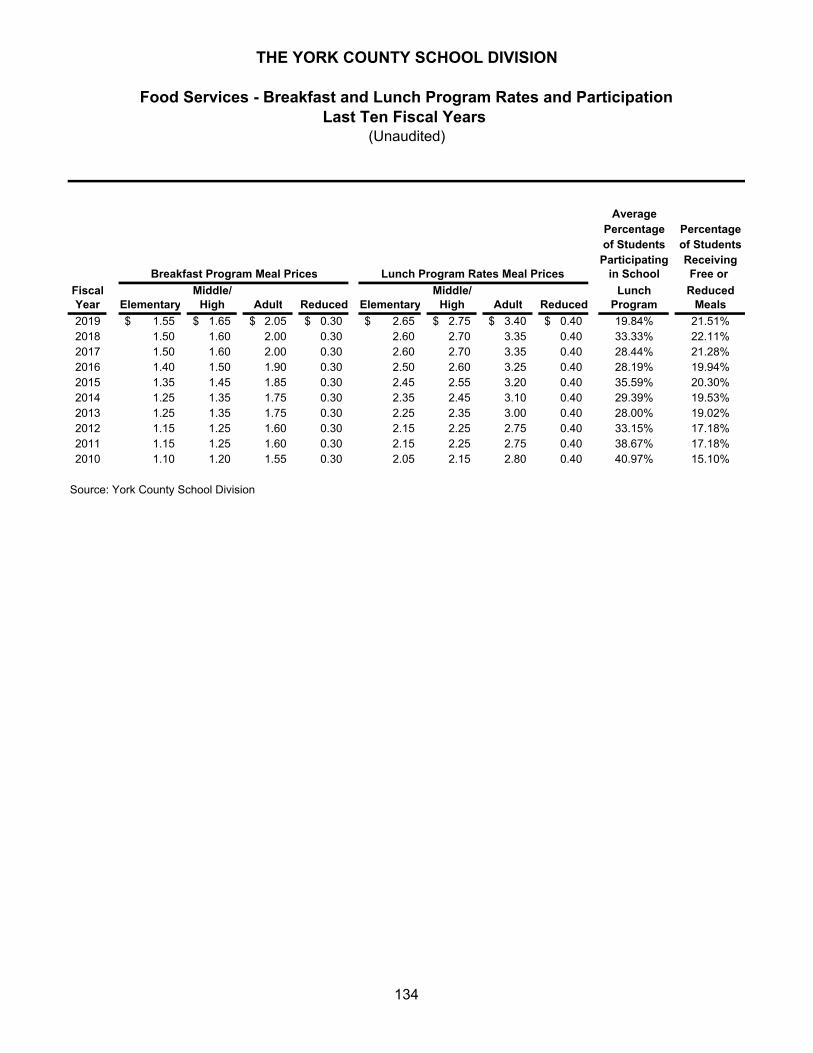
AveragePercentage Percentageof Students of Students
Participating Receivingin School Free or
Fiscal Middle/ Middle/ Lunch ReducedYear Elementary High Adult Reduced Elementary High Adult Reduced Program Meals
2019 1.55$ 1.65$ 2.05$ 0.30$ 2.65$ 2.75$ 3.40$ 0.40$ 19.84% 21.51%2018 1.50 1.60 2.00 0.30 2.60 2.70 3.35 0.40 33.33% 22.11%2017 1.50 1.60 2.00 0.30 2.60 2.70 3.35 0.40 28.44% 21.28%2016 1.40 1.50 1.90 0.30 2.50 2.60 3.25 0.40 28.19% 19.94%2015 1.35 1.45 1.85 0.30 2.45 2.55 3.20 0.40 35.59% 20.30%2014 1.25 1.35 1.75 0.30 2.35 2.45 3.10 0.40 29.39% 19.53%2013 1.25 1.35 1.75 0.30 2.25 2.35 3.00 0.40 28.00% 19.02%2012 1.15 1.25 1.60 0.30 2.15 2.25 2.75 0.40 33.15% 17.18%2011 1.15 1.25 1.60 0.30 2.15 2.25 2.75 0.40 38.67% 17.18%2010 1.10 1.20 1.55 0.30 2.05 2.15 2.80 0.40 40.97% 15.10%
Source: York County School Division
Breakfast Program Meal Prices Lunch Program Rates Meal Prices
THE YORK COUNTY SCHOOL DIVISION
Food Services - Breakfast and Lunch Program Rates and ParticipationLast Ten Fiscal Years
(Unaudited)
134
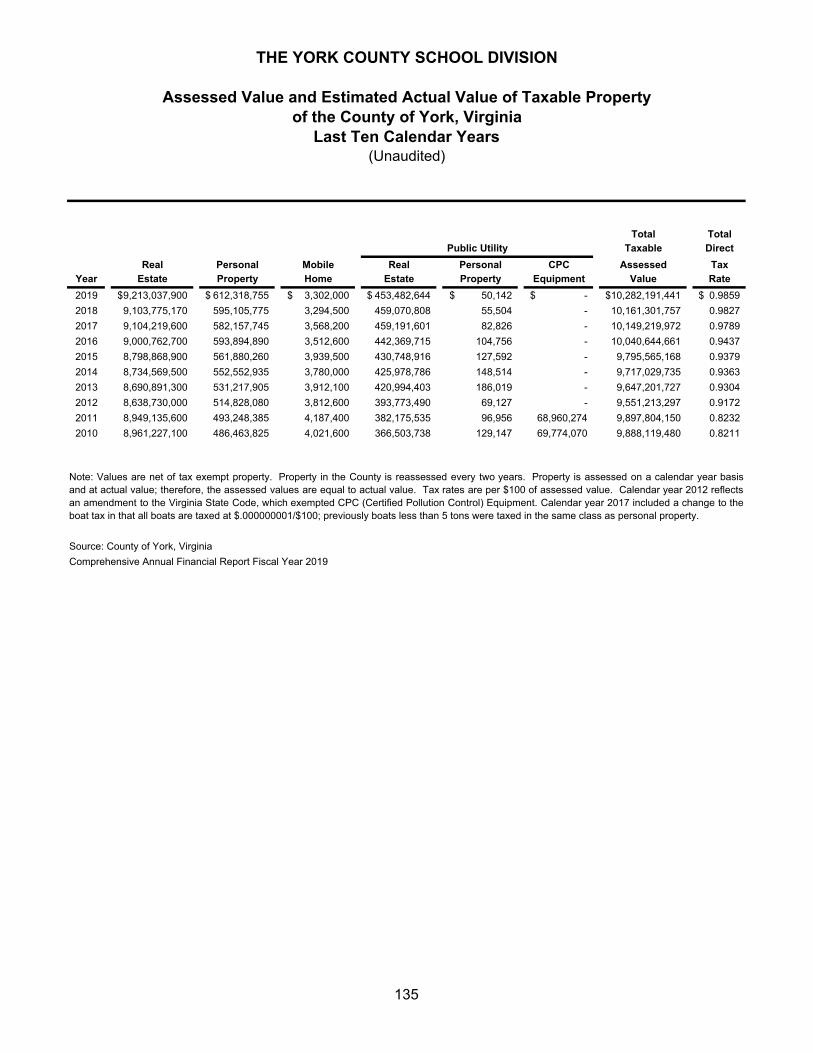
Total Total
Taxable Direct
Real Personal Mobile Real Personal CPC Assessed Tax
Year Estate Property Home Estate Property Equipment Value Rate
2019 9,213,037,900$ 612,318,755$ 3,302,000$ 453,482,644$ 50,142$ -$ 10,282,191,441$ 0.9859$
2018 9,103,775,170 595,105,775 3,294,500 459,070,808 55,504 - 10,161,301,757 0.9827
2017 9,104,219,600 582,157,745 3,568,200 459,191,601 82,826 - 10,149,219,972 0.9789
2016 9,000,762,700 593,894,890 3,512,600 442,369,715 104,756 - 10,040,644,661 0.9437
2015 8,798,868,900 561,880,260 3,939,500 430,748,916 127,592 - 9,795,565,168 0.9379
2014 8,734,569,500 552,552,935 3,780,000 425,978,786 148,514 - 9,717,029,735 0.9363
2013 8,690,891,300 531,217,905 3,912,100 420,994,403 186,019 - 9,647,201,727 0.9304
2012 8,638,730,000 514,828,080 3,812,600 393,773,490 69,127 - 9,551,213,297 0.9172
2011 8,949,135,600 493,248,385 4,187,400 382,175,535 96,956 68,960,274 9,897,804,150 0.8232
2010 8,961,227,100 486,463,825 4,021,600 366,503,738 129,147 69,774,070 9,888,119,480 0.8211
Source: County of York, Virginia
Comprehensive Annual Financial Report Fiscal Year 2019
Note: Values are net of tax exempt property. Property in the County is reassessed every two years. Property is assessed on a calendar year basisand at actual value; therefore, the assessed values are equal to actual value. Tax rates are per $100 of assessed value. Calendar year 2012 reflectsan amendment to the Virginia State Code, which exempted CPC (Certified Pollution Control) Equipment. Calendar year 2017 included a change to theboat tax in that all boats are taxed at $.000000001/$100; previously boats less than 5 tons were taxed in the same class as personal property.
Public Utility
THE YORK COUNTY SCHOOL DIVISION
Assessed Value and Estimated Actual Value of Taxable Property
Last Ten Calendar Years(Unaudited)
of the County of York, Virginia
135
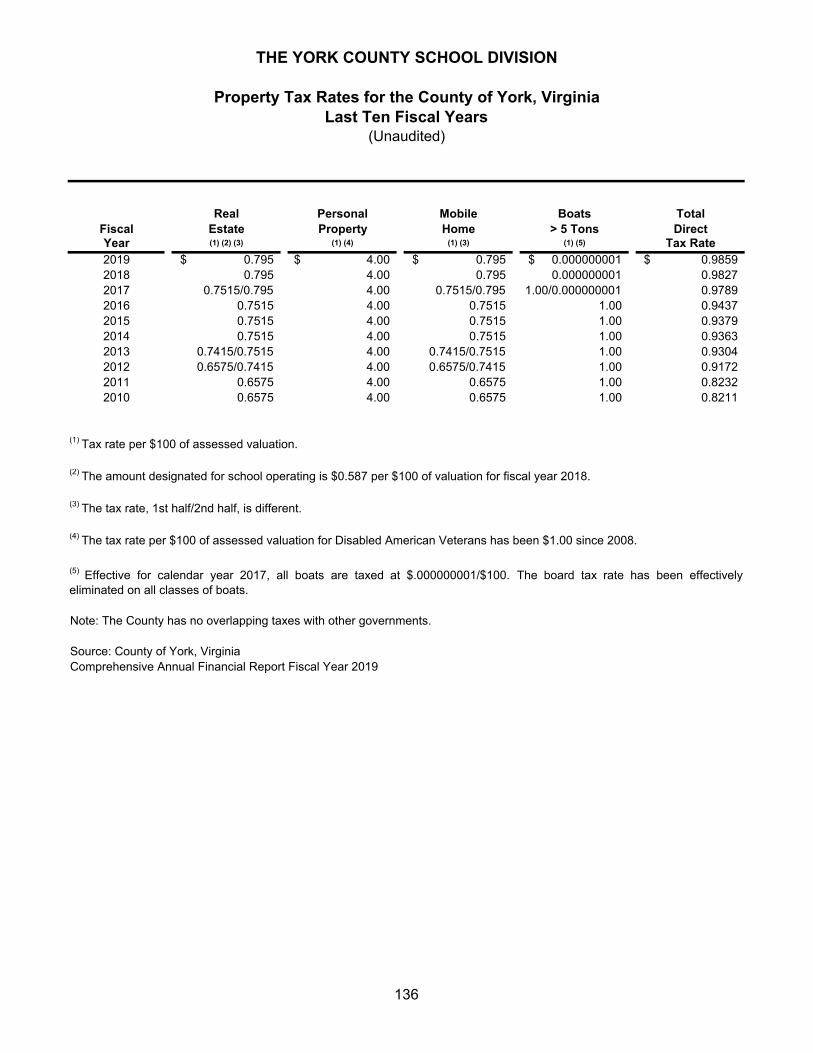
Real Personal Mobile Boats TotalFiscal Estate Property Home > 5 Tons DirectYear (1) (2) (3) (1) (4) (1) (3) (1) (5) Tax Rate2019 0.795$ 4.00$ 0.795$ 0.000000001$ 0.9859$ 2018 0.795 4.00 0.795 0.000000001 0.9827 2017 0.7515/0.795 4.00 0.7515/0.795 1.00/0.000000001 0.9789 2016 0.7515 4.00 0.7515 1.00 0.9437 2015 0.7515 4.00 0.7515 1.00 0.9379 2014 0.7515 4.00 0.7515 1.00 0.9363 2013 0.7415/0.7515 4.00 0.7415/0.7515 1.00 0.9304 2012 0.6575/0.7415 4.00 0.6575/0.7415 1.00 0.9172 2011 0.6575 4.00 0.6575 1.00 0.8232 2010 0.6575 4.00 0.6575 1.00 0.8211
(1) Tax rate per $100 of assessed valuation.
(2) The amount designated for school operating is $0.587 per $100 of valuation for fiscal year 2018.
(3) The tax rate, 1st half/2nd half, is different.
(4) The tax rate per $100 of assessed valuation for Disabled American Veterans has been $1.00 since 2008.
Note: The County has no overlapping taxes with other governments.
Source: County of York, VirginiaComprehensive Annual Financial Report Fiscal Year 2019
(Unaudited)Last Ten Fiscal Years
Property Tax Rates for the County of York, Virginia
THE YORK COUNTY SCHOOL DIVISION
(5) Effective for calendar year 2017, all boats are taxed at $.000000001/$100. The board tax rate has been effectivelyeliminated on all classes of boats.
136
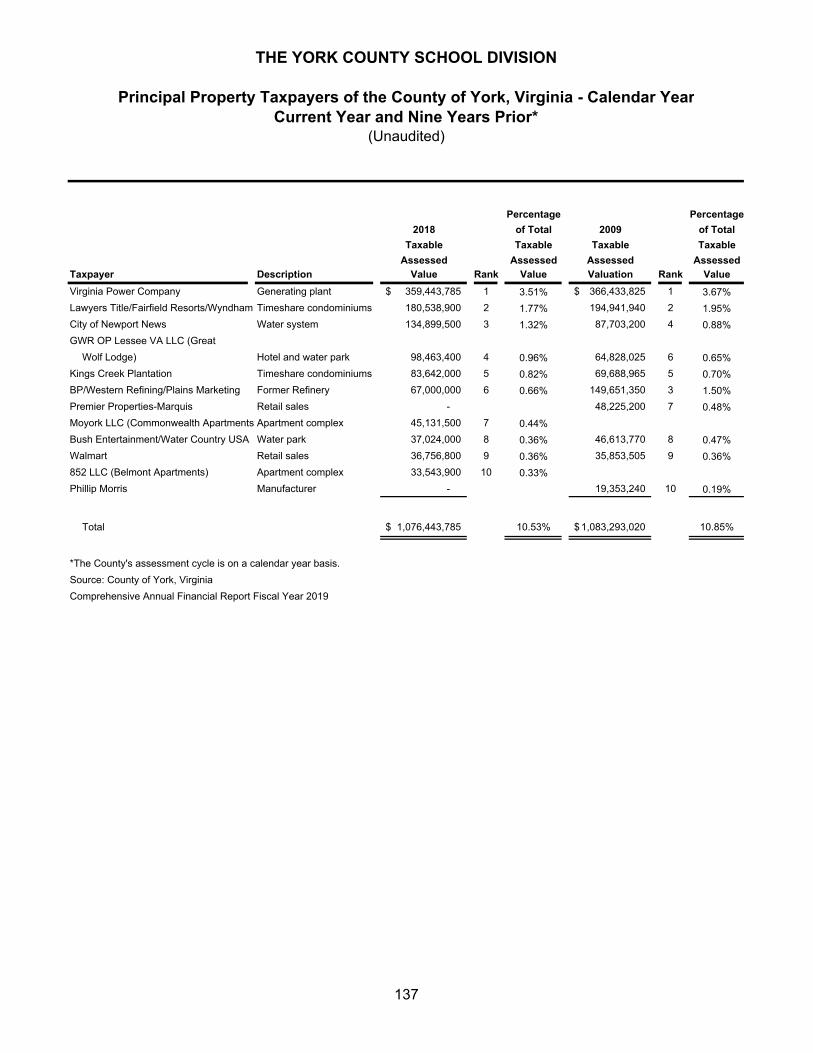
Percentage Percentage
2018 of Total 2009 of Total
Taxable Taxable Taxable Taxable
Assessed Assessed Assessed Assessed
Taxpayer Description Value Rank Value Valuation Rank Value
Virginia Power Company Generating plant 359,443,785$ 1 3.51% 366,433,825$ 1 3.67%
Lawyers Title/Fairfield Resorts/Wyndham Timeshare condominiums 180,538,900 2 1.77% 194,941,940 2 1.95%
City of Newport News Water system 134,899,500 3 1.32% 87,703,200 4 0.88%
GWR OP Lessee VA LLC (Great
Wolf Lodge) Hotel and water park 98,463,400 4 0.96% 64,828,025 6 0.65%
Kings Creek Plantation Timeshare condominiums 83,642,000 5 0.82% 69,688,965 5 0.70%
BP/Western Refining/Plains Marketing Former Refinery 67,000,000 6 0.66% 149,651,350 3 1.50%
Premier Properties-Marquis Retail sales - 48,225,200 7 0.48%
Moyork LLC (Commonwealth Apartments Apartment complex 45,131,500 7 0.44%
Bush Entertainment/Water Country USA Water park 37,024,000 8 0.36% 46,613,770 8 0.47%
Walmart Retail sales 36,756,800 9 0.36% 35,853,505 9 0.36%
852 LLC (Belmont Apartments) Apartment complex 33,543,900 10 0.33%
Phillip Morris Manufacturer - 19,353,240 10 0.19%
Total 1,076,443,785$ 10.53% 1,083,293,020$ 10.85%
*The County's assessment cycle is on a calendar year basis.
Source: County of York, Virginia
Comprehensive Annual Financial Report Fiscal Year 2019
THE YORK COUNTY SCHOOL DIVISION
Principal Property Taxpayers of the County of York, Virginia - Calendar YearCurrent Year and Nine Years Prior*
(Unaudited)
137
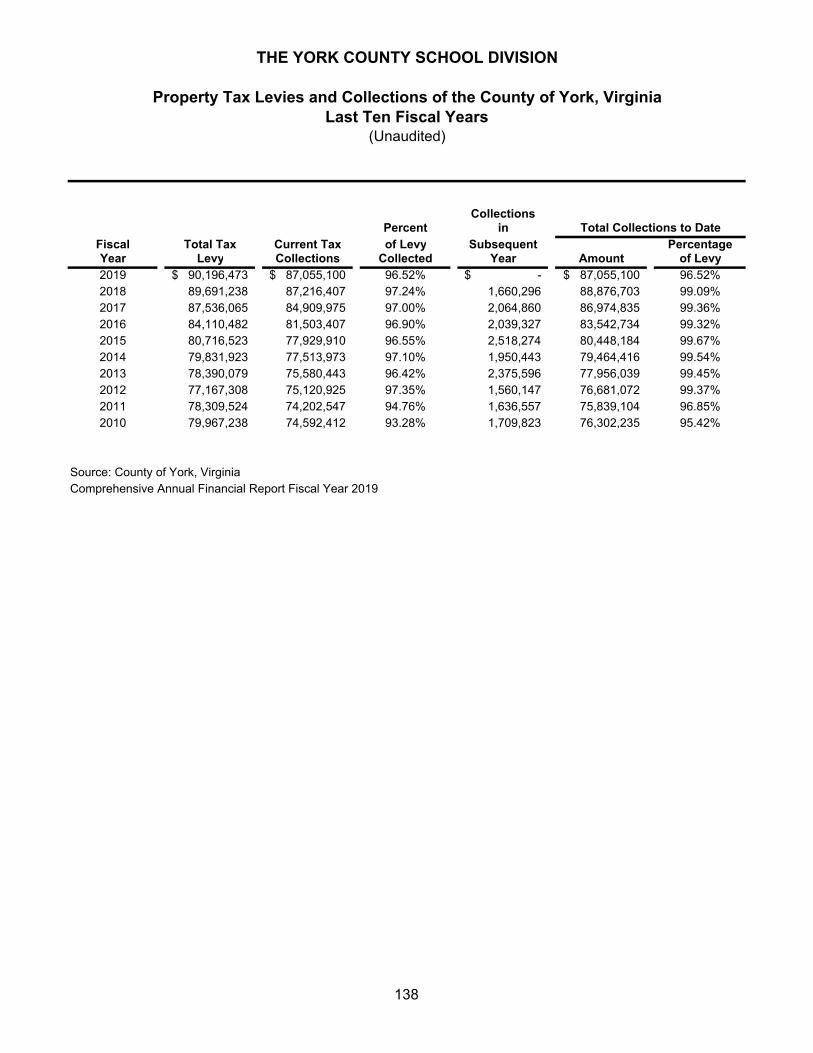
CollectionsPercent in
Fiscal Total Tax Current Tax of Levy Subsequent PercentageYear Levy Collections Collected Year Amount of Levy2019 90,196,473$ 87,055,100$ 96.52% -$ 87,055,100$ 96.52%2018 89,691,238 87,216,407 97.24% 1,660,296 88,876,703 99.09%2017 87,536,065 84,909,975 97.00% 2,064,860 86,974,835 99.36%2016 84,110,482 81,503,407 96.90% 2,039,327 83,542,734 99.32%2015 80,716,523 77,929,910 96.55% 2,518,274 80,448,184 99.67%2014 79,831,923 77,513,973 97.10% 1,950,443 79,464,416 99.54%2013 78,390,079 75,580,443 96.42% 2,375,596 77,956,039 99.45%2012 77,167,308 75,120,925 97.35% 1,560,147 76,681,072 99.37%2011 78,309,524 74,202,547 94.76% 1,636,557 75,839,104 96.85%2010 79,967,238 74,592,412 93.28% 1,709,823 76,302,235 95.42%
Source: County of York, VirginiaComprehensive Annual Financial Report Fiscal Year 2019
Total Collections to Date
THE YORK COUNTY SCHOOL DIVISION
Property Tax Levies and Collections of the County of York, VirginiaLast Ten Fiscal Years
(Unaudited)
138
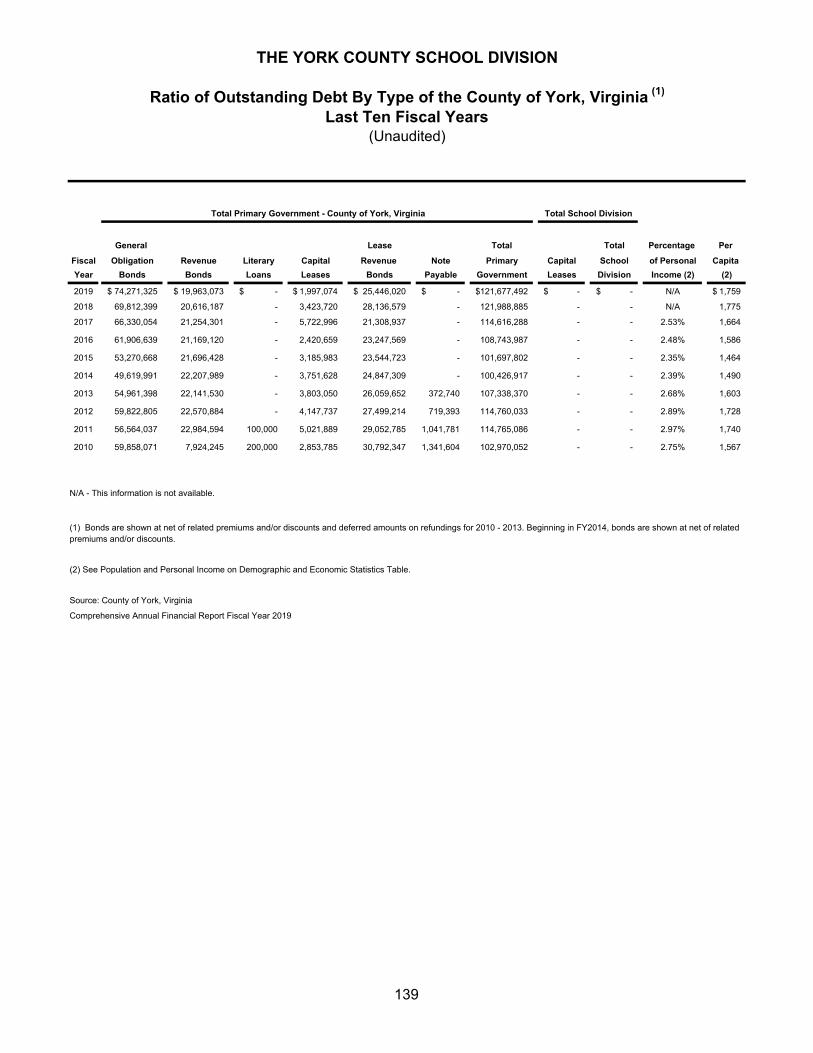
General Lease Total Total Percentage Per
Fiscal Obligation Revenue Literary Capital Revenue Note Primary Capital School of Personal Capita
Year Bonds Bonds Loans Leases Bonds Payable Government Leases Division Income (2) (2)
2019 74,271,325$ 19,963,073$ -$ 1,997,074$ 25,446,020$ -$ 121,677,492$ -$ -$ N/A 1,759$
2018 69,812,399 20,616,187 - 3,423,720 28,136,579 - 121,988,885 - - N/A 1,775
2017 66,330,054 21,254,301 - 5,722,996 21,308,937 - 114,616,288 - - 2.53% 1,664
2016 61,906,639 21,169,120 - 2,420,659 23,247,569 - 108,743,987 - - 2.48% 1,586
2015 53,270,668 21,696,428 - 3,185,983 23,544,723 - 101,697,802 - - 2.35% 1,464
2014 49,619,991 22,207,989 - 3,751,628 24,847,309 - 100,426,917 - - 2.39% 1,490
2013 54,961,398 22,141,530 - 3,803,050 26,059,652 372,740 107,338,370 - - 2.68% 1,603
2012 59,822,805 22,570,884 - 4,147,737 27,499,214 719,393 114,760,033 - - 2.89% 1,728
2011 56,564,037 22,984,594 100,000 5,021,889 29,052,785 1,041,781 114,765,086 - - 2.97% 1,740
2010 59,858,071 7,924,245 200,000 2,853,785 30,792,347 1,341,604 102,970,052 - - 2.75% 1,567
N/A - This information is not available.
Source: County of York, Virginia
Comprehensive Annual Financial Report Fiscal Year 2019
(1) Bonds are shown at net of related premiums and/or discounts and deferred amounts on refundings for 2010 - 2013. Beginning in FY2014, bonds are shown at net of related premiums and/or discounts.
(2) See Population and Personal Income on Demographic and Economic Statistics Table.
THE YORK COUNTY SCHOOL DIVISION
Ratio of Outstanding Debt By Type of the County of York, Virginia (1)
Last Ten Fiscal Years(Unaudited)
Total Primary Government - County of York, Virginia Total School Division
139
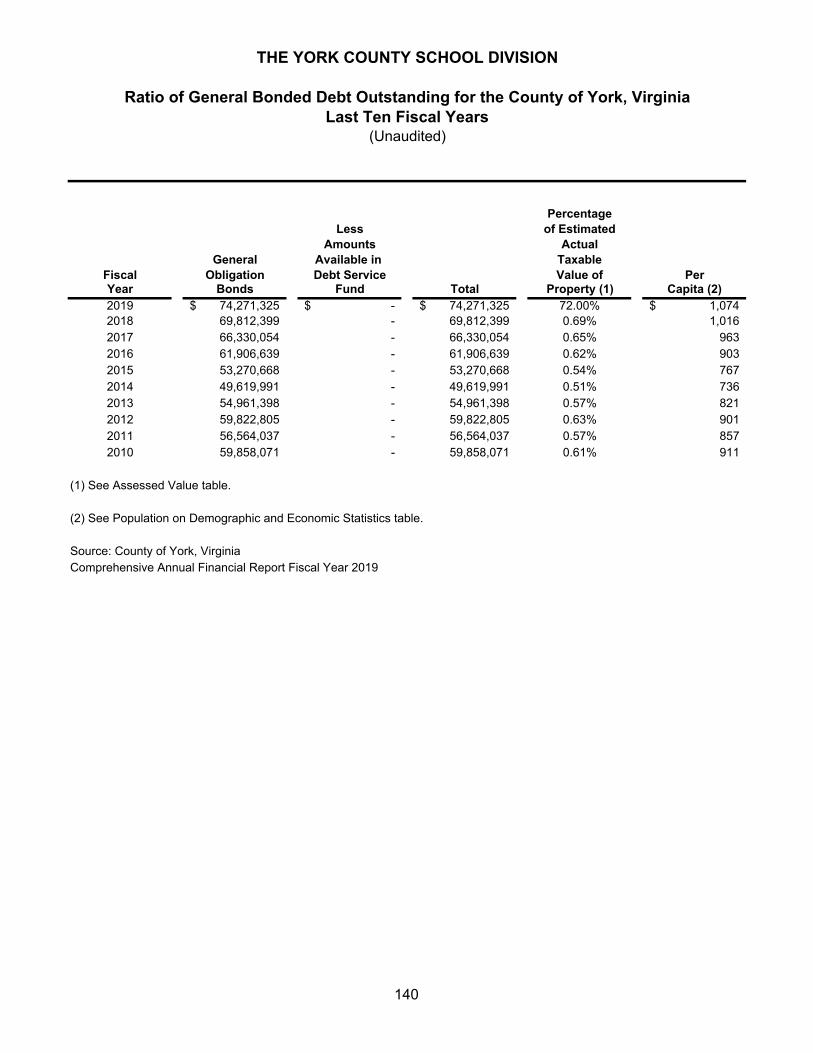
PercentageLess of Estimated
Amounts ActualGeneral Available in Taxable
Fiscal Obligation Debt Service Value of PerYear Bonds Fund Total Property (1) Capita (2)2019 74,271,325$ -$ 74,271,325$ 72.00% 1,074$ 2018 69,812,399 - 69,812,399 0.69% 1,016 2017 66,330,054 - 66,330,054 0.65% 963 2016 61,906,639 - 61,906,639 0.62% 903 2015 53,270,668 - 53,270,668 0.54% 767 2014 49,619,991 - 49,619,991 0.51% 736 2013 54,961,398 - 54,961,398 0.57% 821 2012 59,822,805 - 59,822,805 0.63% 901 2011 56,564,037 - 56,564,037 0.57% 857 2010 59,858,071 - 59,858,071 0.61% 911
Source: County of York, VirginiaComprehensive Annual Financial Report Fiscal Year 2019
THE YORK COUNTY SCHOOL DIVISION
Ratio of General Bonded Debt Outstanding for the County of York, VirginiaLast Ten Fiscal Years
(Unaudited)
(1) See Assessed Value table.
(2) See Population on Demographic and Economic Statistics table.
140
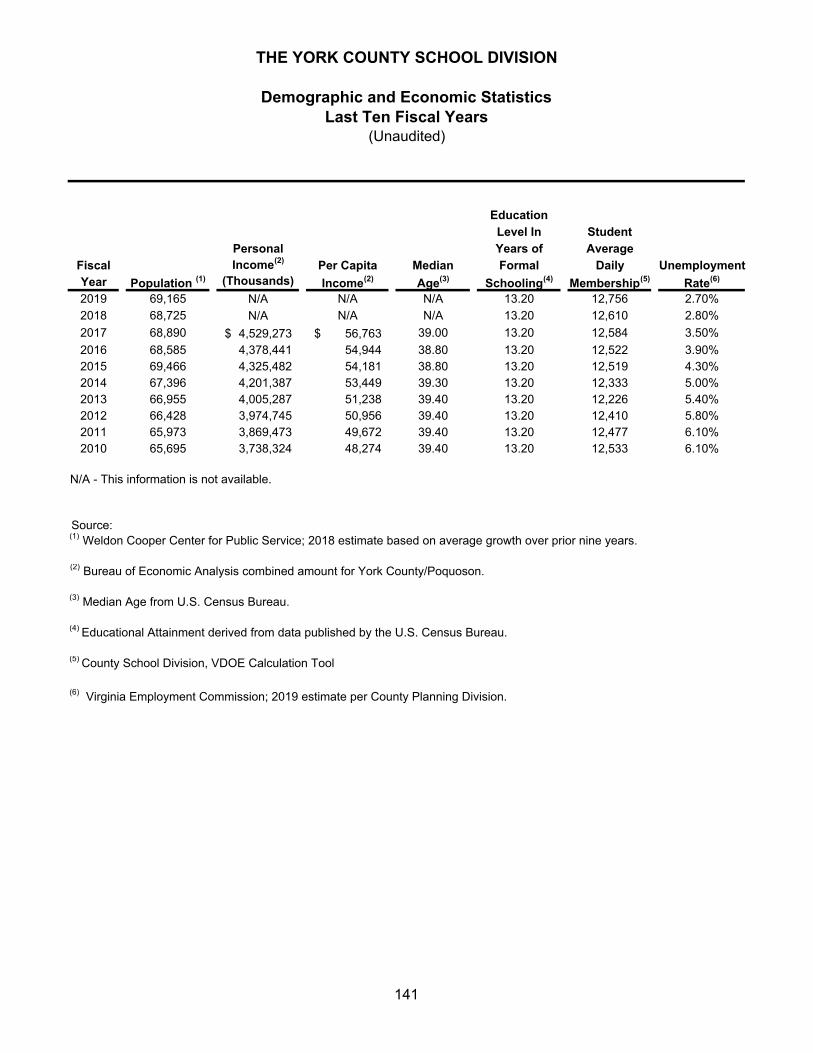
Education
Level In Student
Personal Years of Average
Fiscal Income(2) Per Capita Median Formal Daily UnemploymentYear Population (1) (Thousands) Income(2) Age(3) Schooling(4) Membership(5) Rate(6)
2019 69,165 N/A N/A N/A 13.20 12,756 2.70%
2018 68,725 N/A N/A N/A 13.20 12,610 2.80%
2017 68,890 4,529,273$ 56,763$ 39.00 13.20 12,584 3.50%
2016 68,585 4,378,441 54,944 38.80 13.20 12,522 3.90%2015 69,466 4,325,482 54,181 38.80 13.20 12,519 4.30%2014 67,396 4,201,387 53,449 39.30 13.20 12,333 5.00%2013 66,955 4,005,287 51,238 39.40 13.20 12,226 5.40%2012 66,428 3,974,745 50,956 39.40 13.20 12,410 5.80%2011 65,973 3,869,473 49,672 39.40 13.20 12,477 6.10%2010 65,695 3,738,324 48,274 39.40 13.20 12,533 6.10%
N/A - This information is not available.
Source:
THE YORK COUNTY SCHOOL DIVISION
Demographic and Economic StatisticsLast Ten Fiscal Years
(Unaudited)
(2) Bureau of Economic Analysis combined amount for York County/Poquoson.
(6) Virginia Employment Commission; 2019 estimate per County Planning Division.
(3) Median Age from U.S. Census Bureau.
(4) Educational Attainment derived from data published by the U.S. Census Bureau.
(5) County School Division, VDOE Calculation Tool
(1) Weldon Cooper Center for Public Service; 2018 estimate based on average growth over prior nine years.
141
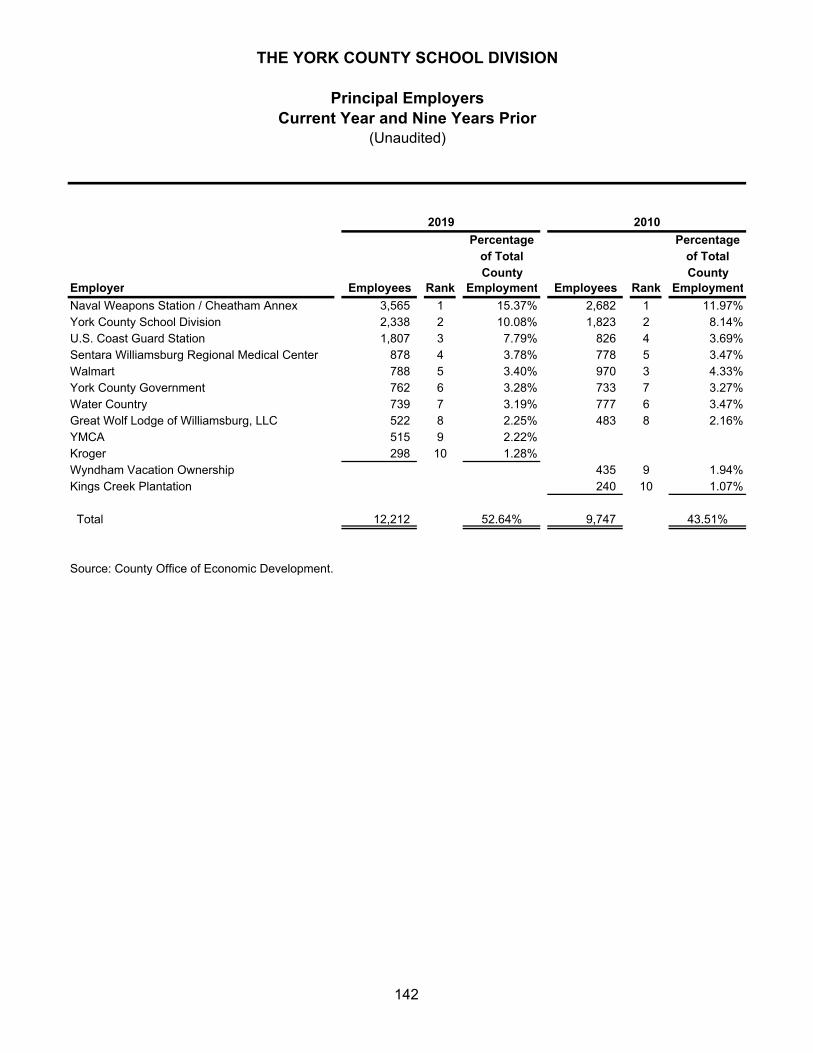
Percentage Percentageof Total of TotalCounty County
Employer Employees Rank Employment Employees Rank Employment
Naval Weapons Station / Cheatham Annex 3,565 1 15.37% 2,682 1 11.97%York County School Division 2,338 2 10.08% 1,823 2 8.14%U.S. Coast Guard Station 1,807 3 7.79% 826 4 3.69%Sentara Williamsburg Regional Medical Center 878 4 3.78% 778 5 3.47%Walmart 788 5 3.40% 970 3 4.33%York County Government 762 6 3.28% 733 7 3.27%Water Country 739 7 3.19% 777 6 3.47%Great Wolf Lodge of Williamsburg, LLC 522 8 2.25% 483 8 2.16%YMCA 515 9 2.22%Kroger 298 10 1.28%Wyndham Vacation Ownership 435 9 1.94%Kings Creek Plantation 240 10 1.07%
Total 12,212 52.64% 9,747 43.51%
Source: County Office of Economic Development.
(Unaudited)
2019 2010
THE YORK COUNTY SCHOOL DIVISION
Principal EmployersCurrent Year and Nine Years Prior
142
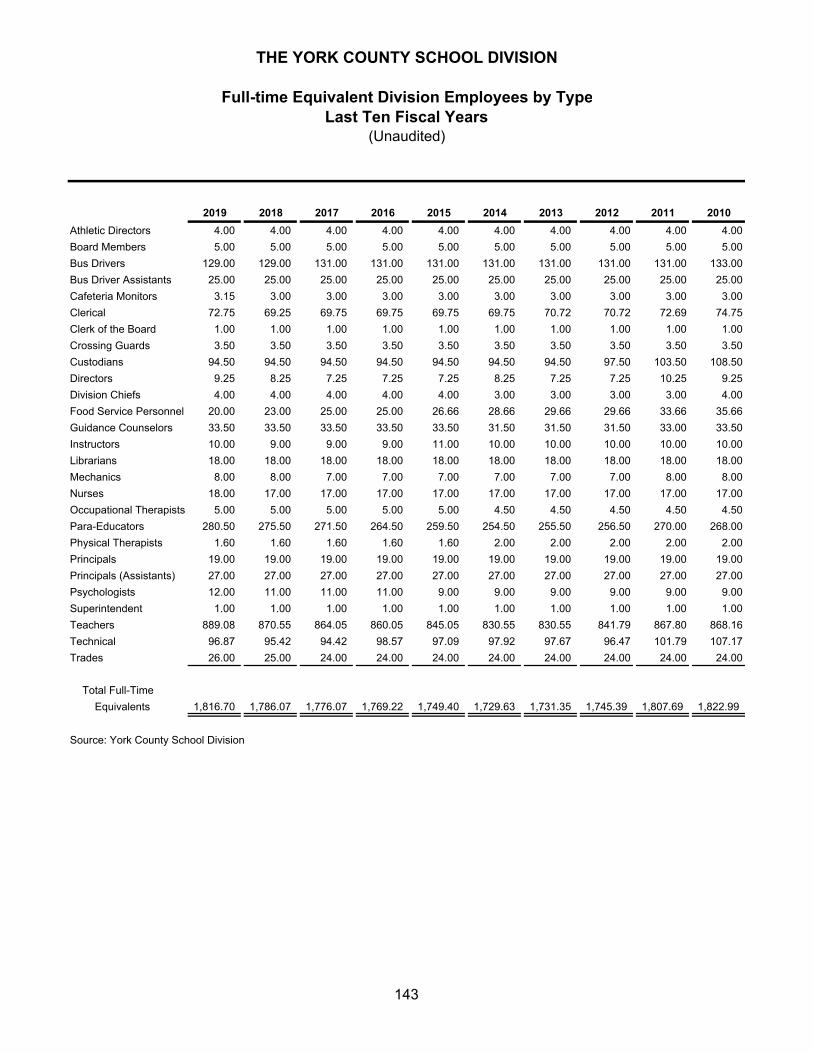
2019 2018 2017 2016 2015 2014 2013 2012 2011 2010
Athletic Directors 4.00 4.00 4.00 4.00 4.00 4.00 4.00 4.00 4.00 4.00
Board Members 5.00 5.00 5.00 5.00 5.00 5.00 5.00 5.00 5.00 5.00
Bus Drivers 129.00 129.00 131.00 131.00 131.00 131.00 131.00 131.00 131.00 133.00
Bus Driver Assistants 25.00 25.00 25.00 25.00 25.00 25.00 25.00 25.00 25.00 25.00
Cafeteria Monitors 3.15 3.00 3.00 3.00 3.00 3.00 3.00 3.00 3.00 3.00
Clerical 72.75 69.25 69.75 69.75 69.75 69.75 70.72 70.72 72.69 74.75
Clerk of the Board 1.00 1.00 1.00 1.00 1.00 1.00 1.00 1.00 1.00 1.00
Crossing Guards 3.50 3.50 3.50 3.50 3.50 3.50 3.50 3.50 3.50 3.50
Custodians 94.50 94.50 94.50 94.50 94.50 94.50 94.50 97.50 103.50 108.50
Directors 9.25 8.25 7.25 7.25 7.25 8.25 7.25 7.25 10.25 9.25
Division Chiefs 4.00 4.00 4.00 4.00 4.00 3.00 3.00 3.00 3.00 4.00
Food Service Personnel 20.00 23.00 25.00 25.00 26.66 28.66 29.66 29.66 33.66 35.66
Guidance Counselors 33.50 33.50 33.50 33.50 33.50 31.50 31.50 31.50 33.00 33.50
Instructors 10.00 9.00 9.00 9.00 11.00 10.00 10.00 10.00 10.00 10.00
Librarians 18.00 18.00 18.00 18.00 18.00 18.00 18.00 18.00 18.00 18.00
Mechanics 8.00 8.00 7.00 7.00 7.00 7.00 7.00 7.00 8.00 8.00
Nurses 18.00 17.00 17.00 17.00 17.00 17.00 17.00 17.00 17.00 17.00
Occupational Therapists 5.00 5.00 5.00 5.00 5.00 4.50 4.50 4.50 4.50 4.50
Para-Educators 280.50 275.50 271.50 264.50 259.50 254.50 255.50 256.50 270.00 268.00
Physical Therapists 1.60 1.60 1.60 1.60 1.60 2.00 2.00 2.00 2.00 2.00
Principals 19.00 19.00 19.00 19.00 19.00 19.00 19.00 19.00 19.00 19.00
Principals (Assistants) 27.00 27.00 27.00 27.00 27.00 27.00 27.00 27.00 27.00 27.00
Psychologists 12.00 11.00 11.00 11.00 9.00 9.00 9.00 9.00 9.00 9.00
Superintendent 1.00 1.00 1.00 1.00 1.00 1.00 1.00 1.00 1.00 1.00
Teachers 889.08 870.55 864.05 860.05 845.05 830.55 830.55 841.79 867.80 868.16
Technical 96.87 95.42 94.42 98.57 97.09 97.92 97.67 96.47 101.79 107.17
Trades 26.00 25.00 24.00 24.00 24.00 24.00 24.00 24.00 24.00 24.00
Total Full-Time
Equivalents 1,816.70 1,786.07 1,776.07 1,769.22 1,749.40 1,729.63 1,731.35 1,745.39 1,807.69 1,822.99
Source: York County School Division
Full-time Equivalent Division Employees by Type
THE YORK COUNTY SCHOOL DIVISION
Last Ten Fiscal Years(Unaudited)
143
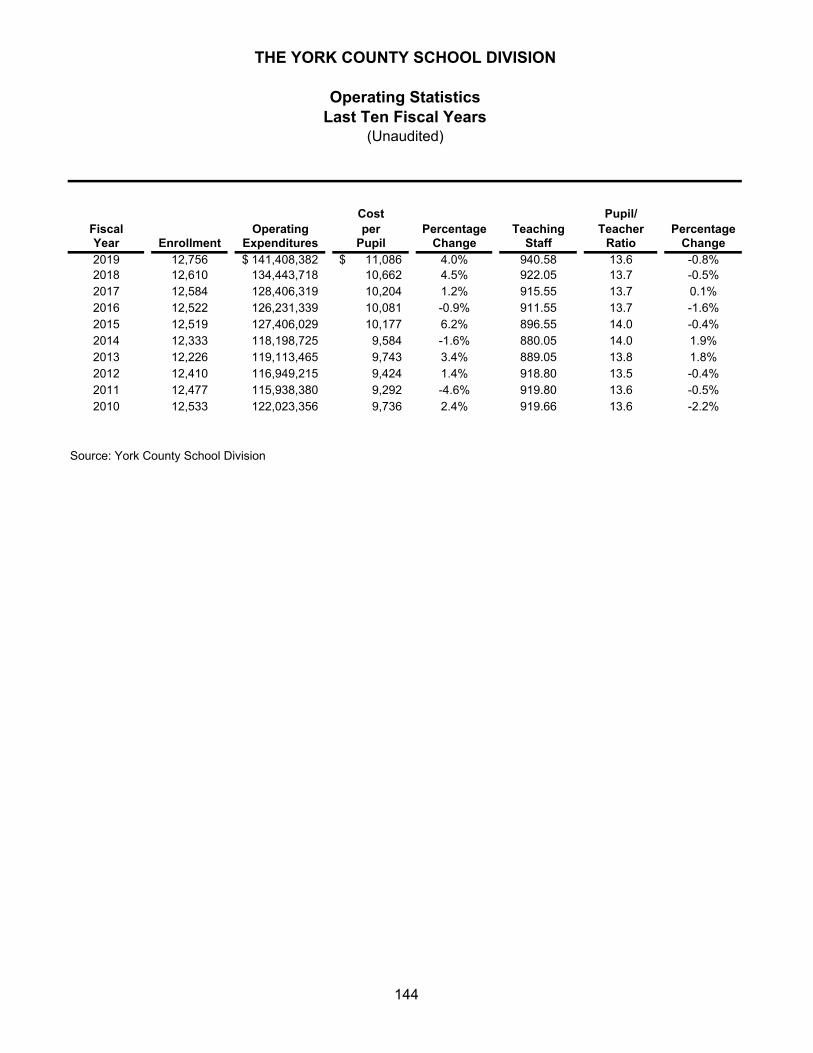
Cost Pupil/Fiscal Operating per Percentage Teaching Teacher PercentageYear Enrollment Expenditures Pupil Change Staff Ratio Change2019 12,756 141,408,382$ 11,086$ 4.0% 940.58 13.6 -0.8%2018 12,610 134,443,718 10,662 4.5% 922.05 13.7 -0.5%2017 12,584 128,406,319 10,204 1.2% 915.55 13.7 0.1%2016 12,522 126,231,339 10,081 -0.9% 911.55 13.7 -1.6%2015 12,519 127,406,029 10,177 6.2% 896.55 14.0 -0.4%2014 12,333 118,198,725 9,584 -1.6% 880.05 14.0 1.9%2013 12,226 119,113,465 9,743 3.4% 889.05 13.8 1.8%2012 12,410 116,949,215 9,424 1.4% 918.80 13.5 -0.4%2011 12,477 115,938,380 9,292 -4.6% 919.80 13.6 -0.5%2010 12,533 122,023,356 9,736 2.4% 919.66 13.6 -2.2%
Source: York County School Division
THE YORK COUNTY SCHOOL DIVISION
Operating StatisticsLast Ten Fiscal Years
(Unaudited)
144
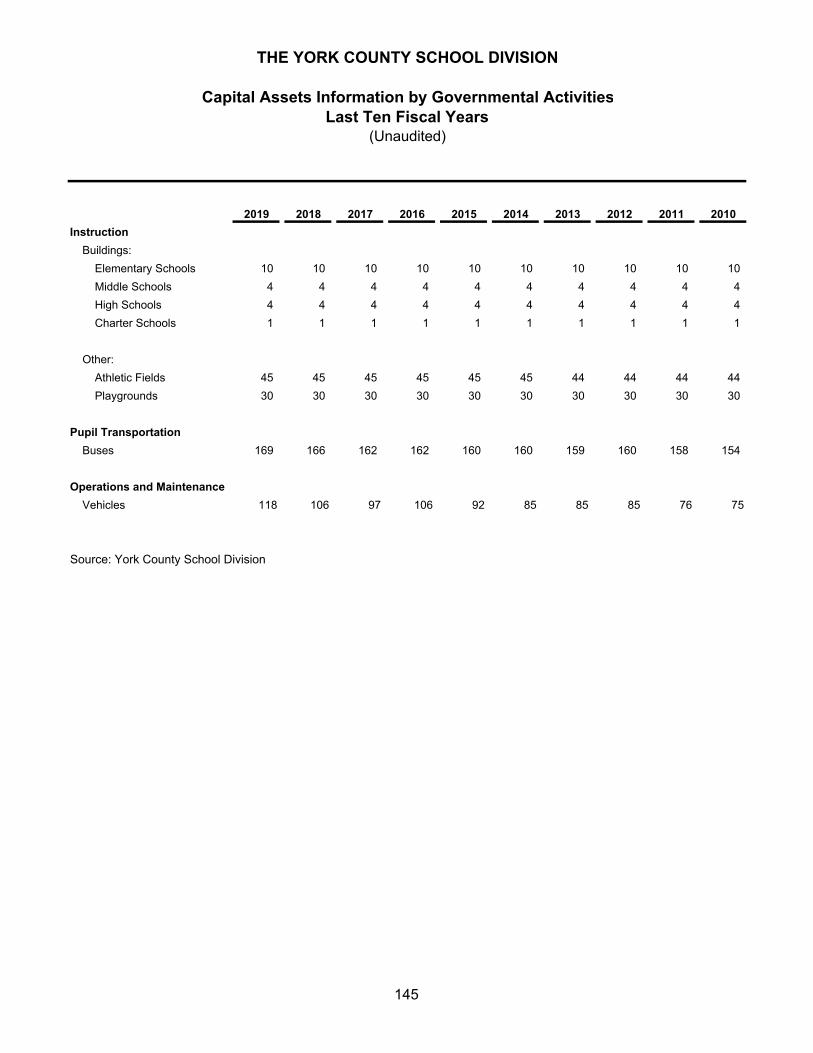
2019 2018 2017 2016 2015 2014 2013 2012 2011 2010
Instruction
Buildings:
Elementary Schools 10 10 10 10 10 10 10 10 10 10
Middle Schools 4 4 4 4 4 4 4 4 4 4
High Schools 4 4 4 4 4 4 4 4 4 4
Charter Schools 1 1 1 1 1 1 1 1 1 1
Other:
Athletic Fields 45 45 45 45 45 45 44 44 44 44
Playgrounds 30 30 30 30 30 30 30 30 30 30
Pupil Transportation
Buses 169 166 162 162 160 160 159 160 158 154
Operations and Maintenance
Vehicles 118 106 97 106 92 85 85 85 76 75
Source: York County School Division
THE YORK COUNTY SCHOOL DIVISION
Capital Assets Information by Governmental ActivitiesLast Ten Fiscal Years
(Unaudited)
145
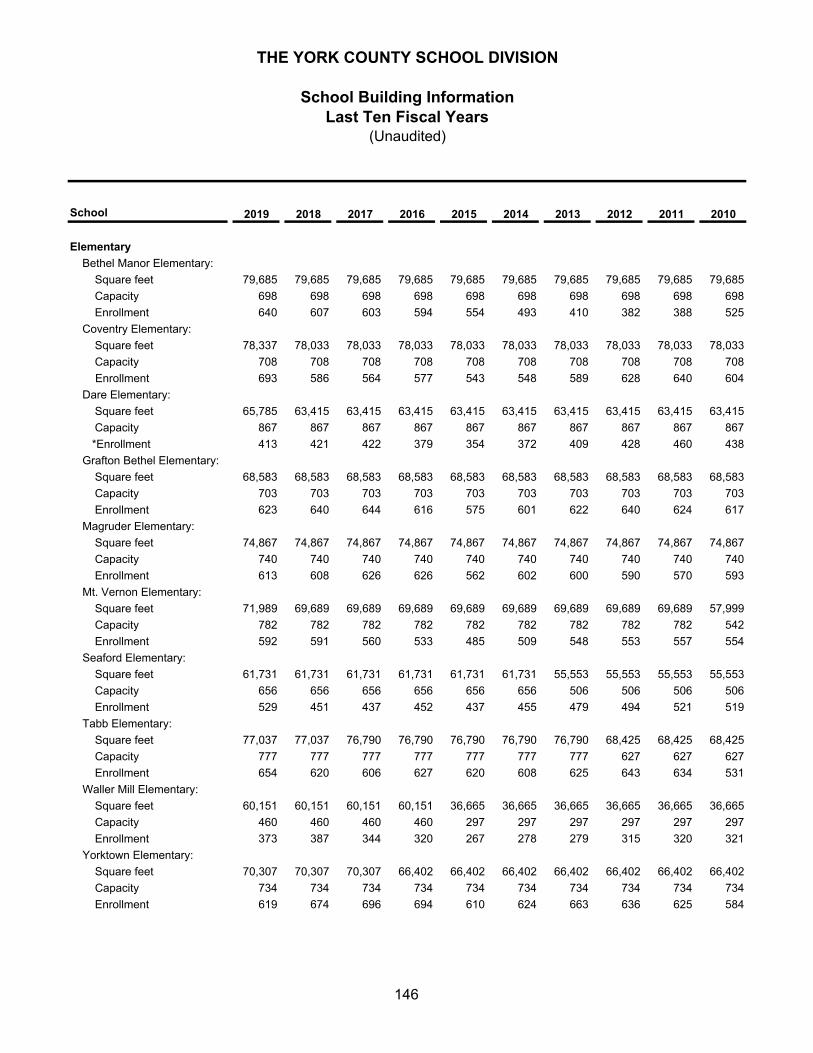
School 2019 2018 2017 2016 2015 2014 2013 2012 2011 2010
Elementary
Bethel Manor Elementary:
Square feet 79,685 79,685 79,685 79,685 79,685 79,685 79,685 79,685 79,685 79,685
Capacity 698 698 698 698 698 698 698 698 698 698
Enrollment 640 607 603 594 554 493 410 382 388 525
Coventry Elementary:
Square feet 78,337 78,033 78,033 78,033 78,033 78,033 78,033 78,033 78,033 78,033
Capacity 708 708 708 708 708 708 708 708 708 708
Enrollment 693 586 564 577 543 548 589 628 640 604
Dare Elementary:
Square feet 65,785 63,415 63,415 63,415 63,415 63,415 63,415 63,415 63,415 63,415
Capacity 867 867 867 867 867 867 867 867 867 867
*Enrollment 413 421 422 379 354 372 409 428 460 438
Grafton Bethel Elementary:
Square feet 68,583 68,583 68,583 68,583 68,583 68,583 68,583 68,583 68,583 68,583
Capacity 703 703 703 703 703 703 703 703 703 703
Enrollment 623 640 644 616 575 601 622 640 624 617
Magruder Elementary:
Square feet 74,867 74,867 74,867 74,867 74,867 74,867 74,867 74,867 74,867 74,867
Capacity 740 740 740 740 740 740 740 740 740 740
Enrollment 613 608 626 626 562 602 600 590 570 593
Mt. Vernon Elementary:
Square feet 71,989 69,689 69,689 69,689 69,689 69,689 69,689 69,689 69,689 57,999
Capacity 782 782 782 782 782 782 782 782 782 542
Enrollment 592 591 560 533 485 509 548 553 557 554
Seaford Elementary:
Square feet 61,731 61,731 61,731 61,731 61,731 61,731 55,553 55,553 55,553 55,553
Capacity 656 656 656 656 656 656 506 506 506 506
Enrollment 529 451 437 452 437 455 479 494 521 519
Tabb Elementary:
Square feet 77,037 77,037 76,790 76,790 76,790 76,790 76,790 68,425 68,425 68,425
Capacity 777 777 777 777 777 777 777 627 627 627
Enrollment 654 620 606 627 620 608 625 643 634 531
Waller Mill Elementary:
Square feet 60,151 60,151 60,151 60,151 36,665 36,665 36,665 36,665 36,665 36,665
Capacity 460 460 460 460 297 297 297 297 297 297
Enrollment 373 387 344 320 267 278 279 315 320 321
Yorktown Elementary:
Square feet 70,307 70,307 70,307 66,402 66,402 66,402 66,402 66,402 66,402 66,402
Capacity 734 734 734 734 734 734 734 734 734 734
Enrollment 619 674 696 694 610 624 663 636 625 584
THE YORK COUNTY SCHOOL DIVISION
School Building InformationLast Ten Fiscal Years
(Unaudited)
146
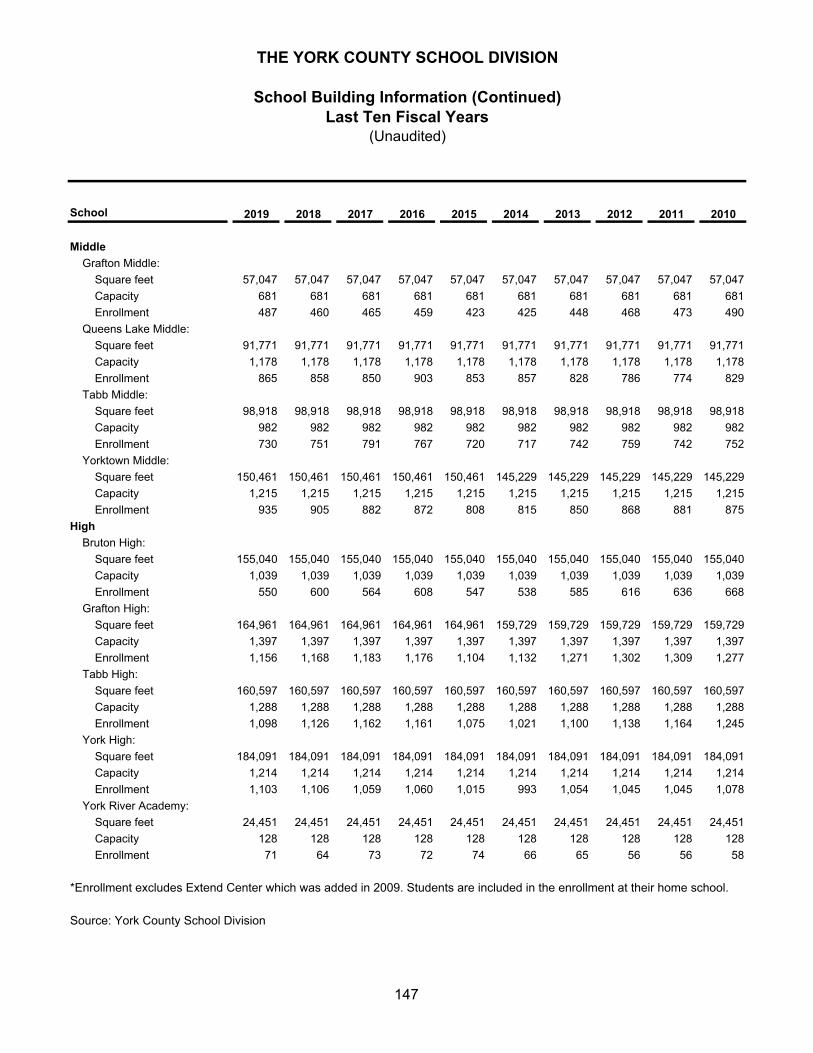
School 2019 2018 2017 2016 2015 2014 2013 2012 2011 2010
Middle
Grafton Middle:
Square feet 57,047 57,047 57,047 57,047 57,047 57,047 57,047 57,047 57,047 57,047
Capacity 681 681 681 681 681 681 681 681 681 681
Enrollment 487 460 465 459 423 425 448 468 473 490
Queens Lake Middle:
Square feet 91,771 91,771 91,771 91,771 91,771 91,771 91,771 91,771 91,771 91,771
Capacity 1,178 1,178 1,178 1,178 1,178 1,178 1,178 1,178 1,178 1,178
Enrollment 865 858 850 903 853 857 828 786 774 829
Tabb Middle:
Square feet 98,918 98,918 98,918 98,918 98,918 98,918 98,918 98,918 98,918 98,918
Capacity 982 982 982 982 982 982 982 982 982 982
Enrollment 730 751 791 767 720 717 742 759 742 752
Yorktown Middle:
Square feet 150,461 150,461 150,461 150,461 150,461 145,229 145,229 145,229 145,229 145,229
Capacity 1,215 1,215 1,215 1,215 1,215 1,215 1,215 1,215 1,215 1,215
Enrollment 935 905 882 872 808 815 850 868 881 875
High
Bruton High:
Square feet 155,040 155,040 155,040 155,040 155,040 155,040 155,040 155,040 155,040 155,040
Capacity 1,039 1,039 1,039 1,039 1,039 1,039 1,039 1,039 1,039 1,039
Enrollment 550 600 564 608 547 538 585 616 636 668
Grafton High:
Square feet 164,961 164,961 164,961 164,961 164,961 159,729 159,729 159,729 159,729 159,729
Capacity 1,397 1,397 1,397 1,397 1,397 1,397 1,397 1,397 1,397 1,397
Enrollment 1,156 1,168 1,183 1,176 1,104 1,132 1,271 1,302 1,309 1,277
Tabb High:
Square feet 160,597 160,597 160,597 160,597 160,597 160,597 160,597 160,597 160,597 160,597
Capacity 1,288 1,288 1,288 1,288 1,288 1,288 1,288 1,288 1,288 1,288
Enrollment 1,098 1,126 1,162 1,161 1,075 1,021 1,100 1,138 1,164 1,245
York High:
Square feet 184,091 184,091 184,091 184,091 184,091 184,091 184,091 184,091 184,091 184,091
Capacity 1,214 1,214 1,214 1,214 1,214 1,214 1,214 1,214 1,214 1,214
Enrollment 1,103 1,106 1,059 1,060 1,015 993 1,054 1,045 1,045 1,078
York River Academy:
Square feet 24,451 24,451 24,451 24,451 24,451 24,451 24,451 24,451 24,451 24,451
Capacity 128 128 128 128 128 128 128 128 128 128
Enrollment 71 64 73 72 74 66 65 56 56 58
Source: York County School Division
*Enrollment excludes Extend Center which was added in 2009. Students are included in the enrollment at their home school.
THE YORK COUNTY SCHOOL DIVISION
School Building Information (Continued)Last Ten Fiscal Years
(Unaudited)
147
COMPLIANCE SECTION
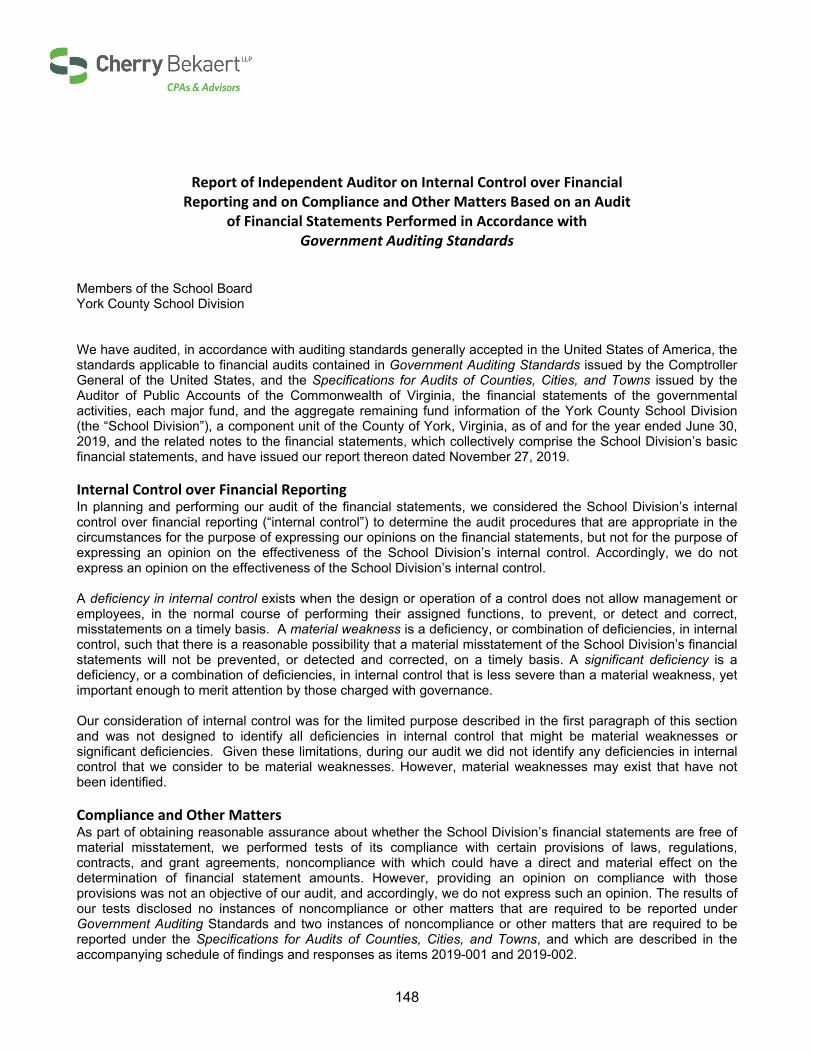
148
Report of Independent Auditor on Internal Control over Financial Reporting and on Compliance and Other Matters Based on an Audit
of Financial Statements Performed in Accordance with Government Auditing Standards
Members of the School Board York County School Division We have audited, in accordance with auditing standards generally accepted in the United States of America, the standards applicable to financial audits contained in Government Auditing Standards issued by the Comptroller General of the United States, and the Specifications for Audits of Counties, Cities, and Towns issued by the Auditor of Public Accounts of the Commonwealth of Virginia, the financial statements of the governmental activities, each major fund, and the aggregate remaining fund information of the York County School Division (the “School Division”), a component unit of the County of York, Virginia, as of and for the year ended June 30, 2019, and the related notes to the financial statements, which collectively comprise the School Division’s basic financial statements, and have issued our report thereon dated November 27, 2019. Internal Control over Financial Reporting In planning and performing our audit of the financial statements, we considered the School Division’s internal control over financial reporting (“internal control”) to determine the audit procedures that are appropriate in the circumstances for the purpose of expressing our opinions on the financial statements, but not for the purpose of expressing an opinion on the effectiveness of the School Division’s internal control. Accordingly, we do not express an opinion on the effectiveness of the School Division’s internal control. A deficiency in internal control exists when the design or operation of a control does not allow management or employees, in the normal course of performing their assigned functions, to prevent, or detect and correct, misstatements on a timely basis. A material weakness is a deficiency, or combination of deficiencies, in internal control, such that there is a reasonable possibility that a material misstatement of the School Division’s financial statements will not be prevented, or detected and corrected, on a timely basis. A significant deficiency is a deficiency, or a combination of deficiencies, in internal control that is less severe than a material weakness, yet important enough to merit attention by those charged with governance. Our consideration of internal control was for the limited purpose described in the first paragraph of this section and was not designed to identify all deficiencies in internal control that might be material weaknesses or significant deficiencies. Given these limitations, during our audit we did not identify any deficiencies in internal control that we consider to be material weaknesses. However, material weaknesses may exist that have not been identified. Compliance and Other Matters As part of obtaining reasonable assurance about whether the School Division’s financial statements are free of material misstatement, we performed tests of its compliance with certain provisions of laws, regulations, contracts, and grant agreements, noncompliance with which could have a direct and material effect on the determination of financial statement amounts. However, providing an opinion on compliance with those provisions was not an objective of our audit, and accordingly, we do not express such an opinion. The results of our tests disclosed no instances of noncompliance or other matters that are required to be reported under Government Auditing Standards and two instances of noncompliance or other matters that are required to be reported under the Specifications for Audits of Counties, Cities, and Towns, and which are described in the accompanying schedule of findings and responses as items 2019-001 and 2019-002.
149
School Division’s Responses to Findings The School Division’s responses to the findings identified in our audit are described in the accompanying schedule of findings and responses. The School Division’s responses were not subjected to the auditing procedures applied in the audit of the financial statements and, accordingly, we express no opinion on them. Purpose of this Report The purpose of this report is solely to describe the scope of our testing of internal control and compliance and the results of that testing and not to provide an opinion on the effectiveness of the entity’s internal control or on compliance. This report is an integral part of an audit performed in accordance with Government Auditing Standards in considering the entity’s internal control and compliance. Accordingly, this communication is not suitable for any other purpose.
Virginia Beach, Virginia November 27, 2019
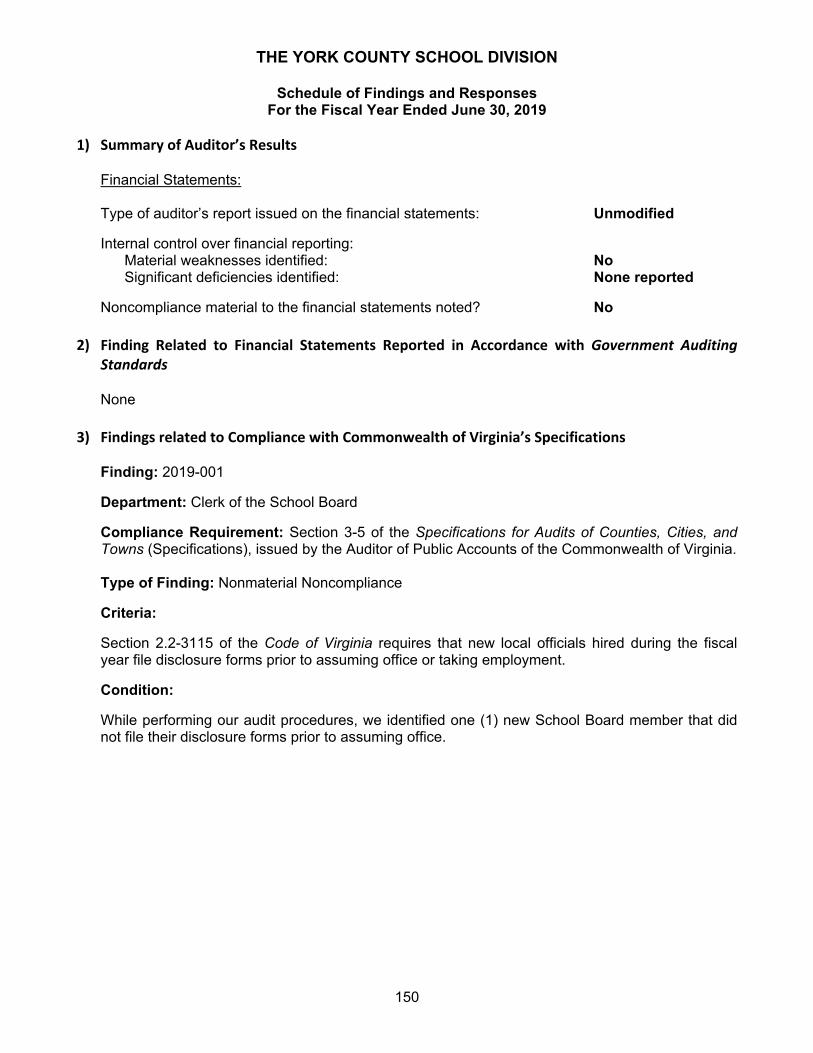
THE YORK COUNTY SCHOOL DIVISION
Schedule of Findings and Responses For the Fiscal Year Ended June 30, 2019
150
1) Summary of Auditor’s Results
Financial Statements:
Type of auditor’s report issued on the financial statements: Unmodified
Internal control over financial reporting: Material weaknesses identified: No Significant deficiencies identified: None reported
Noncompliance material to the financial statements noted? No
2) Finding Related to Financial Statements Reported in Accordance with Government Auditing
Standards None
3) Findings related to Compliance with Commonwealth of Virginia’s Specifications
Finding: 2019-001 Department: Clerk of the School Board Compliance Requirement: Section 3-5 of the Specifications for Audits of Counties, Cities, and Towns (Specifications), issued by the Auditor of Public Accounts of the Commonwealth of Virginia. Type of Finding: Nonmaterial Noncompliance Criteria: Section 2.2-3115 of the Code of Virginia requires that new local officials hired during the fiscal year file disclosure forms prior to assuming office or taking employment. Condition: While performing our audit procedures, we identified one (1) new School Board member that did not file their disclosure forms prior to assuming office.
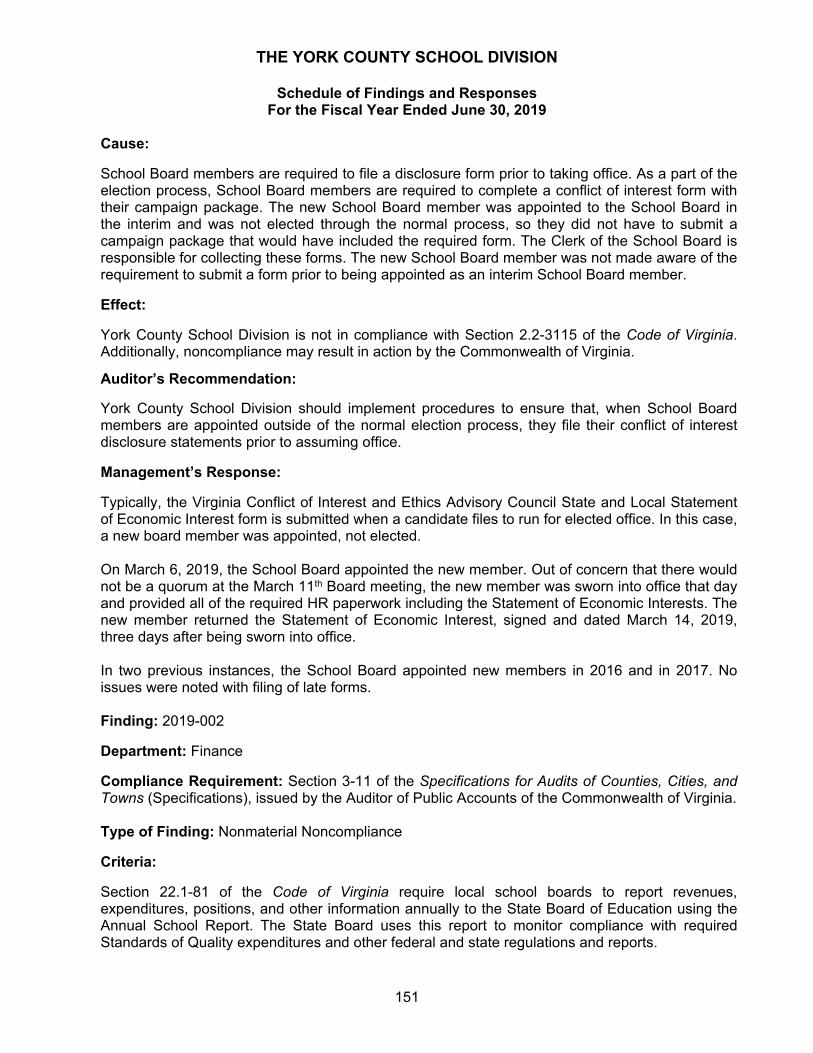
THE YORK COUNTY SCHOOL DIVISION
Schedule of Findings and Responses For the Fiscal Year Ended June 30, 2019
151
Cause: School Board members are required to file a disclosure form prior to taking office. As a part of the election process, School Board members are required to complete a conflict of interest form with their campaign package. The new School Board member was appointed to the School Board in the interim and was not elected through the normal process, so they did not have to submit a campaign package that would have included the required form. The Clerk of the School Board is responsible for collecting these forms. The new School Board member was not made aware of the requirement to submit a form prior to being appointed as an interim School Board member. Effect: York County School Division is not in compliance with Section 2.2-3115 of the Code of Virginia. Additionally, noncompliance may result in action by the Commonwealth of Virginia. Auditor’s Recommendation: York County School Division should implement procedures to ensure that, when School Board members are appointed outside of the normal election process, they file their conflict of interest disclosure statements prior to assuming office. Management’s Response: Typically, the Virginia Conflict of Interest and Ethics Advisory Council State and Local Statement of Economic Interest form is submitted when a candidate files to run for elected office. In this case, a new board member was appointed, not elected. On March 6, 2019, the School Board appointed the new member. Out of concern that there would not be a quorum at the March 11th Board meeting, the new member was sworn into office that day and provided all of the required HR paperwork including the Statement of Economic Interests. The new member returned the Statement of Economic Interest, signed and dated March 14, 2019, three days after being sworn into office. In two previous instances, the School Board appointed new members in 2016 and in 2017. No issues were noted with filing of late forms. Finding: 2019-002 Department: Finance Compliance Requirement: Section 3-11 of the Specifications for Audits of Counties, Cities, and Towns (Specifications), issued by the Auditor of Public Accounts of the Commonwealth of Virginia. Type of Finding: Nonmaterial Noncompliance Criteria: Section 22.1-81 of the Code of Virginia require local school boards to report revenues, expenditures, positions, and other information annually to the State Board of Education using the Annual School Report. The State Board uses this report to monitor compliance with required Standards of Quality expenditures and other federal and state regulations and reports.
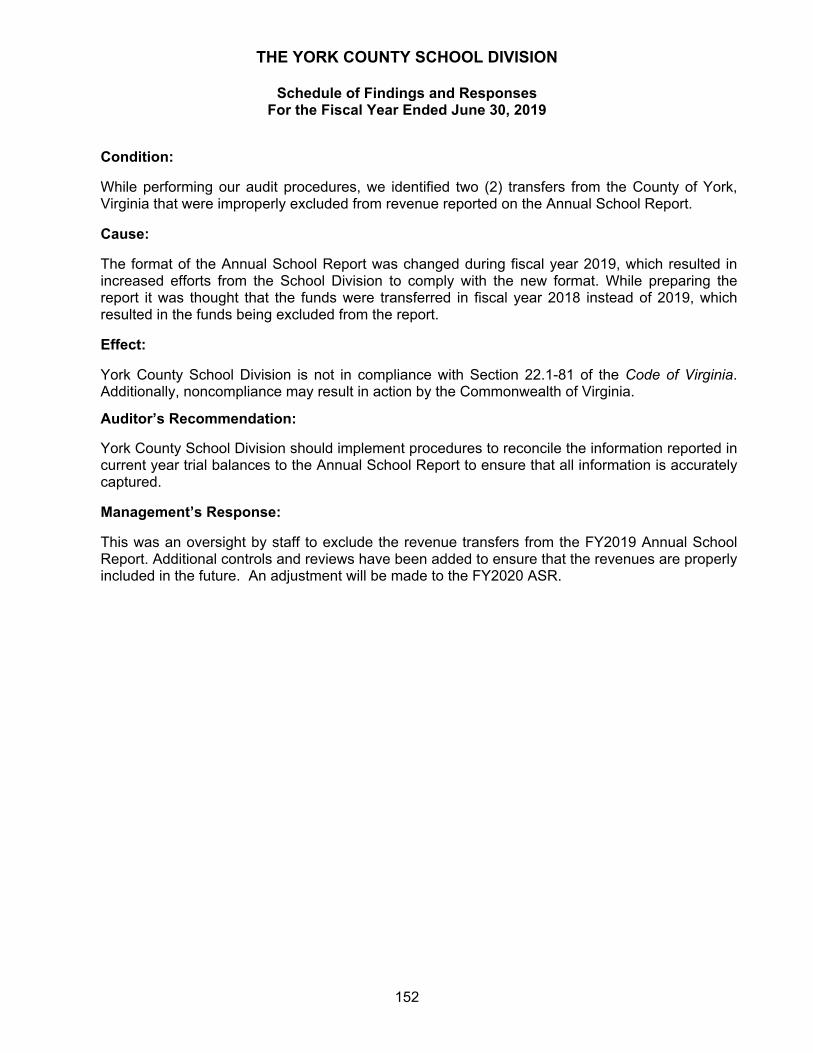
THE YORK COUNTY SCHOOL DIVISION
Schedule of Findings and Responses For the Fiscal Year Ended June 30, 2019
152
Condition: While performing our audit procedures, we identified two (2) transfers from the County of York, Virginia that were improperly excluded from revenue reported on the Annual School Report. Cause: The format of the Annual School Report was changed during fiscal year 2019, which resulted in increased efforts from the School Division to comply with the new format. While preparing the report it was thought that the funds were transferred in fiscal year 2018 instead of 2019, which resulted in the funds being excluded from the report. Effect: York County School Division is not in compliance with Section 22.1-81 of the Code of Virginia. Additionally, noncompliance may result in action by the Commonwealth of Virginia. Auditor’s Recommendation: York County School Division should implement procedures to reconcile the information reported in current year trial balances to the Annual School Report to ensure that all information is accurately captured. Management’s Response: This was an oversight by staff to exclude the revenue transfers from the FY2019 Annual School Report. Additional controls and reviews have been added to ensure that the revenues are properly included in the future. An adjustment will be made to the FY2020 ASR.

THIS PAGE LEFT BLANK INTENTIONALLY


