Embed Size (px)
Citation preview

Comprehensive Evaluation of the Objective Qualityof Life of Chinese Residents: 2006 to 2009
Zhi Li • Peigang Wang
Accepted: 31 July 2012 / Published online: 10 August 2012� Springer Science+Business Media B.V. 2012
Abstract This study performs a comprehensive evaluation of the objective quality of life
(QOL) of the 31 provincial administrative divisions in Mainland China from 2006 to 2009
with principal component analysis (PCA). The objective QOL in China generally decreases
gradually from the eastern coastal regions to the western inland regions, with a significant
gap between the east and the west. Furthermore, the QOL shows an irrational develop-
mental pattern with the natural conditions and the geographical position as the foundations,
and economic development as the dominant factor. Cluster analysis is then used to analyze
further the regional structural characteristics of the QOL in China. The results indicate the
existence of mutual distinctions and internal differentiations among the eastern, middle,
and western regions. The temporal analysis shows that the QOL in China demonstrates a
continuous increase from 2006 to 2009, with a growth rate that speeds up annually.
However, the increase does not mean a harmonious development in all aspects of society,
but the rapid progress of socio-economic well-being, and the slow development or even
deterioration of eco-environment and social security. The tendencies of the QOL in the
four socio-economic regions coincide with that of the national average and the QOL of the
middle and western regions increase significantly faster than that of the eastern region.
However, the disparities between the eastern region and the middle and western regions
expand because of the huge base of regional development differences in China.
Keywords Objective quality of life � Regional disparities �Principal component analysis � Cluster analysis
Z. LiDepartment of Sociology, Wuhan University, Wuhan, China
P. Wang (&)School of Public Health, Wuhan University, Wuhan, Chinae-mail: [email protected]
123
Soc Indic Res (2013) 113:1075–1090DOI 10.1007/s11205-012-0128-3

1 Background
Since the reform and opening-up of the country, the Chinese economy has enjoyed rapid
progress and made significant achievements. From 1978 to 2010, China’s gross domestic
product (GDP) has had an annual increase of 9.8 %. By 2010, its total economic output had
surpassed Japan, and the economy had become the world’s second largest (World Bank
2011). With this rapid development, the living standard of the Chinese people has sig-
nificantly improved. However, the one-sided pursuit of economic growth has also brought
about a series of serious problems, such as the obvious contradiction between economy and
society, serious problems in resources and population, a deteriorating environment, and
increasing social instability. Consequently, China should establish a new notion of
development and change the existing backward developmental pattern. Therefore, a sci-
entific measurement of the QOL of China’s is necessary.
For China, a large country with a vast land and a population of 1.3 billion, special
attention should be given to the regional disparities when the QOL is measured. Since the
reform and opening up, the regional disparities in China has been widening, causing great
concern in the government and society. Based on the Human Development Index (HDI)
released by the United Nations Development Programme (UNDP), provinces (including
municipalities and autonomous regions) with better human development are mainly con-
centrated in the eastern coastal area, whereas provinces with lower levels of human
development are mainly located in the west. In 2008, the municipality of Shanghai had the
highest HDI, which was 44 % points higher than that of Tibet, the province with the lowest
HDI value (UNDP 2010). This aggregate disparity can also be viewed in global com-
parative terms. Based on the 2007–2008 global Human Development Report, the HDI
achievements of Shanghai and Beijing were comparable to those of European countries
such as Portugal, whereas the worst performing Chinese provinces such as Guizhou had
HDIs comparable to that of Namibia in Africa (UNDP 2008).
So far, scholars, both local and foreign, have already conducted a series of research on
the comprehensive evaluation of the objective QOL of China. Studies carried out at the
macroscopic level can be divided into two categories based on the adopted index system.
One is based on the HDI1 released by the UNDP (Lai 2003; Qin and Luo 2004; Tang 1999;
Yang and Hu 2008; Yang et al. 2005), whereas the other, with richer QOL contents, is
based on the index system developed by researchers with different understandings of QOL
(Sun et al. 2005; Yang and Liu 2009). Although HDI in the first category has played a
significant role in the measurement of the three most basic aspects of human development
(i.e., health, education and economy), it can hardly fully reflect the status of a region’s
QOL because of its simplicity and roughness (Carlucci and Pisani 1995; Kelley 1991; Lind
1992, 1993, 2004; Noorbakhsh 1998a, b). For the second category, more attention is paid
to the overall regional disparities in China and the uncoordinated state between different
domains. It seldom focuses on the regional structural feature of QOL by dividing the
country into different groups. In addition, little research has tracked the variation char-
acteristics of QOL of recent years.
1 Since its first release in 1990, HDI has been widely used to measure and rank relative human developmentin various countries. HDI measures the average achievements in a country or region in three basicdimensions of human development (i.e., health, education, and economy) (UNDP 2004). HDI is compre-hensive, simple, and easy to understand; thus, it has achieved wide attention from many countries. Differentfrom the objective weight given by PCA in this paper, HDI uses equal weights for all three-dimensionalindicators when synthesizing the multi-dimensional measurements of human development into a singlecomposite index.
1076 Z. Li, P. Wang
123

The current paper first constructs the composite QOL index and its sub-indices using
PCA, and then analyzes the overall differences of the 31 provincial administrative divi-
sions. Cluster analysis is then used to study further the regional structural features of QOL
in China. The variation characteristics of QOL and the regional disparities from 2006 to
2009 are then analyzed.
2 Data, Indicators, and Methodology
2.1 Data
This study covers the 31 provincial administrative divisions (including 4 municipalities, 22
provinces, and 5 autonomous regions) in Mainland China. Given the data availability, only
the QOL trend from 2006 to 2009 is analyzed. The original data used to construct the
composite index of QOL are obtained from China Statistical Yearbook, China Health
Statistical Yearbook, China Statistical Yearbook on Science and Technology, China Labor
Statistical Yearbook, and China Cultural Relics Statistical Yearbook, or are collated
accordingly. In the 21st century, China has released data on the average life expectancy
only once (excluding the 2010 census data), i.e., the 2000 census data. To ensure com-
prehensiveness and consistency, the current paper uses the per capita life expectancy data
of 2000. In addition, mean values are used to replace individual missing values for indi-
vidual provinces (mainly Tibet).
2.2 Indicators
Objective QOL is closely related to the social development stage and is an important
indicator of the level and status of social development (Chan et al. 2005; Diener and Suh
1997; Lee 2003). Therefore, the research focus should differ when QOL research on
societies at different developmental levels is conducted. On one hand, for a populous
developing country like China, attention must be given mainly to some basic aspects. On
the other hand, demands of higher levels must also be properly considered. By referring to
existing QOL index systems, both domestic and abroad, the objective QOL of Chinese
residents is measured from seven aspects (See Table 1), namely, economy, consumption,
health, science and education, social security, environment, and cultural and leisure
activities. The index system does not include some important indicators and aspects, such
as the number of mobile phones and computers per 100 households (which reflects the
level of consumption), the share of environmental pollution control investment of GDP
(which reflects the status of environmental protection), the Gini coefficient (which reflects
income distribution), and the incidence of criminal cases (which reflects the social security
status), because of data availability or comparability. Special attention is given to some
indicators of social justice, which will be discussed in the last part of this paper.
2.3 Construction of the Index of Objective QOL
PCA is used in constructing the objective QOL index. This technique is a multivariate
statistical method that uses the dimension-reduction ideology to reduce multiple indicators
into several composite indices with little loss of information (Rao 1964; Wang 2007). The
transformed composite indices are usually called principal components, which are the linear
Comprehensive Evaluation of the Objective QOL 1077
123

combination of the original variables, and are mutually uncorrelated. Significant advantages
of this method are that (1) it can avoid overlapping information on multiple indicators and
multicollinearity, so as to better reflect the features of things and internal rules; and (2) the
weights originate from the data, and are therefore objective (Booysen 2002; Ram 1982a, b;
Table 1 The index system of objective QOL
Source
Economy
Per capita GDP (Yuan) CSY (2007–2010)
Per capita household consumption expenditure (Yuan) CSY (2007–2010)
Consumer price index (negative indicator) CSY (2007–2010)
Per capita savings deposit at year-end (Yuan) CSY (2007–2010)
Consumption
Per capita annual consumption expenditure (Yuan) CSY (2007–2010)
Food consumption ratio (%) (negative indicator) CSY (2007–2010)
Health care consumption ratio (%) CSY (2007–2010)
Health
Medical technical personnel in health care institutions per 1,000 persons CHSY (2007–2010)
Beds in health care institutions per 1,000 persons CHSY (2007–2010)
Total dependency ratio (%) (negative indicator) CHSY (2007–2010)
Life expectancy CHSY (2007–2010)
Maternal mortality rate (1/100,000) (negative indicator) CHSY (2007–2010)
Prenatal mortality rate (1/1,000) (negative indicator) CHSY (2007–2010)
Science and education
Per capita education funds (Yuan) CSY (2007–2010)
Number of college students per 100,000 population CSY (2007–2010)
Per capita intramural expenditure on R&D (Yuan) CSYST (2007–2010)
Transaction value in technical market (10,000 Yuan) CSY (2007–2010)
Social security
Registered unemployed rate in urban area (%) (negative indicator) CSY (2007–2010)
Urban basic pension insurance coverage rate (%) CSY (2007–2010)
Basic pension insurance coverage rate in rural areas (%) CLSY (2007–2010)
Unemployment insurance coverage rate (%) CSY (2007–2010)
Number of traffic deaths per 100,000 population (negative indicator) CSY (2007–2010)
Environment
Park Green area in cities per capita (m2) CSY (2007–2010)
Water resources per capita (m3/person) CSY (2007–2010)
Forest coverage rate (%) CSY (2007–2010)
Treatment rate of consumption wastes (%) CSY (2007–2010)
Number of facilities for treatment of waste water per 100,000 population CSY (2007–2010)
Cultural and leisure activities
Per capita education, cultural and recreation services consumption (Yuan) CSY (2007–2010)
Number of public library per 1,000,000 population CCRSY (2007–2010)
CSY china statistical yearbook; CHSY china health statistical yearbook; CSYST china statistical yearbook onscience and technology; CLSY china labor statistical yearbook; CCRSY china cultural relics statisticalyearbook
1078 Z. Li, P. Wang
123
Slottje 1991). To analyze the QOL differences among the 31 provinces in Mainland China,
the classical PCA is used in analyzing the cross-sectional data of 2009. Then, the generalized
principal component analysis (GPCA) is applied to further track the variation characteristics
of QOL from 2006 to 2009. Through the GPCA of panel data, the same structures of the
principal components of each year are assured, making temporal analysis possible (Ren and
Wang 1997; Vidal et al. 2006).
To eliminate the differences in the various indicators with different ranges and metrics,
positive and negative indicators are standardized using eqs. (1) and (2), respectively, as
follows:
Z ¼ ActualValue�MinimumValue
Maximum Value�Minimum Valueð1Þ
Z ¼ MaximumValue� ActualValue
Maximum Value�Minimum Valueð2Þ
Four principal components are extracted in the analysis of both cross-sectional data of
2009 and the panel data from 2006 to 2009 (comprising 82.50 and 78.19 % of the total
explained variance, respectively) using the criterion of Eigen values exceeding 1 as well as
the elbow criterion (Cattell 1966), and are used as the four sub-areas of the QOL. The
composite index of QOL is then constructed by giving weight of variance explained to
each principal component. By comparison, the loading of the indicators on the four
principal components in the cross-sectional analysis and temporal analysis is virtually the
same. In other words, the principal components have the same meaning.
2.4 Cluster Analysis
To further analyze the regional structural characteristics of the QOL in China, the 31
provinces are divided into groups according to the similarity of their scores on the QOL
levels and structural properties. In this article, cluster analysis is applied to the four sub-
indices calculated by cross-sectional analysis. Cluster analysis is a multivariate method
used to divide observations into groups or clusters based on similarities, so that each group
is as homogeneous as possible with respect to the clustering variable(s) (Aldenderfer and
Blashfield 1984; Hair et al. 1998). The significant advantage of this method is that the
standard of classification originates from the data, which can effectively overcome the
subjectivity of the classification based on the size of the composite QOL index (Yang and
Hu 2008). In the current paper, the squared Euclidean distance and Ward’s (Ward 1963)
hierarchical method are used to form clusters.
Two statistics, R2 and semi-partial R2,2 are used to evaluate the cluster solution and to
determine the number of clusters. The merging of 5 clusters into 4 causes a remarkable
decrease of R2 from 0.812 to 0.698, and the corresponding semi-partial R2 increases
dramatically from 0.0418 to 0.1142. Statistics indicates that the five-cluster solution seems
appropriate. In the five-cluster solution, the three Northwestern provinces, namely,
Xinjiang, Gansu, and Qinghai, and the Northeast and North China are clustered into one
group despite different development patterns. Thus, we chose the six-cluster solution
because it is more suitable to China’s actual situation. In the six-cluster solution, the three
provinces Xinjiang, Gansu, and Qinghai are separated from the Northeast and North China,
and are clustered as a group of their own. The present R2 statistical value (0.854) is over
2 Refer to Yang and Hu (2008) for a detailed description of the properties of R2 and semi-partial R2.
Comprehensive Evaluation of the Objective QOL 1079
123
85 %; thus, the ratio of the within-cluster sums of squares and the total sum of squares is
less than 15 %, indicating that the solution satisfies the requirements of within-group
homogeneity and cross-group heterogeneity. Therefore, the clustering result reflects the
regional disparities of various provinces in China.
3 Results
3.1 Overall Differences of the QOL and the Four Subfields of the 31
Provincial Administrative Divisions
Table 2 and Fig. 1 shows that the objective QOL values in the eastern regions of China are
high, whereas those in western regions are low. QOL decreases from the eastern coastal
regions to the western inland regions. As a whole, the QOL values in the eastern regions
are noticeably higher than those of the western regions. The provinces with the top 10 QOL
ranks are all located in the eastern developed regions, whereas those with the 10 worst
values all belong to the less developed western China, except for the Anhui and Jiangxi
provinces. The four principal components are analyzed to study further the distinctions
between the 31 provincial administrative divisions in each field.
(a) Composite Index of Socio-economic Well-being. As the most important aspect of
the objective QOL of China, the composite index of socio-economic well-being shares
very similar distribution characteristics with the composite index of QOL, namely, it
decreases from the eastern coastal regions to the western inland regions. Attention should
also be given to the internal distinctions of the three socio-economic regions (including the
eastern region, the middle region and the western region) of China.3 In the eastern region,
Beijing and Shanghai have a significant advantage compared with other provinces; in the
middle region, the QOL of Jiangxi and Anhui are close to that of the western region; and in
the western region, the QOL of Inner Mongolia and Chongqing stand out, and are even
better than those of most provinces in the middle region.
(b) Composite Index of Maternity and Child Care and Natural Resources (the natural
resources here mainly refers to water and forest resources). In this index, the provinces in
southern China rank first, those in northern China are ranked lower, and those in western
and northwestern China are ranked last. The abundant water and forest resources contribute
largely to the index position of southern China, whereas the lack of natural resources and
the bad conditions of maternity and child health care are the reasons for the low ranking of
western and northwestern China. The low scores of two municipalities, Beijing and
Shanghai, are the results of lack of water and forest resources.
(c) Composite Index of Consumption Structure, Public Cultural Resources, and Eco-
environment. The distribution of this index appears to lack order because of its compo-
sition. However, when seen from a broader perspective, northern China generally gets a
higher mark than southern China. Influences of the three composing dimensions of this
index differ regionally. The higher scores of northeast China, namely Jilin, Heilongjiang
and Liaoning, are due to their reasonable consumption structure; and those of Gansu,
3 Four socio-economic regions are divided in China, namely, the eastern, northeastern, middle and westernregions. The eastern region includes Beijing, Tianjin, Hebei, Shanghai, Jiangsu, Zhejiang, Fujian, Shandong,Guangdong, and Hainan. The northeastern region includes Liaoning, Jilin, and Heilongjiang. The middleregion includes Shanxi, Anhui, Jiangxi, Henan, Hubei, and Hunan. The western region includes InnerMongolia, Guangxi, Chongqing, Sichuan, Guizhou, Yunnan, Tibet, Shaanxi, Gansu, Qinghai, Ningxia, andXinjiang (National Bureau of Statistics of China 2010).
1080 Z. Li, P. Wang
123

Ningxia, Qinghai, and Xinjiang are due to their less developed economies, thereby
resulting in less pollution, and lower population density, thereby resulting in large amounts
of average public cultural resources. Tibet, Guangxi, and Guizhou are left behind for the
unreasonable consumption structure, and the poor scores of Fujian, Zhejiang, and
Guangdong are the results of high population density, which results in lack of average
public cultural resources.
Table 2 The composite index of objective QOL and the four sub-indices (2009)
Provinces Indices and ranks
PC F1 PC F2 PC F3 PC F4 F
Beijing 4.3084 1 0.6107 28 0.2024 18 0.7554 1 2.3659 1
Shanghai 3.6558 2 0.9354 26 0.3370 16 -0.4593 30 2.0206 2
Tianjin 2.4193 3 0.9723 24 0.4678 13 -0.2389 28 1.4181 3
Zhejiang 2.2465 4 1.4643 7 -0.1362 28 -0.6828 31 1.3037 4
Guangdong 2.0205 5 1.4734 6 -0.0889 26 -0.1639 25 1.2244 5
Jiangsu 2.0143 6 1.2353 17 0.1384 21 -0.1014 22 1.2173 6
Liaoning 1.8022 7 1.1719 21 0.7236 9 0.0179 20 1.1727 7
Shandong 1.6332 8 1.2957 15 0.4081 15 0.1154 17 1.0731 8
Heilongjiang 1.3966 12 1.2725 16 1.0457 2 0.1717 14 1.0238 9
Jilin 1.4016 11 1.1963 19 1.0465 1 0.1393 15 1.0140 10
Inner Mongolia 1.4374 9 1.0492 23 0.7944 6 -0.1084 23 0.9689 11
Shanxi 1.3698 13 1.0752 22 0.7000 10 -0.1563 24 0.9243 12
Hebei 1.1957 17 1.4158 9 0.7317 8 0.1347 16 0.9029 13
Chongqing 1.2931 14 1.5512 3 0.0449 23 0.2276 8 0.8994 14
Fujian 1.4348 10 1.5435 4 -0.3370 30 -0.3182 29 0.8961 15
Shaanxi 1.2498 15 1.1903 20 0.5589 11 0.1724 13 0.8818 16
Hubei 1.2107 16 1.3527 12 0.4168 14 0.2419 5 0.8723 17
Henan 1.0461 21 1.4941 5 0.4901 12 0.3494 2 0.8220 18
Ningxia 1.1216 18 0.9413 25 0.9031 4 -0.0952 21 0.8046 19
Hunan 1.0196 22 1.4392 8 0.1989 19 0.2113 9 0.7597 20
Hainan 1.0972 19 1.3403 14 -0.0288 24 0.1909 11 0.7588 21
Sichuan 0.9952 23 1.3624 11 0.1847 20 0.1005 18 0.7284 22
Anhui 0.9310 25 1.4147 10 0.2549 17 0.2399 6 0.7188 23
Jiangxi 0.9505 24 1.5615 1 -0.0597 25 0.3171 3 0.7181 24
Xinjiang 1.0622 20 0.5844 29 0.8041 5 -0.1902 26 0.7075 25
Guangxi 0.8515 26 1.5606 2 -0.2315 29 0.1805 12 0.6397 26
Gansu 0.7689 28 0.8499 27 0.7810 7 0.2362 7 0.6161 27
Qinghai 0.8150 27 0.4683 30 0.9065 3 -0.2224 27 0.5740 28
Yunnan 0.5889 29 1.2062 18 0.0954 22 0.2023 10 0.4936 29
Guizhou 0.5014 30 1.3500 13 -0.1062 27 0.2540 4 0.4489 30
Tibet 0.3826 31 -0.4901 31 -0.4931 31 0.0181 19 0.0733 31
(1) The KMO test (with a statistical value of 0.682) and spherical test (with a statistical significance of0.000) indicate that the data are suitable for PCA. (2) PC F1–PC F4 refers to the four principal components,and F refers to the composite index of objective QOL. (3) F1, Socio-economic well-being; F2, Maternal andchild health care and natural resources; F3, Consumption structure, public cultural resources and eco-environment; F4, Social security
Comprehensive Evaluation of the Objective QOL 1081
123

(d) Composite Index of Social Security. Social security here mainly comprises trans-
portation security and urban instability influenced by unemployment, in which the number
of traffic deaths per 100,000 population weighs more than registered urban unemployment
rate. Except for the high-rank of Beijing due to its low unemployment rate, most provinces
in the eastern region have bad social security conditions, which are distinctively worse than
those of middle and western China. The low rankings of Ningxia, Qinghai, Tibet, and other
provinces in the western and northwestern areas result from the considerably high death
rates from traffic accidents. However, when the low population density is not considered,
the traffic safety conditions of these provinces are not that bad: in 2009, the death tolls in
Ningxia, Qinghai, and Tibet are 457, 578, and 369, respectively, whereas those in
Guangdong, Jiangsu, and Zhejiang are 6,542, 5,202, and 5,689, respectively (National
Bureau of Statistics of China 2010).
3.2 Regional Structural Characteristics of Objective QOL
The 31 provinces are divided into 6 clusters with cluster analysis. Table 3 shows that the
six clusters under the multidimensional clustering are spindle-shaped. All clusters except
for the first and second, are geographically adjacent and environmentally similar in terms
of geographical distribution (see Fig. 2). The means of QOL and the four sub-indices of the
six clusters are compared to investigate the regional structural characteristics of QOL in
China (see Fig. 3).
The first cluster includes Beijing and Shanghai. The two municipalities outclass other
parts of the country in terms of socio-economic well-being, and are at an obvious
Fig. 1 Geographic distribution of the composite index of QOL (2009)
1082 Z. Li, P. Wang
123

advantage when compared with the well-developed second-cluster provinces. However,
these two municipalities have limitations. First, Table 3 indicates that Beijing and
Shanghai are below national average in terms of the composite index of maternal and child
health care and natural resources, and the composite index of consumption structure, public
Fig. 2 Geographic distribution of six clusters under multi-dimensional clustering (2009)
Table 3 Descriptive statistics of the six clusters under multi-dimensional clustering (2009)
Clusters N Mean
PC F1 PC F2 PC F3 PC F4 F
1. Beijing Shanghai 2 3.9821 0.7731 0.2697 0.1481 2.1932
2. Tianjin Zhejiang Guangdong Jiangsu 4 2.1752 1.2863 0.0953 -0.2968 1.2909
3. Liaoning Shandong Heilongjiang Jilin InnerMongolia Shanxi Hebei Shaanxi Hubei NingxiaHenan
11 1.3513 1.2232 0.7108 0.0893 0.9510
4. Chongqing Fujian Hunan Hainan SichuanAnhui Jiangxi Guangxi Yunnan Guizhou
10 0.9663 1.433 0.0015 0.1606 0.7062
5. Xinjiang Gansu Qinghai 3 0.8820 0.6342 0.8305 -0.0588 0.6325
6. Tibet 1 0.3826 -0.4901 -0.4931 0.0181 0.0733
Total 31 1.4265 1.1577 0.3469 0.0497 0.9369
Note: 1. PC F1–PC F4 refers to the four principal components, and F refers to the composite index ofobjective QOL. 2. F1 Socio-economic well-being; F2 Maternal and child health care and natural resources;F3 Consumption structure, public cultural resources and eco-environment; F4 Social security. 3. Theclusters are solution under multi-dimensional clustering
Comprehensive Evaluation of the Objective QOL 1083
123
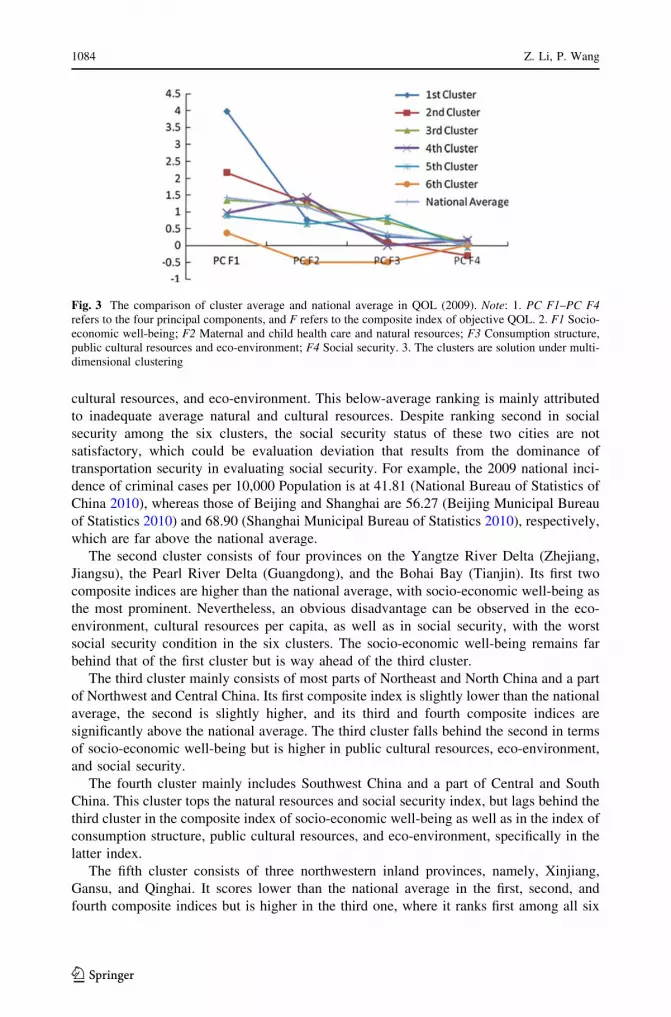
cultural resources, and eco-environment. This below-average ranking is mainly attributed
to inadequate average natural and cultural resources. Despite ranking second in social
security among the six clusters, the social security status of these two cities are not
satisfactory, which could be evaluation deviation that results from the dominance of
transportation security in evaluating social security. For example, the 2009 national inci-
dence of criminal cases per 10,000 Population is at 41.81 (National Bureau of Statistics of
China 2010), whereas those of Beijing and Shanghai are 56.27 (Beijing Municipal Bureau
of Statistics 2010) and 68.90 (Shanghai Municipal Bureau of Statistics 2010), respectively,
which are far above the national average.
The second cluster consists of four provinces on the Yangtze River Delta (Zhejiang,
Jiangsu), the Pearl River Delta (Guangdong), and the Bohai Bay (Tianjin). Its first two
composite indices are higher than the national average, with socio-economic well-being as
the most prominent. Nevertheless, an obvious disadvantage can be observed in the eco-
environment, cultural resources per capita, as well as in social security, with the worst
social security condition in the six clusters. The socio-economic well-being remains far
behind that of the first cluster but is way ahead of the third cluster.
The third cluster mainly consists of most parts of Northeast and North China and a part
of Northwest and Central China. Its first composite index is slightly lower than the national
average, the second is slightly higher, and its third and fourth composite indices are
significantly above the national average. The third cluster falls behind the second in terms
of socio-economic well-being but is higher in public cultural resources, eco-environment,
and social security.
The fourth cluster mainly includes Southwest China and a part of Central and South
China. This cluster tops the natural resources and social security index, but lags behind the
third cluster in the composite index of socio-economic well-being as well as in the index of
consumption structure, public cultural resources, and eco-environment, specifically in the
latter index.
The fifth cluster consists of three northwestern inland provinces, namely, Xinjiang,
Gansu, and Qinghai. It scores lower than the national average in the first, second, and
fourth composite indices but is higher in the third one, where it ranks first among all six
Fig. 3 The comparison of cluster average and national average in QOL (2009). Note: 1. PC F1–PC F4refers to the four principal components, and F refers to the composite index of objective QOL. 2. F1 Socio-economic well-being; F2 Maternal and child health care and natural resources; F3 Consumption structure,public cultural resources and eco-environment; F4 Social security. 3. The clusters are solution under multi-dimensional clustering
1084 Z. Li, P. Wang
123

clusters. Compared with the fourth cluster, it is obviously short in natural resources and
social security, but has a significant advantage in cultural resources per capita.
The sixth cluster includes only Tibet, an inland province. Table 2 and Table 3 show that
Tibet has the lowest first, second, and third composite indices. Even when compared with
the fifth cluster, which also consists of inland provinces, a considerable gap in the first,
second, and third composite indices clearly exists.
3.3 Variation Characteristics of QOL and Regional Disparities
3.3.1 Overall Variation Characteristics of QOL and Regional Disparities
This study analyzes the mean and standard deviation of QOL in the entire country from
2006 to 2009 to determine the overall variation characteristics of QOL and the regional
disparities.
Fig. 4 The trend of national average in QOL and the four sub-indices (2006–2009). Note: 1. The KMO test(with a statistical value of 0.849) and spherical test (with a statistical significance of 0.000) indicate that thedata are suitable for PCA. 2. PC F1–PC F4 refers to the four principal components, and F refers to thecomposite index of objective QOL. 3. F1 Socio-economic well-being; F2 Maternal and child health care andnatural resources; F3 Consumption structure, public cultural resources and eco-environment; F4 Socialsecurity
Table 4 National average and SD in QOL and the four sub-indices (2006–2009)
Indices Mean and SD
2006 2007 2008 2009
PC F1 1.2607 0.6864 1.3353 0.6984 1.4366 0.7369 1.6066 0.7749
PC F2 1.1351 0.3546 1.1496 0.3420 1.1291 0.3492 1.1723 0.3408
PC F3 0.1725 0.3410 0.1323 0.3596 0.1093 0.3621 0.0732 0.3705
PC F4 0.0465 0.2294 0.0263 0.2364 0.0415 0.2296 0.0749 0.2326
F 0.8074 0.3642 0.8429 0.3686 0.8913 0.3866 0.9826 0.3993
Note: 1. The KMO test (with a statistical value of 0.849) and spherical test (with a statistical significance of0.000) indicate that the data are suitable for PCA. 2. PC F1–PC F4 refers to the four principal components,and F refers to the composite index of objective QOL. 3. F1 Socio-economic well-being; F2 Maternal andchild health care and natural resources; F3 Consumption structure, public cultural resources and eco-environment; F4 Social security
Comprehensive Evaluation of the Objective QOL 1085
123

Table 4 and Fig. 4 show that the composite index of the nationwide QOL demonstrates
a continuous increase from 2006 to 2009, with a growth rate that speeds up annually. The
trend varies through the four sub-indices, as follows: (1) the composite index of socio-
economic well-being demonstrates a similar data sequence to the composite index of QOL;
(2) except the slight decrease from 2007 to 2008 and from 2006 to 2007, respectively, the
composite index of maternal and child health care and natural resources and the composite
index of social security display slow but increasing trends; and (3) the composite index of
consumption structure, public cultural resources, and eco-environment demonstrates a
continuous decrease over the 4-year period.
Table 4 indicates that over the 4 years, the standard deviations of the composite index
of QOL of all provinces present a continuous increase from 2006 to 2009, that is, the
regional disparities in QOL are generally raised. However, the trend of the sub-indices
appears different: (1) the regional disparities in the composite index of socio-economic
well-being and the composite index of consumption structure, public cultural resources and
eco-environment increase continuously over the 4-year period; and (2) disparities in the
composite index of maternal and child health care and natural resources and the composite
index of social security fluctuate over the 4 years.
3.3.2 Spatial Variation Characteristics of QOL and the Regional Disparities
For further analysis of the spatial variation characteristics of QOL and the regional dis-
parities from 2006 to 2009, the composite indices of QOL of the four socio-economic
regions in China, namely, the eastern, northeastern, middle, and western regions are
compared.
Fig. 5 The trend of regional and national average in the composite index of QOL (2006–2009)
Table 5 Regional and national average in the composite index of QOL (2006–2009)
Regions Mean Cumulativegrowth rate (%)
2006 2007 2008 2009
Eastern region 1.1252 1.1672 1.2297 1.3273 17.96
Northeastern region 0.9500 0.9840 1.0269 1.1130 17.16
Middle region 0.6887 0.7224 0.7670 0.8427 22.36
Western region 0.5663 0.5976 0.6375 0.7328 29.40
Total 0.8074 0.8429 0.8913 0.9826 21.70
1086 Z. Li, P. Wang
123

Table 5 and Fig. 5 show that the tendencies of the composite indices of QOL in the four
socio-economic regions all coincide with that of the national average. The gradients of the
broken lines in Fig. 5 show that the growth rates of the composite QOL indices in the four
districts speed up over the 4-year period. The cumulative growth rates show that the
composite QOL indices of the middle and western regions increase significantly faster than
that of the eastern region. However, the disparities between the eastern region and the
middle and western regions expand because of the huge base of regional development
differences in China. The gaps between the middle and eastern regions and between the
western and eastern regions expand from 0.4365 to 0.4846 and from 0.5589 to 0.5945,
respectively.
4 Conclusions and Discussion
This study conducts a comprehensive evaluation of the objective QOL in Mainland China
with PCA. Four principal components are extracted in the analysis of both cross-sectional
data of 2009 and the panel data from 2006 to 2009, and used as the four sub-areas of QOL.
Table 2 and Fig. 1 show that the objective QOL of China gradually decreases from the
eastern coastal regions to the western inland regions, with a significant gap in QOL between
the east and the west. Furthermore, the QOL shows an irrational developmental pattern with
the natural conditions and the geographical position as the foundations, and economic
development as the dominant factor. (1) As the most important aspect of the objective QOL
of China, socio-economic well-being shares very similar distribution characteristics with the
composite index of QOL, in that they both gradually decrease from the eastern coastal
regions to the western inland regions. (2) Although the natural condition is no longer the
dominant factor that affects the social development in China, natural resources, together with
maternal and child health care, are still important foundations of the objective QOL in all
regions. Its distribution shows higher values in the east and south, and lower values in the
west and north. (3) With progressing industrialization and urbanization, pollution and
destruction of the environment are growing increasingly serious in the eastern region and
some more developed areas of the middle region. By contrast, pollution and destruction of
the environment are less serious in the western and northwestern regions such as Gansu,
Ningxia, Qinghai and, Xinjiang. Thus, to some degree, a lower degree of industrial invasion
protects QOL in these regions. (4) An increasing number of people are moving to the east
with the widening disparity in regional development. Meanwhile, compared with the middle
and western regions, the cultural resources per capita face increasing shortage (although the
quality of cultural resources in the middle and western regions may not be higher than that in
the east), and social security is deteriorating.
Cluster analysis is applied to the four principal components calculated by cross-sec-
tional analysis to analyze further the regional structural features of the QOL in China.
Unlike the classification according to the size of the composite index of QOL, the clas-
sification standard of cluster analysis originates from the data, thereby effectively over-
coming subjectivity. In addition, cluster analysis divides the observations into groups or
clusters on the basis of similarities, so that each group is as homogeneous as possible with
respect to the clustering variable(s). Such cluster solutions can ensure, within bounds, the
maximum within-group homogeneity and cross-group heterogeneity, which provide a
better understanding of the distinct features of each group (Yang and Hu 2008).
The 31 provinces are divided into 6 clusters using cluster analysis. Mutual distinctions
and internal differentiations exist among the eastern, middle, and western regions. In terms
Comprehensive Evaluation of the Objective QOL 1087
123

of the mutual distinctions, the first and second clusters in the eastern region show a
significant advantage in socio-economic well-being. Compared with the first two clusters,
the third and fourth clusters in the middle region and part of the western region lead in
natural resources and social security. The fifth and sixth clusters have nearly the lowest
first, second, and fourth composite indices, but have a significant advantage in eco-envi-
ronment and cultural resources per capita. In terms of internal differentiations, the second
cluster in the eastern region still has a large gap in socio-economic well-being, but has an
obvious advantage in natural resources compared with the first cluster; in the middle region
and part of the western region, the fourth cluster lags behind in the composite index of
socio-economic well-being and the composite index of consumption structure, public
cultural resources, and eco-environment compared with the third region; and in the western
region, the sixth cluster has a considerable gap with the fifth cluster in terms of the first,
second, and third composite indices.
This paper also analyzes the overall and spatial variation characteristics of QOL and
regional disparities. Table 4 and Fig. 4 show that the composite index of the nationwide
QOL demonstrates a continuous increase from 2006 to 2009, with a growth rate that speeds
up annually. The different development directions of the four sub-indices show that the
notable increase does not mean a harmonious development in all aspects of society, but the
rapid progress of socio-economic well-being, and the slow development or even deterio-
ration of eco-environment and social security. In recent years, the Chinese government has
vigorously promoted the Energy Saving and Emission Reduction Policy. However, the
improvement of the eco-environment is not very significant because of the enormous
environmental pressure brought about by rapid economic growth. Table 5 and Fig. 5 show
that the tendencies of the composite indices of QOL in the four districts coincide with that
of the national average over the 4-year period. The indices of the middle and western
regions increase significantly faster than that of the eastern region, suggesting that China’s
Western Development Strategy and Rise of Central China Plan are both effective. How-
ever, the disparities between the eastern region and the middle and western regions expand
because of the huge base of regional development differences in China.
This study strives to be comprehensive in constructing the index system of QOL.
However, due to data availability or comparability, the proposed index system does not
include some important indicators and aspects, such as indicators of social justice, to which
special attention should be given. According to the Asian Development Bank (ADB), the
Gini coefficient of China from 1993 to 2004 increased from 0.407 to 0.473, making China
one of the most critically unequal Asian countries. Furthermore, according to the World
Bank, the income inequality in China has affected its future sustainable development
(UNDP 2010). Also, in the current paper, provinces are treated as the basic units for
analysis; thus, all territories within a province are viewed as homogenous. However,
disparities within a province, especially between urban and rural areas, can be extremely
large. Upon entering the new century, the income gap among residents of urban and rural
China, widened from 2.79 to 1 in the year 2000 to 3.33 to 1 in the year 2009 (National
Bureau of Statistics of China 2010). Therefore, more segmented data will be helpful in
penetrating the urban and rural disparity masked by the average level of provincial
development. Finally, despite the advantage of objectivity of PCA in comprehensive
evaluation, when principal components are extracted, the composite indices are formed by
indicators of different aspects, with weights from the data, thus easily resulting in diffi-
culties in interpretations of the principal components and the neglect of the importance of
each indicator or aspect (Ginsberg et al. 1986; Somarriba and Pena 2009). In this regard,
the analytic hierarchy process can be used in the latter study.
1088 Z. Li, P. Wang
123

Acknowledgments This study was supported by Humanity and Social Science Foundation of the Ministryof Education, PRC (No. 10YJC840069), and National Natural Science Foundation of China (No. 71173099& 70903002).
References
Aldenderfer, M. S., & Blashfield, R. K. (1984). Cluster analysis. Newbury Park: Sage.Beijing Municipal Bureau of Statistics. (2010). Beijing statistical yearbook 2010. Beijing: China Statistics
Press.Booysen, F. (2002). An overview and evaluation of composite indices of development. Social Indicators
Research, 59, 115–151.Carlucci, F., & Pisani, S. (1995). A multiattribute measure of human development. Social Indicators
Research, 36, 145–176.Cattell, R. B. (1966). Handbook of multivariate experimental psychology. Chicago: Rand McNally.Chan, Y. K., Kwan, C. C. A., & Shek, T. L. D. (2005). Quality of life in Hong Kong: The CUHK Hong
Kong quality of life index. Social Indicators Research, 71, 259–289.Diener, E., & Suh, E. (1997). Measuring quality of life: Economic, social, and subjective indicators. Social
Indicators Research, 40, 189–216.Ginsberg, N., Osborn, J., & Blank, G. (1986). Geographic perspectives on the wealth of nations, Department
of Geography Research Paper No. 220. Chicago: University of Chicago.Hair, J. F., Anderson, R. E., Tatham, R. L., & Black, W. C. (1998). Multivariate data analysis. Upper Saddle
River, NJ: Prentice-Hall.Kelley, A. C. (1991). The human development index: Handle with care. Population and Development
Review, 17, 315–324.Lai, D. (2003). Principal component analysis on human development indicators of china. Social Indicator
Research, 61, 319–330.Lee, H. S. (2003). Objective quality of life in Korea and the OECD countries. Social Indicators Research,
62, 481–508.Lind, N. C. (1992). Some thoughts on the human development index. Social Indicators Research, 27,
89–101.Lind, N. C. (1993). A compound index of national development. Social Indicators Research, 28, 267–284.Lind, N. C. (2004). Values reflected in the human development index. Social Indicators Research, 66,
283–293.National Bureau of Statistics of China. (2010). China statistical yearbook. Beijing: China Statistics Press.Noorbakhsh, F. (1998a). A modified human development index. World Development, 26, 517–528.Noorbakhsh, F. (1998b). The human development indices: Some technical issues and alternative indices.
Journal of International Development, 10, 589–605.Qin, C. L., & Luo, Q. (2004). A study on the regional disparities of human development in china. Economic
Survey, 6, 49–51.Ram, R. (1982a). Composite indices of physical quality of life, basic needs fulfilment, and income: A
principal component representation. Journal of Development Economics, 11, 227–247.Ram, R. (1982b). Intercountry inequalities in income and basic-needs indicators: A recent perspective.
World Development, 20, 899–905.Rao, C. R. (1964). The use and interpretation of principal component analysis in applied research. Sankhya
Ser A, 26, 329–358.Ren, R. E., & Wang, H. W. (1997). Multivariate statistical data analysis: Theory, methods and examples.
Beijing: National Defense Industry Press.Shanghai Municipal Bureau of Statistics. (2010). Shanghai statistical yearbook 2010. Beijing: China Sta-
tistics Press.Slottje, D. J. (1991). Measuring the quality of life across countries. The Review of Economics and Statistics,
73, 684–693.Somarriba, N., & Pena, B. (2009). Synthetic indicators of quality of life in Europe. Social Indicators
Research, 94, 115–133.Sun, F. H., Wei, X., Wang, X. Z., & Shao, J. P. (2005). The quality of life in China provincial capital in
2002. Chinese Journal of Population Sciences, 1, 67–73.Tang, K. L. (1999). Social development in China: Progress and problems. Journal of Contemporary Asia,
29, 95–108.
Comprehensive Evaluation of the Objective QOL 1089
123

UNDP. (2004). Human development report 2004: Cultural liberty in today’s diverse world. New York:Oxford University Press.
UNDP. (2008). China human development report 2007/2008: Basic public services for 1.3 billion people.China Translation and Publishing Corporation: Beijing.
UNDP. (2010). China human development report 2009/2010: China and a sustainable future: towards a lowcarbon economy and society. Beijing: China Translation and Publishing Corporation.
Vidal, R., Ma, Y., & Sastry, S. (2006). Generalized principal component analysis: Modeling & segmen-tation of multivariate mixed data. Available at: http://yima.csl.illinois.edu/psfile/book-VMS.pdf.
Wang, B. J. (2007). Multivariate data analysis. Beijing: Peking University Press.Ward, J. H. Jr. (1963). Hierarchical grouping to optimize an objective function. Journal of the American
Statistical Association, 58, 235–244.World Bank. (2011). World development indicators 2011. Available at: http://data.worldbank.org/
data-catalog/world-development-indicators.Yang, Y. H., & Hu, A. G. (2008). Investigating regional disparities of China’s human development with
cluster analysis: A historical perceptive. Social Indicator Research, 86, 417–432.Yang, Y. H., Hu, A. G., & Zhang, N. (2005). An alternative to human development index with principal
component analysis. Economic Research Journal, 7, 4–17.Yang, X., & Liu, D. (2009). Quantitative analysis on life quality of urban population in china. Population
Journal, 4, 16–22.
1090 Z. Li, P. Wang
123


