Embed Size (px)
Citation preview
IEEE TRANSACTIONS ON MEDICAL IMAGING, VOL. 20, NO. 8, AUGUST 2001 715
Computer-Assisted Bone Age Assessment: ImagePreprocessing and Epiphyseal/Metaphyseal ROI
ExtractionEwa Pietka, Arkadiusz Gertych, Sylwia Pospiech, Fei Cao, H. K. Huang*, Senior Member, IEEE, and V. Gilsanz
Abstract—Clinical assessment of skeletal maturity is based on avisual comparison of a left-hand wrist radiograph with atlas pat-terns. Using a new digital hand atlas an image analysis method-ology is being developed. To assist radiologists in bone age estima-tion. The analysis starts with a preprocessing function yielding epi-physeal/metaphyseal regions of interest (EMROIs). Then, these re-gions are subjected to a feature extraction function. Accuracy hasbeen measured independently at three stages of the image analysis:detection of phalangeal tip, extraction of the EMROIs, and locationof diameters and lower edge of the EMROIs. Extracted featuresdescribe the stage of skeletal development more objectively thanvisual comparison.
Index Terms—Bone age assessment, carpal bones region of in-terest, computer-assisted diagnosis, epiphyseal/metaphyseal regionof interest, hand image processing.
I. INTRODUCTION
BONE age assessment is a procedure frequently performedin pediatric radiology. Based on a radiological examina-
tion of skeletal development of a left-hand wrist, the bone ageis assessed and then compared with the chronological age. Adiscrepancy between these two values indicates abnormalitiesin skeletal development. This examination is universally useddue to its simplicity, minimal radiation exposure, and the avail-ability of multiple ossification centers for evaluation of matu-rity. It is an important procedure in the diagnosis and manage-ment of endocrine disorders serving as one index of therapeuticeffect [1]. Being a useful procedure in the diagnostic evalua-tion of metabolic and growth abnormalities [2], it indicates ac-celeration or decrease of maturation in a variety of syndromes,malformations, and bone dysplasias [3]. Bone age assessmentprocedure is used to for patients with gonadal dysgenesis [4] orwhen metacarpal sign occurs [5]. It is also applied in planningfor an orthopedic procedure for correction of angular deformi-ties or abnormalities of length involving the vertebral column orlong bones.
Manuscript received June 28, 1999; revised May 10, 2001. This workwas supported by the National Institutes of Health (NIH) under GrantR01-LM06270. The Associate Editor responsible for coordinating the reviewof this paper and recommending its publication was A. Manduca.Asteriskindicates corresponding author.
E. Pietka, A. Gertych, and S. Pospiech are with the Silesian University ofTechnology, Institute of Electronics, Division of Biomedical Electronics, PL-44 100 Gliwice, Poland.
F. Cao and V. Gilsanz are with the Childrens Hospital of Los Angeles, De-partment of Radiology, Los Angeles, CA 90027 USA.
*H. K. Huang is with the Childrens Hospital of Los Angeles, Department ofRadiology, 4650 Sunset Blvd., Los Angeles, CA 90027 USA.
Publisher Item Identifier S 0278-0062(01)06581-8.
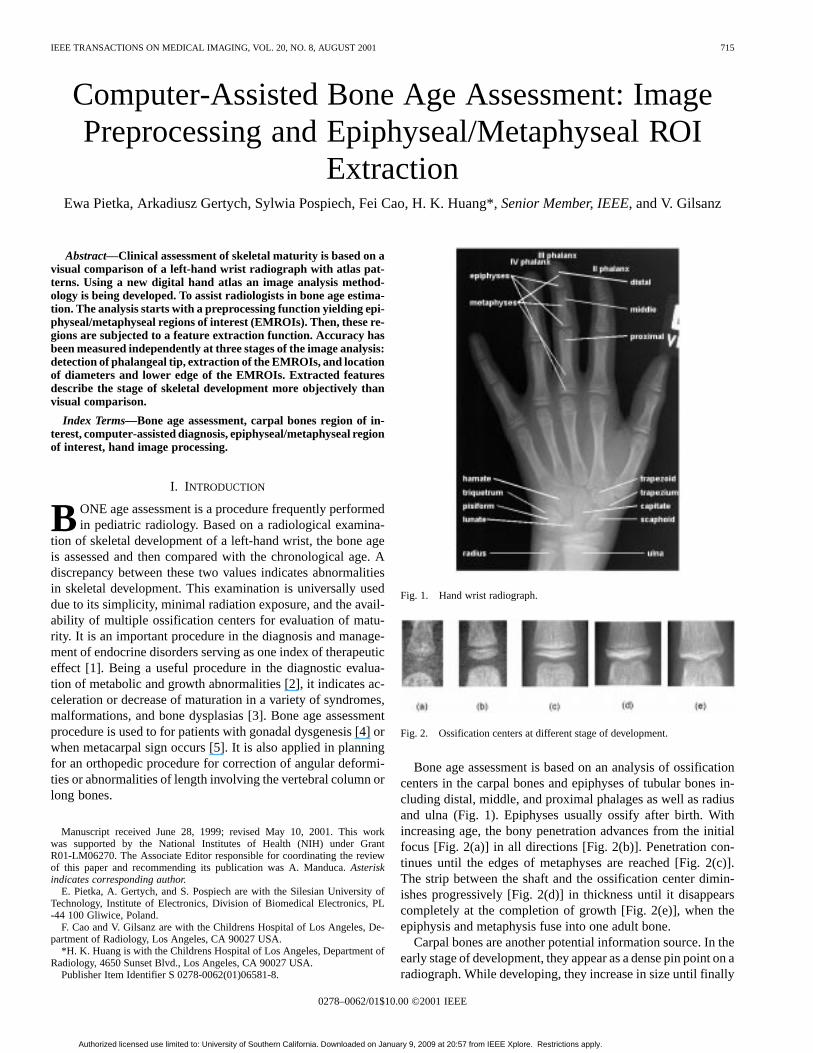
Fig. 1. Hand wrist radiograph.
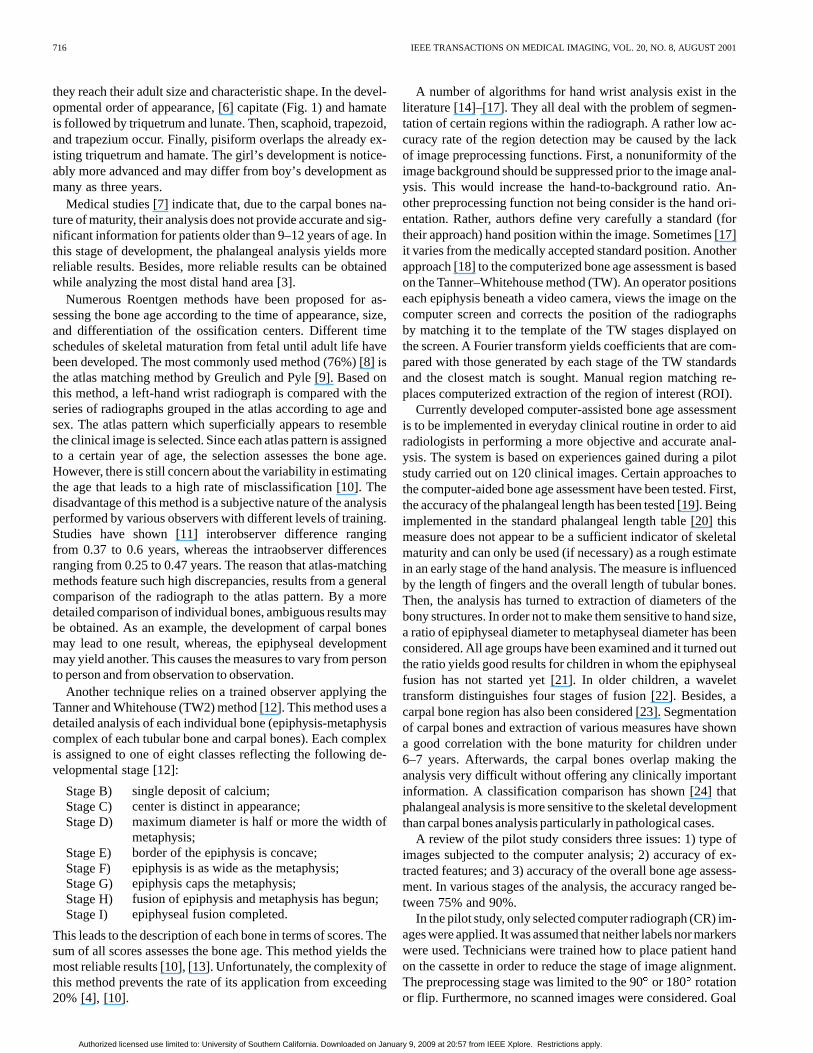
Fig. 2. Ossification centers at different stage of development.
Bone age assessment is based on an analysis of ossificationcenters in the carpal bones and epiphyses of tubular bones in-cluding distal, middle, and proximal phalages as well as radiusand ulna (Fig. 1). Epiphyses usually ossify after birth. Withincreasing age, the bony penetration advances from the initialfocus [Fig. 2(a)] in all directions [Fig. 2(b)]. Penetration con-tinues until the edges of metaphyses are reached [Fig. 2(c)].The strip between the shaft and the ossification center dimin-ishes progressively [Fig. 2(d)] in thickness until it disappearscompletely at the completion of growth [Fig. 2(e)], when theepiphysis and metaphysis fuse into one adult bone.
Carpal bones are another potential information source. In theearly stage of development, they appear as a dense pin point on aradiograph. While developing, they increase in size until finally
0278–0062/01$10.00 ©2001 IEEE
Authorized licensed use limited to: University of Southern California. Downloaded on January 9, 2009 at 20:57 from IEEE Xplore. Restrictions apply.
716 IEEE TRANSACTIONS ON MEDICAL IMAGING, VOL. 20, NO. 8, AUGUST 2001
they reach their adult size and characteristic shape. In the devel-opmental order of appearance, [6] capitate (Fig. 1) and hamateis followed by triquetrum and lunate. Then, scaphoid, trapezoid,and trapezium occur. Finally, pisiform overlaps the already ex-isting triquetrum and hamate. The girl’s development is notice-ably more advanced and may differ from boy’s development asmany as three years.
Medical studies [7] indicate that, due to the carpal bones na-ture of maturity, their analysis does not provide accurate and sig-nificant information for patients older than 9–12 years of age. Inthis stage of development, the phalangeal analysis yields morereliable results. Besides, more reliable results can be obtainedwhile analyzing the most distal hand area [3].
Numerous Roentgen methods have been proposed for as-sessing the bone age according to the time of appearance, size,and differentiation of the ossification centers. Different timeschedules of skeletal maturation from fetal until adult life havebeen developed. The most commonly used method (76%) [8] isthe atlas matching method by Greulich and Pyle [9]. Based onthis method, a left-hand wrist radiograph is compared with theseries of radiographs grouped in the atlas according to age andsex. The atlas pattern which superficially appears to resemblethe clinical image is selected. Since each atlas pattern is assignedto a certain year of age, the selection assesses the bone age.However, there is still concern about the variability in estimatingthe age that leads to a high rate of misclassification [10]. Thedisadvantage of this method is a subjective nature of the analysisperformed by various observers with different levels of training.Studies have shown [11] interobserver difference rangingfrom 0.37 to 0.6 years, whereas the intraobserver differencesranging from 0.25 to 0.47 years. The reason that atlas-matchingmethods feature such high discrepancies, results from a generalcomparison of the radiograph to the atlas pattern. By a moredetailed comparison of individual bones, ambiguous results maybe obtained. As an example, the development of carpal bonesmay lead to one result, whereas, the epiphyseal developmentmay yield another. This causes the measures to vary from personto person and from observation to observation.
Another technique relies on a trained observer applying theTanner and Whitehouse (TW2) method [12]. This method uses adetailed analysis of each individual bone (epiphysis-metaphysiscomplex of each tubular bone and carpal bones). Each complexis assigned to one of eight classes reflecting the following de-velopmental stage [12]:
Stage B) single deposit of calcium;Stage C) center is distinct in appearance;Stage D) maximum diameter is half or more the width of
metaphysis;Stage E) border of the epiphysis is concave;Stage F) epiphysis is as wide as the metaphysis;Stage G) epiphysis caps the metaphysis;Stage H) fusion of epiphysis and metaphysis has begun;Stage I) epiphyseal fusion completed.
This leads to the description of each bone in terms of scores. Thesum of all scores assesses the bone age. This method yields themost reliable results [10], [13]. Unfortunately, the complexity ofthis method prevents the rate of its application from exceeding20% [4], [10].
A number of algorithms for hand wrist analysis exist in theliterature [14]–[17]. They all deal with the problem of segmen-tation of certain regions within the radiograph. A rather low ac-curacy rate of the region detection may be caused by the lackof image preprocessing functions. First, a nonuniformity of theimage background should be suppressed prior to the image anal-ysis. This would increase the hand-to-background ratio. An-other preprocessing function not being consider is the hand ori-entation. Rather, authors define very carefully a standard (fortheir approach) hand position within the image. Sometimes [17]it varies from the medically accepted standard position. Anotherapproach [18] to the computerized bone age assessment is basedon the Tanner–Whitehouse method (TW). An operator positionseach epiphysis beneath a video camera, views the image on thecomputer screen and corrects the position of the radiographsby matching it to the template of the TW stages displayed onthe screen. A Fourier transform yields coefficients that are com-pared with those generated by each stage of the TW standardsand the closest match is sought. Manual region matching re-places computerized extraction of the region of interest (ROI).
Currently developed computer-assisted bone age assessmentis to be implemented in everyday clinical routine in order to aidradiologists in performing a more objective and accurate anal-ysis. The system is based on experiences gained during a pilotstudy carried out on 120 clinical images. Certain approaches tothe computer-aided bone age assessment have been tested. First,the accuracy of the phalangeal length has been tested [19]. Beingimplemented in the standard phalangeal length table [20] thismeasure does not appear to be a sufficient indicator of skeletalmaturity and can only be used (if necessary) as a rough estimatein an early stage of the hand analysis. The measure is influencedby the length of fingers and the overall length of tubular bones.Then, the analysis has turned to extraction of diameters of thebony structures. In order not to make them sensitive to hand size,a ratio of epiphyseal diameter to metaphyseal diameter has beenconsidered. All age groups have been examined and it turned outthe ratio yields good results for children in whom the epiphysealfusion has not started yet [21]. In older children, a wavelettransform distinguishes four stages of fusion [22]. Besides, acarpal bone region has also been considered [23]. Segmentationof carpal bones and extraction of various measures have showna good correlation with the bone maturity for children under6–7 years. Afterwards, the carpal bones overlap making theanalysis very difficult without offering any clinically importantinformation. A classification comparison has shown [24] thatphalangeal analysis is more sensitive to the skeletal developmentthan carpal bones analysis particularly in pathological cases.
A review of the pilot study considers three issues: 1) type ofimages subjected to the computer analysis; 2) accuracy of ex-tracted features; and 3) accuracy of the overall bone age assess-ment. In various stages of the analysis, the accuracy ranged be-tween 75% and 90%.
In the pilot study, only selected computer radiograph (CR) im-ages were applied. It was assumed that neither labels nor markerswere used. Technicians were trained how to place patient handon the cassette in order to reduce the stage of image alignment.The preprocessing stage was limited to the 90or 180 rotationor flip. Furthermore, no scanned images were considered. Goal
Authorized licensed use limited to: University of Southern California. Downloaded on January 9, 2009 at 20:57 from IEEE Xplore. Restrictions apply.
PIETKA et al.: COMPUTER-ASSISTED BONE AGE ASSESSMENT 717
of the pilot study was to indicate, whether a more objective,computer-assisted analysis in possible. Thus, we concentratedour effort on finding features of high discrimination power ableto describe certain stages of skeletal development and applythem to find the skeletal age. Due to the lack of preprocessingfunctions, the algorithm could only be used for images acquiredaccording to a strictly defined protocol. Clustering techniquesroughly eliminated features of no discrimination power andselected those which could serve as input to the fuzzy classifier.
Gained experiences permit image analysis stages of a clinicalcomputer-assisted bone age assessment system to be designed.The currently developed system opens the analysis up to allimages. This means that we deal with CR or scanned images.Image preprocessing functions should make the analysis in-sensitive to the lack of standardization at the image acquisitionstage. The cassette is often not closed very tightly causingbackground nonuniformity. Various labels, markers or clipsmight be placed within the radiation field. The hand is oftenlacking the alignment toward the cassette edges. This requires avery robust image preprocessing stage with background removaland hand wrist extraction. At the stage of feature extraction thehand alignment has to be examined. Dealing with blurred image,the edge detection has to be more robust and a study on distancemeasurement accuracy has to be implemented. Additional (withrespect to the previous study) features are to be extracted in orderto increase the overall accuracy of the skeletal age assessment.
This paper discusses the first part of a computer-aided boneage assessment project, i.e., image preprocessing functions in-cluding the image standardization and background removal aswell as extraction of epiphyseal/metaphyseal regions of interest(EMROIs) which include structures very sensitive to the stageof skeletal maturity. In Section II, the database is described.Then, Section III discusses some image processing issues in-cluding orientation correction and background removal. Proce-dures, presented in Section IV, restrict the image to be analyzesto the phalangeal area. Applying more robust image processingtechniques, Section V discusses extractions of global size anddistance measures.
Papers in preparation will discus the time- and frequency-do-main analysis of the EMROIs and classification issues leadingto the bone age assessment. Finally, the image analysis functionswill be linked to the user interface under development [25], [26].
II. DATA BASE
The analysis is performed on left-hand wrist radiograms se-lected from a normal population and organized into four blocks:black male and female and white male and female. Based on pre-liminary result [27], for pre-pubertal children (0 to 9-years-old)5 images for each age group are collected, whereas, for chil-dren during puberty (10 to 18-year-old) ten images for each agegroup are collected. This gives 135 images per block and a totalof 540 images. These images are being acquired at the USCChildren’s Hospital in Los Angeles.
A separate group of 1000 clinical images (normal and patho-logical) were collected for evaluation. These images were beingacquired at the University of California, San Francisco. A FujiFCR-9000 computed radiography (CR) system is used to acquire
full resolution CR images (2KB 2KB 10 bits) in a DICOM3.0 standard. When analog technology is used, films are digitizedwith a Lumiscan 200 digitizer to 2KB 2KB 10 bits.
III. I MAGE PREPROCESSING
Preprocessing functions are implemented in order to stan-dardize images to be read by radiologists and/or processed ondiagnostic workstations. In both cases, the correction is per-formed as a computerized analysis. In the first case, it precedesthe film printing for hard copy reading, in the second case isincluded as a package within the computer-aided diagnosticsystem. Depending on the application, various preprocessingfunctions have already been implemented. They may be relatedto the file format [28], aswell as to the information field including[29] correction of image orientation, window/level values,look-up-tables in order to enhance the brightness and contrast.
Computer-aided bone age assessment has to handle two typesof images (Section II): CR images and digitized images. Set ofpreprocessing functions implemented in both types may vary.Processing of CR images requires orientation correction andimage content standardization. Digitized images may requirea file format conversion, window/level adjustment, whereas animage orientation procedure should not be necessary.
Clinical implementation of the computer-assisted bone ageassessment requires four conditions to be met by the system: 1)remain open to all images acquired at CR systems and scannedimages; 2) correctly extract features of high discriminationpower; 3) reliably assess the bone maturation; and 4) provide auser-friendly interface. On the other hand, while developing theimage analysis system, one has to keep the overall response timewithin a reasonable time frame. This means that time consumingprocedures performed on the entire image should be avoided.
In order to fulfill the first condition and prepare an imageto the computerized analysis, two preprocessing steps are per-formed. First, the image orientation correction ensures a stan-dard hand position within the image. Second, a background re-moval increases the hand-to-background ratio increasing the ac-curacy of the ROI segmentation.
A. Orientation Correction
As a standard orientation the position viewed by radiologistsis considered (anterioposterior, up–right, left-hand wrist). Whileusing phosphor plates the cassette can be placed in various posi-tions to accommodate the examination conditions. A survey inthe radiology department [29] has shown that between 35% to40% of procedures have not been performed with the conven-tional image orientation. Therefore, it is necessary to developa computerized algorithm to orient these images before furtheranalysis (computerized or radiological) is performed. Separatealgorithms have been developed for each anatomy includinghand wrist images [29].
B. Background Removal
Various definitions of background have already been intro-duced. It is referred toasanareaoutsidetheradiation field,causedby blocking of the collimator and resulting in white borders
Authorized licensed use limited to: University of Southern California. Downloaded on January 9, 2009 at 20:57 from IEEE Xplore. Restrictions apply.
718 IEEE TRANSACTIONS ON MEDICAL IMAGING, VOL. 20, NO. 8, AUGUST 2001
surrounding the radiation field. Its removal reduces the amountof unwanted light in images during the soft copy display as wellas almost transparent borders on the film. Moreover, the removedbackground without delivering any pertinent information, ad-verselyaffectsobserverperformanceand/orcomputerized imageanalysis [30]. Algorithms, which turn to black the unexposedbackground [29], [31], have already been implemented inclinical picture archiving and communication system (PACS)[32] particularly in chest imaging and pediatric radiology.
In image processing systems, background is often referred toas an area outside the patient body (within the radiation field).In this area, landmarks or labels with patient demographic data(name, birthday, ID number, etc.) may also be found. In thissection, the latter background definition is considered.
Extraction of phalanges requires an increase of thehand-to-background ratio. This is of particular importancewhen an under- or overexposed images is subjected to thecomputer analysis. Moreover, significant background nonuni-formity, caused by the not tightly closed cassette, makesoften the future image analysis very inaccurate. Backgroundsuppression is employed in order to obtain the goal.
The removal is based on dynamic thresholding. The dynami-cally adjusted threshold value depends on the local backgroundvalue and is performed in horizontal and vertical direction.In the first stage, a window of fixed size (estimated on thebasis of an average phalangeal width) is sliding in verticaldirection on the top of the image. Statistical parameters (mean,variance, maximum gradient, and maximum value) are found.Two windows of low mean value and variance located on bothsides of the central image axis mark the background area. Meanvalues of these windows increased by their variances define thethreshold values in the corresponding rows.
The lower part of the image is searched for another pairof windows and another threshold value is calculated. Oncebeing found, a linear interpolation in vertical direction yieldsthe threshold value for each row. The interpolation is alsoperformed in the horizontal direction yielding the thresholdvalue for each column.
The thresholding procedure, performed separately in bothdirection, turns to zero values lower than the threshold valuewithout changing pixel values larger than the current threshold.Landmarks and labels remain. They are ignored in furtherimage processing which is based on searching for a predefinedpattern describing the hand wrist.
In order to remove all small noisy elements in the background,particularly between phalanges, a mathematical morphologyprocedure is applied [33]. An erosion function uses a 33pixel structuring element. The transformation turns to zero allelements equal to or smaller than the structuring element.
IV. EPIPHYSEAL/METAPHYSEAL ROI EXTRACTION
Medical observations [9], [12] as well as our pilot studies [22],[24], [27] indicate certain regions to be sensitive to the skeletaldevelopment. Size and shape of epiphyses reflect the stage ofmaturation until it reaches the edge of metaphyses. Then, thegap between both bones diminishes and fusion progresses untilboth epiphysis and metaphysis become one adult bone.
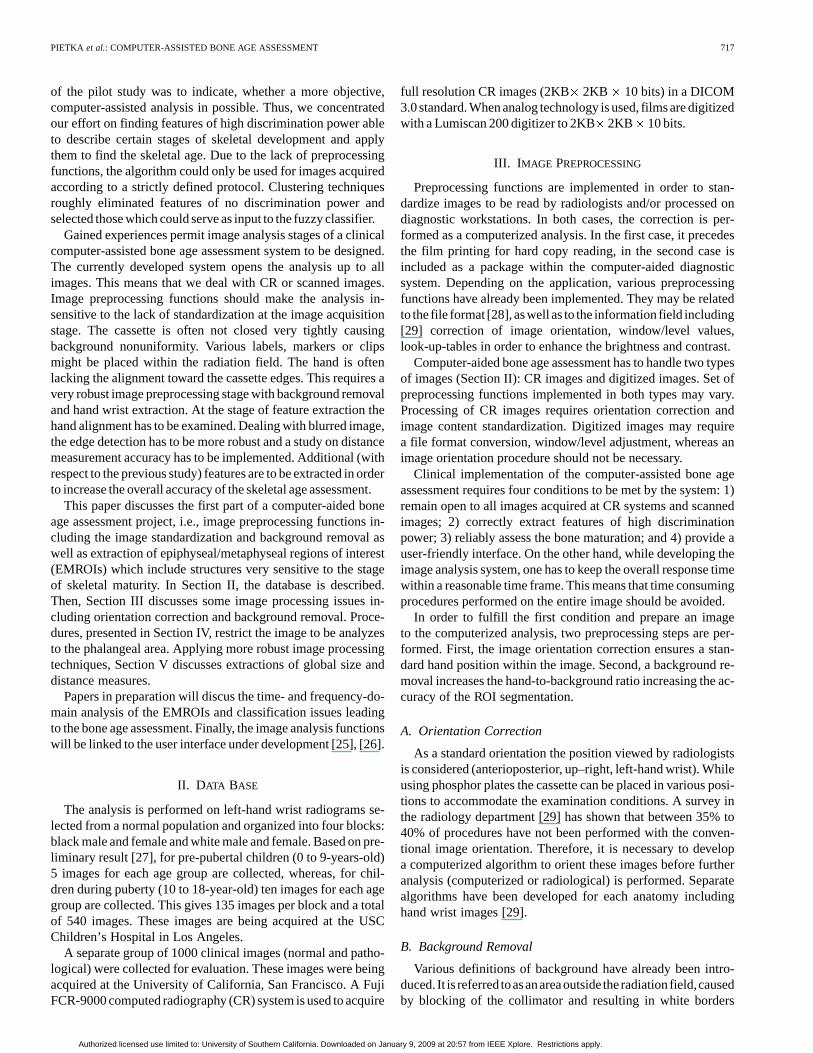
Fig. 3. (a) Epi/metaphyseal ROIs marked on the III phalanx (b) bones includedin EMROI. (c) Separation lines to be located within the EMROI.
Though, image analysis begins with the location of EMROIs.Within each phalanx three EMROIs are extracted [Fig. 3(a)].They include [Fig. 3(b)] the metaphysis, epiphysis, and upperpart of diaphysis of distal and middle phalanges or metaph-ysis, epiphysis, and upper part of metacarpals of proximal pha-langes. Within each EMROIs three lines are extracted. Theymark [Fig. 3(c)] diameters of metaphyses and epiphyses, andthe top edge of diaphyses. Various combinations of two of themallow certain areas of the EMROI to be extracted and subjectedto the feature extraction phase. Moreover, the separation linesyield two features, which roughly indicate the stage of devel-opment: 1) ratio of epiphyseal diameter divided by metaphysealdiameter and 2) epiphyseal diameter divided by width of the gapbetween metaphysis and diaphysis.
Four steps are performed in order to select predefined lines: 1)extraction of phalangeal tip; 2) rough extraction of phalanx longaxis; 3) detection of selection lines between metaphyses anddiaphyses; and 4) detailed EMROI analysis yielding location ofthree lines defined above.
A. Extraction of Phalangeal Tip
At this step a grid pattern covers the thresholded image.Within each grid window a mean value of pixels is found. Thisforms a matrix. In order to reduce low value matrix elements
Authorized licensed use limited to: University of Southern California. Downloaded on January 9, 2009 at 20:57 from IEEE Xplore. Restrictions apply.
PIETKA et al.: COMPUTER-ASSISTED BONE AGE ASSESSMENT 719
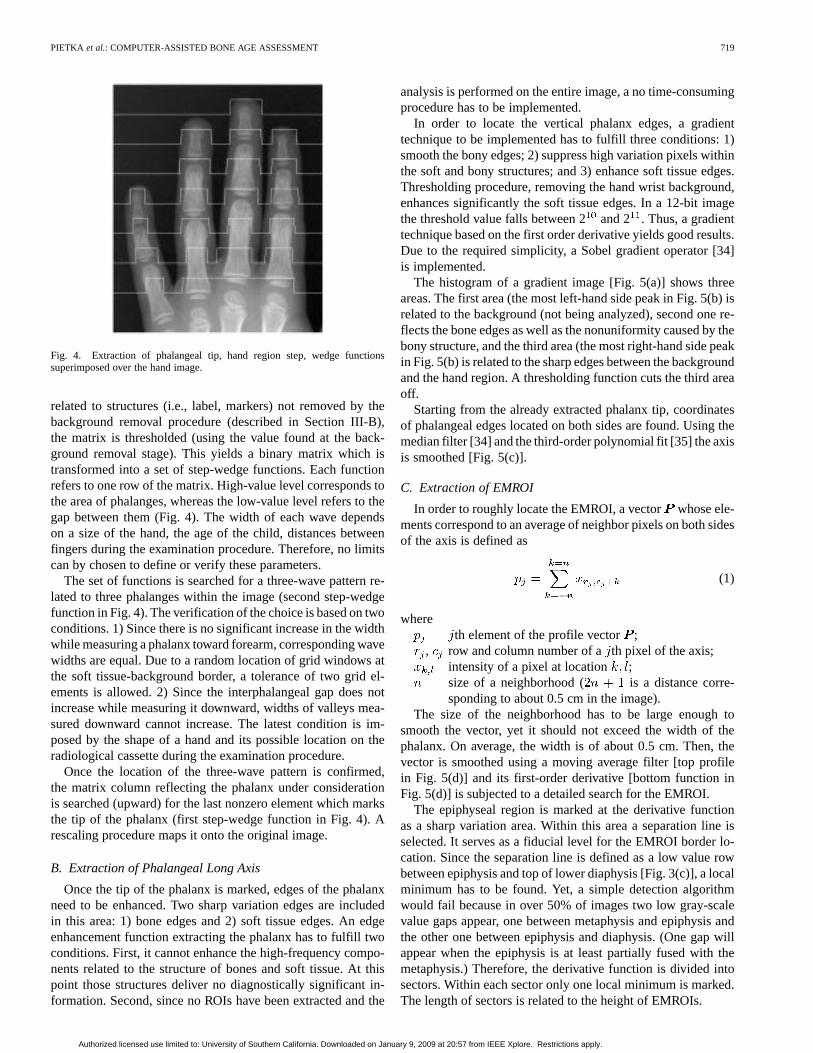
Fig. 4. Extraction of phalangeal tip, hand region step, wedge functionssuperimposed over the hand image.
related to structures (i.e., label, markers) not removed by thebackground removal procedure (described in Section III-B),the matrix is thresholded (using the value found at the back-ground removal stage). This yields a binary matrix which istransformed into a set of step-wedge functions. Each functionrefers to one row of the matrix. High-value level corresponds tothe area of phalanges, whereas the low-value level refers to thegap between them (Fig. 4). The width of each wave dependson a size of the hand, the age of the child, distances betweenfingers during the examination procedure. Therefore, no limitscan by chosen to define or verify these parameters.
The set of functions is searched for a three-wave pattern re-lated to three phalanges within the image (second step-wedgefunction in Fig. 4). The verification of the choice is based on twoconditions. 1) Since there is no significant increase in the widthwhile measuring a phalanx toward forearm, corresponding wavewidths are equal. Due to a random location of grid windows atthe soft tissue-background border, a tolerance of two grid el-ements is allowed. 2) Since the interphalangeal gap does notincrease while measuring it downward, widths of valleys mea-sured downward cannot increase. The latest condition is im-posed by the shape of a hand and its possible location on theradiological cassette during the examination procedure.
Once the location of the three-wave pattern is confirmed,the matrix column reflecting the phalanx under considerationis searched (upward) for the last nonzero element which marksthe tip of the phalanx (first step-wedge function in Fig. 4). Arescaling procedure maps it onto the original image.
B. Extraction of Phalangeal Long Axis
Once the tip of the phalanx is marked, edges of the phalanxneed to be enhanced. Two sharp variation edges are includedin this area: 1) bone edges and 2) soft tissue edges. An edgeenhancement function extracting the phalanx has to fulfill twoconditions. First, it cannot enhance the high-frequency compo-nents related to the structure of bones and soft tissue. At thispoint those structures deliver no diagnostically significant in-formation. Second, since no ROIs have been extracted and the
analysis is performed on the entire image, a no time-consumingprocedure has to be implemented.
In order to locate the vertical phalanx edges, a gradienttechnique to be implemented has to fulfill three conditions: 1)smooth the bony edges; 2) suppress high variation pixels withinthe soft and bony structures; and 3) enhance soft tissue edges.Thresholding procedure, removing the hand wrist background,enhances significantly the soft tissue edges. In a 12-bit imagethe threshold value falls between 2and 2 . Thus, a gradienttechnique based on the first order derivative yields good results.Due to the required simplicity, a Sobel gradient operator [34]is implemented.
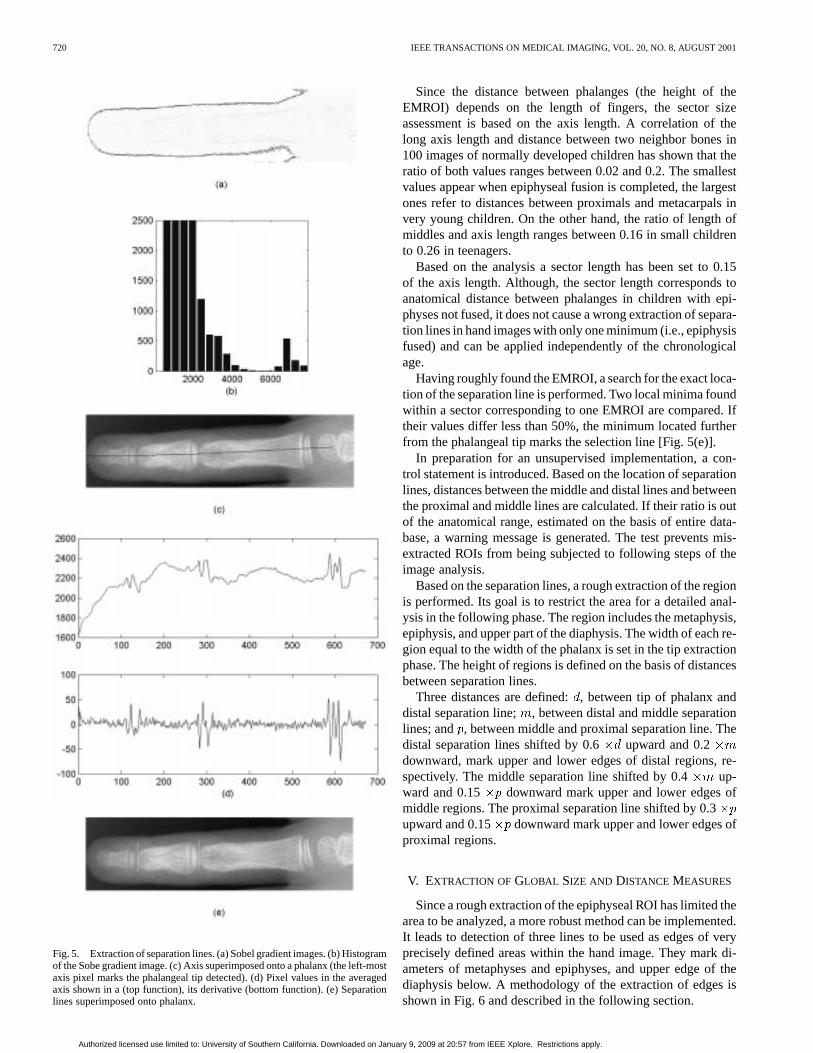
The histogram of a gradient image [Fig. 5(a)] shows threeareas. The first area (the most left-hand side peak in Fig. 5(b) isrelated to the background (not being analyzed), second one re-flects the bone edges as well as the nonuniformity caused by thebony structure, and the third area (the most right-hand side peakin Fig. 5(b) is related to the sharp edges between the backgroundand the hand region. A thresholding function cuts the third areaoff.
Starting from the already extracted phalanx tip, coordinatesof phalangeal edges located on both sides are found. Using themedian filter [34] and the third-order polynomial fit [35] the axisis smoothed [Fig. 5(c)].
C. Extraction of EMROI
In order to roughly locate the EMROI, a vectorwhose ele-ments correspond to an average of neighbor pixels on both sidesof the axis is defined as
(1)
whereth element of the profile vector ;
, row and column number of ath pixel of the axis;intensity of a pixel at location ;size of a neighborhood ( is a distance corre-sponding to about 0.5 cm in the image).
The size of the neighborhood has to be large enough tosmooth the vector, yet it should not exceed the width of thephalanx. On average, the width is of about 0.5 cm. Then, thevector is smoothed using a moving average filter [top profilein Fig. 5(d)] and its first-order derivative [bottom function inFig. 5(d)] is subjected to a detailed search for the EMROI.
The epiphyseal region is marked at the derivative functionas a sharp variation area. Within this area a separation line isselected. It serves as a fiducial level for the EMROI border lo-cation. Since the separation line is defined as a low value rowbetween epiphysis and top of lower diaphysis [Fig. 3(c)], a localminimum has to be found. Yet, a simple detection algorithmwould fail because in over 50% of images two low gray-scalevalue gaps appear, one between metaphysis and epiphysis andthe other one between epiphysis and diaphysis. (One gap willappear when the epiphysis is at least partially fused with themetaphysis.) Therefore, the derivative function is divided intosectors. Within each sector only one local minimum is marked.The length of sectors is related to the height of EMROIs.
Authorized licensed use limited to: University of Southern California. Downloaded on January 9, 2009 at 20:57 from IEEE Xplore. Restrictions apply.
720 IEEE TRANSACTIONS ON MEDICAL IMAGING, VOL. 20, NO. 8, AUGUST 2001
Fig. 5. Extraction of separation lines. (a) Sobel gradient images. (b) Histogramof the Sobe gradient image. (c) Axis superimposed onto a phalanx (the left-mostaxis pixel marks the phalangeal tip detected). (d) Pixel values in the averagedaxis shown in a (top function), its derivative (bottom function). (e) Separationlines superimposed onto phalanx.
Since the distance between phalanges (the height of theEMROI) depends on the length of fingers, the sector sizeassessment is based on the axis length. A correlation of thelong axis length and distance between two neighbor bones in100 images of normally developed children has shown that theratio of both values ranges between 0.02 and 0.2. The smallestvalues appear when epiphyseal fusion is completed, the largestones refer to distances between proximals and metacarpals invery young children. On the other hand, the ratio of length ofmiddles and axis length ranges between 0.16 in small childrento 0.26 in teenagers.
Based on the analysis a sector length has been set to 0.15of the axis length. Although, the sector length corresponds toanatomical distance between phalanges in children with epi-physes not fused, it does not cause a wrong extraction of separa-tion lines in hand images with only one minimum (i.e., epiphysisfused) and can be applied independently of the chronologicalage.
Having roughly found the EMROI, a search for the exact loca-tion of the separation line is performed. Two local minima foundwithin a sector corresponding to one EMROI are compared. Iftheir values differ less than 50%, the minimum located furtherfrom the phalangeal tip marks the selection line [Fig. 5(e)].
In preparation for an unsupervised implementation, a con-trol statement is introduced. Based on the location of separationlines, distances between the middle and distal lines and betweenthe proximal and middle lines are calculated. If their ratio is outof the anatomical range, estimated on the basis of entire data-base, a warning message is generated. The test prevents mis-extracted ROIs from being subjected to following steps of theimage analysis.
Based on the separation lines, a rough extraction of the regionis performed. Its goal is to restrict the area for a detailed anal-ysis in the following phase. The region includes the metaphysis,epiphysis, and upper part of the diaphysis. The width of each re-gion equal to the width of the phalanx is set in the tip extractionphase. The height of regions is defined on the basis of distancesbetween separation lines.
Three distances are defined:, between tip of phalanx anddistal separation line; , between distal and middle separationlines; and , between middle and proximal separation line. Thedistal separation lines shifted by 0.6 upward and 0.2downward, mark upper and lower edges of distal regions, re-spectively. The middle separation line shifted by 0.4 up-ward and 0.15 downward mark upper and lower edges ofmiddle regions. The proximal separation line shifted by 0.3upward and 0.15 downward mark upper and lower edges ofproximal regions.
V. EXTRACTION OF GLOBAL SIZE AND DISTANCE MEASURES
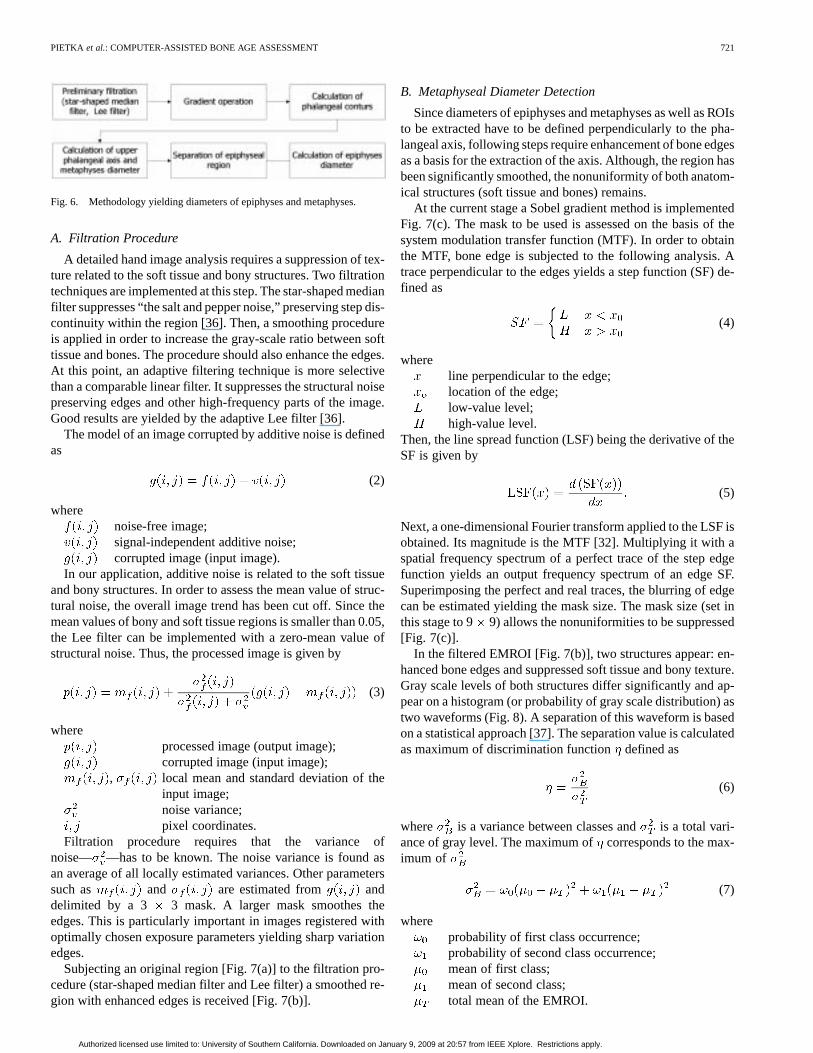
Since a rough extraction of the epiphyseal ROI has limited thearea to be analyzed, a more robust method can be implemented.It leads to detection of three lines to be used as edges of veryprecisely defined areas within the hand image. They mark di-ameters of metaphyses and epiphyses, and upper edge of thediaphysis below. A methodology of the extraction of edges isshown in Fig. 6 and described in the following section.
Authorized licensed use limited to: University of Southern California. Downloaded on January 9, 2009 at 20:57 from IEEE Xplore. Restrictions apply.
PIETKA et al.: COMPUTER-ASSISTED BONE AGE ASSESSMENT 721
Fig. 6. Methodology yielding diameters of epiphyses and metaphyses.
A. Filtration Procedure
A detailed hand image analysis requires a suppression of tex-ture related to the soft tissue and bony structures. Two filtrationtechniques are implemented at this step. The star-shaped medianfilter suppresses “the salt and pepper noise,” preserving step dis-continuity within the region [36]. Then, a smoothing procedureis applied in order to increase the gray-scale ratio between softtissue and bones. The procedure should also enhance the edges.At this point, an adaptive filtering technique is more selectivethan a comparable linear filter. It suppresses the structural noisepreserving edges and other high-frequency parts of the image.Good results are yielded by the adaptive Lee filter [36].
The model of an image corrupted by additive noise is definedas
(2)
wherenoise-free image;signal-independent additive noise;corrupted image (input image).
In our application, additive noise is related to the soft tissueand bony structures. In order to assess the mean value of struc-tural noise, the overall image trend has been cut off. Since themean values of bony and soft tissue regions is smaller than 0.05,the Lee filter can be implemented with a zero-mean value ofstructural noise. Thus, the processed image is given by
(3)
whereprocessed image (output image);corrupted image (input image);
, local mean and standard deviation of theinput image;noise variance;pixel coordinates.
Filtration procedure requires that the variance ofnoise— —has to be known. The noise variance is found asan average of all locally estimated variances. Other parameterssuch as and are estimated from anddelimited by a 3 3 mask. A larger mask smoothes theedges. This is particularly important in images registered withoptimally chosen exposure parameters yielding sharp variationedges.
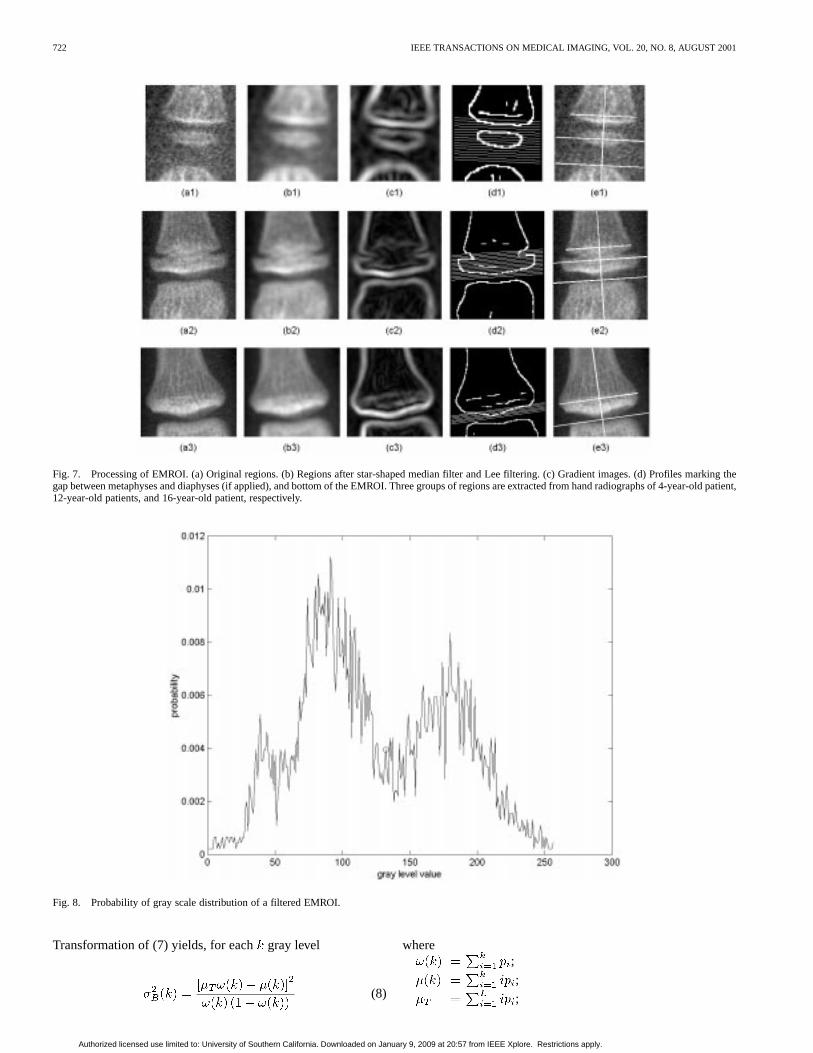
Subjecting an original region [Fig. 7(a)] to the filtration pro-cedure (star-shaped median filter and Lee filter) a smoothed re-gion with enhanced edges is received [Fig. 7(b)].
B. Metaphyseal Diameter Detection
Since diameters of epiphyses and metaphyses as well as ROIsto be extracted have to be defined perpendicularly to the pha-langeal axis, following steps require enhancement of bone edgesas a basis for the extraction of the axis. Although, the region hasbeen significantly smoothed, the nonuniformity of both anatom-ical structures (soft tissue and bones) remains.
At the current stage a Sobel gradient method is implementedFig. 7(c). The mask to be used is assessed on the basis of thesystem modulation transfer function (MTF). In order to obtainthe MTF, bone edge is subjected to the following analysis. Atrace perpendicular to the edges yields a step function (SF) de-fined as
(4)
whereline perpendicular to the edge;location of the edge;low-value level;high-value level.
Then, the line spread function (LSF) being the derivative of theSF is given by
(5)
Next, a one-dimensional Fourier transform applied to the LSF isobtained. Its magnitude is the MTF [32]. Multiplying it with aspatial frequency spectrum of a perfect trace of the step edgefunction yields an output frequency spectrum of an edge SF.Superimposing the perfect and real traces, the blurring of edgecan be estimated yielding the mask size. The mask size (set inthis stage to 9 9) allows the nonuniformities to be suppressed[Fig. 7(c)].
In the filtered EMROI [Fig. 7(b)], two structures appear: en-hanced bone edges and suppressed soft tissue and bony texture.Gray scale levels of both structures differ significantly and ap-pear on a histogram (or probability of gray scale distribution) astwo waveforms (Fig. 8). A separation of this waveform is basedon a statistical approach [37]. The separation value is calculatedas maximum of discrimination functiondefined as
(6)
where is a variance between classes andis a total vari-ance of gray level. The maximum ofcorresponds to the max-imum of
(7)
whereprobability of first class occurrence;probability of second class occurrence;mean of first class;mean of second class;total mean of the EMROI.
Authorized licensed use limited to: University of Southern California. Downloaded on January 9, 2009 at 20:57 from IEEE Xplore. Restrictions apply.
722 IEEE TRANSACTIONS ON MEDICAL IMAGING, VOL. 20, NO. 8, AUGUST 2001
Fig. 7. Processing of EMROI. (a) Original regions. (b) Regions after star-shaped median filter and Lee filtering. (c) Gradient images. (d) Profiles marking thegap between metaphyses and diaphyses (if applied), and bottom of the EMROI. Three groups of regions are extracted from hand radiographs of 4-year-oldpatient,12-year-old patients, and 16-year-old patient, respectively.
Fig. 8. Probability of gray scale distribution of a filtered EMROI.
Transformation of (7) yields, for eachgray level
(8)
where;
;
;
Authorized licensed use limited to: University of Southern California. Downloaded on January 9, 2009 at 20:57 from IEEE Xplore. Restrictions apply.
PIETKA et al.: COMPUTER-ASSISTED BONE AGE ASSESSMENT 723
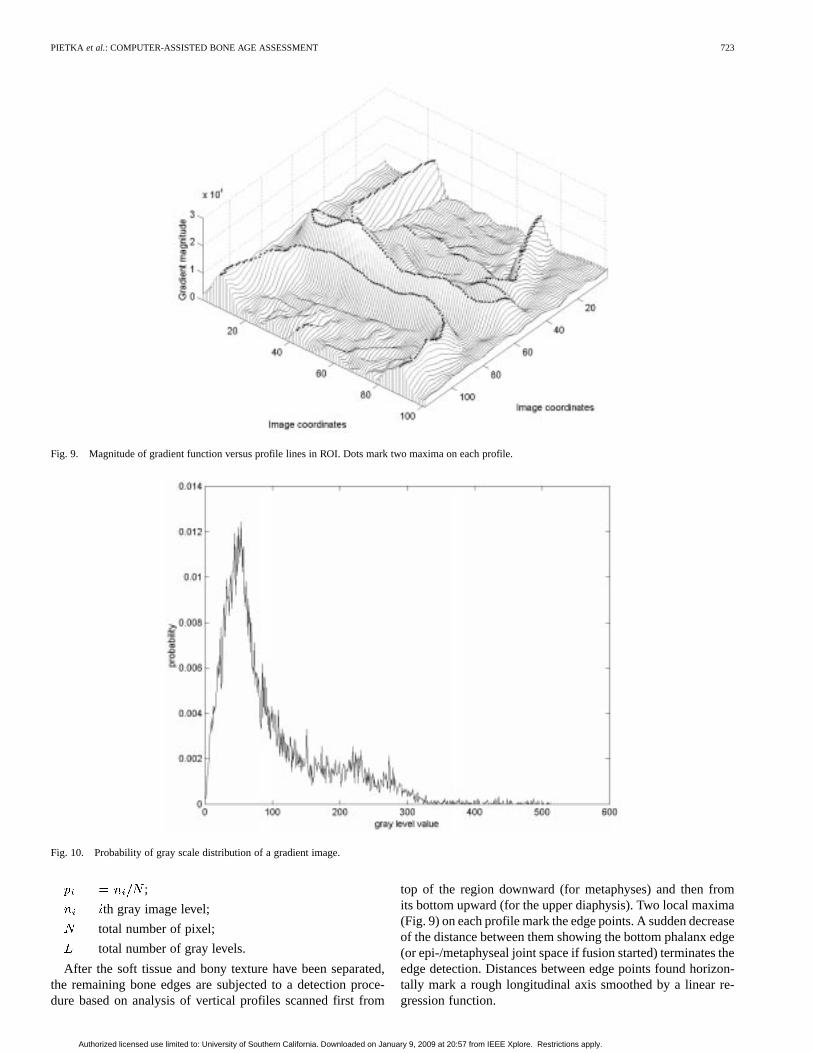
Fig. 9. Magnitude of gradient function versus profile lines in ROI. Dots mark two maxima on each profile.
Fig. 10. Probability of gray scale distribution of a gradient image.
;
th gray image level;
total number of pixel;
total number of gray levels.
After the soft tissue and bony texture have been separated,the remaining bone edges are subjected to a detection proce-dure based on analysis of vertical profiles scanned first from
top of the region downward (for metaphyses) and then fromits bottom upward (for the upper diaphysis). Two local maxima(Fig. 9) on each profile mark the edge points. A sudden decreaseof the distance between them showing the bottom phalanx edge(or epi-/metaphyseal joint space if fusion started) terminates theedge detection. Distances between edge points found horizon-tally mark a rough longitudinal axis smoothed by a linear re-gression function.
Authorized licensed use limited to: University of Southern California. Downloaded on January 9, 2009 at 20:57 from IEEE Xplore. Restrictions apply.
724 IEEE TRANSACTIONS ON MEDICAL IMAGING, VOL. 20, NO. 8, AUGUST 2001
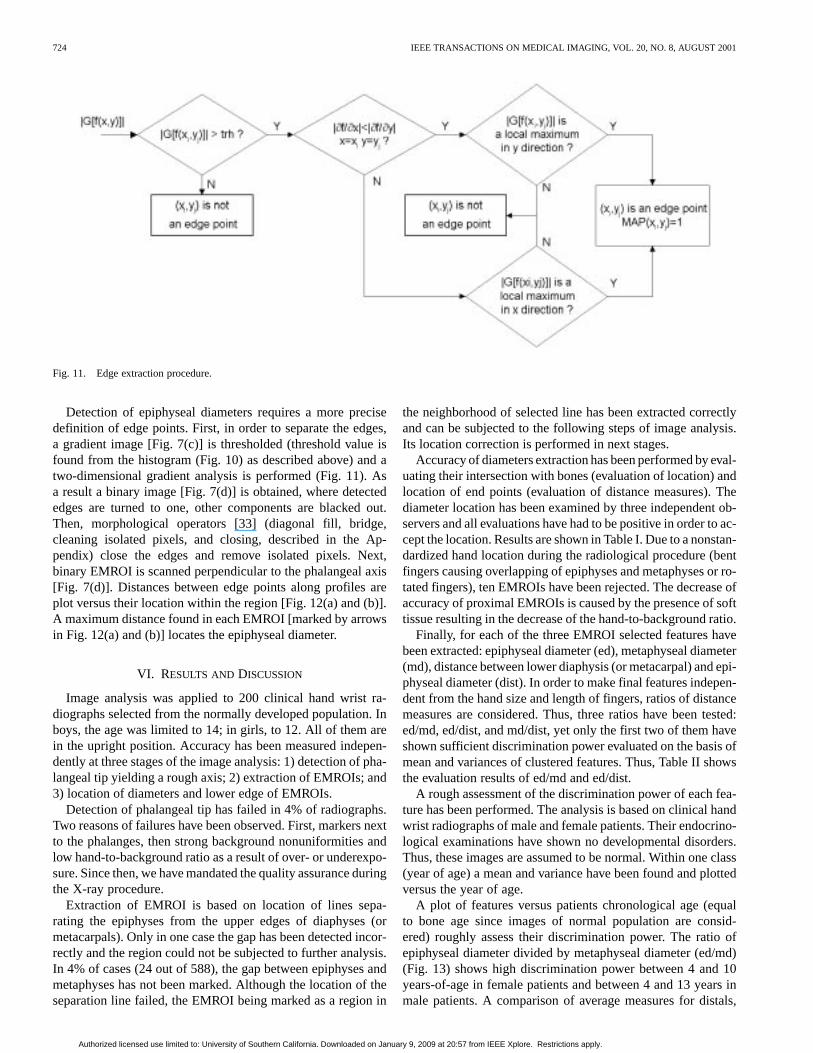
Fig. 11. Edge extraction procedure.
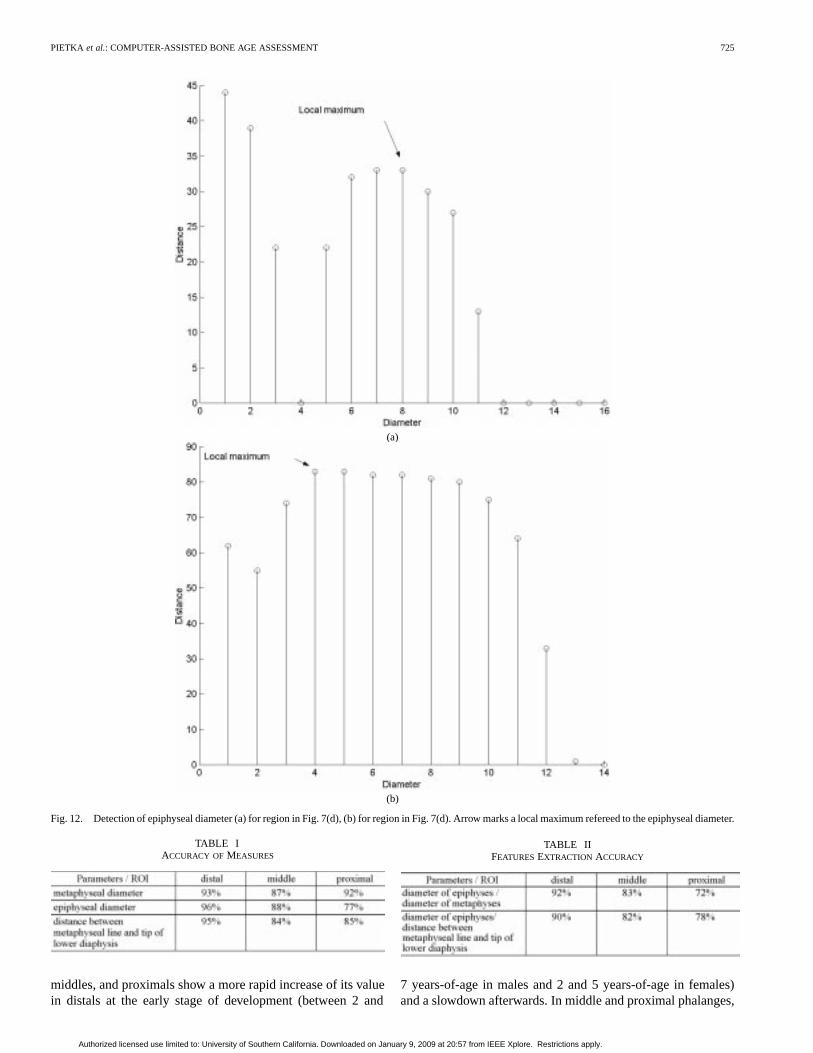
Detection of epiphyseal diameters requires a more precisedefinition of edge points. First, in order to separate the edges,a gradient image [Fig. 7(c)] is thresholded (threshold value isfound from the histogram (Fig. 10) as described above) and atwo-dimensional gradient analysis is performed (Fig. 11). Asa result a binary image [Fig. 7(d)] is obtained, where detectededges are turned to one, other components are blacked out.Then, morphological operators [33] (diagonal fill, bridge,cleaning isolated pixels, and closing, described in the Ap-pendix) close the edges and remove isolated pixels. Next,binary EMROI is scanned perpendicular to the phalangeal axis[Fig. 7(d)]. Distances between edge points along profiles areplot versus their location within the region [Fig. 12(a) and (b)].A maximum distance found in each EMROI [marked by arrowsin Fig. 12(a) and (b)] locates the epiphyseal diameter.
VI. RESULTS AND DISCUSSION
Image analysis was applied to 200 clinical hand wrist ra-diographs selected from the normally developed population. Inboys, the age was limited to 14; in girls, to 12. All of them arein the upright position. Accuracy has been measured indepen-dently at three stages of the image analysis: 1) detection of pha-langeal tip yielding a rough axis; 2) extraction of EMROIs; and3) location of diameters and lower edge of EMROIs.
Detection of phalangeal tip has failed in 4% of radiographs.Two reasons of failures have been observed. First, markers nextto the phalanges, then strong background nonuniformities andlow hand-to-background ratio as a result of over- or underexpo-sure. Since then, we have mandated the quality assurance duringthe X-ray procedure.
Extraction of EMROI is based on location of lines sepa-rating the epiphyses from the upper edges of diaphyses (ormetacarpals). Only in one case the gap has been detected incor-rectly and the region could not be subjected to further analysis.In 4% of cases (24 out of 588), the gap between epiphyses andmetaphyses has not been marked. Although the location of theseparation line failed, the EMROI being marked as a region in
the neighborhood of selected line has been extracted correctlyand can be subjected to the following steps of image analysis.Its location correction is performed in next stages.
Accuracy of diameters extraction has been performed by eval-uating their intersection with bones (evaluation of location) andlocation of end points (evaluation of distance measures). Thediameter location has been examined by three independent ob-servers and all evaluations have had to be positive in order to ac-cept the location. Results are shown in Table I. Due to a nonstan-dardized hand location during the radiological procedure (bentfingers causing overlapping of epiphyses and metaphyses or ro-tated fingers), ten EMROIs have been rejected. The decrease ofaccuracy of proximal EMROIs is caused by the presence of softtissue resulting in the decrease of the hand-to-background ratio.
Finally, for each of the three EMROI selected features havebeen extracted: epiphyseal diameter (ed), metaphyseal diameter(md), distance between lower diaphysis (or metacarpal) and epi-physeal diameter (dist). In order to make final features indepen-dent from the hand size and length of fingers, ratios of distancemeasures are considered. Thus, three ratios have been tested:ed/md, ed/dist, and md/dist, yet only the first two of them haveshown sufficient discrimination power evaluated on the basis ofmean and variances of clustered features. Thus, Table II showsthe evaluation results of ed/md and ed/dist.
A rough assessment of the discrimination power of each fea-ture has been performed. The analysis is based on clinical handwrist radiographs of male and female patients. Their endocrino-logical examinations have shown no developmental disorders.Thus, these images are assumed to be normal. Within one class(year of age) a mean and variance have been found and plottedversus the year of age.
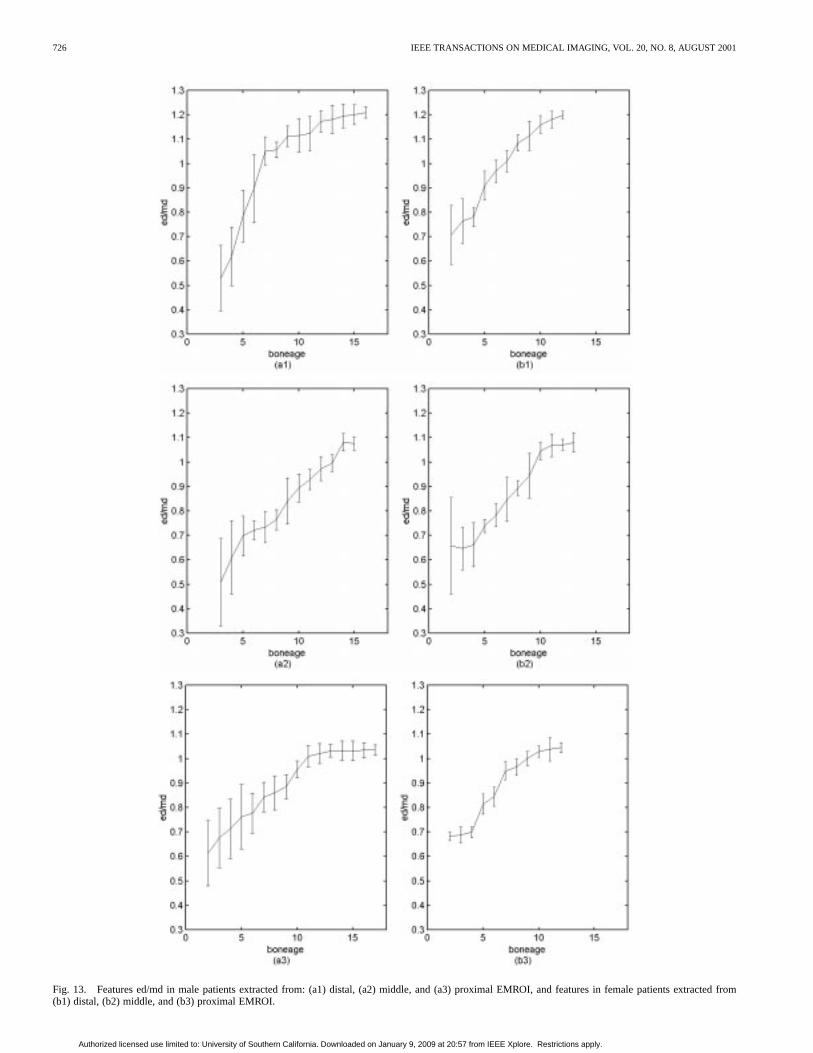
A plot of features versus patients chronological age (equalto bone age since images of normal population are consid-ered) roughly assess their discrimination power. The ratio ofepiphyseal diameter divided by metaphyseal diameter (ed/md)(Fig. 13) shows high discrimination power between 4 and 10years-of-age in female patients and between 4 and 13 years inmale patients. A comparison of average measures for distals,
Authorized licensed use limited to: University of Southern California. Downloaded on January 9, 2009 at 20:57 from IEEE Xplore. Restrictions apply.
PIETKA et al.: COMPUTER-ASSISTED BONE AGE ASSESSMENT 725
(a)
(b)
Fig. 12. Detection of epiphyseal diameter (a) for region in Fig. 7(d), (b) for region in Fig. 7(d). Arrow marks a local maximum refereed to the epiphyseal diameter.
TABLE IACCURACY OFMEASURES
middles, and proximals show a more rapid increase of its valuein distals at the early stage of development (between 2 and
TABLE IIFEATURESEXTRACTION ACCURACY
7 years-of-age in males and 2 and 5 years-of-age in females)and a slowdown afterwards. In middle and proximal phalanges,
Authorized licensed use limited to: University of Southern California. Downloaded on January 9, 2009 at 20:57 from IEEE Xplore. Restrictions apply.
726 IEEE TRANSACTIONS ON MEDICAL IMAGING, VOL. 20, NO. 8, AUGUST 2001
Fig. 13. Features ed/md in male patients extracted from: (a1) distal, (a2) middle, and (a3) proximal EMROI, and features in female patients extractedfrom(b1) distal, (b2) middle, and (b3) proximal EMROI.
Authorized licensed use limited to: University of Southern California. Downloaded on January 9, 2009 at 20:57 from IEEE Xplore. Restrictions apply.
PIETKA et al.: COMPUTER-ASSISTED BONE AGE ASSESSMENT 727
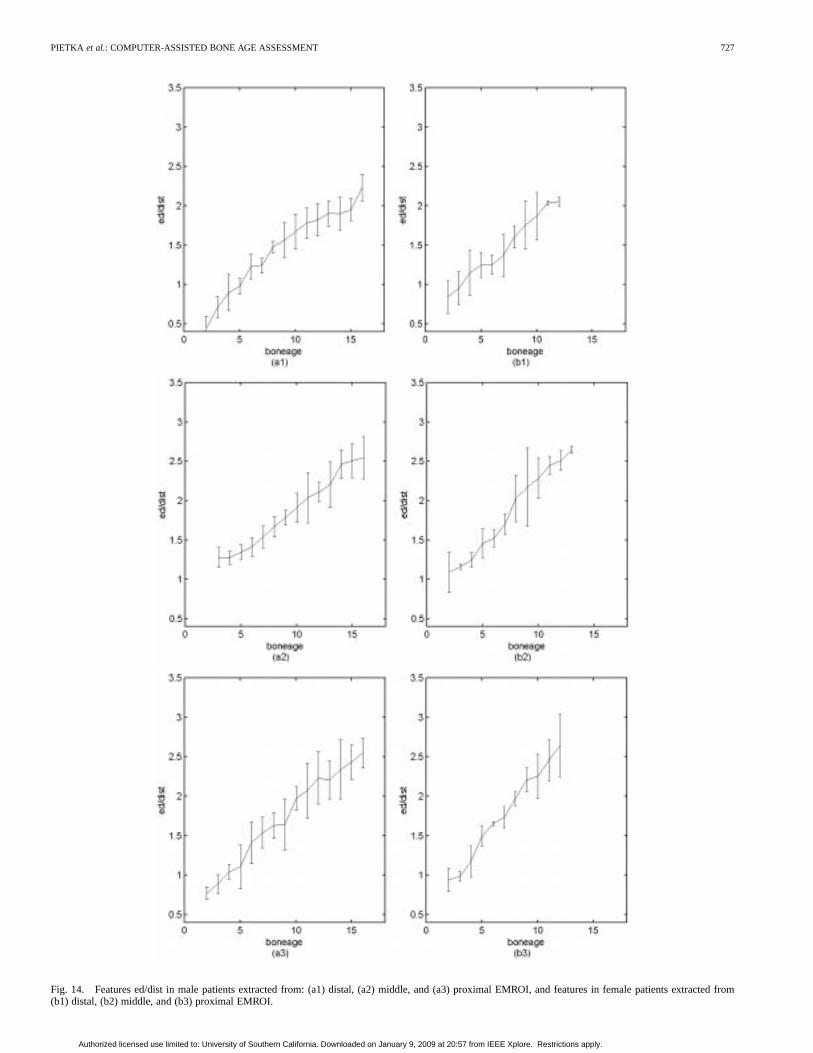
Fig. 14. Features ed/dist in male patients extracted from: (a1) distal, (a2) middle, and (a3) proximal EMROI, and features in female patients extracted from(b1) distal, (b2) middle, and (b3) proximal EMROI.
Authorized licensed use limited to: University of Southern California. Downloaded on January 9, 2009 at 20:57 from IEEE Xplore. Restrictions apply.
728 IEEE TRANSACTIONS ON MEDICAL IMAGING, VOL. 20, NO. 8, AUGUST 2001
a strong increase of the average ed/md starts two years later, yetremains until the epiphyseal fusion begins.
Epiphyseal diameter divided by distance between lowerdiaphysis (or metacarpal) and epiphyseal diameter (Fig. 14)features similar relations at the early stage of development.Values of both parameters depend strongly on the rapid growsof epiphyseal diameter. However, the ed/dist feature keepsincreasing continuously in the later stage of development,even after the ed/md feature does not change significantly.In male patients, average ed/dist increases until 16 years ofage, whereas in female patients it changes until the age of 13.Afterwards a time–frequency domain analysis is performed asa separate study.
Large variances of features in very young children (1–3years-of-age) indicate a rapid grows of epiphyses which shouldnot be combined in one class. The Greulich and Pyle atlasseparates them in more than one class as well. This will also beincluded in future studies.
APPENDIX
Star-Shaped Median Filter:
where:input image;output image;pixel coordinates.
Morphological Operator Definitions: Consider the fol-lowing (3 3) neighborhood pixel pattern in binary image,where 1 (white) or 0 (black)
where;
;;
;;
;;
;.
Four-neighbor erode (erosion):Erase white pixel if at leastone four-connected neighbor pixel is black
Four-neighbor dilate (dilation):Create a white pixel if atleast one four-connected neighbor pixel is white
Diagonal fill: create a white pixel if creation eliminateseight connectivity of the background
where;;;.
Cleaning isolated pixel:erase a white pixel with eightblack neighborhood
Bridge: bridge previously unconnected pixels
where;;
;;;.
where;;;.
Closing: smoothes contours of object, eliminates smallholes in objects, and fuses short gaps between objects. Itoften is obtained by dilating and eroding the image
REFERENCES
[1] D. B. Darling, Radiography of Infants and Children, 1sted. Springfield, IL: Charles C Thomas, 1979, ch. 6, pp. 370–372.
[2] A. Poznanski, S. M. Garn, J. M. Nagy, and J. C. Gall, “Metacarpopha-langeal pattern profiles in the evaluation of skeletal malformations,”Ra-diology, vol. 104, pp. 1–11, 1972.
[3] D. R. Kirks, Practical Pediatric Imaging. Diagnostic Radiology of In-fants and Children, 1st ed. Boston, MA: Little, Brown & Co., 1984,ch. 6, pp. 198–201.
[4] J. Kosowicz, “The Roentgen appearance of the hand and wrist in gonadaldysgenesis,”Radiology, vol. 93, pp. 354–361, 1965.
[5] R. M. Archibald, N. Finby, and F. de Vito, “Endocrine significance ofshort metacarpals,”J.Clin.Endocr., vol. 19, pp. 1312–1322, 1959.
[6] J. W. Pryor, “Time of ossification of the bones of the hand of the maleand female and union of epiphyses with the diaphyses,”Amer. J. Phys.Anthrop., pp. 401–410, 1975.
[7] F. E. Johnston and S. B. Jahina, “The contribution of the carpal bonesto the assessment of skeletal age,”Amer. J. Phys. Anthrop., vol. 23, pp.349–354, 1965.
[8] G. R. Miller, R. K. Levick, and R. Kay, “Assessment of bone age: Acomparison of the Greulich and Pyle and the Tanner and Whitehousemethods,”Clin. Radiol., vol. 37, pp. 119–121, 1986.
[9] W. W. Greulich and S. I. Pyle,Radiographic Atlas of Skeletal Devel-opment of Hand Wrist, 2nd ed. Stanford, CA: Standford Univ. Press,1971.
[10] J. M. H. Buckler, “How to make the most of bone ages,”Arch. DiseaseChildhood, vol. 58, pp. 761–763, 1983.
[11] A. F. Roch, C. G. Rohmann, and G. H. Davila, “Effect of training onreplicability of assessment of skeletal maturity (Greulich — Pyle),”Amer. J. Roentgenol., vol. 108, pp. 511–515, 1970.
Authorized licensed use limited to: University of Southern California. Downloaded on January 9, 2009 at 20:57 from IEEE Xplore. Restrictions apply.
PIETKA et al.: COMPUTER-ASSISTED BONE AGE ASSESSMENT 729
[12] J. M. Tanner and R. H. Whitehouse,Assessment of Skeletal Maturity andPrediction of Adult Height (TW2 Method). London, U.K.: Academic,1975.
[13] A. L. J.. Cole, L. Webb, and T. J. Cole, “Bone age estimation: A com-parison of methods,”Brit. J. Radiol., vol. 108, pp. 683–686, 1988.
[14] D. J. Michael and A. C. Nelson, “HANDX: A model-based system forautomatic segmentation of bones from digital hand radiographs,”IEEETrans. Med. Imag., vol. 8, pp. 64–69, 1989.
[15] S. N. C. Cheng, H. Chan, L. T. Niklason, and R. S. Alder, “Automatedsegmentation of regions on hand radioraphs,”Med. Phys., vol. 21, pp.1293–1200, 1994.
[16] G. K. Manos, A. Y. Cains, I. W. Rickets, and D. Sinclair, “Segmenting ra-diographs of the hand and wrist,”Comput. Methods Programs Biomed.,vol. 43, pp. 227–237, 1994.
[17] J. Duryea, Y. Jiang, P. Countryman, and H. K. Genant, “Automatedalgorithm for the identification of joint space and phalanx margin lo-cation on digital hand radiographs,”Med. Phys., vol. 26, pp. 453–461,1999.
[18] J. M. Tanner and R. D. Gibbons, “Automatic bone age measurementusing computerized image analysis,”J. Ped. Endocrinol., vol. 7, pp.141–145, 1994.
[19] E. Pietka, M. F. McNitt-Gray, and H. K. Huang, “Computer-assistedphalangeal analysis in skeletal age assessment,”IEEE Trans. Med.Imag., vol. 10, pp. 616–620, 1991.
[20] S. M. Garn, K. P. Hertzog, A. K. Poznanski, and J. M. Nagy, “Metacar-pophalangeal length in the evaluation of skeletal malformation,”Radi-ology, vol. 105, pp. 375–381, 1972.
[21] E. Pietka, M. F. McNitt-Gray, T. Hall, and H. K. Huang, “Computerizedbone analysis of hand radiographs,”Proc. SPIE, vol. 1652, pp. 522–528,1992.
[22] E. Pietka and H. K. Huang, “Epiphyseal fusion assessment based onwavelets decomposition analysis,”Computerized Med. Imag. Graph.,vol. 19, pp. 465–472, 1995.
[23] E. Pietka, L. Kaabi, M. L. Kuo, and H. K. Huang, “Feature extractionin carpal-bone analysis,”IEEE Trans. Med. Imag., vol. 12, pp. 44–49,1993.
[24] E. Pietka, “Computer-assisted bone age assessment based on featuresautomatically extracted from a hand radiograph,”Computerized Med.Imag. Graph., vol. 19, pp. 251–259, 1995.
[25] F. Cao, H. K. Huang, E. Pietka, V. Gilsanz, and S. Ominsky, “Diagnosticworkstation for digital hand atlas in bone age assessment,” inProc. SPIEMed. Imag., vol. 3335, 1998, pp. 608–614.
[26] F. Cao, H. K. Huang, E. Pietka, and V. Gilsanz, “Digital hand atlasand computer-aided bone age assessment via Web,” inProc. SPIE Med.Imag., vol. 3662, 1999, pp. 394–402.
[27] E. Pietka and H. K. Huang, “Image Processing Techniques in Bone AgeAssessment,” inImage Processing Techniques and Applications, C. T.Leondes, Ed. New York: Gordon and Breach, 1997.
[28] O. Ratib, R. Appel, and J. R. Scherrer, “Papyrus: A multimodality imagefile format for PACS and teleradiology,”Radiology, vol. 177(P), p. 320,1990.
[29] M. F. McNitt-Gray, E. Pietka, and H. K. Huang, “Image preprocessingfor Picture Archiving and Communication System,”Investigat. Radiol.,vol. 7, pp. 529–535, 1992.
[30] M. Razavi, T. Hall, D. Aberle, A. Hayreptian, M. Loloyan, and S. El-dredge, “Display conditions and lesion detectability: Effect of back-ground light,” inProc. SPIE, vol. 1234, 1990, pp. 776–782.
[31] J. Zhang and H. K. Huang, “Automatic background recognition and re-moval (ABRR) of Computed Radiography images,”IEEE Trans MedImag., vol. 16, pp. 762–771, Dec. 1997.
[32] H. K. Huang,PACS: Basic Principles and Application. New York:Wiley —Liss, 1999.
[33] J. Serra, Ed.,Image Analysis and Mathematical Morphology. NewYork: Academic, 1988, vol. 2.
[34] R. C. Gonzalez and P. Wintz,Digital Image Processing, 2nded. Reading, MA: Addison-Wesley, 1987.
[35] W. H. Press, S. A. Teukolsky, W. T. Vetterling, and B. P. Flannery,Nu-merical Recipes in C. Cambridge, U.K.: Cambrigde Univ. Press, 1992.
[36] J. S. Lim,Two-Dimensional Signal & Image processing. EnglewoodCliffs, NJ: Prentice-Hall, 1990.
[37] N. Otsu, “A threshold selection method from gray-level histograms,”IEEE Trans. Syst., Man, Cybern., vol. SMC-9, pp. 62–66, 1979.
Authorized licensed use limited to: University of Southern California. Downloaded on January 9, 2009 at 20:57 from IEEE Xplore. Restrictions apply.


