Embed Size (px)
Citation preview
9-500-024R E V : J A N U A R Y 1 5 , 2 0 0 2
________________________________________________________________________________________________________________
Professor John Deighton prepared this case. HBS cases are developed solely as the basis for class discussion. Cases are not intended to serve asendorsements, sources of primary data, or illustrations of effective or ineffective management.
Copyright © 1999 President and Fellows of Harvard College. To order copies or request permission to reproduce materials, call 1-800-545-7685,write Harvard Business School Publishing, Boston, MA 02163, or go to http://www.hbsp.harvard.edu. No part of this publication may bereproduced, stored in a retrieval system, used in a spreadsheet, or transmitted in any form or by any means—electronic, mechanical,photocopying, recording, or otherwise—without the permission of Harvard Business School.
J O H N D E I G H T O N
The Brita Products Company
In 1987 when Charlie Couric saw his first Brita pitcher he thought, “A homemade alternative tobottled water!” Here was a product that, with the right marketing support, could be very successful.Couric, a marketing executive with the Clorox Company charged with finding new business ideas,had been browsing health food stores in California when he came across the quirky home waterpitcher-and-filter system made by a small German company, Brita GmbH. He proposed that Cloroxacquire the right to market Brita in the USA, and in 1988 they did so. Couric reflected:
In the early years we had to beg the corporation to invest. Some of my colleagues viewed thepitcher as another waffle iron - used once and then tossed into the basement. We saw itdifferently. We looked at the repeat purchasing of filters, and to us the strategy was obvious.This was a race to put a pitcher on every kitchen countertop, at a loss if necessary.
Clorox supported Couric’s deficit-spending proposal, and a decade later Brita had grown tobecome one of Clorox’s biggest brands. It had rewarded Couric’s faith, spearheading the growth of ahome water filtration industry in the United States. More than 17 million Brita pitchers had beensold, and each pitcher sale started a stream of filter sales. The Brita brand was generating close to$200 million revenues a year.
Now, in 1999, Couric was keeping an eye on a different water purification product launched by asmall competitor, PUR. It was a filter that screwed onto kitchen faucets.1 Clorox had its own versionof the faucet-mounted filter ready for launch, and again a debate had developed over whether todeficit-spend. Some counseled that the faucet-mount had the power to disrupt the pitcher product,and Brita had no choice but to pour money into another race to build another installed base, this timein faucet-mounted products. Others argued that faucet-mounts served a different niche of the waterpurification market from pitchers, and the two could live side-by side. A third group argued thatBrita should do nothing to foster faucet-mounts. Its priority, they argued, was to invest to defend itsinstalled base of pitchers and the associated filter revenue stream. Money spent on promoting afaucet-mount would only erode the pitcher base and interrupt its stream of filter revenues. Theypointed out that PUR was a small, loss-making firm, too weak to succeed at creating a new category,particularly when the early adopters of home water filtration all had pitchers in their homes.
1 Faucet-mounted filters were not themselves a new product—Teledyne had sold one since the 1960s without much success.However, the introduction of solid carbon block technology in 1995 improved performance and increased consumer interest.
For the exclusive use of D. NGUYEN
This document is authorized for use only by Dong Nguyen in MarketingAdministrationFa2013 taught by Partha Krishnamurthy from August 2013 to February 2014.
500-024 The Brita Products Company
2
The Clorox Company
The Clorox Company was a major manufacturer and marketer of laundry additives, householdcleaners, charcoal, auto care products, cat litter and home water purifiers. In January 1999, Cloroxbought First Brands, a $1.2 billion manufacturer of plastic wraps and bags, auto care products, catlitter and home fireplace products. Revenues of the two companies combined would have been $3.9billion in 1998. Some of the well-known U.S. consumer brands that would come under commonownership following the merger were:
Clorox First Brands
Armor All car care products STP automotive products
Fresh Step cat litter Scoop Away cat litter
S.O.S. steel wool pads Ever Clean cat litter
Hidden Valley salad dressing Johnny Cat cat litter
Kingsford charcoal StarterLogg fire starters
Clorox laundry bleach HearthLogg fire logs
Soft Scrub cleaners Glad plastic wraps and bags
Brita water filtration systems
Formula 409 spray cleaner
Tilex cleaners
Pine-Sol cleaner
Liquid Plumr
Under Chairman and CEO G. Craig Sullivan, Clorox followed a strategy of building dominantbrands, pursuing international expansion and acquiring promising businesses. Some 85% of Cloroxbrands were first or second in their categories. Sales beyond the United States would reach 20% ofrevenues after the First Brands merger, up from 18% for Clorox alone.
The Brita Products Company
Brita GmbH, a family-owned corporation headquartered in Tanusstein, Germany, made a varietyof industrial and consumer water filtration products. Before Couric called, it had struggled withoutmuch success to sell its home water filtration system in the United States, most recently through aCanadian agent. After vigorous negotiation, in September 1988 it agreed to let Clorox form asubsidiary, Brita USA, to be the sole U.S. distributor of Brita products. Clorox would buy filters fromBrita GmbH and design and make its own pitchers. Couric became President and General Managerof Brita USA.
For four years, Brita USA struggled. The costs of building distribution, designing products, andpromoting the concept dwarfed the small base of sales. Couric persevered, however, because earlysurveys of users suggested to him that a Brita customer would have a remarkable lifetime value.Each pitcher sale would start a flow of filter sales. Over 80% of pitcher buyers were still using theproduct a year later and many were telling friends to try it and were giving it as gifts. In the 1990s,the product took hold like crabgrass. By 1999, an estimated 13% to 15% of the 103 million householdsin the United States were using a Brita pitcher. Brita had created a home water purification industryworth $350 million at retail, and held a 70% revenue share.
For the exclusive use of D. NGUYEN
This document is authorized for use only by Dong Nguyen in MarketingAdministrationFa2013 taught by Partha Krishnamurthy from August 2013 to February 2014.
The Brita Products Company 500-024
3
The Product
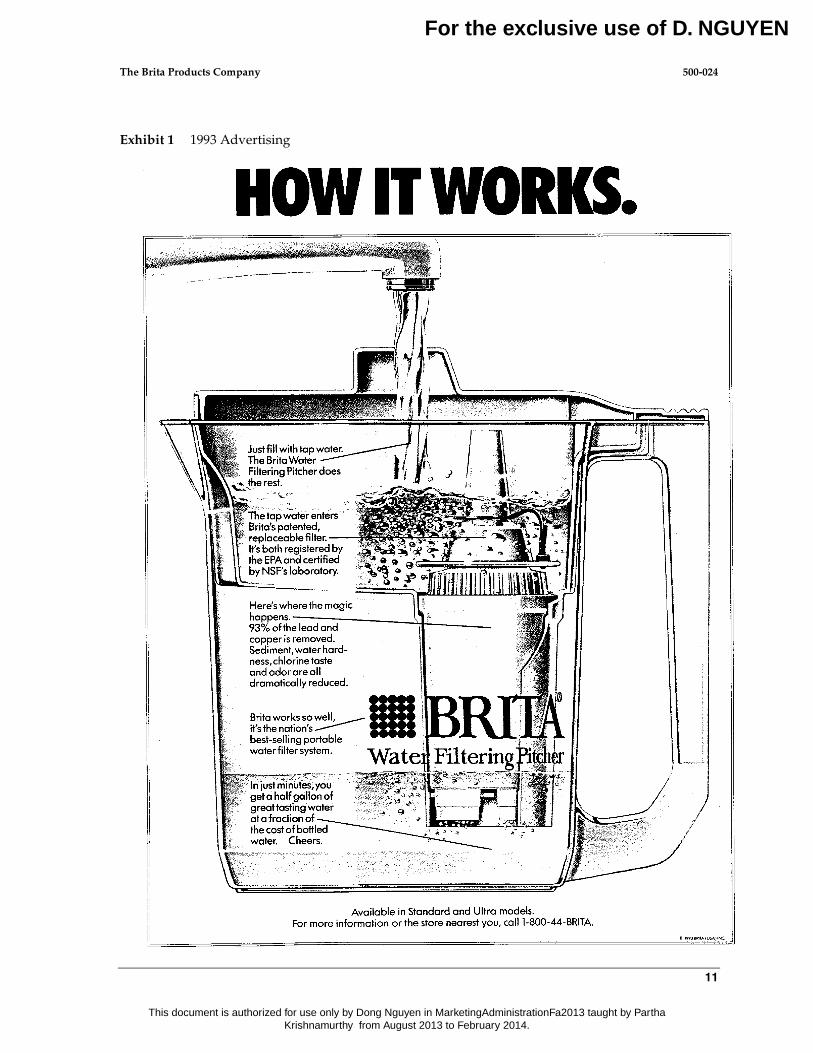
The Brita pour-through filtration system comprised a two-compartment pitcher and a replaceablefilter (Exhibit 1). Tap water, poured into the upper compartment, flowed under gravity through thefilter into the lower compartment, filling it in about five minutes.
The filter had two elements. Activated carbon reduced chlorine, sediment and odors, and an ion-exchange resin removed any heavy metals such as lead, copper, mercury and cadmium, as well astemporary water hardness (calcium and magnesium). The benefits were threefold. Filtered watertasted better, it did not deposit scale when boiled, and, to the extent that it might have containedharmful heavy metals, they were extracted. The filter did not screen out microorganisms such ascryptosporidium and giardia, two sources of gastro-intestinal illness that were potentially fatal topeople with compromised immune systems.
The pitcher system was sold with a single filter in place. Filters required replacement every twomonths or after filtering 40 gallons of water. Brita supplied calendar stickers to help users track whena filter needed replacement. Filters were sold in packs of one, three and five.
Consumer Attitudes and Behavior
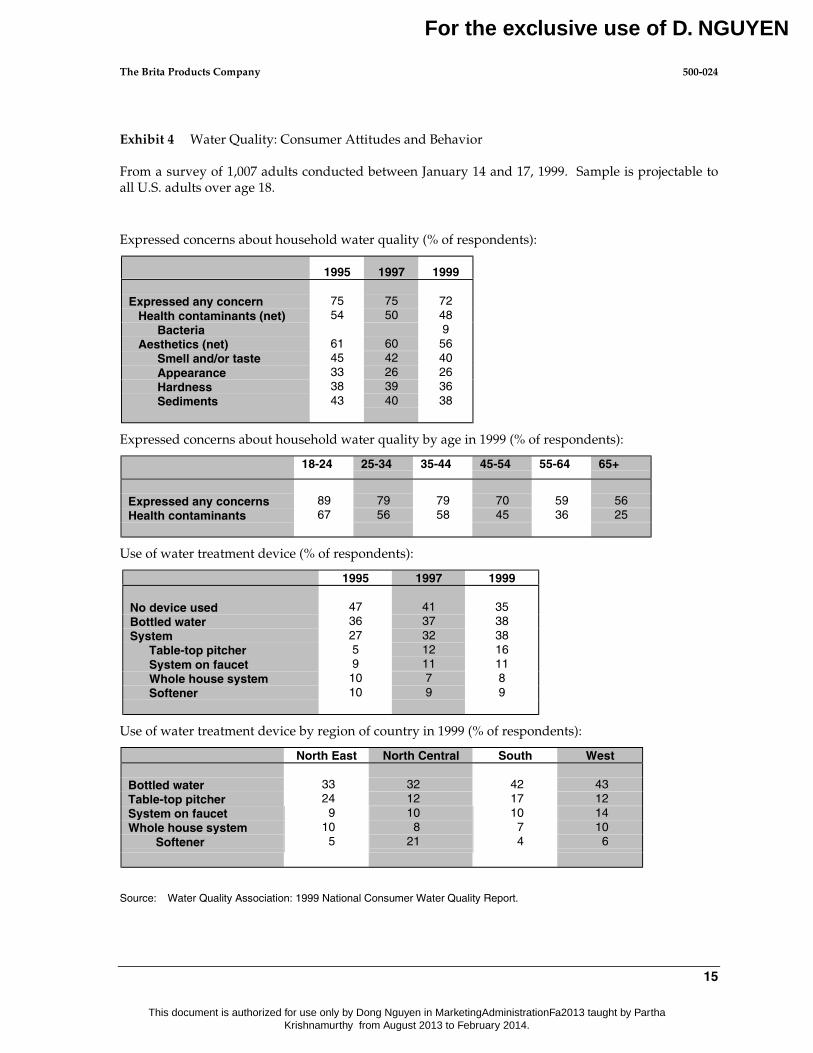
Over the decade of the 1990s, the safety of tap water became a topic of growing concern to U.S.households. In one well-publicized case, two wells supplying the drinking water for the Bostonsuburb of East Woburn, MA were found to be contaminated with industrial solvents, coincident witha number of cases of leukemia. The incident was the subject of a book and a 1998 motion picture, ‘ACivil Action.’ In that year the U.S. Environmental Protection Agency declared that about 10% of thesediment under U.S. surface waters is "sufficiently contaminated" with toxic pollutants to pose ahealth threat to humans and wildlife. Later that year, Congress began requiring municipal waterauthorities to say when contaminant levels exceeded federal regulations. In Milwaukee in 1993,403,000 people were made sick and 111 died when the parasite cryptosporidium entered themunicipal water supply. By the end of the decade, a poll by USA TODAY, CNN and Gallup foundthat 47% of respondents preferred not to drink water straight from the tap.2
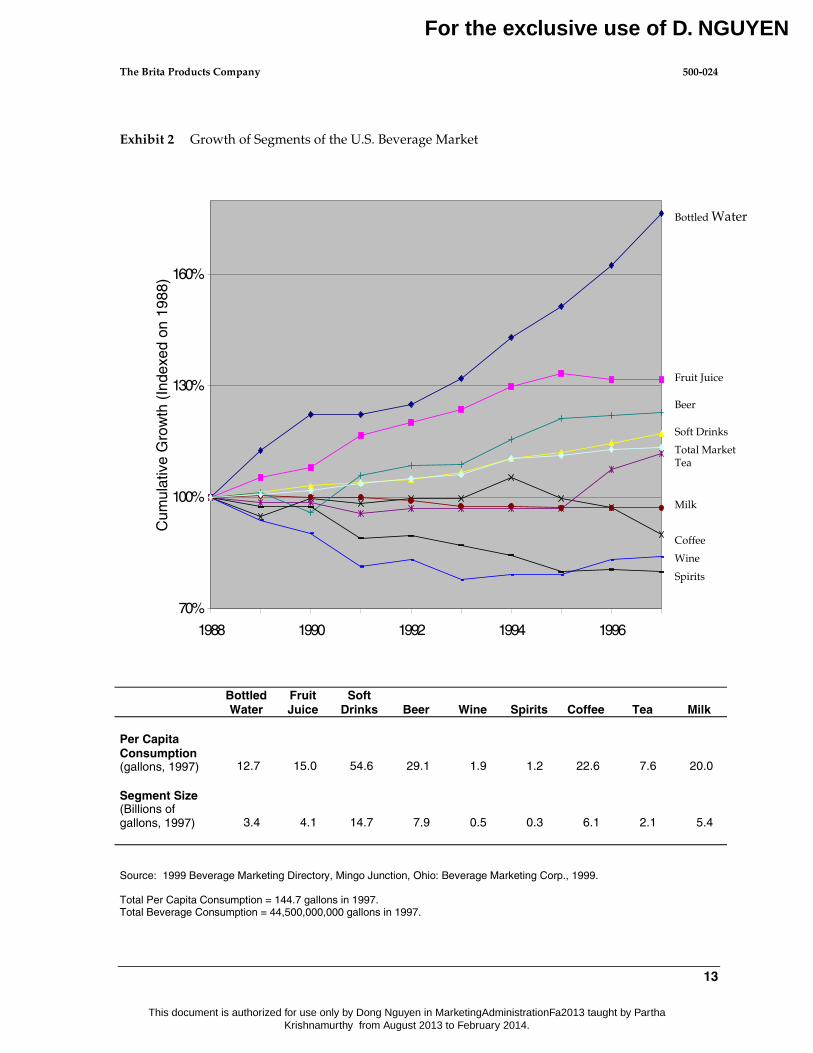
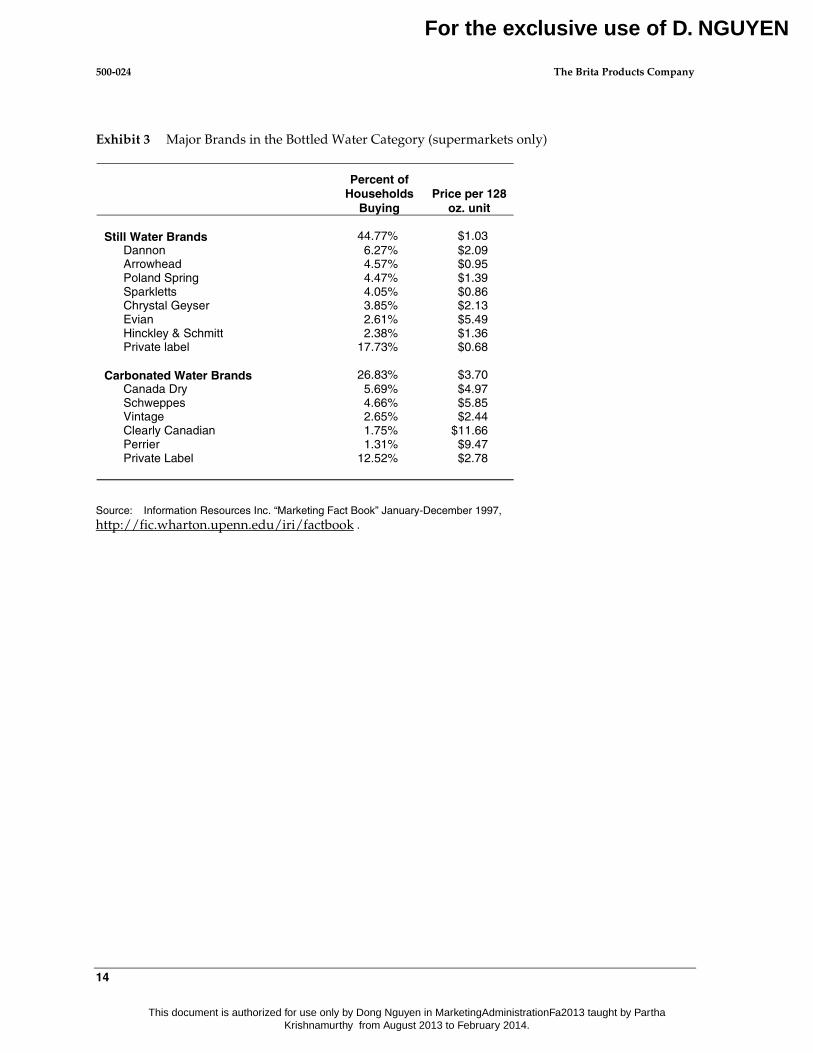
Sales of bottled water from U.S. supermarkets and home delivery services grew rapidly duringthe decade. By 1997, bottled water made up 8% of all the liquids that people paid to drink and wasthe industry’s fastest growing category (Exhibit 2). In that year, 45% of households bought still (non-carbonated) water in supermarkets and 27% bought carbonated water. The average price paid forstill water was about a dollar per 128-ounce container, and carbonated brands averaged about threedollars (Exhibit 3).
A 1998 survey3 found that two-thirds of Americans claimed to be familiar with the expertrecommendation to drink eight, eight-ounce servings of water a day, yet only one in five drank thatquantity of water and 44 percent drank three or fewer water servings daily.
2 Eisler, Peter, Barbara Hansen and Aaron Davis. “Lax oversight raises tap water risks.” USA TODAY, October 21, 1998, p.15A.3 Yankelovich Partners conducted a survey of 3,003 Americans for the Nutrition Information Center at The New York Hospital- Cornell Medical Center and the International Bottled Water Association. The study is described at http://www.bottledwaterweb.com/news/news3.html.
For the exclusive use of D. NGUYEN
This document is authorized for use only by Dong Nguyen in MarketingAdministrationFa2013 taught by Partha Krishnamurthy from August 2013 to February 2014.
500-024 The Brita Products Company
4
A 1999 survey4 found that 72% of all respondents, and 89% of young adults, voiced some concernabout the quality of their household’s water supply. A majority of households used either bottledwater or some water purification system to limit their exposure to public water supplies. The numbertaking no precautions declined from 47% in 1995 to 35% in 1999 (Exhibit 4).
Market Performance
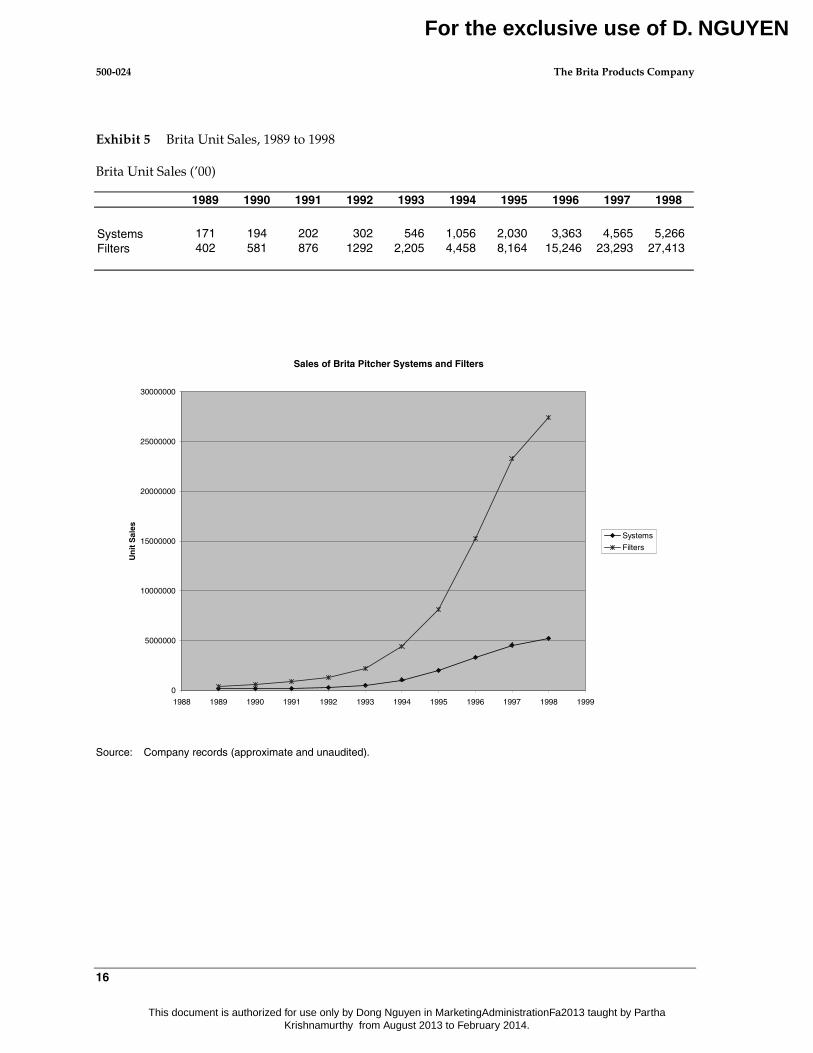
Brita used the term ‘systems’ to refer to pitchers and faucet-mounted units, and ‘filters’ for thereplacement filters. System sales were sluggish for the first four years after launch, but filter salesgrew more rapidly (Exhibit 5). In the early years Couric compared performance in the United Statesto the first years of the product’s life under other Brita distributors in Canada and the UnitedKingdom, and the similarity of the profiles gave him, as early as 1991, the confidence to persevere:
We saw that trial in the United States in the early 1990s was running between the Canadianand the U.K. levels. Close to 25% of buyers told us that they had given a Brita pitcher as a gift.Another reassuring sign was that surveys were finding that more than 80% of those who hadtried the pitcher were still using it a year later. The same surveys reported that they werebuying 2 or 3 filters a year. Each year we tried to relate filter sales to past pitcher sales. Wefound that when we estimated our installed base at 80% of those who had bought a system inthe previous five years, and assumed that the installed base bought 2.5 filters a year, theresulting forecasts of filter sales each year were close to reality.
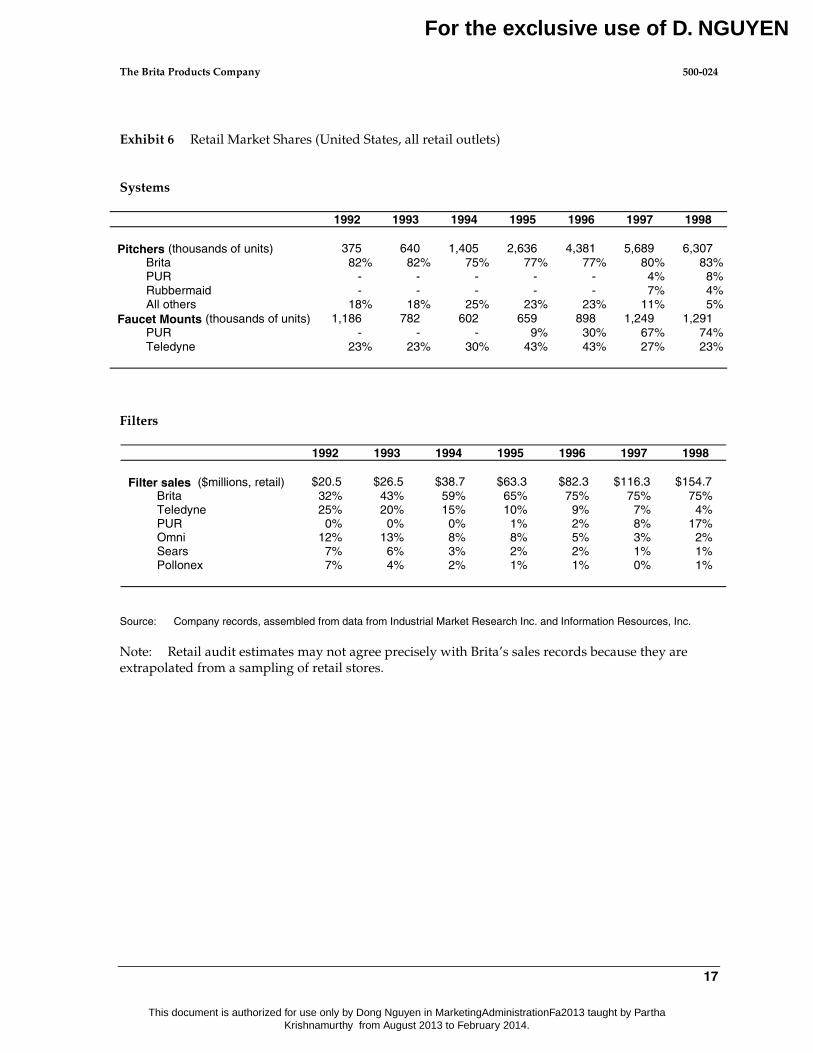
Management tracked system market share in units and filter share in dollars (Exhibit 6). Brita’sshare of combined system and filter market revenues had been steady in the range of 65% to 75%from 1995 to 1999. System unit shares were far more volatile. In July 1998, for example, system salesdoubled over the previous year and Brita’s share increased ten points in response to a so-called‘bogo’ (buy one, get one free) promotion on pitchers, intended to pre-empt a PUR competitive launch.Filter sales had been less responsive to sales promotion activity by manufacturers.
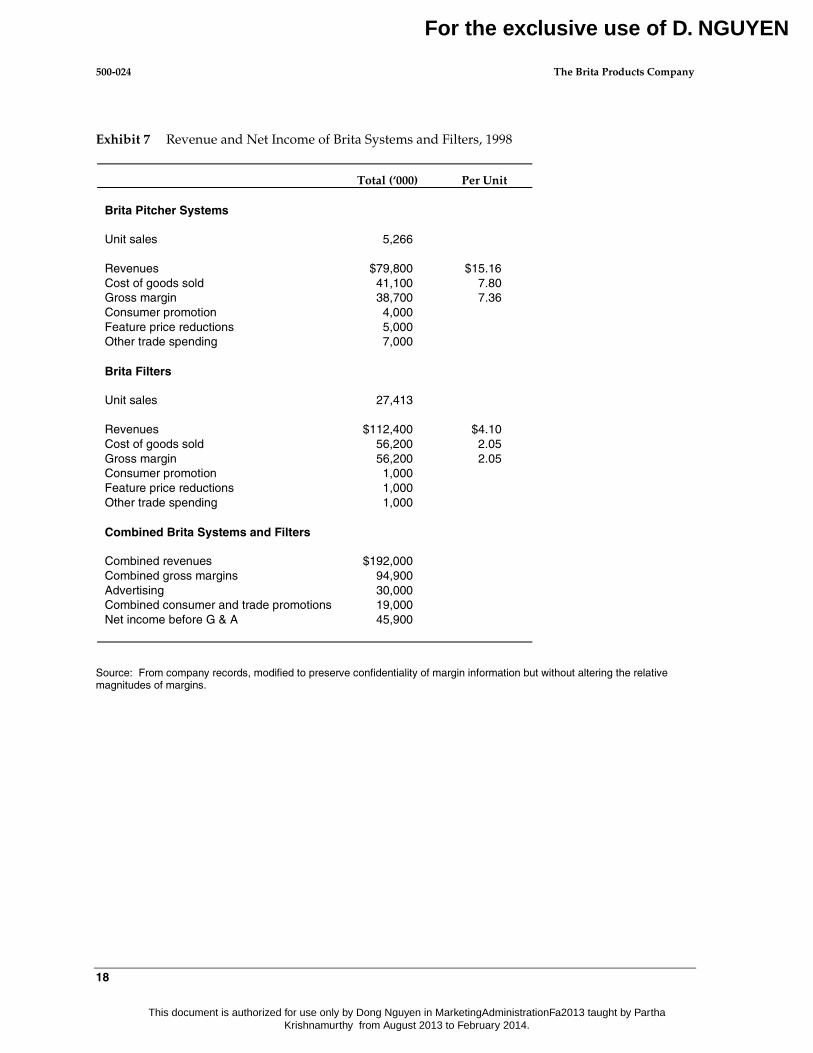
Brita bought pitchers from contract manufacturers at a cost per unit of $7.80. Filters werepurchased from a manufacturing plant owned jointly by Clorox and Brita GmbH for $2.05 per unit,inclusive of a 3% royalty to Brita GmbH. (Profits from this plant were not material.) At the pricesBrita charged retailers in 1999, pitchers earned a contribution to fixed costs of 48.6% of Brita’s netrevenue, and filters earned 50.0%. After advertising and trade promotions, Brita USA earned a netreturn on sales of 24%, the highest of all Clorox business units. Although advertising spendingworked to the benefit of both pitchers and filters, trade promotions were used mainly to secure tradesupport for pitchers. Exhibit 7 summarizes the income statement of the brand in 1998.
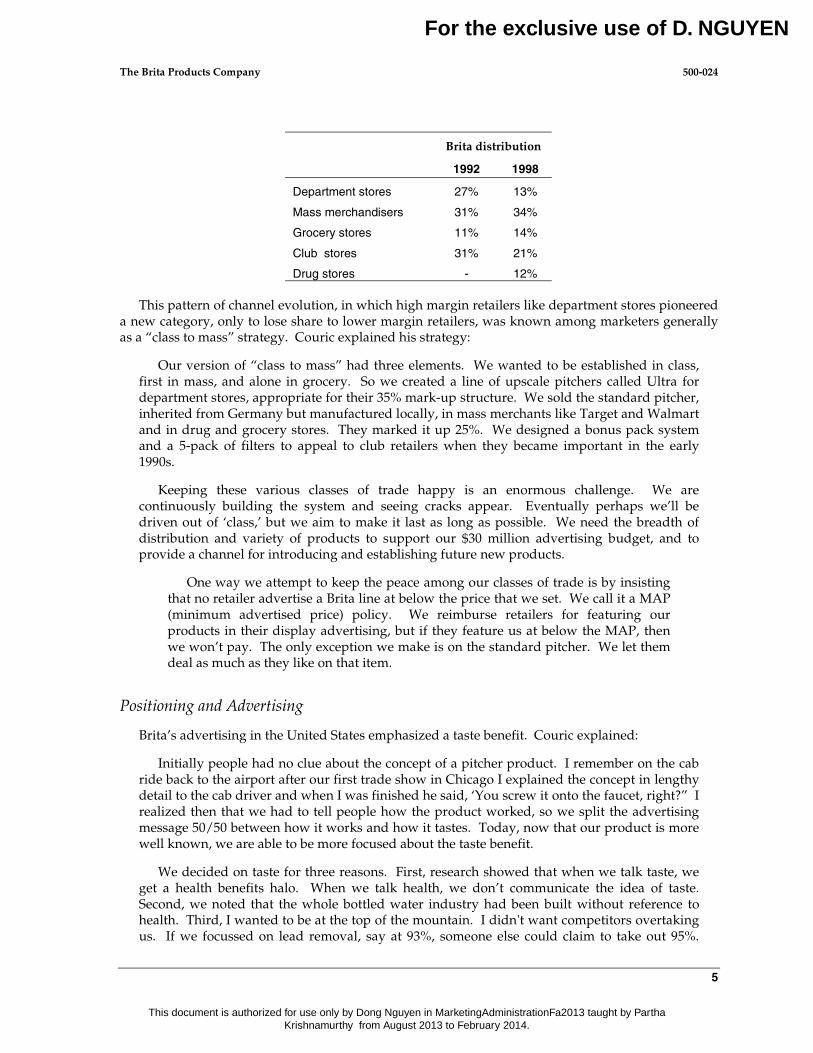
Distribution
At inception, Brita’s main retail outlet had been a health foods chain. Its competitors were instores that stocked housewares, like Sears and Walmart. Couric believed, however, that the productwould flourish in Clorox’s traditional base, grocery and drug outlets, and drove distribution in thatdirection.
4 “1999 National Consumer Water Quality Report,” Lisle, IL: Water Quality Association, 1999.
For the exclusive use of D. NGUYEN
This document is authorized for use only by Dong Nguyen in MarketingAdministrationFa2013 taught by Partha Krishnamurthy from August 2013 to February 2014.
The Brita Products Company 500-024
5
Brita distribution
1992 1998
Department stores 27% 13%
Mass merchandisers 31% 34%
Grocery stores 11% 14%
Club stores 31% 21%
Drug stores - 12%
This pattern of channel evolution, in which high margin retailers like department stores pioneereda new category, only to lose share to lower margin retailers, was known among marketers generallyas a “class to mass” strategy. Couric explained his strategy:
Our version of “class to mass” had three elements. We wanted to be established in class,first in mass, and alone in grocery. So we created a line of upscale pitchers called Ultra fordepartment stores, appropriate for their 35% mark-up structure. We sold the standard pitcher,inherited from Germany but manufactured locally, in mass merchants like Target and Walmartand in drug and grocery stores. They marked it up 25%. We designed a bonus pack systemand a 5-pack of filters to appeal to club retailers when they became important in the early1990s.
Keeping these various classes of trade happy is an enormous challenge. We arecontinuously building the system and seeing cracks appear. Eventually perhaps we’ll bedriven out of ‘class,’ but we aim to make it last as long as possible. We need the breadth ofdistribution and variety of products to support our $30 million advertising budget, and toprovide a channel for introducing and establishing future new products.
One way we attempt to keep the peace among our classes of trade is by insistingthat no retailer advertise a Brita line at below the price that we set. We call it a MAP(minimum advertised price) policy. We reimburse retailers for featuring ourproducts in their display advertising, but if they feature us at below the MAP, thenwe won’t pay. The only exception we make is on the standard pitcher. We let themdeal as much as they like on that item.
Positioning and Advertising
Brita’s advertising in the United States emphasized a taste benefit. Couric explained:
Initially people had no clue about the concept of a pitcher product. I remember on the cabride back to the airport after our first trade show in Chicago I explained the concept in lengthydetail to the cab driver and when I was finished he said, ‘You screw it onto the faucet, right?” Irealized then that we had to tell people how the product worked, so we split the advertisingmessage 50/50 between how it works and how it tastes. Today, now that our product is morewell known, we are able to be more focused about the taste benefit.
We decided on taste for three reasons. First, research showed that when we talk taste, weget a health benefits halo. When we talk health, we don’t communicate the idea of taste.Second, we noted that the whole bottled water industry had been built without reference tohealth. Third, I wanted to be at the top of the mountain. I didn't want competitors overtakingus. If we focussed on lead removal, say at 93%, someone else could claim to take out 95%.
For the exclusive use of D. NGUYEN
This document is authorized for use only by Dong Nguyen in MarketingAdministrationFa2013 taught by Partha Krishnamurthy from August 2013 to February 2014.
500-024 The Brita Products Company
6
With taste, we could say it first, say it loudest, and we could own the benefit. By now, with$100 million of cumulative advertising on the taste claim behind us, we are impossible todislodge.
When we started eleven years ago, the water filtration category had low credibility. It wasbeing investigated all the time for improper or false claims. We didn’t want to get into a claimswar. Our advertising needed to be pure and simple. We showed mountain streams, waterfallsand the outdoors. We promised clear, crisp, refreshing water, which is what we delivered.Today we own the waterfall imagery.
Competition
Brita’s success attracted competitors in droves. Among the brand names that entered the marketwere Culligan, Electrolux, Sunbeam, Kenwood, Corning, Melitta, PUR, Rubbermaid, Teledyne, Omniand Mr. Coffee. None had succeeded in challenging Brita’s leadership, which remained in the rangeof 65% to 75% across the decade. In 1999, the only competitor with double digit market share wasPUR, the brand of a small, publicly held U.S. corporation, Recovery Engineering. This companymade, in addition to water filters, a line of portable drinking water systems for outdoor enthusiastsand desalinators for marine and military use.
At the January 1998 International Housewares Show in Chicago, a dozen manufacturers unveilednew water filtration products or extensions to existing lines. The products appeared to be designed toattack niches not currently served by Brita. "Number 1 is always going to be under attack," BrianBarton, brand manager at Rubbermaid, told the press covering the trade show. "When you have 80%of the market share there's only one way to go and that's south."5
Several products took health and safety positions in reaction to Brita's taste appeal. Number 2brand, PUR, announced that it would spend $40 million in advertising and promotion to support itsline of faucet-mount and pitcher filters. The spend included a $15 million outlay for PUR Plus, a newpitcher system touted as the most technologically-advanced to date. The PUR filter would removecontaminants such as cryptosporidium and giardia. PUR representatives described a promotionalprogram that would begin with a six month infomercial running on national cable television, to befollowed by a schedule of 30-second spots on cable and spot network TV that would point out thedifferences between PUR and current pitchers. Sunbeam, known for blenders and toasters,announced the launch of Fresh Source, a product that removed microbiological cysts as well aschlorine and lead. Sunbeam would back the product with an estimated $10 million of advertising.Number 3 manufacturer Teledyne, unveiled a faucet-mount product at the show.
At the trade show, Brian Sullivan, president and CEO of Recovery Engineering, Minneapolis wasquoted as saying, "If you ask consumers if they want more contaminants taken out or less, they'll saymore. People will pay more for a higher-performing product." PUR’s pitcher was considerably moreexpensive than Brita’s standard product. A Brita representative responded, "The way we see themarket, this business is geared more towards taste. Consumers are interested in taste. Bacteria is waydown the list."6
In a $30 million ad campaign unveiled in the month of the Chicago show, Brita did not mentionharmful impurities. A TV spot dubbed "There Was a Time" features shots of rushing streams set 5 Mehegan, Sean. “Sunbeam, recovery loading up $$ to take on Brita in water filtration.” Brandweek, Vol. 39, Iss. 3, January 19,1998 p. 12.
6 Op cit., p. 12.
For the exclusive use of D. NGUYEN
This document is authorized for use only by Dong Nguyen in MarketingAdministrationFa2013 taught by Partha Krishnamurthy from August 2013 to February 2014.
The Brita Products Company 500-024
7
against a backdrop of mountains and a dark, brooding sky. "There was a time when it was perfect,"the voiceover says. "You can have this taste . . . again."
Rubbermaid had launched a low priced product in 1997, which used a technology similar toBrita’s while attacking it on price/performance. Rubbermaid claimed that its filter could cleanse 8008-oz. glasses of water versus 560 for Brita at the same price. In 1998 the company repackaged itspitcher product and announced a portable 16-oz. bottle with a carbon filter built into the cap.Rubbermaid had not advertised its pitcher in 1997, and sales had been disappointing. At the tradeshow they pledged to step up promotion under a new team led by Cathryn Rings, the former head ofProcter & Gamble's Max Factor cosmetics business. Rings announced at the trade show, "We're goingto try some classic P&G marketing.”
The Faucet Mounted Filter Entry
Prior to 1995, Brita executives expressed little interest in faucet mounted water filtration systems.Of the 50 countries in which Brita GmbH did business, only Japan had a significant faucet business,and that was attributed to space constraints in Japanese kitchens. In 1994 and 1995, however, theysaw a faucet segment forming. Recovery Engineering Inc. launched a faucet mounted product underthe PUR brand name with some success. In 1995, Brita hired an outside design company to design afaucet mount.
Functionally, water from a pitcher was different from water filtered through a faucet-mountedfilter. In favor of pitchers, they were usually stored in refrigerators, so pitcher water was cold whilefaucet water was not. In those parts of the country where tap water was ‘hard’ and left scale depositsand scum when boiled, only pitcher filters but not faucet filters would eliminate hardness. In favor offaucet mounts, the water passed through at higher pressure than through pitcher filters, so finerfilters could be used that could screen for microorganisms and offer protection againstcryptosporidium and giardia. Also, pitcher-filtered water tasted crisper, with lower pH. Finally,faucet-filtered water cost significantly less per glass because the filter lasted longer. Where pitcherwater cost 15 to 20 cents per gallon, faucet-filtered water cost perhaps half.
Were these differences significant to consumers? Did Brita stand for good tasting water, or howyou get it? The Brita team debated whether the faucet mount would be perceived as another way todeliver Brita water. Or would the consumer decide that they were buying something quite different,perhaps even so different that some might consider it a good idea to own both a pitcher and a faucetmount?
As Brita’s filtration technology played no part in the faucet mount design, Clorox was not obligedto use the Brita name on this product. If it did so, however, it was required to pay Brita GmbH aroyalty that, under the 1988 agreement, would be between 3% and 4% of sales depending on themagnitude of sales. It would also be bound by the non-compete clause of the comprehensiveagreement that limited sales of products with the Brita name to North America. Conversations withthe retail trade, however, revealed a distinct preference for carrying the faucet mount under a well-known name like Brita.
The direct cost of the faucet mount system was estimated to be $15.00 and the direct cost of areplacement faucet filter would be $3.00. Pitcher filters could not be used in faucet mounts.
Would a faucet mount cannibalize pitcher and pitcher filter sales? Perhaps, some speculated, thepitcher was a starter product, and customers who had learned to go back to drinking tap waterwould graduate up to the more convenient and sophisticated faucet unit. To explore these and other
For the exclusive use of D. NGUYEN
This document is authorized for use only by Dong Nguyen in MarketingAdministrationFa2013 taught by Partha Krishnamurthy from August 2013 to February 2014.
500-024 The Brita Products Company
8
questions, Clorox commissioned a simulated test market7 from ACNielsen Vantis, a division of theACNielsen BASES group.
Market Simulation Study for the Faucet Filter
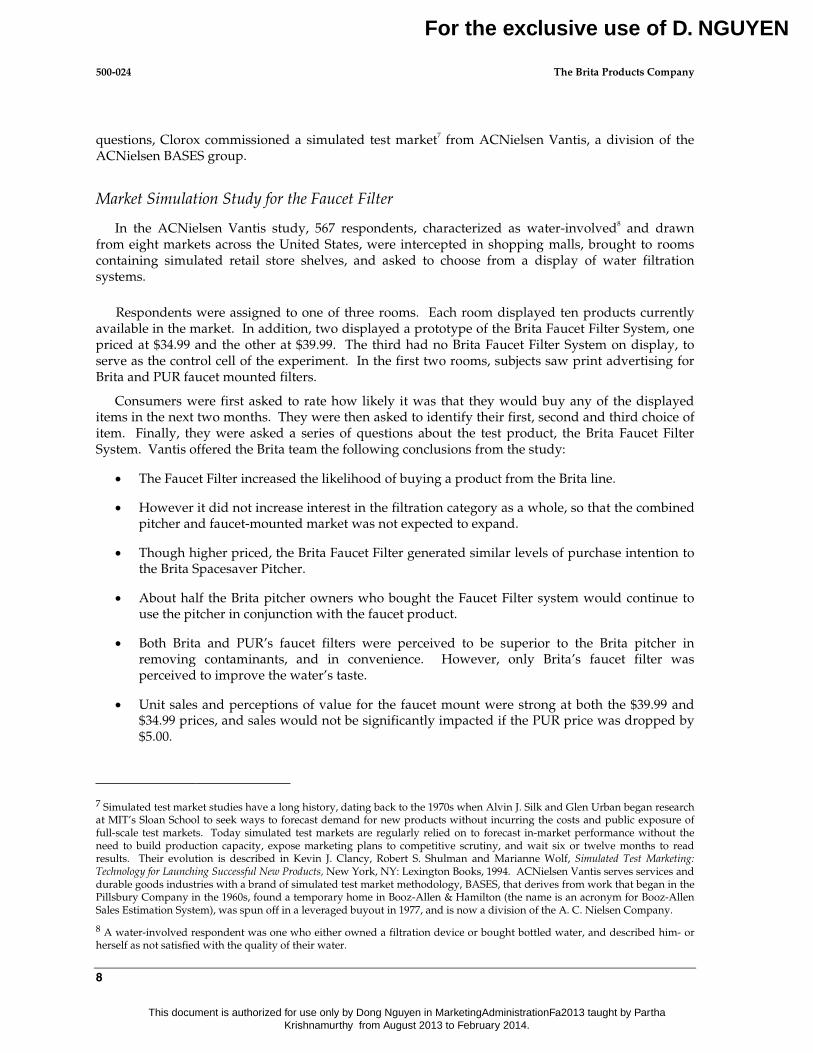
In the ACNielsen Vantis study, 567 respondents, characterized as water-involved8 and drawnfrom eight markets across the United States, were intercepted in shopping malls, brought to roomscontaining simulated retail store shelves, and asked to choose from a display of water filtrationsystems.
Respondents were assigned to one of three rooms. Each room displayed ten products currentlyavailable in the market. In addition, two displayed a prototype of the Brita Faucet Filter System, onepriced at $34.99 and the other at $39.99. The third had no Brita Faucet Filter System on display, toserve as the control cell of the experiment. In the first two rooms, subjects saw print advertising forBrita and PUR faucet mounted filters.
Consumers were first asked to rate how likely it was that they would buy any of the displayeditems in the next two months. They were then asked to identify their first, second and third choice ofitem. Finally, they were asked a series of questions about the test product, the Brita Faucet FilterSystem. Vantis offered the Brita team the following conclusions from the study:
• The Faucet Filter increased the likelihood of buying a product from the Brita line.
• However it did not increase interest in the filtration category as a whole, so that the combinedpitcher and faucet-mounted market was not expected to expand.
• Though higher priced, the Brita Faucet Filter generated similar levels of purchase intention tothe Brita Spacesaver Pitcher.
• About half the Brita pitcher owners who bought the Faucet Filter system would continue touse the pitcher in conjunction with the faucet product.
• Both Brita and PUR’s faucet filters were perceived to be superior to the Brita pitcher inremoving contaminants, and in convenience. However, only Brita’s faucet filter wasperceived to improve the water’s taste.
• Unit sales and perceptions of value for the faucet mount were strong at both the $39.99 and$34.99 prices, and sales would not be significantly impacted if the PUR price was dropped by$5.00.
7 Simulated test market studies have a long history, dating back to the 1970s when Alvin J. Silk and Glen Urban began researchat MIT’s Sloan School to seek ways to forecast demand for new products without incurring the costs and public exposure offull-scale test markets. Today simulated test markets are regularly relied on to forecast in-market performance without theneed to build production capacity, expose marketing plans to competitive scrutiny, and wait six or twelve months to readresults. Their evolution is described in Kevin J. Clancy, Robert S. Shulman and Marianne Wolf, Simulated Test Marketing:Technology for Launching Successful New Products, New York, NY: Lexington Books, 1994. ACNielsen Vantis serves services anddurable goods industries with a brand of simulated test market methodology, BASES, that derives from work that began in thePillsbury Company in the 1960s, found a temporary home in Booz-Allen & Hamilton (the name is an acronym for Booz-AllenSales Estimation System), was spun off in a leveraged buyout in 1977, and is now a division of the A. C. Nielsen Company.
8 A water-involved respondent was one who either owned a filtration device or bought bottled water, and described him- orherself as not satisfied with the quality of their water.
For the exclusive use of D. NGUYEN
This document is authorized for use only by Dong Nguyen in MarketingAdministrationFa2013 taught by Partha Krishnamurthy from August 2013 to February 2014.
The Brita Products Company 500-024
9
The study projected that unit sales of the faucet mount in its first year would lie between 350,000and 1,395,000 units. Half of this volume would come from consumers who would otherwise havebought a Brita pitcher. Whether sales would be at the high or low end of the range depended on howaggressive was Brita’s marketing investment, and how competitors responded. Ten scenarios weregenerated by combining the following factors and levels:
Low High Very High
Consumer advertising $5.4 million $11.1 million $15 millionConsumer promotion $2.0 million $3.0 million $4 millionFeature price reductions $1.8 million $2.3 million $2.8 millionOther trade spending (displays, racks, etc.) $3.2 million $6.1 million $9 million
The ten scenarios gave rise to the following ten sales forecasts:
Scenario:
MinimumAdvertised Price
($5.00 off List)
ConsumerPromotion andTrade Spending
ConsumerAdvertising
CompetitivePricing
First Year UnitSales Forecast
1 $34.99 Low Low Low 340,0002 $34.99 Low Low Current 350,0003 $29.99 Low Low Low 395,0004 $34.99 High High Low 970,0005 $29.99 High High Low 1,125,0006 $29.99 High High Current 1,160,0007 $34.99 High Very High Current 1,205,0008 $34.99 Very High Very High Current 1,245,0009 $29.99 Very High High Current 1,350,000
10 $29.99 Very High Very High Low 1,395,000
Each scenario resulted in a sales and income forecast. For example, scenario 2 led to the followingforecast:
Total households 75.86 millionProduct awareness resulting from $5.4 million advertising 13%Distribution (% of market reached) 72%List price (30% of sales assumed to occur at list) $39.99Feature price (70% of sales assumed to occur at the feature price) $34.99Trade promotion $3.2 million (low)Consumer promotion $2.0 million (low)Competitive pricing current levelsTotal sales (units) 350,000
Brita USA had not asked Vantis for a forecast of sales of replacement filters. The proposedproduct had an LED filter replacement indicator, which would likely increase compliance with filterreplacement recommendations. Each filter would treat 100 gallons of water, about four months’output from a typical kitchen faucet, before the indicator would signal that it was due forreplacement.
For the exclusive use of D. NGUYEN
This document is authorized for use only by Dong Nguyen in MarketingAdministrationFa2013 taught by Partha Krishnamurthy from August 2013 to February 2014.
500-024 The Brita Products Company
10
Couric’s Decision
Couric prepared to call his marketing team together to hear their views on how to take the Britabrand forward. He anticipated that he would hear three points of view: keep the focus on buildingthe installed base of pitchers, shift the budget to encourage the installed base to buy more filters, orput the weight of resources behind building a whole new installed base in faucet-mounts.
He saw many demands on the Brita marketing budget besides the faucet-mount product launch.Household pitcher penetration was slowing, and yet six out of seven households did not have one.Could there be segments who had not responded to the broad appeals of the first decade, but whomight well respond to more targeted communication efforts—specific appeals to singles and toparents of young children, for example? Perhaps investing in direct mail or other highly targetedmarketing tools could cultivate demand in these niches. Then there was the filter opportunity. Britahad never invested in the direct cultivation of filter demand, beyond in-store promotion.
On his desk in the corner office were Recovery Engineering’s published financial results for thequarter ending January 3, 1999. Its quarterly sales were up $1 million on the previous quarter to$19.5 million, but its net loss had more than doubled to $7.2 million. Its stock was trading at $10,down from $35 in mid 1998. Recovery Engineering had raised capital in an Initial Public Offering in1997 on the claim that it had a technological edge over Brita. To be sure, PUR had been first tomarket with a number of new features: the first cryptosporum filter for pitchers, the first mechanicaldevice to indicate when to replace a filter, and the first widely distributed faucet filter. But as Couricweighed how much urgency to put behind the faucet-mount launch, he found comfort in PUR’s flowof red ink.
A Fax and a Phone Call
Couric’s fax began transmitting. Over the line came a report from the Clorox field sales director,with a sketch of a display that had been seen that morning in the Schaumburg, IL branch of TargetStores, in the store’s large water filtration section. A sign over the display had read:
Which water filtration product is right for me?How do different water filters give me great tasting water and protect my family?Choose your level of protection:
• Lead, chlorine.•• Lead, chlorine, cryptosporidium, guardia.••• Lead, chlorine, cryptosporidium, guardia, Lindane (a pesticide), Atrazine (a
herbicide), asbestos.•••• Lead, chlorine, cryptosporidium, guardia, Lindane (a pesticide), Atrazine (a
herbicide), asbestos, benzene, TTHMC.
All product claims are NSF certified to national public health standards.
Beneath the sign he had seen five PUR systems and four Brita systems mounted on identicalbacking cards labeled with one, two, three or four bullets. No PUR system had fewer than twobullets and the PUR Ultimate Faucet Mount had the maximum, four. Not a single Brita system hadmore than one bullet.
Simultaneously, Couric’s phone rang. His investment bankers were advising that Procter andGamble, the world’s largest consumer products company and Clorox’s most respected competitor,was about to close a deal at $35 per share for control of PUR.
For the exclusive use of D. NGUYEN
This document is authorized for use only by Dong Nguyen in MarketingAdministrationFa2013 taught by Partha Krishnamurthy from August 2013 to February 2014.
The Brita Products Company 500-024
11
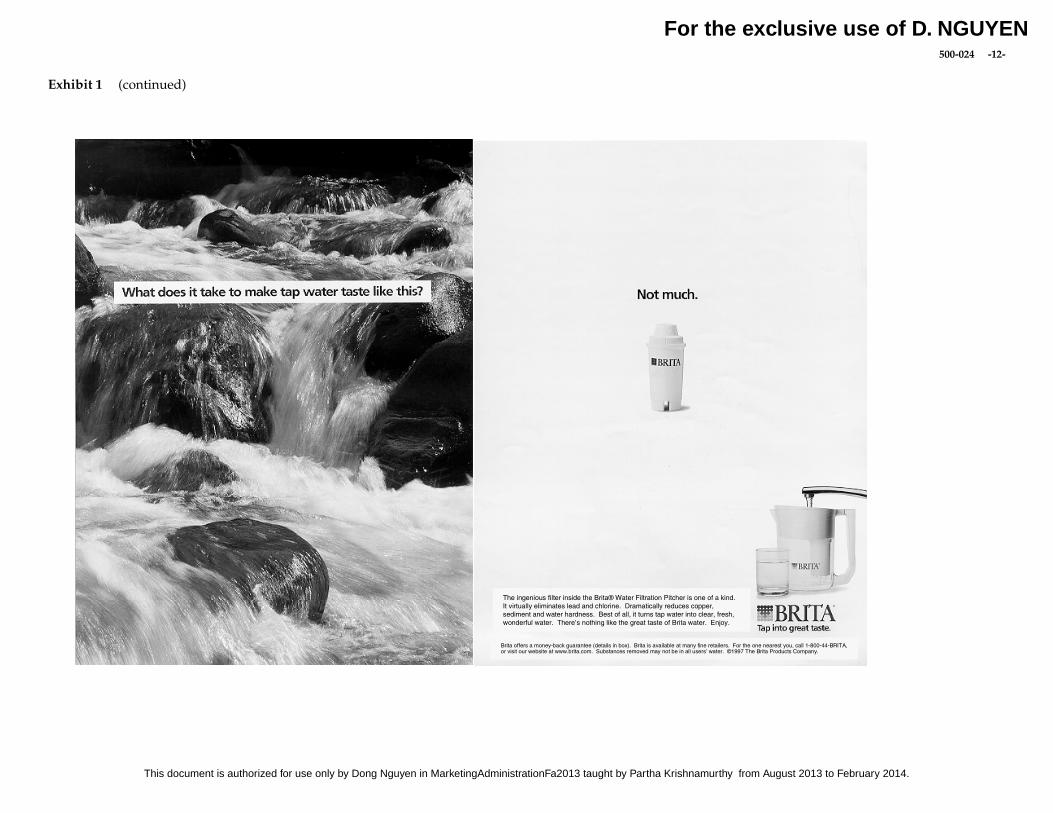
Exhibit 1 1993 Advertising
For the exclusive use of D. NGUYEN
This document is authorized for use only by Dong Nguyen in MarketingAdministrationFa2013 taught by Partha Krishnamurthy from August 2013 to February 2014.
500-024 -12-
Exhibit 1 (continued)
The ingenious filter inside the Brita® Water Filtration Pitcher is one of a kind.It virtually eliminates lead and chlorine. Dramatically reduces copper,sediment and water hardness. Best of all, it turns tap water into clear, fresh,wonderful water. There’s nothing like the great taste of Brita water. Enjoy.
Brita offers a money-back guarantee (details in box). Brita is available at many fine retailers. For the one nearest you, call 1-800-44-BRITA,or visit our website at www.brita.com. Substances removed may not be in all users’ water. ©1997 The Brita Products Company.
For the exclusive use of D. NGUYEN
This document is authorized for use only by Dong Nguyen in MarketingAdministrationFa2013 taught by Partha Krishnamurthy from August 2013 to February 2014.
The Brita Products Company 500-024
13
Exhibit 2 Growth of Segments of the U.S. Beverage Market
70%
100%
130%
160%
1988 1990 1992 1994 1996
Cum
ulat
ive
Gro
wth
(In
dexe
d on
198
8)
BottledWater
FruitJuice
SoftDrinks Beer Wine Spirits Coffee Tea Milk
Per CapitaConsumption(gallons, 1997) 12.7 15.0 54.6 29.1 1.9 1.2 22.6 7.6 20.0
Segment Size(Billions ofgallons, 1997) 3.4 4.1 14.7 7.9 0.5 0.3 6.1 2.1 5.4
Source: 1999 Beverage Marketing Directory, Mingo Junction, Ohio: Beverage Marketing Corp., 1999.
Total Per Capita Consumption = 144.7 gallons in 1997.Total Beverage Consumption = 44,500,000,000 gallons in 1997.
Bottled Water
Fruit Juice
Beer
Soft Drinks
Total MarketTea
Milk
Coffee
Wine
Spirits
For the exclusive use of D. NGUYEN
This document is authorized for use only by Dong Nguyen in MarketingAdministrationFa2013 taught by Partha Krishnamurthy from August 2013 to February 2014.
500-024 The Brita Products Company
14
Exhibit 3 Major Brands in the Bottled Water Category (supermarkets only)
Percent ofHouseholds
BuyingPrice per 128
oz. unit
Still Water Brands 44.77% $1.03Dannon 6.27% $2.09Arrowhead 4.57% $0.95Poland Spring 4.47% $1.39Sparkletts 4.05% $0.86Chrystal Geyser 3.85% $2.13Evian 2.61% $5.49Hinckley & Schmitt 2.38% $1.36Private label 17.73% $0.68
Carbonated Water Brands 26.83% $3.70Canada Dry 5.69% $4.97Schweppes 4.66% $5.85Vintage 2.65% $2.44Clearly Canadian 1.75% $11.66Perrier 1.31% $9.47Private Label 12.52% $2.78
Source: Information Resources Inc. “Marketing Fact Book” January-December 1997,http://fic.wharton.upenn.edu/iri/factbook .
For the exclusive use of D. NGUYEN
This document is authorized for use only by Dong Nguyen in MarketingAdministrationFa2013 taught by Partha Krishnamurthy from August 2013 to February 2014.
The Brita Products Company 500-024
15
Exhibit 4 Water Quality: Consumer Attitudes and Behavior
From a survey of 1,007 adults conducted between January 14 and 17, 1999. Sample is projectable toall U.S. adults over age 18.
Expressed concerns about household water quality (% of respondents):
1995 1997 1999
Expressed any concern 75 75 72Health contaminants (net) 54 50 48
Bacteria 9Aesthetics (net) 61 60 56
Smell and/or taste 45 42 40Appearance 33 26 26Hardness 38 39 36Sediments 43 40 38
Expressed concerns about household water quality by age in 1999 (% of respondents):
18-24 25-34 35-44 45-54 55-64 65+
Expressed any concerns 89 79 79 70 59 56Health contaminants 67 56 58 45 36 25
Use of water treatment device (% of respondents):
1995 1997 1999
No device used 47 41 35Bottled water 36 37 38System 27 32 38
Table-top pitcher 5 12 16System on faucet 9 11 11Whole house system 10 7 8Softener 10 9 9
Use of water treatment device by region of country in 1999 (% of respondents):
North East North Central South West
Bottled water 33 32 42 43Table-top pitcher 24 12 17 12System on faucet 9 10 10 14Whole house system 10 8 7 10
Softener 5 21 4 6
Source: Water Quality Association: 1999 National Consumer Water Quality Report.
For the exclusive use of D. NGUYEN
This document is authorized for use only by Dong Nguyen in MarketingAdministrationFa2013 taught by Partha Krishnamurthy from August 2013 to February 2014.
500-024 The Brita Products Company
16
Exhibit 5 Brita Unit Sales, 1989 to 1998
Brita Unit Sales (’00)
1989 1990 1991 1992 1993 1994 1995 1996 1997 1998
Systems 171 194 202 302 546 1,056 2,030 3,363 4,565 5,266Filters 402 581 876 1292 2,205 4,458 8,164 15,246 23,293 27,413
Source: Company records (approximate and unaudited).
Sales of Brita Pitcher Systems and Filters
0
5000000
10000000
15000000
20000000
25000000
30000000
1988 1989 1990 1991 1992 1993 1994 1995 1996 1997 1998 1999
Un
it S
ales
Systems
Filters
For the exclusive use of D. NGUYEN
This document is authorized for use only by Dong Nguyen in MarketingAdministrationFa2013 taught by Partha Krishnamurthy from August 2013 to February 2014.
The Brita Products Company 500-024
17
Exhibit 6 Retail Market Shares (United States, all retail outlets)
Systems
1992 1993 1994 1995 1996 1997 1998
Pitchers (thousands of units) 375 640 1,405 2,636 4,381 5,689 6,307Brita 82% 82% 75% 77% 77% 80% 83%PUR - - - - - 4% 8%Rubbermaid - - - - - 7% 4%All others 18% 18% 25% 23% 23% 11% 5%
Faucet Mounts (thousands of units) 1,186 782 602 659 898 1,249 1,291PUR - - - 9% 30% 67% 74%Teledyne 23% 23% 30% 43% 43% 27% 23%
Filters
1992 1993 1994 1995 1996 1997 1998
Filter sales ($millions, retail) $20.5 $26.5 $38.7 $63.3 $82.3 $116.3 $154.7Brita 32% 43% 59% 65% 75% 75% 75%Teledyne 25% 20% 15% 10% 9% 7% 4%PUR 0% 0% 0% 1% 2% 8% 17%Omni 12% 13% 8% 8% 5% 3% 2%Sears 7% 6% 3% 2% 2% 1% 1%Pollonex 7% 4% 2% 1% 1% 0% 1%
Source: Company records, assembled from data from Industrial Market Research Inc. and Information Resources, Inc.
Note: Retail audit estimates may not agree precisely with Brita’s sales records because they areextrapolated from a sampling of retail stores.
For the exclusive use of D. NGUYEN
This document is authorized for use only by Dong Nguyen in MarketingAdministrationFa2013 taught by Partha Krishnamurthy from August 2013 to February 2014.
500-024 The Brita Products Company
18
Exhibit 7 Revenue and Net Income of Brita Systems and Filters, 1998
Total (‘000) Per Unit
Brita Pitcher Systems
Unit sales 5,266
Revenues $79,800 $15.16Cost of goods sold 41,100 7.80Gross margin 38,700 7.36Consumer promotion 4,000Feature price reductions 5,000Other trade spending 7,000
Brita Filters
Unit sales 27,413
Revenues $112,400 $4.10Cost of goods sold 56,200 2.05Gross margin 56,200 2.05Consumer promotion 1,000Feature price reductions 1,000Other trade spending 1,000
Combined Brita Systems and Filters
Combined revenues $192,000Combined gross margins 94,900Advertising 30,000Combined consumer and trade promotions 19,000Net income before G & A 45,900
Source: From company records, modified to preserve confidentiality of margin information but without altering the relativemagnitudes of margins.
For the exclusive use of D. NGUYEN
This document is authorized for use only by Dong Nguyen in MarketingAdministrationFa2013 taught by Partha Krishnamurthy from August 2013 to February 2014.