Embed Size (px)
Citation preview

Computer Science & Information Technology 126


David C. Wyld
Dhinaharan Nagamalai (Eds)
Computer Science & Information Technology
10th International Conference on Computer Science, Engineering
and Applications (CCSEA 2020)
July 25~26, 2020, London, United Kingdom
AIRCC Publishing Corporation

Volume Editors
David C. Wyld,
Southeastern Louisiana University, USA
E-mail: [email protected]
Dhinaharan Nagamalai,
Wireilla Net Solutions, Australia
E-mail: [email protected]
ISSN: 2231 - 5403 ISBN: 978-1-925953-24-4
DOI: 10.5121/csit.2020.101001- 10.5121/csit.2020.101019
This work is subject to copyright. All rights are reserved, whether whole or part of the material is
concerned, specifically the rights of translation, reprinting, re-use of illustrations, recitation,
broadcasting, reproduction on microfilms or in any other way, and storage in data banks. Duplication of this publication or parts thereof is permitted only under the provisions of the
International Copyright Law and permission for use must always be obtained from Academy &
Industry Research Collaboration Center. Violations are liable to prosecution under the
International Copyright Law.
Typesetting: Camera-ready by author, data conversion by NnN Net Solutions Private Ltd.,
Chennai, India

Preface
The 10th International Conference on Computer Science, Engineering and Applications (CCSEA 2020) July 25~26, 2020, London, United Kingdom, International Conference on Blockchain and
Internet of Things (BIoT 2020), 8th International Conference on Data Mining & Knowledge
Management Process (DKMP 2020), 9th International Conference on Cloud Computing: Services
and Architecture (CLOUD 2020), International Conference on Natural Language Computing and AI (NLCAI 2020), 6th International Conference on Signal and Image Processing (SIPRO 2020),
International Conference on Big Data and Machine Learning (BDML 2020), 6th International
Conference on Artificial Intelligence and Applications (AIFU 2020) was collocated with 10th International Conference on Computer Science, Engineering and Applications (CCSEA 2020).
The conferences attracted many local and international delegates, presenting a balanced mixture
of intellect from the East and from the West.
The goal of this conference series is to bring together researchers and practitioners from academia and industry to focus on understanding computer science and information technology
and to establish new collaborations in these areas. Authors are invited to contribute to the
conference by submitting articles that illustrate research results, projects, survey work and industrial experiences describing significant advances in all areas of computer science and
information technology.
The CCSEA 2020, BIoT 2020, DKMP 2020, CLOUD 2020, NLCAI 2020, SIPRO 2020, BDML
2020 and AIFU 2020 Committees rigorously invited submissions for many months from researchers, scientists, engineers, students and practitioners related to the relevant themes and
tracks of the workshop. This effort guaranteed submissions from an unparalleled number of
internationally recognized top-level researchers. All the submissions underwent a strenuous peer review process which comprised expert reviewers. These reviewers were selected from a talented
pool of Technical Committee members and external reviewers on the basis of their expertise. The
papers were then reviewed based on their contributions, technical content, originality and clarity.
The entire process, which includes the submission, review and acceptance processes, was done electronically.
In closing, CCSEA 2020, BIoT 2020, DKMP 2020, CLOUD 2020, NLCAI 2020, SIPRO 2020,
BDML 2020 and AIFU 2020 brought together researchers, scientists, engineers, students and
practitioners to exchange and share their experiences, new ideas and research results in all aspects of the main workshop themes and tracks, and to discuss the practical challenges encountered and
the solutions adopted. The book is organized as a collection of papers from the CCSEA 2020,
BIoT 2020, DKMP 2020, CLOUD 2020, NLCAI 2020, SIPRO 2020, BDML 2020 and AIFU 2020.
We would like to thank the General and Program Chairs, organization staff, the members of the
Technical Program Committees and external reviewers for their excellent and tireless work. We
sincerely wish that all attendees benefited scientifically from the conference and wish them every success in their research. It is the humble wish of the conference organizers that the professional
dialogue among the researchers, scientists, engineers, students and educators continues beyond
the event and that the friendships and collaborations forged will linger and prosper for many years to come.
David C. Wyld
Dhinaharan Nagamalai (Eds)

General Chair Organization
David C. Wyld, Southeastern Louisiana University, USA
Dhinaharan Nagamalai, Wireilla Net Solutions, Australia
Program Committee Members
Abbas Akram khorsheed, Mustansiriyah University, Iraq
Abd El-Aziz Ahmed, Cairo University, Egypt Abdelmajid Hajami, FST Settat, Morocco
Abel Gomes, University of Beira Interior, Portugal
Abel J.P. Gomes, Univ. Beira Interior, Portugal Addisson Salazar, Universitat Politècnica de València, Spain
Afaq Ahmad, Sultan Qaboos University, Oman
Ahmed Nabih Zaki Rashed, Menoufia University, Egypt
Ajay Joshi, The University of the West Indies, Caribbean Akhyari Nasir, TATI University College, Malaysia
Ali Khenchaf, Lab-STICC, ENSTA Bretagne, France
Anand Nayyar, Duy Tan University,Viet Nam Asmerilda Hitaj, University of Milano Bicocca, Italy
Azeddine Chikh, University of Tlemcen, Algeria
Azeddine WAHBI, Hassan II University, Morocco Burak Kolukisa, Abdullah Gül University, Turkey
Carlos Juiz, University Of The Balearic Islands, Spain
Chin-Chen Chang, Feng Chia University, Taiwan
Chiunhsiun Lin, National Taipei University, Taiwan Claudio Schifanella, University of Turin, Italy
Dac-Nhuong Le, Haiphong University, Vietnam
Daniel Ekpenyong Asuquo, University of Uyo, Nigeria Der-Chyuan Lou, Chang Gung University, Taiwan
Dhanya Jothimani, Ryerson University, Canada
Dinesh Bhatia, North Eastern Hill University, India
Ding Wang, Nankai University, China Dinh-Thuan Do, Eastern International University, Vietnam
Eda AKMAN AYDIN, Gazi University, Turkey
EL BADAOUI Mohamed, Lyon University, France El Mostapha Aboulhamid, Universite de Montreal, Canada
El-Sayed M. El-Horbaty, Ain Shams University, Egypt
Emad Awada, Applied Science University, Jordan Emeka Ogbuju, Federal University Lokoja, Nigeria
Erdal OZDOGAN, Gazi University, Turkey
Fatma Taher, Zayed University, UAE
Fei HUI, Chang'an University, P.R.China
Francesco Zirilli, Sapienza Universita Roma, Italy
Giuliani Donatella, University of Bologna, Italy Giuliani Donatella, University of Bologna, Italy
Gokhan Goy, Abdullah Gül University, Turkey
Gulden Kokturk, Dokuz Eylul University, Turkey

Haci ILHAN, Yildiz Technical University, Turkey Hamid Ali Abed AL-Asadi, Basra University, Iraq
Husam Suleiman, University of Waterloo, Canada
Ihab Zaqout,Al, Azhar University, Palestine
Isa Maleki, Islamic Azad University, Iran Ishfaq Ahmad, The University of Texas at Arlington, U.S.A
Issa Atoum, The World Islamic Sciences and Education, Jordan
Ivo Pierozzi Junior, Embrapa Agricultural Informatics, Brazil Jafar Mansouri, Ferdowsi University of Mashhad, Iran
Jamal El Abbadi, Mohammadia V University Rabat, Morocco
Jan Ochodnicky, Armed Forces Academy, Slovakia Jiri JAN, Brno University of Technology, Czech Republic
John Tass, University of Patras, Greece
Jun Zhang, South China University of Technology, China
Ke-Lin Du, Concordia University, Canada Khader Mohammad, Birzeit University, Palestine
KHLIFA Nawres, University of Tunis El Manar, Tunisia
Kiramat Rahman, University of Swat, Pakistan LABRAOUI Nabila, University of Tlemcen, Algeria
Malika Yaici, University of Bejaia, Algeria
Malka N. Halgamuge, University of Melbourne, Australia Mamun Bin Ibne Reaz, Universiti Kebangsaan, Malaysia
Manoj Kumar, University of Petroleum and Energy Studies, India
Mario Henrique Souza Pardo, University Of Sao Paulo, Brazil
Maryam Amiri, Arak University, Iran Michael Bewong, Charles Sturt University, Australia
Mohamed Issa, Zagazig University, Egypt
Mohamed Sahbi Bellamine, Carthage University, Tunisia Mohammed Mahmood Ali, Osmania University, India
Mu-Song Chen, Da-Yeh University, Taiwan
N. Yamuna devi, Coimbatore Institute of Technology, India
Nongmaithem Ajith Singh, South East Manipur College, India Omar Yousef Adwan, University of Jordan Amman, Jordan
Omid Mahdi Ebadati E, Kharazmi University, Tehran
Pablo Corral, University Miguel Hernandez of Elche, Spain Pascal LORENZ, University of Haute Alsace, France
Pavel Loskot, Swansea University, UK
Popa Rustem, University of Galati, Romania Prasan Kumar Sahoo, Chang Gung University, Taiwan
R.Gomathi, Bannari Amman Institute Of Technology, India
Rodrigo Campos Bortoletto, São Paulo Federal Institute, Brazil
Ruchi Doshi, BlueCrest University College, Liberia Sajadin Sembiring, Universitas Sumatera Utara, Indonesia
Shahram Babaie, Islamic Azad University, Iran
Smaranda Belciug, University of Craiova,Romania Ting WANG, Huawei Technologies co. Ltd, China
Vitor Jesus, Birmingham City University, United Kingdom
Vladimir BALAN, University Politehnica of Bucharest, Romania Wenwu Wang, University of Surrey,United Kingdom
Yuansong Qiao, Athlone Institute of Technology,Ireland
Zhou Quan, Guangzhou University, China
Zoran Bojkovic, University of Belgrade, Serbia

Technically Sponsored by
Computer Science & Information Technology Community (CSITC)
Artificial Intelligence Community (AIC)
Soft Computing Community (SCC)
Digital Signal & Image Processing Community (DSIPC)
Organized By
Academy & Industry Research Collaboration Center (AIRCC)
TABLE OF CONTENTS
10th International Conference on Computer Science,
Engineering and Applications (CCSEA 2020)
Data Confidentiality in P2P Communication and Smart Contracts of
Blockchain in Industry 4.0…....................................................................................01 - 10
Jan Stodt and Christoph Reich
Role of Multimedia Information Retrieval in Providing a Credible
Evidence for Digital Forensic Investigations: Open Source
Intelligence Investigation Analysis……………..………………………..…..........11 - 22
Amr Adel and Brian Cusack
International Conference on Blockchain and
Internet of Things (BIoT 2020)
Agreements between Enterprises digitized by Smart Contracts in
the Domain of Industry 4.0………………………………………………….….....23 - 32
Kevin Wallis, Jan Stodt, Eugen Jastremskoj and Christoph Reich
Integration of Safety Means with Functions of Blockchain in Multi-layered
Architecture of IoT for Safer Data Transmission Procedures……………….....33 - 50
Raimundas Savukynas
Integrative Framework for Blockchain Implementation: Uniting
Organizational, Business and Engineering Factors……………….………….....51 - 64
Amr Adel
8th International Conference on Data Mining & Knowledge
Management Process (DKMP 2020)
Apply Modern Statistical Clustering Analysis on Detecting Altitude
Sickness and Sports Fatigue Behavior ...…….……………………..………..…. 65 - 72
Mason Chen
A Review of Behavior Analysis of College Students .....….……………..…..…. 73 - 83
Wei-hong WANG, Hong-yan LV, Yu-hui CAO, Lei SUN and Qian FENG

9th International Conference on Cloud Computing:
Services and Architecture (CLOUD 2020)
Ready to Use Virtual Machine Pool Cache using Warm Cache ……………... 85 - 99
Sudeep Kumar, Deepak Kumar Vasthimal and Musen Wen
International Conference on Natural Language
Computing and AI (NLCAI 2020)
Text-based Emotion Aware Recommender ………………….….……….….. 101 - 114
John Kalung Leung, Igor Griva and William G. Kennedy
6th International Conference on Signal and
Image Processing (SIPRO 2020)
An Inner/Outer Loop Ensemble-Variational Data Assimilation Method….. 115 - 125
Yueqi Han, Bo Yang, Yun Zhang, Bojiang Yang and Yapeng Fu
Change Detection using Synthetic Aperture Radar Videos ………………... 127 - 140
Hasara Maithree, Dilan Dinushka and Adeesha Wijayasiri
A Feature-based Fragile Watermarking for Tamper Detection
using Voronoi Diagram Decomposition…………………………………..….. 141 - 160
Nour El-Houda GOLEA and Kamal Eddine MELKEMI
Using SDR Platform to Extract the RF Fingerprint of the Wireless
Devices for Device Identification……………………………………………... 161 – 174
Ting-Yu Lin, Chia-Min Lai and Chi-Wei Chen
Derivation of Loop Gain and Stability Test for Low-pass
Tow-Thomas Biquad Filter………………………………………………….... 175 - 194
MinhTri Tran, Anna Kuwana and Haruo Kobayashi
Tala Classification in Carnatic Music using Audio Thumbnailing……….... 195 - 201
Amulya Sri Pulijala and Suryakanth V Gangashetty
Design of Active Inductor and Stability Test for Passive
RLC Low-Pass Filter………………………………………………………….. 203 - 224
MinhTri Tran, Anna Kuwana, and Haruo Kobayashi
Deep Learning Based Classification of 2D and 3D Images For
Facial Expression Recognition: Comparison Study………………………..... 225 - 233
Fouzia Adjailia, Diana Olejarova and Peter Sincak

International Conference on Big Data and
Machine Learning (BDML 2020)
Approaches to Fraud Detection on Credit Card Transactions
using Artificial Intelligence Methods ……………………….….………....….. 235 - 244
Yusuf Yazici
6th International Conference on Artificial Intelligence
and Applications (AIFU 2020)
Coding with Logistic Softmax Sparse Units ……………………….…….….. 245 - 252
Gustavo A. Lado and Enrique C. Segura
David C. Wyld et al. (Eds): CCSEA, BIoT, DKMP, CLOUD, NLCAI, SIPRO - 2020
pp. 01-10, 2020. CS & IT - CSCP 2020 DOI: 10.5121/csit.2020.101001
DATA CONFIDENTIALITY IN P2P
COMMUNICATION AND SMART CONTRACTS
OF BLOCKCHAIN IN INDUSTRY 4.0
Jan Stodt and Christoph Reich
Institute for Data Science, Cloud Computing, and IT Security at the University
of Applied Sciences Furtwangen, Furtwangen, Baden-Württemberg, Germany
ABSTRACT Increased collaborative production and dynamic selection of production partners within
industry 4.0 manufacturing leads to ever-increasing automatic data exchange between companies. Automatic and unsupervised data exchange creates new attack vectors, which could
be used by a malicious insider to leak secrets via an otherwise considered secure channel
without anyone noticing. In this paper we reflect upon approaches to prevent the exposure of
secret data via blockchain technology, while also providing auditable proof of data exchange.
We show that previous blockchain based privacy protection approaches offer protection, but
give the control of the data to (potentially not trustworthy) third parties, which also can be
considered a privacy violation. The approach taken in this paper is not utilize centralized data
storage for data. It realizes data confidentiality of P2P communication and data processing in
smart contracts of blockchains.
KEYWORDS
blockchain, privacy protection, P2P communication, smart contracts, industry 4.0
1. INTRODUCTION
With the utilization of new technologies, business model and increased collaborative production
leads to ever-increasing automatic data exchange between companies and service providers effective privacy protection is rendered more complicated. Previously in-house hosted services
are outsourced to service providers with the goal of cost reduction and increased value creation.
In the field of the manufacturing industry, companies may cooperate on producing a product
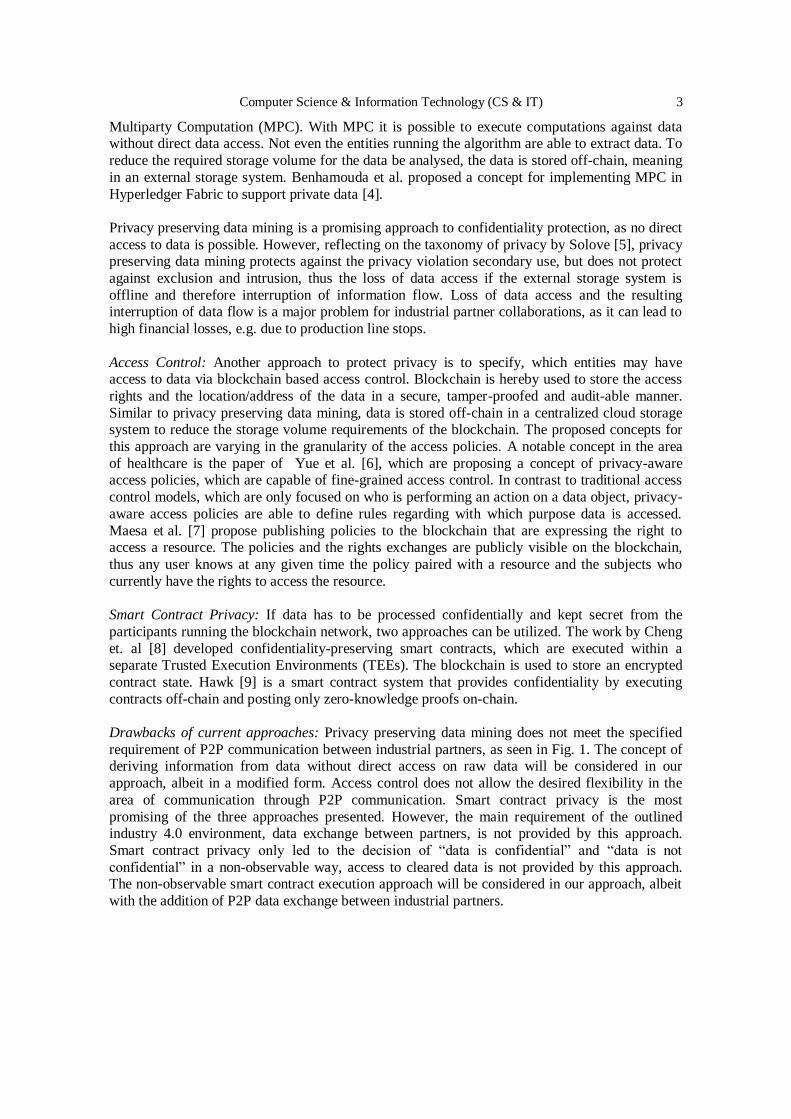
together in a more dynamic way than ever before, resulting in the need for automated and privacy preserving P2P information exchange, as seen in Figure 1.
Figure 1. Peer-to-peer Communication in Industry 4.0; Maintenance Use Case
2 Computer Science & Information Technology (CS & IT)
This paradigm shift is manifested by the concept of industry 4.0 [1]. Formerly data was processed on-premise. Today data is sent to external services and other partners for business automation.
Examples ranging for process data exchange for production planning, quality data exchange for
quality assurance, to exchange of maintenance logs for machine maintenance; all with the goal of
increased service value while also reducing the cost for the service. Intensive communication between different industry partners of potentially private, sensitive, or confidential data results in
loss of control over the data and may leading to serious privacy violations or data breaches. A
recent example is the exposure of confidential data via a robotics vendor, as discussed by UpGuard [2], through an automated and uncontrolled data exchange. The automated data
exchange led to exposure of confidential production information, drivers’ licences of employees
among other highly confidential data. This incident underlines the requirement for confidentiality and privacy protection in automated data exchange.
The companies are in a dilemma. On the one hand they want to automate the processes between
their supplier and service provider, but on the other hand they do not want to reveal their crown jewels of data.
We provide an overview of the three most important state-of-the-art approaches of blockchain based confidentiality and privacy protection methods. We assess their approach of providing
protection and compare them to our approach in the aspect of applicability for an industry 4.0
environment.
The main objectives of this paper are:
1. Evidence collection through blockchain, but remaining confidentiality of data: Blockchain is used to collect evidence of the automated business process for future audits. The developed
Data Communication Module for Blockchain (DCMB) sends data by P2P communication
directly to the participants and collects data exchange evidence.
2. Data confidentiality by using smart contracts: The developed Data Communication Module
for Blockchain (DCMB) enables working with smart contracts using data signatures to keep
the data confidential.
3. Data Protection Against Malicious Intrusion: The trusted execution environment (TEE) (see
Sec. 3.3) protects against infrastructure attacks, with the goal of gaining access to private data.
2. RELATED WORK
Methods for privacy protection depend on the environment in which the data is located, the
desired protection level, the use case of data processing, the potential privacy violates among other characteristics. To the best of my knowledge, there are no papers discussing the application
of blockchain technology for confidential and privacy protection in industrial partner
collaboration. Current Blockchain data confidentiality protection approaches are applied in medical data, voting and personal data storage. These approaches can be grouped into three
categories: a) privacy preserving data mining b) data access control c) confidential smart
contracts.
Privacy Preserving Data Mining: Privacy preserving data mining or privacy protecting
computation, in combination with blockchain was delineated by Frey et al. and Zyskind et al. [3]
among other similar concepts. All concepts share an analogous approach: the utilization of
Computer Science & Information Technology (CS & IT) 3
Multiparty Computation (MPC). With MPC it is possible to execute computations against data without direct data access. Not even the entities running the algorithm are able to extract data. To
reduce the required storage volume for the data be analysed, the data is stored off-chain, meaning
in an external storage system. Benhamouda et al. proposed a concept for implementing MPC in
Hyperledger Fabric to support private data [4].
Privacy preserving data mining is a promising approach to confidentiality protection, as no direct
access to data is possible. However, reflecting on the taxonomy of privacy by Solove [5], privacy preserving data mining protects against the privacy violation secondary use, but does not protect
against exclusion and intrusion, thus the loss of data access if the external storage system is
offline and therefore interruption of information flow. Loss of data access and the resulting interruption of data flow is a major problem for industrial partner collaborations, as it can lead to
high financial losses, e.g. due to production line stops.
Access Control: Another approach to protect privacy is to specify, which entities may have access to data via blockchain based access control. Blockchain is hereby used to store the access
rights and the location/address of the data in a secure, tamper-proofed and audit-able manner.
Similar to privacy preserving data mining, data is stored off-chain in a centralized cloud storage system to reduce the storage volume requirements of the blockchain. The proposed concepts for
this approach are varying in the granularity of the access policies. A notable concept in the area
of healthcare is the paper of Yue et al. [6], which are proposing a concept of privacy-aware access policies, which are capable of fine-grained access control. In contrast to traditional access
control models, which are only focused on who is performing an action on a data object, privacy-
aware access policies are able to define rules regarding with which purpose data is accessed.
Maesa et al. [7] propose publishing policies to the blockchain that are expressing the right to access a resource. The policies and the rights exchanges are publicly visible on the blockchain,
thus any user knows at any given time the policy paired with a resource and the subjects who
currently have the rights to access the resource.
Smart Contract Privacy: If data has to be processed confidentially and kept secret from the
participants running the blockchain network, two approaches can be utilized. The work by Cheng
et. al [8] developed confidentiality-preserving smart contracts, which are executed within a separate Trusted Execution Environments (TEEs). The blockchain is used to store an encrypted
contract state. Hawk [9] is a smart contract system that provides confidentiality by executing
contracts off-chain and posting only zero-knowledge proofs on-chain.
Drawbacks of current approaches: Privacy preserving data mining does not meet the specified
requirement of P2P communication between industrial partners, as seen in Fig. 1. The concept of deriving information from data without direct access on raw data will be considered in our
approach, albeit in a modified form. Access control does not allow the desired flexibility in the
area of communication through P2P communication. Smart contract privacy is the most
promising of the three approaches presented. However, the main requirement of the outlined industry 4.0 environment, data exchange between partners, is not provided by this approach.
Smart contract privacy only led to the decision of “data is confidential” and “data is not
confidential” in a non-observable way, access to cleared data is not provided by this approach. The non-observable smart contract execution approach will be considered in our approach, albeit
with the addition of P2P data exchange between industrial partners.
4 Computer Science & Information Technology (CS & IT)
3. DATA CONFIDENTIALITY IN BLOCKCHAINS FOR P2P COMMUNICATION
AND SMART CONTRACTS
3.1. Confidentiality Audit Trail with Blockchain
The typical use of a blockchain is to collect data for giving evidence of a company-to-company communication (see Fig. 1), that has been sent correctly and in time. Often the data send between
companies is confidential (e.g. number of parts being produced to calculate the leasing rate of a
machine). In the case that all participants of the blockchain must be able to audit the data transfer
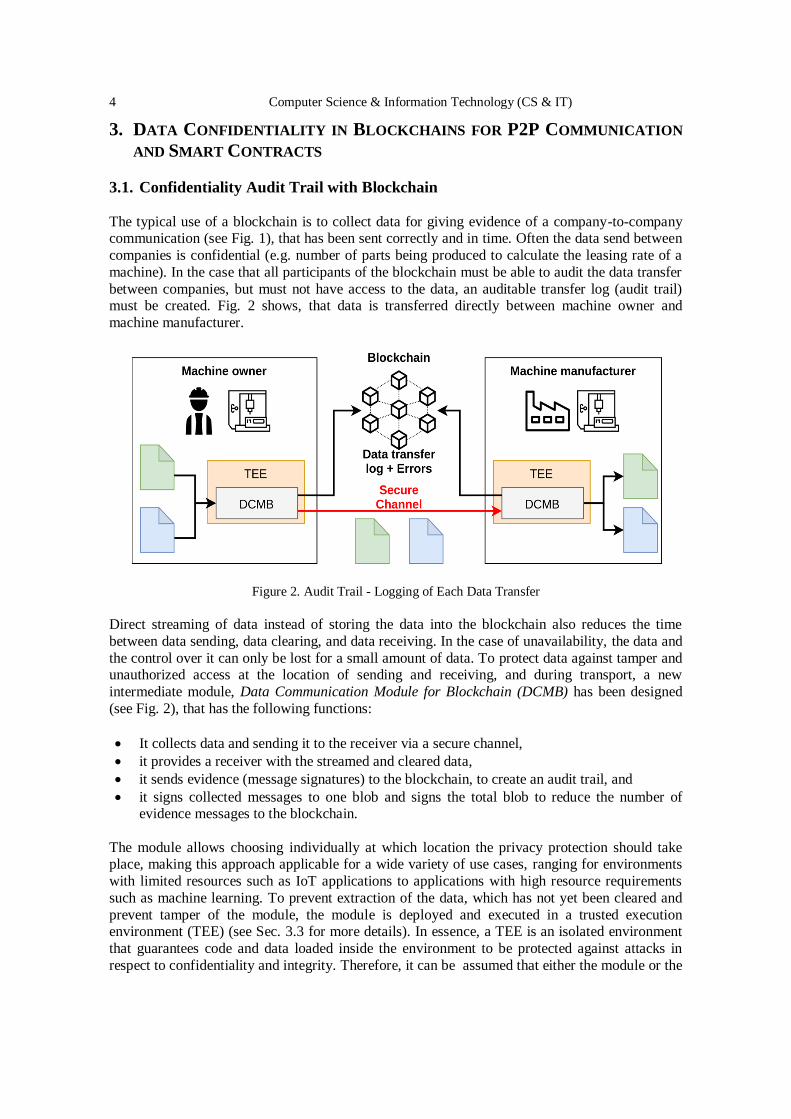
between companies, but must not have access to the data, an auditable transfer log (audit trail) must be created. Fig. 2 shows, that data is transferred directly between machine owner and
machine manufacturer.
Figure 2. Audit Trail - Logging of Each Data Transfer
Direct streaming of data instead of storing the data into the blockchain also reduces the time
between data sending, data clearing, and data receiving. In the case of unavailability, the data and
the control over it can only be lost for a small amount of data. To protect data against tamper and unauthorized access at the location of sending and receiving, and during transport, a new
intermediate module, Data Communication Module for Blockchain (DCMB) has been designed
(see Fig. 2), that has the following functions:
It collects data and sending it to the receiver via a secure channel,
it provides a receiver with the streamed and cleared data,
it sends evidence (message signatures) to the blockchain, to create an audit trail, and
it signs collected messages to one blob and signs the total blob to reduce the number of evidence messages to the blockchain.
The module allows choosing individually at which location the privacy protection should take place, making this approach applicable for a wide variety of use cases, ranging for environments
with limited resources such as IoT applications to applications with high resource requirements
such as machine learning. To prevent extraction of the data, which has not yet been cleared and
prevent tamper of the module, the module is deployed and executed in a trusted execution environment (TEE) (see Sec. 3.3 for more details). In essence, a TEE is an isolated environment
that guarantees code and data loaded inside the environment to be protected against attacks in
respect to confidentiality and integrity. Therefore, it can be assumed that either the module or the
Computer Science & Information Technology (CS & IT) 5
data can be tampered with. The use of the TEE aims to prevent access to uncleared data by attackers or the data recipients.
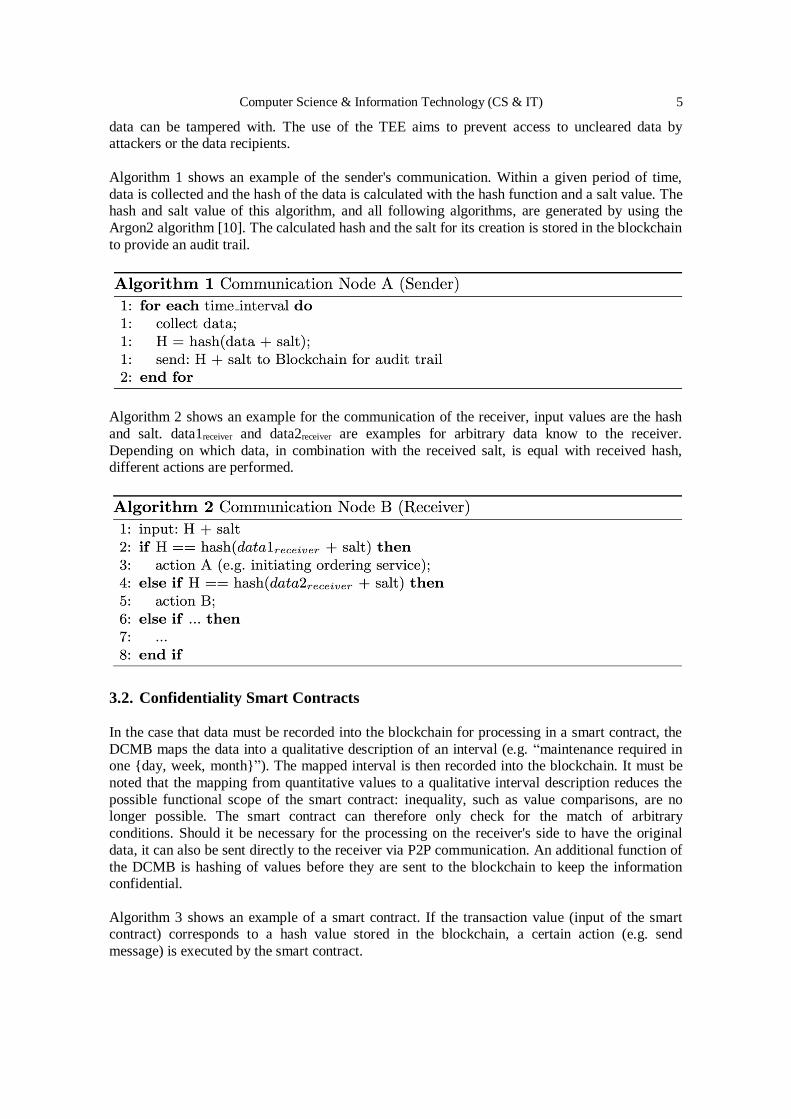
Algorithm 1 shows an example of the sender's communication. Within a given period of time,
data is collected and the hash of the data is calculated with the hash function and a salt value. The hash and salt value of this algorithm, and all following algorithms, are generated by using the
Argon2 algorithm [10]. The calculated hash and the salt for its creation is stored in the blockchain
to provide an audit trail.
Algorithm 2 shows an example for the communication of the receiver, input values are the hash
and salt. data1receiver and data2receiver are examples for arbitrary data know to the receiver.
Depending on which data, in combination with the received salt, is equal with received hash, different actions are performed.
3.2. Confidentiality Smart Contracts
In the case that data must be recorded into the blockchain for processing in a smart contract, the
DCMB maps the data into a qualitative description of an interval (e.g. “maintenance required in one {day, week, month}”). The mapped interval is then recorded into the blockchain. It must be
noted that the mapping from quantitative values to a qualitative interval description reduces the
possible functional scope of the smart contract: inequality, such as value comparisons, are no longer possible. The smart contract can therefore only check for the match of arbitrary
conditions. Should it be necessary for the processing on the receiver's side to have the original
data, it can also be sent directly to the receiver via P2P communication. An additional function of
the DCMB is hashing of values before they are sent to the blockchain to keep the information confidential.
Algorithm 3 shows an example of a smart contract. If the transaction value (input of the smart contract) corresponds to a hash value stored in the blockchain, a certain action (e.g. send
message) is executed by the smart contract.
6 Computer Science & Information Technology (CS & IT)
3.3. Data Communication Module for Blockchain Certification
To execute code in a secure, trusted and non-observable manner, a Trusted Execution
Environment (TEE) may be used, which is based on a Secure Execution Environment (SEE). A SEE provides authenticity, integrity and confidentiality. In additional a TEE also provides remote
attestation to proof its trustworthiness and must be resistant against attacks.
To provide the user of this approach with insights of the DCMB, the source code of the module
should be published to the data sender, the data receiver and a group of validation entities for
validation via a private repository shared by the mentioned entities. Should the source code contain private information, such in Algorithm 4, the source code is only published to the group
of validation entities. This publication of the source code also enables governance and regulation
of the privacy of the DCMB by a group of validation and certification entities for increased trust
in this module. To ensure that source code and the module is mapped to each other in a non-breakable fashion, both are signed and the signatures are stored in the blockchain.
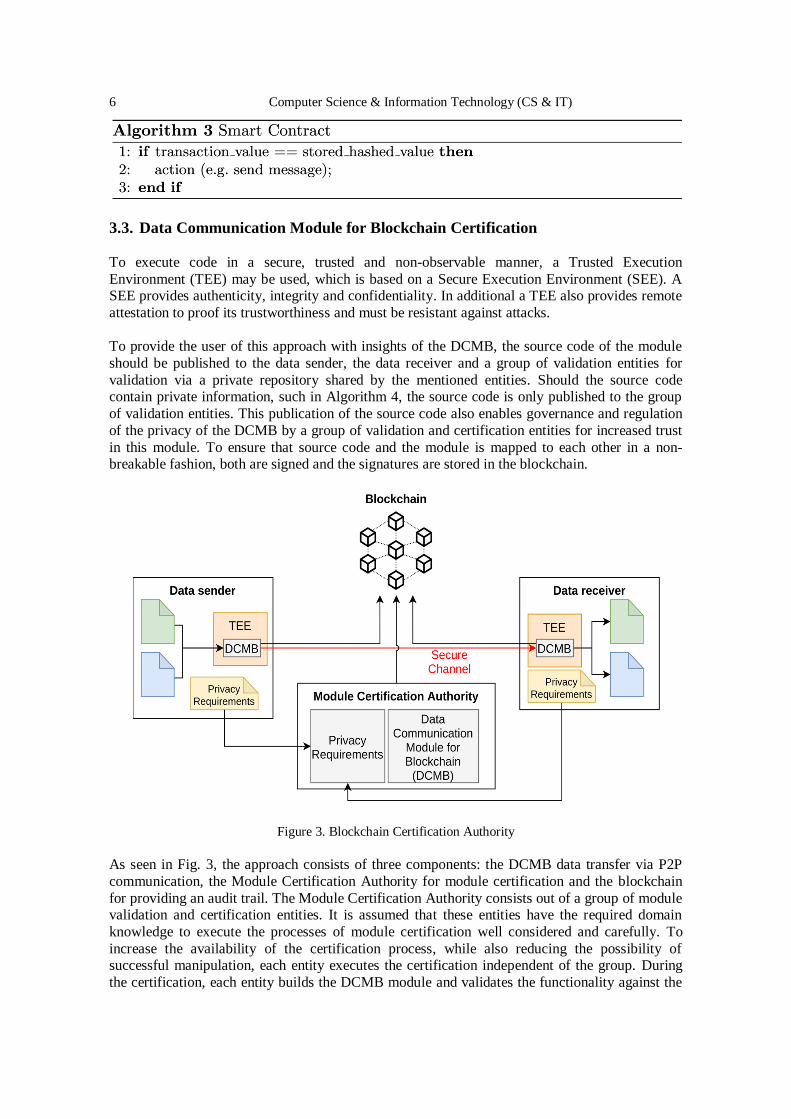
Figure 3. Blockchain Certification Authority
As seen in Fig. 3, the approach consists of three components: the DCMB data transfer via P2P
communication, the Module Certification Authority for module certification and the blockchain
for providing an audit trail. The Module Certification Authority consists out of a group of module validation and certification entities. It is assumed that these entities have the required domain
knowledge to execute the processes of module certification well considered and carefully. To
increase the availability of the certification process, while also reducing the possibility of successful manipulation, each entity executes the certification independent of the group. During
the certification, each entity builds the DCMB module and validates the functionality against the
Computer Science & Information Technology (CS & IT) 7
confidentiality requirements and a confidentiality validation test data set. To establish consensus of the certification status, each entity participates in a voting process via smart contracts.
Certification related information (e.g. validation log, hash of the source code as a reference for
later audit) is available via the blockchain, to create an end-to-end auditable trail. The
certification status is persisted in the blockchain and is queried during the module deployment phase. With this approach, the role of the blockchain shifts from being a distributed access
management to being the canonical source of privacy module “trust”.
4. IMPLEMENTATION OF DATA CONFIDENTIALITY USING BLOCKCHAINS IN
INDUSTRY 4.0
Data Communication Module for Blockchain (DCMB) The DCMB provides a high degree of
adaptability to be applicable for a wide variety of use cases. For example: in an IoT-centric use
case, where reduction in required computation power is the top priority, the DCMB might collect data and transfers it without any further processing. If more computation power is available, the
DCMB might also perform additional data validation tasks. The modular structure of the DCMB
enables individual customization, depending on factors such as intended confidentiality or execution environment restrictions. To ensure compatibility between modules, may created by
different entities, a standardized way of communication (e.g. OPC UA) between the modules was
chosen. Unavailability of the P2P communication is detected by the modules and data is cached
module internally either until the P2P communication is available, the cache is full or a predefined timeout has expired.
To prevent extraction of potentially confidential data and tamper, the modules are executed in a Trusted Execution Environment (TEE), which is available in commodity hardware as well as
certain IoT devices. Before initial deployment of a DCMB module, the module needs to be
certified by the module certification authority.
Secure and Trusted Execution: A Trusted Execution Environment (TEE) is used as protection
against attacks on the DCMB modules. TEE's are available for x86 based systems through, for
example, SCONE by Arnautov et al. [11] and for ARM based systems, for example, ARM TrustZone [12].
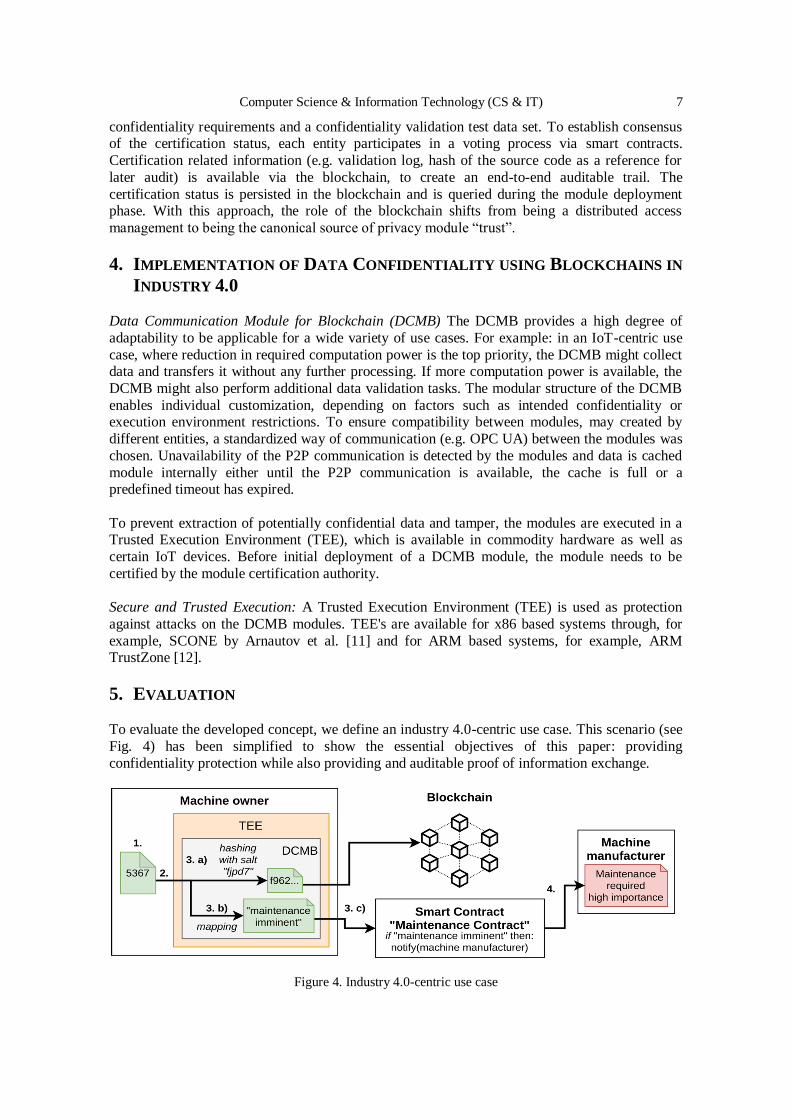
5. EVALUATION To evaluate the developed concept, we define an industry 4.0-centric use case. This scenario (see
Fig. 4) has been simplified to show the essential objectives of this paper: providing
confidentiality protection while also providing and auditable proof of information exchange.
Figure 4. Industry 4.0-centric use case
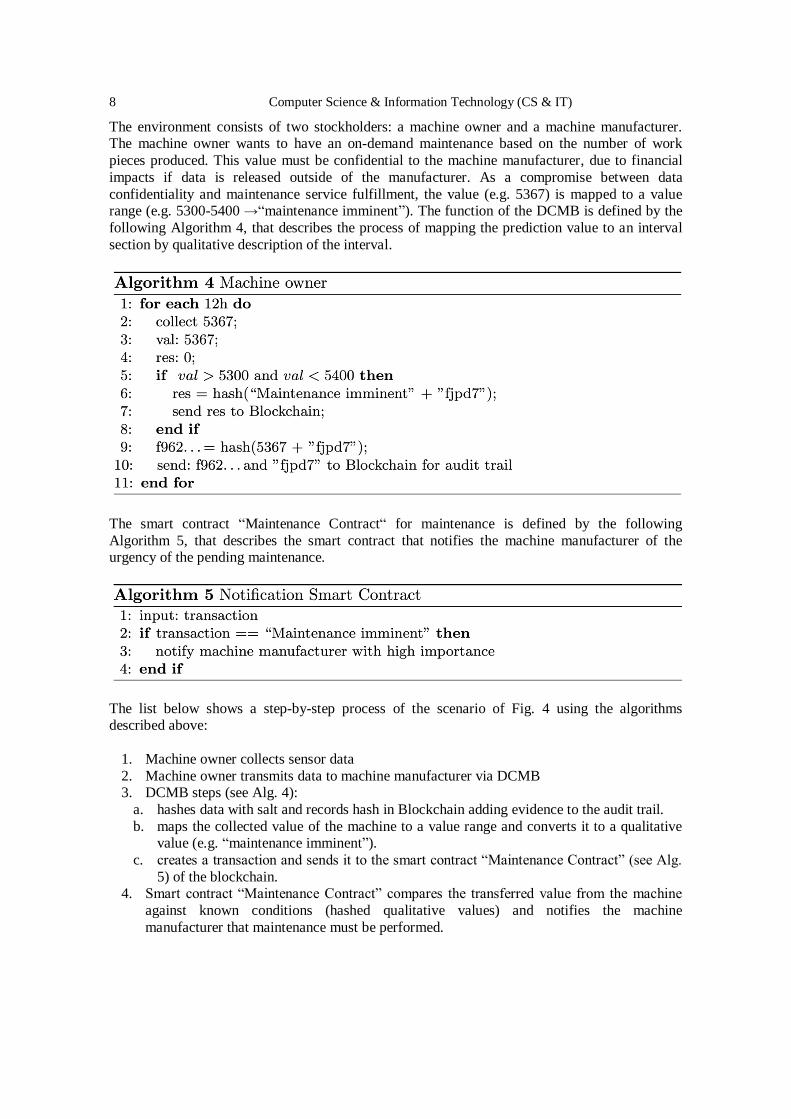
8 Computer Science & Information Technology (CS & IT)
The environment consists of two stockholders: a machine owner and a machine manufacturer. The machine owner wants to have an on-demand maintenance based on the number of work
pieces produced. This value must be confidential to the machine manufacturer, due to financial
impacts if data is released outside of the manufacturer. As a compromise between data
confidentiality and maintenance service fulfillment, the value (e.g. 5367) is mapped to a value range (e.g. 5300-5400 →“maintenance imminent”). The function of the DCMB is defined by the
following Algorithm 4, that describes the process of mapping the prediction value to an interval
section by qualitative description of the interval.
The smart contract “Maintenance Contract“ for maintenance is defined by the following
Algorithm 5, that describes the smart contract that notifies the machine manufacturer of the urgency of the pending maintenance.
The list below shows a step-by-step process of the scenario of Fig. 4 using the algorithms described above:
1. Machine owner collects sensor data
2. Machine owner transmits data to machine manufacturer via DCMB 3. DCMB steps (see Alg. 4):
a. hashes data with salt and records hash in Blockchain adding evidence to the audit trail.
b. maps the collected value of the machine to a value range and converts it to a qualitative value (e.g. “maintenance imminent”).
c. creates a transaction and sends it to the smart contract “Maintenance Contract” (see Alg.
5) of the blockchain. 4. Smart contract “Maintenance Contract” compares the transferred value from the machine
against known conditions (hashed qualitative values) and notifies the machine
manufacturer that maintenance must be performed.
Computer Science & Information Technology (CS & IT) 9
To conclude, it can be said that the presented approach can be integrated into an industry 4.0 environment due to its modular design. Low resource usage, a key requirement of embedded and
IoT environments, can be met by low complexity of the algorithms.
6. CONCLUSION The blockchain is used to build trust between the enterprises working together. In this paper it has
been shown, that an audit trail can be managed by the blockchain without having send the data
through the blockchain. It even can be dynamically set up privacy channels between two enterprises preserving the data privacy. Further, it has been shown, that smart contracts can be
used with hashed values protecting the value from other participants of the blockchain. This
functionality has been implemented by the new designed and customizable modules: The
modules are certified via a Module Certification Authority based on privacy requirements of the data collector. The process of certification is transparent for the users of the modules, since all
information is stored in the blockchain.
ACKNOWLEDGMENT
This research was funded by the European Regional Development Fund (EFRE) and by the Ministry of Science, Research and Art of the State of Baden-Württemberg, Germany.
REFERENCES
[1] H. Kagermann, W. Wahlster, and J. Helbig, “Recommendations for implementing the strategic
initiative Industrie 4.0: Final report of the Industrie 4.0 Working Group,” ForschungsunionBerl. Ger.,
2013.
[2] “Short Circuit: How a Robotics Vendor Exposed Confidential Data for Major Manufacturing
Companies.” https://www.upguard.com/breaches/short-circuit-how-a-robotics-vendor-exposed-
confidential-data-for-major-manufacturing-companies (accessed Apr. 29, 2020).
[3] G. Zyskind, O. Nathan, and A. Pentland, “Enigma: Decentralized Computation Platform with
Guaranteed Privacy,” ArXiv150603471 Cs, Jun. 2015, Accessed: Oct. 09, 2018. [Online]. Available:
http://arxiv.org/abs/1506.03471. [4] F. Benhamouda, S. Halevi, and T. Halevi, “Supporting private data on Hyperledger Fabric with
secure multiparty computation,” in Cloud Engineering (IC2E), 2018 IEEE International Conference
on, 2018, pp. 357–363.
[5] D. J. Solove, “A taxonomy of privacy,” U Pa Rev, vol. 154, p. 477, 2005.
[6] X. Yue, H. Wang, D. Jin, M. Li, and W. Jiang, “Healthcare Data Gateways: Found Healthcare
Intelligence on Blockchain with Novel Privacy Risk Control,” J. Med. Syst., vol. 40, no. 10, p. 218,
Aug. 2016, doi: 10.1007/s10916-016-0574-6.
[7] D. D. F. Maesa, P. Mori, and L. Ricci, “Blockchain based access control,” in IFIP International
Conference on Distributed Applications and Interoperable Systems, 2017, pp. 206–220.
[8] R. Cheng et al., “Ekiden: A Platform for Confidentiality-Preserving, Trustworthy, and Performant
Smart Contracts,” 2019 IEEE Eur. Symp. Secur. Priv. EuroSP, Jun. 2019, doi:
10.1109/eurosp.2019.00023. [9] A. Kosba, A. Miller, E. Shi, Z. Wen, and C. Papamanthou, “Hawk: The Blockchain Model of
Cryptography and Privacy-Preserving Smart Contracts,” in 2016 IEEE Symposium on Security and
Privacy (SP), May 2016, pp. 839–858, doi: 10.1109/SP.2016.55.
[10] A. Biryukov, D. Dinu, and D. Khovratovich, “Argon2: New Generation of Memory-Hard Functions
for Password Hashing and Other Applications,” in 2016 IEEE European Symposium on Security and
Privacy (EuroS P), Mar. 2016, pp. 292–302, doi: 10.1109/EuroSP.2016.31.
[11] S. Arnautov et al., “SCONE: Secure Linux Containers with Intel SGX.,” in OSDI, 2016, vol. 16, pp.
689–703.

10 Computer Science & Information Technology (CS & IT)
[12] J.-E. Ekberg, K. Kostiainen, and N. Asokan, “Trusted execution environments on mobile devices,” in
Proceedings of the 2013 ACM SIGSAC conference on Computer & communications security, 2013,
pp. 1497–1498.
AUTHORS
Jan Stodt, M.Sc.is a member of the Institute for Data Science, Cloud Computing and IT-security and a
member of the faculty of computer science at the University of Applied Science in Furtwangen (HFU). He
received his B. Sc. degree in computer science from the University of Applied Science in Furtwangen
(HFU) in 2017 and his M. Sc. degree in computer science for the University of Applied Science in
Furtwangen (HFU) in 2019.
Christoph Reich is a professor at the faculty of computer science at the University of Applied Science in
Furtwangen (HFU) and teaches in the field of network technologies, programming, IT management,
middleware and IT security. He has the scientific management of the HFU Information and Media Center,
which consists of the departments IT, Online Systems, Learning Systems and HFU library department. As
a director of the Institute for Data Science, Cloud Computing and IT-security (www.wolke.hs-
furtwangen.de), his research focuses on cloud computing, QoS, virtualization and IT security.
© 2020 By AIRCC Publishing Corporation. This article is published under the Creative Commons
Attribution (CC BY) license.
David C. Wyld et al. (Eds): CCSEA, BIoT, DKMP, CLOUD, NLCAI, SIPRO - 2020
pp. 11-22, 2020. CS & IT - CSCP 2020 DOI: 10.5121/csit.2020.101002
ROLE OF MULTIMEDIA INFORMATION
RETRIEVAL IN PROVIDING A CREDIBLE
EVIDENCE FOR DIGITAL FORENSIC
INVESTIGATIONS: OPEN SOURCE
INTELLIGENCE INVESTIGATION ANALYSIS
Amr Adel1 and Brian Cusack2
1Whitecliffe College of Technology & Innovation, Auckland, New Zealand 2Cyber Forensics Research Centre, Auckland University of Technology,
Auckland, New Zealand
ABSTRACT Enhancements in technologies and shifting trends in customer behaviour have resulted in an
increase in the variety, volume, veracity and velocity of available data for conducting digital
forensic analysis. In order to conduct intelligent forensic investigation, open source information
and entity identification must be collected. Challenge of organised crimes are now involved in
drug trafficking, murder, fraud, human trafficking, and high-tech crimes. Criminal Intelligence
using Open Source Intelligence Forensic (OSINT) is established to perform data mining and
link analysis to trace terrorist activities in critical. In this paper, we will investigate the
activities done by a suspect employee. Data mining is to be performed and link analysis as well
to confirm all participating parties and contacted persons used in the communications. The
proposed solution was to identify the scope of the investigation to limit the results, ensure that
expertise and correct tools are ready to be implemented for identifying and collecting potential evidences. This enhanced information and knowledge achieved are of advantage in research.
This form of intelligence building can significantly support real world investigations with
efficient tools. The major advantage of analysing data links in digital forensics is that there may
be case-related information included within unrelated databases.
KEYWORDS
Open Source Intelligence, Information Retrieval,Digital Forensics, Cyber-Crimes & Data
Mining.
1. INTRODUCTION
Increasing the volume of digital forensic data has been defined as a challenge to forensic examiners and investigators due to diversity of devices, and services that play an important role
in collecting digital evidence. This variety of data sources poses challenging issues to forensic
investigators from identifying system’s specifications and storage capacity, processing data acquisition, and analysing the acquired evidence, then reporting these evidence into a technical
report for to be encountered by law enforcement agencies [1].
Five major problems have been outlined for digital forensics in different areas; these areas can be
categorised as complexity problem, diversity problem, consistency and correlation problem,
volume problem, and unified time lining problem [2]. The complexity problem is acquiring data
12 Computer Science & Information Technology (CS & IT)
at its lowest format with a serious increase of data volumes during the process, which needs for sophisticated techniques for reducing/filtering data prior the analysis. The diversity problem
results from the lack of investigating and examining standard techniques in order to be able to
examine the increasing number of data source types. This lack of standardization for adding
different types of formats into the investigation process is causing a complexity of sharing the digital evidence between the international law enforcement agencies that are trained by Digital
Forensic Training Program to deal with triage files [3]. The problem of consistency and
correlation is resulting from static function of existing forensics tools that are designed to catch fragments of evidence, which is considered as limitation and there is a need to perform other
sophisticated functions to assist forensic investigators. The problem of data volume comes from
the lack of automation tools that can handle effectively the large number of data volumes in data storages and the electronic devices that store information. The problem of unified time lining
results from having multiple data sources came from different time zones, which needed as
documented reference and changes in timestamp and clocks.
This paper is organized as follows; section 2 discusses digital forensic environment’s challenges
as well as classifications of data acquisition sources; section 3 analyses the digital forensic gap of
critical infrastructures; section 4 demonstrates the implementation and analysis of an example of open-source intelligence tool. In section 5, we conclude to point some of recent issues to be
investigated in the future.
2. RELATED WORK Due to the sensitive nature of this data, forensic investigators and examiners will have to apply
advanced procedures into consideration for to follow in order to acquire the data. Additionally,
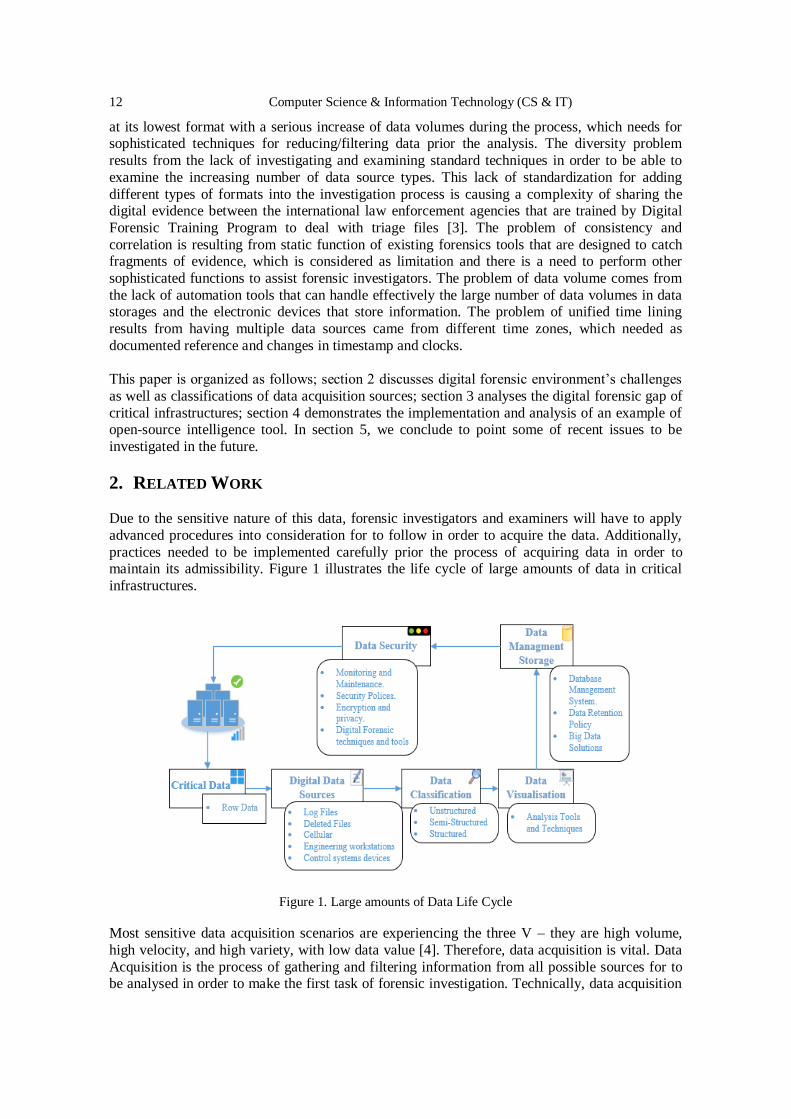
practices needed to be implemented carefully prior the process of acquiring data in order to maintain its admissibility. Figure 1 illustrates the life cycle of large amounts of data in critical
infrastructures.
Figure 1. Large amounts of Data Life Cycle
Most sensitive data acquisition scenarios are experiencing the three V – they are high volume,
high velocity, and high variety, with low data value [4]. Therefore, data acquisition is vital. Data
Acquisition is the process of gathering and filtering information from all possible sources for to be analysed in order to make the first task of forensic investigation. Technically, data acquisition
Computer Science & Information Technology (CS & IT) 13
tends to collect digital evidence from all potential electronic media. For successfully undertaking this task, forensic examiners and investigators have to differentiate between the two types of data
acquisition, which are live acquisition and static acquisition in order to find the suitable method
of collecting the evidence based on the case status [5].
Due to the sophistication of Internet of Things, cloud computing, and distributed computing that
are handling large volumes of data in critical systems, forensic investigators are experiencing a
number of challenges in order to initialise with the first stage, which is data acquisition. Some of these challenges are data complexity, computational complexity, and system complexity [6]. The
development of complex data has supported us with exceptional large-scale trials when dealing
with computational problems.
Data Acquisition’s major function in digital forensic investigations is to provide copies of
original drives. This procedure has to be done on the original drive in order to ensure that there is
another copy in case the original drive corrupted or damaged [6]. This process could be done acquiring volatile and non-volatile data. A volatile data is the data that has been stored in live
system and when shutting down the device, the data will be lost. Control system status, device
memory, network connections and time clocks, command history, and processes running are some of volatile data [7]. Non-volatile data is a concept that aims to keep data unchanged while
computers powered off, which means data is in a stable place. Hard drives or Virtual drives such
as Google drive can recover certain types of stored data and deleted files after the user has accessed his data whether his computer directly or through web browser [1]. For instance, emails,
sheets saved on the computer, or pictures. In addition, there are other sources to find non-volatile
data such as local drives, smart phones, shared folder, and USB thumb drives [8]. Often, during
the examination process of forensic investigation, investigators collect all information from non-volatile data to use them a credible evidence of the incident.
In order to handle digital evidence and conduct successful forensic investigations, sub-functions of data acquisition will need to be identified to forensic examiners and investigators. Data
acquisition sub-functions can be classified as follows:
1. Physical Data Copy 2. Logical Data Copy
3. Data Acquisition Format
4. Command Line Acquisition
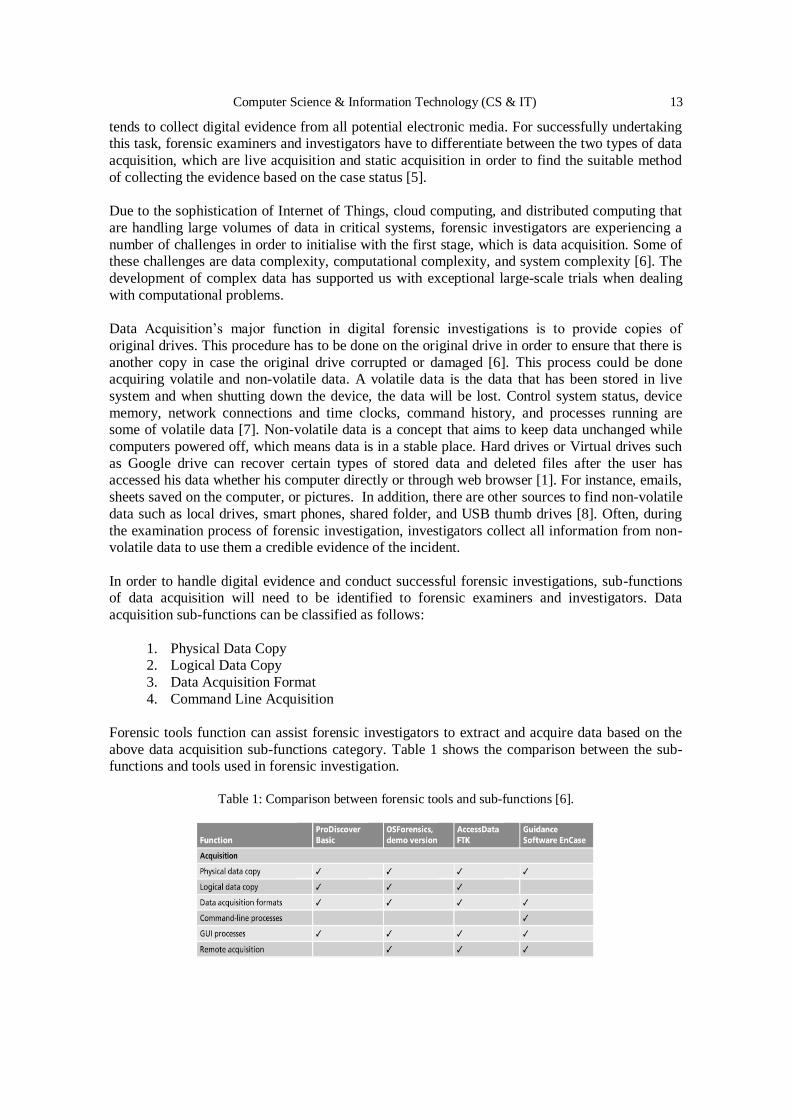
Forensic tools function can assist forensic investigators to extract and acquire data based on the
above data acquisition sub-functions category. Table 1 shows the comparison between the sub-functions and tools used in forensic investigation.
Table 1: Comparison between forensic tools and sub-functions [6].
14 Computer Science & Information Technology (CS & IT)
2.1. Incident Response Team
The arrangement for establishing an incident response team is essential and will have to be take
into consideration especially in industrial control systems. The training and skills required for establishing this team are in different areas that can include control system engineering, digital
forensics, and IT incident response. At least one member of the team must have in-depth
knowledge and at least one member must have a basic knowledge of these skilful areas [13]. For instance, basic knowledge in control system engineering, digital forensics, and IT incident
response will be required by a system engineer, while having an expert-level of understanding in
control systems. A combination of technical skills provides high-level of understanding for
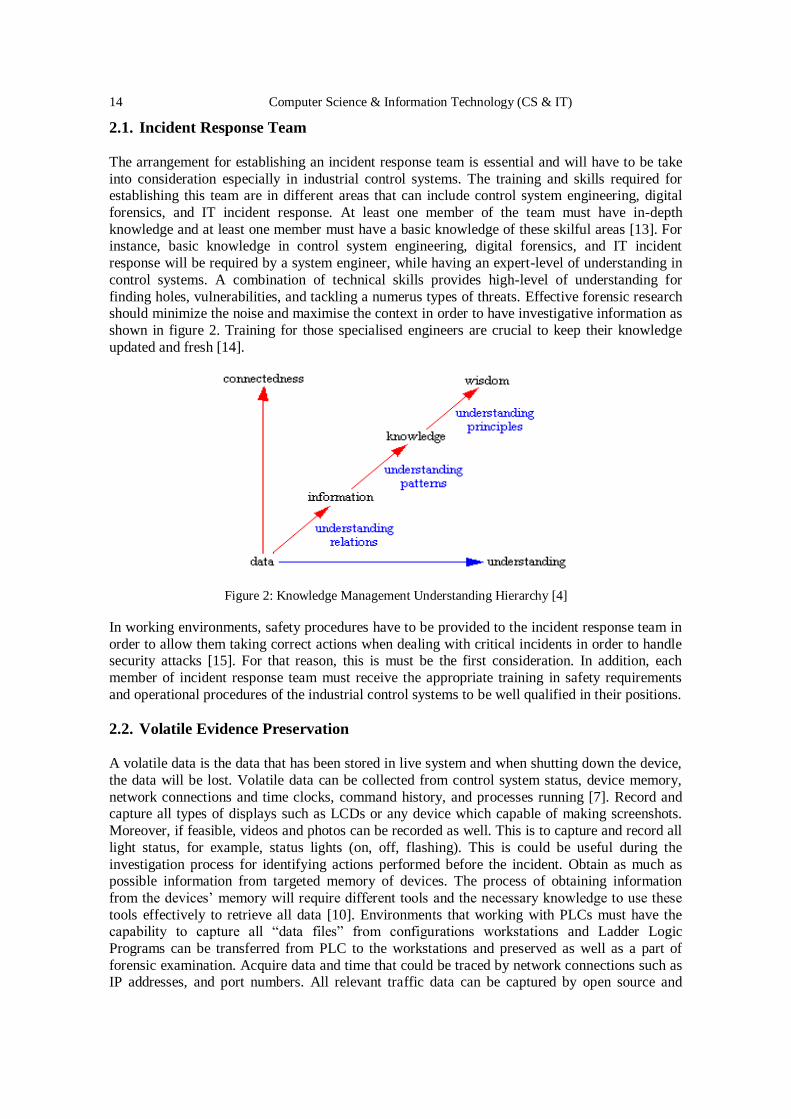
finding holes, vulnerabilities, and tackling a numerus types of threats. Effective forensic research should minimize the noise and maximise the context in order to have investigative information as
shown in figure 2. Training for those specialised engineers are crucial to keep their knowledge
updated and fresh [14].
Figure 2: Knowledge Management Understanding Hierarchy [4]
In working environments, safety procedures have to be provided to the incident response team in
order to allow them taking correct actions when dealing with critical incidents in order to handle security attacks [15]. For that reason, this is must be the first consideration. In addition, each
member of incident response team must receive the appropriate training in safety requirements
and operational procedures of the industrial control systems to be well qualified in their positions.
2.2. Volatile Evidence Preservation A volatile data is the data that has been stored in live system and when shutting down the device,
the data will be lost. Volatile data can be collected from control system status, device memory,
network connections and time clocks, command history, and processes running [7]. Record and capture all types of displays such as LCDs or any device which capable of making screenshots.
Moreover, if feasible, videos and photos can be recorded as well. This is to capture and record all
light status, for example, status lights (on, off, flashing). This is could be useful during the
investigation process for identifying actions performed before the incident. Obtain as much as possible information from targeted memory of devices. The process of obtaining information
from the devices’ memory will require different tools and the necessary knowledge to use these
tools effectively to retrieve all data [10]. Environments that working with PLCs must have the capability to capture all “data files” from configurations workstations and Ladder Logic
Programs can be transferred from PLC to the workstations and preserved as well as a part of
forensic examination. Acquire data and time that could be traced by network connections such as IP addresses, and port numbers. All relevant traffic data can be captured by open source and
Computer Science & Information Technology (CS & IT) 15
commercial applications to perform network reconnaissance [5]. Time and date in many cases are a treasure. The capability of getting time clocks for each performed action can assist in tracing
the incident and will allow forensic investigators to design an accurate timeframe for collecting
particular evidence [1]. On a suspicious system, reviewing the command history can give forensic
examiners a brief about the recent activities that have been done. It also can serve an audit trails for extending as possible in the process of investigating the target machines. In addition,
processes running can give a good review to show a full list of all processes running on the
suspicious machine [9]. This reviewing will help examiners in detecting malicious process and abnormal activities.
2.3. Non-Volatile Evidence Preservation
The concept of non-volatile data is to keep data unchanged while computers powered off, which
means data is in a stable place. Hard drives or Virtual drives such as Google drive can recover certain types of stored data and deleted files after the user has accessed his data whether his
computer directly or through web browser [1]. For instance, emails, sheets saved on the
computer, or pictures. In addition, there are other sources to find non-volatile data such as local evidence drives, cloud storage, shared folder on a local network, smart phones, PDAs, and USB
thumb drives [8]. Often, during the examination process of forensic investigation, investigators
collect all information from non-volatile data to use them a credible evidence of the incident.
Temporary files are some of credible evidence that could be collected during the process of
forensic investigation. Temporary file is created by programs when there are no places for
allocating memory blocks for the tasks. These files are usually deleted after closing the program, but sometimes there are some files keep their temporary files in the computer. Windows registry
is one of powerful evidence forensic investigators can collect. The registry is created database for
the system containing all system’s information such as user’s preferences, settings for hardware/software, and operating system priority in case the computer has multiple operating
systems [16].
Logging event is also effective evidence used to collect event’s information about the system’s transactions that have been made by registered users to be analysed and assessed for its
admissibility [17].
Boot sectors could be vital in the forensic process investigation. It can provide all instructions
about booting operating systems. This is because hard drives usually partitioned into several
partitions, and each of these partitions may has a different operating system. For example, when
computer powered on, it offers a user an option to choose between two operating systems, one of them Windows 7 and the other one is Ubuntu.
History of web browsers and cookies are also a valuable addition to the forensic report. During the forensic process, web History can provide user search for keywords, websites, or saved login
credentials that could lead to sensitive information such as online purchases and bank accounts
[12]. Furthermore, downloaded contents will still be remaining in the hard drive until the user delete it, often, these contents still exist in unallocated space of the hard drive. This could assist
in tracing the incident faster.
2.4. Forensic Challenge with Collection
Operational process of forensics collection in normal environments require understanding the severity nature of cyber forensic incidents and addressing a number of challenges that forensic
investigators encounter during the process of examination such as limitations of cultures, poor
16 Computer Science & Information Technology (CS & IT)
administrations, volatile memory, and insufficient logging systems [18]. In industrial control systems, it is difference. There are additional challenges such as automation, volatility of data,
and data mingling.
One of these challenges is automation. Control system domain will create key information resources in order to handle the data in the direction that to be applied of data retention which is
not a requirement and not cost-effective. Volatility of is the other challenge that forensic
investigators face and his makes the process of collecting data inviable because the data within the collection process is removed, deleted, or overwritten, and this can make it impossible to be
detected in its original state [8]. Furthermore, most examiners are facing another problem in
retrieving data forensically, which known as “Data Mingling” [3]. Data Mingling is a serious problem of data mixture and being indistinguishable. Often, the sample of total data investigated
in the forensic process is comprised of both data related to the incident and data unrelated to the
incident. In order to classify the data, a solution for this problem is presented, which is to
attribute unrelated data to inadequate functions labels.
Research has confirmed that the most vital asset to an attacker could be devices that control the
infrastructures such as field devices in control systems. It is now important to consider information resources security and its capabilities and access levels in control systems in regards
of data retention [16]. The study of understanding how these capabilities can support in forensic
investigation should be taking into consideration.
2.5. Forensic Challenge in Data Analysis There are clear solutions for the forensic issue in critical infrastructures, which can adapt those in
industrial control systems; however, cyber-forensic and anti-forensic tools have not proved that
efficiency in certain areas of computing environments such as data identification, time mismatch, multi-tenancy, owner of data, live forensics, privacy, mobile operating systems, multiple cloud
service providers. [11]. Sophisticated tools such as those that copy processes, examine evidence,
analyse program for generating checksums in order to complete the verification may not fit
perfectly to some of control systems technologies. Consequently, many of digital forensic tools in different areas such as network forensics, database forensics, computer forensics, and mobile
forensics will not be able to fit to operate in the newest physical and virtual systems in computing
environments such in cloud computing environments [15].
Therefore, digital forensics vendors will have to apply new modifications on their software and
frameworks in order to fill the gap and meet the challenge. A core component is the backbone of
any forensic ability. The major function of each one of these core components is to make sure that environments can correctly review the necessary information that has been collected for
review. The problem comes when the investigator has only one or two sources for extracting the
information. This can limit and affects the overall performance in collecting data for analysis [13]. Therefore, it is vital to understand how important to have numerus resources before the
domain comes critical.
2.6. Forensic Challenge in Reporting
The involvedness of critical infrastructures especially in control systems environments along with its installations, and drives configurations make the process of documentation of these
components complex to forensic investigators. Therefore, the documentation must be presented
in order identify all evidence acquisitioned into a one report.
Computer Science & Information Technology (CS & IT) 17
Documentation is principal ensure the success of any forensic investigations in control systems environments. Assertive steps should be followed and taken into consideration from the
beginning for reporting the crime to closure case [19]. Assets’ owners will have to take another
several steps in order to identify and detect any types of changes that could be done during
operating system installation, configurations of devices, hardware, or any elements whose modified behaviour may affect the original equipment manufacturers [20]. Moreover, vendors are
highly recommended to replicate their modified data with asset owners in order to ensure the
credibility of information. Such information must be provided to forensic examiners before getting involved in any forensic activity. Afterwards, forensic examiner will shall note
amendments and justify for them accordingly for best practices.
3. DIGITAL FORENSICS GAP ANALYSIS Due to the advancements in cyber area, the use of internet and information technology have
dramatically increased. Accordingly, this led to serious cyber-attacks that are targeting critical
infrastructures. Digital forensic is chosen for obtaining and investigating all types of digital information including malicious evidence found in suspected systems. This operation is meant to
be done for making sure evidence is admissible for to be presented to the court. Other reason for
performing a formal digital forensic investigation is recovering lost, deleted, or corrupted critical data. The recovered data is a great assist to prosecute the criminals [8].
Formally, sensitive data is an interesting target and is vulnerable to data leakage attack [10].
Digital forensic investigation can help forensic investigators to obtain critical data, such as cluster properties, file retrieval, logging files, metadata, and transaction logs.
In traditional forensic investigations, the forensic investigators are relying on static techniques to remove hard disks and time consuming for acquiring the data. However, a number of
architectural and technical limitations have prevented investigators from performing this type of
investigation in larger IT infrastructures such as diversity in events and input sources [11].
The evidence collected from the forensic investigation is the data stored in the digital systems and
it could be deleted files, hidden files, metadata, corrupted data, hard drive data, in-memory data,
or any other forms of data [9].
The key objective from investigating critical infrastructures forensically is to acquire the data to
obtain desired results in a defensible manner against cyber-attacks such as Botnet attack in order to prevent cyber-criminals from controlling the system [12].
Reporting digital forensics findings is one of critical phase in digital forensics, because it depends
on the investigated environment components, size, and acquired data sources. This stage of digital forensic investigation is to present and discuss all findings and results resulted from
particular investigation to stakeholders who will assess and evaluate the outcome of the
investigation.
4. IMPLEMENTATION
During the hypotheses and examination phase, the forensic investigator found a number of traces
of communications that have been sent to suspicious identities. The open source intelligence forensic testing lab was used to route case three. All software and hardware requirements for the
forensic computer have been preserved.
18 Computer Science & Information Technology (CS & IT)
Throughout the search and data collection and examination phases, an open source intelligence application was effectively engaged. The Maltego version 4.1.0 was employed to obtain and
examine the data. The suspect user contact information has been acquired and plans were set to
test the proposed methodology in the first phase of digital forensic investigation to perform link
analysis. Application specifications were confirmed for the evidence collection phase. As shown in figure 2, the system specification is for Windows 10 used in the investigation.
4.1. Search & Data Collection
To explore the desired and credible traces for the data collection phase, links analysis and data
mining have been implemented in this phase for revealing all possible relationships and links associate to the suspected user. This phase was set to trace machine’s activities, and summary of
these traces shown in the following figure.
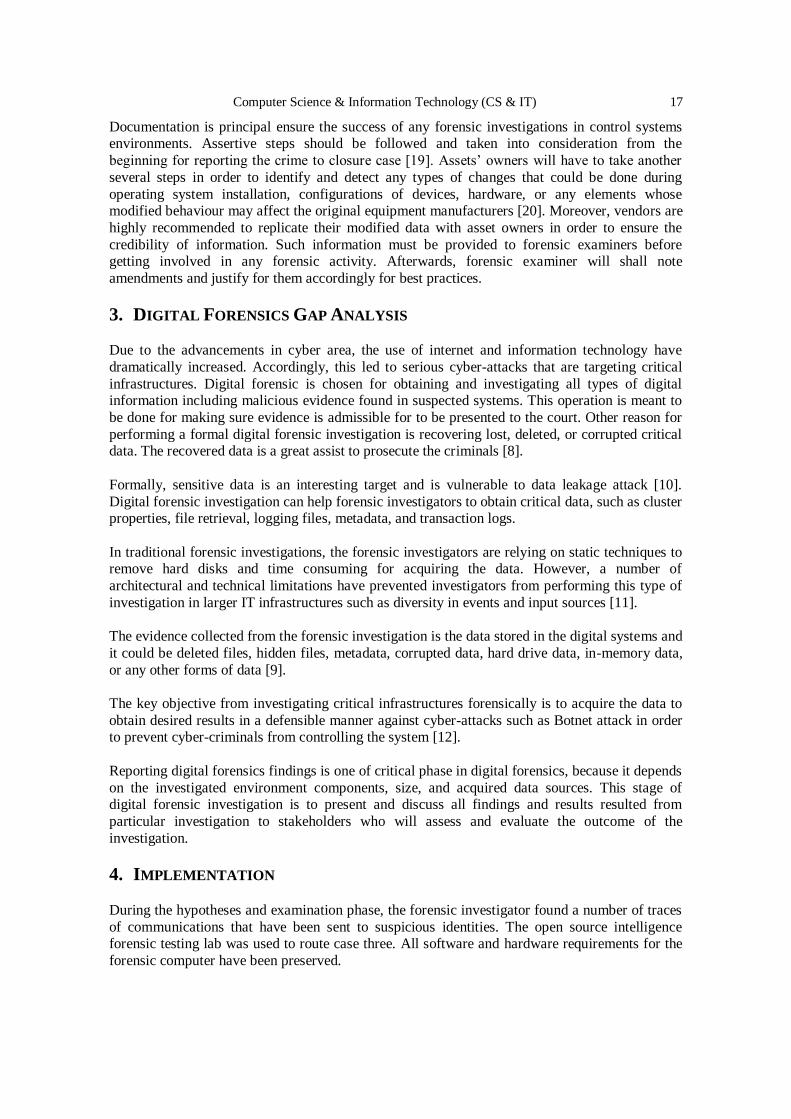
Figure 3: Suspect Email address details
Figure 3 shows all associated communications to the user IP “185.53.179.6”. This IP tracing
reveal a number of internal communications within the organisation and external communications, which require a deep analysis for the type of communications detected. The
figure also shows a number of locations, persons, websites, and net-blocks were involved in his
communications, although his role doesn’t require dealing with this level of communications.
The following phase will conduct a deep linking analysis to examine the metadata linkage found in the above figure.
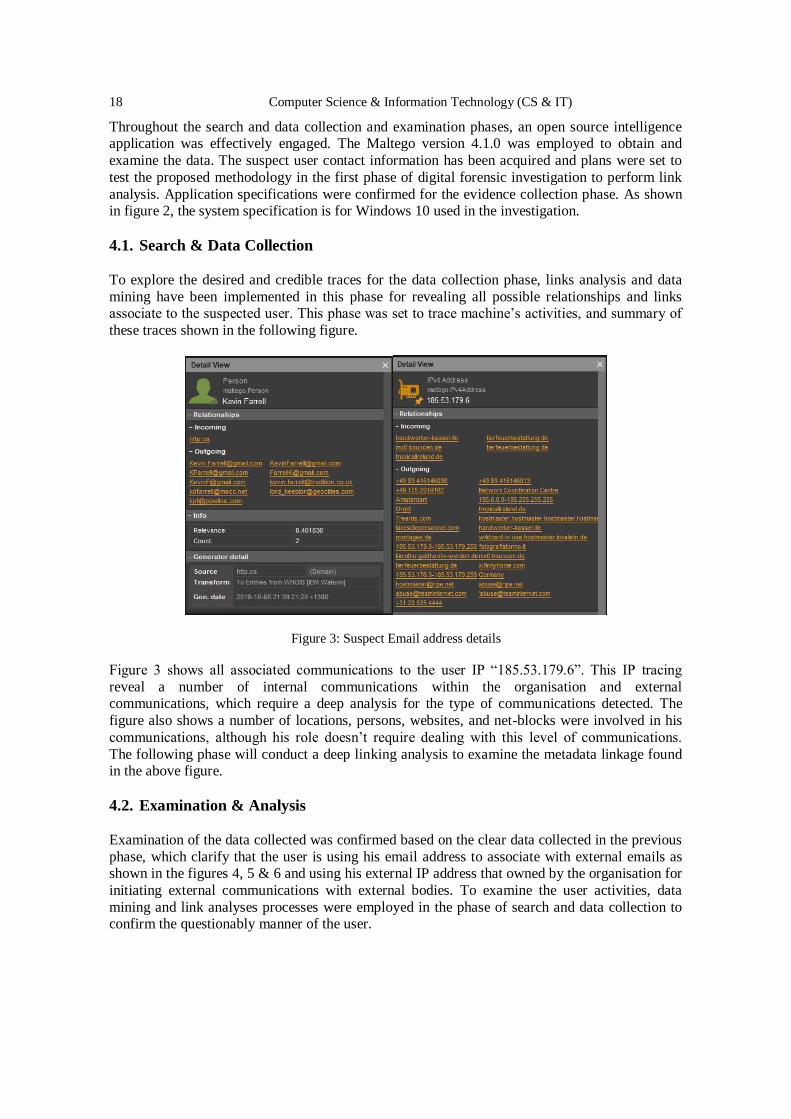
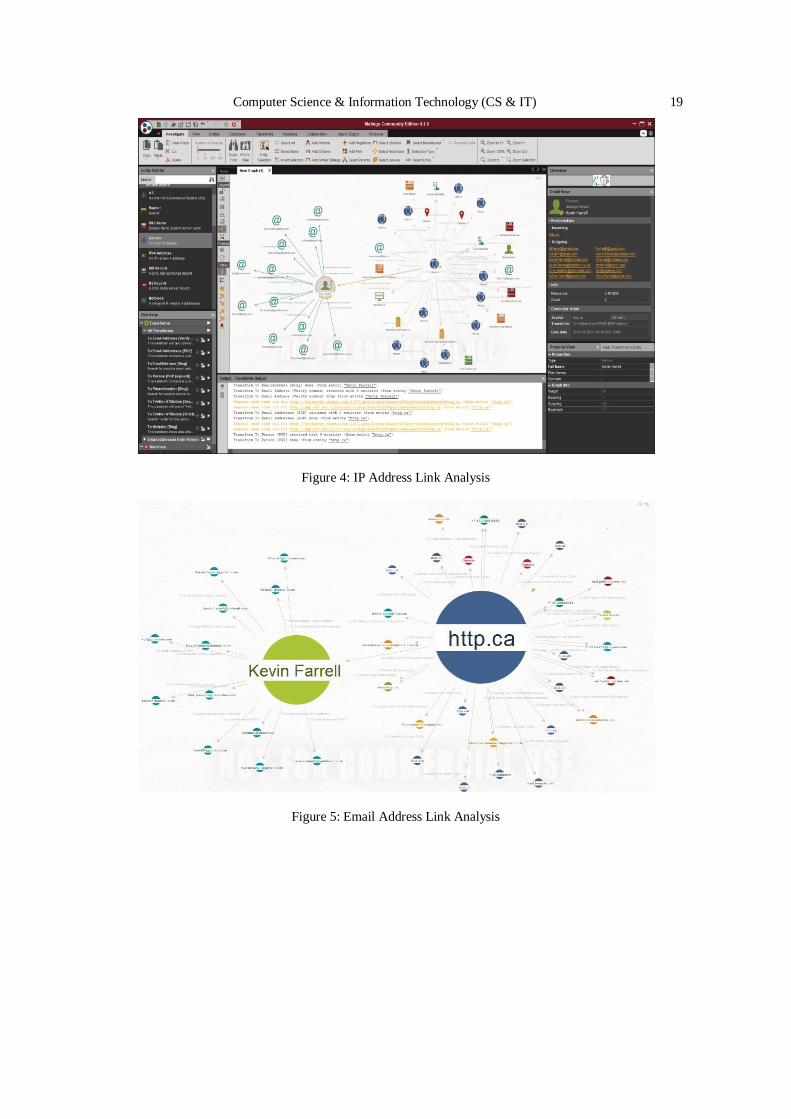
4.2. Examination & Analysis
Examination of the data collected was confirmed based on the clear data collected in the previous
phase, which clarify that the user is using his email address to associate with external emails as shown in the figures 4, 5 & 6 and using his external IP address that owned by the organisation for
initiating external communications with external bodies. To examine the user activities, data
mining and link analyses processes were employed in the phase of search and data collection to confirm the questionably manner of the user.
Computer Science & Information Technology (CS & IT) 19
Figure 4: IP Address Link Analysis
Figure 5: Email Address Link Analysis
20 Computer Science & Information Technology (CS & IT)
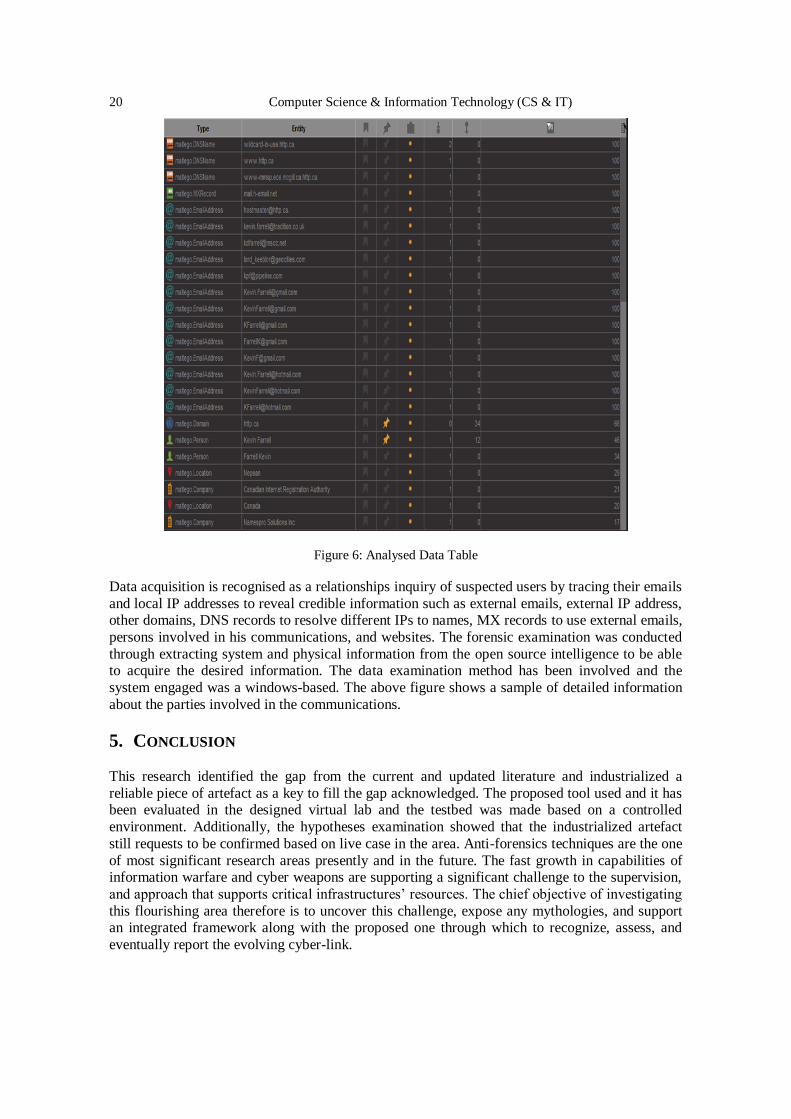
Figure 6: Analysed Data Table
Data acquisition is recognised as a relationships inquiry of suspected users by tracing their emails
and local IP addresses to reveal credible information such as external emails, external IP address, other domains, DNS records to resolve different IPs to names, MX records to use external emails,
persons involved in his communications, and websites. The forensic examination was conducted
through extracting system and physical information from the open source intelligence to be able to acquire the desired information. The data examination method has been involved and the
system engaged was a windows-based. The above figure shows a sample of detailed information
about the parties involved in the communications.
5. CONCLUSION
This research identified the gap from the current and updated literature and industrialized a
reliable piece of artefact as a key to fill the gap acknowledged. The proposed tool used and it has been evaluated in the designed virtual lab and the testbed was made based on a controlled
environment. Additionally, the hypotheses examination showed that the industrialized artefact
still requests to be confirmed based on live case in the area. Anti-forensics techniques are the one
of most significant research areas presently and in the future. The fast growth in capabilities of information warfare and cyber weapons are supporting a significant challenge to the supervision,
and approach that supports critical infrastructures’ resources. The chief objective of investigating
this flourishing area therefore is to uncover this challenge, expose any mythologies, and support an integrated framework along with the proposed one through which to recognize, assess, and
eventually report the evolving cyber-link.
Computer Science & Information Technology (CS & IT) 21
REFERENCES
[1] Quick, D., & Choo, K. R. (2014). Google Drive: Forensic analysis of data remnants. Journal of
Network and Computer Applications, 40, 179-193.
https://www.sciencedirect.com/science/article/pii/S1084804513002051?casa_token=FmDXdVZX3E
YAAAAA:OPEFKx8bFOqPxT4pXlPhYmpAjf9w53y5jWv1IDq5bBolXXuRYreSnCNFG1AoPakax
Co-PCUmEvU
[2] Lillis, D., Becker, B., O'Sullivan, T., & Scanlon, M. (2016). Current challenges and future research
areas for digital forensic investigation. arXiv preprint arXiv:1604.03850.
https://arxiv.org/pdf/1604.03850.pdf
[3] Hitchcock, B., Le-Khac, N., & Scanlon, M. (2016) Tiered Forensic Methodology Model for Digital
Field Triage by Non-Digital Evidence Specialists. Digital Investigation, 13 (S1), 03. https://www.sciencedirect.com/science/article/pii/S1742287616300044
[4] Cavanillas, J. M., Curry, E., & Wahlster, W. (2016). New horizons for a data-driven economy: a
roadmap for usage and exploitation of big data in Europe. Springer.
http://library.oapen.org/bitstream/id/b82b0e7e-d065-4711-ba4d-a97f974f605d/1002241.pdf
[5] Jin, X., Wah, B. W., Cheng, X., & Wang, Y. (2015). Significance and Challenges of Big Data
Research. Big Data Research, Vol. 2(2), 59-64.
https://www.sciencedirect.com/science/article/pii/S2214579615000076?casa_token=Fw_Lm2G0Ae0
AAAAA:KT0ggnTS9eRevNyjiVGBZnB6kMfRrxv6bafWy7A7ltAYCY5Xis-
EwTwqMb4UJUVcWl5hVO5al3Q
[6] Nelson, B., Phillips, A., & Steuart, C. (2016). Guide to computer forensics and investigations:
processing digital evidence. Cengage Learning. Boston, USA. https://college.cengage.com/information_security/course360/computer_forensics_9781133134855/eb
ook/nelson98836_1435498836_02.06_chapter06.pdf
[7] Al-Dhaqm, A., Abd Razak, S., Othman, S. H., Ali, A., Ghaleb, F. A., Rosman, A. S., &Marni, N.
(2020). Database Forensic Investigation Process Models: A Review. IEEE Access, 8, 48477-48490.
https://ieeexplore.ieee.org/stamp/stamp.jsp?arnumber=9016047
[8] Jones, J., & Etzkorn, L. (2016, March). Analysis of digital forensics live system acquisition methods
to achieve optimal evidence preservation. In SoutheastCon 2016 (pp. 1-6). IEEE.
https://ieeexplore.ieee.org/stamp/stamp.jsp?arnumber=7506709&casa_token=6R8Ce1YnpeIAAAAA:
6XIOK-mh4hEFiCKkPvS6F7vz5Cnc4zDmi8bKatPI9eNXSlotTZY5b4dT79l5EG32SxuK0W3WU
QU&tag=1
[9] Kaur, M., Kaur, N., Khurana, S. (2016). A Literature Review on Cyber Forensic and its Analysis
tools. International Journal of Advanced Research in Computer and Communication Engineering, 5(1), 23-28.
[10] Fu, X., Gao, Y., Luo, B., Du, X., &Guizani, M. (2017). Security threats to Hadoop: Data leakage
attacks and investigation. IEEE Network, 31(2), 67-71.
https://ieeexplore.ieee.org/stamp/stamp.jsp?arnumber=7827929&casa_token=VvqwjaViqYkAAAAA
:DQ2j3v6B9KRiiuNAH8EdTJSMxsOzEuvVX9c2M5E2410_PyLcFcCZKb6VkNtenur0LM-
sWt1qbjY
[11] Zuech, R., Khoshgoftaar, T. M., & Wald, R. (2015). Intrusion detection and Big Heterogeneous Data:
A Survey. Journal of Big Data, 2(1), 3. https://link.springer.com/article/10.1186/s40537-015-0013-4
[12] Javadianasl, Y., Manaf, A. A., & Zamani, M. (2017). A practical procedure for collecting more
volatile information in live investigation of botnet attack. In Multimedia Forensics and Security (pp.
381-414). Springer, Cham. https://link.springer.com/chapter/10.1007/978-3-319-44270-9_17 [13] Beebe, N. (2009). Digital forensic research: The good, the bad and the unaddressed. In IFIP
International Conference on Digital Forensics (pp. 17-36). Springer, Berlin, Heidelberg.
https://link.springer.com/content/pdf/10.1007/978-3-642-04155-6_2.pdf
[14] Bellinger, G., Castro, D., & Mills, A. (2004). Data, information, knowledge, and wisdom. https://
homepages.dcc.ufmg.br/~amendes/SistemasInformacaoTP/TextosBasicos/Data-Information-
Knowledge.pdf
[15] Ahmad, A., Hadgkiss, J., & Ruighaver, A. B. (2012). Incident response teams–Challenges in
supporting the organisational security function. Computers & Security, 31(5), 643-652.
https://www.sciencedirect.com/science/article/pii/S0167404812000624?casa_token=tDzspb2LXloAA
AAA:5PrH7ObP8JVUrjN7RZA1ocMYvF0QIfjkWRV2-4Q6l6noeVsPF7sfYCi1ZQ-
H2fG3HL56kQz9zEY
22 Computer Science & Information Technology (CS & IT)
[16] Watt, A. C., & Slay, J. (2015). First Responders Actions to cope with Volatile Digital Evidence.
International Journal of Electronic Security and Digital Forensics, 7(4), 381.
https://www.inderscienceonline.com/doi/abs/10.1504/IJESDF.2015.072182
[17] Ibrahim, N. M., Al-Nemrat, A., Jahankhani, H., & Bashroush, R. (2012). Sufficiency of Windows
Event Log as Evidence in Digital Forensics. In Global Security, Safety and Sustainability & e- Democracy (pp. 253-262) Springer, Berlin, Heidelberg.
https://repository.uel.ac.uk/download/2a0ad15d0574a2ebc4092dd59cfa017501a051f0d102b7ce8f76b
e817e43edd6/433298/Sufficiency%20of%20Windows%20Event%20log%20as%20Evidence%20in%
20Digital%20Forensics2.pdf
[18] Mouhtaropoulos, A., Li, C. T., & Grobler, M. (2014). Digital forensic readiness: are we there yet. J.
Int't Com. L. & Tech., 9, 173.
https://heinonline.org/HOL/Page?handle=hein.journals/jcolate9&div=20&g_sent=1&casa_token=my
k9ar5om1kAAAAA:gjGuq5t2tZjkJ0KoFQeTeb0OpR1xfCIxteukuDSXbMKFcLvPXoFp_vsHgmYz
OzPCzpHk-uRddg&collection=journals
[19] Kothari, C. R., & Garg, G. (2016). Research methodology: methods and techniques. New Delhi,
India: New Age International.
[20] Sahinoglu, M., Stockton, S., Morton, S., Barclay, R., & Eryilmaz, M. (2014). Assessing Digital Forensics risk: A metric survey approach. In Proceedings of the SDPS 2014 Malaysia, 19th
International Conference on Transformative Science and Engineering, Business and Social
Innovation. https://www.researchgate.net/profile/M_Sahinoglu/publication/268507819_ASSESSING
_DIGITAL_FORENSICS_RISK_A_METRIC_SURVEY_APPROACH/links/546d4ad90cf26e95bc3
cb0a0/ASSESSING-DIGITAL-FORENSICS-RISK-A-METRIC-SURVEY-APPROACH.pdf
© 2020 By AIRCC Publishing Corporation. This article is published under the Creative Commons Attribution (CC BY) license.
David C. Wyld et al. (Eds): CCSEA, BIoT, DKMP, CLOUD, NLCAI, SIPRO - 2020
pp. 23-32, 2020. CS & IT - CSCP 2020 DOI: 10.5121/csit.2020.101003
AGREEMENTS BETWEEN ENTERPRISES
DIGITIZED BY SMART CONTRACTS IN THE
DOMAIN OF INDUSTRY 4.0
Kevin Wallis, Jan Stodt, Eugen Jastremskoj and Christoph Reich
Furtwangen University of Applied Science, Germany
ABSTRACT The digital transformation of companies is expected to increase the digital interconnection
between different companies to develop optimized, customized, hybrid business models. These
cross-company business models require secure, reliable, and traceable logging and monitoring
of contractually agreed information sharing between machine tools, operators, and service
providers. This paper discusses how the major requirements for building hybrid business
models can be tackled by the blockchain for building a chain of trust and smart contracts for digitized contracts. A machine maintenance use case is used to discuss the readiness of smart
contracts for the automation of workflows defined in contracts. Furthermore, it is shown that
the number of failures is significantly improved by using these contracts and a blockchain.
KEYWORDS Blockchain, Smart Contracts, Industry 4.0, Digitized Agreements, Maintenance.
1. INTRODUCTION
The digital transformation of companies is expected to increase the digital interconnection
between different companies to develop optimized, customized, hybrid business models. These
cross-company business models require secure, reliable, and traceable logging and monitoring of contractually agreed information sharing between machine tools, operators, and service
providers. With blockchain technology, business processes can be accelerated, automated, and
secured, opening up new value-added opportunities in the context of digitalization. This is done based on the blockchain key features like immutability, distributed nodes, no need for a trusted
third party, self-execution, and accuracy. Other technologies e.g. a central database with
application programming interface (API) or a trusted third party often lack some of these
capabilities. The central database is managed by a single enterprise, which gives the enterprise a decisive advantage in a case of a dispute. Even with a trusted third party (e.g. a lawyer), an
unbiased decision cannot be ensured. Without blockchain, a basis of trust must always be created
before awarding a contract to a service provider. This is necessary because the requirements laid down in the contract can usually only be checked to a limited extent or not at all (e.g. due to lack
of logging, quality control, monitoring, etc.). The use of a blockchain does not require such a
basis of trust, because the quality controls contained in the contract must be stored in the
blockchain. Thus, a company can change a service provider without relying on a basis of trust or having to create a new basis of trust [1]. Contract compliance between companies can be
enforced by 1) collecting contract relevant data, 2) pushing it into the blockchain, and 3)
evaluating it by smart contracts. For example, machine manufacturers who give several years of warranty, would like to have more trust in how their customers are using the machines (e.g. is the
24 Computer Science & Information Technology (CS & IT)
machine always running at its limit? Is periodic maintenance adhered to?). Our paper shows different digitizable agreements and uses a maintenance use case to demonstrate the benefits of
digitized contracts. Furthermore, challenges and solutions for digitized contracts are shown.
Section 2 describes related work based on blockchain and smart contracts. Especially the first
approaches of integrating smart contracts in Industry 4.0 use cases. Operational requirements for hybrid business models like a) continuous chain of trust b) digitized contracts and c) data privacy
and data governance for digitized contracts are given in Section 3. The differentiation between
service level agreements, process level agreements, and business level agreements are done in Section 4. Section 5 contains a table with challenges and solutions for using digitized contracts. A
maintenance use case is explained in Section 6 and used in Section 7 to show the improvements
which can be achieved by using blockchain and smart contracts in comparison to traditional paper contracts. Section 8 concludes with a summary of our work.
2. RELATED WORK
Integrating a blockchain into Industry 4.0 replaces existing error-prone procedures with software
centered and documented processes [2][3]. An architectural approach for integrating a blockchain into Industry 4.0 was introduced by [4]. It proposes to use smart contracts to control resources in
the production process. IoTChain [5], a blockchain security architecture, combines the adaptive
communication environment (ACE) as an authorization framework and the object security architecture for the internet of things (OSCAR) as an encryption framework for the application
layer payload. Additional papers that target blockchain in Industry 4.0 are focusing on preserving
the privacy of data. Rahulamathavan et al. [6] use decentralized attribute-based encryption and decryption for accessing sensor values. Another access control based on smart contracts is
introduced by [7] and uses different contract types like a) access control contracts for specifying
access control of multiple subject-object pairs, b) judge contracts for evaluating user’s
misbehavior during access control and c) register contracts for managing the other contracts. Despite the opportunities for blockchain and Industry 4.0, a profound understanding of the
blockchain is essential otherwise a serious financial loss can happen [8].
While blockchain can heavily utilize the advantages of industry 4.0, many enterprises do not possess a high degree of interconnected machines and infrastructure [9].
Still, blockchain provides benefits to companies with a lower degree of utilization of industry 4.0
technology. As shown by Mushtaq et al. [10] their use-cases that provide greater transparency for consumers, a better Product Life Cycle Tracking and Tracing, and a higher degree of automation
in terms of communication by the utilization of blockchain.
Following the digitization of information of all kinds, the so-called blockchain technology is currently being used to lay the foundations for the digitalization of trust, monetary values, and
services using decentralized architectures. Beside of Bitcoin and other financial services, most
blockchain work is presently found in the area of the supply chain. For example, in the food industry, strict environmental control during transportation has to be ensured [11][12] or similar
applies to medical products [13].
There are first approaches to use blockchain technologies for smart contracts in Industry 4.0. [14] quite fundamentally describes the ideas that lie behind the present project proposal but is quite
strongly oriented towards conventional business processes and not to the connection of machines.
A web API for service level agreement (SLA) contracts was introduced by [15]. The work
focuses on an API specification for the orchestration of SLA contracts but disregards Industry 4.0 use cases where machines, sensors, etc. are part of the SLA contract. Beside Industry 4.0 [16]
discuss the use of smart contract SLAs for mobile communications providers.
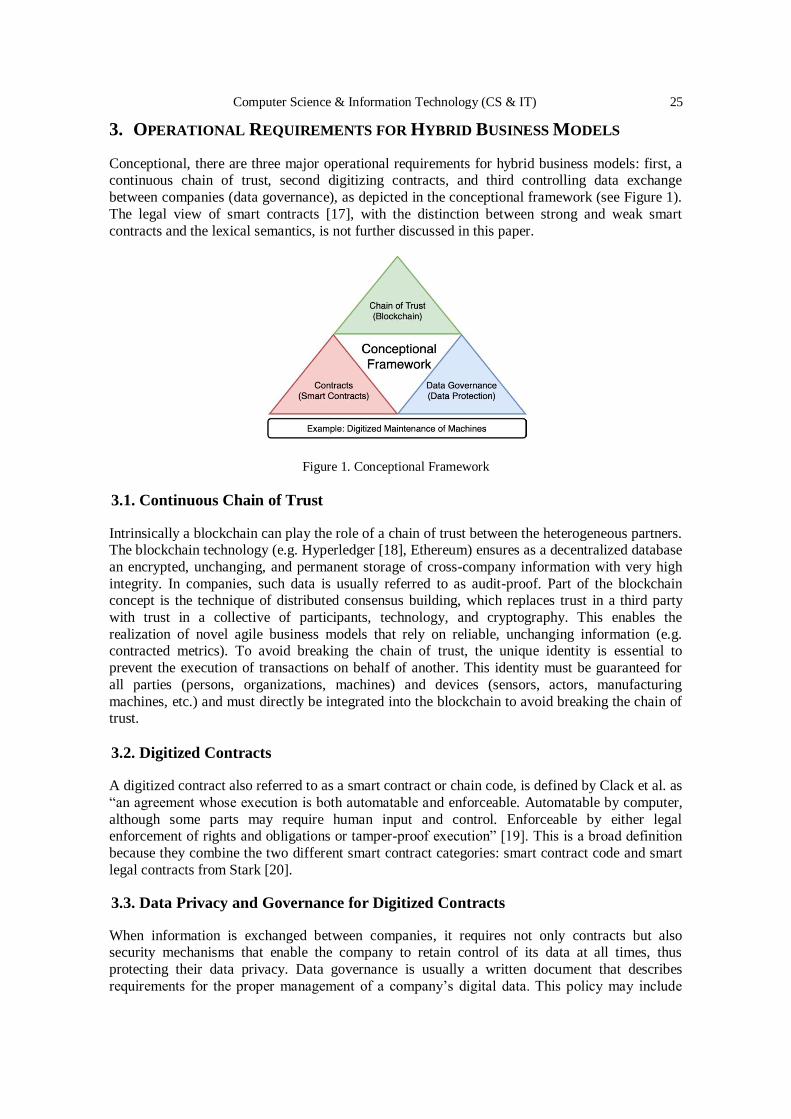
Computer Science & Information Technology (CS & IT) 25
3. OPERATIONAL REQUIREMENTS FOR HYBRID BUSINESS MODELS
Conceptional, there are three major operational requirements for hybrid business models: first, a continuous chain of trust, second digitizing contracts, and third controlling data exchange
between companies (data governance), as depicted in the conceptional framework (see Figure 1).
The legal view of smart contracts [17], with the distinction between strong and weak smart
contracts and the lexical semantics, is not further discussed in this paper.
Figure 1. Conceptional Framework
3.1. Continuous Chain of Trust
Intrinsically a blockchain can play the role of a chain of trust between the heterogeneous partners. The blockchain technology (e.g. Hyperledger [18], Ethereum) ensures as a decentralized database
an encrypted, unchanging, and permanent storage of cross-company information with very high
integrity. In companies, such data is usually referred to as audit-proof. Part of the blockchain concept is the technique of distributed consensus building, which replaces trust in a third party
with trust in a collective of participants, technology, and cryptography. This enables the
realization of novel agile business models that rely on reliable, unchanging information (e.g. contracted metrics). To avoid breaking the chain of trust, the unique identity is essential to
prevent the execution of transactions on behalf of another. This identity must be guaranteed for
all parties (persons, organizations, machines) and devices (sensors, actors, manufacturing
machines, etc.) and must directly be integrated into the blockchain to avoid breaking the chain of trust.
3.2. Digitized Contracts
A digitized contract also referred to as a smart contract or chain code, is defined by Clack et al. as
“an agreement whose execution is both automatable and enforceable. Automatable by computer,
although some parts may require human input and control. Enforceable by either legal enforcement of rights and obligations or tamper-proof execution” [19]. This is a broad definition
because they combine the two different smart contract categories: smart contract code and smart
legal contracts from Stark [20].
3.3. Data Privacy and Governance for Digitized Contracts
When information is exchanged between companies, it requires not only contracts but also security mechanisms that enable the company to retain control of its data at all times, thus
protecting their data privacy. Data governance is usually a written document that describes
requirements for the proper management of a company’s digital data. This policy may include
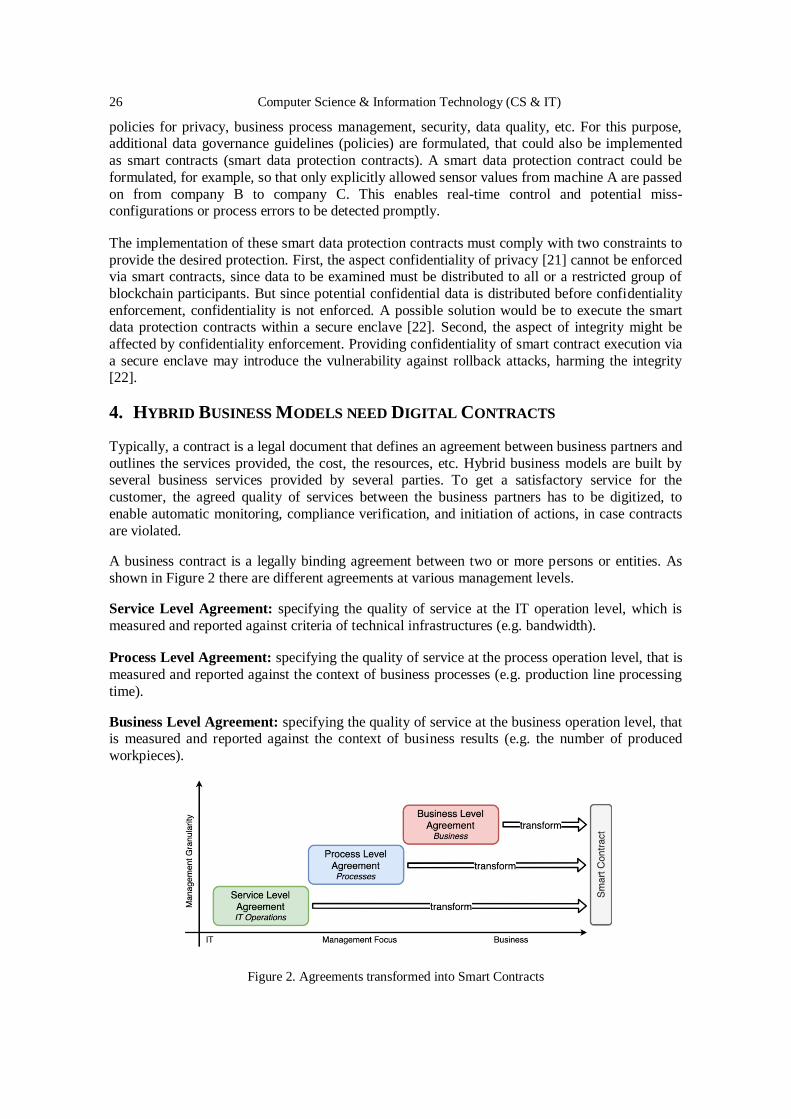
26 Computer Science & Information Technology (CS & IT)
policies for privacy, business process management, security, data quality, etc. For this purpose, additional data governance guidelines (policies) are formulated, that could also be implemented
as smart contracts (smart data protection contracts). A smart data protection contract could be
formulated, for example, so that only explicitly allowed sensor values from machine A are passed
on from company B to company C. This enables real-time control and potential miss-configurations or process errors to be detected promptly.
The implementation of these smart data protection contracts must comply with two constraints to
provide the desired protection. First, the aspect confidentiality of privacy [21] cannot be enforced via smart contracts, since data to be examined must be distributed to all or a restricted group of
blockchain participants. But since potential confidential data is distributed before confidentiality
enforcement, confidentiality is not enforced. A possible solution would be to execute the smart data protection contracts within a secure enclave [22]. Second, the aspect of integrity might be
affected by confidentiality enforcement. Providing confidentiality of smart contract execution via
a secure enclave may introduce the vulnerability against rollback attacks, harming the integrity [22].
4. HYBRID BUSINESS MODELS NEED DIGITAL CONTRACTS
Typically, a contract is a legal document that defines an agreement between business partners and
outlines the services provided, the cost, the resources, etc. Hybrid business models are built by several business services provided by several parties. To get a satisfactory service for the
customer, the agreed quality of services between the business partners has to be digitized, to
enable automatic monitoring, compliance verification, and initiation of actions, in case contracts
are violated.
A business contract is a legally binding agreement between two or more persons or entities. As
shown in Figure 2 there are different agreements at various management levels.
Service Level Agreement: specifying the quality of service at the IT operation level, which is
measured and reported against criteria of technical infrastructures (e.g. bandwidth).
Process Level Agreement: specifying the quality of service at the process operation level, that is
measured and reported against the context of business processes (e.g. production line processing
time).
Business Level Agreement: specifying the quality of service at the business operation level, that is measured and reported against the context of business results (e.g. the number of produced
workpieces).
Figure 2. Agreements transformed into Smart Contracts
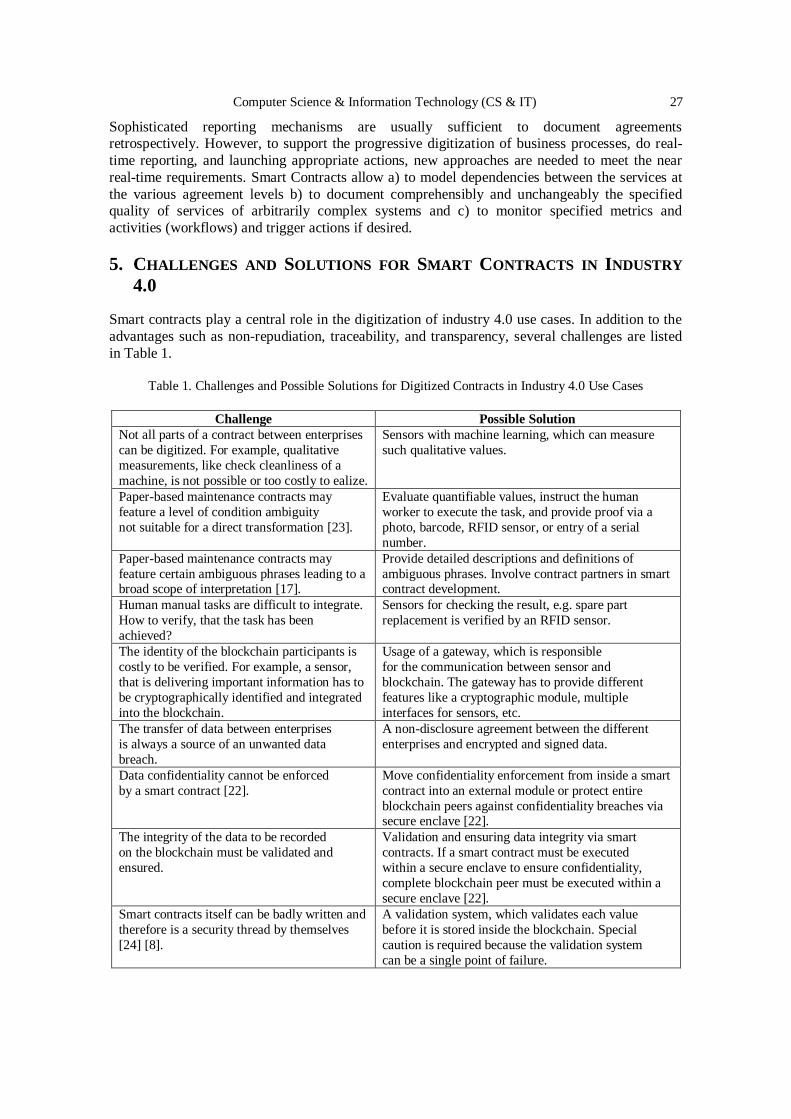
Computer Science & Information Technology (CS & IT) 27
Sophisticated reporting mechanisms are usually sufficient to document agreements retrospectively. However, to support the progressive digitization of business processes, do real-
time reporting, and launching appropriate actions, new approaches are needed to meet the near
real-time requirements. Smart Contracts allow a) to model dependencies between the services at
the various agreement levels b) to document comprehensibly and unchangeably the specified quality of services of arbitrarily complex systems and c) to monitor specified metrics and
activities (workflows) and trigger actions if desired.
5. CHALLENGES AND SOLUTIONS FOR SMART CONTRACTS IN INDUSTRY
4.0
Smart contracts play a central role in the digitization of industry 4.0 use cases. In addition to the
advantages such as non-repudiation, traceability, and transparency, several challenges are listed
in Table 1.
Table 1. Challenges and Possible Solutions for Digitized Contracts in Industry 4.0 Use Cases
Challenge Possible Solution
Not all parts of a contract between enterprises
can be digitized. For example, qualitative
measurements, like check cleanliness of a
machine, is not possible or too costly to ealize.
Sensors with machine learning, which can measure
such qualitative values.
Paper-based maintenance contracts may
feature a level of condition ambiguity
not suitable for a direct transformation [23].
Evaluate quantifiable values, instruct the human
worker to execute the task, and provide proof via a
photo, barcode, RFID sensor, or entry of a serial
number.
Paper-based maintenance contracts may
feature certain ambiguous phrases leading to a broad scope of interpretation [17].
Provide detailed descriptions and definitions of
ambiguous phrases. Involve contract partners in smart contract development.
Human manual tasks are difficult to integrate.
How to verify, that the task has been
achieved?
Sensors for checking the result, e.g. spare part
replacement is verified by an RFID sensor.
The identity of the blockchain participants is
costly to be verified. For example, a sensor,
that is delivering important information has to
be cryptographically identified and integrated
into the blockchain.
Usage of a gateway, which is responsible
for the communication between sensor and
blockchain. The gateway has to provide different
features like a cryptographic module, multiple
interfaces for sensors, etc.
The transfer of data between enterprises
is always a source of an unwanted data
breach.
A non-disclosure agreement between the different
enterprises and encrypted and signed data.
Data confidentiality cannot be enforced
by a smart contract [22].
Move confidentiality enforcement from inside a smart
contract into an external module or protect entire
blockchain peers against confidentiality breaches via secure enclave [22].
The integrity of the data to be recorded
on the blockchain must be validated and
ensured.
Validation and ensuring data integrity via smart
contracts. If a smart contract must be executed
within a secure enclave to ensure confidentiality,
complete blockchain peer must be executed within a
secure enclave [22].
Smart contracts itself can be badly written and
therefore is a security thread by themselves
[24] [8].
A validation system, which validates each value
before it is stored inside the blockchain. Special
caution is required because the validation system
can be a single point of failure.
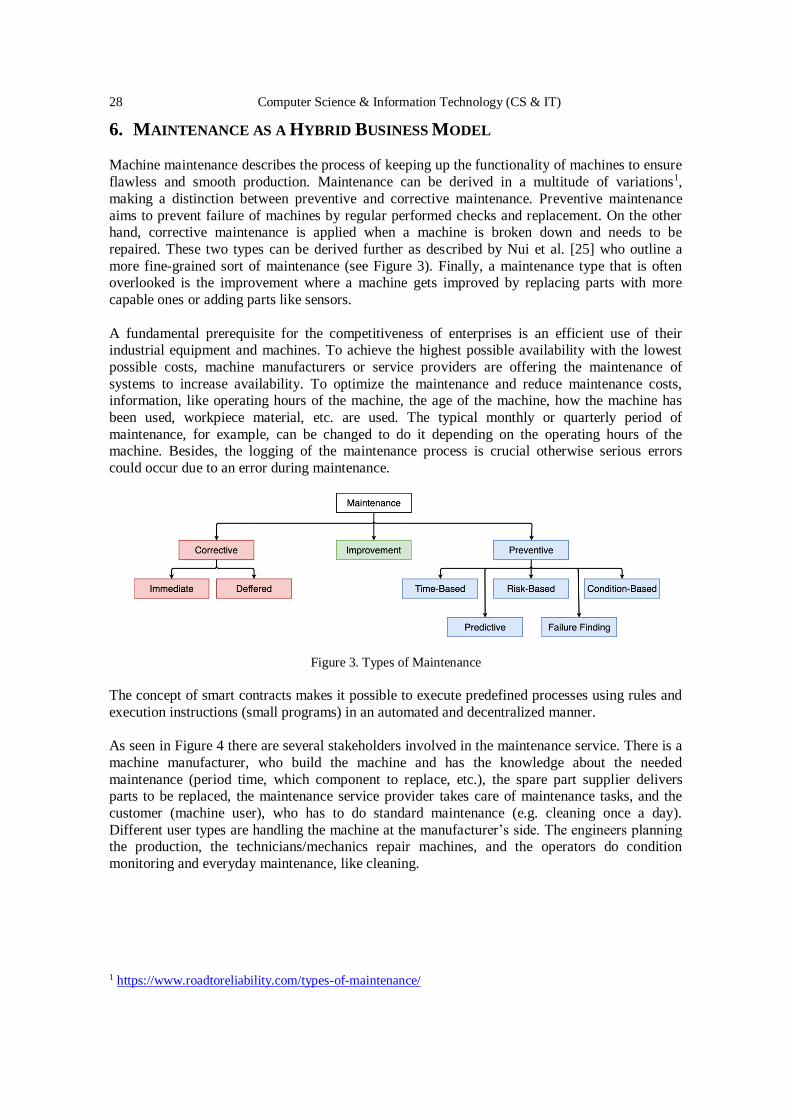
28 Computer Science & Information Technology (CS & IT)
6. MAINTENANCE AS A HYBRID BUSINESS MODEL
Machine maintenance describes the process of keeping up the functionality of machines to ensure
flawless and smooth production. Maintenance can be derived in a multitude of variations1,
making a distinction between preventive and corrective maintenance. Preventive maintenance
aims to prevent failure of machines by regular performed checks and replacement. On the other hand, corrective maintenance is applied when a machine is broken down and needs to be
repaired. These two types can be derived further as described by Nui et al. [25] who outline a
more fine-grained sort of maintenance (see Figure 3). Finally, a maintenance type that is often overlooked is the improvement where a machine gets improved by replacing parts with more
capable ones or adding parts like sensors.
A fundamental prerequisite for the competitiveness of enterprises is an efficient use of their industrial equipment and machines. To achieve the highest possible availability with the lowest
possible costs, machine manufacturers or service providers are offering the maintenance of
systems to increase availability. To optimize the maintenance and reduce maintenance costs, information, like operating hours of the machine, the age of the machine, how the machine has
been used, workpiece material, etc. are used. The typical monthly or quarterly period of
maintenance, for example, can be changed to do it depending on the operating hours of the machine. Besides, the logging of the maintenance process is crucial otherwise serious errors
could occur due to an error during maintenance.
Figure 3. Types of Maintenance
The concept of smart contracts makes it possible to execute predefined processes using rules and
execution instructions (small programs) in an automated and decentralized manner.
As seen in Figure 4 there are several stakeholders involved in the maintenance service. There is a
machine manufacturer, who build the machine and has the knowledge about the needed
maintenance (period time, which component to replace, etc.), the spare part supplier delivers parts to be replaced, the maintenance service provider takes care of maintenance tasks, and the
customer (machine user), who has to do standard maintenance (e.g. cleaning once a day).
Different user types are handling the machine at the manufacturer’s side. The engineers planning the production, the technicians/mechanics repair machines, and the operators do condition
monitoring and everyday maintenance, like cleaning.
1 https://www.roadtoreliability.com/types-of-maintenance/
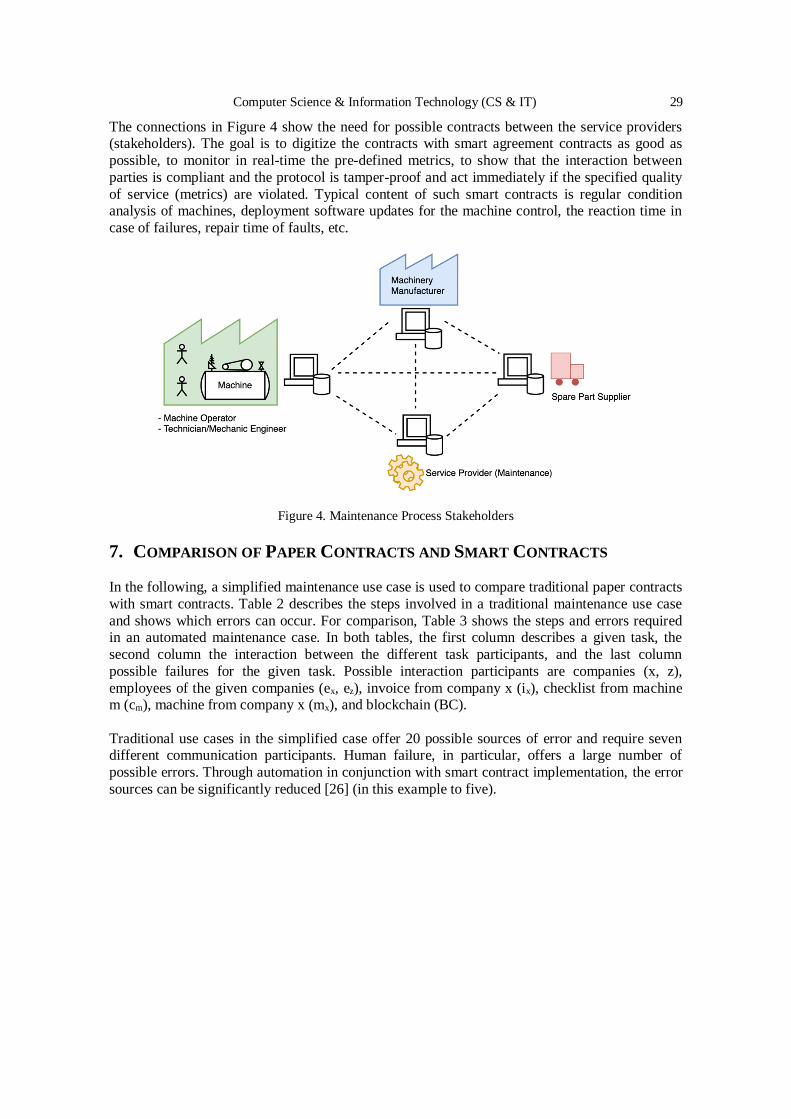
Computer Science & Information Technology (CS & IT) 29
The connections in Figure 4 show the need for possible contracts between the service providers (stakeholders). The goal is to digitize the contracts with smart agreement contracts as good as
possible, to monitor in real-time the pre-defined metrics, to show that the interaction between
parties is compliant and the protocol is tamper-proof and act immediately if the specified quality
of service (metrics) are violated. Typical content of such smart contracts is regular condition analysis of machines, deployment software updates for the machine control, the reaction time in
case of failures, repair time of faults, etc.
Figure 4. Maintenance Process Stakeholders
7. COMPARISON OF PAPER CONTRACTS AND SMART CONTRACTS
In the following, a simplified maintenance use case is used to compare traditional paper contracts
with smart contracts. Table 2 describes the steps involved in a traditional maintenance use case
and shows which errors can occur. For comparison, Table 3 shows the steps and errors required in an automated maintenance case. In both tables, the first column describes a given task, the
second column the interaction between the different task participants, and the last column
possible failures for the given task. Possible interaction participants are companies (x, z),
employees of the given companies (ex, ez), invoice from company x (ix), checklist from machine m (cm), machine from company x (mx), and blockchain (BC).
Traditional use cases in the simplified case offer 20 possible sources of error and require seven different communication participants. Human failure, in particular, offers a large number of
possible errors. Through automation in conjunction with smart contract implementation, the error
sources can be significantly reduced [26] (in this example to five).
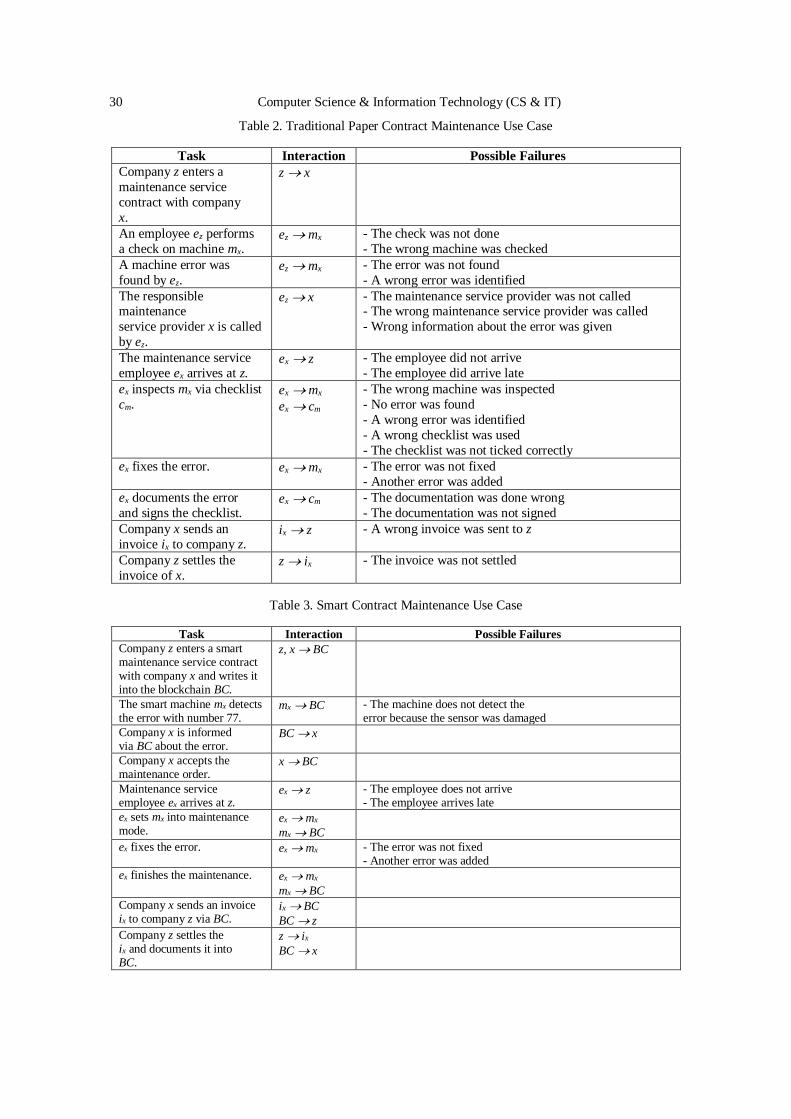
30 Computer Science & Information Technology (CS & IT)
Table 2. Traditional Paper Contract Maintenance Use Case
Task Interaction Possible Failures
Company z enters a
maintenance service
contract with company
x.
z x
An employee ez performs
a check on machine mx. ez mx - The check was not done
- The wrong machine was checked
A machine error was
found by ez. ez mx - The error was not found
- A wrong error was identified
The responsible maintenance
service provider x is called
by ez.
ez x - The maintenance service provider was not called - The wrong maintenance service provider was called
- Wrong information about the error was given
The maintenance service
employee ex arrives at z. ex z - The employee did not arrive
- The employee did arrive late
ex inspects mx via checklist
cm. ex mx
ex cm
- The wrong machine was inspected
- No error was found
- A wrong error was identified
- A wrong checklist was used
- The checklist was not ticked correctly
ex fixes the error. ex mx - The error was not fixed
- Another error was added
ex documents the error
and signs the checklist. ex cm - The documentation was done wrong
- The documentation was not signed
Company x sends an
invoice ix to company z. ix z - A wrong invoice was sent to z
Company z settles the
invoice of x. z ix - The invoice was not settled
Table 3. Smart Contract Maintenance Use Case
Task Interaction Possible Failures
Company z enters a smart maintenance service contract with company x and writes it into the blockchain BC.
z, x BC
The smart machine mx detects the error with number 77.
mx BC - The machine does not detect the error because the sensor was damaged
Company x is informed via BC about the error.
BC x
Company x accepts the maintenance order.
x BC
Maintenance service employee ex arrives at z.
ex z - The employee does not arrive - The employee arrives late
ex sets mx into maintenance mode.
ex mx
mx BC
ex fixes the error. ex mx - The error was not fixed - Another error was added
ex finishes the maintenance. ex mx
mx BC
Company x sends an invoice ix to company z via BC.
ix BC
BC z
Company z settles the ix and documents it into BC.
z ix
BC x
Computer Science & Information Technology (CS & IT) 31
8. CONCLUSION
The paper has shown a concept of how blockchain and smart contracts can be used to support a
well-defined, reliable, traceable interaction of the enterprises to build hybrid business models. It
has been shown that the blockchain technology with smart contracts does have great potential to
transform the business interaction between companies. Through their intrinsic tamper-proof data storage, their established chain of trust between parties without a central clearing organization,
and their possibility to specify contracts for modeling they perfectly fit into the Industry 4.0
domain. Besides, workflow and actions formerly defined in paper contracts between companies can be defined with smart contracts that lead to software supported automatized cross-company
interaction processes. Despite the advantages, there are still some challenges (see Section 5) such
as lack of total contract digitization, scalability, secure incorporation of external information, data
privacy protection, access management, etc.
ACKNOWLEDGEMENTS This work has received funding from European Funds for Regional Development (EFRE) and the
Ministries for Research of Baden-Württemberg (MWK) in the context of the project BISS 4.0
(biss40.in.hs-furtwangen.de).
REFERENCES
[1] B. Waltl, et al. Blockchains and Smart Contracts: A Threat for the Legal Industry? in Business
Transformation through Blockchain. Palgrave Macmillan, Cham, 2019. S. 287-315.
[2] N. Kshetri, “Can blockchain strengthen the internet of things?” IT Professional, vol. 19, no. 4, pp.
68–72, 2017.
[3] K. Christidis and M. Devetsikiotis, “Blockchains and smart contracts for the internet of things” IEEE
Access, vol. 4, pp. 2292–2303, 2016.
[4] N. Teslya and I. Ryabchikov, “Blockchain-based platform architecture for industrial iot” in 2017 21st
Conference of Open Innovations Association (FRUCT), pp. 321–329, 11 2017. [5] O. Alphand, M. Amoretti, T. Claeys, S. Dall’Asta, A. Duda, G. Ferrari, F. Rousseau, B. Tourancheau,
L. Veltri, and F. Zanichelli, “Iotchain: A blockchain security architecture for the internet of things” in
2018 IEEE Wireless Communications and Networking Conference (WCNC), pp. 1–6, 4 2018.
[6] Y. Rahulamathavan, R. C. W. Phan, M. Rajarajan, S. Misra, and A. Kondoz, “Privacy-preserving
blockchain based iot ecosystem using attribute-based encryption” in 2017 IEEE International
Conference on Advanced Networks and Telecommunications Systems (ANTS), pp. 1–6, 12 2017.
[7] Y. Zhang, S. Kasahara, Y. Shen, X. Jiang, and J. Wan, “Smart contract-based access control for the
internet of things” IEEE Internet of Things Journal, pp. 1–1, 2018.
[8] G. Destefanis, M. Marchesi, M. Ortu, R. Tonelli, A. Bracciali, and R. Hierons, “Smart contracts
vulnerabilities: a call for blockchain software engineering?” in 2018 International Workshop on
Blockchain Oriented Software Engineering (IWBOSE), pp. 19–25, 3 2018.
[9] VDE, “Wie schätzen Sie den Entwicklungsstand Deutschlands bei Industrie 4.0 ein?” 2019. Retrieved from https://de.statista.com/statistik/daten/studie/1013642/umfrage/umfrage-zum-entwicklungsstand-
der-industrie-4-0-in-deutschland/
[10] A. Mushtaq and I. U. Haq, “Implications of blockchain in industry 4.o” in 2019 International
Conference on Engineering and Emerging Technologies (ICEET), pp. 1–5, Feb 2019.
[11] M. P. Caro, M. S. Ali, M. Vecchio, and R. Giaffreda, “Blockchain-based traceability in agri-food
supply chain management: A practical implementation” in 2018 IoT Vertical and Topical Summit on
Agriculture - Tuscany (IOT Tuscany), pp. 1–4, 5 2018.
[12] F. Tian, “A supply chain traceability system for food safety based on haccp, blockchain internet of
things” in 2017 International Conference on Service Systems and Service Management, pp. 1–6, 6
2017.
32 Computer Science & Information Technology (CS & IT)
[13] T. Bocek, B. B. Rodrigues, T. Strasser, and B. Stiller, “Blockchains everywhere – a use-case of
blockchains in the pharma supply-chain” in 2017 IFIP/IEEE Symposium on Integrated Network and
Service Management (IM), pp. 772–777, 5 2017.
[14] A. Norta, “Creation of smart-contracting collaborations for decentralized autonomous organizations”
in Perspectives in Business Informatics Research - 14th International Conference, BIR 2015, Tartu, Estonia, August 26-28, 2015, Proceedings, pp. 3–17, 2015.
[15] H. Nakashima and M. Aoyama, “An automation method of SLA contract of web APIs and its
platform based on blockchain concept,” in 2017 IEEE International Conference on Cognitive
Computing (ICCC), pp. 32–39, 6 2017.
[16] E. D. Pascale, J. McMenamy, I. Macaluso, and L. Doyle, “Smart contract SLAs for dense small-cell-
as-a-service” CoRR, vol. abs/1703.04502, 2017.
[17] M. Raskin, “The law of smart contracts,” SSRN Electronic Journal, 2016.
[18] Androulaki, E., Barger, A., Bortnikov, V., Cachin, C., Christidis, K., De Caro, A., ... & Muralidharan,
S. (2018, April). Hyperledger fabric: a distributed operating system for permissioned blockchains. In
Proceedings of the Thirteenth EuroSys Conference (pp. 1-15).
[19] C. D. Clack, V. A. Bakshi, and L. Braine, “Smart contract templates: foundations, design landscape
and research directions,” 2016. [20] J. Stark, “Making Sense of Blockchain Smart Contracts,” 2016. Retrieved from
https://www.coindesk.com/making-sense-smart-contracts
[21] Solove, Daniel J., A Taxonomy of Privacy. University of Pennsylvania Law Review, Vol. 154, No. 3,
p. 477, January 2006; GWU Law School Public Law Research Paper No. 129.
[22] M. Brandenburger, C. Cachin, R. Kapitza, and A. Sorniotti, “Blockchain and trusted computing:
Problems, pitfalls, and a solution for hyperledger fabric”
[23] Mattila, Juri, 2016. "The Blockchain Phenomenon – The Disruptive Potential of Distributed
Consensus Architectures," ETLA Working Papers 38, The Research Institute of the Finnish
Economy.
[24] N. Atzei, M. Bartoletti, and T. Cimoli, “A survey of attacks on ethereum smart contracts sok,” in
Proceedings of the 6th International Conference on Principles of Security and Trust - Volume 10204, (New York, NY, USA), pp. 164–186, Springer-Verlag New York, Inc., 2017.
[25] G. Niu and M. Pecht, “A framework for cost-effective and accurate maintenance combining cbm rcm
and data fusion,” pp. 605 – 611, 08 2009.
[26] Allam, Z. (2018). On smart contracts and organisational performance: A review of smart contracts
through the blockchain technology. Review of Economic and Business Studies, 11(2), 137-156.
© 2020 By AIRCC Publishing Corporation. This article is published under the Creative Commons
Attribution (CC BY) license.
David C. Wyld et al. (Eds): CCSEA, BIoT, DKMP, CLOUD, NLCAI, SIPRO - 2020
pp. 33-50, 2020. CS & IT - CSCP 2020 DOI: 10.5121/csit.2020.101004
INTEGRATION OF SAFETY MEANS WITH
FUNCTIONS OF BLOCKCHAIN IN MULTI-LAYERED ARCHITECTURE OF IOT FOR SAFER
DATA TRANSMISSION PROCEDURES
Raimundas Savukynas
Institute of Data Science and Digital Technologies,
Vilnius University, Vilnius, Lithuania
ABSTRACT The launching and linking process of heterogeneous objects to the Internet of Things (IoT) is
related to some important problems of the identification, authentication for ensuring safety over
the wireless connections. The possibilities of connections to the IoT differ in a broad spectrum
of different equipment, the functionality of objects, communication protocols, etc. This research
study is related to the implementation of safeguard algorithms on the first stages of object
identification and authentication before the permission stage for launching into the working
area of the IoT. The application domain is related to the requirements for the safety of the multi-
layered infrastructure of objects by linking to the whole IoT. Such infrastructure became more
complex according to the risks of very unsafe possibilities. The aim of this research is to
evaluate some safety means related to the identification and authentication stages of objects by
integrating them with the functionality of blockchain. The objectives of this research are related to the development of more safety working algorithms by representing the stages of checking of
the identity of objects. The results demonstrated integration possibilities of implementing the
blockchain functionality for establishing and managing the operational rules for pre-connection
stages of objects to the IoT. The paper shows new results of developing protection means for
ensuring reliable communication in the transmission of outgoing confidential data and
transmission data integrity from different smart objects. As a result, components of necessary
functional capabilities of the communication of IoT are developed by intending to ensure the
safety and reliability of the wireless connection of objects.
KEYWORDS Internet of Things (IoT), data transferring, smart environment, safety means, distributed
databases.
1. INTRODUCTION
The research area is related to the problems of solving of more secure communication and data transferring process of IoT on the stages of identification and authentications of smart objects.
The communication of objects in the IoT environment is often interfering with some disturbances
and unsafety threats under the wireless and smart conditions. The insecurity can occur when disturbing radio communication channels, inserting fake network nodes, performing unsafe
actions with sending data aggregation, implementing of the authorizing information changes in
the network [11], [24], [42], [43], [51]. The violations can occur when the exhausts of energy supply occur during attacks. The essential aspects of safety are the privacy and safety of
transferring processes when data scanned from the smart equipment [52]. The smart sensors are
34 Computer Science & Information Technology (CS & IT)
working on wireless networking background and can be easily applied for unauthorized activities. The smart sensors have possibilities for the provision of unsafety and dangerous actions with the
secret data implementation. The creation of a trusting and intelligent environment, internet-based
items of things are required for secure and intellectual services. The objects have equipped with
smart decision-makers, interacting agents. The IoT itself can act as a large multi-agent system, as well. One of the most critical issues currently being addressed is the development of multi-agent
systems for control of embedded smart environments by ensuring the safety of systems through
the interface. The intelligent environment should be backgrounded to ensure the safer operations of integrated into the IoT heterogenic objects and support more safety communication. The
implementation of intelligence elements in the system could exploit the recently-expanded multi-
agent systems [1], [2], [13], [19], [37].
The possibility of integration of safety means with blockchain functions described in this paper
by proposing the extension of obtaining algorithms, which help avoid some types of IoT risks.
The spectrum of threats has a variety of possibilities, and the detection process became complicated. The experimentation with the concrete simulation modeling environment has
restrictions on the detection of hazardous activities. But some types of risks are described as
flood or de-synchronization attacks, which can be carried out and revealed by [54]. The safety requirements vary significantly from the scope of functional possibilities of integrating objects.
The requirements, according to the Internet Protocol for Smart Objects (IPSO) Alliance, can help
in developing secure communication of smart objects [49].
The approach is based on the multi-layered structure of identification and authentication of IoT
objects by implementing some functions of the blockchain technology to search, record and
delete data, as the black box with the implementation of outside functions of the blockchain. The objects have to interact in a smart environment of IoT only on the application level [32]. The
protocols ensure access to information of authorized users, reliability of the messages between
senders and receivers, and transmission of the data at any time [18]. Some types of vertical safety means are analyzed. The results of using blockchain methods for safety communication described
on the level of step-wise algorithm development to ensure safer communication between IoT
objects in their data transferring process [55]. Another critical factor is the impact of safety
methods, which are implementing in the creating of safety techniques [6] for safer IoT by providing structures for more safety mechanisms. The safety should be ensured at all levels of the
protocols and middleware.
The analysis performed how the object integration stacks and protocols have to be created to
ensure the maximum level of protection, and based on the defined guidelines, a method of IoT
objects identification and authentication was developed in the Fog computing layer by using functions of blockchain technology. The open-source systems and tools have selected for the
method, which allows the developed prototype to be transferred to cloud or virtualization
platforms and used for functionality development [30]. The architecture is modular, supports the
possibility of extensibility of functions, and allows adding new specialized servers or containers to the fog layer. The information received during message processing from the objects is
transmitted to the aggregation servers, systems, or applications to perform further operations with
the received data. The use of the representational state transfer (REST) application interface (API) server allows operations to be performed in a blockchain, so new system components can
use defined API references to provide additional functionality. The ability to receive AMQP
messages in the RabbitMQ broker also implemented, but this broker can also receive messages sent using the MQTT and STOMP protocols. This method is not adaptive to the IoT objects,
which requires additional manual configuration.
Computer Science & Information Technology (CS & IT) 35
2. RELATED WORKS
The safety dimension is a key issue for developing of smart environments of IoT, especially
considering the means for the protection of this environment, because integrated objects and
control software have possibilities to interact with people and other objects in the environment.
Therefore, it is necessary to ensure safety between the IoT objects for equipment safer and reliable communication, but also to ensure safety in the sense of the intelligent environment [59].
The information safety model typically consists of three components proposed [33] as
confidentiality, integrity, and availability (CIA). Although this model has traditionally used in conventional systems, it is also fully suited to intelligent environments for online content control
systems. Confidentiality ensures that information is available to authorized users [50]. As a
general rule, confidentiality is realized by blocking information or restricting access to this
information [35]. Integrity ensures that the data has not been changed without their author’s knowledge. Integrity realized using special message integrity codes (so-called hash codes) that
allow the message recipient to determine whether it has been changed. Accessibility means that
information is available whenever needed. To ensure availability, the system itself must be resistant to various internal errors, failures, and external attacks such as denial-of-service (DoS).
As [23] points out, looking at open systems interconnection (OSI) protocol stack levels in
practice for every level, there are several threats and attack types:
• at the physical level the Internet of Things objects are susceptible to interference and data
packet analysis;
• at the communication level, you can use the MAC protocol for vulnerable causing conflict
at the physical level, unloading the batteries of the IoT objects, or simply contaminating the
channel so that it is impossible to communicate;
• at the routing level, you can perform: blackhole attacks, at the routing level, you can
perform: blackhole attacks, creating network segments where packets are lost.
The wormhole attacks are described in [22], when network nodes are cheated and do not perform
standard routing searches, thus preventing important data forwarding, and spoofing attacks when
the sender does not pretend to be another person or the IoT object than is a real. The selective forwarding does not reach addressee malicious network nodes pretend to be real network nodes
by filtering out certain data packets. The sinkhole attacks are described in [12] when malicious
nodes collect data from neighboring nodes by preventing the recipient from receiving packets. The mechanisms of the attacks on flooding “hello” messages described by [58].
An essential aspect of safety is the privacy of people and organizations, as smart environments
are immediately embedded in people’s living or working environments that can be directly used to collect illegal and secret data on the surrounding environment. The blockchain is used and
adapted for their particular properties. The researchers agree [16] that blockchains and networks
have distinctive properties and can be used in various applications. The most frequently mentioned and most important advantages of the blockchain [9]:
• accountability - information written into blocks and blocks are chained together, data already recorded cannot be deleted, and data stored in the blockchain can be traced;
• integrity - each node in a blockchain network has a complete copy of the blockchain, so
even if the data stored in one or more nodes is changed, the other nodes do not recognize these changes, and which is impractical;
36 Computer Science & Information Technology (CS & IT)
• availability - since a blockchain network distributed and the same information stored on all nodes, once one or more nodes fail, the network can continue to function - all you need to
do is read and write to another node;
• confidence - new information is added to the blockchain only when some or most of the network nodes agree on the information to be recorded, using consensus algorithms;
• access - when a network made up of multiple nodes, it can connect to the node to access the information stored on it, thus ensuring fast data access;
• privacy - depending on the application of blockchains, a high level of privacy can be maintained for network users, since it is sufficient to have a pair of cryptographic keys to
participate in network activities.
The blockchain network types divided into open and closed [41]. The difference between them who can read the information and add new blocks to the chain. The open blockchain networks
used for cryptocurrencies such as Bitcoin [31], Ethereum [4], Zcash [28], Ethereum Smart
Contracts [14]. These networks can be accessed by anyone who wants and has the necessary physical and software connections. The participants can “dig” a network currency, create
transactions, and transfer money. The open blockchain networks cannot be censored because you
need to allocate computing resources, buy currency, or it’s equivalent in the network [45]. As mentioned, the integrity of such blockchain networks ensured through consensus protocols.
The access to closed blockchain networks is restricted, and access is granted only for participants.
These blockchain networks can be divided into two groups: public and private [36]. In situations
where one has to control who can write to the blockchain, and everyone is allowed to read, it is used in public closed networks. For example, public authorities may store financial or job
statements on a blockchain network for transparency purposes and allow the public to view
important information, but only employees of the authority are authorized to enter it. When information stored on the blockchain requires access to both read and write, private closed
networks are used. In the closed blockchain, nodes with known and trusted identities have the
right to process transactions in private blockchain networks, eliminating the need to use PoW or
other algorithms to build consensus. In this case, the incentive to process transactions and build blocks is not an obligation, an agreement, or benefit, rather than seeking the cryptocurrency [21].
3. DEVELOPMENT OF CHECKING ALGORITHM FOR SAFER CONNECTION
OF OBJECTS INTO THE IOT INFRASTRUCTURE
The proposed algorithm of expression of the extended functionality of the checking process of
objects before their connection to the IoT environment is developed with the implementation of
safety procedures presented in Figure 1. The blockchain is an append-only database maintained
in a distributed fashion by the nodes in the peer to peer (P2P) network. The P2P function implies that there is no central control, and all nodes can communicate directly with each other using an
appropriate protocol, allowing for transactions to be exchanged among the peers. Following the
recommendations of representation of the hierarchical structure of the blockchain working structure that consisting of four layers, as provided [38]:
• network layer is the bottom layer of computing nodes guarantees that the system can work
and ensuring communication blockchain nodes in a decentralized way;
• protocol layer consists of fundamental blockchain technologies, such as consensus
algorithms, cryptology methods, and ensures that the system works properly;
Computer Science & Information Technology (CS & IT) 37
• ledger layer is responsible for the primary blockchain mission by transmitting transactions securely and assures that system functions are working correctly;
• application layer provides APIs for the usability of the object’s and is responsible for
interaction with the blockchain system when needed for the business logic.
The identification and authentication process starts when the object initializes the process of data
transmission. The data from object Oi,j,k, transmitted to the Fog layer of the whole architecture. The process of registering and recognizing the object Oi,j,k, is analyzed in a detailed manner.
There are important identifiers of Oi,j,k, where i is the identifier of equipment, j is an authentic
index of the object, and k indicates the functional status of the object. On the stage of registration object Oi,j,k sends a message to the message broker in the Fog layer, which forwards the message
for processing. An object Oi,j,k identifier i consists of the least two variables i={i1,i2}, where:
• i1 – variable represents the unidirectional function of object hardware;
• i2 – variable represents of usage of a physical unclonable function (PUF).
The fog object receives a message from the object and applies it to the blockchain using an API
with a request to verify the object’s identity. In the previously proposed structures of recognition
of objects at the registration stage [39], were proposed the obtaining process only for checking of the object identifier matching with the registering information in the blockchain. Then data
transmitted in the Fog layer for running processes, some checking procedures are included in the
recognition process of the proposed algorithm of the object’s connection before starting the work
process in the IoT environment. The necessary steps needed in the verification procedures for increased safety to start work with a connected object. These three checking procedures are:
• procedure ISCS – is responsible for checking registration conditions of identifier Oi,j,k;
• procedure ACSS – is responsible for checking of authentication conditions;
• procedure SCSS – is responsible for checking of conditions of safety means.
If such types of conditions are not satisfied, the object Oi,j,k removed from the environment, and
some activities performed to informing about the unsafety conditions of Oi,j,k, which forwarded to the stage of removal of the object from the IoT environment.
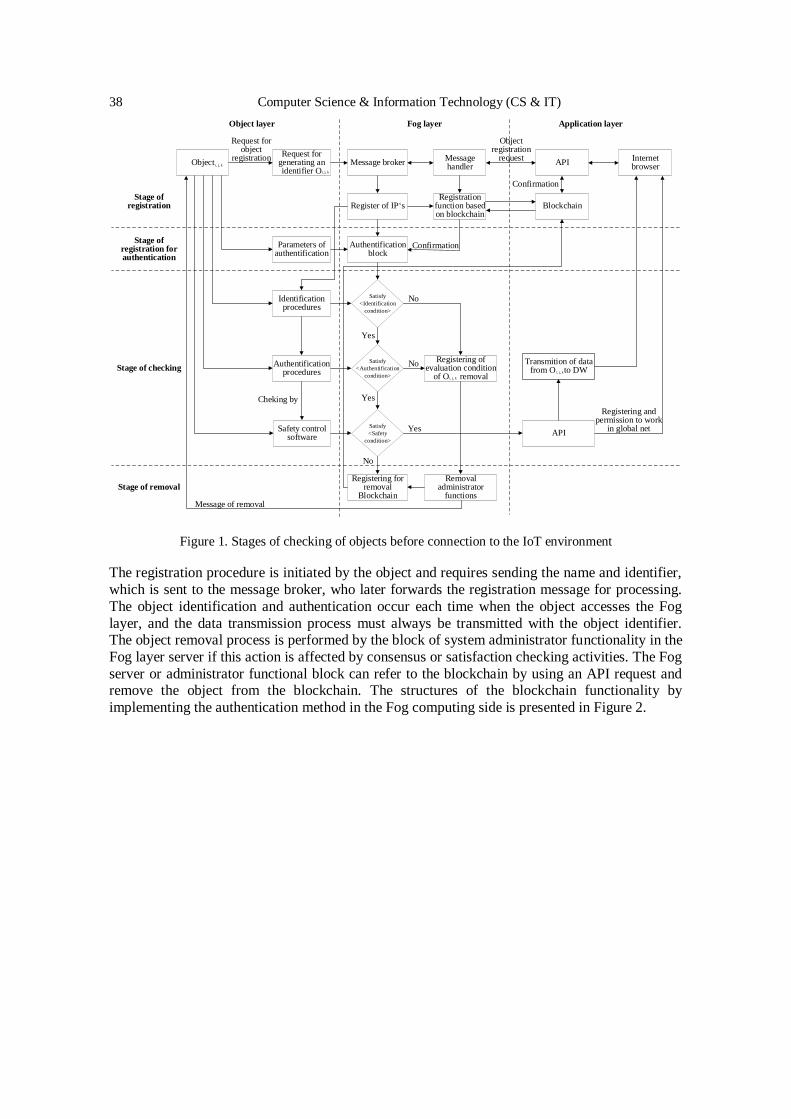
38 Computer Science & Information Technology (CS & IT)
ObjectRequest for
generating an identifier O
i, j, k Message brokerMessage handler
APIInternet browser
Stage of registration
i, j, k
Request forobject
registration
Objectregistration
request
Application layerFog layer
Confirmation
Register of IP sRegistration
function based on blockchain
Authentification block
Parameters of authentification
Stage of registration for authentication
Stage of checking
Satisfy
<Identification
condition>
Satisfy
<Authentification
condition>
Identification procedures
Authentification procedures
Safety control software
Yes
Registering of evaluation condition
of O removali, j, k
No
No
Removal administrator
functions
Registering for removal
BlockchainMessage of removal
Registering and permission to work
in global net
Blockchain
Confirmation
Object layer
Transmition of data from O to DWi, j, k
Stage of removal
Satisfy
<Safety
condition>
No
APIYes
YesCheking by
Figure 1. Stages of checking of objects before connection to the IoT environment
The registration procedure is initiated by the object and requires sending the name and identifier,
which is sent to the message broker, who later forwards the registration message for processing.
The object identification and authentication occur each time when the object accesses the Fog
layer, and the data transmission process must always be transmitted with the object identifier. The object removal process is performed by the block of system administrator functionality in the
Fog layer server if this action is affected by consensus or satisfaction checking activities. The Fog
server or administrator functional block can refer to the blockchain by using an API request and remove the object from the blockchain. The structures of the blockchain functionality by
implementing the authentication method in the Fog computing side is presented in Figure 2.
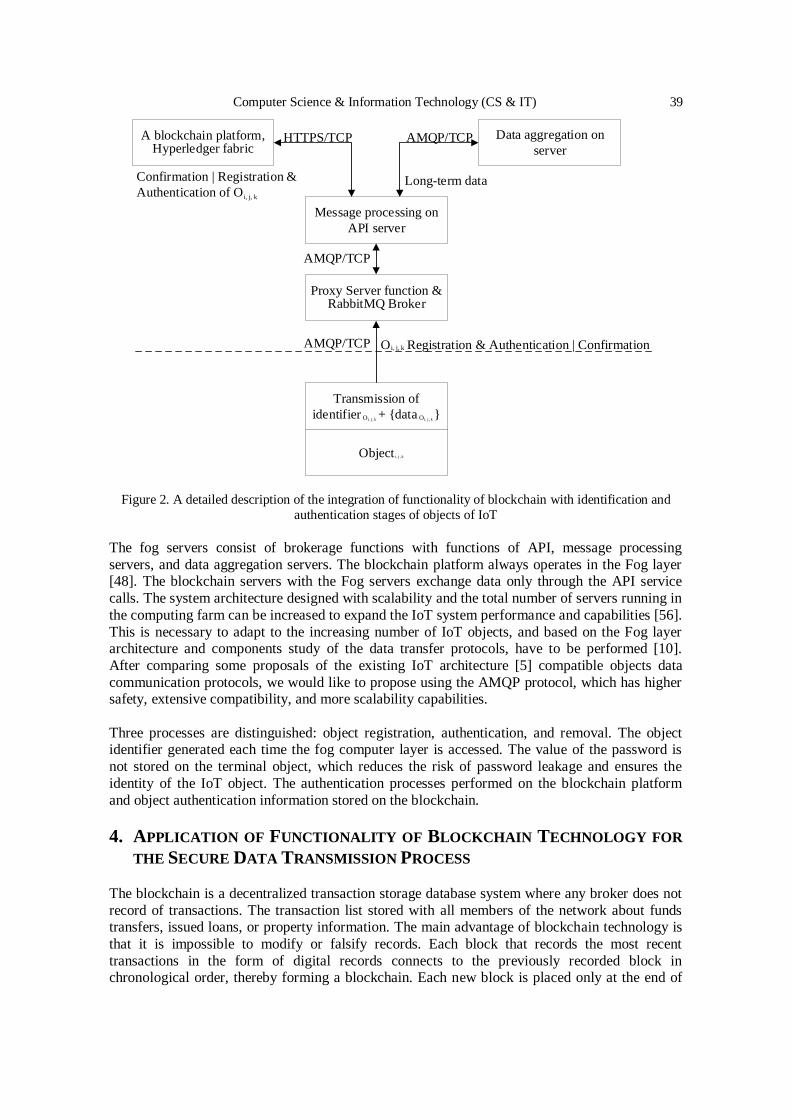
Computer Science & Information Technology (CS & IT) 39
i, j, k
HTTPS/TCPA blockchain platform, Hyperledger fabric
Data aggregation on
server
Message processing on
API server
Proxy Server function & RabbitMQ Broker
Transmission of
identifier + {data }
Object
AMQP/TCP
Confirmation | Registration &
Authentication of OLong-term data
AMQP/TCP
AMQP/TCP O Registration & Authentication | Confirmationi, j, k
i, j , kOi, j , kO
i, j , k
Figure 2. A detailed description of the integration of functionality of blockchain with identification and
authentication stages of objects of IoT
The fog servers consist of brokerage functions with functions of API, message processing
servers, and data aggregation servers. The blockchain platform always operates in the Fog layer [48]. The blockchain servers with the Fog servers exchange data only through the API service
calls. The system architecture designed with scalability and the total number of servers running in
the computing farm can be increased to expand the IoT system performance and capabilities [56].
This is necessary to adapt to the increasing number of IoT objects, and based on the Fog layer architecture and components study of the data transfer protocols, have to be performed [10].
After comparing some proposals of the existing IoT architecture [5] compatible objects data
communication protocols, we would like to propose using the AMQP protocol, which has higher safety, extensive compatibility, and more scalability capabilities.
Three processes are distinguished: object registration, authentication, and removal. The object identifier generated each time the fog computer layer is accessed. The value of the password is
not stored on the terminal object, which reduces the risk of password leakage and ensures the
identity of the IoT object. The authentication processes performed on the blockchain platform
and object authentication information stored on the blockchain.
4. APPLICATION OF FUNCTIONALITY OF BLOCKCHAIN TECHNOLOGY FOR
THE SECURE DATA TRANSMISSION PROCESS
The blockchain is a decentralized transaction storage database system where any broker does not
record of transactions. The transaction list stored with all members of the network about funds transfers, issued loans, or property information. The main advantage of blockchain technology is
that it is impossible to modify or falsify records. Each block that records the most recent
transactions in the form of digital records connects to the previously recorded block in chronological order, thereby forming a blockchain. Each new block is placed only at the end of
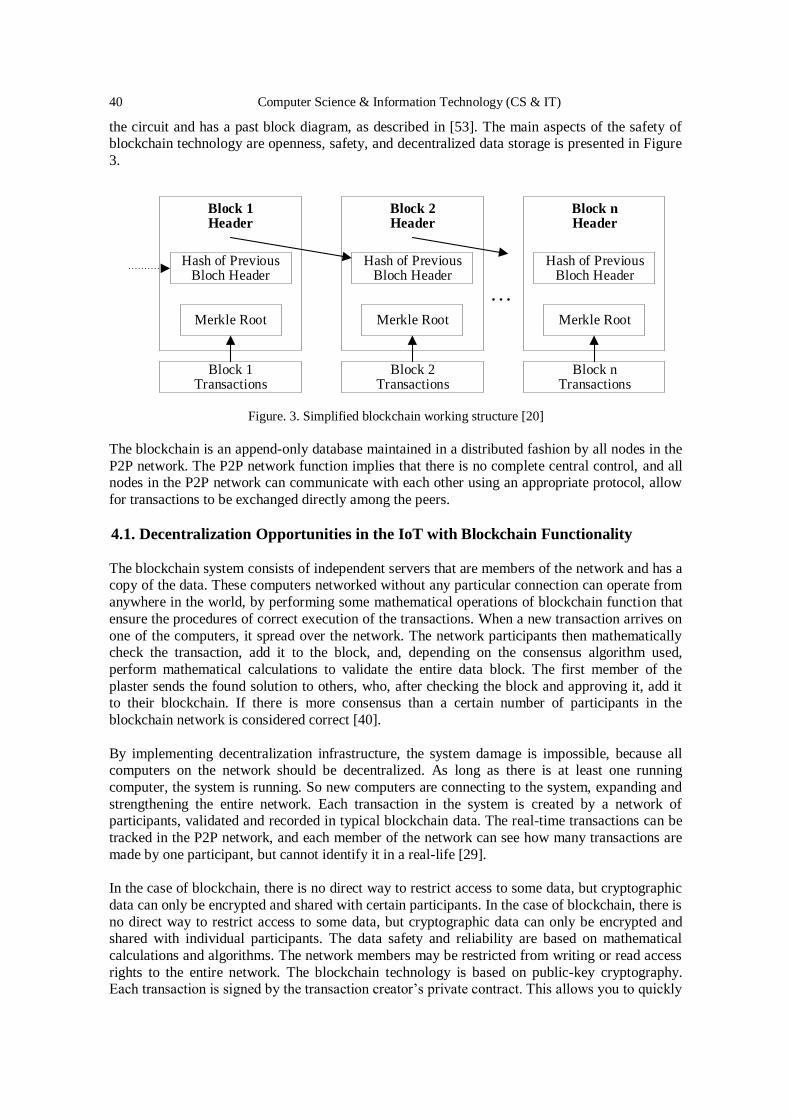
40 Computer Science & Information Technology (CS & IT)
the circuit and has a past block diagram, as described in [53]. The main aspects of the safety of blockchain technology are openness, safety, and decentralized data storage is presented in Figure
3.
Block 1Header
Hash of Previous Bloch Header
Merkle Root
Block 1Transactions
Block 2Header
Hash of Previous Bloch Header
Merkle Root
Block 2Transactions
Block nHeader
Hash of Previous Bloch Header
Merkle Root
Block nTransactions
Figure. 3. Simplified blockchain working structure [20]
The blockchain is an append-only database maintained in a distributed fashion by all nodes in the
P2P network. The P2P network function implies that there is no complete central control, and all nodes in the P2P network can communicate with each other using an appropriate protocol, allow
for transactions to be exchanged directly among the peers.
4.1. Decentralization Opportunities in the IoT with Blockchain Functionality
The blockchain system consists of independent servers that are members of the network and has a copy of the data. These computers networked without any particular connection can operate from
anywhere in the world, by performing some mathematical operations of blockchain function that
ensure the procedures of correct execution of the transactions. When a new transaction arrives on
one of the computers, it spread over the network. The network participants then mathematically check the transaction, add it to the block, and, depending on the consensus algorithm used,
perform mathematical calculations to validate the entire data block. The first member of the
plaster sends the found solution to others, who, after checking the block and approving it, add it to their blockchain. If there is more consensus than a certain number of participants in the
blockchain network is considered correct [40].
By implementing decentralization infrastructure, the system damage is impossible, because all computers on the network should be decentralized. As long as there is at least one running
computer, the system is running. So new computers are connecting to the system, expanding and
strengthening the entire network. Each transaction in the system is created by a network of participants, validated and recorded in typical blockchain data. The real-time transactions can be
tracked in the P2P network, and each member of the network can see how many transactions are
made by one participant, but cannot identify it in a real-life [29].
In the case of blockchain, there is no direct way to restrict access to some data, but cryptographic
data can only be encrypted and shared with certain participants. In the case of blockchain, there is
no direct way to restrict access to some data, but cryptographic data can only be encrypted and shared with individual participants. The data safety and reliability are based on mathematical
calculations and algorithms. The network members may be restricted from writing or read access
rights to the entire network. The blockchain technology is based on public-key cryptography. Each transaction is signed by the transaction creator’s private contract. This allows you to quickly
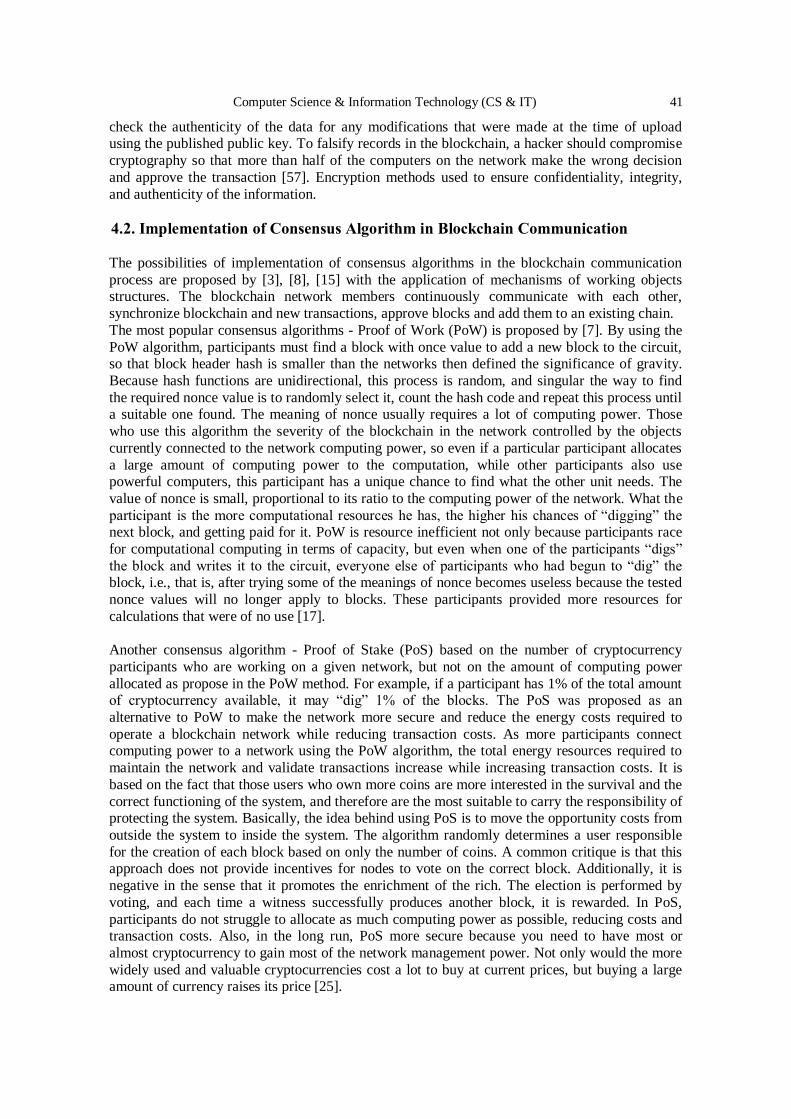
Computer Science & Information Technology (CS & IT) 41
check the authenticity of the data for any modifications that were made at the time of upload using the published public key. To falsify records in the blockchain, a hacker should compromise
cryptography so that more than half of the computers on the network make the wrong decision
and approve the transaction [57]. Encryption methods used to ensure confidentiality, integrity,
and authenticity of the information.
4.2. Implementation of Consensus Algorithm in Blockchain Communication
The possibilities of implementation of consensus algorithms in the blockchain communication
process are proposed by [3], [8], [15] with the application of mechanisms of working objects structures. The blockchain network members continuously communicate with each other,
synchronize blockchain and new transactions, approve blocks and add them to an existing chain.
The most popular consensus algorithms - Proof of Work (PoW) is proposed by [7]. By using the
PoW algorithm, participants must find a block with once value to add a new block to the circuit, so that block header hash is smaller than the networks then defined the significance of gravity.
Because hash functions are unidirectional, this process is random, and singular the way to find
the required nonce value is to randomly select it, count the hash code and repeat this process until a suitable one found. The meaning of nonce usually requires a lot of computing power. Those
who use this algorithm the severity of the blockchain in the network controlled by the objects
currently connected to the network computing power, so even if a particular participant allocates
a large amount of computing power to the computation, while other participants also use powerful computers, this participant has a unique chance to find what the other unit needs. The
value of nonce is small, proportional to its ratio to the computing power of the network. What the
participant is the more computational resources he has, the higher his chances of “digging” the next block, and getting paid for it. PoW is resource inefficient not only because participants race
for computational computing in terms of capacity, but even when one of the participants “digs”
the block and writes it to the circuit, everyone else of participants who had begun to “dig” the block, i.e., that is, after trying some of the meanings of nonce becomes useless because the tested
nonce values will no longer apply to blocks. These participants provided more resources for
calculations that were of no use [17].
Another consensus algorithm - Proof of Stake (PoS) based on the number of cryptocurrency
participants who are working on a given network, but not on the amount of computing power
allocated as propose in the PoW method. For example, if a participant has 1% of the total amount of cryptocurrency available, it may “dig” 1% of the blocks. The PoS was proposed as an
alternative to PoW to make the network more secure and reduce the energy costs required to
operate a blockchain network while reducing transaction costs. As more participants connect computing power to a network using the PoW algorithm, the total energy resources required to
maintain the network and validate transactions increase while increasing transaction costs. It is
based on the fact that those users who own more coins are more interested in the survival and the
correct functioning of the system, and therefore are the most suitable to carry the responsibility of protecting the system. Basically, the idea behind using PoS is to move the opportunity costs from
outside the system to inside the system. The algorithm randomly determines a user responsible
for the creation of each block based on only the number of coins. A common critique is that this approach does not provide incentives for nodes to vote on the correct block. Additionally, it is
negative in the sense that it promotes the enrichment of the rich. The election is performed by
voting, and each time a witness successfully produces another block, it is rewarded. In PoS,
participants do not struggle to allocate as much computing power as possible, reducing costs and transaction costs. Also, in the long run, PoS more secure because you need to have most or
almost cryptocurrency to gain most of the network management power. Not only would the more
widely used and valuable cryptocurrencies cost a lot to buy at current prices, but buying a large amount of currency raises its price [25].
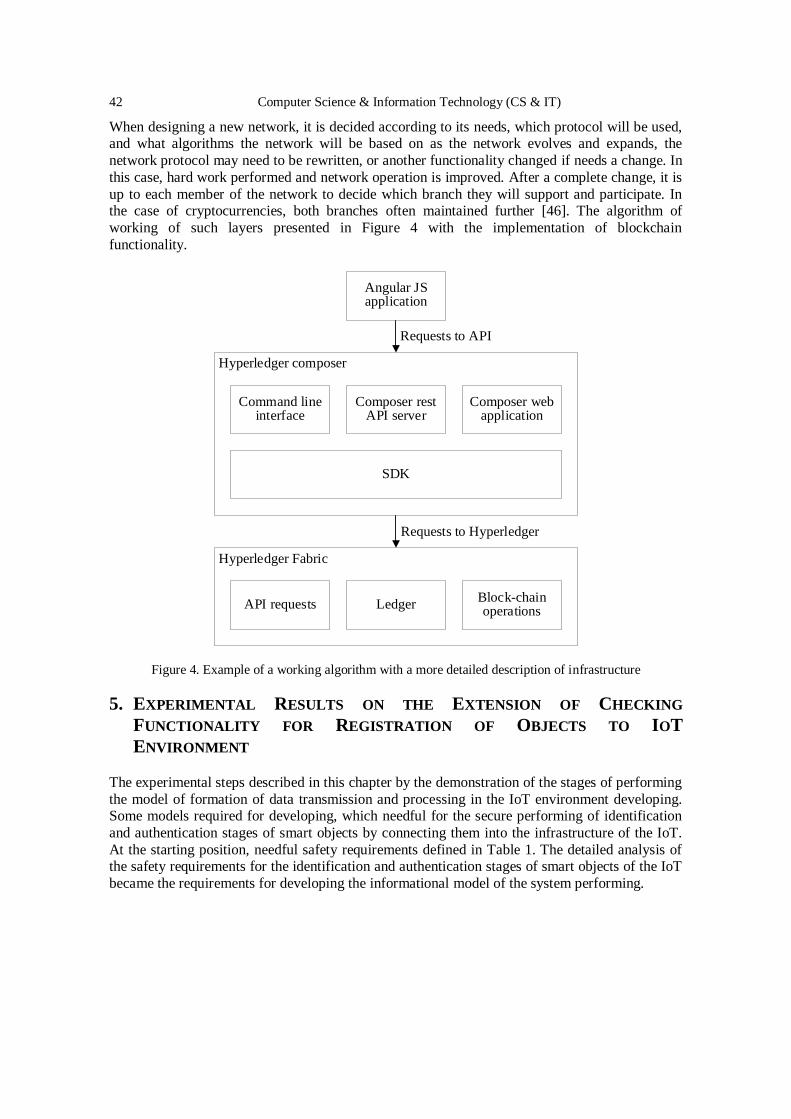
42 Computer Science & Information Technology (CS & IT)
When designing a new network, it is decided according to its needs, which protocol will be used, and what algorithms the network will be based on as the network evolves and expands, the
network protocol may need to be rewritten, or another functionality changed if needs a change. In
this case, hard work performed and network operation is improved. After a complete change, it is
up to each member of the network to decide which branch they will support and participate. In the case of cryptocurrencies, both branches often maintained further [46]. The algorithm of
working of such layers presented in Figure 4 with the implementation of blockchain
functionality.
Requests to API
Angular JS application
Hyperledger composer
Command line interface
Composer rest API server
Composer web application
SDK
Hyperledger Fabric
API requests LedgerBlock-chain operations
Requests to Hyperledger
Figure 4. Example of a working algorithm with a more detailed description of infrastructure
5. EXPERIMENTAL RESULTS ON THE EXTENSION OF CHECKING
FUNCTIONALITY FOR REGISTRATION OF OBJECTS TO IOT
ENVIRONMENT
The experimental steps described in this chapter by the demonstration of the stages of performing
the model of formation of data transmission and processing in the IoT environment developing. Some models required for developing, which needful for the secure performing of identification
and authentication stages of smart objects by connecting them into the infrastructure of the IoT.
At the starting position, needful safety requirements defined in Table 1. The detailed analysis of the safety requirements for the identification and authentication stages of smart objects of the IoT
became the requirements for developing the informational model of the system performing.
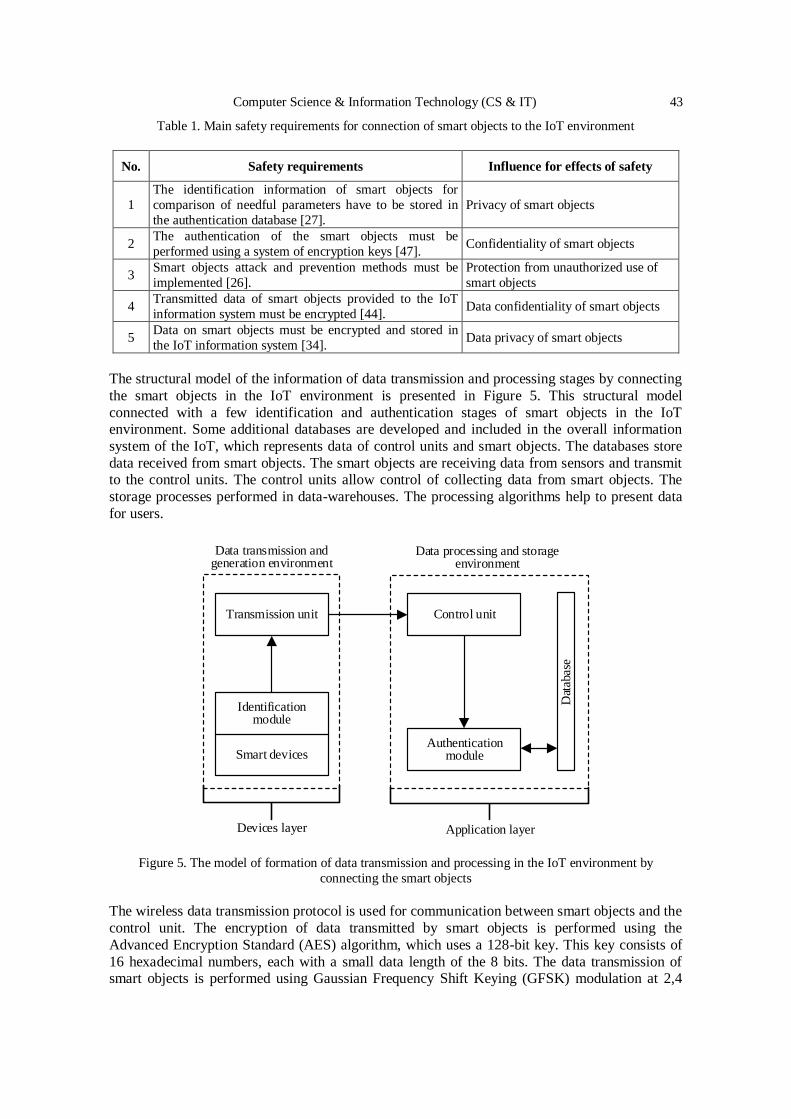
Computer Science & Information Technology (CS & IT) 43
Table 1. Main safety requirements for connection of smart objects to the IoT environment
No. Safety requirements Influence for effects of safety
1
The identification information of smart objects for
comparison of needful parameters have to be stored in
the authentication database [27].
Privacy of smart objects
2 The authentication of the smart objects must be
performed using a system of encryption keys [47]. Confidentiality of smart objects
3 Smart objects attack and prevention methods must be
implemented [26].
Protection from unauthorized use of
smart objects
4 Transmitted data of smart objects provided to the IoT
information system must be encrypted [44]. Data confidentiality of smart objects
5 Data on smart objects must be encrypted and stored in
the IoT information system [34]. Data privacy of smart objects
The structural model of the information of data transmission and processing stages by connecting
the smart objects in the IoT environment is presented in Figure 5. This structural model
connected with a few identification and authentication stages of smart objects in the IoT environment. Some additional databases are developed and included in the overall information
system of the IoT, which represents data of control units and smart objects. The databases store
data received from smart objects. The smart objects are receiving data from sensors and transmit to the control units. The control units allow control of collecting data from smart objects. The
storage processes performed in data-warehouses. The processing algorithms help to present data
for users.
Smart devices
Identification module
Transmission unit
Dat
abas
e
Control unit
Authentication module
Devices layer Application layer
Data transmission and generation environment
Data processing and storage environment
Figure 5. The model of formation of data transmission and processing in the IoT environment by
connecting the smart objects
The wireless data transmission protocol is used for communication between smart objects and the
control unit. The encryption of data transmitted by smart objects is performed using the
Advanced Encryption Standard (AES) algorithm, which uses a 128-bit key. This key consists of
16 hexadecimal numbers, each with a small data length of the 8 bits. The data transmission of smart objects is performed using Gaussian Frequency Shift Keying (GFSK) modulation at 2,4
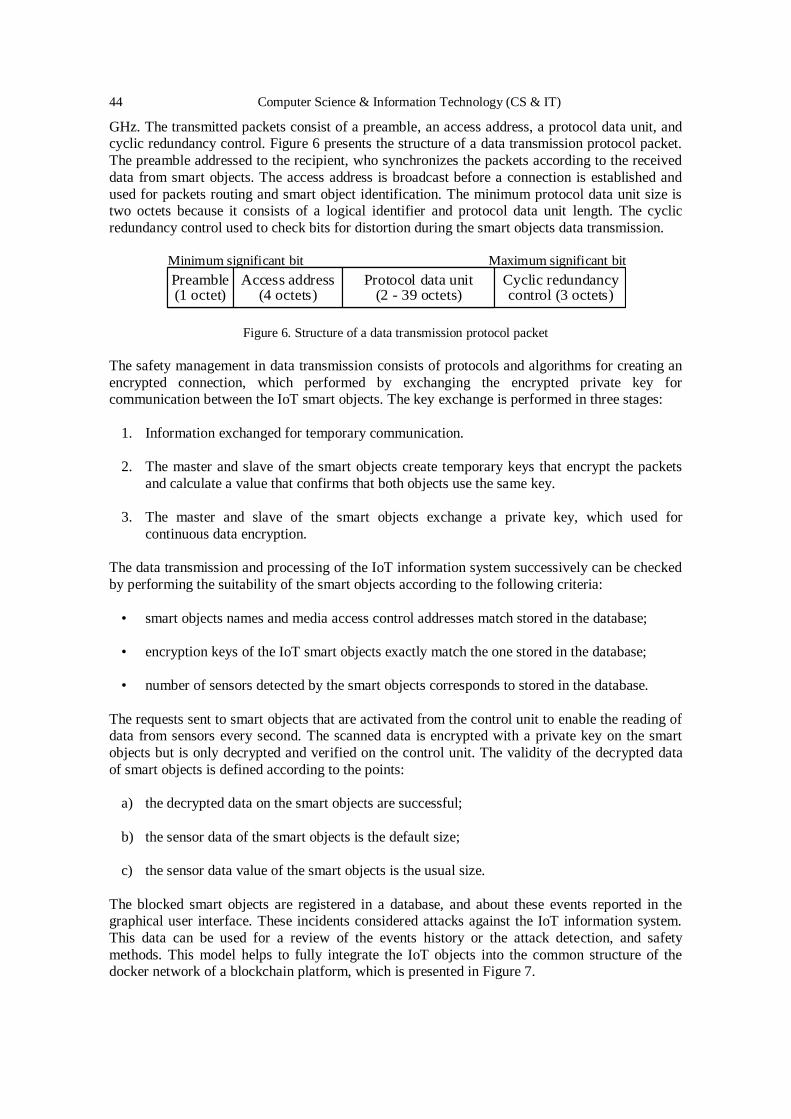
44 Computer Science & Information Technology (CS & IT)
GHz. The transmitted packets consist of a preamble, an access address, a protocol data unit, and cyclic redundancy control. Figure 6 presents the structure of a data transmission protocol packet.
The preamble addressed to the recipient, who synchronizes the packets according to the received
data from smart objects. The access address is broadcast before a connection is established and
used for packets routing and smart object identification. The minimum protocol data unit size is two octets because it consists of a logical identifier and protocol data unit length. The cyclic
redundancy control used to check bits for distortion during the smart objects data transmission.
Preamble(1 octet)
Access address(4 octets)
Protocol data unit(2 - 39 octets)
Cyclic redundancy control (3 octets)
Minimum significant bit Maximum significant bit
Figure 6. Structure of a data transmission protocol packet
The safety management in data transmission consists of protocols and algorithms for creating an
encrypted connection, which performed by exchanging the encrypted private key for communication between the IoT smart objects. The key exchange is performed in three stages:
1. Information exchanged for temporary communication.
2. The master and slave of the smart objects create temporary keys that encrypt the packets
and calculate a value that confirms that both objects use the same key.
3. The master and slave of the smart objects exchange a private key, which used for
continuous data encryption.
The data transmission and processing of the IoT information system successively can be checked
by performing the suitability of the smart objects according to the following criteria:
• smart objects names and media access control addresses match stored in the database;
• encryption keys of the IoT smart objects exactly match the one stored in the database;
• number of sensors detected by the smart objects corresponds to stored in the database.
The requests sent to smart objects that are activated from the control unit to enable the reading of data from sensors every second. The scanned data is encrypted with a private key on the smart
objects but is only decrypted and verified on the control unit. The validity of the decrypted data
of smart objects is defined according to the points:
a) the decrypted data on the smart objects are successful;
b) the sensor data of the smart objects is the default size;
c) the sensor data value of the smart objects is the usual size.
The blocked smart objects are registered in a database, and about these events reported in the graphical user interface. These incidents considered attacks against the IoT information system.
This data can be used for a review of the events history or the attack detection, and safety
methods. This model helps to fully integrate the IoT objects into the common structure of the docker network of a blockchain platform, which is presented in Figure 7.
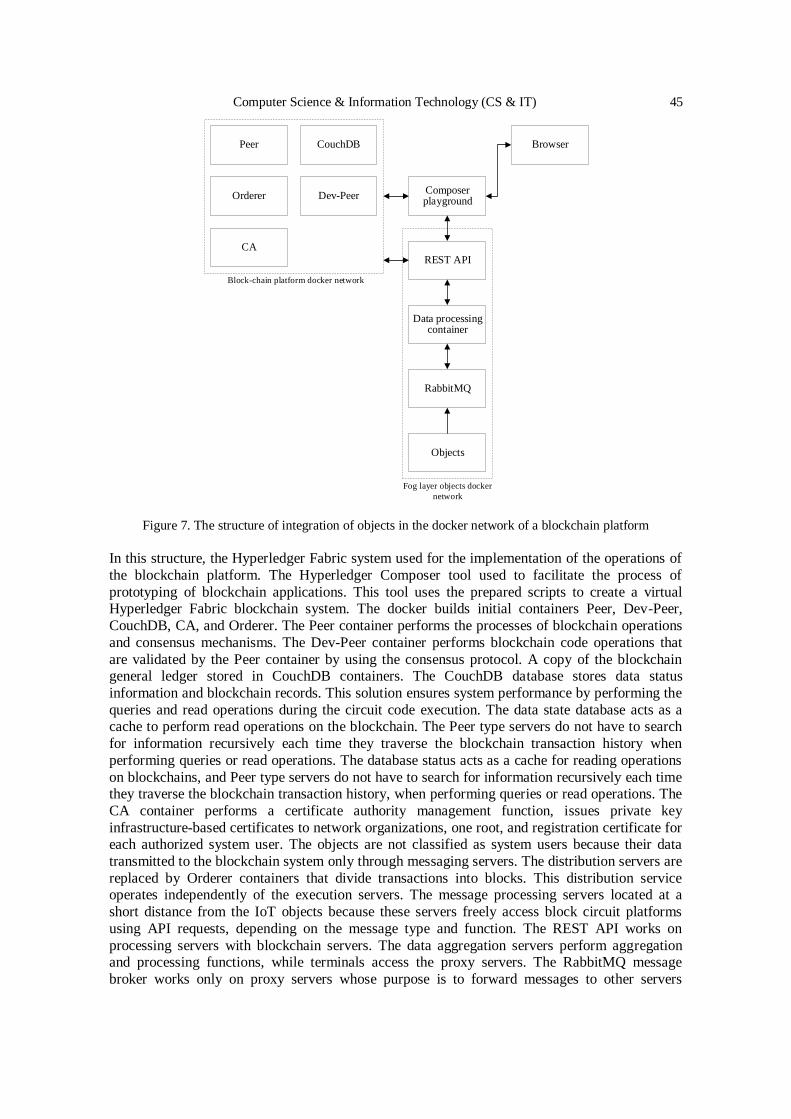
Computer Science & Information Technology (CS & IT) 45
Peer
Objects
RabbitMQ
Block-chain platform docker network
Orderer
CA
CouchDB
Dev-Peer
Peer
Data processing container
REST API
Composer playground
Browser
Fog layer objects docker
network
Figure 7. The structure of integration of objects in the docker network of a blockchain platform
In this structure, the Hyperledger Fabric system used for the implementation of the operations of
the blockchain platform. The Hyperledger Composer tool used to facilitate the process of
prototyping of blockchain applications. This tool uses the prepared scripts to create a virtual Hyperledger Fabric blockchain system. The docker builds initial containers Peer, Dev-Peer,
CouchDB, CA, and Orderer. The Peer container performs the processes of blockchain operations
and consensus mechanisms. The Dev-Peer container performs blockchain code operations that
are validated by the Peer container by using the consensus protocol. A copy of the blockchain general ledger stored in CouchDB containers. The CouchDB database stores data status
information and blockchain records. This solution ensures system performance by performing the
queries and read operations during the circuit code execution. The data state database acts as a cache to perform read operations on the blockchain. The Peer type servers do not have to search
for information recursively each time they traverse the blockchain transaction history when
performing queries or read operations. The database status acts as a cache for reading operations
on blockchains, and Peer type servers do not have to search for information recursively each time they traverse the blockchain transaction history, when performing queries or read operations. The
CA container performs a certificate authority management function, issues private key
infrastructure-based certificates to network organizations, one root, and registration certificate for each authorized system user. The objects are not classified as system users because their data
transmitted to the blockchain system only through messaging servers. The distribution servers are
replaced by Orderer containers that divide transactions into blocks. This distribution service operates independently of the execution servers. The message processing servers located at a
short distance from the IoT objects because these servers freely access block circuit platforms
using API requests, depending on the message type and function. The REST API works on
processing servers with blockchain servers. The data aggregation servers perform aggregation and processing functions, while terminals access the proxy servers. The RabbitMQ message
broker works only on proxy servers whose purpose is to forward messages to other servers
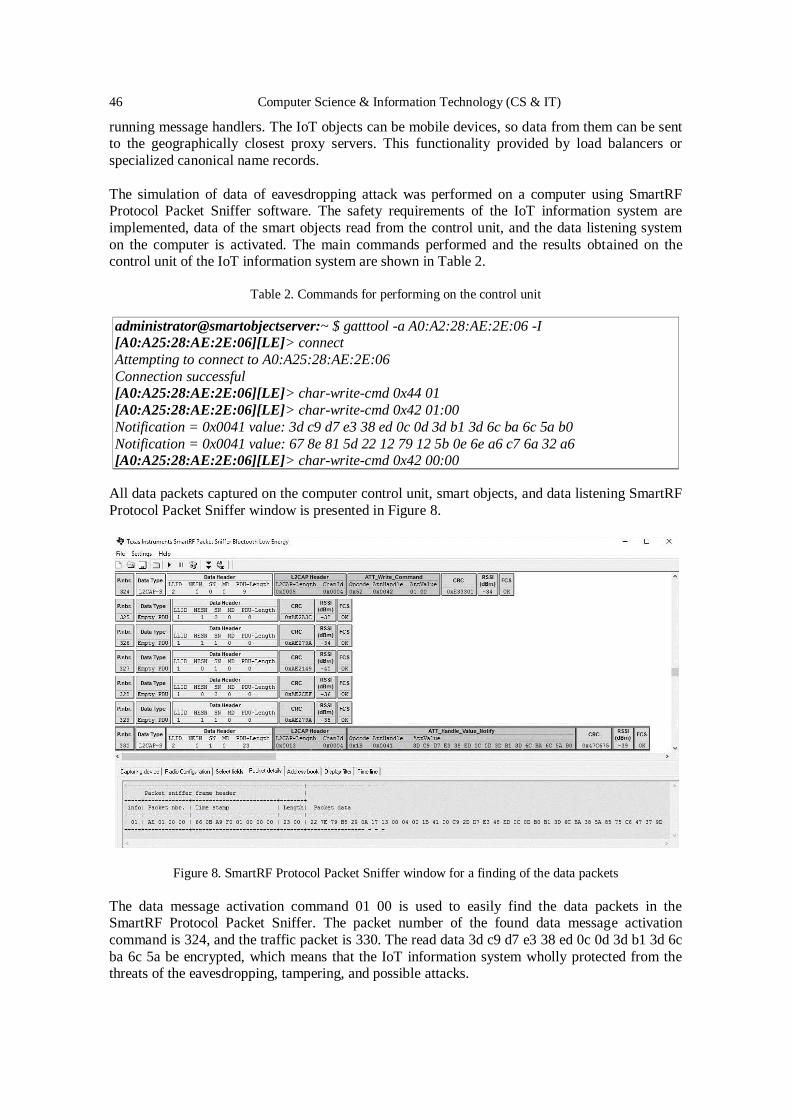
46 Computer Science & Information Technology (CS & IT)
running message handlers. The IoT objects can be mobile devices, so data from them can be sent to the geographically closest proxy servers. This functionality provided by load balancers or
specialized canonical name records.
The simulation of data of eavesdropping attack was performed on a computer using SmartRF Protocol Packet Sniffer software. The safety requirements of the IoT information system are
implemented, data of the smart objects read from the control unit, and the data listening system
on the computer is activated. The main commands performed and the results obtained on the control unit of the IoT information system are shown in Table 2.
Table 2. Commands for performing on the control unit
administrator@smartobjectserver:~ $ gatttool -a A0:A2:28:AE:2E:06 -I [A0:A25:28:AE:2E:06][LE]> connect
Attempting to connect to A0:A25:28:AE:2E:06
Connection successful [A0:A25:28:AE:2E:06][LE]> char-write-cmd 0x44 01
[A0:A25:28:AE:2E:06][LE]> char-write-cmd 0x42 01:00
Notification = 0x0041 value: 3d c9 d7 e3 38 ed 0c 0d 3d b1 3d 6c ba 6c 5a b0
Notification = 0x0041 value: 67 8e 81 5d 22 12 79 12 5b 0e 6e a6 c7 6a 32 a6 [A0:A25:28:AE:2E:06][LE]> char-write-cmd 0x42 00:00
All data packets captured on the computer control unit, smart objects, and data listening SmartRF
Protocol Packet Sniffer window is presented in Figure 8.
Figure 8. SmartRF Protocol Packet Sniffer window for a finding of the data packets
The data message activation command 01 00 is used to easily find the data packets in the SmartRF Protocol Packet Sniffer. The packet number of the found data message activation
command is 324, and the traffic packet is 330. The read data 3d c9 d7 e3 38 ed 0c 0d 3d b1 3d 6c
ba 6c 5a be encrypted, which means that the IoT information system wholly protected from the threats of the eavesdropping, tampering, and possible attacks.
Computer Science & Information Technology (CS & IT) 47
6. CONCLUSIONS
The implementation of safeguard methods on the first stages of identification and authentication
of objects before the permission stage for launching them into the working area of the IoT is very
important. The research works need more careful investigations. We propose some algorithms for
a more secure connection of objects to the functionality of IoT infrastructure. Very prospective initiatives of blockchain development can help in the identification and authentication stages of
objects by the integration of their functionality to the IoT infrastructure for more safety integrity.
The requirements for the safety of the multi-layered infrastructure of objects by linking to the IoT proposed in this article. Such infrastructure became more complex according to the risks of
unsafe possibilities. This research is forwarded for evaluation of some kinds of safety means
related to identification and authentications stages of objects by integrating them with the
functionality of blockchain in the infrastructure of IoT. The objectives are related to the development of model and working algorithms of stages of checking by integrating means for
establishing and managing operational rules of the IoT objects. In future works, we plan to
strengthen the IoT information safety model for the identification and authentication of objects.
REFERENCES [1] Alaba, F. A., Othman, M., Hashem, I. A. T., & Alotaibi, F., (2017) “Internet of Things Security: A
Survey,” Journal of Network and Computer Applications, Vol. 88, No. 1, pp10-28.
[2] Andziulis, A., Dzemydienė, D., Steponavičius, R., & Jakovlev, S., (2011) “Comparison of two
heuristic approaches for solving the production scheduling problem,” International Journal of
Information Technology and Control, Vol.40, No. 2, pp118-122.
[3] Atzei, N., Bartoletti, M., & Cimoli, T., (2017) “A survey of attacks on Ethereum smart contracts,
Proceedings of the 6th Conference on Principles of Security and Trust (ETAPS), pp164-186.
[4] Atzori, M., (2017) “Blockchain Technology and Decentralized Governance: Is the State Still
Necessary,” International Journal of Governance and Regulation, Vol. 6, No. 1, pp1-37.
[5] Baghli, R. B., Najm, E., & Traverson, B., (2016) “Towards a Multi-Leveled Architecture for the
Internet of Things,” Proceedings of the 20th IEEE International Enterprise Distributed Object Computing Workshop (EDOCW), pp182-187.
[6] Benabdessalem, R., Hamdi, M., & Kim, T. H., (2014) “A Survey on Security Models, Techniques,
and Tools for the Internet of Things,” Proceedings of the 7th International Conference on Advanced
Software Engineering and Its Applications (ASEA), pp44-48.
[7] Dwork, C., & Naor, M., (1992) “Pricing via Processing or Combatting Junk Mail,” Proceedings of
the Advances in Cryptology, pp139-147.
[8] Fakhri, D., & Mutijarsa, K., (2018) “Secure IoT Communication using Blockchain Technology,”
Proceedings of the Symposium on Electronics and Smart Devices, pp1-6.
[9] Ferrag, M. A., Derdour, M., Mukherjee, M., Derhab, A., Maglaras, L., & Janicke, H., (2018)
“Blockchain Technologies for the Internet of Things: Research Issues and Challenges,” IEEE Internet
of Things Journal, Vol. 6, No. 2, pp2188-2204. [10] Fersi, G., (2015) “A Distributed and Flexible Architecture for Internet of Things,” Proceedings of the
International Conference on Advanced Wireless, Information, and Communication Technologies
(AWICT), pp. 130-137.
[11] Fink, G. A., Zarhitsky, D. V., Carroll, T. E., & Farquhar, E. D., (2015) “Security and Privacy Grand
Challenges for the Internet of Things,” Proceedings of the Conference on Collaboration Technologies
and Systems (CTS), pp27-34.
[12] Gomba, M., & Nlwya, B., (2017) “Architecture and Security Considerations for Internet of Things,”
Proceedings of the 7th IEEE Conference on Global Wireless Summit (GWS), pp252-256.
[13] Hinai, S. A., & Singh, A, V., (2017) “Internet of Things: Architecture, Security Challenges and
Solutions,” Proceedings of the International Conference on Infocom Technologies and Unmanned
Systems (ICTUS), pp197-201.

48 Computer Science & Information Technology (CS & IT)
[14] Hossain, M. M., Fotouhi, M., & Hasan, R., (2015) “Towards an Analysis of Security Issues,
Challenges, and Open Problems in the Internet of Things,” Proceedings of the 11th IEEE World
Congress on Services, pp21-28.
[15] Khalid, U., Asim, M., Baker, T., Hung, P., Tariq, M., & Rafferty, L., (2020) “A decentralized
lightweight blockchain-based authentication mechanism for IoT systems,” International Journal of Cluster Computing, Vol. 23, No. 1, pp1-21.
[16] Khan, R., Khan, S. U., Zaheer, R., & Khan, S., (2012) “Future Internet: The Internet of Things
Architecture, Possible Applications and Key Challenges” Proceedings of the 10th International
Conference on Frontiers of Information Technology, pp257-260.
[17] Kim, H., Wasicek, A., Mehne, B., & Lee, E. A., (2016) “A Secure Network Architecture for the
Internet of Things Based on Local Authorization Entities,” Proceedings of the 4th IEEE Conference
on Future Internet of Things and Cloud (FiCloud), pp114-122.
[18] Kraijak, S., & Tuwanut, P., (2015) “A Survey on Internet of Things Architecture, Protocols, Possible
Applications, Security, Privacy, Real-World Implementation and Future Trends,” Proceedings of the
16th IEEE Conference on Communication Technology (ICCT), pp26-31.
[19] Kurmis, M., Andziulis, A., Dzemydienė, D., Jakovlev, S., Voznak, M., & Gricius, G., (2015)
“Cooperative context data acquisition and dissemination for situation identification in vehicular communication networks,” Journal of Wireless Personal Communications, Vol. 85, No. 1, pp49-62.
[20] Li, W., Meng, W., Liu, Z., & Au, M., (2020) “Towards Blockchain-Based Software-Defined
Networking: Security Challenges and Solutions,” International Journal of Ieice Transactions on
Information and Systems, vol. E103.D(2), pp196-203.
[21] Lin, I. C., & Liao, T. C., (2017) “A Survey of Blockchain Security Issues and Challenges,”
International Journal of Network Security, Vol. 19, No. 5, pp653-659.
[22] Liu, C., Zhang, Y., Li, Z., Zhang, J., Qin, H., & Zeng, J., (2015) “Dynamic Defense Architecture for
the Security of the Internet of Things,” Proceedings of the 11th International Conference on
Computational Intelligence and Security (CIS), pp390-393.
[23] Madakam, S., Ramaswamy, R., & Tripathi, S., (2015) “Internet of Things (IoT): A Literature
Review,” Journal of Future Computer and Communication, Vol. 3, No. 5, pp164-173. [24] Mahmoud, R., Yousuf, T., Aloul, F., & Zualkernan, I., (2015) “Internet of Things Security: Current
Status, Challenges and Prospective Measures,” Proceedings of the 10th Conference for Internet
Technology and Secured Transactions (ICITST), pp336-341.
[25] Matharu, G. S., Upadhyay, P., & Chaudhary, L., (2014)” The Internet of Things: Challenges and
Security Issues,” Proceedings of the Conference on Emerging Technologies (ICET), pp54-59.
[26] Matulevičius, R., & Savukynas, R., (2019) “Application of the Reference Model for Security Risk
Management in the Internet of Things Systems,” in Lupeikienė, A., Vasilecas, O., Dzemyda, G. (Ed).
Databases and Information Systems X. IOSPress, pp 65-78.
[27] Meidan, Y., Bohadana, M., Shabtai, A., Guarnizo, J., Ochoa, M., Tippenhauer, N., & Elovici, Y.,
(2017), “ProfilIoT: A Machine Learning Approach for IoT Device Identification Based on Network
Traffic Analysis,” Proceedings of the 32nd ACM SIGAPP Symposium on Applied Computing
(SAC), pp. 506-509. [28] Meng, W., Wang, J., Wang, X., Liu, J., Yu, Z., Li, J., Zhao, Y., & Chow, S. M., (2018) “Position
Paper on Blockchain Technology: Smart Contract and Applications,” Proceedings of the 12th
International Conference on Network and System Security, pp474-483.
[29] Miraz, M. H., & Ali, M., (2018) “Blockchain Enabled Enhanced IoT Ecosystem Security,”
Proceedings of the Conference on Emerging Technologies in Computing (iCETiC), pp1-9.
[30] Mynzhasova, A., Radojicic, C., Heinz, C., Kölsch, J., Grimm, C., Rico, J., Keith, D., Castro, R. G., &
Oravec, V., (2017) “Drivers, Standards and Platforms for the IoT: Towards a Digital VICINITY,”
Proceedings of the Conference on Intelligent Systems (IntelliSys), pp1-7.
[31] Nakamoto, S., (2009) “Bitcoin: A Peer-to-Peer Electronic Cash System,” Bitcoin Project, pp. 1-9.
[32] Nastase, L., (2017) “Security in the Internet of Things: A Survey on Application Layer Protocols,”
Proceedings of the 21st Conference on Control Systems and Computer Science (CSCS), pp659-666. [33] Neumann, A. J., Statland, N., & Webb, R. D., (1977) “Post-processing audit tools and techniques,”
Proceedings of the NBS Workshop, pp36-341.
[34] Ning, H., Liu, H., & Yang, L. T., (2013) “Cyberentity Security in the Internet of Things,” Journal of
Innovative Technology for Computer Professionals, Vol. 46, No. 4, pp46-53.
Computer Science & Information Technology (CS & IT) 49
[35] Pal, S., Hitchens, M., & Varadharajan, V., (2017) “Towards A Secure Access Control Architecture
for the Internet of Things,” Proceedings of the 42nd IEEE International Conference on Local
Computer Networks (LCN), pp219-222.
[36] Panarello, A., Tapas, N., Merlino, G., Longo, F., & Puliafito, A., (2018) “Blockchain and IoT
Integration: A Systematic Survey,” International Journal of Sensors, Vol. 18, No. 8, pp1-38. [37] Patra, L., & Rao, U. P., (2016) “Internet of Things - Architecture, Applications, Security and Other
Major Challenges,” Proceedings of the 3rd International Conference on Computing for Sustainable
Development (INDIACom), pp1201-1206.
[38] Paulavičius, R., Grigaitis, S., Igumenov, A., & Filatovas, E., (2019) “A Decade of Blockchain:
Review of the Current Status, Challenges, and Future Directions,” International Journal of
Informatica, Vol. 30, No. 4, pp729-748.
[39] Rathore, H., Mohamed, A., & Guizani, M., (2020) “A Survey of Blockchain Enabled Cyber-Physical
Systems,” International Journal of Sensors, Vol. 20, No. 1, pp1-28.
[40] Ren, Z., Liu, X., Ye, R., & Zhang, T., (2017) “Security and Privacy on Internet of Things,”
Proceedings of the 7th IEEE Conference on Electronics Information and Emergency Communication
(ICEIEC), pp140-144.
[41] Roman, R., Alcaraz, C., Lopez, J., & Sklavos, N., (2011) “Key Management Systems for Sensor Networks in the Context of the Internet of Things,” International Journal of Computers and Electrical
Engineering, Vol. 37, No. 2, pp147-159.
[42] Salman, M. A., (2014) “On Identification of Internet of Things,” International Journal of Sciences:
Basic and Applied Research, Vol. 18, No. 1, pp59-62.
[43] Savukynas, R., & Dzemydienė, D., (2018) “Security Means in Multi-layered Architecture of Internet
of Things for Secure Communication and Data Transmission,” Proceedings of Baltic DB&IS 2018
Conference Forum and Doctoral Consortium co-located with the 13th International Baltic Conference
on Databases and Information Systems, pp127-134.
[44] Shah, S. H., & Yaqoob, I. (2016) “A Survey: Internet of Things (IoT) Technologies, Applications and
Challenges,” Proceedings of the 4th IEEE International Conference on Smart Energy Grid
Engineering (SEGE), pp381-385. [45] Showkat, S., & Qureshi, S. (2020) “Securing the internet of things using blockchain,” Proceedings of
the 10th International Conference on Cloud Computing, Data Science & Engineering (Confluence),
pp540-545.
[46] Sicari, S., Rizzardi, A., Miorandi, D., Cappiello, C., & Coen-Porisini, A., (2016) “A Secure and
Quality-Aware Prototypical Architecture for the Internet of Things,” International Journal of
Information Systems, Vol. 58, No. 1, pp43-55.
[47] Simsek, I., & Rathgeb, E. P., (2019) “Zero-Knowledge and Identity-Based Authentication and Key
Exchange for Internet of Things,” Proceedings of the 5th IEEE World Forum on Internet of Things
(WF-IoT), pp283-288.
[48] Solapure, S. S., & Kenchannavar, H., (2016) “Internet of Things: Internet of Things: A Survey
Related to Various Recent Architectures and Platforms Available,” Proceedings of the 5th IEEE
Conference on Advances in Computing, Communications and Informatics (ICACCI), pp2296-2301. [49] Stammberger, K., Semp, M., Anand, M. B., & Culler, D., (2010) “Introduction to security for smart
Object Networks,” [White paper], Internet Protocol for Smart Objects Alliance, pp1-28.
[50] Suo, H., Wan, J., Zou, C., & Liu, J., (2012) “Security in the IoT: A Review,” Proceedings of the
Conference on Computer Science and Electronics Engineering (ICCSEE), pp648-651.
[51] Tan, J., & Koo, S. G. M., (2014) “A Survey of Technologies in Internet of Things,” Proceedings of
the 10th IEEE International Conference on Distributed Computing in Sensor Systems, pp269-274.
[52] Vasilomanolakis, E., Daubert, J., Luthra, M., Gazis, V., Wiesmaier, A., & Kikiras, P., (2015) “On the
Security and Privacy of Internet of Things Architectures and Systems,” Proceedings of the
International Workshop on Secure Internet of Things (SIoT),” pp49-57.
[53] Wang, H., Wang, L., Zhou, Z., Tao, X., Pau, G., & Arena, F., (2019) “Blockchain-Based Resource
Allocation Model in Fog Computing,” Journal of Applied Sciences, Vol. 9, No. 24, pp1-18. [54] Weber, R. H., (2010) “Internet of Things – New Security and Privacy Challenges,” International
Journal of Computer Law and Security Review, Vol. 26, No. 1, pp23-30.
[55] Wen, Y., Jinlong, W., & Gianchuan, Z., (2016) “Physical Objects Registration and Management for
Internet of Things,” Proceedings of the 35th Chinese Control Conference (CCC), pp8335-8339.

50 Computer Science & Information Technology (CS & IT)
[56] Weyrich, M., & Ebert, C., (2016) “Reference Architectures for the Internet of Things,” International
Journal of IEEE Software, Vol. 33, No. 1, pp112-116.
[57] Xie, S., Zheng, Z., Chen, W., Wu, J., Dai, H. N., & Imran, M., (2020) “Blockchain for cloud
exchange: A survey,” Journal of Computers and Electrical Engineering, Vol. 81, No. 1, pp. 1-12.
[58] Zhao, K., & Ge, L., (2013) “A Survey on the Internet of Things Security,” Proceedings of the 9th Conference on Computational Intelligence and Security (CIS), pp. 663-667.
[59] Zhu, T., Dhelim, S., Zhou, Z., Yang, S., & Ning, H., (2017) ”An Architecture for Aggregating
Information from Distributed Data Nodes for Industrial Internet of Things,” International Journal of
Computers and Electrical Engineering, Vol. 58, No. 1, pp337-349.
AUTHOR
The Ph.D. student of the Group of Intelligent Technologies Research at the Institute
of Data Science and Digital Technologies, Faculty of Mathematics and Informatics,
which is part of Vilnius University. The junior lecturer on Software Engineering,
Systems Theory, and Information Security at Vilnius Gediminas Technical
University. The research interests include advanced database systems, business
process engineering, intelligent information systems, social computing technologies,
software systems engineering, information security.
© 2020 By AIRCC Publishing Corporation. This article is published under the Creative Commons Attribution (CC BY) license.
David C. Wyld et al. (Eds): CCSEA, BIoT, DKMP, CLOUD, NLCAI, SIPRO - 2020
pp. 51-64, 2020. CS & IT - CSCP 2020 DOI: 10.5121/csit.2020.101005
INTEGRATIVE FRAMEWORK FOR
BLOCKCHAIN IMPLEMENTATION: UNITING
ORGANIZATIONAL, BUSINESS AND
ENGINEERING FACTORS
Amr Adel
Whitecliffe College of Technology & Innovation, Auckland, New Zealand
ABSTRACT Adopting new technologies such as the Blockchain technology requires considering the broad
range of different factors associated with the same. There is just the emergence of the scholarly
literature on the Blockchain technology. The studies mainly focus on the technical aspects of the
technology specking on its architecture, way of functioning and such. Not many studies focus on
the framework that can be referred to, to adopt the Blockchain technology. In this study a
framework for adoption of the Blockchain technology has been proposed considering the
different factors such as organizational, business and engineering factors. Each of these factors
has been further divided into sub-factors for better understanding. These factors are interlinked
to one another and mutually influence each other. This framework that has been proposed can
be implemented by the organizations as a point of reference for adopting different applications of Blockchain. The scholars can further expand the study and refine as well as carry out future
research in this domain.
KEYWORDS Blockchain Technology, Framework, Transaction Per Second, Cryptocurrency, Contracts &
General Ledger.
1. INTRODUCTION
Blockchain is an overarching concept which consists of many different applications and
technologies [1]. It is a decentralized digitized ledger for allowing record keeping of peer-peer transactions without the requirement for central authority. The concept of Blockchain has been
compared to internet which has similar underlying applications and technologies. Some experts
are of the belief that Blockchain might have a big transformation on the business like the internet.
It has the potential of replacing the centralized platforms of banking and other cases that includes health information sharing, improvement in business process, automotive ownership, trades and
voting [1]. Blockchain technology has enabled cryptocurrency which comprises of Ethereum and
Bitcoin [35].
A cryptocurrency permits an exchange medium which is similar to US dollar, though it is digital
in nature and utilizes encryption for controlling the creation of new currency and fund
verification. The technology of Blockchain was popularized and created by cryptocurrency which is the bitcoin. Satoshi Nakamoto has created the bitcoin and subsequently the technology of
Blockchain. Bitcoin was released as open source software and Nakamoto mined the initial
Bitcoins, hence successfully implemented the Blockchain technology [1]. Blockchain can be
52 Computer Science & Information Technology (CS & IT)
defined as blocks series which records data in hash functions with a timestamp and link to the existing block. Data is stored in the distributed ledger which eliminates the centralized
vulnerability points. Blockchain technology utilizes peer-peer networking without the necessity
of a central server. Instead it exists across a network of computers. By utilization of the database
system which is distributed through Blockchain, digital ledger across a network is verified by any computer which removes the need for a centralized authority. As per the name Blockchain refers
to a series of blocks combined together with computational algorithms that are complex. A block
consists of the previous block hash, block header and merkle root [3]. For creating a new block, data is collected from the data portion which consists of one or more transactions. A copy of this
information is created, then it is hashed and a pair is made with another hash, hashed and paired
again and once more hashed. Thus, it leaves a single hash which is known as merkle root. New block consists of the information from the block that exists before and the blocks are combined
together since there is a single way in which the blocks fit together on the Blockchain and that is
in a computational way [3].
The use of the technology is growing across different industry sectors ranging from the logistics
operations to the manufacturing and the public services sector. The Blockchain technology is
growing rapidly in the financial services. Cryptocurrency is the common of all association. The crypto tokens are the special types of the virtual currency tokens that reside on their own
Blockchain and these represent an asset or a utility. Tokens can be made use of for
cryptocurrencies, investment tokens and utility tokens [6]. In not only this but also in other forms of Blockchain adoption, the concept that of a distributed ledger forms the means for gathering of
information and its communication between the users. These kinds of distributed ledger are more
about managing a system of different records rather than just maintaining of a database.
Therefore “smart contracts” have become significant amongst the users. A smart contract
provides definition of the various rules as well as the associated penalties in an agreement and in
an automatic way not only executes but also enforces the obligation in the contract [6]. This is more specifically a mechanism that involves digital assets along with two or more different
parties where some or all of those parties put the assets in and theses assets are redistributed
among those parties as per a specific formula depending on a data that is generally not known at
the time when the contract is flagged off. Blockchain as mentioned earlier has brought in revolution mainly in the financial sector as this technology can be said to be as the vision of those
developers that believed current banking system had some flaws. There are many potential uses
of the Blockchain technology such as payment processing and transfer of money, monitoring the supply chains, digital IDs, data sharing, copyright and royalty protection, digital voting and many
more [6]. Transferring of funds from one party to the other can be said to be as the one of the
most logical use of Blockchain. Then comes monitoring of the supply chains in which Blockchain speeds up the processes and thus enhances productivity. Blockchain allows the
businesses as well as the consumers to know how different products performed from the
perspective of quality control as they made their journey from the place of origin to the different
retailers. Blockchain technology has the capability to bring in revolution in the retail sector by becoming the best option for the loyalty programs [10]. This can happen by the creation of a
token-based system that gives rewards to the consumers. These generated tokens can also be
stored within a Blockchain thus incentivizing customers to return to a specific store. This would also help in eliminating fraud as well as waste that is commonly associated with the paper and
card based loyalty rewards programs.
Blockchain technology certainly has the potential to bring in revolution in the market but along
with this there are security issues as well that need to be addressed. The challenges are mainly
associated with the social, technical, adoption and regulatory areas [32]. Adoption of new
technology as such is a challenge as it depends on different factors such as acceptance by the
Computer Science & Information Technology (CS & IT) 53
employees, proper knowledge of the technology, proper analysis as for what specific purpose the technology has to be used and many such things [25]. Reluctance of the employees to adopt new
technologies has always been a concern for the management when thinking of adopting modern
technologies [10]. Therefore, it is required that the technology is understood properly before even
using it for any purpose. Blockchain technology can be integrated with different technologies as well to enhance their performance and have a positive effect on their productivity.
Focusing on the technology, new areas of growth and megatrends managers are trying to position the business organization. Although Blockchain technology exists from 2009, the introduction of
bitcoin has brought into light the other management.
applications and thus has validated that technology of Blockchain is not just for cryptocurrency
and cryptography enthusiasts [12]. The earlier applications proved that Bitcoin can be utilized as
legitimate currency in a market [34]. The theory of diffusion of innovation explains about how a
service, idea or product can be adopted through a system in due course of time. The rate of adoption of innovation is different within people or within an organization that ranges from early
innovators to late laggards [29]. Five main adopter categories are early adopters, late majority,
early majority, innovators and laggards. From a theoretical and managerial standpoint, it is not easy to determine the location of Blockchain technology exactly.
The paper is structured into different sections. Introduction to provide introductory topics about the blockchain applications in terms of electronic market. Research approach to explain how the
conceptual framework was built and based on which procedures to comply with different factors
that have been discussed in the literature review. The literature review focuses on the factors that
affect blockchain implementation in terms of blockchain adoption in critical systems. In this part, the focus will be on identifying the problems and challenges that are faced with the use of
systems. The second objective of the paper is evaluating the performance that is offered with the
use of blockchain technologies. The main aim of this paper is addressed in the section conceptual framework for analysing blockchain technology.
2. RESEARCH APPROACH
To come up with the conceptual framework, firstly the technology and the associated organizations related literary works have been reviewed. This has helped in finding out the major
factors associated with the Blockchain technology. The review provided the research with many
numbers of factors that should be considered by the organizations at the same time raising the most important question as how this particular technology can be managed in the best possible
way. The research has characterized all of these factors on the basis of the institutional
framework of Mohanta, Jena, Panda & Sobhanayak, (2019), into unique factors such as
organizational, engineering and lastly business factors. The framework can be said to be useful enough as this provides the components of the technology, the different parties that are involved
in the technology and lastly the role of the market forces. The different components of the
Blockchain technology are important in their own unique way. The most disruptive component of the Blockchain technology is the component of technology as this particular component can be
shaped in various different ways by the influence of both the actors and the markets. The
different literary works that have been referred to in the research provide an appropriate point of reference for mapping the engineering, the organizational and the business factors. The study
makes use of qualitative data analysis and secondary methods.
Qualitative data analysis provides insight to the study and helps in understanding the topic in a better way. This is a flexible approach as in case useful insights are not being obtained, there is
the provision with the researcher to be quick to adapt questions, make modifications to the
54 Computer Science & Information Technology (CS & IT)
settings or other such variable of the study for bringing in improvisation in the responses. This type of data permits the researcher to be more speculative about the significant areas of the
research and carry out the investigation on the same. The study makes use of secondary data that
is the data which is already collected by someone else and is easily available from different
sources. The advantage of using these data in the research is that the cost of the research decreases and this gives a deeper insights and ads to the knowledge base. This is economical as
compared to the primary data and saves both efforts as well as expenses. This is also preferred
when in limited amount of time research needs to be done. The understanding of the Blockchain technology and its associated components was made easy by selecting the secondary data
sources.
While searching for relevant articles, journals, books some keywords such as “Blockchain”,
“integration” and “adoption” were used that resulted in more than 1000 outcomes in the
databases that include Web of Science, Google Scholar, Business Source Complete and Scopus.
Then these articles were properly scanned after which it was found that amongst so many of the literary works 40 papers laid stress on the adoption and integration of Blockchain. Reading and
reviewing these 40 papers the various important factors were identified. The main aim was to
recognize those factors which were relevant to the topic of the research. The factors identified have been listed below along with proper explanations and their reliability to the Blockchain
technology. Some filters were applied to the sites such as Google Scholar and others as well such
as the time range was set from 2015 to 2020 to ensure that outdated data related to the topic is not taken into consideration. The articles that were available for free from these websites were
accessed and no paid articles were taken for the research. The research methodology that has
been written above was strictly followed to come to the final conclusions. There are certain
limitations in the research methodology such as use of primary data could have helped in statistically analyzing the topic or the work could be presented with some data visualizations
tools such as charts and graphs. The practical implication of adoption of the Blockchain
technology can be understood from the views of the companies or other institutions those who have worked on this. It can be said that using survey method and including appropriate
participants could have helped the research to get a practical touch [7].
The research could have used interviews or focus groups discussions to get a deeper insight about the topic but due to the prevalent situation of the pandemic happening, it was carried out with the
secondary sources. The selection of the secondary sources is what is important in this context.
The study totally depends on these sources thus it was ensured that proper sources are made use of taking the sources from proper sites. Thereafter the keywords checked and furthermore the
articles reviewed properly to check that they are topic relevant. In this way the research was
undertaken keeping in mind all the vital aspects that need to be kept a check on while conducting any research.
3. LITERATURE REVIEW: FACTORS AFFECTING ADOPTION OF
BLOCKCHAIN TECHNOLOGY
There were numerous factors for the adoption of block chain technology and they are classified into three dimensional as follows: Organizational, Engineering and Business.
3.1 Organizational Factors
Institutional arrangements can be observed as the rules regulating the interaction between the
parties. These rules are changed over time and may be different among cultures and markets. Current players may retain the status quo and design the applications of Blockchain in a manner
Computer Science & Information Technology (CS & IT) 55
that it is matching to the recent rules and governance while the new players may shape in new methods which may cause disruption in the markets that exist [7]. Institutional dimensions are
utilized for the categorization of the factors which place a demand on the technology of
Blockchain or the Blockchain application affects them.
3.1.1 Norms and Culture
Blockchain technology needs to be culturally resistant by market incumbents. In addition, resistance to change of companies and customers can have an effect on the Blockchain
technology adoption. Customers are required to accommodate the fact that all the electronic
transactions are secured, safe and complete. Intermediaries are required to go through the variation in roles and responsibilities. Modification and investment of the platform is required by
the investors for becoming Blockchain based and simultaneously providing customer relationship
and services [23]. On the other side new players make their entry to the field and they take a
varied approach since they can be threat to the players who already exist. Current players are benefitted by the customers who exist but the dependencies of the path slow down the progress
speed while the fresh players do not have any type of path dependency but are required to acquire
new customers. Multiple sources reveal that there is a lack of understanding among authorities, business and consumers regarding the utilization of Blockchain, the methods of its operation and
technology does [23]. The decentralized, accountability and possible transparency created by
technology can build new settings where people can depend less on controlled, inefficient services offered through intermediary and associated service providers.
Therefore, it is important to understand how the innovation in technology integration within
individual activities and business strategies for can have understanding its societal impact. Opinions of regulators, public, policymakers are influenced by the Blockchain technology
perception. Bitcoin is perceived as money laundering venue, activities related to drug activities
and other activities which are illegal. It is perceived by the public that mining of bitcoin is a waste of energy. Blockchain can be utilized in both bad and good ways with many other
technologies and as per the study by Sadouskaya, (2017), the advantages of utilizing the
Blockchain technology outweigh the negative sides. Blockchain should not be identified with
bitcoin exclusively. Blockchain can be utilized for applications other than cryptocurrency with the other implementations without any drawbacks related to bitcoin.
3.1.2 Regulations and Legislation
One of the most important challenges of the Blockchain technology is the specific way in which
they are to be regulated [11]. This has to be kept in mind that any technology cannot be subjected to regulation rather the arenas it is being used may require for regulatory constraints. Blockchain
can be made use of in cryptocurrencies, smart contracts and many more things such as distributed
ledgers. At present regulations related to the Blockchain-based digital currency or the
cryptocurrencies have gained attention and other different applications are yet to receive the attention. Government agencies can slow down the adoption process of Blockchain and they even
have the provisions with them to block certain applications. For instance, most recently the
Federal Trade Commission that is FTC and the Securities Exchange Commission that is SEC are making evaluations on whether there is a need to introduce new laws in this context [11]. Various
new laws and new regulations can certainly be taken into consideration for monitoring as well as
regulating the industry for compliance.
There are many countries like Bangladesh, Ecuador, Nepal and Bolivia where there is a ban on
the cryptocurrencies. The policy makers across the world are laying stress on regulating the use
of cryptocurrencies so that taxation could be avoided along with criminal activities. There are
56 Computer Science & Information Technology (CS & IT)
some countries that treat cryptocurrencies as digital money while others consider them to be as commodities. In the year 2015, ECJ or the European Court of Justice exempted cryptocurrency
transactions from VAT and considered these as currency [11]. Thus it can be said that different
laws and regulations can certainly influence as how fast Blockchain technology can develop.
There are certain challenges to the wider adoption of the Blockchain technology despite of the opportunities that it is laced up with. Collaborative governance can help stop the Blockchain
cybercrime and other such criminal activities [14]. The governments that have banned
cryptocurrencies and are against the Blockchain technology require realizing the various societal benefits of the Blockchain. Governments are required to function collaboratively so that the
benefits of the technology can be made use of checking on the crimes that are being done in this
field [28]. The policy makers require revisiting the various regulatory frameworks that include the banking laws, securities laws and lastly the commodities laws so that Blockchain technology
can be incorporated into the frameworks that are already present [14].
3.1.3 Governance
Blockchain has the requirement for being governed but in itself it is an instrument of governance.
For adopting the Blockchain technologies, the participants in the market should put appropriate frameworks of governance in place which consists of rules for approving or rejecting the
participants who are authorized, law applicable in case of disputes and mechanism of correction
[17]. In addition, these frameworks of governance should be attached to the features and functions of Blockchain technology. The risk of manipulation in the market and practices that are
unfair should be mitigated by governance. Due to the proper safeguard absence individuals might
get information access recorded in Blockchain and utilize it for unfair activities like price
manipulation and front run competitors. The outcome is that the requirement for protecting critical information and transparency level should be clear through the rules of privacy.
3.2. Business Factors
This refers to the organization operating in its environment. Organizations make contract and
operate in market structure type for buying and selling products and using their business processes for creating values [15]. Blockchain can bring variation in the way transactions are
handled that influences the structure of the market. Literature challenges the intermediary role in
the market structure.
3.2.1. Market Structures
Blockchain technology adoption needs a degree of computerization at a higher level. Therefore, certain countries are not ready for participating in the solutions on the basis of Blockchain. Since
this technology requires data distribution across various nodes, the magnitude of the issues is
increased for consideration due to processing power, high bandwidth and storage demand [15]. This leads to a condition where some regions and groups are unable to enjoy the Blockchain
technology benefits. The technologies based on Blockchain also hold promise for disrupting the
resilience and structure of financial markets. A report of 2017 highlights the risks and benefits of DLTs for the applications in financial markets, particularly the market volatility increase and the
role that is controversial which smart contracts play if the Blockchain size on the basis of
securities asset grow due to the automated triggers that are embedded and can provoke market
reaction in one direction at the time of stress [15]. The results interconnection can be referred to as bloating. Scalability is among one of the challenges that Blockchain technology faces. The
volumes of the transactions needed by the T2S services are higher than the bitcoin and
Blockchain is not enough for dealing with it in the current stage. Thus the challenge degree will
Computer Science & Information Technology (CS & IT) 57
be dependent on applications. For lower market segments challenge will be lesser whereas a very important role will be played by scalability for products of higher volume.
3.2.2. Contracts and agreements
Moving the existing contracts to new Blockchain technology can certainly need to migrate to the
existing documents or the contracts to the Blockchain form that is equivalent to this. At present
there is no such clarity related to smart contracts thus restricting them to simpler agreements. As per the definition of the smart contracts these are “computer protocols that facilitate, verify,
execute and enforce the terms of a commercial agreement” [15]. For instance, in the agreements
there can be said to be as least subjectivity on fulfillment of the terms. It is the conception of the people that smart contract are e-contracts that is a digital version of any paper based contract but
they are unaware of the fact that the various rules of these mart contracts are embedded in
software. The technology is such that if information gets added and consensus is obtained
between the different parties then this contract gets executed automatically. Unlike paper contracts, the execution of the smart contracts require self-monitoring as well as self-enforcing
that is obtained by a set of scripting, the systems specially been set for monitoring the off-
Blockchain information along with data that is considered as essential for effectively executing the different terms of the smart contracts [15]. It can be said that all these pose significant
programming challenges.
3.2.3. Business Processes
Business processes which are traditional may not seem to be applicable for utilization of
Blockchain as a technology as this is based on middle man cutting principle and thus avoids intermediary transaction fees. Implementation and adoption fees of Blockchain for business that
exists in the short run is very high, especially for those having processes of back office existing,
complex legacy IT systems and creation of processes for being aligned with existing standards which need redesign that is expensive [19]. Replacing or removing certain back office processes
with technology of Blockchain can generate problems.
3.3. Engineering Factors
3.3.1. Information Exchange and Transactions
Time required for processing transactions can be a challenge for Blockchain technology adoption.
Transaction processing time for the network of bitcoin is one transaction per second with a
theoretical maximum of 7 tps (Transaction Per Second) which is small compared to other networks which process transactions [2]. However, this leads to other issues of Blockchain and
size bloat. In time terms processing time of one bitcoin block is 10mins and this means that it
takes minimum of 10mins for a confirmed transaction. For larger transactions it will take longer since it has to outweigh the cost of a double spend attack. 160 GB is the current size of
Blockchain of Bitcoin [2]. When the speed of processing is increased to 2000 tps it is 1.42
PB/year.
3.3.2. Shared Infrastructure
Blockchain adoption has another challenge and that is the need for having a shared infrastructure which can provide entire service delivery value chain like messaging, communication protocols,
transport, decentralized storage, network administrator, decentralized storage, address
management and archival [20]. Blockchain economy needs to develop basic infrastructure components for industries to focus on higher level of development of value added services
58 Computer Science & Information Technology (CS & IT)
instead of focusing on only infrastructure [33]. Economy of Blockchain also has sensitive and complicated aspects of engineering of networks that are decentralized and it is essential for
having a well-developed and secured infrastructure [31]. In recent time it is highlighted that
Blockchain technology has standardization lacking in it on various levels that ranges from smart
contracts to technical protocols. Blockchain development did not have a connection with standard business organizations which existed like ISDA [27]. This forms one of the main reasons for
Blockchain to be called as disruptive. Puthal, Malik, Mohanty, Kougianos & Yang, (2018), added
technology components and process to the framework. Process can be defined as the changes that are needed and their management. On this basis authors concerned with this research developed
PIMT framework for adoption of Blockchain; the process consists of change management and
strategies for ensuring change in long term [26]. Market is the next layer and then it is required to examine which structure of market undergoes changes due to Blockchain. New agreements and
contracts need to be developed within the framework of the new legislative which is developed at
the institutional level. The process of business consists of the responsibilities and activities for
operational level which is concerned with the technology comprises of the software design by utilization of various technologies such as distributed ledger, identification, cryptography. The
first comprehensive framework that is conceptual and provides an overview of relationships of
the factors while considering the adoption of Blockchain. There can be a limitation in the framework for finding application for other industries. The work of Puthal, Malik, Mohanty,
Kougianos & Yang, (2018), categorized the factors which led to the framework proposed for
analyzing the adoption of Blockchain.
It is the comprehensive framework which is first in integration of a range of factors for
Blockchain adoption understanding. It is shown by the framework that various outcomes and
process change is possible since it helps in shaping the form of Blockchain application. The framework presents various factors like engineering, organizational and business mutually
influence and interacts with each other. Interaction of the different factors is dependent on the
context of Blockchain adoption.
3.3.3. Distributed Ledger
Management and access distribution across various nodes leads to security threats since there are numerous back doors by which a system can be attacked. Companies in majority of the networks
use the same code so if any vulnerability is found by a hacker it can result in serious
consequences for the system [16] [30]. Hence, it is important to ensure integrity of users in the ledger distribution and run transactions in a secure way which is again a key challenge for
adopting Blockchain technology widely. In addition to that there is a necessity for the companies
to think about the data security and integrity stored on a ledger. For many ledgers there is a preference for transparent record at the time of Blockchain technology implementation and it is
necessary for companies to ensure that only the individuals having the right permissions can
access the data. Generally, individuals are not comfortable for storing personal records in a way
which is decentralized. Utilizing a distributed ledger is a method for avoiding manipulation which is unseen and it is critical for technology of Blockchain for having cyber protection since
cybercrime is an important concern for participants of the market. Cyber activities fear can
prevent Blockchain adoption for various industries. Proponents argue that there is increased cyber security in Blockchain and testing is a key requirement for a broader scale in an environment
which is highly regulated.
Newness of the technology of Blockchain is a second concern. Blockchain can be assumed to be
in its initial stages; therefore, some information systems do not have security mechanism that is
well developed. Suggestions are such that 15-50 defects are found in a code of 1000 lines. As the
argument by Ølnes& Jansen, (2018), Blockchain has not been used broadly and enough testing

Computer Science & Information Technology (CS & IT) 59
has not been done for it to be free of errors. It is confirmed that the immaturity perceived in the technology builds challenges for companies wanting to implement the technology of Blockchain.
Table 1 shows the summary of major influences that could impact the integration of Blockchain
technologies.
Table 1: Summary of Themain Factorsthat Affectthe Adoptionof Blockchain Technolgies
Factors affecting
adoption of
Blockchain
technology
Challenges References
Organizational Factors
1. Norms and cultures a. Resistance that is due to the prevalent culture.
b. Reluctant to accept the changes.
c. Lack of proper understanding of the Blockchain
technology
[4]
[9]
[22]
[13]
[8]
[21]
[17]
2. Regulations and
legislations
a. Requires introducing new laws
b. Needs to handle taxation
c. Need to consider the nature of Blockchain technologies
[4]
[9]
[5] [22]
[13]
[8]
[16]
[21]
[17]
3. Governance a. Government losing hold
b. Making use of proper government framework
c. Risk related to market manipulation and unfair
practices
[4]
[9]
[22]
[18]
[13]
[8] [21]
[17]
Business factors
1. Market structure a. High degree of computerization gives rise to
volatility.
b. Interconnectedness
[4]
[9]
[22]
[20]
[21]
[17]
2. Contracts and
agreements
a. Lack of appropriate clarity on the smart contracts
b. Confusion of the smart contracts with the e-contracts
[4]
[9]
[22]
[13]
[8] [21]
[17]
3. Business process a. Inability to apply the traditional business processes
b. High cost of adoption
[4]
[9]
[22]
[13]
[8]
[21]
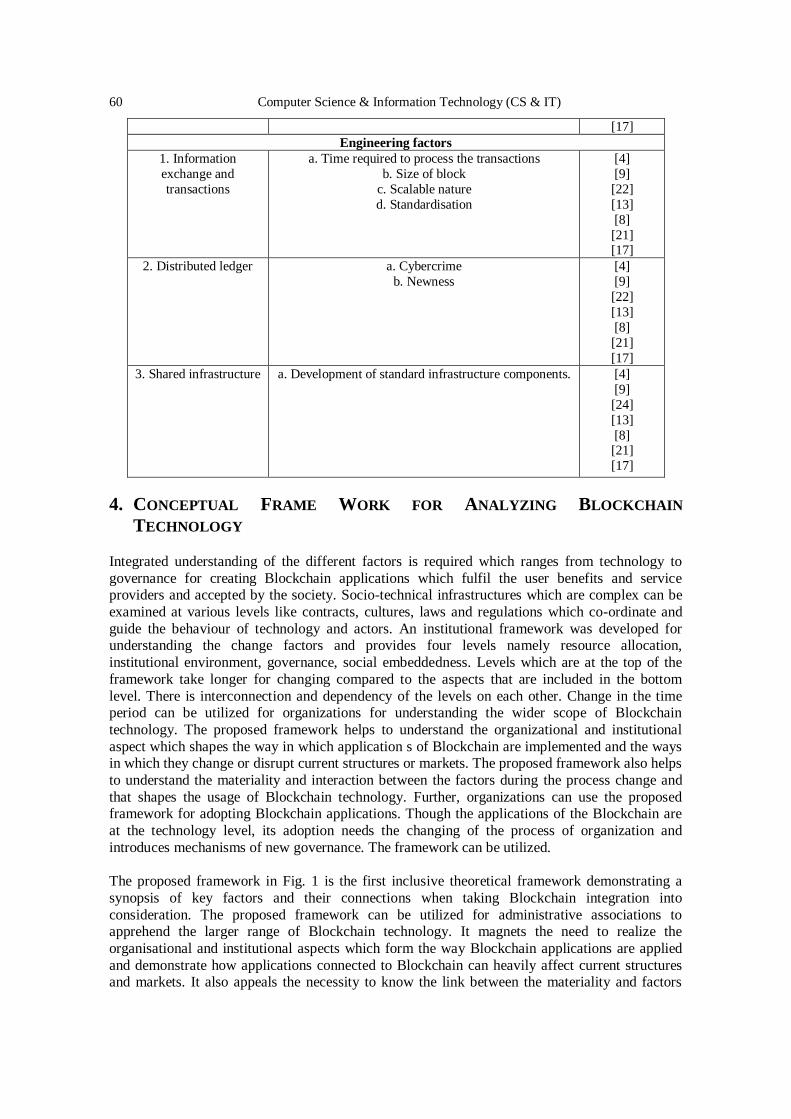
60 Computer Science & Information Technology (CS & IT)
[17]
Engineering factors
1. Information
exchange and
transactions
a. Time required to process the transactions
b. Size of block
c. Scalable nature
d. Standardisation
[4]
[9]
[22]
[13]
[8]
[21] [17]
2. Distributed ledger a. Cybercrime
b. Newness
[4]
[9]
[22]
[13]
[8]
[21]
[17]
3. Shared infrastructure a. Development of standard infrastructure components. [4]
[9]
[24]
[13]
[8] [21]
[17]
4. CONCEPTUAL FRAME WORK FOR ANALYZING BLOCKCHAIN
TECHNOLOGY
Integrated understanding of the different factors is required which ranges from technology to
governance for creating Blockchain applications which fulfil the user benefits and service providers and accepted by the society. Socio-technical infrastructures which are complex can be
examined at various levels like contracts, cultures, laws and regulations which co-ordinate and
guide the behaviour of technology and actors. An institutional framework was developed for understanding the change factors and provides four levels namely resource allocation,
institutional environment, governance, social embeddedness. Levels which are at the top of the
framework take longer for changing compared to the aspects that are included in the bottom
level. There is interconnection and dependency of the levels on each other. Change in the time period can be utilized for organizations for understanding the wider scope of Blockchain
technology. The proposed framework helps to understand the organizational and institutional
aspect which shapes the way in which application s of Blockchain are implemented and the ways in which they change or disrupt current structures or markets. The proposed framework also helps
to understand the materiality and interaction between the factors during the process change and
that shapes the usage of Blockchain technology. Further, organizations can use the proposed framework for adopting Blockchain applications. Though the applications of the Blockchain are
at the technology level, its adoption needs the changing of the process of organization and
introduces mechanisms of new governance. The framework can be utilized.
The proposed framework in Fig. 1 is the first inclusive theoretical framework demonstrating a
synopsis of key factors and their connections when taking Blockchain integration into
consideration. The proposed framework can be utilized for administrative associations to apprehend the larger range of Blockchain technology. It magnets the need to realize the
organisational and institutional aspects which form the way Blockchain applications are applied
and demonstrate how applications connected to Blockchain can heavily affect current structures and markets. It also appeals the necessity to know the link between the materiality and factors
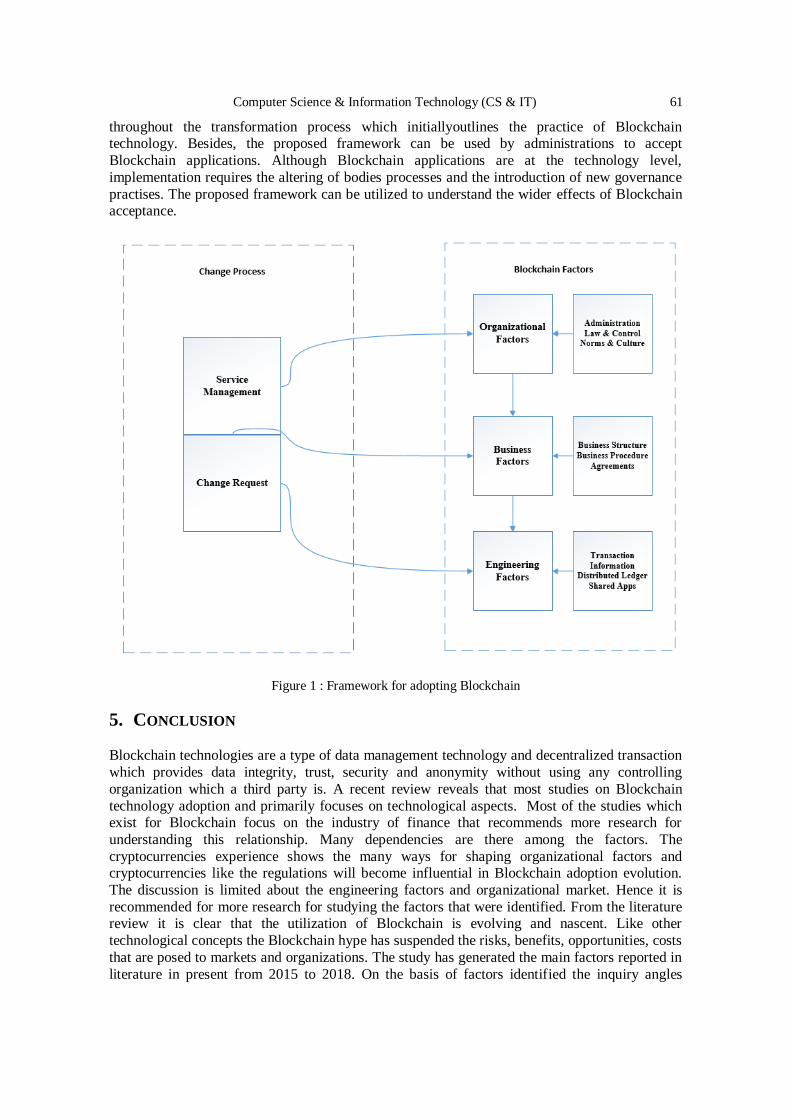
Computer Science & Information Technology (CS & IT) 61
throughout the transformation process which initiallyoutlines the practice of Blockchain technology. Besides, the proposed framework can be used by administrations to accept
Blockchain applications. Although Blockchain applications are at the technology level,
implementation requires the altering of bodies processes and the introduction of new governance
practises. The proposed framework can be utilized to understand the wider effects of Blockchain acceptance.
Figure 1 : Framework for adopting Blockchain
5. CONCLUSION
Blockchain technologies are a type of data management technology and decentralized transaction
which provides data integrity, trust, security and anonymity without using any controlling
organization which a third party is. A recent review reveals that most studies on Blockchain
technology adoption and primarily focuses on technological aspects. Most of the studies which exist for Blockchain focus on the industry of finance that recommends more research for
understanding this relationship. Many dependencies are there among the factors. The
cryptocurrencies experience shows the many ways for shaping organizational factors and cryptocurrencies like the regulations will become influential in Blockchain adoption evolution.
The discussion is limited about the engineering factors and organizational market. Hence it is
recommended for more research for studying the factors that were identified. From the literature review it is clear that the utilization of Blockchain is evolving and nascent. Like other
technological concepts the Blockchain hype has suspended the risks, benefits, opportunities, costs
that are posed to markets and organizations. The study has generated the main factors reported in
literature in present from 2015 to 2018. On the basis of factors identified the inquiry angles
62 Computer Science & Information Technology (CS & IT)
require to be multiple. In this respect, adoption of Blockchain draws from the multitude of existing technology influenced studies change which use market oriented, institutional and
adoption of technology. Hence Blockchain research needs a comprehensive inter-disciplinary
effort and concentrated literature review utilizing all the major reference sources like Business
Source Complete, Google Scholar, Scopus, Web of Science research in depth into adoption of Blockchain. There are certain limitations in the study which the research done in future can
address. The proposed framework’s major focus is Blockchain adoption technology by the
organizations. Research done in future may focus on adoption of technology of Blockchain by the citizens. The proposed framework is conceptual and it has not been tested empirically. The
research of future requires for testing the framework proposed in various contexts. Many factors
have been identified by present studies for providing solutions to the new challenges. The framework proposed on the basis of literature showed the interrelationship between factors and
companies are offered a frame initially while adopting applications of Blockchain. Research done
in future should refine, test and explore the relationships and framework expansion on the basis
of practical evidence. The emergence of technology of Blockchain has been seen as the next revolution that transforms the size and shape of organizations. With new innovations adopters
have encountered many challenges which have prompted technical researchers and experts for
debating on the advantages of Blockchain technology during its early phase. Thus from the above discussion made it can be clearly understood that there needs to be a framework for adoption of
Blockchain. The framework given in this study considers the three essential factors and the sub
factors explaining each of these properly. The most important of all is the legislation sub-factor as this is what makes cryptocurrencies banned in some countries and get accepted in some other.
The social benefits of Blockchain technology need to be understood properly so that it can be
made proper use of by different firms. There needs to be collaboration between the governments
to bring in a common law so that cybercrimes related to the Blockchain technology can be checked.
REFERENCES [1] Al-Saqaf, W., & Seidler, N. (2017). Blockchain technology for social impact: Opportunities and
challenges ahead. Journal of Cyber Policy, 2(3), 338–354.
[2] Atzori, M. (2015). Blockchain technology and decentralized governance: Is the state still necessary?.
Available at SSRN 2709713.
[3] Behnke, K., & Janssen, M. F. W. H. A. (2020). Boundary conditions for traceability in food supply
chains using blockchain technology. International Journal of Information Management, 52, 101969.
[4] Biswas, K., & Muthukkumarasamy, V. (2016, December). Securing smart cities using Blockchain
technology. In 2016 IEEE 18th international conference on high performance computing and communications.
[5] Blossey, G., Eisenhardt, J., & Hahn, G. (2019, January). Blockchain technology in supply chain
management: An application perspective. In Proceedings of the 52nd Hawaii International
Conference on System Sciences.
[6] Fusco, F., Lunesu, M. I., Pani, F. E., & Pinna, A. (2018). Crypto-voting, a Blockchain based e-Voting
System. In KMIS (pp. 221-225).
[7] Holotiuk, F., Pisani, F., & Moormann, J. (2017). The impact of Blockchain technology on business
models in the payments industry. 13th International Conference on Wirtschaftsinformatik, St. Gallen,
Switzerland.
[8] Kamble, S., Gunasekaran, A., & Arha, H. (2019). Understanding the Blockchain technology adoption
in supply Chains-Indian context. International Journal of Production Research, 57(7), 2009-2033. [9] Korpela, K., Hallikas, J., & Dahlberg, T. (2017, January). Digital supply chain transformation toward
Blockchain integration. In proceedings of the 50th Hawaii international conference on system
sciences.
Computer Science & Information Technology (CS & IT) 63
[10] Mackey, T. K., Kuo, T. T., Gummadi, B., Clauson, K. A., Church, G., Grishin, D., ... & Palombini,
M. (2019). ‘Fit-for-purpose?’–challenges and opportunities for applications of Blockchain technology
in the future of healthcare. BMC medicine, 17(1), 1-17.
[11] Min, H. (2019). Blockchain technology for enhancing supply chain resilience. Business Horizons,
62(1), 35-45. [12] Mohanta, B. K., Jena, D., Panda, S. S., & Sobhanayak, S. (2019). Blockchain technology: A survey
on applications and security privacy challenges. Internet of Things, 8, 100107.
[13] Mohanta, B. K., Panda, S. S., & Jena, D. (2018, July). An overview of smart contract and use cases in
Blockchain technology. In 2018 9th International Conference on Computing, Communication and
Networking Technologies (ICCCNT) (pp. 1-4). IEEE.
[14] Morabito, V. (2017). Business innovation through Blockchain. Cham: Springer International
Publishing.
[15] Niranjanamurthy, M., Nithya, B. N., & Jagannatha, S. (2019). Analysis of Blockchain technology:
pros, cons and SWOT. Cluster Computing, 22(6), 14743-14757.
[16] Ølnes, S., & Jansen, A. (2018, May). Blockchain technology as infrastructure in public sector: an
analytical framework. In Proceedings of the 19th Annual International Conference on Digital
Government Research: Governance in the Data Age (pp. 1-10). [17] Orecchini, F., Santiangeli, A., Zuccari, F., Pieroni, A., & Suppa, T. (2018, October). Blockchain
technology in smart city: A new opportunity for smart environment and smart mobility. In
International conference on intelligent computing & optimization (pp. 346-354). Springer, Cham.
[18] Perera, S., Nanayakkara, S., Rodrigo, M. N. N., Senaratne, S., & Weinand, R. (2020). Blockchain
technology: Is it hype or real in the construction industry? Journal of Industrial Information
Integration, 17, 100125.
[19] Pieroni, A., Scarpato, N., Di Nunzio, L., Fallucchi, F., & Raso, M. (2018). Smarter city: smart energy
grid based on Blockchain technology. Int. J. Adv. Sci. Eng. Inf. Technol, 8(1), 298-306.
[19] Post, R., Smit, K., & Zoet, M. (2018). Identifying factors affecting Blockchain technology
diffusion.Twenty-fourth Americas Conference on Information Systems, New Orleans, 2018.
[20] Puthal, D., Malik, N., Mohanty, S. P., Kougianos, E., & Yang, C. (2018). The Blockchain as a decentralized security framework [future directions]. IEEE Consumer Electronics Magazine, 7(2), 18-
21.
[21] Queiroz, M. M., Telles, R., & Bonilla, S. H. (2019). Blockchain and supply chain management
integration: A systematic review of the literature. Supply Chain Management: An International
Journal.
[22] Reyna, A., Martín, C., Chen, J., Soler, E., & Díaz, M. (2018). On Blockchain and its integration with
IoT. Challenges and opportunities. Future generation computer systems, 88, 173-190.
[23] Sadouskaya, K. (2017). Adoption of Blockchain technology in supply chain and logistics supply
chains using Blockchain technology. International Journal of Information Management.
[24] Wang, J., Wu, P., Wang, X., & Shou, W. (2017). The outlook of Blockchain technology for
construction engineering management. Frontiers of engineering management, 67-7
[25] Mendling, J., Weber, I., Aalst, W. V. D., Brocke, J. V., Cabanillas, C., Daniel, F., ... & Gal, A. (2018). Blockchains for business process management-challenges and opportunities. ACM
Transactions on Management Information Systems (TMIS), 9(1), 1-16.
[26] Wong, L. W., Leong, L. Y., Hew, J. J., Tan, G. W. H., & Ooi, K. B. (2019). Time to seize the digital
evolution: Adoption of blockchain in operations and supply chain management among Malaysian
SMEs. International Journal of Information Management, 101997.
[27] Drljevic, N., Aranda, D. A., & Stantchev, V. (2020). Perspectives on risks and standards that affect
the requirements engineering of blockchain technology. Computer Standards & Interfaces, 69,
103409.
[28] Hughes, L., Dwivedi, Y. K., Misra, S. K., Rana, N. P., Raghavan, V., & Akella, V. (2019).
Blockchain research, practice and policy: Applications, benefits, limitations, emerging research
themes and research agenda. International Journal of Information Management, 49, 114-129. [29] Li, J., Greenwood, D., & Kassem, M. (2018). Blockchain in the built environment: analysing current
applications and developing an emergent framework. Diamond Congress Ltd.
[30] Putz, B., & Pernul, G. (2019). Trust factors and insider threats in permissioned distributed ledgers. In
Transactions on Large-Scale Data-and Knowledge-Centered Systems XLII (pp. 25-50). Springer,
Berlin, Heidelberg.
64 Computer Science & Information Technology (CS & IT)
[31] Viriyasitavat, W., Da Xu, L., Bi, Z., & Pungpapong, V. (2019). Blockchain and internet of things for
modern business process in digital economy—the state of the art. IEEE Transactions on
Computational Social Systems, 6(6), 1420-1432.
[32] Werner, F., Basalla, M., Schneider, J., Hayes, D., & Vom Brocke, J. (2020). Blockchain Adoption
from an Interorganizational Systems Perspective–A Mixed-Methods Approach. Information Systems Management, 1-16.
[33] Grover, P., Kar, A. K., & Janssen, M. (2019). Diffusion of blockchain technology. Journal of
Enterprise Information Management.
[34] Kollmann, T., Hensellek, S., de Cruppe, K., & Sirges, A. (2019). Toward a renaissance of
cooperatives fostered by blockchain on electronic marketplaces: A theory-driven case study
approach. Electronic Markets, 1-12.
[35] Jirgensons, M., & Kapenieks, J. (2018). Blockchain and the future of digital learning credential
assessment and management. Journal of Teacher Education for Sustainability, 20(1), 145-156.
AUTHOR
Amr has received his Ph.D. in 2020 in cyber security and digital forensics from
Auckland University of Technology. He used to work on industry research at AUT
cyber forensics research centre. He got his masters in Telecommunications
engineering from University of Sunderland in 2016. Amr got his bachelor degree in
computer science from University of the District of Columbia. He is currently teaching at Whitecliffe College of Technology & Innovation. Previously, He used to
teach IT courses at Auckland University of Technology. His research areas are in
integration between the IT and Education and security aspects of critical sectors,
internet of things, and blockchain applications in complex systems. © 2020 By AIRCC Publishing Corporation. This article is published under the Creative Commons
Attribution (CC BY) license.
David C. Wyld et al. (Eds): CCSEA, BIoT, DKMP, CLOUD, NLCAI, SIPRO - 2020
pp. 65-72, 2020. CS & IT - CSCP 2020 DOI: 10.5121/csit.2020.101006
APPLY MODERN STATISTICAL CLUSTERING
ANALYSIS ON DETECTING ALTITUDE
SICKNESS AND SPORTS FATIGUE BEHAVIOR
Mason Chen
OHS, Stanford University, Palo Alto, USA
ABSTRACT This paper will address Altitude Sickness risk when hiking on the high Mountains. It’s very risky if the people are not aware of their altitude sickness symptom such as Fatigue, Headache,
Dizziness, Insomnia, Shortness of breath during exertion, Nausea, Decreased appetite. The
consequence of altitude sickness could be dangerous on the inconvenient high mountains. Pulse
Oximeter was used to monitor the Oxygen% and Heart Beat at different altitude levels from
near-sea level in San Jose, Denver (5,000 Feet), Estes Park (8,000 Feet), Rocky Mountains
Alpine Center (12,000 Feet). 2.5-mins Jumping Rope exercise was conducted to analyze the
fatigue behavior associated with Altitude Sickness. Statistical analysis was conducted to verify
several hypotheses to predict the Altitude Sickness Risk as well as the Exercise Fatigue
Behavior. This paper has demonstrated how to assess their body strength and readiness before
they may take a strenuous hiking on the high mountains.
KEYWORDS
JMP, Statistics, Altitude Sickness, Data Mining, AI
1. INTRODUCTION
When go to higher altitudes, the environmental pressure drops and less oxygen available. Your
body will need time to adjust to the change in pressure. Any time above 8,000 feet, you can be at risk for altitude sickness. The Oxygen levels are plotted vs. Altitude (feet). There is only 70%
Oxygen available at 10,000 feet. At the highest mountain Everest (29,029’), the Oxygen level is
only around 32%. In 2019 Spring, with a single route to the Everest summit, delays caused by
overcrowding could prove fatal after suffering from what appeared to be altitude sickness. Most climbers can only spend a matter of few minutes at the summit without extra Oxygen supplies in
where is known as the “death zone”. Even when using bottled Oxygen, supplemental Oxygen,
there is only a few hours that mountaineers can survive up there before their bodies start to shut down. If caught in the traffic jam above 25,000 feet, the consequences can be severe. Therefore,
how to detect body altitude sickness earlier is critical for these climbers in certain critical
situation. This paper would demonstrate the real-time Oxygen Concentration% and Heart Beat Rate measurement on detecting any early altitude sickness symptom. The Fatigue factor would
also be addressed.
1.1. Three Kinds of Altitude Sickness
1. Acute Mountain Sickness (AMS) is the mildest form and it’s very common. The symptoms can feel like a hangover – dizziness, headache, muscle aches, nausea [1-3]. Most instances of
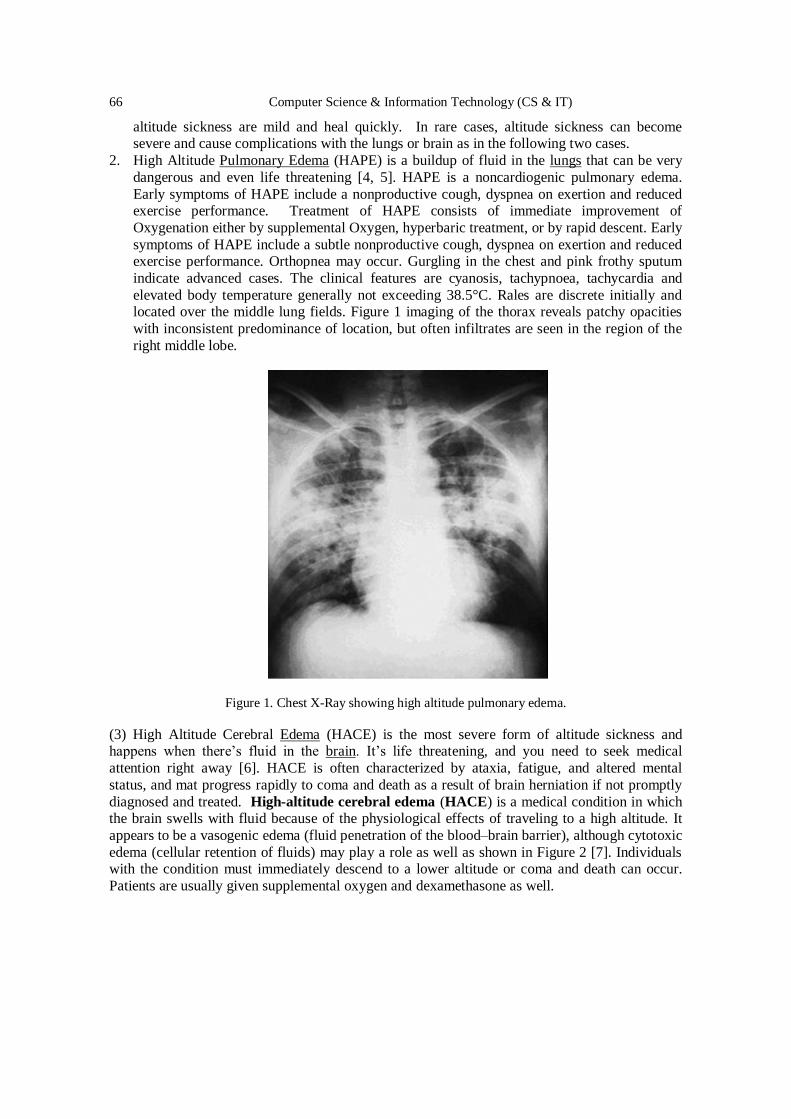
66 Computer Science & Information Technology (CS & IT)
altitude sickness are mild and heal quickly. In rare cases, altitude sickness can become severe and cause complications with the lungs or brain as in the following two cases.
2. High Altitude Pulmonary Edema (HAPE) is a buildup of fluid in the lungs that can be very
dangerous and even life threatening [4, 5]. HAPE is a noncardiogenic pulmonary edema.
Early symptoms of HAPE include a nonproductive cough, dyspnea on exertion and reduced exercise performance. Treatment of HAPE consists of immediate improvement of
Oxygenation either by supplemental Oxygen, hyperbaric treatment, or by rapid descent. Early
symptoms of HAPE include a subtle nonproductive cough, dyspnea on exertion and reduced exercise performance. Orthopnea may occur. Gurgling in the chest and pink frothy sputum
indicate advanced cases. The clinical features are cyanosis, tachypnoea, tachycardia and
elevated body temperature generally not exceeding 38.5°C. Rales are discrete initially and located over the middle lung fields. Figure 1 imaging of the thorax reveals patchy opacities
with inconsistent predominance of location, but often infiltrates are seen in the region of the
right middle lobe.
Figure 1. Chest X-Ray showing high altitude pulmonary edema.
(3) High Altitude Cerebral Edema (HACE) is the most severe form of altitude sickness and happens when there’s fluid in the brain. It’s life threatening, and you need to seek medical
attention right away [6]. HACE is often characterized by ataxia, fatigue, and altered mental
status, and mat progress rapidly to coma and death as a result of brain herniation if not promptly
diagnosed and treated. High-altitude cerebral edema (HACE) is a medical condition in which the brain swells with fluid because of the physiological effects of traveling to a high altitude. It
appears to be a vasogenic edema (fluid penetration of the blood–brain barrier), although cytotoxic
edema (cellular retention of fluids) may play a role as well as shown in Figure 2 [7]. Individuals with the condition must immediately descend to a lower altitude or coma and death can occur.
Patients are usually given supplemental oxygen and dexamethasone as well.

Computer Science & Information Technology (CS & IT) 67
Figure 2. HACE Diagram.
1.2. Prevent Altitude Sickness
Chance of getting altitude sickness depends: how quickly you move to a higher elevation, how
high you go up, the altitude where you sleep, where you live and the altitude there, your age (young people are more likely to get it), and whether you’ve had altitude sickness before. Having
certain illnesses like diabetes or lung disease doesn’t automatically make more likely to develop
altitude sickness. But genes could play a role to handle higher elevations. There are several prevention technologies to lower chance of getting altitude sickness through proper
acclimatization: let your body slowly get used to the changes in air pressure as travel to higher
elevations as followings.
• Start your journey below 10,000 feet.
• If you walk, hike, or climb over 10,000 feet, only go up an additional 1,000 feet per day.
• For every 3,000 feet you climb, rest at least a day at that height.
• “Climb high and sleep low”.
• Drink 3-4 quarts of water daily, and about 70% of your calories are coming from carbs.
• Don’t use tobacco, alcohol, or other medications, such as sleeping pills.
• Know how to identify the first signs of altitude sickness.
The most effective detecting Altitude Sickness is to measure the Body Oxygen Level. Oxygen
Pulse Technology. Pulse Oximeter was used to monitor the Oxygen Saturation% and Heart Beat
Rate at different altitude levels. A clip-like device called a probe uses light to measure how much oxygen is in this blood and how well your heart is pumping oxygen through your body.
Transmissive Mode is most popularly used: a small beams or light pass through the blood in the
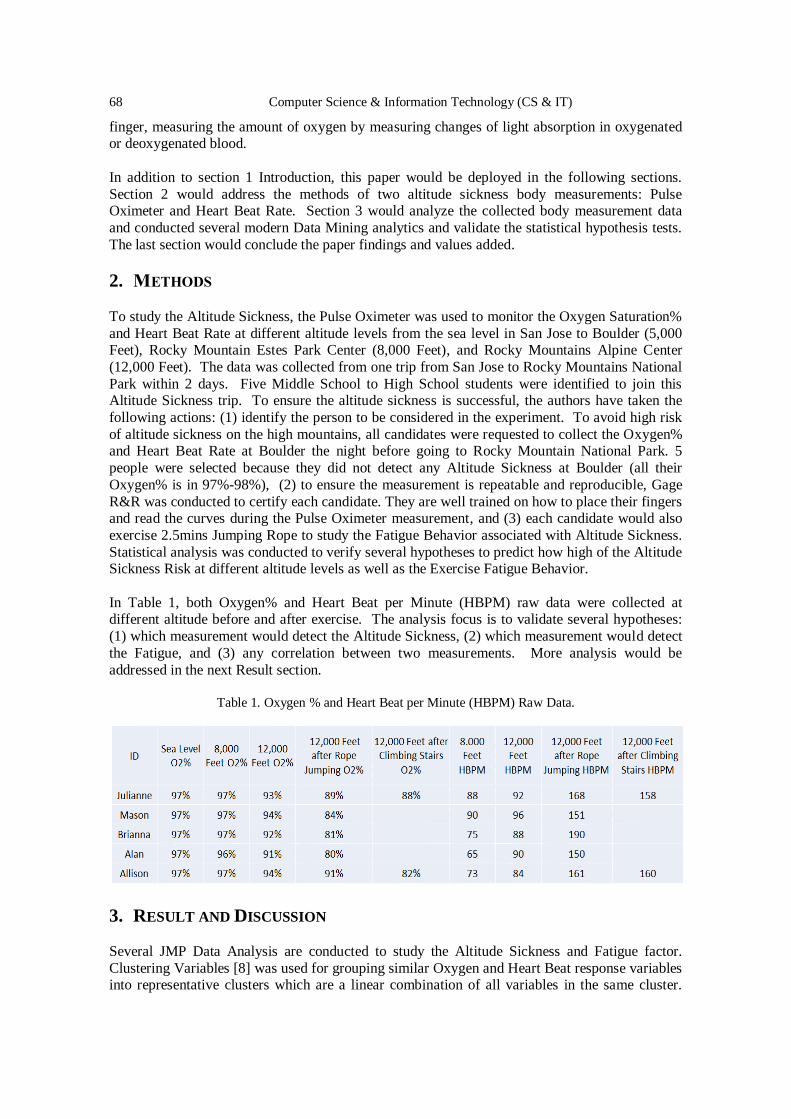
68 Computer Science & Information Technology (CS & IT)
finger, measuring the amount of oxygen by measuring changes of light absorption in oxygenated or deoxygenated blood.
In addition to section 1 Introduction, this paper would be deployed in the following sections.
Section 2 would address the methods of two altitude sickness body measurements: Pulse Oximeter and Heart Beat Rate. Section 3 would analyze the collected body measurement data
and conducted several modern Data Mining analytics and validate the statistical hypothesis tests.
The last section would conclude the paper findings and values added.
2. METHODS
To study the Altitude Sickness, the Pulse Oximeter was used to monitor the Oxygen Saturation%
and Heart Beat Rate at different altitude levels from the sea level in San Jose to Boulder (5,000 Feet), Rocky Mountain Estes Park Center (8,000 Feet), and Rocky Mountains Alpine Center
(12,000 Feet). The data was collected from one trip from San Jose to Rocky Mountains National
Park within 2 days. Five Middle School to High School students were identified to join this Altitude Sickness trip. To ensure the altitude sickness is successful, the authors have taken the
following actions: (1) identify the person to be considered in the experiment. To avoid high risk
of altitude sickness on the high mountains, all candidates were requested to collect the Oxygen% and Heart Beat Rate at Boulder the night before going to Rocky Mountain National Park. 5
people were selected because they did not detect any Altitude Sickness at Boulder (all their
Oxygen% is in 97%-98%), (2) to ensure the measurement is repeatable and reproducible, Gage
R&R was conducted to certify each candidate. They are well trained on how to place their fingers and read the curves during the Pulse Oximeter measurement, and (3) each candidate would also
exercise 2.5mins Jumping Rope to study the Fatigue Behavior associated with Altitude Sickness.
Statistical analysis was conducted to verify several hypotheses to predict how high of the Altitude Sickness Risk at different altitude levels as well as the Exercise Fatigue Behavior.
In Table 1, both Oxygen% and Heart Beat per Minute (HBPM) raw data were collected at different altitude before and after exercise. The analysis focus is to validate several hypotheses:
(1) which measurement would detect the Altitude Sickness, (2) which measurement would detect
the Fatigue, and (3) any correlation between two measurements. More analysis would be
addressed in the next Result section.
Table 1. Oxygen % and Heart Beat per Minute (HBPM) Raw Data.
3. RESULT AND DISCUSSION
Several JMP Data Analysis are conducted to study the Altitude Sickness and Fatigue factor.
Clustering Variables [8] was used for grouping similar Oxygen and Heart Beat response variables into representative clusters which are a linear combination of all variables in the same cluster.
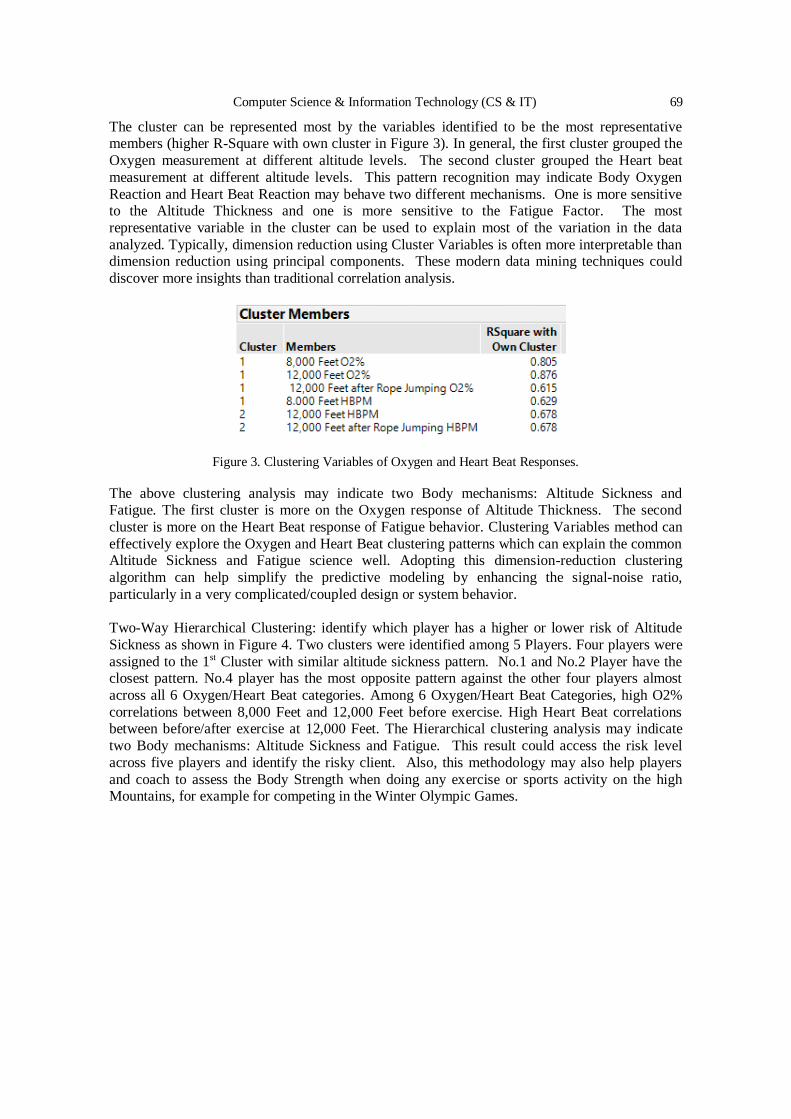
Computer Science & Information Technology (CS & IT) 69
The cluster can be represented most by the variables identified to be the most representative members (higher R-Square with own cluster in Figure 3). In general, the first cluster grouped the
Oxygen measurement at different altitude levels. The second cluster grouped the Heart beat
measurement at different altitude levels. This pattern recognition may indicate Body Oxygen
Reaction and Heart Beat Reaction may behave two different mechanisms. One is more sensitive to the Altitude Thickness and one is more sensitive to the Fatigue Factor. The most
representative variable in the cluster can be used to explain most of the variation in the data
analyzed. Typically, dimension reduction using Cluster Variables is often more interpretable than dimension reduction using principal components. These modern data mining techniques could
discover more insights than traditional correlation analysis.
Figure 3. Clustering Variables of Oxygen and Heart Beat Responses.
The above clustering analysis may indicate two Body mechanisms: Altitude Sickness and Fatigue. The first cluster is more on the Oxygen response of Altitude Thickness. The second
cluster is more on the Heart Beat response of Fatigue behavior. Clustering Variables method can
effectively explore the Oxygen and Heart Beat clustering patterns which can explain the common Altitude Sickness and Fatigue science well. Adopting this dimension-reduction clustering
algorithm can help simplify the predictive modeling by enhancing the signal-noise ratio,
particularly in a very complicated/coupled design or system behavior.
Two-Way Hierarchical Clustering: identify which player has a higher or lower risk of Altitude
Sickness as shown in Figure 4. Two clusters were identified among 5 Players. Four players were
assigned to the 1st Cluster with similar altitude sickness pattern. No.1 and No.2 Player have the closest pattern. No.4 player has the most opposite pattern against the other four players almost
across all 6 Oxygen/Heart Beat categories. Among 6 Oxygen/Heart Beat Categories, high O2%
correlations between 8,000 Feet and 12,000 Feet before exercise. High Heart Beat correlations between before/after exercise at 12,000 Feet. The Hierarchical clustering analysis may indicate
two Body mechanisms: Altitude Sickness and Fatigue. This result could access the risk level
across five players and identify the risky client. Also, this methodology may also help players
and coach to assess the Body Strength when doing any exercise or sports activity on the high Mountains, for example for competing in the Winter Olympic Games.
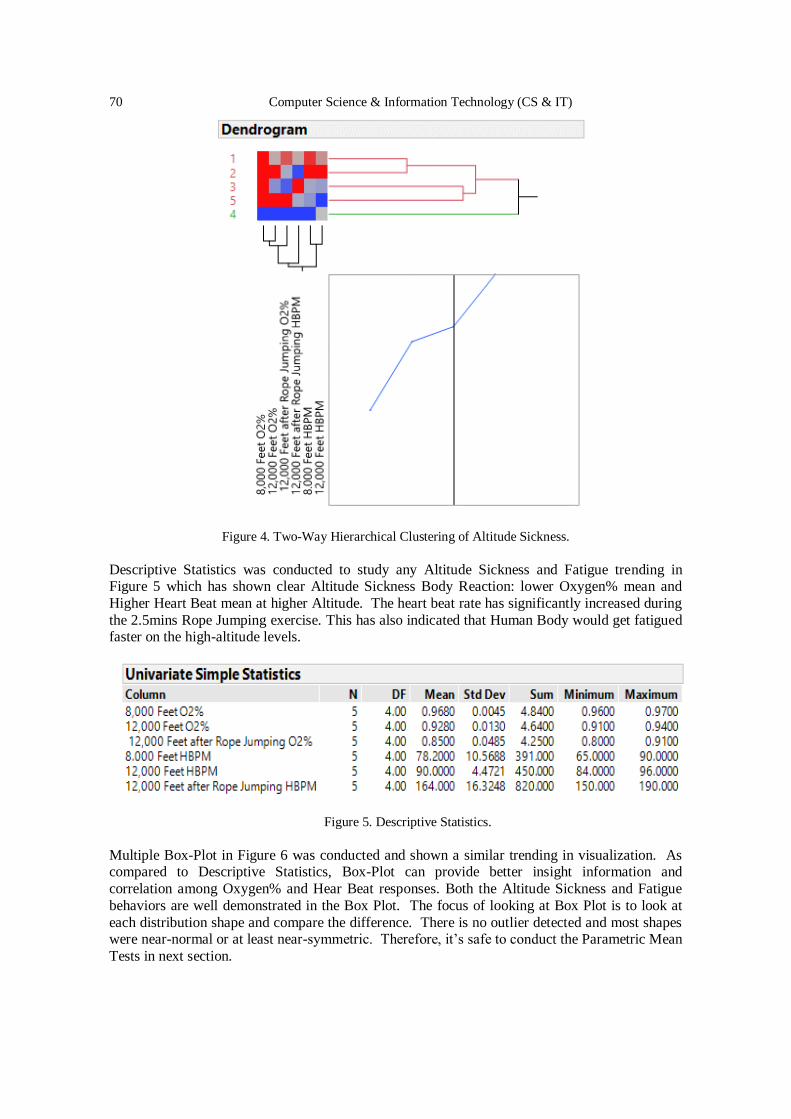
70 Computer Science & Information Technology (CS & IT)
Figure 4. Two-Way Hierarchical Clustering of Altitude Sickness.
Descriptive Statistics was conducted to study any Altitude Sickness and Fatigue trending in Figure 5 which has shown clear Altitude Sickness Body Reaction: lower Oxygen% mean and
Higher Heart Beat mean at higher Altitude. The heart beat rate has significantly increased during
the 2.5mins Rope Jumping exercise. This has also indicated that Human Body would get fatigued faster on the high-altitude levels.
Figure 5. Descriptive Statistics.
Multiple Box-Plot in Figure 6 was conducted and shown a similar trending in visualization. As compared to Descriptive Statistics, Box-Plot can provide better insight information and
correlation among Oxygen% and Hear Beat responses. Both the Altitude Sickness and Fatigue
behaviors are well demonstrated in the Box Plot. The focus of looking at Box Plot is to look at
each distribution shape and compare the difference. There is no outlier detected and most shapes were near-normal or at least near-symmetric. Therefore, it’s safe to conduct the Parametric Mean
Tests in next section.
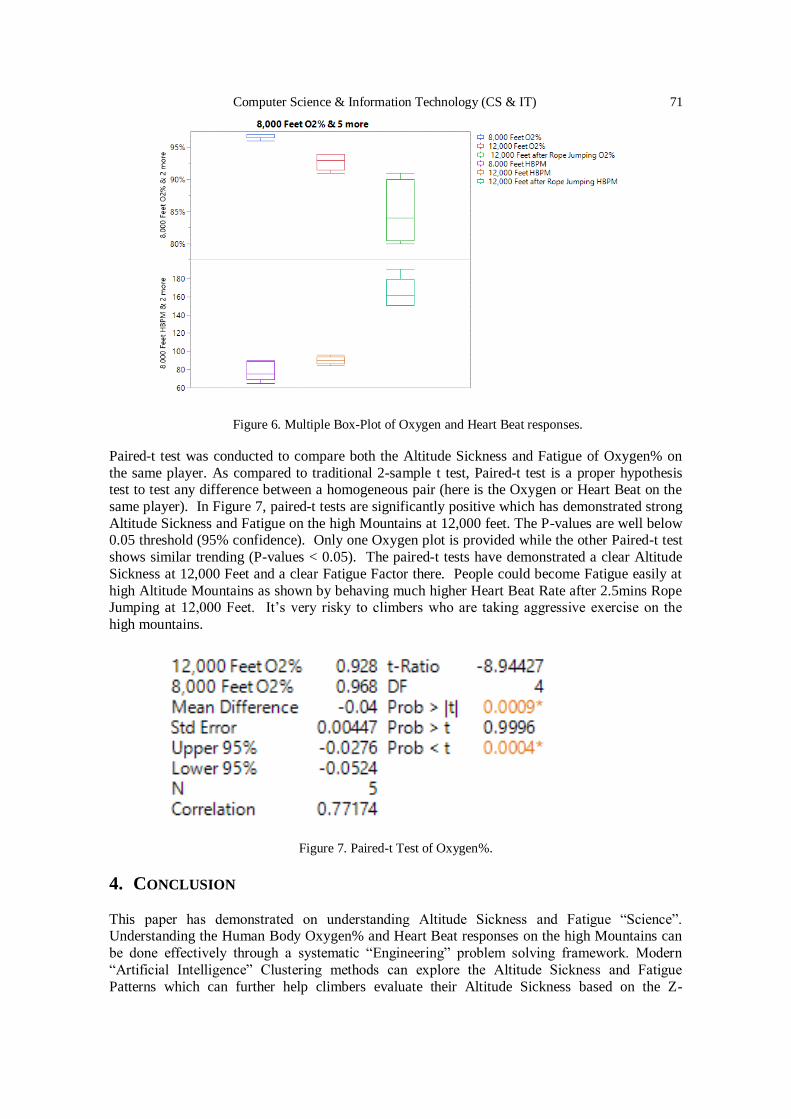
Computer Science & Information Technology (CS & IT) 71
Figure 6. Multiple Box-Plot of Oxygen and Heart Beat responses.
Paired-t test was conducted to compare both the Altitude Sickness and Fatigue of Oxygen% on
the same player. As compared to traditional 2-sample t test, Paired-t test is a proper hypothesis test to test any difference between a homogeneous pair (here is the Oxygen or Heart Beat on the
same player). In Figure 7, paired-t tests are significantly positive which has demonstrated strong
Altitude Sickness and Fatigue on the high Mountains at 12,000 feet. The P-values are well below 0.05 threshold (95% confidence). Only one Oxygen plot is provided while the other Paired-t test
shows similar trending (P-values < 0.05). The paired-t tests have demonstrated a clear Altitude
Sickness at 12,000 Feet and a clear Fatigue Factor there. People could become Fatigue easily at
high Altitude Mountains as shown by behaving much higher Heart Beat Rate after 2.5mins Rope Jumping at 12,000 Feet. It’s very risky to climbers who are taking aggressive exercise on the
high mountains.
Figure 7. Paired-t Test of Oxygen%.
4. CONCLUSION
This paper has demonstrated on understanding Altitude Sickness and Fatigue “Science”. Understanding the Human Body Oxygen% and Heart Beat responses on the high Mountains can
be done effectively through a systematic “Engineering” problem solving framework. Modern
“Artificial Intelligence” Clustering methods can explore the Altitude Sickness and Fatigue
Patterns which can further help climbers evaluate their Altitude Sickness based on the Z-

72 Computer Science & Information Technology (CS & IT)
transformed mathematically Parallel Plot. Both “Descriptive Statistics”, “Box-Plot”, and “Paired-T” can help draw more Oxygen and Heart Beat insight response to address Altitude
Sickness and Fatigue. This method could detect the real time Altitude Sickness and Fatigue risk
by measuring the Oxygen% and Heart Beat Rate at frequent base. The measurement data could
provide the Body Reaction Risk and guide the high risk identified person to take immediate actions to avoid situation getting worse. In the modern Big Data era, most scientists and
engineers shall adopt such Interdisciplinary methodology and integrate subjective root cause
analysis and objective data-driven seamlessly and collectively.
ACKNOWLEDGEMENTS The author would like to statistics advisors Dr. Charles Chen and Mr. Patrick Giuliano and team members
Julianne Chiu, Alan Sean, and Brianna Zheng.
REFERENCES [1] Luo, Elaine (2017), “Acute Mountain Sickness”, Healthline.
[2] Lukes, Andrew, Swenson, Erik & Bartech, Peter (2017), “Acute High-Altitude Sickness”, European
Respiratory Review 2017 26:160096
[3] Paralikar, J. Swapnil (2012), “High Altitude Pulmonary Edema-Clinical Features, Pathophysiology,
Prevention and Treatment”, Indian Journal of Occupational and Environment Medicine, P.59-62
[4] Bartsch P, Mairbauri H, Swenson ER, & Maggiorini M. (2003), “High altitude pulmonary edema”.
Swiss Med Wkly.
[5] Schoene RB. (2008), “Illnesses at high altitude. Chest”. [6] Jensen, Vincent AL (2017), “High Altitude Cerebral Edema (HACE)”, Stat Pearls Publishing LLC.
[7] Hackett PH, Yarnell PR, Hill R, Reynard K, Heit J, & McCormick J. (1998), “High-altitude cerebral
edema evaluated with magnetic resonance imaging: clinical correlation and pathophysiology”.
JAMA. 280(22):1920-5.
[8] Milligan, G.W. (1980), “An Examination of the Effect of Six Types of Error Perturbation on Fifteen
Clustering Algorithms,” Psychometrika, 45, 325–342.
© 2020 By AIRCC Publishing Corporation. This article is published under the Creative Commons
Attribution (CC BY) license.
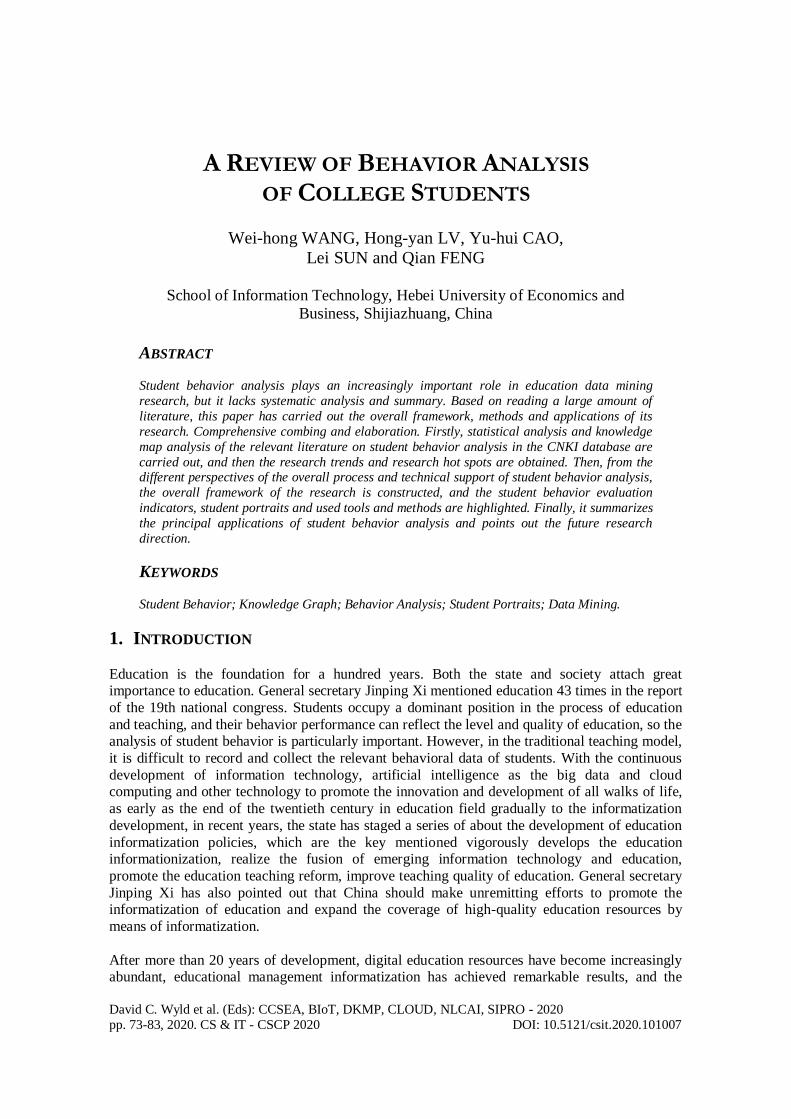
David C. Wyld et al. (Eds): CCSEA, BIoT, DKMP, CLOUD, NLCAI, SIPRO - 2020
pp. 73-83, 2020. CS & IT - CSCP 2020 DOI: 10.5121/csit.2020.101007
A REVIEW OF BEHAVIOR ANALYSIS
OF COLLEGE STUDENTS
Wei-hong WANG, Hong-yan LV, Yu-hui CAO,
Lei SUN and Qian FENG
School of Information Technology, Hebei University of Economics and
Business, Shijiazhuang, China
ABSTRACT
Student behavior analysis plays an increasingly important role in education data mining
research, but it lacks systematic analysis and summary. Based on reading a large amount of
literature, this paper has carried out the overall framework, methods and applications of its
research. Comprehensive combing and elaboration. Firstly, statistical analysis and knowledge
map analysis of the relevant literature on student behavior analysis in the CNKI database are
carried out, and then the research trends and research hot spots are obtained. Then, from the different perspectives of the overall process and technical support of student behavior analysis,
the overall framework of the research is constructed, and the student behavior evaluation
indicators, student portraits and used tools and methods are highlighted. Finally, it summarizes
the principal applications of student behavior analysis and points out the future research
direction.
KEYWORDS
Student Behavior; Knowledge Graph; Behavior Analysis; Student Portraits; Data Mining.
1. INTRODUCTION
Education is the foundation for a hundred years. Both the state and society attach great importance to education. General secretary Jinping Xi mentioned education 43 times in the report
of the 19th national congress. Students occupy a dominant position in the process of education
and teaching, and their behavior performance can reflect the level and quality of education, so the analysis of student behavior is particularly important. However, in the traditional teaching model,
it is difficult to record and collect the relevant behavioral data of students. With the continuous
development of information technology, artificial intelligence as the big data and cloud computing and other technology to promote the innovation and development of all walks of life,
as early as the end of the twentieth century in education field gradually to the informatization
development, in recent years, the state has staged a series of about the development of education
informatization policies, which are the key mentioned vigorously develops the education informationization, realize the fusion of emerging information technology and education,
promote the education teaching reform, improve teaching quality of education. General secretary
Jinping Xi has also pointed out that China should make unremitting efforts to promote the informatization of education and expand the coverage of high-quality education resources by
means of informatization.
After more than 20 years of development, digital education resources have become increasingly abundant, educational management informatization has achieved remarkable results, and the
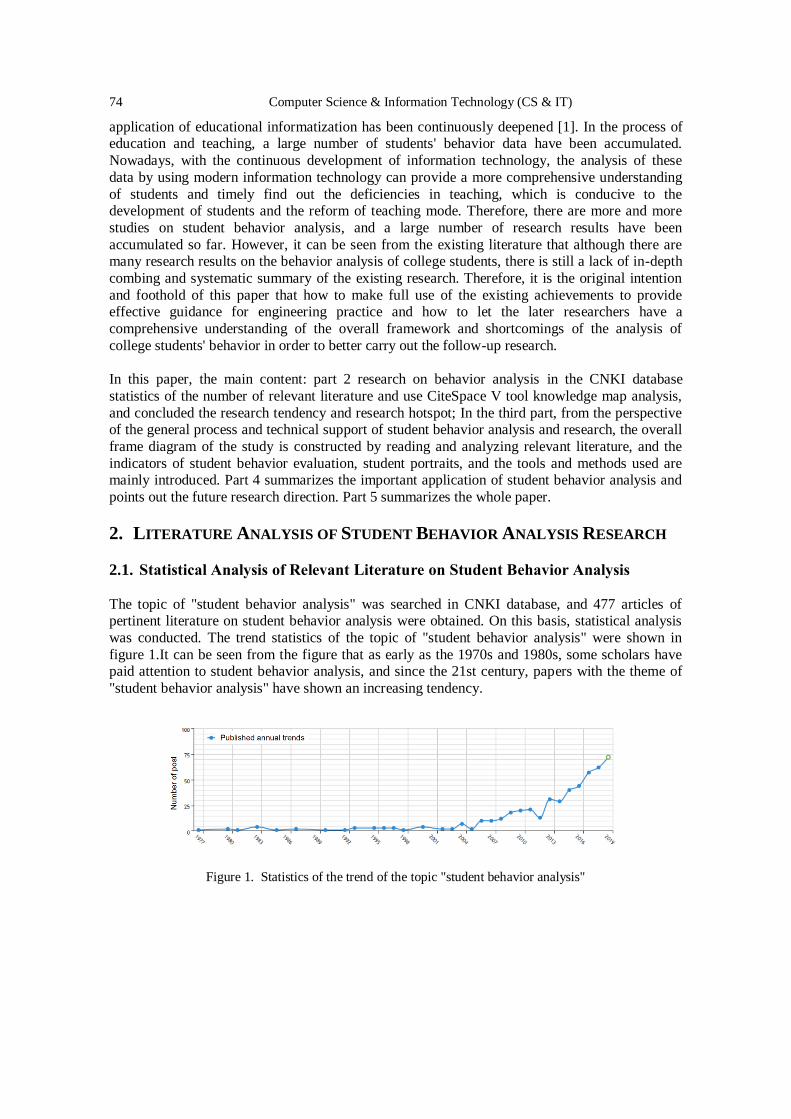
74 Computer Science & Information Technology (CS & IT)
application of educational informatization has been continuously deepened [1]. In the process of education and teaching, a large number of students' behavior data have been accumulated.
Nowadays, with the continuous development of information technology, the analysis of these data by using modern information technology can provide a more comprehensive understanding
of students and timely find out the deficiencies in teaching, which is conducive to the development of students and the reform of teaching mode. Therefore, there are more and more
studies on student behavior analysis, and a large number of research results have been
accumulated so far. However, it can be seen from the existing literature that although there are many research results on the behavior analysis of college students, there is still a lack of in-depth
combing and systematic summary of the existing research. Therefore, it is the original intention
and foothold of this paper that how to make full use of the existing achievements to provide effective guidance for engineering practice and how to let the later researchers have a
comprehensive understanding of the overall framework and shortcomings of the analysis of
college students' behavior in order to better carry out the follow-up research.
In this paper, the main content: part 2 research on behavior analysis in the CNKI database
statistics of the number of relevant literature and use CiteSpace V tool knowledge map analysis,
and concluded the research tendency and research hotspot; In the third part, from the perspective of the general process and technical support of student behavior analysis and research, the overall
frame diagram of the study is constructed by reading and analyzing relevant literature, and the
indicators of student behavior evaluation, student portraits, and the tools and methods used are mainly introduced. Part 4 summarizes the important application of student behavior analysis and
points out the future research direction. Part 5 summarizes the whole paper.
2. LITERATURE ANALYSIS OF STUDENT BEHAVIOR ANALYSIS RESEARCH
2.1. Statistical Analysis of Relevant Literature on Student Behavior Analysis
The topic of "student behavior analysis" was searched in CNKI database, and 477 articles of pertinent literature on student behavior analysis were obtained. On this basis, statistical analysis
was conducted. The trend statistics of the topic of "student behavior analysis" were shown in
figure 1.It can be seen from the figure that as early as the 1970s and 1980s, some scholars have paid attention to student behavior analysis, and since the 21st century, papers with the theme of
"student behavior analysis" have shown an increasing tendency.
Figure 1. Statistics of the trend of the topic "student behavior analysis"
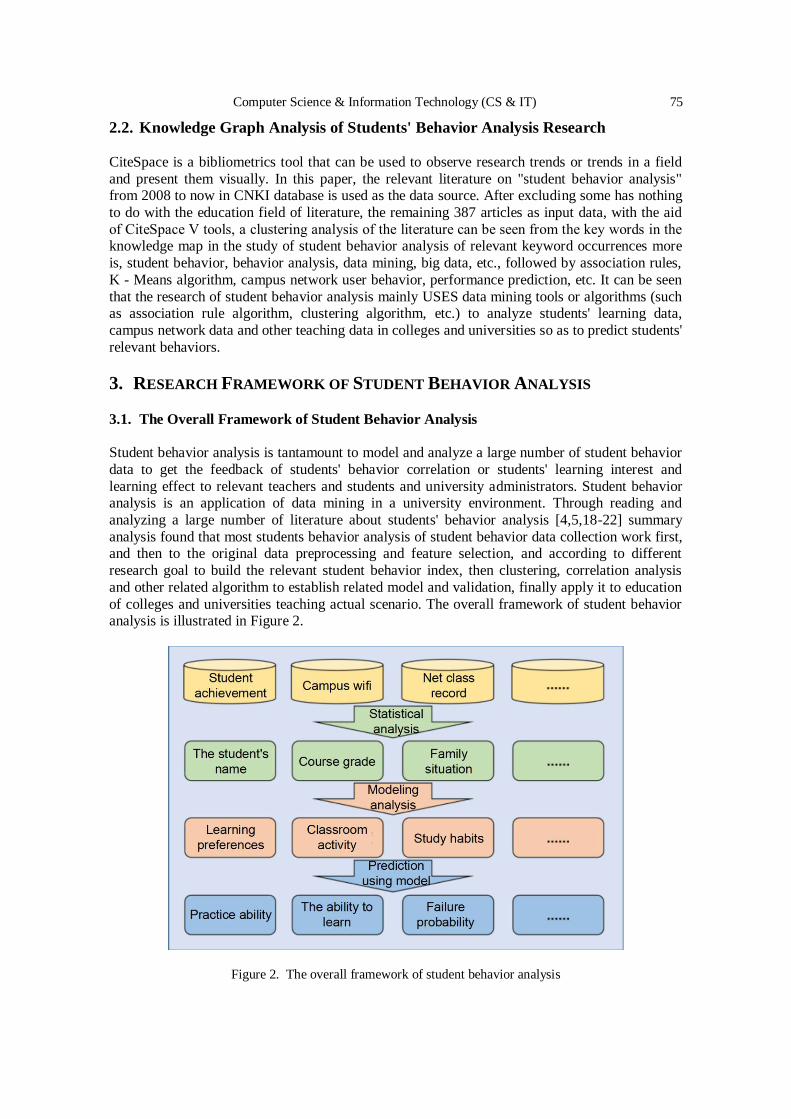
Computer Science & Information Technology (CS & IT) 75
2.2. Knowledge Graph Analysis of Students' Behavior Analysis Research
CiteSpace is a bibliometrics tool that can be used to observe research trends or trends in a field
and present them visually. In this paper, the relevant literature on "student behavior analysis" from 2008 to now in CNKI database is used as the data source. After excluding some has nothing
to do with the education field of literature, the remaining 387 articles as input data, with the aid
of CiteSpace Ⅴ tools, a clustering analysis of the literature can be seen from the key words in the knowledge map in the study of student behavior analysis of relevant keyword occurrences more
is, student behavior, behavior analysis, data mining, big data, etc., followed by association rules,
K - Means algorithm, campus network user behavior, performance prediction, etc. It can be seen
that the research of student behavior analysis mainly USES data mining tools or algorithms (such as association rule algorithm, clustering algorithm, etc.) to analyze students' learning data,
campus network data and other teaching data in colleges and universities so as to predict students'
relevant behaviors.
3. RESEARCH FRAMEWORK OF STUDENT BEHAVIOR ANALYSIS
3.1. The Overall Framework of Student Behavior Analysis
Student behavior analysis is tantamount to model and analyze a large number of student behavior
data to get the feedback of students' behavior correlation or students' learning interest and
learning effect to relevant teachers and students and university administrators. Student behavior analysis is an application of data mining in a university environment. Through reading and
analyzing a large number of literature about students' behavior analysis [4,5,18-22] summary
analysis found that most students behavior analysis of student behavior data collection work first, and then to the original data preprocessing and feature selection, and according to different
research goal to build the relevant student behavior index, then clustering, correlation analysis
and other related algorithm to establish related model and validation, finally apply it to education
of colleges and universities teaching actual scenario. The overall framework of student behavior analysis is illustrated in Figure 2.
Figure 2. The overall framework of student behavior analysis
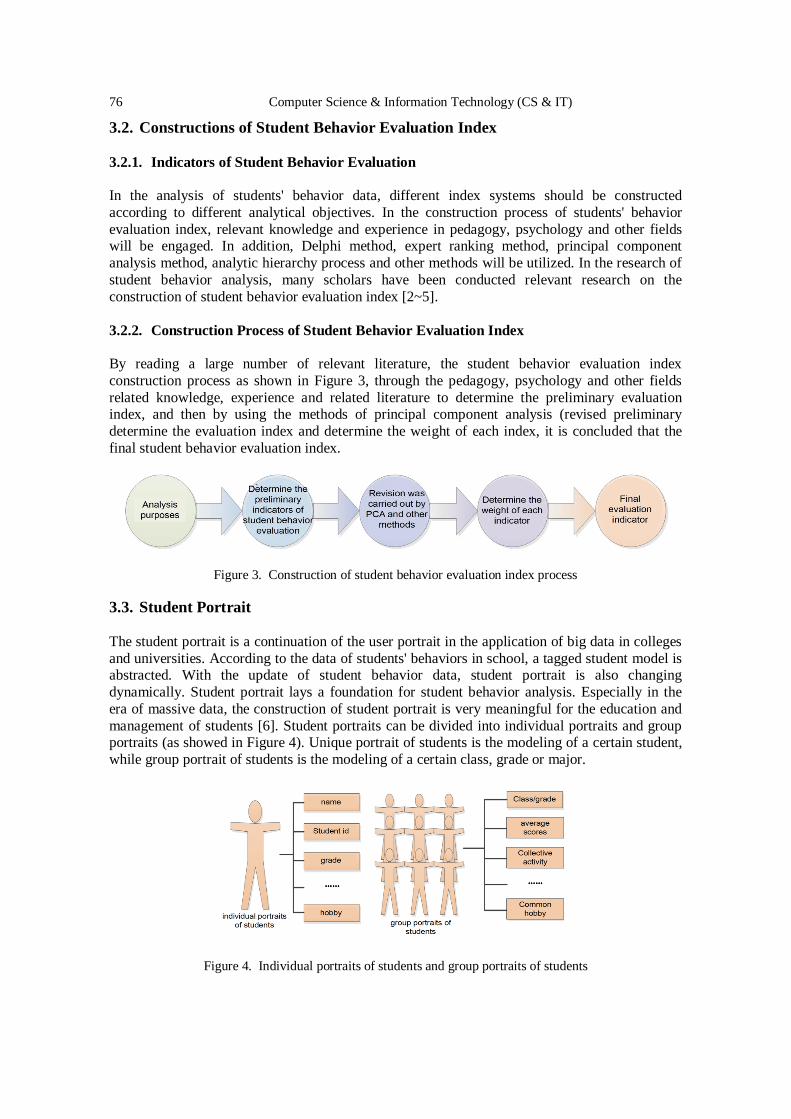
76 Computer Science & Information Technology (CS & IT)
3.2. Constructions of Student Behavior Evaluation Index
3.2.1. Indicators of Student Behavior Evaluation
In the analysis of students' behavior data, different index systems should be constructed
according to different analytical objectives. In the construction process of students' behavior
evaluation index, relevant knowledge and experience in pedagogy, psychology and other fields will be engaged. In addition, Delphi method, expert ranking method, principal component
analysis method, analytic hierarchy process and other methods will be utilized. In the research of
student behavior analysis, many scholars have been conducted relevant research on the
construction of student behavior evaluation index [2~5].
3.2.2. Construction Process of Student Behavior Evaluation Index
By reading a large number of relevant literature, the student behavior evaluation index
construction process as shown in Figure 3, through the pedagogy, psychology and other fields
related knowledge, experience and related literature to determine the preliminary evaluation index, and then by using the methods of principal component analysis (revised preliminary
determine the evaluation index and determine the weight of each index, it is concluded that the
final student behavior evaluation index.
Figure 3. Construction of student behavior evaluation index process
3.3. Student Portrait
The student portrait is a continuation of the user portrait in the application of big data in colleges
and universities. According to the data of students' behaviors in school, a tagged student model is abstracted. With the update of student behavior data, student portrait is also changing
dynamically. Student portrait lays a foundation for student behavior analysis. Especially in the
era of massive data, the construction of student portrait is very meaningful for the education and
management of students [6]. Student portraits can be divided into individual portraits and group portraits (as showed in Figure 4). Unique portrait of students is the modeling of a certain student,
while group portrait of students is the modeling of a certain class, grade or major.
Figure 4. Individual portraits of students and group portraits of students
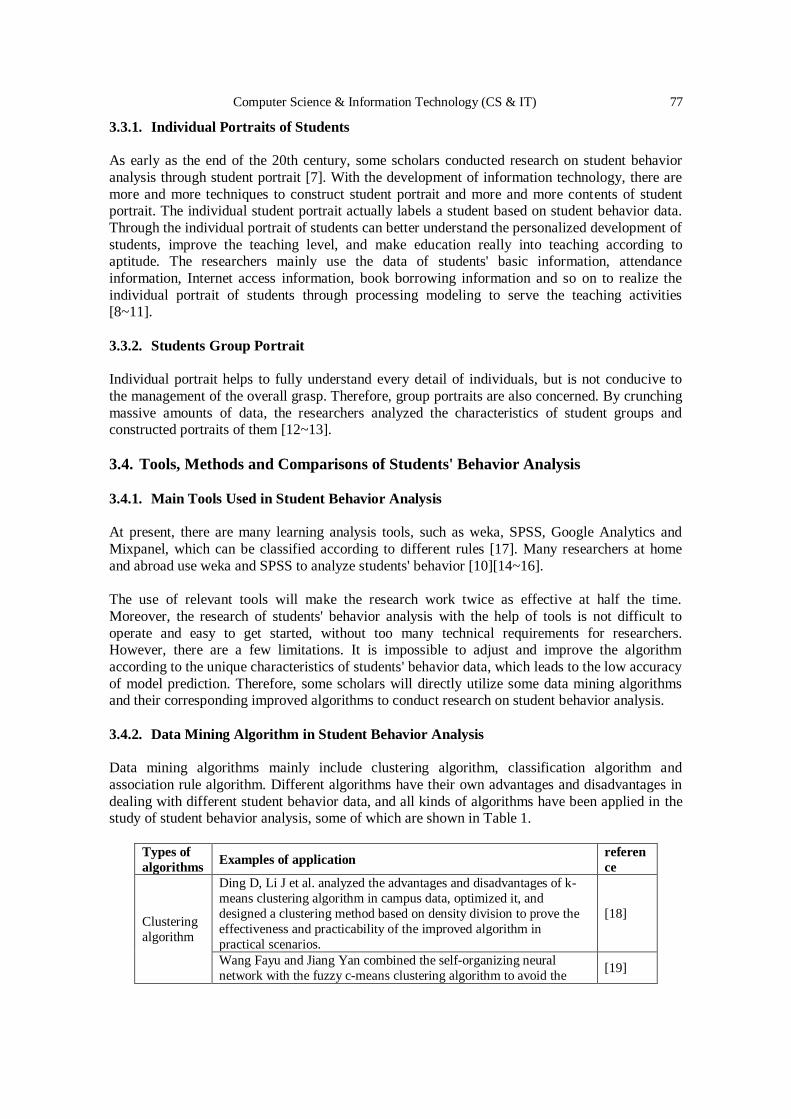
Computer Science & Information Technology (CS & IT) 77
3.3.1. Individual Portraits of Students
As early as the end of the 20th century, some scholars conducted research on student behavior
analysis through student portrait [7]. With the development of information technology, there are
more and more techniques to construct student portrait and more and more contents of student portrait. The individual student portrait actually labels a student based on student behavior data.
Through the individual portrait of students can better understand the personalized development of
students, improve the teaching level, and make education really into teaching according to aptitude. The researchers mainly use the data of students' basic information, attendance
information, Internet access information, book borrowing information and so on to realize the
individual portrait of students through processing modeling to serve the teaching activities [8~11].
3.3.2. Students Group Portrait
Individual portrait helps to fully understand every detail of individuals, but is not conducive to
the management of the overall grasp. Therefore, group portraits are also concerned. By crunching
massive amounts of data, the researchers analyzed the characteristics of student groups and constructed portraits of them [12~13].
3.4. Tools, Methods and Comparisons of Students' Behavior Analysis
3.4.1. Main Tools Used in Student Behavior Analysis
At present, there are many learning analysis tools, such as weka, SPSS, Google Analytics and
Mixpanel, which can be classified according to different rules [17]. Many researchers at home
and abroad use weka and SPSS to analyze students' behavior [10][14~16].
The use of relevant tools will make the research work twice as effective at half the time.
Moreover, the research of students' behavior analysis with the help of tools is not difficult to
operate and easy to get started, without too many technical requirements for researchers. However, there are a few limitations. It is impossible to adjust and improve the algorithm
according to the unique characteristics of students' behavior data, which leads to the low accuracy
of model prediction. Therefore, some scholars will directly utilize some data mining algorithms and their corresponding improved algorithms to conduct research on student behavior analysis.
3.4.2. Data Mining Algorithm in Student Behavior Analysis
Data mining algorithms mainly include clustering algorithm, classification algorithm and
association rule algorithm. Different algorithms have their own advantages and disadvantages in
dealing with different student behavior data, and all kinds of algorithms have been applied in the study of student behavior analysis, some of which are shown in Table 1.
Types of
algorithms Examples of application
referen
ce
Clustering
algorithm
Ding D, Li J et al. analyzed the advantages and disadvantages of k-
means clustering algorithm in campus data, optimized it, and
designed a clustering method based on density division to prove the
effectiveness and practicability of the improved algorithm in
practical scenarios.
[18]
Wang Fayu and Jiang Yan combined the self-organizing neural
network with the fuzzy c-means clustering algorithm to avoid the [19]
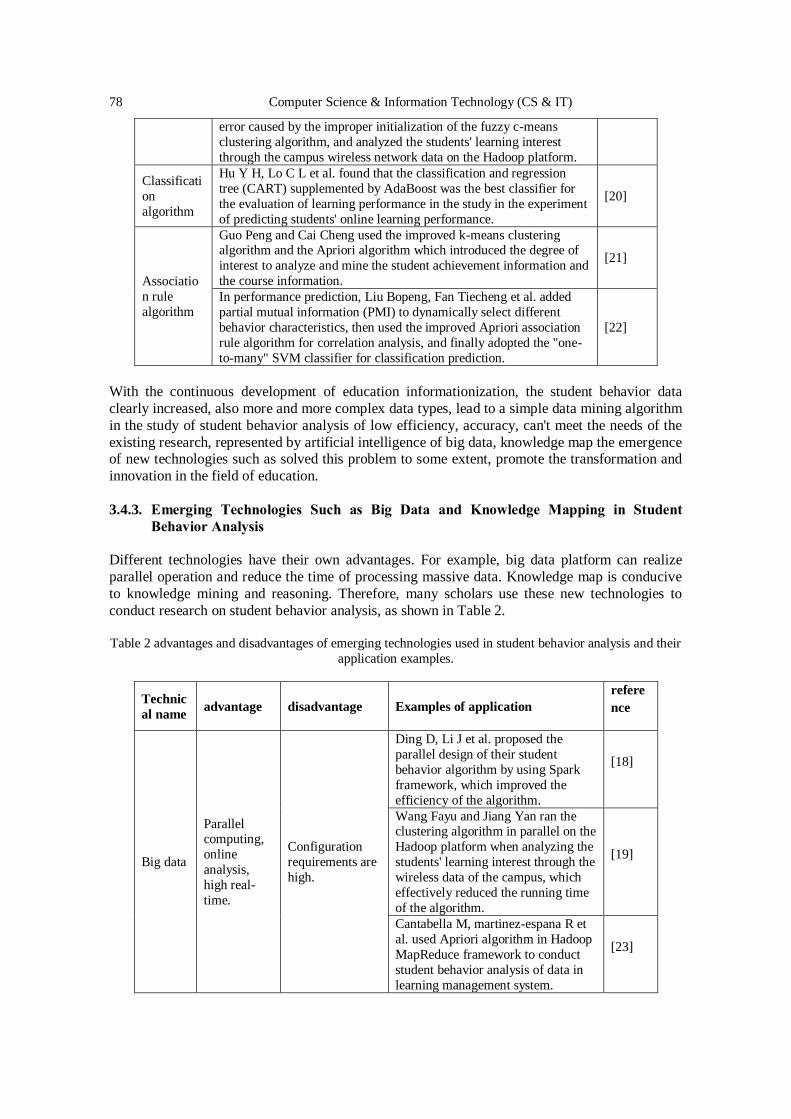
78 Computer Science & Information Technology (CS & IT)
error caused by the improper initialization of the fuzzy c-means
clustering algorithm, and analyzed the students' learning interest
through the campus wireless network data on the Hadoop platform.
Classificati
on
algorithm
Hu Y H, Lo C L et al. found that the classification and regression
tree (CART) supplemented by AdaBoost was the best classifier for
the evaluation of learning performance in the study in the experiment
of predicting students' online learning performance.
[20]
Associatio
n rule
algorithm
Guo Peng and Cai Cheng used the improved k-means clustering algorithm and the Apriori algorithm which introduced the degree of
interest to analyze and mine the student achievement information and
the course information.
[21]
In performance prediction, Liu Bopeng, Fan Tiecheng et al. added
partial mutual information (PMI) to dynamically select different
behavior characteristics, then used the improved Apriori association
rule algorithm for correlation analysis, and finally adopted the "one-
to-many" SVM classifier for classification prediction.
[22]
With the continuous development of education informationization, the student behavior data
clearly increased, also more and more complex data types, lead to a simple data mining algorithm
in the study of student behavior analysis of low efficiency, accuracy, can't meet the needs of the
existing research, represented by artificial intelligence of big data, knowledge map the emergence of new technologies such as solved this problem to some extent, promote the transformation and
innovation in the field of education.
3.4.3. Emerging Technologies Such as Big Data and Knowledge Mapping in Student
Behavior Analysis
Different technologies have their own advantages. For example, big data platform can realize
parallel operation and reduce the time of processing massive data. Knowledge map is conducive
to knowledge mining and reasoning. Therefore, many scholars use these new technologies to
conduct research on student behavior analysis, as shown in Table 2. Table 2 advantages and disadvantages of emerging technologies used in student behavior analysis and their
application examples.
Technic
al name advantage disadvantage Examples of application
refere
nce
Big data
Parallel computing,
online
analysis,
high real-
time.
Configuration
requirements are
high.
Ding D, Li J et al. proposed the
parallel design of their student
behavior algorithm by using Spark
framework, which improved the
efficiency of the algorithm.
[18]
Wang Fayu and Jiang Yan ran the clustering algorithm in parallel on the
Hadoop platform when analyzing the
students' learning interest through the
wireless data of the campus, which
effectively reduced the running time
of the algorithm.
[19]
Cantabella M, martinez-espana R et
al. used Apriori algorithm in Hadoop
MapReduce framework to conduct
student behavior analysis of data in
learning management system.
[23]
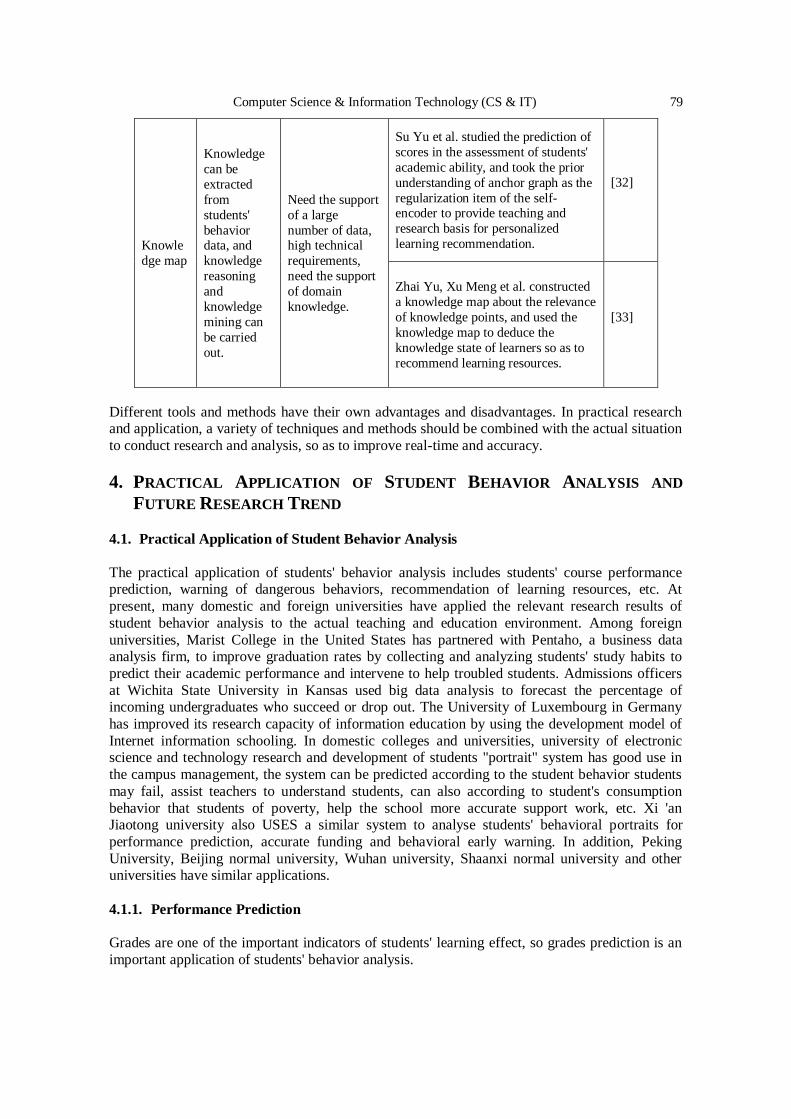
Computer Science & Information Technology (CS & IT) 79
Knowle
dge map
Knowledge
can be
extracted
from
students'
behavior data, and
knowledge
reasoning
and
knowledge
mining can
be carried
out.
Need the support
of a large
number of data, high technical
requirements,
need the support
of domain
knowledge.
Su Yu et al. studied the prediction of
scores in the assessment of students'
academic ability, and took the prior
understanding of anchor graph as the
regularization item of the self-encoder to provide teaching and
research basis for personalized
learning recommendation.
[32]
Zhai Yu, Xu Meng et al. constructed
a knowledge map about the relevance
of knowledge points, and used the
knowledge map to deduce the
knowledge state of learners so as to
recommend learning resources.
[33]
Different tools and methods have their own advantages and disadvantages. In practical research and application, a variety of techniques and methods should be combined with the actual situation
to conduct research and analysis, so as to improve real-time and accuracy.
4. PRACTICAL APPLICATION OF STUDENT BEHAVIOR ANALYSIS AND
FUTURE RESEARCH TREND
4.1. Practical Application of Student Behavior Analysis
The practical application of students' behavior analysis includes students' course performance prediction, warning of dangerous behaviors, recommendation of learning resources, etc. At
present, many domestic and foreign universities have applied the relevant research results of
student behavior analysis to the actual teaching and education environment. Among foreign
universities, Marist College in the United States has partnered with Pentaho, a business data analysis firm, to improve graduation rates by collecting and analyzing students' study habits to
predict their academic performance and intervene to help troubled students. Admissions officers
at Wichita State University in Kansas used big data analysis to forecast the percentage of incoming undergraduates who succeed or drop out. The University of Luxembourg in Germany
has improved its research capacity of information education by using the development model of
Internet information schooling. In domestic colleges and universities, university of electronic science and technology research and development of students "portrait" system has good use in
the campus management, the system can be predicted according to the student behavior students
may fail, assist teachers to understand students, can also according to student's consumption
behavior that students of poverty, help the school more accurate support work, etc. Xi 'an Jiaotong university also USES a similar system to analyse students' behavioral portraits for
performance prediction, accurate funding and behavioral early warning. In addition, Peking
University, Beijing normal university, Wuhan university, Shaanxi normal university and other universities have similar applications.
4.1.1. Performance Prediction
Grades are one of the important indicators of students' learning effect, so grades prediction is an
important application of students' behavior analysis.
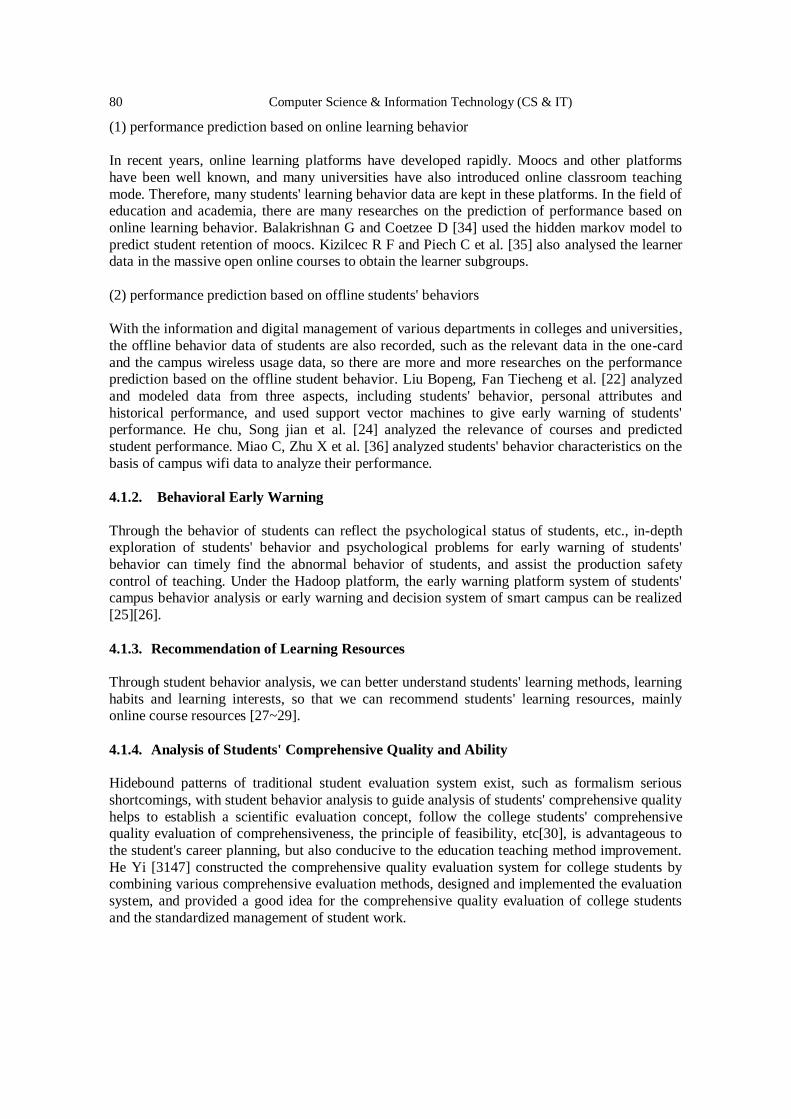
80 Computer Science & Information Technology (CS & IT)
(1) performance prediction based on online learning behavior
In recent years, online learning platforms have developed rapidly. Moocs and other platforms
have been well known, and many universities have also introduced online classroom teaching
mode. Therefore, many students' learning behavior data are kept in these platforms. In the field of education and academia, there are many researches on the prediction of performance based on
online learning behavior. Balakrishnan G and Coetzee D [34] used the hidden markov model to
predict student retention of moocs. Kizilcec R F and Piech C et al. [35] also analysed the learner data in the massive open online courses to obtain the learner subgroups.
(2) performance prediction based on offline students' behaviors
With the information and digital management of various departments in colleges and universities,
the offline behavior data of students are also recorded, such as the relevant data in the one-card
and the campus wireless usage data, so there are more and more researches on the performance prediction based on the offline student behavior. Liu Bopeng, Fan Tiecheng et al. [22] analyzed
and modeled data from three aspects, including students' behavior, personal attributes and
historical performance, and used support vector machines to give early warning of students' performance. He chu, Song jian et al. [24] analyzed the relevance of courses and predicted
student performance. Miao C, Zhu X et al. [36] analyzed students' behavior characteristics on the
basis of campus wifi data to analyze their performance.
4.1.2. Behavioral Early Warning
Through the behavior of students can reflect the psychological status of students, etc., in-depth exploration of students' behavior and psychological problems for early warning of students'
behavior can timely find the abnormal behavior of students, and assist the production safety
control of teaching. Under the Hadoop platform, the early warning platform system of students' campus behavior analysis or early warning and decision system of smart campus can be realized
[25][26].
4.1.3. Recommendation of Learning Resources
Through student behavior analysis, we can better understand students' learning methods, learning
habits and learning interests, so that we can recommend students' learning resources, mainly online course resources [27~29].
4.1.4. Analysis of Students' Comprehensive Quality and Ability
Hidebound patterns of traditional student evaluation system exist, such as formalism serious
shortcomings, with student behavior analysis to guide analysis of students' comprehensive quality
helps to establish a scientific evaluation concept, follow the college students' comprehensive quality evaluation of comprehensiveness, the principle of feasibility, etc[30], is advantageous to
the student's career planning, but also conducive to the education teaching method improvement.
He Yi [3147] constructed the comprehensive quality evaluation system for college students by combining various comprehensive evaluation methods, designed and implemented the evaluation
system, and provided a good idea for the comprehensive quality evaluation of college students
and the standardized management of student work.
Computer Science & Information Technology (CS & IT) 81
4.2. Future Research Trends of Student Behavior Analysis Research
Through the analysis and combing of the existing literature, it can be seen that the research on
student behavior analysis has made some progress, but there are still some deficiencies in the aspects of student behavior evaluation index, related algorithm research, and source of student
behavior data set. This is the trend of future research.
(1) The data sources of student behavior analysis are relatively limited, and there is a lack of
representative public data sets for scholars to study and analyse.
(2) There is a lack of unified indicators of student behavior evaluation, so researchers need to
construct the indicators of student behavior evaluation based on their own analysis objectives and relevant methods.
(3) In related studies, there are more studies on students' personal portraits, which can help to
accurately locate students, but there are few studies on students' group portraits of classes, schools and departments, which is not conducive for managers to grasp the overall situation of
students. Subsequent scholars can carry out research work in the aspect of students' group
portraits. (4) The relevant algorithm used in the study is relatively simple, and the algorithm research in the
field of student behavior analysis is not in-depth enough. The original algorithm can be
reasonably improved according to the data to improve the accuracy of the analysis.
(5) With the continuous development of emerging technologies, knowledge mapping has become a hot research issue in all walks of life, but the combination of knowledge mapping and student
behavior analysis is less, and the relevant domain knowledge mapping is also less.
5. CONCLUSIONS
The analysis of students' behavior plays an increasingly important role in the research of college
education and teaching, but there is a lack of systematic analysis and summary of it, which is not
conducive to the relevant researchers to quickly form a knowledge system and conduct in-depth research. On the basis of reading a large number of literatures, this paper makes a comprehensive
review of the research results of student behavior analysis in recent years, and presents the
research trends and research hotspots of student behavior analysis by means of statistical analysis and knowledge map analysis. Based on the general process, technical support and other aspects
of student behavior analysis research, this paper constructs the overall frame of the research, and
mainly introduces indicators of student behavior evaluation, student portrait and the tools and
methods used. Finally, it summarizes the important application of student behavior analysis and points out the future research direction, which can provide reference and help for researchers.
REFERENCES
[1] Ouyang X , Zhong J , Liu J . Study on the Construction of Wisdom Campus Based on University
Resource Planning (URP)[C]// International Conference on Information Technology in Medicine &
Education. IEEE, 2017.
[2] Shen Xin-yi, Wu Jian-wei, Zhang Yan-xia, Ma Yu-chun. Study on Online Learning Behavior and
Learning Effect Evaluation Model of MOOCAP Learners[J].Distance Education in
China,2019(07):38-46+93.
[3] Wang Yuan-ying, Yin de-zhi.The Evaluation System and Mathematical Model of the Comprehensive
Quality of College Students[J].Journal of Southwest University for Nationalities (Humanities and
Social Sciences Edition),2003(12):191-193. [4] Jianting L , Haoming W . An Evaluation Model of E-learning Behavior Analysis[C]// Proceedings of
the 2011 Third International Workshop on Education Technology and Computer Science - Volume
02. 2011.

82 Computer Science & Information Technology (CS & IT)
[5] Li You-zeng, Zeng Hao. Big Data Application Research of Intelligent Campus Education in Colleges
and Universities Based on Student Behavior Analysis Model[J].China Educational
Technology,2018(07):33-38.
[6] Wang Zheng. Design and Implementation of Academic Warning and Social Analysis System Based
on Student Campus Data[D].Beijing University of Posts and Telecommunications,2019. [7] RE. At-Risk Students: Portraits, Policies, Programs, and Practices.[J]. 1993.
[8] Han Feng-xia.Exploration and Research on Early-warning Mechanism of College Enrollment in the
Era of Big Data[J].The Chinese Journal of ICT in Education,2015(19):46-49.
[9] Liu Xuan. Research and Application of Performance Prediction Model Based on Student
Behavior[D].University of Electronic Science and Technology,2017.
[10] Dong Xiao-xiao, Hu Yan, Chen Yan-ping.Analysis and Research of College Students' Performance
Portrait Based on Campus Data[J].Computer & Digital Engineering,2018,46(06):1200-1204+1262.
[11] Chen Hai-jian, Dai Yong-hui, Han Dong-mei, Feng Yan-jie, Huang Hei-xiao. Discussion on
Learners' Portrait and Individualized Teaching Under Open Teaching[J].Open Education
Research,2017,23(03):105-112.
[12] Zhang Hong-xin, Cheng Feng-fan, Xu Pei-yuan, Tang Ying. Visualizing User Characteristics Based
on Mobile Device Log Data[J].Journal of Software,2016,27(05):1174-1187. [13] Zhang Xue, Tan Yue-ying, Luo Heng. A Group Study of Non-native Language Learners in Online
Learning: Category Portraits and Behavioral Characteristics Analysis[J]. Modern Distance Education,
2019, 181(01):19-27.
[14] Bresfelean V P . Analysis and Predictions on Students' Behavior Using Decision Trees in Weka
Environment[C]// International Conference on Information Technology Interfaces. IEEE, 2007.
[15] Ramesh V , Parkavi P , Ramar K . Predicting Student Performance: A Statistical and Data Mining
Approach[J]. International Journal of Computer Applications, 2013, 63(8):35-39.
[16] Zhang Jia-ting, Zhou Qin, Zhu Zhi-ting. Application of Online Learning Intervention Model from the
Perspective of Learning Analysis[J].Modern Distance Education Research,2017(04):88-96.
[17] Meng Ling-ling, Gu Xiao-qing, Li Ze. Study the Comparative Study of Analytical Tools[J].Open
Education Research,2014,20(04):66-75. [18] Ding D , Li J , Wang H , et al. Student Behavior Clustering Method Based on Campus Big Data[C]//
International Conference on Computational Intelligence & Security. IEEE Computer Society, 2017.
[19] Wang Fa-yu, Jiang Yan. Learning Interest Analysis of Users in Campus Wireless Network Based on
Self-Organizing Neural Network and Fuzzy C-means Clustering Algorithm[J].Application Research
of Computers,2018,35(01):186-189.
[20] Hu Y H , Lo C L , Shih S P . Developing early warning systems to predict students’ online learning
performance[J]. Computers in Human Behavior, 2014, 36:469-478.
[21] Guo Peng, Cai Cheng. Data Mining and Analysis of Students’ Score Based on Clustering and
Association Algorithm[J/OL].Computer Engineering and Applications:1-12[2019-08-
30].http://kns.cnki.net/kcms/detail/11.2127.TP.20190604.0952.014.html.
[22] Liu Bo-peng, Fan Tie-cheng, Yang Hong. Research on Application of Early Warning of Students’
Achievement Based on Sata Mining[J].Journal of Sichuan University(Natural Science Edition),2019,56(02):267-272.
[23] Cantabella M, Martínez-España R, Ayuso B, et al. Analysis of student behavior in learning
management systems through a Big Data framework[J]. Future Generation Computer Systems, 2019,
90: 262-272.
[24] He Chu, Song Jian, Zhuo Tong. Curriculum Association Model and Student Performance Prediction
Based on Spectral Clustering of Frequent Pattern[J].Application Research of
Computers,2015,32(10):2930-2933.
[25] Deng Feng-guang, Zhang Zi-shi. Research on the Construction of Students' Campus Behavior
Analysis and Warning Management Platform Based on Big Data[J].China Educational
Technology,2017(11):60-64.
[26] Su-Hui G, Cheng-Jie B, Quan W. Hadoop-based college student behavior warning decision system[C]//2018 IEEE 3rd International Conference on Big Data Analysis (ICBDA). IEEE, 2018:
217-221.
[27] Liu Min, Zheng Ming-yue. Learning Analytics and Learning Resources Personalized
Recommendation in Smart Education[J].China Educational Technology,2019(09):38-47.
Computer Science & Information Technology (CS & IT) 83
[28] Su Y S , Ding T J , Lue J H , et al. Applying big data analysis technique to students' learning behavior
and learning resource recommendation in a MOOCs course[C]// International Conference on Applied
System Innovation. IEEE, 2017.
[29] Gui Zhong-yan, Zhang Yan-ming, Li Wei-wei. Research on Learning Resource Recommendation
Algorithm Based on Behavior Sequence Analysis[J/OL].Application Research of Computers:1-5[2019-09-17].https://doi.org/10.19734/j.issn.1001-3695.2018.12.0930.
[30] Zhou Lu. The Problems and Improvement of the College Students’ Comprehensive Quality
Assessment[D].Hunan University,2013.
[31] He Yi. Research and Realization of Comprehensive Quality Evaluation System for College Students
in SiChuan Vocational and Technical College Based on Analytic Hierarchy Process[D].University of
Electronic Science and Technology,2012.
[32] Su Yu, Zang Dan, Liu Qing-wen, Zhang Qing-wen, Chen Yu-ying, Ding Hong-qiang. Student score
prediction: A knowledge-aware auto-encoder model[J].Journal of University of Science and
Technology of China,2019,49(01):21-30.
[33] Zhai Yu, Xu Meng, Huang Bin. Personalized Learning Resource Recommendation Based on
Knowledge State[J].Journal of Jishou University(Natural Sciences Edition),2019,40(03):23-27.
[34] Balakrishnan G, Coetzee D. Predicting student retention in massive open online courses using hidden markov models[J]. Electrical Engineering and Computer Sciences University of California at
Berkeley, 2013, 53: 57-58.
[35] Kizilcec R F, Piech C, Schneider E. Deconstructing disengagement: analyzing learner subpopulations
in massive open online courses[C]//Proceedings of the third international conference on learning
analytics and knowledge. ACM, 2013: 170-179.
[36] Miao C, Zhu X, Miao J. The analysis of student grades based on collected data of their Wi-Fi
behaviors on campus[C]//2016 2nd IEEE International Conference on Computer and
Communications (ICCC). IEEE, 2016: 130-134.
© 2020 By AIRCC Publishing Corporation. This article is published under the Creative Commons
Attribution (CC BY) license.

84 Computer Science & Information Technology (CS & IT)
Ready to Use Virtual Machine Pool Cache
using Warm Cache
Sudeep Kumar, Deepak Kumar Vasthimal, and Musen Wen
eBay Inc., 2025 Hamilton Ave, San Jose, CA 95125, USA{sudekumar, dvasthimal, mwen}@ebay.com
Abstract. Today, a plethora of distributed applications are managed on internallyhosted cloud platforms. Such managed platforms are often multi tenant by natureand not specifically tied to a single use-case. Smaller footprint of infrastructure ona managed cloud platform has its own set of challenges especially when applicationsare required to be infrastructure aware for quicker deployments and response times.There are often times and challenges to quickly spawn ready to use instances orhosts on such infrastructure. As part of this paper we outline mechanisms to quicklyspawn ready to use instances for application while also being infrastructure aware.In addition, paper proposes architecture that provides high availability to deployeddistributed applications.
Keywords: cloud computing, virtual machine, elastic, elastic search, consul, cache,java, kibana, mongoDB, high performance computing, architecture.
1 Introduction
Conventional on-demand Virtual Machine (from now referred as VM [7] or VMs)provisioning methods on a cloud [12] platform can be time-consuming and error-prone, especially when there is need to provision [25] VMs in large numbers swiftly.
The following list captures different issues that are often encountered whiletrying to provision a new VM [7] instance on the fly.
– Insufficient availability of compute resources due to capacity constraints.
– Desire to place VMs on different fault domains to avoid concentration of VM[7] instances in the same rack [11] and that eventually leads to non-availabilityof deployed applications over them.
– Transient failures or delays in the service provider platform result in failure oran increase in time to provision a VM [7] instance.
The proposed Elasticsearch-as-a-service platform for VM [7] provisioning is acloud-based platform that provides distributed, easy to scale, and fully managedon demand Elasticsearch [1] clusters. This platform uses the OpenStack [23] basedNova module to get different compute resources (VMs). Nova is designed to powermassively scalable, on-demand, self-service access to compute resources. The SAAS
David C. Wyld et al. (Eds): CCSEA, BIoT, DKMP, CLOUD, NLCAI, SIPRO - 2020pp. 85-99, 2020. CS & IT - CSCP 2020 DOI: 10.5121/csit.2020.101008
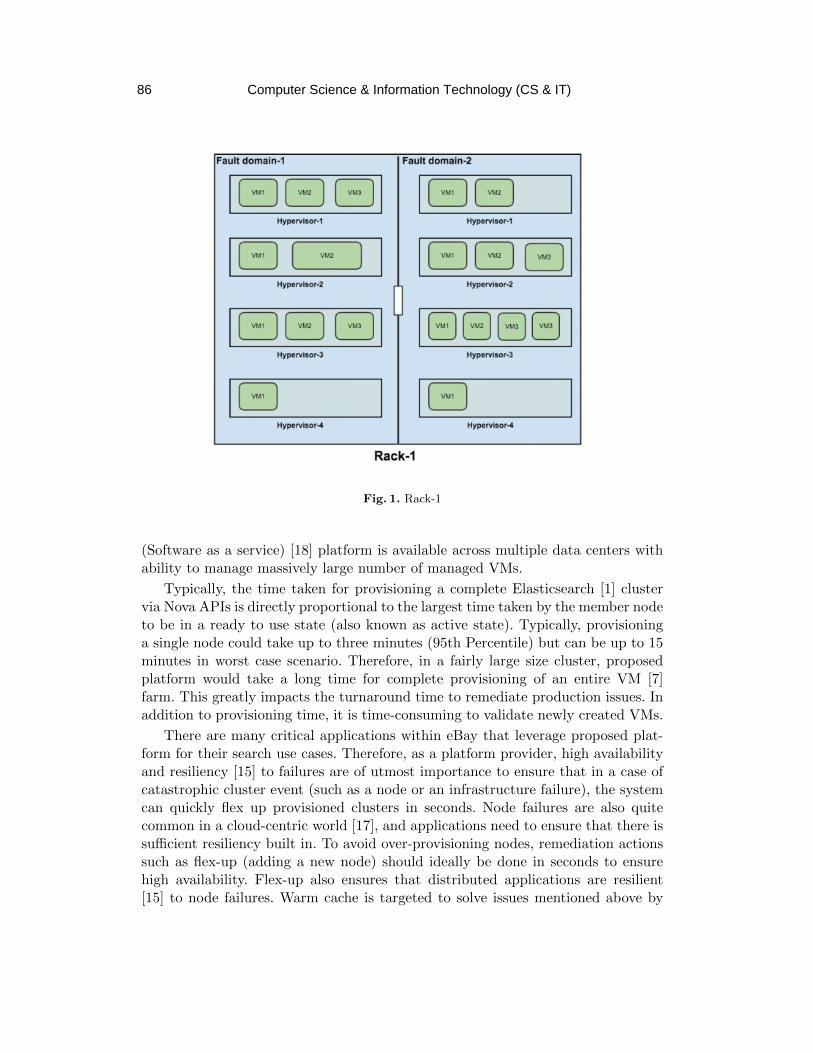
Fig. 1. Rack-1
(Software as a service) [18] platform is available across multiple data centers withability to manage massively large number of managed VMs.
Typically, the time taken for provisioning a complete Elasticsearch [1] clustervia Nova APIs is directly proportional to the largest time taken by the member nodeto be in a ready to use state (also known as active state). Typically, provisioninga single node could take up to three minutes (95th Percentile) but can be up to 15minutes in worst case scenario. Therefore, in a fairly large size cluster, proposedplatform would take a long time for complete provisioning of an entire VM [7]farm. This greatly impacts the turnaround time to remediate production issues. Inaddition to provisioning time, it is time-consuming to validate newly created VMs.
There are many critical applications within eBay that leverage proposed plat-form for their search use cases. Therefore, as a platform provider, high availabilityand resiliency [15] to failures are of utmost importance to ensure that in a case ofcatastrophic cluster event (such as a node or an infrastructure failure), the systemcan quickly flex up provisioned clusters in seconds. Node failures are also quitecommon in a cloud-centric world [17], and applications need to ensure that there issufficient resiliency built in. To avoid over-provisioning nodes, remediation actionssuch as flex-up (adding a new node) should ideally be done in seconds to ensurehigh availability. Flex-up also ensures that distributed applications are resilient[15] to node failures. Warm cache is targeted to solve issues mentioned above by
Computer Science & Information Technology (CS & IT)86
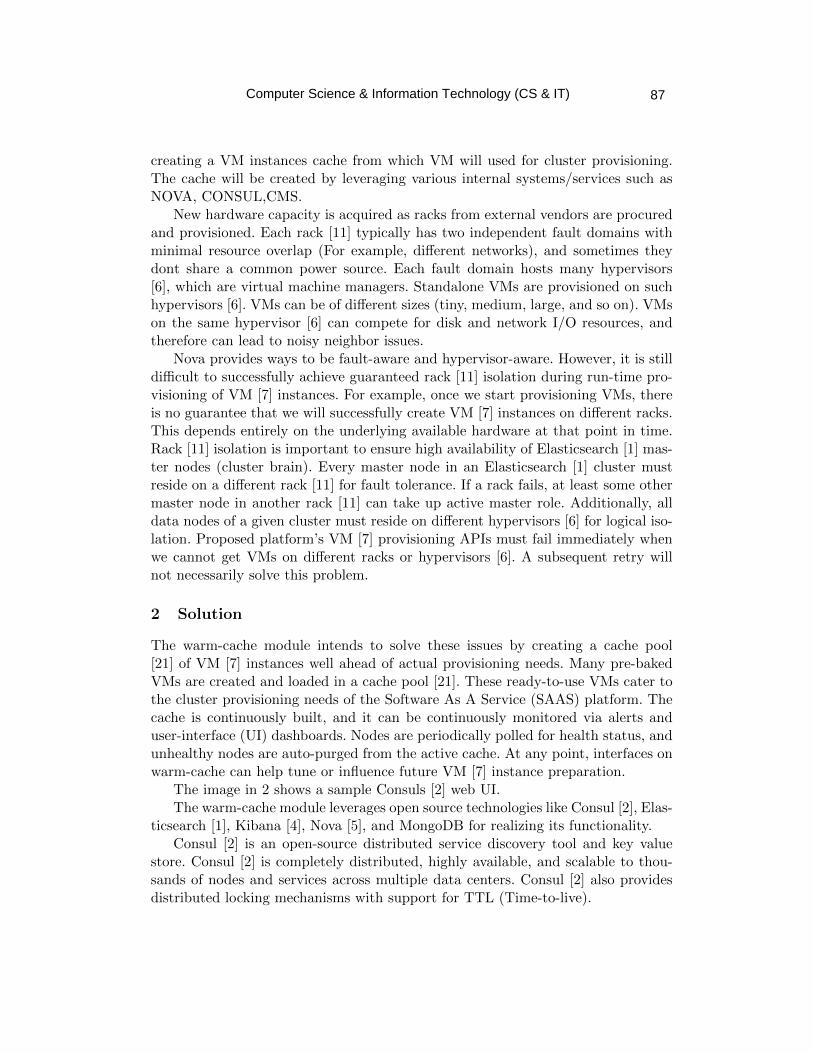
creating a VM instances cache from which VM will used for cluster provisioning.The cache will be created by leveraging various internal systems/services such asNOVA, CONSUL,CMS.
New hardware capacity is acquired as racks from external vendors are procuredand provisioned. Each rack [11] typically has two independent fault domains withminimal resource overlap (For example, different networks), and sometimes theydont share a common power source. Each fault domain hosts many hypervisors[6], which are virtual machine managers. Standalone VMs are provisioned on suchhypervisors [6]. VMs can be of different sizes (tiny, medium, large, and so on). VMson the same hypervisor [6] can compete for disk and network I/O resources, andtherefore can lead to noisy neighbor issues.
Nova provides ways to be fault-aware and hypervisor-aware. However, it is stilldifficult to successfully achieve guaranteed rack [11] isolation during run-time pro-visioning of VM [7] instances. For example, once we start provisioning VMs, thereis no guarantee that we will successfully create VM [7] instances on different racks.This depends entirely on the underlying available hardware at that point in time.Rack [11] isolation is important to ensure high availability of Elasticsearch [1] mas-ter nodes (cluster brain). Every master node in an Elasticsearch [1] cluster mustreside on a different rack [11] for fault tolerance. If a rack fails, at least some othermaster node in another rack [11] can take up active master role. Additionally, alldata nodes of a given cluster must reside on different hypervisors [6] for logical iso-lation. Proposed platform’s VM [7] provisioning APIs must fail immediately whenwe cannot get VMs on different racks or hypervisors [6]. A subsequent retry willnot necessarily solve this problem.
2 Solution
The warm-cache module intends to solve these issues by creating a cache pool[21] of VM [7] instances well ahead of actual provisioning needs. Many pre-bakedVMs are created and loaded in a cache pool [21]. These ready-to-use VMs cater tothe cluster provisioning needs of the Software As A Service (SAAS) platform. Thecache is continuously built, and it can be continuously monitored via alerts anduser-interface (UI) dashboards. Nodes are periodically polled for health status, andunhealthy nodes are auto-purged from the active cache. At any point, interfaces onwarm-cache can help tune or influence future VM [7] instance preparation.
The image in 2 shows a sample Consuls [2] web UI.The warm-cache module leverages open source technologies like Consul [2], Elas-
ticsearch [1], Kibana [4], Nova [5], and MongoDB for realizing its functionality.Consul [2] is an open-source distributed service discovery tool and key value
store. Consul [2] is completely distributed, highly available, and scalable to thou-sands of nodes and services across multiple data centers. Consul [2] also providesdistributed locking mechanisms with support for TTL (Time-to-live).
Computer Science & Information Technology (CS & IT) 87
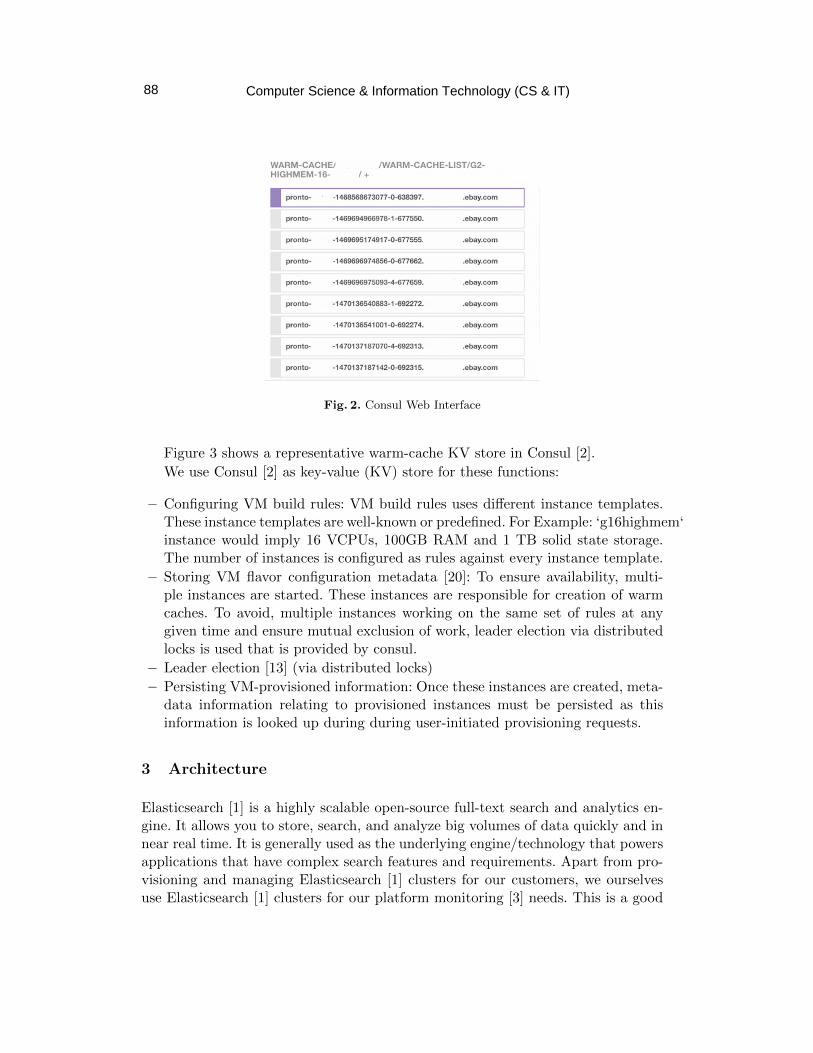
Fig. 2. Consul Web Interface
Figure 3 shows a representative warm-cache KV store in Consul [2].
We use Consul [2] as key-value (KV) store for these functions:
– Configuring VM build rules: VM build rules uses different instance templates.These instance templates are well-known or predefined. For Example: ‘g16highmem‘instance would imply 16 VCPUs, 100GB RAM and 1 TB solid state storage.The number of instances is configured as rules against every instance template.
– Storing VM flavor configuration metadata [20]: To ensure availability, multi-ple instances are started. These instances are responsible for creation of warmcaches. To avoid, multiple instances working on the same set of rules at anygiven time and ensure mutual exclusion of work, leader election via distributedlocks is used that is provided by consul.
– Leader election [13] (via distributed locks)
– Persisting VM-provisioned information: Once these instances are created, meta-data information relating to provisioned instances must be persisted as thisinformation is looked up during during user-initiated provisioning requests.
3 Architecture
Elasticsearch [1] is a highly scalable open-source full-text search and analytics en-gine. It allows you to store, search, and analyze big volumes of data quickly and innear real time. It is generally used as the underlying engine/technology that powersapplications that have complex search features and requirements. Apart from pro-visioning and managing Elasticsearch [1] clusters for our customers, we ourselvesuse Elasticsearch [1] clusters for our platform monitoring [3] needs. This is a good
Computer Science & Information Technology (CS & IT)88
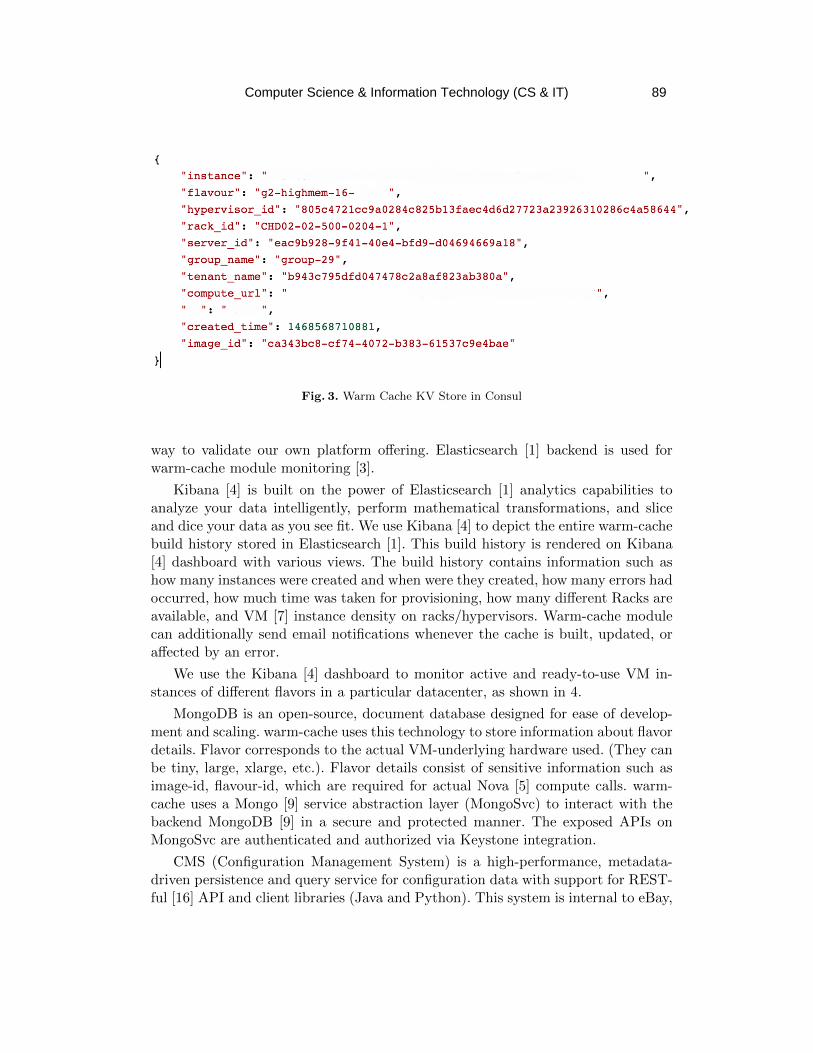
Fig. 3. Warm Cache KV Store in Consul
way to validate our own platform offering. Elasticsearch [1] backend is used forwarm-cache module monitoring [3].
Kibana [4] is built on the power of Elasticsearch [1] analytics capabilities toanalyze your data intelligently, perform mathematical transformations, and sliceand dice your data as you see fit. We use Kibana [4] to depict the entire warm-cachebuild history stored in Elasticsearch [1]. This build history is rendered on Kibana[4] dashboard with various views. The build history contains information such ashow many instances were created and when were they created, how many errors hadoccurred, how much time was taken for provisioning, how many different Racks areavailable, and VM [7] instance density on racks/hypervisors. Warm-cache modulecan additionally send email notifications whenever the cache is built, updated, oraffected by an error.
We use the Kibana [4] dashboard to monitor active and ready-to-use VM in-stances of different flavors in a particular datacenter, as shown in 4.
MongoDB is an open-source, document database designed for ease of develop-ment and scaling. warm-cache uses this technology to store information about flavordetails. Flavor corresponds to the actual VM-underlying hardware used. (They canbe tiny, large, xlarge, etc.). Flavor details consist of sensitive information such asimage-id, flavour-id, which are required for actual Nova [5] compute calls. warm-cache uses a Mongo [9] service abstraction layer (MongoSvc) to interact with thebackend MongoDB [9] in a secure and protected manner. The exposed APIs onMongoSvc are authenticated and authorized via Keystone integration.
CMS (Configuration Management System) is a high-performance, metadata-driven persistence and query service for configuration data with support for REST-ful [16] API and client libraries (Java and Python). This system is internal to eBay,
Computer Science & Information Technology (CS & IT) 89
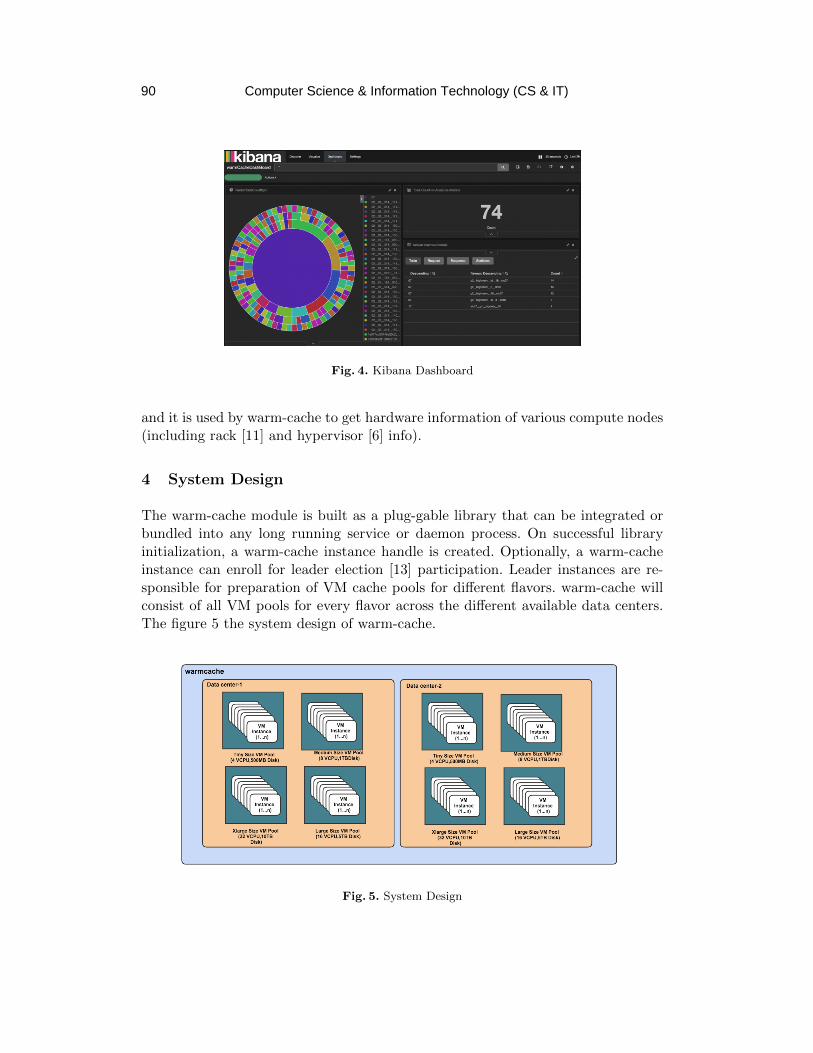
Fig. 4. Kibana Dashboard
and it is used by warm-cache to get hardware information of various compute nodes(including rack [11] and hypervisor [6] info).
4 System Design
The warm-cache module is built as a plug-gable library that can be integrated orbundled into any long running service or daemon process. On successful libraryinitialization, a warm-cache instance handle is created. Optionally, a warm-cacheinstance can enroll for leader election [13] participation. Leader instances are re-sponsible for preparation of VM cache pools for different flavors. warm-cache willconsist of all VM pools for every flavor across the different available data centers.The figure 5 the system design of warm-cache.
Fig. 5. System Design
Computer Science & Information Technology (CS & IT)90
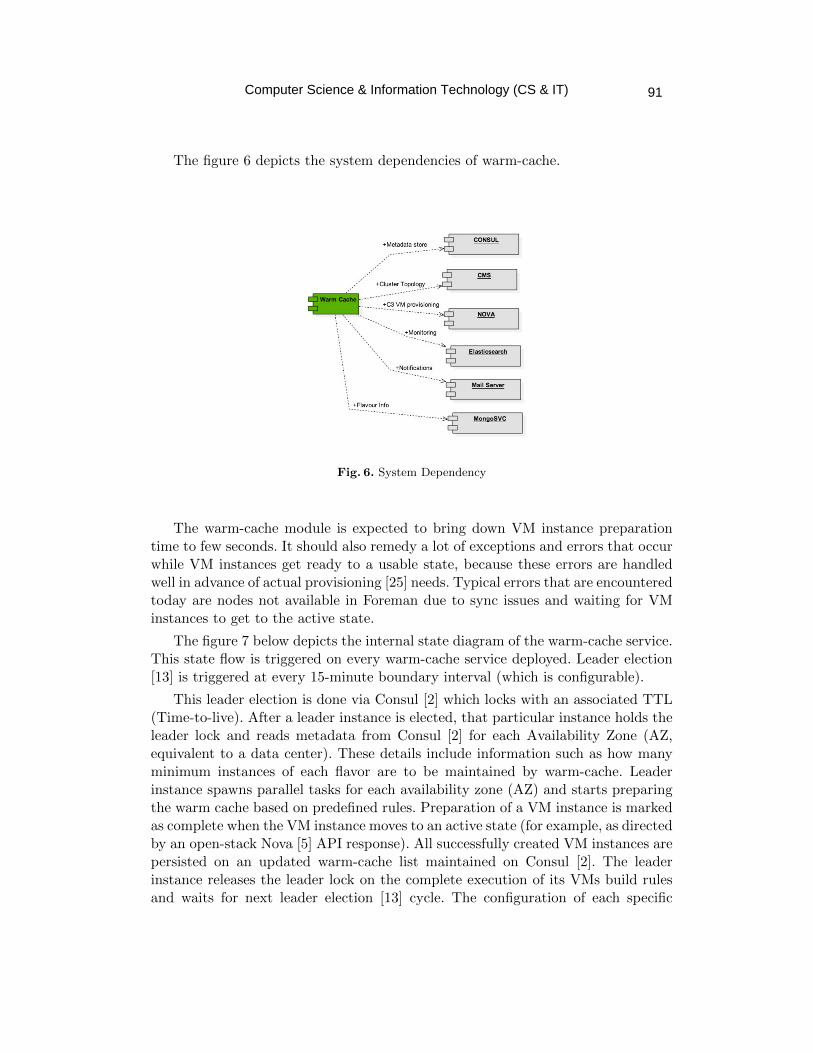
The figure 6 depicts the system dependencies of warm-cache.
Fig. 6. System Dependency
The warm-cache module is expected to bring down VM instance preparationtime to few seconds. It should also remedy a lot of exceptions and errors that occurwhile VM instances get ready to a usable state, because these errors are handledwell in advance of actual provisioning [25] needs. Typical errors that are encounteredtoday are nodes not available in Foreman due to sync issues and waiting for VMinstances to get to the active state.
The figure 7 below depicts the internal state diagram of the warm-cache service.This state flow is triggered on every warm-cache service deployed. Leader election[13] is triggered at every 15-minute boundary interval (which is configurable).
This leader election is done via Consul [2] which locks with an associated TTL(Time-to-live). After a leader instance is elected, that particular instance holds theleader lock and reads metadata from Consul [2] for each Availability Zone (AZ,equivalent to a data center). These details include information such as how manyminimum instances of each flavor are to be maintained by warm-cache. Leaderinstance spawns parallel tasks for each availability zone (AZ) and starts preparingthe warm cache based on predefined rules. Preparation of a VM instance is markedas complete when the VM instance moves to an active state (for example, as directedby an open-stack Nova [5] API response). All successfully created VM instances arepersisted on an updated warm-cache list maintained on Consul [2]. The leaderinstance releases the leader lock on the complete execution of its VMs build rulesand waits for next leader election [13] cycle. The configuration of each specific
Computer Science & Information Technology (CS & IT) 91
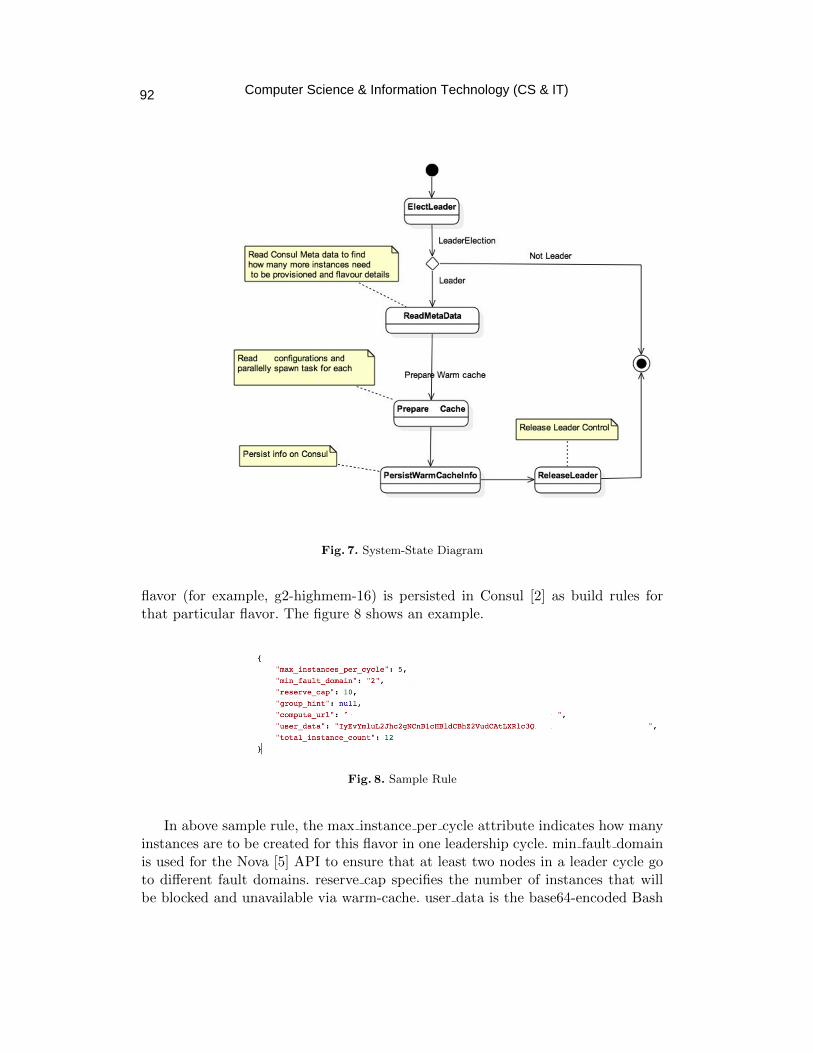
Fig. 7. System-State Diagram
flavor (for example, g2-highmem-16) is persisted in Consul [2] as build rules forthat particular flavor. The figure 8 shows an example.
Fig. 8. Sample Rule
In above sample rule, the max instance per cycle attribute indicates how manyinstances are to be created for this flavor in one leadership cycle. min fault domainis used for the Nova [5] API to ensure that at least two nodes in a leader cycle goto different fault domains. reserve cap specifies the number of instances that willbe blocked and unavailable via warm-cache. user data is the base64-encoded Bash
Computer Science & Information Technology (CS & IT)92
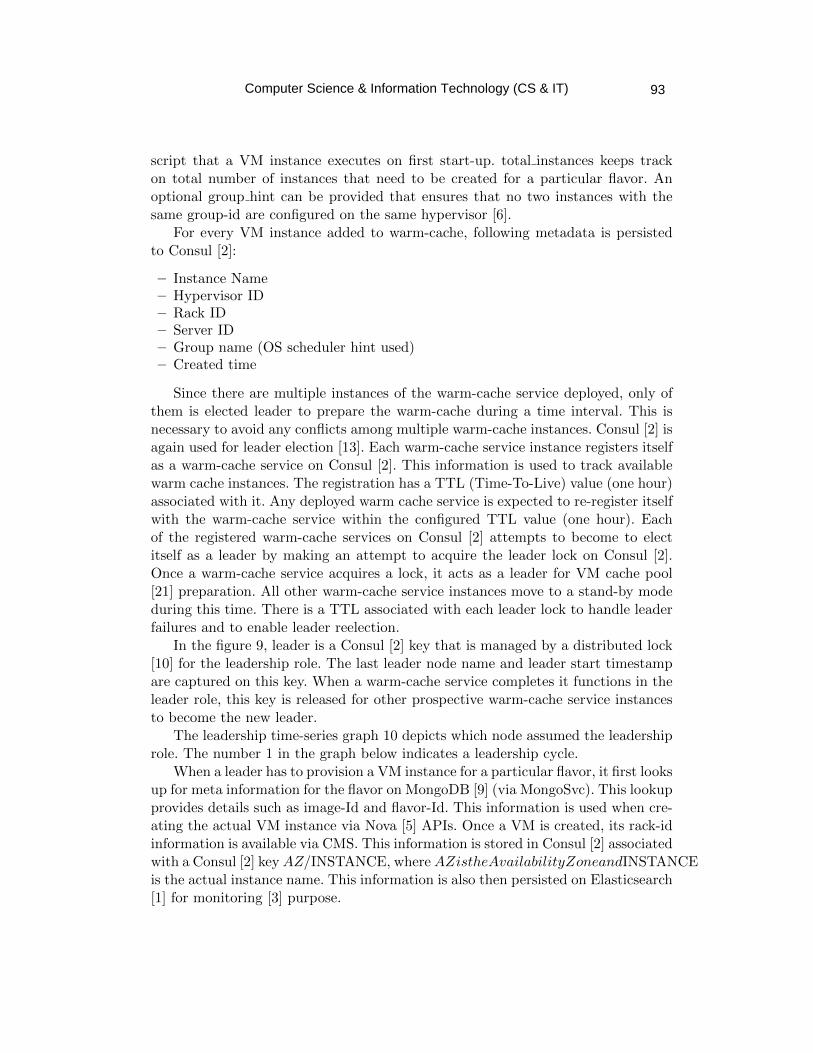
script that a VM instance executes on first start-up. total instances keeps trackon total number of instances that need to be created for a particular flavor. Anoptional group hint can be provided that ensures that no two instances with thesame group-id are configured on the same hypervisor [6].
For every VM instance added to warm-cache, following metadata is persistedto Consul [2]:
– Instance Name– Hypervisor ID– Rack ID– Server ID– Group name (OS scheduler hint used)– Created time
Since there are multiple instances of the warm-cache service deployed, only ofthem is elected leader to prepare the warm-cache during a time interval. This isnecessary to avoid any conflicts among multiple warm-cache instances. Consul [2] isagain used for leader election [13]. Each warm-cache service instance registers itselfas a warm-cache service on Consul [2]. This information is used to track availablewarm cache instances. The registration has a TTL (Time-To-Live) value (one hour)associated with it. Any deployed warm cache service is expected to re-register itselfwith the warm-cache service within the configured TTL value (one hour). Eachof the registered warm-cache services on Consul [2] attempts to become to electitself as a leader by making an attempt to acquire the leader lock on Consul [2].Once a warm-cache service acquires a lock, it acts as a leader for VM cache pool[21] preparation. All other warm-cache service instances move to a stand-by modeduring this time. There is a TTL associated with each leader lock to handle leaderfailures and to enable leader reelection.
In the figure 9, leader is a Consul [2] key that is managed by a distributed lock[10] for the leadership role. The last leader node name and leader start timestampare captured on this key. When a warm-cache service completes it functions in theleader role, this key is released for other prospective warm-cache service instancesto become the new leader.
The leadership time-series graph 10 depicts which node assumed the leadershiprole. The number 1 in the graph below indicates a leadership cycle.
When a leader has to provision a VM instance for a particular flavor, it first looksup for meta information for the flavor on MongoDB [9] (via MongoSvc). This lookupprovides details such as image-Id and flavor-Id. This information is used when cre-ating the actual VM instance via Nova [5] APIs. Once a VM is created, its rack-idinformation is available via CMS. This information is stored in Consul [2] associatedwith a Consul [2] key AZ/INSTANCE, where AZistheAvailabilityZoneandINSTANCEis the actual instance name. This information is also then persisted on Elasticsearch[1] for monitoring [3] purpose.
Computer Science & Information Technology (CS & IT) 93
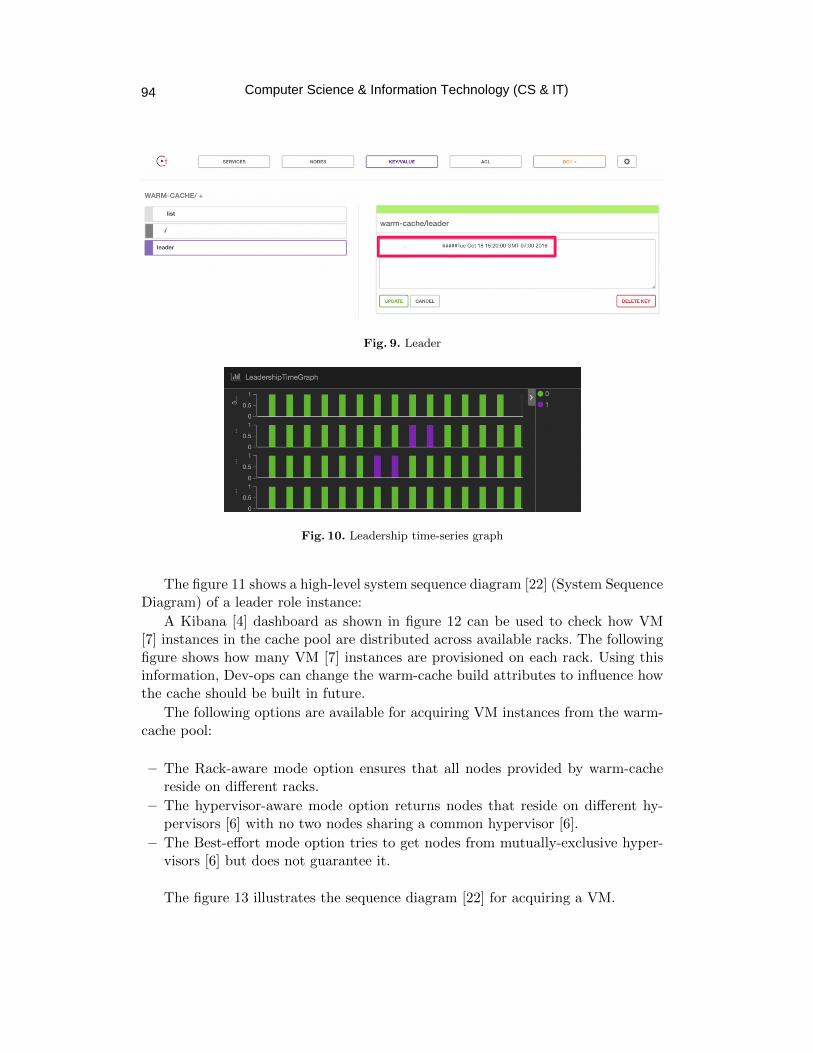
Fig. 9. Leader
Fig. 10. Leadership time-series graph
The figure 11 shows a high-level system sequence diagram [22] (System SequenceDiagram) of a leader role instance:
A Kibana [4] dashboard as shown in figure 12 can be used to check how VM[7] instances in the cache pool are distributed across available racks. The followingfigure shows how many VM [7] instances are provisioned on each rack. Using thisinformation, Dev-ops can change the warm-cache build attributes to influence howthe cache should be built in future.
The following options are available for acquiring VM instances from the warm-cache pool:
– The Rack-aware mode option ensures that all nodes provided by warm-cachereside on different racks.
– The hypervisor-aware mode option returns nodes that reside on different hy-pervisors [6] with no two nodes sharing a common hypervisor [6].
– The Best-effort mode option tries to get nodes from mutually-exclusive hyper-visors [6] but does not guarantee it.
The figure 13 illustrates the sequence diagram [22] for acquiring a VM.
Computer Science & Information Technology (CS & IT)94
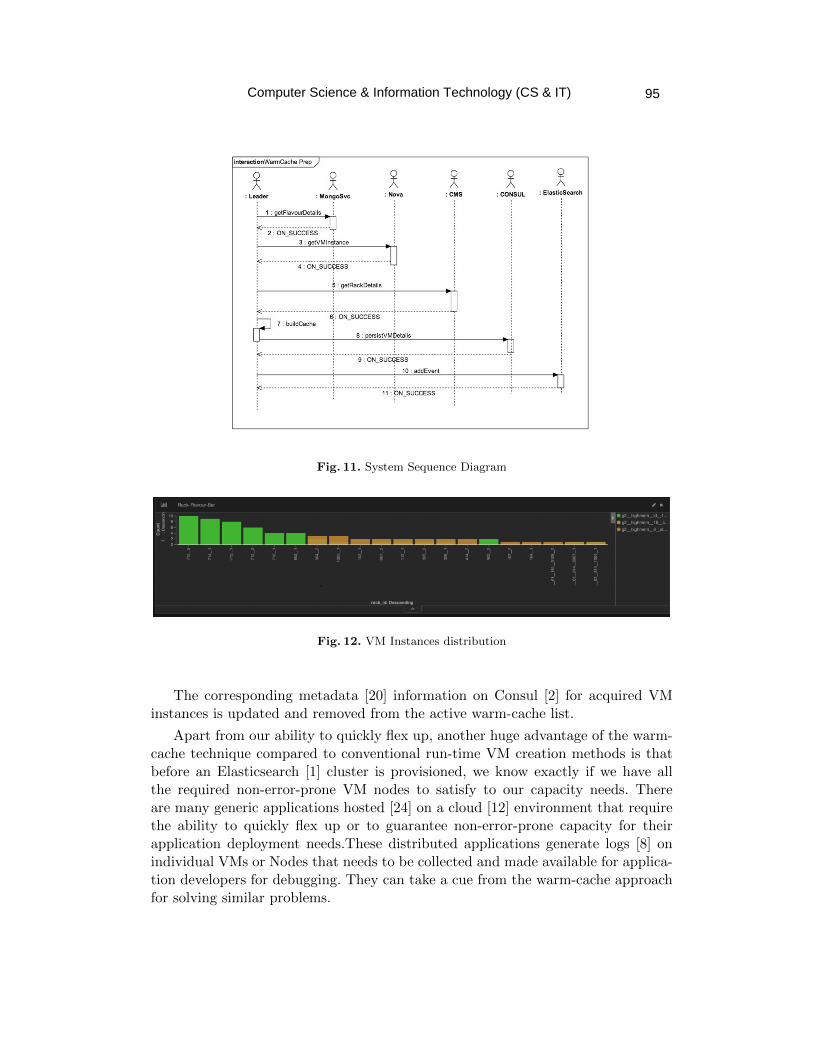
Fig. 11. System Sequence Diagram
Fig. 12. VM Instances distribution
The corresponding metadata [20] information on Consul [2] for acquired VMinstances is updated and removed from the active warm-cache list.
Apart from our ability to quickly flex up, another huge advantage of the warm-cache technique compared to conventional run-time VM creation methods is thatbefore an Elasticsearch [1] cluster is provisioned, we know exactly if we have allthe required non-error-prone VM nodes to satisfy to our capacity needs. Thereare many generic applications hosted [24] on a cloud [12] environment that requirethe ability to quickly flex up or to guarantee non-error-prone capacity for theirapplication deployment needs.These distributed applications generate logs [8] onindividual VMs or Nodes that needs to be collected and made available for applica-tion developers for debugging. They can take a cue from the warm-cache approachfor solving similar problems.
Computer Science & Information Technology (CS & IT) 95
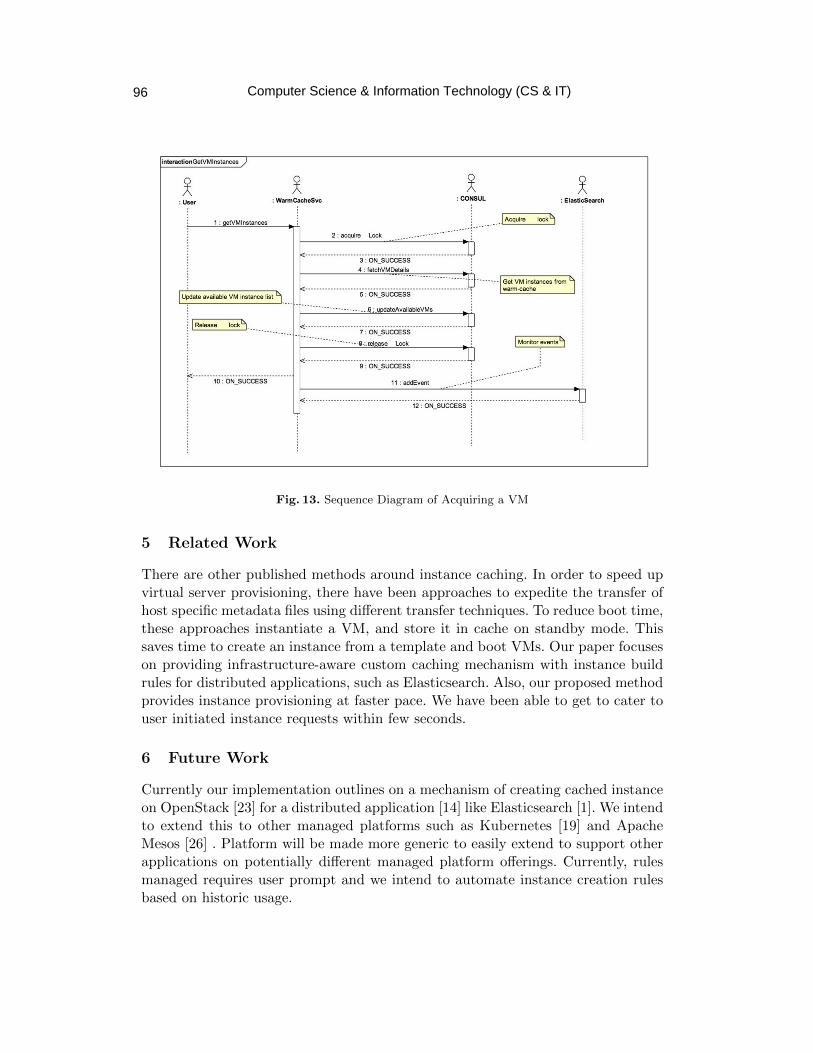
Fig. 13. Sequence Diagram of Acquiring a VM
5 Related Work
There are other published methods around instance caching. In order to speed upvirtual server provisioning, there have been approaches to expedite the transfer ofhost specific metadata files using different transfer techniques. To reduce boot time,these approaches instantiate a VM, and store it in cache on standby mode. Thissaves time to create an instance from a template and boot VMs. Our paper focuseson providing infrastructure-aware custom caching mechanism with instance buildrules for distributed applications, such as Elasticsearch. Also, our proposed methodprovides instance provisioning at faster pace. We have been able to get to cater touser initiated instance requests within few seconds.
6 Future Work
Currently our implementation outlines on a mechanism of creating cached instanceon OpenStack [23] for a distributed application [14] like Elasticsearch [1]. We intendto extend this to other managed platforms such as Kubernetes [19] and ApacheMesos [26] . Platform will be made more generic to easily extend to support otherapplications on potentially different managed platform offerings. Currently, rulesmanaged requires user prompt and we intend to automate instance creation rulesbased on historic usage.
Computer Science & Information Technology (CS & IT)96
7 Conclusion
Managed platforms such as Kubernetes [19], Mesos [26] etc, provide ability to spawnon demand instances. These instances would take up to few minutes, to be com-pletely ready which might not be acceptable for critical hosted applications. In-stance provisioning [25] mechanisms like the one outlined in the paper can alleviatesuch issues. Also a ready to use instance cache guarantees the availability of nodesin case of capacity flex up. There are additional infrastructure rules that are ap-plication specific such as being rack [11] aware. The outlined mechanism in thepaper allows creating similar abstractions on top of managed cloud [12] offeringsout there.
References
1. Elastic Search - https://www.elastic.co/2. Consul - https://www.consul.io/3. D. K. Vasthimal, S. Kumar and M. Somani, ”Near Real-Time Tracking at Scale,” 2017 IEEE
7th International Symposium on Cloud and Service Computing (SC2), Kanazawa, 2017, pp.241-244.
4. Kibana - https://www.elastic.co/products/kibana5. Nova - https://docs.openstack.org/nova/latest/6. Gerald J. Popek and Robert P. Goldberg. 1974. Formal requirements for virtualizable third
generation architectures. Commun. ACM 17, 7 (July 1974), 412-421.7. J. E. Smith and Ravi Nair, ”The architecture of virtual machines,” in Computer, vol. 38, no.
5, pp. 32-38, May 2005.8. D. K. V, R. R. Shah and A. Philip, ”Centralized log management for pepper,” 2011 IEEE
Third International Conference on Cloud Computing Technology and Science, Athens, 2011,pp. 1-3.
9. Kristina Chodorow, (2010) MongoDB: The Definitive Guide. ”O’Reilly Media,Inc.”https://www.overleaf.com/project/5cdb3db3fc43da79efecd23d
10. Y. Breitbart, D. Georgakopoulos, M. Rusinkiewicz and A. Silberschatz, ”On rigorous transac-tion scheduling,” in IEEE Transactions on Software Engineering, vol. 17, no. 9, pp. 954-960,Sept. 1991.
11. The Computer Rack section of The University of Iowa’s DEC PDP-8, documents a relay rackmade in 1965; Nov. 2011.
12. B. Rochwerger et al., ”The Reservoir model and architecture for open federated cloud com-puting,” in IBM Journal of Research and Development, vol. 53, no. 4, pp. 4:1-4:11, July 2009.
13. Patrick Hunt, Mahadev Konar, Flavio P. Junqueira, and Benjamin Reed. 2010. ZooKeeper:wait-free coordination for internet-scale systems. In Proceedings of the 2010 USENIX confer-ence on USENIX annual technical conference (USENIXATC’10). USENIX Association, Berke-ley, CA, USA,
14. Arora, Sanjeev; Barak, Boaz (2009), Computational Complexity A Modern Approach, Cam-bridge, ISBN 978-0-521-42426-4
15. D. Vasthimal, ”Robust and Resilient Migration of Data Processing Systems to Public HadoopGrid,” 2018 IEEE/ACM International Conference on Utility and Cloud Computing Compan-ion (UCC Companion), Zurich, 2018, pp. 21-23.
16. ”Web Services Architecture”. World Wide Web Consortium. 11 February 2004. 3.1.3 Rela-tionship to the World Wide Web and REST Architectures.
Computer Science & Information Technology (CS & IT) 97
17. D. K. Vasthimal, P. K. Srirama and A. K. Akkinapalli, ”Scalable Data Reporting Platform forA/B Tests,” 2019 IEEE 5th Intl Conference on Big Data Security on Cloud (BigDataSecurity),IEEE Intl Conference on High Performance and Smart Computing, (HPSC) and IEEE IntlConference on Intelligent Data and Security (IDS), Washington, DC, USA, 2019, pp. 230-238.
18. N. Gold, A. Mohan, C. Knight and M. Munro, ”Understanding service-oriented software,” inIEEE Software, vol. 21, no. 2, pp. 71-77, March-April 2004.
19. Kelsey Hightower, Brendan Burns, Joe Beda, (2017) Kubernetes: Up and Running: Dive Intothe Future of Infrastructure. ”O’Reilly Media, Inc.”
20. Hui Han, C. L. Giles, E. Manavoglu, Hongyuan Zha, Zhenyue Zhang and E. A. Fox, ”Auto-matic document metadata extraction using support vector machines,” 2003 Joint Conferenceon Digital Libraries, 2003. Proceedings., Houston, TX, USA, 2003, pp. 37-48.
21. Wolfe A, ”Software-Based Cache Partitioning for Real-time Applications”, Third InternationalWorkshop on Responsive Computer Systems, 1993 Sep, OCLC: 39246136
22. Xiaoshan Li, Zhiming Liu and H. Jifeng, ”A formal semantics of UML sequence diagram,” 2004Australian Software Engineering Conference. Proceedings., Melbourne, Victoria, Australia,2004, pp. 168-177.
23. Omar SEFRAOUI, Mohammed AISSAOUI, Mohsine ELEULDJ, ”OpenStack: Toward anOpen-Source Solution for Cloud Computing” 2012 International Journal of Computer Ap-plications (0975 - 8887), Volume 55 - No. 03, October 2012.
24. S. Kumar and D. K. Vasthimal, ”Raw Cardinality Information Discovery for Big Datasets,”2019 IEEE 5th Intl Conference on Big Data Security on Cloud (BigDataSecurity), IEEE IntlConference on High Performance and Smart Computing, (HPSC) and IEEE Intl Conferenceon Intelligent Data and Security (IDS), Washington, DC, USA, 2019, pp. 200-205.
25. B. Guenter, N. Jain and C. Williams, ”Managing cost, performance, and reliability tradeoffsfor energy-aware server provisioning,” 2011 Proceedings IEEE INFOCOM, Shanghai, 2011,pp. 1332-1340.
26. Benjamin Hindman, Andy Konwinski, Matei Zaharia, Ali Ghodsi, Anthony D. Joseph, RandyKatz, Scott Shenker, and Ion Stoica. 2011. Mesos: a platform for fine-grained resource sharingin the data center. In Proceedings of the 8th USENIX conference on Networked systems designand implementation (NSDI’11). USENIX Association, Berkeley, CA, USA, 295-308.
Authors
Sudeep Kumar has deep expertise in building scalable and resilient platforms ca-pable of handling petabytes of unstructured data every day. His industry experiencespans across different domains like E-commerce, Embedded systems and Telecom.Specialized technical skills include solving Big data problems, Building platformsand frameworks, Client Side programming and scalable Server side backends.Deepak Kumar Vasthimal received Bachelors in Computer Science and Engi-neering from Vijayanagar Engineering College, Bellary India and Masters of Sciencein Software Systems from BITS Pilani, India. He is currently Senior MTS, Soft-ware Engineer at eBay Inc. San Jose, California USA. He has filed several patents,research publications in the fields of recommendation algorithms, adaptive dataplatforms, search algorithms, digital advertising platforms, temporal social net-works, graphical user interface, payments, marketplaces, wearable hardware andsystem infrastructure. His current research and engineering focus is building scal-able, multi-tenant, distributed machine learning platform at eBay.
Computer Science & Information Technology (CS & IT)98

Musen Wen is an applied researcher in Search Science and Technology at eBayInc. His research research includes statistical machine learning, deep learning, re-inforcement learning and large-scale practical problems, for example, e-Commercesearch, recommendation, and online advertising. Musen holds a PhD in statisticalmachine learning from the University of California.
Computer Science & Information Technology (CS & IT) 99

100 Computer Science & Information Technology (CS & IT)
David C. Wyld et al. (Eds): CCSEA, BIoT, DKMP, CLOUD, NLCAI, SIPRO - 2020
pp. 101-114, 2020. CS & IT - CSCP 2020 DOI: 10.5121/csit.2020.101009
TEXT-BASED EMOTION AWARE
RECOMMENDER
John Kalung Leung1, Igor Griva2 and William G. Kennedy3
1Computational and Data Sciences Department, Computational Sciences and
Informatics, College of Science, George Mason University, 4400 University
Drive, Fairfax, Virginia 22030, USA 2Department of Mathematical Sciences, MS3F2, Exploratory Hall 4114,
George Mason University,4400 University Drive, Fairfax, Virginia 22030,
USA 3Center for Social Complexity, Computational and Data Sciences Department,
College of Science, George Mason University, 4400 University Drive, Fairfax,
Virginia 22030, USA
ABSTRACT
We apply the concept of users' emotion vectors (UVECs) and movies' emotion vectors (MVECs)
as building components of Emotion Aware Recommender System. We built a comparative
platform that consists of five recommenders based on content-based and collaborative filtering
algorithms. We employed a Tweets Affective Classifier to classify movies' emotion profiles
through movie overviews. We construct MVECs from the movie emotion profiles. We track
users' movie watching history to formulate UVECs by taking the average of all the MVECs from
all the movies a user has watched. With the MVECs, we built an Emotion Aware Recommender
as one of the comparative platforms' algorithms. We evaluated the top-N recommendation lists generated by these Recommenders and found the top-N list of Emotion Aware Recommender
showed serendipity recommendations.
KEYWORDS
Context-Aware, Emotion Text Mining, Affective Computing, Recommender Systems,
Machine Learning
1. INTRODUCTION
We have illustrated in the paper [1] the benefit of using movie emotion vectors (mvec) and user emotion vectors (uvec) to enhance a Recommender's top-N recommendation making process.
The goal of this paper is to make use of mvec and uvec embeddings as emotional components
besides making the top-N recommendations, also develop an end-to-end Emotion Aware
Recommender (EAR). In the article, [1], the mvec embeddings represent a movie's emotional features derived from the movie overview. We developed a Tweets Affective Classifier (TAC)
cable of classifying six primary human emotions, and we added a neutral mood to TAC for
affective computing convenience. We use TAC to classify movie overviews to obtain the movie's emotional profile, mvec. A uvec embeddings represent the mean value of all the mvec film
moods' embeddings a user has watched. In this paper, we expand the coverage of the mvec
embeddings to include other movies' textual metadata, such as genres. We denote the expanded mvec embeddings as item vectors (ivec). In the same token, we named the extended coverage of
uvec, wvec.
102 Computer Science & Information Technology (CS & IT)
We demonstrated, in [1], the affective movie recommendation making through an SVD-CF
Recommender. In this study, we build a comparative Recommender platform, which makes
movie recommendations through Recommender algorithms of Content-based (CB), and
Collaborative Filtering (CF). In the case of CB Recommender, we develop a movie genres CB Recommender denotes as Genres Aware Recommender (GAR). We transform mvec embeddings
of movie overviews into a multi-label emotion classification in One-Hot Encoded (OHE)
embeddings and named the embeddings as ivec. We build an ivec embeddings CB Recommender and denote it as Emotion Aware Recommender (EAR). We then combine the emotion and genres
into an expanded ivec for developing a Multi-channel Aware Recommender (MAR). We also
construct an Item-based Collaborative Filtering (IBCF) and a User-based Collaborative Filtering (UBCF) Recommenders from scratch. We compare the differences between the five
recommender algorithms' comparative performance through the recommendations-making
process.
We apply the Cosine Similarity depicted in equation 2 as the primary algorithm in building our
Recommender platform. In the case of recommended movies in the top-N recommendations
contain similar genres of films that the active user has watched and liked, Cosine Similarity will reveal the closeness in the similarity between the recommended movies and the movies the active
user has viewed and liked. Similarly, we can apply Cosine Similarity to find the similarity in the
emotion profile of a top-N movies list and the movie's emotion profile of an active user who has watched and loved. Moreover, in UBCF, we apply a rating matrix, R, to compute the
collaborative filtering for recommending movies to an active user. Each row of UBCF
in R represents the rating value of films a user has watched and rated; whereas, each column
in R represents a movie of rating scores it received from users who have viewed and assessed. By comparing the Cosine Similarity between the active user and a user in the corresponding rows,
effectively, we compare two rows in R; thus, we know the closeness of the two users. Once we
find the closest similarity score of the active user and a particularuser in R, we scan the active user's unwatched movies that match the watched films of the closest similar user. Through
collaborative filtering, we make the top-N movie recommendations to the active user. Lastly, we
evaluate the performance of Recommenders in the comparative platform by contrasting each top-
N recommendation list generated by the five Recommender algorithms. We find the top-N recommendation list made by the Emotion Aware Recommender (EAR) shows intrigue results.
In the advent of the Internet era, large conglomerates, small and medium businesses (SMB), have deployed Recommender Systems to gain a competitive advantage in providing customers a
personalized, useful business transaction experience while understanding customers' tastes and
decision-making habits. For customers who left feedback regarding their experiences of the goods and services they received, Recommender can mine customers' opinions through sentiment
analysis (SA) to better understand the what, why, and how customers' likes and dislikes the goods
and services they consumed. Also, if customers have rated the goods and services, Recommender
can make use of the rating information along with the sentiment analysis on opinion feedbacks to make a future personalized recommendation of products and services to customers that meet their
tastes and expectation. For example, such Recommender is known as Hybrid Recommender
System using Collaborative Filtering with Sentiment Analysis (CF-SA) [2]. CF-SA Recommender is also known to outperform the baseline Collaborate Filtering Recommender
System in personalized recommendation making [3] [4].
Nevertheless, no Recommender was built with design to explicitly collect human emotions data
[5] [6]. Also, no publicly available dataset contains explicit affective features for implementing a
Recommender System. The alternative for Recommender researchers is to build an affective
aware Recommender by deriving the needed emotional features from some datasets implicitly [7]
Computer Science & Information Technology (CS & IT) 103
and [8] [9]. Movies and music datasets are the two most popular datasets with metadata, such as genres and reviews for affective features mining [5].
In the next section, we will level set readers with the related work in the field of affective
computing and Emotion Aware Recommenders. Next, we will illustrate the development of the comparative platform for the five Recommender algorithms, Tweets Affective Classifier, and
datasets in the methodology section. Next, in the implementation section, we will highlight the
five Recommenders with flowcharts. In the evaluation section, we will show the top-N recommendations lists generated by the five Recommender algorithms while contrasting their
differences. We also will highlight our observations regarding the limitations and deficiencies of
developing the comparative platform. We will document our future work plan in the future work section before closing our report with a conclusion. Following the conclusion section is the
reference section and the authors' brief biography.
2. RELATED WORK Emotion Aware Recommender System (EAR) is a field in active research. Illustrated below are
samples of a few recent works. Orellana-Rodriguez [10] [11] advocated that instead of detecting
the affective polarity features (i.e., positive/negative) of a given short video in YouTube, they detect the paired eight basic human emotions advocated by Plutchik [12] [13] into four opposing
pairs of basic moods: joy–sadness, anger–fear, trust–disgust, and anticipation–surprise. Orellana-
Rodriguez [10] also leveraged the auto extraction of film metadata’s moods context for making
emotion-aware movie recommendations. Qian et al. [14] proposed an EARS based on hybrid information fusion using user rating information as explicit data, user social network data as
implicit information, and sentiment from user reviews as the source of emotional information.
They [14] also claimed the proposed method achieved higher prediction ratings and significantly enhanced the recommendation accuracy. Also, Narducci et al. [15] [16] described a general
architecture for building an EARS and demonstrated through a music Recommender with
promising results.
Moreover, Mizgajski and Morzy [17] formulated an innovative multi-dimensional model EARS
for making recommendations on a large-scale news Recommender. The database consists of over
13 million news pages based on 2.7 million unique user’s self-assessed emotional reactions resulted in over 160,000 emotional reactions collected against 85,000 news articles. Katarya and
Verma [5] completed a literature review of research publications in the Affective Recommender
Systems (ARS) field from 2003 to February 2016. The report offers in-depth views of the evolution of technology and the development of ARS.
The field of human primary Emotion Detection and Recognition (EDR) through artificial
intelligence methods is in active research [18] [19] [20] [21] [22] [23] [24] [25]. In the case of image-oriented data, Facial Detection, and Recognition (FDR) is the main thrust in research [26]
[27] to study basic human emotions through facial expression. For textual based data with
subjective writing, Sentiment Analysis (SA) takes the lead [28] [29] [30] to extract emotions from fine-grained sentiment. The aim is to uncover the affective features from texts or images
and classify the emotional features into the categories of moods. Paul Ekman, a renowned
psychologist and professor emeritus at the University of California, San Francisco, advocated the six basic human moods classification: happiness, sadness, disgust, fear, surprise, and anger [31]
[32]. Ekman later added “contempt” as the seventh primary human emotion to his list [33] [34].
Another renowned psychologist, Robert Plutchik, invented the Wheel of Emotions advocated
eight primary emotions: anger, anticipation, joy, trust, fear, surprise, sadness, and disgust [12]. Research at Glasgow University in 2014 amended that couple pairs of primary human emotions
such as fear and surprise elicit similar facial muscles response, so are disgust and anger. The
104 Computer Science & Information Technology (CS & IT)
study broke the raw human emotions down to four fundamental emotions: happiness, sadness, fear/surprise, and disgust/anger [35] [36]. This paper adopts Paul Ekman’s classification of six
primary human emotions: happiness, sadness, disgust, fear, surprise, and anger for modeling the
ivec embeddings while adding “neutral” as the seventh emotion feature for convenience in
affective computing.
FDR on facial expression has a drawback - it fails to classify an image’s emotional features with
the absence of human face on the image. In the case of using FDR to classify movie poster images, often, the poster may contain a faceless image. Thus, we propose to indirectly classify
the affective features of a poster image through textual-based emotion detection and recognition
(EDR) using a movie overview rather than facial-based FDR directly on the poster image.
3. METHODOLOGY
We propose an innovative method as our contribution to Recommender research, which based on
the following sources:
item’s explicit rating information
item’s implicit affective data embeddings
user’s emotion and taste profile embedding
To implement an end-to-end Multi-channel Emotion Aware Recommender System (e2eMcEARS) or McEAR for short. Several researchers have documented that emotions playing
an essential role in the human decision-making process [37] [38] [39] [40] [41] [42]. Also,
psychologists and researchers in social science know that the state of mind or moods of an
individual affects his decision-making processes [43] [44] [45] [46]. We envision that affective embeddings can represent any product or service. In our previous work [1], we illustrated a
method to derive an emotion classifier from tweets’ affective tags and use the affective model to
predict the mood of a movie through the movie overview. We denoted the mood embeddings of the movie as mvec. We also stated that the value of the embedding of a mvec would hold the
same value throughout its lifespan. Also, we denote uvec represents the average value of all mvec
of the movies a user has watched. The value of uvec will change each time the user watches a movie. We want to expand the coverage of the mvec to other metadata of the movie, such as
genres. We denote the expanded mvec as item embeddings (ivec), which holds the mood
embeddings of movie overview and genres. Similarly, uvec will expand its embedding as the
average value of all ivec of the movies a user has consumed. We denote the expanded uvec embeddings as wvec.
3.1. Overview of the Tweets Affective Classifier Model
We developed the Tweets Affective Classifier (TAC), as illustrated in [1], which employed an
asymmetric butterfly wing double-decker bidirectional LSTM - CNN Conv1D architecture to
detect and recognize emotional features from tweets' text messages. We have preprocessed the seven emotion words embeddings to be used as input to train TAC through the pre-trained GloVe
embeddings using the glove.twitter.27B.200d.txt dataset. We have two types of input words
embeddings: trainable emotion words embeddings and frozen emotion words embeddings. By frozen the embeddings, we mean the weights in the embeddings are frozen and cannot be
modified during TAC's training session. We started with the first half of the butterfly wing by
feeding preprocessed TAC input emotion words embeddings to the double-decker bidirectional LSTM neural nets. We fed the frozen emotion words embeddings to the top bidirectional LSTM
and fed the trainable emotion words embeddings to the bottom bidirectional LSTM. Next, we
Computer Science & Information Technology (CS & IT) 105
concatenated the top and bottom bidirectional LSTM to form the double-decker neural net. We fed the output from the double-decker bidirectional LSTM to seven sets of CNN Conv1D neural
nets with the dropout parameter set at 0.5 in each set of Conv1D as regularization to prevent the
neural net from overfitting. We then concatenated all the outputs of Conv1Ds to form the overall
output of the first half of the butterfly wing neural nets.
The architecture layout of the second half of the butterfly wing neural nets is different from the
peer. We started by setting up seven pairs of CNN Conv1D neural nets. With each pair of Conv1D, we fed in parallel the preprocessed TAC's frozen emotion words embeddings as input to
a Conv1D and the trainable emotion words embeddings to the other. We set the dropout
parameter at 0.5 for all seven pairs of conv1D to prevent overfitting. We concatenated all the outputs of seven pairs Conv1D to become a single output and fed that to a single bidirectional
LSTM with the dropout value set at 0.3. We then concatenated the first half of the butterfly wing
output with the second half to form the overall output. Next, the output then fed through in series
to a MaxPooling1D with the dropout value set at 0.5, followed by a Flatten neural net before going through a Dense neural net and another Dense neural net with sigmoid activation to
classify the emotion classification in a probabilistic distribution. When predicting a movie's
emotion profile using TAC, the classifier will classify the mood of a movie through the movie overview. TAC output the movie emotion prediction in the form of the probabilistic distribution
of seven values, indicating the value in percentage of each class of the seven emotions, or the
emotion profile of the movie.
3.2. Overview of Comparative Platform for Recommenders Building the comparative platform for Recommenders from scratch provides a way to study and
observe the process of making recommendations under different context situations. We apply the
most basic method to build the collection of Recommenders in the comparative platform. Thus, we are not aiming for best practice algorithms to build Recommender with a high performance
nor high throughput in mind; but it is easy to modify and adapt to a different information context,
and highly functional is most desirable. A Recommender is known to build with a specific
domain in mind. As we march down the path of researching Emotion Aware Recommenders, we want the comparative platform that we are developing for the movie-oriented Recommenders can
later transfer the learning to other information domains.
We reckon that in the context of movie domain, for example, a Genres Aware Recommender
(GAR) may be adequate for making movie recommendations through movie genres, but without
some adaptable in processing logic, the movie GAR may not handle well when feeding it with
music genres. Of course, movie GAR will fail to make recommendations if we feed other domain data absence of genre information. However, primary human emotions are the same universally
in different races and cultures. Once we obtain an emotion profile of a user obtains from a
domain, the user's same emotion profile should be transferable to other domains with no required modification. The caveat is that the other domain must contain data that is emotion detectable and
recognizable or emotion aware enable.
3.3. Datasets
The success of any machine learning project requires large enough domain-specific data for computation. For movie-related affecting computing, no affective labeled dataset is readily
available. Thus, we need to build the required dataset by deriving it from the following sources.
For movie rating datasets, we obtained these datasets from the GroupLens' MovieLens repository [47]. We scraped The Movie Database (TMDb) [48] for movie overviews and other metadata.
MovieLens contains a "links" file that provides cross-reference links between MovieLens' movie
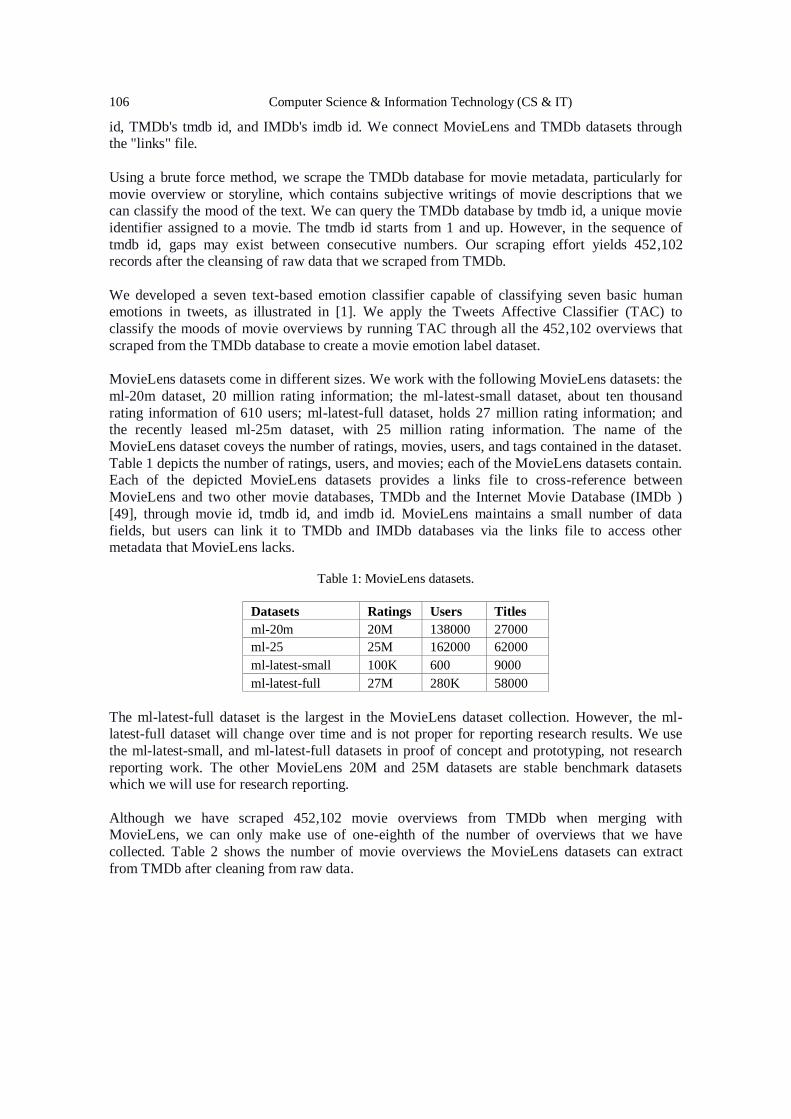
106 Computer Science & Information Technology (CS & IT)
id, TMDb's tmdb id, and IMDb's imdb id. We connect MovieLens and TMDb datasets through the "links" file.
Using a brute force method, we scrape the TMDb database for movie metadata, particularly for
movie overview or storyline, which contains subjective writings of movie descriptions that we can classify the mood of the text. We can query the TMDb database by tmdb id, a unique movie
identifier assigned to a movie. The tmdb id starts from 1 and up. However, in the sequence of
tmdb id, gaps may exist between consecutive numbers. Our scraping effort yields 452,102 records after the cleansing of raw data that we scraped from TMDb.
We developed a seven text-based emotion classifier capable of classifying seven basic human emotions in tweets, as illustrated in [1]. We apply the Tweets Affective Classifier (TAC) to
classify the moods of movie overviews by running TAC through all the 452,102 overviews that
scraped from the TMDb database to create a movie emotion label dataset.
MovieLens datasets come in different sizes. We work with the following MovieLens datasets: the
ml-20m dataset, 20 million rating information; the ml-latest-small dataset, about ten thousand
rating information of 610 users; ml-latest-full dataset, holds 27 million rating information; and the recently leased ml-25m dataset, with 25 million rating information. The name of the
MovieLens dataset coveys the number of ratings, movies, users, and tags contained in the dataset.
Table 1 depicts the number of ratings, users, and movies; each of the MovieLens datasets contain. Each of the depicted MovieLens datasets provides a links file to cross-reference between
MovieLens and two other movie databases, TMDb and the Internet Movie Database (IMDb )
[49], through movie id, tmdb id, and imdb id. MovieLens maintains a small number of data
fields, but users can link it to TMDb and IMDb databases via the links file to access other metadata that MovieLens lacks.
Table 1: MovieLens datasets.
Datasets Ratings Users Titles
ml-20m 20M 138000 27000
ml-25 25M 162000 62000
ml-latest-small 100K 600 9000
ml-latest-full 27M 280K 58000
The ml-latest-full dataset is the largest in the MovieLens dataset collection. However, the ml-latest-full dataset will change over time and is not proper for reporting research results. We use
the ml-latest-small, and ml-latest-full datasets in proof of concept and prototyping, not research
reporting work. The other MovieLens 20M and 25M datasets are stable benchmark datasets which we will use for research reporting.
Although we have scraped 452,102 movie overviews from TMDb when merging with MovieLens, we can only make use of one-eighth of the number of overviews that we have
collected. Table 2 shows the number of movie overviews the MovieLens datasets can extract
from TMDb after cleaning from raw data.
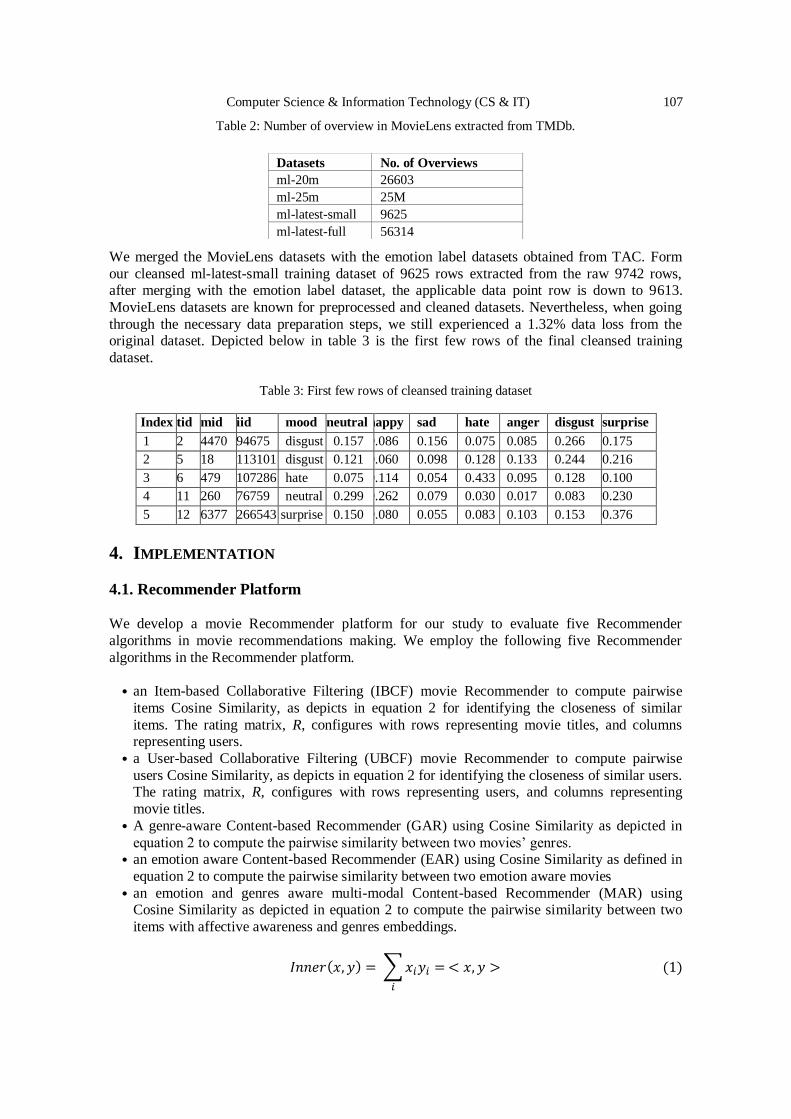
Computer Science & Information Technology (CS & IT) 107
Table 2: Number of overview in MovieLens extracted from TMDb.
We merged the MovieLens datasets with the emotion label datasets obtained from TAC. Form
our cleansed ml-latest-small training dataset of 9625 rows extracted from the raw 9742 rows, after merging with the emotion label dataset, the applicable data point row is down to 9613.
MovieLens datasets are known for preprocessed and cleaned datasets. Nevertheless, when going
through the necessary data preparation steps, we still experienced a 1.32% data loss from the original dataset. Depicted below in table 3 is the first few rows of the final cleansed training
dataset.
Table 3: First few rows of cleansed training dataset
Index tid mid iid mood neutral happy sad hate anger disgust surprise
1 2 4470 94675 disgust 0.157 0.086 0.156 0.075 0.085 0.266 0.175
2 5 18 113101 disgust 0.121 0.060 0.098 0.128 0.133 0.244 0.216
3 6 479 107286 hate 0.075 0.114 0.054 0.433 0.095 0.128 0.100
4 11 260 76759 neutral 0.299 0.262 0.079 0.030 0.017 0.083 0.230
5 12 6377 266543 surprise 0.150 0.080 0.055 0.083 0.103 0.153 0.376
4. IMPLEMENTATION
4.1. Recommender Platform We develop a movie Recommender platform for our study to evaluate five Recommender
algorithms in movie recommendations making. We employ the following five Recommender
algorithms in the Recommender platform.
• an Item-based Collaborative Filtering (IBCF) movie Recommender to compute pairwise
items Cosine Similarity, as depicts in equation 2 for identifying the closeness of similar
items. The rating matrix, R, configures with rows representing movie titles, and columns representing users.
• a User-based Collaborative Filtering (UBCF) movie Recommender to compute pairwise
users Cosine Similarity, as depicts in equation 2 for identifying the closeness of similar users. The rating matrix, R, configures with rows representing users, and columns representing
movie titles.
• A genre-aware Content-based Recommender (GAR) using Cosine Similarity as depicted in
equation 2 to compute the pairwise similarity between two movies’ genres. • an emotion aware Content-based Recommender (EAR) using Cosine Similarity as defined in
equation 2 to compute the pairwise similarity between two emotion aware movies
• an emotion and genres aware multi-modal Content-based Recommender (MAR) using Cosine Similarity as depicted in equation 2 to compute the pairwise similarity between two
items with affective awareness and genres embeddings.
𝐼𝑛𝑛𝑒𝑟(𝑥, 𝑦) = ∑ 𝑥𝑖𝑦𝑖 = < 𝑥, 𝑦 > (1)
𝑖
Datasets No. of Overviews
ml-20m 26603
ml-25m 25M
ml-latest-small 9625
ml-latest-full 56314
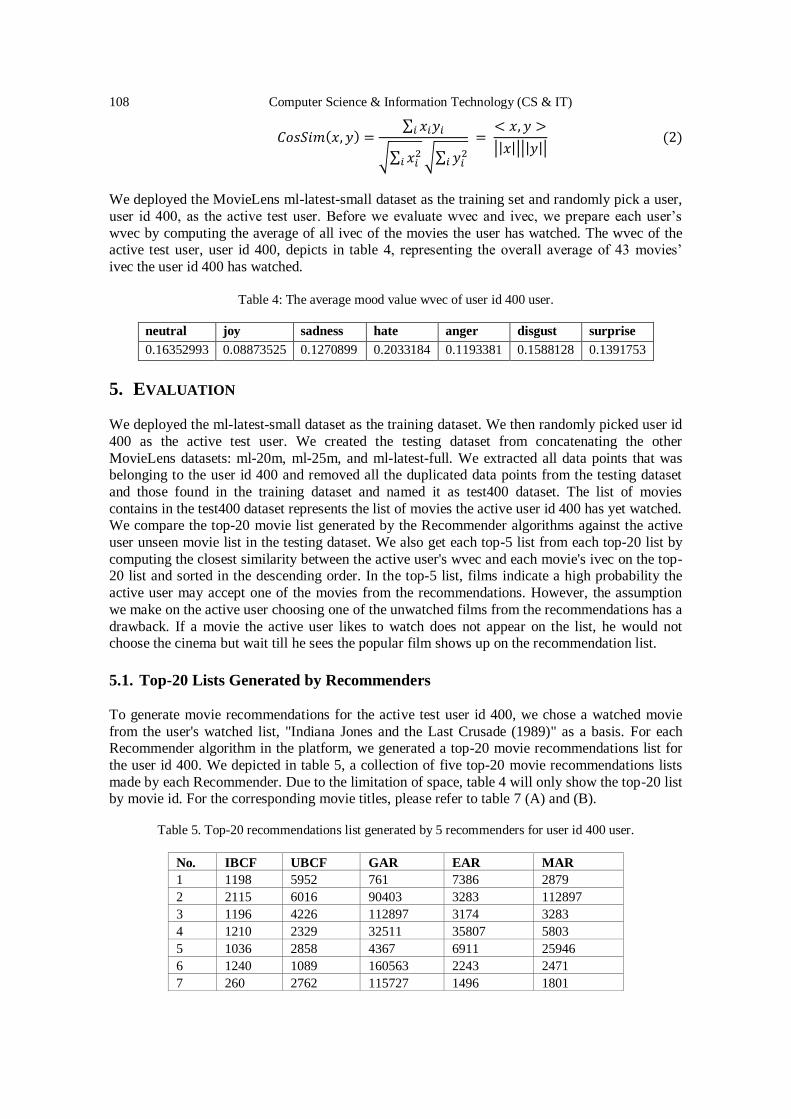
108 Computer Science & Information Technology (CS & IT)
𝐶𝑜𝑠𝑆𝑖𝑚(𝑥, 𝑦) =∑ 𝑥𝑖𝑦𝑖𝑖
√∑ 𝑥𝑖2
𝑖 √∑ 𝑦𝑖2
𝑖
= < 𝑥, 𝑦 >
||𝑥||||𝑦|| (2)
We deployed the MovieLens ml-latest-small dataset as the training set and randomly pick a user,
user id 400, as the active test user. Before we evaluate wvec and ivec, we prepare each user’s
wvec by computing the average of all ivec of the movies the user has watched. The wvec of the active test user, user id 400, depicts in table 4, representing the overall average of 43 movies’
ivec the user id 400 has watched.
Table 4: The average mood value wvec of user id 400 user.
neutral joy sadness hate anger disgust surprise
0.16352993 0.08873525 0.1270899
8
0.2033184
0
0.1193381
9
0.1588128
7
0.1391753
8
5. EVALUATION
We deployed the ml-latest-small dataset as the training dataset. We then randomly picked user id
400 as the active test user. We created the testing dataset from concatenating the other
MovieLens datasets: ml-20m, ml-25m, and ml-latest-full. We extracted all data points that was belonging to the user id 400 and removed all the duplicated data points from the testing dataset
and those found in the training dataset and named it as test400 dataset. The list of movies
contains in the test400 dataset represents the list of movies the active user id 400 has yet watched. We compare the top-20 movie list generated by the Recommender algorithms against the active
user unseen movie list in the testing dataset. We also get each top-5 list from each top-20 list by
computing the closest similarity between the active user's wvec and each movie's ivec on the top-20 list and sorted in the descending order. In the top-5 list, films indicate a high probability the
active user may accept one of the movies from the recommendations. However, the assumption
we make on the active user choosing one of the unwatched films from the recommendations has a
drawback. If a movie the active user likes to watch does not appear on the list, he would not choose the cinema but wait till he sees the popular film shows up on the recommendation list.
5.1. Top-20 Lists Generated by Recommenders
To generate movie recommendations for the active test user id 400, we chose a watched movie
from the user's watched list, "Indiana Jones and the Last Crusade (1989)" as a basis. For each Recommender algorithm in the platform, we generated a top-20 movie recommendations list for
the user id 400. We depicted in table 5, a collection of five top-20 movie recommendations lists
made by each Recommender. Due to the limitation of space, table 4 will only show the top-20 list by movie id. For the corresponding movie titles, please refer to table 7 (A) and (B).
Table 5. Top-20 recommendations list generated by 5 recommenders for user id 400 user.
No. IBCF UBCF GAR EAR MAR
1 1198 5952 761 7386 2879
2 2115 6016 90403 3283 112897
3 1196 4226 112897 3174 3283
4 1210 2329 32511 35807 5803
5 1036 2858 4367 6911 25946
6 1240 1089 160563 2243 2471
7 260 2762 115727 1496 1801
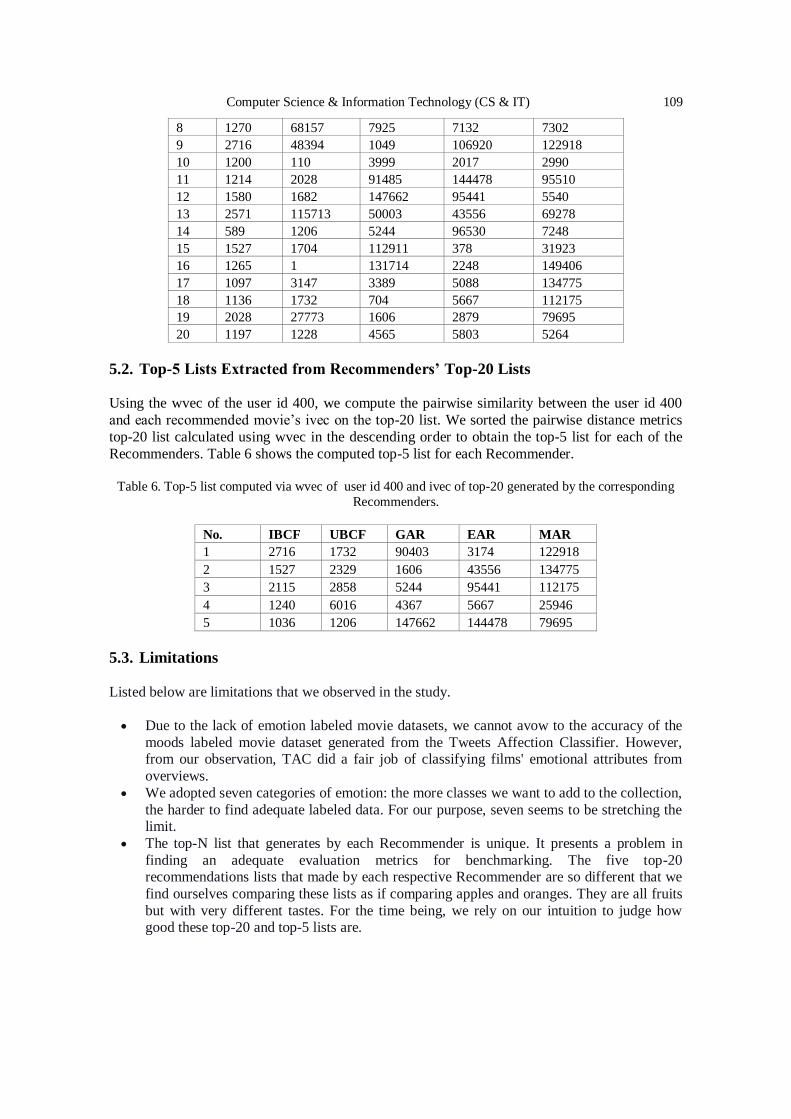
Computer Science & Information Technology (CS & IT) 109
8 1270 68157 7925 7132 7302
9 2716 48394 1049 106920 122918
10 1200 110 3999 2017 2990
11 1214 2028 91485 144478 95510
12 1580 1682 147662 95441 5540
13 2571 115713 50003 43556 69278
14 589 1206 5244 96530 7248
15 1527 1704 112911 378 31923
16 1265 1 131714 2248 149406
17 1097 3147 3389 5088 134775
18 1136 1732 704 5667 112175
19 2028 27773 1606 2879 79695
20 1197 1228 4565 5803 5264
5.2. Top-5 Lists Extracted from Recommenders’ Top-20 Lists Using the wvec of the user id 400, we compute the pairwise similarity between the user id 400
and each recommended movie’s ivec on the top-20 list. We sorted the pairwise distance metrics
top-20 list calculated using wvec in the descending order to obtain the top-5 list for each of the
Recommenders. Table 6 shows the computed top-5 list for each Recommender.
Table 6. Top-5 list computed via wvec of user id 400 and ivec of top-20 generated by the corresponding
Recommenders.
No. IBCF UBCF GAR EAR MAR
1 2716 1732 90403 3174 122918
2 1527 2329 1606 43556 134775
3 2115 2858 5244 95441 112175
4 1240 6016 4367 5667 25946
5 1036 1206 147662 144478 79695
5.3. Limitations
Listed below are limitations that we observed in the study.
Due to the lack of emotion labeled movie datasets, we cannot avow to the accuracy of the
moods labeled movie dataset generated from the Tweets Affection Classifier. However, from our observation, TAC did a fair job of classifying films' emotional attributes from
overviews.
We adopted seven categories of emotion: the more classes we want to add to the collection,
the harder to find adequate labeled data. For our purpose, seven seems to be stretching the limit.
The top-N list that generates by each Recommender is unique. It presents a problem in
finding an adequate evaluation metrics for benchmarking. The five top-20 recommendations lists that made by each respective Recommender are so different that we
find ourselves comparing these lists as if comparing apples and oranges. They are all fruits
but with very different tastes. For the time being, we rely on our intuition to judge how good these top-20 and top-5 lists are.
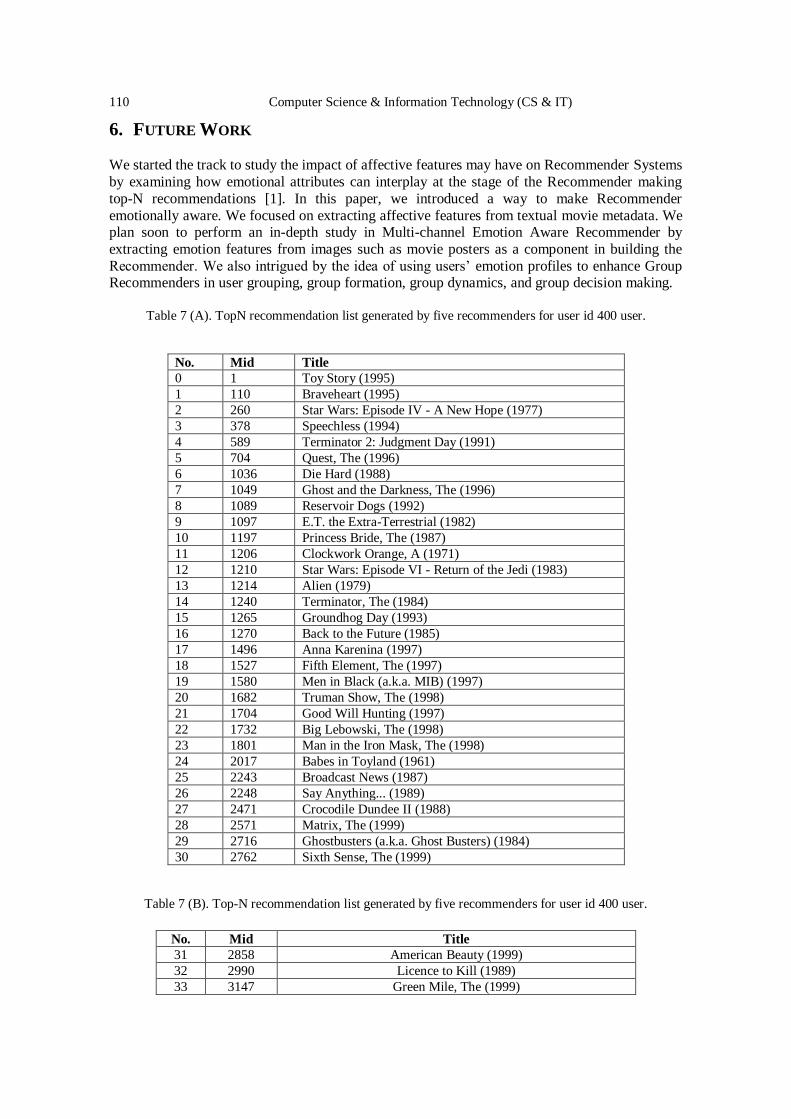
110 Computer Science & Information Technology (CS & IT)
6. FUTURE WORK We started the track to study the impact of affective features may have on Recommender Systems
by examining how emotional attributes can interplay at the stage of the Recommender making
top-N recommendations [1]. In this paper, we introduced a way to make Recommender
emotionally aware. We focused on extracting affective features from textual movie metadata. We plan soon to perform an in-depth study in Multi-channel Emotion Aware Recommender by
extracting emotion features from images such as movie posters as a component in building the
Recommender. We also intrigued by the idea of using users’ emotion profiles to enhance Group Recommenders in user grouping, group formation, group dynamics, and group decision making.
Table 7 (A). TopN recommendation list generated by five recommenders for user id 400 user.
No. Mid Title
0 1 Toy Story (1995)
1 110 Braveheart (1995)
2 260 Star Wars: Episode IV - A New Hope (1977)
3 378 Speechless (1994)
4 589 Terminator 2: Judgment Day (1991)
5 704 Quest, The (1996)
6 1036 Die Hard (1988)
7 1049 Ghost and the Darkness, The (1996)
8 1089 Reservoir Dogs (1992)
9 1097 E.T. the Extra-Terrestrial (1982)
10 1197 Princess Bride, The (1987)
11 1206 Clockwork Orange, A (1971)
12 1210 Star Wars: Episode VI - Return of the Jedi (1983)
13 1214 Alien (1979)
14 1240 Terminator, The (1984)
15 1265 Groundhog Day (1993)
16 1270 Back to the Future (1985)
17 1496 Anna Karenina (1997)
18 1527 Fifth Element, The (1997)
19 1580 Men in Black (a.k.a. MIB) (1997)
20 1682 Truman Show, The (1998)
21 1704 Good Will Hunting (1997)
22 1732 Big Lebowski, The (1998)
23 1801 Man in the Iron Mask, The (1998)
24 2017 Babes in Toyland (1961)
25 2243 Broadcast News (1987)
26 2248 Say Anything... (1989)
27 2471 Crocodile Dundee II (1988)
28 2571 Matrix, The (1999)
29 2716 Ghostbusters (a.k.a. Ghost Busters) (1984)
30 2762 Sixth Sense, The (1999)
Table 7 (B). Top-N recommendation list generated by five recommenders for user id 400 user.
No. Mid Title
31 2858 American Beauty (1999)
32 2990 Licence to Kill (1989)
33 3147 Green Mile, The (1999)
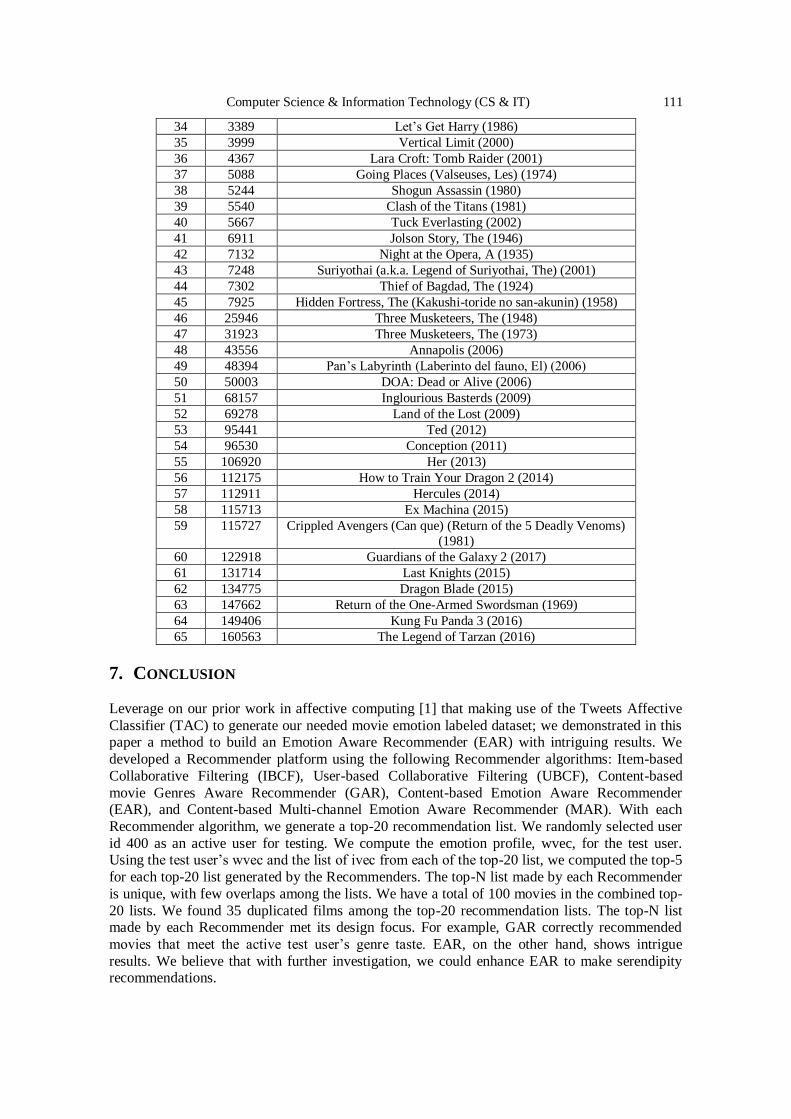
Computer Science & Information Technology (CS & IT) 111
34 3389 Let’s Get Harry (1986)
35 3999 Vertical Limit (2000)
36 4367 Lara Croft: Tomb Raider (2001)
37 5088 Going Places (Valseuses, Les) (1974)
38 5244 Shogun Assassin (1980)
39 5540 Clash of the Titans (1981)
40 5667 Tuck Everlasting (2002)
41 6911 Jolson Story, The (1946)
42 7132 Night at the Opera, A (1935)
43 7248 Suriyothai (a.k.a. Legend of Suriyothai, The) (2001)
44 7302 Thief of Bagdad, The (1924)
45 7925 Hidden Fortress, The (Kakushi-toride no san-akunin) (1958)
46 25946 Three Musketeers, The (1948)
47 31923 Three Musketeers, The (1973)
48 43556 Annapolis (2006)
49 48394 Pan’s Labyrinth (Laberinto del fauno, El) (2006)
50 50003 DOA: Dead or Alive (2006)
51 68157 Inglourious Basterds (2009)
52 69278 Land of the Lost (2009)
53 95441 Ted (2012)
54 96530 Conception (2011)
55 106920 Her (2013)
56 112175 How to Train Your Dragon 2 (2014)
57 112911 Hercules (2014)
58 115713 Ex Machina (2015)
59 115727 Crippled Avengers (Can que) (Return of the 5 Deadly Venoms)
(1981)
60 122918 Guardians of the Galaxy 2 (2017)
61 131714 Last Knights (2015)
62 134775 Dragon Blade (2015)
63 147662 Return of the One-Armed Swordsman (1969)
64 149406 Kung Fu Panda 3 (2016)
65 160563 The Legend of Tarzan (2016)
7. CONCLUSION
Leverage on our prior work in affective computing [1] that making use of the Tweets Affective
Classifier (TAC) to generate our needed movie emotion labeled dataset; we demonstrated in this paper a method to build an Emotion Aware Recommender (EAR) with intriguing results. We
developed a Recommender platform using the following Recommender algorithms: Item-based
Collaborative Filtering (IBCF), User-based Collaborative Filtering (UBCF), Content-based
movie Genres Aware Recommender (GAR), Content-based Emotion Aware Recommender (EAR), and Content-based Multi-channel Emotion Aware Recommender (MAR). With each
Recommender algorithm, we generate a top-20 recommendation list. We randomly selected user
id 400 as an active user for testing. We compute the emotion profile, wvec, for the test user. Using the test user’s wvec and the list of ivec from each of the top-20 list, we computed the top-5
for each top-20 list generated by the Recommenders. The top-N list made by each Recommender
is unique, with few overlaps among the lists. We have a total of 100 movies in the combined top-
20 lists. We found 35 duplicated films among the top-20 recommendation lists. The top-N list made by each Recommender met its design focus. For example, GAR correctly recommended
movies that meet the active test user’s genre taste. EAR, on the other hand, shows intrigue
results. We believe that with further investigation, we could enhance EAR to make serendipity recommendations.

112 Computer Science & Information Technology (CS & IT)
REFERENCES [1] Leung, John Kalung, Griva, Igor & Kennedy, William G., (2020) “Making Use of Affective Features
from Media Content Metadata for Better Movie Recommendation Making”, Preprint at
https://arxiv.org/abs/2007.00636.
[2] Wang, Yibo, Wang, Mingming & Xu, Wei, (2018) “A sentiment-enhanced hybrid recommender
system for movie recommendation: a big data analytics framework”, Wireless Communications and
Mobile Computing.
[3] Wang, Wei & Wang, Hongwei, (2015) “Opinion-enhanced collaborative filtering for recommender systems through sentiment analysis”, New Review of Hypermedia and Multimedia, Vol, 21, No. (3-
4), pp278–300.
[4] Kumar, Gaurav, (2018) “A multi-criteria decision making approach for recommending a product
using sentiment analysis”, In 2018 12th International Conference on Research Challenges in
Information Science (RCIS), IEEE, pp1-6.
[5] Katarya, Rahul & Verma, Om Prakash, (2016) “Recent developments in affective recommender
systems”,Physica A: Statistical Mechanics and its Applications, Vol. 461, pp182-190.
[6] Mizgajski, Jan & Morzy, Miko\laj, (2019) “Affective recommender systems in online news industry:
how emotions influence reading choices”, User Modeling and User-Adapted Interaction, Vol. 29,
Springer,pp345-379.
[7] Haruna, Khalid, Akmar Ismail, Maizatul, Suhendroyono, Suhendroyono, Damiasih, Damiasih,
Pierewan, Adi Cilik, Chiroma, Haruna & Herawan, Tutut, (2017) “Context-aware recommender system: A review of recent developmental process and future research direction”, Applied Sciences,
Vol. 7 No. 12, pp1211.
[8] Tkalčič, Marko, Burnik, Urban, Odić, Ante, Košir, Andrej & Tasič, Jurij, (2012) “Emotion-aware
recommender systems–a framework and a case study”, In International Conference on ICT
Innovations, Springer, pp141-150.
[9] Qian, Yongfeng, Zhang, Yin, Ma, Xiao, Yu, Han & Peng. Limei, (2019) “EARS: Emotion-aware
recommender system based on hybrid information fusion”, Information Fusion, Elsevier, Vol. 46,
pp141-146.
[10] Orellana-Rodriguez, Claudia, Diaz-Aviles, Ernesto & Nejdl, Wolfgang, (2015) “Mining affective
context in short films for emotion-aware recommendation”, In Proceedings of the 26th ACM
Conference on Hypertext & Social Media, pp185-194. [11] Sundermann, Camila Vaccari, Domingues, Marcos Aurélio, Sinoara, Roberta Akemi, Marcacini,
Ricardo Marcondes & Rezende, Solange Oliveira, (2019) “Using opinion mining in context-aware
recommender systems: A systematic review”, Information 10, Multidisciplinary Digital Publishing
Institute, Vol. 42.
[12] Plutchik, Robert, (2001) “The nature of emotions: Human emotions have deep evolutionary roots, a
fact that may explain their complexity and provide tools for clinical practice”, American scientist,
Vol. 89, No. 4, pp344-350.
[13] Noroozi, Fatemeh, Kaminska, Dorota, Corneanu, Ciprian, Sapinski, Tomasz, Escalera, Sergio &
Anbarjafari , Gholamreza, (2018) “Survey on emotional body gesture recognition”, IEEE transactions
on affective computing, IEEE.
[14] Qian, Yongfeng, Zhang, Yin, Ma, Xiao, Yu, Han & Peng, Limei, (2019) “EARS: Emotion-aware
recommender system based on hybrid information fusion”, Vol. 46, pp141-146. [15] Narducci, Fedelucio, De Gemmis, Marco & Lops, Pasquale, (2015) “A general architecture for an
emotion-aware content-based recommender system”, In Proceedings of the 3rd Workshop on
Emotions and Personality in Personalized Systems , pp3-6.
[16] Alhijawi, Bushra & Kilani, Yousef, (2020) “The recommender system: A survey. International
Journal of Advanced Intelligence Paradigms ”, Inderscience Publishers, Vol. 15, pp229-251.
[17] Mizgajski, Jan & Morzy, Mikolaj, (2019) ‘’Affective recommender systems in online news industry:
how emotions influence reading choices”, User Modeling and User-Adapted Interaction, Vol. 29, No.
2, pp345-379.
[18] Schroff, Florian, Kalenichenko, Dmitry & Philbin, James, (2015) “Facenet: A unified embedding for
face recognition and clustering”, In Proceedings of the IEEE conference on computer vision and
pattern recognition, pp815-823. [19] Alimuin, Ryann, Dadios, Elmer, Dayao, Jonathan & Arenas, Shearyl, (2020) “Deep hypersphere
embedding for real-time face recognition”, Telkomnika, Vol. 18.
Computer Science & Information Technology (CS & IT) 113
[20] Lin, Tsung-Yi, Maire, Michael, Belongie, Serge, Hays, James, Perona, Pietro, Ramanan, Deva,
Dollár, Piotr & Zitnick, C Lawrence, (2014) “Microsoft coco: Common objects in context”, In
European conference on computer vision, Springer, pp740-755.
[21] Kim, Dae-Hwan, (2019) “Evaluation of COCO Validation 2017 Dataset with YOLOv3”, Evaluation
6,pp10356-10360. [22] Klare, Brendan F, Klein, Ben, Taborsky, Emma, Blanton, Austin, Cheney, Jordan, Allen, Kristen,
Grother, Patrick, Mah, Alan & Jain Anil K, (2015) “Pushing the frontiers of unconstrained face
detection and recognition: Iarpa janus benchmark a”, In Proceedings of the IEEE conference on
computer vision and pattern recognition, pp1931-1939.
[23] Nada, Hajime, Sindagi, Vishwanath A., Zhang, He & Patel, Vishal M., (2018) “Pushing the limits of
unconstrained face detection: a challenge dataset and baseline results”, In 2018 IEEE 9th
International Conference on Biometrics Theory, Applications and Systems (BTAS), pp1-10.
[24] Özdil, Ahmet & Özbilen, Metin Mete, (2014) “A survey on comparison of face recognition
algorithms”, In 2014 IEEE 8th International Conference on Application of Information and
Communication Technologies (AICT), IEEE, pp1-3.
[25] Wu, Yue & Ji, Qiang (2019) “ Facial landmark detection: A literature survey”, International Journal
of Computer Vision 127, Springer, pp115-142. [26] De Silva, Liyanage C, Miyasato, Tsutomu & Nakatsu, Ryohei, (1997) “Facial emotion recognition
using multi-modal information”, In Proceedings of ICICS 1997 International Conference on
Information, Communications and Signal Processing. Theme: Trends in Information Systems
Engineering and Wireless Multimedia Communications, IEEE, Vol. 1, pp397-401.
[27] Zhang, Jianhua, Yin, Zhong , Chen, Peng & Nichele, Stefano, (2020) “Emotion recognition using
multi-modal data and machine learning techniques: A tutorial and review”, Information Fusion 59,
Elsevier,pp103-126.
[28] Maas, Andrew L., Daly, Raymond E., Pham, Peter T., Huang, Dan, Ng, Andrew Y. & Potts,
Christopher, (2011) “Learning Word Vectors for Sentiment Analysis”, In Proceedings of the 49th
Annual Meeting of the Association for Computational Linguistics: Human Language Technologies,
Portland, Oregon, USA., Association for Computational Linguistics, pp142- 150. [29] Ye, Zhe, Li, Fang & Baldwin, Timothy, (2018) “Encoding sentiment information into word vectors
for sentiment analysis”, In Proceedings of the 27th International Conference on Computational
Linguistics, pp997-1007.
[30] Rezaeinia, Seyed Mahdi, Rahmani, Rouhollah , Ghodsi, Ali & Veisi, Hadi, (2019) “Sentiment
analysis based on improved pre-trained word embeddings”, Expert Systems with Applications 117,
Elsevier, pp139-147.
[31] Ekman, Paul, (1999) “Basic emotions”, Handbook of cognition and emotion, Vol. 98, No. 45-60,
pp16.
[32] Siedlecka, Ewa & Denson, Thomas F, (2019) “Experimental methods for inducing basic emotions: A
qualitative review”, Emotion Review 11, SAGE Publications Sage UK, London, England, pp87-97.
[33] Ekman, Paul, Friesen, Wallace V. & Ellsworth, Phoebe, (2013) “Emotion in the human face:
Guidelines for research and an integration of findings”, Elsevier, Vol. 11. [34] Matsumoto, David & Hwang, Hyi Sung C, (2019) “Culture, emotion, and expression”, Cross-Cultural
Psychology: Contemporary Themes and Perspectives, Wiley Online Library,pp501-515.
[35] Tayib, Saifulazmi & Jamaludin, Zulikha, (2016) “An algorithm to define emotions based on facial
gestures as automated input in survey instrument”, Advanced Science Letters, Vol. 22, No. 10,
pp2889-2893.
[36] Li, Shan & Deng, Weihong, (2020) “Deep facial expression recognition: A survey”, IEEE
Transactions on Affective Computing, IEEE.
[37] Van’t Wout, Mascha, Kahn, René S, Sanfey, Alan G. & Aleman, André, (2006) “Affective state and
decision-making in the ultimatum game”, Experimental brain research, Vol. 169, No. 4, pp564-568.
[38] Heliman, Renata M, (2018) “A new look at the ultimatum game: Relational and individual
differences underlying the division of gains and losses”, Nova Science Publishers. [39] Toda, Masanao (1980) “Emotion and decision making”, Acta Psychologica, Vol. 45, No. 1-3, pp133-
155.
[40] Kratzwald, Bernhard, Ilić, Suzana, Kraus, Mathias , Feuerriegel, Stefan & Prendinger, Helmut,(2018)
“Deep learning for affective computing: Text-based emotion recognition in decision support”,
Decision Support Systems , Elsevier, Vol. 115, pp24-35.
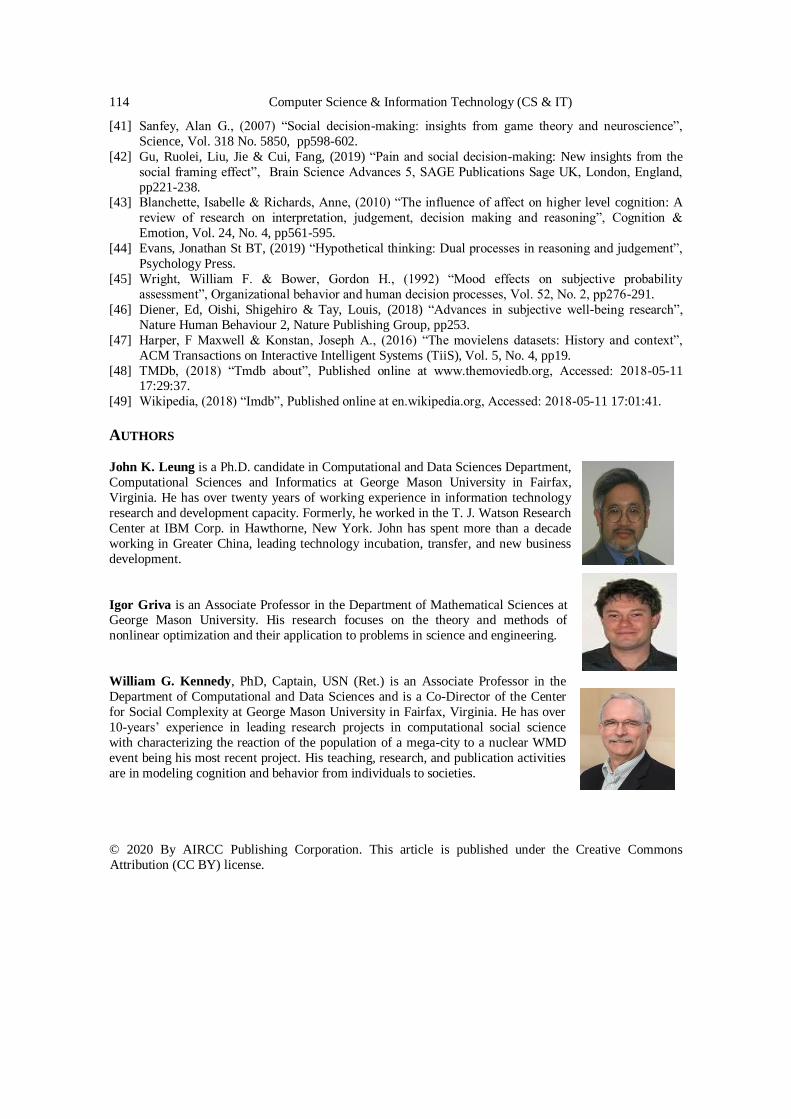
114 Computer Science & Information Technology (CS & IT)
[41] Sanfey, Alan G., (2007) “Social decision-making: insights from game theory and neuroscience”,
Science, Vol. 318 No. 5850, pp598-602.
[42] Gu, Ruolei, Liu, Jie & Cui, Fang, (2019) “Pain and social decision-making: New insights from the
social framing effect”, Brain Science Advances 5, SAGE Publications Sage UK, London, England,
pp221-238. [43] Blanchette, Isabelle & Richards, Anne, (2010) “The influence of affect on higher level cognition: A
review of research on interpretation, judgement, decision making and reasoning”, Cognition &
Emotion, Vol. 24, No. 4, pp561-595.
[44] Evans, Jonathan St BT, (2019) “Hypothetical thinking: Dual processes in reasoning and judgement”,
Psychology Press.
[45] Wright, William F. & Bower, Gordon H., (1992) “Mood effects on subjective probability
assessment”, Organizational behavior and human decision processes, Vol. 52, No. 2, pp276-291.
[46] Diener, Ed, Oishi, Shigehiro & Tay, Louis, (2018) “Advances in subjective well-being research”,
Nature Human Behaviour 2, Nature Publishing Group, pp253.
[47] Harper, F Maxwell & Konstan, Joseph A., (2016) “The movielens datasets: History and context”,
ACM Transactions on Interactive Intelligent Systems (TiiS), Vol. 5, No. 4, pp19.
[48] TMDb, (2018) “Tmdb about”, Published online at www.themoviedb.org, Accessed: 2018-05-11 17:29:37.
[49] Wikipedia, (2018) “Imdb”, Published online at en.wikipedia.org, Accessed: 2018-05-11 17:01:41.
AUTHORS
John K. Leung is a Ph.D. candidate in Computational and Data Sciences Department,
Computational Sciences and Informatics at George Mason University in Fairfax,
Virginia. He has over twenty years of working experience in information technology
research and development capacity. Formerly, he worked in the T. J. Watson Research
Center at IBM Corp. in Hawthorne, New York. John has spent more than a decade
working in Greater China, leading technology incubation, transfer, and new business
development.
Igor Griva is an Associate Professor in the Department of Mathematical Sciences at George Mason University. His research focuses on the theory and methods of
nonlinear optimization and their application to problems in science and engineering.
William G. Kennedy, PhD, Captain, USN (Ret.) is an Associate Professor in the
Department of Computational and Data Sciences and is a Co-Director of the Center
for Social Complexity at George Mason University in Fairfax, Virginia. He has over
10-years’ experience in leading research projects in computational social science
with characterizing the reaction of the population of a mega-city to a nuclear WMD
event being his most recent project. His teaching, research, and publication activities
are in modeling cognition and behavior from individuals to societies.
© 2020 By AIRCC Publishing Corporation. This article is published under the Creative Commons
Attribution (CC BY) license.
David C. Wyld et al. (Eds): CCSEA, BIoT, DKMP, CLOUD, NLCAI, SIPRO - 2020
pp. 115-125, 2020. CS & IT - CSCP 2020 DOI: 10.5121/csit.2020.101010
AN INNER/OUTER LOOP ENSEMBLE-
VARIATIONAL DATA ASSIMILATION METHOD
Yueqi Han1,2, Bo Yang1,2, Yun Zhang1, Bojiang Yang1 and Yapeng Fu1,2
1College of Meteorology and Oceanography,
National University of Defense Technology, Nanjing, China 2National Key Laboratory on Electromagnetic Environmental Effects and
Electro-optical Engineering, PLA Army Engineering University,
Nanjing, China
ABSTRACT Data assimilation (DA) for the non-differentiable parameterized moist physical processes is a
complicated and difficult problem, which may result in the discontinuity of the cost function
(CF) and the emergence of multiple extreme values. To solve the problem, this paper proposes
an inner/outer loop ensemble-variational algorithm (I/OLEnVar) to DA. It uses several
continuous sequences of local linear quadratic functions with single extreme values to
approximate the actual nonlinear CF so as to have extreme point sequences of these functions converge to the global minimum of the nonlinear CF. This algorithm requires no adjoint model
and no modification of the original nonlinear numerical model, so it is convenient and easy to
design in assimilating the observational data during the non-differentiable process. Numerical
experimental results of DA for the non-differentiable problem in moist physical processes
indicate that the I/OLEnVar algorithm is feasible and effective. It can increase the assimilation
accuracy and thus obtain satisfactory results. This algorithm lays the foundation for the
application of I/OLEnVar method to the precipitation observational data assimilation in the
numerical weather prediction (NWP) model.
KEYWORDS Ensemble-variational Data Assimilation, Non-differentiable, Inner/Outer Loop.
1. INTRODUCTION
NWP is an initial/boundary value problem. The more accurate initial condition is, the better the quality of prediction will be [1,2]. DA is a method by which initial values for NWP can be
yielded from observation data and short-term numerical prediction results. Due to large
uncertainty in convective and stratiform condensation processes relating to clouds and precipitation, great importance has been attached to parameterized methods. Generally, these
parameterized moist physical processes of cloud and precipitation in the NWP mode often
contain non-differentiable processes, thus causing the discontinuity of DA cost function and the
appearance of multiple extreme values [3,4].
The conventional variational adjoint method (ADJ) to DA is based upon the differentiability of
the system; therefore, how to tackle the non-differentiable parameterized moist physical processes becomes a significant and difficult problem in the study of DA. To solve it, many
researchers have carried out a lot of meaningful work, including ADJ improvement [5] and the
application of many other methods, such as the smoothing and regularization method [6], the
116 Computer Science & Information Technology (CS & IT)
generalized tangent and adjoint method [7,8], the cluster method [9,10], the non-linear perturbation equation [2,11-14], the particle fliter and the genetic algorithm [15,16], etc.
Nevertheless, these methods are more or less unsatisfactory, unable to find the global optimal
solution or requiring huge efforts to modify the original nonlinear model and the corresponding
adjoint model or to reconstruct the generalized tangent and adjoint model. Meanwhile, the particle filter method needs lots of particles and the genetic algorithm has to deal with the setting
of parameters and other proplems (e.g. the population size or the probability of crossover and
mutation) and the selection of genetic operators[17]. Therefore, the non-differentiable prblem in parameterized cloud and precipitation physical processes brings much trouble to the assimilation
of actual observational data.
In recent years, the ensemble-variational data assimilation (EnVar) that absorbs the merits of the
variational filter and ensemble filter has become the focus of the field. Qiu et al. proposed the
four dimensional variational (4D-Var) method based on ensembles, using the technology of
singular value decomposition (SVD-En4Dvar) [18]. Liu et al. applied the background error covariance estimated from forecast ensembles to variational data assimilation (VDA) and formed
the ensemble-based variational method (En4DVar) [19]. Zupanski et al. put forward the
maximum likelihood ensemble filter [20]. Wu Zhuhui et al. suggested a method based on regional successive analysis scheme [21]. Numerical results illustrated that the EnVar data
assimilation can generate better assimilating effects than the ensemble Kalman filter and the 4D-
Var method. Such a method can realize the flow-dependent evolution of the background error covariance matrix and improve the analytical quality of the dramatic element field of temporal
spatial variation without much energy to complete and maintain the adjoint model [22, 23].
However, when the EnVar is used to deal with the non-differentiable parameterized moist physical processes, the discontinuity of CF still happens and multiple extreme values keep
showing up. Using inner/outer loop thought and iterative method for reference [24-27], this paper
combines the EnVar algorithm with the inner/outer loop algorithm and uses multiple linear quadratic function values to fit the cost function value of the original non-differentiable process.
This approach can avoid the possible CF discontinuity and multiple extreme values and enable
the function to converge to the global minimum point. As a result, it is named inner/outer loop
ensemble-variational algorithm (I/OLEnVar). Numerical experimental results of DA for the non-differentiable process in cloud and precipitation indicate that such an algorithm requires no
modification for the original non-linear numerical model and can better tackle the above-
mentioned DA problems in cloud and precipitation procedures.
The rest of the paper is organised as follows. In Section 2, the I/OLEnVar Algorithm to DA is
proposed and the algorithm process is described in detail. In Section 3, we present two numerical experiments (referred to as OSSEs) to gauge the performance of our I/OLEnVar approach.
Finally, the paper is concluded with a summary and a few concluding remarks given in Section 4.
2. The I/OLEnVar Algorithm to DA
Based on the four dimensional sequenced ensemble-variational algorithm to DA, the CF is defined as:
TT
1 1
1
1 1,
2 2x x x B x x y x O y x
Kk k k k
b b k k k
k
J H H
(1)
Computer Science & Information Technology (CS & IT) 117
in this equation, xb is the ambient field, B is the background error covariance matrix, yk
is the
observational data at the moment k , kH is the observational operator at the moment k , Ok
is
the observational error covariance matrix, the superscript T indicates the vector transition, K is
the observation frequency in the assimilation window and x xk
kM is the variable value of
model predication at the moment k . The purpose of DA is to search for the analytical value
x that coordinates with the numerical model so that the CF (1) can reach its minimum point.
With incremental representation [28, 29], the analytical result of Eq. (1) with EnVar method can
be presented as:
x x xb , x X wb , (2)
where 1 2, , ,X x x xb N L is N initial ensemble perturbations, which satisfies
T
X XB
b b
N
. N represents the number of ensemble prediction members and
T
1 2, , ,w L Nw w w accounts for the weighting factor. To have the CF reach its minimum by
using the quasi-Newton method, conjugate gradient method or other optimal iterative algorithms, a method similar to previous literature [19, 30] is adopted to form a CF when the control variable
in the 4D ensemble-variational method is w and generate the gradient equation for its control
variables. They are as follows:
T
T 1
1
1 1,
2 2w w w I H M X w O I H M X w
Kk k
k k b k k k b
k
J N
T 1
1
,w w H M X O H M X w IK
k
k k b k k k b
k
J N
where I y xk k
k k bH M
; Hk and M k are tangent operators of the observational
operator kH and the model operator kM respectively; and
1 2, , , .H M X H M x H M x H M xk k b k k k k k k N L
When the ensemble membership value of the results of the numerical computation is projected
onto the observational space, it can be obtained that
, 1, 2, , .H M x x x xk k i k k b i k k bH M H M i N
L
By doing so, the use of tangent operators Hk and M k is avoided and wJ is computed.
The I/OLEnVar algorithm to DA (see Figure 1) adopts the computation of the above-given CF for the gradient of the control variable. The inner loop needn’t consider the non-linear effect of
the observational and model operators. In process of inner loop, the Hk and M k are considered
to be constant and variable perturbations are presented in a linear development, and then non-
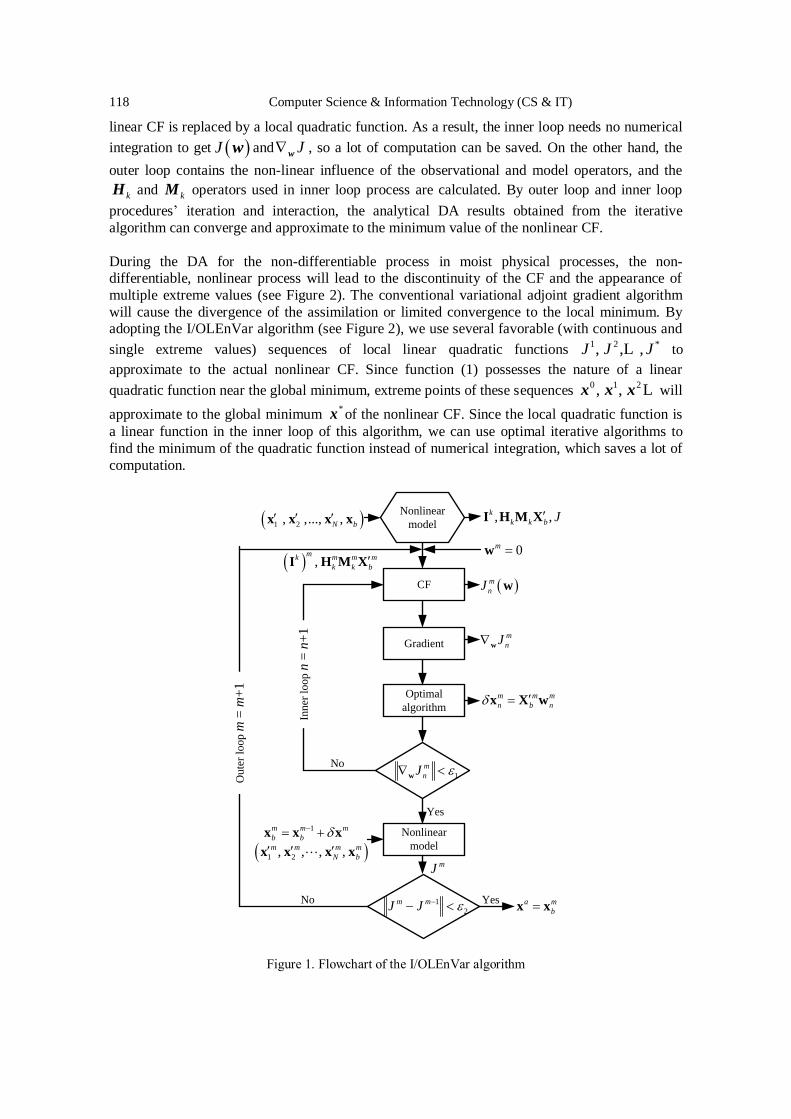
118 Computer Science & Information Technology (CS & IT)
linear CF is replaced by a local quadratic function. As a result, the inner loop needs no numerical
integration to get wJ andw
J , so a lot of computation can be saved. On the other hand, the
outer loop contains the non-linear influence of the observational and model operators, and the
Hk and M k operators used in inner loop process are calculated. By outer loop and inner loop
procedures’ iteration and interaction, the analytical DA results obtained from the iterative
algorithm can converge and approximate to the minimum value of the nonlinear CF.
During the DA for the non-differentiable process in moist physical processes, the non-differentiable, nonlinear process will lead to the discontinuity of the CF and the appearance of
multiple extreme values (see Figure 2). The conventional variational adjoint gradient algorithm
will cause the divergence of the assimilation or limited convergence to the local minimum. By adopting the I/OLEnVar algorithm (see Figure 2), we use several favorable (with continuous and
single extreme values) sequences of local linear quadratic functions 1 2 *, , ,J J JL to
approximate to the actual nonlinear CF. Since function (1) possesses the nature of a linear
quadratic function near the global minimum, extreme points of these sequences 0 1 2, ,x x x L will
approximate to the global minimum *
x of the nonlinear CF. Since the local quadratic function is
a linear function in the inner loop of this algorithm, we can use optimal iterative algorithms to
find the minimum of the quadratic function instead of numerical integration, which saves a lot of
computation.
No
Yes
1 2, ,..., ,x x x xN b , ,k
k k b JI H M X
CF m
nJ w
Optimal
algorithm
m
nJwGradient
1
m
nJ w
Nonlinear
model
Inner
loop n
= n
+1
m m m
n b n x X w
1m m m
b b x x x
1 2, , , ,m m m m
N b x x x xL
No a m
bx x
Oute
r lo
op m
= m
+1
,m
k m m m
k k bI H M X
Yes
mJ
0m w
Nonlinear
model
1
2
m mJ J
Figure 1. Flowchart of the I/OLEnVar algorithm
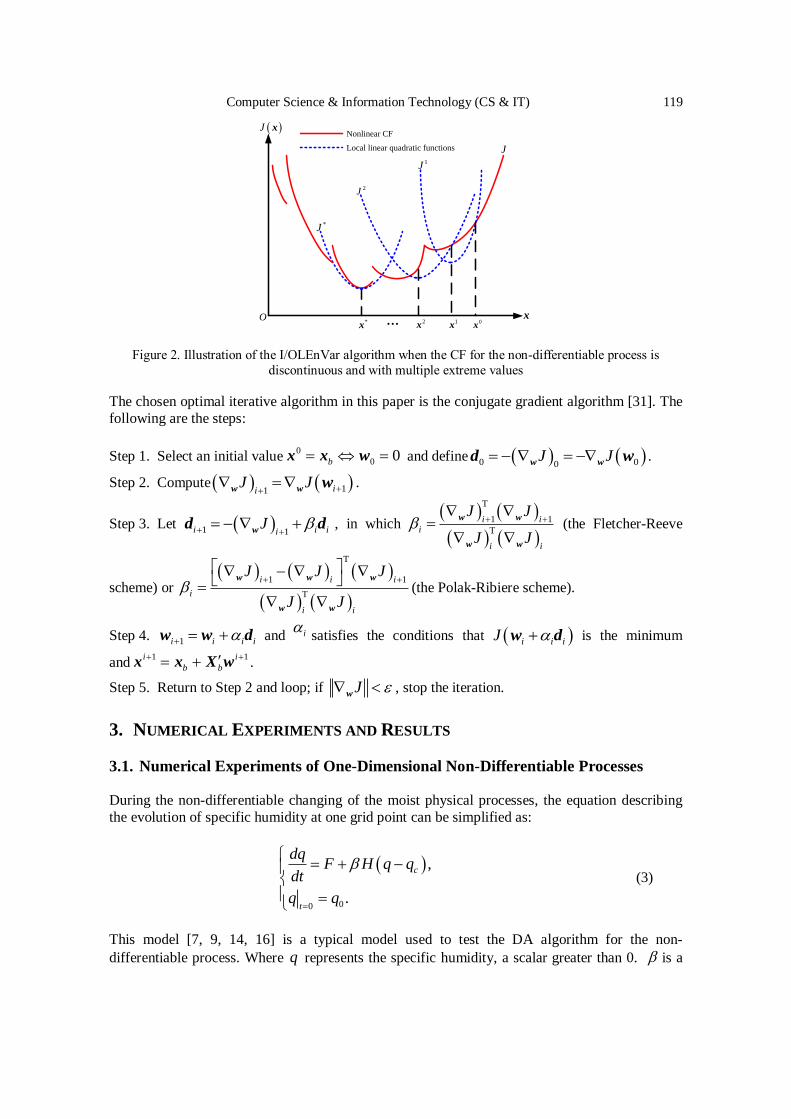
Computer Science & Information Technology (CS & IT) 119
…
J x
J1J
2J
*J
0x
x1
x2
x*x
O
Nonlinear CF
Local linear quadratic functions
Figure 2. Illustration of the I/OLEnVar algorithm when the CF for the non-differentiable process is
discontinuous and with multiple extreme values
The chosen optimal iterative algorithm in this paper is the conjugate gradient algorithm [31]. The
following are the steps:
Step 1. Select an initial value0
0 0x x wb and define 0 00w wd wJ J .
Step 2. Compute 11w w wiiJ J
.
Step 3. Let 1 1wd di i iiJ
, in which
T
1 1
T
w w
w w
i ii
i i
J J
J J
(the Fletcher-Reeve
scheme) or
T
1 1
T
w w w
w w
i i i
i
i i
J J J
J J
(the Polak-Ribiere scheme).
Step 4. 1w w di i i i and i satisfies the conditions that w di i iJ is the minimum
and1 1
x x X wi i
b b
.
Step 5. Return to Step 2 and loop; if wJ , stop the iteration.
3. NUMERICAL EXPERIMENTS AND RESULTS
3.1. Numerical Experiments of One-Dimensional Non-Differentiable Processes During the non-differentiable changing of the moist physical processes, the equation describing
the evolution of specific humidity at one grid point can be simplified as:
00
,
.
c
t
dqF H q q
dt
q q
(3)
This model [7, 9, 14, 16] is a typical model used to test the DA algorithm for the non-
differentiable process. Where q represents the specific humidity, a scalar greater than 0. is a
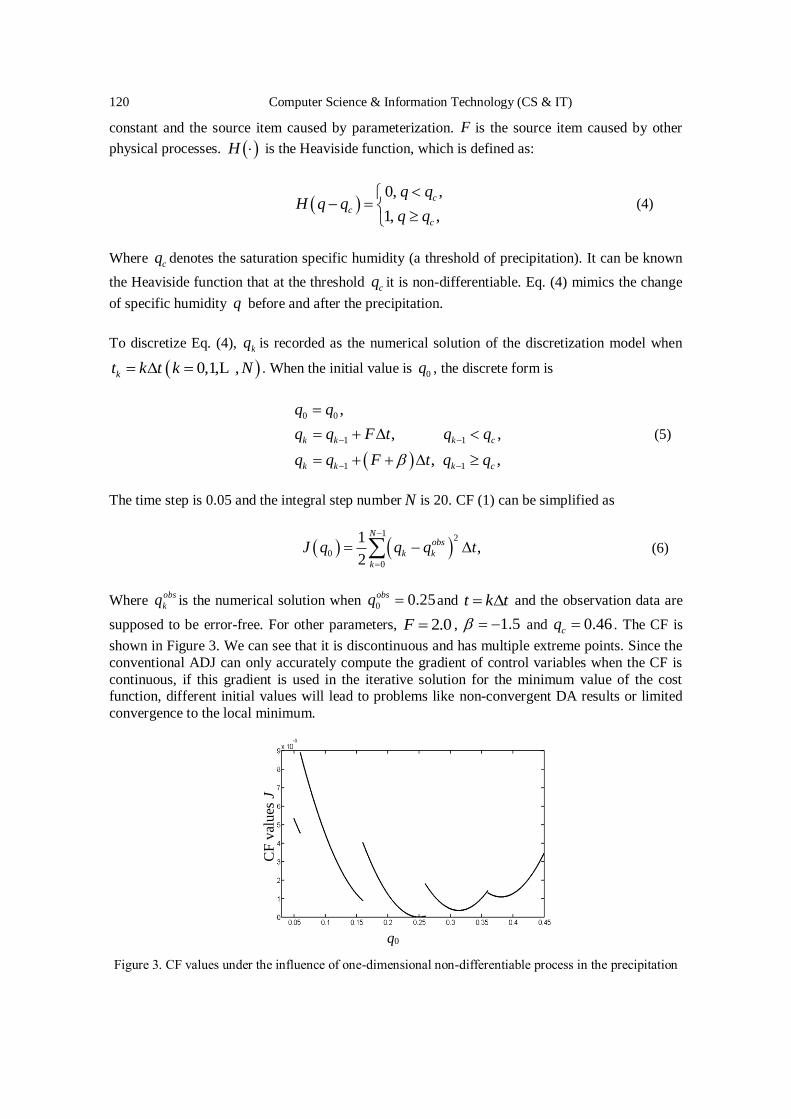
120 Computer Science & Information Technology (CS & IT)
constant and the source item caused by parameterization. F is the source item caused by other
physical processes. H is the Heaviside function, which is defined as:
0, ,
1, ,
c
c
c
q qH q q
q q
(4)
Where cq denotes the saturation specific humidity (a threshold of precipitation). It can be known
the Heaviside function that at the threshold cq it is non-differentiable. Eq. (4) mimics the change
of specific humidity q before and after the precipitation.
To discretize Eq. (4), kq is recorded as the numerical solution of the discretization model when
0,1, ,kt k t k N L . When the initial value is 0q , the discrete form is
0 0
1 1
1 1
,
, ,
, ,
k k k c
k k k c
q q
q q F t q q
q q F t q q
(5)
The time step is 0.05 and the integral step number N is 20. CF (1) can be simplified as
1
2
0
0
1,
2
Nobs
k k
k
J q q q t
(6)
Where obs
kq is the numerical solution when 0 0.25obsq and t k t and the observation data are
supposed to be error-free. For other parameters, 2.0F , 1.5 and 0.46cq . The CF is
shown in Figure 3. We can see that it is discontinuous and has multiple extreme points. Since the
conventional ADJ can only accurately compute the gradient of control variables when the CF is
continuous, if this gradient is used in the iterative solution for the minimum value of the cost function, different initial values will lead to problems like non-convergent DA results or limited
convergence to the local minimum.
Figure 3. CF values under the influence of one-dimensional non-differentiable process in the precipitation
CF
val
ues
J
q0
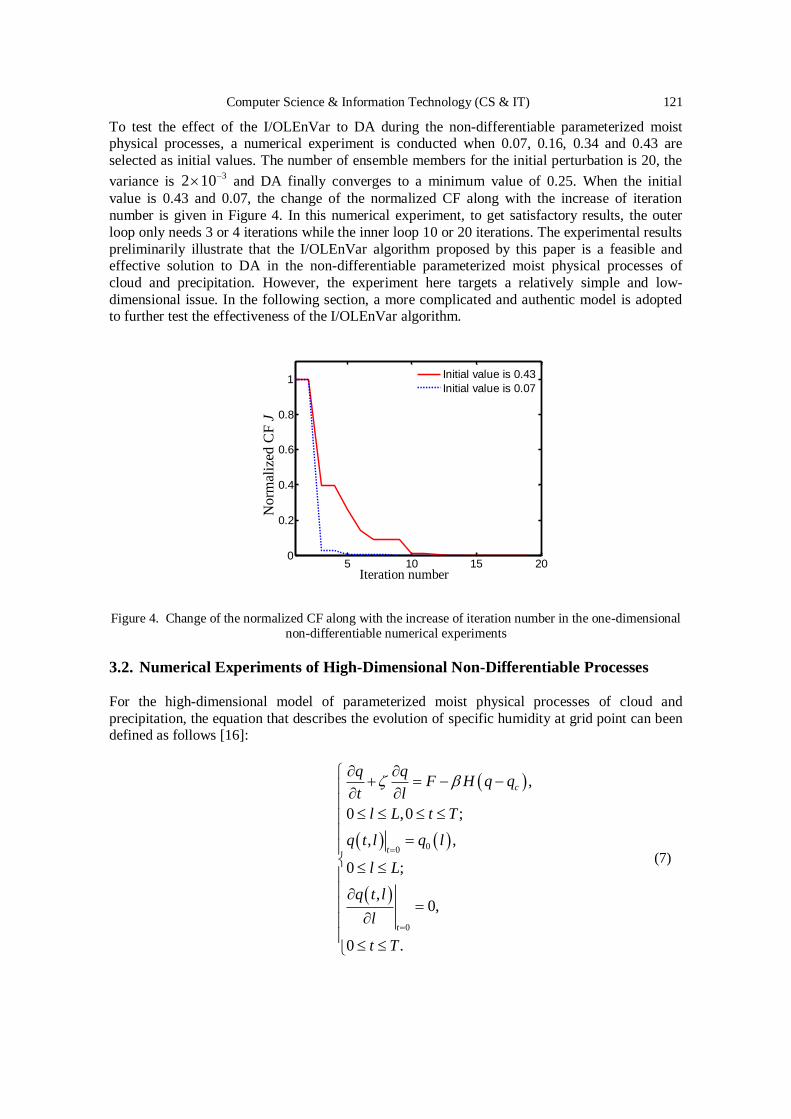
Computer Science & Information Technology (CS & IT) 121
To test the effect of the I/OLEnVar to DA during the non-differentiable parameterized moist physical processes, a numerical experiment is conducted when 0.07, 0.16, 0.34 and 0.43 are
selected as initial values. The number of ensemble members for the initial perturbation is 20, the
variance is 32 10 and DA finally converges to a minimum value of 0.25. When the initial
value is 0.43 and 0.07, the change of the normalized CF along with the increase of iteration
number is given in Figure 4. In this numerical experiment, to get satisfactory results, the outer
loop only needs 3 or 4 iterations while the inner loop 10 or 20 iterations. The experimental results
preliminarily illustrate that the I/OLEnVar algorithm proposed by this paper is a feasible and effective solution to DA in the non-differentiable parameterized moist physical processes of
cloud and precipitation. However, the experiment here targets a relatively simple and low-
dimensional issue. In the following section, a more complicated and authentic model is adopted to further test the effectiveness of the I/OLEnVar algorithm.
Figure 4. Change of the normalized CF along with the increase of iteration number in the one-dimensional
non-differentiable numerical experiments
3.2. Numerical Experiments of High-Dimensional Non-Differentiable Processes
For the high-dimensional model of parameterized moist physical processes of cloud and
precipitation, the equation that describes the evolution of specific humidity at grid point can been defined as follows [16]:
00
0
,
0 ,0 ;
, ,
0 ;
,0,
0 .
c
t
t
q qF H q q
t l
l L t T
q t l q l
l L
q t l
l
t T
(7)
5 10 15 200
0.2
0.4
0.6
0.8
1 Initial value is 0.43
Initial value is 0.07
Iteration number
Norm
aliz
ed C
F J
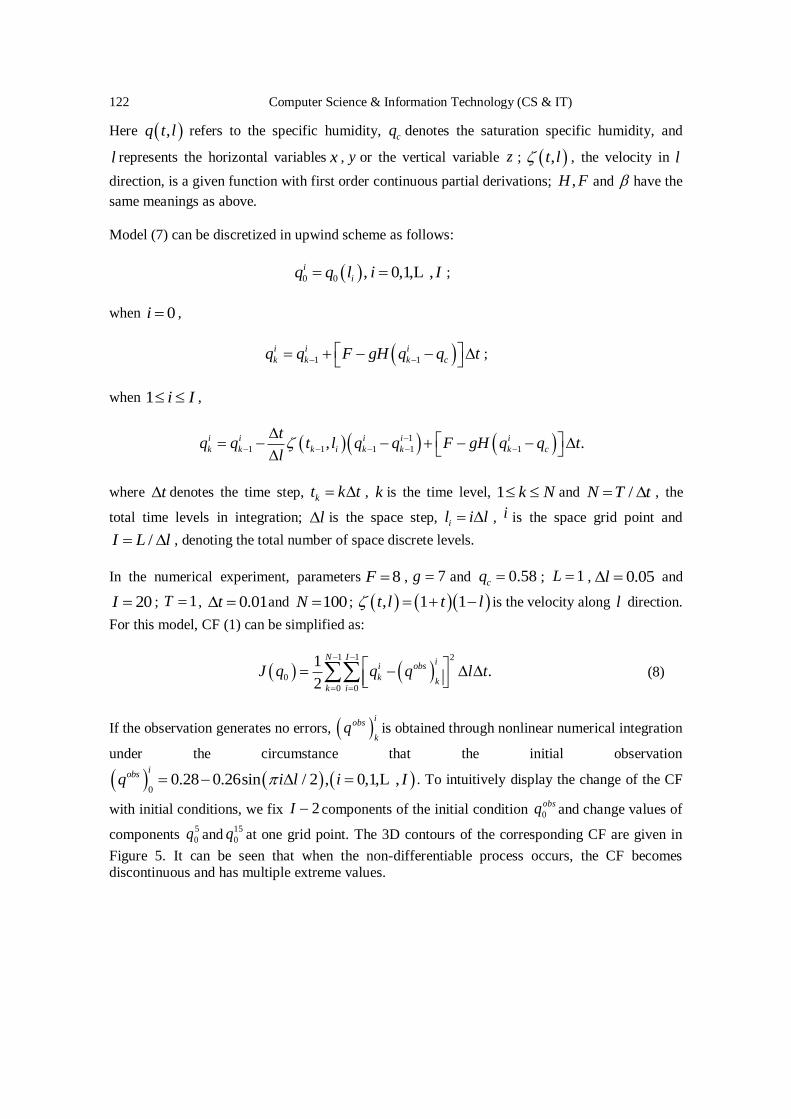
122 Computer Science & Information Technology (CS & IT)
Here ,q t l refers to the specific humidity, cq denotes the saturation specific humidity, and
l represents the horizontal variables x , y or the vertical variable z ; ,t l , the velocity in l
direction, is a given function with first order continuous partial derivations; ,H F and have the
same meanings as above.
Model (7) can be discretized in upwind scheme as follows:
0 0 , 0,1, ,i
iq q l i I L ;
when 0i ,
1 1
i i i
k k k cq q F gH q q t
;
when 1 i I ,
1
1 1 1 1 1, .i i i i i
k k k i k k k c
tq q t l q q F gH q q t
l
where t denotes the time step, kt k t , k is the time level, 1 k N and /N T t , the
total time levels in integration; l is the space step, il i l , i is the space grid point and
/I L l , denoting the total number of space discrete levels.
In the numerical experiment, parameters 8F , 7g and 0.58cq ; 1L , 0.05l and
20I ; 1T , 0.01t and 100N ; , 1 1t l t l is the velocity along l direction.
For this model, CF (1) can be simplified as:
1 1 2
0
0 0
1.
2
N Ii
i obs
k kk i
J q q q l t
(8)
If the observation generates no errors, i
obs
kq is obtained through nonlinear numerical integration
under the circumstance that the initial observation
0
0.28 0.26sin / 2 , 0,1, ,Li
obsq i l i I . To intuitively display the change of the CF
with initial conditions, we fix 2I components of the initial condition 0
obsq and change values of
components 5
0q and15
0q at one grid point. The 3D contours of the corresponding CF are given in
Figure 5. It can be seen that when the non-differentiable process occurs, the CF becomes discontinuous and has multiple extreme values.
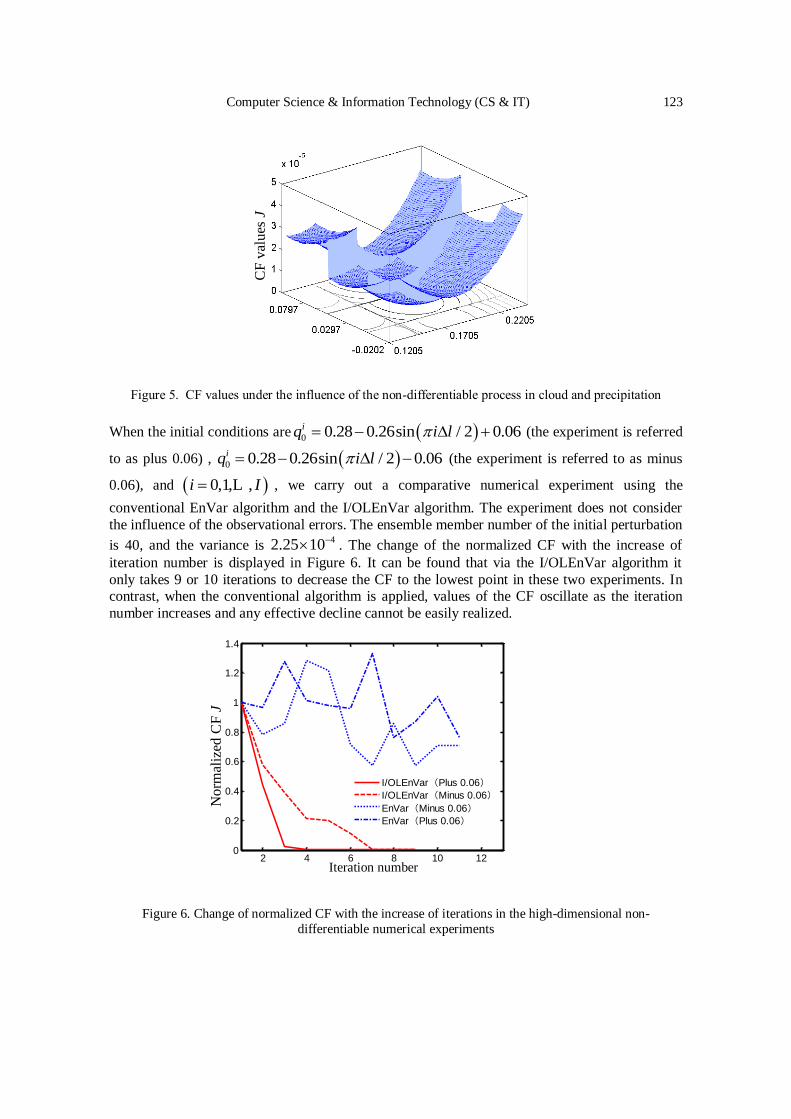
Computer Science & Information Technology (CS & IT) 123
Figure 5. CF values under the influence of the non-differentiable process in cloud and precipitation
When the initial conditions are 0 0.28 0.26sin / 2 0.06iq i l (the experiment is referred
to as plus 0.06) , 0 0.28 0.26sin / 2 0.06iq i l (the experiment is referred to as minus
0.06), and 0,1, ,i I L , we carry out a comparative numerical experiment using the
conventional EnVar algorithm and the I/OLEnVar algorithm. The experiment does not consider
the influence of the observational errors. The ensemble member number of the initial perturbation
is 40, and the variance is 42.25 10 . The change of the normalized CF with the increase of
iteration number is displayed in Figure 6. It can be found that via the I/OLEnVar algorithm it
only takes 9 or 10 iterations to decrease the CF to the lowest point in these two experiments. In contrast, when the conventional algorithm is applied, values of the CF oscillate as the iteration
number increases and any effective decline cannot be easily realized.
Figure 6. Change of normalized CF with the increase of iterations in the high-dimensional non-
differentiable numerical experiments
CF
val
ues
J
2 4 6 8 10 120
0.2
0.4
0.6
0.8
1
1.2
1.4
I/OLEnVar(Plus 0.06)
I/OLEnVar(Minus 0.06)
EnVar(Minus 0.06)EnVar(Plus 0.06)
No
rmal
ized
CF
J
Iteration number
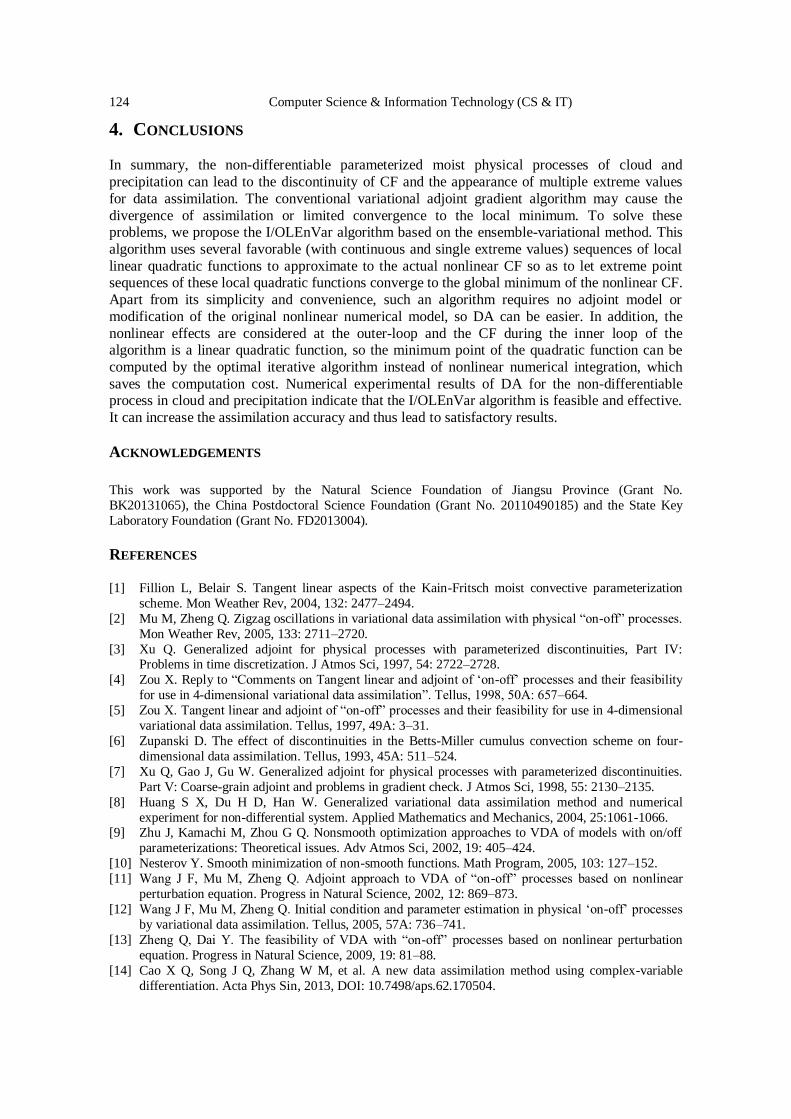
124 Computer Science & Information Technology (CS & IT)
4. CONCLUSIONS In summary, the non-differentiable parameterized moist physical processes of cloud and
precipitation can lead to the discontinuity of CF and the appearance of multiple extreme values
for data assimilation. The conventional variational adjoint gradient algorithm may cause the
divergence of assimilation or limited convergence to the local minimum. To solve these problems, we propose the I/OLEnVar algorithm based on the ensemble-variational method. This
algorithm uses several favorable (with continuous and single extreme values) sequences of local
linear quadratic functions to approximate to the actual nonlinear CF so as to let extreme point sequences of these local quadratic functions converge to the global minimum of the nonlinear CF.
Apart from its simplicity and convenience, such an algorithm requires no adjoint model or
modification of the original nonlinear numerical model, so DA can be easier. In addition, the
nonlinear effects are considered at the outer-loop and the CF during the inner loop of the algorithm is a linear quadratic function, so the minimum point of the quadratic function can be
computed by the optimal iterative algorithm instead of nonlinear numerical integration, which
saves the computation cost. Numerical experimental results of DA for the non-differentiable process in cloud and precipitation indicate that the I/OLEnVar algorithm is feasible and effective.
It can increase the assimilation accuracy and thus lead to satisfactory results.
ACKNOWLEDGEMENTS
This work was supported by the Natural Science Foundation of Jiangsu Province (Grant No.
BK20131065), the China Postdoctoral Science Foundation (Grant No. 20110490185) and the State Key
Laboratory Foundation (Grant No. FD2013004).
REFERENCES [1] Fillion L, Belair S. Tangent linear aspects of the Kain-Fritsch moist convective parameterization
scheme. Mon Weather Rev, 2004, 132: 2477–2494.
[2] Mu M, Zheng Q. Zigzag oscillations in variational data assimilation with physical “on-off” processes.
Mon Weather Rev, 2005, 133: 2711–2720.
[3] Xu Q. Generalized adjoint for physical processes with parameterized discontinuities, Part IV: Problems in time discretization. J Atmos Sci, 1997, 54: 2722–2728.
[4] Zou X. Reply to “Comments on Tangent linear and adjoint of ‘on-off’ processes and their feasibility
for use in 4-dimensional variational data assimilation”. Tellus, 1998, 50A: 657–664.
[5] Zou X. Tangent linear and adjoint of “on-off” processes and their feasibility for use in 4-dimensional
variational data assimilation. Tellus, 1997, 49A: 3–31.
[6] Zupanski D. The effect of discontinuities in the Betts-Miller cumulus convection scheme on four-
dimensional data assimilation. Tellus, 1993, 45A: 511–524.
[7] Xu Q, Gao J, Gu W. Generalized adjoint for physical processes with parameterized discontinuities.
Part V: Coarse-grain adjoint and problems in gradient check. J Atmos Sci, 1998, 55: 2130–2135.
[8] Huang S X, Du H D, Han W. Generalized variational data assimilation method and numerical
experiment for non-differential system. Applied Mathematics and Mechanics, 2004, 25:1061-1066. [9] Zhu J, Kamachi M, Zhou G Q. Nonsmooth optimization approaches to VDA of models with on/off
parameterizations: Theoretical issues. Adv Atmos Sci, 2002, 19: 405–424.
[10] Nesterov Y. Smooth minimization of non-smooth functions. Math Program, 2005, 103: 127–152.
[11] Wang J F, Mu M, Zheng Q. Adjoint approach to VDA of “on-off” processes based on nonlinear
perturbation equation. Progress in Natural Science, 2002, 12: 869–873.
[12] Wang J F, Mu M, Zheng Q. Initial condition and parameter estimation in physical ‘on-off’ processes
by variational data assimilation. Tellus, 2005, 57A: 736–741.
[13] Zheng Q, Dai Y. The feasibility of VDA with “on-off” processes based on nonlinear perturbation
equation. Progress in Natural Science, 2009, 19: 81–88.
[14] Cao X Q, Song J Q, Zhang W M, et al. A new data assimilation method using complex-variable
differentiation. Acta Phys Sin, 2013, DOI: 10.7498/aps.62.170504.
Computer Science & Information Technology (CS & IT) 125
[15] Zupanski M, Navon I M, Zupanski D. The maximum likelihood ensemble filter as a non-
differentiable minimization algorithm. Q J R Meteorol Soc, 2008, 134: 1039–1050.
[16] Zheng Q, Sha J X, Fang C L. An effective genetic algorithm to VDA with discontinuous “on-off”
switches. Sci China Earth Sci, 2011, doi: 10.1007/s11430-011-4300-4.
[17] Snyder C, Bengtsson T, Bickel P, et al. Obstacles to high-dimensional particle filtering. Mon Wea Rev, 2008, 136: 4629–4640.
[18] Qiu C J, Zhang L, Shao A M. An explicit four-dimensional variational data assimilation method. Sci
China Earth Sci, 2007, 50: 1232–1240.
[19] Liu C, Xiao Q, Wang B, An ensemble-based four-dimensional variational data assimilation scheme.
Part I: Technical formulation and preliminary test, Mon Wea Rev, 2008, 136: 3363–3373.
[20] Zupanski M. Maximum likelihood ensemble filter: theoretical aspects. Mon Wea Rev, 2005, 133:
1710–1726.
[21] Wu Zh H, Han Y Q, Zhong Zh, et al. Ensemble variational data assimilation method based on
regional successive analysis scheme. Acta Phys Sin, 2014, DOI: 10.7498/aps.63.079201
[22] Zhang F Q, Zhang M, James A, et al. Coupling ensemble Kalman filter with four-dimensional
variational data assimilation. Adv Atmos Sci, 2009, 26: 1–8.
[23] Zhang L, Qiu Ch J, Zhang Sh W. Experiments on the 4D-variation with ensemble convariances, Acta Meteor Sin, 2009, 67: 1124–1132.
[24] Courtier P, Thépaut J N, Hollingsworth A. A strategy for operational implementation of 4D-Var,
using an incremental approach, Quart J Roy Meteor Soc, 1994, 120: 1367–1387.
[25] Kalnay E, Yang S C. Accelerating the spin-up of ensemble Kalman filtering, Quart J Roy Meteor
Soc, 2010, 136 : 1644–1651.
[26] Min J Z, Wang S Z, Chen J, et al. The implementation and test of iterative EnSRF with Lorenz96
model, Chinese J Atmos Sci (in Chinese), 2012, 36: 889–900.
[27] Shen S, Liu J J, Wang B. An extension of the dimension-reduced projection 4DVar, Atmos Oceanic
Sci Lett, 2014, 7: 324–329.
[27] Lorenc A C. The potential of the ensemble Kalman filter for NWP: a comparison with 4D-VAR. Q J
Roy Meteor Soc, 2003, 129: 3183–3203. [29] Jazwinski A H. Stochastic Processes and Filtering Theory. San Diego: Academic Press, 1970
[30] Han Y Q, Zhong Zh, Wang Y F, et al. Gradient calculation based ensemble variational method and its
application to the inversion of the turbulent coefficient in atmospheric Ekman layer. Acta Phys Sin,
2013, DOI: 10.7498/aps.62.049201.
[31] Hager W W, Zhang H. A new conjugate gradient method with guaranteed descent and an efficient
line search. SIAM J Optim, 2005, 16: 170–192.
AUTHORS
Yueqi Han, 1975.06, associate professor, the main research direction is numerical
weather forecast and data analysis.
© 2020 By AIRCC Publishing Corporation. This article is published under the Creative Commons
Attribution (CC BY) license.

126 Computer Science & Information Technology (CS & IT)
David C. Wyld et al. (Eds): CCSEA, BIoT, DKMP, CLOUD, NLCAI, SIPRO - 2020
pp. 127-140, 2020. CS & IT - CSCP 2020 DOI: 10.5121/csit.2020.101011
CHANGE DETECTION USING SYNTHETIC
APERTURE RADAR VIDEOS
Hasara Maithree, Dilan Dinushka and Adeesha Wijayasiri
Department of Computer Science and Engineering,
University of Moratuwa, Moratuwa, Sri Lanka
ABSTRACT Many researches have been carried out for change detection using temporal SAR images. In this
paper an algorithm for change detection using SAR videos has been proposed. There are
various challenges related to SAR videos such as high level of speckle noise, rotation of SAR
image frames of the video around a particular axis due to the circular movement of airborne
vehicle, non-uniform back scattering of SAR pulses. Hence conventional change detection
algorithms used for optical videos and SAR temporal images cannot be directly utilized for SAR
videos. We propose an algorithm which is a combination of optical flow calculation using Lucas
Kanade (LK) method and blob detection. The developed method follows a four steps approach:
image filtering and enhancement, applying LK method, blob analysis and combining LK method
with blob analysis. The performance of the developed approach was tested on SAR videos available on Sandia National Laboratories website and SAR videos generated by a SAR
simulator.
KEYWORDS Remote Sensing, SAR videos, Change Detection.
1. INTRODUCTION
Synthetic Aperture Radar (SAR) is an important modality for remote sensing applications since it
has the capability of generating high resolution images significantly invariant to the climate
changes, weather and lighting conditions. Tensor product-based transformation of radar return pulse histories are applied to obtain a spatial representation of target objects. SAR imagery uses
the motion of radar antenna over a target region to provide a finer spatial resolution than a normal
beam scanning radar [1], [2].
ViSAR is a SAR imaging mode which is utilized to generate images at a higher rate than a
conventional SAR, hence can be viewed as a video derived from consequent set of image frames. Since images generated from ViSAR systems have a higher resolution despite the adverse climate
changes, these systems can be utilized in many real-world day/nights surveillance and tracking
applications [3].
Most of the research that has been carried out, were focused on change detection in temporal
images using SAR imagery which means, detecting changes between images that have acquired
on different dates. In this paper, we are going to discuss how change detection can be applied on real time Synthetic Aperture Radar (SAR) videos which are generated by aligning consecutive
image frames.
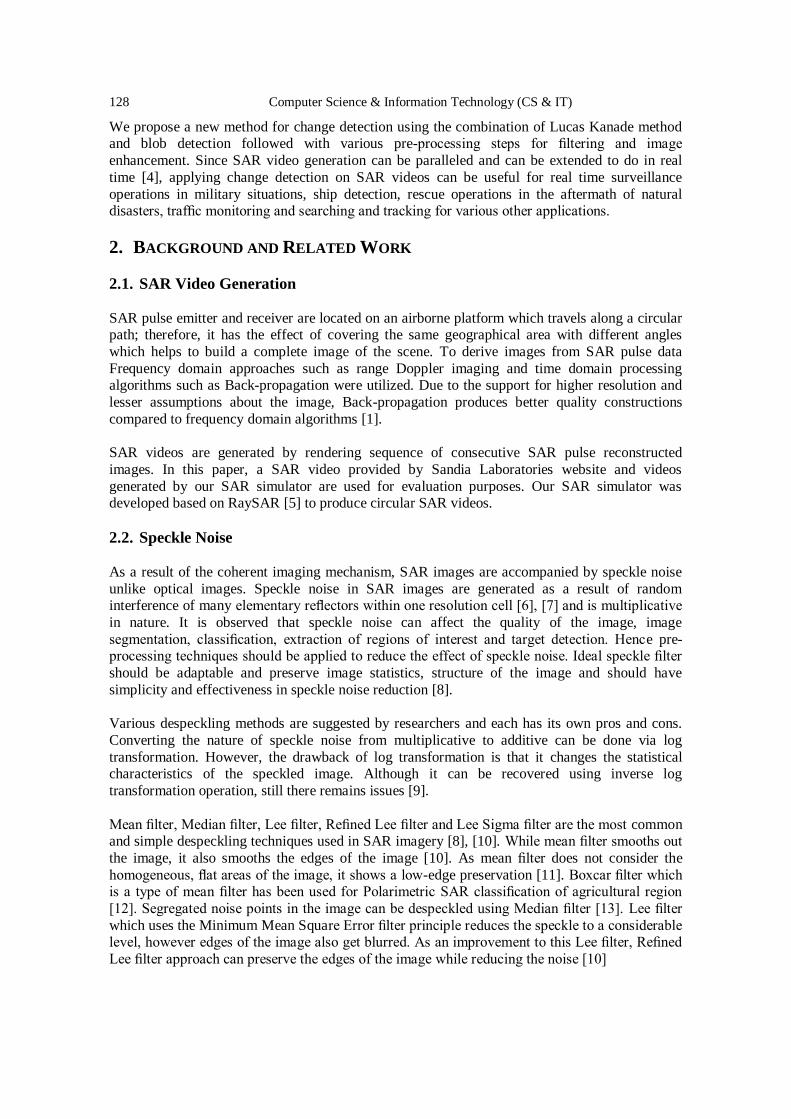
128 Computer Science & Information Technology (CS & IT)
We propose a new method for change detection using the combination of Lucas Kanade method and blob detection followed with various pre-processing steps for filtering and image
enhancement. Since SAR video generation can be paralleled and can be extended to do in real
time [4], applying change detection on SAR videos can be useful for real time surveillance
operations in military situations, ship detection, rescue operations in the aftermath of natural disasters, traffic monitoring and searching and tracking for various other applications.
2. BACKGROUND AND RELATED WORK
2.1. SAR Video Generation
SAR pulse emitter and receiver are located on an airborne platform which travels along a circular path; therefore, it has the effect of covering the same geographical area with different angles
which helps to build a complete image of the scene. To derive images from SAR pulse data
Frequency domain approaches such as range Doppler imaging and time domain processing algorithms such as Back-propagation were utilized. Due to the support for higher resolution and
lesser assumptions about the image, Back-propagation produces better quality constructions
compared to frequency domain algorithms [1].
SAR videos are generated by rendering sequence of consecutive SAR pulse reconstructed
images. In this paper, a SAR video provided by Sandia Laboratories website and videos
generated by our SAR simulator are used for evaluation purposes. Our SAR simulator was developed based on RaySAR [5] to produce circular SAR videos.
2.2. Speckle Noise
As a result of the coherent imaging mechanism, SAR images are accompanied by speckle noise
unlike optical images. Speckle noise in SAR images are generated as a result of random interference of many elementary reflectors within one resolution cell [6], [7] and is multiplicative
in nature. It is observed that speckle noise can affect the quality of the image, image
segmentation, classification, extraction of regions of interest and target detection. Hence pre-processing techniques should be applied to reduce the effect of speckle noise. Ideal speckle filter
should be adaptable and preserve image statistics, structure of the image and should have
simplicity and effectiveness in speckle noise reduction [8].
Various despeckling methods are suggested by researchers and each has its own pros and cons.
Converting the nature of speckle noise from multiplicative to additive can be done via log
transformation. However, the drawback of log transformation is that it changes the statistical characteristics of the speckled image. Although it can be recovered using inverse log
transformation operation, still there remains issues [9].
Mean filter, Median filter, Lee filter, Refined Lee filter and Lee Sigma filter are the most common and simple despeckling techniques used in SAR imagery [8], [10]. While mean filter smooths out
the image, it also smooths the edges of the image [10]. As mean filter does not consider the
homogeneous, flat areas of the image, it shows a low-edge preservation [11]. Boxcar filter which is a type of mean filter has been used for Polarimetric SAR classification of agricultural region
[12]. Segregated noise points in the image can be despeckled using Median filter [13]. Lee filter
which uses the Minimum Mean Square Error filter principle reduces the speckle to a considerable level, however edges of the image also get blurred. As an improvement to this Lee filter, Refined
Lee filter approach can preserve the edges of the image while reducing the noise [10]
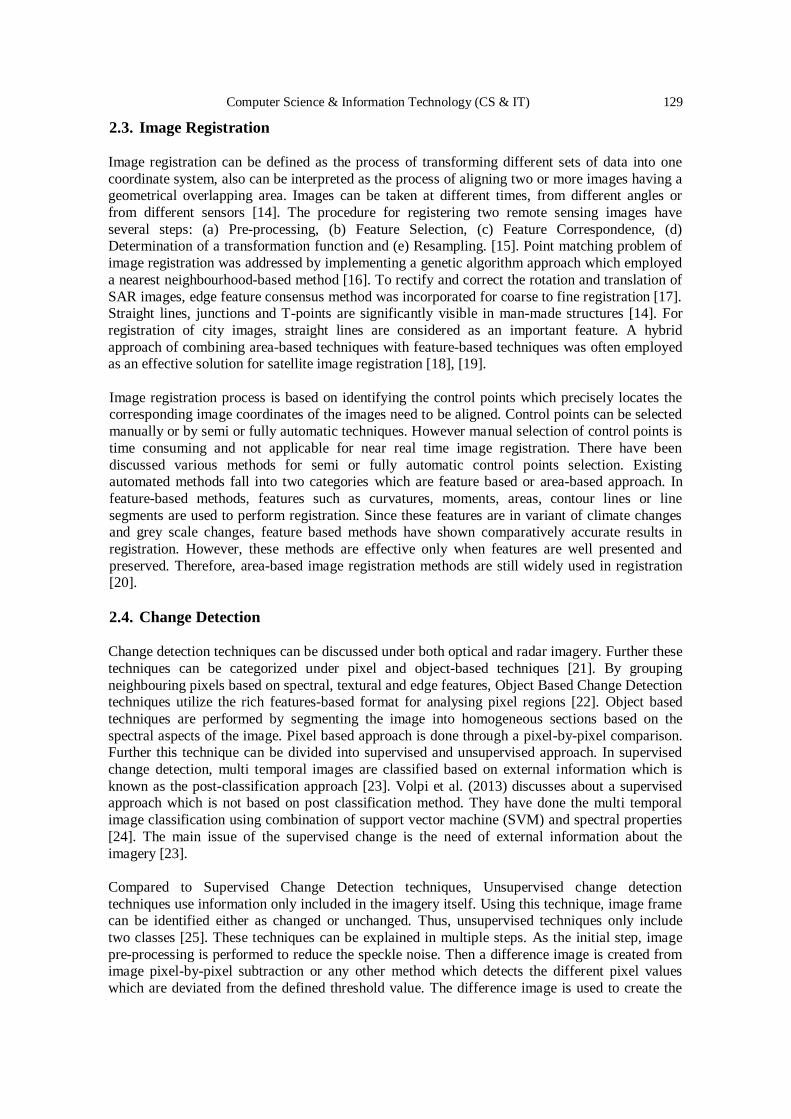
Computer Science & Information Technology (CS & IT) 129
2.3. Image Registration
Image registration can be defined as the process of transforming different sets of data into one
coordinate system, also can be interpreted as the process of aligning two or more images having a geometrical overlapping area. Images can be taken at different times, from different angles or
from different sensors [14]. The procedure for registering two remote sensing images have
several steps: (a) Pre-processing, (b) Feature Selection, (c) Feature Correspondence, (d) Determination of a transformation function and (e) Resampling. [15]. Point matching problem of
image registration was addressed by implementing a genetic algorithm approach which employed
a nearest neighbourhood-based method [16]. To rectify and correct the rotation and translation of
SAR images, edge feature consensus method was incorporated for coarse to fine registration [17]. Straight lines, junctions and T-points are significantly visible in man-made structures [14]. For
registration of city images, straight lines are considered as an important feature. A hybrid
approach of combining area-based techniques with feature-based techniques was often employed as an effective solution for satellite image registration [18], [19].
Image registration process is based on identifying the control points which precisely locates the corresponding image coordinates of the images need to be aligned. Control points can be selected
manually or by semi or fully automatic techniques. However manual selection of control points is
time consuming and not applicable for near real time image registration. There have been
discussed various methods for semi or fully automatic control points selection. Existing automated methods fall into two categories which are feature based or area-based approach. In
feature-based methods, features such as curvatures, moments, areas, contour lines or line
segments are used to perform registration. Since these features are in variant of climate changes and grey scale changes, feature based methods have shown comparatively accurate results in
registration. However, these methods are effective only when features are well presented and
preserved. Therefore, area-based image registration methods are still widely used in registration [20].
2.4. Change Detection
Change detection techniques can be discussed under both optical and radar imagery. Further these
techniques can be categorized under pixel and object-based techniques [21]. By grouping
neighbouring pixels based on spectral, textural and edge features, Object Based Change Detection techniques utilize the rich features-based format for analysing pixel regions [22]. Object based
techniques are performed by segmenting the image into homogeneous sections based on the
spectral aspects of the image. Pixel based approach is done through a pixel-by-pixel comparison. Further this technique can be divided into supervised and unsupervised approach. In supervised
change detection, multi temporal images are classified based on external information which is
known as the post-classification approach [23]. Volpi et al. (2013) discusses about a supervised approach which is not based on post classification method. They have done the multi temporal
image classification using combination of support vector machine (SVM) and spectral properties
[24]. The main issue of the supervised change is the need of external information about the
imagery [23].
Compared to Supervised Change Detection techniques, Unsupervised change detection
techniques use information only included in the imagery itself. Using this technique, image frame can be identified either as changed or unchanged. Thus, unsupervised techniques only include
two classes [25]. These techniques can be explained in multiple steps. As the initial step, image
pre-processing is performed to reduce the speckle noise. Then a difference image is created from image pixel-by-pixel subtraction or any other method which detects the different pixel values
which are deviated from the defined threshold value. The difference image is used to create the
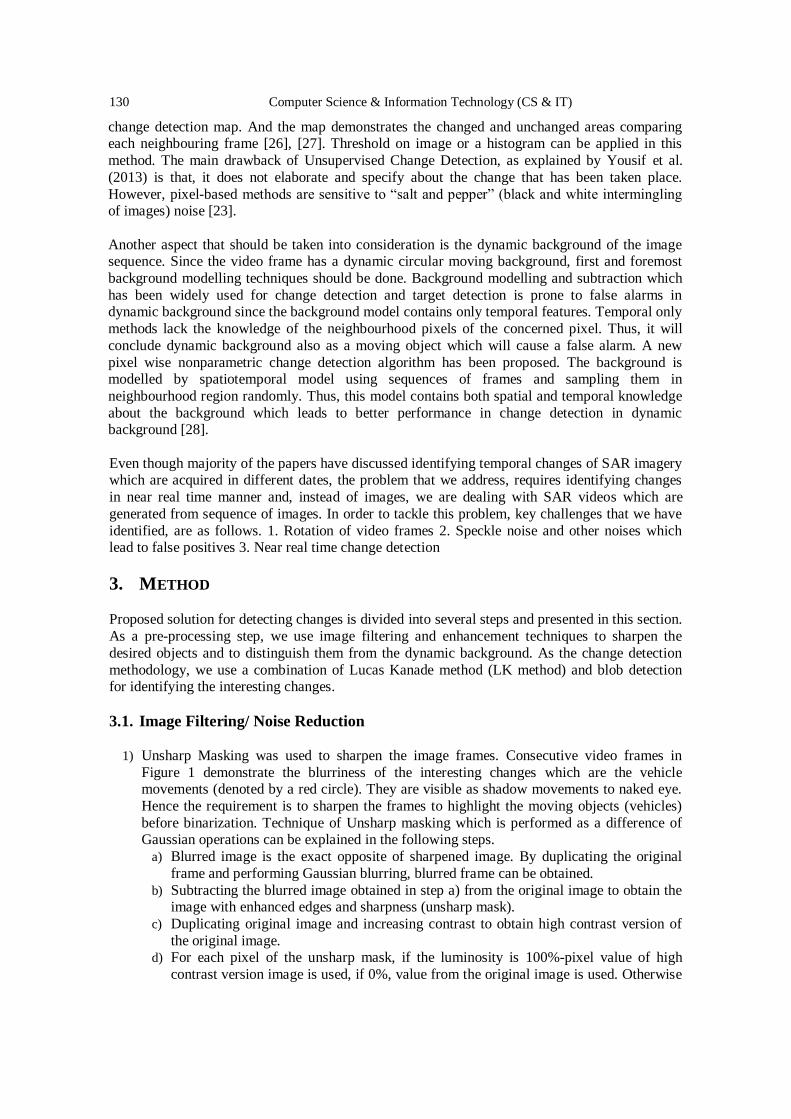
130 Computer Science & Information Technology (CS & IT)
change detection map. And the map demonstrates the changed and unchanged areas comparing each neighbouring frame [26], [27]. Threshold on image or a histogram can be applied in this
method. The main drawback of Unsupervised Change Detection, as explained by Yousif et al.
(2013) is that, it does not elaborate and specify about the change that has been taken place.
However, pixel-based methods are sensitive to “salt and pepper” (black and white intermingling of images) noise [23].
Another aspect that should be taken into consideration is the dynamic background of the image sequence. Since the video frame has a dynamic circular moving background, first and foremost
background modelling techniques should be done. Background modelling and subtraction which
has been widely used for change detection and target detection is prone to false alarms in dynamic background since the background model contains only temporal features. Temporal only
methods lack the knowledge of the neighbourhood pixels of the concerned pixel. Thus, it will
conclude dynamic background also as a moving object which will cause a false alarm. A new
pixel wise nonparametric change detection algorithm has been proposed. The background is modelled by spatiotemporal model using sequences of frames and sampling them in
neighbourhood region randomly. Thus, this model contains both spatial and temporal knowledge
about the background which leads to better performance in change detection in dynamic background [28].
Even though majority of the papers have discussed identifying temporal changes of SAR imagery which are acquired in different dates, the problem that we address, requires identifying changes
in near real time manner and, instead of images, we are dealing with SAR videos which are
generated from sequence of images. In order to tackle this problem, key challenges that we have
identified, are as follows. 1. Rotation of video frames 2. Speckle noise and other noises which lead to false positives 3. Near real time change detection
3. METHOD Proposed solution for detecting changes is divided into several steps and presented in this section.
As a pre-processing step, we use image filtering and enhancement techniques to sharpen the
desired objects and to distinguish them from the dynamic background. As the change detection
methodology, we use a combination of Lucas Kanade method (LK method) and blob detection for identifying the interesting changes.
3.1. Image Filtering/ Noise Reduction
1) Unsharp Masking was used to sharpen the image frames. Consecutive video frames in
Figure 1 demonstrate the blurriness of the interesting changes which are the vehicle movements (denoted by a red circle). They are visible as shadow movements to naked eye.
Hence the requirement is to sharpen the frames to highlight the moving objects (vehicles)
before binarization. Technique of Unsharp masking which is performed as a difference of Gaussian operations can be explained in the following steps.
a) Blurred image is the exact opposite of sharpened image. By duplicating the original
frame and performing Gaussian blurring, blurred frame can be obtained.
b) Subtracting the blurred image obtained in step a) from the original image to obtain the image with enhanced edges and sharpness (unsharp mask).
c) Duplicating original image and increasing contrast to obtain high contrast version of
the original image. d) For each pixel of the unsharp mask, if the luminosity is 100%-pixel value of high
contrast version image is used, if 0%, value from the original image is used. Otherwise
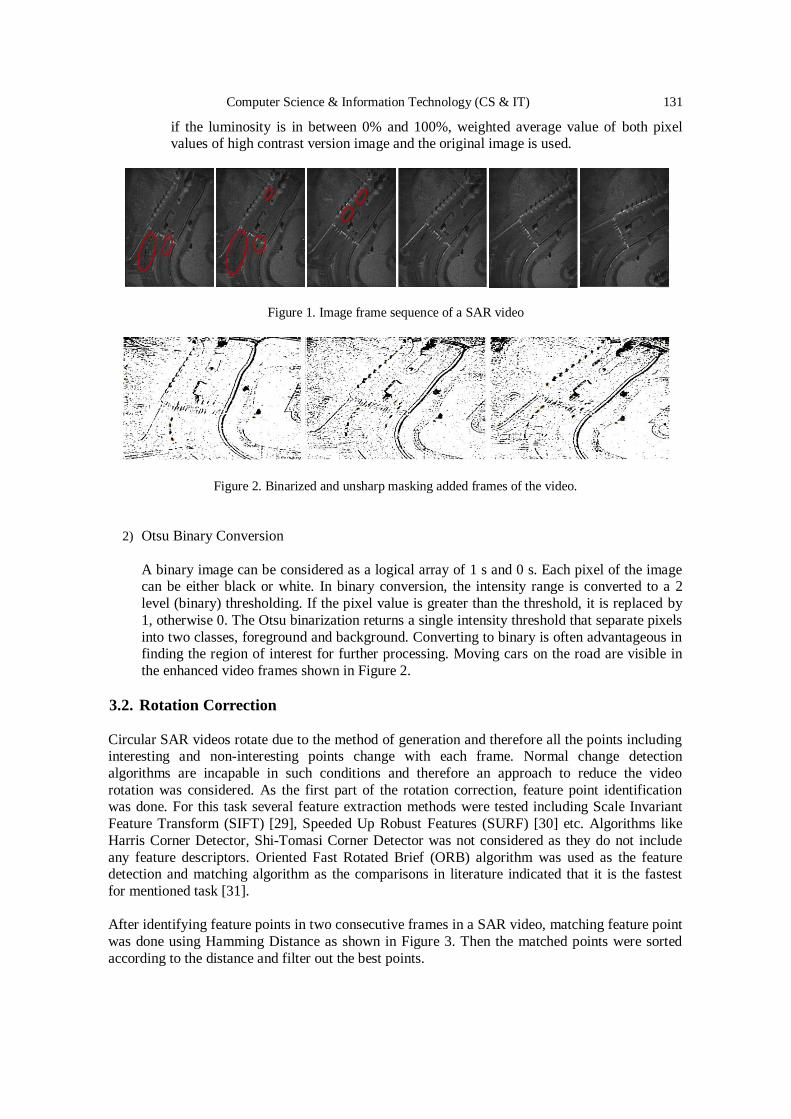
Computer Science & Information Technology (CS & IT) 131
if the luminosity is in between 0% and 100%, weighted average value of both pixel values of high contrast version image and the original image is used.
2) Otsu Binary Conversion
A binary image can be considered as a logical array of 1 s and 0 s. Each pixel of the image can be either black or white. In binary conversion, the intensity range is converted to a 2
level (binary) thresholding. If the pixel value is greater than the threshold, it is replaced by
1, otherwise 0. The Otsu binarization returns a single intensity threshold that separate pixels
into two classes, foreground and background. Converting to binary is often advantageous in finding the region of interest for further processing. Moving cars on the road are visible in
the enhanced video frames shown in Figure 2.
3.2. Rotation Correction
Circular SAR videos rotate due to the method of generation and therefore all the points including interesting and non-interesting points change with each frame. Normal change detection
algorithms are incapable in such conditions and therefore an approach to reduce the video
rotation was considered. As the first part of the rotation correction, feature point identification was done. For this task several feature extraction methods were tested including Scale Invariant
Feature Transform (SIFT) [29], Speeded Up Robust Features (SURF) [30] etc. Algorithms like
Harris Corner Detector, Shi-Tomasi Corner Detector was not considered as they do not include
any feature descriptors. Oriented Fast Rotated Brief (ORB) algorithm was used as the feature detection and matching algorithm as the comparisons in literature indicated that it is the fastest
for mentioned task [31].
After identifying feature points in two consecutive frames in a SAR video, matching feature point
was done using Hamming Distance as shown in Figure 3. Then the matched points were sorted
according to the distance and filter out the best points.
Figure 1. Image frame sequence of a SAR video
Figure 2. Binarized and unsharp masking added frames of the video.
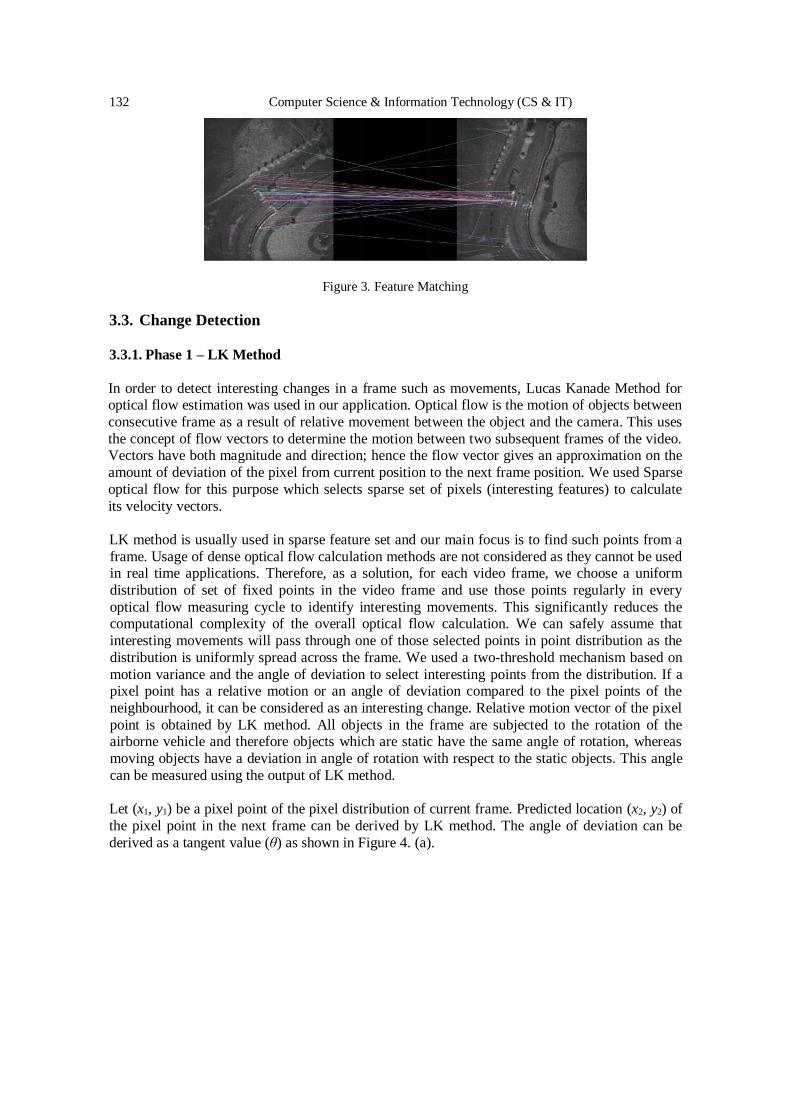
132 Computer Science & Information Technology (CS & IT)
Figure 3. Feature Matching
3.3. Change Detection
3.3.1. Phase 1 – LK Method
In order to detect interesting changes in a frame such as movements, Lucas Kanade Method for optical flow estimation was used in our application. Optical flow is the motion of objects between
consecutive frame as a result of relative movement between the object and the camera. This uses
the concept of flow vectors to determine the motion between two subsequent frames of the video. Vectors have both magnitude and direction; hence the flow vector gives an approximation on the
amount of deviation of the pixel from current position to the next frame position. We used Sparse
optical flow for this purpose which selects sparse set of pixels (interesting features) to calculate
its velocity vectors.
LK method is usually used in sparse feature set and our main focus is to find such points from a
frame. Usage of dense optical flow calculation methods are not considered as they cannot be used in real time applications. Therefore, as a solution, for each video frame, we choose a uniform
distribution of set of fixed points in the video frame and use those points regularly in every
optical flow measuring cycle to identify interesting movements. This significantly reduces the computational complexity of the overall optical flow calculation. We can safely assume that
interesting movements will pass through one of those selected points in point distribution as the
distribution is uniformly spread across the frame. We used a two-threshold mechanism based on
motion variance and the angle of deviation to select interesting points from the distribution. If a pixel point has a relative motion or an angle of deviation compared to the pixel points of the
neighbourhood, it can be considered as an interesting change. Relative motion vector of the pixel
point is obtained by LK method. All objects in the frame are subjected to the rotation of the airborne vehicle and therefore objects which are static have the same angle of rotation, whereas
moving objects have a deviation in angle of rotation with respect to the static objects. This angle
can be measured using the output of LK method.
Let (x1, y1) be a pixel point of the pixel distribution of current frame. Predicted location (x2, y2) of
the pixel point in the next frame can be derived by LK method. The angle of deviation can be
derived as a tangent value (θ) as shown in Figure 4. (a).
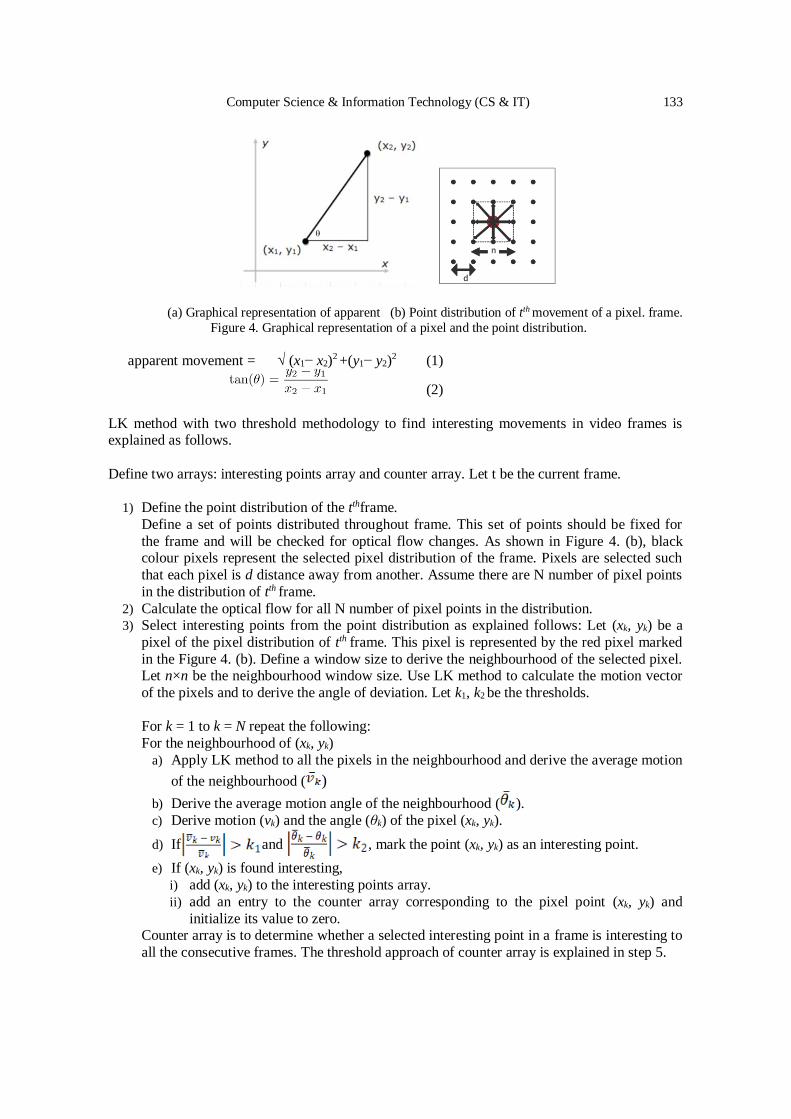
Computer Science & Information Technology (CS & IT) 133
(a) Graphical representation of apparent (b) Point distribution of tth movement of a pixel. frame.
Figure 4. Graphical representation of a pixel and the point distribution.
apparent movement = √ (x1− x2)2 +(y1− y2)
2 (1)
(2)
LK method with two threshold methodology to find interesting movements in video frames is explained as follows.
Define two arrays: interesting points array and counter array. Let t be the current frame.
1) Define the point distribution of the tthframe.
Define a set of points distributed throughout frame. This set of points should be fixed for
the frame and will be checked for optical flow changes. As shown in Figure 4. (b), black colour pixels represent the selected pixel distribution of the frame. Pixels are selected such
that each pixel is d distance away from another. Assume there are N number of pixel points
in the distribution of tth frame.
2) Calculate the optical flow for all N number of pixel points in the distribution. 3) Select interesting points from the point distribution as explained follows: Let (xk, yk) be a
pixel of the pixel distribution of tth frame. This pixel is represented by the red pixel marked
in the Figure 4. (b). Define a window size to derive the neighbourhood of the selected pixel. Let n×n be the neighbourhood window size. Use LK method to calculate the motion vector
of the pixels and to derive the angle of deviation. Let k1, k2 be the thresholds.
For k = 1 to k = N repeat the following:
For the neighbourhood of (xk, yk)
a) Apply LK method to all the pixels in the neighbourhood and derive the average motion
of the neighbourhood ( )
b) Derive the average motion angle of the neighbourhood ( ).
c) Derive motion (vk) and the angle (θk) of the pixel (xk, yk).
d) If and , mark the point (xk, yk) as an interesting point.
e) If (xk, yk) is found interesting,
i) add (xk, yk) to the interesting points array.
ii) add an entry to the counter array corresponding to the pixel point (xk, yk) and
initialize its value to zero. Counter array is to determine whether a selected interesting point in a frame is interesting to
all the consecutive frames. The threshold approach of counter array is explained in step 5.
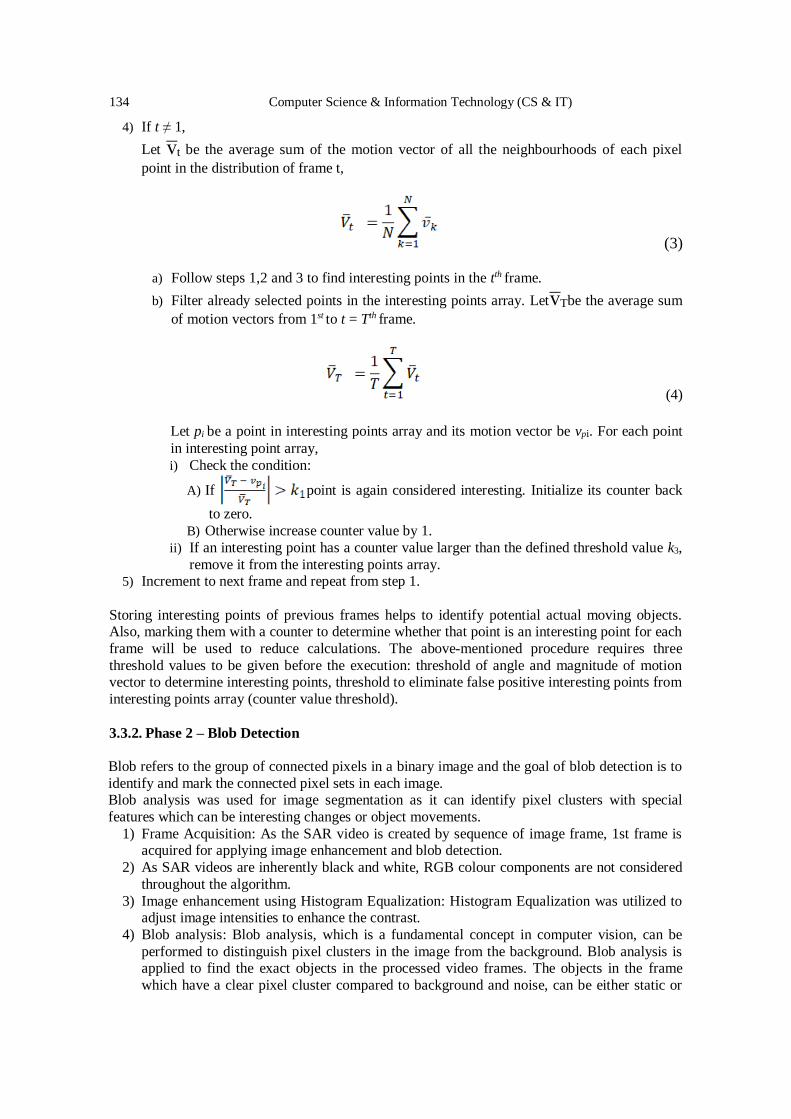
134 Computer Science & Information Technology (CS & IT)
4) If t ≠ 1,
Let vt be the average sum of the motion vector of all the neighbourhoods of each pixel
point in the distribution of frame t,
(3)
a) Follow steps 1,2 and 3 to find interesting points in the tth frame.
b) Filter already selected points in the interesting points array. LetvTbe the average sum
of motion vectors from 1st to t = Tth frame.
(4)
Let pi be a point in interesting points array and its motion vector be vpi. For each point
in interesting point array,
i) Check the condition:
A) If point is again considered interesting. Initialize its counter back
to zero.
B) Otherwise increase counter value by 1.
ii) If an interesting point has a counter value larger than the defined threshold value k3,
remove it from the interesting points array. 5) Increment to next frame and repeat from step 1.
Storing interesting points of previous frames helps to identify potential actual moving objects. Also, marking them with a counter to determine whether that point is an interesting point for each
frame will be used to reduce calculations. The above-mentioned procedure requires three
threshold values to be given before the execution: threshold of angle and magnitude of motion vector to determine interesting points, threshold to eliminate false positive interesting points from
interesting points array (counter value threshold).
3.3.2. Phase 2 – Blob Detection
Blob refers to the group of connected pixels in a binary image and the goal of blob detection is to
identify and mark the connected pixel sets in each image. Blob analysis was used for image segmentation as it can identify pixel clusters with special
features which can be interesting changes or object movements.
1) Frame Acquisition: As the SAR video is created by sequence of image frame, 1st frame is acquired for applying image enhancement and blob detection.
2) As SAR videos are inherently black and white, RGB colour components are not considered
throughout the algorithm.
3) Image enhancement using Histogram Equalization: Histogram Equalization was utilized to adjust image intensities to enhance the contrast.
4) Blob analysis: Blob analysis, which is a fundamental concept in computer vision, can be
performed to distinguish pixel clusters in the image from the background. Blob analysis is applied to find the exact objects in the processed video frames. The objects in the frame
which have a clear pixel cluster compared to background and noise, can be either static or

Computer Science & Information Technology (CS & IT) 135
dynamic. Since the requirement is to identify changes which can be interpreted as dynamic object movements, the separation of static and dynamic blobs is required. This can be
achieved by combining LK method with blob detection. If a pixel cluster can be identified
as a clear blob based on the constraints defined on the features of the blob and if it has an
apparent motion compared to the previous consecutive frames which can be calculated by LK method, the probability of being an interesting change will be increased.
5) Defining thresholds for features of the blob: In order to identify interesting pixel clusters,
constraints for blob features were defined as follows. a) By area: Area of the blob is the number of pixels included in the blob. This feature was
used to remove blobs which were too small. By setting a minimum and maximum
range for area of the blobs, possible objects can be traced down. min area - Minimum area should be defined considering the ratio of the size of the object to the size of the
geographical area captured by the frame. max area - area of the circle of which radius
is defined as the half of the distance between two-pixel points of theselected pixel
distribution of the frame (radius = d/2, where d is denoted in Figure 4. (b)). When generating SAR image frames, objects are modelled by radar pulse reflections
from actual objects, hence pixels of the objects usually have higher intensity compared
to the background. Since we are interested in dynamic changes (of objects), pixels are filtered by a pixel intensity range between 0 to 125.
b) By circularity: Circularity of the blob defines how circular the blob is. This circularity
can be measured by Heywood Circularity Factor. Since the SAR video frames are high resolution image frames which cover a large geographical area, the ratio between
object area and frame size is very small. Hence these objects can be segmented to
circular shapes by a threshold of circular factor.
3.3.3. Phase 3 – Combining LK method with Blob Detection
In order to determine whether an actual change is occurred, the combination of LK method and blob detection is applied in an iterative manner for each frame of the video. The methodology is
explained as follows.
1) Interesting points array and the detected blobs of the current frame are considered. Let t be the current frame number.
a) Let (xt, yt) be an interesting pixel point of tth frame and assume there are N number of
blobs detected in tth frame. b) Let point (xn, yn) be the middle point of an arbitrary blob as denoted by the red pixel in
Figure 5. Let rn be the radius of the detected blob. Consider the area of the square
which is drawn rndistance away from horizontal and vertical directions from (xn, yn), as shown in Figure 5. Let an be the array of pixel points which are within the drawn
square for (xn, yn)
c) For n = 1 to n = N repeat the following
i) Derive (xn, yn), rn, an ii) For all points in an check whether (xt, yt) is found. If found, mark that point as an
interesting change which can be tracked. End the loop.
iii) Otherwise, increment n by 1, to consider the next blob and repeat the loop. d) Repeat steps (a), (b) and (c) for all the interesting points of the current frame.
2) Repeat step 1 for all the frames of the video.
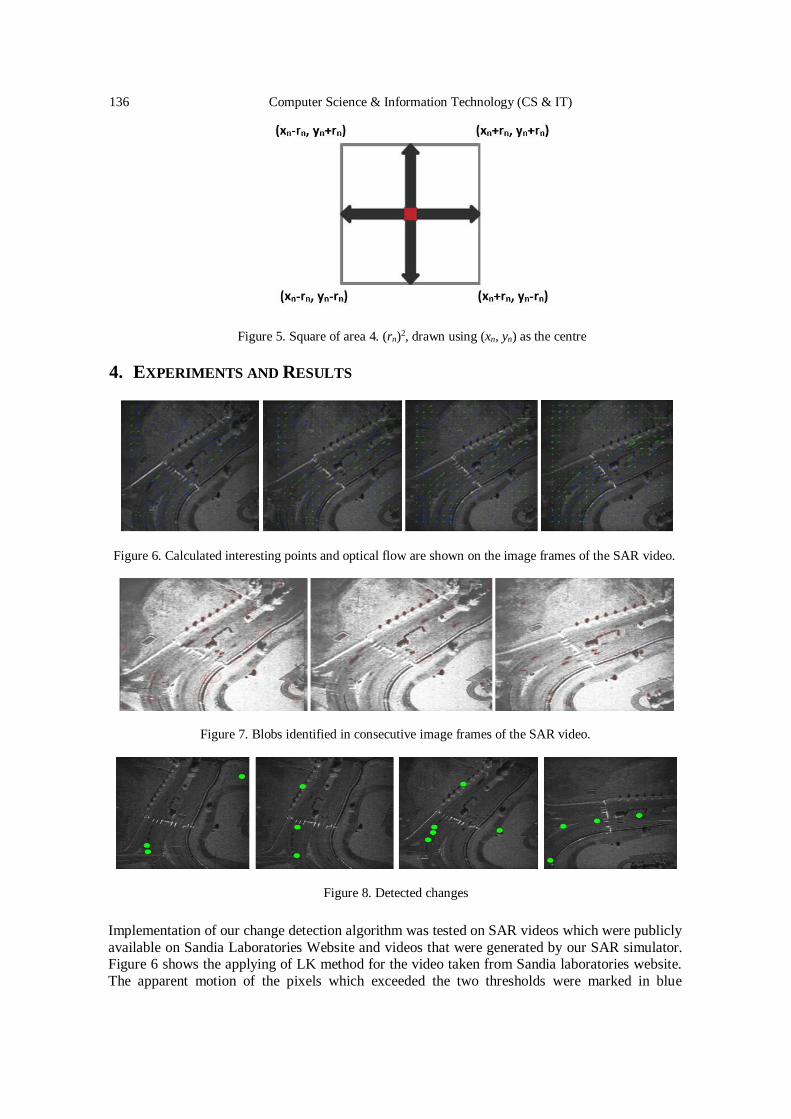
136 Computer Science & Information Technology (CS & IT)
Figure 5. Square of area 4. (rn)2, drawn using (xn, yn) as the centre
4. EXPERIMENTS AND RESULTS
Implementation of our change detection algorithm was tested on SAR videos which were publicly
available on Sandia Laboratories Website and videos that were generated by our SAR simulator. Figure 6 shows the applying of LK method for the video taken from Sandia laboratories website.
The apparent motion of the pixels which exceeded the two thresholds were marked in blue
Figure 6. Calculated interesting points and optical flow are shown on the image frames of the SAR video.
Figure 7. Blobs identified in consecutive image frames of the SAR video.
Figure 8. Detected changes
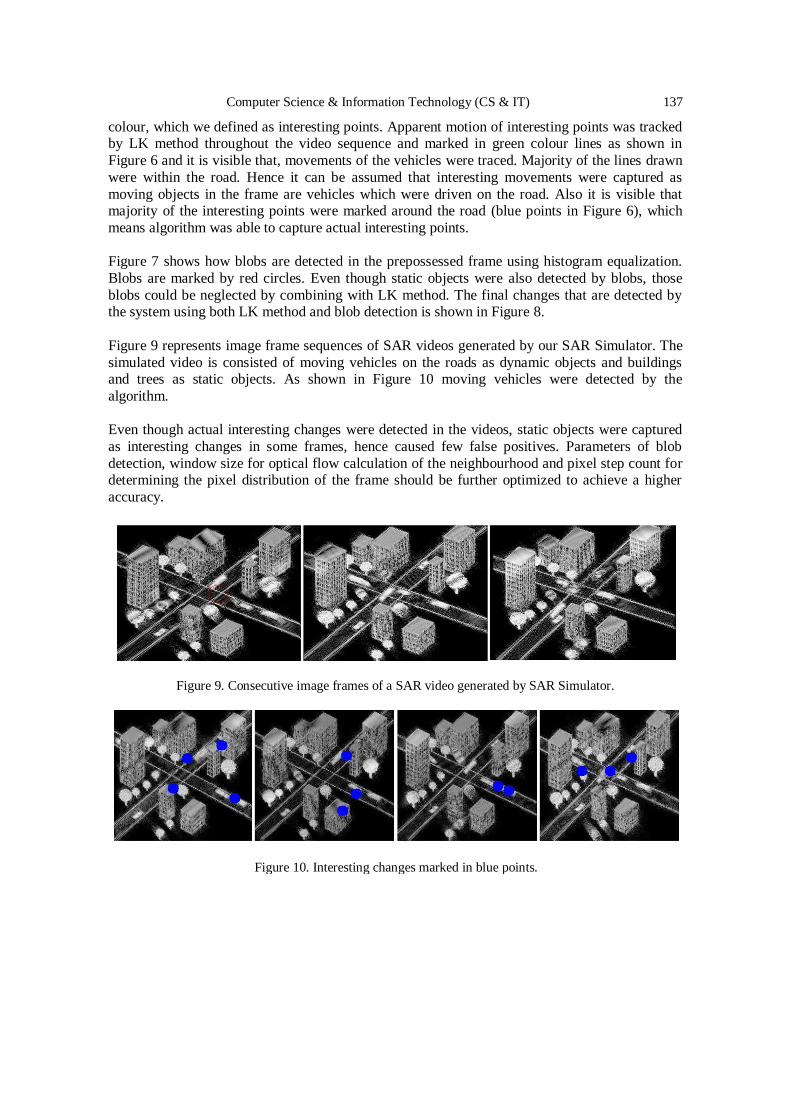
Computer Science & Information Technology (CS & IT) 137
colour, which we defined as interesting points. Apparent motion of interesting points was tracked by LK method throughout the video sequence and marked in green colour lines as shown in
Figure 6 and it is visible that, movements of the vehicles were traced. Majority of the lines drawn
were within the road. Hence it can be assumed that interesting movements were captured as
moving objects in the frame are vehicles which were driven on the road. Also it is visible that majority of the interesting points were marked around the road (blue points in Figure 6), which
means algorithm was able to capture actual interesting points.
Figure 7 shows how blobs are detected in the prepossessed frame using histogram equalization.
Blobs are marked by red circles. Even though static objects were also detected by blobs, those
blobs could be neglected by combining with LK method. The final changes that are detected by the system using both LK method and blob detection is shown in Figure 8.
Figure 9 represents image frame sequences of SAR videos generated by our SAR Simulator. The
simulated video is consisted of moving vehicles on the roads as dynamic objects and buildings and trees as static objects. As shown in Figure 10 moving vehicles were detected by the
algorithm.
Even though actual interesting changes were detected in the videos, static objects were captured
as interesting changes in some frames, hence caused few false positives. Parameters of blob
detection, window size for optical flow calculation of the neighbourhood and pixel step count for determining the pixel distribution of the frame should be further optimized to achieve a higher
accuracy.
Figure 9. Consecutive image frames of a SAR video generated by SAR Simulator.
Figure 10. Interesting changes marked in blue points.
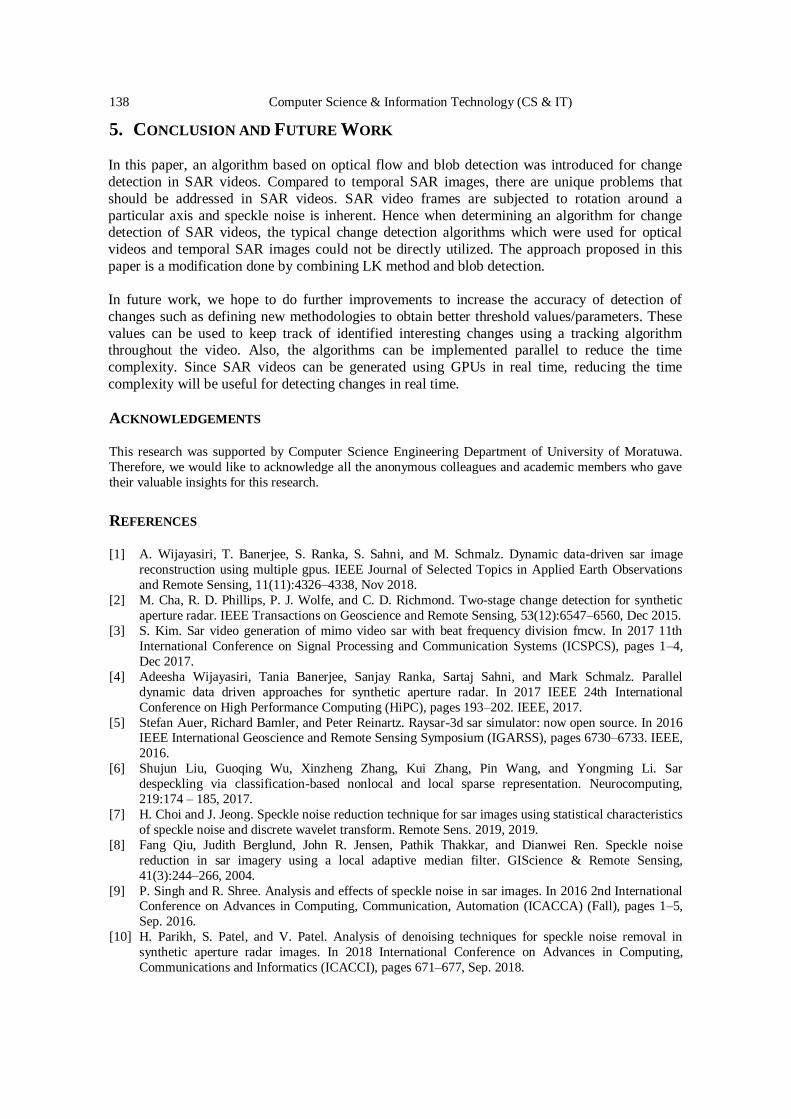
138 Computer Science & Information Technology (CS & IT)
5. CONCLUSION AND FUTURE WORK In this paper, an algorithm based on optical flow and blob detection was introduced for change
detection in SAR videos. Compared to temporal SAR images, there are unique problems that
should be addressed in SAR videos. SAR video frames are subjected to rotation around a
particular axis and speckle noise is inherent. Hence when determining an algorithm for change detection of SAR videos, the typical change detection algorithms which were used for optical
videos and temporal SAR images could not be directly utilized. The approach proposed in this
paper is a modification done by combining LK method and blob detection.
In future work, we hope to do further improvements to increase the accuracy of detection of
changes such as defining new methodologies to obtain better threshold values/parameters. These
values can be used to keep track of identified interesting changes using a tracking algorithm throughout the video. Also, the algorithms can be implemented parallel to reduce the time
complexity. Since SAR videos can be generated using GPUs in real time, reducing the time
complexity will be useful for detecting changes in real time.
ACKNOWLEDGEMENTS This research was supported by Computer Science Engineering Department of University of Moratuwa.
Therefore, we would like to acknowledge all the anonymous colleagues and academic members who gave
their valuable insights for this research.
REFERENCES [1] A. Wijayasiri, T. Banerjee, S. Ranka, S. Sahni, and M. Schmalz. Dynamic data-driven sar image
reconstruction using multiple gpus. IEEE Journal of Selected Topics in Applied Earth Observations
and Remote Sensing, 11(11):4326–4338, Nov 2018.
[2] M. Cha, R. D. Phillips, P. J. Wolfe, and C. D. Richmond. Two-stage change detection for synthetic
aperture radar. IEEE Transactions on Geoscience and Remote Sensing, 53(12):6547–6560, Dec 2015.
[3] S. Kim. Sar video generation of mimo video sar with beat frequency division fmcw. In 2017 11th
International Conference on Signal Processing and Communication Systems (ICSPCS), pages 1–4,
Dec 2017.
[4] Adeesha Wijayasiri, Tania Banerjee, Sanjay Ranka, Sartaj Sahni, and Mark Schmalz. Parallel
dynamic data driven approaches for synthetic aperture radar. In 2017 IEEE 24th International
Conference on High Performance Computing (HiPC), pages 193–202. IEEE, 2017.
[5] Stefan Auer, Richard Bamler, and Peter Reinartz. Raysar-3d sar simulator: now open source. In 2016 IEEE International Geoscience and Remote Sensing Symposium (IGARSS), pages 6730–6733. IEEE,
2016.
[6] Shujun Liu, Guoqing Wu, Xinzheng Zhang, Kui Zhang, Pin Wang, and Yongming Li. Sar
despeckling via classification-based nonlocal and local sparse representation. Neurocomputing,
219:174 – 185, 2017.
[7] H. Choi and J. Jeong. Speckle noise reduction technique for sar images using statistical characteristics
of speckle noise and discrete wavelet transform. Remote Sens. 2019, 2019.
[8] Fang Qiu, Judith Berglund, John R. Jensen, Pathik Thakkar, and Dianwei Ren. Speckle noise
reduction in sar imagery using a local adaptive median filter. GIScience & Remote Sensing,
41(3):244–266, 2004.
[9] P. Singh and R. Shree. Analysis and effects of speckle noise in sar images. In 2016 2nd International Conference on Advances in Computing, Communication, Automation (ICACCA) (Fall), pages 1–5,
Sep. 2016.
[10] H. Parikh, S. Patel, and V. Patel. Analysis of denoising techniques for speckle noise removal in
synthetic aperture radar images. In 2018 International Conference on Advances in Computing,
Communications and Informatics (ICACCI), pages 671–677, Sep. 2018.
Computer Science & Information Technology (CS & IT) 139
[11] D. Barash. Fundamental relationship between bilateral filtering, adaptive smoothing, and the
nonlinear diffusion equation. IEEE Transactions on Pattern Analysis and Machine Intelligence,
24(6):844–847, June 2002.
[12] Xiaodong Huang, Jinfei Wang, Jiali Shang, Chunhua Liao, and Jiangui Liu. Application of
polarization signature to land cover scattering mechanism analysis and classification using multi-temporal c-band polarimetric radarsat-2 imagery. Remote Sensing of Environment, 193:11 – 28,
2017.
[13] J. Lee, L. Jurkevich, Piet Dewaele, Patrick Wambacq, and A. Oosterlinck. Speckle filtering of
synthetic aperture radar images: A review. Remote Sensing Reviews, 8, 02 1994.
[14] Suma Dawn, Vikas Saxena, and Bhudev Sharma. Remote sensing image registration techniques: A
survey. pages 103–112, 06 2010.
[15] A. Ardeshir Goshtasby. 2-D and 3-D Image Registration: For Medical, Remote Sensing, and
Industrial Applications. Wiley-Interscience, New York, NY, USA, 2005.
[16] Flavio Seixas, Luiz Ochi, Aura Conci, and D´ ebora Muchaluat-Saade.´ Image registration using
genetic algorithms. pages 1145–1146, 01 2008.
[17] Chang Yulin, Zhou Zhimin, Chang Wenge, and Jin Tian. A new registration method for multi-
spectral sar images. In Proceedings. 2005 IEEE International Geoscience and Remote Sensing Symposium, 2005. IGARSS ’05., volume 3, pages 1704–1708, July 2005.
[18] Xiuping Jia. Automatic ground control points refinement for remote sensing imagery registration. In
2005 International Conference on Intelligent Sensors, Sensor Networks and Information Processing,
pages 145–149, Dec 2005.
[19] Yonghong Li and C. H. Davis. A combined global and local approach for automated registration of
high-resolution satellite images using optimum extrema points. In IGARSS 2008 - 2008 IEEE
International Geoscience and Remote Sensing Symposium, volume 2, pages II–1032–II–1035, July
2008.
[20] Chaolan Zhang and Clive Fraser. A hierarchical approach to automated registration of high resolution
satellite imagery for change detection. Asian Association on Remote Sensing - 26th Asian
Conference on Remote Sensing and 2nd Asian Space Conference, ACRS 2005, 2, 01 2005. [21] Masroor Hussain, Dongmei Chen, Angela Cheng, Hui Wei, and David Stanley. Change detection
from remotely sensed images: From pixelbased to object-based approaches. ISPRS Journal of
Photogrammetry and Remote Sensing, 80:91 – 106, 2013.
[22] T. Blaschke. Object based image analysis for remote sensing. ISPRS Journal of Photogrammetry and
Remote Sensing, 65(1):2 – 16, 2010.
[23] Osama Yousif. Change detection using multitemporal sar images. 2013.
[24] Michele Volpi, Devis Tuia, Francesca Bovolo, Mikhail Kanevski, and Lorenzo Bruzzone. Supervised
change detection in vhr images using contextual information and support vector machines.
International Journal of Applied Earth Observation and Geoinformation, 20:77 – 85, 2013. Earth
Observation and Geoinformation for Environmental Monitoring.
[25] Swarnajyoti Patra, Susmita Ghosh, and Ashish Ghosh. Histogram thresholding for unsupervised
change detection of remote sensing images. International Journal of Remote Sensing, 32(21):6071–6089, 2011.
[26] L. Bruzzone and D. F. Prieto. Automatic analysis of the difference image for unsupervised change
detection. IEEE Transactions on Geoscience and Remote Sensing, 38(3):1171–1182, May 2000.
[27] Paul L. Rosin and Efstathios Ioannidis. Evaluation of global image thresholding for change detection.
Pattern Recogn. Lett., 24(14):2345– 2356, October 2003.
[28] Yizhong Yang, Qiang Zhang, Pengfei Wang, Xionglou Hu, and Nengju Wu. Moving object detection
for dynamic background scenes based on spatiotemporal model. Advances in Multimedia, 2017:1–9,
06 2017.
[29] David G. Lowe. Distinctive image features from scale-invariant keypoints. International Journal of
Computer Vision, 60(2):91–110, Nov 2004.
[30] Herbert Bay, Andreas Ess, Tinne Tuytelaars, and Luc Van Gool. Speeded-up robust features (surf). Computer Vision and Image Understanding, 110(3):346 – 359, 2008. Similarity Matching in
Computer Vision and Multimedia.
[31] Ebrahim Karami, Siva Prasad, and Mohamed Shehata. Image matching using sift, surf, brief and orb:
Performance comparison for distorted images, 2017.
140 Computer Science & Information Technology (CS & IT)
AUTHORS
Hasara Maithree
Final year undergraduate of Department of Computer Science and Engineering,
University of Moratuwa
Dilan Dinushka Final year undergraduate of Department of Computer Science and Engineering,
University of Moratuwa
Dr. Adeesha Wijayasiri
Lecturer, Department of Computer Science and Engineering, University of Moratuwa
© 2020 By AIRCC Publishing Corporation. This article is published under the Creative Commons
Attribution (CC BY) license.
A Feature-based Fragile Watermarking for TamperDetection using Voronoi Diagram Decomposition
Nour El-Houda GOLEA1 and Kamal Eddine MELKEMI2
1 Department of Computer Science, University of Batna2, [email protected]
2 Department of Computer Science, University of Batna2, [email protected]
Abstract. In this paper, we have proposed a novel feature-based fragile water-marking scheme for image authentication. The proposed technique extracts FeaturePoints (FP) by performing the Harris corner detector and used them as germs todecomposes the host image in segments using Voronoi Diagram (VD). The authen-tication of each segment is guaranteed by using the Cyclic Redundancy Check code(CRC). Then, the CRC encoding procedure is applied to each segment to generatethe watermark. Voronoi decomposition is employed because it has a good retrievalperformance compared to similar geometrical decomposition algorithms. The secu-rity aspect of our proposed method is achieved by using the public key crypto-systemRSA (Rivest–Shamir–Adleman) to encrypt the FP.Experimental results demonstrate the efficiency of our approach in terms of im-perceptibility, the capability of detection of alterations, the capacity of embedding,and computation time. We have also prove the impact of VD decomposition on thequality of the watermarked image compared to block decomposition.The proposed method can be applicable in the case where the tamper detection iscritical and only some regions of interest must be re-transmitted if they are cor-rupted, like in the case of medical images. An example of the application of ourapproach to medical image is briefly presented.
Keywords: Fragile watermarking, feature-based image watermarking, image au-thentication, Voronoi diagram (VD).
1 Introduction
To protect a digital image, a pattern of bits can be inserted into this image for iden-tifying its copyright information. This approach is called digital watermarking [1].
According to the emebedding domain, the watermark information can be em-bedded in three different ways: directly in pixels of original image (spatial do-main) [21], in coefficients of image transformation (transform domain) [3] or infeatures of image (feature domain)[17]. Feature-based watermarking schemes arebased on salient regions, Feature Points (FP) or image characteristics, and areefficient in terms of detection and recovery against geometric attacks. Several pro-posed FP-based watermarking approaches used Harris corner detector [2], [29],Harris-Laplacian [10], Mexican hat wavelet [5] or scale invariant feature transformSIFT [18].
David C. Wyld et al. (Eds): CCSEA, BIoT, DKMP, CLOUD, NLCAI, SIPRO - 2020pp. 141-160, 2020. CS & IT - CSCP 2020 DOI: 10.5121/csit.2020.101012
The watermarking technique has several applications as copyright protection,image authentication, and integrity and according to these applications, the wa-termarking can be respectively: robust [21], fragile [3] and semi-fragile [11]. Fragilewatermarking must be sensitive both to malicious attacks and to accidental contentalteration and it is very desirable to detect corrupted areas.
An efficient fragile watermarking technique must insure some proprieties [12].First, it must embed the watermark imperceptibility, which means that the water-mark should be embedded into the host media invisibly. Second, the watermarkingtechnique must be robust to malicious attacks that try to damage the watermarkfunctionality. Third, the tampering should be detected without using the origi-nal image. Finally, the fragile watermarking technique must be able to locate thetampered regions within an image. There are three kinds of location accuracy,named: locating single-pixel tampered, locating single-block tampered and locatingthe whole signal.
The concept of error checking and correcting codes is widely used in the designof fragile watermarking systems. Lin and al.[15] proposed a fragile block-wise andcontent-based watermarking for image authentication and recovery. In this scheme,the watermark of each block is an encrypted form of its signature, which includesthe block location, a content-feature of another block, and a CRC checksum. Wherethe CRC checksum is used to authenticating only the signature. In [8], a pixel-wisefragile watermarking approach is proposed. This approach authenticates an RGBimage using the CRC checksum. However, the degree of the generator polynomialis very small and does not go beyond six. The most important parameter in errordetection of a message stream is the selection of the generator polynomial. Toovercome this insufficiency and enlarge the degree of the generator polynomial, wepropose a region-wise fragile watermarking technique using a standard polynomialgenerator G(x) having particular mathematical properties like CRC-32, CRC-16,and CRC-8 to generate the watermark. The variation of the size of the polynomialallows on one hand to increase the authentication guarantee and to strengthen thesecurity aspect on the other hand. In another work [9], the standard CRC-32 isused to authenticate only the Region of interest of the medical image. To achievethe authentication and integrity of different types of images, we propose a novelCRC-based fragile watermarking scheme based on FP and VD decomposition ofthe image.
We have organized this paper as follows: Section 2 presents a state of the arton feature based watermarking approaches. Section 3 gives a description of VD.Our approach is presented in Section 4. In Section 5, the experimental results arereported and analyzed. Finally, we concluded our work in Section 6.
Computer Science & Information Technology (CS & IT)142
2 Related works
In [4], Bhattacharjee et al. propose a semi-fragile approach for authenticating digitalimages using a Mexican hat wavelet to extract FP. These features are defined tobe relatively unaffected by lossy compression.
Kutter et al. [13], propose a robust image watermarking scheme. They use theMexican Hat Wavelet to extract features points and the Voronoi diagram (VD) todefine watermark embedding regions. The watermark in each segment is centeredon the location of the corresponding feature. In the extraction process, the sameFP are detected and used to partition the image. Then the watermark is extractedfrom each partition. The drawback of this approach is that the location of FP maybe changed by some pixels because of attack or during the watermarking process.This change will cause problems during the detecting process.
Bas et al. [2], developed another watermarking scheme using the Harris detectorto extract feature points. Then, performing Delaunay Tessellation on the set offeatures to construct a triangular tessellation that they use to embed the watermark.
In [23], Tang and Hang propose a robust image watermarking method whichadopts the Mexican Hat wavelet scale interaction to extract feature points. Thesefeature points are employed as centers of disks that are watermarked. For each disk,two blocks are selected by using the image normalization technique, and the water-mark is embedded in the DFT domain of the two blocks of each disk separately.
In [22] a robust watermarking algorithm based on the discrete cosine transform(DCT) and Voronoi Diagram to segment the image is proposed. The feature extrac-tion point which is used to form the Voronoi segment is built based on Tommasiniet al. algorithm [24]. So, for each segment, the image segment is subdivided intoblocks of size 8×8, (64 pixels). The DCT of the block is then computed. After that,the DCT coefficients are re-ordered into a zigzag scan. A pseudo-random sequenceof real numbers is embedded in the DCT coefficients. Therefore, the modified DCTcoefficients are re-inserted in the zigzag scan. Then, the inverse DCT is applied.Finally, the blocks are merged. Thus, we can obtain the watermarked image aftermerging all image segments.
Seo et al.[19], propose to utilize the Harris-Laplacian method. Scale InvariantFeature Points are detected based on the scale selection at Harris corner points.In the spatial domain, the watermark is embedded in a circularly symmetric waycentered at each selected feature point. In the detection stage, the feature pointsare found similarly and the existence of the watermark decided with correlationenhanced with SPOMF (Symmetrical Phase Only Filter).
Su et al. [20], apply segmentation to determine feature-based spatially local-ized structures for watermark embedding and detection. This method offers goodtolerance to collusion attacks and reasonable robustness to geometric distortions.
Lee et al. [14], developed a watermarking method that is robust to geometricdistortions. They use the Scale Invariant feature transform (SIFT) to extract image
Computer Science & Information Technology (CS & IT) 143
feature points, which are used to generate the number of circular regions. Thewatermark is inserted into the circular patches in an additive way in the spatialdomain. Rotation invariance is achieved using the translation property of the polar-mapped circular patches.
Qi et al.[28] develop a robust content-based watermarking scheme. The imagecontent is represented by important feature points obtained by the image-texture-based adaptive Harris corner detector. These important feature points are geomet-rically significant and therefore are capable of determining the possible geometricattacks with the aid of the Delaunay-tessellation-based triangle matching method.
In [25] Wang et al. proposed another feature-based image watermarking schemerobust to general geometric attacks. The Harris-Laplace detector is also utilized toextract steady feature points from the host image. Then, the local feature regions(LFR) are ascertained adaptively according to the characteristic scale theory, andthey are normalized by an image normalization technique. Finally, according tothe pre-distortion compensation theory, several copies of the digital watermark areembedded into the non-overlapped normalized LFR by comparing the DFT mid-frequency magnitudes.
Wei et al. [27], present a robust watermarking scheme based on feature pointdetection and image normalization. Feature points are detected from the originalimage using the proposed multiresolution feature point detection filter. Then, imagenormalization is applied to the disks centered at these feature points. The water-mark is embedded in the subband coefficients of the DFT domain of each diskseparately. And Watermark detection is based on a local threshold on normalizedcorrelation to detect if a disk has been watermarked, as well as on a global thresholdto detect if the image has been watermarked.
Yuan et al.[29], propose a robust geometric invariant digital image watermarkingscheme based on feature extraction and local Zernike moments. The features pointsare extracted employing the Adaptive Harris Detector. Each extracted circularpatch is decomposed into a collection of binary images and Zernike transform isapplied to the selected binary patches. A spread spectrum communication techniqueis used to embed the watermark. After the watermark is embedded, the inverseZernike transform is applied to reconstruct the corresponding binary patch from thewatermarked Zernike moments. Finally, the watermarked image can be obtainedby replacing the original patches with the watermarked patches. For watermarkextraction, the inverse procedure of watermark embedding is operated. The linearcorrelation is used to detect the existence of the watermark in the Zernike momentsmagnitudes. The watermark is detected when the linear correlation result is largerthan a predefined threshold value.
Computer Science & Information Technology (CS & IT)144
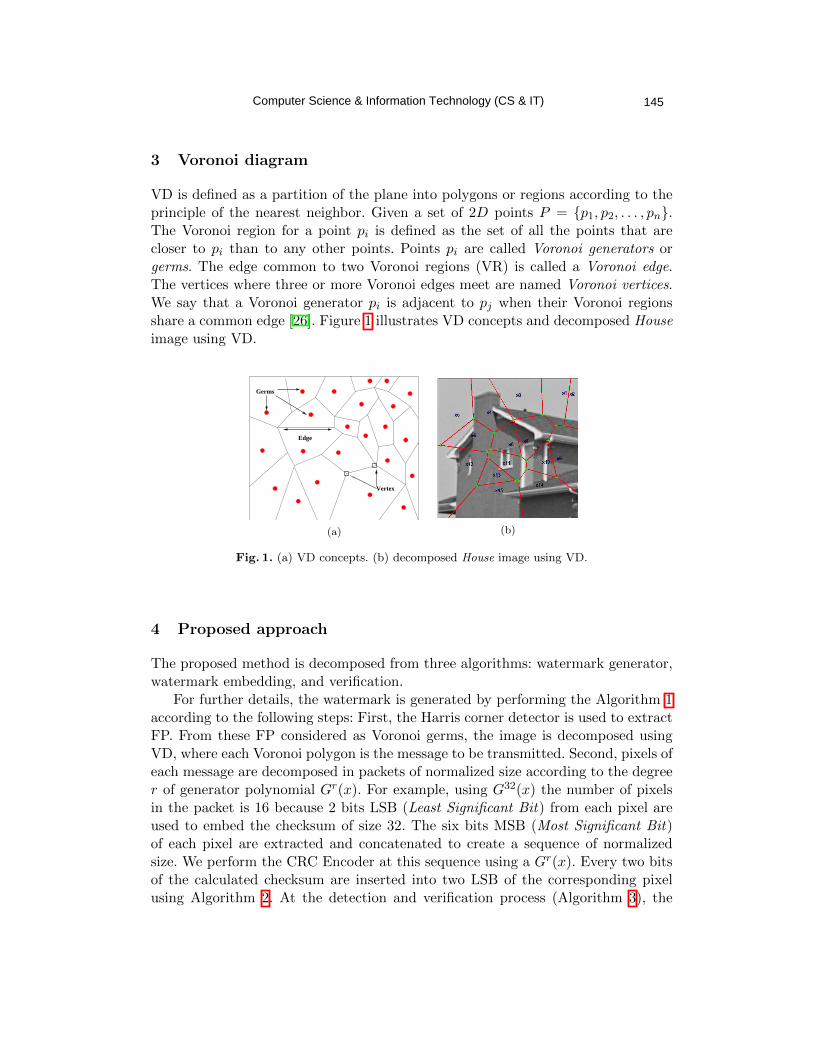
3 Voronoi diagram
VD is defined as a partition of the plane into polygons or regions according to theprinciple of the nearest neighbor. Given a set of 2D points P = {p1, p2, . . . , pn}.The Voronoi region for a point pi is defined as the set of all the points that arecloser to pi than to any other points. Points pi are called Voronoi generators orgerms. The edge common to two Voronoi regions (VR) is called a Voronoi edge.The vertices where three or more Voronoi edges meet are named Voronoi vertices.We say that a Voronoi generator pi is adjacent to pj when their Voronoi regionsshare a common edge [26]. Figure 1 illustrates VD concepts and decomposed Houseimage using VD.
Vertex
Germs
Edge
(a) (b)
Fig. 1. (a) VD concepts. (b) decomposed House image using VD.
4 Proposed approach
The proposed method is decomposed from three algorithms: watermark generator,watermark embedding, and verification.
For further details, the watermark is generated by performing the Algorithm 1according to the following steps: First, the Harris corner detector is used to extractFP. From these FP considered as Voronoi germs, the image is decomposed usingVD, where each Voronoi polygon is the message to be transmitted. Second, pixels ofeach message are decomposed in packets of normalized size according to the degreer of generator polynomial Gr(x). For example, using G32(x) the number of pixelsin the packet is 16 because 2 bits LSB (Least Significant Bit) from each pixel areused to embed the checksum of size 32. The six bits MSB (Most Significant Bit)of each pixel are extracted and concatenated to create a sequence of normalizedsize. We perform the CRC Encoder at this sequence using a Gr(x). Every two bitsof the calculated checksum are inserted into two LSB of the corresponding pixelusing Algorithm 2. At the detection and verification process (Algorithm 3), the
Computer Science & Information Technology (CS & IT) 145
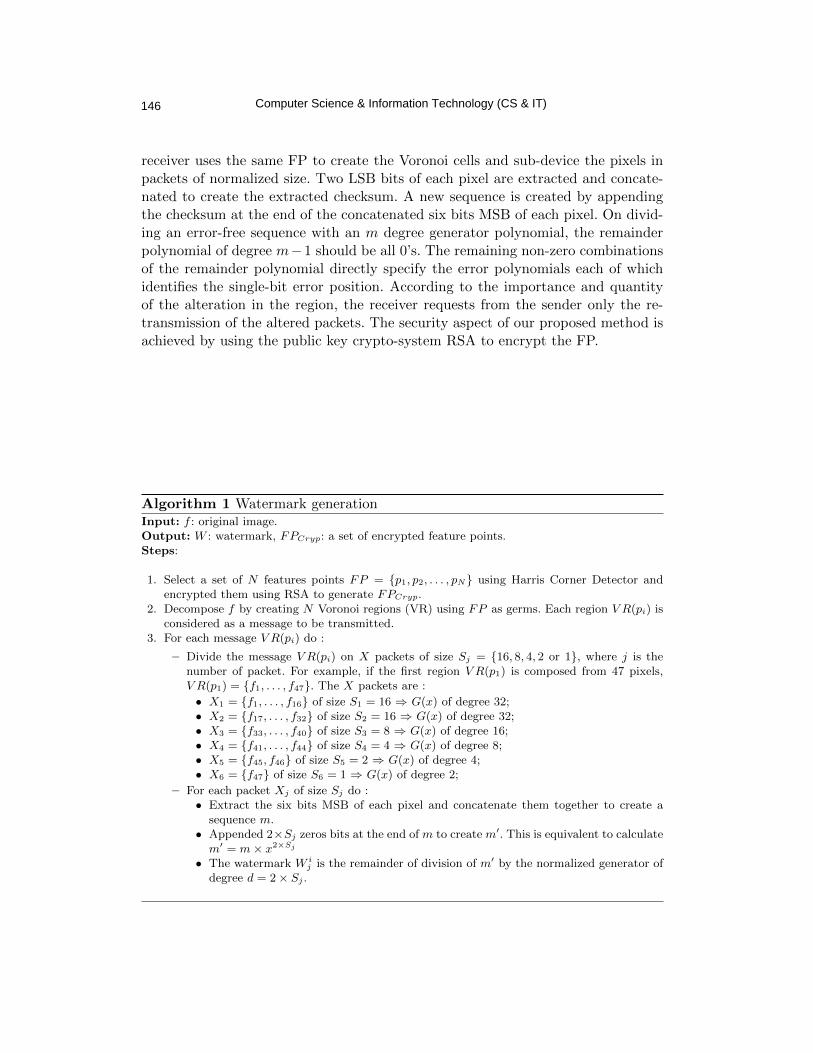
receiver uses the same FP to create the Voronoi cells and sub-device the pixels inpackets of normalized size. Two LSB bits of each pixel are extracted and concate-nated to create the extracted checksum. A new sequence is created by appendingthe checksum at the end of the concatenated six bits MSB of each pixel. On divid-ing an error-free sequence with an m degree generator polynomial, the remainderpolynomial of degree m−1 should be all 0’s. The remaining non-zero combinationsof the remainder polynomial directly specify the error polynomials each of whichidentifies the single-bit error position. According to the importance and quantityof the alteration in the region, the receiver requests from the sender only the re-transmission of the altered packets. The security aspect of our proposed method isachieved by using the public key crypto-system RSA to encrypt the FP.
Algorithm 1 Watermark generationInput: f : original image.Output: W : watermark, FPCryp: a set of encrypted feature points.Steps:
1. Select a set of N features points FP = {p1, p2, . . . , pN} using Harris Corner Detector andencrypted them using RSA to generate FPCryp.
2. Decompose f by creating N Voronoi regions (VR) using FP as germs. Each region V R(pi) isconsidered as a message to be transmitted.
3. For each message V R(pi) do :
– Divide the message V R(pi) on X packets of size Sj = {16, 8, 4, 2 or 1}, where j is thenumber of packet. For example, if the first region V R(p1) is composed from 47 pixels,V R(p1) = {f1, . . . , f47}. The X packets are :
• X1 = {f1, . . . , f16} of size S1 = 16 ⇒ G(x) of degree 32;• X2 = {f17, . . . , f32} of size S2 = 16 ⇒ G(x) of degree 32;• X3 = {f33, . . . , f40} of size S3 = 8 ⇒ G(x) of degree 16;• X4 = {f41, . . . , f44} of size S4 = 4 ⇒ G(x) of degree 8;• X5 = {f45, f46} of size S5 = 2 ⇒ G(x) of degree 4;• X6 = {f47} of size S6 = 1 ⇒ G(x) of degree 2;
– For each packet Xj of size Sj do :• Extract the six bits MSB of each pixel and concatenate them together to create a
sequence m.• Appended 2×Sj zeros bits at the end of m to create m′. This is equivalent to calculate
m′ = m× x2×Sj
• The watermark W ij is the remainder of division of m′ by the normalized generator of
degree d = 2× Sj .
Computer Science & Information Technology (CS & IT)146
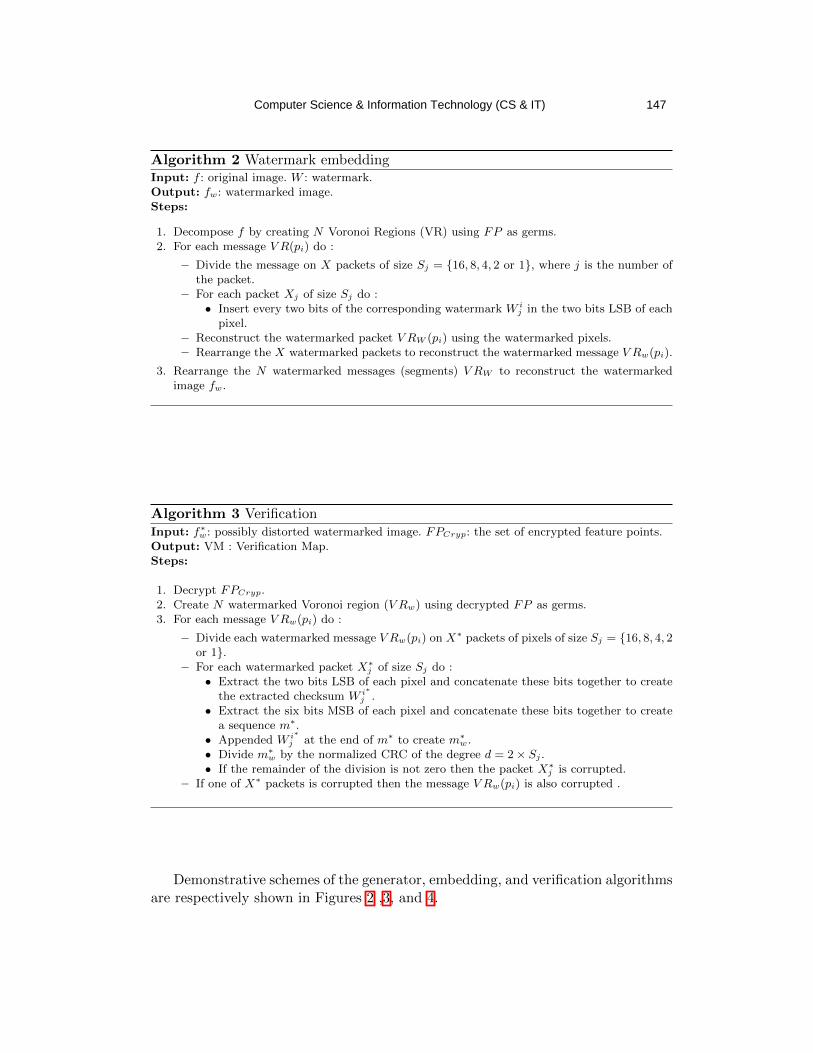
Algorithm 2 Watermark embeddingInput: f : original image. W : watermark.Output: fw: watermarked image.Steps:
1. Decompose f by creating N Voronoi Regions (VR) using FP as germs.2. For each message V R(pi) do :
– Divide the message on X packets of size Sj = {16, 8, 4, 2 or 1}, where j is the number ofthe packet.
– For each packet Xj of size Sj do :• Insert every two bits of the corresponding watermark W i
j in the two bits LSB of eachpixel.
– Reconstruct the watermarked packet V RW (pi) using the watermarked pixels.– Rearrange the X watermarked packets to reconstruct the watermarked message V Rw(pi).
3. Rearrange the N watermarked messages (segments) V RW to reconstruct the watermarkedimage fw.
Algorithm 3 VerificationInput: f∗w: possibly distorted watermarked image. FPCryp: the set of encrypted feature points.Output: VM : Verification Map.Steps:
1. Decrypt FPCryp.2. Create N watermarked Voronoi region (V Rw) using decrypted FP as germs.3. For each message V Rw(pi) do :
– Divide each watermarked message V Rw(pi) on X∗ packets of pixels of size Sj = {16, 8, 4, 2or 1}.
– For each watermarked packet X∗j of size Sj do :• Extract the two bits LSB of each pixel and concatenate these bits together to create
the extracted checksum W i∗j .
• Extract the six bits MSB of each pixel and concatenate these bits together to createa sequence m∗.
• Appended W i∗j at the end of m∗ to create m∗w.
• Divide m∗w by the normalized CRC of the degree d = 2× Sj .• If the remainder of the division is not zero then the packet X∗j is corrupted.
– If one of X∗ packets is corrupted then the message V Rw(pi) is also corrupted .
Demonstrative schemes of the generator, embedding, and verification algorithmsare respectively shown in Figures 2 ,3, and 4.
Computer Science & Information Technology (CS & IT) 147
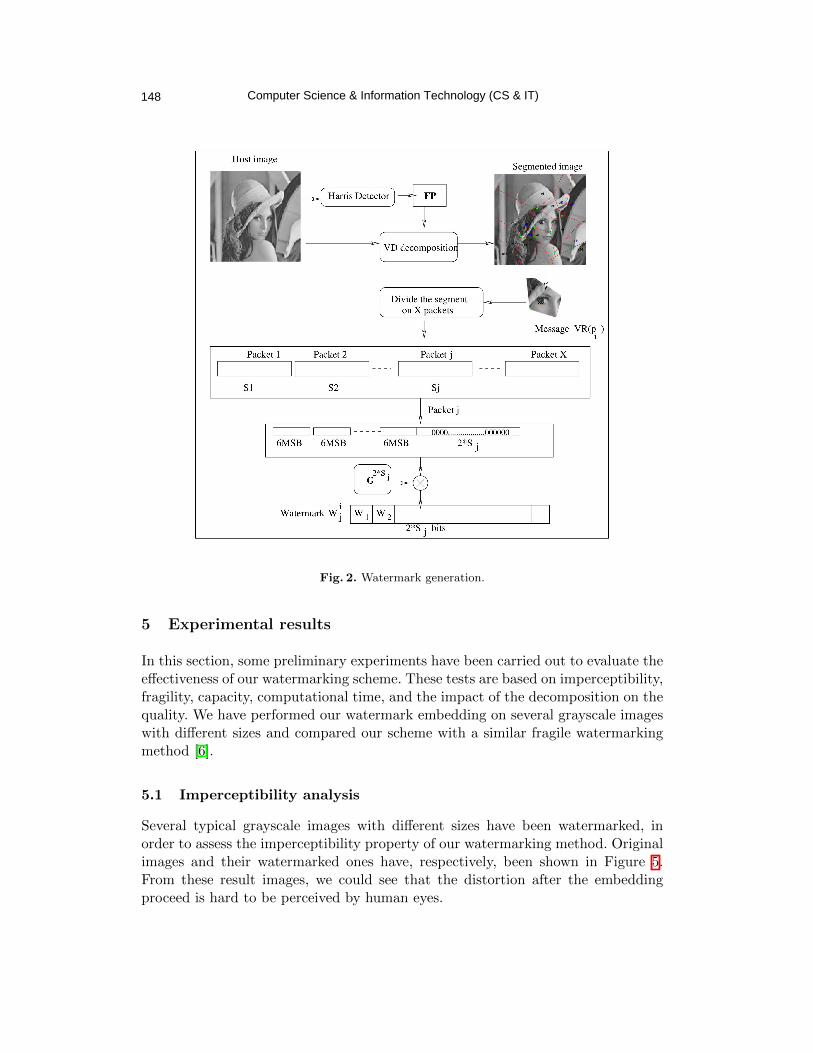
Fig. 2. Watermark generation.
5 Experimental results
In this section, some preliminary experiments have been carried out to evaluate theeffectiveness of our watermarking scheme. These tests are based on imperceptibility,fragility, capacity, computational time, and the impact of the decomposition on thequality. We have performed our watermark embedding on several grayscale imageswith different sizes and compared our scheme with a similar fragile watermarkingmethod [6].
5.1 Imperceptibility analysis
Several typical grayscale images with different sizes have been watermarked, inorder to assess the imperceptibility property of our watermarking method. Originalimages and their watermarked ones have, respectively, been shown in Figure 5.From these result images, we could see that the distortion after the embeddingproceed is hard to be perceived by human eyes.
Computer Science & Information Technology (CS & IT)148
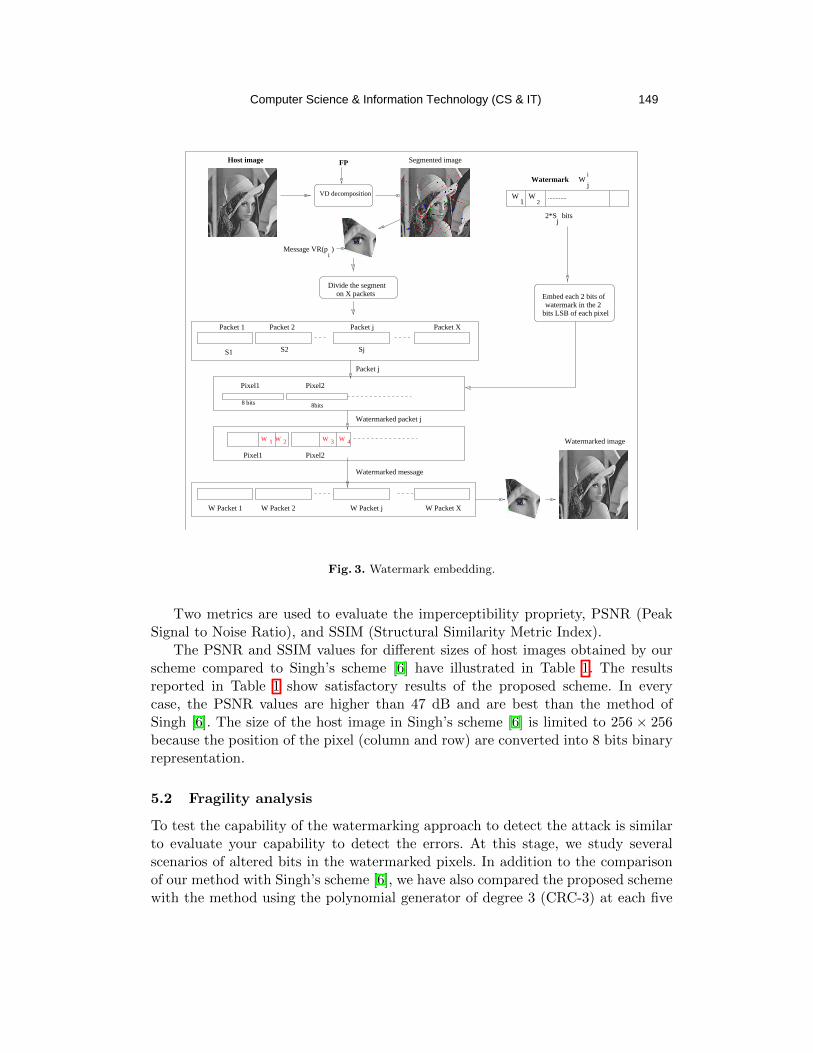
Packet 2Packet 1
Divide the segmenton X packets
Packet X
Watermark
Segmented image
W1
W2
............
2*S
Embed each 2 bits of watermark in the 2
bits LSB of each pixel
bitsj
Pixel2 Pixel1
8 bits 8bits
1 2WW
Pixel1 Pixel2
W Packet 1 W Packet XW Packet 2
Watermarked message
Watermarked image4W3W
FPHost image
iMessage VR(p )
jW
i
Packet j
S1 S2 Sj
Packet j
Watermarked packet j
W Packet j
VD decomposition
Fig. 3. Watermark embedding.
Two metrics are used to evaluate the imperceptibility propriety, PSNR (PeakSignal to Noise Ratio), and SSIM (Structural Similarity Metric Index).
The PSNR and SSIM values for different sizes of host images obtained by ourscheme compared to Singh’s scheme [6] have illustrated in Table 1. The resultsreported in Table 1 show satisfactory results of the proposed scheme. In everycase, the PSNR values are higher than 47 dB and are best than the method ofSingh [6]. The size of the host image in Singh’s scheme [6] is limited to 256 × 256because the position of the pixel (column and row) are converted into 8 bits binaryrepresentation.
5.2 Fragility analysis
To test the capability of the watermarking approach to detect the attack is similarto evaluate your capability to detect the errors. At this stage, we study severalscenarios of altered bits in the watermarked pixels. In addition to the comparisonof our method with Singh’s scheme [6], we have also compared the proposed schemewith the method using the polynomial generator of degree 3 (CRC-3) at each five
Computer Science & Information Technology (CS & IT) 149
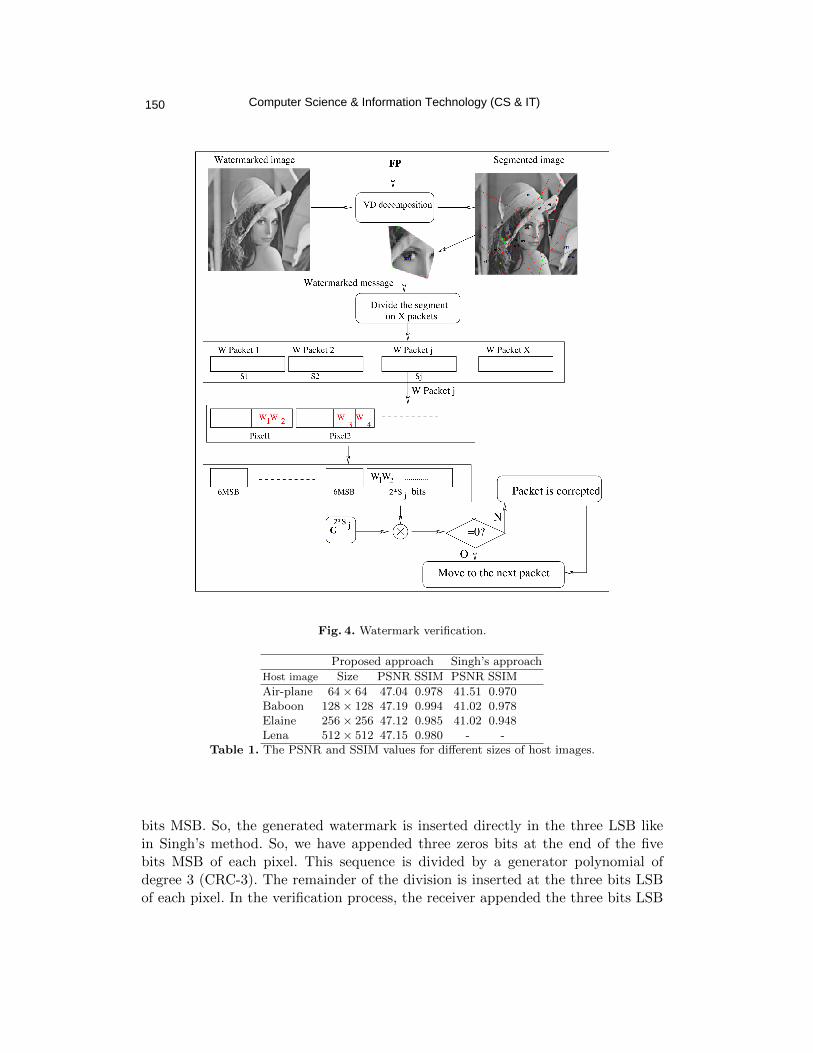
Fig. 4. Watermark verification.
Proposed approach Singh’s approach
Host image Size PSNR SSIM PSNR SSIM
Air-plane 64× 64 47.04 0.978 41.51 0.970Baboon 128× 128 47.19 0.994 41.02 0.978Elaine 256× 256 47.12 0.985 41.02 0.948Lena 512× 512 47.15 0.980 - -
Table 1. The PSNR and SSIM values for different sizes of host images.
bits MSB. So, the generated watermark is inserted directly in the three LSB likein Singh’s method. So, we have appended three zeros bits at the end of the fivebits MSB of each pixel. This sequence is divided by a generator polynomial ofdegree 3 (CRC-3). The remainder of the division is inserted at the three bits LSBof each pixel. In the verification process, the receiver appended the three bits LSB
Computer Science & Information Technology (CS & IT)150
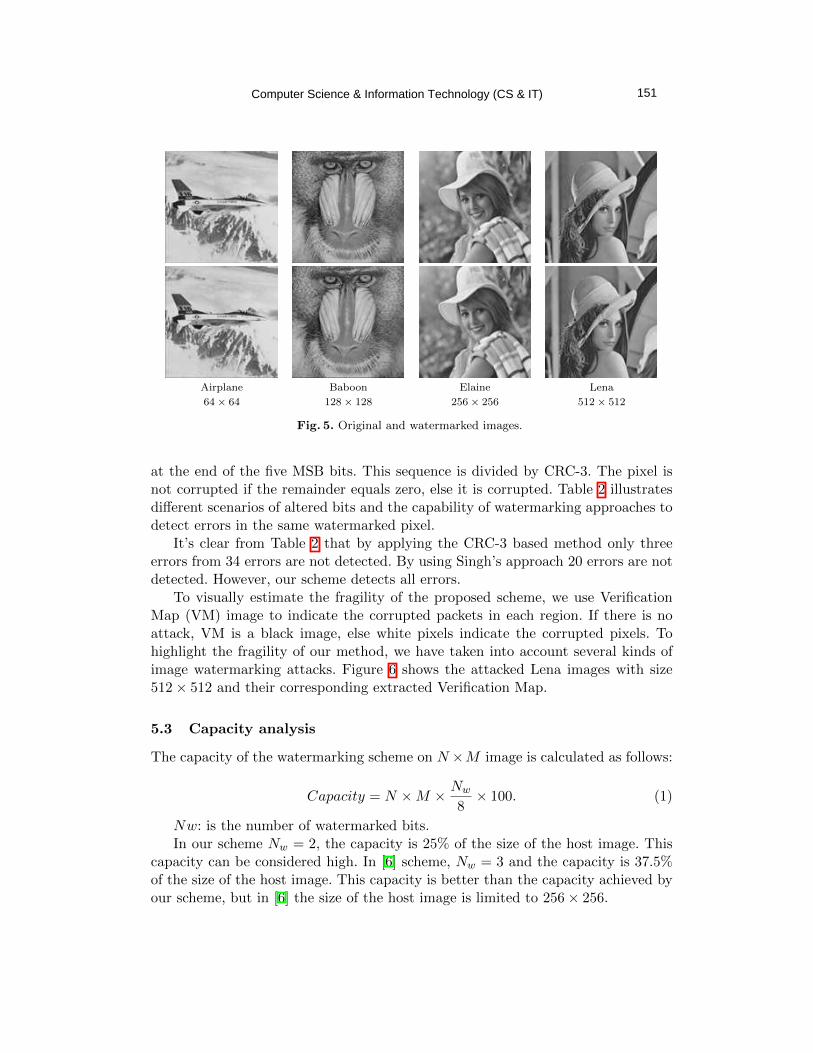
Airplane
64× 64
Baboon
128× 128
Elaine
256× 256
Lena
512× 512
Fig. 5. Original and watermarked images.
at the end of the five MSB bits. This sequence is divided by CRC-3. The pixel isnot corrupted if the remainder equals zero, else it is corrupted. Table 2 illustratesdifferent scenarios of altered bits and the capability of watermarking approaches todetect errors in the same watermarked pixel.
It’s clear from Table 2 that by applying the CRC-3 based method only threeerrors from 34 errors are not detected. By using Singh’s approach 20 errors are notdetected. However, our scheme detects all errors.
To visually estimate the fragility of the proposed scheme, we use VerificationMap (VM) image to indicate the corrupted packets in each region. If there is noattack, VM is a black image, else white pixels indicate the corrupted pixels. Tohighlight the fragility of our method, we have taken into account several kinds ofimage watermarking attacks. Figure 6 shows the attacked Lena images with size512× 512 and their corresponding extracted Verification Map.
5.3 Capacity analysis
The capacity of the watermarking scheme on N ×M image is calculated as follows:
Capacity = N ×M × Nw
8× 100. (1)
Nw: is the number of watermarked bits.In our scheme Nw = 2, the capacity is 25% of the size of the host image. This
capacity can be considered high. In [6] scheme, Nw = 3 and the capacity is 37.5%of the size of the host image. This capacity is better than the capacity achieved byour scheme, but in [6] the size of the host image is limited to 256× 256.
Computer Science & Information Technology (CS & IT) 151
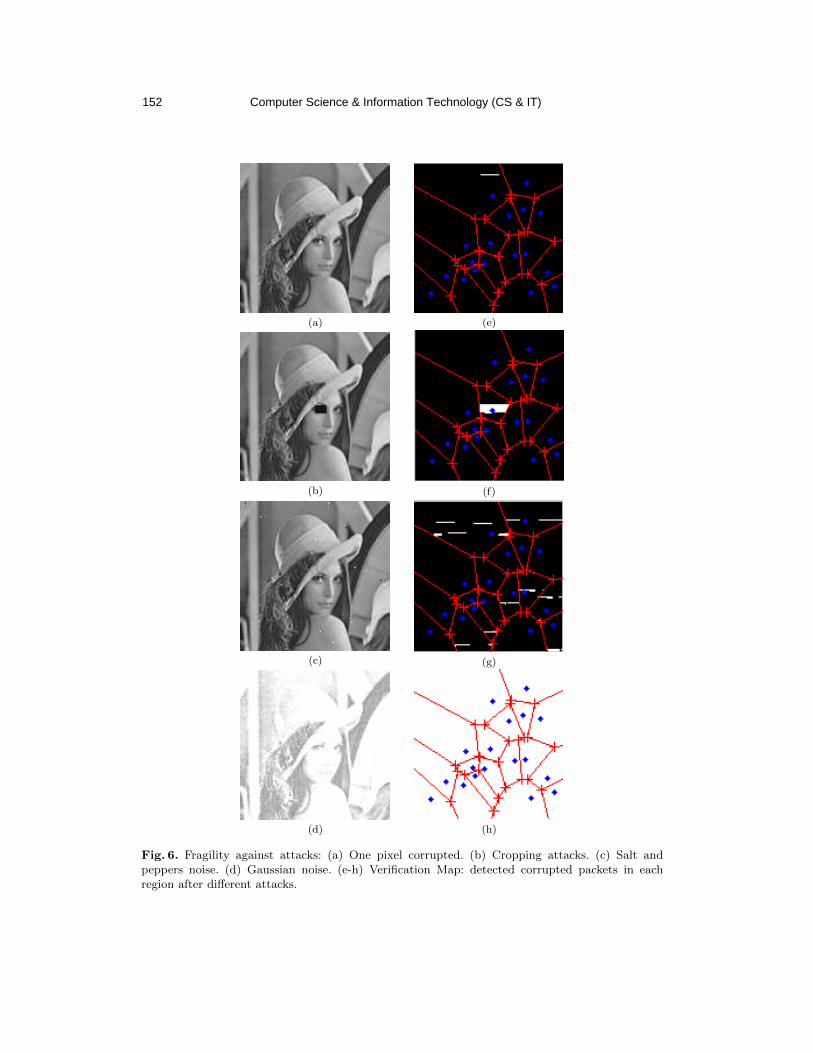
(a) (e)
(b) (f)
(c) (g)
(d) (h)
Fig. 6. Fragility against attacks: (a) One pixel corrupted. (b) Cropping attacks. (c) Salt andpeppers noise. (d) Gaussian noise. (e-h) Verification Map: detected corrupted packets in eachregion after different attacks.
Computer Science & Information Technology (CS & IT)152
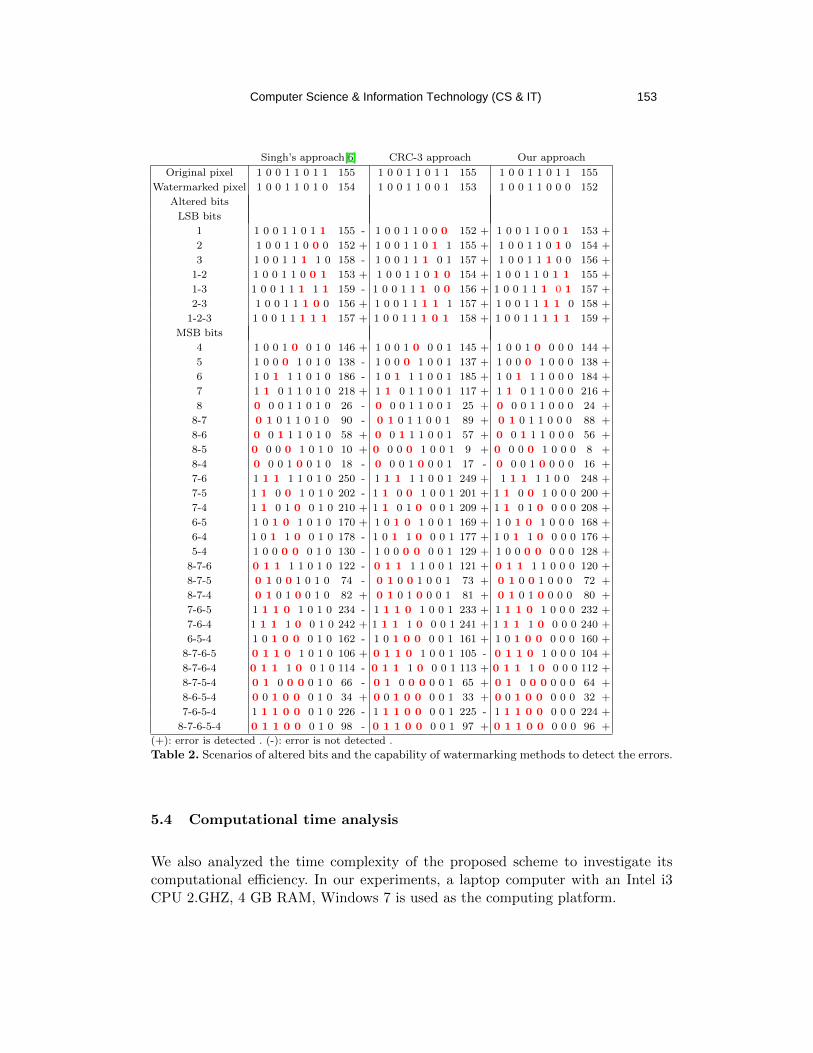
Singh’s approach[6] CRC-3 approach Our approach
Original pixel 1 0 0 1 1 0 1 1 155 1 0 0 1 1 0 1 1 155 1 0 0 1 1 0 1 1 155
Watermarked pixel 1 0 0 1 1 0 1 0 154 1 0 0 1 1 0 0 1 153 1 0 0 1 1 0 0 0 152
Altered bits
LSB bits
1 1 0 0 1 1 0 1 1 155 - 1 0 0 1 1 0 0 0 152 + 1 0 0 1 1 0 0 1 153 +
2 1 0 0 1 1 0 0 0 152 + 1 0 0 1 1 0 1 1 155 + 1 0 0 1 1 0 1 0 154 +
3 1 0 0 1 1 1 1 0 158 - 1 0 0 1 1 1 0 1 157 + 1 0 0 1 1 1 0 0 156 +
1-2 1 0 0 1 1 0 0 1 153 + 1 0 0 1 1 0 1 0 154 + 1 0 0 1 1 0 1 1 155 +
1-3 1 0 0 1 1 1 1 1 159 - 1 0 0 1 1 1 0 0 156 + 1 0 0 1 1 1 0 1 157 +
2-3 1 0 0 1 1 1 0 0 156 + 1 0 0 1 1 1 1 1 157 + 1 0 0 1 1 1 1 0 158 +
1-2-3 1 0 0 1 1 1 1 1 157 + 1 0 0 1 1 1 0 1 158 + 1 0 0 1 1 1 1 1 159 +
MSB bits
4 1 0 0 1 0 0 1 0 146 + 1 0 0 1 0 0 0 1 145 + 1 0 0 1 0 0 0 0 144 +
5 1 0 0 0 1 0 1 0 138 - 1 0 0 0 1 0 0 1 137 + 1 0 0 0 1 0 0 0 138 +
6 1 0 1 1 1 0 1 0 186 - 1 0 1 1 1 0 0 1 185 + 1 0 1 1 1 0 0 0 184 +
7 1 1 0 1 1 0 1 0 218 + 1 1 0 1 1 0 0 1 117 + 1 1 0 1 1 0 0 0 216 +
8 0 0 0 1 1 0 1 0 26 - 0 0 0 1 1 0 0 1 25 + 0 0 0 1 1 0 0 0 24 +
8-7 0 1 0 1 1 0 1 0 90 - 0 1 0 1 1 0 0 1 89 + 0 1 0 1 1 0 0 0 88 +
8-6 0 0 1 1 1 0 1 0 58 + 0 0 1 1 1 0 0 1 57 + 0 0 1 1 1 0 0 0 56 +
8-5 0 0 0 0 1 0 1 0 10 + 0 0 0 0 1 0 0 1 9 + 0 0 0 0 1 0 0 0 8 +
8-4 0 0 0 1 0 0 1 0 18 - 0 0 0 1 0 0 0 1 17 - 0 0 0 1 0 0 0 0 16 +
7-6 1 1 1 1 1 0 1 0 250 - 1 1 1 1 1 0 0 1 249 + 1 1 1 1 1 0 0 248 +
7-5 1 1 0 0 1 0 1 0 202 - 1 1 0 0 1 0 0 1 201 + 1 1 0 0 1 0 0 0 200 +
7-4 1 1 0 1 0 0 1 0 210 + 1 1 0 1 0 0 0 1 209 + 1 1 0 1 0 0 0 0 208 +
6-5 1 0 1 0 1 0 1 0 170 + 1 0 1 0 1 0 0 1 169 + 1 0 1 0 1 0 0 0 168 +
6-4 1 0 1 1 0 0 1 0 178 - 1 0 1 1 0 0 0 1 177 + 1 0 1 1 0 0 0 0 176 +
5-4 1 0 0 0 0 0 1 0 130 - 1 0 0 0 0 0 0 1 129 + 1 0 0 0 0 0 0 0 128 +
8-7-6 0 1 1 1 1 0 1 0 122 - 0 1 1 1 1 0 0 1 121 + 0 1 1 1 1 0 0 0 120 +
8-7-5 0 1 0 0 1 0 1 0 74 - 0 1 0 0 1 0 0 1 73 + 0 1 0 0 1 0 0 0 72 +
8-7-4 0 1 0 1 0 0 1 0 82 + 0 1 0 1 0 0 0 1 81 + 0 1 0 1 0 0 0 0 80 +
7-6-5 1 1 1 0 1 0 1 0 234 - 1 1 1 0 1 0 0 1 233 + 1 1 1 0 1 0 0 0 232 +
7-6-4 1 1 1 1 0 0 1 0 242 + 1 1 1 1 0 0 0 1 241 + 1 1 1 1 0 0 0 0 240 +
6-5-4 1 0 1 0 0 0 1 0 162 - 1 0 1 0 0 0 0 1 161 + 1 0 1 0 0 0 0 0 160 +
8-7-6-5 0 1 1 0 1 0 1 0 106 + 0 1 1 0 1 0 0 1 105 - 0 1 1 0 1 0 0 0 104 +
8-7-6-4 0 1 1 1 0 0 1 0 114 - 0 1 1 1 0 0 0 1 113 + 0 1 1 1 0 0 0 0 112 +
8-7-5-4 0 1 0 0 0 0 1 0 66 - 0 1 0 0 0 0 0 1 65 + 0 1 0 0 0 0 0 0 64 +
8-6-5-4 0 0 1 0 0 0 1 0 34 + 0 0 1 0 0 0 0 1 33 + 0 0 1 0 0 0 0 0 32 +
7-6-5-4 1 1 1 0 0 0 1 0 226 - 1 1 1 0 0 0 0 1 225 - 1 1 1 0 0 0 0 0 224 +
8-7-6-5-4 0 1 1 0 0 0 1 0 98 - 0 1 1 0 0 0 0 1 97 + 0 1 1 0 0 0 0 0 96 +
(+): error is detected . (-): error is not detected .
Table 2. Scenarios of altered bits and the capability of watermarking methods to detect the errors.
5.4 Computational time analysis
We also analyzed the time complexity of the proposed scheme to investigate itscomputational efficiency. In our experiments, a laptop computer with an Intel i3CPU 2.GHZ, 4 GB RAM, Windows 7 is used as the computing platform.
Computer Science & Information Technology (CS & IT) 153
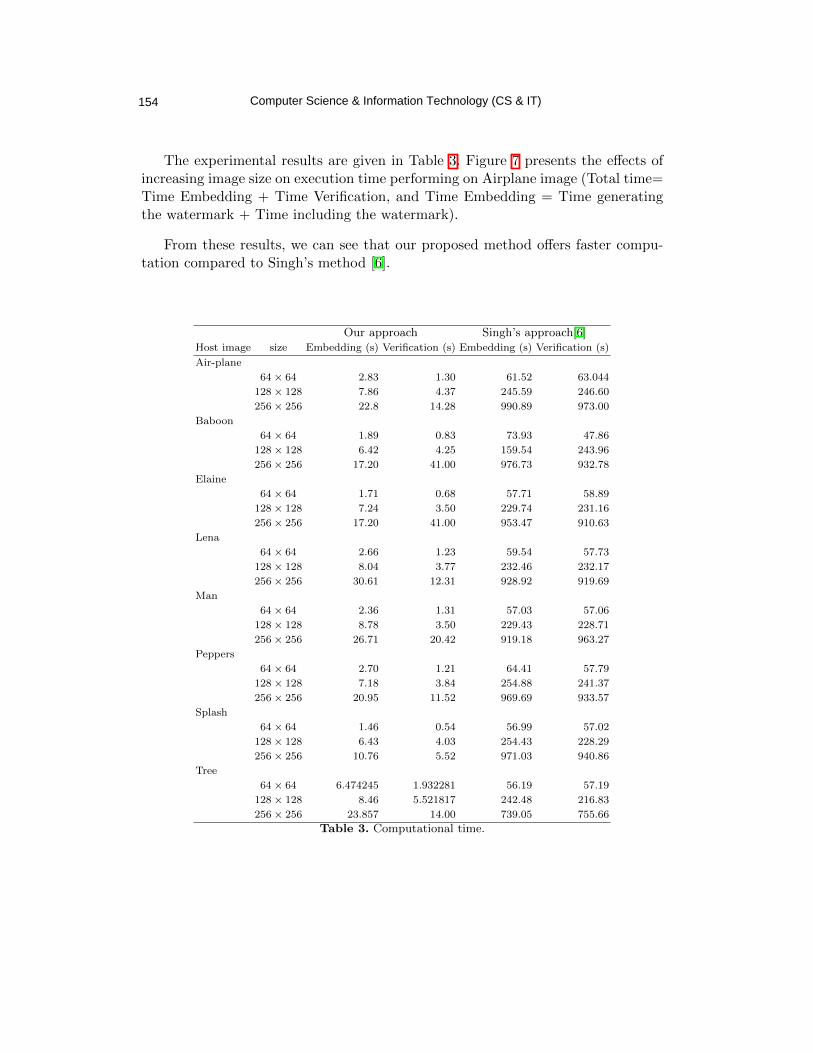
The experimental results are given in Table 3. Figure 7 presents the effects ofincreasing image size on execution time performing on Airplane image (Total time=Time Embedding + Time Verification, and Time Embedding = Time generatingthe watermark + Time including the watermark).
From these results, we can see that our proposed method offers faster compu-tation compared to Singh’s method [6].
Our approach Singh’s approach[6]Host image size Embedding (s) Verification (s) Embedding (s) Verification (s)
Air-plane
64× 64 2.83 1.30 61.52 63.044
128× 128 7.86 4.37 245.59 246.60
256× 256 22.8 14.28 990.89 973.00
Baboon
64× 64 1.89 0.83 73.93 47.86
128× 128 6.42 4.25 159.54 243.96
256× 256 17.20 41.00 976.73 932.78
Elaine
64× 64 1.71 0.68 57.71 58.89
128× 128 7.24 3.50 229.74 231.16
256× 256 17.20 41.00 953.47 910.63
Lena
64× 64 2.66 1.23 59.54 57.73
128× 128 8.04 3.77 232.46 232.17
256× 256 30.61 12.31 928.92 919.69
Man
64× 64 2.36 1.31 57.03 57.06
128× 128 8.78 3.50 229.43 228.71
256× 256 26.71 20.42 919.18 963.27
Peppers
64× 64 2.70 1.21 64.41 57.79
128× 128 7.18 3.84 254.88 241.37
256× 256 20.95 11.52 969.69 933.57
Splash
64× 64 1.46 0.54 56.99 57.02
128× 128 6.43 4.03 254.43 228.29
256× 256 10.76 5.52 971.03 940.86
Tree
64× 64 6.474245 1.932281 56.19 57.19
128× 128 8.46 5.521817 242.48 216.83
256× 256 23.857 14.00 739.05 755.66
Table 3. Computational time.
Computer Science & Information Technology (CS & IT)154
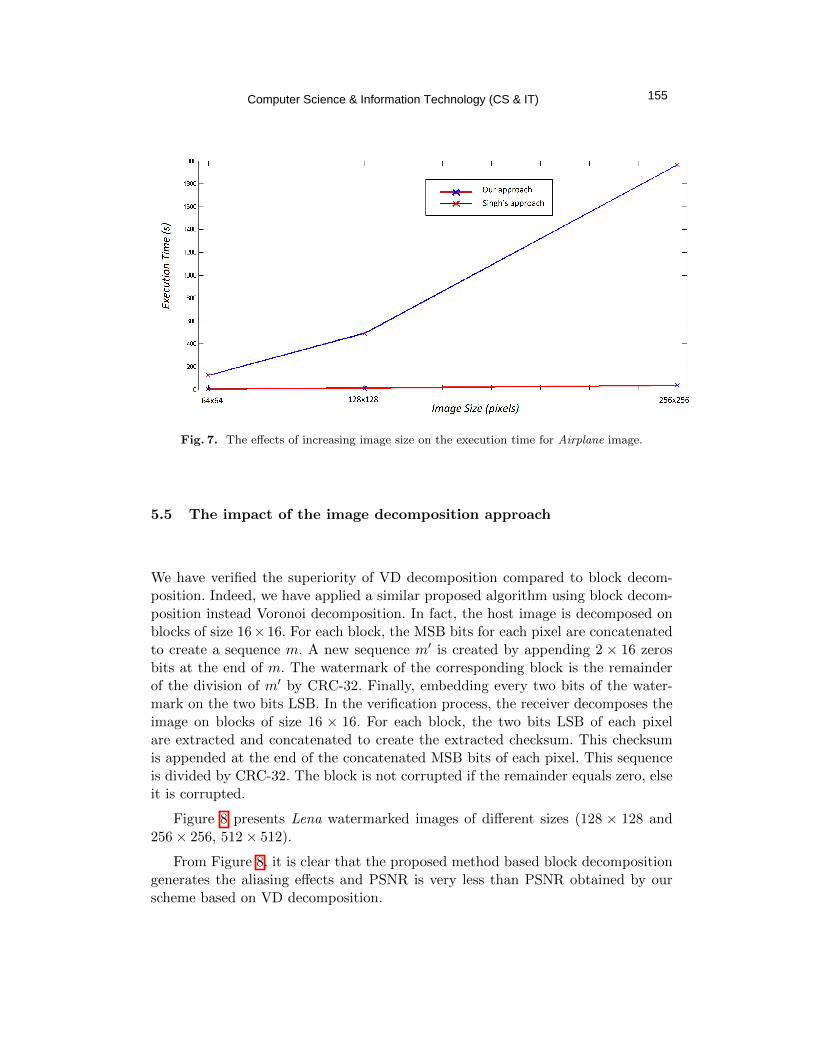
Fig. 7. The effects of increasing image size on the execution time for Airplane image.
5.5 The impact of the image decomposition approach
We have verified the superiority of VD decomposition compared to block decom-position. Indeed, we have applied a similar proposed algorithm using block decom-position instead Voronoi decomposition. In fact, the host image is decomposed onblocks of size 16×16. For each block, the MSB bits for each pixel are concatenatedto create a sequence m. A new sequence m′ is created by appending 2 × 16 zerosbits at the end of m. The watermark of the corresponding block is the remainderof the division of m′ by CRC-32. Finally, embedding every two bits of the water-mark on the two bits LSB. In the verification process, the receiver decomposes theimage on blocks of size 16 × 16. For each block, the two bits LSB of each pixelare extracted and concatenated to create the extracted checksum. This checksumis appended at the end of the concatenated MSB bits of each pixel. This sequenceis divided by CRC-32. The block is not corrupted if the remainder equals zero, elseit is corrupted.
Figure 8 presents Lena watermarked images of different sizes (128 × 128 and256× 256, 512× 512).
From Figure 8, it is clear that the proposed method based block decompositiongenerates the aliasing effects and PSNR is very less than PSNR obtained by ourscheme based on VD decomposition.
Computer Science & Information Technology (CS & IT) 155
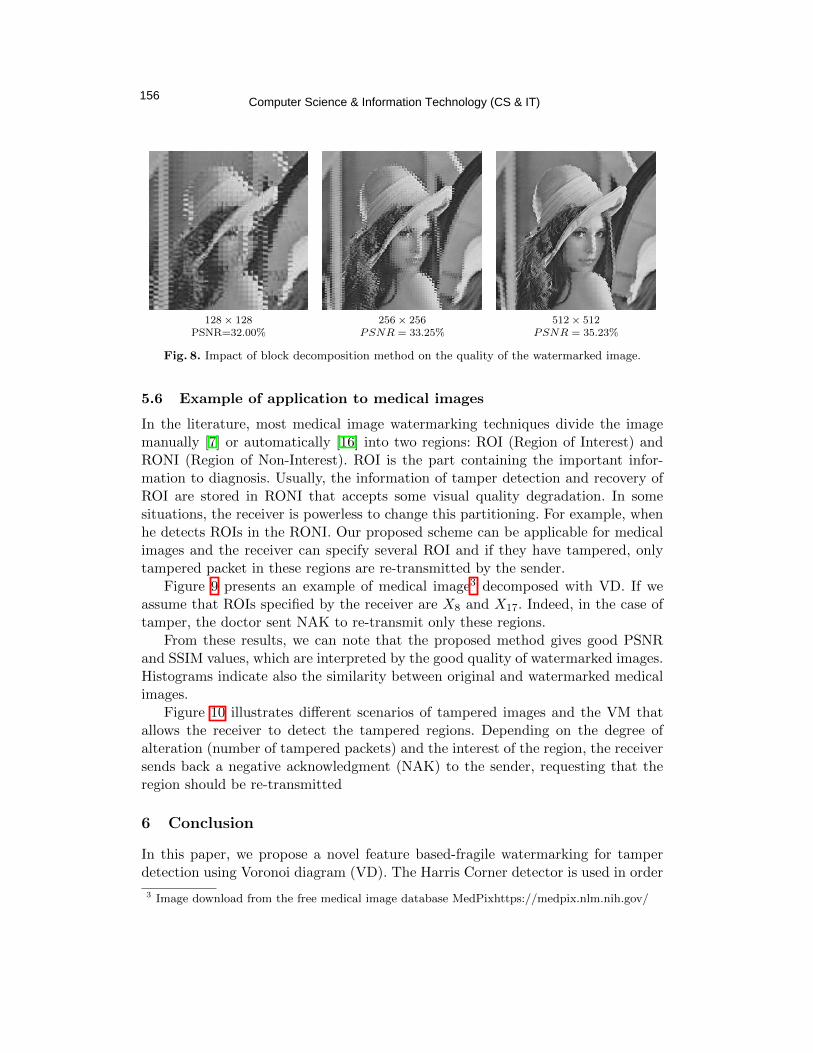
128× 128PSNR=32.00%
256× 256PSNR = 33.25%
512× 512PSNR = 35.23%
Fig. 8. Impact of block decomposition method on the quality of the watermarked image.
5.6 Example of application to medical images
In the literature, most medical image watermarking techniques divide the imagemanually [7] or automatically [16] into two regions: ROI (Region of Interest) andRONI (Region of Non-Interest). ROI is the part containing the important infor-mation to diagnosis. Usually, the information of tamper detection and recovery ofROI are stored in RONI that accepts some visual quality degradation. In somesituations, the receiver is powerless to change this partitioning. For example, whenhe detects ROIs in the RONI. Our proposed scheme can be applicable for medicalimages and the receiver can specify several ROI and if they have tampered, onlytampered packet in these regions are re-transmitted by the sender.
Figure 9 presents an example of medical image3 decomposed with VD. If weassume that ROIs specified by the receiver are X8 and X17. Indeed, in the case oftamper, the doctor sent NAK to re-transmit only these regions.
From these results, we can note that the proposed method gives good PSNRand SSIM values, which are interpreted by the good quality of watermarked images.Histograms indicate also the similarity between original and watermarked medicalimages.
Figure 10 illustrates different scenarios of tampered images and the VM thatallows the receiver to detect the tampered regions. Depending on the degree ofalteration (number of tampered packets) and the interest of the region, the receiversends back a negative acknowledgment (NAK) to the sender, requesting that theregion should be re-transmitted
6 Conclusion
In this paper, we propose a novel feature based-fragile watermarking for tamperdetection using Voronoi diagram (VD). The Harris Corner detector is used in order
3 Image download from the free medical image database MedPixhttps://medpix.nlm.nih.gov/
Computer Science & Information Technology (CS & IT)156
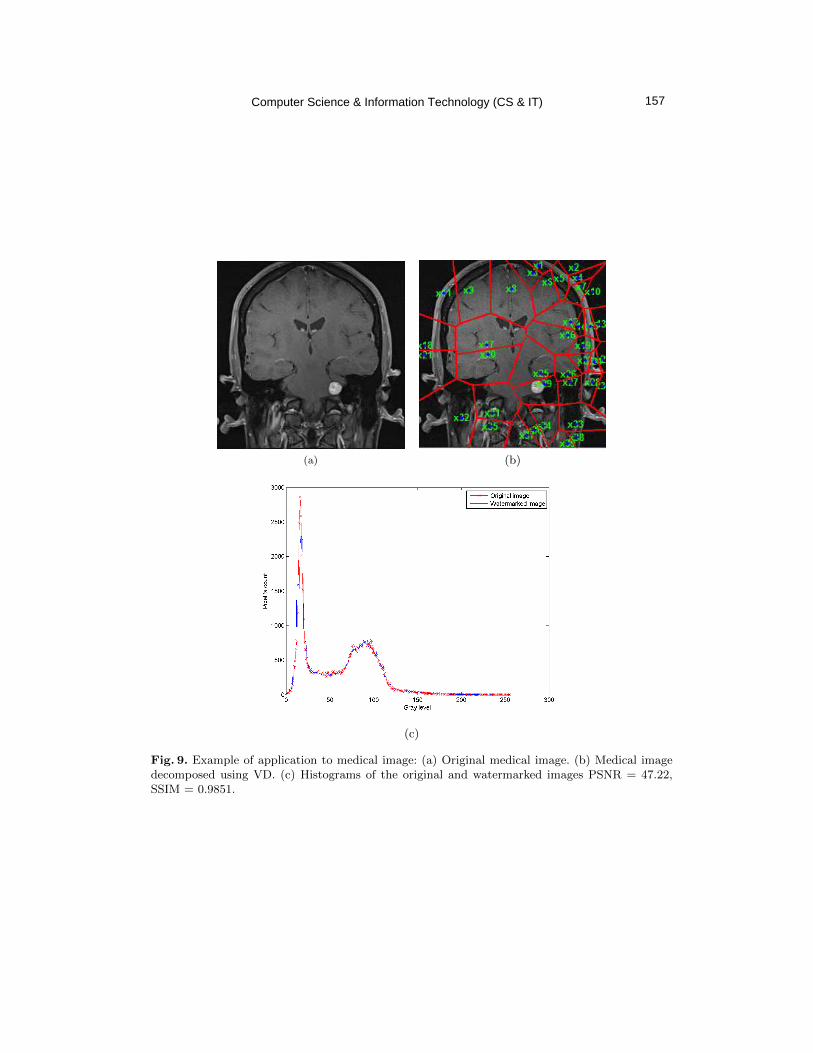
(a) (b)
(c)
Fig. 9. Example of application to medical image: (a) Original medical image. (b) Medical imagedecomposed using VD. (c) Histograms of the original and watermarked images PSNR = 47.22,SSIM = 0.9851.
Computer Science & Information Technology (CS & IT) 157
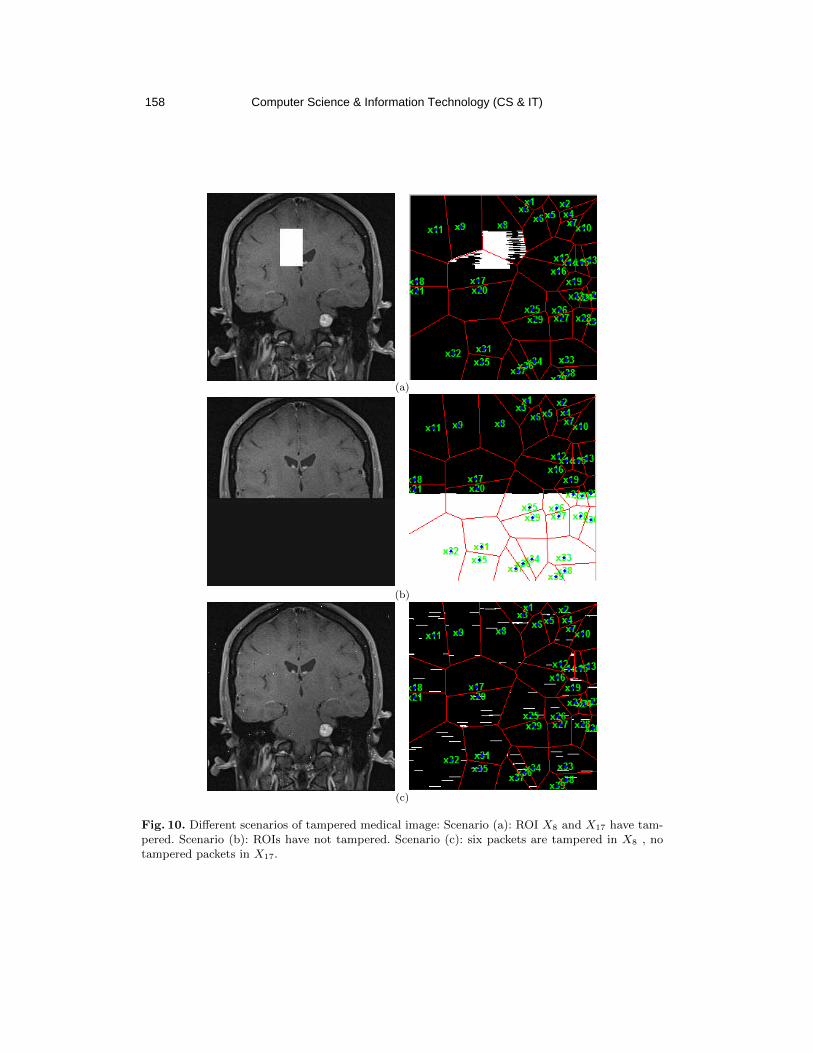
(a)
(b)
(c)
Fig. 10. Different scenarios of tampered medical image: Scenario (a): ROI X8 and X17 have tam-pered. Scenario (b): ROIs have not tampered. Scenario (c): six packets are tampered in X8 , notampered packets in X17.
Computer Science & Information Technology (CS & IT)158
to extract features points (FP) considered as germs to create Voronoi decomposi-tion of the image. The proposed method is secured using the watermarking publickey RSA to encrypt the FP. Our scheme is validated in terms of robustness andefficiency according to the well-known proprieties. Indeed, we have proved that ourscheme ensures a watermarking imperceptibility and the fragility criterion. Besides,the proposed watermarking technique is able to locate the tampered regions. More-over, we have verified that if an unauthorized modification occurred, the locationof the corrupted region will be accurately identified using our scheme. In additionto these assessments, we have also evaluated the run time of the proposed schemecomparing with a similar fragile watermarking scheme. We have proved that theVD decomposition is efficiently applied in the proposed scheme in term of the qual-ity of the watermarked image.The proposed method can be applicable in the casewhere the tamper detection is critical and only some regions of interest must bere-transmitted if they are corrupted, like in the case of medical images.
References
1. Barni, M., Cox, I., Kalker, T., Kim, H.: Digital Watermarking. In: International Workshop,IWDW, Siena, Italy. vol. 3710, pp. 15–17. Lecture Notes in Computer Science (2005)
2. Bas, P., Chassery, J., Macq, B.: Geometrically invariant watermarking using feature points.IEEE Transactions on Image Processing 11(9), 1014–1028 (2002)
3. Bashir, T., Usman, I., Albesher, A.A., Atawneh, S.H., Naqvi, S.S.: A dct domain smart vicinityreliant fragile watermarking technique for dibr 3d-tv. Automatika 61(1), 58–65 (2020)
4. Bhattacharjee, S., Kutter, M.: Compression tolerant image authentication. In: Internationalconference image processing. vol. 1, pp. 435–439. IEEE (1998)
5. Chauhan, D., Singh, A.K., Adarsh, A., Kumar, B., Saini, J.: Combining mexican hat waveletand spread spectrum for adaptive watermarking and its statistical detection using medicalimages. Multimedia Tools and Applications pp. 1–15 (2017)
6. Durgesh, S., Shivendra, S., Suneeta, A.: Self-embedding pixel wise fragile watermarking schemefor image authentication. In: IITM 2013, CCIS 276. pp. 111–122. Springer-Verlag Berlin Hei-delberg (2013)
7. Eswaraiah, R., Reddy, E.S.: Medical image watermarking technique for accurate tamper de-tection in roi and exact recovery of roi. International journal of telemedicine and applications2014, 13 (2014)
8. Golea, N.: A fragile watermarking scheme based CRC checksum and public key cryptosystemfor RGB color image authentication. In: 5th International Conference on Image and SignalProcessing (ICISP 2012). vol. 7340, pp. 316–325. LNCS, Springer (2012)
9. Golea, N.E.H., Melkemi, K.E.: Roi-based fragile watermarking for medical image tamper de-tection. International Journal of High Performance Computing and Networking 13(2), 199–210(2019)
10. Hung, K.L., Yen, C.Y.: Watermarking technique based on harris-laplace feature point detectorcapable of resisting geometric attacks. In: 2019 14th Asia Joint Conference on InformationSecurity (AsiaJCIS). pp. 119–126. IEEE (2019)
11. Huo, Y., Liu, J., Zhang, Q., Zeng, Y., Yang, F., Chang, J., Fan, Y., Liu, C.: Semi-fragile water-marking for color image authentication in power internet of things. In: 2019 IEEE InnovativeSmart Grid Technologies-Asia (ISGT Asia). pp. 2865–2869. IEEE (2019)
12. Kougianos, E., Mohanty, S.P., Mahapatra, R.N.: Hardware assisted watermarking for multi-media. Computers and Electrical Engineering 35(2), 339–358 (2009)
Computer Science & Information Technology (CS & IT) 159
13. Kutter, M., Bhattacharjee, S., Ebrahimi, T.: Towards second generation watermarkingschemes. In: International conference image processing. vol. 1, pp. 320–323. IEEE (1999)
14. Lee, H., Kim, H., Lee, H.: Robust image watermarking using local invariant features. OpticalEngineering - The Journal of SPIE (The International Society for Optical Engineering), U.S.A.45(3), 1–11 (2006)
15. Lin, P.L., Huang, P.W., Peng, A.W.: A fragile watermarking scheme for image authentica-tion with localization and recovery. In: IEEE Sixth International Symposium on MultimediaSoftware Engineering. pp. 146–153. IEEE (2004)
16. Memon, N.A., Chaudhry, A., Ahmad, M., Keerio, Z.A.: Hybrid watermarking of medical im-ages for roi authentication and recovery. International Journal of Computer Mathematics88(10), 2057–2071 (2011)
17. Niu, P.p., Wang, L., Shen, X., Zhang, S.y., Wang, X.y.: A novel robust image watermarking inquaternion wavelet domain based on superpixel segmentation. Multidimensional Systems andSignal Processing pp. 1–22 (2020)
18. Sahu, N., Sur, A.: Sift based video watermarking resistant to temporal scaling. Journal ofVisual Communication and Image Representation 45, 77–86 (2017)
19. Seo, J., Yoo, C.: Localized image watermarking based on feature points of scale-space repre-sentation. Pattern Recognition 37(7), 1365–1375 (2004)
20. Su, K., Kundur, D., Hatzinakos, D.: Spatially localized image dependent watermarking forstatistical invisibility and collusion resistance. IEEE Transaction on Multimedia 7(1), 52–66(2005)
21. Su, Q., Chen, B.: Robust color image watermarking technique in the spatial domain. SoftComputing 22(1), 91–106 (2018)
22. Suhail, M., Obaidat, M.: Digital Watermarking-Based DCT and JPEG Model. IEEE Trans-actions on Instrumentation and Measurement 52(5), 1640–1647 (2003)
23. Tang, C., Hang, H.: A feature-based robust digital image watermarking scheme. IEEE Trans-actions on Image Processing 51(4), 950–959 (2003)
24. Tommasini, T., Fusiello, A., Trucco, E., Roberto, V.: Marking good features track better. In:Computer Vision and Pattern Recognition. pp. 178–183. IEEE (1998)
25. Wang, X., Hou, L., Wu, J.: A feature-based robust digital image watermarking against geo-metric attacks. Image and Vision Computing 26(7), 980–989 (2008)
26. Wang, X., Yang, Y., Yang, H.: Invariant image watermarking using multiscale harris detectorand wavelet moments. Comput. Electr. Eng 36(41), 31–44 (2010)
27. Wei Lu, H.L., Chung, F.L.: Feature based robust watermarking using image normalization.Computers & Electrical Engineering 36(1), 2–18 (2010)
28. Xiaojun, Q., Ji, Q.: A Robust Content-Based Digital Image Watermarking Scheme. SignalProcessing 87(6), 1264–1280 (2007)
29. Yuan, X.C., Pun, C.M.: Geometrically invariant image watermarking based on feature ex-traction and zernike transform. International Journal of Security and Its Applications 6(2),217–222 (2012)
Computer Science & Information Technology (CS & IT)160
David C. Wyld et al. (Eds): CCSEA, BIoT, DKMP, CLOUD, NLCAI, SIPRO - 2020
pp. 161-174, 2020. CS & IT - CSCP 2020 DOI: 10.5121/csit.2020.101013
USING SDR PLATFORM TO EXTRACT THE
RF FINGERPRINT OF THE WIRELESS DEVICES FOR DEVICE IDENTIFICATION
Ting-Yu Lin, Chia-Min Lai and Chi-Wei Chen
Institute for Information Industry, Taipei, R.O.C, Taiwan
ABSTRACT Due to the advent of the Internet of Things era, the number of related wireless devices is increasing, making the abundant and complex information networks formed by communication
between devices. Therefore, security and trust between devices a huge challenge. In the
traditional identification method, there are identifiers such as hash-based message
authentication code, key, and so on, often used to mark a message that the receiving end can
verify it. However, this kind of identifiers is easy to tamper. Therefore, recently researchers
address the idea that using RF fingerprint, also called radio frequency fingerprint, for
identification. Our paper demonstrates a method that extracts properties and identifies each
device. We achieved a high identification rate, 99.9% accuracy in our experiments where the
devices communicate with Wi-Fi protocol. The proposed method can be used as a stand-alone
identification feature, or for two-factor authentication.
KEYWORDS Internet-of-Things (IoT), Authentication, RF fingerprint, Machine Learning (ML), Device
Identification.
1. INTRODUCTION The IoT, Internet of Things, is growing rapidly with the diverse technologies and usages. It
allows data to be transmitted between wireless devices and the Internet. In such a convenience
environment, a great number of devices are also increased and can be seen widely including medical devices, sensors and airplanes [1] (Figure 1). However, in the position of huge business
opportunities, it is also accompanied with risk. It might result in that the information systems to
be intruded, used, damaged, and modified if there is no appropriate management technology
about wireless devices. In other words, the importance of information protection and security cannot be ignored anymore.
The growing number of intelligent devices will create abundant and complex information network that allow the supply chain to utilize wireless technology to realize the communication
between devices. The utilization of the Internet not only help with building the connection
between humans but also linking between human and objects, object and objects. For example,
people make the use of smart phone to control the vehicle or intelligent appliances.
Safety aspect is the most concern issue in IoT. The application data can be personal, agriculture,
industry, enterprise, health care or environmental protection. It should be well-protected in case it is stolen or tampered. For example, the application can save physical conditions, purchasing
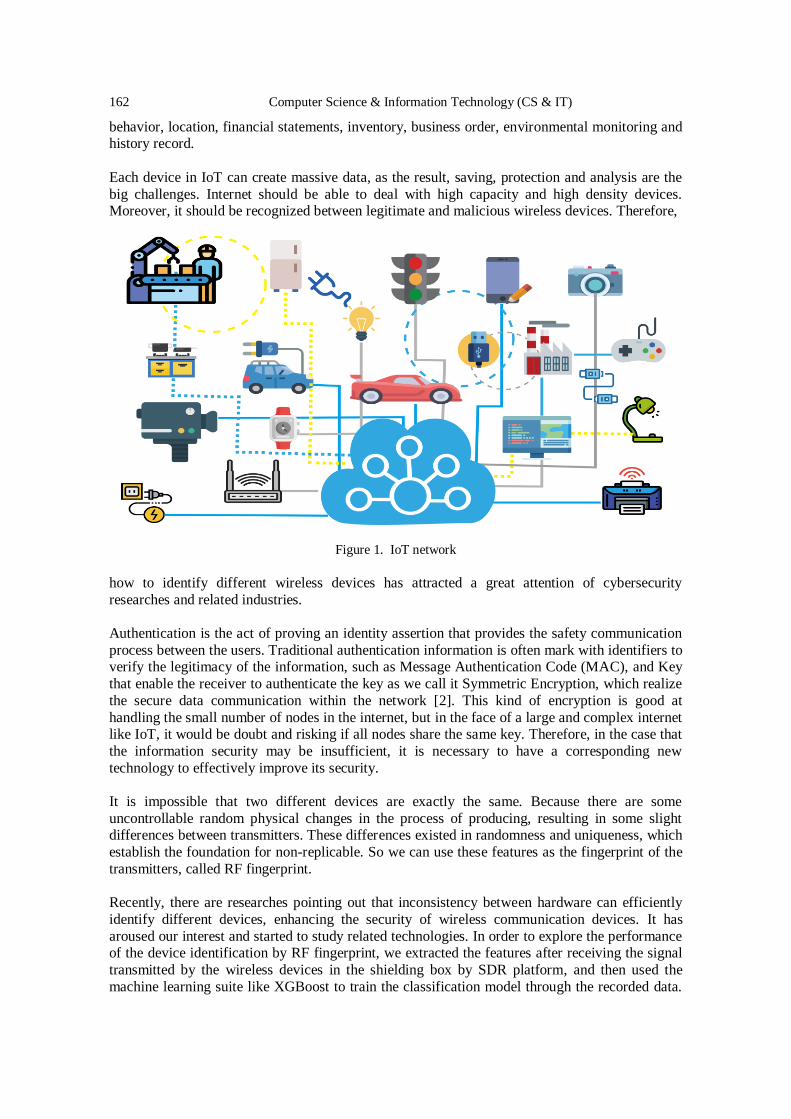
162 Computer Science & Information Technology (CS & IT)
behavior, location, financial statements, inventory, business order, environmental monitoring and history record.
Each device in IoT can create massive data, as the result, saving, protection and analysis are the
big challenges. Internet should be able to deal with high capacity and high density devices. Moreover, it should be recognized between legitimate and malicious wireless devices. Therefore,
Figure 1. IoT network
how to identify different wireless devices has attracted a great attention of cybersecurity
researches and related industries.
Authentication is the act of proving an identity assertion that provides the safety communication
process between the users. Traditional authentication information is often mark with identifiers to verify the legitimacy of the information, such as Message Authentication Code (MAC), and Key
that enable the receiver to authenticate the key as we call it Symmetric Encryption, which realize
the secure data communication within the network [2]. This kind of encryption is good at
handling the small number of nodes in the internet, but in the face of a large and complex internet like IoT, it would be doubt and risking if all nodes share the same key. Therefore, in the case that
the information security may be insufficient, it is necessary to have a corresponding new
technology to effectively improve its security.
It is impossible that two different devices are exactly the same. Because there are some
uncontrollable random physical changes in the process of producing, resulting in some slight differences between transmitters. These differences existed in randomness and uniqueness, which
establish the foundation for non-replicable. So we can use these features as the fingerprint of the
transmitters, called RF fingerprint.
Recently, there are researches pointing out that inconsistency between hardware can efficiently
identify different devices, enhancing the security of wireless communication devices. It has
aroused our interest and started to study related technologies. In order to explore the performance of the device identification by RF fingerprint, we extracted the features after receiving the signal
transmitted by the wireless devices in the shielding box by SDR platform, and then used the
machine learning suite like XGBoost to train the classification model through the recorded data.
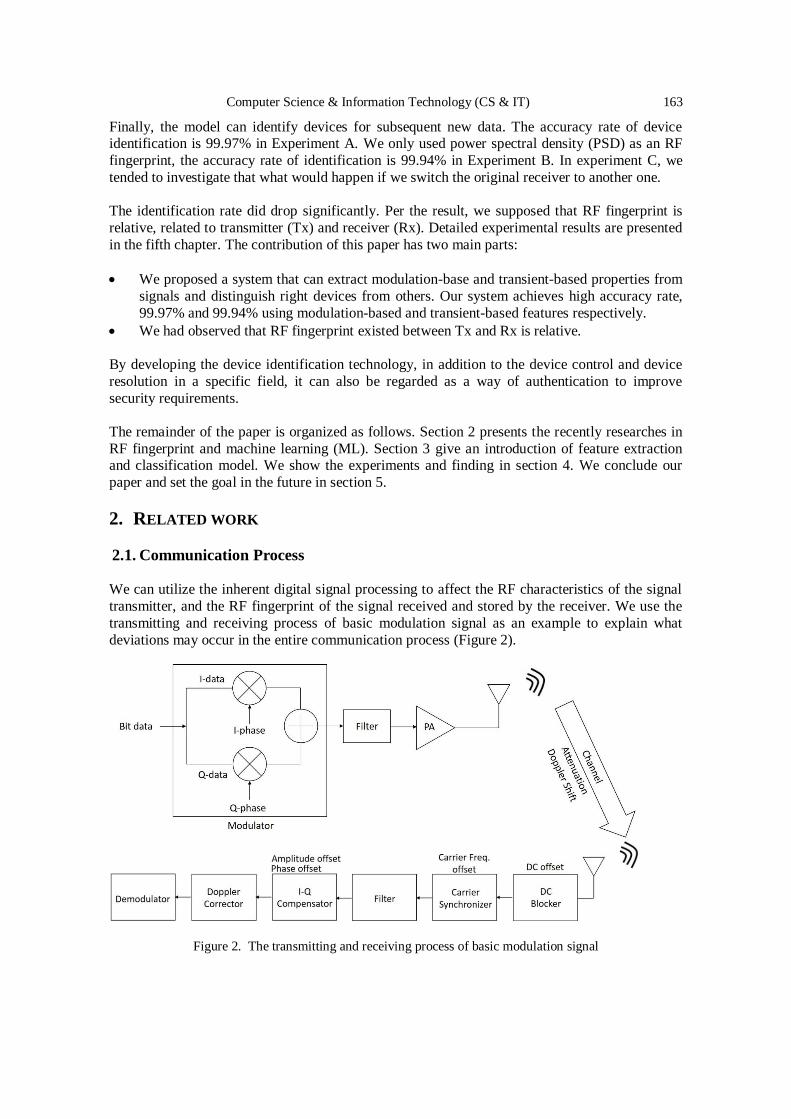
Computer Science & Information Technology (CS & IT) 163
Finally, the model can identify devices for subsequent new data. The accuracy rate of device identification is 99.97% in Experiment A. We only used power spectral density (PSD) as an RF
fingerprint, the accuracy rate of identification is 99.94% in Experiment B. In experiment C, we
tended to investigate that what would happen if we switch the original receiver to another one.
The identification rate did drop significantly. Per the result, we supposed that RF fingerprint is
relative, related to transmitter (Tx) and receiver (Rx). Detailed experimental results are presented
in the fifth chapter. The contribution of this paper has two main parts:
We proposed a system that can extract modulation-base and transient-based properties from
signals and distinguish right devices from others. Our system achieves high accuracy rate,
99.97% and 99.94% using modulation-based and transient-based features respectively.
We had observed that RF fingerprint existed between Tx and Rx is relative.
By developing the device identification technology, in addition to the device control and device
resolution in a specific field, it can also be regarded as a way of authentication to improve
security requirements.
The remainder of the paper is organized as follows. Section 2 presents the recently researches in
RF fingerprint and machine learning (ML). Section 3 give an introduction of feature extraction and classification model. We show the experiments and finding in section 4. We conclude our
paper and set the goal in the future in section 5.
2. RELATED WORK
2.1. Communication Process We can utilize the inherent digital signal processing to affect the RF characteristics of the signal
transmitter, and the RF fingerprint of the signal received and stored by the receiver. We use the
transmitting and receiving process of basic modulation signal as an example to explain what
deviations may occur in the entire communication process (Figure 2).
Figure 2. The transmitting and receiving process of basic modulation signal
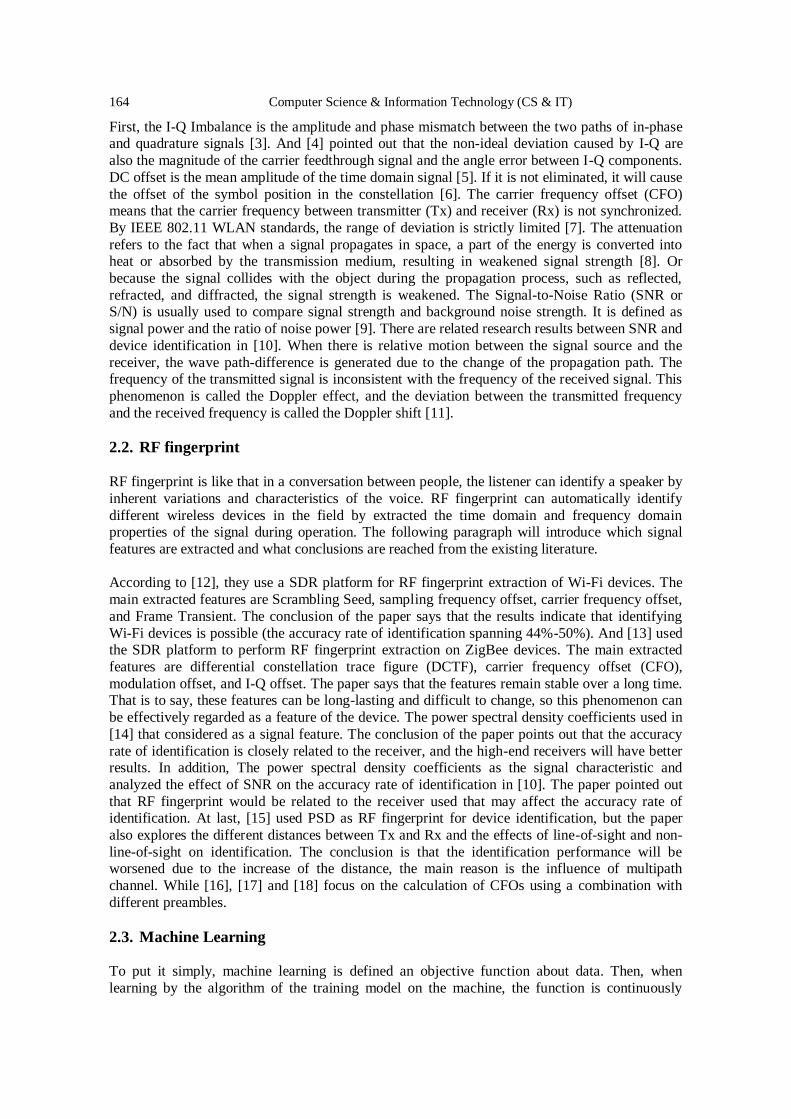
164 Computer Science & Information Technology (CS & IT)
First, the I-Q Imbalance is the amplitude and phase mismatch between the two paths of in-phase and quadrature signals [3]. And [4] pointed out that the non-ideal deviation caused by I-Q are
also the magnitude of the carrier feedthrough signal and the angle error between I-Q components.
DC offset is the mean amplitude of the time domain signal [5]. If it is not eliminated, it will cause
the offset of the symbol position in the constellation [6]. The carrier frequency offset (CFO) means that the carrier frequency between transmitter (Tx) and receiver (Rx) is not synchronized.
By IEEE 802.11 WLAN standards, the range of deviation is strictly limited [7]. The attenuation
refers to the fact that when a signal propagates in space, a part of the energy is converted into heat or absorbed by the transmission medium, resulting in weakened signal strength [8]. Or
because the signal collides with the object during the propagation process, such as reflected,
refracted, and diffracted, the signal strength is weakened. The Signal-to-Noise Ratio (SNR or S/N) is usually used to compare signal strength and background noise strength. It is defined as
signal power and the ratio of noise power [9]. There are related research results between SNR and
device identification in [10]. When there is relative motion between the signal source and the
receiver, the wave path-difference is generated due to the change of the propagation path. The frequency of the transmitted signal is inconsistent with the frequency of the received signal. This
phenomenon is called the Doppler effect, and the deviation between the transmitted frequency
and the received frequency is called the Doppler shift [11].
2.2. RF fingerprint RF fingerprint is like that in a conversation between people, the listener can identify a speaker by
inherent variations and characteristics of the voice. RF fingerprint can automatically identify
different wireless devices in the field by extracted the time domain and frequency domain properties of the signal during operation. The following paragraph will introduce which signal
features are extracted and what conclusions are reached from the existing literature.
According to [12], they use a SDR platform for RF fingerprint extraction of Wi-Fi devices. The
main extracted features are Scrambling Seed, sampling frequency offset, carrier frequency offset,
and Frame Transient. The conclusion of the paper says that the results indicate that identifying
Wi-Fi devices is possible (the accuracy rate of identification spanning 44%-50%). And [13] used the SDR platform to perform RF fingerprint extraction on ZigBee devices. The main extracted
features are differential constellation trace figure (DCTF), carrier frequency offset (CFO),
modulation offset, and I-Q offset. The paper says that the features remain stable over a long time. That is to say, these features can be long-lasting and difficult to change, so this phenomenon can
be effectively regarded as a feature of the device. The power spectral density coefficients used in
[14] that considered as a signal feature. The conclusion of the paper points out that the accuracy
rate of identification is closely related to the receiver, and the high-end receivers will have better results. In addition, The power spectral density coefficients as the signal characteristic and
analyzed the effect of SNR on the accuracy rate of identification in [10]. The paper pointed out
that RF fingerprint would be related to the receiver used that may affect the accuracy rate of identification. At last, [15] used PSD as RF fingerprint for device identification, but the paper
also explores the different distances between Tx and Rx and the effects of line-of-sight and non-
line-of-sight on identification. The conclusion is that the identification performance will be worsened due to the increase of the distance, the main reason is the influence of multipath
channel. While [16], [17] and [18] focus on the calculation of CFOs using a combination with
different preambles.
2.3. Machine Learning To put it simply, machine learning is defined an objective function about data. Then, when
learning by the algorithm of the training model on the machine, the function is continuously
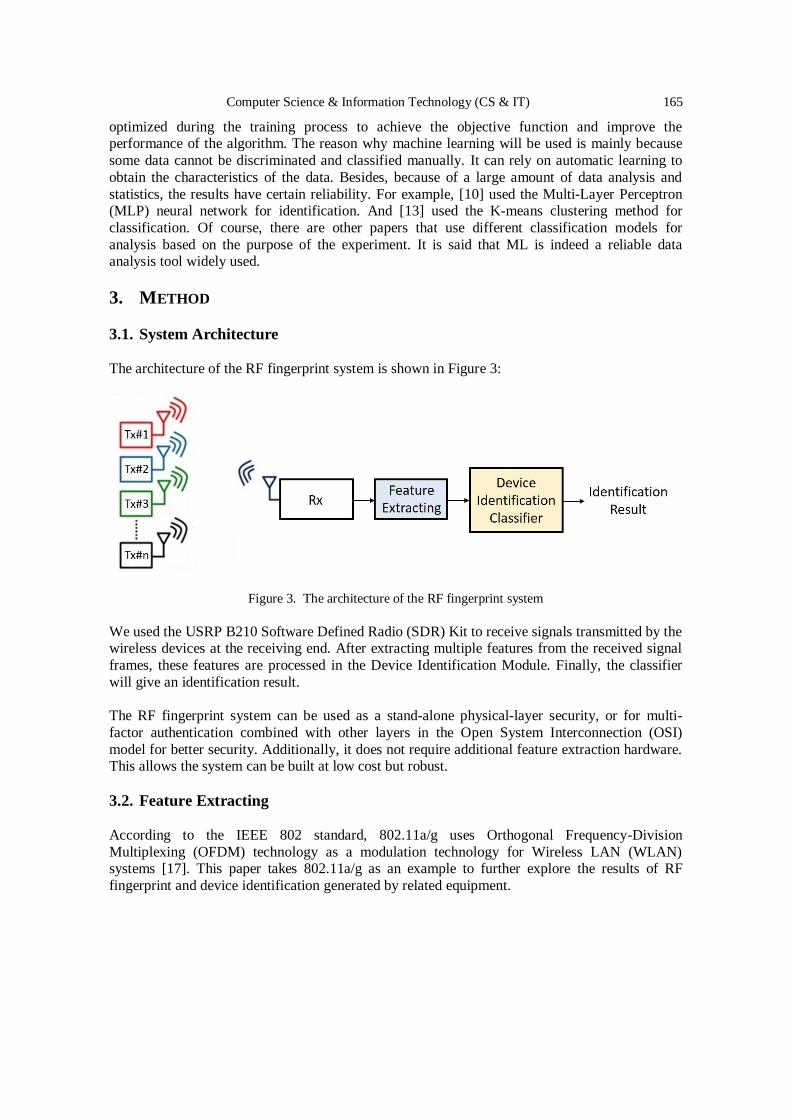
Computer Science & Information Technology (CS & IT) 165
optimized during the training process to achieve the objective function and improve the performance of the algorithm. The reason why machine learning will be used is mainly because
some data cannot be discriminated and classified manually. It can rely on automatic learning to
obtain the characteristics of the data. Besides, because of a large amount of data analysis and
statistics, the results have certain reliability. For example, [10] used the Multi-Layer Perceptron (MLP) neural network for identification. And [13] used the K-means clustering method for
classification. Of course, there are other papers that use different classification models for
analysis based on the purpose of the experiment. It is said that ML is indeed a reliable data analysis tool widely used.
3. METHOD
3.1. System Architecture
The architecture of the RF fingerprint system is shown in Figure 3:
Figure 3. The architecture of the RF fingerprint system
We used the USRP B210 Software Defined Radio (SDR) Kit to receive signals transmitted by the wireless devices at the receiving end. After extracting multiple features from the received signal
frames, these features are processed in the Device Identification Module. Finally, the classifier
will give an identification result.
The RF fingerprint system can be used as a stand-alone physical-layer security, or for multi-
factor authentication combined with other layers in the Open System Interconnection (OSI)
model for better security. Additionally, it does not require additional feature extraction hardware. This allows the system can be built at low cost but robust.
3.2. Feature Extracting
According to the IEEE 802 standard, 802.11a/g uses Orthogonal Frequency-Division
Multiplexing (OFDM) technology as a modulation technology for Wireless LAN (WLAN) systems [17]. This paper takes 802.11a/g as an example to further explore the results of RF
fingerprint and device identification generated by related equipment.
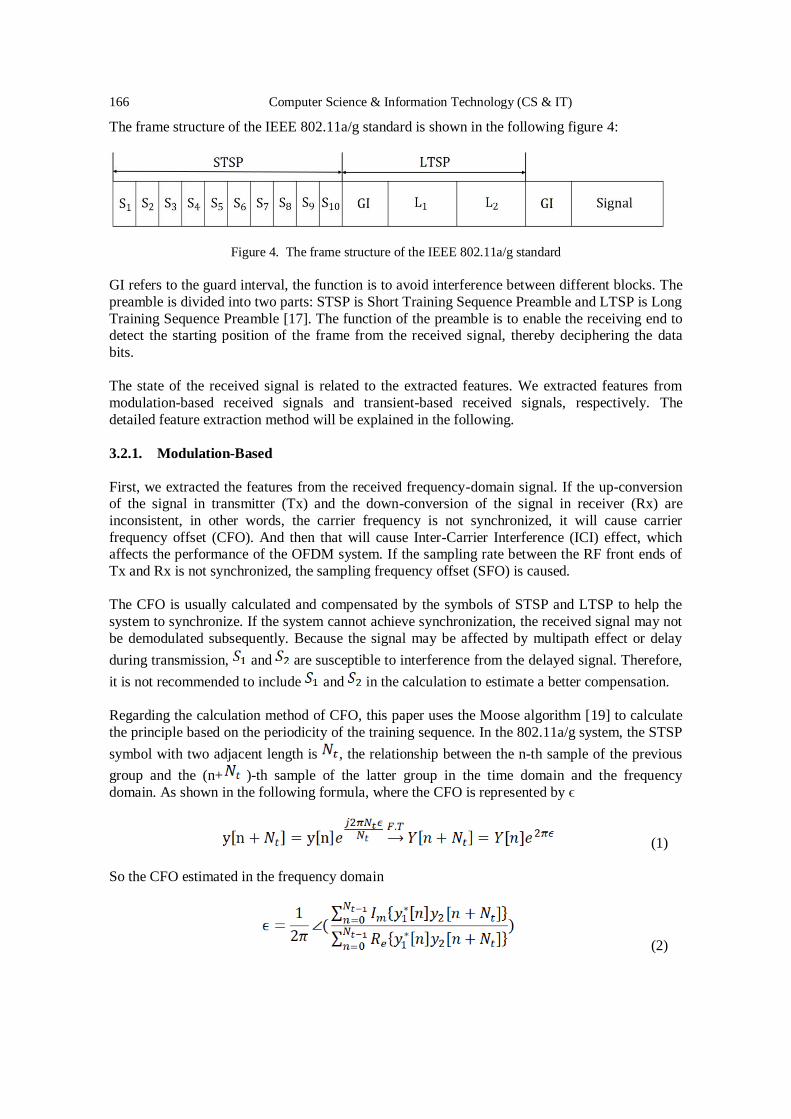
166 Computer Science & Information Technology (CS & IT)
The frame structure of the IEEE 802.11a/g standard is shown in the following figure 4:
Figure 4. The frame structure of the IEEE 802.11a/g standard
GI refers to the guard interval, the function is to avoid interference between different blocks. The
preamble is divided into two parts: STSP is Short Training Sequence Preamble and LTSP is Long
Training Sequence Preamble [17]. The function of the preamble is to enable the receiving end to detect the starting position of the frame from the received signal, thereby deciphering the data
bits.
The state of the received signal is related to the extracted features. We extracted features from
modulation-based received signals and transient-based received signals, respectively. The
detailed feature extraction method will be explained in the following.
3.2.1. Modulation-Based
First, we extracted the features from the received frequency-domain signal. If the up-conversion of the signal in transmitter (Tx) and the down-conversion of the signal in receiver (Rx) are
inconsistent, in other words, the carrier frequency is not synchronized, it will cause carrier
frequency offset (CFO). And then that will cause Inter-Carrier Interference (ICI) effect, which affects the performance of the OFDM system. If the sampling rate between the RF front ends of
Tx and Rx is not synchronized, the sampling frequency offset (SFO) is caused.
The CFO is usually calculated and compensated by the symbols of STSP and LTSP to help the
system to synchronize. If the system cannot achieve synchronization, the received signal may not
be demodulated subsequently. Because the signal may be affected by multipath effect or delay
during transmission, and are susceptible to interference from the delayed signal. Therefore,
it is not recommended to include and in the calculation to estimate a better compensation.
Regarding the calculation method of CFO, this paper uses the Moose algorithm [19] to calculate
the principle based on the periodicity of the training sequence. In the 802.11a/g system, the STSP
symbol with two adjacent length is , the relationship between the n-th sample of the previous
group and the (n+ )-th sample of the latter group in the time domain and the frequency
domain. As shown in the following formula, where the CFO is represented by ϵ
(1)
So the CFO estimated in the frequency domain
(2)
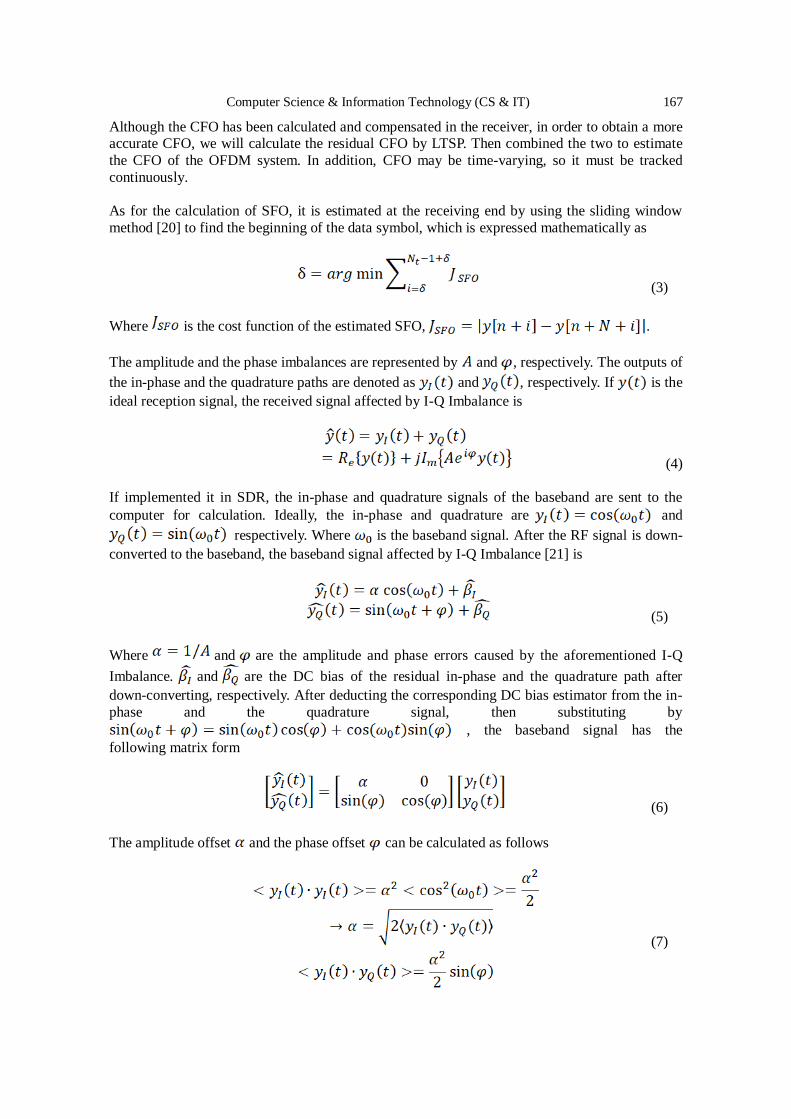
Computer Science & Information Technology (CS & IT) 167
Although the CFO has been calculated and compensated in the receiver, in order to obtain a more accurate CFO, we will calculate the residual CFO by LTSP. Then combined the two to estimate
the CFO of the OFDM system. In addition, CFO may be time-varying, so it must be tracked
continuously.
As for the calculation of SFO, it is estimated at the receiving end by using the sliding window
method [20] to find the beginning of the data symbol, which is expressed mathematically as
(3)
Where is the cost function of the estimated SFO, .
The amplitude and the phase imbalances are represented by and , respectively. The outputs of
the in-phase and the quadrature paths are denoted as and , respectively. If is the
ideal reception signal, the received signal affected by I-Q Imbalance is
(4)
If implemented it in SDR, the in-phase and quadrature signals of the baseband are sent to the
computer for calculation. Ideally, the in-phase and quadrature are and
respectively. Where is the baseband signal. After the RF signal is down-
converted to the baseband, the baseband signal affected by I-Q Imbalance [21] is
(5)
Where and are the amplitude and phase errors caused by the aforementioned I-Q
Imbalance. and are the DC bias of the residual in-phase and the quadrature path after
down-converting, respectively. After deducting the corresponding DC bias estimator from the in-
phase and the quadrature signal, then substituting by
, the baseband signal has the
following matrix form
(6)
The amplitude offset and the phase offset can be calculated as follows
(7)
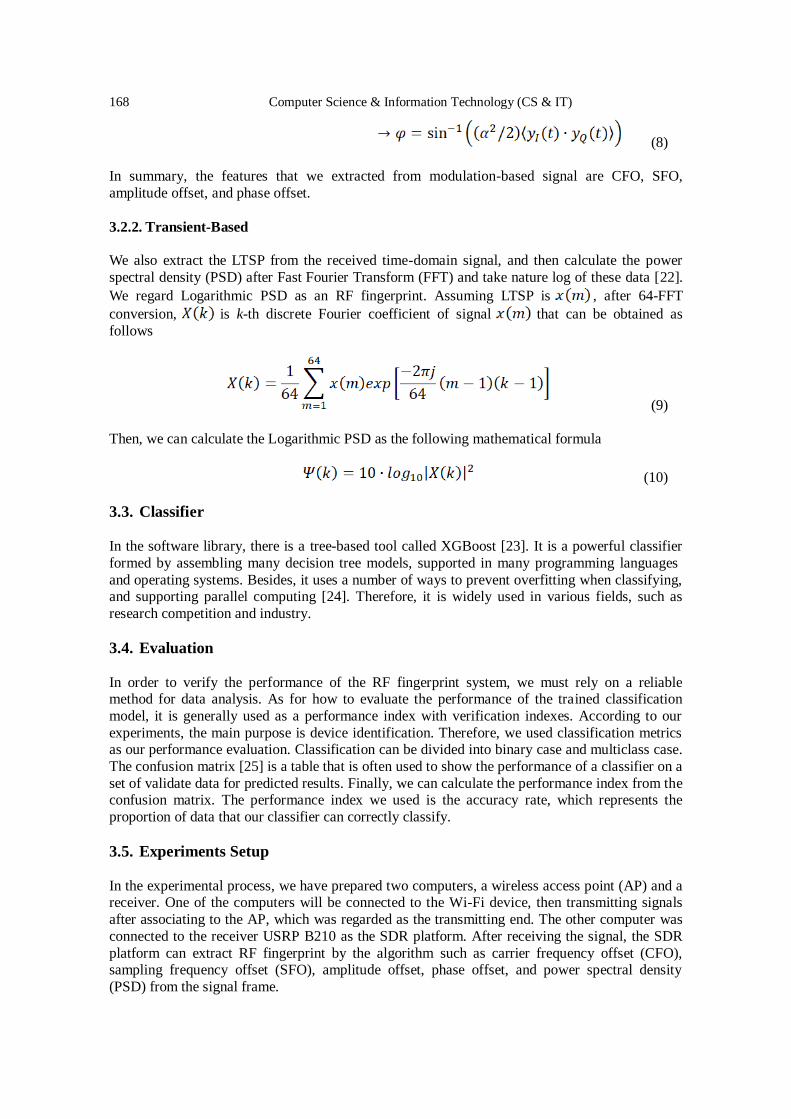
168 Computer Science & Information Technology (CS & IT)
(8)
In summary, the features that we extracted from modulation-based signal are CFO, SFO,
amplitude offset, and phase offset.
3.2.2. Transient-Based
We also extract the LTSP from the received time-domain signal, and then calculate the power
spectral density (PSD) after Fast Fourier Transform (FFT) and take nature log of these data [22].
We regard Logarithmic PSD as an RF fingerprint. Assuming LTSP is , after 64-FFT
conversion, is k-th discrete Fourier coefficient of signal that can be obtained as
follows
(9)
Then, we can calculate the Logarithmic PSD as the following mathematical formula
(10)
3.3. Classifier
In the software library, there is a tree-based tool called XGBoost [23]. It is a powerful classifier
formed by assembling many decision tree models, supported in many programming languages
and operating systems. Besides, it uses a number of ways to prevent overfitting when classifying, and supporting parallel computing [24]. Therefore, it is widely used in various fields, such as
research competition and industry.
3.4. Evaluation
In order to verify the performance of the RF fingerprint system, we must rely on a reliable method for data analysis. As for how to evaluate the performance of the trained classification
model, it is generally used as a performance index with verification indexes. According to our
experiments, the main purpose is device identification. Therefore, we used classification metrics as our performance evaluation. Classification can be divided into binary case and multiclass case.
The confusion matrix [25] is a table that is often used to show the performance of a classifier on a
set of validate data for predicted results. Finally, we can calculate the performance index from the confusion matrix. The performance index we used is the accuracy rate, which represents the
proportion of data that our classifier can correctly classify.
3.5. Experiments Setup
In the experimental process, we have prepared two computers, a wireless access point (AP) and a receiver. One of the computers will be connected to the Wi-Fi device, then transmitting signals
after associating to the AP, which was regarded as the transmitting end. The other computer was
connected to the receiver USRP B210 as the SDR platform. After receiving the signal, the SDR
platform can extract RF fingerprint by the algorithm such as carrier frequency offset (CFO), sampling frequency offset (SFO), amplitude offset, phase offset, and power spectral density
(PSD) from the signal frame.
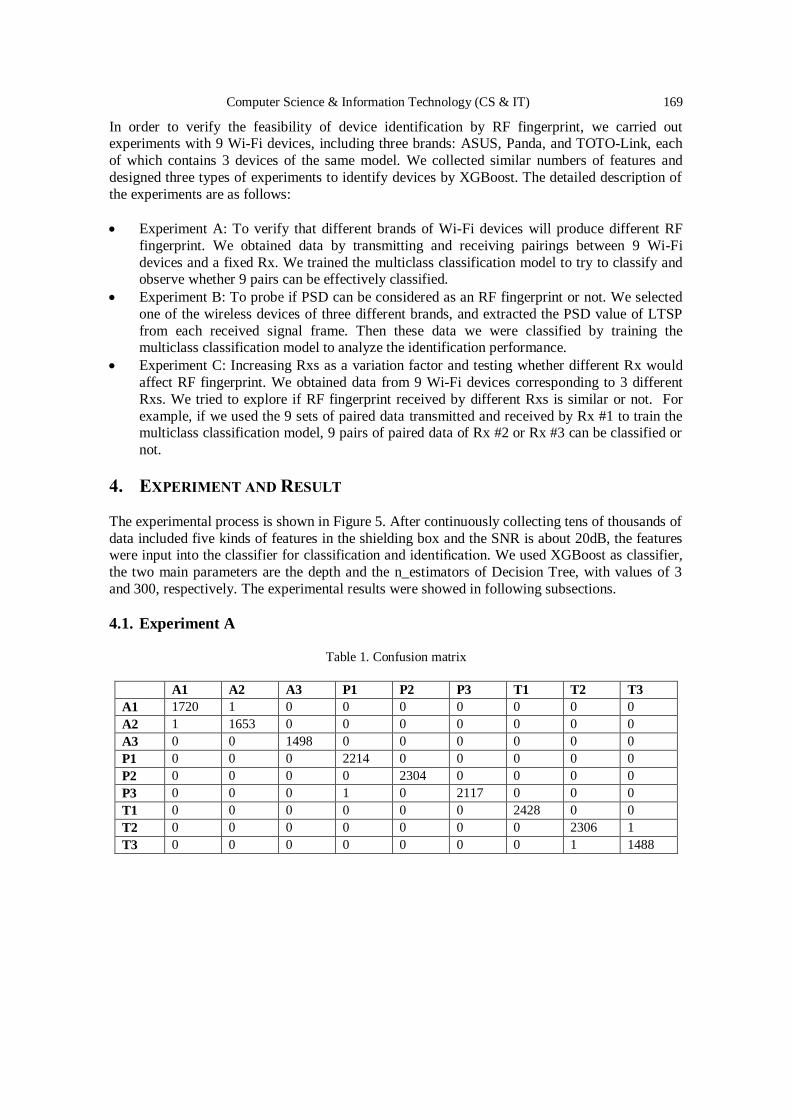
Computer Science & Information Technology (CS & IT) 169
In order to verify the feasibility of device identification by RF fingerprint, we carried out experiments with 9 Wi-Fi devices, including three brands: ASUS, Panda, and TOTO-Link, each
of which contains 3 devices of the same model. We collected similar numbers of features and
designed three types of experiments to identify devices by XGBoost. The detailed description of
the experiments are as follows:
Experiment A: To verify that different brands of Wi-Fi devices will produce different RF
fingerprint. We obtained data by transmitting and receiving pairings between 9 Wi-Fi
devices and a fixed Rx. We trained the multiclass classification model to try to classify and observe whether 9 pairs can be effectively classified.
Experiment B: To probe if PSD can be considered as an RF fingerprint or not. We selected
one of the wireless devices of three different brands, and extracted the PSD value of LTSP
from each received signal frame. Then these data we were classified by training the multiclass classification model to analyze the identification performance.
Experiment C: Increasing Rxs as a variation factor and testing whether different Rx would
affect RF fingerprint. We obtained data from 9 Wi-Fi devices corresponding to 3 different
Rxs. We tried to explore if RF fingerprint received by different Rxs is similar or not. For
example, if we used the 9 sets of paired data transmitted and received by Rx #1 to train the multiclass classification model, 9 pairs of paired data of Rx #2 or Rx #3 can be classified or
not.
4. EXPERIMENT AND RESULT
The experimental process is shown in Figure 5. After continuously collecting tens of thousands of
data included five kinds of features in the shielding box and the SNR is about 20dB, the features were input into the classifier for classification and identification. We used XGBoost as classifier,
the two main parameters are the depth and the n_estimators of Decision Tree, with values of 3
and 300, respectively. The experimental results were showed in following subsections.
4.1. Experiment A
Table 1. Confusion matrix
A1 A2 A3 P1 P2 P3 T1 T2 T3
A1 1720 1 0 0 0 0 0 0 0
A2 1 1653 0 0 0 0 0 0 0
A3 0 0 1498 0 0 0 0 0 0
P1 0 0 0 2214 0 0 0 0 0
P2 0 0 0 0 2304 0 0 0 0
P3 0 0 0 1 0 2117 0 0 0
T1 0 0 0 0 0 0 2428 0 0
T2 0 0 0 0 0 0 0 2306 1
T3 0 0 0 0 0 0 0 1 1488
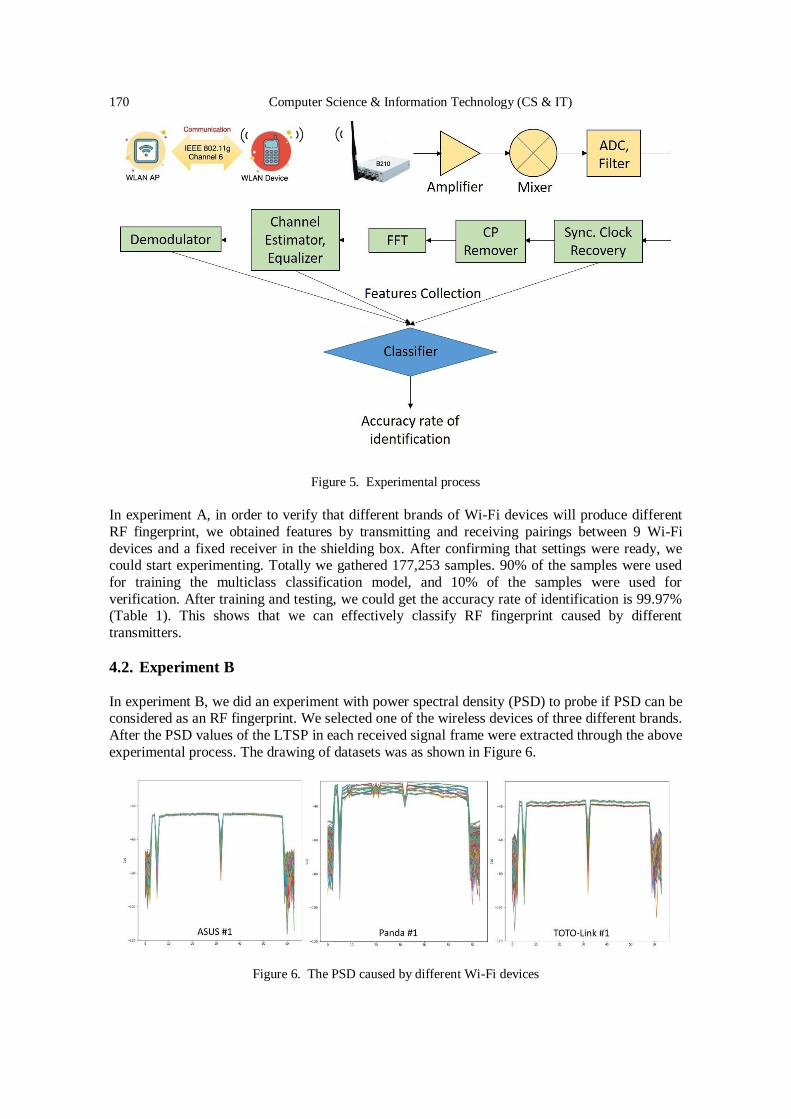
170 Computer Science & Information Technology (CS & IT)
Figure 5. Experimental process
In experiment A, in order to verify that different brands of Wi-Fi devices will produce different
RF fingerprint, we obtained features by transmitting and receiving pairings between 9 Wi-Fi
devices and a fixed receiver in the shielding box. After confirming that settings were ready, we could start experimenting. Totally we gathered 177,253 samples. 90% of the samples were used
for training the multiclass classification model, and 10% of the samples were used for
verification. After training and testing, we could get the accuracy rate of identification is 99.97% (Table 1). This shows that we can effectively classify RF fingerprint caused by different
transmitters.
4.2. Experiment B
In experiment B, we did an experiment with power spectral density (PSD) to probe if PSD can be considered as an RF fingerprint. We selected one of the wireless devices of three different brands.
After the PSD values of the LTSP in each received signal frame were extracted through the above
experimental process. The drawing of datasets was as shown in Figure 6.
Figure 6. The PSD caused by different Wi-Fi devices
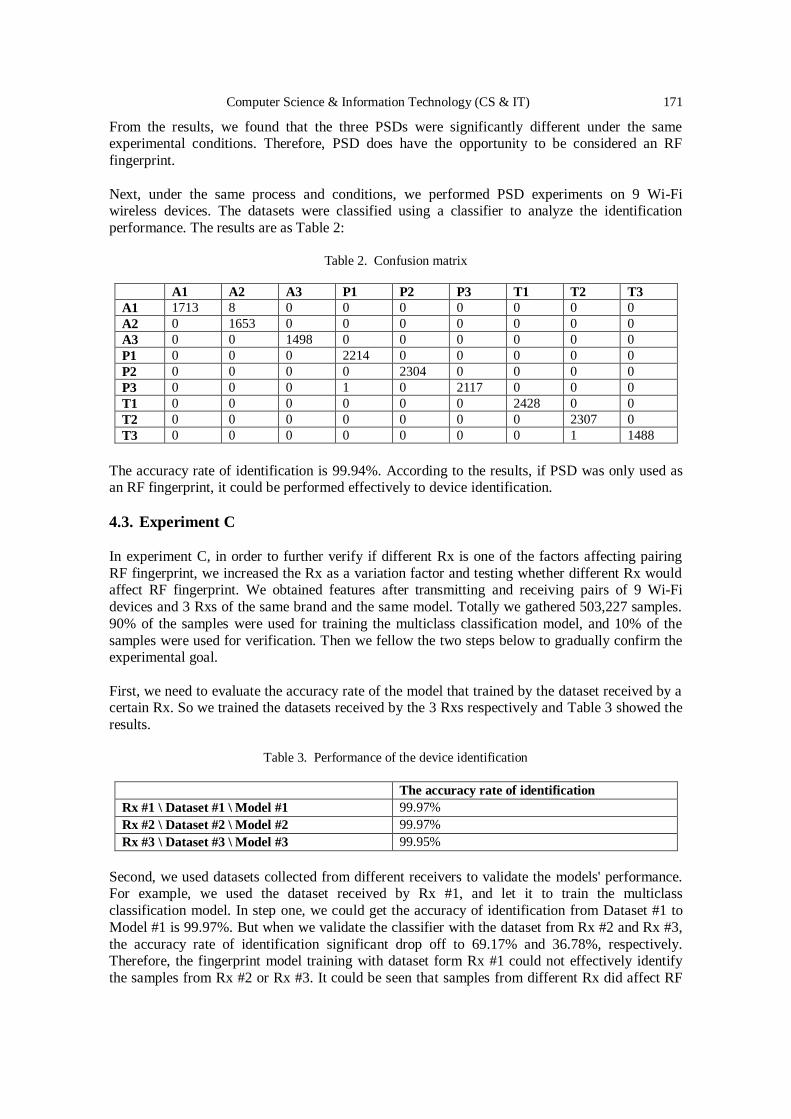
Computer Science & Information Technology (CS & IT) 171
From the results, we found that the three PSDs were significantly different under the same experimental conditions. Therefore, PSD does have the opportunity to be considered an RF
fingerprint.
Next, under the same process and conditions, we performed PSD experiments on 9 Wi-Fi wireless devices. The datasets were classified using a classifier to analyze the identification
performance. The results are as Table 2:
Table 2. Confusion matrix
A1 A2 A3 P1 P2 P3 T1 T2 T3
A1 1713 8 0 0 0 0 0 0 0
A2 0 1653 0 0 0 0 0 0 0
A3 0 0 1498 0 0 0 0 0 0
P1 0 0 0 2214 0 0 0 0 0
P2 0 0 0 0 2304 0 0 0 0
P3 0 0 0 1 0 2117 0 0 0
T1 0 0 0 0 0 0 2428 0 0
T2 0 0 0 0 0 0 0 2307 0
T3 0 0 0 0 0 0 0 1 1488
The accuracy rate of identification is 99.94%. According to the results, if PSD was only used as an RF fingerprint, it could be performed effectively to device identification.
4.3. Experiment C
In experiment C, in order to further verify if different Rx is one of the factors affecting pairing
RF fingerprint, we increased the Rx as a variation factor and testing whether different Rx would affect RF fingerprint. We obtained features after transmitting and receiving pairs of 9 Wi-Fi
devices and 3 Rxs of the same brand and the same model. Totally we gathered 503,227 samples.
90% of the samples were used for training the multiclass classification model, and 10% of the
samples were used for verification. Then we fellow the two steps below to gradually confirm the experimental goal.
First, we need to evaluate the accuracy rate of the model that trained by the dataset received by a certain Rx. So we trained the datasets received by the 3 Rxs respectively and Table 3 showed the
results.
Table 3. Performance of the device identification
The accuracy rate of identification
Rx #1 \ Dataset #1 \ Model #1 99.97%
Rx #2 \ Dataset #2 \ Model #2 99.97%
Rx #3 \ Dataset #3 \ Model #3 99.95%
Second, we used datasets collected from different receivers to validate the models' performance. For example, we used the dataset received by Rx #1, and let it to train the multiclass
classification model. In step one, we could get the accuracy of identification from Dataset #1 to
Model #1 is 99.97%. But when we validate the classifier with the dataset from Rx #2 and Rx #3,
the accuracy rate of identification significant drop off to 69.17% and 36.78%, respectively. Therefore, the fingerprint model training with dataset form Rx #1 could not effectively identify
the samples from Rx #2 or Rx #3. It could be seen that samples from different Rx did affect RF
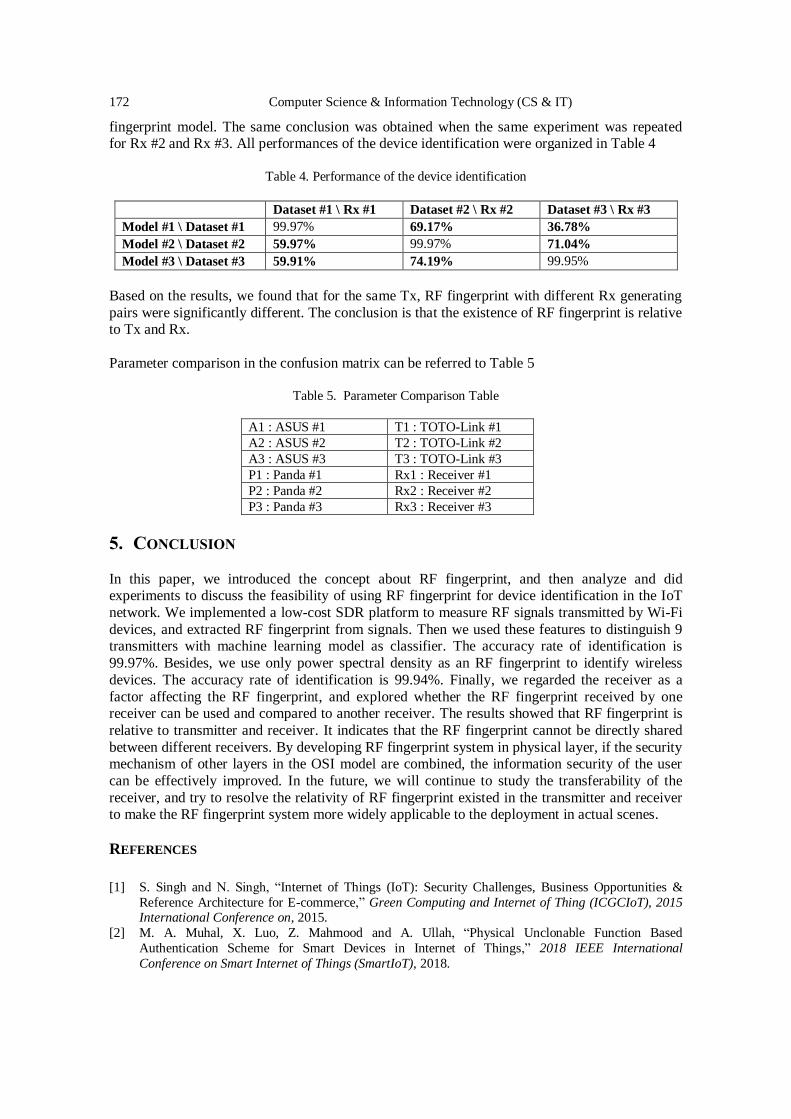
172 Computer Science & Information Technology (CS & IT)
fingerprint model. The same conclusion was obtained when the same experiment was repeated for Rx #2 and Rx #3. All performances of the device identification were organized in Table 4
Table 4. Performance of the device identification
Dataset #1 \ Rx #1 Dataset #2 \ Rx #2 Dataset #3 \ Rx #3
Model #1 \ Dataset #1 99.97% 69.17% 36.78%
Model #2 \ Dataset #2 59.97% 99.97% 71.04%
Model #3 \ Dataset #3 59.91% 74.19% 99.95%
Based on the results, we found that for the same Tx, RF fingerprint with different Rx generating
pairs were significantly different. The conclusion is that the existence of RF fingerprint is relative to Tx and Rx.
Parameter comparison in the confusion matrix can be referred to Table 5
Table 5. Parameter Comparison Table
A1 : ASUS #1 T1 : TOTO-Link #1
A2 : ASUS #2 T2 : TOTO-Link #2
A3 : ASUS #3 T3 : TOTO-Link #3
P1 : Panda #1 Rx1 : Receiver #1
P2 : Panda #2 Rx2 : Receiver #2
P3 : Panda #3 Rx3 : Receiver #3
5. CONCLUSION
In this paper, we introduced the concept about RF fingerprint, and then analyze and did experiments to discuss the feasibility of using RF fingerprint for device identification in the IoT
network. We implemented a low-cost SDR platform to measure RF signals transmitted by Wi-Fi
devices, and extracted RF fingerprint from signals. Then we used these features to distinguish 9 transmitters with machine learning model as classifier. The accuracy rate of identification is
99.97%. Besides, we use only power spectral density as an RF fingerprint to identify wireless
devices. The accuracy rate of identification is 99.94%. Finally, we regarded the receiver as a
factor affecting the RF fingerprint, and explored whether the RF fingerprint received by one receiver can be used and compared to another receiver. The results showed that RF fingerprint is
relative to transmitter and receiver. It indicates that the RF fingerprint cannot be directly shared
between different receivers. By developing RF fingerprint system in physical layer, if the security mechanism of other layers in the OSI model are combined, the information security of the user
can be effectively improved. In the future, we will continue to study the transferability of the
receiver, and try to resolve the relativity of RF fingerprint existed in the transmitter and receiver to make the RF fingerprint system more widely applicable to the deployment in actual scenes.
REFERENCES
[1] S. Singh and N. Singh, “Internet of Things (IoT): Security Challenges, Business Opportunities &
Reference Architecture for E-commerce,” Green Computing and Internet of Thing (ICGCIoT), 2015 International Conference on, 2015.
[2] M. A. Muhal, X. Luo, Z. Mahmood and A. Ullah, “Physical Unclonable Function Based
Authentication Scheme for Smart Devices in Internet of Things,” 2018 IEEE International
Conference on Smart Internet of Things (SmartIoT), 2018.
Computer Science & Information Technology (CS & IT) 173
[3] T. D. Vo-Huu, T. D. Vo-Huu and G. Noubir, “SWiFi: An Open Source SDR for Wi-Fi Networks
High Order Modulation Analysis,” 2008.
[4] Z. Zhuang, X. Ji and Y. Liu, “FBSleuth: Fake Base Station Forensics via Radio Frequency
Fingerprinting,” AsiaCCS 2018, 2018.
[5] DC bias (https://en.wikipedia.org/wiki/DC_bias). [6] B. Chatterjee, D. Das, S. Maity and S. Sen, “RF-PUF: Enhancing IoT Security through
Authentication of Wireless Nodes using In-situ Machine Learning,” IEEE Internet of Things Journal,
2018.
[7] Carrier frequency offset (https://en.wikipedia.org/wiki/Carrier_frequency_offset)
[8] Attenuation (https://baike.baidu.com/item/%E8%A1%B0%E5%87%8F)
[9] Signal-to-noise ratio (https://en.wikipedia.org/wiki/Signal-to-noise_ratio)
[10] S. U. Rehman, K. W. Sowerby, S. Alam and I. Ardekani, “Portability of an RF Fingerprint of a
Wireless Transmitter,” 2014 IEEE Conference on Communications and Network Security, 2014.
[11] Doppler effect (https://en.wikipedia.org/wiki/Doppler_effect)
[12] T. D. Vo-Huu, T. D. Vo-Huu and G. Noubir, “Fingerprinting Wi-Fi Devices Using Software Defined
Radios,” 2016.
[13] L. Peng, A. Hu, J. Zhang, Y. Jiang, J. Yu and Y. Yan, “Design of a Hybrid RF Fingerprint Extraction and Device Classification Scheme,” IEEE Internet of Things Journal, 2018.
[14] S. U. Rehman, K. W. Sowerby and C. Coghill, “Analysis of impersonation attacks on systems using
RF fingerprinting and low-end receivers,” Journal of Computer and System Sciences, 2013.
[15] W. Wang, Z. Sun, S. Piao, B. Zhu and K. Ren, “Wireless Physical-Layer Identification: Modeling and
Validation,” IEEE Transactions on Information Forensics and Security, 2016.
[16] Y. Zhuang and Y. Wan, “LS-based Joint Estimation of Carrier Frequency Offset, I/Q Imbalance and
DC Offset for OFDM-based WLANs,” Proceedings 2013 International Conference on Mechatronic
Sciences, Electric Engineering and Computer (MEC), 2013.
[17] H. Zou and Y. Wan, “A Novel Subspace-Based Carrier Frequency Offset Estimator for OFDM-Based
WLANs With DC Offset,” 2012 2nd International Conference on Consumer Electronics,
Communications and Networks (CECNet), 2012. [18] Qi Cheng, “Joint Estimation of Carrier and Sampling Frequency Offsets Using OFDM WLAN
Preamble,” 2015 15th International Symposium on Communications and Information Technologies
(ISCIT), 2015.
[19] P. H. Moose, “A technique for orthogonal frequency division multiplexing frequency offset
correction,” IEEE Trans. Comm., vol. 42, Issue 10, pp. 2908-2914, Oct. 1994.
[20] Z. Zhang, L. Ge, F. Tian, F. Zeng and G. Xuan, “Effects and Estimation Techniques of Symbol Time
Offset and Carrier Frequency Offset in OFDM System: Simulation and Analysis,” 2014 7th
International Congress on Image and Signal Processing, 2014.
[21] S. Ellingson, “Correcting I-Q imbalance in direct conversion receivers,” http://argus.
naapo.org/~rchilders/swe_argus_pubs/iqbal.pdf, 2003.
[22] T. Ohtsuji, T. Takeuchi, T. Soma and M. Kitsunezuka, “Noise-tolerant, Deep-learning-based Radio
Identification with Logarithmic Power Spectrum,” ICC 2019 - 2019 IEEE International Conference on Communications (ICC), 2019.
[23] XGBoost (https://zh.wikipedia.org/wiki/XGBoost)
[24] The principle of XGBoost (https://kknews.cc/zh-tw/news/grejk5m.html)
[25] Evaluation (https://medium.com/@chih.sheng.huang821/machine_learning-statistical_methods-
model_evaluation-verification index-b03825ff0814.)

174 Computer Science & Information Technology (CS & IT)
AUTHORS
Ting-Yu Lin, Engineer
A graduate of the Communications Engineering at Yuan Ze University in Taiwan.
Research interests include cyber security, communications engineering, etc. Recent
research works are mainly focusing on wireless devices identification and security by
RF fingerprint.
Chia-Min, Sena, Lai, Engineer
A Ph.D. candidate at the Department of Computer Science and Information
Engineering at National Taiwan University of Science and Technology in Taiwan.
Research interests include signal fingerprint, network log analysis, malware analysis,
artificial intelligence. Recent research works are mainly focusing on using deep
learning techniques to explore the security issues.
Chih-Wei Chen, Engineer
A graduate of the Institute of Electronics at National Chiao Tung University in Taiwan.
Research interests include (elliptic curve) cyber security, malware analysis, Reverse
engineering, etc. Recent research works are mainly focusing on radio frequency identification and security.
© 2020 By AIRCC Publishing Corporation. This article is published under the Creative Commons
Attribution (CC BY) license.
David C. Wyld et al. (Eds): CCSEA, BIoT, DKMP, CLOUD, NLCAI, SIPRO - 2020 pp. 175-194, 2020. CS & IT - CSCP 2020 DOI: 10.5121/csit.2020.101014
DERIVATION OF LOOP GAIN AND STABILITY TEST FOR LOW-PASS TOW-THOMAS BIQUAD FILTER
MinhTri Tran, Anna Kuwana and Haruo Kobayashi
Division of Electronics and Informatics,
Gunma University, Kiryu 376-8515, Japan ABSTRACT Proposed derivation and measurement of self-loop function for a low-pass Tow Thomas biquadratic filter are introduced. The self-loop function of this filter is derived and analyzed based on the widened superposition principle. The alternating current conservation technique is proposed to measure the self-loop function. Research results show that the selected passive components (resistors, capacitors) of the frequency compensation of Miller’s capacitors in the operational amplifier and the Tow Thomas filter can cause a damped oscillation noise when the stable conditions for the transfer functions of these networks are not satisfied. KEYWORDS Superposition, Self-loop Function, Stability Test, Tow-Thomas Biquadratic Filter, Voltage Injection.
1. INTRODUCTION An important function of microelectronics vastly used in electronic systems is “filtering”[1]. One of the most famous active filter circuits is the Tow–Thomas bi-quadratic circuit. Although the circuit was introduced many years ago, it is still receiving interest of researchers in modifying it to fit the new CMOS technology [2]. Moreover, feedback control theories are widely applied in the processing of analogue signals [3]. In conventional analysis of a feedback system, the term of “Aβ(s)” is called loop gain when the denominator of the transfer function is simplified as
1+Aβ(s). The stability of a feedback network is determined by the magnitude and phase plots of the loop gain. However, the passive filter is not a closed loop system. Furthermore, the denominator of the transfer function of the analog filter, regardless of active or passive is also simplified as 1+L(s), where L(s) is called “self-loop function”. Therefore, the term of “self-loop function” is proposed to define L(s) for both cases with and without feedback filters. This paper provides an introduction to the derivation of the transfer function, the measurement of self-loop function and stability test for a low-pass Tow-Thomas biquadratic filter based on the alternating current-voltage injection technique and the widened superposition principle. The main contribution of this paper comes from the stability test for a low-pass Two Thomas biquadratic filter based on the widened superposition and the voltage injection technique. Section 2 of the paper mathematically analyzes an illustrative second-order denominator complex function considered in details. Section 3 presents the stability test for a mathematical model of two-stage operational amplifier which is used in the Tow Thomas circuit. SPICE simulation results and the stability test for the Tow Thomas filter are described in Section 4. A brief
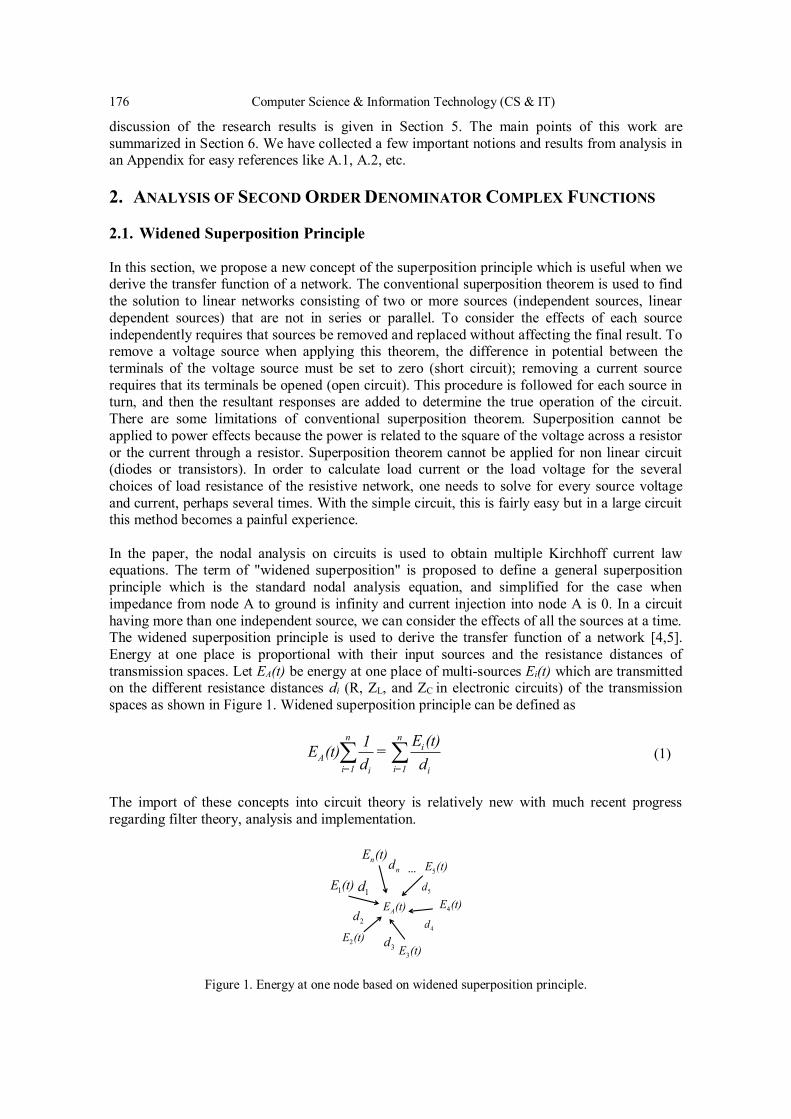
176 Computer Science & Information Technology (CS & IT)
discussion of the research results is given in Section 5. The main points of this work are summarized in Section 6. We have collected a few important notions and results from analysis in an Appendix for easy references like A.1, A.2, etc. 2. ANALYSIS OF SECOND ORDER DENOMINATOR COMPLEX FUNCTIONS 2.1. Widened Superposition Principle In this section, we propose a new concept of the superposition principle which is useful when we derive the transfer function of a network. The conventional superposition theorem is used to find the solution to linear networks consisting of two or more sources (independent sources, linear dependent sources) that are not in series or parallel. To consider the effects of each source independently requires that sources be removed and replaced without affecting the final result. To remove a voltage source when applying this theorem, the difference in potential between the terminals of the voltage source must be set to zero (short circuit); removing a current source requires that its terminals be opened (open circuit). This procedure is followed for each source in turn, and then the resultant responses are added to determine the true operation of the circuit. There are some limitations of conventional superposition theorem. Superposition cannot be applied to power effects because the power is related to the square of the voltage across a resistor or the current through a resistor. Superposition theorem cannot be applied for non linear circuit (diodes or transistors). In order to calculate load current or the load voltage for the several choices of load resistance of the resistive network, one needs to solve for every source voltage and current, perhaps several times. With the simple circuit, this is fairly easy but in a large circuit this method becomes a painful experience. In the paper, the nodal analysis on circuits is used to obtain multiple Kirchhoff current law equations. The term of "widened superposition" is proposed to define a general superposition principle which is the standard nodal analysis equation, and simplified for the case when impedance from node A to ground is infinity and current injection into node A is 0. In a circuit having more than one independent source, we can consider the effects of all the sources at a time. The widened superposition principle is used to derive the transfer function of a network [4,5]. Energy at one place is proportional with their input sources and the resistance distances of transmission spaces. Let EA(t) be energy at one place of multi-sources Ei(t) which are transmitted on the different resistance distances di (R, ZL, and ZC in electronic circuits) of the transmission spaces as shown in Figure 1. Widened superposition principle can be defined as
n ni
Ai=1 i=1i i
E (t)1E (t) =d d
(1)
The import of these concepts into circuit theory is relatively new with much recent progress regarding filter theory, analysis and implementation.
1d
2d
3d4d
5dnd …
1E (t)
2E (t)3E (t)
4E (t)
5E (t)nE (t)
AE (t)
Figure 1. Energy at one node based on widened superposition principle.
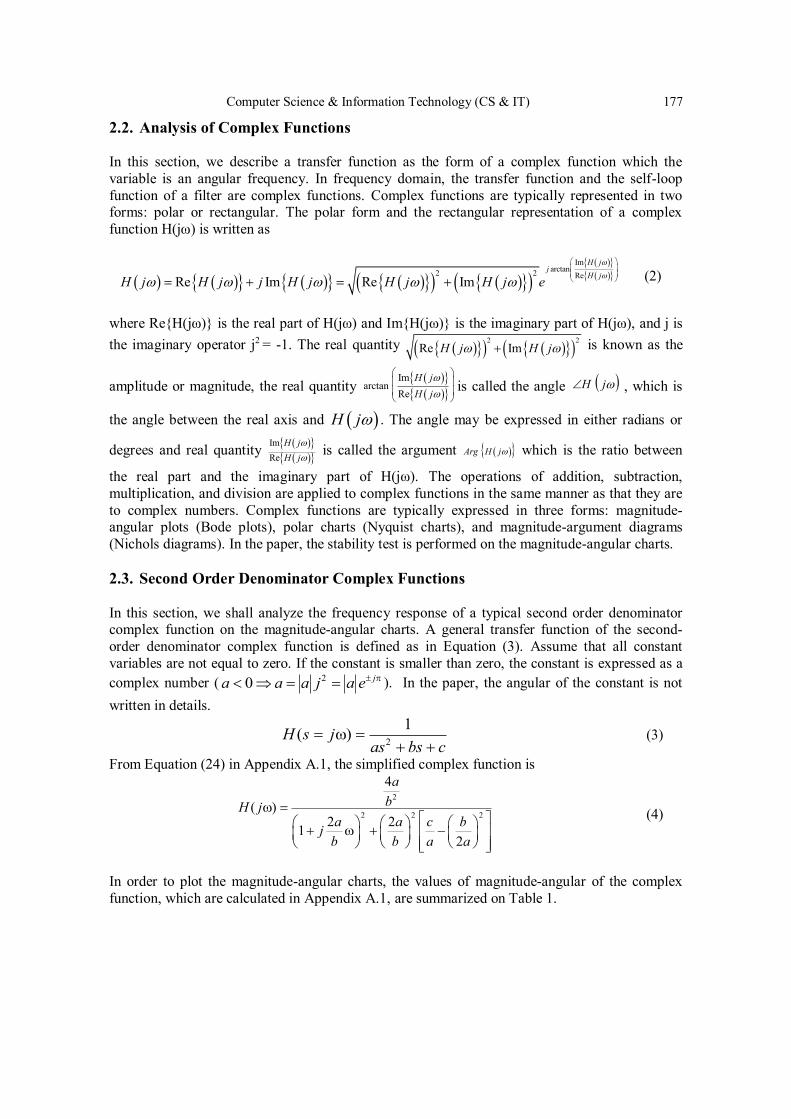
Computer Science & Information Technology (CS & IT) 177
2.2. Analysis of Complex Functions In this section, we describe a transfer function as the form of a complex function which the variable is an angular frequency. In frequency domain, the transfer function and the self-loop function of a filter are complex functions. Complex functions are typically represented in two forms: polar or rectangular. The polar form and the rectangular representation of a complex function H(jω) is written as
Imarctan2 2 ReRe Im Re Im
H jj
H jH j H j j H j H j H j e (2)
where Re{H(jω)} is the real part of H(jω) and Im{H(jω)} is the imaginary part of H(jω), and j is the imaginary operator j2 = -1. The real quantity 2 2
Re ImH j H j is known as the
amplitude or magnitude, the real quantity Im
arctanRe
H jH j is called the angle H j , which is
the angle between the real axis and H j . The angle may be expressed in either radians or
degrees and real quantity ImRe
H jH j is called the argument Arg H j which is the ratio between
the real part and the imaginary part of H(jω). The operations of addition, subtraction, multiplication, and division are applied to complex functions in the same manner as that they are to complex numbers. Complex functions are typically expressed in three forms: magnitude-angular plots (Bode plots), polar charts (Nyquist charts), and magnitude-argument diagrams (Nichols diagrams). In the paper, the stability test is performed on the magnitude-angular charts. 2.3. Second Order Denominator Complex Functions In this section, we shall analyze the frequency response of a typical second order denominator complex function on the magnitude-angular charts. A general transfer function of the second-order denominator complex function is defined as in Equation (3). Assume that all constant variables are not equal to zero. If the constant is smaller than zero, the constant is expressed as a complex number ( 20 ja a a j a e ). In the paper, the angular of the constant is not written in details.
2
1( )H s jas bs c
(3)
From Equation (24) in Appendix A.1, the simplified complex function is
2
2 2 2
4
( )2 21
2
abH j
a a c bjb b a a
(4)
In order to plot the magnitude-angular charts, the values of magnitude-angular of the complex function, which are calculated in Appendix A.1, are summarized on Table 1.
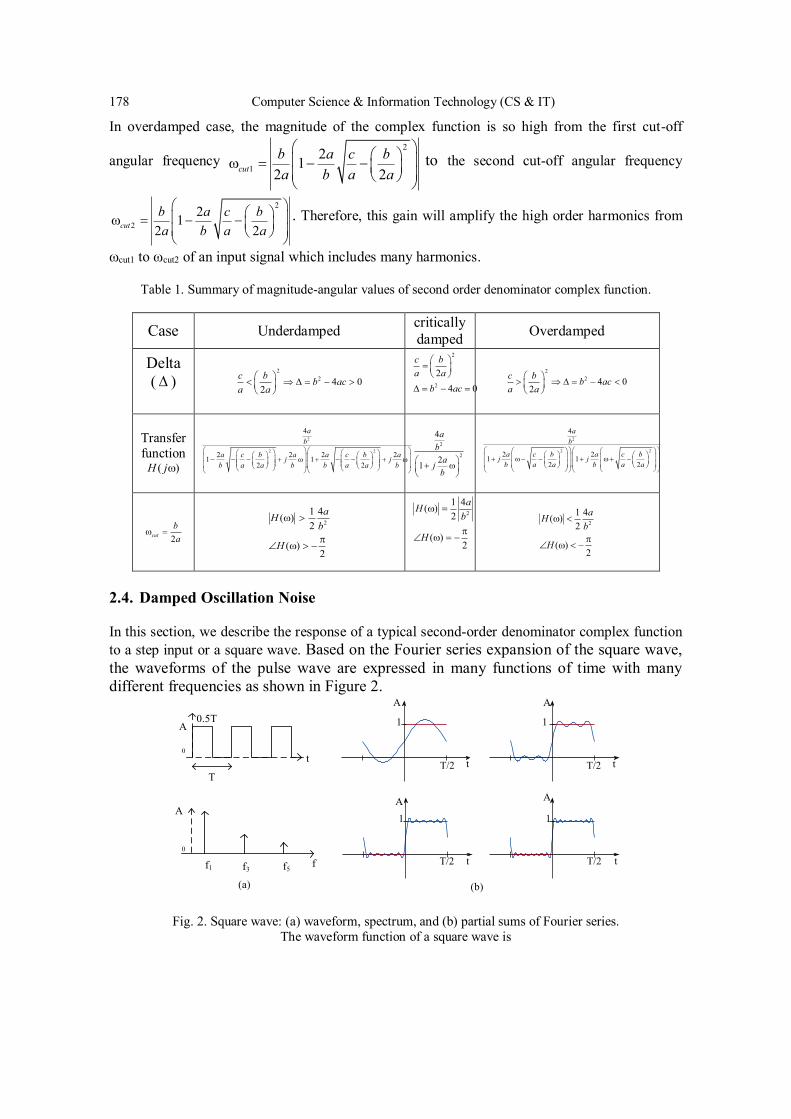
178 Computer Science & Information Technology (CS & IT)
In overdamped case, the magnitude of the complex function is so high from the first cut-off
angular frequency 2
121
2 2cutb a c ba b a a
to the second cut-off angular frequency
2
221
2 2cutb a c ba b a a
. Therefore, this gain will amplify the high order harmonics from
ωcut1 to ωcut2 of an input signal which includes many harmonics.
Table 1. Summary of magnitude-angular values of second order denominator complex function.
Case Underdamped critically damped Overdamped
Delta ( )
22 4 0
2c b b aca a
2
2
24 0
c ba a
b ac
22 4 0
2c b b aca a
Transfer function
( )H j
2
2 2
4
2 2 2 21 12 2
ab
a c b a a c b aj jb a a b b a a b
2
2
4
21
ab
ajb
2
2 2
4
2 21 12 2
ab
a c b a c bj jb a a b a a
2cutba
2
1 4( )2
( )2
aHb
H
2
1 4( )2
( )2
aHb
H
2
1 4( )2
( )2
aHb
H
2.4. Damped Oscillation Noise In this section, we describe the response of a typical second-order denominator complex function to a step input or a square wave. Based on the Fourier series expansion of the square wave, the waveforms of the pulse wave are expressed in many functions of time with many different frequencies as shown in Figure 2.
f1 f3 f5 f
t
A
0
0.5T
T
(b)
0
A
(a)
Fig. 2. Square wave: (a) waveform, spectrum, and (b) partial sums of Fourier series.
The waveform function of a square wave is
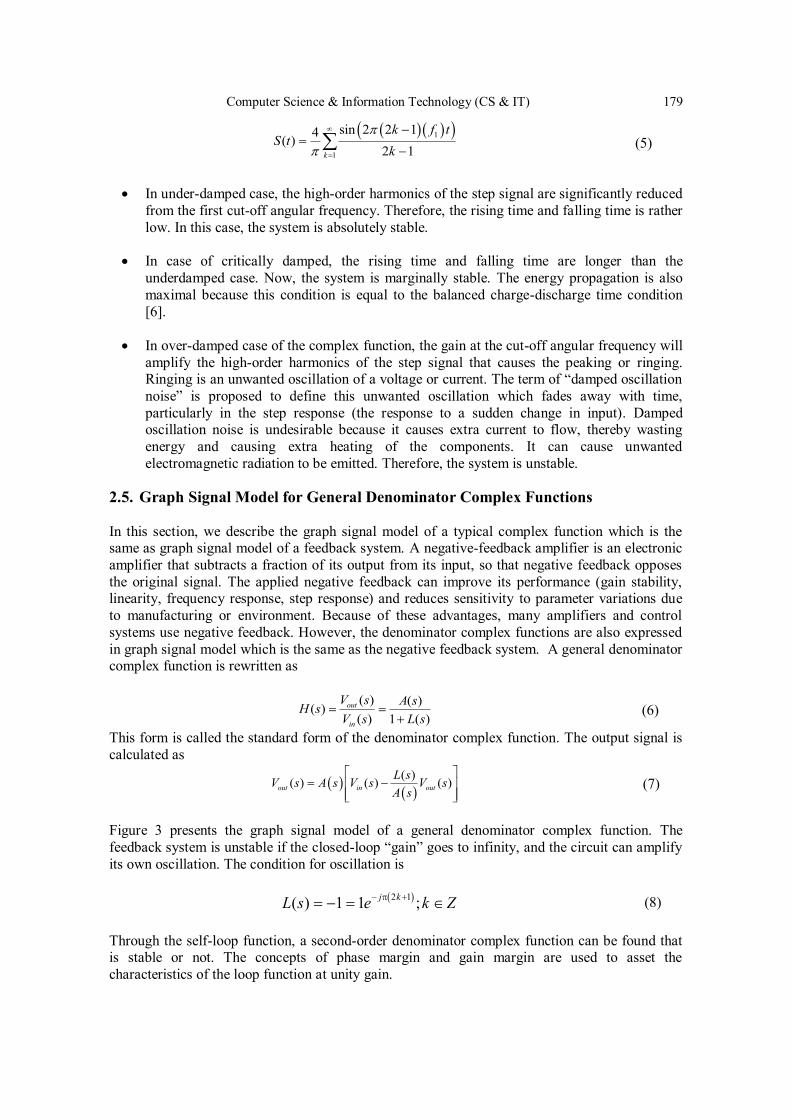
Computer Science & Information Technology (CS & IT) 179
1
1
sin 2 2 14( )2 1k
k f tS t
k (5)
In under-damped case, the high-order harmonics of the step signal are significantly reduced from the first cut-off angular frequency. Therefore, the rising time and falling time is rather low. In this case, the system is absolutely stable.
In case of critically damped, the rising time and falling time are longer than the underdamped case. Now, the system is marginally stable. The energy propagation is also maximal because this condition is equal to the balanced charge-discharge time condition [6].
In over-damped case of the complex function, the gain at the cut-off angular frequency will amplify the high-order harmonics of the step signal that causes the peaking or ringing. Ringing is an unwanted oscillation of a voltage or current. The term of “damped oscillation
noise” is proposed to define this unwanted oscillation which fades away with time, particularly in the step response (the response to a sudden change in input). Damped oscillation noise is undesirable because it causes extra current to flow, thereby wasting energy and causing extra heating of the components. It can cause unwanted electromagnetic radiation to be emitted. Therefore, the system is unstable.
2.5. Graph Signal Model for General Denominator Complex Functions In this section, we describe the graph signal model of a typical complex function which is the same as graph signal model of a feedback system. A negative-feedback amplifier is an electronic amplifier that subtracts a fraction of its output from its input, so that negative feedback opposes the original signal. The applied negative feedback can improve its performance (gain stability, linearity, frequency response, step response) and reduces sensitivity to parameter variations due to manufacturing or environment. Because of these advantages, many amplifiers and control systems use negative feedback. However, the denominator complex functions are also expressed in graph signal model which is the same as the negative feedback system. A general denominator complex function is rewritten as
( ) ( )( )( ) 1 ( )
out
in
V s A sH sV s L s
(6)
This form is called the standard form of the denominator complex function. The output signal is calculated as
( )( ) ( ) ( )out in outL sV s A s V s V sA s
(7)
Figure 3 presents the graph signal model of a general denominator complex function. The feedback system is unstable if the closed-loop “gain” goes to infinity, and the circuit can amplify
its own oscillation. The condition for oscillation is
2 1( ) 1 1 ;j kL s e k Z (8) Through the self-loop function, a second-order denominator complex function can be found that is stable or not. The concepts of phase margin and gain margin are used to asset the characteristics of the loop function at unity gain.
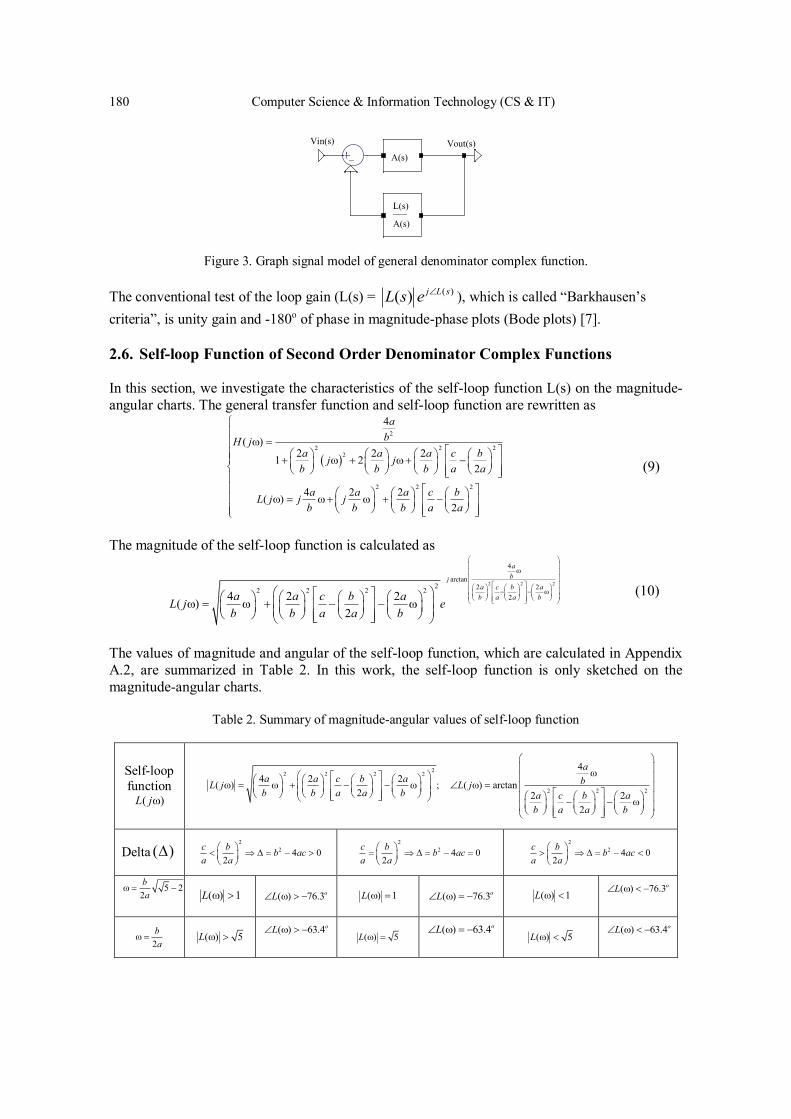
180 Computer Science & Information Technology (CS & IT)
Figure 3. Graph signal model of general denominator complex function.
The conventional test of the loop gain (L(s) = ( )( ) j L sL s e ), which is called “Barkhausen’s
criteria”, is unity gain and -180o of phase in magnitude-phase plots (Bode plots) [7]. 2.6. Self-loop Function of Second Order Denominator Complex Functions In this section, we investigate the characteristics of the self-loop function L(s) on the magnitude-angular charts. The general transfer function and self-loop function are rewritten as
2
2 2 22
2 2 2
4
( )2 2 21 2
2
4 2 2( )2
abH j
a a a c bj jb b b a a
a a a c bL j j jb b b a a
(9)
The magnitude of the self-loop function is calculated as
2 2 2
4
arctan2 2 22 2 2 2
24 2 2( )2
abj
a c b ab a a ba a c b aL j e
b b a a b (10)
The values of magnitude and angular of the self-loop function, which are calculated in Appendix A.2, are summarized in Table 2. In this work, the self-loop function is only sketched on the magnitude-angular charts.
Table 2. Summary of magnitude-angular values of self-loop function
Self-loop function
( )L j
22 2 2 2
2 2 2
44 2 2( ) ; ( ) arctan
2 2 22
aa a c b a bL j L j
b b a a b a c b ab a a b
Delta ( ) 2
2 4 02
c b b aca a
22 4 0
2c b b aca a
22 4 0
2c b b aca a
5 22ba
( ) 1L ( ) 76.3oL ( ) 1L ( ) 76.3oL ( ) 1L ( ) 76.3oL
2ba
( ) 5L ( ) 63.4oL
( ) 5L ( ) 63.4oL
( ) 5L ( ) 63.4oL
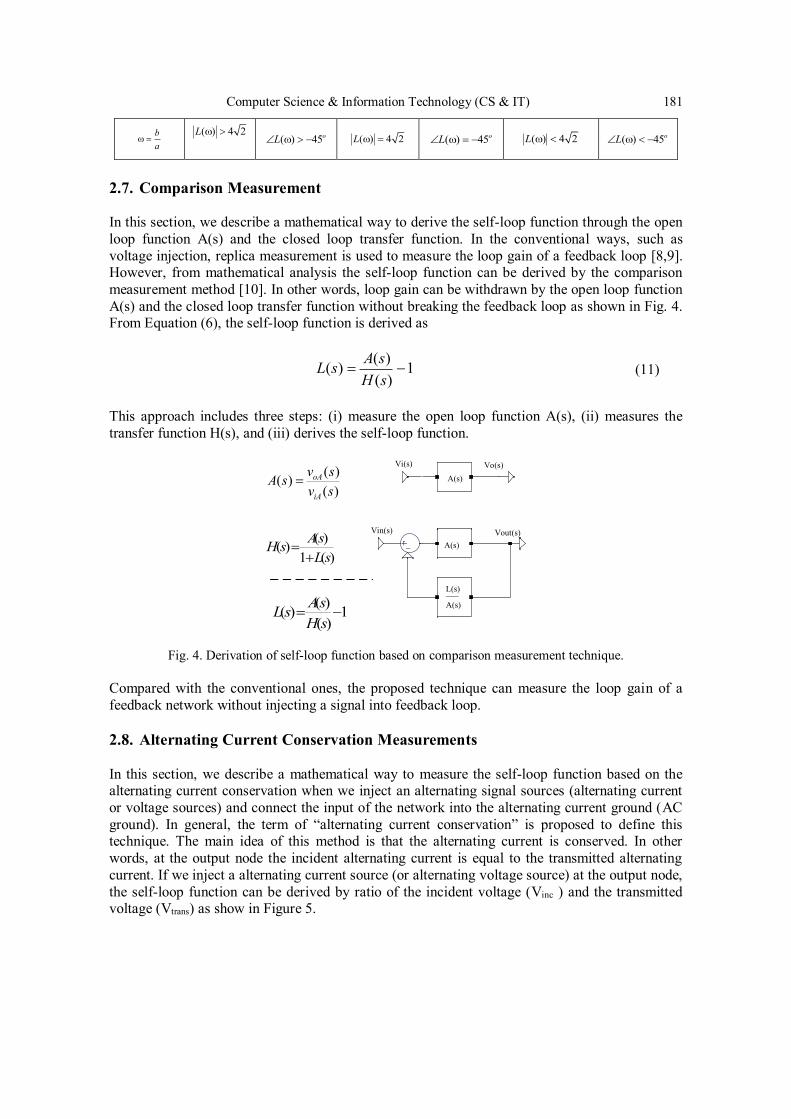
Computer Science & Information Technology (CS & IT) 181
ba
( ) 4 2L
( ) 45oL ( ) 4 2L ( ) 45oL ( ) 4 2L ( ) 45oL
2.7. Comparison Measurement In this section, we describe a mathematical way to derive the self-loop function through the open loop function A(s) and the closed loop transfer function. In the conventional ways, such as voltage injection, replica measurement is used to measure the loop gain of a feedback loop [8,9]. However, from mathematical analysis the self-loop function can be derived by the comparison measurement method [10]. In other words, loop gain can be withdrawn by the open loop function A(s) and the closed loop transfer function without breaking the feedback loop as shown in Fig. 4. From Equation (6), the self-loop function is derived as
( )( ) 1( )
A sL sH s
(11)
This approach includes three steps: (i) measure the open loop function A(s), (ii) measures the transfer function H(s), and (iii) derives the self-loop function.
( )( )( )
oA
iA
v sA sv s
( )( )1 ( )
AsH sL s
( )( ) 1( )
AsL sH s
Fig. 4. Derivation of self-loop function based on comparison measurement technique.
Compared with the conventional ones, the proposed technique can measure the loop gain of a feedback network without injecting a signal into feedback loop. 2.8. Alternating Current Conservation Measurements In this section, we describe a mathematical way to measure the self-loop function based on the alternating current conservation when we inject an alternating signal sources (alternating current or voltage sources) and connect the input of the network into the alternating current ground (AC ground). In general, the term of “alternating current conservation” is proposed to define this technique. The main idea of this method is that the alternating current is conserved. In other words, at the output node the incident alternating current is equal to the transmitted alternating current. If we inject a alternating current source (or alternating voltage source) at the output node, the self-loop function can be derived by ratio of the incident voltage (Vinc ) and the transmitted voltage (Vtrans) as show in Figure 5.
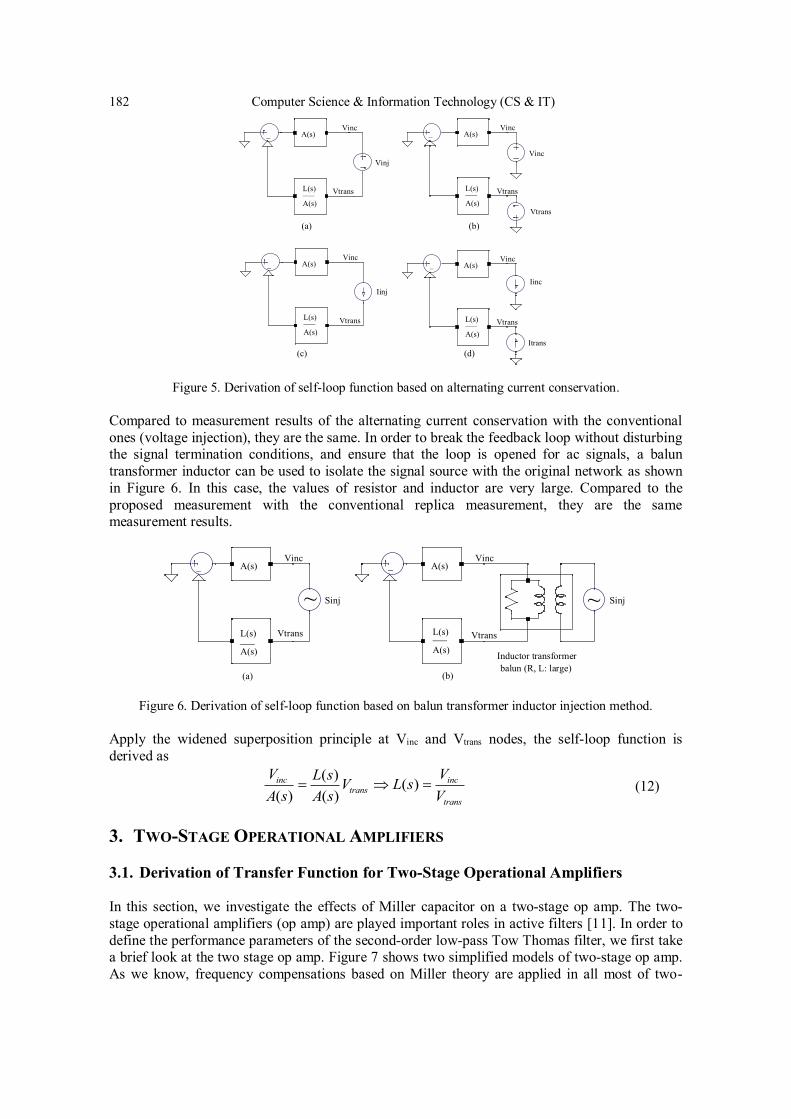
182 Computer Science & Information Technology (CS & IT)
Figure 5. Derivation of self-loop function based on alternating current conservation. Compared to measurement results of the alternating current conservation with the conventional ones (voltage injection), they are the same. In order to break the feedback loop without disturbing the signal termination conditions, and ensure that the loop is opened for ac signals, a balun transformer inductor can be used to isolate the signal source with the original network as shown in Figure 6. In this case, the values of resistor and inductor are very large. Compared to the proposed measurement with the conventional replica measurement, they are the same measurement results.
Figure 6. Derivation of self-loop function based on balun transformer inductor injection method. Apply the widened superposition principle at Vinc and Vtrans nodes, the self-loop function is derived as
( ) ( )( ) ( )inc inc
transtrans
V VL s V L sA s A s V
(12)
3. TWO-STAGE OPERATIONAL AMPLIFIERS 3.1. Derivation of Transfer Function for Two-Stage Operational Amplifiers In this section, we investigate the effects of Miller capacitor on a two-stage op amp. The two-stage operational amplifiers (op amp) are played important roles in active filters [11]. In order to define the performance parameters of the second-order low-pass Tow Thomas filter, we first take a brief look at the two stage op amp. Figure 7 shows two simplified models of two-stage op amp. As we know, frequency compensations based on Miller theory are applied in all most of two-
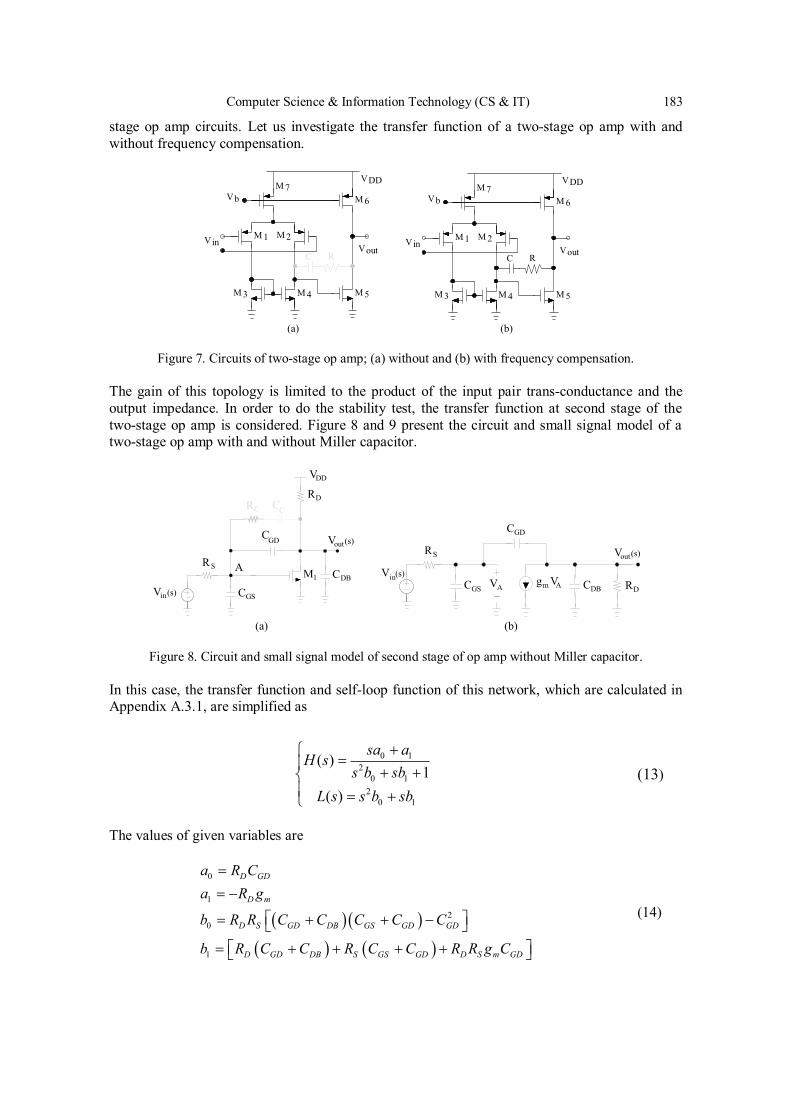
Computer Science & Information Technology (CS & IT) 183
stage op amp circuits. Let us investigate the transfer function of a two-stage op amp with and without frequency compensation.
Figure 7. Circuits of two-stage op amp; (a) without and (b) with frequency compensation. The gain of this topology is limited to the product of the input pair trans-conductance and the output impedance. In order to do the stability test, the transfer function at second stage of the two-stage op amp is considered. Figure 8 and 9 present the circuit and small signal model of a two-stage op amp with and without Miller capacitor.
Figure 8. Circuit and small signal model of second stage of op amp without Miller capacitor. In this case, the transfer function and self-loop function of this network, which are calculated in Appendix A.3.1, are simplified as
0 12
0 12
0 1
( )1
( )
sa aH s
s b sbL s s b sb
(13)
The values of given variables are
0
1
20
1
D GD
D m
D S GD DB GS GD GD
D GD DB S GS GD D S m GD
a R Ca R g
b R R C C C C C
b R C C R C C R R g C
(14)
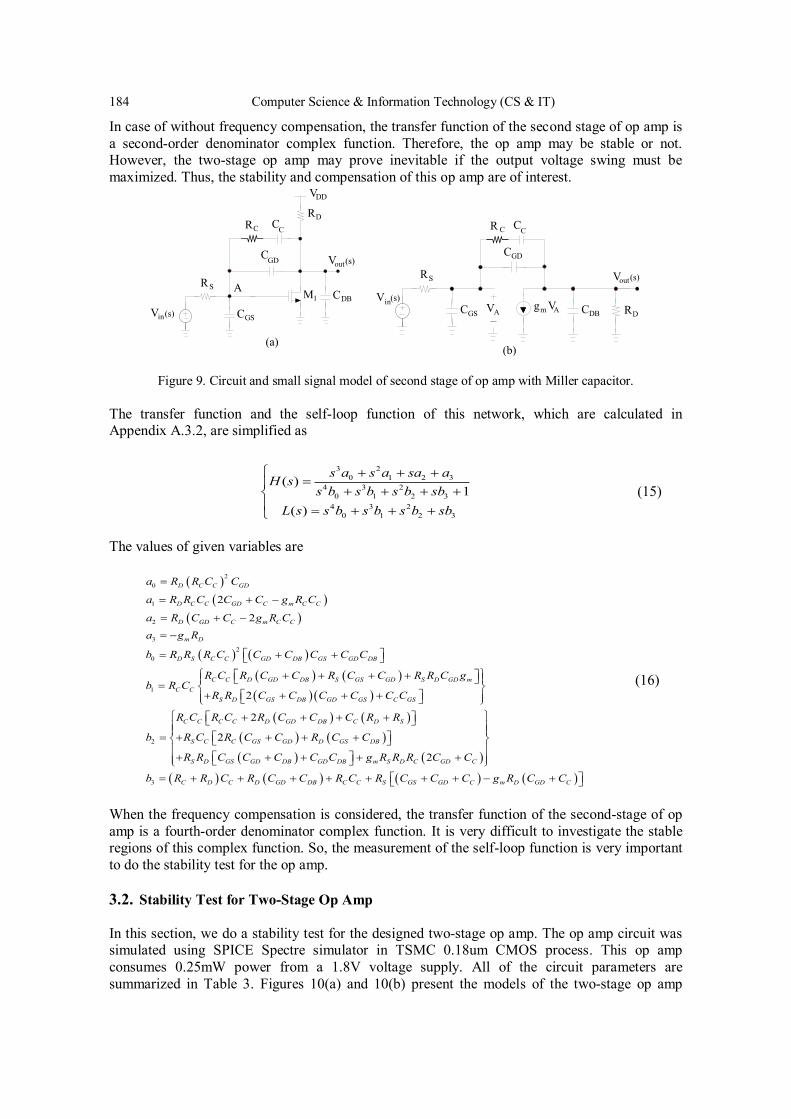
184 Computer Science & Information Technology (CS & IT)
In case of without frequency compensation, the transfer function of the second stage of op amp is a second-order denominator complex function. Therefore, the op amp may be stable or not. However, the two-stage op amp may prove inevitable if the output voltage swing must be maximized. Thus, the stability and compensation of this op amp are of interest.
Figure 9. Circuit and small signal model of second stage of op amp with Miller capacitor. The transfer function and the self-loop function of this network, which are calculated in Appendix A.3.2, are simplified as
3 20 1 2 3
4 3 20 1 2 3
4 3 20 1 2 3
( )1
( )
s a s a sa aH s
s b s b s b sbL s s b s b s b sb
(15)
The values of given variables are
20
1
2
32
0
1
2
2
2
2
2
D C C GD
D C C GD C m C C
D GD C m C C
m D
D S C C GD DB GS GD DB
C C D GD DB S GS GD S D GD mC C
S D GS DB GD GS C GS
C C C C D GD
a R R C C
a R R C C C g R C
a R C C g R Ca g R
b R R R C C C C C C
R C R C C R C C R R C gb R C
R R C C C C C C
R C R C R C C
b
3
2
2
DB C D S
S C C GS GD D GS DB
S D GS GD DB GD DB m S D C GD C
C D C D GD DB C C S GS GD C m D GD C
C R R
R C R C C R C C
R R C C C C C g R R R C C
b R R C R C C R C R C C C g R C C
(16)
When the frequency compensation is considered, the transfer function of the second-stage of op amp is a fourth-order denominator complex function. It is very difficult to investigate the stable regions of this complex function. So, the measurement of the self-loop function is very important to do the stability test for the op amp. 3.2. Stability Test for Two-Stage Op Amp In this section, we do a stability test for the designed two-stage op amp. The op amp circuit was simulated using SPICE Spectre simulator in TSMC 0.18um CMOS process. This op amp consumes 0.25mW power from a 1.8V voltage supply. All of the circuit parameters are summarized in Table 3. Figures 10(a) and 10(b) present the models of the two-stage op amp
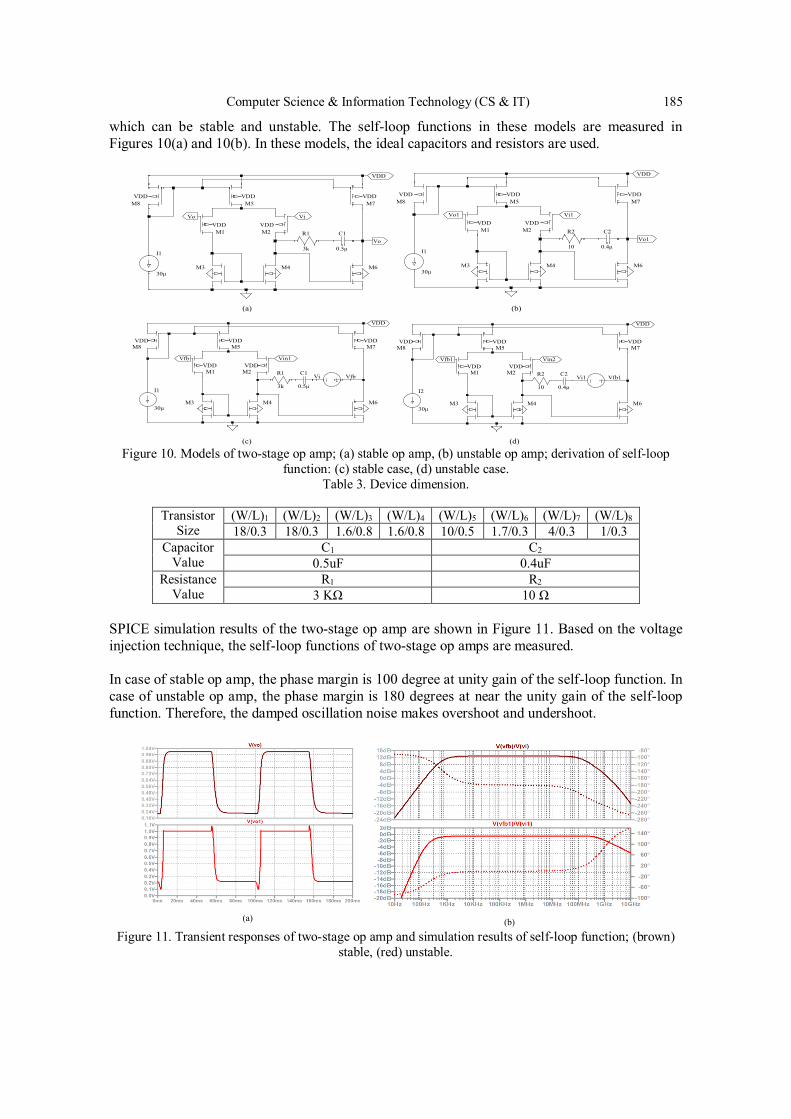
Computer Science & Information Technology (CS & IT) 185
which can be stable and unstable. The self-loop functions in these models are measured in Figures 10(a) and 10(b). In these models, the ideal capacitors and resistors are used.
Figure 10. Models of two-stage op amp; (a) stable op amp, (b) unstable op amp; derivation of self-loop
function: (c) stable case, (d) unstable case. Table 3. Device dimension.
Transistor
Size (W/L)1 (W/L)2 (W/L)3 (W/L)4 (W/L)5 (W/L)6 (W/L)7 (W/L)8 18/0.3 18/0.3 1.6/0.8 1.6/0.8 10/0.5 1.7/0.3 4/0.3 1/0.3
Capacitor Value
C1 C2 0.5uF 0.4uF
Resistance Value
R1 R2 3 KΩ 10 Ω
SPICE simulation results of the two-stage op amp are shown in Figure 11. Based on the voltage injection technique, the self-loop functions of two-stage op amps are measured. In case of stable op amp, the phase margin is 100 degree at unity gain of the self-loop function. In case of unstable op amp, the phase margin is 180 degrees at near the unity gain of the self-loop function. Therefore, the damped oscillation noise makes overshoot and undershoot.
(a) (b) Figure 11. Transient responses of two-stage op amp and simulation results of self-loop function; (brown)
stable, (red) unstable.
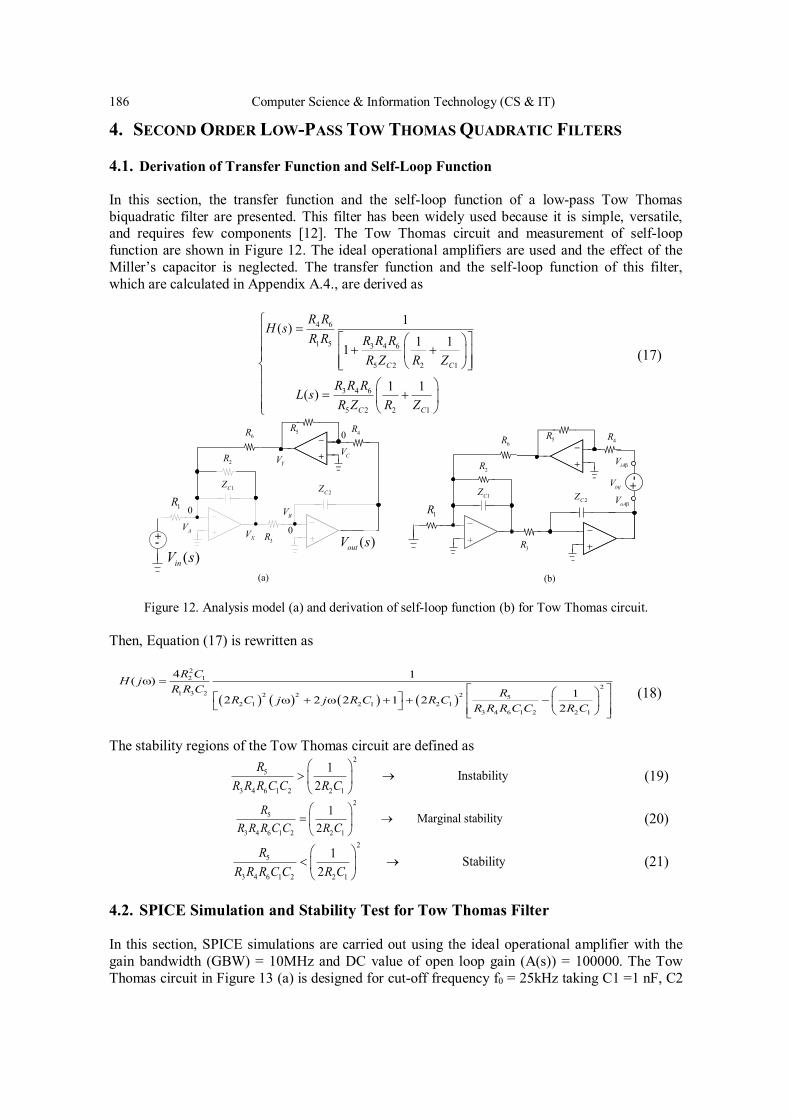
186 Computer Science & Information Technology (CS & IT)
4. SECOND ORDER LOW-PASS TOW THOMAS QUADRATIC FILTERS 4.1. Derivation of Transfer Function and Self-Loop Function In this section, the transfer function and the self-loop function of a low-pass Tow Thomas biquadratic filter are presented. This filter has been widely used because it is simple, versatile, and requires few components [12]. The Tow Thomas circuit and measurement of self-loop function are shown in Figure 12. The ideal operational amplifiers are used and the effect of the Miller’s capacitor is neglected. The transfer function and the self-loop function of this filter, which are calculated in Appendix A.4., are derived as
4 6
1 5 3 4 6
5 2 2 1
3 4 6
5 2 2 1
1( )1 11
1 1( )
C C
C C
R RH s
R R R R RR Z R Z
R R RL s
R Z R Z
(17)
(a) (b)
1R
3R
2R
6R 4R5R
2CZ1CZ
+-( )inV s
( )outV s
YV
0
0
XV
0
AV
CV
BV 1R
3R
2R
6R 4R5R
2CZ1CZ injV
oAV
iAV
+ -
Figure 12. Analysis model (a) and derivation of self-loop function (b) for Tow Thomas circuit. Then, Equation (17) is rewritten as
22 1
21 3 2 2 2 2 5
2 1 2 1 2 13 4 6 1 2 2 1
4 1( )12 2 2 1 2
2
R CH j
R R C RR C j j R C R C
R R R C C R C
(18)
The stability regions of the Tow Thomas circuit are defined as
25
3 4 6 1 2 2 1
1 Instability2
RR R R C C R C
(19)
25
3 4 6 1 2 2 1
1 Marginal stability2
RR R R C C R C
(20) 2
5
3 4 6 1 2 2 1
1 Stability2
RR R R C C R C
(21)
4.2. SPICE Simulation and Stability Test for Tow Thomas Filter In this section, SPICE simulations are carried out using the ideal operational amplifier with the gain bandwidth (GBW) = 10MHz and DC value of open loop gain (A(s)) = 100000. The Tow Thomas circuit in Figure 13 (a) is designed for cut-off frequency f0 = 25kHz taking C1 =1 nF, C2
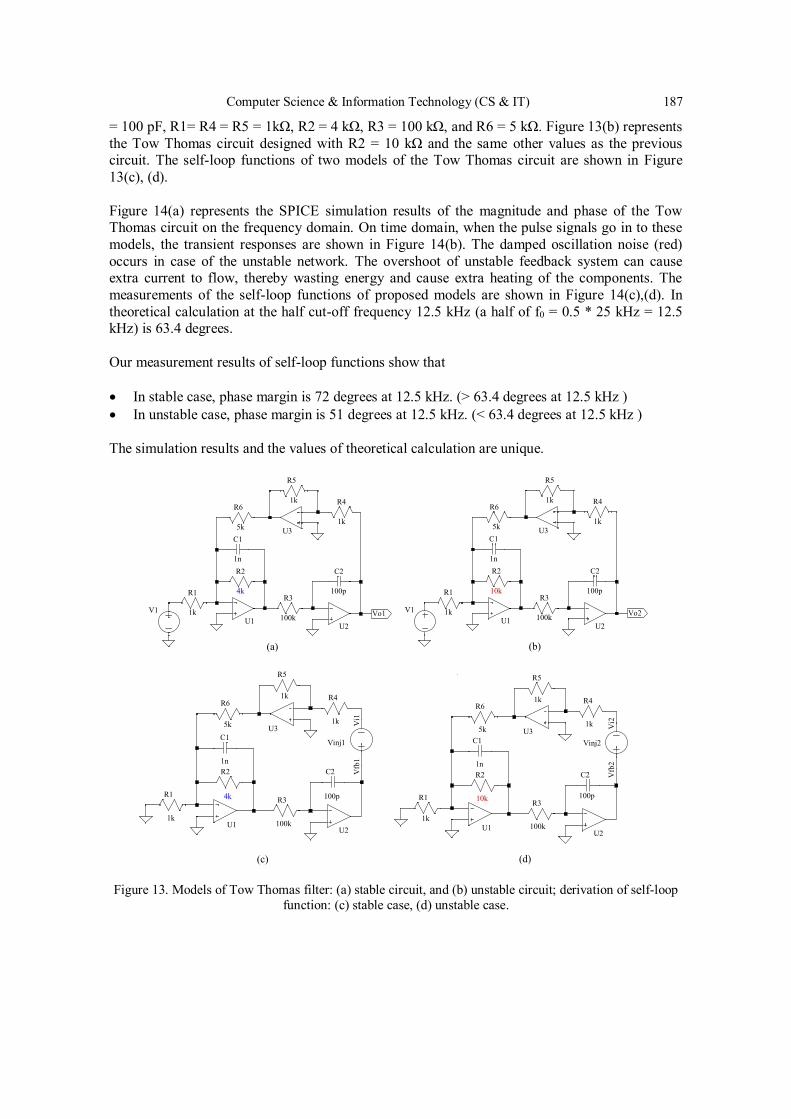
Computer Science & Information Technology (CS & IT) 187
= 100 pF, R1= R4 = R5 = 1kΩ, R2 = 4 kΩ, R3 = 100 kΩ, and R6 = 5 kΩ. Figure 13(b) represents the Tow Thomas circuit designed with R2 = 10 kΩ and the same other values as the previous circuit. The self-loop functions of two models of the Tow Thomas circuit are shown in Figure 13(c), (d). Figure 14(a) represents the SPICE simulation results of the magnitude and phase of the Tow Thomas circuit on the frequency domain. On time domain, when the pulse signals go in to these models, the transient responses are shown in Figure 14(b). The damped oscillation noise (red) occurs in case of the unstable network. The overshoot of unstable feedback system can cause extra current to flow, thereby wasting energy and cause extra heating of the components. The measurements of the self-loop functions of proposed models are shown in Figure 14(c),(d). In theoretical calculation at the half cut-off frequency 12.5 kHz (a half of f0 = 0.5 * 25 kHz = 12.5 kHz) is 63.4 degrees. Our measurement results of self-loop functions show that In stable case, phase margin is 72 degrees at 12.5 kHz. (> 63.4 degrees at 12.5 kHz ) In unstable case, phase margin is 51 degrees at 12.5 kHz. (< 63.4 degrees at 12.5 kHz )
The simulation results and the values of theoretical calculation are unique.
Figure 13. Models of Tow Thomas filter: (a) stable circuit, and (b) unstable circuit; derivation of self-loop function: (c) stable case, (d) unstable case.
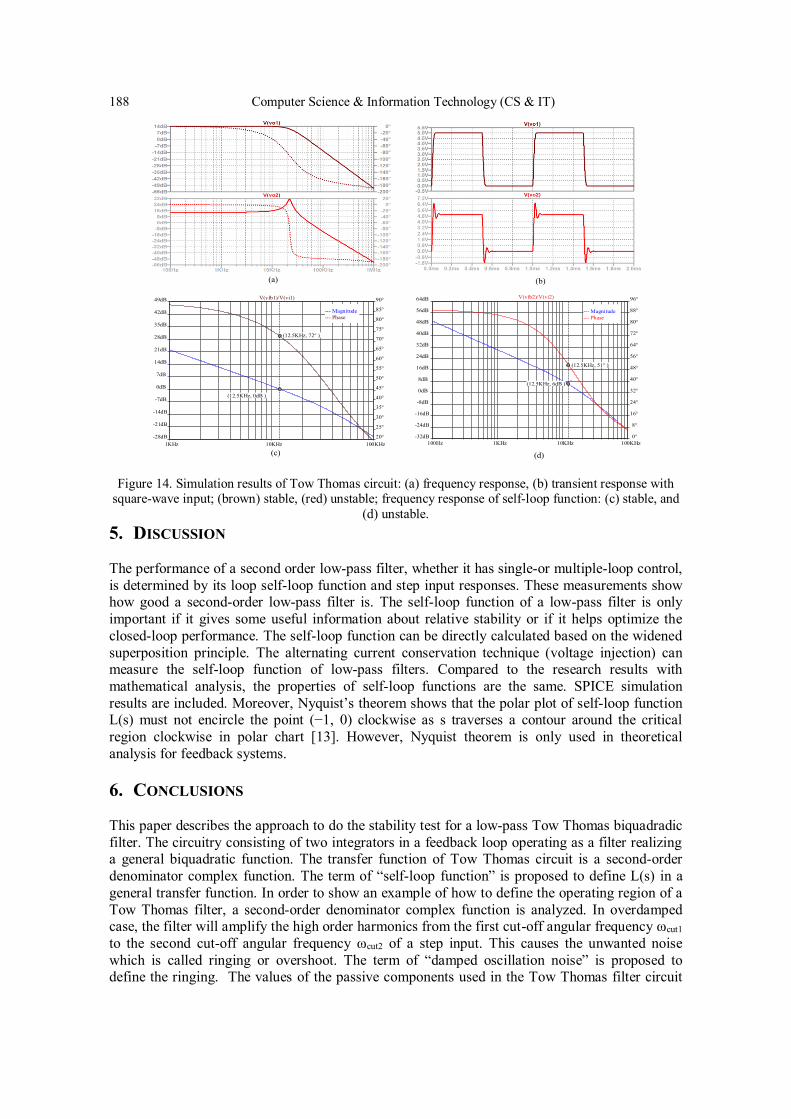
188 Computer Science & Information Technology (CS & IT)
Figure 14. Simulation results of Tow Thomas circuit: (a) frequency response, (b) transient response with square-wave input; (brown) stable, (red) unstable; frequency response of self-loop function: (c) stable, and
(d) unstable. 5. DISCUSSION The performance of a second order low-pass filter, whether it has single-or multiple-loop control, is determined by its loop self-loop function and step input responses. These measurements show how good a second-order low-pass filter is. The self-loop function of a low-pass filter is only important if it gives some useful information about relative stability or if it helps optimize the closed-loop performance. The self-loop function can be directly calculated based on the widened superposition principle. The alternating current conservation technique (voltage injection) can measure the self-loop function of low-pass filters. Compared to the research results with mathematical analysis, the properties of self-loop functions are the same. SPICE simulation results are included. Moreover, Nyquist’s theorem shows that the polar plot of self-loop function L(s) must not encircle the point (−1, 0) clockwise as s traverses a contour around the critical
region clockwise in polar chart [13]. However, Nyquist theorem is only used in theoretical analysis for feedback systems. 6. CONCLUSIONS This paper describes the approach to do the stability test for a low-pass Tow Thomas biquadradic filter. The circuitry consisting of two integrators in a feedback loop operating as a filter realizing a general biquadratic function. The transfer function of Tow Thomas circuit is a second-order denominator complex function. The term of “self-loop function” is proposed to define L(s) in a general transfer function. In order to show an example of how to define the operating region of a Tow Thomas filter, a second-order denominator complex function is analyzed. In overdamped case, the filter will amplify the high order harmonics from the first cut-off angular frequency ωcut1 to the second cut-off angular frequency ωcut2 of a step input. This causes the unwanted noise which is called ringing or overshoot. The term of “damped oscillation noise” is proposed to define the ringing. The values of the passive components used in the Tow Thomas filter circuit

Computer Science & Information Technology (CS & IT) 189
were chosen directly due to the stable conditions. All of the transfer functions were derived based on the widened superposition principle and self-loop functions were measured according to the alternating current conservation technique. The obtained results were acquired to simulations using SPICE models of the devices, including the model of a two-stage operational amplifier. In the paper not only the results of the mathematical model but also the results of simulation of the designed circuits are provided, including the stability test. The simulation results and the values of theoretical calculation of the self-loop function are unique. ACKNOWLEDGEMENTS Foremost, we would like to express our sincere gratitude to advisor, Pro. Tanimoto (Kitami Institute. of Technology, Japan) for continuing supports. REFERENCES [1] H. Kobayashi, N. Kushita, M. Tran, K. Asami, H. San, A. Kuwana, "Analog - Mixed-Signal - RF
Circuits for Complex Signal Processing", IEEE 13th International Conference on ASIC (ASICON 2019) Chongqing, China (Nov, 2019).
[2] M. Tran, C. Huynh, "A Design of RF Front-End for ZigBee Receiver using Low-IF architecture with Poly-phase Filter for Image Rejection", M.S. thesis, University of Technology Ho Chi Minh City – Vietnam, Dec. 2014.
[3] B. Razavi (2016) Design of Analog CMOS Integrated Circuits, 2nd Edition McGraw-Hill. [4] M. Tran, Y. Sun, N. Oiwa, Y. Kobori, A. Kuwana, H. Kobayashi, "Mathematical Analysis and
Design of Parallel RLC Network in Step-down Switching Power Conversion System", Proceedings of International Conference on Technology and Social Science ICTSS 2019, Kiryu, Japan (May. 2019).
[5] M. Tran, N. Kushita, A. Kuwana, H. Kobayashi, "Flat Pass-Band Method with Two RC Band-Stop Filters for 4-Stage Passive RC Quadratic Filter in Low-IF Receiver Systems", IEEE 13th International Conference on ASIC (ASICON 2019) Chongqing, China (Nov. 2019).
[6] M. Tran, Y. Sun, Y. Kobori, A. Kuwana, H. Kobayashi, "Overshoot Cancelation Based on Balanced Charge-Discharge Time Condition for Buck Converter in Mobile Applications", IEEE 13th International Conference on ASIC (ASICON 2019) Chongqing, China (Nov. 2019).
[7] R. Schaumann and M. Valkenberg (2001) Design of Analog Filters, Oxford University Press. [8] R. Middlebrook, "Measurement of Self-Loop function in Feedback Systems", Int. J. Electronics, Vol
38, No. 4, pp. 485-512, 1975. [9] A. Sedra, K. Smith (2010) Microelectronic Circuits, 6th ed. Oxford University Press, New York. [10] M. Tran, "Damped Oscillation Noise Test for Feedback Circuit Based on Comparison Measurement
Technique", 73rd System LSI Joint Seminar, Tokyo Institute of Technology, Tokyo, Japan (Oct. 2019).
[11] H. Kobayashi, M. Tran, K. Asami, A. Kuwana, H. San, "Complex Signal Processing in Analog, Mixed - Signal Circuits", Proceedings of International Conference on Technology and Social Science 2019, Kiryu, Japan (May. 2019).
[12] J. Tow, "Active RC Filters-State-Space Realization", IEEE Proceedings, Vol. 56, no. 6, pp. 1137–
1139, 1968. [13] J. Wang, G. Adhikari, N. Tsukiji, M. Hirano, H. Kobayashi, K. Kurihara, A. Nagahama, I. Noda, K.
Yoshii, "Equivalence Between Nyquist and Routh-Hurwitz Stability Criteria for Operational Amplifier Design", IEEE International Symposium on Intelligent Signal Processing and Communication Systems (ISPACS), Xiamen, China (Nov. 2017).
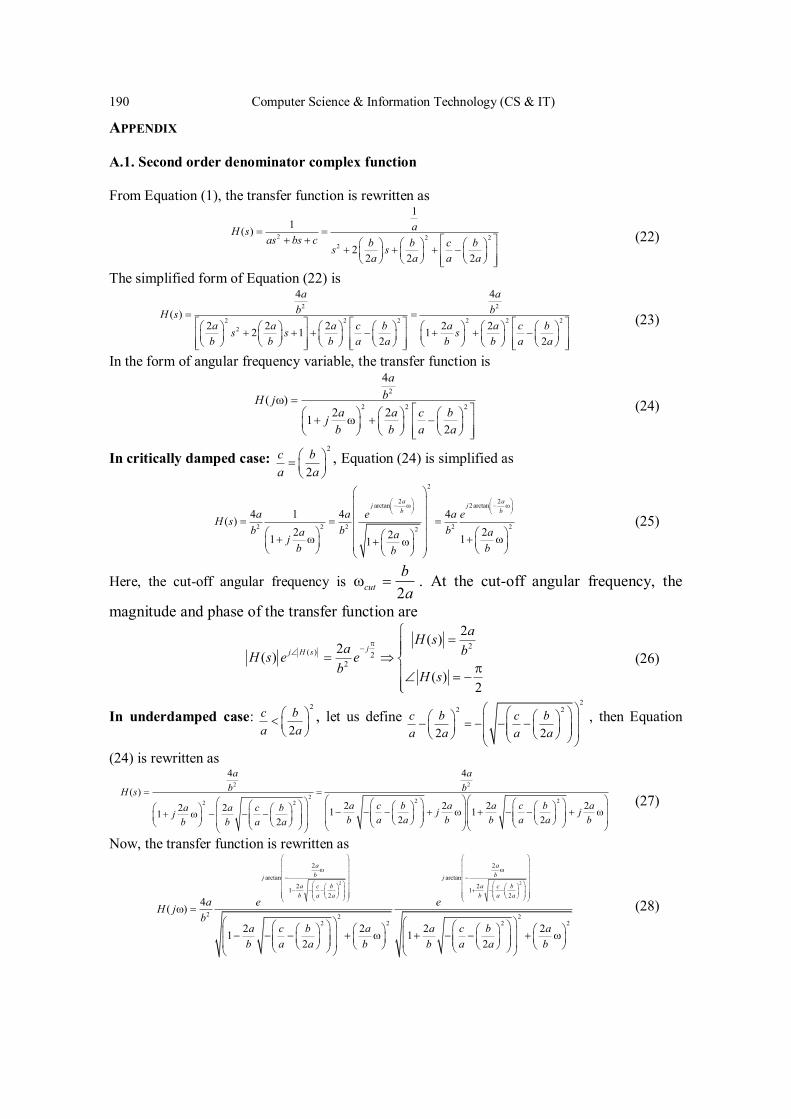
190 Computer Science & Information Technology (CS & IT)
APPENDIX A.1. Second order denominator complex function From Equation (1), the transfer function is rewritten as
2 2 2
2
11( )
22 2 2
aH sas bs c b b c bs s
a a a a
(22)
The simplified form of Equation (22) is
2 2
2 2 2 2 2 22
4 4
( )2 2 2 2 22 1 1
2 2
a ab bH s
a a a c b a a c bs s sb b b a a b b a a
(23)
In the form of angular frequency variable, the transfer function is
2
2 2 2
4
( )2 21
2
abH j
a a c bjb b a a
(24)
In critically damped case: 2
2c ba a
, Equation (24) is simplified as
2
2 2arctan 2 arctan
2 2 2 2 22
4 1 4 4( )2 221 11
a aj jb ba a e a eH s
b b ba aajb bb
(25)
Here, the cut-off angular frequency is 2cutba
. At the cut-off angular frequency, the
magnitude and phase of the transfer function are
2( ) 2
2
2( )2( )
( )2
jj H s
aH sa bH s e e
b H s
(26)
In underdamped case: 2
2c ba a
, let us define 2
2 2
2 2c b c ba a a a
, then Equation
(24) is rewritten as 2 2
2 2 22 2
4 4
( )2 2 2 22 2 1 11 2 22
a ab bH s
a c b a a c b aa a c b j jj b a a b b a a bb b a a
(27)
Now, the transfer function is rewritten as
2 2
2 2
arctan arctan2 21 1
2 2
2 22 2 2
4( )
2 2 21 12 2
a ab bj j
a c b a c bb a a b a a
a e eH jb
a c b a a c bb a a b b a a
222a
b
(28)
Computer Science & Information Technology (CS & IT) 191
The cut-off angular frequencies are 2
121
2 2cutb a c ba b a a
and 2
221
2 2cutb a c ba b a a
In overdamped case: 2
2c ba a
, let us define 2
2 2
2 2c b c bja a a a
, then Equation
(24) is rewritten as
2 2
2 2 22 2
4 4
( )2 22 2 1 11
2 22
a ab bH s
a c b a c ba a c b j jj jb a a b a ab b a a
(29)
Now, the transfer function is rewritten as 2 22 2arctan arctan
2 2
2 2 22 2
4( )
2 21 12 2
a c b a c bj jb a a b a a
a e eH jb
a c b a c bb a a b a a
(30)
The cut-off angular frequencies are 2
121
2 2cutb a c ba b a a
and 2
221
2 2cutb a c ba b a a
.
A.2. Self-loop function of second order denominator complex function From Equation (7), the self-loop function is rewritten as
2 2 24 2 2( )2
a a a c bL j j jb b b a a
(31)
In critically damped case: 2
2c ba a
, the self-loop function is
2 arctan4 4( ) 1 1bjaa a a aL j j j e
b b b b (32)
The cut-off angular frequencies of the self-loop functions are 1 0 and 2ba
. At unity gain
of the self-loop function, we have 24( ) 1 1 1u u u
a aLb b
(33)
Solving Equation (33), the angular frequency u at unity gain is calculated as 5 2
2uba
(34)
The relationship between the angular frequency u and the cut-off angular frequency 2cutba
is
5 25 2
uu cut cut
(35)
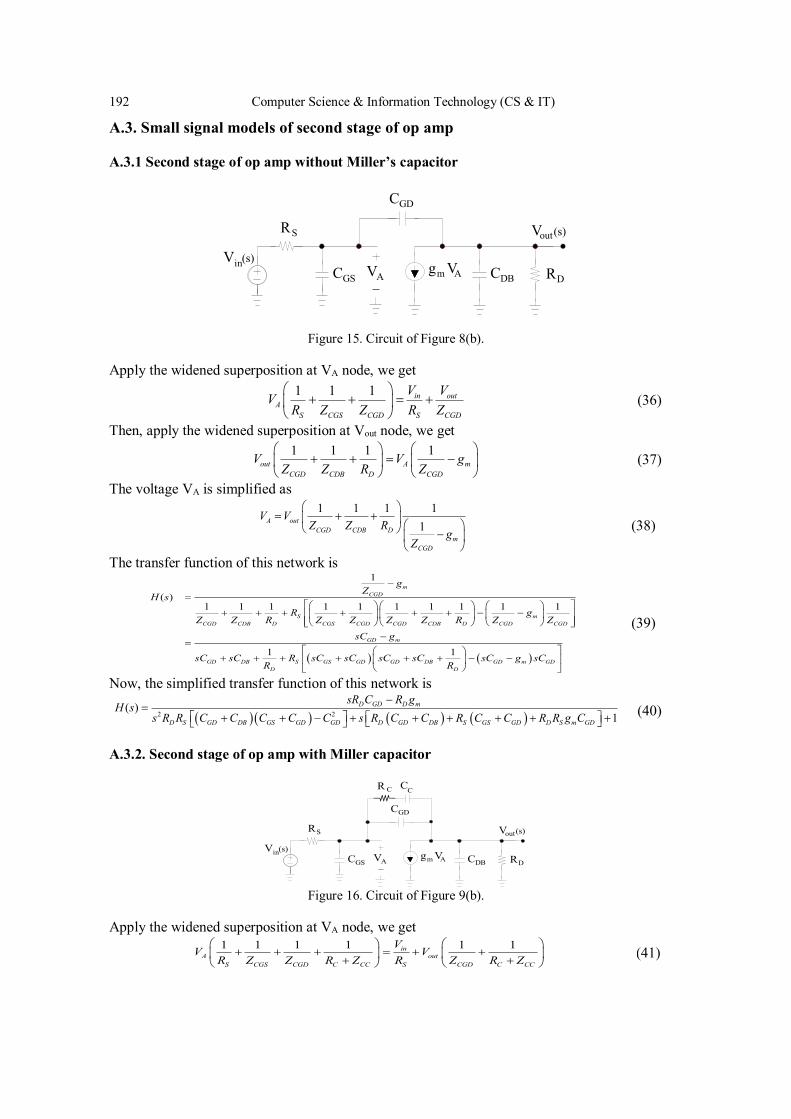
192 Computer Science & Information Technology (CS & IT)
A.3. Small signal models of second stage of op amp A.3.1 Second stage of op amp without Miller’s capacitor
Figure 15. Circuit of Figure 8(b).
Apply the widened superposition at VA node, we get 1 1 1 in out
AS CGS CGD S CGD
V VVR Z Z R Z
(36)
Then, apply the widened superposition at Vout node, we get 1 1 1 1
out A mCGD CDB D CGD
V V gZ Z R Z
(37)
The voltage VA is simplified as 1 1 1 1
1A outCGD CDB D
mCGD
V VZ Z R
gZ
(38)
The transfer function of this network is 1
( )1 1 1 1 1 1 1 1 1 1
1 1
mCGD
S mCGD CDB D CGS CGD CGD CDB D CGD CGD
GD m
GD DB S GS GD GD DB GD m GDD D
gZ
H sR g
Z Z R Z Z Z Z R Z Z
sC g
sC sC R sC sC sC sC sC g sCR R
(39)
Now, the simplified transfer function of this network is
2 2( )
1D GD D m
D S GD DB GS GD GD D GD DB S GS GD D S m GD
sR C R gH s
s R R C C C C C s R C C R C C R R g C
(40)
A.3.2. Second stage of op amp with Miller capacitor
Figure 16. Circuit of Figure 9(b).
Apply the widened superposition at VA node, we get
1 1 1 1 1 1inA out
S CGS CGD C CC S CGD C CC
VV V
R Z Z R Z R Z R Z (41)
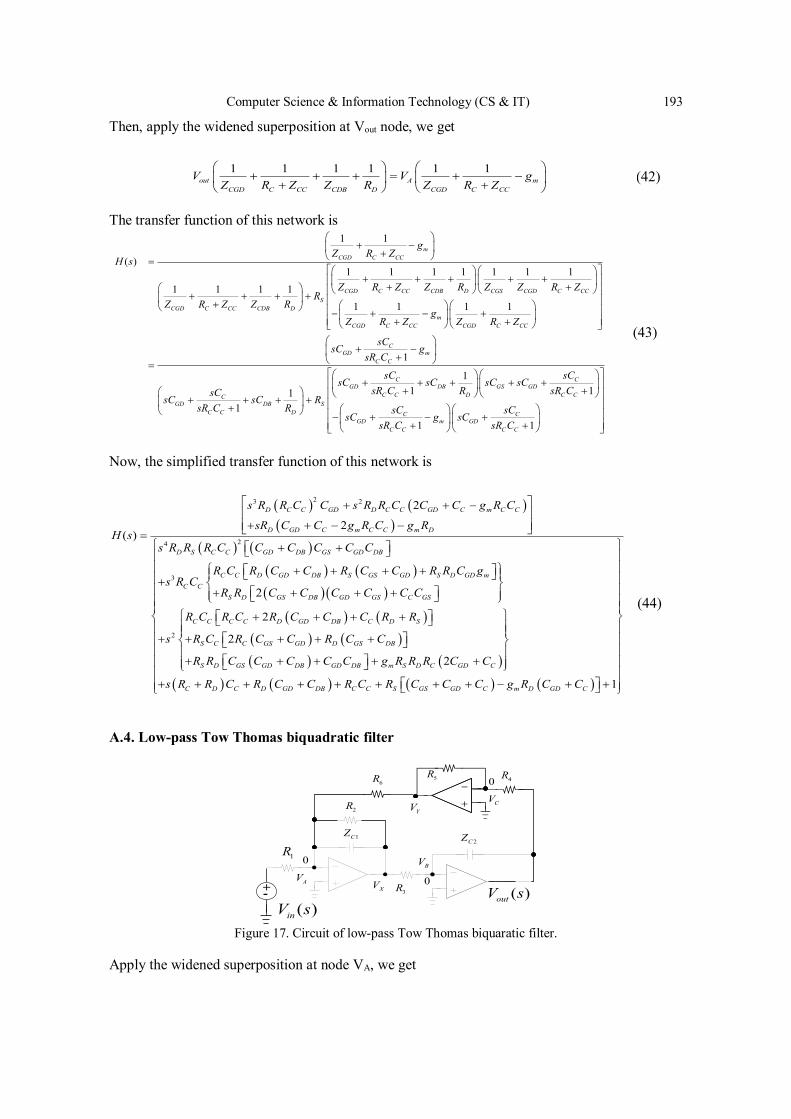
Computer Science & Information Technology (CS & IT) 193
Then, apply the widened superposition at Vout node, we get
1 1 1 1 1 1out A m
CGD C CC CDB D CGD C CC
V V gZ R Z Z R Z R Z
(42)
The transfer function of this network is
1 1
( )1 1 1 1 1 1 1
1 1 1 11 1 1 1
1
mCGD C CC
CGD C CC CDB D CGS CGD C CCS
CGD C CC CDB Dm
CGD C CC CGD C CC
CGD m
C C
GD
gZ R Z
H s
Z R Z Z R Z Z R ZR
Z R Z Z Rg
Z R Z Z R Z
sCsC g
sR C
ssC
11 11
11 1
C CGD DB GS GD
C C D C CCDB S
C C D C CGD m GD
C C C C
sC sCsC sC sC sC
sR C R sR CCsC R
sR C R sC sCsC g sC
sR C sR C
(43)
Now, the simplified transfer function of this network is
23 2
24
3
2
2
2( )
2
2
D C C GD D C C GD C m C C
D GD C m C C m D
D S C C GD DB GS GD DB
C C D GD DB S GS GD S D GD mC C
S D GS DB GD GS C GS
C C C C
s R R C C s R R C C C g R C
sR C C g R C g RH s
s R R R C C C C C C
R C R C C R C C R R C gs R C
R R C C C C C C
R C R C
s 2
2
1
D GD DB C D S
S C C GS GD D GS DB
S D GS GD DB GD DB m S D C GD C
C D C D GD DB C C S GS GD C m D GD C
R C C C R R
R C R C C R C C
R R C C C C C g R R R C C
s R R C R C C R C R C C C g R C C
(44)
A.4. Low-pass Tow Thomas biquadratic filter
1R
3R
2R
6R 4R5R
2CZ1CZ
+-( )inV s
( )outV s
YV
0
0
XV
0
AV
CV
BV
Figure 17. Circuit of low-pass Tow Thomas biquaratic filter.
Apply the widened superposition at node VA, we get
194 Computer Science & Information Technology (CS & IT)
1 2 1 6
1 1 0in YX
C
V VV
R R Z R (45)
Do the same work at node VB, we get 3
3 2 2
0outXX out
C C
V RVV V
R Z Z (46)
Then at node VC, we get 5
4 5 4
0out YY out
V RVV V
R R R (47)
The transfer function of this filter is derived as 4 6
1 5 3 4 6
5 2 2 1
1 3 1 2 2 5
2 1 3 4 6 1 2
1( )1 11
1 11
out
in
C C
V R RH s
V R R R R RR Z R Z
R R C C Rs s
R C R R R C C
(48)
AUTHORS Minh Tri Tran received the B.S. and M.S. degree from the University of Technical Education Ho Chi Minh City (HCMUTE) – Vietnam, and University of Technology Ho Chi Minh City (HCMUT) – Vietnam, in 2011, and 2014, respectively, all in Electrical and Electronic Engineering. He joined the Division of Electronics and Informatics, Gunma University, Japan in 2018, where he is presently working toward the Ph.D. degree in Electrical and Electronic Engineering. His research interests include modelling, analysis, and test of damped oscillation noise and radio-frequency radiation noise in communication systems. Anna Kuwana received the B.S. and M.S. degrees in information science from Ochanomizu University in 2006 and 2007 respectively. She joined Ochanomizu University as a technical staff, and received the Ph.D. degree by thesis only in 2011. She joined Gunma University and presently is an assistant professor in Division of Electronics and Informatics there. Her research interests include computational fluid dynamics. Haruo Kobayashi received the B.S. and M.S. degrees in information physics from University of Tokyo in 1980 and 1982 respectively, the M.S. degree in electrical engineering from University of California, Los Angeles (UCLA) in 1989, and the Ph. D. degree in electrical engineering from Waseda University in 1995. In 1997, he joined Gunma University and presently is a Professor in Division of Electronics and Informatics there. His research interests include mixed-signal integrated circuit design & testing, and signal processing algorithms. © 2020 By AIRCC Publishing Corporation. This article is published under the Creative Commons Attribution (CC BY) license.
David C. Wyld et al. (Eds): CCSEA, BIoT, DKMP, CLOUD, NLCAI, SIPRO - 2020
pp. 195-201, 2020. CS & IT - CSCP 2020 DOI: 10.5121/csit.2020.101015
TALA CLASSIFICATION IN CARNATIC
MUSIC USING AUDIO THUMBNAILING
Amulya Sri Pulijala and Suryakanth V Gangashetty
International Institute of Information Technology, Hyderabad, India
ABSTRACT
The concept of Raga and Tala is integral part of Indian Classical music. Raga is the melodic
component while Tala is the rhythmic component in the music. Hence, Tala classification and
identification is a paramount problem in the area of Music Information Retrieval (MIR)
systems. Although there are seven basic Talas in Carnatic Music, a further subdivision of them
gives a total of 175 ragas. Statistical and machine learning approaches are proposed in
Literature Survey to classify Talas. However, they use complete musical recording for training
and testing. As part of this paper, a novel approach is proposed for the first time in Carnatic
music to classify Talas using repetitive structure called Thumbnails.
KEYWORDS
Tala Classification, Carnatic Music, Audio Thumbnails, SVM, CNN
1. INTRODUCTION Music has become integral part of our lives today. With the digital revolution and growth of
computational power, browsing and storage has become accessible and effective. It has paved a
new way of generation and analysis of music in the area of music signal processing. The
Natyasastra of Bharata and the Sangitaratnakara of Sarangadeva are the oldest existing sources of information on Indian Classical Music. Carnatic and Hindustani are the two broad variations of
classical music in India based on its geographical association. Carnatic belongs to the southern
part, while Hindustani is from northern part of the sub-continent. Swara, Raga and Tala can be described as important elements in Indian classical music. Raga is the melodic part and Talam is
the rhythmic component.
There are 12 notes or swara which forms the primary aspect of Carnatic music as well as
Hindustani classical music, along with raga and tala. It is described as “Sruthi Mata, Laya Pitha”,
which means Shruthi or Tonic or base frequency is considered as Mother whereas Tala is like
father [1]. Tala has no reference in the earliest system of music, popularly referred as "Samagana". However, it existed during Gandarva music. There are various classification
schemes of Tala in Carnatic Music. The ancient 108 anga Talas, the 72 Melakartha Tala system
and the Suladi Sapta Tala system are some of the classification schemes. Among these Sapta Tala system is prominent one which was popularized by Purandaradasa. Seven Talas in Carnatic
music are as follows namely, Adi, Rupaka, Eka, Jhampe, Dhruva, Matya, Ata, Triputa etc.
These seven talas are further subdivided, based on the change in Tala due to change in five
Jaathis (Jaathis of Tala means that the amount of beats that a laghu can take). The five Jaathis are
as follows: Tisra, Chatusra, Khanda, Misra and Sankeerna. Thus we get total of 35 Talas after
dividing on the basis of Jathis. These 35 Talas allow further subdivision based on five
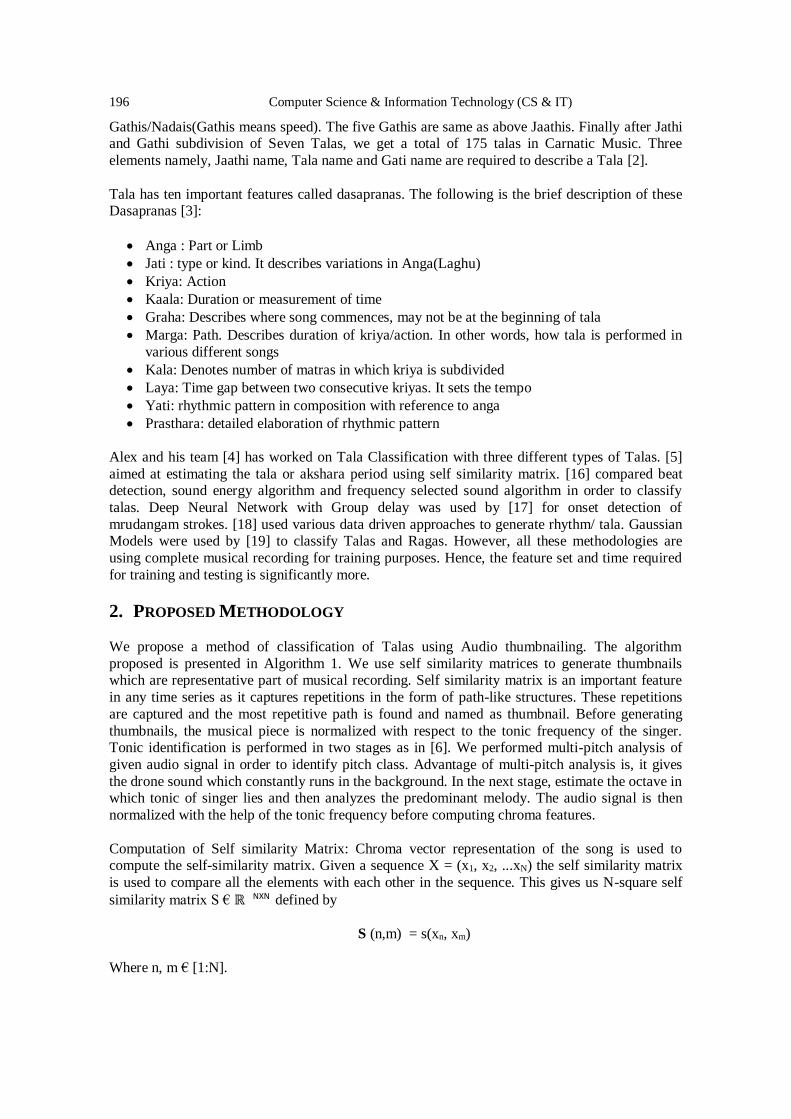
196 Computer Science & Information Technology (CS & IT)
Gathis/Nadais(Gathis means speed). The five Gathis are same as above Jaathis. Finally after Jathi and Gathi subdivision of Seven Talas, we get a total of 175 talas in Carnatic Music. Three
elements namely, Jaathi name, Tala name and Gati name are required to describe a Tala [2].
Tala has ten important features called dasapranas. The following is the brief description of these Dasapranas [3]:
Anga : Part or Limb
Jati : type or kind. It describes variations in Anga(Laghu)
Kriya: Action
Kaala: Duration or measurement of time
Graha: Describes where song commences, may not be at the beginning of tala
Marga: Path. Describes duration of kriya/action. In other words, how tala is performed in
various different songs
Kala: Denotes number of matras in which kriya is subdivided
Laya: Time gap between two consecutive kriyas. It sets the tempo
Yati: rhythmic pattern in composition with reference to anga
Prasthara: detailed elaboration of rhythmic pattern
Alex and his team [4] has worked on Tala Classification with three different types of Talas. [5]
aimed at estimating the tala or akshara period using self similarity matrix. [16] compared beat detection, sound energy algorithm and frequency selected sound algorithm in order to classify
talas. Deep Neural Network with Group delay was used by [17] for onset detection of
mrudangam strokes. [18] used various data driven approaches to generate rhythm/ tala. Gaussian Models were used by [19] to classify Talas and Ragas. However, all these methodologies are
using complete musical recording for training purposes. Hence, the feature set and time required
for training and testing is significantly more.
2. PROPOSED METHODOLOGY
We propose a method of classification of Talas using Audio thumbnailing. The algorithm
proposed is presented in Algorithm 1. We use self similarity matrices to generate thumbnails which are representative part of musical recording. Self similarity matrix is an important feature
in any time series as it captures repetitions in the form of path-like structures. These repetitions
are captured and the most repetitive path is found and named as thumbnail. Before generating
thumbnails, the musical piece is normalized with respect to the tonic frequency of the singer. Tonic identification is performed in two stages as in [6]. We performed multi-pitch analysis of
given audio signal in order to identify pitch class. Advantage of multi-pitch analysis is, it gives
the drone sound which constantly runs in the background. In the next stage, estimate the octave in which tonic of singer lies and then analyzes the predominant melody. The audio signal is then
normalized with the help of the tonic frequency before computing chroma features.
Computation of Self similarity Matrix: Chroma vector representation of the song is used to compute the self-similarity matrix. Given a sequence X = (x1, x2, ...xN) the self similarity matrix
is used to compare all the elements with each other in the sequence. This gives us N-square self
similarity matrix S € ℝ NXN defined by
S (n,m) = s(xn, xm)
Where n, m € [1:N].
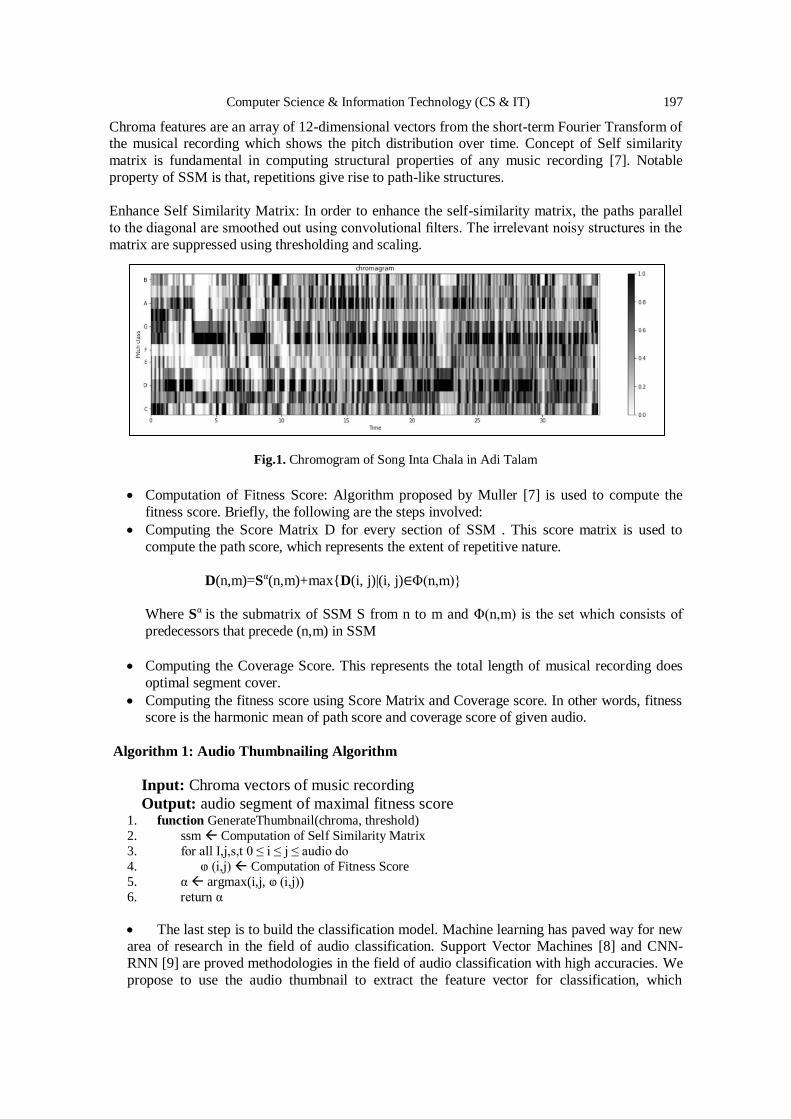
Computer Science & Information Technology (CS & IT) 197
Chroma features are an array of 12-dimensional vectors from the short-term Fourier Transform of the musical recording which shows the pitch distribution over time. Concept of Self similarity
matrix is fundamental in computing structural properties of any music recording [7]. Notable
property of SSM is that, repetitions give rise to path-like structures.
Enhance Self Similarity Matrix: In order to enhance the self-similarity matrix, the paths parallel
to the diagonal are smoothed out using convolutional filters. The irrelevant noisy structures in the
matrix are suppressed using thresholding and scaling.
Fig.1. Chromogram of Song Inta Chala in Adi Talam
Computation of Fitness Score: Algorithm proposed by Muller [7] is used to compute the
fitness score. Briefly, the following are the steps involved:
Computing the Score Matrix D for every section of SSM . This score matrix is used to
compute the path score, which represents the extent of repetitive nature.
D(n,m)=Sα(n,m)+max{D(i, j)|(i, j)∈Φ(n,m)}
Where Sα is the submatrix of SSM S from n to m and Φ(n,m) is the set which consists of
predecessors that precede (n,m) in SSM
Computing the Coverage Score. This represents the total length of musical recording does
optimal segment cover.
Computing the fitness score using Score Matrix and Coverage score. In other words, fitness score is the harmonic mean of path score and coverage score of given audio.
Algorithm 1: Audio Thumbnailing Algorithm
Input: Chroma vectors of music recording
Output: audio segment of maximal fitness score 1. function GenerateThumbnail(chroma, threshold)
2. ssm Computation of Self Similarity Matrix
3. for all I,j,s,t 0 ≤ i ≤ j ≤ audio do
4. ⱷ (i,j) Computation of Fitness Score
5. α argmax(i,j, ⱷ (i,j))
6. return α
The last step is to build the classification model. Machine learning has paved way for new area of research in the field of audio classification. Support Vector Machines [8] and CNN-
RNN [9] are proved methodologies in the field of audio classification with high accuracies. We
propose to use the audio thumbnail to extract the feature vector for classification, which
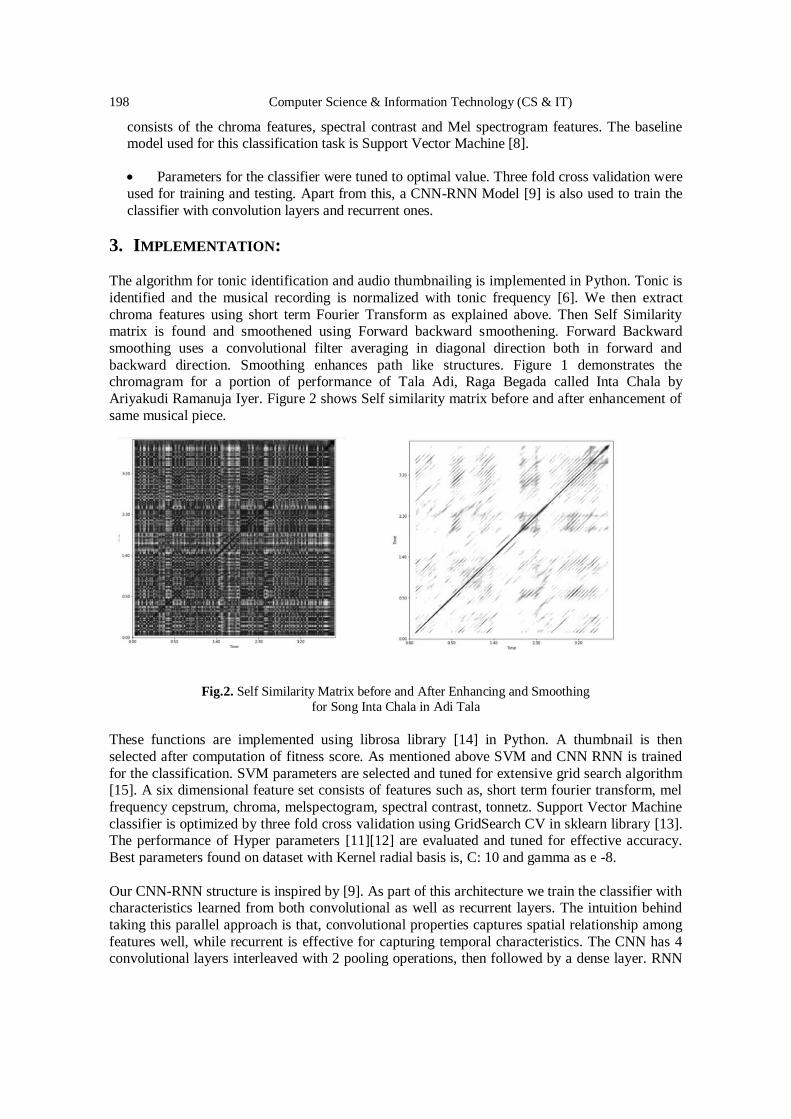
198 Computer Science & Information Technology (CS & IT)
consists of the chroma features, spectral contrast and Mel spectrogram features. The baseline model used for this classification task is Support Vector Machine [8].
Parameters for the classifier were tuned to optimal value. Three fold cross validation were
used for training and testing. Apart from this, a CNN-RNN Model [9] is also used to train the
classifier with convolution layers and recurrent ones.
3. IMPLEMENTATION:
The algorithm for tonic identification and audio thumbnailing is implemented in Python. Tonic is
identified and the musical recording is normalized with tonic frequency [6]. We then extract
chroma features using short term Fourier Transform as explained above. Then Self Similarity matrix is found and smoothened using Forward backward smoothening. Forward Backward
smoothing uses a convolutional filter averaging in diagonal direction both in forward and
backward direction. Smoothing enhances path like structures. Figure 1 demonstrates the chromagram for a portion of performance of Tala Adi, Raga Begada called Inta Chala by
Ariyakudi Ramanuja Iyer. Figure 2 shows Self similarity matrix before and after enhancement of
same musical piece.
Fig.2. Self Similarity Matrix before and After Enhancing and Smoothing
for Song Inta Chala in Adi Tala
These functions are implemented using librosa library [14] in Python. A thumbnail is then
selected after computation of fitness score. As mentioned above SVM and CNN RNN is trained
for the classification. SVM parameters are selected and tuned for extensive grid search algorithm [15]. A six dimensional feature set consists of features such as, short term fourier transform, mel
frequency cepstrum, chroma, melspectogram, spectral contrast, tonnetz. Support Vector Machine
classifier is optimized by three fold cross validation using GridSearch CV in sklearn library [13]. The performance of Hyper parameters [11][12] are evaluated and tuned for effective accuracy.
Best parameters found on dataset with Kernel radial basis is, C: 10 and gamma as e -8.
Our CNN-RNN structure is inspired by [9]. As part of this architecture we train the classifier with characteristics learned from both convolutional as well as recurrent layers. The intuition behind
taking this parallel approach is that, convolutional properties captures spatial relationship among
features well, while recurrent is effective for capturing temporal characteristics. The CNN has 4 convolutional layers interleaved with 2 pooling operations, then followed by a dense layer. RNN

Computer Science & Information Technology (CS & IT) 199
is implemented with LSTM layer and batch size of 128. CNN RNN is implemented in Python using Keras library [20].
Dataset: The dataset provided by CompMusic [10] is used to evaluate the model. Total 140
songs, of which 100 songs were used as training set and 40 songs were used as test data set. Five Talas were used which are as follows: Adi talam (cycle of 8 beats), Rupaka talam(cycle of 6
beats), Chaturasra jati Eka talam(cycle of 4 beats), Trisra jati Eka(cycle of 3 beats), Khanda Jati
Eka(cycle of 5 beats). Selection of these Talas is based on unique number of beats. Table 1 illustrates the division of dataset for training and testing.
The CNN-RNN classification model significantly showed higher accuracy levels compared to standard SVM Classifier. CNN classifier produces a test accuracy of 84% where the SVM
classifier gave an accuracy of 65%.
TABLE I. Table Describing Dataset For Tala Classification
Name of the Tala Number of
Beats
Training,
Testing Set
Average Duration of
songs in min
Adi 8 (20,8) 07.20
Rupaka 6 (20,8) 08.10
Chaturasra Jati
Eka 4 (20,8) 06.40
Tisra Jati Eka 3 (20,8) 09.05
Khanda Jati Eka 5 (20,8) 08.20
4. CONCLUSION AND FUTURE WORK Using the thumbnailing instead of complete musical recording to extract features for training and
testing reduces the feature vector sizes to significant extent. However, extracting the thumbnail is
computationally not an easy task. It takes 90sec to compute thumbnail for an average recording
of 6 min.
Tala classification is not explored by many in the area of Music Information Retrieval and the
problem is unique to genres of Indian subcontinent. Existing researchers have used several statistical methodologies, using complete song. This paper proposes a novel technique to use
repetitive structure of musical recording, namely audio thumbnail to perform the classification.
Audio thumbnailing in Carnatic music is not an explored area of research. We would like to
extend our work on thumbnails towards mrdangam strokes identification and classification of all 175 talas in Carnatic music.
ACKNOWLEDGEMENTS We express our heartfelt gratitude to Comp Music Team for providing Carnatic music dataset. I would like
to thank my Mother who supported selflessly while writing this paper. We would like to thank everyone
who supported us in this endeavour.
REFERENCES
[1] Rowell, Lewis. "Paradigms for a Comparative Mythology of Music." Journal of the Indian
Musicological Society 18.2 (1987): 14.
[2] Music, Robert Morris. "Sets, Scales and Rhythmic Cycles A Classification of Talas in Indian Music."
200 Computer Science & Information Technology (CS & IT)
[3] Venkatarathnam, R. "Musicometric Dynamism of the Jatis." Journal of the Indian Musicological
Society 13.1 (1982): 20.
[4] Kan, Alex, et al. "A Comparison of Machine Learning Approaches to Classify Tala COMP 562."
(2017).
[5] A. Srinivasamurthy and X. Serra, "A supervised approach to hierarchical metrical cycle tracking from audio music recordings," 2014 IEEE International Conference on Acoustics, Speech and Signal
Processing (ICASSP), Florence, 2014, pp. 5217-5221, doi: 10.1109/ICASSP.2014.6854598.
[6] Gulati, Sankalp, et al. "Automatic tonic identification in Indian art music: approaches and
evaluation." Journal of New Music Research 43.1 (2014): 53-71.
[7] M. Muller, N. Jiang, and P. Grosche, “A robust fitness measure for capturing repetitions in music
recordings with applications to audio thumbnailing,” IEEE Transactions on audio, speech, and
language processing, vol. 21, no. 3, pp. 531–543, 2012.
[8] M. A. Hearst, “Support vector machines,” IEEE In-410 telligent Systems, vol. 13, no. 4, p. 18–28,
1998. 411 [Online]. Available: https://doi.org/10. 412 1109/5254.708428
[9] L. Feng, S. Liu, and J. Yao, “Music genre 414 classification with paralleling recurrent convolution-
415 al neural network,” arXiv preprint ar-416 Xiv:1712.08370, 2017
[10] Porter, Alastair, Mohamed Sordo, and Xavier Serra. "Dunya: A system for browsing audio music collections exploiting cultural context." Britto A, Gouyon F, Dixon S. 14th International Society for
Music Information Retrieval Conference (ISMIR); 2013 Nov 4-8; Curitiba, Brazil.[place unknown]:
ISMIR; 2013. p. 101-6.. International Society for Music Information Retrieval (ISMIR), 2013.
[11] Friedrichs, Frauke, and Christian Igel. "Evolutionary tuning of multiple SVM
parameters." Neurocomputing 64 (2005): 107-117.
[12] Lameski, Petre, et al. "SVM parameter tuning with grid search and its impact on reduction of model
over-fitting." Rough Sets, Fuzzy Sets, Data Mining, and Granular Computing. Springer, Cham, 2015.
464-474.
[13] Pedregosa, Fabian, et al. "Scikit-learn: Machine learning in Python." the Journal of machine Learning
research 12 (2011): 2825-2830.
[14] McFee, Brian, et al. "librosa: Audio and music signal analysis in python." Proceedings of the 14th python in science conference. Vol. 8. 2015.
[15] Jiménez, Álvaro Barbero, Jorge López Lázaro, and José R. Dorronsoro. "Finding optimal model
parameters by discrete grid search." Innovations in Hybrid Intelligent Systems. Springer, Berlin,
Heidelberg, 2007. 120-127.
[16] Nitha, K. P., and E. S. Suraj. "An Algorithm for detection of Tala in Carnatic Music for Music
Therapy Applications." International Journal of Research in Engineering, IT and Social Sciences,
ISSN 2250-0588, Volume 09 Issue 5, May 2019, Page 416-42
[17] Sebastian, Jilt, and Hema A. Murthy. "Onset Detection in Composition Items of Carnatic
Music." ISMIR. 2017.
[18] Guedes, Carlos, Konstantinos Trochidis, and Akshay Anantapadmanabhan. "Modeling carnatic
rhythm generation: A data driven approach based on rhythmic analysis." Proceedings of the 15th
Sound & Music Computing Conference. 2018. [19] Heshi, Rushiraj, et al. "Rhythm and timbre analysis for carnatic music processing." Proceedings of
3rd International Conference on Advanced Computing, Networking and Informatics. Springer, New
Delhi, 2016.
[20] Chollet, Francois. Deep Learning mit Python und Keras: Das Praxis-Handbuch vom Entwickler der
Keras-Bibliothek. MITP-Verlags GmbH & Co. KG, 2018.

Computer Science & Information Technology (CS & IT) 201
AUTHORS
Amulya Sri Pulijala, works as Scientist in Indian Space Research Organisation. She is doing Masters in
Computer Science and Engineering from International Institue of Information Technology, Hyderabad. She has done her graduation from Jawaharlal Technological University in 2013. She was awarded for the
project titled “Work stealing algorithm for Multi Core NUMA Architecture”. Her interests include Music
Signal Processing, Multicore architecture.
Suryakanth V Gangashetty works as Asst. Professor in International Institute of Information Technology,
Hyderabad. He received his Doctorate from Indian Institute of Technology, Madras. His research interests
include Speech processing, neural networks, signal processing, pattern recognition, soft computing,
machine learning, image processing, natural language processing, artificial intelligence. His research has
been chronicled in more than 110 journals and conference papers.
© 2020 By AIRCC Publishing Corporation. This article is published under the Creative Commons
Attribution (CC BY) license.

202 Computer Science & Information Technology (CS & IT)
David C. Wyld et al. (Eds): CCSEA, BIoT, DKMP, CLOUD, NLCAI, SIPRO - 2020
pp. 203-224, 2020. CS & IT - CSCP 2020 DOI: 10.5121/csit.2020.101016
DESIGN OF ACTIVE INDUCTOR
AND STABILITY TEST FOR PASSIVE RLC LOW-PASS FILTER
MinhTri Tran, Anna Kuwana, and Haruo Kobayashi
Division of Electronics and Informatics,
Gunma University, Kiryu 376-8515, Japan
ABSTRACT Proposed stability test for RLC low-pass filters is presented. The self-loop functions of these
filters are derived and analyzed based on the widened superposition principle. The alternating
current conservation technique is proposed to measure the self-loop function. An active inductor is replaced with a general impedance converter. Our research results show that the values of
the selected passive components (resistors, capacitors, and inductors) in these filters can cause
a damped oscillation noise when the stable conditions for the transfer functions of these
networks are not satisfied.
KEYWORDS Widened Superposition, RLC Low-Pass Filter, Stability Test, Self-loop Function, Voltage
Injection.
1. INTRODUCTION
Analogue filters are essential in removing noise signals that may accompany a desired signal [1].
Passive low-pass filters employ RLC circuits, but they become impractical at very low
frequencies because of large physical size of inductors and capacitors [2]. Moreover, feedback control theories are widely applied in the processing of analogue signals [3]. In conventional
analysis of a feedback system, the term of “Aβ(s)” is called loop gain when the denominator of a
transfer function is simplified as 1+Aβ(s), where A(s), β(s), are the open loop gain, and the feedback gain, respectively. The stability of a feedback network is determined by the magnitude
and phase plots of the loop gain. However, the passive filter is not a closed loop system.
Furthermore, the denominator of the transfer function of the analogue filter, regardless of active or passive is also simplified as 1+L(s), where L(s) is called “self-loop function”. Therefore, the
term of “self-loop function” is proposed to define L(s) for both cases with and without feedback
filters. This paper provides an introduction to the derivation of the transfer function, the
measurement of the self-loop function and the stability test for RLC low-pass filters.
The main contribution of this paper comes from the stability test for the RLC low-pass filters
based on the widened superposition principle and the alternating current conservation measurement. This paper contains a total of 8 sections and 2 appendices. Section 2 constitutes
background knowledge, with an explanation of the necessity for network analysis based on the
widened superposition principle, an essence of derivation of self-loop function based on an alternating current conversation measurement and a brief presentation of the complex function.
Section 3 mathematically analyzes an illustrative second-order denominator complex function
204 Computer Science & Information Technology (CS & IT)
considered in details. Section 4 and Section 5 focus on the frequency domain analysis and the stability test for serial and parallel RLC low-pass filters. SPICE simulation results for the
proposed design of active inductors for the RLC low pass filters are described in Section 6. A
brief discussion of the research results is given in Section 7. The main points of this work are
summarized in Section 8. We have collected a few important notions and results from analysis in Appendix for easy references.
2. DESIGN CONSIDERATIONS FOR RLC LOW-PASS FILTER
2.1. Widened Superposition Principle
In this section, we propose a new concept of the superposition principle which is useful for deriving the transfer function of a network. The conventional superposition theorem is used to
find the solution to linear networks consisting of two or more sources (independent sources,
linear dependent sources) that are not in series or parallel. To consider the effects of each source independently requires that sources be removed and replaced without affecting the final result.
Therefore, to remove a voltage source when applying this theorem, the difference in potential
between the terminals of the voltage source must be set to zero (short circuit); removing a current
source requires that its terminals be opened (open circuit). This procedure is followed for each source in turn, and then the resultant responses are added to determine the true operation of the
circuit. There are some limitations of conventional superposition theorem. Superposition cannot
be applied to power effects because the power is related to the square of the voltage across a resistor or the current through a resistor. Superposition theorem cannot be applied for non-linear
circuit (diodes or transistors). In order to calculate the load current or the load voltage for the
several choices of the load resistance of the resistive network, one needs to solve for every source voltage and current, perhaps several times. With the simple circuit, this is fairly easy but in a
large circuit this method becomes a painful experience.
In this paper, the nodal analysis on circuits is used to obtain multiple Kirchhoff current law equations. The term of "widened superposition" is proposed to define a general superposition
principle which is the standard nodal analysis equation, and simplified for the case when the
impedance from node A to ground is infinity and the current injection into node A is 0. In a circuit having more than one independent source, we can consider the effects of all the sources at
a time. The widened superposition principle is used to derive the transfer function of a network
[4, 5]. Energy at one place is proportional with their input sources and the resistance distances of
transmission spaces. Let EA(t) be energy at one place of multi-sources Ei(t) which are transmitted on the different resistance distances di (R, ZL, and ZC in electronic circuits) of the transmission
spaces as shown in Figure 1. The widened superposition principle is defined as
n n
i
A
i=1 i=1i i
E (t)1E (t) =
d d (1)
The import of these concepts into circuit theory is relatively new with much recent progress regarding filter theory, analysis and implementation.
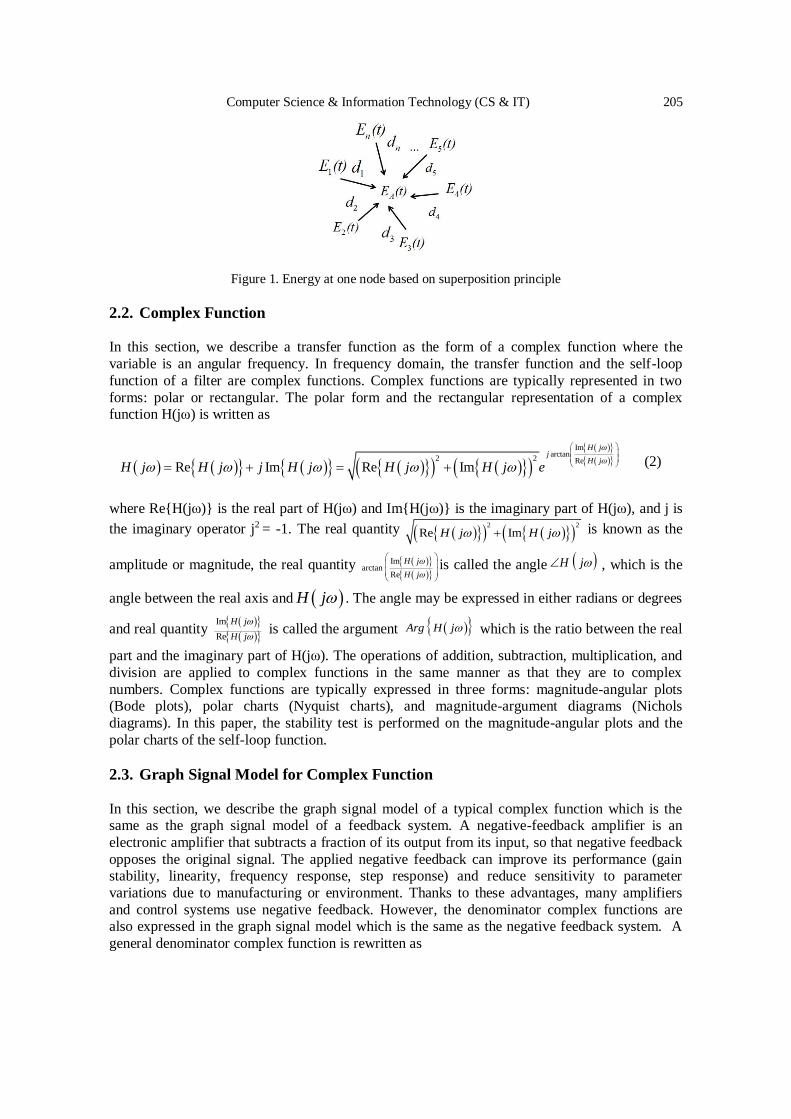
Computer Science & Information Technology (CS & IT) 205
Figure 1. Energy at one node based on superposition principle
2.2. Complex Function In this section, we describe a transfer function as the form of a complex function where the
variable is an angular frequency. In frequency domain, the transfer function and the self-loop
function of a filter are complex functions. Complex functions are typically represented in two
forms: polar or rectangular. The polar form and the rectangular representation of a complex function H(jω) is written as
Imarctan
2 2 ReRe Im Re Im
H jj
H jH j H j j H j H j H j e
(2)
where Re{H(jω)} is the real part of H(jω) and Im{H(jω)} is the imaginary part of H(jω), and j is
the imaginary operator j2 = -1. The real quantity 2 2
Re ImH j H j is known as the
amplitude or magnitude, the real quantity
Imarctan
Re
H j
H j
is called the angle H j , which is the
angle between the real axis and H j . The angle may be expressed in either radians or degrees
and real quantity
Im
Re
H j
H j
is called the argument Arg H j which is the ratio between the real
part and the imaginary part of H(jω). The operations of addition, subtraction, multiplication, and
division are applied to complex functions in the same manner as that they are to complex
numbers. Complex functions are typically expressed in three forms: magnitude-angular plots (Bode plots), polar charts (Nyquist charts), and magnitude-argument diagrams (Nichols
diagrams). In this paper, the stability test is performed on the magnitude-angular plots and the
polar charts of the self-loop function.
2.3. Graph Signal Model for Complex Function
In this section, we describe the graph signal model of a typical complex function which is the same as the graph signal model of a feedback system. A negative-feedback amplifier is an
electronic amplifier that subtracts a fraction of its output from its input, so that negative feedback
opposes the original signal. The applied negative feedback can improve its performance (gain stability, linearity, frequency response, step response) and reduce sensitivity to parameter
variations due to manufacturing or environment. Thanks to these advantages, many amplifiers
and control systems use negative feedback. However, the denominator complex functions are also expressed in the graph signal model which is the same as the negative feedback system. A
general denominator complex function is rewritten as
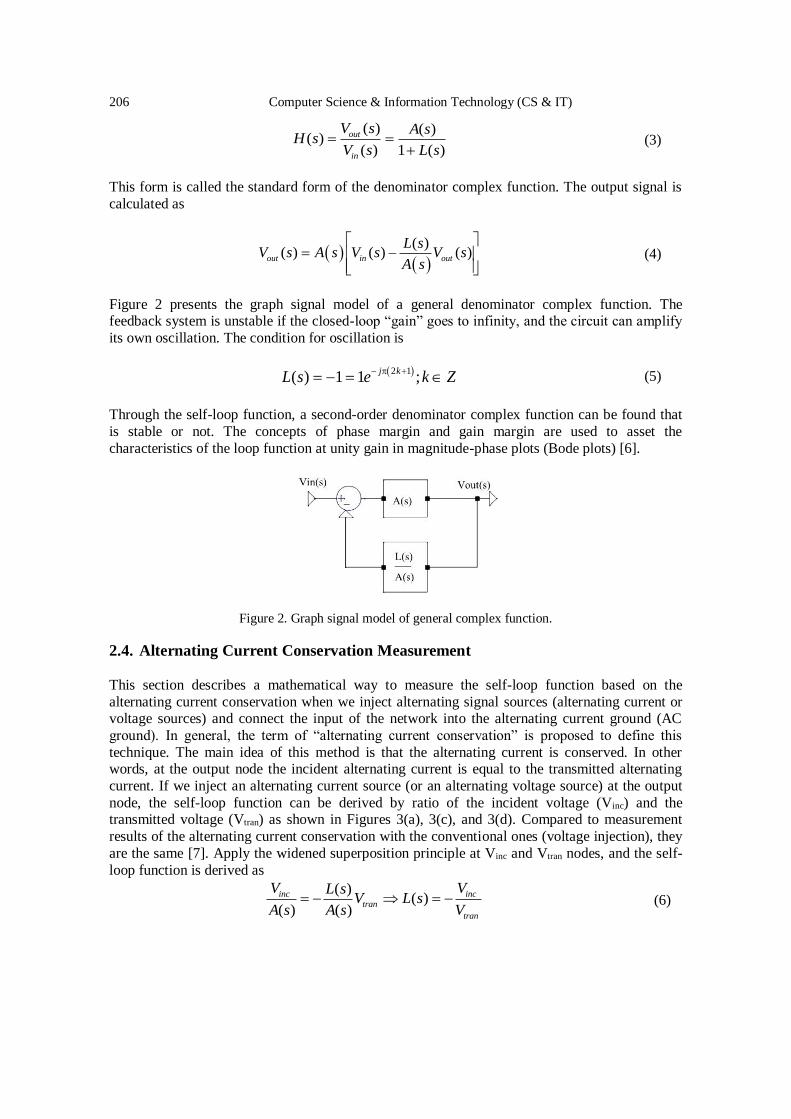
206 Computer Science & Information Technology (CS & IT)
( ) ( )( )
( ) 1 ( )
out
in
V s A sH s
V s L s
(3)
This form is called the standard form of the denominator complex function. The output signal is
calculated as
( )
( ) ( ) ( )out in out
L sV s A s V s V s
A s
(4)
Figure 2 presents the graph signal model of a general denominator complex function. The feedback system is unstable if the closed-loop “gain” goes to infinity, and the circuit can amplify
its own oscillation. The condition for oscillation is
2 1
( ) 1 1 ;j k
L s e k Z
(5)
Through the self-loop function, a second-order denominator complex function can be found that
is stable or not. The concepts of phase margin and gain margin are used to asset the
characteristics of the loop function at unity gain in magnitude-phase plots (Bode plots) [6].
Figure 2. Graph signal model of general complex function.
2.4. Alternating Current Conservation Measurement
This section describes a mathematical way to measure the self-loop function based on the
alternating current conservation when we inject alternating signal sources (alternating current or voltage sources) and connect the input of the network into the alternating current ground (AC
ground). In general, the term of “alternating current conservation” is proposed to define this
technique. The main idea of this method is that the alternating current is conserved. In other words, at the output node the incident alternating current is equal to the transmitted alternating
current. If we inject an alternating current source (or an alternating voltage source) at the output
node, the self-loop function can be derived by ratio of the incident voltage (Vinc) and the transmitted voltage (Vtran) as shown in Figures 3(a), 3(c), and 3(d). Compared to measurement
results of the alternating current conservation with the conventional ones (voltage injection), they
are the same [7]. Apply the widened superposition principle at Vinc and Vtran nodes, and the self-
loop function is derived as
( )( )
( ) ( ) inc inc
tran
tran
V VL sV L s
A s A s V (6)
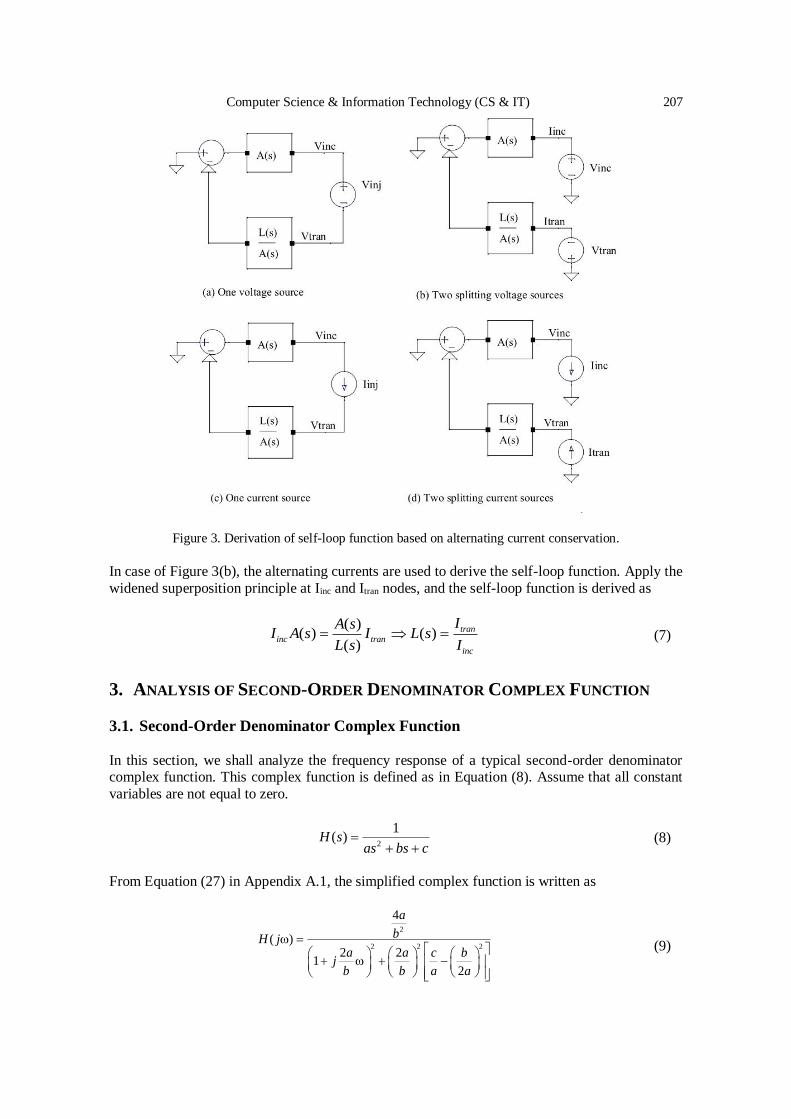
Computer Science & Information Technology (CS & IT) 207
Figure 3. Derivation of self-loop function based on alternating current conservation.
In case of Figure 3(b), the alternating currents are used to derive the self-loop function. Apply the
widened superposition principle at Iinc and Itran nodes, and the self-loop function is derived as
( )( ) ( )
( ) tran
inc tran
inc
IA sI A s I L s
L s I (7)
3. ANALYSIS OF SECOND-ORDER DENOMINATOR COMPLEX FUNCTION
3.1. Second-Order Denominator Complex Function
In this section, we shall analyze the frequency response of a typical second-order denominator complex function. This complex function is defined as in Equation (8). Assume that all constant
variables are not equal to zero.
2
1( )
H s
as bs c (8)
From Equation (27) in Appendix A.1, the simplified complex function is written as
2
2 2 2
4
( )2 2
12
a
bH ja a c b
jb b a a
(9)
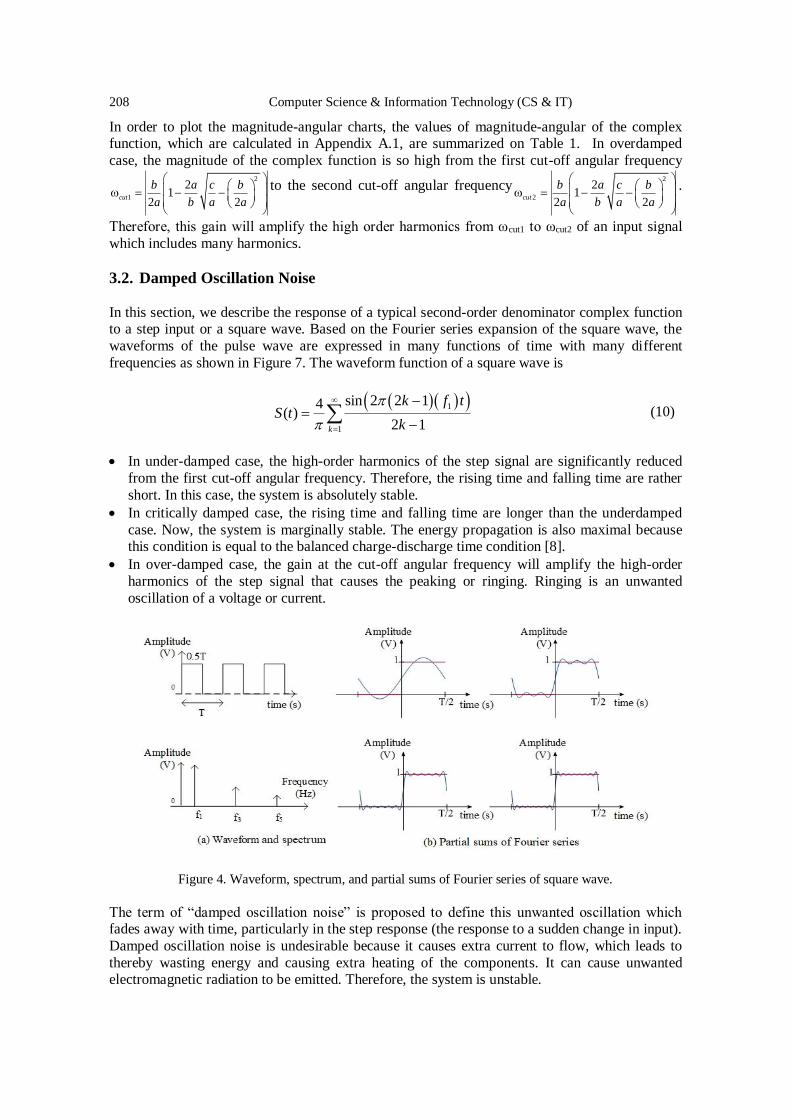
208 Computer Science & Information Technology (CS & IT)
In order to plot the magnitude-angular charts, the values of magnitude-angular of the complex function, which are calculated in Appendix A.1, are summarized on Table 1. In overdamped
case, the magnitude of the complex function is so high from the first cut-off angular frequency 2
1
21
2 2cut
b a c b
a b a a
to the second cut-off angular frequency2
2
21
2 2cut
b a c b
a b a a
.
Therefore, this gain will amplify the high order harmonics from ωcut1 to ωcut2 of an input signal
which includes many harmonics.
3.2. Damped Oscillation Noise
In this section, we describe the response of a typical second-order denominator complex function to a step input or a square wave. Based on the Fourier series expansion of the square wave, the
waveforms of the pulse wave are expressed in many functions of time with many different
frequencies as shown in Figure 7. The waveform function of a square wave is
1
1
sin 2 2 14( )
2 1
k
k f tS t
k (10)
In under-damped case, the high-order harmonics of the step signal are significantly reduced
from the first cut-off angular frequency. Therefore, the rising time and falling time are rather
short. In this case, the system is absolutely stable.
In critically damped case, the rising time and falling time are longer than the underdamped
case. Now, the system is marginally stable. The energy propagation is also maximal because this condition is equal to the balanced charge-discharge time condition [8].
In over-damped case, the gain at the cut-off angular frequency will amplify the high-order
harmonics of the step signal that causes the peaking or ringing. Ringing is an unwanted
oscillation of a voltage or current.
Figure 4. Waveform, spectrum, and partial sums of Fourier series of square wave.
The term of “damped oscillation noise” is proposed to define this unwanted oscillation which fades away with time, particularly in the step response (the response to a sudden change in input).
Damped oscillation noise is undesirable because it causes extra current to flow, which leads to
thereby wasting energy and causing extra heating of the components. It can cause unwanted electromagnetic radiation to be emitted. Therefore, the system is unstable.
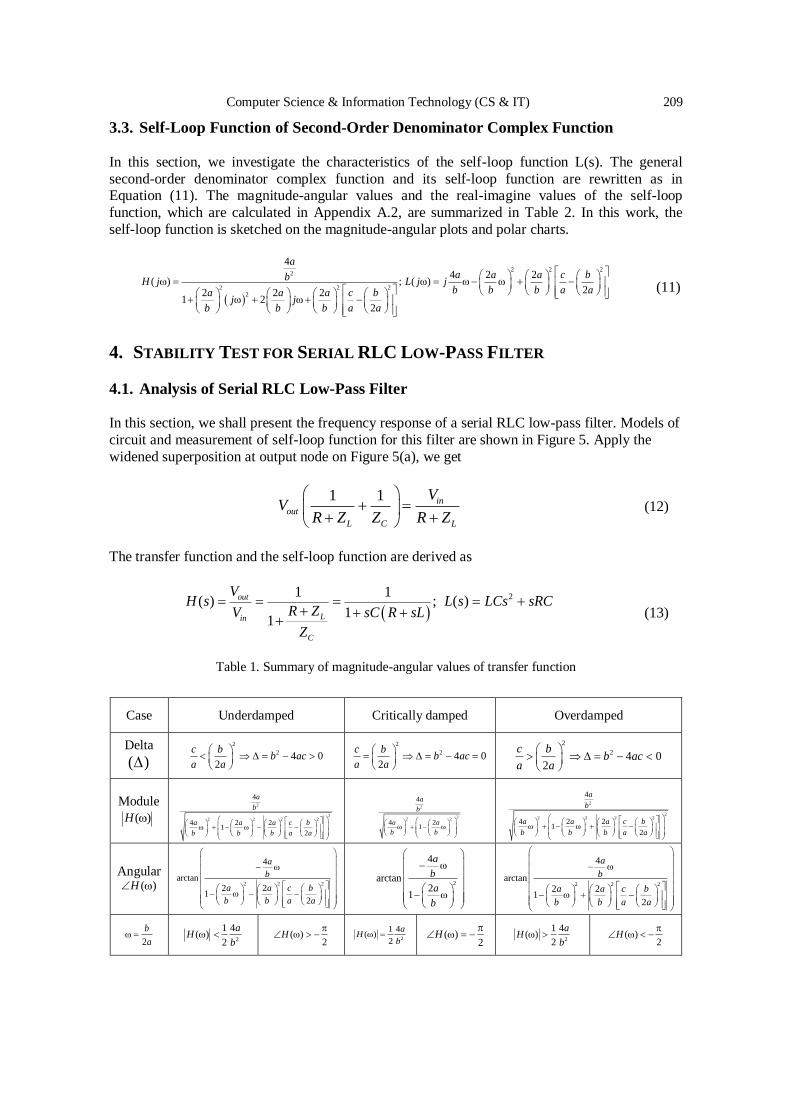
Computer Science & Information Technology (CS & IT) 209
3.3. Self-Loop Function of Second-Order Denominator Complex Function
In this section, we investigate the characteristics of the self-loop function L(s). The general
second-order denominator complex function and its self-loop function are rewritten as in Equation (11). The magnitude-angular values and the real-imagine values of the self-loop
function, which are calculated in Appendix A.2, are summarized in Table 2. In this work, the
self-loop function is sketched on the magnitude-angular plots and polar charts.
2 2 22
2 2 22
4
4 2 2( ) ; ( )
22 2 21 2
2
a
a a a c bbH j L j jb b b a aa a a c b
j jb b b a a
(11)
4. STABILITY TEST FOR SERIAL RLC LOW-PASS FILTER
4.1. Analysis of Serial RLC Low-Pass Filter In this section, we shall present the frequency response of a serial RLC low-pass filter. Models of
circuit and measurement of self-loop function for this filter are shown in Figure 5. Apply the
widened superposition at output node on Figure 5(a), we get
1 1 in
out
L C L
VV
R Z Z R Z
(12)
The transfer function and the self-loop function are derived as
21 1
( ) ; ( )1
1
out
Lin
C
VH s L s LCs sRC
R ZV sC R sL
Z
(13)
Table 1. Summary of magnitude-angular values of transfer function
Case Underdamped Critically damped Overdamped
Delta
( )
2
2 4 02
c bb ac
a a
2
2 4 02
c bb ac
a a
2
2 4 02
c bb ac
a a
Module
( )H 2
22 2 2 2
4
4 2 21
2
a
b
a a a c b
b b b a a
2
22 2
4
4 21
a
b
a a
b b
2
22 2 2 2
4
4 2 21
2
a
b
a a a c b
b b b a a
Angular ( )H 2 2 2
4
arctan2 2
12
a
b
a a c b
b b a a
2
4
arctan2
1
a
b
a
b
2 2 2
4
arctan2 2
12
a
b
a a c b
b b a a
2
b
a
2
1 4( )
2
aH
b
( )
2H
2
1 4( )
2
aH
b
( )
2H
2
1 4( )
2
aH
b
( )
2H
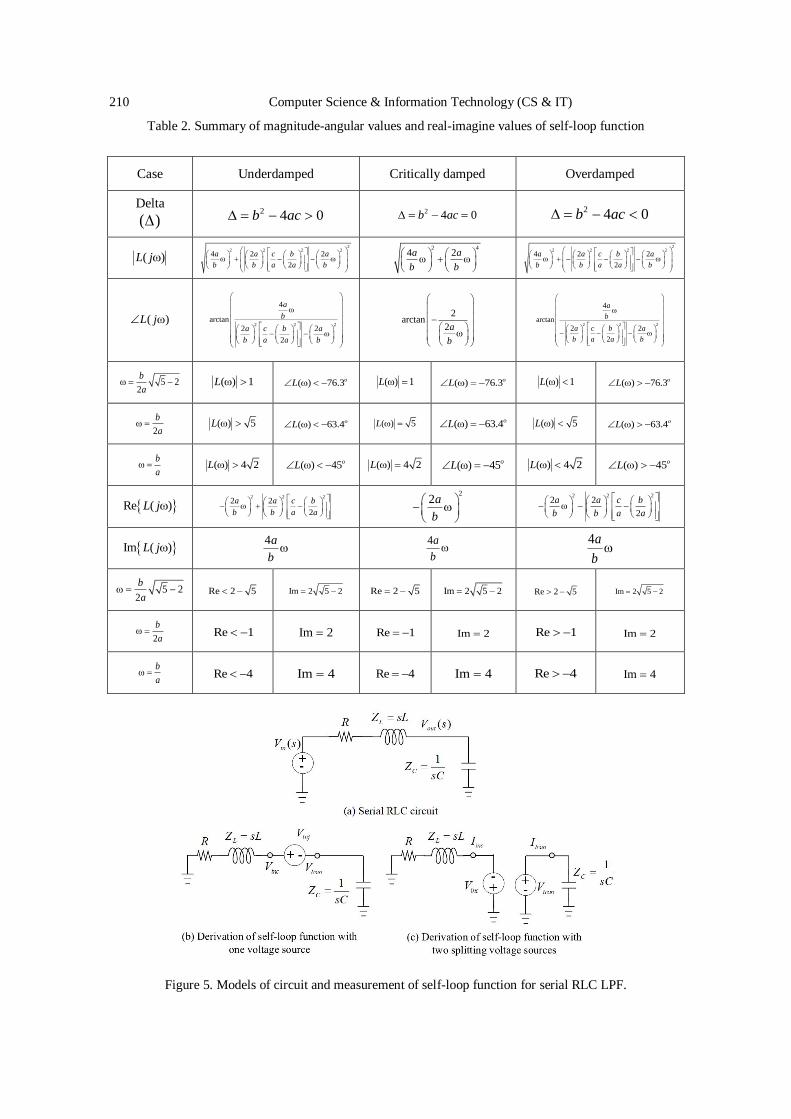
210 Computer Science & Information Technology (CS & IT)
Table 2. Summary of magnitude-angular values and real-imagine values of self-loop function
Case Underdamped Critically damped Overdamped
Delta
( ) 2 4 0b ac 2 4 0b ac 2 4 0b ac
( )L j 2
2 2 2 24 2 2
2
a a c b a
b b a a b
2 44 2a a
b b
22 2 2 2
4 2 2
2
a a c b a
b b a a b
( )L j 2 2 2
4
arctan2 2
2
a
b
a c b a
b a a b
2
arctan2a
b
2 2 2
4
arctan2 2
2
a
b
a c b a
b a a b
5 22
b
a
( ) 1L ( ) 76.3oL ( ) 1L ( ) 76.3oL ( ) 1L ( ) 76.3oL
2
b
a
( ) 5L ( ) 63.4oL ( ) 5L
( ) 63.4oL ( ) 5L ( ) 63.4oL
b
a
( ) 4 2L ( ) 45oL ( ) 4 2L ( ) 45oL ( ) 4 2L ( ) 45oL
Re ( )L j
2 2 22 2
2
a a c b
b b a a
2
2a
b
2 2 22 2
2
a a c b
b b a a
Im ( )L j
4a
b
4a
b
4a
b
5 22
b
a
Re 2 5 Im 2 5 2 Re 2 5 Im 2 5 2 Re 2 5 Im 2 5 2
2
b
a
Re 1 Im 2 Re 1 Im 2 Re 1 Im 2
b
a
Re 4 Im 4 Re 4 Im 4 Re 4 Im 4
Figure 5. Models of circuit and measurement of self-loop function for serial RLC LPF.
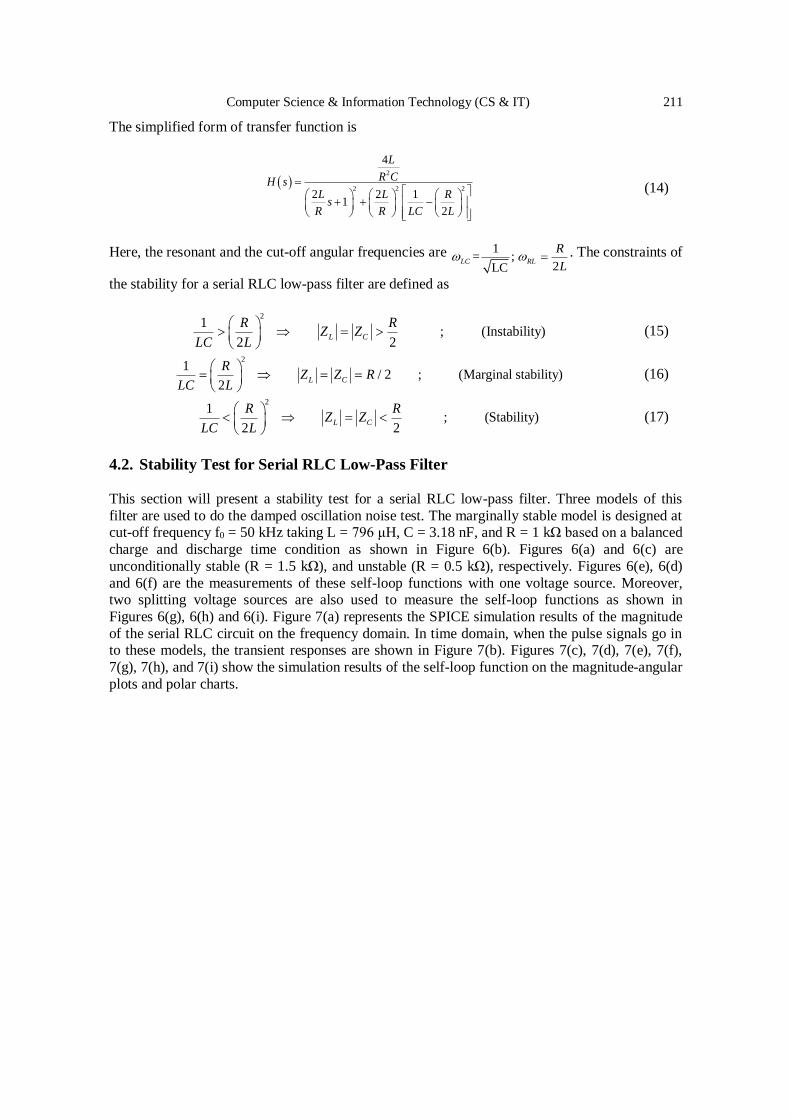
Computer Science & Information Technology (CS & IT) 211
The simplified form of transfer function is
2
2 2 2
4
2 2 11
2
L
R CH sL L R
sR R LC L
(14)
Here, the resonant and the cut-off angular frequencies are 1= ;
2LCLC RL
R
L . The constraints of
the stability for a serial RLC low-pass filter are defined as
2
1; (Instability)
2 2
L C
R RZ Z
LC L (15)
21
/ 2 ; (Marginal stability)2
L C
RZ Z R
LC L (16)
21
; (Stability)2 2
L C
R RZ Z
LC L (17)
4.2. Stability Test for Serial RLC Low-Pass Filter
This section will present a stability test for a serial RLC low-pass filter. Three models of this
filter are used to do the damped oscillation noise test. The marginally stable model is designed at cut-off frequency f0 = 50 kHz taking L = 796 μH, C = 3.18 nF, and R = 1 kΩ based on a balanced
charge and discharge time condition as shown in Figure 6(b). Figures 6(a) and 6(c) are
unconditionally stable (R = 1.5 kΩ), and unstable (R = 0.5 kΩ), respectively. Figures 6(e), 6(d)
and 6(f) are the measurements of these self-loop functions with one voltage source. Moreover, two splitting voltage sources are also used to measure the self-loop functions as shown in
Figures 6(g), 6(h) and 6(i). Figure 7(a) represents the SPICE simulation results of the magnitude
of the serial RLC circuit on the frequency domain. In time domain, when the pulse signals go in to these models, the transient responses are shown in Figure 7(b). Figures 7(c), 7(d), 7(e), 7(f),
7(g), 7(h), and 7(i) show the simulation results of the self-loop function on the magnitude-angular
plots and polar charts.
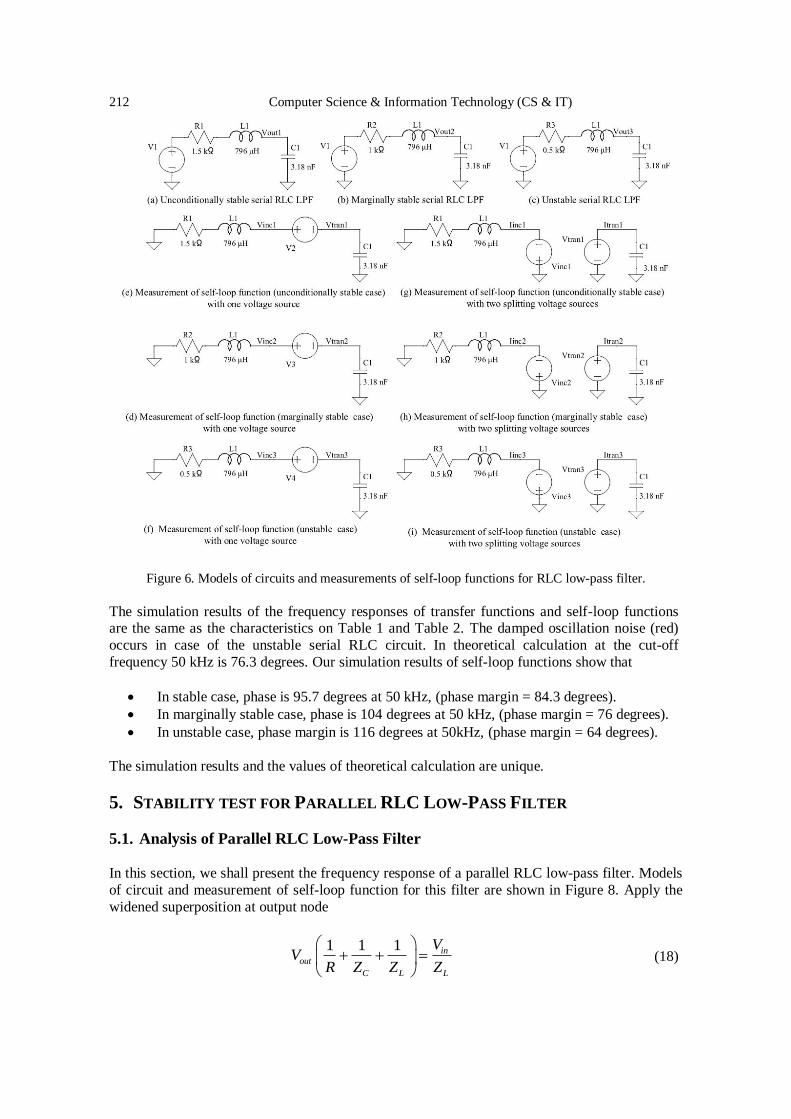
212 Computer Science & Information Technology (CS & IT)
Figure 6. Models of circuits and measurements of self-loop functions for RLC low-pass filter.
The simulation results of the frequency responses of transfer functions and self-loop functions are the same as the characteristics on Table 1 and Table 2. The damped oscillation noise (red)
occurs in case of the unstable serial RLC circuit. In theoretical calculation at the cut-off
frequency 50 kHz is 76.3 degrees. Our simulation results of self-loop functions show that
In stable case, phase is 95.7 degrees at 50 kHz, (phase margin = 84.3 degrees).
In marginally stable case, phase is 104 degrees at 50 kHz, (phase margin = 76 degrees).
In unstable case, phase margin is 116 degrees at 50kHz, (phase margin = 64 degrees).
The simulation results and the values of theoretical calculation are unique.
5. STABILITY TEST FOR PARALLEL RLC LOW-PASS FILTER
5.1. Analysis of Parallel RLC Low-Pass Filter In this section, we shall present the frequency response of a parallel RLC low-pass filter. Models
of circuit and measurement of self-loop function for this filter are shown in Figure 8. Apply the
widened superposition at output node
1 1 1
in
out
C L L
VV
R Z Z Z (18)
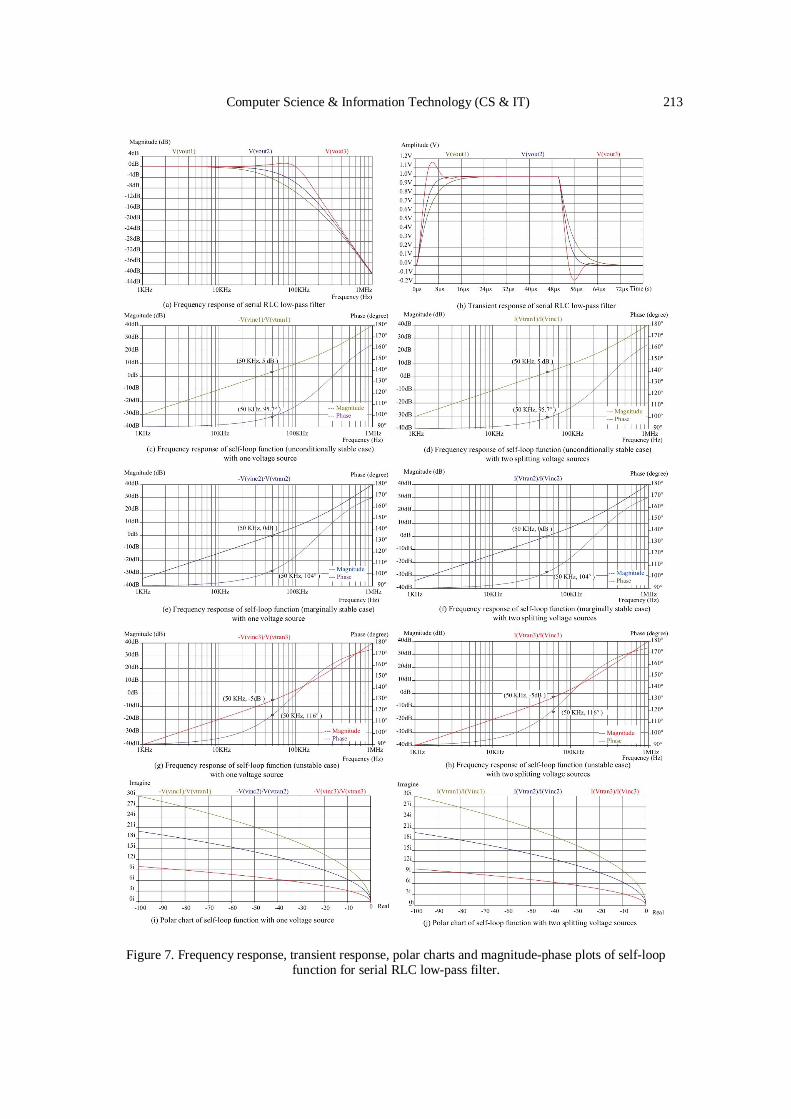
Computer Science & Information Technology (CS & IT) 213
Figure 7. Frequency response, transient response, polar charts and magnitude-phase plots of self-loop function for serial RLC low-pass filter.
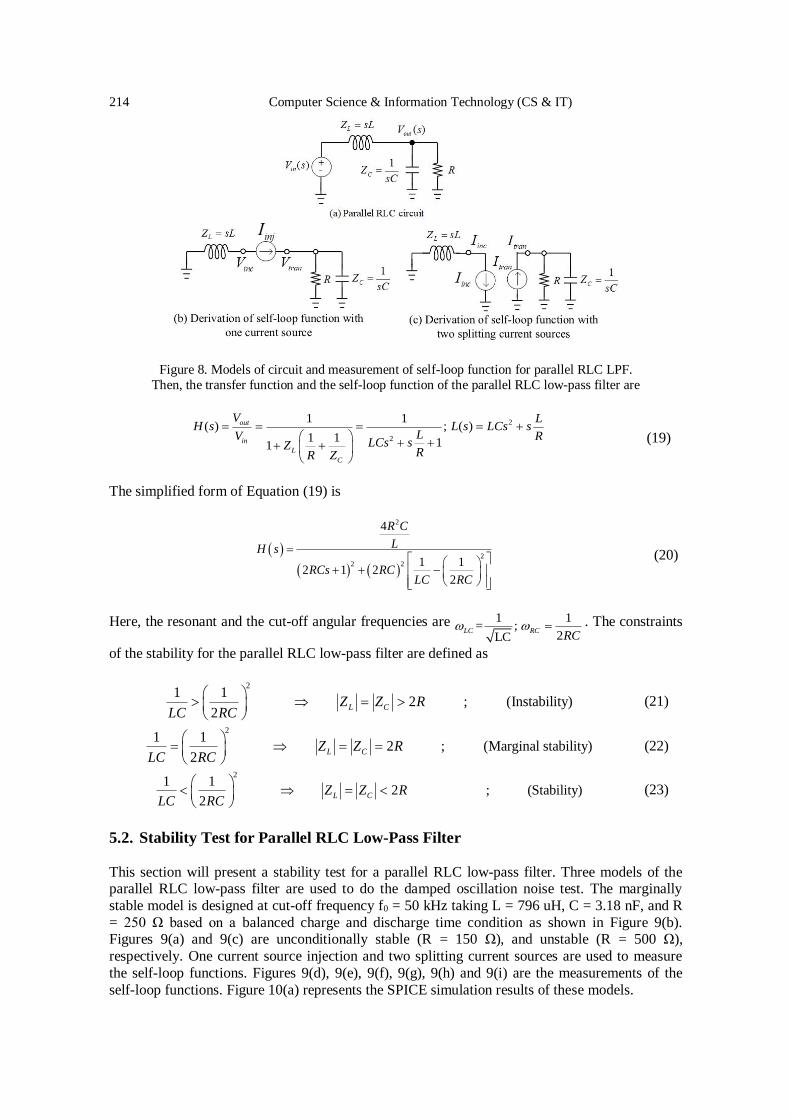
214 Computer Science & Information Technology (CS & IT)
Figure 8. Models of circuit and measurement of self-loop function for parallel RLC LPF.
Then, the transfer function and the self-loop function of the parallel RLC low-pass filter are
2
2
1 1( ) ; ( )
1 1 11
out
in
L
C
V LH s L s LCs s
LV RLCs sZ
RR Z
(19)
The simplified form of Equation (19) is
2
22 2
4
1 12 1 2
2
R C
LH s
RCs RCLC RC
(20)
Here, the resonant and the cut-off angular frequencies are 1 1= ;
2LCLC RC
RC . The constraints
of the stability for the parallel RLC low-pass filter are defined as
2
1 12 ; (Instability)
2
L CZ Z RLC RC
(21)
21 1
2 ; (Marginal stability)2
L CZ Z RLC RC
(22)
21 1
2 ; (Stability)2
L CZ Z RLC RC
(23)
5.2. Stability Test for Parallel RLC Low-Pass Filter
This section will present a stability test for a parallel RLC low-pass filter. Three models of the parallel RLC low-pass filter are used to do the damped oscillation noise test. The marginally
stable model is designed at cut-off frequency f0 = 50 kHz taking L = 796 uH, C = 3.18 nF, and R
= 250 Ω based on a balanced charge and discharge time condition as shown in Figure 9(b). Figures 9(a) and 9(c) are unconditionally stable (R = 150 Ω), and unstable (R = 500 Ω),
respectively. One current source injection and two splitting current sources are used to measure
the self-loop functions. Figures 9(d), 9(e), 9(f), 9(g), 9(h) and 9(i) are the measurements of the
self-loop functions. Figure 10(a) represents the SPICE simulation results of these models.
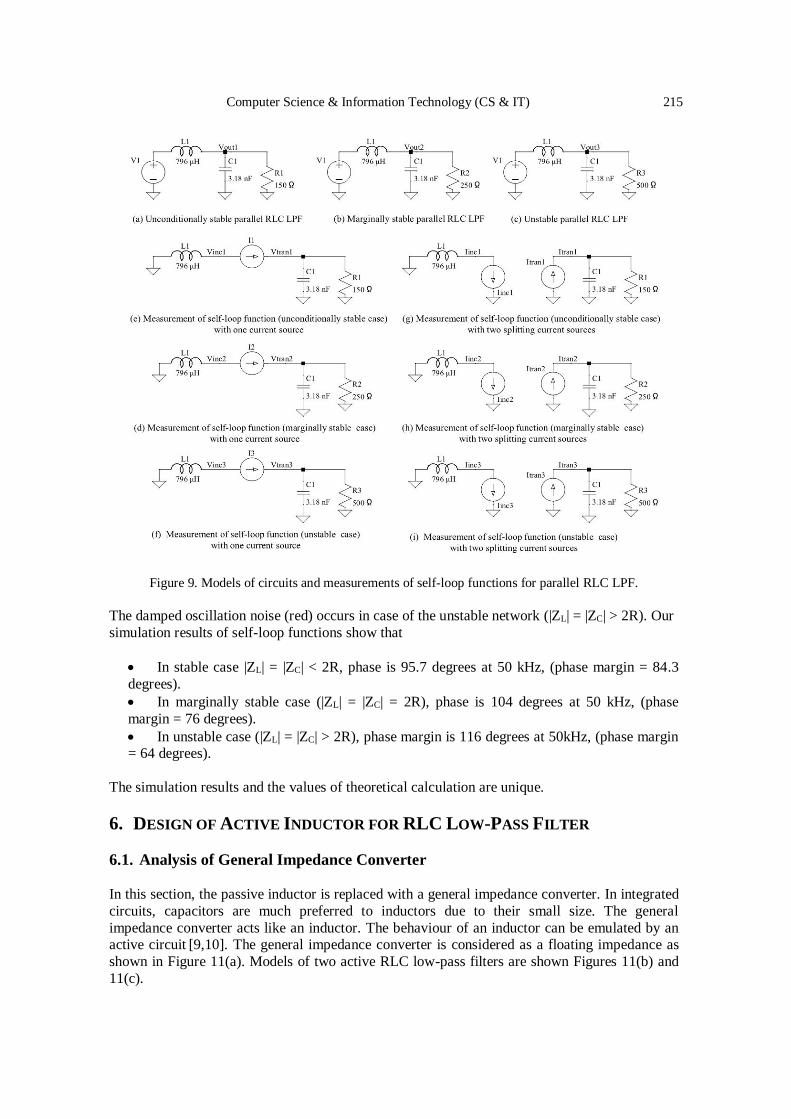
Computer Science & Information Technology (CS & IT) 215
Figure 9. Models of circuits and measurements of self-loop functions for parallel RLC LPF.
The damped oscillation noise (red) occurs in case of the unstable network (|ZL| = |ZC| > 2R). Our
simulation results of self-loop functions show that
In stable case |ZL| = |ZC| < 2R, phase is 95.7 degrees at 50 kHz, (phase margin = 84.3
degrees).
In marginally stable case (|ZL| = |ZC| = 2R), phase is 104 degrees at 50 kHz, (phase
margin = 76 degrees).
In unstable case (|ZL| = |ZC| > 2R), phase margin is 116 degrees at 50kHz, (phase margin = 64 degrees).
The simulation results and the values of theoretical calculation are unique.
6. DESIGN OF ACTIVE INDUCTOR FOR RLC LOW-PASS FILTER
6.1. Analysis of General Impedance Converter In this section, the passive inductor is replaced with a general impedance converter. In integrated
circuits, capacitors are much preferred to inductors due to their small size. The general
impedance converter acts like an inductor. The behaviour of an inductor can be emulated by an active circuit [9,10]. The general impedance converter is considered as a floating impedance as
shown in Figure 11(a). Models of two active RLC low-pass filters are shown Figures 11(b) and
11(c).
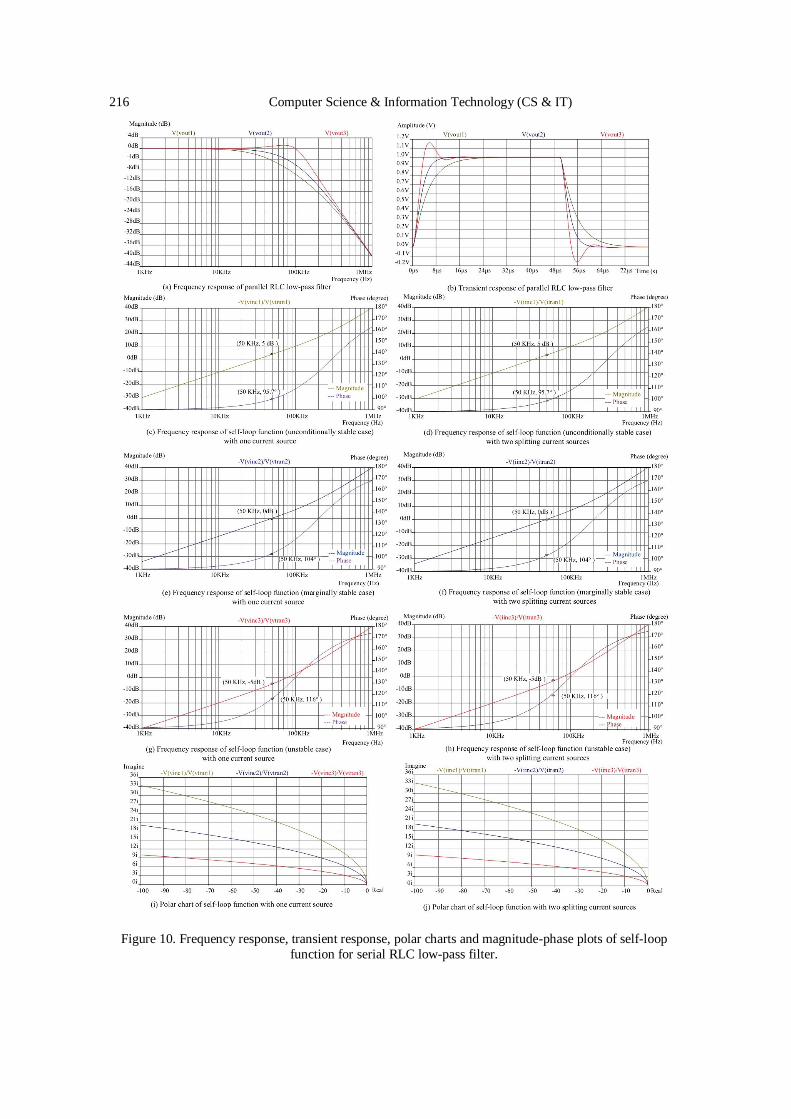
216 Computer Science & Information Technology (CS & IT)
Figure 10. Frequency response, transient response, polar charts and magnitude-phase plots of self-loop
function for serial RLC low-pass filter.
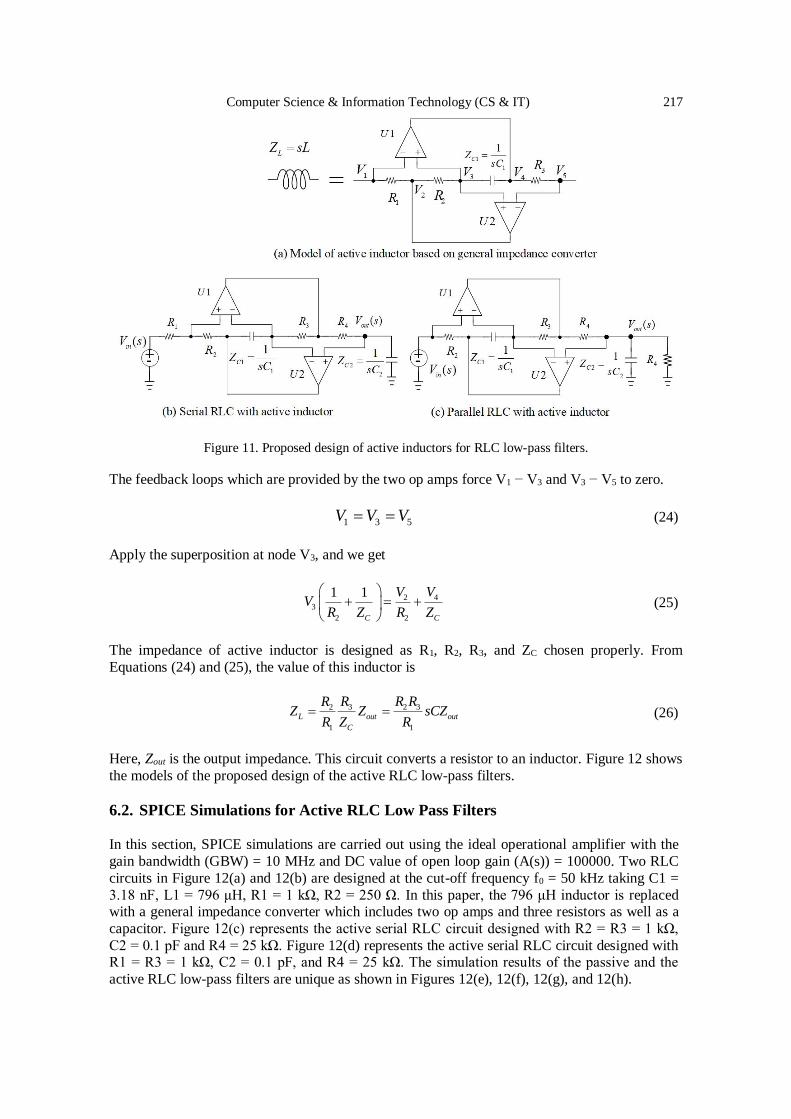
Computer Science & Information Technology (CS & IT) 217
Figure 11. Proposed design of active inductors for RLC low-pass filters.
The feedback loops which are provided by the two op amps force V1 − V3 and V3 − V5 to zero.
1 3 5 V V V (24)
Apply the superposition at node V3, and we get
2 43
2 2
1 1
C C
V VV
R Z R Z (25)
The impedance of active inductor is designed as R1, R2, R3, and ZC chosen properly. From
Equations (24) and (25), the value of this inductor is
3 2 32
1 1
L out out
C
R R RRZ Z sCZ
R Z R (26)
Here, Zout is the output impedance. This circuit converts a resistor to an inductor. Figure 12 shows
the models of the proposed design of the active RLC low-pass filters.
6.2. SPICE Simulations for Active RLC Low Pass Filters In this section, SPICE simulations are carried out using the ideal operational amplifier with the
gain bandwidth (GBW) = 10 MHz and DC value of open loop gain (A(s)) = 100000. Two RLC
circuits in Figure 12(a) and 12(b) are designed at the cut-off frequency f0 = 50 kHz taking C1 =
3.18 nF, L1 = 796 μH, R1 = 1 kΩ, R2 = 250 Ω. In this paper, the 796 μH inductor is replaced with a general impedance converter which includes two op amps and three resistors as well as a
capacitor. Figure 12(c) represents the active serial RLC circuit designed with R2 = R3 = 1 kΩ,
C2 = 0.1 pF and R4 = 25 kΩ. Figure 12(d) represents the active serial RLC circuit designed with R1 = R3 = 1 kΩ, C2 = 0.1 pF, and R4 = 25 kΩ. The simulation results of the passive and the
active RLC low-pass filters are unique as shown in Figures 12(e), 12(f), 12(g), and 12(h).
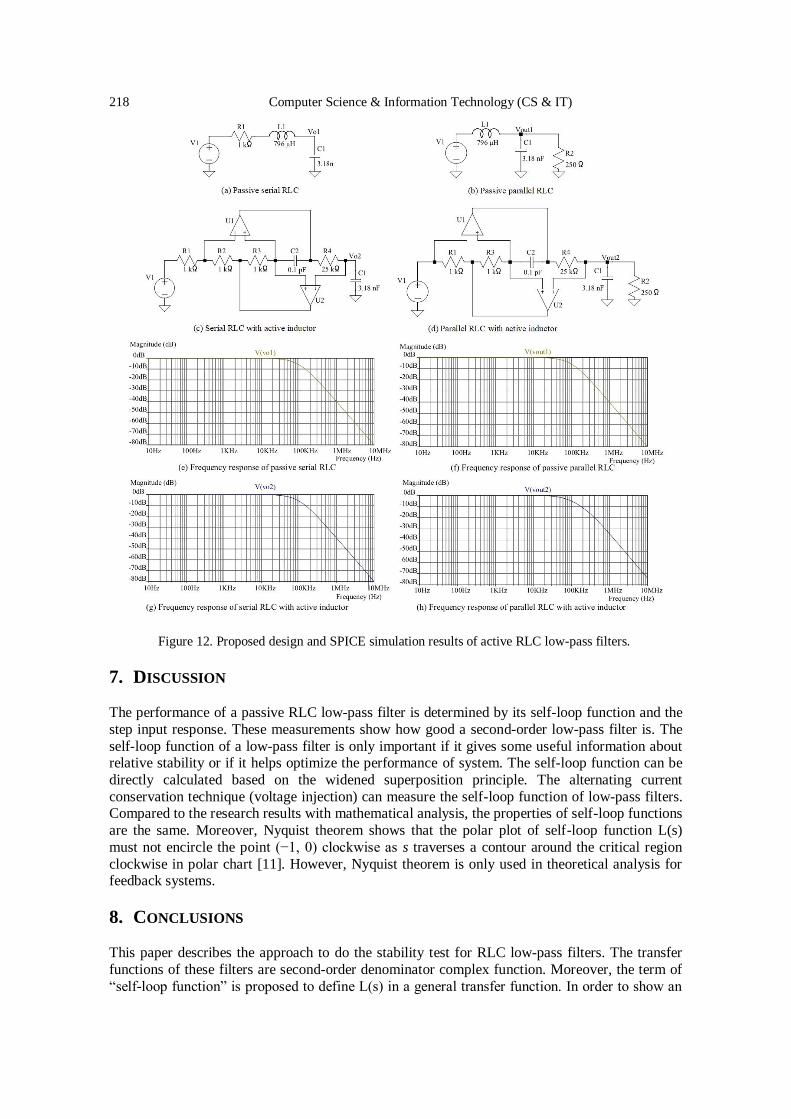
218 Computer Science & Information Technology (CS & IT)
Figure 12. Proposed design and SPICE simulation results of active RLC low-pass filters.
7. DISCUSSION The performance of a passive RLC low-pass filter is determined by its self-loop function and the
step input response. These measurements show how good a second-order low-pass filter is. The
self-loop function of a low-pass filter is only important if it gives some useful information about relative stability or if it helps optimize the performance of system. The self-loop function can be
directly calculated based on the widened superposition principle. The alternating current
conservation technique (voltage injection) can measure the self-loop function of low-pass filters. Compared to the research results with mathematical analysis, the properties of self-loop functions
are the same. Moreover, Nyquist theorem shows that the polar plot of self-loop function L(s)
must not encircle the point (−1, 0) clockwise as s traverses a contour around the critical region
clockwise in polar chart [11]. However, Nyquist theorem is only used in theoretical analysis for feedback systems.
8. CONCLUSIONS This paper describes the approach to do the stability test for RLC low-pass filters. The transfer
functions of these filters are second-order denominator complex function. Moreover, the term of
“self-loop function” is proposed to define L(s) in a general transfer function. In order to show an
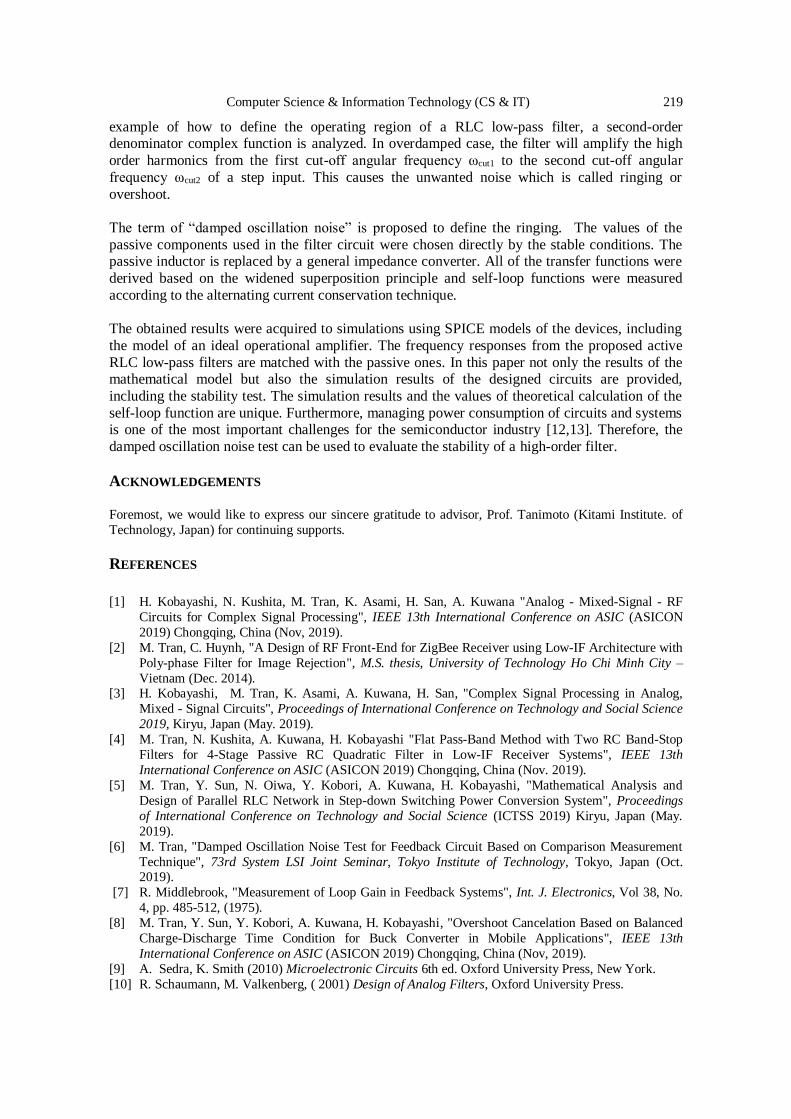
Computer Science & Information Technology (CS & IT) 219
example of how to define the operating region of a RLC low-pass filter, a second-order denominator complex function is analyzed. In overdamped case, the filter will amplify the high
order harmonics from the first cut-off angular frequency ωcut1 to the second cut-off angular
frequency ωcut2 of a step input. This causes the unwanted noise which is called ringing or
overshoot.
The term of “damped oscillation noise” is proposed to define the ringing. The values of the
passive components used in the filter circuit were chosen directly by the stable conditions. The passive inductor is replaced by a general impedance converter. All of the transfer functions were
derived based on the widened superposition principle and self-loop functions were measured
according to the alternating current conservation technique.
The obtained results were acquired to simulations using SPICE models of the devices, including
the model of an ideal operational amplifier. The frequency responses from the proposed active
RLC low-pass filters are matched with the passive ones. In this paper not only the results of the mathematical model but also the simulation results of the designed circuits are provided,
including the stability test. The simulation results and the values of theoretical calculation of the
self-loop function are unique. Furthermore, managing power consumption of circuits and systems is one of the most important challenges for the semiconductor industry [12,13]. Therefore, the
damped oscillation noise test can be used to evaluate the stability of a high-order filter.
ACKNOWLEDGEMENTS Foremost, we would like to express our sincere gratitude to advisor, Prof. Tanimoto (Kitami Institute. of
Technology, Japan) for continuing supports.
REFERENCES
[1] H. Kobayashi, N. Kushita, M. Tran, K. Asami, H. San, A. Kuwana "Analog - Mixed-Signal - RF
Circuits for Complex Signal Processing", IEEE 13th International Conference on ASIC (ASICON
2019) Chongqing, China (Nov, 2019).
[2] M. Tran, C. Huynh, "A Design of RF Front-End for ZigBee Receiver using Low-IF Architecture with
Poly-phase Filter for Image Rejection", M.S. thesis, University of Technology Ho Chi Minh City –
Vietnam (Dec. 2014). [3] H. Kobayashi, M. Tran, K. Asami, A. Kuwana, H. San, "Complex Signal Processing in Analog,
Mixed - Signal Circuits", Proceedings of International Conference on Technology and Social Science
2019, Kiryu, Japan (May. 2019).
[4] M. Tran, N. Kushita, A. Kuwana, H. Kobayashi "Flat Pass-Band Method with Two RC Band-Stop
Filters for 4-Stage Passive RC Quadratic Filter in Low-IF Receiver Systems", IEEE 13th
International Conference on ASIC (ASICON 2019) Chongqing, China (Nov. 2019).
[5] M. Tran, Y. Sun, N. Oiwa, Y. Kobori, A. Kuwana, H. Kobayashi, "Mathematical Analysis and
Design of Parallel RLC Network in Step-down Switching Power Conversion System", Proceedings
of International Conference on Technology and Social Science (ICTSS 2019) Kiryu, Japan (May.
2019).
[6] M. Tran, "Damped Oscillation Noise Test for Feedback Circuit Based on Comparison Measurement
Technique", 73rd System LSI Joint Seminar, Tokyo Institute of Technology, Tokyo, Japan (Oct. 2019).
[7] R. Middlebrook, "Measurement of Loop Gain in Feedback Systems", Int. J. Electronics, Vol 38, No.
4, pp. 485-512, (1975).
[8] M. Tran, Y. Sun, Y. Kobori, A. Kuwana, H. Kobayashi, "Overshoot Cancelation Based on Balanced
Charge-Discharge Time Condition for Buck Converter in Mobile Applications", IEEE 13th
International Conference on ASIC (ASICON 2019) Chongqing, China (Nov, 2019).
[9] A. Sedra, K. Smith (2010) Microelectronic Circuits 6th ed. Oxford University Press, New York.
[10] R. Schaumann, M. Valkenberg, ( 2001) Design of Analog Filters, Oxford University Press.
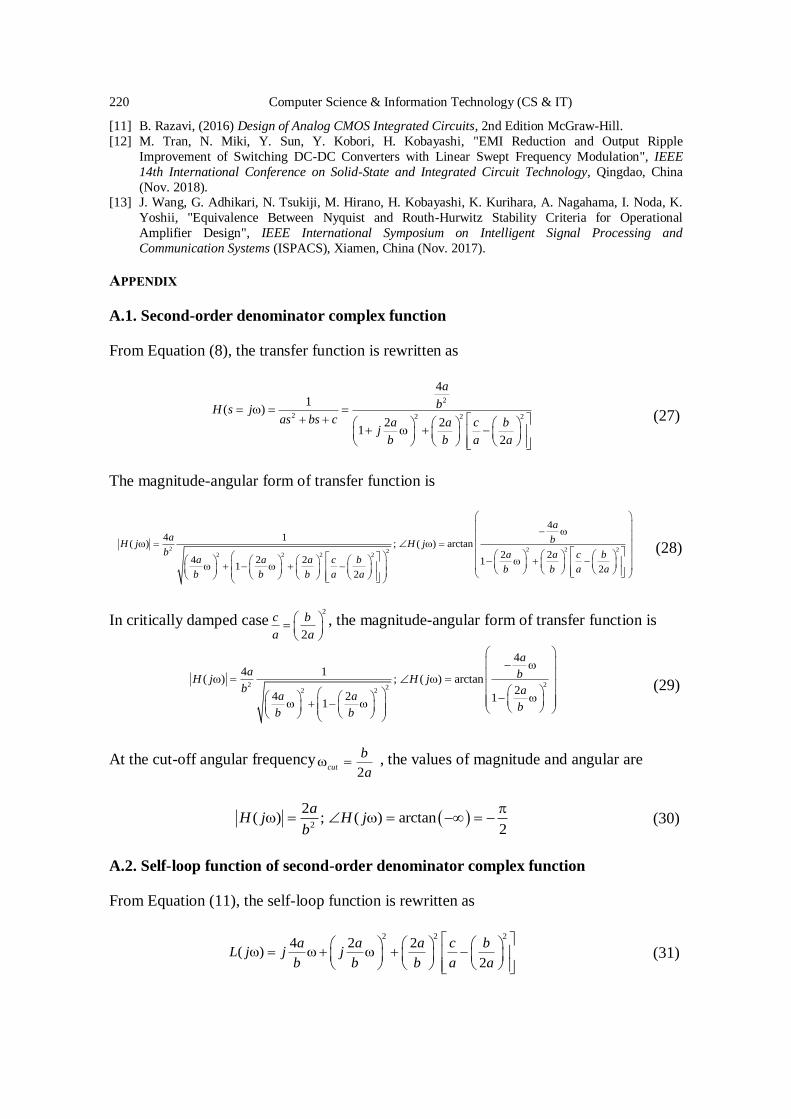
220 Computer Science & Information Technology (CS & IT)
[11] B. Razavi, (2016) Design of Analog CMOS Integrated Circuits, 2nd Edition McGraw-Hill.
[12] M. Tran, N. Miki, Y. Sun, Y. Kobori, H. Kobayashi, "EMI Reduction and Output Ripple
Improvement of Switching DC-DC Converters with Linear Swept Frequency Modulation", IEEE
14th International Conference on Solid-State and Integrated Circuit Technology, Qingdao, China
(Nov. 2018). [13] J. Wang, G. Adhikari, N. Tsukiji, M. Hirano, H. Kobayashi, K. Kurihara, A. Nagahama, I. Noda, K.
Yoshii, "Equivalence Between Nyquist and Routh-Hurwitz Stability Criteria for Operational
Amplifier Design", IEEE International Symposium on Intelligent Signal Processing and
Communication Systems (ISPACS), Xiamen, China (Nov. 2017).
APPENDIX
A.1. Second-order denominator complex function
From Equation (8), the transfer function is rewritten as
2
2 2 2 2
4
1( )
2 21
2
a
bH s jas bs c a a c b
jb b a a
(27)
The magnitude-angular form of transfer function is
2 2 2 222 2 2 2
4
4 1( ) ; ( ) arctan
2 24 2 2 1
1 22
a
a bH j H jb a a c b
a a a c bb b a a
b b b a a
(28)
In critically damped case2
2
c b
a a
, the magnitude-angular form of transfer function is
2 222 2
4
4 1( ) ; ( ) arctan
24 2 1
1
a
a bH j H jb a
a ab
b b
(29)
At the cut-off angular frequency2
cut
b
a , the values of magnitude and angular are
2
2( ) ; ( ) arctan
2
aH j H j
b (30)
A.2. Self-loop function of second-order denominator complex function
From Equation (11), the self-loop function is rewritten as
2 2 2
4 2 2( )
2
a a a c bL j j j
b b b a a (31)
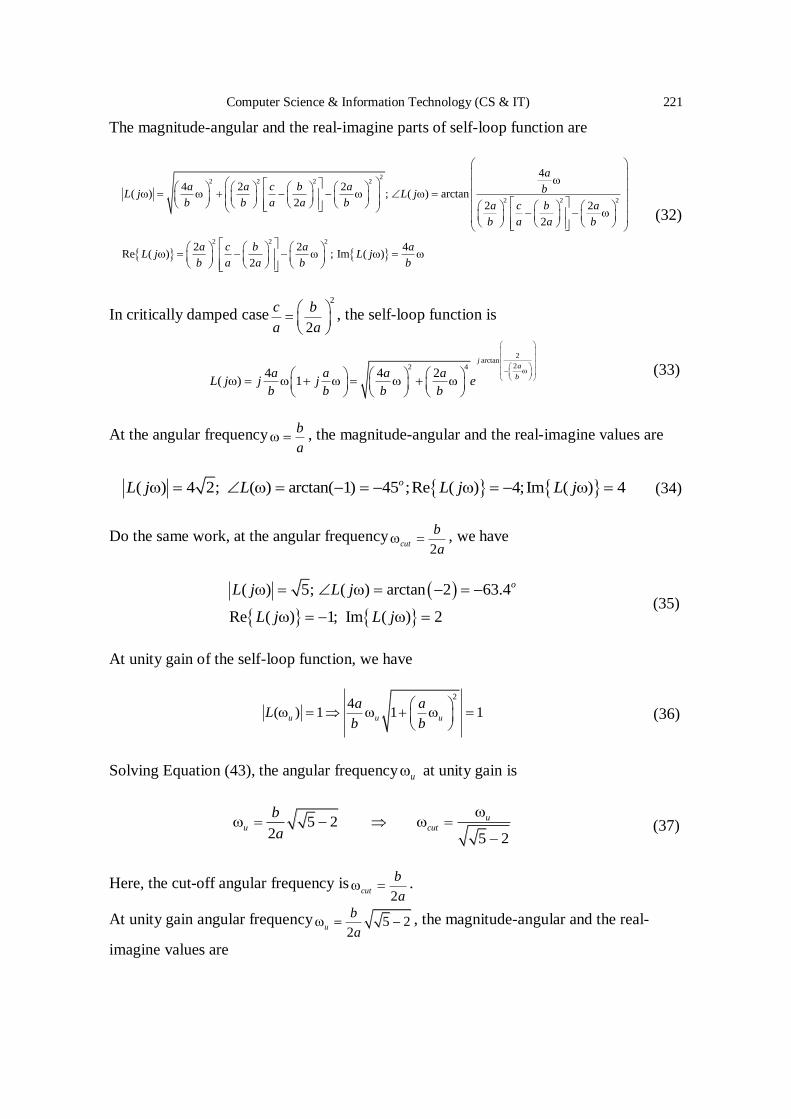
Computer Science & Information Technology (CS & IT) 221
The magnitude-angular and the real-imagine parts of self-loop function are
22 2 2 2
2 2 2
2 2 2
4
4 2 2( ) ; ( ) arctan
2 2 2
2
2 2Re ( ) ; Im
2
a
a a c b a bL j L jb b a a b a c b a
b a a b
a c b aL j L
b a a b
4( )
aj
b
(32)
In critically damped case2
2
c b
a a
, the self-loop function is
2arctan
22 44 4 2
( ) 1
ja
ba a a aL j j j e
b b b b (33)
At the angular frequency b
a , the magnitude-angular and the real-imagine values are
( ) 4 2; ( ) arctan( 1) 45 ;Re ( ) 4;Im ( ) 4 oL j L L j L j (34)
Do the same work, at the angular frequency2
cut
b
a , we have
( ) 5; ( ) arctan 2 63.4
Re ( ) 1; Im ( ) 2
oL j L j
L j L j (35)
At unity gain of the self-loop function, we have
2
4( ) 1 1 1
u u u
a aL
b b (36)
Solving Equation (43), the angular frequency u at unity gain is
5 22 5 2
u
u cut
b
a (37)
Here, the cut-off angular frequency is2
cut
b
a .
At unity gain angular frequency 5 22
u
b
a , the magnitude-angular and the real-
imagine values are
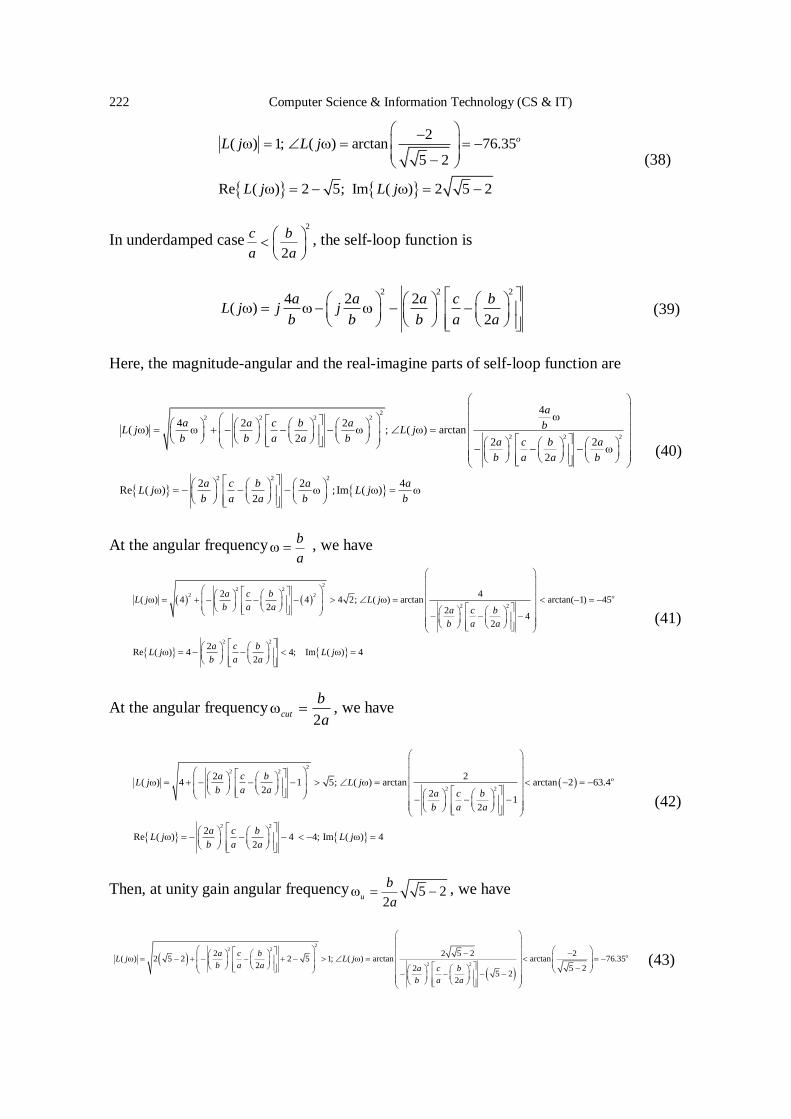
222 Computer Science & Information Technology (CS & IT)
2( ) 1; ( ) arctan 76.35
5 2
Re ( ) 2 5; Im ( ) 2 5 2
oL j L j
L j L j
(38)
In underdamped case2
2
c b
a a
, the self-loop function is
2 2 2
4 2 2( )
2
a a a c bL j j j
b b b a a (39)
Here, the magnitude-angular and the real-imagine parts of self-loop function are
22 2 2 2
2 2 2
2 2
4
4 2 2( ) ; ( ) arctan
2 2 2
2
2 2Re ( )
2
a
a a c b a bL j L jb b a a b a c b a
b a a b
a c b aL j
b a a b
24
; Im ( ) a
L jb
(40)
At the angular frequencyb
a , we have
22 2
2 2
2 2
2 2
2 4( ) 4 4 4 2; ( ) arctan arctan( 1) 45
2 24
2
2Re ( ) 4 4; Im ( ) 4
2
oa c bL j L j
b a a a c b
b a a
a c bL j L j
b a a
(41)
At the angular frequency2
cut
b
a , we have
22 2
2 2
2 2
2 2( ) 4 1 5; ( ) arctan arctan 2 63.4
2 21
2
2Re ( ) 4 4; Im ( ) 4
2
oa c bL j L j
b a a a c b
b a a
a c bL j L j
b a a
(42)
Then, at unity gain angular frequency 5 22
u
b
a , we have
22 2
2 2
2 2 5 2 2( ) 2 5 2 2 5 1; ( ) arctan arctan 76.35
2 5 225 2
2
oa c bL j L j
b a a a c b
b a a
(43)
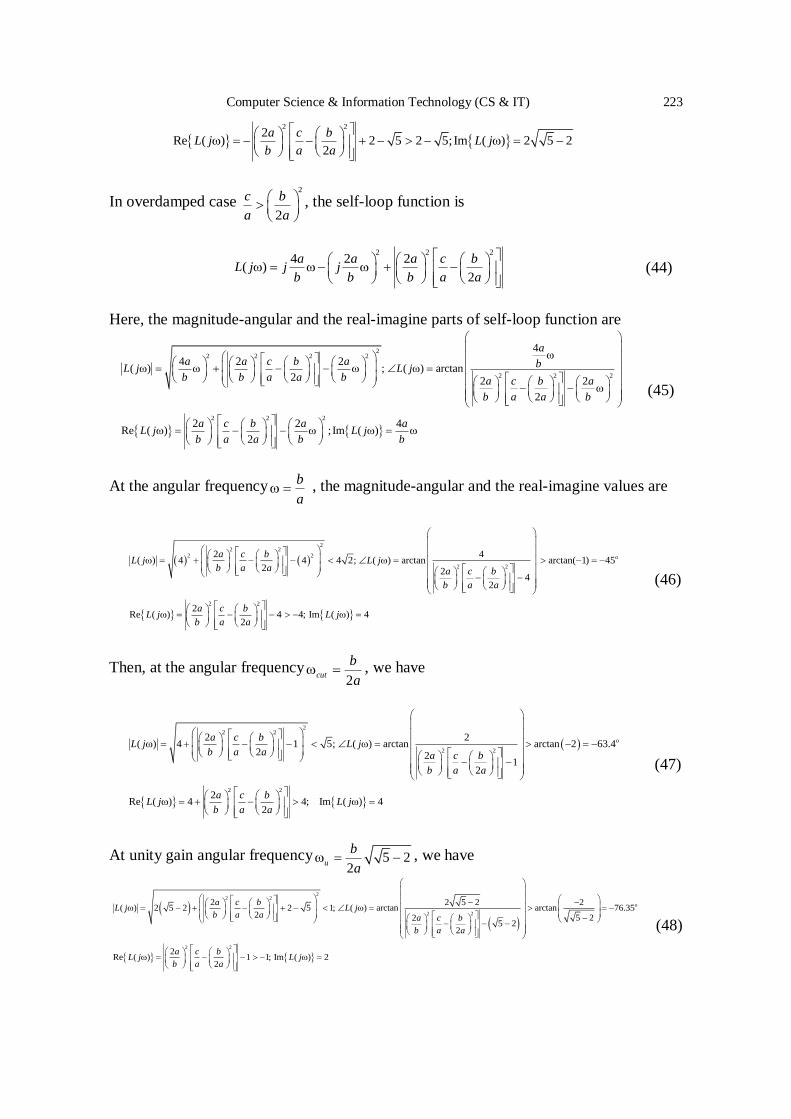
Computer Science & Information Technology (CS & IT) 223
2 2
2Re ( ) 2 5 2 5;Im ( ) 2 5 2
2
a c bL j L j
b a a
In overdamped case 2
2
c b
a a
, the self-loop function is
2 2 2
4 2 2( )
2
a a a c bL j j j
b b b a a (44)
Here, the magnitude-angular and the real-imagine parts of self-loop function are
22 2 2 2
2 2 2
2 2 2
4
4 2 2( ) ; ( ) arctan
2 2 2
2
2 2Re ( ) ; I
2
a
a a c b a bL j L jb b a a b a c b a
b a a b
a c b aL j
b a a b
4m ( )
aL j
b
(45)
At the angular frequencyb
a , the magnitude-angular and the real-imagine values are
22 2
2 2
2 2
2 2
2 4( ) 4 4 4 2; ( ) arctan arctan( 1) 45
2 24
2
2Re ( ) 4 4; Im ( ) 4
2
oa c bL j L j
b a a a c b
b a a
a c bL j L j
b a a
(46)
Then, at the angular frequency2
cut
b
a , we have
22 2
2 2
2 2
2 2( ) 4 1 5; ( ) arctan arctan 2 63.4
2 21
2
2Re ( ) 4 4; Im ( ) 4
2
oa c bL j L j
b a a a c b
b a a
a c bL j L j
b a a
(47)
At unity gain angular frequency 5 22
u
b
a , we have
22 2
2 2
2 2
2 2 5 2 2( ) 2 5 2 2 5 1; ( ) arctan arctan 76.35
2 5 225 2
2
2Re ( ) 1 1; I
2
oa c bL j L j
b a a a c b
b a a
a c bL j
b a a m ( ) 2 L j
(48)
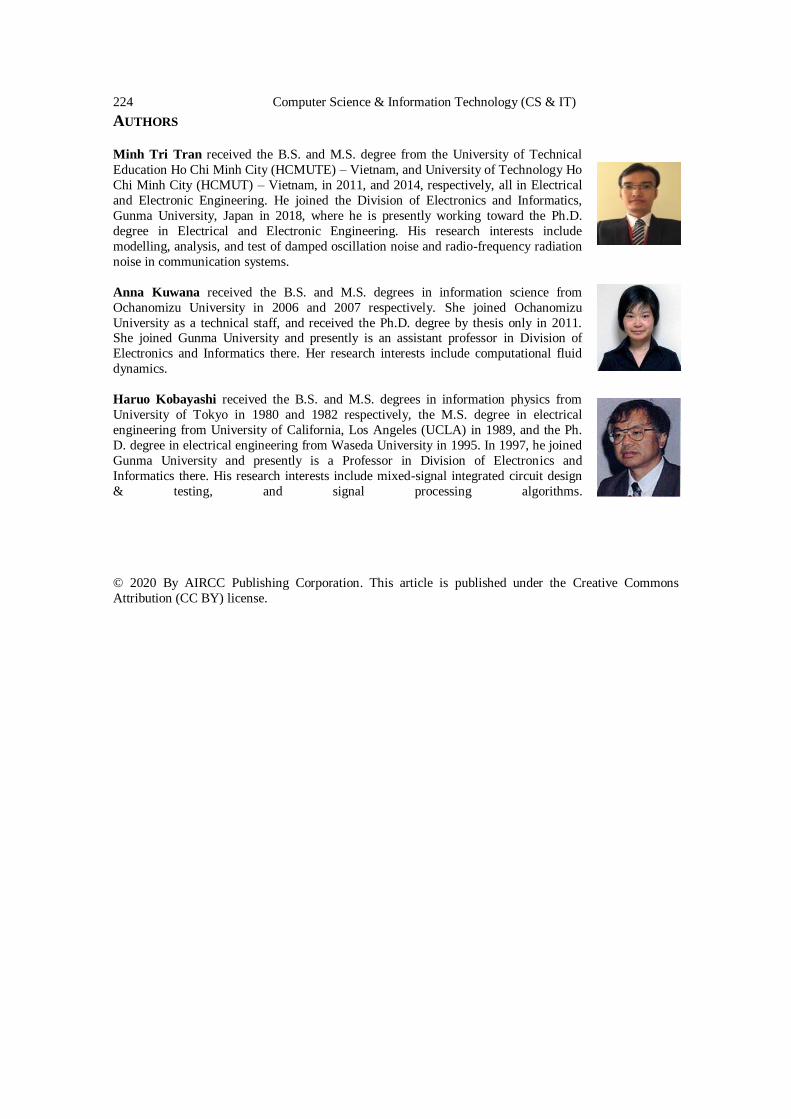
224 Computer Science & Information Technology (CS & IT)
AUTHORS
Minh Tri Tran received the B.S. and M.S. degree from the University of Technical
Education Ho Chi Minh City (HCMUTE) – Vietnam, and University of Technology Ho
Chi Minh City (HCMUT) – Vietnam, in 2011, and 2014, respectively, all in Electrical
and Electronic Engineering. He joined the Division of Electronics and Informatics,
Gunma University, Japan in 2018, where he is presently working toward the Ph.D.
degree in Electrical and Electronic Engineering. His research interests include
modelling, analysis, and test of damped oscillation noise and radio-frequency radiation
noise in communication systems.
Anna Kuwana received the B.S. and M.S. degrees in information science from
Ochanomizu University in 2006 and 2007 respectively. She joined Ochanomizu
University as a technical staff, and received the Ph.D. degree by thesis only in 2011. She joined Gunma University and presently is an assistant professor in Division of
Electronics and Informatics there. Her research interests include computational fluid
dynamics.
Haruo Kobayashi received the B.S. and M.S. degrees in information physics from
University of Tokyo in 1980 and 1982 respectively, the M.S. degree in electrical
engineering from University of California, Los Angeles (UCLA) in 1989, and the Ph.
D. degree in electrical engineering from Waseda University in 1995. In 1997, he joined
Gunma University and presently is a Professor in Division of Electronics and
Informatics there. His research interests include mixed-signal integrated circuit design
& testing, and signal processing algorithms.
© 2020 By AIRCC Publishing Corporation. This article is published under the Creative Commons
Attribution (CC BY) license.
David C. Wyld et al. (Eds): CCSEA, BIoT, DKMP, CLOUD, NLCAI, SIPRO - 2020
pp. 225-233, 2020. CS & IT - CSCP 2020 DOI: 10.5121/csit.2020.101017
DEEP LEARNING BASED
CLASSIFICATION OF 2D AND 3D IMAGES FOR FACIAL EXPRESSION RECOGNITION:
COMPARISON STUDY
Fouzia Adjailia, Diana Olejarova and Peter Sincak
Dep. Cybernetics and Artificial Intelligence, Technical University of Kosice,
Kosice, Slovak Republic.
ABSTRACT Facial expressions are an important communication channel among human beings. The
Classification of facial expressions is a research area which has been proposed in several fields
in recent years, it provides insight into how human can express their emotions which can be
used to inform and identify a person's emotional state. In this paper, we provide the basic
outlines of both two dimensional and three-dimensional facial expression classification with a
number of concepts in detail and the extent of their influence on the classification process. We
also compare the accuracy of two-dimensional (2D) and three-dimensional (3D) proposed
models to analyse the 2D and 3D classification using comprehensive algorithms based on
convolution neural network, the model was trained using a commonly used dataset named
Bosphorus. Using the same experimental setup, we discussed the results obtained in terms of
accuracy and set a new challenge in the classification of facial expression.
KEYWORDS
Convolution neural network, facial expression classification, bosphorus, voxel classification.
1. INTRODUCTION One of the fundamental human traits is our ability to understand, to some extent, non-verbal signals coming from other people. Mimics, gestures and body language are important part of our daily interactions and are rooted in evolutionary signalling theory [1]. Even through emotion as is
doesn't have one specific definition in literature, the term is taken for granted as is. Currently nine emotions are associated with distinct non-verbal expressions and have received cross-cultural support as universal. Research in this topic is supporting the importance of social function of emotion expression [2],[3]. Even through emotions can be derived from many sources (voice, body language, gestures, ...), facial expressions are currently the most popular source. One of the pioneer works by Paul Ekman on this topic identified 6 universal emotions - anger, disgust, fear, happiness, sadness, and surprise [4]. Later, Ekman adopted the FACS from Hjortsjö. The FACS
is anatomically based system for describing all visually discernible facial movements. It breaks down facial expressions into individual components of muscle movement and became the standard for facial expression research. [5][6]. Facial expression recognition helps to generate visual representations for person's emotional state. The concept is particularly relevant to learning about people attention, mood and emotions. Facial expression recognition can have broad applications across diverse environments. For example, the concept of facial expression is a basic technique for identification of a person's feedback regarding an experience. it can be used in
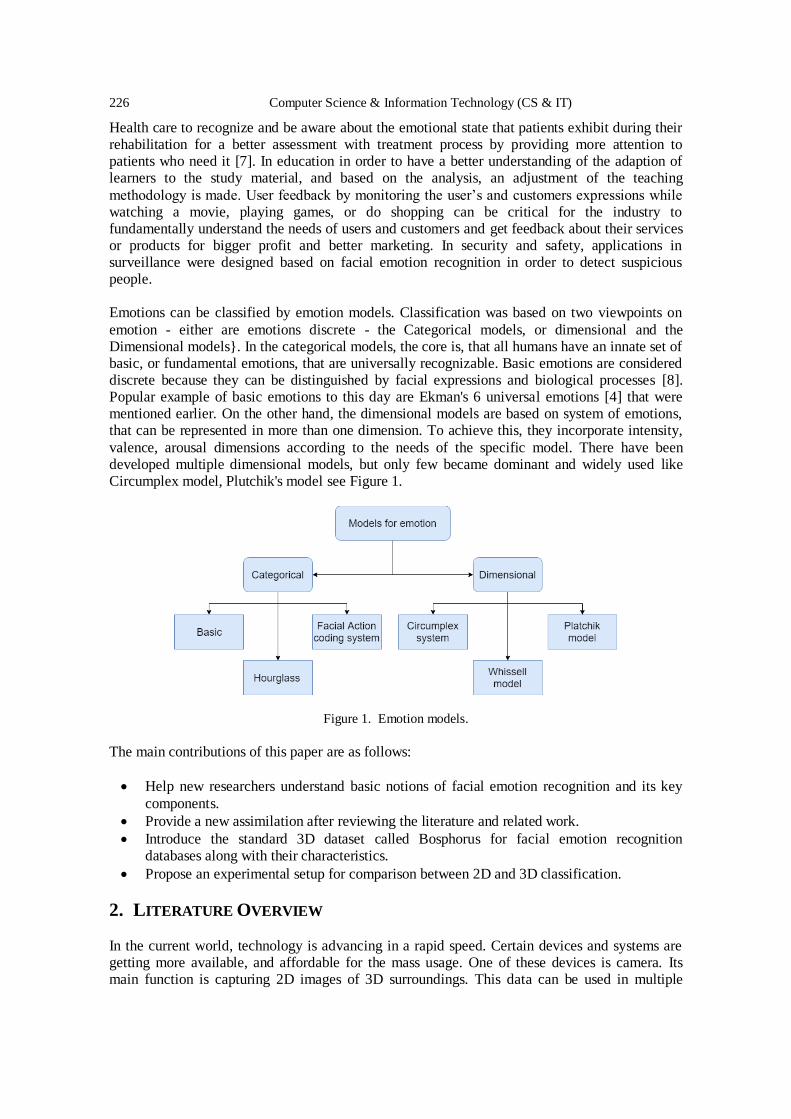
226 Computer Science & Information Technology (CS & IT)
Health care to recognize and be aware about the emotional state that patients exhibit during their rehabilitation for a better assessment with treatment process by providing more attention to patients who need it [7]. In education in order to have a better understanding of the adaption of learners to the study material, and based on the analysis, an adjustment of the teaching
methodology is made. User feedback by monitoring the user’s and customers expressions while watching a movie, playing games, or do shopping can be critical for the industry to fundamentally understand the needs of users and customers and get feedback about their services or products for bigger profit and better marketing. In security and safety, applications in surveillance were designed based on facial emotion recognition in order to detect suspicious people. Emotions can be classified by emotion models. Classification was based on two viewpoints on
emotion - either are emotions discrete - the Categorical models, or dimensional and the Dimensional models}. In the categorical models, the core is, that all humans have an innate set of basic, or fundamental emotions, that are universally recognizable. Basic emotions are considered discrete because they can be distinguished by facial expressions and biological processes [8]. Popular example of basic emotions to this day are Ekman's 6 universal emotions [4] that were mentioned earlier. On the other hand, the dimensional models are based on system of emotions, that can be represented in more than one dimension. To achieve this, they incorporate intensity,
valence, arousal dimensions according to the needs of the specific model. There have been developed multiple dimensional models, but only few became dominant and widely used like Circumplex model, Plutchik's model see Figure 1.
Figure 1. Emotion models.
The main contributions of this paper are as follows:
Help new researchers understand basic notions of facial emotion recognition and its key
components.
Provide a new assimilation after reviewing the literature and related work.
Introduce the standard 3D dataset called Bosphorus for facial emotion recognition databases along with their characteristics.
Propose an experimental setup for comparison between 2D and 3D classification.
2. LITERATURE OVERVIEW In the current world, technology is advancing in a rapid speed. Certain devices and systems are getting more available, and affordable for the mass usage. One of these devices is camera. Its main function is capturing 2D images of 3D surroundings. This data can be used in multiple
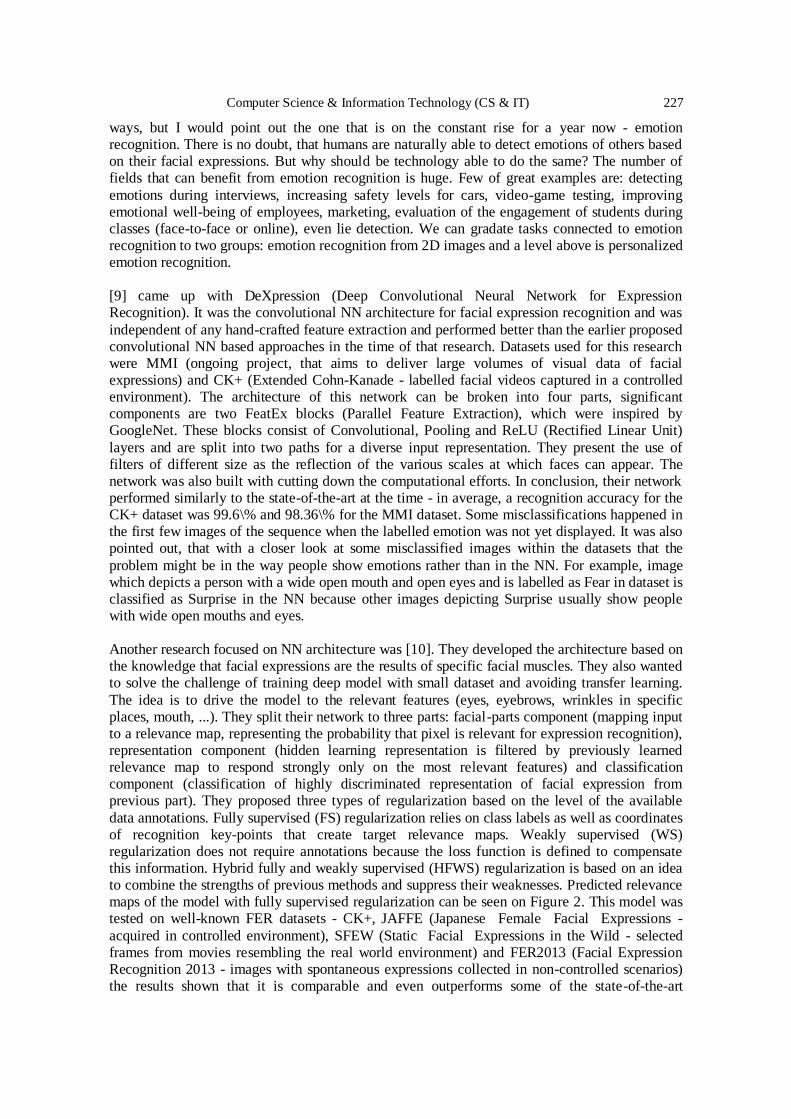
Computer Science & Information Technology (CS & IT) 227
ways, but I would point out the one that is on the constant rise for a year now - emotion recognition. There is no doubt, that humans are naturally able to detect emotions of others based on their facial expressions. But why should be technology able to do the same? The number of fields that can benefit from emotion recognition is huge. Few of great examples are: detecting
emotions during interviews, increasing safety levels for cars, video-game testing, improving emotional well-being of employees, marketing, evaluation of the engagement of students during classes (face-to-face or online), even lie detection. We can gradate tasks connected to emotion recognition to two groups: emotion recognition from 2D images and a level above is personalized emotion recognition. [9] came up with DeXpression (Deep Convolutional Neural Network for Expression Recognition). It was the convolutional NN architecture for facial expression recognition and was
independent of any hand-crafted feature extraction and performed better than the earlier proposed convolutional NN based approaches in the time of that research. Datasets used for this research were MMI (ongoing project, that aims to deliver large volumes of visual data of facial expressions) and CK+ (Extended Cohn-Kanade - labelled facial videos captured in a controlled environment). The architecture of this network can be broken into four parts, significant components are two FeatEx blocks (Parallel Feature Extraction), which were inspired by GoogleNet. These blocks consist of Convolutional, Pooling and ReLU (Rectified Linear Unit)
layers and are split into two paths for a diverse input representation. They present the use of filters of different size as the reflection of the various scales at which faces can appear. The network was also built with cutting down the computational efforts. In conclusion, their network performed similarly to the state-of-the-art at the time - in average, a recognition accuracy for the CK+ dataset was 99.6\% and 98.36\% for the MMI dataset. Some misclassifications happened in the first few images of the sequence when the labelled emotion was not yet displayed. It was also pointed out, that with a closer look at some misclassified images within the datasets that the
problem might be in the way people show emotions rather than in the NN. For example, image which depicts a person with a wide open mouth and open eyes and is labelled as Fear in dataset is classified as Surprise in the NN because other images depicting Surprise usually show people with wide open mouths and eyes. Another research focused on NN architecture was [10]. They developed the architecture based on the knowledge that facial expressions are the results of specific facial muscles. They also wanted to solve the challenge of training deep model with small dataset and avoiding transfer learning.
The idea is to drive the model to the relevant features (eyes, eyebrows, wrinkles in specific places, mouth, ...). They split their network to three parts: facial-parts component (mapping input to a relevance map, representing the probability that pixel is relevant for expression recognition), representation component (hidden learning representation is filtered by previously learned relevance map to respond strongly only on the most relevant features) and classification component (classification of highly discriminated representation of facial expression from previous part). They proposed three types of regularization based on the level of the available
data annotations. Fully supervised (FS) regularization relies on class labels as well as coordinates of recognition key-points that create target relevance maps. Weakly supervised (WS) regularization does not require annotations because the loss function is defined to compensate this information. Hybrid fully and weakly supervised (HFWS) regularization is based on an idea to combine the strengths of previous methods and suppress their weaknesses. Predicted relevance maps of the model with fully supervised regularization can be seen on Figure 2. This model was tested on well-known FER datasets - CK+, JAFFE (Japanese Female Facial Expressions -
acquired in controlled environment), SFEW (Static Facial Expressions in the Wild - selected frames from movies resembling the real world environment) and FER2013 (Facial Expression Recognition 2013 - images with spontaneous expressions collected in non-controlled scenarios) the results shown that it is comparable and even outperforms some of the state-of-the-art
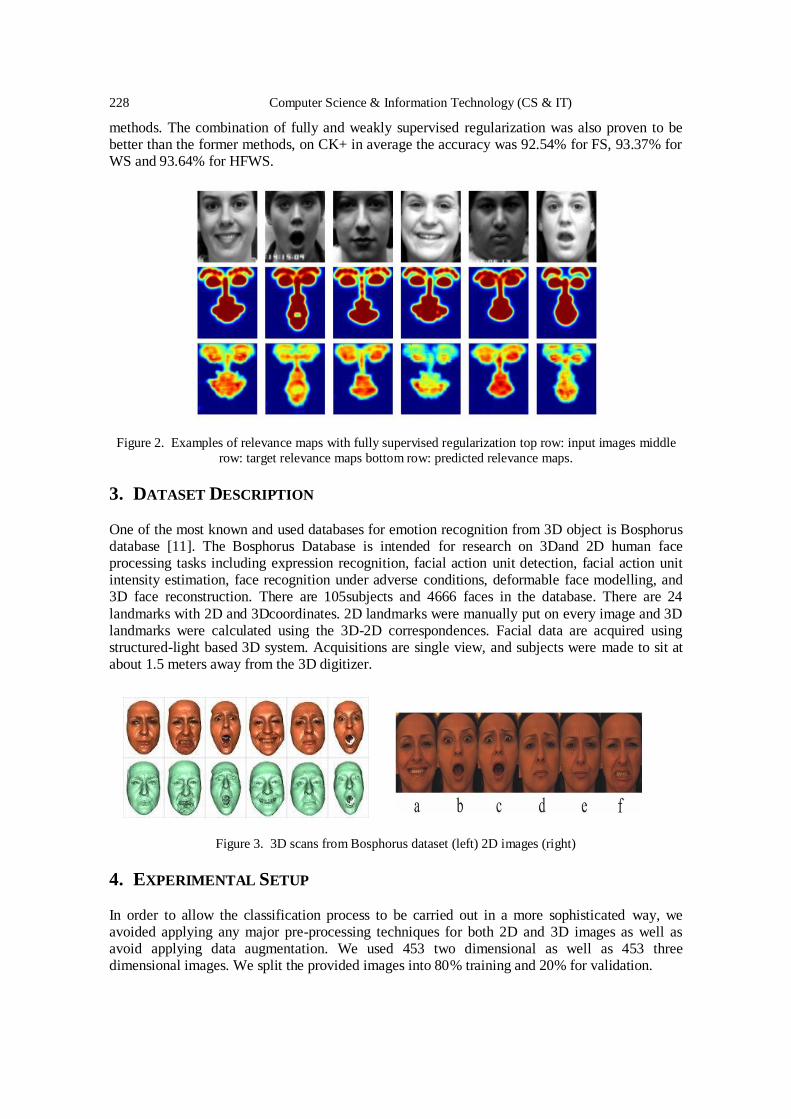
228 Computer Science & Information Technology (CS & IT)
methods. The combination of fully and weakly supervised regularization was also proven to be better than the former methods, on CK+ in average the accuracy was 92.54% for FS, 93.37% for WS and 93.64% for HFWS.
Figure 2. Examples of relevance maps with fully supervised regularization top row: input images middle
row: target relevance maps bottom row: predicted relevance maps.
3. DATASET DESCRIPTION One of the most known and used databases for emotion recognition from 3D object is Bosphorus database [11]. The Bosphorus Database is intended for research on 3Dand 2D human face processing tasks including expression recognition, facial action unit detection, facial action unit intensity estimation, face recognition under adverse conditions, deformable face modelling, and 3D face reconstruction. There are 105subjects and 4666 faces in the database. There are 24
landmarks with 2D and 3Dcoordinates. 2D landmarks were manually put on every image and 3D landmarks were calculated using the 3D-2D correspondences. Facial data are acquired using structured-light based 3D system. Acquisitions are single view, and subjects were made to sit at about 1.5 meters away from the 3D digitizer.
Figure 3. 3D scans from Bosphorus dataset (left) 2D images (right)
4. EXPERIMENTAL SETUP
In order to allow the classification process to be carried out in a more sophisticated way, we avoided applying any major pre-processing techniques for both 2D and 3D images as well as avoid applying data augmentation. We used 453 two dimensional as well as 453 three dimensional images. We split the provided images into 80% training and 20% for validation.
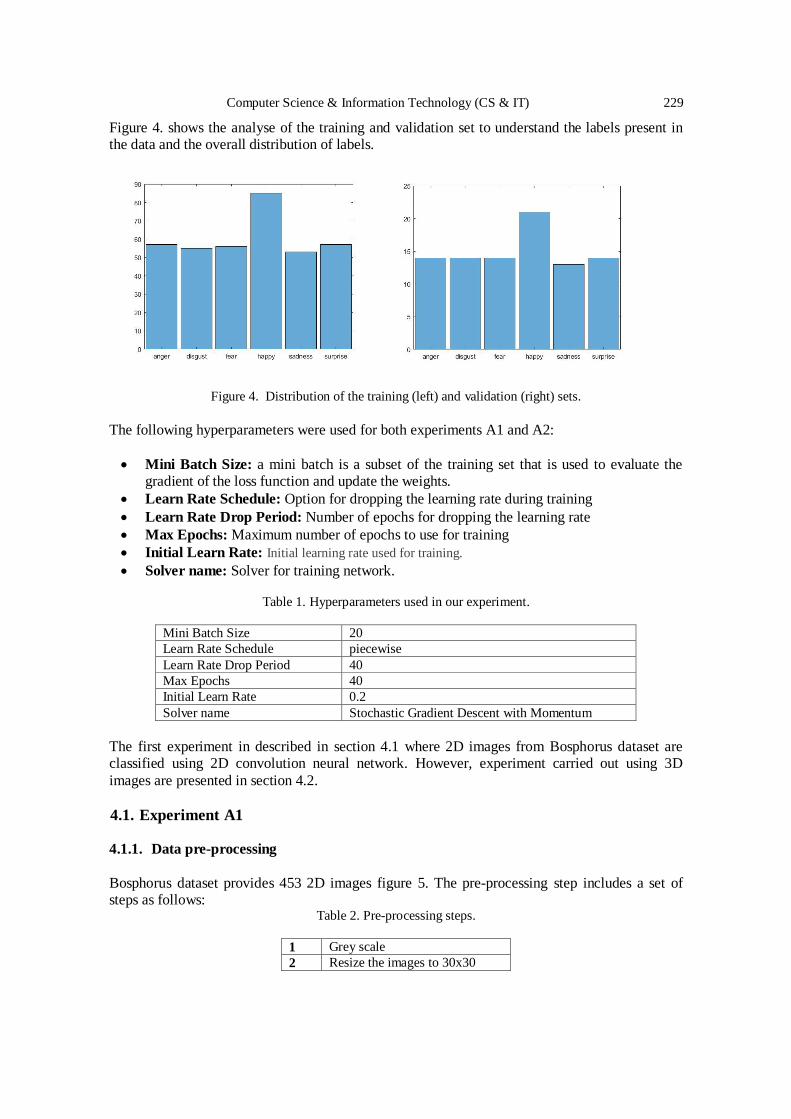
Computer Science & Information Technology (CS & IT) 229
Figure 4. shows the analyse of the training and validation set to understand the labels present in the data and the overall distribution of labels.
Figure 4. Distribution of the training (left) and validation (right) sets.
The following hyperparameters were used for both experiments A1 and A2:
Mini Batch Size: a mini batch is a subset of the training set that is used to evaluate the gradient of the loss function and update the weights.
Learn Rate Schedule: Option for dropping the learning rate during training
Learn Rate Drop Period: Number of epochs for dropping the learning rate
Max Epochs: Maximum number of epochs to use for training
Initial Learn Rate: Initial learning rate used for training.
Solver name: Solver for training network.
Table 1. Hyperparameters used in our experiment.
Mini Batch Size 20
Learn Rate Schedule piecewise
Learn Rate Drop Period 40
Max Epochs 40
Initial Learn Rate 0.2
Solver name Stochastic Gradient Descent with Momentum
The first experiment in described in section 4.1 where 2D images from Bosphorus dataset are classified using 2D convolution neural network. However, experiment carried out using 3D
images are presented in section 4.2.
4.1. Experiment A1
4.1.1. Data pre-processing
Bosphorus dataset provides 453 2D images figure 5. The pre-processing step includes a set of steps as follows:
Table 2. Pre-processing steps.
1 Grey scale
2 Resize the images to 30x30
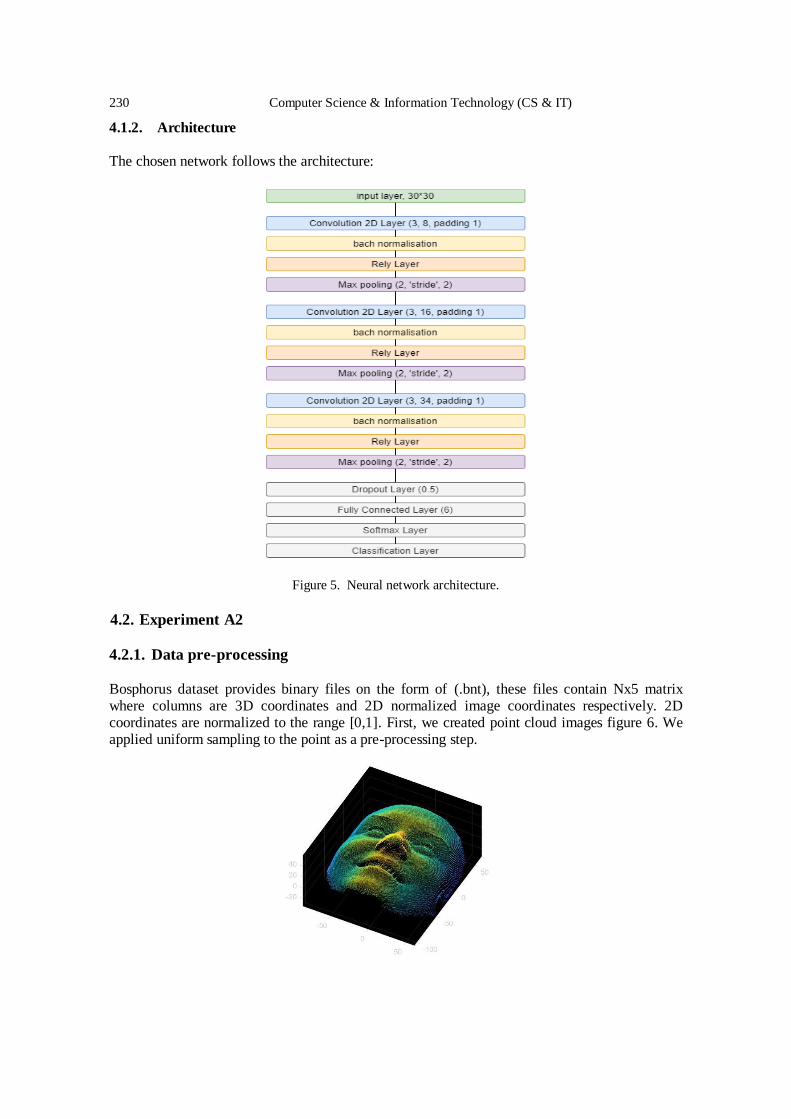
230 Computer Science & Information Technology (CS & IT)
4.1.2. Architecture
The chosen network follows the architecture:
Figure 5. Neural network architecture.
4.2. Experiment A2
4.2.1. Data pre-processing
Bosphorus dataset provides binary files on the form of (.bnt), these files contain Nx5 matrix where columns are 3D coordinates and 2D normalized image coordinates respectively. 2D coordinates are normalized to the range [0,1]. First, we created point cloud images figure 6. We applied uniform sampling to the point as a pre-processing step.
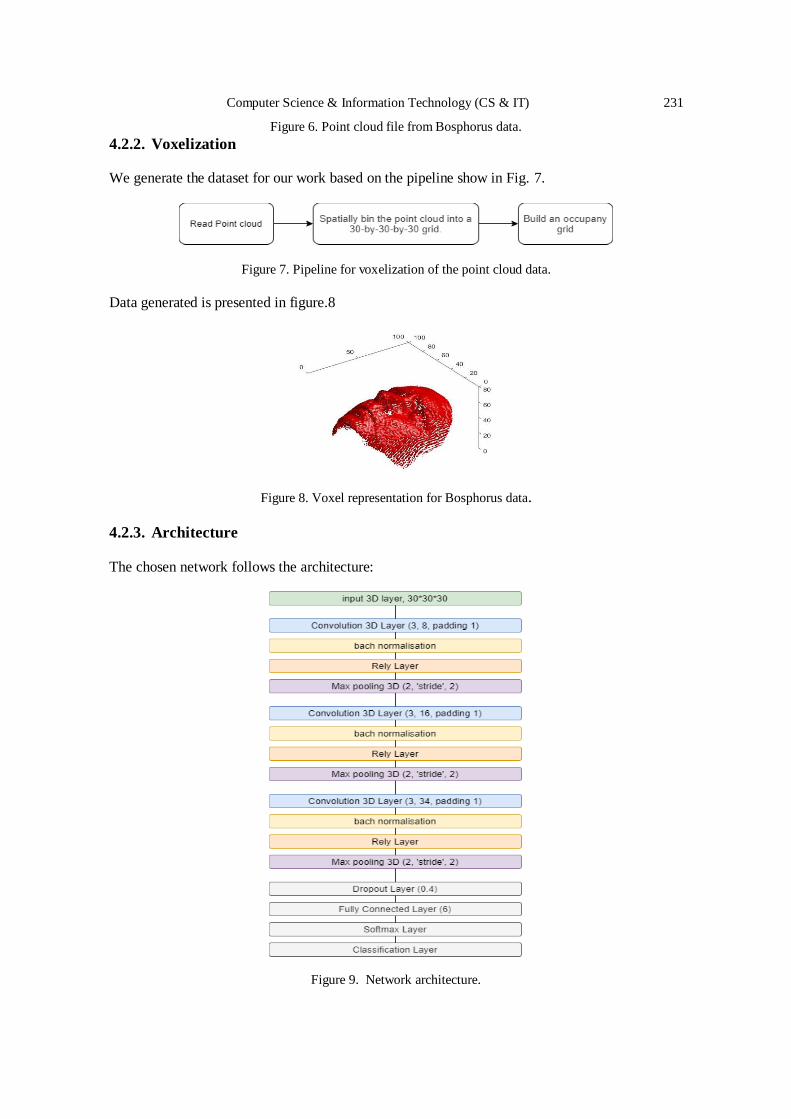
Computer Science & Information Technology (CS & IT) 231
Figure 6. Point cloud file from Bosphorus data.
4.2.2. Voxelization
We generate the dataset for our work based on the pipeline show in Fig. 7.
Figure 7. Pipeline for voxelization of the point cloud data.
Data generated is presented in figure.8
Figure 8. Voxel representation for Bosphorus data.
4.2.3. Architecture The chosen network follows the architecture:
Figure 9. Network architecture.
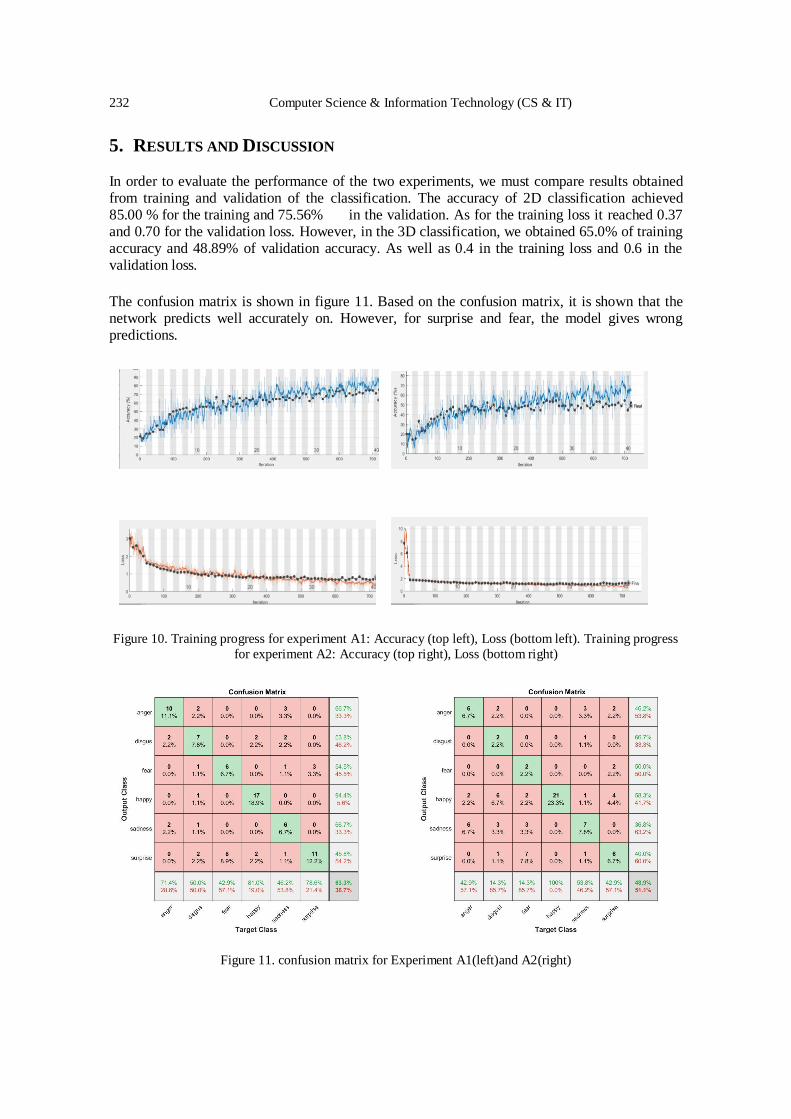
232 Computer Science & Information Technology (CS & IT)
5. RESULTS AND DISCUSSION
In order to evaluate the performance of the two experiments, we must compare results obtained from training and validation of the classification. The accuracy of 2D classification achieved 85.00 % for the training and 75.56% in the validation. As for the training loss it reached 0.37 and 0.70 for the validation loss. However, in the 3D classification, we obtained 65.0% of training accuracy and 48.89% of validation accuracy. As well as 0.4 in the training loss and 0.6 in the validation loss.
The confusion matrix is shown in figure 11. Based on the confusion matrix, it is shown that the network predicts well accurately on. However, for surprise and fear, the model gives wrong predictions.
Figure 10. Training progress for experiment A1: Accuracy (top left), Loss (bottom left). Training progress
for experiment A2: Accuracy (top right), Loss (bottom right)
Figure 11. confusion matrix for Experiment A1(left)and A2(right)
Computer Science & Information Technology (CS & IT) 233
6. CONCLUSION This paper has demonstrated a comparison study for facial expression recognition, for this purpose convolution neural network was used to classify 2D and 3D images from the Bosphorus dataset, for a sophisticated training process we applied the same experimental setup and hyperparameters. Among the observer studies, it appears that 2D classification overall produces slightly more accurate results than 3D classification. Further studies should be performed to
create more 3D data and to develop methods for 3D data augmentation as well as proposing a better voxel classification model.
ACKNOWLEGMENTS This research work was supported by APVV project 015-0730 “Cloud Based Human Robot Interaction”
and FEI grant “Increasing Server Performance for Deep Learning” for the year 2020.
REFERENCES
[1] M. E. McCullough and L. I. Reed, “What the face communicates: Clearing the conceptual ground,”
Current Opinion in Psychology, vol. 7. Elsevier B.V., pp. 110–114, 01-Feb-2016, doi:
10.1016/j.copsyc.2015.08.023. [2] M. Cabanac, “What is emotion?,” Behav. Processes, vol. 60, no. 2, pp. 69–83, Nov. 2002, doi:
10.1016/S0376-6357(02)00078-5.
[3] J. L. Tracy, D. Randles, and C. M. Steckler, “The nonverbal communication of emotions,” Current
Opinion in Behavioral Sciences, vol. 3. Elsevier Ltd, pp. 25–30, 01-Jun-2015, doi:
10.1016/j.cobeha.2015.01.001.
[4] P. Ekman and W. V. Friesen, “Constants across cultures in the face and emotion,” J. Pers. Soc.
Psychol., vol. 17, no. 2, pp. 124–129, Feb. 1971, doi: 10.1037/h0030377.
[5] “Handbook of Emotion Elicitation and Assessment - Google Books.”
https://books.google.sk/books?hl=en&lr=&id=9xhnDAAAQBAJ&oi=fnd&pg=PA203&dq=P.+Ekma
n+-+W.+V.+Friesen.+Facial+Action+Coding+System:+ A+Technique+for+the+
Measurement+of+Facial+Movement.+1978.&ots=nLIwd-hBz0&sig=q74leRchuBapEuo2qY
PbC6Ex3Ts&redir_esc=y#v=onepage&q=P. Ekman - W. V. Friesen. Facial Action Coding
System%3A A Technique for the Measurement of Facial Movement. 1978.&f=false (accessed Jun.
21, 2020).
[6] E. Barsoum, C. Zhang, C. C. Ferrer, and Z. Zhang, “Training deep networks for facial expression
recognition with crowd-sourced label distribution,” in ICMI 2016 - Proceedings of the 18th ACM
International Conference on Multimodal Interaction, 2016, pp. 279–283, doi: 10.1145/2993148.2993165.
[7] M. Alhussein, “Automatic facial emotion recognition using weber local descriptor for e-Healthcare
system,” Cluster Comput., vol. 19, pp. 99–108, 2016, doi: 10.1007/s10586-016-0535-3.
[8] G. Colombetti, “From affect programs to dynamical discrete emotions,” Philos. Psychol., vol. 22, no.
4, pp. 407–425, Aug. 2009, doi: 10.1080/09515080903153600.
[9] P. Burkert, F. Trier, M. Z. Afzal, A. Dengel, and M. Liwicki, “DeXpression: Deep Convolutional
Neural Network for Expression Recognition,” Sep. 2015, Accessed: 21-Jun-2020. [Online].
Available: http://arxiv.org/abs/1509.05371.
[10] P. M. Ferreira, F. Marques, J. S. Cardoso, and A. Rebelo, “Physiological inspired deep neural
networks for emotion recognition,” IEEE Access, vol. 6, pp. 53930–53942, 2018, doi:
10.1109/ACCESS.2018.2870063.
[11] A. Savran et al., “Bosphorus database for 3D face analysis,” in Lecture Notes in Computer Science
(including subseries Lecture Notes in Artificial Intelligence and Lecture Notes in Bioinformatics),
2008, vol. 5372 LNCS, pp. 47–56, doi: 10.1007/978-3-540-89991-4_6.
© 2020 By AIRCC Publishing Corporation. This article is published under the Creative Commons Attribution (CC BY) license.

234 Computer Science & Information Technology (CS & IT)
David C. Wyld et al. (Eds): CCSEA, BIoT, DKMP, CLOUD, NLCAI, SIPRO, BDML - 2020
pp. 235-244, 2020. CS & IT - CSCP 2020 DOI: 10.5121/csit.2020.101018
APPROACHES TO FRAUD DETECTION ON
CREDIT CARD TRANSACTIONS USING
ARTIFICIAL INTELLIGENCE METHODS
Yusuf Yazici
Department of Computer Engineering,
Istanbul Technical University, Istanbul, Turkey
ABSTRACT Credit card fraud is an ongoing problem for almost all industries in the world, and it raises
millions of dollars to the global economy each year. Therefore, there is a number of research either completed or proceeding in order to detect these kinds of frauds in the industry. These
researches generally use rule-based or novel artificial intelligence approaches to find eligible
solutions. The ultimate goal of this paper is to summarize state-of-the-art approaches to fraud
detection using artificial intelligence and machine learning techniques. While summarizing, we
will categorize the common problems such as imbalanced dataset, real time working scenarios,
and feature engineering challenges that almost all research works encounter, and identify
general approaches to solve them. The imbalanced dataset problem occurs because the number
of legitimate transactions is much higher than the fraudulent ones whereas applying the right
feature engineering is substantial as the features obtained from the industries are limited, and
applying feature engineering methods and reforming the dataset is crucial. Also, adapting the
detection system to real time scenarios is a challenge since the number of credit card
transactions in a limited time period is very high. In addition, we will discuss how evaluation metrics and machine learning methods differentiate among each research.
KEYWORDS Credit Card, Fraud Detection, Machine Learning, Survey, Artificial Intelligence
1. INTRODUCTION The number of cashless transactions is at its peak point since the beginning of the digital era and
it is most likely to increase in the future. While that is an advantage and provides ease of use for
customers, it also creates opportunities for fraudsters. Only in 2016, 34,260.6 million transactions have been performed, making a total of 66,089 transactions per second. The net loss of the global
economy out of fraudulent transactions is $2.17 billion [1].
As the loss is quite major, there is a number of research to decrease the causalities created by
credit card fraud. The number of research papers in the finance application area using machine
learning reaches to thousands [2]. While some of them try to solve this using mathematical rule-
based algorithms, recently, machine learning and artificial intelligence techniques are in demand. That is the result of the big data collected from billions of transactions, and this data somehow
could be useful in trying to predict whether a next, unknown transaction is actually a fraud or not.
Credit card fraud could be categorized into two types: Application and behavioral fraud [3]. Application fraud could be defined as getting new cards from banks or companies using false or

236 Computer Science & Information Technology (CS & IT)
others’ information. Behavioral fraud is, on the other hand, could be mail theft, stolen cards, counterfeit card or ‘card holder not present fraud’ [4].
Detecting a credit card fraud is in fact a binary classification problem, where the outcome is
either false or true. That classification problem could be solved using three machine learning tasks: supervised learning, unsupervised learning, and semi-supervised learning. A supervised
learning approach utilizes past, known transactions that are labeled as fraudulent or legitimate.
The past data is trained and the created model is used to predict whether a new transaction is fraud or not. Unsupervised techniques are the ones that do not use the labeled data, but use
unlabeled data to characterize the data distribution of transactions [6]. With that way, the outlier
data could be acceptable as the fraudulent transactions. Clustering and compression algorithms are used to solve unsupervised problems. When the two approaches stated are combined, it brings
out semi-supervised algorithms. These algorithms are generally used when there is less labeled
data in the dataset.
The most common supervised learning algorithms are given below: Logistic Regression,
Decision Trees, Neural Networks, Support Vector Machines (SVMs), Naïve Bayes, K-nearest
neighbor (KNN).
In this survey, we will explore which state-of-the-art machine learning algorithms and methods
are used to solve fraud detection after 2018 to present-day. Besides, while researches are carried out, there are some common problems or challenges almost all works encounter such as
imbalanced dataset, doing the correct feature engineering, or adapting the work to real-time
scenarios. We will categorize these challenges by examining state-of-the-art papers.
The rest of the paper is organized as follows: The approaches that are used to detect fraud
detection on credit card transactions using machine learning methods are given in the Section 2.
Section 3 desribes the common challenges while conducting these works. Lastly, Section 4 concludes the paper.
2. APPROACHES USING MACHINE LEARNING METHODS
Common algorithms and methods used in other works are presented in this section. Table 1. briefly depicts the used methods in the researches.
Akila et al. present an ensemble model named Risk Induced Bayesian Inference Bagging model, RIBIB [1]. They propose a three-step approach: a bagging architecture with a constrained bag
creation method, Risk Induced Bayesian Inference method as base learner, and a weighted voting
combiner. Bagging is a process of combining multiple training datasets, and utilizing them
separately to train multiple classifier models [1]. They evaluated their solution on Brazilian Bank Data and exceled at cost minimizing compared to the other state-of-the-art models.
Sá et al. propose a customized Bayesian Network Classifier (BNC), that is automatically created by an algorithm named Hyper-Heuristic Evolutionary Algorithm (HHEA) [5]. HHEA builds a
custom BNC algorithm, creating an ultimate combination of necessary modules for the dataset at
hand. The dataset they used is UOL PagSegure, which is an online payment service in Brazil. They evaluated their results using F1 score and a term they called as economic efficiency,
measuring the company’s economic loss from fraud. They also use an approach called instance
reweighing while comparing their results with other baselines. It is basically reweighing
(assigning them more importance) false negatives (predicted as legitimate but actually fraudulent), as they are more important for the payment companies (than the other way around)
[5].
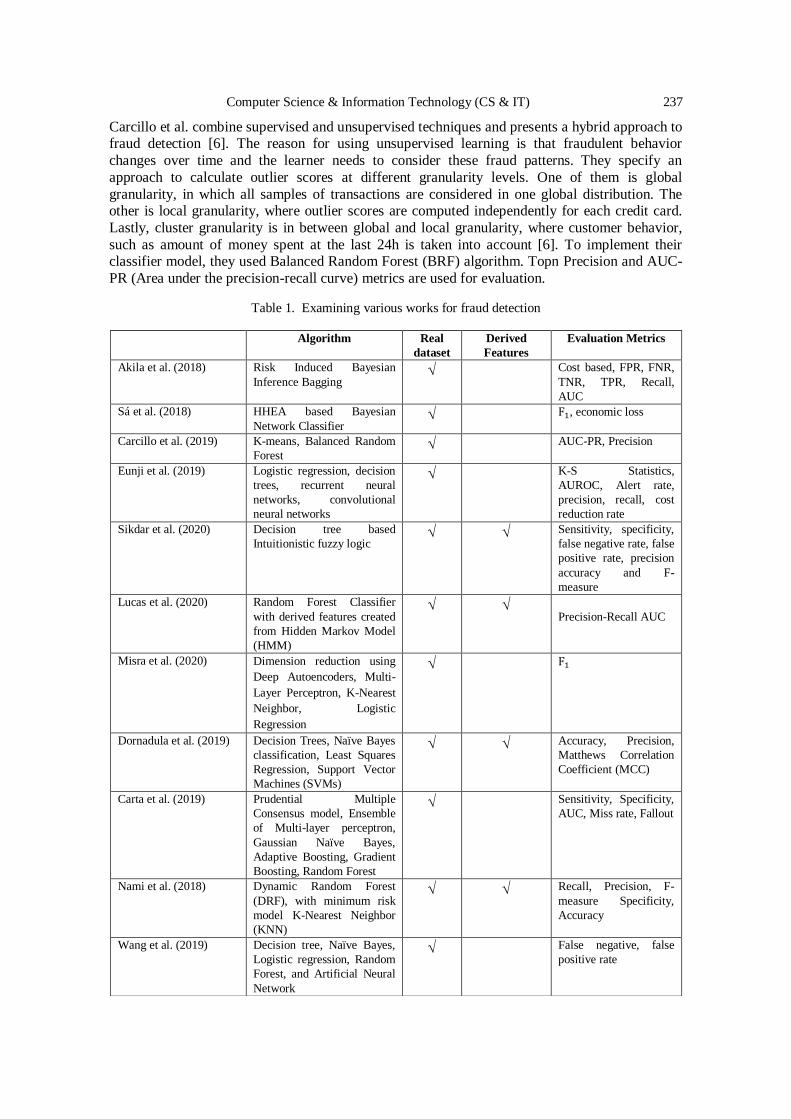
Computer Science & Information Technology (CS & IT) 237
Carcillo et al. combine supervised and unsupervised techniques and presents a hybrid approach to fraud detection [6]. The reason for using unsupervised learning is that fraudulent behavior
changes over time and the learner needs to consider these fraud patterns. They specify an
approach to calculate outlier scores at different granularity levels. One of them is global
granularity, in which all samples of transactions are considered in one global distribution. The other is local granularity, where outlier scores are computed independently for each credit card.
Lastly, cluster granularity is in between global and local granularity, where customer behavior,
such as amount of money spent at the last 24h is taken into account [6]. To implement their classifier model, they used Balanced Random Forest (BRF) algorithm. Topn Precision and AUC-
PR (Area under the precision-recall curve) metrics are used for evaluation.
Table 1. Examining various works for fraud detection
Algorithm Real
dataset
Derived
Features
Evaluation Metrics
Akila et al. (2018) Risk Induced Bayesian
Inference Bagging Cost based, FPR, FNR,
TNR, TPR, Recall,
AUC
Sá et al. (2018) HHEA based Bayesian
Network Classifier F1, economic loss
Carcillo et al. (2019) K-means, Balanced Random
Forest AUC-PR, Precision
Eunji et al. (2019) Logistic regression, decision
trees, recurrent neural
networks, convolutional
neural networks
K-S Statistics,
AUROC, Alert rate,
precision, recall, cost
reduction rate
Sikdar et al. (2020) Decision tree based
Intuitionistic fuzzy logic Sensitivity, specificity,
false negative rate, false
positive rate, precision
accuracy and F-
measure
Lucas et al. (2020) Random Forest Classifier
with derived features created
from Hidden Markov Model
(HMM)
Precision-Recall AUC
Misra et al. (2020) Dimension reduction using
Deep Autoencoders, Multi-
Layer Perceptron, K-Nearest
Neighbor, Logistic
Regression
F1
Dornadula et al. (2019) Decision Trees, Naïve Bayes
classification, Least Squares
Regression, Support Vector
Machines (SVMs)
Accuracy, Precision,
Matthews Correlation
Coefficient (MCC)
Carta et al. (2019) Prudential Multiple
Consensus model, Ensemble
of Multi-layer perceptron,
Gaussian Naïve Bayes,
Adaptive Boosting, Gradient
Boosting, Random Forest
Sensitivity, Specificity,
AUC, Miss rate, Fallout
Nami et al. (2018) Dynamic Random Forest
(DRF), with minimum risk
model K-Nearest Neighbor
(KNN)
Recall, Precision, F-
measure Specificity,
Accuracy
Wang et al. (2019) Decision tree, Naïve Bayes,
Logistic regression, Random
Forest, and Artificial Neural
Network
False negative, false
positive rate
238 Computer Science & Information Technology (CS & IT)
Eunji et al. compare two different approaches to fraud detection: Hybrid ensemble methods and deep learning. They do this comparison in a framework named champion-challenger analysis [7].
The champion model is a model that is used for a while that uses various machine learning
classifiers such as decision trees, logistic regressions, and simple neural network. Each method is
trained using different samples and features and the best outcome is chosen manually by experts [7]. Whereas the challenger framework uses recent deep learning architecture consisting of
convolutional neural networks, recurrent neural networks and their variants. This framework tries
each modern deep learning architecture, specifies activation functions, dropout rates and costs, then finds the best hyperparameters. It then uses early stopping, a way to stop training when no
further improvement is achieved on the validation set, during training. It finally chooses the best
performed model and saves the hyperparameters and complexity settings used on them and tries to find better candidates out of previous experiments [7].
Various evaluation metrics are used to compare each framework: K-S statistics: Maximum value
of difference between two distributions, AUROC: Area under receiver operating characteristics, plot of true positive rate over false positive rate. Alert rate: given a cut-off value to alert by the
user, transactions are alerted over all transactions. Precision: fraudulent transactions predicted as
true (TP) over all alerted transactions (TP + FP). Recall: fraudulent transactions are predicted as true (TP) over fraudulent transactions (TP + FN). Cost reduction rate: the missed frauds (FN) cost
the transaction amount to the owner company. It is calculated using the sum of the amount that
came out as FNs. As a result, the challenger framework which is based on deep learning performs much better than the champion framework.
Sikdar et al. developed a decision tree using intuitionistic fuzzy logic. They argue that it
recognizes the conceptual properties of attributes of transactions, so that legitimate ones are not captured as fraud, or vice-versa [8]. The motivation under using fuzzy logic is that it is not tried
as much as the other artificial intelligence methods on e-transactional fraud detection.
C4.5 algorithm is used with fuzzy logic and intuitionistic fuzzy logic and the final algorithm is
named IFDTC4.5. The fuzzy tests are defined by different attributes and the information gain
ratio is calculated using membership degree and non-membership degree. That information is
then used to create an intuitionistic fuzzy logic algorithm that classifies between fraud, normal, and doubtful transactions. To evaluate the final model, almost all suitable metrics are used:
Sensitivity, specificity, false negative rate, false positive rate, precision accuracy and F-measure.
They show that the proposed method outperforms the existing techniques. Also, this algorithm is argued to work more efficiently and fast compared to others [8].
Pourhabibi et al. review graph-based anomaly detections between 2007-2018. They declare that the general approach is to do the right feature engineering and graph embedding into a feature
space, so that the machine learning models could be built [9]. They also argue that graph-based
anomaly detection techniques have been on the raise since 2017 [9].
As it could be guessed, credit card transactions are not independent events that are isolated;
instead, they are a sequence of transactions [10]. Lucas et al. take this property into account and
create Hidden Markov Model (HMM) to map a current transaction to its previous transactions, extract derived features, and use those features to come up with a Random Forest classifier for
fraud detection [10]. The features created by HMM quantify how similar a sequence is to a past
sequence of a cardholder or terminal [10]. They evaluate the final model using Precision-Recall AUC metric and showed that feature engineering with HMM presents an acceptable rise in the
PR-AUC score.
Computer Science & Information Technology (CS & IT) 239
Misra et al. propose a two-stage model for credit card fraud detection. First, an autoencoder is used to reduce the dimensions so that the transaction attributes are transformed into a lower
dimension feature vector [11]. Then, the final feature vector is sent to a supervised classifier as an
input. An autoencoder is a type of a feed-forward neural network. It regularly has the same input
and output dimensions, yet there exists a reconstruction phase in-between. Initially, there is an encoder that transforms the input to a lower dimension, then the encoder’s output tries to
construct the output layer with the same dimension as the input layer. That step is performed by
the decoder. In this work, only the encoder part of the autoencoder is used. Subsequently, the output from the encoder is used as an input to a number of classifiers: Multi-Layer perceptron, k-
nearest neighbors, logistic regression. F1 score is used to evaluate the final classifier [11]. It
outperforms similar methods in terms of F1.
Dornadula et al. discuss that card transactions are frequently not similar to the past transactions
made by the same cardholder [12]. Therefore, they first group the cardholders based on their
transaction amount: High, medium, and low range partitions. Afterwards, they extract some extra features based on these groups using the sliding-window method [12]. Next, SMOTE (Synthetic
Minority Over-Sampling Technique) operation is performed on the dataset to solve the imbalance
dataset problem. Precision and MCC (Matthews Correlation Coefficient) measures are used to evaluate the model. Among various classifiers, logistic regression, decision tree and random
forest models perform well based on the evaluation metrics.
Carta et al. consolidate state-of-the-art classification algorithms with a model called Prudential
Multiple Consensus. The idea is built upon the fact that the results of different classifiers are not
the same in terms of certain transactions [13]. The algorithm is formed of two steps:
1) A transaction is perceived as legitimate if and only if the current algorithm classifies it as
legitimate and the classification probability is above the average of all algorithms.
Otherwise, it is perceived as fraudulent.
2) Majority voting is applied after all algorithms run the first step and the final decision is
made [13].
Sensitivity, fallout, and AUC evaluation metrics are used to evaluate the model in terms of
combination of a number of algorithms such as Multi-layer perceptron, Gaussian Naïve Bayes,
Adaptive Boosting, Gradient Boosting, and Random Forest. It performs well in terms of Sensitivity and AUC.
Nami et al. present a two-stage solution to the problem. Before starting the algorithm steps, they derive some extra features to acquire an enhanced understanding of cardholders’ spending
behavior [14]. Then, at the first stage, reasoning that new attitudes of cardholders would be closer
to their recent attitudes, a new similarity measure is constructed based on transaction time. That
measure naturally designates more weight to recent transactions [14]. The second stage consists of training a Dynamic Random Forest algorithm applying a minimum risk model. It is a model to
decide the outcome of a transaction with a cost-sensitive approach [15]. Nami et al. tested their
model using various metrics such as recall, precision, f-measure specificity, and accuracy and showed that the minimum risk approach made an increase in performance.
Wang et al. combine machine learning algorithms with customer incentives [22]. They argue that there must be secondary verification in order to achieve more accurate results. The secondary
verification could be applied to certain transactions that are higher than a threshold value. They
specify the strategies and their conditions according to the benefits they offer to retailers, card
issuers, and consumers, resulting in a “win-win-win” success [22]. The existing strategies
240 Computer Science & Information Technology (CS & IT)
generally are no-prevention (doing nothing), and using machine learning techniques for all transactions. The third strategy is to make a second verification with customer incentives [22].
They experiment the different strategies with algorithms Decision tree, Naïve Bayes, Logistic
regression, Random Forest, and Artificial Neural Network.
3. COMMON CHALLENGES
The credit card fraud detection problem shares some common challenges to consider while
implementing efficient machine learning algorithms: They could be grouped as overcoming imbalanced dataset problem, doing the right feature engineering, and executing models in real-
time scenarios.
3.1. Imbalanced Dataset Problem
Almost all datasets of banks or other organizations contain millions of transactions, and all of them share a common problem in terms of state-of-the-art machine learning algorithms:
Imbalanced dataset. The problem arises from the fact that the rate of actual fraud transactions out
of all transactions is nominal. The number of legitimate transactions per day in 2017 completed
by Tier-1 issuers is 5.7m, whereas fraud transactions in the same category is 1150 [17]. This unbalanced data distribution lessens the effectiveness of machine learning models [18]. Hence,
training models to detect fraudulent transactions that are very nominal requires extra caution and
thinking. The general known approaches to the imbalanced dataset problem are categorized into two: Sampling methods, and cost-based methods [30]. We examine how state-of-the-art research
tackles this problem.
Fiore et al. solve the problem by increasing the number of “interesting but underrepresented”
instances in the training set [16]. They achieve this by generating credible examples using
Generative Adversarial Networks (GANs) that mimics “interesting” class examples as much as
possible [16]. From the point of view of sensitivity rate, the classifier generated by the help of GANs gives sufficient results compared to the original classifier.
Rtayli et al. state that the quantity of transactions that are fraudulent is a very small portion of total transactions, and that brings out the imbalanced dataset problem. To solve that issue, they
use Random Forest Classifier to select only relevant features [24]. They use this approach in the
area of Credit Risk Identification and it gives accurate results based on the metrics they use; this
approach could also be used in the credit card fraud detection.
Zeager et al. state that there are common approaches to overcome class imbalance which are
oversampling the minatory class (fraudulent transactions), undersampling the majority class (legitimate transactions), and cost-sensitive cost functions. They utilize an oversampling
approach named SMOTE (synthetic minority oversampling technique), that generates synthetic
examples of fraudulent transactions [26].
Jurgovsky et al., on the other hand, present a different approach to [26] and employ and
undersampling an account level to overcome class imbalance [27]. In depth, they tag accounts
that contain at least one fraudulent transaction as “compromised”, and tag accounts that do not contain any fraudulent transactions as “genuine”. With a probability of 0.9, they randomly pick a
genuine account, and pick a compromised account with a probability of 0.1. The process is
repeated times to create a training set [27].
Computer Science & Information Technology (CS & IT) 241
Zhu et al. suggest an approach called Weighted Extreme Learning Machine (WELM) to solve imbalanced dataset problems [28]. WELM is a transformed version of ELM for imbalanced
datasets assigning different weights to different types of samples [28].
3.2. Feature Engineering Challenge
The pure transaction information extracted from the organization database is quite restricted. The balance of cardholder, transaction time, credit limit, transaction amount are some of them. When
only these ready-to-use features are used to train common machine learning algorithms, the
performance is not likely to vary among them. In order to create a difference, accurate feature
engineering becomes a must. We will look through some research that handle feature engineering in credit card fraud detection scenarios.
Zhang et al. generate a feature engineering method that is dependent on homogeneity-oriented behavior analysis, stating that behavior analysis should be done on distinct groups of transactions
with the same transaction characteristics [19]. These characteristics could be extracted from the
information of time, geographic space, transaction amount, and transaction frequency. For each characteristic found, two strategies are processed for feature engineering: Transaction
aggregation and rule-based strategy [19].
Roy et al. extend the baseline features and add the following new features to their model [20]: Frequency of transactions per month, filling the missing data dummy variables, maximum, mean
authorization amounts in the 8-month period, new variables to indicate when a transaction is
made at a predefined location such as restaurants, gas stations etc., a new variable demonstrating whether a transaction amount in a given retailer is greater than 10% of the standard deviation of
the mean of legitimate transactions for that retailer [20].
Chouikh et al. utilize Convolutional Neural Networks in fraud detection analysis and they argue
that since deep learning algorithms use deep architecture internally, they extract their features
automatically in a hierarchical way with layers navigating from bottom to upwards. With that
way, a feature engineering process that is time and resource consuming is avoided [21].
Wu et al. are interested in credit cards rather than transactions for feature engineering [25]. They
mainly focus on the credit card cash-out problem. It is a fraud technique that spends all limit on the credit card. The study incorporates additional features into the model by receiving
information from industry experts, tips shared by fraudsters online, reports, and news. The
number of total features the study reaches is 521, creating a pool for feature selection studies
[25]. The classifier model created using these feature sets increases the precision performance by 4.6%-8.1% [25].
3.3. Real Time Working Problems
Since the incoming transactions that are processed to the system every day are excessive, and
behaviors of cardholders and fraudsters could change in a rapid way, the classification models should be regenerated frequently. This exposes the question of how efficient the created models
are. We investigate some research done that tries to implement efficient systems to work in a
real-time manner.
Carcillo et al. utilize open source big data tools such as Apache Spark, Kafka and Cassandra to
create a real-time fraud detector called Scalable Real-time Fraud Finder (SCARFF) [23]. They emphasize that the system is tested extensively in terms of scalability, sensitivity, and accuracy;
242 Computer Science & Information Technology (CS & IT)
and it processes 200 transactions per second, which they argue that is much more than their partner, with a rate of 2.4 transactions per second [23].
Patil et al. suggest a fraud detection system on credit cards on a real-time basis analyzing
incoming transactions. It uses Hadoop network to encode data in HDFS format and the SAS system converts the file to raw data. The raw data is transferred to the analytical model in order to
build the data model. That cycle helps the system learn the model by itself in a scalable and real-
time manner [29].
4. CONCLUSIONS
As the digital era matures, the number of transactions that are processed with credit card rises
continuously. Fraudsters could abuse that rise and could convert a possible advantage into a disadvantage. Research is continued to be conducted for how to detect these kind of transactions.
This survey presented how machine learning and artificial intelligence methods are utilized to
detect credit card frauds. Subsequently, some common challenges such as imbalanced dataset, feature engineering, and real-time working scenarios, that are encountered during the progress are
examined by the research basis. It could be concluded that the path is not over to adapt a machine
learning fraud detection system to real-time environment since most of the works conducted still prefer an offline detection mechanism and the number of resarch for solving the problem is
relatively low. On the other hand, the improvement on managing imbalanced dataset and feature
engineering challenges is apparent. There exist some operative and effective methods to solve
each problem and they considerably increase the model performances.
Future work can be performed to improve real-time scenarios combined with sufficient feature
engineering and state-of-the-art machine learning methods.
REFERENCES [1] S. Akila and U. Srinivasulu Reddy, “Cost-sensitive Risk Induced Bayesian Inference Bagging
(RIBIB) for credit card fraud detection,” Journal of Computational Science, vol. 27, pp. 247–254, Jul.
2018, doi: 10.1016/j.jocs.2018.06.009.
[2] A. M. Ozbayoglu, M. U. Gudelek, and O. B. Sezer, “Deep learning for financial applications : A
survey,” Applied Soft Computing, vol. 93, p. 106384, Aug. 2020, doi: 10.1016/j.asoc.2020.106384.
[3] Y. Jin, R. M. Rejesus *, and B. B. Little, “Binary choice models for rare events data: a crop insurance
fraud application,” Applied Economics, vol. 37, no. 7, pp. 841–848, Apr. 2005, doi:
10.1080/0003684042000337433.
[4] S. Bhattacharyya, S. Jha, K. Tharakunnel, and J. C. Westland, “Data mining for credit card fraud: A
comparative study,” Decision Support Systems, vol. 50, no. 3, pp. 602–613, Feb. 2011, doi:
10.1016/j.dss.2010.08.008.
[5] A. G. C. de Sá, A. C. M. Pereira, and G. L. Pappa, “A customized classification algorithm for credit card fraud detection,” Engineering Applications of Artificial Intelligence, vol. 72, pp. 21–29, Jun.
2018, doi: 10.1016/j.engappai.2018.03.011.
[6] F. Carcillo, Y.-A. Le Borgne, O. Caelen, Y. Kessaci, F. Oblé, and G. Bontempi, “Combining
unsupervised and supervised learning in credit card fraud detection,” Information Sciences, May
2019, doi: 10.1016/j.ins.2019.05.042.
[7] E. Kim et al., “Champion-challenger analysis for credit card fraud detection: Hybrid ensemble and
deep learning,” Expert Systems with Applications, vol. 128, pp. 214–224, Aug. 2019, doi:
10.1016/j.eswa.2019.03.042.
[8] S. M. S. Askari and M. A. Hussain, “IFDTC4.5: Intuitionistic fuzzy logic based decision tree for E-
transactional fraud detection,” Journal of Information Security and Applications, vol. 52, p. 102469,
Jun. 2020, doi: 10.1016/j.jisa.2020.102469.
Computer Science & Information Technology (CS & IT) 243
[9] T. Pourhabibi, K.-L. Ong, B. H. Kam, and Y. L. Boo, “Fraud detection: A systematic literature
review of graph-based anomaly detection approaches,” Decision Support Systems, vol. 133, p.
113303, Jun. 2020, doi: 10.1016/j.dss.2020.113303.
[10] Y. Lucas et al., “Towards automated feature engineering for credit card fraud detection using multi-
perspective HMMs,” Future Generation Computer Systems, vol. 102, pp. 393–402, Jan. 2020, doi: 10.1016/j.future.2019.08.029.
[11] S. Misra, S. Thakur, M. Ghosh, and S. K. Saha, “An Autoencoder Based Model for Detecting
Fraudulent Credit Card Transaction,” Procedia Computer Science, vol. 167, pp. 254–262, 2020, doi:
10.1016/j.procs.2020.03.219.
[12] V. N. Dornadula and S. Geetha, “Credit Card Fraud Detection using Machine Learning Algorithms,”
Procedia Computer Science, vol. 165, pp. 631–641, 2019, doi: 10.1016/j.procs.2020.01.057.
[13] S. Carta, G. Fenu, D. Reforgiato Recupero, and R. Saia, “Fraud detection for E-commerce
transactions by employing a prudential Multiple Consensus model,” Journal of Information Security
and Applications, vol. 46, pp. 13–22, Jun. 2019, doi: 10.1016/j.jisa.2019.02.007.
[14] S. Nami and M. Shajari, “Cost-sensitive payment card fraud detection based on dynamic random
forest and k -nearest neighbors,” Expert Systems with Applications, vol. 110, pp. 381–392, Nov.
2018, doi: 10.1016/j.eswa.2018.06.011. [15] A. C. Bahnsen, A. Stojanovic, D. Aouada and B. Ottersten, "Cost Sensitive Credit Card Fraud
Detection Using Bayes Minimum Risk," 2013 12th International Conference on Machine Learning
and Applications, Miami, FL, 2013, pp. 333-338, doi: 10.1109/ICMLA.2013.68.
[16] U. Fiore, A. De Santis, F. Perla, P. Zanetti, and F. Palmieri, “Using generative adversarial networks
for improving classification effectiveness in credit card fraud detection,” Information Sciences, vol.
479, pp. 448–455, Apr. 2019, doi: 10.1016/j.ins.2017.12.030.
[17] N. F. Ryman-Tubb, P. Krause, and W. Garn, “How Artificial Intelligence and machine learning
research impacts payment card fraud detection: A survey and industry benchmark,” Engineering
Applications of Artificial Intelligence, vol. 76, pp. 130–157, Nov. 2018.
[18] N. Japkowicz and S. Stephen, “The class imbalance problem: A systematic study,” IDA, vol. 6, no. 5,
pp. 429–449, Nov. 2002, doi: 10.3233/IDA-2002-6504. [19] X. Zhang, Y. Han, W. Xu, and Q. Wang, “HOBA: A novel feature engineering methodology for
credit card fraud detection with a deep learning architecture,” Information Sciences, May 2019, doi:
10.1016/j.ins.2019.05.023.
[20] Roy, Abhimanyu & Sun, Jingyi & Mahoney, Robert & Alonzi, Loreto & Adams, Stephen & Beling,
Peter. (2018). Deep learning detecting fraud in credit card transactions. 129-134.
10.1109/SIEDS.2018.8374722.
[21] Chouiekh, Alae & Haj, EL. (2018). ConvNets for Fraud Detection analysis. Procedia Computer
Science. 127. 133-138. 10.1016/j.procs.2018.01.107.
[22] Wang, Deshen & Chen, Bintong & Chen, Jing. (2018). Credit Card Fraud Detection Strategies with
Consumer Incentives. Omega. 88. 10.1016/j.omega.2018.07.001.
[23] F. Carcillo, A. Dal Pozzolo, Y.-A. Le Borgne, O. Caelen, Y. Mazzer, and G. Bontempi, “SCARFF :
A scalable framework for streaming credit card fraud detection with spark,” Information Fusion, vol. 41, pp. 182–194, May 2018, doi: 10.1016/j.inffus.2017.09.005.
[24] Rtayli, Naoufal & Enneya, Nourddine. (2020). Selection Features and Support Vector Machine for
Credit Card Risk Identification. Procedia Manufacturing. 46. 941-948.
10.1016/j.promfg.2020.05.012.
[25] Y. Wu, Y. Xu, and J. Li, “Feature construction for fraudulent credit card cash-out detection,”
Decision Support Systems, vol. 127, p. 113155, Dec. 2019.
[26] M. F. Zeager, A. Sridhar, N. Fogal, S. Adams, D. E. Brown and P. A. Beling, "Adversarial learning in
credit card fraud detection," 2017 Systems and Information Engineering Design Symposium
(SIEDS), Charlottesville, VA, 2017, pp. 112-116, doi: 10.1109/SIEDS.2017.7937699.
[27] J. Jurgovsky et al., “Sequence classification for credit-card fraud detection,” Expert Systems with
Applications, vol. 100, pp. 234–245, Jun. 2018, doi: 10.1016/j.eswa.2018.01.037. [28] H. Zhu, G. Liu, M. Zhou, Y. Xie, A. Abusorrah, and Q. Kang, “Optimizing Weighted Extreme
Learning Machines for imbalanced classification and application to credit card fraud detection,”
Neurocomputing, vol. 407, pp. 50–62, Sep. 2020, doi: 10.1016/j.neucom.2020.04.078.
[29] S. Patil, V. Nemade, and P. K. Soni, “Predictive Modelling For Credit Card Fraud Detection Using
Data Analytics,” Procedia Computer Science, vol. 132, pp. 385–395, 2018.

244 Computer Science & Information Technology (CS & IT)
[30] A. Dal Pozzolo, G. Boracchi, O. Caelen, C. Alippi and G. Bontempi, "Credit Card Fraud Detection:
A Realistic Modeling and a Novel Learning Strategy," in IEEE Transactions on Neural Networks and
Learning Systems, vol. 29, no. 8, pp. 3784-3797, Aug. 2018, doi: 10.1109/TNNLS.2017.2736643.
AUTHOR
Yusuf Yazici took his undergraduate degree from the Computer Engineering
Department of Istanbul Technical University. He currently works as a Machine
Learning and Artificial Intelligence Engineer at Turkcell, a leading digital
telecommunication operator in Turkey. He also continues his master degree at the
Computer Engineering Department of Istanbul Technical University. © 2020 By AIRCC Publishing Corporation. This article is published under the Creative Commons
Attribution (CC BY) license.
David C. Wyld et al. (Eds): CCSEA, BIoT, DKMP, CLOUD, NLCAI, SIPRO, BDML, AIFU - 2020
pp. 245-252, 2020. CS & IT - CSCP 2020 DOI: 10.5121/csit.2020.101019
CODING WITH LOGISTIC SOFTMAX
SPARSE UNITS
Gustavo A. Lado and Enrique C. Segura
Facultad de Ciencias Exactas y Naturales,
Universidad de Buenos Aires, Argentina
ABSTRACT
This paper presents a new technique for efficient coding of highly dimensional vectors,
overcoming the typical drawbacks of classical approaches, both, the type of local
representations and those of distributed codifications. The main advantages and disadvantages of these classical approaches are revised and a novel, fully parameterized strategy, is
introduced to obtain representations of intermediate levels of locality and sparsity, according
to the necessities of the particular problem to deal with. The proposed method, called
COLOSSUS (COding with LOgistic Softmax Sparse UnitS) is based on an algorithm that
permits a smooth transition between both extreme behaviours -local, distributed- via a
parameter that regulates the sparsity of the representation. The activation function is of the
logistic type. We propose an appropriate cost function and derive a learning rule which
happens to be similar to the Oja's Hebbian learning rule. Experiments are reported showing
the efficiency of the proposed technique.
KEYWORDS
Neural Networks, Sparse Coding, Autoencoders
1. INTRODUCTION
One of the properties of simple autoencoders is to produce feature vectors in the hidden layer [1].
The type of response usually produced by these models is known as distributed coding, since activation levels are distributed more or less uniformly over all units [2, 3]. Distributed coding is
not the only way to represent feature vectors and, in many cases, it is not the best. Alternatively,
there is also the so-called local coding, in which, generally, only one unit is activated at a time [4]. On the other hand, there is the sparse coding which, in some way, works as an intermediate
mode between local and distributed coding; since it is characterized by higher activation levels
for only a portion of the units at a time, while the activation of the others tends to zero. In many
cases sparse coding is considered the best option to represent feature vectors [5]. This paper explores the possibilities of various coding strategies and presents a novel method that has
several advantages over other techniques commonly used, providing competitive results.
2. BACKGROUND AND MOTIVATION
Local coding is generally used in classification problems. In this case, the active unit indicates to
which category the input belongs, or estimated probabilities are given for the input belonging to
each class. For instance, in the activation function known as winner-takes-all [4, 6] a single unit takes the value of 1 while the others remain on 0. Alternatively, the softmax function computes a
246 Computer Science & Information Technology (CS & IT)
probability distribution, where the unit corresponding to the class of the input is expected to assume the highest level of activation [7].
On the other hand, there are also several methods to produce sparse coding. A relatively simple
method is the so-called Rectified Linear Units (ReLU), where the activation is determined by the rectified function f(x)=max(0, x), used in combination with the inclusion of a penalty term in the
cost function, for example L1 norm on the activation values over the output, weighted by a
parameter λ to regulate the level of dispersion. This makes training difficult because learning must be done by alternating between these two terms of the new cost function, which also does
not guarantee good coding during testing [8, 9, 10].
A more recent variant is the strategy known as top-k sparse coding where, like the ReLUs, the k
maximum activation values are preserved and all the others are set to 0. This ensures that there
are always exactly k active units. However, the selection of these values makes implementation
impractical and generally less efficient. In both cases the use of the max function is because of its computing speed. However, the unbounded nature of this function, in combination with training
methods such as back-propagation, can lead to unstable configurations, such as disproportionate
weight growth [11].
Finally, distributed coding is perhaps the most common one, since it is the type of representation
obtained, for example, in the hidden layers of multi-layer perceptrons [12, 13]. As aforementioned, autoencoders produce this type of codification precisely because they are
formed by layers of perceptrons and their response is the result of activation in their hidden layer.
Nevertheless, there are also some variants of the simple autoencoder such as the so-called tied,
where the weights between the encoder and the decoder are shared, or the denoise, where noise is added only to the input. These alternative techniques produce different types of encodings while
using essentially the same architecture.
Each of these strategies shows interesting properties and, at the same time, different limitations,
especially when looking for an encoding that meets the specific conditions to capture different
types of features. In the following section an alternative strategy is presented to generate the
desired type of sparse coding, trying to keep some of the advantages already mentioned, and avoiding the main drawbacks described.
3. REGULATED SPARSE REPRESENTATION
Given that sparse coding can be seen as a compromise between local and distributed coding, we
consider the possibility of a sparse coding strategy whose activation ratio can be chosen so that it
can behave with any level of sparseness between both extremes.
One type of commonly used activation function that can generate a local coding is softmax. It
can be used in statistics to represent a distribution of categories, i.e. the distribution of
probabilities over N possible categories. This type of function is also known as multinomial logistic regression, since it is a generalization of the logistic regression (in which case N=2). On
the other hand, the logistic function is usually used as activation function to generate distributed
encodings, for example in hidden layers in multi-layer perceptrons.
Computer Science & Information Technology (CS & IT) 247
This illustrates the relationship between the two extreme types of encoding (distributed and local), even when the type of solution we look for is not exactly a probability distribution. It
would be preferable some parameter that permits a smooth transition between both extreme
behaviours.
For this, we will consider a network architecture consisting of an input layer X of dimension M
and an output layer Y of dimension N, preferably with M>N. Layer X can include an extra unit clamped at 1 that represents an activation threshold. The units in Y are expected to take values on
the interval [0,1]. The connections between X and Y are represented by the matrix W, which is
initialized at random. The stimulus received by each unit Yj can be expressed as:
The exponential of the dot product it produces a higher stimulus for the units whose weights
resemble, at least partially, certain features present at the input. In order to control which portion of the units will have a better chance of being activated, a parameter k will be used. For example,
for a value of k=1, a behaviour similar to that of the softmax function is expected, with a single
unit taking a higher level of activation than the others. On the other hand, with a value of 𝑘 =
𝑁 2⁄ it would be similar to the logistic function, with all units having roughly the same
possibilities of activation. However, this parameter does not directly indicate how many units
will be active at a time, and does not even have to be limited to integer values.
The transfer function is a logistic shifted in 1 2⁄ , with a relatively steep β slope, for example with
values between 5 and 10, so that it saturates rapidly when approaching 0 or 1.
In order to estimate the level of activation of the units, one must first compute the average
stimulus they get.
In this manner it is possible to estimate a maximum activation level (2z) and from there
determine a cut-off point p being k steps below this estimated maximum (𝑘 . 2𝑧2⁄ ). That is, the
units with a stimulus higher than p will tend to be activated.
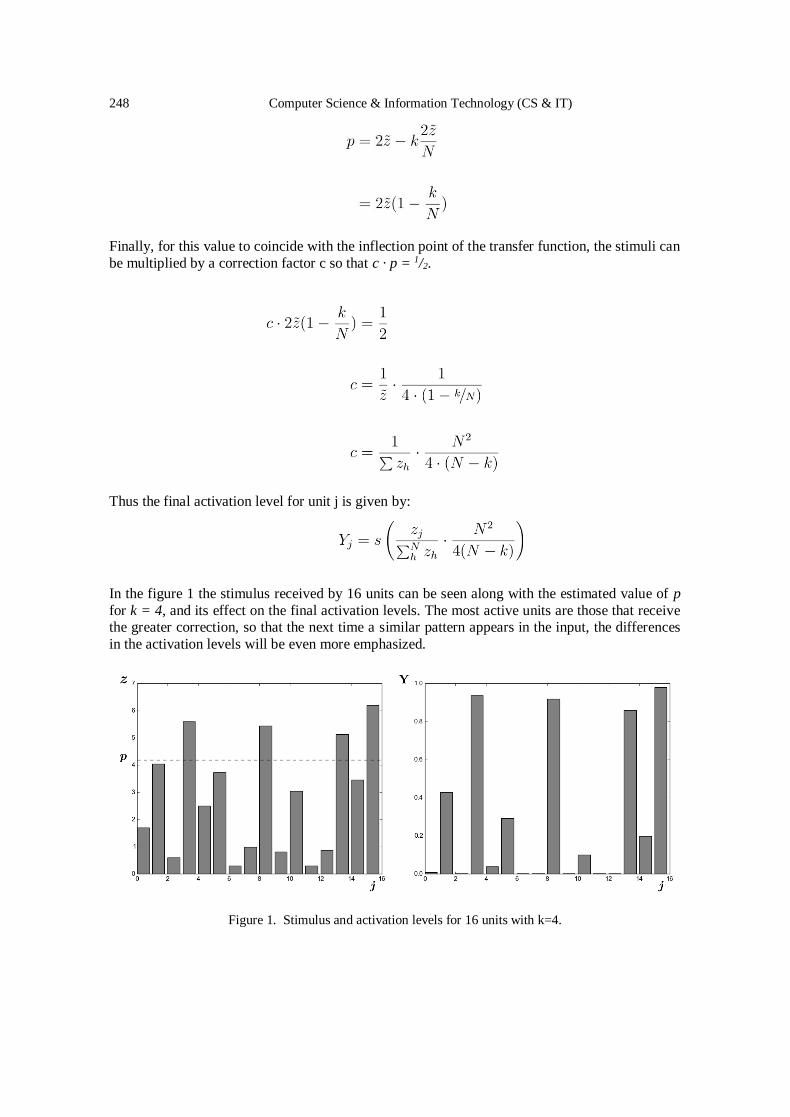
248 Computer Science & Information Technology (CS & IT)
Finally, for this value to coincide with the inflection point of the transfer function, the stimuli can
be multiplied by a correction factor c so that c · p = 1/2.
Thus the final activation level for unit j is given by:
In the figure 1 the stimulus received by 16 units can be seen along with the estimated value of p
for k = 4, and its effect on the final activation levels. The most active units are those that receive the greater correction, so that the next time a similar pattern appears in the input, the differences
in the activation levels will be even more emphasized.
Figure 1. Stimulus and activation levels for 16 units with k=4.
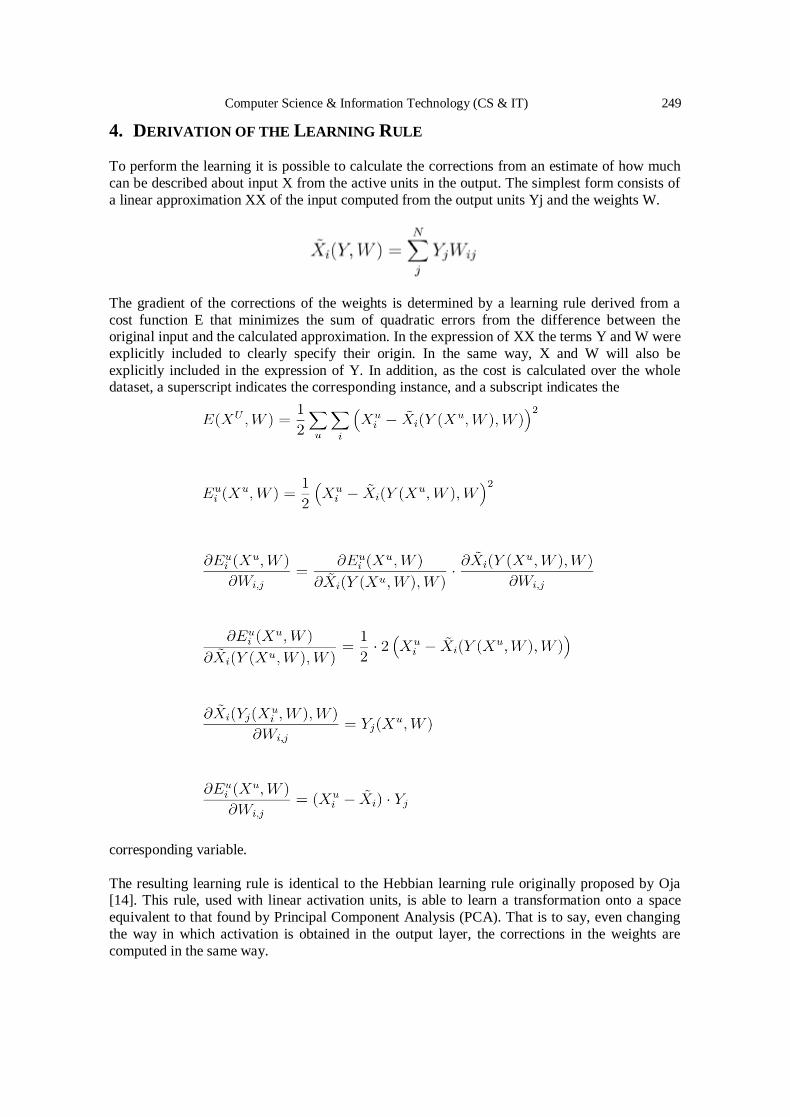
Computer Science & Information Technology (CS & IT) 249
4. DERIVATION OF THE LEARNING RULE To perform the learning it is possible to calculate the corrections from an estimate of how much
can be described about input X from the active units in the output. The simplest form consists of
a linear approximation XX of the input computed from the output units Yj and the weights W.
The gradient of the corrections of the weights is determined by a learning rule derived from a
cost function E that minimizes the sum of quadratic errors from the difference between the original input and the calculated approximation. In the expression of XX the terms Y and W were
explicitly included to clearly specify their origin. In the same way, X and W will also be
explicitly included in the expression of Y. In addition, as the cost is calculated over the whole dataset, a superscript indicates the corresponding instance, and a subscript indicates the
corresponding variable.
The resulting learning rule is identical to the Hebbian learning rule originally proposed by Oja [14]. This rule, used with linear activation units, is able to learn a transformation onto a space
equivalent to that found by Principal Component Analysis (PCA). That is to say, even changing
the way in which activation is obtained in the output layer, the corrections in the weights are
computed in the same way.
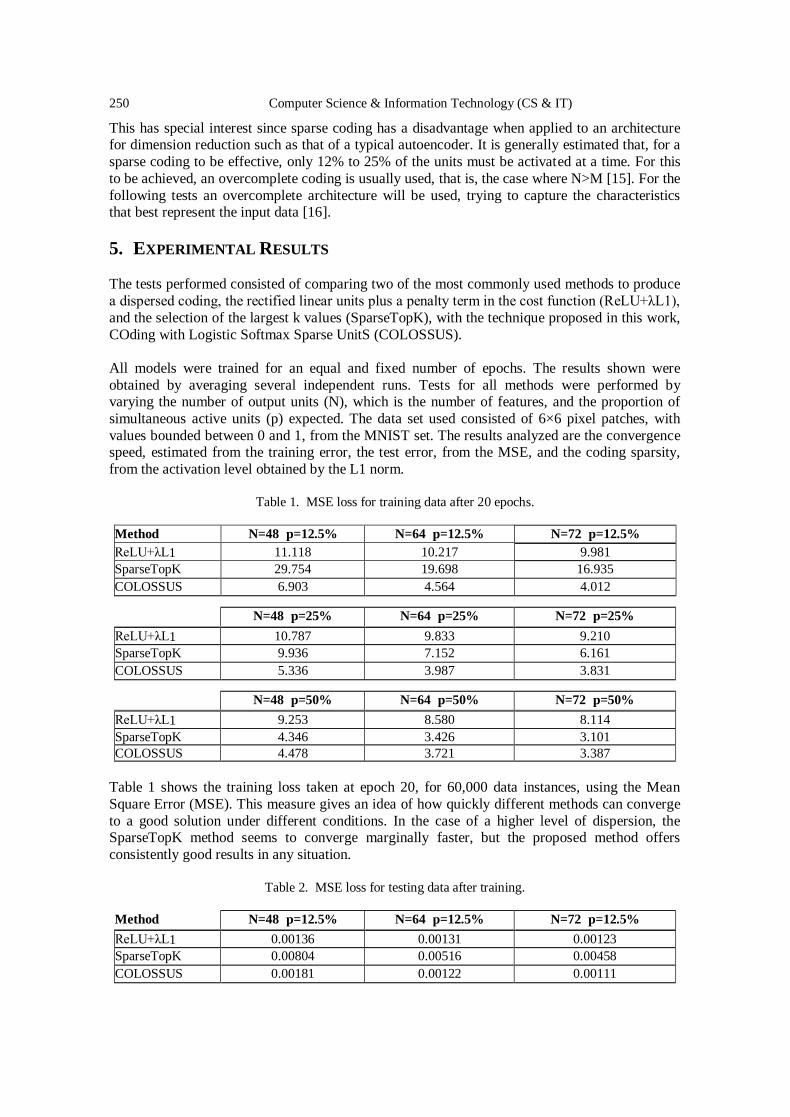
250 Computer Science & Information Technology (CS & IT)
This has special interest since sparse coding has a disadvantage when applied to an architecture for dimension reduction such as that of a typical autoencoder. It is generally estimated that, for a
sparse coding to be effective, only 12% to 25% of the units must be activated at a time. For this
to be achieved, an overcomplete coding is usually used, that is, the case where N>M [15]. For the
following tests an overcomplete architecture will be used, trying to capture the characteristics that best represent the input data [16].
5. EXPERIMENTAL RESULTS The tests performed consisted of comparing two of the most commonly used methods to produce
a dispersed coding, the rectified linear units plus a penalty term in the cost function (ReLU+λL1),
and the selection of the largest k values (SparseTopK), with the technique proposed in this work,
COding with Logistic Softmax Sparse UnitS (COLOSSUS).
All models were trained for an equal and fixed number of epochs. The results shown were
obtained by averaging several independent runs. Tests for all methods were performed by varying the number of output units (N), which is the number of features, and the proportion of
simultaneous active units (p) expected. The data set used consisted of 6×6 pixel patches, with
values bounded between 0 and 1, from the MNIST set. The results analyzed are the convergence speed, estimated from the training error, the test error, from the MSE, and the coding sparsity,
from the activation level obtained by the L1 norm.
Table 1. MSE loss for training data after 20 epochs.
Method N=48 p=12.5% N=64 p=12.5% N=72 p=12.5%
ReLU+λL1 11.118 10.217 9.981
SparseTopK 29.754 19.698 16.935
COLOSSUS 6.903 4.564 4.012
N=48 p=25% N=64 p=25% N=72 p=25%
ReLU+λL1 10.787 9.833 9.210
SparseTopK 9.936 7.152 6.161
COLOSSUS 5.336 3.987 3.831
N=48 p=50% N=64 p=50% N=72 p=50%
ReLU+λL1 9.253 8.580 8.114
SparseTopK 4.346 3.426 3.101
COLOSSUS 4.478 3.721 3.387
Table 1 shows the training loss taken at epoch 20, for 60,000 data instances, using the Mean
Square Error (MSE). This measure gives an idea of how quickly different methods can converge
to a good solution under different conditions. In the case of a higher level of dispersion, the SparseTopK method seems to converge marginally faster, but the proposed method offers
consistently good results in any situation.
Table 2. MSE loss for testing data after training.
Method N=48 p=12.5% N=64 p=12.5% N=72 p=12.5%
ReLU+λL1 0.00136 0.00131 0.00123
SparseTopK 0.00804 0.00516 0.00458
COLOSSUS 0.00181 0.00122 0.00111
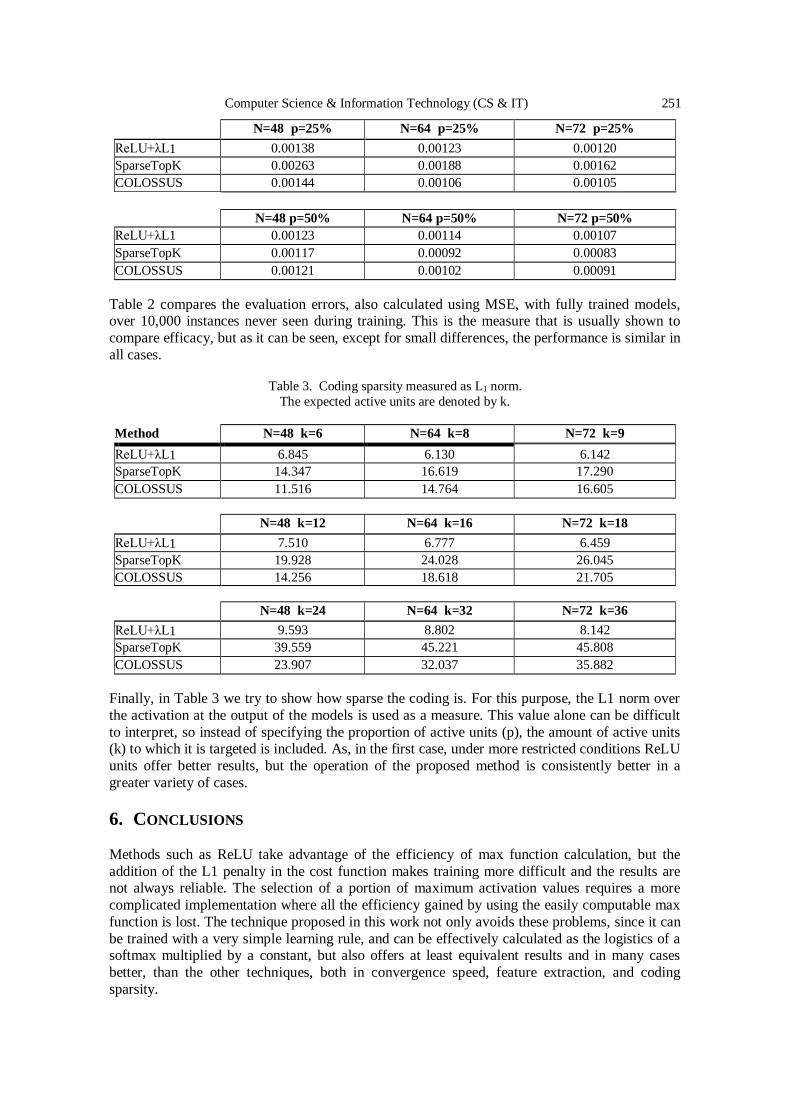
Computer Science & Information Technology (CS & IT) 251
N=48 p=25% N=64 p=25% N=72 p=25%
ReLU+λL1 0.00138 0.00123 0.00120
SparseTopK 0.00263 0.00188 0.00162
COLOSSUS 0.00144 0.00106 0.00105
N=48 p=50% N=64 p=50% N=72 p=50%
ReLU+λL1 0.00123 0.00114 0.00107
SparseTopK 0.00117 0.00092 0.00083
COLOSSUS 0.00121 0.00102 0.00091
Table 2 compares the evaluation errors, also calculated using MSE, with fully trained models, over 10,000 instances never seen during training. This is the measure that is usually shown to
compare efficacy, but as it can be seen, except for small differences, the performance is similar in
all cases.
Table 3. Coding sparsity measured as L1 norm.
The expected active units are denoted by k.
Method N=48 k=6 N=64 k=8 N=72 k=9
ReLU+λL1 6.845 6.130 6.142
SparseTopK 14.347 16.619 17.290
COLOSSUS 11.516 14.764 16.605
N=48 k=12 N=64 k=16 N=72 k=18
ReLU+λL1 7.510 6.777 6.459
SparseTopK 19.928 24.028 26.045
COLOSSUS 14.256 18.618 21.705
N=48 k=24 N=64 k=32 N=72 k=36
ReLU+λL1 9.593 8.802 8.142
SparseTopK 39.559 45.221 45.808
COLOSSUS 23.907 32.037 35.882
Finally, in Table 3 we try to show how sparse the coding is. For this purpose, the L1 norm over
the activation at the output of the models is used as a measure. This value alone can be difficult
to interpret, so instead of specifying the proportion of active units (p), the amount of active units (k) to which it is targeted is included. As, in the first case, under more restricted conditions ReLU
units offer better results, but the operation of the proposed method is consistently better in a
greater variety of cases.
6. CONCLUSIONS
Methods such as ReLU take advantage of the efficiency of max function calculation, but the
addition of the L1 penalty in the cost function makes training more difficult and the results are not always reliable. The selection of a portion of maximum activation values requires a more
complicated implementation where all the efficiency gained by using the easily computable max
function is lost. The technique proposed in this work not only avoids these problems, since it can
be trained with a very simple learning rule, and can be effectively calculated as the logistics of a softmax multiplied by a constant, but also offers at least equivalent results and in many cases
better, than the other techniques, both in convergence speed, feature extraction, and coding
sparsity.
252 Computer Science & Information Technology (CS & IT)
REFERENCES
[1] Vincent, Pascal and Larochelle, Hugo and Lajoie, Isabelle and Bengio, Yoshua and Manzagol,
Pierre-Antoine, "Stacked denoising autoencoders: Learning useful representations in a deep network
with a local denoising criterion", Journal of machine learning research (2010), 3371-- 3408.
[2] Mikolov, Tomas and Sutskever, Ilya and Chen, Kai and Corrado, Greg S and Dean, Jeff, "Distributed
Representations of Words and Phrases and their Compositionality", Curran Associates, Inc. (2013),
3111--3119.
[3] Sutskever, Ilya and Hinton, Geoffrey, "Learning multilevel distributed representations for high-
dimensional sequences" (2007), 548--555.
[4] Samuel Kaski and Teuvo Kohonen, "Winner-take-all networks for physiological models of
competitive learning", Neural Networks (1994), 973 - 984. [5] Rolls, Edmund T and Treves, Alessandro, "The relative advantages of sparse versus distributed
encoding for associative neuronal networks in the brain", Network: computation in neural systems
(1990), 407--421.
[6] Rehn, Martin and Sommer, Friedrich T, "A network that uses few active neurones to code visual
input predicts the diverse shapes of cortical receptive fields.", J Comput Neurosci (2007), 135- 46.
[7] Bridle, John S., "Probabilistic Interpretation of Feedforward Classification Network Outputs, with
Relationships to Statistical Pattern Recogni...", Springer Berlin Heidelberg (1990), 227-- 236.
[8] Donoho, David L. and Elad, Michael, "Optimally sparse representation in general (nonorthogonal)
dictionaries via L1 minimization", Proceedings of the National Academy of Sciences (2003), 2197--
2202.
[9] Gregor, Karol and LeCun, Yann, "Learning Fast Approximations of Sparse Coding" (2010), 399- 406.
[10] Lee, Honglak and Battle, Alexis and Raina, Rajat and Ng, Andrew Y, "Efficient sparse coding
algorithms" (2007), 801--808.
[11] Coates, Adam and Ng, Andrew Y, "The importance of encoding versus training with sparse coding
and vector quantization" (2011), 921--928.
[12] Hinton, Geoffrey E, "Learning multiple layers of representation.", Trends Cogn. Sci. (Regul. Ed.)
(2007), 428-34.
[13] Rumelhart, David E. and Hinton, Geoffrey E. and Williams, Ronald J., "Learning representations by
back-propagating errors", nature (1986), 533.
[14] Oja, Erkki, "Principal components, minor components, and linear neural networks", Neural networks
(1992), 927--935.
[15] Olshausen, Bruno A and Field, David J, "Sparse coding with an overcomplete basis set: A strategy employed by V1?", Vision research (1997), 3311--3325.
[16] Porrill, John and Stone, James V, "Undercomplete independent component analysis for signal
separation and dimension reduction", Citeseer (1998).
© 2020 By AIRCC Publishing Corporation. This article is published under the Creative Commons
Attribution (CC BY) license.
AUTHOR INDEX
Adeesha Wijayasiri 127
Amr Adel 11, 51
Amulya Sri Pulijala 195 Anna Kuwana 175, 203
Bo Yang 115
Bojiang Yang 115 Brian Cusack 11
Chia-Min Lai 161
Chi-Wei Chen 161 Christoph Reich 01, 23
Deepak Kumar Vasthimal 85
Diana Olejarova 225
Dilan Dinushka 127 Enrique C. Segura 245
Eugen Jastremskoj 23
Fouzia Adjailia 225 Gustavo A. Lado 245
Haruo Kobayashi 175, 203
Hasara Maithree 127 Hong-yan LV 73
Igor Griva 101
Jan Stodt 01, 23
John Kalung Leung 101 Kamal Eddine MELKEMI 141
Kevin Wallis 23
Lei SUN 73 Mason Chen 65
MinhTri Tran 175, 203
Musen Wen 85
Nour El-Houda GOLEA 141 Peter Sincak 225
Qian FENG 73
Raimundas Savukynas 33 Sudeep Kumar 85
Suryakanth V Gangashetty 195
Ting-Yu Lin 161 Wei-hong WANG 73
William G. Kennedy 101
Yapeng Fu 115
Yueqi Han 115 Yu-hui CAO 73
Yun Zhang 115
Yusuf Yazici 235


