Embed Size (px)
Citation preview

COMSYN Manufacturer & Exporter of FIBC, PP Fabric, Woven Sacks & Tarpaulin
COMSYN/BSE/2020-21 Date: 034 July, 2020
Online Filing at: listing. bseindia.com
To, i The General Manager,
DCS-CRD BSE Limited PhirozeJeejeebhoy Towers Dalal Street Mumbai- 400001(MH)
BSE Scrip ID: COMSYN ° BSE Scrip Code: 539986
Subject: Submission of ‘Q4-F.Y. 20 Earnings Presentation pursuant to Regulation 30(4)
read with Part A of Schedule III of the SEBI (LODR) Regulations, 2015 as amended from
time to time.
Dear Sir/Madam,
Pursuant to Regulation 30(4) read with Part A of Schedule III of the SEBI (LODR)
Regulations, 2015 as amended from time to time, please find enclosed herewith ‘Commercial
Syn Bags Limited- Q4-F.Y.20 Earnings Presentation.
‘A copy of aforesaid Investor Presentation is also hosted on the website of the company
www.comsyn.com.
You are requested to please take on record the above said document for your reference and
further needful.
Thanking You,
Yours Faithfully,
FOR, COMMERCIAL SYN BAGS LTD.
For Commercial SyryBags Limited
ANIL CHOUD Ry CHAIRMAN & We. NESSIRECTOR DIN: 00017913
Encl. As above
Commercial Syn Bags Limited
CIN ; L25202MP1984PLCO002669 al House, 3-4, Jaora Compound, M.Y.H. Road, INDORE - 452 001, M.P. INDIA
Registered Office ; Commerci Ph. +91-731-2704007, 4279525 Fax : +91-731-2704130 E-mail : [email protected], Visit at : www.comsyn.com
Scanned with CamScanner

COMMERGIAL SYN BAGS LIMITED FY20 / Q4- FY20 Earnings Presentation
COMSYN

Company Overview
Commercial Syn Bags Limited
(COMSYN), one of the oldest players
in the packaging industry,
manufactures bulk flexible
packaging products and industrial traps and covers.
It mainly caters to the B2B segment
and its products cater to various industries like bulk packaging,
agriculture, chemical, cement, food,
construction, etc.
The company offers a huge product
portfolio and a wide range within
each product category to best suit their client needs.
COMSYN
COMSYN TARPAU LIN
Revenue Mix
FIBC (Flexible Intermediate Bulk
Container) constitutes more than
70% of the revenue and is mainly
used for bulk packaging in chemicals,
agriculture, food, cement,
construction industries, etc.
Other products include Tarpaulin,
BOPP Bags, Woven Sacks/Bags, PP
Fabric, Garden Bags, Waste Bags,
Box Bag, Ground covers, Pond Liners,
Mulch Films, Spiral Tubing and Vermi
Beds.
EXPORTS TO
Over 25 countries
Manufacturing
and Distribution Network
The company’s manufacturing units
are located at Pithampur near
Indore, India.
The company produces 5 — 6 Mn Big
Bags annually.
The company have a strong clientele
across all the 6 continents.
EMPLOYEES
Over 1,900
COMSYN
Financial Highlights
‘@He)
er
INR 1,910 Mn
declined by
7.6% YOY
5 Year CAGR
10.3%
INR 238 Mn
REVENUE Se
decreased by
EBITDA 5.9% YOY
{-— 5 Year CAGR
11.4%
INR 114 Mn
up 0.9% YoY
5 Year CAGR
14.1%
PAT

ee | COMSYN
Q4 - FY20 HIGHLIGHTS
Oi | COMSYN
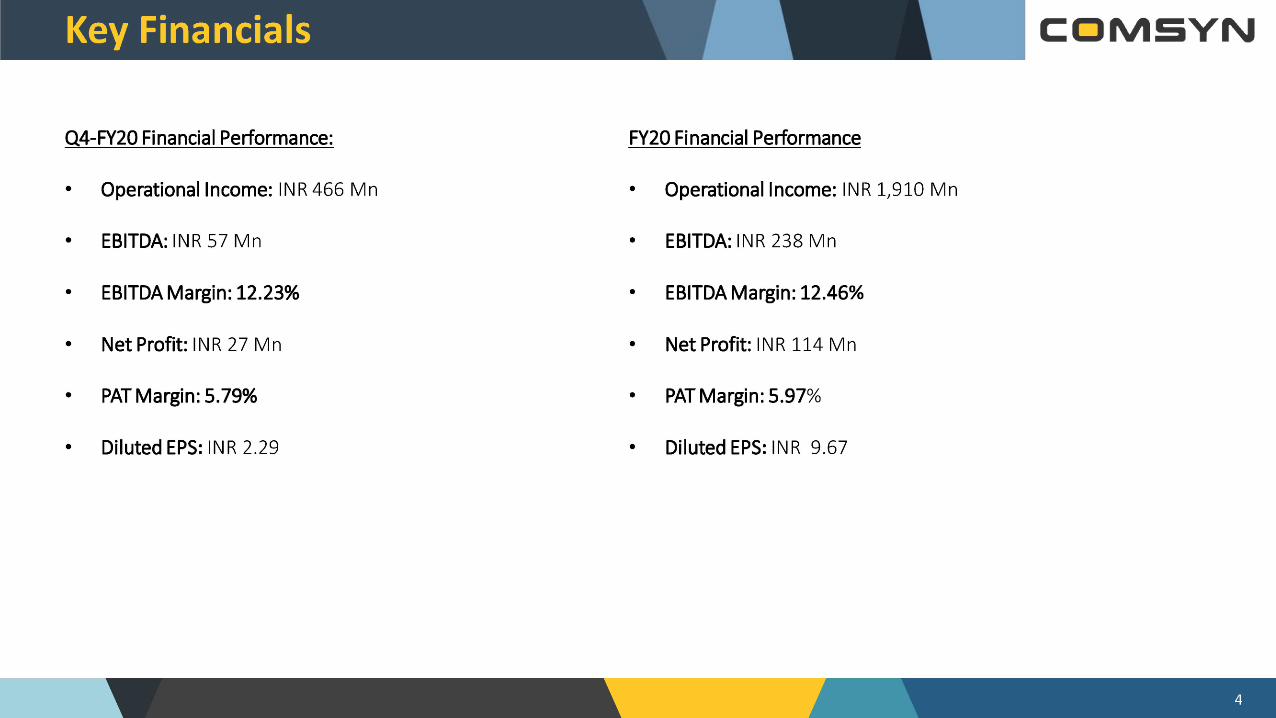
Q4-FY20 Financial Performance: FY20 Financial Performance
¢ Operational Income: INR 466 Mn ¢ Operational Income: INR 1,910 Mn
¢ EBITDA: INR 57 Mn ¢ EBITDA: INR 238 Mn
¢ EBITDA Margin: 12.23% ¢ EBITDA Margin: 12.46%
¢ Net Profit: INR 27 Mn ¢ Net Profit: INR 114 Mn
¢ PAT Margin: 5.79% ¢ PAT Margin: 5.97%
¢ Diluted EPS: INR 2.29 ¢ Diluted EPS: INR 9.67

SO | | | <COMSYN Q4-FY20 Operational Performance:
e The decline is turnover was due to economic slowdown caused by the Covid pandemic.
¢ The Q-0o-Q EBITDA and PAT margins reduced due to decline in turnover.
e The capacity utilization for Q4-FY 20 was ~85% and the overall capacity utilization for FY 20 was “88%.
¢ The tax liability for Q4-FY 20 and for FY 20 reduced due to SEZ exemption and other deductions.
e The customer base remains the same in this quarter.

PARTICULARS (INR Mn)
Operational Revenue
Total Expenses
EBITDA
EBITDA Margins (%)
Other Income
Depreciation
Finance Cost
PBT
Tax
PAT
PAT Margins (%)
Diluted EPS (INR)
Q4-FY20
466
409
57
12.23%
18
37
10
2/7
5.79%
2.29
Q4-FY19
549
483
66
12.02%
10
19
20
37
10
2/
4.92%
2.31
(15.1)%
(15.3)%
(13.6)%
21 Bps
(40.0)%
(5.3)%
(60.0)%
NA
NA
NA
87 Bps
(0.9)%
Q3-FY20
493
428
65
13.18%
4
17
12
40
35
7.10%
2.96
(5.5)%
(4.4)%
(12.3)%
(95) Bps
50.0%
5.9%
(33.3)%
(7.5)%
NA
(22.9)%
(131) Bps
(22.6)%

COMSYN
PARTICULARS (INR Mn) Y-O-Y
Operational Revenue 1,910 2,067 (7.6)%
Total Expenses 1,672 1,810 (7.6)%
EBITDA 238 257 (7.4)%
EBITDA Margins (%) 12.46% 12.43% 3 Bps
Other Income 19 11 72.7%
Depreciation 70 62 12.9%
Finance Cost 43 56 (23.2)%
PBT 144 150 (4.0)%
Tax 30 37 (18.9)%
PAT 114 113 0.9%
PAT Margins (%) 5.97% 5.47% 50 Bps
Other Comprehensive Income - (1) NA
Total Comprehensive Income 114 112 1.8%
Diluted EPS (INR) 9.67 9.56 1.2%

PARTICULARS (INR Mn) PARTICULARS (INR Mn)
COMSYN
EQUITIES & LIABILITIES
Shareholder Funds
(A) Share Capital
(B) Reserves & Surplus
Non-current Liabilities
(A) Long-term Borrowings
(B) Other Financial Liabilities
(C) Deferred Tax Liabilities (Net)
(D) Long-term provisions
Current Liabilities
(A) Short term Borrowings
(B) Trade Payables
(C) Other Financial Liabilities
(D) Other Current Liabilities
(E) Short-term provisions
GRAND TOTAL - EQUITIES & LIABILITES
586
118
468
243
202
10
31
538
290
139
84
11
14
1,367
689
118
571
313
267
10
36
398
179
59
116
28
16
1,400
ASSETS
Non-current Assets
(A) Property, Plant & Equipment
(B) Capital work-in-progress
(C) Other Financial Assets
(D) Other Non-Current Assets
Current Assets
(A) Inventories
(B) Trade Receivables
(C) Cash & Cash Equivalents
(D) Bank balance other then (C)
(E) Short-term loans & advances
(F) Other Financial Assets
(G) Other Current Assets
GRAND TOTAL— ASSETS
650
595
17
32
717
192
359
28
72
61
1,367
781
580
139
32
30
619
302
184
41
47
40
1,400

eS ) COMSYN REVENUE (INR MN) & EBITDA MARGIN (%) PAT (INR MN) & PAT MARGIN (%)
5.47% 5.97%
DEBT TO EQUITY (x)
12.24% 12.46%
4.45% imcHO 3.84%
9.83%
1,610
1,190
FY17 FY18 FY19 FY20 FY17 FY18 FY19 FY20 FYL/ FYI8 FY19 FY20
Mmmm Revenue —==EBITDA Margin mmm PAT (INR Mn) —=PAT Margin (%) m@ Debt to Equity
WORKING CAPITAL CYCLE NET WORTH (INR Mn) AND EPS (INR) BOOK VALUE PER SHARE (INR)
104 a Q7 93 9.67
103 76 95
7/
59
35.0 40.5 49.6 58.3
FY17 FY18 FY19 FY20 FY17 FY18 FY19 FY20 FY17 FY18 FY19 FY20
ee Working Capital Days ==Inventory Days game Net Worth (INR Mn) EPS @ Book Value per Share

COMSYN
Share Price Data as on 31°t March, 2020
60%
50%
40%
30%
20%
10%
0%
-10%
-20%
-30%
-40% | | | | | I | | I | |
Apr-19 May-19 Jun-19 Jul-19 Aug-19 Sep-19 Oct-19 Nov-19 Dec-19 Jan-20 Feb-20 Mar-20
——Comsyn —— Sensex
CN
Share Holding Pattern as on 31% March 2020 Price Data as on 31*t March, 2020 TTS
Face Value 10.0
Promoters CMP 43.3 erty
52 Week H/L 67.05/ 36.40
Market Cap (INR Mn) 511.7
No. of Share outstanding (Mn) 11.8 Public RPA oy.
1 Year Avg. Trading Volume ('000) 6.3

COMSYN
No representation or warranty, express or implied, is made as to, and no reliance should be placed on, the fairness, accuracy, completeness or correctness of the information or opinions contained
in this presentation. Such information and opinions are in all events not current after the date of this presentation. Certain statements made in this presentation may not be based on historical
information or facts and may be "forward looking statements" based on the currently held beliefs and assumptions of the management Commercial Syn Bags Limited (“Company” or “Comsyn”),
which are expressed in good faith and in their opinion reasonable, including those relating to the Company’s general business plans and strategy, its future financial condition and growth
prospects and future developments in its industry and its competitive and regulatory environment.
Forward-looking statements involve known and unknown risks, uncertainties and other factors, which may cause the actual results, financial condition, performance or achievements of the
Company or industry results to differ materially from the results, financial condition, performance or achievements expressed or implied by such forward-looking statements, including future
changes or developments in the Company’s business, its competitive environment and political, economic, legal and social conditions. Further, past performance is not necessarily indicative of
future results. Given these risks, uncertainties and other factors, viewers of this presentation are cautioned not to place undue reliance on these forward-looking statements. The Company
disclaims any obligation to update these forward-looking statements to reflect future events or developments.
This presentation is for general information purposes only, without regard to any specific objectives, financial situations or informational needs of any particular person. This presentation does not
constitute an offer or invitation to purchase or subscribe for any securities in any jurisdiction, including the United States. No part of it should form the basis of or be relied upon in connection with
any investment decision or any contract or commitment to purchase or subscribe for any securities. None of our securities may be offered or sold in the United States, without registration under
the U.S. Securities Act of 1933, as amended, or pursuant to an exemption from registration there from.
This presentation is confidential and may not be copied or disseminated, in whole or in part, and in any manner.
Valorem Advisors Disclaimer:
Valorem Advisors is an Independent Investor Relations Management Service company. This Presentation has been prepared by Valorem Advisors based on information and data which the
Company considers reliable, but Valorem Advisors and the Company makes no representation or warranty, express or implied, whatsoever, and no reliance shall be placed on, the truth, accuracy,
completeness, fairness and reasonableness of the contents of this Presentation. This Presentation may not be all inclusive and may not contain all of the information that you may consider
material. Any liability in respect of the contents of, or any omission from, this Presentation is expressly excluded. Valorem Advisors also hereby certifies that the directors or employees of Valorem
Advisors do not own any stock in personal or company capacity of the Company under review.
For further information please contact our Investor Relations Representatives:
Mr. Anuj Sonpal
/{ Yi Valorem Advisors VALOREM ADVISORS Tel: +91-22-4903-9500
Email: [email protected]