Embed Size (px)
Citation preview
ORIGINAL PAPER
Conservation genetics of xerothermic beetles in Europe:the case of Centricnemus leucogrammus
Łukasz Kajtoch
Received: 31 July 2010 / Accepted: 10 January 2011 / Published online: 23 January 2011
� The Author(s) 2011. This article is published with open access at Springerlink.com
Abstract Xerothermic habitats are closely related to
continental steppes of Eurasia and contain communities
rich in rare and endemic species, especially insects. Con-
sidering the dramatic loss of xerothermic habitats due to
climatic and anthropogenic changes the evaluation of
genetic variation and phylogeographical patterns in xero-
thermic species is a matter of utmost importance if
appropriate conservation measures are to be undertaken. In
this paper 3 mitochondrial genes and 3 nuclear markers
were used for evaluation of genetic diversity of populations
of the weevil Centricnemus leucogrammus from central-
east Europe. These data were used for the recognition of
conservation units as well as centers of genetic diversity
which could be considered as present ‘‘warm-stage’’ refu-
gia for xerothermic beetle assemblages. The most diverse
are eastern and central populations from Ukraine and
central Poland, however, also isolated groups of popula-
tions from the Pannonian Basin and northern Poland pos-
sessed a unique genetic signature. This lead to the
conclusion that all three regional groups of populations are
significantly isolated from each other and represent distinct
evolutionary lineages so they should be considered as
separate Management Units and Evolutionary Significant
Units. C. leucogrammus can be regarded as an excellent
representative for typically xerothermophilous, flightless
beetles and knowledge about its genetic diversity may be
used for the conservation and management of entire xero-
thermic communities, especially for those with low
mobility invertebrate taxa. Further research on the genetic
diversity of various organisms with varying levels of
mobility should be undertaken to broaden our knowledge
on the conservations needs of xerothermic assemblages.
Keywords Phylogeography � Threatened environments �Steppe � Curculionidae � Evolutionary significant units �Management units
Introduction
Xerothermic turfs and thickets are threatened environments
containing communities rich in rare and endemic species,
especially insects. These habitats are closely related to the
continental steppes of Eurasia. In central and western
Europe they are considered as ‘‘warm-stage refugia’’ of
steppe-like habitats (Willis and Van Andel 2004; Ashcroft
2010). However, some probably arose as a result of human
land use (mainly deforestation and pasture development)
(Mazur 2001; Baranska and Jermaczek 2009; Paul 2010).
Due to unfavorable climatic conditions in the temperate
zone, xerothermic habitats are presently fragmented and
limited to steep, dry and warm slopes of hills and scarps
along river valleys.
The fragmentation of natural habitat is generally con-
sidered to be a major threat to many species. Population
genetic theory predicts that isolation of small populations
leads to reduction of genetic diversity (e.g. Frankham et al.
2002). Species with limited dispersal ability are particu-
larly affected by isolation, which may produce substantial
divergence among populations (e.g. Conner and Hartl
2004). Consequently, the evaluation of the extent of iso-
lation of the existing populations and their genetic diversity
are of major concern in assessing the risk of local extinc-
tion of threatened taxa. The rarity of xerothermic habitats
has resulted in their protection in reserves and the Natura
Ł. Kajtoch (&)
Institute of Systematics and Evolution of Animals,
Polish Academy of Science, Cracow, Poland
e-mail: [email protected]
123
J Insect Conserv (2011) 15:787–797
DOI 10.1007/s10841-011-9377-8
2000 network of protected sites according to the Habitats
Directive of the European Union. However, such protected
areas are scarce in Europe; most have a very limited area
and are isolated. Almost nothing is known about the actual
level of isolation of particular xerothermic patches, in
continental, regional and local scales. Xerothermic habitats
are characterized by their specialized vegetation and fauna,
with many species having their main distributions in this
habitat type. Considering the dramatic loss of xerothermic
habitats as a consequence of changes in land use taking
place particularly in central and western Europe (Michalik
and Zarzycki 1995; Mazur and Kubisz 2000; Varga 2001),
but also in eastern Europe (Cremene et al. 2005), the
evaluation of genetic variation and phylogeographical
patterns in xerothermic species is of immediate importance
if appropriate conservation measures are to be undertaken.
Although knowledge of the genetic diversity, phylogeog-
raphy and population genetics of steppe plants (Franzke
et al. 2004; Szczepaniak and Cieslak 2006; Szczepaniak
et al. 2007; Schlee et al. 2007; Wroblewska 2008) and
vertebrates, mainly rodents (Biedrzycka and Konopinski
2008; Banaszek et al. 2009; Krystufek et al. 2009), has
increased significantly in the last years, information con-
cerning invertebrate populations are scarce and limited
mostly to semi-xerothermophilous butterflies (Schmitt and
Hewitt 2004; Gratton et al. 2008) and snails (Pfenninger
and Posada 2002).
Among xerothermic habitats, turfs are particularly
interesting due to their limited distribution and the high
number of rare taxa they sustain. The best known xero-
thermic communities of insects in central Europe include
Lepidoptera (butterflies) (Kostrowicki 1953; Cremene et al.
2005; Goloborod’ko and Fedenko 2008); Orthoptera
(grasshoppers and crickets) (Liana 1987; Varga 2001), and
Cucujiformia (leaf beetles and weevils) (Mazur 2001;
Wasowska 2006).
The most numerous group of xerothermic insects are
weevils (Curculionidae) (Mazur 2001). Previous studies on
xerothermic weevils were focused mainly on their bioge-
ography and ecology (Mazur 2001). Only populations of
two species from central Europe have been studied genet-
ically: Polydrosus inustus (Kajtoch et al. 2009; Kajtoch and
Lachowska-Cierlik 2009) and Centricnemus leucogrammus
(Kajtoch et al. 2009). The latter species is flightless and
ecologically restricted to dry xerothermic turfs, therefore
its mobility is very limited. C. leucogrammus is polypha-
gous so its distribution does not depend on a particular food
(plant) source. These ecological and biological characters
partially explain its present distribution. The main range of
this beetle is located in the steppe zone of southern Russia
and Ukraine, however, it occurs there very sparsely.
According to Winkler (1932) the range of this species is
restricted to Europe, it is also known from only the
European part of Russia (http://www.zin.ru/ANIMALIA/
COLEOPTERA/eng/entimru2.htm). The last information
about its existence in central Asia was probably presented
by Von Heyden (1880–1881) so it is uncertain if this
species actually occurs there, or if this data concerned
another taxon. The western limits of its range are in the
highlands of central Poland. C. leucogrammus also occu-
pies steppe-like habitats in the Pannonian Basin, along the
Danube valley and in the uplands of Germany. Isolated
populations were recently found in northern Poland in the
lower Vistula and lower Oder river valleys. In central
Europe this species does not have a continuous range, but
rather consists of a network of small populations, partially
or fully isolated from each other. However, the sizes of
these populations are quite large, enabling and facilitating
the collection of samples of reasonable size. Recent studies
on C. leucogrammus mitochondrial diversity (Kajtoch et al.
2009) showed that its populations consist of at least six
phylogenetic lineages, partially overlapping in central
Poland and Ukraine. Populations of C. leucogrammus have
probably existed for the last 400 000 years in central
Europe (in steppes, in front of the ice sheet). This weevil,
in common with other steppe and xerothermic species, was
probably more common during Pleistocene glaciations
when climatic and environmental conditions favored dry
grasslands (Adams 1997; Lindner et al. 2006; Magyari
et al. 2010). Its present distribution is limited to ‘‘warm-
stage refugia’’ (Willis and Van Andel 2004; Ashcroft
2010). However, C. leucogrammus is not protected by law
and is not consider as a threatened species, despite a
shrinking range in the last few decades, especially at the
western edge of the species range (e.g. in Polish Silesia)
but also inside its continuous distribution (Kajtoch Ł.,
unpublished data).
It is essential to know the genetic structure of species
throughout their entire ranges in order to develop wide-
scale conservation strategies and plan management actions
according to contemporary genetic differentiation (Avise
et al. 1987; Moritz 1994; Haig 1998). Genetic analyses
have thus become an important tool in many studies of
threatened or endangered species (Moritz 1994; Haig
1998), and by using genetic markers the evolutionary his-
tory of a group can be investigated to determine whether
smaller management units may exist below the species
level (Moritz 1994; Knapen et al. 2003). It has recently
been suggested that focusing on species as the unit of
conservation concern may not be the appropriate scale at
which diversity should be measured (Hughes et al. 1997;
Luck et al. 2003). If gene flow among populations within a
species is restricted, then traits important to a species
interaction in an ecosystem may become geographically
structured. Therefore, local populations will only represent
a subset of the range of ecosystem services exhibited
788 J Insect Conserv (2011) 15:787–797
123
within the entire species (Hughes et al. 1997). The impli-
cation of this finding is that simply conserving species
without regard to population structure may fail to conserve
the full spectrum of functions provided by that species.
Consequently, it becomes critical to understand the nature
of population structure of species.
It is probable that in the fragmented range of C. leuco-
grammus, conservation units such as ‘‘Evolutionary Sig-
nificant Units’’ (ESUs) (Ryder 1986; Waples 1991; Moritz
1994) and ‘‘Management Units’’ (MUs) (Moritz 1994) can
be identified. It is also likely that within the range of
C. leucogrammus areas harboring high genetic diversity
may be identified. These would probably constitute
important warm-stage refugia for this, and also other
xerothermic species.
To determine the genetic diversity and phylogeographic
structure of central European populations and their level of
isolation I used partial sequences of three mitochondrial
genes: cytochrome oxidase II (COII), cytochrome B (CytB)
and nicotinamide adenine dinucleotide dehydrogenase 1
(ND1) along with the tRNALeu gene and a small portion of
16S RNA gene, as well as partial sequences of three
nuclear markers: internal transcribed spacer 2 (ITS2) of
rDNA, the gene encoding the Elongation factor-a (EF-a)
and anonymous sequences (AS1). These data were used for
recognition of conservation units in central European
populations of C. leucogrammus. C. leucogrammus may be
regarded as an excellent representative for typically xero-
thermophilous, flightless beetles and knowledge about its
genetic diversity may be used for the conservation and
management of entire xerothermic communities, particu-
larly of low mobility invertebrate taxa.
Methods
Material
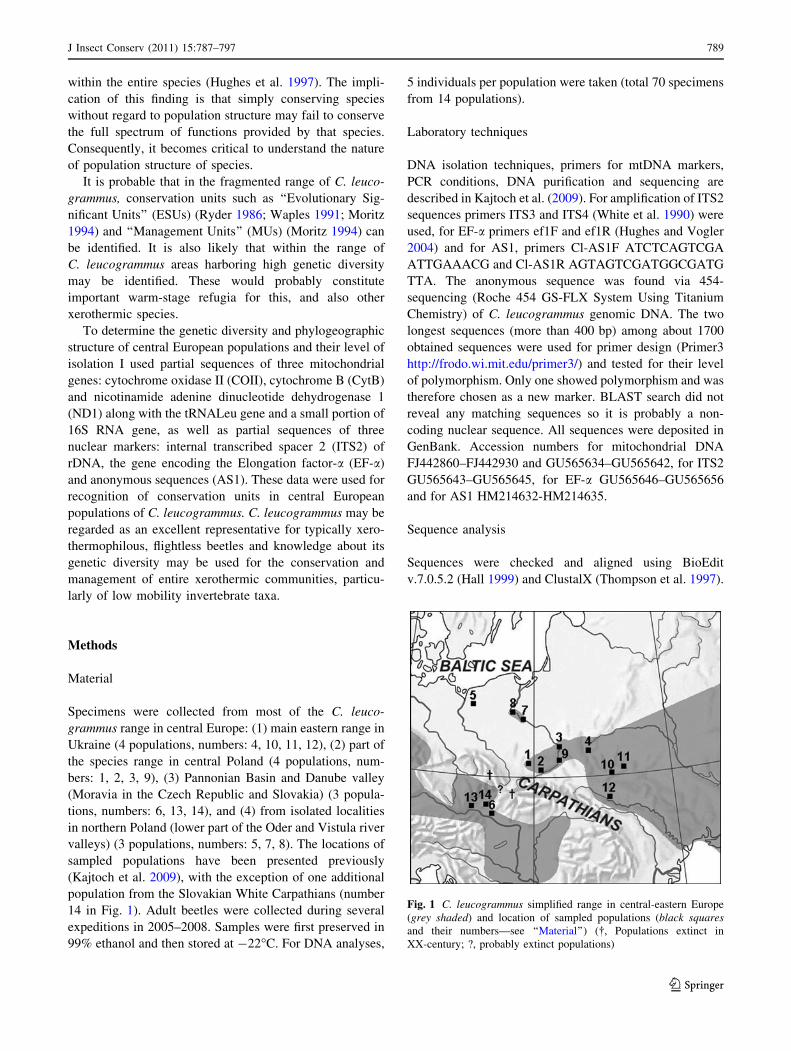
Specimens were collected from most of the C. leuco-
grammus range in central Europe: (1) main eastern range in
Ukraine (4 populations, numbers: 4, 10, 11, 12), (2) part of
the species range in central Poland (4 populations, num-
bers: 1, 2, 3, 9), (3) Pannonian Basin and Danube valley
(Moravia in the Czech Republic and Slovakia) (3 popula-
tions, numbers: 6, 13, 14), and (4) from isolated localities
in northern Poland (lower part of the Oder and Vistula river
valleys) (3 populations, numbers: 5, 7, 8). The locations of
sampled populations have been presented previously
(Kajtoch et al. 2009), with the exception of one additional
population from the Slovakian White Carpathians (number
14 in Fig. 1). Adult beetles were collected during several
expeditions in 2005–2008. Samples were first preserved in
99% ethanol and then stored at -22�C. For DNA analyses,
5 individuals per population were taken (total 70 specimens
from 14 populations).
Laboratory techniques
DNA isolation techniques, primers for mtDNA markers,
PCR conditions, DNA purification and sequencing are
described in Kajtoch et al. (2009). For amplification of ITS2
sequences primers ITS3 and ITS4 (White et al. 1990) were
used, for EF-a primers ef1F and ef1R (Hughes and Vogler
2004) and for AS1, primers Cl-AS1F ATCTCAGTCGA
ATTGAAACG and Cl-AS1R AGTAGTCGATGGCGATG
TTA. The anonymous sequence was found via 454-
sequencing (Roche 454 GS-FLX System Using Titanium
Chemistry) of C. leucogrammus genomic DNA. The two
longest sequences (more than 400 bp) among about 1700
obtained sequences were used for primer design (Primer3
http://frodo.wi.mit.edu/primer3/) and tested for their level
of polymorphism. Only one showed polymorphism and was
therefore chosen as a new marker. BLAST search did not
reveal any matching sequences so it is probably a non-
coding nuclear sequence. All sequences were deposited in
GenBank. Accession numbers for mitochondrial DNA
FJ442860–FJ442930 and GU565634–GU565642, for ITS2
GU565643–GU565645, for EF-a GU565646–GU565656
and for AS1 HM214632-HM214635.
Sequence analysis
Sequences were checked and aligned using BioEdit
v.7.0.5.2 (Hall 1999) and ClustalX (Thompson et al. 1997).
Fig. 1 C. leucogrammus simplified range in central-eastern Europe
(grey shaded) and location of sampled populations (black squaresand their numbers—see ‘‘Material’’) (�, Populations extinct in
XX-century; ?, probably extinct populations)
J Insect Conserv (2011) 15:787–797 789
123
No indels (i.e. insertions or deletions) or stop codons were
observed in the mitochondrial sequences. Also no indels
were found in nuclear sequences except for two short
polymorphic microsatellites in the ITS2 sequences. Iden-
tical sequences were combined into unique haplotypes. All
ITS2 and EF-a sequences were homozygous as judged
from the lack of double peaks in chromatograms in from
both directions; the only exceptions were microsatellites
inside ITS2. The number of microsatellite motifs repeats
was determined for heterozygous specimens on the basis of
forward and reverse sequence comparison. In AS1
sequences some individuals were heterozygous in the 154
and 155 nucleotide positions (most had ‘‘T’’ in both posi-
tions, some ‘‘C’’ and four ‘‘Y’’). BLAST search showed
that between 347 and 432 bp of the obtained EF-asequence is an intron (85 bp). The three fragments of
mtDNA genes obtained (COII, CytB, and ND1-tRNALeu)
were subjected to a partition homogeneity test (Farris et al.
1995) using PAUP* 4.10b (Swofford 2002), which showed
that further analyses could be performed on combined
sequences. Nuclear sequences were analyzed separately for
each marker. Haplotypes were identified and standard
genetic indices such as haplotype diversity (h), nucleotide
diversity (p), number of segregating sites (S) and frequency
of private haplotypes (Np) for populations were computed
using the program DnaSP v.5 (Librado and Rozas 2009).
In most analyses C. leucogrammus populations were
a priori clustered into four groups representing the main
geographic parts of the species range (1) eastern (Ukraine),
(2) central (central Poland), (3) southern (Moravia and
Slovakia) and (4) northern (northern Poland). This group-
ing of samples is in accordance with the genetic distinc-
tiveness of other steppe-like species. I tested if this pattern
is also characteristic for C. leucogrammus.
Mitochondrial sequences were used for phylogenetic
tree reconstruction in previous work (Kajtoch et al. 2009).
As polymorphism of nuclear sequences was low, standard
phylogenetic methods for identification of phylogenetic
clusters were not applied. Instead, haplotype networks were
constructed using the statistical parsimony method (SP)
(Templeton et al. 1992) and the TCS 1.21 program
(Clement et al. 2000). Circles representing haplotypes were
drawn according to the four main groups of populations.
This graphical representation was made to show how the
relationships among haplotypes correspond to their geo-
graphic distribution.
Nucleotide pairwise distances were calculated only for
mitochondrial sequences using MEGA v.4 (Tamura et al.
2007). FST indices were calculated in ARLEQUIN 3.1
using 1.000 permutations to test for statistical significance
(Schneider et al. 2000). A Mantel test (Mantel 1967) was
performed in ARLEQUIN 3.1 to check if the genetic
structure of the populations fits an isolation by distance
model (IBD) (Slatkin 1993), using pairwise FST values and
straight-line geographic distances in kilometers. To test for
geographical structuring of populations, an analysis of
molecular variance (AMOVA) was conducted using AR-
LEQUIN 3.1. Clustering was based on the four main
groups described above. The level of migration between
populations was estimated using the frequency of private
haplotypes (Np) (Slatkin 1985)) and Nm indices (Wright
1951). Nm indices were calculated according to formulas:
Nm & (1 - FST)/4 FST (for nuclear sequences) and
Nm & (1 - FST)/2 FST (for mtDNA). Values of Nm [ 1
indicate a high level of gene flow (Cockerham and Weir
1993). Migration rates (M) were also estimated in program
the Lamarc v.2.1.3 (Kuhner 2006) which takes advantage
of Likelihood Analysis with Metropolis Algorithm using
Random Coalescence (Kuhner and Smith 2007). Bayesian
analyses were used separately for mtDNA (joined
sequences) and nuDNA (sequences of all three markers
were treated as separate regions). Four short chains (10,000
generations, sampling every 20) and two long chains
(1,000,000 generations, sampling every 100) were run,
2,000 initial samples were regarded as burn-in. Analyses
were repeated twice. For calculation of FST indices, Mantel
test, AMOVA and M, all nuclear markers were concate-
nated. Mitochondrial sequences were also combined. The
two microsatellites in the ITS2 sequences were excluded
from the above-mentioned analyses. The polymorphism
exhibited by these microsatellites was only described in the
results.
Results
Genetic diversity
I obtained a 1,632 bp fragment of mitochondrial DNA
(661 bp of COII, 435 bp of CytB and 536 bp of ND1-
tRNALeu-16S), 553–564 bp of ITS2, 658 bp of EF-aand 333 bp of AS1. Among the 70 studied specimens of
C. leucogrammus 45 mitochondrial, 3 ITS2 (excluding
microsatellites), 11 EF-a and 4 AS1 haplotypes were
identified.
A total of 47 segregating sites were detected in the
mitochondrial DNA. Mean haplotype diversity (h) was
0.98 ± 0.01 and mean nucleotide diversity (p) was 0.57%
(Table 1). No population was monomorphic. Except for
one pair of populations from central Poland and one pair of
populations from Slovakia, no haplotypes were shared
between populations, however, neighboring populations
often had similar haplotypes (differing by only one to a few
mutations).
There were only 2 polymorphic segregating sites in
the ITS2 sequences. Mean haplotype diversity (h) was
790 J Insect Conserv (2011) 15:787–797
123
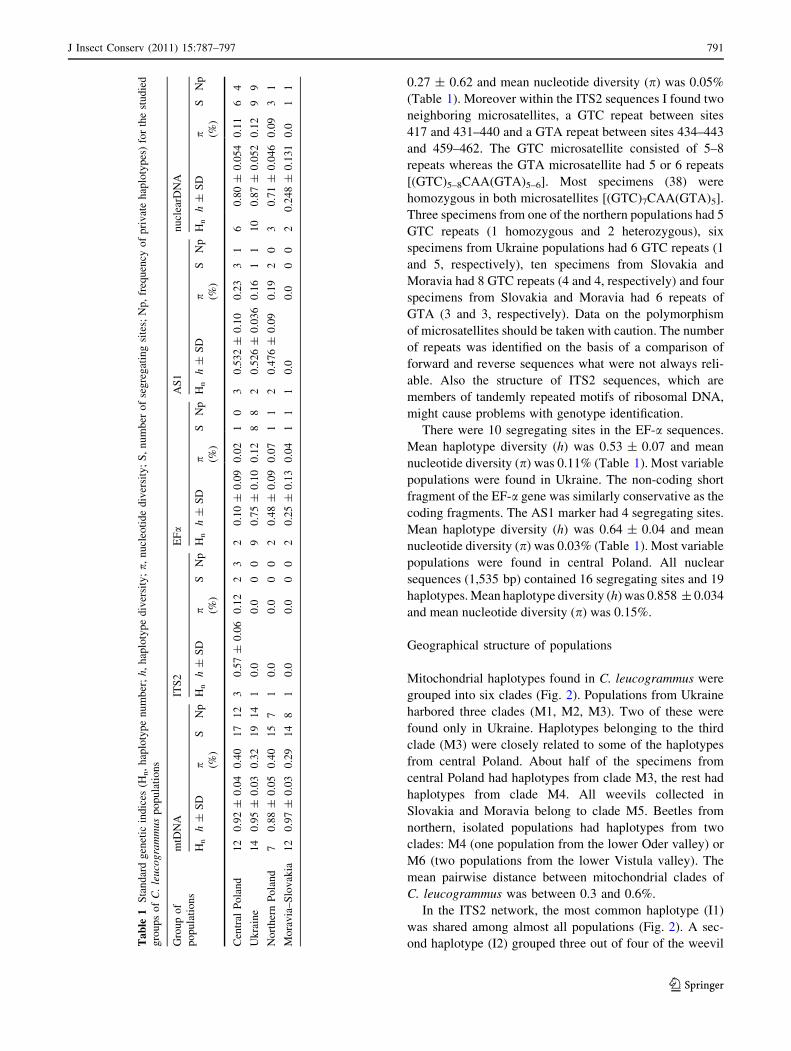
0.27 ± 0.62 and mean nucleotide diversity (p) was 0.05%
(Table 1). Moreover within the ITS2 sequences I found two
neighboring microsatellites, a GTC repeat between sites
417 and 431–440 and a GTA repeat between sites 434–443
and 459–462. The GTC microsatellite consisted of 5–8
repeats whereas the GTA microsatellite had 5 or 6 repeats
[(GTC)5–8CAA(GTA)5–6]. Most specimens (38) were
homozygous in both microsatellites [(GTC)7CAA(GTA)5].
Three specimens from one of the northern populations had 5
GTC repeats (1 homozygous and 2 heterozygous), six
specimens from Ukraine populations had 6 GTC repeats (1
and 5, respectively), ten specimens from Slovakia and
Moravia had 8 GTC repeats (4 and 4, respectively) and four
specimens from Slovakia and Moravia had 6 repeats of
GTA (3 and 3, respectively). Data on the polymorphism
of microsatellites should be taken with caution. The number
of repeats was identified on the basis of a comparison of
forward and reverse sequences what were not always reli-
able. Also the structure of ITS2 sequences, which are
members of tandemly repeated motifs of ribosomal DNA,
might cause problems with genotype identification.
There were 10 segregating sites in the EF-a sequences.
Mean haplotype diversity (h) was 0.53 ± 0.07 and mean
nucleotide diversity (p) was 0.11% (Table 1). Most variable
populations were found in Ukraine. The non-coding short
fragment of the EF-a gene was similarly conservative as the
coding fragments. The AS1 marker had 4 segregating sites.
Mean haplotype diversity (h) was 0.64 ± 0.04 and mean
nucleotide diversity (p) was 0.03% (Table 1). Most variable
populations were found in central Poland. All nuclear
sequences (1,535 bp) contained 16 segregating sites and 19
haplotypes. Mean haplotype diversity (h) was 0.858 ± 0.034
and mean nucleotide diversity (p) was 0.15%.
Geographical structure of populations
Mitochondrial haplotypes found in C. leucogrammus were
grouped into six clades (Fig. 2). Populations from Ukraine
harbored three clades (M1, M2, M3). Two of these were
found only in Ukraine. Haplotypes belonging to the third
clade (M3) were closely related to some of the haplotypes
from central Poland. About half of the specimens from
central Poland had haplotypes from clade M3, the rest had
haplotypes from clade M4. All weevils collected in
Slovakia and Moravia belong to clade M5. Beetles from
northern, isolated populations had haplotypes from two
clades: M4 (one population from the lower Oder valley) or
M6 (two populations from the lower Vistula valley). The
mean pairwise distance between mitochondrial clades of
C. leucogrammus was between 0.3 and 0.6%.
In the ITS2 network, the most common haplotype (I1)
was shared among almost all populations (Fig. 2). A sec-
ond haplotype (I2) grouped three out of four of the weevilTa
ble
1S
tan
dar
dg
enet
icin
dic
es(H
n,
hap
loty
pe
nu
mb
er;
h,
hap
loty
pe
div
ersi
ty;p,
nu
cleo
tid
ed
iver
sity
;S
,n
um
ber
of
seg
reg
atin
gsi
tes;
Np
,fr
equ
ency
of
pri
vat
eh
aplo
typ
es)
for
the
stu
die
d
gro
up
so
fC
.le
uco
gra
mm
us
po
pu
lati
on
s
Gro
up
of
po
pu
lati
on
s
mtD
NA
ITS
2E
Fa
AS
1n
ucl
earD
NA
Hn
h±
SD
p (%)
SN
pH
nh
±S
Dp (%
)
SN
pH
nh
±S
Dp (%
)
SN
pH
nh
±S
Dp (%
)
SN
pH
nh
±S
Dp (%
)
SN
p
Cen
tral
Po
lan
d1
20
.92
±0
.04
0.4
01
71
23
0.5
7±
0.0
60
.12
23
20
.10
±0
.09
0.0
21
03
0.5
32
±0
.10
0.2
33
16
0.8
0±
0.0
54
0.1
16
4
Uk
rain
e1
40
.95
±0
.03
0.3
21
91
41
0.0
0.0
00
90
.75
±0
.10
0.1
28
82
0.5
26
±0
.03
60
.16
11
10
0.8
7±
0.0
52
0.1
29
9
No
rth
ern
Po
lan
d7
0.8
8±
0.0
50
.40
15
71
0.0
0.0
00
20
.48
±0
.09
0.0
71
12
0.4
76
±0
.09
0.1
92
03
0.7
1±
0.0
46
0.0
93
1
Mo
rav
ia–
Slo
vak
ia1
20
.97
±0
.03
0.2
91
48
10
.00
.00
02
0.2
5±
0.1
30
.04
11
10
.00
.00
02
0.2
48
±0
.13
10
.01
1
J Insect Conserv (2011) 15:787–797 791
123
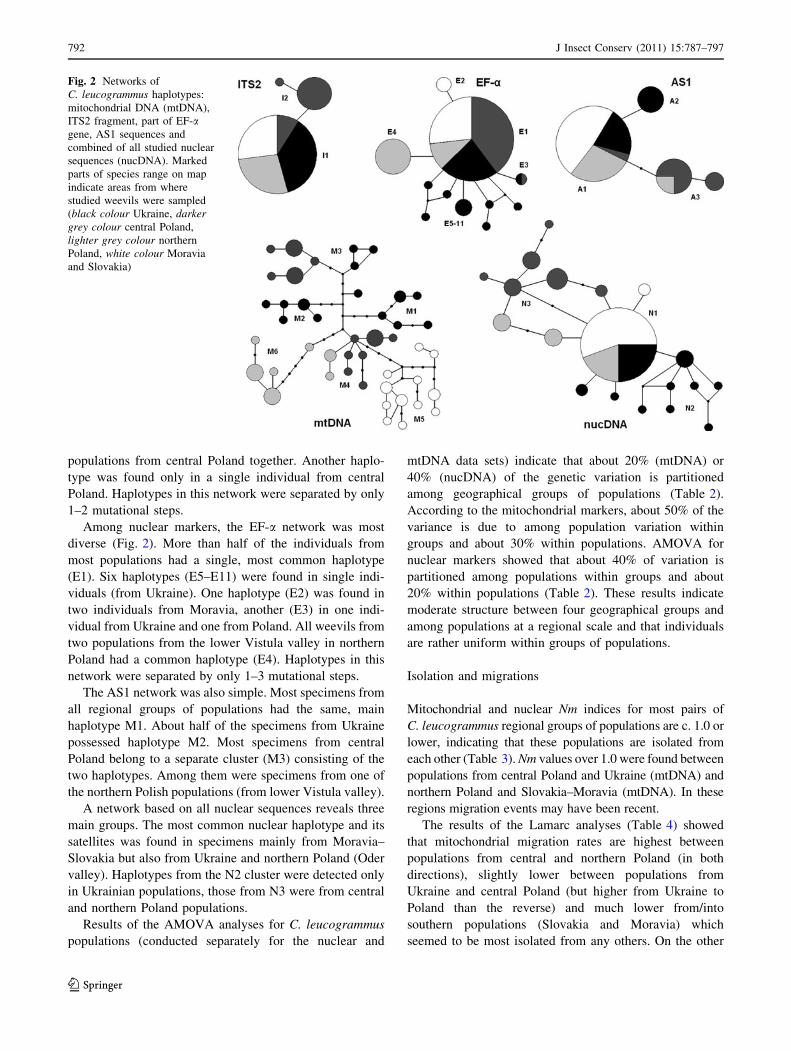
populations from central Poland together. Another haplo-
type was found only in a single individual from central
Poland. Haplotypes in this network were separated by only
1–2 mutational steps.
Among nuclear markers, the EF-a network was most
diverse (Fig. 2). More than half of the individuals from
most populations had a single, most common haplotype
(E1). Six haplotypes (E5–E11) were found in single indi-
viduals (from Ukraine). One haplotype (E2) was found in
two individuals from Moravia, another (E3) in one indi-
vidual from Ukraine and one from Poland. All weevils from
two populations from the lower Vistula valley in northern
Poland had a common haplotype (E4). Haplotypes in this
network were separated by only 1–3 mutational steps.
The AS1 network was also simple. Most specimens from
all regional groups of populations had the same, main
haplotype M1. About half of the specimens from Ukraine
possessed haplotype M2. Most specimens from central
Poland belong to a separate cluster (M3) consisting of the
two haplotypes. Among them were specimens from one of
the northern Polish populations (from lower Vistula valley).
A network based on all nuclear sequences reveals three
main groups. The most common nuclear haplotype and its
satellites was found in specimens mainly from Moravia–
Slovakia but also from Ukraine and northern Poland (Oder
valley). Haplotypes from the N2 cluster were detected only
in Ukrainian populations, those from N3 were from central
and northern Poland populations.
Results of the AMOVA analyses for C. leucogrammus
populations (conducted separately for the nuclear and
mtDNA data sets) indicate that about 20% (mtDNA) or
40% (nucDNA) of the genetic variation is partitioned
among geographical groups of populations (Table 2).
According to the mitochondrial markers, about 50% of the
variance is due to among population variation within
groups and about 30% within populations. AMOVA for
nuclear markers showed that about 40% of variation is
partitioned among populations within groups and about
20% within populations (Table 2). These results indicate
moderate structure between four geographical groups and
among populations at a regional scale and that individuals
are rather uniform within groups of populations.
Isolation and migrations
Mitochondrial and nuclear Nm indices for most pairs of
C. leucogrammus regional groups of populations are c. 1.0 or
lower, indicating that these populations are isolated from
each other (Table 3). Nm values over 1.0 were found between
populations from central Poland and Ukraine (mtDNA) and
northern Poland and Slovakia–Moravia (mtDNA). In these
regions migration events may have been recent.
The results of the Lamarc analyses (Table 4) showed
that mitochondrial migration rates are highest between
populations from central and northern Poland (in both
directions), slightly lower between populations from
Ukraine and central Poland (but higher from Ukraine to
Poland than the reverse) and much lower from/into
southern populations (Slovakia and Moravia) which
seemed to be most isolated from any others. On the other
Fig. 2 Networks of
C. leucogrammus haplotypes:
mitochondrial DNA (mtDNA),
ITS2 fragment, part of EF-agene, AS1 sequences and
combined of all studied nuclear
sequences (nucDNA). Marked
parts of species range on map
indicate areas from where
studied weevils were sampled
(black colour Ukraine, darkergrey colour central Poland,
lighter grey colour northern
Poland, white colour Moravia
and Slovakia)
792 J Insect Conserv (2011) 15:787–797
123
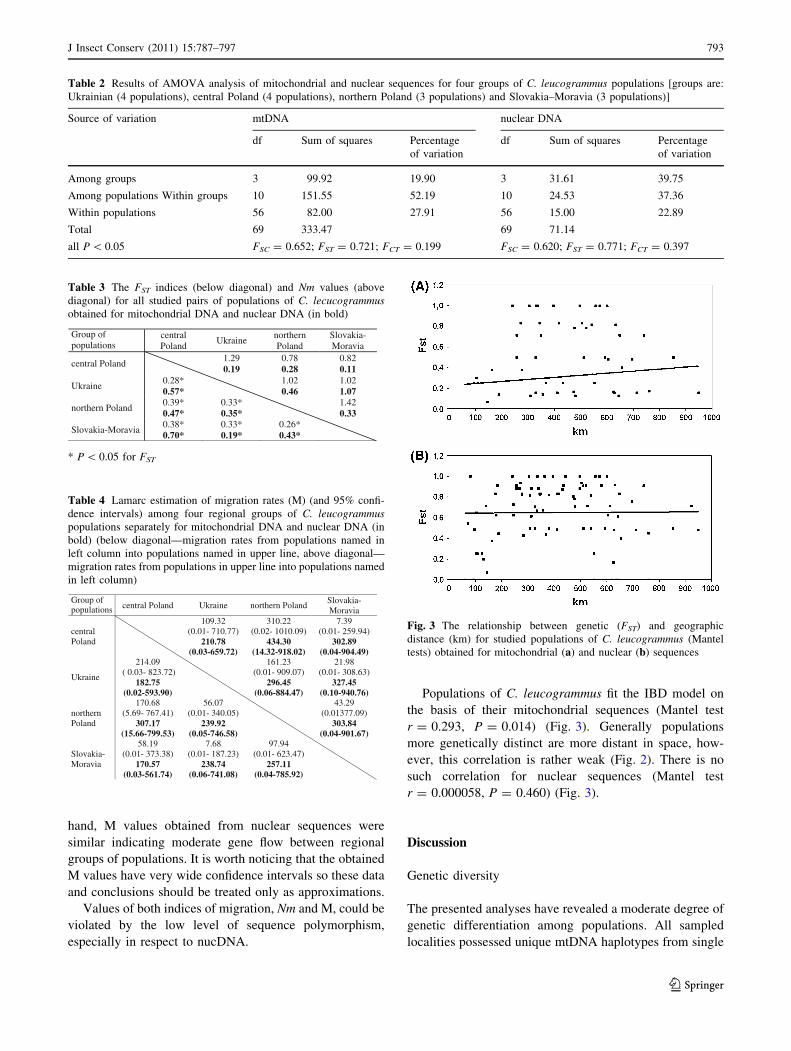
hand, M values obtained from nuclear sequences were
similar indicating moderate gene flow between regional
groups of populations. It is worth noticing that the obtained
M values have very wide confidence intervals so these data
and conclusions should be treated only as approximations.
Values of both indices of migration, Nm and M, could be
violated by the low level of sequence polymorphism,
especially in respect to nucDNA.
Populations of C. leucogrammus fit the IBD model on
the basis of their mitochondrial sequences (Mantel test
r = 0.293, P = 0.014) (Fig. 3). Generally populations
more genetically distinct are more distant in space, how-
ever, this correlation is rather weak (Fig. 2). There is no
such correlation for nuclear sequences (Mantel test
r = 0.000058, P = 0.460) (Fig. 3).
Discussion
Genetic diversity
The presented analyses have revealed a moderate degree of
genetic differentiation among populations. All sampled
localities possessed unique mtDNA haplotypes from single
Table 2 Results of AMOVA analysis of mitochondrial and nuclear sequences for four groups of C. leucogrammus populations [groups are:
Ukrainian (4 populations), central Poland (4 populations), northern Poland (3 populations) and Slovakia–Moravia (3 populations)]
Source of variation mtDNA nuclear DNA
df Sum of squares Percentage
of variation
df Sum of squares Percentage
of variation
Among groups 3 99.92 19.90 3 31.61 39.75
Among populations Within groups 10 151.55 52.19 10 24.53 37.36
Within populations 56 82.00 27.91 56 15.00 22.89
Total 69 333.47 69 71.14
all P \ 0.05 FSC = 0.652; FST = 0.721; FCT = 0.199 FSC = 0.620; FST = 0.771; FCT = 0.397
Table 3 The FST indices (below diagonal) and Nm values (above
diagonal) for all studied pairs of populations of C. lecucogrammusobtained for mitochondrial DNA and nuclear DNA (in bold)
Group of populations
central Poland
Ukrainenorthern Poland
Slovakia-Moravia
central Poland1.290.19
0.780.28
0.820.11
Ukraine0.28*0.57*
1.020.46
1.021.07
northern Poland0.39*0.47*
0.33*0.35*
1.420.33
Slovakia-Moravia0.38*0.70*
0.33*0.19*
0.26*0.43*
* P \ 0.05 for FST
Table 4 Lamarc estimation of migration rates (M) (and 95% confi-
dence intervals) among four regional groups of C. leucogrammuspopulations separately for mitochondrial DNA and nuclear DNA (in
bold) (below diagonal—migration rates from populations named in
left column into populations named in upper line, above diagonal—
migration rates from populations in upper line into populations named
in left column)
Group of populations central Poland Ukraine northern Poland
Slovakia-Moravia
central Poland
109.32(0.01- 710.77)
210.78(0.03-659.72)
310.22(0.02- 1010.09)
434.30(14.32-918.02)
7.39(0.01- 259.94)
302.89(0.04-904.49)
Ukraine
214.09( 0.03- 823.72)
182.75(0.02-593.90)
161.23 (0.01- 909.07)
296.45(0.06-884.47)
21.98 (0.01- 308.63)
327.45(0.10-940.76)
northern Poland
170.68(5.69- 767.41)
307.17(15.66-799.53)
56.07(0.01- 340.05)
239.92(0.05-746.58)
43.29(0.01377.09)
303.84(0.04-901.67)
Slovakia-Moravia
58.19(0.01- 373.38)
170.57(0.03-561.74)
7.68 (0.01- 187.23)
238.74(0.06-741.08)
97.94 (0.01- 623.47)
257.11(0.04-785.92)
Fig. 3 The relationship between genetic (FST) and geographic
distance (km) for studied populations of C. leucogrammus (Mantel
tests) obtained for mitochondrial (a) and nuclear (b) sequences
J Insect Conserv (2011) 15:787–797 793
123
or two–three haplogroups leading to a highly structured
relationship between genetic diversity and geography. The
network obtained from mitochondrial sequence data sug-
gests very little historic interconnectivity between popu-
lations in geographic proximity. Consequently, most
populations are effectively isolated from each other. The
only exceptions are a single pair of neighboring popula-
tions from central Poland and closely located populations
in Slovakia, with shared single haplotypes indicative of
recent or presently restricted gene flow. Related haplotypes
identified in Ukraine and central Poland probably represent
past connection between these two regions during the
Pleistocene glaciations, when dry grasslands were more
common (Adams 1997; Lindner et al. 2006; Magyari et al.
2010). Also one of most northern populations (from the
lower Oder river valley), containing haplotypes very clo-
sely related to some haplotypes from central Poland, may
be the result of species expansion from the south and
subsequent extinction of intermediate populations (Kajtoch
et al. 2009). Indeed a low level of migration between these
regional groups of populations (Ukraine and central
Poland, central and northern Poland, central Poland and
Moravia–Slovakia) was detected (Tables 3, 4).
On the other hand the extensive nuclear DNA haplotype
sharing among populations either results from gene flow or
ancestral polymorphism with an absence of substitution
since population isolation. This pattern may result from a
combination of slower rates of evolution and the longer
time necessary for lineage sorting for the nuclear poly-
morphism compared to variation observed in the mtDNA
genes (Maddison 1997; Carstens and Knowles 2007),
rather than any recent gene flow. Differences in migration
rates calculated from mitochondrial and nuclear sequences
may also be the result of female philopatry and male dis-
persal. This explanation is unlikely in the light of knowl-
edge on C. leucogrammus ecology and biology,
particularly dispersal abilities, which are very poor (Mazur
2001). Both sexes of this species are flightless so probably
males are not more migratory than females. Geographically
distant populations that display highly divergent mtDNA
lineages, like southern and northern populations, share part
of their nuclear haplotypes. However, in some instances,
especially when nuclear sequences are analyzed jointly, the
nuclear DNA data reinforces the notion of ongoing dif-
ferentiation among populations of four geographic groups:
Ukraine, central-Poland, northern-Poland (at least lower
Vistula valley) and Slovakia–Moravia, supporting further
the general observation of moderate population structure
derived from mtDNA. The use of more rapidly evolving
DNA markers such as microsatellites may help resolve
relationships among populations and show present migra-
tion routes and barriers among them, both in regional and
local scales.
The highest genetic diversity was found in populations
from Ukraine where three out of six mitochondrial clades
exist (M1, M2, M3). Nuclear markers revealed significant
diversity of weevils from these eastern populations. Dif-
ferent microsatellite alleles from the ITS2 sequences were
found, both in homo- and heterozygotes, a private AS1
haplotype (A2) and the highest haplotype and nucleotide
diversity of EF-a (nine of eleven haplotypes, except E2 and
E4) and joined nuclear DNA. Populations from central
Poland also exhibit a high level of genetic diversity. These
populations contain two mitochondrial clades (M3 and
M4), one of which (M4) is also central for the whole
mtDNA network. Most weevils from this part of the spe-
cies range have a more distinct ITS2 haplotype (I2) than
the common one (I1) found in other populations, leading to
high haplotype diversity, a private AS1 haplotype (from the
A3 cluster). They also belong to a separate cluster in the
nuclear DNA network. The variability of sequences from
southern populations (Slovakia and Moravia) is lower but
still significant. All these populations belong to one mito-
chondrial clade (M5), which is quite diversified (very high
haplotype diversity) and also have different alleles in the
ITS2 microsatellites. Surprisingly, populations from the
northern part of the C. leucogrammus range, where this
species could have existed for no more than 10,000 years
due to unfavourable environmental conditions (ice-sheet)
(Adams 1997; Lindner et al. 2006; Magyari et al. 2010),
are also quite differentiated genetically. These populations
belong to two mitochondrial clades (M4 and M6), but only
those from the lower Vistula river possessed haplotypes
(clustered in M6 clade) not closely related to haplotypes
from central Poland (clade M4). These populations also
have a single private EF1-a haplotype (E4) and joined
nuclear haplotypes (from cluster N3) and a private number
of repeats in the microsatellites. The data presented above
additionally supports the hypothesis of the long-term sur-
vival of C. leucogrammus populations in situ in central
Europe (Mazur 2001; Kajtoch et al. 2009). The highest
genetic diversity in Ukraine showed that this part of the
species range is probably the most important present
(warm-stage) refuge, at least in central-east Europe. This
finding is congruent with other studies that have found high
genetic diversity and refugia of other steppe animals (e.g.
Spotted suslik Spermophilus suslicus Biedrzycka and
Konopinski 2008; Biedrzycka and Radwan 2008; Common
hamster Cricetus cricetus Banaszek et al. 2009) and plants
(e.g. Oxytropis pilosa Schlee et al. 2007; Melica ciliata and
M. transsilvanica Szczepaniak and Cieslak 2006; Elymus
hispidus Szczepaniak et al. 2007; Iris aphylla Wroblewska
2008). In Ukraine large areas of steppe-like and similar dry
habitats still exist, which could sustain vital populations of
steppe organisms. Also the high genetic diversity of pop-
ulations from fragmented parts of C. leucogrammus show
794 J Insect Conserv (2011) 15:787–797
123
that the central Poland highlands, Pannonian Basin and
even xerothermic ‘‘islands’’ south of the Baltic Sea are
important for C. leucogrammus.
Conservation units
The recognition of conservation units below the species
level is a crucial task if we are to avoid the loss of genetic
diversity in species inhabiting threatened environments
such as xerothermic turfs and thickets. One widely used
framework to distinguish units for conservation has been
that of evolutionary significant units (ESU), originally
proposed by Ryder (1986) but further developed by others
(e.g. Waples 1991; Avise 1994; Vogler and DeSalle 1994;
Fraser and Bernatchez 2001). The results here show the
existence of six discrete genetic units within C. leuco-
grammus at a relatively small geographical scale in central-
east Europe, which could be considered as ESUs. I am
aware of sampling limitations in defining ESUs based
exclusively on maternally inherited mtDNA, which does
not reflect male-mediated gene flow (Moritz 1994; Avise
and Hamrick 1995). The nuclear sequences which I used
were much less polymorphic but they support the recog-
nition of two or three ESUs. The ESU of mitochondrial
clade M6, restricted only to the lower Vistula valley, is also
supported by a distinct EF-a (E4) haplotype and the pres-
ence of a 5-repeat GTC motif in the microsatellite. Popu-
lations from Slovakia and Moravia belong to the second
ESU (mitochondrial clade M5) and some of the specimens
from this region also have a distinct number of microsat-
ellite repeats (8 GTC and 6 GTA), found only in these
populations. In Moravia a distinct EF-a haplotype (E2) was
also found. Most weevils from central Poland had a dif-
ferent ITS2 haplotype (I2) than the common one found in
other populations (I1) and also belong to a separate nu-
cDNA cluster, together with populations from northern
Poland. However these weevils belonged to two mito-
chondrial clades, so they do not form a monophyletic group
and cannot be considered as an ESU.
Fraser and Bernatchez (2001) integrated the ESU into a
more general and flexible concept—Adaptive Evolutionary
Conservation (AEC). In general, any criteria providing
evidence of lineage sorting through highly reduced gene
flow are potentially useful for conservation initiatives
under the ESU definition of AEC. The mtDNA data pre-
sented here suggest significant geographical structuring of
genetic variation across the range of C. leucogrammus, and
the phylogeographic analyses point to long-term historical
isolation among at least the three geographical areas where
this species occurs: (1 and 2) from Ukraine to central
Poland, (3) southern (Pannonian, represented here by
populations from Slovakia and Moravia) and (4) northern
Poland (only lower Vistula valley). Because of the
existence of large areas of habitat discontinuity between
these three regions, their genetic singularity and the
inferred history of the group it seems unlikely that genetic
exchange occurs. These three groups of populations can be
considered as ESUs under the AEC.
The four regional (geographic) groups mentioned above
(1) ‘‘eastern’’ Ukrainian, (2) ‘‘central’’ central Poland, (3)
‘‘southern’’ Slovakia–Moravia and (4) ‘‘northern’’ northern
Poland, at least from the lower Vistula valley, could be
considered as independent management units (MUs),
defined by Moritz (1994). Such a division of the C. leuc-
ogrammus range (at least in central Europe) is also clearly
supported by the distribution of many xerothermic and
steppe-like taxa. Ranges of these species in central Europe
are mainly limited to the steppes of Ukraine (Cremene
et al. 2005) and/or Pannonian Basin (Varga 2001), high-
lands of Poland (Mazur 2001) and Germany and also
sometimes to isolated localities in larger river valleys south
of the Baltic Sea (Mazur 2001). The definition of MUs
within C. leucogrammus corresponding to the main steppe/
xerothermic areas of central Europe is also in good corre-
spondence with differences of conservation status.
Anthropogenic habitat transformation is not equal in the
four areas where the populations of the species are found.
Land-use changes are less intense in the eastern part of the
species range (Ukraine, Russia) where large steppe-like
habitats still exist. However, they have recently been
considered as threatened (Cremene et al. 2005). On the
other hand, xerothermic habitats in central and western
Europe, inhabited by this weevil among others, are much
more threatened. Despite protection of these environments
in many nature reserves and the Natura 2000 network of
the European Union, xerothermic patches are scarce,
fragmented and isolated from each other. Moreover, they
are often devastated because of agricultural conversion or
through forestation. These sites are also susceptible to
nitrification which changes their specific vegetation (used
to poor, dry and warm soil conditions) into more dense
herbaceous areas or shrubland. The current practice of
strict xerothermic turf protection is not working. Many
such habitats in present climatic and environmental con-
ditions, modified by human activity, must be protected
actively by grazing, bush-cutting and even periodically
prescribed burning, but these actions are expensive, par-
ticularly for large habitat patches.
C. leucogrammus can be used as a model organism to
study population genetics of species with restricted dis-
persal ability in xerothermic and steppe habitats. Knowl-
edge about genetic differentiation of the extant and mostly
isolated populations of this weevil species with a frag-
mented distribution is extremely important for the success
of future conservation and restoration actions of xerother-
mic patches. Further research on the genetic diversity of
J Insect Conserv (2011) 15:787–797 795
123
various organisms with different mobility patterns should
be undertaken to broaden our knowledge on the conser-
vations needs of entire xerothermic assemblages.
Acknowledgments I would like to greatly thank M. Mazur, M.
Holecova, D. Kubisz and D. Lachowska-Cierlik for collecting of
some of studied specimens. W. Babik, K. Nadachowska and D.
Lachowska-Cierlik helped in different steps of laboratory or analyt-
ical work. I am also grateful to W. Babik for helpful comments to first
draft of manuscript. This research was partially supported by the
Polish Ministry of Science and Higher Education, grant no N N303
612238.
Open Access This article is distributed under the terms of the
Creative Commons Attribution Noncommercial License which per-
mits any noncommercial use, distribution, and reproduction in any
medium, provided the original author(s) and source are credited.
References
Adams JM (1997) Global land environments since the last intergla-
cial. Oak Ridge National Laboratory. http://www.esd.ornl.gov/
ern/qen/nerc.html
Ashcroft MB (2010) Identifying refugia from climate change.
J Biogeogr 37:1407–1413
Avise JC (1994) Molecular markers, natural history and evolution.
Chapman and Hall, New York
Avise JC, Hamrick JL (eds) (1995) Conservation genetics: case
histories from nature. Chapman and Hall, New York
Avise JC, Arnold J, Ball RM, Bermingham E, Lamb T, Neigel JE,
Reeb CA, Saunders NC (1987) Intraspecific phylogeography: the
mitochondrial DNA bridge between population genetics and
systematics. Annu Rev Ecol Syst 18:489–522
Banaszek A, Jadwiszczak KA, Ratkiewicz M, Ziomek J (2009) Low
genetic diversity and significant structuring of the common hamster
populations Cricetus cricetus in Poland revealed by the mtDNA
control region sequence variation. Acta Theriol 54:289–295
Baranska K, Jermaczek P (2009) Poradnik utrzymania i ochrony
siedliska przyrodniczego 6210 murawy kserotermiczne. [Guide-
book for preservation and conservation of xerothermic habitats
6210]. Wydawnictwo Klubu Przyrodnikow, Swiebodzin
Biedrzycka A, Konopinski MK (2008) Genetic variability and the
effect of habitat fragmentation in spotted suslik Spermophilussuslicus populations from two different regions. Conserv Genet
9:1211–1221
Biedrzycka A, Radwan J (2008) Population fragmentation and major
histocompatibility complex variation in the spotted suslik,
Spermophilus suslicus. Mol Ecol 17:4801–4811
Carstens BC, Knowles LL (2007) Estimating phylogeny from gene
tree probabilities in Melanoplus grasshoppers despite incomplete
lineage sorting. Syst Biol 56:400–411
Clement M, Posada D, Crandall KA (2000) TCS: a computer program
to estimate gene genealogies. Mol Ecol 9:1657–1659
Cockerham CC, Weir BS (1993) Estimation of gene flow from
F-statistics. Evolution 47:855–863
Conner JK, Hartl DL (2004) A primer of ecological genetics. Sinauer
Associates, Inc, Sunderland
Cremene C, Groza G, Rakosy L, Schileyko A, Baur A, Erhardt A,
Baur B (2005) Alterations of steppe-like grasslands in Eastern
Europe: a threat to regional biodiversity hotspots. Conserv Biol
19:1606–1618
Farris JS, Kallersjo M, Kluge AG, Bult C (1995) Constructing a
significance test for incongruence. Syst Biol 44:570–572
Frankham R, Ballou JD, Briscoe DA (2002) Introduction to Conser-
vation Genetics. Cambridge University Press, Cambridge
Franzke A, Hurka H, Janssen D, Neuffer B, Friesen N, Markov M,
Mummenhoff K (2004) Molecular signals for Late Tertiary Early
Quaternary range splits of an Eurasian steppe plant: Clausiaaprica (Brassicaceae). Mol Ecol 13:2789–2795
Fraser DJ, Bernatchez L (2001) Adaptive evolutionary conservation:
towards a unified concept for defining conservation units. Mol
Ecol 10:2741–2752
Goloborod’ko KK, Fedenko VS (2008) Parameters of the wing
coloration in the butterfly genus Colias Fabr. (Lepidoptera,
Pieridae) of the steppe zone of eastern and Central Europe.
Entomol Rev 87:1109–1114
Gratton P, Konopinski MK, Sbordoni SV (2008) Pleistocene evolu-
tionary history of the clouded Apollo (Parnassius mnemosyne):
genetic signatures of climate cycles and a ‘‘time-dependent’’
mitochondrial substitution rate. Mol Ecol 17:4248–4262
Haig SM (1998) Molecular contributions to conservation. Ecology
79:413–425
Hall TA (1999) BioEdit: a user-friendly biological sequence align-
ment editor and analysis program for Windows 95/98/NT.
Nucleic Acids Symp Ser (Lond) 41:95–98
Hughes J, Vogler AP (2004) The phylogeny of acorn weevils (genus
Curculio) from mitochondrial and nuclear DNA sequences: the
problem of incomplete data. Mol Phylogenet Evol 32:601–615
Hughes J, Daily BGC, Ehrlich PR (1997) Population diversity: its
extent and extinction. Science 278:689–692
Kajtoch Ł, Lachowska-Cierlik D (2009) Genetic constitution of
parthenogenetic form of Polydrusus inustus (Coleoptera: Cur-
culionidae)—hints of hybrid origin and recombinations. Folia
Biol-Krakow 57:149–156
Kajtoch Ł, Lachowska-Cierlik D, Mazur M (2009) Genetic diversity
of xerothermic weevils Polydrusus inustus and Centricnemusleucogrammus (Coleoptera: Curculionidae) in central Europe.
Eur J Entomology 106:325–334
Knapen D, Knaepkens G, Bervoets L, Taylor MI, Eens M, Verheyen
E (2003) Conservation unis based on mitochondrial and nuclear
DNA variation among European bullhead populations (Cottusgobio L., 1758) from Flanders, Belgium. Conserv Genet 4:129–
140
Kostrowicki AS (1953) Studia nad fauna motyli wzgorz kseroter-
micznych nad dolna Nida. [Studies on butterflies fauna of
xerothermic hills in vicinity of Nida valley]. Fragm faun Mus
Zool Polon Warszawa 6:263–447
Krystufek B, Bryja J, Buzan EV (2009) Mitochondrial phylogeogra-
phy of the European ground squirrel, Spermophilus citellus,
yields evidence on refugia for steppic taxa in the southern
BalkansMitochondrial phylogeography of the ground squirrel.
Heredity 103:129–135
Kuhner MK (2006) LAMARC 2.0: maximum likelihood and
Bayesian estimation of population parameters. Bioinformatics
22:768–770
Kuhner MK, Smith LP (2007) Comparing likelihood and Bayesian
coalescent estimation of population parameters. Genetics
175:155–165
Liana A (1987) Orthoptera of xerothermic habitats in Poland and their
origin. In: Baccetti B (ed) Evolutionary biology of orthopteroid
insects. Ellis Horwood, Chichester, pp 342–346
Librado P, Rozas J (2009) DnaSP v5: A software for comprehensive
analysis of DNA polymorphism data. Bioinformatics 25:1451–
1452
Lindner L, Bogutsky A, Gozhik P, Marks L, Łanczont M,
Wojnatowicz J (2006) Correlation of Pleistocene deposits in
796 J Insect Conserv (2011) 15:787–797
123
the area between the Baltic and Black Sea, Central Europe.
Geological Quarterly 50:195–210
Luck GW, Daily GC, Ehrlich PR (2003) Population diversity and
ecosystem services. TREE 18:331–336
Maddison WP (1997) Gene trees in species trees. Syst Biol
46:523–536
Magyari EK, Chapman JC, Passmore DG, Allen JRM, Huntley JP,
Huntley B (2010) Holocene persistence of wooded steppe in the
Great Hungarian Plan. J Biogeogr 37:915–935
Mantel N (1967) The detection of disease clustering and a generalized
regression approach. Cancer Res 27:209–220
Mazur M (2001) Ryjkowce kserotermiczne Polski (Curculionoidea:
Nemonychidae, Attelabidae, Apionidae, Curculionidae). Studi-
um zoogeograficzne [Xerothermic weevils of Poland (Curculio-
noidea: Nemonychidae, Attelabidae, Apionidae, Curculionidae).
Zoogeographic studies]. Monografie Fauny Polski 22:1–378
Mazur M, Kubisz D (2000) Ochrona owadow siedlisk kserotermicz-
nych Polski (Insect conservation in xerothermic habitats). (In:)
Ochrona owadow w Polsce u progu integracji z Unia Europejska
(Insect conservation in Poland in the beginning of integration
with European Union). Wiadomosci Entomologiczne 2:129–137
Michalik S, Zarzycki K (1995) Management of xerothermic grass-
lands in Poland: botanical approach. Colloques Phytosociolog-
iques 24:881–895
Moritz C (1994) Defining ‘‘Evolutionarily significant units’’ for
conservation. Tree 9:373–375
Paul W (2010) Szlaki holocenskiej migracji roslin kserotermicznych
na ziemie Polski—przeglad ustalen i hipotez oraz perspektywy
badan [Migration routes of xerothermic plants into Poland—
review of knowledge and hypothesis and research perspectives]
[in:] Ratynska H., Walodn B. 2010. Ciepłolubne murawy w
Polsce. [Thermophilous turfs of Poland]. Bydgoszcz
Pfenninger M, Posada D (2002) Phylogeographic history of the land
snail Candidula unifasciata (Poiret, 1801) (Helicellinae, Sty-
lommatophora): fragmentation, corridor migration and second-
ary contact. Evolution 56:1776–1788
Ryder OA (1986) Species conservation and systematics: the dilemma
of the subspecies. Tree 1:9–10
Schlee M, Grimm G, Goker M, Sauer W, Hemleben V (2007) Molecular
and phytosociological insight into postglacial relicts Lathyruspannonicus and Oxytropis pilosa. In: Phylogeography and con-
servation of postglacial relicts. Symposium Abstrakt Book.
National Museum of Natural History (Luxembourg), pp 31–32.
http://www.symposium.lu/relicts/docs/Abstractbook.pdf
Schmitt T, Hewitt GM (2004) The genetic pattern of population threat
and loss: a case study of butterflies. Mol Ecol 13:21–31
Schneider S, Roessli D, Excoffier L (2000) ARLEQUIN: a software
for population genetics data analysis. University of Geneva,
Geneva
Slatkin M (1985) Rare alleles as indicators of gene flow. Evolution
39:53–65
Slatkin M (1993) Isolation by distance in equilibrium and nonequi-
librium populations. Evolution 47:264–279
Swofford DL (2002) PAUP*. Phylogenetic analysis using parsimony
(*and other methods). Sinauer Associates, Sunderland
Szczepaniak M, Cieslak E (2006) Genetic variation and structure in
natural populations of Melica ciliata and M. trassilvanica(Poaceae) as indicated by AFLP markers. Biodiv Res Conserv
3–4:39–43
Szczepaniak M, Cieslak E, Bednarek PT (2007) Natural hybridization
between Elymus repens and E. hispidus assessed by AFLP
analysis. Acta Soc Bot Pol 76:225–234
Tamura K, Dudley J, Nei M, Kumar S (2007) MEGA4: Molecular
evolutionary genetics analysis (mega) software version 4.0. Mol
Biol Evol 24:1596–1599
Templeton AR, Crandall KA, Sing CF (1992) A cladistic analysis of
phenotypic associations with haplotypes inferred from restriction
endonuclease mapping and DNA sequence data III. Cladogram
estimation. Genetics 132:619–633
Thompson JD, Gibson TJ, Plewniak F, Jeanmougin F, Higgins DG
(1997) The ClustalX windows interface: flexible strategies for
multiple sequence alignment aided by quality analysis tools.
Nucl Acids Res 24:4876–4882
Varga Z (2001) Post-glacial dispersal strategies of Orthoptera and
Lepidoptera in Europe and in the Carpathian basin. In: Proc. 13th
Int. Coll. EIS, September 2001, pp 93–105
Vogler A, Desalle R (1994) Diagnosing units of conservation
management. Conserv Biol 8:354–363
Von Heyden L (1880–1881) Catalog der Coleopteren von Sibirien,
mit Einschluss derjenigen der Turanischen Lander, Turkestans
und der chinesischen Grenzgebiete. (The Catalogue of Coleop-
tera of Siberia with adjacent areas of Turan Land, Turkestan and
borderline of China). der Deutschen Entomologischen Gesell-
schaft. Berlin
Waples RS (1991) Pacific salmon, Oncorhynchus spp., and the
definition of ‘‘species’’ under the Endangered Species Act. US
Natl Mar Fish Serv. Mar Fish Rev 53:11–22
Wasowska M (2006) Chrysomelid communities (Chrysomelidae,
Coleoptera) of xerothermic grasslands (Inuletum ensifoliae) in
the Wyzyna Miechowska Uplands (Central Poland). Biologia
61:565–572
White TJ, Bruns T, Lee S, Taylor J (1990) Amplification and direct
sequencing of fungal ribosomal RNA genes for phylogenetics.
In: Innis MA, Gelfand DH, Shinsky JJ, White TJ (eds) PCR
Protocols: a guide to methods and applications. Academic Press,
San Diego, pp 315–322
Willis KJ, Van Andel TA (2004) Trees or no trees? The environments
of central and eastern Europe during the Last Glaciation. Quat
Sci Rev 23:2369–2387
Winkler A (1932) Catalogus Coleopterorum regionis palaearcticae.
Pars 12. Wien, pp 1393–1520
Wright S (1951) The genetic structure of populations. Ann Eugen
15:323–354
Wroblewska A (2008) From the center to the margins of geographical
range: molecular history of steppe plant Iris aphylla L. in
Europe. Plant Syst Evol 272:49–65
J Insect Conserv (2011) 15:787–797 797
123


